0000729218fmr:C000014819Memberfmr:TH0Member2024-10-31
UNITED STATES
SECURITIES AND EXCHANGE COMMISSION
Washington, D.C. 20549
FORM N-CSR
CERTIFIED SHAREHOLDER REPORT OF REGISTERED
MANAGEMENT INVESTMENT COMPANIES
Investment Company Act file number 811-03855
Fidelity Advisor Series VIII
(Exact name of registrant as specified in charter)
245 Summer St., Boston, Massachusetts 02210
(Address of principal executive offices) (Zip code)
Nicole Macarchuk, Secretary
245 Summer St.
Boston, Massachusetts 02210
(Name and address of agent for service)
Registrant's telephone number, including area code:
617-563-7000
| |
Date of fiscal year end: | October 31 |
|
|
Date of reporting period: | October 31, 2024 |
Item 1.
Reports to Stockholders
| |
| | ANNUAL SHAREHOLDER REPORT | AS OF OCTOBER 31, 2024 | This report describes changes to the Fund that occurred during the reporting period. |
| | Fidelity Advisor® International Capital Appreciation Fund Fidelity Advisor® International Capital Appreciation Fund Class A : FCPAX |
| | | |
This annual shareholder report contains information about Fidelity Advisor® International Capital Appreciation Fund for the period November 1, 2023 to October 31, 2024. You can find additional information about the Fund at fundresearch.fidelity.com/prospectus/sec. You can also request this information by contacting us at 1-877-208-0098 or by sending an e-mail to fidfunddocuments@fidelity.com.
What were your Fund costs for the last year?(based on hypothetical $10,000 investment)
FUND COST (PREVIOUS YEAR)
| | Costs of a $10,000 investment | Costs paid as a percentage of a $10,000 investment | |
| Class A | $ 130 | 1.14% | |
What affected the Fund's performance this period?
•International stocks achieved a strong gain for the 12 months ending October 31, 2024. Resilient global economic growth and a slowing in the pace of inflation in certain regions, as well as a shift to global monetary easing, contributed to a favorable backdrop, despite persistent geopolitical risk.
•Against this backdrop, security selection and an underweight in emerging markets and stock selection in Europe ex U.K. contributed to the fund's performance versus the MSCI All Country World ex US Index (Net MA) for the fiscal year.
•By sector, market selection was the primary contributor, led by an overweight in information technology, where an overweight in semiconductors & semiconductor equipment helped most. Picks and an overweight in industrials also boosted relative performance. Also contributing to our result was a lack of exposure to the lagging energy sector.
•The fund's non-benchmark stake in Nvidia gained 221% and was the top individual relative contributor. The stock was not held at period end. A second notable relative contributor was an overweight in Taiwan Semiconductor Manufacturing (+100%). The company was the fund's largest holding. Another notable relative contributor was an overweight in Brookfield Asset Management (+91%).
•In contrast, from a regional standpoint, security selection in Canada and an overweight in Europe ex U.K., primarily in France, detracted from the fund's relative result.
•By sector, the biggest detractor from performance versus the benchmark was stock selection in information technology, primarily within the software & services industry. Also hurting our result were stock picks in consumer staples and health care.
•The biggest individual relative detractor was our stake in OBIC (-23%). A second notable relative detractor was an underweight in Shopify (+66%). An overweight in LVMH Moet Hennessy Louis Vuitton (-6%) also hurt. The stock was among our largest holdings.
•Notable changes in positioning include increased exposure to China and Japan. By sector, meaningful changes in positioning include increased exposure to communication services and a lower allocation to consumer staples, where we liquidated all of the fund's holdings.
How did the Fund perform over the past 10 years?
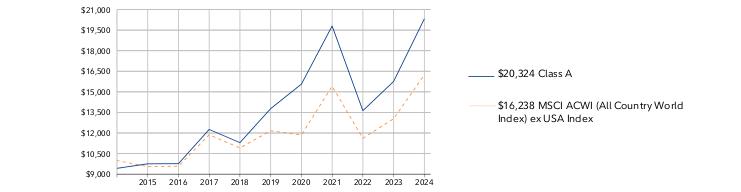
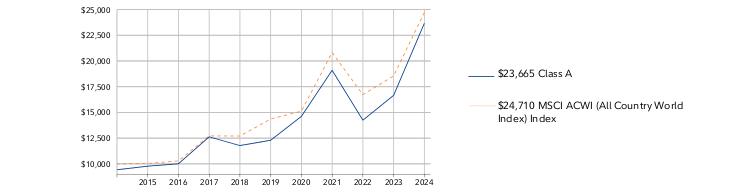
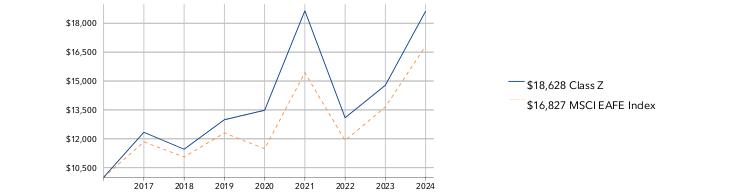
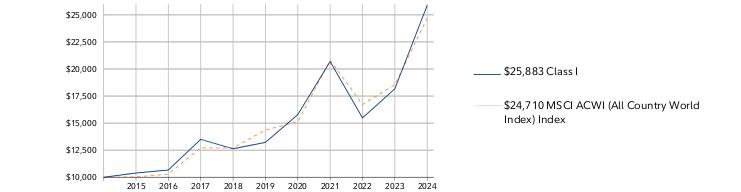
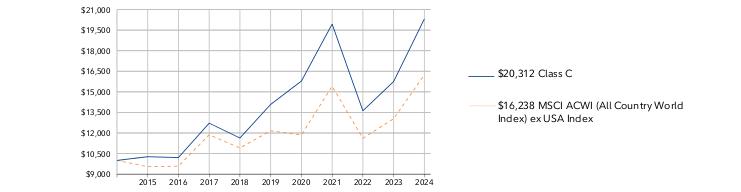
CUMULATIVE PERFORMANCE
October 31, 2014 through October 31, 2024.
Initial investment of $10,000 and the current sales charge was paid.
Class A | $9,425 | $9,751 | $9,763 | $12,259 | $11,297 | $13,774 | $15,561 | $19,803 | $13,628 | $15,759 | $20,324 |
MSCI ACWI (All Country World Index) ex USA Index | $10,000 | $9,545 | $9,583 | $11,868 | $10,910 | $12,161 | $11,862 | $15,403 | $11,613 | $13,038 | $16,238 |
| | 2014 | 2015 | 2016 | 2017 | 2018 | 2019 | 2020 | 2021 | 2022 | 2023 | 2024 |
AVERAGE ANNUAL TOTAL RETURNS:| | 1 Year | 5 Year | 10 Year |
| Class A (incl. 5.75% sales charge) | 21.55% | 6.82% | 7.35% |
| Class A (without 5.75% sales charge) | 28.97% | 8.09% | 7.99% |
| MSCI ACWI (All Country World Index) ex USA Index | 24.55% | 5.95% | 4.97% |
Visit institutional.fidelity.com for more recent performance information. |
The Fund's past performance is not a good predictor of the Fund's future performance. The graph and table do not reflect the deduction of taxes that a shareholder would pay on fund distributions or redemption of fund shares. |
Key Fund Statistics(as of October 31, 2024)
KEY FACTS | | |
| Fund Size | $8,714,030,084 | |
| Number of Holdings | 63 | |
| Total Advisory Fee | $61,601,570 | |
| Portfolio Turnover | 63% | |
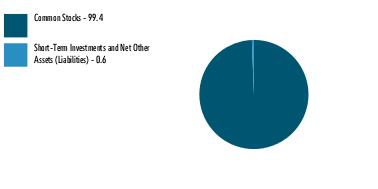
What did the Fund invest in?
(as of October 31, 2024)
MARKET SECTORS (% of Fund's net assets) | | |
| Industrials | 30.8 | |
| Financials | 21.6 | |
| Information Technology | 18.3 | |
| Consumer Discretionary | 11.3 | |
| Materials | 8.8 | |
| Health Care | 4.5 | |
| Communication Services | 4.1 | |
| |
| Common Stocks | 99.4 |
| Short-Term Investments and Net Other Assets (Liabilities) | 0.6 |
ASSET ALLOCATION (% of Fund's net assets) |
|
|
| United States | 20.0 |
| Japan | 12.6 |
| United Kingdom | 10.9 |
| France | 8.8 |
| India | 7.9 |
| Canada | 6.4 |
| China | 5.3 |
| Netherlands | 5.2 |
| Taiwan | 4.5 |
| Others | 18.4 |
GEOGRAPHIC DIVERSIFICATION (% of Fund's net assets) |
|
| |
|
TOP HOLDINGS(% of Fund's net assets) | | |
| Taiwan Semiconductor Manufacturing Co Ltd | 4.5 | |
| Novo Nordisk A/S Series B | 2.9 | |
| Tencent Holdings Ltd | 2.5 | |
| SAP SE | 2.5 | |
| ASML Holding NV | 2.3 | |
| LVMH Moet Hennessy Louis Vuitton SE | 2.3 | |
| Schneider Electric SE | 2.1 | |
| Hitachi Ltd | 1.9 | |
| ABB Ltd | 1.8 | |
| Keyence Corp | 1.7 | |
| | 24.5 | |
How has the Fund changed?
This is a summary of certain changes to the Fund since November 1, 2023. For more complete information, you may review the Fund's next prospectus, which we expect to be available by December 30, 2024 at fundresearch.fidelity.com/prospectus/sec or upon request at 1-877-208-0098 or by sending an e-mail to fidfunddocuments@fidelity.com.
The fees associated with this class changed during the reporting year.The variations in class fees are primarily the result of the following changes: - Management fee
- Operating expenses
- Performance adjustment fee
The fund's transfer agent and pricing & bookkeeping fees were changed to a fixed rate effective December 1, 2023, through February 29, 2024, in anticipation of the transition to a new management fee structure. Effective March 1, 2024, the fund's management contract was amended to incorporate administrative services previously covered under separate services agreements (transfer agent and pricing & bookkeeping). The amended contract incorporates a basic fee rate that may vary by class (subject to a performance adjustment). The Adviser or an affiliate pays certain expenses of managing and operating the fund out of each class's management fee. | The fund's sub-advisory agreement with FIL Investments (Japan) Limited was not renewed.
|
| Fidelity, the Fidelity Investments Logo and all other Fidelity trademarks or service marks used herein are trademarks or service marks of FMR LLC. Any third-party marks that are used herein are trademarks or service marks of their respective owners. © 2024 FMR LLC. All rights reserved. |
| | For additional information about the Fund; including its prospectus, financial information, holdings and proxy information, scan the QR code or visit fundresearch.fidelity.com/prospectus/sec 1.9913824.100 288-TSRA-1224 |
| |
| | ANNUAL SHAREHOLDER REPORT | AS OF OCTOBER 31, 2024 | This report describes changes to the Fund that occurred during the reporting period. |
| | Fidelity Advisor® Emerging Asia Fund Fidelity Advisor® Emerging Asia Fund Class M : FEATX |
| | | |
This annual shareholder report contains information about Fidelity Advisor® Emerging Asia Fund for the period November 1, 2023 to October 31, 2024. You can find additional information about the Fund at fundresearch.fidelity.com/prospectus/sec. You can also request this information by contacting us at 1-877-208-0098 or by sending an e-mail to fidfunddocuments@fidelity.com.
What were your Fund costs for the last year?(based on hypothetical $10,000 investment)
FUND COST (PREVIOUS YEAR)
| | Costs of a $10,000 investment | Costs paid as a percentage of a $10,000 investment | |
| Class M | $ 176 | 1.49% | |
What affected the Fund's performance this period?
•International stocks achieved a strong gain for the 12 months ending October 31, 2024. Resilient global economic growth and a slowing in the pace of inflation in certain regions, as well as a shift to global monetary easing, contributed to a favorable backdrop, despite persistent geopolitical risk.
•Against this backdrop, stock picking and an overweight in Asia Pacific ex Japan, primarily in Singapore, contributed to the fund's performance versus the MSCI AC Asia Ex Japan (Net Mass) Linked Index for the fiscal year. Within emerging markets, stock selection and an overweight in India helped.
•By sector, security selection in consumer discretionary - notably the consumer services segment - was the primary contributor. Stock picking in communication services, primarily within the media & entertainment industry, also boosted the fund's relative performance. Also lifting the fund's relative result were stock picks and an overweight in information technology, primarily within the semiconductors & semiconductor equipment industry.
•The top individual relative contributor was an overweight in Sea (+126%). The company was one of the fund's biggest holdings. A non-benchmark stake in MakeMyTrip gained about 160% and was a second notable relative contributor. The company was among our biggest holdings. Another notable relative contributor was an overweight in Zomato (+125%). This period we decreased our stake in Zomato. The stock was one of our largest holdings.
•In contrast, from a regional standpoint, stock selection in China had the largest negative impact on relative performance. A non-benchmark allocation to the U.K. also detracted from the fund's relative result.
•By sector, the biggest detractors from performance versus the benchmark were stock picks and an overweight in health care. Security selection in financials also hampered the fund's result.
•The largest individual relative detractor was our stake in One97 Communications (-51%). The stock was not held at period end. A second notable relative detractor was an overweight in WuXi AppTec (-43%). We reduced our stake. Another notable relative detractor was our stake in WuXi Biologics (-75%). The stock was not held at period end.
•Notable changes in positioning include increased exposure to China, Hong Kong and Singapore, and reduced stakes in India and South Korea. By sector, meaningful changes in positioning include increased exposure to communication services and industrials, and a lower allocation to health care.
How did the Fund perform over the past 10 years?
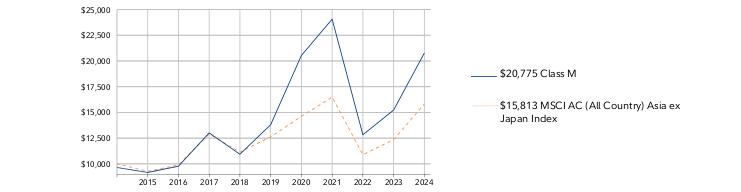
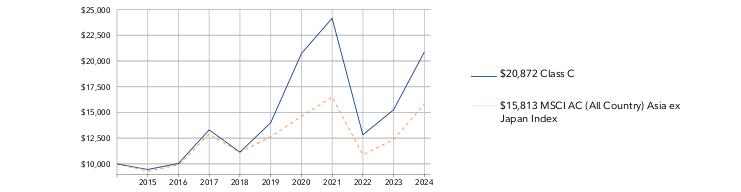
CUMULATIVE PERFORMANCE
October 31, 2014 through October 31, 2024.
Initial investment of $10,000 and the current sales charge was paid.
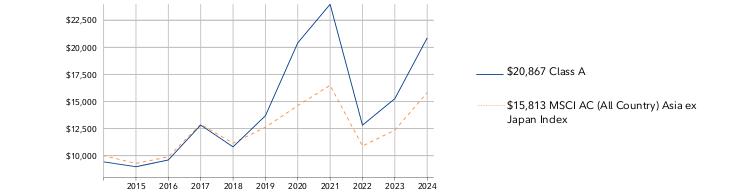
Class M | $9,650 | $9,162 | $9,769 | $13,008 | $10,936 | $13,803 | $20,536 | $24,063 | $12,825 | $15,228 | $20,775 |
MSCI AC (All Country) Asia ex Japan Index | $10,000 | $9,278 | $9,890 | $12,902 | $11,144 | $12,620 | $14,620 | $16,494 | $10,886 | $12,358 | $15,813 |
| | 2014 | 2015 | 2016 | 2017 | 2018 | 2019 | 2020 | 2021 | 2022 | 2023 | 2024 |
AVERAGE ANNUAL TOTAL RETURNS:| | 1 Year | 5 Year | 10 Year |
| Class M (incl. 3.50% sales charge) | 31.65% | 7.75% | 7.59% |
| Class M (without 3.50% sales charge) | 36.42% | 8.52% | 7.97% |
| MSCI AC (All Country) Asia ex Japan Index | 27.96% | 4.61% | 4.69% |
Visit institutional.fidelity.com for more recent performance information. |
The Fund's past performance is not a good predictor of the Fund's future performance. The graph and table do not reflect the deduction of taxes that a shareholder would pay on fund distributions or redemption of fund shares. |
Key Fund Statistics(as of October 31, 2024)
KEY FACTS | | |
| Fund Size | $445,785,792 | |
| Number of Holdings | 132 | |
| Total Advisory Fee | $3,099,900 | |
| Portfolio Turnover | 59% | |
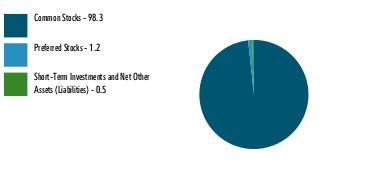
What did the Fund invest in?
(as of October 31, 2024)
MARKET SECTORS (% of Fund's net assets) | | |
| Consumer Discretionary | 28.3 | |
| Information Technology | 26.6 | |
| Communication Services | 12.5 | |
| Financials | 12.3 | |
| Industrials | 8.6 | |
| Health Care | 8.0 | |
| Energy | 1.3 | |
| Real Estate | 0.9 | |
| Consumer Staples | 0.6 | |
| Materials | 0.4 | |
| |
| Common Stocks | 98.3 |
| Preferred Stocks | 1.2 |
| Short-Term Investments and Net Other Assets (Liabilities) | 0.5 |
ASSET ALLOCATION (% of Fund's net assets) |
|
|
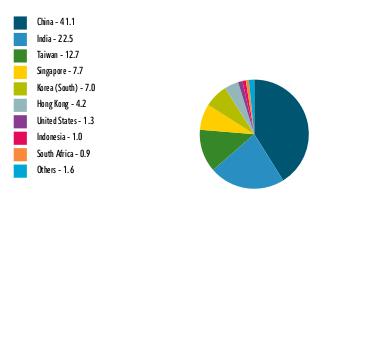
| China | 41.1 |
| India | 22.5 |
| Taiwan | 12.7 |
| Singapore | 7.7 |
| Korea (South) | 7.0 |
| Hong Kong | 4.2 |
| United States | 1.3 |
| Indonesia | 1.0 |
| South Africa | 0.9 |
| Others | 1.6 |
GEOGRAPHIC DIVERSIFICATION (% of Fund's net assets) |
|
| |
|
TOP HOLDINGS(% of Fund's net assets) | | |
| Taiwan Semiconductor Manufacturing Co Ltd | 10.9 | |
| Sea Ltd Class A ADR | 7.1 | |
| PDD Holdings Inc Class A ADR | 4.6 | |
| Zomato Ltd | 4.1 | |
| MakeMyTrip Ltd | 3.7 | |
| Meituan B Shares | 3.1 | |
| HDFC Bank Ltd | 3.0 | |
| Samsung Electronics Co Ltd | 3.0 | |
| Alibaba Group Holding Ltd | 2.8 | |
| Tencent Holdings Ltd | 2.6 | |
| | 44.9 | |
How has the Fund changed?
This is a summary of certain changes to the Fund since November 1, 2023. For more complete information, you may review the Fund's next prospectus, which we expect to be available by December 30, 2024 at fundresearch.fidelity.com/prospectus/sec or upon request at 1-877-208-0098 or by sending an e-mail to fidfunddocuments@fidelity.com.
The fees associated with this class changed during the reporting year.The variations in class fees are primarily the result of the following changes: - Management fee
- Operating expenses
The fund's transfer agent and pricing & bookkeeping fees were changed to a fixed rate effective December 1, 2023, through February 29, 2024, in anticipation of the transition to a new management fee structure. Effective March 1, 2024, the fund's management contract was amended to incorporate administrative services previously covered under separate services agreements (transfer agent and pricing & bookkeeping). The amended contract incorporates a management fee rate that may vary by class. The Adviser or an affiliate pays certain expenses of managing and operating the fund out of each class's management fee. | The fund's sub-advisory agreement with FIL Investments (Japan) Limited was not renewed.
|
| Fidelity, the Fidelity Investments Logo and all other Fidelity trademarks or service marks used herein are trademarks or service marks of FMR LLC. Any third-party marks that are used herein are trademarks or service marks of their respective owners. © 2024 FMR LLC. All rights reserved. |
| | For additional information about the Fund; including its prospectus, financial information, holdings and proxy information, scan the QR code or visit fundresearch.fidelity.com/prospectus/sec 1.9913909.100 760-TSRA-1224 |
| |
| | ANNUAL SHAREHOLDER REPORT | AS OF OCTOBER 31, 2024 | This report describes changes to the Fund that occurred during the reporting period. |
| | Fidelity Advisor® Value Leaders Fund Fidelity Advisor® Value Leaders Fund Class M : FVLTX |
| | | |
This annual shareholder report contains information about Fidelity Advisor® Value Leaders Fund for the period November 1, 2023 to October 31, 2024. You can find additional information about the Fund at fundresearch.fidelity.com/prospectus/sec. You can also request this information by contacting us at 1-877-208-0098 or by sending an e-mail to fidfunddocuments@fidelity.com.
What were your Fund costs for the last year?(based on hypothetical $10,000 investment)
FUND COST (PREVIOUS YEAR)
| | Costs of a $10,000 investment | Costs paid as a percentage of a $10,000 investment | |
| Class M | $ 152 | 1.40% | |
What affected the Fund's performance this period?
•U.S. equities posted a strong advance for the 12 months ending October 31, 2024, driven by a resilient economy, the promise of artificial intelligence to drive transformative change and the Federal Reserve's long-anticipated pivot to cutting interest rates.
•Against this backdrop, security selection was the primary detractor from the fund's performance versus the Russell 1000® Value Index for the fiscal year, led by health care, especially within the health care equipment & services industry. Also hurting our result were stock selection and an underweight in industrials, primarily within the capital goods industry. Stock selection and an overweight in energy also hurt.
•The fund's non-benchmark stake in Parex Resources returned -48% and was the largest individual relative detractor. The second-largest relative detractor was an overweight in Centene (-10%). The stock was one of the fund's largest holdings this period. A non-benchmark stake in Samsung Electronics returned roughly -10% and notably hurt.
•In contrast, the biggest sector contributor to performance versus the benchmark was security selection in consumer discretionary, primarily within the consumer services industry. Stock picking in financials also boosted the fund's relative performance, along with an overweight in banks. Also bolstering our relative result was an underweight in materials.
•The top individual relative contributor was an overweight in Gen Digital (+80%). The company was among the fund's biggest holdings at period end. The second-largest relative contributor was an overweight in H&R Block (+49%). Though we reduced our stake, the company was among the fund's largest holdings. An overweight in Bank of America (+63%) also helped. The company was one of our biggest holdings, but we trimmed the position this period.
•Notable changes in positioning include increased exposure to the communication services and industrials sectors.
How did the Fund perform over the past 10 years?
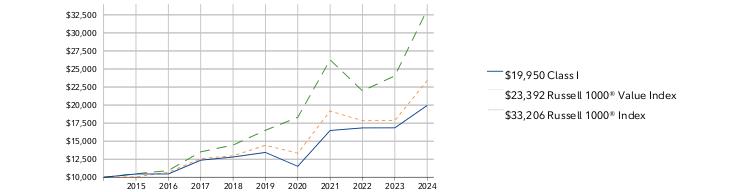
CUMULATIVE PERFORMANCE
October 31, 2014 through October 31, 2024.
Initial investment of $10,000 and the current sales charge was paid.
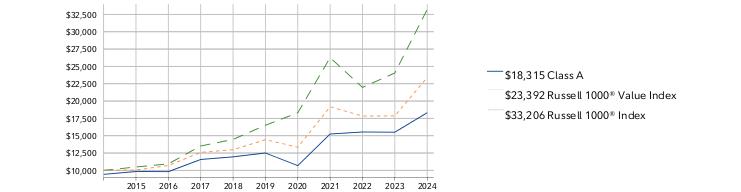
Class M | $9,650 | $10,040 | $9,991 | $11,749 | $12,112 | $12,647 | $10,777 | $15,338 | $15,587 | $15,520 | $18,288 |
Russell 1000® Value Index | $10,000 | $10,053 | $10,693 | $12,595 | $12,977 | $14,432 | $13,340 | $19,178 | $17,836 | $17,860 | $23,392 |
Russell 1000® Index | $10,000 | $10,486 | $10,933 | $13,520 | $14,464 | $16,511 | $18,305 | $26,269 | $21,967 | $24,050 | $33,206 |
| | 2014 | 2015 | 2016 | 2017 | 2018 | 2019 | 2020 | 2021 | 2022 | 2023 | 2024 |
AVERAGE ANNUAL TOTAL RETURNS:| | 1 Year | 5 Year | 10 Year |
| Class M (incl. 3.50% sales charge) | 13.71% | 6.89% | 6.22% |
| Class M (without 3.50% sales charge) | 17.83% | 7.66% | 6.60% |
| Russell 1000® Value Index | 30.98% | 10.14% | 8.87% |
| Russell 1000® Index | 38.07% | 15.00% | 12.75% |
Visit institutional.fidelity.com for more recent performance information. |
The Fund's past performance is not a good predictor of the Fund's future performance. The graph and table do not reflect the deduction of taxes that a shareholder would pay on fund distributions or redemption of fund shares. |
Key Fund Statistics(as of October 31, 2024)
KEY FACTS | | |
| Fund Size | $32,451,832 | |
| Number of Holdings | 38 | |
| Total Advisory Fee | $248,410 | |
| Portfolio Turnover | 32% | |
What did the Fund invest in?
(as of October 31, 2024)
MARKET SECTORS (% of Fund's net assets) | | |
| Financials | 21.3 | |
| Health Care | 16.9 | |
| Consumer Staples | 10.1 | |
| Utilities | 10.0 | |
| Information Technology | 9.6 | |
| Energy | 9.2 | |
| Communication Services | 8.4 | |
| Industrials | 7.9 | |
| Consumer Discretionary | 3.8 | |
| Materials | 1.9 | |
| |
| Common Stocks | 96.5 |
| Preferred Stocks | 2.6 |
| Short-Term Investments and Net Other Assets (Liabilities) | 0.9 |
ASSET ALLOCATION (% of Fund's net assets) |
|
|
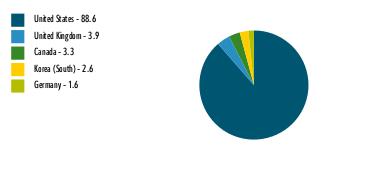
| United States | 88.6 |
| United Kingdom | 3.9 |
| Canada | 3.3 |
| Korea (South) | 2.6 |
| Germany | 1.6 |
GEOGRAPHIC DIVERSIFICATION (% of Fund's net assets) |
|
| |
|
TOP HOLDINGS(% of Fund's net assets) | | |
| UnitedHealth Group Inc | 5.9 | |
| Comcast Corp Class A | 5.3 | |
| Cigna Group/The | 4.4 | |
| Kenvue Inc | 4.1 | |
| Bank of America Corp | 4.1 | |
| Shell PLC ADR | 4.0 | |
| PG&E Corp | 3.9 | |
| JPMorgan Chase & Co | 3.9 | |
| H&R Block Inc | 3.8 | |
| Exxon Mobil Corp | 3.8 | |
| | 43.2 | |
How has the Fund changed?
This is a summary of certain changes to the Fund since November 1, 2023. For more complete information, you may review the Fund's next prospectus, which we expect to be available by December 30, 2024 at fundresearch.fidelity.com/prospectus/sec or upon request at 1-877-208-0098 or by sending an e-mail to fidfunddocuments@fidelity.com.
The fund's transfer agent and pricing & bookkeeping fees were changed to a fixed rate effective December 1, 2023, through February 29, 2024, in anticipation of the transition to a new management fee structure. Effective March 1, 2024, the fund's management contract was amended to incorporate administrative services previously covered under separate services agreements (transfer agent and pricing & bookkeeping). The amended contract incorporates a basic fee rate that may vary by class (subject to a performance adjustment). The Adviser or an affiliate pays certain expenses of managing and operating the fund out of each class's management fee. | |
| Fidelity, the Fidelity Investments Logo and all other Fidelity trademarks or service marks used herein are trademarks or service marks of FMR LLC. Any third-party marks that are used herein are trademarks or service marks of their respective owners. © 2024 FMR LLC. All rights reserved. |
| | For additional information about the Fund; including its prospectus, financial information, holdings and proxy information, scan the QR code or visit fundresearch.fidelity.com/prospectus/sec 1.9913918.100 1269-TSRA-1224 |
| |
| | ANNUAL SHAREHOLDER REPORT | AS OF OCTOBER 31, 2024 | This report describes changes to the Fund that occurred during the reporting period. |
| | Fidelity Advisor® Emerging Asia Fund Fidelity Advisor® Emerging Asia Fund Class Z : FIQPX |
| | | |
This annual shareholder report contains information about Fidelity Advisor® Emerging Asia Fund for the period November 1, 2023 to October 31, 2024. You can find additional information about the Fund at fundresearch.fidelity.com/prospectus/sec. You can also request this information by contacting us at 1-877-208-0098 or by sending an e-mail to fidfunddocuments@fidelity.com.
What were your Fund costs for the last year?(based on hypothetical $10,000 investment)
FUND COST (PREVIOUS YEAR)
| | Costs of a $10,000 investment | Costs paid as a percentage of a $10,000 investment | |
| Class Z | $ 98 | 0.82% | |
What affected the Fund's performance this period?
•International stocks achieved a strong gain for the 12 months ending October 31, 2024. Resilient global economic growth and a slowing in the pace of inflation in certain regions, as well as a shift to global monetary easing, contributed to a favorable backdrop, despite persistent geopolitical risk.
•Against this backdrop, stock picking and an overweight in Asia Pacific ex Japan, primarily in Singapore, contributed to the fund's performance versus the MSCI AC Asia Ex Japan (Net Mass) Linked Index for the fiscal year. Within emerging markets, stock selection and an overweight in India helped.
•By sector, security selection in consumer discretionary - notably the consumer services segment - was the primary contributor. Stock picking in communication services, primarily within the media & entertainment industry, also boosted the fund's relative performance. Also lifting the fund's relative result were stock picks and an overweight in information technology, primarily within the semiconductors & semiconductor equipment industry.
•The top individual relative contributor was an overweight in Sea (+126%). The company was one of the fund's biggest holdings. A non-benchmark stake in MakeMyTrip gained about 160% and was a second notable relative contributor. The company was among our biggest holdings. Another notable relative contributor was an overweight in Zomato (+125%). This period we decreased our stake in Zomato. The stock was one of our largest holdings.
•In contrast, from a regional standpoint, stock selection in China had the largest negative impact on relative performance. A non-benchmark allocation to the U.K. also detracted from the fund's relative result.
•By sector, the biggest detractors from performance versus the benchmark were stock picks and an overweight in health care. Security selection in financials also hampered the fund's result.
•The largest individual relative detractor was our stake in One97 Communications (-51%). The stock was not held at period end. A second notable relative detractor was an overweight in WuXi AppTec (-43%). We reduced our stake. Another notable relative detractor was our stake in WuXi Biologics (-75%). The stock was not held at period end.
•Notable changes in positioning include increased exposure to China, Hong Kong and Singapore, and reduced stakes in India and South Korea. By sector, meaningful changes in positioning include increased exposure to communication services and industrials, and a lower allocation to health care.
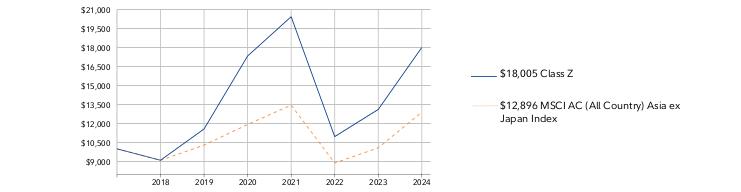
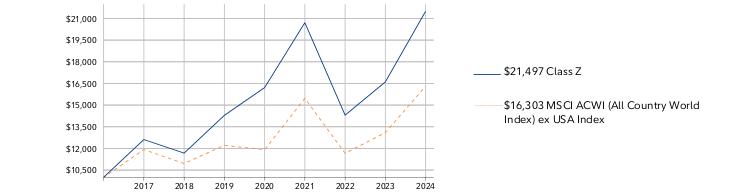
How did the Fund perform over the life of Fund?
CUMULATIVE PERFORMANCE
October 2, 2018 through October 31, 2024.
Initial investment of $10,000.
Class Z | $10,000 | $9,098 | $11,567 | $17,328 | $20,433 | $10,964 | $13,110 |
MSCI AC (All Country) Asia ex Japan Index | $10,000 | $9,088 | $10,292 | $11,923 | $13,452 | $8,878 | $10,078 |
| | 2018 | 2019 | 2020 | 2021 | 2022 | 2023 | 2024 |
AVERAGE ANNUAL TOTAL RETURNS:| | 1 Year | 5 Year | Life of Fund A |
| Class Z | 37.34% | 9.25% | 10.15% |
| MSCI AC (All Country) Asia ex Japan Index | 27.96% | 4.61% | 4.27% |
A From October 2, 2018
Visit institutional.fidelity.com for more recent performance information. |
The Fund's past performance is not a good predictor of the Fund's future performance. The graph and table do not reflect the deduction of taxes that a shareholder would pay on fund distributions or redemption of fund shares. |
Key Fund Statistics(as of October 31, 2024)
KEY FACTS | | |
| Fund Size | $445,785,792 | |
| Number of Holdings | 132 | |
| Total Advisory Fee | $3,099,900 | |
| Portfolio Turnover | 59% | |
What did the Fund invest in?
(as of October 31, 2024)
MARKET SECTORS (% of Fund's net assets) | | |
| Consumer Discretionary | 28.3 | |
| Information Technology | 26.6 | |
| Communication Services | 12.5 | |
| Financials | 12.3 | |
| Industrials | 8.6 | |
| Health Care | 8.0 | |
| Energy | 1.3 | |
| Real Estate | 0.9 | |
| Consumer Staples | 0.6 | |
| Materials | 0.4 | |
| |
| Common Stocks | 98.3 |
| Preferred Stocks | 1.2 |
| Short-Term Investments and Net Other Assets (Liabilities) | 0.5 |
ASSET ALLOCATION (% of Fund's net assets) |
|
|
| China | 41.1 |
| India | 22.5 |
| Taiwan | 12.7 |
| Singapore | 7.7 |
| Korea (South) | 7.0 |
| Hong Kong | 4.2 |
| United States | 1.3 |
| Indonesia | 1.0 |
| South Africa | 0.9 |
| Others | 1.6 |
GEOGRAPHIC DIVERSIFICATION (% of Fund's net assets) |
|
| |
|
TOP HOLDINGS(% of Fund's net assets) | | |
| Taiwan Semiconductor Manufacturing Co Ltd | 10.9 | |
| Sea Ltd Class A ADR | 7.1 | |
| PDD Holdings Inc Class A ADR | 4.6 | |
| Zomato Ltd | 4.1 | |
| MakeMyTrip Ltd | 3.7 | |
| Meituan B Shares | 3.1 | |
| HDFC Bank Ltd | 3.0 | |
| Samsung Electronics Co Ltd | 3.0 | |
| Alibaba Group Holding Ltd | 2.8 | |
| Tencent Holdings Ltd | 2.6 | |
| | 44.9 | |
How has the Fund changed?
This is a summary of certain changes to the Fund since November 1, 2023. For more complete information, you may review the Fund's next prospectus, which we expect to be available by December 30, 2024 at fundresearch.fidelity.com/prospectus/sec or upon request at 1-877-208-0098 or by sending an e-mail to fidfunddocuments@fidelity.com.
The fund's transfer agent and pricing & bookkeeping fees were changed to a fixed rate effective December 1, 2023, through February 29, 2024, in anticipation of the transition to a new management fee structure. Effective March 1, 2024, the fund's management contract was amended to incorporate administrative services previously covered under separate services agreements (transfer agent and pricing & bookkeeping). The amended contract incorporates a management fee rate that may vary by class. The Adviser or an affiliate pays certain expenses of managing and operating the fund out of each class's management fee. | The fund's sub-advisory agreement with FIL Investments (Japan) Limited was not renewed.
|
| Fidelity, the Fidelity Investments Logo and all other Fidelity trademarks or service marks used herein are trademarks or service marks of FMR LLC. Any third-party marks that are used herein are trademarks or service marks of their respective owners. © 2024 FMR LLC. All rights reserved. |
| | For additional information about the Fund; including its prospectus, financial information, holdings and proxy information, scan the QR code or visit fundresearch.fidelity.com/prospectus/sec 1.9913905.100 3274-TSRA-1224 |
| |
| | ANNUAL SHAREHOLDER REPORT | AS OF OCTOBER 31, 2024 | This report describes changes to the Fund that occurred during the reporting period. |
| | Fidelity Advisor® Overseas Fund Fidelity Advisor® Overseas Fund Class M : FAERX |
| | | |
This annual shareholder report contains information about Fidelity Advisor® Overseas Fund for the period November 1, 2023 to October 31, 2024. You can find additional information about the Fund at fundresearch.fidelity.com/prospectus/sec. You can also request this information by contacting us at 1-877-208-0098 or by sending an e-mail to fidfunddocuments@fidelity.com.
What were your Fund costs for the last year?(based on hypothetical $10,000 investment)
FUND COST (PREVIOUS YEAR)
| | Costs of a $10,000 investment | Costs paid as a percentage of a $10,000 investment | |
| Class M | $ 144 | 1.28% | |
What affected the Fund's performance this period?
•International stocks achieved a strong gain for the 12 months ending October 31, 2024. Resilient global economic growth and a slowing in the pace of inflation in certain regions, as well as a shift to global monetary easing, contributed to a favorable backdrop, despite persistent geopolitical risk.
•Against this backdrop, stock picking in the U.K. and Japan contributed to the fund's performance versus the MSCI EAFE Index (Net MA) for the fiscal year.
•By sector, market selection was the primary contributor, led by an underweights in energy and consumer staples. Stock picks and an overweight in industrials, primarily within the capital goods industry, also boosted the fund's relative performance.
•The top individual relative contributor was an overweight in Mitsubishi Heavy Industries (+157%). This was a stake we established this period. The second-largest relative contributor was an overweight in Tokio Marine Holdings (+70%). Although we reduced the fund's stake, the company was one of our largest holdings. Another notable relative contributor was our non-benchmark stake in Taiwan Semiconductor Manufacturing (+101%).
•In contrast, from a regional standpoint, stock selection in the United States and underweights in Japan and Asia Pacific ex Japan detracted from the fund's relative result.
•By sector, the biggest detractor from performance versus the benchmark was stock selection in consumer staples. Also hurting our result were stock picks in consumer discretionary, primarily within the consumer durables & apparel industry. Choices in information technology, primarily within the software & services industry, also hurt. Lastly, the fund's position in cash detracted.
•The largest individual relative detractor was our stake in Diageo (-11%). The stock was not held at period end. A non-benchmark stake in Alten returned approximately -27% and was the second-largest relative detractor. Our overweight stake in Sony Group (+1%) also hurt. The stock was not held at period end.
•Notable changes in positioning include increased exposure to Japan and the United States, and a lower allocation to Sweden. By sector, meaningful changes in positioning include decreased exposure to consumer staples and energy, and a higher allocation to industrials and materials.
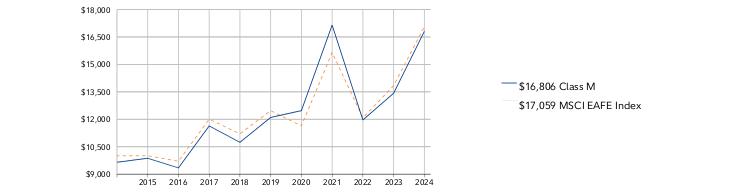
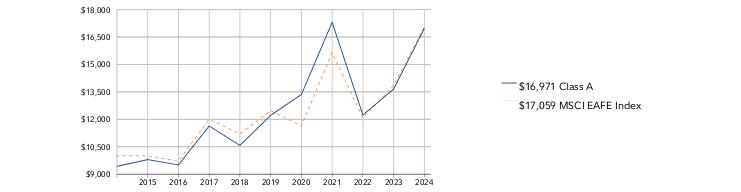
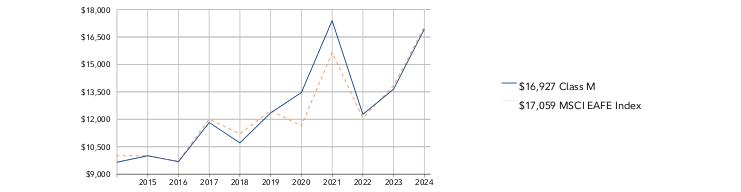
How did the Fund perform over the past 10 years?
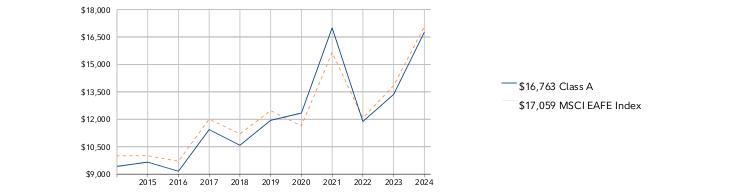
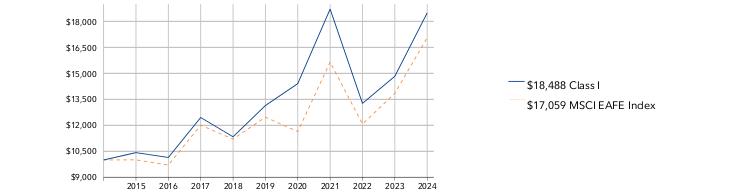
CUMULATIVE PERFORMANCE
October 31, 2014 through October 31, 2024.
Initial investment of $10,000 and the current sales charge was paid.
Class M | $9,650 | $9,869 | $9,342 | $11,637 | $10,740 | $12,099 | $12,473 | $17,151 | $11,962 | $13,422 | $16,806 |
MSCI EAFE Index | $10,000 | $10,008 | $9,705 | $12,004 | $11,206 | $12,472 | $11,638 | $15,647 | $12,073 | $13,841 | $17,059 |
| | 2014 | 2015 | 2016 | 2017 | 2018 | 2019 | 2020 | 2021 | 2022 | 2023 | 2024 |
AVERAGE ANNUAL TOTAL RETURNS:| | 1 Year | 5 Year | 10 Year |
| Class M (incl. 3.50% sales charge) | 20.83% | 6.04% | 5.33% |
| Class M (without 3.50% sales charge) | 25.21% | 6.79% | 5.70% |
| MSCI EAFE Index | 23.25% | 6.46% | 5.49% |
Visit institutional.fidelity.com for more recent performance information. |
The Fund's past performance is not a good predictor of the Fund's future performance. The graph and table do not reflect the deduction of taxes that a shareholder would pay on fund distributions or redemption of fund shares. |
Key Fund Statistics(as of October 31, 2024)
KEY FACTS | | |
| Fund Size | $383,854,611 | |
| Number of Holdings | 93 | |
| Total Advisory Fee | $2,406,862 | |
| Portfolio Turnover | 34% | |
What did the Fund invest in?
(as of October 31, 2024)
MARKET SECTORS (% of Fund's net assets) | | |
| Industrials | 26.0 | |
| Financials | 23.2 | |
| Information Technology | 16.0 | |
| Health Care | 13.8 | |
| Materials | 9.5 | |
| Consumer Discretionary | 7.0 | |
| Consumer Staples | 2.3 | |
| Communication Services | 0.4 | |
| |
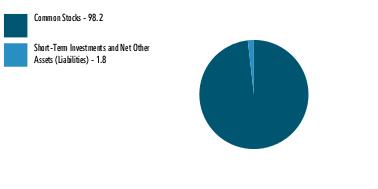
| Common Stocks | 98.2 |
| Short-Term Investments and Net Other Assets (Liabilities) | 1.8 |
ASSET ALLOCATION (% of Fund's net assets) |
|
|
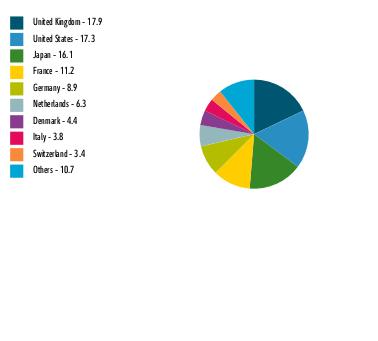
| United Kingdom | 17.9 |
| United States | 17.3 |
| Japan | 16.1 |
| France | 11.2 |
| Germany | 8.9 |
| Netherlands | 6.3 |
| Denmark | 4.4 |
| Italy | 3.8 |
| Switzerland | 3.4 |
| Others | 10.7 |
GEOGRAPHIC DIVERSIFICATION (% of Fund's net assets) |
|
| |
|
TOP HOLDINGS(% of Fund's net assets) | | |
| ASML Holding NV | 3.0 | |
| Novo Nordisk A/S Series B | 3.0 | |
| SAP SE | 2.9 | |
| Astrazeneca PLC | 2.2 | |
| Hitachi Ltd | 2.2 | |
| RELX PLC | 2.2 | |
| Safran SA | 2.0 | |
| Compass Group PLC | 2.0 | |
| Wolters Kluwer NV | 2.0 | |
| Tokio Marine Holdings Inc | 2.0 | |
| | 23.5 | |
How has the Fund changed?
This is a summary of certain changes to the Fund since November 1, 2023. For more complete information, you may review the Fund's next prospectus, which we expect to be available by December 30, 2024 at fundresearch.fidelity.com/prospectus/sec or upon request at 1-877-208-0098 or by sending an e-mail to fidfunddocuments@fidelity.com.
The fees associated with this class changed during the reporting year.The variations in class fees are primarily the result of the following changes: - Management fee
- Operating expenses
The fund's transfer agent and pricing & bookkeeping fees were changed to a fixed rate effective December 1, 2023, through February 29, 2024, in anticipation of the transition to a new management fee structure. Effective March 1, 2024, the fund's management contract was amended to incorporate administrative services previously covered under separate services agreements (transfer agent and pricing & bookkeeping). The amended contract incorporates a basic fee rate that may vary by class (subject to a performance adjustment). The Adviser or an affiliate pays certain expenses of managing and operating the fund out of each class's management fee. | The fund's sub-advisory agreement with FIL Investments (Japan) Limited was not renewed.
|
| Fidelity, the Fidelity Investments Logo and all other Fidelity trademarks or service marks used herein are trademarks or service marks of FMR LLC. Any third-party marks that are used herein are trademarks or service marks of their respective owners. © 2024 FMR LLC. All rights reserved. |
| | For additional information about the Fund; including its prospectus, financial information, holdings and proxy information, scan the QR code or visit fundresearch.fidelity.com/prospectus/sec 1.9913818.100 229-TSRA-1224 |
| |
| | ANNUAL SHAREHOLDER REPORT | AS OF OCTOBER 31, 2024 | This report describes changes to the Fund that occurred during the reporting period. |
| | Fidelity Advisor® Overseas Fund Fidelity Advisor® Overseas Fund Class C : FAOCX |
| | | |
This annual shareholder report contains information about Fidelity Advisor® Overseas Fund for the period November 1, 2023 to October 31, 2024. You can find additional information about the Fund at fundresearch.fidelity.com/prospectus/sec. You can also request this information by contacting us at 1-877-208-0098 or by sending an e-mail to fidfunddocuments@fidelity.com.
What were your Fund costs for the last year?(based on hypothetical $10,000 investment)
FUND COST (PREVIOUS YEAR)
| | Costs of a $10,000 investment | Costs paid as a percentage of a $10,000 investment | |
| Class C | $ 203 | 1.81% | |
What affected the Fund's performance this period?
•International stocks achieved a strong gain for the 12 months ending October 31, 2024. Resilient global economic growth and a slowing in the pace of inflation in certain regions, as well as a shift to global monetary easing, contributed to a favorable backdrop, despite persistent geopolitical risk.
•Against this backdrop, stock picking in the U.K. and Japan contributed to the fund's performance versus the MSCI EAFE Index (Net MA) for the fiscal year.
•By sector, market selection was the primary contributor, led by an underweights in energy and consumer staples. Stock picks and an overweight in industrials, primarily within the capital goods industry, also boosted the fund's relative performance.
•The top individual relative contributor was an overweight in Mitsubishi Heavy Industries (+157%). This was a stake we established this period. The second-largest relative contributor was an overweight in Tokio Marine Holdings (+70%). Although we reduced the fund's stake, the company was one of our largest holdings. Another notable relative contributor was our non-benchmark stake in Taiwan Semiconductor Manufacturing (+101%).
•In contrast, from a regional standpoint, stock selection in the United States and underweights in Japan and Asia Pacific ex Japan detracted from the fund's relative result.
•By sector, the biggest detractor from performance versus the benchmark was stock selection in consumer staples. Also hurting our result were stock picks in consumer discretionary, primarily within the consumer durables & apparel industry. Choices in information technology, primarily within the software & services industry, also hurt. Lastly, the fund's position in cash detracted.
•The largest individual relative detractor was our stake in Diageo (-11%). The stock was not held at period end. A non-benchmark stake in Alten returned approximately -27% and was the second-largest relative detractor. Our overweight stake in Sony Group (+1%) also hurt. The stock was not held at period end.
•Notable changes in positioning include increased exposure to Japan and the United States, and a lower allocation to Sweden. By sector, meaningful changes in positioning include decreased exposure to consumer staples and energy, and a higher allocation to industrials and materials.
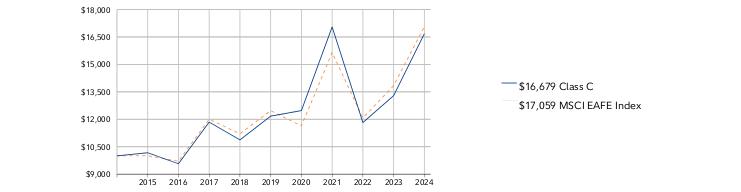
How did the Fund perform over the past 10 years?
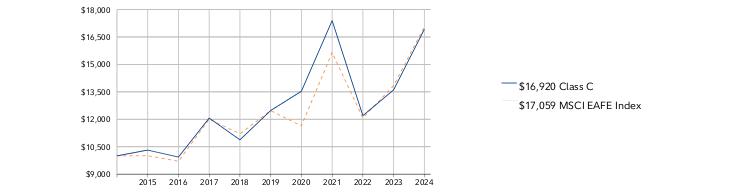
CUMULATIVE PERFORMANCE
October 31, 2014 through October 31, 2024.
Initial investment of $10,000.
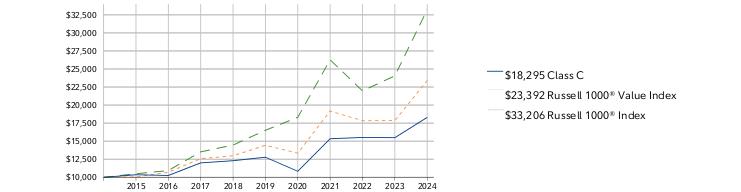
Class C | $10,000 | $10,170 | $9,569 | $11,847 | $10,872 | $12,170 | $12,474 | $17,048 | $11,820 | $13,290 | $16,679 |
MSCI EAFE Index | $10,000 | $10,008 | $9,705 | $12,004 | $11,206 | $12,472 | $11,638 | $15,647 | $12,073 | $13,841 | $17,059 |
| | 2014 | 2015 | 2016 | 2017 | 2018 | 2019 | 2020 | 2021 | 2022 | 2023 | 2024 |
AVERAGE ANNUAL TOTAL RETURNS:| | 1 Year | 5 Year | 10 Year |
| Class C (incl. contingent deferred sales charge) | 23.56% | 6.18% | 5.25% |
| Class C | 24.56% | 6.18% | 5.25% |
| MSCI EAFE Index | 23.25% | 6.46% | 5.49% |
Visit institutional.fidelity.com for more recent performance information. |
The Fund's past performance is not a good predictor of the Fund's future performance. The graph and table do not reflect the deduction of taxes that a shareholder would pay on fund distributions or redemption of fund shares. |
Key Fund Statistics(as of October 31, 2024)
KEY FACTS | | |
| Fund Size | $383,854,611 | |
| Number of Holdings | 93 | |
| Total Advisory Fee | $2,406,862 | |
| Portfolio Turnover | 34% | |
What did the Fund invest in?
(as of October 31, 2024)
MARKET SECTORS (% of Fund's net assets) | | |
| Industrials | 26.0 | |
| Financials | 23.2 | |
| Information Technology | 16.0 | |
| Health Care | 13.8 | |
| Materials | 9.5 | |
| Consumer Discretionary | 7.0 | |
| Consumer Staples | 2.3 | |
| Communication Services | 0.4 | |
| |
| Common Stocks | 98.2 |
| Short-Term Investments and Net Other Assets (Liabilities) | 1.8 |
ASSET ALLOCATION (% of Fund's net assets) |
|
|
| United Kingdom | 17.9 |
| United States | 17.3 |
| Japan | 16.1 |
| France | 11.2 |
| Germany | 8.9 |
| Netherlands | 6.3 |
| Denmark | 4.4 |
| Italy | 3.8 |
| Switzerland | 3.4 |
| Others | 10.7 |
GEOGRAPHIC DIVERSIFICATION (% of Fund's net assets) |
|
| |
|
TOP HOLDINGS(% of Fund's net assets) | | |
| ASML Holding NV | 3.0 | |
| Novo Nordisk A/S Series B | 3.0 | |
| SAP SE | 2.9 | |
| Astrazeneca PLC | 2.2 | |
| Hitachi Ltd | 2.2 | |
| RELX PLC | 2.2 | |
| Safran SA | 2.0 | |
| Compass Group PLC | 2.0 | |
| Wolters Kluwer NV | 2.0 | |
| Tokio Marine Holdings Inc | 2.0 | |
| | 23.5 | |
How has the Fund changed?
This is a summary of certain changes to the Fund since November 1, 2023. For more complete information, you may review the Fund's next prospectus, which we expect to be available by December 30, 2024 at fundresearch.fidelity.com/prospectus/sec or upon request at 1-877-208-0098 or by sending an e-mail to fidfunddocuments@fidelity.com.
The fees associated with this class changed during the reporting year.The variations in class fees are primarily the result of the following changes: - Management fee
- Operating expenses
The fund's transfer agent and pricing & bookkeeping fees were changed to a fixed rate effective December 1, 2023, through February 29, 2024, in anticipation of the transition to a new management fee structure. Effective March 1, 2024, the fund's management contract was amended to incorporate administrative services previously covered under separate services agreements (transfer agent and pricing & bookkeeping). The amended contract incorporates a basic fee rate that may vary by class (subject to a performance adjustment). The Adviser or an affiliate pays certain expenses of managing and operating the fund out of each class's management fee. | The fund's sub-advisory agreement with FIL Investments (Japan) Limited was not renewed.
|
| Fidelity, the Fidelity Investments Logo and all other Fidelity trademarks or service marks used herein are trademarks or service marks of FMR LLC. Any third-party marks that are used herein are trademarks or service marks of their respective owners. © 2024 FMR LLC. All rights reserved. |
| | For additional information about the Fund; including its prospectus, financial information, holdings and proxy information, scan the QR code or visit fundresearch.fidelity.com/prospectus/sec 1.9913821.100 485-TSRA-1224 |
| |
| | ANNUAL SHAREHOLDER REPORT | AS OF OCTOBER 31, 2024 | This report describes changes to the Fund that occurred during the reporting period. |
| | Fidelity Advisor® International Capital Appreciation Fund Fidelity Advisor® International Capital Appreciation Fund Class M : FIATX |
| | | |
This annual shareholder report contains information about Fidelity Advisor® International Capital Appreciation Fund for the period November 1, 2023 to October 31, 2024. You can find additional information about the Fund at fundresearch.fidelity.com/prospectus/sec. You can also request this information by contacting us at 1-877-208-0098 or by sending an e-mail to fidfunddocuments@fidelity.com.
What were your Fund costs for the last year?(based on hypothetical $10,000 investment)
FUND COST (PREVIOUS YEAR)
| | Costs of a $10,000 investment | Costs paid as a percentage of a $10,000 investment | |
| Class M | $ 159 | 1.39% | |
What affected the Fund's performance this period?
•International stocks achieved a strong gain for the 12 months ending October 31, 2024. Resilient global economic growth and a slowing in the pace of inflation in certain regions, as well as a shift to global monetary easing, contributed to a favorable backdrop, despite persistent geopolitical risk.
•Against this backdrop, security selection and an underweight in emerging markets and stock selection in Europe ex U.K. contributed to the fund's performance versus the MSCI All Country World ex US Index (Net MA) for the fiscal year.
•By sector, market selection was the primary contributor, led by an overweight in information technology, where an overweight in semiconductors & semiconductor equipment helped most. Picks and an overweight in industrials also boosted relative performance. Also contributing to our result was a lack of exposure to the lagging energy sector.
•The fund's non-benchmark stake in Nvidia gained 221% and was the top individual relative contributor. The stock was not held at period end. A second notable relative contributor was an overweight in Taiwan Semiconductor Manufacturing (+100%). The company was the fund's largest holding. Another notable relative contributor was an overweight in Brookfield Asset Management (+91%).
•In contrast, from a regional standpoint, security selection in Canada and an overweight in Europe ex U.K., primarily in France, detracted from the fund's relative result.
•By sector, the biggest detractor from performance versus the benchmark was stock selection in information technology, primarily within the software & services industry. Also hurting our result were stock picks in consumer staples and health care.
•The biggest individual relative detractor was our stake in OBIC (-23%). A second notable relative detractor was an underweight in Shopify (+66%). An overweight in LVMH Moet Hennessy Louis Vuitton (-6%) also hurt. The stock was among our largest holdings.
•Notable changes in positioning include increased exposure to China and Japan. By sector, meaningful changes in positioning include increased exposure to communication services and a lower allocation to consumer staples, where we liquidated all of the fund's holdings.
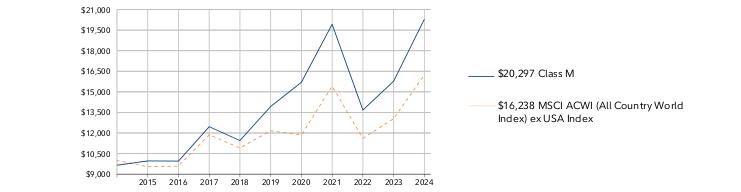
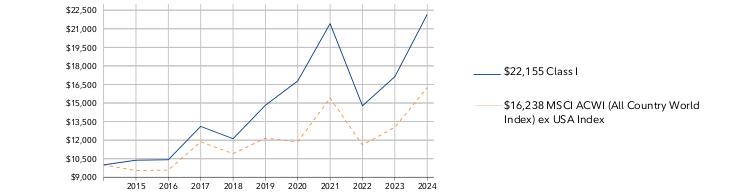
How did the Fund perform over the past 10 years?
CUMULATIVE PERFORMANCE
October 31, 2014 through October 31, 2024.
Initial investment of $10,000 and the current sales charge was paid.
Class M | $9,650 | $9,963 | $9,950 | $12,458 | $11,451 | $13,931 | $15,697 | $19,927 | $13,673 | $15,775 | $20,297 |
MSCI ACWI (All Country World Index) ex USA Index | $10,000 | $9,545 | $9,583 | $11,868 | $10,910 | $12,161 | $11,862 | $15,403 | $11,613 | $13,038 | $16,238 |
| | 2014 | 2015 | 2016 | 2017 | 2018 | 2019 | 2020 | 2021 | 2022 | 2023 | 2024 |
AVERAGE ANNUAL TOTAL RETURNS:| | 1 Year | 5 Year | 10 Year |
| Class M (incl. 3.50% sales charge) | 24.17% | 7.05% | 7.34% |
| Class M (without 3.50% sales charge) | 28.67% | 7.82% | 7.72% |
| MSCI ACWI (All Country World Index) ex USA Index | 24.55% | 5.95% | 4.97% |
Visit institutional.fidelity.com for more recent performance information. |
The Fund's past performance is not a good predictor of the Fund's future performance. The graph and table do not reflect the deduction of taxes that a shareholder would pay on fund distributions or redemption of fund shares. |
Key Fund Statistics(as of October 31, 2024)
KEY FACTS | | |
| Fund Size | $8,714,030,084 | |
| Number of Holdings | 63 | |
| Total Advisory Fee | $61,601,570 | |
| Portfolio Turnover | 63% | |
What did the Fund invest in?
(as of October 31, 2024)
MARKET SECTORS (% of Fund's net assets) | | |
| Industrials | 30.8 | |
| Financials | 21.6 | |
| Information Technology | 18.3 | |
| Consumer Discretionary | 11.3 | |
| Materials | 8.8 | |
| Health Care | 4.5 | |
| Communication Services | 4.1 | |
| |
| Common Stocks | 99.4 |
| Short-Term Investments and Net Other Assets (Liabilities) | 0.6 |
ASSET ALLOCATION (% of Fund's net assets) |
|
|
| United States | 20.0 |
| Japan | 12.6 |
| United Kingdom | 10.9 |
| France | 8.8 |
| India | 7.9 |
| Canada | 6.4 |
| China | 5.3 |
| Netherlands | 5.2 |
| Taiwan | 4.5 |
| Others | 18.4 |
GEOGRAPHIC DIVERSIFICATION (% of Fund's net assets) |
|
| |
|
TOP HOLDINGS(% of Fund's net assets) | | |
| Taiwan Semiconductor Manufacturing Co Ltd | 4.5 | |
| Novo Nordisk A/S Series B | 2.9 | |
| Tencent Holdings Ltd | 2.5 | |
| SAP SE | 2.5 | |
| ASML Holding NV | 2.3 | |
| LVMH Moet Hennessy Louis Vuitton SE | 2.3 | |
| Schneider Electric SE | 2.1 | |
| Hitachi Ltd | 1.9 | |
| ABB Ltd | 1.8 | |
| Keyence Corp | 1.7 | |
| | 24.5 | |
How has the Fund changed?
This is a summary of certain changes to the Fund since November 1, 2023. For more complete information, you may review the Fund's next prospectus, which we expect to be available by December 30, 2024 at fundresearch.fidelity.com/prospectus/sec or upon request at 1-877-208-0098 or by sending an e-mail to fidfunddocuments@fidelity.com.
The fees associated with this class changed during the reporting year.The variations in class fees are primarily the result of the following changes: - Management fee
- Operating expenses
- Performance adjustment fee
The fund's transfer agent and pricing & bookkeeping fees were changed to a fixed rate effective December 1, 2023, through February 29, 2024, in anticipation of the transition to a new management fee structure. Effective March 1, 2024, the fund's management contract was amended to incorporate administrative services previously covered under separate services agreements (transfer agent and pricing & bookkeeping). The amended contract incorporates a basic fee rate that may vary by class (subject to a performance adjustment). The Adviser or an affiliate pays certain expenses of managing and operating the fund out of each class's management fee. | The fund's sub-advisory agreement with FIL Investments (Japan) Limited was not renewed.
|
| Fidelity, the Fidelity Investments Logo and all other Fidelity trademarks or service marks used herein are trademarks or service marks of FMR LLC. Any third-party marks that are used herein are trademarks or service marks of their respective owners. © 2024 FMR LLC. All rights reserved. |
| | For additional information about the Fund; including its prospectus, financial information, holdings and proxy information, scan the QR code or visit fundresearch.fidelity.com/prospectus/sec 1.9913827.100 292-TSRA-1224 |
| |
| | ANNUAL SHAREHOLDER REPORT | AS OF OCTOBER 31, 2024 | This report describes changes to the Fund that occurred during the reporting period. |
| | Fidelity Advisor® Global Capital Appreciation Fund Fidelity Advisor® Global Capital Appreciation Fund Class C : FEUCX |
| | | |
This annual shareholder report contains information about Fidelity Advisor® Global Capital Appreciation Fund for the period November 1, 2023 to October 31, 2024. You can find additional information about the Fund at fundresearch.fidelity.com/prospectus/sec. You can also request this information by contacting us at 1-877-208-0098 or by sending an e-mail to fidfunddocuments@fidelity.com.
What were your Fund costs for the last year?(based on hypothetical $10,000 investment)
FUND COST (PREVIOUS YEAR)
| | Costs of a $10,000 investment | Costs paid as a percentage of a $10,000 investment | |
| Class C | $ 247 | 2.05% | |
What affected the Fund's performance this period?
•Global equities posted a strong advance for the 12 months ending October 31, 2024. Resilient economic growth and a slowing in the pace of inflation in certain regions, as well as a shift to global monetary easing, contributed to a favorable backdrop, despite persistent geopolitical risk.
•Against this backdrop, stock picking in the United States and an underweight in emerging markets contributed to the fund's performance versus the MSCI AC World (Net MA) Linked Index for the fiscal year.
•By sector, security selection was the primary contributor, especially within information technology. Picks in industrials, primarily within the capital goods industry, and communication services, primarily within the media & entertainment industry, also boosted the fund's relative performance.
•The fund's top individual relative contributor was an overweight in Nvidia (+227%). Although we reduced the position, the stock was the fund's biggest holding at period end. A second notable relative contributor was an overweight in Hitachi (+109%). The stock was among our biggest holdings at period end. An overweight in Taiwan Semiconductor Manufacturing (+124%) also contributed. The stock was one of our largest holdings.
•In contrast, from a regional standpoint, stock picks in Canada and emerging markets, primarily in India, detracted from the fund's relative result.
•By sector, a notable detractor from performance versus the benchmark was stock selection in energy. Also modestly hurting our result were an overweight in industrials and an underweight in communication services. Lastly, the fund's position in cash detracted.
•The largest individual relative detractor was our stake in UnitedHealth Group (-9%). The stock was not held at period end. The second-largest relative detractor was an overweight in HDFC Bank (+18%). Another notable relative detractor this period was avoiding Broadcom, a benchmark component that gained 105%.
•Notable changes in positioning include increased exposure to China and the United States. By sector, meaningful changes in positioning include increased exposure to industrials and a lower allocation to energy.
How did the Fund perform over the past 10 years?
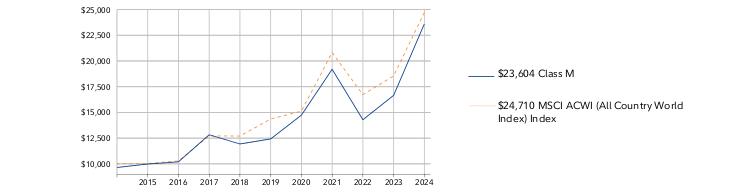
CUMULATIVE PERFORMANCE
October 31, 2014 through October 31, 2024.
Initial investment of $10,000.
Class C | $10,000 | $10,292 | $10,459 | $13,094 | $12,127 | $12,563 | $14,826 | $19,218 | $14,234 | $16,640 | $23,644 |
MSCI ACWI (All Country World Index) Index | $10,000 | $10,035 | $10,284 | $12,721 | $12,703 | $14,362 | $15,121 | $20,822 | $16,723 | $18,547 | $24,710 |
| | 2014 | 2015 | 2016 | 2017 | 2018 | 2019 | 2020 | 2021 | 2022 | 2023 | 2024 |
AVERAGE ANNUAL TOTAL RETURNS:| | 1 Year | 5 Year | 10 Year |
| Class C (incl. contingent deferred sales charge) | 40.03% | 13.13% | 8.99% |
| Class C | 41.03% | 13.13% | 8.99% |
| MSCI ACWI (All Country World Index) Index | 33.23% | 11.46% | 9.47% |
Visit institutional.fidelity.com for more recent performance information. |
The Fund's past performance is not a good predictor of the Fund's future performance. The graph and table do not reflect the deduction of taxes that a shareholder would pay on fund distributions or redemption of fund shares. |
Key Fund Statistics(as of October 31, 2024)
KEY FACTS | | |
| Fund Size | $141,421,538 | |
| Number of Holdings | 54 | |
| Total Advisory Fee | $1,161,739 | |
| Portfolio Turnover | 47% | |
What did the Fund invest in?
(as of October 31, 2024)
MARKET SECTORS (% of Fund's net assets) | | |
| Information Technology | 24.3 | |
| Financials | 23.1 | |
| Industrials | 18.8 | |
| Consumer Discretionary | 11.6 | |
| Communication Services | 8.5 | |
| Health Care | 7.9 | |
| Energy | 3.0 | |
| Materials | 1.2 | |
| |
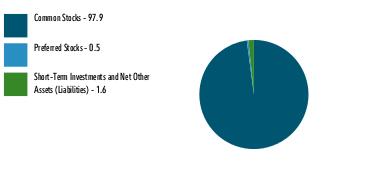
| Common Stocks | 97.9 |
| Preferred Stocks | 0.5 |
| Short-Term Investments and Net Other Assets (Liabilities) | 1.6 |
ASSET ALLOCATION (% of Fund's net assets) |
|
|
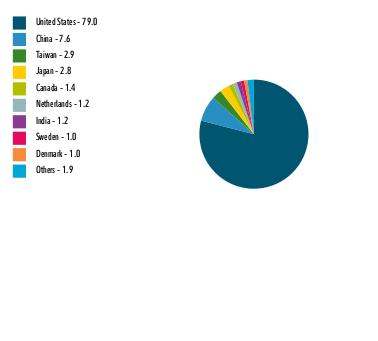
| United States | 79.0 |
| China | 7.6 |
| Taiwan | 2.9 |
| Japan | 2.8 |
| Canada | 1.4 |
| Netherlands | 1.2 |
| India | 1.2 |
| Sweden | 1.0 |
| Denmark | 1.0 |
| Others | 1.9 |
GEOGRAPHIC DIVERSIFICATION (% of Fund's net assets) |
|
| |
|
TOP HOLDINGS(% of Fund's net assets) | | |
| NVIDIA Corp | 6.6 | |
| Meta Platforms Inc Class A | 4.5 | |
| Microsoft Corp | 4.0 | |
| Fiserv Inc | 3.8 | |
| Apple Inc | 3.6 | |
| Amazon.com Inc | 3.5 | |
| Mastercard Inc Class A | 3.1 | |
| Taiwan Semiconductor Manufacturing Co Ltd ADR | 2.9 | |
| Hitachi Ltd | 2.8 | |
| Visa Inc Class A | 2.5 | |
| | 37.3 | |
How has the Fund changed?
This is a summary of certain changes to the Fund since November 1, 2023. For more complete information, you may review the Fund's next prospectus, which we expect to be available by December 30, 2024 at fundresearch.fidelity.com/prospectus/sec or upon request at 1-877-208-0098 or by sending an e-mail to fidfunddocuments@fidelity.com.
The fund's transfer agent and pricing & bookkeeping fees were changed to a fixed rate effective December 1, 2023, through February 29, 2024, in anticipation of the transition to a new management fee structure. Effective March 1, 2024, the fund's management contract was amended to incorporate administrative services previously covered under separate services agreements (transfer agent and pricing & bookkeeping). The amended contract incorporates a management fee rate that may vary by class (subject to a performance adjustment). The Adviser or an affiliate pays certain expenses of managing and operating the fund out of each class's management fee. | The fund's sub-advisory agreement with FIL Investments (Japan) Limited was not renewed.
|
| Fidelity, the Fidelity Investments Logo and all other Fidelity trademarks or service marks used herein are trademarks or service marks of FMR LLC. Any third-party marks that are used herein are trademarks or service marks of their respective owners. © 2024 FMR LLC. All rights reserved. |
| | For additional information about the Fund; including its prospectus, financial information, holdings and proxy information, scan the QR code or visit fundresearch.fidelity.com/prospectus/sec 1.9913902.100 753-TSRA-1224 |
| |
| | ANNUAL SHAREHOLDER REPORT | AS OF OCTOBER 31, 2024 | This report describes changes to the Fund that occurred during the reporting period. |
| | Fidelity Advisor® Focused Emerging Markets Fund Fidelity Advisor® Focused Emerging Markets Fund Class I : FIMKX |
| | | |
This annual shareholder report contains information about Fidelity Advisor® Focused Emerging Markets Fund for the period November 1, 2023 to October 31, 2024. You can find additional information about the Fund at fundresearch.fidelity.com/prospectus/sec. You can also request this information by contacting us at 1-877-208-0098 or by sending an e-mail to fidfunddocuments@fidelity.com.
What were your Fund costs for the last year?(based on hypothetical $10,000 investment)
FUND COST (PREVIOUS YEAR)
| | Costs of a $10,000 investment | Costs paid as a percentage of a $10,000 investment | |
| Class I | $ 109 | 0.95% | |
What affected the Fund's performance this period?
•International stocks achieved a strong gain for the 12 months ending October 31, 2024. Resilient global economic growth and a slowing in the pace of inflation in certain regions, as well as a shift to global monetary easing, contributed to a favorable backdrop, despite persistent geopolitical risk.
•Against this backdrop, stock picking in Emerging Asia and Emerging Europe contributed to the fund's performance versus the MSCI Emerging Markets (Net MA) Index for the fiscal year.
•By sector, security selection was the primary contributor, led by materials. Stock picks in communication services, primarily within the media & entertainment industry, and health care, primarily within the pharmaceuticals, biotechnology & life sciences industry, also boosted the fund's relative performance.
•The top individual relative contributor was an overweight in China Life Insurance (+65%). The stock was among the fund's biggest holdings. The second-largest relative contributor was an overweight in Meituan (+67%). The stock was one of our biggest holdings. Another notable relative contributor was our stake in Taiwan Semiconductor Manufacturing (+100%). The company was the fund's largest holding this period.
•In contrast, from a regional standpoint, stock selection in Latin America and Africa, primarily in South Africa, detracted from the fund's relative result.
•By sector, the biggest detractor from performance versus the benchmark was stock selection in consumer staples. Stock picking and an underweight in information technology, primarily within the technology hardware & equipment industry, also hampered the fund's result. Also hurting our result was an overweight in materials.
•The largest individual relative detractor was an overweight in Wal-Mart de Mexico (-22%). This period we increased our position in Wal-Mart de Mexico. The company was among our biggest holdings at period end. A second notable relative detractor was an overweight in Samsung Electronics (-12%). The stock was one of the fund's largest holdings. Another notable relative detractor was an underweight in Alibaba Group Holding (+23%). The stock was not held at period end.
•Notable changes in positioning include increased exposure to Mexico and a lower allocation to Brazil. By sector, meaningful changes in positioning include increased exposure to health care and a lower allocation to materials.
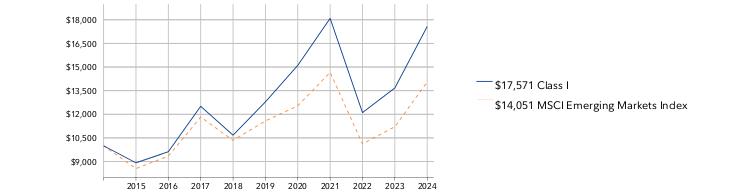
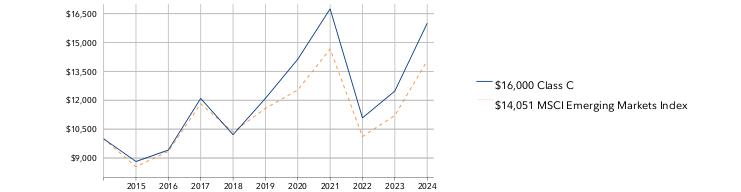
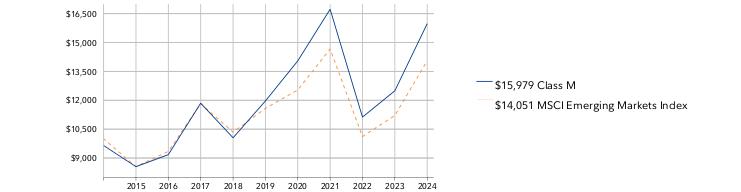
How did the Fund perform over the past 10 years?
CUMULATIVE PERFORMANCE
October 31, 2014 through October 31, 2024.
Initial investment of $10,000.
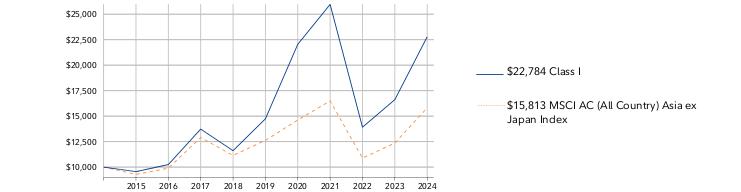
Class I | $10,000 | $8,917 | $9,624 | $12,506 | $10,675 | $12,786 | $15,104 | $18,091 | $12,106 | $13,670 | $17,571 |
MSCI Emerging Markets Index | $10,000 | $8,550 | $9,346 | $11,823 | $10,347 | $11,577 | $12,535 | $14,663 | $10,115 | $11,211 | $14,051 |
| | 2014 | 2015 | 2016 | 2017 | 2018 | 2019 | 2020 | 2021 | 2022 | 2023 | 2024 |
AVERAGE ANNUAL TOTAL RETURNS:| | 1 Year | 5 Year | 10 Year |
| Class I | 28.53% | 6.56% | 5.80% |
| MSCI Emerging Markets Index | 25.33% | 3.95% | 3.46% |
Visit institutional.fidelity.com for more recent performance information. |
The Fund's past performance is not a good predictor of the Fund's future performance. The graph and table do not reflect the deduction of taxes that a shareholder would pay on fund distributions or redemption of fund shares. |
Key Fund Statistics(as of October 31, 2024)
KEY FACTS | | |
| Fund Size | $5,788,031,153 | |
| Number of Holdings | 55 | |
| Total Advisory Fee | $37,704,655 | |
| Portfolio Turnover | 46% | |
What did the Fund invest in?
(as of October 31, 2024)
MARKET SECTORS (% of Fund's net assets) | | |
| Financials | 21.6 | |
| Information Technology | 18.3 | |
| Consumer Discretionary | 14.7 | |
| Communication Services | 10.2 | |
| Industrials | 8.7 | |
| Materials | 8.0 | |
| Health Care | 6.2 | |
| Consumer Staples | 5.5 | |
| Energy | 3.6 | |
| |
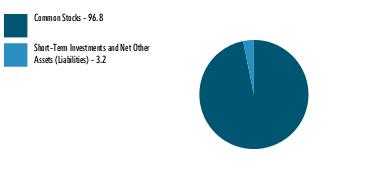
| Common Stocks | 96.8 |
| Short-Term Investments and Net Other Assets (Liabilities) | 3.2 |
ASSET ALLOCATION (% of Fund's net assets) |
|
|
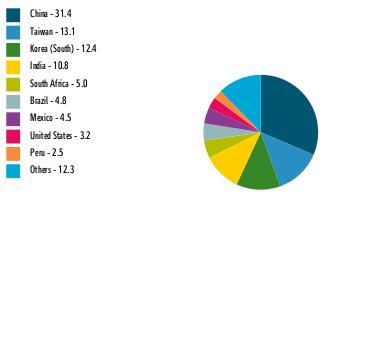
| China | 31.4 |
| Taiwan | 13.1 |
| Korea (South) | 12.4 |
| India | 10.8 |
| South Africa | 5.0 |
| Brazil | 4.8 |
| Mexico | 4.5 |
| United States | 3.2 |
| Peru | 2.5 |
| Others | 12.3 |
GEOGRAPHIC DIVERSIFICATION (% of Fund's net assets) |
|
| |
|
TOP HOLDINGS(% of Fund's net assets) | | |
| Tencent Holdings Ltd | 8.6 | |
| Taiwan Semiconductor Manufacturing Co Ltd | 8.4 | |
| Samsung Electronics Co Ltd | 5.7 | |
| Meituan B Shares | 3.5 | |
| Wal-Mart de Mexico SAB de CV Series V | 3.4 | |
| Haier Smart Home Co Ltd A Shares (China) | 2.9 | |
| Tata Consultancy Services Ltd | 2.7 | |
| China Life Insurance Co Ltd H Shares | 2.7 | |
| PDD Holdings Inc Class A ADR | 2.5 | |
| Credicorp Ltd | 2.5 | |
| | 42.9 | |
How has the Fund changed?
This is a summary of certain changes to the Fund since November 1, 2023. For more complete information, you may review the Fund's next prospectus, which we expect to be available by December 30, 2024 at fundresearch.fidelity.com/prospectus/sec or upon request at 1-877-208-0098 or by sending an e-mail to fidfunddocuments@fidelity.com.
The fees associated with this class changed during the reporting year.The variations in class fees are primarily the result of the following changes: - Management fee
- Operating expenses
The fund's transfer agent and pricing & bookkeeping fees were changed to a fixed rate effective December 1, 2023, through February 29, 2024, in anticipation of the transition to a new management fee structure. Effective March 1, 2024, the fund's management contract was amended to incorporate administrative services previously covered under separate services agreements (transfer agent and pricing & bookkeeping). The amended contract incorporates a management fee rate that may vary by class. The Adviser or an affiliate pays certain expenses of managing and operating the fund out of each class's management fee. | The fund's sub-advisory agreement with FIL Investments (Japan) Limited was not renewed.
|
| Fidelity, the Fidelity Investments Logo and all other Fidelity trademarks or service marks used herein are trademarks or service marks of FMR LLC. Any third-party marks that are used herein are trademarks or service marks of their respective owners. © 2024 FMR LLC. All rights reserved. |
| | For additional information about the Fund; including its prospectus, financial information, holdings and proxy information, scan the QR code or visit fundresearch.fidelity.com/prospectus/sec 1.9913923.100 1290-TSRA-1224 |
| |
| | ANNUAL SHAREHOLDER REPORT | AS OF OCTOBER 31, 2024 | This report describes changes to the Fund that occurred during the reporting period. |
| | Fidelity Advisor® Focused Emerging Markets Fund Fidelity Advisor® Focused Emerging Markets Fund Class Z : FZAEX |
| | | |
This annual shareholder report contains information about Fidelity Advisor® Focused Emerging Markets Fund for the period November 1, 2023 to October 31, 2024. You can find additional information about the Fund at fundresearch.fidelity.com/prospectus/sec. You can also request this information by contacting us at 1-877-208-0098 or by sending an e-mail to fidfunddocuments@fidelity.com.
What were your Fund costs for the last year?(based on hypothetical $10,000 investment)
FUND COST (PREVIOUS YEAR)
| | Costs of a $10,000 investment | Costs paid as a percentage of a $10,000 investment | |
| Class Z | $ 94 | 0.82% | |
What affected the Fund's performance this period?
•International stocks achieved a strong gain for the 12 months ending October 31, 2024. Resilient global economic growth and a slowing in the pace of inflation in certain regions, as well as a shift to global monetary easing, contributed to a favorable backdrop, despite persistent geopolitical risk.
•Against this backdrop, stock picking in Emerging Asia and Emerging Europe contributed to the fund's performance versus the MSCI Emerging Markets (Net MA) Index for the fiscal year.
•By sector, security selection was the primary contributor, led by materials. Stock picks in communication services, primarily within the media & entertainment industry, and health care, primarily within the pharmaceuticals, biotechnology & life sciences industry, also boosted the fund's relative performance.
•The top individual relative contributor was an overweight in China Life Insurance (+65%). The stock was among the fund's biggest holdings. The second-largest relative contributor was an overweight in Meituan (+67%). The stock was one of our biggest holdings. Another notable relative contributor was our stake in Taiwan Semiconductor Manufacturing (+100%). The company was the fund's largest holding this period.
•In contrast, from a regional standpoint, stock selection in Latin America and Africa, primarily in South Africa, detracted from the fund's relative result.
•By sector, the biggest detractor from performance versus the benchmark was stock selection in consumer staples. Stock picking and an underweight in information technology, primarily within the technology hardware & equipment industry, also hampered the fund's result. Also hurting our result was an overweight in materials.
•The largest individual relative detractor was an overweight in Wal-Mart de Mexico (-22%). This period we increased our position in Wal-Mart de Mexico. The company was among our biggest holdings at period end. A second notable relative detractor was an overweight in Samsung Electronics (-12%). The stock was one of the fund's largest holdings. Another notable relative detractor was an underweight in Alibaba Group Holding (+23%). The stock was not held at period end.
•Notable changes in positioning include increased exposure to Mexico and a lower allocation to Brazil. By sector, meaningful changes in positioning include increased exposure to health care and a lower allocation to materials.
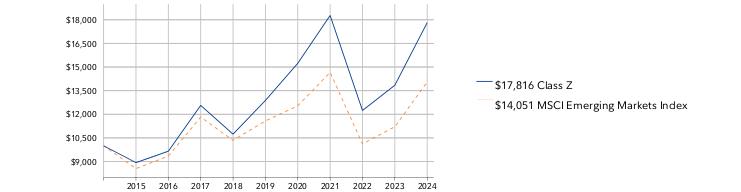
How did the Fund perform over the past 10 years?
CUMULATIVE PERFORMANCE
October 31, 2014 through October 31, 2024.
Initial investment of $10,000.
Class Z | $10,000 | $8,932 | $9,654 | $12,564 | $10,739 | $12,879 | $15,235 | $18,273 | $12,241 | $13,844 | $17,816 |
MSCI Emerging Markets Index | $10,000 | $8,550 | $9,346 | $11,823 | $10,347 | $11,577 | $12,535 | $14,663 | $10,115 | $11,211 | $14,051 |
| | 2014 | 2015 | 2016 | 2017 | 2018 | 2019 | 2020 | 2021 | 2022 | 2023 | 2024 |
AVERAGE ANNUAL TOTAL RETURNS:| | 1 Year | 5 Year | 10 Year |
| Class Z | 28.69% | 6.70% | 5.95% |
| MSCI Emerging Markets Index | 25.33% | 3.95% | 3.46% |
Visit institutional.fidelity.com for more recent performance information. |
The Fund's past performance is not a good predictor of the Fund's future performance. The graph and table do not reflect the deduction of taxes that a shareholder would pay on fund distributions or redemption of fund shares. |
Key Fund Statistics(as of October 31, 2024)
KEY FACTS | | |
| Fund Size | $5,788,031,153 | |
| Number of Holdings | 55 | |
| Total Advisory Fee | $37,704,655 | |
| Portfolio Turnover | 46% | |
What did the Fund invest in?
(as of October 31, 2024)
MARKET SECTORS (% of Fund's net assets) | | |
| Financials | 21.6 | |
| Information Technology | 18.3 | |
| Consumer Discretionary | 14.7 | |
| Communication Services | 10.2 | |
| Industrials | 8.7 | |
| Materials | 8.0 | |
| Health Care | 6.2 | |
| Consumer Staples | 5.5 | |
| Energy | 3.6 | |
| |
| Common Stocks | 96.8 |
| Short-Term Investments and Net Other Assets (Liabilities) | 3.2 |
ASSET ALLOCATION (% of Fund's net assets) |
|
|
| China | 31.4 |
| Taiwan | 13.1 |
| Korea (South) | 12.4 |
| India | 10.8 |
| South Africa | 5.0 |
| Brazil | 4.8 |
| Mexico | 4.5 |
| United States | 3.2 |
| Peru | 2.5 |
| Others | 12.3 |
GEOGRAPHIC DIVERSIFICATION (% of Fund's net assets) |
|
| |
|
TOP HOLDINGS(% of Fund's net assets) | | |
| Tencent Holdings Ltd | 8.6 | |
| Taiwan Semiconductor Manufacturing Co Ltd | 8.4 | |
| Samsung Electronics Co Ltd | 5.7 | |
| Meituan B Shares | 3.5 | |
| Wal-Mart de Mexico SAB de CV Series V | 3.4 | |
| Haier Smart Home Co Ltd A Shares (China) | 2.9 | |
| Tata Consultancy Services Ltd | 2.7 | |
| China Life Insurance Co Ltd H Shares | 2.7 | |
| PDD Holdings Inc Class A ADR | 2.5 | |
| Credicorp Ltd | 2.5 | |
| | 42.9 | |
How has the Fund changed?
This is a summary of certain changes to the Fund since November 1, 2023. For more complete information, you may review the Fund's next prospectus, which we expect to be available by December 30, 2024 at fundresearch.fidelity.com/prospectus/sec or upon request at 1-877-208-0098 or by sending an e-mail to fidfunddocuments@fidelity.com.
The fees associated with this class changed during the reporting year.The variations in class fees are primarily the result of the following changes: - Management fee
- Operating expenses
The fund's transfer agent and pricing & bookkeeping fees were changed to a fixed rate effective December 1, 2023, through February 29, 2024, in anticipation of the transition to a new management fee structure. Effective March 1, 2024, the fund's management contract was amended to incorporate administrative services previously covered under separate services agreements (transfer agent and pricing & bookkeeping). The amended contract incorporates a management fee rate that may vary by class. The Adviser or an affiliate pays certain expenses of managing and operating the fund out of each class's management fee. | The fund's sub-advisory agreement with FIL Investments (Japan) Limited was not renewed.
|
| Fidelity, the Fidelity Investments Logo and all other Fidelity trademarks or service marks used herein are trademarks or service marks of FMR LLC. Any third-party marks that are used herein are trademarks or service marks of their respective owners. © 2024 FMR LLC. All rights reserved. |
| | For additional information about the Fund; including its prospectus, financial information, holdings and proxy information, scan the QR code or visit fundresearch.fidelity.com/prospectus/sec 1.9913924.100 2530-TSRA-1224 |
| |
| | ANNUAL SHAREHOLDER REPORT | AS OF OCTOBER 31, 2024 | This report describes changes to the Fund that occurred during the reporting period. |
| | Fidelity Advisor® Overseas Fund Fidelity Advisor® Overseas Fund Class I : FAOIX |
| | | |
This annual shareholder report contains information about Fidelity Advisor® Overseas Fund for the period November 1, 2023 to October 31, 2024. You can find additional information about the Fund at fundresearch.fidelity.com/prospectus/sec. You can also request this information by contacting us at 1-877-208-0098 or by sending an e-mail to fidfunddocuments@fidelity.com.
What were your Fund costs for the last year?(based on hypothetical $10,000 investment)
FUND COST (PREVIOUS YEAR)
| | Costs of a $10,000 investment | Costs paid as a percentage of a $10,000 investment | |
| Class I | $ 87 | 0.77% | |
What affected the Fund's performance this period?
•International stocks achieved a strong gain for the 12 months ending October 31, 2024. Resilient global economic growth and a slowing in the pace of inflation in certain regions, as well as a shift to global monetary easing, contributed to a favorable backdrop, despite persistent geopolitical risk.
•Against this backdrop, stock picking in the U.K. and Japan contributed to the fund's performance versus the MSCI EAFE Index (Net MA) for the fiscal year.
•By sector, market selection was the primary contributor, led by an underweights in energy and consumer staples. Stock picks and an overweight in industrials, primarily within the capital goods industry, also boosted the fund's relative performance.
•The top individual relative contributor was an overweight in Mitsubishi Heavy Industries (+157%). This was a stake we established this period. The second-largest relative contributor was an overweight in Tokio Marine Holdings (+70%). Although we reduced the fund's stake, the company was one of our largest holdings. Another notable relative contributor was our non-benchmark stake in Taiwan Semiconductor Manufacturing (+101%).
•In contrast, from a regional standpoint, stock selection in the United States and underweights in Japan and Asia Pacific ex Japan detracted from the fund's relative result.
•By sector, the biggest detractor from performance versus the benchmark was stock selection in consumer staples. Also hurting our result were stock picks in consumer discretionary, primarily within the consumer durables & apparel industry. Choices in information technology, primarily within the software & services industry, also hurt. Lastly, the fund's position in cash detracted.
•The largest individual relative detractor was our stake in Diageo (-11%). The stock was not held at period end. A non-benchmark stake in Alten returned approximately -27% and was the second-largest relative detractor. Our overweight stake in Sony Group (+1%) also hurt. The stock was not held at period end.
•Notable changes in positioning include increased exposure to Japan and the United States, and a lower allocation to Sweden. By sector, meaningful changes in positioning include decreased exposure to consumer staples and energy, and a higher allocation to industrials and materials.
How did the Fund perform over the past 10 years?
CUMULATIVE PERFORMANCE
October 31, 2014 through October 31, 2024.
Initial investment of $10,000.
Class I | $10,000 | $10,282 | $9,783 | $12,253 | $11,368 | $12,869 | $13,343 | $18,438 | $12,922 | $14,574 | $18,345 |
MSCI EAFE Index | $10,000 | $10,008 | $9,705 | $12,004 | $11,206 | $12,472 | $11,638 | $15,647 | $12,073 | $13,841 | $17,059 |
| | 2014 | 2015 | 2016 | 2017 | 2018 | 2019 | 2020 | 2021 | 2022 | 2023 | 2024 |
AVERAGE ANNUAL TOTAL RETURNS:| | 1 Year | 5 Year | 10 Year |
| Class I | 25.87% | 7.35% | 6.26% |
| MSCI EAFE Index | 23.25% | 6.46% | 5.49% |
Visit institutional.fidelity.com for more recent performance information. |
The Fund's past performance is not a good predictor of the Fund's future performance. The graph and table do not reflect the deduction of taxes that a shareholder would pay on fund distributions or redemption of fund shares. |
Key Fund Statistics(as of October 31, 2024)
KEY FACTS | | |
| Fund Size | $383,854,611 | |
| Number of Holdings | 93 | |
| Total Advisory Fee | $2,406,862 | |
| Portfolio Turnover | 34% | |
What did the Fund invest in?
(as of October 31, 2024)
MARKET SECTORS (% of Fund's net assets) | | |
| Industrials | 26.0 | |
| Financials | 23.2 | |
| Information Technology | 16.0 | |
| Health Care | 13.8 | |
| Materials | 9.5 | |
| Consumer Discretionary | 7.0 | |
| Consumer Staples | 2.3 | |
| Communication Services | 0.4 | |
| |
| Common Stocks | 98.2 |
| Short-Term Investments and Net Other Assets (Liabilities) | 1.8 |
ASSET ALLOCATION (% of Fund's net assets) |
|
|
| United Kingdom | 17.9 |
| United States | 17.3 |
| Japan | 16.1 |
| France | 11.2 |
| Germany | 8.9 |
| Netherlands | 6.3 |
| Denmark | 4.4 |
| Italy | 3.8 |
| Switzerland | 3.4 |
| Others | 10.7 |
GEOGRAPHIC DIVERSIFICATION (% of Fund's net assets) |
|
| |
|
TOP HOLDINGS(% of Fund's net assets) | | |
| ASML Holding NV | 3.0 | |
| Novo Nordisk A/S Series B | 3.0 | |
| SAP SE | 2.9 | |
| Astrazeneca PLC | 2.2 | |
| Hitachi Ltd | 2.2 | |
| RELX PLC | 2.2 | |
| Safran SA | 2.0 | |
| Compass Group PLC | 2.0 | |
| Wolters Kluwer NV | 2.0 | |
| Tokio Marine Holdings Inc | 2.0 | |
| | 23.5 | |
How has the Fund changed?
This is a summary of certain changes to the Fund since November 1, 2023. For more complete information, you may review the Fund's next prospectus, which we expect to be available by December 30, 2024 at fundresearch.fidelity.com/prospectus/sec or upon request at 1-877-208-0098 or by sending an e-mail to fidfunddocuments@fidelity.com.
The fees associated with this class changed during the reporting year.The variations in class fees are primarily the result of the following changes: - Management fee
- Operating expenses
The fund's transfer agent and pricing & bookkeeping fees were changed to a fixed rate effective December 1, 2023, through February 29, 2024, in anticipation of the transition to a new management fee structure. Effective March 1, 2024, the fund's management contract was amended to incorporate administrative services previously covered under separate services agreements (transfer agent and pricing & bookkeeping). The amended contract incorporates a basic fee rate that may vary by class (subject to a performance adjustment). The Adviser or an affiliate pays certain expenses of managing and operating the fund out of each class's management fee. | The fund's sub-advisory agreement with FIL Investments (Japan) Limited was not renewed.
|
| Fidelity, the Fidelity Investments Logo and all other Fidelity trademarks or service marks used herein are trademarks or service marks of FMR LLC. Any third-party marks that are used herein are trademarks or service marks of their respective owners. © 2024 FMR LLC. All rights reserved. |
| | For additional information about the Fund; including its prospectus, financial information, holdings and proxy information, scan the QR code or visit fundresearch.fidelity.com/prospectus/sec 1.9913822.100 655-TSRA-1224 |
| |
| | ANNUAL SHAREHOLDER REPORT | AS OF OCTOBER 31, 2024 | This report describes changes to the Fund that occurred during the reporting period. |
| | Fidelity Advisor® Diversified International Fund Fidelity Advisor® Diversified International Fund Class Z : FZABX |
| | | |
This annual shareholder report contains information about Fidelity Advisor® Diversified International Fund for the period November 1, 2023 to October 31, 2024. You can find additional information about the Fund at fundresearch.fidelity.com/prospectus/sec. You can also request this information by contacting us at 1-877-208-0098 or by sending an e-mail to fidfunddocuments@fidelity.com.
What were your Fund costs for the last year?(based on hypothetical $10,000 investment)
FUND COST (PREVIOUS YEAR)
| | Costs of a $10,000 investment | Costs paid as a percentage of a $10,000 investment | |
| Class Z | $ 80 | 0.72% | |
What affected the Fund's performance this period?
•International stocks achieved a strong gain for the 12 months ending October 31, 2024. Resilient global economic growth and a slowing in the pace of inflation in certain regions, as well as a shift to global monetary easing, contributed to a favorable backdrop, despite persistent geopolitical risk.
•Against this backdrop, stock picks in Japan and a non-benchmark allocation to emerging markets contributed to the fund's performance versus the MSCI EAFE Index (Net MA) for the fiscal year.
•By sector, the biggest contributors to performance versus the benchmark were picks and an overweight in industrials, primarily within the capital goods industry. Picks in materials also boosted relative performance. Also helping our relative result was an underweight in consumer staples.
•The top individual relative contributor was our non-benchmark stake in Taiwan Semiconductor Manufacturing (+124%). The stock was among our biggest holdings. A second notable relative contributor was an overweight in Hitachi (+109%). Although we trimmed our stake, the company was the fund's largest holding at period end. Another notable relative contributor was an overweight in Mitsubishi Heavy Industries (+127%). This was a stake we established this period.
•In contrast, from a regional standpoint, a non-benchmark allocation to both the United States and Canada detracted from the fund's relative result.
•By sector, the biggest detractor from performance versus the benchmark was stock picking in financials. Stock picks in consumer staples also hampered the fund's result. Also detracting from our result was an overweight in energy. Lastly, the fund's position in cash detracted.
•The fund's non-benchmark stake in Schlumberger returned -20% and was the largest individual relative detractor. The stock was not held at period end. A non-benchmark stake in HDFC Bank gained 18% and was a second notable relative detractor. We reduced the position. Our stake in Pernod-Ricard (-27%) also detracted. This period we decreased our position in Pernod-Ricard.
•Notable changes in positioning include increased exposure to Germany and Switzerland. By sector, meaningful changes in positioning include decreased exposure to consumer staples and a higher allocation to industrials.
How did the Fund perform over the past 10 years?
CUMULATIVE PERFORMANCE
October 31, 2014 through October 31, 2024.
Initial investment of $10,000.
Class Z | $10,000 | $10,434 | $10,168 | $12,502 | $11,404 | $13,233 | $14,527 | $18,899 | $13,420 | $15,026 | $18,762 |
MSCI EAFE Index | $10,000 | $10,008 | $9,705 | $12,004 | $11,206 | $12,472 | $11,638 | $15,647 | $12,073 | $13,841 | $17,059 |
| | 2014 | 2015 | 2016 | 2017 | 2018 | 2019 | 2020 | 2021 | 2022 | 2023 | 2024 |
AVERAGE ANNUAL TOTAL RETURNS:| | 1 Year | 5 Year | 10 Year |
| Class Z | 24.86% | 7.23% | 6.49% |
| MSCI EAFE Index | 23.25% | 6.46% | 5.49% |
Visit institutional.fidelity.com for more recent performance information. |
The Fund's past performance is not a good predictor of the Fund's future performance. The graph and table do not reflect the deduction of taxes that a shareholder would pay on fund distributions or redemption of fund shares. |
Key Fund Statistics(as of October 31, 2024)
KEY FACTS | | |
| Fund Size | $1,404,041,433 | |
| Number of Holdings | 135 | |
| Total Advisory Fee | $10,934,381 | |
| Portfolio Turnover | 33% | |
What did the Fund invest in?
(as of October 31, 2024)
MARKET SECTORS (% of Fund's net assets) | | |
| Industrials | 24.9 | |
| Financials | 22.5 | |
| Information Technology | 15.7 | |
| Health Care | 10.3 | |
| Materials | 8.3 | |
| Consumer Discretionary | 7.4 | |
| Energy | 5.0 | |
| Consumer Staples | 1.9 | |
| Communication Services | 0.5 | |
| Real Estate | 0.2 | |
| |
| Common Stocks | 96.2 |
| Preferred Stocks | 0.5 |
| Short-Term Investments and Net Other Assets (Liabilities) | 3.3 |
ASSET ALLOCATION (% of Fund's net assets) |
|
|
| Japan | 17.1 |
| United States | 16.0 |
| United Kingdom | 14.4 |
| Germany | 8.7 |
| France | 8.1 |
| Canada | 6.5 |
| Netherlands | 5.3 |
| Denmark | 3.5 |
| Sweden | 3.0 |
| Others | 17.4 |
GEOGRAPHIC DIVERSIFICATION (% of Fund's net assets) |
|
| |
|
TOP HOLDINGS(% of Fund's net assets) | | |
| Hitachi Ltd | 2.9 | |
| ASML Holding NV depository receipt | 2.8 | |
| Novo Nordisk A/S Series B | 2.5 | |
| Taiwan Semiconductor Manufacturing Co Ltd ADR | 2.5 | |
| SAP SE | 2.4 | |
| Astrazeneca PLC | 1.8 | |
| RELX PLC (Netherlands) | 1.8 | |
| Wolters Kluwer NV | 1.6 | |
| London Stock Exchange Group PLC | 1.6 | |
| Shell PLC | 1.6 | |
| | 21.5 | |
How has the Fund changed?
This is a summary of certain changes to the Fund since November 1, 2023. For more complete information, you may review the Fund's next prospectus, which we expect to be available by December 30, 2024 at fundresearch.fidelity.com/prospectus/sec or upon request at 1-877-208-0098 or by sending an e-mail to fidfunddocuments@fidelity.com.
The fees associated with this class changed during the reporting year.The variations in class fees are primarily the result of the following changes: - Management fee
- Operating expenses
The fund's transfer agent and pricing & bookkeeping fees were changed to a fixed rate effective December 1, 2023, through February 29, 2024, in anticipation of the transition to a new management fee structure. Effective March 1, 2024, the fund's management contract was amended to incorporate administrative services previously covered under separate services agreements (transfer agent and pricing & bookkeeping). The amended contract incorporates a management fee rate that may vary by class. The Adviser or an affiliate pays certain expenses of managing and operating the fund out of each class's management fee. | The fund's sub-advisory agreement with FIL Investments (Japan) Limited was not renewed.
|
| Fidelity, the Fidelity Investments Logo and all other Fidelity trademarks or service marks used herein are trademarks or service marks of FMR LLC. Any third-party marks that are used herein are trademarks or service marks of their respective owners. © 2024 FMR LLC. All rights reserved. |
| | For additional information about the Fund; including its prospectus, financial information, holdings and proxy information, scan the QR code or visit fundresearch.fidelity.com/prospectus/sec 1.9913896.100 2527-TSRA-1224 |
| |
| | ANNUAL SHAREHOLDER REPORT | AS OF OCTOBER 31, 2024 | This report describes changes to the Fund that occurred during the reporting period. |
| | Fidelity Advisor® Global Capital Appreciation Fund Fidelity Advisor® Global Capital Appreciation Fund Class A : FGEAX |
| | | |
This annual shareholder report contains information about Fidelity Advisor® Global Capital Appreciation Fund for the period November 1, 2023 to October 31, 2024. You can find additional information about the Fund at fundresearch.fidelity.com/prospectus/sec. You can also request this information by contacting us at 1-877-208-0098 or by sending an e-mail to fidfunddocuments@fidelity.com.
What were your Fund costs for the last year?(based on hypothetical $10,000 investment)
FUND COST (PREVIOUS YEAR)
| | Costs of a $10,000 investment | Costs paid as a percentage of a $10,000 investment | |
| Class A | $ 157 | 1.30% | |
What affected the Fund's performance this period?
•Global equities posted a strong advance for the 12 months ending October 31, 2024. Resilient economic growth and a slowing in the pace of inflation in certain regions, as well as a shift to global monetary easing, contributed to a favorable backdrop, despite persistent geopolitical risk.
•Against this backdrop, stock picking in the United States and an underweight in emerging markets contributed to the fund's performance versus the MSCI AC World (Net MA) Linked Index for the fiscal year.
•By sector, security selection was the primary contributor, especially within information technology. Picks in industrials, primarily within the capital goods industry, and communication services, primarily within the media & entertainment industry, also boosted the fund's relative performance.
•The fund's top individual relative contributor was an overweight in Nvidia (+227%). Although we reduced the position, the stock was the fund's biggest holding at period end. A second notable relative contributor was an overweight in Hitachi (+109%). The stock was among our biggest holdings at period end. An overweight in Taiwan Semiconductor Manufacturing (+124%) also contributed. The stock was one of our largest holdings.
•In contrast, from a regional standpoint, stock picks in Canada and emerging markets, primarily in India, detracted from the fund's relative result.
•By sector, a notable detractor from performance versus the benchmark was stock selection in energy. Also modestly hurting our result were an overweight in industrials and an underweight in communication services. Lastly, the fund's position in cash detracted.
•The largest individual relative detractor was our stake in UnitedHealth Group (-9%). The stock was not held at period end. The second-largest relative detractor was an overweight in HDFC Bank (+18%). Another notable relative detractor this period was avoiding Broadcom, a benchmark component that gained 105%.
•Notable changes in positioning include increased exposure to China and the United States. By sector, meaningful changes in positioning include increased exposure to industrials and a lower allocation to energy.
How did the Fund perform over the past 10 years?
CUMULATIVE PERFORMANCE
October 31, 2014 through October 31, 2024.
Initial investment of $10,000 and the current sales charge was paid.
Class A | $9,425 | $9,776 | $10,009 | $12,629 | $11,777 | $12,294 | $14,616 | $19,096 | $14,246 | $16,655 | $23,665 |
MSCI ACWI (All Country World Index) Index | $10,000 | $10,035 | $10,284 | $12,721 | $12,703 | $14,362 | $15,121 | $20,822 | $16,723 | $18,547 | $24,710 |
| | 2014 | 2015 | 2016 | 2017 | 2018 | 2019 | 2020 | 2021 | 2022 | 2023 | 2024 |
AVERAGE ANNUAL TOTAL RETURNS:| | 1 Year | 5 Year | 10 Year |
| Class A (incl. 5.75% sales charge) | 33.92% | 12.65% | 9.00% |
| Class A (without 5.75% sales charge) | 42.09% | 13.99% | 9.64% |
| MSCI ACWI (All Country World Index) Index | 33.23% | 11.46% | 9.47% |
Visit institutional.fidelity.com for more recent performance information. |
The Fund's past performance is not a good predictor of the Fund's future performance. The graph and table do not reflect the deduction of taxes that a shareholder would pay on fund distributions or redemption of fund shares. |
Key Fund Statistics(as of October 31, 2024)
KEY FACTS | | |
| Fund Size | $141,421,538 | |
| Number of Holdings | 54 | |
| Total Advisory Fee | $1,161,739 | |
| Portfolio Turnover | 47% | |
What did the Fund invest in?
(as of October 31, 2024)
MARKET SECTORS (% of Fund's net assets) | | |
| Information Technology | 24.3 | |
| Financials | 23.1 | |
| Industrials | 18.8 | |
| Consumer Discretionary | 11.6 | |
| Communication Services | 8.5 | |
| Health Care | 7.9 | |
| Energy | 3.0 | |
| Materials | 1.2 | |
| |
| Common Stocks | 97.9 |
| Preferred Stocks | 0.5 |
| Short-Term Investments and Net Other Assets (Liabilities) | 1.6 |
ASSET ALLOCATION (% of Fund's net assets) |
|
|
| United States | 79.0 |
| China | 7.6 |
| Taiwan | 2.9 |
| Japan | 2.8 |
| Canada | 1.4 |
| Netherlands | 1.2 |
| India | 1.2 |
| Sweden | 1.0 |
| Denmark | 1.0 |
| Others | 1.9 |
GEOGRAPHIC DIVERSIFICATION (% of Fund's net assets) |
|
| |
|
TOP HOLDINGS(% of Fund's net assets) | | |
| NVIDIA Corp | 6.6 | |
| Meta Platforms Inc Class A | 4.5 | |
| Microsoft Corp | 4.0 | |
| Fiserv Inc | 3.8 | |
| Apple Inc | 3.6 | |
| Amazon.com Inc | 3.5 | |
| Mastercard Inc Class A | 3.1 | |
| Taiwan Semiconductor Manufacturing Co Ltd ADR | 2.9 | |
| Hitachi Ltd | 2.8 | |
| Visa Inc Class A | 2.5 | |
| | 37.3 | |
How has the Fund changed?
This is a summary of certain changes to the Fund since November 1, 2023. For more complete information, you may review the Fund's next prospectus, which we expect to be available by December 30, 2024 at fundresearch.fidelity.com/prospectus/sec or upon request at 1-877-208-0098 or by sending an e-mail to fidfunddocuments@fidelity.com.
The fees associated with this class changed during the reporting year.The variations in class fees are primarily the result of the following changes: - Management fee
- Operating expenses
- Performance adjustment fee
- Expense reductions
The fund's transfer agent and pricing & bookkeeping fees were changed to a fixed rate effective December 1, 2023, through February 29, 2024, in anticipation of the transition to a new management fee structure. Effective March 1, 2024, the fund's management contract was amended to incorporate administrative services previously covered under separate services agreements (transfer agent and pricing & bookkeeping). The amended contract incorporates a management fee rate that may vary by class (subject to a performance adjustment). The Adviser or an affiliate pays certain expenses of managing and operating the fund out of each class's management fee. | The fund's sub-advisory agreement with FIL Investments (Japan) Limited was not renewed.
|
| Fidelity, the Fidelity Investments Logo and all other Fidelity trademarks or service marks used herein are trademarks or service marks of FMR LLC. Any third-party marks that are used herein are trademarks or service marks of their respective owners. © 2024 FMR LLC. All rights reserved. |
| | For additional information about the Fund; including its prospectus, financial information, holdings and proxy information, scan the QR code or visit fundresearch.fidelity.com/prospectus/sec 1.9913901.100 751-TSRA-1224 |
| |
| | ANNUAL SHAREHOLDER REPORT | AS OF OCTOBER 31, 2024 | This report describes changes to the Fund that occurred during the reporting period. |
| | Fidelity Advisor® Diversified International Fund Fidelity Advisor® Diversified International Fund Class A : FDVAX |
| | | |
This annual shareholder report contains information about Fidelity Advisor® Diversified International Fund for the period November 1, 2023 to October 31, 2024. You can find additional information about the Fund at fundresearch.fidelity.com/prospectus/sec. You can also request this information by contacting us at 1-877-208-0098 or by sending an e-mail to fidfunddocuments@fidelity.com.
What were your Fund costs for the last year?(based on hypothetical $10,000 investment)
FUND COST (PREVIOUS YEAR)
| | Costs of a $10,000 investment | Costs paid as a percentage of a $10,000 investment | |
| Class A | $ 128 | 1.14% | |
What affected the Fund's performance this period?
•International stocks achieved a strong gain for the 12 months ending October 31, 2024. Resilient global economic growth and a slowing in the pace of inflation in certain regions, as well as a shift to global monetary easing, contributed to a favorable backdrop, despite persistent geopolitical risk.
•Against this backdrop, stock picks in Japan and a non-benchmark allocation to emerging markets contributed to the fund's performance versus the MSCI EAFE Index (Net MA) for the fiscal year.
•By sector, the biggest contributors to performance versus the benchmark were picks and an overweight in industrials, primarily within the capital goods industry. Picks in materials also boosted relative performance. Also helping our relative result was an underweight in consumer staples.
•The top individual relative contributor was our non-benchmark stake in Taiwan Semiconductor Manufacturing (+124%). The stock was among our biggest holdings. A second notable relative contributor was an overweight in Hitachi (+109%). Although we trimmed our stake, the company was the fund's largest holding at period end. Another notable relative contributor was an overweight in Mitsubishi Heavy Industries (+127%). This was a stake we established this period.
•In contrast, from a regional standpoint, a non-benchmark allocation to both the United States and Canada detracted from the fund's relative result.
•By sector, the biggest detractor from performance versus the benchmark was stock picking in financials. Stock picks in consumer staples also hampered the fund's result. Also detracting from our result was an overweight in energy. Lastly, the fund's position in cash detracted.
•The fund's non-benchmark stake in Schlumberger returned -20% and was the largest individual relative detractor. The stock was not held at period end. A non-benchmark stake in HDFC Bank gained 18% and was a second notable relative detractor. We reduced the position. Our stake in Pernod-Ricard (-27%) also detracted. This period we decreased our position in Pernod-Ricard.
•Notable changes in positioning include increased exposure to Germany and Switzerland. By sector, meaningful changes in positioning include decreased exposure to consumer staples and a higher allocation to industrials.
How did the Fund perform over the past 10 years?
CUMULATIVE PERFORMANCE
October 31, 2014 through October 31, 2024.
Initial investment of $10,000 and the current sales charge was paid.
Class A | $9,425 | $9,795 | $9,504 | $11,633 | $10,570 | $12,216 | $13,354 | $17,302 | $12,235 | $13,648 | $16,971 |
MSCI EAFE Index | $10,000 | $10,008 | $9,705 | $12,004 | $11,206 | $12,472 | $11,638 | $15,647 | $12,073 | $13,841 | $17,059 |
| | 2014 | 2015 | 2016 | 2017 | 2018 | 2019 | 2020 | 2021 | 2022 | 2023 | 2024 |
AVERAGE ANNUAL TOTAL RETURNS:| | 1 Year | 5 Year | 10 Year |
| Class A (incl. 5.75% sales charge) | 17.20% | 5.54% | 5.43% |
| Class A (without 5.75% sales charge) | 24.35% | 6.80% | 6.06% |
| MSCI EAFE Index | 23.25% | 6.46% | 5.49% |
Visit institutional.fidelity.com for more recent performance information. |
The Fund's past performance is not a good predictor of the Fund's future performance. The graph and table do not reflect the deduction of taxes that a shareholder would pay on fund distributions or redemption of fund shares. |
Key Fund Statistics(as of October 31, 2024)
KEY FACTS | | |
| Fund Size | $1,404,041,433 | |
| Number of Holdings | 135 | |
| Total Advisory Fee | $10,934,381 | |
| Portfolio Turnover | 33% | |
What did the Fund invest in?
(as of October 31, 2024)
MARKET SECTORS (% of Fund's net assets) | | |
| Industrials | 24.9 | |
| Financials | 22.5 | |
| Information Technology | 15.7 | |
| Health Care | 10.3 | |
| Materials | 8.3 | |
| Consumer Discretionary | 7.4 | |
| Energy | 5.0 | |
| Consumer Staples | 1.9 | |
| Communication Services | 0.5 | |
| Real Estate | 0.2 | |
| |
| Common Stocks | 96.2 |
| Preferred Stocks | 0.5 |
| Short-Term Investments and Net Other Assets (Liabilities) | 3.3 |
ASSET ALLOCATION (% of Fund's net assets) |
|
|
| Japan | 17.1 |
| United States | 16.0 |
| United Kingdom | 14.4 |
| Germany | 8.7 |
| France | 8.1 |
| Canada | 6.5 |
| Netherlands | 5.3 |
| Denmark | 3.5 |
| Sweden | 3.0 |
| Others | 17.4 |
GEOGRAPHIC DIVERSIFICATION (% of Fund's net assets) |
|
| |
|
TOP HOLDINGS(% of Fund's net assets) | | |
| Hitachi Ltd | 2.9 | |
| ASML Holding NV depository receipt | 2.8 | |
| Novo Nordisk A/S Series B | 2.5 | |
| Taiwan Semiconductor Manufacturing Co Ltd ADR | 2.5 | |
| SAP SE | 2.4 | |
| Astrazeneca PLC | 1.8 | |
| RELX PLC (Netherlands) | 1.8 | |
| Wolters Kluwer NV | 1.6 | |
| London Stock Exchange Group PLC | 1.6 | |
| Shell PLC | 1.6 | |
| | 21.5 | |
How has the Fund changed?
This is a summary of certain changes to the Fund since November 1, 2023. For more complete information, you may review the Fund's next prospectus, which we expect to be available by December 30, 2024 at fundresearch.fidelity.com/prospectus/sec or upon request at 1-877-208-0098 or by sending an e-mail to fidfunddocuments@fidelity.com.
The fund's transfer agent and pricing & bookkeeping fees were changed to a fixed rate effective December 1, 2023, through February 29, 2024, in anticipation of the transition to a new management fee structure. Effective March 1, 2024, the fund's management contract was amended to incorporate administrative services previously covered under separate services agreements (transfer agent and pricing & bookkeeping). The amended contract incorporates a management fee rate that may vary by class. The Adviser or an affiliate pays certain expenses of managing and operating the fund out of each class's management fee. | The fund's sub-advisory agreement with FIL Investments (Japan) Limited was not renewed.
|
| Fidelity, the Fidelity Investments Logo and all other Fidelity trademarks or service marks used herein are trademarks or service marks of FMR LLC. Any third-party marks that are used herein are trademarks or service marks of their respective owners. © 2024 FMR LLC. All rights reserved. |
| | For additional information about the Fund; including its prospectus, financial information, holdings and proxy information, scan the QR code or visit fundresearch.fidelity.com/prospectus/sec 1.9913897.100 731-TSRA-1224 |
| |
| | ANNUAL SHAREHOLDER REPORT | AS OF OCTOBER 31, 2024 | This report describes changes to the Fund that occurred during the reporting period. |
| | Fidelity Advisor® Focused Emerging Markets Fund Fidelity Advisor® Focused Emerging Markets Fund Class C : FMCKX |
| | | |
This annual shareholder report contains information about Fidelity Advisor® Focused Emerging Markets Fund for the period November 1, 2023 to October 31, 2024. You can find additional information about the Fund at fundresearch.fidelity.com/prospectus/sec. You can also request this information by contacting us at 1-877-208-0098 or by sending an e-mail to fidfunddocuments@fidelity.com.
What were your Fund costs for the last year?(based on hypothetical $10,000 investment)
FUND COST (PREVIOUS YEAR)
| | Costs of a $10,000 investment | Costs paid as a percentage of a $10,000 investment | |
| Class C | $ 219 | 1.93% | |
What affected the Fund's performance this period?
•International stocks achieved a strong gain for the 12 months ending October 31, 2024. Resilient global economic growth and a slowing in the pace of inflation in certain regions, as well as a shift to global monetary easing, contributed to a favorable backdrop, despite persistent geopolitical risk.
•Against this backdrop, stock picking in Emerging Asia and Emerging Europe contributed to the fund's performance versus the MSCI Emerging Markets (Net MA) Index for the fiscal year.
•By sector, security selection was the primary contributor, led by materials. Stock picks in communication services, primarily within the media & entertainment industry, and health care, primarily within the pharmaceuticals, biotechnology & life sciences industry, also boosted the fund's relative performance.
•The top individual relative contributor was an overweight in China Life Insurance (+65%). The stock was among the fund's biggest holdings. The second-largest relative contributor was an overweight in Meituan (+67%). The stock was one of our biggest holdings. Another notable relative contributor was our stake in Taiwan Semiconductor Manufacturing (+100%). The company was the fund's largest holding this period.
•In contrast, from a regional standpoint, stock selection in Latin America and Africa, primarily in South Africa, detracted from the fund's relative result.
•By sector, the biggest detractor from performance versus the benchmark was stock selection in consumer staples. Stock picking and an underweight in information technology, primarily within the technology hardware & equipment industry, also hampered the fund's result. Also hurting our result was an overweight in materials.
•The largest individual relative detractor was an overweight in Wal-Mart de Mexico (-22%). This period we increased our position in Wal-Mart de Mexico. The company was among our biggest holdings at period end. A second notable relative detractor was an overweight in Samsung Electronics (-12%). The stock was one of the fund's largest holdings. Another notable relative detractor was an underweight in Alibaba Group Holding (+23%). The stock was not held at period end.
•Notable changes in positioning include increased exposure to Mexico and a lower allocation to Brazil. By sector, meaningful changes in positioning include increased exposure to health care and a lower allocation to materials.
How did the Fund perform over the past 10 years?
CUMULATIVE PERFORMANCE
October 31, 2014 through October 31, 2024.
Initial investment of $10,000.
Class C | $10,000 | $8,819 | $9,414 | $12,097 | $10,211 | $12,099 | $14,132 | $16,748 | $11,084 | $12,480 | $16,000 |
MSCI Emerging Markets Index | $10,000 | $8,550 | $9,346 | $11,823 | $10,347 | $11,577 | $12,535 | $14,663 | $10,115 | $11,211 | $14,051 |
| | 2014 | 2015 | 2016 | 2017 | 2018 | 2019 | 2020 | 2021 | 2022 | 2023 | 2024 |
AVERAGE ANNUAL TOTAL RETURNS:| | 1 Year | 5 Year | 10 Year |
| Class C (incl. contingent deferred sales charge) | 26.25% | 5.42% | 4.81% |
| Class C | 27.25% | 5.42% | 4.81% |
| MSCI Emerging Markets Index | 25.33% | 3.95% | 3.46% |
Visit institutional.fidelity.com for more recent performance information. |
The Fund's past performance is not a good predictor of the Fund's future performance. The graph and table do not reflect the deduction of taxes that a shareholder would pay on fund distributions or redemption of fund shares. |
Key Fund Statistics(as of October 31, 2024)
KEY FACTS | | |
| Fund Size | $5,788,031,153 | |
| Number of Holdings | 55 | |
| Total Advisory Fee | $37,704,655 | |
| Portfolio Turnover | 46% | |
What did the Fund invest in?
(as of October 31, 2024)
MARKET SECTORS (% of Fund's net assets) | | |
| Financials | 21.6 | |
| Information Technology | 18.3 | |
| Consumer Discretionary | 14.7 | |
| Communication Services | 10.2 | |
| Industrials | 8.7 | |
| Materials | 8.0 | |
| Health Care | 6.2 | |
| Consumer Staples | 5.5 | |
| Energy | 3.6 | |
| |
| Common Stocks | 96.8 |
| Short-Term Investments and Net Other Assets (Liabilities) | 3.2 |
ASSET ALLOCATION (% of Fund's net assets) |
|
|
| China | 31.4 |
| Taiwan | 13.1 |
| Korea (South) | 12.4 |
| India | 10.8 |
| South Africa | 5.0 |
| Brazil | 4.8 |
| Mexico | 4.5 |
| United States | 3.2 |
| Peru | 2.5 |
| Others | 12.3 |
GEOGRAPHIC DIVERSIFICATION (% of Fund's net assets) |
|
| |
|
TOP HOLDINGS(% of Fund's net assets) | | |
| Tencent Holdings Ltd | 8.6 | |
| Taiwan Semiconductor Manufacturing Co Ltd | 8.4 | |
| Samsung Electronics Co Ltd | 5.7 | |
| Meituan B Shares | 3.5 | |
| Wal-Mart de Mexico SAB de CV Series V | 3.4 | |
| Haier Smart Home Co Ltd A Shares (China) | 2.9 | |
| Tata Consultancy Services Ltd | 2.7 | |
| China Life Insurance Co Ltd H Shares | 2.7 | |
| PDD Holdings Inc Class A ADR | 2.5 | |
| Credicorp Ltd | 2.5 | |
| | 42.9 | |
How has the Fund changed?
This is a summary of certain changes to the Fund since November 1, 2023. For more complete information, you may review the Fund's next prospectus, which we expect to be available by December 30, 2024 at fundresearch.fidelity.com/prospectus/sec or upon request at 1-877-208-0098 or by sending an e-mail to fidfunddocuments@fidelity.com.
The fees associated with this class changed during the reporting year.The variations in class fees are primarily the result of the following changes: - Management fee
- Operating expenses
The fund's transfer agent and pricing & bookkeeping fees were changed to a fixed rate effective December 1, 2023, through February 29, 2024, in anticipation of the transition to a new management fee structure. Effective March 1, 2024, the fund's management contract was amended to incorporate administrative services previously covered under separate services agreements (transfer agent and pricing & bookkeeping). The amended contract incorporates a management fee rate that may vary by class. The Adviser or an affiliate pays certain expenses of managing and operating the fund out of each class's management fee. | The fund's sub-advisory agreement with FIL Investments (Japan) Limited was not renewed.
|
| Fidelity, the Fidelity Investments Logo and all other Fidelity trademarks or service marks used herein are trademarks or service marks of FMR LLC. Any third-party marks that are used herein are trademarks or service marks of their respective owners. © 2024 FMR LLC. All rights reserved. |
| | For additional information about the Fund; including its prospectus, financial information, holdings and proxy information, scan the QR code or visit fundresearch.fidelity.com/prospectus/sec 1.9913921.100 1288-TSRA-1224 |
| |
| | ANNUAL SHAREHOLDER REPORT | AS OF OCTOBER 31, 2024 | This report describes changes to the Fund that occurred during the reporting period. |
| | Fidelity Advisor® International Capital Appreciation Fund Fidelity Advisor® International Capital Appreciation Fund Class I : FCPIX |
| | | |
This annual shareholder report contains information about Fidelity Advisor® International Capital Appreciation Fund for the period November 1, 2023 to October 31, 2024. You can find additional information about the Fund at fundresearch.fidelity.com/prospectus/sec. You can also request this information by contacting us at 1-877-208-0098 or by sending an e-mail to fidfunddocuments@fidelity.com.
What were your Fund costs for the last year?(based on hypothetical $10,000 investment)
FUND COST (PREVIOUS YEAR)
| | Costs of a $10,000 investment | Costs paid as a percentage of a $10,000 investment | |
| Class I | $ 101 | 0.88% | |
What affected the Fund's performance this period?
•International stocks achieved a strong gain for the 12 months ending October 31, 2024. Resilient global economic growth and a slowing in the pace of inflation in certain regions, as well as a shift to global monetary easing, contributed to a favorable backdrop, despite persistent geopolitical risk.
•Against this backdrop, security selection and an underweight in emerging markets and stock selection in Europe ex U.K. contributed to the fund's performance versus the MSCI All Country World ex US Index (Net MA) for the fiscal year.
•By sector, market selection was the primary contributor, led by an overweight in information technology, where an overweight in semiconductors & semiconductor equipment helped most. Picks and an overweight in industrials also boosted relative performance. Also contributing to our result was a lack of exposure to the lagging energy sector.
•The fund's non-benchmark stake in Nvidia gained 221% and was the top individual relative contributor. The stock was not held at period end. A second notable relative contributor was an overweight in Taiwan Semiconductor Manufacturing (+100%). The company was the fund's largest holding. Another notable relative contributor was an overweight in Brookfield Asset Management (+91%).
•In contrast, from a regional standpoint, security selection in Canada and an overweight in Europe ex U.K., primarily in France, detracted from the fund's relative result.
•By sector, the biggest detractor from performance versus the benchmark was stock selection in information technology, primarily within the software & services industry. Also hurting our result were stock picks in consumer staples and health care.
•The biggest individual relative detractor was our stake in OBIC (-23%). A second notable relative detractor was an underweight in Shopify (+66%). An overweight in LVMH Moet Hennessy Louis Vuitton (-6%) also hurt. The stock was among our largest holdings.
•Notable changes in positioning include increased exposure to China and Japan. By sector, meaningful changes in positioning include increased exposure to communication services and a lower allocation to consumer staples, where we liquidated all of the fund's holdings.
How did the Fund perform over the past 10 years?
CUMULATIVE PERFORMANCE
October 31, 2014 through October 31, 2024.
Initial investment of $10,000.
Class I | $10,000 | $10,380 | $10,417 | $13,112 | $12,118 | $14,818 | $16,786 | $21,418 | $14,776 | $17,129 | $22,155 |
MSCI ACWI (All Country World Index) ex USA Index | $10,000 | $9,545 | $9,583 | $11,868 | $10,910 | $12,161 | $11,862 | $15,403 | $11,613 | $13,038 | $16,238 |
| | 2014 | 2015 | 2016 | 2017 | 2018 | 2019 | 2020 | 2021 | 2022 | 2023 | 2024 |
AVERAGE ANNUAL TOTAL RETURNS:| | 1 Year | 5 Year | 10 Year |
| Class I | 29.34% | 8.38% | 8.28% |
| MSCI ACWI (All Country World Index) ex USA Index | 24.55% | 5.95% | 4.97% |
Visit institutional.fidelity.com for more recent performance information. |
The Fund's past performance is not a good predictor of the Fund's future performance. The graph and table do not reflect the deduction of taxes that a shareholder would pay on fund distributions or redemption of fund shares. |
Key Fund Statistics(as of October 31, 2024)
KEY FACTS | | |
| Fund Size | $8,714,030,084 | |
| Number of Holdings | 63 | |
| Total Advisory Fee | $61,601,570 | |
| Portfolio Turnover | 63% | |
What did the Fund invest in?
(as of October 31, 2024)
MARKET SECTORS (% of Fund's net assets) | | |
| Industrials | 30.8 | |
| Financials | 21.6 | |
| Information Technology | 18.3 | |
| Consumer Discretionary | 11.3 | |
| Materials | 8.8 | |
| Health Care | 4.5 | |
| Communication Services | 4.1 | |
| |
| Common Stocks | 99.4 |
| Short-Term Investments and Net Other Assets (Liabilities) | 0.6 |
ASSET ALLOCATION (% of Fund's net assets) |
|
|
| United States | 20.0 |
| Japan | 12.6 |
| United Kingdom | 10.9 |
| France | 8.8 |
| India | 7.9 |
| Canada | 6.4 |
| China | 5.3 |
| Netherlands | 5.2 |
| Taiwan | 4.5 |
| Others | 18.4 |
GEOGRAPHIC DIVERSIFICATION (% of Fund's net assets) |
|
| |
|
TOP HOLDINGS(% of Fund's net assets) | | |
| Taiwan Semiconductor Manufacturing Co Ltd | 4.5 | |
| Novo Nordisk A/S Series B | 2.9 | |
| Tencent Holdings Ltd | 2.5 | |
| SAP SE | 2.5 | |
| ASML Holding NV | 2.3 | |
| LVMH Moet Hennessy Louis Vuitton SE | 2.3 | |
| Schneider Electric SE | 2.1 | |
| Hitachi Ltd | 1.9 | |
| ABB Ltd | 1.8 | |
| Keyence Corp | 1.7 | |
| | 24.5 | |
How has the Fund changed?
This is a summary of certain changes to the Fund since November 1, 2023. For more complete information, you may review the Fund's next prospectus, which we expect to be available by December 30, 2024 at fundresearch.fidelity.com/prospectus/sec or upon request at 1-877-208-0098 or by sending an e-mail to fidfunddocuments@fidelity.com.
The fees associated with this class changed during the reporting year.The variations in class fees are primarily the result of the following changes: - Management fee
- Operating expenses
- Performance adjustment fee
The fund's transfer agent and pricing & bookkeeping fees were changed to a fixed rate effective December 1, 2023, through February 29, 2024, in anticipation of the transition to a new management fee structure. Effective March 1, 2024, the fund's management contract was amended to incorporate administrative services previously covered under separate services agreements (transfer agent and pricing & bookkeeping). The amended contract incorporates a basic fee rate that may vary by class (subject to a performance adjustment). The Adviser or an affiliate pays certain expenses of managing and operating the fund out of each class's management fee. | The fund's sub-advisory agreement with FIL Investments (Japan) Limited was not renewed.
|
| Fidelity, the Fidelity Investments Logo and all other Fidelity trademarks or service marks used herein are trademarks or service marks of FMR LLC. Any third-party marks that are used herein are trademarks or service marks of their respective owners. © 2024 FMR LLC. All rights reserved. |
| | For additional information about the Fund; including its prospectus, financial information, holdings and proxy information, scan the QR code or visit fundresearch.fidelity.com/prospectus/sec 1.9913826.100 291-TSRA-1224 |
| |
| | ANNUAL SHAREHOLDER REPORT | AS OF OCTOBER 31, 2024 | This report describes changes to the Fund that occurred during the reporting period. |
| | Fidelity Advisor® Value Leaders Fund Fidelity Advisor® Value Leaders Fund Class I : FVLIX |
| | | |
This annual shareholder report contains information about Fidelity Advisor® Value Leaders Fund for the period November 1, 2023 to October 31, 2024. You can find additional information about the Fund at fundresearch.fidelity.com/prospectus/sec. You can also request this information by contacting us at 1-877-208-0098 or by sending an e-mail to fidfunddocuments@fidelity.com.
What were your Fund costs for the last year?(based on hypothetical $10,000 investment)
FUND COST (PREVIOUS YEAR)
| | Costs of a $10,000 investment | Costs paid as a percentage of a $10,000 investment | |
| Class I | $ 98 | 0.90% | |
What affected the Fund's performance this period?
•U.S. equities posted a strong advance for the 12 months ending October 31, 2024, driven by a resilient economy, the promise of artificial intelligence to drive transformative change and the Federal Reserve's long-anticipated pivot to cutting interest rates.
•Against this backdrop, security selection was the primary detractor from the fund's performance versus the Russell 1000® Value Index for the fiscal year, led by health care, especially within the health care equipment & services industry. Also hurting our result were stock selection and an underweight in industrials, primarily within the capital goods industry. Stock selection and an overweight in energy also hurt.
•The fund's non-benchmark stake in Parex Resources returned -48% and was the largest individual relative detractor. The second-largest relative detractor was an overweight in Centene (-10%). The stock was one of the fund's largest holdings this period. A non-benchmark stake in Samsung Electronics returned roughly -10% and notably hurt.
•In contrast, the biggest sector contributor to performance versus the benchmark was security selection in consumer discretionary, primarily within the consumer services industry. Stock picking in financials also boosted the fund's relative performance, along with an overweight in banks. Also bolstering our relative result was an underweight in materials.
•The top individual relative contributor was an overweight in Gen Digital (+80%). The company was among the fund's biggest holdings at period end. The second-largest relative contributor was an overweight in H&R Block (+49%). Though we reduced our stake, the company was among the fund's largest holdings. An overweight in Bank of America (+63%) also helped. The company was one of our biggest holdings, but we trimmed the position this period.
•Notable changes in positioning include increased exposure to the communication services and industrials sectors.
How did the Fund perform over the past 10 years?
CUMULATIVE PERFORMANCE
October 31, 2014 through October 31, 2024.
Initial investment of $10,000.
Class I | $10,000 | $10,458 | $10,461 | $12,364 | $12,810 | $13,445 | $11,521 | $16,485 | $16,841 | $16,849 | $19,950 |
Russell 1000® Value Index | $10,000 | $10,053 | $10,693 | $12,595 | $12,977 | $14,432 | $13,340 | $19,178 | $17,836 | $17,860 | $23,392 |
Russell 1000® Index | $10,000 | $10,486 | $10,933 | $13,520 | $14,464 | $16,511 | $18,305 | $26,269 | $21,967 | $24,050 | $33,206 |
| | 2014 | 2015 | 2016 | 2017 | 2018 | 2019 | 2020 | 2021 | 2022 | 2023 | 2024 |
AVERAGE ANNUAL TOTAL RETURNS:| | 1 Year | 5 Year | 10 Year |
| Class I | 18.40% | 8.21% | 7.15% |
| Russell 1000® Value Index | 30.98% | 10.14% | 8.87% |
| Russell 1000® Index | 38.07% | 15.00% | 12.75% |
Visit institutional.fidelity.com for more recent performance information. |
The Fund's past performance is not a good predictor of the Fund's future performance. The graph and table do not reflect the deduction of taxes that a shareholder would pay on fund distributions or redemption of fund shares. |
Key Fund Statistics(as of October 31, 2024)
KEY FACTS | | |
| Fund Size | $32,451,832 | |
| Number of Holdings | 38 | |
| Total Advisory Fee | $248,410 | |
| Portfolio Turnover | 32% | |
What did the Fund invest in?
(as of October 31, 2024)
MARKET SECTORS (% of Fund's net assets) | | |
| Financials | 21.3 | |
| Health Care | 16.9 | |
| Consumer Staples | 10.1 | |
| Utilities | 10.0 | |
| Information Technology | 9.6 | |
| Energy | 9.2 | |
| Communication Services | 8.4 | |
| Industrials | 7.9 | |
| Consumer Discretionary | 3.8 | |
| Materials | 1.9 | |
| |
| Common Stocks | 96.5 |
| Preferred Stocks | 2.6 |
| Short-Term Investments and Net Other Assets (Liabilities) | 0.9 |
ASSET ALLOCATION (% of Fund's net assets) |
|
|
| United States | 88.6 |
| United Kingdom | 3.9 |
| Canada | 3.3 |
| Korea (South) | 2.6 |
| Germany | 1.6 |
GEOGRAPHIC DIVERSIFICATION (% of Fund's net assets) |
|
| |
|
TOP HOLDINGS(% of Fund's net assets) | | |
| UnitedHealth Group Inc | 5.9 | |
| Comcast Corp Class A | 5.3 | |
| Cigna Group/The | 4.4 | |
| Kenvue Inc | 4.1 | |
| Bank of America Corp | 4.1 | |
| Shell PLC ADR | 4.0 | |
| PG&E Corp | 3.9 | |
| JPMorgan Chase & Co | 3.9 | |
| H&R Block Inc | 3.8 | |
| Exxon Mobil Corp | 3.8 | |
| | 43.2 | |
How has the Fund changed?
This is a summary of certain changes to the Fund since November 1, 2023. For more complete information, you may review the Fund's next prospectus, which we expect to be available by December 30, 2024 at fundresearch.fidelity.com/prospectus/sec or upon request at 1-877-208-0098 or by sending an e-mail to fidfunddocuments@fidelity.com.
The fund's transfer agent and pricing & bookkeeping fees were changed to a fixed rate effective December 1, 2023, through February 29, 2024, in anticipation of the transition to a new management fee structure. Effective March 1, 2024, the fund's management contract was amended to incorporate administrative services previously covered under separate services agreements (transfer agent and pricing & bookkeeping). The amended contract incorporates a basic fee rate that may vary by class (subject to a performance adjustment). The Adviser or an affiliate pays certain expenses of managing and operating the fund out of each class's management fee. | |
| Fidelity, the Fidelity Investments Logo and all other Fidelity trademarks or service marks used herein are trademarks or service marks of FMR LLC. Any third-party marks that are used herein are trademarks or service marks of their respective owners. © 2024 FMR LLC. All rights reserved. |
| | For additional information about the Fund; including its prospectus, financial information, holdings and proxy information, scan the QR code or visit fundresearch.fidelity.com/prospectus/sec 1.9913919.100 1270-TSRA-1224 |
| |
| | ANNUAL SHAREHOLDER REPORT | AS OF OCTOBER 31, 2024 | This report describes changes to the Fund that occurred during the reporting period. |
| | Fidelity Advisor® Global Capital Appreciation Fund Fidelity Advisor® Global Capital Appreciation Fund Class M : FGETX |
| | | |
This annual shareholder report contains information about Fidelity Advisor® Global Capital Appreciation Fund for the period November 1, 2023 to October 31, 2024. You can find additional information about the Fund at fundresearch.fidelity.com/prospectus/sec. You can also request this information by contacting us at 1-877-208-0098 or by sending an e-mail to fidfunddocuments@fidelity.com.
What were your Fund costs for the last year?(based on hypothetical $10,000 investment)
FUND COST (PREVIOUS YEAR)
| | Costs of a $10,000 investment | Costs paid as a percentage of a $10,000 investment | |
| Class M | $ 187 | 1.55% | |
What affected the Fund's performance this period?
•Global equities posted a strong advance for the 12 months ending October 31, 2024. Resilient economic growth and a slowing in the pace of inflation in certain regions, as well as a shift to global monetary easing, contributed to a favorable backdrop, despite persistent geopolitical risk.
•Against this backdrop, stock picking in the United States and an underweight in emerging markets contributed to the fund's performance versus the MSCI AC World (Net MA) Linked Index for the fiscal year.
•By sector, security selection was the primary contributor, especially within information technology. Picks in industrials, primarily within the capital goods industry, and communication services, primarily within the media & entertainment industry, also boosted the fund's relative performance.
•The fund's top individual relative contributor was an overweight in Nvidia (+227%). Although we reduced the position, the stock was the fund's biggest holding at period end. A second notable relative contributor was an overweight in Hitachi (+109%). The stock was among our biggest holdings at period end. An overweight in Taiwan Semiconductor Manufacturing (+124%) also contributed. The stock was one of our largest holdings.
•In contrast, from a regional standpoint, stock picks in Canada and emerging markets, primarily in India, detracted from the fund's relative result.
•By sector, a notable detractor from performance versus the benchmark was stock selection in energy. Also modestly hurting our result were an overweight in industrials and an underweight in communication services. Lastly, the fund's position in cash detracted.
•The largest individual relative detractor was our stake in UnitedHealth Group (-9%). The stock was not held at period end. The second-largest relative detractor was an overweight in HDFC Bank (+18%). Another notable relative detractor this period was avoiding Broadcom, a benchmark component that gained 105%.
•Notable changes in positioning include increased exposure to China and the United States. By sector, meaningful changes in positioning include increased exposure to industrials and a lower allocation to energy.
How did the Fund perform over the past 10 years?
CUMULATIVE PERFORMANCE
October 31, 2014 through October 31, 2024.
Initial investment of $10,000 and the current sales charge was paid.
Class M | $9,650 | $9,982 | $10,197 | $12,828 | $11,934 | $12,424 | $14,734 | $19,194 | $14,288 | $16,655 | $23,604 |
MSCI ACWI (All Country World Index) Index | $10,000 | $10,035 | $10,284 | $12,721 | $12,703 | $14,362 | $15,121 | $20,822 | $16,723 | $18,547 | $24,710 |
| | 2014 | 2015 | 2016 | 2017 | 2018 | 2019 | 2020 | 2021 | 2022 | 2023 | 2024 |
AVERAGE ANNUAL TOTAL RETURNS:| | 1 Year | 5 Year | 10 Year |
| Class M (incl. 3.50% sales charge) | 36.76% | 12.89% | 8.97% |
| Class M (without 3.50% sales charge) | 41.72% | 13.70% | 9.36% |
| MSCI ACWI (All Country World Index) Index | 33.23% | 11.46% | 9.47% |
Visit institutional.fidelity.com for more recent performance information. |
The Fund's past performance is not a good predictor of the Fund's future performance. The graph and table do not reflect the deduction of taxes that a shareholder would pay on fund distributions or redemption of fund shares. |
Key Fund Statistics(as of October 31, 2024)
KEY FACTS | | |
| Fund Size | $141,421,538 | |
| Number of Holdings | 54 | |
| Total Advisory Fee | $1,161,739 | |
| Portfolio Turnover | 47% | |
What did the Fund invest in?
(as of October 31, 2024)
MARKET SECTORS (% of Fund's net assets) | | |
| Information Technology | 24.3 | |
| Financials | 23.1 | |
| Industrials | 18.8 | |
| Consumer Discretionary | 11.6 | |
| Communication Services | 8.5 | |
| Health Care | 7.9 | |
| Energy | 3.0 | |
| Materials | 1.2 | |
| |
| Common Stocks | 97.9 |
| Preferred Stocks | 0.5 |
| Short-Term Investments and Net Other Assets (Liabilities) | 1.6 |
ASSET ALLOCATION (% of Fund's net assets) |
|
|
| United States | 79.0 |
| China | 7.6 |
| Taiwan | 2.9 |
| Japan | 2.8 |
| Canada | 1.4 |
| Netherlands | 1.2 |
| India | 1.2 |
| Sweden | 1.0 |
| Denmark | 1.0 |
| Others | 1.9 |
GEOGRAPHIC DIVERSIFICATION (% of Fund's net assets) |
|
| |
|
TOP HOLDINGS(% of Fund's net assets) | | |
| NVIDIA Corp | 6.6 | |
| Meta Platforms Inc Class A | 4.5 | |
| Microsoft Corp | 4.0 | |
| Fiserv Inc | 3.8 | |
| Apple Inc | 3.6 | |
| Amazon.com Inc | 3.5 | |
| Mastercard Inc Class A | 3.1 | |
| Taiwan Semiconductor Manufacturing Co Ltd ADR | 2.9 | |
| Hitachi Ltd | 2.8 | |
| Visa Inc Class A | 2.5 | |
| | 37.3 | |
How has the Fund changed?
This is a summary of certain changes to the Fund since November 1, 2023. For more complete information, you may review the Fund's next prospectus, which we expect to be available by December 30, 2024 at fundresearch.fidelity.com/prospectus/sec or upon request at 1-877-208-0098 or by sending an e-mail to fidfunddocuments@fidelity.com.
The fees associated with this class changed during the reporting year.The variations in class fees are primarily the result of the following changes: - Management fee
- Operating expenses
- Performance adjustment fee
- Expense reductions
The fund's transfer agent and pricing & bookkeeping fees were changed to a fixed rate effective December 1, 2023, through February 29, 2024, in anticipation of the transition to a new management fee structure. Effective March 1, 2024, the fund's management contract was amended to incorporate administrative services previously covered under separate services agreements (transfer agent and pricing & bookkeeping). The amended contract incorporates a management fee rate that may vary by class (subject to a performance adjustment). The Adviser or an affiliate pays certain expenses of managing and operating the fund out of each class's management fee. | The fund's sub-advisory agreement with FIL Investments (Japan) Limited was not renewed.
|
| Fidelity, the Fidelity Investments Logo and all other Fidelity trademarks or service marks used herein are trademarks or service marks of FMR LLC. Any third-party marks that are used herein are trademarks or service marks of their respective owners. © 2024 FMR LLC. All rights reserved. |
| | For additional information about the Fund; including its prospectus, financial information, holdings and proxy information, scan the QR code or visit fundresearch.fidelity.com/prospectus/sec 1.9913904.100 755-TSRA-1224 |
| |
| | ANNUAL SHAREHOLDER REPORT | AS OF OCTOBER 31, 2024 | This report describes changes to the Fund that occurred during the reporting period. |
| | Fidelity Advisor® Overseas Fund Fidelity Advisor® Overseas Fund Class A : FAOAX |
| | | |
This annual shareholder report contains information about Fidelity Advisor® Overseas Fund for the period November 1, 2023 to October 31, 2024. You can find additional information about the Fund at fundresearch.fidelity.com/prospectus/sec. You can also request this information by contacting us at 1-877-208-0098 or by sending an e-mail to fidfunddocuments@fidelity.com.
What were your Fund costs for the last year?(based on hypothetical $10,000 investment)
FUND COST (PREVIOUS YEAR)
| | Costs of a $10,000 investment | Costs paid as a percentage of a $10,000 investment | |
| Class A | $ 120 | 1.06% | |
What affected the Fund's performance this period?
•International stocks achieved a strong gain for the 12 months ending October 31, 2024. Resilient global economic growth and a slowing in the pace of inflation in certain regions, as well as a shift to global monetary easing, contributed to a favorable backdrop, despite persistent geopolitical risk.
•Against this backdrop, stock picking in the U.K. and Japan contributed to the fund's performance versus the MSCI EAFE Index (Net MA) for the fiscal year.
•By sector, market selection was the primary contributor, led by an underweights in energy and consumer staples. Stock picks and an overweight in industrials, primarily within the capital goods industry, also boosted the fund's relative performance.
•The top individual relative contributor was an overweight in Mitsubishi Heavy Industries (+157%). This was a stake we established this period. The second-largest relative contributor was an overweight in Tokio Marine Holdings (+70%). Although we reduced the fund's stake, the company was one of our largest holdings. Another notable relative contributor was our non-benchmark stake in Taiwan Semiconductor Manufacturing (+101%).
•In contrast, from a regional standpoint, stock selection in the United States and underweights in Japan and Asia Pacific ex Japan detracted from the fund's relative result.
•By sector, the biggest detractor from performance versus the benchmark was stock selection in consumer staples. Also hurting our result were stock picks in consumer discretionary, primarily within the consumer durables & apparel industry. Choices in information technology, primarily within the software & services industry, also hurt. Lastly, the fund's position in cash detracted.
•The largest individual relative detractor was our stake in Diageo (-11%). The stock was not held at period end. A non-benchmark stake in Alten returned approximately -27% and was the second-largest relative detractor. Our overweight stake in Sony Group (+1%) also hurt. The stock was not held at period end.
•Notable changes in positioning include increased exposure to Japan and the United States, and a lower allocation to Sweden. By sector, meaningful changes in positioning include decreased exposure to consumer staples and energy, and a higher allocation to industrials and materials.
How did the Fund perform over the past 10 years?
CUMULATIVE PERFORMANCE
October 31, 2014 through October 31, 2024.
Initial investment of $10,000 and the current sales charge was paid.
Class A | $9,425 | $9,657 | $9,159 | $11,435 | $10,580 | $11,941 | $12,339 | $16,999 | $11,880 | $13,357 | $16,763 |
MSCI EAFE Index | $10,000 | $10,008 | $9,705 | $12,004 | $11,206 | $12,472 | $11,638 | $15,647 | $12,073 | $13,841 | $17,059 |
| | 2014 | 2015 | 2016 | 2017 | 2018 | 2019 | 2020 | 2021 | 2022 | 2023 | 2024 |
AVERAGE ANNUAL TOTAL RETURNS:| | 1 Year | 5 Year | 10 Year |
| Class A (incl. 5.75% sales charge) | 18.28% | 5.76% | 5.30% |
| Class A (without 5.75% sales charge) | 25.50% | 7.02% | 5.93% |
| MSCI EAFE Index | 23.25% | 6.46% | 5.49% |
Visit institutional.fidelity.com for more recent performance information. |
The Fund's past performance is not a good predictor of the Fund's future performance. The graph and table do not reflect the deduction of taxes that a shareholder would pay on fund distributions or redemption of fund shares. |
Key Fund Statistics(as of October 31, 2024)
KEY FACTS | | |
| Fund Size | $383,854,611 | |
| Number of Holdings | 93 | |
| Total Advisory Fee | $2,406,862 | |
| Portfolio Turnover | 34% | |
What did the Fund invest in?
(as of October 31, 2024)
MARKET SECTORS (% of Fund's net assets) | | |
| Industrials | 26.0 | |
| Financials | 23.2 | |
| Information Technology | 16.0 | |
| Health Care | 13.8 | |
| Materials | 9.5 | |
| Consumer Discretionary | 7.0 | |
| Consumer Staples | 2.3 | |
| Communication Services | 0.4 | |
| |
| Common Stocks | 98.2 |
| Short-Term Investments and Net Other Assets (Liabilities) | 1.8 |
ASSET ALLOCATION (% of Fund's net assets) |
|
|
| United Kingdom | 17.9 |
| United States | 17.3 |
| Japan | 16.1 |
| France | 11.2 |
| Germany | 8.9 |
| Netherlands | 6.3 |
| Denmark | 4.4 |
| Italy | 3.8 |
| Switzerland | 3.4 |
| Others | 10.7 |
GEOGRAPHIC DIVERSIFICATION (% of Fund's net assets) |
|
| |
|
TOP HOLDINGS(% of Fund's net assets) | | |
| ASML Holding NV | 3.0 | |
| Novo Nordisk A/S Series B | 3.0 | |
| SAP SE | 2.9 | |
| Astrazeneca PLC | 2.2 | |
| Hitachi Ltd | 2.2 | |
| RELX PLC | 2.2 | |
| Safran SA | 2.0 | |
| Compass Group PLC | 2.0 | |
| Wolters Kluwer NV | 2.0 | |
| Tokio Marine Holdings Inc | 2.0 | |
| | 23.5 | |
How has the Fund changed?
This is a summary of certain changes to the Fund since November 1, 2023. For more complete information, you may review the Fund's next prospectus, which we expect to be available by December 30, 2024 at fundresearch.fidelity.com/prospectus/sec or upon request at 1-877-208-0098 or by sending an e-mail to fidfunddocuments@fidelity.com.
The fees associated with this class changed during the reporting year.The variations in class fees are primarily the result of the following changes: - Management fee
- Operating expenses
The fund's transfer agent and pricing & bookkeeping fees were changed to a fixed rate effective December 1, 2023, through February 29, 2024, in anticipation of the transition to a new management fee structure. Effective March 1, 2024, the fund's management contract was amended to incorporate administrative services previously covered under separate services agreements (transfer agent and pricing & bookkeeping). The amended contract incorporates a basic fee rate that may vary by class (subject to a performance adjustment). The Adviser or an affiliate pays certain expenses of managing and operating the fund out of each class's management fee. | The fund's sub-advisory agreement with FIL Investments (Japan) Limited was not renewed.
|
| Fidelity, the Fidelity Investments Logo and all other Fidelity trademarks or service marks used herein are trademarks or service marks of FMR LLC. Any third-party marks that are used herein are trademarks or service marks of their respective owners. © 2024 FMR LLC. All rights reserved. |
| | For additional information about the Fund; including its prospectus, financial information, holdings and proxy information, scan the QR code or visit fundresearch.fidelity.com/prospectus/sec 1.9913819.100 252-TSRA-1224 |
| |
| | ANNUAL SHAREHOLDER REPORT | AS OF OCTOBER 31, 2024 | This report describes changes to the Fund that occurred during the reporting period. |
| | Fidelity Advisor® Focused Emerging Markets Fund Fidelity Advisor® Focused Emerging Markets Fund Class A : FAMKX |
| | | |
This annual shareholder report contains information about Fidelity Advisor® Focused Emerging Markets Fund for the period November 1, 2023 to October 31, 2024. You can find additional information about the Fund at fundresearch.fidelity.com/prospectus/sec. You can also request this information by contacting us at 1-877-208-0098 or by sending an e-mail to fidfunddocuments@fidelity.com.
What were your Fund costs for the last year?(based on hypothetical $10,000 investment)
FUND COST (PREVIOUS YEAR)
| | Costs of a $10,000 investment | Costs paid as a percentage of a $10,000 investment | |
| Class A | $ 137 | 1.20% | |
What affected the Fund's performance this period?
•International stocks achieved a strong gain for the 12 months ending October 31, 2024. Resilient global economic growth and a slowing in the pace of inflation in certain regions, as well as a shift to global monetary easing, contributed to a favorable backdrop, despite persistent geopolitical risk.
•Against this backdrop, stock picking in Emerging Asia and Emerging Europe contributed to the fund's performance versus the MSCI Emerging Markets (Net MA) Index for the fiscal year.
•By sector, security selection was the primary contributor, led by materials. Stock picks in communication services, primarily within the media & entertainment industry, and health care, primarily within the pharmaceuticals, biotechnology & life sciences industry, also boosted the fund's relative performance.
•The top individual relative contributor was an overweight in China Life Insurance (+65%). The stock was among the fund's biggest holdings. The second-largest relative contributor was an overweight in Meituan (+67%). The stock was one of our biggest holdings. Another notable relative contributor was our stake in Taiwan Semiconductor Manufacturing (+100%). The company was the fund's largest holding this period.
•In contrast, from a regional standpoint, stock selection in Latin America and Africa, primarily in South Africa, detracted from the fund's relative result.
•By sector, the biggest detractor from performance versus the benchmark was stock selection in consumer staples. Stock picking and an underweight in information technology, primarily within the technology hardware & equipment industry, also hampered the fund's result. Also hurting our result was an overweight in materials.
•The largest individual relative detractor was an overweight in Wal-Mart de Mexico (-22%). This period we increased our position in Wal-Mart de Mexico. The company was among our biggest holdings at period end. A second notable relative detractor was an overweight in Samsung Electronics (-12%). The stock was one of the fund's largest holdings. Another notable relative detractor was an underweight in Alibaba Group Holding (+23%). The stock was not held at period end.
•Notable changes in positioning include increased exposure to Mexico and a lower allocation to Brazil. By sector, meaningful changes in positioning include increased exposure to health care and a lower allocation to materials.
How did the Fund perform over the past 10 years?
CUMULATIVE PERFORMANCE
October 31, 2014 through October 31, 2024.
Initial investment of $10,000 and the current sales charge was paid.
Class A | $9,425 | $8,376 | $9,010 | $11,664 | $9,922 | $11,849 | $13,948 | $16,658 | $11,111 | $12,510 | $16,039 |
MSCI Emerging Markets Index | $10,000 | $8,550 | $9,346 | $11,823 | $10,347 | $11,577 | $12,535 | $14,663 | $10,115 | $11,211 | $14,051 |
| | 2014 | 2015 | 2016 | 2017 | 2018 | 2019 | 2020 | 2021 | 2022 | 2023 | 2024 |
AVERAGE ANNUAL TOTAL RETURNS:| | 1 Year | 5 Year | 10 Year |
| Class A (incl. 5.75% sales charge) | 20.83% | 4.99% | 4.84% |
| Class A (without 5.75% sales charge) | 28.20% | 6.24% | 5.46% |
| MSCI Emerging Markets Index | 25.33% | 3.95% | 3.46% |
Visit institutional.fidelity.com for more recent performance information. |
The Fund's past performance is not a good predictor of the Fund's future performance. The graph and table do not reflect the deduction of taxes that a shareholder would pay on fund distributions or redemption of fund shares. |
Key Fund Statistics(as of October 31, 2024)
KEY FACTS | | |
| Fund Size | $5,788,031,153 | |
| Number of Holdings | 55 | |
| Total Advisory Fee | $37,704,655 | |
| Portfolio Turnover | 46% | |
What did the Fund invest in?
(as of October 31, 2024)
MARKET SECTORS (% of Fund's net assets) | | |
| Financials | 21.6 | |
| Information Technology | 18.3 | |
| Consumer Discretionary | 14.7 | |
| Communication Services | 10.2 | |
| Industrials | 8.7 | |
| Materials | 8.0 | |
| Health Care | 6.2 | |
| Consumer Staples | 5.5 | |
| Energy | 3.6 | |
| |
| Common Stocks | 96.8 |
| Short-Term Investments and Net Other Assets (Liabilities) | 3.2 |
ASSET ALLOCATION (% of Fund's net assets) |
|
|
| China | 31.4 |
| Taiwan | 13.1 |
| Korea (South) | 12.4 |
| India | 10.8 |
| South Africa | 5.0 |
| Brazil | 4.8 |
| Mexico | 4.5 |
| United States | 3.2 |
| Peru | 2.5 |
| Others | 12.3 |
GEOGRAPHIC DIVERSIFICATION (% of Fund's net assets) |
|
| |
|
TOP HOLDINGS(% of Fund's net assets) | | |
| Tencent Holdings Ltd | 8.6 | |
| Taiwan Semiconductor Manufacturing Co Ltd | 8.4 | |
| Samsung Electronics Co Ltd | 5.7 | |
| Meituan B Shares | 3.5 | |
| Wal-Mart de Mexico SAB de CV Series V | 3.4 | |
| Haier Smart Home Co Ltd A Shares (China) | 2.9 | |
| Tata Consultancy Services Ltd | 2.7 | |
| China Life Insurance Co Ltd H Shares | 2.7 | |
| PDD Holdings Inc Class A ADR | 2.5 | |
| Credicorp Ltd | 2.5 | |
| | 42.9 | |
How has the Fund changed?
This is a summary of certain changes to the Fund since November 1, 2023. For more complete information, you may review the Fund's next prospectus, which we expect to be available by December 30, 2024 at fundresearch.fidelity.com/prospectus/sec or upon request at 1-877-208-0098 or by sending an e-mail to fidfunddocuments@fidelity.com.
The fees associated with this class changed during the reporting year.The variations in class fees are primarily the result of the following changes: - Management fee
- Operating expenses
The fund's transfer agent and pricing & bookkeeping fees were changed to a fixed rate effective December 1, 2023, through February 29, 2024, in anticipation of the transition to a new management fee structure. Effective March 1, 2024, the fund's management contract was amended to incorporate administrative services previously covered under separate services agreements (transfer agent and pricing & bookkeeping). The amended contract incorporates a management fee rate that may vary by class. The Adviser or an affiliate pays certain expenses of managing and operating the fund out of each class's management fee. | The fund's sub-advisory agreement with FIL Investments (Japan) Limited was not renewed.
|
| Fidelity, the Fidelity Investments Logo and all other Fidelity trademarks or service marks used herein are trademarks or service marks of FMR LLC. Any third-party marks that are used herein are trademarks or service marks of their respective owners. © 2024 FMR LLC. All rights reserved. |
| | For additional information about the Fund; including its prospectus, financial information, holdings and proxy information, scan the QR code or visit fundresearch.fidelity.com/prospectus/sec 1.9913920.100 1286-TSRA-1224 |
| |
| | ANNUAL SHAREHOLDER REPORT | AS OF OCTOBER 31, 2024 | This report describes changes to the Fund that occurred during the reporting period. |
| | Fidelity Advisor® Diversified International Fund Fidelity Advisor® Diversified International Fund Class C : FADCX |
| | | |
This annual shareholder report contains information about Fidelity Advisor® Diversified International Fund for the period November 1, 2023 to October 31, 2024. You can find additional information about the Fund at fundresearch.fidelity.com/prospectus/sec. You can also request this information by contacting us at 1-877-208-0098 or by sending an e-mail to fidfunddocuments@fidelity.com.
What were your Fund costs for the last year?(based on hypothetical $10,000 investment)
FUND COST (PREVIOUS YEAR)
| | Costs of a $10,000 investment | Costs paid as a percentage of a $10,000 investment | |
| Class C | $ 210 | 1.88% | |
What affected the Fund's performance this period?
•International stocks achieved a strong gain for the 12 months ending October 31, 2024. Resilient global economic growth and a slowing in the pace of inflation in certain regions, as well as a shift to global monetary easing, contributed to a favorable backdrop, despite persistent geopolitical risk.
•Against this backdrop, stock picks in Japan and a non-benchmark allocation to emerging markets contributed to the fund's performance versus the MSCI EAFE Index (Net MA) for the fiscal year.
•By sector, the biggest contributors to performance versus the benchmark were picks and an overweight in industrials, primarily within the capital goods industry. Picks in materials also boosted relative performance. Also helping our relative result was an underweight in consumer staples.
•The top individual relative contributor was our non-benchmark stake in Taiwan Semiconductor Manufacturing (+124%). The stock was among our biggest holdings. A second notable relative contributor was an overweight in Hitachi (+109%). Although we trimmed our stake, the company was the fund's largest holding at period end. Another notable relative contributor was an overweight in Mitsubishi Heavy Industries (+127%). This was a stake we established this period.
•In contrast, from a regional standpoint, a non-benchmark allocation to both the United States and Canada detracted from the fund's relative result.
•By sector, the biggest detractor from performance versus the benchmark was stock picking in financials. Stock picks in consumer staples also hampered the fund's result. Also detracting from our result was an overweight in energy. Lastly, the fund's position in cash detracted.
•The fund's non-benchmark stake in Schlumberger returned -20% and was the largest individual relative detractor. The stock was not held at period end. A non-benchmark stake in HDFC Bank gained 18% and was a second notable relative detractor. We reduced the position. Our stake in Pernod-Ricard (-27%) also detracted. This period we decreased our position in Pernod-Ricard.
•Notable changes in positioning include increased exposure to Germany and Switzerland. By sector, meaningful changes in positioning include decreased exposure to consumer staples and a higher allocation to industrials.
How did the Fund perform over the past 10 years?
CUMULATIVE PERFORMANCE
October 31, 2014 through October 31, 2024.
Initial investment of $10,000.
Class C | $10,000 | $10,315 | $9,934 | $12,065 | $10,877 | $12,478 | $13,531 | $17,395 | $12,198 | $13,607 | $16,920 |
MSCI EAFE Index | $10,000 | $10,008 | $9,705 | $12,004 | $11,206 | $12,472 | $11,638 | $15,647 | $12,073 | $13,841 | $17,059 |
| | 2014 | 2015 | 2016 | 2017 | 2018 | 2019 | 2020 | 2021 | 2022 | 2023 | 2024 |
AVERAGE ANNUAL TOTAL RETURNS:| | 1 Year | 5 Year | 10 Year |
| Class C (incl. contingent deferred sales charge) | 22.43% | 5.95% | 5.40% |
| Class C | 23.43% | 5.95% | 5.40% |
| MSCI EAFE Index | 23.25% | 6.46% | 5.49% |
Visit institutional.fidelity.com for more recent performance information. |
The Fund's past performance is not a good predictor of the Fund's future performance. The graph and table do not reflect the deduction of taxes that a shareholder would pay on fund distributions or redemption of fund shares. |
Key Fund Statistics(as of October 31, 2024)
KEY FACTS | | |
| Fund Size | $1,404,041,433 | |
| Number of Holdings | 135 | |
| Total Advisory Fee | $10,934,381 | |
| Portfolio Turnover | 33% | |
What did the Fund invest in?
(as of October 31, 2024)
MARKET SECTORS (% of Fund's net assets) | | |
| Industrials | 24.9 | |
| Financials | 22.5 | |
| Information Technology | 15.7 | |
| Health Care | 10.3 | |
| Materials | 8.3 | |
| Consumer Discretionary | 7.4 | |
| Energy | 5.0 | |
| Consumer Staples | 1.9 | |
| Communication Services | 0.5 | |
| Real Estate | 0.2 | |
| |
| Common Stocks | 96.2 |
| Preferred Stocks | 0.5 |
| Short-Term Investments and Net Other Assets (Liabilities) | 3.3 |
ASSET ALLOCATION (% of Fund's net assets) |
|
|
| Japan | 17.1 |
| United States | 16.0 |
| United Kingdom | 14.4 |
| Germany | 8.7 |
| France | 8.1 |
| Canada | 6.5 |
| Netherlands | 5.3 |
| Denmark | 3.5 |
| Sweden | 3.0 |
| Others | 17.4 |
GEOGRAPHIC DIVERSIFICATION (% of Fund's net assets) |
|
| |
|
TOP HOLDINGS(% of Fund's net assets) | | |
| Hitachi Ltd | 2.9 | |
| ASML Holding NV depository receipt | 2.8 | |
| Novo Nordisk A/S Series B | 2.5 | |
| Taiwan Semiconductor Manufacturing Co Ltd ADR | 2.5 | |
| SAP SE | 2.4 | |
| Astrazeneca PLC | 1.8 | |
| RELX PLC (Netherlands) | 1.8 | |
| Wolters Kluwer NV | 1.6 | |
| London Stock Exchange Group PLC | 1.6 | |
| Shell PLC | 1.6 | |
| | 21.5 | |
How has the Fund changed?
This is a summary of certain changes to the Fund since November 1, 2023. For more complete information, you may review the Fund's next prospectus, which we expect to be available by December 30, 2024 at fundresearch.fidelity.com/prospectus/sec or upon request at 1-877-208-0098 or by sending an e-mail to fidfunddocuments@fidelity.com.
The fees associated with this class changed during the reporting year.The variations in class fees are primarily the result of the following changes: - Management fee
- Operating expenses
The fund's transfer agent and pricing & bookkeeping fees were changed to a fixed rate effective December 1, 2023, through February 29, 2024, in anticipation of the transition to a new management fee structure. Effective March 1, 2024, the fund's management contract was amended to incorporate administrative services previously covered under separate services agreements (transfer agent and pricing & bookkeeping). The amended contract incorporates a management fee rate that may vary by class. The Adviser or an affiliate pays certain expenses of managing and operating the fund out of each class's management fee. | The fund's sub-advisory agreement with FIL Investments (Japan) Limited was not renewed.
|
| Fidelity, the Fidelity Investments Logo and all other Fidelity trademarks or service marks used herein are trademarks or service marks of FMR LLC. Any third-party marks that are used herein are trademarks or service marks of their respective owners. © 2024 FMR LLC. All rights reserved. |
| | For additional information about the Fund; including its prospectus, financial information, holdings and proxy information, scan the QR code or visit fundresearch.fidelity.com/prospectus/sec 1.9913898.100 733-TSRA-1224 |
| |
| | ANNUAL SHAREHOLDER REPORT | AS OF OCTOBER 31, 2024 | This report describes changes to the Fund that occurred during the reporting period. |
| | Fidelity Advisor® Value Leaders Fund Fidelity Advisor® Value Leaders Fund Class C : FVLCX |
| | | |
This annual shareholder report contains information about Fidelity Advisor® Value Leaders Fund for the period November 1, 2023 to October 31, 2024. You can find additional information about the Fund at fundresearch.fidelity.com/prospectus/sec. You can also request this information by contacting us at 1-877-208-0098 or by sending an e-mail to fidfunddocuments@fidelity.com.
What were your Fund costs for the last year?(based on hypothetical $10,000 investment)
FUND COST (PREVIOUS YEAR)
| | Costs of a $10,000 investment | Costs paid as a percentage of a $10,000 investment | |
| Class C | $ 206 | 1.90% | |
What affected the Fund's performance this period?
•U.S. equities posted a strong advance for the 12 months ending October 31, 2024, driven by a resilient economy, the promise of artificial intelligence to drive transformative change and the Federal Reserve's long-anticipated pivot to cutting interest rates.
•Against this backdrop, security selection was the primary detractor from the fund's performance versus the Russell 1000® Value Index for the fiscal year, led by health care, especially within the health care equipment & services industry. Also hurting our result were stock selection and an underweight in industrials, primarily within the capital goods industry. Stock selection and an overweight in energy also hurt.
•The fund's non-benchmark stake in Parex Resources returned -48% and was the largest individual relative detractor. The second-largest relative detractor was an overweight in Centene (-10%). The stock was one of the fund's largest holdings this period. A non-benchmark stake in Samsung Electronics returned roughly -10% and notably hurt.
•In contrast, the biggest sector contributor to performance versus the benchmark was security selection in consumer discretionary, primarily within the consumer services industry. Stock picking in financials also boosted the fund's relative performance, along with an overweight in banks. Also bolstering our relative result was an underweight in materials.
•The top individual relative contributor was an overweight in Gen Digital (+80%). The company was among the fund's biggest holdings at period end. The second-largest relative contributor was an overweight in H&R Block (+49%). Though we reduced our stake, the company was among the fund's largest holdings. An overweight in Bank of America (+63%) also helped. The company was one of our biggest holdings, but we trimmed the position this period.
•Notable changes in positioning include increased exposure to the communication services and industrials sectors.
How did the Fund perform over the past 10 years?
CUMULATIVE PERFORMANCE
October 31, 2014 through October 31, 2024.
Initial investment of $10,000.
Class C | $10,000 | $10,354 | $10,250 | $11,996 | $12,299 | $12,779 | $10,834 | $15,338 | $15,520 | $15,487 | $18,295 |
Russell 1000® Value Index | $10,000 | $10,053 | $10,693 | $12,595 | $12,977 | $14,432 | $13,340 | $19,178 | $17,836 | $17,860 | $23,392 |
Russell 1000® Index | $10,000 | $10,486 | $10,933 | $13,520 | $14,464 | $16,511 | $18,305 | $26,269 | $21,967 | $24,050 | $33,206 |
| | 2014 | 2015 | 2016 | 2017 | 2018 | 2019 | 2020 | 2021 | 2022 | 2023 | 2024 |
AVERAGE ANNUAL TOTAL RETURNS:| | 1 Year | 5 Year | 10 Year |
| Class C (incl. contingent deferred sales charge) | 16.27% | 7.11% | 6.23% |
| Class C | 17.27% | 7.11% | 6.23% |
| Russell 1000® Value Index | 30.98% | 10.14% | 8.87% |
| Russell 1000® Index | 38.07% | 15.00% | 12.75% |
Visit institutional.fidelity.com for more recent performance information. |
The Fund's past performance is not a good predictor of the Fund's future performance. The graph and table do not reflect the deduction of taxes that a shareholder would pay on fund distributions or redemption of fund shares. |
Key Fund Statistics(as of October 31, 2024)
KEY FACTS | | |
| Fund Size | $32,451,832 | |
| Number of Holdings | 38 | |
| Total Advisory Fee | $248,410 | |
| Portfolio Turnover | 32% | |
What did the Fund invest in?
(as of October 31, 2024)
MARKET SECTORS (% of Fund's net assets) | | |
| Financials | 21.3 | |
| Health Care | 16.9 | |
| Consumer Staples | 10.1 | |
| Utilities | 10.0 | |
| Information Technology | 9.6 | |
| Energy | 9.2 | |
| Communication Services | 8.4 | |
| Industrials | 7.9 | |
| Consumer Discretionary | 3.8 | |
| Materials | 1.9 | |
| |
| Common Stocks | 96.5 |
| Preferred Stocks | 2.6 |
| Short-Term Investments and Net Other Assets (Liabilities) | 0.9 |
ASSET ALLOCATION (% of Fund's net assets) |
|
|
| United States | 88.6 |
| United Kingdom | 3.9 |
| Canada | 3.3 |
| Korea (South) | 2.6 |
| Germany | 1.6 |
GEOGRAPHIC DIVERSIFICATION (% of Fund's net assets) |
|
| |
|
TOP HOLDINGS(% of Fund's net assets) | | |
| UnitedHealth Group Inc | 5.9 | |
| Comcast Corp Class A | 5.3 | |
| Cigna Group/The | 4.4 | |
| Kenvue Inc | 4.1 | |
| Bank of America Corp | 4.1 | |
| Shell PLC ADR | 4.0 | |
| PG&E Corp | 3.9 | |
| JPMorgan Chase & Co | 3.9 | |
| H&R Block Inc | 3.8 | |
| Exxon Mobil Corp | 3.8 | |
| | 43.2 | |
How has the Fund changed?
This is a summary of certain changes to the Fund since November 1, 2023. For more complete information, you may review the Fund's next prospectus, which we expect to be available by December 30, 2024 at fundresearch.fidelity.com/prospectus/sec or upon request at 1-877-208-0098 or by sending an e-mail to fidfunddocuments@fidelity.com.
The fund's transfer agent and pricing & bookkeeping fees were changed to a fixed rate effective December 1, 2023, through February 29, 2024, in anticipation of the transition to a new management fee structure. Effective March 1, 2024, the fund's management contract was amended to incorporate administrative services previously covered under separate services agreements (transfer agent and pricing & bookkeeping). The amended contract incorporates a basic fee rate that may vary by class (subject to a performance adjustment). The Adviser or an affiliate pays certain expenses of managing and operating the fund out of each class's management fee. | |
| Fidelity, the Fidelity Investments Logo and all other Fidelity trademarks or service marks used herein are trademarks or service marks of FMR LLC. Any third-party marks that are used herein are trademarks or service marks of their respective owners. © 2024 FMR LLC. All rights reserved. |
| | For additional information about the Fund; including its prospectus, financial information, holdings and proxy information, scan the QR code or visit fundresearch.fidelity.com/prospectus/sec 1.9913917.100 1268-TSRA-1224 |
| |
| | ANNUAL SHAREHOLDER REPORT | AS OF OCTOBER 31, 2024 | This report describes changes to the Fund that occurred during the reporting period. |
| | Fidelity Advisor® Emerging Asia Fund Fidelity Advisor® Emerging Asia Fund Class A : FEAAX |
| | | |
This annual shareholder report contains information about Fidelity Advisor® Emerging Asia Fund for the period November 1, 2023 to October 31, 2024. You can find additional information about the Fund at fundresearch.fidelity.com/prospectus/sec. You can also request this information by contacting us at 1-877-208-0098 or by sending an e-mail to fidfunddocuments@fidelity.com.
What were your Fund costs for the last year?(based on hypothetical $10,000 investment)
FUND COST (PREVIOUS YEAR)
| | Costs of a $10,000 investment | Costs paid as a percentage of a $10,000 investment | |
| Class A | $ 146 | 1.24% | |
What affected the Fund's performance this period?
•International stocks achieved a strong gain for the 12 months ending October 31, 2024. Resilient global economic growth and a slowing in the pace of inflation in certain regions, as well as a shift to global monetary easing, contributed to a favorable backdrop, despite persistent geopolitical risk.
•Against this backdrop, stock picking and an overweight in Asia Pacific ex Japan, primarily in Singapore, contributed to the fund's performance versus the MSCI AC Asia Ex Japan (Net Mass) Linked Index for the fiscal year. Within emerging markets, stock selection and an overweight in India helped.
•By sector, security selection in consumer discretionary - notably the consumer services segment - was the primary contributor. Stock picking in communication services, primarily within the media & entertainment industry, also boosted the fund's relative performance. Also lifting the fund's relative result were stock picks and an overweight in information technology, primarily within the semiconductors & semiconductor equipment industry.
•The top individual relative contributor was an overweight in Sea (+126%). The company was one of the fund's biggest holdings. A non-benchmark stake in MakeMyTrip gained about 160% and was a second notable relative contributor. The company was among our biggest holdings. Another notable relative contributor was an overweight in Zomato (+125%). This period we decreased our stake in Zomato. The stock was one of our largest holdings.
•In contrast, from a regional standpoint, stock selection in China had the largest negative impact on relative performance. A non-benchmark allocation to the U.K. also detracted from the fund's relative result.
•By sector, the biggest detractors from performance versus the benchmark were stock picks and an overweight in health care. Security selection in financials also hampered the fund's result.
•The largest individual relative detractor was our stake in One97 Communications (-51%). The stock was not held at period end. A second notable relative detractor was an overweight in WuXi AppTec (-43%). We reduced our stake. Another notable relative detractor was our stake in WuXi Biologics (-75%). The stock was not held at period end.
•Notable changes in positioning include increased exposure to China, Hong Kong and Singapore, and reduced stakes in India and South Korea. By sector, meaningful changes in positioning include increased exposure to communication services and industrials, and a lower allocation to health care.
How did the Fund perform over the past 10 years?
CUMULATIVE PERFORMANCE
October 31, 2014 through October 31, 2024.
Initial investment of $10,000 and the current sales charge was paid.
Class A | $9,425 | $8,975 | $9,599 | $12,818 | $10,809 | $13,684 | $20,413 | $23,975 | $12,812 | $15,259 | $20,867 |
MSCI AC (All Country) Asia ex Japan Index | $10,000 | $9,278 | $9,890 | $12,902 | $11,144 | $12,620 | $14,620 | $16,494 | $10,886 | $12,358 | $15,813 |
| | 2014 | 2015 | 2016 | 2017 | 2018 | 2019 | 2020 | 2021 | 2022 | 2023 | 2024 |
AVERAGE ANNUAL TOTAL RETURNS:| | 1 Year | 5 Year | 10 Year |
| Class A (incl. 5.75% sales charge) | 28.89% | 7.52% | 7.63% |
| Class A (without 5.75% sales charge) | 36.75% | 8.81% | 8.27% |
| MSCI AC (All Country) Asia ex Japan Index | 27.96% | 4.61% | 4.69% |
Visit institutional.fidelity.com for more recent performance information. |
The Fund's past performance is not a good predictor of the Fund's future performance. The graph and table do not reflect the deduction of taxes that a shareholder would pay on fund distributions or redemption of fund shares. |
Key Fund Statistics(as of October 31, 2024)
KEY FACTS | | |
| Fund Size | $445,785,792 | |
| Number of Holdings | 132 | |
| Total Advisory Fee | $3,099,900 | |
| Portfolio Turnover | 59% | |
What did the Fund invest in?
(as of October 31, 2024)
MARKET SECTORS (% of Fund's net assets) | | |
| Consumer Discretionary | 28.3 | |
| Information Technology | 26.6 | |
| Communication Services | 12.5 | |
| Financials | 12.3 | |
| Industrials | 8.6 | |
| Health Care | 8.0 | |
| Energy | 1.3 | |
| Real Estate | 0.9 | |
| Consumer Staples | 0.6 | |
| Materials | 0.4 | |
| |
| Common Stocks | 98.3 |
| Preferred Stocks | 1.2 |
| Short-Term Investments and Net Other Assets (Liabilities) | 0.5 |
ASSET ALLOCATION (% of Fund's net assets) |
|
|
| China | 41.1 |
| India | 22.5 |
| Taiwan | 12.7 |
| Singapore | 7.7 |
| Korea (South) | 7.0 |
| Hong Kong | 4.2 |
| United States | 1.3 |
| Indonesia | 1.0 |
| South Africa | 0.9 |
| Others | 1.6 |
GEOGRAPHIC DIVERSIFICATION (% of Fund's net assets) |
|
| |
|
TOP HOLDINGS(% of Fund's net assets) | | |
| Taiwan Semiconductor Manufacturing Co Ltd | 10.9 | |
| Sea Ltd Class A ADR | 7.1 | |
| PDD Holdings Inc Class A ADR | 4.6 | |
| Zomato Ltd | 4.1 | |
| MakeMyTrip Ltd | 3.7 | |
| Meituan B Shares | 3.1 | |
| HDFC Bank Ltd | 3.0 | |
| Samsung Electronics Co Ltd | 3.0 | |
| Alibaba Group Holding Ltd | 2.8 | |
| Tencent Holdings Ltd | 2.6 | |
| | 44.9 | |
How has the Fund changed?
This is a summary of certain changes to the Fund since November 1, 2023. For more complete information, you may review the Fund's next prospectus, which we expect to be available by December 30, 2024 at fundresearch.fidelity.com/prospectus/sec or upon request at 1-877-208-0098 or by sending an e-mail to fidfunddocuments@fidelity.com.
The fund's transfer agent and pricing & bookkeeping fees were changed to a fixed rate effective December 1, 2023, through February 29, 2024, in anticipation of the transition to a new management fee structure. Effective March 1, 2024, the fund's management contract was amended to incorporate administrative services previously covered under separate services agreements (transfer agent and pricing & bookkeeping). The amended contract incorporates a management fee rate that may vary by class. The Adviser or an affiliate pays certain expenses of managing and operating the fund out of each class's management fee. | The fund's sub-advisory agreement with FIL Investments (Japan) Limited was not renewed.
|
| Fidelity, the Fidelity Investments Logo and all other Fidelity trademarks or service marks used herein are trademarks or service marks of FMR LLC. Any third-party marks that are used herein are trademarks or service marks of their respective owners. © 2024 FMR LLC. All rights reserved. |
| | For additional information about the Fund; including its prospectus, financial information, holdings and proxy information, scan the QR code or visit fundresearch.fidelity.com/prospectus/sec 1.9913906.100 756-TSRA-1224 |
| |
| | ANNUAL SHAREHOLDER REPORT | AS OF OCTOBER 31, 2024 | This report describes changes to the Fund that occurred during the reporting period. |
| | Fidelity Advisor® Value Leaders Fund Fidelity Advisor® Value Leaders Fund Class A : FVLAX |
| | | |
This annual shareholder report contains information about Fidelity Advisor® Value Leaders Fund for the period November 1, 2023 to October 31, 2024. You can find additional information about the Fund at fundresearch.fidelity.com/prospectus/sec. You can also request this information by contacting us at 1-877-208-0098 or by sending an e-mail to fidfunddocuments@fidelity.com.
What were your Fund costs for the last year?(based on hypothetical $10,000 investment)
FUND COST (PREVIOUS YEAR)
| | Costs of a $10,000 investment | Costs paid as a percentage of a $10,000 investment | |
| Class A | $ 125 | 1.15% | |
What affected the Fund's performance this period?
•U.S. equities posted a strong advance for the 12 months ending October 31, 2024, driven by a resilient economy, the promise of artificial intelligence to drive transformative change and the Federal Reserve's long-anticipated pivot to cutting interest rates.
•Against this backdrop, security selection was the primary detractor from the fund's performance versus the Russell 1000® Value Index for the fiscal year, led by health care, especially within the health care equipment & services industry. Also hurting our result were stock selection and an underweight in industrials, primarily within the capital goods industry. Stock selection and an overweight in energy also hurt.
•The fund's non-benchmark stake in Parex Resources returned -48% and was the largest individual relative detractor. The second-largest relative detractor was an overweight in Centene (-10%). The stock was one of the fund's largest holdings this period. A non-benchmark stake in Samsung Electronics returned roughly -10% and notably hurt.
•In contrast, the biggest sector contributor to performance versus the benchmark was security selection in consumer discretionary, primarily within the consumer services industry. Stock picking in financials also boosted the fund's relative performance, along with an overweight in banks. Also bolstering our relative result was an underweight in materials.
•The top individual relative contributor was an overweight in Gen Digital (+80%). The company was among the fund's biggest holdings at period end. The second-largest relative contributor was an overweight in H&R Block (+49%). Though we reduced our stake, the company was among the fund's largest holdings. An overweight in Bank of America (+63%) also helped. The company was one of our biggest holdings, but we trimmed the position this period.
•Notable changes in positioning include increased exposure to the communication services and industrials sectors.
How did the Fund perform over the past 10 years?
CUMULATIVE PERFORMANCE
October 31, 2014 through October 31, 2024.
Initial investment of $10,000 and the current sales charge was paid.
Class A | $9,425 | $9,832 | $9,814 | $11,567 | $11,952 | $12,506 | $10,684 | $15,244 | $15,537 | $15,504 | $18,315 |
Russell 1000® Value Index | $10,000 | $10,053 | $10,693 | $12,595 | $12,977 | $14,432 | $13,340 | $19,178 | $17,836 | $17,860 | $23,392 |
Russell 1000® Index | $10,000 | $10,486 | $10,933 | $13,520 | $14,464 | $16,511 | $18,305 | $26,269 | $21,967 | $24,050 | $33,206 |
| | 2014 | 2015 | 2016 | 2017 | 2018 | 2019 | 2020 | 2021 | 2022 | 2023 | 2024 |
AVERAGE ANNUAL TOTAL RETURNS:| | 1 Year | 5 Year | 10 Year |
| Class A (incl. 5.75% sales charge) | 11.34% | 6.66% | 6.24% |
| Class A (without 5.75% sales charge) | 18.13% | 7.93% | 6.87% |
| Russell 1000® Value Index | 30.98% | 10.14% | 8.87% |
| Russell 1000® Index | 38.07% | 15.00% | 12.75% |
Visit institutional.fidelity.com for more recent performance information. |
The Fund's past performance is not a good predictor of the Fund's future performance. The graph and table do not reflect the deduction of taxes that a shareholder would pay on fund distributions or redemption of fund shares. |
Key Fund Statistics(as of October 31, 2024)
KEY FACTS | | |
| Fund Size | $32,451,832 | |
| Number of Holdings | 38 | |
| Total Advisory Fee | $248,410 | |
| Portfolio Turnover | 32% | |
What did the Fund invest in?
(as of October 31, 2024)
MARKET SECTORS (% of Fund's net assets) | | |
| Financials | 21.3 | |
| Health Care | 16.9 | |
| Consumer Staples | 10.1 | |
| Utilities | 10.0 | |
| Information Technology | 9.6 | |
| Energy | 9.2 | |
| Communication Services | 8.4 | |
| Industrials | 7.9 | |
| Consumer Discretionary | 3.8 | |
| Materials | 1.9 | |
| |
| Common Stocks | 96.5 |
| Preferred Stocks | 2.6 |
| Short-Term Investments and Net Other Assets (Liabilities) | 0.9 |
ASSET ALLOCATION (% of Fund's net assets) |
|
|
| United States | 88.6 |
| United Kingdom | 3.9 |
| Canada | 3.3 |
| Korea (South) | 2.6 |
| Germany | 1.6 |
GEOGRAPHIC DIVERSIFICATION (% of Fund's net assets) |
|
| |
|
TOP HOLDINGS(% of Fund's net assets) | | |
| UnitedHealth Group Inc | 5.9 | |
| Comcast Corp Class A | 5.3 | |
| Cigna Group/The | 4.4 | |
| Kenvue Inc | 4.1 | |
| Bank of America Corp | 4.1 | |
| Shell PLC ADR | 4.0 | |
| PG&E Corp | 3.9 | |
| JPMorgan Chase & Co | 3.9 | |
| H&R Block Inc | 3.8 | |
| Exxon Mobil Corp | 3.8 | |
| | 43.2 | |
How has the Fund changed?
This is a summary of certain changes to the Fund since November 1, 2023. For more complete information, you may review the Fund's next prospectus, which we expect to be available by December 30, 2024 at fundresearch.fidelity.com/prospectus/sec or upon request at 1-877-208-0098 or by sending an e-mail to fidfunddocuments@fidelity.com.
The fund's transfer agent and pricing & bookkeeping fees were changed to a fixed rate effective December 1, 2023, through February 29, 2024, in anticipation of the transition to a new management fee structure. Effective March 1, 2024, the fund's management contract was amended to incorporate administrative services previously covered under separate services agreements (transfer agent and pricing & bookkeeping). The amended contract incorporates a basic fee rate that may vary by class (subject to a performance adjustment). The Adviser or an affiliate pays certain expenses of managing and operating the fund out of each class's management fee. | |
| Fidelity, the Fidelity Investments Logo and all other Fidelity trademarks or service marks used herein are trademarks or service marks of FMR LLC. Any third-party marks that are used herein are trademarks or service marks of their respective owners. © 2024 FMR LLC. All rights reserved. |
| | For additional information about the Fund; including its prospectus, financial information, holdings and proxy information, scan the QR code or visit fundresearch.fidelity.com/prospectus/sec 1.9913916.100 1266-TSRA-1224 |
| |
| | ANNUAL SHAREHOLDER REPORT | AS OF OCTOBER 31, 2024 | This report describes changes to the Fund that occurred during the reporting period. |
| | Fidelity Advisor® Emerging Asia Fund Fidelity Advisor® Emerging Asia Fund Class I : FERIX |
| | | |
This annual shareholder report contains information about Fidelity Advisor® Emerging Asia Fund for the period November 1, 2023 to October 31, 2024. You can find additional information about the Fund at fundresearch.fidelity.com/prospectus/sec. You can also request this information by contacting us at 1-877-208-0098 or by sending an e-mail to fidfunddocuments@fidelity.com.
What were your Fund costs for the last year?(based on hypothetical $10,000 investment)
FUND COST (PREVIOUS YEAR)
| | Costs of a $10,000 investment | Costs paid as a percentage of a $10,000 investment | |
| Class I | $ 113 | 0.95% | |
What affected the Fund's performance this period?
•International stocks achieved a strong gain for the 12 months ending October 31, 2024. Resilient global economic growth and a slowing in the pace of inflation in certain regions, as well as a shift to global monetary easing, contributed to a favorable backdrop, despite persistent geopolitical risk.
•Against this backdrop, stock picking and an overweight in Asia Pacific ex Japan, primarily in Singapore, contributed to the fund's performance versus the MSCI AC Asia Ex Japan (Net Mass) Linked Index for the fiscal year. Within emerging markets, stock selection and an overweight in India helped.
•By sector, security selection in consumer discretionary - notably the consumer services segment - was the primary contributor. Stock picking in communication services, primarily within the media & entertainment industry, also boosted the fund's relative performance. Also lifting the fund's relative result were stock picks and an overweight in information technology, primarily within the semiconductors & semiconductor equipment industry.
•The top individual relative contributor was an overweight in Sea (+126%). The company was one of the fund's biggest holdings. A non-benchmark stake in MakeMyTrip gained about 160% and was a second notable relative contributor. The company was among our biggest holdings. Another notable relative contributor was an overweight in Zomato (+125%). This period we decreased our stake in Zomato. The stock was one of our largest holdings.
•In contrast, from a regional standpoint, stock selection in China had the largest negative impact on relative performance. A non-benchmark allocation to the U.K. also detracted from the fund's relative result.
•By sector, the biggest detractors from performance versus the benchmark were stock picks and an overweight in health care. Security selection in financials also hampered the fund's result.
•The largest individual relative detractor was our stake in One97 Communications (-51%). The stock was not held at period end. A second notable relative detractor was an overweight in WuXi AppTec (-43%). We reduced our stake. Another notable relative detractor was our stake in WuXi Biologics (-75%). The stock was not held at period end.
•Notable changes in positioning include increased exposure to China, Hong Kong and Singapore, and reduced stakes in India and South Korea. By sector, meaningful changes in positioning include increased exposure to communication services and industrials, and a lower allocation to health care.
How did the Fund perform over the past 10 years?
CUMULATIVE PERFORMANCE
October 31, 2014 through October 31, 2024.
Initial investment of $10,000.
Class I | $10,000 | $9,553 | $10,247 | $13,729 | $11,610 | $14,736 | $22,044 | $25,962 | $13,912 | $16,616 | $22,784 |
MSCI AC (All Country) Asia ex Japan Index | $10,000 | $9,278 | $9,890 | $12,902 | $11,144 | $12,620 | $14,620 | $16,494 | $10,886 | $12,358 | $15,813 |
| | 2014 | 2015 | 2016 | 2017 | 2018 | 2019 | 2020 | 2021 | 2022 | 2023 | 2024 |
AVERAGE ANNUAL TOTAL RETURNS:| | 1 Year | 5 Year | 10 Year |
| Class I | 37.12% | 9.11% | 8.58% |
| MSCI AC (All Country) Asia ex Japan Index | 27.96% | 4.61% | 4.69% |
Visit institutional.fidelity.com for more recent performance information. |
The Fund's past performance is not a good predictor of the Fund's future performance. The graph and table do not reflect the deduction of taxes that a shareholder would pay on fund distributions or redemption of fund shares. |
Key Fund Statistics(as of October 31, 2024)
KEY FACTS | | |
| Fund Size | $445,785,792 | |
| Number of Holdings | 132 | |
| Total Advisory Fee | $3,099,900 | |
| Portfolio Turnover | 59% | |
What did the Fund invest in?
(as of October 31, 2024)
MARKET SECTORS (% of Fund's net assets) | | |
| Consumer Discretionary | 28.3 | |
| Information Technology | 26.6 | |
| Communication Services | 12.5 | |
| Financials | 12.3 | |
| Industrials | 8.6 | |
| Health Care | 8.0 | |
| Energy | 1.3 | |
| Real Estate | 0.9 | |
| Consumer Staples | 0.6 | |
| Materials | 0.4 | |
| |
| Common Stocks | 98.3 |
| Preferred Stocks | 1.2 |
| Short-Term Investments and Net Other Assets (Liabilities) | 0.5 |
ASSET ALLOCATION (% of Fund's net assets) |
|
|
| China | 41.1 |
| India | 22.5 |
| Taiwan | 12.7 |
| Singapore | 7.7 |
| Korea (South) | 7.0 |
| Hong Kong | 4.2 |
| United States | 1.3 |
| Indonesia | 1.0 |
| South Africa | 0.9 |
| Others | 1.6 |
GEOGRAPHIC DIVERSIFICATION (% of Fund's net assets) |
|
| |
|
TOP HOLDINGS(% of Fund's net assets) | | |
| Taiwan Semiconductor Manufacturing Co Ltd | 10.9 | |
| Sea Ltd Class A ADR | 7.1 | |
| PDD Holdings Inc Class A ADR | 4.6 | |
| Zomato Ltd | 4.1 | |
| MakeMyTrip Ltd | 3.7 | |
| Meituan B Shares | 3.1 | |
| HDFC Bank Ltd | 3.0 | |
| Samsung Electronics Co Ltd | 3.0 | |
| Alibaba Group Holding Ltd | 2.8 | |
| Tencent Holdings Ltd | 2.6 | |
| | 44.9 | |
How has the Fund changed?
This is a summary of certain changes to the Fund since November 1, 2023. For more complete information, you may review the Fund's next prospectus, which we expect to be available by December 30, 2024 at fundresearch.fidelity.com/prospectus/sec or upon request at 1-877-208-0098 or by sending an e-mail to fidfunddocuments@fidelity.com.
The fund's transfer agent and pricing & bookkeeping fees were changed to a fixed rate effective December 1, 2023, through February 29, 2024, in anticipation of the transition to a new management fee structure. Effective March 1, 2024, the fund's management contract was amended to incorporate administrative services previously covered under separate services agreements (transfer agent and pricing & bookkeeping). The amended contract incorporates a management fee rate that may vary by class. The Adviser or an affiliate pays certain expenses of managing and operating the fund out of each class's management fee. | The fund's sub-advisory agreement with FIL Investments (Japan) Limited was not renewed.
|
| Fidelity, the Fidelity Investments Logo and all other Fidelity trademarks or service marks used herein are trademarks or service marks of FMR LLC. Any third-party marks that are used herein are trademarks or service marks of their respective owners. © 2024 FMR LLC. All rights reserved. |
| | For additional information about the Fund; including its prospectus, financial information, holdings and proxy information, scan the QR code or visit fundresearch.fidelity.com/prospectus/sec 1.9913908.100 759-TSRA-1224 |
| |
| | ANNUAL SHAREHOLDER REPORT | AS OF OCTOBER 31, 2024 | This report describes changes to the Fund that occurred during the reporting period. |
| | Fidelity Advisor® Overseas Fund Fidelity Advisor® Overseas Fund Class Z : FAOSX |
| | | |
This annual shareholder report contains information about Fidelity Advisor® Overseas Fund for the period November 1, 2023 to October 31, 2024. You can find additional information about the Fund at fundresearch.fidelity.com/prospectus/sec. You can also request this information by contacting us at 1-877-208-0098 or by sending an e-mail to fidfunddocuments@fidelity.com.
What were your Fund costs for the last year?(based on hypothetical $10,000 investment)
FUND COST (PREVIOUS YEAR)
| | Costs of a $10,000 investment | Costs paid as a percentage of a $10,000 investment | |
| Class Z | $ 74 | 0.66% | |
What affected the Fund's performance this period?
•International stocks achieved a strong gain for the 12 months ending October 31, 2024. Resilient global economic growth and a slowing in the pace of inflation in certain regions, as well as a shift to global monetary easing, contributed to a favorable backdrop, despite persistent geopolitical risk.
•Against this backdrop, stock picking in the U.K. and Japan contributed to the fund's performance versus the MSCI EAFE Index (Net MA) for the fiscal year.
•By sector, market selection was the primary contributor, led by an underweights in energy and consumer staples. Stock picks and an overweight in industrials, primarily within the capital goods industry, also boosted the fund's relative performance.
•The top individual relative contributor was an overweight in Mitsubishi Heavy Industries (+157%). This was a stake we established this period. The second-largest relative contributor was an overweight in Tokio Marine Holdings (+70%). Although we reduced the fund's stake, the company was one of our largest holdings. Another notable relative contributor was our non-benchmark stake in Taiwan Semiconductor Manufacturing (+101%).
•In contrast, from a regional standpoint, stock selection in the United States and underweights in Japan and Asia Pacific ex Japan detracted from the fund's relative result.
•By sector, the biggest detractor from performance versus the benchmark was stock selection in consumer staples. Also hurting our result were stock picks in consumer discretionary, primarily within the consumer durables & apparel industry. Choices in information technology, primarily within the software & services industry, also hurt. Lastly, the fund's position in cash detracted.
•The largest individual relative detractor was our stake in Diageo (-11%). The stock was not held at period end. A non-benchmark stake in Alten returned approximately -27% and was the second-largest relative detractor. Our overweight stake in Sony Group (+1%) also hurt. The stock was not held at period end.
•Notable changes in positioning include increased exposure to Japan and the United States, and a lower allocation to Sweden. By sector, meaningful changes in positioning include decreased exposure to consumer staples and energy, and a higher allocation to industrials and materials.
How did the Fund perform over the life of Fund?
CUMULATIVE PERFORMANCE
February 1, 2017 through October 31, 2024.
Initial investment of $10,000.
Class Z | $10,000 | $12,337 | $11,458 | $12,991 | $13,480 | $18,647 | $13,092 | $14,781 |
MSCI EAFE Index | $10,000 | $11,841 | $11,054 | $12,302 | $11,480 | $15,435 | $11,909 | $13,654 |
| | 2017 | 2018 | 2019 | 2020 | 2021 | 2022 | 2023 | 2024 |
AVERAGE ANNUAL TOTAL RETURNS:| | 1 Year | 5 Year | Life of Fund A |
| Class Z | 26.03% | 7.47% | 8.36% |
| MSCI EAFE Index | 23.25% | 6.46% | 6.95% |
A From February 1, 2017
Visit institutional.fidelity.com for more recent performance information. |
The Fund's past performance is not a good predictor of the Fund's future performance. The graph and table do not reflect the deduction of taxes that a shareholder would pay on fund distributions or redemption of fund shares. |
Key Fund Statistics(as of October 31, 2024)
KEY FACTS | | |
| Fund Size | $383,854,611 | |
| Number of Holdings | 93 | |
| Total Advisory Fee | $2,406,862 | |
| Portfolio Turnover | 34% | |
What did the Fund invest in?
(as of October 31, 2024)
MARKET SECTORS (% of Fund's net assets) | | |
| Industrials | 26.0 | |
| Financials | 23.2 | |
| Information Technology | 16.0 | |
| Health Care | 13.8 | |
| Materials | 9.5 | |
| Consumer Discretionary | 7.0 | |
| Consumer Staples | 2.3 | |
| Communication Services | 0.4 | |
| |
| Common Stocks | 98.2 |
| Short-Term Investments and Net Other Assets (Liabilities) | 1.8 |
ASSET ALLOCATION (% of Fund's net assets) |
|
|
| United Kingdom | 17.9 |
| United States | 17.3 |
| Japan | 16.1 |
| France | 11.2 |
| Germany | 8.9 |
| Netherlands | 6.3 |
| Denmark | 4.4 |
| Italy | 3.8 |
| Switzerland | 3.4 |
| Others | 10.7 |
GEOGRAPHIC DIVERSIFICATION (% of Fund's net assets) |
|
| |
|
TOP HOLDINGS(% of Fund's net assets) | | |
| ASML Holding NV | 3.0 | |
| Novo Nordisk A/S Series B | 3.0 | |
| SAP SE | 2.9 | |
| Astrazeneca PLC | 2.2 | |
| Hitachi Ltd | 2.2 | |
| RELX PLC | 2.2 | |
| Safran SA | 2.0 | |
| Compass Group PLC | 2.0 | |
| Wolters Kluwer NV | 2.0 | |
| Tokio Marine Holdings Inc | 2.0 | |
| | 23.5 | |
How has the Fund changed?
This is a summary of certain changes to the Fund since November 1, 2023. For more complete information, you may review the Fund's next prospectus, which we expect to be available by December 30, 2024 at fundresearch.fidelity.com/prospectus/sec or upon request at 1-877-208-0098 or by sending an e-mail to fidfunddocuments@fidelity.com.
The fund's transfer agent and pricing & bookkeeping fees were changed to a fixed rate effective December 1, 2023, through February 29, 2024, in anticipation of the transition to a new management fee structure. Effective March 1, 2024, the fund's management contract was amended to incorporate administrative services previously covered under separate services agreements (transfer agent and pricing & bookkeeping). The amended contract incorporates a basic fee rate that may vary by class (subject to a performance adjustment). The Adviser or an affiliate pays certain expenses of managing and operating the fund out of each class's management fee. | The fund's sub-advisory agreement with FIL Investments (Japan) Limited was not renewed.
|
| Fidelity, the Fidelity Investments Logo and all other Fidelity trademarks or service marks used herein are trademarks or service marks of FMR LLC. Any third-party marks that are used herein are trademarks or service marks of their respective owners. © 2024 FMR LLC. All rights reserved. |
| | For additional information about the Fund; including its prospectus, financial information, holdings and proxy information, scan the QR code or visit fundresearch.fidelity.com/prospectus/sec 1.9913820.100 2884-TSRA-1224 |
| |
| | ANNUAL SHAREHOLDER REPORT | AS OF OCTOBER 31, 2024 | This report describes changes to the Fund that occurred during the reporting period. |
| | Fidelity Advisor® International Capital Appreciation Fund Fidelity Advisor® International Capital Appreciation Fund Class Z : FIDZX |
| | | |
This annual shareholder report contains information about Fidelity Advisor® International Capital Appreciation Fund for the period November 1, 2023 to October 31, 2024. You can find additional information about the Fund at fundresearch.fidelity.com/prospectus/sec. You can also request this information by contacting us at 1-877-208-0098 or by sending an e-mail to fidfunddocuments@fidelity.com.
What were your Fund costs for the last year?(based on hypothetical $10,000 investment)
FUND COST (PREVIOUS YEAR)
| | Costs of a $10,000 investment | Costs paid as a percentage of a $10,000 investment | |
| Class Z | $ 87 | 0.76% | |
What affected the Fund's performance this period?
•International stocks achieved a strong gain for the 12 months ending October 31, 2024. Resilient global economic growth and a slowing in the pace of inflation in certain regions, as well as a shift to global monetary easing, contributed to a favorable backdrop, despite persistent geopolitical risk.
•Against this backdrop, security selection and an underweight in emerging markets and stock selection in Europe ex U.K. contributed to the fund's performance versus the MSCI All Country World ex US Index (Net MA) for the fiscal year.
•By sector, market selection was the primary contributor, led by an overweight in information technology, where an overweight in semiconductors & semiconductor equipment helped most. Picks and an overweight in industrials also boosted relative performance. Also contributing to our result was a lack of exposure to the lagging energy sector.
•The fund's non-benchmark stake in Nvidia gained 221% and was the top individual relative contributor. The stock was not held at period end. A second notable relative contributor was an overweight in Taiwan Semiconductor Manufacturing (+100%). The company was the fund's largest holding. Another notable relative contributor was an overweight in Brookfield Asset Management (+91%).
•In contrast, from a regional standpoint, security selection in Canada and an overweight in Europe ex U.K., primarily in France, detracted from the fund's relative result.
•By sector, the biggest detractor from performance versus the benchmark was stock selection in information technology, primarily within the software & services industry. Also hurting our result were stock picks in consumer staples and health care.
•The biggest individual relative detractor was our stake in OBIC (-23%). A second notable relative detractor was an underweight in Shopify (+66%). An overweight in LVMH Moet Hennessy Louis Vuitton (-6%) also hurt. The stock was among our largest holdings.
•Notable changes in positioning include increased exposure to China and Japan. By sector, meaningful changes in positioning include increased exposure to communication services and a lower allocation to consumer staples, where we liquidated all of the fund's holdings.
How did the Fund perform over the life of Fund?
CUMULATIVE PERFORMANCE
February 1, 2017 through October 31, 2024.
Initial investment of $10,000.
Class Z | $10,000 | $12,614 | $11,673 | $14,290 | $16,211 | $20,706 | $14,302 | $16,607 |
MSCI ACWI (All Country World Index) ex USA Index | $10,000 | $11,916 | $10,954 | $12,210 | $11,910 | $15,465 | $11,660 | $13,090 |
| | 2017 | 2018 | 2019 | 2020 | 2021 | 2022 | 2023 | 2024 |
AVERAGE ANNUAL TOTAL RETURNS:| | 1 Year | 5 Year | Life of Fund A |
| Class Z | 29.44% | 8.51% | 10.38% |
| MSCI ACWI (All Country World Index) ex USA Index | 24.55% | 5.95% | 6.51% |
A From February 1, 2017
Visit institutional.fidelity.com for more recent performance information. |
The Fund's past performance is not a good predictor of the Fund's future performance. The graph and table do not reflect the deduction of taxes that a shareholder would pay on fund distributions or redemption of fund shares. |
Key Fund Statistics(as of October 31, 2024)
KEY FACTS | | |
| Fund Size | $8,714,030,084 | |
| Number of Holdings | 63 | |
| Total Advisory Fee | $61,601,570 | |
| Portfolio Turnover | 63% | |
What did the Fund invest in?
(as of October 31, 2024)
MARKET SECTORS (% of Fund's net assets) | | |
| Industrials | 30.8 | |
| Financials | 21.6 | |
| Information Technology | 18.3 | |
| Consumer Discretionary | 11.3 | |
| Materials | 8.8 | |
| Health Care | 4.5 | |
| Communication Services | 4.1 | |
| |
| Common Stocks | 99.4 |
| Short-Term Investments and Net Other Assets (Liabilities) | 0.6 |
ASSET ALLOCATION (% of Fund's net assets) |
|
|
| United States | 20.0 |
| Japan | 12.6 |
| United Kingdom | 10.9 |
| France | 8.8 |
| India | 7.9 |
| Canada | 6.4 |
| China | 5.3 |
| Netherlands | 5.2 |
| Taiwan | 4.5 |
| Others | 18.4 |
GEOGRAPHIC DIVERSIFICATION (% of Fund's net assets) |
|
| |
|
TOP HOLDINGS(% of Fund's net assets) | | |
| Taiwan Semiconductor Manufacturing Co Ltd | 4.5 | |
| Novo Nordisk A/S Series B | 2.9 | |
| Tencent Holdings Ltd | 2.5 | |
| SAP SE | 2.5 | |
| ASML Holding NV | 2.3 | |
| LVMH Moet Hennessy Louis Vuitton SE | 2.3 | |
| Schneider Electric SE | 2.1 | |
| Hitachi Ltd | 1.9 | |
| ABB Ltd | 1.8 | |
| Keyence Corp | 1.7 | |
| | 24.5 | |
How has the Fund changed?
This is a summary of certain changes to the Fund since November 1, 2023. For more complete information, you may review the Fund's next prospectus, which we expect to be available by December 30, 2024 at fundresearch.fidelity.com/prospectus/sec or upon request at 1-877-208-0098 or by sending an e-mail to fidfunddocuments@fidelity.com.
The fees associated with this class changed during the reporting year.The variations in class fees are primarily the result of the following changes: - Management fee
- Operating expenses
- Performance adjustment fee
The fund's transfer agent and pricing & bookkeeping fees were changed to a fixed rate effective December 1, 2023, through February 29, 2024, in anticipation of the transition to a new management fee structure. Effective March 1, 2024, the fund's management contract was amended to incorporate administrative services previously covered under separate services agreements (transfer agent and pricing & bookkeeping). The amended contract incorporates a basic fee rate that may vary by class (subject to a performance adjustment). The Adviser or an affiliate pays certain expenses of managing and operating the fund out of each class's management fee. | The fund's sub-advisory agreement with FIL Investments (Japan) Limited was not renewed.
|
| Fidelity, the Fidelity Investments Logo and all other Fidelity trademarks or service marks used herein are trademarks or service marks of FMR LLC. Any third-party marks that are used herein are trademarks or service marks of their respective owners. © 2024 FMR LLC. All rights reserved. |
| | For additional information about the Fund; including its prospectus, financial information, holdings and proxy information, scan the QR code or visit fundresearch.fidelity.com/prospectus/sec 1.9913825.100 2886-TSRA-1224 |
| |
| | ANNUAL SHAREHOLDER REPORT | AS OF OCTOBER 31, 2024 | This report describes changes to the Fund that occurred during the reporting period. |
| | Fidelity Advisor® Focused Emerging Markets Fund Fidelity Advisor® Focused Emerging Markets Fund Class M : FTMKX |
| | | |
This annual shareholder report contains information about Fidelity Advisor® Focused Emerging Markets Fund for the period November 1, 2023 to October 31, 2024. You can find additional information about the Fund at fundresearch.fidelity.com/prospectus/sec. You can also request this information by contacting us at 1-877-208-0098 or by sending an e-mail to fidfunddocuments@fidelity.com.
What were your Fund costs for the last year?(based on hypothetical $10,000 investment)
FUND COST (PREVIOUS YEAR)
| | Costs of a $10,000 investment | Costs paid as a percentage of a $10,000 investment | |
| Class M | $ 164 | 1.43% | |
What affected the Fund's performance this period?
•International stocks achieved a strong gain for the 12 months ending October 31, 2024. Resilient global economic growth and a slowing in the pace of inflation in certain regions, as well as a shift to global monetary easing, contributed to a favorable backdrop, despite persistent geopolitical risk.
•Against this backdrop, stock picking in Emerging Asia and Emerging Europe contributed to the fund's performance versus the MSCI Emerging Markets (Net MA) Index for the fiscal year.
•By sector, security selection was the primary contributor, led by materials. Stock picks in communication services, primarily within the media & entertainment industry, and health care, primarily within the pharmaceuticals, biotechnology & life sciences industry, also boosted the fund's relative performance.
•The top individual relative contributor was an overweight in China Life Insurance (+65%). The stock was among the fund's biggest holdings. The second-largest relative contributor was an overweight in Meituan (+67%). The stock was one of our biggest holdings. Another notable relative contributor was our stake in Taiwan Semiconductor Manufacturing (+100%). The company was the fund's largest holding this period.
•In contrast, from a regional standpoint, stock selection in Latin America and Africa, primarily in South Africa, detracted from the fund's relative result.
•By sector, the biggest detractor from performance versus the benchmark was stock selection in consumer staples. Stock picking and an underweight in information technology, primarily within the technology hardware & equipment industry, also hampered the fund's result. Also hurting our result was an overweight in materials.
•The largest individual relative detractor was an overweight in Wal-Mart de Mexico (-22%). This period we increased our position in Wal-Mart de Mexico. The company was among our biggest holdings at period end. A second notable relative detractor was an overweight in Samsung Electronics (-12%). The stock was one of the fund's largest holdings. Another notable relative detractor was an underweight in Alibaba Group Holding (+23%). The stock was not held at period end.
•Notable changes in positioning include increased exposure to Mexico and a lower allocation to Brazil. By sector, meaningful changes in positioning include increased exposure to health care and a lower allocation to materials.
How did the Fund perform over the past 10 years?
CUMULATIVE PERFORMANCE
October 31, 2014 through October 31, 2024.
Initial investment of $10,000 and the current sales charge was paid.
Class M | $9,650 | $8,552 | $9,178 | $11,849 | $10,051 | $11,964 | $14,046 | $16,729 | $11,126 | $12,493 | $15,979 |
MSCI Emerging Markets Index | $10,000 | $8,550 | $9,346 | $11,823 | $10,347 | $11,577 | $12,535 | $14,663 | $10,115 | $11,211 | $14,051 |
| | 2014 | 2015 | 2016 | 2017 | 2018 | 2019 | 2020 | 2021 | 2022 | 2023 | 2024 |
AVERAGE ANNUAL TOTAL RETURNS:| | 1 Year | 5 Year | 10 Year |
| Class M (incl. 3.50% sales charge) | 23.43% | 5.21% | 4.80% |
| Class M (without 3.50% sales charge) | 27.90% | 5.96% | 5.17% |
| MSCI Emerging Markets Index | 25.33% | 3.95% | 3.46% |
Visit institutional.fidelity.com for more recent performance information. |
The Fund's past performance is not a good predictor of the Fund's future performance. The graph and table do not reflect the deduction of taxes that a shareholder would pay on fund distributions or redemption of fund shares. |
Key Fund Statistics(as of October 31, 2024)
KEY FACTS | | |
| Fund Size | $5,788,031,153 | |
| Number of Holdings | 55 | |
| Total Advisory Fee | $37,704,655 | |
| Portfolio Turnover | 46% | |
What did the Fund invest in?
(as of October 31, 2024)
MARKET SECTORS (% of Fund's net assets) | | |
| Financials | 21.6 | |
| Information Technology | 18.3 | |
| Consumer Discretionary | 14.7 | |
| Communication Services | 10.2 | |
| Industrials | 8.7 | |
| Materials | 8.0 | |
| Health Care | 6.2 | |
| Consumer Staples | 5.5 | |
| Energy | 3.6 | |
| |
| Common Stocks | 96.8 |
| Short-Term Investments and Net Other Assets (Liabilities) | 3.2 |
ASSET ALLOCATION (% of Fund's net assets) |
|
|
| China | 31.4 |
| Taiwan | 13.1 |
| Korea (South) | 12.4 |
| India | 10.8 |
| South Africa | 5.0 |
| Brazil | 4.8 |
| Mexico | 4.5 |
| United States | 3.2 |
| Peru | 2.5 |
| Others | 12.3 |
GEOGRAPHIC DIVERSIFICATION (% of Fund's net assets) |
|
| |
|
TOP HOLDINGS(% of Fund's net assets) | | |
| Tencent Holdings Ltd | 8.6 | |
| Taiwan Semiconductor Manufacturing Co Ltd | 8.4 | |
| Samsung Electronics Co Ltd | 5.7 | |
| Meituan B Shares | 3.5 | |
| Wal-Mart de Mexico SAB de CV Series V | 3.4 | |
| Haier Smart Home Co Ltd A Shares (China) | 2.9 | |
| Tata Consultancy Services Ltd | 2.7 | |
| China Life Insurance Co Ltd H Shares | 2.7 | |
| PDD Holdings Inc Class A ADR | 2.5 | |
| Credicorp Ltd | 2.5 | |
| | 42.9 | |
How has the Fund changed?
This is a summary of certain changes to the Fund since November 1, 2023. For more complete information, you may review the Fund's next prospectus, which we expect to be available by December 30, 2024 at fundresearch.fidelity.com/prospectus/sec or upon request at 1-877-208-0098 or by sending an e-mail to fidfunddocuments@fidelity.com.
The fees associated with this class changed during the reporting year.The variations in class fees are primarily the result of the following changes: - Management fee
- Operating expenses
The fund's transfer agent and pricing & bookkeeping fees were changed to a fixed rate effective December 1, 2023, through February 29, 2024, in anticipation of the transition to a new management fee structure. Effective March 1, 2024, the fund's management contract was amended to incorporate administrative services previously covered under separate services agreements (transfer agent and pricing & bookkeeping). The amended contract incorporates a management fee rate that may vary by class. The Adviser or an affiliate pays certain expenses of managing and operating the fund out of each class's management fee. | The fund's sub-advisory agreement with FIL Investments (Japan) Limited was not renewed.
|
| Fidelity, the Fidelity Investments Logo and all other Fidelity trademarks or service marks used herein are trademarks or service marks of FMR LLC. Any third-party marks that are used herein are trademarks or service marks of their respective owners. © 2024 FMR LLC. All rights reserved. |
| | For additional information about the Fund; including its prospectus, financial information, holdings and proxy information, scan the QR code or visit fundresearch.fidelity.com/prospectus/sec 1.9913922.100 1289-TSRA-1224 |
| |
| | ANNUAL SHAREHOLDER REPORT | AS OF OCTOBER 31, 2024 | This report describes changes to the Fund that occurred during the reporting period. |
| | Fidelity Advisor® Diversified International Fund Fidelity Advisor® Diversified International Fund Class M : FADIX |
| | | |
This annual shareholder report contains information about Fidelity Advisor® Diversified International Fund for the period November 1, 2023 to October 31, 2024. You can find additional information about the Fund at fundresearch.fidelity.com/prospectus/sec. You can also request this information by contacting us at 1-877-208-0098 or by sending an e-mail to fidfunddocuments@fidelity.com.
What were your Fund costs for the last year?(based on hypothetical $10,000 investment)
FUND COST (PREVIOUS YEAR)
| | Costs of a $10,000 investment | Costs paid as a percentage of a $10,000 investment | |
| Class M | $ 156 | 1.39% | |
What affected the Fund's performance this period?
•International stocks achieved a strong gain for the 12 months ending October 31, 2024. Resilient global economic growth and a slowing in the pace of inflation in certain regions, as well as a shift to global monetary easing, contributed to a favorable backdrop, despite persistent geopolitical risk.
•Against this backdrop, stock picks in Japan and a non-benchmark allocation to emerging markets contributed to the fund's performance versus the MSCI EAFE Index (Net MA) for the fiscal year.
•By sector, the biggest contributors to performance versus the benchmark were picks and an overweight in industrials, primarily within the capital goods industry. Picks in materials also boosted relative performance. Also helping our relative result was an underweight in consumer staples.
•The top individual relative contributor was our non-benchmark stake in Taiwan Semiconductor Manufacturing (+124%). The stock was among our biggest holdings. A second notable relative contributor was an overweight in Hitachi (+109%). Although we trimmed our stake, the company was the fund's largest holding at period end. Another notable relative contributor was an overweight in Mitsubishi Heavy Industries (+127%). This was a stake we established this period.
•In contrast, from a regional standpoint, a non-benchmark allocation to both the United States and Canada detracted from the fund's relative result.
•By sector, the biggest detractor from performance versus the benchmark was stock picking in financials. Stock picks in consumer staples also hampered the fund's result. Also detracting from our result was an overweight in energy. Lastly, the fund's position in cash detracted.
•The fund's non-benchmark stake in Schlumberger returned -20% and was the largest individual relative detractor. The stock was not held at period end. A non-benchmark stake in HDFC Bank gained 18% and was a second notable relative detractor. We reduced the position. Our stake in Pernod-Ricard (-27%) also detracted. This period we decreased our position in Pernod-Ricard.
•Notable changes in positioning include increased exposure to Germany and Switzerland. By sector, meaningful changes in positioning include decreased exposure to consumer staples and a higher allocation to industrials.
How did the Fund perform over the past 10 years?
CUMULATIVE PERFORMANCE
October 31, 2014 through October 31, 2024.
Initial investment of $10,000 and the current sales charge was paid.
Class M | $9,650 | $10,004 | $9,682 | $11,822 | $10,710 | $12,346 | $13,462 | $17,392 | $12,268 | $13,647 | $16,927 |
MSCI EAFE Index | $10,000 | $10,008 | $9,705 | $12,004 | $11,206 | $12,472 | $11,638 | $15,647 | $12,073 | $13,841 | $17,059 |
| | 2014 | 2015 | 2016 | 2017 | 2018 | 2019 | 2020 | 2021 | 2022 | 2023 | 2024 |
AVERAGE ANNUAL TOTAL RETURNS:| | 1 Year | 5 Year | 10 Year |
| Class M (incl. 3.50% sales charge) | 19.69% | 5.76% | 5.40% |
| Class M (without 3.50% sales charge) | 24.03% | 6.52% | 5.78% |
| MSCI EAFE Index | 23.25% | 6.46% | 5.49% |
Visit institutional.fidelity.com for more recent performance information. |
The Fund's past performance is not a good predictor of the Fund's future performance. The graph and table do not reflect the deduction of taxes that a shareholder would pay on fund distributions or redemption of fund shares. |
Key Fund Statistics(as of October 31, 2024)
KEY FACTS | | |
| Fund Size | $1,404,041,433 | |
| Number of Holdings | 135 | |
| Total Advisory Fee | $10,934,381 | |
| Portfolio Turnover | 33% | |
What did the Fund invest in?
(as of October 31, 2024)
MARKET SECTORS (% of Fund's net assets) | | |
| Industrials | 24.9 | |
| Financials | 22.5 | |
| Information Technology | 15.7 | |
| Health Care | 10.3 | |
| Materials | 8.3 | |
| Consumer Discretionary | 7.4 | |
| Energy | 5.0 | |
| Consumer Staples | 1.9 | |
| Communication Services | 0.5 | |
| Real Estate | 0.2 | |
| |
| Common Stocks | 96.2 |
| Preferred Stocks | 0.5 |
| Short-Term Investments and Net Other Assets (Liabilities) | 3.3 |
ASSET ALLOCATION (% of Fund's net assets) |
|
|
| Japan | 17.1 |
| United States | 16.0 |
| United Kingdom | 14.4 |
| Germany | 8.7 |
| France | 8.1 |
| Canada | 6.5 |
| Netherlands | 5.3 |
| Denmark | 3.5 |
| Sweden | 3.0 |
| Others | 17.4 |
GEOGRAPHIC DIVERSIFICATION (% of Fund's net assets) |
|
| |
|
TOP HOLDINGS(% of Fund's net assets) | | |
| Hitachi Ltd | 2.9 | |
| ASML Holding NV depository receipt | 2.8 | |
| Novo Nordisk A/S Series B | 2.5 | |
| Taiwan Semiconductor Manufacturing Co Ltd ADR | 2.5 | |
| SAP SE | 2.4 | |
| Astrazeneca PLC | 1.8 | |
| RELX PLC (Netherlands) | 1.8 | |
| Wolters Kluwer NV | 1.6 | |
| London Stock Exchange Group PLC | 1.6 | |
| Shell PLC | 1.6 | |
| | 21.5 | |
How has the Fund changed?
This is a summary of certain changes to the Fund since November 1, 2023. For more complete information, you may review the Fund's next prospectus, which we expect to be available by December 30, 2024 at fundresearch.fidelity.com/prospectus/sec or upon request at 1-877-208-0098 or by sending an e-mail to fidfunddocuments@fidelity.com.
The fund's transfer agent and pricing & bookkeeping fees were changed to a fixed rate effective December 1, 2023, through February 29, 2024, in anticipation of the transition to a new management fee structure. Effective March 1, 2024, the fund's management contract was amended to incorporate administrative services previously covered under separate services agreements (transfer agent and pricing & bookkeeping). The amended contract incorporates a management fee rate that may vary by class. The Adviser or an affiliate pays certain expenses of managing and operating the fund out of each class's management fee. | The fund's sub-advisory agreement with FIL Investments (Japan) Limited was not renewed.
|
| Fidelity, the Fidelity Investments Logo and all other Fidelity trademarks or service marks used herein are trademarks or service marks of FMR LLC. Any third-party marks that are used herein are trademarks or service marks of their respective owners. © 2024 FMR LLC. All rights reserved. |
| | For additional information about the Fund; including its prospectus, financial information, holdings and proxy information, scan the QR code or visit fundresearch.fidelity.com/prospectus/sec 1.9913900.100 735-TSRA-1224 |
| |
| | ANNUAL SHAREHOLDER REPORT | AS OF OCTOBER 31, 2024 | This report describes changes to the Fund that occurred during the reporting period. |
| | Fidelity Advisor® Global Capital Appreciation Fund Fidelity Advisor® Global Capital Appreciation Fund Class I : FEUIX |
| | | |
This annual shareholder report contains information about Fidelity Advisor® Global Capital Appreciation Fund for the period November 1, 2023 to October 31, 2024. You can find additional information about the Fund at fundresearch.fidelity.com/prospectus/sec. You can also request this information by contacting us at 1-877-208-0098 or by sending an e-mail to fidfunddocuments@fidelity.com.
What were your Fund costs for the last year?(based on hypothetical $10,000 investment)
FUND COST (PREVIOUS YEAR)
| | Costs of a $10,000 investment | Costs paid as a percentage of a $10,000 investment | |
| Class I | $ 122 | 1.00% | |
What affected the Fund's performance this period?
•Global equities posted a strong advance for the 12 months ending October 31, 2024. Resilient economic growth and a slowing in the pace of inflation in certain regions, as well as a shift to global monetary easing, contributed to a favorable backdrop, despite persistent geopolitical risk.
•Against this backdrop, stock picking in the United States and an underweight in emerging markets contributed to the fund's performance versus the MSCI AC World (Net MA) Linked Index for the fiscal year.
•By sector, security selection was the primary contributor, especially within information technology. Picks in industrials, primarily within the capital goods industry, and communication services, primarily within the media & entertainment industry, also boosted the fund's relative performance.
•The fund's top individual relative contributor was an overweight in Nvidia (+227%). Although we reduced the position, the stock was the fund's biggest holding at period end. A second notable relative contributor was an overweight in Hitachi (+109%). The stock was among our biggest holdings at period end. An overweight in Taiwan Semiconductor Manufacturing (+124%) also contributed. The stock was one of our largest holdings.
•In contrast, from a regional standpoint, stock picks in Canada and emerging markets, primarily in India, detracted from the fund's relative result.
•By sector, a notable detractor from performance versus the benchmark was stock selection in energy. Also modestly hurting our result were an overweight in industrials and an underweight in communication services. Lastly, the fund's position in cash detracted.
•The largest individual relative detractor was our stake in UnitedHealth Group (-9%). The stock was not held at period end. The second-largest relative detractor was an overweight in HDFC Bank (+18%). Another notable relative detractor this period was avoiding Broadcom, a benchmark component that gained 105%.
•Notable changes in positioning include increased exposure to China and the United States. By sector, meaningful changes in positioning include increased exposure to industrials and a lower allocation to energy.
How did the Fund perform over the past 10 years?
CUMULATIVE PERFORMANCE
October 31, 2014 through October 31, 2024.
Initial investment of $10,000.
Class I | $10,000 | $10,396 | $10,672 | $13,503 | $12,632 | $13,224 | $15,785 | $20,685 | $15,485 | $18,168 | $25,883 |
MSCI ACWI (All Country World Index) Index | $10,000 | $10,035 | $10,284 | $12,721 | $12,703 | $14,362 | $15,121 | $20,822 | $16,723 | $18,547 | $24,710 |
| | 2014 | 2015 | 2016 | 2017 | 2018 | 2019 | 2020 | 2021 | 2022 | 2023 | 2024 |
AVERAGE ANNUAL TOTAL RETURNS:| | 1 Year | 5 Year | 10 Year |
| Class I | 42.47% | 14.38% | 9.98% |
| MSCI ACWI (All Country World Index) Index | 33.23% | 11.46% | 9.47% |
Visit institutional.fidelity.com for more recent performance information. |
The Fund's past performance is not a good predictor of the Fund's future performance. The graph and table do not reflect the deduction of taxes that a shareholder would pay on fund distributions or redemption of fund shares. |
Key Fund Statistics(as of October 31, 2024)
KEY FACTS | | |
| Fund Size | $141,421,538 | |
| Number of Holdings | 54 | |
| Total Advisory Fee | $1,161,739 | |
| Portfolio Turnover | 47% | |
What did the Fund invest in?
(as of October 31, 2024)
MARKET SECTORS (% of Fund's net assets) | | |
| Information Technology | 24.3 | |
| Financials | 23.1 | |
| Industrials | 18.8 | |
| Consumer Discretionary | 11.6 | |
| Communication Services | 8.5 | |
| Health Care | 7.9 | |
| Energy | 3.0 | |
| Materials | 1.2 | |
| |
| Common Stocks | 97.9 |
| Preferred Stocks | 0.5 |
| Short-Term Investments and Net Other Assets (Liabilities) | 1.6 |
ASSET ALLOCATION (% of Fund's net assets) |
|
|
| United States | 79.0 |
| China | 7.6 |
| Taiwan | 2.9 |
| Japan | 2.8 |
| Canada | 1.4 |
| Netherlands | 1.2 |
| India | 1.2 |
| Sweden | 1.0 |
| Denmark | 1.0 |
| Others | 1.9 |
GEOGRAPHIC DIVERSIFICATION (% of Fund's net assets) |
|
| |
|
TOP HOLDINGS(% of Fund's net assets) | | |
| NVIDIA Corp | 6.6 | |
| Meta Platforms Inc Class A | 4.5 | |
| Microsoft Corp | 4.0 | |
| Fiserv Inc | 3.8 | |
| Apple Inc | 3.6 | |
| Amazon.com Inc | 3.5 | |
| Mastercard Inc Class A | 3.1 | |
| Taiwan Semiconductor Manufacturing Co Ltd ADR | 2.9 | |
| Hitachi Ltd | 2.8 | |
| Visa Inc Class A | 2.5 | |
| | 37.3 | |
How has the Fund changed?
This is a summary of certain changes to the Fund since November 1, 2023. For more complete information, you may review the Fund's next prospectus, which we expect to be available by December 30, 2024 at fundresearch.fidelity.com/prospectus/sec or upon request at 1-877-208-0098 or by sending an e-mail to fidfunddocuments@fidelity.com.
The fees associated with this class changed during the reporting year.The variations in class fees are primarily the result of the following changes: - Management fee
- Operating expenses
- Performance adjustment fee
- Expense reductions
The fund's transfer agent and pricing & bookkeeping fees were changed to a fixed rate effective December 1, 2023, through February 29, 2024, in anticipation of the transition to a new management fee structure. Effective March 1, 2024, the fund's management contract was amended to incorporate administrative services previously covered under separate services agreements (transfer agent and pricing & bookkeeping). The amended contract incorporates a management fee rate that may vary by class (subject to a performance adjustment). The Adviser or an affiliate pays certain expenses of managing and operating the fund out of each class's management fee. | The fund's sub-advisory agreement with FIL Investments (Japan) Limited was not renewed.
|
| Fidelity, the Fidelity Investments Logo and all other Fidelity trademarks or service marks used herein are trademarks or service marks of FMR LLC. Any third-party marks that are used herein are trademarks or service marks of their respective owners. © 2024 FMR LLC. All rights reserved. |
| | For additional information about the Fund; including its prospectus, financial information, holdings and proxy information, scan the QR code or visit fundresearch.fidelity.com/prospectus/sec 1.9913903.100 754-TSRA-1224 |
| |
| | ANNUAL SHAREHOLDER REPORT | AS OF OCTOBER 31, 2024 | This report describes changes to the Fund that occurred during the reporting period. |
| | Fidelity Advisor® International Capital Appreciation Fund Fidelity Advisor® International Capital Appreciation Fund Class C : FCPCX |
| | | |
This annual shareholder report contains information about Fidelity Advisor® International Capital Appreciation Fund for the period November 1, 2023 to October 31, 2024. You can find additional information about the Fund at fundresearch.fidelity.com/prospectus/sec. You can also request this information by contacting us at 1-877-208-0098 or by sending an e-mail to fidfunddocuments@fidelity.com.
What were your Fund costs for the last year?(based on hypothetical $10,000 investment)
FUND COST (PREVIOUS YEAR)
| | Costs of a $10,000 investment | Costs paid as a percentage of a $10,000 investment | |
| Class C | $ 216 | 1.89% | |
What affected the Fund's performance this period?
•International stocks achieved a strong gain for the 12 months ending October 31, 2024. Resilient global economic growth and a slowing in the pace of inflation in certain regions, as well as a shift to global monetary easing, contributed to a favorable backdrop, despite persistent geopolitical risk.
•Against this backdrop, security selection and an underweight in emerging markets and stock selection in Europe ex U.K. contributed to the fund's performance versus the MSCI All Country World ex US Index (Net MA) for the fiscal year.
•By sector, market selection was the primary contributor, led by an overweight in information technology, where an overweight in semiconductors & semiconductor equipment helped most. Picks and an overweight in industrials also boosted relative performance. Also contributing to our result was a lack of exposure to the lagging energy sector.
•The fund's non-benchmark stake in Nvidia gained 221% and was the top individual relative contributor. The stock was not held at period end. A second notable relative contributor was an overweight in Taiwan Semiconductor Manufacturing (+100%). The company was the fund's largest holding. Another notable relative contributor was an overweight in Brookfield Asset Management (+91%).
•In contrast, from a regional standpoint, security selection in Canada and an overweight in Europe ex U.K., primarily in France, detracted from the fund's relative result.
•By sector, the biggest detractor from performance versus the benchmark was stock selection in information technology, primarily within the software & services industry. Also hurting our result were stock picks in consumer staples and health care.
•The biggest individual relative detractor was our stake in OBIC (-23%). A second notable relative detractor was an underweight in Shopify (+66%). An overweight in LVMH Moet Hennessy Louis Vuitton (-6%) also hurt. The stock was among our largest holdings.
•Notable changes in positioning include increased exposure to China and Japan. By sector, meaningful changes in positioning include increased exposure to communication services and a lower allocation to consumer staples, where we liquidated all of the fund's holdings.
How did the Fund perform over the past 10 years?
CUMULATIVE PERFORMANCE
October 31, 2014 through October 31, 2024.
Initial investment of $10,000.
Class C | $10,000 | $10,270 | $10,210 | $12,716 | $11,635 | $14,081 | $15,784 | $19,940 | $13,619 | $15,750 | $20,312 |
MSCI ACWI (All Country World Index) ex USA Index | $10,000 | $9,545 | $9,583 | $11,868 | $10,910 | $12,161 | $11,862 | $15,403 | $11,613 | $13,038 | $16,238 |
| | 2014 | 2015 | 2016 | 2017 | 2018 | 2019 | 2020 | 2021 | 2022 | 2023 | 2024 |
AVERAGE ANNUAL TOTAL RETURNS:| | 1 Year | 5 Year | 10 Year |
| Class C (incl. contingent deferred sales charge) | 27.05% | 7.28% | 7.34% |
| Class C | 28.05% | 7.28% | 7.34% |
| MSCI ACWI (All Country World Index) ex USA Index | 24.55% | 5.95% | 4.97% |
Visit institutional.fidelity.com for more recent performance information. |
The Fund's past performance is not a good predictor of the Fund's future performance. The graph and table do not reflect the deduction of taxes that a shareholder would pay on fund distributions or redemption of fund shares. |
Key Fund Statistics(as of October 31, 2024)
KEY FACTS | | |
| Fund Size | $8,714,030,084 | |
| Number of Holdings | 63 | |
| Total Advisory Fee | $61,601,570 | |
| Portfolio Turnover | 63% | |
What did the Fund invest in?
(as of October 31, 2024)
MARKET SECTORS (% of Fund's net assets) | | |
| Industrials | 30.8 | |
| Financials | 21.6 | |
| Information Technology | 18.3 | |
| Consumer Discretionary | 11.3 | |
| Materials | 8.8 | |
| Health Care | 4.5 | |
| Communication Services | 4.1 | |
| |
| Common Stocks | 99.4 |
| Short-Term Investments and Net Other Assets (Liabilities) | 0.6 |
ASSET ALLOCATION (% of Fund's net assets) |
|
|
| United States | 20.0 |
| Japan | 12.6 |
| United Kingdom | 10.9 |
| France | 8.8 |
| India | 7.9 |
| Canada | 6.4 |
| China | 5.3 |
| Netherlands | 5.2 |
| Taiwan | 4.5 |
| Others | 18.4 |
GEOGRAPHIC DIVERSIFICATION (% of Fund's net assets) |
|
| |
|
TOP HOLDINGS(% of Fund's net assets) | | |
| Taiwan Semiconductor Manufacturing Co Ltd | 4.5 | |
| Novo Nordisk A/S Series B | 2.9 | |
| Tencent Holdings Ltd | 2.5 | |
| SAP SE | 2.5 | |
| ASML Holding NV | 2.3 | |
| LVMH Moet Hennessy Louis Vuitton SE | 2.3 | |
| Schneider Electric SE | 2.1 | |
| Hitachi Ltd | 1.9 | |
| ABB Ltd | 1.8 | |
| Keyence Corp | 1.7 | |
| | 24.5 | |
How has the Fund changed?
This is a summary of certain changes to the Fund since November 1, 2023. For more complete information, you may review the Fund's next prospectus, which we expect to be available by December 30, 2024 at fundresearch.fidelity.com/prospectus/sec or upon request at 1-877-208-0098 or by sending an e-mail to fidfunddocuments@fidelity.com.
The fees associated with this class changed during the reporting year.The variations in class fees are primarily the result of the following changes: - Management fee
- Operating expenses
- Performance adjustment fee
The fund's transfer agent and pricing & bookkeeping fees were changed to a fixed rate effective December 1, 2023, through February 29, 2024, in anticipation of the transition to a new management fee structure. Effective March 1, 2024, the fund's management contract was amended to incorporate administrative services previously covered under separate services agreements (transfer agent and pricing & bookkeeping). The amended contract incorporates a basic fee rate that may vary by class (subject to a performance adjustment). The Adviser or an affiliate pays certain expenses of managing and operating the fund out of each class's management fee. | The fund's sub-advisory agreement with FIL Investments (Japan) Limited was not renewed.
|
| Fidelity, the Fidelity Investments Logo and all other Fidelity trademarks or service marks used herein are trademarks or service marks of FMR LLC. Any third-party marks that are used herein are trademarks or service marks of their respective owners. © 2024 FMR LLC. All rights reserved. |
| | For additional information about the Fund; including its prospectus, financial information, holdings and proxy information, scan the QR code or visit fundresearch.fidelity.com/prospectus/sec 1.9913823.100 281-TSRA-1224 |
| |
| | ANNUAL SHAREHOLDER REPORT | AS OF OCTOBER 31, 2024 | This report describes changes to the Fund that occurred during the reporting period. |
| | Fidelity Advisor® Emerging Asia Fund Fidelity Advisor® Emerging Asia Fund Class C : FERCX |
| | | |
This annual shareholder report contains information about Fidelity Advisor® Emerging Asia Fund for the period November 1, 2023 to October 31, 2024. You can find additional information about the Fund at fundresearch.fidelity.com/prospectus/sec. You can also request this information by contacting us at 1-877-208-0098 or by sending an e-mail to fidfunddocuments@fidelity.com.
What were your Fund costs for the last year?(based on hypothetical $10,000 investment)
FUND COST (PREVIOUS YEAR)
| | Costs of a $10,000 investment | Costs paid as a percentage of a $10,000 investment | |
| Class C | $ 232 | 1.97% | |
What affected the Fund's performance this period?
•International stocks achieved a strong gain for the 12 months ending October 31, 2024. Resilient global economic growth and a slowing in the pace of inflation in certain regions, as well as a shift to global monetary easing, contributed to a favorable backdrop, despite persistent geopolitical risk.
•Against this backdrop, stock picking and an overweight in Asia Pacific ex Japan, primarily in Singapore, contributed to the fund's performance versus the MSCI AC Asia Ex Japan (Net Mass) Linked Index for the fiscal year. Within emerging markets, stock selection and an overweight in India helped.
•By sector, security selection in consumer discretionary - notably the consumer services segment - was the primary contributor. Stock picking in communication services, primarily within the media & entertainment industry, also boosted the fund's relative performance. Also lifting the fund's relative result were stock picks and an overweight in information technology, primarily within the semiconductors & semiconductor equipment industry.
•The top individual relative contributor was an overweight in Sea (+126%). The company was one of the fund's biggest holdings. A non-benchmark stake in MakeMyTrip gained about 160% and was a second notable relative contributor. The company was among our biggest holdings. Another notable relative contributor was an overweight in Zomato (+125%). This period we decreased our stake in Zomato. The stock was one of our largest holdings.
•In contrast, from a regional standpoint, stock selection in China had the largest negative impact on relative performance. A non-benchmark allocation to the U.K. also detracted from the fund's relative result.
•By sector, the biggest detractors from performance versus the benchmark were stock picks and an overweight in health care. Security selection in financials also hampered the fund's result.
•The largest individual relative detractor was our stake in One97 Communications (-51%). The stock was not held at period end. A second notable relative detractor was an overweight in WuXi AppTec (-43%). We reduced our stake. Another notable relative detractor was our stake in WuXi Biologics (-75%). The stock was not held at period end.
•Notable changes in positioning include increased exposure to China, Hong Kong and Singapore, and reduced stakes in India and South Korea. By sector, meaningful changes in positioning include increased exposure to communication services and industrials, and a lower allocation to health care.
How did the Fund perform over the past 10 years?
CUMULATIVE PERFORMANCE
October 31, 2014 through October 31, 2024.
Initial investment of $10,000.
Class C | $10,000 | $9,454 | $10,034 | $13,304 | $11,136 | $13,995 | $20,717 | $24,152 | $12,814 | $15,263 | $20,872 |
MSCI AC (All Country) Asia ex Japan Index | $10,000 | $9,278 | $9,890 | $12,902 | $11,144 | $12,620 | $14,620 | $16,494 | $10,886 | $12,358 | $15,813 |
| | 2014 | 2015 | 2016 | 2017 | 2018 | 2019 | 2020 | 2021 | 2022 | 2023 | 2024 |
AVERAGE ANNUAL TOTAL RETURNS:| | 1 Year | 5 Year | 10 Year |
| Class C (incl. contingent deferred sales charge) | 34.75% | 7.99% | 7.64% |
| Class C | 35.75% | 7.99% | 7.64% |
| MSCI AC (All Country) Asia ex Japan Index | 27.96% | 4.61% | 4.69% |
Visit institutional.fidelity.com for more recent performance information. |
The Fund's past performance is not a good predictor of the Fund's future performance. The graph and table do not reflect the deduction of taxes that a shareholder would pay on fund distributions or redemption of fund shares. |
Key Fund Statistics(as of October 31, 2024)
KEY FACTS | | |
| Fund Size | $445,785,792 | |
| Number of Holdings | 132 | |
| Total Advisory Fee | $3,099,900 | |
| Portfolio Turnover | 59% | |
What did the Fund invest in?
(as of October 31, 2024)
MARKET SECTORS (% of Fund's net assets) | | |
| Consumer Discretionary | 28.3 | |
| Information Technology | 26.6 | |
| Communication Services | 12.5 | |
| Financials | 12.3 | |
| Industrials | 8.6 | |
| Health Care | 8.0 | |
| Energy | 1.3 | |
| Real Estate | 0.9 | |
| Consumer Staples | 0.6 | |
| Materials | 0.4 | |
| |
| Common Stocks | 98.3 |
| Preferred Stocks | 1.2 |
| Short-Term Investments and Net Other Assets (Liabilities) | 0.5 |
ASSET ALLOCATION (% of Fund's net assets) |
|
|
| China | 41.1 |
| India | 22.5 |
| Taiwan | 12.7 |
| Singapore | 7.7 |
| Korea (South) | 7.0 |
| Hong Kong | 4.2 |
| United States | 1.3 |
| Indonesia | 1.0 |
| South Africa | 0.9 |
| Others | 1.6 |
GEOGRAPHIC DIVERSIFICATION (% of Fund's net assets) |
|
| |
|
TOP HOLDINGS(% of Fund's net assets) | | |
| Taiwan Semiconductor Manufacturing Co Ltd | 10.9 | |
| Sea Ltd Class A ADR | 7.1 | |
| PDD Holdings Inc Class A ADR | 4.6 | |
| Zomato Ltd | 4.1 | |
| MakeMyTrip Ltd | 3.7 | |
| Meituan B Shares | 3.1 | |
| HDFC Bank Ltd | 3.0 | |
| Samsung Electronics Co Ltd | 3.0 | |
| Alibaba Group Holding Ltd | 2.8 | |
| Tencent Holdings Ltd | 2.6 | |
| | 44.9 | |
How has the Fund changed?
This is a summary of certain changes to the Fund since November 1, 2023. For more complete information, you may review the Fund's next prospectus, which we expect to be available by December 30, 2024 at fundresearch.fidelity.com/prospectus/sec or upon request at 1-877-208-0098 or by sending an e-mail to fidfunddocuments@fidelity.com.
The fund's transfer agent and pricing & bookkeeping fees were changed to a fixed rate effective December 1, 2023, through February 29, 2024, in anticipation of the transition to a new management fee structure. Effective March 1, 2024, the fund's management contract was amended to incorporate administrative services previously covered under separate services agreements (transfer agent and pricing & bookkeeping). The amended contract incorporates a management fee rate that may vary by class. The Adviser or an affiliate pays certain expenses of managing and operating the fund out of each class's management fee. | The fund's sub-advisory agreement with FIL Investments (Japan) Limited was not renewed.
|
| Fidelity, the Fidelity Investments Logo and all other Fidelity trademarks or service marks used herein are trademarks or service marks of FMR LLC. Any third-party marks that are used herein are trademarks or service marks of their respective owners. © 2024 FMR LLC. All rights reserved. |
| | For additional information about the Fund; including its prospectus, financial information, holdings and proxy information, scan the QR code or visit fundresearch.fidelity.com/prospectus/sec 1.9913907.100 758-TSRA-1224 |
| |
| | ANNUAL SHAREHOLDER REPORT | AS OF OCTOBER 31, 2024 | This report describes changes to the Fund that occurred during the reporting period. |
| | Fidelity Advisor® Diversified International Fund Fidelity Advisor® Diversified International Fund Class I : FDVIX |
| | | |
This annual shareholder report contains information about Fidelity Advisor® Diversified International Fund for the period November 1, 2023 to October 31, 2024. You can find additional information about the Fund at fundresearch.fidelity.com/prospectus/sec. You can also request this information by contacting us at 1-877-208-0098 or by sending an e-mail to fidfunddocuments@fidelity.com.
What were your Fund costs for the last year?(based on hypothetical $10,000 investment)
FUND COST (PREVIOUS YEAR)
| | Costs of a $10,000 investment | Costs paid as a percentage of a $10,000 investment | |
| Class I | $ 100 | 0.89% | |
What affected the Fund's performance this period?
•International stocks achieved a strong gain for the 12 months ending October 31, 2024. Resilient global economic growth and a slowing in the pace of inflation in certain regions, as well as a shift to global monetary easing, contributed to a favorable backdrop, despite persistent geopolitical risk.
•Against this backdrop, stock picks in Japan and a non-benchmark allocation to emerging markets contributed to the fund's performance versus the MSCI EAFE Index (Net MA) for the fiscal year.
•By sector, the biggest contributors to performance versus the benchmark were picks and an overweight in industrials, primarily within the capital goods industry. Picks in materials also boosted relative performance. Also helping our relative result was an underweight in consumer staples.
•The top individual relative contributor was our non-benchmark stake in Taiwan Semiconductor Manufacturing (+124%). The stock was among our biggest holdings. A second notable relative contributor was an overweight in Hitachi (+109%). Although we trimmed our stake, the company was the fund's largest holding at period end. Another notable relative contributor was an overweight in Mitsubishi Heavy Industries (+127%). This was a stake we established this period.
•In contrast, from a regional standpoint, a non-benchmark allocation to both the United States and Canada detracted from the fund's relative result.
•By sector, the biggest detractor from performance versus the benchmark was stock picking in financials. Stock picks in consumer staples also hampered the fund's result. Also detracting from our result was an overweight in energy. Lastly, the fund's position in cash detracted.
•The fund's non-benchmark stake in Schlumberger returned -20% and was the largest individual relative detractor. The stock was not held at period end. A non-benchmark stake in HDFC Bank gained 18% and was a second notable relative detractor. We reduced the position. Our stake in Pernod-Ricard (-27%) also detracted. This period we decreased our position in Pernod-Ricard.
•Notable changes in positioning include increased exposure to Germany and Switzerland. By sector, meaningful changes in positioning include decreased exposure to consumer staples and a higher allocation to industrials.
How did the Fund perform over the past 10 years?
CUMULATIVE PERFORMANCE
October 31, 2014 through October 31, 2024.
Initial investment of $10,000.
Class I | $10,000 | $10,424 | $10,143 | $12,451 | $11,338 | $13,140 | $14,406 | $18,708 | $13,265 | $14,831 | $18,488 |
MSCI EAFE Index | $10,000 | $10,008 | $9,705 | $12,004 | $11,206 | $12,472 | $11,638 | $15,647 | $12,073 | $13,841 | $17,059 |
| | 2014 | 2015 | 2016 | 2017 | 2018 | 2019 | 2020 | 2021 | 2022 | 2023 | 2024 |
AVERAGE ANNUAL TOTAL RETURNS:| | 1 Year | 5 Year | 10 Year |
| Class I | 24.66% | 7.07% | 6.34% |
| MSCI EAFE Index | 23.25% | 6.46% | 5.49% |
Visit institutional.fidelity.com for more recent performance information. |
The Fund's past performance is not a good predictor of the Fund's future performance. The graph and table do not reflect the deduction of taxes that a shareholder would pay on fund distributions or redemption of fund shares. |
Key Fund Statistics(as of October 31, 2024)
KEY FACTS | | |
| Fund Size | $1,404,041,433 | |
| Number of Holdings | 135 | |
| Total Advisory Fee | $10,934,381 | |
| Portfolio Turnover | 33% | |
What did the Fund invest in?
(as of October 31, 2024)
MARKET SECTORS (% of Fund's net assets) | | |
| Industrials | 24.9 | |
| Financials | 22.5 | |
| Information Technology | 15.7 | |
| Health Care | 10.3 | |
| Materials | 8.3 | |
| Consumer Discretionary | 7.4 | |
| Energy | 5.0 | |
| Consumer Staples | 1.9 | |
| Communication Services | 0.5 | |
| Real Estate | 0.2 | |
| |
| Common Stocks | 96.2 |
| Preferred Stocks | 0.5 |
| Short-Term Investments and Net Other Assets (Liabilities) | 3.3 |
ASSET ALLOCATION (% of Fund's net assets) |
|
|
| Japan | 17.1 |
| United States | 16.0 |
| United Kingdom | 14.4 |
| Germany | 8.7 |
| France | 8.1 |
| Canada | 6.5 |
| Netherlands | 5.3 |
| Denmark | 3.5 |
| Sweden | 3.0 |
| Others | 17.4 |
GEOGRAPHIC DIVERSIFICATION (% of Fund's net assets) |
|
| |
|
TOP HOLDINGS(% of Fund's net assets) | | |
| Hitachi Ltd | 2.9 | |
| ASML Holding NV depository receipt | 2.8 | |
| Novo Nordisk A/S Series B | 2.5 | |
| Taiwan Semiconductor Manufacturing Co Ltd ADR | 2.5 | |
| SAP SE | 2.4 | |
| Astrazeneca PLC | 1.8 | |
| RELX PLC (Netherlands) | 1.8 | |
| Wolters Kluwer NV | 1.6 | |
| London Stock Exchange Group PLC | 1.6 | |
| Shell PLC | 1.6 | |
| | 21.5 | |
How has the Fund changed?
This is a summary of certain changes to the Fund since November 1, 2023. For more complete information, you may review the Fund's next prospectus, which we expect to be available by December 30, 2024 at fundresearch.fidelity.com/prospectus/sec or upon request at 1-877-208-0098 or by sending an e-mail to fidfunddocuments@fidelity.com.
The fund's transfer agent and pricing & bookkeeping fees were changed to a fixed rate effective December 1, 2023, through February 29, 2024, in anticipation of the transition to a new management fee structure. Effective March 1, 2024, the fund's management contract was amended to incorporate administrative services previously covered under separate services agreements (transfer agent and pricing & bookkeeping). The amended contract incorporates a management fee rate that may vary by class. The Adviser or an affiliate pays certain expenses of managing and operating the fund out of each class's management fee. | The fund's sub-advisory agreement with FIL Investments (Japan) Limited was not renewed.
|
| Fidelity, the Fidelity Investments Logo and all other Fidelity trademarks or service marks used herein are trademarks or service marks of FMR LLC. Any third-party marks that are used herein are trademarks or service marks of their respective owners. © 2024 FMR LLC. All rights reserved. |
| | For additional information about the Fund; including its prospectus, financial information, holdings and proxy information, scan the QR code or visit fundresearch.fidelity.com/prospectus/sec 1.9913899.100 734-TSRA-1224 |
Item 2.
Code of Ethics
As of the end of the period, October 31, 2024, Fidelity Advisor Series VIII (the trust) has adopted a code of ethics, as defined in Item 2 of Form N-CSR, that applies to its President and Treasurer and its Chief Financial Officer. A copy of the code of ethics is filed as an exhibit to this Form N-CSR.
Item 3.
Audit Committee Financial Expert
The Board of Trustees of the trust has determined that Donald F. Donahue is an audit committee financial expert, as defined in Item 3 of Form N-CSR. Mr. Donahue is independent for purposes of Item 3 of Form N-CSR.
Item 4.
Principal Accountant Fees and Services
Fees and Services
The following table presents fees billed by Deloitte & Touche LLP, the member firms of Deloitte Touche Tohmatsu, and their respective affiliates (collectively, “Deloitte Entities”) in each of the last two fiscal years for services rendered to Fidelity Advisor Focused Emerging Markets Fund and Fidelity Advisor International Capital Appreciation Fund (the “Fund(s)”):
Services Billed by Deloitte Entities
October 31, 2024 FeesA
| | | | |
| Audit Fees | Audit-Related Fees | Tax Fees | All Other Fees |
Fidelity Advisor Focused Emerging Markets Fund | $41,900 | $- | $12,300 | $1,000 |
Fidelity Advisor International Capital Appreciation Fund | $50,800 | $- | $12,000 | $1,200 |
| | | | |
| Audit Fees | Audit-Related Fees | Tax Fees | All Other Fees |
Fidelity Advisor Focused Emerging Markets Fund | $42,000 | $- | $12,300 | $1,200 |
Fidelity Advisor International Capital Appreciation Fund | $51,100 | $- | $12,000 | $1,300 |
A Amounts may reflect rounding.
The following table presents fees billed by PricewaterhouseCoopers LLP (“PwC”) in each of the last two fiscal years for services rendered to Fidelity Advisor Diversified International Fund, Fidelity Advisor Emerging Asia Fund, Fidelity Advisor Global Capital Appreciation Fund, Fidelity Advisor Overseas Fund and Fidelity Advisor Value Leaders Fund (the “Fund(s)”):
Services Billed by PwC
October 31, 2024 FeesA
| | | | |
| Audit Fees | Audit-Related Fees | Tax Fees | All Other Fees |
Fidelity Advisor Diversified International Fund | $55,100 | $4,700 | $19,200 | $1,600 |
Fidelity Advisor Emerging Asia Fund | $57,700 | $5,200 | $13,100 | $1,800 |
Fidelity Advisor Global Capital Appreciation Fund | $49,000 | $4,600 | $13,100 | $1,600 |
Fidelity Advisor Overseas Fund | $57,800 | $5,300 | $13,400 | $1,800 |
Fidelity Advisor Value Leaders Fund | $35,700 | $3,400 | $12,100 | $1,200 |
| | | | |
| Audit Fees | Audit-Related Fees | Tax Fees | All Other Fees |
Fidelity Advisor Diversified International Fund | $50,100 | $4,800 | $41,300 | $1,600 |
Fidelity Advisor Emerging Asia Fund | $57,900 | $5,300 | $13,100 | $1,800 |
Fidelity Advisor Global Capital Appreciation Fund | $49,200 | $4,700 | $13,100 | $1,600 |
Fidelity Advisor Overseas Fund | $58,000 | $5,400 | $28,400 | $1,800 |
Fidelity Advisor Value Leaders Fund | $35,800 | $3,600 | $12,100 | $1,200 |
A Amounts may reflect rounding.
The following table(s) present(s) fees billed by Deloitte Entities and PwC that were required to be approved by the Audit Committee for services that relate directly to the operations and financial reporting of the Fund(s) and that are rendered on behalf of Fidelity Management & Research Company LLC ("FMR") and entities controlling, controlled by, or under common control with FMR (not including any sub-adviser whose role is primarily portfolio management and is subcontracted with or overseen by another investment adviser) that provide ongoing services to the Fund(s) (“Fund Service Providers”):
Services Billed by Deloitte Entities
| | |
| October 31, 2024A | October 31, 2023A |
Audit-Related Fees | $125,000 | $75,000 |
Tax Fees | $- | $- |
All Other Fees | $2,929,500 | $- |
A Amounts may reflect rounding.
Services Billed by PwC
| | |
| October 31, 2024A | October 31, 2023A |
Audit-Related Fees | $9,701,800 | $8,881,200 |
Tax Fees | $61,000 | $1,000 |
All Other Fees | $35,000 | $- |
A Amounts may reflect rounding.
“Audit-Related Fees” represent fees billed for assurance and related services that are reasonably related to the performance of the fund audit or the review of the fund's financial statements and that are not reported under Audit Fees.
“Tax Fees” represent fees billed for tax compliance, tax advice or tax planning that relate directly to the operations and financial reporting of the fund.
“All Other Fees” represent fees billed for services provided to the fund or Fund Service Provider, a significant portion of which are assurance related, that relate directly to the operations and financial reporting of the fund, excluding those services that are reported under Audit Fees, Audit-Related Fees or Tax Fees.
Assurance services must be performed by an independent public accountant.
* * *
The aggregate non-audit fees billed by Deloitte Entities and PwC for services rendered to the Fund(s), FMR (not including any sub-adviser whose role is primarily portfolio management and is subcontracted with or overseen by another investment adviser), and any Fund Service Provider for each of the last two fiscal years of the Fund(s) are as follows:
| | |
Billed By | October 31, 2024A | October 31, 2023A |
Deloitte Entities | $3,375,500 | $5,833,900 |
PwC | $15,438,600 | $14,553,100 |
A Amounts may reflect rounding.
The trust's Audit Committee has considered non-audit services that were not pre-approved that were provided by Deloitte Entities and PwC to Fund Service Providers to be compatible with maintaining the independence of Deloitte Entities and PwC in its(their) audit of the Fund(s), taking into account representations from Deloitte Entities and PwC, in accordance with Public Company Accounting Oversight Board rules, regarding its independence from the Fund(s) and its(their) related entities and FMR’s review of the appropriateness and permissibility under applicable law of such non-audit services prior to their provision to the Fund(s) Service Providers.
Audit Committee Pre-Approval Policies and Procedures
The trust’s Audit Committee must pre-approve all audit and non-audit services provided by a fund’s independent registered public accounting firm relating to the operations or financial reporting of the fund. Prior to the commencement of any audit or non-audit services to a fund, the Audit Committee reviews the services to determine whether they are appropriate and permissible under applicable law.
The Audit Committee has adopted policies and procedures to, among other purposes, provide a framework for the Committee’s consideration of non-audit services by the audit firms that audit the Fidelity funds. The policies and procedures require that any non-audit service provided by a fund audit firm to a Fidelity fund and any non-audit service provided by a fund auditor to a Fund Service Provider that relates directly to the operations and financial reporting of a Fidelity fund (“Covered Service”) are subject to approval by the Audit Committee before such service is provided.
All Covered Services must be approved in advance of provision of the service either: (i) by formal resolution of the Audit Committee, or (ii) by oral or written approval of the service by the Chair of the Audit Committee (or if the Chair is unavailable, such other member of the Audit Committee as may be designated by the Chair to act in the Chair’s absence). The approval contemplated by (ii) above is permitted where the Treasurer determines that action on such an engagement is necessary before the next meeting of the Audit Committee.
Non-audit services provided by a fund audit firm to a Fund Service Provider that do not relate directly to the operations and financial reporting of a Fidelity fund are reported to the Audit Committee periodically.
Non-Audit Services Approved Pursuant to Rule 2-01(c)(7)(i)(C) and (ii) of Regulation S-X (“De Minimis Exception”)
There were no non-audit services approved or required to be approved by the Audit Committee pursuant to the De Minimis Exception during the Fund’s(s’) last two fiscal years relating to services provided to (i) the Fund(s) or (ii) any Fund Service Provider that relate directly to the operations and financial reporting of the Fund(s).
The Registrant has not retained, for the preparation of the audit report on the financial statements included in the Form N-CSR, a registered public accounting firm that has a branch or office that is located in a foreign jurisdiction and that the Public Company Accounting Oversight Board (the “PCAOB”) has determined that the PCAOB is unable to inspect or investigate completely because of a position taken by an authority in the foreign jurisdiction.
The Registrant is not a “foreign issuer,” as defined in 17 CFR 240.3b-4.
Item 5.
Audit Committee of Listed Registrants
Not applicable.
Item 6.
Investments
(a)
Not applicable.
(b)
Not applicable.
Item 7.
Financial Statements and Financial Highlights for Open-End Management Investment Companies
Fidelity Advisor® Global Capital Appreciation Fund
Annual Report
October 31, 2024
Contents
To view a fund's proxy voting guidelines and proxy voting record for the 12-month period ended June 30, visit http://www.fidelity.com/proxyvotingresults or visit the Securities and Exchange Commission's (SEC) web site at http://www.sec.gov.
You may also call 1-877-208-0098 to request a free copy of the proxy voting guidelines.
Standard & Poor's, S&P and S&P 500 are registered service marks of The McGraw-Hill Companies, Inc. and have been licensed for use by Fidelity Distributors Corporation.
Other third-party marks appearing herein are the property of their respective owners.
All other marks appearing herein are registered or unregistered trademarks or service marks of FMR LLC or an affiliated company. © 2024 FMR LLC. All rights reserved.
This report and the financial statements contained herein are submitted for the general information of the shareholders of the Fund. This report is not authorized for distribution to prospective investors in the Fund unless preceded or accompanied by an effective prospectus.
A fund files its complete schedule of portfolio holdings with the SEC for the first and third quarters of each fiscal year on Form N-PORT. Forms N-PORT are available on the SEC's web site at http://www.sec.gov. A fund's Forms N-PORT may be reviewed and copied at the SEC's Public Reference Room in Washington, DC. Information regarding the operation of the SEC's Public Reference Room may be obtained by calling 1-800-SEC-0330.
For a complete list of a fund's portfolio holdings, view the most recent holdings listing, semiannual report, or annual report on Fidelity's web site at http://www.fidelity.com, http://www.institutional.fidelity.com, or http://www.401k.com, as applicable.
NOT FDIC INSURED •MAY LOSE VALUE •NO BANK GUARANTEE
Neither the Fund nor Fidelity Distributors Corporation is a bank.
Item 7: Financial Statements and Financial Highlights for Open-End Management Investment Companies (Annual Report)
Fidelity Advisor® Global Capital Appreciation Fund
Schedule of Investments October 31, 2024
Showing Percentage of Net Assets
| Common Stocks - 97.9% |
| | | Shares | Value ($) |
| Canada - 1.4% | | | |
| Canadian Natural Resources Ltd. | | 57,800 | 1,966,356 |
| China - 7.6% | | | |
| Alibaba Group Holding Ltd. | | 201,400 | 2,463,588 |
| Meituan Class B (a)(b) | | 97,700 | 2,308,687 |
| NXP Semiconductors NV | | 6,500 | 1,524,250 |
| PDD Holdings, Inc. ADR (a) | | 18,000 | 2,170,620 |
| Tencent Holdings Ltd. | | 43,100 | 2,247,326 |
TOTAL CHINA | | | 10,714,471 |
| Denmark - 1.0% | | | |
| Novo Nordisk A/S Series B | | 12,500 | 1,402,063 |
| France - 0.9% | | | |
| LVMH Moet Hennessy Louis Vuitton SE | | 1,850 | 1,231,583 |
| Germany - 0.8% | | | |
| Rheinmetall AG | | 2,250 | 1,158,127 |
| India - 1.2% | | | |
| HDFC Bank Ltd. | | 83,900 | 1,724,494 |
| Japan - 2.9% | | | |
| Hitachi Ltd. | | 160,000 | 4,019,978 |
| Netherlands - 1.2% | | | |
| ASML Holding NV (Netherlands) | | 2,600 | 1,756,847 |
| Sweden - 1.0% | | | |
| Bergman & Beving AB (B Shares) | | 50,443 | 1,417,956 |
| Taiwan - 2.9% | | | |
| Taiwan Semiconductor Manufacturing Co. Ltd. sponsored ADR | | 21,500 | 4,096,610 |
| United Kingdom - 0.2% | | | |
| Starling Bank Ltd. Series D (a)(c)(d) | | 72,300 | 295,530 |
| United States of America - 76.8% | | | |
| Allison Transmission Holdings, Inc. | | 27,000 | 2,885,220 |
| Alphabet, Inc. Class A | | 19,500 | 3,336,645 |
| Amazon.com, Inc. (a) | | 26,600 | 4,958,240 |
| American Express Co. | | 7,200 | 1,944,576 |
| Amphenol Corp. Class A | | 37,400 | 2,506,548 |
| Apollo Global Management, Inc. | | 18,500 | 2,650,310 |
| Apple, Inc. | | 22,800 | 5,150,748 |
| Arthur J. Gallagher & Co. | | 8,700 | 2,446,440 |
| Boston Scientific Corp. (a) | | 36,100 | 3,033,122 |
| Cintas Corp. | | 11,600 | 2,387,396 |
| Danaher Corp. | | 9,200 | 2,260,072 |
| Deckers Outdoor Corp. (a) | | 20,000 | 3,217,800 |
| Eli Lilly & Co. | | 2,850 | 2,364,759 |
| Exxon Mobil Corp. | | 18,800 | 2,195,464 |
| Fiserv, Inc. (a) | | 26,150 | 5,175,085 |
| Fortune Brands Innovations, Inc. | | 17,900 | 1,491,607 |
| Ingersoll Rand, Inc. | | 18,400 | 1,766,400 |
| Intercontinental Exchange, Inc. | | 15,100 | 2,353,637 |
| JPMorgan Chase & Co. | | 15,200 | 3,373,184 |
| Marvell Technology, Inc. | | 21,200 | 1,698,332 |
| MasterCard, Inc. Class A | | 8,900 | 4,446,351 |
| Meta Platforms, Inc. Class A | | 11,300 | 6,413,654 |
| Microsoft Corp. | | 13,950 | 5,668,583 |
| Moody's Corp. | | 5,000 | 2,270,200 |
| NVIDIA Corp. | | 70,300 | 9,333,027 |
| Pure Storage, Inc. Class A (a) | | 19,600 | 980,980 |
| S&P Global, Inc. | | 4,700 | 2,257,692 |
| Salesforce, Inc. | | 3,500 | 1,019,795 |
| Sherwin-Williams Co. | | 4,900 | 1,757,973 |
| The Boeing Co. (a) | | 11,960 | 1,785,748 |
| Thermo Fisher Scientific, Inc. | | 3,900 | 2,130,648 |
| Trane Technologies PLC | | 4,500 | 1,665,720 |
| United Rentals, Inc. | | 2,200 | 1,788,160 |
| Visa, Inc. Class A | | 12,400 | 3,594,140 |
| W.W. Grainger, Inc. | | 1,700 | 1,885,691 |
| Watsco, Inc. | | 4,200 | 1,986,642 |
| Westinghouse Air Brake Tech Co. | | 13,200 | 2,481,336 |
TOTAL UNITED STATES OF AMERICA | | | 108,661,925 |
| TOTAL COMMON STOCKS (Cost $88,020,319) | | | 138,445,940 |
| | | | |
| Convertible Preferred Stocks - 0.5% |
| | | Shares | Value ($) |
| United States of America - 0.5% | | | |
Wasabi Holdings, Inc. Series C (a)(c)(d) (Cost $549,999) | | 50,623 | 682,398 |
| | | | |
| Money Market Funds - 1.6% |
| | | Shares | Value ($) |
Fidelity Cash Central Fund 4.87% (e) (Cost $2,261,769) | | 2,261,316 | 2,261,769 |
| | | | |
| TOTAL INVESTMENT IN SECURITIES - 100.0% (Cost $90,832,087) | 141,390,107 |
NET OTHER ASSETS (LIABILITIES) - 0.0% | 31,431 |
| NET ASSETS - 100.0% | 141,421,538 |
| | |
Legend
| (b) | Security exempt from registration under Rule 144A of the Securities Act of 1933. These securities may be resold in transactions exempt from registration, normally to qualified institutional buyers. At the end of the period, the value of these securities amounted to $2,308,687 or 1.6% of net assets. |
| (c) | Restricted securities (including private placements) - Investment in securities not registered under the Securities Act of 1933 (excluding 144A issues). At the end of the period, the value of restricted securities (excluding 144A issues) amounted to $977,928 or 0.7% of net assets. |
| (e) | Affiliated fund that is generally available only to investment companies and other accounts managed by Fidelity Investments. The rate quoted is the annualized seven-day yield of the fund at period end. A complete unaudited listing of the fund's holdings as of its most recent quarter end is available upon request. In addition, each Fidelity Central Fund's financial statements, which are not covered by the Fund's Report of Independent Registered Public Accounting Firm, are available on the SEC's website or upon request. |
| Additional information on each restricted holding is as follows: |
| Security | Acquisition Date | Acquisition Cost ($) |
| Starling Bank Ltd. Series D | 6/18/21 - 4/05/22 | 138,336 |
| | | |
| Wasabi Holdings, Inc. Series C | 3/31/21 - 4/30/21 | 549,998 |
| | | |
Affiliated Central Funds
Fiscal year to date information regarding the Fund's investments in Fidelity Central Funds, including the ownership percentage, is presented below.
| Affiliate | Value, beginning of period ($) | Purchases ($) | Sales Proceeds ($) | Dividend Income ($) | Realized Gain (loss) ($) | Change in Unrealized appreciation (depreciation) ($) | Value, end of period ($) | % ownership, end of period |
| Fidelity Cash Central Fund 4.87% | 12,424,845 | 45,944,091 | 56,107,178 | 437,730 | 11 | - | 2,261,769 | 0.0% |
| Fidelity Securities Lending Cash Central Fund 4.87% | 610,370 | 15,262,552 | 15,872,922 | 1,078 | - | - | - | 0.0% |
| Total | 13,035,215 | 61,206,643 | 71,980,100 | 438,808 | 11 | - | 2,261,769 | |
| | | | | | | | | |
Amounts in the dividend income column in the above table include any capital gain distributions from underlying funds, which are presented in the corresponding line item in the Statement of Operations, if applicable.
Amounts in the dividend income column for Fidelity Securities Lending Cash Central Fund represents the income earned on investing cash collateral, less rebates paid to borrowers and any lending agent fees associated with the loan, plus any premium payments received for lending certain types of securities.
Amounts included in the purchases and sales proceeds columns may include in-kind transactions, if applicable.
Investment Valuation
The following is a summary of the inputs used, as of October 31, 2024, involving the Fund's assets and liabilities carried at fair value. The inputs or methodology used for valuing securities may not be an indication of the risk associated with investing in those securities. For more information on valuation inputs, and their aggregation into the levels used below, please refer to the Investment Valuation section in the accompanying Notes to Financial Statements.
| Valuation Inputs at Reporting Date: |
| Description | Total ($) | Level 1 ($) | Level 2 ($) | Level 3 ($) |
Investments in Securities: | | | | |
|
| Equities: | | | | |
Communication Services | 11,997,625 | 9,750,299 | 2,247,326 | - |
Consumer Discretionary | 16,350,518 | 10,346,660 | 6,003,858 | - |
Energy | 4,161,820 | 4,161,820 | - | - |
Financials | 32,531,639 | 30,511,615 | 1,724,494 | 295,530 |
Health Care | 11,190,664 | 9,788,601 | 1,402,063 | - |
Industrials | 26,719,981 | 22,700,003 | 4,019,978 | - |
Information Technology | 34,418,118 | 33,735,720 | - | 682,398 |
Materials | 1,757,973 | 1,757,973 | - | - |
|
| Money Market Funds | 2,261,769 | 2,261,769 | - | - |
| Total Investments in Securities: | 141,390,107 | 125,014,460 | 15,397,719 | 977,928 |
Financial Statements
| Statement of Assets and Liabilities |
As of October 31, 2024 |
| Assets | | | | |
| Investment in securities, at value - See accompanying schedule: | | | | |
Unaffiliated issuers (cost $88,570,318) | $ | 139,128,338 | | |
Fidelity Central Funds (cost $2,261,769) | | 2,261,769 | | |
| | | | | |
| | | | | |
| Total Investment in Securities (cost $90,832,087) | | | $ | 141,390,107 |
| Foreign currency held at value (cost $256) | | | | 249 |
| Receivable for fund shares sold | | | | 93,059 |
| Dividends receivable | | | | 107,277 |
| Distributions receivable from Fidelity Central Funds | | | | 24,024 |
| Prepaid expenses | | | | 174 |
| Other receivables | | | | 43,281 |
Total assets | | | | 141,658,171 |
| Liabilities | | | | |
| Payable for fund shares redeemed | $ | 18,294 | | |
| Accrued management fee | | 120,718 | | |
| Distribution and service plan fees payable | | 26,859 | | |
| Audit fee payable | | 61,100 | | |
| Other payables and accrued expenses | | 9,662 | | |
| Total liabilities | | | | 236,633 |
| Net Assets | | | $ | 141,421,538 |
| Net Assets consist of: | | | | |
| Paid in capital | | | $ | 80,855,586 |
| Total accumulated earnings (loss) | | | | 60,565,952 |
| Net Assets | | | $ | 141,421,538 |
| | | | | |
| Net Asset Value and Maximum Offering Price | | | | |
| Class A : | | | | |
Net Asset Value and redemption price per share ($52,354,881 ÷ 2,015,523 shares)(a) | | | $ | 25.98 |
| Maximum offering price per share (100/94.25 of $25.98) | | | $ | 27.56 |
| Class M : | | | | |
Net Asset Value and redemption price per share ($23,753,560 ÷ 982,743 shares)(a) | | | $ | 24.17 |
| Maximum offering price per share (100/96.50 of $24.17) | | | $ | 25.05 |
| Class C : | | | | |
Net Asset Value and offering price per share ($6,463,933 ÷ 316,919 shares)(a) | | | $ | 20.40 |
| Class I : | | | | |
Net Asset Value, offering price and redemption price per share ($58,849,164 ÷ 2,095,816 shares) | | | $ | 28.08 |
(a)Redemption price per share is equal to net asset value less any applicable contingent deferred sales charge. |
| Statement of Operations |
| Year ended October 31, 2024 |
| Investment Income | | | | |
| Dividends | | | $ | 1,168,030 |
| Income from Fidelity Central Funds (including $1,078 from security lending) | | | | 438,808 |
| Income before foreign taxes withheld | | | $ | 1,606,838 |
| Less foreign taxes withheld | | | | (69,668) |
| Total income | | | | 1,537,170 |
| Expenses | | | | |
| Management fee | | | | |
| Basic fee | $ | 1,057,460 | | |
| Performance adjustment | | 109,527 | | |
| Transfer agent fees | | 64,995 | | |
| Distribution and service plan fees | | 280,756 | | |
| Accounting fees | | 13,479 | | |
| Custodian fees and expenses | | 6,653 | | |
| Independent trustees' fees and expenses | | 572 | | |
| Registration fees | | 62,311 | | |
| Audit fees | | 77,772 | | |
| Legal | | 4,867 | | |
| Miscellaneous | | 3,325 | | |
| Total expenses before reductions | | 1,681,717 | | |
| Expense reductions | | (22,896) | | |
| Total expenses after reductions | | | | 1,658,821 |
| Net Investment income (loss) | | | | (121,651) |
| Realized and Unrealized Gain (Loss) | | | | |
| Net realized gain (loss) on: | | | | |
| Investment Securities: | | | | |
| Unaffiliated issuers (net of foreign taxes of $40,231) | | 11,215,473 | | |
| Fidelity Central Funds | | 11 | | |
| Foreign currency transactions | | 3,904 | | |
| Total net realized gain (loss) | | | | 11,219,388 |
| Change in net unrealized appreciation (depreciation) on: | | | | |
| Investment Securities: | | | | |
| Unaffiliated issuers (net of decrease in deferred foreign taxes of $6,661) | | 32,491,793 | | |
| Assets and liabilities in foreign currencies | | 290 | | |
| Total change in net unrealized appreciation (depreciation) | | | | 32,492,083 |
| Net gain (loss) | | | | 43,711,471 |
| Net increase (decrease) in net assets resulting from operations | | | $ | 43,589,820 |
| Statement of Changes in Net Assets |
| |
| | Year ended October 31, 2024 | | Year ended October 31, 2023 |
| Increase (Decrease) in Net Assets | | | | |
| Operations | | | | |
| Net investment income (loss) | $ | (121,651) | $ | 451,576 |
| Net realized gain (loss) | | 11,219,388 | | 6,999,028 |
| Change in net unrealized appreciation (depreciation) | | 32,492,083 | | 6,089,775 |
| Net increase (decrease) in net assets resulting from operations | | 43,589,820 | | 13,540,379 |
| Distributions to shareholders | | (6,869,783) | | - |
| | | | | |
| Share transactions - net increase (decrease) | | 4,986,323 | | 4,868,472 |
| Total increase (decrease) in net assets | | 41,706,360 | | 18,408,851 |
| | | | | |
| Net Assets | | | | |
| Beginning of period | | 99,715,178 | | 81,306,327 |
| End of period | $ | 141,421,538 | $ | 99,715,178 |
| | | | | |
| | | | | |
Financial Highlights
Fidelity Advisor® Global Capital Appreciation Fund Class A |
| |
| Years ended October 31, | | 2024 | | 2023 | | 2022 | | 2021 | | 2020 |
Selected Per-Share Data | | | | | | | | | | |
| Net asset value, beginning of period | $ | 19.50 | $ | 16.68 | $ | 24.21 | $ | 18.53 | $ | 15.65 |
| Income from Investment Operations | | | | | | | | | | |
Net investment income (loss) A,B | | (.04) | | .08 | | (.06) | | (.09) C | | (.08) |
| Net realized and unrealized gain (loss) | | 7.85 | | 2.74 | | (5.64) | | 5.77 | | 3.03 |
| Total from investment operations | | 7.81 | | 2.82 | | (5.70) | | 5.68 | | 2.95 |
| Distributions from net investment income | | (.05) | | - | | - | | - | | (.07) |
| Distributions from net realized gain | | (1.27) | | - | | (1.83) | | - | | - |
| Total distributions | | (1.33) D | | - | | (1.83) | | - | | (.07) |
| Net asset value, end of period | $ | 25.98 | $ | 19.50 | $ | 16.68 | $ | 24.21 | $ | 18.53 |
Total Return E,F | | | | 16.91% | | (25.40)% | | 30.65% | | 18.89% |
Ratios to Average Net Assets A,G,H | | | | | | | | | | |
| Expenses before reductions | | 1.33% | | 1.22% | | 1.31% | | 1.15% | | 1.23% |
| Expenses net of fee waivers, if any | | | | 1.22% | | 1.30% | | 1.15% | | 1.23% |
| Expenses net of all reductions | | 1.30% | | 1.22% | | 1.30% | | 1.15% | | 1.21% |
| Net investment income (loss) | | (.15)% | | .42% | | (.32)% | | (.42)% C | | (.45)% |
| Supplemental Data | | | | | | | | | | |
| Net assets, end of period (000 omitted) | $ | 52,355 | $ | 32,433 | $ | 28,069 | $ | 40,398 | $ | 31,247 |
Portfolio turnover rate I | | | | 39% | | 42% | | 58% | | 44% |
ANet investment income (loss) is affected by the timing of the declaration of dividends by any underlying mutual funds or exchange-traded funds (ETFs). Net investment income (loss) of any mutual funds or ETFs is not included in the Fund's net investment income (loss) ratio.
BCalculated based on average shares outstanding during the period.
CNet investment income per share reflects one or more large, non-recurring dividend(s) which amounted to $.02 per share. Excluding such non-recurring dividend(s), the ratio of net investment income (loss) to average net assets would have been (.50)%.
DTotal distributions per share do not sum due to rounding.
ETotal returns would have been lower if certain expenses had not been reduced during the applicable periods shown.
FTotal returns do not include the effect of the sales charges.
GFees and expenses of any underlying mutual funds or exchange-traded funds (ETFs) are not included in the Fund's expense ratio. The Fund indirectly bears its proportionate share of these expenses. For additional expense information related to investments in Fidelity Central Funds, please refer to the "Investments in Fidelity Central Funds" note found in the Notes to Financial Statements section of the most recent Annual or Semi-Annual report.
HExpense ratios reflect operating expenses of the class. Expenses before reductions do not reflect amounts reimbursed, waived, or reduced through arrangements with the investment adviser, brokerage services, or other offset arrangements, if applicable, and do not represent the amount paid by the class during periods when reimbursements, waivers or reductions occur.
IAmount does not include the portfolio activity of any underlying mutual funds or exchange-traded funds (ETFs).
Fidelity Advisor® Global Capital Appreciation Fund Class M |
| |
| Years ended October 31, | | 2024 | | 2023 | | 2022 | | 2021 | | 2020 |
Selected Per-Share Data | | | | | | | | | | |
| Net asset value, beginning of period | $ | 18.22 | $ | 15.63 | $ | 22.85 | $ | 17.54 | $ | 14.82 |
| Income from Investment Operations | | | | | | | | | | |
Net investment income (loss) A,B | | (.09) | | .03 | | (.10) | | (.14) C | | (.12) |
| Net realized and unrealized gain (loss) | | 7.31 | | 2.56 | | (5.29) | | 5.45 | | 2.87 |
| Total from investment operations | | 7.22 | | 2.59 | | (5.39) | | 5.31 | | 2.75 |
| Distributions from net investment income | | - | | - | | - | | - | | (.03) |
| Distributions from net realized gain | | (1.27) | | - | | (1.83) | | - | | - |
| Total distributions | | (1.27) | | - | | (1.83) | | - | | (.03) |
| Net asset value, end of period | $ | 24.17 | $ | 18.22 | $ | 15.63 | $ | 22.85 | $ | 17.54 |
Total Return D,E | | | | 16.57% | | (25.56)% | | 30.27% | | 18.59% |
Ratios to Average Net Assets B,F,G | | | | | | | | | | |
| Expenses before reductions | | 1.58% | | 1.47% | | 1.56% | | 1.41% | | 1.51% |
| Expenses net of fee waivers, if any | | | | 1.47% | | 1.55% | | 1.41% | | 1.50% |
| Expenses net of all reductions | | 1.55% | | 1.47% | | 1.55% | | 1.41% | | 1.49% |
| Net investment income (loss) | | (.40)% | | .18% | | (.58)% | | (.68)% C | | (.73)% |
| Supplemental Data | | | | | | | | | | |
| Net assets, end of period (000 omitted) | $ | 23,754 | $ | 17,748 | $ | 16,273 | $ | 22,618 | $ | 18,864 |
Portfolio turnover rate H | | | | 39% | | 42% | | 58% | | 44% |
ACalculated based on average shares outstanding during the period.
BNet investment income (loss) is affected by the timing of the declaration of dividends by any underlying mutual funds or exchange-traded funds (ETFs). Net investment income (loss) of any mutual funds or ETFs is not included in the Fund's net investment income (loss) ratio.
CNet investment income per share reflects one or more large, non-recurring dividend(s) which amounted to $.02 per share. Excluding such non-recurring dividend(s), the ratio of net investment income (loss) to average net assets would have been (.76)%.
DTotal returns would have been lower if certain expenses had not been reduced during the applicable periods shown.
ETotal returns do not include the effect of the sales charges.
FFees and expenses of any underlying mutual funds or exchange-traded funds (ETFs) are not included in the Fund's expense ratio. The Fund indirectly bears its proportionate share of these expenses. For additional expense information related to investments in Fidelity Central Funds, please refer to the "Investments in Fidelity Central Funds" note found in the Notes to Financial Statements section of the most recent Annual or Semi-Annual report.
GExpense ratios reflect operating expenses of the class. Expenses before reductions do not reflect amounts reimbursed, waived, or reduced through arrangements with the investment adviser, brokerage services, or other offset arrangements, if applicable, and do not represent the amount paid by the class during periods when reimbursements, waivers or reductions occur.
HAmount does not include the portfolio activity of any underlying mutual funds or exchange-traded funds (ETFs).
Fidelity Advisor® Global Capital Appreciation Fund Class C |
| |
| Years ended October 31, | | 2024 | | 2023 | | 2022 | | 2021 | | 2020 |
Selected Per-Share Data | | | | | | | | | | |
| Net asset value, beginning of period | $ | 15.62 | $ | 13.47 | $ | 20.04 | $ | 15.46 | $ | 13.10 |
| Income from Investment Operations | | | | | | | | | | |
Net investment income (loss) A,B | | (.17) | | (.06) | | (.17) | | (.22) C | | (.17) |
| Net realized and unrealized gain (loss) | | 6.21 | | 2.21 | | (4.57) | | 4.80 | | 2.53 |
| Total from investment operations | | 6.04 | | 2.15 | | (4.74) | | 4.58 | | 2.36 |
| Distributions from net realized gain | | (1.26) | | - | | (1.83) | | - | | - |
| Total distributions | | (1.26) | | - | | (1.83) | | - | | - |
| Net asset value, end of period | $ | 20.40 | $ | 15.62 | $ | 13.47 | $ | 20.04 | $ | 15.46 |
Total Return D,E | | | | 15.96% | | (25.94)% | | 29.62% | | 18.02% |
Ratios to Average Net Assets B,F,G | | | | | | | | | | |
| Expenses before reductions | | 2.08% | | 2.01% | | 2.08% | | 1.92% | | 1.99% |
| Expenses net of fee waivers, if any | | | | 2.01% | | 2.05% | | 1.92% | | 1.98% |
| Expenses net of all reductions | | 2.05% | | 2.01% | | 2.05% | | 1.92% | | 1.97% |
| Net investment income (loss) | | (.90)% | | (.36)% | | (1.07)% | | (1.19)% C | | (1.21)% |
| Supplemental Data | | | | | | | | | | |
| Net assets, end of period (000 omitted) | $ | 6,464 | $ | 4,192 | $ | 4,907 | $ | 8,044 | $ | 9,134 |
Portfolio turnover rate H | | | | 39% | | 42% | | 58% | | 44% |
ACalculated based on average shares outstanding during the period.
BNet investment income (loss) is affected by the timing of the declaration of dividends by any underlying mutual funds or exchange-traded funds (ETFs). Net investment income (loss) of any mutual funds or ETFs is not included in the Fund's net investment income (loss) ratio.
CNet investment income per share reflects one or more large, non-recurring dividend(s) which amounted to $.01 per share. Excluding such non-recurring dividend(s), the ratio of net investment income (loss) to average net assets would have been (1.27)%.
DTotal returns would have been lower if certain expenses had not been reduced during the applicable periods shown.
ETotal returns do not include the effect of the contingent deferred sales charge.
FFees and expenses of any underlying mutual funds or exchange-traded funds (ETFs) are not included in the Fund's expense ratio. The Fund indirectly bears its proportionate share of these expenses. For additional expense information related to investments in Fidelity Central Funds, please refer to the "Investments in Fidelity Central Funds" note found in the Notes to Financial Statements section of the most recent Annual or Semi-Annual report.
GExpense ratios reflect operating expenses of the class. Expenses before reductions do not reflect amounts reimbursed, waived, or reduced through arrangements with the investment adviser, brokerage services, or other offset arrangements, if applicable, and do not represent the amount paid by the class during periods when reimbursements, waivers or reductions occur.
HAmount does not include the portfolio activity of any underlying mutual funds or exchange-traded funds (ETFs).
Fidelity Advisor® Global Capital Appreciation Fund Class I |
| |
| Years ended October 31, | | 2024 | | 2023 | | 2022 | | 2021 | | 2020 |
Selected Per-Share Data | | | | | | | | | | |
| Net asset value, beginning of period | $ | 20.99 | $ | 17.89 | $ | 25.75 | $ | 19.65 | $ | 16.57 |
| Income from Investment Operations | | | | | | | | | | |
Net investment income (loss) A,B | | .04 | | .16 | | - C | | (.02) D | | (.02) |
| Net realized and unrealized gain (loss) | | 8.45 | | 2.94 | | (6.03) | | 6.12 | | 3.21 |
| Total from investment operations | | 8.49 | | 3.10 | | (6.03) | | 6.10 | | 3.19 |
| Distributions from net investment income | | (.13) | | - | | - | | - | | (.11) |
| Distributions from net realized gain | | (1.27) | | - | | (1.83) | | - | | - |
| Total distributions | | (1.40) | | - | | (1.83) | | - | | (.11) |
| Net asset value, end of period | $ | 28.08 | $ | 20.99 | $ | 17.89 | $ | 25.75 | $ | 19.65 |
Total Return E | | | | 17.33% | | (25.14)% | | 31.04% | | 19.37% |
Ratios to Average Net Assets B,F,G | | | | | | | | | | |
| Expenses before reductions | | 1.01% | | .88% | | .97% | | .82% | | .89% |
| Expenses net of fee waivers, if any | | | | .88% | | .96% | | .82% | | .89% |
| Expenses net of all reductions | | 1.00% | | .88% | | .96% | | .82% | | .87% |
| Net investment income (loss) | | .14% | | .76% | | .01% | | (.09)% D | | (.11)% |
| Supplemental Data | | | | | | | | | | |
| Net assets, end of period (000 omitted) | $ | 58,849 | $ | 45,342 | $ | 32,058 | $ | 49,146 | $ | 38,359 |
Portfolio turnover rate H | | | | 39% | | 42% | | 58% | | 44% |
ACalculated based on average shares outstanding during the period.
BNet investment income (loss) is affected by the timing of the declaration of dividends by any underlying mutual funds or exchange-traded funds (ETFs). Net investment income (loss) of any mutual funds or ETFs is not included in the Fund's net investment income (loss) ratio.
CAmount represents less than $.005 per share.
DNet investment income per share reflects one or more large, non-recurring dividend(s) which amounted to $.02 per share. Excluding such non-recurring dividend(s), the ratio of net investment income (loss) to average net assets would have been (.17)%.
ETotal returns would have been lower if certain expenses had not been reduced during the applicable periods shown.
FFees and expenses of any underlying mutual funds or exchange-traded funds (ETFs) are not included in the Fund's expense ratio. The Fund indirectly bears its proportionate share of these expenses. For additional expense information related to investments in Fidelity Central Funds, please refer to the "Investments in Fidelity Central Funds" note found in the Notes to Financial Statements section of the most recent Annual or Semi-Annual report.
GExpense ratios reflect operating expenses of the class. Expenses before reductions do not reflect amounts reimbursed, waived, or reduced through arrangements with the investment adviser, brokerage services, or other offset arrangements, if applicable, and do not represent the amount paid by the class during periods when reimbursements, waivers or reductions occur.
HAmount does not include the portfolio activity of any underlying mutual funds or exchange-traded funds (ETFs).
Notes to Financial Statements
For the period ended October 31, 2024
1. Organization.
Fidelity Advisor Global Capital Appreciation Fund (the Fund) is a fund of Fidelity Advisor Series VIII (the Trust) and is authorized to issue an unlimited number of shares. The Trust is registered under the Investment Company Act of 1940, as amended (the 1940 Act), as an open-end management investment company organized as a Massachusetts business trust. The Fund offers Class A, Class M, Class C and Class I shares, each of which has equal rights as to assets and voting privileges. Class A, Class M, Class C and Class I are Fidelity Advisor classes. Each class has exclusive voting rights with respect to matters that affect that class. Class C shares will automatically convert to Class A shares after a holding period of eight years from the initial date of purchase, with certain exceptions.
2. Investments in Fidelity Central Funds.
Funds may invest in Fidelity Central Funds, which are open-end investment companies generally available only to other investment companies and accounts managed by the investment adviser and its affiliates. The Schedule of Investments lists any Fidelity Central Funds held as an investment as of period end, but does not include the underlying holdings of each Fidelity Central Fund. An investing fund indirectly bears its proportionate share of the expenses of the underlying Fidelity Central Funds.
Based on its investment objective, each Fidelity Central Fund may invest or participate in various investment vehicles or strategies that are similar to those of the investing fund. These strategies are consistent with the investment objectives of the investing fund and may involve certain economic risks which may cause a decline in value of each of the Fidelity Central Funds and thus a decline in the value of the investing fund.
| Fidelity Central Fund | Investment Manager | Investment Objective | Investment Practices | Expense RatioA |
| Fidelity Money Market Central Funds | Fidelity Management & Research Company LLC (FMR) | Each fund seeks to obtain a high level of current income consistent with the preservation of capital and liquidity. | Short-term Investments | Less than .005% |
A Expenses expressed as a percentage of average net assets and are as of each underlying Central Fund's most recent annual or semi-annual shareholder report.
A complete unaudited list of holdings for each Fidelity Central Fund is available upon request or at the Securities and Exchange Commission website at www.sec.gov. In addition, the financial statements of the Fidelity Central Funds which contain the significant accounting policies (including investment valuation policies) of those funds, and are not covered by the Report of Independent Registered Public Accounting Firm, are available on the Securities and Exchange Commission website or upon request.
3. Significant Accounting Policies.
The Fund is an investment company and applies the accounting and reporting guidance of the Financial Accounting Standards Board (FASB) Accounting Standards Codification Topic 946 Financial Services - Investment Companies. The financial statements have been prepared in conformity with accounting principles generally accepted in the United States of America (GAAP), which require management to make certain estimates and assumptions at the date of the financial statements. Actual results could differ from those estimates. Subsequent events, if any, through the date that the financial statements were issued have been evaluated in the preparation of the financial statements. The Fund's Schedule of Investments lists any underlying mutual funds or exchange-traded funds (ETFs) but does not include the underlying holdings of these funds. The following summarizes the significant accounting policies of the Fund:
Investment Valuation. Investments are valued as of 4:00 p.m. Eastern time on the last calendar day of the period. The Board of Trustees (the Board) has designated the Fund's investment adviser as the valuation designee responsible for the fair valuation function and performing fair value determinations as needed. The investment adviser has established a Fair Value Committee (the Committee) to carry out the day-to-day fair valuation responsibilities and has adopted policies and procedures to govern the fair valuation process and the activities of the Committee. In accordance with these fair valuation policies and procedures, which have been approved by the Board, the Fund attempts to obtain prices from one or more third party pricing services or brokers to value its investments. When current market prices, quotations or currency exchange rates are not readily available or reliable, investments will be fair valued in good faith by the Committee, in accordance with the policies and procedures. Factors used in determining fair value vary by investment type and may include market or investment specific events, transaction data, estimated cash flows, and market observations of comparable investments. The frequency that the fair valuation procedures are used cannot be predicted and they may be utilized to a significant extent. The Committee manages the Fund's fair valuation practices and maintains the fair valuation policies and procedures. The Fund's investment adviser reports to the Board information regarding the fair valuation process and related material matters.
The Fund categorizes the inputs to valuation techniques used to value its investments into a disclosure hierarchy consisting of three levels as shown below:
Level 1 - unadjusted quoted prices in active markets for identical investments
Level 2 - other significant observable inputs (including quoted prices for similar investments, interest rates, prepayment speeds, etc.)
Level 3 - unobservable inputs (including the Fund's own assumptions based on the best information available)
Valuation techniques used to value the Fund's investments by major category are as follows:
Equity securities, including restricted securities, for which market quotations are readily available, are valued at the last reported sale price or official closing price as reported by a third party pricing service on the primary market or exchange on which they are traded and are categorized as Level 1 in the hierarchy. In the event there were no sales during the day or closing prices are not available, securities are valued at the last quoted bid price or may be valued using the last available price and are generally categorized as Level 2 in the hierarchy. For foreign equity securities, when market or security specific events arise, comparisons to the valuation of American Depositary Receipts (ADRs), futures contracts, Exchange-Traded Funds (ETFs) and certain indexes as well as quoted prices for similar securities may be used and would be categorized as Level 2 in the hierarchy. For equity securities, including restricted securities, where observable inputs are limited, assumptions about market activity and risk are used and these securities may be categorized as Level 3 in the hierarchy.
Investments in open-end mutual funds, including the Fidelity Central Funds, are valued at their closing net asset value (NAV) each business day and are categorized as Level 1 in the hierarchy.
Changes in valuation techniques may result in transfers in or out of an assigned level within the disclosure hierarchy. The aggregate value of investments by input level as of October 31, 2024 is included at the end of the Fund's Schedule of Investments.
Foreign Currency. Certain Funds may use foreign currency contracts to facilitate transactions in foreign-denominated securities. Gains and losses from these transactions may arise from changes in the value of the foreign currency or if the counterparties do not perform under the contracts' terms.
Foreign-denominated assets, including investment securities, and liabilities are translated into U.S. dollars at the exchange rates at period end. Purchases and sales of investment securities, income and dividends received, and expenses denominated in foreign currencies are translated into U.S. dollars at the exchange rate in effect on the transaction date.
The effects of exchange rate fluctuations on investments are included with the net realized and unrealized gain (loss) on investment securities. Other foreign currency transactions resulting in realized and unrealized gain (loss) are disclosed separately.
Investment Transactions and Income. For financial reporting purposes, the Fund's investment holdings and NAV include trades executed through the end of the last business day of the period. The NAV per share for processing shareholder transactions is calculated as of the close of business of the New York Stock Exchange (NYSE), normally 4:00 p.m. Eastern time and includes trades executed through the end of the prior business day. Gains and losses on securities sold are determined on the basis of identified cost and include proceeds received from litigation. Commissions paid to certain brokers with whom the investment adviser, or its affiliates, places trades on behalf of a fund include an amount in addition to trade execution, which may be rebated back to a fund. Any such rebates are included in net realized gain (loss) on investments in the Statement of Operations. Dividend income is recorded on the ex-dividend date, except for certain dividends from foreign securities where the ex-dividend date may have passed, which are recorded as soon as the Fund is informed of the ex-dividend date. Non-cash dividends included in dividend income, if any, are recorded at the fair market value of the securities received. Income and capital gain distributions from Fidelity Central Funds, if any, are recorded on the ex-dividend date. Investment income is recorded net of foreign taxes withheld where recovery of such taxes is uncertain. Funds may file withholding tax reclaims in certain jurisdictions to recover a portion of amounts previously withheld. Any withholding tax reclaims income is included in the Statement of Operations in foreign taxes withheld. Any receivables for withholding tax reclaims are included in the Statement of Assets and Liabilities in dividends receivable.
Class Allocations and Expenses. Investment income, realized and unrealized capital gains and losses, common expenses of a fund, and certain fund-level expense reductions, if any, are allocated daily on a pro-rata basis to each class based on the relative net assets of each class to the total net assets of a fund. Each class differs with respect to transfer agent and distribution and service plan fees incurred, as applicable. Certain expense reductions may also differ by class, if applicable. For the reporting period, the allocated portion of income and expenses to each class as a percent of its average net assets may vary due to the timing of recording these transactions in relation to fluctuating net assets of the classes. Expenses directly attributable to a fund are charged to that fund. Expenses attributable to more than one fund are allocated among the respective funds on the basis of relative net assets or other appropriate methods. Expenses included in the accompanying financial statements reflect the expenses of that fund and do not include any expenses associated with any underlying mutual funds or exchange-traded funds (ETFs). Although not included in a fund's expenses, a fund indirectly bears its proportionate share of these expenses through the net asset value of each underlying mutual fund or exchange-traded fund (ETF). Expense estimates are accrued in the period to which they relate and adjustments are made when actual amounts are known.
Income Tax Information and Distributions to Shareholders. Each year, the Fund intends to qualify as a regulated investment company under Subchapter M of the Internal Revenue Code, including distributing substantially all of its taxable income and realized gains. As a result, no provision for U.S. Federal income taxes is required. As of October 31, 2024, the Fund did not have any unrecognized tax benefits in the financial statements; nor is the Fund aware of any tax positions for which it is reasonably possible that the total amounts of unrecognized tax benefits will significantly change in the next twelve months. The Fund files a U.S. federal tax return, in addition to state and local tax returns as required. The Fund's federal income tax returns are subject to examination by the Internal Revenue Service (IRS) for a period of three fiscal years after they are filed. State and local tax returns may be subject to examination for an additional fiscal year depending on the jurisdiction. Foreign taxes are provided for based on the Fund's understanding of the tax rules and rates that exist in the foreign markets in which it invests. The Fund is subject to a tax imposed on capital gains by certain countries in which it invests. An estimated deferred tax liability for net unrealized appreciation on the applicable securities is included in Other payables and accrued expenses on the Statement of Assets and Liabilities.
Distributions are declared and recorded on the ex-dividend date. Income and capital gain distributions are declared separately for each class. Income and capital gain distributions are determined in accordance with income tax regulations, which may differ from GAAP. In addition, the Fund claimed a portion of the payment made to redeeming shareholders as a distribution for income tax purposes.
Capital accounts within the financial statements are adjusted for permanent book-tax differences. These adjustments have no impact on net assets or the results of operations. Capital accounts are not adjusted for temporary book-tax differences which will reverse in a subsequent period.
Book-tax differences are primarily due to foreign currency transactions, net operating losses, certain foreign taxes, and losses deferred due to wash sales and excise tax regulations.
As of period end, the cost and unrealized appreciation (depreciation) in securities, and derivatives if applicable, for federal income tax purposes were as follows:
| Gross unrealized appreciation | $51,351,621 |
| Gross unrealized depreciation | (810,235) |
| Net unrealized appreciation (depreciation) | $50,541,386 |
| Tax Cost | $90,848,721 |
The tax-based components of distributable earnings as of period end were as follows:
| Undistributed long-term capital gain | $10,259,918 |
| Net unrealized appreciation (depreciation) on securities and other investments | $50,504,184 |
| | |
| | |
The Fund intends to elect to defer to its next fiscal year $191,804 of ordinary losses recognized during the period January 1, 2024 to October 31, 2024.
The tax character of distributions paid was as follows:
| | October 31, 2024 | October 31, 2023 |
| Ordinary Income | $425,657 | $- |
| Long-term Capital Gains | 6,444,126 | - |
| Total | $6,869,783 | $- |
Restricted Securities (including Private Placements). Funds may invest in securities that are subject to legal or contractual restrictions on resale. These securities generally may be resold in transactions exempt from registration or to the public if the securities are registered. Disposal of these securities may involve time-consuming negotiations and expense, and prompt sale at an acceptable price may be difficult. Information regarding restricted securities held at period end is included at the end of the Schedule of Investments, if applicable.
New Accounting Pronouncement. In November 2023, the FASB issued Accounting Standards Update (ASU) 2023-07 Segment Reporting (Topic 280): Improvements to Reportable Segment Disclosures. Effective for fiscal years beginning after December 15, 2023 and interim periods within fiscal years beginning after December 15, 2024, the amendments enhance required disclosures of segment information for public entities on an annual and interim basis. The ASU allows for early adoption with updates applied retrospectively. Management is currently evaluating the impact of the ASU but does not expect this guidance to materially impact the financial statements.
4. Purchases and Sales of Investments.
Purchases and sales of securities, other than short-term securities and in-kind transactions, as applicable, are noted in the table below.
| | Purchases ($) | Sales ($) |
| Fidelity Advisor Global Capital Appreciation Fund | 66,560,463 | 58,485,739 |
5. Fees and Other Transactions with Affiliates.
Management Fee. Fidelity Management & Research Company LLC (the investment adviser) and its affiliates provide the Fund with investment management related services for which the Fund pays a monthly management fee.
Effective March 1, 2024, the Fund's management contract was amended to incorporate administrative services previously covered under separate services agreements (Transfer Agent and Accounting agreements). The amended contract incorporates a basic fee rate that may vary by class (subject to a performance adjustment). The investment adviser or an affiliate pays certain expenses of managing and operating the Fund out of each class's management fee. Each class of the Fund pays a management fee to the investment adviser. The management fee is calculated and paid to the investment adviser every month. The management fee is determined by calculating a basic fee and then applying a performance adjustment. When determining a class's basic fee, a mandate rate is calculated based on the monthly average net assets of a group of funds advised by FMR within a designated asset class. A discount rate is subtracted from the mandate rate once the Fund's monthly average net assets reach a certain level. The mandate rate and discount rate may vary by class. The annual basic fee rate for a class of shares of the Fund is the lesser of (1) the class's mandate rate reduced by the class's discount rate (if applicable) or (2) the amount set forth in the following table.
| | Maximum Management Fee Rate % |
| Class A | .87 |
| Class M | .87 |
| Class C | .87 |
| Class I | .80 |
One-twelfth of the basic fee rate for a class is applied to the average net assets of the class for the month, giving a dollar amount which is the basic fee for the class for that month. A different management fee rate may be applicable to each class of the Fund. The difference between classes is the result of separate arrangements for class-level services and/or waivers of certain expenses. It is not the result of any difference in advisory or custodial fees or other expenses related to the management of the Fund's assets, which do not vary by class. For the portion of the reporting period on or after March 1, 2024, the total annualized management fee rates were as follows:
| | Total Management Fee Rate % |
| Class A | .87 |
| Class M | .87 |
| Class C | .87 |
| Class I | .80 |
Prior to March 1, 2024, the management fee was the sum of an individual fund fee rate that was based on an annual rate of .45% of the Fund's average net assets and an annualized group fee rate that averaged .22% during the period. The group fee rate was based upon the monthly average net assets of a group of registered investment companies with which the investment adviser has management contracts. The group fee rate decreased as assets under management increased and increased as assets under management decreased. For the portion of the reporting period prior to March 1, 2024, the total annualized management fee rate was .67%.
The performance adjustment rate is calculated monthly by comparing over the performance period the Fund's performance to that of the performance adjustment index listed below.
| | Performance Adjustment Index |
| Fidelity Advisor Global Capital Appreciation Fund | MSCI All Country World Index |
For the purposes of calculating the performance adjustment for the Fund, the Fund's investment performance is based on the performance of Class I. To the extent that other classes of the Fund have higher expenses, this could result in those classes bearing a larger positive performance adjustment and smaller negative performance adjustment than would be the case if each class's own performance were considered. The performance period is the most recent 36 month period. The maximum annualized performance adjustment rate is ±.20% of the Fund's average net assets over the performance period. The performance adjustment rate is divided by twelve and multiplied by the Fund's average net assets over the performance period, and the resulting dollar amount is proportionately added to or subtracted from a class's basic fee. For the entire reporting period, the total annual performance adjustment was .08%.
Effective March 1, 2024, the Fund's sub-advisory agreements with FMR Investment Management (UK) Limited, Fidelity Management & Research (Hong Kong) Limited, and Fidelity Management & Research (Japan) Limited were amended to provide that the investment adviser pays each sub-adviser monthly fees equal to 110% of the sub-adviser's costs for providing sub-advisory services.
Effective March 1, 2024, the Fund's sub-advisory agreement with FIL Investment Advisors (FIA) was amended to provide that the investment adviser pays FIA monthly fees at an annual rate of 0.38% with respect to the average daily net assets of the Fund managed by FIA. FIA in turn pays FIA(UK).
Distribution and Service Plan Fees. In accordance with Rule 12b-1 of the 1940 Act, the Fund has adopted separate Distribution and Service Plans for each class of shares. Certain classes pay Fidelity Distributors Company LLC (FDC), an affiliate of the investment adviser, separate Distribution and Service Fees, each of which is based on an annual percentage of each class' average net assets. In addition, FDC may pay financial intermediaries for selling shares of the Fund and providing shareholder support services. For the period, the Distribution and Service Fee rates, total fees and amounts retained by FDC were as follows:
| | Distribution Fee | Service Fee | Total Fees ($) | Retained by FDC ($) |
| Class A | - % | .25% | 111,616 | 1,741 |
| Class M | .25% | .25% | 110,849 | - |
| Class C | .75% | .25% | 58,291 | 8,151 |
| | | | 280,756 | 9,892 |
Sales Load. FDC may receive a front-end sales charge of up to 5.75% for selling Class A shares and 3.50% for selling Class M shares, some of which is paid to financial intermediaries for selling shares of the Fund. Depending on the holding period, FDC may receive contingent deferred sales charges levied on Class A, Class M and Class C redemptions. The deferred sales charges are 1.00% for Class C shares, 1.00% for certain purchases of Class A shares and .25% for certain purchases of Class M shares.
For the period, sales charge amounts retained by FDC were as follows:
| | Retained by FDC ($) |
| Class A | 22,026 |
| Class M | 1,101 |
Class CA | 155 |
| | 23,282 |
A When Class C shares are initially sold, FDC pays commissions from its own resources to financial intermediaries through which the sales are made.
Transfer Agent Fees. Fidelity Investments Institutional Operations Company LLC (FIIOC), an affiliate of the investment adviser, is the transfer, dividend disbursing and shareholder servicing agent for each class of the Fund. Effective March 1, 2024, the Fund's management contract was amended to incorporate transfer agent services and associated fees previously covered under a separate services agreement. FIIOC pays for typesetting, printing and mailing of shareholder reports, except proxy statements.
During the period December 1, 2023 through February 29, 2024, the transfer agent fees for each class were a fixed annual rate of class-level average net assets as follows:
| | % of Class-Level Average Net Assets | |
| Class A | .2000 | |
| Class M | .2000 | |
| Class C | .2000 | |
| Class I | .1317 | |
| | |
| | | |
Prior to December 1, 2023, FIIOC received account fees and asset-based fees that varied according to the account size and type of account of the shareholders of the respective classes of the Fund. FIIOC received an asset-based fee of average net assets. For the portion of the reporting period prior to March 1, 2024, the fees were equivalent to the following annualized rates:| | Amount ($) | % of Class-Level Average Net Assets |
| Class A | 25,637 | .20 |
| Class M | 13,307 | .20 |
| Class C | 3,406 | .21 |
| Class I | 22,645 | .13 |
| 64,995 | |
Accounting Fees. Fidelity Service Company, Inc. (FSC), an affiliate of the investment adviser, maintains the Fund's accounting records. Effective March 1, 2024, the Fund's management contract was amended to incorporate accounting services and associated fees previously covered under a separate services agreement.
During the period December 1, 2023 through February 29, 2024, the accounting fees were a fixed annual rate of average net assets as follows:
| | % of Average Net Assets |
| Fidelity Advisor Global Capital Appreciation Fund | .0354 |
Prior to December 1, 2023, the accounting fee was based on the level of average net assets for each month. For the portion of the reporting period prior to March 1, 2024, the fees were equivalent to the following annualized rates:
| | % of Average Net Assets |
| Fidelity Advisor Global Capital Appreciation Fund | .04 |
Brokerage Commissions. A portion of portfolio transactions were placed with brokerage firms which are affiliates of the investment adviser. Brokerage commissions are included in net realized gain (loss) and change in net unrealized appreciation (depreciation) in the Statement of Operations. The commissions paid to these affiliated firms were as follows:
| | Amount ($) |
| Fidelity Advisor Global Capital Appreciation Fund | 345 |
Interfund Trades. Funds may purchase from or sell securities to other Fidelity Funds under procedures adopted by the Board. The procedures have been designed to ensure these interfund trades are executed in accordance with Rule 17a-7 of the 1940 Act. Any interfund trades are included within the respective purchases and sales amounts shown in the Purchases and Sales of Investments note. Interfund trades during the period are noted in the table below.
| | Purchases ($) | Sales ($) | Realized Gain (Loss)($) |
| Fidelity Advisor Global Capital Appreciation Fund | 6,526,963 | 3,874,031 | 1,112,787 |
6. Committed Line of Credit.
Certain Funds participate with other funds managed by the investment adviser or an affiliate in a $4.25 billion credit facility (the "line of credit") to be utilized for temporary or emergency purposes to fund shareholder redemptions or for other short-term liquidity purposes. The participating funds have agreed to pay commitment fees on their pro-rata portion of the line of credit, which are reflected in Miscellaneous expenses on the Statement of Operations, and are listed below. During the period, there were no borrowings on this line of credit.
| | Amount ($) |
| Fidelity Advisor Global Capital Appreciation Fund | 206 |
7. Security Lending.
Funds lend portfolio securities from time to time in order to earn additional income. Lending agents are used, including National Financial Services (NFS), an affiliate of the investment adviser. Pursuant to a securities lending agreement, NFS will receive a fee, which is capped at 9.9% of a fund's daily lending revenue, for its services as lending agent. A fund may lend securities to certain qualified borrowers, including NFS. On the settlement date of the loan, a fund receives collateral (in the form of U.S. Treasury obligations, letters of credit and/or cash) against the loaned securities and maintains collateral in an amount not less than 100% of the market value of the loaned securities during the period of the loan. The market value of the loaned securities is determined at the close of business of a fund and any additional required collateral is delivered to a fund on the next business day. A fund or borrower may terminate the loan at any time, and if the borrower defaults on its obligation to return the securities loaned because of insolvency or other reasons, a fund may apply collateral received from the borrower against the obligation. A fund may experience delays and costs in recovering the securities loaned. Any cash collateral received is invested in the Fidelity Securities Lending Cash Central Fund. Any loaned securities are identified as such in the Schedule of Investments, and the value of loaned securities and cash collateral at period end, as applicable, are presented in the Statement of Assets and Liabilities. Security lending income represents the income earned on investing cash collateral, less rebates paid to borrowers and any lending agent fees associated with the loan, plus any premium payments received for lending certain types of securities. Security lending income is presented in the Statement of Operations as a component of income from Fidelity Central Funds. Affiliated security lending activity, if any, was as follows:
| | Total Security Lending Fees Paid to NFS ($) | Security Lending Income From Securities Loaned to NFS ($) | Value of Securities Loaned to NFS at Period End ($) |
| Fidelity Advisor Global Capital Appreciation Fund | 109 | - | - |
8. Expense Reductions.
The investment adviser contractually agreed to reimburse expenses of each class to the extent annual operating expenses exceeded certain levels of class-level average net assets as noted in the table below. This reimbursement will remain in place through February 28, 2026. Some expenses, for example the compensation of the independent Trustees, and certain miscellaneous expenses such as proxy and shareholder meeting expenses, are excluded from this reimbursement.
The following classes were in reimbursement during the period:
| | Expense Limitations | Reimbursement ($) |
| Class A | 1.30% | 10,475 |
| Class M | 1.55% | 5,547 |
| Class C | 2.05% | 1,368 |
| Class I | 1.05% | - |
| | | 17,390 |
Through arrangements with the Fund's custodian, credits realized as a result of certain uninvested cash balances were used to reduce the Fund's expenses. During the period, custodian credits reduced the Fund's expenses by $231. During the period, transfer agent credits reduced each class' expenses as noted in the table below.
| | Expense reduction ($) |
| Class M | 27 |
| | 27 |
In addition, during the period the investment adviser or an affiliate reimbursed and/or waived a portion of fund-level operating expenses in the amount of $5,248.
9. Distributions to Shareholders.
Distributions to shareholders of each class were as follows:
| | Year ended October 31, 2024 | Year ended October 31, 2023 |
| Fidelity Advisor Global Capital Appreciation Fund | | |
| Distributions to shareholders | | |
| Class A | $2,253,708 | $ - |
| Class M | 1,218,995 | - |
| Class C | 351,095 | - |
| Class I | 3,045,985 | - |
Total | $6,869,783 | $ - |
10. Share Transactions.
Share transactions for each class were as follows and may contain in-kind transactions, automatic conversions between classes or exchanges between affiliated funds:
| | Shares | Shares | Dollars | Dollars |
| | Year ended October 31, 2024 | Year ended October 31, 2023 | Year ended October 31, 2024 | Year ended October 31, 2023 |
| Fidelity Advisor Global Capital Appreciation Fund | | | | |
| Class A | | | | |
| Shares sold | 580,194 | 236,799 | $13,581,623 | $4,608,114 |
| Reinvestment of distributions | 110,134 | - | 2,200,473 | - |
| Shares redeemed | (338,218) | (256,152) | (7,868,280) | (4,908,049) |
| Net increase (decrease) | 352,110 | (19,353) | $7,913,816 | $(299,935) |
| Class M | | | | |
| Shares sold | 74,061 | 43,515 | $1,615,042 | $776,382 |
| Reinvestment of distributions | 65,309 | - | 1,216,704 | - |
| Shares redeemed | (130,727) | (110,804) | (2,882,762) | (1,962,893) |
| Net increase (decrease) | 8,643 | (67,289) | $(51,016) | $(1,186,511) |
| Class C | | | | |
| Shares sold | 110,150 | 37,916 | $2,044,519 | $590,266 |
| Reinvestment of distributions | 22,230 | - | 351,017 | - |
| Shares redeemed | (83,851) | (133,865) | (1,589,146) | (2,055,865) |
| Net increase (decrease) | 48,529 | (95,949) | $806,390 | $(1,465,599) |
| Class I | | | | |
| Shares sold | 714,022 | 661,612 | $18,371,174 | $13,832,392 |
| Reinvestment of distributions | 134,331 | - | 2,893,489 | - |
| Shares redeemed | (913,085) | (292,717) | (24,947,530) | (6,011,875) |
| Net increase (decrease) | (64,732) | 368,895 | $(3,682,867) | $7,820,517 |
11. Other.
A fund's organizational documents provide former and current trustees and officers with a limited indemnification against liabilities arising in connection with the performance of their duties to the fund. In the normal course of business, a fund may also enter into contracts that provide general indemnifications. A fund's maximum exposure under these arrangements is unknown as this would be dependent on future claims that may be made against a fund. The risk of material loss from such claims is considered remote.
12. Risk and Uncertainties.
Many factors affect a fund's performance. Developments that disrupt global economies and financial markets, such as pandemics, epidemics, outbreaks of infectious diseases, war, terrorism, and environmental disasters, may significantly affect a fund's investment performance. The effects of these developments to a fund will be impacted by the types of securities in which a fund invests, the financial condition, industry, economic sector, and geographic location of an issuer, and a fund's level of investment in the securities of that issuer. Significant concentrations in security types, issuers, industries, sectors, and geographic locations may magnify the factors that affect a fund's performance.
Report of Independent Registered Public Accounting Firm
To the Board of Trustees of Fidelity Advisor Series VIII and Shareholders of Fidelity Advisor Global Capital Appreciation Fund
Opinion on the Financial Statements
We have audited the accompanying statement of assets and liabilities, including the schedule of investments, of Fidelity Advisor Global Capital Appreciation Fund (one of the funds constituting Fidelity Advisor Series VIII, referred to hereafter as the "Fund") as of October 31, 2024, the related statement of operations for the year ended October 31, 2024, the statement of changes in net assets for each of the two years in the period ended October 31, 2024, including the related notes, and the financial highlights for each of the five years in the period ended October 31, 2024 (collectively referred to as the "financial statements"). In our opinion, the financial statements present fairly, in all material respects, the financial position of the Fund as of October 31, 2024, the results of its operations for the year then ended, the changes in its net assets for each of the two years in the period ended October 31, 2024 and the financial highlights for each of the five years in the period ended October 31, 2024 in conformity with accounting principles generally accepted in the United States of America.
Basis for Opinion
These financial statements are the responsibility of the Fund's management. Our responsibility is to express an opinion on the Fund's financial statements based on our audits. We are a public accounting firm registered with the Public Company Accounting Oversight Board (United States) (PCAOB) and are required to be independent with respect to the Fund in accordance with the U.S. federal securities laws and the applicable rules and regulations of the Securities and Exchange Commission and the PCAOB.
We conducted our audits of these financial statements in accordance with the standards of the PCAOB. Those standards require that we plan and perform the audit to obtain reasonable assurance about whether the financial statements are free of material misstatement, whether due to error or fraud.
Our audits included performing procedures to assess the risks of material misstatement of the financial statements, whether due to error or fraud, and performing procedures that respond to those risks. Such procedures included examining, on a test basis, evidence regarding the amounts and disclosures in the financial statements. Our audits also included evaluating the accounting principles used and significant estimates made by management, as well as evaluating the overall presentation of the financial statements. Our procedures included confirmation of securities owned as of October 31, 2024 by correspondence with the custodian and issuers of privately offered securities. We believe that our audits provide a reasonable basis for our opinion.
/s/ PricewaterhouseCoopers LLP
Boston, Massachusetts
December 16, 2024
We have served as the auditor of one or more investment companies in the Fidelity group of funds since 1932.
Distributions
(Unaudited)The dividend and capital gains distributions for the fund(s) are available on Fidelity.com or Institutional.Fidelity.com.
The fund hereby designates as a capital gain dividend with respect to the taxable year ended October 31, 2024, $10,424,193, or, if subsequently determined to be different, the net capital gain of such year.
The fund designates 100.00% of the short-term capital gain dividends distributed in October, respectively during the fiscal year as qualifying to be taxed as short-term capital gain dividends for nonresident alien shareholders.
Class A designates 100%; Class M designates 100%; and Class I designates 97%,; of the dividends distributed in December 2023 during the fiscal year as qualifying for the dividends-received deduction for corporate shareholders.
Class A, Class M, and Class I designate 100% of the dividends distributed during the fiscal year as amounts which may be taken into account as a dividend for purposes of the maximum rate under section 1(h)(11) of the Internal Revenue Code.
The fund will notify shareholders in January 2025 of amounts for use in preparing 2024 income tax returns.
Item 8: Changes in and Disagreements with Accountants for Open-End Management Investment Companies
(Unaudited)
Note: This is not applicable for any fund included in this document.
Item 9: Proxy Disclosures for Open-End Management Investment Companies
(Unaudited)
| A special meeting of shareholders was held on July 16, 2024. The results of votes taken among shareholders on the proposal before them are reported below. Each vote reported represents one dollar of net asset value held on the record date for the meeting. |
| Proposal 1 |
| To elect a Board of Trustees. |
| | # of Votes | % of Votes |
| Bettina Doulton |
| Affirmative | 9,667,916,942.83 | 98.16 |
| Withheld | 181,261,836.48 | 1.84 |
| TOTAL | 9,849,178,779.31 | 100.00 |
| Robert A. Lawrence |
| Affirmative | 9,643,385,159.26 | 97.91 |
| Withheld | 205,793,620.05 | 2.09 |
| TOTAL | 9,849,178,779.31 | 100.00 |
| Vijay C. Advani |
| Affirmative | 9,650,856,015.95 | 97.99 |
| Withheld | 198,322,763.36 | 2.01 |
| TOTAL | 9,849,178,779.31 | 100.00 |
| Thomas P. Bostick |
| Affirmative | 9,653,685,826.52 | 98.02 |
| Withheld | 195,492,952.79 | 1.98 |
| TOTAL | 9,849,178,779.31 | 100.00 |
| Donald F. Donahue |
| Affirmative | 9,653,599,026.45 | 98.01 |
| Withheld | 195,579,752.86 | 1.99 |
| TOTAL | 9,849,178,779.31 | 100.00 |
| Vicki L. Fuller |
| Affirmative | 9,666,491,582.97 | 98.15 |
| Withheld | 182,687,196.34 | 1.85 |
| TOTAL | 9,849,178,779.31 | 100.00 |
| Patricia L. Kampling |
| Affirmative | 9,664,290,979.63 | 98.12 |
| Withheld | 184,887,799.68 | 1.88 |
| TOTAL | 9,849,178,779.31 | 100.00 |
| Thomas A. Kennedy |
| Affirmative | 9,646,944,497.07 | 97.95 |
| Withheld | 202,234,282.24 | 2.05 |
| TOTAL | 9,849,178,779.31 | 100.00 |
| Oscar Munoz |
| Affirmative | 9,652,669,495.50 | 98.00 |
| Withheld | 196,509,283.81 | 2.00 |
| TOTAL | 9,849,178,779.31 | 100.00 |
| Karen B. Peetz |
| Affirmative | 9,656,405,594.63 | 98.04 |
| Withheld | 192,773,184.68 | 1.96 |
| TOTAL | 9,849,178,779.31 | 100.00 |
| David M. Thomas |
| Affirmative | 9,644,713,946.63 | 97.92 |
| Withheld | 204,464,832.68 | 2.08 |
| TOTAL | 9,849,178,779.31 | 100.00 |
| Susan Tomasky |
| Affirmative | 9,654,121,207.44 | 98.02 |
| Withheld | 195,057,571.87 | 1.98 |
| TOTAL | 9,849,178,779.31 | 100.00 |
| Michael E. Wiley |
| Affirmative | 9,642,438,416.20 | 97.90 |
| Withheld | 206,740,363.11 | 2.10 |
| TOTAL | 9,849,178,779.31 | 100.00 |
| | | |
| Proposal 1 reflects trust-wide proposal and voting results. |
Item 10: Remuneration Paid to Directors, Officers, and others of Open-End Management Investment Companies
(Unaudited)
Note: This information is disclosed as part of the financial statements for each Fund as part of Item 7: Financial Statements and Financial Highlights for Open-End Management Investment companies.
Item 11: Statement Regarding Basis for Approval of Investment Advisory Contract
(Unaudited)
Board Approval of Investment Advisory Contracts and Management Fees
Fidelity Advisor Global Capital Appreciation Fund
Each year, the Board of Trustees, including the Independent Trustees (together, the Board), considers the renewal of the fund's management contract with Fidelity Management & Research Company LLC (FMR) and certain affiliates and the sub-advisory agreements (together, the Advisory Contracts) for the fund. FMR and the sub-advisers are referred to herein as the Investment Advisers. The Board, assisted by the advice of fund counsel and Independent Trustees' counsel, requests and considers a broad range of information relevant to the renewal of the Advisory Contracts throughout the year.
The Board meets regularly and, at each of its meetings, covers an extensive agenda of topics and materials and considers factors that are relevant to its annual consideration of the renewal of the fund's Advisory Contracts, including the services and support provided to the fund and its shareholders. The Board, acting directly and through its Committees (each of which is composed of and chaired by Independent Trustees), requests and receives information concerning the annual consideration of the renewal of the fund's Advisory Contracts. The Board also meets as needed to review matters specifically related to the Board's annual consideration of the renewal of the Advisory Contracts. Members of the Board may also meet with trustees of other Fidelity funds through joint ad hoc committees to discuss certain matters relevant to all of the Fidelity funds.
At its May 2024 meeting, the Board unanimously determined to renew the fund's Advisory Contracts. In reaching its determination, the Board considered all factors it believed relevant, including (i) the nature, extent, and quality of the services provided to the fund and its shareholders (including the investment performance of the fund); (ii) the competitiveness relative to peer funds of the fund's management fee and the total expense ratio of a representative class (Class I, which was selected because it was the largest class without 12b-1 fees); (iii) the total costs of the services provided by and the profits realized by FMR and its affiliates (Fidelity) from its relationships with the fund; and (iv) the extent to which, if any, economies of scale exist and are realized as the fund grows, and whether any economies of scale are appropriately shared with fund shareholders. The Board also considered the broad range of investment choices available to shareholders from FMR's competitors and that the fund's shareholders have chosen to invest in the fund, which is part of the Fidelity family of funds. The Board's decision to renew the Advisory Contracts was not based on any single factor.
The Board reached a determination, with the assistance of fund counsel and Independent Trustees' counsel and through the exercise of its business judgment, that the renewal of the Advisory Contracts was in the best interests of the fund and its shareholders and that the compensation payable under the Advisory Contracts was fair and reasonable in light of all of the surrounding circumstances.
Nature, Extent, and Quality of Services Provided. The Board considered staffing as it relates to the fund, including the backgrounds and experience of investment personnel of the Investment Advisers, and also considered the Investment Advisers' implementation of the fund's investment program. The Independent Trustees also had discussions with senior management of Fidelity's investment operations and investment groups. The Board considered the structure of the investment personnel compensation program and whether this structure provides appropriate incentives to act in the best interests of the fund. Additionally, the Board considered the portfolio managers' investments, if any, in the funds that they manage.
Resources Dedicated to Investment Management and Support Services. The Board and the Fund Oversight and Research Committees reviewed the general qualifications and capabilities of Fidelity's investment staff, including its size, education, experience, and resources, as well as Fidelity's approach to recruiting, training, managing, and compensating investment personnel. The Board noted the resources devoted to expansion of Fidelity's global investment organization, and that Fidelity's analysts have extensive resources, tools and capabilities that allow them to conduct sophisticated quantitative and fundamental analysis, as well as credit analysis of issuers, counterparties and guarantors. Further, the Board considered that Fidelity's investment professionals have sufficient access to global information and data so as to provide competitive investment results over time, and that those professionals also have access to sophisticated tools that permit them to assess portfolio construction and risk and performance attribution characteristics continuously, as well as to transmit new information and research conclusions rapidly around the world. Additionally, in its deliberations, the Board considered Fidelity's trading, risk management, compliance, and technology and operations capabilities and resources, which are integral parts of the investment management process.
Shareholder and Administrative Services. The Board considered (i) the nature, extent, quality, and cost of advisory, administrative, shareholder, transfer agency, and pricing and bookkeeping services performed by the Investment Advisers and their affiliates under the Advisory Contracts; (ii) the nature and extent of Fidelity's supervision of third party service providers, principally custodians, subcustodians, and pricing vendors; and (iii) the resources devoted by Fidelity to, and the record of compliance with, the fund's compliance policies and procedures. The Board also reviewed the allocation of fund brokerage, including allocations to brokers affiliated with the Investment Advisers, the use of brokerage commissions to pay fund expenses, and the use of "soft" commission dollars to pay for research services. The Board also considered the fund's securities lending activities and any payments made to Fidelity relating to securities lending under a separate agreement.
The Board noted that the growth of fund assets over time across the complex allows Fidelity to reinvest in the development of services designed to enhance the value and convenience of the Fidelity funds as investment vehicles. These services include 24-hour access to account information and market information over the Internet and through telephone representatives, investor education materials and asset allocation tools. The Board also considered that it reviews customer service metrics such as telephone response times, continuity of services on the website and metrics addressing services at Fidelity Investor Centers.
Investment in a Large Fund Family. The Board considered the benefits to shareholders of investing in a fund that is part of a large family of funds offering a variety of investment disciplines and providing a large variety of fund investor services. The Board noted that Fidelity had taken, or had made recommendations that resulted in the Fidelity funds taking, a number of actions over the previous year that benefited particular funds and/or the Fidelity funds in general.
Investment Performance. The Board took into account discussions that occur with representatives of the Investment Advisers, and reports that it receives, at Board meetings throughout the year, relating to fund investment performance. In this regard, the Board noted that as part of regularly scheduled fund reviews and other reports to the Board on fund performance, the Board considered annualized return information for the fund for different time periods, measured against an appropriate securities market index (benchmark index) and an appropriate peer group of funds with similar objectives (peer group). The Board also considered information about performance attribution. In its ongoing evaluation of fund investment performance, the Board gives particular attention to information indicating changes in performance of the funds over different time periods and discussed with the Investment Advisers the reasons for any overperformance or underperformance.
In addition to reviewing absolute and relative fund performance, the Independent Trustees periodically consider the appropriateness of fund performance metrics in evaluating the results achieved. The Independent Trustees generally give greater weight to fund performance over longer time periods than over shorter time periods. Depending on the circumstances, the Independent Trustees may be satisfied with a fund's performance notwithstanding that it lags its benchmark index or peer group for certain periods.
Based on its review, the Board concluded that the nature, extent, and quality of services provided to the fund under the Advisory Contracts should continue to benefit the shareholders of the fund.
Competitiveness of Management Fee and Total Expense Ratio. The Board was provided with information regarding industry trends in management fees and expenses. The Board considered that, effective March 1, 2024, an amended Advisory Contract with FMR went into effect with class-level management fees based on tiered schedules and subject to a maximum class-level rate (the management fee). The Board also considered that in exchange for the variable management fee, each class of the fund receives investment advisory, management, administrative, transfer agent, and pricing and bookkeeping services. In its review of the management fee and total expense ratio of Class I, the Board considered a pro forma management fee rate for Class I as if it had been in effect for the 12-month period ended September 30, 2023, as well as other third-party fund expenses, as applicable, such as custodial, legal, and audit fees and any fund-paid 12b-1 fees. The Board noted that Fidelity may agree to waive fees or reimburse expenses from time to time, and the extent to which, if any, it has done so for the fund. The Board also considered information about the impact of the fund's performance adjustment.
Comparisons of Management Fees and Total Expense Ratios. Among other things, the Board reviewed data for selected groups of competitive funds and classes (referred to as "mapped groups") that were compiled by Fidelity based on combining similar investment objective categories (as classified by Morningstar) that have comparable investment mandates. The data reviewed by the Board included (i) gross management fee comparisons (before taking into account expense reimbursements or caps and without taking into account the fund's performance adjustment) relative to the total universe of funds within the mapped group; (ii) gross management fee comparisons relative to a subset of non-Fidelity funds in the mapped group that are similar in size and management fee structure to the fund (referred to as the "asset size peer group"); (iii) total expense comparisons of Class I of the fund relative to funds and classes in the mapped group that have a similar sales load structure to Class I of the fund (referred to as the "similar sales load structure group"); and (iv) total expense comparisons of Class I of the fund relative to funds and classes in the similar sales load structure group that are similar in size and management fee structure to the fund (referred to as the "total expense asset size peer group"). The total expense asset size peer group comparison excludes performance adjustments and fund-paid 12b-1 fees to eliminate variability in fee structures.
The information provided to the Board indicated that the fund's management fee rate ranked above the competitive median of the mapped group for the 12-month period ended September 30, 2023 and below the competitive median of the asset size peer group for the 12-month period ended September 30, 2023. Further, the information provided to the Board indicated that the total expense ratio of Class I of the fund ranked below the competitive median of the similar sales load structure group for the 12-month period ended September 30, 2023 and below the competitive median of the total expense asset size peer group for the 12-month period ended September 30, 2023. The Board noted that the fund's management fee rate was one basis point above the median and that Fidelity has said that it believes the fund's management fee rate is reasonable for the overall value of the nature and quality of services that the management fee covers.
The Board noted that a different variable management fee rate is applicable to each class of the fund. The Board considered that the difference in management fee rates between classes is the result of separate arrangements for class-level services and/or waivers of certain expenses and not the result of any difference in advisory or custodial fees or other expenses related to the management of the fund's assets, which do not vary by class.
The Board also considered that the fund's management fee is subject to upward or downward adjustment depending upon whether, and to what extent, the fund's investment performance for the performance period (a rolling 36-month period) exceeds, or is exceeded by, a securities index, thus leading to a performance adjustment for the same period. The Board noted that the performance adjustment provides FMR with a strong economic incentive to seek to achieve superior long-term performance for the fund's shareholders and helps to more closely align the interests of FMR and the shareholders of the fund.
In connection with its consideration of the fund's performance adjustment, the Board noted that the performance of Class I is used for purposes of determining the performance adjustment. The Board noted that to the extent the performance adjustment was based on the performance of a share class with higher total annual operating expenses, the fund would be subject to a smaller positive and larger negative performance adjustment. The Board considered the appropriateness of the use of Class I as the basis for the performance adjustment. The Board noted that Class I is typically the largest class (reflecting the actual investment experience for the plurality of shareholders), employs a standard expense structure, and does not include fund-paid 12b-1 fees, which Fidelity believes makes it a more appropriate measurement of Fidelity's investment skill.
Other Contractual Arrangements. The Board further considered that FMR has contractually agreed to reimburse Class A, Class M, Class C, and Class I of the fund to the extent that total operating expenses, with certain exceptions, as a percentage of their respective average net assets, exceed 1.30%, 1.55%, 2.05%, and 1.05% through February 28, 2025.
Fees Charged to Other Fidelity Clients. The Board also considered Fidelity fee structures and other information with respect to clients of Fidelity, such as other funds advised or subadvised by Fidelity, pension plan clients, and other institutional clients with similar mandates. The Board noted that a joint ad hoc committee created by it and the boards of other Fidelity funds periodically reviews and compares Fidelity's institutional investment advisory business with its business of providing services to the Fidelity funds and also noted the most recent findings of the committee. The Board noted that the committee's review included a consideration of the differences in services provided, fees charged, and costs incurred, as well as competition in the markets serving the different categories of clients.
Based on its review, the Board concluded that the fund's management fee, including the use of Class I as the basis for the performance adjustment, is fair and reasonable in light of the services that the fund receives and the other factors considered. Further, based on its review of total expense ratios and fees charged to other Fidelity clients, the Board concluded that the total expense ratio of each class of the fund was reasonable in light of the services that the fund and its shareholders receive and the other factors considered.
Costs of the Services and Profitability. The Board considered the revenues earned and the expenses incurred by Fidelity in conducting the business of developing, marketing, distributing, managing, administering and servicing the fund and servicing the fund's shareholders. The Board also considered the level of Fidelity's profits in respect of all the Fidelity funds.
On an annual basis, Fidelity presents to the Board information about the profitability of its relationships with the fund. Fidelity calculates profitability information for each fund, as well as aggregate profitability information for groups of Fidelity funds and all Fidelity funds, using a series of detailed revenue and cost allocation methodologies which originate with the books and records of Fidelity on which Fidelity's audited financial statements are based. The Audit Committee of the Board reviews any significant changes from the prior year's methodologies.
A public accounting firm has been engaged annually by the Board as part of the Board's assessment of Fidelity's profitability analysis. The engagement includes the review and assessment of the methodologies used by Fidelity in determining the revenues and expenses attributable to Fidelity's fund business, and completion of agreed-upon procedures in respect of the mathematical accuracy of certain fund profitability information and its conformity to established allocation methodologies. After considering the reports issued under the engagement and information provided by Fidelity, the Board concluded that while other allocation methods may also be reasonable, Fidelity's profitability methodologies are reasonable in all material respects.
The Board also reviewed Fidelity's non-fund businesses and potential indirect benefits such businesses may have received as a result of their association with Fidelity's fund business (i.e., fall-out benefits) as well as cases where Fidelity's affiliates may benefit from the funds' business. The Board considered areas where potential indirect benefits to the Fidelity funds from their relationships with Fidelity may exist. The Board's consideration of these matters was informed by the findings of a joint ad hoc committee created by it and the boards of other Fidelity funds to evaluate potential fall-out benefits.
The Board considered the costs of the services provided by and the profits realized by Fidelity in connection with the operation of the fund and was satisfied that the profitability was not excessive.
Economies of Scale. The Board considered whether there have been economies of scale in respect of the management of the Fidelity funds, whether the Fidelity funds (including the fund) have appropriately benefited from any such economies of scale, and whether there is potential for realization of any further economies of scale. The Board considered the extent to which the fund will benefit from economies of scale as assets grow through increased services to the fund, through waivers or reimbursements, or through fee or expense ratio reductions. The Board also noted that a committee created by it and the boards of other Fidelity funds periodically analyzes whether Fidelity attains economies of scale in respect of the management and servicing of the Fidelity funds, whether the Fidelity funds have appropriately benefited from such economies of scale, and whether there is potential for realization of any further economies of scale.
The Board recognized that the fund's management contract incorporates a variable management fee structure, which provides breakpoints as a way to share, in part, any potential economies of scale that may exist at the asset class level and through a discount that considers both fund size and total assets of the four applicable asset classes. The Board considered that the variable management fee is designed to deliver the benefits of economies of scale to fund shareholders even if assets of any particular fund are unchanged or have declined, because some portion of Fidelity's costs are attributable to services provided to all funds subject to the variable management fee, and all such funds benefit if those costs can be allocated among more assets. The Board concluded that, given the variable management fee structure, fund shareholders will benefit from lower management fees due to the application of the breakpoints and discount factor, regardless of whether Fidelity achieves any such economies of scale.
The Board concluded, taking into account the analysis of the committee, that economies of scale, if any, are being appropriately shared between fund shareholders and Fidelity.
Additional Information Requested by the Board. In order to develop fully the factual basis for consideration of the Fidelity funds' advisory contracts, the Board requested and received additional information on certain topics, including but not limited to: (i) fund flow and performance trends, in particular the underperformance of certain funds and strategies, and Fidelity's long-term strategies for certain funds; (ii) the operation of performance fees and the rationale for implementing performance fees on certain categories of funds but not others; (iii) Fidelity's pricing philosophy compared to competitors; (iv) fund profitability methodology and data; (v) evaluation of competitive fund data and peer group classifications and fee and expense comparisons; (vi) the management fee and expense structures for different funds and classes and information about the differences between various fee and expense structures; (vii) the variable management fee implemented for certain funds effective March 1, 2024; and (viii) information regarding other accounts managed by Fidelity and the funds' sub-advisory arrangements.
Conclusion. Based on its evaluation of all of the conclusions noted above, and after considering all factors it believed relevant, the Board, including the Independent Trustees, concluded that the advisory and sub-advisory fee arrangements are fair and reasonable in light of all of the surrounding circumstances and that the fund's Advisory Contracts should be renewed through May 31, 2025.
1.728713.125
AGLO-ANN-1224
Fidelity Advisor® Diversified International Fund
Annual Report
October 31, 2024
Contents
To view a fund's proxy voting guidelines and proxy voting record for the 12-month period ended June 30, visit http://www.fidelity.com/proxyvotingresults or visit the Securities and Exchange Commission's (SEC) web site at http://www.sec.gov.
You may also call 1-877-208-0098 to request a free copy of the proxy voting guidelines.
Standard & Poor's, S&P and S&P 500 are registered service marks of The McGraw-Hill Companies, Inc. and have been licensed for use by Fidelity Distributors Corporation.
Other third-party marks appearing herein are the property of their respective owners.
All other marks appearing herein are registered or unregistered trademarks or service marks of FMR LLC or an affiliated company. © 2024 FMR LLC. All rights reserved.
This report and the financial statements contained herein are submitted for the general information of the shareholders of the Fund. This report is not authorized for distribution to prospective investors in the Fund unless preceded or accompanied by an effective prospectus.
A fund files its complete schedule of portfolio holdings with the SEC for the first and third quarters of each fiscal year on Form N-PORT. Forms N-PORT are available on the SEC's web site at http://www.sec.gov. A fund's Forms N-PORT may be reviewed and copied at the SEC's Public Reference Room in Washington, DC. Information regarding the operation of the SEC's Public Reference Room may be obtained by calling 1-800-SEC-0330.
For a complete list of a fund's portfolio holdings, view the most recent holdings listing, semiannual report, or annual report on Fidelity's web site at http://www.fidelity.com, http://www.institutional.fidelity.com, or http://www.401k.com, as applicable.
NOT FDIC INSURED •MAY LOSE VALUE •NO BANK GUARANTEE
Neither the Fund nor Fidelity Distributors Corporation is a bank.
Item 7: Financial Statements and Financial Highlights for Open-End Management Investment Companies (Annual Report)
Fidelity Advisor® Diversified International Fund
Schedule of Investments October 31, 2024
Showing Percentage of Net Assets
| Common Stocks - 96.2% |
| | | Shares | Value ($) (000s) |
| Australia - 1.0% | | | |
| Aristocrat Leisure Ltd. | | 239,966 | 9,656 |
| CAR Group Ltd. | | 94,070 | 2,317 |
| Steadfast Group Ltd. | | 521,145 | 1,877 |
TOTAL AUSTRALIA | | | 13,850 |
| Belgium - 0.8% | | | |
| UCB SA | | 59,958 | 11,531 |
| Canada - 6.5% | | | |
| Alimentation Couche-Tard, Inc. (multi-vtg.) | | 245,616 | 12,809 |
| Cameco Corp. | | 144,984 | 7,576 |
| Canadian Natural Resources Ltd. | | 408,302 | 13,885 |
| Constellation Software, Inc. | | 4,948 | 14,922 |
| Constellation Software, Inc. warrants 3/31/40 (a)(b) | | 7,474 | 0 |
| Franco-Nevada Corp. | | 70,089 | 9,304 |
| Imperial Oil Ltd. | | 146,974 | 10,967 |
| Ivanhoe Mines Ltd. (a) | | 726,230 | 9,602 |
| Lumine Group, Inc. (a) | | 20,819 | 485 |
| MEG Energy Corp. | | 202,469 | 3,701 |
| South Bow Corp. | | 66,200 | 1,653 |
| Thomson Reuters Corp. | | 40,047 | 6,555 |
TOTAL CANADA | | | 91,459 |
| China - 0.8% | | | |
| Chervon Holdings Ltd. | | 265,595 | 699 |
| NXP Semiconductors NV | | 43,595 | 10,223 |
TOTAL CHINA | | | 10,922 |
| Denmark - 3.5% | | | |
| DSV A/S | | 63,400 | 13,780 |
| Novo Nordisk A/S Series B | | 310,197 | 34,793 |
TOTAL DENMARK | | | 48,573 |
| France - 8.1% | | | |
| Air Liquide SA | | 95,818 | 17,180 |
| Alten SA | | 9,460 | 800 |
| AXA SA | | 294,017 | 11,040 |
| Capgemini SA | | 78,921 | 13,691 |
| Danone SA | | 41,800 | 2,986 |
| EssilorLuxottica SA | | 52,485 | 12,297 |
| Legrand SA | | 92,741 | 10,468 |
| LVMH Moet Hennessy Louis Vuitton SE | | 31,956 | 21,274 |
| Pernod Ricard SA | | 265 | 33 |
| Safran SA | | 60,258 | 13,640 |
| Thales SA | | 66,493 | 10,715 |
TOTAL FRANCE | | | 114,124 |
| Germany - 8.7% | | | |
| Allianz SE | | 67,590 | 21,278 |
| BioNTech SE ADR (a) | | 31,700 | 3,585 |
| Deutsche Borse AG | | 64,068 | 14,882 |
| Fresenius SE & Co. KGaA (a) | | 177,900 | 6,486 |
| Hannover Reuck SE | | 37,536 | 9,860 |
| HeidelbergCement AG | | 25,368 | 2,793 |
| Merck KGaA | | 69,196 | 11,441 |
| Muenchener Rueckversicherungs-Gesellschaft AG in Muenchen | | 25,082 | 12,826 |
| Rheinmetall AG | | 904 | 465 |
| SAP SE | | 143,074 | 33,406 |
| Siemens AG | | 23,280 | 4,529 |
TOTAL GERMANY | | | 121,551 |
| Hong Kong - 0.8% | | | |
| AIA Group Ltd. | | 1,437,382 | 11,344 |
| India - 2.3% | | | |
| Axis Bank Ltd. | | 364,800 | 5,011 |
| Fairfax India Holdings Corp. (a)(c) | | 168,624 | 2,470 |
| HDFC Bank Ltd. | | 720,600 | 14,811 |
| Hindustan Aeronautics Ltd. | | 31,400 | 1,580 |
| Reliance Industries Ltd. | | 247,375 | 3,911 |
| Reliance Industries Ltd. (a) | | 247,375 | 3,883 |
TOTAL INDIA | | | 31,666 |
| Indonesia - 0.6% | | | |
| PT Bank Central Asia Tbk | | 12,134,469 | 7,853 |
| Ireland - 0.7% | | | |
| Kingspan Group PLC (Ireland) | | 120,111 | 10,537 |
| Italy - 2.7% | | | |
| FinecoBank SpA | | 455,767 | 7,280 |
| Interpump Group SpA | | 31,519 | 1,400 |
| Prysmian SpA | | 67,900 | 4,787 |
| Ryanair Holdings PLC sponsored ADR | | 82,785 | 3,664 |
| UniCredit SpA | | 484,236 | 21,422 |
TOTAL ITALY | | | 38,553 |
| Japan - 17.1% | | | |
| BayCurrent Consulting, Inc. | | 122,759 | 3,990 |
| Capcom Co. Ltd. | | 199,750 | 3,953 |
| Fast Retailing Co. Ltd. | | 31,416 | 10,044 |
| Fuji Electric Co. Ltd. | | 147,750 | 7,525 |
| FUJIFILM Holdings Corp. | | 426,514 | 10,146 |
| Fujitsu Ltd. | | 361,353 | 6,947 |
| Hitachi Ltd. | | 1,593,240 | 40,033 |
| Hoya Corp. | | 133,785 | 17,900 |
| IHI Corp. | | 27,100 | 1,443 |
| Itochu Corp. | | 314,515 | 15,558 |
| Kansai Paint Co. Ltd. | | 128,200 | 2,088 |
| Keyence Corp. | | 25,557 | 11,537 |
| Mitsubishi Electric Corp. | | 450,052 | 7,918 |
| Mitsubishi Heavy Industries Ltd. | | 1,434,918 | 20,257 |
| Mitsui & Co. Ltd. | | 216,900 | 4,422 |
| ORIX Corp. | | 479,171 | 10,096 |
| Renesas Electronics Corp. | | 520,244 | 6,970 |
| Rohto Pharmaceutical Co. Ltd. | | 66,500 | 1,495 |
| Shin-Etsu Chemical Co. Ltd. | | 573,654 | 21,021 |
| Sumitomo Mitsui Financial Group, Inc. | | 418,230 | 8,873 |
| Suzuki Motor Corp. | | 218,950 | 2,173 |
| Tokio Marine Holdings, Inc. | | 496,271 | 17,874 |
| Tokyo Electron Ltd. | | 53,830 | 7,921 |
TOTAL JAPAN | | | 240,184 |
| Luxembourg - 0.4% | | | |
| CVC Capital Partners PLC (c) | | 300,100 | 6,297 |
| Netherlands - 5.3% | | | |
| ASML Holding NV (depository receipt) | | 57,450 | 38,638 |
| BE Semiconductor Industries NV | | 47,945 | 5,108 |
| IMCD NV | | 51,375 | 8,162 |
| Wolters Kluwer NV | | 133,139 | 22,404 |
TOTAL NETHERLANDS | | | 74,312 |
| Portugal - 0.1% | | | |
| Galp Energia SGPS SA | | 126,929 | 2,164 |
| Spain - 2.4% | | | |
| Banco Santander SA (Spain) | | 2,517,196 | 12,299 |
| CaixaBank SA | | 1,891,722 | 11,528 |
| Industria de Diseno Textil SA (d) | | 162,670 | 9,254 |
TOTAL SPAIN | | | 33,081 |
| Sweden - 3.0% | | | |
| Atlas Copco AB (A Shares) | | 610,448 | 10,074 |
| Indutrade AB | | 516,471 | 13,990 |
| Investor AB (B Shares) | | 604,891 | 17,114 |
| Kry International AB (a)(b)(e) | | 15,457 | 324 |
TOTAL SWEDEN | | | 41,502 |
| Switzerland - 2.2% | | | |
| Compagnie Financiere Richemont SA Series A | | 68,774 | 10,014 |
| Galderma Group AG | | 37,827 | 3,540 |
| Partners Group Holding AG | | 3,719 | 5,138 |
| Sika AG | | 29,208 | 8,134 |
| UBS Group AG | | 149,563 | 4,597 |
TOTAL SWITZERLAND | | | 31,423 |
| Taiwan - 2.5% | | | |
| Taiwan Semiconductor Manufacturing Co. Ltd. sponsored ADR | | 182,267 | 34,729 |
| United Kingdom - 14.4% | | | |
| 3i Group PLC | | 264,781 | 10,858 |
| Ashtead Group PLC | | 75,169 | 5,610 |
| AstraZeneca PLC (United Kingdom) | | 182,189 | 25,924 |
| B&M European Value Retail SA | | 273,780 | 1,368 |
| BAE Systems PLC | | 1,117,993 | 18,019 |
| Big Yellow Group PLC | | 142,618 | 2,221 |
| Compass Group PLC | | 533,258 | 17,318 |
| Diageo PLC | | 221,619 | 6,844 |
| Flutter Entertainment PLC (a) | | 24,785 | 5,797 |
| Games Workshop Group PLC | | 22,628 | 3,490 |
| InterContinental Hotel Group PLC | | 112,133 | 12,368 |
| Lloyds Banking Group PLC | | 18,243,900 | 12,523 |
| London Stock Exchange Group PLC | | 163,555 | 22,168 |
| RELX PLC (Euronext N.V.) | | 538,472 | 24,964 |
| Rolls-Royce Holdings PLC (a) | | 2,156,738 | 14,882 |
| RS GROUP PLC | | 603,792 | 5,411 |
| Sage Group PLC | | 491,171 | 6,140 |
| Starling Bank Ltd. Series D (a)(b)(e) | | 1,191,700 | 4,871 |
| Unilever PLC | | 23,100 | 1,409 |
TOTAL UNITED KINGDOM | | | 202,185 |
| United States of America - 12.3% | | | |
| Alcon, Inc. (Switzerland) | | 192,054 | 17,699 |
| CRH PLC | | 170,447 | 16,251 |
| Experian PLC | | 154,890 | 7,544 |
| Ferguson Enterprises, Inc. | | 77,497 | 15,309 |
| Holcim AG | | 143,117 | 14,100 |
| Linde PLC | | 38,242 | 17,444 |
| Marsh & McLennan Companies, Inc. | | 58,577 | 12,784 |
| Marvell Technology, Inc. | | 140,754 | 11,276 |
| MasterCard, Inc. Class A | | 21,744 | 10,863 |
| Nestle SA (Reg. S) | | 14,166 | 1,339 |
| S&P Global, Inc. | | 19,055 | 9,153 |
| Schneider Electric SA | | 64,119 | 16,610 |
| Shell PLC (London) | | 654,701 | 21,859 |
TOTAL UNITED STATES OF AMERICA | | | 172,231 |
| TOTAL COMMON STOCKS (Cost $845,866) | | | 1,350,071 |
| | | | |
| Convertible Preferred Stocks - 0.5% |
| | | Shares | Value ($) (000s) |
| Estonia - 0.1% | | | |
| Bolt Technology OU Series E (a)(b)(e) | | 10,541 | 1,935 |
| United States of America - 0.4% | | | |
| Wasabi Holdings, Inc.: | | | |
| Series C (a)(b)(e) | | 372,910 | 5,027 |
| Series D (a)(b)(e) | | 39,419 | 663 |
TOTAL UNITED STATES OF AMERICA | | | 5,690 |
| TOTAL CONVERTIBLE PREFERRED STOCKS (Cost $7,351) | | | 7,625 |
| | | | |
| Money Market Funds - 3.3% |
| | | Shares | Value ($) (000s) |
| Fidelity Cash Central Fund 4.87% (f) | | 38,818,546 | 38,826 |
| Fidelity Securities Lending Cash Central Fund 4.87% (f)(g) | | 7,976,417 | 7,977 |
| TOTAL MONEY MARKET FUNDS (Cost $46,803) | | | 46,803 |
| | | | |
| TOTAL INVESTMENT IN SECURITIES - 100.0% (Cost $900,020) | 1,404,499 |
NET OTHER ASSETS (LIABILITIES) - 0.0% | (458) |
| NET ASSETS - 100.0% | 1,404,041 |
| | |
Any values shown as $0 in the Schedule of Investments may reflect amounts less than $500.
Legend
| (c) | Security exempt from registration under Rule 144A of the Securities Act of 1933. These securities may be resold in transactions exempt from registration, normally to qualified institutional buyers. At the end of the period, the value of these securities amounted to $8,767,000 or 0.6% of net assets. |
| (d) | Security or a portion of the security is on loan at period end. |
| (e) | Restricted securities (including private placements) - Investment in securities not registered under the Securities Act of 1933 (excluding 144A issues). At the end of the period, the value of restricted securities (excluding 144A issues) amounted to $12,820,000 or 0.9% of net assets. |
| (f) | Affiliated fund that is generally available only to investment companies and other accounts managed by Fidelity Investments. The rate quoted is the annualized seven-day yield of the fund at period end. A complete unaudited listing of the fund's holdings as of its most recent quarter end is available upon request. In addition, each Fidelity Central Fund's financial statements, which are not covered by the Fund's Report of Independent Registered Public Accounting Firm, are available on the SEC's website or upon request. |
| (g) | Investment made with cash collateral received from securities on loan. |
| Additional information on each restricted holding is as follows: |
| Security | Acquisition Date | Acquisition Cost ($) (000s) |
| Bolt Technology OU Series E | 1/03/22 | 2,739 |
| | | |
| Kry International AB | 5/14/21 - 10/30/24 | 1,022 |
| | | |
| Starling Bank Ltd. Series D | 6/18/21 - 4/05/22 | 2,274 |
| | | |
| Wasabi Holdings, Inc. Series C | 3/31/21 | 4,052 |
| | | |
| Wasabi Holdings, Inc. Series D | 9/09/22 | 560 |
| | | |
Affiliated Central Funds
Fiscal year to date information regarding the Fund's investments in Fidelity Central Funds, including the ownership percentage, is presented below.
| Affiliate (Amounts in thousands) | Value, beginning of period ($) | Purchases ($) | Sales Proceeds ($) | Dividend Income ($) | Realized Gain (loss) ($) | Change in Unrealized appreciation (depreciation) ($) | Value, end of period ($) | % ownership, end of period |
| Fidelity Cash Central Fund 4.87% | 62,960 | 213,849 | 237,983 | 2,186 | - | - | 38,826 | 0.1% |
| Fidelity Securities Lending Cash Central Fund 4.87% | 6,177 | 146,435 | 144,635 | 34 | - | - | 7,977 | 0.0% |
| Total | 69,137 | 360,284 | 382,618 | 2,220 | - | - | 46,803 | |
| | | | | | | | | |
Amounts in the dividend income column in the above table include any capital gain distributions from underlying funds, which are presented in the corresponding line item in the Statement of Operations, if applicable.
Amounts in the dividend income column for Fidelity Securities Lending Cash Central Fund represents the income earned on investing cash collateral, less rebates paid to borrowers and any lending agent fees associated with the loan, plus any premium payments received for lending certain types of securities.
Amounts included in the purchases and sales proceeds columns may include in-kind transactions, if applicable.
Investment Valuation
The following is a summary of the inputs used, as of October 31, 2024, involving the Fund's assets and liabilities carried at fair value. The inputs or methodology used for valuing securities may not be an indication of the risk associated with investing in those securities. For more information on valuation inputs, and their aggregation into the levels used below, please refer to the Investment Valuation section in the accompanying Notes to Financial Statements.
| Valuation Inputs at Reporting Date: |
Description (Amounts in thousands) | Total ($) | Level 1 ($) | Level 2 ($) | Level 3 ($) |
Investments in Securities: | | | | |
|
| Equities: | | | | |
Communication Services | 6,270 | - | 6,270 | - |
Consumer Discretionary | 103,455 | 19,909 | 83,546 | - |
Consumer Staples | 26,915 | 12,842 | 14,073 | - |
Energy | 69,599 | 39,946 | 29,653 | - |
Financials | 318,990 | 108,895 | 205,224 | 4,871 |
Health Care | 145,196 | 66,579 | 78,617 | - |
Industrials | 346,245 | 155,297 | 190,948 | - |
Information Technology | 220,888 | 122,321 | 90,618 | 7,949 |
Materials | 117,917 | 77,628 | 40,289 | - |
Real Estate | 2,221 | 2,221 | - | - |
|
| Money Market Funds | 46,803 | 46,803 | - | - |
| Total Investments in Securities: | 1,404,499 | 652,441 | 739,238 | 12,820 |
Financial Statements
| Statement of Assets and Liabilities |
As of October 31, 2024 Amounts in thousands (except per-share amounts) |
| Assets | | | | |
| Investment in securities, at value (including securities loaned of $7,389) - See accompanying schedule: | | | | |
Unaffiliated issuers (cost $853,217) | $ | 1,357,696 | | |
Fidelity Central Funds (cost $46,803) | | 46,803 | | |
| | | | | |
| | | | | |
| Total Investment in Securities (cost $900,020) | | | $ | 1,404,499 |
| Receivable for investments sold | | | | 6,507 |
| Receivable for fund shares sold | | | | 818 |
| Dividends receivable | | | | 2,492 |
| Reclaims receivable | | | | 4,639 |
| Distributions receivable from Fidelity Central Funds | | | | 249 |
| Prepaid expenses | | | | 2 |
| Other receivables | | | | 355 |
Total assets | | | | 1,419,561 |
| Liabilities | | | | |
| Payable for investments purchased | $ | 4,015 | | |
| Payable for fund shares redeemed | | 847 | | |
| Accrued management fee | | 989 | | |
| Distribution and service plan fees payable | | 175 | | |
| Deferred taxes | | 1,298 | | |
| Other payables and accrued expenses | | 219 | | |
| Collateral on securities loaned | | 7,977 | | |
| Total liabilities | | | | 15,520 |
| Net Assets | | | $ | 1,404,041 |
| Net Assets consist of: | | | | |
| Paid in capital | | | $ | 835,929 |
| Total accumulated earnings (loss) | | | | 568,112 |
| Net Assets | | | $ | 1,404,041 |
| | | | | |
| Net Asset Value and Maximum Offering Price | | | | |
| Class A : | | | | |
Net Asset Value and redemption price per share ($480,646 ÷ 17,772 shares)(a) | | | $ | 27.05 |
| Maximum offering price per share (100/94.25 of $27.05) | | | $ | 28.70 |
| Class M : | | | | |
Net Asset Value and redemption price per share ($132,129 ÷ 4,954 shares)(a) | | | $ | 26.67 |
| Maximum offering price per share (100/96.50 of $26.67) | | | $ | 27.64 |
| Class C : | | | | |
Net Asset Value and offering price per share ($16,784 ÷ 662 shares)(a) | | | $ | 25.35 |
| Class I : | | | | |
Net Asset Value, offering price and redemption price per share ($497,901 ÷ 17,977 shares) | | | $ | 27.70 |
| Class Z : | | | | |
Net Asset Value, offering price and redemption price per share ($276,581 ÷ 10,001 shares) | | | $ | 27.66 |
(a)Redemption price per share is equal to net asset value less any applicable contingent deferred sales charge. |
| Statement of Operations |
| Year ended October 31, 2024 Amounts in thousands |
| Investment Income | | | | |
| Dividends | | | $ | 28,600 |
| Income from Fidelity Central Funds (including $34 from security lending) | | | | 2,220 |
| Income before foreign taxes withheld | | | $ | 30,820 |
| Less foreign taxes withheld | | | | (2,631) |
| Total income | | | | 28,189 |
| Expenses | | | | |
| Management fee | $ | 10,999 | | |
| Transfer agent fees | | 771 | | |
| Distribution and service plan fees | | 2,072 | | |
| Accounting fees | | 206 | | |
| Custodian fees and expenses | | 116 | | |
| Independent trustees' fees and expenses | | 7 | | |
| Registration fees | | 92 | | |
| Audit fees | | 167 | | |
| Legal | | 3 | | |
| Miscellaneous | | 38 | | |
| Total expenses before reductions | | 14,471 | | |
| Expense reductions | | (67) | | |
| Total expenses after reductions | | | | 14,404 |
| Net Investment income (loss) | | | | 13,785 |
| Realized and Unrealized Gain (Loss) | | | | |
| Net realized gain (loss) on: | | | | |
| Investment Securities: | | | | |
| Unaffiliated issuers (net of foreign taxes of $820) | | 61,970 | | |
| Redemptions in-kind | | 48,796 | | |
| Foreign currency transactions | | (100) | | |
| Total net realized gain (loss) | | | | 110,666 |
| Change in net unrealized appreciation (depreciation) on: | | | | |
| Investment Securities: | | | | |
| Unaffiliated issuers (net of increase in deferred foreign taxes of $2) | | 188,211 | | |
| Assets and liabilities in foreign currencies | | 86 | | |
| Total change in net unrealized appreciation (depreciation) | | | | 188,297 |
| Net gain (loss) | | | | 298,963 |
| Net increase (decrease) in net assets resulting from operations | | | $ | 312,748 |
| Statement of Changes in Net Assets |
| |
| Amount in thousands | | Year ended October 31, 2024 | | Year ended October 31, 2023 |
| Increase (Decrease) in Net Assets | | | | |
| Operations | | | | |
| Net investment income (loss) | $ | 13,785 | $ | 15,905 |
| Net realized gain (loss) | | 110,666 | | 56,469 |
| Change in net unrealized appreciation (depreciation) | | 188,297 | | 82,113 |
| Net increase (decrease) in net assets resulting from operations | | 312,748 | | 154,487 |
| Distributions to shareholders | | (58,942) | | (28,131) |
| | | | | |
| Share transactions - net increase (decrease) | | (159,238) | | (103,254) |
| Total increase (decrease) in net assets | | 94,568 | | 23,102 |
| | | | | |
| Net Assets | | | | |
| Beginning of period | | 1,309,473 | | 1,286,371 |
| End of period | $ | 1,404,041 | $ | 1,309,473 |
| | | | | |
| | | | | |
Financial Highlights
Fidelity Advisor® Diversified International Fund Class A |
| |
| Years ended October 31, | | 2024 | | 2023 | | 2022 | | 2021 | | 2020 |
Selected Per-Share Data | | | | | | | | | | |
| Net asset value, beginning of period | $ | 22.68 | $ | 20.71 | $ | 32.52 | $ | 25.10 | $ | 23.28 |
| Income from Investment Operations | | | | | | | | | | |
Net investment income (loss) A,B | | .21 | | .23 | | .16 | | .09 | | .04 |
| Net realized and unrealized gain (loss) | | 5.17 | | 2.16 | | (8.81) | | 7.33 | | 2.11 |
| Total from investment operations | | 5.38 | | 2.39 | | (8.65) | | 7.42 | | 2.15 |
| Distributions from net investment income | | (.31) | | (.02) | | (.31) | | - | | (.26) |
| Distributions from net realized gain | | (.71) | | (.40) | | (2.85) | | - | | (.07) |
| Total distributions | | (1.01) C | | (.42) | | (3.16) | | - | | (.33) |
| Net asset value, end of period | $ | 27.05 | $ | 22.68 | $ | 20.71 | $ | 32.52 | $ | 25.10 |
Total Return D,E | | | | 11.55% | | (29.28)% | | 29.56% | | 9.32% |
Ratios to Average Net Assets B,F,G | | | | | | | | | | |
| Expenses before reductions | | 1.14% | | 1.18% | | 1.16% | | 1.16% | | 1.18% |
| Expenses net of fee waivers, if any | | | | 1.17% | | 1.16% | | 1.15% | | 1.18% |
| Expenses net of all reductions | | 1.14% | | 1.17% | | 1.16% | | 1.15% | | 1.17% |
| Net investment income (loss) | | .81% | | .98% | | .65% | | .30% | | .16% |
| Supplemental Data | | | | | | | | | | |
| Net assets, end of period (in millions) | $ | 481 | $ | 421 | $ | 400 | $ | 621 | $ | 514 |
Portfolio turnover rate H | | | | 23% I | | 20% | | 30% | | 30% |
ACalculated based on average shares outstanding during the period.
BNet investment income (loss) is affected by the timing of the declaration of dividends by any underlying mutual funds or exchange-traded funds (ETFs). Net investment income (loss) of any mutual funds or ETFs is not included in the Fund's net investment income (loss) ratio.
CTotal distributions per share do not sum due to rounding.
DTotal returns would have been lower if certain expenses had not been reduced during the applicable periods shown.
ETotal returns do not include the effect of the sales charges.
FFees and expenses of any underlying mutual funds or exchange-traded funds (ETFs) are not included in the Fund's expense ratio. The Fund indirectly bears its proportionate share of these expenses. For additional expense information related to investments in Fidelity Central Funds, please refer to the "Investments in Fidelity Central Funds" note found in the Notes to Financial Statements section of the most recent Annual or Semi-Annual report.
GExpense ratios reflect operating expenses of the class. Expenses before reductions do not reflect amounts reimbursed, waived, or reduced through arrangements with the investment adviser, brokerage services, or other offset arrangements, if applicable, and do not represent the amount paid by the class during periods when reimbursements, waivers or reductions occur.
HAmount does not include the portfolio activity of any underlying mutual funds or exchange-traded funds (ETFs).
IPortfolio turnover rate excludes securities received or delivered in-kind.
Fidelity Advisor® Diversified International Fund Class M |
| |
| Years ended October 31, | | 2024 | | 2023 | | 2022 | | 2021 | | 2020 |
Selected Per-Share Data | | | | | | | | | | |
| Net asset value, beginning of period | $ | 22.37 | $ | 20.47 | $ | 32.17 | $ | 24.90 | $ | 23.10 |
| Income from Investment Operations | | | | | | | | | | |
Net investment income (loss) A,B | | .14 | | .17 | | .10 | | .01 | | (.03) |
| Net realized and unrealized gain (loss) | | 5.11 | | 2.13 | | (8.72) | | 7.26 | | 2.10 |
| Total from investment operations | | 5.25 | | 2.30 | | (8.62) | | 7.27 | | 2.07 |
| Distributions from net investment income | | (.24) | | - | | (.23) | | - | | (.20) |
| Distributions from net realized gain | | (.71) | | (.40) | | (2.85) | | - | | (.07) |
| Total distributions | | (.95) | | (.40) | | (3.08) | | - | | (.27) |
| Net asset value, end of period | $ | 26.67 | $ | 22.37 | $ | 20.47 | $ | 32.17 | $ | 24.90 |
Total Return C,D | | | | 11.24% | | (29.46)% | | 29.20% | | 9.04% |
Ratios to Average Net Assets B,E,F | | | | | | | | | | |
| Expenses before reductions | | 1.39% | | 1.44% | | 1.42% | | 1.41% | | 1.45% |
| Expenses net of fee waivers, if any | | | | 1.43% | | 1.41% | | 1.41% | | 1.45% |
| Expenses net of all reductions | | 1.39% | | 1.43% | | 1.41% | | 1.41% | | 1.44% |
| Net investment income (loss) | | .56% | | .73% | | .39% | | .04% | | (.11)% |
| Supplemental Data | | | | | | | | | | |
| Net assets, end of period (in millions) | $ | 132 | $ | 120 | $ | 118 | $ | 183 | $ | 159 |
Portfolio turnover rate G | | | | 23% H | | 20% | | 30% | | 30% |
ACalculated based on average shares outstanding during the period.
BNet investment income (loss) is affected by the timing of the declaration of dividends by any underlying mutual funds or exchange-traded funds (ETFs). Net investment income (loss) of any mutual funds or ETFs is not included in the Fund's net investment income (loss) ratio.
CTotal returns would have been lower if certain expenses had not been reduced during the applicable periods shown.
DTotal returns do not include the effect of the sales charges.
EFees and expenses of any underlying mutual funds or exchange-traded funds (ETFs) are not included in the Fund's expense ratio. The Fund indirectly bears its proportionate share of these expenses. For additional expense information related to investments in Fidelity Central Funds, please refer to the "Investments in Fidelity Central Funds" note found in the Notes to Financial Statements section of the most recent Annual or Semi-Annual report.
FExpense ratios reflect operating expenses of the class. Expenses before reductions do not reflect amounts reimbursed, waived, or reduced through arrangements with the investment adviser, brokerage services, or other offset arrangements, if applicable, and do not represent the amount paid by the class during periods when reimbursements, waivers or reductions occur.
GAmount does not include the portfolio activity of any underlying mutual funds or exchange-traded funds (ETFs).
HPortfolio turnover rate excludes securities received or delivered in-kind.
Fidelity Advisor® Diversified International Fund Class C |
| |
| Years ended October 31, | | 2024 | | 2023 | | 2022 | | 2021 | | 2020 |
Selected Per-Share Data | | | | | | | | | | |
| Net asset value, beginning of period | $ | 21.27 | $ | 19.58 | $ | 30.84 | $ | 23.99 | $ | 22.20 |
| Income from Investment Operations | | | | | | | | | | |
Net investment income (loss) A,B | | .02 | | .04 | | (.04) | | (.14) | | (.14) |
| Net realized and unrealized gain (loss) | | 4.86 | | 2.05 | | (8.37) | | 6.99 | | 2.01 |
| Total from investment operations | | 4.88 | | 2.09 | | (8.41) | | 6.85 | | 1.87 |
| Distributions from net investment income | | (.09) | | - | | - | | - | | (.01) |
| Distributions from net realized gain | | (.71) | | (.40) | | (2.85) | | - | | (.07) |
| Total distributions | | (.80) | | (.40) | | (2.85) | | - | | (.08) |
| Net asset value, end of period | $ | 25.35 | $ | 21.27 | $ | 19.58 | $ | 30.84 | $ | 23.99 |
Total Return C,D | | | | 10.67% | | (29.88)% | | 28.55% | | 8.44% |
Ratios to Average Net Assets B,E,F | | | | | | | | | | |
| Expenses before reductions | | 1.88% | | 1.99% | | 1.96% | | 1.95% | | 1.98% |
| Expenses net of fee waivers, if any | | | | 1.98% | | 1.96% | | 1.95% | | 1.98% |
| Expenses net of all reductions | | 1.88% | | 1.98% | | 1.96% | | 1.95% | | 1.96% |
| Net investment income (loss) | | .07% | | .18% | | (.16)% | | (.50)% | | (.64)% |
| Supplemental Data | | | | | | | | | | |
| Net assets, end of period (in millions) | $ | 17 | $ | 18 | $ | 21 | $ | 39 | $ | 48 |
Portfolio turnover rate G | | | | 23% H | | 20% | | 30% | | 30% |
ACalculated based on average shares outstanding during the period.
BNet investment income (loss) is affected by the timing of the declaration of dividends by any underlying mutual funds or exchange-traded funds (ETFs). Net investment income (loss) of any mutual funds or ETFs is not included in the Fund's net investment income (loss) ratio.
CTotal returns would have been lower if certain expenses had not been reduced during the applicable periods shown.
DTotal returns do not include the effect of the contingent deferred sales charge.
EFees and expenses of any underlying mutual funds or exchange-traded funds (ETFs) are not included in the Fund's expense ratio. The Fund indirectly bears its proportionate share of these expenses. For additional expense information related to investments in Fidelity Central Funds, please refer to the "Investments in Fidelity Central Funds" note found in the Notes to Financial Statements section of the most recent Annual or Semi-Annual report.
FExpense ratios reflect operating expenses of the class. Expenses before reductions do not reflect amounts reimbursed, waived, or reduced through arrangements with the investment adviser, brokerage services, or other offset arrangements, if applicable, and do not represent the amount paid by the class during periods when reimbursements, waivers or reductions occur.
GAmount does not include the portfolio activity of any underlying mutual funds or exchange-traded funds (ETFs).
HPortfolio turnover rate excludes securities received or delivered in-kind.
Fidelity Advisor® Diversified International Fund Class I |
| |
| Years ended October 31, | | 2024 | | 2023 | | 2022 | | 2021 | | 2020 |
Selected Per-Share Data | | | | | | | | | | |
| Net asset value, beginning of period | $ | 23.20 | $ | 21.19 | $ | 33.20 | $ | 25.57 | $ | 23.68 |
| Income from Investment Operations | | | | | | | | | | |
Net investment income (loss) A,B | | .28 | | .30 | | .23 | | .17 | | .10 |
| Net realized and unrealized gain (loss) | | 5.29 | | 2.20 | | (9.00) | | 7.47 | | 2.16 |
| Total from investment operations | | 5.57 | | 2.50 | | (8.77) | | 7.64 | | 2.26 |
| Distributions from net investment income | | (.36) | | (.09) | | (.39) | | (.01) | | (.30) |
| Distributions from net realized gain | | (.71) | | (.40) | | (2.85) | | - | | (.07) |
| Total distributions | | (1.07) | | (.49) | | (3.24) | | (.01) | | (.37) |
| Net asset value, end of period | $ | 27.70 | $ | 23.20 | $ | 21.19 | $ | 33.20 | $ | 25.57 |
Total Return C | | | | 11.80% | | (29.09)% | | 29.87% | | 9.63% |
Ratios to Average Net Assets A,D,E | | | | | | | | | | |
| Expenses before reductions | | .89% | | .94% | | .91% | | .90% | | .92% |
| Expenses net of fee waivers, if any | | | | .93% | | .91% | | .90% | | .92% |
| Expenses net of all reductions | | .89% | | .93% | | .91% | | .90% | | .91% |
| Net investment income (loss) | | 1.06% | | 1.23% | | .90% | | .55% | | .42% |
| Supplemental Data | | | | | | | | | | |
| Net assets, end of period (in millions) | $ | 498 | $ | 457 | $ | 457 | $ | 725 | $ | 595 |
Portfolio turnover rate F | | | | 23% G | | 20% | | 30% | | 30% |
ANet investment income (loss) is affected by the timing of the declaration of dividends by any underlying mutual funds or exchange-traded funds (ETFs). Net investment income (loss) of any mutual funds or ETFs is not included in the Fund's net investment income (loss) ratio.
BCalculated based on average shares outstanding during the period.
CTotal returns would have been lower if certain expenses had not been reduced during the applicable periods shown.
DExpense ratios reflect operating expenses of the class. Expenses before reductions do not reflect amounts reimbursed, waived, or reduced through arrangements with the investment adviser, brokerage services, or other offset arrangements, if applicable, and do not represent the amount paid by the class during periods when reimbursements, waivers or reductions occur.
EFees and expenses of any underlying mutual funds or exchange-traded funds (ETFs) are not included in the Fund's expense ratio. The Fund indirectly bears its proportionate share of these expenses. For additional expense information related to investments in Fidelity Central Funds, please refer to the "Investments in Fidelity Central Funds" note found in the Notes to Financial Statements section of the most recent Annual or Semi-Annual report.
FAmount does not include the portfolio activity of any underlying mutual funds or exchange-traded funds (ETFs).
GPortfolio turnover rate excludes securities received or delivered in-kind.
Fidelity Advisor® Diversified International Fund Class Z |
| |
| Years ended October 31, | | 2024 | | 2023 | | 2022 | | 2021 | | 2020 |
Selected Per-Share Data | | | | | | | | | | |
| Net asset value, beginning of period | $ | 23.17 | $ | 21.18 | $ | 33.19 | $ | 25.55 | $ | 23.67 |
| Income from Investment Operations | | | | | | | | | | |
Net investment income (loss) A,B | | .33 | | .34 | | .26 | | .22 | | .14 |
| Net realized and unrealized gain (loss) | | 5.27 | | 2.19 | | (8.98) | | 7.46 | | 2.15 |
| Total from investment operations | | 5.60 | | 2.53 | | (8.72) | | 7.68 | | 2.29 |
| Distributions from net investment income | | (.41) | | (.14) | | (.44) | | (.04) | | (.34) |
| Distributions from net realized gain | | (.71) | | (.40) | | (2.85) | | - | | (.07) |
| Total distributions | | (1.11) C | | (.54) | | (3.29) | | (.04) | | (.41) |
| Net asset value, end of period | $ | 27.66 | $ | 23.17 | $ | 21.18 | $ | 33.19 | $ | 25.55 |
Total Return D | | | | 11.96% | | (28.99)% | | 30.10% | | 9.78% |
Ratios to Average Net Assets B,E,F | | | | | | | | | | |
| Expenses before reductions | | .72% | | .77% | | .76% | | .76% | | .77% |
| Expenses net of fee waivers, if any | | | | .77% | | .75% | | .76% | | .77% |
| Expenses net of all reductions | | .72% | | .77% | | .75% | | .76% | | .76% |
| Net investment income (loss) | | 1.23% | | 1.39% | | 1.05% | | .70% | | .57% |
| Supplemental Data | | | | | | | | | | |
| Net assets, end of period (in millions) | $ | 277 | $ | 294 | $ | 290 | $ | 393 | $ | 289 |
Portfolio turnover rate G | | | | 23% H | | 20% | | 30% | | 30% |
ACalculated based on average shares outstanding during the period.
BNet investment income (loss) is affected by the timing of the declaration of dividends by any underlying mutual funds or exchange-traded funds (ETFs). Net investment income (loss) of any mutual funds or ETFs is not included in the Fund's net investment income (loss) ratio.
CTotal distributions per share do not sum due to rounding.
DTotal returns would have been lower if certain expenses had not been reduced during the applicable periods shown.
EFees and expenses of any underlying mutual funds or exchange-traded funds (ETFs) are not included in the Fund's expense ratio. The Fund indirectly bears its proportionate share of these expenses. For additional expense information related to investments in Fidelity Central Funds, please refer to the "Investments in Fidelity Central Funds" note found in the Notes to Financial Statements section of the most recent Annual or Semi-Annual report.
FExpense ratios reflect operating expenses of the class. Expenses before reductions do not reflect amounts reimbursed, waived, or reduced through arrangements with the investment adviser, brokerage services, or other offset arrangements, if applicable, and do not represent the amount paid by the class during periods when reimbursements, waivers or reductions occur.
GAmount does not include the portfolio activity of any underlying mutual funds or exchange-traded funds (ETFs).
HPortfolio turnover rate excludes securities received or delivered in-kind.
Notes to Financial Statements
For the period ended October 31, 2024
(Amounts in thousands except percentages)
1. Organization.
Fidelity Advisor Diversified International Fund (the Fund) is a fund of Fidelity Advisor Series VIII (the Trust) and is authorized to issue an unlimited number of shares. The Trust is registered under the Investment Company Act of 1940, as amended (the 1940 Act), as an open-end management investment company organized as a Massachusetts business trust. The Fund offers Class A, Class M, Class C, Class I and Class Z shares, each of which has equal rights as to assets and voting privileges. Class A, Class M, Class C, Class I and Class Z are Fidelity Advisor classes. Each class has exclusive voting rights with respect to matters that affect that class. Class C shares will automatically convert to Class A shares after a holding period of eight years from the initial date of purchase, with certain exceptions.
2. Investments in Fidelity Central Funds.
Funds may invest in Fidelity Central Funds, which are open-end investment companies generally available only to other investment companies and accounts managed by the investment adviser and its affiliates. The Schedule of Investments lists any Fidelity Central Funds held as an investment as of period end, but does not include the underlying holdings of each Fidelity Central Fund. An investing fund indirectly bears its proportionate share of the expenses of the underlying Fidelity Central Funds.
Based on its investment objective, each Fidelity Central Fund may invest or participate in various investment vehicles or strategies that are similar to those of the investing fund. These strategies are consistent with the investment objectives of the investing fund and may involve certain economic risks which may cause a decline in value of each of the Fidelity Central Funds and thus a decline in the value of the investing fund.
| Fidelity Central Fund | Investment Manager | Investment Objective | Investment Practices | Expense RatioA |
| Fidelity Money Market Central Funds | Fidelity Management & Research Company LLC (FMR) | Each fund seeks to obtain a high level of current income consistent with the preservation of capital and liquidity. | Short-term Investments | Less than .005% |
A Expenses expressed as a percentage of average net assets and are as of each underlying Central Fund's most recent annual or semi-annual shareholder report.
A complete unaudited list of holdings for each Fidelity Central Fund is available upon request or at the Securities and Exchange Commission website at www.sec.gov. In addition, the financial statements of the Fidelity Central Funds which contain the significant accounting policies (including investment valuation policies) of those funds, and are not covered by the Report of Independent Registered Public Accounting Firm, are available on the Securities and Exchange Commission website or upon request.
3. Significant Accounting Policies.
The Fund is an investment company and applies the accounting and reporting guidance of the Financial Accounting Standards Board (FASB) Accounting Standards Codification Topic 946 Financial Services - Investment Companies. The financial statements have been prepared in conformity with accounting principles generally accepted in the United States of America (GAAP), which require management to make certain estimates and assumptions at the date of the financial statements. Actual results could differ from those estimates. Subsequent events, if any, through the date that the financial statements were issued have been evaluated in the preparation of the financial statements. The Fund's Schedule of Investments lists any underlying mutual funds or exchange-traded funds (ETFs) but does not include the underlying holdings of these funds. The following summarizes the significant accounting policies of the Fund:
Investment Valuation. Investments are valued as of 4:00 p.m. Eastern time on the last calendar day of the period. The Board of Trustees (the Board) has designated the Fund's investment adviser as the valuation designee responsible for the fair valuation function and performing fair value determinations as needed. The investment adviser has established a Fair Value Committee (the Committee) to carry out the day-to-day fair valuation responsibilities and has adopted policies and procedures to govern the fair valuation process and the activities of the Committee. In accordance with these fair valuation policies and procedures, which have been approved by the Board, the Fund attempts to obtain prices from one or more third party pricing services or brokers to value its investments. When current market prices, quotations or currency exchange rates are not readily available or reliable, investments will be fair valued in good faith by the Committee, in accordance with the policies and procedures. Factors used in determining fair value vary by investment type and may include market or investment specific events, transaction data, estimated cash flows, and market observations of comparable investments. The frequency that the fair valuation procedures are used cannot be predicted and they may be utilized to a significant extent. The Committee manages the Fund's fair valuation practices and maintains the fair valuation policies and procedures. The Fund's investment adviser reports to the Board information regarding the fair valuation process and related material matters.
The Fund categorizes the inputs to valuation techniques used to value its investments into a disclosure hierarchy consisting of three levels as shown below:
Level 1 - unadjusted quoted prices in active markets for identical investments
Level 2 - other significant observable inputs (including quoted prices for similar investments, interest rates, prepayment speeds, etc.)
Level 3 - unobservable inputs (including the Fund's own assumptions based on the best information available)
Valuation techniques used to value the Fund's investments by major category are as follows:
Equity securities, including restricted securities, for which market quotations are readily available, are valued at the last reported sale price or official closing price as reported by a third party pricing service on the primary market or exchange on which they are traded and are categorized as Level 1 in the hierarchy. In the event there were no sales during the day or closing prices are not available, securities are valued at the last quoted bid price or may be valued using the last available price and are generally categorized as Level 2 in the hierarchy. For foreign equity securities, when market or security specific events arise, comparisons to the valuation of American Depositary Receipts (ADRs), futures contracts, Exchange-Traded Funds (ETFs) and certain indexes as well as quoted prices for similar securities may be used and would be categorized as Level 2 in the hierarchy. For equity securities, including restricted securities, where observable inputs are limited, assumptions about market activity and risk are used and these securities may be categorized as Level 3 in the hierarchy.
Investments in open-end mutual funds, including the Fidelity Central Funds, are valued at their closing net asset value (NAV) each business day and are categorized as Level 1 in the hierarchy.
Changes in valuation techniques may result in transfers in or out of an assigned level within the disclosure hierarchy. The aggregate value of investments by input level as of October 31, 2024 is included at the end of the Fund's Schedule of Investments.
Foreign Currency. Foreign-denominated assets, including investment securities, and liabilities are translated into U.S. dollars at the exchange rates at period end. Purchases and sales of investment securities, income and dividends received, and expenses denominated in foreign currencies are translated into U.S. dollars at the exchange rate in effect on the transaction date.
The effects of exchange rate fluctuations on investments are included with the net realized and unrealized gain (loss) on investment securities. Other foreign currency transactions resulting in realized and unrealized gain (loss) are disclosed separately.
Realized gains and losses on foreign currency transactions arise from the disposition of foreign currency, realized changes in the value of foreign currency between the trade and settlement dates on security transactions, and the difference between the amounts of dividends, interest and foreign withholding taxes recorded on transaction date and the U.S. dollar equivalent of the amounts actually received or paid. Unrealized gains and losses on assets and liabilities in foreign currencies arise from changes in the value of foreign currency, and from assets and liabilities denominated in foreign currencies, other than investments, which are held at period end.
Investment Transactions and Income. For financial reporting purposes, the Fund's investment holdings and NAV include trades executed through the end of the last business day of the period. The NAV per share for processing shareholder transactions is calculated as of the close of business of the New York Stock Exchange (NYSE), normally 4:00 p.m. Eastern time and includes trades executed through the end of the prior business day. Gains and losses on securities sold are determined on the basis of identified cost and include proceeds received from litigation. Commissions paid to certain brokers with whom the investment adviser, or its affiliates, places trades on behalf of a fund include an amount in addition to trade execution, which may be rebated back to a fund. Any such rebates are included in net realized gain (loss) on investments in the Statement of Operations. Dividend income is recorded on the ex-dividend date, except for certain dividends from foreign securities where the ex-dividend date may have passed, which are recorded as soon as the Fund is informed of the ex-dividend date. Non-cash dividends included in dividend income, if any, are recorded at the fair market value of the securities received. Income and capital gain distributions from Fidelity Central Funds, if any, are recorded on the ex-dividend date. Investment income is recorded net of foreign taxes withheld where recovery of such taxes is uncertain. Funds may file withholding tax reclaims in certain jurisdictions to recover a portion of amounts previously withheld. Any withholding tax reclaims income is included in the Statement of Operations in foreign taxes withheld. Any receivables for withholding tax reclaims are included in the Statement of Assets and Liabilities in reclaims receivable.
Class Allocations and Expenses. Investment income, realized and unrealized capital gains and losses, common expenses of a fund, and certain fund-level expense reductions, if any, are allocated daily on a pro-rata basis to each class based on the relative net assets of each class to the total net assets of a fund. Each class differs with respect to transfer agent and distribution and service plan fees incurred, as applicable. Certain expense reductions may also differ by class, if applicable. For the reporting period, the allocated portion of income and expenses to each class as a percent of its average net assets may vary due to the timing of recording these transactions in relation to fluctuating net assets of the classes. Expenses directly attributable to a fund are charged to that fund. Expenses attributable to more than one fund are allocated among the respective funds on the basis of relative net assets or other appropriate methods. Expenses included in the accompanying financial statements reflect the expenses of that fund and do not include any expenses associated with any underlying mutual funds or exchange-traded funds (ETFs). Although not included in a fund's expenses, a fund indirectly bears its proportionate share of these expenses through the net asset value of each underlying mutual fund or exchange-traded fund (ETF). Expense estimates are accrued in the period to which they relate and adjustments are made when actual amounts are known.
Income Tax Information and Distributions to Shareholders. Each year, the Fund intends to qualify as a regulated investment company under Subchapter M of the Internal Revenue Code, including distributing substantially all of its taxable income and realized gains. As a result, no provision for U.S. Federal income taxes is required. As of October 31, 2024, the Fund did not have any unrecognized tax benefits in the financial statements; nor is the Fund aware of any tax positions for which it is reasonably possible that the total amounts of unrecognized tax benefits will significantly change in the next twelve months. The Fund files a U.S. federal tax return, in addition to state and local tax returns as required. The Fund's federal income tax returns are subject to examination by the Internal Revenue Service (IRS) for a period of three fiscal years after they are filed. State and local tax returns may be subject to examination for an additional fiscal year depending on the jurisdiction. Foreign taxes are provided for based on the Fund's understanding of the tax rules and rates that exist in the foreign markets in which it invests. The Fund is subject to a tax imposed on capital gains by certain countries in which it invests. An estimated deferred tax liability for net unrealized appreciation on the applicable securities is included in Other payables and accrued expenses on the Statement of Assets and Liabilities.
Distributions are declared and recorded on the ex-dividend date. Income and capital gain distributions are declared separately for each class. Income and capital gain distributions are determined in accordance with income tax regulations, which may differ from GAAP.
Capital accounts within the financial statements are adjusted for permanent book-tax differences. These adjustments have no impact on net assets or the results of operations. Capital accounts are not adjusted for temporary book-tax differences which will reverse in a subsequent period.
Book-tax differences are primarily due to foreign currency transactions, certain foreign taxes, passive foreign investment companies (PFIC), redemptions in-kind and losses deferred due to wash sales.
As of period end, the cost and unrealized appreciation (depreciation) in securities, and derivatives if applicable, for federal income tax purposes were as follows:
| Gross unrealized appreciation | $506,700 |
| Gross unrealized depreciation | (17,213) |
| Net unrealized appreciation (depreciation) | $489,487 |
| Tax Cost | $915,012 |
The tax-based components of distributable earnings as of period end were as follows:
| Undistributed ordinary income | $21,855 |
| Undistributed long-term capital gain | $58,170 |
| Net unrealized appreciation (depreciation) on securities and other investments | $489,385 |
| | |
The tax character of distributions paid was as follows:
| | October 31, 2024 | October 31, 2023 |
| Ordinary Income | $19,152 | $ 4,096 |
| Long-term Capital Gains | 39,790 | 24,035 |
| Total | $58,942 | $ 28,131 |
Restricted Securities (including Private Placements). Funds may invest in securities that are subject to legal or contractual restrictions on resale. These securities generally may be resold in transactions exempt from registration or to the public if the securities are registered. Disposal of these securities may involve time-consuming negotiations and expense, and prompt sale at an acceptable price may be difficult. Information regarding restricted securities held at period end is included at the end of the Schedule of Investments, if applicable.
New Accounting Pronouncement. In November 2023, the FASB issued Accounting Standards Update (ASU) 2023-07 Segment Reporting (Topic 280): Improvements to Reportable Segment Disclosures. Effective for fiscal years beginning after December 15, 2023 and interim periods within fiscal years beginning after December 15, 2024, the amendments enhance required disclosures of segment information for public entities on an annual and interim basis. The ASU allows for early adoption with updates applied retrospectively. Management is currently evaluating the impact of the ASU but does not expect this guidance to materially impact the financial statements.
4. Purchases and Sales of Investments.
Purchases and sales of securities, other than short-term securities and in-kind transactions, as applicable, are noted in the table below.
| | Purchases ($) | Sales ($) |
| Fidelity Advisor Diversified International Fund | 461,944 | 538,701 |
Unaffiliated Redemptions In-Kind. Shares that were redeemed in-kind for investments, including accrued interest and cash, if any, are shown in the table below. The net realized gain or loss on investments delivered through in-kind redemptions is included in the "Net realized gain (loss) on: Redemptions in-kind" line in the accompanying Statement of Operations. The amount of the in-kind redemptions is included in share transactions in the accompanying Statement of Changes in Net Assets. There was no gain or loss for federal income tax purposes.
| | Shares | Total net realized gain or loss ($) | Total Proceeds ($) |
| Fidelity Advisor Diversified International Fund | 3,978 | 48,796 | 107,774 |
Prior Fiscal Year Unaffiliated Redemptions In-Kind. Shares that were redeemed in-kind for investments, including accrued interest and cash, if any, are shown in the table below; along with realized gain or loss on investments delivered through in-kind redemptions. The amount of the in-kind redemptions is included in share transactions in the accompanying Statement of Changes in Net Assets. There was no gain or loss for federal income tax purposes.
| | Shares | Total net realized gain or loss ($) | Total Proceeds ($) |
| Fidelity Advisor Diversified International Fund | 1,648 | 15,675 | 39,881 |
5. Fees and Other Transactions with Affiliates.
Management Fee. Fidelity Management & Research Company LLC (the investment adviser) and its affiliates provide the Fund with investment management related services for which the Fund pays a monthly management fee.
Effective March 1, 2024, the Fund's management contract was amended to incorporate administrative services previously covered under separate services agreements (Transfer Agent and Accounting agreements). The amended contract incorporates a management fee rate that may vary by class. The investment adviser or an affiliate pays certain expenses of managing and operating the Fund out of each class's management fee. Each class of the Fund pays a management fee to the investment adviser. The management fee is calculated and paid to the investment adviser every month. When determining a class's management fee, a mandate rate is calculated based on the monthly average net assets of a group of funds advised by FMR within a designated asset class. A discount rate is subtracted from the mandate rate once the Fund's monthly average net assets reach a certain level. The mandate rate and discount rate may vary by class. The annual management fee rate for a class of shares of the Fund is the lesser of (1) the class's mandate rate reduced by the class's discount rate (if applicable) or (2) the amount set forth in the following table.
| | Maximum Management Fee Rate % |
| Class A | .85 |
| Class M | .86 |
| Class C | .86 |
| Class I | .86 |
| Class Z | .70 |
One-twelfth of the management fee rate for a class is applied to the average net assets of the class for the month, giving a dollar amount which is the management fee for the class for that month. A different management fee rate may be applicable to each class of the Fund. The difference between classes is the result of separate arrangements for class-level services and/or waivers of certain expenses. It is not the result of any difference in advisory or custodial fees or other expenses related to the management of the Fund's assets, which do not vary by class. For the portion of the reporting period on or after March 1, 2024, the total annualized management fee rates were as follows:
| | Total Management Fee Rate % |
| Class A | .85 |
| Class M | .85 |
| Class C | .85 |
| Class I | .85 |
| Class Z | .70 |
Prior to March 1, 2024, the management fee was the sum of an individual fund fee rate that was based on an annual rate of .42% of the Fund's average net assets and an annualized group fee rate that averaged .22% during the period. The group fee rate was based upon the monthly average net assets of a group of registered investment companies with which the investment adviser has management contracts. The group fee rate decreased as assets under management increased and increased as assets under management decreased. For the portion of the reporting period prior to March 1, 2024, the total annualized management fee rate was .65%.
Effective March 1, 2024, the Fund's sub-advisory agreements with FMR Investment Management (UK) Limited, Fidelity Management & Research (Hong Kong) Limited, and Fidelity Management & Research (Japan) Limited were amended to provide that the investment adviser pays each sub-adviser monthly fees equal to 110% of the sub-adviser's costs for providing sub-advisory services.
Effective March 1, 2024, the Fund's sub-advisory agreement with FIL Investment Advisors (FIA) was amended to provide that the investment adviser pays FIA monthly fees at an annual rate of 0.44% with respect to the average daily net assets of the Fund managed by FIA. FIA in turn pays FIA(UK).
Distribution and Service Plan Fees. In accordance with Rule 12b-1 of the 1940 Act, the Fund has adopted separate Distribution and Service Plans for each class of shares. Certain classes pay Fidelity Distributors Company LLC (FDC), an affiliate of the investment adviser, separate Distribution and Service Fees, each of which is based on an annual percentage of each class' average net assets. In addition, FDC may pay financial intermediaries for selling shares of the Fund and providing shareholder support services. For the period, the Distribution and Service Fee rates, total fees and amounts retained by FDC were as follows:
| | Distribution Fee | Service Fee | Total Fees ($) | Retained by FDC ($) |
| Class A | - % | .25% | 1,209 | 11 |
| Class M | .25% | .25% | 677 | 2 |
| Class C | .75% | .25% | 186 | 15 |
| | | | 2,072 | 28 |
Sales Load. FDC may receive a front-end sales charge of up to 5.75% for selling Class A shares and 3.50% for selling Class M shares, some of which is paid to financial intermediaries for selling shares of the Fund. Depending on the holding period, FDC may receive contingent deferred sales charges levied on Class A, Class M and Class C redemptions. The deferred sales charges are 1.00% for Class C shares, 1.00% for certain purchases of Class A shares and .25% for certain purchases of Class M shares.
For the period, sales charge amounts retained by FDC were as follows:
| | Retained by FDC ($) |
| Class A | 26 |
| Class M | 3 |
Class CA | 1 |
| | 30 |
A When Class C shares are initially sold, FDC pays commissions from its own resources to financial intermediaries through which the sales are made.
Transfer Agent Fees. Fidelity Investments Institutional Operations Company LLC (FIIOC), an affiliate of the investment adviser, is the transfer, dividend disbursing and shareholder servicing agent for each class of the Fund. Effective March 1, 2024, the Fund's management contract was amended to incorporate transfer agent services and associated fees previously covered under a separate services agreement. FIIOC pays for typesetting, printing and mailing of shareholder reports, except proxy statements.
During the period December 1, 2023 through February 29, 2024, the transfer agent fees for each class were a fixed annual rate of class-level average net assets as follows:
| | % of Class-Level Average Net Assets |
| Class A | .1933 |
| Class M | .2000 |
| Class C | .2000 |
| Class I | .2000 |
| Class Z | .0420 |
Prior to December 1, 2023, FIIOC received account fees and asset-based fees that varied according to the account size and type of account of the shareholders of the respective classes of the Fund, except for Class Z. FIIOC received an asset-based fee of Class Z's average net assets. For the portion of the reporting period prior to March 1, 2024, the fees were equivalent to the following annualized rates:
| | Amount ($) | % of Class-Level Average Net Assets |
| Class A | 297 | .19 |
| Class M | 87 | .20 |
| Class C | 13 | .21 |
| Class I | 328 | .20 |
| Class Z | 46 | .04 |
| 771 | |
Accounting Fees. Fidelity Service Company, Inc. (FSC), an affiliate of the investment adviser, maintains the Fund's accounting records. Effective March 1, 2024, the Fund's management contract was amended to incorporate accounting services and associated fees previously covered under a separate services agreement.
During the period December 1, 2023 through February 29, 2024, the accounting fees were a fixed annual rate of average net assets as follows:
| | % of Average Net Assets |
| Fidelity Advisor Diversified International Fund | .0429 |
Prior to December 1, 2023, the accounting fee was based on the level of average net assets for each month. For the portion of the reporting period prior to March 1, 2024, the fees were equivalent to the following annualized rates:
| | % of Average Net Assets |
| Fidelity Advisor Diversified International Fund | .04 |
| | |
Brokerage Commissions. A portion of portfolio transactions were placed with brokerage firms which are affiliates of the investment adviser. Brokerage commissions are included in net realized gain (loss) and change in net unrealized appreciation (depreciation) in the Statement of Operations. The commissions paid to these affiliated firms were as follows:
| | Amount |
| Fidelity Advisor Diversified International Fund | -A |
| | |
A In the amount of less than five-hundred dollars
Interfund Trades. Funds may purchase from or sell securities to other Fidelity Funds under procedures adopted by the Board. The procedures have been designed to ensure these interfund trades are executed in accordance with Rule 17a-7 of the 1940 Act. Any interfund trades are included within the respective purchases and sales amounts shown in the Purchases and Sales of Investments note. Interfund trades during the period are noted in the table below.
| | Purchases ($) | Sales ($) | Realized Gain (Loss)($) |
| Fidelity Advisor Diversified International Fund | 3,785 | 30,081 | 5,318 |
6. Committed Line of Credit.
Certain Funds participate with other funds managed by the investment adviser or an affiliate in a $4.25 billion credit facility (the "line of credit") to be utilized for temporary or emergency purposes to fund shareholder redemptions or for other short-term liquidity purposes. The participating funds have agreed to pay commitment fees on their pro-rata portion of the line of credit, which are reflected in Miscellaneous expenses on the Statement of Operations, and are listed below. During the period, there were no borrowings on this line of credit.
| | Amount ($) |
| Fidelity Advisor Diversified International Fund | 2 |
7. Security Lending.
Funds lend portfolio securities from time to time in order to earn additional income. Lending agents are used, including National Financial Services (NFS), an affiliate of the investment adviser. Pursuant to a securities lending agreement, NFS will receive a fee, which is capped at 9.9% of a fund's daily lending revenue, for its services as lending agent. A fund may lend securities to certain qualified borrowers, including NFS. On the settlement date of the loan, a fund receives collateral (in the form of U.S. Treasury obligations, letters of credit and/or cash) against the loaned securities and maintains collateral in an amount not less than 100% of the market value of the loaned securities during the period of the loan. The market value of the loaned securities is determined at the close of business of a fund and any additional required collateral is delivered to a fund on the next business day. A fund or borrower may terminate the loan at any time, and if the borrower defaults on its obligation to return the securities loaned because of insolvency or other reasons, a fund may apply collateral received from the borrower against the obligation. A fund may experience delays and costs in recovering the securities loaned. Any cash collateral received is invested in the Fidelity Securities Lending Cash Central Fund. Any loaned securities are identified as such in the Schedule of Investments, and the value of loaned securities and cash collateral at period end, as applicable, are presented in the Statement of Assets and Liabilities. Security lending income represents the income earned on investing cash collateral, less rebates paid to borrowers and any lending agent fees associated with the loan, plus any premium payments received for lending certain types of securities. Security lending income is presented in the Statement of Operations as a component of income from Fidelity Central Funds. Affiliated security lending activity, if any, was as follows:
| | Total Security Lending Fees Paid to NFS ($) | Security Lending Income From Securities Loaned to NFS ($) | Value of Securities Loaned to NFS at Period End ($) |
| Fidelity Advisor Diversified International Fund | 4 | - | - |
8. Expense Reductions.
Through arrangements with the Fund's custodian and each class' transfer agent, credits realized as a result of certain uninvested cash balances were used to reduce the Fund's expenses. During the period, custodian credits reduced the Fund's expenses by $1. During the period, transfer agent credits reduced each class' expenses as noted in the table below.| | Expense reduction |
| | |
| Class M | $ -A |
A In the amount of less than five-hundred dollars | |
| | |
In addition, during the period the investment adviser or an affiliate reimbursed and/or waived a portion of fund-level operating expenses in the amount of $66.
9. Distributions to Shareholders.
Distributions to shareholders of each class were as follows:
| | Year ended October 31, 2024 | Year ended October 31, 2023 |
| Fidelity Advisor Diversified International Fund | | |
| Distributions to shareholders | | |
| Class A | $18,579 | $8,055 |
| Class M | 5,022 | 2,274 |
| Class C | 662 | 428 |
| Class I | 20,547 | 9,902 |
| Class Z | 14,132 | 7,472 |
Total | $58,942 | $28,131 |
10. Share Transactions.
Share transactions for each class were as follows and may contain in-kind transactions, automatic conversions between classes or exchanges between affiliated funds:
| | Shares | Shares | Dollars | Dollars |
| | Year ended October 31, 2024 | Year ended October 31, 2023 | Year ended October 31, 2024 | Year ended October 31, 2023 |
| Fidelity Advisor Diversified International Fund | | | | |
| Class A | | | | |
| Shares sold | 755 | 1,201 | $19,640 | $28,447 |
| Reinvestment of distributions | 731 | 336 | 17,371 | 7,596 |
| Shares redeemed | (2,270) | (2,309) | (59,315) | (54,664) |
| Net increase (decrease) | (784) | (772) | $(22,304) | $(18,621) |
| Class M | | | | |
| Shares sold | 158 | 266 | $4,075 | $6,211 |
| Reinvestment of distributions | 210 | 100 | 4,923 | 2,237 |
| Shares redeemed | (780) | (743) | (20,124) | (17,392) |
| Net increase (decrease) | (412) | (377) | $(11,126) | $(8,944) |
| Class C | | | | |
| Shares sold | 60 | 105 | $1,469 | $2,330 |
| Reinvestment of distributions | 28 | 19 | 636 | 416 |
| Shares redeemed | (280) | (361) | (6,854) | (8,084) |
| Net increase (decrease) | (192) | (237) | $(4,749) | $(5,338) |
| Class I | | | | |
| Shares sold | 2,386 | 3,192 | $63,789 | $77,403 |
| Reinvestment of distributions | 693 | 346 | 16,819 | 7,975 |
| Shares redeemed | (4,794) | (5,428) | (127,428) | (130,786) |
| Net increase (decrease) | (1,715) | (1,890) | $(46,820) | $(45,408) |
| Class Z | | | | |
| Shares sold | 2,708 | 2,604 | $72,750 | $62,842 |
| Reinvestment of distributions | 550 | 307 | 13,319 | 7,055 |
| Shares redeemed | (5,924) | (3,933) | (160,308) | (94,840) |
| Net increase (decrease) | (2,666) | (1,022) | $(74,239) | $(24,943) |
11. Other.
A fund's organizational documents provide former and current trustees and officers with a limited indemnification against liabilities arising in connection with the performance of their duties to the fund. In the normal course of business, a fund may also enter into contracts that provide general indemnifications. A fund's maximum exposure under these arrangements is unknown as this would be dependent on future claims that may be made against a fund. The risk of material loss from such claims is considered remote.
12. Risk and Uncertainties.
Many factors affect a fund's performance. Developments that disrupt global economies and financial markets, such as pandemics, epidemics, outbreaks of infectious diseases, war, terrorism, and environmental disasters, may significantly affect a fund's investment performance. The effects of these developments to a fund will be impacted by the types of securities in which a fund invests, the financial condition, industry, economic sector, and geographic location of an issuer, and a fund's level of investment in the securities of that issuer. Significant concentrations in security types, issuers, industries, sectors, and geographic locations may magnify the factors that affect a fund's performance.
Report of Independent Registered Public Accounting Firm
To the Board of Trustees of Fidelity Advisor Series VIII and Shareholders of Fidelity Advisor Diversified International Fund
Opinion on the Financial Statements
We have audited the accompanying statement of assets and liabilities, including the schedule of investments, of Fidelity Advisor Diversified International Fund (one of the funds constituting Fidelity Advisor Series VIII, referred to hereafter as the "Fund") as of October 31, 2024, the related statement of operations for the year ended October 31, 2024, the statement of changes in net assets for each of the two years in the period ended October 31, 2024, including the related notes, and the financial highlights for each of the five years in the period ended October 31, 2024 (collectively referred to as the "financial statements"). In our opinion, the financial statements present fairly, in all material respects, the financial position of the Fund as of October 31, 2024, the results of its operations for the year then ended, the changes in its net assets for each of the two years in the period ended October 31, 2024 and the financial highlights for each of the five years in the period ended October 31, 2024 in conformity with accounting principles generally accepted in the United States of America.
Basis for Opinion
These financial statements are the responsibility of the Fund's management. Our responsibility is to express an opinion on the Fund's financial statements based on our audits. We are a public accounting firm registered with the Public Company Accounting Oversight Board (United States) (PCAOB) and are required to be independent with respect to the Fund in accordance with the U.S. federal securities laws and the applicable rules and regulations of the Securities and Exchange Commission and the PCAOB.
We conducted our audits of these financial statements in accordance with the standards of the PCAOB. Those standards require that we plan and perform the audit to obtain reasonable assurance about whether the financial statements are free of material misstatement, whether due to error or fraud.
Our audits included performing procedures to assess the risks of material misstatement of the financial statements, whether due to error or fraud, and performing procedures that respond to those risks. Such procedures included examining, on a test basis, evidence regarding the amounts and disclosures in the financial statements. Our audits also included evaluating the accounting principles used and significant estimates made by management, as well as evaluating the overall presentation of the financial statements. Our procedures included confirmation of securities owned as of October 31, 2024 by correspondence with the custodian, issuers of privately offered securities and brokers; when replies were not received from brokers, we performed other auditing procedures. We believe that our audits provide a reasonable basis for our opinion.
/s/ PricewaterhouseCoopers LLP
Boston, Massachusetts
December 13, 2024
We have served as the auditor of one or more investment companies in the Fidelity group of funds since 1932.
Distributions
(Unaudited)The dividend and capital gains distributions for the fund(s) are available on Fidelity.com or Institutional.Fidelity.com.
The fund hereby designates as a capital gain dividend with respect to the taxable year ended October 31, 2024, $58,243,586, or, if subsequently determined to be different, the net capital gain of such year.
The fund designates $591,392 of distributions paid during the fiscal year ended 2024 as qualifying to be taxed as section 163(j) interest dividends.
Class A designates 2%; Class M designates 3%; Class C designates 6%; Class I designates 2%; and Class Z designates 2%; of the dividend distributed during the fiscal year as qualifying for the dividends-received deduction for corporate shareholders.
Class A, Class M, Class C, Class I, and Class Z designate 100% of the dividend distributed during the fiscal year as amounts which may be taken into account as a dividend for purposes of the maximum rate under section 1(h)(11) of the Internal Revenue Code.
The amounts per share which represent income derived from sources within, and taxes paid to, foreign countries or possessions of the United States are as follows:
| | Pay Date | Income | Taxes |
| Fidelity Advisor Diversified International Fund | | | |
| Class A | 12/11/2023 | $0.3154 | $0.0423 |
| Class M | 12/11/2023 | $0.2575 | $0.0423 |
| Class C | 12/11/2023 | $0.1225 | $0.0423 |
| Class I | 12/11/2023 | $0.3680 | $0.0423 |
| Class Z | 12/11/2023 | $0.4069 | $0.0423 |
The fund will notify shareholders in January 2025 of amounts for use in preparing 2024 income tax returns.
Item 8: Changes in and Disagreements with Accountants for Open-End Management Investment Companies
(Unaudited)
Note: This is not applicable for any fund included in this document.
Item 9: Proxy Disclosures for Open-End Management Investment Companies
(Unaudited)
| A special meeting of shareholders was held on July 16, 2024. The results of votes taken among shareholders on the proposal before them are reported below. Each vote reported represents one dollar of net asset value held on the record date for the meeting. |
| Proposal 1 |
| To elect a Board of Trustees. |
| | # of Votes | % of Votes |
| Bettina Doulton |
| Affirmative | 9,667,916,942.83 | 98.16 |
| Withheld | 181,261,836.48 | 1.84 |
| TOTAL | 9,849,178,779.31 | 100.00 |
| Robert A. Lawrence |
| Affirmative | 9,643,385,159.26 | 97.91 |
| Withheld | 205,793,620.05 | 2.09 |
| TOTAL | 9,849,178,779.31 | 100.00 |
| Vijay C. Advani |
| Affirmative | 9,650,856,015.95 | 97.99 |
| Withheld | 198,322,763.36 | 2.01 |
| TOTAL | 9,849,178,779.31 | 100.00 |
| Thomas P. Bostick |
| Affirmative | 9,653,685,826.52 | 98.02 |
| Withheld | 195,492,952.79 | 1.98 |
| TOTAL | 9,849,178,779.31 | 100.00 |
| Donald F. Donahue |
| Affirmative | 9,653,599,026.45 | 98.01 |
| Withheld | 195,579,752.86 | 1.99 |
| TOTAL | 9,849,178,779.31 | 100.00 |
| Vicki L. Fuller |
| Affirmative | 9,666,491,582.97 | 98.15 |
| Withheld | 182,687,196.34 | 1.85 |
| TOTAL | 9,849,178,779.31 | 100.00 |
| Patricia L. Kampling |
| Affirmative | 9,664,290,979.63 | 98.12 |
| Withheld | 184,887,799.68 | 1.88 |
| TOTAL | 9,849,178,779.31 | 100.00 |
| Thomas A. Kennedy |
| Affirmative | 9,646,944,497.07 | 97.95 |
| Withheld | 202,234,282.24 | 2.05 |
| TOTAL | 9,849,178,779.31 | 100.00 |
| Oscar Munoz |
| Affirmative | 9,652,669,495.50 | 98.00 |
| Withheld | 196,509,283.81 | 2.00 |
| TOTAL | 9,849,178,779.31 | 100.00 |
| Karen B. Peetz |
| Affirmative | 9,656,405,594.63 | 98.04 |
| Withheld | 192,773,184.68 | 1.96 |
| TOTAL | 9,849,178,779.31 | 100.00 |
| David M. Thomas |
| Affirmative | 9,644,713,946.63 | 97.92 |
| Withheld | 204,464,832.68 | 2.08 |
| TOTAL | 9,849,178,779.31 | 100.00 |
| Susan Tomasky |
| Affirmative | 9,654,121,207.44 | 98.02 |
| Withheld | 195,057,571.87 | 1.98 |
| TOTAL | 9,849,178,779.31 | 100.00 |
| Michael E. Wiley |
| Affirmative | 9,642,438,416.20 | 97.90 |
| Withheld | 206,740,363.11 | 2.10 |
| TOTAL | 9,849,178,779.31 | 100.00 |
| | | |
| Proposal 1 reflects trust-wide proposal and voting results. |
Item 10: Remuneration Paid to Directors, Officers, and others of Open-End Management Investment Companies
(Unaudited)
Note: This information is disclosed as part of the financial statements for each Fund as part of Item 7: Financial Statements and Financial Highlights for Open-End Management Investment companies.
Item 11: Statement Regarding Basis for Approval of Investment Advisory Contract
(Unaudited)
Board Approval of Investment Advisory Contracts and Management Fees
Fidelity Advisor Diversified International Fund
Each year, the Board of Trustees, including the Independent Trustees (together, the Board), considers the renewal of the fund's management contract with Fidelity Management & Research Company LLC (FMR) and certain affiliates and the sub-advisory agreements (together, the Advisory Contracts) for the fund. FMR and the sub-advisers are referred to herein as the Investment Advisers. The Board, assisted by the advice of fund counsel and Independent Trustees' counsel, requests and considers a broad range of information relevant to the renewal of the Advisory Contracts throughout the year.
The Board meets regularly and, at each of its meetings, covers an extensive agenda of topics and materials and considers factors that are relevant to its annual consideration of the renewal of the fund's Advisory Contracts, including the services and support provided to the fund and its shareholders. The Board, acting directly and through its Committees (each of which is composed of and chaired by Independent Trustees), requests and receives information concerning the annual consideration of the renewal of the fund's Advisory Contracts. The Board also meets as needed to review matters specifically related to the Board's annual consideration of the renewal of the Advisory Contracts. Members of the Board may also meet with trustees of other Fidelity funds through joint ad hoc committees to discuss certain matters relevant to all of the Fidelity funds.
At its May 2024 meeting, the Board unanimously determined to renew the fund's Advisory Contracts. In reaching its determination, the Board considered all factors it believed relevant, including (i) the nature, extent, and quality of the services provided to the fund and its shareholders (including the investment performance of the fund); (ii) the competitiveness relative to peer funds of the fund's management fee and the total expense ratio of a representative class (Class I, which was selected because it was the largest class without 12b-1 fees); (iii) the total costs of the services provided by and the profits realized by FMR and its affiliates (Fidelity) from its relationships with the fund; and (iv) the extent to which, if any, economies of scale exist and are realized as the fund grows, and whether any economies of scale are appropriately shared with fund shareholders. The Board also considered the broad range of investment choices available to shareholders from FMR's competitors and that the fund's shareholders have chosen to invest in the fund, which is part of the Fidelity family of funds. The Board's decision to renew the Advisory Contracts was not based on any single factor.
The Board reached a determination, with the assistance of fund counsel and Independent Trustees' counsel and through the exercise of its business judgment, that the renewal of the Advisory Contracts was in the best interests of the fund and its shareholders and that the compensation payable under the Advisory Contracts was fair and reasonable in light of all of the surrounding circumstances.
Nature, Extent, and Quality of Services Provided. The Board considered staffing as it relates to the fund, including the backgrounds and experience of investment personnel of the Investment Advisers, and also considered the Investment Advisers' implementation of the fund's investment program. The Independent Trustees also had discussions with senior management of Fidelity's investment operations and investment groups. The Board considered the structure of the investment personnel compensation program and whether this structure provides appropriate incentives to act in the best interests of the fund. Additionally, the Board considered the portfolio managers' investments, if any, in the funds that they manage.
Resources Dedicated to Investment Management and Support Services. The Board and the Fund Oversight and Research Committees reviewed the general qualifications and capabilities of Fidelity's investment staff, including its size, education, experience, and resources, as well as Fidelity's approach to recruiting, training, managing, and compensating investment personnel. The Board noted the resources devoted to expansion of Fidelity's global investment organization, and that Fidelity's analysts have extensive resources, tools and capabilities that allow them to conduct sophisticated quantitative and fundamental analysis, as well as credit analysis of issuers, counterparties and guarantors. Further, the Board considered that Fidelity's investment professionals have sufficient access to global information and data so as to provide competitive investment results over time, and that those professionals also have access to sophisticated tools that permit them to assess portfolio construction and risk and performance attribution characteristics continuously, as well as to transmit new information and research conclusions rapidly around the world. Additionally, in its deliberations, the Board considered Fidelity's trading, risk management, compliance, and technology and operations capabilities and resources, which are integral parts of the investment management process.
Shareholder and Administrative Services. The Board considered (i) the nature, extent, quality, and cost of advisory, administrative, shareholder, transfer agency, and pricing and bookkeeping services performed by the Investment Advisers and their affiliates under the Advisory Contracts; (ii) the nature and extent of Fidelity's supervision of third party service providers, principally custodians, subcustodians, and pricing vendors; and (iii) the resources devoted by Fidelity to, and the record of compliance with, the fund's compliance policies and procedures. The Board also reviewed the allocation of fund brokerage, including allocations to brokers affiliated with the Investment Advisers, the use of brokerage commissions to pay fund expenses, and the use of "soft" commission dollars to pay for research services. The Board also considered the fund's securities lending activities and any payments made to Fidelity relating to securities lending under a separate agreement.
The Board noted that the growth of fund assets over time across the complex allows Fidelity to reinvest in the development of services designed to enhance the value and convenience of the Fidelity funds as investment vehicles. These services include 24-hour access to account information and market information over the Internet and through telephone representatives, investor education materials and asset allocation tools. The Board also considered that it reviews customer service metrics such as telephone response times, continuity of services on the website and metrics addressing services at Fidelity Investor Centers.
Investment in a Large Fund Family. The Board considered the benefits to shareholders of investing in a fund that is part of a large family of funds offering a variety of investment disciplines and providing a large variety of fund investor services. The Board noted that Fidelity had taken, or had made recommendations that resulted in the Fidelity funds taking, a number of actions over the previous year that benefited particular funds and/or the Fidelity funds in general.
Investment Performance. The Board took into account discussions that occur with representatives of the Investment Advisers, and reports that it receives, at Board meetings throughout the year, relating to fund investment performance. In this regard the Board noted that as part of regularly scheduled fund reviews and other reports to the Board on fund performance, the Board considered annualized return information for the fund for different time periods, measured against an appropriate securities market index (benchmark index) and an appropriate peer group of funds with similar objectives (peer group). The Board also considered information about performance attribution. In its ongoing evaluation of fund investment performance, the Board gives particular attention to information indicating changes in performance of the funds over different time periods and discussed with the Investment Advisers the reasons for any overperformance or underperformance.
In addition to reviewing absolute and relative fund performance, the Independent Trustees periodically consider the appropriateness of fund performance metrics in evaluating the results achieved. The Independent Trustees generally give greater weight to fund performance over longer time periods than over shorter time periods. Depending on the circumstances, the Independent Trustees may be satisfied with a fund's performance notwithstanding that it lags its benchmark index or peer group for certain periods.
Based on its review, the Board concluded that the nature, extent, and quality of services provided to the fund under the Advisory Contracts should continue to benefit the shareholders of the fund.
Competitiveness of Management Fee and Total Expense Ratio. The Board was provided with information regarding industry trends in management fees and expenses. The Board considered that, effective March 1, 2024, an amended Advisory Contract with FMR went into effect with class-level management fees based on tiered schedules and subject to a maximum class-level rate (the management fee). The Board also considered that in exchange for the variable management fee, each class of the fund receives investment advisory, management, administrative, transfer agent, and pricing and bookkeeping services. In its review of the management fee and total expense ratio of Class I, the Board considered a pro forma management fee rate for Class I as if it had been in effect for the 12-month period ended September 30, 2023, as well as other third-party fund expenses, as applicable, such as custodial, legal, and audit fees and any fund-paid 12b-1 fees. The Board noted that Fidelity may agree to waive fees or reimburse expenses from time to time, and the extent to which, if any, it has done so for the fund.
Comparisons of Management Fees and Total Expense Ratios. Among other things, the Board reviewed data for selected groups of competitive funds and classes (referred to as "mapped groups") that were compiled by Fidelity based on combining similar investment objective categories (as classified by Morningstar) that have comparable investment mandates. The data reviewed by the Board included (i) gross management fee comparisons (before taking into account expense reimbursements or caps) relative to the total universe of funds within the mapped group; (ii) gross management fee comparisons relative to a subset of non-Fidelity funds in the mapped group that are similar in size and management fee structure to the fund (referred to as the "asset size peer group"); (iii) total expense comparisons of Class I of the fund relative to funds and classes in the mapped group that have a similar sales load structure to Class I of the fund (referred to as the "similar sales load structure group"); and (iv) total expense comparisons of Class I of the fund relative to funds and classes in the similar sales load structure group that are similar in size and management fee structure to the fund (referred to as the "total expense asset size peer group"). The total expense asset size peer group comparison excludes performance adjustments and fund-paid 12b-1 fees to eliminate variability in fee structures.
The information provided to the Board indicated that the fund's management fee rate ranked above the competitive median of the mapped group for the 12-month period ended September 30, 2023 and above the competitive median of the asset size peer group for the 12-month period ended September 30, 2023. Further, the information provided to the Board indicated that the total expense ratio of Class I of the fund ranked above the competitive median of the similar sales load structure group for the 12-month period ended September 30, 2023 and below the competitive median of the total expense asset size peer group for the 12-month period ended September 30, 2023.
The Board considered that the fund has a variable unified management fee, which covers expenses for services beyond portfolio management. The Board considered that, in general, various factors can affect total expense ratios. The Board noted that, although Class I is categorized by Lipper as an institutional class, Class I has no investment minimum, unlike most other funds and classes categorized as institutional. As a result, FMR believes Class I is generally more comparable to retail funds and classes. The Board considered that, when compared to retail funds and classes, Class I would not be above the similar sales load structure growth competitive median for 2023.
The Board noted that a different variable management fee rate is applicable to each class of the fund. The Board considered that the difference in management fee rates between classes is the result of separate arrangements for class-level services and/or waivers of certain expenses and not the result of any difference in advisory or custodial fees or other expenses related to the management of the fund's assets, which do not vary by class.
Fees Charged to Other Fidelity Clients. The Board also considered Fidelity fee structures and other information with respect to clients of Fidelity, such as other funds advised or subadvised by Fidelity, pension plan clients, and other institutional clients with similar mandates. The Board noted that a joint ad hoc committee created by it and the boards of other Fidelity funds periodically reviews and compares Fidelity's institutional investment advisory business with its business of providing services to the Fidelity funds and also noted the most recent findings of the committee. The Board noted that the committee's review included a consideration of the differences in services provided, fees charged, and costs incurred, as well as competition in the markets serving the different categories of clients.
Based on its review, the Board concluded that the fund's management fee is fair and reasonable in light of the services that the fund receives and the other factors considered. Further, based on its review of total expense ratios and fees charged to other Fidelity clients, the Board concluded that the total expense ratio of each class of the fund was reasonable in light of the services that the fund and its shareholders receive and the other factors considered.
Costs of the Services and Profitability. The Board considered the revenues earned and the expenses incurred by Fidelity in conducting the business of developing, marketing, distributing, managing, administering and servicing the fund and servicing the fund's shareholders. The Board also considered the level of Fidelity's profits in respect of all the Fidelity funds.
On an annual basis, Fidelity presents to the Board information about the profitability of its relationships with the fund. Fidelity calculates profitability information for each fund, as well as aggregate profitability information for groups of Fidelity funds and all Fidelity funds, using a series of detailed revenue and cost allocation methodologies which originate with the books and records of Fidelity on which Fidelity's audited financial statements are based. The Audit Committee of the Board reviews any significant changes from the prior year's methodologies.
A public accounting firm has been engaged annually by the Board as part of the Board's assessment of Fidelity's profitability analysis. The engagement includes the review and assessment of the methodologies used by Fidelity in determining the revenues and expenses attributable to Fidelity's fund business, and completion of agreed-upon procedures in respect of the mathematical accuracy of certain fund profitability information and its conformity to established allocation methodologies. After considering the reports issued under the engagement and information provided by Fidelity, the Board concluded that while other allocation methods may also be reasonable, Fidelity's profitability methodologies are reasonable in all material respects.
The Board also reviewed Fidelity's non-fund businesses and potential indirect benefits such businesses may have received as a result of their association with Fidelity's fund business (i.e., fall-out benefits) as well as cases where Fidelity's affiliates may benefit from the funds' business. The Board considered areas where potential indirect benefits to the Fidelity funds from their relationships with Fidelity may exist. The Board's consideration of these matters was informed by the findings of a joint ad hoc committee created by it and the boards of other Fidelity funds to evaluate potential fall-out benefits.
The Board considered the costs of the services provided by and the profits realized by Fidelity in connection with the operation of the fund and was satisfied that the profitability was not excessive.
Economies of Scale. The Board considered whether there have been economies of scale in respect of the management of the Fidelity funds, whether the Fidelity funds (including the fund) have appropriately benefited from any such economies of scale, and whether there is potential for realization of any further economies of scale. The Board considered the extent to which the fund will benefit from economies of scale as assets grow through increased services to the fund, through waivers or reimbursements, or through fee or expense ratio reductions. The Board also noted that a committee created by it and the boards of other Fidelity funds periodically analyzes whether Fidelity attains economies of scale in respect of the management and servicing of the Fidelity funds, whether the Fidelity funds have appropriately benefited from such economies of scale, and whether there is potential for realization of any further economies of scale.
The Board recognized that the fund's management contract incorporates a variable management fee structure, which provides breakpoints as a way to share, in part, any potential economies of scale that may exist at the asset class level and through a discount that considers both fund size and total assets of the four applicable asset classes. The Board considered that the variable management fee is designed to deliver the benefits of economies of scale to fund shareholders even if assets of any particular fund are unchanged or have declined, because some portion of Fidelity's costs are attributable to services provided to all funds subject to the variable management fee, and all such funds benefit if those costs can be allocated among more assets. The Board concluded that, given the variable management fee structure, fund shareholders will benefit from lower management fees due to the application of the breakpoints and discount factor, regardless of whether Fidelity achieves any such economies of scale.
The Board concluded, taking into account the analysis of the committee, that economies of scale, if any, are being appropriately shared between fund shareholders and Fidelity.
Additional Information Requested by the Board. In order to develop fully the factual basis for consideration of the Fidelity funds' advisory contracts, the Board requested and received additional information on certain topics, including but not limited to: (i) fund flow and performance trends, in particular the underperformance of certain funds and strategies, and Fidelity's long-term strategies for certain funds; (ii) the operation of performance fees and the rationale for implementing performance fees on certain categories of funds but not others; (iii) Fidelity's pricing philosophy compared to competitors; (iv) fund profitability methodology and data; (v) evaluation of competitive fund data and peer group classifications and fee and expense comparisons; (vi) the management fee and expense structures for different funds and classes and information about the differences between various fee and expense structures; (vii) the variable management fee implemented for certain funds effective March 1, 2024; and (viii) information regarding other accounts managed by Fidelity and the funds' sub-advisory arrangements.
Conclusion. Based on its evaluation of all of the conclusions noted above, and after considering all factors it believed relevant, the Board, including the Independent Trustees, concluded that the advisory and sub-advisory fee arrangements are fair and reasonable in light of all of the surrounding circumstances and that the fund's Advisory Contracts should be renewed through May 31, 2025.
1.728709.125
ADIF-ANN-1224
Fidelity Advisor® Overseas Fund
Annual Report
October 31, 2024
Contents
To view a fund's proxy voting guidelines and proxy voting record for the 12-month period ended June 30, visit http://www.fidelity.com/proxyvotingresults or visit the Securities and Exchange Commission's (SEC) web site at http://www.sec.gov.
You may also call 1-877-208-0098 to request a free copy of the proxy voting guidelines.
Standard & Poor's, S&P and S&P 500 are registered service marks of The McGraw-Hill Companies, Inc. and have been licensed for use by Fidelity Distributors Corporation.
Other third-party marks appearing herein are the property of their respective owners.
All other marks appearing herein are registered or unregistered trademarks or service marks of FMR LLC or an affiliated company. © 2024 FMR LLC. All rights reserved.
This report and the financial statements contained herein are submitted for the general information of the shareholders of the Fund. This report is not authorized for distribution to prospective investors in the Fund unless preceded or accompanied by an effective prospectus.
A fund files its complete schedule of portfolio holdings with the SEC for the first and third quarters of each fiscal year on Form N-PORT. Forms N-PORT are available on the SEC's web site at http://www.sec.gov. A fund's Forms N-PORT may be reviewed and copied at the SEC's Public Reference Room in Washington, DC. Information regarding the operation of the SEC's Public Reference Room may be obtained by calling 1-800-SEC-0330.
For a complete list of a fund's portfolio holdings, view the most recent holdings listing, semiannual report, or annual report on Fidelity's web site at http://www.fidelity.com, http://www.institutional.fidelity.com, or http://www.401k.com, as applicable.
NOT FDIC INSURED •MAY LOSE VALUE •NO BANK GUARANTEE
Neither the Fund nor Fidelity Distributors Corporation is a bank.
Item 7: Financial Statements and Financial Highlights for Open-End Management Investment Companies (Annual Report)
Fidelity Advisor® Overseas Fund
Schedule of Investments October 31, 2024
Showing Percentage of Net Assets
| Common Stocks - 98.1% |
| | | Shares | Value ($) (000s) |
| Bailiwick of Jersey - 0.4% | | | |
| JTC PLC (a) | | 129,400 | 1,715 |
| Belgium - 0.8% | | | |
| Azelis Group NV | | 40,800 | 809 |
| KBC Group NV | | 31,675 | 2,297 |
TOTAL BELGIUM | | | 3,106 |
| Canada - 1.5% | | | |
| Constellation Software, Inc. | | 1,780 | 5,368 |
| Constellation Software, Inc. warrants 3/31/40 (b)(c) | | 2,780 | 0 |
| Lumine Group, Inc. (b) | | 22,141 | 516 |
TOTAL CANADA | | | 5,884 |
| Denmark - 4.4% | | | |
| DSV A/S | | 24,700 | 5,368 |
| Novo Nordisk A/S Series B | | 101,900 | 11,430 |
TOTAL DENMARK | | | 16,798 |
| France - 11.2% | | | |
| Accor SA | | 84,200 | 3,816 |
| Air Liquide SA | | 38,511 | 6,905 |
| Alten SA | | 22,075 | 1,866 |
| Capgemini SA | | 25,978 | 4,507 |
| Dassault Systemes SA | | 106,000 | 3,628 |
| EssilorLuxottica SA | | 20,925 | 4,903 |
| LVMH Moet Hennessy Louis Vuitton SE | | 9,781 | 6,511 |
| Safran SA | | 34,600 | 7,832 |
| Thales SA | | 18,900 | 3,046 |
TOTAL FRANCE | | | 43,014 |
| Germany - 8.9% | | | |
| Allianz SE | | 19,223 | 6,052 |
| Deutsche Borse AG | | 25,103 | 5,831 |
| Hannover Reuck SE | | 21,629 | 5,682 |
| Merck KGaA | | 20,900 | 3,456 |
| SAP SE | | 48,400 | 11,301 |
| Siemens Healthineers AG (a) | | 31,700 | 1,654 |
TOTAL GERMANY | | | 33,976 |
| India - 0.8% | | | |
| HDFC Bank Ltd. | | 144,984 | 2,980 |
| Indonesia - 0.9% | | | |
| PT Bank Central Asia Tbk | | 5,470,900 | 3,541 |
| Ireland - 1.0% | | | |
| Kingspan Group PLC (Ireland) | | 43,904 | 3,852 |
| Italy - 3.8% | | | |
| FinecoBank SpA | | 219,563 | 3,507 |
| GVS SpA (a)(b) | | 28,462 | 191 |
| Industrie de Nora SpA (d) | | 16,200 | 152 |
| Interpump Group SpA | | 5,900 | 262 |
| Recordati SpA | | 84,220 | 4,773 |
| UniCredit SpA | | 126,789 | 5,609 |
TOTAL ITALY | | | 14,494 |
| Japan - 16.1% | | | |
| Ajinomoto Co., Inc. | | 117,600 | 4,518 |
| BayCurrent Consulting, Inc. | | 40,000 | 1,300 |
| Capcom Co. Ltd. | | 100,500 | 1,989 |
| DENSO Corp. | | 117,100 | 1,663 |
| Disco Corp. | | 1,500 | 427 |
| Ebara Corp. | | 1,300 | 20 |
| Fuji Electric Co. Ltd. | | 12,940 | 659 |
| FUJIFILM Holdings Corp. | | 175,300 | 4,170 |
| Hitachi Ltd. | | 336,700 | 8,460 |
| Hoya Corp. | | 38,331 | 5,128 |
| Mitsubishi Heavy Industries Ltd. | | 475,000 | 6,706 |
| NOF Corp. | | 134,013 | 2,177 |
| Renesas Electronics Corp. | | 205,900 | 2,759 |
| Rohto Pharmaceutical Co. Ltd. | | 52,700 | 1,185 |
| Shin-Etsu Chemical Co. Ltd. | | 188,106 | 6,893 |
| Suzuki Motor Corp. | | 202,684 | 2,011 |
| TIS, Inc. | | 42,727 | 1,065 |
| Tokio Marine Holdings, Inc. | | 209,089 | 7,531 |
| Tokyo Electron Ltd. | | 21,281 | 3,132 |
TOTAL JAPAN | | | 61,793 |
| Netherlands - 6.3% | | | |
| ASML Holding NV (Netherlands) | | 17,006 | 11,488 |
| IMCD NV | | 28,850 | 4,583 |
| Topicus.Com, Inc. | | 6,230 | 533 |
| Wolters Kluwer NV | | 45,014 | 7,575 |
TOTAL NETHERLANDS | | | 24,179 |
| Spain - 1.2% | | | |
| CaixaBank SA | | 763,800 | 4,654 |
| Sweden - 2.7% | | | |
| Addlife AB B Shares | | 124,837 | 1,586 |
| Atlas Copco AB (A Shares) | | 241,692 | 3,989 |
| Indutrade AB | | 171,925 | 4,657 |
| Kry International AB (b)(c)(e) | | 7,253 | 152 |
TOTAL SWEDEN | | | 10,384 |
| Switzerland - 3.4% | | | |
| ABB Ltd. (Reg.) | | 14,804 | 823 |
| Galderma Group AG (b) | | 17,965 | 1,681 |
| Partners Group Holding AG | | 3,880 | 5,360 |
| Sika AG | | 18,082 | 5,036 |
TOTAL SWITZERLAND | | | 12,900 |
| Taiwan - 1.4% | | | |
| Taiwan Semiconductor Manufacturing Co. Ltd. | | 172,300 | 5,421 |
| United Kingdom - 17.8% | | | |
| 3i Group PLC | | 134,000 | 5,495 |
| AstraZeneca PLC (United Kingdom) | | 60,000 | 8,538 |
| BAE Systems PLC | | 295,000 | 4,755 |
| Compass Group PLC | | 239,254 | 7,770 |
| Diploma PLC | | 63,967 | 3,512 |
| Halma PLC | | 91,400 | 2,917 |
| InterContinental Hotel Group PLC | | 45,628 | 5,033 |
| Lloyds Banking Group PLC | | 5,797,900 | 3,980 |
| London Stock Exchange Group PLC | | 54,600 | 7,400 |
| RELX PLC (London Stock Exchange) | | 182,384 | 8,364 |
| Rolls-Royce Holdings PLC (b) | | 711,600 | 4,910 |
| Sage Group PLC | | 229,100 | 2,864 |
| Tesco PLC | | 655,400 | 2,894 |
TOTAL UNITED KINGDOM | | | 68,432 |
| United States of America - 15.5% | | | |
| Alcon, Inc. (Switzerland) | | 56,500 | 5,207 |
| CDW Corp. | | 1,357 | 255 |
| CRH PLC | | 43,400 | 4,142 |
| Experian PLC | | 109,200 | 5,318 |
| Ferguson Enterprises, Inc. | | 24,800 | 4,899 |
| Holcim AG | | 48,430 | 4,771 |
| ICON PLC (b) | | 9,100 | 2,021 |
| Linde PLC | | 13,734 | 6,265 |
| Marsh & McLennan Companies, Inc. | | 29,730 | 6,488 |
| S&P Global, Inc. | | 11,931 | 5,731 |
| Schneider Electric SA | | 27,500 | 7,124 |
| Thermo Fisher Scientific, Inc. | | 5,400 | 2,950 |
| Visa, Inc. Class A | | 14,900 | 4,319 |
TOTAL UNITED STATES OF AMERICA | | | 59,490 |
| TOTAL COMMON STOCKS (Cost $256,932) | | | 376,613 |
| | | | |
| Money Market Funds - 1.6% |
| | | Shares | Value ($) (000s) |
| Fidelity Cash Central Fund 4.87% (f) | | 5,787,329 | 5,788 |
| Fidelity Securities Lending Cash Central Fund 4.87% (f)(g) | | 141,760 | 142 |
| TOTAL MONEY MARKET FUNDS (Cost $5,930) | | | 5,930 |
| | | | |
| TOTAL INVESTMENT IN SECURITIES - 99.7% (Cost $262,862) | 382,543 |
NET OTHER ASSETS (LIABILITIES) - 0.3% | 1,312 |
| NET ASSETS - 100.0% | 383,855 |
| | |
Any values shown as $0 in the Schedule of Investments may reflect amounts less than $500.
Legend
| (a) | Security exempt from registration under Rule 144A of the Securities Act of 1933. These securities may be resold in transactions exempt from registration, normally to qualified institutional buyers. At the end of the period, the value of these securities amounted to $3,560,000 or 0.9% of net assets. |
| (d) | Security or a portion of the security is on loan at period end. |
| (e) | Restricted securities (including private placements) - Investment in securities not registered under the Securities Act of 1933 (excluding 144A issues). At the end of the period, the value of restricted securities (excluding 144A issues) amounted to $152,000 or 0.0% of net assets. |
| (f) | Affiliated fund that is generally available only to investment companies and other accounts managed by Fidelity Investments. The rate quoted is the annualized seven-day yield of the fund at period end. A complete unaudited listing of the fund's holdings as of its most recent quarter end is available upon request. In addition, each Fidelity Central Fund's financial statements, which are not covered by the Fund's Report of Independent Registered Public Accounting Firm, are available on the SEC's website or upon request. |
| (g) | Investment made with cash collateral received from securities on loan. |
| Additional information on each restricted holding is as follows: |
| Security | Acquisition Date | Acquisition Cost ($) (000s) |
| Kry International AB | 5/14/21 - 10/30/24 | 480 |
| | | |
Affiliated Central Funds
Fiscal year to date information regarding the Fund's investments in Fidelity Central Funds, including the ownership percentage, is presented below.
| Affiliate (Amounts in thousands) | Value, beginning of period ($) | Purchases ($) | Sales Proceeds ($) | Dividend Income ($) | Realized Gain (loss) ($) | Change in Unrealized appreciation (depreciation) ($) | Value, end of period ($) | % ownership, end of period |
| Fidelity Cash Central Fund 4.87% | 4,244 | 73,677 | 72,133 | 194 | - | - | 5,788 | 0.0% |
| Fidelity Securities Lending Cash Central Fund 4.87% | - | 3,240 | 3,098 | 6 | - | - | 142 | 0.0% |
| Total | 4,244 | 76,917 | 75,231 | 200 | - | - | 5,930 | |
| | | | | | | | | |
Amounts in the dividend income column in the above table include any capital gain distributions from underlying funds, which are presented in the corresponding line item in the Statement of Operations, if applicable.
Amounts in the dividend income column for Fidelity Securities Lending Cash Central Fund represents the income earned on investing cash collateral, less rebates paid to borrowers and any lending agent fees associated with the loan, plus any premium payments received for lending certain types of securities.
Amounts included in the purchases and sales proceeds columns may include in-kind transactions, if applicable.
Investment Valuation
The following is a summary of the inputs used, as of October 31, 2024, involving the Fund's assets and liabilities carried at fair value. The inputs or methodology used for valuing securities may not be an indication of the risk associated with investing in those securities. For more information on valuation inputs, and their aggregation into the levels used below, please refer to the Investment Valuation section in the accompanying Notes to Financial Statements.
| Valuation Inputs at Reporting Date: |
Description (Amounts in thousands) | Total ($) | Level 1 ($) | Level 2 ($) | Level 3 ($) |
Investments in Securities: | | | | |
|
| Equities: | | | | |
Communication Services | 1,989 | - | 1,989 | - |
Consumer Discretionary | 26,804 | 3,816 | 22,988 | - |
Consumer Staples | 8,597 | - | 8,597 | - |
Financials | 88,172 | 35,099 | 53,073 | - |
Health Care | 53,327 | 28,231 | 25,096 | - |
Industrials | 99,166 | 44,224 | 54,942 | - |
Information Technology | 62,369 | 25,807 | 36,410 | 152 |
Materials | 36,189 | 20,214 | 15,975 | - |
|
| Money Market Funds | 5,930 | 5,930 | - | - |
| Total Investments in Securities: | 382,543 | 163,321 | 219,070 | 152 |
Financial Statements
| Statement of Assets and Liabilities |
As of October 31, 2024 Amounts in thousands (except per-share amounts) |
| Assets | | | | |
| Investment in securities, at value (including securities loaned of $129) - See accompanying schedule: | | | | |
Unaffiliated issuers (cost $256,932) | $ | 376,613 | | |
Fidelity Central Funds (cost $5,930) | | 5,930 | | |
| | | | | |
| | | | | |
| Total Investment in Securities (cost $262,862) | | | $ | 382,543 |
| Receivable for investments sold | | | | 2,956 |
| Receivable for fund shares sold | | | | 129 |
| Dividends receivable | | | | 595 |
| Reclaims receivable | | | | 1,669 |
| Distributions receivable from Fidelity Central Funds | | | | 15 |
| Other receivables | | | | 91 |
Total assets | | | | 387,998 |
| Liabilities | | | | |
| Payable for investments purchased | $ | 3,410 | | |
| Payable for fund shares redeemed | | 187 | | |
| Accrued management fee | | 199 | | |
| Distribution and service plan fees payable | | 88 | | |
| Other payables and accrued expenses | | 117 | | |
| Collateral on securities loaned | | 142 | | |
| Total liabilities | | | | 4,143 |
| Net Assets | | | $ | 383,855 |
| Net Assets consist of: | | | | |
| Paid in capital | | | $ | 277,331 |
| Total accumulated earnings (loss) | | | | 106,524 |
| Net Assets | | | $ | 383,855 |
| | | | | |
| Net Asset Value and Maximum Offering Price | | | | |
| Class A : | | | | |
Net Asset Value and redemption price per share ($45,467 ÷ 1,399 shares)(a)(b) | | | $ | 32.49 |
| Maximum offering price per share (100/94.25 of $32.49) | | | $ | 34.47 |
| Class M : | | | | |
Net Asset Value and redemption price per share ($175,287 ÷ 5,265 shares)(a) | | | $ | 33.29 |
| Maximum offering price per share (100/96.50 of $33.29) | | | $ | 34.50 |
| Class C : | | | | |
Net Asset Value and offering price per share ($2,615 ÷ 85 shares)(a)(b) | | | $ | 30.78 |
| Class I : | | | | |
Net Asset Value, offering price and redemption price per share ($50,814 ÷ 1,514 shares)(b) | | | $ | 33.57 |
| Class Z : | | | | |
Net Asset Value, offering price and redemption price per share ($109,672 ÷ 3,272 shares) | | | $ | 33.52 |
(a)Redemption price per share is equal to net asset value less any applicable contingent deferred sales charge. |
(b)Corresponding Net Asset Value does not calculate due to rounding of fractional net assets and/or shares. |
| Statement of Operations |
| Year ended October 31, 2024 Amounts in thousands |
| Investment Income | | | | |
| Dividends | | | $ | 7,346 |
| Income from Fidelity Central Funds (including $6 from security lending) | | | | 200 |
| Income before foreign taxes withheld | | | $ | 7,546 |
| Less foreign taxes withheld | | | | (530) |
| Total income | | | | 7,016 |
| Expenses | | | | |
| Management fee | | | | |
| Basic fee | $ | 2,873 | | |
| Performance adjustment | | (450) | | |
| Transfer agent fees | | 172 | | |
| Distribution and service plan fees | | 1,045 | | |
| Accounting fees | | 60 | | |
| Custodian fees and expenses | | 51 | | |
| Independent trustees' fees and expenses | | 2 | | |
| Registration fees | | 74 | | |
| Audit fees | | 100 | | |
| Legal | | 2 | | |
| Miscellaneous | | 10 | | |
| Total expenses before reductions | | 3,939 | | |
| Expense reductions | | (17) | | |
| Total expenses after reductions | | | | 3,922 |
| Net Investment income (loss) | | | | 3,094 |
| Realized and Unrealized Gain (Loss) | | | | |
| Net realized gain (loss) on: | | | | |
| Investment Securities: | | | | |
| Unaffiliated issuers (net of foreign taxes of $97) | | 18,608 | | |
| Foreign currency transactions | | (28) | | |
| Total net realized gain (loss) | | | | 18,580 |
| Change in net unrealized appreciation (depreciation) on: | | | | |
| Investment Securities: | | | | |
| Unaffiliated issuers (net of decrease in deferred foreign taxes of $24) | | 60,154 | | |
| Assets and liabilities in foreign currencies | | 13 | | |
| Total change in net unrealized appreciation (depreciation) | | | | 60,167 |
| Net gain (loss) | | | | 78,747 |
| Net increase (decrease) in net assets resulting from operations | | | $ | 81,841 |
| Statement of Changes in Net Assets |
| |
| Amount in thousands | | Year ended October 31, 2024 | | Year ended October 31, 2023 |
| Increase (Decrease) in Net Assets | | | | |
| Operations | | | | |
| Net investment income (loss) | $ | 3,094 | $ | 3,255 |
| Net realized gain (loss) | | 18,580 | | 7,127 |
| Change in net unrealized appreciation (depreciation) | | 60,167 | | 30,705 |
| Net increase (decrease) in net assets resulting from operations | | 81,841 | | 41,087 |
| Distributions to shareholders | | (2,839) | | (1,443) |
| | | | | |
| Share transactions - net increase (decrease) | | (22,452) | | (26,879) |
| Total increase (decrease) in net assets | | 56,550 | | 12,765 |
| | | | | |
| Net Assets | | | | |
| Beginning of period | | 327,305 | | 314,540 |
| End of period | $ | 383,855 | $ | 327,305 |
| | | | | |
| | | | | |
Financial Highlights
Fidelity Advisor® Overseas Fund Class A |
| |
| Years ended October 31, | | 2024 | | 2023 | | 2022 | | 2021 | | 2020 |
Selected Per-Share Data | | | | | | | | | | |
| Net asset value, beginning of period | $ | 26.09 | $ | 23.29 | $ | 34.07 | $ | 24.73 | $ | 24.27 |
| Income from Investment Operations | | | | | | | | | | |
Net investment income (loss) A,B | | .24 | | .23 | | .14 | | (.04) | | (.02) |
| Net realized and unrealized gain (loss) | | 6.39 | | 2.67 | | (10.20) | | 9.38 | | .83 |
| Total from investment operations | | 6.63 | | 2.90 | | (10.06) | | 9.34 | | .81 |
| Distributions from net investment income | | (.23) | | (.10) | | - | | - | | (.35) |
| Distributions from net realized gain | | - | | - | | (.72) | | - | | - |
| Total distributions | | (.23) | | (.10) | | (.72) | | - | | (.35) |
| Net asset value, end of period | $ | 32.49 | $ | 26.09 | $ | 23.29 | $ | 34.07 | $ | 24.73 |
Total Return C,D | | | | 12.43% | | (30.12)% | | 37.77% | | 3.33% |
Ratios to Average Net Assets B,E,F | | | | | | | | | | |
| Expenses before reductions | | 1.07% | | 1.13% | | 1.36% | | 1.43% | | 1.49% |
| Expenses net of fee waivers, if any | | | | 1.12% | | 1.36% | | 1.43% | | 1.49% |
| Expenses net of all reductions | | 1.06% | | 1.12% | | 1.36% | | 1.43% | | 1.48% |
| Net investment income (loss) | | .77% | | .84% | | .51% | | (.12)% | | (.08)% |
| Supplemental Data | | | | | | | | | | |
| Net assets, end of period (in millions) | $ | 45 | $ | 38 | $ | 35 | $ | 56 | $ | 46 |
Portfolio turnover rate G | | | | 37% | | 46% | | 33% H | | 46% |
ACalculated based on average shares outstanding during the period.
BNet investment income (loss) is affected by the timing of the declaration of dividends by any underlying mutual funds or exchange-traded funds (ETFs). Net investment income (loss) of any mutual funds or ETFs is not included in the Fund's net investment income (loss) ratio.
CTotal returns would have been lower if certain expenses had not been reduced during the applicable periods shown.
DTotal returns do not include the effect of the sales charges.
EFees and expenses of any underlying mutual funds or exchange-traded funds (ETFs) are not included in the Fund's expense ratio. The Fund indirectly bears its proportionate share of these expenses. For additional expense information related to investments in Fidelity Central Funds, please refer to the "Investments in Fidelity Central Funds" note found in the Notes to Financial Statements section of the most recent Annual or Semi-Annual report.
FExpense ratios reflect operating expenses of the class. Expenses before reductions do not reflect amounts reimbursed, waived, or reduced through arrangements with the investment adviser, brokerage services, or other offset arrangements, if applicable, and do not represent the amount paid by the class during periods when reimbursements, waivers or reductions occur.
GAmount does not include the portfolio activity of any underlying mutual funds or exchange-traded funds (ETFs).
HPortfolio turnover rate excludes securities received or delivered in-kind.
Fidelity Advisor® Overseas Fund Class M |
| |
| Years ended October 31, | | 2024 | | 2023 | | 2022 | | 2021 | | 2020 |
Selected Per-Share Data | | | | | | | | | | |
| Net asset value, beginning of period | $ | 26.73 | $ | 23.85 | $ | 34.94 | $ | 25.41 | $ | 24.94 |
| Income from Investment Operations | | | | | | | | | | |
Net investment income (loss) A,B | | .18 | | .18 | | .09 | | (.11) | | (.07) |
| Net realized and unrealized gain (loss) | | 6.54 | | 2.73 | | (10.46) | | 9.64 | | .84 |
| Total from investment operations | | 6.72 | | 2.91 | | (10.37) | | 9.53 | | .77 |
| Distributions from net investment income | | (.16) | | (.03) | | - | | - | | (.30) |
| Distributions from net realized gain | | - | | - | | (.72) | | - | | - |
| Total distributions | | (.16) | | (.03) | | (.72) | | - | | (.30) |
| Net asset value, end of period | $ | 33.29 | $ | 26.73 | $ | 23.85 | $ | 34.94 | $ | 25.41 |
Total Return C,D | | | | 12.21% | | (30.26)% | | 37.50% | | 3.09% |
Ratios to Average Net Assets B,E,F | | | | | | | | | | |
| Expenses before reductions | | 1.28% | | 1.33% | | 1.57% | | 1.65% | | 1.71% |
| Expenses net of fee waivers, if any | | | | 1.33% | | 1.57% | | 1.65% | | 1.70% |
| Expenses net of all reductions | | 1.28% | | 1.33% | | 1.57% | | 1.65% | | 1.70% |
| Net investment income (loss) | | .55% | | .64% | | .30% | | (.34)% | | (.29)% |
| Supplemental Data | | | | | | | | | | |
| Net assets, end of period (in millions) | $ | 175 | $ | 155 | $ | 150 | $ | 238 | $ | 194 |
Portfolio turnover rate G | | | | 37% | | 46% | | 33% H | | 46% |
ACalculated based on average shares outstanding during the period.
BNet investment income (loss) is affected by the timing of the declaration of dividends by any underlying mutual funds or exchange-traded funds (ETFs). Net investment income (loss) of any mutual funds or ETFs is not included in the Fund's net investment income (loss) ratio.
CTotal returns would have been lower if certain expenses had not been reduced during the applicable periods shown.
DTotal returns do not include the effect of the sales charges.
EFees and expenses of any underlying mutual funds or exchange-traded funds (ETFs) are not included in the Fund's expense ratio. The Fund indirectly bears its proportionate share of these expenses. For additional expense information related to investments in Fidelity Central Funds, please refer to the "Investments in Fidelity Central Funds" note found in the Notes to Financial Statements section of the most recent Annual or Semi-Annual report.
FExpense ratios reflect operating expenses of the class. Expenses before reductions do not reflect amounts reimbursed, waived, or reduced through arrangements with the investment adviser, brokerage services, or other offset arrangements, if applicable, and do not represent the amount paid by the class during periods when reimbursements, waivers or reductions occur.
GAmount does not include the portfolio activity of any underlying mutual funds or exchange-traded funds (ETFs).
HPortfolio turnover rate excludes securities received or delivered in-kind.
Fidelity Advisor® Overseas Fund Class C |
| |
| Years ended October 31, | | 2024 | | 2023 | | 2022 | | 2021 | | 2020 |
Selected Per-Share Data | | | | | | | | | | |
| Net asset value, beginning of period | $ | 24.71 | $ | 22.15 | $ | 32.69 | $ | 23.92 | $ | 23.46 |
| Income from Investment Operations | | | | | | | | | | |
Net investment income (loss) A,B | | .01 | | .01 | | (.08) | | (.28) | | (.21) |
| Net realized and unrealized gain (loss) | | 6.06 | | 2.55 | | (9.74) | | 9.05 | | .80 |
| Total from investment operations | | 6.07 | | 2.56 | | (9.82) | | 8.77 | | .59 |
| Distributions from net investment income | | - | | - | | - | | - | | (.13) |
| Distributions from net realized gain | | - | | - | | (.72) | | - | | - |
| Total distributions | | - | | - | | (.72) | | - | | (.13) |
| Net asset value, end of period | $ | 30.78 | $ | 24.71 | $ | 22.15 | $ | 32.69 | $ | 23.92 |
Total Return C,D | | | | 11.56% | | (30.66)% | | 36.66% | | 2.50% |
Ratios to Average Net Assets B,E,F | | | | | | | | | | |
| Expenses before reductions | | 1.81% | | 1.92% | | 2.16% | | 2.25% | | 2.31% |
| Expenses net of fee waivers, if any | | | | 1.91% | | 2.16% | | 2.25% | | 2.31% |
| Expenses net of all reductions | | 1.81% | | 1.91% | | 2.16% | | 2.25% | | 2.30% |
| Net investment income (loss) | | .02% | | .05% | | (.29)% | | (.94)% | | (.89)% |
| Supplemental Data | | | | | | | | | | |
| Net assets, end of period (in millions) | $ | 3 | $ | 2 | $ | 3 | $ | 5 | $ | 5 |
Portfolio turnover rate G | | | | 37% | | 46% | | 33% H | | 46% |
ACalculated based on average shares outstanding during the period.
BNet investment income (loss) is affected by the timing of the declaration of dividends by any underlying mutual funds or exchange-traded funds (ETFs). Net investment income (loss) of any mutual funds or ETFs is not included in the Fund's net investment income (loss) ratio.
CTotal returns would have been lower if certain expenses had not been reduced during the applicable periods shown.
DTotal returns do not include the effect of the contingent deferred sales charge.
EFees and expenses of any underlying mutual funds or exchange-traded funds (ETFs) are not included in the Fund's expense ratio. The Fund indirectly bears its proportionate share of these expenses. For additional expense information related to investments in Fidelity Central Funds, please refer to the "Investments in Fidelity Central Funds" note found in the Notes to Financial Statements section of the most recent Annual or Semi-Annual report.
FExpense ratios reflect operating expenses of the class. Expenses before reductions do not reflect amounts reimbursed, waived, or reduced through arrangements with the investment adviser, brokerage services, or other offset arrangements, if applicable, and do not represent the amount paid by the class during periods when reimbursements, waivers or reductions occur.
GAmount does not include the portfolio activity of any underlying mutual funds or exchange-traded funds (ETFs).
HPortfolio turnover rate excludes securities received or delivered in-kind.
Fidelity Advisor® Overseas Fund Class I |
| |
| Years ended October 31, | | 2024 | | 2023 | | 2022 | | 2021 | | 2020 |
Selected Per-Share Data | | | | | | | | | | |
| Net asset value, beginning of period | $ | 26.94 | $ | 24.03 | $ | 35.03 | $ | 25.35 | $ | 24.79 |
| Income from Investment Operations | | | | | | | | | | |
Net investment income (loss) A,B | | .35 | | .32 | | .23 | | .06 | | .07 |
| Net realized and unrealized gain (loss) | | 6.58 | | 2.75 | | (10.51) | | 9.62 | | .84 |
| Total from investment operations | | 6.93 | | 3.07 | | (10.28) | | 9.68 | | .91 |
| Distributions from net investment income | | (.30) | | (.16) | | - | | - | | (.35) |
| Distributions from net realized gain | | - | | - | | (.72) | | - | | - |
| Total distributions | | (.30) | | (.16) | | (.72) | | - | | (.35) |
| Net asset value, end of period | $ | 33.57 | $ | 26.94 | $ | 24.03 | $ | 35.03 | $ | 25.35 |
Total Return C | | | | 12.78% | | (29.91)% | | 38.19% | | 3.68% |
Ratios to Average Net Assets B,D,E | | | | | | | | | | |
| Expenses before reductions | | .77% | | .83% | | 1.08% | | 1.12% | | 1.15% |
| Expenses net of fee waivers, if any | | | | .83% | | 1.08% | | 1.12% | | 1.15% |
| Expenses net of all reductions | | .77% | | .83% | | 1.08% | | 1.12% | | 1.14% |
| Net investment income (loss) | | 1.06% | | 1.14% | | .79% | | .19% | | .27% |
| Supplemental Data | | | | | | | | | | |
| Net assets, end of period (in millions) | $ | 51 | $ | 49 | $ | 48 | $ | 85 | $ | 121 |
Portfolio turnover rate F | | | | 37% | | 46% | | 33% G | | 46% |
ACalculated based on average shares outstanding during the period.
BNet investment income (loss) is affected by the timing of the declaration of dividends by any underlying mutual funds or exchange-traded funds (ETFs). Net investment income (loss) of any mutual funds or ETFs is not included in the Fund's net investment income (loss) ratio.
CTotal returns would have been lower if certain expenses had not been reduced during the applicable periods shown.
DFees and expenses of any underlying mutual funds or exchange-traded funds (ETFs) are not included in the Fund's expense ratio. The Fund indirectly bears its proportionate share of these expenses. For additional expense information related to investments in Fidelity Central Funds, please refer to the "Investments in Fidelity Central Funds" note found in the Notes to Financial Statements section of the most recent Annual or Semi-Annual report.
EExpense ratios reflect operating expenses of the class. Expenses before reductions do not reflect amounts reimbursed, waived, or reduced through arrangements with the investment adviser, brokerage services, or other offset arrangements, if applicable, and do not represent the amount paid by the class during periods when reimbursements, waivers or reductions occur.
FAmount does not include the portfolio activity of any underlying mutual funds or exchange-traded funds (ETFs).
GPortfolio turnover rate excludes securities received or delivered in-kind.
Fidelity Advisor® Overseas Fund Class Z |
| |
| Years ended October 31, | | 2024 | | 2023 | | 2022 | | 2021 | | 2020 |
Selected Per-Share Data | | | | | | | | | | |
| Net asset value, beginning of period | $ | 26.91 | $ | 24.03 | $ | 34.97 | $ | 25.28 | $ | 24.79 |
| Income from Investment Operations | | | | | | | | | | |
Net investment income (loss) A,B | | .38 | | .36 | | .27 | | .09 | | .09 |
| Net realized and unrealized gain (loss) | | 6.58 | | 2.74 | | (10.49) | | 9.60 | | .84 |
| Total from investment operations | | 6.96 | | 3.10 | | (10.22) | | 9.69 | | .93 |
| Distributions from net investment income | | (.35) | | (.22) | | - | | - | | (.44) |
| Distributions from net realized gain | | - | | - | | (.72) | | - | | - |
| Total distributions | | (.35) | | (.22) | | (.72) | | - | | (.44) |
| Net asset value, end of period | $ | 33.52 | $ | 26.91 | $ | 24.03 | $ | 34.97 | $ | 25.28 |
Total Return C | | | | 12.90% | | (29.79)% | | 38.33% | | 3.77% |
Ratios to Average Net Assets B,D,E | | | | | | | | | | |
| Expenses before reductions | | .66% | | .70% | | .94% | | 1.02% | | 1.07% |
| Expenses net of fee waivers, if any | | | | .69% | | .93% | | 1.02% | | 1.06% |
| Expenses net of all reductions | | .66% | | .69% | | .93% | | 1.02% | | 1.05% |
| Net investment income (loss) | | 1.17% | | 1.27% | | .94% | | .29% | | .35% |
| Supplemental Data | | | | | | | | | | |
| Net assets, end of period (in millions) | $ | 110 | $ | 83 | $ | 80 | $ | 108 | $ | 47 |
Portfolio turnover rate F | | | | 37% | | 46% | | 33% G | | 46% |
ACalculated based on average shares outstanding during the period.
BNet investment income (loss) is affected by the timing of the declaration of dividends by any underlying mutual funds or exchange-traded funds (ETFs). Net investment income (loss) of any mutual funds or ETFs is not included in the Fund's net investment income (loss) ratio.
CTotal returns would have been lower if certain expenses had not been reduced during the applicable periods shown.
DFees and expenses of any underlying mutual funds or exchange-traded funds (ETFs) are not included in the Fund's expense ratio. The Fund indirectly bears its proportionate share of these expenses. For additional expense information related to investments in Fidelity Central Funds, please refer to the "Investments in Fidelity Central Funds" note found in the Notes to Financial Statements section of the most recent Annual or Semi-Annual report.
EExpense ratios reflect operating expenses of the class. Expenses before reductions do not reflect amounts reimbursed, waived, or reduced through arrangements with the investment adviser, brokerage services, or other offset arrangements, if applicable, and do not represent the amount paid by the class during periods when reimbursements, waivers or reductions occur.
FAmount does not include the portfolio activity of any underlying mutual funds or exchange-traded funds (ETFs).
GPortfolio turnover rate excludes securities received or delivered in-kind.
Notes to Financial Statements
For the period ended October 31, 2024
(Amounts in thousands except percentages)
1. Organization.
Fidelity Advisor Overseas Fund (the Fund) is a fund of Fidelity Advisor Series VIII (the Trust) and is authorized to issue an unlimited number of shares. The Trust is registered under the Investment Company Act of 1940, as amended (the 1940 Act), as an open-end management investment company organized as a Massachusetts business trust. The Fund offers Class A, Class M, Class C, Class I and Class Z shares, each of which has equal rights as to assets and voting privileges. Class A, Class M, Class C, Class I and Class Z are Fidelity Advisor classes. Each class has exclusive voting rights with respect to matters that affect that class. Class C shares will automatically convert to Class A shares after a holding period of eight years from the initial date of purchase, with certain exceptions.
2. Investments in Fidelity Central Funds.
Funds may invest in Fidelity Central Funds, which are open-end investment companies generally available only to other investment companies and accounts managed by the investment adviser and its affiliates. The Schedule of Investments lists any Fidelity Central Funds held as an investment as of period end, but does not include the underlying holdings of each Fidelity Central Fund. An investing fund indirectly bears its proportionate share of the expenses of the underlying Fidelity Central Funds.
Based on its investment objective, each Fidelity Central Fund may invest or participate in various investment vehicles or strategies that are similar to those of the investing fund. These strategies are consistent with the investment objectives of the investing fund and may involve certain economic risks which may cause a decline in value of each of the Fidelity Central Funds and thus a decline in the value of the investing fund.
| Fidelity Central Fund | Investment Manager | Investment Objective | Investment Practices | Expense RatioA |
| Fidelity Money Market Central Funds | Fidelity Management & Research Company LLC (FMR) | Each fund seeks to obtain a high level of current income consistent with the preservation of capital and liquidity. | Short-term Investments | Less than .005% |
A Expenses expressed as a percentage of average net assets and are as of each underlying Central Fund's most recent annual or semi-annual shareholder report.
A complete unaudited list of holdings for each Fidelity Central Fund is available upon request or at the Securities and Exchange Commission website at www.sec.gov. In addition, the financial statements of the Fidelity Central Funds which contain the significant accounting policies (including investment valuation policies) of those funds, and are not covered by the Report of Independent Registered Public Accounting Firm, are available on the Securities and Exchange Commission website or upon request.
3. Significant Accounting Policies.
The Fund is an investment company and applies the accounting and reporting guidance of the Financial Accounting Standards Board (FASB) Accounting Standards Codification Topic 946 Financial Services - Investment Companies. The financial statements have been prepared in conformity with accounting principles generally accepted in the United States of America (GAAP), which require management to make certain estimates and assumptions at the date of the financial statements. Actual results could differ from those estimates. Subsequent events, if any, through the date that the financial statements were issued have been evaluated in the preparation of the financial statements. The Fund's Schedule of Investments lists any underlying mutual funds or exchange-traded funds (ETFs) but does not include the underlying holdings of these funds. The following summarizes the significant accounting policies of the Fund:
Investment Valuation. Investments are valued as of 4:00 p.m. Eastern time on the last calendar day of the period. The Board of Trustees (the Board) has designated the Fund's investment adviser as the valuation designee responsible for the fair valuation function and performing fair value determinations as needed. The investment adviser has established a Fair Value Committee (the Committee) to carry out the day-to-day fair valuation responsibilities and has adopted policies and procedures to govern the fair valuation process and the activities of the Committee. In accordance with these fair valuation policies and procedures, which have been approved by the Board, the Fund attempts to obtain prices from one or more third party pricing services or brokers to value its investments. When current market prices, quotations or currency exchange rates are not readily available or reliable, investments will be fair valued in good faith by the Committee, in accordance with the policies and procedures. Factors used in determining fair value vary by investment type and may include market or investment specific events, transaction data, estimated cash flows, and market observations of comparable investments. The frequency that the fair valuation procedures are used cannot be predicted and they may be utilized to a significant extent. The Committee manages the Fund's fair valuation practices and maintains the fair valuation policies and procedures. The Fund's investment adviser reports to the Board information regarding the fair valuation process and related material matters.
The Fund categorizes the inputs to valuation techniques used to value its investments into a disclosure hierarchy consisting of three levels as shown below:
Level 1 - unadjusted quoted prices in active markets for identical investments
Level 2 - other significant observable inputs (including quoted prices for similar investments, interest rates, prepayment speeds, etc.)
Level 3 - unobservable inputs (including the Fund's own assumptions based on the best information available)
Valuation techniques used to value the Fund's investments by major category are as follows:
Equity securities, including restricted securities, for which market quotations are readily available, are valued at the last reported sale price or official closing price as reported by a third party pricing service on the primary market or exchange on which they are traded and are categorized as Level 1 in the hierarchy. In the event there were no sales during the day or closing prices are not available, securities are valued at the last quoted bid price or may be valued using the last available price and are generally categorized as Level 2 in the hierarchy. For foreign equity securities, when market or security specific events arise, comparisons to the valuation of American Depositary Receipts (ADRs), futures contracts, Exchange-Traded Funds (ETFs) and certain indexes as well as quoted prices for similar securities may be used and would be categorized as Level 2 in the hierarchy. For equity securities, including restricted securities, where observable inputs are limited, assumptions about market activity and risk are used and these securities may be categorized as Level 3 in the hierarchy.
Investments in open-end mutual funds, including the Fidelity Central Funds, are valued at their closing net asset value (NAV) each business day and are categorized as Level 1 in the hierarchy.
Changes in valuation techniques may result in transfers in or out of an assigned level within the disclosure hierarchy. The aggregate value of investments by input level as of October 31, 2024 is included at the end of the Fund's Schedule of Investments.
Foreign Currency. Certain Funds may use foreign currency contracts to facilitate transactions in foreign-denominated securities. Gains and losses from these transactions may arise from changes in the value of the foreign currency or if the counterparties do not perform under the contracts' terms.
Foreign-denominated assets, including investment securities, and liabilities are translated into U.S. dollars at the exchange rates at period end. Purchases and sales of investment securities, income and dividends received, and expenses denominated in foreign currencies are translated into U.S. dollars at the exchange rate in effect on the transaction date.
The effects of exchange rate fluctuations on investments are included with the net realized and unrealized gain (loss) on investment securities. Other foreign currency transactions resulting in realized and unrealized gain (loss) are disclosed separately.
Investment Transactions and Income. For financial reporting purposes, the Fund's investment holdings and NAV include trades executed through the end of the last business day of the period. The NAV per share for processing shareholder transactions is calculated as of the close of business of the New York Stock Exchange (NYSE), normally 4:00 p.m. Eastern time and includes trades executed through the end of the prior business day. Gains and losses on securities sold are determined on the basis of identified cost and include proceeds received from litigation. Commissions paid to certain brokers with whom the investment adviser, or its affiliates, places trades on behalf of a fund include an amount in addition to trade execution, which may be rebated back to a fund. Any such rebates are included in net realized gain (loss) on investments in the Statement of Operations. Dividend income is recorded on the ex-dividend date, except for certain dividends from foreign securities where the ex-dividend date may have passed, which are recorded as soon as the Fund is informed of the ex-dividend date. Non-cash dividends included in dividend income, if any, are recorded at the fair market value of the securities received. Income and capital gain distributions from Fidelity Central Funds, if any, are recorded on the ex-dividend date. Investment income is recorded net of foreign taxes withheld where recovery of such taxes is uncertain. Funds may file withholding tax reclaims in certain jurisdictions to recover a portion of amounts previously withheld. Any withholding tax reclaims income is included in the Statement of Operations in foreign taxes withheld. Any receivables for withholding tax reclaims are included in the Statement of Assets and Liabilities in reclaims receivable. The Fund has filed tax reclaims for previously withheld taxes on dividends earned in certain European Union (EU) countries. These additional filings are subject to various administrative proceedings by the local jurisdictions' tax authorities within the EU, as well as a number of related judicial proceedings. Income recognized for EU reclaims is included with other reclaims in the Statement of Operations in foreign taxes withheld. These reclaims are recorded when the amount is known and there are no significant uncertainties on collectability.
Class Allocations and Expenses. Investment income, realized and unrealized capital gains and losses, common expenses of a fund, and certain fund-level expense reductions, if any, are allocated daily on a pro-rata basis to each class based on the relative net assets of each class to the total net assets of a fund. Each class differs with respect to transfer agent and distribution and service plan fees incurred, as applicable. Certain expense reductions may also differ by class, if applicable. For the reporting period, the allocated portion of income and expenses to each class as a percent of its average net assets may vary due to the timing of recording these transactions in relation to fluctuating net assets of the classes. Expenses directly attributable to a fund are charged to that fund. Expenses attributable to more than one fund are allocated among the respective funds on the basis of relative net assets or other appropriate methods. Expenses included in the accompanying financial statements reflect the expenses of that fund and do not include any expenses associated with any underlying mutual funds or exchange-traded funds (ETFs). Although not included in a fund's expenses, a fund indirectly bears its proportionate share of these expenses through the net asset value of each underlying mutual fund or exchange-traded fund (ETF). Expense estimates are accrued in the period to which they relate and adjustments are made when actual amounts are known.
Income Tax Information and Distributions to Shareholders. Each year, the Fund intends to qualify as a regulated investment company under Subchapter M of the Internal Revenue Code, including distributing substantially all of its taxable income and realized gains. As a result, no provision for U.S. Federal income taxes is required. As of October 31, 2024, the Fund did not have any unrecognized tax benefits in the financial statements; nor is the Fund aware of any tax positions for which it is reasonably possible that the total amounts of unrecognized tax benefits will significantly change in the next twelve months. The Fund files a U.S. federal tax return, in addition to state and local tax returns as required. The Fund's federal income tax returns are subject to examination by the Internal Revenue Service (IRS) for a period of three fiscal years after they are filed. State and local tax returns may be subject to examination for an additional fiscal year depending on the jurisdiction. Foreign taxes are provided for based on the Fund's understanding of the tax rules and rates that exist in the foreign markets in which it invests. The Fund is subject to a tax imposed on capital gains by certain countries in which it invests. An estimated deferred tax liability for net unrealized appreciation on the applicable securities is included in Other payables and accrued expenses on the Statement of Assets and Liabilities.
Distributions are declared and recorded on the ex-dividend date. Income and capital gain distributions are declared separately for each class. Income and capital gain distributions are determined in accordance with income tax regulations, which may differ from GAAP. In addition, the Fund claimed a portion of the payment made to redeeming shareholders as a distribution for income tax purposes.
Capital accounts within the financial statements are adjusted for permanent book-tax differences. These adjustments have no impact on net assets or the results of operations. Capital accounts are not adjusted for temporary book-tax differences which will reverse in a subsequent period.
Book-tax differences are primarily due to foreign currency transactions, certain foreign taxes, passive foreign investment companies (PFIC), capital loss carryforwards and losses deferred due to wash sales.
As of period end, the cost and unrealized appreciation (depreciation) in securities, and derivatives if applicable, for federal income tax purposes were as follows:
| Gross unrealized appreciation | $121,495 |
| Gross unrealized depreciation | (4,357) |
| Net unrealized appreciation (depreciation) | $117,138 |
| Tax Cost | $265,405 |
The tax-based components of distributable earnings as of period end were as follows:
| Undistributed ordinary income | $4,921 |
| Capital loss carryforward | $(15,439) |
| Net unrealized appreciation (depreciation) on securities and other investments | $117,081 |
Capital loss carryforwards are only available to offset future capital gains of the Fund to the extent provided by regulations and may be limited. The capital loss carryforward information presented below, including any applicable limitation, is estimated as of fiscal period end and is subject to adjustment.
Short-term | $(15,439) |
Long-term | - |
| Total capital loss carryforward | $(15,439) |
The tax character of distributions paid was as follows:
| | October 31, 2024 | October 31, 2023 |
| Ordinary Income | $2,839 | $ 1,443 |
| Total | $2,839 | $ 1,443 |
Restricted Securities (including Private Placements). Funds may invest in securities that are subject to legal or contractual restrictions on resale. These securities generally may be resold in transactions exempt from registration or to the public if the securities are registered. Disposal of these securities may involve time-consuming negotiations and expense, and prompt sale at an acceptable price may be difficult. Information regarding restricted securities held at period end is included at the end of the Schedule of Investments, if applicable.
New Accounting Pronouncement. In November 2023, the FASB issued Accounting Standards Update (ASU) 2023-07 Segment Reporting (Topic 280): Improvements to Reportable Segment Disclosures. Effective for fiscal years beginning after December 15, 2023 and interim periods within fiscal years beginning after December 15, 2024, the amendments enhance required disclosures of segment information for public entities on an annual and interim basis. The ASU allows for early adoption with updates applied retrospectively. Management is currently evaluating the impact of the ASU but does not expect this guidance to materially impact the financial statements.
4. Purchases and Sales of Investments.
Purchases and sales of securities, other than short-term securities and in-kind transactions, as applicable, are noted in the table below.
| | Purchases ($) | Sales ($) |
| Fidelity Advisor Overseas Fund | 126,128 | 148,096 |
5. Fees and Other Transactions with Affiliates.
Management Fee. Fidelity Management & Research Company LLC (the investment adviser) and its affiliates provide the Fund with investment management related services for which the Fund pays a monthly management fee.
Effective March 1, 2024, the Fund's management contract was amended to incorporate administrative services previously covered under separate services agreements (Transfer Agent and Accounting agreements). The amended contract incorporates a basic fee rate that may vary by class (subject to a performance adjustment). The investment adviser or an affiliate pays certain expenses of managing and operating the Fund out of each class's management fee. Each class of the Fund pays a management fee to the investment adviser. The management fee is calculated and paid to the investment adviser every month. The management fee is determined by calculating a basic fee and then applying a performance adjustment. When determining a class's basic fee, a mandate rate is calculated based on the monthly average net assets of a group of funds advised by FMR within a designated asset class. A discount rate is subtracted from the mandate rate once the Fund's monthly average net assets reach a certain level. The mandate rate and discount rate may vary by class. The annual basic fee rate for a class of shares of the Fund is the lesser of (1) the class's mandate rate reduced by the class's discount rate (if applicable) or (2) the amount set forth in the following table.
| | Maximum Management Fee Rate % |
| Class A | .86 |
| Class M | .83 |
| Class C | .86 |
| Class I | .82 |
| Class Z | .70 |
One-twelfth of the basic fee rate for a class is applied to the average net assets of the class for the month, giving a dollar amount which is the basic fee for the class for that month. A different management fee rate may be applicable to each class of the Fund. The difference between classes is the result of separate arrangements for class-level services and/or waivers of certain expenses. It is not the result of any difference in advisory or custodial fees or other expenses related to the management of the Fund's assets, which do not vary by class. For the portion of the reporting period on or after March 1, 2024, the total annualized management fee rates were as follows:
| | Total Management Fee Rate % |
| Class A | .86 |
| Class M | .83 |
| Class C | .86 |
| Class I | .82 |
| Class Z | .70 |
Prior to March 1, 2024, the management fee was the sum of an individual fund fee rate that was based on an annual rate of .42% of the Fund's average net assets and an annualized group fee rate that averaged .22% during the period. The group fee rate was based upon the monthly average net assets of a group of registered investment companies with which the investment adviser has management contracts. The group fee rate decreased as assets under management increased and increased as assets under management decreased. For the portion of the reporting period prior to March 1, 2024, the total annualized management fee rate was .65%.
The performance adjustment rate is calculated monthly by comparing over the performance period the Fund's performance to that of the performance adjustment index listed below.
| | Performance Adjustment Index |
| Fidelity Advisor Overseas Fund | MSCI EAFE Index |
For the purposes of calculating the performance adjustment for the Fund, the Fund's investment performance is based on the performance of the asset-weighted return of all classes. To the extent that other classes of the Fund have higher expenses, this could result in those classes bearing a larger positive performance adjustment and smaller negative performance adjustment than would be the case if each class's own performance were considered. The performance period is the most recent 36 month period. The maximum annualized performance adjustment rate is ±.20% of the Fund's average net assets over the performance period. The performance adjustment rate is divided by twelve and multiplied by the Fund's average net assets over the performance period, and the resulting dollar amount is proportionately added to or subtracted from a class's basic fee. For the entire reporting period, the total annual performance adjustment was (.12)%.
Effective March 1, 2024, the Fund's sub-advisory agreements with FMR Investment Management (UK) Limited, Fidelity Management & Research (Hong Kong) Limited, and Fidelity Management & Research (Japan) Limited were amended to provide that the investment adviser pays each sub-adviser monthly fees equal to 110% of the sub-adviser's costs for providing sub-advisory services.
Effective March 1, 2024, the Fund's sub-advisory agreement with FIL Investment Advisors (FIA) was amended to provide that the investment adviser pays FIA monthly fees at an annual rate of 0.44% with respect to the average daily net assets of the Fund managed by FIA. FIA in turn pays FIA(UK).
Distribution and Service Plan Fees. In accordance with Rule 12b-1 of the 1940 Act, the Fund has adopted separate Distribution and Service Plans for each class of shares. Certain classes pay Fidelity Distributors Company LLC (FDC), an affiliate of the investment adviser, separate Distribution and Service Fees, each of which is based on an annual percentage of each class' average net assets. In addition, FDC may pay financial intermediaries for selling shares of the Fund and providing shareholder support services. For the period, the Distribution and Service Fee rates, total fees and amounts retained by FDC were as follows:
| | Distribution Fee | Service Fee | Total Fees ($) | Retained by FDC ($) | | |
| Class A | - % | .25% | 113 | 2 | | |
| Class M | .25% | .25% | 904 | 3 | | |
| Class C | .75% | .25% | 28 | 2 | | |
| | | | 1,045 | 7 | | |
Sales Load. FDC may receive a front-end sales charge of up to 5.75% for selling Class A shares and 3.50% for selling Class M shares, some of which is paid to financial intermediaries for selling shares of the Fund. Depending on the holding period, FDC may receive contingent deferred sales charges levied on Class A, Class M and Class C redemptions. The deferred sales charges are 1.00% for Class C shares, 1.00% for certain purchases of Class A shares and .25% for certain purchases of Class M shares.
For the period, sales charge amounts retained by FDC were as follows:
| | Retained by FDC ($) |
| Class A | 4 |
| Class M | 1 |
Class C A | - B 5 |
A When Class C shares are initially sold, FDC pays commissions from its own resources to financial intermediaries through which the sales are made.
B In the amount of less than five hundred dollars.
Transfer Agent Fees. Fidelity Investments Institutional Operations Company LLC (FIIOC), an affiliate of the investment adviser, is the transfer, dividend disbursing and shareholder servicing agent for each class of the Fund. Effective March 1, 2024, the Fund's management contract was amended to incorporate transfer agent services and associated fees previously covered under a separate services agreement. FIIOC pays for typesetting, printing and mailing of shareholder reports, except proxy statements.
During the period December 1, 2023 through February 29, 2024, the transfer agent fees for each class were a fixed annual rate of class-level average net assets as follows:
| | % of Class-Level Average Net Assets | |
| Class A | .2000 | |
| Class M | .1739 | |
| Class C | .2000 | |
| Class I | .1679 | |
| Class Z | .0420 | |
| | |
| | | |
Prior to December 1, 2023, FIIOC received account fees and asset-based fees that varied according to the account size and type of account of the shareholders of the respective classes of the Fund, except for Class Z. FIIOC received an asset-based fee of Class Z's average net assets. For the portion of the reporting period prior to March 1, 2024, the fees were equivalent to the following annualized rates:
| | Amount ($) | % of Class-Level Average Net Assets |
| Class A | 29 | .20 |
| Class M | 100 | .17 |
| Class C | 2 | .21 |
| Class I | 28 | .17 |
| Class Z | 13 | .04 |
| 172 | |
Accounting Fees. Fidelity Service Company, Inc. (FSC), an affiliate of the investment adviser, maintains the Fund's accounting records. Effective March 1, 2024, the Fund's management contract was amended to incorporate accounting services and associated fees previously covered under a separate services agreement.
During the period December 1, 2023 through February 29, 2024, the accounting fees were a fixed annual rate of average net assets as follows:
| | % of Average Net Assets |
| Fidelity Advisor Overseas Fund | .0497 |
Prior to December 1, 2023, the accounting fee was based on the level of average net assets for each month. For the portion of the reporting period prior to March 1, 2024, the fees were equivalent to the following annualized rates:
| | % of Average Net Assets |
| Fidelity Advisor Overseas Fund | .05 |
| | |
Brokerage Commissions. A portion of portfolio transactions were placed with brokerage firms which are affiliates of the investment adviser. Brokerage commissions are included in net realized gain (loss) and change in net unrealized appreciation (depreciation) in the Statement of Operations. The commissions paid to these affiliated firms were as follows:
| | Amount($) |
Fidelity Advisor Overseas Fund | - A |
A In the amount of less than five hundred dollars.
Interfund Trades. Funds may purchase from or sell securities to other Fidelity Funds under procedures adopted by the Board. The procedures have been designed to ensure these interfund trades are executed in accordance with Rule 17a-7 of the 1940 Act. Any interfund trades are included within the respective purchases and sales amounts shown in the Purchases and Sales of Investments note. Interfund trades during the period are noted in the table below.
| | Purchases ($) | Sales ($) | Realized Gain (Loss)($) |
| Fidelity Advisor Overseas Fund | 2,261 | 10,035 | 2,382 |
| | | | |
Other. During the period, the investment adviser reimbursed the Fund for certain losses as follows:
| | Amount ($) |
| Fidelity Advisor Overseas Fund | 22 |
6. Committed Line of Credit.
Certain Funds participate with other funds managed by the investment adviser or an affiliate in a $4.25 billion credit facility (the "line of credit") to be utilized for temporary or emergency purposes to fund shareholder redemptions or for other short-term liquidity purposes. The participating funds have agreed to pay commitment fees on their pro-rata portion of the line of credit, which are reflected in Miscellaneous expenses on the Statement of Operations, and are listed below. During the period, there were no borrowings on this line of credit.
| | Amount ($) |
| Fidelity Advisor Overseas Fund | 1 |
7. Security Lending.
Funds lend portfolio securities from time to time in order to earn additional income. Lending agents are used, including National Financial Services (NFS), an affiliate of the investment adviser. Pursuant to a securities lending agreement, NFS will receive a fee, which is capped at 9.9% of a fund's daily lending revenue, for its services as lending agent. A fund may lend securities to certain qualified borrowers, including NFS. On the settlement date of the loan, a fund receives collateral (in the form of U.S. Treasury obligations, letters of credit and/or cash) against the loaned securities and maintains collateral in an amount not less than 100% of the market value of the loaned securities during the period of the loan. The market value of the loaned securities is determined at the close of business of a fund and any additional required collateral is delivered to a fund on the next business day. A fund or borrower may terminate the loan at any time, and if the borrower defaults on its obligation to return the securities loaned because of insolvency or other reasons, a fund may apply collateral received from the borrower against the obligation. A fund may experience delays and costs in recovering the securities loaned. Any cash collateral received is invested in the Fidelity Securities Lending Cash Central Fund. Any loaned securities are identified as such in the Schedule of Investments, and the value of loaned securities and cash collateral at period end, as applicable, are presented in the Statement of Assets and Liabilities. Security lending income represents the income earned on investing cash collateral, less rebates paid to borrowers and any lending agent fees associated with the loan, plus any premium payments received for lending certain types of securities. Security lending income is presented in the Statement of Operations as a component of income from Fidelity Central Funds. Affiliated security lending activity, if any, was as follows:
| | Total Security Lending Fees Paid to NFS ($) | Security Lending Income From Securities Loaned to NFS ($) | Value of Securities Loaned to NFS at Period End ($) |
| Fidelity Advisor Overseas Fund | 1 | - | - |
8. Expense Reductions.
During the period the investment adviser or an affiliate reimbursed and/or waived a portion of fund-level operating expenses in the amount of $17.
9. Distributions to Shareholders.
Distributions to shareholders of each class were as follows:
| | Year ended October 31, 2024 | Year ended October 31, 2023 |
| Fidelity Advisor Overseas Fund | | |
| Distributions to shareholders | | |
| Class A | $323 | $143 |
| Class M | 922 | 199 |
| Class I | 511 | 328 |
| Class Z | 1,083 | 773 |
Total | $2,839 | $1,443 |
10. Share Transactions.
Share transactions for each class were as follows and may contain in-kind transactions, automatic conversions between classes or exchanges between affiliated funds:
| | Shares | Shares | Dollars | Dollars |
| | Year ended October 31, 2024 | Year ended October 31, 2023 | Year ended October 31, 2024 | Year ended October 31, 2023 |
| Fidelity Advisor Overseas Fund | | | | |
| Class A | | | | |
| Shares sold | 109 | 252 | $3,492 | $7,037 |
| Reinvestment of distributions | 11 | 5 | 304 | 135 |
| Shares redeemed | (162) | (319) | (5,130) | (8,807) |
| Net increase (decrease) | (42) | (62) | $(1,334) | $(1,635) |
| Class M | | | | |
| Shares sold | 474 | 675 | $15,411 | $19,002 |
| Reinvestment of distributions | 31 | 7 | 908 | 197 |
| Shares redeemed | (1,046) | (1,149) | (34,048) | (32,405) |
| Net increase (decrease) | (541) | (467) | $(17,729) | $(13,206) |
| Class C | | | | |
| Shares sold | 11 | 13 | $330 | $351 |
| Shares redeemed | (24) | (36) | (737) | (934) |
| Net increase (decrease) | (13) | (23) | $(407) | $(583) |
| Class I | | | | |
| Shares sold | 433 | 971 | $14,036 | $28,244 |
| Reinvestment of distributions | 15 | 11 | 445 | 290 |
| Shares redeemed | (752) | (1,147) | (23,940) | (33,319) |
| Net increase (decrease) | (304) | (165) | $(9,459) | $(4,785) |
| Class Z | | | | |
| Shares sold | 842 | 618 | $27,812 | $17,103 |
| Reinvestment of distributions | 9 | 6 | 279 | 165 |
| Shares redeemed | (668) | (846) | (21,614) | (23,938) |
| Net increase (decrease) | 183 | (222) | $6,477 | $(6,670) |
11. Other.
A fund's organizational documents provide former and current trustees and officers with a limited indemnification against liabilities arising in connection with the performance of their duties to the fund. In the normal course of business, a fund may also enter into contracts that provide general indemnifications. A fund's maximum exposure under these arrangements is unknown as this would be dependent on future claims that may be made against a fund. The risk of material loss from such claims is considered remote.
12. Risk and Uncertainties.
Many factors affect a fund's performance. Developments that disrupt global economies and financial markets, such as pandemics, epidemics, outbreaks of infectious diseases, war, terrorism, and environmental disasters, may significantly affect a fund's investment performance. The effects of these developments to a fund will be impacted by the types of securities in which a fund invests, the financial condition, industry, economic sector, and geographic location of an issuer, and a fund's level of investment in the securities of that issuer. Significant concentrations in security types, issuers, industries, sectors, and geographic locations may magnify the factors that affect a fund's performance.
Report of Independent Registered Public Accounting Firm
To the Board of Trustees of Fidelity Advisor Series VIII and Shareholders of Fidelity Advisor Overseas Fund
Opinion on the Financial Statements
We have audited the accompanying statement of assets and liabilities, including the schedule of investments, of Fidelity Advisor Overseas Fund (one of the funds constituting Fidelity Advisor Series VIII, referred to hereafter as the "Fund") as of October 31, 2024, the related statement of operations for the year ended October 31, 2024, the statement of changes in net assets for each of the two years in the period ended October 31, 2024, including the related notes, and the financial highlights for each of the five years in the period ended October 31, 2024 (collectively referred to as the "financial statements"). In our opinion, the financial statements present fairly, in all material respects, the financial position of the Fund as of October 31, 2024, the results of its operations for the year then ended, the changes in its net assets for each of the two years in the period ended October 31, 2024 and the financial highlights for each of the five years in the period ended October 31, 2024 in conformity with accounting principles generally accepted in the United States of America.
Basis for Opinion
These financial statements are the responsibility of the Fund's management. Our responsibility is to express an opinion on the Fund's financial statements based on our audits. We are a public accounting firm registered with the Public Company Accounting Oversight Board (United States) (PCAOB) and are required to be independent with respect to the Fund in accordance with the U.S. federal securities laws and the applicable rules and regulations of the Securities and Exchange Commission and the PCAOB.
We conducted our audits of these financial statements in accordance with the standards of the PCAOB. Those standards require that we plan and perform the audit to obtain reasonable assurance about whether the financial statements are free of material misstatement, whether due to error or fraud.
Our audits included performing procedures to assess the risks of material misstatement of the financial statements, whether due to error or fraud, and performing procedures that respond to those risks. Such procedures included examining, on a test basis, evidence regarding the amounts and disclosures in the financial statements. Our audits also included evaluating the accounting principles used and significant estimates made by management, as well as evaluating the overall presentation of the financial statements. Our procedures included confirmation of securities owned as of October 31, 2024 by correspondence with the custodian, issuers of privately offered securities and brokers; when replies were not received from brokers, we performed other auditing procedures. We believe that our audits provide a reasonable basis for our opinion.
/s/ PricewaterhouseCoopers LLP
Boston, Massachusetts
December 16, 2024
We have served as the auditor of one or more investment companies in the Fidelity group of funds since 1932.
Distributions
(Unaudited)The dividend and capital gains distributions for the fund(s) are available on Fidelity.com or Institutional.Fidelity.com.
The fund designates $39,763 of distributions paid during the fiscal year ended 2024 as qualifying to be taxed as section 163(j) interest dividends.
Class A designates 4% and 11%; Class M designates 6%, and 11%; Class I designates 3% and 11%; and Class Z designates 3%, and 11%; of the dividends distributed December 1st and December 29th, respectively, during the fiscal year as qualifying for the dividends-received deduction for corporate shareholders.
Class A, Class M, Class I, and Class Z designate 100% of each dividend distributed during the fiscal year as amounts which may be taken into account as a dividend for purposes of the maximum rate under section 1(h)(11) of the Internal Revenue Code.
The amounts per share which represent income derived from sources within, and taxes paid to, foreign countries or possessions of the United States are as follows:
| | Pay Date | Income | Taxes |
| Fidelity Advisor Overseas Funds | | | |
| Class A | 12/04/2023 | $0.2444 | $0.0534 |
| Class M | 12/04/2023 | $0.1824 | $0.0534 |
| Class C | 12/04/2023 | $0.0000 | $0.0000 |
| Class I | 12/04/2023 | $0.3159 | $0.0534 |
Class Z | 12/04/2023 | $0.3626 | $0.0534 |
The fund will notify shareholders in January 2025 of amounts for use in preparing 2024 income tax returns.
Item 8: Changes in and Disagreements with Accountants for Open-End Management Investment Companies
(Unaudited)
Note: This is not applicable for any fund included in this document.
Item 9: Proxy Disclosures for Open-End Management Investment Companies
(Unaudited)
| A special meeting of shareholders was held on July 16, 2024. The results of votes taken among shareholders on the proposal before them are reported below. Each vote reported represents one dollar of net asset value held on the record date for the meeting. |
| Proposal 1 |
| To elect a Board of Trustees. |
| | # of Votes | % of Votes |
| Bettina Doulton |
| Affirmative | 9,667,916,942.83 | 98.16 |
| Withheld | 181,261,836.48 | 1.84 |
| TOTAL | 9,849,178,779.31 | 100.00 |
| Robert A. Lawrence |
| Affirmative | 9,643,385,159.26 | 97.91 |
| Withheld | 205,793,620.05 | 2.09 |
| TOTAL | 9,849,178,779.31 | 100.00 |
| Vijay C. Advani |
| Affirmative | 9,650,856,015.95 | 97.99 |
| Withheld | 198,322,763.36 | 2.01 |
| TOTAL | 9,849,178,779.31 | 100.00 |
| Thomas P. Bostick |
| Affirmative | 9,653,685,826.52 | 98.02 |
| Withheld | 195,492,952.79 | 1.98 |
| TOTAL | 9,849,178,779.31 | 100.00 |
| Donald F. Donahue |
| Affirmative | 9,653,599,026.45 | 98.01 |
| Withheld | 195,579,752.86 | 1.99 |
| TOTAL | 9,849,178,779.31 | 100.00 |
| Vicki L. Fuller |
| Affirmative | 9,666,491,582.97 | 98.15 |
| Withheld | 182,687,196.34 | 1.85 |
| TOTAL | 9,849,178,779.31 | 100.00 |
| Patricia L. Kampling |
| Affirmative | 9,664,290,979.63 | 98.12 |
| Withheld | 184,887,799.68 | 1.88 |
| TOTAL | 9,849,178,779.31 | 100.00 |
| Thomas A. Kennedy |
| Affirmative | 9,646,944,497.07 | 97.95 |
| Withheld | 202,234,282.24 | 2.05 |
| TOTAL | 9,849,178,779.31 | 100.00 |
| Oscar Munoz |
| Affirmative | 9,652,669,495.50 | 98.00 |
| Withheld | 196,509,283.81 | 2.00 |
| TOTAL | 9,849,178,779.31 | 100.00 |
| Karen B. Peetz |
| Affirmative | 9,656,405,594.63 | 98.04 |
| Withheld | 192,773,184.68 | 1.96 |
| TOTAL | 9,849,178,779.31 | 100.00 |
| David M. Thomas |
| Affirmative | 9,644,713,946.63 | 97.92 |
| Withheld | 204,464,832.68 | 2.08 |
| TOTAL | 9,849,178,779.31 | 100.00 |
| Susan Tomasky |
| Affirmative | 9,654,121,207.44 | 98.02 |
| Withheld | 195,057,571.87 | 1.98 |
| TOTAL | 9,849,178,779.31 | 100.00 |
| Michael E. Wiley |
| Affirmative | 9,642,438,416.20 | 97.90 |
| Withheld | 206,740,363.11 | 2.10 |
| TOTAL | 9,849,178,779.31 | 100.00 |
| | | |
| Proposal 1 reflects trust-wide proposal and voting results. |
Item 10: Remuneration Paid to Directors, Officers, and others of Open-End Management Investment Companies
(Unaudited)
Note: This information is disclosed as part of the financial statements for each Fund as part of Item 7: Financial Statements and Financial Highlights for Open-End Management Investment companies.
Item 11: Statement Regarding Basis for Approval of Investment Advisory Contract
(Unaudited)
Board Approval of Investment Advisory Contracts and Management Fees
Fidelity Advisor Overseas Fund
Each year, the Board of Trustees, including the Independent Trustees (together, the Board), considers the renewal of the fund's management contract with Fidelity Management & Research Company LLC (FMR) and certain affiliates and the sub-advisory agreements (together, the Advisory Contracts) for the fund. FMR and the sub-advisers are referred to herein as the Investment Advisers. The Board, assisted by the advice of fund counsel and Independent Trustees' counsel, requests and considers a broad range of information relevant to the renewal of the Advisory Contracts throughout the year.
The Board meets regularly and, at each of its meetings, covers an extensive agenda of topics and materials and considers factors that are relevant to its annual consideration of the renewal of the fund's Advisory Contracts, including the services and support provided to the fund and its shareholders. The Board, acting directly and through its Committees (each of which is composed of and chaired by Independent Trustees), requests and receives information concerning the annual consideration of the renewal of the fund's Advisory Contracts. The Board also meets as needed to review matters specifically related to the Board's annual consideration of the renewal of the Advisory Contracts. Members of the Board may also meet with trustees of other Fidelity funds through joint ad hoc committees to discuss certain matters relevant to all of the Fidelity funds.
At its May 2024 meeting, the Board unanimously determined to renew the fund's Advisory Contracts. In reaching its determination, the Board considered all factors it believed relevant, including (i) the nature, extent, and quality of the services provided to the fund and its shareholders (including the investment performance of the fund); (ii) the competitiveness relative to peer funds of the fund's management fee and the total expense ratio of a representative class (Class I, which was selected because it was the largest class without 12b-1 fees); (iii) the total costs of the services provided by and the profits realized by FMR and its affiliates (Fidelity) from its relationships with the fund; and (iv) the extent to which, if any, economies of scale exist and are realized as the fund grows, and whether any economies of scale are appropriately shared with fund shareholders. The Board also considered the broad range of investment choices available to shareholders from FMR's competitors and that the fund's shareholders have chosen to invest in the fund, which is part of the Fidelity family of funds. The Board's decision to renew the Advisory Contracts was not based on any single factor.
The Board reached a determination, with the assistance of fund counsel and Independent Trustees' counsel and through the exercise of its business judgment, that the renewal of the Advisory Contracts was in the best interests of the fund and its shareholders and that the compensation payable under the Advisory Contracts was fair and reasonable in light of all of the surrounding circumstances.
Nature, Extent, and Quality of Services Provided. The Board considered staffing as it relates to the fund, including the backgrounds and experience of investment personnel of the Investment Advisers, and also considered the Investment Advisers' implementation of the fund's investment program. The Independent Trustees also had discussions with senior management of Fidelity's investment operations and investment groups. The Board considered the structure of the investment personnel compensation program and whether this structure provides appropriate incentives to act in the best interests of the fund. Additionally, the Board considered the portfolio managers' investments, if any, in the funds that they manage.
Resources Dedicated to Investment Management and Support Services. The Board and the Fund Oversight and Research Committees reviewed the general qualifications and capabilities of Fidelity's investment staff, including its size, education, experience, and resources, as well as Fidelity's approach to recruiting, training, managing, and compensating investment personnel. The Board noted the resources devoted to expansion of Fidelity's global investment organization, and that Fidelity's analysts have extensive resources, tools and capabilities that allow them to conduct sophisticated quantitative and fundamental analysis, as well as credit analysis of issuers, counterparties and guarantors. Further, the Board considered that Fidelity's investment professionals have sufficient access to global information and data so as to provide competitive investment results over time, and that those professionals also have access to sophisticated tools that permit them to assess portfolio construction and risk and performance attribution characteristics continuously, as well as to transmit new information and research conclusions rapidly around the world. Additionally, in its deliberations, the Board considered Fidelity's trading, risk management, compliance, and technology and operations capabilities and resources, which are integral parts of the investment management process.
Shareholder and Administrative Services. The Board considered (i) the nature, extent, quality, and cost of advisory, administrative, shareholder, transfer agency, and pricing and bookkeeping services performed by the Investment Advisers and their affiliates under the Advisory Contracts; (ii) the nature and extent of Fidelity's supervision of third party service providers, principally custodians, subcustodians, and pricing vendors; and (iii) the resources devoted by Fidelity to, and the record of compliance with, the fund's compliance policies and procedures. The Board also reviewed the allocation of fund brokerage, including allocations to brokers affiliated with the Investment Advisers, the use of brokerage commissions to pay fund expenses, and the use of "soft" commission dollars to pay for research services. The Board also considered the fund's securities lending activities and any payments made to Fidelity relating to securities lending under a separate agreement.
The Board noted that the growth of fund assets over time across the complex allows Fidelity to reinvest in the development of services designed to enhance the value and convenience of the Fidelity funds as investment vehicles. These services include 24-hour access to account information and market information over the Internet and through telephone representatives, investor education materials and asset allocation tools. The Board also considered that it reviews customer service metrics such as telephone response times, continuity of services on the website and metrics addressing services at Fidelity Investor Centers.
Investment in a Large Fund Family. The Board considered the benefits to shareholders of investing in a fund that is part of a large family of funds offering a variety of investment disciplines and providing a large variety of fund investor services. The Board noted that Fidelity had taken, or had made recommendations that resulted in the Fidelity funds taking, a number of actions over the previous year that benefited particular funds and/or the Fidelity funds in general.
Investment Performance. The Board took into account discussions that occur with representatives of the Investment Advisers, and reports that it receives, at Board meetings throughout the year, relating to fund investment performance. In this regard the Board noted that as part of regularly scheduled fund reviews and other reports to the Board on fund performance, the Board considered annualized return information for the fund for different time periods, measured against an appropriate securities market index (benchmark index) and an appropriate peer group of funds with similar objectives (peer group). The Board also considered information about performance attribution. In its ongoing evaluation of fund investment performance, the Board gives particular attention to information indicating changes in performance of the funds over different time periods and discussed with the Investment Advisers the reasons for any overperformance or underperformance.
In addition to reviewing absolute and relative fund performance, the Independent Trustees periodically consider the appropriateness of fund performance metrics in evaluating the results achieved. The Independent Trustees generally give greater weight to fund performance over longer time periods than over shorter time periods. Depending on the circumstances, the Independent Trustees may be satisfied with a fund's performance notwithstanding that it lags its benchmark index or peer group for certain periods.
Based on its review, the Board concluded that the nature, extent, and quality of services provided to the fund under the Advisory Contracts should continue to benefit the shareholders of the fund.
Competitiveness of Management Fee and Total Expense Ratio. The Board was provided with information regarding industry trends in management fees and expenses. The Board considered that, effective March 1, 2024, an amended Advisory Contract with FMR went into effect with class-level management fees based on tiered schedules and subject to a maximum class-level rate (the management fee). The Board also considered that in exchange for the variable management fee, each class of the fund receives investment advisory, management, administrative, transfer agent, and pricing and bookkeeping services. In its review of the management fee and total expense ratio of Class I, the Board considered a pro forma management fee rate for Class I as if it had been in effect for the 12-month period ended September 30, 2023, as well as other third-party fund expenses, as applicable, such as custodial, legal, and audit fees and any fund-paid 12b-1 fees. The Board noted that Fidelity may agree to waive fees or reimburse expenses from time to time, and the extent to which, if any, it has done so for the fund. The Board also considered information about the impact of the fund's performance adjustment.
Comparisons of Management Fees and Total Expense Ratios. Among other things, the Board reviewed data for selected groups of competitive funds and classes (referred to as "mapped groups") that were compiled by Fidelity based on combining similar investment objective categories (as classified by Morningstar) that have comparable investment mandates. The data reviewed by the Board included (i) gross management fee comparisons (before taking into account expense reimbursements or caps and without taking into account the fund's performance adjustment) relative to the total universe of funds within the mapped group; (ii) gross management fee comparisons relative to a subset of non-Fidelity funds in the mapped group that are similar in size and management fee structure to the fund (referred to as the "asset size peer group"); (iii) total expense comparisons of Class I of the fund relative to funds and classes in the mapped group that have a similar sales load structure to Class I of the fund (referred to as the "similar sales load structure group"); and (iv) total expense comparisons of Class I of the fund relative to funds and classes in the similar sales load structure group that are similar in size and management fee structure to the fund (referred to as the "total expense asset size peer group"). The total expense asset size peer group comparison excludes performance adjustments and fund-paid 12b-1 fees to eliminate variability in fee structures.
The information provided to the Board indicated that the fund's management fee rate ranked above the competitive median of the mapped group for the 12-month period ended September 30, 2023 and below the competitive median of the asset size peer group for the 12-month period ended September 30, 2023. Further, the information provided to the Board indicated that the total expense ratio of Class I of the fund ranked below the competitive median of the similar sales load structure group for the 12-month period ended September 30, 2023 and below the competitive median of the total expense asset size peer group for the 12-month period ended September 30, 2023. The Board considered that the fund has a variable unitary management fee that covers expenses for services beyond portfolio management.
The Board noted that a different variable management fee rate is applicable to each class of the fund. The Board considered that the difference in management fee rates between classes is the result of separate arrangements for class-level services and/or waivers of certain expenses and not the result of any difference in advisory or custodial fees or other expenses related to the management of the fund's assets, which do not vary by class.
The Board also considered that the fund's management fee is subject to upward or downward adjustment depending upon whether, and to what extent, the fund's investment performance for the performance period (a rolling 36-month period) exceeds, or is exceeded by, a securities index, thus leading to a performance adjustment for the same period. The Board noted that the performance adjustment provides FMR with a strong economic incentive to seek to achieve superior long-term performance for the fund's shareholders and helps to more closely align the interests of FMR and the shareholders of the fund.
Fees Charged to Other Fidelity Clients. The Board also considered Fidelity fee structures and other information with respect to clients of Fidelity, such as other funds advised or subadvised by Fidelity, pension plan clients, and other institutional clients with similar mandates. The Board noted that a joint ad hoc committee created by it and the boards of other Fidelity funds periodically reviews and compares Fidelity's institutional investment advisory business with its business of providing services to the Fidelity funds and also noted the most recent findings of the committee. The Board noted that the committee's review included a consideration of the differences in services provided, fees charged, and costs incurred, as well as competition in the markets serving the different categories of clients.
Based on its review, the Board concluded that the fund's management fee is fair and reasonable in light of the services that the fund receives and the other factors considered. Further based on its review of total expense ratios and fees charged to other Fidelity clients, the Board concluded that the total expense ratio of each class of the fund was reasonable in light of the services that the fund and its shareholders receive and the other factors considered.
Costs of the Services and Profitability. The Board considered the revenues earned and the expenses incurred by Fidelity in conducting the business of developing, marketing, distributing, managing, administering and servicing the fund and servicing the fund's shareholders. The Board also considered the level of Fidelity's profits in respect of all the Fidelity funds.
On an annual basis, Fidelity presents to the Board information about the profitability of its relationships with the fund. Fidelity calculates profitability information for each fund, as well as aggregate profitability information for groups of Fidelity funds and all Fidelity funds, using a series of detailed revenue and cost allocation methodologies which originate with the books and records of Fidelity on which Fidelity's audited financial statements are based. The Audit Committee of the Board reviews any significant changes from the prior year's methodologies.
A public accounting firm has been engaged annually by the Board as part of the Board's assessment of Fidelity's profitability analysis. The engagement includes the review and assessment of the methodologies used by Fidelity in determining the revenues and expenses attributable to Fidelity's fund business, and completion of agreed-upon procedures in respect of the mathematical accuracy of certain fund profitability information and its conformity to established allocation methodologies. After considering the reports issued under the engagement and information provided by Fidelity, the Board concluded that while other allocation methods may also be reasonable, Fidelity's profitability methodologies are reasonable in all material respects.
The Board also reviewed Fidelity's non-fund businesses and potential indirect benefits such businesses may have received as a result of their association with Fidelity's fund business (i.e., fall-out benefits) as well as cases where Fidelity's affiliates may benefit from the funds' business. The Board considered areas where potential indirect benefits to the Fidelity funds from their relationships with Fidelity may exist. The Board's consideration of these matters was informed by the findings of a joint ad hoc committee created by it and the boards of other Fidelity funds to evaluate potential fall-out benefits.
The Board considered the costs of the services provided by and the profits realized by Fidelity in connection with the operation of the fund and was satisfied that the profitability was not excessive.
Economies of Scale. The Board considered whether there have been economies of scale in respect of the management of the Fidelity funds, whether the Fidelity funds (including the fund) have appropriately benefited from any such economies of scale, and whether there is potential for realization of any further economies of scale. The Board considered the extent to which the fund will benefit from economies of scale as assets grow through increased services to the fund, through waivers or reimbursements, or through fee or expense ratio reductions. The Board also noted that a committee created by it and the boards of other Fidelity funds periodically analyzes whether Fidelity attains economies of scale in respect of the management and servicing of the Fidelity funds, whether the Fidelity funds have appropriately benefited from such economies of scale, and whether there is potential for realization of any further economies of scale.
The Board recognized that the fund's management contract incorporates a variable management fee structure, which provides breakpoints as a way to share, in part, any potential economies of scale that may exist at the asset class level and through a discount that considers both fund size and total assets of the four applicable asset classes. The Board considered that the variable management fee is designed to deliver the benefits of economies of scale to fund shareholders even if assets of any particular fund are unchanged or have declined, because some portion of Fidelity's costs are attributable to services provided to all funds subject to the variable management fee, and all such funds benefit if those costs can be allocated among more assets. The Board concluded that, given the variable management fee structure, fund shareholders will benefit from lower management fees due to the application of the breakpoints and discount factor, regardless of whether Fidelity achieves any such economies of scale.
The Board concluded, taking into account the analysis of the committee, that economies of scale, if any, are being appropriately shared between fund shareholders and Fidelity.
Additional Information Requested by the Board. In order to develop fully the factual basis for consideration of the Fidelity funds' advisory contracts, the Board requested and received additional information on certain topics, including but not limited to: (i) fund flow and performance trends, in particular the underperformance of certain funds and strategies, and Fidelity's long-term strategies for certain funds; (ii) the operation of performance fees and the rationale for implementing performance fees on certain categories of funds but not others; (iii) Fidelity's pricing philosophy compared to competitors; (iv) fund profitability methodology and data; (v) evaluation of competitive fund data and peer group classifications and fee and expense comparisons; (vi) the management fee and expense structures for different funds and classes and information about the differences between various fee and expense structures; (vii) the variable management fee implemented for certain funds effective March 1, 2024; and (viii) information regarding other accounts managed by Fidelity and the funds' sub-advisory arrangements.
Conclusion. Based on its evaluation of all of the conclusions noted above, and after considering all factors it believed relevant, the Board, including the Independent Trustees, concluded that the advisory and sub-advisory fee arrangements are fair and reasonable in light of all of the surrounding circumstances and that the fund's Advisory Contracts should be renewed through May 31, 2025.
1.538536.127
OS-ANN-1224
Fidelity Advisor® International Capital Appreciation Fund
Annual Report
October 31, 2024
Contents
To view a fund's proxy voting guidelines and proxy voting record for the 12-month period ended June 30, visit http://www.fidelity.com/proxyvotingresults or visit the Securities and Exchange Commission's (SEC) web site at http://www.sec.gov.
You may also call 1-877-208-0098 to request a free copy of the proxy voting guidelines.
Standard & Poor's, S&P and S&P 500 are registered service marks of The McGraw-Hill Companies, Inc. and have been licensed for use by Fidelity Distributors Corporation.
Other third-party marks appearing herein are the property of their respective owners.
All other marks appearing herein are registered or unregistered trademarks or service marks of FMR LLC or an affiliated company. © 2024 FMR LLC. All rights reserved.
This report and the financial statements contained herein are submitted for the general information of the shareholders of the Fund. This report is not authorized for distribution to prospective investors in the Fund unless preceded or accompanied by an effective prospectus.
A fund files its complete schedule of portfolio holdings with the SEC for the first and third quarters of each fiscal year on Form N-PORT. Forms N-PORT are available on the SEC's web site at http://www.sec.gov. A fund's Forms N-PORT may be reviewed and copied at the SEC's Public Reference Room in Washington, DC. Information regarding the operation of the SEC's Public Reference Room may be obtained by calling 1-800-SEC-0330.
For a complete list of a fund's portfolio holdings, view the most recent holdings listing, semiannual report, or annual report on Fidelity's web site at http://www.fidelity.com, http://www.institutional.fidelity.com, or http://www.401k.com, as applicable.
NOT FDIC INSURED •MAY LOSE VALUE •NO BANK GUARANTEE
Neither the Fund nor Fidelity Distributors Corporation is a bank.
Item 7: Financial Statements and Financial Highlights for Open-End Management Investment Companies (Annual Report)
Fidelity Advisor® International Capital Appreciation Fund
Schedule of Investments October 31, 2024
Showing Percentage of Net Assets
| Common Stocks - 99.4% |
| | | Shares | Value ($) |
| Brazil - 1.5% | | | |
| MercadoLibre, Inc. (a) | | 64,520 | 131,438,854 |
| Canada - 6.3% | | | |
| Brookfield Asset Management Ltd. Class A (b) | | 2,851,382 | 151,237,301 |
| Canadian Pacific Kansas City Ltd. | | 1,770,119 | 136,552,219 |
| Constellation Software, Inc. | | 49,773 | 150,105,087 |
| Constellation Software, Inc. warrants 3/31/40 (a)(c) | | 50,717 | 4 |
| Thomson Reuters Corp. | | 707,813 | 115,859,993 |
TOTAL CANADA | | | 553,754,604 |
| China - 5.3% | | | |
| Meituan Class B (a)(d) | | 5,987,700 | 141,491,585 |
| Tencent Holdings Ltd. | | 4,118,200 | 214,731,723 |
| Trip.com Group Ltd. ADR (a) | | 1,650,300 | 106,279,320 |
TOTAL CHINA | | | 462,502,628 |
| Denmark - 4.3% | | | |
| DSV A/S | | 561,008 | 121,932,474 |
| Novo Nordisk A/S Series B | | 2,236,881 | 250,899,784 |
TOTAL DENMARK | | | 372,832,258 |
| France - 8.8% | | | |
| Air Liquide SA | | 785,755 | 140,886,974 |
| Compagnie de St.-Gobain | | 1,435,260 | 130,156,478 |
| Hermes International SCA | | 66,275 | 149,515,969 |
| LVMH Moet Hennessy Louis Vuitton SE | | 289,859 | 192,965,093 |
| Safran SA | | 664,615 | 150,446,042 |
TOTAL FRANCE | | | 763,970,556 |
| Germany - 3.9% | | | |
| HeidelbergCement AG | | 1,147,728 | 126,342,243 |
| SAP SE | | 915,761 | 213,816,548 |
TOTAL GERMANY | | | 340,158,791 |
| India - 7.9% | | | |
| Axis Bank Ltd. | | 9,225,058 | 126,722,718 |
| Bharti Airtel Ltd. | | 7,249,211 | 138,749,725 |
| HDFC Bank Ltd. | | 7,339,202 | 150,851,156 |
| ICICI Bank Ltd. | | 9,758,856 | 149,692,501 |
| Larsen & Toubro Ltd. | | 2,873,905 | 123,450,230 |
TOTAL INDIA | | | 689,466,330 |
| Indonesia - 1.5% | | | |
| PT Bank Central Asia Tbk | | 203,749,341 | 131,865,872 |
| Ireland - 1.3% | | | |
| Kingspan Group PLC (Ireland) | | 1,288,205 | 113,010,408 |
| Italy - 2.8% | | | |
| Ferrari NV (Italy) | | 273,166 | 130,680,552 |
| Prysmian SpA | | 1,627,131 | 114,725,679 |
TOTAL ITALY | | | 245,406,231 |
| Japan - 12.6% | | | |
| Disco Corp. | | 521,507 | 148,386,890 |
| Hitachi Ltd. | | 6,522,721 | 163,882,453 |
| Hoya Corp. | | 1,060,593 | 141,901,030 |
| Keyence Corp. | | 335,282 | 151,350,882 |
| Recruit Holdings Co. Ltd. | | 2,295,977 | 140,198,162 |
| Shin-Etsu Chemical Co. Ltd. | | 3,753,603 | 137,546,895 |
| Tokio Marine Holdings, Inc. | | 4,183,937 | 150,689,365 |
| Tokyo Electron Ltd. | | 410,250 | 60,369,542 |
TOTAL JAPAN | | | 1,094,325,219 |
| Netherlands - 5.2% | | | |
| ASM International NV (Netherlands) | | 232,809 | 129,708,498 |
| ASML Holding NV (Netherlands) | | 295,009 | 199,340,620 |
| Wolters Kluwer NV | | 717,324 | 120,707,642 |
TOTAL NETHERLANDS | | | 449,756,760 |
| Sweden - 1.4% | | | |
| Atlas Copco AB (A Shares) | | 7,606,622 | 125,535,256 |
| Switzerland - 1.8% | | | |
| ABB Ltd. (Reg.) | | 2,809,247 | 156,113,055 |
| Taiwan - 4.5% | | | |
| Taiwan Semiconductor Manufacturing Co. Ltd. | | 12,448,618 | 391,653,572 |
| United Kingdom - 10.9% | | | |
| 3i Group PLC | | 3,172,265 | 130,087,348 |
| Ashtead Group PLC | | 1,812,104 | 135,243,421 |
| BAE Systems PLC | | 8,141,639 | 131,221,315 |
| InterContinental Hotel Group PLC | | 1,239,447 | 136,707,968 |
| London Stock Exchange Group PLC | | 1,002,867 | 135,924,475 |
| RELX PLC (London Stock Exchange) | | 3,080,079 | 141,251,513 |
| Rolls-Royce Holdings PLC (a) | | 20,418,789 | 140,897,786 |
TOTAL UNITED KINGDOM | | | 951,333,826 |
| United States of America - 19.4% | | | |
| Arthur J. Gallagher & Co. | | 435,273 | 122,398,768 |
| Broadcom, Inc. | | 809,551 | 137,437,473 |
| CRH PLC | | 1,219,795 | 116,297,613 |
| Experian PLC | | 2,726,526 | 132,788,705 |
| Holcim AG | | 1,369,488 | 134,926,801 |
| Linde PLC | | 255,017 | 116,326,005 |
| Marsh & McLennan Companies, Inc. | | 554,652 | 121,047,252 |
| MasterCard, Inc. Class A | | 275,873 | 137,823,392 |
| Moody's Corp. | | 249,838 | 113,436,446 |
| S&P Global, Inc. | | 257,462 | 123,674,446 |
| Schneider Electric SA | | 688,325 | 178,309,735 |
| Visa, Inc. Class A | | 489,878 | 141,991,138 |
| Waste Connections, Inc. (Canada) | | 641,394 | 113,381,194 |
TOTAL UNITED STATES OF AMERICA | | | 1,689,838,968 |
| TOTAL COMMON STOCKS (Cost $6,414,134,092) | | | 8,662,963,188 |
| | | | |
| Money Market Funds - 2.3% |
| | | Shares | Value ($) |
| Fidelity Cash Central Fund 4.87% (e) | | 56,097,266 | 56,108,485 |
| Fidelity Securities Lending Cash Central Fund 4.87% (e)(f) | | 141,753,825 | 141,768,000 |
| TOTAL MONEY MARKET FUNDS (Cost $197,876,485) | | | 197,876,485 |
| | | | |
| TOTAL INVESTMENT IN SECURITIES - 101.7% (Cost $6,612,010,577) | 8,860,839,673 |
NET OTHER ASSETS (LIABILITIES) - (1.7)% | (146,809,589) |
| NET ASSETS - 100.0% | 8,714,030,084 |
| | |
Legend
| (b) | Security or a portion of the security is on loan at period end. |
| (d) | Security exempt from registration under Rule 144A of the Securities Act of 1933. These securities may be resold in transactions exempt from registration, normally to qualified institutional buyers. At the end of the period, the value of these securities amounted to $141,491,585 or 1.6% of net assets. |
| (e) | Affiliated fund that is generally available only to investment companies and other accounts managed by Fidelity Investments. The rate quoted is the annualized seven-day yield of the fund at period end. A complete unaudited listing of the fund's holdings as of its most recent quarter end is available upon request. In addition, each Fidelity Central Fund's financial statements, which are not covered by the Fund's Report of Independent Registered Public Accounting Firm, are available on the SEC's website or upon request. |
| (f) | Investment made with cash collateral received from securities on loan. |
Affiliated Central Funds
Fiscal year to date information regarding the Fund's investments in Fidelity Central Funds, including the ownership percentage, is presented below.
| Affiliate | Value, beginning of period ($) | Purchases ($) | Sales Proceeds ($) | Dividend Income ($) | Realized Gain (loss) ($) | Change in Unrealized appreciation (depreciation) ($) | Value, end of period ($) | % ownership, end of period |
| Fidelity Cash Central Fund 4.87% | 101,117,912 | 2,920,246,104 | 2,965,265,321 | 7,365,250 | 9,790 | - | 56,108,485 | 0.1% |
| Fidelity Securities Lending Cash Central Fund 4.87% | 21,521,790 | 372,609,626 | 252,363,416 | 49,576 | - | - | 141,768,000 | 0.6% |
| Total | 122,639,702 | 3,292,855,730 | 3,217,628,737 | 7,414,826 | 9,790 | - | 197,876,485 | |
| | | | | | | | | |
Amounts in the dividend income column in the above table include any capital gain distributions from underlying funds, which are presented in the corresponding line item in the Statement of Operations, if applicable.
Amounts in the dividend income column for Fidelity Securities Lending Cash Central Fund represents the income earned on investing cash collateral, less rebates paid to borrowers and any lending agent fees associated with the loan, plus any premium payments received for lending certain types of securities.
Amounts included in the purchases and sales proceeds columns may include in-kind transactions, if applicable.
Investment Valuation
The following is a summary of the inputs used, as of October 31, 2024, involving the Fund's assets and liabilities carried at fair value. The inputs or methodology used for valuing securities may not be an indication of the risk associated with investing in those securities. For more information on valuation inputs, and their aggregation into the levels used below, please refer to the Investment Valuation section in the accompanying Notes to Financial Statements.
| Valuation Inputs at Reporting Date: |
| Description | Total ($) | Level 1 ($) | Level 2 ($) | Level 3 ($) |
Investments in Securities: | | | | |
|
| Equities: | | | | |
Communication Services | 353,481,448 | - | 353,481,448 | - |
Consumer Discretionary | 989,079,341 | 517,914,695 | 471,164,646 | - |
Financials | 1,887,442,178 | 911,608,743 | 975,833,435 | - |
Health Care | 392,800,814 | - | 392,800,814 | - |
Industrials | 2,685,663,760 | 1,104,201,735 | 1,581,462,025 | - |
Information Technology | 1,582,169,116 | 616,591,678 | 965,577,434 | 4 |
Materials | 772,326,531 | 493,892,662 | 278,433,869 | - |
|
| Money Market Funds | 197,876,485 | 197,876,485 | - | - |
| Total Investments in Securities: | 8,860,839,673 | 3,842,085,998 | 5,018,753,671 | 4 |
Financial Statements
| Statement of Assets and Liabilities |
As of October 31, 2024 |
| Assets | | | | |
| Investment in securities, at value (including securities loaned of $136,715,904) - See accompanying schedule: | | | | |
Unaffiliated issuers (cost $6,414,134,092) | $ | 8,662,963,188 | | |
Fidelity Central Funds (cost $197,876,485) | | 197,876,485 | | |
| | | | | |
| | | | | |
| Total Investment in Securities (cost $6,612,010,577) | | | $ | 8,860,839,673 |
| Foreign currency held at value (cost $24,422) | | | | 24,418 |
| Receivable for investments sold | | | | 79,558,252 |
| Receivable for fund shares sold | | | | 8,679,132 |
| Dividends receivable | | | | 9,016,253 |
| Reclaims receivable | | | | 12,437,159 |
| Distributions receivable from Fidelity Central Funds | | | | 418,197 |
| Prepaid expenses | | | | 10,050 |
| Other receivables | | | | 1,966,534 |
Total assets | | | | 8,972,949,668 |
| Liabilities | | | | |
| Payable for investments purchased | $ | 73,557,699 | | |
| Payable for fund shares redeemed | | 8,336,041 | | |
| Accrued management fee | | 5,483,509 | | |
| Distribution and service plan fees payable | | 308,701 | | |
| Deferred taxes | | 28,977,471 | | |
| Other payables and accrued expenses | | 488,163 | | |
| Collateral on securities loaned | | 141,768,000 | | |
| Total liabilities | | | | 258,919,584 |
| Net Assets | | | $ | 8,714,030,084 |
| Net Assets consist of: | | | | |
| Paid in capital | | | $ | 6,760,025,934 |
| Total accumulated earnings (loss) | | | | 1,954,004,150 |
| Net Assets | | | $ | 8,714,030,084 |
| | | | | |
| Net Asset Value and Maximum Offering Price | | | | |
| Class A : | | | | |
Net Asset Value and redemption price per share ($643,558,970 ÷ 21,260,682 shares)(a) | | | $ | 30.27 |
| Maximum offering price per share (100/94.25 of $30.27) | | | $ | 32.12 |
| Class M : | | | | |
Net Asset Value and redemption price per share ($192,004,317 ÷ 6,563,076 shares)(a) | | | $ | 29.26 |
| Maximum offering price per share (100/96.50 of $29.26) | | | $ | 30.32 |
| Class C : | | | | |
Net Asset Value and offering price per share ($105,448,818 ÷ 4,118,064 shares)(a) | | | $ | 25.61 |
| Class I : | | | | |
Net Asset Value, offering price and redemption price per share ($5,528,020,951 ÷ 169,378,137 shares) | | | $ | 32.64 |
| Class Z : | | | | |
Net Asset Value, offering price and redemption price per share ($2,244,997,028 ÷ 68,527,553 shares) | | | $ | 32.76 |
(a)Redemption price per share is equal to net asset value less any applicable contingent deferred sales charge. |
| Statement of Operations |
| Year ended October 31, 2024 |
| Investment Income | | | | |
| Dividends | | | $ | 104,817,061 |
| Income from Fidelity Central Funds (including $49,576 from security lending) | | | | 7,414,826 |
| Income before foreign taxes withheld | | | $ | 112,231,887 |
| Less foreign taxes withheld | | | | (7,566,334) |
| Total income | | | | 104,665,553 |
| Expenses | | | | |
| Management fee | | | | |
| Basic fee | $ | 58,449,914 | | |
| Performance adjustment | | 3,463,500 | | |
| Transfer agent fees | | 3,183,738 | | |
| Distribution and service plan fees | | 3,486,737 | | |
| Accounting fees | | 576,480 | | |
| Custodian fees and expenses | | 841,660 | | |
| Independent trustees' fees and expenses | | 33,482 | | |
| Registration fees | | 475,909 | | |
| Audit fees | | 95,227 | | |
| Legal | | 6,288 | | |
| Interest | | 173,438 | | |
| Miscellaneous | | 277,629 | | |
| Total expenses before reductions | | 71,064,002 | | |
| Expense reductions | | (325,136) | | |
| Total expenses after reductions | | | | 70,738,866 |
| Net Investment income (loss) | | | | 33,926,687 |
| Realized and Unrealized Gain (Loss) | | | | |
| Net realized gain (loss) on: | | | | |
| Investment Securities: | | | | |
| Unaffiliated issuers (net of foreign taxes of $6,052,969) | | 363,149,952 | | |
| Fidelity Central Funds | | 9,790 | | |
| Foreign currency transactions | | 2,833,272 | | |
| Total net realized gain (loss) | | | | 365,993,014 |
| Change in net unrealized appreciation (depreciation) on: | | | | |
| Investment Securities: | | | | |
| Unaffiliated issuers (net of increase in deferred foreign taxes of $19,641,781) | | 1,341,044,675 | | |
| Assets and liabilities in foreign currencies | | (157,786) | | |
| Total change in net unrealized appreciation (depreciation) | | | | 1,340,886,889 |
| Net gain (loss) | | | | 1,706,879,903 |
| Net increase (decrease) in net assets resulting from operations | | | $ | 1,740,806,590 |
| Statement of Changes in Net Assets |
| |
| | Year ended October 31, 2024 | | Year ended October 31, 2023 |
| Increase (Decrease) in Net Assets | | | | |
| Operations | | | | |
| Net investment income (loss) | $ | 33,926,687 | $ | 25,633,375 |
| Net realized gain (loss) | | 365,993,014 | | 65,435,640 |
| Change in net unrealized appreciation (depreciation) | | 1,340,886,889 | | 619,562,948 |
| Net increase (decrease) in net assets resulting from operations | | 1,740,806,590 | | 710,631,963 |
| Distributions to shareholders | | (23,553,740) | | - |
| | | | | |
| Share transactions - net increase (decrease) | | 1,277,028,450 | | 263,865,104 |
| Total increase (decrease) in net assets | | 2,994,281,300 | | 974,497,067 |
| | | | | |
| Net Assets | | | | |
| Beginning of period | | 5,719,748,784 | | 4,745,251,717 |
| End of period | $ | 8,714,030,084 | $ | 5,719,748,784 |
| | | | | |
| | | | | |
Financial Highlights
Fidelity Advisor® International Capital Appreciation Fund Class A |
| |
| Years ended October 31, | | 2024 | | 2023 | | 2022 | | 2021 | | 2020 |
Selected Per-Share Data | | | | | | | | | | |
| Net asset value, beginning of period | $ | 23.51 | $ | 20.33 | $ | 30.72 | $ | 24.14 | $ | 21.45 |
| Income from Investment Operations | | | | | | | | | | |
Net investment income (loss) A,B | | .06 | | .06 | | (.04) | | (.09) | | - C |
| Net realized and unrealized gain (loss) | | 6.74 | | 3.12 | | (9.21) | | 6.67 | | 2.77 |
| Total from investment operations | | 6.80 | | 3.18 | | (9.25) | | 6.58 | | 2.77 |
| Distributions from net investment income | | (.04) | | - | | - | | - | | (.08) |
| Distributions from net realized gain | | - | | - | | (1.14) | | - | | - |
| Total distributions | | (.04) | | - | | (1.14) | | - | | (.08) |
| Net asset value, end of period | $ | 30.27 | $ | 23.51 | $ | 20.33 | $ | 30.72 | $ | 24.14 |
Total Return D,E | | | | 15.64% | | (31.18)% | | 27.26% | | 12.97% |
Ratios to Average Net Assets B,F,G | | | | | | | | | | |
| Expenses before reductions | | 1.14% | | 1.06% | | 1.24% | | 1.23% | | 1.28% |
| Expenses net of fee waivers, if any | | | | 1.06% | | 1.24% | | 1.23% | | 1.28% |
| Expenses net of all reductions | | 1.14% | | 1.06% | | 1.24% | | 1.23% | | 1.24% |
| Net investment income (loss) | | .19% | | .23% | | (.18)% | | (.30)% | | (.01)% |
| Supplemental Data | | | | | | | | | | |
| Net assets, end of period (000 omitted) | $ | 643,559 | $ | 464,374 | $ | 400,112 | $ | 592,640 | $ | 382,795 |
Portfolio turnover rate H | | | | 80% | | 110% I | | 128% | | 121% |
ACalculated based on average shares outstanding during the period.
BNet investment income (loss) is affected by the timing of the declaration of dividends by any underlying mutual funds or exchange-traded funds (ETFs). Net investment income (loss) of any mutual funds or ETFs is not included in the Fund's net investment income (loss) ratio.
CAmount represents less than $.005 per share.
DTotal returns would have been lower if certain expenses had not been reduced during the applicable periods shown.
ETotal returns do not include the effect of the sales charges.
FFees and expenses of any underlying mutual funds or exchange-traded funds (ETFs) are not included in the Fund's expense ratio. The Fund indirectly bears its proportionate share of these expenses. For additional expense information related to investments in Fidelity Central Funds, please refer to the "Investments in Fidelity Central Funds" note found in the Notes to Financial Statements section of the most recent Annual or Semi-Annual report.
GExpense ratios reflect operating expenses of the class. Expenses before reductions do not reflect amounts reimbursed, waived, or reduced through arrangements with the investment adviser, brokerage services, or other offset arrangements, if applicable, and do not represent the amount paid by the class during periods when reimbursements, waivers or reductions occur.
HAmount does not include the portfolio activity of any underlying mutual funds or exchange-traded funds (ETFs).
IPortfolio turnover rate excludes securities received or delivered in-kind.
Fidelity Advisor® International Capital Appreciation Fund Class M |
| |
| Years ended October 31, | | 2024 | | 2023 | | 2022 | | 2021 | | 2020 |
Selected Per-Share Data | | | | | | | | | | |
| Net asset value, beginning of period | $ | 22.74 | $ | 19.71 | $ | 29.82 | $ | 23.49 | $ | 20.89 |
| Income from Investment Operations | | | | | | | | | | |
Net investment income (loss) A,B | | (.02) | | (.01) | | (.10) | | (.15) | | (.06) |
| Net realized and unrealized gain (loss) | | 6.54 | | 3.04 | | (8.95) | | 6.48 | | 2.70 |
| Total from investment operations | | 6.52 | | 3.03 | | (9.05) | | 6.33 | | 2.64 |
| Distributions from net investment income | | - | | - | | - | | - | | (.04) |
| Distributions from net realized gain | | - | | - | | (1.06) | | - | | - |
| Total distributions | | - | | - | | (1.06) | | - | | (.04) |
| Net asset value, end of period | $ | 29.26 | $ | 22.74 | $ | 19.71 | $ | 29.82 | $ | 23.49 |
Total Return C,D | | | | 15.37% | | (31.39)% | | 26.95% | | 12.67% |
Ratios to Average Net Assets B,E,F | | | | | | | | | | |
| Expenses before reductions | | 1.39% | | 1.31% | | 1.49% | | 1.49% | | 1.53% |
| Expenses net of fee waivers, if any | | | | 1.31% | | 1.49% | | 1.48% | | 1.53% |
| Expenses net of all reductions | | 1.39% | | 1.31% | | 1.49% | | 1.48% | | 1.49% |
| Net investment income (loss) | | (.06)% | | (.02)% | | (.43)% | | (.55)% | | (.26)% |
| Supplemental Data | | | | | | | | | | |
| Net assets, end of period (000 omitted) | $ | 192,004 | $ | 149,358 | $ | 126,232 | $ | 191,997 | $ | 143,072 |
Portfolio turnover rate G | | | | 80% | | 110% H | | 128% | | 121% |
ACalculated based on average shares outstanding during the period.
BNet investment income (loss) is affected by the timing of the declaration of dividends by any underlying mutual funds or exchange-traded funds (ETFs). Net investment income (loss) of any mutual funds or ETFs is not included in the Fund's net investment income (loss) ratio.
CTotal returns would have been lower if certain expenses had not been reduced during the applicable periods shown.
DTotal returns do not include the effect of the sales charges.
EFees and expenses of any underlying mutual funds or exchange-traded funds (ETFs) are not included in the Fund's expense ratio. The Fund indirectly bears its proportionate share of these expenses. For additional expense information related to investments in Fidelity Central Funds, please refer to the "Investments in Fidelity Central Funds" note found in the Notes to Financial Statements section of the most recent Annual or Semi-Annual report.
FExpense ratios reflect operating expenses of the class. Expenses before reductions do not reflect amounts reimbursed, waived, or reduced through arrangements with the investment adviser, brokerage services, or other offset arrangements, if applicable, and do not represent the amount paid by the class during periods when reimbursements, waivers or reductions occur.
GAmount does not include the portfolio activity of any underlying mutual funds or exchange-traded funds (ETFs).
HPortfolio turnover rate excludes securities received or delivered in-kind.
Fidelity Advisor® International Capital Appreciation Fund Class C |
| |
| Years ended October 31, | | 2024 | | 2023 | | 2022 | | 2021 | | 2020 |
Selected Per-Share Data | | | | | | | | | | |
| Net asset value, beginning of period | $ | 20.00 | $ | 17.43 | $ | 26.58 | $ | 21.04 | $ | 18.77 |
| Income from Investment Operations | | | | | | | | | | |
Net investment income (loss) A,B | | (.14) | | (.11) | | (.20) | | (.26) | | (.15) |
| Net realized and unrealized gain (loss) | | 5.75 | | 2.68 | | (7.92) | | 5.80 | | 2.42 |
| Total from investment operations | | 5.61 | | 2.57 | | (8.12) | | 5.54 | | 2.27 |
| Distributions from net realized gain | | - | | - | | (1.03) | | - | | - |
| Total distributions | | - | | - | | (1.03) | | - | | - |
| Net asset value, end of period | $ | 25.61 | $ | 20.00 | $ | 17.43 | $ | 26.58 | $ | 21.04 |
Total Return C,D | | | | 14.74% | | (31.70)% | | 26.33% | | 12.09% |
Ratios to Average Net Assets B,E,F | | | | | | | | | | |
| Expenses before reductions | | 1.90% | | 1.81% | | 1.99% | | 1.98% | | 2.02% |
| Expenses net of fee waivers, if any | | | | 1.81% | | 1.99% | | 1.98% | | 2.02% |
| Expenses net of all reductions | | 1.89% | | 1.81% | | 1.99% | | 1.98% | | 1.99% |
| Net investment income (loss) | | (.56)% | | (.52)% | | (.93)% | | (1.05)% | | (.75)% |
| Supplemental Data | | | | | | | | | | |
| Net assets, end of period (000 omitted) | $ | 105,449 | $ | 96,072 | $ | 97,124 | $ | 169,018 | $ | 125,630 |
Portfolio turnover rate G | | | | 80% | | 110% H | | 128% | | 121% |
ACalculated based on average shares outstanding during the period.
BNet investment income (loss) is affected by the timing of the declaration of dividends by any underlying mutual funds or exchange-traded funds (ETFs). Net investment income (loss) of any mutual funds or ETFs is not included in the Fund's net investment income (loss) ratio.
CTotal returns would have been lower if certain expenses had not been reduced during the applicable periods shown.
DTotal returns do not include the effect of the contingent deferred sales charge.
EFees and expenses of any underlying mutual funds or exchange-traded funds (ETFs) are not included in the Fund's expense ratio. The Fund indirectly bears its proportionate share of these expenses. For additional expense information related to investments in Fidelity Central Funds, please refer to the "Investments in Fidelity Central Funds" note found in the Notes to Financial Statements section of the most recent Annual or Semi-Annual report.
FExpense ratios reflect operating expenses of the class. Expenses before reductions do not reflect amounts reimbursed, waived, or reduced through arrangements with the investment adviser, brokerage services, or other offset arrangements, if applicable, and do not represent the amount paid by the class during periods when reimbursements, waivers or reductions occur.
GAmount does not include the portfolio activity of any underlying mutual funds or exchange-traded funds (ETFs).
HPortfolio turnover rate excludes securities received or delivered in-kind.
Fidelity Advisor® International Capital Appreciation Fund Class I |
| |
| Years ended October 31, | | 2024 | | 2023 | | 2022 | | 2021 | | 2020 |
Selected Per-Share Data | | | | | | | | | | |
| Net asset value, beginning of period | $ | 25.33 | $ | 21.85 | $ | 32.92 | $ | 25.83 | $ | 22.93 |
| Income from Investment Operations | | | | | | | | | | |
Net investment income (loss) A,B | | .14 | | .13 | | .02 | | (.01) | | .06 |
| Net realized and unrealized gain (loss) | | 7.28 | | 3.35 | | (9.88) | | 7.13 | | 2.97 |
| Total from investment operations | | 7.42 | | 3.48 | | (9.86) | | 7.12 | | 3.03 |
| Distributions from net investment income | | (.11) | | - | | - | | (.03) | | (.13) |
| Distributions from net realized gain | | - | | - | | (1.21) | | - | | - |
| Total distributions | | (.11) | | - | | (1.21) | | (.03) | | (.13) |
| Net asset value, end of period | $ | 32.64 | $ | 25.33 | $ | 21.85 | $ | 32.92 | $ | 25.83 |
Total Return C | | | | 15.93% | | (31.01)% | | 27.60% | | 13.28% |
Ratios to Average Net Assets B,D,E | | | | | | | | | | |
| Expenses before reductions | | .89% | | .80% | | .98% | | .97% | | 1.01% |
| Expenses net of fee waivers, if any | | | | .79% | | .97% | | .97% | | 1.01% |
| Expenses net of all reductions | | .88% | | .79% | | .97% | | .97% | | .97% |
| Net investment income (loss) | | .45% | | .49% | | .08% | | (.04)% | | .26% |
| Supplemental Data | | | | | | | | | | |
| Net assets, end of period (000 omitted) | $ | 5,528,021 | $ | 3,758,357 | $ | 3,228,604 | $ | 6,128,293 | $ | 3,883,309 |
Portfolio turnover rate F | | | | 80% | | 110% G | | 128% | | 121% |
ACalculated based on average shares outstanding during the period.
BNet investment income (loss) is affected by the timing of the declaration of dividends by any underlying mutual funds or exchange-traded funds (ETFs). Net investment income (loss) of any mutual funds or ETFs is not included in the Fund's net investment income (loss) ratio.
CTotal returns would have been lower if certain expenses had not been reduced during the applicable periods shown.
DFees and expenses of any underlying mutual funds or exchange-traded funds (ETFs) are not included in the Fund's expense ratio. The Fund indirectly bears its proportionate share of these expenses. For additional expense information related to investments in Fidelity Central Funds, please refer to the "Investments in Fidelity Central Funds" note found in the Notes to Financial Statements section of the most recent Annual or Semi-Annual report.
EExpense ratios reflect operating expenses of the class. Expenses before reductions do not reflect amounts reimbursed, waived, or reduced through arrangements with the investment adviser, brokerage services, or other offset arrangements, if applicable, and do not represent the amount paid by the class during periods when reimbursements, waivers or reductions occur.
FAmount does not include the portfolio activity of any underlying mutual funds or exchange-traded funds (ETFs).
GPortfolio turnover rate excludes securities received or delivered in-kind.
Fidelity Advisor® International Capital Appreciation Fund Class Z |
| |
| Years ended October 31, | | 2024 | | 2023 | | 2022 | | 2021 | | 2020 |
Selected Per-Share Data | | | | | | | | | | |
| Net asset value, beginning of period | $ | 25.43 | $ | 21.90 | $ | 32.99 | $ | 25.88 | $ | 22.96 |
| Income from Investment Operations | | | | | | | | | | |
Net investment income (loss) A,B | | .18 | | .16 | | .06 | | .03 | | .09 |
| Net realized and unrealized gain (loss) | | 7.29 | | 3.37 | | (9.91) | | 7.14 | | 2.98 |
| Total from investment operations | | 7.47 | | 3.53 | | (9.85) | | 7.17 | | 3.07 |
| Distributions from net investment income | | (.14) | | - | | - | | (.06) | | (.15) |
| Distributions from net realized gain | | - | | - | | (1.24) | | - | | - |
| Total distributions | | (.14) | | - | | (1.24) | | (.06) | | (.15) |
| Net asset value, end of period | $ | 32.76 | $ | 25.43 | $ | 21.90 | $ | 32.99 | $ | 25.88 |
Total Return C | | | | 16.12% | | (30.93)% | | 27.73% | | 13.45% |
Ratios to Average Net Assets B,D,E | | | | | | | | | | |
| Expenses before reductions | | .76% | | .67% | | .85% | | .85% | | .88% |
| Expenses net of fee waivers, if any | | | | .67% | | .85% | | .85% | | .88% |
| Expenses net of all reductions | | .76% | | .67% | | .85% | | .85% | | .84% |
| Net investment income (loss) | | .57% | | .62% | | .21% | | .09% | | .39% |
| Supplemental Data | | | | | | | | | | |
| Net assets, end of period (000 omitted) | $ | 2,244,997 | $ | 1,251,587 | $ | 893,180 | $ | 1,845,967 | $ | 1,130,329 |
Portfolio turnover rate F | | | | 80% | | 110% G | | 128% | | 121% |
ACalculated based on average shares outstanding during the period.
BNet investment income (loss) is affected by the timing of the declaration of dividends by any underlying mutual funds or exchange-traded funds (ETFs). Net investment income (loss) of any mutual funds or ETFs is not included in the Fund's net investment income (loss) ratio.
CTotal returns would have been lower if certain expenses had not been reduced during the applicable periods shown.
DFees and expenses of any underlying mutual funds or exchange-traded funds (ETFs) are not included in the Fund's expense ratio. The Fund indirectly bears its proportionate share of these expenses. For additional expense information related to investments in Fidelity Central Funds, please refer to the "Investments in Fidelity Central Funds" note found in the Notes to Financial Statements section of the most recent Annual or Semi-Annual report.
EExpense ratios reflect operating expenses of the class. Expenses before reductions do not reflect amounts reimbursed, waived, or reduced through arrangements with the investment adviser, brokerage services, or other offset arrangements, if applicable, and do not represent the amount paid by the class during periods when reimbursements, waivers or reductions occur.
FAmount does not include the portfolio activity of any underlying mutual funds or exchange-traded funds (ETFs).
GPortfolio turnover rate excludes securities received or delivered in-kind.
Notes to Financial Statements
For the period ended October 31, 2024
1. Organization.
Fidelity Advisor International Capital Appreciation Fund (the Fund) is a fund of Fidelity Advisor Series VIII (the Trust) and is authorized to issue an unlimited number of shares. The Trust is registered under the Investment Company Act of 1940, as amended (the 1940 Act), as an open-end management investment company organized as a Massachusetts business trust. The Fund offers Class A, Class M, Class C, Class I and Class Z shares, each of which has equal rights as to assets and voting privileges. Class A, Class M, Class C, Class I and Class Z are Fidelity Advisor classes. Each class has exclusive voting rights with respect to matters that affect that class. Class C shares will automatically convert to Class A shares after a holding period of eight years from the initial date of purchase, with certain exceptions. The Fund's investments in emerging markets can be subject to social, economic, regulatory, and political uncertainties and can be extremely volatile.
2. Investments in Fidelity Central Funds.
Funds may invest in Fidelity Central Funds, which are open-end investment companies generally available only to other investment companies and accounts managed by the investment adviser and its affiliates. The Schedule of Investments lists any Fidelity Central Funds held as an investment as of period end, but does not include the underlying holdings of each Fidelity Central Fund. An investing fund indirectly bears its proportionate share of the expenses of the underlying Fidelity Central Funds.
Based on its investment objective, each Fidelity Central Fund may invest or participate in various investment vehicles or strategies that are similar to those of the investing fund. These strategies are consistent with the investment objectives of the investing fund and may involve certain economic risks which may cause a decline in value of each of the Fidelity Central Funds and thus a decline in the value of the investing fund.
| Fidelity Central Fund | Investment Manager | Investment Objective | Investment Practices | Expense RatioA |
| Fidelity Money Market Central Funds | Fidelity Management & Research Company LLC (FMR) | Each fund seeks to obtain a high level of current income consistent with the preservation of capital and liquidity. | Short-term Investments | Less than .005% |
A Expenses expressed as a percentage of average net assets and are as of each underlying Central Fund's most recent annual or semi-annual shareholder report.
A complete unaudited list of holdings for each Fidelity Central Fund is available upon request or at the Securities and Exchange Commission website at www.sec.gov. In addition, the financial statements of the Fidelity Central Funds which contain the significant accounting policies (including investment valuation policies) of those funds, and are not covered by the Report of Independent Registered Public Accounting Firm, are available on the Securities and Exchange Commission website or upon request.
3. Significant Accounting Policies.
The Fund is an investment company and applies the accounting and reporting guidance of the Financial Accounting Standards Board (FASB) Accounting Standards Codification Topic 946 Financial Services - Investment Companies. The financial statements have been prepared in conformity with accounting principles generally accepted in the United States of America (GAAP), which require management to make certain estimates and assumptions at the date of the financial statements. Actual results could differ from those estimates. Subsequent events, if any, through the date that the financial statements were issued have been evaluated in the preparation of the financial statements. The Fund's Schedule of Investments lists any underlying mutual funds or exchange-traded funds (ETFs) but does not include the underlying holdings of these funds. The following summarizes the significant accounting policies of the Fund:
Investment Valuation. Investments are valued as of 4:00 p.m. Eastern time on the last calendar day of the period. The Board of Trustees (the Board) has designated the Fund's investment adviser as the valuation designee responsible for the fair valuation function and performing fair value determinations as needed. The investment adviser has established a Fair Value Committee (the Committee) to carry out the day-to-day fair valuation responsibilities and has adopted policies and procedures to govern the fair valuation process and the activities of the Committee. In accordance with these fair valuation policies and procedures, which have been approved by the Board, the Fund attempts to obtain prices from one or more third party pricing services or brokers to value its investments. When current market prices, quotations or currency exchange rates are not readily available or reliable, investments will be fair valued in good faith by the Committee, in accordance with the policies and procedures. Factors used in determining fair value vary by investment type and may include market or investment specific events, transaction data, estimated cash flows, and market observations of comparable investments. The frequency that the fair valuation procedures are used cannot be predicted and they may be utilized to a significant extent. The Committee manages the Fund's fair valuation practices and maintains the fair valuation policies and procedures. The Fund's investment adviser reports to the Board information regarding the fair valuation process and related material matters.
The Fund categorizes the inputs to valuation techniques used to value its investments into a disclosure hierarchy consisting of three levels as shown below:
Level 1 - unadjusted quoted prices in active markets for identical investments
Level 2 - other significant observable inputs (including quoted prices for similar investments, interest rates, prepayment speeds, etc.)
Level 3 - unobservable inputs (including the Fund's own assumptions based on the best information available)
Valuation techniques used to value the Fund's investments by major category are as follows:
Equity securities, including restricted securities, for which market quotations are readily available, are valued at the last reported sale price or official closing price as reported by a third party pricing service on the primary market or exchange on which they are traded and are categorized as Level 1 in the hierarchy. In the event there were no sales during the day or closing prices are not available, securities are valued at the last quoted bid price or may be valued using the last available price and are generally categorized as Level 2 in the hierarchy. For foreign equity securities, when market or security specific events arise, comparisons to the valuation of American Depositary Receipts (ADRs), futures contracts, Exchange-Traded Funds (ETFs) and certain indexes as well as quoted prices for similar securities may be used and would be categorized as Level 2 in the hierarchy. For equity securities, including restricted securities, where observable inputs are limited, assumptions about market activity and risk are used and these securities may be categorized as Level 3 in the hierarchy.
Investments in open-end mutual funds, including the Fidelity Central Funds, are valued at their closing net asset value (NAV) each business day and are categorized as Level 1 in the hierarchy.
Changes in valuation techniques may result in transfers in or out of an assigned level within the disclosure hierarchy. The aggregate value of investments by input level as of October 31, 2024 is included at the end of the Fund's Schedule of Investments.
Foreign Currency. Certain Funds may use foreign currency contracts to facilitate transactions in foreign-denominated securities. Gains and losses from these transactions may arise from changes in the value of the foreign currency or if the counterparties do not perform under the contracts' terms.
Foreign-denominated assets, including investment securities, and liabilities are translated into U.S. dollars at the exchange rates at period end. Purchases and sales of investment securities, income and dividends received, and expenses denominated in foreign currencies are translated into U.S. dollars at the exchange rate in effect on the transaction date.
The effects of exchange rate fluctuations on investments are included with the net realized and unrealized gain (loss) on investment securities. Other foreign currency transactions resulting in realized and unrealized gain (loss) are disclosed separately.
Investment Transactions and Income. For financial reporting purposes, the Fund's investment holdings and NAV include trades executed through the end of the last business day of the period. The NAV per share for processing shareholder transactions is calculated as of the close of business of the New York Stock Exchange (NYSE), normally 4:00 p.m. Eastern time and includes trades executed through the end of the prior business day. Gains and losses on securities sold are determined on the basis of identified cost and include proceeds received from litigation. Commissions paid to certain brokers with whom the investment adviser, or its affiliates, places trades on behalf of a fund include an amount in addition to trade execution, which may be rebated back to a fund. Any such rebates are included in net realized gain (loss) on investments in the Statement of Operations. Dividend income is recorded on the ex-dividend date, except for certain dividends from foreign securities where the ex-dividend date may have passed, which are recorded as soon as the Fund is informed of the ex-dividend date. Non-cash dividends included in dividend income, if any, are recorded at the fair market value of the securities received. Income and capital gain distributions from Fidelity Central Funds, if any, are recorded on the ex-dividend date. Certain distributions received by the Fund represent a return of capital or capital gain. The Fund determines the components of these distributions subsequent to the ex-dividend date, based upon receipt of tax filings or other correspondence relating to the underlying investment. These distributions are recorded as a reduction of cost of investments and/or as a realized gain. Investment income is recorded net of foreign taxes withheld where recovery of such taxes is uncertain. Funds may file withholding tax reclaims in certain jurisdictions to recover a portion of amounts previously withheld. Any withholding tax reclaims income is included in the Statement of Operations in foreign taxes withheld. Any receivables for withholding tax reclaims are included in the Statement of Assets and Liabilities in reclaims receivable. The Fund has filed tax reclaims for previously withheld taxes on dividends earned in certain European Union (EU) countries. These additional filings are subject to various administrative proceedings by the local jurisdictions' tax authorities within the EU, as well as a number of related judicial proceedings. Income recognized for EU reclaims is included with other reclaims in the Statement of Operations in foreign taxes withheld. These reclaims are recorded when the amount is known and there are no significant uncertainties on collectability.
Class Allocations and Expenses. Investment income, realized and unrealized capital gains and losses, common expenses of a fund, and certain fund-level expense reductions, if any, are allocated daily on a pro-rata basis to each class based on the relative net assets of each class to the total net assets of a fund. Each class differs with respect to transfer agent and distribution and service plan fees incurred, as applicable. Certain expense reductions may also differ by class, if applicable. For the reporting period, the allocated portion of income and expenses to each class as a percent of its average net assets may vary due to the timing of recording these transactions in relation to fluctuating net assets of the classes. Expenses directly attributable to a fund are charged to that fund. Expenses attributable to more than one fund are allocated among the respective funds on the basis of relative net assets or other appropriate methods. Expenses included in the accompanying financial statements reflect the expenses of that fund and do not include any expenses associated with any underlying mutual funds or exchange-traded funds (ETFs). Although not included in a fund's expenses, a fund indirectly bears its proportionate share of these expenses through the net asset value of each underlying mutual fund or exchange-traded fund (ETF). Expense estimates are accrued in the period to which they relate and adjustments are made when actual amounts are known.
Income Tax Information and Distributions to Shareholders. Each year, the Fund intends to qualify as a regulated investment company under Subchapter M of the Internal Revenue Code, including distributing substantially all of its taxable income and realized gains. As a result, no provision for U.S. Federal income taxes is required. As of October 31, 2024, the Fund did not have any unrecognized tax benefits in the financial statements; nor is the Fund aware of any tax positions for which it is reasonably possible that the total amounts of unrecognized tax benefits will significantly change in the next twelve months. The Fund files a U.S. federal tax return, in addition to state and local tax returns as required. The Fund's federal income tax returns are subject to examination by the Internal Revenue Service (IRS) for a period of three fiscal years after they are filed. State and local tax returns may be subject to examination for an additional fiscal year depending on the jurisdiction. Foreign taxes are provided for based on the Fund's understanding of the tax rules and rates that exist in the foreign markets in which it invests. The Fund is subject to a tax imposed on capital gains by certain countries in which it invests. An estimated deferred tax liability for net unrealized appreciation on the applicable securities is included in Deferred taxes on the Statement of Assets and Liabilities.
Distributions are declared and recorded on the ex-dividend date. Income and capital gain distributions are declared separately for each class. Income and capital gain distributions are determined in accordance with income tax regulations, which may differ from GAAP. In addition, the Fund claimed a portion of the payment made to redeeming shareholders as a distribution for income tax purposes.
Capital accounts within the financial statements are adjusted for permanent book-tax differences. These adjustments have no impact on net assets or the results of operations. Capital accounts are not adjusted for temporary book-tax differences which will reverse in a subsequent period.
Book-tax differences are primarily due to foreign currency transactions, certain foreign taxes, passive foreign investment companies (PFIC), capital loss carryforwards and losses deferred due to wash sales.
As of period end, the cost and unrealized appreciation (depreciation) in securities, and derivatives if applicable, for federal income tax purposes were as follows:
| Gross unrealized appreciation | $2,278,058,533 |
| Gross unrealized depreciation | (71,731,302) |
| Net unrealized appreciation (depreciation) | $2,206,327,231 |
| Tax Cost | $6,654,512,442 |
The tax-based components of distributable earnings as of period end were as follows:
| Undistributed ordinary income | $60,668,731 |
| Capital loss carryforward | $(283,412,891) |
| Net unrealized appreciation (depreciation) on securities and other investments | $2,205,725,782 |
Capital loss carryforwards are only available to offset future capital gains of the Fund to the extent provided by regulations and may be limited. The capital loss carryforward information presented below, including any applicable limitation, is estimated as of fiscal period end and is subject to adjustment.
Short-term | $(283,412,891) |
| Total capital loss carryforward | $(283,412,891) |
The tax character of distributions paid was as follows:
| | October 31, 2024 | October 31, 2023 |
| Ordinary Income | $23,553,740 | $ - |
| Long-term Capital Gains | - | - |
| Total | $23,553,740 | $ - |
Restricted Securities (including Private Placements). Funds may invest in securities that are subject to legal or contractual restrictions on resale. These securities generally may be resold in transactions exempt from registration or to the public if the securities are registered. Disposal of these securities may involve time-consuming negotiations and expense, and prompt sale at an acceptable price may be difficult. Information regarding restricted securities held at period end is included at the end of the Schedule of Investments, if applicable.
New Accounting Pronouncement. In November 2023, the FASB issued Accounting Standards Update (ASU) 2023-07 Segment Reporting (Topic 280): Improvements to Reportable Segment Disclosures. Effective for fiscal years beginning after December 15, 2023 and interim periods within fiscal years beginning after December 15, 2024, the amendments enhance required disclosures of segment information for public entities on an annual and interim basis. The ASU allows for early adoption with updates applied retrospectively. Management is currently evaluating the impact of the ASU but does not expect this guidance to materially impact the financial statements.
4. Purchases and Sales of Investments.
Purchases and sales of securities, other than short-term securities and in-kind transactions, as applicable, are noted in the table below.
| | Purchases ($) | Sales ($) |
| Fidelity Advisor International Capital Appreciation Fund | 6,155,615,691 | 4,814,207,690 |
5. Fees and Other Transactions with Affiliates.
Management Fee. Fidelity Management & Research Company LLC (the investment adviser) and its affiliates provide the Fund with investment management related services for which the Fund pays a monthly management fee.
Effective March 1, 2024, the Fund's management contract was amended to incorporate administrative services previously covered under separate services agreements (Transfer Agent and Accounting agreements). The amended contract incorporates a basic fee rate that may vary by class (subject to a performance adjustment). The investment adviser or an affiliate pays certain expenses of managing and operating the Fund out of each class's management fee. Each class of the Fund pays a management fee to the investment adviser. The management fee is calculated and paid to the investment adviser every month. The management fee is determined by calculating a basic fee and then applying a performance adjustment. When determining a class's basic fee, a mandate rate is calculated based on the monthly average net assets of a group of funds advised by FMR within a designated asset class. A discount rate is subtracted from the mandate rate once the Fund's monthly average net assets reach a certain level. The mandate rate and discount rate may vary by class. The annual basic fee rate for a class of shares of the Fund is the lesser of (1) the class's mandate rate reduced by the class's discount rate (if applicable) or (2) the amount set forth in the following table.
| | Maximum Management Fee Rate % |
| Class A | .85 |
| Class M | .85 |
| Class C | .85 |
| Class I | .84 |
| Class Z | .71 |
One-twelfth of the basic fee rate for a class is applied to the average net assets of the class for the month, giving a dollar amount which is the basic fee for the class for that month. A different management fee rate may be applicable to each class of the Fund. The difference between classes is the result of separate arrangements for class-level services and/or waivers of certain expenses. It is not the result of any difference in advisory or custodial fees or other expenses related to the management of the Fund's assets, which do not vary by class. For the portion of the reporting period on or after March 1, 2024, the total annualized management fee rates were as follows:
| | Total Management Fee Rate % |
| Class A | .80 |
| Class M | .80 |
| Class C | .80 |
| Class I | .80 |
| Class Z | .68 |
Prior to March 1, 2024, the management fee was the sum of an individual fund fee rate that was based on an annual rate of .45% of the Fund's average net assets and an annualized group fee rate that averaged .22% during the period. The group fee rate was based upon the monthly average net assets of a group of registered investment companies with which the investment adviser has management contracts. The group fee rate decreased as assets under management increased and increased as assets under management decreased. For the portion of the reporting period prior to March 1, 2024, the total annualized management fee rate was .67%.
The performance adjustment rate is calculated monthly by comparing over the performance period the Fund's performance to that of the performance adjustment index listed below.
| | Performance Adjustment Index |
| Fidelity Advisor International Capital Appreciation Fund | MSCI All Country World ex USA Index |
For the purposes of calculating the performance adjustment for the Fund, the Fund's investment performance is based on the performance of Class I. To the extent that other classes of the Fund have higher expenses, this could result in those classes bearing a larger positive performance adjustment and smaller negative performance adjustment than would be the case if each class's own performance were considered. The performance period is the most recent 36 month period. The maximum annualized performance adjustment rate is ±.20% of the Fund's average net assets over the performance period. The performance adjustment rate is divided by twelve and multiplied by the Fund's average net assets over the performance period, and the resulting dollar amount is proportionately added to or subtracted from a class's basic fee. For the entire reporting period, the total annual performance adjustment was .04%.
Effective March 1, 2024, the Fund's sub-advisory agreements with FMR Investment Management (UK) Limited, Fidelity Management & Research (Hong Kong) Limited, and Fidelity Management & Research (Japan) Limited were amended to provide that the investment adviser pays each sub-adviser monthly fees equal to 110% of the sub-adviser's costs for providing sub-advisory services.
Effective March 1, 2024, the Fund's sub-advisory agreement with FIL Investment Advisors (FIA) was amended to provide that the investment adviser pays FIA monthly fees at an annual rate of 0.44% with respect to the average daily net assets of the Fund managed by FIA. FIA in turn pays FIA(UK).
Distribution and Service Plan Fees. In accordance with Rule 12b-1 of the 1940 Act, the Fund has adopted separate Distribution and Service Plans for each class of shares. Certain classes pay Fidelity Distributors Company LLC (FDC), an affiliate of the investment adviser, separate Distribution and Service Fees, each of which is based on an annual percentage of each class' average net assets. In addition, FDC may pay financial intermediaries for selling shares of the Fund and providing shareholder support services. For the period, the Distribution and Service Fee rates, total fees and amounts retained by FDC were as follows:
| | Distribution Fee | Service Fee | Total Fees ($) | Retained by FDC ($) |
| Class A | - % | .25% | 1,483,052 | 58,464 |
| Class M | .25% | .25% | 908,116 | 339 |
| Class C | .75% | .25% | 1,095,569 | 109,837 |
| | | | 3,486,737 | 168,640 |
Sales Load. FDC may receive a front-end sales charge of up to 5.75% for selling Class A shares and 3.50% for selling Class M shares, some of which is paid to financial intermediaries for selling shares of the Fund. Depending on the holding period, FDC may receive contingent deferred sales charges levied on Class A, Class M and Class C redemptions. The deferred sales charges are 1.00% for Class C shares, 1.00% for certain purchases of Class A shares and .25% for certain purchases of Class M shares.
For the period, sales charge amounts retained by FDC were as follows:
| | Retained by FDC ($) |
| Class A | 188,164 |
| Class M | 9,623 |
Class CA | 252 |
| | 198,039 |
A When Class C shares are initially sold, FDC pays commissions from its own resources to financial intermediaries through which the sales are made.
Transfer Agent Fees. Fidelity Investments Institutional Operations Company LLC (FIIOC), an affiliate of the investment adviser, is the transfer, dividend disbursing and shareholder servicing agent for each class of the Fund. Effective March 1, 2024, the Fund's management contract was amended to incorporate transfer agent services and associated fees previously covered under a separate services agreement. FIIOC pays for typesetting, printing and mailing of shareholder reports, except proxy statements.
During the period December 1, 2023 through February 29, 2024, the transfer agent fees for each class were a fixed annual rate of class-level average net assets as follows:
| | % of Class-Level Average Net Assets |
| Class A | .1799 |
| Class M | .1815 |
| Class C | .1814 |
| Class I | .1672 |
| Class Z | .0420 |
Prior to December 1, 2023, FIIOC received account fees and asset-based fees that varied according to the account size and type of account of the shareholders of the respective classes of the Fund, except for Class Z. FIIOC received an asset-based fee of Class Z's average net assets. For the portion of the reporting period prior to March 1, 2024, the fees were equivalent to the following annualized rates:
| | Amount ($) | % of Class-Level Average Net Assets |
| Class A | 321,322 | .18 |
| Class M | 102,129 | .18 |
| Class C | 64,405 | .18 |
| Class I | 2,487,537 | .17 |
| Class Z | 208,345 | .04 |
| 3,183,738 | |
Accounting Fees. Fidelity Service Company, Inc. (FSC), an affiliate of the investment adviser, maintains the Fund's accounting records. Effective March 1, 2024, the Fund's management contract was amended to incorporate accounting services and associated fees previously covered under a separate services agreement.
During the period December 1, 2023 through February 29, 2024, the accounting fees were a fixed annual rate of average net assets as follows:
| | % of Average Net Assets |
| Fidelity Advisor International Capital Appreciation Fund | .0257 |
Prior to December 1, 2023, the accounting fee was based on the level of average net assets for each month. For the portion of the reporting period prior to March 1, 2024, the fees were equivalent to the following annualized rates:
| | % of Average Net Assets |
| Fidelity Advisor International Capital Appreciation Fund | .03 |
Brokerage Commissions. A portion of portfolio transactions were placed with brokerage firms which are affiliates of the investment adviser. Brokerage commissions are included in net realized gain (loss) and change in net unrealized appreciation (depreciation) in the Statement of Operations. The commissions paid to these affiliated firms were as follows:
| | Amount ($) |
| Fidelity Advisor International Capital Appreciation Fund | 4,482 |
Interfund Lending Program. Pursuant to an Exemptive Order issued by the Securities and Exchange Commission (the SEC), the Fund, along with other registered investment companies having management contracts with Fidelity Management & Research Company LLC (FMR), or other affiliated entities of FMR, may participate in an interfund lending program. This program provides an alternative credit facility allowing the Fund to borrow from, or lend money to, other participating affiliated funds at rates that are beneficial to both the borrowing and lending fund. Borrowings under the program are generally for temporary or emergency purposes, including meeting fund shareholder redemptions. The interfund loan rate is determined, as specified in the Exemptive Order, by averaging, (1) the higher of the overnight time deposit rate and the current overnight repurchase agreement rate, and (2) a benchmark rate representing the lowest bank loan rate available to the funds. At period end, there were no interfund loans outstanding. Activity in this program during the period for which loans were outstanding was as follows:
| | Borrower or Lender | Average Loan Balance ($) | Weighted Average Interest Rate | Interest Expense ($) |
Fidelity Advisor International Capital Appreciation Fund | Borrower | 59,294,947 | 5.54% | 173,438 |
Interfund Trades. Funds may purchase from or sell securities to other Fidelity Funds under procedures adopted by the Board. The procedures have been designed to ensure these interfund trades are executed in accordance with Rule 17a-7 of the 1940 Act. Any interfund trades are included within the respective purchases and sales amounts shown in the Purchases and Sales of Investments note. Interfund trades during the period are noted in the table below.
| | Purchases ($) | Sales ($) | Realized Gain (Loss)($) |
| Fidelity Advisor International Capital Appreciation Fund | 447,347,559 | 160,748,526 | 13,603,079 |
6. Committed Line of Credit.
Certain Funds participate with other funds managed by the investment adviser or an affiliate in a $4.25 billion credit facility (the "line of credit") to be utilized for temporary or emergency purposes to fund shareholder redemptions or for other short-term liquidity purposes. The participating funds have agreed to pay commitment fees on their pro-rata portion of the line of credit, which are reflected in Miscellaneous expenses on the Statement of Operations, and are listed below. During the period, there were no borrowings on this line of credit.
| | Amount ($) |
| Fidelity Advisor International Capital Appreciation Fund | 12,087 |
7. Security Lending.
Funds lend portfolio securities from time to time in order to earn additional income. Lending agents are used, including National Financial Services (NFS), an affiliate of the investment adviser. Pursuant to a securities lending agreement, NFS will receive a fee, which is capped at 9.9% of a fund's daily lending revenue, for its services as lending agent. A fund may lend securities to certain qualified borrowers, including NFS. On the settlement date of the loan, a fund receives collateral (in the form of U.S. Treasury obligations, letters of credit and/or cash) against the loaned securities and maintains collateral in an amount not less than 100% of the market value of the loaned securities during the period of the loan. The market value of the loaned securities is determined at the close of business of a fund and any additional required collateral is delivered to a fund on the next business day. A fund or borrower may terminate the loan at any time, and if the borrower defaults on its obligation to return the securities loaned because of insolvency or other reasons, a fund may apply collateral received from the borrower against the obligation. A fund may experience delays and costs in recovering the securities loaned. Any cash collateral received is invested in the Fidelity Securities Lending Cash Central Fund. Any loaned securities are identified as such in the Schedule of Investments, and the value of loaned securities and cash collateral at period end, as applicable, are presented in the Statement of Assets and Liabilities. Security lending income represents the income earned on investing cash collateral, less rebates paid to borrowers and any lending agent fees associated with the loan, plus any premium payments received for lending certain types of securities. Security lending income is presented in the Statement of Operations as a component of income from Fidelity Central Funds. Affiliated security lending activity, if any, was as follows:
| | Total Security Lending Fees Paid to NFS ($) | Security Lending Income From Securities Loaned to NFS ($) | Value of Securities Loaned to NFS at Period End ($) |
| Fidelity Advisor International Capital Appreciation Fund | 5,261 | - | - |
8. Expense Reductions.
Through arrangements with the Fund's custodian, credits realized as a result of certain uninvested cash balances were used to reduce the Fund's expenses. During the period, custodian credits reduced the Fund's expenses by $13,292.
In addition, during the period the investment adviser or an affiliate reimbursed and/or waived a portion of fund-level operating expenses in the amount of $311,844.
9. Distributions to Shareholders.
Distributions to shareholders of each class were as follows:
| | Year ended October 31, 2024 | Year ended October 31, 2023 |
| Fidelity Advisor International Capital Appreciation Fund | | |
| Distributions to shareholders | | |
| Class A | $870,929 | $ - |
| Class I | 15,991,995 | - |
| Class Z | 6,690,816 | - |
Total | $23,553,740 | $ - |
10. Share Transactions.
Share transactions for each class were as follows and may contain in-kind transactions, automatic conversions between classes or exchanges between affiliated funds:
| | Shares | Shares | Dollars | Dollars |
| | Year ended October 31, 2024 | Year ended October 31, 2023 | Year ended October 31, 2024 | Year ended October 31, 2023 |
| Fidelity Advisor International Capital Appreciation Fund | | | | |
| Class A | | | | |
| Shares sold | 5,808,743 | 4,796,858 | $169,048,534 | $115,824,521 |
| Reinvestment of distributions | 31,487 | - | 831,259 | - |
| Shares redeemed | (4,334,796) | (4,724,109) | (125,148,012) | (113,169,898) |
| Net increase (decrease) | 1,505,434 | 72,749 | $44,731,781 | $2,654,623 |
| Class M | | | | |
| Shares sold | 1,113,295 | 1,026,152 | $31,447,656 | $24,224,045 |
| Shares redeemed | (1,119,030) | (861,061) | (31,087,875) | (19,943,927) |
| Net increase (decrease) | (5,735) | 165,091 | $359,781 | $4,280,118 |
| Class C | | | | |
| Shares sold | 529,931 | 531,513 | $13,012,983 | $11,110,295 |
| Shares redeemed | (1,215,180) | (1,301,508) | (29,852,476) | (26,610,764) |
| Net increase (decrease) | (685,249) | (769,995) | $(16,839,493) | $(15,500,469) |
| Class I | | | | |
| Shares sold | 70,383,221 | 48,481,950 | $2,192,561,556 | $1,261,327,839 |
| Reinvestment of distributions | 460,990 | - | 13,087,499 | - |
| Shares redeemed | (49,827,073) | (47,885,050) | (1,569,187,346) | (1,214,605,904) |
| Net increase (decrease) | 21,017,138 | 596,900 | $636,461,709 | $46,721,935 |
| Class Z | | | | |
| Shares sold | 36,793,530 | 21,823,068 | $1,169,069,923 | $566,083,303 |
| Reinvestment of distributions | 186,982 | - | 5,323,368 | - |
| Shares redeemed | (17,679,228) | (13,377,996) | (562,078,619) | (340,374,406) |
| Net increase (decrease) | 19,301,284 | 8,445,072 | $612,314,672 | $225,708,897 |
11. Other.
A fund's organizational documents provide former and current trustees and officers with a limited indemnification against liabilities arising in connection with the performance of their duties to the fund. In the normal course of business, a fund may also enter into contracts that provide general indemnifications. A fund's maximum exposure under these arrangements is unknown as this would be dependent on future claims that may be made against a fund. The risk of material loss from such claims is considered remote.
12. Risk and Uncertainties.
Many factors affect a fund's performance. Developments that disrupt global economies and financial markets, such as pandemics, epidemics, outbreaks of infectious diseases, war, terrorism, and environmental disasters, may significantly affect a fund's investment performance. The effects of these developments to a fund will be impacted by the types of securities in which a fund invests, the financial condition, industry, economic sector, and geographic location of an issuer, and a fund's level of investment in the securities of that issuer. Significant concentrations in security types, issuers, industries, sectors, and geographic locations may magnify the factors that affect a fund's performance.
Report of Independent Registered Public Accounting Firm
To the Board of Trustees of Fidelity Advisor Series VIII and the Shareholders of Fidelity Advisor International Capital Appreciation Fund:
Opinion on the Financial Statements and Financial Highlights
We have audited the accompanying statement of assets and liabilities of Fidelity Advisor International Capital Appreciation Fund (the "Fund"), a fund of Fidelity Advisor Series VIII, including the schedule of investments, as of October 31, 2024, the related statement of operations for the year then ended, the statement of changes in net assets for each of the two years in the period then ended, the financial highlights for each of the five years in the period then ended, and the related notes. In our opinion, the financial statements and financial highlights present fairly, in all material respects, the financial position of the Fund as of October 31, 2024, and the results of its operations for the year then ended, the changes in its net assets for each of the two years in the period then ended, and the financial highlights for each of the five years in the period then ended in conformity with accounting principles generally accepted in the United States of America.
Basis for Opinion
These financial statements and financial highlights are the responsibility of the Fund's management. Our responsibility is to express an opinion on the Fund's financial statements and financial highlights based on our audits. We are a public accounting firm registered with the Public Company Accounting Oversight Board (United States) (PCAOB) and are required to be independent with respect to the Fund in accordance with the U.S. federal securities laws and the applicable rules and regulations of the Securities and Exchange Commission and the PCAOB.
We conducted our audits in accordance with the standards of the PCAOB. Those standards require that we plan and perform the audit to obtain reasonable assurance about whether the financial statements and financial highlights are free of material misstatement, whether due to error or fraud. The Fund is not required to have, nor were we engaged to perform, an audit of its internal control over financial reporting. As part of our audits, we are required to obtain an understanding of internal control over financial reporting but not for the purpose of expressing an opinion on the effectiveness of the Fund's internal control over financial reporting. Accordingly, we express no such opinion.
Our audits included performing procedures to assess the risks of material misstatement of the financial statements and financial highlights, whether due to error or fraud, and performing procedures that respond to those risks. Such procedures included examining, on a test basis, evidence regarding the amounts and disclosures in the financial statements and financial highlights. Our audits also included evaluating the accounting principles used and significant estimates made by management, as well as evaluating the overall presentation of the financial statements and financial highlights. Our procedures included confirmation of securities owned as of October 31, 2024, by correspondence with the custodian and brokers; when replies were not received from brokers, we performed other auditing procedures. We believe that our audits provide a reasonable basis for our opinion.
/s/ Deloitte & Touche LLP
Boston, Massachusetts
December 13, 2024
We have served as the auditor of one or more of the Fidelity investment companies since 1999.
Distributions
(Unaudited)The dividend and capital gains distributions for the fund(s) are available on Fidelity.com or Institutional.Fidelity.com.
The fund designates $364,140 of distributions paid during the fiscal year ended 2024 as qualifying to be taxed as section 163(j) interest dividends.
Class A designates 32%; Class I designates 17%; and Class Z designates 14% of the dividends distributed in December 2023, during the fiscal year as qualifying for the dividends-received deduction for corporate shareholders.
Class A, Class I, and Class Z designate 100% of the dividends distributed during the fiscal year as amounts which may be taken into account as a dividend for purposes of the maximum rate under section 1(h)(11) of the Internal Revenue Code.
The amounts per share which represent income derived from sources within, and taxes paid to, foreign countries or possessions of the United States are as follows:
| | Pay Date | Income | Taxes |
| Fidelity Advisor International Capital Appreciation Fund | | | |
| Class A | 12/04/2023 | $0.0606 | $0.0235 |
| Class M | 12/04/2023 | $0.0000 | $0.0000 |
| Class C | 12/04/2023 | $0.0000 | $0.0000 |
| Class I | 12/04/2023 | $0.1163 | $0.0235 |
| Class Z | 12/04/2023 | $0.1442 | $0.0235 |
The fund will notify shareholders in January 2025 of amounts for use in preparing 2024 income tax returns.
Item 8: Changes in and Disagreements with Accountants for Open-End Management Investment Companies
(Unaudited)
Note: This is not applicable for any fund included in this document.
Item 9: Proxy Disclosures for Open-End Management Investment Companies
(Unaudited)
| A special meeting of shareholders was held on July 16, 2024. The results of votes taken among shareholders on the proposal before them are reported below. Each vote reported represents one dollar of net asset value held on the record date for the meeting. |
| Proposal 1 |
| To elect a Board of Trustees. |
| | # of Votes | % of Votes |
| Bettina Doulton |
| Affirmative | 9,667,916,942.83 | 98.16 |
| Withheld | 181,261,836.48 | 1.84 |
| TOTAL | 9,849,178,779.31 | 100.00 |
| Robert A. Lawrence |
| Affirmative | 9,643,385,159.26 | 97.91 |
| Withheld | 205,793,620.05 | 2.09 |
| TOTAL | 9,849,178,779.31 | 100.00 |
| Vijay C. Advani |
| Affirmative | 9,650,856,015.95 | 97.99 |
| Withheld | 198,322,763.36 | 2.01 |
| TOTAL | 9,849,178,779.31 | 100.00 |
| Thomas P. Bostick |
| Affirmative | 9,653,685,826.52 | 98.02 |
| Withheld | 195,492,952.79 | 1.98 |
| TOTAL | 9,849,178,779.31 | 100.00 |
| Donald F. Donahue |
| Affirmative | 9,653,599,026.45 | 98.01 |
| Withheld | 195,579,752.86 | 1.99 |
| TOTAL | 9,849,178,779.31 | 100.00 |
| Vicki L. Fuller |
| Affirmative | 9,666,491,582.97 | 98.15 |
| Withheld | 182,687,196.34 | 1.85 |
| TOTAL | 9,849,178,779.31 | 100.00 |
| Patricia L. Kampling |
| Affirmative | 9,664,290,979.63 | 98.12 |
| Withheld | 184,887,799.68 | 1.88 |
| TOTAL | 9,849,178,779.31 | 100.00 |
| Thomas A. Kennedy |
| Affirmative | 9,646,944,497.07 | 97.95 |
| Withheld | 202,234,282.24 | 2.05 |
| TOTAL | 9,849,178,779.31 | 100.00 |
| Oscar Munoz |
| Affirmative | 9,652,669,495.50 | 98.00 |
| Withheld | 196,509,283.81 | 2.00 |
| TOTAL | 9,849,178,779.31 | 100.00 |
| Karen B. Peetz |
| Affirmative | 9,656,405,594.63 | 98.04 |
| Withheld | 192,773,184.68 | 1.96 |
| TOTAL | 9,849,178,779.31 | 100.00 |
| David M. Thomas |
| Affirmative | 9,644,713,946.63 | 97.92 |
| Withheld | 204,464,832.68 | 2.08 |
| TOTAL | 9,849,178,779.31 | 100.00 |
| Susan Tomasky |
| Affirmative | 9,654,121,207.44 | 98.02 |
| Withheld | 195,057,571.87 | 1.98 |
| TOTAL | 9,849,178,779.31 | 100.00 |
| Michael E. Wiley |
| Affirmative | 9,642,438,416.20 | 97.90 |
| Withheld | 206,740,363.11 | 2.10 |
| TOTAL | 9,849,178,779.31 | 100.00 |
| | | |
| Proposal 1 reflects trust-wide proposal and voting results. |
Item 10: Remuneration Paid to Directors, Officers, and others of Open-End Management Investment Companies
(Unaudited)
Note: This information is disclosed as part of the financial statements for each Fund as part of Item 7: Financial Statements and Financial Highlights for Open-End Management Investment companies.
Item 11: Statement Regarding Basis for Approval of Investment Advisory Contract
(Unaudited)
Board Approval of Investment Advisory Contracts and Management Fees
Fidelity Advisor International Capital Appreciation Fund
Each year, the Board of Trustees, including the Independent Trustees (together, the Board), considers the renewal of the fund's management contract with Fidelity Management & Research Company LLC (FMR) and certain affiliates and the sub-advisory agreements (together, the Advisory Contracts) for the fund. FMR and the sub-advisers are referred to herein as the Investment Advisers. The Board, assisted by the advice of fund counsel and Independent Trustees' counsel, requests and considers a broad range of information relevant to the renewal of the Advisory Contracts throughout the year.
The Board meets regularly and, at each of its meetings, covers an extensive agenda of topics and materials and considers factors that are relevant to its annual consideration of the renewal of the fund's Advisory Contracts, including the services and support provided to the fund and its shareholders. The Board, acting directly and through its Committees (each of which is composed of and chaired by Independent Trustees), requests and receives information concerning the annual consideration of the renewal of the fund's Advisory Contracts. The Board also meets as needed to review matters specifically related to the Board's annual consideration of the renewal of the Advisory Contracts. Members of the Board may also meet with trustees of other Fidelity funds through joint ad hoc committees to discuss certain matters relevant to all of the Fidelity funds.
At its May 2024 meeting, the Board unanimously determined to renew the fund's Advisory Contracts. In reaching its determination, the Board considered all factors it believed relevant, including (i) the nature, extent, and quality of the services provided to the fund and its shareholders (including the investment performance of the fund); (ii) the competitiveness relative to peer funds of the fund's management fee and the total expense ratio of a representative class (Class I, which was selected because it was the largest class without 12b-1 fees); (iii) the total costs of the services provided by and the profits realized by FMR and its affiliates (Fidelity) from its relationships with the fund; and (iv) the extent to which, if any, economies of scale exist and are realized as the fund grows, and whether any economies of scale are appropriately shared with fund shareholders. The Board also considered the broad range of investment choices available to shareholders from FMR's competitors and that the fund's shareholders have chosen to invest in the fund, which is part of the Fidelity family of funds. The Board's decision to renew the Advisory Contracts was not based on any single factor.
The Board reached a determination, with the assistance of fund counsel and Independent Trustees' counsel and through the exercise of its business judgment, that the renewal of the Advisory Contracts was in the best interests of the fund and its shareholders and that the compensation payable under the Advisory Contracts was fair and reasonable in light of all of the surrounding circumstances.
Nature, Extent, and Quality of Services Provided. The Board considered staffing as it relates to the fund, including the backgrounds and experience of investment personnel of the Investment Advisers, and also considered the Investment Advisers' implementation of the fund's investment program. The Independent Trustees also had discussions with senior management of Fidelity's investment operations and investment groups. The Board considered the structure of the investment personnel compensation program and whether this structure provides appropriate incentives to act in the best interests of the fund. Additionally, the Board considered the portfolio managers' investments, if any, in the funds that they manage.
Resources Dedicated to Investment Management and Support Services. The Board and the Fund Oversight and Research Committees reviewed the general qualifications and capabilities of Fidelity's investment staff, including its size, education, experience, and resources, as well as Fidelity's approach to recruiting, training, managing, and compensating investment personnel. The Board noted the resources devoted to expansion of Fidelity's global investment organization, and that Fidelity's analysts have extensive resources, tools and capabilities that allow them to conduct sophisticated quantitative and fundamental analysis, as well as credit analysis of issuers, counterparties and guarantors. Further, the Board considered that Fidelity's investment professionals have sufficient access to global information and data so as to provide competitive investment results over time, and that those professionals also have access to sophisticated tools that permit them to assess portfolio construction and risk and performance attribution characteristics continuously, as well as to transmit new information and research conclusions rapidly around the world. Additionally, in its deliberations, the Board considered Fidelity's trading, risk management, compliance, and technology and operations capabilities and resources, which are integral parts of the investment management process.
Shareholder and Administrative Services. The Board considered (i) the nature, extent, quality, and cost of advisory, administrative, shareholder, transfer agency, and pricing and bookkeeping services performed by the Investment Advisers and their affiliates under the Advisory Contracts; (ii) the nature and extent of Fidelity's supervision of third party service providers, principally custodians, subcustodians, and pricing vendors; and (iii) the resources devoted by Fidelity to, and the record of compliance with, the fund's compliance policies and procedures. The Board also reviewed the allocation of fund brokerage, including allocations to brokers affiliated with the Investment Advisers, the use of brokerage commissions to pay fund expenses, and the use of "soft" commission dollars to pay for research services. The Board also considered the fund's securities lending activities and any payments made to Fidelity relating to securities lending under a separate agreement.
The Board noted that the growth of fund assets over time across the complex allows Fidelity to reinvest in the development of services designed to enhance the value and convenience of the Fidelity funds as investment vehicles. These services include 24-hour access to account information and market information over the Internet and through telephone representatives, investor education materials and asset allocation tools. The Board also considered that it reviews customer service metrics such as telephone response times, continuity of services on the website and metrics addressing services at Fidelity Investor Centers.
Investment in a Large Fund Family.
Investment Performance. The Board took into account discussions that occur with representatives of the Investment Advisers, and reports that it receives, at Board meetings throughout the year, relating to fund investment performance. In this regard the Board noted that as part of regularly scheduled fund reviews and other reports to the Board on fund performance, the Board considered annualized return information for the fund for different time periods, measured against an appropriate securities market index (benchmark index) and an appropriate peer group of funds with similar objectives (peer group). The Board also considered information about performance attribution. In its ongoing evaluation of fund investment performance, the Board gives particular attention to information indicating changes in performance of the funds over different time periods and discussed with the Investment Advisers the reasons for any overperformance or underperformance.
In addition to reviewing absolute and relative fund performance, the Independent Trustees periodically consider the appropriateness of fund performance metrics in evaluating the results achieved. The Independent Trustees generally give greater weight to fund performance over longer time periods than over shorter time periods. Depending on the circumstances, the Independent Trustees may be satisfied with a fund's performance notwithstanding that it lags its benchmark index or peer group for certain periods.
Based on its review, the Board concluded that the nature, extent, and quality of services provided to the fund under the Advisory Contracts should continue to benefit the shareholders of the fund.
Competitiveness of Management Fee and Total Expense Ratio. The Board was provided with information regarding industry trends in management fees and expenses. The Board considered that, effective March 1, 2024, an amended Advisory Contract with FMR went into effect with class-level management fees based on tiered schedules and subject to a maximum class-level rate (the management fee). The Board also considered that in exchange for the variable management fee, each class of the fund receives investment advisory, management, administrative, transfer agent, and pricing and bookkeeping services. In its review of the management fee and total expense ratio of Class I, the Board considered a pro forma management fee rate for Class I as if it had been in effect for the 12-month period ended September 30, 2023, as well as other third-party fund expenses, as applicable, such as custodial, legal, and audit fees and any fund-paid 12b-1 fees. The Board noted that Fidelity may agree to waive fees or reimburse expenses from time to time, and the extent to which, if any, it has done so for the fund. The Board also considered information about the impact of the fund's performance adjustment.
Comparisons of Management Fees and Total Expense Ratios. Among other things, the Board reviewed data for selected groups of competitive funds and classes (referred to as "mapped groups") that were compiled by Fidelity based on combining similar investment objective categories (as classified by Morningstar) that have comparable investment mandates. The data reviewed by the Board included (i) gross management fee comparisons (before taking into account expense reimbursements or caps and without taking into account the fund's performance adjustment) relative to the total universe of funds within the mapped group; (ii) gross management fee comparisons relative to a subset of non-Fidelity funds in the mapped group that are similar in size and management fee structure to the fund (referred to as the "asset size peer group"); (iii) total expense comparisons of Class I of the fund relative to funds and classes in the mapped group that have a similar sales load structure to Class I of the fund (referred to as the "similar sales load structure group"); and (iv) total expense comparisons of Class I of the fund relative to funds and classes in the similar sales load structure group that are similar in size and management fee structure to the fund (referred to as the "total expense asset size peer group"). The total expense asset size peer group comparison excludes performance adjustments and fund-paid 12b-1 fees to eliminate variability in fee structures.
The information provided to the Board indicated that the fund's management fee rate ranked above the competitive median of the mapped group for the 12-month period ended September 30, 2023 and above the competitive median of the asset size peer group for the 12-month period ended September 30, 2023. Further, the information provided to the Board indicated that the total expense ratio of Class I of the fund ranked below the competitive median of the similar sales load structure group for the 12-month period ended September 30, 2023 and below the competitive median of the total expense asset size peer group for the 12-month period ended September 30, 2023. The Board considered that the fund has a variable unified management fee that covers expenses for services beyond portfolio management.
The Board noted that a different variable management fee rate is applicable to each class of the fund. The Board considered that the difference in management fee rates between classes is the result of separate arrangements for class-level services and/or waivers of certain expenses and not the result of any difference in advisory or custodial fees or other expenses related to the management of the fund's assets, which do not vary by class.
The Board also considered that the fund's management fee is subject to upward or downward adjustment depending upon whether, and to what extent, the fund's investment performance for the performance period (a rolling 36-month period) exceeds, or is exceeded by, a securities index, thus leading to a performance adjustment for the same period. The Board noted that the performance adjustment provides FMR with a strong economic incentive to seek to achieve superior long-term performance for the fund's shareholders and helps to more closely align the interests of FMR and the shareholders of the fund.
In connection with its consideration of the fund's performance adjustment, the Board noted that the performance of Class I is used for purposes of determining the performance adjustment. The Board noted that to the extent the performance adjustment was based on the performance of a share class with higher total annual operating expenses, the fund would be subject to a smaller positive and larger negative performance adjustment. The Board considered the appropriateness of the use of Class I as the basis for the performance adjustment. The Board noted that Class I is typically the largest class (reflecting the actual investment experience for the plurality of shareholders), employs a standard expense structure, and does not include fund-paid 12b-1 fees, which Fidelity believes makes it a more appropriate measurement of Fidelity's investment skill.
Fees Charged to Other Fidelity Clients. The Board also considered Fidelity fee structures and other information with respect to clients of Fidelity, such as other funds advised or subadvised by Fidelity, pension plan clients, and other institutional clients with similar mandates. The Board noted that a joint ad hoc committee created by it and the boards of other Fidelity funds periodically reviews and compares Fidelity's institutional investment advisory business with its business of providing services to the Fidelity funds and also noted the most recent findings of the committee. The Board noted that the committee's review included a consideration of the differences in services provided, fees charged, and costs incurred, as well as competition in the markets serving the different categories of clients.
Based on its review, the Board concluded that the fund's management fee, including the use of Class I as the basis for the performance adjustment, is fair and reasonable in light of the services that the fund receives and the other factors considered. Further based on its review of total expense ratios and fees charged to other Fidelity clients, the Board concluded that the total expense ratio of each class of the fund was reasonable in light of the services that the fund and its shareholders receive and the other factors considered.
Costs of the Services and Profitability. The Board considered the revenues earned and the expenses incurred by Fidelity in conducting the business of developing, marketing, distributing, managing, administering and servicing the fund and servicing the fund's shareholders. The Board also considered the level of Fidelity's profits in respect of all the Fidelity funds.
On an annual basis, Fidelity presents to the Board information about the profitability of its relationships with the fund. Fidelity calculates profitability information for each fund, as well as aggregate profitability information for groups of Fidelity funds and all Fidelity funds, using a series of detailed revenue and cost allocation methodologies which originate with the books and records of Fidelity on which Fidelity's audited financial statements are based. The Audit Committee of the Board reviews any significant changes from the prior year's methodologies.
A public accounting firm has been engaged annually by the Board as part of the Board's assessment of Fidelity's profitability analysis. The engagement includes the review and assessment of the methodologies used by Fidelity in determining the revenues and expenses attributable to Fidelity's fund business, and completion of agreed-upon procedures in respect of the mathematical accuracy of certain fund profitability information and its conformity to established allocation methodologies. After considering the reports issued under the engagement and information provided by Fidelity, the Board concluded that while other allocation methods may also be reasonable, Fidelity's profitability methodologies are reasonable in all material respects.
The Board also reviewed Fidelity's non-fund businesses and potential indirect benefits such businesses may have received as a result of their association with Fidelity's fund business (i.e., fall-out benefits) as well as cases where Fidelity's affiliates may benefit from the funds' business. The Board considered areas where potential indirect benefits to the Fidelity funds from their relationships with Fidelity may exist. The Board's consideration of these matters was informed by the findings of a joint ad hoc committee created by it and the boards of other Fidelity funds to evaluate potential fall-out benefits.
The Board considered the costs of the services provided by and the profits realized by Fidelity in connection with the operation of the fund and was satisfied that the profitability was not excessive.
Economies of Scale. The Board considered whether there have been economies of scale in respect of the management of the Fidelity funds, whether the Fidelity funds (including the fund) have appropriately benefited from any such economies of scale, and whether there is potential for realization of any further economies of scale. The Board considered the extent to which the fund will benefit from economies of scale as assets grow through increased services to the fund, through waivers or reimbursements, or through fee or expense ratio reductions. The Board also noted that a committee created by it and the boards of other Fidelity funds periodically analyzes whether Fidelity attains economies of scale in respect of the management and servicing of the Fidelity funds, whether the Fidelity funds have appropriately benefited from such economies of scale, and whether there is potential for realization of any further economies of scale.
The Board recognized that the fund's management contract incorporates a variable management fee structure, which provides breakpoints as a way to share, in part, any potential economies of scale that may exist at the asset class level and through a discount that considers both fund size and total assets of the four applicable asset classes. The Board considered that the variable management fee is designed to deliver the benefits of economies of scale to fund shareholders even if assets of any particular fund are unchanged or have declined, because some portion of Fidelity's costs are attributable to services provided to all funds subject to the variable management fee, and all such funds benefit if those costs can be allocated among more assets. The Board concluded that, given the variable management fee structure, fund shareholders will benefit from lower management fees due to the application of the breakpoints and discount factor, regardless of whether Fidelity achieves any such economies of scale.
The Board concluded, taking into account the analysis of the committee, that economies of scale, if any, are being appropriately shared between fund shareholders and Fidelity.
Additional Information Requested by the Board. In order to develop fully the factual basis for consideration of the Fidelity funds' advisory contracts, the Board requested and received additional information on certain topics, including but not limited to: (i) fund flow and performance trends, in particular the underperformance of certain funds and strategies, and Fidelity's long-term strategies for certain funds; (ii) the operation of performance fees and the rationale for implementing performance fees on certain categories of funds but not others; (iii) Fidelity's pricing philosophy compared to competitors; (iv) fund profitability methodology and data; (v) evaluation of competitive fund data and peer group classifications and fee and expense comparisons; (vi) the management fee and expense structures for different funds and classes and information about the differences between various fee and expense structures; (vii) the variable management fee implemented for certain funds effective March 1, 2024; and (viii) information regarding other accounts managed by Fidelity and the funds' sub-advisory arrangements.
Conclusion. Based on its evaluation of all of the conclusions noted above, and after considering all factors it believed relevant, the Board, including the Independent Trustees, concluded that the advisory and sub-advisory fee arrangements are fair and reasonable in light of all of the surrounding circumstances and that the fund's Advisory Contracts should be renewed through May 31, 2025.
1.711985.126
AICAP-ANN-1224
Fidelity Advisor® Focused Emerging Markets Fund
Annual Report
October 31, 2024
Contents
To view a fund's proxy voting guidelines and proxy voting record for the 12-month period ended June 30, visit http://www.fidelity.com/proxyvotingresults or visit the Securities and Exchange Commission's (SEC) web site at http://www.sec.gov.
You may also call 1-877-208-0098 to request a free copy of the proxy voting guidelines.
Standard & Poor's, S&P and S&P 500 are registered service marks of The McGraw-Hill Companies, Inc. and have been licensed for use by Fidelity Distributors Corporation.
Other third-party marks appearing herein are the property of their respective owners.
All other marks appearing herein are registered or unregistered trademarks or service marks of FMR LLC or an affiliated company. © 2024 FMR LLC. All rights reserved.
This report and the financial statements contained herein are submitted for the general information of the shareholders of the Fund. This report is not authorized for distribution to prospective investors in the Fund unless preceded or accompanied by an effective prospectus.
A fund files its complete schedule of portfolio holdings with the SEC for the first and third quarters of each fiscal year on Form N-PORT. Forms N-PORT are available on the SEC's web site at http://www.sec.gov. A fund's Forms N-PORT may be reviewed and copied at the SEC's Public Reference Room in Washington, DC. Information regarding the operation of the SEC's Public Reference Room may be obtained by calling 1-800-SEC-0330.
For a complete list of a fund's portfolio holdings, view the most recent holdings listing, semiannual report, or annual report on Fidelity's web site at http://www.fidelity.com, http://www.institutional.fidelity.com, or http://www.401k.com, as applicable.
NOT FDIC INSURED •MAY LOSE VALUE •NO BANK GUARANTEE
Neither the Fund nor Fidelity Distributors Corporation is a bank.
Item 7: Financial Statements and Financial Highlights for Open-End Management Investment Companies (Annual Report)
Fidelity Advisor® Focused Emerging Markets Fund
Schedule of Investments October 31, 2024
Showing Percentage of Net Assets
| Common Stocks - 96.8% |
| | | Shares | Value ($) |
| Australia - 0.8% | | | |
| Paladin Energy Ltd. (Australia) (a) | | 7,432,461 | 48,932,396 |
| Brazil - 4.8% | | | |
| Gerdau SA sponsored ADR | | 26,989,580 | 84,207,490 |
| Itau Unibanco Holding SA | | 17,734,480 | 107,433,356 |
| Petroleo Brasileiro SA - Petrobras sponsored ADR | | 6,464,378 | 86,945,884 |
TOTAL BRAZIL | | | 278,586,730 |
| Canada - 1.4% | | | |
| Barrick Gold Corp. | | 4,280,000 | 82,689,600 |
| Chile - 1.4% | | | |
| Antofagasta PLC | | 3,575,400 | 79,850,388 |
| China - 31.4% | | | |
| China Construction Bank Corp. (H Shares) | | 120,337,000 | 93,409,978 |
| China Life Insurance Co. Ltd. (H Shares) | | 74,531,000 | 157,986,538 |
| Haier Smart Home Co. Ltd. (A Shares) | | 41,186,899 | 169,204,943 |
| Hansoh Pharmaceutical Group Co. Ltd. (b) | | 47,094,000 | 109,802,033 |
| Kweichow Moutai Co. Ltd. (A Shares) | | 232,303 | 49,876,512 |
| Meituan Class B (a)(b) | | 8,317,740 | 196,551,299 |
| New Oriental Education & Technology Group, Inc. | | 13,317,000 | 83,338,554 |
| PDD Holdings, Inc. ADR (a) | | 1,188,400 | 143,309,156 |
| Shandong Sinocera Functional Material Co. Ltd. (A Shares) | | 7,731,800 | 20,740,767 |
| Shangri-La Asia Ltd. | | 57,356,556 | 41,432,094 |
| Shenzhen Inovance Technology Co. Ltd. (A Shares) | | 15,834,674 | 123,591,670 |
| Tencent Holdings Ltd. | | 9,539,700 | 497,420,286 |
| Tsingtao Brewery Co. Ltd. (H Shares) | | 6,655,875 | 42,857,770 |
| WuXi AppTec Co. Ltd. (H Shares) (b)(c) | | 13,151,400 | 87,461,133 |
TOTAL CHINA | | | 1,816,982,733 |
| Greece - 1.9% | | | |
| National Bank of Greece SA | | 13,974,021 | 109,137,733 |
| Hong Kong - 0.8% | | | |
| Pacific Basin Shipping Ltd. | | 172,147,000 | 47,412,118 |
| Hungary - 1.3% | | | |
| Richter Gedeon PLC | | 2,554,788 | 73,797,261 |
| India - 10.8% | | | |
| Axis Bank Ltd. | | 6,601,000 | 90,676,575 |
| HDFC Bank Ltd. | | 5,334,696 | 109,650,212 |
| ICICI Bank Ltd. | | 6,838,700 | 104,899,806 |
| JK Cement Ltd. | | 1,034,400 | 53,031,229 |
| Larsen & Toubro Ltd. | | 1,501,745 | 64,508,314 |
| Solar Industries India Ltd. | | 377,650 | 45,795,598 |
| Tata Consultancy Services Ltd. | | 3,366,000 | 158,322,666 |
TOTAL INDIA | | | 626,884,400 |
| Korea (South) - 12.4% | | | |
| Hd Hyundai Mipo (a) | | 804,402 | 63,834,929 |
| Hyundai Mobis | | 376,420 | 67,876,618 |
| Hyundai Motor Co. Ltd. | | 299,170 | 46,232,226 |
| Korea Aerospace Industries Ltd. | | 2,915,360 | 123,359,679 |
| Samsung Biologics Co. Ltd. (a)(b) | | 120,010 | 87,080,372 |
| Samsung Electronics Co. Ltd. | | 7,780,121 | 331,433,601 |
TOTAL KOREA (SOUTH) | | | 719,817,425 |
| Malaysia - 1.0% | | | |
| CIMB Group Holdings Bhd | | 31,232,400 | 56,634,638 |
| Mexico - 4.5% | | | |
| Fomento Economico Mexicano S.A.B. de CV sponsored ADR | | 309,957 | 30,031,734 |
| Grupo Financiero Banorte S.A.B. de CV | | 4,795,800 | 33,394,079 |
| Wal-Mart de Mexico SA de CV Series V | | 71,537,600 | 196,706,502 |
TOTAL MEXICO | | | 260,132,315 |
| Netherlands - 0.3% | | | |
| Nebius Group NV Series A (a) | | 798,300 | 17,067,654 |
| Peru - 2.5% | | | |
| Credicorp Ltd. (United States) | | 774,900 | 142,682,337 |
| Poland - 2.1% | | | |
| Powszechna Kasa Oszczednosci Bank SA | | 8,721,978 | 121,588,001 |
| Russia - 0.0% | | | |
| LUKOIL PJSC sponsored ADR (a)(d) | | 782,000 | 8 |
| Sberbank of Russia sponsored ADR (a)(d) | | 3,242,100 | 32 |
TOTAL RUSSIA | | | 40 |
| South Africa - 5.0% | | | |
| FirstRand Ltd. (c) | | 26,285,500 | 115,490,471 |
| Impala Platinum Holdings Ltd. (a) | | 14,768,385 | 97,479,171 |
| MTN Group Ltd. | | 14,942,065 | 74,210,446 |
TOTAL SOUTH AFRICA | | | 287,180,088 |
| Taiwan - 13.1% | | | |
| ECLAT Textile Co. Ltd. | | 5,924,000 | 99,342,759 |
| HIWIN Technologies Corp. | | 11,974,660 | 87,495,327 |
| Taiwan Semiconductor Manufacturing Co. Ltd. | | 15,375,554 | 483,739,693 |
| Yageo Corp. | | 5,155,230 | 87,967,837 |
TOTAL TAIWAN | | | 758,545,616 |
| United Arab Emirates - 1.3% | | | |
| Adnoc Gas PLC | | 82,816,200 | 74,630,517 |
| TOTAL COMMON STOCKS (Cost $4,958,143,434) | | | 5,602,551,990 |
| | | | |
| Money Market Funds - 4.5% |
| | | Shares | Value ($) |
| Fidelity Cash Central Fund 4.87% (e) | | 159,664,410 | 159,696,342 |
| Fidelity Securities Lending Cash Central Fund 4.87% (e)(f) | | 98,694,542 | 98,704,412 |
| TOTAL MONEY MARKET FUNDS (Cost $258,400,754) | | | 258,400,754 |
| | | | |
| TOTAL INVESTMENT IN SECURITIES - 101.3% (Cost $5,216,544,188) | 5,860,952,744 |
NET OTHER ASSETS (LIABILITIES) - (1.3)% | (72,921,591) |
| NET ASSETS - 100.0% | 5,788,031,153 |
| | |
Legend
| (b) | Security exempt from registration under Rule 144A of the Securities Act of 1933. These securities may be resold in transactions exempt from registration, normally to qualified institutional buyers. At the end of the period, the value of these securities amounted to $480,894,837 or 8.3% of net assets. |
| (c) | Security or a portion of the security is on loan at period end. |
| (e) | Affiliated fund that is generally available only to investment companies and other accounts managed by Fidelity Investments. The rate quoted is the annualized seven-day yield of the fund at period end. A complete unaudited listing of the fund's holdings as of its most recent quarter end is available upon request. In addition, each Fidelity Central Fund's financial statements, which are not covered by the Fund's Report of Independent Registered Public Accounting Firm, are available on the SEC's website or upon request. |
| (f) | Investment made with cash collateral received from securities on loan. |
Affiliated Central Funds
Fiscal year to date information regarding the Fund's investments in Fidelity Central Funds, including the ownership percentage, is presented below.
| Affiliate | Value, beginning of period ($) | Purchases ($) | Sales Proceeds ($) | Dividend Income ($) | Realized Gain (loss) ($) | Change in Unrealized appreciation (depreciation) ($) | Value, end of period ($) | % ownership, end of period |
| Fidelity Cash Central Fund 4.87% | 21,497,428 | 1,806,232,703 | 1,668,035,851 | 7,248,946 | 2,062 | - | 159,696,342 | 0.3% |
| Fidelity Securities Lending Cash Central Fund 4.87% | - | 396,961,616 | 298,257,204 | 300,556 | - | - | 98,704,412 | 0.4% |
| Total | 21,497,428 | 2,203,194,319 | 1,966,293,055 | 7,549,502 | 2,062 | - | 258,400,754 | |
| | | | | | | | | |
Amounts in the dividend income column in the above table include any capital gain distributions from underlying funds, which are presented in the corresponding line item in the Statement of Operations, if applicable.
Amounts in the dividend income column for Fidelity Securities Lending Cash Central Fund represents the income earned on investing cash collateral, less rebates paid to borrowers and any lending agent fees associated with the loan, plus any premium payments received for lending certain types of securities.
Amounts included in the purchases and sales proceeds columns may include in-kind transactions, if applicable.
Investment Valuation
The following is a summary of the inputs used, as of October 31, 2024, involving the Fund's assets and liabilities carried at fair value. The inputs or methodology used for valuing securities may not be an indication of the risk associated with investing in those securities. For more information on valuation inputs, and their aggregation into the levels used below, please refer to the Investment Valuation section in the accompanying Notes to Financial Statements.
| Valuation Inputs at Reporting Date: |
| Description | Total ($) | Level 1 ($) | Level 2 ($) | Level 3 ($) |
Investments in Securities: | | | | |
|
| Equities: | | | | |
Communication Services | 588,698,386 | 17,067,654 | 571,630,732 | - |
Consumer Discretionary | 847,287,649 | 143,309,156 | 703,978,493 | - |
Consumer Staples | 319,472,518 | 226,738,236 | 92,734,282 | - |
Energy | 210,508,805 | 161,576,401 | 48,932,396 | 8 |
Financials | 1,242,983,756 | 514,235,506 | 728,748,218 | 32 |
Health Care | 358,140,799 | 73,797,261 | 284,343,538 | - |
Industrials | 510,202,037 | - | 510,202,037 | - |
Information Technology | 1,061,463,797 | - | 1,061,463,797 | - |
Materials | 463,794,243 | 246,747,478 | 217,046,765 | - |
|
| Money Market Funds | 258,400,754 | 258,400,754 | - | - |
| Total Investments in Securities: | 5,860,952,744 | 1,641,872,446 | 4,219,080,258 | 40 |
Financial Statements
| Statement of Assets and Liabilities |
As of October 31, 2024 |
| Assets | | | | |
| Investment in securities, at value (including securities loaned of $93,594,188) - See accompanying schedule: | | | | |
Unaffiliated issuers (cost $4,958,143,434) | $ | 5,602,551,990 | | |
Fidelity Central Funds (cost $258,400,754) | | 258,400,754 | | |
| | | | | |
| | | | | |
| Total Investment in Securities (cost $5,216,544,188) | | | $ | 5,860,952,744 |
| Foreign currency held at value (cost $7,661) | | | | 7,721 |
| Receivable for investments sold | | | | 9,369,060 |
| Receivable for fund shares sold | | | | 33,089,218 |
| Dividends receivable | | | | 4,877,065 |
| Distributions receivable from Fidelity Central Funds | | | | 942,588 |
| Prepaid expenses | | | | 5,775 |
| Other receivables | | | | 489,757 |
Total assets | | | | 5,909,733,928 |
| Liabilities | | | | |
| Payable for investments purchased | $ | 2,434,326 | | |
| Payable for fund shares redeemed | | 3,235,210 | | |
| Accrued management fee | | 4,196,233 | | |
| Distribution and service plan fees payable | | 65,449 | | |
| Deferred taxes | | 12,244,812 | | |
| Other payables and accrued expenses | | 822,333 | | |
| Collateral on securities loaned | | 98,704,412 | | |
| Total liabilities | | | | 121,702,775 |
| Net Assets | | | $ | 5,788,031,153 |
| Net Assets consist of: | | | | |
| Paid in capital | | | $ | 5,373,427,709 |
| Total accumulated earnings (loss) | | | | 414,603,444 |
| Net Assets | | | $ | 5,788,031,153 |
| | | | | |
| Net Asset Value and Maximum Offering Price | | | | |
| Class A : | | | | |
Net Asset Value and redemption price per share ($155,870,920 ÷ 4,815,175 shares)(a) | | | $ | 32.37 |
| Maximum offering price per share (100/94.25 of $32.37) | | | $ | 34.34 |
| Class M : | | | | |
Net Asset Value and redemption price per share ($32,971,452 ÷ 1,031,024 shares)(a) | | | $ | 31.98 |
| Maximum offering price per share (100/96.50 of $31.98) | | | $ | 33.14 |
| Class C : | | | | |
Net Asset Value and offering price per share ($19,447,322 ÷ 648,590 shares)(a) | | | $ | 29.98 |
| Class I : | | | | |
Net Asset Value, offering price and redemption price per share ($3,373,539,182 ÷ 103,627,195 shares) | | | $ | 32.55 |
| Class Z : | | | | |
Net Asset Value, offering price and redemption price per share ($2,206,202,277 ÷ 67,862,620 shares) | | | $ | 32.51 |
(a)Redemption price per share is equal to net asset value less any applicable contingent deferred sales charge. |
| Statement of Operations |
| Year ended October 31, 2024 |
| Investment Income | | | | |
| Dividends | | | $ | 119,930,722 |
| Income from Fidelity Central Funds (including $300,556 from security lending) | | | | 7,549,502 |
| Income before foreign taxes withheld | | | $ | 127,480,224 |
| Less foreign taxes withheld | | | | (11,957,354) |
| Total income | | | | 115,522,870 |
| Expenses | | | | |
| Management fee | $ | 37,877,979 | | |
| Transfer agent fees | | 1,625,577 | | |
| Distribution and service plan fees | | 756,957 | | |
| Accounting fees | | 515,052 | | |
| Custodian fees and expenses | | 715,985 | | |
| Independent trustees' fees and expenses | | 19,286 | | |
| Registration fees | | 326,069 | | |
| Audit fees | | 102,203 | | |
| Legal | | 4,022 | | |
| Interest | | 19,144 | | |
| Miscellaneous | | 257,218 | | |
| Total expenses before reductions | | 42,219,492 | | |
| Expense reductions | | (180,333) | | |
| Total expenses after reductions | | | | 42,039,159 |
| Net Investment income (loss) | | | | 73,483,711 |
| Realized and Unrealized Gain (Loss) | | | | |
| Net realized gain (loss) on: | | | | |
| Investment Securities: | | | | |
| Unaffiliated issuers (net of foreign taxes of $17,726,140) | | 35,001,005 | | |
| Fidelity Central Funds | | 2,062 | | |
| Foreign currency transactions | | (1,169,464) | | |
| Total net realized gain (loss) | | | | 33,833,603 |
| Change in net unrealized appreciation (depreciation) on: | | | | |
| Investment Securities: | | | | |
| Unaffiliated issuers (net of increase in deferred foreign taxes of $3,436,665) | | 950,973,386 | | |
| Assets and liabilities in foreign currencies | | (98,643) | | |
| Total change in net unrealized appreciation (depreciation) | | | | 950,874,743 |
| Net gain (loss) | | | | 984,708,346 |
| Net increase (decrease) in net assets resulting from operations | | | $ | 1,058,192,057 |
| Statement of Changes in Net Assets |
| |
| | Year ended October 31, 2024 | | Year ended October 31, 2023 |
| Increase (Decrease) in Net Assets | | | | |
| Operations | | | | |
| Net investment income (loss) | $ | 73,483,711 | $ | 61,421,663 |
| Net realized gain (loss) | | 33,833,603 | | (123,198,980) |
| Change in net unrealized appreciation (depreciation) | | 950,874,743 | | 170,184,390 |
| Net increase (decrease) in net assets resulting from operations | | 1,058,192,057 | | 108,407,073 |
| Distributions to shareholders | | (63,079,567) | | (23,514,660) |
| | | | | |
| Share transactions - net increase (decrease) | | 1,094,846,532 | | 1,894,591,299 |
| Total increase (decrease) in net assets | | 2,089,959,022 | | 1,979,483,712 |
| | | | | |
| Net Assets | | | | |
| Beginning of period | | 3,698,072,131 | | 1,718,588,419 |
| End of period | $ | 5,788,031,153 | $ | 3,698,072,131 |
| | | | | |
| | | | | |
Financial Highlights
Fidelity Advisor® Focused Emerging Markets Fund Class A |
| |
| Years ended October 31, | | 2024 | | 2023 | | 2022 | | 2021 | | 2020 |
Selected Per-Share Data | | | | | | | | | | |
| Net asset value, beginning of period | $ | 25.58 | $ | 22.89 | $ | 36.01 | $ | 30.73 | $ | 26.18 |
| Income from Investment Operations | | | | | | | | | | |
Net investment income (loss) A,B | | .40 | | .47 C | | .59 | | .31 | | .15 |
| Net realized and unrealized gain (loss) | | 6.75 | | 2.42 | | (12.07) | | 5.64 | | 4.48 |
| Total from investment operations | | 7.15 | | 2.89 | | (11.48) | | 5.95 | | 4.63 |
| Distributions from net investment income | | (.36) | | (.20) | | (.52) | | (.05) | | (.08) |
| Distributions from net realized gain | | - | | - | | (1.12) | | (.62) | | - |
| Total distributions | | (.36) | | (.20) | | (1.64) | | (.67) | | (.08) |
| Net asset value, end of period | $ | 32.37 | $ | 25.58 | $ | 22.89 | $ | 36.01 | $ | 30.73 |
Total Return D,E | | | | 12.59% | | (33.30)% | | 19.43% | | 17.71% |
Ratios to Average Net Assets B,F,G | | | | | | | | | | |
| Expenses before reductions | | 1.20% | | 1.33% | | 1.34% | | 1.32% | | 1.39% |
| Expenses net of fee waivers, if any | | | | 1.33% | | 1.34% | | 1.32% | | 1.39% |
| Expenses net of all reductions | | 1.20% | | 1.33% | | 1.34% | | 1.32% | | 1.36% |
| Net investment income (loss) | | 1.34% | | 1.72% C | | 1.99% | | .83% | | .54% |
| Supplemental Data | | | | | | | | | | |
| Net assets, end of period (000 omitted) | $ | 155,871 | $ | 130,156 | $ | 117,404 | $ | 191,955 | $ | 150,749 |
Portfolio turnover rate H | | | | 33% | | 63% | | 51% | | 66% |
ACalculated based on average shares outstanding during the period.
BNet investment income (loss) is affected by the timing of the declaration of dividends by any underlying mutual funds or exchange-traded funds (ETFs). Net investment income (loss) of any mutual funds or ETFs is not included in the Fund's net investment income (loss) ratio.
CNet investment income per share reflects one or more large, non-recurring dividend(s) which amounted to $.10 per share. Excluding such non-recurring dividend(s), the ratio of net investment income (loss) to average net assets would have been 1.37%.
DTotal returns would have been lower if certain expenses had not been reduced during the applicable periods shown.
ETotal returns do not include the effect of the sales charges.
FFees and expenses of any underlying mutual funds or exchange-traded funds (ETFs) are not included in the Fund's expense ratio. The Fund indirectly bears its proportionate share of these expenses. For additional expense information related to investments in Fidelity Central Funds, please refer to the "Investments in Fidelity Central Funds" note found in the Notes to Financial Statements section of the most recent Annual or Semi-Annual report.
GExpense ratios reflect operating expenses of the class. Expenses before reductions do not reflect amounts reimbursed, waived, or reduced through arrangements with the investment adviser, brokerage services, or other offset arrangements, if applicable, and do not represent the amount paid by the class during periods when reimbursements, waivers or reductions occur.
HAmount does not include the portfolio activity of any underlying mutual funds or exchange-traded funds (ETFs).
Fidelity Advisor® Focused Emerging Markets Fund Class M |
| |
| Years ended October 31, | | 2024 | | 2023 | | 2022 | | 2021 | | 2020 |
Selected Per-Share Data | | | | | | | | | | |
| Net asset value, beginning of period | $ | 25.26 | $ | 22.60 | $ | 35.56 | $ | 30.36 | $ | 25.86 |
| Income from Investment Operations | | | | | | | | | | |
Net investment income (loss) A,B | | .32 | | .39 C | | .50 | | .20 | | .07 |
| Net realized and unrealized gain (loss) | | 6.68 | | 2.40 | | (11.94) | | 5.58 | | 4.43 |
| Total from investment operations | | 7.00 | | 2.79 | | (11.44) | | 5.78 | | 4.50 |
| Distributions from net investment income | | (.28) | | (.13) | | (.41) | | - | | - |
| Distributions from net realized gain | | - | | - | | (1.12) | | (.58) | | - |
| Total distributions | | (.28) | | (.13) | | (1.52) D | | (.58) | | - |
| Net asset value, end of period | $ | 31.98 | $ | 25.26 | $ | 22.60 | $ | 35.56 | $ | 30.36 |
Total Return E,F | | | | 12.30% | | (33.50)% | | 19.10% | | 17.40% |
Ratios to Average Net Assets B,G,H | | | | | | | | | | |
| Expenses before reductions | | 1.44% | | 1.60% | | 1.62% | | 1.61% | | 1.68% |
| Expenses net of fee waivers, if any | | | | 1.60% | | 1.62% | | 1.60% | | 1.67% |
| Expenses net of all reductions | | 1.43% | | 1.59% | | 1.62% | | 1.60% | | 1.64% |
| Net investment income (loss) | | 1.10% | | 1.45% C | | 1.71% | | .55% | | .25% |
| Supplemental Data | | | | | | | | | | |
| Net assets, end of period (000 omitted) | $ | 32,971 | $ | 29,402 | $ | 28,497 | $ | 48,494 | $ | 42,509 |
Portfolio turnover rate I | | | | 33% | | 63% | | 51% | | 66% |
ACalculated based on average shares outstanding during the period.
BNet investment income (loss) is affected by the timing of the declaration of dividends by any underlying mutual funds or exchange-traded funds (ETFs). Net investment income (loss) of any mutual funds or ETFs is not included in the Fund's net investment income (loss) ratio.
CNet investment income per share reflects one or more large, non-recurring dividend(s) which amounted to $.09 per share. Excluding such non-recurring dividend(s), the ratio of net investment income (loss) to average net assets would have been 1.10%.
DTotal distributions per share do not sum due to rounding.
ETotal returns would have been lower if certain expenses had not been reduced during the applicable periods shown.
FTotal returns do not include the effect of the sales charges.
GFees and expenses of any underlying mutual funds or exchange-traded funds (ETFs) are not included in the Fund's expense ratio. The Fund indirectly bears its proportionate share of these expenses. For additional expense information related to investments in Fidelity Central Funds, please refer to the "Investments in Fidelity Central Funds" note found in the Notes to Financial Statements section of the most recent Annual or Semi-Annual report.
HExpense ratios reflect operating expenses of the class. Expenses before reductions do not reflect amounts reimbursed, waived, or reduced through arrangements with the investment adviser, brokerage services, or other offset arrangements, if applicable, and do not represent the amount paid by the class during periods when reimbursements, waivers or reductions occur.
IAmount does not include the portfolio activity of any underlying mutual funds or exchange-traded funds (ETFs).
Fidelity Advisor® Focused Emerging Markets Fund Class C |
| |
| Years ended October 31, | | 2024 | | 2023 | | 2022 | | 2021 | | 2020 |
Selected Per-Share Data | | | | | | | | | | |
| Net asset value, beginning of period | $ | 23.69 | $ | 21.21 | $ | 33.42 | $ | 28.57 | $ | 24.46 |
| Income from Investment Operations | | | | | | | | | | |
Net investment income (loss) A,B | | .17 | | .24 C | | .33 | | .01 | | (.06) |
| Net realized and unrealized gain (loss) | | 6.26 | | 2.24 | | (11.21) | | 5.27 | | 4.17 |
| Total from investment operations | | 6.43 | | 2.48 | | (10.88) | | 5.28 | | 4.11 |
| Distributions from net investment income | | (.14) | | - | | (.21) | | - | | - |
| Distributions from net realized gain | | - | | - | | (1.12) | | (.43) | | - |
| Total distributions | | (.14) | | - | | (1.33) | | (.43) | | - |
| Net asset value, end of period | $ | 29.98 | $ | 23.69 | $ | 21.21 | $ | 33.42 | $ | 28.57 |
Total Return D,E | | | | 11.69% | | (33.82)% | | 18.52% | | 16.80% |
Ratios to Average Net Assets B,F,G | | | | | | | | | | |
| Expenses before reductions | | 1.93% | | 2.10% | | 2.12% | | 2.11% | | 2.18% |
| Expenses net of fee waivers, if any | | | | 2.10% | | 2.12% | | 2.11% | | 2.17% |
| Expenses net of all reductions | | 1.93% | | 2.10% | | 2.12% | | 2.11% | | 2.14% |
| Net investment income (loss) | | .61% | | .95% C | | 1.21% | | .04% | | (.25)% |
| Supplemental Data | | | | | | | | | | |
| Net assets, end of period (000 omitted) | $ | 19,447 | $ | 19,041 | $ | 19,733 | $ | 37,777 | $ | 35,268 |
Portfolio turnover rate H | | | | 33% | | 63% | | 51% | | 66% |
ACalculated based on average shares outstanding during the period.
BNet investment income (loss) is affected by the timing of the declaration of dividends by any underlying mutual funds or exchange-traded funds (ETFs). Net investment income (loss) of any mutual funds or ETFs is not included in the Fund's net investment income (loss) ratio.
CNet investment income per share reflects one or more large, non-recurring dividend(s) which amounted to $.09 per share. Excluding such non-recurring dividend(s), the ratio of net investment income (loss) to average net assets would have been .60%.
DTotal returns would have been lower if certain expenses had not been reduced during the applicable periods shown.
ETotal returns do not include the effect of the contingent deferred sales charge.
FFees and expenses of any underlying mutual funds or exchange-traded funds (ETFs) are not included in the Fund's expense ratio. The Fund indirectly bears its proportionate share of these expenses. For additional expense information related to investments in Fidelity Central Funds, please refer to the "Investments in Fidelity Central Funds" note found in the Notes to Financial Statements section of the most recent Annual or Semi-Annual report.
GExpense ratios reflect operating expenses of the class. Expenses before reductions do not reflect amounts reimbursed, waived, or reduced through arrangements with the investment adviser, brokerage services, or other offset arrangements, if applicable, and do not represent the amount paid by the class during periods when reimbursements, waivers or reductions occur.
HAmount does not include the portfolio activity of any underlying mutual funds or exchange-traded funds (ETFs).
Fidelity Advisor® Focused Emerging Markets Fund Class I |
| |
| Years ended October 31, | | 2024 | | 2023 | | 2022 | | 2021 | | 2020 |
Selected Per-Share Data | | | | | | | | | | |
| Net asset value, beginning of period | $ | 25.75 | $ | 23.06 | $ | 36.27 | $ | 30.94 | $ | 26.34 |
| Income from Investment Operations | | | | | | | | | | |
Net investment income (loss) A,B | | .48 | | .56 C | | .66 | | .42 | | .24 |
| Net realized and unrealized gain (loss) | | 6.78 | | 2.43 | | (12.12) | | 5.67 | | 4.51 |
| Total from investment operations | | 7.26 | | 2.99 | | (11.46) | | 6.09 | | 4.75 |
| Distributions from net investment income | | (.46) | | (.30) | | (.63) | | (.15) | | (.15) |
| Distributions from net realized gain | | - | | - | | (1.12) | | (.62) | | - |
| Total distributions | | (.46) | | (.30) | | (1.75) | | (.76) D | | (.15) |
| Net asset value, end of period | $ | 32.55 | $ | 25.75 | $ | 23.06 | $ | 36.27 | $ | 30.94 |
Total Return E | | | | 12.92% | | (33.08)% | | 19.77% | | 18.13% |
Ratios to Average Net Assets B,F,G | | | | | | | | | | |
| Expenses before reductions | | .96% | | 1.02% | | 1.03% | | 1.03% | | 1.06% |
| Expenses net of fee waivers, if any | | | | 1.01% | | 1.03% | | 1.03% | | 1.06% |
| Expenses net of all reductions | | .95% | | 1.01% | | 1.03% | | 1.03% | | 1.03% |
| Net investment income (loss) | | 1.58% | | 2.04% C | | 2.31% | | 1.13% | | .86% |
| Supplemental Data | | | | | | | | | | |
| Net assets, end of period (000 omitted) | $ | 3,373,539 | $ | 2,063,159 | $ | 696,741 | $ | 660,307 | $ | 312,731 |
Portfolio turnover rate H | | | | 33% | | 63% | | 51% | | 66% |
ACalculated based on average shares outstanding during the period.
BNet investment income (loss) is affected by the timing of the declaration of dividends by any underlying mutual funds or exchange-traded funds (ETFs). Net investment income (loss) of any mutual funds or ETFs is not included in the Fund's net investment income (loss) ratio.
CNet investment income per share reflects one or more large, non-recurring dividend(s) which amounted to $.10 per share. Excluding such non-recurring dividend(s), the ratio of net investment income (loss) to average net assets would have been 1.69%.
DTotal distributions per share do not sum due to rounding.
ETotal returns would have been lower if certain expenses had not been reduced during the applicable periods shown.
FFees and expenses of any underlying mutual funds or exchange-traded funds (ETFs) are not included in the Fund's expense ratio. The Fund indirectly bears its proportionate share of these expenses. For additional expense information related to investments in Fidelity Central Funds, please refer to the "Investments in Fidelity Central Funds" note found in the Notes to Financial Statements section of the most recent Annual or Semi-Annual report.
GExpense ratios reflect operating expenses of the class. Expenses before reductions do not reflect amounts reimbursed, waived, or reduced through arrangements with the investment adviser, brokerage services, or other offset arrangements, if applicable, and do not represent the amount paid by the class during periods when reimbursements, waivers or reductions occur.
HAmount does not include the portfolio activity of any underlying mutual funds or exchange-traded funds (ETFs).
Fidelity Advisor® Focused Emerging Markets Fund Class Z |
| |
| Years ended October 31, | | 2024 | | 2023 | | 2022 | | 2021 | | 2020 |
Selected Per-Share Data | | | | | | | | | | |
| Net asset value, beginning of period | $ | 25.71 | $ | 23.01 | $ | 36.21 | $ | 30.89 | $ | 26.33 |
| Income from Investment Operations | | | | | | | | | | |
Net investment income (loss) A,B | | .52 | | .59 C | | .71 | | .47 | | .28 |
| Net realized and unrealized gain (loss) | | 6.76 | | 2.44 | | (12.11) | | 5.66 | | 4.50 |
| Total from investment operations | | 7.28 | | 3.03 | | (11.40) | | 6.13 | | 4.78 |
| Distributions from net investment income | | (.48) | | (.33) | | (.68) | | (.20) | | (.22) |
| Distributions from net realized gain | | - | | - | | (1.12) | | (.62) | | - |
| Total distributions | | (.48) | | (.33) | | (1.80) | | (.81) D | | (.22) |
| Net asset value, end of period | $ | 32.51 | $ | 25.71 | $ | 23.01 | $ | 36.21 | $ | 30.89 |
Total Return E | | | | 13.10% | | (33.01)% | | 19.94% | | 18.29% |
Ratios to Average Net Assets B,F,G | | | | | | | | | | |
| Expenses before reductions | | .83% | | .89% | | .90% | | .90% | | .94% |
| Expenses net of fee waivers, if any | | | | .88% | | .90% | | .90% | | .93% |
| Expenses net of all reductions | | .82% | | .88% | | .90% | | .90% | | .90% |
| Net investment income (loss) | | 1.71% | | 2.16% C | | 2.43% | | 1.25% | | .99% |
| Supplemental Data | | | | | | | | | | |
| Net assets, end of period (000 omitted) | $ | 2,206,202 | $ | 1,456,314 | $ | 856,213 | $ | 1,127,699 | $ | 542,418 |
Portfolio turnover rate H | | | | 33% | | 63% | | 51% | | 66% |
ACalculated based on average shares outstanding during the period.
BNet investment income (loss) is affected by the timing of the declaration of dividends by any underlying mutual funds or exchange-traded funds (ETFs). Net investment income (loss) of any mutual funds or ETFs is not included in the Fund's net investment income (loss) ratio.
CNet investment income per share reflects one or more large, non-recurring dividend(s) which amounted to $.10 per share. Excluding such non-recurring dividend(s), the ratio of net investment income (loss) to average net assets would have been 1.81%.
DTotal distributions per share do not sum due to rounding.
ETotal returns would have been lower if certain expenses had not been reduced during the applicable periods shown.
FFees and expenses of any underlying mutual funds or exchange-traded funds (ETFs) are not included in the Fund's expense ratio. The Fund indirectly bears its proportionate share of these expenses. For additional expense information related to investments in Fidelity Central Funds, please refer to the "Investments in Fidelity Central Funds" note found in the Notes to Financial Statements section of the most recent Annual or Semi-Annual report.
GExpense ratios reflect operating expenses of the class. Expenses before reductions do not reflect amounts reimbursed, waived, or reduced through arrangements with the investment adviser, brokerage services, or other offset arrangements, if applicable, and do not represent the amount paid by the class during periods when reimbursements, waivers or reductions occur.
HAmount does not include the portfolio activity of any underlying mutual funds or exchange-traded funds (ETFs).
Notes to Financial Statements
For the period ended October 31, 2024
1. Organization.
Fidelity Advisor Focused Emerging Markets Fund (the Fund) is a fund of Fidelity Advisor Series VIII (the Trust) and is authorized to issue an unlimited number of shares. The Trust is registered under the Investment Company Act of 1940, as amended (the 1940 Act), as an open-end management investment company organized as a Massachusetts business trust. The Fund offers Class A, Class M, Class C, Class I and Class Z shares, each of which has equal rights as to assets and voting privileges. Class A, Class M, Class C, Class I and Class Z are Fidelity Advisor classes. Each class has exclusive voting rights with respect to matters that affect that class. Class C shares will automatically convert to Class A shares after a holding period of eight years from the initial date of purchase, with certain exceptions. The Fund's investments in emerging markets can be subject to social, economic, regulatory, and political uncertainties and can be extremely volatile.
2. Investments in Fidelity Central Funds.
Funds may invest in Fidelity Central Funds, which are open-end investment companies generally available only to other investment companies and accounts managed by the investment adviser and its affiliates. The Schedule of Investments lists any Fidelity Central Funds held as an investment as of period end, but does not include the underlying holdings of each Fidelity Central Fund. An investing fund indirectly bears its proportionate share of the expenses of the underlying Fidelity Central Funds.
Based on its investment objective, each Fidelity Central Fund may invest or participate in various investment vehicles or strategies that are similar to those of the investing fund. These strategies are consistent with the investment objectives of the investing fund and may involve certain economic risks which may cause a decline in value of each of the Fidelity Central Funds and thus a decline in the value of the investing fund.
| Fidelity Central Fund | Investment Manager | Investment Objective | Investment Practices | Expense RatioA |
| Fidelity Money Market Central Funds | Fidelity Management & Research Company LLC (FMR) | Each fund seeks to obtain a high level of current income consistent with the preservation of capital and liquidity. | Short-term Investments | Less than .005% |
A Expenses expressed as a percentage of average net assets and are as of each underlying Central Fund's most recent annual or semi-annual shareholder report.
A complete unaudited list of holdings for each Fidelity Central Fund is available upon request or at the Securities and Exchange Commission website at www.sec.gov. In addition, the financial statements of the Fidelity Central Funds which contain the significant accounting policies (including investment valuation policies) of those funds, and are not covered by the Report of Independent Registered Public Accounting Firm, are available on the Securities and Exchange Commission website or upon request.
3. Significant Accounting Policies.
The Fund is an investment company and applies the accounting and reporting guidance of the Financial Accounting Standards Board (FASB) Accounting Standards Codification Topic 946 Financial Services - Investment Companies. The financial statements have been prepared in conformity with accounting principles generally accepted in the United States of America (GAAP), which require management to make certain estimates and assumptions at the date of the financial statements. Actual results could differ from those estimates. Subsequent events, if any, through the date that the financial statements were issued have been evaluated in the preparation of the financial statements. The Fund's Schedule of Investments lists any underlying mutual funds or exchange-traded funds (ETFs) but does not include the underlying holdings of these funds. The following summarizes the significant accounting policies of the Fund:
Investment Valuation. Investments are valued as of 4:00 p.m. Eastern time on the last calendar day of the period. The Board of Trustees (the Board) has designated the Fund's investment adviser as the valuation designee responsible for the fair valuation function and performing fair value determinations as needed. The investment adviser has established a Fair Value Committee (the Committee) to carry out the day-to-day fair valuation responsibilities and has adopted policies and procedures to govern the fair valuation process and the activities of the Committee. In accordance with these fair valuation policies and procedures, which have been approved by the Board, the Fund attempts to obtain prices from one or more third party pricing services or brokers to value its investments. When current market prices, quotations or currency exchange rates are not readily available or reliable, investments will be fair valued in good faith by the Committee, in accordance with the policies and procedures. Factors used in determining fair value vary by investment type and may include market or investment specific events, transaction data, estimated cash flows, and market observations of comparable investments. The frequency that the fair valuation procedures are used cannot be predicted and they may be utilized to a significant extent. The Committee manages the Fund's fair valuation practices and maintains the fair valuation policies and procedures. The Fund's investment adviser reports to the Board information regarding the fair valuation process and related material matters.
The Fund categorizes the inputs to valuation techniques used to value its investments into a disclosure hierarchy consisting of three levels as shown below:
Level 1 - unadjusted quoted prices in active markets for identical investments
Level 2 - other significant observable inputs (including quoted prices for similar investments, interest rates, prepayment speeds, etc.)
Level 3 - unobservable inputs (including the Fund's own assumptions based on the best information available)
Valuation techniques used to value the Fund's investments by major category are as follows:
Equity securities, including restricted securities, for which market quotations are readily available, are valued at the last reported sale price or official closing price as reported by a third party pricing service on the primary market or exchange on which they are traded and are categorized as Level 1 in the hierarchy. In the event there were no sales during the day or closing prices are not available, securities are valued at the last quoted bid price or may be valued using the last available price and are generally categorized as Level 2 in the hierarchy. For foreign equity securities, when market or security specific events arise, comparisons to the valuation of American Depositary Receipts (ADRs), futures contracts, Exchange-Traded Funds (ETFs) and certain indexes as well as quoted prices for similar securities may be used and would be categorized as Level 2 in the hierarchy. For equity securities, including restricted securities, where observable inputs are limited, assumptions about market activity and risk are used and these securities may be categorized as Level 3 in the hierarchy.
Investments in open-end mutual funds, including the Fidelity Central Funds, are valued at their closing net asset value (NAV) each business day and are categorized as Level 1 in the hierarchy.
Changes in valuation techniques may result in transfers in or out of an assigned level within the disclosure hierarchy. The aggregate value of investments by input level as of October 31, 2024 is included at the end of the Fund's Schedule of Investments.
Foreign Currency. Certain Funds may use foreign currency contracts to facilitate transactions in foreign-denominated securities. Gains and losses from these transactions may arise from changes in the value of the foreign currency or if the counterparties do not perform under the contracts' terms.
Foreign-denominated assets, including investment securities, and liabilities are translated into U.S. dollars at the exchange rates at period end. Purchases and sales of investment securities, income and dividends received, and expenses denominated in foreign currencies are translated into U.S. dollars at the exchange rate in effect on the transaction date.
The effects of exchange rate fluctuations on investments are included with the net realized and unrealized gain (loss) on investment securities. Other foreign currency transactions resulting in realized and unrealized gain (loss) are disclosed separately.
Investment Transactions and Income. For financial reporting purposes, the Fund's investment holdings and NAV include trades executed through the end of the last business day of the period. The NAV per share for processing shareholder transactions is calculated as of the close of business of the New York Stock Exchange (NYSE), normally 4:00 p.m. Eastern time and includes trades executed through the end of the prior business day. Gains and losses on securities sold are determined on the basis of identified cost and include proceeds received from litigation. Commissions paid to certain brokers with whom the investment adviser, or its affiliates, places trades on behalf of a fund include an amount in addition to trade execution, which may be rebated back to a fund. Any such rebates are included in net realized gain (loss) on investments in the Statement of Operations. Dividend income is recorded on the ex-dividend date, except for certain dividends from foreign securities where the ex-dividend date may have passed, which are recorded as soon as the Fund is informed of the ex-dividend date. Non-cash dividends included in dividend income, if any, are recorded at the fair market value of the securities received. Income and capital gain distributions from Fidelity Central Funds, if any, are recorded on the ex-dividend date. Investment income is recorded net of foreign taxes withheld where recovery of such taxes is uncertain. Funds may file withholding tax reclaims in certain jurisdictions to recover a portion of amounts previously withheld. Any withholding tax reclaims income is included in the Statement of Operations in foreign taxes withheld. Any receivables for withholding tax reclaims are included in the Statement of Assets and Liabilities in dividends receivable.
Class Allocations and Expenses. Investment income, realized and unrealized capital gains and losses, common expenses of a fund, and certain fund-level expense reductions, if any, are allocated daily on a pro-rata basis to each class based on the relative net assets of each class to the total net assets of a fund. Each class differs with respect to transfer agent and distribution and service plan fees incurred, as applicable. Certain expense reductions may also differ by class, if applicable. For the reporting period, the allocated portion of income and expenses to each class as a percent of its average net assets may vary due to the timing of recording these transactions in relation to fluctuating net assets of the classes. Expenses directly attributable to a fund are charged to that fund. Expenses attributable to more than one fund are allocated among the respective funds on the basis of relative net assets or other appropriate methods. Expenses included in the accompanying financial statements reflect the expenses of that fund and do not include any expenses associated with any underlying mutual funds or exchange-traded funds (ETFs). Although not included in a fund's expenses, a fund indirectly bears its proportionate share of these expenses through the net asset value of each underlying mutual fund or exchange-traded fund (ETF). Expense estimates are accrued in the period to which they relate and adjustments are made when actual amounts are known.
Income Tax Information and Distributions to Shareholders. Each year, the Fund intends to qualify as a regulated investment company under Subchapter M of the Internal Revenue Code, including distributing substantially all of its taxable income and realized gains. As a result, no provision for U.S. Federal income taxes is required. As of October 31, 2024, the Fund did not have any unrecognized tax benefits in the financial statements; nor is the Fund aware of any tax positions for which it is reasonably possible that the total amounts of unrecognized tax benefits will significantly change in the next twelve months. The Fund files a U.S. federal tax return, in addition to state and local tax returns as required. The Fund's federal income tax returns are subject to examination by the Internal Revenue Service (IRS) for a period of three fiscal years after they are filed. State and local tax returns may be subject to examination for an additional fiscal year depending on the jurisdiction. Foreign taxes are provided for based on the Fund's understanding of the tax rules and rates that exist in the foreign markets in which it invests. The Fund is subject to a tax imposed on capital gains by certain countries in which it invests. An estimated deferred tax liability for net unrealized appreciation on the applicable securities is included in Deferred taxes on the Statement of Assets and Liabilities.
Distributions are declared and recorded on the ex-dividend date. Income and capital gain distributions are declared separately for each class. Income and capital gain distributions are determined in accordance with income tax regulations, which may differ from GAAP. In addition, the Fund claimed a portion of the payment made to redeeming shareholders as a distribution for income tax purposes.
Capital accounts within the financial statements are adjusted for permanent book-tax differences. These adjustments have no impact on net assets or the results of operations. Capital accounts are not adjusted for temporary book-tax differences which will reverse in a subsequent period.
Book-tax differences are primarily due to foreign currency transactions, certain foreign taxes, passive foreign investment companies (PFIC), capital loss carryforwards and losses deferred due to wash sales.
As of period end, the cost and unrealized appreciation (depreciation) in securities, and derivatives if applicable, for federal income tax purposes were as follows:
| Gross unrealized appreciation | $1,020,116,082 |
| Gross unrealized depreciation | (418,128,061) |
| Net unrealized appreciation (depreciation) | $601,988,021 |
| Tax Cost | $5,258,964,724 |
The tax-based components of distributable earnings as of period end were as follows:
| Undistributed ordinary income | $49,026,377 |
| Capital loss carryforward | $(224,011,138) |
| Net unrealized appreciation (depreciation) on securities and other investments | $601,833,020 |
Capital loss carryforwards are only available to offset future capital gains of the Fund to the extent provided by regulations and may be limited. The capital loss carryforward information presented below, including any applicable limitation, is estimated as of fiscal period end and is subject to adjustment.
Short-term | $(169,854,699) |
Long-term | (54,156,439) |
| Total capital loss carryforward | $(224,011,138) |
The tax character of distributions paid was as follows:
| | October 31, 2024 | October 31, 2023 |
| Ordinary Income | $63,079,567 | $ 23,514,660 |
Restricted Securities (including Private Placements). Funds may invest in securities that are subject to legal or contractual restrictions on resale. These securities generally may be resold in transactions exempt from registration or to the public if the securities are registered. Disposal of these securities may involve time-consuming negotiations and expense, and prompt sale at an acceptable price may be difficult. Information regarding restricted securities held at period end is included at the end of the Schedule of Investments, if applicable.
New Accounting Pronouncement. In November 2023, the FASB issued Accounting Standards Update (ASU) 2023-07 Segment Reporting (Topic 280): Improvements to Reportable Segment Disclosures. Effective for fiscal years beginning after December 15, 2023 and interim periods within fiscal years beginning after December 15, 2024, the amendments enhance required disclosures of segment information for public entities on an annual and interim basis. The ASU allows for early adoption with updates applied retrospectively. Management is currently evaluating the impact of the ASU but does not expect this guidance to materially impact the financial statements.
4. Purchases and Sales of Investments.
Purchases and sales of securities, other than short-term securities in-kind transactions, as applicable, are noted in the table below.
| | Purchases ($) | Sales ($) |
| Fidelity Advisor Focused Emerging Markets Fund | 2,953,392,878 | 2,030,783,855 |
5. Fees and Other Transactions with Affiliates.
Management Fee. Fidelity Management & Research Company LLC (the investment adviser) and its affiliates provide the Fund with investment management related services for which the Fund pays a monthly management fee.
Effective March 1, 2024, the Fund's management contract was amended to incorporate administrative services previously covered under separate services agreements (Transfer Agent and Accounting agreements). The amended contract incorporates a management fee rate that may vary by class. The investment adviser or an affiliate pays certain expenses of managing and operating the Fund out of each class's management fee. Each class of the Fund pays a management fee to the investment adviser. The management fee is calculated and paid to the investment adviser every month. When determining a class's management fee, a mandate rate is calculated based on the monthly average net assets of a group of funds advised by FMR within a designated asset class. A discount rate is subtracted from the mandate rate once the Fund's monthly average net assets reach a certain level. The mandate rate and discount rate may vary by class. The annual management fee rate for a class of shares of the Fund is the lesser of (1) the class's mandate rate reduced by the class's discount rate (if applicable) or (2) the amount set forth in the following table.
| | Maximum Management Fee Rate % |
| Class A | .98 |
| Class M | .98 |
| Class C | .98 |
| Class I | .95 |
| Class Z | .83 |
One-twelfth of the management fee rate for a class is applied to the average net assets of the class for the month, giving a dollar amount which is the management fee for the class for that month. A different management fee rate may be applicable to each class of the Fund. The difference between classes is the result of separate arrangements for class-level services and/or waivers of certain expenses. It is not the result of any difference in advisory or custodial fees or other expenses related to the management of the Fund's assets, which do not vary by class. For the portion of the reporting period on or after March 1, 2024, the total annualized management fee rates were as follows:
| | Total Management Fee Rate % |
| Class A | .90 |
| Class M | .90 |
| Class C | .90 |
| Class I | .90 |
| Class Z | .78 |
Prior to March 1, 2024, the management fee was the sum of an individual fund fee rate that was based on an annual rate of .55% of the Fund's average net assets and an annualized group fee rate that averaged .22% during the period. The group fee rate was based upon the monthly average net assets of a group of registered investment companies with which the investment adviser has management contracts. The group fee rate decreased as assets under management increased and increased as assets under management decreased. For the portion of the reporting period prior to March 1, 2024, the total annualized management fee rate was .77%.
Effective March 1, 2024, the Fund's sub-advisory agreements with FMR Investment Management (UK) Limited, Fidelity Management & Research (Hong Kong) Limited, and Fidelity Management & Research (Japan) Limited were amended to provide that the investment adviser pays each sub-adviser monthly fees equal to 110% of the sub-adviser's costs for providing sub-advisory services.
Effective March 1, 2024, the Fund's sub-advisory agreement with FIL Investment Advisors (FIA) was amended to provide that the investment adviser pays FIA monthly fees at an annual rate of 0.50% with respect to the average daily net assets of the Fund managed by FIA. FIA in turn pays FIA(UK).
Distribution and Service Plan Fees. In accordance with Rule 12b-1 of the 1940 Act, the Fund has adopted separate Distribution and Service Plans for each class of shares. Certain classes pay Fidelity Distributors Company LLC (FDC), an affiliate of the investment adviser, separate Distribution and Service Fees, each of which is based on an annual percentage of each class' average net assets. In addition, FDC may pay financial intermediaries for selling shares of the Fund and providing shareholder support services. For the period, the Distribution and Service Fee rates, total fees and amounts retained by FDC were as follows:
| | Distribution Fee | Service Fee | Total Fees ($) | Retained by FDC ($) |
| Class A | - % | .25% | 399,548 | 6,102 |
| Class M | .25% | .25% | 159,522 | 195 |
| Class C | .75% | .25% | 197,887 | 21,006 |
| | | | 756,957 | 27,303 |
Sales Load. FDC may receive a front-end sales charge of up to 5.75% for selling Class A shares and 3.50% for selling Class M shares, some of which is paid to financial intermediaries for selling shares of the Fund. Depending on the holding period, FDC may receive contingent deferred sales charges levied on Class A, Class M and Class C redemptions. The deferred sales charges are 1.00% for Class C shares, 1.00% for certain purchases of Class A shares and .25% for certain purchases of Class M shares.
For the period, sales charge amounts retained by FDC were as follows:
| | Retained by FDC ($) |
| Class A | 18,521 |
| Class M | 1,635 |
Class CA | 469 |
| | 20,625 |
A When Class C shares are initially sold, FDC pays commissions from its own resources to financial intermediaries through which the sales are made.
Transfer Agent Fees. Fidelity Investments Institutional Operations Company LLC (FIIOC), an affiliate of the investment adviser, is the transfer, dividend disbursing and shareholder servicing agent for each class of the Fund. Effective March 1, 2024, the Fund's management contract was amended to incorporate transfer agent services and associated fees previously covered under a separate services agreement. FIIOC pays for typesetting, printing and mailing of shareholder reports, except proxy statements.
During the period December 1, 2023 through February 29, 2024, the transfer agent fees for each class were a fixed annual rate of class-level average net assets as follows:
| | % of Class-Level Average Net Assets |
| Class A | .2000 |
| Class M | .2000 |
| Class C | .2000 |
| Class I | .1658 |
| Class Z | .0420 |
Prior to December 1, 2023, FIIOC received account fees and asset-based fees that varied according to the account size and type of account of the shareholders of the respective classes of the Fund, except for Class Z. FIIOC received an asset-based fee of Class Z's average net assets. For the portion of the reporting period prior to March 1, 2024, the fees were equivalent to the following annualized rates:
| | Amount ($) | % of Class-Level Average Net Assets |
| Class A | 100,858 | .21 |
| Class M | 21,565 | .21 |
| Class C | 13,803 | .21 |
| Class I | 1,287,340 | .17 |
| Class Z | 202,011 | .04 |
| 1,625,577 | |
Accounting Fees. Fidelity Service Company, Inc. (FSC), an affiliate of the investment adviser, maintains the Fund's accounting records. Effective March 1, 2024, the Fund's management contract was amended to incorporate accounting services and associated fees previously covered under a separate services agreement.
During the period December 1, 2023 through February 29, 2024, the accounting fees were a fixed annual rate of average net assets as follows:
| | % of Average Net Assets |
| Fidelity Advisor Focused Emerging Markets Fund | .0409 |
Prior to December 1, 2023, the accounting fee was based on the level of average net assets for each month. For the portion of the reporting period prior to March 1, 2024, the fees were equivalent to the following annualized rates:
| | % of Average Net Assets |
| Fidelity Advisor Focused Emerging Markets Fund | .04 |
Brokerage Commissions. A portion of portfolio transactions were placed with brokerage firms which are affiliates of the investment adviser. Brokerage commissions are included in net realized gain (loss) and change in net unrealized appreciation (depreciation) in the Statement of Operations. The commissions paid to these affiliated firms were as follows:
| | Amount ($) |
| Fidelity Advisor Focused Emerging Markets Fund | 11,951 |
Interfund Lending Program. Pursuant to an Exemptive Order issued by the Securities and Exchange Commission (the SEC), the Fund, along with other registered investment companies having management contracts with Fidelity Management & Research Company LLC (FMR), or other affiliated entities of FMR, may participate in an interfund lending program. This program provides an alternative credit facility allowing the Fund to borrow from, or lend money to, other participating affiliated funds at rates that are beneficial to both the borrowing and lending fund. Borrowings under the program are generally for temporary or emergency purposes, including meeting fund shareholder redemptions. The interfund loan rate is determined, as specified in the Exemptive Order, by averaging, (1) the higher of the overnight time deposit rate and the current overnight repurchase agreement rate, and (2) a benchmark rate representing the lowest bank loan rate available to the funds. At period end, there were no interfund loans outstanding. Activity in this program during the period for which loans were outstanding was as follows:
| | Borrower or Lender | Average Loan Balance ($) | Weighted Average Interest Rate | Interest Expense ($) |
Fidelity Advisor Focused Emerging Markets Fund | Borrower | 61,917,000 | 5.57% | 19,144 |
Interfund Trades. Funds may purchase from or sell securities to other Fidelity Funds under procedures adopted by the Board. The procedures have been designed to ensure these interfund trades are executed in accordance with Rule 17a-7 of the 1940 Act. Any interfund trades are included within the respective purchases and sales amounts shown in the Purchases and Sales of Investments note. Interfund trades during the period are noted in the table below.
| | Purchases ($) | Sales ($) | Realized Gain (Loss)($) |
| Fidelity Advisor Focused Emerging Markets Fund | 45,357,046 | 39,654,705 | 2,710,578 |
6. Committed Line of Credit.
Certain Funds participate with other funds managed by the investment adviser or an affiliate in a $4.25 billion credit facility (the "line of credit") to be utilized for temporary or emergency purposes to fund shareholder redemptions or for other short-term liquidity purposes. The participating funds have agreed to pay commitment fees on their pro-rata portion of the line of credit, which are reflected in Miscellaneous expenses on the Statement of Operations, and are listed below. During the period, there were no borrowings on this line of credit.
| | Amount ($) |
| Fidelity Advisor Focused Emerging Markets Fund | 6,900 |
7. Security Lending.
Funds lend portfolio securities from time to time in order to earn additional income. Lending agents are used, including National Financial Services (NFS), an affiliate of the investment adviser. Pursuant to a securities lending agreement, NFS will receive a fee, which is capped at 9.9% of a fund's daily lending revenue, for its services as lending agent. A fund may lend securities to certain qualified borrowers, including NFS. On the settlement date of the loan, a fund receives collateral (in the form of U.S. Treasury obligations, letters of credit and/or cash) against the loaned securities and maintains collateral in an amount not less than 100% of the market value of the loaned securities during the period of the loan. The market value of the loaned securities is determined at the close of business of a fund and any additional required collateral is delivered to a fund on the next business day. A fund or borrower may terminate the loan at any time, and if the borrower defaults on its obligation to return the securities loaned because of insolvency or other reasons, a fund may apply collateral received from the borrower against the obligation. A fund may experience delays and costs in recovering the securities loaned. Any cash collateral received is invested in the Fidelity Securities Lending Cash Central Fund. Any loaned securities are identified as such in the Schedule of Investments, and the value of loaned securities and cash collateral at period end, as applicable, are presented in the Statement of Assets and Liabilities. Security lending income represents the income earned on investing cash collateral, less rebates paid to borrowers and any lending agent fees associated with the loan, plus any premium payments received for lending certain types of securities. Security lending income is presented in the Statement of Operations as a component of income from Fidelity Central Funds. Affiliated security lending activity, if any, was as follows:
| | Total Security Lending Fees Paid to NFS ($) | Security Lending Income From Securities Loaned to NFS ($) | Value of Securities Loaned to NFS at Period End ($) |
| Fidelity Advisor Focused Emerging Markets Fund | 32,995 | - | - |
8. Expense Reductions.
During the period, custodian credits reduced the Fund's expenses by $6,946. During the period, transfer agent credits reduced each class' expenses as noted in the table below.
| | Expense reduction ($) |
| Class M | 63 |
In addition, during the period the investment adviser or an affiliate reimbursed and/or waived a portion of fund-level operating expenses in the amount of $173,324.
9. Distributions to Shareholders.
Distributions to shareholders of each class were as follows:
| | Year ended October 31, 2024 | Year ended October 31, 2023 |
| Fidelity Advisor Focused Emerging Markets Fund | | |
| Distributions to shareholders | | |
| Class A | $1,789,296 | $1,026,327 |
| Class M | 312,730 | 156,866 |
| Class C | 108,628 | - |
| Class I | 36,223,237 | 9,611,585 |
| Class Z | 24,645,676 | 12,719,882 |
Total | $63,079,567 | $23,514,660 |
10. Share Transactions.
Share transactions for each class were as follows and may contain in-kind transactions, automatic conversions between classes or exchanges between affiliated funds:
| | Shares | Shares | Dollars | Dollars |
| | Year ended October 31, 2024 | Year ended October 31, 2023 | Year ended October 31, 2024 | Year ended October 31, 2023 |
| Fidelity Advisor Focused Emerging Markets Fund | | | | |
| Class A | | | | |
| Shares sold | 1,883,136 | 1,139,512 | $53,501,106 | $31,480,973 |
| Reinvestment of distributions | 64,490 | 37,305 | 1,745,982 | 1,002,465 |
| Shares redeemed | (2,220,913) | (1,217,283) | (66,776,382) | (33,144,535) |
| Net increase (decrease) | (273,287) | (40,466) | $(11,529,294) | $(661,097) |
| Class M | | | | |
| Shares sold | 55,108 | 87,737 | $1,622,702 | $2,388,915 |
| Reinvestment of distributions | 11,291 | 5,728 | 302,725 | 152,271 |
| Shares redeemed | (199,270) | (190,279) | (5,740,822) | (5,187,284) |
| Net increase (decrease) | (132,871) | (96,814) | $(3,815,395) | $(2,646,098) |
| Class C | | | | |
| Shares sold | 77,449 | 141,189 | $2,145,140 | $3,648,827 |
| Reinvestment of distributions | 4,219 | - | 106,700 | - |
| Shares redeemed | (236,770) | (268,014) | (6,482,078) | (6,759,598) |
| Net increase (decrease) | (155,102) | (126,825) | $(4,230,238) | $(3,110,771) |
| Class I | | | | |
| Shares sold | 47,240,845 | 67,051,000 | $1,423,685,697 | $1,830,571,553 |
| Reinvestment of distributions | 1,180,312 | 286,193 | 32,052,946 | 7,724,700 |
| Shares redeemed | (24,916,196) | (17,433,766) | (732,811,436) | (475,311,650) |
| Net increase (decrease) | 23,504,961 | 49,903,427 | $722,927,207 | $1,362,984,603 |
| Class Z | | | | |
| Shares sold | 37,027,090 | 44,675,967 | $1,135,617,648 | $1,215,199,674 |
| Reinvestment of distributions | 360,193 | 177,977 | 9,755,940 | 4,789,905 |
| Shares redeemed | (26,176,147) | (25,413,754) | (753,879,336) | (681,964,917) |
| Net increase (decrease) | 11,211,136 | 19,440,190 | $391,494,252 | $538,024,662 |
11. Other.
A fund's organizational documents provide former and current trustees and officers with a limited indemnification against liabilities arising in connection with the performance of their duties to the fund. In the normal course of business, a fund may also enter into contracts that provide general indemnifications. A fund's maximum exposure under these arrangements is unknown as this would be dependent on future claims that may be made against a fund. The risk of material loss from such claims is considered remote.
12. Risk and Uncertainties.
Many factors affect a fund's performance. Developments that disrupt global economies and financial markets, such as pandemics, epidemics, outbreaks of infectious diseases, war, terrorism, and environmental disasters, may significantly affect a fund's investment performance. The effects of these developments to a fund will be impacted by the types of securities in which a fund invests, the financial condition, industry, economic sector, and geographic location of an issuer, and a fund's level of investment in the securities of that issuer. Significant concentrations in security types, issuers, industries, sectors, and geographic locations may magnify the factors that affect a fund's performance.
Report of Independent Registered Public Accounting Firm
To the Board of Trustees of Fidelity Advisor Series VIII and the Shareholders of Fidelity Advisor Focused Emerging Markets Fund:
Opinion on the Financial Statements and Financial Highlights
We have audited the accompanying statement of assets and liabilities of Fidelity Advisor Focused Emerging Markets Fund (the "Fund"), a fund of Fidelity Advisor Series VIII, including the schedule of investments, as of October 31, 2024, the related statement of operations for the year then ended, the statement of changes in net assets for each of the two years in the period then ended, the financial highlights for each of the five years in the period then ended, and the related notes. In our opinion, the financial statements and financial highlights present fairly, in all material respects, the financial position of the Fund as of October 31, 2024, and the results of its operations for the year then ended, the changes in its net assets for each of the two years in the period then ended, and the financial highlights for each of the five years in the period then ended in conformity with accounting principles generally accepted in the United States of America.
Basis for Opinion
These financial statements and financial highlights are the responsibility of the Fund's management. Our responsibility is to express an opinion on the Fund's financial statements and financial highlights based on our audits. We are a public accounting firm registered with the Public Company Accounting Oversight Board (United States) (PCAOB) and are required to be independent with respect to the Fund in accordance with the U.S. federal securities laws and the applicable rules and regulations of the Securities and Exchange Commission and the PCAOB.
We conducted our audits in accordance with the standards of the PCAOB. Those standards require that we plan and perform the audit to obtain reasonable assurance about whether the financial statements and financial highlights are free of material misstatement, whether due to error or fraud. The Fund is not required to have, nor were we engaged to perform, an audit of its internal control over financial reporting. As part of our audits, we are required to obtain an understanding of internal control over financial reporting but not for the purpose of expressing an opinion on the effectiveness of the Fund's internal control over financial reporting. Accordingly, we express no such opinion.
Our audits included performing procedures to assess the risks of material misstatement of the financial statements and financial highlights, whether due to error or fraud, and performing procedures that respond to those risks. Such procedures included examining, on a test basis, evidence regarding the amounts and disclosures in the financial statements and financial highlights. Our audits also included evaluating the accounting principles used and significant estimates made by management, as well as evaluating the overall presentation of the financial statements and financial highlights. Our procedures included confirmation of securities owned as of October 31, 2024, by correspondence with the custodian and brokers; when replies were not received from brokers, we performed other auditing procedures. We believe that our audits provide a reasonable basis for our opinion.
/s/ Deloitte & Touche LLP
Boston, Massachusetts
December 12, 2024
We have served as the auditor of one or more of the Fidelity investment companies since 1999.
Distributions
(Unaudited)The dividend and capital gains distributions for the fund(s) are available on Fidelity.com or Institutional.Fidelity.com.
The fund designates $2,272,595 of distributions paid during the fiscal year ended 2024 as qualifying to be taxed as section 163(j) interest dividends.
A percentage of the dividends distributed during the fiscal year for the following funds may be taken into account as a dividend for purposes of the maximum rate under section 1(h)(11) of the Internal Revenue Code.
| | Class A | Class C | Class M | Class I | Class Z | |
| Fidelity Advisor Focused Emerging Markets Fund | | | | | | |
| December 08, 2023 | 98.54% | 100% | 100% | 80.16% | 76.75% | |
| December 27, 2023 | 89.85% | 89.85% | 89.85% | 89.85% | 89.85% | |
| | | | | | | | |
The amounts per share which represent income derived from sources within, and taxes paid to, foreign countries or possessions of the United States are as follows:
| | Pay Date | Income | Taxes |
| Fidelity Advisor Focused Emerging Markets Fund | | | |
Class A Class A | 12/11/2023 12/28/2023 | $0.4220 $0.0000 | $0.0964 $0.0000 |
Class C Class C | 12/11/2023 12/28/2023 | $0.2160 $0.0000 | $0.0964 $0.0000 |
Class M Class M | 12/11/2023 12/28/2023 | $0.3453 $0.0000 | $0.0964 $0.0000 |
Class I Class I Class Z Class Z | 12/11/2023 12/28/2023 12/11/2023 12/28/2023 | $0.5188 $0.0000 $0.5418 $0.0000 | $0.0964 $0.0000 $0.0964 $0.0000 |
The fund will notify shareholders in January 2025 of amounts for use in preparing 2024 income tax returns.
Item 8: Changes in and Disagreements with Accountants for Open-End Management Investment Companies
(Unaudited)
Note: This is not applicable for any fund included in this document.
Item 9: Proxy Disclosures for Open-End Management Investment Companies
(Unaudited)
| A special meeting of shareholders was held on July 16, 2024. The results of votes taken among shareholders on the proposal before them are reported below. Each vote reported represents one dollar of net asset value held on the record date for the meeting. |
| Proposal 1 |
| To elect a Board of Trustees. |
| | # of Votes | % of Votes |
| Bettina Doulton |
| Affirmative | 9,667,916,942.83 | 98.16 |
| Withheld | 181,261,836.48 | 1.84 |
| TOTAL | 9,849,178,779.31 | 100.00 |
| Robert A. Lawrence |
| Affirmative | 9,643,385,159.26 | 97.91 |
| Withheld | 205,793,620.05 | 2.09 |
| TOTAL | 9,849,178,779.31 | 100.00 |
| Vijay C. Advani |
| Affirmative | 9,650,856,015.95 | 97.99 |
| Withheld | 198,322,763.36 | 2.01 |
| TOTAL | 9,849,178,779.31 | 100.00 |
| Thomas P. Bostick |
| Affirmative | 9,653,685,826.52 | 98.02 |
| Withheld | 195,492,952.79 | 1.98 |
| TOTAL | 9,849,178,779.31 | 100.00 |
| Donald F. Donahue |
| Affirmative | 9,653,599,026.45 | 98.01 |
| Withheld | 195,579,752.86 | 1.99 |
| TOTAL | 9,849,178,779.31 | 100.00 |
| Vicki L. Fuller |
| Affirmative | 9,666,491,582.97 | 98.15 |
| Withheld | 182,687,196.34 | 1.85 |
| TOTAL | 9,849,178,779.31 | 100.00 |
| Patricia L. Kampling |
| Affirmative | 9,664,290,979.63 | 98.12 |
| Withheld | 184,887,799.68 | 1.88 |
| TOTAL | 9,849,178,779.31 | 100.00 |
| Thomas A. Kennedy |
| Affirmative | 9,646,944,497.07 | 97.95 |
| Withheld | 202,234,282.24 | 2.05 |
| TOTAL | 9,849,178,779.31 | 100.00 |
| Oscar Munoz |
| Affirmative | 9,652,669,495.50 | 98.00 |
| Withheld | 196,509,283.81 | 2.00 |
| TOTAL | 9,849,178,779.31 | 100.00 |
| Karen B. Peetz |
| Affirmative | 9,656,405,594.63 | 98.04 |
| Withheld | 192,773,184.68 | 1.96 |
| TOTAL | 9,849,178,779.31 | 100.00 |
| David M. Thomas |
| Affirmative | 9,644,713,946.63 | 97.92 |
| Withheld | 204,464,832.68 | 2.08 |
| TOTAL | 9,849,178,779.31 | 100.00 |
| Susan Tomasky |
| Affirmative | 9,654,121,207.44 | 98.02 |
| Withheld | 195,057,571.87 | 1.98 |
| TOTAL | 9,849,178,779.31 | 100.00 |
| Michael E. Wiley |
| Affirmative | 9,642,438,416.20 | 97.90 |
| Withheld | 206,740,363.11 | 2.10 |
| TOTAL | 9,849,178,779.31 | 100.00 |
| | | |
| Proposal 1 reflects trust-wide proposal and voting results. |
Item 10: Remuneration Paid to Directors, Officers, and others of Open-End Management Investment Companies
(Unaudited)
Note: This information is disclosed as part of the financial statements for each Fund as part of Item 7: Financial Statements and Financial Highlights for Open-End Management Investment companies.
Item 11: Statement Regarding Basis for Approval of Investment Advisory Contract
(Unaudited)
Board Approval of Investment Advisory Contracts and Management Fees
Fidelity Advisor Focused Emerging Markets Fund
Each year, the Board of Trustees, including the Independent Trustees (together, the Board), considers the renewal of the fund's management contract with Fidelity Management & Research Company LLC (FMR) and certain affiliates and the sub-advisory agreements (together, the Advisory Contracts) for the fund. FMR and the sub-advisers are referred to herein as the Investment Advisers. The Board, assisted by the advice of fund counsel and Independent Trustees' counsel, requests and considers a broad range of information relevant to the renewal of the Advisory Contracts throughout the year.
The Board meets regularly and, at each of its meetings, covers an extensive agenda of topics and materials and considers factors that are relevant to its annual consideration of the renewal of the fund's Advisory Contracts, including the services and support provided to the fund and its shareholders. The Board, acting directly and through its Committees (each of which is composed of and chaired by Independent Trustees), requests and receives information concerning the annual consideration of the renewal of the fund's Advisory Contracts. The Board also meets as needed to review matters specifically related to the Board's annual consideration of the renewal of the Advisory Contracts. Members of the Board may also meet with trustees of other Fidelity funds through joint ad hoc committees to discuss certain matters relevant to all of the Fidelity funds.
At its May 2024 meeting, the Board unanimously determined to renew the fund's Advisory Contracts. In reaching its determination, the Board considered all factors it believed relevant, including (i) the nature, extent, and quality of the services provided to the fund and its shareholders (including the investment performance of the fund); (ii) the competitiveness relative to peer funds of the fund's management fee and the total expense ratio of a representative class (Class I, which was selected because it was the largest class without 12b-1 fees); (iii) the total costs of the services provided by and the profits realized by FMR and its affiliates (Fidelity) from its relationships with the fund; and (iv) the extent to which, if any, economies of scale exist and are realized as the fund grows, and whether any economies of scale are appropriately shared with fund shareholders. The Board also considered the broad range of investment choices available to shareholders from FMR's competitors and that the fund's shareholders have chosen to invest in the fund, which is part of the Fidelity family of funds. The Board's decision to renew the Advisory Contracts was not based on any single factor.
The Board reached a determination, with the assistance of fund counsel and Independent Trustees' counsel and through the exercise of its business judgment, that the renewal of the Advisory Contracts was in the best interests of the fund and its shareholders and that the compensation payable under the Advisory Contracts was fair and reasonable in light of all of the surrounding circumstances.
Nature, Extent, and Quality of Services Provided. The Board considered staffing as it relates to the fund, including the backgrounds and experience of investment personnel of the Investment Advisers, and also considered the Investment Advisers' implementation of the fund's investment program. The Independent Trustees also had discussions with senior management of Fidelity's investment operations and investment groups. The Board considered the structure of the investment personnel compensation program and whether this structure provides appropriate incentives to act in the best interests of the fund. Additionally, the Board considered the portfolio managers' investments, if any, in the funds that they manage.
Resources Dedicated to Investment Management and Support Services. The Board and the Fund Oversight and Research Committees reviewed the general qualifications and capabilities of Fidelity's investment staff, including its size, education, experience, and resources, as well as Fidelity's approach to recruiting, training, managing, and compensating investment personnel. The Board noted the resources devoted to expansion of Fidelity's global investment organization, and that Fidelity's analysts have extensive resources, tools and capabilities that allow them to conduct sophisticated quantitative and fundamental analysis, as well as credit analysis of issuers, counterparties and guarantors. Further, the Board considered that Fidelity's investment professionals have sufficient access to global information and data so as to provide competitive investment results over time, and that those professionals also have access to sophisticated tools that permit them to assess portfolio construction and risk and performance attribution characteristics continuously, as well as to transmit new information and research conclusions rapidly around the world. Additionally, in its deliberations, the Board considered Fidelity's trading, risk management, compliance, and technology and operations capabilities and resources, which are integral parts of the investment management process.
Shareholder and Administrative Services. The Board considered (i) the nature, extent, quality, and cost of advisory, administrative, shareholder, transfer agency, and pricing and bookkeeping services performed by the Investment Advisers and their affiliates under the Advisory Contracts; (ii) the nature and extent of Fidelity's supervision of third party service providers, principally custodians, subcustodians, and pricing vendors; and (iii) the resources devoted by Fidelity to, and the record of compliance with, the fund's compliance policies and procedures. The Board also reviewed the allocation of fund brokerage, including allocations to brokers affiliated with the Investment Advisers, the use of brokerage commissions to pay fund expenses, and the use of "soft" commission dollars to pay for research services. The Board also considered the fund's securities lending activities and any payments made to Fidelity relating to securities lending under a separate agreement.
The Board noted that the growth of fund assets over time across the complex allows Fidelity to reinvest in the development of services designed to enhance the value and convenience of the Fidelity funds as investment vehicles. These services include 24-hour access to account information and market information over the Internet and through telephone representatives, investor education materials and asset allocation tools. The Board also considered that it reviews customer service metrics such as telephone response times, continuity of services on the website and metrics addressing services at Fidelity Investor Centers.
Investment in a Large Fund Family. The Board considered the benefits to shareholders of investing in a fund that is part of a large family of funds offering a variety of investment disciplines and providing a large variety of fund investor services. The Board noted that Fidelity had taken, or had made recommendations that resulted in the Fidelity funds taking, a number of actions over the previous year that benefited particular funds and/or the Fidelity funds in general.
Investment Performance. The Board took into account discussions that occur with representatives of the Investment Advisers, and reports that it receives, at Board meetings throughout the year, relating to fund investment performance. In this regard the Board noted that as part of regularly scheduled fund reviews and other reports to the Board on fund performance, the Board considered annualized return information for the fund for different time periods, measured against an appropriate securities market index (benchmark index) and an appropriate peer group of funds with similar objectives (peer group). The Board also considered information about performance attribution. In its ongoing evaluation of fund investment performance, the Board gives particular attention to information indicating changes in performance of the funds over different time periods and discussed with the Investment Advisers the reasons for any overperformance or underperformance. The fund underperformed its benchmark and peers for the one- and three-year periods ended February 29, 2024, and as a result, the Board continues to engage in discussions with FMR about the steps it is taking to address the fund's performance.
In addition to reviewing absolute and relative fund performance, the Independent Trustees periodically consider the appropriateness of fund performance metrics in evaluating the results achieved. The Independent Trustees generally give greater weight to fund performance over longer time periods than over shorter time periods. Depending on the circumstances, the Independent Trustees may be satisfied with a fund's performance notwithstanding that it lags its benchmark index or peer group for certain periods.
Based on its review, the Board concluded that the nature, extent, and quality of services provided to the fund under the Advisory Contracts should continue to benefit the shareholders of the fund.
Competitiveness of Management Fee and Total Expense Ratio. The Board was provided with information regarding industry trends in management fees and expenses. The Board considered that, effective March 1, 2024, an amended Advisory Contract with FMR went into effect with class-level management fees based on tiered schedules and subject to a maximum class-level rate (the management fee). The Board also considered that in exchange for the variable management fee, each class of the fund receives investment advisory, management, administrative, transfer agent, and pricing and bookkeeping services. In its review of the management fee and total expense ratio of Class I, the Board considered a pro forma management fee rate for Class I as if it had been in effect for the 12-month period ended September 30, 2023, as well as other third-party fund expenses, as applicable, such as custodial, legal, and audit fees and any fund-paid 12b-1 fees. The Board noted that Fidelity may agree to waive fees or reimburse expenses from time to time, and the extent to which, if any, it has done so for the fund.
Comparisons of Management Fees and Total Expense Ratios. Among other things, the Board reviewed data for selected groups of competitive funds and classes (referred to as "mapped groups") that were compiled by Fidelity based on combining similar investment objective categories (as classified by Morningstar) that have comparable investment mandates. The data reviewed by the Board included (i) gross management fee comparisons (before taking into account expense reimbursements or caps) relative to the total universe of funds within the mapped group; (ii) gross management fee comparisons relative to a subset of non-Fidelity funds in the mapped group that are similar in size and management fee structure to the fund (referred to as the "asset size peer group"); (iii) total expense comparisons of Class I of the fund relative to funds and classes in the mapped group that have a similar sales load structure to Class I of the fund (referred to as the "similar sales load structure group"); and (iv) total expense comparisons of Class I of the fund relative to funds and classes in the similar sales load structure group that are similar in size and management fee structure to the fund (referred to as the "total expense asset size peer group"). The total expense asset size peer group comparison excludes performance adjustments and fund-paid 12b-1 fees to eliminate variability in fee structures.
The information provided to the Board indicated that the fund's management fee rate ranked below the competitive median of the mapped group for the 12-month period ended September 30, 2023 and below the competitive median of the asset size peer group for the 12-month period ended September 30, 2023. Further, the information provided to the Board indicated that the total expense ratio of Class I of the fund ranked below the competitive median of the similar sales load structure group for the 12-month period ended September 30, 2023 and below the competitive median of the total expense asset size peer group for the 12-month period ended September 30, 2023.
The Board noted that a different variable management fee rate is applicable to each class of the fund. The Board considered that the difference in management fee rates between classes is the result of separate arrangements for class-level services and/or waivers of certain expenses and not the result of any difference in advisory or custodial fees or other expenses related to the management of the fund's assets, which do not vary by class.
Fees Charged to Other Fidelity Clients. The Board also considered Fidelity fee structures and other information with respect to clients of Fidelity, such as other funds advised or subadvised by Fidelity, pension plan clients, and other institutional clients with similar mandates. The Board noted that a joint ad hoc committee created by it and the boards of other Fidelity funds periodically reviews and compares Fidelity's institutional investment advisory business with its business of providing services to the Fidelity funds and also noted the most recent findings of the committee. The Board noted that the committee's review included a consideration of the differences in services provided, fees charged, and costs incurred, as well as competition in the markets serving the different categories of clients.
Based on its review, the Board concluded that the fund's management fee is fair and reasonable in light of the services that the fund receives and the other factors considered. Further, based on its review of total expense ratios and fees charged to other Fidelity clients, the Board concluded that the total expense ratio of each class of the fund was reasonable in light of the services that the fund and its shareholders receive and the other factors considered.
Costs of the Services and Profitability. The Board considered the revenues earned and the expenses incurred by Fidelity in conducting the business of developing, marketing, distributing, managing, administering and servicing the fund and servicing the fund's shareholders. The Board also considered the level of Fidelity's profits in respect of all the Fidelity funds.
On an annual basis, Fidelity presents to the Board information about the profitability of its relationships with the fund. Fidelity calculates profitability information for each fund, as well as aggregate profitability information for groups of Fidelity funds and all Fidelity funds, using a series of detailed revenue and cost allocation methodologies which originate with the books and records of Fidelity on which Fidelity's audited financial statements are based. The Audit Committee of the Board reviews any significant changes from the prior year's methodologies.
A public accounting firm has been engaged annually by the Board as part of the Board's assessment of Fidelity's profitability analysis. The engagement includes the review and assessment of the methodologies used by Fidelity in determining the revenues and expenses attributable to Fidelity's fund business, and completion of agreed-upon procedures in respect of the mathematical accuracy of certain fund profitability information and its conformity to established allocation methodologies. After considering the reports issued under the engagement and information provided by Fidelity, the Board concluded that while other allocation methods may also be reasonable, Fidelity's profitability methodologies are reasonable in all material respects.
The Board also reviewed Fidelity's non-fund businesses and potential indirect benefits such businesses may have received as a result of their association with Fidelity's fund business (i.e., fall-out benefits) as well as cases where Fidelity's affiliates may benefit from the funds' business. The Board considered areas where potential indirect benefits to the Fidelity funds from their relationships with Fidelity may exist. The Board's consideration of these matters was informed by the findings of a joint ad hoc committee created by it and the boards of other Fidelity funds to evaluate potential fall-out benefits.
The Board considered the costs of the services provided by and the profits realized by Fidelity in connection with the operation of the fund and was satisfied that the profitability was not excessive.
Economies of Scale. The Board considered whether there have been economies of scale in respect of the management of the Fidelity funds, whether the Fidelity funds (including the fund) have appropriately benefited from any such economies of scale, and whether there is potential for realization of any further economies of scale. The Board considered the extent to which the fund will benefit from economies of scale as assets grow through increased services to the fund, through waivers or reimbursements, or through fee or expense ratio reductions. The Board also noted that a committee created by it and the boards of other Fidelity funds periodically analyzes whether Fidelity attains economies of scale in respect of the management and servicing of the Fidelity funds, whether the Fidelity funds have appropriately benefited from such economies of scale, and whether there is potential for realization of any further economies of scale.
The Board recognized that the fund's management contract incorporates a variable management fee structure, which provides breakpoints as a way to share, in part, any potential economies of scale that may exist at the asset class level and through a discount that considers both fund size and total assets of the four applicable asset classes. The Board considered that the variable management fee is designed to deliver the benefits of economies of scale to fund shareholders even if assets of any particular fund are unchanged or have declined, because some portion of Fidelity's costs are attributable to services provided to all funds subject to the variable management fee, and all such funds benefit if those costs can be allocated among more assets. The Board concluded that, given the variable management fee structure, fund shareholders will benefit from lower management fees due to the application of the breakpoints and discount factor, regardless of whether Fidelity achieves any such economies of scale.
The Board concluded, taking into account the analysis of the committee, that economies of scale, if any, are being appropriately shared between fund shareholders and Fidelity.
Additional Information Requested by the Board. In order to develop fully the factual basis for consideration of the Fidelity funds' advisory contracts, the Board requested and received additional information on certain topics, including but not limited to: (i) fund flow and performance trends, in particular the underperformance of certain funds and strategies, and Fidelity's long-term strategies for certain funds; (ii) the operation of performance fees and the rationale for implementing performance fees on certain categories of funds but not others; (iii) Fidelity's pricing philosophy compared to competitors; (iv) fund profitability methodology and data; (v) evaluation of competitive fund data and peer group classifications and fee and expense comparisons; (vi) the management fee and expense structures for different funds and classes and information about the differences between various fee and expense structures; (vii) the variable management fee implemented for certain funds effective March 1, 2024; and (viii) information regarding other accounts managed by Fidelity and the funds' sub-advisory arrangements.
Conclusion. Based on its evaluation of all of the conclusions noted above, and after considering all factors it believed relevant, the Board, including the Independent Trustees, concluded that the advisory and sub-advisory fee arrangements are fair and reasonable in light of all of the surrounding circumstances and that the fund's Advisory Contracts should be renewed through May 31, 2025.
1.809299.120
FAEM-ANN-1224
Fidelity Advisor® Emerging Asia Fund
Annual Report
October 31, 2024
Contents
To view a fund's proxy voting guidelines and proxy voting record for the 12-month period ended June 30, visit http://www.fidelity.com/proxyvotingresults or visit the Securities and Exchange Commission's (SEC) web site at http://www.sec.gov.
You may also call 1-877-208-0098 to request a free copy of the proxy voting guidelines.
Standard & Poor's, S&P and S&P 500 are registered service marks of The McGraw-Hill Companies, Inc. and have been licensed for use by Fidelity Distributors Corporation.
Other third-party marks appearing herein are the property of their respective owners.
All other marks appearing herein are registered or unregistered trademarks or service marks of FMR LLC or an affiliated company. © 2024 FMR LLC. All rights reserved.
This report and the financial statements contained herein are submitted for the general information of the shareholders of the Fund. This report is not authorized for distribution to prospective investors in the Fund unless preceded or accompanied by an effective prospectus.
A fund files its complete schedule of portfolio holdings with the SEC for the first and third quarters of each fiscal year on Form N-PORT. Forms N-PORT are available on the SEC's web site at http://www.sec.gov. A fund's Forms N-PORT may be reviewed and copied at the SEC's Public Reference Room in Washington, DC. Information regarding the operation of the SEC's Public Reference Room may be obtained by calling 1-800-SEC-0330.
For a complete list of a fund's portfolio holdings, view the most recent holdings listing, semiannual report, or annual report on Fidelity's web site at http://www.fidelity.com, http://www.institutional.fidelity.com, or http://www.401k.com, as applicable.
NOT FDIC INSURED •MAY LOSE VALUE •NO BANK GUARANTEE
Neither the Fund nor Fidelity Distributors Corporation is a bank.
Item 7: Financial Statements and Financial Highlights for Open-End Management Investment Companies (Annual Report)
Fidelity Advisor® Emerging Asia Fund
Schedule of Investments October 31, 2024
Showing Percentage of Net Assets
| Common Stocks - 98.3% |
| | | Shares | Value ($) |
| China - 40.3% | | | |
| Advanced Micro-Fabrication Equipment, Inc., China (A Shares) | | 332,300 | 8,972,524 |
| AK Medical Holdings Ltd. (a)(b) | | 3,696,640 | 2,272,728 |
| Alibaba Group Holding Ltd. | | 1,014,002 | 12,403,592 |
| Alibaba Group Holding Ltd. sponsored ADR | | 41,128 | 4,029,721 |
| Asymchem Laboratories Tianjin Co. Ltd.: | | | |
| (A Shares) | | 27,021 | 315,422 |
| (H Shares) (b) | | 97,100 | 704,101 |
| Beijing Chunlizhengda Medical Instruments Co. Ltd. | | 233,500 | 459,914 |
| Beijing Sinohytec Co. Ltd. (A Shares) | | 225,735 | 789,019 |
| BYD Co. Ltd.: | | | |
| (A Shares) | | 77,600 | 3,196,355 |
| (H Shares) | | 185,843 | 6,712,393 |
| China Resources Beverage Holdings Co. Ltd. | | 21,800 | 42,283 |
| Contemporary Amperex Technology Co. Ltd. | | 133,080 | 4,617,178 |
| Empyrean Technology Co. Ltd. (A Shares) | | 63,000 | 884,448 |
| Estun Automation Co. Ltd.: | | | |
| (A Shares) | | 842,500 | 1,793,738 |
| (A Shares) | | 406,600 | 865,678 |
| Flat Glass Group Co. Ltd. (A Shares) | | 1,113,852 | 4,502,900 |
| Glodon Co. Ltd. (A Shares) | | 2,216,681 | 4,410,201 |
| GRG Metrology & Test Co. Ltd. (A Shares) | | 336,869 | 822,938 |
| Guangzhou Kingmed Diagnostics Group Co. Ltd. (A Shares) | | 142,356 | 682,698 |
| Hangzhou Tigermed Consulting Co. Ltd. (A Shares) | | 111,108 | 982,756 |
| Hygeia Healthcare Holdings Co. (a)(b)(c) | | 127,618 | 288,589 |
| Innovent Biologics, Inc. (b)(c) | | 298,176 | 1,296,224 |
| Joinn Laboratories China Co. Ltd. (A Shares) | | 282,936 | 696,079 |
| Kangji Medical Holdings Ltd. (a) | | 601,846 | 448,462 |
| Kanzhun Ltd. ADR | | 54,440 | 792,102 |
| KE Holdings, Inc. ADR | | 184,772 | 4,052,050 |
| Kindstar Globalgene Technology, Inc. (b) | | 2,507,460 | 377,553 |
| Kingsemi Co. Ltd. (A Shares) | | 250,345 | 3,065,418 |
| Li Auto, Inc. ADR (a)(c) | | 144,104 | 3,604,041 |
| Li Ning Co. Ltd. | | 903,669 | 1,843,854 |
| Maxscend Microelectronics Co. Ltd. (A Shares) | | 54,300 | 727,594 |
| Meituan Class B (b)(c) | | 593,193 | 14,017,372 |
| Microport Cardioflow Medtech Corp. (a)(b)(c) | | 3,840,994 | 356,150 |
| MicroPort NeuroTech Ltd. | | 213,838 | 258,297 |
| MicroTech Medical (Hangzhou) Co. Ltd. (H Shares) (b)(c) | | 515,994 | 291,066 |
| NAURA Technology Group Co. Ltd. | | 158,273 | 8,709,504 |
| NXP Semiconductors NV | | 15,812 | 3,707,914 |
| PDD Holdings, Inc. ADR (c) | | 165,884 | 20,003,952 |
| Ping An Insurance Group Co. of China Ltd. (H Shares) | | 1,252,678 | 7,761,323 |
| SG Micro Corp. (A Shares) | | 34,500 | 431,930 |
| Shandong Weigao Orthopaedic Device Co. Ltd. (A Shares) | | 781,600 | 3,269,999 |
| Shanghai Aohua Photoelectricity Endoscope Co. Ltd. (A Shares) | | 132,130 | 982,475 |
| Shanghai MicroPort Endovascula MedTech Group Co. Ltd. (A Shares) | | 45,264 | 633,909 |
| Shenzhen Mindray Bio-Medical Electronics Co. Ltd. (A Shares) | | 107,939 | 4,042,607 |
| Silergy Corp. | | 60,000 | 933,894 |
| SITC International Holdings Co. Ltd. | | 927,217 | 2,620,604 |
| Skyverse Technology Co. Ltd. | | 164,400 | 1,631,462 |
| Smoore International Holdings Ltd. (a)(b) | | 690,519 | 901,507 |
| SonoScape Medical Corp. | | 197,800 | 989,714 |
| TAL Education Group ADR (c) | | 256,646 | 2,853,904 |
| Tencent Holdings Ltd. | | 222,051 | 11,578,212 |
| Tofflon Science & Technology Group Co. Ltd. (A Shares) | | 1,096,086 | 1,970,437 |
| Trip.com Group Ltd. (c) | | 33,907 | 2,182,068 |
| Venus MedTech Hangzhou, Inc. (H Shares) (a)(b)(c)(d) | | 1,074,577 | 621,461 |
| Warom Technology, Inc. Co. (A Shares) | | 350,800 | 1,009,914 |
| Weihai Guangwei Composites Co. Ltd. (A Shares) | | 257,944 | 1,267,601 |
| WuXi AppTec Co. Ltd. (H Shares) (a)(b) | | 396,690 | 2,638,119 |
| WuXi XDC Cayman, Inc. (a) | | 2,059,853 | 6,122,771 |
| Zeekr Intelligent Technology Holding Ltd. ADR | | 9,600 | 241,056 |
| ZKH Group Ltd. (A Shares) (c) | | 9 | 1 |
| Zylox-Tonbridge Medical Technology Co. Ltd. (b)(c) | | 722,079 | 1,058,883 |
TOTAL CHINA | | | 179,740,659 |
| Hong Kong - 4.2% | | | |
| AIA Group Ltd. | | 957,516 | 7,557,021 |
| Hong Kong Exchanges and Clearing Ltd. | | 192,944 | 7,725,549 |
| Huanxi Media Group Ltd. (a)(c) | | 9,140,292 | 691,697 |
| J&T Global Express Ltd. | | 3,684,780 | 2,909,636 |
TOTAL HONG KONG | | | 18,883,903 |
| India - 22.5% | | | |
| Afcons Infrastructure Ltd. | | 64,673 | 356,096 |
| Afcons Infrastructure Ltd. | | 124,352 | 684,695 |
| Afcons Infrastructure Ltd. | | 124,352 | 684,695 |
| Amber Enterprises India Ltd. (c) | | 13,601 | 973,116 |
| Aster DM Healthcare Ltd. (b) | | 130,646 | 688,939 |
| Bajaj Finance Ltd. | | 53,208 | 4,345,949 |
| Bajaj Housing Finance Ltd. (h) | | 847,547 | 1,339,559 |
| Bharat Electronics Ltd. | | 364,242 | 1,229,502 |
| Computer Age Management Services Private Ltd. | | 123,807 | 6,522,699 |
| Delhivery Private Ltd. (c) | | 1,280,346 | 5,408,311 |
| Devyani International Ltd. (c) | | 299,938 | 602,280 |
| Divi's Laboratories Ltd. | | 20,100 | 1,404,762 |
| Eicher Motors Ltd. | | 21,284 | 1,235,240 |
| GMR Airports Infrastructure Ltd. (c) | | 929,186 | 872,333 |
| HDFC Asset Management Co. Ltd. (b) | | 69,065 | 3,524,390 |
| HDFC Bank Ltd. | | 643,728 | 13,231,290 |
| HDFC Standard Life Insurance Co. Ltd. (b) | | 239,940 | 2,049,396 |
| Hindustan Aeronautics Ltd. | | 82,034 | 4,127,998 |
| Hyundai Motor India Ltd. | | 144,113 | 3,095,421 |
| INOX India Ltd. | | 46,774 | 630,419 |
| Juniper Hotels Ltd. | | 355,523 | 1,422,111 |
| Kotak Mahindra Bank Ltd. | | 31,346 | 643,523 |
| Larsen & Toubro Ltd. | | 23,610 | 1,014,181 |
| MakeMyTrip Ltd. (a)(c) | | 161,674 | 16,408,294 |
| Page Industries Ltd. | | 1,212 | 621,031 |
| Reliance Industries Ltd. | | 177,982 | 2,814,172 |
| Reliance Industries Ltd. (c) | | 177,982 | 2,794,047 |
| Sapphire Foods India Ltd. (c) | | 256,151 | 976,355 |
| SIS Ltd. (c) | | 142,378 | 678,965 |
| SRF Ltd. | | 21,297 | 566,247 |
| Syngene International Ltd. (b) | | 70,087 | 715,940 |
| Vijaya Diagnostic Centre Pvt Ltd. | | 49,866 | 591,492 |
| Zomato Ltd. (c) | | 6,213,531 | 17,826,187 |
TOTAL INDIA | | | 100,079,635 |
| Indonesia - 1.0% | | | |
| PT Bank Central Asia Tbk | | 4,443,727 | 2,875,965 |
| PT Bank Rakyat Indonesia (Persero) Tbk | | 5,484,013 | 1,671,824 |
TOTAL INDONESIA | | | 4,547,789 |
| Japan - 0.8% | | | |
| Freee KK (c) | | 68,490 | 1,278,120 |
| Money Forward, Inc. (c) | | 64,144 | 2,092,736 |
TOTAL JAPAN | | | 3,370,856 |
| Korea (South) - 6.6% | | | |
| Delivery Hero AG (b)(c) | | 180,139 | 7,647,283 |
| Gabia, Inc. | | 64,100 | 627,017 |
| Kakao Corp. | | 30,988 | 827,467 |
| NAVER Corp. | | 56,843 | 6,975,910 |
| Samsung Electronics Co. Ltd. | | 306,733 | 13,066,843 |
| Webtoon Entertainment, Inc. | | 40,910 | 425,464 |
TOTAL KOREA (SOUTH) | | | 29,569,984 |
| Singapore - 7.7% | | | |
| Oversea-Chinese Banking Corp. Ltd. | | 138,900 | 1,593,614 |
| Sea Ltd. ADR Class A (c) | | 334,978 | 31,504,681 |
| United Overseas Bank Ltd. | | 48,105 | 1,169,387 |
TOTAL SINGAPORE | | | 34,267,682 |
| South Africa - 0.9% | | | |
| Naspers Ltd. Class N | | 16,200 | 3,828,829 |
| Switzerland - 0.4% | | | |
| Yunnan Botanee Bio-Technology Group Co. Ltd. ELS (UBS AG London Branch Bank Warrant Programme) Class A warrants 3/10/25 (b) | | 87,100 | 635,170 |
| ZWSOFT Co. Ltd. Guangzhou ELS (UBS AG London Branch Bank Warrant Programme) Class A warrants 9/25/25 (b) | | 97,608 | 1,270,585 |
TOTAL SWITZERLAND | | | 1,905,755 |
| Taiwan - 12.7% | | | |
| E Ink Holdings, Inc. | | 334,000 | 3,136,156 |
| MediaTek, Inc. | | 38,000 | 1,484,089 |
| Taiwan Semiconductor Manufacturing Co. Ltd. | | 1,540,393 | 48,463,243 |
| Taiwan Semiconductor Manufacturing Co. Ltd. sponsored ADR | | 8,288 | 1,579,196 |
| Unimicron Technology Corp. | | 366,000 | 1,793,287 |
TOTAL TAIWAN | | | 56,455,971 |
| United Kingdom - 0.1% | | | |
| Endava PLC ADR (c) | | 26,908 | 636,374 |
| United States of America - 0.8% | | | |
| ON Semiconductor Corp. (c) | | 25,782 | 1,817,373 |
| Space Exploration Technologies Corp. (c)(d)(e) | | 6,000 | 701,520 |
| Teradyne, Inc. | | 10,984 | 1,166,611 |
TOTAL UNITED STATES OF AMERICA | | | 3,685,504 |
| Vietnam - 0.3% | | | |
| Vietnam Dairy Products Corp. | | 491,921 | 1,285,782 |
| TOTAL COMMON STOCKS (Cost $309,287,689) | | | 438,258,723 |
| | | | |
| Preferred Stocks - 1.2% |
| | | Shares | Value ($) |
| Convertible Preferred Stocks - 0.8% | | | |
| China - 0.8% | | | |
| ByteDance Ltd. Series E1 (c)(d)(e) | | 11,980 | 2,985,057 |
| dMed Biopharmaceutical Co. Ltd. Series C (c)(d)(e) | | 65,318 | 354,024 |
| | | | 3,339,081 |
| India - 0.0% | | | |
| Meesho: | | | |
| Series D2 (d)(e) | | 2,422 | 134,494 |
| Series E (d)(e) | | 403 | 22,379 |
| Series F (c)(d)(e) | | 374 | 21,131 |
| | | | 178,004 |
TOTAL CONVERTIBLE PREFERRED STOCKS | | | 3,517,085 |
| Nonconvertible Preferred Stocks - 0.4% | | | |
| Korea (South) - 0.4% | | | |
| Samsung Electronics Co. Ltd. | | 52,435 | 1,809,687 |
| TOTAL PREFERRED STOCKS (Cost $4,108,967) | | | 5,326,772 |
| | | | |
| Money Market Funds - 7.0% |
| | | Shares | Value ($) |
| Fidelity Cash Central Fund 4.87% (f) | | 5,588,956 | 5,590,074 |
| Fidelity Securities Lending Cash Central Fund 4.87% (f)(g) | | 25,476,577 | 25,479,124 |
| TOTAL MONEY MARKET FUNDS (Cost $31,069,198) | | | 31,069,198 |
| | | | |
| TOTAL INVESTMENT IN SECURITIES - 106.5% (Cost $344,465,854) | 474,654,693 |
NET OTHER ASSETS (LIABILITIES) - (6.5)% | (28,868,901) |
| NET ASSETS - 100.0% | 445,785,792 |
| | |
Security Type Abbreviations
| ELS | - | EQUITY-LINKED SECURITY |
Legend
| (a) | Security or a portion of the security is on loan at period end. |
| (b) | Security exempt from registration under Rule 144A of the Securities Act of 1933. These securities may be resold in transactions exempt from registration, normally to qualified institutional buyers. At the end of the period, the value of these securities amounted to $41,355,456 or 9.3% of net assets. |
| (e) | Restricted securities (including private placements) - Investment in securities not registered under the Securities Act of 1933 (excluding 144A issues). At the end of the period, the value of restricted securities (excluding 144A issues) amounted to $4,218,605 or 0.9% of net assets. |
| (f) | Affiliated fund that is generally available only to investment companies and other accounts managed by Fidelity Investments. The rate quoted is the annualized seven-day yield of the fund at period end. A complete unaudited listing of the fund's holdings as of its most recent quarter end is available upon request. In addition, each Fidelity Central Fund's financial statements, which are not covered by the Fund's Report of Independent Registered Public Accounting Firm, are available on the SEC's website or upon request. |
| (g) | Investment made with cash collateral received from securities on loan. |
| (h) | Equity security is subject to lock-up or market standoff agreement. Fair value is based on the unadjusted market price of the equivalent equity security. As of period end, the total fair value of unadjusted equity securities subject to contractual sale restrictions is $1,339,559 and all restrictions are set to expire on or before December 31, 2024. Under normal market conditions, there are no circumstances that could cause the restrictions to lapse. |
| Additional information on each restricted holding is as follows: |
| Security | Acquisition Date | Acquisition Cost ($) |
| ByteDance Ltd. Series E1 | 11/18/20 | 1,312,699 |
| | | |
| dMed Biopharmaceutical Co. Ltd. Series C | 12/01/20 | 927,721 |
| | | |
| Meesho Series D2 | 7/15/24 | 135,632 |
| | | |
| Meesho Series E | 7/15/24 | 22,568 |
| | | |
| Meesho Series F | 7/15/24 | 20,944 |
| | | |
| Space Exploration Technologies Corp. | 2/16/21 | 251,994 |
| | | |
Affiliated Central Funds
Fiscal year to date information regarding the Fund's investments in Fidelity Central Funds, including the ownership percentage, is presented below.
| Affiliate | Value, beginning of period ($) | Purchases ($) | Sales Proceeds ($) | Dividend Income ($) | Realized Gain (loss) ($) | Change in Unrealized appreciation (depreciation) ($) | Value, end of period ($) | % ownership, end of period |
| Fidelity Cash Central Fund 4.87% | - | 138,569,064 | 132,978,972 | 245,370 | (18) | - | 5,590,074 | 0.0% |
| Fidelity Securities Lending Cash Central Fund 4.87% | 7,074,240 | 144,279,113 | 125,874,229 | 256,325 | - | - | 25,479,124 | 0.1% |
| Total | 7,074,240 | 282,848,177 | 258,853,201 | 501,695 | (18) | - | 31,069,198 | |
| | | | | | | | | |
Amounts in the dividend income column in the above table include any capital gain distributions from underlying funds, which are presented in the corresponding line item in the Statement of Operations, if applicable.
Amounts in the dividend income column for Fidelity Securities Lending Cash Central Fund represents the income earned on investing cash collateral, less rebates paid to borrowers and any lending agent fees associated with the loan, plus any premium payments received for lending certain types of securities.
Amounts included in the purchases and sales proceeds columns may include in-kind transactions, if applicable.
Investment Valuation
The following is a summary of the inputs used, as of October 31, 2024, involving the Fund's assets and liabilities carried at fair value. The inputs or methodology used for valuing securities may not be an indication of the risk associated with investing in those securities. For more information on valuation inputs, and their aggregation into the levels used below, please refer to the Investment Valuation section in the accompanying Notes to Financial Statements.
| Valuation Inputs at Reporting Date: |
| Description | Total ($) | Level 1 ($) | Level 2 ($) | Level 3 ($) |
Investments in Securities: | | | | |
|
| Equities: | | | | |
Communication Services | 55,780,590 | 32,722,247 | 20,073,286 | 2,985,057 |
Consumer Discretionary | 125,902,459 | 47,140,968 | 78,583,487 | 178,004 |
Consumer Staples | 2,864,742 | - | 2,864,742 | - |
Energy | 5,608,219 | - | 5,608,219 | - |
Financials | 55,488,790 | - | 55,488,790 | - |
Health Care | 35,515,571 | - | 34,540,086 | 975,485 |
Industrials | 38,340,120 | 1 | 37,638,599 | 701,520 |
Information Technology | 118,199,106 | 8,907,468 | 109,291,638 | - |
Materials | 1,833,848 | - | 1,833,848 | - |
Real Estate | 4,052,050 | 4,052,050 | - | - |
|
| Money Market Funds | 31,069,198 | 31,069,198 | - | - |
| Total Investments in Securities: | 474,654,693 | 123,891,932 | 345,922,695 | 4,840,066 |
The following is a reconciliation of Investments in Securities for which Level 3 inputs were used in determining value:
| |
| Investments in Securities: | |
| Beginning Balance | $ | 6,278,069 | |
| Net Realized Gain (Loss) on Investment Securities | | (4,165,445) | |
| Net Unrealized Gain (Loss) on Investment Securities | | 5,703,621 | |
| Cost of Purchases | | 179,144 | |
| Proceeds of Sales | | (3,764,885) | |
| Amortization/Accretion | | - | |
| Transfers into Level 3 | | 609,562 | |
| Transfers out of Level 3 | | - | |
| Ending Balance | $ | 4,840,066 | |
| The change in unrealized gain (loss) for the period attributable to Level 3 securities held at October 31, 2024 | $ | 381,509 | |
| The information used in the above reconciliation represents fiscal year to date activity for any Investments in Securities identified as using Level 3 inputs at either the beginning or the end of the current fiscal period. Cost of purchases and proceeds of sales may include securities received and/or delivered through in-kind transactions, corporate actions or exchanges. Transfers into Level 3 were attributable to a lack of observable market data resulting from decreases in market activity, decreases in liquidity, security restructurings or corporate actions. Transfers out of Level 3 were attributable to observable market data becoming available for those securities. Transfers in or out of Level 3 represent the beginning value of any Security or Instrument where a change in the pricing level occurred from the beginning to the end of the period. Realized and unrealized gains (losses) disclosed in the reconciliation are included in Net Gain (Loss) on the Fund's Statement of Operations. | |
Financial Statements
| Statement of Assets and Liabilities |
As of October 31, 2024 |
| Assets | | | | |
| Investment in securities, at value (including securities loaned of $23,913,448) - See accompanying schedule: | | | | |
Unaffiliated issuers (cost $313,396,656) | $ | 443,585,495 | | |
Fidelity Central Funds (cost $31,069,198) | | 31,069,198 | | |
| | | | | |
| | | | | |
| Total Investment in Securities (cost $344,465,854) | | | $ | 474,654,693 |
| Foreign currency held at value (cost $1,360,660) | | | | 1,360,397 |
| Receivable for fund shares sold | | | | 119,941 |
| Dividends receivable | | | | 79,304 |
| Distributions receivable from Fidelity Central Funds | | | | 80,946 |
| Prepaid expenses | | | | 473 |
| Other receivables | | | | 172,599 |
Total assets | | | | 476,468,353 |
| Liabilities | | | | |
| Payable for investments purchased | $ | 415,883 | | |
| Payable for fund shares redeemed | | 485,779 | | |
| Accrued management fee | | 323,940 | | |
| Distribution and service plan fees payable | | 55,724 | | |
| Deferred taxes | | 3,814,405 | | |
| Other payables and accrued expenses | | 112,245 | | |
| Collateral on securities loaned | | 25,474,585 | | |
| Total liabilities | | | | 30,682,561 |
| Net Assets | | | $ | 445,785,792 |
| Net Assets consist of: | | | | |
| Paid in capital | | | $ | 487,797,320 |
| Total accumulated earnings (loss) | | | | (42,011,528) |
| Net Assets | | | $ | 445,785,792 |
| | | | | |
| Net Asset Value and Maximum Offering Price | | | | |
| Class A : | | | | |
Net Asset Value and redemption price per share ($145,193,072 ÷ 3,041,476 shares)(a)(b) | | | $ | 47.74 |
| Maximum offering price per share (100/94.25 of $47.74) | | | $ | 50.65 |
| Class M : | | | | |
Net Asset Value and redemption price per share ($37,386,419 ÷ 822,248 shares)(a)(b) | | | $ | 45.47 |
| Maximum offering price per share (100/96.50 of $45.47) | | | $ | 47.12 |
| Class C : | | | | |
Net Asset Value and offering price per share ($9,500,557 ÷ 234,916 shares)(a) | | | $ | 40.44 |
| Class I : | | | | |
Net Asset Value, offering price and redemption price per share ($170,908,856 ÷ 3,409,126 shares)(b) | | | $ | 50.13 |
| Class Z : | | | | |
Net Asset Value, offering price and redemption price per share ($82,796,888 ÷ 1,650,423 shares) | | | $ | 50.17 |
(a)Redemption price per share is equal to net asset value less any applicable contingent deferred sales charge. |
(b)Corresponding Net Asset Value does not calculate due to rounding of fractional net assets and/or shares. |
| Statement of Operations |
| Year ended October 31, 2024 |
| Investment Income | | | | |
| Dividends | | | $ | 4,820,771 |
| Income from Fidelity Central Funds (including $256,325 from security lending) | | | | 501,695 |
| Income before foreign taxes withheld | | | $ | 5,322,466 |
| Less foreign taxes withheld | | | | (587,900) |
| Total income | | | | 4,734,566 |
| Expenses | | | | |
| Management fee | $ | 3,117,019 | | |
| Transfer agent fees | | 205,650 | | |
| Distribution and service plan fees | | 591,984 | | |
| Accounting fees | | 63,648 | | |
| Custodian fees and expenses | | 145,583 | | |
| Independent trustees' fees and expenses | | 1,807 | | |
| Registration fees | | 81,828 | | |
| Audit fees | | 119,877 | | |
| Legal | | 987 | | |
| Interest | | 3,583 | | |
| Miscellaneous | | 19,454 | | |
| Total expenses before reductions | | 4,351,420 | | |
| Expense reductions | | (17,228) | | |
| Total expenses after reductions | | | | 4,334,192 |
| Net Investment income (loss) | | | | 400,374 |
| Realized and Unrealized Gain (Loss) | | | | |
| Net realized gain (loss) on: | | | | |
| Investment Securities: | | | | |
| Unaffiliated issuers (net of foreign taxes of $3,323,578) | | 17,717,817 | | |
| Fidelity Central Funds | | (18) | | |
| Foreign currency transactions | | (72,780) | | |
| Total net realized gain (loss) | | | | 17,645,019 |
| Change in net unrealized appreciation (depreciation) on: | | | | |
| Investment Securities: | | | | |
| Unaffiliated issuers (net of increase in deferred foreign taxes of $1,320,148) | | 105,741,047 | | |
| Assets and liabilities in foreign currencies | | 116,824 | | |
| Total change in net unrealized appreciation (depreciation) | | | | 105,857,871 |
| Net gain (loss) | | | | 123,502,890 |
| Net increase (decrease) in net assets resulting from operations | | | $ | 123,903,264 |
| Statement of Changes in Net Assets |
| |
| | Year ended October 31, 2024 | | Year ended October 31, 2023 |
| Increase (Decrease) in Net Assets | | | | |
| Operations | | | | |
| Net investment income (loss) | $ | 400,374 | $ | (539,519) |
| Net realized gain (loss) | | 17,645,019 | | (80,332,504) |
| Change in net unrealized appreciation (depreciation) | | 105,857,871 | | 150,350,780 |
| Net increase (decrease) in net assets resulting from operations | | 123,903,264 | | 69,478,757 |
| Share transactions - net increase (decrease) | | (60,857,038) | | (55,569,856) |
| Total increase (decrease) in net assets | | 63,046,226 | | 13,908,901 |
| | | | | |
| Net Assets | | | | |
| Beginning of period | | 382,739,566 | | 368,830,665 |
| End of period | $ | 445,785,792 | $ | 382,739,566 |
| | | | | |
| | | | | |
Financial Highlights
Fidelity Advisor® Emerging Asia Fund Class A |
| |
| Years ended October 31, | | 2024 | | 2023 | | 2022 | | 2021 | | 2020 |
Selected Per-Share Data | | | | | | | | | | |
| Net asset value, beginning of period | $ | 34.91 | $ | 29.31 | $ | 61.78 | $ | 56.33 | $ | 39.85 |
| Income from Investment Operations | | | | | | | | | | |
Net investment income (loss) A,B | | (.02) | | (.10) | | (.25) | | (.40) C | | (.18) |
| Net realized and unrealized gain (loss) | | 12.85 | | 5.70 | | (25.86) | | 10.17 | | 18.77 |
| Total from investment operations | | 12.83 | | 5.60 | | (26.11) | | 9.77 | | 18.59 |
| Distributions from net investment income | | - | | - | | - | | - | | (.13) D |
| Distributions from net realized gain | | - | | - | | (6.36) | | (4.32) | | (1.99) D |
| Total distributions | | - | | - | | (6.36) | | (4.32) | | (2.11) E |
| Net asset value, end of period | $ | 47.74 | $ | 34.91 | $ | 29.31 | $ | 61.78 | $ | 56.33 |
Total Return F,G | | | | 19.11% | | (46.56)% | | 17.45% | | 49.18% |
Ratios to Average Net Assets B,H,I | | | | | | | | | | |
| Expenses before reductions | | 1.24% | | 1.28% | | 1.25% | | 1.20% | | 1.26% |
| Expenses net of fee waivers, if any | | | | 1.27% | | 1.25% | | 1.20% | | 1.26% |
| Expenses net of all reductions | | 1.24% | | 1.27% | | 1.25% | | 1.20% | | 1.23% |
| Net investment income (loss) | | (.04)% | | (.28)% | | (.61)% | | (.61)% C | | (.40)% |
| Supplemental Data | | | | | | | | | | |
| Net assets, end of period (000 omitted) | $ | 145,193 | $ | 122,142 | $ | 115,657 | $ | 271,275 | $ | 208,546 |
Portfolio turnover rate J | | | | 58% | | 44% | | 79% | | 110% |
ACalculated based on average shares outstanding during the period.
BNet investment income (loss) is affected by the timing of the declaration of dividends by any underlying mutual funds or exchange-traded funds (ETFs). Net investment income (loss) of any mutual funds or ETFs is not included in the Fund's net investment income (loss) ratio.
CNet investment income per share reflects one or more large, non-recurring dividend(s) which amounted to $.06 per share. Excluding such non-recurring dividend(s), the ratio of net investment income (loss) to average net assets would have been (.71)%.
DThe amount shown reflects reclassifications related to book to tax differences that were made in the year shown.
ETotal distributions per share do not sum due to rounding.
FTotal returns would have been lower if certain expenses had not been reduced during the applicable periods shown.
GTotal returns do not include the effect of the sales charges.
HFees and expenses of any underlying mutual funds or exchange-traded funds (ETFs) are not included in the Fund's expense ratio. The Fund indirectly bears its proportionate share of these expenses. For additional expense information related to investments in Fidelity Central Funds, please refer to the "Investments in Fidelity Central Funds" note found in the Notes to Financial Statements section of the most recent Annual or Semi-Annual report.
IExpense ratios reflect operating expenses of the class. Expenses before reductions do not reflect amounts reimbursed, waived, or reduced through arrangements with the investment adviser, brokerage services, or other offset arrangements, if applicable, and do not represent the amount paid by the class during periods when reimbursements, waivers or reductions occur.
JAmount does not include the portfolio activity of any underlying mutual funds or exchange-traded funds (ETFs).
Fidelity Advisor® Emerging Asia Fund Class M |
| |
| Years ended October 31, | | 2024 | | 2023 | | 2022 | | 2021 | | 2020 |
Selected Per-Share Data | | | | | | | | | | |
| Net asset value, beginning of period | $ | 33.33 | $ | 28.07 | $ | 59.60 | $ | 54.51 | $ | 38.61 |
| Income from Investment Operations | | | | | | | | | | |
Net investment income (loss) A,B | | (.12) | | (.19) | | (.34) | | (.55) C | | (.29) |
| Net realized and unrealized gain (loss) | | 12.26 | | 5.45 | | (24.83) | | 9.87 | | 18.19 |
| Total from investment operations | | 12.14 | | 5.26 | | (25.17) | | 9.32 | | 17.90 |
| Distributions from net investment income | | - | | - | | - | | - | | (.01) D |
| Distributions from net realized gain | | - | | - | | (6.36) | | (4.23) | | (1.99) D |
| Total distributions | | - | | - | | (6.36) | | (4.23) | | (2.00) |
| Net asset value, end of period | $ | 45.47 | $ | 33.33 | $ | 28.07 | $ | 59.60 | $ | 54.51 |
Total Return E,F | | | | 18.74% | | (46.70)% | | 17.18% | | 48.78% |
Ratios to Average Net Assets B,G,H | | | | | | | | | | |
| Expenses before reductions | | 1.49% | | 1.55% | | 1.52% | | 1.45% | | 1.54% |
| Expenses net of fee waivers, if any | | | | 1.55% | | 1.52% | | 1.45% | | 1.53% |
| Expenses net of all reductions | | 1.49% | | 1.54% | | 1.52% | | 1.45% | | 1.51% |
| Net investment income (loss) | | (.29)% | | (.55)% | | (.88)% | | (.87)% C | | (.68)% |
| Supplemental Data | | | | | | | | | | |
| Net assets, end of period (000 omitted) | $ | 37,386 | $ | 30,814 | $ | 27,239 | $ | 60,893 | $ | 54,436 |
Portfolio turnover rate I | | | | 58% | | 44% | | 79% | | 110% |
ACalculated based on average shares outstanding during the period.
BNet investment income (loss) is affected by the timing of the declaration of dividends by any underlying mutual funds or exchange-traded funds (ETFs). Net investment income (loss) of any mutual funds or ETFs is not included in the Fund's net investment income (loss) ratio.
CNet investment income per share reflects one or more large, non-recurring dividend(s) which amounted to $.06 per share. Excluding such non-recurring dividend(s), the ratio of net investment income (loss) to average net assets would have been (.96)%.
DThe amount shown reflects reclassifications related to book to tax differences that were made in the year shown.
ETotal returns would have been lower if certain expenses had not been reduced during the applicable periods shown.
FTotal returns do not include the effect of the sales charges.
GFees and expenses of any underlying mutual funds or exchange-traded funds (ETFs) are not included in the Fund's expense ratio. The Fund indirectly bears its proportionate share of these expenses. For additional expense information related to investments in Fidelity Central Funds, please refer to the "Investments in Fidelity Central Funds" note found in the Notes to Financial Statements section of the most recent Annual or Semi-Annual report.
HExpense ratios reflect operating expenses of the class. Expenses before reductions do not reflect amounts reimbursed, waived, or reduced through arrangements with the investment adviser, brokerage services, or other offset arrangements, if applicable, and do not represent the amount paid by the class during periods when reimbursements, waivers or reductions occur.
IAmount does not include the portfolio activity of any underlying mutual funds or exchange-traded funds (ETFs).
Fidelity Advisor® Emerging Asia Fund Class C |
| |
| Years ended October 31, | | 2024 | | 2023 | | 2022 | | 2021 | | 2020 |
Selected Per-Share Data | | | | | | | | | | |
| Net asset value, beginning of period | $ | 29.79 | $ | 25.21 | $ | 54.45 | $ | 50.22 | $ | 35.77 |
| Income from Investment Operations | | | | | | | | | | |
Net investment income (loss) A,B | | (.27) | | (.31) | | (.48) | | (.80) C | | (.47) |
| Net realized and unrealized gain (loss) | | 10.92 | | 4.89 | | (22.40) | | 9.10 | | 16.79 |
| Total from investment operations | | 10.65 | | 4.58 | | (22.88) | | 8.30 | | 16.32 |
| Distributions from net realized gain | | - | | - | | (6.36) | | (4.07) | | (1.87) |
| Total distributions | | - | | - | | (6.36) | | (4.07) | | (1.87) |
| Net asset value, end of period | $ | 40.44 | $ | 29.79 | $ | 25.21 | $ | 54.45 | $ | 50.22 |
Total Return D,E | | | | 18.17% | | (46.94)% | | 16.58% | | 48.03% |
Ratios to Average Net Assets B,F,G | | | | | | | | | | |
| Expenses before reductions | | 1.97% | | 2.01% | | 1.99% | | 1.96% | | 2.03% |
| Expenses net of fee waivers, if any | | | | 2.01% | | 1.99% | | 1.96% | | 2.02% |
| Expenses net of all reductions | | 1.97% | | 2.01% | | 1.99% | | 1.96% | | 1.99% |
| Net investment income (loss) | | (.77)% | | (1.02)% | | (1.35)% | | (1.37)% C | | (1.17)% |
| Supplemental Data | | | | | | | | | | |
| Net assets, end of period (000 omitted) | $ | 9,501 | $ | 8,864 | $ | 9,087 | $ | 26,377 | $ | 28,233 |
Portfolio turnover rate H | | | | 58% | | 44% | | 79% | | 110% |
ACalculated based on average shares outstanding during the period.
BNet investment income (loss) is affected by the timing of the declaration of dividends by any underlying mutual funds or exchange-traded funds (ETFs). Net investment income (loss) of any mutual funds or ETFs is not included in the Fund's net investment income (loss) ratio.
CNet investment income per share reflects one or more large, non-recurring dividend(s) which amounted to $.05 per share. Excluding such non-recurring dividend(s), the ratio of net investment income (loss) to average net assets would have been (1.47)%.
DTotal returns would have been lower if certain expenses had not been reduced during the applicable periods shown.
ETotal returns do not include the effect of the contingent deferred sales charge.
FFees and expenses of any underlying mutual funds or exchange-traded funds (ETFs) are not included in the Fund's expense ratio. The Fund indirectly bears its proportionate share of these expenses. For additional expense information related to investments in Fidelity Central Funds, please refer to the "Investments in Fidelity Central Funds" note found in the Notes to Financial Statements section of the most recent Annual or Semi-Annual report.
GExpense ratios reflect operating expenses of the class. Expenses before reductions do not reflect amounts reimbursed, waived, or reduced through arrangements with the investment adviser, brokerage services, or other offset arrangements, if applicable, and do not represent the amount paid by the class during periods when reimbursements, waivers or reductions occur.
HAmount does not include the portfolio activity of any underlying mutual funds or exchange-traded funds (ETFs).
Fidelity Advisor® Emerging Asia Fund Class I |
| |
| Years ended October 31, | | 2024 | | 2023 | | 2022 | | 2021 | | 2020 |
Selected Per-Share Data | | | | | | | | | | |
| Net asset value, beginning of period | $ | 36.56 | $ | 30.61 | $ | 64.13 | $ | 58.29 | $ | 41.16 |
| Income from Investment Operations | | | | | | | | | | |
Net investment income (loss) A,B | | .10 | | - C | | (.14) | | (.24) D | | (.07) |
| Net realized and unrealized gain (loss) | | 13.47 | | 5.95 | | (26.95) | | 10.53 | | 19.42 |
| Total from investment operations | | 13.57 | | 5.95 | | (27.09) | | 10.29 | | 19.35 |
| Distributions from net investment income | | - | | - | | (.07) | | - | | (.23) E |
| Distributions from net realized gain | | - | | - | | (6.36) | | (4.45) | | (1.99) E |
| Total distributions | | - | | - | | (6.43) | | (4.45) | | (2.22) |
| Net asset value, end of period | $ | 50.13 | $ | 36.56 | $ | 30.61 | $ | 64.13 | $ | 58.29 |
Total Return F | | | | 19.44% | | (46.41)% | | 17.77% | | 49.59% |
Ratios to Average Net Assets B,G,H | | | | | | | | | | |
| Expenses before reductions | | .96% | | .99% | | .97% | | .94% | | 1.00% |
| Expenses net of fee waivers, if any | | | | .99% | | .97% | | .94% | | 1.00% |
| Expenses net of all reductions | | .95% | | .99% | | .97% | | .94% | | .97% |
| Net investment income (loss) | | .24% | | -% I | | (.33)% | | (.36)% D | | (.14)% |
| Supplemental Data | | | | | | | | | | |
| Net assets, end of period (000 omitted) | $ | 170,909 | $ | 152,325 | $ | 143,659 | $ | 472,553 | $ | 414,664 |
Portfolio turnover rate J | | | | 58% | | 44% | | 79% | | 110% |
ACalculated based on average shares outstanding during the period.
BNet investment income (loss) is affected by the timing of the declaration of dividends by any underlying mutual funds or exchange-traded funds (ETFs). Net investment income (loss) of any mutual funds or ETFs is not included in the Fund's net investment income (loss) ratio.
CAmount represents less than $.005 per share.
DNet investment income per share reflects one or more large, non-recurring dividend(s) which amounted to $.06 per share. Excluding such non-recurring dividend(s), the ratio of net investment income (loss) to average net assets would have been (.45)%.
EThe amount shown reflects reclassifications related to book to tax differences that were made in the year shown.
FTotal returns would have been lower if certain expenses had not been reduced during the applicable periods shown.
GFees and expenses of any underlying mutual funds or exchange-traded funds (ETFs) are not included in the Fund's expense ratio. The Fund indirectly bears its proportionate share of these expenses. For additional expense information related to investments in Fidelity Central Funds, please refer to the "Investments in Fidelity Central Funds" note found in the Notes to Financial Statements section of the most recent Annual or Semi-Annual report.
HExpense ratios reflect operating expenses of the class. Expenses before reductions do not reflect amounts reimbursed, waived, or reduced through arrangements with the investment adviser, brokerage services, or other offset arrangements, if applicable, and do not represent the amount paid by the class during periods when reimbursements, waivers or reductions occur.
IAmount represents less than .005%.
JAmount does not include the portfolio activity of any underlying mutual funds or exchange-traded funds (ETFs).
Fidelity Advisor® Emerging Asia Fund Class Z |
| |
| Years ended October 31, | | 2024 | | 2023 | | 2022 | | 2021 | | 2020 |
Selected Per-Share Data | | | | | | | | | | |
| Net asset value, beginning of period | $ | 36.53 | $ | 30.55 | $ | 64.10 | $ | 58.22 | $ | 41.12 |
| Income from Investment Operations | | | | | | | | | | |
Net investment income (loss) A,B | | .16 | | .05 | | (.08) | | (.15) C | | - D |
| Net realized and unrealized gain (loss) | | 13.48 | | 5.93 | | (26.89) | | 10.50 | | 19.38 |
| Total from investment operations | | 13.64 | | 5.98 | | (26.97) | | 10.35 | | 19.38 |
| Distributions from net investment income | | - | | - | | (.22) | | - | | (.30) E |
| Distributions from net realized gain | | - | | - | | (6.36) | | (4.47) | | (1.99) E |
| Total distributions | | - | | - | | (6.58) | | (4.47) | | (2.28) F |
| Net asset value, end of period | $ | 50.17 | $ | 36.53 | $ | 30.55 | $ | 64.10 | $ | 58.22 |
Total Return G | | | | 19.57% | | (46.34)% | | 17.92% | | 49.80% |
Ratios to Average Net Assets A,H,I | | | | | | | | | | |
| Expenses before reductions | | .83% | | .86% | | .84% | | .81% | | .86% |
| Expenses net of fee waivers, if any | | | | .85% | | .84% | | .81% | | .85% |
| Expenses net of all reductions | | .82% | | .85% | | .84% | | .81% | | .82% |
| Net investment income (loss) | | .37% | | .14% | | (.20)% | | (.22)% C | | -% J |
| Supplemental Data | | | | | | | | | | |
| Net assets, end of period (000 omitted) | $ | 82,797 | $ | 68,594 | $ | 73,190 | $ | 264,327 | $ | 103,477 |
Portfolio turnover rate K | | | | 58% | | 44% | | 79% | | 110% |
ANet investment income (loss) is affected by the timing of the declaration of dividends by any underlying mutual funds or exchange-traded funds (ETFs). Net investment income (loss) of any mutual funds or ETFs is not included in the Fund's net investment income (loss) ratio.
BCalculated based on average shares outstanding during the period.
CNet investment income per share reflects one or more large, non-recurring dividend(s) which amounted to $.06 per share. Excluding such non-recurring dividend(s), the ratio of net investment income (loss) to average net assets would have been (.32)%.
DAmount represents less than $.005 per share.
EThe amount shown reflects reclassifications related to book to tax differences that were made in the year shown.
FTotal distributions per share do not sum due to rounding.
GTotal returns would have been lower if certain expenses had not been reduced during the applicable periods shown.
HFees and expenses of any underlying mutual funds or exchange-traded funds (ETFs) are not included in the Fund's expense ratio. The Fund indirectly bears its proportionate share of these expenses. For additional expense information related to investments in Fidelity Central Funds, please refer to the "Investments in Fidelity Central Funds" note found in the Notes to Financial Statements section of the most recent Annual or Semi-Annual report.
IExpense ratios reflect operating expenses of the class. Expenses before reductions do not reflect amounts reimbursed, waived, or reduced through arrangements with the investment adviser, brokerage services, or other offset arrangements, if applicable, and do not represent the amount paid by the class during periods when reimbursements, waivers or reductions occur.
JAmount represents less than .005%.
KAmount does not include the portfolio activity of any underlying mutual funds or exchange-traded funds (ETFs).
Notes to Financial Statements
For the period ended October 31, 2024
1. Organization.
Fidelity Advisor Emerging Asia Fund (the Fund) is a fund of Fidelity Advisor Series VIII (the Trust) and is authorized to issue an unlimited number of shares. The Trust is registered under the Investment Company Act of 1940, as amended (the 1940 Act), as an open-end management investment company organized as a Massachusetts business trust. The Fund offers Class A, Class M, Class C, Class I and Class Z shares, each of which has equal rights as to assets and voting privileges. Class A, Class M, Class C, Class I and Class Z are Fidelity Advisor classes. Each class has exclusive voting rights with respect to matters that affect that class. Class C shares will automatically convert to Class A shares after a holding period of eight years from the initial date of purchase, with certain exceptions. The Fund's investments in emerging markets can be subject to social, economic, regulatory, and political uncertainties and can be extremely volatile.
2. Investments in Fidelity Central Funds.
Funds may invest in Fidelity Central Funds, which are open-end investment companies generally available only to other investment companies and accounts managed by the investment adviser and its affiliates. The Schedule of Investments lists any Fidelity Central Funds held as an investment as of period end, but does not include the underlying holdings of each Fidelity Central Fund. An investing fund indirectly bears its proportionate share of the expenses of the underlying Fidelity Central Funds.
Based on its investment objective, each Fidelity Central Fund may invest or participate in various investment vehicles or strategies that are similar to those of the investing fund. These strategies are consistent with the investment objectives of the investing fund and may involve certain economic risks which may cause a decline in value of each of the Fidelity Central Funds and thus a decline in the value of the investing fund.
| Fidelity Central Fund | Investment Manager | Investment Objective | Investment Practices | Expense RatioA |
| Fidelity Money Market Central Funds | Fidelity Management & Research Company LLC (FMR) | Each fund seeks to obtain a high level of current income consistent with the preservation of capital and liquidity. | Short-term Investments | Less than .005% |
A Expenses expressed as a percentage of average net assets and are as of each underlying Central Fund's most recent annual or semi-annual shareholder report.
A complete unaudited list of holdings for each Fidelity Central Fund is available upon request or at the Securities and Exchange Commission website at www.sec.gov. In addition, the financial statements of the Fidelity Central Funds which contain the significant accounting policies (including investment valuation policies) of those funds, and are not covered by the Report of Independent Registered Public Accounting Firm, are available on the Securities and Exchange Commission website or upon request.
3. Significant Accounting Policies.
The Fund is an investment company and applies the accounting and reporting guidance of the Financial Accounting Standards Board (FASB) Accounting Standards Codification Topic 946 Financial Services - Investment Companies. The financial statements have been prepared in conformity with accounting principles generally accepted in the United States of America (GAAP), which require management to make certain estimates and assumptions at the date of the financial statements. Actual results could differ from those estimates. Subsequent events, if any, through the date that the financial statements were issued have been evaluated in the preparation of the financial statements. The Fund's Schedule of Investments lists any underlying mutual funds or exchange-traded funds (ETFs) but does not include the underlying holdings of these funds. The following summarizes the significant accounting policies of the Fund:
Investment Valuation. Investments are valued as of 4:00 p.m. Eastern time on the last calendar day of the period. The Board of Trustees (the Board) has designated the Fund's investment adviser as the valuation designee responsible for the fair valuation function and performing fair value determinations as needed. The investment adviser has established a Fair Value Committee (the Committee) to carry out the day-to-day fair valuation responsibilities and has adopted policies and procedures to govern the fair valuation process and the activities of the Committee. In accordance with these fair valuation policies and procedures, which have been approved by the Board, the Fund attempts to obtain prices from one or more third party pricing services or brokers to value its investments. When current market prices, quotations or currency exchange rates are not readily available or reliable, investments will be fair valued in good faith by the Committee, in accordance with the policies and procedures. Factors used in determining fair value vary by investment type and may include market or investment specific events, transaction data, estimated cash flows, and market observations of comparable investments. The frequency that the fair valuation procedures are used cannot be predicted and they may be utilized to a significant extent. The Committee manages the Fund's fair valuation practices and maintains the fair valuation policies and procedures. The Fund's investment adviser reports to the Board information regarding the fair valuation process and related material matters.
The Fund categorizes the inputs to valuation techniques used to value its investments into a disclosure hierarchy consisting of three levels as shown below:
Level 1 - unadjusted quoted prices in active markets for identical investments
Level 2 - other significant observable inputs (including quoted prices for similar investments, interest rates, prepayment speeds, etc.)
Level 3 - unobservable inputs (including the Fund's own assumptions based on the best information available)
Valuation techniques used to value the Fund's investments by major category are as follows:
Equity securities, including restricted securities, for which market quotations are readily available, are valued at the last reported sale price or official closing price as reported by a third party pricing service on the primary market or exchange on which they are traded and are categorized as Level 1 in the hierarchy. In the event there were no sales during the day or closing prices are not available, securities are valued at the last quoted bid price or may be valued using the last available price and are generally categorized as Level 2 in the hierarchy. For foreign equity securities, when market or security specific events arise, comparisons to the valuation of American Depositary Receipts (ADRs), futures contracts, Exchange-Traded Funds (ETFs) and certain indexes as well as quoted prices for similar securities may be used and would be categorized as Level 2 in the hierarchy. For equity securities, including restricted securities, where observable inputs are limited, assumptions about market activity and risk are used and these securities may be categorized as Level 3 in the hierarchy.
Investments in open-end mutual funds, including the Fidelity Central Funds, are valued at their closing net asset value (NAV) each business day and are categorized as Level 1 in the hierarchy.
The following provides information on Level 3 securities held by the Fund that were valued at period end based on unobservable inputs. These amounts exclude valuations provided by a broker.
| Asset Type | Fair Value | Valuation Technique(s) | Unobservable Input | Amount or Range/Weighted Average | Impact to Valuation from an Increase in InputA |
| Equities | $ 4,840,064 | Market comparable | Enterprise value/Revenue multiple (EV/R) | 2.5 - 2.8 / 2.5 | Increase |
| | | | Enterprise value/EBITDA multiple (EV/EBITDA) | 22.3 | Increase |
| | | Market approach | Discount rate | 20.0% | Decrease |
| | | Black scholes | Discount rate | 4.0% | Increase |
| | | | Term | 3.0 | Increase |
| | | | Volatility | 60.0% | Increase |
| | | | | | |
| | | | | | |
| | | | | | |
| | | | | | |
A Represents the directional change in the fair value of the Level 3 investments that could have resulted from an increase in the corresponding input as of period end. A decrease to the unobservable input would have had the opposite effect. Significant changes in these inputs may have resulted in a significantly higher or lower fair value measurement at period end.
Changes in valuation techniques may result in transfers in or out of an assigned level within the disclosure hierarchy. The aggregate value of investments by input level as of October 31, 2024, as well as a roll forward of Level 3 investments, is included at the end of the Fund's Schedule of Investments.
Foreign Currency. Certain Funds may use foreign currency contracts to facilitate transactions in foreign-denominated securities. Gains and losses from these transactions may arise from changes in the value of the foreign currency or if the counterparties do not perform under the contracts' terms.
Foreign-denominated assets, including investment securities, and liabilities are translated into U.S. dollars at the exchange rates at period end. Purchases and sales of investment securities, income and dividends received, and expenses denominated in foreign currencies are translated into U.S. dollars at the exchange rate in effect on the transaction date.
The effects of exchange rate fluctuations on investments are included with the net realized and unrealized gain (loss) on investment securities. Other foreign currency transactions resulting in realized and unrealized gain (loss) are disclosed separately.
Investment Transactions and Income. For financial reporting purposes, the Fund's investment holdings and NAV include trades executed through the end of the last business day of the period. The NAV per share for processing shareholder transactions is calculated as of the close of business of the New York Stock Exchange (NYSE), normally 4:00 p.m. Eastern time and includes trades executed through the end of the prior business day. Gains and losses on securities sold are determined on the basis of identified cost and include proceeds received from litigation. Commissions paid to certain brokers with whom the investment adviser, or its affiliates, places trades on behalf of a fund include an amount in addition to trade execution, which may be rebated back to a fund. Any such rebates are included in net realized gain (loss) on investments in the Statement of Operations. Dividend income is recorded on the ex-dividend date, except for certain dividends from foreign securities where the ex-dividend date may have passed, which are recorded as soon as the Fund is informed of the ex-dividend date. Non-cash dividends included in dividend income, if any, are recorded at the fair market value of the securities received. Income and capital gain distributions from Fidelity Central Funds, if any, are recorded on the ex-dividend date. Interest income is accrued as earned and includes coupon interest and amortization of premium and accretion of discount on debt securities as applicable. Investment income is recorded net of foreign taxes withheld where recovery of such taxes is uncertain. Funds may file withholding tax reclaims in certain jurisdictions to recover a portion of amounts previously withheld. Any withholding tax reclaims income is included in the Statement of Operations in foreign taxes withheld. Any receivables for withholding tax reclaims are included in the Statement of Assets and Liabilities in dividends receivable.
Class Allocations and Expenses. Investment income, realized and unrealized capital gains and losses, common expenses of a fund, and certain fund-level expense reductions, if any, are allocated daily on a pro-rata basis to each class based on the relative net assets of each class to the total net assets of a fund. Each class differs with respect to transfer agent and distribution and service plan fees incurred, as applicable. Certain expense reductions may also differ by class, if applicable. For the reporting period, the allocated portion of income and expenses to each class as a percent of its average net assets may vary due to the timing of recording these transactions in relation to fluctuating net assets of the classes. Expenses directly attributable to a fund are charged to that fund. Expenses attributable to more than one fund are allocated among the respective funds on the basis of relative net assets or other appropriate methods. Expenses included in the accompanying financial statements reflect the expenses of that fund and do not include any expenses associated with any underlying mutual funds or exchange-traded funds (ETFs). Although not included in a fund's expenses, a fund indirectly bears its proportionate share of these expenses through the net asset value of each underlying mutual fund or exchange-traded fund (ETF). Expense estimates are accrued in the period to which they relate and adjustments are made when actual amounts are known.
Income Tax Information and Distributions to Shareholders. Each year, the Fund intends to qualify as a regulated investment company under Subchapter M of the Internal Revenue Code, including distributing substantially all of its taxable income and realized gains. As a result, no provision for U.S. Federal income taxes is required. As of October 31, 2024, the Fund did not have any unrecognized tax benefits in the financial statements; nor is the Fund aware of any tax positions for which it is reasonably possible that the total amounts of unrecognized tax benefits will significantly change in the next twelve months. The Fund files a U.S. federal tax return, in addition to state and local tax returns as required. The Fund's federal income tax returns are subject to examination by the Internal Revenue Service (IRS) for a period of three fiscal years after they are filed. State and local tax returns may be subject to examination for an additional fiscal year depending on the jurisdiction. Foreign taxes are provided for based on the Fund's understanding of the tax rules and rates that exist in the foreign markets in which it invests. The Fund is subject to a tax imposed on capital gains by certain countries in which it invests. An estimated deferred tax liability for net unrealized appreciation on the applicable securities is included in Deferred taxes on the Statement of Assets and Liabilities.
Distributions are declared and recorded on the ex-dividend date. Income and capital gain distributions are declared separately for each class. Income and capital gain distributions are determined in accordance with income tax regulations, which may differ from GAAP.
Capital accounts within the financial statements are adjusted for permanent book-tax differences. These adjustments have no impact on net assets or the results of operations. Capital accounts are not adjusted for temporary book-tax differences which will reverse in a subsequent period.
Book-tax differences are primarily due to foreign currency transactions, certain foreign taxes, passive foreign investment companies (PFIC), net operating losses, capital loss carryforwards and losses deferred due to wash sales and excise tax regulations.
As of period end, the cost and unrealized appreciation (depreciation) in securities, and derivatives if applicable, for federal income tax purposes were as follows:
| Gross unrealized appreciation | $168,556,649 |
| Gross unrealized depreciation | (42,823,794) |
| Net unrealized appreciation (depreciation) | $125,732,855 |
| Tax Cost | $348,921,838 |
The tax-based components of distributable earnings as of period end were as follows:
| Capital loss carryforward | $(162,297,665) |
| Net unrealized appreciation (depreciation) on securities and other investments | $125,640,298 |
| | |
The fund intends to elect to defer to it's next fiscal year $1,539,758 of ordinary losses recognized during the period January 1, 2024 to October 31,2024.
Capital loss carryforwards are only available to offset future capital gains of the Fund to the extent provided by regulations and may be limited. The capital loss carryforward information presented below, including any applicable limitation, is estimated as of fiscal period end and is subject to adjustment.
Short-term | $(80,954,333) |
Long-term | (81,343,332) |
| Total capital loss carryforward | $(162,297,665) |
The tax character of distributions paid was as follows:
| | October 31, 2024 | October 31, 2023 |
| Ordinary Income | $- | $- |
| Long-term Capital Gains | - | - |
| Total | $- | $- |
Restricted Securities (including Private Placements). Funds may invest in securities that are subject to legal or contractual restrictions on resale. These securities generally may be resold in transactions exempt from registration or to the public if the securities are registered. Disposal of these securities may involve time-consuming negotiations and expense, and prompt sale at an acceptable price may be difficult. Information regarding restricted securities held at period end is included at the end of the Schedule of Investments, if applicable.
New Accounting Pronouncement. In November 2023, the FASB issued Accounting Standards Update (ASU) 2023-07 Segment Reporting (Topic 280): Improvements to Reportable Segment Disclosures. Effective for fiscal years beginning after December 15, 2023 and interim periods within fiscal years beginning after December 15, 2024, the amendments enhance required disclosures of segment information for public entities on an annual and interim basis. The ASU allows for early adoption with updates applied retrospectively. Management is currently evaluating the impact of the ASU but does not expect this guidance to materially impact the financial statements.
4. Purchases and Sales of Investments.
Purchases and sales of securities, other than short-term securities and in-kind transactions, as applicable, are noted in the table below.
| | Purchases ($) | Sales ($) |
| Fidelity Advisor Emerging Asia Fund | 233,718,023 | 297,110,947 |
5. Fees and Other Transactions with Affiliates.
Management Fee. Fidelity Management & Research Company LLC (the investment adviser) and its affiliates provide the Fund with investment management related services for which the Fund pays a monthly management fee.
Effective March 1, 2024, the Fund's management contract was amended to incorporate administrative services previously covered under separate services agreements (Transfer Agent and Accounting agreements). The amended contract incorporates a management fee rate that may vary by class. The investment adviser or an affiliate pays certain expenses of managing and operating the Fund out of each class's management fee. Each class of the Fund pays a management fee to the investment adviser. The management fee is calculated and paid to the investment adviser every month. When determining a class's management fee, a mandate rate is calculated based on the monthly average net assets of a group of funds advised by FMR within a designated asset class. A discount rate is subtracted from the mandate rate once the Fund's monthly average net assets reach a certain level. The mandate rate and discount rate may vary by class. The annual management fee rate for a class of shares of the Fund is the lesser of (1) the class's mandate rate reduced by the class's discount rate (if applicable) or (2) the amount set forth in the following table.
| | Maximum Management Fee Rate % |
| Class A | .88 |
| Class M | .88 |
| Class C | .87 |
| Class I | .86 |
| Class Z | .72 |
One-twelfth of the management fee rate for a class is applied to the average net assets of the class for the month, giving a dollar amount which is the management fee for the class for that month. A different management fee rate may be applicable to each class of the Fund. The difference between classes is the result of separate arrangements for class-level services and/or waivers of certain expenses. It is not the result of any difference in advisory or custodial fees or other expenses related to the management of the Fund's assets, which do not vary by class. For the portion of the reporting period on or after March 1, 2024, the total annualized management fee rates were as follows:
| | Total Management Fee Rate % |
| Class A | .88 |
| Class M | .88 |
| Class C | .87 |
| Class I | .86 |
| Class Z | .72 |
Prior to March 1, 2024, the management fee was the sum of an individual fund fee rate that was based on an annual rate of .45% of the Fund's average net assets and an annualized group fee rate that averaged .22% during the period. The group fee rate was based upon the monthly average net assets of a group of registered investment companies with which the investment adviser has management contracts. The group fee rate decreased as assets under management increased and increased as assets under management decreased. For the portion of the reporting period prior to March 1, 2024, the total annualized management fee rate was .67%.
Effective March 1, 2024, the Fund's sub-advisory agreements with FMR Investment Management (UK) Limited, Fidelity Management & Research (Hong Kong) Limited, and Fidelity Management & Research (Japan) Limited were amended to provide that the investment adviser pays each sub-adviser monthly fees equal to 110% of the sub-adviser's costs for providing sub-advisory services.
Effective March 1, 2024, the Fund's sub-advisory agreement with FIL Investment Advisors (FIA) was amended to provide that the investment adviser pays FIA monthly fees at an annual rate of 0.50% with respect to the average daily net assets of the Fund managed by FIA. FIA in turn pays FIA(UK).
Distribution and Service Plan Fees. In accordance with Rule 12b-1 of the 1940 Act, the Fund has adopted separate Distribution and Service Plans for each class of shares. Certain classes pay Fidelity Distributors Company LLC (FDC), an affiliate of the investment adviser, separate Distribution and Service Fees, each of which is based on an annual percentage of each class' average net assets. In addition, FDC may pay financial intermediaries for selling shares of the Fund and providing shareholder support services. For the period, the Distribution and Service Fee rates, total fees and amounts retained by FDC were as follows:
| | Distribution Fee | Service Fee | Total Fees ($) | Retained by FDC ($) |
| Class A | - % | .25% | 332,005 | 2,068 |
| Class M | .25% | .25% | 169,116 | 338 |
| Class C | .75% | .25% | 90,863 | 7,866 |
| | | | 591,984 | 10,272 |
Sales Load. FDC may receive a front-end sales charge of up to 5.75% for selling Class A shares and 3.50% for selling Class M shares, some of which is paid to financial intermediaries for selling shares of the Fund. Depending on the holding period, FDC may receive contingent deferred sales charges levied on Class A, Class M and Class C redemptions. The deferred sales charges are 1.00% for Class C shares, 1.00% for certain purchases of Class A shares and .25% for certain purchases of Class M shares.
For the period, sales charge amounts retained by FDC were as follows:
| | Retained by FDC ($) |
| Class A | 12,252 |
| Class M | 864 |
Class CA | 79 |
| | 13,195 |
A When Class C shares are initially sold, FDC pays commissions from its own resources to financial intermediaries through which the sales are made.
Transfer Agent Fees. Fidelity Investments Institutional Operations Company LLC (FIIOC), an affiliate of the investment adviser, is the transfer, dividend disbursing and shareholder servicing agent for each class of the Fund. Effective March 1, 2024, the Fund's management contract was amended to incorporate transfer agent services and associated fees previously covered under a separate services agreement. FIIOC pays for typesetting, printing and mailing of shareholder reports, except proxy statements.
During the period December 1, 2023 through February 29, 2024, the transfer agent fees for each class were a fixed annual rate of class-level average net assets as follows:
| | % of Class-Level Average Net Assets | |
| Class A | .2000 | |
| Class M | .2000 | |
| Class C | .1874 | |
| Class I | .1732 | |
| Class Z | .0420 | |
| | |
| | | |
Prior to December 1, 2023, FIIOC received account fees and asset-based fees that varied according to the account size and type of account of the shareholders of the respective classes of the Fund, except for Class Z. FIIOC received an asset-based fee of Class Z's average net assets. For the portion of the reporting period prior to March 1, 2024, the fees were equivalent to the following annualized rates:
| | Amount ($) | % of Class-Level Average Net Assets |
| Class A | 85,161 | .20 |
| Class M | 22,247 | .21 |
| Class C | 5,673 | .19 |
| Class I | 82,816 | .17 |
| Class Z | 9,753 | .04 |
| 205,650 | |
Accounting Fees. Fidelity Service Company, Inc. (FSC), an affiliate of the investment adviser, maintains the Fund's accounting records. Effective March 1, 2024, the Fund's management contract was amended to incorporate accounting services and associated fees previously covered under a separate services agreement.
During the period December 1, 2023 through February 29, 2024, the accounting fees were a fixed annual rate of average net assets as follows:
| | % of Average Net Assets |
| Fidelity Advisor Emerging Asia Fund | .0497 |
Prior to December 1, 2023, the accounting fee was based on the level of average net assets for each month. For the portion of the reporting period prior to March 1, 2024, the fees were equivalent to the following annualized rates:
| | % of Average Net Assets |
| Fidelity Advisor Emerging Asia Fund | .05 |
Brokerage Commissions. A portion of portfolio transactions were placed with brokerage firms which are affiliates of the investment adviser. Brokerage commissions are included in net realized gain (loss) and change in net unrealized appreciation (depreciation) in the Statement of Operations. The commissions paid to these affiliated firms were as follows:
| | Amount ($) |
| Fidelity Advisor Emerging Asia Fund | 1,685 |
Interfund Lending Program. Pursuant to an Exemptive Order issued by the Securities and Exchange Commission (the SEC), the Fund, along with other registered investment companies having management contracts with Fidelity Management & Research Company LLC (FMR), or other affiliated entities of FMR, may participate in an interfund lending program. This program provides an alternative credit facility allowing the Fund to borrow from, or lend money to, other participating affiliated funds at rates that are beneficial to both the borrowing and lending fund. Borrowings under the program are generally for temporary or emergency purposes, including meeting fund shareholder redemptions. The interfund loan rate is determined, as specified in the Exemptive Order, by averaging, (1) the higher of the overnight time deposit rate and the current overnight repurchase agreement rate, and (2) a benchmark rate representing the lowest bank loan rate available to the funds. At period end, there were no interfund loans outstanding. Activity in this program during the period for which loans were outstanding was as follows:
| | Borrower or Lender | Average Loan Balance ($) | Weighted Average Interest Rate | Interest Expense ($) |
| Fidelity Advisor Emerging Asia Fund | Borrower | 3,310,714 | 5.57% | 3,583 |
Interfund Trades. Funds may purchase from or sell securities to other Fidelity Funds under procedures adopted by the Board. The procedures have been designed to ensure these interfund trades are executed in accordance with Rule 17a-7 of the 1940 Act. Any interfund trades are included within the respective purchases and sales amounts shown in the Purchases and Sales of Investments note. Interfund trades during the period are noted in the table below.
| | Purchases ($) | Sales ($) | Realized Gain (Loss)($) |
| Fidelity Advisor Emerging Asia Fund | 3,207,035 | 14,543,181 | 1,775,698 |
6. Committed Line of Credit.
Certain Funds participate with other funds managed by the investment adviser or an affiliate in a $4.25 billion credit facility (the "line of credit") to be utilized for temporary or emergency purposes to fund shareholder redemptions or for other short-term liquidity purposes. The participating funds have agreed to pay commitment fees on their pro-rata portion of the line of credit, which are reflected in Miscellaneous expenses on the Statement of Operations, and are listed below. During the period, there were no borrowings on this line of credit.
| | Amount ($) |
| Fidelity Advisor Emerging Asia Fund | 629 |
7. Security Lending.
Funds lend portfolio securities from time to time in order to earn additional income. Lending agents are used, including National Financial Services (NFS), an affiliate of the investment adviser. Pursuant to a securities lending agreement, NFS will receive a fee, which is capped at 9.9% of a fund's daily lending revenue, for its services as lending agent. A fund may lend securities to certain qualified borrowers, including NFS. On the settlement date of the loan, a fund receives collateral (in the form of U.S. Treasury obligations, letters of credit and/or cash) against the loaned securities and maintains collateral in an amount not less than 100% of the market value of the loaned securities during the period of the loan. The market value of the loaned securities is determined at the close of business of a fund and any additional required collateral is delivered to a fund on the next business day. A fund or borrower may terminate the loan at any time, and if the borrower defaults on its obligation to return the securities loaned because of insolvency or other reasons, a fund may apply collateral received from the borrower against the obligation. A fund may experience delays and costs in recovering the securities loaned. Any cash collateral received is invested in the Fidelity Securities Lending Cash Central Fund. Any loaned securities are identified as such in the Schedule of Investments, and the value of loaned securities and cash collateral at period end, as applicable, are presented in the Statement of Assets and Liabilities. Security lending income represents the income earned on investing cash collateral, less rebates paid to borrowers and any lending agent fees associated with the loan, plus any premium payments received for lending certain types of securities. Security lending income is presented in the Statement of Operations as a component of income from Fidelity Central Funds. Affiliated security lending activity, if any, was as follows:
| | Total Security Lending Fees Paid to NFS ($) | Security Lending Income From Securities Loaned to NFS ($) | Value of Securities Loaned to NFS at Period End ($) |
| Fidelity Advisor Emerging Asia Fund | 27,199 | 1 | - |
8. Expense Reductions.
Through arrangements with the Fund's custodian, credits realized as a result of certain uninvested cash balances were used to reduce the Fund's expenses. During the period, transfer agent credits reduced each class' expenses as noted in the table below.
| | Expense reduction ($) |
| | |
| Class M | 109 |
| | 109 |
In addition, during the period the investment adviser or an affiliate reimbursed and/or waived a portion of fund-level operating expenses in the amount of $17,119.
9. Share Transactions.
Share transactions for each class were as follows and may contain in-kind transactions, automatic conversions between classes or exchanges between affiliated funds:
| | Shares | Shares | Dollars | Dollars |
| | Year ended October 31, 2024 | Year ended October 31, 2023 | Year ended October 31, 2024 | Year ended October 31, 2023 |
| Fidelity Advisor Emerging Asia Fund | | | | |
| Class A | | | | |
| Shares sold | 191,381 | 281,898 | $7,914,072 | $10,325,265 |
| Shares redeemed | (649,067) | (728,232) | (26,255,484) | (26,132,011) |
| Net increase (decrease) | (457,686) | (446,334) | $(18,341,412) | $(15,806,746) |
| Class M | | | | |
| Shares sold | 38,179 | 82,598 | $1,502,781 | $2,883,095 |
| Shares redeemed | (140,440) | (128,553) | (5,379,693) | (4,423,525) |
| Net increase (decrease) | (102,261) | (45,955) | $(3,876,912) | $(1,540,430) |
| Class C | | | | |
| Shares sold | 26,601 | 54,577 | $903,320 | $1,704,473 |
| Shares redeemed | (89,219) | (117,545) | (3,063,176) | (3,620,432) |
| Net increase (decrease) | (62,618) | (62,968) | $(2,159,856) | $(1,915,959) |
| Class I | | | | |
| Shares sold | 1,139,290 | 2,605,228 | $52,290,478 | $100,199,113 |
| Shares redeemed | (1,896,959) | (3,131,075) | (79,983,582) | (117,071,474) |
| Net increase (decrease) | (757,669) | (525,847) | $(27,693,104) | $(16,872,361) |
| Class Z | | | | |
| Shares sold | 340,063 | 487,825 | $15,181,622 | $18,334,130 |
| Shares redeemed | (567,266) | (1,005,778) | (23,967,376) | (37,768,490) |
| Net increase (decrease) | (227,203) | (517,953) | $(8,785,754) | $(19,434,360) |
10. Other.
A fund's organizational documents provide former and current trustees and officers with a limited indemnification against liabilities arising in connection with the performance of their duties to the fund. In the normal course of business, a fund may also enter into contracts that provide general indemnifications. A fund's maximum exposure under these arrangements is unknown as this would be dependent on future claims that may be made against a fund. The risk of material loss from such claims is considered remote.
11. Risk and Uncertainties.
Many factors affect a fund's performance. Developments that disrupt global economies and financial markets, such as pandemics, epidemics, outbreaks of infectious diseases, war, terrorism, and environmental disasters, may significantly affect a fund's investment performance. The effects of these developments to a fund will be impacted by the types of securities in which a fund invests, the financial condition, industry, economic sector, and geographic location of an issuer, and a fund's level of investment in the securities of that issuer. Significant concentrations in security types, issuers, industries, sectors, and geographic locations may magnify the factors that affect a fund's performance.
Report of Independent Registered Public Accounting Firm
To the Board of Trustees of Fidelity Advisor Series VIII and Shareholders of Fidelity Advisor Emerging Asia Fund
Opinion on the Financial Statements
We have audited the accompanying statement of assets and liabilities, including the schedule of investments, of Fidelity Advisor Emerging Asia Fund (one of the funds constituting Fidelity Advisor Series VIII, referred to hereafter as the "Fund") as of October 31, 2024, the related statement of operations for the year ended October 31, 2024, the statement of changes in net assets for each of the two years in the period ended October 31, 2024, including the related notes, and the financial highlights for each of the five years in the period ended October 31, 2024 (collectively referred to as the "financial statements"). In our opinion, the financial statements present fairly, in all material respects, the financial position of the Fund as of October 31, 2024, the results of its operations for the year then ended, the changes in its net assets for each of the two years in the period ended October 31, 2024 and the financial highlights for each of the five years in the period ended October 31, 2024 in conformity with accounting principles generally accepted in the United States of America.
Basis for Opinion
These financial statements are the responsibility of the Fund's management. Our responsibility is to express an opinion on the Fund's financial statements based on our audits. We are a public accounting firm registered with the Public Company Accounting Oversight Board (United States) (PCAOB) and are required to be independent with respect to the Fund in accordance with the U.S. federal securities laws and the applicable rules and regulations of the Securities and Exchange Commission and the PCAOB.
We conducted our audits of these financial statements in accordance with the standards of the PCAOB. Those standards require that we plan and perform the audit to obtain reasonable assurance about whether the financial statements are free of material misstatement, whether due to error or fraud.
Our audits included performing procedures to assess the risks of material misstatement of the financial statements, whether due to error or fraud, and performing procedures that respond to those risks. Such procedures included examining, on a test basis, evidence regarding the amounts and disclosures in the financial statements. Our audits also included evaluating the accounting principles used and significant estimates made by management, as well as evaluating the overall presentation of the financial statements. Our procedures included confirmation of securities owned as of October 31, 2024 by correspondence with the custodian, issuers of privately offered securities and brokers; when replies were not received from brokers, we performed other auditing procedures. We believe that our audits provide a reasonable basis for our opinion.
/s/ PricewaterhouseCoopers LLP
Boston, Massachusetts
December 13, 2024
We have served as the auditor of one or more investment companies in the Fidelity group of funds since 1932.
Distributions
(Unaudited)The dividend and capital gains distributions for the fund(s) are available on Fidelity.com or Institutional.Fidelity.com.
The fund will notify shareholders in January 2025 of amounts for use in preparing 2024 income tax returns.
Item 8: Changes in and Disagreements with Accountants for Open-End Management Investment Companies
(Unaudited)
Note: This is not applicable for any fund included in this document.
Item 9: Proxy Disclosures for Open-End Management Investment Companies
(Unaudited)
| A special meeting of shareholders was held on July 16, 2024. The results of votes taken among shareholders on the proposal before them are reported below. Each vote reported represents one dollar of net asset value held on the record date for the meeting. |
| Proposal 1 |
| To elect a Board of Trustees. |
| | # of Votes | % of Votes |
| Bettina Doulton |
| Affirmative | 9,667,916,942.83 | 98.16 |
| Withheld | 181,261,836.48 | 1.84 |
| TOTAL | 9,849,178,779.31 | 100.00 |
| Robert A. Lawrence |
| Affirmative | 9,643,385,159.26 | 97.91 |
| Withheld | 205,793,620.05 | 2.09 |
| TOTAL | 9,849,178,779.31 | 100.00 |
| Vijay C. Advani |
| Affirmative | 9,650,856,015.95 | 97.99 |
| Withheld | 198,322,763.36 | 2.01 |
| TOTAL | 9,849,178,779.31 | 100.00 |
| Thomas P. Bostick |
| Affirmative | 9,653,685,826.52 | 98.02 |
| Withheld | 195,492,952.79 | 1.98 |
| TOTAL | 9,849,178,779.31 | 100.00 |
| Donald F. Donahue |
| Affirmative | 9,653,599,026.45 | 98.01 |
| Withheld | 195,579,752.86 | 1.99 |
| TOTAL | 9,849,178,779.31 | 100.00 |
| Vicki L. Fuller |
| Affirmative | 9,666,491,582.97 | 98.15 |
| Withheld | 182,687,196.34 | 1.85 |
| TOTAL | 9,849,178,779.31 | 100.00 |
| Patricia L. Kampling |
| Affirmative | 9,664,290,979.63 | 98.12 |
| Withheld | 184,887,799.68 | 1.88 |
| TOTAL | 9,849,178,779.31 | 100.00 |
| Thomas A. Kennedy |
| Affirmative | 9,646,944,497.07 | 97.95 |
| Withheld | 202,234,282.24 | 2.05 |
| TOTAL | 9,849,178,779.31 | 100.00 |
| Oscar Munoz |
| Affirmative | 9,652,669,495.50 | 98.00 |
| Withheld | 196,509,283.81 | 2.00 |
| TOTAL | 9,849,178,779.31 | 100.00 |
| Karen B. Peetz |
| Affirmative | 9,656,405,594.63 | 98.04 |
| Withheld | 192,773,184.68 | 1.96 |
| TOTAL | 9,849,178,779.31 | 100.00 |
| David M. Thomas |
| Affirmative | 9,644,713,946.63 | 97.92 |
| Withheld | 204,464,832.68 | 2.08 |
| TOTAL | 9,849,178,779.31 | 100.00 |
| Susan Tomasky |
| Affirmative | 9,654,121,207.44 | 98.02 |
| Withheld | 195,057,571.87 | 1.98 |
| TOTAL | 9,849,178,779.31 | 100.00 |
| Michael E. Wiley |
| Affirmative | 9,642,438,416.20 | 97.90 |
| Withheld | 206,740,363.11 | 2.10 |
| TOTAL | 9,849,178,779.31 | 100.00 |
| | | |
| Proposal 1 reflects trust-wide proposal and voting results. |
Item 10: Remuneration Paid to Directors, Officers, and others of Open-End Management Investment Companies
(Unaudited)
Note: This information is disclosed as part of the financial statements for each Fund as part of Item 7: Financial Statements and Financial Highlights for Open-End Management Investment companies.
Item 11: Statement Regarding Basis for Approval of Investment Advisory Contract
(Unaudited)
Board Approval of Investment Advisory Contracts and Management Fees
Fidelity Advisor Emerging Asia Fund
Each year, the Board of Trustees, including the Independent Trustees (together, the Board), considers the renewal of the fund's management contract with Fidelity Management & Research Company LLC (FMR) and certain affiliates and the sub-advisory agreements (together, the Advisory Contracts) for the fund. FMR and the sub-advisers are referred to herein as the Investment Advisers. The Board, assisted by the advice of fund counsel and Independent Trustees' counsel, requests and considers a broad range of information relevant to the renewal of the Advisory Contracts throughout the year.
The Board meets regularly and, at each of its meetings, covers an extensive agenda of topics and materials and considers factors that are relevant to its annual consideration of the renewal of the fund's Advisory Contracts, including the services and support provided to the fund and its shareholders. The Board, acting directly and through its Committees (each of which is composed of and chaired by Independent Trustees), requests and receives information concerning the annual consideration of the renewal of the fund's Advisory Contracts. The Board also meets as needed to review matters specifically related to the Board's annual consideration of the renewal of the Advisory Contracts. Members of the Board may also meet with trustees of other Fidelity funds through joint ad hoc committees to discuss certain matters relevant to all of the Fidelity funds.
At its May 2024 meeting, the Board unanimously determined to renew the fund's Advisory Contracts. In reaching its determination, the Board considered all factors it believed relevant, including (i) the nature, extent, and quality of the services provided to the fund and its shareholders (including the investment performance of the fund); (ii) the competitiveness relative to peer funds of the fund's management fee and the total expense ratio of a representative class (Class I, which was selected because it was the largest class without 12b-1 fees); (iii) the total costs of the services provided by and the profits realized by FMR and its affiliates (Fidelity) from its relationships with the fund; and (iv) the extent to which, if any, economies of scale exist and are realized as the fund grows, and whether any economies of scale are appropriately shared with fund shareholders. The Board also considered the broad range of investment choices available to shareholders from FMR's competitors and that the fund's shareholders have chosen to invest in the fund, which is part of the Fidelity family of funds. The Board's decision to renew the Advisory Contracts was not based on any single factor.
The Board reached a determination, with the assistance of fund counsel and Independent Trustees' counsel and through the exercise of its business judgment, that the renewal of the Advisory Contracts was in the best interests of the fund and its shareholders and that the compensation payable under the Advisory Contracts was fair and reasonable in light of all of the surrounding circumstances.
Nature, Extent, and Quality of Services Provided. The Board considered staffing as it relates to the fund, including the backgrounds and experience of investment personnel of the Investment Advisers, and also considered the Investment Advisers' implementation of the fund's investment program. The Independent Trustees also had discussions with senior management of Fidelity's investment operations and investment groups. The Board considered the structure of the investment personnel compensation program and whether this structure provides appropriate incentives to act in the best interests of the fund. Additionally, the Board considered the portfolio managers' investments, if any, in the funds that they manage.
Resources Dedicated to Investment Management and Support Services. The Board and the Fund Oversight and Research Committees reviewed the general qualifications and capabilities of Fidelity's investment staff, including its size, education, experience, and resources, as well as Fidelity's approach to recruiting, training, managing, and compensating investment personnel. The Board noted the resources devoted to expansion of Fidelity's global investment organization, and that Fidelity's analysts have extensive resources, tools and capabilities that allow them to conduct sophisticated quantitative and fundamental analysis, as well as credit analysis of issuers, counterparties and guarantors. Further, the Board considered that Fidelity's investment professionals have sufficient access to global information and data so as to provide competitive investment results over time, and that those professionals also have access to sophisticated tools that permit them to assess portfolio construction and risk and performance attribution characteristics continuously, as well as to transmit new information and research conclusions rapidly around the world. Additionally, in its deliberations, the Board considered Fidelity's trading, risk management, compliance, and technology and operations capabilities and resources, which are integral parts of the investment management process.
Shareholder and Administrative Services. The Board considered (i) the nature, extent, quality, and cost of advisory, administrative, shareholder, transfer agency, and pricing and bookkeeping services performed by the Investment Advisers and their affiliates under the Advisory Contracts; (ii) the nature and extent of Fidelity's supervision of third party service providers, principally custodians, subcustodians, and pricing vendors; and (iii) the resources devoted by Fidelity to, and the record of compliance with, the fund's compliance policies and procedures. The Board also reviewed the allocation of fund brokerage, including allocations to brokers affiliated with the Investment Advisers, the use of brokerage commissions to pay fund expenses, and the use of "soft" commission dollars to pay for research services. The Board also considered the fund's securities lending activities and any payments made to Fidelity relating to securities lending under a separate agreement.
The Board noted that the growth of fund assets over time across the complex allows Fidelity to reinvest in the development of services designed to enhance the value and convenience of the Fidelity funds as investment vehicles. These services include 24-hour access to account information and market information over the Internet and through telephone representatives, investor education materials and asset allocation tools. The Board also considered that it reviews customer service metrics such as telephone response times, continuity of services on the website and metrics addressing services at Fidelity Investor Centers.
Investment in a Large Fund Family. The Board considered the benefits to shareholders of investing in a fund that is part of a large family of funds offering a variety of investment disciplines and providing a large variety of fund investor services. The Board noted that Fidelity had taken, or had made recommendations that resulted in the Fidelity funds taking, a number of actions over the previous year that benefited particular funds and/or the Fidelity funds in general.
Investment Performance. The Board took into account discussions that occur with representatives of the Investment Advisers, and reports that it receives, at Board meetings throughout the year, relating to fund investment performance. In this regard the Board noted that as part of regularly scheduled fund reviews and other reports to the Board on fund performance, the Board considered annualized return information for the fund for different time periods, measured against an appropriate securities market index (benchmark index). The Board also considered information about performance attribution. In its ongoing evaluation of fund investment performance, the Board gives particular attention to information indicating changes in performance of the funds over different time periods and discussed with the Investment Advisers the reasons for any overperformance or underperformance.
In addition to reviewing absolute and relative fund performance, the Independent Trustees periodically consider the appropriateness of fund performance metrics in evaluating the results achieved. The Independent Trustees generally give greater weight to fund performance over longer time periods than over shorter time periods. Depending on the circumstances, the Independent Trustees may be satisfied with a fund's performance notwithstanding that it lags its benchmark index or peer group for certain periods.
Based on its review, the Board concluded that the nature, extent, and quality of services provided to the fund under the Advisory Contracts should continue to benefit the shareholders of the fund.
Competitiveness of Management Fee and Total Expense Ratio. The Board was provided with information regarding industry trends in management fees and expenses. The Board considered that, effective March 1, 2024, an amended Advisory Contract with FMR went into effect with class-level management fees based on tiered schedules and subject to a maximum class-level rate (the management fee). The Board also considered that in exchange for the variable management fee, each class of the fund receives investment advisory, management, administrative, transfer agent, and pricing and bookkeeping services. In its review of the management fee and total expense ratio of Class I, the Board considered a pro forma management fee rate for Class I as if it had been in effect for the 12-month period ended September 30, 2023, as well as other third-party fund expenses, as applicable, such as custodial, legal, and audit fees and any fund-paid 12b-1 fees. The Board noted that Fidelity may agree to waive fees or reimburse expenses from time to time, and the extent to which, if any, it has done so for the fund.
Comparisons of Management Fees and Total Expense Ratios. Among other things, the Board reviewed data for selected groups of competitive funds and classes (referred to as "mapped groups") that were compiled by Fidelity based on combining similar investment objective categories (as classified by Morningstar) that have comparable investment mandates. The data reviewed by the Board included (i) gross management fee comparisons (before taking into account expense reimbursements or caps) relative to the total universe of funds within the mapped group; (ii) gross management fee comparisons relative to a subset of non-Fidelity funds in the mapped group that are similar in size and management fee structure to the fund (referred to as the "asset size peer group"); (iii) total expense comparisons of Class I of the fund relative to funds and classes in the mapped group that have a similar sales load structure to Class I of the fund (referred to as the "similar sales load structure group"); and (iv) total expense comparisons of Class I of the fund relative to funds and classes in the similar sales load structure group that are similar in size and management fee structure to the fund (referred to as the "total expense asset size peer group"). The total expense asset size peer group comparison excludes performance adjustments and fund-paid 12b-1 fees to eliminate variability in fee structures.
The information provided to the Board indicated that the fund's management fee rate ranked below the competitive median of the mapped group for the 12-month period ended September 30, 2023 and below the competitive median of the asset size peer group for the 12-month period ended September 30, 2023. Further, the information provided to the Board indicated that the total expense ratio of Class I of the fund ranked below the competitive median of the similar sales load structure group for the 12-month period ended September 30, 2023 and below the competitive median of the total expense asset size peer group for the 12-month period ended September 30, 2023.
The Board noted that a different variable management fee rate is applicable to each class of the fund. The Board considered that the difference in management fee rates between classes is the result of separate arrangements for class-level services and/or waivers of certain expenses and not the result of any difference in advisory or custodial fees or other expenses related to the management of the fund's assets, which do not vary by class.
Fees Charged to Other Fidelity Clients. The Board also considered Fidelity fee structures and other information with respect to clients of Fidelity, such as other funds advised or subadvised by Fidelity, pension plan clients, and other institutional clients with similar mandates. The Board noted that a joint ad hoc committee created by it and the boards of other Fidelity funds periodically reviews and compares Fidelity's institutional investment advisory business with its business of providing services to the Fidelity funds and also noted the most recent findings of the committee. The Board noted that the committee's review included a consideration of the differences in services provided, fees charged, and costs incurred, as well as competition in the markets serving the different categories of clients.
Based on its review, the Board concluded that the fund's management fee is fair and reasonable in light of the services that the fund receives and the other factors considered. Further, based on its review of total expense ratios and fees charged to other Fidelity clients, the Board concluded that the total expense ratio of each class of the fund was reasonable in light of the services that the fund and its shareholders receive and the other factors considered.
Costs of the Services and Profitability. The Board considered the revenues earned and the expenses incurred by Fidelity in conducting the business of developing, marketing, distributing, managing, administering and servicing the fund and servicing the fund's shareholders. The Board also considered the level of Fidelity's profits in respect of all the Fidelity funds.
On an annual basis, Fidelity presents to the Board information about the profitability of its relationships with the fund. Fidelity calculates profitability information for each fund, as well as aggregate profitability information for groups of Fidelity funds and all Fidelity funds, using a series of detailed revenue and cost allocation methodologies which originate with the books and records of Fidelity on which Fidelity's audited financial statements are based. The Audit Committee of the Board reviews any significant changes from the prior year's methodologies.
A public accounting firm has been engaged annually by the Board as part of the Board's assessment of Fidelity's profitability analysis. The engagement includes the review and assessment of the methodologies used by Fidelity in determining the revenues and expenses attributable to Fidelity's fund business, and completion of agreed-upon procedures in respect of the mathematical accuracy of certain fund profitability information and its conformity to established allocation methodologies. After considering the reports issued under the engagement and information provided by Fidelity, the Board concluded that while other allocation methods may also be reasonable, Fidelity's profitability methodologies are reasonable in all material respects.
The Board also reviewed Fidelity's non-fund businesses and potential indirect benefits such businesses may have received as a result of their association with Fidelity's fund business (i.e., fall-out benefits) as well as cases where Fidelity's affiliates may benefit from the funds' business. The Board considered areas where potential indirect benefits to the Fidelity funds from their relationships with Fidelity may exist. The Board's consideration of these matters was informed by the findings of a joint ad hoc committee created by it and the boards of other Fidelity funds to evaluate potential fall-out benefits.
The Board considered the costs of the services provided by and the profits realized by Fidelity in connection with the operation of the fund and was satisfied that the profitability was not excessive.
Economies of Scale. The Board considered whether there have been economies of scale in respect of the management of the Fidelity funds, whether the Fidelity funds (including the fund) have appropriately benefited from any such economies of scale, and whether there is potential for realization of any further economies of scale. The Board considered the extent to which the fund will benefit from economies of scale as assets grow through increased services to the fund, through waivers or reimbursements, or through fee or expense ratio reductions. The Board also noted that a committee created by it and the boards of other Fidelity funds periodically analyzes whether Fidelity attains economies of scale in respect of the management and servicing of the Fidelity funds, whether the Fidelity funds have appropriately benefited from such economies of scale, and whether there is potential for realization of any further economies of scale.
The Board recognized that the fund's management contract incorporates a variable management fee structure, which provides breakpoints as a way to share, in part, any potential economies of scale that may exist at the asset class level and through a discount that considers both fund size and total assets of the four applicable asset classes. The Board considered that the variable management fee is designed to deliver the benefits of economies of scale to fund shareholders even if assets of any particular fund are unchanged or have declined, because some portion of Fidelity's costs are attributable to services provided to all funds subject to the variable management fee, and all such funds benefit if those costs can be allocated among more assets. The Board concluded that, given the variable management fee structure, fund shareholders will benefit from lower management fees due to the application of the breakpoints and discount factor, regardless of whether Fidelity achieves any such economies of scale.
The Board concluded, taking into account the analysis of the committee, that economies of scale, if any, are being appropriately shared between fund shareholders and Fidelity.
Additional Information Requested by the Board. In order to develop fully the factual basis for consideration of the Fidelity funds' advisory contracts, the Board requested and received additional information on certain topics, including but not limited to: (i) fund flow and performance trends, in particular the underperformance of certain funds and strategies, and Fidelity's long-term strategies for certain funds; (ii) the operation of performance fees and the rationale for implementing performance fees on certain categories of funds but not others; (iii) Fidelity's pricing philosophy compared to competitors; (iv) fund profitability methodology and data; (v) evaluation of competitive fund data and peer group classifications and fee and expense comparisons; (vi) the management fee and expense structures for different funds and classes and information about the differences between various fee and expense structures; (vii) the variable management fee implemented for certain funds effective March 1, 2024; and (viii) information regarding other accounts managed by Fidelity and the funds' sub-advisory arrangements.
Conclusion. Based on its evaluation of all of the conclusions noted above, and after considering all factors it believed relevant, the Board, including the Independent Trustees, concluded that the advisory and sub-advisory fee arrangements are fair and reasonable in light of all of the surrounding circumstances and that the fund's Advisory Contracts should be renewed through May 31, 2025.
1.703376.127
AEA-ANN-1224
Fidelity Advisor® Value Leaders Fund
Annual Report
October 31, 2024
Contents
To view a fund's proxy voting guidelines and proxy voting record for the 12-month period ended June 30, visit http://www.fidelity.com/proxyvotingresults or visit the Securities and Exchange Commission's (SEC) web site at http://www.sec.gov.
You may also call 1-877-208-0098 to request a free copy of the proxy voting guidelines.
Standard & Poor's, S&P and S&P 500 are registered service marks of The McGraw-Hill Companies, Inc. and have been licensed for use by Fidelity Distributors Corporation.
Other third-party marks appearing herein are the property of their respective owners.
All other marks appearing herein are registered or unregistered trademarks or service marks of FMR LLC or an affiliated company. © 2024 FMR LLC. All rights reserved.
This report and the financial statements contained herein are submitted for the general information of the shareholders of the Fund. This report is not authorized for distribution to prospective investors in the Fund unless preceded or accompanied by an effective prospectus.
A fund files its complete schedule of portfolio holdings with the SEC for the first and third quarters of each fiscal year on Form N-PORT. Forms N-PORT are available on the SEC's web site at http://www.sec.gov. A fund's Forms N-PORT may be reviewed and copied at the SEC's Public Reference Room in Washington, DC. Information regarding the operation of the SEC's Public Reference Room may be obtained by calling 1-800-SEC-0330.
For a complete list of a fund's portfolio holdings, view the most recent holdings listing, semiannual report, or annual report on Fidelity's web site at http://www.fidelity.com, http://www.institutional.fidelity.com, or http://www.401k.com, as applicable.
NOT FDIC INSURED •MAY LOSE VALUE •NO BANK GUARANTEE
Neither the Fund nor Fidelity Distributors Corporation is a bank.
Item 7: Financial Statements and Financial Highlights for Open-End Management Investment Companies (Annual Report)
Fidelity Advisor® Value Leaders Fund
Schedule of Investments October 31, 2024
Showing Percentage of Net Assets
| Common Stocks - 96.4% |
| | | Shares | Value ($) |
| COMMUNICATION SERVICES - 8.4% | | | |
| Entertainment - 3.1% | | | |
| The Walt Disney Co. | | 10,386 | 999,133 |
| Media - 5.3% | | | |
| Comcast Corp. Class A | | 39,282 | 1,715,445 |
TOTAL COMMUNICATION SERVICES | | | 2,714,578 |
| CONSUMER DISCRETIONARY - 3.8% | | | |
| Diversified Consumer Services - 3.8% | | | |
| H&R Block, Inc. | | 20,802 | 1,242,503 |
| CONSUMER STAPLES - 10.1% | | | |
| Beverages - 1.6% | | | |
| Keurig Dr. Pepper, Inc. | | 16,103 | 530,594 |
| Consumer Staples Distribution & Retail - 1.0% | | | |
| Alimentation Couche-Tard, Inc. (multi-vtg.) | | 6,201 | 323,377 |
| Food Products - 3.4% | | | |
| Mondelez International, Inc. | | 7,707 | 527,775 |
| Tyson Foods, Inc. Class A | | 9,862 | 577,815 |
| | | | 1,105,590 |
| Personal Care Products - 4.1% | | | |
| Kenvue, Inc. | | 57,495 | 1,318,360 |
TOTAL CONSUMER STAPLES | | | 3,277,921 |
| ENERGY - 9.2% | | | |
| Oil, Gas & Consumable Fuels - 9.2% | | | |
| Exxon Mobil Corp. | | 10,631 | 1,241,488 |
| Parex Resources, Inc. | | 48,900 | 454,108 |
| Shell PLC ADR | | 19,223 | 1,298,514 |
| | | | 2,994,110 |
| FINANCIALS - 21.2% | | | |
| Banks - 14.4% | | | |
| Bank of America Corp. | | 31,244 | 1,306,624 |
| JPMorgan Chase & Co. | | 5,628 | 1,248,966 |
| PNC Financial Services Group, Inc. | | 4,209 | 792,428 |
| U.S. Bancorp | | 10,168 | 491,216 |
| Wells Fargo & Co. | | 12,745 | 827,405 |
| | | | 4,666,639 |
| Insurance - 6.8% | | | |
| Chubb Ltd. | | 3,904 | 1,102,646 |
| The Travelers Companies, Inc. | | 4,538 | 1,116,076 |
| | | | 2,218,722 |
TOTAL FINANCIALS | | | 6,885,361 |
| HEALTH CARE - 16.8% | | | |
| Health Care Providers & Services - 15.0% | | | |
| Centene Corp. (a) | | 19,227 | 1,197,073 |
| Cigna Group | | 4,503 | 1,417,589 |
| Elevance Health, Inc. | | 874 | 354,634 |
| UnitedHealth Group, Inc. | | 3,392 | 1,914,786 |
| | | | 4,884,082 |
| Pharmaceuticals - 1.8% | | | |
| AstraZeneca PLC sponsored ADR | | 8,243 | 586,489 |
TOTAL HEALTH CARE | | | 5,470,571 |
| INDUSTRIALS - 7.9% | | | |
| Air Freight & Logistics - 1.0% | | | |
| FedEx Corp. | | 1,231 | 337,109 |
| Building Products - 1.1% | | | |
| Johnson Controls International PLC | | 4,824 | 364,453 |
| Electrical Equipment - 1.0% | | | |
| Regal Rexnord Corp. | | 1,942 | 323,421 |
| Industrial Conglomerates - 1.6% | | | |
| Siemens AG | | 2,598 | 505,441 |
| Machinery - 3.2% | | | |
| Deere & Co. | | 2,527 | 1,022,652 |
TOTAL INDUSTRIALS | | | 2,553,076 |
| INFORMATION TECHNOLOGY - 7.0% | | | |
| IT Services - 3.4% | | | |
| Amdocs Ltd. | | 12,528 | 1,099,269 |
| Software - 3.6% | | | |
| Gen Digital, Inc. | | 40,360 | 1,174,880 |
TOTAL INFORMATION TECHNOLOGY | | | 2,274,149 |
| MATERIALS - 2.0% | | | |
| Chemicals - 2.0% | | | |
| CF Industries Holdings, Inc. | | 4,115 | 338,376 |
| Nutrien Ltd. | | 6,276 | 299,240 |
| | | | 637,616 |
| UTILITIES - 10.0% | | | |
| Electric Utilities - 6.3% | | | |
| Edison International | | 9,639 | 794,254 |
| PG&E Corp. | | 62,254 | 1,258,776 |
| | | | 2,053,030 |
| Multi-Utilities - 3.7% | | | |
| National Grid PLC | | 53,493 | 671,666 |
| Sempra | | 6,158 | 513,392 |
| | | | 1,185,058 |
TOTAL UTILITIES | | | 3,238,088 |
| TOTAL COMMON STOCKS (Cost $24,311,925) | | | 31,287,973 |
| | | | |
| Nonconvertible Preferred Stocks - 2.6% |
| | | Shares | Value ($) |
| INFORMATION TECHNOLOGY - 2.6% | | | |
| Technology Hardware, Storage & Peripherals - 2.6% | | | |
Samsung Electronics Co. Ltd. (Cost $984,756) | | 24,762 | 854,610 |
| | | | |
| Money Market Funds - 0.6% |
| | | Shares | Value ($) |
Fidelity Cash Central Fund 4.87% (b) (Cost $173,620) | | 173,586 | 173,620 |
| | | | |
| TOTAL INVESTMENT IN SECURITIES - 99.6% (Cost $25,470,301) | 32,316,203 |
NET OTHER ASSETS (LIABILITIES) - 0.4% | 135,629 |
| NET ASSETS - 100.0% | 32,451,832 |
| | |
Legend
| (b) | Affiliated fund that is generally available only to investment companies and other accounts managed by Fidelity Investments. The rate quoted is the annualized seven-day yield of the fund at period end. A complete unaudited listing of the fund's holdings as of its most recent quarter end is available upon request. In addition, each Fidelity Central Fund's financial statements, which are not covered by the Fund's Report of Independent Registered Public Accounting Firm, are available on the SEC's website or upon request. |
Affiliated Central Funds
Fiscal year to date information regarding the Fund's investments in Fidelity Central Funds, including the ownership percentage, is presented below.
| Affiliate | Value, beginning of period ($) | Purchases ($) | Sales Proceeds ($) | Dividend Income ($) | Realized Gain (loss) ($) | Change in Unrealized appreciation (depreciation) ($) | Value, end of period ($) | % ownership, end of period |
| Fidelity Cash Central Fund 4.87% | 604,938 | 9,032,630 | 9,463,986 | 40,514 | 38 | - | 173,620 | 0.0% |
| Total | 604,938 | 9,032,630 | 9,463,986 | 40,514 | 38 | - | 173,620 | |
| | | | | | | | | |
Amounts in the dividend income column in the above table include any capital gain distributions from underlying funds, which are presented in the corresponding line item in the Statement of Operations, if applicable.
Amounts included in the purchases and sales proceeds columns may include in-kind transactions, if applicable.
Investment Valuation
The following is a summary of the inputs used, as of October 31, 2024, involving the Fund's assets and liabilities carried at fair value. The inputs or methodology used for valuing securities may not be an indication of the risk associated with investing in those securities. For more information on valuation inputs, and their aggregation into the levels used below, please refer to the Investment Valuation section in the accompanying Notes to Financial Statements.
| Valuation Inputs at Reporting Date: |
| Description | Total ($) | Level 1 ($) | Level 2 ($) | Level 3 ($) |
Investments in Securities: | | | | |
|
| Equities: | | | | |
Communication Services | 2,714,578 | 2,714,578 | - | - |
Consumer Discretionary | 1,242,503 | 1,242,503 | - | - |
Consumer Staples | 3,277,921 | 3,277,921 | - | - |
Energy | 2,994,110 | 2,994,110 | - | - |
Financials | 6,885,361 | 6,885,361 | - | - |
Health Care | 5,470,571 | 5,470,571 | - | - |
Industrials | 2,553,076 | 2,047,635 | 505,441 | - |
Information Technology | 3,128,759 | 2,274,149 | 854,610 | - |
Materials | 637,616 | 637,616 | - | - |
Utilities | 3,238,088 | 2,566,422 | 671,666 | - |
|
| Money Market Funds | 173,620 | 173,620 | - | - |
| Total Investments in Securities: | 32,316,203 | 30,284,486 | 2,031,717 | - |
Financial Statements
| Statement of Assets and Liabilities |
As of October 31, 2024 |
| Assets | | | | |
| Investment in securities, at value - See accompanying schedule: | | | | |
Unaffiliated issuers (cost $25,296,681) | $ | 32,142,583 | | |
Fidelity Central Funds (cost $173,620) | | 173,620 | | |
| | | | | |
| | | | | |
| Total Investment in Securities (cost $25,470,301) | | | $ | 32,316,203 |
| Cash | | | | 21,918 |
| Receivable for investments sold | | | | 160,034 |
| Receivable for fund shares sold | | | | 744 |
| Dividends receivable | | | | 30,874 |
| Distributions receivable from Fidelity Central Funds | | | | 2,546 |
| Prepaid expenses | | | | 41 |
Total assets | | | | 32,532,360 |
| Liabilities | | | | |
| Payable for fund shares redeemed | $ | 8,584 | | |
| Accrued management fee | | 21,767 | | |
| Distribution and service plan fees payable | | 8,750 | | |
| Audit fee payable | | 40,830 | | |
| Other payables and accrued expenses | | 597 | | |
| Total liabilities | | | | 80,528 |
| Net Assets | | | $ | 32,451,832 |
| Net Assets consist of: | | | | |
| Paid in capital | | | $ | 22,612,582 |
| Total accumulated earnings (loss) | | | | 9,839,250 |
| Net Assets | | | $ | 32,451,832 |
| | | | | |
| Net Asset Value and Maximum Offering Price | | | | |
| Class A : | | | | |
Net Asset Value and redemption price per share ($20,389,633 ÷ 886,525 shares)(a) | | | $ | 23.00 |
| Maximum offering price per share (100/94.25 of $23.00) | | | $ | 24.40 |
| Class M : | | | | |
Net Asset Value and redemption price per share ($5,610,095 ÷ 242,886 shares)(a) | | | $ | 23.10 |
| Maximum offering price per share (100/96.50 of $23.10) | | | $ | 23.94 |
| Class C : | | | | |
Net Asset Value and offering price per share ($2,300,334 ÷ 103,755 shares)(a) | | | $ | 22.17 |
| Class I : | | | | |
Net Asset Value, offering price and redemption price per share ($4,151,770 ÷ 179,101 shares) | | | $ | 23.18 |
(a)Redemption price per share is equal to net asset value less any applicable contingent deferred sales charge. |
| Statement of Operations |
| Year ended October 31, 2024 |
| Investment Income | | | | |
| Dividends | | | $ | 752,824 |
| Income from Fidelity Central Funds | | | | 40,514 |
| Total income | | | | 793,338 |
| Expenses | | | | |
| Management fee | | | | |
| Basic fee | $ | 220,535 | | |
| Performance adjustment | | 29,367 | | |
| Transfer agent fees | | 21,178 | | |
| Distribution and service plan fees | | 103,519 | | |
| Accounting fees and expenses | | 3,916 | | |
| Custodian fees and expenses | | 2,785 | | |
| Independent trustees' fees and expenses | | 155 | | |
| Registration fees | | 55,024 | | |
| Audit fees | | 46,502 | | |
| Legal | | 1,425 | | |
| Miscellaneous | | 834 | | |
| Total expenses before reductions | | 485,240 | | |
| Expense reductions | | (77,957) | | |
| Total expenses after reductions | | | | 407,283 |
| Net Investment income (loss) | | | | 386,055 |
| Realized and Unrealized Gain (Loss) | | | | |
| Net realized gain (loss) on: | | | | |
| Investment Securities: | | | | |
| Unaffiliated issuers | | 2,807,580 | | |
| Fidelity Central Funds | | 38 | | |
| Foreign currency transactions | | 190 | | |
| Total net realized gain (loss) | | | | 2,807,808 |
| Change in net unrealized appreciation (depreciation) on: | | | | |
| Investment Securities: | | | | |
| Unaffiliated issuers | | 2,405,988 | | |
| Assets and liabilities in foreign currencies | | 17 | | |
| Total change in net unrealized appreciation (depreciation) | | | | 2,406,005 |
| Net gain (loss) | | | | 5,213,813 |
| Net increase (decrease) in net assets resulting from operations | | | $ | 5,599,868 |
| Statement of Changes in Net Assets |
| |
| | Year ended October 31, 2024 | | Year ended October 31, 2023 |
| Increase (Decrease) in Net Assets | | | | |
| Operations | | | | |
| Net investment income (loss) | $ | 386,055 | $ | 397,037 |
| Net realized gain (loss) | | 2,807,808 | | 1,233,023 |
| Change in net unrealized appreciation (depreciation) | | 2,406,005 | | (1,681,317) |
| Net increase (decrease) in net assets resulting from operations | | 5,599,868 | | (51,257) |
| Distributions to shareholders | | (1,690,795) | | (767,694) |
| | | | | |
| Share transactions - net increase (decrease) | | (3,182,801) | | (6,072,225) |
| Total increase (decrease) in net assets | | 726,272 | | (6,891,176) |
| | | | | |
| Net Assets | | | | |
| Beginning of period | | 31,725,560 | | 38,616,736 |
| End of period | $ | 32,451,832 | $ | 31,725,560 |
| | | | | |
| | | | | |
Financial Highlights
Fidelity Advisor® Value Leaders Fund Class A |
| |
| Years ended October 31, | | 2024 | | 2023 | | 2022 | | 2021 | | 2020 |
Selected Per-Share Data | | | | | | | | | | |
| Net asset value, beginning of period | $ | 20.54 | $ | 20.97 | $ | 22.22 | $ | 15.67 | $ | 18.62 |
| Income from Investment Operations | | | | | | | | | | |
Net investment income (loss) A,B | | .26 | | .23 | | .17 | | .17 | | .15 |
| Net realized and unrealized gain (loss) | | 3.33 | | (.26) | | .18 | | 6.49 | | (2.81) |
| Total from investment operations | | 3.59 | | (.03) | | .35 | | 6.66 | | (2.66) |
| Distributions from net investment income | | (.29) | | (.13) | | (.15) | | (.11) | | (.20) |
| Distributions from net realized gain | | (.84) | | (.27) | | (1.45) | | - | | (.09) |
| Total distributions | | (1.13) | | (.40) | | (1.60) | | (.11) | | (.29) |
| Net asset value, end of period | $ | 23.00 | $ | 20.54 | $ | 20.97 | $ | 22.22 | $ | 15.67 |
Total Return C,D | | | | (.21)% | | 1.92% | | 42.68% | | (14.57)% |
Ratios to Average Net Assets A,E,F | | | | | | | | | | |
| Expenses before reductions | | 1.38% | | 1.41% | | 1.29% | | 1.27% | | 1.35% |
| Expenses net of fee waivers, if any | | | | 1.14% | | 1.15% | | 1.15% | | 1.25% |
| Expenses net of all reductions | | 1.14% | | 1.14% | | 1.15% | | 1.15% | | 1.24% |
| Net investment income (loss) | | 1.19% | | 1.11% | | .83% | | .83% | | .91% |
| Supplemental Data | | | | | | | | | | |
| Net assets, end of period (000 omitted) | $ | 20,390 | $ | 18,484 | $ | 20,328 | $ | 16,513 | $ | 10,954 |
Portfolio turnover rate G | | | | 40% | | 39% | | 51% | | 144% |
ANet investment income (loss) is affected by the timing of the declaration of dividends by any underlying mutual funds or exchange-traded funds (ETFs). Net investment income (loss) of any mutual funds or ETFs is not included in the Fund's net investment income (loss) ratio.
BCalculated based on average shares outstanding during the period.
CTotal returns would have been lower if certain expenses had not been reduced during the applicable periods shown.
DTotal returns do not include the effect of the sales charges.
EFees and expenses of any underlying mutual funds or exchange-traded funds (ETFs) are not included in the Fund's expense ratio. The Fund indirectly bears its proportionate share of these expenses. For additional expense information related to investments in Fidelity Central Funds, please refer to the "Investments in Fidelity Central Funds" note found in the Notes to Financial Statements section of the most recent Annual or Semi-Annual report.
FExpense ratios reflect operating expenses of the class. Expenses before reductions do not reflect amounts reimbursed, waived, or reduced through arrangements with the investment adviser, brokerage services, or other offset arrangements, if applicable, and do not represent the amount paid by the class during periods when reimbursements, waivers or reductions occur.
GAmount does not include the portfolio activity of any underlying mutual funds or exchange-traded funds (ETFs).
Fidelity Advisor® Value Leaders Fund Class M |
| |
| Years ended October 31, | | 2024 | | 2023 | | 2022 | | 2021 | | 2020 |
Selected Per-Share Data | | | | | | | | | | |
| Net asset value, beginning of period | $ | 20.62 | $ | 21.05 | $ | 22.30 | $ | 15.72 | $ | 18.68 |
| Income from Investment Operations | | | | | | | | | | |
Net investment income (loss) A,B | | .21 | | .18 | | .12 | | .12 | | .11 |
| Net realized and unrealized gain (loss) | | 3.34 | | (.26) | | .17 | | 6.52 | | (2.83) |
| Total from investment operations | | 3.55 | | (.08) | | .29 | | 6.64 | | (2.72) |
| Distributions from net investment income | | (.23) | | (.08) | | (.09) | | (.06) | | (.15) |
| Distributions from net realized gain | | (.84) | | (.27) | | (1.45) | | - | | (.09) |
| Total distributions | | (1.07) | | (.35) | | (1.54) | | (.06) | | (.24) |
| Net asset value, end of period | $ | 23.10 | $ | 20.62 | $ | 21.05 | $ | 22.30 | $ | 15.72 |
Total Return C,D | | | | (.43)% | | 1.63% | | 42.32% | | (14.79)% |
Ratios to Average Net Assets B,E,F | | | | | | | | | | |
| Expenses before reductions | | 1.62% | | 1.65% | | 1.55% | | 1.54% | | 1.64% |
| Expenses net of fee waivers, if any | | | | 1.40% | | 1.40% | | 1.41% | | 1.50% |
| Expenses net of all reductions | | 1.39% | | 1.39% | | 1.40% | | 1.41% | | 1.49% |
| Net investment income (loss) | | .94% | | .86% | | .57% | | .57% | | .66% |
| Supplemental Data | | | | | | | | | | |
| Net assets, end of period (000 omitted) | $ | 5,610 | $ | 5,376 | $ | 5,569 | $ | 5,275 | $ | 3,821 |
Portfolio turnover rate G | | | | 40% | | 39% | | 51% | | 144% |
ACalculated based on average shares outstanding during the period.
BNet investment income (loss) is affected by the timing of the declaration of dividends by any underlying mutual funds or exchange-traded funds (ETFs). Net investment income (loss) of any mutual funds or ETFs is not included in the Fund's net investment income (loss) ratio.
CTotal returns would have been lower if certain expenses had not been reduced during the applicable periods shown.
DTotal returns do not include the effect of the sales charges.
EFees and expenses of any underlying mutual funds or exchange-traded funds (ETFs) are not included in the Fund's expense ratio. The Fund indirectly bears its proportionate share of these expenses. For additional expense information related to investments in Fidelity Central Funds, please refer to the "Investments in Fidelity Central Funds" note found in the Notes to Financial Statements section of the most recent Annual or Semi-Annual report.
FExpense ratios reflect operating expenses of the class. Expenses before reductions do not reflect amounts reimbursed, waived, or reduced through arrangements with the investment adviser, brokerage services, or other offset arrangements, if applicable, and do not represent the amount paid by the class during periods when reimbursements, waivers or reductions occur.
GAmount does not include the portfolio activity of any underlying mutual funds or exchange-traded funds (ETFs).
Fidelity Advisor® Value Leaders Fund Class C |
| |
| Years ended October 31, | | 2024 | | 2023 | | 2022 | | 2021 | | 2020 |
Selected Per-Share Data | | | | | | | | | | |
| Net asset value, beginning of period | $ | 19.81 | $ | 20.29 | $ | 21.49 | $ | 15.18 | $ | 17.99 |
| Income from Investment Operations | | | | | | | | | | |
Net investment income (loss) A,B | | .09 | | .07 | | .02 | | .01 | | .03 |
| Net realized and unrealized gain (loss) | | 3.22 | | (.26) | | .18 | | 6.30 | | (2.75) |
| Total from investment operations | | 3.31 | | (.19) | | .20 | | 6.31 | | (2.72) |
| Distributions from net investment income | | (.12) | | (.02) | | - | | - | | - |
| Distributions from net realized gain | | (.84) | | (.27) | | (1.40) | | - | | (.09) |
| Total distributions | | (.95) C | | (.29) | | (1.40) | | - | | (.09) |
| Net asset value, end of period | $ | 22.17 | $ | 19.81 | $ | 20.29 | $ | 21.49 | $ | 15.18 |
Total Return D,E | | | | (.99)% | | 1.19% | | 41.57% | | (15.22)% |
Ratios to Average Net Assets B,F,G | | | | | | | | | | |
| Expenses before reductions | | 2.14% | | 2.21% | | 2.10% | | 2.09% | | 2.18% |
| Expenses net of fee waivers, if any | | | | 1.90% | | 1.90% | | 1.93% | | 2.00% |
| Expenses net of all reductions | | 1.89% | | 1.90% | | 1.89% | | 1.93% | | 1.99% |
| Net investment income (loss) | | .44% | | .36% | | .08% | | .05% | | .16% |
| Supplemental Data | | | | | | | | | | |
| Net assets, end of period (000 omitted) | $ | 2,300 | $ | 2,469 | $ | 2,847 | $ | 1,875 | $ | 1,763 |
Portfolio turnover rate H | | | | 40% | | 39% | | 51% | | 144% |
ACalculated based on average shares outstanding during the period.
BNet investment income (loss) is affected by the timing of the declaration of dividends by any underlying mutual funds or exchange-traded funds (ETFs). Net investment income (loss) of any mutual funds or ETFs is not included in the Fund's net investment income (loss) ratio.
CTotal distributions per share do not sum due to rounding.
DTotal returns would have been lower if certain expenses had not been reduced during the applicable periods shown.
ETotal returns do not include the effect of the contingent deferred sales charge.
FFees and expenses of any underlying mutual funds or exchange-traded funds (ETFs) are not included in the Fund's expense ratio. The Fund indirectly bears its proportionate share of these expenses. For additional expense information related to investments in Fidelity Central Funds, please refer to the "Investments in Fidelity Central Funds" note found in the Notes to Financial Statements section of the most recent Annual or Semi-Annual report.
GExpense ratios reflect operating expenses of the class. Expenses before reductions do not reflect amounts reimbursed, waived, or reduced through arrangements with the investment adviser, brokerage services, or other offset arrangements, if applicable, and do not represent the amount paid by the class during periods when reimbursements, waivers or reductions occur.
HAmount does not include the portfolio activity of any underlying mutual funds or exchange-traded funds (ETFs).
Fidelity Advisor® Value Leaders Fund Class I |
| |
| Years ended October 31, | | 2024 | | 2023 | | 2022 | | 2021 | | 2020 |
Selected Per-Share Data | | | | | | | | | | |
| Net asset value, beginning of period | $ | 20.70 | $ | 21.12 | $ | 22.39 | $ | 15.80 | $ | 18.78 |
| Income from Investment Operations | | | | | | | | | | |
Net investment income (loss) A,B | | .32 | | .29 | | .22 | | .23 | | .20 |
| Net realized and unrealized gain (loss) | | 3.34 | | (.27) | | .18 | | 6.54 | | (2.82) |
| Total from investment operations | | 3.66 | | .02 | | .40 | | 6.77 | | (2.62) |
| Distributions from net investment income | | (.35) | | (.17) | | (.22) | | (.18) | | (.27) |
| Distributions from net realized gain | | (.84) | | (.27) | | (1.45) | | - | | (.09) |
| Total distributions | | (1.18) C | | (.44) | | (1.67) | | (.18) | | (.36) |
| Net asset value, end of period | $ | 23.18 | $ | 20.70 | $ | 21.12 | $ | 22.39 | $ | 15.80 |
Total Return D | | | | .05% | | 2.16% | | 43.08% | | (14.31)% |
Ratios to Average Net Assets B,E,F | | | | | | | | | | |
| Expenses before reductions | | 1.07% | | 1.08% | | .94% | | .94% | | .99% |
| Expenses net of fee waivers, if any | | | | .90% | | .89% | | .87% | | .99% |
| Expenses net of all reductions | | .89% | | .90% | | .89% | | .87% | | .98% |
| Net investment income (loss) | | 1.44% | | 1.36% | | 1.08% | | 1.11% | | 1.17% |
| Supplemental Data | | | | | | | | | | |
| Net assets, end of period (000 omitted) | $ | 4,152 | $ | 5,397 | $ | 9,872 | $ | 3,041 | $ | 1,898 |
Portfolio turnover rate G | | | | 40% | | 39% | | 51% | | 144% |
ACalculated based on average shares outstanding during the period.
BNet investment income (loss) is affected by the timing of the declaration of dividends by any underlying mutual funds or exchange-traded funds (ETFs). Net investment income (loss) of any mutual funds or ETFs is not included in the Fund's net investment income (loss) ratio.
CTotal distributions per share do not sum due to rounding.
DTotal returns would have been lower if certain expenses had not been reduced during the applicable periods shown.
EFees and expenses of any underlying mutual funds or exchange-traded funds (ETFs) are not included in the Fund's expense ratio. The Fund indirectly bears its proportionate share of these expenses. For additional expense information related to investments in Fidelity Central Funds, please refer to the "Investments in Fidelity Central Funds" note found in the Notes to Financial Statements section of the most recent Annual or Semi-Annual report.
FExpense ratios reflect operating expenses of the class. Expenses before reductions do not reflect amounts reimbursed, waived, or reduced through arrangements with the investment adviser, brokerage services, or other offset arrangements, if applicable, and do not represent the amount paid by the class during periods when reimbursements, waivers or reductions occur.
GAmount does not include the portfolio activity of any underlying mutual funds or exchange-traded funds (ETFs).
Notes to Financial Statements
For the period ended October 31, 2024
1. Organization.
Fidelity Advisor Value Leaders Fund (the Fund) is a fund of Fidelity Advisor Series VIII (the Trust) and is authorized to issue an unlimited number of shares. The Trust is registered under the Investment Company Act of 1940, as amended (the 1940 Act), as an open-end management investment company organized as a Massachusetts business trust. The Fund offers Class A, Class M, Class C and Class I shares, each of which has equal rights as to assets and voting privileges. Class A, Class M, Class C and Class I are Fidelity Advisor classes. Each class has exclusive voting rights with respect to matters that affect that class. Class C shares will automatically convert to Class A shares after a holding period of eight years from the initial date of purchase, with certain exceptions.
2. Investments in Fidelity Central Funds.
Funds may invest in Fidelity Central Funds, which are open-end investment companies generally available only to other investment companies and accounts managed by the investment adviser and its affiliates. The Schedule of Investments lists any Fidelity Central Funds held as an investment as of period end, but does not include the underlying holdings of each Fidelity Central Fund. An investing fund indirectly bears its proportionate share of the expenses of the underlying Fidelity Central Funds.
Based on its investment objective, each Fidelity Central Fund may invest or participate in various investment vehicles or strategies that are similar to those of the investing fund. These strategies are consistent with the investment objectives of the investing fund and may involve certain economic risks which may cause a decline in value of each of the Fidelity Central Funds and thus a decline in the value of the investing fund.
| Fidelity Central Fund | Investment Manager | Investment Objective | Investment Practices | Expense RatioA |
| Fidelity Money Market Central Funds | Fidelity Management & Research Company LLC (FMR) | Each fund seeks to obtain a high level of current income consistent with the preservation of capital and liquidity. | Short-term Investments | Less than .005% |
A Expenses expressed as a percentage of average net assets and are as of each underlying Central Fund's most recent annual or semi-annual shareholder report.
A complete unaudited list of holdings for each Fidelity Central Fund is available upon request or at the Securities and Exchange Commission website at www.sec.gov. In addition, the financial statements of the Fidelity Central Funds which contain the significant accounting policies (including investment valuation policies) of those funds, and are not covered by the Report of Independent Registered Public Accounting Firm, are available on the Securities and Exchange Commission website or upon request.
3. Significant Accounting Policies.
The Fund is an investment company and applies the accounting and reporting guidance of the Financial Accounting Standards Board (FASB) Accounting Standards Codification Topic 946 Financial Services - Investment Companies. The financial statements have been prepared in conformity with accounting principles generally accepted in the United States of America (GAAP), which require management to make certain estimates and assumptions at the date of the financial statements. Actual results could differ from those estimates. Subsequent events, if any, through the date that the financial statements were issued have been evaluated in the preparation of the financial statements. The Fund's Schedule of Investments lists any underlying mutual funds or exchange-traded funds (ETFs) but does not include the underlying holdings of these funds. The following summarizes the significant accounting policies of the Fund:
Investment Valuation. Investments are valued as of 4:00 p.m. Eastern time on the last calendar day of the period. The Board of Trustees (the Board) has designated the Fund's investment adviser as the valuation designee responsible for the fair valuation function and performing fair value determinations as needed. The investment adviser has established a Fair Value Committee (the Committee) to carry out the day-to-day fair valuation responsibilities and has adopted policies and procedures to govern the fair valuation process and the activities of the Committee. In accordance with these fair valuation policies and procedures, which have been approved by the Board, the Fund attempts to obtain prices from one or more third party pricing services or brokers to value its investments. When current market prices, quotations or currency exchange rates are not readily available or reliable, investments will be fair valued in good faith by the Committee, in accordance with the policies and procedures. Factors used in determining fair value vary by investment type and may include market or investment specific events, transaction data, estimated cash flows, and market observations of comparable investments. The frequency that the fair valuation procedures are used cannot be predicted and they may be utilized to a significant extent. The Committee manages the Fund's fair valuation practices and maintains the fair valuation policies and procedures. The Fund's investment adviser reports to the Board information regarding the fair valuation process and related material matters.
The Fund categorizes the inputs to valuation techniques used to value its investments into a disclosure hierarchy consisting of three levels as shown below:
Level 1 - unadjusted quoted prices in active markets for identical investments
Level 2 - other significant observable inputs (including quoted prices for similar investments, interest rates, prepayment speeds, etc.)
Level 3 - unobservable inputs (including the Fund's own assumptions based on the best information available)
Valuation techniques used to value the Fund's investments by major category are as follows:
Equity securities, including restricted securities, for which market quotations are readily available, are valued at the last reported sale price or official closing price as reported by a third party pricing service on the primary market or exchange on which they are traded and are categorized as Level 1 in the hierarchy. In the event there were no sales during the day or closing prices are not available, securities are valued at the last quoted bid price or may be valued using the last available price and are generally categorized as Level 2 in the hierarchy. For foreign equity securities, when market or security specific events arise, comparisons to the valuation of American Depositary Receipts (ADRs), futures contracts, Exchange-Traded Funds (ETFs) and certain indexes as well as quoted prices for similar securities may be used and would be categorized as Level 2 in the hierarchy. For equity securities, including restricted securities, where observable inputs are limited, assumptions about market activity and risk are used and these securities may be categorized as Level 3 in the hierarchy.
Investments in open-end mutual funds, including the Fidelity Central Funds, are valued at their closing net asset value (NAV) each business day and are categorized as Level 1 in the hierarchy.
Changes in valuation techniques may result in transfers in or out of an assigned level within the disclosure hierarchy. The aggregate value of investments by input level as of October 31, 2024 is included at the end of the Fund's Schedule of Investments.
Foreign Currency. Certain Funds may use foreign currency contracts to facilitate transactions in foreign-denominated securities. Gains and losses from these transactions may arise from changes in the value of the foreign currency or if the counterparties do not perform under the contracts' terms.
Foreign-denominated assets, including investment securities, and liabilities are translated into U.S. dollars at the exchange rates at period end. Purchases and sales of investment securities, income and dividends received, and expenses denominated in foreign currencies are translated into U.S. dollars at the exchange rate in effect on the transaction date.
The effects of exchange rate fluctuations on investments are included with the net realized and unrealized gain (loss) on investment securities. Other foreign currency transactions resulting in realized and unrealized gain (loss) are disclosed separately.
Investment Transactions and Income. For financial reporting purposes, the Fund's investment holdings and NAV include trades executed through the end of the last business day of the period. The NAV per share for processing shareholder transactions is calculated as of the close of business of the New York Stock Exchange (NYSE), normally 4:00 p.m. Eastern time and includes trades executed through the end of the prior business day. Gains and losses on securities sold are determined on the basis of identified cost and include proceeds received from litigation. Commissions paid to certain brokers with whom the investment adviser, or its affiliates, places trades on behalf of a fund include an amount in addition to trade execution, which may be rebated back to a fund. Any such rebates are included in net realized gain (loss) on investments in the Statement of Operations. Dividend income is recorded on the ex-dividend date, except for certain dividends from foreign securities where the ex-dividend date may have passed, which are recorded as soon as the Fund is informed of the ex-dividend date. Non-cash dividends included in dividend income, if any, are recorded at the fair market value of the securities received. Income and capital gain distributions from Fidelity Central Funds, if any, are recorded on the ex-dividend date. Investment income is recorded net of foreign taxes withheld where recovery of such taxes is uncertain. Funds may file withholding tax reclaims in certain jurisdictions to recover a portion of amounts previously withheld. Any withholding tax reclaims income is included in the Statement of Operations in dividends. Any receivables for withholding tax reclaims are included in the Statement of Assets and Liabilities in dividends receivable.
Class Allocations and Expenses. Investment income, realized and unrealized capital gains and losses, common expenses of a fund, and certain fund-level expense reductions, if any, are allocated daily on a pro-rata basis to each class based on the relative net assets of each class to the total net assets of a fund. Each class differs with respect to transfer agent and distribution and service plan fees incurred, as applicable. Certain expense reductions may also differ by class, if applicable. For the reporting period, the allocated portion of income and expenses to each class as a percent of its average net assets may vary due to the timing of recording these transactions in relation to fluctuating net assets of the classes. Expenses directly attributable to a fund are charged to that fund. Expenses attributable to more than one fund are allocated among the respective funds on the basis of relative net assets or other appropriate methods. Expenses included in the accompanying financial statements reflect the expenses of that fund and do not include any expenses associated with any underlying mutual funds or exchange-traded funds (ETFs). Although not included in a fund's expenses, a fund indirectly bears its proportionate share of these expenses through the net asset value of each underlying mutual fund or exchange-traded fund (ETF). Expense estimates are accrued in the period to which they relate and adjustments are made when actual amounts are known.
Income Tax Information and Distributions to Shareholders. Each year, the Fund intends to qualify as a regulated investment company under Subchapter M of the Internal Revenue Code, including distributing substantially all of its taxable income and realized gains. As a result, no provision for U.S. Federal income taxes is required. As of October 31, 2024, the Fund did not have any unrecognized tax benefits in the financial statements; nor is the Fund aware of any tax positions for which it is reasonably possible that the total amounts of unrecognized tax benefits will significantly change in the next twelve months. The Fund files a U.S. federal tax return, in addition to state and local tax returns as required. The Fund's federal income tax returns are subject to examination by the Internal Revenue Service (IRS) for a period of three fiscal years after they are filed. State and local tax returns may be subject to examination for an additional fiscal year depending on the jurisdiction. Foreign taxes are provided for based on the Fund's understanding of the tax rules and rates that exist in the foreign markets in which it invests.
Distributions are declared and recorded on the ex-dividend date. Income and capital gain distributions are declared separately for each class. Income and capital gain distributions are determined in accordance with income tax regulations, which may differ from GAAP.
Capital accounts within the financial statements are adjusted for permanent book-tax differences. These adjustments have no impact on net assets or the results of operations. Capital accounts are not adjusted for temporary book-tax differences which will reverse in a subsequent period.
Book-tax differences are primarily due to foreign currency transactions and losses deferred due to wash sales.
As of period end, the cost and unrealized appreciation (depreciation) in securities, and derivatives if applicable, for federal income tax purposes were as follows:
| Gross unrealized appreciation | $7,722,939 |
| Gross unrealized depreciation | (938,012) |
| Net unrealized appreciation (depreciation) | $6,784,927 |
| Tax Cost | $25,531,276 |
The tax-based components of distributable earnings as of period end were as follows:
| Undistributed ordinary income | $295,566 |
| Undistributed long-term capital gain | $2,758,638 |
| Net unrealized appreciation (depreciation) on securities and other investments | $6,785,047 |
The tax character of distributions paid was as follows:
| | October 31, 2024 | October 31, 2023 |
| Ordinary Income | $851,828 | $ 242,274 |
| Long-term Capital Gains | 838,967 | 525,420 |
| Total | $1,690,795 | $ 767,694 |
New Accounting Pronouncement. In November 2023, the FASB issued Accounting Standards Update (ASU) 2023-07 Segment Reporting (Topic 280): Improvements to Reportable Segment Disclosures. Effective for fiscal years beginning after December 15, 2023 and interim periods within fiscal years beginning after December 15, 2024, the amendments enhance required disclosures of segment information for public entities on an annual and interim basis. The ASU allows for early adoption with updates applied retrospectively. Management is currently evaluating the impact of the ASU but does not expect this guidance to materially impact the financial statements.
4. Purchases and Sales of Investments.
Purchases and sales of securities, other than short-term securities and in-kind transactions, as applicable, are noted in the table below.
| | Purchases ($) | Sales ($) |
| Fidelity Advisor Value Leaders Fund | 10,688,462 | 14,614,991 |
5. Fees and Other Transactions with Affiliates.
Management Fee. Fidelity Management & Research Company LLC (the investment adviser) and its affiliates provide the Fund with investment management related services for which the Fund pays a monthly management fee.
Effective March 1, 2024, the Fund's management contract was amended to incorporate administrative services previously covered under separate services agreements (Transfer Agent and Accounting agreements). The amended contract incorporates a basic fee rate that may vary by class (subject to a performance adjustment). The investment adviser or an affiliate pays certain expenses of managing and operating the Fund out of each class's management fee. Each class of the Fund pays a management fee to the investment adviser. The management fee is calculated and paid to the investment adviser every month. The management fee is determined by calculating a basic fee and then applying a performance adjustment. When determining a class's basic fee, a mandate rate is calculated based on the monthly average net assets of a group of funds advised by FMR within a designated asset class. A discount rate is subtracted from the mandate rate once the Fund's monthly average net assets reach a certain level. The mandate rate and discount rate may vary by class. The annual basic fee rate for a class of shares of the Fund is the lesser of (1) the class's mandate rate reduced by the class's discount rate (if applicable) or (2) the amount set forth in the following table.
| | Maximum Management Fee Rate % |
| Class A | .72 |
| Class M | .71 |
| Class C | .72 |
| Class I | .66 |
One-twelfth of the basic fee rate for a class is applied to the average net assets of the class for the month, giving a dollar amount which is the basic fee for the class for that month. A different management fee rate may be applicable to each class of the Fund. The difference between classes is the result of separate arrangements for class-level services and/or waivers of certain expenses. It is not the result of any difference in advisory or custodial fees or other expenses related to the management of the Fund's assets, which do not vary by class. For the portion of the reporting period on or after March 1, 2024, the total annualized management fee rates were as follows:
| | Total Management Fee Rate % |
| Class A | .72 |
| Class M | .71 |
| Class C | .72 |
| Class I | .66 |
Prior to March 1, 2024, the management fee was the sum of an individual fund fee rate that was based on an annual rate of .30% of the Fund's average net assets and an annualized group fee rate that averaged .22% during the period. The group fee rate was based upon the monthly average net assets of a group of registered investment companies with which the investment adviser has management contracts. The group fee rate decreased as assets under management increased and increased as assets under management decreased. For the portion of the reporting period prior to March 1, 2024, the total annualized management fee rate was .52%.
The performance adjustment rate is calculated monthly by comparing over the performance period the Fund's performance to that of the performance adjustment index listed below.
| | Performance Adjustment Index |
| Fidelity Advisor Value Leaders Fund | Russell 1000 Value Index |
For the purposes of calculating the performance adjustment for the Fund, the Fund's investment performance is based on the performance of Class I. To the extent that other classes of the Fund have higher expenses, this could result in those classes bearing a larger positive performance adjustment and smaller negative performance adjustment than would be the case if each class's own performance were considered. The performance period is the most recent 36 month period. The maximum annualized performance adjustment rate is ±.20% of the Fund's average net assets over the performance period. The performance adjustment rate is divided by twelve and multiplied by the Fund's average net assets over the performance period, and the resulting dollar amount is proportionately added to or subtracted from a class's basic fee. For the entire reporting period, the total annual performance adjustment was .09%.
Effective March 1, 2024, the Fund's sub-advisory agreements with FMR Investment Management (UK) Limited, Fidelity Management & Research (Hong Kong) Limited, and Fidelity Management & Research (Japan) Limited were amended to provide that the investment adviser pays each sub-adviser monthly fees equal to 110% of the sub-adviser's costs for providing sub-advisory services.
Distribution and Service Plan Fees. In accordance with Rule 12b-1 of the 1940 Act, the Fund has adopted separate Distribution and Service Plans for each class of shares. Certain classes pay Fidelity Distributors Company LLC (FDC), an affiliate of the investment adviser, separate Distribution and Service Fees, each of which is based on an annual percentage of each class' average net assets. In addition, FDC may pay financial intermediaries for selling shares of the Fund and providing shareholder support services. For the period, the Distribution and Service Fee rates, total fees and amounts retained by FDC were as follows:
| | Distribution Fee | Service Fee | Total Fees ($) | Retained by FDC ($) | |
| Class A | - % | .25% | 50,968 | 938 | |
| Class M | .25% | .25% | 28,298 | 41 | |
| Class C | .75% | .25% | 24,253 | 2,659 | |
| | | | 103,519 | 3,638 | |
Sales Load. FDC may receive a front-end sales charge of up to 5.75% for selling Class A shares and 3.50% for selling Class M shares, some of which is paid to financial intermediaries for selling shares of the Fund. Depending on the holding period, FDC may receive contingent deferred sales charges levied on Class A, Class M and Class C redemptions. The deferred sales charges are 1.00% for Class C shares, 1.00% for certain purchases of Class A shares and .25% for certain purchases of Class M shares.
For the period, sales charge amounts retained by FDC were as follows:
| | Retained by FDC ($) |
| Class A | 4,690 |
| Class M | 320 |
Class CA | 201 |
| | 5,211 |
A When Class C shares are initially sold, FDC pays commissions from its own resources to financial intermediaries through which the sales are made.
Transfer Agent Fees. Fidelity Investments Institutional Operations Company LLC (FIIOC), an affiliate of the investment adviser, is the transfer, dividend disbursing and shareholder servicing agent for each class of the Fund. Effective March 1, 2024, the Fund's management contract was amended to incorporate transfer agent services and associated fees previously covered under a separate services agreement. FIIOC pays for typesetting, printing and mailing of shareholder reports, except proxy statements.
During the period December 1, 2023 through February 29, 2024, the transfer agent fees for each class were a fixed annual rate of class-level average net assets as follows:
| | % of Class-Level Average Net Assets | |
| Class A | .2000 | |
| Class M | .1933 | |
| Class C | .2000 | |
| Class I | .1412 | |
| | |
| | | |
Prior to December 1, 2023, FIIOC received account fees and asset-based fees that varied according to the account size and type of account of the shareholders of the respective classes of the Fund. For the portion of the reporting period prior to March 1, 2024, the fees were equivalent to the following annualized rates:
| | Amount ($) | % of Class-Level Average Net Assets |
| Class A | 13,147 | .20 |
| Class M | 3,627 | .19 |
| Class C | 1,794 | .21 |
| Class I | 2,610 | .14 |
| 21,178 | |
Accounting Fees. Fidelity Service Company, Inc. (FSC), an affiliate of the investment adviser, maintains the Fund's accounting records. Effective March 1, 2024, the Fund's management contract was amended to incorporate accounting services and associated fees previously covered under a separate services agreement.
During the period December 1, 2023 through February 29, 2024, the accounting fees were a fixed annual rate of average net assets as follows:
| | % of Average Net Assets |
| Fidelity Advisor Value Leaders Fund | 0.0354 |
Prior to December 1, 2023, the accounting fee was based on the level of average net assets for each month. For the portion of the reporting period prior to March 1, 2024, the fees were equivalent to the following annualized rates:
| | % of Average Net Assets |
| Fidelity Advisor Value Leaders Fund | .04 |
Brokerage Commissions. A portion of portfolio transactions were placed with brokerage firms which are affiliates of the investment adviser. Brokerage commissions are included in net realized gain (loss) and change in net unrealized appreciation (depreciation) in the Statement of Operations. The commissions paid to these affiliated firms were as follows:
| | Amount ($) |
| Fidelity Advisor Value Leaders Fund | 111 |
Interfund Trades. Funds may purchase from or sell securities to other Fidelity Funds under procedures adopted by the Board. The procedures have been designed to ensure these interfund trades are executed in accordance with Rule 17a-7 of the 1940 Act. Any interfund trades are included within the respective purchases and sales amounts shown in the Purchases and Sales of Investments note. Interfund trades during the period are noted in the table below.
| | Purchases ($) | Sales ($) | Realized Gain (Loss)($) |
| Fidelity Advisor Value Leaders Fund | 996,927 | 1,102,180 | 63,725 |
6. Committed Line of Credit.
Certain Funds participate with other funds managed by the investment adviser or an affiliate in a $4.25 billion credit facility (the "line of credit") to be utilized for temporary or emergency purposes to fund shareholder redemptions or for other short-term liquidity purposes. The participating funds have agreed to pay commitment fees on their pro-rata portion of the line of credit, which are reflected in Miscellaneous expenses on the Statement of Operations, and are listed below. During the period, there were no borrowings on this line of credit.
| | Amount ($) |
| Fidelity Advisor Value Leaders Fund | 54 |
7. Expense Reductions.
The investment adviser contractually agreed to reimburse expenses of each class to the extent annual operating expenses exceeded certain levels of class-level average net assets as noted in the table below. This reimbursement will remain in place through February 28, 2026. Some expenses, for example the compensation of the independent Trustees, and certain miscellaneous expenses such as proxy and shareholder meeting expenses, are excluded from this reimbursement.
The following classes were in reimbursement during the period:
| | Expense Limitations | Reimbursement ($) |
| Class A | 1.15% | 46,060 |
| Class M | 1.40% | 12,406 |
| Class C | 1.90% | 5,836 |
| Class I | .90% | 9,576 |
| | | 73,878 |
Through arrangements with the Fund's custodian, credits realized as a result of certain uninvested cash balances were used to reduce the Fund's expenses. During the period, custodian credits reduced the Fund's expenses by $2,587.
In addition, during the period the investment adviser or an affiliate reimbursed and/or waived a portion of fund-level operating expenses in the amount of $1,492.
8. Distributions to Shareholders.
Distributions to shareholders of each class were as follows:
| | Year ended October 31, 2024 | Year ended October 31, 2023 |
| Fidelity Advisor Value Leaders Fund | | |
| Distributions to shareholders | | |
| Class A | $996,266 | $392,714 |
| Class M | 278,249 | 101,153 |
| Class C | 116,715 | 43,995 |
| Class I | 299,565 | 229,832 |
Total | $1,690,795 | $767,694 |
9. Share Transactions.
Share transactions for each class were as follows and may contain in-kind transactions, automatic conversions between classes or exchanges between affiliated funds:
| | Shares | Shares | Dollars | Dollars |
| | Year ended October 31, 2024 | Year ended October 31, 2023 | Year ended October 31, 2024 | Year ended October 31, 2023 |
| Fidelity Advisor Value Leaders Fund | | | | |
| Class A | | | | |
| Shares sold | 104,532 | 191,201 | $2,300,788 | $4,013,617 |
| Reinvestment of distributions | 47,737 | 18,365 | 979,093 | 386,214 |
| Shares redeemed | (165,731) | (279,017) | (3,672,368) | (5,815,069) |
| Net increase (decrease) | (13,462) | (69,451) | $(392,487) | $(1,415,238) |
| Class M | | | | |
| Shares sold | 24,106 | 62,208 | $545,486 | $1,314,625 |
| Reinvestment of distributions | 13,265 | 4,759 | 273,788 | 100,652 |
| Shares redeemed | (55,253) | (70,749) | (1,235,122) | (1,475,048) |
| Net increase (decrease) | (17,882) | (3,782) | $(415,848) | $(59,771) |
| Class C | | | | |
| Shares sold | 14,503 | 42,856 | $307,709 | $873,648 |
| Reinvestment of distributions | 5,865 | 2,154 | 116,715 | 43,995 |
| Shares redeemed | (41,219) | (60,744) | (872,635) | (1,220,460) |
| Net increase (decrease) | (20,851) | (15,734) | $(448,211) | $(302,817) |
| Class I | | | | |
| Shares sold | 27,338 | 133,971 | $626,350 | $2,861,829 |
| Reinvestment of distributions | 14,510 | 10,836 | 299,341 | 229,069 |
| Shares redeemed | (123,521) | (351,523) | (2,851,946) | (7,385,297) |
| Net increase (decrease) | (81,673) | (206,716) | $(1,926,255) | $(4,294,399) |
10. Other.
A fund's organizational documents provide former and current trustees and officers with a limited indemnification against liabilities arising in connection with the performance of their duties to the fund. In the normal course of business, a fund may also enter into contracts that provide general indemnifications. A fund's maximum exposure under these arrangements is unknown as this would be dependent on future claims that may be made against a fund. The risk of material loss from such claims is considered remote.
11. Risk and Uncertainties.
Many factors affect a fund's performance. Developments that disrupt global economies and financial markets, such as pandemics, epidemics, outbreaks of infectious diseases, war, terrorism, and environmental disasters, may significantly affect a fund's investment performance. The effects of these developments to a fund will be impacted by the types of securities in which a fund invests, the financial condition, industry, economic sector, and geographic location of an issuer, and a fund's level of investment in the securities of that issuer. Significant concentrations in security types, issuers, industries, sectors, and geographic locations may magnify the factors that affect a fund's performance.
Report of Independent Registered Public Accounting Firm
To the Board of Trustees of Fidelity Advisor Series VIII and Shareholders of Fidelity Advisor Value Leaders Fund
Opinion on the Financial Statements
We have audited the accompanying statement of assets and liabilities, including the schedule of investments, of Fidelity Advisor Value Leaders Fund (one of the funds constituting Fidelity Advisor Series VIII, referred to hereafter as the "Fund") as of October 31, 2024, the related statement of operations for the year ended October 31, 2024, the statement of changes in net assets for each of the two years in the period ended October 31, 2024, including the related notes, and the financial highlights for each of the five years in the period ended October 31, 2024 (collectively referred to as the "financial statements"). In our opinion, the financial statements present fairly, in all material respects, the financial position of the Fund as of October 31, 2024, the results of its operations for the year then ended, the changes in its net assets for each of the two years in the period ended October 31, 2024 and the financial highlights for each of the five years in the period ended October 31, 2024 in conformity with accounting principles generally accepted in the United States of America.
Basis for Opinion
These financial statements are the responsibility of the Fund's management. Our responsibility is to express an opinion on the Fund's financial statements based on our audits. We are a public accounting firm registered with the Public Company Accounting Oversight Board (United States) (PCAOB) and are required to be independent with respect to the Fund in accordance with the U.S. federal securities laws and the applicable rules and regulations of the Securities and Exchange Commission and the PCAOB.
We conducted our audits of these financial statements in accordance with the standards of the PCAOB. Those standards require that we plan and perform the audit to obtain reasonable assurance about whether the financial statements are free of material misstatement, whether due to error or fraud.
Our audits included performing procedures to assess the risks of material misstatement of the financial statements, whether due to error or fraud, and performing procedures that respond to those risks. Such procedures included examining, on a test basis, evidence regarding the amounts and disclosures in the financial statements. Our audits also included evaluating the accounting principles used and significant estimates made by management, as well as evaluating the overall presentation of the financial statements. Our procedures included confirmation of securities owned as of October 31, 2024 by correspondence with the custodian. We believe that our audits provide a reasonable basis for our opinion.
/s/ PricewaterhouseCoopers LLP
Boston, Massachusetts
December 16, 2024
We have served as the auditor of one or more investment companies in the Fidelity group of funds since 1932.
Distributions
(Unaudited)The dividend and capital gains distributions for the fund(s) are available on Fidelity.com or Institutional.Fidelity.com.
The fund hereby designates as a capital gain dividend with respect to the taxable year ended October 31, 2024, $2,759,849, or, if subsequently determined to be different, the net capital gain of such year.
The fund designates 99.84% of the short-term capital gain dividend distributed during the fiscal year as qualifying to be taxed as short-term capital gain dividends for nonresident alien shareholders.
The fund designates $26,250 of distributions paid during the fiscal year ended 2024 as qualifying to be taxed as section 163(j) interest dividends.
Class A designates 74%; Class M designates 82%; Class C designates 100%; and Class I designates 67%; of the dividend distributed during the fiscal year as qualifying for the dividends-received deduction for corporate shareholders.
Class A designates 95.89%; Class M designates 100%; Class C designates 100%; and Class I designates 87.38%; of the dividend distributed during the fiscal year as amounts which may be taken into account as a dividend for purposes of the maximum rate under section 1(h)(11) of the Internal Revenue Code.
The fund will notify shareholders in January 2025 of amounts for use in preparing 2024 income tax returns.
Item 8: Changes in and Disagreements with Accountants for Open-End Management Investment Companies
(Unaudited)
Note: This is not applicable for any fund included in this document.
Item 9: Proxy Disclosures for Open-End Management Investment Companies
(Unaudited)
| A special meeting of shareholders was held on July 16, 2024. The results of votes taken among shareholders on the proposal before them are reported below. Each vote reported represents one dollar of net asset value held on the record date for the meeting. |
| Proposal 1 |
| To elect a Board of Trustees. |
| | # of Votes | % of Votes |
| Bettina Doulton |
| Affirmative | 9,667,916,942.83 | 98.16 |
| Withheld | 181,261,836.48 | 1.84 |
| TOTAL | 9,849,178,779.31 | 100.00 |
| Robert A. Lawrence |
| Affirmative | 9,643,385,159.26 | 97.91 |
| Withheld | 205,793,620.05 | 2.09 |
| TOTAL | 9,849,178,779.31 | 100.00 |
| Vijay C. Advani |
| Affirmative | 9,650,856,015.95 | 97.99 |
| Withheld | 198,322,763.36 | 2.01 |
| TOTAL | 9,849,178,779.31 | 100.00 |
| Thomas P. Bostick |
| Affirmative | 9,653,685,826.52 | 98.02 |
| Withheld | 195,492,952.79 | 1.98 |
| TOTAL | 9,849,178,779.31 | 100.00 |
| Donald F. Donahue |
| Affirmative | 9,653,599,026.45 | 98.01 |
| Withheld | 195,579,752.86 | 1.99 |
| TOTAL | 9,849,178,779.31 | 100.00 |
| Vicki L. Fuller |
| Affirmative | 9,666,491,582.97 | 98.15 |
| Withheld | 182,687,196.34 | 1.85 |
| TOTAL | 9,849,178,779.31 | 100.00 |
| Patricia L. Kampling |
| Affirmative | 9,664,290,979.63 | 98.12 |
| Withheld | 184,887,799.68 | 1.88 |
| TOTAL | 9,849,178,779.31 | 100.00 |
| Thomas A. Kennedy |
| Affirmative | 9,646,944,497.07 | 97.95 |
| Withheld | 202,234,282.24 | 2.05 |
| TOTAL | 9,849,178,779.31 | 100.00 |
| Oscar Munoz |
| Affirmative | 9,652,669,495.50 | 98.00 |
| Withheld | 196,509,283.81 | 2.00 |
| TOTAL | 9,849,178,779.31 | 100.00 |
| Karen B. Peetz |
| Affirmative | 9,656,405,594.63 | 98.04 |
| Withheld | 192,773,184.68 | 1.96 |
| TOTAL | 9,849,178,779.31 | 100.00 |
| David M. Thomas |
| Affirmative | 9,644,713,946.63 | 97.92 |
| Withheld | 204,464,832.68 | 2.08 |
| TOTAL | 9,849,178,779.31 | 100.00 |
| Susan Tomasky |
| Affirmative | 9,654,121,207.44 | 98.02 |
| Withheld | 195,057,571.87 | 1.98 |
| TOTAL | 9,849,178,779.31 | 100.00 |
| Michael E. Wiley |
| Affirmative | 9,642,438,416.20 | 97.90 |
| Withheld | 206,740,363.11 | 2.10 |
| TOTAL | 9,849,178,779.31 | 100.00 |
| | | |
| Proposal 1 reflects trust-wide proposal and voting results. |
Item 10: Remuneration Paid to Directors, Officers, and others of Open-End Management Investment Companies
(Unaudited)
Note: This information is disclosed as part of the financial statements for each Fund as part of Item 7: Financial Statements and Financial Highlights for Open-End Management Investment companies.
Item 11: Statement Regarding Basis for Approval of Investment Advisory Contract
(Unaudited)
Board Approval of Investment Advisory Contracts and Management Fees
Fidelity Advisor Value Leaders Fund
Each year, the Board of Trustees, including the Independent Trustees (together, the Board), considers the renewal of the fund's management contract with Fidelity Management & Research Company LLC (FMR) and certain affiliates and the sub-advisory agreements (together, the Advisory Contracts) for the fund. FMR and the sub-advisers are referred to herein as the Investment Advisers. The Board, assisted by the advice of fund counsel and Independent Trustees' counsel, requests and considers a broad range of information relevant to the renewal of the Advisory Contracts throughout the year.
The Board meets regularly and, at each of its meetings, covers an extensive agenda of topics and materials and considers factors that are relevant to its annual consideration of the renewal of the fund's Advisory Contracts, including the services and support provided to the fund and its shareholders. The Board, acting directly and through its Committees (each of which is composed of and chaired by Independent Trustees), requests and receives information concerning the annual consideration of the renewal of the fund's Advisory Contracts. The Board also meets as needed to review matters specifically related to the Board's annual consideration of the renewal of the Advisory Contracts. Members of the Board may also meet with trustees of other Fidelity funds through joint ad hoc committees to discuss certain matters relevant to all of the Fidelity funds.
At its May 2024 meeting, the Board unanimously determined to renew the fund's Advisory Contracts. In reaching its determination, the Board considered all factors it believed relevant, including (i) the nature, extent, and quality of the services provided to the fund and its shareholders (including the investment performance of the fund); (ii) the competitiveness relative to peer funds of the fund's management fee and the total expense ratio of a representative class (Class I, which was selected because it was the largest class without 12b-1 fees); (iii) the total costs of the services provided by and the profits realized by FMR and its affiliates (Fidelity) from its relationships with the fund; and (iv) the extent to which, if any, economies of scale exist and are realized as the fund grows, and whether any economies of scale are appropriately shared with fund shareholders. The Board also considered the broad range of investment choices available to shareholders from FMR's competitors and that the fund's shareholders have chosen to invest in the fund, which is part of the Fidelity family of funds. The Board's decision to renew the Advisory Contracts was not based on any single factor.
The Board reached a determination, with the assistance of fund counsel and Independent Trustees' counsel and through the exercise of its business judgment, that the renewal of the Advisory Contracts was in the best interests of the fund and its shareholders and that the compensation payable under the Advisory Contracts was fair and reasonable in light of all of the surrounding circumstances.
Nature, Extent, and Quality of Services Provided. The Board considered staffing as it relates to the fund, including the backgrounds and experience of investment personnel of the Investment Advisers, and also considered the Investment Advisers' implementation of the fund's investment program. The Independent Trustees also had discussions with senior management of Fidelity's investment operations and investment groups. The Board considered the structure of the investment personnel compensation program and whether this structure provides appropriate incentives to act in the best interests of the fund. Additionally, the Board considered the portfolio managers' investments, if any, in the funds that they manage.
Resources Dedicated to Investment Management and Support Services. The Board and the Fund Oversight and Research Committees reviewed the general qualifications and capabilities of Fidelity's investment staff, including its size, education, experience, and resources, as well as Fidelity's approach to recruiting, training, managing, and compensating investment personnel. The Board noted the resources devoted to expansion of Fidelity's global investment organization, and that Fidelity's analysts have extensive resources, tools and capabilities that allow them to conduct sophisticated quantitative and fundamental analysis, as well as credit analysis of issuers, counterparties and guarantors. Further, the Board considered that Fidelity's investment professionals have sufficient access to global information and data so as to provide competitive investment results over time, and that those professionals also have access to sophisticated tools that permit them to assess portfolio construction and risk and performance attribution characteristics continuously, as well as to transmit new information and research conclusions rapidly around the world. Additionally, in its deliberations, the Board considered Fidelity's trading, risk management, compliance, and technology and operations capabilities and resources, which are integral parts of the investment management process.
Shareholder and Administrative Services. The Board considered (i) the nature, extent, quality, and cost of advisory, administrative, shareholder, transfer agency, and pricing and bookkeeping services performed by the Investment Advisers and their affiliates under the Advisory Contracts; (ii) the nature and extent of Fidelity's supervision of third party service providers, principally custodians, subcustodians, and pricing vendors; and (iii) the resources devoted by Fidelity to, and the record of compliance with, the fund's compliance policies and procedures. The Board also reviewed the allocation of fund brokerage, including allocations to brokers affiliated with the Investment Advisers, the use of brokerage commissions to pay fund expenses, and the use of "soft" commission dollars to pay for research services. The Board also considered the fund's securities lending activities and any payments made to Fidelity relating to securities lending under a separate agreement.
The Board noted that the growth of fund assets over time across the complex allows Fidelity to reinvest in the development of services designed to enhance the value and convenience of the Fidelity funds as investment vehicles. These services include 24-hour access to account information and market information over the Internet and through telephone representatives, investor education materials and asset allocation tools. The Board also considered that it reviews customer service metrics such as telephone response times, continuity of services on the website and metrics addressing services at Fidelity Investor Centers.
Investment in a Large Fund Family. The Board considered the benefits to shareholders of investing in a fund that is part of a large family of funds offering a variety of investment disciplines and providing a large variety of fund investor services. The Board noted that Fidelity had taken, or had made recommendations that resulted in the Fidelity funds taking, a number of actions over the previous year that benefited particular funds and/or the Fidelity funds in general.
Investment Performance. The Board took into account discussions that occur with representatives of the Investment Advisers, and reports that it receives, at Board meetings throughout the year, relating to fund investment performance. In this regard the Board noted that as part of regularly scheduled fund reviews and other reports to the Board on fund performance, the Board considered annualized return information for the fund for different time periods, measured against an appropriate securities market index (benchmark index) and an appropriate peer group of funds with similar objectives (peer group). The Board also considered information about performance attribution. In its ongoing evaluation of fund investment performance, the Board gives particular attention to information indicating changes in performance of the funds over different time periods and discussed with the Investment Advisers the reasons for any overperformance or underperformance.
In addition to reviewing absolute and relative fund performance, the Independent Trustees periodically consider the appropriateness of fund performance metrics in evaluating the results achieved. The Independent Trustees generally give greater weight to fund performance over longer time periods than over shorter time periods. Depending on the circumstances, the Independent Trustees may be satisfied with a fund's performance notwithstanding that it lags its benchmark index or peer group for certain periods.
Based on its review, the Board concluded that the nature, extent, and quality of services provided to the fund under the Advisory Contracts should continue to benefit the shareholders of the fund.
Competitiveness of Management Fee and Total Expense Ratio. The Board was provided with information regarding industry trends in management fees and expenses. The Board considered that, effective March 1, 2024, an amended Advisory Contract with FMR went into effect with class-level management fees based on tiered schedules and subject to a maximum class-level rate (the management fee). The Board also considered that in exchange for the variable management fee, each class of the fund receives investment advisory, management, administrative, transfer agent, and pricing and bookkeeping services. In its review of the management fee and total expense ratio of Class I, the Board considered a pro forma management fee rate for Class I as if it had been in effect for the 12-month period ended September 30, 2023, as well as other third-party fund expenses, as applicable, such as custodial, legal, and audit fees and any fund-paid 12b-1 fees. The Board noted that Fidelity may agree to waive fees or reimburse expenses from time to time, and the extent to which, if any, it has done so for the fund. The Board also considered information about the impact of the fund's performance adjustment.
Comparisons of Management Fees and Total Expense Ratios. Among other things, the Board reviewed data for selected groups of competitive funds and classes (referred to as "mapped groups") that were compiled by Fidelity based on combining similar investment objective categories (as classified by Morningstar) that have comparable investment mandates. The data reviewed by the Board included (i) gross management fee comparisons (before taking into account expense reimbursements or caps and without taking into account the fund's performance adjustment) relative to the total universe of funds within the mapped group; (ii) gross management fee comparisons relative to a subset of non-Fidelity funds in the mapped group that are similar in size and management fee structure to the fund (referred to as the "asset size peer group"); (iii) total expense comparisons of Class I of the fund relative to funds and classes in the mapped group that have a similar sales load structure to Class I of the fund (referred to as the "similar sales load structure group"); and (iv) total expense comparisons of Class I of the fund relative to funds and classes in the similar sales load structure group that are similar in size and management fee structure to the fund (referred to as the "total expense asset size peer group"). The total expense asset size peer group comparison excludes performance adjustments and fund-paid 12b-1 fees to eliminate variability in fee structures.
The information provided to the Board indicated that the fund's management fee rate ranked below the competitive median of the mapped group for the 12-month period ended September 30, 2023 and below the competitive median of the asset size peer group for the 12-month period ended September 30, 2023. Further, the information provided to the Board indicated that the total expense ratio of Class I of the fund ranked above the competitive median of the similar sales load structure group for the 12-month period ended September 30, 2023 and below the competitive median of the total expense asset size peer group for the 12-month period ended September 30, 2023.
The Board noted that, although Class I is categorized by Lipper as an institutional class, Class I has no investment minimum, unlike most other funds and classes categorized as institutional. As a result, FMR believes Class I is generally more comparable to retail funds and classes. The Board considered that, when compared to retail funds and classes, Class I would not be above the similar sales load structure growth competitive median for 2023.
The Board noted that a different variable management fee rate is applicable to each class of the fund. The Board considered that the difference in management fee rates between classes is the result of separate arrangements for class-level services and/or waivers of certain expenses and not the result of any difference in advisory or custodial fees or other expenses related to the management of the fund's assets, which do not vary by class.
The Board also considered that the fund's management fee is subject to upward or downward adjustment depending upon whether, and to what extent, the fund's investment performance for the performance period (a rolling 36-month period) exceeds, or is exceeded by, a securities index, thus leading to a performance adjustment for the same period. The Board noted that the performance adjustment provides FMR with a strong economic incentive to seek to achieve superior long-term performance for the fund's shareholders and helps to more closely align the interests of FMR and the shareholders of the fund.
In connection with its consideration of the fund's performance adjustment, the Board noted that the performance of Class I is used for purposes of determining the performance adjustment. The Board noted that to the extent the performance adjustment was based on the performance of a share class with higher total annual operating expenses, the fund would be subject to a smaller positive and larger negative performance adjustment. The Board considered the appropriateness of the use of Class I as the basis for the performance adjustment. The Board noted that Class I is typically the largest class (reflecting the actual investment experience for the plurality of shareholders), employs a standard expense structure, and does not include fund-paid 12b-1 fees, which Fidelity believes makes it a more appropriate measurement of Fidelity's investment skill.
Other Contractual Arrangements. The Board further considered that FMR has contractually agreed to reimburse Class A, Class M, Class C, and Class I of the fund to the extent that total operating expenses, with certain exceptions, as a percentage of their respective average net assets, exceed 1.15%, 1.40%, 1.90%, and 0.90% through February 28, 2025.
Fees Charged to Other Fidelity Clients. The Board also considered Fidelity fee structures and other information with respect to clients of Fidelity, such as other funds advised or subadvised by Fidelity, pension plan clients, and other institutional clients with similar mandates. The Board noted that a joint ad hoc committee created by it and the boards of other Fidelity funds periodically reviews and compares Fidelity's institutional investment advisory business with its business of providing services to the Fidelity funds and also noted the most recent findings of the committee. The Board noted that the committee's review included a consideration of the differences in services provided, fees charged, and costs incurred, as well as competition in the markets serving the different categories of clients.
Based on its review, the Board concluded that the fund's management fee, including the use of Class I as the basis for the performance adjustment, is fair and reasonable in light of the services that the fund receives and the other factors considered. Further based on its review of total expense ratios and fees charged to other Fidelity clients, the Board concluded that the total expense ratio of each class of the fund was reasonable in light of the services that the fund and its shareholders receive and the other factors considered.
Costs of the Services and Profitability. The Board considered the revenues earned and the expenses incurred by Fidelity in conducting the business of developing, marketing, distributing, managing, administering and servicing the fund and servicing the fund's shareholders. The Board also considered the level of Fidelity's profits in respect of all the Fidelity funds.
On an annual basis, Fidelity presents to the Board information about the profitability of its relationships with the fund. Fidelity calculates profitability information for each fund, as well as aggregate profitability information for groups of Fidelity funds and all Fidelity funds, using a series of detailed revenue and cost allocation methodologies which originate with the books and records of Fidelity on which Fidelity's audited financial statements are based. The Audit Committee of the Board reviews any significant changes from the prior year's methodologies.
A public accounting firm has been engaged annually by the Board as part of the Board's assessment of Fidelity's profitability analysis. The engagement includes the review and assessment of the methodologies used by Fidelity in determining the revenues and expenses attributable to Fidelity's fund business, and completion of agreed-upon procedures in respect of the mathematical accuracy of certain fund profitability information and its conformity to established allocation methodologies. After considering the reports issued under the engagement and information provided by Fidelity, the Board concluded that while other allocation methods may also be reasonable, Fidelity's profitability methodologies are reasonable in all material respects.
The Board also reviewed Fidelity's non-fund businesses and potential indirect benefits such businesses may have received as a result of their association with Fidelity's fund business (i.e., fall-out benefits) as well as cases where Fidelity's affiliates may benefit from the funds' business. The Board considered areas where potential indirect benefits to the Fidelity funds from their relationships with Fidelity may exist. The Board's consideration of these matters was informed by the findings of a joint ad hoc committee created by it and the boards of other Fidelity funds to evaluate potential fall-out benefits.
The Board considered the costs of the services provided by and the profits realized by Fidelity in connection with the operation of the fund and was satisfied that the profitability was not excessive.
Economies of Scale. The Board considered whether there have been economies of scale in respect of the management of the Fidelity funds, whether the Fidelity funds (including the fund) have appropriately benefited from any such economies of scale, and whether there is potential for realization of any further economies of scale. The Board considered the extent to which the fund will benefit from economies of scale as assets grow through increased services to the fund, through waivers or reimbursements, or through fee or expense ratio reductions. The Board also noted that a committee created by it and the boards of other Fidelity funds periodically analyzes whether Fidelity attains economies of scale in respect of the management and servicing of the Fidelity funds, whether the Fidelity funds have appropriately benefited from such economies of scale, and whether there is potential for realization of any further economies of scale.
The Board recognized that the fund's management contract incorporates a variable management fee structure, which provides breakpoints as a way to share, in part, any potential economies of scale that may exist at the asset class level and through a discount that considers both fund size and total assets of the four applicable asset classes. The Board considered that the variable management fee is designed to deliver the benefits of economies of scale to fund shareholders even if assets of any particular fund are unchanged or have declined, because some portion of Fidelity's costs are attributable to services provided to all funds subject to the variable management fee, and all such funds benefit if those costs can be allocated among more assets. The Board concluded that, given the variable management fee structure, fund shareholders will benefit from lower management fees due to the application of the breakpoints and discount factor, regardless of whether Fidelity achieves any such economies of scale.
The Board concluded, taking into account the analysis of the committee, that economies of scale, if any, are being appropriately shared between fund shareholders and Fidelity.
Additional Information Requested by the Board. In order to develop fully the factual basis for consideration of the Fidelity funds' advisory contracts, the Board requested and received additional information on certain topics, including but not limited to: (i) fund flow and performance trends, in particular the underperformance of certain funds and strategies, and Fidelity's long-term strategies for certain funds; (ii) the operation of performance fees and the rationale for implementing performance fees on certain categories of funds but not others; (iii) Fidelity's pricing philosophy compared to competitors; (iv) fund profitability methodology and data; (v) evaluation of competitive fund data and peer group classifications and fee and expense comparisons; (vi) the management fee and expense structures for different funds and classes and information about the differences between various fee and expense structures; (vii) the variable management fee implemented for certain funds effective March 1, 2024; and (viii) information regarding other accounts managed by Fidelity and the funds' sub-advisory arrangements.
Conclusion. Based on its evaluation of all of the conclusions noted above, and after considering all factors it believed relevant, the Board, including the Independent Trustees, concluded that the advisory and sub-advisory fee arrangements are fair and reasonable in light of all of the surrounding circumstances and that the fund's Advisory Contracts should be renewed through May 31, 2025.
1.793577.121
AVLF-ANN-1224
Item 8.
Changes in and Disagreements with Accountants for Open-End Management Investment Companies
See Item 7.
Item 9.
Proxy Disclosures for Open-End Management Investment Companies
See Item 7.
Item 10.
Remuneration Paid to Directors, Officers, and Others of Open-End Management Investment Companies
See Item 7.
Item 11.
Statement Regarding Basis for Approval of Investment Advisory Contract
See Item 7.
Item 12.
Disclosure of Proxy Voting Policies and Procedures for Closed-End Management Investment Companies
Not applicable.
Item 13.
Portfolio Managers of Closed-End Management Investment Companies
Not applicable.
Item 14.
Purchase of Equity Securities by Closed-End Management Investment Company and Affiliated Purchasers
Not applicable.
Item 15.
Submission of Matters to a Vote of Security Holders
There were no material changes to the procedures by which shareholders may recommend nominees to the trust’s Board of Trustees.
Item 16.
Controls and Procedures
(a)(i) The President and Treasurer and the Chief Financial Officer have concluded that the trust’s disclosure controls and procedures (as defined in Rule 30a-3(c) under the Investment Company Act) provide reasonable assurances that material information relating to the trust is made known to them by the appropriate persons, based on their evaluation of these controls and procedures as of a date within 90 days of the filing date of this report.
(a)(ii) There was no change in the trust’s internal control over financial reporting (as defined in Rule 30a-3(d) under the Investment Company Act) that occurred during the period covered by this report that has materially affected, or is reasonably likely to materially affect, the trust’s internal control over financial reporting.
Item 17.
Disclosure of Securities Lending Activities for Closed-End Management Investment Companies
Not applicable.
Item 18.
Recovery of Erroneously Awarded Compensation
(a)
Not applicable.
(b)
Not applicable.
Item 19.
Exhibits
SIGNATURES
Pursuant to the requirements of the Securities Exchange Act of 1934 and the Investment Company Act of 1940, the registrant has duly caused this report to be signed on its behalf by the undersigned, thereunto duly authorized.
Fidelity Advisor Series VIII
|
By: | /s/Stacie M. Smith |
| Stacie M. Smith |
| President and Treasurer (Principal Executive Officer) |
|
|
Date: | December 20, 2024 |
Pursuant to the requirements of the Securities Exchange Act of 1934 and the Investment Company Act of 1940, this report has been signed below by the following persons on behalf of the registrant and in the capacities and on the dates indicated.
|
By: | /s/Stacie M. Smith |
| Stacie M. Smith |
| President and Treasurer (Principal Executive Officer) |
|
|
Date: | December 20, 2024 |
|
By: | /s/Stephanie Caron |
| Stephanie Caron |
| Chief Financial Officer (Principal Financial Officer) |
|
|
Date: | December 20, 2024 |