UNITED STATES
SECURITIES AND EXCHANGE COMMISSION
Washington, D.C. 20549
FORM N-CSR
CERTIFIED SHAREHOLDER REPORT OF REGISTERED
MANAGEMENT INVESTMENT COMPANIES
Investment Company Act file number 811-03855
Fidelity Advisor Series VIII
(Exact name of registrant as specified in charter)
245 Summer St., Boston, Massachusetts 02210
(Address of principal executive offices) (Zip code)
Cynthia Lo Bessette, Secretary
245 Summer St.
Boston, Massachusetts 02210
(Name and address of agent for service)
Registrant's telephone number, including area code:
617-563-7000
| |
Date of fiscal year end: | October 31 |
|
|
Date of reporting period: | October 31, 2019 |
Item 1.
Reports to Stockholders
Fidelity Advisor® Overseas Fund
Annual Report
October 31, 2019

See the inside front cover for important information about access to your fund’s shareholder reports.

Beginning on January 1, 2021, as permitted by regulations adopted by the Securities and Exchange Commission, paper copies of a fund’s shareholder reports will no longer be sent by mail, unless you specifically request paper copies of the reports from the fund or from your financial intermediary, such as a financial advisor, broker-dealer or bank. Instead, the reports will be made available on a website, and you will be notified by mail each time a report is posted and provided with a website link to access the report.
If you already elected to receive shareholder reports electronically, you will not be affected by this change and you need not take any action. You may elect to receive shareholder reports and other communications from a fund electronically, by contacting your financial intermediary. For Fidelity customers, visit Fidelity's web site or call Fidelity using the contact information listed below.
You may elect to receive all future reports in paper free of charge. If you wish to continue receiving paper copies of your shareholder reports, you may contact your financial intermediary or, if you are a Fidelity customer, visit Fidelity’s website, or call Fidelity at the applicable toll-free number listed below. Your election to receive reports in paper will apply to all funds held with the fund complex/your financial intermediary.
| Account Type | Website | Phone Number |
| Brokerage, Mutual Fund, or Annuity Contracts: | fidelity.com/mailpreferences | 1-800-343-3548 |
| Employer Provided Retirement Accounts: | netbenefits.fidelity.com/preferences (choose 'no' under Required Disclosures to continue to print) | 1-800-343-0860 |
| Advisor Sold Accounts Serviced Through Your Financial Intermediary: | Contact Your Financial Intermediary | Your Financial Intermediary's phone number |
| Advisor Sold Accounts Serviced by Fidelity: | institutional.fidelity.com | 1-877-208-0098 |
Contents
To view a fund's proxy voting guidelines and proxy voting record for the 12-month period ended June 30, visit http://www.fidelity.com/proxyvotingresults or visit the Securities and Exchange Commission's (SEC) web site at http://www.sec.gov.
You may also call 1-877-208-0098 to request a free copy of the proxy voting guidelines.
Standard & Poor's, S&P and S&P 500 are registered service marks of The McGraw-Hill Companies, Inc. and have been licensed for use by Fidelity Distributors Corporation.
Other third-party marks appearing herein are the property of their respective owners.
All other marks appearing herein are registered or unregistered trademarks or service marks of FMR LLC or an affiliated company. © 2019 FMR LLC. All rights reserved.
This report and the financial statements contained herein are submitted for the general information of the shareholders of the Fund. This report is not authorized for distribution to prospective investors in the Fund unless preceded or accompanied by an effective prospectus.
A fund files its complete schedule of portfolio holdings with the SEC for the first and third quarters of each fiscal year on Form N-PORT. Forms N-PORT are available on the SEC’s web site at http://www.sec.gov. A fund's Forms N-PORT may be reviewed and copied at the SEC’s Public Reference Room in Washington, DC. Information regarding the operation of the SEC's Public Reference Room may be obtained by calling 1-800-SEC-0330.
For a complete list of a fund's portfolio holdings, view the most recent holdings listing, semiannual report, or annual report on Fidelity's web site at http://www.fidelity.com, http://www.institutional.fidelity.com, or http://www.401k.com, as applicable.
NOT FDIC INSURED •MAY LOSE VALUE •NO BANK GUARANTEE
Neither the Fund nor Fidelity Distributors Corporation is a bank.
Performance: The Bottom Line
Average annual total return reflects the change in the value of an investment, assuming reinvestment of distributions from dividend income and capital gains (the profits earned upon the sale of securities that have grown in value, if any) and assuming a constant rate of performance each year. The hypothetical investment and the average annual total returns do not reflect the deduction of taxes that a shareholder would pay on fund distributions or the redemption of fund shares. During periods of reimbursement by Fidelity, a fund’s total return will be greater than it would be had the reimbursement not occurred. How a fund did yesterday is no guarantee of how it will do tomorrow.
Average Annual Total Returns
| For the periods ended October 31, 2019 | Past 1 year | Past 5 years | Past 10 years |
| Class A (incl. 5.75% sales charge) | 6.37% | 3.61% | 5.62% |
| Class M (incl. 3.50% sales charge) | 8.71% | 3.88% | 5.67% |
| Class C (incl. contingent deferred sales charge) | 10.94% | 4.01% | 5.42% |
| Class I | 13.21% | 5.17% | 6.60% |
| Class Z | 13.38% | 5.24% | 6.63% |
Class C shares' contingent deferred sales charges included in the past one year, past five years and past ten years total return figures are 1%, 0% and 0%, respectively.
The initial offering of Class Z shares took place on February 1, 2017. Returns prior to February 1, 2017, are those of Class I.
$10,000 Over 10 Years
Let's say hypothetically that $10,000 was invested in Fidelity Advisor® Overseas Fund - Class A on October 31, 2009, and the current 5.75% sales charge was paid.
The chart shows how the value of your investment would have changed, and also shows how the MSCI EAFE Index performed over the same period.

| Period Ending Values |
| $17,273 | Fidelity Advisor® Overseas Fund - Class A |
| $17,206 | MSCI EAFE Index |
Management's Discussion of Fund Performance
Market Recap: The MSCI ACWI (All Country World Index) ex USA Index gained 11.47% for the 12 months ending October 31, 2019, as international stocks reflected a confluence of factors, including escalating trade tension, and moderating but still positive global economic growth. Currency fluctuations were largely modest and varied by region, muting the overall impact on international equity returns. In late December, the U.S. Federal Reserve shifted from raising interest rates to a more dovish policy in 2019, joining many foreign central banks. In June, international stocks rose 6.03%, as policy stimulus in China stabilized that country’s economic growth. The Fed cut its policy rate in July for the first time since 2008. However, the index returned -1.21% for the month, followed by -3.08% in August. In September, the Fed cut its policy rate another quarter point, citing concerns about slowing economic growth and muted inflation, and did the same in October, leading to monthly gains of 2.59% and 3.49%, respectively. For the full 12 months, the growth-oriented information technology sector (+22%) led the way, followed by utilities (+20%) and real estate (+18%), two high-dividend-yielding categories. Conversely, energy was roughly flat, while materials (+6%) and communication services (7%) also lagged. By region, Asia Pacific ex Japan (+16%), Europe ex U.K (+13%), Canada (+12%) and emerging markets (+12%) fared best. Meanwhile, the U.K. (+7%) and Japan (+10%) trailed the broader market.
Comments from Lead Portfolio Manager Vincent Montemaggiore: For the year, the fund’s share classes (excluding sales charges, if applicable) returned roughly 12% to 13%, topping the 11.30% return of the benchmark MSCI EAFE Index. Favorable stock selection and a sizable overweighting in information technology jointly added the most value versus the benchmark. Picks in industrials, financials and consumer discretionary also contributed meaningfully. Geographically, security selection in the U.K. and Japan notably helped, as did non-benchmark exposure to the United States. At the stock level, Japan-based Hoya was our top relative contributor, delivering accelerating growth and a positive outlook in several of the firm’s technology businesses. The fund’s overweight in London Stock Exchange Group also contributed meaningfully, as did a non-benchmark stake in Canada-based Constellation Software. Conversely, positioning in consumer staples and real estate worked against the fund’s relative performance, along with avoiding utilities. Regionally, stock selection in Continental Europe weighed most on our result versus the benchmark. Among individual holdings, not owning shares of Swiss food and beverage giant Nestle earlier in the period hurt relative performance most during the past year. Overweighting Norwegian energy producer Equinor and Swedish bank Swedbank further detracted.
The views expressed above reflect those of the portfolio manager(s) only through the end of the period as stated on the cover of this report and do not necessarily represent the views of Fidelity or any other person in the Fidelity organization. Any such views are subject to change at any time based upon market or other conditions and Fidelity disclaims any responsibility to update such views. These views may not be relied on as investment advice and, because investment decisions for a Fidelity fund are based on numerous factors, may not be relied on as an indication of trading intent on behalf of any Fidelity fund.
Investment Summary (Unaudited)
Top Five Stocks as of October 31, 2019
| | % of fund's net assets |
| Roche Holding AG (participation certificate) (Switzerland, Pharmaceuticals) | 2.4 |
| Unilever NV (Netherlands, Personal Products) | 1.8 |
| Nestle SA (Reg. S) (Switzerland, Food Products) | 1.8 |
| SAP SE (Germany, Software) | 1.8 |
| LVMH Moet Hennessy Louis Vuitton SE (France, Textiles, Apparel & Luxury Goods) | 1.7 |
| | 9.5 |
Top Five Market Sectors as of October 31, 2019
| | % of fund's net assets |
| Financials | 19.2 |
| Industrials | 18.3 |
| Health Care | 13.9 |
| Consumer Staples | 13.4 |
| Information Technology | 13.2 |
Top Five Countries as of October 31, 2019
| (excluding cash equivalents) | % of fund's net assets |
| Japan | 16.8 |
| United Kingdom | 14.5 |
| Switzerland | 9.2 |
| France | 9.1 |
| Netherlands | 8.2 |
Asset Allocation (% of fund's net assets)
| As of October 31, 2019 |
| | Stocks | 98.4% |
| | Investment Companies | 0.4% |
| | Short-Term Investments and Net Other Assets (Liabilities) | 1.2% |

Percentages are adjusted for the effect of futures contracts and swaps, if applicable.
Schedule of Investments October 31, 2019
Showing Percentage of Net Assets
| Common Stocks - 98.1% | | | |
| | | Shares | Value (000s) |
| Australia - 0.2% | | | |
| Insurance Australia Group Ltd. | | 55,268 | $303 |
| Lovisa Holdings Ltd. (a) | | 22,364 | 207 |
| National Storage (REIT) unit | | 238,666 | 306 |
| realestate.com.au Ltd. | | 2,302 | 173 |
|
| TOTAL AUSTRALIA | | | 989 |
|
| Austria - 0.5% | | | |
| Erste Group Bank AG | | 56,400 | 1,992 |
| Mayr-Melnhof Karton AG | | 2,600 | 320 |
|
| TOTAL AUSTRIA | | | 2,312 |
|
| Bailiwick of Jersey - 1.5% | | | |
| Experian PLC | | 125,600 | 3,950 |
| Glencore Xstrata PLC | | 106,700 | 322 |
| Sanne Group PLC | | 296,819 | 2,030 |
|
| TOTAL BAILIWICK OF JERSEY | | | 6,302 |
|
| Belgium - 1.3% | | | |
| KBC Groep NV | | 77,213 | 5,415 |
| Bermuda - 2.2% | | | |
| Credicorp Ltd. (United States) | | 10,100 | 2,162 |
| Hiscox Ltd. | | 140,800 | 2,716 |
| Hongkong Land Holdings Ltd. | | 35,900 | 197 |
| IHS Markit Ltd. (b) | | 58,201 | 4,075 |
| SmarTone Telecommunications Holdings Ltd. | | 285,000 | 247 |
|
| TOTAL BERMUDA | | | 9,397 |
|
| Brazil - 0.7% | | | |
| IRB Brasil Resseguros SA | | 340,800 | 3,211 |
| Canada - 1.0% | | | |
| Constellation Software, Inc. | | 4,200 | 4,148 |
| Cayman Islands - 0.3% | | | |
| SITC International Holdings Co. Ltd. | | 536,000 | 590 |
| Value Partners Group Ltd. | | 645,000 | 340 |
| ZTO Express (Cayman), Inc. sponsored ADR | | 22,100 | 486 |
|
| TOTAL CAYMAN ISLANDS | | | 1,416 |
|
| China - 0.3% | | | |
| Gree Electric Appliances, Inc. of Zhuhai (A Shares) | | 75,100 | 626 |
| Yunnan Baiyao Group Co. Ltd. (A Shares) | | 44,563 | 548 |
|
| TOTAL CHINA | | | 1,174 |
|
| Denmark - 1.6% | | | |
| A.P. Moller - Maersk A/S Series A | | 251 | 301 |
| DSV A/S | | 43,909 | 4,261 |
| Netcompany Group A/S (b)(c) | | 40,444 | 1,722 |
| Scandinavian Tobacco Group A/S (c) | | 31,836 | 376 |
| Vestas Wind Systems A/S | | 3,500 | 285 |
|
| TOTAL DENMARK | | | 6,945 |
|
| Finland - 0.2% | | | |
| Nokian Tyres PLC | | 14,300 | 408 |
| UPM-Kymmene Corp. | | 13,300 | 432 |
|
| TOTAL FINLAND | | | 840 |
|
| France - 9.1% | | | |
| Altarea SCA | | 1,404 | 308 |
| ALTEN | | 21,905 | 2,405 |
| Amundi SA (c) | | 31,061 | 2,217 |
| Capgemini SA | | 37,394 | 4,210 |
| Danone SA | | 57,829 | 4,791 |
| Edenred SA | | 55,469 | 2,920 |
| Elior SA (c) | | 57,619 | 745 |
| Essilor International SA | | 16,293 | 2,486 |
| LVMH Moet Hennessy Louis Vuitton SE | | 16,907 | 7,220 |
| Natixis SA | | 120,757 | 554 |
| Sanofi SA | | 7,200 | 664 |
| SR Teleperformance SA | | 19,579 | 4,437 |
| Total SA | | 118,931 | 6,288 |
|
| TOTAL FRANCE | | | 39,245 |
|
| Germany - 7.1% | | | |
| adidas AG | | 15,233 | 4,704 |
| Bayer AG | | 33,125 | 2,570 |
| Bertrandt AG | | 6,526 | 326 |
| Deutsche Borse AG | | 23,984 | 3,714 |
| Deutsche Post AG | | 94,856 | 3,359 |
| Hannover Reuck SE | | 22,027 | 3,901 |
| Instone Real Estate Group BV (b)(c) | | 15,911 | 373 |
| JOST Werke AG (c) | | 6,740 | 189 |
| SAP SE | | 57,297 | 7,592 |
| Scout24 AG (c) | | 3,405 | 211 |
| Vonovia SE | | 69,506 | 3,698 |
|
| TOTAL GERMANY | | | 30,637 |
|
| Hong Kong - 1.8% | | | |
| AIA Group Ltd. | | 707,500 | 7,045 |
| Dah Sing Banking Group Ltd. | | 226,000 | 292 |
| Dah Sing Financial Holdings Ltd. | | 90,800 | 338 |
|
| TOTAL HONG KONG | | | 7,675 |
|
| India - 0.7% | | | |
| HDFC Bank Ltd. | | 150,800 | 2,611 |
| Shriram Transport Finance Co. Ltd. | | 37,400 | 599 |
|
| TOTAL INDIA | | | 3,210 |
|
| Indonesia - 0.5% | | | |
| PT Astra International Tbk | | 1,089,900 | 539 |
| PT Bank Rakyat Indonesia Tbk | | 6,095,000 | 1,826 |
|
| TOTAL INDONESIA | | | 2,365 |
|
| Ireland - 2.9% | | | |
| DCC PLC (United Kingdom) | | 40,109 | 3,759 |
| Irish Residential Properties REIT PLC | | 153,300 | 300 |
| Kerry Group PLC Class A | | 33,090 | 4,001 |
| Kingspan Group PLC (Ireland) | | 41,744 | 2,163 |
| United Drug PLC (United Kingdom) | | 217,143 | 2,174 |
|
| TOTAL IRELAND | | | 12,397 |
|
| Israel - 0.4% | | | |
| NICE Systems Ltd. sponsored ADR (b) | | 10,982 | 1,733 |
| Italy - 1.4% | | | |
| FinecoBank SpA | | 216,300 | 2,437 |
| Recordati SpA | | 89,575 | 3,763 |
|
| TOTAL ITALY | | | 6,200 |
|
| Japan - 16.8% | | | |
| A/S One Corp. | | 8,100 | 677 |
| AEON Financial Service Co. Ltd. | | 23,300 | 355 |
| Arata Corp. | | 9,200 | 345 |
| Daiichikosho Co. Ltd. | | 4,780 | 227 |
| Elecom Co. Ltd. | | 35,100 | 1,363 |
| GMO Internet, Inc. | | 26,000 | 437 |
| Hoya Corp. | | 77,600 | 6,858 |
| Iriso Electronics Co. Ltd. | | 36,100 | 1,785 |
| Kao Corp. | | 55,100 | 4,430 |
| Keyence Corp. | | 7,800 | 4,932 |
| KH Neochem Co. Ltd. | | 92,600 | 2,255 |
| Koshidaka Holdings Co. Ltd. | | 57,600 | 836 |
| Miroku Jyoho Service Co., Ltd. | | 51,740 | 1,364 |
| Nabtesco Corp. | | 16,730 | 533 |
| Nakanishi, Inc. | | 11,740 | 196 |
| Nitori Holdings Co. Ltd. | | 19,830 | 3,018 |
| NOF Corp. | | 66,000 | 2,229 |
| Olympus Corp. | | 233,320 | 3,175 |
| Oracle Corp. Japan | | 22,100 | 1,943 |
| ORIX Corp. | | 174,880 | 2,748 |
| Otsuka Corp. | | 64,900 | 2,617 |
| PALTAC Corp. | | 27,800 | 1,341 |
| Paramount Bed Holdings Co. Ltd. | | 8,200 | 314 |
| Persol Holdings Co., Ltd. | | 99,900 | 1,919 |
| Recruit Holdings Co. Ltd. | | 104,040 | 3,458 |
| Relo Group, Inc. | | 58,500 | 1,432 |
| Renesas Electronics Corp. (b) | | 54,300 | 368 |
| S Foods, Inc. | | 49,300 | 1,328 |
| Shiseido Co. Ltd. | | 42,700 | 3,521 |
| SMC Corp. | | 9,300 | 4,018 |
| Subaru Corp. | | 23,300 | 668 |
| Sundrug Co. Ltd. | | 10,680 | 353 |
| Suzuki Motor Corp. | | 51,400 | 2,427 |
| Tsuruha Holdings, Inc. | | 29,500 | 3,318 |
| USS Co. Ltd. | | 127,100 | 2,462 |
| Welcia Holdings Co. Ltd. | | 47,520 | 2,731 |
| Zozo, Inc. (a) | | 22,000 | 512 |
|
| TOTAL JAPAN | | | 72,493 |
|
| Kenya - 0.5% | | | |
| Safaricom Ltd. | | 7,184,200 | 2,069 |
| Korea (South) - 0.3% | | | |
| LG Chemical Ltd. | | 5,534 | 1,454 |
| Luxembourg - 0.3% | | | |
| Eurofins Scientific SA | | 2,482 | 1,257 |
| Malta - 0.1% | | | |
| Kambi Group PLC (b) | | 25,800 | 426 |
| Mexico - 0.2% | | | |
| Grupo Financiero Banorte S.A.B. de CV Series O | | 181,900 | 993 |
| Netherlands - 8.2% | | | |
| ASML Holding NV (Netherlands) | | 23,300 | 6,107 |
| ASR Nederland NV | | 11,500 | 421 |
| Grandvision NV (c) | | 73,600 | 2,249 |
| Heineken NV (Bearer) | | 41,100 | 4,192 |
| IMCD Group BV | | 48,690 | 3,796 |
| Intertrust NV (c) | | 22,624 | 430 |
| Koninklijke Philips Electronics NV | | 109,130 | 4,788 |
| Prosus NV (b) | | 11,500 | 793 |
| QIAGEN NV (Germany) (b) | | 46,990 | 1,410 |
| Unilever NV | | 132,300 | 7,813 |
| Wolters Kluwer NV | | 48,100 | 3,542 |
|
| TOTAL NETHERLANDS | | | 35,541 |
|
| New Zealand - 0.5% | | | |
| EBOS Group Ltd. | | 129,228 | 2,041 |
| Norway - 1.8% | | | |
| Adevinta ASA: | | | |
| rights 11/12/19 (b) | | 83,100 | 13 |
| Class B | | 153,650 | 1,754 |
| Equinor ASA | | 182,440 | 3,375 |
| Schibsted ASA: | | | |
| (A Shares) | | 72,700 | 2,134 |
| (B Shares) | | 8,199 | 229 |
| Skandiabanken ASA (c) | | 33,092 | 235 |
|
| TOTAL NORWAY | | | 7,740 |
|
| South Africa - 0.4% | | | |
| Naspers Ltd. Class N | | 11,400 | 1,613 |
| Spain - 1.1% | | | |
| Amadeus IT Holding SA Class A | | 42,756 | 3,163 |
| Prosegur Cash SA (c) | | 904,900 | 1,413 |
|
| TOTAL SPAIN | | | 4,576 |
|
| Sweden - 4.4% | | | |
| Addlife AB | | 67,184 | 1,503 |
| AddTech AB (B Shares) | | 52,474 | 1,459 |
| ASSA ABLOY AB (B Shares) | | 137,500 | 3,265 |
| EQT AB (b) | | 145,900 | 1,400 |
| Ericsson (B Shares) | | 67,300 | 588 |
| Hexagon AB (B Shares) | | 54,100 | 2,762 |
| HEXPOL AB (B Shares) | | 37,040 | 330 |
| Indutrade AB | | 106,120 | 3,266 |
| Securitas AB (B Shares) | | 20,700 | 331 |
| Svenska Handelsbanken AB (A Shares) | | 310,300 | 3,114 |
| Swedbank AB (A Shares) | | 46,600 | 652 |
| Swedish Match Co. AB | | 6,200 | 291 |
|
| TOTAL SWEDEN | | | 18,961 |
|
| Switzerland - 9.2% | | | |
| Alcon, Inc. (b) | | 56,400 | 3,343 |
| Julius Baer Group Ltd. | | 75,540 | 3,345 |
| Lonza Group AG | | 12,431 | 4,473 |
| Nestle SA (Reg. S) | | 72,660 | 7,773 |
| Roche Holding AG (participation certificate) | | 34,226 | 10,305 |
| Sika AG | | 23,285 | 4,001 |
| Sonova Holding AG Class B | | 10,690 | 2,449 |
| Swiss Re Ltd. | | 37,750 | 3,953 |
|
| TOTAL SWITZERLAND | | | 39,642 |
|
| Taiwan - 1.0% | | | |
| Taiwan Semiconductor Manufacturing Co. Ltd. | | 419,300 | 4,101 |
| United Kingdom - 14.5% | | | |
| Aggreko PLC | | 35,579 | 364 |
| AstraZeneca PLC (United Kingdom) | | 8,300 | 809 |
| Beazley PLC | | 355,400 | 2,700 |
| BP PLC | | 152,694 | 968 |
| Cineworld Group PLC | | 719,195 | 2,075 |
| Close Brothers Group PLC | | 11,318 | 203 |
| Compass Group PLC | | 187,878 | 5,002 |
| Cranswick PLC | | 55,270 | 2,222 |
| Dechra Pharmaceuticals PLC | | 42,220 | 1,438 |
| Diageo PLC | | 174,800 | 7,155 |
| Diploma PLC | | 125,580 | 2,601 |
| Hilton Food Group PLC | | 103,945 | 1,368 |
| InterContinental Hotel Group PLC | | 44,755 | 2,708 |
| Intertek Group PLC | | 44,490 | 3,084 |
| James Fisher and Sons PLC | | 50,577 | 1,274 |
| John Wood Group PLC | | 26,170 | 115 |
| JTC PLC (c) | | 145,400 | 680 |
| Keywords Studios PLC | | 19,900 | 286 |
| Lloyds Banking Group PLC | | 902,366 | 664 |
| London Stock Exchange Group PLC | | 51,230 | 4,617 |
| M&G PLC (b) | | 86,369 | 239 |
| Mondi PLC | | 110,300 | 2,282 |
| Prudential PLC | | 253,409 | 4,426 |
| RELX PLC (London Stock Exchange) | | 163,600 | 3,937 |
| Rentokil Initial PLC | | 535,100 | 3,150 |
| Rightmove PLC | | 40,600 | 315 |
| Rolls-Royce Holdings PLC | | 36,707 | 338 |
| Rolls-Royce Holdings PLC (b) | | 1,688,522 | 2 |
| Rotork PLC | | 80,043 | 313 |
| Sabre Insurance Group PLC (c) | | 154,481 | 590 |
| St. James's Place Capital PLC | | 32,560 | 439 |
| Standard Life PLC | | 130,061 | 511 |
| The Weir Group PLC | | 9,891 | 173 |
| Ultra Electronics Holdings PLC | | 63,909 | 1,614 |
| Unilever PLC | | 12,300 | 736 |
| Victrex PLC | | 61,170 | 1,740 |
| Volution Group PLC | | 581,600 | 1,503 |
|
| TOTAL UNITED KINGDOM | | | 62,641 |
|
| United States of America - 5.1% | | | |
| Alphabet, Inc. Class C (b) | | 1,483 | 1,869 |
| Becton, Dickinson & Co. | | 9,400 | 2,406 |
| Boston Scientific Corp. (b) | | 58,900 | 2,456 |
| Global Payments, Inc. | | 17,789 | 3,010 |
| International Flavors & Fragrances, Inc. | | 15,500 | 1,891 |
| Marsh & McLennan Companies, Inc. | | 34,300 | 3,554 |
| Moody's Corp. | | 8,730 | 1,927 |
| Roper Technologies, Inc. | | 6,600 | 2,224 |
| S&P Global, Inc. | | 10,603 | 2,735 |
|
| TOTAL UNITED STATES OF AMERICA | | | 22,072 |
|
| TOTAL COMMON STOCKS | | | |
| (Cost $352,768) | | | 423,231 |
|
| Nonconvertible Preferred Stocks - 0.3% | | | |
| Germany - 0.3% | | | |
| Henkel AG & Co. KGaA | | | |
| (Cost $1,573) | | 12,058 | 1,253 |
|
| Investment Companies - 0.4% | | | |
| United States of America - 0.4% | | | |
| iShares MSCI Japan ETF | | | |
| (Cost $1,594) | | 30,300 | 1,778 |
|
| Money Market Funds - 1.2% | | | |
| Fidelity Cash Central Fund 1.83% (d) | | 4,649,794 | 4,651 |
| Fidelity Securities Lending Cash Central Fund 1.84% (d)(e) | | 646,077 | 646 |
| TOTAL MONEY MARKET FUNDS | | | |
| (Cost $5,297) | | | 5,297 |
| TOTAL INVESTMENT IN SECURITIES - 100.0% | | | |
| (Cost $361,232) | | | 431,559 |
| NET OTHER ASSETS (LIABILITIES) - 0.0% | | | (175) |
| NET ASSETS - 100% | | | $431,384 |
Security Type Abbreviations
ETF – Exchange-Traded Fund
Categorizations in the Schedule of Investments are based on country or territory of incorporation.
Legend
(a) Security or a portion of the security is on loan at period end.
(b) Non-income producing
(c) Security exempt from registration under Rule 144A of the Securities Act of 1933. These securities may be resold in transactions exempt from registration, normally to qualified institutional buyers. At the end of the period, the value of these securities amounted to $11,430,000 or 2.6% of net assets.
(d) Affiliated fund that is generally available only to investment companies and other accounts managed by Fidelity Investments. The rate quoted is the annualized seven-day yield of the fund at period end. A complete unaudited listing of the fund's holdings as of its most recent quarter end is available upon request. In addition, each Fidelity Central Fund's financial statements, which are not covered by the Fund's Report of Independent Registered Public Accounting Firm, are available on the SEC's website or upon request.
(e) Investment made with cash collateral received from securities on loan.
Affiliated Central Funds
Information regarding fiscal year to date income earned by the Fund from investments in Fidelity Central Funds is as follows:
| Fund | Income earned |
| | (Amounts in thousands) |
| Fidelity Cash Central Fund | $290 |
| Fidelity Securities Lending Cash Central Fund | 102 |
| Total | $392 |
Amounts in the income column in the above table include any capital gain distributions from underlying funds, which are presented in the corresponding line-item in the Statement of Operations, if applicable. Amount for Fidelity Securities Lending Cash Central Fund represents the income earned on investing cash collateral, less rebates paid to borrowers and any lending agent fees associated with the loan, plus any premium payments received for lending certain types of securities.
Investment Valuation
The following is a summary of the inputs used, as of October 31, 2019, involving the Fund's assets and liabilities carried at fair value. The inputs or methodology used for valuing securities may not be an indication of the risk associated with investing in those securities. For more information on valuation inputs, and their aggregation into the levels used below, please refer to the Investment Valuation section in the accompanying Notes to Financial Statements.
| | Valuation Inputs at Reporting Date: |
| Description | Total | Level 1 | Level 2 | Level 3 |
| (Amounts in thousands) | | | | |
| Investments in Securities: | | | | |
| Equities: | | | | |
| Communication Services | $11,316 | $10,669 | $647 | $-- |
| Consumer Discretionary | 41,335 | 11,811 | 29,524 | -- |
| Consumer Staples | 57,652 | 22,252 | 35,400 | -- |
| Energy | 10,746 | 3,490 | 7,256 | -- |
| Financials | 83,524 | 47,187 | 36,337 | -- |
| Health Care | 59,617 | 26,672 | 32,945 | -- |
| Industrials | 79,788 | 65,382 | 14,406 | -- |
| Information Technology | 56,636 | 23,439 | 33,197 | -- |
| Materials | 17,256 | 12,450 | 4,806 | -- |
| Real Estate | 6,614 | 4,679 | 1,935 | -- |
| Investment Companies | 1,778 | 1,778 | -- | -- |
| Money Market Funds | 5,297 | 5,297 | -- | -- |
| Total Investments in Securities: | $431,559 | $235,106 | $196,453 | $-- |
See accompanying notes which are an integral part of the financial statements.
Financial Statements
Statement of Assets and Liabilities
| Amounts in thousands (except per-share amounts) | | October 31, 2019 |
| Assets | | |
Investment in securities, at value (including securities loaned of $615) — See accompanying schedule:
Unaffiliated issuers (cost $355,935) | $426,262 | |
| Fidelity Central Funds (cost $5,297) | 5,297 | |
| Total Investment in Securities (cost $361,232) | | $431,559 |
| Foreign currency held at value (cost $23) | | 23 |
| Receivable for investments sold | | 1,025 |
| Receivable for fund shares sold | | 54 |
| Dividends receivable | | 1,643 |
| Distributions receivable from Fidelity Central Funds | | 11 |
| Prepaid expenses | | 1 |
| Other receivables | | 76 |
| Total assets | | 434,392 |
| Liabilities | | |
| Payable for investments purchased | $1,504 | |
| Payable for fund shares redeemed | 206 | |
| Accrued management fee | 290 | |
| Distribution and service plan fees payable | 105 | |
| Other affiliated payables | 111 | |
| Other payables and accrued expenses | 146 | |
| Collateral on securities loaned | 646 | |
| Total liabilities | | 3,008 |
| Net Assets | | $431,384 |
| Net Assets consist of: | | |
| Paid in capital | | $374,621 |
| Total accumulated earnings (loss) | | 56,763 |
| Net Assets | | $431,384 |
| Net Asset Value and Maximum Offering Price | | |
| Class A: | | |
| Net Asset Value and redemption price per share ($48,844 ÷ 2,012.46 shares)(a) | | $24.27 |
| Maximum offering price per share (100/94.25 of $24.27) | | $25.75 |
| Class M: | | |
| Net Asset Value and redemption price per share ($220,953 ÷ 8,858.30 shares)(a) | | $24.94 |
| Maximum offering price per share (100/96.50 of $24.94) | | $25.84 |
| Class C: | | |
| Net Asset Value and offering price per share ($6,153 ÷ 262.24 shares)(a) | | $23.46 |
| Class I: | | |
| Net Asset Value, offering price and redemption price per share ($117,223 ÷ 4,728.94 shares) | | $24.79 |
| Class Z: | | |
| Net Asset Value, offering price and redemption price per share ($38,211 ÷ 1,541.25 shares) | | $24.79 |
(a) Redemption price per share is equal to net asset value less any applicable contingent deferred sales charge.
See accompanying notes which are an integral part of the financial statements.
Statement of Operations
| Amounts in thousands | | Year ended October 31, 2019 |
| Investment Income | | |
| Dividends | | $14,114 |
| Non-Cash dividends | | 2,936 |
| Interest | | 3 |
| Income from Fidelity Central Funds (including $102 from security lending) | | 392 |
| Income before foreign taxes withheld | | 17,445 |
| Less foreign taxes withheld | | (1,332) |
| Total income | | 16,113 |
| Expenses | | |
| Management fee | | |
| Basic fee | $3,926 | |
| Performance adjustment | (198) | |
| Transfer agent fees | 1,086 | |
| Distribution and service plan fees | 1,286 | |
| Accounting and security lending fees | 298 | |
| Custodian fees and expenses | 105 | |
| Independent trustees' fees and expenses | 3 | |
| Registration fees | 80 | |
| Audit | 88 | |
| Legal | 6 | |
| Interest | 1 | |
| Miscellaneous | 4 | |
| Total expenses before reductions | 6,685 | |
| Expense reductions | (72) | |
| Total expenses after reductions | | 6,613 |
| Net investment income (loss) | | 9,500 |
| Realized and Unrealized Gain (Loss) | | |
| Net realized gain (loss) on: | | |
| Investment securities: | | |
| Unaffiliated issuers (net of foreign taxes of $69) | (17,362) | |
| Redemptions in-kind with affiliated entities | 37,143 | |
| Foreign currency transactions | (97) | |
| Futures contracts | (1,003) | |
| Total net realized gain (loss) | | 18,681 |
| Change in net unrealized appreciation (depreciation) on: | | |
| Investment securities: | | |
| Unaffiliated issuers (net of increase in deferred foreign taxes of $31) | 39,127 | |
| Assets and liabilities in foreign currencies | 11 | |
| Total change in net unrealized appreciation (depreciation) | | 39,138 |
| Net gain (loss) | | 57,819 |
| Net increase (decrease) in net assets resulting from operations | | $67,319 |
See accompanying notes which are an integral part of the financial statements.
Statement of Changes in Net Assets
| Amounts in thousands | Year ended October 31, 2019 | Year ended October 31, 2018 |
| Increase (Decrease) in Net Assets | | |
| Operations | | |
| Net investment income (loss) | $9,500 | $7,747 |
| Net realized gain (loss) | 18,681 | 21,240 |
| Change in net unrealized appreciation (depreciation) | 39,138 | (78,971) |
| Net increase (decrease) in net assets resulting from operations | 67,319 | (49,984) |
| Distributions to shareholders | (26,504) | (23,429) |
| Share transactions - net increase (decrease) | (236,426) | 35,007 |
| Total increase (decrease) in net assets | (195,611) | (38,406) |
| Net Assets | | |
| Beginning of period | 626,995 | 665,401 |
| End of period | $431,384 | $626,995 |
See accompanying notes which are an integral part of the financial statements.
Financial Highlights
Fidelity Advisor Overseas Fund Class A
| Years ended October 31, | 2019 | 2018 | 2017 | 2016 | 2015 |
| Selected Per–Share Data | | | | | |
| Net asset value, beginning of period | $22.48 | $25.20 | $20.40 | $21.59 | $21.09 |
| Income from Investment Operations | | | | | |
| Net investment income (loss)A | .35 | .28 | .23 | .20 | .19 |
| Net realized and unrealized gain (loss) | 2.38 | (2.10) | 4.78 | (1.31) | .33 |
| Total from investment operations | 2.73 | (1.82) | 5.01 | (1.11) | .52 |
| Distributions from net investment income | (.21) | (.22) | (.20) | (.08) | (.02) |
| Distributions from net realized gain | (.73) | (.69) | (.02) | – | – |
| Total distributions | (.94) | (.90)B | (.21)C | (.08) | (.02) |
| Redemption fees added to paid in capitalA | – | – | –D | –D | –D |
| Net asset value, end of period | $24.27 | $22.48 | $25.20 | $20.40 | $21.59 |
| Total ReturnE,F | 12.86% | (7.48)% | 24.86% | (5.16)% | 2.46% |
| Ratios to Average Net AssetsG,H | | | | | |
| Expenses before reductions | 1.21% | 1.21% | 1.25% | 1.36% | 1.35% |
| Expenses net of fee waivers, if any | 1.21% | 1.21% | 1.25% | 1.35% | 1.35% |
| Expenses net of all reductions | 1.19% | 1.20% | 1.23% | 1.35% | 1.34% |
| Net investment income (loss) | 1.53% | 1.13% | 1.05% | .96% | .89% |
| Supplemental Data | | | | | |
| Net assets, end of period (in millions) | $49 | $44 | $69 | $58 | $78 |
| Portfolio turnover rateI | 45%J | 39% | 42% | 94% | 29% |
A Calculated based on average shares outstanding during the period.
B Total distributions of $.90 per share is comprised of distributions from net investment income of $.219 and distributions from net realized gain of $.685 per share.
C Total distributions of $.21 per share is comprised of distributions from net investment income of $.198 and distributions from net realized gain of $.015 per share.
D Amount represents less than $.005 per share.
E Total returns would have been lower if certain expenses had not been reduced during the applicable periods shown.
F Total returns do not include the effect of the sales charges.
G Fees and expenses of any underlying Fidelity Central Funds are not included in the Fund's expense ratio. The Fund indirectly bears its proportionate share of the expenses of any underlying Fidelity Central Funds.
H Expense ratios reflect operating expenses of the class. Expenses before reductions do not reflect amounts reimbursed by the investment adviser or reductions from brokerage service arrangements or reductions from other expense offset arrangements and do not represent the amount paid by the class during periods when reimbursements or reductions occur. Expenses net of fee waivers reflect expenses after reimbursement by the investment adviser but prior to reductions from brokerage service arrangements or other expense offset arrangements. Expenses net of all reductions represent the net expenses paid by the class.
I Amount does not include the portfolio activity of any underlying Fidelity Central Funds.
J Portfolio turnover rate excludes securities received or delivered in-kind.
See accompanying notes which are an integral part of the financial statements.
Fidelity Advisor Overseas Fund Class M
| Years ended October 31, | 2019 | 2018 | 2017 | 2016 | 2015 |
| Selected Per–Share Data | | | | | |
| Net asset value, beginning of period | $23.06 | $25.84 | $20.91 | $22.11 | $21.62 |
| Income from Investment Operations | | | | | |
| Net investment income (loss)A | .31 | .23 | .19 | .16 | .15 |
| Net realized and unrealized gain (loss) | 2.45 | (2.15) | 4.90 | (1.34) | .34 |
| Total from investment operations | 2.76 | (1.92) | 5.09 | (1.18) | .49 |
| Distributions from net investment income | (.15) | (.17) | (.15) | (.02) | – |
| Distributions from net realized gain | (.73) | (.69) | (.02) | – | – |
| Total distributions | (.88) | (.86) | (.16)B | (.02) | – |
| Redemption fees added to paid in capitalA | – | – | –C | –C | –C |
| Net asset value, end of period | $24.94 | $23.06 | $25.84 | $20.91 | $22.11 |
| Total ReturnD,E | 12.65% | (7.71)% | 24.57% | (5.34)% | 2.27% |
| Ratios to Average Net AssetsF,G | | | | | |
| Expenses before reductions | 1.42% | 1.44% | 1.46% | 1.56% | 1.55% |
| Expenses net of fee waivers, if any | 1.42% | 1.43% | 1.46% | 1.56% | 1.55% |
| Expenses net of all reductions | 1.40% | 1.43% | 1.44% | 1.56% | 1.55% |
| Net investment income (loss) | 1.32% | .90% | .84% | .76% | .69% |
| Supplemental Data | | | | | |
| Net assets, end of period (in millions) | $221 | $218 | $272 | $237 | $285 |
| Portfolio turnover rateH | 45%I | 39% | 42% | 94% | 29% |
A Calculated based on average shares outstanding during the period.
B Total distributions of $.16 per share is comprised of distributions from net investment income of $.148 and distributions from net realized gain of $.015 per share.
C Amount represents less than $.005 per share.
D Total returns would have been lower if certain expenses had not been reduced during the applicable periods shown.
E Total returns do not include the effect of the sales charges.
F Fees and expenses of any underlying Fidelity Central Funds are not included in the Fund's expense ratio. The Fund indirectly bears its proportionate share of the expenses of any underlying Fidelity Central Funds.
G Expense ratios reflect operating expenses of the class. Expenses before reductions do not reflect amounts reimbursed by the investment adviser or reductions from brokerage service arrangements or reductions from other expense offset arrangements and do not represent the amount paid by the class during periods when reimbursements or reductions occur. Expenses net of fee waivers reflect expenses after reimbursement by the investment adviser but prior to reductions from brokerage service arrangements or other expense offset arrangements. Expenses net of all reductions represent the net expenses paid by the class.
H Amount does not include the portfolio activity of any underlying Fidelity Central Funds.
I Portfolio turnover rate excludes securities received or delivered in-kind.
See accompanying notes which are an integral part of the financial statements.
Fidelity Advisor Overseas Fund Class C
| Years ended October 31, | 2019 | 2018 | 2017 | 2016 | 2015 |
| Selected Per–Share Data | | | | | |
| Net asset value, beginning of period | $21.72 | $24.41 | $19.74 | $20.98 | $20.63 |
| Income from Investment Operations | | | | | |
| Net investment income (loss)A | .15 | .07 | .05 | .03 | .02 |
| Net realized and unrealized gain (loss) | 2.32 | (2.02) | 4.64 | (1.27) | .33 |
| Total from investment operations | 2.47 | (1.95) | 4.69 | (1.24) | .35 |
| Distributions from net investment income | – | (.06) | (.01) | – | – |
| Distributions from net realized gain | (.73) | (.69) | (.02) | – | – |
| Total distributions | (.73) | (.74)B | (.02)C | – | – |
| Redemption fees added to paid in capitalA | – | – | –D | –D | –D |
| Net asset value, end of period | $23.46 | $21.72 | $24.41 | $19.74 | $20.98 |
| Total ReturnE,F | 11.94% | (8.23)% | 23.81% | (5.91)% | 1.70% |
| Ratios to Average Net AssetsG,H | | | | | |
| Expenses before reductions | 2.03% | 2.03% | 2.06% | 2.16% | 2.15% |
| Expenses net of fee waivers, if any | 2.03% | 2.03% | 2.05% | 2.16% | 2.15% |
| Expenses net of all reductions | 2.02% | 2.02% | 2.04% | 2.16% | 2.14% |
| Net investment income (loss) | .70% | .31% | .24% | .16% | .09% |
| Supplemental Data | | | | | |
| Net assets, end of period (in millions) | $6 | $13 | $17 | $16 | $19 |
| Portfolio turnover rateI | 45%J | 39% | 42% | 94% | 29% |
A Calculated based on average shares outstanding during the period.
B Total distributions of $.74 per share is comprised of distributions from net investment income of $.058 and distributions from net realized gain of $.685 per share.
C Total distributions of $.02 per share is comprised of distributions from net investment income of $.009 and distributions from net realized gain of $.015 per share.
D Amount represents less than $.005 per share.
E Total returns would have been lower if certain expenses had not been reduced during the applicable periods shown.
F Total returns do not include the effect of the contingent deferred sales charge.
G Fees and expenses of any underlying Fidelity Central Funds are not included in the Fund's expense ratio. The Fund indirectly bears its proportionate share of the expenses of any underlying Fidelity Central Funds.
H Expense ratios reflect operating expenses of the class. Expenses before reductions do not reflect amounts reimbursed by the investment adviser or reductions from brokerage service arrangements or reductions from other expense offset arrangements and do not represent the amount paid by the class during periods when reimbursements or reductions occur. Expenses net of fee waivers reflect expenses after reimbursement by the investment adviser but prior to reductions from brokerage service arrangements or other expense offset arrangements. Expenses net of all reductions represent the net expenses paid by the class.
I Amount does not include the portfolio activity of any underlying Fidelity Central Funds.
J Portfolio turnover rate excludes securities received or delivered in-kind.
See accompanying notes which are an integral part of the financial statements.
Fidelity Advisor Overseas Fund Class I
| Years ended October 31, | 2019 | 2018 | 2017 | 2016 | 2015 |
| Selected Per–Share Data | | | | | |
| Net asset value, beginning of period | $22.99 | $25.74 | $20.86 | $22.06 | $21.55 |
| Income from Investment Operations | | | | | |
| Net investment income (loss)A | .42 | .36 | .31 | .27 | .27 |
| Net realized and unrealized gain (loss) | 2.43 | (2.15) | 4.87 | (1.33) | .34 |
| Total from investment operations | 2.85 | (1.79) | 5.18 | (1.06) | .61 |
| Distributions from net investment income | (.32) | (.28) | (.29) | (.14) | (.10) |
| Distributions from net realized gain | (.73) | (.69) | (.02) | – | – |
| Total distributions | (1.05) | (.96)B | (.30)C | (.14) | (.10) |
| Redemption fees added to paid in capitalA | – | – | –D | –D | –D |
| Net asset value, end of period | $24.79 | $22.99 | $25.74 | $20.86 | $22.06 |
| Total ReturnE | 13.21% | (7.23)% | 25.24% | (4.85)% | 2.82% |
| Ratios to Average Net AssetsF,G | | | | | |
| Expenses before reductions | .91% | .92% | .95% | 1.04% | 1.03% |
| Expenses net of fee waivers, if any | .91% | .92% | .94% | 1.04% | 1.03% |
| Expenses net of all reductions | .90% | .91% | .92% | 1.03% | 1.02% |
| Net investment income (loss) | 1.82% | 1.42% | 1.35% | 1.28% | 1.21% |
| Supplemental Data | | | | | |
| Net assets, end of period (in millions) | $117 | $305 | $306 | $311 | $298 |
| Portfolio turnover rateH | 45%I | 39% | 42% | 94% | 29% |
A Calculated based on average shares outstanding during the period.
B Total distributions of $.96 per share is comprised of distributions from net investment income of $.276 and distributions from net realized gain of $.685 per share.
C Total distributions of $.30 per share is comprised of distributions from net investment income of $.287 and distributions from net realized gain of $.015 per share.
D Amount represents less than $.005 per share.
E Total returns would have been lower if certain expenses had not been reduced during the applicable periods shown.
F Fees and expenses of any underlying Fidelity Central Funds are not included in the Fund's expense ratio. The Fund indirectly bears its proportionate share of the expenses of any underlying Fidelity Central Funds.
G Expense ratios reflect operating expenses of the class. Expenses before reductions do not reflect amounts reimbursed by the investment adviser or reductions from brokerage service arrangements or reductions from other expense offset arrangements and do not represent the amount paid by the class during periods when reimbursements or reductions occur. Expenses net of fee waivers reflect expenses after reimbursement by the investment adviser but prior to reductions from brokerage service arrangements or other expense offset arrangements. Expenses net of all reductions represent the net expenses paid by the class.
H Amount does not include the portfolio activity of any underlying Fidelity Central Funds.
I Portfolio turnover rate excludes securities received or delivered in-kind.
See accompanying notes which are an integral part of the financial statements.
Fidelity Advisor Overseas Fund Class Z
| Years ended October 31, | 2019 | 2018 | 2017 A |
| Selected Per–Share Data | | | |
| Net asset value, beginning of period | $23.00 | $25.76 | $20.88 |
| Income from Investment Operations | | | |
| Net investment income (loss)B | .45 | .38 | .19 |
| Net realized and unrealized gain (loss) | 2.43 | (2.14) | 4.69 |
| Total from investment operations | 2.88 | (1.76) | 4.88 |
| Distributions from net investment income | (.36) | (.31) | – |
| Distributions from net realized gain | (.73) | (.69) | – |
| Total distributions | (1.09) | (1.00) | – |
| Net asset value, end of period | $24.79 | $23.00 | $25.76 |
| Total ReturnC,D | 13.38% | (7.13)% | 23.37% |
| Ratios to Average Net AssetsE,F | | | |
| Expenses before reductions | .77% | .79% | .82%G |
| Expenses net of fee waivers, if any | .77% | .79% | .82%G |
| Expenses net of all reductions | .76% | .78% | .80%G |
| Net investment income (loss) | 1.96% | 1.55% | 1.02%G |
| Supplemental Data | | | |
| Net assets, end of period (in millions) | $38 | $47 | $2 |
| Portfolio turnover rateH | 45%I | 39% | 42% |
A For the period February 1, 2017 (commencement of sale of shares) to October 31, 2017.
B Calculated based on average shares outstanding during the period.
C Total returns for periods of less than one year are not annualized.
D Total returns would have been lower if certain expenses had not been reduced during the applicable periods shown.
E Fees and expenses of any underlying Fidelity Central Funds are not included in the Fund's expense ratio. The Fund indirectly bears its proportionate share of the expenses of any underlying Fidelity Central Funds.
F Expense ratios reflect operating expenses of the class. Expenses before reductions do not reflect amounts reimbursed by the investment adviser or reductions from brokerage service arrangements or reductions from other expense offset arrangements and do not represent the amount paid by the class during periods when reimbursements or reductions occur. Expense ratios before reductions for start-up periods may not be representative of longer-term operating periods. Expenses net of fee waivers reflect expenses after reimbursement by the investment adviser but prior to reductions from brokerage service arrangements or other expense offset arrangements. Expenses net of all reductions represent the net expenses paid by the class.
G Annualized
H Amount does not include the portfolio activity of any underlying Fidelity Central Funds.
I Portfolio turnover rate excludes securities received or delivered in-kind.
See accompanying notes which are an integral part of the financial statements.
Notes to Financial Statements
For the period ended October 31, 2019
(Amounts in thousands except percentages)
1. Organization.
Fidelity Advisor Overseas Fund (the Fund) is a fund of Fidelity Advisor Series VIII (the Trust) and is authorized to issue an unlimited number of shares. The Trust is registered under the Investment Company Act of 1940, as amended (the 1940 Act), as an open-end management investment company organized as a Massachusetts business trust. The Fund offers Class A, Class M, Class C, Class I and Class Z shares, each of which has equal rights as to assets and voting privileges. Each class has exclusive voting rights with respect to matters that affect that class. Effective March 1, 2019, Class C shares will automatically convert to Class A shares after a holding period of ten years from the initial date of purchase, with certain exceptions.
2. Investments in Fidelity Central Funds.
The Fund invests in Fidelity Central Funds, which are open-end investment companies generally available only to other investment companies and accounts managed by the investment adviser and its affiliates. The Fund's Schedule of Investments lists each of the Fidelity Central Funds held as of period end, if any, as an investment of the Fund, but does not include the underlying holdings of each Fidelity Central Fund. As an Investing Fund, the Fund indirectly bears its proportionate share of the expenses of the underlying Fidelity Central Funds.
The Money Market Central Funds seek preservation of capital and current income and are managed by Fidelity Investments Money Management, Inc. (FIMM), an affiliate of the investment adviser. Annualized expenses of the Money Market Central Funds as of their most recent shareholder report date ranged from less than .005% to .01%.
A complete unaudited list of holdings for each Fidelity Central Fund is available upon request or at the Securities and Exchange Commission (the SEC) website at www.sec.gov. In addition, the financial statements of the Fidelity Central Funds, which are not covered by the Fund's Report of Independent Registered Public Accounting Firm, are available on the SEC website or upon request.
3. Significant Accounting Policies.
The Fund is an investment company and applies the accounting and reporting guidance of the Financial Accounting Standards Board (FASB) Accounting Standards Codification Topic 946 Financial Services – Investments Companies. The financial statements have been prepared in conformity with accounting principles generally accepted in the United States of America (GAAP), which require management to make certain estimates and assumptions at the date of the financial statements. Actual results could differ from those estimates. Subsequent events, if any, through the date that the financial statements were issued have been evaluated in the preparation of the financial statements. The following summarizes the significant accounting policies of the Fund:
Investment Valuation. Investments are valued as of 4:00 p.m. Eastern time on the last calendar day of the period. The Board of Trustees (the Board) has delegated the day to day responsibility for the valuation of the Fund's investments to the Fair Value Committee (the Committee) established by the Fund's investment adviser. In accordance with valuation policies and procedures approved by the Board, the Fund attempts to obtain prices from one or more third party pricing vendors or brokers to value its investments. When current market prices, quotations or currency exchange rates are not readily available or reliable, investments will be fair valued in good faith by the Committee, in accordance with procedures adopted by the Board. Factors used in determining fair value vary by investment type and may include market or investment specific events. The frequency with which these procedures are used cannot be predicted and they may be utilized to a significant extent. The Committee oversees the Fund's valuation policies and procedures and reports to the Board on the Committee's activities and fair value determinations. The Board monitors the appropriateness of the procedures used in valuing the Fund's investments and ratifies the fair value determinations of the Committee.
The Fund categorizes the inputs to valuation techniques used to value its investments into a disclosure hierarchy consisting of three levels as shown below:
- Level 1 – quoted prices in active markets for identical investments
- Level 2 – other significant observable inputs (including quoted prices for similar investments, interest rates, prepayment speeds, etc.)
- Level 3 – unobservable inputs (including the Fund's own assumptions based on the best information available)
Valuation techniques used to value the Fund's investments by major category are as follows:
Equity securities, including restricted securities, for which market quotations are readily available, are valued at the last reported sale price or official closing price as reported by a third party pricing vendor on the primary market or exchange on which they are traded and are categorized as Level 1 in the hierarchy. In the event there were no sales during the day or closing prices are not available, securities are valued at the last quoted bid price or may be valued using the last available price and are generally categorized as Level 2 in the hierarchy. For foreign equity securities, when market or security specific events arise, comparisons to the valuation of American Depositary Receipts (ADRs), futures contracts, Exchange-Traded Funds (ETFs) and certain indexes as well as quoted prices for similar securities may be used and would be categorized as Level 2 in the hierarchy. For equity securities, including restricted securities, where observable inputs are limited, assumptions about market activity and risk are used and these securities may be categorized as Level 3 in the hierarchy.
ETFs are valued at their last sale price or official closing price as reported by a third party pricing vendor on the primary market or exchange on which they are traded and are categorized as Level 1 in the hierarchy. In the event there were no sales during the day but the exchange reports a closing bid level, ETFs are valued at the closing bid and would be categorized as Level 1 in the hierarchy. In the event there was no closing bid, ETFs may be valued by another method that the Board believes reflects fair value in accordance with the Board's fair value pricing policies and may be categorized as Level 2 in the hierarchy.
Investments in open-end mutual funds, including the Fidelity Central Funds, are valued at their closing net asset value (NAV) each business day and are categorized as Level 1 in the hierarchy.
Changes in valuation techniques may result in transfers in or out of an assigned level within the disclosure hierarchy. The aggregate value of investments by input level as of October 31, 2019 is included at the end of the Fund's Schedule of Investments.
Foreign Currency. The Fund may use foreign currency contracts to facilitate transactions in foreign-denominated securities. Gains and losses from these transactions may arise from changes in the value of the foreign currency or if the counterparties do not perform under the contracts' terms.
Foreign-denominated assets, including investment securities, and liabilities are translated into U.S. dollars at the exchange rates at period end. Purchases and sales of investment securities, income and dividends received and expenses denominated in foreign currencies are translated into U.S. dollars at the exchange rate in effect on the transaction date.
The effects of exchange rate fluctuations on investments are included with the net realized and unrealized gain (loss) on investment securities. Other foreign currency transactions resulting in realized and unrealized gain (loss) are disclosed separately.
Investment Transactions and Income. For financial reporting purposes, the Fund's investment holdings and NAV include trades executed through the end of the last business day of the period. The NAV per share for processing shareholder transactions is calculated as of the close of business of the New York Stock Exchange (NYSE), normally 4:00 p.m. Eastern time and includes trades executed through the end of the prior business day. Gains and losses on securities sold are determined on the basis of identified cost and include proceeds received from litigation. Dividend income is recorded on the ex-dividend date, except for certain dividends from foreign securities where the ex-dividend date may have passed, which are recorded as soon as the Fund is informed of the ex-dividend date. Non-cash dividends included in dividend income, if any, are recorded at the fair market value of the securities received. Income and capital gain distributions from Fidelity Central Funds, if any, are recorded on the ex-dividend date. Interest income is accrued as earned and includes coupon interest and amortization of premium and accretion of discount on debt securities as applicable. Investment income is recorded net of foreign taxes withheld where recovery of such taxes is uncertain.
Class Allocations and Expenses. Investment income, realized and unrealized capital gains and losses, common expenses of the Fund, and certain fund-level expense reductions, if any, are allocated daily on a pro-rata basis to each class based on the relative net assets of each class to the total net assets of the Fund. Each class differs with respect to transfer agent and distribution and service plan fees incurred. Certain expense reductions may also differ by class. For the reporting period, the allocated portion of income and expenses to each class as a percent of its average net assets may vary due to the timing of recording these transactions in relation to fluctuating net assets of the classes. Expenses directly attributable to a fund are charged to that fund. Expenses attributable to more than one fund are allocated among the respective funds on the basis of relative net assets or other appropriate methods. Expense estimates are accrued in the period to which they relate and adjustments are made when actual amounts are known.
Income Tax Information and Distributions to Shareholders. Each year, the Fund intends to qualify as a regulated investment company under Subchapter M of the Internal Revenue Code, including distributing substantially all of its taxable income and realized gains. As a result, no provision for U.S. Federal income taxes is required. As of October 31, 2019, the Fund did not have any unrecognized tax benefits in the financial statements; nor is the Fund aware of any tax positions for which it is reasonably possible that the total amounts of unrecognized tax benefits will significantly change in the next twelve months. The Fund files a U.S. federal tax return, in addition to state and local tax returns as required. The Fund's federal income tax returns are subject to examination by the Internal Revenue Service (IRS) for a period of three fiscal years after they are filed. State and local tax returns may be subject to examination for an additional fiscal year depending on the jurisdiction. Foreign taxes are provided for based on the Fund's understanding of the tax rules and rates that exist in the foreign markets in which it invests. The Fund is subject to a tax imposed on capital gains by certain countries in which it invests. An estimated deferred tax liability for net unrealized appreciation on the applicable securities is included in Other payables and accrued expenses on the Statement of Assets & Liabilities.
Distributions are declared and recorded on the ex-dividend date. Income and capital gain distributions are declared separately for each class. Income and capital gain distributions are determined in accordance with income tax regulations, which may differ from GAAP. In addition, the Fund claimed a portion of the payment made to redeeming shareholders as a distribution for income tax purposes.
Capital accounts within the financial statements are adjusted for permanent book-tax differences. These adjustments have no impact on net assets or the results of operations. Capital accounts are not adjusted for temporary book-tax differences which will reverse in a subsequent period.
Book-tax differences are primarily due to foreign currency transactions, passive foreign investment companies (PFIC), redemptions in kind and losses deferred due to wash sales.
As of period end, the cost and unrealized appreciation (depreciation) in securities, and derivatives if applicable, for federal income tax purposes were as follows:
| Gross unrealized appreciation | $82,227 |
| Gross unrealized depreciation | (13,458) |
| Net unrealized appreciation (depreciation) | $68,769 |
| Tax Cost | $362,790 |
The tax-based components of distributable earnings as of period end were as follows:
| Undistributed ordinary income | $5,662 |
| Capital loss carryforward | $(17,575) |
| Net unrealized appreciation (depreciation) on securities and other investments | $68,707 |
Capital loss carryforwards are only available to offset future capital gains of the Fund to the extent provided by regulations and may be limited. Under the Regulated Investment Company Modernization Act of 2010 (the Act), the Fund is permitted to carry forward capital losses incurred in taxable years beginning after December 22, 2010 for an unlimited period and such capital losses are required to be used prior to any losses that expire. The capital loss carryforward information presented below, including any applicable limitation, is estimated as of fiscal period end and is subject to adjustment.
| No expiration | |
| Short-term | $(8,508) |
| Long-term | (9,067) |
| Total no expiration | $(17,575) |
The tax character of distributions paid was as follows:
| | October 31, 2019 | October 31, 2018 |
| Ordinary Income | $6,745 | $ 7,102 |
| Long-term Capital Gains | 19,759 | 16,327 |
| Total | $26,504 | $ 23,429 |
Restricted Securities. The Fund may invest in securities that are subject to legal or contractual restrictions on resale. These securities generally may be resold in transactions exempt from registration or to the public if the securities are registered. Disposal of these securities may involve time-consuming negotiations and expense, and prompt sale at an acceptable price may be difficult. Information regarding restricted securities is included at the end of the Fund's Schedule of Investments.
4. Derivative Instruments.
Risk Exposures and the Use of Derivative Instruments. The Fund's investment objective allows the Fund to enter into various types of derivative contracts, including futures contracts. Derivatives are investments whose value is primarily derived from underlying assets, indices or reference rates and may be transacted on an exchange or over-the-counter (OTC). Derivatives may involve a future commitment to buy or sell a specified asset based on specified terms, to exchange future cash flows at periodic intervals based on a notional principal amount, or for one party to make one or more payments upon the occurrence of specified events in exchange for periodic payments from the other party.
The Fund used derivatives to increase returns and to manage exposure to certain risks as defined below. The success of any strategy involving derivatives depends on analysis of numerous economic factors, and if the strategies for investment do not work as intended, the Fund may not achieve its objectives.
The Fund's use of derivatives increased or decreased its exposure to the following risk:
| Equity Risk | Equity risk relates to the fluctuations in the value of financial instruments as a result of changes in market prices (other than those arising from interest rate risk or foreign exchange risk), whether caused by factors specific to an individual investment, its issuer, or all factors affecting all instruments traded in a market or market segment.
|
The Fund is also exposed to additional risks from investing in derivatives, such as liquidity risk and counterparty credit risk. Liquidity risk is the risk that the Fund will be unable to close out the derivative in the open market in a timely manner. Counterparty credit risk is the risk that the counterparty will not be able to fulfill its obligation to the Fund. Counterparty credit risk related to exchange-traded futures contracts may be mitigated by the protection provided by the exchange on which they trade.
Investing in derivatives may involve greater risks than investing in the underlying assets directly and, to varying degrees, may involve risk of loss in excess of any initial investment and collateral received and amounts recognized in the Statement of Assets and Liabilities. In addition, there may be the risk that the change in value of the derivative contract does not correspond to the change in value of the underlying instrument.
Futures Contracts. A futures contract is an agreement between two parties to buy or sell a specified underlying instrument for a fixed price at a specified future date. The Fund used futures contracts to manage its exposure to the stock market.
Upon entering into a futures contract, a fund is required to deposit either cash or securities (initial margin) with a clearing broker in an amount equal to a certain percentage of the face value of the contract. Futures contracts are marked-to-market daily and subsequent daily payments (variation margin) are made or received by a fund depending on the daily fluctuations in the value of the futures contracts and are recorded as unrealized appreciation or (depreciation). This receivable and/or payable, if any, is included in daily variation margin on futures contracts in the Statement of Assets and Liabilities. Realized gain or (loss) is recorded upon the expiration or closing of a futures contract. The net realized gain (loss) and change in net unrealized appreciation (depreciation) on futures contracts during the period is presented in the Statement of Operations.
Any open futures contracts at period end are presented in the Schedule of Investments under the caption "Futures Contracts". The notional amount at value reflects each contract's exposure to the underlying instrument or index at period end.
5. Purchases and Sales of Investments.
Purchases and sales of securities, other than short-term securities and in-kind transactions, aggregated $261,329 and $323,916, respectively.
6. Fees and Other Transactions with Affiliates.
Management Fee. Fidelity Management & Research Company (the investment adviser) and its affiliates provide the Fund with investment management related services for which the Fund pays a monthly management fee. The management fee is the sum of an individual fund fee rate that is based on an annual rate of .424% of the Fund's average net assets and an annualized group fee rate that averaged .24% during the period. The group fee rate is based upon the average net assets of all the mutual funds advised by the investment adviser, including any mutual funds previously advised by the investment adviser that are currently advised by Fidelity SelectCo, LLC, an affiliate of the investment adviser. The group fee rate decreases as assets under management increase and increases as assets under management decrease. In addition, the management fee is subject to a performance adjustment (up to a maximum of +/- .20% of the Fund's average net assets over a 36 month performance period). The upward or downward adjustment to the management fee is based on the investment performance of the asset-weighted return of all classes as compared to its benchmark index, the MSCI EAFE Index, over the same 36 month performance period. For the reporting period, the total annual management fee rate, including the performance adjustment, was .63% of the Fund's average net assets. The performance adjustment included in the management fee rate may be higher or lower than the maximum performance adjustment rate due to the difference between the average net assets for the reporting and performance periods.
Distribution and Service Plan Fees. In accordance with Rule 12b-1 of the 1940 Act, the Fund has adopted separate Distribution and Service Plans for each class of shares. Certain classes pay Fidelity Distributors Corporation (FDC), an affiliate of the investment adviser, separate Distribution and Service Fees, each of which is based on an annual percentage of each class' average net assets. In addition, FDC may pay financial intermediaries for selling shares of the Fund and providing shareholder support services. For the period, the Distribution and Service Fee rates, total fees and amounts retained by FDC were as follows:
| | Distribution Fee | Service Fee | Total Fees | Retained by FDC |
| Class A | -% | .25% | $116 | $3 |
| Class M | .25% | .25% | 1,086 | 12 |
| Class C | .75% | .25% | 84 | 6 |
| | | | $1,286 | $21 |
Sales Load. FDC may receive a front-end sales charge of up to 5.75% for selling Class A shares and 3.50% for selling Class M shares, some of which is paid to financial intermediaries for selling shares of the Fund. Depending on the holding period, FDC may receive contingent deferred sales charges levied on Class A, Class M and Class C redemptions. The deferred sales charges are 1.00% for Class C shares, 1.00% for certain purchases of Class A shares and .25% for certain purchases of Class M shares.
For the period, sales charge amounts retained by FDC were as follows:
| | Retained by FDC |
| Class A | $4 |
| Class M | 2 |
| Class C(a) | –(b) |
| | $6 |
(a) When Class C shares are initially sold, FDC pays commissions from its own resources to financial intermediaries through which the sales are made.
(b) Amount is less than five hundred dollars.
Transfer Agent Fees. Fidelity Investments Institutional Operations Company, Inc., (FIIOC), an affiliate of the investment adviser, is the transfer, dividend disbursing and shareholder servicing agent for each class of the Fund. FIIOC receives account fees and asset-based fees that vary according to the account size and type of account of the shareholders of the respective classes of the Fund, except for Class Z. FIIOC receives an asset-based fee of Class Z's average net assets. FIIOC pays for typesetting, printing and mailing of shareholder reports, except proxy statements.
For the period, transfer agent fees for each class were as follows:
| | Amount | % of Class-Level Average Net Assets |
| Class A | $106 | .23 |
| Class M | 410 | .19 |
| Class C | 25 | .30 |
| Class I | 532 | .18 |
| Class Z | 13 | .05 |
| | $1,086 | |
Accounting and Security Lending Fees. Fidelity Service Company, Inc. (FSC), an affiliate of the investment adviser, maintains the Fund's accounting records. The accounting fee is based on the level of average net assets for each month. Prior to April 1, 2019, FSC had a separate agreement with the Fund for administration of the security lending program, based on the number and duration of lending transactions. For the period, the total fees paid for accounting and administration of securities lending were equivalent to an annual rate of .05%.
Brokerage Commissions. The Fund placed a portion of its portfolio transactions with brokerage firms which are affiliates of the investment adviser. Brokerage commissions are included in net realized gain (loss) and change in net unrealized appreciation (depreciation) in the Statement of Operations. The commissions paid to these affiliated firms were in the amount of less than five hundred dollars for the period.
Interfund Lending Program. Pursuant to an Exemptive Order issued by the SEC, the Fund, along with other registered investment companies having management contracts with Fidelity Management & Research Company (FMR) or other affiliated entities of FMR, may participate in an interfund lending program. This program provides an alternative credit facility allowing the funds to borrow from, or lend money to, other participating affiliated funds. At period end, there were no interfund loans outstanding. The Fund's activity in this program during the period for which loans were outstanding was as follows:
| Borrower or Lender | Average Loan Balance | Weighted Average Interest Rate | Interest Expense |
| Borrower | $6,725 | 2.67% | $1 |
Interfund Trades. The Fund may purchase from or sell securities to other Fidelity Funds under procedures adopted by the Board. The procedures have been designed to ensure these interfund trades are executed in accordance with Rule 17a-7 of the 1940 Act. Interfund trades are included within the respective purchases and sales amounts shown in the Purchases and Sales of Investments note.
Affiliated Redemptions In-Kind. During the period, 7,266 shares of the Fund were redeemed in-kind for investments and cash with a value of $175,742. The net realized gain of $37,143 on investments delivered through in-kind redemptions is included in the accompanying Statement of Operations. The amount of the in-kind redemptions is included in share transactions in the accompanying Statement of Changes in Net Assets as well as the Notes to Financial Statements. The Fund recognized no gain or loss for federal income tax purposes.
7. Committed Line of Credit.
The Fund participates with other funds managed by the investment adviser or an affiliate in a $4.25 billion credit facility (the "line of credit") to be utilized for temporary or emergency purposes to fund shareholder redemptions or for other short-term liquidity purposes. The Fund has agreed to pay commitment fees on its pro-rata portion of the line of credit, which amounted to $2 and is reflected in Miscellaneous expenses on the Statement of Operations. During the period, the Fund did not borrow on this line of credit.
8. Security Lending.
The Fund lends portfolio securities from time to time in order to earn additional income. For equity securities, lending agents are used, including National Financial Services (NFS), an affiliate of the Fund. Pursuant to a securities lending agreement, NFS will receive a fee, which is capped at 9.9% of daily lending revenue, for its services as lending agent. The Fund may lend securities to certain qualified borrowers, including NFS. On the settlement date of the loan, the Fund receives collateral (in the form of U.S. Treasury obligations, letters of credit and/or cash) against the loaned securities and maintains collateral in an amount not less than 100% of the market value of the loaned securities during the period of the loan. The market value of the loaned securities is determined at the close of business of the Fund and any additional required collateral is delivered to the Fund on the next business day. The Fund or borrower may terminate the loan at any time, and if the borrower defaults on its obligation to return the securities loaned because of insolvency or other reasons, the Fund may apply collateral received from the borrower against the obligation. The Fund may experience delays and costs in recovering the securities loaned. Any cash collateral received is invested in the Fidelity Securities Lending Cash Central Fund. The value of loaned securities and cash collateral at period end are disclosed on the Fund's Statement of Assets and Liabilities. Total fees paid by the Fund to NFS, as lending agent, amounted to less than five hundred dollars. Security lending income represents the income earned on investing cash collateral, less rebates paid to borrowers and any lending agent fees associated with the loan, plus any premium payments received for lending certain types of securities. Security lending income is presented in the Statement of Operations as a component of income from Fidelity Central Funds. During the period, there were no securities loaned to NFS.
9. Expense Reductions.
Commissions paid to certain brokers with whom the investment adviser, or its affiliates, places trades on behalf of the Fund include an amount in addition to trade execution, which may be rebated back to the Fund to offset certain expenses. This amount totaled $67 for the period.
In addition, during the period the investment adviser reimbursed and/or waived a portion of fund-level operating expenses in the amount of $5.
10. Distributions to Shareholders.
Distributions to shareholders of each class were as follows:
| | Year ended
October 31, 2019 | Year ended
October 31, 2018 |
| Distributions to shareholders | | |
| Class A | $1,792 | $2,452 |
| Class M | 8,320 | 8,968 |
| Class C | 405 | 506 |
| Class I | 13,825 | 11,363 |
| Class Z | 2,162 | 140 |
| Total | $26,504 | $23,429 |
11. Share Transactions.
Share transactions for each class were as follows and may contain automatic conversions between classes or exchanges between affiliated funds:
| | Shares | Shares | Dollars | Dollars |
| | Year ended October 31, 2019 | Year ended October 31, 2018 | Year ended October 31, 2019 | Year ended October 31, 2018 |
| Class A | | | | |
| Shares sold | 359 | 268 | $8,058 | $6,680 |
| Reinvestment of distributions | 82 | 97 | 1,682 | 2,369 |
| Shares redeemed | (370) | (1,166) | (8,415) | (28,586) |
| Net increase (decrease) | 71 | (801) | $1,325 | $(19,537) |
| Class M | | | | |
| Shares sold | 1,153 | 1,484 | $26,662 | $37,742 |
| Reinvestment of distributions | 387 | 354 | 8,221 | 8,851 |
| Shares redeemed | (2,139) | (2,899) | (49,578) | (73,413) |
| Net increase (decrease) | (599) | (1,061) | $(14,695) | $(26,820) |
| Class C | | | | |
| Shares sold | 20 | 85 | $442 | $2,077 |
| Reinvestment of distributions | 20 | 20 | 400 | 477 |
| Shares redeemed | (374) | (189) | (8,113) | (4,547) |
| Net increase (decrease) | (334) | (84) | $(7,271) | $(1,993) |
| Class I | | | | |
| Shares sold | 1,668 | 3,512 | $37,446 | $87,065 |
| Reinvestment of distributions | 498 | 332 | 10,458 | 8,235 |
| Shares redeemed | (10,721)(a) | (2,465) | (255,996)(a) | (61,772) |
| Net increase (decrease) | (8,555) | 1,379 | $(208,092) | $33,528 |
| Class Z | | | | |
| Shares sold | 1,247 | 3,080 | $28,907 | $77,109 |
| Reinvestment of distributions | 51 | 5 | 1,076 | 118 |
| Shares redeemed | (1,796) | (1,104) | (37,676) | (27,398) |
| Net increase (decrease) | (498) | 1,981 | $(7,693) | $49,829 |
(a) Amount includes in-kind redemptions (see the Affiliated Redemptions In-Kind note for additional details).
12. Other.
The Fund's organizational documents provide former and current trustees and officers with a limited indemnification against liabilities arising in connection with the performance of their duties to the Fund. In the normal course of business, the Fund may also enter into contracts that provide general indemnifications. The Fund's maximum exposure under these arrangements is unknown as this would be dependent on future claims that may be made against the Fund. The risk of material loss from such claims is considered remote.
At the end of the period, Strategic Advisers Fidelity International Fund was the owner of record of approximately 18% of the total outstanding shares of the Fund.
Report of Independent Registered Public Accounting Firm
To the Board of Trustees of Fidelity Advisor Series VIII and Shareholders of Fidelity Advisor Overseas Fund:
Opinion on the Financial Statements
We have audited the accompanying statement of assets and liabilities, including the schedule of investments, of Fidelity Advisor Overseas Fund (one of the funds constituting Fidelity Advisor Series VIII, referred to hereafter as the “Fund”) as of October 31, 2019, the related statement of operations for the year ended October 31, 2019, the statement of changes in net assets for each of the two years in the period ended October 31, 2019, including the related notes, and the financial highlights for each of the periods indicated therein (collectively referred to as the “financial statements”). In our opinion, the financial statements present fairly, in all material respects, the financial position of the Fund as of October 31, 2019, the results of its operations for the year then ended, the changes in its net assets for each of the two years in the period ended October 31, 2019 and the financial highlights for each of the periods indicated therein in conformity with accounting principles generally accepted in the United States of America.
Basis for Opinion
These financial statements are the responsibility of the Fund’s management. Our responsibility is to express an opinion on the Fund’s financial statements based on our audits. We are a public accounting firm registered with the Public Company Accounting Oversight Board (United States) (PCAOB) and are required to be independent with respect to the Fund in accordance with the U.S. federal securities laws and the applicable rules and regulations of the Securities and Exchange Commission and the PCAOB.
We conducted our audits of these financial statements in accordance with the standards of the PCAOB. Those standards require that we plan and perform the audit to obtain reasonable assurance about whether the financial statements are free of material misstatement, whether due to error or fraud.
Our audits included performing procedures to assess the risks of material misstatement of the financial statements, whether due to error or fraud, and performing procedures that respond to those risks. Such procedures included examining, on a test basis, evidence regarding the amounts and disclosures in the financial statements. Our audits also included evaluating the accounting principles used and significant estimates made by management, as well as evaluating the overall presentation of the financial statements. Our procedures included confirmation of securities owned as of October 31, 2019 by correspondence with the custodian and brokers; when replies were not received from brokers, we performed other auditing procedures. We believe that our audits provide a reasonable basis for our opinion.
PricewaterhouseCoopers LLP
Boston, Massachusetts
December 11, 2019
We have served as the auditor of one or more investment companies in the Fidelity group of funds since 1932.
Trustees and Officers
The Trustees, Members of the Advisory Board (if any), and officers of the trust and fund, as applicable, are listed below. The Board of Trustees governs the fund and is responsible for protecting the interests of shareholders. The Trustees are experienced executives who meet periodically throughout the year to oversee the fund's activities, review contractual arrangements with companies that provide services to the fund, oversee management of the risks associated with such activities and contractual arrangements, and review the fund's performance. Except for Jonathan Chiel, each of the Trustees oversees 298 funds. Mr. Chiel oversees 171 funds.
The Trustees hold office without limit in time except that (a) any Trustee may resign; (b) any Trustee may be removed by written instrument, signed by at least two-thirds of the number of Trustees prior to such removal; (c) any Trustee who requests to be retired or who has become incapacitated by illness or injury may be retired by written instrument signed by a majority of the other Trustees; and (d) any Trustee may be removed at any special meeting of shareholders by a two-thirds vote of the outstanding voting securities of the trust. Each Trustee who is not an interested person (as defined in the 1940 Act) of the trust and the fund is referred to herein as an Independent Trustee. Each Independent Trustee shall retire not later than the last day of the calendar year in which his or her 75th birthday occurs. The Independent Trustees may waive this mandatory retirement age policy with respect to individual Trustees. Officers and Advisory Board Members hold office without limit in time, except that any officer or Advisory Board Member may resign or may be removed by a vote of a majority of the Trustees at any regular meeting or any special meeting of the Trustees. Except as indicated, each individual has held the office shown or other offices in the same company for the past five years.
The fund’s Statement of Additional Information (SAI) includes more information about the Trustees. To request a free copy, call Fidelity at 1-877-208-0098.
Experience, Skills, Attributes, and Qualifications of the Trustees. The Governance and Nominating Committee has adopted a statement of policy that describes the experience, qualifications, attributes, and skills that are necessary and desirable for potential Independent Trustee candidates (Statement of Policy). The Board believes that each Trustee satisfied at the time he or she was initially elected or appointed a Trustee, and continues to satisfy, the standards contemplated by the Statement of Policy. The Governance and Nominating Committee also engages professional search firms to help identify potential Independent Trustee candidates who have the experience, qualifications, attributes, and skills consistent with the Statement of Policy. From time to time, additional criteria based on the composition and skills of the current Independent Trustees, as well as experience or skills that may be appropriate in light of future changes to board composition, business conditions, and regulatory or other developments, have also been considered by the professional search firms and the Governance and Nominating Committee. In addition, the Board takes into account the Trustees' commitment and participation in Board and committee meetings, as well as their leadership of standing and ad hoc committees throughout their tenure.
In determining that a particular Trustee was and continues to be qualified to serve as a Trustee, the Board has considered a variety of criteria, none of which, in isolation, was controlling. The Board believes that, collectively, the Trustees have balanced and diverse experience, qualifications, attributes, and skills, which allow the Board to operate effectively in governing the fund and protecting the interests of shareholders. Information about the specific experience, skills, attributes, and qualifications of each Trustee, which in each case led to the Board's conclusion that the Trustee should serve (or continue to serve) as a trustee of the fund, is provided below.
Board Structure and Oversight Function. James C. Curvey is an interested person and currently serves as Chairman. The Trustees have determined that an interested Chairman is appropriate and benefits shareholders because an interested Chairman has a personal and professional stake in the quality and continuity of services provided to the fund. Independent Trustees exercise their informed business judgment to appoint an individual of their choosing to serve as Chairman, regardless of whether the Trustee happens to be independent or a member of management. The Independent Trustees have determined that they can act independently and effectively without having an Independent Trustee serve as Chairman and that a key structural component for assuring that they are in a position to do so is for the Independent Trustees to constitute a substantial majority for the Board. The Independent Trustees also regularly meet in executive session. Ned C. Lautenbach serves as Chairman of the Independent Trustees and as such (i) acts as a liaison between the Independent Trustees and management with respect to matters important to the Independent Trustees and (ii) with management prepares agendas for Board meetings.
Fidelity® funds are overseen by different Boards of Trustees. The fund's Board oversees Fidelity's high income and certain equity funds, and other Boards oversee Fidelity's investment-grade bond, money market, asset allocation, and other equity funds. The asset allocation funds may invest in Fidelity® funds overseen by the fund's Board. The use of separate Boards, each with its own committee structure, allows the Trustees of each group of Fidelity® funds to focus on the unique issues of the funds they oversee, including common research, investment, and operational issues. On occasion, the separate Boards establish joint committees to address issues of overlapping consequences for the Fidelity® funds overseen by each Board.
The Trustees operate using a system of committees to facilitate the timely and efficient consideration of all matters of importance to the Trustees, the fund, and fund shareholders and to facilitate compliance with legal and regulatory requirements and oversight of the fund's activities and associated risks. The Board, acting through its committees, has charged FMR and its affiliates with (i) identifying events or circumstances the occurrence of which could have demonstrably adverse effects on the fund's business and/or reputation; (ii) implementing processes and controls to lessen the possibility that such events or circumstances occur or to mitigate the effects of such events or circumstances if they do occur; and (iii) creating and maintaining a system designed to evaluate continuously business and market conditions in order to facilitate the identification and implementation processes described in (i) and (ii) above. Because the day-to-day operations and activities of the fund are carried out by or through FMR, its affiliates, and other service providers, the fund's exposure to risks is mitigated but not eliminated by the processes overseen by the Trustees. While each of the Board's committees has responsibility for overseeing different aspects of the fund's activities, oversight is exercised primarily through the Operations, Audit, and Compliance Committees. Appropriate personnel, including but not limited to the fund's Chief Compliance Officer (CCO), FMR's internal auditor, the independent accountants, the fund's Treasurer and portfolio management personnel, make periodic reports to the Board's committees, as appropriate, including an annual review of Fidelity's risk management program for the Fidelity® funds. The responsibilities of each standing committee, including their oversight responsibilities, are described further under "Standing Committees of the Trustees."
Interested Trustees*:
Correspondence intended for a Trustee who is an interested person may be sent to Fidelity Investments, 245 Summer Street, Boston, Massachusetts 02210.
Name, Year of Birth; Principal Occupations and Other Relevant Experience+
Jonathan Chiel (1957)
Year of Election or Appointment: 2016
Trustee
Mr. Chiel also serves as Trustee of other Fidelity® funds. Mr. Chiel is Executive Vice President and General Counsel for FMR LLC (diversified financial services company, 2012-present). Previously, Mr. Chiel served as general counsel (2004-2012) and senior vice president and deputy general counsel (2000-2004) for John Hancock Financial Services; a partner with Choate, Hall & Stewart (1996-2000) (law firm); and an Assistant United States Attorney for the United States Attorney’s Office of the District of Massachusetts (1986-95), including Chief of the Criminal Division (1993-1995). Mr. Chiel is a director on the boards of the Boston Bar Foundation and the Maimonides School.
James C. Curvey (1935)
Year of Election or Appointment: 2007
Trustee
Chairman of the Board of Trustees
Mr. Curvey also serves as Trustee of other Fidelity® funds. Mr. Curvey is Vice Chairman (2007-present) and Director of FMR LLC (diversified financial services company). In addition, Mr. Curvey is an Overseer Emeritus for the Boston Symphony Orchestra, a Director of Artis-Naples, and a Trustee of Brewster Academy in Wolfeboro, New Hampshire. Previously, Mr. Curvey served as a Director of Fidelity Research & Analysis Co. (investment adviser firm, 2009-2018), Director of Fidelity Investments Money Management, Inc. (investment adviser firm, 2009-2014) and a Director of FMR and FMR Co., Inc. (investment adviser firms, 2007-2014).
* Determined to be an “Interested Trustee” by virtue of, among other things, his or her affiliation with the trust or various entities under common control with FMR.
+ The information includes the Trustee's principal occupation during the last five years and other information relating to the experience, attributes, and skills relevant to the Trustee's qualifications to serve as a Trustee, which led to the conclusion that the Trustee should serve as a Trustee for the fund.
Independent Trustees:
Correspondence intended for an Independent Trustee may be sent to Fidelity Investments, P.O. Box 55235, Boston, Massachusetts 02205-5235.
Name, Year of Birth; Principal Occupations and Other Relevant Experience+
Dennis J. Dirks (1948)
Year of Election or Appointment: 2005
Trustee
Mr. Dirks also serves as Trustee of other Fidelity® funds. Prior to his retirement in May 2003, Mr. Dirks was Chief Operating Officer and a member of the Board of The Depository Trust & Clearing Corporation (DTCC). He also served as President, Chief Operating Officer, and Board member of The Depository Trust Company (DTC) and President and Board member of the National Securities Clearing Corporation (NSCC). In addition, Mr. Dirks served as Chief Executive Officer and Board member of the Government Securities Clearing Corporation, Chief Executive Officer and Board member of the Mortgage-Backed Securities Clearing Corporation, as a Trustee and a member of the Finance Committee of Manhattan College (2005-2008), as a Trustee and a member of the Finance Committee of AHRC of Nassau County (2006-2008), as a member of the Independent Directors Council (IDC) Governing Council (2010-2015), and as a member of the Board of Directors for The Brookville Center for Children’s Services, Inc. (2009-2017). Mr. Dirks is a member of the Finance Committee (2016-present) and Board of Directors (2017-present) and is Treasurer (2018-present) of the Asolo Repertory Theatre.
Donald F. Donahue (1950)
Year of Election or Appointment: 2018
Trustee
Mr. Donahue also serves as a Trustee of other Fidelity® funds. Mr. Donahue is President and Chief Executive Officer of Miranda Partners, LLC (risk consulting for the financial services industry, 2012-present). Previously, Mr. Donahue served as a Member of the Advisory Board of certain Fidelity® funds (2015-2018) and Chief Executive Officer (2006-2012), Chief Operating Officer (2003-2006), and Managing Director, Customer Marketing and Development (1999-2003) of The Depository Trust & Clearing Corporation (financial markets infrastructure). Mr. Donahue serves as a Member (2007-present) and Co-Chairman (2016-present) of the Board of Directors of United Way of New York, Member of the Board of Directors of NYC Leadership Academy (2012-present) and Member of the Board of Advisors of Ripple Labs, Inc. (financial services, 2015-present). He also served as Chairman (2010-2012) and Member of the Board of Directors (2012-2013) of Omgeo, LLC (financial services), Treasurer of United Way of New York (2012-2016), and Member of the Board of Directors of XBRL US (financial services non-profit, 2009-2012) and the International Securities Services Association (2009-2012).
Alan J. Lacy (1953)
Year of Election or Appointment: 2008
Trustee
Mr. Lacy also serves as Trustee of other Fidelity® funds. Mr. Lacy serves as a Director of Bristol-Myers Squibb Company (global pharmaceuticals, 2008-present). He is a Trustee of the California Chapter of The Nature Conservancy (2015-present) and a Director of the Center for Advanced Study in the Behavioral Sciences at Stanford University (2015-present). In addition, Mr. Lacy served as Senior Adviser (2007-2014) of Oak Hill Capital Partners, L.P. (private equity) and also served as Chief Executive Officer (2005) and Vice Chairman (2005-2006) of Sears Holdings Corporation (retail) and Chief Executive Officer and Chairman of the Board of Sears, Roebuck and Co. (retail, 2000-2005). Previously, Mr. Lacy served as Chairman (2014-2017) and a member (2010-2017) of the Board of Directors of Dave & Buster’s Entertainment, Inc. (restaurant and entertainment complexes), as Chairman (2008-2011) and a member (2006-2015) of the Board of Trustees of the National Parks Conservation Association, and as a member of the Board of Directors for The Hillman Companies, Inc. (hardware wholesalers, 2010-2014), Earth Fare, Inc. (retail grocery, 2010-2014), and The Western Union Company (global money transfer, 2006-2011).
Ned C. Lautenbach (1944)
Year of Election or Appointment: 2000
Trustee
Chairman of the Independent Trustees
Mr. Lautenbach also serves as Trustee of other Fidelity® funds. Mr. Lautenbach currently serves as Chair (2018-present) and Member (2013-present) of the Board of Governors, State University System of Florida and is a member of the Council on Foreign Relations (1994-present). He is also a member and has most recently served as Chairman of the Board of Directors of Artis-Naples (2012-present). Previously, Mr. Lautenbach served as a member and then Lead Director of the Board of Directors of Eaton Corporation (diversified industrial, 1997-2016). He was also a Partner and Advisory Partner at Clayton, Dubilier & Rice, LLC (private equity investment, 1998-2010), as well as a Director of Sony Corporation (2006-2007). In addition, Mr. Lautenbach also had a 30-year career with IBM (technology company) during which time he served as Senior Vice President and a member of the Corporate Executive Committee (1968-1998).
Joseph Mauriello (1944)
Year of Election or Appointment: 2008
Trustee
Mr. Mauriello also serves as Trustee of other Fidelity® funds. Prior to his retirement in January 2006, Mr. Mauriello served in numerous senior management positions including Deputy Chairman and Chief Operating Officer (2004-2005), and Vice Chairman of Financial Services (2002-2004) of KPMG LLP US (professional services, 1965-2005). Mr. Mauriello currently serves as a member of the Independent Directors Council (IDC) Governing Council (2015-present). Previously, Mr. Mauriello served as a member of the Board of Directors of XL Group plc. (global insurance and re-insurance, 2006-2018).
Cornelia M. Small (1944)
Year of Election or Appointment: 2005
Trustee
Ms. Small also serves as Trustee of other Fidelity® funds. Ms. Small is a member of the Board of Directors (2009-present) and Chair of the Investment Committee (2010-present) of the Teagle Foundation. Ms. Small also serves on the Investment Committee of the Berkshire Taconic Community Foundation (2008-present). Previously, Ms. Small served as Chairperson (2002-2008) and a member of the Investment Committee and Chairperson (2008-2012) and a member of the Board of Trustees of Smith College. In addition, Ms. Small served as Chief Investment Officer, Director of Global Equity Investments, and a member of the Board of Directors of Scudder, Stevens & Clark and Scudder Kemper Investments.
Garnett A. Smith (1947)
Year of Election or Appointment: 2018
Trustee
Mr. Smith also serves as Trustee of other Fidelity® funds. Prior to Mr. Smith's retirement, he served as Chairman and Chief Executive Officer of Inbrand Corp. (manufacturer of personal absorbent products, 1990-1997). He also served as President (1986-1990) of Inbrand Corp. Prior to his employment with Inbrand Corp., he was employed by a retail fabric chain and North Carolina National Bank. In addition, Mr. Smith served as a Member of the Advisory Board of certain Fidelity® funds (2012-2013) and as a board member of the Jackson Hole Land Trust (2009-2012).
David M. Thomas (1949)
Year of Election or Appointment: 2008
Trustee
Mr. Thomas also serves as Trustee of other Fidelity® funds. Mr. Thomas serves as Non-Executive Chairman of the Board of Directors of Fortune Brands Home and Security (home and security products, 2011-present) and as a member of the Board of Directors (2004-present) and Presiding Director (2013-present) of Interpublic Group of Companies, Inc. (marketing communication). Previously, Mr. Thomas served as Executive Chairman (2005-2006) and Chairman and Chief Executive Officer (2000-2005) of IMS Health, Inc. (pharmaceutical and healthcare information solutions), a Director of Fortune Brands, Inc. (consumer products, 2000-2011), and a member of the Board of Trustees of the University of Florida (2013-2018).
+ The information includes the Trustee's principal occupation during the last five years and other information relating to the experience, attributes, and skills relevant to the Trustee's qualifications to serve as a Trustee, which led to the conclusion that the Trustee should serve as a Trustee for the fund.
Advisory Board Members and Officers:
Correspondence intended for a Member of the Advisory Board (if any) may be sent to Fidelity Investments, P.O. Box 55235, Boston, Massachusetts 02205-5235. Correspondence intended for an officer or Peter S. Lynch may be sent to Fidelity Investments, 245 Summer Street, Boston, Massachusetts 02210. Officers appear below in alphabetical order.
Name, Year of Birth; Principal Occupation
Vicki L. Fuller (1957)
Year of Election or Appointment: 2018
Member of the Advisory Board
Ms. Fuller also serves as Member of the Advisory Board of other Fidelity® funds. Ms. Fuller serves as a member of the Board of Directors, Audit Committee, and Nominating and Governance Committee of The Williams Companies, Inc. (natural gas infrastructure, 2018-present). Previously, Ms. Fuller served as the Chief Investment Officer of the New York State Common Retirement Fund (2012-2018) and held a variety of positions at AllianceBernstein L.P. (global asset management, 1985-2012), including Managing Director (2006-2012) and Senior Vice President and Senior Portfolio Manager (2001-2006).
Peter S. Lynch (1944)
Year of Election or Appointment: 2003
Member of the Advisory Board
Mr. Lynch also serves as Member of the Advisory Board of other Fidelity® funds. Mr. Lynch is Vice Chairman and a Director of FMR (investment adviser firm) and FMR Co., Inc. (investment adviser firm). In addition, Mr. Lynch serves as a Trustee of Boston College and as the Chairman of the Inner-City Scholarship Fund. Previously, Mr. Lynch served on the Special Olympics International Board of Directors (1997-2006).
Michael E. Wiley (1950)
Year of Election or Appointment: 2018
Member of the Advisory Board
Mr. Wiley also serves as Trustee or Member of the Advisory Board of other Fidelity® funds. Mr. Wiley serves as a Director of High Point Resources (exploration and production, 2005-present). Previously, Mr. Wiley served as a Director of Andeavor Corporation (independent oil refiner and marketer, 2005-2018), a Director of Andeavor Logistics LP (natural resources logistics, 2015-2018), a Director of Post Oak Bank (privately-held bank, 2004-2018), a Director of Asia Pacific Exploration Consolidated (international oil and gas exploration and production, 2008-2013), a member of the Board of Trustees of the University of Tulsa (2000-2006; 2007-2010), a Senior Energy Advisor of Katzenbach Partners, LLC (consulting, 2006-2007), an Advisory Director of Riverstone Holdings (private investment), a Director of Spinnaker Exploration Company (exploration and production, 2001-2005) and Chairman, President, and CEO of Baker Hughes, Inc. (oilfield services, 2000-2004).
Elizabeth Paige Baumann (1968)
Year of Election or Appointment: 2017
Anti-Money Laundering (AML) Officer
Ms. Baumann also serves as AML Officer of other funds. She is Chief AML Officer (2012-present) and Senior Vice President (2014-present) of FMR LLC (diversified financial services company) and is an employee of Fidelity Investments. Previously, Ms. Baumann served as AML Officer of the funds (2012-2016), and Vice President (2007-2014) and Deputy Anti-Money Laundering Officer (2007-2012) of FMR LLC.
Craig S. Brown (1977)
Year of Election or Appointment: 2019
Assistant Treasurer
Mr. Brown also serves as Assistant Treasurer of other funds. Mr. Brown is an employee of Fidelity Investments (2013-present).
John J. Burke III (1964)
Year of Election or Appointment: 2018
Chief Financial Officer
Mr. Burke also serves as Chief Financial Officer of other funds. Mr. Burke serves as Head of Investment Operations for Fidelity Fund and Investment Operations (2018-present) and is an employee of Fidelity Investments (1998-present). Previously Mr. Burke served as head of Asset Management Investment Operations (2012-2018).
William C. Coffey (1969)
Year of Election or Appointment: 2019
Assistant Secretary
Mr. Coffey also serves as Assistant Secretary of other funds. He is Senior Vice President and Deputy General Counsel of FMR LLC (diversified financial services company, 2010-present), and is an employee of Fidelity Investments. Previously, Mr. Coffey served as Secretary and CLO of certain funds (2018-2019); CLO, Secretary, and Senior Vice President of Fidelity Management & Research Company and FMR Co., Inc. (investment adviser firms, 2018-2019); Secretary of Fidelity SelectCo, LLC and Fidelity Investments Money Management, Inc. (investment adviser firms, 2018-2019); CLO of Fidelity Management & Research (Hong Kong) Limited, FMR Investment Management (UK) Limited, and Fidelity Management & Research (Japan) Limited (investment adviser firms, 2018-2019); and Assistant Secretary of certain funds (2009-2018).
Timothy M. Cohen (1969)
Year of Election or Appointment: 2018
Vice President
Mr. Cohen also serves as Vice President of other funds. Mr. Cohen serves as Executive Vice President of Fidelity SelectCo, LLC (2019-present), Co-Head of Equity (2018-present), a Director of Fidelity Management & Research (Japan) Limited (investment adviser firm, 2016-present), and is an employee of Fidelity Investments. Previously, Mr. Cohen served as Head of Global Equity Research (2016-2018), Chief Investment Officer - Equity and a Director of Fidelity Management & Research (U.K.) Inc. (investment adviser firm, 2013-2015) and as a Director of Fidelity Management & Research (Hong Kong) Limited (investment adviser firm, 2017).
Jonathan Davis (1968)
Year of Election or Appointment: 2010
Assistant Treasurer
Mr. Davis also serves as Assistant Treasurer of other funds. Mr. Davis serves as Assistant Treasurer of FMR Capital, Inc. (2017-present) and is an employee of Fidelity Investments. Previously, Mr. Davis served as Vice President and Associate General Counsel of FMR LLC (diversified financial services company, 2003-2010).
Adrien E. Deberghes (1967)
Year of Election or Appointment: 2016
Assistant Treasurer
Mr. Deberghes also serves as an officer of other funds. He serves as Assistant Treasurer of FMR Capital, Inc. (2017-present), Executive Vice President of Fidelity Investments Money Management, Inc. (FIMM) (investment adviser firm, 2016-present), and is an employee of Fidelity Investments (2008-present). Previously, Mr. Deberghes served as President and Treasurer of certain Fidelity® funds (2013-2018). Prior to joining Fidelity Investments, Mr. Deberghes was Senior Vice President of Mutual Fund Administration at State Street Corporation (2007-2008), Senior Director of Mutual Fund Administration at Investors Bank & Trust (2005-2007), and Director of Finance for Dunkin' Brands (2000-2005). Previously, Mr. Deberghes served in other fund officer roles.
Laura M. Del Prato (1964)
Year of Election or Appointment: 2018
Assistant Treasurer
Ms. Del Prato also serves as an officer of other funds. Ms. Del Prato is an employee of Fidelity Investments (2017-present). Prior to joining Fidelity Investments, Ms. Del Prato served as a Managing Director and Treasurer of the JPMorgan Mutual Funds (2014-2017). Prior to JPMorgan, Ms. Del Prato served as a partner at Cohen Fund Audit Services (accounting firm, 2012-2013) and KPMG LLP (accounting firm, 2004-2012).
Colm A. Hogan (1973)
Year of Election or Appointment: 2016
Deputy Treasurer
Mr. Hogan also serves as an officer of other funds. Mr. Hogan serves as Assistant Treasurer of FMR Capital, Inc. (2017-present) and is an employee of Fidelity Investments (2005-present). Previously, Mr. Hogan served as Assistant Treasurer of certain Fidelity® funds (2016-2018).
Pamela R. Holding (1964)
Year of Election or Appointment: 2018
Vice President
Ms. Holding also serves as Vice President of other funds. Ms. Holding serves as Executive Vice President of Fidelity SelectCo, LLC (2019-present), Co-Head of Equity (2018-present) and is an employee of Fidelity Investments (2013-present). Previously, Ms. Holding served as Chief Investment Officer of Fidelity Institutional Asset Management (2013-2018).
Cynthia Lo Bessette (1969)
Year of Election or Appointment: 2019
Secretary and Chief Legal Officer (CLO)
Ms. Lo Bessette also serves as Secretary and CLO of other funds. Ms. Lo Bessette serves as CLO, Secretary, and Senior Vice President of Fidelity Management & Research Company and FMR Co., Inc. (investment adviser firms, 2019-present); Secretary of Fidelity SelectCo, LLC and Fidelity Investments Money Management, Inc. (investment adviser firms, 2019-present); and CLO of Fidelity Management & Research (Hong Kong) Limited, FMR Investment Management (UK) Limited, and Fidelity Management & Research (Japan) Limited (investment adviser firms, 2019-present). She is a Senior Vice President and Deputy General Counsel of FMR LLC (diversified financial services company, 2019-present), and is an employee of Fidelity Investments. Previously, Ms. Lo Bessette served as Executive Vice President, General Counsel (2016-2019) and Senior Vice President, Deputy General Counsel (2015-2016) of OppenheimerFunds (investment management company) and Deputy Chief Legal Officer (2013-2015) of Jennison Associates LLC (investment adviser firm).
Chris Maher (1972)
Year of Election or Appointment: 2013
Assistant Treasurer
Mr. Maher serves as Assistant Treasurer of other funds. Mr. Maher is Vice President of Valuation Oversight, serves as Assistant Treasurer of FMR Capital, Inc. (2017-present), and is an employee of Fidelity Investments. Previously, Mr. Maher served as Vice President of Asset Management Compliance (2013), Vice President of the Program Management Group of FMR (investment adviser firm, 2010-2013), and Vice President of Valuation Oversight (2008-2010).
Kenneth B. Robins (1969)
Year of Election or Appointment: 2016
Chief Compliance Officer
Mr. Robins also serves as an officer of other funds. Mr. Robins serves as Compliance Officer of Fidelity Management & Research Company and FMR Co., Inc. (investment adviser firms, 2016-present) and is an employee of Fidelity Investments (2004-present). Previously, Mr. Robins served as Executive Vice President of Fidelity Investments Money Management, Inc. (investment adviser firm, 2013-2016) and served in other fund officer roles.
Stacie M. Smith (1974)
Year of Election or Appointment: 2016
President and Treasurer
Ms. Smith also serves as an officer of other funds. Ms. Smith serves as Assistant Treasurer of FMR Capital, Inc. (2017-present), is an employee of Fidelity Investments (2009-present), and has served in other fund officer roles. Prior to joining Fidelity Investments, Ms. Smith served as Senior Audit Manager of Ernst & Young LLP (accounting firm, 1996-2009). Previously, Ms. Smith served as Assistant Treasurer (2013-2018) and Deputy Treasurer (2013-2016) of certain Fidelity® funds.
Marc L. Spector (1972)
Year of Election or Appointment: 2016
Assistant Treasurer
Mr. Spector also serves as an officer of other funds. Mr. Spector serves as Assistant Treasurer of FMR Capital, Inc. (2017-present) and is an employee of Fidelity Investments (2016-present). Prior to joining Fidelity Investments, Mr. Spector served as Director at the Siegfried Group (accounting firm, 2013-2016), and prior to Siegfried Group as audit senior manager at Deloitte & Touche (accounting firm, 2005-2013).
Jim Wegmann (1979)
Year of Election or Appointment: 2019
Assistant Treasurer
Mr. Wegmann also serves as Assistant Treasurer of other funds. Mr. Wegmann is an employee of Fidelity Investments (2011-present).
Shareholder Expense Example
As a shareholder of the Fund, you incur two types of costs: (1) transaction costs, including sales charges (loads) on purchase payments or redemption proceeds, and (2) ongoing costs, including management fees, distribution and/or service (12b-1) fees and other Fund expenses. This Example is intended to help you understand your ongoing costs (in dollars) of investing in the Fund and to compare these costs with the ongoing costs of investing in other mutual funds.
The Example is based on an investment of $1,000 invested at the beginning of the period and held for the entire period (May 1, 2019 to October 31, 2019).
Actual Expenses
The first line of the accompanying table for each class of the Fund provides information about actual account values and actual expenses. You may use the information in this line, together with the amount you invested, to estimate the expenses that you paid over the period. Simply divide your account value by $1,000.00 (for example, an $8,600 account value divided by $1,000.00 = 8.6), then multiply the result by the number in the first line for a class of the Fund under the heading entitled "Expenses Paid During Period" to estimate the expenses you paid on your account during this period. In addition, the Fund, as a shareholder in the underlying Fidelity Central Funds, will indirectly bear its pro-rata share of the fees and expenses incurred by the underlying Fidelity Central Funds. These fees and expenses are not included in the Fund's annualized expense ratio used to calculate the expense estimate in the table below.
Hypothetical Example for Comparison Purposes
The second line of the accompanying table for each class of the Fund provides information about hypothetical account values and hypothetical expenses based on a Class' actual expense ratio and an assumed rate of return of 5% per year before expenses, which is not the Class' actual return. The hypothetical account values and expenses may not be used to estimate the actual ending account balance or expenses you paid for the period. You may use this information to compare the ongoing costs of investing in the Fund and other funds. To do so, compare this 5% hypothetical example with the 5% hypothetical examples that appear in the shareholder reports of the other funds. In addition, the Fund, as a shareholder in the underlying Fidelity Central Funds, will indirectly bear its pro-rata share of the fees and expenses incurred by the underlying Fidelity Central Funds. These fees and expenses are not included in the Fund's annualized expense ratio used to calculate the expense estimate in the table below.
Please note that the expenses shown in the table are meant to highlight your ongoing costs only and do not reflect any transaction costs. Therefore, the second line of the table is useful in comparing ongoing costs only, and will not help you determine the relative total costs of owning different funds. In addition, if these transactional costs were included, your costs would have been higher.
| | Annualized Expense Ratio-A | Beginning
Account Value
May 1, 2019 | Ending
Account Value
October 31, 2019 | Expenses Paid
During Period-B
May 1, 2019
to October 31, 2019 |
| Class A | 1.25% | | | |
| Actual | | $1,000.00 | $1,038.50 | $6.42 |
| Hypothetical-C | | $1,000.00 | $1,018.90 | $6.36 |
| Class M | 1.46% | | | |
| Actual | | $1,000.00 | $1,037.40 | $7.50 |
| Hypothetical-C | | $1,000.00 | $1,017.85 | $7.43 |
| Class C | 2.07% | | | |
| Actual | | $1,000.00 | $1,034.40 | $10.61 |
| Hypothetical-C | | $1,000.00 | $1,014.77 | $10.51 |
| Class I | .96% | | | |
| Actual | | $1,000.00 | $1,039.80 | $4.94 |
| Hypothetical-C | | $1,000.00 | $1,020.37 | $4.89 |
| Class Z | .82% | | | |
| Actual | | $1,000.00 | $1,040.70 | $4.22 |
| Hypothetical-C | | $1,000.00 | $1,021.07 | $4.18 |
A Annualized expense ratio reflects expenses net of applicable fee waivers.
B Expenses are equal to each Class' annualized expense ratio, multiplied by the average account value over the period, multiplied by 184/365 (to reflect the one-half year period).
C 5% return per year before expenses
Distributions (Unaudited)
Class A designates 3%; Class M designates 4%; Class I designates 2%; and Class Z designates 2%; of the dividend distributed in December 2018 during the fiscal year as qualifying for the dividends–received deduction for corporate shareholders.
Class A, Class M, Class I, and Class Z designate 100% of the dividend distributed during the fiscal year as amounts which may be taken into account as a dividend for purposes of the maximum rate under section 1(h)(11) of the Internal Revenue Code.
The amounts per share which represent income derived from sources within, and taxes paid to, foreign countries or possessions of the United States are as follows:
| | Pay Date | Income | Taxes |
| Fidelity Advisor Overseas Fund | | | |
| Class A | 12/10/18 | $0.2425 | $0.0365 |
| Class M | 12/10/18 | $0.1895 | $0.0365 |
| Class I | 12/10/18 | $0.3545 | $0.0365 |
| Class Z | 12/10/18 | $0.3965 | $0.0365 |
|
The fund will notify shareholders in January 2020 of amounts for use in preparing 2019 income tax returns.

OS-ANN-1219
1.538536.122
Fidelity Advisor® International Capital Appreciation Fund
Annual Report
October 31, 2019
See the inside front cover for important information about access to your fund’s shareholder reports.
Beginning on January 1, 2021, as permitted by regulations adopted by the Securities and Exchange Commission, paper copies of a fund’s shareholder reports will no longer be sent by mail, unless you specifically request paper copies of the reports from the fund or from your financial intermediary, such as a financial advisor, broker-dealer or bank. Instead, the reports will be made available on a website, and you will be notified by mail each time a report is posted and provided with a website link to access the report.
If you already elected to receive shareholder reports electronically, you will not be affected by this change and you need not take any action. You may elect to receive shareholder reports and other communications from a fund electronically, by contacting your financial intermediary. For Fidelity customers, visit Fidelity's web site or call Fidelity using the contact information listed below.
You may elect to receive all future reports in paper free of charge. If you wish to continue receiving paper copies of your shareholder reports, you may contact your financial intermediary or, if you are a Fidelity customer, visit Fidelity’s website, or call Fidelity at the applicable toll-free number listed below. Your election to receive reports in paper will apply to all funds held with the fund complex/your financial intermediary.
| Account Type | Website | Phone Number |
| Brokerage, Mutual Fund, or Annuity Contracts: | fidelity.com/mailpreferences | 1-800-343-3548 |
| Employer Provided Retirement Accounts: | netbenefits.fidelity.com/preferences (choose 'no' under Required Disclosures to continue to print) | 1-800-343-0860 |
| Advisor Sold Accounts Serviced Through Your Financial Intermediary: | Contact Your Financial Intermediary | Your Financial Intermediary's phone number |
| Advisor Sold Accounts Serviced by Fidelity: | institutional.fidelity.com | 1-877-208-0098 |
Contents
To view a fund's proxy voting guidelines and proxy voting record for the 12-month period ended June 30, visit http://www.fidelity.com/proxyvotingresults or visit the Securities and Exchange Commission's (SEC) web site at http://www.sec.gov.
You may also call 1-877-208-0098 to request a free copy of the proxy voting guidelines.
Standard & Poor's, S&P and S&P 500 are registered service marks of The McGraw-Hill Companies, Inc. and have been licensed for use by Fidelity Distributors Corporation.
Other third-party marks appearing herein are the property of their respective owners.
All other marks appearing herein are registered or unregistered trademarks or service marks of FMR LLC or an affiliated company. © 2019 FMR LLC. All rights reserved.
This report and the financial statements contained herein are submitted for the general information of the shareholders of the Fund. This report is not authorized for distribution to prospective investors in the Fund unless preceded or accompanied by an effective prospectus.
A fund files its complete schedule of portfolio holdings with the SEC for the first and third quarters of each fiscal year on Form N-PORT. Forms N-PORT are available on the SEC’s web site at http://www.sec.gov. A fund's Forms N-PORT may be reviewed and copied at the SEC’s Public Reference Room in Washington, DC. Information regarding the operation of the SEC's Public Reference Room may be obtained by calling 1-800-SEC-0330.
For a complete list of a fund's portfolio holdings, view the most recent holdings listing, semiannual report, or annual report on Fidelity's web site at http://www.fidelity.com, http://www.institutional.fidelity.com, or http://www.401k.com, as applicable.
NOT FDIC INSURED •MAY LOSE VALUE •NO BANK GUARANTEE
Neither the Fund nor Fidelity Distributors Corporation is a bank.
Performance: The Bottom Line
Average annual total return reflects the change in the value of an investment, assuming reinvestment of distributions from dividend income and capital gains (the profits earned upon the sale of securities that have grown in value, if any) and assuming a constant rate of performance each year. The hypothetical investment and the average annual total returns do not reflect the deduction of taxes that a shareholder would pay on fund distributions or the redemption of fund shares. During periods of reimbursement by Fidelity, a fund’s total return will be greater than it would be had the reimbursement not occurred. How a fund did yesterday is no guarantee of how it will do tomorrow.
Average Annual Total Returns
| For the periods ended October 31, 2019 | Past 1 year | Past 5 years | Past 10 years |
| Class A (incl. 5.75% sales charge) | 14.92% | 6.61% | 8.77% |
| Class M (incl. 3.50% sales charge) | 17.41% | 6.86% | 8.76% |
| Class C (incl. contingent deferred sales charge) | 20.02% | 7.08% | 8.61% |
| Class I | 22.29% | 8.18% | 9.70% |
| Class Z | 22.41% | 8.26% | 9.74% |
Class C shares' contingent deferred sales charges included in the past one year, past five years and past ten years total return figures are 1%, 0% and 0%, respectively.
The initial offering of Class Z shares took place on February 1, 2017. Returns prior to February 1, 2017, are those of Class I.
$10,000 Over 10 Years
Let's say hypothetically that $10,000 was invested in Fidelity Advisor® International Capital Appreciation Fund - Class A on October 31, 2009, and the current 5.75% sales charge was paid.
The chart shows how the value of your investment would have changed, and also shows how the MSCI ACWI (All Country World Index) ex USA Index performed over the same period.
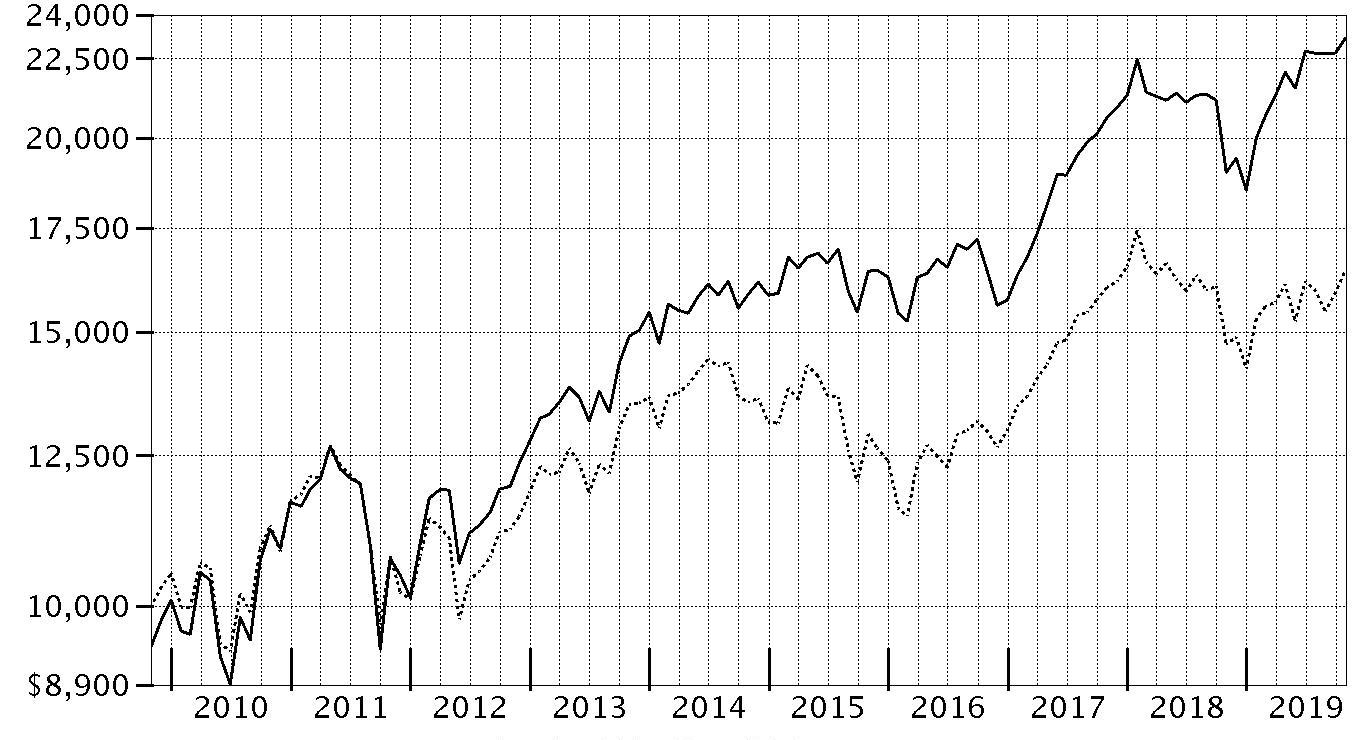
| Period Ending Values |
| $23,184 | Fidelity Advisor® International Capital Appreciation Fund - Class A |
| $16,440 | MSCI ACWI (All Country World Index) ex USA Index |
Management's Discussion of Fund Performance
Market Recap: The MSCI ACWI (All Country World Index) ex USA Index gained 11.47% for the 12 months ending October 31, 2019, as international stocks reflected a confluence of factors, including escalating trade tension, and moderating but still positive global economic growth. Currency fluctuations were largely modest and varied by region, muting the overall impact on international equity returns. In late December, the U.S. Federal Reserve shifted from raising interest rates to a more dovish policy in 2019, joining many foreign central banks. In June, international stocks rose 6.03%, as policy stimulus in China stabilized that country’s economic growth. The Fed cut its policy rate in July for the first time since 2008. However, the index returned -1.21% for the month, followed by -3.08% in August. In September, the Fed cut its policy rate another quarter point, citing concerns about slowing economic growth and muted inflation, and did the same in October, leading to monthly gains of 2.59% and 3.49%, respectively. For the full 12 months, the growth-oriented information technology sector (+22%) led the way, followed by utilities (+20%) and real estate (+18%), two high-dividend-yielding categories. Conversely, energy was roughly flat, while materials (+6%) and communication services (7%) also lagged. By region, Asia Pacific ex Japan (+16%), Europe ex U.K (+13%), Canada (+12%) and emerging markets (+12%) fared best. Meanwhile, the U.K. (+7%) and Japan (+10%) trailed the broader market.
Comments from Portfolio Manager Sammy Simnegar: For the year, the fund’s share classes (excluding sales charges, if applicable) gained roughly 21% to 22%, well ahead of the 11.47% advance of the benchmark MSCI ACWI (All Country World Index) ex USA Index. Stock selection in financials, industrials, and the consumer-oriented sectors all contributed meaningfully to performance versus the benchmark the past 12 months, as did a sizable overweighting among information technology stocks. Geographically, positioning in continental Europe proved rewarding, particularly in France, Germany and the Netherlands. In emerging markets, exposure to China and India stood out. The fund’s top relative contributor was B3 (Brasil Bolsa Balcao), Brazil’s stock exchange. The fund also benefited from overweightings in two China-based liquor manufacturers, Kweichow Moutai and Wuliangye Yibin, as well as out-of-benchmark positions in two suppliers of commercial and military aircraft parts, TransDigm Group and Heico. Conversely, picks in the retailing segment of consumer discretionary and the fund's positioning in semiconductors & semiconductor equipment detracted modestly, as did a cash position averaging about 2%. A non-benchmark stake in MercadoLibre, a Latin American operator of e-commerce marketplaces, was the portfolio's largest relative detractor. Overweighting Taiwan Semiconductor Manufacturing and Belgium-based Umicore – a producer of electric-vehicle battery cathodes – also hurt. We exited the Umicore position by period end.
The views expressed above reflect those of the portfolio manager(s) only through the end of the period as stated on the cover of this report and do not necessarily represent the views of Fidelity or any other person in the Fidelity organization. Any such views are subject to change at any time based upon market or other conditions and Fidelity disclaims any responsibility to update such views. These views may not be relied on as investment advice and, because investment decisions for a Fidelity fund are based on numerous factors, may not be relied on as an indication of trading intent on behalf of any Fidelity fund.
Investment Summary (Unaudited)
Top Five Stocks as of October 31, 2019
| | % of fund's net assets |
| Nestle SA (Reg. S) (Switzerland, Food Products) | 2.5 |
| Alibaba Group Holding Ltd. sponsored ADR (Cayman Islands, Internet & Direct Marketing Retail) | 2.1 |
| Tencent Holdings Ltd. (Cayman Islands, Interactive Media & Services) | 1.9 |
| Taiwan Semiconductor Manufacturing Co. Ltd. (Taiwan, Semiconductors & Semiconductor Equipment) | 1.9 |
| Unilever NV (Netherlands, Personal Products) | 1.5 |
| | 9.9 |
Top Five Market Sectors as of October 31, 2019
| | % of fund's net assets |
| Industrials | 22.6 |
| Information Technology | 18.8 |
| Consumer Discretionary | 14.1 |
| Consumer Staples | 13.3 |
| Financials | 12.9 |
Top Five Countries as of October 31, 2019
| (excluding cash equivalents) | % of fund's net assets |
| France | 12.9 |
| United Kingdom | 9.0 |
| Canada | 8.7 |
| Germany | 6.3 |
| Switzerland | 6.3 |
Percentages are adjusted for the effect of futures contracts, if applicable.
Asset Allocation (% of fund's net assets)
| As of October 31, 2019 |
| | Stocks | 96.5% |
| | Short-Term Investments and Net Other Assets (Liabilities) | 3.5% |

Schedule of Investments October 31, 2019
Showing Percentage of Net Assets
| Common Stocks - 96.5% | | | |
| | | Shares | Value |
| Australia - 1.8% | | | |
| Sydney Airport unit | | 4,358,697 | $26,398,215 |
| Transurban Group unit | | 2,600,700 | 26,636,233 |
|
| TOTAL AUSTRALIA | | | 53,034,448 |
|
| Bailiwick of Jersey - 0.9% | | | |
| Experian PLC | | 874,000 | 27,488,260 |
| Bermuda - 1.6% | | | |
| Hiscox Ltd. | | 1,231,000 | 23,743,234 |
| IHS Markit Ltd. (a) | | 340,700 | 23,855,814 |
|
| TOTAL BERMUDA | | | 47,599,048 |
|
| Brazil - 2.8% | | | |
| BM&F BOVESPA SA | | 2,526,900 | 30,482,838 |
| Lojas Renner SA | | 2,008,300 | 25,413,596 |
| Rumo SA (a) | | 4,399,700 | 25,012,632 |
|
| TOTAL BRAZIL | | | 80,909,066 |
|
| Canada - 8.7% | | | |
| Alimentation Couche-Tard, Inc. Class B (sub. vtg.) | | 937,900 | 28,127,743 |
| Brookfield Asset Management, Inc. | | 563,800 | 31,149,950 |
| Canadian National Railway Co. | | 375,540 | 33,587,892 |
| Canadian Pacific Railway Ltd. | | 129,600 | 29,471,184 |
| CGI Group, Inc. Class A (sub. vtg.) (a) | | 343,700 | 26,716,275 |
| Constellation Software, Inc. | | 27,380 | 27,041,778 |
| Restaurant Brands International, Inc. | | 415,900 | 27,209,857 |
| Thomson Reuters Corp. | | 386,800 | 25,993,218 |
| Waste Connection, Inc. (Canada) | | 277,930 | 25,672,283 |
|
| TOTAL CANADA | | | 254,970,180 |
|
| Cayman Islands - 5.9% | | | |
| Alibaba Group Holding Ltd. sponsored ADR (a) | | 350,260 | 61,880,434 |
| New Oriental Education & Technology Group, Inc. sponsored ADR (a) | | 231,800 | 28,293,508 |
| Shenzhou International Group Holdings Ltd. | | 1,850,200 | 25,567,273 |
| Tencent Holdings Ltd. | | 1,418,200 | 57,526,330 |
|
| TOTAL CAYMAN ISLANDS | | | 173,267,545 |
|
| China - 1.1% | | | |
| Ping An Insurance Group Co. of China Ltd. (H Shares) | | 2,868,500 | 33,107,627 |
| Denmark - 1.9% | | | |
| Coloplast A/S Series B | | 225,500 | 27,172,568 |
| DSV A/S | | 288,200 | 27,964,710 |
|
| TOTAL DENMARK | | | 55,137,278 |
|
| Finland - 0.8% | | | |
| Kone OYJ (B Shares) | | 384,700 | 24,473,349 |
| France - 12.9% | | | |
| Air Liquide SA | | 241,770 | 32,114,848 |
| Dassault Systemes SA | | 201,900 | 30,635,613 |
| Edenred SA | | 536,736 | 28,254,943 |
| Hermes International SCA | | 41,125 | 29,584,030 |
| Kering SA | | 53,266 | 30,309,742 |
| L'Oreal SA | | 125,620 | 36,679,224 |
| LVMH Moet Hennessy Louis Vuitton SE | | 100,571 | 42,949,452 |
| Pernod Ricard SA | | 172,600 | 31,858,879 |
| Remy Cointreau SA | | 192,385 | 25,726,582 |
| Safran SA | | 194,000 | 30,691,829 |
| SR Teleperformance SA | | 121,100 | 27,444,767 |
| VINCI SA | | 284,000 | 31,864,567 |
|
| TOTAL FRANCE | | | 378,114,476 |
|
| Germany - 6.3% | | | |
| adidas AG | | 100,657 | 31,079,943 |
| Deutsche Borse AG | | 182,900 | 28,323,839 |
| Nemetschek Se | | 511,109 | 25,993,818 |
| SAP SE | | 332,100 | 44,003,742 |
| Symrise AG | | 270,300 | 26,010,451 |
| Vonovia SE | | 570,800 | 30,372,818 |
|
| TOTAL GERMANY | | | 185,784,611 |
|
| Hong Kong - 1.4% | | | |
| AIA Group Ltd. | | 4,193,800 | 41,762,803 |
| India - 2.8% | | | |
| HDFC Bank Ltd. | | 1,501,832 | 26,002,392 |
| Housing Development Finance Corp. Ltd. | | 1,073,969 | 32,208,760 |
| Kotak Mahindra Bank Ltd. | | 1,127,546 | 24,990,567 |
|
| TOTAL INDIA | | | 83,201,719 |
|
| Indonesia - 0.9% | | | |
| PT Bank Central Asia Tbk | | 11,705,300 | 26,200,297 |
| Ireland - 2.7% | | | |
| Kerry Group PLC Class A | | 217,740 | 26,324,444 |
| Kingspan Group PLC (Ireland) | | 510,860 | 26,471,150 |
| Linde PLC | | 128,600 | 25,507,810 |
|
| TOTAL IRELAND | | | 78,303,404 |
|
| Israel - 0.9% | | | |
| NICE Systems Ltd. sponsored ADR (a) | | 172,000 | 27,139,880 |
| Italy - 3.6% | | | |
| Amplifon SpA | | 1,053,300 | 26,455,269 |
| Davide Campari-Milano SpA | | 2,597,500 | 23,798,787 |
| Enel SpA | | 4,154,300 | 32,197,338 |
| Moncler SpA | | 623,370 | 24,013,747 |
|
| TOTAL ITALY | | | 106,465,141 |
|
| Japan - 6.2% | | | |
| Hoya Corp. | | 330,200 | 29,182,161 |
| Kao Corp. | | 377,900 | 30,382,664 |
| Keyence Corp. | | 51,734 | 32,711,223 |
| OBIC Co. Ltd. | | 233,400 | 29,222,899 |
| Recruit Holdings Co. Ltd. | | 942,300 | 31,316,439 |
| Shiseido Co. Ltd. | | 352,400 | 29,054,658 |
|
| TOTAL JAPAN | | | 181,870,044 |
|
| Netherlands - 5.7% | | | |
| ASML Holding NV (Netherlands) | | 152,900 | 40,077,324 |
| Ferrari NV | | 177,000 | 28,318,192 |
| InterXion Holding NV (a) | | 301,479 | 26,596,477 |
| Unilever NV | | 757,000 | 44,704,737 |
| Wolters Kluwer NV | | 366,200 | 26,964,077 |
|
| TOTAL NETHERLANDS | | | 166,660,807 |
|
| Philippines - 0.9% | | | |
| SM Prime Holdings, Inc. | | 35,443,800 | 27,195,346 |
| Spain - 4.1% | | | |
| Amadeus IT Holding SA Class A | | 398,191 | 29,461,755 |
| Cellnex Telecom SA (b) | | 608,191 | 26,223,674 |
| Cellnex Telecom SA (a) | | 176,571 | 7,613,300 |
| Ferrovial SA | | 854,700 | 25,222,913 |
| Iberdrola SA | | 3,068,151 | 31,537,518 |
|
| TOTAL SPAIN | | | 120,059,160 |
|
| Sweden - 2.9% | | | |
| ASSA ABLOY AB (B Shares) | | 1,171,500 | 27,821,226 |
| Atlas Copco AB (A Shares) | | 787,700 | 27,826,514 |
| Hexagon AB (B Shares) | | 565,100 | 28,846,981 |
|
| TOTAL SWEDEN | | | 84,494,721 |
|
| Switzerland - 6.3% | | | |
| Givaudan SA | | 9,178 | 26,952,525 |
| Nestle SA (Reg. S) | | 677,670 | 72,498,050 |
| Partners Group Holding AG | | 34,129 | 26,611,279 |
| Sika AG | | 170,288 | 29,258,810 |
| Temenos Group AG | | 202,300 | 28,863,381 |
|
| TOTAL SWITZERLAND | | | 184,184,045 |
|
| Taiwan - 1.9% | | | |
| Taiwan Semiconductor Manufacturing Co. Ltd. | | 5,796,000 | 56,692,575 |
| United Kingdom - 9.0% | | | |
| Ashtead Group PLC | | 923,300 | 28,082,001 |
| Atlassian Corp. PLC (a) | | 232,600 | 28,095,754 |
| Compass Group PLC | | 1,179,250 | 31,396,457 |
| Diageo PLC | | 925,954 | 37,900,203 |
| Halma PLC | | 1,099,900 | 26,692,793 |
| London Stock Exchange Group PLC | | 290,800 | 26,206,556 |
| Prudential PLC | | 1,613,800 | 28,187,982 |
| RELX PLC (London Stock Exchange) | | 1,350,258 | 32,497,473 |
| Rentokil Initial PLC | | 4,568,500 | 26,896,430 |
|
| TOTAL UNITED KINGDOM | | | 265,955,649 |
|
| United States of America - 2.5% | | | |
| MasterCard, Inc. Class A | | 84,550 | 23,404,286 |
| MercadoLibre, Inc. (a) | | 50,700 | 26,441,064 |
| Visa, Inc. Class A | | 133,040 | 23,795,534 |
|
| TOTAL UNITED STATES OF AMERICA | | | 73,640,884 |
|
| TOTAL COMMON STOCKS | | | |
| (Cost $2,443,580,627) | | | 2,837,712,363 |
|
| Money Market Funds - 3.3% | | | |
| Fidelity Cash Central Fund 1.83% (c) | | | |
| (Cost $98,136,298) | | 98,116,675 | 98,136,298 |
| TOTAL INVESTMENT IN SECURITIES - 99.8% | | | |
| (Cost $2,541,716,925) | | | 2,935,848,661 |
| NET OTHER ASSETS (LIABILITIES) - 0.2% | | | 6,000,572 |
| NET ASSETS - 100% | | | $2,941,849,233 |
Categorizations in the Schedule of Investments are based on country or territory of incorporation.
Legend
(a) Non-income producing
(b) Security exempt from registration under Rule 144A of the Securities Act of 1933. These securities may be resold in transactions exempt from registration, normally to qualified institutional buyers. At the end of the period, the value of these securities amounted to $26,223,674 or 0.9% of net assets.
(c) Affiliated fund that is generally available only to investment companies and other accounts managed by Fidelity Investments. The rate quoted is the annualized seven-day yield of the fund at period end. A complete unaudited listing of the fund's holdings as of its most recent quarter end is available upon request. In addition, each Fidelity Central Fund's financial statements, which are not covered by the Fund's Report of Independent Registered Public Accounting Firm, are available on the SEC's website or upon request.
Affiliated Central Funds
Information regarding fiscal year to date income earned by the Fund from investments in Fidelity Central Funds is as follows:
| Fund | Income earned |
| Fidelity Cash Central Fund | $1,136,961 |
| Fidelity Securities Lending Cash Central Fund | 443,177 |
| Total | $1,580,138 |
Amounts in the income column in the above table include any capital gain distributions from underlying funds, which are presented in the corresponding line-item in the Statement of Operations, if applicable. Amount for Fidelity Securities Lending Cash Central Fund represents the income earned on investing cash collateral, less rebates paid to borrowers and any lending agent fees associated with the loan, plus any premium payments received for lending certain types of securities.
Investment Valuation
The following is a summary of the inputs used, as of October 31, 2019, involving the Fund's assets and liabilities carried at fair value. The inputs or methodology used for valuing securities may not be an indication of the risk associated with investing in those securities. For more information on valuation inputs, and their aggregation into the levels used below, please refer to the Investment Valuation section in the accompanying Notes to Financial Statements.
| | Valuation Inputs at Reporting Date: |
| Description | Total | Level 1 | Level 2 | Level 3 |
| Investments in Securities: | | | | |
| Equities: | | | | |
| Communication Services | $91,363,304 | $33,836,974 | $57,526,330 | $-- |
| Consumer Discretionary | 412,457,295 | 312,544,113 | 99,913,182 | -- |
| Consumer Staples | 387,055,971 | 217,220,396 | 169,835,575 | -- |
| Financials | 378,978,124 | 111,987,301 | 266,990,823 | -- |
| Health Care | 82,809,998 | 53,627,837 | 29,182,161 | -- |
| Industrials | 667,908,119 | 555,736,006 | 112,172,113 | -- |
| Information Technology | 555,992,088 | 353,284,325 | 202,707,763 | -- |
| Materials | 139,844,444 | 139,844,444 | -- | -- |
| Real Estate | 57,568,164 | 30,372,818 | 27,195,346 | -- |
| Utilities | 63,734,856 | -- | 63,734,856 | -- |
| Money Market Funds | 98,136,298 | 98,136,298 | -- | -- |
| Total Investments in Securities: | $2,935,848,661 | $1,906,590,512 | $1,029,258,149 | $-- |
See accompanying notes which are an integral part of the financial statements.
Financial Statements
Statement of Assets and Liabilities
| | | October 31, 2019 |
| Assets | | |
Investment in securities, at value — See accompanying schedule:
Unaffiliated issuers (cost $2,443,580,627) | $2,837,712,363 | |
| Fidelity Central Funds (cost $98,136,298) | 98,136,298 | |
| Total Investment in Securities (cost $2,541,716,925) | | $2,935,848,661 |
| Cash | | 904 |
| Receivable for investments sold | | 34,985,590 |
| Receivable for fund shares sold | | 12,828,358 |
| Dividends receivable | | 2,381,978 |
| Distributions receivable from Fidelity Central Funds | | 132,144 |
| Prepaid expenses | | 4,296 |
| Other receivables | | 607,943 |
| Total assets | | 2,986,789,874 |
| Liabilities | | |
| Payable for investments purchased | $40,060,711 | |
| Payable for fund shares redeemed | 1,616,053 | |
| Accrued management fee | 1,842,628 | |
| Distribution and service plan fees payable | 198,724 | |
| Other affiliated payables | 455,321 | |
| Other payables and accrued expenses | 767,204 | |
| Total liabilities | | 44,940,641 |
| Net Assets | | $2,941,849,233 |
| Net Assets consist of: | | |
| Paid in capital | | $2,552,100,848 |
| Total accumulated earnings (loss) | | 389,748,385 |
| Net Assets | | $2,941,849,233 |
| Net Asset Value and Maximum Offering Price | | |
| Class A: | | |
| Net Asset Value and redemption price per share ($278,326,119 ÷ 12,974,026 shares)(a) | | $21.45 |
| Maximum offering price per share (100/94.25 of $21.45) | | $22.76 |
| Class M: | | |
| Net Asset Value and redemption price per share ($127,176,060 ÷ 6,088,802 shares)(a) | | $20.89 |
| Maximum offering price per share (100/96.50 of $20.89) | | $21.65 |
| Class C: | | |
| Net Asset Value and offering price per share ($112,149,692 ÷ 5,976,019 shares)(a) | | $18.77 |
| Class I: | | |
| Net Asset Value, offering price and redemption price per share ($2,020,956,424 ÷ 88,133,271 shares) | | $22.93 |
| Class Z: | | |
| Net Asset Value, offering price and redemption price per share ($403,240,938 ÷ 17,560,294 shares) | | $22.96 |
(a) Redemption price per share is equal to net asset value less any applicable contingent deferred sales charge.
See accompanying notes which are an integral part of the financial statements.
Statement of Operations
| | | Year ended October 31, 2019 |
| Investment Income | | |
| Dividends | | $31,459,621 |
| Non-Cash dividends | | 9,774,968 |
| Income from Fidelity Central Funds (including $443,177 from security lending) | | 1,580,138 |
| Income before foreign taxes withheld | | 42,814,727 |
| Less foreign taxes withheld | | (3,014,230) |
| Total income | | 39,800,497 |
| Expenses | | |
| Management fee | | |
| Basic fee | $14,893,688 | |
| Performance adjustment | 1,437,150 | |
| Transfer agent fees | 3,496,648 | |
| Distribution and service plan fees | 2,136,285 | |
| Accounting and security lending fees | 953,161 | |
| Custodian fees and expenses | 248,606 | |
| Independent trustees' fees and expenses | 11,497 | |
| Registration fees | 240,295 | |
| Audit | 95,258 | |
| Legal | 5,672 | |
| Interest | 28,438 | |
| Miscellaneous | 12,863 | |
| Total expenses before reductions | 23,559,561 | |
| Expense reductions | (341,101) | |
| Total expenses after reductions | | 23,218,460 |
| Net investment income (loss) | | 16,582,037 |
| Realized and Unrealized Gain (Loss) | | |
| Net realized gain (loss) on: | | |
| Investment securities: | | |
| Unaffiliated issuers | 23,905,287 | |
| Fidelity Central Funds | 688 | |
| Foreign currency transactions | (459,439) | |
| Total net realized gain (loss) | | 23,446,536 |
| Change in net unrealized appreciation (depreciation) on: | | |
| Investment securities: | | |
| Unaffiliated issuers (net of increase in deferred foreign taxes of $588,082) | 376,465,642 | |
| Assets and liabilities in foreign currencies | 123,738 | |
| Total change in net unrealized appreciation (depreciation) | | 376,589,380 |
| Net gain (loss) | | 400,035,916 |
| Net increase (decrease) in net assets resulting from operations | | $416,617,953 |
See accompanying notes which are an integral part of the financial statements.
Statement of Changes in Net Assets
| | Year ended October 31, 2019 | Year ended October 31, 2018 |
| Increase (Decrease) in Net Assets | | |
| Operations | | |
| Net investment income (loss) | $16,582,037 | $7,599,775 |
| Net realized gain (loss) | 23,446,536 | (43,030,217) |
| Change in net unrealized appreciation (depreciation) | 376,589,380 | (131,981,031) |
| Net increase (decrease) in net assets resulting from operations | 416,617,953 | (167,411,473) |
| Distributions to shareholders | (7,117,696) | (1,800,404) |
| Share transactions - net increase (decrease) | 877,461,117 | 766,075,127 |
| Total increase (decrease) in net assets | 1,286,961,374 | 596,863,250 |
| Net Assets | | |
| Beginning of period | 1,654,887,859 | 1,058,024,609 |
| End of period | $2,941,849,233 | $1,654,887,859 |
See accompanying notes which are an integral part of the financial statements.
Financial Highlights
Fidelity Advisor International Capital Appreciation Fund Class A
| Years ended October 31, | 2019 | 2018 | 2017 | 2016 | 2015 |
| Selected Per–Share Data | | | | | |
| Net asset value, beginning of period | $17.63 | $19.14 | $15.26 | $15.25 | $14.77 |
| Income from Investment Operations | | | | | |
| Net investment income (loss)A | .11B | .07 | .04 | .05 | .05 |
| Net realized and unrealized gain (loss) | 3.75 | (1.57) | 3.86 | (.03) | .46 |
| Total from investment operations | 3.86 | (1.50) | 3.90 | .02 | .51 |
| Distributions from net investment income | (.04) | (.01) | (.02) | (.01) | (.03) |
| Total distributions | (.04) | (.01) | (.02) | (.01) | (.03) |
| Redemption fees added to paid in capitalA | – | – | –C | –C | –C |
| Net asset value, end of period | $21.45 | $17.63 | $19.14 | $15.26 | $15.25 |
| Total ReturnD,E | 21.93% | (7.85)% | 25.56% | .12% | 3.46% |
| Ratios to Average Net AssetsF,G | | | | | |
| Expenses before reductions | 1.27% | 1.29% | 1.38% | 1.50% | 1.58% |
| Expenses net of fee waivers, if any | 1.27% | 1.29% | 1.37% | 1.45% | 1.45% |
| Expenses net of all reductions | 1.25% | 1.23% | 1.35% | 1.43% | 1.42% |
| Net investment income (loss) | .57%B | .35% | .21% | .34% | .30% |
| Supplemental Data | | | | | |
| Net assets, end of period (000 omitted) | $278,326 | $190,278 | $173,948 | $127,536 | $89,753 |
| Portfolio turnover rateH | 133% | 151% | 155% | 167% | 176% |
A Calculated based on average shares outstanding during the period.
B Net investment income per share reflects a large, non-recurring dividend which amounted to $.08 per share. Excluding this non-recurring dividend, the ratio of net investment income (loss) to average net assets would have been .15%.
C Amount represents less than $.005 per share.
D Total returns would have been lower if certain expenses had not been reduced during the applicable periods shown.
E Total returns do not include the effect of the sales charges.
F Fees and expenses of any underlying Fidelity Central Funds are not included in the Fund's expense ratio. The Fund indirectly bears its proportionate share of the expenses of any underlying Fidelity Central Funds.
G Expense ratios reflect operating expenses of the class. Expenses before reductions do not reflect amounts reimbursed by the investment adviser or reductions from brokerage service arrangements or reductions from other expense offset arrangements and do not represent the amount paid by the class during periods when reimbursements or reductions occur. Expenses net of fee waivers reflect expenses after reimbursement by the investment adviser but prior to reductions from brokerage service arrangements or other expense offset arrangements. Expenses net of all reductions represent the net expenses paid by the class.
H Amount does not include the portfolio activity of any underlying Fidelity Central Funds.
See accompanying notes which are an integral part of the financial statements.
Fidelity Advisor International Capital Appreciation Fund Class M
| Years ended October 31, | 2019 | 2018 | 2017 | 2016 | 2015 |
| Selected Per–Share Data | | | | | |
| Net asset value, beginning of period | $17.17 | $18.68 | $14.92 | $14.94 | $14.47 |
| Income from Investment Operations | | | | | |
| Net investment income (loss)A | .06B | .02 | (.01) | .01 | .01 |
| Net realized and unrealized gain (loss) | 3.66 | (1.53) | 3.77 | (.03) | .46 |
| Total from investment operations | 3.72 | (1.51) | 3.76 | (.02) | .47 |
| Redemption fees added to paid in capitalA | – | – | –C | –C | –C |
| Net asset value, end of period | $20.89 | $17.17 | $18.68 | $14.92 | $14.94 |
| Total ReturnD,E | 21.67% | (8.08)% | 25.20% | (.13)% | 3.25% |
| Ratios to Average Net AssetsF,G | | | | | |
| Expenses before reductions | 1.53% | 1.55% | 1.63% | 1.76% | 1.86% |
| Expenses net of fee waivers, if any | 1.53% | 1.55% | 1.63% | 1.70% | 1.70% |
| Expenses net of all reductions | 1.51% | 1.49% | 1.61% | 1.68% | 1.67% |
| Net investment income (loss) | .31%B | .10% | (.04)% | .09% | .05% |
| Supplemental Data | | | | | |
| Net assets, end of period (000 omitted) | $127,176 | $87,750 | $86,547 | $62,866 | $60,293 |
| Portfolio turnover rateH | 133% | 151% | 155% | 167% | 176% |
A Calculated based on average shares outstanding during the period.
B Net investment income per share reflects a large, non-recurring dividend which amounted to $.08 per share. Excluding this non-recurring dividend, the ratio of net investment income (loss) to average net assets would have been (.11) %.
C Amount represents less than $.005 per share.
D Total returns would have been lower if certain expenses had not been reduced during the applicable periods shown.
E Total returns do not include the effect of the sales charges.
F Fees and expenses of any underlying Fidelity Central Funds are not included in the Fund's expense ratio. The Fund indirectly bears its proportionate share of the expenses of any underlying Fidelity Central Funds.
G Expense ratios reflect operating expenses of the class. Expenses before reductions do not reflect amounts reimbursed by the investment adviser or reductions from brokerage service arrangements or reductions from other expense offset arrangements and do not represent the amount paid by the class during periods when reimbursements or reductions occur. Expenses net of fee waivers reflect expenses after reimbursement by the investment adviser but prior to reductions from brokerage service arrangements or other expense offset arrangements. Expenses net of all reductions represent the net expenses paid by the class.
H Amount does not include the portfolio activity of any underlying Fidelity Central Funds.
See accompanying notes which are an integral part of the financial statements.
Fidelity Advisor International Capital Appreciation Fund Class C
| Years ended October 31, | 2019 | 2018 | 2017 | 2016 | 2015 |
| Selected Per–Share Data | | | | | |
| Net asset value, beginning of period | $15.51 | $16.95 | $13.61 | $13.69 | $13.33 |
| Income from Investment Operations | | | | | |
| Net investment income (loss)A | (.03)B | (.07) | (.08) | (.06) | (.06) |
| Net realized and unrealized gain (loss) | 3.29 | (1.37) | 3.42 | (.02) | .42 |
| Total from investment operations | 3.26 | (1.44) | 3.34 | (.08) | .36 |
| Redemption fees added to paid in capitalA | – | – | –C | –C | –C |
| Net asset value, end of period | $18.77 | $15.51 | $16.95 | $13.61 | $13.69 |
| Total ReturnD,E | 21.02% | (8.50)% | 24.54% | (.58)% | 2.70% |
| Ratios to Average Net AssetsF,G | | | | | |
| Expenses before reductions | 2.02% | 2.04% | 2.13% | 2.27% | 2.33% |
| Expenses net of fee waivers, if any | 2.01% | 2.04% | 2.12% | 2.20% | 2.20% |
| Expenses net of all reductions | 2.00% | 1.99% | 2.10% | 2.18% | 2.17% |
| Net investment income (loss) | (.17)%B | (.40)% | (.54)% | (.41)% | (.45)% |
| Supplemental Data | | | | | |
| Net assets, end of period (000 omitted) | $112,150 | $107,858 | $85,022 | $42,146 | $36,491 |
| Portfolio turnover rateH | 133% | 151% | 155% | 167% | 176% |
A Calculated based on average shares outstanding during the period.
B Net investment income per share reflects a large, non-recurring dividend which amounted to $.07 per share. Excluding this non-recurring dividend, the ratio of net investment income (loss) to average net assets would have been (.60) %.
C Amount represents less than $.005 per share.
D Total returns would have been lower if certain expenses had not been reduced during the applicable periods shown.
E Total returns do not include the effect of the contingent deferred sales charge.
F Fees and expenses of any underlying Fidelity Central Funds are not included in the Fund's expense ratio. The Fund indirectly bears its proportionate share of the expenses of any underlying Fidelity Central Funds.
G Expense ratios reflect operating expenses of the class. Expenses before reductions do not reflect amounts reimbursed by the investment adviser or reductions from brokerage service arrangements or reductions from other expense offset arrangements and do not represent the amount paid by the class during periods when reimbursements or reductions occur. Expenses net of fee waivers reflect expenses after reimbursement by the investment adviser but prior to reductions from brokerage service arrangements or other expense offset arrangements. Expenses net of all reductions represent the net expenses paid by the class.
H Amount does not include the portfolio activity of any underlying Fidelity Central Funds.
See accompanying notes which are an integral part of the financial statements.
Fidelity Advisor International Capital Appreciation Fund Class I
| Years ended October 31, | 2019 | 2018 | 2017 | 2016 | 2015 |
| Selected Per–Share Data | | | | | |
| Net asset value, beginning of period | $18.85 | $20.44 | $16.30 | $16.28 | $15.75 |
| Income from Investment Operations | | | | | |
| Net investment income (loss)A | .18B | .13 | .09 | .10 | .09 |
| Net realized and unrealized gain (loss) | 4.00 | (1.68) | 4.11 | (.04) | .51 |
| Total from investment operations | 4.18 | (1.55) | 4.20 | .06 | .60 |
| Distributions from net investment income | (.10) | (.04) | (.06) | (.04) | (.07) |
| Total distributions | (.10) | (.04) | (.06) | (.04) | (.07) |
| Redemption fees added to paid in capitalA | – | – | –C | –C | –C |
| Net asset value, end of period | $22.93 | $18.85 | $20.44 | $16.30 | $16.28 |
| Total ReturnD | 22.29% | (7.58)% | 25.87% | .36% | 3.80% |
| Ratios to Average Net AssetsE,F | | | | | |
| Expenses before reductions | .99% | 1.02% | 1.09% | 1.21% | 1.27% |
| Expenses net of fee waivers, if any | .99% | 1.02% | 1.08% | 1.20% | 1.20% |
| Expenses net of all reductions | .98% | .96% | 1.06% | 1.18% | 1.17% |
| Net investment income (loss) | .85%B | .63% | .50% | .59% | .55% |
| Supplemental Data | | | | | |
| Net assets, end of period (000 omitted) | $2,020,956 | $1,115,089 | $652,774 | $169,594 | $72,421 |
| Portfolio turnover rateG | 133% | 151% | 155% | 167% | 176% |
A Calculated based on average shares outstanding during the period.
B Net investment income per share reflects a large, non-recurring dividend which amounted to $.09 per share. Excluding this non-recurring dividend, the ratio of net investment income (loss) to average net assets would have been .43%.
C Amount represents less than $.005 per share.
D Total returns would have been lower if certain expenses had not been reduced during the applicable periods shown.
E Fees and expenses of any underlying Fidelity Central Funds are not included in the Fund's expense ratio. The Fund indirectly bears its proportionate share of the expenses of any underlying Fidelity Central Funds.
F Expense ratios reflect operating expenses of the class. Expenses before reductions do not reflect amounts reimbursed by the investment adviser or reductions from brokerage service arrangements or reductions from other expense offset arrangements and do not represent the amount paid by the class during periods when reimbursements or reductions occur. Expenses net of fee waivers reflect expenses after reimbursement by the investment adviser but prior to reductions from brokerage service arrangements or other expense offset arrangements. Expenses net of all reductions represent the net expenses paid by the class.
G Amount does not include the portfolio activity of any underlying Fidelity Central Funds.
See accompanying notes which are an integral part of the financial statements.
Fidelity Advisor International Capital Appreciation Fund Class Z
| Years ended October 31, | 2019 | 2018 | 2017 A |
| Selected Per–Share Data | | | |
| Net asset value, beginning of period | $18.88 | $20.46 | $16.22 |
| Income from Investment Operations | | | |
| Net investment income (loss)B | .21C | .16 | .06 |
| Net realized and unrealized gain (loss) | 3.99 | (1.68) | 4.18 |
| Total from investment operations | 4.20 | (1.52) | 4.24 |
| Distributions from net investment income | (.12) | (.06) | – |
| Total distributions | (.12) | (.06) | – |
| Redemption fees added to paid in capitalB | – | – | –D |
| Net asset value, end of period | $22.96 | $18.88 | $20.46 |
| Total ReturnE,F | 22.41% | (7.46)% | 26.14% |
| Ratios to Average Net AssetsG,H | | | |
| Expenses before reductions | .87% | .89% | .96%I |
| Expenses net of fee waivers, if any | .87% | .89% | .96%I |
| Expenses net of all reductions | .85% | .83% | .94%I |
| Net investment income (loss) | .97%C | .76% | .42%I |
| Supplemental Data | | | |
| Net assets, end of period (000 omitted) | $403,241 | $153,913 | $59,734 |
| Portfolio turnover rateJ | 133% | 151% | 155% |
A For the period February 1, 2017 (commencement of sale of shares) to October 31, 2017.
B Calculated based on average shares outstanding during the period.
C Net investment income per share reflects a large, non-recurring dividend which amounted to $.09 per share. Excluding this non-recurring dividend, the ratio of net investment income (loss) to average net assets would have been .55%.
D Amount represents less than $.005 per share.
E Total returns for periods of less than one year are not annualized.
F Total returns would have been lower if certain expenses had not been reduced during the applicable periods shown.
G Fees and expenses of any underlying Fidelity Central Funds are not included in the Fund's expense ratio. The Fund indirectly bears its proportionate share of the expenses of any underlying Fidelity Central Funds.
H Expense ratios reflect operating expenses of the class. Expenses before reductions do not reflect amounts reimbursed by the investment adviser or reductions from brokerage service arrangements or reductions from other expense offset arrangements and do not represent the amount paid by the class during periods when reimbursements or reductions occur. Expense ratios before reductions for start-up periods may not be representative of longer-term operating periods. Expenses net of fee waivers reflect expenses after reimbursement by the investment adviser but prior to reductions from brokerage service arrangements or other expense offset arrangements. Expenses net of all reductions represent the net expenses paid by the class.
I Annualized
J Amount does not include the portfolio activity of any underlying Fidelity Central Funds.
See accompanying notes which are an integral part of the financial statements.
Notes to Financial Statements
For the period ended October 31, 2019
1. Organization.
Fidelity Advisor International Capital Appreciation Fund (the Fund) is a fund of Fidelity Advisor Series VIII (the Trust) and is authorized to issue an unlimited number of shares. The Trust is registered under the Investment Company Act of 1940, as amended (the 1940 Act), as an open-end management investment company organized as a Massachusetts business trust. The Fund offers Class A, Class M, Class C, Class I and Class Z shares, each of which has equal rights as to assets and voting privileges. Each class has exclusive voting rights with respect to matters that affect that class. Effective March 1, 2019, Class C shares will automatically convert to Class A shares after a holding period of ten years from the initial date of purchase, with certain exceptions. The Fund's investments in emerging markets can be subject to social, economic, regulatory, and political uncertainties and can be extremely volatile.
2. Investments in Fidelity Central Funds.
The Fund invests in Fidelity Central Funds, which are open-end investment companies generally available only to other investment companies and accounts managed by the investment adviser and its affiliates. The Fund's Schedule of Investments lists each of the Fidelity Central Funds held as of period end, if any, as an investment of the Fund, but does not include the underlying holdings of each Fidelity Central Fund. As an Investing Fund, the Fund indirectly bears its proportionate share of the expenses of the underlying Fidelity Central Funds.
The Money Market Central Funds seek preservation of capital and current income and are managed by Fidelity Investments Money Management, Inc. (FIMM), an affiliate of the investment adviser. Annualized expenses of the Money Market Central Funds as of their most recent shareholder report date ranged from less than .005% to .01%.
A complete unaudited list of holdings for each Fidelity Central Fund is available upon request or at the Securities and Exchange Commission (the SEC) website at www.sec.gov. In addition, the financial statements of the Fidelity Central Funds, which are not covered by the Fund's Report of Independent Registered Public Accounting Firm, are available on the SEC website or upon request.
3. Significant Accounting Policies.
The Fund is an investment company and applies the accounting and reporting guidance of the Financial Accounting Standards Board (FASB) Accounting Standards Codification Topic 946 Financial Services – Investments Companies. The financial statements have been prepared in conformity with accounting principles generally accepted in the United States of America (GAAP), which require management to make certain estimates and assumptions at the date of the financial statements. Actual results could differ from those estimates. Subsequent events, if any, through the date that the financial statements were issued have been evaluated in the preparation of the financial statements. The following summarizes the significant accounting policies of the Fund:
Investment Valuation. Investments are valued as of 4:00 p.m. Eastern time on the last calendar day of the period. The Board of Trustees (the Board) has delegated the day to day responsibility for the valuation of the Fund's investments to the Fair Value Committee (the Committee) established by the Fund's investment adviser. In accordance with valuation policies and procedures approved by the Board, the Fund attempts to obtain prices from one or more third party pricing vendors or brokers to value its investments. When current market prices, quotations or currency exchange rates are not readily available or reliable, investments will be fair valued in good faith by the Committee, in accordance with procedures adopted by the Board. Factors used in determining fair value vary by investment type and may include market or investment specific events. The frequency with which these procedures are used cannot be predicted and they may be utilized to a significant extent. The Committee oversees the Fund's valuation policies and procedures and reports to the Board on the Committee's activities and fair value determinations. The Board monitors the appropriateness of the procedures used in valuing the Fund's investments and ratifies the fair value determinations of the Committee.
The Fund categorizes the inputs to valuation techniques used to value its investments into a disclosure hierarchy consisting of three levels as shown below:
- Level 1 – quoted prices in active markets for identical investments
- Level 2 – other significant observable inputs (including quoted prices for similar investments, interest rates, prepayment speeds, etc.)
- Level 3 – unobservable inputs (including the Fund's own assumptions based on the best information available)
Valuation techniques used to value the Fund's investments by major category are as follows:
Equity securities, including restricted securities, for which market quotations are readily available, are valued at the last reported sale price or official closing price as reported by a third party pricing vendor on the primary market or exchange on which they are traded and are categorized as Level 1 in the hierarchy. In the event there were no sales during the day or closing prices are not available, securities are valued at the last quoted bid price or may be valued using the last available price and are generally categorized as Level 2 in the hierarchy. For foreign equity securities, when market or security specific events arise, comparisons to the valuation of American Depositary Receipts (ADRs), futures contracts, Exchange-Traded Funds (ETFs) and certain indexes as well as quoted prices for similar securities may be used and would be categorized as Level 2 in the hierarchy. For equity securities, including restricted securities, where observable inputs are limited, assumptions about market activity and risk are used and these securities may be categorized as Level 3 in the hierarchy.
Investments in open-end mutual funds, including the Fidelity Central Funds, are valued at their closing net asset value (NAV) each business day and are categorized as Level 1 in the hierarchy.
Changes in valuation techniques may result in transfers in or out of an assigned level within the disclosure hierarchy. The aggregate value of investments by input level as of October 31, 2019 is included at the end of the Fund's Schedule of Investments.
Foreign Currency. The Fund may use foreign currency contracts to facilitate transactions in foreign-denominated securities. Gains and losses from these transactions may arise from changes in the value of the foreign currency or if the counterparties do not perform under the contracts' terms.
Foreign-denominated assets, including investment securities, and liabilities are translated into U.S. dollars at the exchange rates at period end. Purchases and sales of investment securities, income and dividends received and expenses denominated in foreign currencies are translated into U.S. dollars at the exchange rate in effect on the transaction date.
The effects of exchange rate fluctuations on investments are included with the net realized and unrealized gain (loss) on investment securities. Other foreign currency transactions resulting in realized and unrealized gain (loss) are disclosed separately.
Investment Transactions and Income. For financial reporting purposes, the Fund's investment holdings and NAV include trades executed through the end of the last business day of the period. The NAV per share for processing shareholder transactions is calculated as of the close of business of the New York Stock Exchange (NYSE), normally 4:00 p.m. Eastern time and includes trades executed through the end of the prior business day. Gains and losses on securities sold are determined on the basis of identified cost and include proceeds received from litigation. Dividend income is recorded on the ex-dividend date, except for certain dividends from foreign securities where the ex-dividend date may have passed, which are recorded as soon as the Fund is informed of the ex-dividend date. Non-cash dividends included in dividend income, if any, are recorded at the fair market value of the securities received. Income and capital gain distributions from Fidelity Central Funds, if any, are recorded on the ex-dividend date. Certain distributions received by the Fund represent a return of capital or capital gain. The Fund determines the components of these distributions subsequent to the ex-dividend date, based upon receipt of tax filings or other correspondence relating to the underlying investment. These distributions are recorded as a reduction of cost of investments and/or as a realized gain. Large, non-recurring dividends recognized by the Fund are presented separately on the Statement of Operations as "Non-cash dividends" and the impact of these dividends is presented in the Financial Highlights. Investment income is recorded net of foreign taxes withheld where recovery of such taxes is uncertain.
Class Allocations and Expenses. Investment income, realized and unrealized capital gains and losses, common expenses of the Fund, and certain fund-level expense reductions, if any, are allocated daily on a pro-rata basis to each class based on the relative net assets of each class to the total net assets of the Fund. Each class differs with respect to transfer agent and distribution and service plan fees incurred. Certain expense reductions may also differ by class. For the reporting period, the allocated portion of income and expenses to each class as a percent of its average net assets may vary due to the timing of recording these transactions in relation to fluctuating net assets of the classes. Expenses directly attributable to a fund are charged to that fund. Expenses attributable to more than one fund are allocated among the respective funds on the basis of relative net assets or other appropriate methods. Expense estimates are accrued in the period to which they relate and adjustments are made when actual amounts are known.
Income Tax Information and Distributions to Shareholders. Each year, the Fund intends to qualify as a regulated investment company under Subchapter M of the Internal Revenue Code, including distributing substantially all of its taxable income and realized gains. As a result, no provision for U.S. Federal income taxes is required. As of October 31, 2019, the Fund did not have any unrecognized tax benefits in the financial statements; nor is the Fund aware of any tax positions for which it is reasonably possible that the total amounts of unrecognized tax benefits will significantly change in the next twelve months. The Fund files a U.S. federal tax return, in addition to state and local tax returns as required. The Fund's federal income tax returns are subject to examination by the Internal Revenue Service (IRS) for a period of three fiscal years after they are filed. State and local tax returns may be subject to examination for an additional fiscal year depending on the jurisdiction. Foreign taxes are provided for based on the Fund's understanding of the tax rules and rates that exist in the foreign markets in which it invests. The Fund is subject to a tax imposed on capital gains by certain countries in which it invests. An estimated deferred tax liability for net unrealized appreciation on the applicable securities is included in Other payables and accrued expenses on the Statement of Assets & Liabilities.
Distributions are declared and recorded on the ex-dividend date. Income and capital gain distributions are declared separately for each class. Income and capital gain distributions are determined in accordance with income tax regulations, which may differ from GAAP.
Capital accounts within the financial statements are adjusted for permanent book-tax differences. These adjustments have no impact on net assets or the results of operations. Capital accounts are not adjusted for temporary book-tax differences which will reverse in a subsequent period.
Book-tax differences are primarily due to foreign currency transactions, certain foreign taxes, capital loss carryforwards and losses deferred due to wash sales.
As of period end, the cost and unrealized appreciation (depreciation) in securities, and derivatives if applicable, for federal income tax purposes were as follows:
| Gross unrealized appreciation | $412,497,915 |
| Gross unrealized depreciation | (22,681,780) |
| Net unrealized appreciation (depreciation) | $389,816,135 |
| Tax Cost | $2,546,032,526 |
The tax-based components of distributable earnings as of period end were as follows:
| Undistributed ordinary income | $16,089,820 |
| Capital loss carryforward | $(15,443,313) |
| Net unrealized appreciation (depreciation) on securities and other investments | $389,689,959 |
Capital loss carryforwards are only available to offset future capital gains of the Fund to the extent provided by regulations and may be limited. Under the Regulated Investment Company Modernization Act of 2010 (the Act), the Fund is permitted to carry forward capital losses incurred in taxable years beginning after December 22, 2010 for an unlimited period and such capital losses are required to be used prior to any losses that expire. The capital loss carryforward information presented below, including any applicable limitation, is estimated as of fiscal period end and is subject to adjustment.
| No expiration | |
| Short-term | $(15,443,313) |
The tax character of distributions paid was as follows:
| | October 31, 2019 | October 31, 2018 |
| Ordinary Income | $7,117,696 | $ 1,800,404 |
Restricted Securities. The Fund may invest in securities that are subject to legal or contractual restrictions on resale. These securities generally may be resold in transactions exempt from registration or to the public if the securities are registered. Disposal of these securities may involve time-consuming negotiations and expense, and prompt sale at an acceptable price may be difficult. Information regarding restricted securities is included at the end of the Fund's Schedule of Investments.
4. Purchases and Sales of Investments.
Purchases and sales of securities, other than short-term securities, aggregated $3,617,681,141 and $2,826,924,772, respectively.
5. Fees and Other Transactions with Affiliates.
Management Fee. Fidelity Management & Research Company (the investment adviser) and its affiliates provide the Fund with investment management related services for which the Fund pays a monthly management fee. The management fee is the sum of an individual fund fee rate that is based on an annual rate of .45% of the Fund's average net assets and an annualized group fee rate that averaged .24% during the period. The group fee rate is based upon the average net assets of all the mutual funds advised by the investment adviser, including any mutual funds previously advised by the investment adviser that are currently advised by Fidelity SelectCo, LLC, an affiliate of the investment adviser. The group fee rate decreases as assets under management increase and increases as assets under management decrease. In addition, the management fee is subject to a performance adjustment (up to a maximum of +/- .20% of the Fund's average net assets over a 36 month performance period). The upward or downward adjustment to the management fee is based on the relative investment performance of Class I of the Fund as compared to its benchmark index, the MSCI All Country World ex USA Index, over the same 36 month performance period. For the reporting period, the total annual management fee rate, including the performance adjustment, was .75% of the Fund's average net assets. The performance adjustment included in the management fee rate may be higher or lower than the maximum performance adjustment rate due to the difference between the average net assets for the reporting and performance periods.
Distribution and Service Plan Fees. In accordance with Rule 12b-1 of the 1940 Act, the Fund has adopted separate Distribution and Service Plans for each class of shares. Certain classes pay Fidelity Distributors Corporation (FDC), an affiliate of the investment adviser, separate Distribution and Service Fees, each of which is based on an annual percentage of each class' average net assets. In addition, FDC may pay financial intermediaries for selling shares of the Fund and providing shareholder support services. For the period, the Distribution and Service Fee rates, total fees and amounts retained by FDC were as follows:
| | Distribution Fee | Service Fee | Total Fees | Retained by FDC |
| Class A | -% | .25% | $555,520 | $40,367 |
| Class M | .25% | .25% | 506,522 | 1,658 |
| Class C | .75% | .25% | 1,074,243 | 254,230 |
| | | | $2,136,285 | $296,255 |
Sales Load. FDC may receive a front-end sales charge of up to 5.75% for selling Class A shares and 3.50% for selling Class M shares, some of which is paid to financial intermediaries for selling shares of the Fund. Depending on the holding period, FDC may receive contingent deferred sales charges levied on Class A, Class M and Class C redemptions. The deferred sales charges are 1.00% for Class C shares, 1.00% for certain purchases of Class A shares and .25% for certain purchases of Class M shares.
For the period, sales charge amounts retained by FDC were as follows:
| | Retained by FDC |
| Class A | $166,998 |
| Class M | 16,137 |
| Class C(a) | 21,916 |
| | $205,051 |
(a) When Class C shares are initially sold, FDC pays commissions from its own resources to financial intermediaries through which the sales are made.
Transfer Agent Fees. Fidelity Investments Institutional Operations Company, Inc., (FIIOC), an affiliate of the investment adviser, is the transfer, dividend disbursing and shareholder servicing agent for each class of the Fund. FIIOC receives account fees and asset-based fees that vary according to the account size and type of account of the shareholders of the respective classes of the Fund, except for Class Z. FIIOC receives an asset-based fee of Class Z's average net assets. FIIOC pays for typesetting, printing and mailing of shareholder reports, except proxy statements.
For the period, transfer agent fees for each class were as follows:
| | Amount | % of Class-Level Average Net Assets |
| Class A | $444,363 | .20 |
| Class M | 209,291 | .21 |
| Class C | 207,929 | .19 |
| Class I | 2,511,635 | .17 |
| Class Z | 123,430 | .05 |
| | $3,496,648 | |
Accounting and Security Lending Fees. Fidelity Service Company, Inc. (FSC), an affiliate of the investment adviser, maintains the Fund's accounting records. The accounting fee is based on the level of average net assets for each month. Prior to April 1, 2019, FSC had a separate agreement with the Fund for administration of the security lending program, based on the number and duration of lending transactions. For the period, the total fees paid for accounting and administration of securities lending were equivalent to an annual rate of .04%.
Brokerage Commissions. The Fund placed a portion of its portfolio transactions with brokerage firms which are affiliates of the investment adviser. Brokerage commissions are included in net realized gain (loss) and change in net unrealized appreciation (depreciation) in the Statement of Operations. The commissions paid to these affiliated firms were $21,494 for the period.
Interfund Lending Program. Pursuant to an Exemptive Order issued by the SEC, the Fund, along with other registered investment companies having management contracts with Fidelity Management & Research Company (FMR) or other affiliated entities of FMR, may participate in an interfund lending program. This program provides an alternative credit facility allowing the funds to borrow from, or lend money to, other participating affiliated funds. At period end, there were no interfund loans outstanding. The Fund's activity in this program during the period for which loans were outstanding was as follows:
| Borrower or Lender | Average Loan Balance | Weighted Average Interest Rate | Interest Expense |
| Borrower | $17,295,652 | 2.57% | $28,438 |
Interfund Trades. The Fund may purchase from or sell securities to other Fidelity Funds under procedures adopted by the Board. The procedures have been designed to ensure these interfund trades are executed in accordance with Rule 17a-7 of the 1940 Act. Interfund trades are included within the respective purchases and sales amounts shown in the Purchases and Sales of Investments note.
6. Committed Line of Credit.
The Fund participates with other funds managed by the investment adviser or an affiliate in a $4.25 billion credit facility (the "line of credit") to be utilized for temporary or emergency purposes to fund shareholder redemptions or for other short-term liquidity purposes. The Fund has agreed to pay commitment fees on its pro-rata portion of the line of credit, which amounted to $5,435 and is reflected in Miscellaneous expenses on the Statement of Operations. During the period, the Fund did not borrow on this line of credit.
7. Security Lending.
The Fund lends portfolio securities from time to time in order to earn additional income. For equity securities, lending agents are used, including National Financial Services (NFS), an affiliate of the Fund. Pursuant to a securities lending agreement, NFS will receive a fee, which is capped at 9.9% of daily lending revenue, for its services as lending agent. The Fund may lend securities to certain qualified borrowers, including NFS. On the settlement date of the loan, the Fund receives collateral (in the form of U.S. Treasury obligations, letters of credit and/or cash) against the loaned securities and maintains collateral in an amount not less than 100% of the market value of the loaned securities during the period of the loan. The market value of the loaned securities is determined at the close of business of the Fund and any additional required collateral is delivered to the Fund on the next business day. The Fund or borrower may terminate the loan at any time, and if the borrower defaults on its obligation to return the securities loaned because of insolvency or other reasons, the Fund may apply collateral received from the borrower against the obligation. The Fund may experience delays and costs in recovering the securities loaned. Any cash collateral received is invested in the Fidelity Securities Lending Cash Central Fund. At period end, there were no security loans outstanding. Total fees paid by the Fund to NFS, as lending agent, amounted to $239. Security lending income represents the income earned on investing cash collateral, less rebates paid to borrowers and any lending agent fees associated with the loan, plus any premium payments received for lending certain types of securities. Security lending income is presented in the Statement of Operations as a component of income from Fidelity Central Funds, and includes $72,876 from securities loaned to NFS, as affiliated borrower.
8. Expense Reductions.
Commissions paid to certain brokers with whom the investment adviser, or its affiliates, places trades on behalf of the Fund include an amount in addition to trade execution, which may be rebated back to the Fund to offset certain expenses. This amount totaled $326,616 for the period. In addition, through arrangements with the Fund's custodian, credits realized as a result of certain uninvested cash balances were used to reduce the Fund's expenses. During the period, custodian credits reduced the Fund's expenses by $1,920.
In addition, during the period the investment adviser reimbursed and/or waived a portion of fund-level operating expenses in the amount of $12,565.
9. Distributions to Shareholders.
Distributions to shareholders of each class were as follows:
| | Year ended
October 31, 2019 | Year ended
October 31, 2018 |
| Distributions to shareholders | | |
| Class A | $402,278 | $85,926 |
| Class I | 5,699,242 | 1,520,196 |
| Class Z | 1,016,176 | 194,282 |
| Total | $7,117,696 | $1,800,404 |
10. Share Transactions.
Share transactions for each class were as follows and may contain automatic conversions between classes or exchanges between affiliated funds:
| | Shares | Shares | Dollars | Dollars |
| | Year ended October 31, 2019 | Year ended October 31, 2018 | Year ended October 31, 2019 | Year ended October 31, 2018 |
| Class A | | | | |
| Shares sold | 5,533,808 | 5,619,393 | $110,458,286 | $111,188,105 |
| Reinvestment of distributions | 22,478 | 4,343 | 392,018 | 84,071 |
| Shares redeemed | (3,374,729) | (3,921,150) | (64,580,390) | (75,740,806) |
| Net increase (decrease) | 2,181,557 | 1,702,586 | $46,269,914 | $35,531,370 |
| Class M | | | | |
| Shares sold | 1,952,405 | 1,392,282 | $38,636,480 | $26,802,724 |
| Shares redeemed | (973,543) | (915,804) | (18,369,399) | (17,480,449) |
| Net increase (decrease) | 978,862 | 476,478 | $20,267,081 | $9,322,275 |
| Class C | | | | |
| Shares sold | 1,621,399 | 3,456,992 | $27,727,620 | $60,466,658 |
| Shares redeemed | (2,601,635) | (1,517,181) | (44,012,034) | (25,987,529) |
| Net increase (decrease) | (980,236) | 1,939,811 | $(16,284,414) | $34,479,129 |
| Class I | | | | |
| Shares sold | 56,664,995 | 42,034,960 | $1,190,102,614 | $884,843,888 |
| Reinvestment of distributions | 250,184 | 64,781 | 4,653,416 | 1,337,720 |
| Shares redeemed | (27,933,337) | (14,886,018) | (567,157,476) | (307,898,733) |
| Net increase (decrease) | 28,981,842 | 27,213,723 | $627,598,554 | $578,282,875 |
| Class Z | | | | |
| Shares sold | 12,961,355 | 6,965,818 | $273,077,124 | $144,277,729 |
| Reinvestment of distributions | 38,432 | 6,285 | 715,226 | 129,857 |
| Shares redeemed | (3,591,416) | (1,739,970) | (74,182,368) | (35,948,108) |
| Net increase (decrease) | 9,408,371 | 5,232,133 | $199,609,982 | $108,459,478 |
11. Other.
The Fund's organizational documents provide former and current trustees and officers with a limited indemnification against liabilities arising in connection with the performance of their duties to the Fund. In the normal course of business, the Fund may also enter into contracts that provide general indemnifications. The Fund's maximum exposure under these arrangements is unknown as this would be dependent on future claims that may be made against the Fund. The risk of material loss from such claims is considered remote.
Report of Independent Registered Public Accounting Firm
To the Trustees of Fidelity Advisor Series VIII and Shareholders of Fidelity Advisor International Capital Appreciation Fund:
Opinion on the Financial Statements and Financial Highlights
We have audited the accompanying statement of assets and liabilities of Fidelity Advisor International Capital Appreciation Fund (the “Fund”), a fund of Fidelity Advisor Series VIII, including the schedule of investments, as of October 31, 2019, and the related statement of operations for the year then ended, the statement of changes in net assets for each of the two years in the period then ended, the financial highlights for each of the five years in the period then ended, and the related notes. In our opinion, the financial statements and financial highlights present fairly, in all material respects, the financial position of the Fund as of October 31, 2019, and the results of its operations for the year then ended, the changes in its net assets for each of the two years in the period then ended, and the financial highlights for each of the five years in the period then ended, in conformity with accounting principles generally accepted in the United States of America.
Basis for Opinion
These financial statements and financial highlights are the responsibility of the Fund's management. Our responsibility is to express an opinion on the Fund's financial statements and financial highlights based on our audits. We are a public accounting firm registered with the Public Company Accounting Oversight Board (United States) (PCAOB) and are required to be independent with respect to the Fund in accordance with the U.S. federal securities laws and the applicable rules and regulations of the Securities and Exchange Commission and the PCAOB.
We conducted our audits in accordance with the standards of the PCAOB. Those standards require that we plan and perform the audit to obtain reasonable assurance about whether the financial statements and financial highlights are free of material misstatement, whether due to error or fraud. The Fund is not required to have, nor were we engaged to perform, an audit of its internal control over financial reporting. As part of our audits we are required to obtain an understanding of internal control over financial reporting but not for the purpose of expressing an opinion on the effectiveness of the Fund’s internal control over financial reporting. Accordingly, we express no such opinion.
Our audits included performing procedures to assess the risks of material misstatement of the financial statements and financial highlights, whether due to error or fraud, and performing procedures that respond to those risks. Such procedures included examining, on a test basis, evidence regarding the amounts and disclosures in the financial statements and financial highlights. Our audits also included evaluating the accounting principles used and significant estimates made by management, as well as evaluating the overall presentation of the financial statements and financial highlights. Our procedures included confirmation of securities owned as of October 31, 2019, by correspondence with the custodians and brokers; when replies were not received from brokers, we performed other auditing procedures. We believe that our audits provide a reasonable basis for our opinion.
/s/ Deloitte & Touche LLP
Boston, Massachusetts
December 12, 2019
We have served as the auditor of one or more of the Fidelity investment companies since 1999.
Trustees and Officers
The Trustees, Members of the Advisory Board (if any), and officers of the trust and fund, as applicable, are listed below. The Board of Trustees governs the fund and is responsible for protecting the interests of shareholders. The Trustees are experienced executives who meet periodically throughout the year to oversee the fund's activities, review contractual arrangements with companies that provide services to the fund, oversee management of the risks associated with such activities and contractual arrangements, and review the fund's performance. Except for Jonathan Chiel, each of the Trustees oversees 298 funds. Mr. Chiel oversees 171 funds.
The Trustees hold office without limit in time except that (a) any Trustee may resign; (b) any Trustee may be removed by written instrument, signed by at least two-thirds of the number of Trustees prior to such removal; (c) any Trustee who requests to be retired or who has become incapacitated by illness or injury may be retired by written instrument signed by a majority of the other Trustees; and (d) any Trustee may be removed at any special meeting of shareholders by a two-thirds vote of the outstanding voting securities of the trust. Each Trustee who is not an interested person (as defined in the 1940 Act) of the trust and the fund is referred to herein as an Independent Trustee. Each Independent Trustee shall retire not later than the last day of the calendar year in which his or her 75th birthday occurs. The Independent Trustees may waive this mandatory retirement age policy with respect to individual Trustees. Officers and Advisory Board Members hold office without limit in time, except that any officer or Advisory Board Member may resign or may be removed by a vote of a majority of the Trustees at any regular meeting or any special meeting of the Trustees. Except as indicated, each individual has held the office shown or other offices in the same company for the past five years.
The fund’s Statement of Additional Information (SAI) includes more information about the Trustees. To request a free copy, call Fidelity at 1-877-208-0098.
Experience, Skills, Attributes, and Qualifications of the Trustees. The Governance and Nominating Committee has adopted a statement of policy that describes the experience, qualifications, attributes, and skills that are necessary and desirable for potential Independent Trustee candidates (Statement of Policy). The Board believes that each Trustee satisfied at the time he or she was initially elected or appointed a Trustee, and continues to satisfy, the standards contemplated by the Statement of Policy. The Governance and Nominating Committee also engages professional search firms to help identify potential Independent Trustee candidates who have the experience, qualifications, attributes, and skills consistent with the Statement of Policy. From time to time, additional criteria based on the composition and skills of the current Independent Trustees, as well as experience or skills that may be appropriate in light of future changes to board composition, business conditions, and regulatory or other developments, have also been considered by the professional search firms and the Governance and Nominating Committee. In addition, the Board takes into account the Trustees' commitment and participation in Board and committee meetings, as well as their leadership of standing and ad hoc committees throughout their tenure.
In determining that a particular Trustee was and continues to be qualified to serve as a Trustee, the Board has considered a variety of criteria, none of which, in isolation, was controlling. The Board believes that, collectively, the Trustees have balanced and diverse experience, qualifications, attributes, and skills, which allow the Board to operate effectively in governing the fund and protecting the interests of shareholders. Information about the specific experience, skills, attributes, and qualifications of each Trustee, which in each case led to the Board's conclusion that the Trustee should serve (or continue to serve) as a trustee of the fund, is provided below.
Board Structure and Oversight Function. James C. Curvey is an interested person and currently serves as Chairman. The Trustees have determined that an interested Chairman is appropriate and benefits shareholders because an interested Chairman has a personal and professional stake in the quality and continuity of services provided to the fund. Independent Trustees exercise their informed business judgment to appoint an individual of their choosing to serve as Chairman, regardless of whether the Trustee happens to be independent or a member of management. The Independent Trustees have determined that they can act independently and effectively without having an Independent Trustee serve as Chairman and that a key structural component for assuring that they are in a position to do so is for the Independent Trustees to constitute a substantial majority for the Board. The Independent Trustees also regularly meet in executive session. Ned C. Lautenbach serves as Chairman of the Independent Trustees and as such (i) acts as a liaison between the Independent Trustees and management with respect to matters important to the Independent Trustees and (ii) with management prepares agendas for Board meetings.
Fidelity® funds are overseen by different Boards of Trustees. The fund's Board oversees Fidelity's high income and certain equity funds, and other Boards oversee Fidelity's investment-grade bond, money market, asset allocation, and other equity funds. The asset allocation funds may invest in Fidelity® funds overseen by the fund's Board. The use of separate Boards, each with its own committee structure, allows the Trustees of each group of Fidelity® funds to focus on the unique issues of the funds they oversee, including common research, investment, and operational issues. On occasion, the separate Boards establish joint committees to address issues of overlapping consequences for the Fidelity® funds overseen by each Board.
The Trustees operate using a system of committees to facilitate the timely and efficient consideration of all matters of importance to the Trustees, the fund, and fund shareholders and to facilitate compliance with legal and regulatory requirements and oversight of the fund's activities and associated risks. The Board, acting through its committees, has charged FMR and its affiliates with (i) identifying events or circumstances the occurrence of which could have demonstrably adverse effects on the fund's business and/or reputation; (ii) implementing processes and controls to lessen the possibility that such events or circumstances occur or to mitigate the effects of such events or circumstances if they do occur; and (iii) creating and maintaining a system designed to evaluate continuously business and market conditions in order to facilitate the identification and implementation processes described in (i) and (ii) above. Because the day-to-day operations and activities of the fund are carried out by or through FMR, its affiliates, and other service providers, the fund's exposure to risks is mitigated but not eliminated by the processes overseen by the Trustees. While each of the Board's committees has responsibility for overseeing different aspects of the fund's activities, oversight is exercised primarily through the Operations, Audit, and Compliance Committees. Appropriate personnel, including but not limited to the fund's Chief Compliance Officer (CCO), FMR's internal auditor, the independent accountants, the fund's Treasurer and portfolio management personnel, make periodic reports to the Board's committees, as appropriate, including an annual review of Fidelity's risk management program for the Fidelity® funds. The responsibilities of each standing committee, including their oversight responsibilities, are described further under "Standing Committees of the Trustees."
Interested Trustees*:
Correspondence intended for a Trustee who is an interested person may be sent to Fidelity Investments, 245 Summer Street, Boston, Massachusetts 02210.
Name, Year of Birth; Principal Occupations and Other Relevant Experience+
Jonathan Chiel (1957)
Year of Election or Appointment: 2016
Trustee
Mr. Chiel also serves as Trustee of other Fidelity® funds. Mr. Chiel is Executive Vice President and General Counsel for FMR LLC (diversified financial services company, 2012-present). Previously, Mr. Chiel served as general counsel (2004-2012) and senior vice president and deputy general counsel (2000-2004) for John Hancock Financial Services; a partner with Choate, Hall & Stewart (1996-2000) (law firm); and an Assistant United States Attorney for the United States Attorney’s Office of the District of Massachusetts (1986-95), including Chief of the Criminal Division (1993-1995). Mr. Chiel is a director on the boards of the Boston Bar Foundation and the Maimonides School.
James C. Curvey (1935)
Year of Election or Appointment: 2007
Trustee
Chairman of the Board of Trustees
Mr. Curvey also serves as Trustee of other Fidelity® funds. Mr. Curvey is Vice Chairman (2007-present) and Director of FMR LLC (diversified financial services company). In addition, Mr. Curvey is an Overseer Emeritus for the Boston Symphony Orchestra, a Director of Artis-Naples, and a Trustee of Brewster Academy in Wolfeboro, New Hampshire. Previously, Mr. Curvey served as a Director of Fidelity Research & Analysis Co. (investment adviser firm, 2009-2018), Director of Fidelity Investments Money Management, Inc. (investment adviser firm, 2009-2014) and a Director of FMR and FMR Co., Inc. (investment adviser firms, 2007-2014).
* Determined to be an “Interested Trustee” by virtue of, among other things, his or her affiliation with the trust or various entities under common control with FMR.
+ The information includes the Trustee's principal occupation during the last five years and other information relating to the experience, attributes, and skills relevant to the Trustee's qualifications to serve as a Trustee, which led to the conclusion that the Trustee should serve as a Trustee for the fund.
Independent Trustees:
Correspondence intended for an Independent Trustee may be sent to Fidelity Investments, P.O. Box 55235, Boston, Massachusetts 02205-5235.
Name, Year of Birth; Principal Occupations and Other Relevant Experience+
Dennis J. Dirks (1948)
Year of Election or Appointment: 2005
Trustee
Mr. Dirks also serves as Trustee of other Fidelity® funds. Prior to his retirement in May 2003, Mr. Dirks was Chief Operating Officer and a member of the Board of The Depository Trust & Clearing Corporation (DTCC). He also served as President, Chief Operating Officer, and Board member of The Depository Trust Company (DTC) and President and Board member of the National Securities Clearing Corporation (NSCC). In addition, Mr. Dirks served as Chief Executive Officer and Board member of the Government Securities Clearing Corporation, Chief Executive Officer and Board member of the Mortgage-Backed Securities Clearing Corporation, as a Trustee and a member of the Finance Committee of Manhattan College (2005-2008), as a Trustee and a member of the Finance Committee of AHRC of Nassau County (2006-2008), as a member of the Independent Directors Council (IDC) Governing Council (2010-2015), and as a member of the Board of Directors for The Brookville Center for Children’s Services, Inc. (2009-2017). Mr. Dirks is a member of the Finance Committee (2016-present) and Board of Directors (2017-present) and is Treasurer (2018-present) of the Asolo Repertory Theatre.
Donald F. Donahue (1950)
Year of Election or Appointment: 2018
Trustee
Mr. Donahue also serves as a Trustee of other Fidelity® funds. Mr. Donahue is President and Chief Executive Officer of Miranda Partners, LLC (risk consulting for the financial services industry, 2012-present). Previously, Mr. Donahue served as a Member of the Advisory Board of certain Fidelity® funds (2015-2018) and Chief Executive Officer (2006-2012), Chief Operating Officer (2003-2006), and Managing Director, Customer Marketing and Development (1999-2003) of The Depository Trust & Clearing Corporation (financial markets infrastructure). Mr. Donahue serves as a Member (2007-present) and Co-Chairman (2016-present) of the Board of Directors of United Way of New York, Member of the Board of Directors of NYC Leadership Academy (2012-present) and Member of the Board of Advisors of Ripple Labs, Inc. (financial services, 2015-present). He also served as Chairman (2010-2012) and Member of the Board of Directors (2012-2013) of Omgeo, LLC (financial services), Treasurer of United Way of New York (2012-2016), and Member of the Board of Directors of XBRL US (financial services non-profit, 2009-2012) and the International Securities Services Association (2009-2012).
Alan J. Lacy (1953)
Year of Election or Appointment: 2008
Trustee
Mr. Lacy also serves as Trustee of other Fidelity® funds. Mr. Lacy serves as a Director of Bristol-Myers Squibb Company (global pharmaceuticals, 2008-present). He is a Trustee of the California Chapter of The Nature Conservancy (2015-present) and a Director of the Center for Advanced Study in the Behavioral Sciences at Stanford University (2015-present). In addition, Mr. Lacy served as Senior Adviser (2007-2014) of Oak Hill Capital Partners, L.P. (private equity) and also served as Chief Executive Officer (2005) and Vice Chairman (2005-2006) of Sears Holdings Corporation (retail) and Chief Executive Officer and Chairman of the Board of Sears, Roebuck and Co. (retail, 2000-2005). Previously, Mr. Lacy served as Chairman (2014-2017) and a member (2010-2017) of the Board of Directors of Dave & Buster’s Entertainment, Inc. (restaurant and entertainment complexes), as Chairman (2008-2011) and a member (2006-2015) of the Board of Trustees of the National Parks Conservation Association, and as a member of the Board of Directors for The Hillman Companies, Inc. (hardware wholesalers, 2010-2014), Earth Fare, Inc. (retail grocery, 2010-2014), and The Western Union Company (global money transfer, 2006-2011).
Ned C. Lautenbach (1944)
Year of Election or Appointment: 2000
Trustee
Chairman of the Independent Trustees
Mr. Lautenbach also serves as Trustee of other Fidelity® funds. Mr. Lautenbach currently serves as Chair (2018-present) and Member (2013-present) of the Board of Governors, State University System of Florida and is a member of the Council on Foreign Relations (1994-present). He is also a member and has most recently served as Chairman of the Board of Directors of Artis-Naples (2012-present). Previously, Mr. Lautenbach served as a member and then Lead Director of the Board of Directors of Eaton Corporation (diversified industrial, 1997-2016). He was also a Partner and Advisory Partner at Clayton, Dubilier & Rice, LLC (private equity investment, 1998-2010), as well as a Director of Sony Corporation (2006-2007). In addition, Mr. Lautenbach also had a 30-year career with IBM (technology company) during which time he served as Senior Vice President and a member of the Corporate Executive Committee (1968-1998).
Joseph Mauriello (1944)
Year of Election or Appointment: 2008
Trustee
Mr. Mauriello also serves as Trustee of other Fidelity® funds. Prior to his retirement in January 2006, Mr. Mauriello served in numerous senior management positions including Deputy Chairman and Chief Operating Officer (2004-2005), and Vice Chairman of Financial Services (2002-2004) of KPMG LLP US (professional services, 1965-2005). Mr. Mauriello currently serves as a member of the Independent Directors Council (IDC) Governing Council (2015-present). Previously, Mr. Mauriello served as a member of the Board of Directors of XL Group plc. (global insurance and re-insurance, 2006-2018).
Cornelia M. Small (1944)
Year of Election or Appointment: 2005
Trustee
Ms. Small also serves as Trustee of other Fidelity® funds. Ms. Small is a member of the Board of Directors (2009-present) and Chair of the Investment Committee (2010-present) of the Teagle Foundation. Ms. Small also serves on the Investment Committee of the Berkshire Taconic Community Foundation (2008-present). Previously, Ms. Small served as Chairperson (2002-2008) and a member of the Investment Committee and Chairperson (2008-2012) and a member of the Board of Trustees of Smith College. In addition, Ms. Small served as Chief Investment Officer, Director of Global Equity Investments, and a member of the Board of Directors of Scudder, Stevens & Clark and Scudder Kemper Investments.
Garnett A. Smith (1947)
Year of Election or Appointment: 2018
Trustee
Mr. Smith also serves as Trustee of other Fidelity® funds. Prior to Mr. Smith's retirement, he served as Chairman and Chief Executive Officer of Inbrand Corp. (manufacturer of personal absorbent products, 1990-1997). He also served as President (1986-1990) of Inbrand Corp. Prior to his employment with Inbrand Corp., he was employed by a retail fabric chain and North Carolina National Bank. In addition, Mr. Smith served as a Member of the Advisory Board of certain Fidelity® funds (2012-2013) and as a board member of the Jackson Hole Land Trust (2009-2012).
David M. Thomas (1949)
Year of Election or Appointment: 2008
Trustee
Mr. Thomas also serves as Trustee of other Fidelity® funds. Mr. Thomas serves as Non-Executive Chairman of the Board of Directors of Fortune Brands Home and Security (home and security products, 2011-present) and as a member of the Board of Directors (2004-present) and Presiding Director (2013-present) of Interpublic Group of Companies, Inc. (marketing communication). Previously, Mr. Thomas served as Executive Chairman (2005-2006) and Chairman and Chief Executive Officer (2000-2005) of IMS Health, Inc. (pharmaceutical and healthcare information solutions), a Director of Fortune Brands, Inc. (consumer products, 2000-2011), and a member of the Board of Trustees of the University of Florida (2013-2018).
+ The information includes the Trustee's principal occupation during the last five years and other information relating to the experience, attributes, and skills relevant to the Trustee's qualifications to serve as a Trustee, which led to the conclusion that the Trustee should serve as a Trustee for the fund.
Advisory Board Members and Officers:
Correspondence intended for a Member of the Advisory Board (if any) may be sent to Fidelity Investments, P.O. Box 55235, Boston, Massachusetts 02205-5235. Correspondence intended for an officer or Peter S. Lynch may be sent to Fidelity Investments, 245 Summer Street, Boston, Massachusetts 02210. Officers appear below in alphabetical order.
Name, Year of Birth; Principal Occupation
Vicki L. Fuller (1957)
Year of Election or Appointment: 2018
Member of the Advisory Board
Ms. Fuller also serves as Member of the Advisory Board of other Fidelity® funds. Ms. Fuller serves as a member of the Board of Directors, Audit Committee, and Nominating and Governance Committee of The Williams Companies, Inc. (natural gas infrastructure, 2018-present). Previously, Ms. Fuller served as the Chief Investment Officer of the New York State Common Retirement Fund (2012-2018) and held a variety of positions at AllianceBernstein L.P. (global asset management, 1985-2012), including Managing Director (2006-2012) and Senior Vice President and Senior Portfolio Manager (2001-2006).
Peter S. Lynch (1944)
Year of Election or Appointment: 2003
Member of the Advisory Board
Mr. Lynch also serves as Member of the Advisory Board of other Fidelity® funds. Mr. Lynch is Vice Chairman and a Director of FMR (investment adviser firm) and FMR Co., Inc. (investment adviser firm). In addition, Mr. Lynch serves as a Trustee of Boston College and as the Chairman of the Inner-City Scholarship Fund. Previously, Mr. Lynch served on the Special Olympics International Board of Directors (1997-2006).
Michael E. Wiley (1950)
Year of Election or Appointment: 2018
Member of the Advisory Board
Mr. Wiley also serves as Trustee or Member of the Advisory Board of other Fidelity® funds. Mr. Wiley serves as a Director of High Point Resources (exploration and production, 2005-present). Previously, Mr. Wiley served as a Director of Andeavor Corporation (independent oil refiner and marketer, 2005-2018), a Director of Andeavor Logistics LP (natural resources logistics, 2015-2018), a Director of Post Oak Bank (privately-held bank, 2004-2018), a Director of Asia Pacific Exploration Consolidated (international oil and gas exploration and production, 2008-2013), a member of the Board of Trustees of the University of Tulsa (2000-2006; 2007-2010), a Senior Energy Advisor of Katzenbach Partners, LLC (consulting, 2006-2007), an Advisory Director of Riverstone Holdings (private investment), a Director of Spinnaker Exploration Company (exploration and production, 2001-2005) and Chairman, President, and CEO of Baker Hughes, Inc. (oilfield services, 2000-2004).
Elizabeth Paige Baumann (1968)
Year of Election or Appointment: 2017
Anti-Money Laundering (AML) Officer
Ms. Baumann also serves as AML Officer of other funds. She is Chief AML Officer (2012-present) and Senior Vice President (2014-present) of FMR LLC (diversified financial services company) and is an employee of Fidelity Investments. Previously, Ms. Baumann served as AML Officer of the funds (2012-2016), and Vice President (2007-2014) and Deputy Anti-Money Laundering Officer (2007-2012) of FMR LLC.
Craig S. Brown (1977)
Year of Election or Appointment: 2019
Assistant Treasurer
Mr. Brown also serves as Assistant Treasurer of other funds. Mr. Brown is an employee of Fidelity Investments (2013-present).
John J. Burke III (1964)
Year of Election or Appointment: 2018
Chief Financial Officer
Mr. Burke also serves as Chief Financial Officer of other funds. Mr. Burke serves as Head of Investment Operations for Fidelity Fund and Investment Operations (2018-present) and is an employee of Fidelity Investments (1998-present). Previously Mr. Burke served as head of Asset Management Investment Operations (2012-2018).
William C. Coffey (1969)
Year of Election or Appointment: 2019
Assistant Secretary
Mr. Coffey also serves as Assistant Secretary of other funds. He is Senior Vice President and Deputy General Counsel of FMR LLC (diversified financial services company, 2010-present), and is an employee of Fidelity Investments. Previously, Mr. Coffey served as Secretary and CLO of certain funds (2018-2019); CLO, Secretary, and Senior Vice President of Fidelity Management & Research Company and FMR Co., Inc. (investment adviser firms, 2018-2019); Secretary of Fidelity SelectCo, LLC and Fidelity Investments Money Management, Inc. (investment adviser firms, 2018-2019); CLO of Fidelity Management & Research (Hong Kong) Limited, FMR Investment Management (UK) Limited, and Fidelity Management & Research (Japan) Limited (investment adviser firms, 2018-2019); and Assistant Secretary of certain funds (2009-2018).
Timothy M. Cohen (1969)
Year of Election or Appointment: 2018
Vice President
Mr. Cohen also serves as Vice President of other funds. Mr. Cohen serves as Executive Vice President of Fidelity SelectCo, LLC (2019-present), Co-Head of Equity (2018-present), a Director of Fidelity Management & Research (Japan) Limited (investment adviser firm, 2016-present), and is an employee of Fidelity Investments. Previously, Mr. Cohen served as Head of Global Equity Research (2016-2018), Chief Investment Officer - Equity and a Director of Fidelity Management & Research (U.K.) Inc. (investment adviser firm, 2013-2015) and as a Director of Fidelity Management & Research (Hong Kong) Limited (investment adviser firm, 2017).
Jonathan Davis (1968)
Year of Election or Appointment: 2010
Assistant Treasurer
Mr. Davis also serves as Assistant Treasurer of other funds. Mr. Davis serves as Assistant Treasurer of FMR Capital, Inc. (2017-present) and is an employee of Fidelity Investments. Previously, Mr. Davis served as Vice President and Associate General Counsel of FMR LLC (diversified financial services company, 2003-2010).
Adrien E. Deberghes (1967)
Year of Election or Appointment: 2016
Assistant Treasurer
Mr. Deberghes also serves as an officer of other funds. He serves as Assistant Treasurer of FMR Capital, Inc. (2017-present), Executive Vice President of Fidelity Investments Money Management, Inc. (FIMM) (investment adviser firm, 2016-present), and is an employee of Fidelity Investments (2008-present). Previously, Mr. Deberghes served as President and Treasurer of certain Fidelity® funds (2013-2018). Prior to joining Fidelity Investments, Mr. Deberghes was Senior Vice President of Mutual Fund Administration at State Street Corporation (2007-2008), Senior Director of Mutual Fund Administration at Investors Bank & Trust (2005-2007), and Director of Finance for Dunkin' Brands (2000-2005). Previously, Mr. Deberghes served in other fund officer roles.
Laura M. Del Prato (1964)
Year of Election or Appointment: 2018
Assistant Treasurer
Ms. Del Prato also serves as an officer of other funds. Ms. Del Prato is an employee of Fidelity Investments (2017-present). Prior to joining Fidelity Investments, Ms. Del Prato served as a Managing Director and Treasurer of the JPMorgan Mutual Funds (2014-2017). Prior to JPMorgan, Ms. Del Prato served as a partner at Cohen Fund Audit Services (accounting firm, 2012-2013) and KPMG LLP (accounting firm, 2004-2012).
Colm A. Hogan (1973)
Year of Election or Appointment: 2016
Deputy Treasurer
Mr. Hogan also serves as an officer of other funds. Mr. Hogan serves as Assistant Treasurer of FMR Capital, Inc. (2017-present) and is an employee of Fidelity Investments (2005-present). Previously, Mr. Hogan served as Assistant Treasurer of certain Fidelity® funds (2016-2018).
Pamela R. Holding (1964)
Year of Election or Appointment: 2018
Vice President
Ms. Holding also serves as Vice President of other funds. Ms. Holding serves as Executive Vice President of Fidelity SelectCo, LLC (2019-present), Co-Head of Equity (2018-present) and is an employee of Fidelity Investments (2013-present). Previously, Ms. Holding served as Chief Investment Officer of Fidelity Institutional Asset Management (2013-2018).
Cynthia Lo Bessette (1969)
Year of Election or Appointment: 2019
Secretary and Chief Legal Officer (CLO)
Ms. Lo Bessette also serves as Secretary and CLO of other funds. Ms. Lo Bessette serves as CLO, Secretary, and Senior Vice President of Fidelity Management & Research Company and FMR Co., Inc. (investment adviser firms, 2019-present); Secretary of Fidelity SelectCo, LLC and Fidelity Investments Money Management, Inc. (investment adviser firms, 2019-present); and CLO of Fidelity Management & Research (Hong Kong) Limited, FMR Investment Management (UK) Limited, and Fidelity Management & Research (Japan) Limited (investment adviser firms, 2019-present). She is a Senior Vice President and Deputy General Counsel of FMR LLC (diversified financial services company, 2019-present), and is an employee of Fidelity Investments. Previously, Ms. Lo Bessette served as Executive Vice President, General Counsel (2016-2019) and Senior Vice President, Deputy General Counsel (2015-2016) of OppenheimerFunds (investment management company) and Deputy Chief Legal Officer (2013-2015) of Jennison Associates LLC (investment adviser firm).
Chris Maher (1972)
Year of Election or Appointment: 2013
Assistant Treasurer
Mr. Maher serves as Assistant Treasurer of other funds. Mr. Maher is Vice President of Valuation Oversight, serves as Assistant Treasurer of FMR Capital, Inc. (2017-present), and is an employee of Fidelity Investments. Previously, Mr. Maher served as Vice President of Asset Management Compliance (2013), Vice President of the Program Management Group of FMR (investment adviser firm, 2010-2013), and Vice President of Valuation Oversight (2008-2010).
Kenneth B. Robins (1969)
Year of Election or Appointment: 2016
Chief Compliance Officer
Mr. Robins also serves as an officer of other funds. Mr. Robins serves as Compliance Officer of Fidelity Management & Research Company and FMR Co., Inc. (investment adviser firms, 2016-present) and is an employee of Fidelity Investments (2004-present). Previously, Mr. Robins served as Executive Vice President of Fidelity Investments Money Management, Inc. (investment adviser firm, 2013-2016) and served in other fund officer roles.
Stacie M. Smith (1974)
Year of Election or Appointment: 2016
President and Treasurer
Ms. Smith also serves as an officer of other funds. Ms. Smith serves as Assistant Treasurer of FMR Capital, Inc. (2017-present), is an employee of Fidelity Investments (2009-present), and has served in other fund officer roles. Prior to joining Fidelity Investments, Ms. Smith served as Senior Audit Manager of Ernst & Young LLP (accounting firm, 1996-2009). Previously, Ms. Smith served as Assistant Treasurer (2013-2018) and Deputy Treasurer (2013-2016) of certain Fidelity® funds.
Marc L. Spector (1972)
Year of Election or Appointment: 2016
Assistant Treasurer
Mr. Spector also serves as an officer of other funds. Mr. Spector serves as Assistant Treasurer of FMR Capital, Inc. (2017-present) and is an employee of Fidelity Investments (2016-present). Prior to joining Fidelity Investments, Mr. Spector served as Director at the Siegfried Group (accounting firm, 2013-2016), and prior to Siegfried Group as audit senior manager at Deloitte & Touche (accounting firm, 2005-2013).
Jim Wegmann (1979)
Year of Election or Appointment: 2019
Assistant Treasurer
Mr. Wegmann also serves as Assistant Treasurer of other funds. Mr. Wegmann is an employee of Fidelity Investments (2011-present).
Shareholder Expense Example
As a shareholder of the Fund, you incur two types of costs: (1) transaction costs, including sales charges (loads) on purchase payments or redemption proceeds, and (2) ongoing costs, including management fees, distribution and/or service (12b-1) fees and other Fund expenses. This Example is intended to help you understand your ongoing costs (in dollars) of investing in the Fund and to compare these costs with the ongoing costs of investing in other mutual funds.
The Example is based on an investment of $1,000 invested at the beginning of the period and held for the entire period (May 1, 2019 to October 31, 2019).
Actual Expenses
The first line of the accompanying table for each class of the Fund provides information about actual account values and actual expenses. You may use the information in this line, together with the amount you invested, to estimate the expenses that you paid over the period. Simply divide your account value by $1,000.00 (for example, an $8,600 account value divided by $1,000.00 = 8.6), then multiply the result by the number in the first line for a class of the Fund under the heading entitled "Expenses Paid During Period" to estimate the expenses you paid on your account during this period. In addition, the Fund, as a shareholder in the underlying Fidelity Central Funds, will indirectly bear its pro-rata share of the fees and expenses incurred by the underlying Fidelity Central Funds. These fees and expenses are not included in the Fund's annualized expense ratio used to calculate the expense estimate in the table below.
Hypothetical Example for Comparison Purposes
The second line of the accompanying table for each class of the Fund provides information about hypothetical account values and hypothetical expenses based on a Class' actual expense ratio and an assumed rate of return of 5% per year before expenses, which is not the Class' actual return. The hypothetical account values and expenses may not be used to estimate the actual ending account balance or expenses you paid for the period. You may use this information to compare the ongoing costs of investing in the Fund and other funds. To do so, compare this 5% hypothetical example with the 5% hypothetical examples that appear in the shareholder reports of the other funds. In addition, the Fund, as a shareholder in the underlying Fidelity Central Funds, will indirectly bear its pro-rata share of the fees and expenses incurred by the underlying Fidelity Central Funds. These fees and expenses are not included in the Fund's annualized expense ratio used to calculate the expense estimate in the table below.
Please note that the expenses shown in the table are meant to highlight your ongoing costs only and do not reflect any transaction costs. Therefore, the second line of the table is useful in comparing ongoing costs only, and will not help you determine the relative total costs of owning different funds. In addition, if these transactional costs were included, your costs would have been higher.
| | Annualized Expense Ratio-A | Beginning
Account Value
May 1, 2019 | Ending
Account Value
October 31, 2019 | Expenses Paid
During Period-B
May 1, 2019
to October 31, 2019 |
| Class A | 1.30% | | | |
| Actual | | $1,000.00 | $1,051.50 | $6.72 |
| Hypothetical-C | | $1,000.00 | $1,018.65 | $6.61 |
| Class M | 1.55% | | | |
| Actual | | $1,000.00 | $1,050.30 | $8.01 |
| Hypothetical-C | | $1,000.00 | $1,017.39 | $7.88 |
| Class C | 2.04% | | | |
| Actual | | $1,000.00 | $1,048.00 | $10.53 |
| Hypothetical-C | | $1,000.00 | $1,014.92 | $10.36 |
| Class I | 1.02% | | | |
| Actual | | $1,000.00 | $1,053.30 | $5.28 |
| Hypothetical-C | | $1,000.00 | $1,020.06 | $5.19 |
| Class Z | .89% | | | |
| Actual | | $1,000.00 | $1,053.70 | $4.61 |
| Hypothetical-C | | $1,000.00 | $1,020.72 | $4.53 |
A Annualized expense ratio reflects expenses net of applicable fee waivers.
B Expenses are equal to each Class' annualized expense ratio, multiplied by the average account value over the period, multiplied by 184/365 (to reflect the one-half year period).
C 5% return per year before expenses
Distributions (Unaudited)
Class A designates 28%, Class I designates 15% and Class Z designates 12% of the dividends distributed during the fiscal year as qualifying for the dividends–received deduction for corporate shareholders.
Class A, Class I and Class Z designate 100% of the dividends distributed during the fiscal year as amounts which may be taken into account as a dividend for purposes of the maximum rate under section 1(h)(11) of the Internal Revenue Code.
The amounts per share which represent income derived from sources within, and taxes paid to, foreign countries or possessions of the United States are as follows:
| | Pay Date | Income | Taxes |
| Class A | 12/10/18 | $0.0676 | $0.0296 |
| Class M | 12/10/18 | $0.0000 | $0.0000 |
| Class C | 12/10/18 | $0.0000 | $0.0000 |
| Class I | 12/10/18 | $0.1276 | $0.0296 |
| Class Z | 12/10/18 | $0.1526 | $0.0296 |
|
The fund will notify shareholders in January 2020 of amounts for use in preparing 2019 income tax returns.
AICAP-ANN-1219
1.711985.121
Fidelity Advisor® Diversified International Fund
Annual Report
October 31, 2019
See the inside front cover for important information about access to your fund’s shareholder reports.
Beginning on January 1, 2021, as permitted by regulations adopted by the Securities and Exchange Commission, paper copies of a fund’s shareholder reports will no longer be sent by mail, unless you specifically request paper copies of the reports from the fund or from your financial intermediary, such as a financial advisor, broker-dealer or bank. Instead, the reports will be made available on a website, and you will be notified by mail each time a report is posted and provided with a website link to access the report.
If you already elected to receive shareholder reports electronically, you will not be affected by this change and you need not take any action. You may elect to receive shareholder reports and other communications from a fund electronically, by contacting your financial intermediary. For Fidelity customers, visit Fidelity's web site or call Fidelity using the contact information listed below.
You may elect to receive all future reports in paper free of charge. If you wish to continue receiving paper copies of your shareholder reports, you may contact your financial intermediary or, if you are a Fidelity customer, visit Fidelity’s website, or call Fidelity at the applicable toll-free number listed below. Your election to receive reports in paper will apply to all funds held with the fund complex/your financial intermediary.
| Account Type | Website | Phone Number |
| Brokerage, Mutual Fund, or Annuity Contracts: | fidelity.com/mailpreferences | 1-800-343-3548 |
| Employer Provided Retirement Accounts: | netbenefits.fidelity.com/preferences (choose 'no' under Required Disclosures to continue to print) | 1-800-343-0860 |
| Advisor Sold Accounts Serviced Through Your Financial Intermediary: | Contact Your Financial Intermediary | Your Financial Intermediary's phone number |
| Advisor Sold Accounts Serviced by Fidelity: | institutional.fidelity.com | 1-877-208-0098 |
Contents
To view a fund's proxy voting guidelines and proxy voting record for the 12-month period ended June 30, visit http://www.fidelity.com/proxyvotingresults or visit the Securities and Exchange Commission's (SEC) web site at http://www.sec.gov.
You may also call 1-877-208-0098 to request a free copy of the proxy voting guidelines.
Standard & Poor's, S&P and S&P 500 are registered service marks of The McGraw-Hill Companies, Inc. and have been licensed for use by Fidelity Distributors Corporation.
Other third-party marks appearing herein are the property of their respective owners.
All other marks appearing herein are registered or unregistered trademarks or service marks of FMR LLC or an affiliated company. © 2019 FMR LLC. All rights reserved.
This report and the financial statements contained herein are submitted for the general information of the shareholders of the Fund. This report is not authorized for distribution to prospective investors in the Fund unless preceded or accompanied by an effective prospectus.
A fund files its complete schedule of portfolio holdings with the SEC for the first and third quarters of each fiscal year on Form N-PORT. Forms N-PORT are available on the SEC’s web site at http://www.sec.gov. A fund's Forms N-PORT may be reviewed and copied at the SEC’s Public Reference Room in Washington, DC. Information regarding the operation of the SEC's Public Reference Room may be obtained by calling 1-800-SEC-0330.
For a complete list of a fund's portfolio holdings, view the most recent holdings listing, semiannual report, or annual report on Fidelity's web site at http://www.fidelity.com, http://www.institutional.fidelity.com, or http://www.401k.com, as applicable.
NOT FDIC INSURED •MAY LOSE VALUE •NO BANK GUARANTEE
Neither the Fund nor Fidelity Distributors Corporation is a bank.
Performance: The Bottom Line
Average annual total return reflects the change in the value of an investment, assuming reinvestment of distributions from dividend income and capital gains (the profits earned upon the sale of securities that have grown in value, if any) and assuming a constant rate of performance each year. The hypothetical investment and the average annual total returns do not reflect the deduction of taxes that a shareholder would pay on fund distributions or the redemption of fund shares. During periods of reimbursement by Fidelity, a fund’s total return will be greater than it would be had the reimbursement not occurred. How a fund did yesterday is no guarantee of how it will do tomorrow.
Average Annual Total Returns
| For the periods ended October 31, 2019 | Past 1 year | Past 5 years | Past 10 years |
| Class A (incl. 5.75% sales charge) | 8.93% | 4.08% | 6.12% |
| Class M (incl. 3.50% sales charge) | 11.24% | 4.30% | 6.10% |
| Class C (incl. contingent deferred sales charge) | 13.72% | 4.53% | 5.95% |
| Class I | 15.89% | 5.61% | 7.06% |
| Class Z | 16.04% | 5.76% | 7.16% |
Class C shares' contingent deferred sales charges included in the past one year, past five years and past ten years total return figures are 1%, 0% and 0%, respectively.
The initial offering of Class Z shares took place on August 13, 2013. Returns prior to August 13, 2013, are those of Class I.
$10,000 Over 10 Years
Let's say hypothetically that $10,000 was invested in Fidelity Advisor® Diversified International Fund - Class A on October 31, 2009, and the current 5.75% sales charge was paid.
The chart shows how the value of your investment would have changed, and also shows how the MSCI EAFE Index performed over the same period.

| Period Ending Values |
| $18,106 | Fidelity Advisor® Diversified International Fund - Class A |
| $17,206 | MSCI EAFE Index |
Management's Discussion of Fund Performance
Market Recap: The MSCI ACWI (All Country World Index) ex USA Index gained 11.47% for the 12 months ending October 31, 2019, as international stocks reflected a confluence of factors, including escalating trade tension, and moderating but still positive global economic growth. Currency fluctuations were largely modest and varied by region, muting the overall impact on international equity returns. In late December, the U.S. Federal Reserve shifted from raising interest rates to a more dovish policy in 2019, joining many foreign central banks. In June, international stocks rose 6.03%, as policy stimulus in China stabilized that country’s economic growth. The Fed cut its policy rate in July for the first time since 2008. However, the index returned -1.21% for the month, followed by -3.08% in August. In September, the Fed cut its policy rate another quarter point, citing concerns about slowing economic growth and muted inflation, and did the same in October, leading to monthly gains of 2.59% and 3.49%, respectively. For the full 12 months, the growth-oriented information technology sector (+22%) led the way, followed by utilities (+20%) and real estate (+18%), two high-dividend-yielding categories. Conversely, energy was roughly flat, while materials (+6%) and communication services (7%) also lagged. By region, Asia Pacific ex Japan (+16%), Europe ex U.K (+13%), Canada (+12%) and emerging markets (+12%) fared best. Meanwhile, the U.K. (+7%) and Japan (+10%) trailed the broader market.
Comments from Portfolio Manager Bill Bower: For the fiscal year, the fund’s share classes (excluding sales charges, if applicable) gained roughly 15% to 16%, handily outperforming the 11.30% result of benchmark MSCI EAFE Index. Favorable stock selection was the primary driver of the fund’s outperformance the past 12 months, as our picks in 10 of 11 equity sectors outperformed the index. By sector, the biggest contribution to the fund’s relative result came from picks in the financials sector, followed by choices in information technology and industrials. Regionally, choices in emerging markets added the most value, with notable outperformance in China and India. Stock picking in the non-benchmark U.S. region, along with Japan, also contributed meaningfully. In terms of individual stocks, an overweighted stake in Japanese optical and glass products manufacturer Hoya (+58%) was the fund’s largest contributor the past year. A large position in photolithography systems manufacturer ASML (+53%) also helped. Conversely, being underweighted in the higher-dividend-yielding and strong-performing utilities and real estate sectors held back the fund’s performance relative to the index. At the stock level, not owning Switzerland-based food and beverage manufacturer Nestle (+29%), an index constituent, weighed on the fund’s relative result. An overweighting in Norway-based oil & gas company Equinor (-26%) also hurt this period. Elsewhere, a cash position of roughly 4%, on average, also detracted in an uptrending market.
The views expressed above reflect those of the portfolio manager(s) only through the end of the period as stated on the cover of this report and do not necessarily represent the views of Fidelity or any other person in the Fidelity organization. Any such views are subject to change at any time based upon market or other conditions and Fidelity disclaims any responsibility to update such views. These views may not be relied on as investment advice and, because investment decisions for a Fidelity fund are based on numerous factors, may not be relied on as an indication of trading intent on behalf of any Fidelity fund.
Investment Summary (Unaudited)
Top Five Stocks as of October 31, 2019
| | % of fund's net assets |
| SAP SE (Germany, Software) | 2.5 |
| Roche Holding AG (participation certificate) (Switzerland, Pharmaceuticals) | 2.2 |
| ASML Holding NV (Netherlands, Semiconductors & Semiconductor Equipment) | 2.0 |
| AIA Group Ltd. (Hong Kong, Insurance) | 1.8 |
| AstraZeneca PLC (United Kingdom) (United Kingdom, Pharmaceuticals) | 1.8 |
| | 10.3 |
Top Five Market Sectors as of October 31, 2019
| | % of fund's net assets |
| Financials | 19.3 |
| Information Technology | 16.6 |
| Industrials | 16.0 |
| Health Care | 14.4 |
| Consumer Discretionary | 8.7 |
Top Five Countries as of October 31, 2019
| (excluding cash equivalents) | % of fund's net assets |
| Japan | 17.4 |
| Germany | 11.4 |
| United Kingdom | 11.0 |
| France | 7.9 |
| Netherlands | 7.1 |
Asset Allocation (% of fund's net assets)
| As of October 31, 2019 |
| | Stocks | 99.0% |
| | Short-Term Investments and Net Other Assets (Liabilities) | 1.0% |

Schedule of Investments October 31, 2019
Showing Percentage of Net Assets
| Common Stocks - 99.0% | | | |
| | | Shares | Value (000s) |
| Australia - 1.1% | | | |
| CSL Ltd. | | 65,351 | $11,525 |
| Magellan Financial Group Ltd. | | 202,401 | 6,713 |
|
| TOTAL AUSTRALIA | | | 18,238 |
|
| Bailiwick of Jersey - 0.8% | | | |
| Experian PLC | | 285,900 | 8,992 |
| Ferguson PLC | | 54,546 | 4,658 |
|
| TOTAL BAILIWICK OF JERSEY | | | 13,650 |
|
| Belgium - 0.9% | | | |
| KBC Groep NV | | 214,480 | 15,041 |
| Bermuda - 1.8% | | | |
| China Gas Holdings Ltd. | | 592,800 | 2,525 |
| Credicorp Ltd. (United States) | | 30,205 | 6,465 |
| Hiscox Ltd. | | 308,500 | 5,950 |
| IHS Markit Ltd. (a) | | 120,088 | 8,409 |
| Marvell Technology Group Ltd. | | 251,500 | 6,134 |
|
| TOTAL BERMUDA | | | 29,483 |
|
| Brazil - 0.8% | | | |
| BM&F BOVESPA SA | | 388,900 | 4,691 |
| Notre Dame Intermedica Participacoes SA | | 206,600 | 3,091 |
| Rumo SA (a) | | 820,500 | 4,665 |
|
| TOTAL BRAZIL | | | 12,447 |
|
| Canada - 3.2% | | | |
| Alimentation Couche-Tard, Inc. Class B (sub. vtg.) | | 612,700 | 18,375 |
| Cenovus Energy, Inc. (Canada) | | 515,400 | 4,391 |
| Constellation Software, Inc. | | 7,500 | 7,407 |
| Fairfax India Holdings Corp. (a)(b) | | 315,500 | 3,565 |
| Franco-Nevada Corp. | | 49,700 | 4,822 |
| Kirkland Lake Gold Ltd. | | 99,100 | 4,654 |
| Waste Connection, Inc. (Canada) | | 35,200 | 3,251 |
| Wheaton Precious Metals Corp. | | 161,400 | 4,524 |
|
| TOTAL CANADA | | | 50,989 |
|
| Cayman Islands - 1.9% | | | |
| Alibaba Group Holding Ltd. sponsored ADR (a) | | 75,800 | 13,392 |
| Anta Sports Products Ltd. | | 669,000 | 6,544 |
| Tencent Holdings Ltd. | | 217,600 | 8,826 |
| Zai Lab Ltd. ADR (a) | | 62,254 | 2,104 |
|
| TOTAL CAYMAN ISLANDS | | | 30,866 |
|
| China - 1.0% | | | |
| Kweichow Moutai Co. Ltd. (A Shares) | | 47,076 | 7,879 |
| Ping An Insurance Group Co. of China Ltd. (H Shares) | | 598,500 | 6,908 |
| Yantai Jereh Oilfield Services (A Shares) | | 212,323 | 923 |
|
| TOTAL CHINA | | | 15,710 |
|
| Denmark - 1.5% | | | |
| DSV A/S | | 121,500 | 11,789 |
| Netcompany Group A/S (a)(b) | | 66,300 | 2,823 |
| ORSTED A/S (b) | | 118,900 | 10,430 |
|
| TOTAL DENMARK | | | 25,042 |
|
| France - 7.9% | | | |
| Amundi SA (b) | | 120,158 | 8,577 |
| Capgemini SA | | 115,600 | 13,015 |
| Danone SA | | 131,300 | 10,877 |
| Dassault Systemes SA | | 25,600 | 3,884 |
| Edenred SA | | 52,900 | 2,785 |
| Essilor International SA | | 18,700 | 2,853 |
| Kering SA | | 9,271 | 5,275 |
| Legrand SA | | 83,700 | 6,533 |
| LVMH Moet Hennessy Louis Vuitton SE | | 50,343 | 21,499 |
| Pernod Ricard SA | | 27,800 | 5,131 |
| Sanofi SA | | 173,555 | 16,000 |
| SR Teleperformance SA | | 65,100 | 14,754 |
| VINCI SA | | 143,500 | 16,101 |
|
| TOTAL FRANCE | | | 127,284 |
|
| Germany - 11.4% | | | |
| adidas AG | | 57,409 | 17,726 |
| Allianz SE | | 69,100 | 16,876 |
| Bayer AG | | 145,726 | 11,305 |
| Deutsche Borse AG | | 93,400 | 14,464 |
| Deutsche Post AG | | 287,026 | 10,164 |
| Hannover Reuck SE | | 61,400 | 10,875 |
| Linde PLC | | 95,138 | 18,808 |
| Morphosys AG (a) | | 14,783 | 1,610 |
| Morphosys AG sponsored ADR (a) | | 93,817 | 2,554 |
| MTU Aero Engines Holdings AG | | 9,200 | 2,456 |
| RWE AG | | 425,100 | 12,958 |
| SAP SE | | 301,373 | 39,930 |
| Scout24 AG (b) | | 107,200 | 6,630 |
| Symrise AG | | 95,100 | 9,151 |
| Vonovia SE | | 181,000 | 9,631 |
|
| TOTAL GERMANY | | | 185,138 |
|
| Hong Kong - 2.0% | | | |
| AIA Group Ltd. | | 2,856,200 | 28,443 |
| Techtronic Industries Co. Ltd. | | 472,000 | 3,689 |
|
| TOTAL HONG KONG | | | 32,132 |
|
| India - 4.3% | | | |
| Axis Bank Ltd. | | 705,358 | 7,303 |
| HDFC Bank Ltd. | | 1,132,942 | 19,616 |
| Housing Development Finance Corp. Ltd. | | 539,087 | 16,167 |
| Kotak Mahindra Bank Ltd. | | 303,740 | 6,732 |
| Reliance Industries Ltd. | | 849,408 | 17,495 |
| Tech Mahindra Ltd. | | 163,700 | 1,703 |
|
| TOTAL INDIA | | | 69,016 |
|
| Indonesia - 1.1% | | | |
| PT Bank Central Asia Tbk | | 4,048,900 | 9,063 |
| PT Bank Rakyat Indonesia Tbk | | 29,051,600 | 8,705 |
|
| TOTAL INDONESIA | | | 17,768 |
|
| Ireland - 2.7% | | | |
| CRH PLC | | 257,400 | 9,383 |
| DCC PLC (United Kingdom) | | 27,400 | 2,568 |
| Kerry Group PLC Class A | | 92,700 | 11,207 |
| Kingspan Group PLC (Ireland) | | 200,181 | 10,373 |
| Ryanair Holdings PLC sponsored ADR (a) | | 132,936 | 9,922 |
|
| TOTAL IRELAND | | | 43,453 |
|
| Italy - 1.4% | | | |
| Enel SpA | | 1,089,100 | 8,441 |
| FinecoBank SpA | | 380,400 | 4,285 |
| Moncler SpA | | 82,500 | 3,178 |
| Recordati SpA | | 153,300 | 6,441 |
|
| TOTAL ITALY | | | 22,345 |
|
| Japan - 17.4% | | | |
| Astellas Pharma, Inc. | | 101,800 | 1,747 |
| Bandai Namco Holdings, Inc. | | 77,800 | 4,784 |
| Daikin Industries Ltd. | | 83,300 | 11,659 |
| Hoya Corp. | | 308,700 | 27,282 |
| Iriso Electronics Co. Ltd. | | 26,351 | 1,303 |
| Itochu Corp. | | 428,400 | 8,957 |
| Kao Corp. | | 160,500 | 12,904 |
| Keyence Corp. | | 37,500 | 23,711 |
| KH Neochem Co. Ltd. | | 86,000 | 2,094 |
| Minebea Mitsumi, Inc. | | 940,600 | 17,863 |
| Misumi Group, Inc. | | 198,700 | 4,995 |
| Nabtesco Corp. | | 77,400 | 2,464 |
| Nidec Corp. | | 24,100 | 3,548 |
| Nitori Holdings Co. Ltd. | | 79,403 | 12,086 |
| Oracle Corp. Japan | | 26,600 | 2,338 |
| ORIX Corp. | | 846,400 | 13,301 |
| PALTAC Corp. | | 49,600 | 2,392 |
| Persol Holdings Co., Ltd. | | 320,200 | 6,150 |
| Recruit Holdings Co. Ltd. | | 468,800 | 15,580 |
| Renesas Electronics Corp. (a) | | 1,096,000 | 7,420 |
| ROHM Co. Ltd. | | 21,100 | 1,672 |
| Shin-Etsu Chemical Co. Ltd. | | 129,000 | 14,384 |
| Shiseido Co. Ltd. | | 137,600 | 11,345 |
| SMC Corp. | | 32,400 | 13,998 |
| SoftBank Corp. | | 116,800 | 4,493 |
| Sony Corp. | | 181,900 | 11,072 |
| Suzuki Motor Corp. | | 139,100 | 6,567 |
| Tokyo Electron Ltd. | | 46,900 | 9,502 |
| Tsuruha Holdings, Inc. | | 114,100 | 12,835 |
| Welcia Holdings Co. Ltd. | | 131,306 | 7,545 |
| Yahoo! Japan Corp. | | 1,649,500 | 5,078 |
|
| TOTAL JAPAN | | | 281,069 |
|
| Korea (South) - 0.7% | | | |
| LG Chemical Ltd. | | 11,573 | 3,041 |
| SK Hynix, Inc. | | 116,090 | 8,134 |
|
| TOTAL KOREA (SOUTH) | | | 11,175 |
|
| Luxembourg - 0.7% | | | |
| B&M European Value Retail SA | | 1,946,595 | 9,337 |
| Globant SA (a) | | 17,100 | 1,595 |
|
| TOTAL LUXEMBOURG | | | 10,932 |
|
| Mexico - 0.1% | | | |
| Grupo Financiero Banorte S.A.B. de CV Series O | | 292,800 | 1,598 |
| Netherlands - 7.1% | | | |
| Adyen BV (a)(b) | | 2,093 | 1,469 |
| ASML Holding NV (c) | | 120,600 | 31,594 |
| Ferrari NV | | 21,500 | 3,440 |
| Heineken NV (Bearer) | | 78,500 | 8,007 |
| InterXion Holding NV (a) | | 54,700 | 4,826 |
| Koninklijke Philips Electronics NV | | 294,500 | 12,921 |
| NXP Semiconductors NV | | 118,900 | 13,517 |
| Unilever NV | | 415,800 | 24,555 |
| Wolters Kluwer NV | | 196,900 | 14,498 |
|
| TOTAL NETHERLANDS | | | 114,827 |
|
| New Zealand - 0.3% | | | |
| Ryman Healthcare Group Ltd. | | 666,045 | 5,505 |
| Norway - 1.4% | | | |
| Adevinta ASA: | | | |
| rights 11/12/19 (a) | | 392,000 | 60 |
| Class B | | 549,000 | 6,268 |
| Equinor ASA | | 441,300 | 8,163 |
| Schibsted ASA (A Shares) | | 292,800 | 8,597 |
|
| TOTAL NORWAY | | | 23,088 |
|
| South Africa - 0.1% | | | |
| Capitec Bank Holdings Ltd. | | 26,600 | 2,417 |
| Spain - 0.7% | | | |
| Amadeus IT Holding SA Class A | | 29,600 | 2,190 |
| Cellnex Telecom SA (a) | | 48,969 | 2,111 |
| Cellnex Telecom SA (b) | | 151,800 | 6,545 |
| Masmovil Ibercom SA (a) | | 24,650 | 570 |
|
| TOTAL SPAIN | | | 11,416 |
|
| Sweden - 2.3% | | | |
| ASSA ABLOY AB (B Shares) | | 501,900 | 11,919 |
| Coor Service Management Holding AB (b) | | 129,589 | 1,107 |
| EQT AB (a) | | 103,000 | 988 |
| Ericsson (B Shares) | | 961,000 | 8,398 |
| Hexagon AB (B Shares) | | 128,700 | 6,570 |
| Indutrade AB | | 147,400 | 4,537 |
| Svenska Handelsbanken AB (A Shares) | | 381,300 | 3,827 |
|
| TOTAL SWEDEN | | | 37,346 |
|
| Switzerland - 6.4% | | | |
| Alcon, Inc. (Switzerland) (a) | | 205,812 | 12,155 |
| Julius Baer Group Ltd. | | 151,580 | 6,713 |
| Lonza Group AG | | 26,786 | 9,639 |
| Medacta Group SA (b) | | 21,200 | 1,732 |
| Roche Holding AG (participation certificate) | | 116,437 | 35,042 |
| Sika AG | | 110,178 | 18,931 |
| Sonova Holding AG Class B | | 27,033 | 6,193 |
| Swiss Re Ltd. | | 96,350 | 10,089 |
| Temenos Group AG | | 22,260 | 3,176 |
|
| TOTAL SWITZERLAND | | | 103,670 |
|
| Taiwan - 1.0% | | | |
| Taiwan Semiconductor Manufacturing Co. Ltd. sponsored ADR | | 298,900 | 15,432 |
| United Kingdom - 11.0% | | | |
| Aon PLC | | 41,600 | 8,035 |
| Ascential PLC (b) | | 622,177 | 2,814 |
| AstraZeneca PLC (United Kingdom) | | 290,779 | 28,356 |
| Beazley PLC | | 583,600 | 4,434 |
| Big Yellow Group PLC | | 181,700 | 2,688 |
| BP PLC sponsored ADR | | 373,900 | 14,175 |
| Coca-Cola European Partners PLC | | 120,100 | 6,427 |
| Compass Group PLC | | 472,092 | 12,569 |
| InterContinental Hotel Group PLC | | 86,053 | 5,207 |
| Lloyds Banking Group PLC | | 11,016,200 | 8,104 |
| London Stock Exchange Group PLC | | 200,800 | 18,096 |
| M&G PLC (a) | | 1,022,894 | 2,833 |
| Network International Holdings PLC (b) | | 574,000 | 4,023 |
| Ocado Group PLC (a) | | 123,300 | 2,123 |
| Prudential PLC | | 1,022,894 | 17,867 |
| RELX PLC (Euronext N.V.) | | 627,647 | 15,092 |
| Rentokil Initial PLC | | 1,425,000 | 8,389 |
| Smith & Nephew PLC | | 481,800 | 10,343 |
| Standard Chartered PLC (United Kingdom) | | 802,488 | 7,287 |
|
| TOTAL UNITED KINGDOM | | | 178,862 |
|
| United States of America - 6.0% | | | |
| 10X Genomics, Inc. (a) | | 2,600 | 151 |
| Alphabet, Inc. Class C (a) | | 7,249 | 9,135 |
| Amgen, Inc. | | 27,400 | 5,843 |
| Becton, Dickinson & Co. | | 27,800 | 7,117 |
| Boston Scientific Corp. (a) | | 196,300 | 8,186 |
| Coty, Inc. Class A | | 408,864 | 4,780 |
| IQVIA Holdings, Inc. (a) | | 55,600 | 8,030 |
| Marsh & McLennan Companies, Inc. | | 79,900 | 8,279 |
| MasterCard, Inc. Class A | | 58,400 | 16,166 |
| Microsoft Corp. | | 70,400 | 10,093 |
| The Booking Holdings, Inc. (a) | | 1,600 | 3,278 |
| Visa, Inc. Class A | | 90,000 | 16,097 |
|
| TOTAL UNITED STATES OF AMERICA | | | 97,155 |
|
| TOTAL COMMON STOCKS | | | |
| (Cost $1,156,682) | | | 1,603,094 |
|
| Money Market Funds - 1.1% | | | |
| Fidelity Cash Central Fund 1.83% (d) | | 13,881,353 | 13,884 |
| Fidelity Securities Lending Cash Central Fund 1.84% (d)(e) | | 3,849,081 | 3,849 |
| TOTAL MONEY MARKET FUNDS | | | |
| (Cost $17,733) | | | 17,733 |
| TOTAL INVESTMENT IN SECURITIES - 100.1% | | | |
| (Cost $1,174,415) | | | 1,620,827 |
| NET OTHER ASSETS (LIABILITIES) - (0.1)% | | | (1,926) |
| NET ASSETS - 100% | | | $1,618,901 |
| Forward Foreign Currency Contracts | | | | | | |
| Currency Purchased (000s) | Currency Sold (000s) | Counterparty | Settlement | Unrealized Appreciation/Depreciation (000s) |
| JPY | 1,000 | USD | 9 | State Street Bank And Trust Co. | 11/13/19 | $0 |
| TOTAL FORWARD FOREIGN CURRENCY CONTRACTS | | | | | | $0 |
| | | | | | Unrealized Appreciation | 0 |
Currency Abbreviations
JPY – Japanese yen
USD – U.S. dollar
Categorizations in the Schedule of Investments are based on country or territory of incorporation.
Values shown as $0 in the Schedule of Investments may reflect amounts less than $500.
Legend
(a) Non-income producing
(b) Security exempt from registration under Rule 144A of the Securities Act of 1933. These securities may be resold in transactions exempt from registration, normally to qualified institutional buyers. At the end of the period, the value of these securities amounted to $49,715,000 or 3.1% of net assets.
(c) Security or a portion of the security is on loan at period end.
(d) Affiliated fund that is generally available only to investment companies and other accounts managed by Fidelity Investments. The rate quoted is the annualized seven-day yield of the fund at period end. A complete unaudited listing of the fund's holdings as of its most recent quarter end is available upon request. In addition, each Fidelity Central Fund's financial statements, which are not covered by the Fund's Report of Independent Registered Public Accounting Firm, are available on the SEC's website or upon request.
(e) Investment made with cash collateral received from securities on loan.
Affiliated Central Funds
Information regarding fiscal year to date income earned by the Fund from investments in Fidelity Central Funds is as follows:
| Fund | Income earned |
| | (Amounts in thousands) |
| Fidelity Cash Central Fund | $1,476 |
| Fidelity Securities Lending Cash Central Fund | 136 |
| Total | $1,612 |
Amounts in the income column in the above table include any capital gain distributions from underlying funds, which are presented in the corresponding line-item in the Statement of Operations, if applicable. Amount for Fidelity Securities Lending Cash Central Fund represents the income earned on investing cash collateral, less rebates paid to borrowers and any lending agent fees associated with the loan, plus any premium payments received for lending certain types of securities.
Investment Valuation
The following is a summary of the inputs used, as of October 31, 2019, involving the Fund's assets and liabilities carried at fair value. The inputs or methodology used for valuing securities may not be an indication of the risk associated with investing in those securities. For more information on valuation inputs, and their aggregation into the levels used below, please refer to the Investment Valuation section in the accompanying Notes to Financial Statements.
| | Valuation Inputs at Reporting Date: |
| Description | Total | Level 1 | Level 2 | Level 3 |
| (Amounts in thousands) | | | | |
| Investments in Securities: | | | | |
| Equities: | | | | |
| Communication Services | $61,127 | $42,730 | $18,397 | $-- |
| Consumer Discretionary | 143,322 | 60,602 | 82,720 | -- |
| Consumer Staples | 141,867 | 78,482 | 63,385 | -- |
| Energy | 45,147 | 26,729 | 18,418 | -- |
| Financials | 314,307 | 105,409 | 208,898 | -- |
| Health Care | 234,872 | 74,846 | 160,026 | -- |
| Industrials | 261,865 | 156,385 | 105,480 | -- |
| Information Technology | 264,122 | 168,145 | 95,977 | -- |
| Materials | 89,792 | 63,931 | 25,861 | -- |
| Real Estate | 12,319 | 12,319 | -- | -- |
| Utilities | 34,354 | 23,388 | 10,966 | -- |
| Money Market Funds | 17,733 | 17,733 | -- | -- |
| Total Investments in Securities: | $1,620,827 | $830,699 | $790,128 | $-- |
| Derivative Instruments: | | | | |
| Assets | | | | |
| Forward Foreign Currency Contracts | $0 | $-- | $0 | $-- |
| Total Assets | $0 | $-- | $0 | $-- |
| Total Derivative Instruments: | $0 | $-- | $0 | $-- |
Value of Derivative Instruments
The following table is a summary of the Fund's value of derivative instruments by primary risk exposure as of October 31, 2019. For additional information on derivative instruments, please refer to the Derivative Instruments section in the accompanying Notes to Financial Statements.
| Primary Risk Exposure / Derivative Type | Value |
| | Asset | Liability |
| (Amounts in thousands) | | |
| Foreign Exchange Risk | | |
| Forward Foreign Currency Contracts | $0 | $-- |
| Total Foreign Exchange Risk | 0 | -- |
| Total Value of Derivatives | $0 | $-- |
See accompanying notes which are an integral part of the financial statements.
Financial Statements
Statement of Assets and Liabilities
| Amounts in thousands (except per-share amounts) | | October 31, 2019 |
| Assets | | |
Investment in securities, at value (including securities loaned of $3,720) — See accompanying schedule:
Unaffiliated issuers (cost $1,156,682) | $1,603,094 | |
| Fidelity Central Funds (cost $17,733) | 17,733 | |
| Total Investment in Securities (cost $1,174,415) | | $1,620,827 |
| Receivable for investments sold | | 3,587 |
| Receivable for fund shares sold | | 593 |
| Dividends receivable | | 4,457 |
| Distributions receivable from Fidelity Central Funds | | 28 |
| Prepaid expenses | | 3 |
| Other receivables | | 99 |
| Total assets | | 1,629,594 |
| Liabilities | | |
| Payable to custodian bank | $30 | |
| Payable for investments purchased | 2,534 | |
| Payable for fund shares redeemed | 1,390 | |
| Accrued management fee | 955 | |
| Distribution and service plan fees payable | 227 | |
| Other affiliated payables | 330 | |
| Other payables and accrued expenses | 1,379 | |
| Collateral on securities loaned | 3,848 | |
| Total liabilities | | 10,693 |
| Net Assets | | $1,618,901 |
| Net Assets consist of: | | |
| Paid in capital | | $1,200,977 |
| Total accumulated earnings (loss) | | 417,924 |
| Net Assets | | $1,618,901 |
| Net Asset Value and Maximum Offering Price | | |
| Class A: | | |
| Net Asset Value and redemption price per share ($529,831 ÷ 22,761 shares)(a) | | $23.28 |
| Maximum offering price per share (100/94.25 of $23.28) | | $24.70 |
| Class M: | | |
| Net Asset Value and redemption price per share ($172,790 ÷ 7,481 shares)(a) | | $23.10 |
| Maximum offering price per share (100/96.50 of $23.10) | | $23.94 |
| Class C: | | |
| Net Asset Value and offering price per share ($59,219 ÷ 2,668 shares)(a) | | $22.20 |
| Class I: | | |
| Net Asset Value, offering price and redemption price per share ($582,722 ÷ 24,606 shares) | | $23.68 |
| Class Z: | | |
| Net Asset Value, offering price and redemption price per share ($274,339 ÷ 11,589 shares) | | $23.67 |
(a) Redemption price per share is equal to net asset value less any applicable contingent deferred sales charge.
See accompanying notes which are an integral part of the financial statements.
Statement of Operations
| Amounts in thousands | | Year ended October 31, 2019 |
| Investment Income | | |
| Dividends | | $37,363 |
| Non-Cash dividends | | 2,976 |
| Income from Fidelity Central Funds (including $136 from security lending) | | 1,612 |
| Income before foreign taxes withheld | | 41,951 |
| Less foreign taxes withheld | | (3,192) |
| Total income | | 38,759 |
| Expenses | | |
| Management fee | $11,887 | |
| Transfer agent fees | 3,261 | |
| Distribution and service plan fees | 3,016 | |
| Accounting and security lending fees | 798 | |
| Custodian fees and expenses | 188 | |
| Independent trustees' fees and expenses | 10 | |
| Registration fees | 97 | |
| Audit | 94 | |
| Legal | 5 | |
| Miscellaneous | 15 | |
| Total expenses before reductions | 19,371 | |
| Expense reductions | (106) | |
| Total expenses after reductions | | 19,265 |
| Net investment income (loss) | | 19,494 |
| Realized and Unrealized Gain (Loss) | | |
| Net realized gain (loss) on: | | |
| Investment securities: | | |
| Unaffiliated issuers | (31,868) | |
| Redemptions in-kind with affiliated entities | 59,872 | |
| Fidelity Central Funds | 1 | |
| Foreign currency transactions | (93) | |
| Total net realized gain (loss) | | 27,912 |
| Change in net unrealized appreciation (depreciation) on: | | |
| Investment securities: | | |
| Unaffiliated issuers (net of increase in deferred foreign taxes of $1,223) | 210,542 | |
| Assets and liabilities in foreign currencies | 99 | |
| Total change in net unrealized appreciation (depreciation) | | 210,641 |
| Net gain (loss) | | 238,553 |
| Net increase (decrease) in net assets resulting from operations | | $258,047 |
See accompanying notes which are an integral part of the financial statements.
Statement of Changes in Net Assets
| Amounts in thousands | Year ended October 31, 2019 | Year ended October 31, 2018 |
| Increase (Decrease) in Net Assets | | |
| Operations | | |
| Net investment income (loss) | $19,494 | $21,211 |
| Net realized gain (loss) | 27,912 | 65,951 |
| Change in net unrealized appreciation (depreciation) | 210,641 | (274,393) |
| Net increase (decrease) in net assets resulting from operations | 258,047 | (187,231) |
| Distributions to shareholders | (82,038) | (24,045) |
| Share transactions - net increase (decrease) | (449,235) | (148,877) |
| Total increase (decrease) in net assets | (273,226) | (360,153) |
| Net Assets | | |
| Beginning of period | 1,892,127 | 2,252,280 |
| End of period | $1,618,901 | $1,892,127 |
See accompanying notes which are an integral part of the financial statements.
Financial Highlights
Fidelity Advisor Diversified International Fund Class A
| Years ended October 31, | 2019 | 2018 | 2017 | 2016 | 2015 |
| Selected Per–Share Data | | | | | |
| Net asset value, beginning of period | $21.08 | $23.43 | $19.38 | $20.10 | $19.56 |
| Income from Investment Operations | | | | | |
| Net investment income (loss)A | .21 | .21 | .17 | .18 | .15 |
| Net realized and unrealized gain (loss) | 2.90 | (2.33)B | 4.11 | (.77) | .61 |
| Total from investment operations | 3.11 | (2.12) | 4.28 | (.59) | .76 |
| Distributions from net investment income | (.17) | (.16) | (.19) | (.13) | (.20) |
| Distributions from net realized gain | (.74) | (.07) | (.05) | – | (.02) |
| Total distributions | (.91) | (.23) | (.23)C | (.13) | (.22) |
| Redemption fees added to paid in capitalA | – | – | –D | –D | –D |
| Net asset value, end of period | $23.28 | $21.08 | $23.43 | $19.38 | $20.10 |
| Total ReturnE,F | 15.57% | (9.14)B | 22.39% | (2.97)% | 3.93% |
| Ratios to Average Net AssetsG,H | | | | | |
| Expenses before reductions | 1.19% | 1.19% | 1.21% | 1.23% | 1.22% |
| Expenses net of fee waivers, if any | 1.19% | 1.19% | 1.21% | 1.23% | 1.22% |
| Expenses net of all reductions | 1.19% | 1.17% | 1.20% | 1.22% | 1.21% |
| Net investment income (loss) | .97% | .89% | .82% | .92% | .75% |
| Supplemental Data | | | | | |
| Net assets, end of period (in millions) | $530 | $463 | $579 | $574 | $662 |
| Portfolio turnover rateI | 37%J | 32% | 44% | 31% | 34% |
A Calculated based on average shares outstanding during the period.
B Net realized and unrealized gain (loss) per share reflects proceeds received from litigation which amounted to $.11 per share. Excluding these litigation proceeds, the total return would have been (9.62)%
C Total distributions of $.23 per share is comprised of distributions from net investment income of $.187 and distributions from net realized gain of $.046 per share.
D Amount represents less than $.005 per share.
E Total returns would have been lower if certain expenses had not been reduced during the applicable periods shown.
F Total returns do not include the effect of the sales charges.
G Fees and expenses of any underlying Fidelity Central Funds are not included in the Fund's expense ratio. The Fund indirectly bears its proportionate share of the expenses of any underlying Fidelity Central Funds.
H Expense ratios reflect operating expenses of the class. Expenses before reductions do not reflect amounts reimbursed by the investment adviser or reductions from brokerage service arrangements or reductions from other expense offset arrangements and do not represent the amount paid by the class during periods when reimbursements or reductions occur. Expenses net of fee waivers reflect expenses after reimbursement by the investment adviser but prior to reductions from brokerage service arrangements or other expense offset arrangements. Expenses net of all reductions represent the net expenses paid by the class.
I Amount does not include the portfolio activity of any underlying Fidelity Central Funds.
J Portfolio turnover rate excludes securities received or delivered in-kind.
See accompanying notes which are an integral part of the financial statements.
Fidelity Advisor Diversified International Fund Class M
| Years ended October 31, | 2019 | 2018 | 2017 | 2016 | 2015 |
| Selected Per–Share Data | | | | | |
| Net asset value, beginning of period | $20.91 | $23.24 | $19.21 | $19.92 | $19.38 |
| Income from Investment Operations | | | | | |
| Net investment income (loss)A | .15 | .14 | .12 | .13 | .10 |
| Net realized and unrealized gain (loss) | 2.88 | (2.31)B | 4.08 | (.77) | .61 |
| Total from investment operations | 3.03 | (2.17) | 4.20 | (.64) | .71 |
| Distributions from net investment income | (.11) | (.09) | (.13) | (.07) | (.15) |
| Distributions from net realized gain | (.74) | (.07) | (.05) | – | (.02) |
| Total distributions | (.84)C | (.16) | (.17)D | (.07) | (.17) |
| Redemption fees added to paid in capitalA | – | – | –E | –E | –E |
| Net asset value, end of period | $23.10 | $20.91 | $23.24 | $19.21 | $19.92 |
| Total ReturnF,G | 15.27% | (9.40)%B | 22.10% | (3.22)% | 3.67% |
| Ratios to Average Net AssetsH,I | | | | | |
| Expenses before reductions | 1.46% | 1.46% | 1.48% | 1.49% | 1.48% |
| Expenses net of fee waivers, if any | 1.46% | 1.46% | 1.47% | 1.49% | 1.48% |
| Expenses net of all reductions | 1.46% | 1.44% | 1.47% | 1.48% | 1.47% |
| Net investment income (loss) | .70% | .62% | .56% | .66% | .49% |
| Supplemental Data | | | | | |
| Net assets, end of period (in millions) | $173 | $175 | $224 | $224 | $271 |
| Portfolio turnover rateJ | 37%K | 32% | 44% | 31% | 34% |
A Calculated based on average shares outstanding during the period.
B Net realized and unrealized gain (loss) per share reflects proceeds received from litigation which amounted to $.11 per share. Excluding these litigation proceeds, the total return would have been (9.88)%
C Total distributions of $.84 per share is comprised of distributions from net investment income of $.109 and distributions from net realized gain of $.735 per share.
D Total distributions of $.17 per share is comprised of distributions from net investment income of $.128 and distributions from net realized gain of $.046 per share.
E Amount represents less than $.005 per share.
F Total returns would have been lower if certain expenses had not been reduced during the applicable periods shown.
G Total returns do not include the effect of the sales charges.
H Fees and expenses of any underlying Fidelity Central Funds are not included in the Fund's expense ratio. The Fund indirectly bears its proportionate share of the expenses of any underlying Fidelity Central Funds.
I Expense ratios reflect operating expenses of the class. Expenses before reductions do not reflect amounts reimbursed by the investment adviser or reductions from brokerage service arrangements or reductions from other expense offset arrangements and do not represent the amount paid by the class during periods when reimbursements or reductions occur. Expenses net of fee waivers reflect expenses after reimbursement by the investment adviser but prior to reductions from brokerage service arrangements or other expense offset arrangements. Expenses net of all reductions represent the net expenses paid by the class.
J Amount does not include the portfolio activity of any underlying Fidelity Central Funds.
K Portfolio turnover rate excludes securities received or delivered in-kind.
See accompanying notes which are an integral part of the financial statements.
Fidelity Advisor Diversified International Fund Class C
| Years ended October 31, | 2019 | 2018 | 2017 | 2016 | 2015 |
| Selected Per–Share Data | | | | | |
| Net asset value, beginning of period | $20.11 | $22.35 | $18.48 | $19.19 | $18.68 |
| Income from Investment Operations | | | | | |
| Net investment income (loss)A | .04 | .03 | .01 | .03 | –B |
| Net realized and unrealized gain (loss) | 2.79 | (2.23)C | 3.94 | (.74) | .59 |
| Total from investment operations | 2.83 | (2.20) | 3.95 | (.71) | .59 |
| Distributions from net investment income | – | – | (.03) | – | (.06) |
| Distributions from net realized gain | (.74) | (.04) | (.05) | – | (.02) |
| Total distributions | (.74) | (.04) | (.08) | – | (.08) |
| Redemption fees added to paid in capitalA | – | – | –B | –B | –B |
| Net asset value, end of period | $22.20 | $20.11 | $22.35 | $18.48 | $19.19 |
| Total ReturnD,E | 14.72% | (9.85)%C | 21.46% | (3.70)% | 3.15% |
| Ratios to Average Net AssetsF,G | | | | | |
| Expenses before reductions | 1.98% | 1.95% | 1.96% | 1.98% | 1.97% |
| Expenses net of fee waivers, if any | 1.98% | 1.95% | 1.96%�� | 1.98% | 1.97% |
| Expenses net of all reductions | 1.97% | 1.94% | 1.96% | 1.98% | 1.96% |
| Net investment income (loss) | .18% | .13% | .07% | .17% | - %H |
| Supplemental Data | | | | | |
| Net assets, end of period (in millions) | $59 | $150 | $211 | $206 | $251 |
| Portfolio turnover rateI | 37%J | 32% | 44% | 31% | 34% |
A Calculated based on average shares outstanding during the period.
B Amount represents less than $.005 per share.
C Net realized and unrealized gain (loss) per share reflects proceeds received from litigation which amounted to $.11 per share. Excluding these litigation proceeds, the total return would have been (10.33)%.
D Total returns would have been lower if certain expenses had not been reduced during the applicable periods shown.
E Total returns do not include the effect of the contingent deferred sales charge.
F Fees and expenses of any underlying Fidelity Central Funds are not included in the Fund's expense ratio. The Fund indirectly bears its proportionate share of the expenses of any underlying Fidelity Central Funds.
G Expense ratios reflect operating expenses of the class. Expenses before reductions do not reflect amounts reimbursed by the investment adviser or reductions from brokerage service arrangements or reductions from other expense offset arrangements and do not represent the amount paid by the class during periods when reimbursements or reductions occur. Expenses net of fee waivers reflect expenses after reimbursement by the investment adviser but prior to reductions from brokerage service arrangements or other expense offset arrangements. Expenses net of all reductions represent the net expenses paid by the class.
H Amount represents less than .005%.
I Amount does not include the portfolio activity of any underlying Fidelity Central Funds.
J Portfolio turnover rate excludes securities received or delivered in-kind.
See accompanying notes which are an integral part of the financial statements.
Fidelity Advisor Diversified International Fund Class I
| Years ended October 31, | 2019 | 2018 | 2017 | 2016 | 2015 |
| Selected Per–Share Data | | | | | |
| Net asset value, beginning of period | $21.44 | $23.85 | $19.73 | $20.46 | $19.91 |
| Income from Investment Operations | | | | | |
| Net investment income (loss)A | .27 | .27 | .24 | .24 | .21 |
| Net realized and unrealized gain (loss) | 2.95 | (2.37)B | 4.18 | (.78) | .63 |
| Total from investment operations | 3.22 | (2.10) | 4.42 | (.54) | .84 |
| Distributions from net investment income | (.24) | (.24) | (.25) | (.19) | (.26) |
| Distributions from net realized gain | (.74) | (.07) | (.05) | – | (.02) |
| Total distributions | (.98) | (.31) | (.30) | (.19) | (.29)C |
| Redemption fees added to paid in capitalA | – | – | –D | –D | –D |
| Net asset value, end of period | $23.68 | $21.44 | $23.85 | $19.73 | $20.46 |
| Total ReturnE | 15.89% | (8.94)%B | 22.75% | (2.69)% | 4.24% |
| Ratios to Average Net AssetsF,G | | | | | |
| Expenses before reductions | .92% | .92% | .93% | .94% | .94% |
| Expenses net of fee waivers, if any | .92% | .92% | .93% | .94% | .94% |
| Expenses net of all reductions | .91% | .91% | .92% | .94% | .94% |
| Net investment income (loss) | 1.24% | 1.16% | 1.10% | 1.21% | 1.03% |
| Supplemental Data | | | | | |
| Net assets, end of period (in millions) | $583 | $807 | $953 | $757 | $747 |
| Portfolio turnover rateH | 37%I | 32% | 44% | 31% | 34% |
A Calculated based on average shares outstanding during the period.
B Net realized and unrealized gain (loss) per share reflects proceeds received from litigation which amounted to $.11 per share. Excluding these litigation proceeds, the total return would have been (9.42)%.
C Total distributions of $.29 per share is comprised of distributions from net investment income of $.263 and distributions from net realized gain of $.022 per share.
D Amount represents less than $.005 per share.
E Total returns would have been lower if certain expenses had not been reduced during the applicable periods shown.
F Fees and expenses of any underlying Fidelity Central Funds are not included in the Fund's expense ratio. The Fund indirectly bears its proportionate share of the expenses of any underlying Fidelity Central Funds.
G Expense ratios reflect operating expenses of the class. Expenses before reductions do not reflect amounts reimbursed by the investment adviser or reductions from brokerage service arrangements or reductions from other expense offset arrangements and do not represent the amount paid by the class during periods when reimbursements or reductions occur. Expenses net of fee waivers reflect expenses after reimbursement by the investment adviser but prior to reductions from brokerage service arrangements or other expense offset arrangements. Expenses net of all reductions represent the net expenses paid by the class.
H Amount does not include the portfolio activity of any underlying Fidelity Central Funds.
I Portfolio turnover rate excludes securities received or delivered in-kind.
See accompanying notes which are an integral part of the financial statements.
Fidelity Advisor Diversified International Fund Class Z
| Years ended October 31, | 2019 | 2018 | 2017 | 2016 | 2015 |
| Selected Per–Share Data | | | | | |
| Net asset value, beginning of period | $21.44 | $23.85 | $19.73 | $20.46 | $19.93 |
| Income from Investment Operations | | | | | |
| Net investment income (loss)A | .30 | .31 | .27 | .27 | .24 |
| Net realized and unrealized gain (loss) | 2.94 | (2.37)B | 4.18 | (.78) | .61 |
| Total from investment operations | 3.24 | (2.06) | 4.45 | (.51) | .85 |
| Distributions from net investment income | (.28) | (.28) | (.28) | (.22) | (.30) |
| Distributions from net realized gain | (.74) | (.07) | (.05) | – | (.02) |
| Total distributions | (1.01)C | (.35) | (.33) | (.22) | (.32) |
| Redemption fees added to paid in capitalA | – | – | –D | –D | –D |
| Net asset value, end of period | $23.67 | $21.44 | $23.85 | $19.73 | $20.46 |
| Total ReturnE | 16.04% | (8.78)%B | 22.94% | (2.54)% | 4.34% |
| Ratios to Average Net AssetsF,G | | | | | |
| Expenses before reductions | .77% | .78% | .78% | .79% | .79% |
| Expenses net of fee waivers, if any | .77% | .78% | .78% | .79% | .79% |
| Expenses net of all reductions | .77% | .76% | .78% | .79% | .78% |
| Net investment income (loss) | 1.39% | 1.30% | 1.25% | 1.36% | 1.18% |
| Supplemental Data | | | | | |
| Net assets, end of period (in millions) | $274 | $298 | $286 | $93 | $83 |
| Portfolio turnover rateH | 37%I | 32% | 44% | 31% | 34% |
A Calculated based on average shares outstanding during the period.
B Net realized and unrealized gain (loss) per share reflects proceeds received from litigation which amounted to $.11 per share. Excluding these litigation proceeds, the total return would have been (9.26)%.
C Total distributions of $1.01 per share is comprised of distributions from net investment income of $.276 and distributions from net realized gain of $.735 per share.
D Amount represents less than $.005 per share.
E Total returns would have been lower if certain expenses had not been reduced during the applicable periods shown.
F Fees and expenses of any underlying Fidelity Central Funds are not included in the Fund's expense ratio. The Fund indirectly bears its proportionate share of the expenses of any underlying Fidelity Central Funds.
G Expense ratios reflect operating expenses of the class. Expenses before reductions do not reflect amounts reimbursed by the investment adviser or reductions from brokerage service arrangements or reductions from other expense offset arrangements and do not represent the amount paid by the class during periods when reimbursements or reductions occur. Expenses net of fee waivers reflect expenses after reimbursement by the investment adviser but prior to reductions from brokerage service arrangements or other expense offset arrangements. Expenses net of all reductions represent the net expenses paid by the class.
H Amount does not include the portfolio activity of any underlying Fidelity Central Funds.
I Portfolio turnover rate excludes securities received or delivered in-kind.
See accompanying notes which are an integral part of the financial statements.
Notes to Financial Statements
For the period ended October 31, 2019
(Amounts in thousands except percentages)
1. Organization.
Fidelity Advisor Diversified International Fund (the Fund) is a fund of Fidelity Advisor Series VIII (the Trust) and is authorized to issue an unlimited number of shares. The Trust is registered under the Investment Company Act of 1940, as amended (the 1940 Act), as an open-end management investment company organized as a Massachusetts business trust. The Fund offers Class A, Class M, Class C, Class I and Class Z shares, each of which has equal rights as to assets and voting privileges. Each class has exclusive voting rights with respect to matters that affect that class. Effective March 1, 2019, Class C shares will automatically convert to Class A shares after a holding period of ten years from the initial date of purchase, with certain exceptions. The Fund's investments in emerging markets can be subject to social, economic, regulatory, and political uncertainties and can be extremely volatile.
2. Investments in Fidelity Central Funds.
The Fund invests in Fidelity Central Funds, which are open-end investment companies generally available only to other investment companies and accounts managed by the investment adviser and its affiliates. The Fund's Schedule of Investments lists each of the Fidelity Central Funds held as of period end, if any, as an investment of the Fund, but does not include the underlying holdings of each Fidelity Central Fund. As an Investing Fund, the Fund indirectly bears its proportionate share of the expenses of the underlying Fidelity Central Funds.
The Money Market Central Funds seek preservation of capital and current income and are managed by Fidelity Investments Money Management, Inc. (FIMM), an affiliate of the investment adviser. Annualized expenses of the Money Market Central Funds as of their most recent shareholder report date ranged from less than .005% to .01%.
A complete unaudited list of holdings for each Fidelity Central Fund is available upon request or at the Securities and Exchange Commission (the SEC) website at www.sec.gov. In addition, the financial statements of the Fidelity Central Funds, which are not covered by the Fund's Report of Independent Registered Public Accounting Firm, are available on the SEC website or upon request.
3. Significant Accounting Policies.
The Fund is an investment company and applies the accounting and reporting guidance of the Financial Accounting Standards Board (FASB) Accounting Standards Codification Topic 946 Financial Services – Investments Companies. The financial statements have been prepared in conformity with accounting principles generally accepted in the United States of America (GAAP), which require management to make certain estimates and assumptions at the date of the financial statements. Actual results could differ from those estimates. Subsequent events, if any, through the date that the financial statements were issued have been evaluated in the preparation of the financial statements. The following summarizes the significant accounting policies of the Fund:
Investment Valuation. Investments are valued as of 4:00 p.m. Eastern time on the last calendar day of the period. The Board of Trustees (the Board) has delegated the day to day responsibility for the valuation of the Fund's investments to the Fair Value Committee (the Committee) established by the Fund's investment adviser. In accordance with valuation policies and procedures approved by the Board, the Fund attempts to obtain prices from one or more third party pricing vendors or brokers to value its investments. When current market prices, quotations or currency exchange rates are not readily available or reliable, investments will be fair valued in good faith by the Committee, in accordance with procedures adopted by the Board. Factors used in determining fair value vary by investment type and may include market or investment specific events. The frequency with which these procedures are used cannot be predicted and they may be utilized to a significant extent. The Committee oversees the Fund's valuation policies and procedures and reports to the Board on the Committee's activities and fair value determinations. The Board monitors the appropriateness of the procedures used in valuing the Fund's investments and ratifies the fair value determinations of the Committee.
The Fund categorizes the inputs to valuation techniques used to value its investments into a disclosure hierarchy consisting of three levels as shown below:
- Level 1 – quoted prices in active markets for identical investments
- Level 2 – other significant observable inputs (including quoted prices for similar investments, interest rates, prepayment speeds, etc.)
- Level 3 – unobservable inputs (including the Fund's own assumptions based on the best information available)
Valuation techniques used to value the Fund's investments by major category are as follows:
Equity securities, including restricted securities, for which market quotations are readily available, are valued at the last reported sale price or official closing price as reported by a third party pricing vendor on the primary market or exchange on which they are traded and are categorized as Level 1 in the hierarchy. In the event there were no sales during the day or closing prices are not available, securities are valued at the last quoted bid price or may be valued using the last available price and are generally categorized as Level 2 in the hierarchy. For foreign equity securities, when market or security specific events arise, comparisons to the valuation of American Depositary Receipts (ADRs), futures contracts, Exchange-Traded Funds (ETFs) and certain indexes as well as quoted prices for similar securities may be used and would be categorized as Level 2 in the hierarchy. For equity securities, including restricted securities, where observable inputs are limited, assumptions about market activity and risk are used and these securities may be categorized as Level 3 in the hierarchy.
The U.S. dollar value of foreign currency contracts is determined using currency exchange rates supplied by a pricing service and are categorized as Level 2 in the hierarchy. Investments in open-end mutual funds, including the Fidelity Central Funds, are valued at their closing net asset value (NAV) each business day and are categorized as Level 1 in the hierarchy.
Changes in valuation techniques may result in transfers in or out of an assigned level within the disclosure hierarchy. The aggregate value of investments by input level as of October 31, 2019 is included at the end of the Fund's Schedule of Investments.
Foreign Currency. The Fund may use foreign currency contracts to facilitate transactions in foreign-denominated securities. Gains and losses from these transactions may arise from changes in the value of the foreign currency or if the counterparties do not perform under the contracts' terms.
Foreign-denominated assets, including investment securities, and liabilities are translated into U.S. dollars at the exchange rates at period end. Purchases and sales of investment securities, income and dividends received and expenses denominated in foreign currencies are translated into U.S. dollars at the exchange rate in effect on the transaction date.
The effects of exchange rate fluctuations on investments are included with the net realized and unrealized gain (loss) on investment securities. Other foreign currency transactions resulting in realized and unrealized gain (loss) are disclosed separately.
Investment Transactions and Income. For financial reporting purposes, the Fund's investment holdings and NAV include trades executed through the end of the last business day of the period. The NAV per share for processing shareholder transactions is calculated as of the close of business of the New York Stock Exchange (NYSE), normally 4:00 p.m. Eastern time and includes trades executed through the end of the prior business day. Gains and losses on securities sold are determined on the basis of identified cost and include proceeds received from litigation. Dividend income is recorded on the ex-dividend date, except for certain dividends from foreign securities where the ex-dividend date may have passed, which are recorded as soon as the Fund is informed of the ex-dividend date. Non-cash dividends included in dividend income, if any, are recorded at the fair market value of the securities received. Income and capital gain distributions from Fidelity Central Funds, if any, are recorded on the ex-dividend date. Certain distributions received by the Fund represent a return of capital or capital gain. The Fund determines the components of these distributions subsequent to the ex-dividend date, based upon receipt of tax filings or other correspondence relating to the underlying investment. These distributions are recorded as a reduction of cost of investments and/or as a realized gain. Investment income is recorded net of foreign taxes withheld where recovery of such taxes is uncertain.
Class Allocations and Expenses. Investment income, realized and unrealized capital gains and losses, common expenses of the Fund, and certain fund-level expense reductions, if any, are allocated daily on a pro-rata basis to each class based on the relative net assets of each class to the total net assets of the Fund. Each class differs with respect to transfer agent and distribution and service plan fees incurred. Certain expense reductions may also differ by class. For the reporting period, the allocated portion of income and expenses to each class as a percent of its average net assets may vary due to the timing of recording these transactions in relation to fluctuating net assets of the classes. Expenses directly attributable to a fund are charged to that fund. Expenses attributable to more than one fund are allocated among the respective funds on the basis of relative net assets or other appropriate methods. Expense estimates are accrued in the period to which they relate and adjustments are made when actual amounts are known.
Income Tax Information and Distributions to Shareholders. Each year, the Fund intends to qualify as a regulated investment company under Subchapter M of the Internal Revenue Code, including distributing substantially all of its taxable income and realized gains. As a result, no provision for U.S. Federal income taxes is required. As of October 31, 2019, the Fund did not have any unrecognized tax benefits in the financial statements; nor is the Fund aware of any tax positions for which it is reasonably possible that the total amounts of unrecognized tax benefits will significantly change in the next twelve months. The Fund files a U.S. federal tax return, in addition to state and local tax returns as required. The Fund's federal income tax returns are subject to examination by the Internal Revenue Service (IRS) for a period of three fiscal years after they are filed. State and local tax returns may be subject to examination for an additional fiscal year depending on the jurisdiction. Foreign taxes are provided for based on the Fund's understanding of the tax rules and rates that exist in the foreign markets in which it invests. The Fund is subject to a tax imposed on capital gains by certain countries in which it invests. An estimated deferred tax liability for net unrealized appreciation on the applicable securities is included in Other payables and accrued expenses on the Statement of Assets & Liabilities.
Distributions are declared and recorded on the ex-dividend date. Income and capital gain distributions are declared separately for each class. Income and capital gain distributions are determined in accordance with income tax regulations, which may differ from GAAP.
Capital accounts within the financial statements are adjusted for permanent book-tax differences. These adjustments have no impact on net assets or the results of operations. Capital accounts are not adjusted for temporary book-tax differences which will reverse in a subsequent period.
Book-tax differences are primarily due to foreign currency transactions, passive foreign investment companies (PFIC), certain deemed distributions, redemptions in kind, deferred trustees compensation, capital loss carryforwards and losses deferred due to wash sales.
As of period end, the cost and unrealized appreciation (depreciation) in securities, and derivatives if applicable, for federal income tax purposes were as follows:
| Gross unrealized appreciation | $ 467,990 |
| Gross unrealized depreciation | (29,200) |
| Net unrealized appreciation (depreciation) | $438,790 |
| Tax Cost | $1,182,037 |
The tax-based components of distributable earnings as of period end were as follows:
| Undistributed ordinary income | $23,307 |
| Capital loss carryforward | $(42,890) |
| Net unrealized appreciation (depreciation) on securities and other investments | $438,731 |
Capital loss carryforwards are only available to offset future capital gains of the Fund to the extent provided by regulations and may be limited. Under the Regulated Investment Company Modernization Act of 2010 (the Act), the Fund is permitted to carry forward capital losses incurred in taxable years beginning after December 22, 2010 for an unlimited period and such capital losses are required to be used prior to any losses that expire. The capital loss carryforward information presented below, including any applicable limitation, is estimated as of fiscal period end and is subject to adjustment.
| No expiration | |
| Short-term | $(42,890) |
The tax character of distributions paid was as follows:
| | October 31, 2019 | October 31, 2018 |
| Ordinary Income | $17,407 | $ 24,045 |
| Long-term Capital Gains | 64,631 | – |
| Total | $82,038 | $ 24,045 |
Restricted Securities. The Fund may invest in securities that are subject to legal or contractual restrictions on resale. These securities generally may be resold in transactions exempt from registration or to the public if the securities are registered. Disposal of these securities may involve time-consuming negotiations and expense, and prompt sale at an acceptable price may be difficult. Information regarding restricted securities is included at the end of the Fund's Schedule of Investments.
4. Derivative Instruments.
Risk Exposures and the Use of Derivative Instruments. The Fund's investment objective allows the Fund to enter into various types of derivative contracts, including forward foreign currency contracts. Derivatives are investments whose value is primarily derived from underlying assets, indices or reference rates and may be transacted on an exchange or over-the-counter (OTC). Derivatives may involve a future commitment to buy or sell a specified asset based on specified terms, to exchange future cash flows at periodic intervals based on a notional principal amount, or for one party to make one or more payments upon the occurrence of specified events in exchange for periodic payments from the other party.
The Fund used derivatives to increase returns and to manage exposure to certain risks as defined below. The success of any strategy involving derivatives depends on analysis of numerous economic factors, and if the strategies for investment do not work as intended, the Fund may not achieve its objectives.
The Fund's use of derivatives increased or decreased its exposure to the following risk:
| Foreign Exchange Risk | Foreign exchange rate risk relates to fluctuations in the value of an asset or liability due to changes in currency exchange rates.
|
The Fund is also exposed to additional risks from investing in derivatives, such as liquidity risk and counterparty credit risk. Liquidity risk is the risk that the Fund will be unable to close out the derivative in the open market in a timely manner. Counterparty credit risk is the risk that the counterparty will not be able to fulfill its obligation to the Fund.
Investing in derivatives may involve greater risks than investing in the underlying assets directly and, to varying degrees, may involve risk of loss in excess of any initial investment and collateral received and amounts recognized in the Statement of Assets and Liabilities. In addition, there may be the risk that the change in value of the derivative contract does not correspond to the change in value of the underlying instrument.
Forward Foreign Currency Contracts. Forward foreign currency contracts represent obligations to purchase or sell foreign currency on a specified future date at a price fixed at the time the contracts are entered into. The Fund used forward foreign currency contracts to facilitate transactions in foreign-denominated securities and to manage exposure to certain foreign currencies.
Forward foreign currency contracts are valued daily and fluctuations in exchange rates on open contracts are recorded as unrealized appreciation or (depreciation) and reflected in the Statement of Assets and Liabilities. When the contract is closed, the Fund realizes a gain or loss equal to the difference between the closing value and the value at the time it was opened. The net realized gain (loss) and change in net unrealized appreciation (depreciation) on forward foreign currency contracts during the period is less than five hundred dollars.
Any open forward foreign currency contracts at period end are presented in the Schedule of Investments under the caption "Forward Foreign Currency Contracts." The contract amount and unrealized appreciation (depreciation) reflects each contract's exposure to the underlying currency at period end and is representative of volume of activity during the period.
5. Purchases and Sales of Investments.
Purchases and sales of securities, other than short-term securities and in-kind transactions, aggregated $631,298 and $884,687, respectively.
6. Fees and Other Transactions with Affiliates.
Management Fee. Fidelity Management & Research Company (the investment adviser) and its affiliates provide the Fund with investment management related services for which the Fund pays a monthly management fee. The management fee is the sum of an individual fund fee rate that is based on an annual rate of .424% of the Fund's average net assets and an annualized group fee rate that averaged .24% during the period. The group fee rate is based upon the average net assets of all the mutual funds advised by the investment adviser, including any mutual funds previously advised by the investment adviser that are currently advised by Fidelity SelectCo, LLC, an affiliate of the investment adviser. The group fee rate decreases as assets under management increase and increases as assets under management decrease. For the reporting period, the total annual management fee rate was .66% of the Fund's average net assets.
Distribution and Service Plan Fees. In accordance with Rule 12b-1 of the 1940 Act, the Fund has adopted separate Distribution and Service Plans for each class of shares. Certain classes pay Fidelity Distributors Corporation (FDC), an affiliate of the investment adviser, separate Distribution and Service Fees, each of which is based on an annual percentage of each class' average net assets. In addition, FDC may pay financial intermediaries for selling shares of the Fund and providing shareholder support services. For the period, the Distribution and Service Fee rates, total fees and amounts retained by FDC were as follows:
| | Distribution Fee | Service Fee | Total Fees | Retained by FDC |
| Class A | -% | .25% | $1,222 | $11 |
| Class M | .25% | .25% | 857 | 11 |
| Class C | .75% | .25% | 937 | 52 |
| | | | $3,016 | $74 |
Sales Load. FDC may receive a front-end sales charge of up to 5.75% for selling Class A shares and 3.50% for selling Class M shares, some of which is paid to financial intermediaries for selling shares of the Fund. Depending on the holding period, FDC may receive contingent deferred sales charges levied on Class A, Class M and Class C redemptions. The deferred sales charges are 1.00% for Class C shares, 1.00% for certain purchases of Class A shares and .25% for certain purchases of Class M shares.
For the period, sales charge amounts retained by FDC were as follows:
| | Retained by FDC |
| Class A | $42 |
| Class M | 8 |
| Class C(a) | 7 |
| | $57 |
(a) When Class C shares are initially sold, FDC pays commissions from its own resources to financial intermediaries through which the sales are made.
Transfer Agent Fees. Fidelity Investments Institutional Operations Company, Inc., (FIIOC), an affiliate of the investment adviser, is the transfer, dividend disbursing and shareholder servicing agent for each class of the Fund. FIIOC receives account fees and asset-based fees that vary according to the account size and type of account of the shareholders of the respective classes of the Fund, except for Class Z. FIIOC receives an asset-based fee of Class Z's average net assets. FIIOC pays for typesetting, printing and mailing of shareholder reports, except proxy statements.
For the period, transfer agent fees for each class were as follows:
| | Amount | % of Class-Level Average Net Assets |
| Class A | $1,057 | .22 |
| Class M | 400 | .23 |
| Class C | 220 | .24 |
| Class I | 1,456 | .19 |
| Class Z | 128 | .05 |
| | $3,261 | |
Accounting and Security Lending Fees. Fidelity Service Company, Inc. (FSC), an affiliate of the investment adviser, maintains the Fund's accounting records. The accounting fee is based on the level of average net assets for each month. Prior to April 1, 2019, FSC had a separate agreement with the Fund for administration of the security lending program, based on the number and duration of lending transactions. For the period, the total fees paid for accounting and administration of securities lending were equivalent to an annual rate of .04%.
Brokerage Commissions. The Fund placed a portion of its portfolio transactions with brokerage firms which are affiliates of the investment adviser. Brokerage commissions are included in net realized gain (loss) and change in net unrealized appreciation (depreciation) in the Statement of Operations. The commissions paid to these affiliated firms were $2 for the period.
Interfund Trades. The Fund may purchase from or sell securities to other Fidelity Funds under procedures adopted by the Board. The procedures have been designed to ensure these interfund trades are executed in accordance with Rule 17a-7 of the 1940 Act. Interfund trades are included within the respective purchases and sales amounts shown in the Purchases and Sales of Investments note.
Affiliated Redemptions In-Kind. During the period, 7,626 shares of the Fund were redeemed in-kind for investments, and cash with a value of $178,533. The net realized gain of $59,872 on investments delivered through in-kind redemptions is included in the accompanying Statement of Operations. The amount of the in-kind redemptions is included in share transactions in the accompanying Statement of Changes in Net Assets as well as the Notes to Financial Statements. The Fund recognized no gain or loss for federal income tax purposes.
7. Committed Line of Credit.
The Fund participates with other funds managed by the investment adviser or an affiliate in a $4.25 billion credit facility (the "line of credit") to be utilized for temporary or emergency purposes to fund shareholder redemptions or for other short-term liquidity purposes. The Fund has agreed to pay commitment fees on its pro-rata portion of the line of credit, which amounted to $5 and is reflected in Miscellaneous expenses on the Statement of Operations. During the period, the Fund did not borrow on this line of credit.
8. Security Lending.
The Fund lends portfolio securities from time to time in order to earn additional income. For equity securities, lending agents are used, including National Financial Services (NFS), an affiliate of the Fund. Pursuant to a securities lending agreement, NFS will receive a fee, which is capped at 9.9% of daily lending revenue, for its services as lending agent. The Fund may lend securities to certain qualified borrowers, including NFS. On the settlement date of the loan, the Fund receives collateral (in the form of U.S. Treasury obligations, letters of credit and/or cash) against the loaned securities and maintains collateral in an amount not less than 100% of the market value of the loaned securities during the period of the loan. The market value of the loaned securities is determined at the close of business of the Fund and any additional required collateral is delivered to the Fund on the next business day. The Fund or borrower may terminate the loan at any time, and if the borrower defaults on its obligation to return the securities loaned because of insolvency or other reasons, the Fund may apply collateral received from the borrower against the obligation. The Fund may experience delays and costs in recovering the securities loaned. Any cash collateral received is invested in the Fidelity Securities Lending Cash Central Fund. The value of loaned securities and cash collateral at period end are disclosed on the Fund's Statement of Assets and Liabilities. At period end, there were no security loans outstanding with NFS, as affiliated borrower. Total fees paid by the Fund to NFS, as lending agent, amounted to $1. Security lending income represents the income earned on investing cash collateral, less rebates paid to borrowers and any lending agent fees associated with the loan, plus any premium payments received for lending certain types of securities. Security lending income is presented in the Statement of Operations as a component of income from Fidelity Central Funds, and includes $3 from securities loaned to NFS, as affiliated borrower.
9. Expense Reductions.
Commissions paid to certain brokers with whom the investment adviser, or its affiliates, places trades on behalf of the Fund include an amount in addition to trade execution, which may be rebated back to the Fund to offset certain expenses. This amount totaled $94 for the period. In addition, through arrangements with the Fund's custodian, credits realized as a result of certain uninvested cash balances were used to reduce the Fund's expenses. During the period, these credits reduced the Fund's custody expenses in an amount less than five hundred dollars.
In addition, during the period the investment adviser reimbursed and/or waived a portion of fund-level operating expenses in the amount of $12.
10. Distributions to Shareholders.
Distributions to shareholders of each class were as follows:
| | Year ended
October 31, 2019 | Year ended
October 31, 2018 |
| Distributions to shareholders | | |
| Class A | $19,552 | $5,653 |
| Class M | 6,962 | 1,520 |
| Class C | 5,360 | 401 |
| Class I | 36,042 | 12,234 |
| Class Z | 14,122 | 4,237 |
| Total | $82,038 | $24,045 |
11. Share Transactions.
Share transactions for each class were as follows and may contain automatic conversions between classes or exchanges between affiliated funds:
| | Shares | Shares | Dollars | Dollars |
| | Year ended October 31, 2019 | Year ended October 31, 2018 | Year ended October 31, 2019 | Year ended October 31, 2018 |
| Class A | | | | |
| Shares sold | 4,974 | 2,464 | $105,441 | $58,230 |
| Reinvestment of distributions | 940 | 235 | 18,360 | 5,469 |
| Shares redeemed | (5,125) | (5,429) | (108,261) | (126,599) |
| Net increase (decrease) | 789 | (2,730) | $15,540 | $(62,900) |
| Class M | | | | |
| Shares sold | 400 | 557 | $8,353 | $13,025 |
| Reinvestment of distributions | 353 | 64 | 6,857 | 1,487 |
| Shares redeemed | (1,625) | (1,889) | (34,489) | (44,045) |
| Net increase (decrease) | (872) | (1,268) | $(19,279) | $(29,533) |
| Class C | | | | |
| Shares sold | 213 | 462 | $4,251 | $10,419 |
| Reinvestment of distributions | 280 | 16 | 5,253 | 361 |
| Shares redeemed | (5,276) | (2,468) | (106,762) | (55,659) |
| Net increase (decrease) | (4,783) | (1,990) | $(97,258) | $(44,879) |
| Class I | | | | |
| Shares sold | 4,341 | 6,999 | $92,727 | $164,832 |
| Reinvestment of distributions | 1,548 | 434 | 30,665 | 10,246 |
| Shares redeemed | (18,901)(a) | (9,766) | (420,405)(a) | (231,388) |
| Net increase (decrease) | (13,012) | (2,333) | $(297,013) | $(56,310) |
| Class Z | | | | |
| Shares sold | 4,031 | 5,480 | $85,902 | $130,793 |
| Reinvestment of distributions | 636 | 164 | 12,575 | 3,858 |
| Shares redeemed | (6,981) | (3,743) | (149,702) | (89,906) |
| Net increase (decrease) | (2,314) | 1,901 | $(51,225) | $44,745 |
(a) Amount includes in-kind exchanges (see the Affiliated Redemptions In-Kind note for additional details).
12. Other.
The Fund's organizational documents provide former and current trustees and officers with a limited indemnification against liabilities arising in connection with the performance of their duties to the Fund. In the normal course of business, the Fund may also enter into contracts that provide general indemnifications. The Fund's maximum exposure under these arrangements is unknown as this would be dependent on future claims that may be made against the Fund. The risk of material loss from such claims is considered remote.
Report of Independent Registered Public Accounting Firm
To the Board of Trustees of Fidelity Advisor Series VIII and Shareholders of Fidelity Advisor Diversified International Fund:
Opinion on the Financial Statements
We have audited the accompanying statement of assets and liabilities, including the schedule of investments, of Fidelity Advisor Diversified International Fund (one of the funds constituting Fidelity Advisor Series VIII, referred to hereafter as the “Fund”) as of October 31, 2019, the related statement of operations for the year ended October 31, 2019, the statement of changes in net assets for each of the two years in the period ended October 31, 2019, including the related notes, and the financial highlights for each of the five years in the period ended October 31, 2019 (collectively referred to as the “financial statements”). In our opinion, the financial statements present fairly, in all material respects, the financial position of the Fund as of October 31, 2019, the results of its operations for the year then ended, the changes in its net assets for each of the two years in the period ended October 31, 2019 and the financial highlights for each of the five years in the period ended October 31, 2019 in conformity with accounting principles generally accepted in the United States of America.
Basis for Opinion
These financial statements are the responsibility of the Fund’s management. Our responsibility is to express an opinion on the Fund’s financial statements based on our audits. We are a public accounting firm registered with the Public Company Accounting Oversight Board (United States) (PCAOB) and are required to be independent with respect to the Fund in accordance with the U.S. federal securities laws and the applicable rules and regulations of the Securities and Exchange Commission and the PCAOB.
We conducted our audits of these financial statements in accordance with the standards of the PCAOB. Those standards require that we plan and perform the audit to obtain reasonable assurance about whether the financial statements are free of material misstatement, whether due to error or fraud.
Our audits included performing procedures to assess the risks of material misstatement of the financial statements, whether due to error or fraud, and performing procedures that respond to those risks. Such procedures included examining, on a test basis, evidence regarding the amounts and disclosures in the financial statements. Our audits also included evaluating the accounting principles used and significant estimates made by management, as well as evaluating the overall presentation of the financial statements. Our procedures included confirmation of securities owned as of October 31, 2019 by correspondence with the custodian and brokers; when replies were not received from brokers, we performed other auditing procedures. We believe that our audits provide a reasonable basis for our opinion.
PricewaterhouseCoopers LLP
Boston, Massachusetts
December 11, 2019
We have served as the auditor of one or more investment companies in the Fidelity group of funds since 1932.
Trustees and Officers
The Trustees, Members of the Advisory Board (if any), and officers of the trust and fund, as applicable, are listed below. The Board of Trustees governs the fund and is responsible for protecting the interests of shareholders. The Trustees are experienced executives who meet periodically throughout the year to oversee the fund's activities, review contractual arrangements with companies that provide services to the fund, oversee management of the risks associated with such activities and contractual arrangements, and review the fund's performance. Except for Jonathan Chiel, each of the Trustees oversees 298 funds. Mr. Chiel oversees 171 funds.
The Trustees hold office without limit in time except that (a) any Trustee may resign; (b) any Trustee may be removed by written instrument, signed by at least two-thirds of the number of Trustees prior to such removal; (c) any Trustee who requests to be retired or who has become incapacitated by illness or injury may be retired by written instrument signed by a majority of the other Trustees; and (d) any Trustee may be removed at any special meeting of shareholders by a two-thirds vote of the outstanding voting securities of the trust. Each Trustee who is not an interested person (as defined in the 1940 Act) of the trust and the fund is referred to herein as an Independent Trustee. Each Independent Trustee shall retire not later than the last day of the calendar year in which his or her 75th birthday occurs. The Independent Trustees may waive this mandatory retirement age policy with respect to individual Trustees. Officers and Advisory Board Members hold office without limit in time, except that any officer or Advisory Board Member may resign or may be removed by a vote of a majority of the Trustees at any regular meeting or any special meeting of the Trustees. Except as indicated, each individual has held the office shown or other offices in the same company for the past five years.
The fund’s Statement of Additional Information (SAI) includes more information about the Trustees. To request a free copy, call Fidelity at 1-877-208-0098.
Experience, Skills, Attributes, and Qualifications of the Trustees. The Governance and Nominating Committee has adopted a statement of policy that describes the experience, qualifications, attributes, and skills that are necessary and desirable for potential Independent Trustee candidates (Statement of Policy). The Board believes that each Trustee satisfied at the time he or she was initially elected or appointed a Trustee, and continues to satisfy, the standards contemplated by the Statement of Policy. The Governance and Nominating Committee also engages professional search firms to help identify potential Independent Trustee candidates who have the experience, qualifications, attributes, and skills consistent with the Statement of Policy. From time to time, additional criteria based on the composition and skills of the current Independent Trustees, as well as experience or skills that may be appropriate in light of future changes to board composition, business conditions, and regulatory or other developments, have also been considered by the professional search firms and the Governance and Nominating Committee. In addition, the Board takes into account the Trustees' commitment and participation in Board and committee meetings, as well as their leadership of standing and ad hoc committees throughout their tenure.
In determining that a particular Trustee was and continues to be qualified to serve as a Trustee, the Board has considered a variety of criteria, none of which, in isolation, was controlling. The Board believes that, collectively, the Trustees have balanced and diverse experience, qualifications, attributes, and skills, which allow the Board to operate effectively in governing the fund and protecting the interests of shareholders. Information about the specific experience, skills, attributes, and qualifications of each Trustee, which in each case led to the Board's conclusion that the Trustee should serve (or continue to serve) as a trustee of the fund, is provided below.
Board Structure and Oversight Function. James C. Curvey is an interested person and currently serves as Chairman. The Trustees have determined that an interested Chairman is appropriate and benefits shareholders because an interested Chairman has a personal and professional stake in the quality and continuity of services provided to the fund. Independent Trustees exercise their informed business judgment to appoint an individual of their choosing to serve as Chairman, regardless of whether the Trustee happens to be independent or a member of management. The Independent Trustees have determined that they can act independently and effectively without having an Independent Trustee serve as Chairman and that a key structural component for assuring that they are in a position to do so is for the Independent Trustees to constitute a substantial majority for the Board. The Independent Trustees also regularly meet in executive session. Ned C. Lautenbach serves as Chairman of the Independent Trustees and as such (i) acts as a liaison between the Independent Trustees and management with respect to matters important to the Independent Trustees and (ii) with management prepares agendas for Board meetings.
Fidelity® funds are overseen by different Boards of Trustees. The fund's Board oversees Fidelity's high income and certain equity funds, and other Boards oversee Fidelity's investment-grade bond, money market, asset allocation, and other equity funds. The asset allocation funds may invest in Fidelity® funds overseen by the fund's Board. The use of separate Boards, each with its own committee structure, allows the Trustees of each group of Fidelity® funds to focus on the unique issues of the funds they oversee, including common research, investment, and operational issues. On occasion, the separate Boards establish joint committees to address issues of overlapping consequences for the Fidelity® funds overseen by each Board.
The Trustees operate using a system of committees to facilitate the timely and efficient consideration of all matters of importance to the Trustees, the fund, and fund shareholders and to facilitate compliance with legal and regulatory requirements and oversight of the fund's activities and associated risks. The Board, acting through its committees, has charged FMR and its affiliates with (i) identifying events or circumstances the occurrence of which could have demonstrably adverse effects on the fund's business and/or reputation; (ii) implementing processes and controls to lessen the possibility that such events or circumstances occur or to mitigate the effects of such events or circumstances if they do occur; and (iii) creating and maintaining a system designed to evaluate continuously business and market conditions in order to facilitate the identification and implementation processes described in (i) and (ii) above. Because the day-to-day operations and activities of the fund are carried out by or through FMR, its affiliates, and other service providers, the fund's exposure to risks is mitigated but not eliminated by the processes overseen by the Trustees. While each of the Board's committees has responsibility for overseeing different aspects of the fund's activities, oversight is exercised primarily through the Operations, Audit, and Compliance Committees. Appropriate personnel, including but not limited to the fund's Chief Compliance Officer (CCO), FMR's internal auditor, the independent accountants, the fund's Treasurer and portfolio management personnel, make periodic reports to the Board's committees, as appropriate, including an annual review of Fidelity's risk management program for the Fidelity® funds. The responsibilities of each standing committee, including their oversight responsibilities, are described further under "Standing Committees of the Trustees."
Interested Trustees*:
Correspondence intended for a Trustee who is an interested person may be sent to Fidelity Investments, 245 Summer Street, Boston, Massachusetts 02210.
Name, Year of Birth; Principal Occupations and Other Relevant Experience+
Jonathan Chiel (1957)
Year of Election or Appointment: 2016
Trustee
Mr. Chiel also serves as Trustee of other Fidelity® funds. Mr. Chiel is Executive Vice President and General Counsel for FMR LLC (diversified financial services company, 2012-present). Previously, Mr. Chiel served as general counsel (2004-2012) and senior vice president and deputy general counsel (2000-2004) for John Hancock Financial Services; a partner with Choate, Hall & Stewart (1996-2000) (law firm); and an Assistant United States Attorney for the United States Attorney’s Office of the District of Massachusetts (1986-95), including Chief of the Criminal Division (1993-1995). Mr. Chiel is a director on the boards of the Boston Bar Foundation and the Maimonides School.
James C. Curvey (1935)
Year of Election or Appointment: 2007
Trustee
Chairman of the Board of Trustees
Mr. Curvey also serves as Trustee of other Fidelity® funds. Mr. Curvey is Vice Chairman (2007-present) and Director of FMR LLC (diversified financial services company). In addition, Mr. Curvey is an Overseer Emeritus for the Boston Symphony Orchestra, a Director of Artis-Naples, and a Trustee of Brewster Academy in Wolfeboro, New Hampshire. Previously, Mr. Curvey served as a Director of Fidelity Research & Analysis Co. (investment adviser firm, 2009-2018), Director of Fidelity Investments Money Management, Inc. (investment adviser firm, 2009-2014) and a Director of FMR and FMR Co., Inc. (investment adviser firms, 2007-2014).
* Determined to be an “Interested Trustee” by virtue of, among other things, his or her affiliation with the trust or various entities under common control with FMR.
+ The information includes the Trustee's principal occupation during the last five years and other information relating to the experience, attributes, and skills relevant to the Trustee's qualifications to serve as a Trustee, which led to the conclusion that the Trustee should serve as a Trustee for the fund.
Independent Trustees:
Correspondence intended for an Independent Trustee may be sent to Fidelity Investments, P.O. Box 55235, Boston, Massachusetts 02205-5235.
Name, Year of Birth; Principal Occupations and Other Relevant Experience+
Dennis J. Dirks (1948)
Year of Election or Appointment: 2005
Trustee
Mr. Dirks also serves as Trustee of other Fidelity® funds. Prior to his retirement in May 2003, Mr. Dirks was Chief Operating Officer and a member of the Board of The Depository Trust & Clearing Corporation (DTCC). He also served as President, Chief Operating Officer, and Board member of The Depository Trust Company (DTC) and President and Board member of the National Securities Clearing Corporation (NSCC). In addition, Mr. Dirks served as Chief Executive Officer and Board member of the Government Securities Clearing Corporation, Chief Executive Officer and Board member of the Mortgage-Backed Securities Clearing Corporation, as a Trustee and a member of the Finance Committee of Manhattan College (2005-2008), as a Trustee and a member of the Finance Committee of AHRC of Nassau County (2006-2008), as a member of the Independent Directors Council (IDC) Governing Council (2010-2015), and as a member of the Board of Directors for The Brookville Center for Children’s Services, Inc. (2009-2017). Mr. Dirks is a member of the Finance Committee (2016-present) and Board of Directors (2017-present) and is Treasurer (2018-present) of the Asolo Repertory Theatre.
Donald F. Donahue (1950)
Year of Election or Appointment: 2018
Trustee
Mr. Donahue also serves as a Trustee of other Fidelity® funds. Mr. Donahue is President and Chief Executive Officer of Miranda Partners, LLC (risk consulting for the financial services industry, 2012-present). Previously, Mr. Donahue served as a Member of the Advisory Board of certain Fidelity® funds (2015-2018) and Chief Executive Officer (2006-2012), Chief Operating Officer (2003-2006), and Managing Director, Customer Marketing and Development (1999-2003) of The Depository Trust & Clearing Corporation (financial markets infrastructure). Mr. Donahue serves as a Member (2007-present) and Co-Chairman (2016-present) of the Board of Directors of United Way of New York, Member of the Board of Directors of NYC Leadership Academy (2012-present) and Member of the Board of Advisors of Ripple Labs, Inc. (financial services, 2015-present). He also served as Chairman (2010-2012) and Member of the Board of Directors (2012-2013) of Omgeo, LLC (financial services), Treasurer of United Way of New York (2012-2016), and Member of the Board of Directors of XBRL US (financial services non-profit, 2009-2012) and the International Securities Services Association (2009-2012).
Alan J. Lacy (1953)
Year of Election or Appointment: 2008
Trustee
Mr. Lacy also serves as Trustee of other Fidelity® funds. Mr. Lacy serves as a Director of Bristol-Myers Squibb Company (global pharmaceuticals, 2008-present). He is a Trustee of the California Chapter of The Nature Conservancy (2015-present) and a Director of the Center for Advanced Study in the Behavioral Sciences at Stanford University (2015-present). In addition, Mr. Lacy served as Senior Adviser (2007-2014) of Oak Hill Capital Partners, L.P. (private equity) and also served as Chief Executive Officer (2005) and Vice Chairman (2005-2006) of Sears Holdings Corporation (retail) and Chief Executive Officer and Chairman of the Board of Sears, Roebuck and Co. (retail, 2000-2005). Previously, Mr. Lacy served as Chairman (2014-2017) and a member (2010-2017) of the Board of Directors of Dave & Buster’s Entertainment, Inc. (restaurant and entertainment complexes), as Chairman (2008-2011) and a member (2006-2015) of the Board of Trustees of the National Parks Conservation Association, and as a member of the Board of Directors for The Hillman Companies, Inc. (hardware wholesalers, 2010-2014), Earth Fare, Inc. (retail grocery, 2010-2014), and The Western Union Company (global money transfer, 2006-2011).
Ned C. Lautenbach (1944)
Year of Election or Appointment: 2000
Trustee
Chairman of the Independent Trustees
Mr. Lautenbach also serves as Trustee of other Fidelity® funds. Mr. Lautenbach currently serves as Chair (2018-present) and Member (2013-present) of the Board of Governors, State University System of Florida and is a member of the Council on Foreign Relations (1994-present). He is also a member and has most recently served as Chairman of the Board of Directors of Artis-Naples (2012-present). Previously, Mr. Lautenbach served as a member and then Lead Director of the Board of Directors of Eaton Corporation (diversified industrial, 1997-2016). He was also a Partner and Advisory Partner at Clayton, Dubilier & Rice, LLC (private equity investment, 1998-2010), as well as a Director of Sony Corporation (2006-2007). In addition, Mr. Lautenbach also had a 30-year career with IBM (technology company) during which time he served as Senior Vice President and a member of the Corporate Executive Committee (1968-1998).
Joseph Mauriello (1944)
Year of Election or Appointment: 2008
Trustee
Mr. Mauriello also serves as Trustee of other Fidelity® funds. Prior to his retirement in January 2006, Mr. Mauriello served in numerous senior management positions including Deputy Chairman and Chief Operating Officer (2004-2005), and Vice Chairman of Financial Services (2002-2004) of KPMG LLP US (professional services, 1965-2005). Mr. Mauriello currently serves as a member of the Independent Directors Council (IDC) Governing Council (2015-present). Previously, Mr. Mauriello served as a member of the Board of Directors of XL Group plc. (global insurance and re-insurance, 2006-2018).
Cornelia M. Small (1944)
Year of Election or Appointment: 2005
Trustee
Ms. Small also serves as Trustee of other Fidelity® funds. Ms. Small is a member of the Board of Directors (2009-present) and Chair of the Investment Committee (2010-present) of the Teagle Foundation. Ms. Small also serves on the Investment Committee of the Berkshire Taconic Community Foundation (2008-present). Previously, Ms. Small served as Chairperson (2002-2008) and a member of the Investment Committee and Chairperson (2008-2012) and a member of the Board of Trustees of Smith College. In addition, Ms. Small served as Chief Investment Officer, Director of Global Equity Investments, and a member of the Board of Directors of Scudder, Stevens & Clark and Scudder Kemper Investments.
Garnett A. Smith (1947)
Year of Election or Appointment: 2018
Trustee
Mr. Smith also serves as Trustee of other Fidelity® funds. Prior to Mr. Smith's retirement, he served as Chairman and Chief Executive Officer of Inbrand Corp. (manufacturer of personal absorbent products, 1990-1997). He also served as President (1986-1990) of Inbrand Corp. Prior to his employment with Inbrand Corp., he was employed by a retail fabric chain and North Carolina National Bank. In addition, Mr. Smith served as a Member of the Advisory Board of certain Fidelity® funds (2012-2013) and as a board member of the Jackson Hole Land Trust (2009-2012).
David M. Thomas (1949)
Year of Election or Appointment: 2008
Trustee
Mr. Thomas also serves as Trustee of other Fidelity® funds. Mr. Thomas serves as Non-Executive Chairman of the Board of Directors of Fortune Brands Home and Security (home and security products, 2011-present) and as a member of the Board of Directors (2004-present) and Presiding Director (2013-present) of Interpublic Group of Companies, Inc. (marketing communication). Previously, Mr. Thomas served as Executive Chairman (2005-2006) and Chairman and Chief Executive Officer (2000-2005) of IMS Health, Inc. (pharmaceutical and healthcare information solutions), a Director of Fortune Brands, Inc. (consumer products, 2000-2011), and a member of the Board of Trustees of the University of Florida (2013-2018).
+ The information includes the Trustee's principal occupation during the last five years and other information relating to the experience, attributes, and skills relevant to the Trustee's qualifications to serve as a Trustee, which led to the conclusion that the Trustee should serve as a Trustee for the fund.
Advisory Board Members and Officers:
Correspondence intended for a Member of the Advisory Board (if any) may be sent to Fidelity Investments, P.O. Box 55235, Boston, Massachusetts 02205-5235. Correspondence intended for an officer or Peter S. Lynch may be sent to Fidelity Investments, 245 Summer Street, Boston, Massachusetts 02210. Officers appear below in alphabetical order.
Name, Year of Birth; Principal Occupation
Vicki L. Fuller (1957)
Year of Election or Appointment: 2018
Member of the Advisory Board
Ms. Fuller also serves as Member of the Advisory Board of other Fidelity® funds. Ms. Fuller serves as a member of the Board of Directors, Audit Committee, and Nominating and Governance Committee of The Williams Companies, Inc. (natural gas infrastructure, 2018-present). Previously, Ms. Fuller served as the Chief Investment Officer of the New York State Common Retirement Fund (2012-2018) and held a variety of positions at AllianceBernstein L.P. (global asset management, 1985-2012), including Managing Director (2006-2012) and Senior Vice President and Senior Portfolio Manager (2001-2006).
Peter S. Lynch (1944)
Year of Election or Appointment: 2003
Member of the Advisory Board
Mr. Lynch also serves as Member of the Advisory Board of other Fidelity® funds. Mr. Lynch is Vice Chairman and a Director of FMR (investment adviser firm) and FMR Co., Inc. (investment adviser firm). In addition, Mr. Lynch serves as a Trustee of Boston College and as the Chairman of the Inner-City Scholarship Fund. Previously, Mr. Lynch served on the Special Olympics International Board of Directors (1997-2006).
Michael E. Wiley (1950)
Year of Election or Appointment: 2018
Member of the Advisory Board
Mr. Wiley also serves as Trustee or Member of the Advisory Board of other Fidelity® funds. Mr. Wiley serves as a Director of High Point Resources (exploration and production, 2005-present). Previously, Mr. Wiley served as a Director of Andeavor Corporation (independent oil refiner and marketer, 2005-2018), a Director of Andeavor Logistics LP (natural resources logistics, 2015-2018), a Director of Post Oak Bank (privately-held bank, 2004-2018), a Director of Asia Pacific Exploration Consolidated (international oil and gas exploration and production, 2008-2013), a member of the Board of Trustees of the University of Tulsa (2000-2006; 2007-2010), a Senior Energy Advisor of Katzenbach Partners, LLC (consulting, 2006-2007), an Advisory Director of Riverstone Holdings (private investment), a Director of Spinnaker Exploration Company (exploration and production, 2001-2005) and Chairman, President, and CEO of Baker Hughes, Inc. (oilfield services, 2000-2004).
Elizabeth Paige Baumann (1968)
Year of Election or Appointment: 2017
Anti-Money Laundering (AML) Officer
Ms. Baumann also serves as AML Officer of other funds. She is Chief AML Officer (2012-present) and Senior Vice President (2014-present) of FMR LLC (diversified financial services company) and is an employee of Fidelity Investments. Previously, Ms. Baumann served as AML Officer of the funds (2012-2016), and Vice President (2007-2014) and Deputy Anti-Money Laundering Officer (2007-2012) of FMR LLC.
Craig S. Brown (1977)
Year of Election or Appointment: 2019
Assistant Treasurer
Mr. Brown also serves as Assistant Treasurer of other funds. Mr. Brown is an employee of Fidelity Investments (2013-present).
John J. Burke III (1964)
Year of Election or Appointment: 2018
Chief Financial Officer
Mr. Burke also serves as Chief Financial Officer of other funds. Mr. Burke serves as Head of Investment Operations for Fidelity Fund and Investment Operations (2018-present) and is an employee of Fidelity Investments (1998-present). Previously Mr. Burke served as head of Asset Management Investment Operations (2012-2018).
William C. Coffey (1969)
Year of Election or Appointment: 2019
Assistant Secretary
Mr. Coffey also serves as Assistant Secretary of other funds. He is Senior Vice President and Deputy General Counsel of FMR LLC (diversified financial services company, 2010-present), and is an employee of Fidelity Investments. Previously, Mr. Coffey served as Secretary and CLO of certain funds (2018-2019); CLO, Secretary, and Senior Vice President of Fidelity Management & Research Company and FMR Co., Inc. (investment adviser firms, 2018-2019); Secretary of Fidelity SelectCo, LLC and Fidelity Investments Money Management, Inc. (investment adviser firms, 2018-2019); CLO of Fidelity Management & Research (Hong Kong) Limited, FMR Investment Management (UK) Limited, and Fidelity Management & Research (Japan) Limited (investment adviser firms, 2018-2019); and Assistant Secretary of certain funds (2009-2018).
Timothy M. Cohen (1969)
Year of Election or Appointment: 2018
Vice President
Mr. Cohen also serves as Vice President of other funds. Mr. Cohen serves as Executive Vice President of Fidelity SelectCo, LLC (2019-present), Co-Head of Equity (2018-present), a Director of Fidelity Management & Research (Japan) Limited (investment adviser firm, 2016-present), and is an employee of Fidelity Investments. Previously, Mr. Cohen served as Head of Global Equity Research (2016-2018), Chief Investment Officer - Equity and a Director of Fidelity Management & Research (U.K.) Inc. (investment adviser firm, 2013-2015) and as a Director of Fidelity Management & Research (Hong Kong) Limited (investment adviser firm, 2017).
Jonathan Davis (1968)
Year of Election or Appointment: 2010
Assistant Treasurer
Mr. Davis also serves as Assistant Treasurer of other funds. Mr. Davis serves as Assistant Treasurer of FMR Capital, Inc. (2017-present) and is an employee of Fidelity Investments. Previously, Mr. Davis served as Vice President and Associate General Counsel of FMR LLC (diversified financial services company, 2003-2010).
Adrien E. Deberghes (1967)
Year of Election or Appointment: 2016
Assistant Treasurer
Mr. Deberghes also serves as an officer of other funds. He serves as Assistant Treasurer of FMR Capital, Inc. (2017-present), Executive Vice President of Fidelity Investments Money Management, Inc. (FIMM) (investment adviser firm, 2016-present), and is an employee of Fidelity Investments (2008-present). Previously, Mr. Deberghes served as President and Treasurer of certain Fidelity® funds (2013-2018). Prior to joining Fidelity Investments, Mr. Deberghes was Senior Vice President of Mutual Fund Administration at State Street Corporation (2007-2008), Senior Director of Mutual Fund Administration at Investors Bank & Trust (2005-2007), and Director of Finance for Dunkin' Brands (2000-2005). Previously, Mr. Deberghes served in other fund officer roles.
Laura M. Del Prato (1964)
Year of Election or Appointment: 2018
Assistant Treasurer
Ms. Del Prato also serves as an officer of other funds. Ms. Del Prato is an employee of Fidelity Investments (2017-present). Prior to joining Fidelity Investments, Ms. Del Prato served as a Managing Director and Treasurer of the JPMorgan Mutual Funds (2014-2017). Prior to JPMorgan, Ms. Del Prato served as a partner at Cohen Fund Audit Services (accounting firm, 2012-2013) and KPMG LLP (accounting firm, 2004-2012).
Colm A. Hogan (1973)
Year of Election or Appointment: 2016
Deputy Treasurer
Mr. Hogan also serves as an officer of other funds. Mr. Hogan serves as Assistant Treasurer of FMR Capital, Inc. (2017-present) and is an employee of Fidelity Investments (2005-present). Previously, Mr. Hogan served as Assistant Treasurer of certain Fidelity® funds (2016-2018).
Pamela R. Holding (1964)
Year of Election or Appointment: 2018
Vice President
Ms. Holding also serves as Vice President of other funds. Ms. Holding serves as Executive Vice President of Fidelity SelectCo, LLC (2019-present), Co-Head of Equity (2018-present) and is an employee of Fidelity Investments (2013-present). Previously, Ms. Holding served as Chief Investment Officer of Fidelity Institutional Asset Management (2013-2018).
Cynthia Lo Bessette (1969)
Year of Election or Appointment: 2019
Secretary and Chief Legal Officer (CLO)
Ms. Lo Bessette also serves as Secretary and CLO of other funds. Ms. Lo Bessette serves as CLO, Secretary, and Senior Vice President of Fidelity Management & Research Company and FMR Co., Inc. (investment adviser firms, 2019-present); Secretary of Fidelity SelectCo, LLC and Fidelity Investments Money Management, Inc. (investment adviser firms, 2019-present); and CLO of Fidelity Management & Research (Hong Kong) Limited, FMR Investment Management (UK) Limited, and Fidelity Management & Research (Japan) Limited (investment adviser firms, 2019-present). She is a Senior Vice President and Deputy General Counsel of FMR LLC (diversified financial services company, 2019-present), and is an employee of Fidelity Investments. Previously, Ms. Lo Bessette served as Executive Vice President, General Counsel (2016-2019) and Senior Vice President, Deputy General Counsel (2015-2016) of OppenheimerFunds (investment management company) and Deputy Chief Legal Officer (2013-2015) of Jennison Associates LLC (investment adviser firm).
Chris Maher (1972)
Year of Election or Appointment: 2013
Assistant Treasurer
Mr. Maher serves as Assistant Treasurer of other funds. Mr. Maher is Vice President of Valuation Oversight, serves as Assistant Treasurer of FMR Capital, Inc. (2017-present), and is an employee of Fidelity Investments. Previously, Mr. Maher served as Vice President of Asset Management Compliance (2013), Vice President of the Program Management Group of FMR (investment adviser firm, 2010-2013), and Vice President of Valuation Oversight (2008-2010).
Kenneth B. Robins (1969)
Year of Election or Appointment: 2016
Chief Compliance Officer
Mr. Robins also serves as an officer of other funds. Mr. Robins serves as Compliance Officer of Fidelity Management & Research Company and FMR Co., Inc. (investment adviser firms, 2016-present) and is an employee of Fidelity Investments (2004-present). Previously, Mr. Robins served as Executive Vice President of Fidelity Investments Money Management, Inc. (investment adviser firm, 2013-2016) and served in other fund officer roles.
Stacie M. Smith (1974)
Year of Election or Appointment: 2016
President and Treasurer
Ms. Smith also serves as an officer of other funds. Ms. Smith serves as Assistant Treasurer of FMR Capital, Inc. (2017-present), is an employee of Fidelity Investments (2009-present), and has served in other fund officer roles. Prior to joining Fidelity Investments, Ms. Smith served as Senior Audit Manager of Ernst & Young LLP (accounting firm, 1996-2009). Previously, Ms. Smith served as Assistant Treasurer (2013-2018) and Deputy Treasurer (2013-2016) of certain Fidelity® funds.
Marc L. Spector (1972)
Year of Election or Appointment: 2016
Assistant Treasurer
Mr. Spector also serves as an officer of other funds. Mr. Spector serves as Assistant Treasurer of FMR Capital, Inc. (2017-present) and is an employee of Fidelity Investments (2016-present). Prior to joining Fidelity Investments, Mr. Spector served as Director at the Siegfried Group (accounting firm, 2013-2016), and prior to Siegfried Group as audit senior manager at Deloitte & Touche (accounting firm, 2005-2013).
Jim Wegmann (1979)
Year of Election or Appointment: 2019
Assistant Treasurer
Mr. Wegmann also serves as Assistant Treasurer of other funds. Mr. Wegmann is an employee of Fidelity Investments (2011-present).
Shareholder Expense Example
As a shareholder of the Fund, you incur two types of costs: (1) transaction costs, including sales charges (loads) on purchase payments or redemption proceeds and (2) ongoing costs, including management fees, distribution and/or service (12b-1) fees and other Fund expenses. This Example is intended to help you understand your ongoing costs (in dollars) of investing in the Fund and to compare these costs with the ongoing costs of investing in other mutual funds.
The Example is based on an investment of $1,000 invested at the beginning of the period and held for the entire period (May 1, 2019 to October 31, 2019).
Actual Expenses
The first line of the accompanying table for each class of the Fund provides information about actual account values and actual expenses. You may use the information in this line, together with the amount you invested, to estimate the expenses that you paid over the period. Simply divide your account value by $1,000.00 (for example, an $8,600 account value divided by $1,000.00 = 8.6), then multiply the result by the number in the first line for a class of the Fund under the heading entitled "Expenses Paid During Period" to estimate the expenses you paid on your account during this period. In addition, the Fund, as a shareholder in the underlying Fidelity Central Funds, will indirectly bear its pro-rata share of the fees and expenses incurred by the underlying Fidelity Central Funds. These fees and expenses are not included in the Fund's annualized expense ratio used to calculate the expense estimate in the table below.
Hypothetical Example for Comparison Purposes
The second line of the accompanying table for each class of the Fund provides information about hypothetical account values and hypothetical expenses based on a Class' actual expense ratio and an assumed rate of return of 5% per year before expenses, which is not the Class' actual return. The hypothetical account values and expenses may not be used to estimate the actual ending account balance or expenses you paid for the period. You may use this information to compare the ongoing costs of investing in the Fund and other funds. To do so, compare this 5% hypothetical example with the 5% hypothetical examples that appear in the shareholder reports of the other funds. In addition, the Fund, as a shareholder in the underlying Fidelity Central Funds, will indirectly bear its pro-rata share of the fees and expenses incurred by the underlying Fidelity Central Funds. These fees and expenses are not included in the Fund's annualized expense ratio used to calculate the expense estimate in the table below.
Please note that the expenses shown in the table are meant to highlight your ongoing costs only and do not reflect any transaction costs. Therefore, the second line of the table is useful in comparing ongoing costs only, and will not help you determine the relative total costs of owning different funds. In addition, if these transactional costs were included, your costs would have been higher.
| | Annualized Expense Ratio-A | Beginning
Account Value
May 1, 2019 | Ending
Account Value
October 31, 2019 | Expenses Paid
During Period-B
May 1, 2019
to October 31, 2019 |
| Class A | 1.19% | | | |
| Actual | | $1,000.00 | $1,057.70 | $6.17 |
| Hypothetical-C | | $1,000.00 | $1,019.21 | $6.06 |
| Class M | 1.45% | | | |
| Actual | | $1,000.00 | $1,056.20 | $7.51 |
| Hypothetical-C | | $1,000.00 | $1,017.90 | $7.38 |
| Class C | 1.93% | | | |
| Actual | | $1,000.00 | $1,053.60 | $9.99 |
| Hypothetical-C | | $1,000.00 | $1,015.48 | $9.80 |
| Class I | .91% | | | |
| Actual | | $1,000.00 | $1,059.00 | $4.72 |
| Hypothetical-C | | $1,000.00 | $1,020.62 | $4.63 |
| Class Z | .76% | | | |
| Actual | | $1,000.00 | $1,060.00 | $3.95 |
| Hypothetical-C | | $1,000.00 | $1,021.37 | $3.87 |
A Annualized expense ratio reflects expenses net of applicable fee waivers.
B Expenses are equal to each Class' annualized expense ratio, multiplied by the average account value over the period, multiplied by 184/365 (to reflect the one-half year period).
C 5% return per year before expenses
Distributions (Unaudited)
The Board of Trustees of Fidelity Advisor Diversified International Fund voted to pay to shareholders of record at the opening of business on record date, the following distributions per share derived from capital gains realized from sales of portfolio securities, and dividends derived from net investment income:
| | Pay Date | Record Date | Dividends | Capital Gains |
| Fidelity Advisor Diversified International Fund | | | | |
| Class A | 12/09/19 | 12/06/19 | $0.261 | $0.067 |
| Class M | 12/09/19 | 12/06/19 | $0.204 | $0.067 |
| Class C | 12/09/19 | 12/06/19 | $0.013 | $0.067 |
| Class I | 12/09/19 | 12/06/19 | $0.299 | $0.067 |
| Class Z | 12/09/19 | 12/06/19 | $0.339 | $0.067 |
|
Class A designates 9%, Class M designates 13%, Class I designates 7% and Class Z designates 6% of the dividends distributed in December 2018, respectively, during the fiscal year as qualifying for the dividends–received deduction for corporate shareholders.
Class A, Class M, Class I and Class Z designate 100% of the dividends distributed during the fiscal year as amounts which may be taken into account as a dividend for purposes of the maximum rate under section 1(h)(11) of the Internal Revenue Code.
The amounts per share which represent income derived from sources within, and taxes paid to, foreign countries or possessions of the United States are as follows:
| | Pay Date | Income | Taxes |
| Fidelity Advisor Diversified International Fund | | | |
| Class A | 12/10/2018 | 0.2118 | 0.0388 |
| Class M | 12/10/2018 | 0.1478 | 0.0388 |
| Class C | 12/10/2018 | 0.0000 | 0.0000 |
| Class I | 12/10/2018 | 0.2808 | 0.0388 |
| Class Z | 12/10/2018 | 0.3148 | 0.0388 |
|
The fund will notify shareholders in January 2020 of amounts for use in preparing 2019 income tax returns.
ADIF-ANN-1219
1.728709.120
Fidelity Advisor® Global Capital Appreciation Fund
Annual Report
October 31, 2019
See the inside front cover for important information about access to your fund’s shareholder reports.
Beginning on January 1, 2021, as permitted by regulations adopted by the Securities and Exchange Commission, paper copies of a fund’s shareholder reports will no longer be sent by mail, unless you specifically request paper copies of the reports from the fund or from your financial intermediary, such as a financial advisor, broker-dealer or bank. Instead, the reports will be made available on a website, and you will be notified by mail each time a report is posted and provided with a website link to access the report.
If you already elected to receive shareholder reports electronically, you will not be affected by this change and you need not take any action. You may elect to receive shareholder reports and other communications from a fund electronically, by contacting your financial intermediary. For Fidelity customers, visit Fidelity's web site or call Fidelity using the contact information listed below.
You may elect to receive all future reports in paper free of charge. If you wish to continue receiving paper copies of your shareholder reports, you may contact your financial intermediary or, if you are a Fidelity customer, visit Fidelity’s website, or call Fidelity at the applicable toll-free number listed below. Your election to receive reports in paper will apply to all funds held with the fund complex/your financial intermediary.
| Account Type | Website | Phone Number |
| Brokerage, Mutual Fund, or Annuity Contracts: | fidelity.com/mailpreferences | 1-800-343-3548 |
| Employer Provided Retirement Accounts: | netbenefits.fidelity.com/preferences (choose 'no' under Required Disclosures to continue to print) | 1-800-343-0860 |
| Advisor Sold Accounts Serviced Through Your Financial Intermediary: | Contact Your Financial Intermediary | Your Financial Intermediary's phone number |
| Advisor Sold Accounts Serviced by Fidelity: | institutional.fidelity.com | 1-877-208-0098 |
Contents
To view a fund's proxy voting guidelines and proxy voting record for the 12-month period ended June 30, visit http://www.fidelity.com/proxyvotingresults or visit the Securities and Exchange Commission's (SEC) web site at http://www.sec.gov.
You may also call 1-877-208-0098 to request a free copy of the proxy voting guidelines.
Standard & Poor's, S&P and S&P 500 are registered service marks of The McGraw-Hill Companies, Inc. and have been licensed for use by Fidelity Distributors Corporation.
Other third-party marks appearing herein are the property of their respective owners.
All other marks appearing herein are registered or unregistered trademarks or service marks of FMR LLC or an affiliated company. © 2019 FMR LLC. All rights reserved.
This report and the financial statements contained herein are submitted for the general information of the shareholders of the Fund. This report is not authorized for distribution to prospective investors in the Fund unless preceded or accompanied by an effective prospectus.
A fund files its complete schedule of portfolio holdings with the SEC for the first and third quarters of each fiscal year on Form N-PORT. Forms N-PORT are available on the SEC’s web site at http://www.sec.gov. A fund's Forms N-PORT may be reviewed and copied at the SEC’s Public Reference Room in Washington, DC. Information regarding the operation of the SEC's Public Reference Room may be obtained by calling 1-800-SEC-0330.
For a complete list of a fund's portfolio holdings, view the most recent holdings listing, semiannual report, or annual report on Fidelity's web site at http://www.fidelity.com, http://www.institutional.fidelity.com, or http://www.401k.com, as applicable.
NOT FDIC INSURED •MAY LOSE VALUE •NO BANK GUARANTEE
Neither the Fund nor Fidelity Distributors Corporation is a bank.
Performance: The Bottom Line
Average annual total return reflects the change in the value of an investment, assuming reinvestment of distributions from dividend income and capital gains (the profits earned upon the sale of securities that have grown in value, if any) and assuming a constant rate of performance each year. The hypothetical investment and the average annual total returns do not reflect the deduction of taxes that a shareholder would pay on fund distributions or the redemption of fund shares. During periods of reimbursement by Fidelity, a fund’s total return will be greater than it would be had the reimbursement not occurred. How a fund did yesterday is no guarantee of how it will do tomorrow.
Average Annual Total Returns
| For the periods ended October 31, 2019 | Past 1 year | Past 5 years | Past 10 years |
| Class A (incl. 5.75% sales charge) | (1.61)% | 4.22% | 7.85% |
| Class M (incl. 3.50% sales charge) | 0.46% | 4.44% | 7.81% |
| Class C (incl. contingent deferred sales charge) | 2.67% | 4.67% | 7.68% |
| Class I | 4.69% | 5.75% | 8.81% |
Class C shares' contingent deferred sales charges included in the past one year, past five years and past ten years total return figures are 1%, 0% and 0%, respectively.
$10,000 Over 10 Years
Let's say hypothetically that $10,000 was invested in Fidelity Advisor® Global Capital Appreciation Fund - Class A on October 31, 2009, and the current 5.75% sales charge was paid.
The chart shows how the value of your investment would have changed, and also shows how the MSCI ACWI (All Country World Index) Index performed over the same period.

| Period Ending Values |
| $21,291 | Fidelity Advisor® Global Capital Appreciation Fund - Class A |
| $24,154 | MSCI ACWI (All Country World Index) Index |
Management's Discussion of Fund Performance
Market Recap: Global equities gained 13.06% for the 12 months ending October 31, 2019, according to the MSCI ACWI (All Country World Index) Index. Currency fluctuations were largely modest and varied by region, muting the overall impact on international equity returns. The period began amid a challenging fourth quarter of 2018, when concerns about slowing global economic growth resulted in a -12.67% return for the index. The tide shifted as the calendar turned, as the U.S. Federal Reserve moved from raising interest rates to a more dovish policy, joining many foreign central banks. The index rallied 12.29% in the first quarter of 2019. After a down month in May (-5.88%), due to U.S.–China trade tension, stocks reversed course in June (+6.58%) and finished the second quarter with a 3.73% gain. In July, the Fed cut its policy rate for the first time since 2008, but global stocks retreated in August. Low interest rates around the world and two additional rate cuts by the Fed lifted stocks through the end of October. By sector for the full period, falling U.S. interest rates sparked demand for two high-dividend-yielding sectors, real estate (+23%) and utilities (+22%). Investors favoring growth-oriented stocks boosted information technology (+22%) and consumer discretionary (+16%). Conversely, falling commodity prices hurt energy (-6%). By region, Asia-Pacific ex Japan (+16%), the U.S. (+14%) and Europe ex U.K. (+13%) fared best, while the U.K. (+7%) was held back by its inability to approve a plan to “Brexit” the European Union.
Comments from Portfolio Manager Bill Bower: For the fiscal year, the fund’s share classes (excluding sales charges, if applicable) returned roughly 4% to 5%, well behind the benchmark, the MSCI ACWI (All Country World Index) Index. Unfavorable stock selection was the primary reason for the fund’s underperformance the past year. More specifically, choices in the industrials, health care and information technology sectors notably underperformed. To a lesser extent, sector positioning also detracted. Regionally, most of the relative weakness was derived from picks in the U.S., which represented roughly 55% of the MSCI ACWI index. A position in cash of 2%, on average, also detracted in a rising market. Non-benchmark exposure to New Jersey-based information technology processing company Conduent (-53%) was the fund’s biggest individual relative detractor, as the company reported two consecutive quarters of weaker-than-expected earnings. I sold Conduent by period end. An overweighting in Delaware-based specialty chemicals manufacturer Chemours also hurt, returning about -58% until I eliminated the position, due largely to disappointing earnings. Conversely, security selection in emerging markets and Japan added value versus the benchmark, as did my choices in the consumer discretionary and consumer staples sectors. The fund’s biggest contributor was an overweighting in Philadelphia-based metal can, container and specialty packaging company Crown Holdings. Shares of the company advanced roughly 45% while held in the fund. A non-benchmark position in London-based digital advertising company S4 Capital, which I established this period, gained 24% and was the fund’s biggest relative contributor.
The views expressed above reflect those of the portfolio manager(s) only through the end of the period as stated on the cover of this report and do not necessarily represent the views of Fidelity or any other person in the Fidelity organization. Any such views are subject to change at any time based upon market or other conditions and Fidelity disclaims any responsibility to update such views. These views may not be relied on as investment advice and, because investment decisions for a Fidelity fund are based on numerous factors, may not be relied on as an indication of trading intent on behalf of any Fidelity fund.
Note to Shareholders: On August 15, 2019, Bill Bower assumed co-management responsibilities for the fund, joining Tom Allen until October 1, 2019, at which point Tom came off the fund, leaving Bill sole portfolio manager.
Investment Summary (Unaudited)
Top Five Stocks as of October 31, 2019
| | % of fund's net assets |
| Microsoft Corp. (United States of America, Software) | 3.1 |
| MasterCard, Inc. Class A (United States of America, IT Services) | 3.1 |
| Alphabet, Inc. Class A (United States of America, Interactive Media & Services) | 2.6 |
| ASML Holding NV (Netherlands) (Netherlands, Semiconductors & Semiconductor Equipment) | 2.1 |
| Taiwan Semiconductor Manufacturing Co. Ltd. (Taiwan, Semiconductors & Semiconductor Equipment) | 2.1 |
| | 13.0 |
Top Five Market Sectors as of October 31, 2019
| | % of fund's net assets |
| Information Technology | 31.1 |
| Financials | 14.5 |
| Consumer Discretionary | 13.2 |
| Communication Services | 10.5 |
| Health Care | 10.1 |
Top Five Countries as of October 31, 2019
| (excluding cash equivalents) | % of fund's net assets |
| United States of America | 51.9 |
| Cayman Islands | 5.2 |
| Japan | 4.7 |
| Germany | 4.5 |
| United Kingdom | 4.1 |
Percentages are adjusted for the effect of futures contracts, if applicable.
Asset Allocation (% of fund's net assets)
| As of October 31, 2019 |
| | Stocks | 98.2% |
| | Short-Term Investments and Net Other Assets (Liabilities) | 1.8% |

Schedule of Investments October 31, 2019
Showing Percentage of Net Assets
| Common Stocks - 98.2% | | | |
| | | Shares | Value |
| Bailiwick of Jersey - 1.1% | | | |
| WNS Holdings Ltd. sponsored ADR (a) | | 16,700 | $1,032,728 |
| Bermuda - 1.5% | | | |
| Genpact Ltd. | | 25,000 | 979,250 |
| Marvell Technology Group Ltd. | | 21,200 | 517,068 |
|
| TOTAL BERMUDA | | | 1,496,318 |
|
| Brazil - 1.0% | | | |
| Rumo SA (a) | | 166,300 | 945,428 |
| Canada - 1.3% | | | |
| Alimentation Couche-Tard, Inc. Class B (sub. vtg.) | | 39,000 | 1,169,615 |
| Canada Goose Holdings, Inc. (a) | | 3,100 | 129,686 |
| Pan American Silver Corp. rights (a)(b) | | 38,400 | 0 |
|
| TOTAL CANADA | | | 1,299,301 |
|
| Cayman Islands - 5.2% | | | |
| Alibaba Group Holding Ltd. sponsored ADR (a) | | 8,600 | 1,519,362 |
| Anta Sports Products Ltd. | | 115,000 | 1,124,944 |
| New Oriental Education & Technology Group, Inc. sponsored ADR (a) | | 8,600 | 1,049,716 |
| Tencent Holdings Ltd. | | 34,500 | 1,399,421 |
| ZTO Express (Cayman), Inc. sponsored ADR | | 100 | 2,200 |
|
| TOTAL CAYMAN ISLANDS | | | 5,095,643 |
|
| China - 1.2% | | | |
| Ping An Insurance Group Co. of China Ltd. (H Shares) | | 103,500 | 1,194,575 |
| Yunnan Baiyao Group Co. Ltd. (A Shares) | | 300 | 3,687 |
|
| TOTAL CHINA | | | 1,198,262 |
|
| Denmark - 1.0% | | | |
| DSV A/S | | 10,600 | 1,028,542 |
| France - 3.2% | | | |
| LVMH Moet Hennessy Louis Vuitton SE | | 3,800 | 1,622,813 |
| SR Teleperformance SA | | 6,800 | 1,541,077 |
|
| TOTAL FRANCE | | | 3,163,890 |
|
| Germany - 4.5% | | | |
| Allianz SE | | 6,300 | 1,538,603 |
| Deutsche Borse AG | | 6,300 | 975,616 |
| MTU Aero Engines Holdings AG | | 3,700 | 987,910 |
| RWE AG | | 31,600 | 963,204 |
|
| TOTAL GERMANY | | | 4,465,333 |
|
| Hong Kong - 1.8% | | | |
| AIA Group Ltd. | | 176,000 | 1,752,648 |
| India - 3.0% | | | |
| HDFC Bank Ltd. | | 54,232 | 938,961 |
| Housing Development Finance Corp. Ltd. | | 37,300 | 1,118,642 |
| Kotak Mahindra Bank Ltd. | | 41,100 | 910,927 |
| Praxis Home Retail Ltd. (a) | | 5 | 5 |
|
| TOTAL INDIA | | | 2,968,535 |
|
| Ireland - 1.7% | | | |
| Accenture PLC Class A | | 9,100 | 1,687,322 |
| Italy - 1.1% | | | |
| FinecoBank SpA | | 93,100 | 1,048,728 |
| Japan - 4.7% | | | |
| Hoya Corp. | | 14,800 | 1,307,983 |
| Kao Corp. | | 12,900 | 1,037,143 |
| Keyence Corp. | | 2,000 | 1,264,593 |
| Shiseido Co. Ltd. | | 11,800 | 972,886 |
|
| TOTAL JAPAN | | | 4,582,605 |
|
| Kenya - 0.0% | | | |
| Safaricom Ltd. | | 100 | 29 |
| Netherlands - 3.4% | | | |
| ASML Holding NV (Netherlands) | | 8,000 | 2,096,917 |
| NXP Semiconductors NV | | 11,200 | 1,273,216 |
|
| TOTAL NETHERLANDS | | | 3,370,133 |
|
| Spain - 1.7% | | | |
| Cellnex Telecom SA (c) | | 29,100 | 1,254,719 |
| Cellnex Telecom SA (a) | | 8,442 | 363,998 |
|
| TOTAL SPAIN | | | 1,618,717 |
|
| Switzerland - 2.7% | | | |
| Roche Holding AG (participation certificate) | | 5,070 | 1,525,847 |
| Sika AG | | 6,710 | 1,152,909 |
|
| TOTAL SWITZERLAND | | | 2,678,756 |
|
| Taiwan - 2.1% | | | |
| Taiwan Semiconductor Manufacturing Co. Ltd. | | 212,000 | 2,073,641 |
| United Kingdom - 4.1% | | | |
| ConvaTec Group PLC (c) | | 1,192 | 3,044 |
| Dechra Pharmaceuticals PLC | | 27,900 | 950,489 |
| Diageo PLC | | 80 | 3,274 |
| Discoverie Group PLC | | 88,475 | 520,312 |
| Lloyds Banking Group PLC | | 1 | 1 |
| London Stock Exchange Group PLC | | 11,100 | 1,000,319 |
| S4 Capital PLC (a)(d) | | 698,932 | 1,502,900 |
|
| TOTAL UNITED KINGDOM | | | 3,980,339 |
|
| United States of America - 51.9% | | | |
| Activision Blizzard, Inc. | | 22,900 | 1,283,087 |
| Adobe, Inc. (a) | | 5,400 | 1,500,822 |
| Alphabet, Inc. Class A (a) | | 2,000 | 2,517,600 |
| Amazon.com, Inc. (a) | | 1,100 | 1,954,326 |
| AMETEK, Inc. | | 12,200 | 1,118,130 |
| Amphenol Corp. Class A | | 11,200 | 1,123,696 |
| Autodesk, Inc. (a) | | 8,400 | 1,237,824 |
| Boston Scientific Corp. (a) | | 30,500 | 1,271,850 |
| Cintas Corp. | | 4,600 | 1,235,882 |
| Costco Wholesale Corp. | | 4,200 | 1,247,862 |
| Dollar General Corp. | | 7,600 | 1,218,584 |
| Ecolab, Inc. | | 6,200 | 1,190,834 |
| Equinix, Inc. | | 2,100 | 1,190,238 |
| Euronet Worldwide, Inc. (a) | | 6,700 | 938,469 |
| Fidelity National Information Services, Inc. | | 14,800 | 1,950,048 |
| Intercontinental Exchange, Inc. | | 13,200 | 1,245,024 |
| Intuitive Surgical, Inc. (a) | | 2,300 | 1,271,785 |
| Marsh & McLennan Companies, Inc. | | 12,400 | 1,284,888 |
| MasterCard, Inc. Class A | | 10,900 | 3,017,229 |
| Maximus, Inc. | | 12,800 | 982,272 |
| Micron Technology, Inc. (a) | | 28,400 | 1,350,420 |
| Microsoft Corp. | | 21,300 | 3,053,782 |
| Northrop Grumman Corp. | | 4,600 | 1,621,408 |
| Penn National Gaming, Inc. (a) | | 3,148 | 67,100 |
| Qualcomm, Inc. | | 12,900 | 1,037,676 |
| S&P Global, Inc. | | 5,000 | 1,289,950 |
| Salesforce.com, Inc. (a) | | 9,900 | 1,549,251 |
| Starbucks Corp. | | 16,900 | 1,429,064 |
| Stryker Corp. | | 5,700 | 1,232,739 |
| Synopsys, Inc. (a) | | 9,000 | 1,221,750 |
| The Booking Holdings, Inc. (a) | | 600 | 1,229,262 |
| The RealReal, Inc. | | 11,200 | 258,832 |
| The Walt Disney Co. | | 14,900 | 1,935,808 |
| Thermo Fisher Scientific, Inc. | | 4,300 | 1,298,514 |
| TJX Companies, Inc. | | 26,200 | 1,510,430 |
| UnitedHealth Group, Inc. | | 4,400 | 1,111,880 |
| Verisk Analytics, Inc. | | 6,900 | 998,430 |
|
| TOTAL UNITED STATES OF AMERICA | | | 50,976,746 |
|
| TOTAL COMMON STOCKS | | | |
| (Cost $89,513,657) | | | 96,463,644 |
|
| Money Market Funds - 1.7% | | | |
| Fidelity Cash Central Fund 1.83% (e) | | 1,188,540 | 1,188,778 |
| Fidelity Securities Lending Cash Central Fund 1.84% (e)(f) | | 525,140 | 525,192 |
| TOTAL MONEY MARKET FUNDS | | | |
| (Cost $1,713,970) | | | 1,713,970 |
| TOTAL INVESTMENT IN SECURITIES - 99.9% | | | |
| (Cost $91,227,627) | | | 98,177,614 |
| NET OTHER ASSETS (LIABILITIES) - 0.1% | | | 86,760 |
| NET ASSETS - 100% | | | $98,264,374 |
Categorizations in the Schedule of Investments are based on country or territory of incorporation.
Legend
(a) Non-income producing
(b) Level 3 security
(c) Security exempt from registration under Rule 144A of the Securities Act of 1933. These securities may be resold in transactions exempt from registration, normally to qualified institutional buyers. At the end of the period, the value of these securities amounted to $1,257,763 or 1.3% of net assets.
(d) Security or a portion of the security is on loan at period end.
(e) Affiliated fund that is generally available only to investment companies and other accounts managed by Fidelity Investments. The rate quoted is the annualized seven-day yield of the fund at period end. A complete unaudited listing of the fund's holdings as of its most recent quarter end is available upon request. In addition, each Fidelity Central Fund's financial statements, which are not covered by the Fund's Report of Independent Registered Public Accounting Firm, are available on the SEC's website or upon request.
(f) Investment made with cash collateral received from securities on loan.
Affiliated Central Funds
Information regarding fiscal year to date income earned by the Fund from investments in Fidelity Central Funds is as follows:
| Fund | Income earned |
| Fidelity Cash Central Fund | $46,025 |
| Fidelity Securities Lending Cash Central Fund | 17,273 |
| Total | $63,298 |
Amounts in the income column in the above table include any capital gain distributions from underlying funds, which are presented in the corresponding line-item in the Statement of Operations, if applicable. Amount for Fidelity Securities Lending Cash Central Fund represents the income earned on investing cash collateral, less rebates paid to borrowers and any lending agent fees associated with the loan, plus any premium payments received for lending certain types of securities.
Investment Valuation
The following is a summary of the inputs used, as of October 31, 2019, involving the Fund's assets and liabilities carried at fair value. The inputs or methodology used for valuing securities may not be an indication of the risk associated with investing in those securities. For more information on valuation inputs, and their aggregation into the levels used below, please refer to the Investment Valuation section in the accompanying Notes to Financial Statements.
| | Valuation Inputs at Reporting Date: |
| Description | Total | Level 1 | Level 2 | Level 3 |
| Investments in Securities: | | | | |
| Equities: | | | | |
| Communication Services | $10,257,562 | $8,858,141 | $1,399,421 | $-- |
| Consumer Discretionary | 13,114,124 | 10,366,362 | 2,747,762 | -- |
| Consumer Staples | 4,430,780 | 2,417,477 | 2,013,303 | -- |
| Financials | 14,298,882 | 4,868,590 | 9,430,292 | -- |
| Health Care | 9,977,818 | 7,140,301 | 2,837,517 | -- |
| Industrials | 9,479,007 | 9,479,007 | -- | -- |
| Information Technology | 30,408,286 | 24,973,135 | 5,435,151 | -- |
| Materials | 2,343,743 | 2,343,743 | -- | 0 |
| Real Estate | 1,190,238 | 1,190,238 | -- | -- |
| Utilities | 963,204 | 963,204 | -- | -- |
| Money Market Funds | 1,713,970 | 1,713,970 | -- | -- |
| Total Investments in Securities: | $98,177,614 | $74,314,168 | $23,863,446 | $0 |
See accompanying notes which are an integral part of the financial statements.
Financial Statements
Statement of Assets and Liabilities
| | | October 31, 2019 |
| Assets | | |
Investment in securities, at value (including securities loaned of $501,352) — See accompanying schedule:
Unaffiliated issuers (cost $89,513,657) | $96,463,644 | |
| Fidelity Central Funds (cost $1,713,970) | 1,713,970 | |
| Total Investment in Securities (cost $91,227,627) | | $98,177,614 |
| Foreign currency held at value (cost $99,325) | | 99,871 |
| Receivable for investments sold | | 1,194,231 |
| Receivable for fund shares sold | | 14,430 |
| Dividends receivable | | 112,537 |
| Distributions receivable from Fidelity Central Funds | | 1,126 |
| Prepaid expenses | | 194 |
| Other receivables | | 49,516 |
| Total assets | | 99,649,519 |
| Liabilities | | |
| Payable for investments purchased | $412,832 | |
| Payable for fund shares redeemed | 302,005 | |
| Accrued management fee | 33,726 | |
| Distribution and service plan fees payable | 24,179 | |
| Other affiliated payables | 20,569 | |
| Other payables and accrued expenses | 66,684 | |
| Collateral on securities loaned | 525,150 | |
| Total liabilities | | 1,385,145 |
| Net Assets | | $98,264,374 |
| Net Assets consist of: | | |
| Paid in capital | | $92,620,554 |
| Total accumulated earnings (loss) | | 5,643,820 |
| Net Assets | | $98,264,374 |
| Net Asset Value and Maximum Offering Price | | |
| Class A: | | |
| Net Asset Value and redemption price per share ($30,045,826 ÷ 1,920,039 shares)(a) | | $15.65 |
| Maximum offering price per share (100/94.25 of $15.65) | | $16.60 |
| Class M: | | |
| Net Asset Value and redemption price per share ($18,610,792 ÷ 1,255,965 shares)(a) | | $14.82 |
| Maximum offering price per share (100/96.50 of $14.82) | | $15.36 |
| Class C: | | |
| Net Asset Value and offering price per share ($12,539,943 ÷ 957,375 shares)(a) | | $13.10 |
| Class I: | | |
| Net Asset Value, offering price and redemption price per share ($37,067,813 ÷ 2,236,410 shares) | | $16.57 |
(a) Redemption price per share is equal to net asset value less any applicable contingent deferred sales charge.
See accompanying notes which are an integral part of the financial statements.
Statement of Operations
| | | Year ended October 31, 2019 |
| Investment Income | | |
| Dividends | | $1,962,339 |
| Interest | | 167 |
| Income from Fidelity Central Funds (including $17,273 from security lending) | | 63,298 |
| Income before foreign taxes withheld | | 2,025,804 |
| Less foreign taxes withheld | | (107,397) |
| Total income | | 1,918,407 |
| Expenses | | |
| Management fee | | |
| Basic fee | $737,032 | |
| Performance adjustment | (262,735) | |
| Transfer agent fees | 227,474 | |
| Distribution and service plan fees | 334,707 | |
| Accounting and security lending fees | 41,813 | |
| Custodian fees and expenses | 35,789 | |
| Independent trustees' fees and expenses | 626 | |
| Registration fees | 59,675 | |
| Audit | 90,409 | |
| Legal | 4,996 | |
| Miscellaneous | 728 | |
| Total expenses before reductions | 1,270,514 | |
| Expense reductions | (6,265) | |
| Total expenses after reductions | | 1,264,249 |
| Net investment income (loss) | | 654,158 |
| Realized and Unrealized Gain (Loss) | | |
| Net realized gain (loss) on: | | |
| Investment securities: | | |
| Unaffiliated issuers | (1,423,451) | |
| Fidelity Central Funds | (5) | |
| Foreign currency transactions | (15,401) | |
| Total net realized gain (loss) | | (1,438,857) |
| Change in net unrealized appreciation (depreciation) on: | | |
| Investment securities: | | |
| Unaffiliated issuers | 4,800,740 | |
| Assets and liabilities in foreign currencies | 5,056 | |
| Total change in net unrealized appreciation (depreciation) | | 4,805,796 |
| Net gain (loss) | | 3,366,939 |
| Net increase (decrease) in net assets resulting from operations | | $4,021,097 |
See accompanying notes which are an integral part of the financial statements.
Statement of Changes in Net Assets
| | Year ended October 31, 2019 | Year ended October 31, 2018 |
| Increase (Decrease) in Net Assets | | |
| Operations | | |
| Net investment income (loss) | $654,158 | $281,292 |
| Net realized gain (loss) | (1,438,857) | 12,417,623 |
| Change in net unrealized appreciation (depreciation) | 4,805,796 | (21,261,349) |
| Net increase (decrease) in net assets resulting from operations | 4,021,097 | (8,562,434) |
| Distributions to shareholders | (10,356,661) | (17,875,671) |
| Share transactions - net increase (decrease) | (15,097,541) | 6,794,419 |
| Redemption fees | – | 407 |
| Total increase (decrease) in net assets | (21,433,105) | (19,643,279) |
| Net Assets | | |
| Beginning of period | 119,697,479 | 139,340,758 |
| End of period | $98,264,374 | $119,697,479 |
See accompanying notes which are an integral part of the financial statements.
Financial Highlights
Fidelity Advisor Global Capital Appreciation Fund Class A
| Years ended October 31, | 2019 | 2018 | 2017 | 2016 | 2015 |
| Selected Per–Share Data | | | | | |
| Net asset value, beginning of period | $16.48 | $20.21 | $16.18 | $15.89 | $15.32 |
| Income from Investment Operations | | | | | |
| Net investment income (loss)A | .10 | .05 | .05 | –B | (.01) |
| Net realized and unrealized gain (loss) | .50 | (1.22) | 4.15 | .38 | .58 |
| Total from investment operations | .60 | (1.17) | 4.20 | .38 | .57 |
| Distributions from net investment income | (.02) | (.04) | – | – | – |
| Distributions from net realized gain | (1.41) | (2.52) | (.17) | (.09) | – |
| Total distributions | (1.43) | (2.56) | (.17) | (.09) | – |
| Redemption fees added to paid in capitalA | – | –B | –B | –B | –B |
| Net asset value, end of period | $15.65 | $16.48 | $20.21 | $16.18 | $15.89 |
| Total ReturnC,D | 4.39% | (6.74)% | 26.17% | 2.39% | 3.72% |
| Ratios to Average Net AssetsE,F | | | | | |
| Expenses before reductions | 1.14% | 1.39% | 1.48% | 1.55% | 1.57% |
| Expenses net of fee waivers, if any | 1.14% | 1.39% | 1.45% | 1.45% | 1.45% |
| Expenses net of all reductions | 1.14% | 1.37% | 1.44% | 1.44% | 1.44% |
| Net investment income (loss) | .66% | .26% | .28% | (.02)% | (.07)% |
| Supplemental Data | | | | | |
| Net assets, end of period (000 omitted) | $30,046 | $33,589 | $38,710 | $39,565 | $41,225 |
| Portfolio turnover rateG | 142% | 99% | 137% | 122% | 176% |
A Calculated based on average shares outstanding during the period.
B Amount represents less than $.005 per share.
C Total returns would have been lower if certain expenses had not been reduced during the applicable periods shown.
D Total returns do not include the effect of the sales charges.
E Fees and expenses of any underlying Fidelity Central Funds are not included in the Fund's expense ratio. The Fund indirectly bears its proportionate share of the expenses of any underlying Fidelity Central Funds.
F Expense ratios reflect operating expenses of the class. Expenses before reductions do not reflect amounts reimbursed by the investment adviser or reductions from brokerage service arrangements or reductions from other expense offset arrangements and do not represent the amount paid by the class during periods when reimbursements or reductions occur. Expenses net of fee waivers reflect expenses after reimbursement by the investment adviser but prior to reductions from brokerage service arrangements or other expense offset arrangements. Expenses net of all reductions represent the net expenses paid by the class.
G Amount does not include the portfolio activity of any underlying Fidelity Central Funds.
See accompanying notes which are an integral part of the financial statements.
Fidelity Advisor Global Capital Appreciation Fund Class M
| Years ended October 31, | 2019 | 2018 | 2017 | 2016 | 2015 |
| Selected Per–Share Data | | | | | |
| Net asset value, beginning of period | $15.70 | $19.37 | $15.56 | $15.32 | $14.81 |
| Income from Investment Operations | | | | | |
| Net investment income (loss)A | .05 | – | .01 | (.04) | (.05) |
| Net realized and unrealized gain (loss) | .48 | (1.15) | 3.97 | .37 | .56 |
| Total from investment operations | .53 | (1.15) | 3.98 | .33 | .51 |
| Distributions from net investment income | – | – | – | – | – |
| Distributions from net realized gain | (1.41) | (2.52) | (.17) | (.09) | – |
| Total distributions | (1.41) | (2.52) | (.17) | (.09) | – |
| Redemption fees added to paid in capitalA | – | –B | –B | –B | –B |
| Net asset value, end of period | $14.82 | $15.70 | $19.37 | $15.56 | $15.32 |
| Total ReturnC,D | 4.10% | (6.97)% | 25.80% | 2.15% | 3.44% |
| Ratios to Average Net AssetsE,F | | | | | |
| Expenses before reductions | 1.43% | 1.67% | 1.77% | 1.85% | 1.89% |
| Expenses net of fee waivers, if any | 1.43% | 1.67% | 1.70% | 1.70% | 1.70% |
| Expenses net of all reductions | 1.42% | 1.65% | 1.69% | 1.69% | 1.69% |
| Net investment income (loss) | .37% | (.01)% | .03% | (.27)% | (.32)% |
| Supplemental Data | | | | | |
| Net assets, end of period (000 omitted) | $18,611 | $21,339 | $25,535 | $21,351 | $24,017 |
| Portfolio turnover rateG | 142% | 99% | 137% | 122% | 176% |
A Calculated based on average shares outstanding during the period.
B Amount represents less than $.005 per share.
C Total returns would have been lower if certain expenses had not been reduced during the applicable periods shown.
D Total returns do not include the effect of the sales charges.
E Fees and expenses of any underlying Fidelity Central Funds are not included in the Fund's expense ratio. The Fund indirectly bears its proportionate share of the expenses of any underlying Fidelity Central Funds.
F Expense ratios reflect operating expenses of the class. Expenses before reductions do not reflect amounts reimbursed by the investment adviser or reductions from brokerage service arrangements or reductions from other expense offset arrangements and do not represent the amount paid by the class during periods when reimbursements or reductions occur. Expenses net of fee waivers reflect expenses after reimbursement by the investment adviser but prior to reductions from brokerage service arrangements or other expense offset arrangements. Expenses net of all reductions represent the net expenses paid by the class.
G Amount does not include the portfolio activity of any underlying Fidelity Central Funds.
See accompanying notes which are an integral part of the financial statements.
Fidelity Advisor Global Capital Appreciation Fund Class C
| Years ended October 31, | 2019�� | 2018 | 2017 | 2016 | 2015 |
| Selected Per–Share Data | | | | | |
| Net asset value, beginning of period | $14.11 | $17.65 | $14.26 | $14.12 | $13.72 |
| Income from Investment Operations | | | | | |
| Net investment income (loss)A | (.01) | (.08) | (.07) | (.11) | (.12) |
| Net realized and unrealized gain (loss) | .41 | (1.02) | 3.63 | .34 | .52 |
| Total from investment operations | .40 | (1.10) | 3.56 | .23 | .40 |
| Distributions from net investment income | – | – | – | – | – |
| Distributions from net realized gain | (1.41) | (2.44) | (.17) | (.09) | – |
| Total distributions | (1.41) | (2.44) | (.17) | (.09) | – |
| Redemption fees added to paid in capitalA | – | –B | –B | –B | –B |
| Net asset value, end of period | $13.10 | $14.11 | $17.65 | $14.26 | $14.12 |
| Total ReturnC,D | 3.59% | (7.39)% | 25.20% | 1.62% | 2.92% |
| Ratios to Average Net AssetsE,F | | | | | |
| Expenses before reductions | 1.90% | 2.14% | 2.23% | 2.31% | 2.34% |
| Expenses net of fee waivers, if any | 1.90% | 2.14% | 2.20% | 2.20% | 2.20% |
| Expenses net of all reductions | 1.89% | 2.12% | 2.19% | 2.19% | 2.19% |
| Net investment income (loss) | (.10)% | (.48)% | (.47)% | (.77)% | (.82)% |
| Supplemental Data | | | | | |
| Net assets, end of period (000 omitted) | $12,540 | $19,741 | $24,215 | $19,942 | $21,186 |
| Portfolio turnover rateG | 142% | 99% | 137% | 122% | 176% |
A Calculated based on average shares outstanding during the period.
B Amount represents less than $.005 per share.
C Total returns would have been lower if certain expenses had not been reduced during the applicable periods shown.
D Total returns do not include the effect of the contingent deferred sales charge.
E Fees and expenses of any underlying Fidelity Central Funds are not included in the Fund's expense ratio. The Fund indirectly bears its proportionate share of the expenses of any underlying Fidelity Central Funds.
F Expense ratios reflect operating expenses of the class. Expenses before reductions do not reflect amounts reimbursed by the investment adviser or reductions from brokerage service arrangements or reductions from other expense offset arrangements and do not represent the amount paid by the class during periods when reimbursements or reductions occur. Expenses net of fee waivers reflect expenses after reimbursement by the investment adviser but prior to reductions from brokerage service arrangements or other expense offset arrangements. Expenses net of all reductions represent the net expenses paid by the class.
G Amount does not include the portfolio activity of any underlying Fidelity Central Funds.
See accompanying notes which are an integral part of the financial statements.
Fidelity Advisor Global Capital Appreciation Fund Class I
| Years ended October 31, | 2019 | 2018 | 2017 | 2016 | 2015 |
| Selected Per–Share Data | | | | | |
| Net asset value, beginning of period | $17.37 | $21.16 | $16.90 | $16.55 | $15.92 |
| Income from Investment Operations | | | | | |
| Net investment income (loss)A | .16 | .11 | .11 | .04 | .03 |
| Net realized and unrealized gain (loss) | .52 | (1.28) | 4.33 | .40 | .60 |
| Total from investment operations | .68 | (1.17) | 4.44 | .44 | .63 |
| Distributions from net investment income | (.08) | (.10) | – | – | – |
| Distributions from net realized gain | (1.41) | (2.52) | (.18) | (.09) | – |
| Total distributions | (1.48)B | (2.62) | (.18) | (.09) | – |
| Redemption fees added to paid in capitalA | – | –C | –C | –C | –C |
| Net asset value, end of period | $16.57 | $17.37 | $21.16 | $16.90 | $16.55 |
| Total ReturnD | 4.69% | (6.45)% | 26.52% | 2.66% | 3.96% |
| Ratios to Average Net AssetsE,F | | | | | |
| Expenses before reductions | .82% | 1.09% | 1.16% | 1.22% | 1.26% |
| Expenses net of fee waivers, if any | .82% | 1.09% | 1.16% | 1.20% | 1.20% |
| Expenses net of all reductions | .82% | 1.07% | 1.15% | 1.19% | 1.19% |
| Net investment income (loss) | .97% | .57% | .57% | .23% | .18% |
| Supplemental Data | | | | | |
| Net assets, end of period (000 omitted) | $37,068 | $45,029 | $50,881 | $57,060 | $59,117 |
| Portfolio turnover rateG | 142% | 99% | 137% | 122% | 176% |
A Calculated based on average shares outstanding during the period.
B Total distributions of $1.48 per share is comprised of distributions from net investment income of $.076 and distributions from net realized gain of $1.406 per share.
C Amount represents less than $.005 per share.
D Total returns would have been lower if certain expenses had not been reduced during the applicable periods shown.
E Fees and expenses of any underlying Fidelity Central Funds are not included in the Fund's expense ratio. The Fund indirectly bears its proportionate share of the expenses of any underlying Fidelity Central Funds.
F Expense ratios reflect operating expenses of the class. Expenses before reductions do not reflect amounts reimbursed by the investment adviser or reductions from brokerage service arrangements or reductions from other expense offset arrangements and do not represent the amount paid by the class during periods when reimbursements or reductions occur. Expenses net of fee waivers reflect expenses after reimbursement by the investment adviser but prior to reductions from brokerage service arrangements or other expense offset arrangements. Expenses net of all reductions represent the net expenses paid by the class.
G Amount does not include the portfolio activity of any underlying Fidelity Central Funds.
See accompanying notes which are an integral part of the financial statements.
Notes to Financial Statements
For the period ended October 31, 2019
1. Organization.
Fidelity Advisor Global Capital Appreciation Fund (the Fund) is a fund of Fidelity Advisor Series VIII (the Trust) and is authorized to issue an unlimited number of shares. The Trust is registered under the Investment Company Act of 1940, as amended (the 1940 Act), as an open-end management investment company organized as a Massachusetts business trust. The Fund offers Class A, Class M, Class C and Class I shares, each of which has equal rights as to assets and voting privileges. Each class has exclusive voting rights with respect to matters that affect that class. Effective March 1, 2019, Class C shares will automatically convert to Class A shares after a holding period of ten years from the initial date of purchase, with certain exceptions.
2. Investments in Fidelity Central Funds.
The Fund invests in Fidelity Central Funds, which are open-end investment companies generally available only to other investment companies and accounts managed by the investment adviser and its affiliates. The Fund's Schedule of Investments lists each of the Fidelity Central Funds held as of period end, if any, as an investment of the Fund, but does not include the underlying holdings of each Fidelity Central Fund. As an Investing Fund, the Fund indirectly bears its proportionate share of the expenses of the underlying Fidelity Central Funds.
The Money Market Central Funds seek preservation of capital and current income and are managed by Fidelity Investments Money Management, Inc. (FIMM), an affiliate of the investment adviser. Annualized expenses of the Money Market Central Funds as of their most recent shareholder report date ranged from less than .005% to .01%.
A complete unaudited list of holdings for each Fidelity Central Fund is available upon request or at the Securities and Exchange Commission (the SEC) website at www.sec.gov. In addition, the financial statements of the Fidelity Central Funds, which are not covered by the Fund's Report of Independent Registered Public Accounting Firm, are available on the SEC website or upon request.
3. Significant Accounting Policies.
The Fund is an investment company and applies the accounting and reporting guidance of the Financial Accounting Standards Board (FASB) Accounting Standards Codification Topic 946 Financial Services – Investments Companies. The financial statements have been prepared in conformity with accounting principles generally accepted in the United States of America (GAAP), which require management to make certain estimates and assumptions at the date of the financial statements. Actual results could differ from those estimates. Subsequent events, if any, through the date that the financial statements were issued have been evaluated in the preparation of the financial statements. The following summarizes the significant accounting policies of the Fund:
Investment Valuation. Investments are valued as of 4:00 p.m. Eastern time on the last calendar day of the period. The Board of Trustees (the Board) has delegated the day to day responsibility for the valuation of the Fund's investments to the Fair Value Committee (the Committee) established by the Fund's investment adviser. In accordance with valuation policies and procedures approved by the Board, the Fund attempts to obtain prices from one or more third party pricing vendors or brokers to value its investments. When current market prices, quotations or currency exchange rates are not readily available or reliable, investments will be fair valued in good faith by the Committee, in accordance with procedures adopted by the Board. Factors used in determining fair value vary by investment type and may include market or investment specific events. The frequency with which these procedures are used cannot be predicted and they may be utilized to a significant extent. The Committee oversees the Fund's valuation policies and procedures and reports to the Board on the Committee's activities and fair value determinations. The Board monitors the appropriateness of the procedures used in valuing the Fund's investments and ratifies the fair value determinations of the Committee.
The Fund categorizes the inputs to valuation techniques used to value its investments into a disclosure hierarchy consisting of three levels as shown below:
- Level 1 – quoted prices in active markets for identical investments
- Level 2 – other significant observable inputs (including quoted prices for similar investments, interest rates, prepayment speeds, etc.)
- Level 3 – unobservable inputs (including the Fund's own assumptions based on the best information available)
Valuation techniques used to value the Fund's investments by major category are as follows:
Equity securities, including restricted securities, for which market quotations are readily available, are valued at the last reported sale price or official closing price as reported by a third party pricing vendor on the primary market or exchange on which they are traded and are categorized as Level 1 in the hierarchy. In the event there were no sales during the day or closing prices are not available, securities are valued at the last quoted bid price or may be valued using the last available price and are generally categorized as Level 2 in the hierarchy. For foreign equity securities, when market or security specific events arise, comparisons to the valuation of American Depositary Receipts (ADRs), futures contracts, Exchange-Traded Funds (ETFs) and certain indexes as well as quoted prices for similar securities may be used and would be categorized as Level 2 in the hierarchy. For equity securities, including restricted securities, where observable inputs are limited, assumptions about market activity and risk are used and these securities may be categorized as Level 3 in the hierarchy.
Investments in open-end mutual funds, including the Fidelity Central Funds, are valued at their closing net asset value (NAV) each business day and are categorized as Level 1 in the hierarchy.
Changes in valuation techniques may result in transfers in or out of an assigned level within the disclosure hierarchy. The aggregate value of investments by input level as of October 31, 2019 is included at the end of the Fund's Schedule of Investments.
Foreign Currency. The Fund may use foreign currency contracts to facilitate transactions in foreign-denominated securities. Gains and losses from these transactions may arise from changes in the value of the foreign currency or if the counterparties do not perform under the contracts' terms.
Foreign-denominated assets, including investment securities, and liabilities are translated into U.S. dollars at the exchange rates at period end. Purchases and sales of investment securities, income and dividends received and expenses denominated in foreign currencies are translated into U.S. dollars at the exchange rate in effect on the transaction date.
The effects of exchange rate fluctuations on investments are included with the net realized and unrealized gain (loss) on investment securities. Other foreign currency transactions resulting in realized and unrealized gain (loss) are disclosed separately.
Investment Transactions and Income. For financial reporting purposes, the Fund's investment holdings and NAV include trades executed through the end of the last business day of the period. The NAV per share for processing shareholder transactions is calculated as of the close of business of the New York Stock Exchange (NYSE), normally 4:00 p.m. Eastern time and includes trades executed through the end of the prior business day. Gains and losses on securities sold are determined on the basis of identified cost and include proceeds received from litigation. Dividend income is recorded on the ex-dividend date, except for certain dividends from foreign securities where the ex-dividend date may have passed, which are recorded as soon as the Fund is informed of the ex-dividend date. Non-cash dividends included in dividend income, if any, are recorded at the fair market value of the securities received. Income and capital gain distributions from Fidelity Central Funds, if any, are recorded on the ex-dividend date. Certain distributions received by the Fund represent a return of capital or capital gain. The Fund determines the components of these distributions subsequent to the ex-dividend date, based upon receipt of tax filings or other correspondence relating to the underlying investment. These distributions are recorded as a reduction of cost of investments and/or as a realized gain. Interest income is accrued as earned and includes coupon interest and amortization of premium and accretion of discount on debt securities as applicable. Investment income is recorded net of foreign taxes withheld where recovery of such taxes is uncertain.
Class Allocations and Expenses. Investment income, realized and unrealized capital gains and losses, common expenses of the Fund, and certain fund-level expense reductions, if any, are allocated daily on a pro-rata basis to each class based on the relative net assets of each class to the total net assets of the Fund. Each class differs with respect to transfer agent and distribution and service plan fees incurred. Certain expense reductions may also differ by class. For the reporting period, the allocated portion of income and expenses to each class as a percent of its average net assets may vary due to the timing of recording these transactions in relation to fluctuating net assets of the classes. Expenses directly attributable to a fund are charged to that fund. Expenses attributable to more than one fund are allocated among the respective funds on the basis of relative net assets or other appropriate methods. Expense estimates are accrued in the period to which they relate and adjustments are made when actual amounts are known.
Income Tax Information and Distributions to Shareholders. Each year, the Fund intends to qualify as a regulated investment company under Subchapter M of the Internal Revenue Code, including distributing substantially all of its taxable income and realized gains. As a result, no provision for U.S. Federal income taxes is required. As of October 31, 2019, the Fund did not have any unrecognized tax benefits in the financial statements; nor is the Fund aware of any tax positions for which it is reasonably possible that the total amounts of unrecognized tax benefits will significantly change in the next twelve months. The Fund files a U.S. federal tax return, in addition to state and local tax returns as required. The Fund's federal income tax returns are subject to examination by the Internal Revenue Service (IRS) for a period of three fiscal years after they are filed. State and local tax returns may be subject to examination for an additional fiscal year depending on the jurisdiction. Foreign taxes are provided for based on the Fund's understanding of the tax rules and rates that exist in the foreign markets in which it invests.
Distributions are declared and recorded on the ex-dividend date. Income and capital gain distributions are declared separately for each class. Income and capital gain distributions are determined in accordance with income tax regulations, which may differ from GAAP. In addition, the Fund claimed a portion of the payment made to redeeming shareholders as a distribution for income tax purposes.
Capital accounts within the financial statements are adjusted for permanent book-tax differences. These adjustments have no impact on net assets or the results of operations. Capital accounts are not adjusted for temporary book-tax differences which will reverse in a subsequent period.
Book-tax differences are primarily due to foreign currency transactions, passive foreign investment companies (PFIC), capital loss carryforwards and losses deferred due to wash sales.
As of period end, the cost and unrealized appreciation (depreciation) in securities, and derivatives if applicable, for federal income tax purposes were as follows:
| Gross unrealized appreciation | $7,292,303 |
| Gross unrealized depreciation | (499,706) |
| Net unrealized appreciation (depreciation) | $6,792,597 |
| Tax Cost | $91,385,017 |
The tax-based components of distributable earnings as of period end were as follows:
| Undistributed ordinary income | $407,005 |
| Capital Loss Carryforward | $(1,527,900) |
| Net unrealized appreciation (depreciation) on securities and other investments | $6,764,718 |
Capital loss carryforwards are only available to offset future capital gains of the Fund to the extent provided by regulations and may be limited. Under the Regulated Investment Company Modernization Act of 2010 (the Act), the Fund is permitted to carry forward capital losses incurred in taxable years beginning after December 22, 2010 for an unlimited period and such capital losses are required to be used prior to any losses that expire. The capital loss carryforward information presented below, including any applicable limitation, is estimated as of fiscal period end and is subject to adjustment.
| No expiration | |
| Short-term | $(1,527,900) |
The tax character of distributions paid was as follows:
| | October 31, 2019 | October 31, 2018 |
| Ordinary Income | $235,858 | $ 5,723,707 |
| Long-term Capital Gains | 10,120,802 | 12,151,964 |
| Total | $10,356,660 | $17,875,671 |
Restricted Securities. The Fund may invest in securities that are subject to legal or contractual restrictions on resale. These securities generally may be resold in transactions exempt from registration or to the public if the securities are registered. Disposal of these securities may involve time-consuming negotiations and expense, and prompt sale at an acceptable price may be difficult. Information regarding restricted securities is included at the end of the Fund's Schedule of Investments.
4. Purchases and Sales of Investments.
Purchases and sales of securities, other than short-term securities, aggregated $148,045,229 and $170,722,724, respectively.
5. Fees and Other Transactions with Affiliates.
Management Fee. Fidelity Management & Research Company (the investment adviser) and its affiliates provide the Fund with investment management related services for which the Fund pays a monthly management fee. The management fee is the sum of an individual fund fee rate that is based on an annual rate of .45% of the Fund's average net assets and an annualized group fee rate that averaged .24% during the period. The group fee rate is based upon the average net assets of all the mutual funds advised by the investment adviser, including any mutual funds previously advised by the investment adviser that are currently advised by Fidelity SelectCo, LLC, an affiliate of the investment adviser. The group fee rate decreases as assets under management increase and increases as assets under management decrease. In addition, the management fee is subject to a performance adjustment (up to a maximum of +/- .20% of the Fund's average net assets over a 36 month performance period). The upward or downward adjustment to the management fee is based on the relative investment performance of Class I of the Fund as compared to its benchmark index, the MSCI All Country World Index, over the same 36 month performance period. For the reporting period, the total annual management fee rate, including the performance adjustment, was .44% of the Fund's average net assets. The performance adjustment included in the management fee rate may be higher or lower than the maximum performance adjustment rate due to the difference between the average net assets for the reporting and performance periods.
Distribution and Service Plan Fees. In accordance with Rule 12b-1 of the 1940 Act, the Fund has adopted separate Distribution and Service Plans for each class of shares. Certain classes pay Fidelity Distributors Corporation (FDC), an affiliate of the investment adviser, separate Distribution and Service Fees, each of which is based on an annual percentage of each class' average net assets. In addition, FDC may pay financial intermediaries for selling shares of the Fund and providing shareholder support services. For the period, the Distribution and Service Fee rates, total fees and amounts retained by FDC were as follows:
| | Distribution Fee | Service Fee | Total Fees | Retained by FDC |
| Class A | -% | .25% | $80,590 | $1,227 |
| Class M | .25% | .25% | 100,238 | 1,050 |
| Class C | .75% | .25% | 153,879 | 19,568 |
| | | | $334,707 | $ 21,845 |
Sales Load. FDC may receive a front-end sales charge of up to 5.75% for selling Class A shares and 3.50% for selling Class M shares, some of which is paid to financial intermediaries for selling shares of the Fund. Depending on the holding period, FDC may receive contingent deferred sales charges levied on Class A, Class M and Class C redemptions. The deferred sales charges are 1.00% for Class C shares, 1.00% for certain purchases of Class A shares and .25% for certain purchases of Class M shares.
For the period, sales charge amounts retained by FDC were as follows:
| | Retained by FDC |
| Class A | $3,662 |
| Class M | 2,432 |
| Class C(a) | 1,035 |
| | $7,129 |
(a) When Class C shares are initially sold, FDC pays commissions from its own resources to financial intermediaries through which the sales are made.
Transfer Agent Fees. Fidelity Investments Institutional Operations Company, Inc., (FIIOC), an affiliate of the investment adviser, is the transfer, dividend disbursing and shareholder servicing agent for each class of the Fund. FIIOC receives account fees and asset-based fees that vary according to the account size and type of account of the shareholders of the respective classes of the Fund. FIIOC pays for typesetting, printing and mailing of shareholder reports, except proxy statements.
For the period, transfer agent fees for each class were as follows:
| | Amount | % of Class-Level Average Net Assets |
| Class A | $74,316 | .23 |
| Class M | 53,957 | .27 |
| Class C | 35,561 | .23 |
| Class I | 63,640 | .16 |
| | $227,474 | |
Accounting and Security Lending Fees. Fidelity Service Company, Inc. (FSC), an affiliate of the investment adviser, maintains the Fund's accounting records. The accounting fee is based on the level of average net assets for each month. Prior to April 1, 2019, FSC had a separate agreement with the Fund for administration of the security lending program, based on the number and duration of lending transactions. For the period, the total fees paid for accounting and administration of securities lending were equivalent to an annual rate of .04%.
Brokerage Commissions. The Fund placed a portion of its portfolio transactions with brokerage firms which are affiliates of the investment adviser. Brokerage commissions are included in net realized gain (loss) and change in net unrealized appreciation (depreciation) in the Statement of Operations. The commissions paid to these affiliated firms were $2,200 for the period.
Interfund Trades. The Fund may purchase from or sell securities to other Fidelity Funds under procedures adopted by the Board. The procedures have been designed to ensure these interfund trades are executed in accordance with Rule 17a-7 of the 1940 Act. Interfund trades are included within the respective purchases and sales amounts shown in the Purchases and Sales of Investments note.
6. Committed Line of Credit.
The Fund participates with other funds managed by the investment adviser or an affiliate in a $4.25 billion credit facility (the "line of credit") to be utilized for temporary or emergency purposes to fund shareholder redemptions or for other short-term liquidity purposes. The Fund has agreed to pay commitment fees on its pro-rata portion of the line of credit, which amounted to $292 and is reflected in Miscellaneous expenses on the Statement of Operations. During the period, the Fund did not borrow on this line of credit.
7. Security Lending.
The Fund lends portfolio securities from time to time in order to earn additional income. For equity securities, lending agents are used, including National Financial Services (NFS), an affiliate of the Fund. Pursuant to a securities lending agreement, NFS will receive a fee, which is capped at 9.9% of daily lending revenue, for its services as lending agent. The Fund may lend securities to certain qualified borrowers including NFS. On the settlement date of the loan, the Fund receives collateral (in the form of U.S. Treasury obligations, letters of credit and/or cash) against the loaned securities and maintains collateral in an amount not less than 100% of the market value of the loaned securities during the period of the loan. The market value of the loaned securities is determined at the close of business of the Fund and any additional required collateral is delivered to the Fund on the next business day. The Fund or borrower may terminate the loan at any time, and if the borrower defaults on its obligation to return the securities loaned because of insolvency or other reasons, the Fund may apply collateral received from the borrower against the obligation. The Fund may experience delays and costs in recovering the securities loaned. Any cash collateral received is invested in the Fidelity Securities Lending Cash Central Fund. The value of loaned securities and cash collateral at period end are disclosed on the Fund's Statement of Assets and Liabilities. Total fees paid by the Fund to NFS, as lending agent, amounted to $7. Security lending income represents the income earned on investing cash collateral, less rebates paid to borrowers and any lending agent fees associated with the loan, plus any premium payments received for lending certain types of securities. Security lending income is presented in the Statement of Operations as a component of income from Fidelity Central Funds. During the period, there were no securities loaned to NFS.
8. Expense Reductions.
Commissions paid to certain brokers with whom the investment adviser, or its affiliates, places trades on behalf of the Fund include an amount in addition to trade execution, which may be rebated back to the Fund to offset certain expenses. This amount totaled $5,417 for the period.
In addition, during the period the investment adviser reimbursed and/or waived a portion of fund-level operating expenses in the amount of $848.
9. Distributions to Shareholders.
Distributions to shareholders of each class were as follows:
| | Year ended
October 31, 2019 | Year ended
October 31, 2018 |
| Distributions to shareholders | | |
| Class A | $2,906,974 | $4,934,393 |
| Class M | 1,898,257 | 3,322,710 |
| Class C | 1,864,569 | 3,329,453 |
| Class I | 3,686,861 | 6,289,115 |
| Total | $10,356,661 | $17,875,671 |
10. Share Transactions.
Share transactions for each class were as follows and may contain automatic conversions between classes or exchanges between affiliated funds:
| | Shares | Shares | Dollars | Dollars |
| | Year ended October 31, 2019 | Year ended October 31, 2018 | Year ended October 31, 2019 | Year ended October 31, 2018 |
| Class A | | | | |
| Shares sold | 361,379 | 327,844 | $5,512,165 | $6,088,684 |
| Reinvestment of distributions | 198,251 | 267,705 | 2,854,816 | 4,779,482 |
| Shares redeemed | (678,050) | (472,747) | (10,201,045) | (8,656,517) |
| Net increase (decrease) | (118,420) | 122,802 | $(1,834,064) | $2,211,649 |
| Class M | | | | |
| Shares sold | 157,333 | 148,419 | $2,304,552 | $2,645,272 |
| Reinvestment of distributions | 138,334 | 194,710 | 1,891,020 | 3,320,374 |
| Shares redeemed | (398,868) | (301,937) | (5,717,418) | (5,316,454) |
| Net increase (decrease) | (103,201) | 41,192 | $(1,521,846) | $649,192 |
| Class C | | | | |
| Shares sold | 116,326 | 336,353 | $1,442,132 | $5,409,086 |
| Reinvestment of distributions | 150,390 | 209,356 | 1,825,734 | 3,222,495 |
| Shares redeemed | (708,736) | (517,958) | (9,141,834) | (8,241,987) |
| Net increase (decrease) | (442,020) | 27,751 | $(5,873,968) | $389,594 |
| Class I | | | | |
| Shares sold | 315,717 | 523,929 | $5,071,601 | $10,283,715 |
| Reinvestment of distributions | 229,038 | 322,367 | 3,483,673 | 6,048,866 |
| Shares redeemed | (901,180) | (658,439) | (14,422,937) | (12,788,597) |
| Net increase (decrease) | (356,425) | 187,857 | $(5,867,663) | $3,543,984 |
11. Other.
The Fund's organizational documents provide former and current trustees and officers with a limited indemnification against liabilities arising in connection with the performance of their duties to the Fund. In the normal course of business, the Fund may also enter into contracts that provide general indemnifications. The Fund's maximum exposure under these arrangements is unknown as this would be dependent on future claims that may be made against the Fund. The risk of material loss from such claims is considered remote.
Report of Independent Registered Public Accounting Firm
To the Board of Trustees of Fidelity Advisor Series VIII and Shareholders of Fidelity Advisor Global Capital Appreciation Fund:
Opinion on the Financial Statements
We have audited the accompanying statement of assets and liabilities, including the schedule of investments, of Fidelity Advisor Global Capital Appreciation Fund (one of the funds constituting Fidelity Advisor Series VIII, referred to hereafter as the “Fund”) as of October 31, 2019, the related statement of operations for the year ended October 31, 2019, the statement of changes in net assets for each of the two years in the period ended October 31, 2019, including the related notes, and the financial highlights for each of the five years in the period ended October 31, 2019 (collectively referred to as the “financial statements”). In our opinion, the financial statements present fairly, in all material respects, the financial position of the Fund as of October 31, 2019, the results of its operations for the year then ended, the changes in its net assets for each of the two years in the period ended October 31, 2019 and the financial highlights for each of the five years in the period ended October 31, 2019 in conformity with accounting principles generally accepted in the United States of America.
Basis for Opinion
These financial statements are the responsibility of the Fund’s management. Our responsibility is to express an opinion on the Fund’s financial statements based on our audits. We are a public accounting firm registered with the Public Company Accounting Oversight Board (United States) (PCAOB) and are required to be independent with respect to the Fund in accordance with the U.S. federal securities laws and the applicable rules and regulations of the Securities and Exchange Commission and the PCAOB.
We conducted our audits of these financial statements in accordance with the standards of the PCAOB. Those standards require that we plan and perform the audit to obtain reasonable assurance about whether the financial statements are free of material misstatement, whether due to error or fraud.
Our audits included performing procedures to assess the risks of material misstatement of the financial statements, whether due to error or fraud, and performing procedures that respond to those risks. Such procedures included examining, on a test basis, evidence regarding the amounts and disclosures in the financial statements. Our audits also included evaluating the accounting principles used and significant estimates made by management, as well as evaluating the overall presentation of the financial statements. Our procedures included confirmation of securities owned as of October 31, 2019 by correspondence with the custodian and brokers; when replies were not received from brokers, we performed other auditing procedures. We believe that our audits provide a reasonable basis for our opinion.
PricewaterhouseCoopers LLP
Boston, Massachusetts
December 11, 2019
We have served as the auditor of one or more investment companies in the Fidelity group of funds since 1932.
Trustees and Officers
The Trustees, Members of the Advisory Board (if any), and officers of the trust and fund, as applicable, are listed below. The Board of Trustees governs the fund and is responsible for protecting the interests of shareholders. The Trustees are experienced executives who meet periodically throughout the year to oversee the fund's activities, review contractual arrangements with companies that provide services to the fund, oversee management of the risks associated with such activities and contractual arrangements, and review the fund's performance. Except for Jonathan Chiel, each of the Trustees oversees 298 funds. Mr. Chiel oversees 171 funds.
The Trustees hold office without limit in time except that (a) any Trustee may resign; (b) any Trustee may be removed by written instrument, signed by at least two-thirds of the number of Trustees prior to such removal; (c) any Trustee who requests to be retired or who has become incapacitated by illness or injury may be retired by written instrument signed by a majority of the other Trustees; and (d) any Trustee may be removed at any special meeting of shareholders by a two-thirds vote of the outstanding voting securities of the trust. Each Trustee who is not an interested person (as defined in the 1940 Act) of the trust and the fund is referred to herein as an Independent Trustee. Each Independent Trustee shall retire not later than the last day of the calendar year in which his or her 75th birthday occurs. The Independent Trustees may waive this mandatory retirement age policy with respect to individual Trustees. Officers and Advisory Board Members hold office without limit in time, except that any officer or Advisory Board Member may resign or may be removed by a vote of a majority of the Trustees at any regular meeting or any special meeting of the Trustees. Except as indicated, each individual has held the office shown or other offices in the same company for the past five years.
The fund’s Statement of Additional Information (SAI) includes more information about the Trustees. To request a free copy, call Fidelity at 1-877-208-0098.
Experience, Skills, Attributes, and Qualifications of the Trustees. The Governance and Nominating Committee has adopted a statement of policy that describes the experience, qualifications, attributes, and skills that are necessary and desirable for potential Independent Trustee candidates (Statement of Policy). The Board believes that each Trustee satisfied at the time he or she was initially elected or appointed a Trustee, and continues to satisfy, the standards contemplated by the Statement of Policy. The Governance and Nominating Committee also engages professional search firms to help identify potential Independent Trustee candidates who have the experience, qualifications, attributes, and skills consistent with the Statement of Policy. From time to time, additional criteria based on the composition and skills of the current Independent Trustees, as well as experience or skills that may be appropriate in light of future changes to board composition, business conditions, and regulatory or other developments, have also been considered by the professional search firms and the Governance and Nominating Committee. In addition, the Board takes into account the Trustees' commitment and participation in Board and committee meetings, as well as their leadership of standing and ad hoc committees throughout their tenure.
In determining that a particular Trustee was and continues to be qualified to serve as a Trustee, the Board has considered a variety of criteria, none of which, in isolation, was controlling. The Board believes that, collectively, the Trustees have balanced and diverse experience, qualifications, attributes, and skills, which allow the Board to operate effectively in governing the fund and protecting the interests of shareholders. Information about the specific experience, skills, attributes, and qualifications of each Trustee, which in each case led to the Board's conclusion that the Trustee should serve (or continue to serve) as a trustee of the fund, is provided below.
Board Structure and Oversight Function. James C. Curvey is an interested person and currently serves as Chairman. The Trustees have determined that an interested Chairman is appropriate and benefits shareholders because an interested Chairman has a personal and professional stake in the quality and continuity of services provided to the fund. Independent Trustees exercise their informed business judgment to appoint an individual of their choosing to serve as Chairman, regardless of whether the Trustee happens to be independent or a member of management. The Independent Trustees have determined that they can act independently and effectively without having an Independent Trustee serve as Chairman and that a key structural component for assuring that they are in a position to do so is for the Independent Trustees to constitute a substantial majority for the Board. The Independent Trustees also regularly meet in executive session. Ned C. Lautenbach serves as Chairman of the Independent Trustees and as such (i) acts as a liaison between the Independent Trustees and management with respect to matters important to the Independent Trustees and (ii) with management prepares agendas for Board meetings.
Fidelity® funds are overseen by different Boards of Trustees. The fund's Board oversees Fidelity's high income and certain equity funds, and other Boards oversee Fidelity's investment-grade bond, money market, asset allocation, and other equity funds. The asset allocation funds may invest in Fidelity® funds overseen by the fund's Board. The use of separate Boards, each with its own committee structure, allows the Trustees of each group of Fidelity® funds to focus on the unique issues of the funds they oversee, including common research, investment, and operational issues. On occasion, the separate Boards establish joint committees to address issues of overlapping consequences for the Fidelity® funds overseen by each Board.
The Trustees operate using a system of committees to facilitate the timely and efficient consideration of all matters of importance to the Trustees, the fund, and fund shareholders and to facilitate compliance with legal and regulatory requirements and oversight of the fund's activities and associated risks. The Board, acting through its committees, has charged FMR and its affiliates with (i) identifying events or circumstances the occurrence of which could have demonstrably adverse effects on the fund's business and/or reputation; (ii) implementing processes and controls to lessen the possibility that such events or circumstances occur or to mitigate the effects of such events or circumstances if they do occur; and (iii) creating and maintaining a system designed to evaluate continuously business and market conditions in order to facilitate the identification and implementation processes described in (i) and (ii) above. Because the day-to-day operations and activities of the fund are carried out by or through FMR, its affiliates, and other service providers, the fund's exposure to risks is mitigated but not eliminated by the processes overseen by the Trustees. While each of the Board's committees has responsibility for overseeing different aspects of the fund's activities, oversight is exercised primarily through the Operations, Audit, and Compliance Committees. Appropriate personnel, including but not limited to the fund's Chief Compliance Officer (CCO), FMR's internal auditor, the independent accountants, the fund's Treasurer and portfolio management personnel, make periodic reports to the Board's committees, as appropriate, including an annual review of Fidelity's risk management program for the Fidelity® funds. The responsibilities of each standing committee, including their oversight responsibilities, are described further under "Standing Committees of the Trustees."
Interested Trustees*:
Correspondence intended for a Trustee who is an interested person may be sent to Fidelity Investments, 245 Summer Street, Boston, Massachusetts 02210.
Name, Year of Birth; Principal Occupations and Other Relevant Experience+
Jonathan Chiel (1957)
Year of Election or Appointment: 2016
Trustee
Mr. Chiel also serves as Trustee of other Fidelity® funds. Mr. Chiel is Executive Vice President and General Counsel for FMR LLC (diversified financial services company, 2012-present). Previously, Mr. Chiel served as general counsel (2004-2012) and senior vice president and deputy general counsel (2000-2004) for John Hancock Financial Services; a partner with Choate, Hall & Stewart (1996-2000) (law firm); and an Assistant United States Attorney for the United States Attorney’s Office of the District of Massachusetts (1986-95), including Chief of the Criminal Division (1993-1995). Mr. Chiel is a director on the boards of the Boston Bar Foundation and the Maimonides School.
James C. Curvey (1935)
Year of Election or Appointment: 2007
Trustee
Chairman of the Board of Trustees
Mr. Curvey also serves as Trustee of other Fidelity® funds. Mr. Curvey is Vice Chairman (2007-present) and Director of FMR LLC (diversified financial services company). In addition, Mr. Curvey is an Overseer Emeritus for the Boston Symphony Orchestra, a Director of Artis-Naples, and a Trustee of Brewster Academy in Wolfeboro, New Hampshire. Previously, Mr. Curvey served as a Director of Fidelity Research & Analysis Co. (investment adviser firm, 2009-2018), Director of Fidelity Investments Money Management, Inc. (investment adviser firm, 2009-2014) and a Director of FMR and FMR Co., Inc. (investment adviser firms, 2007-2014).
* Determined to be an “Interested Trustee” by virtue of, among other things, his or her affiliation with the trust or various entities under common control with FMR.
+ The information includes the Trustee's principal occupation during the last five years and other information relating to the experience, attributes, and skills relevant to the Trustee's qualifications to serve as a Trustee, which led to the conclusion that the Trustee should serve as a Trustee for the fund.
Independent Trustees:
Correspondence intended for an Independent Trustee may be sent to Fidelity Investments, P.O. Box 55235, Boston, Massachusetts 02205-5235.
Name, Year of Birth; Principal Occupations and Other Relevant Experience+
Dennis J. Dirks (1948)
Year of Election or Appointment: 2005
Trustee
Mr. Dirks also serves as Trustee of other Fidelity® funds. Prior to his retirement in May 2003, Mr. Dirks was Chief Operating Officer and a member of the Board of The Depository Trust & Clearing Corporation (DTCC). He also served as President, Chief Operating Officer, and Board member of The Depository Trust Company (DTC) and President and Board member of the National Securities Clearing Corporation (NSCC). In addition, Mr. Dirks served as Chief Executive Officer and Board member of the Government Securities Clearing Corporation, Chief Executive Officer and Board member of the Mortgage-Backed Securities Clearing Corporation, as a Trustee and a member of the Finance Committee of Manhattan College (2005-2008), as a Trustee and a member of the Finance Committee of AHRC of Nassau County (2006-2008), as a member of the Independent Directors Council (IDC) Governing Council (2010-2015), and as a member of the Board of Directors for The Brookville Center for Children’s Services, Inc. (2009-2017). Mr. Dirks is a member of the Finance Committee (2016-present) and Board of Directors (2017-present) and is Treasurer (2018-present) of the Asolo Repertory Theatre.
Donald F. Donahue (1950)
Year of Election or Appointment: 2018
Trustee
Mr. Donahue also serves as a Trustee of other Fidelity® funds. Mr. Donahue is President and Chief Executive Officer of Miranda Partners, LLC (risk consulting for the financial services industry, 2012-present). Previously, Mr. Donahue served as a Member of the Advisory Board of certain Fidelity® funds (2015-2018) and Chief Executive Officer (2006-2012), Chief Operating Officer (2003-2006), and Managing Director, Customer Marketing and Development (1999-2003) of The Depository Trust & Clearing Corporation (financial markets infrastructure). Mr. Donahue serves as a Member (2007-present) and Co-Chairman (2016-present) of the Board of Directors of United Way of New York, Member of the Board of Directors of NYC Leadership Academy (2012-present) and Member of the Board of Advisors of Ripple Labs, Inc. (financial services, 2015-present). He also served as Chairman (2010-2012) and Member of the Board of Directors (2012-2013) of Omgeo, LLC (financial services), Treasurer of United Way of New York (2012-2016), and Member of the Board of Directors of XBRL US (financial services non-profit, 2009-2012) and the International Securities Services Association (2009-2012).
Alan J. Lacy (1953)
Year of Election or Appointment: 2008
Trustee
Mr. Lacy also serves as Trustee of other Fidelity® funds. Mr. Lacy serves as a Director of Bristol-Myers Squibb Company (global pharmaceuticals, 2008-present). He is a Trustee of the California Chapter of The Nature Conservancy (2015-present) and a Director of the Center for Advanced Study in the Behavioral Sciences at Stanford University (2015-present). In addition, Mr. Lacy served as Senior Adviser (2007-2014) of Oak Hill Capital Partners, L.P. (private equity) and also served as Chief Executive Officer (2005) and Vice Chairman (2005-2006) of Sears Holdings Corporation (retail) and Chief Executive Officer and Chairman of the Board of Sears, Roebuck and Co. (retail, 2000-2005). Previously, Mr. Lacy served as Chairman (2014-2017) and a member (2010-2017) of the Board of Directors of Dave & Buster’s Entertainment, Inc. (restaurant and entertainment complexes), as Chairman (2008-2011) and a member (2006-2015) of the Board of Trustees of the National Parks Conservation Association, and as a member of the Board of Directors for The Hillman Companies, Inc. (hardware wholesalers, 2010-2014), Earth Fare, Inc. (retail grocery, 2010-2014), and The Western Union Company (global money transfer, 2006-2011).
Ned C. Lautenbach (1944)
Year of Election or Appointment: 2000
Trustee
Chairman of the Independent Trustees
Mr. Lautenbach also serves as Trustee of other Fidelity® funds. Mr. Lautenbach currently serves as Chair (2018-present) and Member (2013-present) of the Board of Governors, State University System of Florida and is a member of the Council on Foreign Relations (1994-present). He is also a member and has most recently served as Chairman of the Board of Directors of Artis-Naples (2012-present). Previously, Mr. Lautenbach served as a member and then Lead Director of the Board of Directors of Eaton Corporation (diversified industrial, 1997-2016). He was also a Partner and Advisory Partner at Clayton, Dubilier & Rice, LLC (private equity investment, 1998-2010), as well as a Director of Sony Corporation (2006-2007). In addition, Mr. Lautenbach also had a 30-year career with IBM (technology company) during which time he served as Senior Vice President and a member of the Corporate Executive Committee (1968-1998).
Joseph Mauriello (1944)
Year of Election or Appointment: 2008
Trustee
Mr. Mauriello also serves as Trustee of other Fidelity® funds. Prior to his retirement in January 2006, Mr. Mauriello served in numerous senior management positions including Deputy Chairman and Chief Operating Officer (2004-2005), and Vice Chairman of Financial Services (2002-2004) of KPMG LLP US (professional services, 1965-2005). Mr. Mauriello currently serves as a member of the Independent Directors Council (IDC) Governing Council (2015-present). Previously, Mr. Mauriello served as a member of the Board of Directors of XL Group plc. (global insurance and re-insurance, 2006-2018).
Cornelia M. Small (1944)
Year of Election or Appointment: 2005
Trustee
Ms. Small also serves as Trustee of other Fidelity® funds. Ms. Small is a member of the Board of Directors (2009-present) and Chair of the Investment Committee (2010-present) of the Teagle Foundation. Ms. Small also serves on the Investment Committee of the Berkshire Taconic Community Foundation (2008-present). Previously, Ms. Small served as Chairperson (2002-2008) and a member of the Investment Committee and Chairperson (2008-2012) and a member of the Board of Trustees of Smith College. In addition, Ms. Small served as Chief Investment Officer, Director of Global Equity Investments, and a member of the Board of Directors of Scudder, Stevens & Clark and Scudder Kemper Investments.
Garnett A. Smith (1947)
Year of Election or Appointment: 2018
Trustee
Mr. Smith also serves as Trustee of other Fidelity® funds. Prior to Mr. Smith's retirement, he served as Chairman and Chief Executive Officer of Inbrand Corp. (manufacturer of personal absorbent products, 1990-1997). He also served as President (1986-1990) of Inbrand Corp. Prior to his employment with Inbrand Corp., he was employed by a retail fabric chain and North Carolina National Bank. In addition, Mr. Smith served as a Member of the Advisory Board of certain Fidelity® funds (2012-2013) and as a board member of the Jackson Hole Land Trust (2009-2012).
David M. Thomas (1949)
Year of Election or Appointment: 2008
Trustee
Mr. Thomas also serves as Trustee of other Fidelity® funds. Mr. Thomas serves as Non-Executive Chairman of the Board of Directors of Fortune Brands Home and Security (home and security products, 2011-present) and as a member of the Board of Directors (2004-present) and Presiding Director (2013-present) of Interpublic Group of Companies, Inc. (marketing communication). Previously, Mr. Thomas served as Executive Chairman (2005-2006) and Chairman and Chief Executive Officer (2000-2005) of IMS Health, Inc. (pharmaceutical and healthcare information solutions), a Director of Fortune Brands, Inc. (consumer products, 2000-2011), and a member of the Board of Trustees of the University of Florida (2013-2018).
+ The information includes the Trustee's principal occupation during the last five years and other information relating to the experience, attributes, and skills relevant to the Trustee's qualifications to serve as a Trustee, which led to the conclusion that the Trustee should serve as a Trustee for the fund.
Advisory Board Members and Officers:
Correspondence intended for a Member of the Advisory Board (if any) may be sent to Fidelity Investments, P.O. Box 55235, Boston, Massachusetts 02205-5235. Correspondence intended for an officer or Peter S. Lynch may be sent to Fidelity Investments, 245 Summer Street, Boston, Massachusetts 02210. Officers appear below in alphabetical order.
Name, Year of Birth; Principal Occupation
Vicki L. Fuller (1957)
Year of Election or Appointment: 2018
Member of the Advisory Board
Ms. Fuller also serves as Member of the Advisory Board of other Fidelity® funds. Ms. Fuller serves as a member of the Board of Directors, Audit Committee, and Nominating and Governance Committee of The Williams Companies, Inc. (natural gas infrastructure, 2018-present). Previously, Ms. Fuller served as the Chief Investment Officer of the New York State Common Retirement Fund (2012-2018) and held a variety of positions at AllianceBernstein L.P. (global asset management, 1985-2012), including Managing Director (2006-2012) and Senior Vice President and Senior Portfolio Manager (2001-2006).
Peter S. Lynch (1944)
Year of Election or Appointment: 2003
Member of the Advisory Board
Mr. Lynch also serves as Member of the Advisory Board of other Fidelity® funds. Mr. Lynch is Vice Chairman and a Director of FMR (investment adviser firm) and FMR Co., Inc. (investment adviser firm). In addition, Mr. Lynch serves as a Trustee of Boston College and as the Chairman of the Inner-City Scholarship Fund. Previously, Mr. Lynch served on the Special Olympics International Board of Directors (1997-2006).
Michael E. Wiley (1950)
Year of Election or Appointment: 2018
Member of the Advisory Board
Mr. Wiley also serves as Trustee or Member of the Advisory Board of other Fidelity® funds. Mr. Wiley serves as a Director of High Point Resources (exploration and production, 2005-present). Previously, Mr. Wiley served as a Director of Andeavor Corporation (independent oil refiner and marketer, 2005-2018), a Director of Andeavor Logistics LP (natural resources logistics, 2015-2018), a Director of Post Oak Bank (privately-held bank, 2004-2018), a Director of Asia Pacific Exploration Consolidated (international oil and gas exploration and production, 2008-2013), a member of the Board of Trustees of the University of Tulsa (2000-2006; 2007-2010), a Senior Energy Advisor of Katzenbach Partners, LLC (consulting, 2006-2007), an Advisory Director of Riverstone Holdings (private investment), a Director of Spinnaker Exploration Company (exploration and production, 2001-2005) and Chairman, President, and CEO of Baker Hughes, Inc. (oilfield services, 2000-2004).
Elizabeth Paige Baumann (1968)
Year of Election or Appointment: 2017
Anti-Money Laundering (AML) Officer
Ms. Baumann also serves as AML Officer of other funds. She is Chief AML Officer (2012-present) and Senior Vice President (2014-present) of FMR LLC (diversified financial services company) and is an employee of Fidelity Investments. Previously, Ms. Baumann served as AML Officer of the funds (2012-2016), and Vice President (2007-2014) and Deputy Anti-Money Laundering Officer (2007-2012) of FMR LLC.
Craig S. Brown (1977)
Year of Election or Appointment: 2019
Assistant Treasurer
Mr. Brown also serves as Assistant Treasurer of other funds. Mr. Brown is an employee of Fidelity Investments (2013-present).
John J. Burke III (1964)
Year of Election or Appointment: 2018
Chief Financial Officer
Mr. Burke also serves as Chief Financial Officer of other funds. Mr. Burke serves as Head of Investment Operations for Fidelity Fund and Investment Operations (2018-present) and is an employee of Fidelity Investments (1998-present). Previously Mr. Burke served as head of Asset Management Investment Operations (2012-2018).
William C. Coffey (1969)
Year of Election or Appointment: 2019
Assistant Secretary
Mr. Coffey also serves as Assistant Secretary of other funds. He is Senior Vice President and Deputy General Counsel of FMR LLC (diversified financial services company, 2010-present), and is an employee of Fidelity Investments. Previously, Mr. Coffey served as Secretary and CLO of certain funds (2018-2019); CLO, Secretary, and Senior Vice President of Fidelity Management & Research Company and FMR Co., Inc. (investment adviser firms, 2018-2019); Secretary of Fidelity SelectCo, LLC and Fidelity Investments Money Management, Inc. (investment adviser firms, 2018-2019); CLO of Fidelity Management & Research (Hong Kong) Limited, FMR Investment Management (UK) Limited, and Fidelity Management & Research (Japan) Limited (investment adviser firms, 2018-2019); and Assistant Secretary of certain funds (2009-2018).
Timothy M. Cohen (1969)
Year of Election or Appointment: 2018
Vice President
Mr. Cohen also serves as Vice President of other funds. Mr. Cohen serves as Executive Vice President of Fidelity SelectCo, LLC (2019-present), Co-Head of Equity (2018-present), a Director of Fidelity Management & Research (Japan) Limited (investment adviser firm, 2016-present), and is an employee of Fidelity Investments. Previously, Mr. Cohen served as Head of Global Equity Research (2016-2018), Chief Investment Officer - Equity and a Director of Fidelity Management & Research (U.K.) Inc. (investment adviser firm, 2013-2015) and as a Director of Fidelity Management & Research (Hong Kong) Limited (investment adviser firm, 2017).
Jonathan Davis (1968)
Year of Election or Appointment: 2010
Assistant Treasurer
Mr. Davis also serves as Assistant Treasurer of other funds. Mr. Davis serves as Assistant Treasurer of FMR Capital, Inc. (2017-present) and is an employee of Fidelity Investments. Previously, Mr. Davis served as Vice President and Associate General Counsel of FMR LLC (diversified financial services company, 2003-2010).
Adrien E. Deberghes (1967)
Year of Election or Appointment: 2016
Assistant Treasurer
Mr. Deberghes also serves as an officer of other funds. He serves as Assistant Treasurer of FMR Capital, Inc. (2017-present), Executive Vice President of Fidelity Investments Money Management, Inc. (FIMM) (investment adviser firm, 2016-present), and is an employee of Fidelity Investments (2008-present). Previously, Mr. Deberghes served as President and Treasurer of certain Fidelity® funds (2013-2018). Prior to joining Fidelity Investments, Mr. Deberghes was Senior Vice President of Mutual Fund Administration at State Street Corporation (2007-2008), Senior Director of Mutual Fund Administration at Investors Bank & Trust (2005-2007), and Director of Finance for Dunkin' Brands (2000-2005). Previously, Mr. Deberghes served in other fund officer roles.
Laura M. Del Prato (1964)
Year of Election or Appointment: 2018
Assistant Treasurer
Ms. Del Prato also serves as an officer of other funds. Ms. Del Prato is an employee of Fidelity Investments (2017-present). Prior to joining Fidelity Investments, Ms. Del Prato served as a Managing Director and Treasurer of the JPMorgan Mutual Funds (2014-2017). Prior to JPMorgan, Ms. Del Prato served as a partner at Cohen Fund Audit Services (accounting firm, 2012-2013) and KPMG LLP (accounting firm, 2004-2012).
Colm A. Hogan (1973)
Year of Election or Appointment: 2016
Deputy Treasurer
Mr. Hogan also serves as an officer of other funds. Mr. Hogan serves as Assistant Treasurer of FMR Capital, Inc. (2017-present) and is an employee of Fidelity Investments (2005-present). Previously, Mr. Hogan served as Assistant Treasurer of certain Fidelity® funds (2016-2018).
Pamela R. Holding (1964)
Year of Election or Appointment: 2018
Vice President
Ms. Holding also serves as Vice President of other funds. Ms. Holding serves as Executive Vice President of Fidelity SelectCo, LLC (2019-present), Co-Head of Equity (2018-present) and is an employee of Fidelity Investments (2013-present). Previously, Ms. Holding served as Chief Investment Officer of Fidelity Institutional Asset Management (2013-2018).
Cynthia Lo Bessette (1969)
Year of Election or Appointment: 2019
Secretary and Chief Legal Officer (CLO)
Ms. Lo Bessette also serves as Secretary and CLO of other funds. Ms. Lo Bessette serves as CLO, Secretary, and Senior Vice President of Fidelity Management & Research Company and FMR Co., Inc. (investment adviser firms, 2019-present); Secretary of Fidelity SelectCo, LLC and Fidelity Investments Money Management, Inc. (investment adviser firms, 2019-present); and CLO of Fidelity Management & Research (Hong Kong) Limited, FMR Investment Management (UK) Limited, and Fidelity Management & Research (Japan) Limited (investment adviser firms, 2019-present). She is a Senior Vice President and Deputy General Counsel of FMR LLC (diversified financial services company, 2019-present), and is an employee of Fidelity Investments. Previously, Ms. Lo Bessette served as Executive Vice President, General Counsel (2016-2019) and Senior Vice President, Deputy General Counsel (2015-2016) of OppenheimerFunds (investment management company) and Deputy Chief Legal Officer (2013-2015) of Jennison Associates LLC (investment adviser firm).
Chris Maher (1972)
Year of Election or Appointment: 2013
Assistant Treasurer
Mr. Maher serves as Assistant Treasurer of other funds. Mr. Maher is Vice President of Valuation Oversight, serves as Assistant Treasurer of FMR Capital, Inc. (2017-present), and is an employee of Fidelity Investments. Previously, Mr. Maher served as Vice President of Asset Management Compliance (2013), Vice President of the Program Management Group of FMR (investment adviser firm, 2010-2013), and Vice President of Valuation Oversight (2008-2010).
Kenneth B. Robins (1969)
Year of Election or Appointment: 2016
Chief Compliance Officer
Mr. Robins also serves as an officer of other funds. Mr. Robins serves as Compliance Officer of Fidelity Management & Research Company and FMR Co., Inc. (investment adviser firms, 2016-present) and is an employee of Fidelity Investments (2004-present). Previously, Mr. Robins served as Executive Vice President of Fidelity Investments Money Management, Inc. (investment adviser firm, 2013-2016) and served in other fund officer roles.
Stacie M. Smith (1974)
Year of Election or Appointment: 2016
President and Treasurer
Ms. Smith also serves as an officer of other funds. Ms. Smith serves as Assistant Treasurer of FMR Capital, Inc. (2017-present), is an employee of Fidelity Investments (2009-present), and has served in other fund officer roles. Prior to joining Fidelity Investments, Ms. Smith served as Senior Audit Manager of Ernst & Young LLP (accounting firm, 1996-2009). Previously, Ms. Smith served as Assistant Treasurer (2013-2018) and Deputy Treasurer (2013-2016) of certain Fidelity® funds.
Marc L. Spector (1972)
Year of Election or Appointment: 2016
Assistant Treasurer
Mr. Spector also serves as an officer of other funds. Mr. Spector serves as Assistant Treasurer of FMR Capital, Inc. (2017-present) and is an employee of Fidelity Investments (2016-present). Prior to joining Fidelity Investments, Mr. Spector served as Director at the Siegfried Group (accounting firm, 2013-2016), and prior to Siegfried Group as audit senior manager at Deloitte & Touche (accounting firm, 2005-2013).
Jim Wegmann (1979)
Year of Election or Appointment: 2019
Assistant Treasurer
Mr. Wegmann also serves as Assistant Treasurer of other funds. Mr. Wegmann is an employee of Fidelity Investments (2011-present).
Shareholder Expense Example
As a shareholder of the Fund, you incur two types of costs: (1) transaction costs, including sales charges (loads) on purchase payments or redemption proceeds, and (2) ongoing costs, including management fees, distribution and/or service (12b-1) fees and other Fund expenses. This Example is intended to help you understand your ongoing costs (in dollars) of investing in the Fund and to compare these costs with the ongoing costs of investing in other mutual funds.
The Example is based on an investment of $1,000 invested at the beginning of the period and held for the entire period (May 1, 2019 to October 31, 2019).
Actual Expenses
The first line of the accompanying table for each class of the Fund provides information about actual account values and actual expenses. You may use the information in this line, together with the amount you invested, to estimate the expenses that you paid over the period. Simply divide your account value by $1,000.00 (for example, an $8,600 account value divided by $1,000.00 = 8.6), then multiply the result by the number in the first line for a class of the Fund under the heading entitled "Expenses Paid During Period" to estimate the expenses you paid on your account during this period. In addition, the Fund, as a shareholder in the underlying Fidelity Central Funds, will indirectly bear its pro-rata share of the fees and expenses incurred by the underlying Fidelity Central Funds. These fees and expenses are not included in the Fund's annualized expense ratio used to calculate the expense estimate in the table below.
Hypothetical Example for Comparison Purposes
The second line of the accompanying table for each class of the Fund provides information about hypothetical account values and hypothetical expenses based on a Class' actual expense ratio and an assumed rate of return of 5% per year before expenses, which is not the Class' actual return. The hypothetical account values and expenses may not be used to estimate the actual ending account balance or expenses you paid for the period. You may use this information to compare the ongoing costs of investing in the Fund and other funds. To do so, compare this 5% hypothetical example with the 5% hypothetical examples that appear in the shareholder reports of the other funds. In addition, the Fund, as a shareholder in the underlying Fidelity Central Funds, will indirectly bear its pro-rata share of the fees and expenses incurred by the underlying Fidelity Central Funds. These fees and expenses are not included in the Fund's annualized expense ratio used to calculate the expense estimate in the table below.
Please note that the expenses shown in the table are meant to highlight your ongoing costs only and do not reflect any transaction costs. Therefore, the second line of the table is useful in comparing ongoing costs only, and will not help you determine the relative total costs of owning different funds. In addition, if these transactional costs were included, your costs would have been higher.
| | Annualized Expense Ratio-A | Beginning
Account Value
May 1, 2019 | Ending
Account Value
October 31, 2019 | Expenses Paid
During Period-B
May 1, 2019
to October 31, 2019 |
| Class A | 1.07% | | | |
| Actual | | $1,000.00 | $983.70 | $5.35 |
| Hypothetical-C | | $1,000.00 | $1,019.81 | $5.45 |
| Class M | 1.36% | | | |
| Actual | | $1,000.00 | $982.10 | $6.79 |
| Hypothetical-C | | $1,000.00 | $1,018.35 | $6.92 |
| Class C | 1.80% | | | |
| Actual | | $1,000.00 | $979.80 | $8.98 |
| Hypothetical-C | | $1,000.00 | $1,016.13 | $9.15 |
| Class I | .74% | | | |
| Actual | | $1,000.00 | $984.60 | $3.70 |
| Hypothetical-C | | $1,000.00 | $1,021.48 | $3.77 |
A Annualized expense ratio reflects expenses net of applicable fee waivers.
B Expenses are equal to each Class' annualized expense ratio, multiplied by the average account value over the period, multiplied by 184/365 (to reflect the one-half year period).
C 5% return per year before expenses
Distributions (Unaudited)
Class A and Class I designate 100% of the dividend distributed during the fiscal year as qualifying for the dividends–received deduction for corporate shareholders.
Class A and Class I designate 100% of the dividend distributed during the fiscal year as amounts which may be taken into account as a dividend for purposes of the maximum rate under section 1(h)(11) of the Internal Revenue Code.
The fund will notify shareholders in January 2020 of amounts for use in preparing 2019 income tax returns.
AGLO-ANN-1219
1.728713.120
Fidelity Advisor® Emerging Asia Fund
Annual Report
October 31, 2019
See the inside front cover for important information about access to your fund’s shareholder reports.
Beginning on January 1, 2021, as permitted by regulations adopted by the Securities and Exchange Commission, paper copies of a fund’s shareholder reports will no longer be sent by mail, unless you specifically request paper copies of the reports from the fund or from your financial intermediary, such as a financial advisor, broker-dealer or bank. Instead, the reports will be made available on a website, and you will be notified by mail each time a report is posted and provided with a website link to access the report.
If you already elected to receive shareholder reports electronically, you will not be affected by this change and you need not take any action. You may elect to receive shareholder reports and other communications from a fund electronically, by contacting your financial intermediary. For Fidelity customers, visit Fidelity's web site or call Fidelity using the contact information listed below.
You may elect to receive all future reports in paper free of charge. If you wish to continue receiving paper copies of your shareholder reports, you may contact your financial intermediary or, if you are a Fidelity customer, visit Fidelity’s website, or call Fidelity at the applicable toll-free number listed below. Your election to receive reports in paper will apply to all funds held with the fund complex/your financial intermediary.
| Account Type | Website | Phone Number |
| Brokerage, Mutual Fund, or Annuity Contracts: | fidelity.com/mailpreferences | 1-800-343-3548 |
| Employer Provided Retirement Accounts: | netbenefits.fidelity.com/preferences (choose 'no' under Required Disclosures to continue to print) | 1-800-343-0860 |
| Advisor Sold Accounts Serviced Through Your Financial Intermediary: | Contact Your Financial Intermediary | Your Financial Intermediary's phone number |
| Advisor Sold Accounts Serviced by Fidelity: | institutional.fidelity.com | 1-877-208-0098 |
Contents
To view a fund's proxy voting guidelines and proxy voting record for the 12-month period ended June 30, visit http://www.fidelity.com/proxyvotingresults or visit the Securities and Exchange Commission's (SEC) web site at http://www.sec.gov.
You may also call 1-877-208-0098 to request a free copy of the proxy voting guidelines.
Standard & Poor's, S&P and S&P 500 are registered service marks of The McGraw-Hill Companies, Inc. and have been licensed for use by Fidelity Distributors Corporation.
Other third-party marks appearing herein are the property of their respective owners.
All other marks appearing herein are registered or unregistered trademarks or service marks of FMR LLC or an affiliated company. © 2019 FMR LLC. All rights reserved.
This report and the financial statements contained herein are submitted for the general information of the shareholders of the Fund. This report is not authorized for distribution to prospective investors in the Fund unless preceded or accompanied by an effective prospectus.
A fund files its complete schedule of portfolio holdings with the SEC for the first and third quarters of each fiscal year on Form N-PORT. Forms N-PORT are available on the SEC’s web site at http://www.sec.gov. A fund's Forms N-PORT may be reviewed and copied at the SEC’s Public Reference Room in Washington, DC. Information regarding the operation of the SEC's Public Reference Room may be obtained by calling 1-800-SEC-0330.
For a complete list of a fund's portfolio holdings, view the most recent holdings listing, semiannual report, or annual report on Fidelity's web site at http://www.fidelity.com, http://www.institutional.fidelity.com, or http://www.401k.com, as applicable.
NOT FDIC INSURED •MAY LOSE VALUE •NO BANK GUARANTEE
Neither the Fund nor Fidelity Distributors Corporation is a bank.
Performance: The Bottom Line
Average annual total return reflects the change in the value of an investment, assuming reinvestment of distributions from dividend income and capital gains (the profits earned upon the sale of securities that have grown in value, if any) and assuming a constant rate of performance each year. The hypothetical investment and the average annual total returns do not reflect the deduction of taxes that a shareholder would pay on fund distributions or the redemption of fund shares. During periods of reimbursement by Fidelity, a fund’s total return will be greater than it would be had the reimbursement not occurred. How a fund did yesterday is no guarantee of how it will do tomorrow.
Average Annual Total Returns
| For the periods ended October 31, 2019 | Past 1 year | Past 5 years | Past 10 years |
| Class A (incl. 5.75% sales charge) | 19.32% | 6.47% | 7.46% |
| Class M (incl. 3.50% sales charge) | 21.80% | 6.66% | 7.39% |
| Class C (incl. contingent deferred sales charge) | 24.67% | 6.95% | 7.30% |
| Class I | 26.93% | 8.06% | 8.42% |
| Class Z | 27.14% | 8.10% | 8.43% |
Class C shares' contingent deferred sales charges included in the past one year, past five years and past ten years total return figures are 1%, 0% and 0%, respectively.
The initial offering of Class Z shares took place on October 2, 2018. Returns prior to October 2, 2018, are those of Class I.
$10,000 Over 10 Years
Let's say hypothetically that $10,000 was invested in Fidelity Advisor® Emerging Asia Fund - Class A on October 31, 2009, and the current 5.75% sales charge was paid.
The chart shows how the value of your investment would have changed, and also shows how the MSCI AC (All Country) Asia ex Japan Index performed over the same period.
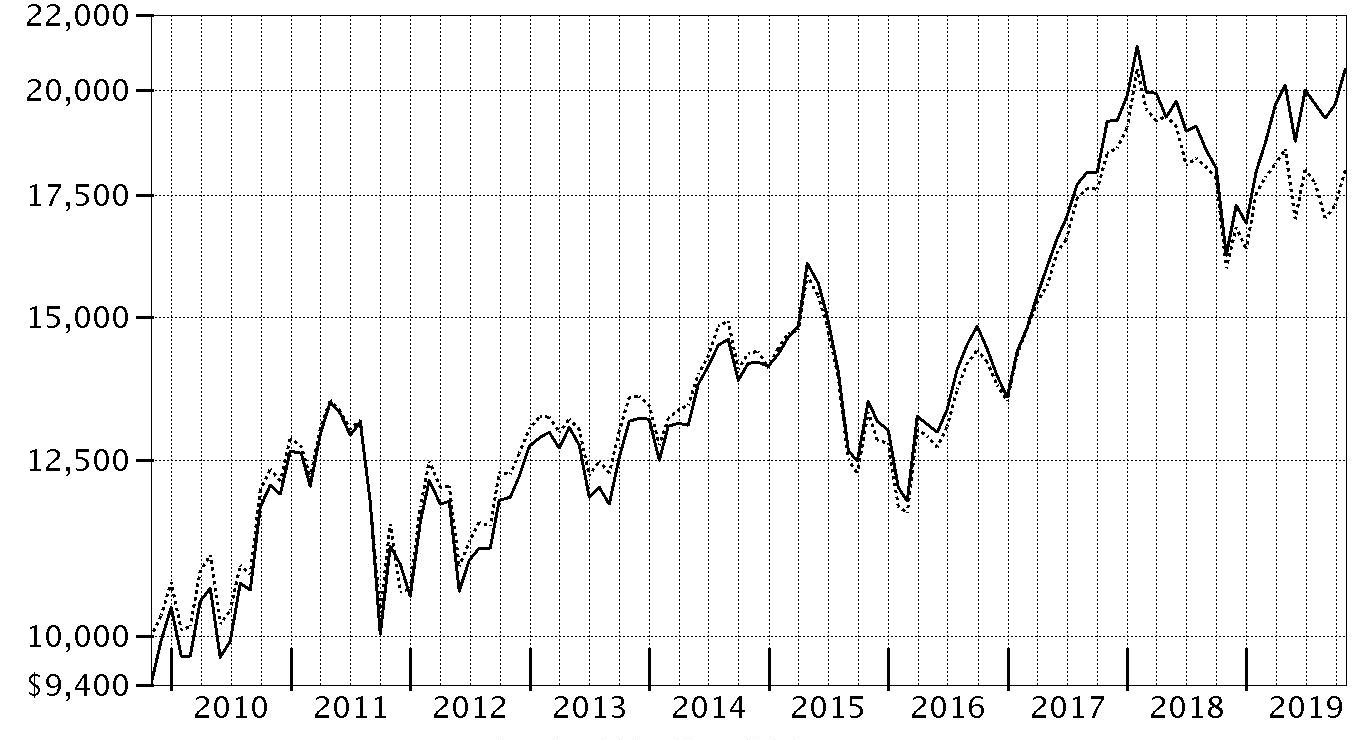
| Period Ending Values |
| $20,532 | Fidelity Advisor® Emerging Asia Fund - Class A |
| $18,064 | MSCI AC (All Country) Asia ex Japan Index |
Management's Discussion of Fund Performance
Market Recap: The MSCI ACWI (All Country World Index) ex USA Index gained 11.47% for the 12 months ending October 31, 2019, as international stocks reflected a confluence of factors, including escalating trade tension, and moderating but still positive global economic growth. Currency fluctuations were largely modest and varied by region, muting the overall impact on international equity returns. In late December, the U.S. Federal Reserve shifted from raising interest rates to a more dovish policy in 2019, joining many foreign central banks. In June, international stocks rose 6.03%, as policy stimulus in China stabilized that country’s economic growth. The Fed cut its policy rate in July for the first time since 2008. However, the index returned -1.21% for the month, followed by -3.08% in August. In September, the Fed cut its policy rate another quarter point, citing concerns about slowing economic growth and muted inflation, and did the same in October, leading to monthly gains of 2.59% and 3.49%, respectively. For the full 12 months, the growth-oriented information technology sector (+22%) led the way, followed by utilities (+20%) and real estate (+18%), two high-dividend-yielding categories. Conversely, energy was roughly flat, while materials (+6%) and communication services (7%) also lagged. By region, Asia Pacific ex Japan (+16%), Europe ex U.K (+13%), Canada (+12%) and emerging markets (+12%) fared best. Meanwhile, the U.K. (+7%) and Japan (+10%) trailed the broader market.
Comments from Co-Portfolio Manager John Dance: For the year, the fund’s share classes (excluding sales charges, if applicable) returned roughly 26% to 27%, well ahead of the 13.24% return of the benchmark MSCI AC (All Country) Asia ex Japan Index. Stock selection mainly drove the fund’s advantage over the benchmark, especially in the consumer staples, industrials and financials sectors. Geographically, picks in emerging markets lifted relative performance. A large overweighting in China-based liquor manufacturer Kweichow Moutai was our top relative contributor. In the same category, Wuliangye Yibin lifted our relative result. We exited this position. Overweighting India-based conglomerate Reliance Industries also proved timely, as did avoiding China-based internet search provider Baidu. Conversely, picks in real estate detracted mildly, along with a cash position averaging roughly 4%. Geographically, Australia hampered our relative result. The largest relative detractor this period was Dah Sing Banking Group, a Hong-Kong-based bank. South Korea’s Hyundai Marine & Fire Insurance and Hong Kong-based Vtech Holdings, a provider of consumer electronics, toys and contract manufacturing services, were other meaningful detractors. By period end, we sold Hyundai Marine & Fire and Vtech Holdings, and significantly reduced the fund’s stake in Dah Sing Banking Group.
The views expressed above reflect those of the portfolio manager(s) only through the end of the period as stated on the cover of this report and do not necessarily represent the views of Fidelity or any other person in the Fidelity organization. Any such views are subject to change at any time based upon market or other conditions and Fidelity disclaims any responsibility to update such views. These views may not be relied on as investment advice and, because investment decisions for a Fidelity fund are based on numerous factors, may not be relied on as an indication of trading intent on behalf of any Fidelity fund.
Note to shareholders: On June 1, 2019, Xiaoting Zhao assumed co-management responsibilities, joining John Dance until year-end, when John comes off of the fund.
Investment Summary (Unaudited)
Top Ten Stocks as of October 31, 2019
| | % of fund's net assets |
| Tencent Holdings Ltd. | 8.6 |
| Taiwan Semiconductor Manufacturing Co. Ltd. | 7.6 |
| Samsung Electronics Co. Ltd. | 4.8 |
| AIA Group Ltd. | 4.5 |
| Alibaba Group Holding Ltd. sponsored ADR | 3.7 |
| SK Hynix, Inc. | 2.8 |
| Housing Development Finance Corp. Ltd. | 2.6 |
| Reliance Industries Ltd. | 2.4 |
| Ping An Insurance Group Co. of China Ltd. (H Shares) | 2.3 |
| Pinduoduo, Inc. ADR | 2.1 |
| | 41.4 |
Top Five Market Sectors as of October 31, 2019
| | % of fund's net assets |
| Information Technology | 23.5 |
| Financials | 20.5 |
| Consumer Discretionary | 16.5 |
| Communication Services | 12.4 |
| Real Estate | 5.3 |
Asset Allocation (% of fund's net assets)
| As of October 31, 2019 |
| | Stocks | 98.2% |
| | Short-Term Investments and Net Other Assets (Liabilities) | 1.8% |

Schedule of Investments October 31, 2019
Showing Percentage of Net Assets
| Common Stocks - 96.9% | | | |
| | | Shares | Value |
| Australia - 0.5% | | | |
| Blue Sky Alternative Investments Ltd. (a)(b) | | 347,682 | $2 |
| HUB24 Ltd. (c) | | 183,191 | 1,555,082 |
|
| TOTAL AUSTRALIA | | | 1,555,084 |
|
| Bermuda - 0.4% | | | |
| Tai Cheung Holdings Ltd. | | 1,608,146 | 1,291,600 |
| Cayman Islands - 25.3% | | | |
| Alibaba Group Holding Ltd. sponsored ADR (a) | | 68,232 | 12,054,547 |
| Bilibili, Inc. ADR (a) | | 29,800 | 470,542 |
| CStone Pharmaceuticals Co. Ltd. (a)(d) | | 1,027,000 | 1,369,127 |
| Geely Automobile Holdings Ltd. | | 1,082,000 | 2,047,373 |
| Hansoh Pharmaceutical Group Co. Ltd. (d) | | 519,130 | 1,577,148 |
| International Housewares Retail Co. Ltd. | | 7,264,395 | 1,694,483 |
| Kingsoft Corp. Ltd. (a) | | 741,800 | 1,707,209 |
| Longfor Properties Co. Ltd. (d) | | 522,000 | 2,166,380 |
| Meituan Dianping Class B (a) | | 331,256 | 3,951,269 |
| New Oriental Education & Technology Group, Inc. sponsored ADR (a) | | 43,000 | 5,248,580 |
| Pinduoduo, Inc. ADR (a) | | 169,655 | 6,935,496 |
| Shenzhou International Group Holdings Ltd. | | 292,008 | 4,035,157 |
| SITC International Holdings Co. Ltd. | | 1,851,625 | 2,038,822 |
| Sunny Optical Technology Group Co. Ltd. | | 110,800 | 1,780,986 |
| TAL Education Group ADR (a) | | 125,200 | 5,359,812 |
| Tencent Holdings Ltd. | | 699,360 | 28,368,087 |
| Wuxi Biologics (Cayman), Inc. (a)(d) | | 191,500 | 2,250,406 |
|
| TOTAL CAYMAN ISLANDS | | | 83,055,424 |
|
| China - 13.9% | | | |
| AVIC Jonhon OptronicTechnology Co. Ltd. | | 283,510 | 1,623,159 |
| Chongqing Fuling Zhacai Group Co. Ltd. Group (A Shares) | | 492,442 | 1,624,184 |
| Contemporary Amperex Technology Co. Ltd. | | 131,600 | 1,283,660 |
| Foshan Haitian Flavouring & Food Co. Ltd. (A Shares) | | 107,888 | 1,711,062 |
| Great Wall Motor Co. Ltd. (H Shares) | | 3,109,500 | 2,519,477 |
| Hangzhou Tigermed Consulting Co. Ltd. (A Shares) | | 288,708 | 2,799,419 |
| Industrial & Commercial Bank of China Ltd. (H Shares) | | 7,785,000 | 5,577,122 |
| Inner Mongoli Yili Industries Co. Ltd. (A Shares) | | 404,000 | 1,662,785 |
| Kweichow Moutai Co. Ltd. (A Shares) | | 15,394 | 2,576,488 |
| Ping An Insurance Group Co. of China Ltd. (H Shares) | | 663,409 | 7,656,928 |
| Qingdao Port International Co. Ltd. (H Shares) (d) | | 2,152,797 | 1,234,590 |
| Shanghai Bairun Investment Holding Group Co. Ltd. (A Shares) | | 929,800 | 3,518,945 |
| Shanghai M&G Stationery, Inc. (A Shares) | | 260,400 | 1,849,141 |
| Shenzhen Inovance Technology Co. Ltd. (A Shares) | | 576,600 | 2,039,987 |
| Shenzhen Mindray Bio-Medical Electronics Co. Ltd. (A Shares) | | 87,706 | 2,214,529 |
| WuXi AppTec Co. Ltd. (H Shares) (d) | | 156,400 | 1,885,672 |
| Yunnan Baiyao Group Co. Ltd. (A Shares) | | 168,658 | 2,072,595 |
| Zhejiang Sanhua Intelligent Controls Co. Ltd. (A Shares) | | 889,093 | 1,766,373 |
|
| TOTAL CHINA | | | 45,616,116 |
|
| Hong Kong - 8.0% | | | |
| AIA Group Ltd. | | 1,500,950 | 14,946,798 |
| China Overseas Land and Investment Ltd. | | 750,000 | 2,366,620 |
| CNOOC Ltd. | | 1,270,000 | 1,890,078 |
| Dah Sing Banking Group Ltd. | | 238,025 | 307,718 |
| Hong Kong Exchanges and Clearing Ltd. | | 138,759 | 4,322,903 |
| Sino Land Ltd. | | 1,689,022 | 2,524,864 |
|
| TOTAL HONG KONG | | | 26,358,981 |
|
| India - 15.3% | | | |
| Asian Paints Ltd. | | 66,400 | 1,691,353 |
| Aster DM Healthcare Ltd. (a)(d) | | 14,600 | 27,757 |
| Bajaj Finance Ltd. | | 43,000 | 2,436,679 |
| CCL Products (India) Ltd. (a) | | 291,279 | 846,063 |
| HDFC Asset Management Co. Ltd. (d) | | 71,296 | 3,003,114 |
| HDFC Bank Ltd. | | 325,454 | 5,634,840 |
| Housing Development Finance Corp. Ltd. | | 280,606 | 8,415,486 |
| Indraprastha Gas Ltd. (a) | | 405,036 | 2,231,915 |
| Kotak Mahindra Bank Ltd. | | 116,700 | 2,586,501 |
| Maruti Suzuki India Ltd. | | 26,200 | 2,789,563 |
| Oberoi Realty Ltd. (a) | | 349,907 | 2,495,825 |
| Page Industries Ltd. | | 3,900 | 1,412,937 |
| Petronet LNG Ltd. | | 732,933 | 2,955,388 |
| Power Grid Corp. of India Ltd. | | 993,632 | 2,776,594 |
| Reliance Industries Ltd. | | 375,496 | 7,733,875 |
| Shree Cement Ltd. | | 6,600 | 1,848,852 |
| TCNS Clothing Co. Ltd. (a)(d) | | 139,631 | 1,482,127 |
|
| TOTAL INDIA | | | 50,368,869 |
|
| Indonesia - 3.1% | | | |
| PT Bank Central Asia Tbk | | 2,690,623 | 6,022,496 |
| PT Bank Rakyat Indonesia Tbk | | 13,900,645 | 4,165,124 |
|
| TOTAL INDONESIA | | | 10,187,620 |
|
| Korea (South) - 9.9% | | | |
| Kakao Corp. | | 17,200 | 2,079,655 |
| LG Chemical Ltd. | | 6,753 | 1,774,387 |
| Samsung Electronics Co. Ltd. | | 364,696 | 15,706,089 |
| Samsung SDI Co. Ltd. | | 20,300 | 3,946,244 |
| SK Hynix, Inc. | | 129,894 | 9,101,426 |
|
| TOTAL KOREA (SOUTH) | | | 32,607,801 |
|
| Malaysia - 0.3% | | | |
| Bursa Malaysia Bhd | | 671,600 | 971,674 |
| Multi-National - 1.7% | | | |
| HKT Trust/HKT Ltd. unit | | 3,588,332 | 5,582,225 |
| Netherlands - 1.0% | | | |
| ASML Holding NV (Netherlands) | | 13,045 | 3,419,285 |
| Philippines - 2.2% | | | |
| Ayala Land, Inc. | | 4,842,664 | 4,624,596 |
| Jollibee Food Corp. | | 593,500 | 2,710,035 |
|
| TOTAL PHILIPPINES | | | 7,334,631 |
|
| Singapore - 0.5% | | | |
| Wing Tai Holdings Ltd. | | 1,198,378 | 1,787,227 |
| Taiwan - 8.7% | | | |
| Micro-Star International Co. Ltd. | | 567,000 | 1,673,224 |
| Taiwan Semiconductor Manufacturing Co. Ltd. | | 2,555,393 | 24,995,136 |
| Voltronic Power Technology Corp. | | 88,350 | 1,955,415 |
|
| TOTAL TAIWAN | | | 28,623,775 |
|
| Thailand - 1.6% | | | |
| Home Product Center PCL (For. Reg.) | | 4,525,167 | 2,577,522 |
| Thai Beverage PCL | | 3,809,893 | 2,557,920 |
|
| TOTAL THAILAND | | | 5,135,442 |
|
| United States of America - 4.0% | | | |
| DouYu International Holdings Ltd. ADR | | 545,283 | 4,236,849 |
| Lam Research Corp. | | 12,483 | 3,383,392 |
| Micron Technology, Inc. (a) | | 56,800 | 2,700,840 |
| NVIDIA Corp. | | 13,700 | 2,753,974 |
|
| TOTAL UNITED STATES OF AMERICA | | | 13,075,055 |
|
| Vietnam - 0.5% | | | |
| Vietnam Dairy Products Corp. | | 285,600 | 1,597,737 |
| TOTAL COMMON STOCKS | | | |
| (Cost $234,817,046) | | | 318,568,546 |
|
| Nonconvertible Preferred Stocks - 1.3% | | | |
| Korea (South) - 1.3% | | | |
| Samsung Electronics Co. Ltd. | | | |
| (Cost $4,080,205) | | 118,570 | 4,159,053 |
|
| Money Market Funds - 2.3% | | | |
| Fidelity Cash Central Fund 1.83% (e) | | 7,091,551 | 7,092,970 |
| Fidelity Securities Lending Cash Central Fund 1.84% (e)(f) | | 596,245 | 596,304 |
| TOTAL MONEY MARKET FUNDS | | | |
| (Cost $7,689,274) | | | 7,689,274 |
| TOTAL INVESTMENT IN SECURITIES - 100.5% | | | |
| (Cost $246,586,525) | | | 330,416,873 |
| NET OTHER ASSETS (LIABILITIES) - (0.5)% | | | (1,533,757) |
| NET ASSETS - 100% | | | $328,883,116 |
Categorizations in the Schedule of Investments are based on country or territory of incorporation.
Legend
(a) Non-income producing
(b) Level 3 security
(c) Security or a portion of the security is on loan at period end.
(d) Security exempt from registration under Rule 144A of the Securities Act of 1933. These securities may be resold in transactions exempt from registration, normally to qualified institutional buyers. At the end of the period, the value of these securities amounted to $14,996,321 or 4.6% of net assets.
(e) Affiliated fund that is generally available only to investment companies and other accounts managed by Fidelity Investments. The rate quoted is the annualized seven-day yield of the fund at period end. A complete unaudited listing of the fund's holdings as of its most recent quarter end is available upon request. In addition, each Fidelity Central Fund's financial statements, which are not covered by the Fund's Report of Independent Registered Public Accounting Firm, are available on the SEC's website or upon request.
(f) Investment made with cash collateral received from securities on loan.
Affiliated Central Funds
Information regarding fiscal year to date income earned by the Fund from investments in Fidelity Central Funds is as follows:
| Fund | Income earned |
| Fidelity Cash Central Fund | $237,279 |
| Fidelity Securities Lending Cash Central Fund | 27,596 |
| Total | $264,875 |
Amounts in the income column in the above table include any capital gain distributions from underlying funds, which are presented in the corresponding line-item in the Statement of Operations, if applicable. Amount for Fidelity Securities Lending Cash Central Fund represents the income earned on investing cash collateral, less rebates paid to borrowers and any lending agent fees associated with the loan, plus any premium payments received for lending certain types of securities.
Investment Valuation
The following is a summary of the inputs used, as of October 31, 2019, involving the Fund's assets and liabilities carried at fair value. The inputs or methodology used for valuing securities may not be an indication of the risk associated with investing in those securities. For more information on valuation inputs, and their aggregation into the levels used below, please refer to the Investment Valuation section in the accompanying Notes to Financial Statements.
| | Valuation Inputs at Reporting Date: |
| Description | Total | Level 1 | Level 2 | Level 3 |
| Investments in Securities: | | | | |
| Equities: | | | | |
| Communication Services | $40,737,358 | $6,787,046 | $33,950,312 | $-- |
| Consumer Discretionary | 54,818,378 | 29,598,435 | 25,219,943 | -- |
| Consumer Staples | 16,095,184 | -- | 16,095,184 | -- |
| Energy | 12,579,341 | -- | 12,579,341 | -- |
| Financials | 67,602,467 | -- | 67,602,465 | 2 |
| Health Care | 14,196,653 | -- | 14,196,653 | -- |
| Industrials | 12,167,988 | 1,955,415 | 10,212,573 | -- |
| Information Technology | 76,950,017 | 43,424,242 | 33,525,775 | -- |
| Materials | 5,314,592 | 1,774,387 | 3,540,205 | -- |
| Real Estate | 17,257,112 | -- | 17,257,112 | -- |
| Utilities | 5,008,509 | -- | 5,008,509 | -- |
| Money Market Funds | 7,689,274 | 7,689,274 | -- | -- |
| Total Investments in Securities: | $330,416,873 | $91,228,799 | $239,188,072 | $2 |
See accompanying notes which are an integral part of the financial statements.
Financial Statements
Statement of Assets and Liabilities
| | | October 31, 2019 |
| Assets | | |
Investment in securities, at value (including securities loaned of $567,744) — See accompanying schedule:
Unaffiliated issuers (cost $238,897,251) | $322,727,599 | |
| Fidelity Central Funds (cost $7,689,274) | 7,689,274 | |
| Total Investment in Securities (cost $246,586,525) | | $330,416,873 |
| Foreign currency held at value (cost $305,060) | | 304,950 |
| Receivable for investments sold | | 3,092,494 |
| Receivable for fund shares sold | | 156,417 |
| Dividends receivable | | 193,060 |
| Distributions receivable from Fidelity Central Funds | | 10,291 |
| Prepaid expenses | | 519 |
| Other receivables | | 131,235 |
| Total assets | | 334,305,839 |
| Liabilities | | |
| Payable for investments purchased | $3,770,746 | |
| Payable for fund shares redeemed | 166,805 | |
| Accrued management fee | 182,453 | |
| Distribution and service plan fees payable | 64,513 | |
| Other affiliated payables | 65,248 | |
| Other payables and accrued expenses | 576,658 | |
| Collateral on securities loaned | 596,300 | |
| Total liabilities | | 5,422,723 |
| Net Assets | | $328,883,116 |
| Net Assets consist of: | | |
| Paid in capital | | $229,328,297 |
| Total accumulated earnings (loss) | | 99,554,819 |
| Net Assets | | $328,883,116 |
| Net Asset Value and Maximum Offering Price | | |
| Class A: | | |
| Net Asset Value and redemption price per share ($144,576,711 ÷ 3,628,349 shares)(a) | | $39.85 |
| Maximum offering price per share (100/94.25 of $39.85) | | $42.28 |
| Class M: | | |
| Net Asset Value and redemption price per share ($39,196,629 ÷ 1,015,088 shares)(a) | | $38.61 |
| Maximum offering price per share (100/96.50 of $38.61) | | $40.01 |
| Class C: | | |
| Net Asset Value and offering price per share ($23,583,500 ÷ 659,321 shares)(a) | | $35.77 |
| Class I: | | |
| Net Asset Value, offering price and redemption price per share ($76,981,227 ÷ 1,870,118 shares) | | $41.16 |
| Class Z: | | |
| Net Asset Value, offering price and redemption price per share ($44,545,049 ÷ 1,083,282 shares) | | $41.12 |
(a) Redemption price per share is equal to net asset value less any applicable contingent deferred sales charge.
See accompanying notes which are an integral part of the financial statements.
Statement of Operations
| | | Year ended October 31, 2019 |
| Investment Income | | |
| Dividends | | $5,732,713 |
| Income from Fidelity Central Funds (including $27,596 from security lending) | | 264,875 |
| Income before foreign taxes withheld | | 5,997,588 |
| Less foreign taxes withheld | | (526,550) |
| Total income | | 5,471,038 |
| Expenses | | |
| Management fee | $1,945,828 | |
| Transfer agent fees | 605,725 | |
| Distribution and service plan fees | 861,806 | |
| Accounting and security lending fees | 146,671 | |
| Custodian fees and expenses | 91,993 | |
| Independent trustees' fees and expenses | 1,562 | |
| Registration fees | 98,205 | |
| Audit | 114,204 | |
| Legal | 1,713 | |
| Interest | 439 | |
| Miscellaneous | 2,049 | |
| Total expenses before reductions | 3,870,195 | |
| Expense reductions | (25,689) | |
| Total expenses after reductions | | 3,844,506 |
| Net investment income (loss) | | 1,626,532 |
| Realized and Unrealized Gain (Loss) | | |
| Net realized gain (loss) on: | | |
| Investment securities: | | |
| Unaffiliated issuers | 16,007,301 | |
| Fidelity Central Funds | 4 | |
| Foreign currency transactions | (175,253) | |
| Total net realized gain (loss) | | 15,832,052 |
| Change in net unrealized appreciation (depreciation) on: | | |
| Investment securities: | | |
| Unaffiliated issuers (net of increase in deferred foreign taxes of $471,713) | 48,040,874 | |
| Assets and liabilities in foreign currencies | (3,475) | |
| Total change in net unrealized appreciation (depreciation) | | 48,037,399 |
| Net gain (loss) | | 63,869,451 |
| Net increase (decrease) in net assets resulting from operations | | $65,495,983 |
See accompanying notes which are an integral part of the financial statements.
Statement of Changes in Net Assets
| | Year ended October 31, 2019 | Year ended October 31, 2018 |
| Increase (Decrease) in Net Assets | | |
| Operations | | |
| Net investment income (loss) | $1,626,532 | $1,583,642 |
| Net realized gain (loss) | 15,832,052 | 20,926,638 |
| Change in net unrealized appreciation (depreciation) | 48,037,399 | (71,369,376) |
| Net increase (decrease) in net assets resulting from operations | 65,495,983 | (48,859,096) |
| Distributions to shareholders | (15,626,454) | (1,669,451) |
| Share transactions - net increase (decrease) | 30,152,901 | (10,181,121) |
| Redemption fees | – | 5,359 |
| Total increase (decrease) in net assets | 80,022,430 | (60,704,309) |
| Net Assets | | |
| Beginning of period | 248,860,686 | 309,564,995 |
| End of period | $328,883,116 | $248,860,686 |
See accompanying notes which are an integral part of the financial statements.
Financial Highlights
Fidelity Advisor Emerging Asia Fund Class A
| Years ended October 31, | 2019 | 2018 | 2017 | 2016 | 2015 |
| Selected Per–Share Data | | | | | |
| Net asset value, beginning of period | $33.52 | $39.98 | $30.26 | $28.75 | $32.05 |
| Income from Investment Operations | | | | | |
| Net investment income (loss)A | .23 | .25 | .27 | .29 | .31 |
| Net realized and unrealized gain (loss) | 8.23 | (6.48) | 9.75 | 1.67 | (1.76) |
| Total from investment operations | 8.46 | (6.23) | 10.02 | 1.96 | (1.45) |
| Distributions from net investment income | (.19) | (.22) | (.24) | (.22) | (.18) |
| Distributions from net realized gain | (1.93) | (.01) | (.07) | (.23) | (1.67) |
| Total distributions | (2.13)B | (.23) | (.31) | (.45) | (1.86)C |
| Redemption fees added to paid in capitalA | – | –D | .01 | –D | .01 |
| Net asset value, end of period | $39.85 | $33.52 | $39.98 | $30.26 | $28.75 |
| Total ReturnE,F | 26.60% | (15.67)% | 33.54% | 6.95% | (4.78)% |
| Ratios to Average Net AssetsG,H | | | | | |
| Expenses before reductions | 1.32% | 1.32% | 1.38% | 1.42% | 1.37% |
| Expenses net of fee waivers, if any | 1.32% | 1.32% | 1.37% | 1.42% | 1.37% |
| Expenses net of all reductions | 1.31% | 1.30% | 1.36% | 1.42% | 1.36% |
| Net investment income (loss) | .62% | .62% | .80% | 1.03% | 1.00% |
| Supplemental Data | | | | | |
| Net assets, end of period (000 omitted) | $144,577 | $106,775 | $137,165 | $119,449 | $125,528 |
| Portfolio turnover rateI | 69%J | 34% | 43% | 75% | 70% |
A Calculated based on average shares outstanding during the period.
B Total distributions of $2.13 per share is comprised of distributions from net investment income of $.194 and distributions from net realized gain of $1.933 per share.
C Total distributions of $1.86 per share is comprised of distributions from net investment income of $.183 and distributions from net realized gain of $1.674 per share.
D Amount represents less than $.005 per share.
E Total returns would have been lower if certain expenses had not been reduced during the applicable periods shown.
F Total returns do not include the effect of the sales charges.
G Fees and expenses of any underlying Fidelity Central Funds are not included in the Fund's expense ratio. The Fund indirectly bears its proportionate share of the expenses of any underlying Fidelity Central Funds.
H Expense ratios reflect operating expenses of the class. Expenses before reductions do not reflect amounts reimbursed by the investment adviser or reductions from brokerage service arrangements or reductions from other expense offset arrangements and do not represent the amount paid by the class during periods when reimbursements or reductions occur. Expenses net of fee waivers reflect expenses after reimbursement by the investment adviser but prior to reductions from brokerage service arrangements or other expense offset arrangements. Expenses net of all reductions represent the net expenses paid by the class.
I Amount does not include the portfolio activity of any underlying Fidelity Central Funds.
J Portfolio turnover rate excludes securities received or delivered in-kind.
See accompanying notes which are an integral part of the financial statements.
Fidelity Advisor Emerging Asia Fund Class M
| Years ended October 31, | 2019 | 2018 | 2017 | 2016 | 2015 |
| Selected Per–Share Data | | | | | |
| Net asset value, beginning of period | $32.50 | $38.80 | $29.39 | $27.93 | $31.17 |
| Income from Investment Operations | | | | | |
| Net investment income (loss)A | .12 | .13 | .16 | .20 | .21 |
| Net realized and unrealized gain (loss) | 7.98 | (6.29) | 9.49 | 1.62 | (1.71) |
| Total from investment operations | 8.10 | (6.16) | 9.65 | 1.82 | (1.50) |
| Distributions from net investment income | (.05) | (.13) | (.18) | (.13) | (.08) |
| Distributions from net realized gain | (1.93) | (.01) | (.07) | (.23) | (1.67) |
| Total distributions | (1.99)B | (.14) | (.25) | (.36) | (1.75) |
| Redemption fees added to paid in capitalA | – | –C | .01 | –C | .01 |
| Net asset value, end of period | $38.61 | $32.50 | $38.80 | $29.39 | $27.93 |
| Total ReturnD,E | 26.21% | (15.93)% | 33.16% | 6.62% | (5.05)% |
| Ratios to Average Net AssetsF,G | | | | | |
| Expenses before reductions | 1.61% | 1.61% | 1.68% | 1.72% | 1.68% |
| Expenses net of fee waivers, if any | 1.61% | 1.61% | 1.68% | 1.72% | 1.68% |
| Expenses net of all reductions | 1.60% | 1.59% | 1.66% | 1.72% | 1.67% |
| Net investment income (loss) | .32% | .33% | .50% | .72% | .69% |
| Supplemental Data | | | | | |
| Net assets, end of period (000 omitted) | $39,197 | $33,478 | $44,730 | $35,791 | $37,720 |
| Portfolio turnover rateH | 69%I | 34% | 43% | 75% | 70% |
A Calculated based on average shares outstanding during the period.
B Total distributions of $1.99 per share is comprised of distributions from net investment income of $.054 and distributions from net realized gain of $1.933 per share.
C Amount represents less than $.005 per share.
D Total returns would have been lower if certain expenses had not been reduced during the applicable periods shown.
E Total returns do not include the effect of the sales charges.
F Fees and expenses of any underlying Fidelity Central Funds are not included in the Fund's expense ratio. The Fund indirectly bears its proportionate share of the expenses of any underlying Fidelity Central Funds.
G Expense ratios reflect operating expenses of the class. Expenses before reductions do not reflect amounts reimbursed by the investment adviser or reductions from brokerage service arrangements or reductions from other expense offset arrangements and do not represent the amount paid by the class during periods when reimbursements or reductions occur. Expenses net of fee waivers reflect expenses after reimbursement by the investment adviser but prior to reductions from brokerage service arrangements or other expense offset arrangements. Expenses net of all reductions represent the net expenses paid by the class.
H Amount does not include the portfolio activity of any underlying Fidelity Central Funds.
I Portfolio turnover rate excludes securities received or delivered in-kind.
See accompanying notes which are an integral part of the financial statements.
Fidelity Advisor Emerging Asia Fund Class C
| Years ended October 31, | 2019 | 2018 | 2017 | 2016 | 2015 |
| Selected Per–Share Data | | | | | |
| Net asset value, beginning of period | $30.32 | $36.29 | $27.52 | $26.17 | $29.30 |
| Income from Investment Operations | | | | | |
| Net investment income (loss)A | (.04) | (.04) | .02 | .07 | .07 |
| Net realized and unrealized gain (loss) | 7.42 | (5.86) | 8.89 | 1.52 | (1.59) |
| Total from investment operations | 7.38 | (5.90) | 8.91 | 1.59 | (1.52) |
| Distributions from net investment income | – | (.05) | (.08) | (.01) | – |
| Distributions from net realized gain | (1.93) | (.01) | (.07) | (.23) | (1.62) |
| Total distributions | (1.93) | (.07)B | (.14)C | (.24) | (1.62) |
| Redemption fees added to paid in capitalA | – | –D | –D | –D | .01 |
| Net asset value, end of period | $35.77 | $30.32 | $36.29 | $27.52 | $26.17 |
| Total ReturnE,F | 25.67% | (16.30)% | 32.58% | 6.14% | (5.46)% |
| Ratios to Average Net AssetsG,H | | | | | |
| Expenses before reductions | 2.08% | 2.06% | 2.11% | 2.16% | 2.11% |
| Expenses net of fee waivers, if any | 2.07% | 2.05% | 2.11% | 2.16% | 2.11% |
| Expenses net of all reductions | 2.06% | 2.04% | 2.09% | 2.16% | 2.10% |
| Net investment income (loss) | (.14)% | (.11)% | .07% | .29% | .26% |
| Supplemental Data | | | | | |
| Net assets, end of period (000 omitted) | $23,584 | $48,507 | $60,852 | $43,016 | $51,651 |
| Portfolio turnover rateI | 69%J | 34% | 43% | 75% | 70% |
A Calculated based on average shares outstanding during the period.
B Total distributions of $.07 per share is comprised of distributions from net investment income of $.054 and distributions from net realized gain of $.013 per share.
C Total distributions of $.14 per share is comprised of distributions from net investment income of $.076 and distributions from net realized gain of $.067 per share.
D Amount represents less than $.005 per share.
E Total returns would have been lower if certain expenses had not been reduced during the applicable periods shown.
F Total returns do not include the effect of the contingent deferred sales charge.
G Fees and expenses of any underlying Fidelity Central Funds are not included in the Fund's expense ratio. The Fund indirectly bears its proportionate share of the expenses of any underlying Fidelity Central Funds.
H Expense ratios reflect operating expenses of the class. Expenses before reductions do not reflect amounts reimbursed by the investment adviser or reductions from brokerage service arrangements or reductions from other expense offset arrangements and do not represent the amount paid by the class during periods when reimbursements or reductions occur. Expenses net of fee waivers reflect expenses after reimbursement by the investment adviser but prior to reductions from brokerage service arrangements or other expense offset arrangements. Expenses net of all reductions represent the net expenses paid by the class.
I Amount does not include the portfolio activity of any underlying Fidelity Central Funds.
J Portfolio turnover rate excludes securities received or delivered in-kind.
See accompanying notes which are an integral part of the financial statements.
Fidelity Advisor Emerging Asia Fund Class I
| Years ended October 31, | 2019 | 2018 | 2017 | 2016 | 2015 |
| Selected Per–Share Data | | | | | |
| Net asset value, beginning of period | $34.60 | $41.27 | $31.19 | $29.63 | $33.00 |
| Income from Investment Operations | | | | | |
| Net investment income (loss)A | .34 | .37 | .38 | .39 | .41 |
| Net realized and unrealized gain (loss) | 8.48 | (6.68) | 10.06 | 1.72 | (1.81) |
| Total from investment operations | 8.82 | (6.31) | 10.44 | 2.11 | (1.40) |
| Distributions from net investment income | (.33) | (.34) | (.31) | (.32) | (.31) |
| Distributions from net realized gain | (1.93) | (.01) | (.07) | (.23) | (1.67) |
| Total distributions | (2.26) | (.36)B | (.37)C | (.55) | (1.98) |
| Redemption fees added to paid in capitalA | – | –D | .01 | –D | .01 |
| Net asset value, end of period | $41.16 | $34.60 | $41.27 | $31.19 | $29.63 |
| Total ReturnE | 26.93% | (15.43)% | 33.97% | 7.27% | (4.47)% |
| Ratios to Average Net AssetsF,G | | | | | |
| Expenses before reductions | 1.04% | 1.03% | 1.08% | 1.11% | 1.07% |
| Expenses net of fee waivers, if any | 1.03% | 1.03% | 1.07% | 1.11% | 1.07% |
| Expenses net of all reductions | 1.03% | 1.02% | 1.06% | 1.11% | 1.06% |
| Net investment income (loss) | .90% | .91% | 1.10% | 1.34% | 1.30% |
| Supplemental Data | | | | | |
| Net assets, end of period (000 omitted) | $76,981 | $59,527 | $66,818 | $37,364 | $51,569 |
| Portfolio turnover rateH | 69%I | 34% | 43% | 75% | 70% |
A Calculated based on average shares outstanding during the period.
B Total distributions of $.36 per share is comprised of distributions from net investment income of $.342 and distributions from net realized gain of $.013 per share.
C Total distributions of $.37 per share is comprised of distributions from net investment income of $.307 and distributions from net realized gain of $.067 per share.
D Amount represents less than $.005 per share.
E Total returns would have been lower if certain expenses had not been reduced during the applicable periods shown.
F Fees and expenses of any underlying Fidelity Central Funds are not included in the Fund's expense ratio. The Fund indirectly bears its proportionate share of the expenses of any underlying Fidelity Central Funds.
G Expense ratios reflect operating expenses of the class. Expenses before reductions do not reflect amounts reimbursed by the investment adviser or reductions from brokerage service arrangements or reductions from other expense offset arrangements and do not represent the amount paid by the class during periods when reimbursements or reductions occur. Expenses net of fee waivers reflect expenses after reimbursement by the investment adviser but prior to reductions from brokerage service arrangements or other expense offset arrangements. Expenses net of all reductions represent the net expenses paid by the class.
H Amount does not include the portfolio activity of any underlying Fidelity Central Funds.
I Portfolio turnover rate excludes securities received or delivered in-kind.
See accompanying notes which are an integral part of the financial statements.
Fidelity Advisor Emerging Asia Fund Class Z
| Years ended October 31, | 2019 | 2018 A |
| Selected Per–Share Data | | |
| Net asset value, beginning of period | $34.60 | $38.03 |
| Income from Investment Operations | | |
| Net investment income (loss)B | .40 | – |
| Net realized and unrealized gain (loss) | 8.47 | (3.43) |
| Total from investment operations | 8.87 | (3.43) |
| Distributions from net investment income | (.42) | – |
| Distributions from net realized gain | (1.93) | – |
| Total distributions | (2.35) | – |
| Redemption fees added to paid in capitalB | – | –C |
| Net asset value, end of period | $41.12 | $34.60 |
| Total ReturnD,E | 27.14% | (9.02)% |
| Ratios to Average Net AssetsF,G | | |
| Expenses before reductions | .89% | .97%H |
| Expenses net of fee waivers, if any | .89% | .97%H |
| Expenses net of all reductions | .89% | .95%H |
| Net investment income (loss) | 1.04% | (.02)%H |
| Supplemental Data | | |
| Net assets, end of period (000 omitted) | $44,545 | $573 |
| Portfolio turnover rateI | 69%J | 34% |
A For the period October 2, 2018 (commencement of sale of shares) to October 31, 2018.
B Calculated based on average shares outstanding during the period.
C Amount represents less than $.005 per share.
D Total returns for periods of less than one year are not annualized.
E Total returns would have been lower if certain expenses had not been reduced during the applicable periods shown.
F Fees and expenses of any underlying Fidelity Central Funds are not included in the Fund's expense ratio. The Fund indirectly bears its proportionate share of the expenses of any underlying Fidelity Central Funds.
G Expense ratios reflect operating expenses of the class. Expenses before reductions do not reflect amounts reimbursed by the investment adviser or reductions from brokerage service arrangements or reductions from other expense offset arrangements and do not represent the amount paid by the class during periods when reimbursements or reductions occur. Expense ratios before reductions for start-up periods may not be representative of longer-term operating periods. Expenses net of fee waivers reflect expenses after reimbursement by the investment adviser but prior to reductions from brokerage service arrangements or other expense offset arrangements. Expenses net of all reductions represent the net expenses paid by the class.
H Annualized
I Amount does not include the portfolio activity of any underlying Fidelity Central Funds.
J Portfolio turnover rate excludes securities received or delivered in-kind.
See accompanying notes which are an integral part of the financial statements.
Notes to Financial Statements
For the period ended October 31, 2019
1. Organization.
Fidelity Advisor Emerging Asia Fund (the Fund) is a fund of Fidelity Advisor Series VIII (the Trust) and is authorized to issue an unlimited number of shares. The Trust is registered under the Investment Company Act of 1940, as amended (the 1940 Act), as an open-end management investment company organized as a Massachusetts business trust. The Fund offers Class A, Class M, Class C, Class I and Class Z shares, each of which has equal rights as to assets and voting privileges. Each class has exclusive voting rights with respect to matters that affect that class. Effective March 1, 2019, Class C shares will automatically convert to Class A shares after a holding period of ten years from the initial date of purchase, with certain exceptions. The Fund's investments in emerging markets can be subject to social, economic, regulatory, and political uncertainties and can be extremely volatile.
2. Investments in Fidelity Central Funds.
The Fund invests in Fidelity Central Funds, which are open-end investment companies generally available only to other investment companies and accounts managed by the investment adviser and its affiliates. The Fund's Schedule of Investments lists each of the Fidelity Central Funds held as of period end, if any, as an investment of the Fund, but does not include the underlying holdings of each Fidelity Central Fund. As an Investing Fund, the Fund indirectly bears its proportionate share of the expenses of the underlying Fidelity Central Funds.
The Money Market Central Funds seek preservation of capital and current income and are managed by Fidelity Investments Money Management, Inc. (FIMM), an affiliate of the investment adviser. Annualized expenses of the Money Market Central Funds as of their most recent shareholder report date ranged from less than .005% to .01%.
A complete unaudited list of holdings for each Fidelity Central Fund is available upon request or at the Securities and Exchange Commission (the SEC) website at www.sec.gov. In addition, the financial statements of the Fidelity Central Funds, which are not covered by the Fund's Report of Independent Registered Public Accounting Firm, are available on the SEC website or upon request.
3. Significant Accounting Policies.
The Fund is an investment company and applies the accounting and reporting guidance of the Financial Accounting Standards Board (FASB) Accounting Standards Codification Topic 946 Financial Services – Investments Companies. The financial statements have been prepared in conformity with accounting principles generally accepted in the United States of America (GAAP), which require management to make certain estimates and assumptions at the date of the financial statements. Actual results could differ from those estimates. Subsequent events, if any, through the date that the financial statements were issued have been evaluated in the preparation of the financial statements. The following summarizes the significant accounting policies of the Fund:
Investment Valuation. Investments are valued as of 4:00 p.m. Eastern time on the last calendar day of the period. The Board of Trustees (the Board) has delegated the day to day responsibility for the valuation of the Fund's investments to the Fair Value Committee (the Committee) established by the Fund's investment adviser. In accordance with valuation policies and procedures approved by the Board, the Fund attempts to obtain prices from one or more third party pricing vendors or brokers to value its investments. When current market prices, quotations or currency exchange rates are not readily available or reliable, investments will be fair valued in good faith by the Committee, in accordance with procedures adopted by the Board. Factors used in determining fair value vary by investment type and may include market or investment specific events. The frequency with which these procedures are used cannot be predicted and they may be utilized to a significant extent. The Committee oversees the Fund's valuation policies and procedures and reports to the Board on the Committee's activities and fair value determinations. The Board monitors the appropriateness of the procedures used in valuing the Fund's investments and ratifies the fair value determinations of the Committee.
The Fund categorizes the inputs to valuation techniques used to value its investments into a disclosure hierarchy consisting of three levels as shown below:
- Level 1 – quoted prices in active markets for identical investments
- Level 2 – other significant observable inputs (including quoted prices for similar investments, interest rates, prepayment speeds, etc.)
- Level 3 – unobservable inputs (including the Fund's own assumptions based on the best information available)
Valuation techniques used to value the Fund's investments by major category are as follows:
Equity securities, including restricted securities, for which market quotations are readily available, are valued at the last reported sale price or official closing price as reported by a third party pricing vendor on the primary market or exchange on which they are traded and are categorized as Level 1 in the hierarchy. In the event there were no sales during the day or closing prices are not available, securities are valued at the last quoted bid price or may be valued using the last available price and are generally categorized as Level 2 in the hierarchy. For foreign equity securities, when market or security specific events arise, comparisons to the valuation of American Depositary Receipts (ADRs), futures contracts, Exchange-Traded Funds (ETFs) and certain indexes as well as quoted prices for similar securities may be used and would be categorized as Level 2 in the hierarchy. For equity securities, including restricted securities, where observable inputs are limited, assumptions about market activity and risk are used and these securities may be categorized as Level 3 in the hierarchy.
Investments in open-end mutual funds, including the Fidelity Central Funds, are valued at their closing net asset value (NAV) each business day and are categorized as Level 1 in the hierarchy.
Changes in valuation techniques may result in transfers in or out of an assigned level within the disclosure hierarchy. The aggregate value of investments by input level as of October 31, 2019 is included at the end of the Fund's Schedule of Investments.
Foreign Currency. The Fund may use foreign currency contracts to facilitate transactions in foreign-denominated securities. Gains and losses from these transactions may arise from changes in the value of the foreign currency or if the counterparties do not perform under the contracts' terms.
Foreign-denominated assets, including investment securities, and liabilities are translated into U.S. dollars at the exchange rates at period end. Purchases and sales of investment securities, income and dividends received and expenses denominated in foreign currencies are translated into U.S. dollars at the exchange rate in effect on the transaction date.
The effects of exchange rate fluctuations on investments are included with the net realized and unrealized gain (loss) on investment securities. Other foreign currency transactions resulting in realized and unrealized gain (loss) are disclosed separately.
Investment Transactions and Income. For financial reporting purposes, the Fund's investment holdings and NAV include trades executed through the end of the last business day of the period. The NAV per share for processing shareholder transactions is calculated as of the close of business of the New York Stock Exchange (NYSE), normally 4:00 p.m. Eastern time and includes trades executed through the end of the prior business day. Gains and losses on securities sold are determined on the basis of identified cost and include proceeds received from litigation. Dividend income is recorded on the ex-dividend date, except for certain dividends from foreign securities where the ex-dividend date may have passed, which are recorded as soon as the Fund is informed of the ex-dividend date. Non-cash dividends included in dividend income, if any, are recorded at the fair market value of the securities received. Income and capital gain distributions from Fidelity Central Funds, if any, are recorded on the ex-dividend date. Certain distributions received by the Fund represent a return of capital or capital gain. The Fund determines the components of these distributions subsequent to the ex-dividend date, based upon receipt of tax filings or other correspondence relating to the underlying investment. These distributions are recorded as a reduction of cost of investments and/or as a realized gain. Investment income is recorded net of foreign taxes withheld where recovery of such taxes is uncertain.
Class Allocations and Expenses. Investment income, realized and unrealized capital gains and losses, common expenses of the Fund, and certain fund-level expense reductions, if any, are allocated daily on a pro-rata basis to each class based on the relative net assets of each class to the total net assets of the Fund. Each class differs with respect to transfer agent and distribution and service plan fees incurred. Certain expense reductions may also differ by class. For the reporting period, the allocated portion of income and expenses to each class as a percent of its average net assets may vary due to the timing of recording these transactions in relation to fluctuating net assets of the classes. Expenses directly attributable to a fund are charged to that fund. Expenses attributable to more than one fund are allocated among the respective funds on the basis of relative net assets or other appropriate methods. Expense estimates are accrued in the period to which they relate and adjustments are made when actual amounts are known.
Income Tax Information and Distributions to Shareholders. Each year, the Fund intends to qualify as a regulated investment company under Subchapter M of the Internal Revenue Code, including distributing substantially all of its taxable income and realized gains. As a result, no provision for U.S. Federal income taxes is required. As of October 31, 2019, the Fund did not have any unrecognized tax benefits in the financial statements; nor is the Fund aware of any tax positions for which it is reasonably possible that the total amounts of unrecognized tax benefits will significantly change in the next twelve months. The Fund files a U.S. federal tax return, in addition to state and local tax returns as required. The Fund's federal income tax returns are subject to examination by the Internal Revenue Service (IRS) for a period of three fiscal years after they are filed. State and local tax returns may be subject to examination for an additional fiscal year depending on the jurisdiction. Foreign taxes are provided for based on the Fund's understanding of the tax rules and rates that exist in the foreign markets in which it invests. The Fund is subject to a tax imposed on capital gains by certain countries in which it invests. An estimated deferred tax liability for net unrealized appreciation on the applicable securities is included in Other payables and accrued expenses on the Statement of Assets & Liabilities.
Distributions are declared and recorded on the ex-dividend date. Income and capital gain distributions are declared separately for each class. Income and capital gain distributions are determined in accordance with income tax regulations, which may differ from GAAP. In addition, the Fund claimed a portion of the payment made to redeeming shareholders as a distribution for income tax purposes.
Capital accounts within the financial statements are adjusted for permanent book-tax differences. These adjustments have no impact on net assets or the results of operations. Capital accounts are not adjusted for temporary book-tax differences which will reverse in a subsequent period.
Book-tax differences are primarily due to foreign currency transactions, passive foreign investment companies (PFIC) and losses deferred due to wash sales.
As of period end, the cost and unrealized appreciation (depreciation) in securities, and derivatives if applicable, for federal income tax purposes were as follows:
| Gross unrealized appreciation | $89,356,529 |
| Gross unrealized depreciation | (6,785,212) |
| Net unrealized appreciation (depreciation) | $82,571,317 |
| Tax Cost | $247,845,556 |
The tax-based components of distributable earnings as of period end were as follows:
| Undistributed ordinary income | $1,968,766 |
| Undistributed long-term capital gain | $15,564,259 |
| Net unrealized appreciation (depreciation) on securities and other investments | $82,493,507 |
The tax character of distributions paid was as follows:
| | October 31, 2019 | October 31, 2018 |
| Ordinary Income | $1,232,122 | $ 1,669,451 |
| Long-term Capital Gains | 14,394,332 | – |
| Total | $15,626,454 | $ 1,669,451 |
Restricted Securities. The Fund may invest in securities that are subject to legal or contractual restrictions on resale. These securities generally may be resold in transactions exempt from registration or to the public if the securities are registered. Disposal of these securities may involve time-consuming negotiations and expense, and prompt sale at an acceptable price may be difficult. Information regarding restricted securities is included at the end of the Fund's Schedule of Investments.
4. Purchases and Sales of Investments.
Purchases and sales of securities, other than short-term securities and in-kind transactions, aggregated $191,469,157 and $187,962,978, respectively.
5. Fees and Other Transactions with Affiliates.
Management Fee. Fidelity Management & Research Company (the investment adviser) and its affiliates provide the Fund with investment management related services for which the Fund pays a monthly management fee. The management fee is the sum of an individual fund fee rate that is based on an annual rate of .45% of the Fund's average net assets and an annualized group fee rate that averaged .24% during the period. The group fee rate is based upon the average net assets of all the mutual funds advised by the investment adviser, including any mutual funds previously advised by the investment adviser that are currently advised by Fidelity SelectCo, LLC, an affiliate of the investment adviser. The group fee rate decreases as assets under management increase and increases as assets under management decrease. For the reporting period, the total annual management fee rate was .69% of the Fund's average net assets.
Distribution and Service Plan Fees. In accordance with Rule 12b-1 of the 1940 Act, the Fund has adopted separate Distribution and Service Plans for each class of shares. Certain classes pay Fidelity Distributors Corporation (FDC), an affiliate of the investment adviser, separate Distribution and Service Fees, each of which is based on an annual percentage of each class' average net assets. In addition, FDC may pay financial intermediaries for selling shares of the Fund and providing shareholder support services. For the period, the Distribution and Service Fee rates, total fees and amounts retained by FDC were as follows:
| | Distribution Fee | Service Fee | Total Fees | Retained by FDC |
| Class A | -% | .25% | $319,565 | $6,546 |
| Class M | .25% | .25% | 190,012 | 3,682 |
| Class C | .75% | .25% | 352,229 | 26,081 |
| | | | $861,806 | $ 36,309 |
Sales Load. FDC may receive a front-end sales charge of up to 5.75% for selling Class A shares and 3.50% for selling Class M shares, some of which is paid to financial intermediaries for selling shares of the Fund. Depending on the holding period, FDC may receive contingent deferred sales charges levied on Class A, Class M and Class C redemptions. The deferred sales charges are 1.00% for Class C shares, 1.00% for certain purchases of Class A shares and .25% for certain purchases of Class M shares.
For the period, sales charge amounts retained by FDC were as follows:
| | Retained by FDC |
| Class A | $16,939 |
| Class M | 3,975 |
| Class C(a) | 4,200 |
| | $25,114 |
(a) When Class C shares are initially sold, FDC pays commissions from its own resources to financial intermediaries through which the sales are made.
Transfer Agent Fees. Fidelity Investments Institutional Operations Company, Inc., (FIIOC), an affiliate of the investment adviser, is the transfer, dividend disbursing and shareholder servicing agent for each class of the Fund. FIIOC receives account fees and asset-based fees that vary according to the account size and type of account of the shareholders of the respective classes of the Fund, except for Class Z. FIIOC receives an asset-based fee of Class Z's average net assets. FIIOC pays for typesetting, printing and mailing of shareholder reports, except proxy statements.
For the period, transfer agent fees for each class were as follows:
| | Amount | % of Class-Level Average Net Assets |
| Class A | $289,162 | .23 |
| Class M | 101,439 | .27 |
| Class C | 76,810 | .22 |
| Class I | 132,528 | .19 |
| Class Z | 5,786 | .04 |
| | $605,725 | |
Accounting and Security Lending Fees. Fidelity Service Company, Inc. (FSC), an affiliate of the investment adviser, maintains the Fund's accounting records. The accounting fee is based on the level of average net assets for each month. Prior to April 1, 2019, FSC had a separate agreement with the Fund for administration of the security lending program, based on the number and duration of lending transactions. For the period, the total fees paid for accounting and administration of securities lending were equivalent to an annual rate of .05%.
Brokerage Commissions. The Fund placed a portion of its portfolio transactions with brokerage firms which are affiliates of the investment adviser. Brokerage commissions are included in net realized gain (loss) and change in net unrealized appreciation (depreciation) in the Statement of Operations. The commissions paid to these affiliated firms were $1,366 for the period.
Interfund Lending Program. Pursuant to an Exemptive Order issued by the SEC, the Fund, along with other registered investment companies having management contracts with Fidelity Management & Research Company (FMR) or other affiliated entities of FMR, may participate in an interfund lending program. This program provides an alternative credit facility allowing the funds to borrow from, or lend money to, other participating affiliated funds. At period end, there were no interfund loans outstanding. The Fund's activity in this program during the period for which loans were outstanding was as follows:
| Borrower or Lender | Average Loan Balance | Weighted Average Interest Rate | Interest Expense |
| Borrower | $1,194,500 | 2.20% | $439 |
Interfund Trades. The Fund may purchase from or sell securities to other Fidelity Funds under procedures adopted by the Board. The procedures have been designed to ensure these interfund trades are executed in accordance with Rule 17a-7 of the 1940 Act. Interfund trades are included within the respective purchases and sales amounts shown in the Purchases and Sales of Investments note.
Affiliated Exchanges In-Kind. During the period, the Fund received investments, including accrued interest and cash valued at $27,823,070 in exchange for 730,264 shares of the Fund. The amount of in-kind exchanges is included in share transactions in the accompanying Statement of Changes in Net Assets as well as the Notes to Financial Statements.
6. Committed Line of Credit.
The Fund participates with other funds managed by the investment adviser or an affiliate in a $4.25 billion credit facility (the "line of credit") to be utilized for temporary or emergency purposes to fund shareholder redemptions or for other short-term liquidity purposes. The Fund has agreed to pay commitment fees on its pro-rata portion of the line of credit, which amounted to $735 and is reflected in Miscellaneous expenses on the Statement of Operations. During the period, the Fund did not borrow on this line of credit.
7. Security Lending.
The Fund lends portfolio securities from time to time in order to earn additional income. For equity securities, lending agents are used, including National Financial Services (NFS), an affiliate of the Fund. Pursuant to a securities lending agreement, NFS will receive a fee, which is capped at 9.9% of daily lending revenue, for its services as lending agent. The Fund may lend securities to certain qualified borrowers, including NFS. On the settlement date of the loan, the Fund receives collateral (in the form of U.S. Treasury obligations, letters of credit and/or cash) against the loaned securities and maintains collateral in an amount not less than 100% of the market value of the loaned securities during the period of the loan. The market value of the loaned securities is determined at the close of business of the Fund and any additional required collateral is delivered to the Fund on the next business day. The Fund or borrower may terminate the loan at any time, and if the borrower defaults on its obligation to return the securities loaned because of insolvency or other reasons, the Fund may apply collateral received from the borrower against the obligation. The Fund may experience delays and costs in recovering the securities loaned. Any cash collateral received is invested in the Fidelity Securities Lending Cash Central Fund. The value of loaned securities and cash collateral at period end are disclosed on the Fund's Statement of Assets and Liabilities. Security lending income represents the income earned on investing cash collateral, less rebates paid to borrowers and any lending agent fees associated with the loan, plus any premium payments received for lending certain types of securities. Security lending income is presented in the Statement of Operations as a component of income from Fidelity Central Funds. During the period, there were no securities loaned to NFS.
8. Expense Reductions.
Commissions paid to certain brokers with whom the investment adviser, or its affiliates, places trades on behalf of the Fund include an amount in addition to trade execution, which may be rebated back to the Fund to offset certain expenses. This amount totaled $7,467 for the period. In addition, through arrangements with the Fund's custodian, credits realized as a result of certain uninvested cash balances were used to reduce the Fund's expenses. During the period, custodian credits reduced the Fund's expenses by $143.
In addition, during the period the investment adviser reimbursed and/or waived a portion of fund-level operating expenses in the amount of $2,016 and portion of class-level operating expenses as follows:
| | Amount |
| Class A | $6,907 |
| Class M | 2,269 |
| Class C | 2,951 |
| Class I | 3,879 |
| Class Z | 57 |
| | $16,063 |
9. Distributions to Shareholders.
Distributions to shareholders of each class were as follows:
| | Year ended
October 31, 2019 | Year ended
October 31, 2018 |
| Distributions to shareholders | | |
| Class A | $6,691,786 | $782,369 |
| Class M | 2,031,064 | 164,115 |
| Class C | 3,030,598 | 114,683 |
| Class I | 3,816,719 | 608,284 |
| Class Z | 56,287 | – |
| Total | $15,626,454 | $1,669,451 |
10. Share Transactions.
Share transactions for each class were as follows and may contain automatic conversions between classes or exchanges between affiliated funds:
| | Shares | Shares | Dollars | Dollars |
| | Year ended October 31, 2019 | Year ended October 31, 2018(a) | Year ended October 31, 2019 | Year ended October 31, 2018(a) |
| Class A | | | | |
| Shares sold | 890,097 | 347,979 | $33,055,278 | $13,983,752 |
| Reinvestment of distributions | 188,292 | 18,295 | 6,170,338 | 726,143 |
| Shares redeemed | (635,645) | (611,537) | (23,172,423) | (24,140,514) |
| Net increase (decrease) | 442,744 | (245,263) | $16,053,193 | $(9,430,619) |
| Class M | | | | |
| Shares sold | 96,541 | 106,289 | $3,369,385 | $4,193,456 |
| Reinvestment of distributions | 63,400 | 4,228 | 2,018,654 | 163,108 |
| Shares redeemed | (174,962) | (233,325) | (6,248,124) | (8,901,416) |
| Net increase (decrease) | (15,021) | (122,808) | $(860,085) | $(4,544,852) |
| Class C | | | | |
| Shares sold | 102,684 | 264,089 | $3,392,318 | $9,881,327 |
| Reinvestment of distributions | 97,571 | 2,994 | 2,890,051 | 108,193 |
| Shares redeemed | (1,140,615) | (344,108) | (37,957,664) | (12,330,390) |
| Net increase (decrease) | (940,360) | (77,025) | $(31,675,295) | $(2,340,870) |
| Class I | | | | |
| Shares sold | 937,770 | 916,032 | $35,923,043 | $38,220,251 |
| Reinvestment of distributions | 96,243 | 13,464 | 3,250,123 | 550,139 |
| Shares redeemed | (884,566) | (828,029) | (33,418,045) | (33,233,325) |
| Net increase (decrease) | 149,447 | 101,467 | $5,755,121 | $5,537,065 |
| Class Z | | | | |
| Shares sold | 1,143,097(b) | 16,569 | $43,891,849(b) | $598,155 |
| Reinvestment of distributions | 783 | – | 26,366 | – |
| Shares redeemed | (77,167) | – | (3,038,248) | – |
| Net increase (decrease) | 1,066,713 | 16,569 | $40,879,967 | $598,155 |
(a) Share transactions for Class Z are for the period October 2, 2018 (commencement of sale of shares) to October 31, 2018.
(b) Amount includes in-kind exchanges (see the Affiliated Exchanges In-Kind note for additional details).
11. Other.
The Fund's organizational documents provide former and current trustees and officers with a limited indemnification against liabilities arising in connection with the performance of their duties to the Fund. In the normal course of business, the Fund may also enter into contracts that provide general indemnifications. The Fund's maximum exposure under these arrangements is unknown as this would be dependent on future claims that may be made against the Fund. The risk of material loss from such claims is considered remote.
Report of Independent Registered Public Accounting Firm
To the Board of Trustees of Fidelity Advisor Series VIII and Shareholders of Fidelity Advisor Emerging Asia Fund:
Opinion on the Financial Statements
We have audited the accompanying statement of assets and liabilities, including the schedule of investments, of Fidelity Advisor Emerging Asia Fund (one of the funds constituting Fidelity Advisor Series VIII, referred to hereafter as the “Fund”) as of October 31, 2019, the related statement of operations for the year ended October 31, 2019, the statement of changes in net assets for each of the two years in the period ended October 31, 2019, including the related notes, and the financial highlights for each of the periods indicated therein (collectively referred to as the “financial statements”). In our opinion, the financial statements present fairly, in all material respects, the financial position of the Fund as of October 31, 2019, the results of its operations for the year then ended, the changes in its net assets for each of the two years in the period ended October 31, 2019 and the financial highlights for each of the periods indicated therein in conformity with accounting principles generally accepted in the United States of America.
Basis for Opinion
These financial statements are the responsibility of the Fund’s management. Our responsibility is to express an opinion on the Fund’s financial statements based on our audits. We are a public accounting firm registered with the Public Company Accounting Oversight Board (United States) (PCAOB) and are required to be independent with respect to the Fund in accordance with the U.S. federal securities laws and the applicable rules and regulations of the Securities and Exchange Commission and the PCAOB.
We conducted our audits of these financial statements in accordance with the standards of the PCAOB. Those standards require that we plan and perform the audit to obtain reasonable assurance about whether the financial statements are free of material misstatement, whether due to error or fraud.
Our audits included performing procedures to assess the risks of material misstatement of the financial statements, whether due to error or fraud, and performing procedures that respond to those risks. Such procedures included examining, on a test basis, evidence regarding the amounts and disclosures in the financial statements. Our audits also included evaluating the accounting principles used and significant estimates made by management, as well as evaluating the overall presentation of the financial statements. Our procedures included confirmation of securities owned as of October 31, 2019 by correspondence with the custodian and brokers; when replies were not received from brokers, we performed other auditing procedures. We believe that our audits provide a reasonable basis for our opinion.
PricewaterhouseCoopers LLP
Boston, Massachusetts
December 11, 2019
We have served as the auditor of one or more investment companies in the Fidelity group of funds since 1932.
Trustees and Officers
The Trustees, Members of the Advisory Board (if any), and officers of the trust and fund, as applicable, are listed below. The Board of Trustees governs the fund and is responsible for protecting the interests of shareholders. The Trustees are experienced executives who meet periodically throughout the year to oversee the fund's activities, review contractual arrangements with companies that provide services to the fund, oversee management of the risks associated with such activities and contractual arrangements, and review the fund's performance. Except for Jonathan Chiel, each of the Trustees oversees 298 funds. Mr. Chiel oversees 171 funds.
The Trustees hold office without limit in time except that (a) any Trustee may resign; (b) any Trustee may be removed by written instrument, signed by at least two-thirds of the number of Trustees prior to such removal; (c) any Trustee who requests to be retired or who has become incapacitated by illness or injury may be retired by written instrument signed by a majority of the other Trustees; and (d) any Trustee may be removed at any special meeting of shareholders by a two-thirds vote of the outstanding voting securities of the trust. Each Trustee who is not an interested person (as defined in the 1940 Act) of the trust and the fund is referred to herein as an Independent Trustee. Each Independent Trustee shall retire not later than the last day of the calendar year in which his or her 75th birthday occurs. The Independent Trustees may waive this mandatory retirement age policy with respect to individual Trustees. Officers and Advisory Board Members hold office without limit in time, except that any officer or Advisory Board Member may resign or may be removed by a vote of a majority of the Trustees at any regular meeting or any special meeting of the Trustees. Except as indicated, each individual has held the office shown or other offices in the same company for the past five years.
The fund’s Statement of Additional Information (SAI) includes more information about the Trustees. To request a free copy, call Fidelity at 1-877-208-0098.
Experience, Skills, Attributes, and Qualifications of the Trustees. The Governance and Nominating Committee has adopted a statement of policy that describes the experience, qualifications, attributes, and skills that are necessary and desirable for potential Independent Trustee candidates (Statement of Policy). The Board believes that each Trustee satisfied at the time he or she was initially elected or appointed a Trustee, and continues to satisfy, the standards contemplated by the Statement of Policy. The Governance and Nominating Committee also engages professional search firms to help identify potential Independent Trustee candidates who have the experience, qualifications, attributes, and skills consistent with the Statement of Policy. From time to time, additional criteria based on the composition and skills of the current Independent Trustees, as well as experience or skills that may be appropriate in light of future changes to board composition, business conditions, and regulatory or other developments, have also been considered by the professional search firms and the Governance and Nominating Committee. In addition, the Board takes into account the Trustees' commitment and participation in Board and committee meetings, as well as their leadership of standing and ad hoc committees throughout their tenure.
In determining that a particular Trustee was and continues to be qualified to serve as a Trustee, the Board has considered a variety of criteria, none of which, in isolation, was controlling. The Board believes that, collectively, the Trustees have balanced and diverse experience, qualifications, attributes, and skills, which allow the Board to operate effectively in governing the fund and protecting the interests of shareholders. Information about the specific experience, skills, attributes, and qualifications of each Trustee, which in each case led to the Board's conclusion that the Trustee should serve (or continue to serve) as a trustee of the fund, is provided below.
Board Structure and Oversight Function. James C. Curvey is an interested person and currently serves as Chairman. The Trustees have determined that an interested Chairman is appropriate and benefits shareholders because an interested Chairman has a personal and professional stake in the quality and continuity of services provided to the fund. Independent Trustees exercise their informed business judgment to appoint an individual of their choosing to serve as Chairman, regardless of whether the Trustee happens to be independent or a member of management. The Independent Trustees have determined that they can act independently and effectively without having an Independent Trustee serve as Chairman and that a key structural component for assuring that they are in a position to do so is for the Independent Trustees to constitute a substantial majority for the Board. The Independent Trustees also regularly meet in executive session. Ned C. Lautenbach serves as Chairman of the Independent Trustees and as such (i) acts as a liaison between the Independent Trustees and management with respect to matters important to the Independent Trustees and (ii) with management prepares agendas for Board meetings.
Fidelity® funds are overseen by different Boards of Trustees. The fund's Board oversees Fidelity's high income and certain equity funds, and other Boards oversee Fidelity's investment-grade bond, money market, asset allocation, and other equity funds. The asset allocation funds may invest in Fidelity® funds overseen by the fund's Board. The use of separate Boards, each with its own committee structure, allows the Trustees of each group of Fidelity® funds to focus on the unique issues of the funds they oversee, including common research, investment, and operational issues. On occasion, the separate Boards establish joint committees to address issues of overlapping consequences for the Fidelity® funds overseen by each Board.
The Trustees operate using a system of committees to facilitate the timely and efficient consideration of all matters of importance to the Trustees, the fund, and fund shareholders and to facilitate compliance with legal and regulatory requirements and oversight of the fund's activities and associated risks. The Board, acting through its committees, has charged FMR and its affiliates with (i) identifying events or circumstances the occurrence of which could have demonstrably adverse effects on the fund's business and/or reputation; (ii) implementing processes and controls to lessen the possibility that such events or circumstances occur or to mitigate the effects of such events or circumstances if they do occur; and (iii) creating and maintaining a system designed to evaluate continuously business and market conditions in order to facilitate the identification and implementation processes described in (i) and (ii) above. Because the day-to-day operations and activities of the fund are carried out by or through FMR, its affiliates, and other service providers, the fund's exposure to risks is mitigated but not eliminated by the processes overseen by the Trustees. While each of the Board's committees has responsibility for overseeing different aspects of the fund's activities, oversight is exercised primarily through the Operations, Audit, and Compliance Committees. Appropriate personnel, including but not limited to the fund's Chief Compliance Officer (CCO), FMR's internal auditor, the independent accountants, the fund's Treasurer and portfolio management personnel, make periodic reports to the Board's committees, as appropriate, including an annual review of Fidelity's risk management program for the Fidelity® funds. The responsibilities of each standing committee, including their oversight responsibilities, are described further under "Standing Committees of the Trustees."
Interested Trustees*:
Correspondence intended for a Trustee who is an interested person may be sent to Fidelity Investments, 245 Summer Street, Boston, Massachusetts 02210.
Name, Year of Birth; Principal Occupations and Other Relevant Experience+
Jonathan Chiel (1957)
Year of Election or Appointment: 2016
Trustee
Mr. Chiel also serves as Trustee of other Fidelity® funds. Mr. Chiel is Executive Vice President and General Counsel for FMR LLC (diversified financial services company, 2012-present). Previously, Mr. Chiel served as general counsel (2004-2012) and senior vice president and deputy general counsel (2000-2004) for John Hancock Financial Services; a partner with Choate, Hall & Stewart (1996-2000) (law firm); and an Assistant United States Attorney for the United States Attorney’s Office of the District of Massachusetts (1986-95), including Chief of the Criminal Division (1993-1995). Mr. Chiel is a director on the boards of the Boston Bar Foundation and the Maimonides School.
James C. Curvey (1935)
Year of Election or Appointment: 2007
Trustee
Chairman of the Board of Trustees
Mr. Curvey also serves as Trustee of other Fidelity® funds. Mr. Curvey is Vice Chairman (2007-present) and Director of FMR LLC (diversified financial services company). In addition, Mr. Curvey is an Overseer Emeritus for the Boston Symphony Orchestra, a Director of Artis-Naples, and a Trustee of Brewster Academy in Wolfeboro, New Hampshire. Previously, Mr. Curvey served as a Director of Fidelity Research & Analysis Co. (investment adviser firm, 2009-2018), Director of Fidelity Investments Money Management, Inc. (investment adviser firm, 2009-2014) and a Director of FMR and FMR Co., Inc. (investment adviser firms, 2007-2014).
* Determined to be an “Interested Trustee” by virtue of, among other things, his or her affiliation with the trust or various entities under common control with FMR.
+ The information includes the Trustee's principal occupation during the last five years and other information relating to the experience, attributes, and skills relevant to the Trustee's qualifications to serve as a Trustee, which led to the conclusion that the Trustee should serve as a Trustee for the fund.
Independent Trustees:
Correspondence intended for an Independent Trustee may be sent to Fidelity Investments, P.O. Box 55235, Boston, Massachusetts 02205-5235.
Name, Year of Birth; Principal Occupations and Other Relevant Experience+
Dennis J. Dirks (1948)
Year of Election or Appointment: 2005
Trustee
Mr. Dirks also serves as Trustee of other Fidelity® funds. Prior to his retirement in May 2003, Mr. Dirks was Chief Operating Officer and a member of the Board of The Depository Trust & Clearing Corporation (DTCC). He also served as President, Chief Operating Officer, and Board member of The Depository Trust Company (DTC) and President and Board member of the National Securities Clearing Corporation (NSCC). In addition, Mr. Dirks served as Chief Executive Officer and Board member of the Government Securities Clearing Corporation, Chief Executive Officer and Board member of the Mortgage-Backed Securities Clearing Corporation, as a Trustee and a member of the Finance Committee of Manhattan College (2005-2008), as a Trustee and a member of the Finance Committee of AHRC of Nassau County (2006-2008), as a member of the Independent Directors Council (IDC) Governing Council (2010-2015), and as a member of the Board of Directors for The Brookville Center for Children’s Services, Inc. (2009-2017). Mr. Dirks is a member of the Finance Committee (2016-present) and Board of Directors (2017-present) and is Treasurer (2018-present) of the Asolo Repertory Theatre.
Donald F. Donahue (1950)
Year of Election or Appointment: 2018
Trustee
Mr. Donahue also serves as a Trustee of other Fidelity® funds. Mr. Donahue is President and Chief Executive Officer of Miranda Partners, LLC (risk consulting for the financial services industry, 2012-present). Previously, Mr. Donahue served as a Member of the Advisory Board of certain Fidelity® funds (2015-2018) and Chief Executive Officer (2006-2012), Chief Operating Officer (2003-2006), and Managing Director, Customer Marketing and Development (1999-2003) of The Depository Trust & Clearing Corporation (financial markets infrastructure). Mr. Donahue serves as a Member (2007-present) and Co-Chairman (2016-present) of the Board of Directors of United Way of New York, Member of the Board of Directors of NYC Leadership Academy (2012-present) and Member of the Board of Advisors of Ripple Labs, Inc. (financial services, 2015-present). He also served as Chairman (2010-2012) and Member of the Board of Directors (2012-2013) of Omgeo, LLC (financial services), Treasurer of United Way of New York (2012-2016), and Member of the Board of Directors of XBRL US (financial services non-profit, 2009-2012) and the International Securities Services Association (2009-2012).
Alan J. Lacy (1953)
Year of Election or Appointment: 2008
Trustee
Mr. Lacy also serves as Trustee of other Fidelity® funds. Mr. Lacy serves as a Director of Bristol-Myers Squibb Company (global pharmaceuticals, 2008-present). He is a Trustee of the California Chapter of The Nature Conservancy (2015-present) and a Director of the Center for Advanced Study in the Behavioral Sciences at Stanford University (2015-present). In addition, Mr. Lacy served as Senior Adviser (2007-2014) of Oak Hill Capital Partners, L.P. (private equity) and also served as Chief Executive Officer (2005) and Vice Chairman (2005-2006) of Sears Holdings Corporation (retail) and Chief Executive Officer and Chairman of the Board of Sears, Roebuck and Co. (retail, 2000-2005). Previously, Mr. Lacy served as Chairman (2014-2017) and a member (2010-2017) of the Board of Directors of Dave & Buster’s Entertainment, Inc. (restaurant and entertainment complexes), as Chairman (2008-2011) and a member (2006-2015) of the Board of Trustees of the National Parks Conservation Association, and as a member of the Board of Directors for The Hillman Companies, Inc. (hardware wholesalers, 2010-2014), Earth Fare, Inc. (retail grocery, 2010-2014), and The Western Union Company (global money transfer, 2006-2011).
Ned C. Lautenbach (1944)
Year of Election or Appointment: 2000
Trustee
Chairman of the Independent Trustees
Mr. Lautenbach also serves as Trustee of other Fidelity® funds. Mr. Lautenbach currently serves as Chair (2018-present) and Member (2013-present) of the Board of Governors, State University System of Florida and is a member of the Council on Foreign Relations (1994-present). He is also a member and has most recently served as Chairman of the Board of Directors of Artis-Naples (2012-present). Previously, Mr. Lautenbach served as a member and then Lead Director of the Board of Directors of Eaton Corporation (diversified industrial, 1997-2016). He was also a Partner and Advisory Partner at Clayton, Dubilier & Rice, LLC (private equity investment, 1998-2010), as well as a Director of Sony Corporation (2006-2007). In addition, Mr. Lautenbach also had a 30-year career with IBM (technology company) during which time he served as Senior Vice President and a member of the Corporate Executive Committee (1968-1998).
Joseph Mauriello (1944)
Year of Election or Appointment: 2008
Trustee
Mr. Mauriello also serves as Trustee of other Fidelity® funds. Prior to his retirement in January 2006, Mr. Mauriello served in numerous senior management positions including Deputy Chairman and Chief Operating Officer (2004-2005), and Vice Chairman of Financial Services (2002-2004) of KPMG LLP US (professional services, 1965-2005). Mr. Mauriello currently serves as a member of the Independent Directors Council (IDC) Governing Council (2015-present). Previously, Mr. Mauriello served as a member of the Board of Directors of XL Group plc. (global insurance and re-insurance, 2006-2018).
Cornelia M. Small (1944)
Year of Election or Appointment: 2005
Trustee
Ms. Small also serves as Trustee of other Fidelity® funds. Ms. Small is a member of the Board of Directors (2009-present) and Chair of the Investment Committee (2010-present) of the Teagle Foundation. Ms. Small also serves on the Investment Committee of the Berkshire Taconic Community Foundation (2008-present). Previously, Ms. Small served as Chairperson (2002-2008) and a member of the Investment Committee and Chairperson (2008-2012) and a member of the Board of Trustees of Smith College. In addition, Ms. Small served as Chief Investment Officer, Director of Global Equity Investments, and a member of the Board of Directors of Scudder, Stevens & Clark and Scudder Kemper Investments.
Garnett A. Smith (1947)
Year of Election or Appointment: 2018
Trustee
Mr. Smith also serves as Trustee of other Fidelity® funds. Prior to Mr. Smith's retirement, he served as Chairman and Chief Executive Officer of Inbrand Corp. (manufacturer of personal absorbent products, 1990-1997). He also served as President (1986-1990) of Inbrand Corp. Prior to his employment with Inbrand Corp., he was employed by a retail fabric chain and North Carolina National Bank. In addition, Mr. Smith served as a Member of the Advisory Board of certain Fidelity® funds (2012-2013) and as a board member of the Jackson Hole Land Trust (2009-2012).
David M. Thomas (1949)
Year of Election or Appointment: 2008
Trustee
Mr. Thomas also serves as Trustee of other Fidelity® funds. Mr. Thomas serves as Non-Executive Chairman of the Board of Directors of Fortune Brands Home and Security (home and security products, 2011-present) and as a member of the Board of Directors (2004-present) and Presiding Director (2013-present) of Interpublic Group of Companies, Inc. (marketing communication). Previously, Mr. Thomas served as Executive Chairman (2005-2006) and Chairman and Chief Executive Officer (2000-2005) of IMS Health, Inc. (pharmaceutical and healthcare information solutions), a Director of Fortune Brands, Inc. (consumer products, 2000-2011), and a member of the Board of Trustees of the University of Florida (2013-2018).
+ The information includes the Trustee's principal occupation during the last five years and other information relating to the experience, attributes, and skills relevant to the Trustee's qualifications to serve as a Trustee, which led to the conclusion that the Trustee should serve as a Trustee for the fund.
Advisory Board Members and Officers:
Correspondence intended for a Member of the Advisory Board (if any) may be sent to Fidelity Investments, P.O. Box 55235, Boston, Massachusetts 02205-5235. Correspondence intended for an officer or Peter S. Lynch may be sent to Fidelity Investments, 245 Summer Street, Boston, Massachusetts 02210. Officers appear below in alphabetical order.
Name, Year of Birth; Principal Occupation
Vicki L. Fuller (1957)
Year of Election or Appointment: 2018
Member of the Advisory Board
Ms. Fuller also serves as Member of the Advisory Board of other Fidelity® funds. Ms. Fuller serves as a member of the Board of Directors, Audit Committee, and Nominating and Governance Committee of The Williams Companies, Inc. (natural gas infrastructure, 2018-present). Previously, Ms. Fuller served as the Chief Investment Officer of the New York State Common Retirement Fund (2012-2018) and held a variety of positions at AllianceBernstein L.P. (global asset management, 1985-2012), including Managing Director (2006-2012) and Senior Vice President and Senior Portfolio Manager (2001-2006).
Peter S. Lynch (1944)
Year of Election or Appointment: 2003
Member of the Advisory Board
Mr. Lynch also serves as Member of the Advisory Board of other Fidelity® funds. Mr. Lynch is Vice Chairman and a Director of FMR (investment adviser firm) and FMR Co., Inc. (investment adviser firm). In addition, Mr. Lynch serves as a Trustee of Boston College and as the Chairman of the Inner-City Scholarship Fund. Previously, Mr. Lynch served on the Special Olympics International Board of Directors (1997-2006).
Michael E. Wiley (1950)
Year of Election or Appointment: 2018
Member of the Advisory Board
Mr. Wiley also serves as Trustee or Member of the Advisory Board of other Fidelity® funds. Mr. Wiley serves as a Director of High Point Resources (exploration and production, 2005-present). Previously, Mr. Wiley served as a Director of Andeavor Corporation (independent oil refiner and marketer, 2005-2018), a Director of Andeavor Logistics LP (natural resources logistics, 2015-2018), a Director of Post Oak Bank (privately-held bank, 2004-2018), a Director of Asia Pacific Exploration Consolidated (international oil and gas exploration and production, 2008-2013), a member of the Board of Trustees of the University of Tulsa (2000-2006; 2007-2010), a Senior Energy Advisor of Katzenbach Partners, LLC (consulting, 2006-2007), an Advisory Director of Riverstone Holdings (private investment), a Director of Spinnaker Exploration Company (exploration and production, 2001-2005) and Chairman, President, and CEO of Baker Hughes, Inc. (oilfield services, 2000-2004).
Elizabeth Paige Baumann (1968)
Year of Election or Appointment: 2017
Anti-Money Laundering (AML) Officer
Ms. Baumann also serves as AML Officer of other funds. She is Chief AML Officer (2012-present) and Senior Vice President (2014-present) of FMR LLC (diversified financial services company) and is an employee of Fidelity Investments. Previously, Ms. Baumann served as AML Officer of the funds (2012-2016), and Vice President (2007-2014) and Deputy Anti-Money Laundering Officer (2007-2012) of FMR LLC.
Craig S. Brown (1977)
Year of Election or Appointment: 2019
Assistant Treasurer
Mr. Brown also serves as Assistant Treasurer of other funds. Mr. Brown is an employee of Fidelity Investments (2013-present).
John J. Burke III (1964)
Year of Election or Appointment: 2018
Chief Financial Officer
Mr. Burke also serves as Chief Financial Officer of other funds. Mr. Burke serves as Head of Investment Operations for Fidelity Fund and Investment Operations (2018-present) and is an employee of Fidelity Investments (1998-present). Previously Mr. Burke served as head of Asset Management Investment Operations (2012-2018).
William C. Coffey (1969)
Year of Election or Appointment: 2019
Assistant Secretary
Mr. Coffey also serves as Assistant Secretary of other funds. He is Senior Vice President and Deputy General Counsel of FMR LLC (diversified financial services company, 2010-present), and is an employee of Fidelity Investments. Previously, Mr. Coffey served as Secretary and CLO of certain funds (2018-2019); CLO, Secretary, and Senior Vice President of Fidelity Management & Research Company and FMR Co., Inc. (investment adviser firms, 2018-2019); Secretary of Fidelity SelectCo, LLC and Fidelity Investments Money Management, Inc. (investment adviser firms, 2018-2019); CLO of Fidelity Management & Research (Hong Kong) Limited, FMR Investment Management (UK) Limited, and Fidelity Management & Research (Japan) Limited (investment adviser firms, 2018-2019); and Assistant Secretary of certain funds (2009-2018).
Timothy M. Cohen (1969)
Year of Election or Appointment: 2018
Vice President
Mr. Cohen also serves as Vice President of other funds. Mr. Cohen serves as Executive Vice President of Fidelity SelectCo, LLC (2019-present), Co-Head of Equity (2018-present), a Director of Fidelity Management & Research (Japan) Limited (investment adviser firm, 2016-present), and is an employee of Fidelity Investments. Previously, Mr. Cohen served as Head of Global Equity Research (2016-2018), Chief Investment Officer - Equity and a Director of Fidelity Management & Research (U.K.) Inc. (investment adviser firm, 2013-2015) and as a Director of Fidelity Management & Research (Hong Kong) Limited (investment adviser firm, 2017).
Jonathan Davis (1968)
Year of Election or Appointment: 2010
Assistant Treasurer
Mr. Davis also serves as Assistant Treasurer of other funds. Mr. Davis serves as Assistant Treasurer of FMR Capital, Inc. (2017-present) and is an employee of Fidelity Investments. Previously, Mr. Davis served as Vice President and Associate General Counsel of FMR LLC (diversified financial services company, 2003-2010).
Adrien E. Deberghes (1967)
Year of Election or Appointment: 2016
Assistant Treasurer
Mr. Deberghes also serves as an officer of other funds. He serves as Assistant Treasurer of FMR Capital, Inc. (2017-present), Executive Vice President of Fidelity Investments Money Management, Inc. (FIMM) (investment adviser firm, 2016-present), and is an employee of Fidelity Investments (2008-present). Previously, Mr. Deberghes served as President and Treasurer of certain Fidelity® funds (2013-2018). Prior to joining Fidelity Investments, Mr. Deberghes was Senior Vice President of Mutual Fund Administration at State Street Corporation (2007-2008), Senior Director of Mutual Fund Administration at Investors Bank & Trust (2005-2007), and Director of Finance for Dunkin' Brands (2000-2005). Previously, Mr. Deberghes served in other fund officer roles.
Laura M. Del Prato (1964)
Year of Election or Appointment: 2018
Assistant Treasurer
Ms. Del Prato also serves as an officer of other funds. Ms. Del Prato is an employee of Fidelity Investments (2017-present). Prior to joining Fidelity Investments, Ms. Del Prato served as a Managing Director and Treasurer of the JPMorgan Mutual Funds (2014-2017). Prior to JPMorgan, Ms. Del Prato served as a partner at Cohen Fund Audit Services (accounting firm, 2012-2013) and KPMG LLP (accounting firm, 2004-2012).
Colm A. Hogan (1973)
Year of Election or Appointment: 2016
Deputy Treasurer
Mr. Hogan also serves as an officer of other funds. Mr. Hogan serves as Assistant Treasurer of FMR Capital, Inc. (2017-present) and is an employee of Fidelity Investments (2005-present). Previously, Mr. Hogan served as Assistant Treasurer of certain Fidelity® funds (2016-2018).
Pamela R. Holding (1964)
Year of Election or Appointment: 2018
Vice President
Ms. Holding also serves as Vice President of other funds. Ms. Holding serves as Executive Vice President of Fidelity SelectCo, LLC (2019-present), Co-Head of Equity (2018-present) and is an employee of Fidelity Investments (2013-present). Previously, Ms. Holding served as Chief Investment Officer of Fidelity Institutional Asset Management (2013-2018).
Cynthia Lo Bessette (1969)
Year of Election or Appointment: 2019
Secretary and Chief Legal Officer (CLO)
Ms. Lo Bessette also serves as Secretary and CLO of other funds. Ms. Lo Bessette serves as CLO, Secretary, and Senior Vice President of Fidelity Management & Research Company and FMR Co., Inc. (investment adviser firms, 2019-present); Secretary of Fidelity SelectCo, LLC and Fidelity Investments Money Management, Inc. (investment adviser firms, 2019-present); and CLO of Fidelity Management & Research (Hong Kong) Limited, FMR Investment Management (UK) Limited, and Fidelity Management & Research (Japan) Limited (investment adviser firms, 2019-present). She is a Senior Vice President and Deputy General Counsel of FMR LLC (diversified financial services company, 2019-present), and is an employee of Fidelity Investments. Previously, Ms. Lo Bessette served as Executive Vice President, General Counsel (2016-2019) and Senior Vice President, Deputy General Counsel (2015-2016) of OppenheimerFunds (investment management company) and Deputy Chief Legal Officer (2013-2015) of Jennison Associates LLC (investment adviser firm).
Chris Maher (1972)
Year of Election or Appointment: 2013
Assistant Treasurer
Mr. Maher serves as Assistant Treasurer of other funds. Mr. Maher is Vice President of Valuation Oversight, serves as Assistant Treasurer of FMR Capital, Inc. (2017-present), and is an employee of Fidelity Investments. Previously, Mr. Maher served as Vice President of Asset Management Compliance (2013), Vice President of the Program Management Group of FMR (investment adviser firm, 2010-2013), and Vice President of Valuation Oversight (2008-2010).
Kenneth B. Robins (1969)
Year of Election or Appointment: 2016
Chief Compliance Officer
Mr. Robins also serves as an officer of other funds. Mr. Robins serves as Compliance Officer of Fidelity Management & Research Company and FMR Co., Inc. (investment adviser firms, 2016-present) and is an employee of Fidelity Investments (2004-present). Previously, Mr. Robins served as Executive Vice President of Fidelity Investments Money Management, Inc. (investment adviser firm, 2013-2016) and served in other fund officer roles.
Stacie M. Smith (1974)
Year of Election or Appointment: 2016
President and Treasurer
Ms. Smith also serves as an officer of other funds. Ms. Smith serves as Assistant Treasurer of FMR Capital, Inc. (2017-present), is an employee of Fidelity Investments (2009-present), and has served in other fund officer roles. Prior to joining Fidelity Investments, Ms. Smith served as Senior Audit Manager of Ernst & Young LLP (accounting firm, 1996-2009). Previously, Ms. Smith served as Assistant Treasurer (2013-2018) and Deputy Treasurer (2013-2016) of certain Fidelity® funds.
Marc L. Spector (1972)
Year of Election or Appointment: 2016
Assistant Treasurer
Mr. Spector also serves as an officer of other funds. Mr. Spector serves as Assistant Treasurer of FMR Capital, Inc. (2017-present) and is an employee of Fidelity Investments (2016-present). Prior to joining Fidelity Investments, Mr. Spector served as Director at the Siegfried Group (accounting firm, 2013-2016), and prior to Siegfried Group as audit senior manager at Deloitte & Touche (accounting firm, 2005-2013).
Jim Wegmann (1979)
Year of Election or Appointment: 2019
Assistant Treasurer
Mr. Wegmann also serves as Assistant Treasurer of other funds. Mr. Wegmann is an employee of Fidelity Investments (2011-present).
Shareholder Expense Example
As a shareholder of the Fund, you incur two types of costs: (1) transaction costs, including sales charges (loads) on purchase payments or redemption proceeds, and (2) ongoing costs, including management fees, distribution and/or service (12b-1) fees and other Fund expenses. This Example is intended to help you understand your ongoing costs (in dollars) of investing in the Fund and to compare these costs with the ongoing costs of investing in other mutual funds.
The Example is based on an investment of $1,000 invested at the beginning of the period and held for the entire period (May 1, 2019 to October 31, 2019).
Actual Expenses
The first line of the accompanying table for each class of the Fund provides information about actual account values and actual expenses. You may use the information in this line, together with the amount you invested, to estimate the expenses that you paid over the period. Simply divide your account value by $1,000.00 (for example, an $8,600 account value divided by $1,000.00 = 8.6), then multiply the result by the number in the first line for a class of the Fund under the heading entitled "Expenses Paid During Period" to estimate the expenses you paid on your account during this period. In addition, the Fund, as a shareholder in the underlying Fidelity Central Funds, will indirectly bear its pro-rata share of the fees and expenses incurred by the underlying Fidelity Central Funds. These fees and expenses are not included in the Fund's annualized expense ratio used to calculate the expense estimate in the table below.
Hypothetical Example for Comparison Purposes
The second line of the accompanying table for each class of the Fund provides information about hypothetical account values and hypothetical expenses based on a Class' actual expense ratio and an assumed rate of return of 5% per year before expenses, which is not the Class' actual return. The hypothetical account values and expenses may not be used to estimate the actual ending account balance or expenses you paid for the period. You may use this information to compare the ongoing costs of investing in the Fund and other funds. To do so, compare this 5% hypothetical example with the 5% hypothetical examples that appear in the shareholder reports of the other funds. In addition, the Fund, as a shareholder in the underlying Fidelity Central Funds, will indirectly bear its pro-rata share of the fees and expenses incurred by the underlying Fidelity Central Funds. These fees and expenses are not included in the Fund's annualized expense ratio used to calculate the expense estimate in the table below.
Please note that the expenses shown in the table are meant to highlight your ongoing costs only and do not reflect any transaction costs. Therefore, the second line of the table is useful in comparing ongoing costs only, and will not help you determine the relative total costs of owning different funds. In addition, if these transactional costs were included, your costs would have been higher.
| | Annualized Expense Ratio-A | Beginning
Account Value
May 1, 2019 | Ending
Account Value
October 31, 2019 | Expenses Paid
During Period-B
May 1, 2019
to October 31, 2019 |
| Class A | 1.29% | | | |
| Actual | | $1,000.00 | $1,020.00 | $6.57 |
| Hypothetical-C | | $1,000.00 | $1,018.70 | $6.56 |
| Class M | 1.57% | | | |
| Actual | | $1,000.00 | $1,018.20 | $7.99 |
| Hypothetical-C | | $1,000.00 | $1,017.29 | $7.98 |
| Class C | 1.97% | | | |
| Actual | | $1,000.00 | $1,016.20 | $10.01 |
| Hypothetical-C | | $1,000.00 | $1,015.27 | $10.01 |
| Class I | 1.01% | | | |
| Actual | | $1,000.00 | $1,021.10 | $5.15 |
| Hypothetical-C | | $1,000.00 | $1,020.11 | $5.14 |
| Class Z | .91% | | | |
| Actual | | $1,000.00 | $1,022.10 | $4.64 |
| Hypothetical-C | | $1,000.00 | $1,020.62 | $4.63 |
A Annualized expense ratio reflects expenses net of applicable fee waivers.
B Expenses are equal to each Class' annualized expense ratio, multiplied by the average account value over the period, multiplied by 184/365 (to reflect the one-half year period).
C 5% return per year before expenses
Distributions (Unaudited)
The Board of Trustees of Fidelity Advisor Emerging Asia Fund voted to pay to shareholders of record at the opening of business on record date, the following distributions per share derived from capital gains realized from sales of portfolio securities, and dividends derived from net investment income:
| | Pay Date | Record Date | Dividends | Capital Gains |
| Fidelity Advisor Emerging Asia Fund | | | | |
| Class A | 12/09/2019 | 12/06/2019 | $0.156 | $1.958 |
| Class M | 12/09/2019 | 12/06/2019 | $0.037 | $1.958 |
| Class C | 12/09/2019 | 12/06/2019 | $0.000 | $1.866 |
| Class I | 12/09/2019 | 12/06/2019 | $0.263 | $1.958 |
| Class Z | 12/09/2019 | 12/06/2019 | $0.326 | $1.958 |
The fund hereby designates as a capital gain dividend with respect to the taxable year ended October 31, 2019, $15,566,408, or, if subsequently determined to be different, the net capital gain of such year.
Class A, Class M, Class I, and Class Z designate 100% of the dividends distributed during the fiscal year as amounts which may be taken into account as a dividend for purposes of the maximum rate under section 1(h)(11) of the Internal Revenue Code.
The amounts per share which represent income derived from sources within, and taxes paid to, foreign countries or possessions of the United States are as follows:
| | Pay Date | Income | Taxes |
| Fidelity Advisor Emerging Asia Fund | | | |
| Class A | 12/10/2018 | $0.2827 | $0.0887 |
| Class M | 12/10/2018 | $0.1427 | $0.0887 |
| Class C | 12/10/2018 | $0.0000 | $0.0000 |
| Class I | 12/10/2018 | $0.4187 | $0.0887 |
| Class Z | 12/10/2018 | $0.5067 | $0.0887 |
|
The fund will notify shareholders in January 2020 of amounts for use in preparing 2019 income tax returns.
AEA-ANN-1219
1.703376.122
Fidelity Advisor® Value Leaders Fund
Annual Report
October 31, 2019
See the inside front cover for important information about access to your fund’s shareholder reports.
Beginning on January 1, 2021, as permitted by regulations adopted by the Securities and Exchange Commission, paper copies of a fund’s shareholder reports will no longer be sent by mail, unless you specifically request paper copies of the reports from the fund or from your financial intermediary, such as a financial advisor, broker-dealer or bank. Instead, the reports will be made available on a website, and you will be notified by mail each time a report is posted and provided with a website link to access the report.
If you already elected to receive shareholder reports electronically, you will not be affected by this change and you need not take any action. You may elect to receive shareholder reports and other communications from a fund electronically, by contacting your financial intermediary. For Fidelity customers, visit Fidelity's web site or call Fidelity using the contact information listed below.
You may elect to receive all future reports in paper free of charge. If you wish to continue receiving paper copies of your shareholder reports, you may contact your financial intermediary or, if you are a Fidelity customer, visit Fidelity’s website, or call Fidelity at the applicable toll-free number listed below. Your election to receive reports in paper will apply to all funds held with the fund complex/your financial intermediary.
| Account Type | Website | Phone Number |
| Brokerage, Mutual Fund, or Annuity Contracts: | fidelity.com/mailpreferences | 1-800-343-3548 |
| Employer Provided Retirement Accounts: | netbenefits.fidelity.com/preferences (choose 'no' under Required Disclosures to continue to print) | 1-800-343-0860 |
| Advisor Sold Accounts Serviced Through Your Financial Intermediary: | Contact Your Financial Intermediary | Your Financial Intermediary's phone number |
| Advisor Sold Accounts Serviced by Fidelity: | institutional.fidelity.com | 1-877-208-0098 |
Contents
To view a fund's proxy voting guidelines and proxy voting record for the 12-month period ended June 30, visit http://www.fidelity.com/proxyvotingresults or visit the Securities and Exchange Commission's (SEC) web site at http://www.sec.gov.
You may also call 1-877-208-0098 to request a free copy of the proxy voting guidelines.
Standard & Poor's, S&P and S&P 500 are registered service marks of The McGraw-Hill Companies, Inc. and have been licensed for use by Fidelity Distributors Corporation.
Other third-party marks appearing herein are the property of their respective owners.
All other marks appearing herein are registered or unregistered trademarks or service marks of FMR LLC or an affiliated company. © 2019 FMR LLC. All rights reserved.
This report and the financial statements contained herein are submitted for the general information of the shareholders of the Fund. This report is not authorized for distribution to prospective investors in the Fund unless preceded or accompanied by an effective prospectus.
A fund files its complete schedule of portfolio holdings with the SEC for the first and third quarters of each fiscal year on Form N-PORT. Forms N-PORT are available on the SEC’s web site at http://www.sec.gov. A fund's Forms N-PORT may be reviewed and copied at the SEC’s Public Reference Room in Washington, DC. Information regarding the operation of the SEC's Public Reference Room may be obtained by calling 1-800-SEC-0330.
For a complete list of a fund's portfolio holdings, view the most recent holdings listing, semiannual report, or annual report on Fidelity's web site at http://www.fidelity.com, http://www.institutional.fidelity.com, or http://www.401k.com, as applicable.
NOT FDIC INSURED •MAY LOSE VALUE •NO BANK GUARANTEE
Neither the Fund nor Fidelity Distributors Corporation is a bank.
Performance: The Bottom Line
Average annual total return reflects the change in the value of an investment, assuming reinvestment of distributions from dividend income and capital gains (the profits earned upon the sale of securities that have grown in value, if any) and assuming a constant rate of performance each year. The hypothetical investment and the average annual total returns do not reflect the deduction of taxes that a shareholder would pay on fund distributions or the redemption of fund shares. During periods of reimbursement by Fidelity, a fund’s total return will be greater than it would be had the reimbursement not occurred. How a fund did yesterday is no guarantee of how it will do tomorrow.
Average Annual Total Returns
| For the periods ended October 31, 2019 | Past 1 year | Past 5 years | Past 10 years |
| Class A (incl. 5.75% sales charge) | (1.38)% | 4.57% | 8.39% |
| Class M (incl. 3.50% sales charge) | 0.76% | 4.81% | 8.38% |
| Class C (incl. contingent deferred sales charge) | 2.94% | 5.03% | 8.23% |
| Class I | 4.96% | 6.10% | 9.34% |
Class C shares' contingent deferred sales charges included in the past one year, past five years and past ten years total return figures are 1%, 0% and 0%, respectively.
$10,000 Over 10 Years
Let's say hypothetically that $10,000 was invested in Fidelity Advisor® Value Leaders Fund - Class A on October 31, 2009, and the current 5.75% sales charge was paid.
The chart shows how the value of your investment would have changed, and also shows how the Russell 1000® Value Index performed over the same period.
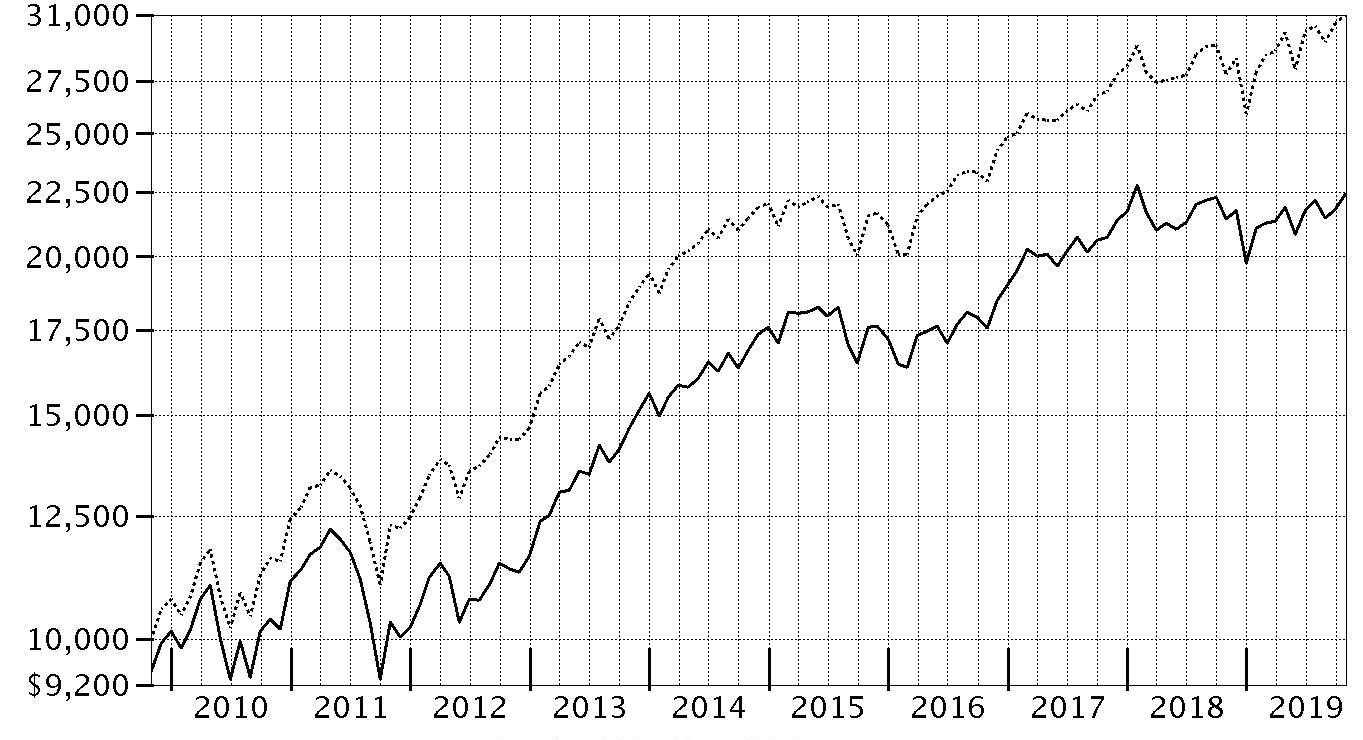
| Period Ending Values |
| $22,381 | Fidelity Advisor® Value Leaders Fund - Class A |
| $30,959 | Russell 1000® Value Index |
Management's Discussion of Fund Performance
Market Recap: The S&P 500
® index gained 14.33% for the 12 months ending October 31, 2019, ending the period just shy of a record close after seesawing due to trade tension, interest rates, economic data and an inverted yield curve, among other factors. Upbeat company earnings and outlooks, along with signs the Federal Reserve may pause on rates, boosted stocks to an all-time high on April 30. In May, however, volatility spiked and the index sunk as trade negotiations between the U.S. and China broke down. The bull market roared back in June and recorded a series of highs in July, when the Fed, affirming a dovish shift in policy, cut interest rates for the first time since 2008. Volatility intensified in August, however, as the U.S. Treasury yield curve inverted for the first time since 2007, which some investors viewed as a sign the U.S. economy could be heading for recession. The market proved resilient, rising in the final two months and reaching a new high on October 30, when the Fed cut interest rates for the third time this year. For the full 12 months, the defensive real estate (+27%) and utilities (+24%) sectors led the way, followed by information technology (+23%). Communication services and consumer discretionary each gained about 16%, while industrials advanced 15%. In contrast, energy (-11%) was by far the weakest sector – slipping on lower oil prices. Other notable laggards included health care (+9%) and financials (+12%). Lastly, consumer staples and materials finished roughly in line with the index.
Comments from Portfolio Manager Sean Gavin: For the fiscal year, the fund share classes (excluding sales charges, if applicable) gained roughly 4% to 5%, trailing the 11.21% advance of the benchmark Russell 1000
® Value Index. Versus the benchmark, stock selection in the health care, financials and industrials sectors detracted most. Security selection and an underweighting in information technology also hurt relative performance. Within health care, our biggest individual detractor by far was an untimely early-period overweighting in CVS Health (-27%), which combines a retail drug store chain, pharmacy-benefit-management division and health insurance business. I sold CVS from the fund in April. Health insurer Cigna (-1%), one of the fund's largest holdings, also hurt our relative result. Other individual detractors were PVH (-28%), a leading global apparel company that struggled in a difficult environment for retailers, and C.H. Robinson Worldwide (-15%), a provider of truck-brokerage services that faced mounting competitive challenges. In contrast, security selection within the food, beverage & tobacco segment of the consumer staples sector notably contributed, especially C&C Group (+40%), an Ireland-based maker of alcoholic drinks, and chocolate maker Hershey (+41%). Elsewhere, discount retailer (+45%) Dollar General was the top individual contributor, reflecting the company's sales growth and strong market position.
The views expressed above reflect those of the portfolio manager(s) only through the end of the period as stated on the cover of this report and do not necessarily represent the views of Fidelity or any other person in the Fidelity organization. Any such views are subject to change at any time based upon market or other conditions and Fidelity disclaims any responsibility to update such views. These views may not be relied on as investment advice and, because investment decisions for a Fidelity fund are based on numerous factors, may not be relied on as an indication of trading intent on behalf of any Fidelity fund.
Investment Summary (Unaudited)
Top Ten Stocks as of October 31, 2019
| | % of fund's net assets |
| Comcast Corp. Class A | 5.7 |
| Cigna Corp. | 5.5 |
| Berkshire Hathaway, Inc. Class B | 5.0 |
| UnitedHealth Group, Inc. | 4.2 |
| Exxon Mobil Corp. | 4.0 |
| Roche Holding AG (participation certificate) | 3.9 |
| The Walt Disney Co. | 3.6 |
| Wells Fargo & Co. | 3.5 |
| Celgene Corp. | 3.4 |
| CBRE Group, Inc. | 3.3 |
| | 42.1 |
Top Five Market Sectors as of October 31, 2019
| | % of fund's net assets |
| Financials | 26.2 |
| Health Care | 24.8 |
| Communication Services | 11.4 |
| Energy | 7.9 |
| Consumer Staples | 6.9 |
Asset Allocation (% of fund's net assets)
| As of October 31, 2019* |
| | Stocks | 95.4% |
| | Short-Term Investments and Net Other Assets (Liabilities) | 4.6% |

* Foreign investments – 17.1%
Schedule of Investments October 31, 2019
Showing Percentage of Net Assets
| Common Stocks - 95.4% | | | |
| | | Shares | Value |
| COMMUNICATION SERVICES - 11.4% | | | |
| Diversified Telecommunication Services - 0.5% | | | |
| Verizon Communications, Inc. | | 2,200 | $133,034 |
| Entertainment - 3.6% | | | |
| The Walt Disney Co. | | 7,408 | 962,447 |
| Media - 7.3% | | | |
| Comcast Corp. Class A | | 34,400 | 1,541,810 |
| Fox Corp. Class A | | 5,800 | 185,832 |
| Interpublic Group of Companies, Inc. | | 11,600 | 252,300 |
| | | | 1,979,942 |
|
| TOTAL COMMUNICATION SERVICES | | | 3,075,423 |
|
| CONSUMER DISCRETIONARY - 3.7% | | | |
| Multiline Retail - 2.3% | | | |
| Dollar General Corp. | | 3,900 | 625,326 |
| Textiles, Apparel & Luxury Goods - 1.4% | | | |
| PVH Corp. | | 4,100 | 357,356 |
|
| TOTAL CONSUMER DISCRETIONARY | | | 982,682 |
|
| CONSUMER STAPLES - 6.9% | | | |
| Beverages - 2.5% | | | |
| C&C Group PLC (United Kingdom) | | 135,402 | 666,493 |
| Food Products - 4.4% | | | |
| Danone SA | | 6,200 | 513,616 |
| The Hershey Co. | | 4,500 | 660,915 |
| | | | 1,174,531 |
|
| TOTAL CONSUMER STAPLES | | | 1,841,024 |
|
| ENERGY - 7.9% | | | |
| Oil, Gas & Consumable Fuels - 7.9% | | | |
| Exxon Mobil Corp. | | 15,900 | 1,074,363 |
| GasLog Partners LP | | 16,600 | 328,846 |
| Golar LNG Partners LP | | 30,700 | 312,526 |
| Teekay LNG Partners LP | | 28,900 | 415,871 |
| | | | 2,131,606 |
| FINANCIALS - 26.2% | | | |
| Banks - 9.0% | | | |
| M&T Bank Corp. | | 900 | 140,877 |
| SunTrust Banks, Inc. | | 9,200 | 628,728 |
| U.S. Bancorp | | 12,171 | 693,990 |
| Wells Fargo & Co. | | 18,326 | 946,171 |
| | | | 2,409,766 |
| Capital Markets - 2.8% | | | |
| Goldman Sachs Group, Inc. | | 3,500 | 746,830 |
| Consumer Finance - 0.5% | | | |
| Discover Financial Services | | 1,700 | 136,442 |
| Diversified Financial Services - 5.0% | | | |
| Berkshire Hathaway, Inc. Class B (a) | | 6,400 | 1,360,512 |
| Insurance - 5.4% | | | |
| Chubb Ltd. | | 5,100 | 777,342 |
| The Travelers Companies, Inc. | | 5,100 | 668,406 |
| | | | 1,445,748 |
| Mortgage Real Estate Investment Trusts - 3.5% | | | |
| AGNC Investment Corp. | | 34,000 | 579,700 |
| MFA Financial, Inc. | | 48,100 | 365,079 |
| | | | 944,779 |
|
| TOTAL FINANCIALS | | | 7,044,077 |
|
| HEALTH CARE - 24.8% | | | |
| Biotechnology - 4.3% | | | |
| Amgen, Inc. | | 1,100 | 234,575 |
| Celgene Corp. (a) | | 8,600 | 929,058 |
| | | | 1,163,633 |
| Health Care Providers & Services - 15.1% | | | |
| Anthem, Inc. | | 2,200 | 591,976 |
| Centene Corp. (a) | | 15,900 | 843,972 |
| Cigna Corp. | | 8,300 | 1,481,218 |
| UnitedHealth Group, Inc. | | 4,500 | 1,137,150 |
| | | | 4,054,316 |
| Pharmaceuticals - 5.4% | | | |
| Bristol-Myers Squibb Co. | | 7,300 | 418,801 |
| Roche Holding AG (participation certificate) | | 3,450 | 1,038,298 |
| | | | 1,457,099 |
|
| TOTAL HEALTH CARE | | | 6,675,048 |
|
| INDUSTRIALS - 3.4% | | | |
| Aerospace & Defense - 2.1% | | | |
| General Dynamics Corp. | | 800 | 141,440 |
| United Technologies Corp. | | 2,900 | 416,382 |
| | | | 557,822 |
| Air Freight & Logistics - 1.3% | | | |
| C.H. Robinson Worldwide, Inc. (b) | | 4,700 | 355,508 |
|
| TOTAL INDUSTRIALS | | | 913,330 |
|
| INFORMATION TECHNOLOGY - 5.0% | | | |
| IT Services - 5.0% | | | |
| Amdocs Ltd. | | 8,200 | 534,640 |
| Cognizant Technology Solutions Corp. Class A | | 7,600 | 463,144 |
| The Western Union Co. | | 13,900 | 348,334 |
| | | | 1,346,118 |
| REAL ESTATE - 4.4% | | | |
| Equity Real Estate Investment Trusts (REITs) - 1.1% | | | |
| Simon Property Group, Inc. | | 2,000 | 301,360 |
| Real Estate Management & Development - 3.3% | | | |
| CBRE Group, Inc. (a) | | 16,400 | 878,220 |
|
| TOTAL REAL ESTATE | | | 1,179,580 |
|
| UTILITIES - 1.7% | | | |
| Electric Utilities - 1.7% | | | |
| Exelon Corp. | | 10,100 | 459,449 |
| TOTAL COMMON STOCKS | | | |
| (Cost $21,652,959) | | | 25,648,337 |
|
| Money Market Funds - 8.6% | | | |
| Fidelity Cash Central Fund 1.83% (c) | | 1,843,307 | 1,843,675 |
| Fidelity Securities Lending Cash Central Fund 1.84% (c)(d) | | 464,580 | 464,627 |
| TOTAL MONEY MARKET FUNDS | | | |
| (Cost $2,308,302) | | | 2,308,302 |
| TOTAL INVESTMENT IN SECURITIES - 104.0% | | | |
| (Cost $23,961,261) | | | 27,956,639 |
| NET OTHER ASSETS (LIABILITIES) - (4.0)% | | | (1,087,891) |
| NET ASSETS - 100% | | | $26,868,748 |
Legend
(a) Non-income producing
(b) Security or a portion of the security is on loan at period end.
(c) Affiliated fund that is generally available only to investment companies and other accounts managed by Fidelity Investments. The rate quoted is the annualized seven-day yield of the fund at period end. A complete unaudited listing of the fund's holdings as of its most recent quarter end is available upon request. In addition, each Fidelity Central Fund's financial statements, which are not covered by the Fund's Report of Independent Registered Public Accounting Firm, are available on the SEC's website or upon request.
(d) Investment made with cash collateral received from securities on loan.
Affiliated Central Funds
Information regarding fiscal year to date income earned by the Fund from investments in Fidelity Central Funds is as follows:
| Fund | Income earned |
| Fidelity Cash Central Fund | $17,108 |
| Fidelity Securities Lending Cash Central Fund | 206 |
| Total | $17,314 |
Amounts in the income column in the above table include any capital gain distributions from underlying funds, which are presented in the corresponding line-item in the Statement of Operations, if applicable. Amount for Fidelity Securities Lending Cash Central Fund represents the income earned on investing cash collateral, less rebates paid to borrowers and any lending agent fees associated with the loan, plus any premium payments received for lending certain types of securities.
Investment Valuation
The following is a summary of the inputs used, as of October 31, 2019, involving the Fund's assets and liabilities carried at fair value. The inputs or methodology used for valuing securities may not be an indication of the risk associated with investing in those securities. For more information on valuation inputs, and their aggregation into the levels used below, please refer to the Investment Valuation section in the accompanying Notes to Financial Statements.
| | Valuation Inputs at Reporting Date: |
| Description | Total | Level 1 | Level 2 | Level 3 |
| Investments in Securities: | | | | |
| Equities: | | | | |
| Communication Services | $3,075,423 | $3,075,423 | $-- | $-- |
| Consumer Discretionary | 982,682 | 982,682 | -- | -- |
| Consumer Staples | 1,841,024 | 1,327,408 | 513,616 | -- |
| Energy | 2,131,606 | 2,131,606 | -- | -- |
| Financials | 7,044,077 | 7,044,077 | -- | -- |
| Health Care | 6,675,048 | 5,636,750 | 1,038,298 | -- |
| Industrials | 913,330 | 913,330 | -- | -- |
| Information Technology | 1,346,118 | 1,346,118 | -- | -- |
| Real Estate | 1,179,580 | 1,179,580 | -- | -- |
| Utilities | 459,449 | 459,449 | -- | -- |
| Money Market Funds | 2,308,302 | 2,308,302 | -- | -- |
| Total Investments in Securities: | $27,956,639 | $26,404,725 | $1,551,914 | $-- |
Other Information
Distribution of investments by country or territory of incorporation, as a percentage of Total Net Assets, is as follows (Unaudited):
| United States of America | 82.9% |
| Switzerland | 6.8% |
| Marshall Islands | 3.9% |
| Ireland | 2.5% |
| Bailiwick of Guernsey | 2.0% |
| France | 1.9% |
| | 100.0% |
See accompanying notes which are an integral part of the financial statements.
Financial Statements
Statement of Assets and Liabilities
| | | October 31, 2019 |
| Assets | | |
Investment in securities, at value (including securities loaned of $216,474) — See accompanying schedule:
Unaffiliated issuers (cost $21,652,959) | $25,648,337 | |
| Fidelity Central Funds (cost $2,308,302) | 2,308,302 | |
| Total Investment in Securities (cost $23,961,261) | | $27,956,639 |
| Cash | | 22,605 |
| Receivable for investments sold | | 229,802 |
| Receivable for fund shares sold | | 24,262 |
| Dividends receivable | | 28,061 |
| Distributions receivable from Fidelity Central Funds | | 2,233 |
| Prepaid expenses | | 48 |
| Other receivables | | 129 |
| Total assets | | 28,263,779 |
| Liabilities | | |
| Payable for investments purchased | $866,258 | |
| Payable for fund shares redeemed | 10 | |
| Accrued management fee | 10,286 | |
| Distribution and service plan fees payable | 7,717 | |
| Other affiliated payables | 5,625 | |
| Other payables and accrued expenses | 40,510 | |
| Collateral on securities loaned | 464,625 | |
| Total liabilities | | 1,395,031 |
| Net Assets | | $26,868,748 |
| Net Assets consist of: | | |
| Paid in capital | | $22,754,878 |
| Total accumulated earnings (loss) | | 4,113,870 |
| Net Assets | | $26,868,748 |
| Net Asset Value and Maximum Offering Price | | |
| Class A: | | |
| Net Asset Value and redemption price per share ($16,647,788 ÷ 893,889 shares)(a) | | $18.62 |
| Maximum offering price per share (100/94.25 of $18.62) | | $19.76 |
| Class M: | | |
| Net Asset Value and redemption price per share ($5,145,855 ÷ 275,484 shares)(a) | | $18.68 |
| Maximum offering price per share (100/96.50 of $18.68) | | $19.36 |
| Class C: | | |
| Net Asset Value and offering price per share ($2,733,030 ÷ 151,893 shares)(a) | | $17.99 |
| Class I: | | |
| Net Asset Value, offering price and redemption price per share ($2,342,075 ÷ 124,684 shares) | | $18.78 |
(a) Redemption price per share is equal to net asset value less any applicable contingent deferred sales charge.
See accompanying notes which are an integral part of the financial statements.
Statement of Operations
| | | Year ended October 31, 2019 |
| Investment Income | | |
| Dividends | | $631,742 |
| Income from Fidelity Central Funds (including $206 from security lending) | | 17,314 |
| Total income | | 649,056 |
| Expenses | | |
| Management fee | | |
| Basic fee | $147,299 | |
| Performance adjustment | (50,697) | |
| Transfer agent fees | 61,832 | |
| Distribution and service plan fees | 103,220 | |
| Accounting and security lending fees | 10,657 | |
| Custodian fees and expenses | 3,698 | |
| Independent trustees' fees and expenses | 157 | |
| Registration fees | 56,818 | |
| Audit | 53,682 | |
| Legal | 3,580 | |
| Miscellaneous | 170 | |
| Total expenses before reductions | 390,416 | |
| Expense reductions | (15,485) | |
| Total expenses after reductions | | 374,931 |
| Net investment income (loss) | | 274,125 |
| Realized and Unrealized Gain (Loss) | | |
| Net realized gain (loss) on: | | |
| Investment securities: | | |
| Unaffiliated issuers | (40,420) | |
| Fidelity Central Funds | 2 | |
| Foreign currency transactions | 126 | |
| Futures contracts | 40,741 | |
| Total net realized gain (loss) | | 449 |
| Change in net unrealized appreciation (depreciation) on: | | |
| Investment securities: | | |
| Unaffiliated issuers | 946,035 | |
| Assets and liabilities in foreign currencies | 81 | |
| Total change in net unrealized appreciation (depreciation) | | 946,116 |
| Net gain (loss) | | 946,565 |
| Net increase (decrease) in net assets resulting from operations | | $1,220,690 |
See accompanying notes which are an integral part of the financial statements.
Statement of Changes in Net Assets
| | Year ended October 31, 2019 | Year ended October 31, 2018 |
| Increase (Decrease) in Net Assets | | |
| Operations | | |
| Net investment income (loss) | $274,125 | $217,634 |
| Net realized gain (loss) | 449 | 2,239,985 |
| Change in net unrealized appreciation (depreciation) | 946,116 | (1,305,995) |
| Net increase (decrease) in net assets resulting from operations | 1,220,690 | 1,151,624 |
| Distributions to shareholders | (2,172,169) | (177,168) |
| Share transactions - net increase (decrease) | (1,793,974) | (4,744,571) |
| Total increase (decrease) in net assets | (2,745,453) | (3,770,115) |
| Net Assets | | |
| Beginning of period | 29,614,201 | 33,384,316 |
| End of period | $26,868,748 | $29,614,201 |
See accompanying notes which are an integral part of the financial statements.
Financial Highlights
Fidelity Advisor Value Leaders Fund Class A
| Years ended October 31, | 2019 | 2018 | 2017 | 2016 | 2015 |
| Selected Per–Share Data | | | | | |
| Net asset value, beginning of period | $19.31 | $18.81 | $16.03 | $16.34 | $15.79 |
| Income from Investment Operations | | | | | |
| Net investment income (loss)A | .20 | .16 | .11 | .12 | .29 |
| Net realized and unrealized gain (loss) | .58B | .47C | 2.75 | (.15)D | .39E |
| Total from investment operations | .78 | .63 | 2.86 | (.03) | .68 |
| Distributions from net investment income | (.19) | (.13) | (.08) | (.27) | (.12) |
| Distributions from net realized gain | (1.28) | – | – | (.02) | (.01) |
| Total distributions | (1.47) | (.13) | (.08) | (.28)F | (.13) |
| Net asset value, end of period | $18.62 | $19.31 | $18.81 | $16.03 | $16.34 |
| Total ReturnG,H | 4.64%B | 3.33%C | 17.87% | (.18)%D | 4.32%E |
| Ratios to Average Net AssetsI,J | | | | | |
| Expenses before reductions | 1.29% | 1.25% | 1.39% | 1.47% | 1.49% |
| Expenses net of fee waivers, if any | 1.25% | 1.25% | 1.25% | 1.25% | 1.25% |
| Expenses net of all reductions | 1.25% | 1.25% | 1.25% | 1.24% | 1.25% |
| Net investment income (loss) | 1.12% | .81% | .61% | .77% | 1.78% |
| Supplemental Data | | | | | |
| Net assets, end of period (000 omitted) | $16,648 | $15,105 | $17,848 | $16,448 | $18,237 |
| Portfolio turnover rateK | 37% | 35% | 34% | 63% | 54% |
A Calculated based on average shares outstanding during the period.
B Net realized and unrealized gain (loss) per share reflects proceeds received from litigation which amounted to $.03 per share. Excluding these litigation proceeds, the total return would have been 4.45%.
C Net realized and unrealized gain (loss) per share reflects proceeds received from litigation which amounted to $.02 per share. Excluding these litigation proceeds, the total return would have been 3.21%.
D Net realized and unrealized gain (loss) per share reflects proceeds received from litigation which amounted to $.01 per share. Excluding these litigation proceeds, the total return would have been (.24)%.
E Net realized and unrealized gain (loss) per share reflects proceeds received from litigation which amounted to $.05 per share. Excluding these litigation proceeds, the total return would have been 4.01%.
F Total distributions of $.28 per share is comprised of distributions from net investment income of $.265 and distributions from net realized gain of $.017 per share.
G Total returns would have been lower if certain expenses had not been reduced during the applicable periods shown.
H Total returns do not include the effect of the sales charges.
I Fees and expenses of any underlying Fidelity Central Funds are not included in the Fund's expense ratio. The Fund indirectly bears its proportionate share of the expenses of any underlying Fidelity Central Funds.
J Expense ratios reflect operating expenses of the class. Expenses before reductions do not reflect amounts reimbursed by the investment adviser or reductions from brokerage service arrangements or reductions from other expense offset arrangements and do not represent the amount paid by the class during periods when reimbursements or reductions occur. Expenses net of fee waivers reflect expenses after reimbursement by the investment adviser but prior to reductions from brokerage service arrangements or other expense offset arrangements. Expenses net of all reductions represent the net expenses paid by the class.
K Amount does not include the portfolio activity of any underlying Fidelity Central Funds.
See accompanying notes which are an integral part of the financial statements.
Fidelity Advisor Value Leaders Fund Class M
| Years ended October 31, | 2019 | 2018 | 2017 | 2016 | 2015 |
| Selected Per–Share Data | | | | | |
| Net asset value, beginning of period | $19.34 | $18.82 | $16.04 | $16.33 | $15.78 |
| Income from Investment Operations | | | | | |
| Net investment income (loss)A | .16 | .11 | .07 | .08 | .25 |
| Net realized and unrealized gain (loss) | .59B | .47C | 2.75 | (.16)D | .39E |
| Total from investment operations | .75 | .58 | 2.82 | (.08) | .64 |
| Distributions from net investment income | (.13) | (.06) | (.04) | (.20) | (.08) |
| Distributions from net realized gain | (1.28) | – | – | (.02) | (.01) |
| Total distributions | (1.41) | (.06) | (.04) | (.21)F | (.09) |
| Net asset value, end of period | $18.68 | $19.34 | $18.82 | $16.04 | $16.33 |
| Total ReturnG,H | 4.42%B | 3.09%C | 17.60% | (.49)%D | 4.04%E |
| Ratios to Average Net AssetsI,J | | | | | |
| Expenses before reductions | 1.58% | 1.54% | 1.67% | 1.77% | 1.78% |
| Expenses net of fee waivers, if any | 1.50% | 1.50% | 1.50% | 1.50% | 1.50% |
| Expenses net of all reductions | 1.50% | 1.50% | 1.50% | 1.49% | 1.50% |
| Net investment income (loss) | .87% | .56% | .37% | .52% | 1.53% |
| Supplemental Data | | | | | |
| Net assets, end of period (000 omitted) | $5,146 | $4,987 | $5,866 | $6,732 | $7,672 |
| Portfolio turnover rateK | 37% | 35% | 34% | 63% | 54% |
A Calculated based on average shares outstanding during the period.
B Net realized and unrealized gain (loss) per share reflects proceeds received from litigation which amounted to $.03 per share. Excluding these litigation proceeds, the total return would have been 4.23%.
C Net realized and unrealized gain (loss) per share reflects proceeds received from litigation which amounted to $.02 per share. Excluding these litigation proceeds, the total return would have been 2.97%.
D Net realized and unrealized gain (loss) per share reflects proceeds received from litigation which amounted to $.01 per share. Excluding these litigation proceeds, the total return would have been (.55)%.
E Net realized and unrealized gain (loss) per share reflects proceeds received from litigation which amounted to $.05 per share. Excluding these litigation proceeds, the total return would have been 3.73%.
F Total distributions of $.21 per share is comprised of distributions from net investment income of $.195 and distributions from net realized gain of $.017 per share.
G Total returns would have been lower if certain expenses had not been reduced during the applicable periods shown.
H Total returns do not include the effect of the sales charges.
I Fees and expenses of any underlying Fidelity Central Funds are not included in the Fund's expense ratio. The Fund indirectly bears its proportionate share of the expenses of any underlying Fidelity Central Funds.
J Expense ratios reflect operating expenses of the class. Expenses before reductions do not reflect amounts reimbursed by the investment adviser or reductions from brokerage service arrangements or reductions from other expense offset arrangements and do not represent the amount paid by the class during periods when reimbursements or reductions occur. Expenses net of fee waivers reflect expenses after reimbursement by the investment adviser but prior to reductions from brokerage service arrangements or other expense offset arrangements. Expenses net of all reductions represent the net expenses paid by the class.
K Amount does not include the portfolio activity of any underlying Fidelity Central Funds.
See accompanying notes which are an integral part of the financial statements.
Fidelity Advisor Value Leaders Fund Class C
| Years ended October 31, | 2019 | 2018 | 2017 | 2016 | 2015 |
| Selected Per–Share Data | | | | | |
| Net asset value, beginning of period | $18.67 | $18.21 | $15.56 | $15.88 | $15.35 |
| Income from Investment Operations | | | | | |
| Net investment income (loss)A | .06 | .01 | (.02) | –B | .17 |
| Net realized and unrealized gain (loss) | .58C | .45D | 2.67 | (.16)E | .37F |
| Total from investment operations | .64 | .46 | 2.65 | (.16) | .54 |
| Distributions from net investment income | (.04) | – | – | (.15) | – |
| Distributions from net realized gain | (1.28) | – | – | (.02) | (.01) |
| Total distributions | (1.32) | – | – | (.16)G | (.01) |
| Net asset value, end of period | $17.99 | $18.67 | $18.21 | $15.56 | $15.88 |
| Total ReturnH,I | 3.90%C | 2.53%D | 17.03% | (1.00)%E | 3.54%F |
| Ratios to Average Net AssetsJ,K | | | | | |
| Expenses before reductions | 2.13% | 2.09% | 2.22% | 2.29% | 2.29% |
| Expenses net of fee waivers, if any | 2.00% | 2.00% | 1.99% | 2.00% | 2.00% |
| Expenses net of all reductions | 2.00% | 2.00% | 1.99% | 1.99% | 2.00% |
| Net investment income (loss) | .37% | .06% | (.13)% | .02% | 1.03% |
| Supplemental Data | | | | | |
| Net assets, end of period (000 omitted) | $2,733 | $5,298 | $5,619 | $5,057 | $5,662 |
| Portfolio turnover rateL | 37% | 35% | 34% | 63% | 54% |
A Calculated based on average shares outstanding during the period.
B Amount represents less than $.005 per share.
C Net realized and unrealized gain (loss) per share reflects proceeds received from litigation which amounted to $.03 per share. Excluding these litigation proceeds, the total return would have been 3.71%.
D Net realized and unrealized gain (loss) per share reflects proceeds received from litigation which amounted to $.02 per share. Excluding these litigation proceeds, the total return would have been 2.41%.
E Net realized and unrealized gain (loss) per share reflects proceeds received from litigation which amounted to $.01 per share. Excluding these litigation proceeds, the total return would have been (1.06)%.
F Net realized and unrealized gain (loss) per share reflects proceeds received from litigation which amounted to $.05 per share. Excluding these litigation proceeds, the total return would have been 3.23%.
G Total distributions of $.16 per share is comprised of distributions from net investment income of $.147 and distributions from net realized gain of $.017 per share.
H Total returns would have been lower if certain expenses had not been reduced during the applicable periods shown.
I Total returns do not include the effect of the contingent deferred sales charge.
J Fees and expenses of any underlying Fidelity Central Funds are not included in the Fund's expense ratio. The Fund indirectly bears its proportionate share of the expenses of any underlying Fidelity Central Funds.
K Expense ratios reflect operating expenses of the class. Expenses before reductions do not reflect amounts reimbursed by the investment adviser or reductions from brokerage service arrangements or reductions from other expense offset arrangements and do not represent the amount paid by the class during periods when reimbursements or reductions occur. Expenses net of fee waivers reflect expenses after reimbursement by the investment adviser but prior to reductions from brokerage service arrangements or other expense offset arrangements. Expenses net of all reductions represent the net expenses paid by the class.
L Amount does not include the portfolio activity of any underlying Fidelity Central Funds.
See accompanying notes which are an integral part of the financial statements.
Fidelity Advisor Value Leaders Fund Class I
| Years ended October 31, | 2019 | 2018 | 2017 | 2016 | 2015 |
| Selected Per–Share Data | | | | | |
| Net asset value, beginning of period | $19.47 | $18.97 | $16.16 | $16.48 | $15.93 |
| Income from Investment Operations | | | | | |
| Net investment income (loss)A | .25 | .22 | .16 | .16 | .34 |
| Net realized and unrealized gain (loss) | .59B | .46C | 2.77 | (.15)D | .39E |
| Total from investment operations | .84 | .68 | 2.93 | .01 | .73 |
| Distributions from net investment income | (.26) | (.18) | (.12) | (.31) | (.17) |
| Distributions from net realized gain | (1.28) | – | – | (.02) | (.01) |
| Total distributions | (1.53)F | (.18) | (.12) | (.33) | (.18) |
| Net asset value, end of period | $18.78 | $19.47 | $18.97 | $16.16 | $16.48 |
| Total ReturnG | 4.96%B | 3.61%C | 18.19% | .03%D | 4.58%E |
| Ratios to Average Net AssetsH,I | | | | | |
| Expenses before reductions | .97% | .96% | 1.12% | 1.18% | 1.18% |
| Expenses net of fee waivers, if any | .97% | .96% | 1.00% | 1.00% | 1.00% |
| Expenses net of all reductions | .96% | .96% | 1.00% | .99% | 1.00% |
| Net investment income (loss) | 1.41% | 1.10% | .87% | 1.02% | 2.03% |
| Supplemental Data | | | | | |
| Net assets, end of period (000 omitted) | $2,342 | $4,225 | $4,052 | $3,287 | $3,052 |
| Portfolio turnover rateJ | 37% | 35% | 34% | 63% | 54% |
A Calculated based on average shares outstanding during the period.
B Net realized and unrealized gain (loss) per share reflects proceeds received from litigation which amounted to $.03 per share. Excluding these litigation proceeds, the total return would have been 4.77%.
C Net realized and unrealized gain (loss) per share reflects proceeds received from litigation which amounted to $.02 per share. Excluding these litigation proceeds, the total return would have been 3.49%.
D Net realized and unrealized gain (loss) per share reflects proceeds received from litigation which amounted to $.01 per share. Excluding these litigation proceeds, the total return would have been (.03)%.
E Net realized and unrealized gain (loss) per share reflects proceeds received from litigation which amounted to $.05 per share. Excluding these litigation proceeds, the total return would have been 4.27%.
F Total distributions of $1.53 per share is comprised of distributions from net investment income of $.255 and distributions from net realized gain of $1.278 per share.
G Total returns would have been lower if certain expenses had not been reduced during the applicable periods shown.
H Fees and expenses of any underlying Fidelity Central Funds are not included in the Fund's expense ratio. The Fund indirectly bears its proportionate share of the expenses of any underlying Fidelity Central Funds.
I Expense ratios reflect operating expenses of the class. Expenses before reductions do not reflect amounts reimbursed by the investment adviser or reductions from brokerage service arrangements or reductions from other expense offset arrangements and do not represent the amount paid by the class during periods when reimbursements or reductions occur. Expenses net of fee waivers reflect expenses after reimbursement by the investment adviser but prior to reductions from brokerage service arrangements or other expense offset arrangements. Expenses net of all reductions represent the net expenses paid by the class.
J Amount does not include the portfolio activity of any underlying Fidelity Central Funds.
See accompanying notes which are an integral part of the financial statements.
Notes to Financial Statements
For the period ended October 31, 2019
1. Organization.
Fidelity Advisor Value Leaders Fund (the Fund) is a fund of Fidelity Advisor Series VIII (the Trust) and is authorized to issue an unlimited number of shares. The Trust is registered under the Investment Company Act of 1940, as amended (the 1940 Act), as an open-end management investment company organized as a Massachusetts business trust. The Fund offers Class A, Class M, Class C and Class I shares, each of which has equal rights as to assets and voting privileges. Each class has exclusive voting rights with respect to matters that affect that class. Effective March 1, 2019, Class C shares will automatically convert to Class A shares after a holding period of ten years from the initial date of purchase, with certain exceptions.
2. Investments in Fidelity Central Funds.
The Fund invests in Fidelity Central Funds, which are open-end investment companies generally available only to other investment companies and accounts managed by the investment adviser and its affiliates. The Fund's Schedule of Investments lists each of the Fidelity Central Funds held as of period end, if any, as an investment of the Fund, but does not include the underlying holdings of each Fidelity Central Fund. As an Investing Fund, the Fund indirectly bears its proportionate share of the expenses of the underlying Fidelity Central Funds.
The Money Market Central Funds seek preservation of capital and current income and are managed by Fidelity Investments Money Management, Inc. (FIMM), an affiliate of the investment adviser. Annualized expenses of the Money Market Central Funds as of their most recent shareholder report date ranged from less than .005% to .01%.
A complete unaudited list of holdings for each Fidelity Central Fund is available upon request or at the Securities and Exchange Commission (the SEC) website at www.sec.gov. In addition, the financial statements of the Fidelity Central Funds, which are not covered by the Fund's Report of Independent Registered Public Accounting Firm, are available on the SEC website or upon request.
3. Significant Accounting Policies.
The Fund is an investment company and applies the accounting and reporting guidance of the Financial Accounting Standards Board (FASB) Accounting Standards Codification Topic 946 Financial Services – Investments Companies. The financial statements have been prepared in conformity with accounting principles generally accepted in the United States of America (GAAP), which require management to make certain estimates and assumptions at the date of the financial statements. Actual results could differ from those estimates. Subsequent events, if any, through the date that the financial statements were issued have been evaluated in the preparation of the financial statements. The following summarizes the significant accounting policies of the Fund:
Investment Valuation. Investments are valued as of 4:00 p.m. Eastern time on the last calendar day of the period. The Board of Trustees (the Board) has delegated the day to day responsibility for the valuation of the Fund's investments to the Fair Value Committee (the Committee) established by the Fund's investment adviser. In accordance with valuation policies and procedures approved by the Board, the Fund attempts to obtain prices from one or more third party pricing vendors or brokers to value its investments. When current market prices, quotations or currency exchange rates are not readily available or reliable, investments will be fair valued in good faith by the Committee, in accordance with procedures adopted by the Board. Factors used in determining fair value vary by investment type and may include market or investment specific events. The frequency with which these procedures are used cannot be predicted and they may be utilized to a significant extent. The Committee oversees the Fund's valuation policies and procedures and reports to the Board on the Committee's activities and fair value determinations. The Board monitors the appropriateness of the procedures used in valuing the Fund's investments and ratifies the fair value determinations of the Committee.
The Fund categorizes the inputs to valuation techniques used to value its investments into a disclosure hierarchy consisting of three levels as shown below:
- Level 1 – quoted prices in active markets for identical investments
- Level 2 – other significant observable inputs (including quoted prices for similar investments, interest rates, prepayment speeds, etc.)
- Level 3 – unobservable inputs (including the Fund's own assumptions based on the best information available)
Valuation techniques used to value the Fund's investments by major category are as follows:
Equity securities, including restricted securities, for which market quotations are readily available, are valued at the last reported sale price or official closing price as reported by a third party pricing vendor on the primary market or exchange on which they are traded and are categorized as Level 1 in the hierarchy. In the event there were no sales during the day or closing prices are not available, securities are valued at the last quoted bid price or may be valued using the last available price and are generally categorized as Level 2 in the hierarchy. For foreign equity securities, when market or security specific events arise, comparisons to the valuation of American Depositary Receipts (ADRs), futures contracts, Exchange-Traded Funds (ETFs) and certain indexes as well as quoted prices for similar securities may be used and would be categorized as Level 2 in the hierarchy. For equity securities, including restricted securities, where observable inputs are limited, assumptions about market activity and risk are used and these securities may be categorized as Level 3 in the hierarchy.
Investments in open-end mutual funds, including the Fidelity Central Funds, are valued at their closing net asset value (NAV) each business day and are categorized as Level 1 in the hierarchy.
Changes in valuation techniques may result in transfers in or out of an assigned level within the disclosure hierarchy. The aggregate value of investments by input level as of October 31, 2019 is included at the end of the Fund's Schedule of Investments.
Foreign Currency. The Fund may use foreign currency contracts to facilitate transactions in foreign-denominated securities. Gains and losses from these transactions may arise from changes in the value of the foreign currency or if the counterparties do not perform under the contracts' terms.
Foreign-denominated assets, including investment securities, and liabilities are translated into U.S. dollars at the exchange rates at period end. Purchases and sales of investment securities, income and dividends received and expenses denominated in foreign currencies are translated into U.S. dollars at the exchange rate in effect on the transaction date.
The effects of exchange rate fluctuations on investments are included with the net realized and unrealized gain (loss) on investment securities. Other foreign currency transactions resulting in realized and unrealized gain (loss) are disclosed separately.
Investment Transactions and Income. For financial reporting purposes, the Fund's investment holdings and NAV include trades executed through the end of the last business day of the period. The NAV per share for processing shareholder transactions is calculated as of the close of business of the New York Stock Exchange (NYSE), normally 4:00 p.m. Eastern time and includes trades executed through the end of the prior business day. Gains and losses on securities sold are determined on the basis of identified cost and include proceeds received from litigation. Dividend income is recorded on the ex-dividend date, except for certain dividends from foreign securities where the ex-dividend date may have passed, which are recorded as soon as the Fund is informed of the ex-dividend date. Non-cash dividends included in dividend income, if any, are recorded at the fair market value of the securities received. Income and capital gain distributions from Fidelity Central Funds, if any, are recorded on the ex-dividend date. Certain distributions received by the Fund represent a return of capital or capital gain. The Fund determines the components of these distributions subsequent to the ex-dividend date, based upon receipt of tax filings or other correspondence relating to the underlying investment. These distributions are recorded as a reduction of cost of investments and/or as a realized gain. Investment income is recorded net of foreign taxes withheld where recovery of such taxes is uncertain.
Class Allocations and Expenses. Investment income, realized and unrealized capital gains and losses, common expenses of the Fund, and certain fund-level expense reductions, if any, are allocated daily on a pro-rata basis to each class based on the relative net assets of each class to the total net assets of the Fund. Each class differs with respect to transfer agent and distribution and service plan fees incurred. Certain expense reductions may also differ by class. For the reporting period, the allocated portion of income and expenses to each class as a percent of its average net assets may vary due to the timing of recording these transactions in relation to fluctuating net assets of the classes. Expenses directly attributable to a fund are charged to that fund. Expenses attributable to more than one fund are allocated among the respective funds on the basis of relative net assets or other appropriate methods. Expense estimates are accrued in the period to which they relate and adjustments are made when actual amounts are known.
Income Tax Information and Distributions to Shareholders. Each year, the Fund intends to qualify as a regulated investment company under Subchapter M of the Internal Revenue Code, including distributing substantially all of its taxable income and realized gains. As a result, no provision for U.S. Federal income taxes is required. As of October 31, 2019, the Fund did not have any unrecognized tax benefits in the financial statements; nor is the Fund aware of any tax positions for which it is reasonably possible that the total amounts of unrecognized tax benefits will significantly change in the next twelve months. The Fund files a U.S. federal tax return, in addition to state and local tax returns as required. The Fund's federal income tax returns are subject to examination by the Internal Revenue Service (IRS) for a period of three fiscal years after they are filed. State and local tax returns may be subject to examination for an additional fiscal year depending on the jurisdiction. Foreign taxes are provided for based on the Fund's understanding of the tax rules and rates that exist in the foreign markets in which it invests.
Distributions are declared and recorded on the ex-dividend date. Income and capital gain distributions are declared separately for each class. Income and capital gain distributions are determined in accordance with income tax regulations, which may differ from GAAP.
Capital accounts within the financial statements are adjusted for permanent book-tax differences. These adjustments have no impact on net assets or the results of operations. Capital accounts are not adjusted for temporary book-tax differences which will reverse in a subsequent period.
Book-tax differences are primarily due to foreign currency transactions, partnerships, futures transactions and losses deferred due to wash sales.
As of period end, the cost and unrealized appreciation (depreciation) in securities, and derivatives if applicable, for federal income tax purposes were as follows:
| Gross unrealized appreciation | $4,524,325 |
| Gross unrealized depreciation | (654,980) |
| Net unrealized appreciation (depreciation) | $3,869,345 |
| Tax Cost | $24,087,294 |
The tax-based components of distributable earnings as of period end were as follows:
| Undistributed ordinary income | $251,456 |
| Undistributed long-term capital gain | $22,477 |
| Net unrealized appreciation (depreciation) on securities and other investments | $3,839,938 |
The tax character of distributions paid was as follows:
| | October 31, 2019 | October 31, 2018 |
| Ordinary Income | $257,014 | $ 177,168 |
| Long-term Capital Gains | 1,915,155 | – |
| Total | $2,172,169 | $ 177,168 |
4. Derivative Instruments.
Risk Exposures and the Use of Derivative Instruments. The Fund's investment objective allows the Fund to enter into various types of derivative contracts, including futures contracts. Derivatives are investments whose value is primarily derived from underlying assets, indices or reference rates and may be transacted on an exchange or over-the-counter (OTC). Derivatives may involve a future commitment to buy or sell a specified asset based on specified terms, to exchange future cash flows at periodic intervals based on a notional principal amount, or for one party to make one or more payments upon the occurrence of specified events in exchange for periodic payments from the other party.
The Fund used derivatives to increase returns and to manage exposure to certain risks as defined below. The success of any strategy involving derivatives depends on analysis of numerous economic factors, and if the strategies for investment do not work as intended, the Fund may not achieve its objectives.
The Fund's use of derivatives increased or decreased its exposure to the following risk:
| Equity Risk | Equity risk relates to the fluctuations in the value of financial instruments as a result of changes in market prices (other than those arising from interest rate risk or foreign exchange risk), whether caused by factors specific to an individual investment, its issuer, or all factors affecting all instruments traded in a market or market segment.
|
The Fund is also exposed to additional risks from investing in derivatives, such as liquidity risk and counterparty credit risk. Liquidity risk is the risk that the Fund will be unable to close out the derivative in the open market in a timely manner. Counterparty credit risk is the risk that the counterparty will not be able to fulfill its obligation to the Fund. Counterparty credit risk related to exchange-traded futures contracts may be mitigated by the protection provided by the exchange on which they trade.
Investing in derivatives may involve greater risks than investing in the underlying assets directly and, to varying degrees, may involve risk of loss in excess of any initial investment and collateral received and amounts recognized in the Statement of Assets and Liabilities. In addition, there may be the risk that the change in value of the derivative contract does not correspond to the change in value of the underlying instrument.
Futures Contracts. A futures contract is an agreement between two parties to buy or sell a specified underlying instrument for a fixed price at a specified future date. The Fund used futures contracts to manage its exposure to the stock market.
Upon entering into a futures contract, a fund is required to deposit either cash or securities (initial margin) with a clearing broker in an amount equal to a certain percentage of the face value of the contract. Futures contracts are marked-to-market daily and subsequent daily payments (variation margin) are made or received by a fund depending on the daily fluctuations in the value of the futures contracts and are recorded as unrealized appreciation or (depreciation). This receivable and/or payable, if any, is included in daily variation margin on futures contracts in the Statement of Assets and Liabilities. Realized gain or (loss) is recorded upon the expiration or closing of a futures contract. The net realized gain (loss) and change in net unrealized appreciation (depreciation) on futures contracts during the period is presented in the Statement of Operations.
Any open futures contracts at period end are presented in the Schedule of Investments under the caption "Futures Contracts". The notional amount at value reflects each contract's exposure to the underlying instrument or index at period end.
5. Purchases and Sales of Investments.
Purchases and sales of securities, other than short-term securities, aggregated $9,753,086 and $13,337,103, respectively.
6. Fees and Other Transactions with Affiliates.
Management Fee. Fidelity Management & Research Company (the investment adviser) and its affiliates provide the Fund with investment management related services for which the Fund pays a monthly management fee. The management fee is the sum of an individual fund fee rate that is based on an annual rate of .30% of the Fund's average net assets and an annualized group fee rate that averaged .24% during the period. The group fee rate is based upon the average net assets of all the mutual funds advised by the investment adviser, including any mutual funds previously advised by the investment adviser that are currently advised by Fidelity SelectCo, LLC, an affiliate of the investment adviser. The group fee rate decreases as assets under management increase and increases as assets under management decrease. In addition, the management fee is subject to a performance adjustment (up to a maximum of +/- .20% of the Fund's average net assets over a 36 month performance period). The upward or downward adjustment to the management fee is based on the relative investment performance of Class I of the Fund as compared to its benchmark index, the Russell 1000 Value Index, over the same 36 month performance period. For the reporting period, the total annual management fee rate, including the performance adjustment, was .35% of the Fund's average net assets. The performance adjustment included in the management fee rate may be higher or lower than the maximum performance adjustment rate due to the difference between the average net assets for the reporting and performance periods.
Distribution and Service Plan Fees. In accordance with Rule 12b-1 of the 1940 Act, the Fund has adopted separate Distribution and Service Plans for each class of shares. Certain classes pay Fidelity Distributors Corporation (FDC), an affiliate of the investment adviser, separate Distribution and Service Fees, each of which is based on an annual percentage of each class' average net assets. In addition, FDC may pay financial intermediaries for selling shares of the Fund and providing shareholder support services. For the period, the Distribution and Service Fee rates, total fees and amounts retained by FDC were as follows:
| | Distribution Fee | Service Fee | Total Fees | Retained by FDC |
| Class A | -% | .25% | $38,899 | $783 |
| Class M | .25% | .25% | 25,626 | 213 |
| Class C | .75% | .25% | 38,695 | 2,831 |
| | | | $103,220 | $3,827 |
Sales Load. FDC may receive a front-end sales charge of up to 5.75% for selling Class A shares and 3.50% for selling Class M shares, some of which is paid to financial intermediaries for selling shares of the Fund. Depending on the holding period, FDC may receive contingent deferred sales charges levied on Class A, Class M and Class C redemptions. The deferred sales charges are 1.00% for Class C shares, 1.00% for certain purchases of Class A shares and .25% for certain purchases of Class M shares.
For the period, sales charge amounts retained by FDC were as follows:
| | Retained by FDC |
| Class A | $2,656 |
| Class M | 615 |
| Class C(a) | 292 |
| | $3,563 |
(a) When Class C shares are initially sold, FDC pays commissions from its own resources to financial intermediaries through which the sales are made.
Transfer Agent Fees. Fidelity Investments Institutional Operations Company, Inc., (FIIOC), an affiliate of the investment adviser, is the transfer, dividend disbursing and shareholder servicing agent for each class of the Fund. FIIOC receives account fees and asset-based fees that vary according to the account size and type of account of the shareholders of the respective classes of the Fund. FIIOC pays for typesetting, printing and mailing of shareholder reports, except proxy statements.
For the period, transfer agent fees for each class were as follows:
| | Amount | % of Class-Level Average Net Assets |
| Class A | $33,292 | .21 |
| Class M | 13,188 | .26 |
| Class C | 11,266 | .29 |
| Class I | 4,086 | .14 |
| | $61,832 | |
Accounting and Security Lending Fees. Fidelity Service Company, Inc. (FSC), an affiliate of the investment adviser, maintains the Fund's accounting records. The accounting fee is based on the level of average net assets for each month. Prior to April 1, 2019, FSC had a separate agreement with the Fund for administration of the security lending program, based on the number and duration of lending transactions. For the period, the total fees paid for accounting and administration of securities lending were equivalent to an annual rate of .04%.
Brokerage Commissions. The Fund placed a portion of its portfolio transactions with brokerage firms which are affiliates of the investment adviser. Brokerage commissions are included in net realized gain (loss) and change in net unrealized appreciation (depreciation) in the Statement of Operations. The commissions paid to these affiliated firms were $186 for the period.
Interfund Trades. The Fund may purchase from or sell securities to other Fidelity Funds under procedures adopted by the Board. The procedures have been designed to ensure these interfund trades are executed in accordance with Rule 17a-7 of the 1940 Act. Interfund trades are included within the respective purchases and sales amounts shown in the Purchases and Sales of Investments note.
7. Committed Line of Credit.
The Fund participates with other funds managed by the investment adviser or an affiliate in a $4.25 billion credit facility (the "line of credit") to be utilized for temporary or emergency purposes to fund shareholder redemptions or for other short-term liquidity purposes. The Fund has agreed to pay commitment fees on its pro-rata portion of the line of credit, which amounted to $74 and is reflected in Miscellaneous expenses on the Statement of Operations. During the period, the Fund did not borrow on this line of credit.
8. Security Lending.
The Fund lends portfolio securities from time to time in order to earn additional income. For equity securities, lending agents are used, including National Financial Services (NFS), an affiliate of the Fund. Pursuant to a securities lending agreement, NFS will receive a fee, which is capped at 9.9% of daily lending revenue, for its services as lending agent. The Fund may lend securities to certain qualified borrowers, including NFS. On the settlement date of the loan, the Fund receives collateral (in the form of U.S. Treasury obligations, letters of credit and/or cash) against the loaned securities and maintains collateral in an amount not less than 100% of the market value of the loaned securities during the period of the loan. The market value of the loaned securities is determined at the close of business of the Fund and any additional required collateral is delivered to the Fund on the next business day. The Fund or borrower may terminate the loan at any time, and if the borrower defaults on its obligation to return the securities loaned because of insolvency or other reasons, the Fund may apply collateral received from the borrower against the obligation. The Fund may experience delays and costs in recovering the securities loaned. Any cash collateral received is invested in Fidelity Securities Lending Cash Central Fund. The value of loaned securities and cash collateral at period end are disclosed on the Fund's Statement of Assets and Liabilities. Total fees paid by the Fund to NFS, as lending agent, amounted to $20. Security lending income represents the income earned on investing cash collateral, less rebates paid to borrowers and any lending agent fees associated with the loan, plus any premium payments received for lending certain types of securities. Security lending income is presented in the Statement of Operations as a component of income from Fidelity Central Funds. During the period, there were no securities loaned to NFS.
9. Expense Reductions.
The investment adviser contractually agreed to reimburse each class to the extent annual operating expenses exceeded certain levels of class-level average net assets as noted in the table below. This reimbursement will remain in place through February 28, 2021. Some expenses, for example the compensation of the independent Trustees, and certain miscellaneous expenses such as proxy and shareholder meeting expenses, are excluded from this reimbursement.
The following classes were in reimbursement during the period:
| | Expense Limitations | Reimbursement |
| Class A | 1.25% | $5,562 |
| Class M | 1.50% | 4,011 |
| Class C | 2.00% | 4,729 |
| | | $14,302 |
Commissions paid to certain brokers with whom the investment adviser, or its affiliates, places trades on behalf of the Fund include an amount in addition to trade execution, which may be rebated back to the Fund to offset certain expenses. This amount totaled $788 for the period. In addition, through arrangements with the Fund's custodian, credits realized as a result of certain uninvested cash balances were used to reduce the Fund's expenses. During the period, custodian credits reduced the Fund's expenses by $176.
In addition, during the period the investment adviser reimbursed and/or waived a portion of fund-level operating expenses in the amount of $219.
10. Distributions to Shareholders.
Distributions to shareholders of each class were as follows:
| | Year ended
October 31, 2019 | Year ended
October 31, 2018 |
| Distributions to shareholders | | |
| Class A | $1,115,067 | $113,174 |
| Class M | 369,129 | 19,042 |
| Class C | 369,297 | – |
| Class I | 318,676 | 44,952 |
| Total | $2,172,169 | $177,168 |
11. Share Transactions.
Share transactions for each class were as follows and may contain automatic conversions between classes or exchanges between affiliated funds:
| | Shares | Shares | Dollars | Dollars |
| | Year ended October 31, 2019 | Year ended October 31, 2018 | Year ended October 31, 2019 | Year ended October 31, 2018 |
| Class A | | | | |
| Shares sold | 229,385 | 65,937 | $4,056,134 | $1,294,206 |
| Reinvestment of distributions | 63,431 | 5,767 | 1,096,720 | 111,530 |
| Shares redeemed | (181,162) | (238,442) | (3,251,975) | (4,673,543) |
| Net increase (decrease) | 111,654 | (166,738) | $1,900,879 | $(3,267,807) |
| Class M | | | | |
| Shares sold | 38,519 | 13,950 | $680,239 | $273,190 |
| Reinvestment of distributions | 20,833 | 959 | 362,077 | 18,619 |
| Shares redeemed | (41,676) | (68,747) | (745,887) | (1,339,051) |
| Net increase (decrease) | 17,676 | (53,838) | $296,429 | $(1,047,242) |
| Class C | | | | |
| Shares sold | 45,474 | 24,252 | $751,074 | $460,882 |
| Reinvestment of distributions | 21,782 | – | 366,152 | – |
| Shares redeemed | (199,068) | (49,189) | (3,443,473) | (931,780) |
| Net increase (decrease) | (131,812) | (24,937) | $(2,326,247) | $(470,898) |
| Class I | | | | |
| Shares sold | 28,564 | 105,068 | $515,965 | $2,041,577 |
| Reinvestment of distributions | 18,169 | 2,283 | 315,952 | 44,422 |
| Shares redeemed | (139,027) | (103,976) | (2,496,952) | (2,044,623) |
| Net increase (decrease) | (92,294) | 3,375 | $(1,665,035) | $41,376 |
12. Other.
The Fund's organizational documents provide former and current trustees and officers with a limited indemnification against liabilities arising in connection with the performance of their duties to the Fund. In the normal course of business, the Fund may also enter into contracts that provide general indemnifications. The Fund's maximum exposure under these arrangements is unknown as this would be dependent on future claims that may be made against the Fund. The risk of material loss from such claims is considered remote.
Report of Independent Registered Public Accounting Firm
To the Board of Trustees of Fidelity Advisor Series VIII and Shareholders of Fidelity Advisor Value Leaders Fund:
Opinion on the Financial Statements
We have audited the accompanying statement of assets and liabilities, including the schedule of investments, of Fidelity Advisor Value Leaders Fund (one of the funds constituting Fidelity Advisor Series VIII, referred to hereafter as the “Fund”) as of October 31, 2019, the related statement of operations for the year ended October 31, 2019, the statement of changes in net assets for each of the two years in the period ended October 31, 2019, including the related notes, and the financial highlights for each of the five years in the period ended October 31, 2019 (collectively referred to as the “financial statements”). In our opinion, the financial statements present fairly, in all material respects, the financial position of the Fund as of October 31, 2019, the results of its operations for the year then ended, the changes in its net assets for each of the two years in the period ended October 31, 2019 and the financial highlights for each of the five years in the period ended October 31, 2019 in conformity with accounting principles generally accepted in the United States of America.
Basis for Opinion
These financial statements are the responsibility of the Fund’s management. Our responsibility is to express an opinion on the Fund’s financial statements based on our audits. We are a public accounting firm registered with the Public Company Accounting Oversight Board (United States) (PCAOB) and are required to be independent with respect to the Fund in accordance with the U.S. federal securities laws and the applicable rules and regulations of the Securities and Exchange Commission and the PCAOB.
We conducted our audits of these financial statements in accordance with the standards of the PCAOB. Those standards require that we plan and perform the audit to obtain reasonable assurance about whether the financial statements are free of material misstatement, whether due to error or fraud.
Our audits included performing procedures to assess the risks of material misstatement of the financial statements, whether due to error or fraud, and performing procedures that respond to those risks. Such procedures included examining, on a test basis, evidence regarding the amounts and disclosures in the financial statements. Our audits also included evaluating the accounting principles used and significant estimates made by management, as well as evaluating the overall presentation of the financial statements. Our procedures included confirmation of securities owned as of October 31, 2019 by correspondence with the custodian and brokers; when replies were not received from brokers, we performed other auditing procedures. We believe that our audits provide a reasonable basis for our opinion.
PricewaterhouseCoopers LLP
Boston, Massachusetts
December 11, 2019
We have served as the auditor of one or more investment companies in the Fidelity group of funds since 1932.
Trustees and Officers
The Trustees, Members of the Advisory Board (if any), and officers of the trust and fund, as applicable, are listed below. The Board of Trustees governs the fund and is responsible for protecting the interests of shareholders. The Trustees are experienced executives who meet periodically throughout the year to oversee the fund's activities, review contractual arrangements with companies that provide services to the fund, oversee management of the risks associated with such activities and contractual arrangements, and review the fund's performance. Except for Jonathan Chiel, each of the Trustees oversees 298 funds. Mr. Chiel oversees 171 funds.
The Trustees hold office without limit in time except that (a) any Trustee may resign; (b) any Trustee may be removed by written instrument, signed by at least two-thirds of the number of Trustees prior to such removal; (c) any Trustee who requests to be retired or who has become incapacitated by illness or injury may be retired by written instrument signed by a majority of the other Trustees; and (d) any Trustee may be removed at any special meeting of shareholders by a two-thirds vote of the outstanding voting securities of the trust. Each Trustee who is not an interested person (as defined in the 1940 Act) of the trust and the fund is referred to herein as an Independent Trustee. Each Independent Trustee shall retire not later than the last day of the calendar year in which his or her 75th birthday occurs. The Independent Trustees may waive this mandatory retirement age policy with respect to individual Trustees. Officers and Advisory Board Members hold office without limit in time, except that any officer or Advisory Board Member may resign or may be removed by a vote of a majority of the Trustees at any regular meeting or any special meeting of the Trustees. Except as indicated, each individual has held the office shown or other offices in the same company for the past five years.
The fund’s Statement of Additional Information (SAI) includes more information about the Trustees. To request a free copy, call Fidelity at 1-877-208-0098.
Experience, Skills, Attributes, and Qualifications of the Trustees. The Governance and Nominating Committee has adopted a statement of policy that describes the experience, qualifications, attributes, and skills that are necessary and desirable for potential Independent Trustee candidates (Statement of Policy). The Board believes that each Trustee satisfied at the time he or she was initially elected or appointed a Trustee, and continues to satisfy, the standards contemplated by the Statement of Policy. The Governance and Nominating Committee also engages professional search firms to help identify potential Independent Trustee candidates who have the experience, qualifications, attributes, and skills consistent with the Statement of Policy. From time to time, additional criteria based on the composition and skills of the current Independent Trustees, as well as experience or skills that may be appropriate in light of future changes to board composition, business conditions, and regulatory or other developments, have also been considered by the professional search firms and the Governance and Nominating Committee. In addition, the Board takes into account the Trustees' commitment and participation in Board and committee meetings, as well as their leadership of standing and ad hoc committees throughout their tenure.
In determining that a particular Trustee was and continues to be qualified to serve as a Trustee, the Board has considered a variety of criteria, none of which, in isolation, was controlling. The Board believes that, collectively, the Trustees have balanced and diverse experience, qualifications, attributes, and skills, which allow the Board to operate effectively in governing the fund and protecting the interests of shareholders. Information about the specific experience, skills, attributes, and qualifications of each Trustee, which in each case led to the Board's conclusion that the Trustee should serve (or continue to serve) as a trustee of the fund, is provided below.
Board Structure and Oversight Function. James C. Curvey is an interested person and currently serves as Chairman. The Trustees have determined that an interested Chairman is appropriate and benefits shareholders because an interested Chairman has a personal and professional stake in the quality and continuity of services provided to the fund. Independent Trustees exercise their informed business judgment to appoint an individual of their choosing to serve as Chairman, regardless of whether the Trustee happens to be independent or a member of management. The Independent Trustees have determined that they can act independently and effectively without having an Independent Trustee serve as Chairman and that a key structural component for assuring that they are in a position to do so is for the Independent Trustees to constitute a substantial majority for the Board. The Independent Trustees also regularly meet in executive session. Ned C. Lautenbach serves as Chairman of the Independent Trustees and as such (i) acts as a liaison between the Independent Trustees and management with respect to matters important to the Independent Trustees and (ii) with management prepares agendas for Board meetings.
Fidelity® funds are overseen by different Boards of Trustees. The fund's Board oversees Fidelity's high income and certain equity funds, and other Boards oversee Fidelity's investment-grade bond, money market, asset allocation, and other equity funds. The asset allocation funds may invest in Fidelity® funds overseen by the fund's Board. The use of separate Boards, each with its own committee structure, allows the Trustees of each group of Fidelity® funds to focus on the unique issues of the funds they oversee, including common research, investment, and operational issues. On occasion, the separate Boards establish joint committees to address issues of overlapping consequences for the Fidelity® funds overseen by each Board.
The Trustees operate using a system of committees to facilitate the timely and efficient consideration of all matters of importance to the Trustees, the fund, and fund shareholders and to facilitate compliance with legal and regulatory requirements and oversight of the fund's activities and associated risks. The Board, acting through its committees, has charged FMR and its affiliates with (i) identifying events or circumstances the occurrence of which could have demonstrably adverse effects on the fund's business and/or reputation; (ii) implementing processes and controls to lessen the possibility that such events or circumstances occur or to mitigate the effects of such events or circumstances if they do occur; and (iii) creating and maintaining a system designed to evaluate continuously business and market conditions in order to facilitate the identification and implementation processes described in (i) and (ii) above. Because the day-to-day operations and activities of the fund are carried out by or through FMR, its affiliates, and other service providers, the fund's exposure to risks is mitigated but not eliminated by the processes overseen by the Trustees. While each of the Board's committees has responsibility for overseeing different aspects of the fund's activities, oversight is exercised primarily through the Operations, Audit, and Compliance Committees. Appropriate personnel, including but not limited to the fund's Chief Compliance Officer (CCO), FMR's internal auditor, the independent accountants, the fund's Treasurer and portfolio management personnel, make periodic reports to the Board's committees, as appropriate, including an annual review of Fidelity's risk management program for the Fidelity® funds. The responsibilities of each standing committee, including their oversight responsibilities, are described further under "Standing Committees of the Trustees."
Interested Trustees*:
Correspondence intended for a Trustee who is an interested person may be sent to Fidelity Investments, 245 Summer Street, Boston, Massachusetts 02210.
Name, Year of Birth; Principal Occupations and Other Relevant Experience+
Jonathan Chiel (1957)
Year of Election or Appointment: 2016
Trustee
Mr. Chiel also serves as Trustee of other Fidelity® funds. Mr. Chiel is Executive Vice President and General Counsel for FMR LLC (diversified financial services company, 2012-present). Previously, Mr. Chiel served as general counsel (2004-2012) and senior vice president and deputy general counsel (2000-2004) for John Hancock Financial Services; a partner with Choate, Hall & Stewart (1996-2000) (law firm); and an Assistant United States Attorney for the United States Attorney’s Office of the District of Massachusetts (1986-95), including Chief of the Criminal Division (1993-1995). Mr. Chiel is a director on the boards of the Boston Bar Foundation and the Maimonides School.
James C. Curvey (1935)
Year of Election or Appointment: 2007
Trustee
Chairman of the Board of Trustees
Mr. Curvey also serves as Trustee of other Fidelity® funds. Mr. Curvey is Vice Chairman (2007-present) and Director of FMR LLC (diversified financial services company). In addition, Mr. Curvey is an Overseer Emeritus for the Boston Symphony Orchestra, a Director of Artis-Naples, and a Trustee of Brewster Academy in Wolfeboro, New Hampshire. Previously, Mr. Curvey served as a Director of Fidelity Research & Analysis Co. (investment adviser firm, 2009-2018), Director of Fidelity Investments Money Management, Inc. (investment adviser firm, 2009-2014) and a Director of FMR and FMR Co., Inc. (investment adviser firms, 2007-2014).
* Determined to be an “Interested Trustee” by virtue of, among other things, his or her affiliation with the trust or various entities under common control with FMR.
+ The information includes the Trustee's principal occupation during the last five years and other information relating to the experience, attributes, and skills relevant to the Trustee's qualifications to serve as a Trustee, which led to the conclusion that the Trustee should serve as a Trustee for the fund.
Independent Trustees:
Correspondence intended for an Independent Trustee may be sent to Fidelity Investments, P.O. Box 55235, Boston, Massachusetts 02205-5235.
Name, Year of Birth; Principal Occupations and Other Relevant Experience+
Dennis J. Dirks (1948)
Year of Election or Appointment: 2005
Trustee
Mr. Dirks also serves as Trustee of other Fidelity® funds. Prior to his retirement in May 2003, Mr. Dirks was Chief Operating Officer and a member of the Board of The Depository Trust & Clearing Corporation (DTCC). He also served as President, Chief Operating Officer, and Board member of The Depository Trust Company (DTC) and President and Board member of the National Securities Clearing Corporation (NSCC). In addition, Mr. Dirks served as Chief Executive Officer and Board member of the Government Securities Clearing Corporation, Chief Executive Officer and Board member of the Mortgage-Backed Securities Clearing Corporation, as a Trustee and a member of the Finance Committee of Manhattan College (2005-2008), as a Trustee and a member of the Finance Committee of AHRC of Nassau County (2006-2008), as a member of the Independent Directors Council (IDC) Governing Council (2010-2015), and as a member of the Board of Directors for The Brookville Center for Children’s Services, Inc. (2009-2017). Mr. Dirks is a member of the Finance Committee (2016-present) and Board of Directors (2017-present) and is Treasurer (2018-present) of the Asolo Repertory Theatre.
Donald F. Donahue (1950)
Year of Election or Appointment: 2018
Trustee
Mr. Donahue also serves as a Trustee of other Fidelity® funds. Mr. Donahue is President and Chief Executive Officer of Miranda Partners, LLC (risk consulting for the financial services industry, 2012-present). Previously, Mr. Donahue served as a Member of the Advisory Board of certain Fidelity® funds (2015-2018) and Chief Executive Officer (2006-2012), Chief Operating Officer (2003-2006), and Managing Director, Customer Marketing and Development (1999-2003) of The Depository Trust & Clearing Corporation (financial markets infrastructure). Mr. Donahue serves as a Member (2007-present) and Co-Chairman (2016-present) of the Board of Directors of United Way of New York, Member of the Board of Directors of NYC Leadership Academy (2012-present) and Member of the Board of Advisors of Ripple Labs, Inc. (financial services, 2015-present). He also served as Chairman (2010-2012) and Member of the Board of Directors (2012-2013) of Omgeo, LLC (financial services), Treasurer of United Way of New York (2012-2016), and Member of the Board of Directors of XBRL US (financial services non-profit, 2009-2012) and the International Securities Services Association (2009-2012).
Alan J. Lacy (1953)
Year of Election or Appointment: 2008
Trustee
Mr. Lacy also serves as Trustee of other Fidelity® funds. Mr. Lacy serves as a Director of Bristol-Myers Squibb Company (global pharmaceuticals, 2008-present). He is a Trustee of the California Chapter of The Nature Conservancy (2015-present) and a Director of the Center for Advanced Study in the Behavioral Sciences at Stanford University (2015-present). In addition, Mr. Lacy served as Senior Adviser (2007-2014) of Oak Hill Capital Partners, L.P. (private equity) and also served as Chief Executive Officer (2005) and Vice Chairman (2005-2006) of Sears Holdings Corporation (retail) and Chief Executive Officer and Chairman of the Board of Sears, Roebuck and Co. (retail, 2000-2005). Previously, Mr. Lacy served as Chairman (2014-2017) and a member (2010-2017) of the Board of Directors of Dave & Buster’s Entertainment, Inc. (restaurant and entertainment complexes), as Chairman (2008-2011) and a member (2006-2015) of the Board of Trustees of the National Parks Conservation Association, and as a member of the Board of Directors for The Hillman Companies, Inc. (hardware wholesalers, 2010-2014), Earth Fare, Inc. (retail grocery, 2010-2014), and The Western Union Company (global money transfer, 2006-2011).
Ned C. Lautenbach (1944)
Year of Election or Appointment: 2000
Trustee
Chairman of the Independent Trustees
Mr. Lautenbach also serves as Trustee of other Fidelity® funds. Mr. Lautenbach currently serves as Chair (2018-present) and Member (2013-present) of the Board of Governors, State University System of Florida and is a member of the Council on Foreign Relations (1994-present). He is also a member and has most recently served as Chairman of the Board of Directors of Artis-Naples (2012-present). Previously, Mr. Lautenbach served as a member and then Lead Director of the Board of Directors of Eaton Corporation (diversified industrial, 1997-2016). He was also a Partner and Advisory Partner at Clayton, Dubilier & Rice, LLC (private equity investment, 1998-2010), as well as a Director of Sony Corporation (2006-2007). In addition, Mr. Lautenbach also had a 30-year career with IBM (technology company) during which time he served as Senior Vice President and a member of the Corporate Executive Committee (1968-1998).
Joseph Mauriello (1944)
Year of Election or Appointment: 2008
Trustee
Mr. Mauriello also serves as Trustee of other Fidelity® funds. Prior to his retirement in January 2006, Mr. Mauriello served in numerous senior management positions including Deputy Chairman and Chief Operating Officer (2004-2005), and Vice Chairman of Financial Services (2002-2004) of KPMG LLP US (professional services, 1965-2005). Mr. Mauriello currently serves as a member of the Independent Directors Council (IDC) Governing Council (2015-present). Previously, Mr. Mauriello served as a member of the Board of Directors of XL Group plc. (global insurance and re-insurance, 2006-2018).
Cornelia M. Small (1944)
Year of Election or Appointment: 2005
Trustee
Ms. Small also serves as Trustee of other Fidelity® funds. Ms. Small is a member of the Board of Directors (2009-present) and Chair of the Investment Committee (2010-present) of the Teagle Foundation. Ms. Small also serves on the Investment Committee of the Berkshire Taconic Community Foundation (2008-present). Previously, Ms. Small served as Chairperson (2002-2008) and a member of the Investment Committee and Chairperson (2008-2012) and a member of the Board of Trustees of Smith College. In addition, Ms. Small served as Chief Investment Officer, Director of Global Equity Investments, and a member of the Board of Directors of Scudder, Stevens & Clark and Scudder Kemper Investments.
Garnett A. Smith (1947)
Year of Election or Appointment: 2018
Trustee
Mr. Smith also serves as Trustee of other Fidelity® funds. Prior to Mr. Smith's retirement, he served as Chairman and Chief Executive Officer of Inbrand Corp. (manufacturer of personal absorbent products, 1990-1997). He also served as President (1986-1990) of Inbrand Corp. Prior to his employment with Inbrand Corp., he was employed by a retail fabric chain and North Carolina National Bank. In addition, Mr. Smith served as a Member of the Advisory Board of certain Fidelity® funds (2012-2013) and as a board member of the Jackson Hole Land Trust (2009-2012).
David M. Thomas (1949)
Year of Election or Appointment: 2008
Trustee
Mr. Thomas also serves as Trustee of other Fidelity® funds. Mr. Thomas serves as Non-Executive Chairman of the Board of Directors of Fortune Brands Home and Security (home and security products, 2011-present) and as a member of the Board of Directors (2004-present) and Presiding Director (2013-present) of Interpublic Group of Companies, Inc. (marketing communication). Previously, Mr. Thomas served as Executive Chairman (2005-2006) and Chairman and Chief Executive Officer (2000-2005) of IMS Health, Inc. (pharmaceutical and healthcare information solutions), a Director of Fortune Brands, Inc. (consumer products, 2000-2011), and a member of the Board of Trustees of the University of Florida (2013-2018).
+ The information includes the Trustee's principal occupation during the last five years and other information relating to the experience, attributes, and skills relevant to the Trustee's qualifications to serve as a Trustee, which led to the conclusion that the Trustee should serve as a Trustee for the fund.
Advisory Board Members and Officers:
Correspondence intended for a Member of the Advisory Board (if any) may be sent to Fidelity Investments, P.O. Box 55235, Boston, Massachusetts 02205-5235. Correspondence intended for an officer or Peter S. Lynch may be sent to Fidelity Investments, 245 Summer Street, Boston, Massachusetts 02210. Officers appear below in alphabetical order.
Name, Year of Birth; Principal Occupation
Vicki L. Fuller (1957)
Year of Election or Appointment: 2018
Member of the Advisory Board
Ms. Fuller also serves as Member of the Advisory Board of other Fidelity® funds. Ms. Fuller serves as a member of the Board of Directors, Audit Committee, and Nominating and Governance Committee of The Williams Companies, Inc. (natural gas infrastructure, 2018-present). Previously, Ms. Fuller served as the Chief Investment Officer of the New York State Common Retirement Fund (2012-2018) and held a variety of positions at AllianceBernstein L.P. (global asset management, 1985-2012), including Managing Director (2006-2012) and Senior Vice President and Senior Portfolio Manager (2001-2006).
Peter S. Lynch (1944)
Year of Election or Appointment: 2003
Member of the Advisory Board
Mr. Lynch also serves as Member of the Advisory Board of other Fidelity® funds. Mr. Lynch is Vice Chairman and a Director of FMR (investment adviser firm) and FMR Co., Inc. (investment adviser firm). In addition, Mr. Lynch serves as a Trustee of Boston College and as the Chairman of the Inner-City Scholarship Fund. Previously, Mr. Lynch served on the Special Olympics International Board of Directors (1997-2006).
Michael E. Wiley (1950)
Year of Election or Appointment: 2018
Member of the Advisory Board
Mr. Wiley also serves as Trustee or Member of the Advisory Board of other Fidelity® funds. Mr. Wiley serves as a Director of High Point Resources (exploration and production, 2005-present). Previously, Mr. Wiley served as a Director of Andeavor Corporation (independent oil refiner and marketer, 2005-2018), a Director of Andeavor Logistics LP (natural resources logistics, 2015-2018), a Director of Post Oak Bank (privately-held bank, 2004-2018), a Director of Asia Pacific Exploration Consolidated (international oil and gas exploration and production, 2008-2013), a member of the Board of Trustees of the University of Tulsa (2000-2006; 2007-2010), a Senior Energy Advisor of Katzenbach Partners, LLC (consulting, 2006-2007), an Advisory Director of Riverstone Holdings (private investment), a Director of Spinnaker Exploration Company (exploration and production, 2001-2005) and Chairman, President, and CEO of Baker Hughes, Inc. (oilfield services, 2000-2004).
Elizabeth Paige Baumann (1968)
Year of Election or Appointment: 2017
Anti-Money Laundering (AML) Officer
Ms. Baumann also serves as AML Officer of other funds. She is Chief AML Officer (2012-present) and Senior Vice President (2014-present) of FMR LLC (diversified financial services company) and is an employee of Fidelity Investments. Previously, Ms. Baumann served as AML Officer of the funds (2012-2016), and Vice President (2007-2014) and Deputy Anti-Money Laundering Officer (2007-2012) of FMR LLC.
Craig S. Brown (1977)
Year of Election or Appointment: 2019
Assistant Treasurer
Mr. Brown also serves as Assistant Treasurer of other funds. Mr. Brown is an employee of Fidelity Investments (2013-present).
John J. Burke III (1964)
Year of Election or Appointment: 2018
Chief Financial Officer
Mr. Burke also serves as Chief Financial Officer of other funds. Mr. Burke serves as Head of Investment Operations for Fidelity Fund and Investment Operations (2018-present) and is an employee of Fidelity Investments (1998-present). Previously Mr. Burke served as head of Asset Management Investment Operations (2012-2018).
William C. Coffey (1969)
Year of Election or Appointment: 2019
Assistant Secretary
Mr. Coffey also serves as Assistant Secretary of other funds. He is Senior Vice President and Deputy General Counsel of FMR LLC (diversified financial services company, 2010-present), and is an employee of Fidelity Investments. Previously, Mr. Coffey served as Secretary and CLO of certain funds (2018-2019); CLO, Secretary, and Senior Vice President of Fidelity Management & Research Company and FMR Co., Inc. (investment adviser firms, 2018-2019); Secretary of Fidelity SelectCo, LLC and Fidelity Investments Money Management, Inc. (investment adviser firms, 2018-2019); CLO of Fidelity Management & Research (Hong Kong) Limited, FMR Investment Management (UK) Limited, and Fidelity Management & Research (Japan) Limited (investment adviser firms, 2018-2019); and Assistant Secretary of certain funds (2009-2018).
Timothy M. Cohen (1969)
Year of Election or Appointment: 2018
Vice President
Mr. Cohen also serves as Vice President of other funds. Mr. Cohen serves as Executive Vice President of Fidelity SelectCo, LLC (2019-present), Co-Head of Equity (2018-present), a Director of Fidelity Management & Research (Japan) Limited (investment adviser firm, 2016-present), and is an employee of Fidelity Investments. Previously, Mr. Cohen served as Head of Global Equity Research (2016-2018), Chief Investment Officer - Equity and a Director of Fidelity Management & Research (U.K.) Inc. (investment adviser firm, 2013-2015) and as a Director of Fidelity Management & Research (Hong Kong) Limited (investment adviser firm, 2017).
Jonathan Davis (1968)
Year of Election or Appointment: 2010
Assistant Treasurer
Mr. Davis also serves as Assistant Treasurer of other funds. Mr. Davis serves as Assistant Treasurer of FMR Capital, Inc. (2017-present) and is an employee of Fidelity Investments. Previously, Mr. Davis served as Vice President and Associate General Counsel of FMR LLC (diversified financial services company, 2003-2010).
Adrien E. Deberghes (1967)
Year of Election or Appointment: 2016
Assistant Treasurer
Mr. Deberghes also serves as an officer of other funds. He serves as Assistant Treasurer of FMR Capital, Inc. (2017-present), Executive Vice President of Fidelity Investments Money Management, Inc. (FIMM) (investment adviser firm, 2016-present), and is an employee of Fidelity Investments (2008-present). Previously, Mr. Deberghes served as President and Treasurer of certain Fidelity® funds (2013-2018). Prior to joining Fidelity Investments, Mr. Deberghes was Senior Vice President of Mutual Fund Administration at State Street Corporation (2007-2008), Senior Director of Mutual Fund Administration at Investors Bank & Trust (2005-2007), and Director of Finance for Dunkin' Brands (2000-2005). Previously, Mr. Deberghes served in other fund officer roles.
Laura M. Del Prato (1964)
Year of Election or Appointment: 2018
Assistant Treasurer
Ms. Del Prato also serves as an officer of other funds. Ms. Del Prato is an employee of Fidelity Investments (2017-present). Prior to joining Fidelity Investments, Ms. Del Prato served as a Managing Director and Treasurer of the JPMorgan Mutual Funds (2014-2017). Prior to JPMorgan, Ms. Del Prato served as a partner at Cohen Fund Audit Services (accounting firm, 2012-2013) and KPMG LLP (accounting firm, 2004-2012).
Colm A. Hogan (1973)
Year of Election or Appointment: 2016
Deputy Treasurer
Mr. Hogan also serves as an officer of other funds. Mr. Hogan serves as Assistant Treasurer of FMR Capital, Inc. (2017-present) and is an employee of Fidelity Investments (2005-present). Previously, Mr. Hogan served as Assistant Treasurer of certain Fidelity® funds (2016-2018).
Pamela R. Holding (1964)
Year of Election or Appointment: 2018
Vice President
Ms. Holding also serves as Vice President of other funds. Ms. Holding serves as Executive Vice President of Fidelity SelectCo, LLC (2019-present), Co-Head of Equity (2018-present) and is an employee of Fidelity Investments (2013-present). Previously, Ms. Holding served as Chief Investment Officer of Fidelity Institutional Asset Management (2013-2018).
Cynthia Lo Bessette (1969)
Year of Election or Appointment: 2019
Secretary and Chief Legal Officer (CLO)
Ms. Lo Bessette also serves as Secretary and CLO of other funds. Ms. Lo Bessette serves as CLO, Secretary, and Senior Vice President of Fidelity Management & Research Company and FMR Co., Inc. (investment adviser firms, 2019-present); Secretary of Fidelity SelectCo, LLC and Fidelity Investments Money Management, Inc. (investment adviser firms, 2019-present); and CLO of Fidelity Management & Research (Hong Kong) Limited, FMR Investment Management (UK) Limited, and Fidelity Management & Research (Japan) Limited (investment adviser firms, 2019-present). She is a Senior Vice President and Deputy General Counsel of FMR LLC (diversified financial services company, 2019-present), and is an employee of Fidelity Investments. Previously, Ms. Lo Bessette served as Executive Vice President, General Counsel (2016-2019) and Senior Vice President, Deputy General Counsel (2015-2016) of OppenheimerFunds (investment management company) and Deputy Chief Legal Officer (2013-2015) of Jennison Associates LLC (investment adviser firm).
Chris Maher (1972)
Year of Election or Appointment: 2013
Assistant Treasurer
Mr. Maher serves as Assistant Treasurer of other funds. Mr. Maher is Vice President of Valuation Oversight, serves as Assistant Treasurer of FMR Capital, Inc. (2017-present), and is an employee of Fidelity Investments. Previously, Mr. Maher served as Vice President of Asset Management Compliance (2013), Vice President of the Program Management Group of FMR (investment adviser firm, 2010-2013), and Vice President of Valuation Oversight (2008-2010).
Kenneth B. Robins (1969)
Year of Election or Appointment: 2016
Chief Compliance Officer
Mr. Robins also serves as an officer of other funds. Mr. Robins serves as Compliance Officer of Fidelity Management & Research Company and FMR Co., Inc. (investment adviser firms, 2016-present) and is an employee of Fidelity Investments (2004-present). Previously, Mr. Robins served as Executive Vice President of Fidelity Investments Money Management, Inc. (investment adviser firm, 2013-2016) and served in other fund officer roles.
Stacie M. Smith (1974)
Year of Election or Appointment: 2016
President and Treasurer
Ms. Smith also serves as an officer of other funds. Ms. Smith serves as Assistant Treasurer of FMR Capital, Inc. (2017-present), is an employee of Fidelity Investments (2009-present), and has served in other fund officer roles. Prior to joining Fidelity Investments, Ms. Smith served as Senior Audit Manager of Ernst & Young LLP (accounting firm, 1996-2009). Previously, Ms. Smith served as Assistant Treasurer (2013-2018) and Deputy Treasurer (2013-2016) of certain Fidelity® funds.
Marc L. Spector (1972)
Year of Election or Appointment: 2016
Assistant Treasurer
Mr. Spector also serves as an officer of other funds. Mr. Spector serves as Assistant Treasurer of FMR Capital, Inc. (2017-present) and is an employee of Fidelity Investments (2016-present). Prior to joining Fidelity Investments, Mr. Spector served as Director at the Siegfried Group (accounting firm, 2013-2016), and prior to Siegfried Group as audit senior manager at Deloitte & Touche (accounting firm, 2005-2013).
Jim Wegmann (1979)
Year of Election or Appointment: 2019
Assistant Treasurer
Mr. Wegmann also serves as Assistant Treasurer of other funds. Mr. Wegmann is an employee of Fidelity Investments (2011-present).
Shareholder Expense Example
As a shareholder of the Fund, you incur two types of costs: (1) transaction costs, including sales charges (loads) on purchase payments or redemption proceeds, and (2) ongoing costs, including management fees, distribution and/or service (12b-1) fees and other Fund expenses. This Example is intended to help you understand your ongoing costs (in dollars) of investing in the Fund and to compare these costs with the ongoing costs of investing in other mutual funds.
The Example is based on an investment of $1,000 invested at the beginning of the period and held for the entire period (May 1, 2019 to October 31, 2019).
Actual Expenses
The first line of the accompanying table for each class of the Fund provides information about actual account values and actual expenses. You may use the information in this line, together with the amount you invested, to estimate the expenses that you paid over the period. Simply divide your account value by $1,000.00 (for example, an $8,600 account value divided by $1,000.00 = 8.6), then multiply the result by the number in the first line for a class of the Fund under the heading entitled "Expenses Paid During Period" to estimate the expenses you paid on your account during this period. In addition, the Fund, as a shareholder in the underlying Fidelity Central Funds, will indirectly bear its pro-rata share of the fees and expenses incurred by the underlying Fidelity Central Funds. These fees and expenses are not included in the Fund's annualized expense ratio used to calculate the expense estimate in the table below.
Hypothetical Example for Comparison Purposes
The second line of the accompanying table for each class of the Fund provides information about hypothetical account values and hypothetical expenses based on a Class' actual expense ratio and an assumed rate of return of 5% per year before expenses, which is not the Class' actual return. The hypothetical account values and expenses may not be used to estimate the actual ending account balance or expenses you paid for the period. You may use this information to compare the ongoing costs of investing in the Fund and other funds. To do so, compare this 5% hypothetical example with the 5% hypothetical examples that appear in the shareholder reports of the other funds. In addition, the Fund, as a shareholder in the underlying Fidelity Central Funds, will indirectly bear its pro-rata share of the fees and expenses incurred by the underlying Fidelity Central Funds. These fees and expenses are not included in the Fund's annualized expense ratio used to calculate the expense estimate in the table below.
Please note that the expenses shown in the table are meant to highlight your ongoing costs only and do not reflect any transaction costs. Therefore, the second line of the table is useful in comparing ongoing costs only, and will not help you determine the relative total costs of owning different funds. In addition, if these transactional costs were included, your costs would have been higher.
| | Annualized Expense Ratio-A | Beginning
Account Value
May 1, 2019 | Ending
Account Value
October 31, 2019 | Expenses Paid
During Period-B
May 1, 2019
to October 31, 2019 |
| Class A | 1.25% | | | |
| Actual | | $1,000.00 | $1,023.60 | $6.38 |
| Hypothetical-C | | $1,000.00 | $1,018.90 | $6.36 |
| Class M | 1.50% | | | |
| Actual | | $1,000.00 | $1,022.40 | $7.65 |
| Hypothetical-C | | $1,000.00 | $1,017.64 | $7.63 |
| Class C | 2.00% | | | |
| Actual | | $1,000.00 | $1,019.80 | $10.18 |
| Hypothetical-C | | $1,000.00 | $1,015.12 | $10.16 |
| Class I | .90% | | | |
| Actual | | $1,000.00 | $1,025.10 | $4.59 |
| Hypothetical-C | | $1,000.00 | $1,020.67 | $4.58 |
A Annualized expense ratio reflects expenses net of applicable fee waivers.
B Expenses are equal to each Class' annualized expense ratio, multiplied by the average account value over the period, multiplied by 184/365 (to reflect the one-half year period).
C 5% return per year before expenses
Distributions (Unaudited)
The Board of Trustees of Fidelity Advisor Value Leaders Fund voted to pay to shareholders of record at the opening of business on record date, the following distributions per share derived from capital gains realized from sales of portfolio securities, and dividends derived from net investment income:
| | Pay Date | Record Date | Dividends | Capital Gains |
| Fidelity Advisor® Value Leaders Fund | | | | |
| Class A | 12/09/19 | 12/06/19 | $0.200 | $0.090 |
| Class M | 12/09/19 | 12/06/19 | $0.152 | $0.090 |
| Class C | 12/09/19 | 12/06/19 | $0.000 | $0.089 |
| Class I | 12/09/19 | 12/06/19 | $0.267 | $0.090 |
|
The fund hereby designates as a capital gain dividend with respect to the taxable year ended October 31, 2019, $22,477, or, if subsequently determined to be different, the net capital gain of such year.
Class A designates 92%; Class M designates 100%; Class C designates 100%; and Class I designates 70%; of the dividends distributed in December, respectively during the fiscal year as qualifying for the dividends–received deduction for corporate shareholders.
Class A, Class M, Class C, and Class I designate 100% of the dividends distributed during the fiscal year as amounts which may be taken into account as a dividend for purposes of the maximum rate under section 1(h)(11) of the Internal Revenue Code.
The fund will notify shareholders in January 2020 of amounts for use in preparing 2019 income tax returns.
AVLF-ANN-1219
1.793577.116
Fidelity Advisor® Emerging Markets Fund
Annual Report
October 31, 2019
See the inside front cover for important information about access to your fund’s shareholder reports.
Beginning on January 1, 2021, as permitted by regulations adopted by the Securities and Exchange Commission, paper copies of a fund’s shareholder reports will no longer be sent by mail, unless you specifically request paper copies of the reports from the fund or from your financial intermediary, such as a financial advisor, broker-dealer or bank. Instead, the reports will be made available on a website, and you will be notified by mail each time a report is posted and provided with a website link to access the report.
If you already elected to receive shareholder reports electronically, you will not be affected by this change and you need not take any action. You may elect to receive shareholder reports and other communications from a fund electronically, by contacting your financial intermediary. For Fidelity customers, visit Fidelity's web site or call Fidelity using the contact information listed below.
You may elect to receive all future reports in paper free of charge. If you wish to continue receiving paper copies of your shareholder reports, you may contact your financial intermediary or, if you are a Fidelity customer, visit Fidelity’s website, or call Fidelity at the applicable toll-free number listed below. Your election to receive reports in paper will apply to all funds held with the fund complex/your financial intermediary.
| Account Type | Website | Phone Number |
| Brokerage, Mutual Fund, or Annuity Contracts: | fidelity.com/mailpreferences | 1-800-343-3548 |
| Employer Provided Retirement Accounts: | netbenefits.fidelity.com/preferences (choose 'no' under Required Disclosures to continue to print) | 1-800-343-0860 |
| Advisor Sold Accounts Serviced Through Your Financial Intermediary: | Contact Your Financial Intermediary | Your Financial Intermediary's phone number |
| Advisor Sold Accounts Serviced by Fidelity: | institutional.fidelity.com | 1-877-208-0098 |
Contents
To view a fund's proxy voting guidelines and proxy voting record for the 12-month period ended June 30, visit http://www.fidelity.com/proxyvotingresults or visit the Securities and Exchange Commission's (SEC) web site at http://www.sec.gov.
You may also call 1-877-208-0098 to request a free copy of the proxy voting guidelines.
Standard & Poor's, S&P and S&P 500 are registered service marks of The McGraw-Hill Companies, Inc. and have been licensed for use by Fidelity Distributors Corporation.
Other third-party marks appearing herein are the property of their respective owners.
All other marks appearing herein are registered or unregistered trademarks or service marks of FMR LLC or an affiliated company. © 2019 FMR LLC. All rights reserved.
This report and the financial statements contained herein are submitted for the general information of the shareholders of the Fund. This report is not authorized for distribution to prospective investors in the Fund unless preceded or accompanied by an effective prospectus.
A fund files its complete schedule of portfolio holdings with the SEC for the first and third quarters of each fiscal year on Form N-PORT. Forms N-PORT are available on the SEC’s web site at http://www.sec.gov. A fund's Forms N-PORT may be reviewed and copied at the SEC’s Public Reference Room in Washington, DC. Information regarding the operation of the SEC's Public Reference Room may be obtained by calling 1-800-SEC-0330.
For a complete list of a fund's portfolio holdings, view the most recent holdings listing, semiannual report, or annual report on Fidelity's web site at http://www.fidelity.com, http://www.institutional.fidelity.com, or http://www.401k.com, as applicable.
NOT FDIC INSURED •MAY LOSE VALUE •NO BANK GUARANTEE
Neither the Fund nor Fidelity Distributors Corporation is a bank.
Performance: The Bottom Line
Average annual total return reflects the change in the value of an investment, assuming reinvestment of distributions from dividend income and capital gains (the profits earned upon the sale of securities that have grown in value, if any) and assuming a constant rate of performance each year. The hypothetical investment and the average annual total returns do not reflect the deduction of taxes that a shareholder would pay on fund distributions or the redemption of fund shares. During periods of reimbursement by Fidelity, a fund’s total return will be greater than it would be had the reimbursement not occurred. How a fund did yesterday is no guarantee of how it will do tomorrow.
Average Annual Total Returns
| For the periods ended October 31, 2019 | Past 1 year | Past 5 years | Past 10 years |
| Class A (incl. 5.75% sales charge) | 12.56% | 3.45% | 4.14% |
| Class M (incl. 3.50% sales charge) | 14.86% | 3.65% | 4.11% |
| Class C (incl. contingent deferred sales charge) | 17.48% | 3.88% | 3.97% |
| Class I | 19.78% | 5.04% | 5.11% |
| Class Z | 19.93% | 5.19% | 5.21% |
Class C shares' contingent deferred sales charges included in the past one year, past five years and past ten years total return figures are 1%, 0% and 0%, respectively.
The initial offering of Class Z shares took place on August 13, 2013. Returns prior to August 13, 2013, are those of Class I.
$10,000 Over 10 Years
Let's say hypothetically that $10,000 was invested in Fidelity Advisor® Emerging Markets Fund - Class A on October 31, 2009, and the current 5.75% sales charge was paid.
The chart shows how the value of your investment would have changed, and also shows how the MSCI Emerging Markets Index performed over the same period.

| Period Ending Values |
| $15,006 | Fidelity Advisor® Emerging Markets Fund - Class A |
| $14,574 | MSCI Emerging Markets Index |
Management's Discussion of Fund Performance
Market Recap: The MSCI ACWI (All Country World Index) ex USA Index gained 11.47% for the 12 months ending October 31, 2019, as international stocks reflected a confluence of factors, including escalating trade tension, and moderating but still positive global economic growth. Currency fluctuations were largely modest and varied by region, muting the overall impact on international equity returns. In late December, the U.S. Federal Reserve shifted from raising interest rates to a more dovish policy in 2019, joining many foreign central banks. In June, international stocks rose 6.03%, as policy stimulus in China stabilized that country’s economic growth. The Fed cut its policy rate in July for the first time since 2008. However, the index returned -1.21% for the month, followed by -3.08% in August. In September, the Fed cut its policy rate another quarter point, citing concerns about slowing economic growth and muted inflation, and did the same in October, leading to monthly gains of 2.59% and 3.49%, respectively. For the full 12 months, the growth-oriented information technology sector (+22%) led the way, followed by utilities (+20%) and real estate (+18%), two high-dividend-yielding categories. Conversely, energy was roughly flat, while materials (+6%) and communication services (7%) also lagged. By region, Asia Pacific ex Japan (+16%), Europe ex U.K (+13%), Canada (+12%) and emerging markets (+12%) fared best. Meanwhile, the U.K. (+7%) and Japan (+10%) trailed the broader market.
Comments from Portfolio Manager Sam Polyak: For the year, the fund’s share classes (excluding sales charges, if applicable) gained roughly 18% to 20%, well ahead of the 11.89% advance of the benchmark MSCI Emerging Markets Index. Stock selection mainly drove the fund’s advantage over the benchmark, especially in the financials, consumer staples and consumer discretionary sectors. Geographically, China, South Korea and South Africa added significant value. Among individual holdings, Wuliangye Yibin, a China-based liquor manufacturer, contributed more on a relative basis than any other stock. I sold this position from the fund by period end. A non-benchmark investment in South Africa’s Impala Platinum Holdings also helped, as did a stake in South Korea-based Samsung Electronics, which I built into the fund’s largest position by October 31. Conversely, overweighting the materials sector detracted modestly. By country, non-benchmark exposure to the U.K. and Germany, as well as positioning in India, Thailand and Chile, weighed on the fund's relative return. Thailand-based Siam Cement detracted more than any other individual stock investment, followed by State Bank of India and China-based internet company Tencent Holdings.
The views expressed above reflect those of the portfolio manager(s) only through the end of the period as stated on the cover of this report and do not necessarily represent the views of Fidelity or any other person in the Fidelity organization. Any such views are subject to change at any time based upon market or other conditions and Fidelity disclaims any responsibility to update such views. These views may not be relied on as investment advice and, because investment decisions for a Fidelity fund are based on numerous factors, may not be relied on as an indication of trading intent on behalf of any Fidelity fund.
Note to shareholders: On February 22, 2019, Sam Polyak assumed co-management responsibilities for the fund, joining Co-Manager Sammy Simnegar. As of October 1, 2019, Simnegar no longer manages the fund, leaving Polyak as sole Portfolio Manager.
Investment Summary (Unaudited)
Top Five Stocks as of October 31, 2019
| | % of fund's net assets |
| Samsung Electronics Co. Ltd. (Korea (South), Technology Hardware, Storage & Peripherals) | 9.2 |
| Tencent Holdings Ltd. (Cayman Islands, Interactive Media & Services) | 6.8 |
| Taiwan Semiconductor Manufacturing Co. Ltd. (Taiwan, Semiconductors & Semiconductor Equipment) | 5.9 |
| Industrial & Commercial Bank of China Ltd. (H Shares) (China, Banks) | 4.4 |
| Haier Smart Home Co. Ltd. (A Shares) (China, Household Durables) | 3.7 |
| | 30.0 |
Top Five Market Sectors as of October 31, 2019
| | % of fund's net assets |
| Financials | 24.2 |
| Information Technology | 20.9 |
| Materials | 11.6 |
| Consumer Discretionary | 9.2 |
| Industrials | 8.1 |
Top Five Countries as of October 31, 2019
| (excluding cash equivalents) | % of fund's net assets |
| China | 19.4 |
| Cayman Islands | 14.0 |
| Taiwan | 12.3 |
| Korea (South) | 12.1 |
| Brazil | 9.0 |
Asset Allocation (% of fund's net assets)
| As of October 31, 2019 |
| | Stocks | 98.9% |
| | Short-Term Investments and Net Other Assets (Liabilities) | 1.1% |

Schedule of Investments October 31, 2019
Showing Percentage of Net Assets
| Common Stocks - 95.8% | | | |
| | | Shares | Value |
| Brazil - 5.9% | | | |
| BM&F BOVESPA SA | | 624,200 | $7,529,933 |
| IRB Brasil Resseguros SA | | 1,216,000 | 11,458,083 |
| Natura Cosmeticos SA | | 710,600 | 5,521,081 |
| Suzano Papel e Celulose SA | | 1,409,100 | 11,468,152 |
|
| TOTAL BRAZIL | | | 35,977,249 |
|
| Cayman Islands - 14.0% | | | |
| Airtac International Group | | 745,037 | 10,199,126 |
| JD.com, Inc. sponsored ADR (a) | | 207,633 | 6,467,768 |
| Li Ning Co. Ltd. | | 4,318,000 | 14,641,571 |
| Meituan Dianping Class B (a) | | 602,300 | 7,184,320 |
| PagSeguro Digital Ltd. (a) | | 145,041 | 5,378,120 |
| Tencent Holdings Ltd. | | 1,018,300 | 41,305,219 |
|
| TOTAL CAYMAN ISLANDS | | | 85,176,124 |
|
| Chile - 0.9% | | | |
| Banco de Chile | | 43,720,200 | 5,630,096 |
| China - 19.4% | | | |
| AVIC Jonhon OptronicTechnology Co. Ltd. | | 1,327,620 | 7,600,923 |
| C&S Paper Co. Ltd. (A Shares) | | 2,525,436 | 4,465,698 |
| China Life Insurance Co. Ltd. (H Shares) | | 3,874,000 | 9,962,733 |
| China Merchants Bank Co. Ltd. (H Shares) | | 4,076,000 | 19,439,387 |
| China Petroleum & Chemical Corp. (H Shares) | | 15,050,000 | 8,560,067 |
| Haier Smart Home Co. Ltd. (A Shares) | | 9,807,742 | 22,275,972 |
| Industrial & Commercial Bank of China Ltd. (H Shares) | | 37,809,000 | 27,086,115 |
| Shenzhen Inovance Technology Co. Ltd. (A Shares) | | 3,437,394 | 12,161,361 |
| Yantai Jereh Oilfield Services (A Shares) | | 1,601,500 | 6,965,481 |
|
| TOTAL CHINA | | | 118,517,737 |
|
| Hong Kong - 4.4% | | | |
| China Resources Beer Holdings Co. Ltd. | | 3,514,000 | 18,016,369 |
| CNOOC Ltd. sponsored ADR | | 58,473 | 8,685,579 |
|
| TOTAL HONG KONG | | | 26,701,948 |
|
| India - 4.9% | | | |
| Housing Development Finance Corp. Ltd. | | 211,598 | 6,345,909 |
| Infosys Ltd. sponsored ADR | | 571,560 | 5,481,260 |
| Larsen & Toubro Ltd. | | 286,800 | 5,946,245 |
| Shree Cement Ltd. | | 18,218 | 5,103,392 |
| Solar Industries India Ltd. (a) | | 484,753 | 7,239,489 |
|
| TOTAL INDIA | | | 30,116,295 |
|
| Indonesia - 1.1% | | | |
| PT Bank Mandiri (Persero) Tbk | | 12,856,000 | 6,426,321 |
| Israel - 2.3% | | | |
| Elbit Systems Ltd. (Israel) | | 86,300 | 14,140,717 |
| Korea (South) - 12.1% | | | |
| Samsung Electronics Co. Ltd. | | 1,296,011 | 55,814,331 |
| Shinhan Financial Group Co. Ltd. | | 492,190 | 17,828,170 |
|
| TOTAL KOREA (SOUTH) | | | 73,642,501 |
|
| Mexico - 3.8% | | | |
| CEMEX S.A.B. de CV sponsored ADR | | 1,366,900 | 5,153,213 |
| Grupo Financiero Banorte S.A.B. de CV Series O | | 3,248,900 | 17,733,709 |
|
| TOTAL MEXICO | | | 22,886,922 |
|
| Peru - 3.1% | | | |
| Compania de Minas Buenaventura SA sponsored ADR | | 1,249,548 | 19,168,066 |
| Philippines - 1.5% | | | |
| Ayala Land, Inc. | | 9,677,000 | 9,241,239 |
| Russia - 5.8% | | | |
| Lukoil PJSC sponsored ADR | | 122,400 | 11,255,904 |
| MMC Norilsk Nickel PJSC sponsored ADR | | 409,835 | 11,352,430 |
| Sberbank of Russia sponsored ADR | | 862,400 | 12,677,280 |
|
| TOTAL RUSSIA | | | 35,285,614 |
|
| Singapore - 1.6% | | | |
| CapitaLand Ltd. | | 3,594,700 | 9,501,595 |
| South Africa - 1.1% | | | |
| Impala Platinum Holdings Ltd. (a) | | 948,900 | 6,521,509 |
| Taiwan - 12.3% | | | |
| Realtek Semiconductor Corp. | | 1,067,000 | 7,924,307 |
| Sporton International, Inc. | | 1,069,000 | 6,659,781 |
| Taiwan Semiconductor Manufacturing Co. Ltd. | | 3,719,000 | 36,376,757 |
| Unified-President Enterprises Corp. | | 6,397,000 | 15,773,310 |
| Yageo Corp. | | 813,000 | 8,370,451 |
|
| TOTAL TAIWAN | | | 75,104,606 |
|
| Thailand - 0.7% | | | |
| Siam Cement PCL (For. Reg.) | | 371,300 | 4,515,974 |
| United States of America - 0.9% | | | |
| MercadoLibre, Inc. (a) | | 10,518 | 5,485,347 |
| TOTAL COMMON STOCKS | | | |
| (Cost $540,573,560) | | | 584,039,860 |
|
| Nonconvertible Preferred Stocks - 3.1% | | | |
| Brazil - 3.1% | | | |
| Itau Unibanco Holding SA | | 680,880 | 6,150,924 |
| Petroleo Brasileiro SA - Petrobras sponsored ADR | | 767,578 | 12,465,467 |
| TOTAL NONCONVERTIBLE PREFERRED STOCKS | | | |
| (Cost $14,925,916) | | | 18,616,391 |
|
| Money Market Funds - 2.5% | | | |
| Fidelity Cash Central Fund 1.83% (b) | | | |
| (Cost $15,115,630) | | 15,112,608 | 15,115,630 |
| TOTAL INVESTMENT IN SECURITIES - 101.4% | | | |
| (Cost $570,615,106) | | | 617,771,881 |
| NET OTHER ASSETS (LIABILITIES) - (1.4)% | | | (8,268,179) |
| NET ASSETS - 100% | | | $609,503,702 |
Categorizations in the Schedule of Investments are based on country or territory of incorporation.
Legend
(a) Non-income producing
(b) Affiliated fund that is generally available only to investment companies and other accounts managed by Fidelity Investments. The rate quoted is the annualized seven-day yield of the fund at period end. A complete unaudited listing of the fund's holdings as of its most recent quarter end is available upon request. In addition, each Fidelity Central Fund's financial statements, which are not covered by the Fund's Report of Independent Registered Public Accounting Firm, are available on the SEC's website or upon request.
Affiliated Central Funds
Information regarding fiscal year to date income earned by the Fund from investments in Fidelity Central Funds is as follows:
| Fund | Income earned |
| Fidelity Cash Central Fund | $510,902 |
| Fidelity Securities Lending Cash Central Fund | 375,266 |
| Total | $886,168 |
Amounts in the income column in the above table include any capital gain distributions from underlying funds, which are presented in the corresponding line-item in the Statement of Operations, if applicable. Amount for Fidelity Securities Lending Cash Central Fund represents the income earned on investing cash collateral, less rebates paid to borrowers and any lending agent fees associated with the loan, plus any premium payments received for lending certain types of securities.
Investment Valuation
The following is a summary of the inputs used, as of October 31, 2019, involving the Fund's assets and liabilities carried at fair value. The inputs or methodology used for valuing securities may not be an indication of the risk associated with investing in those securities. For more information on valuation inputs, and their aggregation into the levels used below, please refer to the Investment Valuation section in the accompanying Notes to Financial Statements.
| | Valuation Inputs at Reporting Date: |
| Description | Total | Level 1 | Level 2 | Level 3 |
| Investments in Securities: | | | | |
| Equities: | | | | |
| Communication Services | $41,305,219 | $-- | $41,305,219 | $-- |
| Consumer Discretionary | 56,054,978 | 11,953,115 | 44,101,863 | -- |
| Consumer Staples | 43,776,458 | 21,294,391 | 22,482,067 | -- |
| Energy | 47,932,498 | 32,406,950 | 15,525,548 | -- |
| Financials | 148,268,660 | 61,180,025 | 87,088,635 | -- |
| Industrials | 49,107,230 | 30,999,624 | 18,107,606 | -- |
| Information Technology | 126,946,149 | 82,968,469 | 43,977,680 | -- |
| Materials | 70,522,225 | 53,663,370 | 16,858,855 | -- |
| Real Estate | 18,742,834 | -- | 18,742,834 | -- |
| Money Market Funds | 15,115,630 | 15,115,630 | -- | -- |
| Total Investments in Securities: | $617,771,881 | $309,581,574 | $308,190,307 | $-- |
See accompanying notes which are an integral part of the financial statements.
Financial Statements
Statement of Assets and Liabilities
| | | October 31, 2019 |
| Assets | | |
Investment in securities, at value — See accompanying schedule:
Unaffiliated issuers (cost $555,499,476) | $602,656,251 | |
| Fidelity Central Funds (cost $15,115,630) | 15,115,630 | |
| Total Investment in Securities (cost $570,615,106) | | $617,771,881 |
| Cash | | 310,578 |
| Foreign currency held at value (cost $12,309) | | 12,454 |
| Receivable for investments sold | | 385,156 |
| Receivable for fund shares sold | | 964,703 |
| Dividends receivable | | 827,672 |
| Distributions receivable from Fidelity Central Funds | | 23,910 |
| Prepaid expenses | | 1,525 |
| Other receivables | | 127,190 |
| Total assets | | 620,425,069 |
| Liabilities | | |
| Payable for investments purchased | $5,788,864 | |
| Payable for fund shares redeemed | 4,224,096 | |
| Accrued management fee | 482,994 | |
| Distribution and service plan fees payable | 82,860 | |
| Other affiliated payables | 166,155 | |
| Other payables and accrued expenses | 176,398 | |
| Total liabilities | | 10,921,367 |
| Net Assets | | $609,503,702 |
| Net Assets consist of: | | |
| Paid in capital | | $564,558,983 |
| Total accumulated earnings (loss) | | 44,944,719 |
| Net Assets | | $609,503,702 |
| Net Asset Value and Maximum Offering Price | | |
| Class A: | | |
| Net Asset Value and redemption price per share ($144,062,232 ÷ 5,502,917 shares)(a) | | $26.18 |
| Maximum offering price per share (100/94.25 of $26.18) | | $27.78 |
| Class M: | | |
| Net Asset Value and redemption price per share ($45,309,928 ÷ 1,751,903 shares)(a) | | $25.86 |
| Maximum offering price per share (100/96.50 of $25.86) | | $26.80 |
| Class C: | | |
| Net Asset Value and offering price per share ($41,614,584 ÷ 1,701,334 shares)(a) | | $24.46 |
| Class I: | | |
| Net Asset Value, offering price and redemption price per share ($288,485,355 ÷ 10,951,878 shares) | | $26.34 |
| Class Z: | | |
| Net Asset Value, offering price and redemption price per share ($90,031,603 ÷ 3,418,926 shares) | | $26.33 |
(a) Redemption price per share is equal to net asset value less any applicable contingent deferred sales charge.
See accompanying notes which are an integral part of the financial statements.
Statement of Operations
| | | Year ended October 31, 2019 |
| Investment Income | | |
| Dividends | | $15,214,591 |
| Non-Cash dividends | | 9,212,728 |
| Income from Fidelity Central Funds (including $375,266 from security lending) | | 886,168 |
| Income before foreign taxes withheld | | 25,313,487 |
| Less foreign taxes withheld | | (1,754,063) |
| Total income | | 23,559,424 |
| Expenses | | |
| Management fee | $6,167,136 | |
| Transfer agent fees | 1,559,721 | |
| Distribution and service plan fees | 1,046,857 | |
| Accounting and security lending fees | 377,406 | |
| Custodian fees and expenses | 267,915 | |
| Independent trustees' fees and expenses | 4,352 | |
| Registration fees | 116,495 | |
| Audit | 121,970 | |
| Legal | 2,861 | |
| Interest | 10,351 | |
| Miscellaneous | 5,117 | |
| Total expenses before reductions | 9,680,181 | |
| Expense reductions | (212,120) | |
| Total expenses after reductions | | 9,468,061 |
| Net investment income (loss) | | 14,091,363 |
| Realized and Unrealized Gain (Loss) | | |
| Net realized gain (loss) on: | | |
| Investment securities: | | |
| Unaffiliated issuers | 110,616,983 | |
| Redemptions in-kind with affiliated entities | 21,790,807 | |
| Fidelity Central Funds | 98 | |
| Foreign currency transactions | (604,631) | |
| Futures contracts | (240,361) | |
| Total net realized gain (loss) | | 131,562,896 |
| Change in net unrealized appreciation (depreciation) on: | | |
| Investment securities: | | |
| Unaffiliated issuers | (14,002,984) | |
| Assets and liabilities in foreign currencies | 29,317 | |
| Total change in net unrealized appreciation (depreciation) | | (13,973,667) |
| Net gain (loss) | | 117,589,229 |
| Net increase (decrease) in net assets resulting from operations | | $131,680,592 |
See accompanying notes which are an integral part of the financial statements.
Statement of Changes in Net Assets
| | Year ended October 31, 2019 | Year ended October 31, 2018 |
| Increase (Decrease) in Net Assets | | |
| Operations | | |
| Net investment income (loss) | $14,091,363 | $2,986,977 |
| Net realized gain (loss) | 131,562,896 | (29,147,894) |
| Change in net unrealized appreciation (depreciation) | (13,973,667) | (95,549,261) |
| Net increase (decrease) in net assets resulting from operations | 131,680,592 | (121,710,178) |
| Distributions to shareholders | (87,939,723) | (2,511,924) |
| Share transactions - net increase (decrease) | (106,326,281) | 188,083,026 |
| Redemption fees | – | 14,852 |
| Total increase (decrease) in net assets | (62,585,412) | 63,875,776 |
| Net Assets | | |
| Beginning of period | 672,089,114 | 608,213,338 |
| End of period | $609,503,702 | $672,089,114 |
See accompanying notes which are an integral part of the financial statements.
Financial Highlights
Fidelity Advisor Emerging Markets Fund Class A
| Years ended October 31, | 2019 | 2018 | 2017 | 2016 | 2015 |
| Selected Per–Share Data | | | | | |
| Net asset value, beginning of period | $24.48 | $28.86 | $22.30 | $20.73 | $23.38 |
| Income from Investment Operations | | | | | |
| Net investment income (loss)A | .44B | .09 | .08 | .02 | .06 |
| Net realized and unrealized gain (loss) | 4.26 | (4.39) | 6.49 | 1.55 | (2.66) |
| Total from investment operations | 4.70 | (4.30) | 6.57 | 1.57 | (2.60) |
| Distributions from net investment income | (.06)C | (.05) | (.01) | – | (.02) |
| Distributions from net realized gain | (2.94)C | (.03) | – | – | (.03) |
| Total distributions | (3.00) | (.08) | (.01) | – | (.05) |
| Redemption fees added to paid in capitalA | – | –D | –D | –D | –D |
| Net asset value, end of period | $26.18 | $24.48 | $28.86 | $22.30 | $20.73 |
| Total ReturnE,F | 19.42% | (14.93)% | 29.46% | 7.57% | (11.13)% |
| Ratios to Average Net AssetsG,H | | | | | |
| Expenses before reductions | 1.41% | 1.44% | 1.47% | 1.51% | 1.52% |
| Expenses net of fee waivers, if any | 1.41% | 1.44% | 1.47% | 1.51% | 1.52% |
| Expenses net of all reductions | 1.39% | 1.40% | 1.46% | 1.51% | 1.50% |
| Net investment income (loss) | 1.62%B | .30% | .34% | .11% | .28% |
| Supplemental Data | | | | | |
| Net assets, end of period (000 omitted) | $144,062 | $120,499 | $142,129 | $118,092 | $112,931 |
| Portfolio turnover rateI | 166%J | 87% | 86% | 85% | 110% |
A Calculated based on average shares outstanding during the period.
B Net investment income per share reflects a large, non-recurring dividend which amounted to $.32 per share. Excluding this non-recurring dividend, the ratio of net investment income (loss) to average net assets would have been .44%.
C The amounts shown reflect certain reclassifications related to book to tax differences that were made in the year shown.
D Amount represents less than $.005 per share.
E Total returns would have been lower if certain expenses had not been reduced during the applicable periods shown.
F Total returns do not include the effect of the sales charges.
G Fees and expenses of any underlying Fidelity Central Funds are not included in the Fund's expense ratio. The Fund indirectly bears its proportionate share of the expenses of any underlying Fidelity Central Funds.
H Expense ratios reflect operating expenses of the class. Expenses before reductions do not reflect amounts reimbursed by the investment adviser or reductions from brokerage service arrangements or reductions from other expense offset arrangements and do not represent the amount paid by the class during periods when reimbursements or reductions occur. Expenses net of fee waivers reflect expenses after reimbursement by the investment adviser but prior to reductions from brokerage service arrangements or other expense offset arrangements. Expenses net of all reductions represent the net expenses paid by the class.
I Amount does not include the portfolio activity of any underlying Fidelity Central Funds.
J Portfolio turnover rate excludes securities received or delivered in-kind.
See accompanying notes which are an integral part of the financial statements.
Fidelity Advisor Emerging Markets Fund Class M
| Years ended October 31, | 2019 | 2018 | 2017 | 2016 | 2015 |
| Selected Per–Share Data | | | | | |
| Net asset value, beginning of period | $24.25 | $28.61 | $22.16 | $20.65 | $23.30 |
| Income from Investment Operations | | | | | |
| Net investment income (loss)A | .36B | –C | .02 | (.03) | .01 |
| Net realized and unrealized gain (loss) | 4.20 | (4.34) | 6.43 | 1.54 | (2.66) |
| Total from investment operations | 4.56 | (4.34) | 6.45 | 1.51 | (2.65) |
| Distributions from net investment income | (.02)D | – | – | – | – |
| Distributions from net realized gain | (2.93)D | (.02) | – | – | – |
| Total distributions | (2.95) | (.02) | – | – | – |
| Redemption fees added to paid in capitalA | – | –C | –C | –C | –C |
| Net asset value, end of period | $25.86 | $24.25 | $28.61 | $22.16 | $20.65 |
| Total ReturnE,F | 19.03% | (15.17)% | 29.11% | 7.31% | (11.37)% |
| Ratios to Average Net AssetsG,H | | | | | |
| Expenses before reductions | 1.70% | 1.73% | 1.75% | 1.77% | 1.78% |
| Expenses net of fee waivers, if any | 1.70% | 1.73% | 1.75% | 1.77% | 1.78% |
| Expenses net of all reductions | 1.68% | 1.69% | 1.73% | 1.77% | 1.76% |
| Net investment income (loss) | 1.33%B | - %I | .06% | (.15)% | .02% |
| Supplemental Data | | | | | |
| Net assets, end of period (000 omitted) | $45,310 | $40,616 | $53,572 | $44,575 | $43,365 |
| Portfolio turnover rateJ | 166%K | 87% | 86% | 85% | 110% |
A Calculated based on average shares outstanding during the period.
B Net investment income per share reflects a large, non-recurring dividend which amounted to $.32 per share. Excluding this non-recurring dividend, the ratio of net investment income (loss) to average net assets would have been .15%.
C Amount represents less than $.005 per share.
D The amounts shown reflect certain reclassifications related to book to tax differences that were made in the year shown.
E Total returns would have been lower if certain expenses had not been reduced during the applicable periods shown.
F Total returns do not include the effect of the sales charges.
G Fees and expenses of any underlying Fidelity Central Funds are not included in the Fund's expense ratio. The Fund indirectly bears its proportionate share of the expenses of any underlying Fidelity Central Funds.
H Expense ratios reflect operating expenses of the class. Expenses before reductions do not reflect amounts reimbursed by the investment adviser or reductions from brokerage service arrangements or reductions from other expense offset arrangements and do not represent the amount paid by the class during periods when reimbursements or reductions occur. Expenses net of fee waivers reflect expenses after reimbursement by the investment adviser but prior to reductions from brokerage service arrangements or other expense offset arrangements. Expenses net of all reductions represent the net expenses paid by the class.
I Amount represents less than .005%.
J Amount does not include the portfolio activity of any underlying Fidelity Central Funds.
K Portfolio turnover rate excludes securities received or delivered in-kind.
See accompanying notes which are an integral part of the financial statements.
Fidelity Advisor Emerging Markets Fund Class C
| Years ended October 31, | 2019 | 2018 | 2017 | 2016 | 2015 |
| Selected Per–Share Data | | | | | |
| Net asset value, beginning of period | $23.18 | $27.46 | $21.37 | $20.02 | $22.70 |
| Income from Investment Operations | | | | | |
| Net investment income (loss)A | .22B | (.13) | (.10) | (.13) | (.10) |
| Net realized and unrealized gain (loss) | 4.01 | (4.15) | 6.19 | 1.48 | (2.58) |
| Total from investment operations | 4.23 | (4.28) | 6.09 | 1.35 | (2.68) |
| Distributions from net investment income | (.02)C | – | – | – | – |
| Distributions from net realized gain | (2.93)C | – | – | – | – |
| Total distributions | (2.95) | – | – | – | – |
| Redemption fees added to paid in capitalA | – | –D | –D | –D | –D |
| Net asset value, end of period | $24.46 | $23.18 | $27.46 | $21.37 | $20.02 |
| Total ReturnE,F | 18.48% | (15.59)% | 28.50% | 6.74% | (11.81)% |
| Ratios to Average Net AssetsG,H | | | | | |
| Expenses before reductions | 2.20% | 2.22% | 2.24% | 2.26% | 2.27% |
| Expenses net of fee waivers, if any | 2.20% | 2.22% | 2.24% | 2.26% | 2.27% |
| Expenses net of all reductions | 2.17% | 2.19% | 2.22% | 2.26% | 2.26% |
| Net investment income (loss) | .83%B | (.49)% | (.43)% | (.64)% | (.47)% |
| Supplemental Data | | | | | |
| Net assets, end of period (000 omitted) | $41,615 | $50,617 | $57,599 | $43,848 | $46,595 |
| Portfolio turnover rateI | 166%J | 87% | 86% | 85% | 110% |
A Calculated based on average shares outstanding during the period.
B Net investment income per share reflects a large, non-recurring dividend which amounted to $.30 per share. Excluding this non-recurring dividend, the ratio of net investment income (loss) to average net assets would have been (.34)%.
C The amounts shown reflect certain reclassifications related to book to tax differences that were made in the year shown.
D Amount represents less than $.005 per share.
E Total returns would have been lower if certain expenses had not been reduced during the applicable periods shown.
F Total returns do not include the effect of the contingent deferred sales charge.
G Fees and expenses of any underlying Fidelity Central Funds are not included in the Fund's expense ratio. The Fund indirectly bears its proportionate share of the expenses of any underlying Fidelity Central Funds.
H Expense ratios reflect operating expenses of the class. Expenses before reductions do not reflect amounts reimbursed by the investment adviser or reductions from brokerage service arrangements or reductions from other expense offset arrangements and do not represent the amount paid by the class during periods when reimbursements or reductions occur. Expenses net of fee waivers reflect expenses after reimbursement by the investment adviser but prior to reductions from brokerage service arrangements or other expense offset arrangements. Expenses net of all reductions represent the net expenses paid by the class.
I Amount does not include the portfolio activity of any underlying Fidelity Central Funds.
J Portfolio turnover rate excludes securities received or delivered in-kind.
See accompanying notes which are an integral part of the financial statements.
Fidelity Advisor Emerging Markets Fund Class I
| Years ended October 31, | 2019 | 2018 | 2017 | 2016 | 2015 |
| Selected Per–Share Data | | | | | |
| Net asset value, beginning of period | $24.65 | $29.03 | $22.44 | $20.83 | $23.50 |
| Income from Investment Operations | | | | | |
| Net investment income (loss)A | .54B | .18 | .17 | .10 | .14 |
| Net realized and unrealized gain (loss) | 4.26 | (4.41) | 6.51 | 1.55 | (2.67) |
| Total from investment operations | 4.80 | (4.23) | 6.68 | 1.65 | (2.53) |
| Distributions from net investment income | (.17)C | (.12) | (.09) | (.04) | (.11) |
| Distributions from net realized gain | (2.94)C | (.03) | – | – | (.03) |
| Total distributions | (3.11) | (.15) | (.09) | (.04) | (.14) |
| Redemption fees added to paid in capitalA | – | –D | –D | –D | –D |
| Net asset value, end of period | $26.34 | $24.65 | $29.03 | $22.44 | $20.83 |
| Total ReturnE | 19.78% | (14.64)% | 29.94% | 7.93% | (10.83)% |
| Ratios to Average Net AssetsF,G | | | | | |
| Expenses before reductions | 1.09% | 1.12% | 1.13% | 1.16% | 1.17% |
| Expenses net of fee waivers, if any | 1.09% | 1.12% | 1.13% | 1.16% | 1.17% |
| Expenses net of all reductions | 1.06% | 1.08% | 1.11% | 1.15% | 1.16% |
| Net investment income (loss) | 1.94%B | .62% | .68% | .46% | .63% |
| Supplemental Data | | | | | |
| Net assets, end of period (000 omitted) | $288,485 | $394,904 | $340,526 | $242,116 | $209,270 |
| Portfolio turnover rateH | 166%I | 87% | 86% | 85% | 110% |
A Calculated based on average shares outstanding during the period.
B Net investment income per share reflects a large, non-recurring dividend which amounted to $.33 per share. Excluding this non-recurring dividend, the ratio of net investment income (loss) to average net assets would have been .77%.
C The amounts shown reflect certain reclassifications related to book to tax differences that were made in the year shown.
D Amount represents less than $.005 per share.
E Total returns would have been lower if certain expenses had not been reduced during the applicable periods shown.
F Fees and expenses of any underlying Fidelity Central Funds are not included in the Fund's expense ratio. The Fund indirectly bears its proportionate share of the expenses of any underlying Fidelity Central Funds.
G Expense ratios reflect operating expenses of the class. Expenses before reductions do not reflect amounts reimbursed by the investment adviser or reductions from brokerage service arrangements or reductions from other expense offset arrangements and do not represent the amount paid by the class during periods when reimbursements or reductions occur. Expenses net of fee waivers reflect expenses after reimbursement by the investment adviser but prior to reductions from brokerage service arrangements or other expense offset arrangements. Expenses net of all reductions represent the net expenses paid by the class.
H Amount does not include the portfolio activity of any underlying Fidelity Central Funds.
I Portfolio turnover rate excludes securities received or delivered in-kind.
See accompanying notes which are an integral part of the financial statements.
Fidelity Advisor Emerging Markets Fund Class Z
| Years ended October 31, | 2019 | 2018 | 2017 | 2016 | 2015 |
| Selected Per–Share Data | | | | | |
| Net asset value, beginning of period | $24.65 | $29.02 | $22.44 | $20.83 | $23.50 |
| Income from Investment Operations | | | | | |
| Net investment income (loss)A | .57B | .22 | .21 | .13 | .17 |
| Net realized and unrealized gain (loss) | 4.26 | (4.41) | 6.50 | 1.55 | (2.66) |
| Total from investment operations | 4.83 | (4.19) | 6.71 | 1.68 | (2.49) |
| Distributions from net investment income | (.21)C | (.15) | (.13) | (.07) | (.14) |
| Distributions from net realized gain | (2.94)C | (.03) | – | – | (.03) |
| Total distributions | (3.15) | (.18) | (.13) | (.07) | (.18)D |
| Redemption fees added to paid in capitalA | – | –E | –E | –E | –E |
| Net asset value, end of period | $26.33 | $24.65 | $29.02 | $22.44 | $20.83 |
| Total ReturnF,G | 19.93% | (14.52)% | 30.13% | 8.09% | (10.68)% |
| Ratios to Average Net AssetsH,I | | | | | |
| Expenses before reductions | .95% | .98% | .98% | 1.01% | 1.02% |
| Expenses net of fee waivers, if any | .95% | .98% | .98% | 1.01% | 1.02% |
| Expenses net of all reductions | .92% | .94% | .97% | 1.00% | 1.00% |
| Net investment income (loss) | 2.09%B | .76% | .82% | .61% | .78% |
| Supplemental Data | | | | | |
| Net assets, end of period (000 omitted) | $90,032 | $65,453 | $14,387 | $6,261 | $6,114 |
| Portfolio turnover rateJ | 166%K | 87% | 86% | 85% | 110% |
A Calculated based on average shares outstanding during the period.
B Net investment income per share reflects a large, non-recurring dividend which amounted to $.32 per share. Excluding this non-recurring dividend, the ratio of net investment income (loss) to average net assets would have been .91%.
C The amounts shown reflect certain reclassifications related to book to tax differences that were made in the year shown.
D Total distributions of $.18 per share is comprised of distributions from net investment income of $.143 and distributions from net realized gain of $.033 per share.
E Amount represents less than $.005 per share.
F Total returns for periods of less than one year are not annualized.
G Total returns would have been lower if certain expenses had not been reduced during the applicable periods shown.
H Fees and expenses of any underlying Fidelity Central Funds are not included in the Fund's expense ratio. The Fund indirectly bears its proportionate share of the expenses of any underlying Fidelity Central Funds.
I Expense ratios reflect operating expenses of the class. Expenses before reductions do not reflect amounts reimbursed by the investment adviser or reductions from brokerage service arrangements or reductions from other expense offset arrangements and do not represent the amount paid by the class during periods when reimbursements or reductions occur. Expenses net of fee waivers reflect expenses after reimbursement by the investment adviser but prior to reductions from brokerage service arrangements or other expense offset arrangements. Expenses net of all reductions represent the net expenses paid by the class.
J Amount does not include the portfolio activity of any underlying Fidelity Central Funds.
K Portfolio turnover rate excludes securities received or delivered in-kind.
See accompanying notes which are an integral part of the financial statements.
Notes to Financial Statements
For the period ended October 31, 2019
1. Organization.
Fidelity Advisor Emerging Markets Fund (the Fund) is a fund of Fidelity Advisor Series VIII (the Trust) and is authorized to issue an unlimited number of shares. The Trust is registered under the Investment Company Act of 1940, as amended (the 1940 Act), as an open-end management investment company organized as a Massachusetts business trust. The Fund offers Class A, Class M, Class C, Class I and Class Z shares, each of which has equal rights as to assets and voting privileges. Each class has exclusive voting rights with respect to matters that affect that class. Effective March 1, 2019, Class C shares will automatically convert to Class A shares after a holding period of ten years from the initial date of purchase, with certain exceptions. The Fund's investments in emerging markets can be subject to social, economic, regulatory, and political uncertainties and can be extremely volatile.
2. Investments in Fidelity Central Funds.
The Fund invests in Fidelity Central Funds, which are open-end investment companies generally available only to other investment companies and accounts managed by the investment adviser and its affiliates. The Fund's Schedule of Investments lists each of the Fidelity Central Funds held as of period end, if any, as an investment of the Fund, but does not include the underlying holdings of each Fidelity Central Fund. As an Investing Fund, the Fund indirectly bears its proportionate share of the expenses of the underlying Fidelity Central Funds.
The Money Market Central Funds seek preservation of capital and current income and are managed by Fidelity Investments Money Management, Inc. (FIMM), an affiliate of the investment adviser. Annualized expenses of the Money Market Central Funds as of their most recent shareholder report date ranged from less than .005% to .01%.
A complete unaudited list of holdings for each Fidelity Central Fund is available upon request or at the Securities and Exchange Commission (the SEC) website at www.sec.gov. In addition, the financial statements of the Fidelity Central Funds, which are not covered by the Fund's Report of Independent Registered Public Accounting Firm, are available on the SEC website or upon request.
3. Significant Accounting Policies.
The Fund is an investment company and applies the accounting and reporting guidance of the Financial Accounting Standards Board (FASB) Accounting Standards Codification Topic 946 Financial Services – Investments Companies. The financial statements have been prepared in conformity with accounting principles generally accepted in the United States of America (GAAP), which require management to make certain estimates and assumptions at the date of the financial statements. Actual results could differ from those estimates. Subsequent events, if any, through the date that the financial statements were issued have been evaluated in the preparation of the financial statements. The following summarizes the significant accounting policies of the Fund:
Investment Valuation. Investments are valued as of 4:00 p.m. Eastern time on the last calendar day of the period. The Board of Trustees (the Board) has delegated the day to day responsibility for the valuation of the Fund's investments to the Fair Value Committee (the Committee) established by the Fund's investment adviser. In accordance with valuation policies and procedures approved by the Board, the Fund attempts to obtain prices from one or more third party pricing vendors or brokers to value its investments. When current market prices, quotations or currency exchange rates are not readily available or reliable, investments will be fair valued in good faith by the Committee, in accordance with procedures adopted by the Board. Factors used in determining fair value vary by investment type and may include market or investment specific events. The frequency with which these procedures are used cannot be predicted and they may be utilized to a significant extent. The Committee oversees the Fund's valuation policies and procedures and reports to the Board on the Committee's activities and fair value determinations. The Board monitors the appropriateness of the procedures used in valuing the Fund's investments and ratifies the fair value determinations of the Committee.
The Fund categorizes the inputs to valuation techniques used to value its investments into a disclosure hierarchy consisting of three levels as shown below:
- Level 1 – quoted prices in active markets for identical investments
- Level 2 – other significant observable inputs (including quoted prices for similar investments, interest rates, prepayment speeds, etc.)
- Level 3 – unobservable inputs (including the Fund's own assumptions based on the best information available)
Valuation techniques used to value the Fund's investments by major category are as follows:
Equity securities, including restricted securities, for which market quotations are readily available, are valued at the last reported sale price or official closing price as reported by a third party pricing vendor on the primary market or exchange on which they are traded and are categorized as Level 1 in the hierarchy. In the event there were no sales during the day or closing prices are not available, securities are valued at the last quoted bid price or may be valued using the last available price and are generally categorized as Level 2 in the hierarchy. For foreign equity securities, when market or security specific events arise, comparisons to the valuation of American Depositary Receipts (ADRs), futures contracts, Exchange-Traded Funds (ETFs) and certain indexes as well as quoted prices for similar securities may be used and would be categorized as Level 2 in the hierarchy. For equity securities, including restricted securities, where observable inputs are limited, assumptions about market activity and risk are used and these securities may be categorized as Level 3 in the hierarchy.
Investments in open-end mutual funds, including the Fidelity Central Funds, are valued at their closing net asset value (NAV) each business day and are categorized as Level 1 in the hierarchy.
Changes in valuation techniques may result in transfers in or out of an assigned level within the disclosure hierarchy. The aggregate value of investments by input level as of October 31, 2019 is included at the end of the Fund's Schedule of Investments.
Foreign Currency. The Fund may use foreign currency contracts to facilitate transactions in foreign-denominated securities. Gains and losses from these transactions may arise from changes in the value of the foreign currency or if the counterparties do not perform under the contracts' terms.
Foreign-denominated assets, including investment securities, and liabilities are translated into U.S. dollars at the exchange rates at period end. Purchases and sales of investment securities, income and dividends received and expenses denominated in foreign currencies are translated into U.S. dollars at the exchange rate in effect on the transaction date.
The effects of exchange rate fluctuations on investments are included with the net realized and unrealized gain (loss) on investment securities. Other foreign currency transactions resulting in realized and unrealized gain (loss) are disclosed separately.
Investment Transactions and Income. For financial reporting purposes, the Fund's investment holdings and NAV include trades executed through the end of the last business day of the period. The NAV per share for processing shareholder transactions is calculated as of the close of business of the New York Stock Exchange (NYSE), normally 4:00 p.m. Eastern time and includes trades executed through the end of the prior business day. Gains and losses on securities sold are determined on the basis of identified cost and include proceeds received from litigation. Dividend income is recorded on the ex-dividend date, except for certain dividends from foreign securities where the ex-dividend date may have passed, which are recorded as soon as the Fund is informed of the ex-dividend date. Non-cash dividends included in dividend income, if any, are recorded at the fair market value of the securities received. Income and capital gain distributions from Fidelity Central Funds, if any, are recorded on the ex-dividend date. Certain distributions received by the Fund represent a return of capital or capital gain. The Fund determines the components of these distributions subsequent to the ex-dividend date, based upon receipt of tax filings or other correspondence relating to the underlying investment. These distributions are recorded as a reduction of cost of investments and/or as a realized gain. Large, non-recurring dividends recognized by the Fund are presented separately on the Statement of Operations as "Non-cash dividends" and the impact of these dividends is presented in the Financial Highlights. Investment income is recorded net of foreign taxes withheld where recovery of such taxes is uncertain.
Class Allocations and Expenses. Investment income, realized and unrealized capital gains and losses, common expenses of the Fund, and certain fund-level expense reductions, if any, are allocated daily on a pro-rata basis to each class based on the relative net assets of each class to the total net assets of the Fund. Each class differs with respect to transfer agent and distribution and service plan fees incurred. Certain expense reductions may also differ by class. For the reporting period, the allocated portion of income and expenses to each class as a percent of its average net assets may vary due to the timing of recording these transactions in relation to fluctuating net assets of the classes. Expenses directly attributable to a fund are charged to that fund. Expenses attributable to more than one fund are allocated among the respective funds on the basis of relative net assets or other appropriate methods. Expense estimates are accrued in the period to which they relate and adjustments are made when actual amounts are known.
Income Tax Information and Distributions to Shareholders. Each year, the Fund intends to qualify as a regulated investment company under Subchapter M of the Internal Revenue Code, including distributing substantially all of its taxable income and realized gains. As a result, no provision for U.S. Federal income taxes is required. As of October 31, 2019, the Fund did not have any unrecognized tax benefits in the financial statements; nor is the Fund aware of any tax positions for which it is reasonably possible that the total amounts of unrecognized tax benefits will significantly change in the next twelve months. The Fund files a U.S. federal tax return, in addition to state and local tax returns as required. The Fund's federal income tax returns are subject to examination by the Internal Revenue Service (IRS) for a period of three fiscal years after they are filed. State and local tax returns may be subject to examination for an additional fiscal year depending on the jurisdiction. Foreign taxes are provided for based on the Fund's understanding of the tax rules and rates that exist in the foreign markets in which it invests.
Distributions are declared and recorded on the ex-dividend date. Income and capital gain distributions are declared separately for each class. Income and capital gain distributions are determined in accordance with income tax regulations, which may differ from GAAP. These differences resulted in distribution reclassifications. In addition, the Fund claimed a portion of the payment made to redeeming shareholders as a distribution for income tax purposes.
Capital accounts within the financial statements are adjusted for permanent book-tax differences. These adjustments have no impact on net assets or the results of operations. Capital accounts are not adjusted for temporary book-tax differences which will reverse in a subsequent period.
Book-tax differences are primarily due to foreign currency transactions, futures transactions, redemptions in kind and losses deferred due to wash sales.
As of period end, the cost and unrealized appreciation (depreciation) in securities, and derivatives if applicable, for federal income tax purposes were as follows:
| Gross unrealized appreciation | $65,514,995 |
| Gross unrealized depreciation | (21,975,036) |
| Net unrealized appreciation (depreciation) | $43,539,959 |
| Tax Cost | $574,231,922 |
The tax-based components of distributable earnings as of period end were as follows:
| Undistributed ordinary income | $1,402,661 |
| Net unrealized appreciation (depreciation) on securities and other investments | $43,542,059 |
The tax character of distributions paid was as follows:
| | October 31, 2019 | October 31, 2018 |
| Ordinary Income | $3,791,593 | $ 2,511,924 |
| Long-term Capital Gains | 84,148,130 | – |
| Total | $87,939,723 | $ 2,511,924 |
4. Derivative Instruments.
Risk Exposures and the Use of Derivative Instruments. The Fund's investment objective allows the Fund to enter into various types of derivative contracts, including futures contracts. Derivatives are investments whose value is primarily derived from underlying assets, indices or reference rates and may be transacted on an exchange or over-the-counter (OTC). Derivatives may involve a future commitment to buy or sell a specified asset based on specified terms, to exchange future cash flows at periodic intervals based on a notional principal amount, or for one party to make one or more payments upon the occurrence of specified events in exchange for periodic payments from the other party.
The Fund used derivatives to increase returns and to manage exposure to certain risks as defined below. The success of any strategy involving derivatives depends on analysis of numerous economic factors, and if the strategies for investment do not work as intended, the Fund may not achieve its objectives.
The Fund's use of derivatives increased or decreased its exposure to the following risk:
| Equity Risk | Equity risk relates to the fluctuations in the value of financial instruments as a result of changes in market prices (other than those arising from interest rate risk or foreign exchange risk), whether caused by factors specific to an individual investment, its issuer, or all factors affecting all instruments traded in a market or market segment.
|
The Fund is also exposed to additional risks from investing in derivatives, such as liquidity risk and counterparty credit risk. Liquidity risk is the risk that the Fund will be unable to close out the derivative in the open market in a timely manner. Counterparty credit risk is the risk that the counterparty will not be able to fulfill its obligation to the Fund. Counterparty credit risk related to exchange-traded futures contracts may be mitigated by the protection provided by the exchange on which they trade.
Investing in derivatives may involve greater risks than investing in the underlying assets directly and, to varying degrees, may involve risk of loss in excess of any initial investment and collateral received and amounts recognized in the Statement of Assets and Liabilities. In addition, there may be the risk that the change in value of the derivative contract does not correspond to the change in value of the underlying instrument.
Futures Contracts. A futures contract is an agreement between two parties to buy or sell a specified underlying instrument for a fixed price at a specified future date. The Fund used futures contracts to manage its exposure to the stock market.
Upon entering into a futures contract, a fund is required to deposit either cash or securities (initial margin) with a clearing broker in an amount equal to a certain percentage of the face value of the contract. Futures contracts are marked-to-market daily and subsequent daily payments (variation margin) are made or received by a fund depending on the daily fluctuations in the value of the futures contracts and are recorded as unrealized appreciation or (depreciation). This receivable and/or payable, if any, is included in daily variation margin on futures contracts in the Statement of Assets and Liabilities. Realized gain or (loss) is recorded upon the expiration or closing of a futures contract. The net realized gain (loss) and change in net unrealized appreciation (depreciation) on futures contracts during the period is presented in the Statement of Operations.
Any open futures contracts at period end are presented in the Schedule of Investments under the caption "Futures Contracts". The notional amount at value reflects each contract's exposure to the underlying instrument or index at period end.
5. Purchases and Sales of Investments.
Purchases and sales of securities, other than short-term securities and in-kind transactions, aggregated $1,247,807,593 and $1,313,266,985, respectively.
6. Fees and Other Transactions with Affiliates.
Management Fee. Fidelity Management & Research Company (the investment adviser) and its affiliates provide the Fund with investment management related services for which the Fund pays a monthly management fee. The management fee is the sum of an individual fund fee rate that is based on an annual rate of .55% of the Fund's average net assets and an annualized group fee rate that averaged .24% during the period. The group fee rate is based upon the average net assets of all the mutual funds advised by the investment adviser, including any mutual funds previously advised by the investment adviser that are currently advised by Fidelity SelectCo, LLC, an affiliate of the investment adviser. The group fee rate decreases as assets under management increase and increases as assets under management decrease. For the reporting period, the total annual management fee rate was .79% of the Fund's average net assets.
Distribution and Service Plan Fees. In accordance with Rule 12b-1 of the 1940 Act, the Fund has adopted separate Distribution and Service Plans for each class of shares. Certain classes pay Fidelity Distributors Corporation (FDC), an affiliate of the investment adviser, separate Distribution and Service Fees, each of which is based on an annual percentage of each class' average net assets. In addition, FDC may pay financial intermediaries for selling shares of the Fund and providing shareholder support services. For the period, the Distribution and Service Fee rates, total fees and amounts retained by FDC were as follows:
| | Distribution Fee | Service Fee | Total Fees | Retained by FDC |
| Class A | -% | .25% | $349,710 | $15,083 |
| Class M | .25% | .25% | 226,626 | 1,359 |
| Class C | .75% | .25% | 470,521 | 73,683 |
| | | | $1,046,857 | $90,125 |
Sales Load. FDC may receive a front-end sales charge of up to 5.75% for selling Class A shares and 3.50% for selling Class M shares, some of which is paid to financial intermediaries for selling shares of the Fund. Depending on the holding period, FDC may receive contingent deferred sales charges levied on Class A, Class M and Class C redemptions. The deferred sales charges are 1.00% for Class C shares, 1.00% for certain purchases of Class A shares and .25% for certain purchases of Class M shares.
For the period, sales charge amounts retained by FDC were as follows:
| | Retained by FDC |
| Class A | $46,456 |
| Class M | 5,660 |
| Class C(a) | 11,261 |
| | $63,377 |
(a) When Class C shares are initially sold, FDC pays commissions from its own resources to financial intermediaries through which the sales are made.
Transfer Agent Fees. Fidelity Investments Institutional Operations Company, Inc., (FIIOC), an affiliate of the investment adviser, is the transfer, dividend disbursing and shareholder servicing agent for each class of the Fund. FIIOC receives account fees and asset-based fees that vary according to the account size and type of account of the shareholders of the respective classes of the Fund, except for Class Z. FIIOC receives an asset-based fee of Class Z's average net assets. FIIOC pays for typesetting, printing and mailing of shareholder reports, except proxy statements.
For the period, transfer agent fees for each class were as follows:
| | Amount | % of Class-Level Average Net Assets |
| Class A | $366,160 | .26 |
| Class M | 137,145 | .30 |
| Class C | 138,393 | .29 |
| Class I | 882,198 | .19 |
| Class Z | 35,825 | .05 |
| | $1,559,721 | |
Accounting and Security Lending Fees. Fidelity Service Company, Inc. (FSC), an affiliate of the investment adviser, maintains the Fund's accounting records. The accounting fee is based on the level of average net assets for each month. Prior to April 1, 2019, FSC had a separate agreement with the Fund for administration of the security lending program, based on the number and duration of lending transactions. For the period, the total fees paid for accounting and administration of securities lending were equivalent to an annual rate of .05%.
Brokerage Commissions. The Fund placed a portion of its portfolio transactions with brokerage firms which are affiliates of the investment adviser. Brokerage commissions are included in net realized gain (loss) and change in net unrealized appreciation (depreciation) in the Statement of Operations. The commissions paid to these affiliated firms were $7,017 for the period.
Interfund Lending Program. Pursuant to an Exemptive Order issued by the SEC, the Fund, along with other registered investment companies having management contracts with Fidelity Management & Research Company (FMR) or other affiliated entities of FMR, may participate in an interfund lending program. This program provides an alternative credit facility allowing the funds to borrow from, or lend money to, other participating affiliated funds. At period end, there were no interfund loans outstanding. The Fund's activity in this program during the period for which loans were outstanding was as follows:
| Borrower or Lender | Average Loan Balance | Weighted Average Interest Rate | Interest Expense |
| Borrower | $6,029,667 | 2.46% | $9,876 |
Interfund Trades. The Fund may purchase from or sell securities to other Fidelity Funds under procedures adopted by the Board. The procedures have been designed to ensure these interfund trades are executed in accordance with Rule 17a-7 of the 1940 Act. Interfund trades are included within the respective purchases and sales amounts shown in the Purchases and Sales of Investments note.
Affiliated Redemptions In-Kind. During the period, 8,278,452 shares of the Fund were redeemed in-kind for investments and cash with a value of $216,946,766. The net realized gain of $21,790,807 on investments delivered through in-kind redemptions is included in the accompanying Statement of Operations. The amount of the in-kind redemptions is included in share transactions in the accompanying Statement of Changes in Net Assets as well as the Notes to Financial Statements. The Fund recognized no gain or loss for federal income tax purposes.
7. Committed Line of Credit.
The Fund participates with other funds managed by the investment adviser or an affiliate in a $4.25 billion credit facility (the "line of credit") to be utilized for temporary or emergency purposes to fund shareholder redemptions or for other short-term liquidity purposes. The Fund has agreed to pay commitment fees on its pro-rata portion of the line of credit, which amounted to $2,053 and is reflected in Miscellaneous expenses on the Statement of Operations. During the period, the Fund did not borrow on this line of credit.
8. Security Lending.
The Fund lends portfolio securities from time to time in order to earn additional income. For equity securities, lending agents are used, including National Financial Services (NFS), an affiliate of the Fund. Pursuant to a securities lending agreement, NFS will receive a fee, which is capped at 9.9% of daily lending revenue, for its services as lending agent. The Fund may lend securities to certain qualified borrowers, including NFS. On the settlement date of the loan, the Fund receives collateral (in the form of U.S. Treasury obligations, letters of credit and/or cash) against the loaned securities and maintains collateral in an amount not less than 100% of the market value of the loaned securities during the period of the loan. The market value of the loaned securities is determined at the close of business of the Fund and any additional required collateral is delivered to the Fund on the next business day. The Fund or borrower may terminate the loan at any time, and if the borrower defaults on its obligation to return the securities loaned because of insolvency or other reasons, the Fund may apply collateral received from the borrower against the obligation. The Fund may experience delays and costs in recovering the securities loaned. Any cash collateral received is invested in the Fidelity Securities Lending Cash Central Fund. At period end, there were no security loans outstanding. Total fees paid by the Fund to NFS, as lending agent, amounted to $61. Security lending income represents the income earned on investing cash collateral, less rebates paid to borrowers and any lending agent fees associated with the loan, plus any premium payments received for lending certain types of securities. Security lending income is presented in the Statement of Operations as a component of income from Fidelity Central Funds, and includes $1,616 from securities loaned to NFS, as affiliated borrower.
9. Bank Borrowings.
The Fund is permitted to have bank borrowings for temporary or emergency purposes to fund shareholder redemptions or for other short-term liquidity requirements. The Fund has established borrowing arrangements with certain banks. The interest rate on the borrowings is the bank's base rate, as revised from time to time. The average loan balance during the period for which loans were outstanding amounted to $5,894,000. The weighted average interest rate was 2.90%. The interest expense amounted to $475 under the bank borrowing program. At period end, there were no bank borrowings outstanding.
10. Expense Reductions.
Commissions paid to certain brokers with whom the investment adviser, or its affiliates, places trades on behalf of the Fund include an amount in addition to trade execution, which may be rebated back to the Fund to offset certain expenses. This amount totaled $206,774 for the period.
In addition, during the period the investment adviser reimbursed and/or waived a portion of fund-level operating expenses in the amount of $5,346.
11. Distributions to Shareholders.
Distributions to shareholders of each class were as follows:
| | Year ended
October 31, 2019 | Year ended
October 31, 2018 |
| Distributions to shareholders | | |
| Class A | $14,899,450 | $422,265 |
| Class M | 4,711,016 | 43,443 |
| Class C | 4,549,289 | – |
| Class I | 54,137,961 | 1,940,128 |
| Class Z | 9,642,007 | 106,088 |
| Total | $87,939,723 | $2,511,924 |
12. Share Transactions.
Share transactions for each class were as follows and may contain automatic conversions between classes or exchanges between affiliated funds:
| | Shares | Shares | Dollars | Dollars |
| | Year ended October 31, 2019 | Year ended October 31, 2018 | Year ended October 31, 2019 | Year ended October 31, 2018 |
| Class A | | | | |
| Shares sold | 1,430,815 | 1,818,267 | $39,176,287 | $54,273,489 |
| Reinvestment of distributions | 566,067 | 14,191 | 14,535,345 | 413,945 |
| Shares redeemed | (1,415,545) | (1,835,818) | (38,558,494) | (52,952,761) |
| Net increase (decrease) | 581,337 | (3,360) | $15,153,138 | $1,734,673 |
| Class M | | | | |
| Shares sold | 275,556 | 368,577 | $7,483,344 | $10,833,460 |
| Reinvestment of distributions | 181,883 | 1,470 | 4,618,003 | 42,562 |
| Shares redeemed | (380,538) | (567,779) | (10,326,369) | (16,368,292) |
| Net increase (decrease) | 76,901 | (197,732) | $1,774,978 | $(5,492,270) |
| Class C | | | | |
| Shares sold | 374,961 | 802,559 | $9,619,101 | $22,631,257 |
| Reinvestment of distributions | 184,738 | – | 4,437,414 | – |
| Shares redeemed | (1,041,747) | (716,551) | (27,016,202) | (19,774,590) |
| Net increase (decrease) | (482,048) | 86,008 | $(12,959,687) | $2,856,667 |
| Class I | | | | |
| Shares sold | 9,079,219 | 11,185,060 | $250,388,511 | $325,175,327 |
| Reinvestment of distributions | 2,016,037 | 64,636 | 52,007,429 | 1,892,548 |
| Shares redeemed | (16,164,775)(a) | (6,959,175) | (434,388,374)(a) | (201,129,363) |
| Net increase (decrease) | (5,069,519) | 4,290,521 | $(131,992,434) | $125,938,512 |
| Class Z | | | | |
| Shares sold | 2,185,898 | 3,269,160 | $59,546,339 | $93,628,959 |
| Reinvestment of distributions | 290,594 | 3,332 | 7,490,854 | 97,427 |
| Shares redeemed | (1,713,122) | (1,112,760) | (45,339,469) | (30,680,942) |
| Net increase (decrease) | 763,370 | 2,159,732 | $21,697,724 | $63,045,444 |
(a) Amount includes in-kind redemptions (see the Affiliated Redemptions In-Kind note for additional details).
13. Other.
The Fund's organizational documents provide former and current trustees and officers with a limited indemnification against liabilities arising in connection with the performance of their duties to the Fund. In the normal course of business, the Fund may also enter into contracts that provide general indemnifications. The Fund's maximum exposure under these arrangements is unknown as this would be dependent on future claims that may be made against the Fund. The risk of material loss from such claims is considered remote.
Report of Independent Registered Public Accounting Firm
To the Trustees of Fidelity Advisor Series VIII and Shareholders of Fidelity Advisor Emerging Markets Fund:
Opinion on the Financial Statements and Financial Highlights
We have audited the accompanying statement of assets and liabilities of Fidelity Advisor Emerging Markets Fund (the “Fund”), a fund of Fidelity Advisor Series VIII, including the schedule of investments, as of October 31, 2019, and the related statement of operations for the year then ended, the statement of changes in net assets for each of the two years in the period then ended, the financial highlights for each of the five years in the period then ended, and the related notes. In our opinion, the financial statements and financial highlights present fairly, in all material respects, the financial position of the Fund as of October 31, 2019, and the results of its operations for the year then ended, the changes in its net assets for each of the two years in the period then ended, and the financial highlights for each of the five years in the period then ended, in conformity with accounting principles generally accepted in the United States of America.
Basis for Opinion
These financial statements and financial highlights are the responsibility of the Fund's management. Our responsibility is to express an opinion on the Fund's financial statements and financial highlights based on our audits. We are a public accounting firm registered with the Public Company Accounting Oversight Board (United States) (PCAOB) and are required to be independent with respect to the Fund in accordance with the U.S. federal securities laws and the applicable rules and regulations of the Securities and Exchange Commission and the PCAOB.
We conducted our audits in accordance with the standards of the PCAOB. Those standards require that we plan and perform the audit to obtain reasonable assurance about whether the financial statements and financial highlights are free of material misstatement, whether due to error or fraud. The Fund is not required to have, nor were we engaged to perform, an audit of its internal control over financial reporting. As part of our audits we are required to obtain an understanding of internal control over financial reporting but not for the purpose of expressing an opinion on the effectiveness of the Fund’s internal control over financial reporting. Accordingly, we express no such opinion.
Our audits included performing procedures to assess the risks of material misstatement of the financial statements and financial highlights, whether due to error or fraud, and performing procedures that respond to those risks. Such procedures included examining, on a test basis, evidence regarding the amounts and disclosures in the financial statements and financial highlights. Our audits also included evaluating the accounting principles used and significant estimates made by management, as well as evaluating the overall presentation of the financial statements and financial highlights. Our procedures included confirmation of securities owned as of October 31, 2019, by correspondence with the custodians and brokers; when replies were not received from brokers, we performed other auditing procedures. We believe that our audits provide a reasonable basis for our opinion.
/s/ Deloitte & Touche LLP
Boston, Massachusetts
December 11, 2019
We have served as the auditor of one or more of the Fidelity investment companies since 1999.
Trustees and Officers
The Trustees, Members of the Advisory Board (if any), and officers of the trust and fund, as applicable, are listed below. The Board of Trustees governs the fund and is responsible for protecting the interests of shareholders. The Trustees are experienced executives who meet periodically throughout the year to oversee the fund's activities, review contractual arrangements with companies that provide services to the fund, oversee management of the risks associated with such activities and contractual arrangements, and review the fund's performance. Except for Jonathan Chiel, each of the Trustees oversees 298 funds. Mr. Chiel oversees 171 funds.
The Trustees hold office without limit in time except that (a) any Trustee may resign; (b) any Trustee may be removed by written instrument, signed by at least two-thirds of the number of Trustees prior to such removal; (c) any Trustee who requests to be retired or who has become incapacitated by illness or injury may be retired by written instrument signed by a majority of the other Trustees; and (d) any Trustee may be removed at any special meeting of shareholders by a two-thirds vote of the outstanding voting securities of the trust. Each Trustee who is not an interested person (as defined in the 1940 Act) of the trust and the fund is referred to herein as an Independent Trustee. Each Independent Trustee shall retire not later than the last day of the calendar year in which his or her 75th birthday occurs. The Independent Trustees may waive this mandatory retirement age policy with respect to individual Trustees. Officers and Advisory Board Members hold office without limit in time, except that any officer or Advisory Board Member may resign or may be removed by a vote of a majority of the Trustees at any regular meeting or any special meeting of the Trustees. Except as indicated, each individual has held the office shown or other offices in the same company for the past five years.
The fund’s Statement of Additional Information (SAI) includes more information about the Trustees. To request a free copy, call Fidelity at 1-877-208-0098.
Experience, Skills, Attributes, and Qualifications of the Trustees. The Governance and Nominating Committee has adopted a statement of policy that describes the experience, qualifications, attributes, and skills that are necessary and desirable for potential Independent Trustee candidates (Statement of Policy). The Board believes that each Trustee satisfied at the time he or she was initially elected or appointed a Trustee, and continues to satisfy, the standards contemplated by the Statement of Policy. The Governance and Nominating Committee also engages professional search firms to help identify potential Independent Trustee candidates who have the experience, qualifications, attributes, and skills consistent with the Statement of Policy. From time to time, additional criteria based on the composition and skills of the current Independent Trustees, as well as experience or skills that may be appropriate in light of future changes to board composition, business conditions, and regulatory or other developments, have also been considered by the professional search firms and the Governance and Nominating Committee. In addition, the Board takes into account the Trustees' commitment and participation in Board and committee meetings, as well as their leadership of standing and ad hoc committees throughout their tenure.
In determining that a particular Trustee was and continues to be qualified to serve as a Trustee, the Board has considered a variety of criteria, none of which, in isolation, was controlling. The Board believes that, collectively, the Trustees have balanced and diverse experience, qualifications, attributes, and skills, which allow the Board to operate effectively in governing the fund and protecting the interests of shareholders. Information about the specific experience, skills, attributes, and qualifications of each Trustee, which in each case led to the Board's conclusion that the Trustee should serve (or continue to serve) as a trustee of the fund, is provided below.
Board Structure and Oversight Function. James C. Curvey is an interested person and currently serves as Chairman. The Trustees have determined that an interested Chairman is appropriate and benefits shareholders because an interested Chairman has a personal and professional stake in the quality and continuity of services provided to the fund. Independent Trustees exercise their informed business judgment to appoint an individual of their choosing to serve as Chairman, regardless of whether the Trustee happens to be independent or a member of management. The Independent Trustees have determined that they can act independently and effectively without having an Independent Trustee serve as Chairman and that a key structural component for assuring that they are in a position to do so is for the Independent Trustees to constitute a substantial majority for the Board. The Independent Trustees also regularly meet in executive session. Ned C. Lautenbach serves as Chairman of the Independent Trustees and as such (i) acts as a liaison between the Independent Trustees and management with respect to matters important to the Independent Trustees and (ii) with management prepares agendas for Board meetings.
Fidelity® funds are overseen by different Boards of Trustees. The fund's Board oversees Fidelity's high income and certain equity funds, and other Boards oversee Fidelity's investment-grade bond, money market, asset allocation, and other equity funds. The asset allocation funds may invest in Fidelity® funds overseen by the fund's Board. The use of separate Boards, each with its own committee structure, allows the Trustees of each group of Fidelity® funds to focus on the unique issues of the funds they oversee, including common research, investment, and operational issues. On occasion, the separate Boards establish joint committees to address issues of overlapping consequences for the Fidelity® funds overseen by each Board.
The Trustees operate using a system of committees to facilitate the timely and efficient consideration of all matters of importance to the Trustees, the fund, and fund shareholders and to facilitate compliance with legal and regulatory requirements and oversight of the fund's activities and associated risks. The Board, acting through its committees, has charged FMR and its affiliates with (i) identifying events or circumstances the occurrence of which could have demonstrably adverse effects on the fund's business and/or reputation; (ii) implementing processes and controls to lessen the possibility that such events or circumstances occur or to mitigate the effects of such events or circumstances if they do occur; and (iii) creating and maintaining a system designed to evaluate continuously business and market conditions in order to facilitate the identification and implementation processes described in (i) and (ii) above. Because the day-to-day operations and activities of the fund are carried out by or through FMR, its affiliates, and other service providers, the fund's exposure to risks is mitigated but not eliminated by the processes overseen by the Trustees. While each of the Board's committees has responsibility for overseeing different aspects of the fund's activities, oversight is exercised primarily through the Operations, Audit, and Compliance Committees. Appropriate personnel, including but not limited to the fund's Chief Compliance Officer (CCO), FMR's internal auditor, the independent accountants, the fund's Treasurer and portfolio management personnel, make periodic reports to the Board's committees, as appropriate, including an annual review of Fidelity's risk management program for the Fidelity® funds. The responsibilities of each standing committee, including their oversight responsibilities, are described further under "Standing Committees of the Trustees."
Interested Trustees*:
Correspondence intended for a Trustee who is an interested person may be sent to Fidelity Investments, 245 Summer Street, Boston, Massachusetts 02210.
Name, Year of Birth; Principal Occupations and Other Relevant Experience+
Jonathan Chiel (1957)
Year of Election or Appointment: 2016
Trustee
Mr. Chiel also serves as Trustee of other Fidelity® funds. Mr. Chiel is Executive Vice President and General Counsel for FMR LLC (diversified financial services company, 2012-present). Previously, Mr. Chiel served as general counsel (2004-2012) and senior vice president and deputy general counsel (2000-2004) for John Hancock Financial Services; a partner with Choate, Hall & Stewart (1996-2000) (law firm); and an Assistant United States Attorney for the United States Attorney’s Office of the District of Massachusetts (1986-95), including Chief of the Criminal Division (1993-1995). Mr. Chiel is a director on the boards of the Boston Bar Foundation and the Maimonides School.
James C. Curvey (1935)
Year of Election or Appointment: 2007
Trustee
Chairman of the Board of Trustees
Mr. Curvey also serves as Trustee of other Fidelity® funds. Mr. Curvey is Vice Chairman (2007-present) and Director of FMR LLC (diversified financial services company). In addition, Mr. Curvey is an Overseer Emeritus for the Boston Symphony Orchestra, a Director of Artis-Naples, and a Trustee of Brewster Academy in Wolfeboro, New Hampshire. Previously, Mr. Curvey served as a Director of Fidelity Research & Analysis Co. (investment adviser firm, 2009-2018), Director of Fidelity Investments Money Management, Inc. (investment adviser firm, 2009-2014) and a Director of FMR and FMR Co., Inc. (investment adviser firms, 2007-2014).
* Determined to be an “Interested Trustee” by virtue of, among other things, his or her affiliation with the trust or various entities under common control with FMR.
+ The information includes the Trustee's principal occupation during the last five years and other information relating to the experience, attributes, and skills relevant to the Trustee's qualifications to serve as a Trustee, which led to the conclusion that the Trustee should serve as a Trustee for the fund.
Independent Trustees:
Correspondence intended for an Independent Trustee may be sent to Fidelity Investments, P.O. Box 55235, Boston, Massachusetts 02205-5235.
Name, Year of Birth; Principal Occupations and Other Relevant Experience+
Dennis J. Dirks (1948)
Year of Election or Appointment: 2005
Trustee
Mr. Dirks also serves as Trustee of other Fidelity® funds. Prior to his retirement in May 2003, Mr. Dirks was Chief Operating Officer and a member of the Board of The Depository Trust & Clearing Corporation (DTCC). He also served as President, Chief Operating Officer, and Board member of The Depository Trust Company (DTC) and President and Board member of the National Securities Clearing Corporation (NSCC). In addition, Mr. Dirks served as Chief Executive Officer and Board member of the Government Securities Clearing Corporation, Chief Executive Officer and Board member of the Mortgage-Backed Securities Clearing Corporation, as a Trustee and a member of the Finance Committee of Manhattan College (2005-2008), as a Trustee and a member of the Finance Committee of AHRC of Nassau County (2006-2008), as a member of the Independent Directors Council (IDC) Governing Council (2010-2015), and as a member of the Board of Directors for The Brookville Center for Children’s Services, Inc. (2009-2017). Mr. Dirks is a member of the Finance Committee (2016-present) and Board of Directors (2017-present) and is Treasurer (2018-present) of the Asolo Repertory Theatre.
Donald F. Donahue (1950)
Year of Election or Appointment: 2018
Trustee
Mr. Donahue also serves as a Trustee of other Fidelity® funds. Mr. Donahue is President and Chief Executive Officer of Miranda Partners, LLC (risk consulting for the financial services industry, 2012-present). Previously, Mr. Donahue served as a Member of the Advisory Board of certain Fidelity® funds (2015-2018) and Chief Executive Officer (2006-2012), Chief Operating Officer (2003-2006), and Managing Director, Customer Marketing and Development (1999-2003) of The Depository Trust & Clearing Corporation (financial markets infrastructure). Mr. Donahue serves as a Member (2007-present) and Co-Chairman (2016-present) of the Board of Directors of United Way of New York, Member of the Board of Directors of NYC Leadership Academy (2012-present) and Member of the Board of Advisors of Ripple Labs, Inc. (financial services, 2015-present). He also served as Chairman (2010-2012) and Member of the Board of Directors (2012-2013) of Omgeo, LLC (financial services), Treasurer of United Way of New York (2012-2016), and Member of the Board of Directors of XBRL US (financial services non-profit, 2009-2012) and the International Securities Services Association (2009-2012).
Alan J. Lacy (1953)
Year of Election or Appointment: 2008
Trustee
Mr. Lacy also serves as Trustee of other Fidelity® funds. Mr. Lacy serves as a Director of Bristol-Myers Squibb Company (global pharmaceuticals, 2008-present). He is a Trustee of the California Chapter of The Nature Conservancy (2015-present) and a Director of the Center for Advanced Study in the Behavioral Sciences at Stanford University (2015-present). In addition, Mr. Lacy served as Senior Adviser (2007-2014) of Oak Hill Capital Partners, L.P. (private equity) and also served as Chief Executive Officer (2005) and Vice Chairman (2005-2006) of Sears Holdings Corporation (retail) and Chief Executive Officer and Chairman of the Board of Sears, Roebuck and Co. (retail, 2000-2005). Previously, Mr. Lacy served as Chairman (2014-2017) and a member (2010-2017) of the Board of Directors of Dave & Buster’s Entertainment, Inc. (restaurant and entertainment complexes), as Chairman (2008-2011) and a member (2006-2015) of the Board of Trustees of the National Parks Conservation Association, and as a member of the Board of Directors for The Hillman Companies, Inc. (hardware wholesalers, 2010-2014), Earth Fare, Inc. (retail grocery, 2010-2014), and The Western Union Company (global money transfer, 2006-2011).
Ned C. Lautenbach (1944)
Year of Election or Appointment: 2000
Trustee
Chairman of the Independent Trustees
Mr. Lautenbach also serves as Trustee of other Fidelity® funds. Mr. Lautenbach currently serves as Chair (2018-present) and Member (2013-present) of the Board of Governors, State University System of Florida and is a member of the Council on Foreign Relations (1994-present). He is also a member and has most recently served as Chairman of the Board of Directors of Artis-Naples (2012-present). Previously, Mr. Lautenbach served as a member and then Lead Director of the Board of Directors of Eaton Corporation (diversified industrial, 1997-2016). He was also a Partner and Advisory Partner at Clayton, Dubilier & Rice, LLC (private equity investment, 1998-2010), as well as a Director of Sony Corporation (2006-2007). In addition, Mr. Lautenbach also had a 30-year career with IBM (technology company) during which time he served as Senior Vice President and a member of the Corporate Executive Committee (1968-1998).
Joseph Mauriello (1944)
Year of Election or Appointment: 2008
Trustee
Mr. Mauriello also serves as Trustee of other Fidelity® funds. Prior to his retirement in January 2006, Mr. Mauriello served in numerous senior management positions including Deputy Chairman and Chief Operating Officer (2004-2005), and Vice Chairman of Financial Services (2002-2004) of KPMG LLP US (professional services, 1965-2005). Mr. Mauriello currently serves as a member of the Independent Directors Council (IDC) Governing Council (2015-present). Previously, Mr. Mauriello served as a member of the Board of Directors of XL Group plc. (global insurance and re-insurance, 2006-2018).
Cornelia M. Small (1944)
Year of Election or Appointment: 2005
Trustee
Ms. Small also serves as Trustee of other Fidelity® funds. Ms. Small is a member of the Board of Directors (2009-present) and Chair of the Investment Committee (2010-present) of the Teagle Foundation. Ms. Small also serves on the Investment Committee of the Berkshire Taconic Community Foundation (2008-present). Previously, Ms. Small served as Chairperson (2002-2008) and a member of the Investment Committee and Chairperson (2008-2012) and a member of the Board of Trustees of Smith College. In addition, Ms. Small served as Chief Investment Officer, Director of Global Equity Investments, and a member of the Board of Directors of Scudder, Stevens & Clark and Scudder Kemper Investments.
Garnett A. Smith (1947)
Year of Election or Appointment: 2018
Trustee
Mr. Smith also serves as Trustee of other Fidelity® funds. Prior to Mr. Smith's retirement, he served as Chairman and Chief Executive Officer of Inbrand Corp. (manufacturer of personal absorbent products, 1990-1997). He also served as President (1986-1990) of Inbrand Corp. Prior to his employment with Inbrand Corp., he was employed by a retail fabric chain and North Carolina National Bank. In addition, Mr. Smith served as a Member of the Advisory Board of certain Fidelity® funds (2012-2013) and as a board member of the Jackson Hole Land Trust (2009-2012).
David M. Thomas (1949)
Year of Election or Appointment: 2008
Trustee
Mr. Thomas also serves as Trustee of other Fidelity® funds. Mr. Thomas serves as Non-Executive Chairman of the Board of Directors of Fortune Brands Home and Security (home and security products, 2011-present) and as a member of the Board of Directors (2004-present) and Presiding Director (2013-present) of Interpublic Group of Companies, Inc. (marketing communication). Previously, Mr. Thomas served as Executive Chairman (2005-2006) and Chairman and Chief Executive Officer (2000-2005) of IMS Health, Inc. (pharmaceutical and healthcare information solutions), a Director of Fortune Brands, Inc. (consumer products, 2000-2011), and a member of the Board of Trustees of the University of Florida (2013-2018).
+ The information includes the Trustee's principal occupation during the last five years and other information relating to the experience, attributes, and skills relevant to the Trustee's qualifications to serve as a Trustee, which led to the conclusion that the Trustee should serve as a Trustee for the fund.
Advisory Board Members and Officers:
Correspondence intended for a Member of the Advisory Board (if any) may be sent to Fidelity Investments, P.O. Box 55235, Boston, Massachusetts 02205-5235. Correspondence intended for an officer or Peter S. Lynch may be sent to Fidelity Investments, 245 Summer Street, Boston, Massachusetts 02210. Officers appear below in alphabetical order.
Name, Year of Birth; Principal Occupation
Vicki L. Fuller (1957)
Year of Election or Appointment: 2018
Member of the Advisory Board
Ms. Fuller also serves as Member of the Advisory Board of other Fidelity® funds. Ms. Fuller serves as a member of the Board of Directors, Audit Committee, and Nominating and Governance Committee of The Williams Companies, Inc. (natural gas infrastructure, 2018-present). Previously, Ms. Fuller served as the Chief Investment Officer of the New York State Common Retirement Fund (2012-2018) and held a variety of positions at AllianceBernstein L.P. (global asset management, 1985-2012), including Managing Director (2006-2012) and Senior Vice President and Senior Portfolio Manager (2001-2006).
Peter S. Lynch (1944)
Year of Election or Appointment: 2003
Member of the Advisory Board
Mr. Lynch also serves as Member of the Advisory Board of other Fidelity® funds. Mr. Lynch is Vice Chairman and a Director of FMR (investment adviser firm) and FMR Co., Inc. (investment adviser firm). In addition, Mr. Lynch serves as a Trustee of Boston College and as the Chairman of the Inner-City Scholarship Fund. Previously, Mr. Lynch served on the Special Olympics International Board of Directors (1997-2006).
Michael E. Wiley (1950)
Year of Election or Appointment: 2018
Member of the Advisory Board
Mr. Wiley also serves as Trustee or Member of the Advisory Board of other Fidelity® funds. Mr. Wiley serves as a Director of High Point Resources (exploration and production, 2005-present). Previously, Mr. Wiley served as a Director of Andeavor Corporation (independent oil refiner and marketer, 2005-2018), a Director of Andeavor Logistics LP (natural resources logistics, 2015-2018), a Director of Post Oak Bank (privately-held bank, 2004-2018), a Director of Asia Pacific Exploration Consolidated (international oil and gas exploration and production, 2008-2013), a member of the Board of Trustees of the University of Tulsa (2000-2006; 2007-2010), a Senior Energy Advisor of Katzenbach Partners, LLC (consulting, 2006-2007), an Advisory Director of Riverstone Holdings (private investment), a Director of Spinnaker Exploration Company (exploration and production, 2001-2005) and Chairman, President, and CEO of Baker Hughes, Inc. (oilfield services, 2000-2004).
Elizabeth Paige Baumann (1968)
Year of Election or Appointment: 2017
Anti-Money Laundering (AML) Officer
Ms. Baumann also serves as AML Officer of other funds. She is Chief AML Officer (2012-present) and Senior Vice President (2014-present) of FMR LLC (diversified financial services company) and is an employee of Fidelity Investments. Previously, Ms. Baumann served as AML Officer of the funds (2012-2016), and Vice President (2007-2014) and Deputy Anti-Money Laundering Officer (2007-2012) of FMR LLC.
Craig S. Brown (1977)
Year of Election or Appointment: 2019
Assistant Treasurer
Mr. Brown also serves as Assistant Treasurer of other funds. Mr. Brown is an employee of Fidelity Investments (2013-present).
John J. Burke III (1964)
Year of Election or Appointment: 2018
Chief Financial Officer
Mr. Burke also serves as Chief Financial Officer of other funds. Mr. Burke serves as Head of Investment Operations for Fidelity Fund and Investment Operations (2018-present) and is an employee of Fidelity Investments (1998-present). Previously Mr. Burke served as head of Asset Management Investment Operations (2012-2018).
William C. Coffey (1969)
Year of Election or Appointment: 2019
Assistant Secretary
Mr. Coffey also serves as Assistant Secretary of other funds. He is Senior Vice President and Deputy General Counsel of FMR LLC (diversified financial services company, 2010-present), and is an employee of Fidelity Investments. Previously, Mr. Coffey served as Secretary and CLO of certain funds (2018-2019); CLO, Secretary, and Senior Vice President of Fidelity Management & Research Company and FMR Co., Inc. (investment adviser firms, 2018-2019); Secretary of Fidelity SelectCo, LLC and Fidelity Investments Money Management, Inc. (investment adviser firms, 2018-2019); CLO of Fidelity Management & Research (Hong Kong) Limited, FMR Investment Management (UK) Limited, and Fidelity Management & Research (Japan) Limited (investment adviser firms, 2018-2019); and Assistant Secretary of certain funds (2009-2018).
Timothy M. Cohen (1969)
Year of Election or Appointment: 2018
Vice President
Mr. Cohen also serves as Vice President of other funds. Mr. Cohen serves as Executive Vice President of Fidelity SelectCo, LLC (2019-present), Co-Head of Equity (2018-present), a Director of Fidelity Management & Research (Japan) Limited (investment adviser firm, 2016-present), and is an employee of Fidelity Investments. Previously, Mr. Cohen served as Head of Global Equity Research (2016-2018), Chief Investment Officer - Equity and a Director of Fidelity Management & Research (U.K.) Inc. (investment adviser firm, 2013-2015) and as a Director of Fidelity Management & Research (Hong Kong) Limited (investment adviser firm, 2017).
Jonathan Davis (1968)
Year of Election or Appointment: 2010
Assistant Treasurer
Mr. Davis also serves as Assistant Treasurer of other funds. Mr. Davis serves as Assistant Treasurer of FMR Capital, Inc. (2017-present) and is an employee of Fidelity Investments. Previously, Mr. Davis served as Vice President and Associate General Counsel of FMR LLC (diversified financial services company, 2003-2010).
Adrien E. Deberghes (1967)
Year of Election or Appointment: 2016
Assistant Treasurer
Mr. Deberghes also serves as an officer of other funds. He serves as Assistant Treasurer of FMR Capital, Inc. (2017-present), Executive Vice President of Fidelity Investments Money Management, Inc. (FIMM) (investment adviser firm, 2016-present), and is an employee of Fidelity Investments (2008-present). Previously, Mr. Deberghes served as President and Treasurer of certain Fidelity® funds (2013-2018). Prior to joining Fidelity Investments, Mr. Deberghes was Senior Vice President of Mutual Fund Administration at State Street Corporation (2007-2008), Senior Director of Mutual Fund Administration at Investors Bank & Trust (2005-2007), and Director of Finance for Dunkin' Brands (2000-2005). Previously, Mr. Deberghes served in other fund officer roles.
Laura M. Del Prato (1964)
Year of Election or Appointment: 2018
Assistant Treasurer
Ms. Del Prato also serves as an officer of other funds. Ms. Del Prato is an employee of Fidelity Investments (2017-present). Prior to joining Fidelity Investments, Ms. Del Prato served as a Managing Director and Treasurer of the JPMorgan Mutual Funds (2014-2017). Prior to JPMorgan, Ms. Del Prato served as a partner at Cohen Fund Audit Services (accounting firm, 2012-2013) and KPMG LLP (accounting firm, 2004-2012).
Colm A. Hogan (1973)
Year of Election or Appointment: 2016
Deputy Treasurer
Mr. Hogan also serves as an officer of other funds. Mr. Hogan serves as Assistant Treasurer of FMR Capital, Inc. (2017-present) and is an employee of Fidelity Investments (2005-present). Previously, Mr. Hogan served as Assistant Treasurer of certain Fidelity® funds (2016-2018).
Pamela R. Holding (1964)
Year of Election or Appointment: 2018
Vice President
Ms. Holding also serves as Vice President of other funds. Ms. Holding serves as Executive Vice President of Fidelity SelectCo, LLC (2019-present), Co-Head of Equity (2018-present) and is an employee of Fidelity Investments (2013-present). Previously, Ms. Holding served as Chief Investment Officer of Fidelity Institutional Asset Management (2013-2018).
Cynthia Lo Bessette (1969)
Year of Election or Appointment: 2019
Secretary and Chief Legal Officer (CLO)
Ms. Lo Bessette also serves as Secretary and CLO of other funds. Ms. Lo Bessette serves as CLO, Secretary, and Senior Vice President of Fidelity Management & Research Company and FMR Co., Inc. (investment adviser firms, 2019-present); Secretary of Fidelity SelectCo, LLC and Fidelity Investments Money Management, Inc. (investment adviser firms, 2019-present); and CLO of Fidelity Management & Research (Hong Kong) Limited, FMR Investment Management (UK) Limited, and Fidelity Management & Research (Japan) Limited (investment adviser firms, 2019-present). She is a Senior Vice President and Deputy General Counsel of FMR LLC (diversified financial services company, 2019-present), and is an employee of Fidelity Investments. Previously, Ms. Lo Bessette served as Executive Vice President, General Counsel (2016-2019) and Senior Vice President, Deputy General Counsel (2015-2016) of OppenheimerFunds (investment management company) and Deputy Chief Legal Officer (2013-2015) of Jennison Associates LLC (investment adviser firm).
Chris Maher (1972)
Year of Election or Appointment: 2013
Assistant Treasurer
Mr. Maher serves as Assistant Treasurer of other funds. Mr. Maher is Vice President of Valuation Oversight, serves as Assistant Treasurer of FMR Capital, Inc. (2017-present), and is an employee of Fidelity Investments. Previously, Mr. Maher served as Vice President of Asset Management Compliance (2013), Vice President of the Program Management Group of FMR (investment adviser firm, 2010-2013), and Vice President of Valuation Oversight (2008-2010).
Kenneth B. Robins (1969)
Year of Election or Appointment: 2016
Chief Compliance Officer
Mr. Robins also serves as an officer of other funds. Mr. Robins serves as Compliance Officer of Fidelity Management & Research Company and FMR Co., Inc. (investment adviser firms, 2016-present) and is an employee of Fidelity Investments (2004-present). Previously, Mr. Robins served as Executive Vice President of Fidelity Investments Money Management, Inc. (investment adviser firm, 2013-2016) and served in other fund officer roles.
Stacie M. Smith (1974)
Year of Election or Appointment: 2016
President and Treasurer
Ms. Smith also serves as an officer of other funds. Ms. Smith serves as Assistant Treasurer of FMR Capital, Inc. (2017-present), is an employee of Fidelity Investments (2009-present), and has served in other fund officer roles. Prior to joining Fidelity Investments, Ms. Smith served as Senior Audit Manager of Ernst & Young LLP (accounting firm, 1996-2009). Previously, Ms. Smith served as Assistant Treasurer (2013-2018) and Deputy Treasurer (2013-2016) of certain Fidelity® funds.
Marc L. Spector (1972)
Year of Election or Appointment: 2016
Assistant Treasurer
Mr. Spector also serves as an officer of other funds. Mr. Spector serves as Assistant Treasurer of FMR Capital, Inc. (2017-present) and is an employee of Fidelity Investments (2016-present). Prior to joining Fidelity Investments, Mr. Spector served as Director at the Siegfried Group (accounting firm, 2013-2016), and prior to Siegfried Group as audit senior manager at Deloitte & Touche (accounting firm, 2005-2013).
Jim Wegmann (1979)
Year of Election or Appointment: 2019
Assistant Treasurer
Mr. Wegmann also serves as Assistant Treasurer of other funds. Mr. Wegmann is an employee of Fidelity Investments (2011-present).
Shareholder Expense Example
As a shareholder of the Fund, you incur two types of costs: (1) transaction costs, including sales charges (loads) on purchase payments or redemption proceeds, and (2) ongoing costs, including management fees, distribution and/or service (12b-1) fees and other Fund expenses. This Example is intended to help you understand your ongoing costs (in dollars) of investing in the Fund and to compare these costs with the ongoing costs of investing in other mutual funds.
The Example is based on an investment of $1,000 invested at the beginning of the period and held for the entire period (May 1, 2019 to October 31, 2019).
Actual Expenses
The first line of the accompanying table for each class of the Fund provides information about actual account values and actual expenses. You may use the information in this line, together with the amount you invested, to estimate the expenses that you paid over the period. Simply divide your account value by $1,000.00 (for example, an $8,600 account value divided by $1,000.00 = 8.6), then multiply the result by the number in the first line for a class of the Fund under the heading entitled "Expenses Paid During Period" to estimate the expenses you paid on your account during this period. In addition, the Fund, as a shareholder in the underlying Fidelity Central Funds, will indirectly bear its pro-rata share of the fees and expenses incurred by the underlying Fidelity Central Funds. These fees and expenses are not included in the Fund's annualized expense ratio used to calculate the expense estimate in the table below.
Hypothetical Example for Comparison Purposes
The second line of the accompanying table for each class of the Fund provides information about hypothetical account values and hypothetical expenses based on a Class' actual expense ratio and an assumed rate of return of 5% per year before expenses, which is not the Class' actual return. The hypothetical account values and expenses may not be used to estimate the actual ending account balance or expenses you paid for the period. You may use this information to compare the ongoing costs of investing in the Fund and other funds. To do so, compare this 5% hypothetical example with the 5% hypothetical examples that appear in the shareholder reports of the other funds. In addition, the Fund, as a shareholder in the underlying Fidelity Central Funds, will indirectly bear its pro-rata share of the fees and expenses incurred by the underlying Fidelity Central Funds. These fees and expenses are not included in the Fund's annualized expense ratio used to calculate the expense estimate in the table below.
Please note that the expenses shown in the table are meant to highlight your ongoing costs only and do not reflect any transaction costs. Therefore, the second line of the table is useful in comparing ongoing costs only, and will not help you determine the relative total costs of owning different funds. In addition, if these transactional costs were included, your costs would have been higher.
| | Annualized Expense Ratio-A | Beginning
Account Value
May 1, 2019 | Ending
Account Value
October 31, 2019 | Expenses Paid
During Period-B
May 1, 2019
to October 31, 2019 |
| Class A | 1.39% | | | |
| Actual | | $1,000.00 | $994.80 | $6.99 |
| Hypothetical-C | | $1,000.00 | $1,018.20 | $7.07 |
| Class M | 1.68% | | | |
| Actual | | $1,000.00 | $992.90 | $8.44 |
| Hypothetical-C | | $1,000.00 | $1,016.74 | $8.54 |
| Class C | 2.16% | | | |
| Actual | | $1,000.00 | $990.80 | $10.84 |
| Hypothetical-C | | $1,000.00 | $1,014.32 | $10.97 |
| Class I | 1.07% | | | |
| Actual | | $1,000.00 | $996.20 | $5.38 |
| Hypothetical-C | | $1,000.00 | $1,019.81 | $5.45 |
| Class Z | .93% | | | |
| Actual | | $1,000.00 | $996.80 | $4.68 |
| Hypothetical-C | | $1,000.00 | $1,020.52 | $4.74 |
A Annualized expense ratio reflects expenses net of applicable fee waivers.
B Expenses are equal to each Class' annualized expense ratio, multiplied by the average account value over the period, multiplied by 184/365 (to reflect the one-half year period).
C 5% return per year before expenses
Distributions (Unaudited)
The fund hereby designates as a capital gain dividend with respect to the taxable year ended October 31, 2019, $84,148,130, or, if subsequently determined to be different, the net capital gain of such year.
Class A designates 16%; Class I designates 8%; and Class Z designates 6% of the dividend distributed during the fiscal year as qualifying for the dividends–received deduction for corporate shareholders.
Class A, Class I, and Class Z designate 100% of the dividend distributed during the fiscal year as amounts which may be taken into account as a dividend for purposes of the maximum rate under section 1(h)(11) of the Internal Revenue Code.
The amounts per share which represent income derived from sources within, and taxes paid to, foreign countries or possessions of the United States are as follows:
| | Pay Date | Income | Taxes |
| Fidelity Advisor Emerging Markets Fund | | | |
| Class A | 12/10/18 | $0.0965 | $0.0555 |
| Class M | 12/10/18 | $0.0000 | $0.0000 |
| Class C | 12/10/18 | $0.0000 | $0.0000 |
| Class I | 12/10/18 | $0.2065 | $0.0555 |
| Class Z | 12/10/18 | $0.2465 | $0.0555 |
|
The fund will notify shareholders in January 2020 of amounts for use in preparing 2019 income tax returns.
FAEM-ANN-1219
1.809299.115
Fidelity Advisor® Global Equity Income Fund
Annual Report
October 31, 2019
See the inside front cover for important information about access to your fund’s shareholder reports.
Beginning on January 1, 2021, as permitted by regulations adopted by the Securities and Exchange Commission, paper copies of a fund’s shareholder reports will no longer be sent by mail, unless you specifically request paper copies of the reports from the fund or from your financial intermediary, such as a financial advisor, broker-dealer or bank. Instead, the reports will be made available on a website, and you will be notified by mail each time a report is posted and provided with a website link to access the report.
If you already elected to receive shareholder reports electronically, you will not be affected by this change and you need not take any action. You may elect to receive shareholder reports and other communications from a fund electronically, by contacting your financial intermediary. For Fidelity customers, visit Fidelity's web site or call Fidelity using the contact information listed below.
You may elect to receive all future reports in paper free of charge. If you wish to continue receiving paper copies of your shareholder reports, you may contact your financial intermediary or, if you are a Fidelity customer, visit Fidelity’s website, or call Fidelity at the applicable toll-free number listed below. Your election to receive reports in paper will apply to all funds held with the fund complex/your financial intermediary.
| Account Type | Website | Phone Number |
| Brokerage, Mutual Fund, or Annuity Contracts: | fidelity.com/mailpreferences | 1-800-343-3548 |
| Employer Provided Retirement Accounts: | netbenefits.fidelity.com/preferences (choose 'no' under Required Disclosures to continue to print) | 1-800-343-0860 |
| Advisor Sold Accounts Serviced Through Your Financial Intermediary: | Contact Your Financial Intermediary | Your Financial Intermediary's phone number |
| Advisor Sold Accounts Serviced by Fidelity: | institutional.fidelity.com | 1-877-208-0098 |
Contents
To view a fund's proxy voting guidelines and proxy voting record for the 12-month period ended June 30, visit http://www.fidelity.com/proxyvotingresults or visit the Securities and Exchange Commission's (SEC) web site at http://www.sec.gov.
You may also call 1-877-208-0098 to request a free copy of the proxy voting guidelines.
Standard & Poor's, S&P and S&P 500 are registered service marks of The McGraw-Hill Companies, Inc. and have been licensed for use by Fidelity Distributors Corporation.
Other third-party marks appearing herein are the property of their respective owners.
All other marks appearing herein are registered or unregistered trademarks or service marks of FMR LLC or an affiliated company. © 2019 FMR LLC. All rights reserved.
This report and the financial statements contained herein are submitted for the general information of the shareholders of the Fund. This report is not authorized for distribution to prospective investors in the Fund unless preceded or accompanied by an effective prospectus.
A fund files its complete schedule of portfolio holdings with the SEC for the first and third quarters of each fiscal year on Form N-PORT. Forms N-PORT are available on the SEC’s web site at http://www.sec.gov. A fund's Forms N-PORT may be reviewed and copied at the SEC’s Public Reference Room in Washington, DC. Information regarding the operation of the SEC's Public Reference Room may be obtained by calling 1-800-SEC-0330.
For a complete list of a fund's portfolio holdings, view the most recent holdings listing, semiannual report, or annual report on Fidelity's web site at http://www.fidelity.com, http://www.institutional.fidelity.com, or http://www.401k.com, as applicable.
NOT FDIC INSURED •MAY LOSE VALUE •NO BANK GUARANTEE
Neither the Fund nor Fidelity Distributors Corporation is a bank.
Performance: The Bottom Line
Average annual total return reflects the change in the value of an investment, assuming reinvestment of distributions from dividend income and capital gains (the profits earned upon the sale of securities that have grown in value, if any) and assuming a constant rate of performance each year. The hypothetical investment and the average annual total returns do not reflect the deduction of taxes that a shareholder would pay on fund distributions or the redemption of fund shares. During periods of reimbursement by Fidelity, a fund’s total return will be greater than it would be had the reimbursement not occurred. How a fund did yesterday is no guarantee of how it will do tomorrow.
Average Annual Total Returns
| For the periods ended October 31, 2019 | Past 1 year | Past 5 years | Life of fundA |
| Class A (incl. 5.75% sales charge) | 7.94% | 5.53% | 8.15% |
| Class M (incl. 3.50% sales charge) | 10.24% | 5.77% | 8.22% |
| Class C (incl. contingent deferred sales charge) | 12.71% | 6.00% | 8.19% |
| Class I | 14.84% | 7.07% | 9.29% |
| Class Z | 15.00% | 7.10% | 9.31% |
A From May 2, 2012
Class C shares' contingent deferred sales charges included in the past one year and life of fund total return figures are 1% and 0%, respectively.
The initial offering of Class Z shares took place on October 2, 2018. Returns prior to October 2, 2018, are those of Class I.
$10,000 Over Life of Fund
Let's say hypothetically that $10,000 was invested in Fidelity Advisor® Global Equity Income Fund - Class A on May 2, 2012, when the fund started, and the current 5.75% sales charge was paid.
The chart shows how the value of your investment would have changed, and also shows how the MSCI ACWI (All Country World Index) Index performed over the same period.
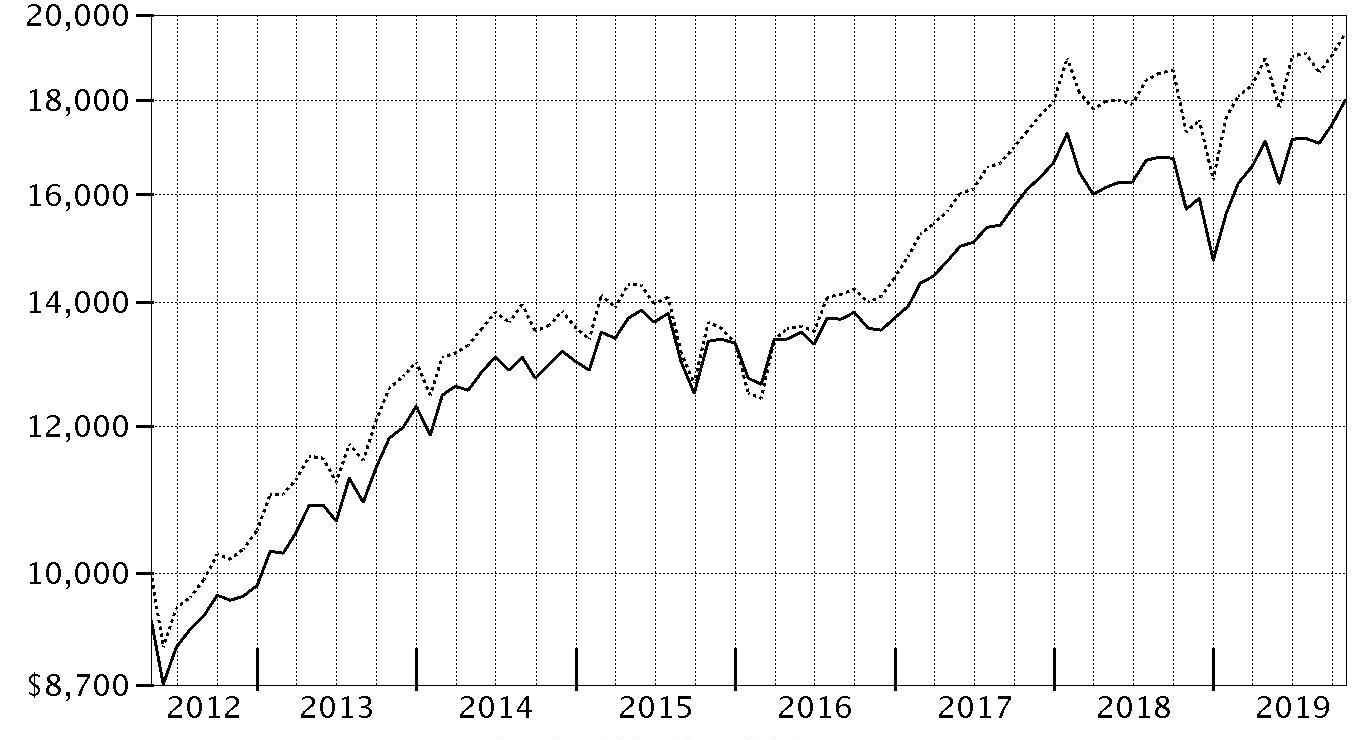
| Period Ending Values |
| $18,000 | Fidelity Advisor® Global Equity Income Fund - Class A |
| $19,542 | MSCI ACWI (All Country World Index) Index |
Management's Discussion of Fund Performance
Market Recap: Global equities gained 13.06% for the 12 months ending October 31, 2019, according to the MSCI ACWI (All Country World Index) Index. Currency fluctuations were largely modest and varied by region, muting the overall impact on international equity returns. The period began amid a challenging fourth quarter of 2018, when concerns about slowing global economic growth resulted in a -12.67% return for the index. The tide shifted as the calendar turned, as the U.S. Federal Reserve moved from raising interest rates to a more dovish policy, joining many foreign central banks. The index rallied 12.29% in the first quarter of 2019. After a down month in May (-5.88%), due to U.S.–China trade tension, stocks reversed course in June (+6.58%) and finished the second quarter with a 3.73% gain. In July, the Fed cut its policy rate for the first time since 2008, but global stocks retreated in August. Low interest rates around the world and two additional rate cuts by the Fed lifted stocks through the end of October. By sector for the full period, falling U.S. interest rates sparked demand for two high-dividend-yielding sectors, real estate (+23%) and utilities (+22%). Investors favoring growth-oriented stocks boosted information technology (+22%) and consumer discretionary (+16%). Conversely, falling commodity prices hurt energy (-6%). By region, Asia-Pacific ex Japan (+16%), the U.S. (+14%) and Europe ex U.K. (+13%) fared best, while the U.K. (+7%) was held back by its inability to approve a plan to “Brexit” the European Union.
Comments from Portfolio Manager Ramona Persaud: For the fiscal year, the fund’s share classes (excluding sales charges, if applicable) gained roughly 14% to 15%, topping the benchmark MSCI ACWI (All Country World Index) Index. Versus the benchmark, security selection contributed the past 12 months, led by the health care, information technology, industrials and financials sectors. Conversely, picks in consumer staples and positioning in consumer discretionary detracted from relative performance. By region, my choices in Japan, emerging markets and Asia Pacific ex Japan helped most, whereas an overweighting in the U.K. hurt. A sizable stake in Hoya was the top individual contributor, as shares of the Japanese manufacturer of optical products gained about 58%, due in part to strong sales of its contact lenses. It also helped to overweight American Tower (+44%), a real estate investment trust (REIT) that rents towers used to build out current- and next-generation cellular service networks. Conversely, ConocoPhillips was the fund’s largest relative detractor this period. Our shares of the multinational energy giant returned about -20%, falling along with the broader energy sector amid a decline in oil prices. An overweighting in tobacco firm Altria Group also detracted, returning about -26%.
The views expressed above reflect those of the portfolio manager(s) only through the end of the period as stated on the cover of this report and do not necessarily represent the views of Fidelity or any other person in the Fidelity organization. Any such views are subject to change at any time based upon market or other conditions and Fidelity disclaims any responsibility to update such views. These views may not be relied on as investment advice and, because investment decisions for a Fidelity fund are based on numerous factors, may not be relied on as an indication of trading intent on behalf of any Fidelity fund.
Investment Summary (Unaudited)
Top Five Stocks as of October 31, 2019
| | % of fund's net assets |
| Microsoft Corp. (United States of America, Software) | 4.1 |
| Apple, Inc. (United States of America, Technology Hardware, Storage & Peripherals) | 4.1 |
| Hoya Corp. (Japan, Health Care Equipment & Supplies) | 2.6 |
| American Tower Corp. (United States of America, Equity Real Estate Investment Trusts (REITs)) | 2.2 |
| JPMorgan Chase & Co. (United States of America, Banks) | 2.1 |
| | 15.1 |
Top Five Market Sectors as of October 31, 2019
| | % of fund's net assets |
| Financials | 18.7 |
| Health Care | 15.7 |
| Information Technology | 15.4 |
| Consumer Staples | 11.7 |
| Industrials | 9.7 |
Top Five Countries as of October 31, 2019
| (excluding cash equivalents) | % of fund's net assets |
| United States of America | 52.7 |
| Japan | 8.1 |
| United Kingdom | 7.2 |
| Switzerland | 4.7 |
| Canada | 4.3 |
Asset Allocation (% of fund's net assets)
| As of October 31, 2019 |
| | Stocks | 97.1% |
| | Short-Term Investments and Net Other Assets (Liabilities) | 2.9% |

Schedule of Investments October 31, 2019
Showing Percentage of Net Assets
| Common Stocks - 96.7% | | | |
| | | Shares | Value |
| Bailiwick of Guernsey - 0.2% | | | |
| Amdocs Ltd. | | 708 | $46,162 |
| Bailiwick of Jersey - 0.3% | | | |
| WPP PLC | | 6,064 | 75,676 |
| Belgium - 0.8% | | | |
| KBC Groep NV | | 2,458 | 172,380 |
| Bermuda - 0.9% | | | |
| Dairy Farm International Holdings Ltd. | | 1,279 | 7,709 |
| Hiscox Ltd. | | 3,743 | 72,194 |
| IHS Markit Ltd. (a) | | 1,479 | 103,560 |
|
| TOTAL BERMUDA | | | 183,463 |
|
| Brazil - 0.5% | | | |
| Equatorial Energia SA | | 2,500 | 63,508 |
| Ultrapar Participacoes SA | | 10,300 | 48,463 |
|
| TOTAL BRAZIL | | | 111,971 |
|
| Canada - 4.3% | | | |
| Alimentation Couche-Tard, Inc. Class B (sub. vtg.) | | 5,138 | 154,089 |
| Constellation Software, Inc. | | 410 | 404,935 |
| Fairfax Financial Holdings Ltd. (sub. vtg.) | | 108 | 45,755 |
| Imperial Oil Ltd. | | 4,233 | 105,415 |
| Suncor Energy, Inc. | | 6,758 | 200,929 |
|
| TOTAL CANADA | | | 911,123 |
|
| Cayman Islands - 1.0% | | | |
| Best Pacific International Holdings Ltd. | | 42,184 | 14,245 |
| SITC International Holdings Co. Ltd. | | 172,006 | 189,396 |
| Value Partners Group Ltd. | | 16,375 | 8,620 |
|
| TOTAL CAYMAN ISLANDS | | | 212,261 |
|
| China - 0.5% | | | |
| Kweichow Moutai Co. Ltd. (A Shares) | | 600 | 100,422 |
| France - 2.1% | | | |
| Amundi SA (b) | | 296 | 21,128 |
| Elior SA (b) | | 4,500 | 58,168 |
| Sanofi SA | | 2,158 | 198,940 |
| SR Teleperformance SA | | 100 | 22,663 |
| VINCI SA | | 1,359 | 152,479 |
|
| TOTAL FRANCE | | | 453,378 |
|
| Germany - 1.9% | | | |
| Deutsche Post AG | | 2,101 | 74,398 |
| Hannover Reuck SE | | 640 | 113,350 |
| Linde PLC | | 561 | 110,902 |
| SAP SE | | 774 | 102,556 |
|
| TOTAL GERMANY | | | 401,206 |
|
| Hong Kong - 1.4% | | | |
| AIA Group Ltd. | | 17,894 | 178,192 |
| Techtronic Industries Co. Ltd. | | 15,830 | 123,712 |
|
| TOTAL HONG KONG | | | 301,904 |
|
| India - 1.1% | | | |
| HDFC Asset Management Co. Ltd. (b) | | 1,000 | 42,122 |
| HDFC Bank Ltd. sponsored ADR | | 1,162 | 70,987 |
| Housing Development Finance Corp. Ltd. | | 1,500 | 44,986 |
| Reliance Industries Ltd. | | 4,200 | 86,505 |
|
| TOTAL INDIA | | | 244,600 |
|
| Ireland - 1.2% | | | |
| Accenture PLC Class A | | 1,431 | 265,336 |
| Japan - 8.1% | | | |
| Aucnet, Inc. | | 791 | 10,864 |
| Daiichikosho Co. Ltd. | | 3,397 | 161,484 |
| Daiwa Industries Ltd. | | 4,700 | 52,726 |
| Hoya Corp. | | 6,178 | 545,995 |
| Inaba Denki Sangyo Co. Ltd. | | 2,336 | 107,313 |
| Japan Meat Co. Ltd. | | 8,550 | 174,888 |
| Minebea Mitsumi, Inc. | | 6,863 | 130,339 |
| Mitani Shoji Co. Ltd. | | 1,279 | 64,257 |
| Nippon Telegraph & Telephone Corp. | | 2,576 | 127,880 |
| Nitori Holdings Co. Ltd. | | 463 | 70,474 |
| Ryohin Keikaku Co. Ltd. | | 90 | 2,004 |
| Sony Corp. | | 2,576 | 156,799 |
| Tsuruha Holdings, Inc. | | 1,175 | 132,174 |
|
| TOTAL JAPAN | | | 1,737,197 |
|
| Kenya - 0.5% | | | |
| Safaricom Ltd. | | 395,500 | 113,902 |
| Liberia - 0.5% | | | |
| Royal Caribbean Cruises Ltd. | | 970 | 105,565 |
| Luxembourg - 1.4% | | | |
| B&M European Value Retail SA | | 61,298 | 294,027 |
| Multi-National - 0.8% | | | |
| HKT Trust/HKT Ltd. unit | | 109,037 | 169,625 |
| Netherlands - 2.3% | | | |
| NXP Semiconductors NV | | 1,891 | 214,969 |
| Unilever NV | | 4,831 | 285,295 |
|
| TOTAL NETHERLANDS | | | 500,264 |
|
| Nigeria - 0.1% | | | |
| Guaranty Trust Bank PLC | | 186,272 | 12,804 |
| Norway - 0.4% | | | |
| Equinor ASA | | 4,860 | 89,895 |
| Sweden - 0.3% | | | |
| Indutrade AB | | 1,764 | 54,295 |
| Switzerland - 4.7% | | | |
| Alcon, Inc. (a) | | 354 | 20,982 |
| Banque Cantonale Vaudoise | | 140 | 109,701 |
| Chubb Ltd. | | 1,350 | 205,767 |
| Nestle SA (Reg. S) | | 2,959 | 316,558 |
| Roche Holding AG (participation certificate) | | 1,194 | 359,341 |
|
| TOTAL SWITZERLAND | | | 1,012,349 |
|
| Taiwan - 1.5% | | | |
| Taiwan Semiconductor Manufacturing Co. Ltd. | | 33,000 | 322,784 |
| United Kingdom - 7.2% | | | |
| AstraZeneca PLC sponsored ADR | | 6,268 | 307,320 |
| BP PLC | | 27,237 | 172,720 |
| British American Tobacco PLC (United Kingdom) | | 2,871 | 100,416 |
| Cineworld Group PLC | | 16,361 | 47,197 |
| Cranswick PLC | | 604 | 24,285 |
| Diageo PLC | | 3,520 | 144,077 |
| Hilton Food Group PLC | | 16,107 | 211,980 |
| Imperial Brands PLC | | 1,885 | 41,324 |
| London Stock Exchange Group PLC | | 600 | 54,071 |
| Micro Focus International PLC | | 5,579 | 76,573 |
| Moneysupermarket.com Group PLC | | 17,438 | 77,501 |
| Reckitt Benckiser Group PLC | | 1,672 | 129,382 |
| St. James's Place Capital PLC | | 3,531 | 47,614 |
| Standard Life PLC | | 12,185 | 47,904 |
| Victrex PLC | | 1,760 | 50,065 |
|
| TOTAL UNITED KINGDOM | | | 1,532,429 |
|
| United States of America - 52.7% | | | |
| Altria Group, Inc. | | 3,466 | 155,242 |
| Ameren Corp. | | 2,353 | 182,828 |
| American Tower Corp. | | 2,120 | 462,330 |
| AMETEK, Inc. | | 3,452 | 316,376 |
| Amgen, Inc. | | 2,040 | 435,030 |
| Apple, Inc. | | 3,492 | 868,670 |
| Bank of America Corp. | | 10,861 | 339,623 |
| Becton, Dickinson & Co. | | 1,140 | 291,840 |
| Berkshire Hathaway, Inc. Class B (a) | | 476 | 101,188 |
| Bristol-Myers Squibb Co. | | 3,741 | 214,621 |
| Capital One Financial Corp. | | 2,806 | 261,660 |
| Charter Communications, Inc. Class A (a) | | 291 | 136,147 |
| Chevron Corp. | | 2,490 | 289,189 |
| Cigna Corp. | | 458 | 81,735 |
| Citigroup, Inc. | | 1,587 | 114,042 |
| Comcast Corp. Class A | | 5,691 | 255,071 |
| ConocoPhillips Co. | | 3,362 | 185,582 |
| Corteva, Inc. | | 749 | 19,759 |
| Danaher Corp. | | 1,168 | 160,974 |
| Diamond Hill Investment Group, Inc. | | 310 | 43,667 |
| Dow, Inc. | | 1,094 | 55,236 |
| DowDuPont, Inc. | | 748 | 49,301 |
| Eli Lilly & Co. | | 1,262 | 143,805 |
| Equifax, Inc. | | 476 | 65,074 |
| Fortive Corp. | | 1,289 | 88,941 |
| General Dynamics Corp. | | 466 | 82,389 |
| General Electric Co. | | 14,436 | 144,071 |
| Huntington Bancshares, Inc. | | 1,878 | 26,536 |
| Interpublic Group of Companies, Inc. | | 3,283 | 71,405 |
| Johnson & Johnson | | 1,775 | 234,371 |
| JPMorgan Chase & Co. | | 3,616 | 451,711 |
| Kroger Co. | | 1,797 | 44,278 |
| Lowe's Companies, Inc. | | 2,614 | 291,749 |
| M&T Bank Corp. | | 349 | 54,629 |
| Marsh & McLennan Companies, Inc. | | 712 | 73,777 |
| McCormick & Co., Inc. (non-vtg.) | | 231 | 37,119 |
| MetLife, Inc. | | 1,727 | 80,806 |
| Microsoft Corp. | | 6,169 | 884,446 |
| MSCI, Inc. | | 545 | 127,835 |
| NextEra Energy, Inc. | | 467 | 111,305 |
| Northrop Grumman Corp. | | 288 | 101,514 |
| NRG Energy, Inc. | | 2,597 | 104,192 |
| PepsiCo, Inc. | | 2,072 | 284,216 |
| Philip Morris International, Inc. | | 898 | 73,133 |
| Phillips 66 Co. | | 1,084 | 126,633 |
| PVH Corp. | | 581 | 50,640 |
| Qualcomm, Inc. | | 1,280 | 102,963 |
| S&P Global, Inc. | | 530 | 136,735 |
| SunTrust Banks, Inc. | | 3,822 | 261,195 |
| T-Mobile U.S., Inc. (a) | | 363 | 30,006 |
| The J.M. Smucker Co. | | 1,074 | 113,500 |
| The Travelers Companies, Inc. | | 953 | 124,900 |
| The Walt Disney Co. | | 1,397 | 181,498 |
| U.S. Bancorp | | 2,635 | 150,248 |
| United Technologies Corp. | | 1,215 | 174,450 |
| UnitedHealth Group, Inc. | | 1,373 | 346,957 |
| Valero Energy Corp. | | 1,462 | 141,785 |
| Verizon Communications, Inc. | | 3,929 | 237,587 |
| Vistra Energy Corp. | | 2,323 | 62,791 |
| WEC Energy Group, Inc. | | 817 | 77,125 |
| Wells Fargo & Co. | | 6,984 | 360,584 |
|
| TOTAL UNITED STATES OF AMERICA | | | 11,277,010 |
|
| TOTAL COMMON STOCKS | | | |
| (Cost $15,893,001) | | | 20,702,028 |
|
| Nonconvertible Preferred Stocks - 0.4% | | | |
| Brazil - 0.4% | | | |
| Itau Unibanco Holding SA | | | |
| (Cost $76,922) | | 8,500 | 76,787 |
|
| Money Market Funds - 2.3% | | | |
| Fidelity Cash Central Fund 1.83% (c) | | | |
| (Cost $502,911) | | 502,811 | 502,911 |
| TOTAL INVESTMENT IN SECURITIES - 99.4% | | | |
| (Cost $16,472,834) | | | 21,281,726 |
| NET OTHER ASSETS (LIABILITIES) - 0.6% | | | 126,598 |
| NET ASSETS - 100% | | | $21,408,324 |
Categorizations in the Schedule of Investments are based on country or territory of incorporation.
Legend
(a) Non-income producing
(b) Security exempt from registration under Rule 144A of the Securities Act of 1933. These securities may be resold in transactions exempt from registration, normally to qualified institutional buyers. At the end of the period, the value of these securities amounted to $121,418 or 0.6% of net assets.
(c) Affiliated fund that is generally available only to investment companies and other accounts managed by Fidelity Investments. The rate quoted is the annualized seven-day yield of the fund at period end. A complete unaudited listing of the fund's holdings as of its most recent quarter end is available upon request. In addition, each Fidelity Central Fund's financial statements, which are not covered by the Fund's Report of Independent Registered Public Accounting Firm, are available on the SEC's website or upon request.
Affiliated Central Funds
Information regarding fiscal year to date income earned by the Fund from investments in Fidelity Central Funds is as follows:
| Fund | Income earned |
| Fidelity Cash Central Fund | $11,567 |
| Total | $11,567 |
Amounts in the income column in the above table include any capital gain distributions from underlying funds, which are presented in the corresponding line-item in the Statement of Operations, if applicable.
Investment Valuation
The following is a summary of the inputs used, as of October 31, 2019, involving the Fund's assets and liabilities carried at fair value. The inputs or methodology used for valuing securities may not be an indication of the risk associated with investing in those securities. For more information on valuation inputs, and their aggregation into the levels used below, please refer to the Investment Valuation section in the accompanying Notes to Financial Statements.
| | Valuation Inputs at Reporting Date: |
| Description | Total | Level 1 | Level 2 | Level 3 |
| Investments in Securities: | | | | |
| Equities: | | | | |
| Communication Services | $1,607,478 | $1,072,813 | $534,665 | $-- |
| Consumer Discretionary | 1,132,036 | 877,650 | 254,386 | -- |
| Consumer Staples | 2,530,087 | 1,424,461 | 1,105,626 | -- |
| Energy | 1,447,116 | 1,187,891 | 259,225 | -- |
| Financials | 4,033,498 | 3,705,507 | 327,991 | -- |
| Health Care | 3,341,911 | 2,237,635 | 1,104,276 | -- |
| Industrials | 2,047,953 | 1,380,210 | 667,743 | -- |
| Information Technology | 3,289,394 | 2,787,481 | 501,913 | -- |
| Materials | 285,263 | 285,263 | -- | -- |
| Real Estate | 462,330 | 462,330 | -- | -- |
| Utilities | 601,749 | 601,749 | -- | -- |
| Money Market Funds | 502,911 | 502,911 | -- | -- |
| Total Investments in Securities: | $21,281,726 | $16,525,901 | $4,755,825 | $-- |
See accompanying notes which are an integral part of the financial statements.
Financial Statements
Statement of Assets and Liabilities
| | | October 31, 2019 |
| Assets | | |
Investment in securities, at value — See accompanying schedule:
Unaffiliated issuers (cost $15,969,923) | $20,778,815 | |
| Fidelity Central Funds (cost $502,911) | 502,911 | |
| Total Investment in Securities (cost $16,472,834) | | $21,281,726 |
| Cash | | 7,057 |
| Foreign currency held at value (cost $2,008) | | 2,009 |
| Receivable for investments sold | | 137,410 |
| Receivable for fund shares sold | | 9,199 |
| Dividends receivable | | 46,400 |
| Distributions receivable from Fidelity Central Funds | | 662 |
| Prepaid expenses | | 32 |
| Receivable from investment adviser for expense reductions | | 2,660 |
| Other receivables | | 72 |
| Total assets | | 21,487,227 |
| Liabilities | | |
| Accrued management fee | $11,903 | |
| Distribution and service plan fees payable | 6,360 | |
| Audit fees payable | 47,099 | |
| Other affiliated payables | 4,707 | |
| Other payables and accrued expenses | 8,834 | |
| Total liabilities | | 78,903 |
| Net Assets | | $21,408,324 |
| Net Assets consist of: | | |
| Paid in capital | | $16,739,488 |
| Total accumulated earnings (loss) | | 4,668,836 |
| Net Assets | | $21,408,324 |
| Net Asset Value and Maximum Offering Price | | |
| Class A: | | |
| Net Asset Value and redemption price per share ($8,313,931 ÷ 542,297 shares)(a) | | $15.33 |
| Maximum offering price per share (100/94.25 of $15.33) | | $16.27 |
| Class M: | | |
| Net Asset Value and redemption price per share ($3,135,154 ÷ 204,609 shares)(a) | | $15.32 |
| Maximum offering price per share (100/96.50 of $15.32) | | $15.88 |
| Class C: | | |
| Net Asset Value and offering price per share ($4,173,060 ÷ 273,784 shares)(a) | | $15.24 |
| Class I: | | |
| Net Asset Value, offering price and redemption price per share ($2,187,631 ÷ 142,553 shares) | | $15.35 |
| Class Z: | | |
| Net Asset Value, offering price and redemption price per share ($3,598,548 ÷ 234,144 shares) | | $15.37 |
(a) Redemption price per share is equal to net asset value less any applicable contingent deferred sales charge.
See accompanying notes which are an integral part of the financial statements.
Statement of Operations
| | | Year ended October 31, 2019 |
| Investment Income | | |
| Dividends | | $516,950 |
| Interest | | 14 |
| Income from Fidelity Central Funds | | 11,567 |
| Income before foreign taxes withheld | | 528,531 |
| Less foreign taxes withheld | | (21,278) |
| Total income | | 507,253 |
| Expenses | | |
| Management fee | $125,936 | |
| Transfer agent fees | 46,645 | |
| Distribution and service plan fees | 76,477 | |
| Accounting fees and expenses | 9,489 | |
| Custodian fees and expenses | 6,229 | |
| Independent trustees' fees and expenses | 103 | |
| Registration fees | 82,572 | |
| Audit | 78,193 | |
| Legal | 1,342 | |
| Miscellaneous | 112 | |
| Total expenses before reductions | 427,098 | |
| Expense reductions | (132,470) | |
| Total expenses after reductions | | 294,628 |
| Net investment income (loss) | | 212,625 |
| Realized and Unrealized Gain (Loss) | | |
| Net realized gain (loss) on: | | |
| Investment securities: | | |
| Unaffiliated issuers | (128,608) | |
| Foreign currency transactions | (325) | |
| Total net realized gain (loss) | | (128,933) |
| Change in net unrealized appreciation (depreciation) on: | | |
| Investment securities: | | |
| Unaffiliated issuers (net of increase in deferred foreign taxes of $5,944) | 2,461,748 | |
| Assets and liabilities in foreign currencies | 330 | |
| Total change in net unrealized appreciation (depreciation) | | 2,462,078 |
| Net gain (loss) | | 2,333,145 |
| Net increase (decrease) in net assets resulting from operations | | $2,545,770 |
See accompanying notes which are an integral part of the financial statements.
Statement of Changes in Net Assets
| | Year ended October 31, 2019 | Year ended October 31, 2018 |
| Increase (Decrease) in Net Assets | | |
| Operations | | |
| Net investment income (loss) | $212,625 | $228,323 |
| Net realized gain (loss) | (128,933) | 465,547 |
| Change in net unrealized appreciation (depreciation) | 2,462,078 | (1,263,147) |
| Net increase (decrease) in net assets resulting from operations | 2,545,770 | (569,277) |
| Distributions to shareholders | (584,031) | (539,380) |
| Share transactions - net increase (decrease) | 814,416 | 2,003,577 |
| Total increase (decrease) in net assets | 2,776,155 | 894,920 |
| Net Assets | | |
| Beginning of period | 18,632,169 | 17,737,249 |
| End of period | $21,408,324 | $18,632,169 |
See accompanying notes which are an integral part of the financial statements.
Financial Highlights
Fidelity Advisor Global Equity Income Fund Class A
| Years ended October 31, | 2019 | 2018 | 2017 | 2016 | 2015 |
| Selected Per–Share Data | | | | | |
| Net asset value, beginning of period | $13.86 | $14.63 | $12.44 | $12.50 | $12.96 |
| Income from Investment Operations | | | | | |
| Net investment income (loss)A | .19 | .19 | .13 | .12 | .12 |
| Net realized and unrealized gain (loss) | 1.76 | (.52) | 2.20 | .09 | .24 |
| Total from investment operations | 1.95 | (.33) | 2.33 | .21 | .36 |
| Distributions from net investment income | (.20) | (.18) | (.13) | (.11) | (.11) |
| Distributions from net realized gain | (.28) | (.26) | (.01) | (.16) | (.71) |
| Total distributions | (.48) | (.44) | (.14) | (.27) | (.82) |
| Net asset value, end of period | $15.33 | $13.86 | $14.63 | $12.44 | $12.50 |
| Total ReturnB,C | 14.52% | (2.41)% | 18.79% | 1.72% | 2.85% |
| Ratios to Average Net AssetsD,E | | | | | |
| Expenses before reductions | 2.18% | 1.91% | 2.05% | 2.13% | 2.42% |
| Expenses net of fee waivers, if any | 1.45% | 1.45% | 1.45% | 1.45% | 1.45% |
| Expenses net of all reductions | 1.45% | 1.44% | 1.45% | 1.45% | 1.44% |
| Net investment income (loss) | 1.32% | 1.33% | .96% | .96% | .95% |
| Supplemental Data | | | | | |
| Net assets, end of period (000 omitted) | $8,314 | $8,427 | $7,441 | $6,068 | $4,552 |
| Portfolio turnover rateF | 18%G | 37% | 48% | 43% | 87% |
A Calculated based on average shares outstanding during the period.
B Total returns would have been lower if certain expenses had not been reduced during the applicable periods shown.
C Total returns do not include the effect of the sales charges.
D Fees and expenses of any underlying Fidelity Central Funds are not included in the Fund's expense ratio. The Fund indirectly bears its proportionate share of the expenses of any underlying Fidelity Central Funds.
E Expense ratios reflect operating expenses of the class. Expenses before reductions do not reflect amounts reimbursed by the investment adviser or reductions from brokerage service arrangements or reductions from other expense offset arrangements and do not represent the amount paid by the class during periods when reimbursements or reductions occur. Expenses net of fee waivers reflect expenses after reimbursement by the investment adviser but prior to reductions from brokerage service arrangements or other expense offset arrangements. Expenses net of all reductions represent the net expenses paid by the class.
F Amount does not include the portfolio activity of any underlying Fidelity Central Funds.
G Portfolio turnover rate excludes securities received or delivered in-kind.
See accompanying notes which are an integral part of the financial statements.
Fidelity Advisor Global Equity Income Fund Class M
| Years ended October 31, | 2019 | 2018 | 2017 | 2016 | 2015 |
| Selected Per–Share Data | | | | | |
| Net asset value, beginning of period | $13.85 | $14.62 | $12.44 | $12.49 | $12.95 |
| Income from Investment Operations | | | | | |
| Net investment income (loss)A | .15 | .16 | .10 | .09 | .09 |
| Net realized and unrealized gain (loss) | 1.76 | (.53) | 2.18 | .10 | .24 |
| Total from investment operations | 1.91 | (.37) | 2.28 | .19 | .33 |
| Distributions from net investment income | (.16) | (.14) | (.10) | (.08) | (.08) |
| Distributions from net realized gain | (.28) | (.26) | (.01) | (.16) | (.71) |
| Total distributions | (.44) | (.40) | (.10)B | (.24) | (.79) |
| Net asset value, end of period | $15.32 | $13.85 | $14.62 | $12.44 | $12.49 |
| Total ReturnC,D | 14.23% | (2.64)% | 18.42% | 1.53% | 2.59% |
| Ratios to Average Net AssetsE,F | | | | | |
| Expenses before reductions | 2.49% | 2.21% | 2.35% | 2.46% | 2.73% |
| Expenses net of fee waivers, if any | 1.70% | 1.70% | 1.70% | 1.70% | 1.70% |
| Expenses net of all reductions | 1.70% | 1.69% | 1.69% | 1.70% | 1.69% |
| Net investment income (loss) | 1.07% | 1.08% | .71% | .71% | .70% |
| Supplemental Data | | | | | |
| Net assets, end of period (000 omitted) | $3,135 | $3,279 | $3,573 | $2,508 | $2,484 |
| Portfolio turnover rateG | 18%H | 37% | 48% | 43% | 87% |
A Calculated based on average shares outstanding during the period.
B Total distributions of $.10 per share is comprised of distributions from net investment income of $.096 and distributions from net realized gain of $.007 per share.
C Total returns would have been lower if certain expenses had not been reduced during the applicable periods shown.
D Total returns do not include the effect of the sales charges.
E Fees and expenses of any underlying Fidelity Central Funds are not included in the Fund's expense ratio. The Fund indirectly bears its proportionate share of the expenses of any underlying Fidelity Central Funds.
F Expense ratios reflect operating expenses of the class. Expenses before reductions do not reflect amounts reimbursed by the investment adviser or reductions from brokerage service arrangements or reductions from other expense offset arrangements and do not represent the amount paid by the class during periods when reimbursements or reductions occur. Expenses net of fee waivers reflect expenses after reimbursement by the investment adviser but prior to reductions from brokerage service arrangements or other expense offset arrangements. Expenses net of all reductions represent the net expenses paid by the class.
G Amount does not include the portfolio activity of any underlying Fidelity Central Funds.
H Portfolio turnover rate excludes securities received or delivered in-kind.
See accompanying notes which are an integral part of the financial statements.
Fidelity Advisor Global Equity Income Fund Class C
| Years ended October 31, | 2019 | 2018 | 2017 | 2016 | 2015 |
| Selected Per–Share Data | | | | | |
| Net asset value, beginning of period | $13.77 | $14.57 | $12.39 | $12.46 | $12.93 |
| Income from Investment Operations | | | | | |
| Net investment income (loss)A | .08 | .08 | .03 | .03 | .03 |
| Net realized and unrealized gain (loss) | 1.75 | (.53) | 2.19 | .09 | .24 |
| Total from investment operations | 1.83 | (.45) | 2.22 | .12 | .27 |
| Distributions from net investment income | (.09) | (.09) | (.03) | (.03) | (.05) |
| Distributions from net realized gain | (.28) | (.26) | (.01) | (.16) | (.70) |
| Total distributions�� | (.36)B | (.35) | (.04) | (.19) | (.74)C |
| Net asset value, end of period | $15.24 | $13.77 | $14.57 | $12.39 | $12.46 |
| Total ReturnD,E | 13.71% | (3.22)% | 17.91% | .99% | 2.10% |
| Ratios to Average Net AssetsF,G | | | | | |
| Expenses before reductions | 2.99% | 2.72% | 2.85% | 2.93% | 3.23% |
| Expenses net of fee waivers, if any | 2.20% | 2.20% | 2.20% | 2.20% | 2.20% |
| Expenses net of all reductions | 2.20% | 2.19% | 2.20% | 2.20% | 2.19% |
| Net investment income (loss) | .57% | .58% | .21% | .21% | .20% |
| Supplemental Data | | | | | |
| Net assets, end of period (000 omitted) | $4,173 | $4,340 | $4,190 | $3,588 | $3,225 |
| Portfolio turnover rateH | 18%I | 37% | 48% | 43% | 87% |
A Calculated based on average shares outstanding during the period.
B Total distributions of $.36 per share is comprised of distributions from net investment income of $.085 and distributions from net realized gain of $.278 per share.
C Total distributions of $.74 per share is comprised of distributions from net investment income of $.046 and distributions from net realized gain of $.695 per share.
D Total returns would have been lower if certain expenses had not been reduced during the applicable periods shown.
E Total returns do not include the effect of the contingent deferred sales charge.
F Fees and expenses of any underlying Fidelity Central Funds are not included in the Fund's expense ratio. The Fund indirectly bears its proportionate share of the expenses of any underlying Fidelity Central Funds.
G Expense ratios reflect operating expenses of the class. Expenses before reductions do not reflect amounts reimbursed by the investment adviser or reductions from brokerage service arrangements or reductions from other expense offset arrangements and do not represent the amount paid by the class during periods when reimbursements or reductions occur. Expenses net of fee waivers reflect expenses after reimbursement by the investment adviser but prior to reductions from brokerage service arrangements or other expense offset arrangements. Expenses net of all reductions represent the net expenses paid by the class.
H Amount does not include the portfolio activity of any underlying Fidelity Central Funds.
I Portfolio turnover rate excludes securities received or delivered in-kind.
See accompanying notes which are an integral part of the financial statements.
Fidelity Advisor Global Equity Income Fund Class I
| Years ended October 31, | 2019 | 2018 | 2017 | 2016 | 2015 |
| Selected Per–Share Data | | | | | |
| Net asset value, beginning of period | $13.88 | $14.66 | $12.46 | $12.51 | $12.97 |
| Income from Investment Operations | | | | | |
| Net investment income (loss)A | .22 | .23 | .16 | .15 | .15 |
| Net realized and unrealized gain (loss) | 1.77 | (.53) | 2.21 | .10 | .24 |
| Total from investment operations | 1.99 | (.30) | 2.37 | .25 | .39 |
| Distributions from net investment income | (.24) | (.22) | (.16) | (.14) | (.14) |
| Distributions from net realized gain | (.28) | (.26) | (.01) | (.16) | (.71) |
| Total distributions | (.52) | (.48) | (.17) | (.30) | (.85) |
| Net asset value, end of period | $15.35 | $13.88 | $14.66 | $12.46 | $12.51 |
| Total ReturnB | 14.84% | (2.20)% | 19.12% | 2.04% | 3.09% |
| Ratios to Average Net AssetsC,D | | | | | |
| Expenses before reductions | 1.83% | 1.51% | 1.77% | 1.68% | 2.11% |
| Expenses net of fee waivers, if any | 1.20% | 1.20% | 1.20% | 1.20% | 1.20% |
| Expenses net of all reductions | 1.20% | 1.19% | 1.20% | 1.20% | 1.19% |
| Net investment income (loss) | 1.57% | 1.58% | 1.21% | 1.21% | 1.20% |
| Supplemental Data | | | | | |
| Net assets, end of period (000 omitted) | $2,188 | $2,493 | $2,533 | $7,159 | $1,167 |
| Portfolio turnover rateE | 18%F | 37% | 48% | 43% | 87% |
A Calculated based on average shares outstanding during the period.
B Total returns would have been lower if certain expenses had not been reduced during the applicable periods shown.
C Fees and expenses of any underlying Fidelity Central Funds are not included in the Fund's expense ratio. The Fund indirectly bears its proportionate share of the expenses of any underlying Fidelity Central Funds.
D Expense ratios reflect operating expenses of the class. Expenses before reductions do not reflect amounts reimbursed by the investment adviser or reductions from brokerage service arrangements or reductions from other expense offset arrangements and do not represent the amount paid by the class during periods when reimbursements or reductions occur. Expenses net of fee waivers reflect expenses after reimbursement by the investment adviser but prior to reductions from brokerage service arrangements or other expense offset arrangements. Expenses net of all reductions represent the net expenses paid by the class.
E Amount does not include the portfolio activity of any underlying Fidelity Central Funds.
F Portfolio turnover rate excludes securities received or delivered in-kind.
See accompanying notes which are an integral part of the financial statements.
Fidelity Advisor Global Equity Income Fund Class Z
| Years ended October 31, | 2019 | 2018 A |
| Selected Per–Share Data | | |
| Net asset value, beginning of period | $13.88 | $14.88 |
| Income from Investment Operations | | |
| Net investment income (loss)B | .25 | .01 |
| Net realized and unrealized gain (loss) | 1.76 | (.94) |
| Total from investment operations | 2.01 | (.93) |
| Distributions from net investment income | (.24) | (.07) |
| Distributions from net realized gain | (.28) | – |
| Total distributions | (.52) | (.07) |
| Net asset value, end of period | $15.37 | $13.88 |
| Total ReturnC,D | 15.00% | (6.31)% |
| Ratios to Average Net AssetsE,F | | |
| Expenses before reductions | 1.37%G | 1.08%H |
| Expenses net of fee waivers, if any | 1.04%G | 1.05%H |
| Expenses net of all reductions | 1.04%G | 1.04%H |
| Net investment income (loss) | 1.73% | .45%H |
| Supplemental Data | | |
| Net assets, end of period (000 omitted) | $3,599 | $94 |
| Portfolio turnover rateI | 18%J | 37% |
A For the period October 2, 2018 (commencement of sale of shares) to October 31, 2018.
B Calculated based on average shares outstanding during the period.
C Total returns for periods of less than one year are not annualized.
D Total returns would have been lower if certain expenses had not been reduced during the applicable periods shown.
E Fees and expenses of any underlying Fidelity Central Funds are not included in the Fund's expense ratio. The Fund indirectly bears its proportionate share of the expenses of any underlying Fidelity Central Funds.
F Expense ratios reflect operating expenses of the class. Expenses before reductions do not reflect amounts reimbursed by the investment adviser or reductions from brokerage service arrangements or reductions from other expense offset arrangements and do not represent the amount paid by the class during periods when reimbursements or reductions occur. Expense ratios before reductions for start-up periods may not be representative of longer-term operating periods. Expenses net of fee waivers reflect expenses after reimbursement by the investment adviser but prior to reductions from brokerage service arrangements or other expense offset arrangements. Expenses net of all reductions represent the net expenses paid by the class.
G On certain classes, the size and fluctuation of net assets and expense amounts may cause ratios to differ from contractual rates.
H Annualized
I Amount does not include the portfolio activity of any underlying Fidelity Central Funds.
J Portfolio turnover rate excludes securities received or delivered in-kind.
See accompanying notes which are an integral part of the financial statements.
Notes to Financial Statements
For the period ended October 31, 2019
1. Organization.
Fidelity Advisor Global Equity Income Fund (the Fund) is a fund of Fidelity Advisor Series VIII (the Trust) and is authorized to issue an unlimited number of shares. The Trust is registered under the Investment Company Act of 1940, as amended (the 1940 Act), as an open-end management investment company organized as a Massachusetts business trust. The Fund offers Class A, Class M, Class C, Class I and Class Z shares, each of which has equal rights as to assets and voting privileges. Each class has exclusive voting rights with respect to matters that affect that class. Effective March 1, 2019, Class C shares will automatically convert to Class A shares after a holding period of ten years from the initial date of purchase, with certain exceptions.
2. Investments in Fidelity Central Funds.
The Fund invests in Fidelity Central Funds, which are open-end investment companies generally available only to other investment companies and accounts managed by the investment adviser and its affiliates. The Fund's Schedule of Investments lists each of the Fidelity Central Funds held as of period end, if any, as an investment of the Fund, but does not include the underlying holdings of each Fidelity Central Fund. As an Investing Fund, the Fund indirectly bears its proportionate share of the expenses of the underlying Fidelity Central Funds.
The Money Market Central Funds seek preservation of capital and current income and are managed by Fidelity Investments Money Management, Inc. (FIMM), an affiliate of the investment adviser. Annualized expenses of the Money Market Central Funds as of their most recent shareholder report date ranged from less than .005% to .01%.
A complete unaudited list of holdings for each Fidelity Central Fund is available upon request or at the Securities and Exchange Commission (the SEC) website at www.sec.gov. In addition, the financial statements of the Fidelity Central Funds, which are not covered by the Fund's Report of Independent Registered Public Accounting Firm, are available on the SEC website or upon request.
3. Significant Accounting Policies.
The Fund is an investment company and applies the accounting and reporting guidance of the Financial Accounting Standards Board (FASB) Accounting Standards Codification Topic 946 Financial Services – Investments Companies. The financial statements have been prepared in conformity with accounting principles generally accepted in the United States of America (GAAP), which require management to make certain estimates and assumptions at the date of the financial statements. Actual results could differ from those estimates. Subsequent events, if any, through the date that the financial statements were issued have been evaluated in the preparation of the financial statements. The following summarizes the significant accounting policies of the Fund:
Investment Valuation. Investments are valued as of 4:00 p.m. Eastern time on the last calendar day of the period. The Board of Trustees (the Board) has delegated the day to day responsibility for the valuation of the Fund's investments to the Fair Value Committee (the Committee) established by the Fund's investment adviser. In accordance with valuation policies and procedures approved by the Board, the Fund attempts to obtain prices from one or more third party pricing vendors or brokers to value its investments. When current market prices, quotations or currency exchange rates are not readily available or reliable, investments will be fair valued in good faith by the Committee, in accordance with procedures adopted by the Board. Factors used in determining fair value vary by investment type and may include market or investment specific events. The frequency with which these procedures are used cannot be predicted and they may be utilized to a significant extent. The Committee oversees the Fund's valuation policies and procedures and reports to the Board on the Committee's activities and fair value determinations. The Board monitors the appropriateness of the procedures used in valuing the Fund's investments and ratifies the fair value determinations of the Committee.
The Fund categorizes the inputs to valuation techniques used to value its investments into a disclosure hierarchy consisting of three levels as shown below:
- Level 1 – quoted prices in active markets for identical investments
- Level 2 – other significant observable inputs (including quoted prices for similar investments, interest rates, prepayment speeds, etc.)
- Level 3 – unobservable inputs (including the Fund's own assumptions based on the best information available)
Valuation techniques used to value the Fund's investments by major category are as follows:
Equity securities, including restricted securities, for which market quotations are readily available, are valued at the last reported sale price or official closing price as reported by a third party pricing vendor on the primary market or exchange on which they are traded and are categorized as Level 1 in the hierarchy. In the event there were no sales during the day or closing prices are not available, securities are valued at the last quoted bid price or may be valued using the last available price and are generally categorized as Level 2 in the hierarchy. For foreign equity securities, when market or security specific events arise, comparisons to the valuation of American Depositary Receipts (ADRs), futures contracts, Exchange-Traded Funds (ETFs) and certain indexes as well as quoted prices for similar securities may be used and would be categorized as Level 2 in the hierarchy. For equity securities, including restricted securities, where observable inputs are limited, assumptions about market activity and risk are used and these securities may be categorized as Level 3 in the hierarchy.
Investments in open-end mutual funds, including the Fidelity Central Funds, are valued at their closing net asset value (NAV) each business day and are categorized as Level 1 in the hierarchy.
Changes in valuation techniques may result in transfers in or out of an assigned level within the disclosure hierarchy. The aggregate value of investments by input level as of October 31, 2019 is included at the end of the Fund's Schedule of Investments.
Foreign Currency. The Fund may use foreign currency contracts to facilitate transactions in foreign-denominated securities. Gains and losses from these transactions may arise from changes in the value of the foreign currency or if the counterparties do not perform under the contracts' terms.
Foreign-denominated assets, including investment securities, and liabilities are translated into U.S. dollars at the exchange rates at period end. Purchases and sales of investment securities, income and dividends received and expenses denominated in foreign currencies are translated into U.S. dollars at the exchange rate in effect on the transaction date.
The effects of exchange rate fluctuations on investments are included with the net realized and unrealized gain (loss) on investment securities. Other foreign currency transactions resulting in realized and unrealized gain (loss) are disclosed separately.
Investment Transactions and Income. For financial reporting purposes, the Fund's investment holdings and NAV include trades executed through the end of the last business day of the period. The NAV per share for processing shareholder transactions is calculated as of the close of business of the New York Stock Exchange (NYSE), normally 4:00 p.m. Eastern time and includes trades executed through the end of the prior business day. Gains and losses on securities sold are determined on the basis of identified cost and include proceeds received from litigation. Dividend income is recorded on the ex-dividend date, except for certain dividends from foreign securities where the ex-dividend date may have passed, which are recorded as soon as the Fund is informed of the ex-dividend date. Non-cash dividends included in dividend income, if any, are recorded at the fair market value of the securities received. Income and capital gain distributions from Fidelity Central Funds, if any, are recorded on the ex-dividend date. Certain distributions received by the Fund represent a return of capital or capital gain. The Fund determines the components of these distributions subsequent to the ex-dividend date, based upon receipt of tax filings or other correspondence relating to the underlying investment. These distributions are recorded as a reduction of cost of investments and/or as a realized gain. Interest income is accrued as earned and includes coupon interest and amortization of premium and accretion of discount on debt securities as applicable. Investment income is recorded net of foreign taxes withheld where recovery of such taxes is uncertain.
Class Allocations and Expenses. Investment income, realized and unrealized capital gains and losses, common expenses of the Fund, and certain fund-level expense reductions, if any, are allocated daily on a pro-rata basis to each class based on the relative net assets of each class to the total net assets of the Fund. Each class differs with respect to transfer agent and distribution and service plan fees incurred. Certain expense reductions may also differ by class. For the reporting period, the allocated portion of income and expenses to each class as a percent of its average net assets may vary due to the timing of recording these transactions in relation to fluctuating net assets of the classes. Expenses directly attributable to a fund are charged to that fund. Expenses attributable to more than one fund are allocated among the respective funds on the basis of relative net assets or other appropriate methods. Expense estimates are accrued in the period to which they relate and adjustments are made when actual amounts are known.
Income Tax Information and Distributions to Shareholders. Each year, the Fund intends to qualify as a regulated investment company under Subchapter M of the Internal Revenue Code, including distributing substantially all of its taxable income and realized gains. As a result, no provision for U.S. Federal income taxes is required. As of October 31, 2019, the Fund did not have any unrecognized tax benefits in the financial statements; nor is the Fund aware of any tax positions for which it is reasonably possible that the total amounts of unrecognized tax benefits will significantly change in the next twelve months. The Fund files a U.S. federal tax return, in addition to state and local tax returns as required. The Fund's federal income tax returns are subject to examination by the Internal Revenue Service (IRS) for a period of three fiscal years after they are filed. State and local tax returns may be subject to examination for an additional fiscal year depending on the jurisdiction. Foreign taxes are provided for based on the Fund's understanding of the tax rules and rates that exist in the foreign markets in which it invests. The Fund is subject to a tax imposed on capital gains by certain countries in which it invests. An estimated deferred tax liability for net unrealized appreciation on the applicable securities is included in Other payables and accrued expenses on the Statement of Assets & Liabilities.
Distributions are declared and recorded on the ex-dividend date. Income and capital gain distributions are declared separately for each class. Income and capital gain distributions are determined in accordance with income tax regulations, which may differ from GAAP.
Capital accounts within the financial statements are adjusted for permanent book-tax differences. These adjustments have no impact on net assets or the results of operations. Capital accounts are not adjusted for temporary book-tax differences which will reverse in a subsequent period.
Book-tax differences are primarily due to foreign currency transactions, passive foreign investment companies (PFIC), partnerships, capital loss carryforwards and losses deferred due to wash sales.
As of period end, the cost and unrealized appreciation (depreciation) in securities, and derivatives if applicable, for federal income tax purposes were as follows:
| Gross unrealized appreciation | $5,289,859 |
| Gross unrealized depreciation | (486,087) |
| Net unrealized appreciation (depreciation) | $4,803,772 |
| Tax Cost | $16,477,954 |
The tax-based components of distributable earnings as of period end were as follows:
| Undistributed ordinary income | $3,930 |
| Capital loss carryforward | $(132,714) |
| Net unrealized appreciation (depreciation) on securities and other investments | $4,803,563 |
Capital loss carryforwards are only available to offset future capital gains of the Fund to the extent provided by regulations and may be limited. Under the Regulated Investment Company Modernization Act of 2010 (the Act), the Fund is permitted to carry forward capital losses incurred in taxable years beginning after December 22, 2010 for an unlimited period and such capital losses are required to be used prior to any losses that expire. The capital loss carryforward information presented below, including any applicable limitation, is estimated as of fiscal period end and is subject to adjustment.
| No expiration | |
| Short-term | $(132,714) |
| Total capital loss carryforward | $(132,714) |
The tax character of distributions paid was as follows:
| | October 31, 2019 | October 31, 2018 |
| Ordinary Income | $219,427 | $ 214,748 |
| Long-term Capital Gains | 364,604 | 324,632 |
| Total | $584,031 | $ 539,380 |
Restricted Securities. The Fund may invest in securities that are subject to legal or contractual restrictions on resale. These securities generally may be resold in transactions exempt from registration or to the public if the securities are registered. Disposal of these securities may involve time-consuming negotiations and expense, and prompt sale at an acceptable price may be difficult. Information regarding restricted securities is included at the end of the Fund's Schedule of Investments.
4. Purchases and Sales of Investments.
Purchases and sales of securities, other than short-term securities and in-kind transactions, aggregated $3,247,391 and $5,987,396, respectively.
5. Fees and Other Transactions with Affiliates.
Management Fee. Fidelity Management & Research Company (the investment adviser) and its affiliates provide the Fund with investment management related services for which the Fund pays a monthly management fee. The management fee is the sum of an individual fund fee rate that is based on an annual rate of .45% of the Fund's average net assets and an annualized group fee rate that averaged .24% during the period. The group fee rate is based upon the average net assets of all the mutual funds advised by the investment adviser, including any mutual funds previously advised by the investment adviser that are currently advised by Fidelity SelectCo, LLC, an affiliate of the investment adviser. The group fee rate decreases as assets under management increase and increases as assets under management decrease. For the reporting period, the total annual management fee rate was .69% of the Fund's average net assets.
Distribution and Service Plan Fees. In accordance with Rule 12b-1 of the 1940 Act, the Fund has adopted separate Distribution and Service Plans for each class of shares. Certain classes pay Fidelity Distributors Corporation (FDC), an affiliate of the investment adviser, separate Distribution and Service Fees, each of which is based on an annual percentage of each class' average net assets. In addition, FDC may pay financial intermediaries for selling shares of the Fund and providing shareholder support services. For the period, the Distribution and Service Fee rates, total fees and amounts retained by FDC were as follows:
| | Distribution Fee | Service Fee | Total Fees | Retained by FDC |
| Class A | -% | .25% | $19,718 | $451 |
| Class M | .25% | .25% | 15,642 | 116 |
| Class C | .75% | .25% | 41,117 | 4,535 |
| | | | $76,477 | $5,102 |
Sales Load. FDC may receive a front-end sales charge of up to 5.75% for selling Class A shares and 3.50% for selling Class M shares, some of which is paid to financial intermediaries for selling shares of the Fund. Depending on the holding period, FDC may receive contingent deferred sales charges levied on Class A, Class M and Class C redemptions. The deferred sales charges are 1.00% for Class C shares, 1.00% for certain purchases of Class A shares and .25% for certain purchases of Class M shares.
For the period, sales charge amounts retained by FDC were as follows:
| | Retained by FDC |
| Class A | $2,641 |
| Class M | 867 |
| Class C(a) | 254 |
| | $3,762 |
(a) When Class C shares are initially sold, FDC pays commissions from its own resources to financial intermediaries through which the sales are made.
Transfer Agent Fees. Fidelity Investments Institutional Operations Company, Inc., (FIIOC), an affiliate of the investment adviser, is the transfer, dividend disbursing and shareholder servicing agent for each class of the Fund. FIIOC receives account fees and asset-based fees that vary according to the account size and type of account of the shareholders of the respective classes of the Fund, except for Class Z. FIIOC receives an asset-based fee of Class Z's average net assets. FIIOC pays for typesetting, printing and mailing of shareholder reports, except proxy statements.
For the period, transfer agent fees for each class were as follows:
| | Amount | % of Class-Level Average Net Assets |
| Class A | $20,927 | .27 |
| Class M | 9,686 | .31 |
| Class C | 12,556 | .31 |
| Class I | 3,010 | .14 |
| Class Z | 466 | .04 |
| | $46,645 | |
Accounting Fees. Fidelity Service Company, Inc. (FSC), an affiliate of the investment adviser, maintains the Fund's accounting records. The fee is based on the level of average net assets for each month. For the period, the fees were equivalent to an annual rate of .05%.
Brokerage Commissions. The Fund placed a portion of its portfolio transactions with brokerage firms which are affiliates of the investment adviser. Brokerage commissions are included in net realized gain (loss) and change in net unrealized appreciation (depreciation) in the Statement of Operations. The commissions paid to these affiliated firms were $70 for the period.
Interfund Trades. The Fund may purchase from or sell securities to other Fidelity Funds under procedures adopted by the Board. The procedures have been designed to ensure these interfund trades are executed in accordance with Rule 17a-7 of the 1940 Act. Interfund trades are included within the respective purchases and sales amounts shown in the Purchases and Sales of Investments note.
Affiliated Exchanges In-Kind. During the period, the Fund received cash valued at $2,873,785 in exchange for 199,985 shares of the Fund. The amount of in-kind exchanges is included in share transactions in the accompanying Statement of Changes in Net Assets as well as the Notes to Financial Statements.
6. Committed Line of Credit.
The Fund participates with other funds managed by the investment adviser or an affiliate in a $4.25 billion credit facility (the "line of credit") to be utilized for temporary or emergency purposes to fund shareholder redemptions or for other short-term liquidity purposes. The Fund has agreed to pay commitment fees on its pro-rata portion of the line of credit, which amounted to $48 and is reflected in Miscellaneous expenses on the Statement of Operations. During the period, the Fund did not borrow on this line of credit.
7. Expense Reductions.
The investment adviser contractually agreed to reimburse each class to the extent annual operating expenses exceeded certain levels of class-level average net assets as noted in the table below. This reimbursement will remain in place through February 28, 2021. Some expenses, for example the compensation of the independent Trustees, and certain miscellaneous expenses such as proxy and shareholder meeting expenses, are excluded from this reimbursement.
The following classes were in reimbursement during the period:
| | Expense Limitations | Reimbursement |
| Class A | 1.45% | $50,888 |
| Class M | 1.70% | 21,880 |
| Class C | 2.20% | 28,553 |
| Class I | 1.20% | 11,515 |
| Class Z | 1.05% | 3,093 |
| | | $115,929 |
Commissions paid to certain brokers with whom the investment adviser, or its affiliates, places trades on behalf of the Fund include an amount in addition to trade execution, which may be rebated back to the Fund to offset certain expenses. This amount totaled $174 for the period. Through arrangements with the Fund's custodian, credits realized as a result of certain uninvested cash balances were used to reduce the Fund's expenses. During the period, custodian credits reduced the Fund's expenses by $166.
In addition, during the period the investment adviser reimbursed and/or waived a portion of fund-level operating expenses in the amount of $138 and a portion of class-level operating expenses as follows:
| | Amount |
| Class A | $6,911 |
| Class M | 2,824 |
| Class C | 3,929 |
| Class I | 2,073 |
| Class Z | 326 |
| | $16,063 |
8. Distributions to Shareholders.
Distributions to shareholders of each class were as follows:
| | Year ended
October 31, 2019 | Year ended
October 31, 2018(a) |
| Distributions to shareholders | | |
| Class A | $270,065 | $248,761 |
| Class M | 99,489 | 101,394 |
| Class C | 110,999 | 108,482 |
| Class I | 83,903 | 80,306 |
| Class Z | 19,575 | 437 |
| Total | $584,031 | $539,380 |
(a) Distributions for Class Z are for the period October 2, 2018 (commencement of sale of shares) to October 31, 2018.
9. Share Transactions.
Share transactions for each class were as follows and may contain automatic conversions between classes or exchanges between affiliated funds:
| | Shares | Shares | Dollars | Dollars |
| | Year ended October 31, 2019 | Year ended October 31, 2018(a) | Year ended October 31, 2019 | Year ended October 31, 2018(a) |
| Class A | | | | |
| Shares sold | 129,393 | 239,391 | $1,827,794 | $3,544,767 |
| Reinvestment of distributions | 19,302 | 16,454 | 261,557 | 240,039 |
| Shares redeemed | (214,567) | (156,221) | (2,969,152) | (2,283,605) |
| Net increase (decrease) | (65,872) | 99,624 | $(879,801) | $1,501,201 |
| Class M | | | | |
| Shares sold | 17,076 | 74,172 | $241,489 | $1,084,407 |
| Reinvestment of distributions | 7,299 | 6,928 | 98,432 | 101,155 |
| Shares redeemed | (56,580) | (88,594) | (793,802) | (1,286,364) |
| Net increase (decrease) | (32,205) | (7,494) | $(453,881) | $(100,802) |
| Class C | | | | |
| Shares sold | 30,573 | 79,555 | $427,156 | $1,159,649 |
| Reinvestment of distributions | 8,318 | 7,417 | 110,537 | 107,901 |
| Shares redeemed | (80,242) | (59,540) | (1,120,787) | (861,126) |
| Net increase (decrease) | (41,351) | 27,432 | $(583,094) | $406,424 |
| Class I | | | | |
| Shares sold | 22,259 | 70,175 | $319,348 | $1,032,359 |
| Reinvestment of distributions | 5,822 | 4,702 | 78,959 | 68,667 |
| Shares redeemed | (65,197) | (68,072) | (914,344) | (1,004,709) |
| Net increase (decrease) | (37,116) | 6,805 | $(516,037) | $96,317 |
| Class Z | | | | |
| Shares sold | 238,795(b) | 6,720 | $3,417,153(b) | $100,000 |
| Reinvestment of distributions | 1,186 | 30 | 17,015 | 437 |
| Shares redeemed | (12,587) | – | (186,939) | – |
| Net increase (decrease) | 227,394 | 6,750 | $3,247,229 | $100,437 |
(a) Share transactions for Class Z are for the period October 2, 2018 (commencement of sale of shares) to October 31, 2018.
(b) Amount includes in-kind exchanges (see the Affiliated Exchanges In-Kind note for additional details).
10. Other.
The Fund's organizational documents provide former and current trustees and officers with a limited indemnification against liabilities arising in connection with the performance of their duties to the Fund. In the normal course of business, the Fund may also enter into contracts that provide general indemnifications. The Fund's maximum exposure under these arrangements is unknown as this would be dependent on future claims that may be made against the Fund. The risk of material loss from such claims is considered remote.
Report of Independent Registered Public Accounting Firm
To the Board of Trustees of Fidelity Advisor Series VIII and Shareholders of Fidelity Advisor Global Equity Income Fund:
Opinion on the Financial Statements
We have audited the accompanying statement of assets and liabilities, including the schedule of investments, of Fidelity Advisor Global Equity Income Fund (one of the funds constituting Fidelity Advisor Series VIII, referred to hereafter as the “Fund”) as of October 31, 2019, the related statement of operations for the year ended October 31, 2019, the statement of changes in net assets for each of the two years in the period ended October 31, 2019, including the related notes, and the financial highlights for each of the periods indicated therein (collectively referred to as the “financial statements”). In our opinion, the financial statements present fairly, in all material respects, the financial position of the Fund as of October 31, 2019, the results of its operations for the year then ended, the changes in its net assets for each of the two years in the period ended October 31, 2019 and the financial highlights for each of the periods indicated therein in conformity with accounting principles generally accepted in the United States of America.
Basis for Opinion
These financial statements are the responsibility of the Fund’s management. Our responsibility is to express an opinion on the Fund’s financial statements based on our audits. We are a public accounting firm registered with the Public Company Accounting Oversight Board (United States) (PCAOB) and are required to be independent with respect to the Fund in accordance with the U.S. federal securities laws and the applicable rules and regulations of the Securities and Exchange Commission and the PCAOB.
We conducted our audits of these financial statements in accordance with the standards of the PCAOB. Those standards require that we plan and perform the audit to obtain reasonable assurance about whether the financial statements are free of material misstatement, whether due to error or fraud.
Our audits included performing procedures to assess the risks of material misstatement of the financial statements, whether due to error or fraud, and performing procedures that respond to those risks. Such procedures included examining, on a test basis, evidence regarding the amounts and disclosures in the financial statements. Our audits also included evaluating the accounting principles used and significant estimates made by management, as well as evaluating the overall presentation of the financial statements. Our procedures included confirmation of securities owned as of October 31, 2019 by correspondence with the custodian. We believe that our audits provide a reasonable basis for our opinion.
PricewaterhouseCoopers LLP
Boston, Massachusetts
December 13, 2019
We have served as the auditor of one or more investment companies in the Fidelity group of funds since 1932.
Trustees and Officers
The Trustees, Members of the Advisory Board (if any), and officers of the trust and fund, as applicable, are listed below. The Board of Trustees governs the fund and is responsible for protecting the interests of shareholders. The Trustees are experienced executives who meet periodically throughout the year to oversee the fund's activities, review contractual arrangements with companies that provide services to the fund, oversee management of the risks associated with such activities and contractual arrangements, and review the fund's performance. Except for Jonathan Chiel, each of the Trustees oversees 298 funds. Mr. Chiel oversees 171 funds.
The Trustees hold office without limit in time except that (a) any Trustee may resign; (b) any Trustee may be removed by written instrument, signed by at least two-thirds of the number of Trustees prior to such removal; (c) any Trustee who requests to be retired or who has become incapacitated by illness or injury may be retired by written instrument signed by a majority of the other Trustees; and (d) any Trustee may be removed at any special meeting of shareholders by a two-thirds vote of the outstanding voting securities of the trust. Each Trustee who is not an interested person (as defined in the 1940 Act) of the trust and the fund is referred to herein as an Independent Trustee. Each Independent Trustee shall retire not later than the last day of the calendar year in which his or her 75th birthday occurs. The Independent Trustees may waive this mandatory retirement age policy with respect to individual Trustees. Officers and Advisory Board Members hold office without limit in time, except that any officer or Advisory Board Member may resign or may be removed by a vote of a majority of the Trustees at any regular meeting or any special meeting of the Trustees. Except as indicated, each individual has held the office shown or other offices in the same company for the past five years.
The fund’s Statement of Additional Information (SAI) includes more information about the Trustees. To request a free copy, call Fidelity at 1-877-208-0098.
Experience, Skills, Attributes, and Qualifications of the Trustees. The Governance and Nominating Committee has adopted a statement of policy that describes the experience, qualifications, attributes, and skills that are necessary and desirable for potential Independent Trustee candidates (Statement of Policy). The Board believes that each Trustee satisfied at the time he or she was initially elected or appointed a Trustee, and continues to satisfy, the standards contemplated by the Statement of Policy. The Governance and Nominating Committee also engages professional search firms to help identify potential Independent Trustee candidates who have the experience, qualifications, attributes, and skills consistent with the Statement of Policy. From time to time, additional criteria based on the composition and skills of the current Independent Trustees, as well as experience or skills that may be appropriate in light of future changes to board composition, business conditions, and regulatory or other developments, have also been considered by the professional search firms and the Governance and Nominating Committee. In addition, the Board takes into account the Trustees' commitment and participation in Board and committee meetings, as well as their leadership of standing and ad hoc committees throughout their tenure.
In determining that a particular Trustee was and continues to be qualified to serve as a Trustee, the Board has considered a variety of criteria, none of which, in isolation, was controlling. The Board believes that, collectively, the Trustees have balanced and diverse experience, qualifications, attributes, and skills, which allow the Board to operate effectively in governing the fund and protecting the interests of shareholders. Information about the specific experience, skills, attributes, and qualifications of each Trustee, which in each case led to the Board's conclusion that the Trustee should serve (or continue to serve) as a trustee of the fund, is provided below.
Board Structure and Oversight Function. James C. Curvey is an interested person and currently serves as Chairman. The Trustees have determined that an interested Chairman is appropriate and benefits shareholders because an interested Chairman has a personal and professional stake in the quality and continuity of services provided to the fund. Independent Trustees exercise their informed business judgment to appoint an individual of their choosing to serve as Chairman, regardless of whether the Trustee happens to be independent or a member of management. The Independent Trustees have determined that they can act independently and effectively without having an Independent Trustee serve as Chairman and that a key structural component for assuring that they are in a position to do so is for the Independent Trustees to constitute a substantial majority for the Board. The Independent Trustees also regularly meet in executive session. Ned C. Lautenbach serves as Chairman of the Independent Trustees and as such (i) acts as a liaison between the Independent Trustees and management with respect to matters important to the Independent Trustees and (ii) with management prepares agendas for Board meetings.
Fidelity® funds are overseen by different Boards of Trustees. The fund's Board oversees Fidelity's high income and certain equity funds, and other Boards oversee Fidelity's investment-grade bond, money market, asset allocation, and other equity funds. The asset allocation funds may invest in Fidelity® funds overseen by the fund's Board. The use of separate Boards, each with its own committee structure, allows the Trustees of each group of Fidelity® funds to focus on the unique issues of the funds they oversee, including common research, investment, and operational issues. On occasion, the separate Boards establish joint committees to address issues of overlapping consequences for the Fidelity® funds overseen by each Board.
The Trustees operate using a system of committees to facilitate the timely and efficient consideration of all matters of importance to the Trustees, the fund, and fund shareholders and to facilitate compliance with legal and regulatory requirements and oversight of the fund's activities and associated risks. The Board, acting through its committees, has charged FMR and its affiliates with (i) identifying events or circumstances the occurrence of which could have demonstrably adverse effects on the fund's business and/or reputation; (ii) implementing processes and controls to lessen the possibility that such events or circumstances occur or to mitigate the effects of such events or circumstances if they do occur; and (iii) creating and maintaining a system designed to evaluate continuously business and market conditions in order to facilitate the identification and implementation processes described in (i) and (ii) above. Because the day-to-day operations and activities of the fund are carried out by or through FMR, its affiliates, and other service providers, the fund's exposure to risks is mitigated but not eliminated by the processes overseen by the Trustees. While each of the Board's committees has responsibility for overseeing different aspects of the fund's activities, oversight is exercised primarily through the Operations, Audit, and Compliance Committees. Appropriate personnel, including but not limited to the fund's Chief Compliance Officer (CCO), FMR's internal auditor, the independent accountants, the fund's Treasurer and portfolio management personnel, make periodic reports to the Board's committees, as appropriate, including an annual review of Fidelity's risk management program for the Fidelity® funds. The responsibilities of each standing committee, including their oversight responsibilities, are described further under "Standing Committees of the Trustees."
Interested Trustees*:
Correspondence intended for a Trustee who is an interested person may be sent to Fidelity Investments, 245 Summer Street, Boston, Massachusetts 02210.
Name, Year of Birth; Principal Occupations and Other Relevant Experience+
Jonathan Chiel (1957)
Year of Election or Appointment: 2016
Trustee
Mr. Chiel also serves as Trustee of other Fidelity® funds. Mr. Chiel is Executive Vice President and General Counsel for FMR LLC (diversified financial services company, 2012-present). Previously, Mr. Chiel served as general counsel (2004-2012) and senior vice president and deputy general counsel (2000-2004) for John Hancock Financial Services; a partner with Choate, Hall & Stewart (1996-2000) (law firm); and an Assistant United States Attorney for the United States Attorney’s Office of the District of Massachusetts (1986-95), including Chief of the Criminal Division (1993-1995). Mr. Chiel is a director on the boards of the Boston Bar Foundation and the Maimonides School.
James C. Curvey (1935)
Year of Election or Appointment: 2007
Trustee
Chairman of the Board of Trustees
Mr. Curvey also serves as Trustee of other Fidelity® funds. Mr. Curvey is Vice Chairman (2007-present) and Director of FMR LLC (diversified financial services company). In addition, Mr. Curvey is an Overseer Emeritus for the Boston Symphony Orchestra, a Director of Artis-Naples, and a Trustee of Brewster Academy in Wolfeboro, New Hampshire. Previously, Mr. Curvey served as a Director of Fidelity Research & Analysis Co. (investment adviser firm, 2009-2018), Director of Fidelity Investments Money Management, Inc. (investment adviser firm, 2009-2014) and a Director of FMR and FMR Co., Inc. (investment adviser firms, 2007-2014).
* Determined to be an “Interested Trustee” by virtue of, among other things, his or her affiliation with the trust or various entities under common control with FMR.
+ The information includes the Trustee's principal occupation during the last five years and other information relating to the experience, attributes, and skills relevant to the Trustee's qualifications to serve as a Trustee, which led to the conclusion that the Trustee should serve as a Trustee for the fund.
Independent Trustees:
Correspondence intended for an Independent Trustee may be sent to Fidelity Investments, P.O. Box 55235, Boston, Massachusetts 02205-5235.
Name, Year of Birth; Principal Occupations and Other Relevant Experience+
Dennis J. Dirks (1948)
Year of Election or Appointment: 2005
Trustee
Mr. Dirks also serves as Trustee of other Fidelity® funds. Prior to his retirement in May 2003, Mr. Dirks was Chief Operating Officer and a member of the Board of The Depository Trust & Clearing Corporation (DTCC). He also served as President, Chief Operating Officer, and Board member of The Depository Trust Company (DTC) and President and Board member of the National Securities Clearing Corporation (NSCC). In addition, Mr. Dirks served as Chief Executive Officer and Board member of the Government Securities Clearing Corporation, Chief Executive Officer and Board member of the Mortgage-Backed Securities Clearing Corporation, as a Trustee and a member of the Finance Committee of Manhattan College (2005-2008), as a Trustee and a member of the Finance Committee of AHRC of Nassau County (2006-2008), as a member of the Independent Directors Council (IDC) Governing Council (2010-2015), and as a member of the Board of Directors for The Brookville Center for Children’s Services, Inc. (2009-2017). Mr. Dirks is a member of the Finance Committee (2016-present) and Board of Directors (2017-present) and is Treasurer (2018-present) of the Asolo Repertory Theatre.
Donald F. Donahue (1950)
Year of Election or Appointment: 2018
Trustee
Mr. Donahue also serves as a Trustee of other Fidelity® funds. Mr. Donahue is President and Chief Executive Officer of Miranda Partners, LLC (risk consulting for the financial services industry, 2012-present). Previously, Mr. Donahue served as a Member of the Advisory Board of certain Fidelity® funds (2015-2018) and Chief Executive Officer (2006-2012), Chief Operating Officer (2003-2006), and Managing Director, Customer Marketing and Development (1999-2003) of The Depository Trust & Clearing Corporation (financial markets infrastructure). Mr. Donahue serves as a Member (2007-present) and Co-Chairman (2016-present) of the Board of Directors of United Way of New York, Member of the Board of Directors of NYC Leadership Academy (2012-present) and Member of the Board of Advisors of Ripple Labs, Inc. (financial services, 2015-present). He also served as Chairman (2010-2012) and Member of the Board of Directors (2012-2013) of Omgeo, LLC (financial services), Treasurer of United Way of New York (2012-2016), and Member of the Board of Directors of XBRL US (financial services non-profit, 2009-2012) and the International Securities Services Association (2009-2012).
Alan J. Lacy (1953)
Year of Election or Appointment: 2008
Trustee
Mr. Lacy also serves as Trustee of other Fidelity® funds. Mr. Lacy serves as a Director of Bristol-Myers Squibb Company (global pharmaceuticals, 2008-present). He is a Trustee of the California Chapter of The Nature Conservancy (2015-present) and a Director of the Center for Advanced Study in the Behavioral Sciences at Stanford University (2015-present). In addition, Mr. Lacy served as Senior Adviser (2007-2014) of Oak Hill Capital Partners, L.P. (private equity) and also served as Chief Executive Officer (2005) and Vice Chairman (2005-2006) of Sears Holdings Corporation (retail) and Chief Executive Officer and Chairman of the Board of Sears, Roebuck and Co. (retail, 2000-2005). Previously, Mr. Lacy served as Chairman (2014-2017) and a member (2010-2017) of the Board of Directors of Dave & Buster’s Entertainment, Inc. (restaurant and entertainment complexes), as Chairman (2008-2011) and a member (2006-2015) of the Board of Trustees of the National Parks Conservation Association, and as a member of the Board of Directors for The Hillman Companies, Inc. (hardware wholesalers, 2010-2014), Earth Fare, Inc. (retail grocery, 2010-2014), and The Western Union Company (global money transfer, 2006-2011).
Ned C. Lautenbach (1944)
Year of Election or Appointment: 2000
Trustee
Chairman of the Independent Trustees
Mr. Lautenbach also serves as Trustee of other Fidelity® funds. Mr. Lautenbach currently serves as Chair (2018-present) and Member (2013-present) of the Board of Governors, State University System of Florida and is a member of the Council on Foreign Relations (1994-present). He is also a member and has most recently served as Chairman of the Board of Directors of Artis-Naples (2012-present). Previously, Mr. Lautenbach served as a member and then Lead Director of the Board of Directors of Eaton Corporation (diversified industrial, 1997-2016). He was also a Partner and Advisory Partner at Clayton, Dubilier & Rice, LLC (private equity investment, 1998-2010), as well as a Director of Sony Corporation (2006-2007). In addition, Mr. Lautenbach also had a 30-year career with IBM (technology company) during which time he served as Senior Vice President and a member of the Corporate Executive Committee (1968-1998).
Joseph Mauriello (1944)
Year of Election or Appointment: 2008
Trustee
Mr. Mauriello also serves as Trustee of other Fidelity® funds. Prior to his retirement in January 2006, Mr. Mauriello served in numerous senior management positions including Deputy Chairman and Chief Operating Officer (2004-2005), and Vice Chairman of Financial Services (2002-2004) of KPMG LLP US (professional services, 1965-2005). Mr. Mauriello currently serves as a member of the Independent Directors Council (IDC) Governing Council (2015-present). Previously, Mr. Mauriello served as a member of the Board of Directors of XL Group plc. (global insurance and re-insurance, 2006-2018).
Cornelia M. Small (1944)
Year of Election or Appointment: 2005
Trustee
Ms. Small also serves as Trustee of other Fidelity® funds. Ms. Small is a member of the Board of Directors (2009-present) and Chair of the Investment Committee (2010-present) of the Teagle Foundation. Ms. Small also serves on the Investment Committee of the Berkshire Taconic Community Foundation (2008-present). Previously, Ms. Small served as Chairperson (2002-2008) and a member of the Investment Committee and Chairperson (2008-2012) and a member of the Board of Trustees of Smith College. In addition, Ms. Small served as Chief Investment Officer, Director of Global Equity Investments, and a member of the Board of Directors of Scudder, Stevens & Clark and Scudder Kemper Investments.
Garnett A. Smith (1947)
Year of Election or Appointment: 2018
Trustee
Mr. Smith also serves as Trustee of other Fidelity® funds. Prior to Mr. Smith's retirement, he served as Chairman and Chief Executive Officer of Inbrand Corp. (manufacturer of personal absorbent products, 1990-1997). He also served as President (1986-1990) of Inbrand Corp. Prior to his employment with Inbrand Corp., he was employed by a retail fabric chain and North Carolina National Bank. In addition, Mr. Smith served as a Member of the Advisory Board of certain Fidelity® funds (2012-2013) and as a board member of the Jackson Hole Land Trust (2009-2012).
David M. Thomas (1949)
Year of Election or Appointment: 2008
Trustee
Mr. Thomas also serves as Trustee of other Fidelity® funds. Mr. Thomas serves as Non-Executive Chairman of the Board of Directors of Fortune Brands Home and Security (home and security products, 2011-present) and as a member of the Board of Directors (2004-present) and Presiding Director (2013-present) of Interpublic Group of Companies, Inc. (marketing communication). Previously, Mr. Thomas served as Executive Chairman (2005-2006) and Chairman and Chief Executive Officer (2000-2005) of IMS Health, Inc. (pharmaceutical and healthcare information solutions), a Director of Fortune Brands, Inc. (consumer products, 2000-2011), and a member of the Board of Trustees of the University of Florida (2013-2018).
+ The information includes the Trustee's principal occupation during the last five years and other information relating to the experience, attributes, and skills relevant to the Trustee's qualifications to serve as a Trustee, which led to the conclusion that the Trustee should serve as a Trustee for the fund.
Advisory Board Members and Officers:
Correspondence intended for a Member of the Advisory Board (if any) may be sent to Fidelity Investments, P.O. Box 55235, Boston, Massachusetts 02205-5235. Correspondence intended for an officer or Peter S. Lynch may be sent to Fidelity Investments, 245 Summer Street, Boston, Massachusetts 02210. Officers appear below in alphabetical order.
Name, Year of Birth; Principal Occupation
Vicki L. Fuller (1957)
Year of Election or Appointment: 2018
Member of the Advisory Board
Ms. Fuller also serves as Member of the Advisory Board of other Fidelity® funds. Ms. Fuller serves as a member of the Board of Directors, Audit Committee, and Nominating and Governance Committee of The Williams Companies, Inc. (natural gas infrastructure, 2018-present). Previously, Ms. Fuller served as the Chief Investment Officer of the New York State Common Retirement Fund (2012-2018) and held a variety of positions at AllianceBernstein L.P. (global asset management, 1985-2012), including Managing Director (2006-2012) and Senior Vice President and Senior Portfolio Manager (2001-2006).
Peter S. Lynch (1944)
Year of Election or Appointment: 2003
Member of the Advisory Board
Mr. Lynch also serves as Member of the Advisory Board of other Fidelity® funds. Mr. Lynch is Vice Chairman and a Director of FMR (investment adviser firm) and FMR Co., Inc. (investment adviser firm). In addition, Mr. Lynch serves as a Trustee of Boston College and as the Chairman of the Inner-City Scholarship Fund. Previously, Mr. Lynch served on the Special Olympics International Board of Directors (1997-2006).
Michael E. Wiley (1950)
Year of Election or Appointment: 2018
Member of the Advisory Board
Mr. Wiley also serves as Trustee or Member of the Advisory Board of other Fidelity® funds. Mr. Wiley serves as a Director of High Point Resources (exploration and production, 2005-present). Previously, Mr. Wiley served as a Director of Andeavor Corporation (independent oil refiner and marketer, 2005-2018), a Director of Andeavor Logistics LP (natural resources logistics, 2015-2018), a Director of Post Oak Bank (privately-held bank, 2004-2018), a Director of Asia Pacific Exploration Consolidated (international oil and gas exploration and production, 2008-2013), a member of the Board of Trustees of the University of Tulsa (2000-2006; 2007-2010), a Senior Energy Advisor of Katzenbach Partners, LLC (consulting, 2006-2007), an Advisory Director of Riverstone Holdings (private investment), a Director of Spinnaker Exploration Company (exploration and production, 2001-2005) and Chairman, President, and CEO of Baker Hughes, Inc. (oilfield services, 2000-2004).
Elizabeth Paige Baumann (1968)
Year of Election or Appointment: 2017
Anti-Money Laundering (AML) Officer
Ms. Baumann also serves as AML Officer of other funds. She is Chief AML Officer (2012-present) and Senior Vice President (2014-present) of FMR LLC (diversified financial services company) and is an employee of Fidelity Investments. Previously, Ms. Baumann served as AML Officer of the funds (2012-2016), and Vice President (2007-2014) and Deputy Anti-Money Laundering Officer (2007-2012) of FMR LLC.
Craig S. Brown (1977)
Year of Election or Appointment: 2019
Assistant Treasurer
Mr. Brown also serves as Assistant Treasurer of other funds. Mr. Brown is an employee of Fidelity Investments (2013-present).
John J. Burke III (1964)
Year of Election or Appointment: 2018
Chief Financial Officer
Mr. Burke also serves as Chief Financial Officer of other funds. Mr. Burke serves as Head of Investment Operations for Fidelity Fund and Investment Operations (2018-present) and is an employee of Fidelity Investments (1998-present). Previously Mr. Burke served as head of Asset Management Investment Operations (2012-2018).
William C. Coffey (1969)
Year of Election or Appointment: 2019
Assistant Secretary
Mr. Coffey also serves as Assistant Secretary of other funds. He is Senior Vice President and Deputy General Counsel of FMR LLC (diversified financial services company, 2010-present), and is an employee of Fidelity Investments. Previously, Mr. Coffey served as Secretary and CLO of certain funds (2018-2019); CLO, Secretary, and Senior Vice President of Fidelity Management & Research Company and FMR Co., Inc. (investment adviser firms, 2018-2019); Secretary of Fidelity SelectCo, LLC and Fidelity Investments Money Management, Inc. (investment adviser firms, 2018-2019); CLO of Fidelity Management & Research (Hong Kong) Limited, FMR Investment Management (UK) Limited, and Fidelity Management & Research (Japan) Limited (investment adviser firms, 2018-2019); and Assistant Secretary of certain funds (2009-2018).
Timothy M. Cohen (1969)
Year of Election or Appointment: 2018
Vice President
Mr. Cohen also serves as Vice President of other funds. Mr. Cohen serves as Executive Vice President of Fidelity SelectCo, LLC (2019-present), Co-Head of Equity (2018-present), a Director of Fidelity Management & Research (Japan) Limited (investment adviser firm, 2016-present), and is an employee of Fidelity Investments. Previously, Mr. Cohen served as Head of Global Equity Research (2016-2018), Chief Investment Officer - Equity and a Director of Fidelity Management & Research (U.K.) Inc. (investment adviser firm, 2013-2015) and as a Director of Fidelity Management & Research (Hong Kong) Limited (investment adviser firm, 2017).
Jonathan Davis (1968)
Year of Election or Appointment: 2010
Assistant Treasurer
Mr. Davis also serves as Assistant Treasurer of other funds. Mr. Davis serves as Assistant Treasurer of FMR Capital, Inc. (2017-present) and is an employee of Fidelity Investments. Previously, Mr. Davis served as Vice President and Associate General Counsel of FMR LLC (diversified financial services company, 2003-2010).
Adrien E. Deberghes (1967)
Year of Election or Appointment: 2016
Assistant Treasurer
Mr. Deberghes also serves as an officer of other funds. He serves as Assistant Treasurer of FMR Capital, Inc. (2017-present), Executive Vice President of Fidelity Investments Money Management, Inc. (FIMM) (investment adviser firm, 2016-present), and is an employee of Fidelity Investments (2008-present). Previously, Mr. Deberghes served as President and Treasurer of certain Fidelity® funds (2013-2018). Prior to joining Fidelity Investments, Mr. Deberghes was Senior Vice President of Mutual Fund Administration at State Street Corporation (2007-2008), Senior Director of Mutual Fund Administration at Investors Bank & Trust (2005-2007), and Director of Finance for Dunkin' Brands (2000-2005). Previously, Mr. Deberghes served in other fund officer roles.
Laura M. Del Prato (1964)
Year of Election or Appointment: 2018
Assistant Treasurer
Ms. Del Prato also serves as an officer of other funds. Ms. Del Prato is an employee of Fidelity Investments (2017-present). Prior to joining Fidelity Investments, Ms. Del Prato served as a Managing Director and Treasurer of the JPMorgan Mutual Funds (2014-2017). Prior to JPMorgan, Ms. Del Prato served as a partner at Cohen Fund Audit Services (accounting firm, 2012-2013) and KPMG LLP (accounting firm, 2004-2012).
Colm A. Hogan (1973)
Year of Election or Appointment: 2016
Deputy Treasurer
Mr. Hogan also serves as an officer of other funds. Mr. Hogan serves as Assistant Treasurer of FMR Capital, Inc. (2017-present) and is an employee of Fidelity Investments (2005-present). Previously, Mr. Hogan served as Assistant Treasurer of certain Fidelity® funds (2016-2018).
Pamela R. Holding (1964)
Year of Election or Appointment: 2018
Vice President
Ms. Holding also serves as Vice President of other funds. Ms. Holding serves as Executive Vice President of Fidelity SelectCo, LLC (2019-present), Co-Head of Equity (2018-present) and is an employee of Fidelity Investments (2013-present). Previously, Ms. Holding served as Chief Investment Officer of Fidelity Institutional Asset Management (2013-2018).
Cynthia Lo Bessette (1969)
Year of Election or Appointment: 2019
Secretary and Chief Legal Officer (CLO)
Ms. Lo Bessette also serves as Secretary and CLO of other funds. Ms. Lo Bessette serves as CLO, Secretary, and Senior Vice President of Fidelity Management & Research Company and FMR Co., Inc. (investment adviser firms, 2019-present); Secretary of Fidelity SelectCo, LLC and Fidelity Investments Money Management, Inc. (investment adviser firms, 2019-present); and CLO of Fidelity Management & Research (Hong Kong) Limited, FMR Investment Management (UK) Limited, and Fidelity Management & Research (Japan) Limited (investment adviser firms, 2019-present). She is a Senior Vice President and Deputy General Counsel of FMR LLC (diversified financial services company, 2019-present), and is an employee of Fidelity Investments. Previously, Ms. Lo Bessette served as Executive Vice President, General Counsel (2016-2019) and Senior Vice President, Deputy General Counsel (2015-2016) of OppenheimerFunds (investment management company) and Deputy Chief Legal Officer (2013-2015) of Jennison Associates LLC (investment adviser firm).
Chris Maher (1972)
Year of Election or Appointment: 2013
Assistant Treasurer
Mr. Maher serves as Assistant Treasurer of other funds. Mr. Maher is Vice President of Valuation Oversight, serves as Assistant Treasurer of FMR Capital, Inc. (2017-present), and is an employee of Fidelity Investments. Previously, Mr. Maher served as Vice President of Asset Management Compliance (2013), Vice President of the Program Management Group of FMR (investment adviser firm, 2010-2013), and Vice President of Valuation Oversight (2008-2010).
Kenneth B. Robins (1969)
Year of Election or Appointment: 2016
Chief Compliance Officer
Mr. Robins also serves as an officer of other funds. Mr. Robins serves as Compliance Officer of Fidelity Management & Research Company and FMR Co., Inc. (investment adviser firms, 2016-present) and is an employee of Fidelity Investments (2004-present). Previously, Mr. Robins served as Executive Vice President of Fidelity Investments Money Management, Inc. (investment adviser firm, 2013-2016) and served in other fund officer roles.
Stacie M. Smith (1974)
Year of Election or Appointment: 2016
President and Treasurer
Ms. Smith also serves as an officer of other funds. Ms. Smith serves as Assistant Treasurer of FMR Capital, Inc. (2017-present), is an employee of Fidelity Investments (2009-present), and has served in other fund officer roles. Prior to joining Fidelity Investments, Ms. Smith served as Senior Audit Manager of Ernst & Young LLP (accounting firm, 1996-2009). Previously, Ms. Smith served as Assistant Treasurer (2013-2018) and Deputy Treasurer (2013-2016) of certain Fidelity® funds.
Marc L. Spector (1972)
Year of Election or Appointment: 2016
Assistant Treasurer
Mr. Spector also serves as an officer of other funds. Mr. Spector serves as Assistant Treasurer of FMR Capital, Inc. (2017-present) and is an employee of Fidelity Investments (2016-present). Prior to joining Fidelity Investments, Mr. Spector served as Director at the Siegfried Group (accounting firm, 2013-2016), and prior to Siegfried Group as audit senior manager at Deloitte & Touche (accounting firm, 2005-2013).
Jim Wegmann (1979)
Year of Election or Appointment: 2019
Assistant Treasurer
Mr. Wegmann also serves as Assistant Treasurer of other funds. Mr. Wegmann is an employee of Fidelity Investments (2011-present).
Shareholder Expense Example
As a shareholder of the Fund, you incur two types of costs: (1) transaction costs, including sales charges (loads) on purchase payments or redemption proceeds, and (2) ongoing costs, including management fees, distribution and/or service (12b-1) fees and other Fund expenses. This Example is intended to help you understand your ongoing costs (in dollars) of investing in the Fund and to compare these costs with the ongoing costs of investing in other mutual funds.
The Example is based on an investment of $1,000 invested at the beginning of the period and held for the entire period (May 1, 2019 to October 31, 2019).
Actual Expenses
The first line of the accompanying table for each class of the Fund provides information about actual account values and actual expenses. You may use the information in this line, together with the amount you invested, to estimate the expenses that you paid over the period. Simply divide your account value by $1,000.00 (for example, an $8,600 account value divided by $1,000.00 = 8.6), then multiply the result by the number in the first line for a class of the Fund under the heading entitled "Expenses Paid During Period" to estimate the expenses you paid on your account during this period. In addition, the Fund, as a shareholder in the underlying Fidelity Central Funds, will indirectly bear its pro-rata share of the fees and expenses incurred by the underlying Fidelity Central Funds. These fees and expenses are not included in the Fund's annualized expense ratio used to calculate the expense estimate in the table below.
Hypothetical Example for Comparison Purposes
The second line of the accompanying table for each class of the Fund provides information about hypothetical account values and hypothetical expenses based on a Class' actual expense ratio and an assumed rate of return of 5% per year before expenses, which is not the Class' actual return. The hypothetical account values and expenses may not be used to estimate the actual ending account balance or expenses you paid for the period. You may use this information to compare the ongoing costs of investing in the Fund and other funds. To do so, compare this 5% hypothetical example with the 5% hypothetical examples that appear in the shareholder reports of the other funds. In addition, the Fund, as a shareholder in the underlying Fidelity Central Funds, will indirectly bear its pro-rata share of the fees and expenses incurred by the underlying Fidelity Central Funds. These fees and expenses are not included in the Fund's annualized expense ratio used to calculate the expense estimate in the table below.
Please note that the expenses shown in the table are meant to highlight your ongoing costs only and do not reflect any transaction costs. Therefore, the second line of the table is useful in comparing ongoing costs only, and will not help you determine the relative total costs of owning different funds. In addition, if these transactional costs were included, your costs would have been higher.
| | Annualized Expense Ratio-A | Beginning
Account Value
May 1, 2019 | Ending
Account Value
October 31, 2019 | Expenses Paid
During Period-B
May 1, 2019
to October 31, 2019 |
| Class A | 1.45% | | | |
| Actual | | $1,000.00 | $1,052.50 | $7.50 |
| Hypothetical-C | | $1,000.00 | $1,017.90 | $7.38 |
| Class M | 1.70% | | | |
| Actual | | $1,000.00 | $1,050.40 | $8.79 |
| Hypothetical-C | | $1,000.00 | $1,016.64 | $8.64 |
| Class C | 2.20% | | | |
| Actual | | $1,000.00 | $1,048.10 | $11.36 |
| Hypothetical-C | | $1,000.00 | $1,014.12 | $11.17 |
| Class I | 1.20% | | | |
| Actual | | $1,000.00 | $1,053.70 | $6.21 |
| Hypothetical-C | | $1,000.00 | $1,019.16 | $6.11 |
| Class Z | 1.05% | | | |
| Actual | | $1,000.00 | $1,054.30 | $5.44 |
| Hypothetical-C | | $1,000.00 | $1,019.91 | $5.35 |
A Annualized expense ratio reflects expenses net of applicable fee waivers.
B Expenses are equal to each Class' annualized expense ratio, multiplied by the average account value over the period, multiplied by 184/365 (to reflect the one-half year period).
C 5% return per year before expenses
Distributions (Unaudited)
A total of 0.59% of the dividends distributed during the fiscal year was derived from interest on U.S. Government securities which is generally exempt from state income tax.
Class A, Class M, Class C, Class I and Class Z designate 100% of the dividends distributed during the fiscal year as qualifying for the dividends-received deduction for corporate shareholders.
Class A, Class M, Class C, Class I and Class Z designate 100% of the dividends distributed during the fiscal year as amounts which may be taken into account as a dividend for the purposes of the maximum rate under section 1(h)(11) of the Internal Revenue Code.
The fund will notify shareholders in January 2020 of amounts for use in preparing 2019 income tax returns.
AGED-ANN-1219
1.938151.107
Item 2.
Code of Ethics
As of the end of the period, October 31, 2019, Fidelity Advisor Series VIII (the trust) has adopted a code of ethics, as defined in Item 2 of Form N-CSR, that applies to its President and Treasurer and its Chief Financial Officer. A copy of the code of ethics is filed as an exhibit to this Form N-CSR.
Item 3.
Audit Committee Financial Expert
The Board of Trustees of the trust has determined that Joseph Mauriello is an audit committee financial expert, as defined in Item 3 of Form N-CSR. Mr. Mauriello is independent for purposes of Item 3 of Form N-CSR.
Item 4.
Principal Accountant Fees and Services
Fees and Services
The following table presents fees billed by Deloitte & Touche LLP, the member firms of Deloitte Touche Tohmatsu, and their respective affiliates (collectively, “Deloitte Entities”) in each of the last two fiscal years for services rendered to Fidelity Advisor Emerging Markets Fund and Fidelity Advisor International Capital Appreciation Fund (the “Fund(s)”):
Services Billed by Deloitte Entities
October 31, 2019 FeesA
| | | | |
| Audit Fees | Audit-Related Fees | Tax Fees | All Other Fees |
Fidelity Advisor Emerging Markets Fund | $46,000 | $100 | $7,100 | $1,200 |
Fidelity Advisor International Capital Appreciation Fund | $54,000 | $100 | $7,100 | $1,400 |
| | | | |
| Audit Fees | Audit-Related Fees | Tax Fees | All Other Fees |
Fidelity Advisor Emerging Markets Fund | $46,000 | $100 | $7,100 | $1,400 |
Fidelity Advisor International Capital Appreciation Fund | $55,000 | $100 | $7,100 | $1,600 |
AAmounts may reflect rounding.
The following table presents fees billed by PricewaterhouseCoopers LLP (“PwC”) in each of the last two fiscal years for services rendered to Fidelity Advisor Diversified International Fund, Fidelity Advisor Emerging Asia Fund, Fidelity Advisor Global Capital Appreciation Fund, Fidelity Advisor Global Equity Income Fund, Fidelity Advisor Overseas Fund and Fidelity Advisor Value Leaders Fund (the “Fund(s)”):
Services Billed by PwC
October 31, 2019 FeesA
| | | | |
| Audit Fees | Audit-Related Fees | Tax Fees | All Other Fees |
Fidelity Advisor Diversified International Fund | $56,000 | $4,800 | $6,400 | $2,100 |
Fidelity Advisor Emerging Asia Fund | $71,000 | $5,200 | $5,300 | $2,400 |
Fidelity Advisor Global Capital Appreciation Fund | $55,000 | $4,600 | $5,500 | $2,100 |
Fidelity Advisor Global Equity Income Fund | $55,000 | $4,000 | $5,300 | $1,800 |
Fidelity Advisor Overseas Fund | $63,000 | $5,300 | $5,500 | $2,400 |
Fidelity Advisor Value Leaders Fund | $43,000 | $3,600 | $4,600 | $1,600 |
| | | | |
| Audit Fees | Audit-Related Fees | Tax Fees | All Other Fees |
Fidelity Advisor Diversified International Fund | $58,000 | $5,200 | $6,300 | $2,600 |
Fidelity Advisor Emerging Asia Fund | $65,000 | $5,700 | $5,200 | $2,800 |
Fidelity Advisor Global Capital Appreciation Fund | $57,000 | $5,000 | $5,200 | $2,500 |
Fidelity Advisor Global Equity Income Fund | $48,000 | $4,300 | $5,200 | $2,100 |
Fidelity Advisor Overseas Fund | $66,000 | $5,800 | $5,400 | $2,900 |
Fidelity Advisor Value Leaders Fund | $43,000 | $3,900 | $4,400 | $1,900 |
AAmounts may reflect rounding.
The following table(s) present(s) fees billed by Deloitte Entities and PwC that were required to be approved by the Audit Committee for services that relate directly to the operations and financial reporting of the Fund(s) and that are rendered on behalf of Fidelity Management & Research Company ("FMR") and entities controlling, controlled by, or under common control with FMR (not including any sub-adviser whose role is primarily portfolio management and is subcontracted with or overseen by another investment adviser) that provide ongoing services to the Fund(s) (“Fund Service Providers”):
Services Billed by Deloitte Entities
| | |
| October 31, 2019A | October 31, 2018A |
Audit-Related Fees | $290,000 | $5,000 |
Tax Fees | $5,000 | $5,000 |
All Other Fees | $- | $- |
A Amounts may reflect rounding.
Services Billed by PwC
| | |
| October 31, 2019A | October 31, 2018A |
Audit-Related Fees | $7,890,000 | $7,745,000 |
Tax Fees | $10,000 | $20,000 |
All Other Fees | $- | $- |
A Amounts may reflect rounding.
“Audit-Related Fees” represent fees billed for assurance and related services that are reasonably related to the performance of the fund audit or the review of the fund's financial statements and that are not reported under Audit Fees.
“Tax Fees” represent fees billed for tax compliance, tax advice or tax planning that relate directly to the operations and financial reporting of the fund.
“All Other Fees” represent fees billed for services provided to the fund or Fund Service Provider, a significant portion of which are assurance related, that relate directly to the operations and financial reporting of the fund, excluding those services that are reported under Audit Fees, Audit-Related Fees or Tax Fees.
Assurance services must be performed by an independent public accountant.
* * *
The aggregate non-audit fees billed by Deloitte Entities and PwC for services rendered to the Fund(s), FMR (not including any sub-adviser whose role is primarily portfolio management and is subcontracted with or overseen by another investment adviser), and any Fund Service Provider for each of the last two fiscal years of the Fund(s) are as follows:
| | |
Billed By | October 31, 2019A | October 31, 2018A |
Deloitte Entities | $590,000 | $495,000 |
PwC | $12,615,000 | $11,015,000 |
A Amounts may reflect rounding.
The trust's Audit Committee has considered non-audit services that were not pre-approved that were provided by Deloitte Entities and PwC to Fund Service Providers to be compatible with maintaining the independence of Deloitte Entities and PwC in its(their) audit of the Fund(s), taking into account representations from Deloitte Entities and PwC, in accordance with Public Company Accounting Oversight Board rules, regarding its independence from the Fund(s) and its(their) related entities and FMR’s review of the appropriateness and permissibility under applicable law of such non-audit services prior to their provision to the Fund(s) Service Providers.
Audit Committee Pre-Approval Policies and Procedures
The trust’s Audit Committee must pre-approve all audit and non-audit services provided by a fund’s independent registered public accounting firm relating to the operations or financial reporting of the fund. Prior to the commencement of any audit or non-audit services to a fund, the Audit Committee reviews the services to determine whether they are appropriate and permissible under applicable law.
The Audit Committee has adopted policies and procedures to, among other purposes, provide a framework for the Committee’s consideration of non-audit services by the audit firms that audit the Fidelity funds. The policies and procedures require that any non-audit service provided by a fund audit firm to a Fidelity fund and any non-audit service provided by a fund auditor to a Fund Service Provider that relates directly to the operations and financial reporting of a Fidelity fund (“Covered Service”) are subject to approval by the Audit Committee before such service is provided.
All Covered Services must be approved in advance of provision of the service either: (i) by formal resolution of the Audit Committee, or (ii) by oral or written approval of the service by the Chair of the Audit Committee (or if the Chair is unavailable, such other member of the Audit Committee as may be designated by the Chair to act in the Chair’s absence). The approval contemplated by (ii) above is permitted where the Treasurer determines that action on such an engagement is necessary before the next meeting of the Audit Committee.
Non-audit services provided by a fund audit firm to a Fund Service Provider that do not relate directly to the operations and financial reporting of a Fidelity fund are reported to the Audit Committee periodically.
Non-Audit Services Approved Pursuant to Rule 2-01(c)(7)(i)(C) and (ii) of Regulation S-X (“De Minimis Exception”)
There were no non-audit services approved or required to be approved by the Audit Committee pursuant to the De Minimis Exception during the Fund’s(s’) last two fiscal years relating to services provided to (i) the Fund(s) or (ii) any Fund Service Provider that relate directly to the operations and financial reporting of the Fund(s).
Item 5.
Audit Committee of Listed Registrants
Not applicable.
Item 6.
Investments
(a)
Not applicable.
(b)
Not applicable.
Item 7.
Disclosure of Proxy Voting Policies and Procedures for Closed-End Management Investment Companies
Not applicable.
Item 8.
Portfolio Managers of Closed-End Management Investment Companies
Not applicable.
Item 9.
Purchase of Equity Securities by Closed-End Management Investment Company and Affiliated Purchasers
Not applicable.
Item 10.
Submission of Matters to a Vote of Security Holders
There were no material changes to the procedures by which shareholders may recommend nominees to the trust’s Board of Trustees.
Item 11.
Controls and Procedures
(a)(i) The President and Treasurer and the Chief Financial Officer have concluded that the trust’s disclosure controls and procedures (as defined in Rule 30a-3(c) under the
Investment Company Act) provide reasonable assurances that material information relating to the trust is made known to them by the appropriate persons, based on their evaluation of these controls and procedures as of a date within 90 days of the filing date of this report.
(a)(ii) There was no change in the trust’s internal control over financial reporting (as defined in Rule 30a-3(d) under the Investment Company Act) that occurred during the period covered by this report that has materially affected, or is reasonably likely to materially affect, the trust’s internal control over financial reporting.
Item 12.
Disclosure of Securities Lending Activities for Closed-End Management
Investment Companies
Not applicable.
Item 13.
Exhibits
| | |
(a) | (1) | Code of Ethics pursuant to Item 2 of Form N-CSR is filed and attached hereto as EX-99.CODE ETH. |
(a) | (2) | Certification pursuant to Rule 30a-2(a) under the Investment Company Act of 1940 (17 CFR 270.30a-2(a)) is filed and attached hereto as Exhibit 99.CERT. |
(a) | (3) | Not applicable. |
(b) |
| Certification pursuant to Rule 30a-2(b) under the Investment Company Act of 1940 (17 CFR 270.30a-2(b)) is furnished and attached hereto as Exhibit 99.906CERT. |
SIGNATURES
Pursuant to the requirements of the Securities Exchange Act of 1934 and the Investment Company Act of 1940, the registrant has duly caused this report to be signed on its behalf by the undersigned, thereunto duly authorized.
Fidelity Advisor Series VIII
| |
By: | /s/Stacie M. Smith |
| Stacie M. Smith |
| President and Treasurer |
|
|
Date: | December 26, 2019 |
Pursuant to the requirements of the Securities Exchange Act of 1934 and the Investment Company Act of 1940, this report has been signed below by the following persons on behalf of the registrant and in the capacities and on the dates indicated.
| |
By: | /s/Stacie M. Smith |
| Stacie M. Smith |
| President and Treasurer |
|
|
Date: | December 26, 2019 |
| |
By: | /s/John J. Burke III |
| John J. Burke III |
| Chief Financial Officer |
|
|
Date: | December 26, 2019 |