UNITED STATES
SECURITIES AND EXCHANGE COMMISSION
Washington, D.C. 20549
FORM N-CSR
Certified Shareholder Report of
Registered Management Investment Companies
Investment Company Act File Number: 811-03857
American Funds Insurance Series
(Exact Name of Registrant as Specified in Charter)
333 South Hope Street
Los Angeles, California 90071
(Address of Principal Executive Offices)
Registrant's telephone number, including area code: (213) 486-9200
Date of fiscal year end: December 31
Date of reporting period: December 31, 2018
Steven I. Koszalka
American Funds Insurance Series
333 South Hope Street
Los Angeles, California 90071
(Name and Address of Agent for Service)
ITEM 1 – Reports to Stockholders
| American Funds Insurance Series® | |
| Annual report for the year ended December 31, 2018 | |

We believe in
investing in global
companies for
the long term.
Beginning on January 1, 2021, as permitted by regulations adopted by the U.S. Securities and Exchange Commission, you may not receive paper copies of the fund’s shareholder reports from the insurance company that offers your contract unless you specifically request paper copies from the insurance company or from your financial intermediary. Instead, the shareholder reports will be made available on a website, and the insurance company will notify you by mail each time a report is posted and provide you with a website link to access the report. Instructions for requesting paper copies will be provided by your insurance company.
If you have already elected to receive shareholder reports electronically, you will not be affected by this change and do not need to take any action. You may elect to receive shareholder reports and other communications from the insurance company electronically by following the instructions provided by the insurance company.
You may elect to receive paper copies of all future reports free of charge from the insurance company. You can inform the insurance company that you wish to continue receiving paper copies of your shareholder reports by following the instructions provided by the insurance company. Your election to receive paper reports will apply to all investment options available under your contract.
American Funds Insurance Series, by Capital Group, is the underlying investment vehicle for many variable annuities and insurance products. For more than 85 years, Capital Group has invested with a long-term focus based on thorough research and attention to risk.
Investing for short periods makes losses more likely. For current information and month-end results, visit americanfunds.com/afis. For information about your insurance contract and month-end results, go to the website of the company that issued your contract.
Investing outside the United States involves risks, such as currency fluctuations, periods of illiquidity and price volatility, as more fully described in the prospectus. These risks may be heightened in connection with investments in developing countries. Investing in small-capitalization stocks can involve greater risk than is customarily associated with investing in stocks of larger, more established companies. The return of principal for bond funds and for funds with significant underlying bond holdings is not guaranteed. Fund shares are subject to the same interest rate, inflation and credit risks associated with the underlying bond holdings. High-yield bonds are subject to greater fluctuations in value and risk of loss of income and principal than investment-grade bonds. Bond ratings, which typically range from AAA/Aaa (highest) to D (lowest), are assigned by credit rating agencies such as Standard & Poor’s, Moody’s and/or Fitch as an indication of an issuer’s creditworthiness. Futures may not provide an effective hedge of the underlying securities because changes in the prices of futures may not track those of the securities they are intended to hedge. In addition, the managed risk strategy may not effectively protect the funds from market declines and will limit the funds’ participation in market gains. The use of the managed risk strategy could cause the funds’ returns to lag those of the applicable underlying funds in certain rising market conditions. Refer to the funds’ prospectuses and the Risk Factors section of this report for more information on these and other risks associated with investing in the funds.
Investments are not FDIC-insured, nor are they deposits of or guaranteed by a bank or any other entity, so they may lose value.
Contents
Global equity markets, pressured by rising interest rates and a slowing global economy, fell on an annual basis for the first time since 2015, as measured by the 9.42% decline in the MSCI ACWI (All Country World Index).1,2Tighter monetary policy, potentially peaking earnings and a brewing trade war involving the U.S., China and Europe reverberated around the world, halting one of the longest-running bull markets in history.
Despite strong corporate earnings and economic growth boosted by tax cuts early in the year, a decline of 4.50% was recorded by the MSCI USA Index.1,3The nation’s GDP is estimated to have grown at an annualized 3.4% in the third quarter with the U.S. unemployment rate remaining at 3.7% in November, the lowest level in nearly 50 years. However, a series of trade-related issues between the U.S. and China that elevated geopolitical tensions, combined with political turmoil and high valuation in the U.S., contributed to a decline in the fourth quarter that wiped out the gains of the previous three quarters. Meanwhile, the Federal Reserve raised the benchmark federal funds rate to a range of 2.25% to 2.50%. The Fed continued on its path to reduce the size of its balance sheet and raised rates by a quarter percentage point four times over the past 12 months. This added to investor unease by the time they got to the fourth increase.
In Europe, worries over trade, delays in reaching a separation agreement between the U.K. and the European Union, and a general retreat in favor of U.S. equities hurt markets. The MSCI Europe Index1fell 14.86% with Germany (-22.17%), Italy (-17.75%), France (-12.76%) and the U.K. (-14.15%) all registering double-digit losses. In an unexpected shift from the prior year, the European economy lurched to a near halt. Deteriorating trade relations also weighed on European stocks, given the region’s dependence on international trade. Adding to those concerns, the European Central Bank ended its bond-buying stimulus program in December, removing a degree of support for the economy. As business sentiment dropped, eurozone economic growth slowed to an annualized 0.6% in the third quarter, down from 2.3% at the end of 2017. Elsewhere among developed markets, Japanese equities declined 12.88% as the economy stumbled, contracting for the first time since 2015. Private consumption faltered and output declined, owing partly to natural disasters that hurt exports and tourism.
Emerging markets stocks also fell (the MSCI Emerging Markets Investable Market Index1,4was down 15.05%), dragged down by China’s weakening economy, heightened U.S.-China trade frictions and a rally in the U.S. dollar. In China, selling intensified as the economy decelerated and its trade clash with the U.S. escalated. Chinese stocks (-18.74%) posted their worst annual return since 2011, as shares of their leading technology-related companies fell from lofty levels. Individual market economies
All market indexes referenced in this report are unmanaged and, therefore, have no expenses. Investors cannot invest directly in an index. Country returns are based on MSCI indexes, which reflect reinvestment of distributions and dividends net of withholding taxes, except for the MSCI USA Index, which reflects dividends gross of withholding taxes.
| 1 | Source: MSCI. |
| 2 | The MSCI ACWI is a free float-adjusted market capitalization-weighted index that is designed to measure equity market results in the global developed and emerging markets, consisting of more than 40 developed and emerging market country indexes. Results reflect dividends net of withholding taxes. |
| 3 | The MSCI USA Index is a free float-adjusted, market capitalization-weighted index that is designed to measure the U.S. portion of the world market. Results reflect dividends gross of withholding taxes. |
| 4 | MSCI Emerging Markets Investable Market Index (IMI) is a free float-adjusted market capitalization-weighted index that is designed to measure results of the large-, mid-, and small-capitalization segments of more than 20 emerging equity markets. Results reflect dividends net of withholding taxes. |
| American Funds Insurance Series | 1 |
— Brazil and Turkey most notably — were impacted by idiosyncratic political and economic developments.
In bond markets, U.S. corporate investment-grade securities (rated BBB/ Baa and above) declined 2.51% (as measured by the Bloomberg Barclays U.S. Corporate Investment Grade Index5,6), while U.S. high-yield corporate debt slipped 2.08% (as measured by the Bloomberg Barclays U.S. Corporate High Yield 2% Issuer Capped Index5,7). More broadly, the Bloomberg Barclays Global Aggregate Index5,8was down 1.20%, while the Bloomberg Barclays U.S. Aggregate Index5,9was virtually unchanged at 0.01%. The 10-year Treasury yield, which stood at 2.40% on December 31, 2017, rose marginally to finish at 2.69%. The J.P. Morgan Emerging Markets Bond Index – Global10lost 4.61%.
In currency markets, the U.S. dollar rose against most currencies. The euro (-4.80%), British pound (-5.85%) and Canadian dollar (-8.26%) all experienced headwinds from a stronger U.S. dollar. Although most currencies slipped, the Japanese yen was a rare gainer, as it rose 2.68% against the dollar.
Looking ahead
All over the globe, economies appear to be slowing down and equity markets are exhibiting volatility. The current environment is rife with uncertainty, from trade-related disputes to geopolitical tensions to elevated debt levels. We will be following and analyzing each of these issues. But now that these uncertainties have been priced into markets, we can utilize these new lower valuations as we search for securities that are attractive on a longer-term basis. We’re careful by nature, and we know that after a period when everyone is very concerned, it is usually a good time to pick one’s head up and look around for bargains.
Our time-tested approach — based on extensive research, a long-term outlook and close attention to valuation — has served investors well over time. As always, we thank you for your continued support of our efforts and we look forward to reporting to you again in six months.
Sincerely,

Donald D. O’Neal
Co-President

Alan N. Berro
Co-President
February 12, 2019
| 5 | Source: Bloomberg Index Services Ltd. |
| 6 | The Bloomberg Barclays U.S. Corporate Investment Grade Index represents the universe of investment grade, publicly issued U.S. corporate and specified foreign debentures and secured notes that meet the specified maturity, liquidity and quality requirements. |
| 7 | The Bloomberg Barclays U.S. Corporate High Yield 2% Issuer Capped Index covers the universe of fixed-rate, non-investment-grade debt. The index limits the maximum exposure of any one issuer to 2%. |
| 8 | The Bloomberg Barclays Global Aggregate Index represents the global investment-grade fixed income markets. |
| 9 | The Bloomberg Barclays U.S. Aggregate Index represents the U.S. investment-grade fixed-rate bond market. |
| 10 | The J.P. Morgan Emerging Markets Bond Index – Global tracks total returns for U.S. dollar-denominated debt instruments issued by emerging markets sovereign and quasi-sovereign entities, including Brady bonds, loans and Eurobonds. |
| 2 | American Funds Insurance Series |
Summary investment portfolios
Summary investment portfolios are designed to streamline this report and help investors better focus on the funds’ principal holdings. Ultra-Short Bond Fund, Managed Risk Growth Fund, Managed Risk International Fund, Managed Risk Blue Chip Income and Growth Fund, Managed Risk Growth-Income Fund and Managed Risk Asset Allocation Fund show a complete listing of portfolio holdings. See the inside back cover for details on how to obtain a complete schedule of portfolio holdings for each fund in the series.
Unless otherwise indicated, American Funds Insurance Series investment results are for Class 1 shares (Class P1 shares for managed risk funds). Class 1A shares began operations on January 6, 2017. Class 2 shares began operations on April 30, 1997. Class 3 shares began operations on January 16, 2004. Class 4 shares began operations on December 14, 2012. Results encompassing periods prior to those dates assume a hypothetical investment in Class 1 shares and include the deduction of additional annual expenses (0.25% for Class 1A shares, 0.25% for Class 2 shares, 0.18% for Class 3 shares and 0.50% for Class 4 shares).
The variable annuities and life insurance contracts that use the series funds contain certain fees and expenses not reflected in this report. Investment results assume all distributions are reinvested and reflect applicable fees and expenses. The series investment adviser waived a portion of its management fees for all existing funds from September 1, 2004, through December 31, 2008, for Global Growth and Income Fund from May 1, 2006, through December 31, 2008, for International Growth and Income Fund from November 18, 2008, through December 31, 2008, for U.S. Government/AAA-Rated Securities Fund from July 1, 2010, through December 31, 2010, and for Blue Chip Income and Growth Fund from February 1, 2014, through January 31, 2015.
For the managed risk funds, the investment adviser is currently waiving a portion of its management fee equal to 0.05% of the funds’ net assets. In addition, the investment adviser is currently reimbursing a portion of other expenses for Managed Risk International Fund and Managed Risk Growth-Income Fund. The waivers and reimbursements will be in effect through at least May 1, 2020, unless modified or terminated by the series board. After that time, the investment adviser may elect to extend, modify or terminate the reimbursements. The waivers may only be modified or terminated with the approval of the series board. Applicable fund results shown reflect the waivers and reimbursements, without which results would have been lower. See the Financial Highlights tables in this report for details.
The Managed Risk Growth Fund pursues its objective by investing in shares of American Funds Insurance Series — Growth FundSMand American Funds Insurance Series — Bond FundSM. The Managed Risk International Fund pursues its objective by investing in shares of American Funds Insurance Series — International FundSMand American Funds Insurance Series — Bond FundSM. The Managed Risk Blue Chip Income and Growth Fund pursues its objective by investing in shares of American Funds Insurance Series — Blue Chip Income and Growth FundSMand American Funds Insurance Series — U.S. Government/AAA-Rated Securities FundSM. The Managed Risk Growth-Income Fund pursues its objective by investing in shares of American Funds Insurance Series — Growth-Income FundSMand American Funds Insurance Series — Bond FundSM. The Managed Risk Asset Allocation Fund pursues its objective by investing in shares of American Funds Insurance Series — Asset Allocation FundSM. The funds seek to manage portfolio volatility and provide downside protection, primarily through the use of exchange-traded futures. The benefit of the funds’ managed risk strategy should be most apparent during periods of high volatility and in down markets. In steady or rising markets, the funds’ results can be expected to lag those of the underlying fund.
Funds are listed in the report as follows: equity, balanced, fixed income and managed risk.
| American Funds Insurance Series | 3 |
Fund results shown are for past periods and are not predictive of results for future periods. Current and future results may be lower or higher than those shown. Unit prices and returns will vary, so investors may lose money. For current information and month-end results, visit americanfunds.com/afis. For information about your insurance contract and month-end results, go to the website of the company that issued your contract.
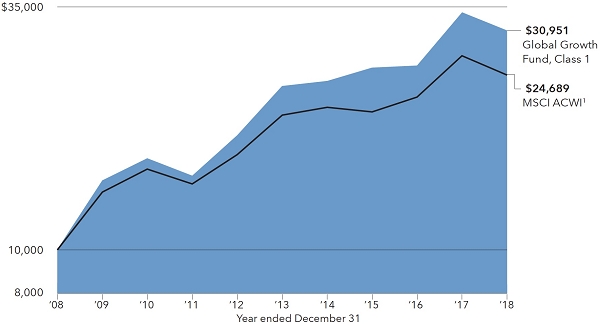
Global Growth Fund slipped 8.81% for the 12 months ended December 31, 2018, compared with a 9.42% decrease for the MSCI ACWI (All Country World Index),1a free float-adjusted market capitalization-weighted index that is designed to measure equity market results in the global developed and emerging markets, consisting of more than 40 developed and emerging market country indexes.
Global stocks, as measured by the MSCI ACWI, ended the year in negative territory hurt by slowing economic growth, increased volatility and higher interest rates in the U.S. While ongoing turmoil over the U.K.’s departure from the European Union weighed on European stocks, a combination of a stronger U.S. dollar and heightened U.S.-China trade frictions impacted emerging markets equities. Cyclical stocks posted the biggest losses, underscored by double-digit declines in the financials, industrials and materials sectors.
An eclectic mix of financials and consumer discretionary investments boosted the fund’s relative returns. Amazon reported strong third-quarter earnings that beat analyst estimates thanks to its cloud and advertising segments, and was the top contributor to the fund’s relative returns. Investments in information technology were the biggest drag on relative results led by AAC Technologies Holdings, Tencent and Facebook, losing ground as a broad selloff continued in the formerly high-flying sector.
On a geographic basis, stocks of companies domiciled in the U.S., Germany and India were additive to relative results, while stocks of companies based in the U.K., China and Brazil lagged.
Despite market volatility, the fund’s portfolio managers are optimistic they will continue to find good companies globally that offer high-quality products, and whose values are not yet fully reflected in their share prices.
| Country diversification | Percent of net assets | |||
| The Americas | ||||
| United States | 43.6 | % | ||
| Other | 1.2 | |||
| 44.8 | ||||
| Europe | ||||
| United Kingdom | 6.8 | |||
| Netherlands | 5.0 | |||
| France | 4.4 | |||
| Switzerland | 3.8 | |||
| Germany | 1.8 | |||
| Russian Federation | 1.3 | |||
| Sweden | 1.1 | |||
| Other | 2.8 | |||
| 27.0 | ||||
| Asia/Pacific Basin | ||||
| China | 4.7 | |||
| Japan | 4.4 | |||
| Taiwan | 4.3 | |||
| Hong Kong | 3.2 | |||
| India | 1.9 | |||
| Other | 2.4 | |||
| 20.9 | ||||
| Other regions | ||||
| South Africa | 1.7 | |||
| Short-term securities & other assets less liabilities | 5.6 | |||
| Total | 100.0 | % | ||
| Largest equity securities | Percent of net assets | |||
| Amazon | 6.24 | % | ||
| TSMC | 3.82 | |||
| Alphabet | 3.54 | |||
| ASML | 3.32 | |||
| Microsoft | 2.92 | |||
| Visa | 2.74 | |||
| Alibaba Group | 2.32 | |||
| AIA Group | 2.26 | |||
| Broadcom | 2.25 | |||
| Airbus Group | 1.91 | |||
| 4 | American Funds Insurance Series |
Global Growth Fund
How a $10,000 investment has grown
Average annual total returns based on a $1,000 investment
For periods ended December 31, 2018
| Lifetime | Expense | |||||||||||||||||||
| 1 year | 5 years | 10 years | (since April 30, 1997) | ratio | ||||||||||||||||
| Class 1 | –8.81 | % | 5.92 | % | 11.96 | % | 9.16 | % | .55 | % | ||||||||||
| Class 1A | –9.02 | 5.66 | 11.69 | 8.89 | .80 | |||||||||||||||
| Class 2 | –9.04 | 5.65 | 11.69 | 8.89 | .80 | |||||||||||||||
| Class 4 | –9.24 | 5.39 | 11.45 | 8.64 | 1.05 | |||||||||||||||
Investment results assume all distributions are reinvested and reflect applicable fees and expenses. The fund’s investment adviser waived a portion of its management fees from September 1, 2004, through December 31, 2008. Applicable fund results shown reflect the waiver, without which they would have been lower. Expense ratios are as of the fund’s prospectus dated May 1, 2019 (unaudited). See the Financial Highlights table in this report for details.
Any market index shown is unmanaged and, therefore, has no expenses. Investors cannot invest directly in an index.
| 1 | Source: MSCI. The MSCI index result reflects dividends net of withholding taxes and reinvestment of distributions. |
| Where the fund’s assets were invested as of December 31, 2018 | Percent of net assets |

| American Funds Insurance Series | 5 |
Global Small Capitalization Fund
Fund results shown are for past periods and are not predictive of results for future periods. Current and future results may be lower or higher than those shown. Unit prices and returns will vary, so investors may lose money. For current information and month-end results, visit americanfunds.com/afis. For information about your insurance contract and month-end results, go to the website of the company that issued your contract.
Global Small Capitalization Fund declined 10.31% for the 12 months ended December 31, 2018. Its benchmark, the MSCI All Country World Small Cap Index,1a free float-adjusted market capitalization-weighted index that is designed to measure equity market results of smaller capitalization companies in both developed and emerging markets, fell 14.39%.
Global stocks, as measured by the MSCI ACWI, ended the year in negative territory hurt by slowing economic growth, increased volatility and higher interest rates in the U.S. While ongoing turmoil over the U.K.’s departure from the European Union weighed on European stocks, a combination of a stronger U.S. dollar and heightened U.S.-China trade frictions impacted emerging markets equities. Cyclical stocks posted the biggest losses, underscored by double-digit declines in the financials, industrials and materials sectors.
Fund holdings in the health care sector, which includes investments across multiple sub-segments from biotechnology and pharmaceuticals to life sciences tools and services, aided returns. Evolent Health contributed to the fund’s results as the benefits of value-based care gained support. However, the fund’s investments in consumer discretionary stocks, such as Tele Columbus and Melco International Development, hurt results amid market volatility and weak economic data from the Eurozone and China.
While investments in U.S. companies were additive to relative returns, investments in companies domiciled in Hong Kong detracted.
The fund’s portfolio managers continue to seek investment opportunities in undervalued companies that have the potential to revolutionize industries and benefit shareholders. Innovation at smaller health care companies, for example, helps facilitate breakthroughs and the biotechnology industry is an area of interest due to continuous improvements in drug research methods and approval processes. The fund also currently invests in nearly 300 companies diversified across geographies. Political uncertainty in both the U.S. and U.K. leads to some concerns about business confidence in the short term. As always, we maintain our commitment to investing for the long term and believe our rigorous bottom-up research into each potential equity investment can help achieve this goal.
| Country diversification | Percent of net assets | |||
| The Americas | ||||
| United States | 42.4 | % | ||
| Brazil | 1.5 | |||
| Canada | 1.2 | |||
| Other | .7 | |||
| 45.8 | ||||
| Asia/Pacific Basin | ||||
| India | 5.8 | |||
| Japan | 5.5 | |||
| China | 4.7 | |||
| Hong Kong | 2.6 | |||
| Philippines | 1.8 | |||
| South Korea | 1.2 | |||
| Thailand | 1.0 | |||
| Taiwan | 1.0 | |||
| Other | 1.1 | |||
| 24.7 | ||||
| Europe | ||||
| United Kingdom | 7.3 | |||
| Germany | 2.2 | |||
| Sweden | 2.0 | |||
| Switzerland | 1.1 | |||
| Italy | 1.1 | |||
| Other | 4.9 | |||
| 18.6 | ||||
| Short-term securities & other assets less liabilities | 10.9 | |||
| Total | 100.0 | % | ||
| Largest equity securities | Percent of net assets | |||
| GW Pharmaceuticals | 2.19 | % | ||
| Insulet | 1.87 | |||
| Kotak Mahindra Bank | 1.54 | |||
| Paycom | 1.44 | |||
| Allakos | 1.27 | |||
| Molina Healthcare | 1.21 | |||
| Five Below | 1.18 | |||
| International Container Terminal Services | 1.17 | |||
| iRhythm | 1.17 | |||
| Integra LifeSciences Holdings | 1.14 | |||
| 6 | American Funds Insurance Series |
Global Small Capitalization Fund
How a $10,000 investment has grown

Average annual total returns based on a $1,000 investment
For periods ended December 31, 2018
| Lifetime | Expense | |||||||||||||||||||
| 1 year | 5 years | 10 years | (since April 30, 1998) | ratio | ||||||||||||||||
| Class 1 | –10.31 | % | 3.57 | % | 11.32 | % | 8.73 | % | .74 | % | ||||||||||
| Class 1A | –10.56 | 3.32 | 11.04 | 8.46 | .99 | |||||||||||||||
| Class 2 | –10.55 | 3.32 | 11.04 | 8.46 | .99 | |||||||||||||||
| Class 4 | –10.80 | 3.06 | 10.77 | 8.19 | 1.24 | |||||||||||||||
Investment results assume all distributions are reinvested and reflect applicable fees and expenses. The fund’s investment adviser waived a portion of its management fees from September 1, 2004, through December 31, 2008. Applicable fund results shown reflect the waiver, without which they would have been lower. Expense ratios are as of the fund’s prospectus dated May 1, 2019 (unaudited). See the Financial Highlights table in this report for details.
Any market index shown is unmanaged and, therefore, has no expenses. Investors cannot invest directly in an index.
| 1 | Source: MSCI. The MSCI index result reflects dividends net of withholding taxes and reinvestment of distributions. |
| Where the fund’s assets were invested as of December 31, 2018 | Percent of net assets |

| American Funds Insurance Series | 7 |
Growth Fund
Fund results shown are for past periods and are not predictive of results for future periods. Current and future results may be lower or higher than those shown. Unit prices and returns will vary, so investors may lose money. For current information and month-end results, visit americanfunds.com/afis. For information about your insurance contract and month-end results, go to the website of the company that issued your contract.
Growth Fund marginally lost 0.01% for the 12 months ended December 31, 2018, compared with a 4.38% decline in its benchmark index, Standard & Poor’s 500 Composite Index,1a market capitalization-weighted index based on the results of approximately 500 widely held common stocks.
U.S. equities declined for the first calendar year since 2008. Concerns over trade conflicts, slowing global growth and high valuations contributed to persistent volatility. Energy and materials companies were further pressured by falling commodity prices. While growth-oriented stocks performed relatively better than defensive stocks, many companies experienced wild swings throughout the year.
Investments in the information technology and consumer discretionary sectors boosted the fund’s returns. Among the fund’s top contributors to returns (posting double-digit gains) was consumer discretionary company Amazon and information technology company ServiceNow. While Amazon reported strong third-quarter earnings that beat analyst estimates thanks to its cloud and advertising segments, ServiceNow benefited from increased demand for cloud services. Exposure to the energy sector detracted from fund results as oil prices plummeted on concerns of excess supply.
Although U.S. economic growth remained strong with GDP growing at an annualized pace of 3.4% in the third quarter, the fund’s portfolio managers are keeping a close watch on the impact of interest rate hikes on economic activity and the outlook for corporate profit growth in the U.S. Portfolio managers continue to favor well-positioned, growth-oriented companies that are capable of generating free cash flow in myriad economic environments and remain optimistic that our global research will help us identify attractive long-term investment opportunities.
| Largest equity securities | Percent of net assets | |||
| Microsoft | 4.53 | % | ||
| 4.20 | ||||
| Broadcom | 3.70 | |||
| UnitedHealth Group | 3.59 | |||
| Amazon | 3.40 | |||
| Alphabet | 3.05 | |||
| Netflix | 2.74 | |||
| Tesla | 2.57 | |||
| Regeneron Pharmaceuticals | 2.14 | |||
| Intuitive Surgical | 1.92 | |||
| 8 | American Funds Insurance Series |
Growth Fund
How a $10,000 investment has grown
![]()
Average annual total returns based on a $1,000 investment
For periods ended December 31, 2018
| Lifetime | Expense | |||||||||||||||||||
| 1 year | 5 years | 10 years | (since February 8, 1984) | ratio | ||||||||||||||||
| Class 1 | –0.01 | % | 10.47 | % | 15.00 | % | 12.44 | % | .34 | % | ||||||||||
| Class 1A | –0.26 | 10.20 | 14.72 | 12.16 | .59 | |||||||||||||||
| Class 2 | –0.25 | 10.19 | 14.72 | 12.16 | .59 | |||||||||||||||
| Class 3 | –0.18 | 10.26 | 14.80 | 12.24 | .52 | |||||||||||||||
| Class 4 | –0.50 | 9.92 | 14.45 | 11.89 | .84 | |||||||||||||||
Investment results assume all distributions are reinvested and reflect applicable fees and expenses. The fund’s investment adviser waived a portion of its management fees from September 1, 2004, through December 31, 2008. Applicable fund results shown reflect the waiver, without which they would have been lower. Expense ratios are as of the fund’s prospectus dated May 1, 2019 (unaudited). See the Financial Highlights table in this report for details.
Any market index shown is unmanaged and, therefore, has no expenses. Investors cannot invest directly in an index.
| 1 | Source: S&P Dow Jones Indices LLC. |
| Where the fund’s assets were invested as of December 31, 2018 | Percent of net assets |

| American Funds Insurance Series | 9 |
International Fund
Fund results shown are for past periods and are not predictive of results for future periods. Current and future results may be lower or higher than those shown. Unit prices and returns will vary, so investors may lose money. For current information and month-end results, visit americanfunds.com/afis. For information about your insurance contract and month-end results, go to the website of the company that issued your contract.
International Fund declined 12.94% for the 12 months ended December 31, 2018. That compares to the 14.20% decline of its benchmark, the MSCI ACWI (All Country World Index) ex USA,1a free float-adjusted market capitalization-weighted index that is designed to measure equity market results in the global developed and emerging markets (consisting of more than 40 developed and emerging market country indexes excluding the U.S.).
Global stocks, as measured by the MSCI ACWI, ended the year in negative territory hurt by slowing economic growth, increased volatility and higher interest rates in the U.S. While ongoing turmoil over the U.K.’s departure from the European Union weighed on European stocks, a combination of a stronger U.S. dollar and heightened U.S.-China trade frictions impacted emerging markets equities. Cyclical stocks posted the biggest losses, underscored by double-digit declines in the financials, industrials and materials sectors.
In the fund, stocks in the financials sector generated the highest relative returns. Within the sector, HDFC Bank reported profit growth in the second quarter and AIA Group reported strong earnings for the first half of the year. On the flip side, investments in consumer staples companies were a drag on results. Within the sector, British American Tobacco hindered results amid pressure from competition and regulation.
The fund’s portfolio managers continue to monitor key indicators in advanced countries — from wage growth and inflation dynamics to the impact of technology and demographics on productivity — as they seek the flexibility to pivot to areas of opportunity. Our focus on a company’s fundamental growth drivers and intrinsic worth is critical to helping us identify companies that we believe represent the best value over the long term.
| Country diversification | Percent of net assets | |||
| Asia/Pacific Basin | ||||
| Japan | 13.1 | % | ||
| China | 9.6 | |||
| Hong Kong | 7.3 | |||
| India | 7.0 | |||
| South Korea | 3.7 | |||
| Philippines | 1.1 | |||
| Australia | 1.0 | |||
| Other | 1.1 | |||
| 43.9 | ||||
| Europe | ||||
| United Kingdom | 11.5 | |||
| France | 10.2 | |||
| Switzerland | 5.1 | |||
| Germany | 2.8 | |||
| Spain | 2.4 | |||
| Netherlands | 1.4 | |||
| Ireland | 1.1 | |||
| Other | 1.8 | |||
| 36.3 | ||||
| The Americas | ||||
| Canada | 2.9 | |||
| Brazil | 2.0 | |||
| United States | 1.7 | |||
| Mexico | .4 | |||
| 7.0 | ||||
| Other regions | ||||
| Israel | 1.2 | |||
| Other | .6 | |||
| 1.8 | ||||
| Short-term securities & other assets less liabilities | 11.0 | |||
| Total | 100.0 | % | ||
| Largest equity securities | Percent of net assets | |||
| AIA Group | 3.78 | % | ||
| HDFC Bank | 3.21 | |||
| Airbus | 3.12 | |||
| Novartis | 3.11 | |||
| Tencent | 2.22 | |||
| Shire | 2.17 | |||
| Samsung Electronics | 1.90 | |||
| Pernod Ricard | 1.69 | |||
| Alibaba Group | 1.68 | |||
| Royal Dutch Shell | 1.53 | |||
| 10 | American Funds Insurance Series |
International Fund
How a $10,000 investment has grown

Average annual total returns based on a $1,000 investment
For periods ended December 31, 2018
| Lifetime | Expense | |||||||||||||||||||
| 1 year | 5 years | 10 years | (since May 1, 1990) | ratio | ||||||||||||||||
| Class 1 | –12.94 | % | 2.26 | % | 7.93 | % | 7.72 | % | .53 | % | ||||||||||
| Class 1A | –13.11 | 2.02 | 7.67 | 7.45 | .78 | |||||||||||||||
| Class 2 | –13.13 | 2.01 | 7.65 | 7.45 | .78 | |||||||||||||||
| Class 3 | –13.10 | 2.07 | 7.73 | 7.53 | .71 | |||||||||||||||
| Class 4 | –13.41 | 1.75 | 7.41 | 7.19 | 1.03 | |||||||||||||||
Investment results assume all distributions are reinvested and reflect applicable fees and expenses. The fund’s investment adviser waived a portion of its management fees from September 1, 2004, through December 31, 2008. Applicable fund results shown reflect the waiver, without which they would have been lower. Expense ratios are as of the fund’s prospectus dated May 1, 2019 (unaudited). See the Financial Highlights table in this report for details.
Any market index shown is unmanaged and, therefore, has no expenses. Investors cannot invest directly in an index.
| 1 | Source: MSCI. The MSCI index result reflects dividends net of withholding taxes and reinvestment of distributions. |
| Where the fund’s assets were invested as of December 31, 2018 | Percent of net assets |

| American Funds Insurance Series | 11 |
New World Fund®
Fund results shown are for past periods and are not predictive of results for future periods. Current and future results may be lower or higher than those shown. Unit prices and returns will vary, so investors may lose money. For current information and month-end results, visit americanfunds.com/afis. For information about your insurance contract and month-end results, go to the website of the company that issued your contract.
New World Fund was down 13.83% for the 12 months ended December 31, 2018. Its benchmark index, the MSCI ACWI (All Country World Index),1 a free float-adjusted market capitalization-weighted index that is designed to measure equity market results in the global developed and emerging markets (consisting of more than 40 developed and emerging market country indexes), declined 9.42%. The MSCI Emerging Markets Index,1a free float-adjusted market capitalization-weighted index that is designed to measure equity market results in the global emerging markets (consisting of more than 20 emerging market country indexes), decreased by 14.58%.
Global stocks, as measured by the MSCI ACWI, ended the year in negative territory hurt by slowing economic growth, increased volatility and higher interest rates in the U.S. While ongoing turmoil over the U.K.’s departure from the European Union weighed on European stocks, a combination of a stronger U.S. dollar and heightened U.S.-China trade frictions impacted emerging markets equities. In emerging markets, Russia was impacted by U.S. sanctions, while Argentina suffered from a currency crisis as the peso collapsed more than 45% against the greenback.
Investments in the energy sector were beneficial to the fund. Reliance Industries rose led by strong earnings growth from its petrochemical business. The company also benefited from continued expansion and success of its telecommunications network Jio. Among detractors, investments in the financials sector hurt results with Grupo Financiero Galicia hindering returns, despite reporting a rise in second-quarter profits from the same period in 2017. Investments in tobacco companies such as British American Tobacco were also a drag on results due to concerns about nicotine regulation in the U.S., as well as competition from vaping and heat-not-burn products.
At this point in the market cycle and amid increased volatility, selectivity and close attention to individual holdings are particularly important. The fund’s portfolio managers continue to pursue a bottom-up approach to investing and continue to search for undervalued companies with solid foundations around the world.
| Country diversification | Percent of net assets | |||
| Asia/Pacific Basin | ||||
| India | 13.0 | % | ||
| China | 10.3 | |||
| Japan | 4.8 | |||
| Taiwan | 3.1 | |||
| Hong Kong | 2.9 | |||
| Other | 3.3 | |||
| 37.4 | ||||
| The Americas | ||||
| United States | 15.5 | |||
| Brazil | 9.1 | |||
| Canada | 1.3 | |||
| Other | 2.6 | |||
| 28.5 | ||||
| Europe | ||||
| United Kingdom | 4.9 | |||
| France | 2.3 | |||
| Russian Federation | 2.1 | |||
| Switzerland | 2.1 | |||
| Germany | 1.3 | |||
| Other | 2.3 | |||
| 15.0 | ||||
| Other regions | ||||
| Other | 2.0 | |||
| Short-term securities & other assets less liabilities | 17.1 | |||
| Total | 100.0 | % | ||
| Largest equity securities | Percent of net assets | |||
| Reliance Industries | 6.16 | % | ||
| TSMC | 2.89 | |||
| HDFC Bank | 2.71 | |||
| Alphabet | 2.21 | |||
| AIA Group | 1.79 | |||
| Alibaba Group | 1.76 | |||
| PagSeguro Digital | 1.75 | |||
| Vale | 1.74 | |||
| British American Tobacco | 1.62 | |||
| B3 | 1.48 | |||
| 12 | American Funds Insurance Series |
New World Fund
How a $10,000 investment has grown

Average annual total returns based on a $1,000 investment
For periods ended December 31, 2018
| Lifetime | Expense | |||||||||||||||||||
| 1 year | 5 years | 10 years | (since June 17, 1999) | ratio | ||||||||||||||||
| Class 1 | –13.83 | % | 1.14 | % | 7.87 | % | 7.51 | % | .76 | % | ||||||||||
| Class 1A | –14.02 | 0.89 | 7.61 | 7.24 | 1.01 | |||||||||||||||
| Class 2 | –14.04 | 0.89 | 7.61 | 7.24 | 1.01 | |||||||||||||||
| Class 4 | –14.25 | 0.63 | 7.35 | 6.98 | 1.26 | |||||||||||||||
Investment results assume all distributions are reinvested and reflect applicable fees and expenses. The fund’s investment adviser waived a portion of its management fees from September 1, 2004, through December 31, 2008. Applicable fund results shown reflect the waiver, without which they would have been lower. Expense ratios are as of the fund’s prospectus dated May 1, 2019 (unaudited). See the Financial Highlights table in this report for details.
Any market index shown is unmanaged and, therefore, has no expenses. Investors cannot invest directly in an index.
| 1 | Source: MSCI. Results for MSCI indexes reflect dividends net of withholding taxes and reinvestment of distributions. |
| Where the fund’s assets were invested as of December 31, 2018 | Percent of net assets |

| American Funds Insurance Series | 13 |
Blue Chip Income and Growth Fund
Fund results shown are for past periods and are not predictive of results for future periods. Current and future results may be lower or higher than those shown. Unit prices and returns will vary, so investors may lose money. For current information and month-end results, visit americanfunds.com/afis. For information about your insurance contract and month-end results, go to the website of the company that issued your contract.
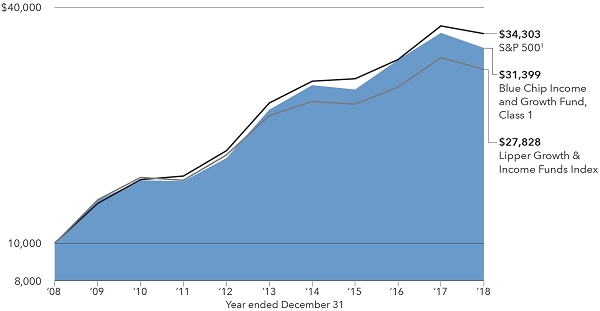
Blue Chip Income and Growth Fund lost 8.45% for the 12 months ended December 31, 2018, trailing its benchmark index, Standard & Poor’s 500 Composite Index,1a market capitalization-weighted index based on the results of approximately 500 widely held common stocks, which declined 4.38%.
U.S. equities declined for the first calendar year since 2008. Concerns over trade conflicts, slowing global growth and high valuations contributed to persistent volatility. Energy and materials companies were further pressured by falling commodity prices. While growth-oriented stocks performed relatively better than defensive stocks, many companies experienced wild swings throughout the year.
Over the fiscal year, stock selection in the materials sector helped marginally boost relative returns, while positions in health care and industrials lagged, as did holdings among the less-cyclical consumer staples sector. In particular, tobacco companies were hurt by concerns about nicotine regulation in the U.S., as well as competition from vaping and heat-not-burn products. The fund was also disadvantaged by its lower holding of select, U.S. growth stocks.
The fund’s portfolio managers are keeping a close watch on the U.S. economy. Portfolio managers continue to favor more stable, high-dividend-paying companies that are likely to hold up better in weak markets, while providing consistent income and remain optimistic that our global research will help us identify attractive long-term investment opportunities.
| Largest equity securities | Percent of net assets | |||
| AbbVie | 7.70 | % | ||
| Abbott Laboratories | 5.19 | |||
| Lowe’s | 3.58 | |||
| Amgen | 3.43 | |||
| Microsoft | 3.30 | |||
| Intel | 3.22 | |||
| EOG Resources | 2.95 | |||
| Gilead Sciences | 2.93 | |||
| Philip Morris International | 2.78 | |||
| QUALCOMM | 2.72 | |||
| 14 | American Funds Insurance Series |
Blue Chip Income and Growth Fund
How a $10,000 investment has grown
Average annual total returns based on a $1,000 investment
For periods ended December 31, 2018
| Lifetime | Expense | |||||||||||||||||||
| 1 year | 5 years | 10 years | (since July 5, 2001) | ratio | ||||||||||||||||
| Class 1 | –8.45 | % | 7.55 | % | 12.12 | % | 5.91 | % | .41 | % | ||||||||||
| Class 1A | –8.67 | 7.30 | 11.85 | 5.65 | .66 | |||||||||||||||
| Class 2 | –8.66 | 7.28 | 11.86 | 5.64 | .66 | |||||||||||||||
| Class 4 | –8.92 | 7.01 | 11.63 | 5.41 | .91 | |||||||||||||||
Investment results assume all distributions are reinvested and reflect applicable fees and expenses. The fund’s investment adviser waived a portion of its management fees from September 1, 2004, through December 31, 2008, and from February 1, 2014, through January 31, 2015. Applicable fund results shown reflect the waiver, without which they would have been lower. Expense ratios are as of the fund’s prospectus dated May 1, 2019 (unaudited). See the Financial Highlights table in this report for details.
Any market index shown is unmanaged and, therefore, has no expenses. Investors cannot invest directly in an index.
| 1 | Source: S&P Dow Jones Indices LLC. |
| Where the fund’s assets were invested as of December 31, 2018 | Percent of net assets |
| American Funds Insurance Series | 15 |
Global Growth and Income Fund
Fund results shown are for past periods and are not predictive of results for future periods. Current and future results may be lower or higher than those shown. Unit prices and returns will vary, so investors may lose money. For current information and month-end results, visit americanfunds.com/afis. For information about your insurance contract and month-end results, go to the website of the company that issued your contract.
Global Growth and Income Fund declined 9.36% for the 12 months ended December 31, 2018, compared with a 9.42% decrease in its benchmark index, MSCI ACWI (All Country World Index),1a free float-adjusted market capitalization-weighted index that is designed to measure equity market results in the global developed and emerging markets, consisting of more than 40 developed and emerging market country indexes.
Global stocks, as measured by the MSCI ACWI, ended the year in negative territory hurt by slowing economic growth, increased volatility and higher interest rates in the U.S. While ongoing turmoil over the U.K.’s departure from the European Union weighed on European stocks, a combination of a stronger U.S. dollar and heightened U.S.-China trade frictions impacted emerging markets equities. Cyclical stocks posted the biggest losses, underscored by double-digit declines in the financials, industrials and materials sectors.
Several sectors including health care contributed to the fund’s returns. Health care companies UnitedHealth Group and Centene rallied on solid earnings reports and were among the top contributors to results. On the downside, investments in information technology – representing the fund’s largest sector holding – were a drag on relative results led by PagSeguro and AAC Technologies Holdings, losing ground as a broad selloff continued in the formerly high-flying sector.
With quantitative easing programs ending or set to end and slower economic growth in the U.S. and Europe, the fund’s portfolio managers remain cautiously optimistic about prospects for the global economy. Portfolio managers continue to invest based on a bottom-up approach to long-term investing and believe they can uncover promising companies with sustainable dividends and income.
| Country diversification | Percent of net assets | |||
| The Americas | ||||
| United States | 37.5 | % | ||
| Brazil | 6.0 | |||
| Canada | 1.5 | |||
| Other | .2 | |||
| 45.2 | ||||
| Europe | ||||
| France | 6.5 | |||
| United Kingdom | 5.8 | |||
| Switzerland | 3.7 | |||
| Germany | 2.6 | |||
| Denmark | 2.1 | |||
| Netherlands | 2.1 | |||
| Spain | 1.2 | |||
| Italy | 1.0 | |||
| Other | 1.6 | |||
| 26.6 | ||||
| Asia/Pacific Basin | ||||
| Japan | 6.8 | |||
| Taiwan | 3.8 | |||
| India | 3.6 | |||
| China | 2.3 | |||
| Hong Kong | 1.6 | |||
| Australia | 1.3 | |||
| Other | 2.2 | |||
| 21.6 | ||||
| Other regions | ||||
| Israel | .5 | |||
| Short-term securities & other assets less liabilities | 6.1 | |||
| Total | 100.0 | % | ||
| Largest equity securities | Percent of net assets | |||
| Nintendo | 4.24 | % | ||
| TSMC | 3.85 | |||
| UnitedHealth Group | 3.74 | |||
| Airbus Group | 3.12 | |||
| Reliance Industries | 2.83 | |||
| Vale | 2.49 | |||
| Microsoft | 2.33 | |||
| Nestlé | 2.18 | |||
| Alphabet | 2.04 | |||
| Broadcom | 2.04 | |||
| 16 | American Funds Insurance Series |
Global Growth and Income Fund
How a $10,000 investment has grown

Average annual total returns based on a $1,000 investment
For periods ended December 31, 2018
| 1 year | 5 years | 10 years | Lifetime (since May 1, 2006) | Expense ratio | ||||||||||||||||
| Class 1 | –9.36 | % | 5.26 | % | 10.84 | % | 5.87 | % | .63 | % | ||||||||||
| Class 1A | –9.62 | 5.03 | 10.59 | 5.62 | .88 | |||||||||||||||
| Class 2 | –9.63 | 4.97 | 10.56 | 5.60 | .88 | |||||||||||||||
| Class 4 | –9.89 | 4.71 | 10.31 | 5.36 | 1.13 | |||||||||||||||
Investment results assume all distributions are reinvested and reflect applicable fees and expenses. The fund’s investment adviser waived a portion of its management fees from May 1, 2006, through December 31, 2008. Applicable fund results shown reflect the waiver, without which they would have been lower. Expense ratios are as of the fund’s prospectus dated May 1, 2019 (unaudited). See the Financial Highlights table in this report for details.
Any market index shown is unmanaged and, therefore, has no expenses. Investors cannot invest directly in an index.
| 1 | Source MSCI. The MSCI index result reflects dividends net of withholding taxes and reinvestment of distributions. |
| Where the fund’s assets were invested as of December 31, 2018 | Percent of net assets |

| American Funds Insurance Series | 17 |
Growth-Income Fund
Fund results shown are for past periods and are not predictive of results for future periods. Current and future results may be lower or higher than those shown. Unit prices and returns will vary, so investors may lose money. For current information and month-end results, visit americanfunds.com/afis. For information about your insurance contract and month-end results, go to the website of the company that issued your contract.
Growth-Income Fund lost 1.55% for the 12 months ended December 31, 2018. Standard & Poor’s 500 Composite Index,1a market capitalization-weighted index based on the results of approximately 500 widely held common stocks, declined 4.38%.
U.S. equities declined for the first calendar year since 2008. Concerns over trade conflicts, slowing global growth and high valuations contributed to persistent volatility. Energy and materials companies were further pressured by falling commodity prices. While growth-oriented stocks performed relatively better than defensive stocks, many companies experienced wild swings throughout the year.
Regarding the fund, investments in the consumer discretionary sector contributed the most to the fund’s relative returns. Among consumer discretionary companies, Amazon reported strong third-quarter earnings that beat analyst estimates thanks to its cloud and advertising segments. On the downside, investments in the energy sector, such as EOG Resources and Schlumberger, detracted from the fund’s results as oil prices plummeted on concerns of a glut.
| Largest equity holdings | Percent of net assets | |||
| Microsoft | 3.30 | % | ||
| Alphabet | 2.32 | |||
| AbbVie | 2.25 | |||
| 2.18 | ||||
| UnitedHealth Group | 1.91 | |||
| Amazon | 1.76 | |||
| Broadcom | 1.69 | |||
| JPMorgan Chase | 1.63 | |||
| Intel | 1.56 | |||
| Gilead Sciences | 1.49 | |||
| 18 | American Funds Insurance Series |
Growth-Income Fund
How a $10,000 investment has grown
![]()
Average annual total returns based on a $1,000 investment
For periods ended December 31, 2018
| 1 year | 5 years | 10 years | Lifetime (since February 8, 1984) | Expense ratio | ||||||||||||||||
| Class 1 | –1.55 | % | 8.79 | % | 13.26 | % | 11.06 | % | .28 | % | ||||||||||
| Class 1A | –1.78 | 8.53 | 12.98 | 10.78 | .53 | |||||||||||||||
| Class 2 | –1.79 | 8.51 | 12.98 | 10.78 | .53 | |||||||||||||||
| Class 3 | –1.72 | 8.59 | 13.05 | 10.86 | .46 | |||||||||||||||
| Class 4 | –2.05 | 8.24 | 12.71 | 10.51 | .78 | |||||||||||||||
Investment results assume all distributions are reinvested and reflect applicable fees and expenses. The fund’s investment adviser waived a portion of its management fees from September 1, 2004, through December 31, 2008. Applicable fund results shown reflect the waiver, without which they would have been lower. Expense ratios are as of the fund’s prospectus dated May 1, 2019 (unaudited). See the Financial Highlights table in this report for details.
Any market index shown is unmanaged and, therefore, has no expenses. Investors cannot invest directly in an index.
| 1 | Source: S&P Dow Jones Indices LLC. |
| Where the fund’s assets were invested as of December 31, 2018 | Percent of net assets |

| American Funds Insurance Series | 19 |
International Growth and Income Fund
Fund results shown are for past periods and are not predictive of results for future periods. Current and future results may be lower or higher than those shown. Unit prices and returns will vary, so investors may lose money. For current information and month-end results, visit americanfunds.com/afis. For information about your insurance contract and month-end results, go to the website of the company that issued your contract.
International Growth and Income Fund declined 11.00% for the 12 months ended December 31, 2018, compared to the 14.20% decline in its benchmark index, the MSCI ACWI (All Country World Index) ex USA,1a free float-adjusted market capitalization-weighted index that is designed to measure equity market results in the global developed and emerging markets (consisting of more than 40 developed and emerging market country indexes excluding the U.S.).
Global stocks, as measured by the MSCI ACWI, ended the year in negative territory hurt by slowing economic growth, increased volatility and higher interest rates in the U.S. While ongoing turmoil over the U.K.’s departure from the European Union weighed on European stocks, a combination of a stronger U.S. dollar and heightened U.S.-China trade frictions impacted emerging markets equities. Cyclical stocks posted the biggest losses, underscored by double-digit declines in the financials, industrials and materials sectors.
An eclectic mix of stocks contributed to the fund’s relative returns led by companies in the industrials and utilities sectors. Danish energy group Ørsted recorded double-digit returns and was among the top contributors to the fund’s returns as the company reported strong third-quarter profits from operational wind farms. On the downside, investments in the consumer staples sector was a weak spot. British American Tobacco detracted from relative results amid pressure from competition and regulation.
The fund’s portfolio managers continue to monitor global geopolitics that may derail economic growth, and are optimistic that global research combined with the fund’s flexible mandate will help us identify attractive investment opportunities.
| Country diversification | Percent of net assets | |||
| Europe | ||||
| United Kingdom | 20.4 | % | ||
| France | 9.5 | |||
| Switzerland | 5.3 | |||
| Germany | 4.1 | |||
| Spain | 3.1 | |||
| Denmark | 2.2 | |||
| Sweden | 1.9 | |||
| Netherlands | 1.5 | |||
| Russian Federation | 1.3 | |||
| Norway | 1.0 | |||
| Other | .7 | |||
| 51.0 | ||||
| Asia/Pacific Basin | ||||
| China | 7.4 | |||
| Japan | 7.4 | |||
| Hong Kong | 6.5 | |||
| India | 4.0 | |||
| South Korea | 3.0 | |||
| Philippines | 1.1 | |||
| Thailand | 1.0 | |||
| Other | 1.5 | |||
| 31.9 | ||||
| The Americas | ||||
| Brazil | 3.1 | |||
| Other | 1.7 | |||
| 4.8 | ||||
| Other regions | ||||
| Turkey | 1.8 | |||
| Other | .8 | |||
| 2.6 | ||||
| Short-term securities & other assets less liabilities | 9.7 | |||
| Total | 100.0 | % | ||
| Largest equity securities | Percent of net assets | |||
| Royal Dutch Shell | 4.56 | % | ||
| Shire | 4.04 | |||
| Rio Tinto | 3.11 | |||
| HDFC Bank | 2.79 | |||
| Novartis | 2.72 | |||
| British American Tobacco | 2.56 | |||
| Sun Hung Kai Properties | 2.37 | |||
| Ørsted | 2.20 | |||
| CK Asset Holdings | 2.15 | |||
| Zurich | 2.06 | |||
| 20 | American Funds Insurance Series |
International Growth and Income Fund
How a $10,000 investment has grown

Average annual total returns based on a $1,000 investment
For periods ended December 31, 2018
| 1 year | 5 years | 10 years | Lifetime (since November 18, 2008) | Expense ratio | ||||||||||||||||
| Class 1 | –11.00 | % | 0.83 | % | 7.19 | % | 8.05 | % | .66 | % | ||||||||||
| Class 1A | –11.24 | 0.60 | 6.93 | 7.79 | .91 | |||||||||||||||
| Class 2 | –11.23 | 0.58 | 6.92 | 7.77 | .91 | |||||||||||||||
| Class 4 | –11.46 | 0.33 | 6.69 | 7.54 | 1.16 | |||||||||||||||
Investment results assume all distributions are reinvested and reflect applicable fees and expenses. The fund’s investment adviser waived a portion of its management fees from November 18, 2008, through December 31, 2008. Applicable fund results shown reflect the waiver, without which they would have been lower. Expense ratios are as of the fund’s prospectus dated May 1, 2019 (unaudited). See the Financial Highlights table in this report for details.
Any market index shown is unmanaged and, therefore, has no expenses. Investors cannot invest directly in an index.
| 1 | Source: MSCI. The MSCI index result reflects dividends net of withholding taxes and reinvestment of distributions. |
| Where the fund’s assets were invested as of December 31, 2018 | Percent of net assets |

| American Funds Insurance Series | 21 |
Capital Income Builder®
Fund results shown are for past periods and are not predictive of results for future periods. Current and future results may be lower or higher than those shown. Unit prices and returns will vary, so investors may lose money. For current information and month-end results, visit americanfunds.com/afis. For information about your insurance contract and month-end results, go to the website of the company that issued your contract.
Capital Income Builder, a mix of stocks and bonds, lost 6.77% for the 12 months ended December 31, 2018. During the same period, the MSCI ACWI (All Country World Index)1, a free float-adjusted market capitalization-weighted index that is designed to measure equity market results in the global developed and emerging markets (consisting of more than 40 developed and emerging market country indexes), declined 9.42%. The Bloomberg Barclays U.S. Aggregate Index,2which represents the U.S. investment-grade (rated BBB/Baa and above) fixed-rate bond market, was virtually unchanged and returned 0.01%. The index blend of 70%/30% MSCI ACWI/Bloomberg Barclays U.S. Aggregate Index3lost 6.48%. The Lipper Global Equity Income Funds Average4, a measure of similar funds, fell 9.41%.
U.S. equities declined for the first calendar year since 2008. Concerns over trade conflicts, slowing global growth and high valuations contributed to persistent volatility. Energy and materials companies were further pressured by falling commodity prices. While growth-oriented stocks performed relatively better than defensive stocks, many companies experienced wild swings throughout the year. In a turbulent year, a fourth quarter rally helped bonds outperform other asset classes.
In the equity portfolio, the best contributors to the fund in relative terms were the financials and real estate sectors. A mix of stocks such as CME Group and American Tower contributed to results on the back of strong third quarter earnings that beat analyst estimates. The fund’s fixed income portfolio was also additive to results and benefited from duration positioning.
On the downside, the consumer staples sector, which comprised the second-largest share of the fund’s equity holdings, detracted from returns. Tobacco firms Philip Morris International and British American Tobacco fell due to competition from next-generation smoking products, such as JUUL.
The current market environment is rife with uncertainty. Given that the U.S. is late in the economic cycle, the fund’s portfolio managers are paying close attention to companies’ leverage and are more sharply focused on monitoring balance sheets. They seek to avoid companies that take on debt to pay dividends, and are focused on identifying companies with strong business models and a commitment to paying and growing dividends over time. Higher interest rates should also allow portfolio managers to reinvest bond coupon payments into higher yielding securities, thereby generating more income from the bond portfolio.
| Country diversification | Percent of net assets | |||
| The Americas | ||||
| United States | 56.1 | % | ||
| Canada | 2.6 | |||
| 58.7 | ||||
| Europe | ||||
| United Kingdom | 12.4 | |||
| France | 3.4 | |||
| Switzerland | 2.9 | |||
| Sweden | 2.0 | |||
| Italy | 1.5 | |||
| Netherlands | 1.0 | |||
| Other | 2.7 | |||
| 25.9 | ||||
| Asia/Pacific Basin | ||||
| Hong Kong | 3.1 | |||
| Taiwan | 2.3 | |||
| Japan | 1.3 | |||
| Singapore | 1.2 | |||
| New Zealand | 1.0 | |||
| Other | .4 | |||
| 9.3 | ||||
| Short-term securities & other assets less liabilities | 6.1 | |||
| Total | 100.0 | % | ||
| 22 | American Funds Insurance Series |
Capital Income Builder
How a $10,000 investment has grown

Average annual total returns based on a $1,000 investment
For periods ended December 31, 2018
| Lifetime | Expense | |||||||||||
| 1 year | (since May 1, 2014) | ratio | ||||||||||
| Class 1 | –6.77 | % | 1.82 | % | .54 | % | ||||||
| Class 1A | –7.01 | 1.57 | .79 | |||||||||
| Class 2 | –7.08 | 1.68 | .79 | |||||||||
| Class 4 | –7.25 | 1.31 | 1.04 | |||||||||
Investment results assume all distributions are reinvested and reflect applicable fees and expenses. Expense ratios are as of the fund’s prospectus dated May 1, 2019 (unaudited). See the Financial Highlights table in this report for details.
Any market index shown is unmanaged and, therefore, has no expenses. Investors cannot invest directly in an index.
| 1 | Source: MSCI. The MSCI index result reflects dividends net of withholding taxes and reinvestment of distributions. |
| 2 | Source: Bloomberg Index Services Ltd. |
| 3 | Data sources: MSCI and Bloomberg Index Services Ltd. The 70%/30% MSCI ACWI/Bloomberg Barclays U.S. Aggregate Index blends the MSCI ACWI (All Country World Index) with the Bloomberg Barclays U.S. Aggregate Index by weighting their total returns at 70% and 30%, respectively. Its result assumes the blend is rebalanced monthly. |
| 4 | Source: Thomson Reuters Lipper. |
| Where the fund’s assets were invested as of December 31, 2018 | Percent of net assets |

| American Funds Insurance Series | 23 |
Asset Allocation Fund
Fund results shown are for past periods and are not predictive of results for future periods. Current and future results may be lower or higher than those shown. Unit prices and returns will vary, so investors may lose money. For current information and month-end results, visit americanfunds.com/afis. For information about your insurance contract and month-end results, go to the website of the company that issued your contract.
Asset Allocation Fund, which is a mix of stocks and bonds, fell 4.35% for the 12 months ended December 31, 2018. Standard & Poor’s 500 Composite Index,1a market capitalization-weighted index based on the results of approximately 500 widely held common stocks, declined 4.38% over the same period, while the Bloomberg Barclays U.S. Aggregate Index,2which represents the U.S. investment-grade (rated BBB/Baa and above) fixed-rate bond market, returned 0.01%. A blend of the two indexes, the 60%/40% S&P 500 Index/Bloomberg Barclays U.S. Aggregate Index,3slipped 2.35%.
U.S. equities declined for the first time since 2008. Concerns over trade conflicts, slowing global growth and high valuations contributed to persistent volatility. Energy and materials companies were further pressured by falling commodity prices. While growth-oriented stocks performed relatively better than defensive stocks, many companies experienced wild swings throughout the year. In a turbulent year, a fourth quarter rally helped bonds outperform other asset classes.
Investments in the health care sector — one of the fund’s largest sector holdings — contributed to the fund’s returns. Molina Healthcare, UnitedHealth Group and Express Scripts boosted results, as all three companies had double-digit returns, which were on the back of strong third-quarter earnings for UnitedHealth Group and Express Scripts. On the downside, energy stocks detracted from returns as oil prices slipped due to fears of growing U.S. output and weaker global demand. The fund’s fixed income holdings were also a drag on returns due to curve positioning.
The fund’s portfolio managers continue to evaluate the economic and market-sector implications of the current administration’s decisions regarding trade. The fund’s cash position allows portfolio managers to remain flexible and better navigate uncertainty by focusing on opportunities when stock prices are favorable.
| Largest equity securities | Percent of net assets | |||
| Microsoft | 2.88 | % | ||
| TSMC | 2.26 | |||
| Broadcom | 2.21 | |||
| UnitedHealth Group | 2.19 | |||
| Johnson & Johnson | 1.95 | |||
| DowDuPont | 1.81 | |||
| Boeing | 1.60 | |||
| Philip Morris International | 1.58 | |||
| Nestlé | 1.47 | |||
| Cigna | 1.40 | |||
| 24 | American Funds Insurance Series |
Asset Allocation Fund
How a $10,000 investment has grown

Average annual total returns based on a $1,000 investment
For periods ended December 31, 2018
| Lifetime | Expense | |||||||||||||||||||
| 1 year | 5 years | 10 years | (since August 1,1989) | ratio | ||||||||||||||||
| Class 1 | –4.35 | % | 5.60 | % | 10.44 | % | 8.22 | % | .29 | % | ||||||||||
| Class 1A | –4.58 | 5.35 | 10.17 | 7.95 | .54 | |||||||||||||||
| Class 2 | –4.60 | 5.33 | 10.16 | 7.95 | .54 | |||||||||||||||
| Class 3 | –4.49 | 5.41 | 10.24 | 8.03 | .47 | |||||||||||||||
| Class 4 | –4.83 | 5.07 | 9.93 | 7.70 | .79 | |||||||||||||||
Investment results assume all distributions are reinvested and reflect applicable fees and expenses. The fund’s investment adviser waived a portion of its management fees from September 1, 2004, through December 31, 2008. Applicable fund results shown reflect the waiver, without which they would have been lower. Expense ratios are as of the fund’s prospectus dated May 1, 2019 (unaudited). See the Financial Highlights table in this report for details.
Any market index shown is unmanaged and, therefore, has no expenses. Investors cannot invest directly in an index.
| 1 | Source: S&P Dow Jones Indices LLC. |
| 2 | Source: Bloomberg Index Services Ltd. |
| 3 | Data sources: S&P Dow Jones Indices LLC and Bloomberg Index Services Ltd. The 60%/40% S&P 500 Index/Bloomberg Barclays U.S. Aggregate Index blends the S&P 500 with the Bloomberg Barclays U.S. Aggregate Index by weighting their cumulative total returns at 60% and 40%, respectively. This assumes the blend is rebalanced monthly. |
| Where the fund’s assets were invested as of December 31, 2018 | Percent of net assets |

| American Funds Insurance Series | 25 |
Global Balanced Fund
Fund results shown are for past periods and are not predictive of results for future periods. Current and future results may be lower or higher than those shown. Unit prices and returns will vary, so investors may lose money. For current information and month-end results, visit americanfunds.com/afis. For information about your insurance contract and month-end results, go to the website of the company that issued your contract.
Global Balanced Fund declined 5.81% for the 12 months ended December 31, 2018. The MSCI ACWI (All Country World Index)1, a free float-adjusted market capitalization-weighted index that is designed to measure equity market results in the global developed and emerging markets (consisting of more than 40 developed and emerging market country indexes), lost 9.42%, while the Bloomberg Barclays Global Aggregate Index,2a measure of global investment-grade bonds (rated BBB/Baa and above), fell 1.20%. The 60%/40% MSCI ACWI/ Bloomberg Barclays Global Aggregate Index3, a blend of the two indexes, slipped 6.00%.
Global stocks, as measured by the MSCI ACWI, ended the year in negative territory hurt by slowing economic growth, increased volatility and higher interest rates in the U.S. While ongoing turmoil over the U.K.’s departure from the European Union weighed on European stocks, a combination of a stronger U.S. dollar and heightened U.S.-China trade frictions impacted emerging markets equities.
Investments in the health care sector boosted the fund’s returns led by companies such as U.S. health insurer Humana. The company’s shares hit new highs on the back of strong third-quarter earnings and amid a wider boost to the health insurance sector following U.S. congressional mid-term elections.
On the flip side, investments in consumer staples companies hindered results. In particular, tobacco companies were hurt by concerns about nicotine regulation in the U.S. and increased competition. Fixed income investments also detracted from returns led by the fund’s exposure to emerging market debt.
While there is reason for caution in the global outlook, there are broad themes that offer the fund’s portfolio managers investment opportunities. Equity investments in health care and technology can provide exposure to innovations with significant growth potential. Within fixed income, portfolio managers see pockets of opportunities in emerging markets, such as Mexico and Poland, where selling in response to higher rates belies underlying strengths.
| Largest sectors in common stock holdings | Percent of net assets | |||
| Information technology | 11.3 | % | ||
| Financials | 8.1 | |||
| Health care | 7.5 | |||
| Industrials | 6.8 | |||
| Energy | 5.0 | |||
| Largest fixed income holdings (by issuer) | ||||
| U.S. Treasury | 12.5 | |||
| Japanese Government | 4.3 | |||
| Mexican Government | 1.2 | |||
| Polish Government | 1.1 | |||
| Fannie Mae | 1.1 | |||
| Currency diversification | Percent of net assets |
| Equity securities | Bonds & notes | Forward currency contracts | Short–term securities & other assets less liabilities | Total | ||||||||||||||||
| U.S. dollars | 29.2 | % | 21.3 | % | .3 | % | 6.3 | % | 57.1 | % | ||||||||||
| Euros | 7.4 | 3.6 | .4 | — | 11.4 | |||||||||||||||
| Japanese yen | 2.8 | 4.3 | .7 | — | 7.8 | |||||||||||||||
| British pounds | 6.3 | .7 | .7 | — | 7.7 | |||||||||||||||
| Hong Kong dollars | 2.5 | — | — | — | 2.5 | |||||||||||||||
| Swiss francs | 2.1 | — | — | — | 2.1 | |||||||||||||||
| Danish kroner | 1.0 | .6 | — | — | 1.6 | |||||||||||||||
| Taiwan new dollar | 1.5 | — | — | — | 1.5 | |||||||||||||||
| Other currencies | 3.9 | 6.5 | (2.1 | ) | — | 8.3 | ||||||||||||||
| 100.0 | % | |||||||||||||||||||
| Largest equity securities | Percent of net assets | |||
| Nintendo | 1.55 | % | ||
| ASML | 1.54 | |||
| TSMC | 1.46 | |||
| Merck | 1.39 | |||
| Microsoft | 1.34 | |||
| Boeing | 1.34 | |||
| JPMorgan Chase | 1.29 | |||
| Humana | 1.28 | |||
| HSBC Holding | 1.22 | |||
| PagSeguro | 1.13 | |||
| 26 | American Funds Insurance Series |
Global Balanced Fund
How a $10,000 investment has grown

Average annual total returns based on a $1,000 investment
For periods ended December 31, 2018
| Lifetime | Expense | |||||||||||||||
| 1 year | 5 years | (since May 2, 2011) | ratio | |||||||||||||
| Class 1 | –5.81 | 3.66 | % | 4.75 | % | .72 | % | |||||||||
| Class 1A | –6.03 | 3.43 | 4.51 | .97 | ||||||||||||
| Class 2 | –6.01 | 3.40 | 4.49 | .97 | ||||||||||||
| Class 4 | –6.31 | 3.29 | 4.38 | 1.22 | ||||||||||||
Investment results assume all distributions are reinvested and reflect applicable fees and expenses. Expense ratios are as of the fund’s prospectus dated May 1, 2019 (unaudited). See the Financial Highlights table in this report for details.
Any market index shown is unmanaged and, therefore, has no expenses. Investors cannot invest directly in an index.
| 1 | Source: MSCI. The MSCI index result reflects dividends net of withholding taxes and reinvestment of distributions. |
| 2 | Source: Bloomberg Index Services Ltd. |
| 3 | Data sources: MSCI and Bloomberg Index Services Ltd. The 60%/40% MSCI ACWI/Barclays Global Aggregate Index blends the MSCI ACWI (All Country World Index) with the Bloomberg Barclays Global Aggregate Index by weighting their cumulative total returns at 60% and 40%, respectively. Its result assumes the blend is rebalanced monthly. |
| Where the fund’s assets were invested as of December 31, 2018 | Percent of net assets |

| American Funds Insurance Series | 27 |
Bond Fund
Fund results shown are for past periods and are not predictive of results for future periods. Current and future results may be lower or higher than those shown. Unit prices and returns will vary, so investors may lose money. For current information and month-end results, visit americanfunds.com/afis. For information about your insurance contract and month-end results, go to the website of the company that issued your contract.
Bond Fund slipped 0.45% for the 12 months ended December 31, 2018. In comparison, the fund’s benchmark, the Bloomberg Barclays U.S. Aggregate Index,1which represents the U.S. investment-grade (rated BBB/Baa and above) fixed-rate bond market, was flat and returned 0.01%.
Rising yields made for mixed results across bond sectors as the 10-year Treasury yield rose 29 basis points. The Federal Reserve hiked the federal funds target rate four times this year to a range of 2.25% to 2.50% on the back of a strong labor market and solid economic growth.
The fund’s exposure to higher-yielding securities contributed to results. Bond investments across a mix of issuers and sectors exposed the fund to idiosyncratic risks and an underweight position in U.S. Treasuries detracted from results.
On the whole, the U.S. economy appears to be in good shape and is expected to grow at a moderate pace. The Fed is well ahead of its peers on its path to monetary policy normalization that may help contribute to a more stable environment for interest rate hikes. The fund’s portfolio managers are optimistic about total returns against such a backdrop and for investing in a spectrum of U.S. fixed income securities.
| Largest holdings (by issuer) | Percent of net assets | |||
| U.S. Treasury | 28.9 | % | ||
| Fannie Mae | 12.3 | |||
| Freddie Mac | 5.5 | |||
| Ginnie Mae | 4.8 | |||
| Mexican Government | 2.6 | |||
| Teva Pharmaceutical | 1.7 | |||
| State of Illinois | 1.3 | |||
| Portuguese Government | 1.3 | |||
| Bank of America | 1.1 | |||
| Japanese Government | 1.1 | |||
| 28 | American Funds Insurance Series |
Bond Fund
How a $10,000 investment has grown
![]()
Average annual total returns based on a $1,000 investment
For periods ended December 31, 2018
| Lifetime | Expense | |||||||||||||||||||
| 1 year | 5 years | 10 years | (since January 2, 1996) | ratio | ||||||||||||||||
| Class 1 | –0.45 | % | 2.52 | % | 4.16 | % | 4.51 | % | .38 | % | ||||||||||
| Class 1A | –0.60 | 2.29 | 3.91 | 4.26 | .63 | |||||||||||||||
| Class 2 | –0.71 | 2.27 | 3.90 | 4.25 | .63 | |||||||||||||||
| Class 4 | –0.89 | 2.03 | 3.66 | 4.00 | .88 | |||||||||||||||
Investment results assume all distributions are reinvested and reflect applicable fees and expenses. The fund’s investment adviser waived a portion of its management fees from September 1, 2004, through December 31, 2008. Applicable fund results shown reflect the waiver, without which they would have been lower. Expense ratios are as of the fund’s prospectus dated May 1, 2019 (unaudited). See the Financial Highlights table in this report for details.
Any market index shown is unmanaged and, therefore, has no expenses. Investors cannot invest directly in an index.
| 1 | Source: Bloomberg Index Services Ltd. |
| Where the fund’s assets were invested as of December 31, 2018 | Percent of net assets |

| American Funds Insurance Series | 29 |
Global Bond Fund
Fund results shown are for past periods and are not predictive of results for future periods. Current and future results may be lower or higher than those shown. Unit prices and returns will vary, so investors may lose money. For current information and month-end results, visit americanfunds.com/afis. For information about your insurance contract and month-end results, go to the website of the company that issued your contract.
Global Bond Fund slipped 1.14% for the 12 months ended December 31, 2018. This was in line with the fund’s benchmark, the Bloomberg Barclays Global Aggregate Index,1which measures global investment-grade bonds (rated BBB/Baa and above) that declined 1.20%.
U.S. Treasury bonds rose modestly, boosted by safe-haven buying as volatile financial markets sent investors fleeing for cover. The positive gains, however, masked a more tumultuous year as rising U.S. interest rates jolted markets around the world. The U.S. dollar also strengthened in response to higher rates and quantitative tightening. Investment-grade and high-yield corporate bonds finished the year in negative territory, as did emerging markets debt. Meanwhile, the Federal Reserve hiked the federal funds target rate four times this year to a range of 2.25% to 2.50%.
Country allocation contributed the most to the fund’s relative returns, driven by above-benchmark investments in Polish, Indian and Brazilian debt. On the downside, duration positioning and currency exposure hampered returns. Emerging market currencies were particularly under pressure due to a stronger dollar, and investments in the Indian rupee hindered results.
As growth in the U.S. moderates, the fund’s portfolio managers seek to identify long-term investments around the world such as in emerging markets where corporate and high-yield debt may present opportunities. Given the fund’s core objective is to provide a high-level of total return over the long term, the fund’s portfolio managers maintain a cautious approach to investing in different sectors of the bond market, such as high-yield debt.
| Percent of net assets | ||||||||
| Currency weighting (after hedging) by country | ||||||||
| United States2 | 47.5 | % | ||||||
| Japan | 16.9 | |||||||
| Eurozone3 | 15.7 | |||||||
| United Kingdom | 5.0 | |||||||
| Mexico | 3.6 | |||||||
| Poland | 2.5 | |||||||
| Denmark | 1.7 | |||||||
| Other | 7.1 | |||||||
| Total | 100.0 | % | ||||||
| Non-U.S. government bonds by country | ||||||||
| Eurozone3: | ||||||||
| Germany | 2.7 | % | ||||||
| Spain | 2.0 | |||||||
| Italy | 1.4 | |||||||
| Other | 2.0 | 8.1 | % | |||||
| Japan | 11.9 | |||||||
| Poland | 3.8 | |||||||
| Mexico | 3.5 | |||||||
| India | 2.2 | |||||||
| United Kingdom | 2.0 | |||||||
| Brazil | 1.6 | |||||||
| Romania | 1.6 | |||||||
| Thailand | 1.3 | |||||||
| Other | 11.7 | |||||||
| Total | 47.7 | % | ||||||
| Largest holdings (by issuer) | Percent of net assets | |||
| U.S. Treasury | 18.2 | % | ||
| Japanese Government | 11.9 | |||
| Mexican Government | 3.9 | |||
| Polish Government | 3.8 | |||
| Nykredit Realkredit | 3.1 | |||
| Fannie Mae | 2.6 | |||
| German Government | 2.5 | |||
| Indian Government | 2.0 | |||
| Spanish Government | 2.0 | |||
| Brazilian Government | 1.7 | |||
| 30 | American Funds Insurance Series |
Global Bond Fund
How a $10,000 investment has grown

Average annual total returns based on a $1,000 investment
For periods ended December 31, 2018
| Lifetime | Expense | |||||||||||||||||||
| 1 year | 5 years | 10 years | (since October 4, 2006) | ratio | ||||||||||||||||
| Class 1 | –1.14 | % | 1.31 | % | 3.04 | % | 3.75 | % | .57 | % | ||||||||||
| Class 1A | –1.29 | 1.10 | 2.80 | 3.51 | .82 | |||||||||||||||
| Class 24 | –1.33 | 1.04 | 2.78 | 3.49 | .82 | |||||||||||||||
| Class 4 | –1.61 | 0.80 | 2.57 | 3.27 | 1.07 | |||||||||||||||
Investment results assume all distributions are reinvested and reflect applicable fees and expenses. The fund’s investment adviser waived a portion of its management fees from October 4, 2006, through December 31, 2008. Applicable fund results shown reflect the waiver, without which they would have been lower. Expense ratios are as of the fund’s prospectus dated May 1, 2019 (unaudited). See the Financial Highlights table in this report for details.
Any market index shown is unmanaged and, therefore, has no expenses. Investors cannot invest directly in an index.
| 1 | Source: Bloomberg Index Services Ltd. |
| 2 | Includes U.S. dollar-denominated debt of other countries, totaling 13.7%. |
| 3 | Countries using the euro as a common currency; those represented in the fund’s portfolio are France, Germany, Greece, Ireland, Italy, Portugal and Spain. |
| 4 | Global Bond Fund Class 2 shares were first sold on November 6, 2006. Results prior to that date are hypothetical based on Class 1 share results adjusted for estimated additional annual expenses of 0.25%. |
| Where the fund’s assets were invested as of December 31, 2018 | Percent of net assets |

| American Funds Insurance Series | 31 |
High-Income Bond Fund
Fund results shown are for past periods and are not predictive of results for future periods. Current and future results may be lower or higher than those shown. Unit prices and returns will vary, so investors may lose money. For current information and month-end results, visit americanfunds.com/afis. For information about your insurance contract and month-end results, go to the website of the company that issued your contract.
High-Income Bond Fund declined 2.15% for the 12 months ended December 31, 2018. In comparison, the fund’s benchmark, the Bloomberg Barclays U.S. Corporate High Yield 2% Issuer Capped Index,1which measures non-investment-grade bonds and limits the exposure of an issuer to 2%, fell 2.08%.
Rising yields made for mixed results across bond sectors as the 10-year Treasury yield rose 29 basis points. The Federal Reserve hiked the federal funds target rate four times this year to a range of 2.25% to 2.50% on the back of a strong labor market and solid economic growth.
While the fund’s returns were in line with the benchmark, an allocation to select industries contributed to relative returns — an underweight position in consumer cyclicals and an overweight position in technology boosted results.
The fund’s portfolio managers continue to believe current fundamentals support a mildly constructive outlook for the high-yield market. While we are monitoring the Federal Reserve’s tightening monetary policy, the higher yields and relatively short duration of high-yield bonds should help mitigate any impact from rising rates.
| Largest holdings (by issuer) | Percent of net assets | |||
| Bausch Health Companies | 2.6 | % | ||
| Tenet Healthcare | 1.9 | |||
| Cheniere Energy | 1.9 | |||
| Frontier Communications | 1.8 | |||
| First Quantum Minerals | 1.8 | |||
| iHeartMedia, Inc. | 1.6 | |||
| Petsmart | 1.5 | |||
| Cleveland-Cliffs | 1.4 | |||
| CCO Holdings LLC and CCO Holdings Capital | 1.3 | |||
| Gogo | 1.2 | |||
| 32 | American Funds Insurance Series |
High-Income Bond Fund
How a $10,000 investment has grown

Average annual total returns based on a $1,000 investment
For periods ended December 31, 2018
| Lifetime | Expense | |||||||||||||||||||
| 1 year | 5 years | 10 years | (since February 8, 1984) | ratio | ||||||||||||||||
| Class 1 | –2.15 | % | 3.01 | % | 8.79 | % | 8.55 | % | .50 | % | ||||||||||
| Class 1A | –2.35 | 2.78 | 8.53 | 8.28 | .75 | |||||||||||||||
| Class 2 | –2.34 | 2.77 | 8.51 | 8.28 | .75 | |||||||||||||||
| Class 3 | –2.33 | 2.82 | 8.58 | 8.35 | .68 | |||||||||||||||
| Class 4 | –2.64 | 2.50 | 8.30 | 8.02 | 1.00 | |||||||||||||||
Investment results assume all distributions are reinvested and reflect applicable fees and expenses. The fund’s investment adviser waived a portion of its management fees from September 1, 2004, through December 31, 2008. Applicable fund results shown reflect the waiver, without which they would have been lower. Expense ratios are as of the fund’s prospectus dated May 1, 2019 (unaudited). See the Financial Highlights table in this report for details.
Any market index shown is unmanaged and, therefore, has no expenses. Investors cannot invest directly in an index.
| 1 | Source: Bloomberg Index Services Ltd. |
| Where the fund’s assets were invested as of December 31, 2018 | Percent of net assets |

| American Funds Insurance Series | 33 |
Mortgage Fund
Fund results shown are for past periods and are not predictive of results for future periods. Current and future results may be lower or higher than those shown. Unit prices and returns will vary, so investors may lose money. For current information and month-end results, visit americanfunds.com/afis. For information about your insurance contract and month-end results, go to the website of the company that issued your contract.
Mortgage Fund gained 0.58% for the 12 months ended December 31, 2018, while the Bloomberg Barclays U.S. Mortgage-Backed Securities Index,1which covers the mortgage-backed pass-through securities of Ginnie Mae, Fannie Mae and Freddie Mac, rose 0.99%.
Rising yields made for mixed results across bond sectors as the 10-year Treasury yield rose 29 basis points. The Federal Reserve hiked the federal funds target rate four times this year to a range of 2.25% to 2.50% on the back of a strong labor market and solid economic growth.
The fund’s allocation to Treasuries, Agency debentures, and high-quality liquid asset-backed securities contributed to relative results as agency mortgage-backed securities lagged some of the other sectors during the calendar year. Duration had little impact and on the downside the fund’s yield curve position detracted from results.
The fund’s portfolio managers remain focused on meeting the core objectives of the fund — providing current income and protecting capital. The fund’s relatively low allocation to agency mortgage-backed securities, combined with an interest rate stance that anticipates that the yield curve will steepen, are positions that the portfolio managers expect will contribute to relative results in the future as markets evolve. As the Fed continues to withdraw liquidity by divesting Treasuries and mortgage securities from its balance sheet, more attractive valuations for mortgage investments are expected to emerge.
| Breakdown of mortgage-backed obligations | Percent of net assets | |||||||
| 30-year pass-throughs: | ||||||||
| Freddie Mac | 6.3 | % | ||||||
| Ginnie Mae | 21.5 | |||||||
| Fannie Mae | 18.1 | 45.9 | % | |||||
| Other | 26.0 | |||||||
| Total | 71.9 | % | ||||||
| 34 | American Funds Insurance Series |
Mortgage Fund
How a $10,000 investment has grown
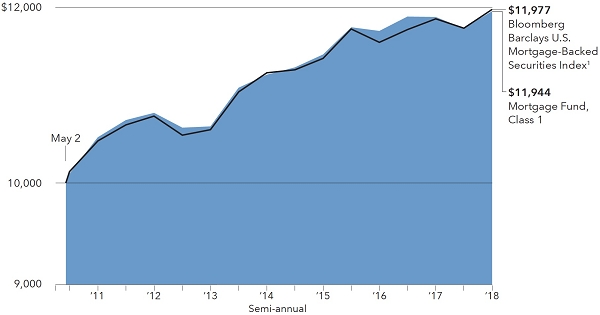
Average annual total returns based on a $1,000 investment
For periods ended December 31, 2018
| Lifetime | Expense | |||||||||||||||
| 1 year | 5 years | (since May 2, 2011) | ratio | |||||||||||||
| Class 1 | 0.58 | % | 2.42 | % | 2.34 | % | .48 | % | ||||||||
| Class 1A | 0.36 | 2.17 | 2.09 | .73 | ||||||||||||
| Class 2 | 0.32 | 2.16 | 2.09 | .73 | ||||||||||||
| Class 4 | 0.07 | 1.92 | 1.91 | .98 | ||||||||||||
Investment results assume all distributions are reinvested and reflect applicable fees and expenses. Expense ratios are as of the fund’s prospectus dated May 1, 2019 (unaudited). See the Financial Highlights table in this report for details.
Any market index shown is unmanaged and, therefore, has no expenses. Investors cannot invest directly in an index.
| 1 | Source: Bloomberg Index Services Ltd. |
| Where the fund’s assets were invested as of December 31, 2018 | Percent of net assets |

| American Funds Insurance Series | 35 |
Ultra-Short Bond Fund
Fund results shown are for past periods and are not predictive of results for future periods. Current and future results may be lower or higher than those shown. Unit prices and returns will vary, so investors may lose money. For current information and month-end results, visit americanfunds.com/afis. For information about your insurance contract and month-end results, go to the website of the company that issued your contract.
Ultra-Short Bond Fund gained 1.58% for the 12 months ended December 31, 2018, compared with a 1.99% rise in the Bloomberg Barclays Short-Term Government/Corporate Index,1which consists of investment-grade (rated BBB/Baa and above), fixed-rate, publicly placed, dollar-denominated and non-convertible securities with remaining maturity from one up to (but not including) 12 months within either the government or corporate sector.
The fund’s returns were higher than in 2017 as the Federal Reserve continued on its path to reducing the size of its balance sheet, raising rates by a quarter percentage point four times over the past 12 months, to the current range of 2.25% to 2.50%. Given an increase in interest rates to reassure investors of persistent U.S. economic strength, the fund’s portfolio managers believe the fund has the potential to provide current income.
| 36 | American Funds Insurance Series |
Ultra-Short Bond Fund
Average annual total returns based on a $1,000 investment
For periods ended December 31, 2018
| Lifetime | Expense | |||||||||||||||||||
| 1 year | 5 years | 10 years | (since February 8, 1984) | ratio | ||||||||||||||||
| Class 1 | 1.58 | % | 0.37 | % | 0.10 | % | 3.44 | % | .35 | % | ||||||||||
| Class 1A | 1.58 | 0.23 | –0.10 | 3.19 | .60 | |||||||||||||||
| Class 2 | 1.36 | 0.13 | –0.15 | 3.18 | .60 | |||||||||||||||
| Class 3 | 1.38 | 0.18 | –0.09 | 3.25 | .53 | |||||||||||||||
| Class 4 | 1.14 | –0.06 | –0.33 | 2.94 | .85 | |||||||||||||||
Investment results assume all distributions are reinvested and reflect applicable fees and expenses. The fund’s investment adviser waived a portion of its management fees from September 1, 2004, through December 31, 2008. Applicable fund results shown reflect the waiver, without which they would have been lower. Expense ratios are as of the fund’s prospectus dated May 1, 2019 (unaudited). See the Financial Highlights table in this report for details.
Any market index shown is unmanaged and, therefore, has no expenses. Investors cannot invest directly in an index.
| 1 | Source: Bloomberg Index Services Ltd. |
| Where the fund’s assets were invested as of December 31, 2018 | Percent of net assets | |||
| Commercial paper | 69.8 | % | ||
| U.S Treasury bills | 24.4 | |||
| Federal agency discount notes | 5.9 | |||
| Other assets less liabilities | (.1 | ) | ||
| Total | 100.0 | % | ||
| American Funds Insurance Series | 37 |
U.S. Government/AAA-Rated Securities Fund
Fund results shown are for past periods and are not predictive of results for future periods. Current and future results may be lower or higher than those shown. Unit prices and returns will vary, so investors may lose money. For current information and month-end results, visit americanfunds.com/afis. For information about your insurance contract and month-end results, go to the website of the company that issued your contract.
U.S. Government/AAA-Rated Securities Fund rose 0.91% for the 12 months ended December 31, 2018, while the Bloomberg Barclays U.S. Government/Mortgage-Backed Securities Index,1which covers obligations issued by the U.S. Treasury and U.S. government agencies, increased by 0.93%.
Rising yields made for mixed results across bond sectors as the 10-year Treasury yield rose 29 basis points. The Federal Reserve hiked the federal funds target rate four times this year to a range of 2.25% to 2.50% on the back of a strong labor market and solid economic growth.
During the period, curve positioning led by higher yields contributed to relative returns. On the downside, TIPS (Treasury inflation protected securities) detracted from relative returns as inflation expectations fell in the fourth quarter of 2018.
The fund strives to meet its objective of providing a high level of current income consistent with the preservation of capital. The fund’s portfolio managers have positioned the fund with the expectation that rate hikes in the near future will be at a gradual pace and believe this can lead to a steepening yield curve and higher inflation expectations.
| Breakdown of mortgage-backed obligations | Percent of net assets | |||||||
| 30-year pass-throughs: | ||||||||
| Fannie Mae | 12.3 | % | ||||||
| Ginnie Mac | 4.7 | |||||||
| Freddie Mac | 2.5 | 19.5 | % | |||||
| 15-year pass-throughs | 2.3 | |||||||
| Other | 6.8 | |||||||
| Total | 28.6 | % | ||||||
| 38 | American Funds Insurance Series |
U.S. Government/AAA-Rated Securities Fund
How a $10,000 investment has grown
![]()
Average annual total returns based on a $1,000 investment
For periods ended December 31, 2018
| Lifetime | Expense | |||||||||||||||||||
| 1 year | 5 years | 10 years | (since December 2, 1985) | ratio | ||||||||||||||||
| Class 1 | 0.91 | % | 2.26 | % | 2.69 | % | 5.71 | % | .36 | % | ||||||||||
| Class 1A | 0.70 | 2.04 | 2.45 | 5.45 | .61 | |||||||||||||||
| Class 2 | 0.73 | 2.01 | 2.44 | 5.45 | .61 | |||||||||||||||
| Class 3 | 0.71 | 2.07 | 2.50 | 5.52 | .54 | |||||||||||||||
| Class 4 | 0.50 | 1.75 | 2.22 | 5.20 | .86 | |||||||||||||||
Investment results assume all distributions are reinvested and reflect applicable fees and expenses. The fund’s investment adviser waived a portion of its management fees from September 1, 2004, through December 31, 2008, and from July 1, 2010, through December 31, 2010. Applicable fund results shown reflect the waiver, without which they would have been lower. Expense ratios are as of the fund’s prospectus dated May 1, 2019 (unaudited). See the Financial Highlights table in this report for details.
Any market index shown is unmanaged and, therefore, has no expenses. Investors cannot invest directly in an index.
| 1 | Source: Bloomberg Index Services Ltd. |
| Where the fund’s assets were invested as of December 31, 2018 | Percent of net assets |

| American Funds Insurance Series | 39 |
Managed Risk Growth Fund
Fund results shown are for past periods and are not predictive of results for future periods. Current and future results may be lower or higher than those shown. Unit prices and returns will vary, so investors may lose money. For current information and month-end results, visit americanfunds.com/afis. For information about your insurance contract and month-end results, go to the website of the company that issued your contract.
The fund slipped 0.04% for the 12 months ended December 31, 2018. Standard & Poor’s 500 Managed Risk Index – Moderate Aggressive1fell 2.51%. Standard & Poor’s 500 Composite Index,2a market capitalization-weighted index based on the results of approximately 500 widely held common stocks, lost 4.38%.
The fund pursues its objective by investing in shares of American Funds Insurance Series – Growth FundSMand American Funds Insurance Series – Bond FundSMwhile seeking to manage portfolio volatility and provide downside protection, primarily through the use of exchange-traded futures. The benefit of the fund’s managed risk strategy should be most apparent during periods of high volatility and in down markets. In steady or rising markets, the fund’s results can be expected to lag those of the underlying Growth Fund.
The underlying Growth Fund’s investments in consumer discretionary added to returns, while investments in communication services detracted from the fund’s results.
How a $10,000 investment has grown

Average annual total returns based on a $1,000 investment
For periods ended December 31, 2018
| Lifetime | Gross expense | Net expense | ||||||||||||||
| 1 year | (since May 1, 2013) | ratio | ratio | |||||||||||||
| Class P1 | –0.04 | % | 7.94 | % | .77 | % | .72 | % | ||||||||
| Class P2 | –0.37 | 7.62 | 1.02 | .97 | ||||||||||||
Any market index shown is unmanaged and, therefore, has no expenses. Investors cannot invest directly in an index.
| 1 | Source: S&P Dow Jones Indices LLC. Standard & Poor’s Managed Risk Index Series is designed to simulate a dynamic protective portfolio that allocates between the underlying equity index and cash, based on realized volatilities of the underlying equity and bond indexes, while maintaining a fixed allocation to the underlying bond index. |
| 2 | Source: S&P Dow Jones Indices LLC. |
Milliman Financial Risk Management LLC serves as the subadviser with respect to the management of the fund’s managed risk strategy.
| 40 | American Funds Insurance Series |
Managed Risk International Fund
Fund results shown are for past periods and are not predictive of results for future periods. Current and future results may be lower or higher than those shown. Unit prices and returns will vary, so investors may lose money. For current information and month-end results, visit americanfunds.com/afis. For information about your insurance contract and month-end results, go to the website of the company that issued your contract.
The fund declined 10.11% for the 12 months ended December 31, 2018, compared to the S&P EPAC Ex. Korea LargeMidCap Managed Risk Index – Moderate Aggressive,1which fell 10.15%. The MSCI ACWI (All Country World Index) ex USA,2a free float-adjusted market capitalization-weighted index that is designed to measure equity market results in the global developed and emerging markets (consisting of more than 40 developed and emerging market country indexes excluding the U.S.), decreased by 14.20%.
The fund pursues its objective by investing in shares of American Funds Insurance Series – International FundSMand American Funds Insurance Series – Bond FundSMwhile seeking to manage portfolio volatility and provide downside protection, primarily through the use of exchange-traded futures. The benefit of the fund’s managed risk strategy should be most apparent during periods of high volatility and in down markets. In steady or rising markets, the fund’s results can be expected to lag those of the underlying International Fund.
The underlying International Fund’s investments in the financials sector added to returns, while investments in the consumer staples sector hindered the fund’s results.
How a $10,000 investment has grown
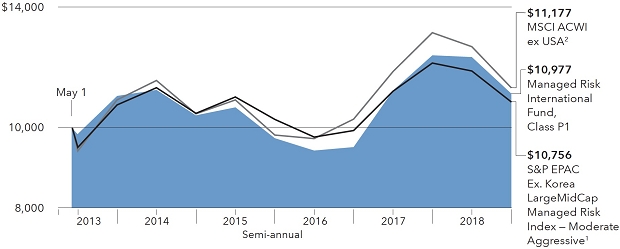
Average annual total returns based on a $1,000 investment
For periods ended December 31, 2018
| Lifetime | Gross expense | Net expense | ||||||||||||||
| 1 year | (since May 1, 2013) | ratio | ratio | |||||||||||||
| Class P1 | –10.11 | % | 1.66 | % | .96 | % | .87 | % | ||||||||
| Class P2 | –10.50 | 1.25 | 1.21 | 1.12 | ||||||||||||
Any market index shown is unmanaged and, therefore, has no expenses. Investors cannot invest directly in an index.
| 1 | Source: S&P Dow Jones Indices LLC. Standard & Poor’s Managed Risk Index Series is designed to simulate a dynamic protective portfolio that allocates between the underlying equity index and cash, based on realized volatilities of the underlying equity and bond indexes, while maintaining a fixed allocation to the underlying bond index. |
| 2 | Source: MSCI. The MSCI index result reflects reinvestment of distributions and dividends net of withholding taxes. |
Milliman Financial Risk Management LLC serves as the subadviser with respect to the management of the fund’s managed risk strategy.
| American Funds Insurance Series | 41 |
Managed Risk Blue Chip Income and Growth Fund
Fund results shown are for past periods and are not predictive of results for future periods. Current and future results may be lower or higher than those shown. Unit prices and returns will vary, so investors may lose money. For current information and month-end results, visit americanfunds.com/afis. For information about your insurance contract and month-end results, go to the website of the company that issued your contract.
The fund lost 6.99% for the 12 months ended December 31, 2018, trailing the S&P 500 Managed Risk Index – Moderate,1which fell 2.13%. Standard & Poor’s 500 Composite Index,2a market capitalization-weighted index based on the results of approximately 500 widely held common stocks, decreased by 4.38%.
The fund pursues its objective by investing in shares of American Funds Insurance Series – Blue Chip Income and Growth FundSMand American Funds Insurance Series – U.S. Government/AAA-Rated Securities FundSMwhile seeking to manage portfolio volatility and provide downside protection, primarily through the use of exchange-traded futures. The benefit of the fund’s managed risk strategy should be most apparent during periods of high volatility and in down markets. In steady or rising markets, the fund’s results can be expected to lag those of the underlying Blue Chip Income and Growth Fund.
The underlying Blue Chip Income and Growth Fund’s investments in consumer staples stocks detracted the most from the fund’s results.
How a $10,000 investment has grown
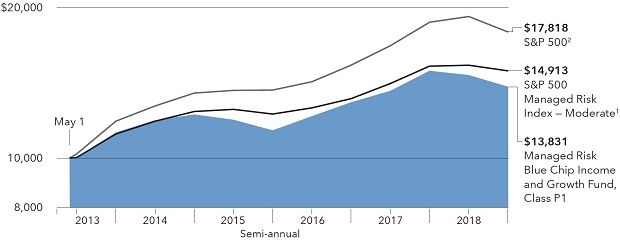
Average annual total returns based on a $1,000 investment
For periods ended December 31, 2018
| Lifetime | Gross expense | Net expense | ||||||||||||||||||
| 1 year | 5 years | (since May 1, 2013) | ratio | ratio | ||||||||||||||||
| Class P1 | –6.99 | % | 4.28 | % | 5.89 | % | .82 | % | .77 | % | ||||||||||
| Class P2 | –7.38 | 3.87 | 5.50 | 1.07 | 1.02 | |||||||||||||||
Any market index shown is unmanaged and, therefore, has no expenses. Investors cannot invest directly in an index.
| 1 | Source: S&P Dow Jones Indices LLC. Standard & Poor’s Managed Risk Index Series is designed to simulate a dynamic protective portfolio that allocates between the underlying equity index and cash, based on realized volatilities of the underlying equity and bond indexes, while maintaining a fixed allocation to the underlying bond index. |
| 2 | Source: S&P Dow Jones Indices LLC. |
Milliman Financial Risk Management LLC serves as the subadviser with respect to the management of the fund’s managed risk strategy.
| 42 | American Funds Insurance Series |
Managed Risk Growth-Income Fund
Fund results shown are for past periods and are not predictive of results for future periods. Current and future results may be lower or higher than those shown. Unit prices and returns will vary, so investors may lose money. For current information and month-end results, visit americanfunds.com/afis. For information about your insurance contract and month-end results, go to the website of the company that issued your contract.
The fund slipped 1.66% for the 12 months ended December 31, 2018, compared to the S&P 500 Managed Risk Index – Moderate,1which declined 2.13%. Standard & Poor’s 500 Composite Index,2a market capitalization-weighted index based on the results of approximately 500 widely held common stocks, decreased by 4.38%.
The fund pursues its objective by investing in shares of American Funds Insurance Series – Growth-Income FundSMand American Funds Insurance Series – Bond FundSMwhile seeking to manage portfolio volatility and provide downside protection, primarily through the use of exchange-traded futures. The benefit of the fund’s managed risk strategy should be most apparent during periods of high volatility and in down markets. In steady or rising markets, the fund’s results can be expected to lag those of the underlying Growth-Income Fund.
The underlying Growth-Income Fund’s investments in the consumer discretionary sector contributed the most to the fund’s relative returns, while investments in the information technology sector detracted the most from the fund’s relative results.
How a $10,000 investment has grown

Average annual total returns based on a $1,000 investment
For periods ended December 31, 2018
| Lifetime | Gross expense | Net expense | ||||||||||||||||||
| 1 year | 5 years | (since May 1, 2013) | ratio | ratio | ||||||||||||||||
| Class P1 | –1.66 | % | 5.08 | % | 7.27 | % | .73 | % | .67 | % | ||||||||||
| Class P2 | –1.97 | 4.73 | 6.93 | .98 | .92 | |||||||||||||||
Any market index shown is unmanaged and, therefore, has no expenses. Investors cannot invest directly in an index.
| 1 | Source: S&P Dow Jones Indices LLC. Standard & Poor’s Managed Risk Index Series is designed to simulate a dynamic protective portfolio that allocates between the underlying equity index and cash, based on realized volatilities of the underlying equity and bond indexes, while maintaining a fixed allocation to the underlying bond index. |
| 2 | Source: S&P Dow Jones Indices LLC. |
Milliman Financial Risk Management LLC serves as the subadviser with respect to the management of the fund’s managed risk strategy.
| American Funds Insurance Series | 43 |
Managed Risk Asset Allocation Fund
Fund results shown are for past periods and are not predictive of results for future periods. Current and future results may be lower or higher than those shown. Unit prices and returns will vary, so investors may lose money. For current information and month-end results, visit americanfunds.com/afis. For information about your insurance contract and month-end results, go to the website of the company that issued your contract.
The fund declined 4.63% for the 12 months ended December 31, 2018, trailing the S&P 500 Managed Risk Index – Moderate Conservative,1which lost 1.88%. Standard & Poor’s 500 Composite Index,2a market capitalization-weighted index based on the results of approximately 500 widely held common stocks, fell 4.38%.
The fund pursues its objective by investing in shares of American Funds Insurance Series – Asset Allocation FundSMwhile seeking to manage portfolio volatility and provide downside protection, primarily through the use of exchange-traded futures. The benefit of the fund’s managed risk strategy should be most apparent during periods of high volatility and in down markets. In steady or rising markets, the fund’s results can be expected to lag those of the underlying Asset Allocation Fund.
The fund’s underlying investments in the industrials sector contributed the most to relative returns, while investments in the energy sector hindered results the most.
| 44 | American Funds Insurance Series |
Managed Risk Asset Allocation Fund
How a $10,000 investment has grown

Average annual total returns based on a $1,000 investment
For periods ended December 31, 2018
| Lifetime | Gross expense | Net expense | ||||||||||||||||||
| 1 year | 5 years | (since September 28, 2012) | ratio | ratio | ||||||||||||||||
| Class P1 | –4.63 | % | 3.86 | % | 6.45 | % | .69 | % | .64 | % | ||||||||||
| Class P2 | –4.89 | 3.58 | 6.18 | .94 | .89 | |||||||||||||||
Any market index shown is unmanaged and, therefore, has no expenses. Investors cannot invest directly in an index.
| 1 | Source: S&P Dow Jones Indices LLC. Standard & Poor’s Managed Risk Index Series is designed to simulate a dynamic protective portfolio that allocates between the underlying equity index and cash, based on realized volatilities of the underlying equity and bond indexes, while maintaining a fixed allocation to the underlying bond index. |
| 2 | Source: S&P Dow Jones Indices LLC. |
| 3 | Source: Bloomberg Index Services Ltd. |
Milliman Financial Risk Management LLC serves as the subadviser with respect to the management of the fund’s managed risk strategy.
| American Funds Insurance Series | 45 |
Summary investment portfolioDecember 31, 2018
| Common stocks 94.37% | Shares | Value (000) | ||||||
| Information technology 24.34% | ||||||||
| Taiwan Semiconductor Manufacturing Co., Ltd.1 | 27,188,000 | $ | 197,997 | |||||
| Taiwan Semiconductor Manufacturing Co., Ltd. (ADR) | 335,000 | 12,365 | ||||||
| ASML Holding NV | 648,442 | 101,904 | ||||||
| ASML Holding NV (New York registered) | 517,300 | 80,502 | ||||||
| Microsoft Corp. | 1,583,100 | 160,795 | ||||||
| Visa Inc., Class A | 1,142,800 | 150,781 | ||||||
| Broadcom Inc. | 487,050 | 123,847 | ||||||
| Temenos AG1 | 637,000 | 76,403 | ||||||
| Paycom Software, Inc.2 | 357,000 | 43,715 | ||||||
| Amadeus IT Group SA, Class A, non-registered shares | 486,200 | 33,892 | ||||||
| Adobe Inc.2 | 135,000 | 30,542 | ||||||
| Other securities | 326,242 | |||||||
| 1,338,985 | ||||||||
| Consumer discretionary 17.99% | ||||||||
| Amazon.com, Inc.2 | 228,600 | 343,350 | ||||||
| Alibaba Group Holding Ltd. (ADR)2 | 931,050 | 127,619 | ||||||
| NIKE, Inc., Class B | 562,500 | 41,704 | ||||||
| Home Depot, Inc. | 236,800 | 40,687 | ||||||
| Just Eat PLC2 | 5,292,000 | 39,581 | ||||||
| Booking Holdings Inc.2 | 22,700 | 39,099 | ||||||
| Ocado Group PLC2 | 3,115,000 | 31,366 | ||||||
| Moncler SpA1 | 915,000 | 30,352 | ||||||
| Other securities | 296,182 | |||||||
| 989,940 | ||||||||
| Health care 12.51% | ||||||||
| UnitedHealth Group Inc. | 324,200 | 80,765 | ||||||
| Merck & Co., Inc. | 886,000 | 67,699 | ||||||
| Boston Scientific Corp.2 | 1,638,200 | 57,894 | ||||||
| Elanco Animal Health Inc.2 | 1,799,658 | 56,743 | ||||||
| AstraZeneca PLC | 721,300 | 53,995 | ||||||
| Sartorius AG, nonvoting preferred, non-registered shares1 | 381,500 | 47,577 | ||||||
| Mettler-Toledo International Inc.2 | 65,000 | 36,763 | ||||||
| Cigna Corp. | 177,511 | 33,713 | ||||||
| Hologic, Inc.2 | 800,000 | 32,880 | ||||||
| Fisher & Paykel Healthcare Corp. Ltd. | 3,680,000 | 32,110 | ||||||
| Other securities | 188,418 | |||||||
| 688,557 | ||||||||
| Communication services 10.57% | ||||||||
| Alphabet Inc., Class A2 | 116,500 | 121,738 | ||||||
| Alphabet Inc., Class C2 | 71,052 | 73,582 | ||||||
| Nintendo Co., Ltd.1 | 345,600 | 92,022 | ||||||
| Naspers Ltd., Class N | 379,000 | 76,189 | ||||||
| Tencent Holdings Ltd. | 1,800,000 | 72,179 | ||||||
| Facebook, Inc., Class A2 | 408,000 | 53,485 | ||||||
| SoftBank Group Corp.1 | 776,000 | 51,643 | ||||||
| Other securities | 40,753 | |||||||
| 581,591 | ||||||||
| Financials 10.39% | ||||||||
| AIA Group Ltd. | 15,004,900 | 124,554 | ||||||
| JPMorgan Chase & Co. | 853,600 | 83,328 | ||||||
| Kotak Mahindra Bank Ltd. | 3,471,000 | 62,470 | ||||||
| MarketAxess Holdings Inc. | 211,000 | 44,586 | ||||||
| Société Générale | 1,234,350 | 39,345 | ||||||
| Other securities | 217,484 | |||||||
| 571,767 | ||||||||
| 46 | American Funds Insurance Series |
Global Growth Fund
| Common stocks | Shares | Value (000) | ||||||
| Consumer staples 6.94% | ||||||||
| Nestlé SA1 | 739,650 | $ | 60,038 | |||||
| Coca-Cola European Partners PLC | 1,194,500 | 54,768 | ||||||
| British American Tobacco PLC | 1,710,800 | 54,514 | ||||||
| Philip Morris International Inc. | 602,200 | 40,203 | ||||||
| Other securities | 172,025 | |||||||
| 381,548 | ||||||||
| Industrials 6.15% | ||||||||
| Airbus SE, non-registered shares | 1,093,500 | 105,192 | ||||||
| Other securities | 233,387 | |||||||
| 338,579 | ||||||||
| Materials 2.82% | ||||||||
| Sherwin-Williams Co. | 155,500 | 61,183 | ||||||
| Other securities | 94,160 | |||||||
| 155,343 | ||||||||
| Energy 2.66% | ||||||||
| Royal Dutch Shell PLC, Class B | 1,042,000 | 31,078 | ||||||
| Other securities | 115,155 | |||||||
| 146,233 | ||||||||
| Total common stocks (cost: $3,929,871,000) | 5,192,543 | |||||||
| Short-term securities 5.35% | Principal amount (000) | |||||||
| Federal Home Loan Bank 2.15%–2.29% due 1/2/2019–1/10/2019 | $ | 60,100 | 60,080 | |||||
| Nestle Capital Corp. 2.68% due 3/19/20193 | 40,000 | 39,778 | ||||||
| Toronto-Dominion Bank 2.65% due 2/20/20193 | 50,000 | 49,815 | ||||||
| U.S. Treasury Bills 2.37% due 2/12/2019 | 50,000 | 49,868 | ||||||
| Other securities | 94,832 | |||||||
| Total short-term securities (cost: $294,370,000) | 294,373 | |||||||
| Total investment securities 99.72% (cost: $4,224,241,000) | 5,486,916 | |||||||
| Other assets less liabilities 0.28% | 15,237 | |||||||
| Net assets 100.00% | $ | 5,502,153 | ||||||
This summary investment portfolio is designed to streamline the report and help investors better focus on the fund’s principal holdings. See the inside back cover for details on how to obtain a complete schedule of portfolio holdings.
“Other securities” includes all issues that are not disclosed separately in the summary investment portfolio.
| 1 | Valued under fair value procedures adopted by authority of the board of trustees. The total value of all such securities, including those in “Other securities,” was $1,042,869,000, which represented 18.95% of the net assets of the fund. This amount includes $1,012,346,000 related to certain securities trading outside the U.S. whose values were adjusted as a result of significant market movements following the close of local trading. |
| 2 | Security did not produce income during the last 12 months. |
| 3 | Acquired in a transaction exempt from registration under Rule 144A or Section 4(2) of the Securities Act of 1933. May be resold in the U.S. in transactions exempt from registration, normally to qualified institutional buyers. The total value of all such securities, including those in “Other securities,” was $168,168,000, which represented 3.06% of the net assets of the fund. |
Key to abbreviation
ADR = American Depositary Receipts
See notes to financial statements
| American Funds Insurance Series | 47 |
Global Small Capitalization Fund
Summary investment portfolioDecember 31, 2018
| Common stocks 88.97% | Shares | Value (000) | ||||||
| Health care 21.25% | ||||||||
| GW Pharmaceuticals PLC (ADR)1 | 823,718 | $ | 80,222 | |||||
| Insulet Corp.1 | 860,355 | 68,243 | ||||||
| Allakos Inc.1,2 | 886,580 | 46,341 | ||||||
| Molina Healthcare, Inc.1 | 381,000 | 44,280 | ||||||
| iRhythm Technologies, Inc.1 | 614,905 | 42,724 | ||||||
| Integra LifeSciences Holdings Corp.1 | 926,365 | 41,779 | ||||||
| Evolent Health, Inc., Class A1 | 1,545,000 | 30,823 | ||||||
| Illumina, Inc.1 | 100,200 | 30,053 | ||||||
| NuCana PLC (ADR)1,2,3 | 2,067,724 | 29,982 | ||||||
| China Biologic Products Holdings, Inc.1,2 | 360,000 | 27,328 | ||||||
| Haemonetics Corp.1 | 242,825 | 24,295 | ||||||
| CONMED Corp. | 332,500 | 21,346 | ||||||
| Other securities | 289,222 | |||||||
| 776,638 | ||||||||
| Information technology 15.61% | ||||||||
| Paycom Software, Inc.1 | 428,885 | 52,517 | ||||||
| Mellanox Technologies, Ltd.1 | 389,200 | 35,954 | ||||||
| Qorvo, Inc.1 | 510,300 | 30,991 | ||||||
| Cree, Inc.1 | 711,507 | 30,435 | ||||||
| HubSpot, Inc.1 | 229,100 | 28,805 | ||||||
| Ceridian HCM Holding Inc.1,2 | 801,777 | 27,653 | ||||||
| Other securities | 363,983 | |||||||
| 570,338 | ||||||||
| Industrials 14.49% | ||||||||
| International Container Terminal Services, Inc.4 | 22,581,620 | 42,947 | ||||||
| Nihon M&A Center Inc.4 | 1,667,392 | 33,670 | ||||||
| frontdoor, inc.1 | 903,000 | 24,029 | ||||||
| Bravida Holding AB4 | 3,229,000 | 22,319 | ||||||
| Other securities | 406,656 | |||||||
| 529,621 | ||||||||
| Consumer discretionary 13.40% | ||||||||
| Five Below, Inc.1 | 423,000 | 43,281 | ||||||
| Melco International Development Ltd. | 15,579,000 | 31,753 | ||||||
| Mattel, Inc.1,2 | 2,583,800 | 25,812 | ||||||
| Domino’s Pizza, Inc. | 100,000 | 24,799 | ||||||
| ServiceMaster Global Holdings, Inc.1 | 658,750 | 24,202 | ||||||
| Cedar Fair, LP | 500,000 | 23,650 | ||||||
| Hilton Grand Vacations Inc.1 | 851,000 | 22,458 | ||||||
| Other securities | 293,641 | |||||||
| 489,596 | ||||||||
| Financials 8.66% | ||||||||
| Kotak Mahindra Bank Ltd. | 3,135,263 | 56,427 | ||||||
| Essent Group Ltd.1 | 1,018,841 | 34,824 | ||||||
| Trupanion, Inc.1,2 | 1,140,800 | 29,045 | ||||||
| Cannae Holdings, Inc.1 | 1,625,000 | 27,820 | ||||||
| Bharat Financial Inclusion Ltd.1 | 1,897,444 | 27,523 | ||||||
| Other securities | 140,992 | |||||||
| 316,631 | ||||||||
| Materials 3.90% | ||||||||
| Lundin Mining Corp. | 6,820,000 | 28,175 | ||||||
| Allegheny Technologies Inc.1 | 1,200,950 | 26,145 | ||||||
| Other securities | 88,349 | |||||||
| 142,669 | ||||||||
| 48 | American Funds Insurance Series |
Global Small Capitalization Fund
| Common stocks | Shares | Value (000) | ||||||
| Consumer staples 3.31% | ||||||||
| Other securities | $ | 120,907 | ||||||
| Communication services 2.54% | ||||||||
| Entertainment One Ltd. | 5,114,389 | 23,246 | ||||||
| Other securities | 69,377 | |||||||
| 92,623 | ||||||||
| Energy 2.13% | ||||||||
| Other securities | 77,770 | |||||||
| Real estate 2.02% | ||||||||
| WHA Corp. PCL4 | 229,577,250 | 30,221 | ||||||
| MGM Growth Properties LLC REIT, Class A | 892,500 | 23,571 | ||||||
| Other securities | 19,934 | |||||||
| 73,726 | ||||||||
| Utilities 1.66% | ||||||||
| ENN Energy Holdings Ltd. | 4,686,900 | 41,569 | ||||||
| Other securities | 19,216 | |||||||
| 60,785 | ||||||||
| Total common stocks (cost: $2,973,377,000) | 3,251,304 | |||||||
| Bonds, notes & other debt instruments 0.13% | Principal amount (000) | |||||||
| U.S. Treasury bonds & notes 0.13% | ||||||||
| U.S. Treasury 0.13% | ||||||||
| Other securities | 4,989 | |||||||
| Total bonds, notes & other debt instruments (cost: $4,991,000) | 4,989 | |||||||
| Short-term securities 12.25% | ||||||||
| Commercial paper 8.31% | ||||||||
| National Australia Bank Ltd. 2.34% due 1/16/20195 | $ | 40,000 | 39,957 | |||||
| Sumitomo Mitsui Banking Corp. 2.57% due 2/15/20195 | 50,000 | 49,838 | ||||||
| Canadian Imperial Bank of Commerce 2.56% due 1/15/20195 | 32,000 | 31,968 | ||||||
| ExxonMobil Corp. 2.36% due 1/4/2019 | 50,000 | 49,987 | ||||||
| Mizuho Bank, Ltd. 2.50% due 2/1/20195 | 62,400 | 62,261 | ||||||
| United Overseas Bank Ltd. 2.71% due 3/4/20195 | 50,000 | 49,764 | ||||||
| Other securities | 19,894 | |||||||
| 303,669 | ||||||||
| Shares | ||||||||
| Money market investments 1.49% | ||||||||
| Fidelity Institutional Money Market Funds - Government Portfolio6 | 6,646 | 6,646 | ||||||
| Goldman Sachs Financial Square Government Fund6 | 16,023 | 16,023 | ||||||
| Invesco Short-Term Investments Trust - Government & Agency Portfolio6 | 29,254 | 29,254 | ||||||
| Morgan Stanley Institutional Liquidity Funds - Government Portfolio6 | 2,513 | 2,513 | ||||||
| 54,436 | ||||||||
| American Funds Insurance Series | 49 |
Global Small Capitalization Fund
| Short-term securities(continued) | Principal amount (000) | Value (000) | ||||||
| Bonds & notes of governments & government agencies outside the U.S. 1.00% | ||||||||
| KfW 2.43% due 1/11/20195 | $ | 28,600 | $ | 28,579 | ||||
| Other securities | 7,888 | |||||||
| 36,467 | ||||||||
| Federal agency discount notes 0.82% | ||||||||
| Federal Home Loan Bank 2.29% due 1/10/2019 | 30,000 | 29,984 | ||||||
| U.S. Treasury bonds & notes 0.63% | ||||||||
| U.S. Treasury Bills 2.35% due 2/7/2019 | 23,100 | 23,046 | ||||||
| Total short-term securities (cost: $447,616,000) | 447,602 | |||||||
| Total investment securities 101.35% (cost: $3,425,984,000) | 3,703,895 | |||||||
| Other assets less liabilities (1.35)% | (49,381 | ) | ||||||
| Net assets 100.00% | $ | 3,654,514 | ||||||
This summary investment portfolio is designed to streamline the report and help investors better focus on the fund’s principal holdings. See the inside back cover for details on how to obtain a complete schedule of portfolio holdings.
“Other securities” includes all issues that are not disclosed separately in the summary investment portfolio. One security in “Other securities” (with a value of $16,560,000, an aggregate cost of $8,280,000, and which represented .45% of the net assets of the fund) was acquired on 5/1/2015 through private placement transactions exempt from registration under the Securities Act of 1933, which may subject it to legal or contractual restrictions on resale.
Investments in affiliates
A company is an affiliate of the fund under the Investment Company Act of 1940 if the fund’s holdings in that company represent 5% or more of the outstanding voting shares. The value of the fund’s holdings in affiliated companies is included in “Other securities” under the respective industry sectors in the summary investment portfolio. Further details on these holdings and related transactions during the year ended December 31, 2018, appear below.
| Beginning shares | Additions | Reductions | Ending shares | Net realized gain (000) | Net unrealized depreciation (000) | Dividend income (000) | Value of affiliates at 12/31/2018 (000) | |||||||||||||||||||||||||
| Common stocks 0.82% | ||||||||||||||||||||||||||||||||
| Health care 0.82% | ||||||||||||||||||||||||||||||||
| NuCana PLC (ADR)1,2 | 416,620 | 1,651,104 | — | 2,067,724 | $ | — | $ | (13,335 | ) | $ | — | $ | 29,982 | |||||||||||||||||||
| Consumer discretionary 0.00% | ||||||||||||||||||||||||||||||||
| Hostelworld Group PLC7 | 6,212,000 | — | 6,212,000 | — | 2,632 | (6,656 | ) | 437 | — | |||||||||||||||||||||||
| Total 0.82% | $ | 2,632 | $ | (19,991 | ) | $ | 437 | $ | 29,982 | |||||||||||||||||||||||
| 50 | American Funds Insurance Series |
Global Small Capitalization Fund
| 1 | Security did not produce income during the last 12 months. |
| 2 | All or a portion of this security was on loan. The total value of all such securities, including those in “Other securities,” was $67,607,000, which represented 1.85% of the net assets of the fund. Refer to Note 5 for more information on securities lending. |
| 3 | Represents an affiliated company as defined under the Investment Company Act of 1940. |
| 4 | Valued under fair value procedures adopted by authority of the board of trustees. The total value of all such securities, including those in “Other securities,” was $729,211,000, which represented 19.95% of the net assets of the fund. This amount includes $697,427,000 related to certain securities trading outside the U.S. whose values were adjusted as a result of significant market movements following the close of local trading. |
| 5 | Acquired in a transaction exempt from registration under Rule 144A or Section 4(2) of the Securities Act of 1933. May be resold in the U.S. in transactions exempt from registration, normally to qualified institutional buyers. The total value of all such securities, including those in “Other securities,” was $309,041,000, which represented 8.46% of the net assets of the fund. |
| 6 | Security purchased with cash collateral from securities on loan. Refer to Note 5 for more information on securities lending. |
| 7 | Unaffiliated issuer at 12/31/2018. |
Key to abbreviation
ADR = American Depositary Receipts
See notes to financial statements
| American Funds Insurance Series | 51 |
Summary investment portfolioDecember 31, 2018
| Common stocks 91.48% | Shares | Value (000) | ||||||
| Information technology 21.29% | ||||||||
| Microsoft Corp. | 10,468,400 | $ | 1,063,275 | |||||
| Broadcom Inc. | 3,414,000 | 868,112 | ||||||
| ASML Holding NV (New York registered) | 1,278,400 | 198,944 | ||||||
| ASML Holding NV | 985,000 | 154,794 | ||||||
| Visa Inc., Class A | 2,650,400 | 349,694 | ||||||
| Taiwan Semiconductor Manufacturing Co., Ltd.1 | 31,814,000 | 231,687 | ||||||
| Taiwan Semiconductor Manufacturing Co., Ltd. (ADR) | 2,419,592 | 89,307 | ||||||
| ServiceNow, Inc.2 | 1,653,000 | 294,317 | ||||||
| Intel Corp. | 4,769,400 | 223,828 | ||||||
| Workday, Inc., Class A2 | 1,123,000 | 179,321 | ||||||
| Samsung Electronics Co., Ltd.1 | 3,901,400 | 134,758 | ||||||
| Paycom Software, Inc.2 | 1,028,500 | 125,940 | ||||||
| RingCentral, Inc., Class A2 | 1,433,100 | 118,145 | ||||||
| Other securities | 958,728 | |||||||
| 4,990,850 | ||||||||
| Health care 16.77% | ||||||||
| UnitedHealth Group Inc. | 3,377,000 | 841,278 | ||||||
| Regeneron Pharmaceuticals, Inc.2 | 1,341,000 | 500,864 | ||||||
| Intuitive Surgical, Inc.2 | 940,500 | 450,424 | ||||||
| Humana Inc. | 1,056,200 | 302,580 | ||||||
| Centene Corp.2 | 2,014,700 | 232,295 | ||||||
| Vertex Pharmaceuticals Inc.2 | 1,400,900 | 232,143 | ||||||
| Boston Scientific Corp.2 | 4,791,000 | 169,314 | ||||||
| Cigna Corp. | 739,902 | 140,522 | ||||||
| Thermo Fisher Scientific Inc. | 622,100 | 139,220 | ||||||
| Other securities | 924,343 | |||||||
| 3,932,983 | ||||||||
| Communication services 13.53% | ||||||||
| Facebook, Inc., Class A2 | 7,518,400 | 985,587 | ||||||
| Alphabet Inc., Class C2 | 532,700 | 551,670 | ||||||
| Alphabet Inc., Class A2 | 157,500 | 164,581 | ||||||
| Netflix, Inc.2 | 2,401,060 | 642,668 | ||||||
| Charter Communications, Inc., Class A2 | 997,380 | 284,223 | ||||||
| Comcast Corp., Class A | 7,616,400 | 259,339 | ||||||
| Activision Blizzard, Inc. | 3,895,800 | 181,427 | ||||||
| Other securities | 103,032 | |||||||
| 3,172,527 | ||||||||
| Consumer discretionary 13.10% | ||||||||
| Amazon.com, Inc.2 | 531,016 | 797,570 | ||||||
| Tesla, Inc.2 | 1,813,000 | 603,366 | ||||||
| Home Depot, Inc. | 2,568,237 | 441,274 | ||||||
| NIKE, Inc., Class B | 2,479,800 | 183,852 | ||||||
| Ulta Beauty, Inc.2 | 700,000 | 171,388 | ||||||
| Other securities | 875,296 | |||||||
| 3,072,746 | ||||||||
| Financials 9.72% | ||||||||
| Wells Fargo & Co. | 7,294,754 | 336,142 | ||||||
| Berkshire Hathaway Inc., Class A2 | 410 | 125,460 | ||||||
| BlackRock, Inc. | 494,000 | 194,053 | ||||||
| JPMorgan Chase & Co. | 1,683,000 | 164,294 | ||||||
| PNC Financial Services Group, Inc. | 1,133,600 | 132,529 | ||||||
| Intercontinental Exchange, Inc. | 1,699,900 | 128,054 | ||||||
| Goldman Sachs Group, Inc. | 752,400 | 125,688 | ||||||
| Legal & General Group PLC | 40,158,246 | 118,239 | ||||||
| Other securities | 955,543 | |||||||
| 2,280,002 | ||||||||
| 52 | American Funds Insurance Series |
Growth Fund
| Common stocks | Shares | Value (000) | ||||||
| Industrials 5.14% | ||||||||
| TransDigm Group Inc.2 | 717,100 | $ | 243,857 | |||||
| MTU Aero Engines AG1 | 751,103 | 136,234 | ||||||
| Other securities | 824,453 | |||||||
| 1,204,544 | ||||||||
| Energy 5.04% | ||||||||
| Concho Resources Inc.2 | 2,421,560 | 248,912 | ||||||
| EOG Resources, Inc. | 2,182,000 | 190,292 | ||||||
| Diamondback Energy, Inc. | 1,189,000 | 110,220 | ||||||
| Other securities | 632,511 | |||||||
| 1,181,935 | ||||||||
| Materials 2.68% | ||||||||
| Linde PLC | 705,000 | 110,008 | ||||||
| Other securities | 519,044 | |||||||
| 629,052 | ||||||||
| Consumer staples 2.22% | ||||||||
| Costco Wholesale Corp. | 627,500 | 127,828 | ||||||
| Other securities | 391,450 | |||||||
| 519,278 | ||||||||
| Real estate 1.59% | ||||||||
| Equinix, Inc. REIT | 433,500 | 152,835 | ||||||
| Other securities | 218,914 | |||||||
| 371,749 | ||||||||
| Utilities 0.40% | ||||||||
| Other securities | 94,291 | |||||||
| Total common stocks (cost: $14,970,485,000) | 21,449,957 | |||||||
| Convertible stocks 0.06% | ||||||||
| Consumer discretionary 0.06% | ||||||||
| Other securities | 13,104 | |||||||
| Total convertible stocks (cost: $10,650,000) | 13,104 | |||||||
| Short-term securities 8.29% | Principal amount (000) | |||||||
| Federal Home Loan Bank 2.22%–2.39% due 1/7/2019–2/21/2019 | $ | 728,800 | 727,650 | |||||
| U.S. Treasury Bills 2.16%–2.43% due 1/2/2019–5/2/2019 | 689,200 | 686,594 | ||||||
| Other securities | 530,171 | |||||||
| Total short-term securities (cost: $1,944,441,000) | 1,944,415 | |||||||
| Total investment securities 99.83% (cost: $16,925,576,000) | 23,407,476 | |||||||
| Other assets less liabilities 0.17% | 40,385 | |||||||
| Net assets 100.00% | $ | 23,447,861 | ||||||
| American Funds Insurance Series | 53 |
Growth Fund
This summary investment portfolio is designed to streamline the report and help investors better focus on the fund’s principal holdings. See the inside back cover for details on how to obtain a complete schedule of portfolio holdings.
“Other securities” includes all issues that are not disclosed separately in the summary investment portfolio. Some securities in “Other securities” (with an aggregate value of $50,104,000, an aggregate cost of $47,650,000, and which represented .21% of the net assets of the fund) were acquired from 5/22/2015 to 12/21/2018 through private placement transactions exempt from registration under the Securities Act of 1933, which may subject them to legal or contractual restrictions on resale. “Other securities” also includes securities (with an aggregate value of $427,632,000, which represented 1.82% of the net assets of the fund) which were acquired in transactions exempt from registration under Rule 144A or Section 4(2) of the Securities Act of 1933 and may be resold in the U.S. in transactions exempt from registration, normally to qualified institutional buyers.
| 1 | Valued under fair value procedures adopted by authority of the board of trustees. The total value of all such securities, including those in “Other securities,” was $819,772,000, which represented 3.50% of the net assets of the fund. This amount includes $719,983,000 related to certain securities trading outside the U.S. whose values were adjusted as a result of significant market movements following the close of local trading. |
| 2 | Security did not produce income during the last 12 months. |
Key to abbreviation
ADR = American Depositary Receipts
See notes to financial statements
| 54 | American Funds Insurance Series |
Summary investment portfolioDecember 31, 2018
| Common stocks 88.00% | Shares | Value (000) | ||||||
| Financials 15.22% | ||||||||
| AIA Group Ltd. | 40,985,700 | $ | 340,217 | |||||
| HDFC Bank Ltd. | 7,804,100 | 237,169 | ||||||
| HDFC Bank Ltd. (ADR) | 498,647 | 51,655 | ||||||
| Kotak Mahindra Bank Ltd. | 6,186,048 | 111,334 | ||||||
| Axis Bank Ltd.1 | 7,399,300 | 65,700 | ||||||
| Axis Bank Ltd.1,2,3,4 | 3,222,055 | 26,034 | ||||||
| Prudential PLC | 3,810,265 | 68,089 | ||||||
| Credit Suisse Group AG2 | 5,523,789 | 60,403 | ||||||
| Other securities | 411,019 | |||||||
| 1,371,620 | ||||||||
| Industrials 13.93% | ||||||||
| Airbus SE, non-registered shares | 2,926,849 | 281,555 | ||||||
| Yamato Holdings Co., Ltd.2 | 4,239,395 | 116,573 | ||||||
| Rolls-Royce Holdings PLC1 | 10,833,188 | 114,606 | ||||||
| Adani Ports & Special Economic Zone Ltd. | 14,643,483 | 81,319 | ||||||
| SMC Corp.2 | 266,100 | 80,325 | ||||||
| Ryanair Holdings PLC (ADR)1 | 991,700 | 70,748 | ||||||
| Melrose Industries PLC | 33,132,733 | 69,196 | ||||||
| Safran SA | 549,000 | 66,298 | ||||||
| Other securities | 374,728 | |||||||
| 1,255,348 | ||||||||
| Health care 12.21% | ||||||||
| Novartis AG2 | 3,279,000 | 280,111 | ||||||
| Shire PLC | 3,360,150 | 195,726 | ||||||
| Teva Pharmaceutical Industries Ltd. (ADR) | 7,166,598 | 110,509 | ||||||
| Grifols, SA, Class B, preferred nonvoting, non-registered shares | 3,026,230 | 55,962 | ||||||
| Grifols, SA, Class A, non-registered shares | 881,000 | 23,116 | ||||||
| Grifols, SA, Class B (ADR) | 793,690 | 14,572 | ||||||
| Fresenius SE & Co. KGaA2 | 1,819,000 | 88,503 | ||||||
| Chugai Pharmaceutical Co., Ltd.2 | 1,434,500 | 83,302 | ||||||
| Daiichi Sankyo Co., Ltd.2 | 2,160,000 | 69,011 | ||||||
| Hikma Pharmaceuticals PLC | 2,761,980 | 60,410 | ||||||
| Other securities | 118,954 | |||||||
| 1,100,176 | ||||||||
| Consumer discretionary 10.25% | ||||||||
| Alibaba Group Holding Ltd. (ADR)1 | 1,104,000 | 151,325 | ||||||
| Galaxy Entertainment Group Ltd. | 18,284,000 | 116,282 | ||||||
| Kering SA | 176,551 | 83,260 | ||||||
| Hyundai Motor Co.2 | 682,393 | 72,333 | ||||||
| Industria de Diseño Textil, SA | 2,566,027 | 65,710 | ||||||
| Ryohin Keikaku Co., Ltd.2 | 248,400 | 59,976 | ||||||
| Other securities | 374,282 | |||||||
| 923,168 | ||||||||
| Consumer staples 6.67% | ||||||||
| Pernod Ricard SA | 929,337 | 152,584 | ||||||
| Nestlé SA2 | 1,003,500 | 81,454 | ||||||
| Kirin Holdings Co., Ltd.2 | 3,139,000 | 65,793 | ||||||
| British American Tobacco PLC | 1,862,200 | 59,339 | ||||||
| Other securities | 242,250 | |||||||
| 601,420 | ||||||||
| Communication services 6.52% | ||||||||
| Tencent Holdings Ltd. | 4,992,087 | 200,181 | ||||||
| SoftBank Group Corp.2 | 1,283,900 | 85,443 | ||||||
| Nintendo Co., Ltd.2 | 216,239 | 57,577 | ||||||
| Other securities | 243,972 | |||||||
| 587,173 | ||||||||
| American Funds Insurance Series | 55 |
International Fund
| Common stocks (continued) | Shares | Value (000) | ||||||
| Information technology 5.65% | ||||||||
| Samsung Electronics Co., Ltd.2 | 4,945,950 | $ | 170,838 | |||||
| ASML Holding NV | 507,174 | 79,703 | ||||||
| Other securities | 258,653 | |||||||
| 509,194 | ||||||||
| Materials 5.65% | ||||||||
| Asahi Kasei Corp.2 | 11,328,780 | 116,444 | ||||||
| Vale SA, ordinary nominative (ADR) | 6,875,266 | 90,685 | ||||||
| Vale SA, ordinary nominative | 102,481 | 1,348 | ||||||
| Teck Resources Ltd., Class B | 3,152,000 | 67,856 | ||||||
| Other securities | 232,548 | |||||||
| 508,881 | ||||||||
| Utilities 5.31% | ||||||||
| ENN Energy Holdings Ltd. | 14,004,000 | 124,204 | ||||||
| China Gas Holdings Ltd. | 24,134,000 | 85,989 | ||||||
| Ørsted AS2 | 1,235,208 | 82,426 | ||||||
| Other securities | 185,495 | |||||||
| 478,114 | ||||||||
| Energy 4.58% | ||||||||
| Royal Dutch Shell PLC, Class B | 3,191,000 | 95,174 | ||||||
| Royal Dutch Shell PLC, Class A | 1,440,256 | 42,360 | ||||||
| Other securities | 274,769 | |||||||
| 412,303 | ||||||||
| Real estate 2.01% | ||||||||
| China Overseas Land & Investment Ltd. | 19,930,217 | 68,466 | ||||||
| Other securities | 112,771 | |||||||
| 181,237 | ||||||||
| Total common stocks (cost: $7,462,877,000) | 7,928,634 | |||||||
| Rights & warrants 0.14% | ||||||||
| Financials 0.07% | ||||||||
| Axis Bank Ltd., warrants, expire 20191,2 | 2,466,000 | 6,664 | ||||||
| Other securities | — | |||||||
| 6,664 | ||||||||
| Real estate 0.07% | ||||||||
| Other securities | 6,382 | |||||||
| Total rights & warrants (cost: $13,714,000) | 13,046 | |||||||
| Bonds, notes & other debt instruments 0.87% | Principal amount (000) | |||||||
| Corporate bonds & notes 0.50% | ||||||||
| Other 0.50% | ||||||||
| Other securities | 44,890 | |||||||
| Total corporate bonds & notes | 44,890 | |||||||
| Bonds & notes of governments & government agencies outside the U.S. 0.37% | ||||||||
| Other securities | 33,018 | |||||||
| Total bonds, notes & other debt instruments (cost: $70,215,000) | 77,908 | |||||||
| 56 | American Funds Insurance Series |
International Fund
| Short-term securities 10.84% | Principal amount (000) | Value (000) | ||||||
| Canadian Imperial Bank of Commerce 2.31%–2.50% due 1/22/2019–1/25/20194 | $ | 100,000 | $ | 99,839 | ||||
| Federal Home Loan Bank 2.15%–2.41% due 1/2/2019–3/21/2019 | 314,475 | 313,688 | ||||||
| Mizuho Bank, Ltd. 2.61% due 2/25/20194 | 75,000 | 74,694 | ||||||
| Siemens Capital Co. LLC 2.50% due 2/19/20194 | 55,000 | 54,808 | ||||||
| U.S. Treasury Bill 2.38% due 2/19/2019 | 125,000 | 124,608 | ||||||
| Other securities | 309,216 | |||||||
| Total short-term securities (cost: $976,875,000) | 976,853 | |||||||
| Total investment securities 99.85% (cost: $8,523,681,000) | 8,996,441 | |||||||
| Other assets less liabilities 0.15% | 13,669 | |||||||
| Net assets 100.00% | $ | 9,010,110 | ||||||
This summary investment portfolio is designed to streamline the report and help investors better focus on the fund’s principal holdings. See the inside back cover for details on how to obtain a complete schedule of portfolio holdings.
“Other securities” includes all issues that are not disclosed separately in the summary investment portfolio.
Forward currency contracts
| Contract amount | Unrealized depreciation | ||||||||||
| Purchases (000) | Sales (000) | Counterparty | Settlement date | at 12/31/2018 (000) | |||||||
| USD39,858 | INR2,825,000 | Goldman Sachs | 1/17/2019 | $(525 | ) | ||||||
The following footnotes apply to either the individual securities noted or one or more of the securities aggregated and listed as a single line item.
| 1 | Security did not produce income during the last 12 months. |
| 2 | Valued under fair value procedures adopted by authority of the board of trustees. The total value of all such securities, including those in “Other securities,” was $2,613,221,000, which represented 29.00% of the net assets of the fund. This amount includes $2,569,796,000 related to certain securities trading outside the U.S. whose values were adjusted as a result of significant market movements following the close of local trading. |
| 3 | Acquired through a private placement transaction exempt from registration under the Securities Act of 1933. May be subject to legal or contractual restrictions on resale. Further details on this holding appear below. |
| 4 | Acquired in a transaction exempt from registration under Rule 144A or Section 4(2) of the Securities Act of 1933. May be resold in the U.S. in transactions exempt from registration, normally to qualified institutional buyers. The total value of all such securities, including those in “Other securities,” was $462,479,000, which represented 5.13% of the net assets of the fund. |
| Private placement security | Acquisition date | Cost (000) | Value (000) | Percent of net assets | ||||||
| Axis Bank Ltd. | 11/14/2017 | $17,232 | $26,034 | .29 | % | |||||
Key to abbreviations and symbol
ADR = American Depositary Receipts
INR = Indian rupees
USD/$ = U.S. dollars
See notes to financial statements
| American Funds Insurance Series | 57 |
Summary investment portfolioDecember 31, 2018
| Common stocks 79.74% | Shares | Value (000) | ||||||
| Information technology 16.77% | ||||||||
| Taiwan Semiconductor Manufacturing Co., Ltd.1 | 9,901,000 | $ | 72,104 | |||||
| Taiwan Semiconductor Manufacturing Co., Ltd. (ADR) | 400,000 | 14,764 | ||||||
| PagSeguro Digital Ltd., Class A2 | 2,813,223 | 52,692 | ||||||
| Broadcom Inc. | 167,150 | 42,503 | ||||||
| Temenos AG1 | 204,800 | 24,564 | ||||||
| Microsoft Corp. | 232,100 | 23,574 | ||||||
| StoneCo Ltd., Class A2 | 1,275,126 | 23,513 | ||||||
| Kingdee International Software Group Co. Ltd. | 22,463,000 | 19,851 | ||||||
| Keyence Corp.1 | 38,300 | 19,434 | ||||||
| EPAM Systems, Inc.2 | 167,200 | 19,397 | ||||||
| Visa Inc., Class A | 132,000 | 17,416 | ||||||
| Murata Manufacturing Co., Ltd.1 | 123,800 | 16,783 | ||||||
| Other securities | 158,420 | |||||||
| 505,015 | ||||||||
| Financials 10.94% | ||||||||
| HDFC Bank Ltd. | 2,688,876 | 81,716 | ||||||
| AIA Group Ltd. | 6,477,600 | 53,770 | ||||||
| B3 SA - Brasil, Bolsa, Balcao | 6,435,200 | 44,515 | ||||||
| IndusInd Bank Ltd. | 906,300 | 20,761 | ||||||
| Shriram Transport Finance Co. Ltd. | 1,150,000 | 20,425 | ||||||
| Sberbank of Russia PJSC (ADR) | 1,551,500 | 17,004 | ||||||
| Other securities | 91,189 | |||||||
| 329,380 | ||||||||
| Energy 9.73% | ||||||||
| Reliance Industries Ltd. | 11,548,513 | 185,473 | ||||||
| Royal Dutch Shell PLC, Class B | 1,284,000 | 38,296 | ||||||
| Royal Dutch Shell PLC, Class A | 68,628 | 2,019 | ||||||
| LUKOIL Oil Co. PJSC (ADR) | 303,000 | 21,658 | ||||||
| Exxon Mobil Corp. | 32,000 | 2,182 | ||||||
| Other securities | 43,261 | |||||||
| 292,889 | ||||||||
| Consumer discretionary 9.40% | ||||||||
| Alibaba Group Holding Ltd. (ADR)2 | 386,237 | 52,941 | ||||||
| Sony Corp.1 | 767,000 | 37,102 | ||||||
| General Motors Co. | 542,000 | 18,130 | ||||||
| Other securities | 174,720 | |||||||
| 282,893 | ||||||||
| Health care 8.35% | ||||||||
| Yunnan Baiyao Group Co., Ltd., Class A1 | 2,730,912 | 29,419 | ||||||
| BioMarin Pharmaceutical Inc.2 | 318,000 | 27,078 | ||||||
| AstraZeneca PLC | 268,500 | 20,099 | ||||||
| Other securities | 174,692 | |||||||
| 251,288 | ||||||||
| Consumer staples 6.31% | ||||||||
| British American Tobacco PLC | 1,529,000 | 48,722 | ||||||
| JBS SA, ordinary nominative | 9,930,600 | 29,696 | ||||||
| Nestlé SA1 | 258,196 | 20,958 | ||||||
| Kweichow Moutai Co., Ltd., Class A1 | 225,899 | 19,388 | ||||||
| Other securities | 71,102 | |||||||
| 189,866 | ||||||||
| 58 | American Funds Insurance Series |
New World Fund
| Common stocks | Shares | Value (000) | ||||||
| Communication services 5.74% | ||||||||
| Alphabet Inc., Class C2 | 47,300 | $ | 48,984 | |||||
| Alphabet Inc., Class A2 | 16,900 | 17,660 | ||||||
| Tencent Holdings Ltd. | 591,600 | 23,723 | ||||||
| Facebook, Inc., Class A2 | 162,200 | 21,263 | ||||||
| Other securities | 61,205 | |||||||
| 172,835 | ||||||||
| Materials 5.59% | ||||||||
| Vale SA, ordinary nominative | 3,595,086 | 47,307 | ||||||
| Vale SA, ordinary nominative (ADR) | 395,000 | 5,210 | ||||||
| First Quantum Minerals Ltd. | 3,305,000 | 26,727 | ||||||
| Other securities | 89,219 | |||||||
| 168,463 | ||||||||
| Industrials 4.49% | ||||||||
| Azul SA, preference shares (ADR)2 | 866,446 | 23,992 | ||||||
| Azul SA, preference shares2 | 838,500 | 7,788 | ||||||
| Airbus SE, non-registered shares | 280,229 | 26,957 | ||||||
| Nidec Corp.1 | 151,400 | 17,171 | ||||||
| Other securities | 59,384 | |||||||
| 135,292 | ||||||||
| Real estate 1.34% | ||||||||
| American Tower Corp. REIT | 176,800 | 27,968 | ||||||
| Other securities | 12,440 | |||||||
| 40,408 | ||||||||
| Utilities 1.08% | ||||||||
| Other securities | 32,453 | |||||||
| Total common stocks (cost: $2,216,498,000) | 2,400,782 | |||||||
| Rights & warrants 0.11% | ||||||||
| Consumer staples 0.11% | ||||||||
| Other securities | 3,502 | |||||||
| Total rights & warrants (cost: $3,452,000) | 3,502 | |||||||
| Bonds, notes & other debt instruments 3.09% | Principal amount (000) | |||||||
| Bonds & notes of governments & government agencies outside the U.S. 2.61% | ||||||||
| Other securities | 78,507 | |||||||
| Corporate bonds & notes 0.48% | ||||||||
| Other 0.48% | ||||||||
| Other securities | 14,360 | |||||||
| Total corporate bonds & notes | 14,360 | |||||||
| Total bonds, notes & other debt instruments (cost: $97,609,000) | 92,867 | |||||||
| Short-term securities 16.68% | ||||||||
| American Honda Finance Corp. 2.35% due 1/10/2019 | $ | 25,000 | 24,983 | |||||
| ANZ New Zealand (International) Ltd. 2.72% due 3/13/20193 | 20,000 | 19,893 | ||||||
| Bank of Nova Scotia 2.62% due 2/19/20193 | 50,000 | 49,820 | ||||||
| Colgate-Palmolive Co. 2.39% due 1/14/20193 | 20,000 | 19,981 | ||||||
| Commonwealth Bank of Australia 2.50% due 1/23/20193 | 49,600 | 49,522 | ||||||
| ExxonMobil Corp. 2.38% due 1/8/2019 | 40,000 | 39,979 | ||||||
| Federal Home Loan Bank 2.37% due 2/22/2019 | 95,500 | 95,169 | ||||||
| Mizuho Bank, Ltd. 2.51% due 2/1/20193 | 69,800 | 69,645 | ||||||
| American Funds Insurance Series | 59 |
New World Fund
| Short-term securities (continued) | Principal amount (000) | Value (000) | ||||||
| Swedbank AB 2.56% due 2/1/2019 | $ | 88,900 | $ | 88,705 | ||||
| Toronto-Dominion Bank 2.39% due 1/7/20193 | 21,100 | 21,090 | ||||||
| Other securities | 23,530 | |||||||
| Total short-term securities (cost: $502,291,000) | 502,317 | |||||||
| Total investment securities 99.62% (cost: $2,819,850,000) | 2,999,468 | |||||||
| Other assets less liabilities 0.38% | 11,411 | |||||||
| Net assets 100.00% | $ | 3,010,879 | ||||||
This summary investment portfolio is designed to streamline the report and help investors better focus on the fund’s principal holdings. See the inside back cover for details on how to obtain a complete schedule of portfolio holdings.
“Other securities” includes all issues that are not disclosed separately in the summary investment portfolio.
Forward currency contracts
| Contract amount | Unrealized appreciation (depreciation) | ||||||||||
| Purchases (000) | Sales (000) | Counterparty | Settlement date | at 12/31/2018 (000) | |||||||
| INR120,000 | USD1,673 | HSBC Bank | 1/10/2019 | $ | 44 | ||||||
| USD1,689 | INR120,000 | Citibank | 1/10/2019 | (28 | ) | ||||||
| EUR590 | USD672 | Morgan Stanley | 1/14/2019 | 5 | |||||||
| USD674 | EUR590 | JPMorgan Chase | 1/14/2019 | (2 | ) | ||||||
| INR112,350 | USD1,565 | HSBC Bank | 1/15/2019 | 41 | |||||||
| USD1,586 | INR112,350 | HSBC Bank | 1/15/2019 | (20 | ) | ||||||
| EUR385 | USD439 | Morgan Stanley | 1/18/2019 | 3 | |||||||
| USD439 | EUR385 | HSBC Bank | 1/18/2019 | (3 | ) | ||||||
| USD406 | EUR320 | Citibank | 3/6/2019 | 37 | |||||||
| EUR320 | USD366 | Morgan Stanley | 3/6/2019 | 2 | |||||||
| USD531 | EUR415 | Goldman Sachs | 3/8/2019 | 53 | |||||||
| USD323 | EUR255 | Goldman Sachs | 3/8/2019 | 29 | |||||||
| EUR670 | USD767 | Morgan Stanley | 3/8/2019 | 5 | |||||||
| USD1,397 | EUR1,100 | JPMorgan Chase | 3/15/2019 | 128 | |||||||
| EUR1,100 | USD1,259 | Morgan Stanley | 3/15/2019 | 9 | |||||||
| $ | 303 | ||||||||||
| 1 | Valued under fair value procedures adopted by authority of the board of trustees. The total value of all such securities, including those in “Other securities,” was $486,458,000, which represented 16.16% of the net assets of the fund. This amount includes $463,432,000 related to certain securities trading outside the U.S. whose values were adjusted as a result of significant market movements following the close of local trading. |
| 2 | Security did not produce income during the last 12 months. |
| 3 | Acquired in a transaction exempt from registration under Rule 144A or Section 4(2) of the Securities Act of 1933. May be resold in the U.S. in transactions exempt from registration, normally to qualified institutional buyers. The total value of all such securities, including those in “Other securities,” was $277,296,000, which represented 9.21% of the net assets of the fund. |
Key to abbreviations and symbol
ADR = American Depositary Receipts
EUR = Euros
INR = Indian rupees
USD/$ = U.S. dollars
See notes to financial statements
| 60 | American Funds Insurance Series |
Blue Chip Income and Growth Fund
Summary investment portfolioDecember 31, 2018
| Common stocks 94.94% | Shares | Value (000) | ||||||
| Health care 25.24% | ||||||||
| AbbVie Inc. | 6,711,500 | $ | 618,733 | |||||
| Abbott Laboratories | 5,764,000 | 416,910 | ||||||
| Amgen Inc. | 1,416,510 | 275,752 | ||||||
| Gilead Sciences, Inc. | 3,761,212 | 235,264 | ||||||
| Teva Pharmaceutical Industries Ltd. (ADR) | 10,833,800 | 167,057 | ||||||
| Medtronic PLC | 900,000 | 81,864 | ||||||
| UnitedHealth Group Inc. | 211,000 | 52,564 | ||||||
| Thermo Fisher Scientific Inc. | 209,600 | 46,907 | ||||||
| Other securities | 132,401 | |||||||
| 2,027,452 | ||||||||
| Information technology 13.45% | ||||||||
| Microsoft Corp. | 2,612,000 | 265,301 | ||||||
| Intel Corp. | 5,515,000 | 258,819 | ||||||
| QUALCOMM Inc. | 3,845,300 | 218,836 | ||||||
| Broadcom Inc. | 385,000 | 97,898 | ||||||
| Texas Instruments Inc. | 780,000 | 73,710 | ||||||
| Mastercard Inc., Class A | 337,000 | 63,575 | ||||||
| Apple Inc. | 400,000 | 63,096 | ||||||
| Other securities | 39,281 | |||||||
| 1,080,516 | ||||||||
| Consumer staples 12.67% | ||||||||
| Philip Morris International Inc. | 3,349,900 | 223,639 | ||||||
| Coca-Cola Co. | 3,558,000 | 168,471 | ||||||
| Altria Group, Inc. | 2,872,800 | 141,888 | ||||||
| Costco Wholesale Corp. | 591,255 | 120,444 | ||||||
| British American Tobacco PLC (ADR) | 3,723,112 | 118,618 | ||||||
| Kimberly-Clark Corp. | 500,000 | 56,970 | ||||||
| Kellogg Co. | 792,000 | 45,152 | ||||||
| PepsiCo, Inc. | 400,000 | 44,192 | ||||||
| Other securities | 98,359 | |||||||
| 1,017,733 | ||||||||
| Energy 9.44% | ||||||||
| EOG Resources, Inc. | 2,713,800 | 236,671 | ||||||
| Exxon Mobil Corp. | 2,699,800 | 184,099 | ||||||
| Royal Dutch Shell PLC, Class B (ADR) | 1,737,000 | 104,116 | ||||||
| Halliburton Co. | 2,844,730 | 75,613 | ||||||
| Canadian Natural Resources, Ltd. | 2,673,000 | 64,499 | ||||||
| Noble Energy, Inc. | 2,862,000 | 53,691 | ||||||
| Other securities | 39,514 | |||||||
| 758,203 | ||||||||
| Communication services 9.11% | ||||||||
| Alphabet Inc., Class A1 | 184,550 | 192,847 | ||||||
| Alphabet Inc., Class C1 | 20,500 | 21,230 | ||||||
| Verizon Communications Inc. | 3,306,480 | 185,890 | ||||||
| Facebook, Inc., Class A1 | 1,089,000 | 142,757 | ||||||
| CBS Corp., Class B | 2,886,400 | 126,194 | ||||||
| Viacom Inc., Class B | 2,435,136 | 62,583 | ||||||
| 731,501 | ||||||||
| Industrials 8.56% | ||||||||
| General Dynamics Corp. | 1,206,000 | 189,595 | ||||||
| CSX Corp. | 2,726,000 | 169,366 | ||||||
| Illinois Tool Works Inc. | 650,000 | 82,349 | ||||||
| Union Pacific Corp. | 400,000 | 55,292 | ||||||
| American Funds Insurance Series | 61 |
Blue Chip Income and Growth Fund
| Common stocks (continued) | Shares | Value (000) | ||||||
| Industrials (continued) | ||||||||
| United Technologies Corp. | 500,000 | $ | 53,240 | |||||
| Northrop Grumman Corp. | 174,300 | 42,686 | ||||||
| Other securities | 94,989 | |||||||
| 687,517 | ||||||||
| Consumer discretionary 8.11% | ||||||||
| Lowe’s Companies, Inc. | 3,111,572 | 287,385 | ||||||
| Marriott International, Inc., Class A | 952,500 | 103,403 | ||||||
| McDonald’s Corp. | 500,000 | 88,785 | ||||||
| General Motors Co. | 1,752,800 | 58,631 | ||||||
| Other securities | 112,783 | |||||||
| 650,987 | ||||||||
| Financials 4.89% | ||||||||
| JPMorgan Chase & Co. | 1,579,000 | 154,142 | ||||||
| Charles Schwab Corp. | 2,655,000 | 110,262 | ||||||
| U.S. Bancorp | 1,000,000 | 45,700 | ||||||
| Other securities | 82,299 | |||||||
| 392,403 | ||||||||
| Materials 1.68% | ||||||||
| Linde PLC | 665,700 | 103,876 | ||||||
| Other securities | 31,028 | |||||||
| 134,904 | ||||||||
| Other 1.79% | ||||||||
| Other securities | 143,876 | |||||||
| Total common stocks (cost: $6,925,880,000) | 7,625,092 | |||||||
| Rights & warrants 0.05% | ||||||||
| Financials 0.05% | ||||||||
| Other securities | 3,520 | |||||||
| Total rights & warrants (cost: $10,088,000) | 3,520 | |||||||
| Short-term securities 4.85% | Principal amount (000) | |||||||
| Coca-Cola Co. 2.40% due 1/23/20192 | $ | 15,000 | 14,976 | |||||
| Federal Home Loan Bank 2.33%–2.36% due 1/18/2019–2/14/2019 | 154,500 | 154,194 | ||||||
| U.S. Treasury Bills 2.24%–2.38% due 1/2/2019–2/19/2019 | 99,300 | 99,160 | ||||||
| Other securities | 121,091 | |||||||
| Total short-term securities (cost: $389,429,000) | 389,421 | |||||||
| Total investment securities 99.84% (cost: $7,325,397,000) | 8,018,033 | |||||||
| Other assets less liabilities 0.16% | 13,239 | |||||||
| Net assets 100.00% | $ | 8,031,272 | ||||||
| 62 | American Funds Insurance Series |
Blue Chip Income and Growth Fund
This summary investment portfolio is designed to streamline the report and help investors better focus on the fund’s principal holdings. See the inside back cover for details on how to obtain a complete schedule of portfolio holdings.
“Other securities” includes all issues that are not disclosed separately in the summary investment portfolio.
| 1 | Security did not produce income during the last 12 months. |
| 2 | Acquired in a transaction exempt from registration under Rule 144A or Section 4(2) of the Securities Act of 1933. May be resold in the U.S. in transactions exempt from registration, normally to qualified institutional buyers. The total value of all such securities, including those in “Other securities,” was $54,948,000, which represented .68% of the net assets of the fund. |
Key to abbreviation
ADR = American Depositary Receipts
See notes to financial statements
| American Funds Insurance Series | 63 |
Summary investment portfolioDecember 31, 2018
| Common stocks 91.72% | Shares | Value (000) | ||||||
| Information technology 15.54% | ||||||||
| Taiwan Semiconductor Manufacturing Co., Ltd.1 | 9,589,800 | $ | 69,838 | |||||
| Microsoft Corp. | 416,000 | 42,253 | ||||||
| Broadcom Inc. | 145,500 | 36,998 | ||||||
| Murata Manufacturing Co., Ltd.1 | 170,000 | 23,046 | ||||||
| Apple Inc. | 119,000 | 18,771 | ||||||
| PagSeguro Digital Ltd., Class A2 | 998,752 | 18,707 | ||||||
| Tableau Software, Inc., Class A2 | 104,000 | 12,480 | ||||||
| ASML Holding NV | 70,000 | 11,001 | ||||||
| Halma PLC | 610,000 | 10,605 | ||||||
| Other securities | 38,430 | |||||||
| 282,129 | ||||||||
| Health care 11.07% | ||||||||
| UnitedHealth Group Inc. | 272,825 | 67,966 | ||||||
| Merck & Co., Inc. | 282,000 | 21,548 | ||||||
| Hologic, Inc.2 | 400,000 | 16,440 | ||||||
| Novartis AG1 | 148,000 | 12,643 | ||||||
| AstraZeneca PLC | 167,000 | 12,501 | ||||||
| Boston Scientific Corp.2 | 351,000 | 12,404 | ||||||
| Centene Corp.2 | 101,000 | 11,645 | ||||||
| Other securities | 45,961 | |||||||
| 201,108 | ||||||||
| Financials 10.25% | ||||||||
| AIA Group Ltd. | 3,005,000 | 24,944 | ||||||
| CME Group Inc., Class A | 75,000 | 14,109 | ||||||
| HDFC Bank Ltd. | 444,000 | 13,493 | ||||||
| DBS Group Holdings Ltd. | 705,000 | 12,254 | ||||||
| Blackstone Group LP | 355,000 | 10,583 | ||||||
| Ping An Insurance (Group) Co. of China, Ltd., Class H | 1,195,000 | 10,553 | ||||||
| Other securities | 100,183 | |||||||
| 186,119 | ||||||||
| Communication services 10.13% | ||||||||
| Nintendo Co., Ltd.1 | 289,000 | 76,951 | ||||||
| Alphabet Inc., Class A2 | 26,500 | 27,691 | ||||||
| Alphabet Inc., Class C2 | 9,000 | 9,321 | ||||||
| Vivendi SA | 715,200 | 17,438 | ||||||
| Other securities | 52,538 | |||||||
| 183,939 | ||||||||
| Industrials 9.89% | ||||||||
| Airbus SE, non-registered shares | 589,200 | 56,679 | ||||||
| Boeing Co. | 97,400 | 31,411 | ||||||
| Safran SA | 143,000 | 17,269 | ||||||
| Lockheed Martin Corp. | 45,000 | 11,783 | ||||||
| CCR SA, ordinary nominative | 4,025,000 | 11,631 | ||||||
| Other securities | 50,746 | |||||||
| 179,519 | ||||||||
| Consumer discretionary 9.55% | ||||||||
| Home Depot, Inc. | 146,000 | 25,086 | ||||||
| LVMH Moët Hennessy-Louis Vuitton SE | 56,200 | 16,626 | ||||||
| Carnival Corp., units | 319,000 | 15,727 | ||||||
| Alibaba Group Holding Ltd. (ADR)2 | 93,500 | 12,816 | ||||||
| Daimler AG1 | 222,000 | 11,680 | ||||||
| Norwegian Cruise Line Holdings Ltd.2 | 275,000 | 11,657 | ||||||
| Other securities | 79,751 | |||||||
| 173,343 | ||||||||
| 64 | American Funds Insurance Series |
Global Growth and Income Fund
| Common stocks | Shares | Value (000) | ||||||
| Materials 6.53% | ||||||||
| Vale SA, ordinary nominative | 2,925,000 | $ | 38,489 | |||||
| Vale SA, ordinary nominative (ADR) | 505,000 | 6,661 | ||||||
| Other securities | 73,399 | |||||||
| 118,549 | ||||||||
| Energy 6.04% | ||||||||
| Reliance Industries Ltd. | 3,195,148 | 51,315 | ||||||
| Royal Dutch Shell PLC, Class B | 450,000 | 13,422 | ||||||
| Galp Energia, SGPS, SA, Class B | 708,000 | 11,190 | ||||||
| Other securities | 33,752 | |||||||
| 109,679 | ||||||||
| Consumer staples 5.58% | ||||||||
| Nestlé SA1 | 488,700 | 39,668 | ||||||
| British American Tobacco PLC | 937,000 | 29,858 | ||||||
| Other securities | 31,809 | |||||||
| 101,335 | ||||||||
| Real estate 3.69% | ||||||||
| MGM Growth Properties LLC REIT, Class A | 676,200 | 17,858 | ||||||
| Gaming and Leisure Properties, Inc. REIT | 425,000 | 13,732 | ||||||
| Other securities | 35,494 | |||||||
| 67,084 | ||||||||
| Utilities 3.45% | ||||||||
| Ørsted AS1 | 491,552 | 32,802 | ||||||
| Enel SPA1 | 2,780,000 | 16,066 | ||||||
| Other securities | 13,861 | |||||||
| 62,729 | ||||||||
| Total common stocks (cost: $1,481,838,000) | 1,665,533 | |||||||
| Bonds, notes & other debt instruments 2.17% | Principal amount (000) | |||||||
| Corporate bonds & notes 2.17% | ||||||||
| Communication services 1.87% | ||||||||
| Sprint Corp. 7.25% 2021 | $ | 33,000 | 33,858 | |||||
| Health care 0.30% | ||||||||
| Other securities | 5,526 | |||||||
| Total bonds, notes & other debt instruments (cost: $38,299,000) | 39,384 | |||||||
| Short-term securities 5.89% | ||||||||
| BASF SE 2.50% due 1/11/20193 | 15,000 | 14,989 | ||||||
| Federal Home Loan Bank 2.15%–2.38% due 1/2/2019–2/19/2019 | 57,200 | 57,104 | ||||||
| KfW 2.51% due 2/13/20193 | 25,000 | 24,922 | ||||||
| Other securities | 9,999 | |||||||
| Total short-term securities (cost: $107,023,000) | 107,014 | |||||||
| Total investment securities 99.78% (cost: $1,627,160,000) | 1,811,931 | |||||||
| Other assets less liabilities 0.22% | 3,943 | |||||||
| Net assets 100.00% | $ | 1,815,874 | ||||||
| American Funds Insurance Series | 65 |
Global Growth and Income Fund
This summary investment portfolio is designed to streamline the report and help investors better focus on the fund’s principal holdings. See the inside back cover for details on how to obtain a complete schedule of portfolio holdings.
“Other securities” includes all issues that are not disclosed separately in the summary investment portfolio.
Forward currency contracts
| Unrealized | |||||||||||
| Contract amount | appreciation | ||||||||||
| Purchases | Sales | Settlement | at 12/31/2018 | ||||||||
| (000) | (000) | Counterparty | date | (000) | |||||||
| USD7,748 | AUD10,500 | Citibank | 1/11/2019 | $351 | |||||||
| 1 | Valued under fair value procedures adopted by authority of the board of trustees. The total value of all such securities, including those in “Other securities,” was $395,472,000, which represented 21.78% of the net assets of the fund. This amount includes $391,460,000 related to certain securities trading outside the U.S. whose values were adjusted as a result of significant market movements following the close of local trading. |
| 2 | Security did not produce income during the last 12 months. |
| 3 | Acquired in a transaction exempt from registration under Rule 144A or Section 4(2) of the Securities Act of 1933. May be resold in the U.S. in transactions exempt from registration, normally to qualified institutional buyers. The total value of all such securities, including those in “Other securities,” was $49,910,000, which represented 2.75% of the net assets of the fund. |
Key to abbreviations and symbol
AUD = Australian dollars
ADR = American Depositary Receipts
USD/$ = U.S. dollars
See notes to financial statements
| 66 | American Funds Insurance Series |
Summary investment portfolioDecember 31, 2018
| Common stocks 90.59% | Shares | Value (000) | ||||||
| Health care 15.91% | ||||||||
| AbbVie Inc. | 7,288,241 | $ | 671,903 | |||||
| UnitedHealth Group Inc. | 2,286,268 | 569,555 | ||||||
| Gilead Sciences, Inc. | 7,114,800 | 445,031 | ||||||
| Amgen Inc. | 2,283,200 | 444,470 | ||||||
| Abbott Laboratories | 4,812,269 | 348,071 | ||||||
| Merck & Co., Inc. | 3,714,380 | 283,816 | ||||||
| Cigna Corp. | 1,277,418 | 242,607 | ||||||
| Eli Lilly and Co. | 1,567,600 | 181,403 | ||||||
| Other securities | 1,566,133 | |||||||
| 4,752,989 | ||||||||
| Information technology 13.79% | ||||||||
| Microsoft Corp. | 9,710,500 | 986,297 | ||||||
| Broadcom Inc. | 1,985,134 | 504,780 | ||||||
| Intel Corp. | 9,945,900 | 466,761 | ||||||
| Texas Instruments Inc. | 3,188,582 | 301,321 | ||||||
| Accenture PLC, Class A | 1,490,900 | 210,232 | ||||||
| QUALCOMM Inc. | 3,500,275 | 199,201 | ||||||
| Other securities | 1,449,685 | |||||||
| 4,118,277 | ||||||||
| Financials 11.01% | ||||||||
| JPMorgan Chase & Co. | 4,986,230 | 486,756 | ||||||
| Bank of New York Mellon Corp. | 6,217,700 | 292,667 | ||||||
| CME Group Inc., Class A | 1,464,600 | 275,521 | ||||||
| Wells Fargo & Co. | 5,210,100 | 240,081 | ||||||
| Intercontinental Exchange, Inc. | 3,183,555 | 239,817 | ||||||
| Aon PLC, Class A | 1,214,800 | 176,583 | ||||||
| Berkshire Hathaway Inc., Class B1 | 814,500 | 166,305 | ||||||
| Other securities | 1,410,515 | |||||||
| 3,288,245 | ||||||||
| Communication services 10.28% | ||||||||
| Alphabet Inc., Class C1 | 348,784 | 361,204 | ||||||
| Alphabet Inc., Class A1 | 317,250 | 331,514 | ||||||
| Facebook, Inc., Class A1 | 4,975,927 | 652,294 | ||||||
| Netflix, Inc.1 | 1,266,777 | 339,066 | ||||||
| Verizon Communications Inc. | 4,588,600 | 257,971 | ||||||
| Twenty-First Century Fox, Inc., Class A | 4,796,000 | 230,784 | ||||||
| Comcast Corp., Class A | 5,903,800 | 201,024 | ||||||
| Other securities | 695,140 | |||||||
| 3,068,997 | ||||||||
| Industrials 9.19% | ||||||||
| General Dynamics Corp. | 2,033,000 | 319,608 | ||||||
| Airbus SE, non-registered shares | 2,559,564 | 246,223 | ||||||
| BWX Technologies, Inc.2 | 5,290,948 | 202,273 | ||||||
| Textron Inc. | 3,831,077 | 176,191 | ||||||
| Other securities | 1,800,478 | |||||||
| 2,744,773 | ||||||||
| Consumer staples 8.91% | ||||||||
| Coca-Cola Co. | 8,433,100 | 399,307 | ||||||
| Philip Morris International Inc. | 3,686,270 | 246,095 | ||||||
| British American Tobacco PLC | 6,830,460 | 217,653 | ||||||
| British American Tobacco PLC (ADR) | 479,440 | 15,275 | ||||||
| Pernod Ricard SA | 1,233,233 | 202,480 | ||||||
| Other securities | 1,579,033 | |||||||
| 2,659,843 | ||||||||
| American Funds Insurance Series | 67 |
Growth-Income Fund
| Common stocks (continued) | Shares | Value (000) | ||||||
| Energy 6.84% | ||||||||
| Exxon Mobil Corp. | 5,277,700 | $ | 359,886 | |||||
| Chevron Corp. | 2,725,900 | 296,551 | ||||||
| EOG Resources, Inc. | 2,406,800 | 209,897 | ||||||
| Enbridge Inc. (CAD denominated) | 5,120,559 | 159,071 | ||||||
| Enbridge Inc. (CAD denominated)3 | 1,340,553 | 41,644 | ||||||
| Other securities | 974,704 | |||||||
| 2,041,753 | ||||||||
| Consumer discretionary 6.35% | ||||||||
| Amazon.com, Inc.1 | 350,400 | 526,290 | ||||||
| Lowe’s Companies, Inc. | 2,000,000 | 184,720 | ||||||
| Other securities | 1,184,040 | |||||||
| 1,895,050 | ||||||||
| Materials 4.69% | ||||||||
| Celanese Corp. | 3,329,233 | 299,531 | ||||||
| Vale SA, ordinary nominative (ADR) | 14,557,884 | 192,018 | ||||||
| Vale SA, ordinary nominative | 3,570,848 | 46,988 | ||||||
| DowDuPont Inc. | 3,404,500 | 182,073 | ||||||
| Linde PLC | 1,152,000 | 179,758 | ||||||
| International Flavors & Fragrances Inc. | 1,267,500 | 170,187 | ||||||
| Other securities | 330,092 | |||||||
| 1,400,647 | ||||||||
| Real estate 1.79% | ||||||||
| Crown Castle International Corp. REIT | 1,827,000 | 198,467 | ||||||
| Other securities | 337,258 | |||||||
| 535,725 | ||||||||
| Utilities 1.68% | ||||||||
| Sempra Energy | 1,840,000 | 199,070 | ||||||
| Other securities | 303,746 | |||||||
| 502,816 | ||||||||
| Mutual funds 0.15% | ||||||||
| Other securities | 45,729 | |||||||
| Total common stocks (cost: $22,571,835,000) | 27,054,844 | |||||||
| Convertible stocks 0.13% | ||||||||
| Real estate 0.13% | ||||||||
| Other securities | 38,828 | |||||||
| Total convertible stocks (cost: $39,390,000) | 38,828 | |||||||
| Convertible bonds 0.09% | Principal amount (000) | |||||||
| Energy 0.09% | ||||||||
| Other securities | 27,617 | |||||||
| Total convertible bonds (cost: $43,359,000) | 27,617 | |||||||
| Short-term securities 9.11% | ||||||||
| Chevron Corp. 2.50% due 2/11/20193 | $ | 30,000 | 29,913 | |||||
| Coca-Cola Co. 2.27% due 1/3/20193 | 20,000 | 19,996 | ||||||
| ExxonMobil Corp. 2.46% due 2/5/2019 | 100,000 | 99,752 | ||||||
| Federal Home Loan Bank 2.20%–2.41% due 1/4/2019–3/26/2019 | 1,219,600 | 1,215,496 | ||||||
| General Dynamics Corp. 2.52% due 1/10/20193 | 45,000 | 44,970 | ||||||
| 68 | American Funds Insurance Series |
Growth-Income Fund
| Short-term securities | Principal amount (000) | Value (000) | ||||||
| Merck & Co. Inc. 2.35%–2.50% due 1/29/2019–2/27/20193 | $ | 126,900 | $ | 126,512 | ||||
| U.S. Treasury Bills 2.27%–2.43% due 1/17/2019–5/2/2019 | 672,600 | 669,783 | ||||||
| Other securities | 513,291 | |||||||
| Total short-term securities (cost: $2,719,773,000) | 2,719,713 | |||||||
| Total investment securities 99.92% (cost: $25,374,357,000) | 29,841,002 | |||||||
| Other assets less liabilities 0.08% | 23,133 | |||||||
| Net assets 100.00% | $ | 29,864,135 | ||||||
This summary investment portfolio is designed to streamline the report and help investors better focus on the fund’s principal holdings. See the inside back cover for details on how to obtain a complete schedule of portfolio holdings.
“Other securities” includes all issues that are not disclosed separately in the summary investment portfolio. “Other securities” includes securities which were valued under fair value procedures adopted by authority of the board of trustees. The total value of securities which were valued under fair value procedures was $1,082,559,000, which represented 3.62% of the net assets of the fund. This amount includes $974,212,000 related to certain securities trading outside the U.S. whose values were adjusted as a result of significant market movements following the close of local trading.
Investments in affiliates
A company is an affiliate of the fund under the Investment Company Act of 1940 if the fund’s holdings in that company represent 5% or more of the outstanding voting shares. The value of the fund’s affiliated-company holding is shown in the summary investment portfolio. Further details on this holding and related transactions during the year ended December 31, 2018, appear below.
| Beginning shares | Additions | Reductions | Ending shares | Net realized gain (000) | Net unrealized depreciation (000) | Dividend income (000) | Value of affiliate at 12/31/2018 (000) | |||||||||||||
| Common stocks 0.68% | ||||||||||||||||||||
| Industrials 0.68% | ||||||||||||||||||||
| BWX Technologies, Inc. | 4,772,174 | 518,774 | — | 5,290,948 | $ — | $ | (116,886 | ) | $ 3,182 | $ 202,273 | ||||||||||
The following footnotes apply to either the individual securities noted or one or more of the securities aggregated and listed as a single line item.
| 1 | Security did not produce income during the last 12 months. |
| 2 | Represents an affiliated company as defined under the Investment Company Act of 1940. |
| 3 | Acquired in a transaction exempt from registration under Rule 144A or Section 4(2) of the Securities Act of 1933. May be resold in the U.S. in transactions exempt from registration, normally to qualified institutional buyers. The total value of all such securities, including those in “Other securities,” was $706,416,000, which represented 2.37% of the net assets of the fund. |
Key to abbreviations
ADR = American Depositary Receipts
CAD = Canadian dollars
See notes to financial statements
| American Funds Insurance Series | 69 |
International Growth and Income Fund
Summary investment portfolioDecember 31, 2018
| Common stocks 89.17% | Shares | Value (000) | ||||||
| Financials 18.67% | ||||||||
| HDFC Bank Ltd. | 1,228,800 | $ | 37,344 | |||||
| Zurich Insurance Group AG1 | 92,200 | 27,498 | ||||||
| AIA Group Ltd. | 1,833,000 | 15,215 | ||||||
| KB Financial Group Inc.1 | 356,500 | 14,918 | ||||||
| Swedbank AB, Class A1 | 611,000 | 13,631 | ||||||
| GT Capital Holdings, Inc.1 | 733,589 | 13,598 | ||||||
| Itaú Unibanco Holding SA, preferred nominative (ADR) | 1,486,950 | 13,591 | ||||||
| Prudential PLC | 738,000 | 13,188 | ||||||
| Banco Santander, SA | 2,611,538 | 11,888 | ||||||
| Sumitomo Mitsui Financial Group, Inc.1 | 308,000 | 10,218 | ||||||
| Other securities | 78,569 | |||||||
| 249,658 | ||||||||
| Health care 13.34% | ||||||||
| Shire PLC | 927,000 | 53,997 | ||||||
| Novartis AG1 | 426,145 | 36,404 | ||||||
| Fresenius SE & Co. KGaA1 | 551,600 | 26,838 | ||||||
| Daiichi Sankyo Co., Ltd.1 | 561,000 | 17,924 | ||||||
| Teva Pharmaceutical Industries Ltd. (ADR) | 662,000 | 10,208 | ||||||
| Other securities | 33,003 | |||||||
| 178,374 | ||||||||
| Industrials 8.49% | ||||||||
| Airbus SE, non-registered shares | 253,960 | 24,430 | ||||||
| Shanghai International Airport Co., Ltd., Class A1 | 2,855,033 | 21,203 | ||||||
| ASSA ABLOY AB, Class B1 | 681,100 | 12,151 | ||||||
| Adani Ports & Special Economic Zone Ltd. | 2,008,779 | 11,155 | ||||||
| Airports of Thailand PCL, foreign registered1 | 5,250,000 | 10,333 | ||||||
| Other securities | 34,231 | |||||||
| 113,503 | ||||||||
| Energy 7.09% | ||||||||
| Royal Dutch Shell PLC, Class A | 1,933,691 | 56,872 | ||||||
| Royal Dutch Shell PLC, Class B | 138,000 | 4,116 | ||||||
| TOTAL SA | 399,350 | 21,130 | ||||||
| Other securities | 12,695 | |||||||
| 94,813 | ||||||||
| Materials 7.06% | ||||||||
| Rio Tinto PLC | 874,100 | 41,557 | ||||||
| Vale SA, ordinary nominative (ADR) | 1,386,000 | 18,281 | ||||||
| Yara International ASA1 | 343,000 | 13,223 | ||||||
| Other securities | 21,347 | |||||||
| 94,408 | ||||||||
| Real estate 7.04% | ||||||||
| Sun Hung Kai Properties Ltd. | 2,227,000 | 31,739 | ||||||
| CK Asset Holdings Ltd. | 3,939,348 | 28,826 | ||||||
| Daito Trust Construction Co., Ltd.1 | 95,500 | 13,077 | ||||||
| China Resources Land Ltd. | 3,162,000 | 12,155 | ||||||
| Other securities | 8,396 | |||||||
| 94,193 | ||||||||
| Consumer staples 7.04% | ||||||||
| British American Tobacco PLC | 1,075,402 | 34,268 | ||||||
| Pernod Ricard SA | 128,650 | 21,123 | ||||||
| Coca-Cola Icecek AS, Class C | 2,631,000 | 15,351 | ||||||
| Imperial Brands PLC | 316,016 | 9,574 | ||||||
| Other securities | 13,864 | |||||||
| 94,180 | ||||||||
| 70 | American Funds Insurance Series |
International Growth and Income Fund
| Common stocks | Shares | Value (000) | ||||||
| Communication services 6.31% | ||||||||
| Tencent Holdings Ltd. | 440,700 | $ | 17,672 | |||||
| BT Group PLC | 4,859,461 | 14,748 | ||||||
| Yandex NV, Class A2 | 470,000 | 12,855 | ||||||
| Other securities | 39,178 | |||||||
| 84,453 | ||||||||
| Utilities 6.08% | ||||||||
| Ørsted AS1 | 441,200 | 29,441 | ||||||
| ENN Energy Holdings Ltd. | 1,658,000 | 14,705 | ||||||
| Naturgy Energy Group, SA | 400,000 | 10,202 | ||||||
| Other securities | 26,923 | |||||||
| 81,271 | ||||||||
| Consumer discretionary 4.49% | ||||||||
| LVMH Moët Hennessy-Louis Vuitton SE | 48,000 | 14,200 | ||||||
| EssilorLuxottica | 105,000 | 13,288 | ||||||
| Other securities | 32,513 | |||||||
| 60,001 | ||||||||
| Information technology 3.56% | ||||||||
| Samsung Electronics Co., Ltd.1 | 417,500 | 14,421 | ||||||
| Tokyo Electron Ltd.1 | 96,500 | 11,004 | ||||||
| Taiwan Semiconductor Manufacturing Co., Ltd.1 | 1,464,000 | 10,662 | ||||||
| Other securities | 11,493 | |||||||
| 47,580 | ||||||||
| Total common stocks (cost: $1,222,804,000) | 1,192,434 | |||||||
| Bonds, notes & other debt instruments 1.14% | Principal amount (000) | |||||||
| Bonds & notes of governments & government agencies outside the U.S. 0.61% | ||||||||
| Other securities | 8,169 | |||||||
| Corporate bonds & notes 0.53% | ||||||||
| Other 0.53% | ||||||||
| Other securities | 7,102 | |||||||
| Total corporate bonds & notes | 7,102 | |||||||
| Total bonds, notes & other debt instruments (cost: $15,574,000) | 15,271 | |||||||
| Short-term securities 9.40% | ||||||||
| BASF SE 2.62% due 2/5/20193 | $ | 10,000 | 9,975 | |||||
| Federal Home Loan Bank 2.22%–2.41% due 1/2/2019–3/21/2019 | 49,700 | 49,556 | ||||||
| KfW 2.43% due 1/11/20193 | 23,200 | 23,183 | ||||||
| L’Oréal USA, Inc. 2.50% due 1/16/20193 | 10,000 | 9,989 | ||||||
| National Rural Utilities Cooperative Finance Corp. 2.50% due 2/6/2019 | 18,100 | 18,054 | ||||||
| Siemens Capital Corp. 2.50% due 1/16/20193 | 15,000 | 14,984 | ||||||
| Total short-term securities (cost: $125,744,000) | 125,741 | |||||||
| Total investment securities 99.71% (cost: $1,364,122,000) | 1,333,446 | |||||||
| Other assets less liabilities 0.29% | 3,812 | |||||||
| Net assets 100.00% | $ | 1,337,258 | ||||||
| American Funds Insurance Series | 71 |
International Growth and Income Fund
This summary investment portfolio is designed to streamline the report and help investors better focus on the fund’s principal holdings. See the inside back cover for details on how to obtain a complete schedule of portfolio holdings.
“Other securities” includes all issues that are not disclosed separately in the summary investment portfolio.
| 1 | Valued under fair value procedures adopted by authority of the board of trustees. The total value of all such securities, including those in “Other securities,” was $410,893,000, which represented 30.73% of the net assets of the fund. This entire amount relates to certain securities trading outside the U.S. whose values were adjusted as a result of significant market movements following the close of local trading. |
| 2 | Security did not produce income during the last 12 months. |
| 3 | Acquired in a transaction exempt from registration under Rule 144A or Section 4(2) of the Securities Act of 1933. May be resold in the U.S. in transactions exempt from registration, normally to qualified institutional buyers. The total value of all such securities, including those in “Other securities,” was $59,763,000, which represented 4.47% of the net assets of the fund. |
Key to abbreviation
ADR = American Depositary Receipts
See notes to financial statements
| 72 | American Funds Insurance Series |
Summary investment portfolioDecember 31, 2018
| Common stocks 68.05% | Shares | Value (000) | ||||||
| Financials 10.16% | ||||||||
| CME Group Inc., Class A | 73,016 | $ | 13,736 | |||||
| Zurich Insurance Group AG1 | 23,867 | 7,118 | ||||||
| Wells Fargo & Co. | 148,000 | 6,820 | ||||||
| Sampo Oyj, Class A1 | 130,569 | 5,747 | ||||||
| Svenska Handelsbanken AB, Class A1 | 475,408 | 5,274 | ||||||
| DBS Group Holdings Ltd. | 293,600 | 5,103 | ||||||
| Other securities | 24,783 | |||||||
| 68,581 | ||||||||
| Consumer staples 9.24% | ||||||||
| Philip Morris International Inc. | 145,220 | 9,695 | ||||||
| Coca-Cola Co. | 177,700 | 8,414 | ||||||
| Diageo PLC | 233,000 | 8,301 | ||||||
| Altria Group, Inc. | 150,370 | 7,427 | ||||||
| British American Tobacco PLC | 189,300 | 6,032 | ||||||
| Nestlé SA1 | 69,277 | 5,623 | ||||||
| Other securities | 16,929 | |||||||
| 62,421 | ||||||||
| Information technology 8.94% | ||||||||
| Broadcom Inc. | 47,700 | 12,129 | ||||||
| Microsoft Corp. | 99,520 | 10,108 | ||||||
| Taiwan Semiconductor Manufacturing Co., Ltd.1 | 1,277,800 | 9,306 | ||||||
| Intel Corp. | 176,700 | 8,292 | ||||||
| QUALCOMM Inc. | 140,900 | 8,019 | ||||||
| Other securities | 12,493 | |||||||
| 60,347 | ||||||||
| Real estate 7.81% | ||||||||
| Crown Castle International Corp. REIT | 118,400 | 12,862 | ||||||
| American Tower Corp. REIT | 68,369 | 10,815 | ||||||
| Link Real Estate Investment Trust REIT | 582,500 | 5,899 | ||||||
| Other securities | 23,132 | |||||||
| 52,708 | ||||||||
| Energy 6.62% | ||||||||
| Enbridge Inc. (CAD denominated) | 335,970 | 10,437 | ||||||
| Royal Dutch Shell PLC, Class B | 321,740 | 9,596 | ||||||
| Royal Dutch Shell PLC, Class B (ADR) | 8,500 | 509 | ||||||
| Royal Dutch Shell PLC, Class A | 101 | 3 | ||||||
| Williams Companies, Inc. | 231,200 | 5,098 | ||||||
| Chevron Corp. | 22,600 | 2,459 | ||||||
| Other securities | 16,621 | |||||||
| 44,723 | ||||||||
| Communication services 6.02% | ||||||||
| Vodafone Group PLC | 5,377,800 | 10,481 | ||||||
| Verizon Communications Inc. | 119,950 | 6,743 | ||||||
| Koninklijke KPN NV | 2,175,375 | 6,381 | ||||||
| HKT Trust and HKT Ltd., units | 3,699,240 | 5,329 | ||||||
| Other securities | 11,749 | |||||||
| 40,683 | ||||||||
| Health care 5.69% | ||||||||
| AstraZeneca PLC | 105,100 | 7,867 | ||||||
| AstraZeneca PLC (ADR) | 145,100 | 5,511 | ||||||
| Johnson & Johnson | 60,200 | 7,769 | ||||||
| Pfizer Inc. | 158,900 | 6,936 | ||||||
| Other securities | 10,313 | |||||||
| 38,396 | ||||||||
| American Funds Insurance Series | 73 |
Capital Income Builder
| Common stocks (continued) | Shares | Value (000) | ||||||
| Utilities 5.52% | ||||||||
| Edison International | 135,100 | $ | 7,670 | |||||
| Enel SPA1 | 1,284,246 | 7,422 | ||||||
| SSE PLC | 477,689 | 6,585 | ||||||
| Other securities | 15,588 | |||||||
| 37,265 | ||||||||
| Consumer discretionary 3.52% | ||||||||
| Las Vegas Sands Corp. | 154,300 | 8,031 | ||||||
| Other securities | 15,747 | |||||||
| 23,778 | ||||||||
| Industrials 3.12% | ||||||||
| Airbus SE, non-registered shares | 73,714 | 7,091 | ||||||
| Boeing Co. | 17,900 | 5,773 | ||||||
| Other securities | 8,208 | |||||||
| 21,072 | ||||||||
| Materials 1.41% | ||||||||
| Other securities | 9,546 | |||||||
| Total common stocks (cost: $480,374,000) | 459,520 | |||||||
| Rights & warrants 0.00% | ||||||||
| Energy 0.00% | ||||||||
| Other securities | — | |||||||
| Total rights & warrants (cost: $1,000) | — | |||||||
| Convertible stocks 0.91% | ||||||||
| Utilities 0.61% | ||||||||
| Other securities | 4,128 | |||||||
| Real estate 0.30% | ||||||||
| Crown Castle International Corp. REIT, Series A, 6.875% convertible preferred 2020 | 1,900 | 1,999 | ||||||
| Total convertible stocks (cost: $6,292,000) | 6,127 | |||||||
| Bonds, notes & other debt instruments 24.91% | Principal amount (000) | |||||||
| U.S. Treasury bonds & notes 13.84% | ||||||||
| U.S. Treasury 13.02% | ||||||||
| U.S. Treasury 1.625% 2022 | $ | 6,050 | 5,872 | |||||
| U.S. Treasury 2.00% 2022 | 15,000 | 14,741 | ||||||
| U.S. Treasury 2.125% 2022 | 8,800 | 8,681 | ||||||
| U.S. Treasury 2.00% 2025 | 13,200 | 12,729 | ||||||
| U.S. Treasury 2.00% 2026 | 7,500 | 7,160 | ||||||
| U.S. Treasury, principal only, 0% 2047 | 12,400 | 5,188 | ||||||
| U.S. Treasury 1.75%–3.13% 2021–20482 | 33,658 | 33,580 | ||||||
| 87,951 | ||||||||
| U.S. Treasury inflation-protected securities 0.82% | ||||||||
| U.S. Treasury Inflation-Protected Security 0.625% 20233 | 5,599 | 5,512 | ||||||
| Total U.S. Treasury bonds & notes | 93,463 | |||||||
| 74 | American Funds Insurance Series |
Capital Income Builder
| Bonds, notes & other debt instruments | Principal amount (000) | Value (000) | ||||||
| Mortgage-backed obligations 6.96% | ||||||||
| Federal agency mortgage-backed obligations 6.72% | ||||||||
| Fannie Mae 4.00% 20474 | $ | 9,196 | $ | 9,385 | ||||
| Fannie Mae 4.50% 20484,5 | 6,846 | 7,099 | ||||||
| Fannie Mae 4.50% 20484 | 5,816 | 6,033 | ||||||
| Fannie Mae 4.50% 20484 | 5,689 | 5,901 | ||||||
| Fannie Mae 3.50%–4.00% 2046–20494,5 | 2,344 | 2,382 | ||||||
| Government National Mortgage Assn. 4.30%–6.87% 2049–20634,5 | 7,553 | 7,817 | ||||||
| Other securities | 6,759 | |||||||
| 45,376 | ||||||||
| Collateralized mortgage-backed obligations (privately originated) 0.24% | ||||||||
| Other securities | 1,582 | |||||||
| Total mortgage-backed obligations | 46,958 | |||||||
| Corporate bonds & notes 3.97% | ||||||||
| Financials 0.98% | ||||||||
| CME Group Inc. 4.15% 2048 | 100 | 102 | ||||||
| Wells Fargo & Co. 3.55%–4.60% 2021–2023 | 600 | 606 | ||||||
| Other securities | 5,886 | |||||||
| 6,594 | ||||||||
| Utilities 0.83% | ||||||||
| Enel Finance International SA 3.625% 20276 | 215 | 190 | ||||||
| Southern California Edison Co. 4.65% 2043 | 100 | 101 | ||||||
| Other securities | 5,297 | |||||||
| 5,588 | ||||||||
| Health care 0.54% | ||||||||
| AstraZeneca PLC 3.38%–3.50% 2023–2025 | 470 | 463 | ||||||
| Other securities | 3,196 | |||||||
| 3,659 | ||||||||
| Communication services 0.38% | ||||||||
| Verizon Communications Inc. 4.329% 2028 | 312 | 314 | ||||||
| Vodafone Group PLC 3.75%–5.25% 2024–2048 | 600 | 582 | ||||||
| Other securities | 1,668 | |||||||
| 2,564 | ||||||||
| Consumer staples 0.36% | ||||||||
| Philip Morris International Inc. 2.63%–3.60% 2022–2023 | 273 | 265 | ||||||
| Other securities | 2,203 | |||||||
| 2,468 | ||||||||
| Energy 0.26% | ||||||||
| Shell International Finance BV 3.50% 2023 | 100 | 101 | ||||||
| Other securities | 1,629 | |||||||
| 1,730 | ||||||||
| Information technology 0.04% | ||||||||
| Broadcom Ltd. 3.50%–3.88% 2027–2028 | 328 | 291 | ||||||
| Other 0.58% | ||||||||
| Other securities | 3,923 | |||||||
| Total corporate bonds & notes | 26,817 | |||||||
| American Funds Insurance Series | 75 |
Capital Income Builder
| Bonds, notes & other debt instruments(continued) | Principal amount (000) | Value (000) | ||||||
| Asset-backed obligations 0.14% | ||||||||
| Other securities | $ | 967 | ||||||
| Total bonds, notes & other debt instruments (cost: $169,549,000) | 168,205 | |||||||
| Short-term securities 6.79% | ||||||||
| Chevron Corp. 2.39% due 1/28/20196 | $ | 10,000 | 9,981 | |||||
| Federal Home Loan Bank 2.33%–2.38% due 1/18/2019–2/21/2019 | 22,200 | 22,140 | ||||||
| National Rural Utilities Cooperative Finance Corp. 2.52% due 1/31/2019 | 9,600 | 9,579 | ||||||
| Pfizer Inc. 2.31% due 1/15/20196 | 4,200 | 4,196 | ||||||
| Total short-term securities (cost: $45,898,000) | 45,896 | |||||||
| Total investment securities 100.66% (cost: $702,114,000) | 679,748 | |||||||
| Other assets less liabilities (0.66)% | (4,468 | ) | ||||||
| Net assets 100.00% | $ | 675,280 | ||||||
This summary investment portfolio is designed to streamline the report and help investors better focus on the fund’s principal holdings. See the inside back cover for details on how to obtain a complete schedule of portfolio holdings.
“Other securities” includes all issues that are not disclosed separately in the summary investment portfolio.
Futures contracts
| Unrealized | |||||||||||||||
| appreciation | |||||||||||||||
| Notional | Value at | (depreciation) | |||||||||||||
| Number of | amount7 | 12/31/20188 | at 12/31/2018 | ||||||||||||
| Contracts | Type | contracts | Expiration | (000) | (000) | (000) | |||||||||
| 90 Day Euro Dollar Futures | Long | 100 | December 2019 | $25,000 | $24,338 | $ | 151 | ||||||||
| 2 Year U.S. Treasury Note Futures | Long | 49 | April 2019 | 9,800 | 10,403 | 67 | |||||||||
| 5 Year U.S. Treasury Note Futures | Long | 988 | April 2019 | 98,800 | 113,311 | 1,810 | |||||||||
| 10 Year Ultra U.S. Treasury Note Futures | Short | 473 | March 2019 | (47,300 | ) | (61,527 | ) | (1,820 | ) | ||||||
| 20 Year U.S. Treasury Bond Futures | Long | 64 | March 2019 | 6,400 | 9,344 | 439 | |||||||||
| 30 Year Ultra U.S. Treasury Bond Futures | Short | 26 | March 2019 | (2,600 | ) | (4,177 | ) | (218 | ) | ||||||
| $ | 429 | ||||||||||||||
The following footnotes apply to either the individual securities noted or one or more of the securities aggregated and listed as a single line item.
| 1 | Valued under fair value procedures adopted by authority of the board of trustees. The total value of all such securities, including those in “Other securities,” was $77,218,000, which represented 11.43% of the net assets of the fund. This amount includes $76,827,000 related to certain securities trading outside the U.S. whose values were adjusted as a result of significant market movements following the close of local trading. |
| 2 | All or a portion of this security was pledged as collateral. The total value of pledged collateral was $284,000, which represented .04% of the net assets of the fund. |
| 3 | Index-linked bond whose principal amount moves with a government price index. |
| 4 | Principal payments may be made periodically. Therefore, the effective maturity date may be earlier than the stated maturity date. |
| 5 | Purchased on a TBA basis. |
| 6 | Acquired in a transaction exempt from registration under Rule 144A or Section 4(2) of the Securities Act of 1933. May be resold in the U.S. in transactions exempt from registration, normally to qualified institutional buyers. The total value of all such securities, including those in “Other securities,” was $23,524,000, which represented 3.48% of the net assets of the fund. |
| 7 | Notional amount is calculated based on the number of contracts and notional contract size. |
| 8 | Value is calculated based on the notional amount and current market price. |
| 76 | American Funds Insurance Series |
Capital Income Builder
Key to abbreviations
ADR = American Depositary Receipts
CAD = Canadian dollars
TBA = To-be-announced
See notes to financial statements
| American Funds Insurance Series | 77 |
Summary investment portfolioDecember 31, 2018
| Common stocks 58.94% | Shares | Value (000) | ||||||
| Information technology 13.64% | ||||||||
| Microsoft Corp. | 6,500,000 | $ | 660,205 | |||||
| Taiwan Semiconductor Manufacturing Co., Ltd. (ADR) | 14,016,000 | 517,331 | ||||||
| Broadcom Inc. | 1,995,000 | 507,289 | ||||||
| VeriSign, Inc.1 | 2,000,000 | 296,580 | ||||||
| ASML Holding NV (New York registered) | 1,865,000 | 290,231 | ||||||
| Intel Corp. | 5,820,000 | 273,133 | ||||||
| Intuit Inc. | 1,100,000 | 216,535 | ||||||
| Visa Inc., Class A | 1,032,000 | 136,162 | ||||||
| Other securities | 230,164 | |||||||
| 3,127,630 | ||||||||
| Health care 11.11% | ||||||||
| UnitedHealth Group Inc. | 2,016,300 | 502,301 | ||||||
| Johnson & Johnson | 3,472,000 | 448,062 | ||||||
| Cigna Corp. | 1,689,540 | 320,877 | ||||||
| Humana Inc. | 965,000 | 276,453 | ||||||
| AbbVie Inc. | 2,675,300 | 246,636 | ||||||
| Merck & Co., Inc. | 2,420,300 | 184,935 | ||||||
| Bluebird Bio, Inc.1 | 1,617,100 | 160,416 | ||||||
| Other securities | 406,972 | |||||||
| 2,546,652 | ||||||||
| Financials 9.49% | ||||||||
| Chubb Ltd. | 2,450,000 | 316,491 | ||||||
| Arch Capital Group Ltd.1 | 8,595,000 | 229,658 | ||||||
| First Republic Bank | 2,580,000 | 224,202 | ||||||
| Wells Fargo & Co. | 3,500,000 | 161,280 | ||||||
| JPMorgan Chase & Co. | 1,600,000 | 156,192 | ||||||
| Bank of America Corp. | 6,000,000 | 147,840 | ||||||
| CME Group Inc., Class A | 738,200 | 138,870 | ||||||
| Citigroup Inc. | 2,500,000 | 130,150 | ||||||
| Other securities | 670,432 | |||||||
| 2,175,115 | ||||||||
| Industrials 4.39% | ||||||||
| Boeing Co. | 1,140,000 | 367,650 | ||||||
| Northrop Grumman Corp. | 1,249,400 | 305,978 | ||||||
| Lockheed Martin Corp. | 847,200 | 221,831 | ||||||
| Other securities | 111,429 | |||||||
| 1,006,888 | ||||||||
| Energy 4.17% | ||||||||
| Noble Energy, Inc. | 10,500,000 | 196,980 | ||||||
| Cenovus Energy Inc. | 27,000,000 | 189,862 | ||||||
| Royal Dutch Shell PLC, Class B (ADR) | 2,745,000 | 164,535 | ||||||
| Other securities | 404,961 | |||||||
| 956,338 | ||||||||
| Consumer discretionary 3.94% | ||||||||
| Home Depot, Inc. | 1,125,000 | 193,297 | ||||||
| Amazon.com, Inc.1 | 103,000 | 154,703 | ||||||
| General Motors Co. | 4,100,000 | 137,145 | ||||||
| VF Corp. | 1,600,000 | 114,144 | ||||||
| Other securities | 304,124 | |||||||
| 903,413 |
| 78 | American Funds Insurance Series |
Asset Allocation Fund
| Common stocks | Shares | Value (000) | ||||||
| Communication services 3.70% | ||||||||
| Comcast Corp., Class A | 7,550,000 | $ | 257,077 | |||||
| Facebook, Inc., Class A1 | 1,332,000 | 174,612 | ||||||
| Verizon Communications Inc. | 2,040,000 | 114,689 | ||||||
| Other securities | 301,633 | |||||||
| 848,011 | ||||||||
| Consumer staples 3.52% | ||||||||
| Philip Morris International Inc. | 5,430,000 | 362,507 | ||||||
| Nestlé SA2 | 3,242,230 | 263,173 | ||||||
| Nestlé SA (ADR) | 900,000 | 72,864 | ||||||
| Other securities | 109,682 | |||||||
| 808,226 | ||||||||
| Materials 3.23% | ||||||||
| DowDuPont Inc. | 7,753,100 | 414,636 | ||||||
| Other securities | 324,972 | |||||||
| 739,608 | ||||||||
| Utilities 0.94% | ||||||||
| CMS Energy Corp. | 2,284,700 | 113,435 | ||||||
| Other securities | 102,464 | |||||||
| 215,899 | ||||||||
| Real estate 0.81% | ||||||||
| Other securities | 184,779 | |||||||
| Total common stocks (cost: $10,995,856,000) | 13,512,559 | |||||||
| Rights & warrants 0.00% | ||||||||
| Other 0.00% | ||||||||
| Other securities | 242 | |||||||
| Total rights & warrants (cost: $70,000) | 242 | |||||||
| Convertible stocks 0.03% | ||||||||
| Industrials 0.03% | ||||||||
| Other securities | 6,074 | |||||||
| Total convertible stocks (cost: $4,800,000) | 6,074 | |||||||
| Convertible bonds 0.00% | Principal amount (000) | |||||||
| Communication services 0.00% | ||||||||
| Other securities | 1,272 | |||||||
| Bonds, notes & other debt instruments 28.92% | ||||||||
| U.S. Treasury bonds & notes 12.30% | ||||||||
| U.S. Treasury 9.54% | ||||||||
| U.S. Treasury 1.50% 2019 | $ | 400,000 | 399,688 | |||||
| U.S. Treasury 1.25% 20203 | 298,117 | 293,842 | ||||||
| U.S. Treasury 1.625% 2020 | 125,000 | 123,238 | ||||||
| U.S. Treasury 2.25% 2027 | 126,075 | 122,452 | ||||||
| U.S. Treasury 1.13%–4.75% 2019–20483 | 1,260,397 | 1,247,301 | ||||||
| 2,186,521 | ||||||||
| American Funds Insurance Series | 79 |
Asset Allocation Fund
| Bonds, notes & other debt instruments(continued) | Principal amount (000) | Value (000) | ||||||
| U.S. Treasury bonds & notes (continued) | ||||||||
| U.S. Treasury inflation-protected securities 2.76% | ||||||||
| U.S. Treasury Inflation-Protected Security 0.625% 20244 | $ | 221,289 | $ | 217,968 | ||||
| U.S. Treasury Inflation-Protected Security 1.375% 20443,4 | 139,180 | 144,107 | ||||||
| U.S. Treasury Inflation-Protected Securities 0.13%–2.38% 2021–20474 | 283,125 | 271,873 | ||||||
| 633,948 | ||||||||
| Total U.S. Treasury bonds & notes | 2,820,469 | |||||||
| Corporate bonds & notes 9.97% | ||||||||
| Energy 1.60% | ||||||||
| Other securities | 367,218 | |||||||
| Financials 1.56% | ||||||||
| ACE INA Holdings Inc. 2.30%–4.35% 2020–2045 | 6,905 | 6,864 | ||||||
| Other securities | 349,954 | |||||||
| 356,818 | ||||||||
| Health care 1.52% | ||||||||
| AbbVie Inc. 4.25%–4.88% 2028–2048 | 11,404 | 10,435 | ||||||
| Cigna Corp. 3.40%–4.90% 2021–20485 | 18,585 | 18,521 | ||||||
| Johnson & Johnson 2.45% 2026 | 5,285 | 4,970 | ||||||
| Other securities | 315,654 | |||||||
| 349,580 | ||||||||
| Communication services 1.07% | ||||||||
| Comcast Corp. 2.35%–4.70% 2025–2048 | 24,439 | 24,085 | ||||||
| NBCUniversal Enterprise, Inc. 1.974% 20195 | 100 | 100 | ||||||
| Other securities | 220,154 | |||||||
| 244,339 | ||||||||
| Materials 0.73% | ||||||||
| Dow Chemical Co. 4.55% 20255 | 8,394 | 8,556 | ||||||
| DowDuPont Inc. 4.21%–4.73% 2023–2028 | 16,125 | 16,632 | ||||||
| Other securities | 142,841 | |||||||
| 168,029 | ||||||||
| Industrials 0.63% | ||||||||
| Lockheed Martin Corp. 2.50%–3.55% 2020–2026 | 10,050 | 9,962 | ||||||
| Northrop Grumman Corp. 2.93%–3.25% 2025–2028 | 8,140 | 7,676 | ||||||
| Other securities | 127,441 | |||||||
| 145,079 | ||||||||
| Consumer staples 0.59% | ||||||||
| Nestle Holdings, Inc. 3.50% 20255 | 4,500 | 4,526 | ||||||
| Philip Morris International Inc. 1.88%–4.25% 2020–2044 | 15,405 | 14,816 | ||||||
| Other securities | 116,177 | |||||||
| 135,519 | ||||||||
| Information technology 0.29% | ||||||||
| Broadcom Ltd. 3.00%–3.63% 2022–2028 | 6,277 | 5,582 | ||||||
| Microsoft Corp. 4.10%–4.20% 2035–2037 | 7,000 | 7,268 | ||||||
| Other securities | 52,778 | |||||||
| 65,628 | ||||||||
| Other 1.98% | ||||||||
| Other securities | 454,358 | |||||||
| Total corporate bonds & notes | 2,286,568 | |||||||
| 80 | American Funds Insurance Series |
Asset Allocation Fund
| Bonds, notes & other debt instruments | Principal amount (000) | Value (000) | ||||||
| Mortgage-backed obligations 5.75% | ||||||||
| Federal agency mortgage-backed obligations 5.59% | ||||||||
| Fannie Mae 0%–7.50% 2021–20496,7,8 | $ | 576,633 | $ | 585,310 | ||||
| Freddie Mac 3.00%–6.50% 2037–20496,8 | 309,698 | 312,698 | ||||||
| Other securities | 383,453 | |||||||
| 1,281,461 | ||||||||
| Other 0.16% | ||||||||
| Other securities | 37,382 | |||||||
| Total mortgage-backed obligations | 1,318,843 | |||||||
| Federal agency bonds & notes 0.07% | ||||||||
| Fannie Mae 1.88%–2.00% 2022–2026 | 16,000 | 15,031 | ||||||
| Other 0.83% | ||||||||
| Other securities | 190,115 | |||||||
| Total bonds, notes & other debt instruments (cost: $6,771,429,000) | 6,631,026 | |||||||
| Short-term securities 13.60% | ||||||||
| Federal Home Loan Bank 2.13%–2.41% due 1/2/2019–3/15/2019 | 1,506,150 | 1,501,682 | ||||||
| Merck & Co. Inc. 2.37%–2.50% due 1/23/2019–2/27/20195 | 149,000 | 148,526 | ||||||
| U.S. Treasury Bills 2.12%–2.38% due 1/15/2019–3/7/2019 | 660,200 | 658,327 | ||||||
| United Parcel Service Inc. 2.34%–2.40% due 1/14/2019–1/22/20195 | 175,000 | 174,804 | ||||||
| Other securities | 633,289 | |||||||
| Total short-term securities (cost: $3,116,790,000) | 3,116,628 | |||||||
| Total investment securities 101.49% (cost: $20,890,335,000) | 23,267,801 | |||||||
| Other assets less liabilities (1.49)% | (342,350 | ) | ||||||
| Net assets 100.00% | $ | 22,925,451 | ||||||
This summary investment portfolio is designed to streamline the report and help investors better focus on the fund’s principal holdings. See the inside back cover for details on how to obtain a complete schedule of portfolio holdings.
“Other securities” includes all issues that are not disclosed separately in the summary investment portfolio. “Other securities“ also includes loan participations and assignments, which may be subject to legal or contractual restrictions on resale. The total value of all such loans was $43,203,000, which represented ..19% of the net assets of the fund. Some securities in “Other securities” (with an aggregate value of $30,904,000, an aggregate cost of $36,241,000, and which represented .13% of the net assets of the fund) were acquired from 9/26/2013 to 11/16/2018 through private placement transactions exempt from registration under the Securities Act of 1933, which may subject them to legal or contractual restrictions on resale.
| American Funds Insurance Series | 81 |
Asset Allocation Fund
Futures contracts
| Contracts | Type | Number of contracts | Expiration | Notional amount (000) | 9 | Value at 12/31/2018 (000) | 10 | Unrealized appreciation (depreciation) at 12/31/2018 (000) | ||||||||||||
| 2 Year U.S. Treasury Note Futures | Long | 2,898 | April 2019 | $ | 579,600 | $ | 615,282 | $ | 2,012 | |||||||||||
| 5 Year U.S. Treasury Note Futures | Long | 1,317 | April 2019 | 131,700 | 151,043 | 2,659 | ||||||||||||||
| 10 Year U.S. Treasury Note Futures | Long | 817 | March 2019 | 81,700 | 99,687 | 1,364 | ||||||||||||||
| 10 Year Ultra U.S. Treasury Note Futures | Short | 211 | March 2019 | (21,100 | ) | (27,447 | ) | (874 | ) | |||||||||||
| $ | 5,161 | |||||||||||||||||||
Swap contracts
Interest rate swaps
| Upfront | Unrealized | |||||||||||||||||||||
| Value at | payments/ | depreciation | ||||||||||||||||||||
| Expiration | Notional | 12/31/2018 | receipts | at 12/31/2018 | ||||||||||||||||||
| Receive | Pay | date | (000) | (000) | (000) | (000) | ||||||||||||||||
| 1.6365% | 3-month USD-LIBOR | 10/16/2019 | $ | 124,000 | $(1,066 | ) | $ | — | $ | (1,066 | ) | |||||||||||
| U.S. EFFR | 2.4435% | 12/20/2023 | 17,844 | (137 | ) | — | (137 | ) | ||||||||||||||
| U.S. EFFR | 2.45375% | 12/20/2023 | 159,848 | (1,304 | ) | — | (1,304 | ) | ||||||||||||||
| U.S. EFFR | 2.4225% | 12/24/2023 | 73,206 | (490 | ) | — | (490 | ) | ||||||||||||||
| 3-month USD-LIBOR | 2.945% | 10/16/2044 | 28,000 | (560 | ) | — | (560 | ) | ||||||||||||||
| $ | — | $ | (3,557 | ) | ||||||||||||||||||
| 82 | American Funds Insurance Series |
Asset Allocation Fund
Investments in affiliates
A company is an affiliate of the fund under the Investment Company Act of 1940 if the fund’s holdings in that company represent 5% or more of the outstanding voting shares. The value of the fund’s holdings in affiliated companies is included in “Other securities” under the respective industry sectors in the summary investment portfolio. Further details on these holdings and related transactions during the year ended December 31, 2018, appear below.
| Beginning | Ending | Net | Net | Dividend | Value of | |||||||||||||||||||||||||||
| shares or | shares or | realized | unrealized | or interest | affiliates at | |||||||||||||||||||||||||||
| principal | principal | gain | depreciation | income | 12/31/2018 | |||||||||||||||||||||||||||
| amount | Additions | Reductions | amount | (000) | (000) | (000) | (000) | |||||||||||||||||||||||||
| Common stocks 0.59% | ||||||||||||||||||||||||||||||||
| Energy 0.14% | ||||||||||||||||||||||||||||||||
| Weatherford International PLC1 | 56,000,000 | 4,000,000 | — | 60,000,000 | $ | — | $ | (210,215 | ) | $ | — | $ | 33,540 | |||||||||||||||||||
| Consumer discretionary 0.45% | ||||||||||||||||||||||||||||||||
| Dillard’s, Inc., Class A (USA)11 | 807,618 | 892,382 | — | 1,700,000 | — | (9,607 | ) | 562 | 102,527 | |||||||||||||||||||||||
| Total common stocks | 136,067 | |||||||||||||||||||||||||||||||
| Bonds, notes & other debt instruments 0.08% | ||||||||||||||||||||||||||||||||
| Energy 0.08% | ||||||||||||||||||||||||||||||||
| Weatherford International PLC 4.50% 2022 | $ | 2,670,000 | $ | 3,695,000 | — | $ | 6,365,000 | — | (1,890 | ) | 340 | 3,755 | ||||||||||||||||||||
| Weatherford International PLC 8.25% 2023 | $ | 5,500,000 | $ | 300,000 | — | $ | 5,800,000 | — | (2,350 | ) | 484 | 3,523 | ||||||||||||||||||||
| Weatherford International PLC 9.875% 2024 | — | $ | 1,000,000 | — | $ | 1,000,000 | — | (391 | ) | 86 | 620 | |||||||||||||||||||||
| Weatherford International PLC 9.875% 20255 | — | $ | 2,550,000 | — | $ | 2,550,000 | — | (973 | ) | 214 | 1,562 | |||||||||||||||||||||
| Weatherford International PLC 6.50% 2036 | $ | 7,595,000 | — | — | $ | 7,595,000 | �� | — | (2,323 | ) | 519 | 3,987 | ||||||||||||||||||||
| Weatherford International PLC 6.75% 2040 | $ | 7,825,000 | — | — | $ | 7,825,000 | — | (2,412 | ) | 553 | 4,069 | |||||||||||||||||||||
| 17,516 | ||||||||||||||||||||||||||||||||
| Total 0.67% | $ | — | $ | (230,161 | ) | $ | 2,758 | $ | 153,583 | |||||||||||||||||||||||
The following footnotes apply to either the individual securities noted or one or more of the securities aggregated and listed as a single line item.
| 1 | Security did not produce income during the last 12 months. |
| 2 | Valued under fair value procedures adopted by authority of the board of trustees. The total value of all such securities, including those in “Other securities,” was $396,462,000, which represented 1.73% of the net assets of the fund. This amount includes $369,780,000 related to certain securities trading outside the U.S. whose values were adjusted as a result of significant market movements following the close of local trading. |
| 3 | All or a portion of this security was pledged as collateral. The total value of pledged collateral was $10,162,000, which represented .04% of the net assets of the fund. |
| 4 | Index-linked bond whose principal amount moves with a government price index. |
| 5 | Acquired in a transaction exempt from registration under Rule 144A or Section 4(2) of the Securities Act of 1933. May be resold in the U.S. in transactions exempt from registration, normally to qualified institutional buyers. The total value of all such securities, including those in “Other securities,” was $1,612,443,000, which represented 7.03% of the net assets of the fund. |
| 6 | Principal payments may be made periodically. Therefore, the effective maturity date may be earlier than the stated maturity date. |
| 7 | Coupon rate may change periodically. |
| 8 | Purchased on a TBA basis. |
| 9 | Notional amount is calculated based on the number of contracts and notional contract size. |
| 10 | Value is calculated based on the notional amount and current market price. |
| 11 | This security was an unaffiliated issuer in its initial period of acquisition at 12/31/2017; it was not publicly disclosed. |
Key to abbreviations and symbol
ADR = American Depositary Receipts
EFFR = Effective Federal Funds Rate
LIBOR = London Interbank Offered Rate
TBA = To-be-announced
USD/$ = U.S. dollars
See notes to financial statements
| American Funds Insurance Series | 83 |
Summary investment portfolioDecember 31, 2018
| Common stocks 56.65% | Shares | Value (000) | ||||||
| Information technology 11.31% | ||||||||
| ASML Holding NV | 35,800 | $ | 5,626 | |||||
| Taiwan Semiconductor Manufacturing Co., Ltd.1 | 732,000 | 5,331 | ||||||
| Microsoft Corp. | 48,500 | 4,926 | ||||||
| PagSeguro Digital Ltd., Class A2 | 220,528 | 4,130 | ||||||
| Broadcom Inc. | 15,150 | 3,852 | ||||||
| Temenos AG1 | 25,000 | 2,999 | ||||||
| Keyence Corp.1 | 4,400 | 2,233 | ||||||
| Intel Corp. | 44,000 | 2,065 | ||||||
| Other securities | 10,273 | |||||||
| 41,435 | ||||||||
| Financials 8.12% | ||||||||
| JPMorgan Chase & Co. | 48,270 | 4,712 | ||||||
| HSBC Holdings PLC (GBP denominated) | 539,633 | 4,449 | ||||||
| Berkshire Hathaway Inc., Class A2 | 12 | 3,672 | ||||||
| B3 SA - Brasil, Bolsa, Balcao | 376,000 | 2,601 | ||||||
| HDFC Bank Ltd. (ADR) | 21,605 | 2,238 | ||||||
| Credicorp Ltd. | 10,050 | 2,228 | ||||||
| Wells Fargo & Co. | 47,900 | 2,207 | ||||||
| AIA Group Ltd. | 250,000 | 2,075 | ||||||
| Other securities | 5,545 | |||||||
| 29,727 | ||||||||
| Health care 7.49% | ||||||||
| Merck & Co., Inc. | 66,870 | 5,110 | ||||||
| Humana Inc. | 16,330 | 4,678 | ||||||
| UnitedHealth Group Inc. | 8,985 | 2,238 | ||||||
| Other securities | 15,420 | |||||||
| 27,446 | ||||||||
| Industrials 6.81% | ||||||||
| Boeing Co. | 15,250 | 4,918 | ||||||
| Edenred SA | 65,000 | 2,391 | ||||||
| Other securities | 17,629 | |||||||
| 24,938 | ||||||||
| Energy 4.95% | ||||||||
| ConocoPhillips | 56,006 | 3,492 | ||||||
| Royal Dutch Shell PLC, Class B | 114,200 | 3,406 | ||||||
| LUKOIL Oil Co. PJSC (ADR) | 39,800 | 2,845 | ||||||
| Enbridge Inc. (CAD denominated) | 62,117 | 1,929 | ||||||
| Enbridge Inc. (CAD denominated)3 | 16,157 | 502 | ||||||
| TOTAL SA | 45,200 | 2,391 | ||||||
| Other securities | 3,564 | |||||||
| 18,129 | ||||||||
| Consumer staples 4.85% | ||||||||
| Nestlé SA1 | 45,300 | 3,677 | ||||||
| Philip Morris International Inc. | 50,800 | 3,391 | ||||||
| British American Tobacco PLC | 78,900 | 2,514 | ||||||
| Coca-Cola European Partners PLC | 48,000 | 2,201 | ||||||
| Other securities | 5,994 | |||||||
| 17,777 | ||||||||
| Consumer discretionary 4.05% | ||||||||
| Amazon.com, Inc.2 | 2,500 | 3,755 | ||||||
| Ocado Group PLC2 | 259,500 | 2,613 | ||||||
| Other securities | 8,465 | |||||||
| 14,833 | ||||||||
| 84 | American Funds Insurance Series |
Global Balanced Fund
| Common stocks | Shares | Value (000) | ||||||
| Materials 3.54% | ||||||||
| DowDuPont Inc. | 40,738 | $ | 2,179 | |||||
| Linde PLC1 | 13,706 | 2,176 | ||||||
| Randgold Resources Ltd.1 | 25,000 | 2,068 | ||||||
| Other securities | 6,530 | |||||||
| 12,953 | ||||||||
| Communication services 2.21% | ||||||||
| Nintendo Co., Ltd.1 | 21,300 | 5,671 | ||||||
| Other securities | 2,412 | |||||||
| 8,083 | ||||||||
| Real estate 1.91% | ||||||||
| Link Real Estate Investment Trust REIT | 211,697 | 2,144 | ||||||
| Other securities | 4,838 | |||||||
| 6,982 | ||||||||
| Utilities 1.41% | ||||||||
| Ørsted AS1 | 33,800 | 2,255 | ||||||
| ENN Energy Holdings Ltd. | 232,000 | 2,058 | ||||||
| Other securities | 839 | |||||||
| 5,152 | ||||||||
| Total common stocks (cost: $181,317,000) | 207,455 | |||||||
| Bonds, notes & other debt instruments 36.97% | Principal amount (000) | |||||||
| Bonds & notes of governments & government agencies outside the U.S. 16.15% | ||||||||
| Canada 1.00%–2.25% 2022–2025 | C$ | 2,000 | 1,484 | |||||
| Japan, Series 395, 0.10% 2020 | ¥ | 251,100 | 2,301 | |||||
| Japan, Series 346, 0.10% 2027 | 380,450 | 3,529 | ||||||
| Japan 0.10%–1.70% 2020–20464 | 1,018,875 | 9,836 | ||||||
| Poland (Republic of) 3.25%–5.75% 2020–2025 | PLN | 14,140 | 4,068 | |||||
| United Mexican States 5.75%–10.00% 2020–2042 | MXN | 63,500 | 2,995 | |||||
| United Mexican States 4.15%–4.60% 2027–2046 | $ | 600 | 565 | |||||
| Other securities | 34,368 | |||||||
| 59,146 | ||||||||
| U.S. Treasury bonds & notes 12.50% | ||||||||
| U.S. Treasury 10.13% | ||||||||
| U.S. Treasury 2.875% 2021 | 2,250 | 2,276 | ||||||
| U.S. Treasury 1.625% 2022 | 2,850 | 2,766 | ||||||
| U.S. Treasury 2.875% 2023 | 2,250 | 2,288 | ||||||
| U.S. Treasury 2.25% 2027 | 2,800 | 2,711 | ||||||
| U.S. Treasury 2.875% 20285 | 2,170 | 2,205 | ||||||
| U.S. Treasury 1.00%–3.13% 2019–20465 | 25,142 | 24,843 | ||||||
| 37,089 | ||||||||
| U.S. Treasury inflation-protected securities 2.37% | ||||||||
| U.S. Treasury Inflation-Protected Securities 0.13%–2.38% 2022–20444 | 8,962 | 8,681 | ||||||
| Total U.S. Treasury bonds & notes | 45,770 | |||||||
| Corporate bonds & notes 6.43% | ||||||||
| Financials 1.61% | ||||||||
| Banco Nacional de Comercio Exterior SNC 3.80% 2026 (UST Yield Curve Rate T Note Constant Maturity 5 year + 3.00% on 8/11/2021)3,6 | 200 | 191 | ||||||
| Berkshire Hathaway Inc. 3.00% 2022 | 75 | 75 | ||||||
| HSBC Holdings PLC 3.375% 2024 (5 year EURO Mid Swap + 1.95% on 1/10/2019)6 | € | 100 | 115 | |||||
| HSBC Holdings PLC 3.03%–4.29% 2023–20266 | $ | 650 | 633 | |||||
| American Funds Insurance Series | 85 |
Global Balanced Fund
| Bonds, notes & other debt instruments(continued) | Principal amount (000) | Value (000) | ||||||
| Corporate bonds & notes (continued) | ||||||||
| Financials (continued) | ||||||||
| JPMorgan Chase & Co. 2.55%–6.75% 2021–20496 | $ | 389 | $ | 387 | ||||
| JPMorgan Chase Bank NA (3-month USD-LIBOR + 0.34%) 2.848% 20217 | 300 | 297 | ||||||
| Other securities | 4,193 | |||||||
| 5,891 | ||||||||
| Utilities 0.98% | ||||||||
| Sierra Pacific Power Co., General and Refunding Mortgage Notes, Series T, 3.375% 2023 | 72 | 72 | ||||||
| Other securities | 3,539 | |||||||
| 3,611 | ||||||||
| Health care 0.92% | ||||||||
| Humana Inc. 3.15% 2022 | 100 | 98 | ||||||
| Other securities | 3,277 | |||||||
| 3,375 | ||||||||
| Consumer discretionary 0.56% | ||||||||
| Amazon.com, Inc. 2.80%–3.15% 2024–2027 | 220 | 213 | ||||||
| Other securities | 1,826 | |||||||
| 2,039 | ||||||||
| Energy 0.53% | ||||||||
| Petróleos Mexicanos 7.47% 2026 | MXN | 4,000 | 150 | |||||
| Petróleos Mexicanos 6.35%–6.50% 2027–2048 | $ | 487 | 408 | |||||
| Shell International Finance BV 3.50% 2023 | 330 | 334 | ||||||
| Other securities | 1,035 | |||||||
| 1,927 | ||||||||
| Information technology 0.31% | ||||||||
| Broadcom Ltd. 3.875% 2027 | 190 | 171 | ||||||
| Microsoft Corp. 2.40%–3.30% 2026–2027 | 652 | 630 | ||||||
| Other securities | 338 | |||||||
| 1,139 | ||||||||
| Other 1.52% | ||||||||
| Other securities | 5,550 | |||||||
| Total corporate bonds & notes | 23,532 | |||||||
| Mortgage-backed obligations 1.89% | ||||||||
| Federal agency mortgage-backed obligations 1.18% | ||||||||
| Fannie Mae 4.00%–4.50% 2041–20498,9 | 3,775 | 3,871 | ||||||
| Other securities | 474 | |||||||
| 4,345 | ||||||||
| Other 0.71% | ||||||||
| Other securities | 2,591 | |||||||
| Total mortgage-backed obligations | 6,936 | |||||||
| Total bonds, notes & other debt instruments(cost: $138,335,000) | 135,384 | |||||||
| 86 | American Funds Insurance Series |
Global Balanced Fund
| Short-term securities 6.99% | Principal amount (000) | Value (000) | ||||||
| Canada Bill 2.32% due 1/3/2019 | $ | 6,000 | $ | 6,000 | ||||
| Federal Home Loan Bank 2.15%–2.39% due 1/2/2019–1/22/2019 | 9,600 | 9,592 | ||||||
| National Rural Utilities Cooperative Finance Corp. 2.55% due 1/14/2019 | 5,000 | 4,995 | ||||||
| U.S. Treasury Bills 2.28% due 1/15/2019 | 5,000 | 4,996 | ||||||
| Total short-term securities (cost: $25,583,000) | 25,583 | |||||||
| Total investment securities 100.61% (cost: $345,235,000) | 368,422 | |||||||
| Other assets less liabilities (0.61)% | (2,233 | ) | ||||||
| Net assets 100.00% | $ | 366,189 | ||||||
This summary investment portfolio is designed to streamline the report and help investors better focus on the fund’s principal holdings. See the inside back cover for details on how to obtain a complete schedule of portfolio holdings.
“Other securities” includes all issues that are not disclosed separately in the summary investment portfolio.
Futures contracts
| Contracts | Type | Number of contracts | Expiration | Notional amount (000) | 10 | Value at 12/31/2018 (000) | 11 | Unrealized appreciation at 12/31/2018 (000) | ||||||||||||
| 2 Year U.S. Treasury Note Futures | Long | 6 | April 2019 | $1,200 | $ | 1,274 | $ | 6 | ||||||||||||
| 5 Year U.S. Treasury Note Futures | Long | 97 | April 2019 | 9,700 | 11,124 | 116 | ||||||||||||||
| 10 Year Ultra U.S. Treasury Note Futures | Long | 9 | March 2019 | 900 | 1,171 | 38 | ||||||||||||||
| 10 Year U.S. Treasury Note Futures | Long | 7 | March 2019 | 700 | 854 | 20 | ||||||||||||||
| $ | 180 | |||||||||||||||||||
Forward currency contracts
| Unrealized | ||||||||||||||
| (depreciation) | ||||||||||||||
| Contract amount | appreciation | |||||||||||||
| Purchases | Sales | Settlement | at 12/31/2018 | |||||||||||
| (000) | (000) | Counterparty | date | (000) | ||||||||||
| USD500 | MYR2,100 | JPMorgan Chase | 1/4/2019 | $(8 | ) | |||||||||
| USD482 | THB15,900 | HSBC Bank | 1/8/2019 | (6 | ) | |||||||||
| USD1,367 | EUR1,200 | Citibank | 1/8/2019 | (9 | ) | |||||||||
| JPY57,806 | EUR450 | HSBC Bank | 1/9/2019 | 12 | ||||||||||
| JPY42,300 | USD374 | Citibank | 1/9/2019 | 12 | ||||||||||
| EUR534 | USD606 | Goldman Sachs | 1/9/2019 | 6 | ||||||||||
| USD354 | JPY40,000 | Bank of New York Mellon | 1/9/2019 | (11 | ) | |||||||||
| USD513 | BRL2,000 | Citibank | 1/10/2019 | (3 | ) | |||||||||
| USD350 | INR24,900 | Citibank | 1/10/2019 | (6 | ) | |||||||||
| JPY9,730 | USD86 | JPMorgan Chase | 1/11/2019 | 3 | ||||||||||
| JPY9,730 | USD86 | Goldman Sachs | 1/11/2019 | 3 | ||||||||||
| USD162 | ILS600 | Goldman Sachs | 1/11/2019 | 1 | ||||||||||
| USD497 | PLN1,870 | JPMorgan Chase | 1/11/2019 | (3 | ) | |||||||||
| USD172 | JPY19,459 | Goldman Sachs | 1/11/2019 | (6 | ) | |||||||||
| USD356 | INR25,000 | Citibank | 1/14/2019 | (1 | ) | |||||||||
| USD378 | MYR1,580 | JPMorgan Chase | 1/14/2019 | (4 | ) | |||||||||
| USD692 | INR49,000 | HSBC Bank | 1/15/2019 | (9 | ) | |||||||||
| JPY116,594 | USD1,033 | JPMorgan Chase | 1/17/2019 | 32 | ||||||||||
| USD871 | CAD1,165 | Citibank | 1/17/2019 | 17 | ||||||||||
| EUR938 | USD1,068 | Goldman Sachs | 1/17/2019 | 9 | ||||||||||
| KRW900,000 | USD802 | JPMorgan Chase | 1/17/2019 | 5 | ||||||||||
| USD259 | THB8,500 | Bank of America, N.A. | 1/17/2019 | (2 | ) | |||||||||
| American Funds Insurance Series | 87 |
Global Balanced Fund
Forward currency contracts(continued)
| Unrealized | |||||||||||||||
| (depreciation) | |||||||||||||||
| Contract amount | appreciation | ||||||||||||||
| Purchases | Sales | Settlement | at 12/31/2018 | ||||||||||||
| (000) | (000) | Counterparty | date | (000) | |||||||||||
| USD796 | KRW900,000 | Morgan Stanley | 1/17/2019 | $ | (11 | ) | |||||||||
| USD740 | JPY83,520 | Citibank | 1/17/2019 | (23 | ) | ||||||||||
| JPY110,281 | EUR860 | Goldman Sachs | 1/18/2019 | 21 | |||||||||||
| USD520 | AUD725 | JPMorgan Chase | 1/18/2019 | 10 | |||||||||||
| USD113 | CAD150 | Goldman Sachs | 1/18/2019 | 4 | |||||||||||
| KRW532,100 | USD475 | HSBC Bank | 1/18/2019 | 2 | |||||||||||
| GBP190 | USD243 | Citibank | 1/18/2019 | (1 | ) | ||||||||||
| USD474 | KRW532,100 | Goldman Sachs | 1/18/2019 | (3 | ) | ||||||||||
| USD116 | INR8,300 | Citibank | 1/22/2019 | (3 | ) | ||||||||||
| USD588 | BRL2,300 | JPMorgan Chase | 1/22/2019 | (5 | ) | ||||||||||
| GBP1,476 | USD1,871 | Citibank | 1/24/2019 | 13 | |||||||||||
| EUR1,565 | USD1,787 | JPMorgan Chase | 1/24/2019 | 10 | |||||||||||
| GBP270 | EUR300 | Bank of America, N.A. | 1/24/2019 | — | 12 | ||||||||||
| NOK2,700 | USD316 | Bank of New York Mellon | 1/24/2019 | (3 | ) | ||||||||||
| USD699 | AUD970 | UBS AG | 1/25/2019 | 15 | |||||||||||
| USD462 | INR32,718 | JPMorgan Chase | 1/25/2019 | (6 | ) | ||||||||||
| EUR717 | USD812 | HSBC Bank | 1/28/2019 | 11 | |||||||||||
| EUR400 | USD459 | HSBC Bank | 1/28/2019 | 1 | |||||||||||
| NOK3,054 | USD351 | UBS AG | 1/29/2019 | 3 | |||||||||||
| USD143 | MXN2,900 | HSBC Bank | 1/29/2019 | (3 | ) | ||||||||||
| JPY85,000 | USD754 | JPMorgan Chase | 2/13/2019 | 24 | |||||||||||
| USD504 | CNH3,500 | JPMorgan Chase | 2/28/2019 | (6 | ) | ||||||||||
| USD62 | BRL250 | HSBC Bank | 12/20/2019 | — | 12 | ||||||||||
| $ | 82 | ||||||||||||||
Swap contracts
Interest rate swaps
| Unrealized | ||||||||||||||||||||
| Upfront | (depreciation) | |||||||||||||||||||
| Value at | payments/ | appreciation | ||||||||||||||||||
| Expiration | Notional | 12/31/2018 | receipts | at 12/31/2018 | ||||||||||||||||
| Receive | Pay | date | (000) | (000) | (000) | (000) | ||||||||||||||
| U.S. EFFR | 2.521% | 5/1/2019 | $ | 153,000 | $ | (19 | ) | $ | — | $ | (19 | ) | ||||||||
| (0.0385)% | EONIA | 12/4/2021 | € | 4,300 | 12 | — | 12 | |||||||||||||
| (0.0405)% | EONIA | 12/4/2021 | 4,400 | 12 | — | 12 | ||||||||||||||
| $ | — | $ | 5 | |||||||||||||||||
| 88 | American Funds Insurance Series |
Global Balanced Fund
The following footnotes apply to either the individual securities noted or one or more of the securities aggregated and listed as a single line item.
| 1 | Valued under fair value procedures adopted by authority of the board of trustees. The total value of all such securities, including those in “Other securities,” was $42,136,000, which represented 11.51% of the net assets of the fund. This amount includes $40,068,000 related to certain securities trading outside the U.S. whose values were adjusted as a result of significant market movements following the close of local trading. |
| 2 | Security did not produce income during the last 12 months. |
| 3 | Acquired in a transaction exempt from registration under Rule 144A of the Securities Act of 1933. May be resold in the U.S. in transactions exempt from registration, normally to qualified institutional buyers. The total value of all such securities, including those in “Other securities,” was $10,661,000, which represented 2.91% of the net assets of the fund. |
| 4 | Index-linked bond whose principal amount moves with a government price index. |
| 5 | All or a portion of this security was pledged as collateral. The total value of pledged collateral was $154,000, which represented .04% of the net assets of the fund. |
| 6 | Step bond; coupon rate may change at a later date. |
| 7 | Coupon rate may change periodically. |
| 8 | Principal payments may be made periodically. Therefore, the effective maturity date may be earlier than the stated maturity date. |
| 9 | Purchased on a TBA basis. |
| 10 | Notional amount is calculated based on the number of contracts and notional contract size. |
| 11 | Value is calculated based on the notional amount and current market price. |
| 12 | Amount less than one thousand. |
Key to abbreviations and symbols
ADR = American Depositary Receipts
AUD = Australian dollars
BRL = Brazilian reais
CAD/C$ = Canadian dollars
CNH = Chinese yuan renminbi
EFFR = Effective Federal Funds Rate
EONIA = Euro Overnight Index Average
EUR/€ = Euros
GBP = British pounds
ILS = Israeli shekels
INR = Indian rupees
JPY/¥ = Japanese yen
KRW = South Korean won
LIBOR = London Interbank Offered Rate
MXN = Mexican pesos
MYR = Malaysian ringgits
NOK = Norwegian kroner
PLN = Polish zloty
TBA = To-be-announced
THB = Thai baht
USD/$ = U.S. dollars
See notes to financial statements
| American Funds Insurance Series | 89 |
Summary investment portfolioDecember 31, 2018
| Bonds, notes & other debt instruments 98.44% | Principal amount (000) | Value (000) | ||||||
| Corporate bonds & notes 36.57% | ||||||||
| Financials 10.49% | ||||||||
| Bank of America Corp. 2.82%–4.27% 2023–20291 | $ | 111,866 | $ | 108,914 | ||||
| General Motors Financial Co. 4.20% 2021 | 12,600 | 12,602 | ||||||
| Intesa Sanpaolo SpA 5.017% 20242 | 70,790 | 64,129 | ||||||
| Morgan Stanley 2.50%–3.88% 2021–20291,3 | 103,230 | 100,523 | ||||||
| Other securities | 747,734 | |||||||
| 1,033,902 | ||||||||
| Health care 6.53% | ||||||||
| Teva Pharmaceutical Finance Co. BV 2.80% 2023 | 77,814 | 67,082 | ||||||
| Teva Pharmaceutical Finance Co. BV 2.20%–6.75% 2021–2046 | 133,539 | 103,666 | ||||||
| Other securities | 472,682 | |||||||
| 643,430 | ||||||||
| Energy 5.02% | ||||||||
| Petróleos Mexicanos 7.47% 2026 | MXN | 295,000 | 11,075 | |||||
| Petróleos Mexicanos 4.63%–6.75% 2022–2048 | $ | 65,035 | 57,055 | |||||
| Other securities | 426,114 | |||||||
| 494,244 | ||||||||
| Utilities 3.49% | ||||||||
| Other securities | 344,262 | |||||||
| Consumer discretionary 3.03% | ||||||||
| General Motors Co. 4.35%–5.95% 2025–2049 | 20,265 | 18,401 | ||||||
| General Motors Financial Co. 3.15%–3.95% 2020–2024 | 71,039 | 67,851 | ||||||
| Other securities | 212,152 | |||||||
| 298,404 | ||||||||
| Consumer staples 2.82% | ||||||||
| Other securities | 277,569 | |||||||
| Communication services 2.07% | ||||||||
| Other securities | 204,443 | |||||||
| Industrials 1.04% | ||||||||
| Other securities | 102,117 | |||||||
| Other 2.08% | ||||||||
| Other securities | 205,279 | |||||||
| Total corporate bonds & notes | 3,603,650 | |||||||
| U.S. Treasury bonds & notes 28.94% | ||||||||
| U.S. Treasury 23.96% | ||||||||
| U.S. Treasury 2.25% 2023 | 110,600 | 109,231 | ||||||
| U.S. Treasury 2.50% 2023 | 57,200 | 57,218 | ||||||
| U.S. Treasury 2.625% 2023 | 297,846 | 299,451 | ||||||
| U.S. Treasury 2.75% 2023 | 173,600 | 175,425 | ||||||
| U.S. Treasury 2.125% 20244 | 250,100 | 245,361 | ||||||
| U.S. Treasury 2.125% 20244 | 72,100 | 70,548 | ||||||
| U.S. Treasury 2.125% 2024 | 72,100 | 70,475 | ||||||
| U.S. Treasury 2.25% 2024 | 65,000 | 64,175 | ||||||
| U.S. Treasury 2.625% 2025 | 76,884 | 77,076 | ||||||
| U.S. Treasury 2.75% 2025 | 132,000 | 133,361 | ||||||
| U.S. Treasury 2.875% 2025 | 162,218 | 165,056 | ||||||
| U.S. Treasury 2.875% 2025 | 96,200 | 97,906 | ||||||
| U.S. Treasury 2.25% 2027 | 120,200 | 116,223 | ||||||
| 90 | American Funds Insurance Series |
Bond Fund
| Bonds, notes & other debt instruments | Principal amount (000) | Value (000) | ||||||
| U.S. Treasury 2.25% 2027 | $ | 73,175 | $ | 71,072 | ||||
| U.S. Treasury 3.125% 2028 | 125,656 | 130,492 | ||||||
| U.S. Treasury 3.00% 20484 | 72,499 | 72,268 | ||||||
| U.S. Treasury 3.125% 20484 | 85,768 | 87,519 | ||||||
| U.S. Treasury 3.375% 20484 | 105,392 | 112,851 | ||||||
| U.S. Treasury 2.38%–8.75% 2020–2045 | 195,161 | 206,044 | ||||||
| 2,361,752 | ||||||||
| U.S. Treasury inflation-protected securities 4.98% | ||||||||
| U.S. Treasury Inflation-Protected Security 0.625% 20235 | 50,902 | 50,107 | ||||||
| U.S. Treasury Inflation-Protected Security 0.375% 20255 | 54,409 | 52,483 | ||||||
| U.S. Treasury Inflation-Protected Security 0.375% 20275 | 155,061 | 147,380 | ||||||
| U.S. Treasury Inflation-Protected Security 0.50% 20285 | 128,145 | 122,360 | ||||||
| U.S. Treasury Inflation-Protected Security 0.75% 20285 | 71,633 | 70,160 | ||||||
| U.S. Treasury Inflation-Protected Securities 0.88%–1.00% 2047–20484,5 | 57,402 | 48,055 | ||||||
| 490,545 | ||||||||
| Total U.S. Treasury bonds & notes | 2,852,297 | |||||||
| Mortgage-backed obligations 22.67% | ||||||||
| Federal agency mortgage-backed obligations 22.65% | ||||||||
| Fannie Mae 3.50% 20476 | 94,234 | 94,300 | ||||||
| Fannie Mae 3.50% 20476 | 65,315 | 65,360 | ||||||
| Fannie Mae 3.50% 20496,7 | 538,377 | 538,494 | ||||||
| Fannie Mae 4.00% 20496,7 | 225,210 | 229,666 | ||||||
| Fannie Mae 4.50% 20496,7 | 98,000 | 101,542 | ||||||
| Fannie Mae 3.00%–9.19% 2023–20493,6 | 170,534 | 172,675 | ||||||
| Freddie Mac 3.50% 20476 | 111,522 | 111,566 | ||||||
| Freddie Mac 3.50% 20476 | 61,286 | 61,335 | ||||||
| Freddie Mac 4.00% 20486 | 63,344 | 64,620 | ||||||
| Freddie Mac 4.00% 20486 | 58,724 | 59,906 | ||||||
| Freddie Mac 4.00% 20486 | 50,769 | 51,791 | ||||||
| Freddie Mac 3.00%–5.50% 2033–20486 | 186,165 | 186,978 | ||||||
| Government National Mortgage Assn. 4.00% 20496,7 | 78,661 | 80,560 | ||||||
| Government National Mortgage Assn. 4.00% 20496,7 | 69,539 | 71,158 | ||||||
| Government National Mortgage Assn. 4.50% 20496,7 | 117,450 | 121,553 | ||||||
| Government National Mortgage Assn. 5.00% 20496,7 | 168,137 | 174,944 | ||||||
| Government National Mortgage Assn. 5.00% 20496,7 | 23,839 | 24,782 | ||||||
| Other securities | 21,002 | |||||||
| 2,232,232 | ||||||||
| Other 0.02% | ||||||||
| Other securities | 1,863 | |||||||
| Total mortgage-backed obligations | 2,234,095 | |||||||
| Bonds & notes of governments & government agencies outside the U.S. 6.22% | ||||||||
| Italy (Republic of) 0.95% 2023 | € | 45,000 | 50,312 | |||||
| Italy (Republic of) 2.00% 2028 | 21,000 | 23,045 | ||||||
| Japan, Series 20, 0.10% 20255 | ¥ | 11,430,000 | 107,256 | |||||
| Portuguese Republic 5.125% 2024 | $ | 89,175 | 93,569 | |||||
| Portuguese Republic 4.10%–5.65% 2024–2045 | € | 20,375 | 29,237 | |||||
| United Mexican States, Series M, 6.50% 2021 | MXN | 3,132,700 | 152,312 | |||||
| United Mexican States 3.60% 2025 | $ | 11,500 | 10,994 | |||||
| United Mexican States, Series M, 5.75% 2026 | MXN | 527,500 | 22,701 | |||||
| Other securities | 123,316 | |||||||
| 612,742 | ||||||||
| Asset-backed obligations 2.00% | ||||||||
| Other securities | 197,268 | |||||||
| American Funds Insurance Series | 91 |
Bond Fund
| Bonds, notes & other debt instruments (continued) | Principal amount (000) | Value (000) | ||||||
| Municipals 1.93% | ||||||||
| Illinois 1.64% | ||||||||
| G.O. Bonds, Pension Funding Series 2003, 4.95% 2023 | $ | 27,060 | $ | 27,489 | ||||
| G.O. Bonds, Pension Funding Series 2003, 5.10% 20336 | 86,885 | 82,973 | ||||||
| G.O. Bonds, Pension Funding Series 2013, 5.877% 2019 | 400 | 402 | ||||||
| G.O. Bonds, Series 2013-B, 3.65% 2020 | 1,825 | 1,826 | ||||||
| G.O. Bonds, Series 2013-B, 4.11% 2022 | 750 | 748 | ||||||
| G.O. Bonds, Series 2013-B, 4.31% 2023 | 2,125 | 2,101 | ||||||
| G.O. Bonds, Taxable Build America Bonds, Series 2010-2, 5.65% 2020 | 250 | 256 | ||||||
| G.O. Bonds, Taxable Build America Bonds, Series 2010-2, 5.85% 2022 | 2,370 | 2,487 | ||||||
| G.O. Bonds, Taxable Build America Bonds, Series 2010-2, 5.95% 2023 | 3,210 | 3,376 | ||||||
| G.O. Bonds, Taxable Build America Bonds, Series 2010-3, 5.547% 2019 | 335 | 337 | ||||||
| G.O. Bonds, Taxable Build America Bonds, Series 2010-3, 5.727% 2020 | 2,400 | 2,462 | ||||||
| G.O. Bonds, Taxable Build America Bonds, Series 2010-5, 6.20% 20216 | 5,838 | 6,050 | ||||||
| Other securities | 31,113 | |||||||
| 161,620 | ||||||||
| Other 0.29% | ||||||||
| Other securities | 28,321 | |||||||
| Total municipals | 189,941 | |||||||
| Federal agency bonds & notes 0.11% | ||||||||
| Fannie Mae 2.125% 2026 | 11,910 | 11,395 | ||||||
| Total bonds, notes & other debt instruments (cost: $9,812,916,000) | 9,701,388 | |||||||
| Common stocks 0.01% | Shares | |||||||
| Other 0.01% | ||||||||
| Other securities | 422 | |||||||
| Total common stocks (cost: $1,854,000) | 422 | |||||||
| Rights & warrants 0.00% | ||||||||
| Energy 0.00% | ||||||||
| Other securities | 67 | |||||||
| Total rights & warrants (cost: $18,000) | 67 | |||||||
| Short-term securities 12.62% | Principal amount (000) | |||||||
| Chevron Corp. 2.49% due 2/4/20192 | $ | 75,000 | 74,819 | |||||
| Fannie Mae 2.23% due 1/2/2019 | 3,200 | 3,199 | ||||||
| Federal Home Loan Bank 2.23%–2.39% due 1/11/2019–3/6/2019 | 483,800 | 482,671 | ||||||
| Italian Treasury Bill 0.53% due 8/14/2019 | € | 46,400 | 53,030 | |||||
| Merck & Co. Inc. 2.38% due 1/25/2019–1/29/20192 | $ | 80,000 | 79,849 | |||||
| U.S. Treasury Bills 2.19%–2.44% due 1/17/2019–5/16/2019 | 366,500 | 364,843 | ||||||
| Wal-Mart Stores, Inc. 2.46%–2.49% due 1/7/2019–1/14/20192 | 64,800 | 64,756 | ||||||
| Other securities | 120,466 | |||||||
| Total short-term securities (cost: $1,244,163,000) | 1,243,633 | |||||||
| Total investment securities 111.07% (cost: $11,058,951,000) | 10,945,510 | |||||||
| Other assets less liabilities (11.07)% | (1,090,823 | ) | ||||||
| Net assets 100.00% | $ | 9,854,687 | ||||||
| 92 | American Funds Insurance Series |
Bond Fund
This summary investment portfolio is designed to streamline the report and help investors better focus on the fund’s principal holdings. See the inside back cover for details on how to obtain a complete schedule of portfolio holdings.
“Other securities” includes all issues that are not disclosed separately in the summary investment portfolio. “Other securities” includes securities which were valued under fair value procedures adopted by authority of the board of trustees. The total value of securities which were valued under fair value procedures was $1,591,000, which represented .02% of the net assets of the fund. “Other securities” also includes loan participations and assignments, which may be subject to legal or contractual restrictions on resale. The total value of all such loans was $1,243,000, which represented .01% of the net assets of the fund.
Futures contracts
| Contracts | Type | Number of contracts | Expiration | Notional amount (000) | 8 | Value at 12/31/2018 (000) | 9 | Unrealized appreciation (depreciation) at 12/31/2018 (000) | |||||||||||||
| 2 Year U.S. Treasury Note Futures | Long | 3,076 | April 2019 | $ | 615,200 | $ | 653,073 | $ | 2,119 | ||||||||||||
| 5 Year Euro-Bobl Futures | Short | 2,022 | March 2019 | € | (202,200 | ) | (307,010 | ) | (813 | ) | |||||||||||
| 5 Year U.S. Treasury Note Futures | Long | 10,571 | April 2019 | $ | 1,057,100 | 1,212,362 | 17,566 | ||||||||||||||
| 10 Year Euro-Bund Futures | Short | 715 | March 2019 | € | (71,500 | ) | (133,974 | ) | (934 | ) | |||||||||||
| 10 Year U.S. Treasury Note Futures | Long | 579 | March 2019 | $ | 57,900 | 70,647 | 1,495 | ||||||||||||||
| 10 Year Ultra U.S. Treasury Note Futures | Short | 171 | March 2019 | (17,100 | ) | (22,243 | ) | (666 | ) | ||||||||||||
| 30 Year Euro-Buxl Futures | Long | 268 | March 2019 | € | 26,800 | 55,462 | 1,118 | ||||||||||||||
| 30 Year Ultra U.S. Treasury Bond Futures | Short | 33 | March 2019 | $ | (3,300 | ) | (5,302 | ) | (277 | ) | |||||||||||
| $ | 19,608 | ||||||||||||||||||||
Forward currency contracts
| Contract amount | Unrealized (depreciation) appreciation | ||||||||||
| Purchases (000) | Sales (000) | Counterparty | Settlement date | at 12/31/2018 (000) | |||||||
| USD25,523 | EUR22,400 | Citibank | 1/8/2019 | $ | (159 | ) | |||||
| USD12,784 | JPY1,445,000 | Bank of America, N.A. | 1/11/2019 | (412 | ) | ||||||
| USD60,130 | MXN1,220,000 | Citibank | 1/11/2019 | (1,853 | ) | ||||||
| KRW44,456,000 | USD39,480 | JPMorgan Chase | 1/14/2019 | 380 | |||||||
| USD40,106 | KRW44,456,000 | Morgan Stanley | 1/14/2019 | 247 | |||||||
| USD53,016 | EUR46,600 | HSBC Bank | 1/17/2019 | (456 | ) | ||||||
| USD117,705 | MXN2,400,000 | Morgan Stanley | 1/17/2019 | (4,095 | ) | ||||||
| JPY13,203,300 | USD117,462 | Goldman Sachs | 1/18/2019 | 3,183 | |||||||
| EUR34,400 | USD39,182 | Citibank | 1/18/2019 | 294 | |||||||
| CNH273,100 | USD39,613 | Citibank | 1/18/2019 | 149 | |||||||
| USD39,868 | CNH273,100 | HSBC Bank | 1/18/2019 | 107 | |||||||
| USD439 | EUR385 | HSBC Bank | 1/18/2019 | (3 | ) | ||||||
| USD39,223 | EUR34,400 | HSBC Bank | 1/18/2019 | (253 | ) | ||||||
| USD39,249 | JPY4,444,800 | Citibank | 1/18/2019 | (1,365 | ) | ||||||
| USD78,055 | JPY8,758,500 | HSBC Bank | 1/18/2019 | (1,976 | ) | ||||||
| USD5,622 | EUR4,925 | JPMorgan Chase | 1/24/2019 | (33 | ) | ||||||
| USD12,492 | MXN252,000 | Citibank | 1/24/2019 | (281 | ) | ||||||
| USD124,696 | EUR109,250 | HSBC Bank | 1/24/2019 | (743 | ) | ||||||
| USD64,722 | JPY7,300,000 | Morgan Stanley | 1/24/2019 | (2,013 | ) | ||||||
| USD30,599 | JPY3,430,000 | Goldman Sachs | 1/29/2019 | (770 | ) | ||||||
| USD54,526 | EUR46,000 | Bank of America, N.A. | 8/14/2019 | 781 | |||||||
| $ | (9,271 | ) | |||||||||
| American Funds Insurance Series | 93 |
Bond Fund
Swap contracts
Interest rate swaps
| Receive | Pay | Expiration date | Notional (000) | Value at 12/31/2018 (000) | Upfront payments/ receipts (000) | Unrealized (depreciation) appreciation at 12/31/2018 (000) | |||||||||||||||
| 1.6915% | 3-month USD-LIBOR | 6/3/2020 | $ | 1,600 | $ | (23 | ) | $— | $ | (23 | ) | ||||||||||
| 3-month USD-LIBOR | 1.975% | 4/27/2022 | 15,000 | 288 | — | 288 | |||||||||||||||
| U.S. EFFR | 2.4435% | 12/20/2023 | 5,508 | (42 | ) | — | (42 | ) | |||||||||||||
| U.S. EFFR | 2.45375% | 12/20/2023 | 49,336 | (403 | ) | — | (403 | ) | |||||||||||||
| U.S. EFFR | 2.4225% | 12/24/2023 | 22,594 | (151 | ) | — | (152 | ) | |||||||||||||
| 6-month EURIBOR | 0.9852% | 10/17/2024 | € | 25,000 | (1,119 | ) | — | (1,119 | ) | ||||||||||||
| 3-month USD-LIBOR | 2.438% | 11/19/2024 | $ | 750 | 6 | — | 6 | ||||||||||||||
| 3-month USD-LIBOR | 2.0475% | 3/23/2025 | 450 | 14 | — | 14 | |||||||||||||||
| 3-month USD-LIBOR | 2.3175% | 5/8/2025 | 1,500 | 25 | — | 25 | |||||||||||||||
| 3-month USD-LIBOR | 2.339% | 5/13/2025 | 375 | 6 | — | 6 | |||||||||||||||
| 3-month USD-LIBOR | 2.351% | 5/15/2025 | 590 | 9 | — | 9 | |||||||||||||||
| 3-month USD-LIBOR | 2.287% | 5/20/2025 | 500 | 9 | — | 9 | |||||||||||||||
| 3-month USD-LIBOR | 2.227% | 5/28/2025 | 260 | 6 | — | 6 | |||||||||||||||
| 3-month USD-LIBOR | 2.2125% | 5/29/2025 | 465 | 11 | — | 11 | |||||||||||||||
| 3-month USD-LIBOR | 2.451% | 6/5/2025 | 650 | 6 | — | 6 | |||||||||||||||
| 3-month USD-LIBOR | 2.46% | 6/10/2025 | 2,536 | 22 | — | 22 | |||||||||||||||
| 3-month USD-LIBOR | 2.455% | 6/24/2025 | 235 | 2 | — | 2 | |||||||||||||||
| 3-month USD-LIBOR | 2.397% | 7/13/2025 | 900 | 11 | — | 11 | |||||||||||||||
| 3-month USD-LIBOR | 2.535% | 7/15/2025 | 800 | 4 | — | 4 | |||||||||||||||
| 3-month USD-LIBOR | 2.4615% | 7/22/2025 | 1,300 | 12 | — | 12 | |||||||||||||||
| 3-month USD-LIBOR | 2.312% | 7/29/2025 | 1,000 | 18 | — | 18 | |||||||||||||||
| 3-month USD-LIBOR | 2.331% | 7/30/2025 | 435 | 7 | — | 7 | |||||||||||||||
| 3-month USD-LIBOR | 2.228% | 9/4/2025 | 12,000 | 285 | — | 285 | |||||||||||||||
| 6-month JPY-LIBOR | 0.0875% | 3/10/2026 | ¥ | 11,100,000 | (92 | ) | — | (92 | ) | ||||||||||||
| 3-month USD-LIBOR | 1.595% | 5/12/2026 | $ | 8,500 | 593 | — | 593 | ||||||||||||||
| 3-month USD-LIBOR | 1.592% | 5/12/2026 | 4,000 | 280 | — | 280 | |||||||||||||||
| 3.0865% | 3-month USD-LIBOR | 8/18/2034 | 2,250 | 80 | — | 80 | |||||||||||||||
| 2.844% | 3-month USD-LIBOR | 6/11/2035 | 3,250 | 11 | — | 11 | |||||||||||||||
| 2.773% | 3-month USD-LIBOR | 7/13/2035 | 500 | (3 | ) | — | (3 | ) | |||||||||||||
| 2.589% | 3-month USD-LIBOR | 9/4/2035 | 3,100 | (98 | ) | — | (98 | ) | |||||||||||||
| 2.377% | 3-month USD-LIBOR | 4/29/2045 | 1,910 | (169 | ) | — | (169 | ) | |||||||||||||
| 6-month JPY-LIBOR | 0.58295% | 3/23/2046 | ¥ | 2,000,000 | 518 | — | 518 | ||||||||||||||
| 0.64355% | 6-month JPY-LIBOR | 4/27/2046 | 2,000,000 | (237 | ) | — | (237 | ) | |||||||||||||
| 3-month USD-LIBOR | 2.1155% | 5/13/2046 | $ | 2,400 | 342 | — | 342 | ||||||||||||||
| $— | $ | 227 | |||||||||||||||||||
| 94 | American Funds Insurance Series |
Bond Fund
The following footnotes apply to either the individual securities noted or one or more of the securities aggregated and listed as a single line item.
| 1 | Step bond; coupon rate may change at a later date. |
| 2 | Acquired in a transaction exempt from registration under Rule 144A or Section 4(2) of the Securities Act of 1933. May be resold in the U.S. in transactions exempt from registration, normally to qualified institutional buyers. The total value of all such securities, including those in “Other securities,” was $1,180,984,000, which represented 11.98% of the net assets of the fund. |
| 3 | Coupon rate may change periodically. |
| 4 | All or a portion of this security was pledged as collateral. The total value of pledged collateral was $25,155,000, which represented .26% of the net assets of the fund. |
| 5 | Index-linked bond whose principal amount moves with a government price index. |
| 6 | Principal payments may be made periodically. Therefore, the effective maturity date may be earlier than the stated maturity date. |
| 7 | Purchased on a TBA basis. |
| 8 | Notional amount is calculated based on the number of contracts and notional contract size. |
| 9 | Value is calculated based on the notional amount and current market price. |
Key to abbreviations and symbols
CNH = Chinese yuan renminbi
EFFR = Effective Federal Funds Rate
EUR/€ = Euros
EURIBOR = Euro Interbank Offered Rate
G.O. = General Obligation
JPY/¥ = Japanese yen
KRW = South Korean won
LIBOR = London Interbank Offered Rate
MXN = Mexican pesos
TBA = To-be-announced
USD/$ = U.S. dollars
See notes to financial statements
| American Funds Insurance Series | 95 |
Summary investment portfolioDecember 31, 2018
| Bonds, notes & other debt instruments 92.18% | Principal amount (000) | Value (000) | ||||||
| Japanese yen 11.88% | ||||||||
| Japan, Series 395, 0.10% 2020 | ¥ | 5,380,000 | $ | 49,306 | ||||
| Japan, Series 19, 0.10% 20241 | 2,428,632 | 22,734 | ||||||
| Japan, Series 18, 0.10% 20241 | 1,958,856 | 18,301 | ||||||
| Japan, Series 21, 0.10% 20261 | 989,420 | 9,329 | ||||||
| Japan, Series 346, 0.10% 2027 | 3,125,000 | 28,990 | ||||||
| Japan, Series 116, 2.20% 2030 | 1,735,000 | 19,560 | ||||||
| Japan, Series 145, 1.70% 2033 | 2,210,000 | 24,308 | ||||||
| Japan 0.10%–2.30% 2020–20481 | 7,835,970 | 75,509 | ||||||
| 248,037 | ||||||||
| Euros 11.27% | ||||||||
| Canada 3.50% 2020 | € | 2,500 | 2,983 | |||||
| Germany (Federal Republic of) 0.50% 2027 | 12,360 | 14,640 | ||||||
| Germany (Federal Republic of) 0.50% 2028 | 11,000 | 12,976 | ||||||
| Germany (Federal Republic of) 1.25% 20482 | 8,750 | 11,016 | ||||||
| Germany (Federal Republic of) 1.75%–6.25% 2024–2046 | 9,670 | 14,363 | ||||||
| Ireland (Republic of) 0.90% 2028 | 8,090 | 9,275 | ||||||
| Italy (Republic of) 1.35% 2022 | 12,950 | 14,891 | ||||||
| Italy (Republic of) 2.05%–4.75% 2023–2027 | 12,730 | 15,089 | ||||||
| Romania 2.88%–3.88% 2029–2038 | 12,150 | 13,170 | ||||||
| Spain (Kingdom of) 1.45% 2027 | 18,230 | 21,194 | ||||||
| Spain (Kingdom of) 1.50% 2027 | 10,350 | 12,131 | ||||||
| Spain (Kingdom of) 2.70%–2.90% 2046–2048 | 7,145 | 8,415 | ||||||
| Other securities | 85,261 | |||||||
| 235,404 | ||||||||
| Mexican pesos 3.57% | ||||||||
| Petróleos Mexicanos 7.47% 2026 | MXN | 59,000 | 2,215 | |||||
| United Mexican States, Series M, 8.00% 2023 | 301,000 | 14,960 | ||||||
| United Mexican States, Series M, 5.75% 2026 | 611,500 | 26,316 | ||||||
| United Mexican States 6.50%–10.00% 2020–2042 | 618,500 | 30,947 | ||||||
| 74,438 | ||||||||
| Polish zloty 3.51% | ||||||||
| Poland (Republic of), Series 1021, 5.75% 2021 | PLN | 101,030 | 29,970 | |||||
| Poland (Republic of), Series 0922, 5.75% 2022 | 34,600 | 10,513 | ||||||
| Poland (Republic of), Series 0725, 3.25% 2025 | 34,750 | 9,721 | ||||||
| Poland (Republic of) 1.50%–5.25% 2020–2023 | 82,090 | 23,109 | ||||||
| 73,313 | ||||||||
| Danish kroner 3.15% | ||||||||
| Nykredit Realkredit AS, Series 01E, 1.50% 20373 | DKr | 107,828 | 16,675 | |||||
| Nykredit Realkredit AS, Series 01E, 1.50% 20403 | 284,656 | 43,453 | ||||||
| Nykredit Realkredit AS 2.00%–2.50% 2037–20473 | 35,015 | 5,605 | ||||||
| 65,733 | ||||||||
| Indian rupees 2.19% | ||||||||
| India (Republic of) 8.83% 2023 | INR | 884,200 | 13,507 | |||||
| India (Republic of) 6.79%–7.88% 2021–2030 | 2,013,270 | 28,514 | ||||||
| Other securities | 3,779 | |||||||
| 45,800 | ||||||||
| British pounds 2.08% | ||||||||
| United Kingdom 3.25% 2044 | £ | 6,500 | 10,597 | |||||
| United Kingdom 1.25%–4.25% 2022–2047 | 22,535 | 30,170 | ||||||
| Other securities | 2,609 | |||||||
| 43,376 | ||||||||
| 96 | American Funds Insurance Series |
Global Bond Fund
| Bonds, notes & other debt instruments | Principal amount (000) | Value (000) | ||||||
| Brazilian reais 1.58% | ||||||||
| Brazil (Federative Republic of) 0% 2021 | BRL | 14,000 | $ | 3,000 | ||||
| Brazil (Federative Republic of) 0% 2022 | 75,000 | 14,641 | ||||||
| Brazil (Federative Republic of) 10.00% 2025 | 57,090 | 15,395 | ||||||
| 33,036 | ||||||||
| Thai baht 1.30% | ||||||||
| Thailand (Kingdom of) 2.125% 2026 | THB | 317,750 | 9,552 | |||||
| Thailand (Kingdom of) 1.88%–3.85% 2022–2032 | 363,200 | 11,440 | ||||||
| Other securities | 6,237 | |||||||
| 27,229 | ||||||||
| Israeli shekels 0.88% | ||||||||
| Israel (State of) 5.50% 2042 | ILS | 29,300 | 10,802 | |||||
| Other securities | 7,518 | |||||||
| 18,320 | ||||||||
| Chilean pesos 0.73% | ||||||||
| Chile (Banco Central de) 4.00% 2023 | CLP | 6,765,000 | 9,796 | |||||
| Other securities | 5,378 | |||||||
| 15,174 | ||||||||
| Malaysian ringgits 0.72% | ||||||||
| Malaysia (Federation of), Series 0310, 4.498% 2030 | MYR | 42,250 | 10,327 | |||||
| Other securities | 4,802 | |||||||
| 15,129 | ||||||||
| Romanian leu 0.69% | ||||||||
| Romania 2.30%–5.95% 2020–2022 | RON | 59,100 | 14,495 | |||||
| Canadian dollars 0.48% | ||||||||
| Canada 1.00%–2.25% 2022–2025 | C$ | 10,500 | 7,808 | |||||
| Other securities | 2,231 | |||||||
| 10,039 | ||||||||
| U.S. dollars 43.81% | ||||||||
| Banco Nacional de Comercio Exterior SNC 3.80% 2026 (UST Yield Curve Rate T Note Constant Maturity 5 year + 3.00% on 8/11/2021)4,5 | $ | 880 | 843 | |||||
| Fannie Mae 3.50% 20493,6 | 15,500 | 15,503 | ||||||
| Fannie Mae 4.00% 20493,6 | 17,329 | 17,672 | ||||||
| Fannie Mae 4.50% 20493,6 | 13,050 | 13,522 | ||||||
| Fannie Mae 2.18%–4.00% 2022–20483 | 8,034 | 8,110 | ||||||
| Petrobras Global Finance Co. 5.30%–6.13% 2022–2025 | 2,307 | 2,256 | ||||||
| Petróleos Mexicanos 6.35%–6.50% 2027–2048 | 3,602 | 3,264 | ||||||
| Poland (Republic of) 3.25%–4.00% 2024–2026 | 5,570 | 5,508 | ||||||
| Romania 5.125% 20485 | 6,200 | 5,991 | ||||||
| U.S. Treasury 1.875% 20242 | 9,400 | 9,076 | ||||||
| U.S. Treasury 2.75% 2025 | 10,140 | 10,244 | ||||||
| U.S. Treasury 2.00% 20262 | 33,560 | 32,039 | ||||||
| U.S. Treasury 2.25% 2027 | 27,700 | 26,783 | ||||||
| U.S. Treasury 2.75% 20282 | 62,500 | 62,881 | ||||||
| U.S. Treasury 2.875% 2028 | 43,500 | 44,217 | ||||||
| U.S. Treasury 2.875% 2028 | 19,850 | 20,171 | ||||||
| U.S. Treasury 2.75% 20472 | 17,800 | 16,872 | ||||||
| U.S. Treasury 3.00% 20482 | 23,800 | 23,724 | ||||||
| U.S. Treasury 3.00% 2048 | 10,600 | 10,559 | ||||||
| U.S. Treasury 2.13%–2.88% 2020–2025 | 36,730 | 36,781 | ||||||
| U.S. Treasury Inflation-Protected Security 0.625% 20241 | 27,337 | 26,927 | ||||||
| U.S. Treasury Inflation-Protected Security 0.25% 20251 | 11,851 | 11,349 | ||||||
| U.S. Treasury Inflation-Protected Security 0.625% 20261 | 10,323 | 10,059 | ||||||
| American Funds Insurance Series | 97 |
Global Bond Fund
| Bonds, notes & other debt instruments (continued) | Principal amount (000) | Value (000) | ||||||
| U.S. dollars (continued) | ||||||||
| U.S. Treasury Inflation-Protected Securities 0.13%–2.38% 2023–20461,2 | $ | 39,818 | $ | 38,799 | ||||
| United Mexican States 4.15% 2027 | 1,910 | 1,850 | ||||||
| Other securities | 459,714 | |||||||
| 914,714 | ||||||||
| Other 4.34% | ||||||||
| Other securities | 90,558 | |||||||
| Total bonds, notes & other debt instruments (cost: $1,967,091,000) | 1,924,795 | |||||||
| Convertible bonds 0.00% | ||||||||
| U.S. dollars 0.00% | ||||||||
| Other securities | 100 | |||||||
| Total convertible bonds (cost: $110,000) | 100 | |||||||
| Convertible stocks 0.05% | Shares | |||||||
| U.S. dollars 0.05% | ||||||||
| Other securities | 1,033 | |||||||
| Total convertible stocks (cost: $816,000) | 1,033 | |||||||
| Common stocks 0.05% | ||||||||
| Swiss francs 0.01% | ||||||||
| Other securities | 283 | |||||||
| U.S. dollars 0.04% | ||||||||
| Other securities | 752 | |||||||
| Total common stocks (cost: $3,196,000) | 1,035 | |||||||
| Rights & warrants 0.00% | ||||||||
| U.S. dollars 0.00% | ||||||||
| Other securities | 41 | |||||||
| Total rights & warrants (cost: $11,000) | 41 | |||||||
| Short-term securities 9.42% | Principal amount (000) | |||||||
| Bank of New York Mellon Corp. 2.30% due 1/2/2019 | $ | 17,600 | 17,598 | |||||
| Canada Bill 2.32% due 1/3/2019 | 20,000 | 19,996 | ||||||
| Federal Home Loan Bank 2.29% due 1/10/2019 | 10,000 | 9,995 | ||||||
| Japanese Treasury Discount Bill (0.14)% due 5/20/2019 | ¥ | 11,900,000 | 108,639 | |||||
| Québec (Province of) 2.52% due 1/22/20195 | $ | 15,000 | 14,978 | |||||
| Other securities | 25,382 | |||||||
| Total short-term securities (cost: $195,904,000) | 196,588 | |||||||
| Total investment securities 101.70% (cost: $2,167,128,000) | 2,123,592 | |||||||
| Other assets less liabilities (1.70)% | (35,575 | ) | ||||||
| Net assets 100.00% | $ | 2,088,017 | ||||||
| 98 | American Funds Insurance Series |
Global Bond Fund
This summary investment portfolio is designed to streamline the report and help investors better focus on the fund’s principal holdings. See the inside back cover for details on how to obtain a complete schedule of portfolio holdings.
“Other securities” includes all issues that are not disclosed separately in the summary investment portfolio. “Other securities” includes securities which were valued under fair value procedures adopted by authority of the board of trustees. The total value of securities which were valued under fair value procedures was $2,483,000, which represented .12% of the net assets of the fund. This amount includes $283,000 related to certain securities trading outside the U.S. whose values were adjusted as a result of significant market movements following the close of local trading. “Other securities” also includes loan participations and assignments, which may be subject to legal or contractual restrictions on resale. The total value of all such loans was $3,706,000, which represented .18% of the net assets of the fund. Some securities in “Other securities” (with an aggregate value of $2,768,000, an aggregate cost of $2,711,000, and which represented .13% of the net assets of the fund) were acquired from 8/31/2015 to 11/16/2018 through private placement transactions exempt from registration under the Securities Act of 1933, which may subject them to legal or contractual restrictions on resale.
Futures contracts
| Contracts | Type | Number of contracts | Expiration | Notional amount (000) | 7 | Value at 12/31/2018 (000) | 8 | Unrealized (depreciation) appreciation at 12/31/2018 (000) | |||||||||||||
| 90 Day Euro Dollar Futures | Short | 224 | September 2019 | $ | (56,000 | ) | $ | (54,510 | ) | $ | (171 | ) | |||||||||
| 5 Year U.S. Treasury Note Futures | Long | 2,309 | April 2019 | 230,900 | 264,813 | 3,348 | |||||||||||||||
| 10 Year Euro-Bund Futures | Long | 149 | March 2019 | € | 14,900 | 27,919 | 193 | ||||||||||||||
| 10 Year Ultra U.S. Treasury Note Futures | Long | 232 | March 2019 | $ | 23,200 | 30,178 | 972 | ||||||||||||||
| 10 Year U.S. Treasury Note Futures | Long | 175 | March 2019 | 17,500 | 21,353 | 493 | |||||||||||||||
| 30 Year Euro-Buxl Futures | Long | 54 | March 2019 | € | 5,400 | 11,175 | 225 | ||||||||||||||
| 30 Year Ultra U.S. Treasury Bond Futures | Short | 94 | March 2019 | $ | (9,400 | ) | (15,102 | ) | (789 | ) | |||||||||||
| $ | 4,271 | ||||||||||||||||||||
Forward currency contracts
| Contract amount | Unrealized (depreciation) appreciation | ||||||||||
| Purchases (000) | Sales (000) | Counterparty | Settlement date | at 12/31/2018 (000) | |||||||
| USD1,415 | EUR1,235 | Morgan Stanley | 1/4/2019 | $ | (1 | ) | |||||
| GBP5,400 | USD6,935 | Citibank | 1/4/2019 | (51 | ) | ||||||
| USD5,236 | MYR22,000 | JPMorgan Chase | 1/4/2019 | (87 | ) | ||||||
| EUR23,161 | DKK172,900 | Morgan Stanley | 1/7/2019 | 3 | |||||||
| USD8,200 | CNH57,000 | Citibank | 1/7/2019 | (100 | ) | ||||||
| USD8,990 | ILS33,250 | Bank of America, N.A. | 1/8/2019 | 92 | |||||||
| EUR6,815 | USD7,765 | Citibank | 1/8/2019 | 48 | |||||||
| USD11,166 | EUR9,800 | Citibank | 1/8/2019 | (69 | ) | ||||||
| USD7,414 | THB244,600 | HSBC Bank | 1/8/2019 | (98 | ) | ||||||
| JPY1,402,472 | USD12,401 | Citibank | 1/9/2019 | 405 | |||||||
| JPY898,800 | USD7,932 | HSBC Bank | 1/9/2019 | 274 | |||||||
| JPY616,594 | EUR4,800 | HSBC Bank | 1/9/2019 | 126 | |||||||
| EUR10,070 | USD11,427 | Goldman Sachs | 1/9/2019 | 120 | |||||||
| GBP2,900 | USD3,707 | Goldman Sachs | 1/9/2019 | (9 | ) | ||||||
| NOK32,228 | DKK24,600 | Citibank | 1/9/2019 | (49 | ) | ||||||
| USD3,560 | JPY400,000 | Morgan Stanley | 1/9/2019 | (92 | ) | ||||||
| USD3,479 | JPY392,473 | JPMorgan Chase | 1/9/2019 | (105 | ) | ||||||
| USD3,933 | JPY445,000 | Bank of New York Mellon | 1/9/2019 | (131 | ) | ||||||
| USD8,751 | JPY988,000 | Bank of New York Mellon | 1/9/2019 | (270 | ) | ||||||
| USD8,438 | BRL32,900 | Citibank | 1/10/2019 | (44 | ) | ||||||
| USD7,107 | INR504,900 | Citibank | 1/10/2019 | (116 | ) | ||||||
| JPY652,169 | USD5,766 | JPMorgan Chase | 1/11/2019 | 190 | |||||||
| JPY652,169 | USD5,766 | Goldman Sachs | 1/11/2019 | 190 | |||||||
| USD5,171 | CAD6,810 | Bank of America, N.A. | 1/11/2019 | 181 | |||||||
| JPY429,000 | USD3,818 | HSBC Bank | 1/11/2019 | 100 | |||||||
| EUR4,100 | USD4,676 | Bank of America, N.A. | 1/11/2019 | 26 | |||||||
| American Funds Insurance Series | 99 |
Global Bond Fund
Forward currency contracts(continued)
| Contract amount | Unrealized (depreciation) appreciation | ||||||||||
| Purchases (000) | Sales (000) | Counterparty | Settlement date | at 12/31/2018 (000) | |||||||
| USD2,787 | ILS10,350 | Goldman Sachs | 1/11/2019 | $ | 17 | ||||||
| EUR3,810 | USD4,362 | Citibank | 1/11/2019 | 7 | |||||||
| USD1,439 | CNH10,000 | Bank of America, N.A. | 1/11/2019 | (17 | ) | ||||||
| USD5,584 | PLN21,020 | JPMorgan Chase | 1/11/2019 | (34 | ) | ||||||
| USD9,031 | EUR7,910 | HSBC Bank | 1/11/2019 | (40 | ) | ||||||
| NOK34,715 | USD4,070 | HSBC Bank | 1/11/2019 | (53 | ) | ||||||
| USD2,787 | JPY314,337 | JPMorgan Chase | 1/11/2019 | (84 | ) | ||||||
| USD6,138 | JPY693,000 | Morgan Stanley | 1/11/2019 | (191 | ) | ||||||
| USD6,420 | JPY726,000 | Goldman Sachs | 1/11/2019 | (210 | ) | ||||||
| USD11,983 | INR852,700 | HSBC Bank | 1/11/2019 | (215 | ) | ||||||
| USD7,733 | COP24,598,000 | Goldman Sachs | 1/14/2019 | 164 | |||||||
| EUR14,620 | USD16,744 | Citibank | 1/14/2019 | 27 | |||||||
| DKK49,300 | USD7,562 | Morgan Stanley | 1/14/2019 | 13 | |||||||
| COP24,598,000 | USD7,574 | Citibank | 1/14/2019 | (5 | ) | ||||||
| GBP3,000 | USD3,842 | Bank of America, N.A. | 1/14/2019 | (15 | ) | ||||||
| USD5,446 | EUR4,765 | JPMorgan Chase | 1/14/2019 | (20 | ) | ||||||
| USD7,641 | INR536,000 | Citibank | 1/14/2019 | (24 | ) | ||||||
| USD3,515 | MYR14,700 | JPMorgan Chase | 1/14/2019 | (42 | ) | ||||||
| USD7,492 | DKK49,300 | HSBC Bank | 1/14/2019 | (83 | ) | ||||||
| JPY925,000 | AUD11,424 | Morgan Stanley | 1/15/2019 | 401 | |||||||
| USD7,602 | CLP5,210,800 | Goldman Sachs | 1/15/2019 | 91 | |||||||
| USD2,613 | INR185,000 | Goldman Sachs | 1/15/2019 | (32 | ) | ||||||
| USD2,612 | INR185,000 | Citibank | 1/15/2019 | (34 | ) | ||||||
| CLP5,210,800 | USD7,816 | HSBC Bank | 1/15/2019 | (305 | ) | ||||||
| JPY2,838,652 | USD25,158 | Goldman Sachs | 1/17/2019 | 778 | |||||||
| JPY2,613,753 | USD23,167 | JPMorgan Chase | 1/17/2019 | 715 | |||||||
| EUR29,522 | USD33,592 | Goldman Sachs | 1/17/2019 | 283 | |||||||
| KRW10,400,000 | USD9,265 | JPMorgan Chase | 1/17/2019 | 61 | |||||||
| USD365 | JPY41,240 | Morgan Stanley | 1/17/2019 | (11 | ) | ||||||
| USD2,369 | THB77,700 | Bank of America, N.A. | 1/17/2019 | (18 | ) | ||||||
| USD9,204 | KRW10,400,000 | Morgan Stanley | 1/17/2019 | (122 | ) | ||||||
| USD23,182 | JPY2,613,753 | JPMorgan Chase | 1/17/2019 | (699 | ) | ||||||
| USD22,776 | AUD31,600 | JPMorgan Chase | 1/18/2019 | 510 | |||||||
| JPY1,061,774 | EUR8,280 | Goldman Sachs | 1/18/2019 | 200 | |||||||
| USD3,805 | AUD5,300 | JPMorgan Chase | 1/18/2019 | 71 | |||||||
| KRW8,289,700 | USD7,397 | HSBC Bank | 1/18/2019 | 37 | |||||||
| GBP2,890 | USD3,693 | Citibank | 1/18/2019 | (6 | ) | ||||||
| USD7,381 | KRW8,289,700 | Goldman Sachs | 1/18/2019 | (53 | ) | ||||||
| AUD31,600 | USD23,270 | Citibank | 1/18/2019 | (1,004 | ) | ||||||
| USD7,968 | ZAR114,700 | Citibank | 1/22/2019 | 18 | |||||||
| USD2,044 | BRL8,000 | JPMorgan Chase | 1/22/2019 | (18 | ) | ||||||
| USD4,171 | INR299,650 | Citibank | 1/22/2019 | (110 | ) | ||||||
| TRY13,100 | USD1,928 | Citibank | 1/24/2019 | 512 | |||||||
| GBP19,649 | USD24,901 | Citibank | 1/24/2019 | 175 | |||||||
| GBP6,123 | USD7,757 | HSBC Bank | 1/24/2019 | 57 | |||||||
| GBP4,430 | EUR4,917 | Bank of America, N.A. | 1/24/2019 | 8 | |||||||
| EUR13,105 | PLN56,400 | HSBC Bank | 1/24/2019 | (30 | ) | ||||||
| NOK37,200 | USD4,352 | Bank of New York Mellon | 1/24/2019 | (45 | ) | ||||||
| USD2,192 | TRY13,100 | Morgan Stanley | 1/24/2019 | (248 | ) | ||||||
| USD9,370 | AUD13,010 | UBS AG | 1/25/2019 | 202 | |||||||
| USD2,300 | INR163,000 | JPMorgan Chase | 1/25/2019 | (28 | ) | ||||||
| EUR12,479 | USD14,143 | HSBC Bank | 1/28/2019 | 190 | |||||||
| EUR6,600 | USD7,570 | HSBC Bank | 1/28/2019 | 11 | |||||||
| GBP2,580 | USD3,267 | HSBC Bank | 1/29/2019 | 27 | |||||||
| USD6,286 | CNH44,000 | JPMorgan Chase | 1/31/2019 | (119 | ) | ||||||
| JPY964,000 | USD8,549 | JPMorgan Chase | 2/13/2019 | 277 | |||||||
| USD5,553 | CNH38,600 | JPMorgan Chase | 2/28/2019 | (66 | ) | ||||||
| 100 | American Funds Insurance Series |
Global Bond Fund
| Contract amount | Unrealized (depreciation) appreciation | ||||||||||
| Purchases (000) | Sales (000) | Counterparty | Settlement date | at 12/31/2018 (000) | |||||||
| USD5,778 | BRL19,300 | Citibank | 3/11/2019 | $ | 824 | ||||||
| BRL19,300 | USD5,077 | JPMorgan Chase | 3/11/2019 | (123 | ) | ||||||
| USD16,793 | BRL56,500 | JPMorgan Chase | 3/15/2019 | 2,296 | |||||||
| BRL28,900 | USD7,207 | Citibank | 3/15/2019 | 208 | |||||||
| USD1,143 | EUR900 | JPMorgan Chase | 3/15/2019 | 105 | |||||||
| BRL27,600 | USD7,227 | JPMorgan Chase | 3/15/2019 | (145 | ) | ||||||
| USD3,620 | BRL14,200 | JPMorgan Chase | 3/18/2019 | (23 | ) | ||||||
| USD947 | EUR745 | Goldman Sachs | 4/12/2019 | 85 | |||||||
| USD4,015 | BRL15,125 | Morgan Stanley | 4/30/2019 | 148 | |||||||
| JPY4,675,000 | USD41,886 | JPMorgan Chase | 5/20/2019 | 1,270 | |||||||
| USD110,652 | JPY11,900,000 | Citibank | 5/20/2019 | 801 | |||||||
| JPY445,496 | USD3,988 | Citibank | 5/20/2019 | 124 | |||||||
| USD2,780 | BRL11,000 | Morgan Stanley | 12/16/2019 | 20 | |||||||
| USD10,781 | BRL43,200 | Citibank | 12/18/2019 | (58 | ) | ||||||
| USD2,365 | BRL9,500 | HSBC Bank | 12/20/2019 | (18 | ) | ||||||
| $ | 6,918 | ||||||||||
Swap contracts
Interest rate swaps
| Receive | Pay | Expiration date | Notional (000) | Value at 12/31/2018 (000) | Upfront payments/ receipts (000) | Unrealized (depreciation) appreciation at 12/31/2018 (000) | |||||||||||||||||
| U.S. EFFR | 2.521% | 5/1/2019 | $ | 2,284,000 | $ | (284 | ) | $ | — | $ | (284 | ) | |||||||||||
| (0.025)% | EONIA | 12/3/2021 | € | 48,000 | 152 | — | 152 | ||||||||||||||||
| (0.0385)% | EONIA | 12/4/2021 | 64,600 | 183 | — | 183 | |||||||||||||||||
| $ | — | $ | 51 | ||||||||||||||||||||
The following footnotes apply to either the individual securities noted or one or more of the securities aggregated and listed as a single line item.
| 1 | Index-linked bond whose principal amount moves with a government price index. |
| 2 | All or a portion of this security was pledged as collateral. The total value of pledged collateral was $4,216,000, which represented .20% of the net assets of the fund. |
| 3 | Principal payments may be made periodically. Therefore, the effective maturity date may be earlier than the stated maturity date. |
| 4 | Step bond; coupon rate may change at a later date. |
| 5 | Acquired in a transaction exempt from registration under Rule 144A or Section 4(2) of the Securities Act of 1933. May be resold in the U.S. in transactions exempt from registration, normally to qualified institutional buyers. The total value of all such securities, including those in “Other securities,” was $188,658,000, which represented 9.04% of the net assets of the fund. |
| 6 | Purchased on a TBA basis. |
| 7 | Notional amount is calculated based on the number of contracts and notional contract size. |
| 8 | Value is calculated based on the notional amount and current market price. |
| American Funds Insurance Series | 101 |
Global Bond Fund
Key to abbreviations and symbols
ADR = American Depositary Receipts
AUD/A$ = Australian dollars
BRL = Brazilian reais
CAD/C$ = Canadian dollars
CDI = CREST Depository Interest
CHF = Swiss francs
CLP = Chilean pesos
CNH = Chinese yuan renminbi
DKr = Danish kroner
EFFR = Effective Federal Funds Rate
EONIA = Euro Overnight Index Average
EUR/€ = Euros
EURIBOR = Euro Interbank Offered Rate
GBP/£ = British pounds
ILS = Israeli shekels
INR = Indian rupees
JPY/¥ = Japanese yen
KRW = South Korean won
LIBOR = London Interbank Offered Rate
MXN = Mexican pesos
MYR = Malaysian ringgits
NOK/NKr = Norwegian kroner
PEN = Peruvian nuevos soles
PLN = Polish zloty
TBA = To-be-announced
THB = Thai baht
USD/$ = U.S. dollars
ZAR = South African rand
See notes to financial statements
| 102 | American Funds Insurance Series |
Summary investment portfolioDecember 31, 2018
| Bonds, notes & other debt instruments 94.82% | Principal amount (000) | Value (000) | ||||||
| Corporate bonds & notes 94.56% | ||||||||
| Communication services 15.62% | ||||||||
| Cablevision Systems Corp. 6.75% 2021 | $ | 5,025 | $ | 5,163 | ||||
| CCO Holdings LLC and CCO Holdings Capital Corp. 5.75% 20261 | 6,450 | 6,337 | ||||||
| CCO Holdings LLC and CCO Holdings Capital Corp. 4.00%–5.88% 2023–20281 | 10,400 | 9,816 | ||||||
| CenturyLink, Inc. 6.75% 2023 | 7,100 | 6,860 | ||||||
| Clear Channel Worldwide Holdings, Inc. 7.625% 2020 | 18,500 | 18,107 | ||||||
| Frontier Communications Corp. 10.50% 2022 | 9,440 | 6,608 | ||||||
| Frontier Communications Corp. 11.00% 2025 | 16,975 | 10,651 | ||||||
| Frontier Communications Corp. 7.13%–9.25% 2019–20261 | 5,750 | 4,886 | ||||||
| Gogo Inc. 12.50% 20221 | 13,925 | 14,943 | ||||||
| iHeartCommunications, Inc. 9.00% 20192 | 1,025 | 692 | ||||||
| Intelsat Jackson Holding Co. 8.50% 20241 | 6,625 | 6,459 | ||||||
| Meredith Corp. 6.875% 20261 | 9,015 | 8,835 | ||||||
| Sprint Corp. 11.50% 2021 | 7,130 | 8,110 | ||||||
| Sprint Corp. 6.88%–8.75% 2021–2032 | 6,820 | 6,822 | ||||||
| Other securities | 73,784 | |||||||
| 188,073 | ||||||||
| Energy 14.89% | ||||||||
| Blackstone CQP Holdco LP 6.00% 20211,3 | 1,600 | 1,610 | ||||||
| Blackstone CQP Holdco LP 6.50% 20211,3 | 17,430 | 17,561 | ||||||
| Cheniere Energy Partners, LP 5.25% 2025 | 950 | 889 | ||||||
| Cheniere Energy, Inc. 5.88%–7.00% 2024–2025 | 3,175 | 3,262 | ||||||
| CONSOL Energy Inc. 5.875% 2022 | 9,824 | 9,456 | ||||||
| Teekay Corp. 8.50% 2020 | 10,418 | 9,988 | ||||||
| Other securities | 136,552 | |||||||
| 179,318 | ||||||||
| Health care 14.79% | ||||||||
| HCA Inc. 4.50%–7.50% 2020–2047 | 14,665 | 14,358 | ||||||
| Kinetic Concepts, Inc. 12.50% 20211 | 7,628 | 8,200 | ||||||
| Molina Healthcare, Inc. 5.375% 2022 | 11,060 | 10,714 | ||||||
| Molina Healthcare, Inc. 4.875% 20251 | 2,919 | 2,675 | ||||||
| Rotech Healthcare Inc., Term Loan, (3-month USD-LIBOR + 11.00%) 13.34% 2023(100% PIK)4,5,6,7,8,9 | 7,398 | 6,730 | ||||||
| Tenet Healthcare Corp. 4.375% 2021 | 5,755 | 5,597 | ||||||
| Tenet Healthcare Corp. 4.50%–8.13% 2020–2024 | 18,222 | 17,882 | ||||||
| Valeant Pharmaceuticals International, Inc. 5.875% 20231 | 10,610 | 9,854 | ||||||
| Valeant Pharmaceuticals International, Inc. 6.125% 20251 | 11,130 | 9,739 | ||||||
| Valeant Pharmaceuticals International, Inc. 9.25% 20261 | 6,210 | 6,226 | ||||||
| Valeant Pharmaceuticals International, Inc. 5.63%–9.00% 2021–20251 | 3,465 | 3,445 | ||||||
| Valeant Pharmaceuticals International, Inc., Term Loan B, (3-month USD-LIBOR + 3.00%) 5.379% 20254,5,6 | 1,612 | 1,548 | ||||||
| Other securities | 81,103 | |||||||
| 178,071 | ||||||||
| Materials 12.38% | ||||||||
| Cleveland-Cliffs Inc. 4.875% 20241 | 5,500 | 5,129 | ||||||
| Cleveland-Cliffs Inc. 5.75% 2025 | 13,250 | 11,958 | ||||||
| First Quantum Minerals Ltd. 7.50% 20251 | 10,200 | 8,453 | ||||||
| First Quantum Minerals Ltd. 6.50%–7.25% 2021–20261 | 15,470 | 13,639 | ||||||
| Freeport-McMoRan Inc. 3.55% 2022 | 5,315 | 5,043 | ||||||
| Platform Specialty Products Corp. 5.875% 20251 | 6,435 | 6,049 | ||||||
| Ryerson Inc. 11.00% 20221 | 7,186 | 7,258 | ||||||
| Other securities | 91,478 | |||||||
| 149,007 | ||||||||
| American Funds Insurance Series | 103 |
High-Income Bond Fund
| Bonds, notes & other debt instruments (continued) | Principal amount (000) | Value (000) | ||||||
| Corporate bonds & notes (continued) | ||||||||
| Industrials 9.44% | ||||||||
| Builders FirstSource, Inc. 5.625% 20241 | $ | 8,310 | $ | 7,739 | ||||
| DAE Aviation Holdings, Inc. 10.00% 20231 | 7,790 | 8,335 | ||||||
| Deck Chassis Acquisition Inc. 10.00% 20231 | 6,615 | 6,383 | ||||||
| Hertz Global Holdings Inc. 7.625% 20221 | 5,669 | 5,357 | ||||||
| Other securities | 85,897 | |||||||
| 113,711 | ||||||||
| Consumer discretionary 9.33% | ||||||||
| Cirsa Gaming Corporation SA 7.875% 20231 | 5,860 | 5,827 | ||||||
| Petsmart, Inc. 5.875% 20251 | 15,240 | 11,087 | ||||||
| Petsmart, Inc. 7.13%–8.88% 2023–20251 | 12,275 | 7,200 | ||||||
| Sally Holdings LLC and Sally Capital Inc. 5.625% 2025 | 6,555 | 6,055 | ||||||
| Six Flags Entertainment Corp. 4.875% 20241 | 5,475 | 5,174 | ||||||
| Sotheby’s 4.875% 20251 | 5,795 | 5,273 | ||||||
| Uber Technologies, Inc. 8.00% 20261 | 6,950 | 6,724 | ||||||
| Other securities | 64,953 | |||||||
| 112,293 | ||||||||
| Information technology 7.37% | ||||||||
| Almonde Inc., Term Loan, (3-month USD-LIBOR + 7.25%) 10.053% 20254,5,6 | 7,150 | 6,605 | ||||||
| Camelot Finance SA 7.875% 20241 | 7,405 | 7,200 | ||||||
| Genesys Telecommunications Laboratories, Inc. 10.00% 20241 | 4,895 | 5,140 | ||||||
| Infor Software 7.125% 20211,7 | 6,935 | 6,779 | ||||||
| Kronos Inc., Term Loan B, (3-month USD-LIBOR + 8.25%) 9.25% 20244,5,6 | 8,645 | 8,563 | ||||||
| Unisys Corp. 10.75% 20221 | 6,600 | 7,252 | ||||||
| Other securities | 47,146 | |||||||
| 88,685 | ||||||||
| Financials 3.48% | ||||||||
| Compass Diversified Holdings 8.00% 20261 | 5,710 | 5,664 | ||||||
| FS Energy and Power Fund 7.50% 20231 | 5,765 | 5,491 | ||||||
| HUB International Ltd. 7.00% 20261 | 6,155 | 5,601 | ||||||
| Other securities | 25,142 | |||||||
| 41,898 | ||||||||
| Utilities 3.00% | ||||||||
| Other securities | 36,139 | |||||||
| Consumer staples 2.17% | ||||||||
| B&G Foods, Inc. 5.25% 2025 | 5,758 | 5,377 | ||||||
| Other securities | 20,705 | |||||||
| 26,082 | ||||||||
| Real estate 2.09% | ||||||||
| Howard Hughes Corp. 5.375% 20251 | 6,520 | 6,161 | ||||||
| Other securities | 18,979 | |||||||
| 25,140 | ||||||||
| Total corporate bonds & notes | 1,138,417 | |||||||
| Other bonds & notes 0.26% | ||||||||
| Other securities | 3,083 | |||||||
| Total bonds, notes & other debt instruments (cost: $1,229,811,000) | 1,141,500 | |||||||
| 104 | American Funds Insurance Series |
High-Income Bond Fund
| Convertible bonds 0.45% | Principal amount (000) | Value (000) | ||||||
| Communication services 0.23% | ||||||||
| Gogo Inc., convertible notes, 6.00% 20221 | $ | 2,140 | $ | 1,958 | ||||
| Other securities | 818 | |||||||
| 2,776 | ||||||||
| Other 0.22% | ||||||||
| Other securities | 2,662 | |||||||
| Total convertible bonds (cost: $6,098,000) | 5,438 | |||||||
| Convertible stocks 0.54% | Shares | |||||||
| Industrials 0.49% | ||||||||
| Associated Materials, LLC, 14.00% convertible preferred 20208,9 | 4,850 | 5,892 | ||||||
| Utilities 0.05% | ||||||||
| Other securities | 629 | |||||||
| Total convertible stocks (cost: $5,288,000) | 6,521 | |||||||
| Common stocks 1.03% | ||||||||
| Communication services 0.01% | ||||||||
| Frontier Communications Corp. | 13,333 | 32 | ||||||
| Other securities | 86 | |||||||
| 118 | ||||||||
| Other 1.02% | ||||||||
| Other securities | 12,265 | |||||||
| Total common stocks (cost: $16,871,000) | 12,383 | |||||||
| Rights & warrants 0.02% | ||||||||
| Energy 0.02% | ||||||||
| Other securities | 256 | |||||||
| Total rights & warrants (cost: $71,000) | 256 | |||||||
| Short-term securities 1.40% | Principal amount (000) | |||||||
| ADP Tax Services, Inc. 2.38% due 1/2/20191 | $ | 6,800 | 6,799 | |||||
| Apple Inc. 2.33% due 1/9/20191 | 10,000 | 9,994 | ||||||
| Total short-term securities (cost: $16,795,000) | 16,793 | |||||||
| Total investment securities 98.26% (cost: $1,274,934,000) | 1,182,891 | |||||||
| Other assets less liabilities 1.74% | 21,008 | |||||||
| Net assets 100.00% | $ | 1,203,899 | ||||||
This summary investment portfolio is designed to streamline the report and help investors better focus on the fund’s principal holdings. See the inside back cover for details on how to obtain a complete schedule of portfolio holdings.
“Other securities” includes all issues that are not disclosed separately in the summary investment portfolio. “Other securities” also includes securities which were pledged as collateral. The total value of pledged collateral was $1,233,000, which represented 0.10% of the net assets of the fund.
| American Funds Insurance Series | 105 |
High-Income Bond Fund
Swap contracts
Interest rate swaps
| Receive | Pay | Expiration date | Notional (000) | Value at 12/31/2018 (000) | Upfront payments/ receipts (000) | Unrealized (depreciation) appreciation at 12/31/2018 (000) | ||||||||||||
| 3-month USD-LIBOR | 2.772% | 2/28/2025 | $7,200 | $ (71) | $ | — | $ | (71 | ) | |||||||||
| 3-month USD-LIBOR | 2.2825% | 4/13/2027 | 5,300 | 149 | — | 149 | ||||||||||||
| 2.2865% | 3-month USD-LIBOR | 10/2/2027 | 10,100 | (309) | — | (309 | ) | |||||||||||
| 3-month USD-LIBOR | 2.6475% | 1/25/2028 | 2,500 | 7 | — | 7 | ||||||||||||
| $ | — | $ | (224 | ) | ||||||||||||||
Credit default swaps
Centrally cleared credit default swaps on credit indices — buy protection
| Receive | Pay/ Payment frequency | Expiration date | Notional (000) | Value at 12/31/2018 (000) | Upfront payments (000) | Unrealized appreciation at 12/31/2018 (000) | |||||||||||
| CDX.NA.HY.31 | 5.00%/Quarterly | 12/20/2023 | $24,200 | $(482) | $ | (1,706) | $ | 1,224 | |||||||||
| CDX.NA.IG.31 | 1.00%/Quarterly | 12/20/2023 | 34,525 | (192) | (512) | 320 | |||||||||||
| $ | (2,218) | $ | 1,544 | ||||||||||||||
The following footnotes apply to either the individual securities noted or one or more of the securities aggregated and listed as a single line item.
| 1 | Acquired in a transaction exempt from registration under Rule 144A or Section 4(2) of the Securities Act of 1933. May be resold in the U.S. in transactions exempt from registration, normally to qualified institutional buyers. The total value of all such securities, including those in “Other securities,” was $681,560,000, which represented 56.61% of the net assets of the fund. |
| 2 | Scheduled interest and/or principal payment was not received. |
| 3 | Acquired through a private placement transaction exempt from registration under the Securities Act of 1933. May be subject to legal or contractual restrictions on resale. Further details on these holdings appear below. |
| 4 | Loan participations and assignments; may be subject to legal or contractual restrictions on resale. The total value of all such loans, including those in “Other securities,” was $76,517,000, which represented 6.36% of the net assets of the fund. |
| 5 | Principal payments may be made periodically. Therefore, the effective maturity date may be earlier than the stated maturity date. |
| 6 | Coupon rate may change periodically. |
| 7 | Payment in kind; the issuer has the option of paying additional securities in lieu of cash. Most recent payment was 100% cash unless otherwise noted. |
| 8 | Valued under fair value procedures adopted by authority of the board of trustees. The total value of all such securities, including those in “Other securities,” was $30,796,000, which represented 2.56% of the net assets of the fund. This amount includes $3,926,000 related to certain securities trading outside the U.S. whose values were adjusted as a result of significant market movements following the close of local trading. |
| 9 | Value determined using significant unobservable inputs. |
| Private placement securities | Acquisition date(s) | Cost (000) | Value (000) | Percent of net assets | ||||||||||
| Blackstone CQP Holdco LP 6.50% 2021 | 3/6/2017-2/5/2018 | $ | 17,430 | $ | 17,561 | 1.46 | % | |||||||
| Blackstone CQP Holdco LP 6.00% 2021 | 8/9/2017 | 1,600 | 1,610 | .13 | ||||||||||
| Other securities | 12/13/2012-11/16/2018 | 5,683 | 3,671 | .31 | ||||||||||
| Total private placement securities | $ | 24,713 | $ | 22,842 | 1.90 | % | ||||||||
Key to abbreviations and symbol
LIBOR = London Interbank Offered Rate
USD/$ = U.S. dollars
See notes to financial statements
| 106 | American Funds Insurance Series |
Summary investment portfolioDecember 31, 2018
| Bonds, notes & other debt instruments 95.20% | Principal amount (000) | Value (000) | ||||||
| Mortgage-backed obligations 71.87% | ||||||||
| Federal agency mortgage-backed obligations 68.28% | ||||||||
| Fannie Mae 4.00% 20471 | $ | 7,103 | $ | 7,249 | ||||
| Fannie Mae 4.00% 20471 | 4,751 | 4,848 | ||||||
| Fannie Mae 4.50% 20481 | 14,594 | 15,132 | ||||||
| Fannie Mae 4.50% 20481 | 7,755 | 8,044 | ||||||
| Fannie Mae 4.50% 20481 | 4,339 | 4,501 | ||||||
| Fannie Mae 4.50% 20481,2 | 1,663 | 1,724 | ||||||
| Fannie Mae 3.50% 20491,2 | 3,200 | 3,201 | ||||||
| Fannie Mae 4.00% 20491,2 | 5,163 | 5,265 | ||||||
| Fannie Mae 4.00%–5.00% 2036–20481 | 2,455 | 2,517 | ||||||
| Freddie Mac 4.00% 20361 | 5,020 | 5,180 | ||||||
| Freddie Mac 3.203% 20451,3 | 2,217 | 2,234 | ||||||
| Freddie Mac 3.00% 20461 | 7,155 | 7,036 | ||||||
| Freddie Mac 4.00% 20481 | 1,857 | 1,895 | ||||||
| Freddie Mac 4.00% 20481 | 1,842 | 1,880 | ||||||
| Freddie Mac 2.60%–5.00% 2020–20361 | 5,086 | 5,209 | ||||||
| Freddie Mac, Series K031, Class A2, Multi Family, 3.30% 20231 | 4,722 | 4,795 | ||||||
| Freddie Mac Seasoned Credit Risk Transfer Trust, Series 2017-2, Class HA, 2.50% 20561 | 1,671 | 1,642 | ||||||
| Freddie Mac Seasoned Credit Risk Transfer Trust, Series 2017-2, Class MA, 3.00% 20561 | 1,588 | 1,533 | ||||||
| Freddie Mac Seasoned Credit Risk Transfer Trust, Series 2017-4, Class HT, 2.50% 20571,3 | 12,143 | 11,833 | ||||||
| Freddie Mac Seasoned Credit Risk Transfer Trust, Series 2018-2, Class MT, 3.50% 20571 | 10,978 | 10,862 | ||||||
| Freddie Mac Seasoned Credit Risk Transfer Trust, Series 2017-4, Class MT, 3.50% 20571 | 7,496 | 7,448 | ||||||
| Freddie Mac Seasoned Loan Structured Transaction, Series 2018-2, Class A1, 3.50% 20281,3 | 7,830 | 7,698 | ||||||
| Freddie Mac Seasoned Loan Structured Transaction, Series 2018-1, Class A1, 3.50% 20281 | 2,101 | 2,093 | ||||||
| Government National Mortgage Assn. 5.50% 20401 | 1,797 | 1,900 | ||||||
| Government National Mortgage Assn. 3.50% 20431 | 2,015 | 2,042 | ||||||
| Government National Mortgage Assn. 4.25% 20441 | 1,724 | 1,796 | ||||||
| Government National Mortgage Assn. 4.00% 20491,2 | 6,200 | 6,350 | ||||||
| Government National Mortgage Assn. 4.50% 20491,2 | 34,750 | 35,964 | ||||||
| Government National Mortgage Assn. 5.00% 20491,2 | 2,627 | 2,734 | ||||||
| Government National Mortgage Assn. 3.50%–6.50% 2034–20661,2 | 17,870 | 18,265 | ||||||
| Vendee Mortgage Trust, Series 2011-2, Class V, 3.75% 20281 | 4,166 | 4,131 | ||||||
| Vendee Mortgage Trust, Series 2010-1, Class DA, 4.25% 20351 | 478 | 484 | ||||||
| Other securities | 1,324 | |||||||
| 198,809 | ||||||||
| Collateralized mortgage-backed obligations (privately originated) 3.59% | ||||||||
| Finance of America Structured Securities Trust, Series 2018-HB1, Class A, 3.375% 20281,3,4 | 2,287 | 2,293 | ||||||
| Other securities | 8,168 | |||||||
| 10,461 | ||||||||
| Total mortgage-backed obligations | 209,270 | |||||||
| U.S. Treasury bonds & notes 10.99% | ||||||||
| U.S. Treasury 6.63% | ||||||||
| U.S. Treasury 2.00% 2022 | 2,400 | 2,359 | ||||||
| U.S. Treasury 1.75% 2023 | 3,500 | 3,393 | ||||||
| U.S. Treasury 2.875% 2023 | 4,350 | 4,423 | ||||||
| U.S. Treasury 2.50% 2024 | 2,500 | 2,496 | ||||||
| U.S. Treasury 3.00% 20485 | 5,000 | 4,981 | ||||||
| U.S. Treasury 1.50%–2.75% 2020–2023 | 1,668 | 1,650 | ||||||
| 19,302 | ||||||||
| American Funds Insurance Series | 107 |
Mortgage Fund
| Bonds, notes & other debt instruments (continued) | Principal amount (000) | Value (000) | ||||||
| U.S. Treasury bonds & notes (continued) | ||||||||
| U.S. Treasury inflation-protected securities 4.36% | ||||||||
| U.S. Treasury Inflation-Protected Security 0.625% 20236 | $ | 6,108 | $ | 6,013 | ||||
| U.S. Treasury Inflation-Protected Security 2.125% 20416 | 127 | 150 | ||||||
| U.S. Treasury Inflation-Protected Security 0.75% 20425,6 | 7,201 | 6,547 | ||||||
| 12,710 | ||||||||
| Total U.S. Treasury bonds & notes | 32,012 | |||||||
| Federal agency bonds & notes 6.35% | ||||||||
| Fannie Mae 2.00% 2022 | 5,800 | 5,716 | ||||||
| Federal Home Loan Bank 1.38%–1.88% 2021 | 13,000 | 12,767 | ||||||
| 18,483 | ||||||||
| Asset-backed obligations 5.96% | ||||||||
| Hertz Vehicle Financing LLC, Rental Car Asset-Backed Notes, Series 2015-1, Class A, 2.73% 20211,4 | 1,823 | 1,808 | ||||||
| SLM Private Credit Student Loan Trust, Series 2010-1, Class A, (1-month USD-LIBOR + 0.40%) 2.906% 20251,3 | 2,629 | 2,573 | ||||||
| Other securities | 12,959 | |||||||
| 17,340 | ||||||||
| Corporate bonds & notes 0.03% | ||||||||
| Financials 0.03% | ||||||||
| Other securities | 80 | |||||||
| Total bonds, notes & other debt instruments (cost: $278,182,000) | 277,185 | |||||||
| Short-term securities 22.86% | ||||||||
| ADP Tax Services, Inc. 2.38% due 1/2/20194 | 8,700 | 8,699 | ||||||
| Emerson Electric Co. 2.37% due 1/4/20194 | 3,300 | 3,299 | ||||||
| ExxonMobil Corp. 2.43% due 1/10/2019 | 5,000 | 4,997 | ||||||
| Federal Home Loan Bank 2.23%–2.27% due 1/4/2019–1/11/2019 | 15,000 | 14,993 | ||||||
| Kimberly-Clark Corp. 2.47% due 1/11/20194 | 2,100 | 2,098 | ||||||
| Mizuho Bank, Ltd. 2.42% due 1/4/20194 | 10,000 | 9,997 | ||||||
| National Rural Utilities Cooperative Finance Corp. 2.50% due 1/8/2019 | 11,000 | 10,994 | ||||||
| Paccar Financial Corp. 2.50% due 1/29/2019 | 2,600 | 2,595 | ||||||
| Pfizer Inc. 2.43% due 1/10/20194 | 5,100 | 5,097 | ||||||
| Québec (Province of) 2.53% due 1/22/20194 | 3,800 | 3,794 | ||||||
| Total short-term securities (cost: $66,566,000) | 66,563 | |||||||
| Total investment securities 118.06% (cost: $344,748,000) | 343,748 | |||||||
| Other assets less liabilities (18.06)% | (52,573 | ) | ||||||
| Net assets 100.00% | $ | 291,175 | ||||||
This summary investment portfolio is designed to streamline the report and help investors better focus on the fund’s principal holdings. See the inside back cover for details on how to obtain a complete schedule of portfolio holdings.
“Other securities” includes all issues that are not disclosed separately in the summary investment portfolio. “Other securities” includes securities which were valued under fair value procedures adopted by authority of the board of trustees. The total value of securities which were valued under fair value procedures was $2,863,000, which represented .98% of the net assets of the fund.
| 108 | American Funds Insurance Series |
Mortgage Fund
Futures contracts
| Contracts | Type | Number of contracts | Expiration | Notional amount (000) | 7 | Value at 12/31/2018 (000) | 8 | Unrealized appreciation at 12/31/2018 (000) | |||||||
| 90 Day Euro Dollar Futures | Long | 108 | December 2019 | $27,000 | $26,285 | $ | 163 | ||||||||
| 2 Year U.S. Treasury Note Futures | Long | 374 | April 2019 | 74,800 | 79,405 | 188 | |||||||||
| 5 Year U.S. Treasury Note Futures | Long | 464 | April 2019 | 46,400 | 53,215 | 741 | |||||||||
| 10 Year Ultra U.S. Treasury Note Futures | Long | 102 | March 2019 | 10,200 | 13,268 | 427 | |||||||||
| 20 Year U.S. Treasury Bond Futures | Long | 56 | March 2019 | 5,600 | 8,176 | 338 | |||||||||
| 30 Year Ultra U.S. Treasury Bond Futures | Long | 5 | March 2019 | 500 | 803 | 42 | |||||||||
| $ | 1,899 | ||||||||||||||
Swap contracts
Interest rate swaps
| Receive | Pay | Expiration date | Notional (000) | Value at 12/31/2018 (000) | Upfront payments/ receipts (000) | Unrealized appreciation (depreciation) at 12/31/2018 (000) | ||||||||||||
| 2.5215% | U.S. EFFR | 8/29/2020 | $16,490 | $ 47 | $ | — | $ | 47 | ||||||||||
| 3-month USD-LIBOR | 2.806% | 8/29/2020 | 300 | (1) | — | (1 | ) | |||||||||||
| 2.622% | U.S. EFFR | 9/14/2020 | 7,500 | 34 | — | 34 | ||||||||||||
| 2.729% | U.S. EFFR | 10/22/2020 | 22,900 | 152 | — | 152 | ||||||||||||
| 2.4825% | U.S. EFFR | 12/26/2020 | 41,000 | 104 | — | 104 | ||||||||||||
| 3-month USD-LIBOR | 1.217% | 9/22/2021 | 11,500 | 421 | — | 421 | ||||||||||||
| 3-month USD-LIBOR | 1.225% | 9/22/2021 | 11,500 | 418 | — | 418 | ||||||||||||
| 3-month USD-LIBOR | 1.2796% | 10/11/2021 | 14,500 | 513 | — | 513 | ||||||||||||
| 2.0135% | 3-month USD-LIBOR | 10/20/2021 | 30,000 | (473) | — | (473 | ) | |||||||||||
| 2.012% | 3-month USD-LIBOR | 10/4/2022 | 9,000 | (182) | — | (182 | ) | |||||||||||
| 2.00% | 3-month USD-LIBOR | 10/5/2022 | 41,500 | (857) | — | (856 | ) | |||||||||||
| 2.1045% | 3-month USD-LIBOR | 10/31/2022 | 4,000 | (68) | — | (68 | ) | |||||||||||
| 3-month USD-LIBOR | 2.2835% | 1/5/2023 | 36,000 | 398 | — | 398 | ||||||||||||
| 3-month USD-LIBOR | 2.24% | 12/5/2026 | 10,500 | 310 | — | 310 | ||||||||||||
| 3-month USD-LIBOR | 2.27% | 12/5/2026 | 8,500 | 232 | — | 232 | ||||||||||||
| 3-month USD-LIBOR | 3.206% | 7/31/2044 | 1,000 | (69) | — | (69 | ) | |||||||||||
| 3-month USD-LIBOR | 3.238% | 8/8/2044 | 2,000 | (150) | — | (150 | ) | |||||||||||
| 3-month USD-LIBOR | 3.2265% | 9/25/2044 | 3,000 | (219) | — | (219 | ) | |||||||||||
| U.S. EFFR | 2.145% | 11/9/2047 | 2,200 | 167 | — | 167 | ||||||||||||
| U.S. EFFR | 2.153% | 11/10/2047 | 2,200 | 163 | — | 163 | ||||||||||||
| U.S. EFFR | 2.155% | 11/10/2047 | 1,280 | 95 | — | 95 | ||||||||||||
| U.S. EFFR | 2.17% | 11/13/2047 | 2,320 | 164 | — | 164 | ||||||||||||
| U.S. EFFR | 2.5635% | 2/12/2048 | 4,528 | (49) | — | (49 | ) | |||||||||||
| 2.98% | 3-month USD-LIBOR | 3/15/2048 | 300 | 9 | — | 9 | ||||||||||||
| 2.9625% | 3-month USD-LIBOR | 3/15/2048 | 300 | 8 | — | 8 | ||||||||||||
| U.S. EFFR | 2.4615% | 3/15/2048 | 300 | 3 | — | 3 | ||||||||||||
| U.S. EFFR | 2.485% | 3/15/2048 | 300 | 2 | — | 2 | ||||||||||||
| U.S. EFFR | 2.425% | 3/16/2048 | 600 | 11 | — | 11 | ||||||||||||
| 2.917% | 3-month USD-LIBOR | 3/16/2048 | 600 | 10 | — | 10 | ||||||||||||
| $ | — | $ | 1,194 | |||||||||||||||
| American Funds Insurance Series | 109 |
Mortgage Fund
The following footnotes apply to either the individual securities noted or one or more of the securities aggregated and listed as a single line item.
| 1 | Principal payments may be made periodically. Therefore, the effective maturity date may be earlier than the stated maturity date. |
| 2 | Purchased on a TBA basis. |
| 3 | Coupon rate may change periodically. |
| 4 | Acquired in a transaction exempt from registration under Rule 144A or Section 4(2) of the Securities Act of 1933. May be resold in the U.S. in transactions exempt from registration, normally to qualified institutional buyers. The total value of all such securities, including those in “Other securities,” was $52,359,000, which represented 17.98% of the net assets of the fund. |
| 5 | All or a portion of this security was pledged as collateral. The total value of pledged collateral was $2,758,000, which represented .95% of the net assets of the fund. |
| 6 | Index-linked bond whose principal amount moves with a government price index. |
| 7 | Notional amount is calculated based on the number of contracts and notional contract size. |
| 8 | Value is calculated based on the notional amount and current market price. |
Key to abbreviations and symbol
EFFR = Effective Federal Funds Rate
LIBOR = London Interbank Offered Rate
TBA = To-be-announced
USD/$ = U.S. dollars
See notes to financial statements
| 110 | American Funds Insurance Series |
Investment portfolioDecember 31, 2018
| Short-term securities 100.11% | Principal amount (000) | Value (000) | ||||||
| Commercial paper 69.84% | ||||||||
| 3M Co. 2.40% due 1/7/20191 | $ | 10,000 | $ | 9,996 | ||||
| Alberta (Province of) 2.48% due 1/22/20191 | 10,000 | 9,985 | ||||||
| Apple Inc. 2.45% due 2/5/20191 | 10,000 | 9,975 | ||||||
| Bank of New York Mellon Corp. 2.34% due 1/22/2019 | 8,000 | 7,988 | ||||||
| BASF SE 2.56% due 2/1/20191 | 8,750 | 8,730 | ||||||
| CHARTA, LLC 2.85% due 3/26/20191 | 8,022 | 7,968 | ||||||
| Coca-Cola Co. 2.30% due 1/4/20191 | 10,000 | 9,997 | ||||||
| Emerson Electric Co. 2.52% due 1/17/20191 | 10,000 | 9,989 | ||||||
| IBM Credit LLC 2.47% due 1/22/20191 | 10,000 | 9,985 | ||||||
| Intel Corp. 2.40% due 1/10/20191 | 7,000 | 6,995 | ||||||
| John Deere Capital Corp. 2.40% due 1/16/20191 | 10,000 | 9,989 | ||||||
| KfW 2.46% due 1/18/20191 | 8,400 | 8,390 | ||||||
| Merck & Co. Inc. 2.50% due 2/27/20191 | 10,000 | 9,960 | ||||||
| Mizuho Bank, Ltd. 2.48% due 1/15/20191 | 10,000 | 9,990 | ||||||
| National Australia Bank Ltd. 2.65% due 2/25/20191 | 10,000 | 9,959 | ||||||
| National Rural Utilities Cooperative Finance Corp. 2.40% due 1/4/2019 | 6,000 | 5,998 | ||||||
| Nordea Bank AB 2.77% due 3/18/20191 | 10,000 | 9,942 | ||||||
| Paccar Financial Corp. 2.39% due 1/2/2019 | 8,000 | 7,999 | ||||||
| Pfizer Inc. 2.28% due 1/14/20191 | 7,400 | 7,393 | ||||||
| Procter & Gamble Co. 2.30% due 1/14/20191 | 10,000 | 9,991 | ||||||
| Siemens Capital Corp. 2.50% due 1/16/20191 | 4,700 | 4,695 | ||||||
| Simon Property Group, LP 2.51% due 1/14/20191 | 8,100 | 8,092 | ||||||
| United Overseas Bank Ltd. 2.55% due 1/8/20191 | 5,000 | 4,997 | ||||||
| United Parcel Service Inc. 2.34% due 1/22/20191 | 5,000 | 4,993 | ||||||
| Wal-Mart Stores, Inc. 2.37% due 1/7/20191 | 10,000 | 9,995 | ||||||
| 213,991 | ||||||||
| U.S. Treasury bonds & notes 24.41% | ||||||||
| U.S. Treasury Bills 2.23%–2.38% due 1/8/2019–2/19/2019 | 74,900 | 74,797 | ||||||
| Federal agency discount notes 5.86% | ||||||||
| Fannie Mae 2.29% due 1/23/2019 | 3,000 | 2,996 | ||||||
| Federal Home Loan Bank 2.38% due 2/8/2019 | 15,000 | 14,962 | ||||||
| 17,958 | ||||||||
| Total short-term securities (cost: $306,754,000) | 306,746 | |||||||
| Total investment securities 100.11% (cost: $306,754,000) | 306,746 | |||||||
| Other assets less liabilities (0.11)% | (342 | ) | ||||||
| Net assets 100.00% | $ | 306,404 | ||||||
| 1 | Acquired in a transaction exempt from registration under Rule 144A or Section 4(2) of the Securities Act of 1933. May be resold in the U.S. in transactions exempt from registration, normally to qualified institutional buyers. The total value of all such securities was $192,006,000, which represented 62.66% of the net assets of the fund. |
See notes to financial statements
| American Funds Insurance Series | 111 |
U.S. Government/AAA-Rated Securities Fund
Summary investment portfolioDecember 31, 2018
| Bonds, notes & other debt instruments 97.30% | Principal amount (000) | Value (000) | ||||||
| U.S. Treasury bonds & notes 47.72% | ||||||||
| U.S. Treasury 39.27% | ||||||||
| U.S. Treasury 2.25% 2020 | $ | 29,900 | $ | 29,789 | ||||
| U.S. Treasury 2.50% 2020 | 78,000 | 77,950 | ||||||
| U.S. Treasury 1.125% 2021 | 31,950 | 30,853 | ||||||
| U.S. Treasury 1.75% 20211 | 33,540 | 32,877 | ||||||
| U.S. Treasury 2.00% 2021 | 46,300 | 45,692 | ||||||
| U.S. Treasury 2.125% 2021 | 23,450 | 23,241 | ||||||
| U.S. Treasury 2.25% 2021 | 23,580 | 23,459 | ||||||
| U.S. Treasury 1.75% 2022 | 174,300 | 170,261 | ||||||
| U.S. Treasury 1.875% 2022 | 63,000 | 61,823 | ||||||
| U.S. Treasury 1.875% 2022 | 25,000 | 24,496 | ||||||
| U.S. Treasury 2.00% 2022 | 69,500 | 68,300 | ||||||
| U.S. Treasury 2.125% 20231 | 64,095 | 62,954 | ||||||
| U.S. Treasury 2.50% 2023 | 49,894 | 49,910 | ||||||
| U.S. Treasury 2.625% 2023 | 31,000 | 31,170 | ||||||
| U.S. Treasury 2.875% 2023 | 43,000 | 43,721 | ||||||
| U.S. Treasury 2.875% 2023 | 22,500 | 22,896 | ||||||
| U.S. Treasury 2.125% 2024 | 55,975 | 54,713 | ||||||
| U.S. Treasury 2.50% 2024 | 44,000 | 43,931 | ||||||
| U.S. Treasury 2.75% 2025 | 38,000 | 38,392 | ||||||
| U.S. Treasury 2.875% 2025 | 25,000 | 25,434 | ||||||
| U.S. Treasury 1.38%–2.88% 2020–2028 | 167,015 | 165,047 | ||||||
| 1,126,909 | ||||||||
| U.S. Treasury inflation-protected securities 8.45% | ||||||||
| U.S. Treasury Inflation-Protected Security 0.625% 20232 | 36,140 | 35,576 | ||||||
| U.S. Treasury Inflation-Protected Security 0.75% 20282 | 39,288 | 38,480 | ||||||
| U.S. Treasury Inflation-Protected Security 1.375% 20441,2 | 46,878 | 48,537 | ||||||
| U.S. Treasury Inflation-Protected Security 1.00% 20481,2 | 43,513 | 33,238 | ||||||
| U.S. Treasury Inflation-Protected Securities 0.14%–2.13% 2022–20471,2 | 92,250 | 86,670 | ||||||
| 242,501 | ||||||||
| Total U.S. Treasury bonds & notes | 1,369,410 | |||||||
| Mortgage-backed obligations 28.63% | ||||||||
| Federal agency mortgage-backed obligations 28.63% | ||||||||
| Fannie Mae 4.00% 20343,4 | 40,000 | 40,933 | ||||||
| Fannie Mae 3.00% 20363 | 26,454 | 26,207 | ||||||
| Fannie Mae 4.00% 20473 | 31,328 | 31,969 | ||||||
| Fannie Mae 4.50% 20483,4 | 44,012 | 45,636 | ||||||
| Fannie Mae 4.50% 20483 | 42,653 | 44,240 | ||||||
| Fannie Mae 3.50% 20493,4 | 69,981 | 69,997 | ||||||
| Fannie Mae 0%–9.19% 2022–20493,4,5 | 142,780 | 144,922 | ||||||
| Freddie Mac 3.50% 20333 | 25,000 | 25,333 | ||||||
| Freddie Mac 0%–5.50% 2020–20493,4,5 | 77,993 | 79,500 | ||||||
| Freddie Mac Seasoned Credit Risk Transfer Trust, Series 2018-2, Class MT, 3.50% 20573 | 42,088 | 41,644 | ||||||
| Freddie Mac Seasoned Loan Structured Transaction, Series 2018-2, Class A1, 3.50% 20283,5 | 45,026 | 44,268 | ||||||
| Government National Mortgage Assn. 3.50% 20493,4 | 25,000 | 25,172 | ||||||
| Government National Mortgage Assn. 4.00% 20493,4 | 40,200 | 41,171 | ||||||
| Government National Mortgage Assn. 4.50% 20493,4 | 34,075 | 35,265 | ||||||
| Government National Mortgage Assn. 3.00%–6.64% 2034–20653,4,5 | 46,756 | 48,654 | ||||||
| Other securities | 76,482 | |||||||
| 821,393 | ||||||||
| Federal agency bonds & notes 20.95% | ||||||||
| Fannie Mae 1.25%–7.13% 2019–2030 | 85,400 | 87,260 | ||||||
| Federal Home Loan Bank 3.25%–5.50% 2023–2036 | 30,315 | 31,296 | ||||||
| Freddie Mac 2.38%–3.75% 2019–2021 | 112,750 | 112,469 | ||||||
| Private Export Funding Corp. 1.45%–3.55% 2019–2024 | 28,840 | 28,957 | ||||||
| Tennessee Valley Authority 2.88%–5.88% 2021–2060 | 47,305 | 49,048 | ||||||
| 112 | American Funds Insurance Series |
U.S. Government/AAA-Rated Securities Fund
| Bonds, notes & other debt instruments | Principal amount (000) | Value (000) | ||||||
| U.S. Department of Housing and Urban Development 1.98%–3.70% 2020–2034 | $ | 73,632 | $ | 73,777 | ||||
| United States Agency for International Development, Iraq (State of), 2.149% 2022 | 6,670 | 6,566 | ||||||
| United States Agency for International Development, Jordan (Kingdom of) 1.95%–3.00% 2019–2025 | 194,000 | 193,524 | ||||||
| United States Agency for International Development, Morocco (Kingdom of) 7.55% 20263 | 3,328 | 3,838 | ||||||
| United States Agency for International Development, Tunisia (Kingdom of) 1.416% 2021 | 3,000 | 2,907 | ||||||
| United States Agency for International Development, Ukraine 1.47%–1.84% 2019–2021 | 5,855 | 5,712 | ||||||
| Other securities | 5,720 | |||||||
| 601,074 | ||||||||
| Total bonds, notes & other debt instruments (cost: $2,805,986,000) | 2,791,877 | |||||||
| Short-term securities 11.11% | ||||||||
| Apple Inc. 2.36% due 1/23/20196 | 25,000 | 24,960 | ||||||
| Bank of New York Mellon Corp. 2.34% due 1/22/2019 | 50,000 | 49,924 | ||||||
| Chevron Corp. 2.38%–2.49% due 1/9/2019–2/4/20196 | 51,900 | 51,815 | ||||||
| National Rural Utilities Cooperative Finance Corp. 2.50% due 2/5/2019 | 60,000 | 59,850 | ||||||
| Procter & Gamble Co. 2.50% due 2/7/20196 | 25,000 | 24,933 | ||||||
| Tennessee Valley Authority 2.31% due 1/15/2019 | 38,000 | 37,966 | ||||||
| Wal-Mart Stores, Inc. 2.42% due 1/15/20196 | 40,000 | 39,959 | ||||||
| Other securities | 29,420 | |||||||
| Total short-term securities (cost: $318,855,000) | 318,827 | |||||||
| Total investment securities 108.41% (cost: $3,124,841,000) | 3,110,704 | |||||||
| Other assets less liabilities (8.41)% | (241,401 | ) | ||||||
| Net assets 100.00% | $ | 2,869,303 | ||||||
This summary investment portfolio is designed to streamline the report and help investors better focus on the fund’s principal holdings. See the inside back cover for details on how to obtain a complete schedule of portfolio holdings.
“Other securities” includes all issues that are not disclosed separately in the summary investment portfolio.
Futures contracts
| Unrealized | |||||||||||||||
| appreciation | |||||||||||||||
| Notional | Value at | (depreciation) | |||||||||||||
| Number of | amount | 7 | 12/31/2018 | 8 | at 12/31/2018 | ||||||||||
| Contracts | Type | contracts | Expiration | (000) | (000) | (000) | |||||||||
| 90 Day Euro Dollar Futures | Long | 623 | December 2019 | $ 155,750 | $ 151,623 | $ | 941 | ||||||||
| 90 Day Euro Dollar Futures | Long | 316 | December 2021 | 79,000 | 77,029 | 431 | |||||||||
| 2 Year U.S. Treasury Note Futures | Long | 3,850 | April 2019 | 770,000 | 817,403 | 4,332 | |||||||||
| 5 Year U.S. Treasury Note Futures | Long | 11,518 | April 2019 | 1,151,800 | 1,320,970 | 20,231 | |||||||||
| 10 Year U.S. Treasury Note Futures | Long | 2,675 | March 2019 | 267,500 | 326,392 | 4,968 | |||||||||
| 10 Year Ultra U.S. Treasury Note Futures | Short | 1,050 | March 2019 | (105,000 | ) | (136,582 | ) | (3,030 | ) | ||||||
| 20 Year U.S. Treasury Bond Futures | Long | 108 | March 2019 | 10,800 | 15,768 | 118 | |||||||||
| 30 Year Ultra U.S. Treasury Bond Futures | Short | 172 | March 2019 | (17,200 | ) | (27,633 | ) | (541 | ) | ||||||
| $ | 27,450 | ||||||||||||||
| American Funds Insurance Series | 113 |
U.S. Government/AAA-Rated Securities Fund
Swap contracts
Interest rate swaps
| Receive | Pay | Expiration date | Notional (000) | Value at 12/31/2018 (000) | Upfront payments/ receipts (000) | Unrealized appreciation (depreciation) at 12/31/2018 (000) | |||||||||||||
| 2.40625% | U.S. EFFR | 3/20/2019 | $ | 3,420,000 | $ 9 | $ | — | $ | 9 | ||||||||||
| 2.426% | U.S. EFFR | 5/1/2019 | 1,625,200 | 24 | — | 24 | |||||||||||||
| 2.414% | U.S. EFFR | 5/1/2019 | 2,374,800 | 1 | — | 1 | |||||||||||||
| 2.782% | U.S. EFFR | 9/18/2019 | 884,184 | 438 | — | 438 | |||||||||||||
| U.S. EFFR | 2.405% | 1/29/2020 | 1,463,000 | (67 | ) | — | (67 | ) | |||||||||||
| U.S. EFFR | 2.403% | 1/29/2020 | 2,027,000 | (88 | ) | — | (88 | ) | |||||||||||
| 1.997% | U.S. EFFR | 2/13/2020 | 60,900 | (257 | ) | — | (257 | ) | |||||||||||
| 1.989% | U.S. EFFR | 2/13/2020 | 61,000 | (263 | ) | — | (263 | ) | |||||||||||
| 3-month USD-LIBOR | 2.761% | 4/27/2020 | 100,000 | (63 | ) | — | (63 | ) | |||||||||||
| 3-month USD-LIBOR | 2.8025% | 8/15/2020 | 101,840 | (194 | ) | — | (194 | ) | |||||||||||
| 2.5045% | U.S. EFFR | 8/29/2020 | 133,910 | 344 | — | 344 | |||||||||||||
| 2.5215% | U.S. EFFR | 8/29/2020 | 98,090 | 279 | — | 279 | |||||||||||||
| 3-month USD-LIBOR | 2.806% | 8/29/2020 | 34,300 | (68 | ) | — | (68 | ) | |||||||||||
| 2.48% | U.S. EFFR | 12/20/2020 | 82,528 | 200 | — | 200 | |||||||||||||
| 2.4825% | U.S. EFFR | 12/26/2020 | 665,000 | 1,684 | — | 1,684 | |||||||||||||
| 3-month USD-LIBOR | 1.217% | 9/22/2021 | 60,000 | 2,195 | — | 2,195 | |||||||||||||
| 3-month USD-LIBOR | 1.225% | 9/22/2021 | 60,000 | 2,182 | — | 2,182 | |||||||||||||
| 3-month USD-LIBOR | 1.2255% | 9/23/2021 | 5,000 | 182 | — | 182 | |||||||||||||
| 3-month USD-LIBOR | 1.9665% | 2/2/2022 | 50,000 | 921 | — | 921 | |||||||||||||
| 3-month USD-LIBOR | 2.2175% | 3/17/2022 | 52,000 | 592 | — | 592 | |||||||||||||
| 3-month USD-LIBOR | 1.8675% | 4/19/2022 | 70,000 | 1,577 | — | 1,577 | |||||||||||||
| 3-month USD-LIBOR | 1.75918% | 4/29/2022 | 58,000 | 1,514 | — | 1,514 | |||||||||||||
| 2.5775% | U.S. EFFR | 7/16/2022 | 181,639 | 671 | — | 671 | |||||||||||||
| 3-month USD-LIBOR | 1.948% | 7/28/2022 | 20,000 | 427 | — | 427 | |||||||||||||
| 2.80% | 3-month USD-LIBOR | 9/2/2022 | 280,000 | 1,670 | — | 1,670 | |||||||||||||
| 2.75% | 3-month USD-LIBOR | 9/2/2022 | 280,000 | 1,408 | — | 1,408 | |||||||||||||
| 2.009% | 3-month USD-LIBOR | 10/4/2022 | 50,000 | (1,017 | ) | — | (1,017 | ) | |||||||||||
| 2.08934% | 3-month USD-LIBOR | 11/17/2022 | 40,700 | (723 | ) | — | (723 | ) | |||||||||||
| 2.2025% | 3-month USD-LIBOR | 12/4/2022 | 20,000 | (276 | ) | — | (276 | ) | |||||||||||
| 3-month USD-LIBOR | 2.2455% | 12/21/2022 | 25,000 | 310 | — | 310 | |||||||||||||
| 2.27403% | 3-month USD-LIBOR | 12/29/2022 | 60,000 | (683 | ) | — | (683 | ) | |||||||||||
| 3-month USD-LIBOR | 2.6778% | 2/12/2023 | 51,000 | (213 | ) | — | (213 | ) | |||||||||||
| 2.7435% | 3-month USD-LIBOR | 2/16/2023 | 41,000 | 278 | — | 278 | |||||||||||||
| 3-month USD-LIBOR | 2.8655% | 4/23/2023 | 55,000 | (668 | ) | — | (668 | ) | |||||||||||
| 2.5815% | U.S. EFFR | 5/25/2023 | 80,000 | 1,099 | — | 1,099 | |||||||||||||
| 2.9075% | 3-month USD-LIBOR | 9/7/2023 | 50,000 | 734 | — | 734 | |||||||||||||
| 3-month USD-LIBOR | 3.09009% | 10/31/2023 | 46,320 | (1,095 | ) | — | (1,095 | ) | |||||||||||
| 3-month USD-LIBOR | 3.0965% | 10/31/2023 | 46,055 | (1,102 | ) | — | (1,102 | ) | |||||||||||
| U.S. EFFR | 2.4435% | 12/20/2023 | 7,589 | (58 | ) | — | (58 | ) | |||||||||||
| U.S. EFFR | 2.45375% | 12/20/2023 | 67,985 | (555 | ) | — | (555 | ) | |||||||||||
| U.S. EFFR | 2.4325% | 12/21/2023 | 24,000 | (172 | ) | — | (172 | ) | |||||||||||
| 3-month USD-LIBOR | 2.0815% | 2/10/2024 | 28,700 | 683 | — | 683 | |||||||||||||
| 3-month USD-LIBOR | 2.0955% | 2/10/2024 | 14,300 | 331 | — | 331 | |||||||||||||
| 3-month USD-LIBOR | 2.3875% | 3/17/2024 | 160,700 | 1,520 | — | 1,520 | |||||||||||||
| 3-month USD-LIBOR | 2.12813% | 10/3/2024 | 65,000 | 1,617 | — | 1,617 | |||||||||||||
| 3-month USD-LIBOR | 2.4595% | 1/12/2025 | 26,400 | 203 | — | 203 | |||||||||||||
| 3-month USD-LIBOR | 2.588% | 1/26/2025 | 15,600 | 7 | — | 7 | |||||||||||||
| 2.8775% | 3-month USD-LIBOR | 3/23/2025 | 29,800 | 473 | — | 473 | |||||||||||||
| 3-month USD-LIBOR | 2.24% | 12/5/2026 | 55,100 | 1,625 | — | 1,625 | |||||||||||||
| 3-month USD-LIBOR | 2.27% | 12/5/2026 | 44,900 | 1,227 | — | 1,227 | |||||||||||||
| 2.579% | 3-month USD-LIBOR | 3/14/2027 | 53,000 | (306 | ) | — | (306 | ) | |||||||||||
| 2.333% | 3-month USD-LIBOR | 3/29/2027 | 42,000 | (1,020 | ) | — | (1,020 | ) | |||||||||||
| 2.91% | 3-month USD-LIBOR | 2/1/2028 | 16,000 | 84 | — | 84 | |||||||||||||
| 2.908% | 3-month USD-LIBOR | 2/1/2028 | 16,000 | 83 | — | 83 | |||||||||||||
| 2.925% | 3-month USD-LIBOR | 2/1/2028 | 12,800 | 75 | — | 75 | |||||||||||||
| 2.92% | 3-month USD-LIBOR | 2/2/2028 | 12,200 | 69 | — | 69 | |||||||||||||
| 114 | American Funds Insurance Series |
U.S. Government/AAA-Rated Securities Fund
| Receive | Pay | Expiration date | Notional (000) | Value at 12/31/2018 (000) | Upfront payments/ receipts (000) | Unrealized appreciation (depreciation) at 12/31/2018 (000) | |||||||||||||
| U.S. EFFR | 2.5065% | 3/22/2028 | $ | 8,700 | $ (92 | ) | $ | — | $ | (92 | ) | ||||||||
| U.S. EFFR | 2.535% | 3/23/2028 | 6,700 | (87 | ) | — | (87 | ) | |||||||||||
| U.S. EFFR | 2.471% | 3/27/2028 | 8,100 | (62 | ) | — | (62 | ) | |||||||||||
| U.S. EFFR | 2.4575% | 3/29/2028 | 9,638 | (62 | ) | — | (62 | ) | |||||||||||
| U.S. EFFR | 2.424% | 3/30/2028 | 8,160 | (30 | ) | — | (30 | ) | |||||||||||
| U.S. EFFR | 2.412% | 4/5/2028 | 3,702 | (10 | ) | — | (10 | ) | |||||||||||
| 3-month USD-LIBOR | 2.97125% | 9/2/2030 | 62,000 | (1,081 | ) | — | (1,081 | ) | |||||||||||
| 3-month USD-LIBOR | 3.005% | 9/2/2030 | 62,000 | (1,259 | ) | — | (1,259 | ) | |||||||||||
| 3-month USD-LIBOR | 2.9625% | 2/1/2038 | 9,800 | 30 | — | 30 | |||||||||||||
| 3-month USD-LIBOR | 2.963% | 2/1/2038 | 9,800 | 30 | — | 30 | |||||||||||||
| 3-month USD-LIBOR | 2.986% | 2/1/2038 | 7,800 | 11 | — | 11 | |||||||||||||
| 3-month USD-LIBOR | 2.967% | 2/2/2038 | 7,600 | 21 | — | 21 | |||||||||||||
| 3-month USD-LIBOR | 3.34% | 6/27/2044 | 10,000 | (937 | ) | — | (937 | ) | |||||||||||
| 3-month USD-LIBOR | 3.206% | 7/31/2044 | 16,000 | (1,108 | ) | — | (1,108 | ) | |||||||||||
| 3-month USD-LIBOR | 3.238% | 8/8/2044 | 16,000 | (1,201 | ) | — | (1,201 | ) | |||||||||||
| 3-month USD-LIBOR | 2.7045% | 1/2/2045 | 12,000 | 310 | — | 310 | |||||||||||||
| 3-month USD-LIBOR | 2.5055% | 1/9/2045 | 11,000 | 700 | — | 700 | |||||||||||||
| 3-month USD-LIBOR | 2.4945% | 1/9/2045 | 2,000 | 131 | — | 131 | |||||||||||||
| 3-month USD-LIBOR | 2.52822% | 11/23/2045 | 4,390 | 266 | — | 266 | |||||||||||||
| U.S. EFFR | 2.166% | 10/23/2047 | 10,000 | 714 | — | 714 | |||||||||||||
| U.S. EFFR | 2.145% | 11/9/2047 | 15,400 | 1,169 | — | 1,169 | |||||||||||||
| U.S. EFFR | 2.153% | 11/10/2047 | 15,300 | 1,137 | — | 1,137 | |||||||||||||
| U.S. EFFR | 2.155% | 11/10/2047 | 8,640 | 638 | — | 638 | |||||||||||||
| U.S. EFFR | 2.17% | 11/13/2047 | 15,660 | 1,109 | — | 1,109 | |||||||||||||
| U.S. EFFR | 2.5635% | 2/12/2048 | 33,204 | (358 | ) | — | (358 | ) | |||||||||||
| U.S. EFFR | 2.4615% | 3/15/2048 | 2,000 | 20 | — | 20 | |||||||||||||
| U.S. EFFR | 2.485% | 3/15/2048 | 2,000 | 11 | — | 11 | |||||||||||||
| U.S. EFFR | 2.425% | 3/16/2048 | 4,100 | 73 | — | 73 | |||||||||||||
| U.S. EFFR | 2.505% | 3/22/2048 | 4,300 | 5 | — | 5 | |||||||||||||
| U.S. EFFR | 2.51375% | 3/22/2048 | 4,700 | (3 | ) | — | (3 | ) | |||||||||||
| U.S. EFFR | 2.625% | 5/25/2048 | 18,000 | (435 | ) | — | (435 | ) | |||||||||||
| U.S. EFFR | 2.445% | 6/4/2048 | 6,700 | 90 | — | 90 | |||||||||||||
| U.S. EFFR | 2.52% | 8/24/2048 | 4,500 | (9 | ) | — | (9 | ) | |||||||||||
| 3.236% | 3-month USD-LIBOR | 10/31/2048 | 10,650 | 896 | — | 896 | |||||||||||||
| 3.22859% | 3-month USD-LIBOR | 10/31/2048 | 10,645 | 879 | — | 879 | |||||||||||||
| $ | — | $ | 19,354 | ||||||||||||||||
| American Funds Insurance Series | 115 |
U.S. Government/AAA-Rated Securities Fund
The following footnotes apply to either the individual securities noted or one or more of the securities aggregated and listed as a single line item.
| 1 | All or a portion of this security was pledged as collateral. The total value of pledged collateral was $36,486,000, which represented 1.27% of the net assets of the fund. |
| 2 | Index-linked bond whose principal amount moves with a government price index. |
| 3 | Principal payments may be made periodically. Therefore, the effective maturity date may be earlier than the stated maturity date. |
| 4 | Purchased on a TBA basis. |
| 5 | Coupon rate may change periodically. |
| 6 | Acquired in a transaction exempt from registration under Rule 144A or Section 4(2) of the Securities Act of 1933. May be resold in the U.S. in transactions exempt from registration, normally to qualified institutional buyers. The total value of all such securities, including those in “Other securities,” was $151,166,000, which represented 5.27% of the net assets of the fund. |
| 7 | Notional amount is calculated based on the number of contracts and notional contract size. |
| 8 | Value is calculated based on the notional amount and current market price. |
Key to abbreviations and symbol
EFFR = Effective Federal Funds Rate
LIBOR = London Interbank Offered Rate
TBA = To-be-announced
USD/$ = U.S. dollars
See notes to financial statements
| 116 | American Funds Insurance Series |
Investment portfolioDecember 31, 2018
| Growth funds 80.77% | Shares | Value (000) | ||||||
| American Funds Insurance Series – Growth Fund, Class 1 | 3,963,500 | $ | 277,286 | |||||
| Total growth funds(cost: $279,168,000) | 277,286 | |||||||
| Fixed income funds 15.59% | ||||||||
| American Funds Insurance Series – Bond Fund, Class 1 | 5,110,855 | 53,511 | ||||||
| Total fixed income funds (cost: $55,321,000) | 53,511 | |||||||
| Short-term securities 1.50% | ||||||||
| Government Cash Management Fund | 5,144,216 | 5,144 | ||||||
| Total short-term securities(cost: $5,144,000) | 5,144 | |||||||
| Total investment securities 97.86%(cost: $339,633,000) | 335,941 | |||||||
| Other assets less liabilities 2.14% | 7,332 | |||||||
| Net assets 100.00% | $ | 343,273 | ||||||
Futures contracts
| Contracts | Type | Number of contracts | Expiration | Notional amount (000) | 1 | Value at 12/31/2018 (000) | 2 | Unrealized appreciation (depreciation) at 12/31/2018 (000) | ||||||||||||||
| 5 Year U.S. Treasury Note Futures | Long | 1,474 | March 2019 | $ | 147,400 | $169,049 | $ | 1,914 | ||||||||||||||
| FTSE 100 Index Contracts | Short | 33 | March 2019 | £ | — | 3 | (2,801 | ) | 18 | |||||||||||||
| Euro Stoxx 50 Index Contracts | Short | 131 | March 2019 | € | (1 | ) | (4,464 | ) | 86 | |||||||||||||
| Nikkei 225 Index Contracts | Short | 1 | March 2019 | ¥ | (1 | ) | (182 | ) | 10 | |||||||||||||
| S&P Mid 400 E-mini Index Contracts | Short | 7 | March 2019 | $ | (1 | ) | (1,164 | ) | 49 | |||||||||||||
| Mini MSCI Emerging Market Index Contracts | Short | 123 | March 2019 | (6 | ) | (5,946 | ) | 37 | ||||||||||||||
| Russell 2000 Mini Index Contracts | Short | 229 | March 2019 | (12 | ) | (15,446 | ) | 629 | ||||||||||||||
| S&P 500 E-mini Index Contracts | Short | 895 | March 2019 | (45 | ) | (112,108 | ) | 3,193 | ||||||||||||||
| British Pound Currency Contracts | Short | 36 | March 2019 | (2,250 | ) | (2,878 | ) | (18 | ) | |||||||||||||
| Euro Currency Contracts | Short | 33 | March 2019 | (4,125 | ) | (4,753 | ) | (20 | ) | |||||||||||||
| Japanese Yen Currency Contracts | Short | 2 | March 2019 | (25,000 | ) | (229 | ) | (7 | ) | |||||||||||||
| $ | 5,891 | |||||||||||||||||||||
| American Funds Insurance Series | 117 |
Managed Risk Growth Fund
Investments in affiliates
These holdings are affiliates of the fund under the Investment Company Act of 1940 since they are controlled by the same board of trustees as the series. Further details on these holdings and related transactions during the year ended December 31, 2018, appear below.
| Beginning shares | Additions | Reductions | Ending shares | Net realized gain (loss) (000) | Net unrealized depreciation (000) | Dividend income (000) | Value of affiliates at 12/31/2018 (000) | |||||||||||||||||||||||||
| Growth funds 80.77% | ||||||||||||||||||||||||||||||||
| American Funds Insurance Series – Growth Fund, Class 1 | 2,960,791 | 1,174,907 | 172,198 | 3,963,500 | $ | 2,267 | $ | (31,537 | ) | $ | 1,939 | $ | 277,286 | |||||||||||||||||||
| Fixed income funds 15.59% | ||||||||||||||||||||||||||||||||
| American Funds Insurance Series – Bond Fund, Class 1 | 4,022,202 | 1,831,995 | 743,342 | 5,110,855 | (255 | ) | (1,309 | ) | 1,401 | 53,511 | ||||||||||||||||||||||
| Total 96.36% | $ | 2,012 | $ | (32,846 | ) | $ | 3,340 | $ | 330,797 | |||||||||||||||||||||||
| 1 | Notional amount is calculated based on the number of contracts and notional contract size. |
| 2 | Value is calculated based on the notional amount and current market price. |
| 3 | Amount less than one thousand. |
Key to symbols
£ = British pounds
€ = Euros
¥ = Japanese yen
See notes to financial statements
| 118 | American Funds Insurance Series |
Managed Risk International Fund
Investment portfolioDecember 31, 2018
| Growth funds 79.58% | Shares | Value (000) | ||||||
| American Funds Insurance Series – International Fund, Class 1 | 6,802,836 | $ | 120,138 | |||||
| Total growth funds (cost: $126,861,000) | 120,138 | |||||||
| Fixed income funds 15.00% | ||||||||
| American Funds Insurance Series – Bond Fund, Class 1 | 2,162,908 | 22,646 | ||||||
| Total fixed income funds(cost: $23,477,000) | 22,646 | |||||||
| Short-term securities 3.43% | ||||||||
| Government Cash Management Fund | 5,178,097 | 5,178 | ||||||
| Total short-term securities(cost: $5,178,000) | 5,178 | |||||||
| Total investment securities 98.01%(cost: $155,516,000) | 147,962 | |||||||
| Other assets less liabilities 1.99% | 2,997 | |||||||
| Net assets 100.00% | $ | 150,959 | ||||||
Futures contracts
| Contracts | Type | Number of contracts | Expiration | Notional amount (000) | 1 | Value at 12/31/2018 (000) | 2 | Unrealized appreciation (depreciation) at 12/31/2018 (000) | |||||||||||||||
| 5 Year U.S. Treasury Note Futures | Long | 472 | March 2019 | $ | 47,200 | $ | 54,133 | $ | 615 | ||||||||||||||
| S&P 500 E-mini Index Contracts | Short | 3 | March 2019 | — | 3 | (376 | ) | 23 | |||||||||||||||
| FTSE 100 Index Contracts | Short | 55 | March 2019 | £ | (1 | ) | (4,668 | ) | 65 | ||||||||||||||
| Russell 2000 Mini Index Contracts | Short | 13 | March 2019 | $ | (1 | ) | (877 | ) | 44 | ||||||||||||||
| Euro Stoxx 50 Index Contracts | Short | 353 | March 2019 | € | (4 | ) | (12,028 | ) | 268 | ||||||||||||||
| Mini MSCI Emerging Market Index Contracts | Short | 323 | March 2019 | $ | (16 | ) | (15,614 | ) | 186 | ||||||||||||||
| Nikkei 225 Index Contracts | Short | 37 | March 2019 | ¥ | (37 | ) | (6,751 | ) | 296 | ||||||||||||||
| British Pound Currency Contracts | Short | 60 | March 2019 | $ | (3,750 | ) | (4,796 | ) | (35 | ) | |||||||||||||
| Euro Currency Contracts | Short | 88 | March 2019 | (11,000 | ) | (12,675 | ) | (61 | ) | ||||||||||||||
| Japanese Yen Currency Contracts | Short | 61 | March 2019 | (762,500 | ) | (6,993 | ) | (182 | ) | ||||||||||||||
| $ | 1,219 | ||||||||||||||||||||||
| American Funds Insurance Series | 119 |
Managed Risk International Fund
Investments in affiliates
These holdings are affiliates of the fund under the Investment Company Act of 1940 since they are controlled by the same board of trustees as the series. Further details on these holdings and related transactions during the year ended December 31, 2018, appear below.
| Beginning shares | Additions | Reductions | Ending shares | Net realized gain (loss) (000) | Net unrealized depreciation (000) | Dividend income (000) | Value of affiliates at 12/31/2018 (000) | |||||||||||||||||||||||||
| Growth funds 79.58% | ||||||||||||||||||||||||||||||||
| American Funds Insurance Series – International Fund, Class 1 | 5,479,657 | 1,623,392 | 300,213 | 6,802,836 | $ | 360 | $ | (25,996 | ) | $ | 2,591 | $ | 120,138 | |||||||||||||||||||
| Fixed income funds 15.00% | ||||||||||||||||||||||||||||||||
| American Funds Insurance Series – Bond Fund, Class 1 | 2,063,150 | 605,333 | 505,575 | 2,162,908 | (190 | ) | (574 | ) | 611 | 22,646 | ||||||||||||||||||||||
| Total 94.58% | $ | 170 | $ | (26,570 | ) | $ | 3,202 | $ | 142,784 | |||||||||||||||||||||||
| 1 | Notional amount is calculated based on the number of contracts and notional contract size. |
| 2 | Value is calculated based on the notional amount and current market price. |
| 3 | Amount less than one thousand. |
Key to symbols
£ = British pounds
€ = Euros
¥ = Japanese yen
See notes to financial statements
| 120 | American Funds Insurance Series |
Managed Risk Blue Chip Income and Growth Fund
Investment portfolioDecember 31, 2018
| Growth-and-income funds 80.54% | Shares | Value (000) | ||||||
| American Funds Insurance Series – Blue Chip Income and Growth Fund, Class 1 | 21,901,978 | $ | 271,146 | |||||
| Total growth-and-income funds(cost: $294,629,000) | 271,146 | |||||||
| Fixed income funds 15.90% | ||||||||
| American Funds Insurance Series – U.S. Government/AAA-Rated Securities Fund, Class 1 | 4,484,388 | 53,544 | ||||||
| Total fixed income funds(cost: $54,558,000) | 53,544 | |||||||
| Short-term securities 1.37% | ||||||||
| Government Cash Management Fund | 4,613,010 | 4,613 | ||||||
| Total short-term securities(cost: $4,613,000) | 4,613 | |||||||
| Total investment securities 97.81%(cost: $353,800,000) | 329,303 | |||||||
| Other assets less liabilities 2.19% | 7,366 | |||||||
| Net assets 100.00% | $ | 336,669 | ||||||
Futures contracts
| Contracts | Type | Number of contracts | Expiration | Notional amount (000) | 1 | Value at 12/31/2018 (000) | 2 | Unrealized appreciation (depreciation) at 12/31/2018 (000) | ||||||||||||||
| 5 Year U.S. Treasury Note Futures | Long | 1,512 | March 2019 | $ | 151,200 | $ | 173,408 | $ | 1,865 | |||||||||||||
| FTSE 100 Index Contracts | Short | 24 | March 2019 | £ | — | 3 | (2,037 | ) | 10 | |||||||||||||
| S&P Mid 400 E-mini Index Contracts | Short | 4 | March 2019 | $ | — | 3 | (665 | ) | 18 | |||||||||||||
| Euro Stoxx 50 Index Contracts | Short | 117 | March 2019 | € | (1 | ) | (3,987 | ) | 74 | |||||||||||||
| Mini MSCI Emerging Market Index Contracts | Short | 42 | March 2019 | $ | (2 | ) | (2,030 | ) | 13 | |||||||||||||
| Russell 2000 Mini Index Contracts | Short | 34 | March 2019 | (2 | ) | (2,293 | ) | 81 | ||||||||||||||
| S&P 500 E-mini Index Contracts | Short | 1,088 | March 2019 | (54 | ) | (136,283 | ) | 3,750 | ||||||||||||||
| British Pound Currency Contracts | Short | 27 | March 2019 | (1,688 | ) | (2,158 | ) | (13 | ) | |||||||||||||
| Euro Currency Contracts | Short | 29 | March 2019 | (3,625 | ) | (4,177 | ) | (17 | ) | |||||||||||||
| $ | 5,781 | |||||||||||||||||||||
| American Funds Insurance Series | 121 |
Managed Risk Blue Chip Income and Growth Fund
Investments in affiliates
These holdings are affiliates of the fund under the Investment Company Act of 1940 since they are controlled by the same board of trustees as the series. Further details on these holdings and related transactions during the year ended December 31, 2018, appear below.
| Beginning shares | Additions | Reductions | Ending shares | Net realized gain (loss) (000) | Net unrealized depreciation (000) | Dividend income (000) | Value of affiliates at 12/31/2018 (000) | |||||||||||||||||||||||||
| Growth-and-income funds 80.54% | ||||||||||||||||||||||||||||||||
| American Funds Insurance Series – Blue Chip Income and Growth Fund, Class 1 | 19,699,331 | 4,153,608 | 1,950,961 | 21,901,978 | $ | 4,481 | $ | (54,782 | ) | $ | 6,179 | $ | 271,146 | |||||||||||||||||||
| Fixed income funds 15.90% | ||||||||||||||||||||||||||||||||
| American Funds Insurance Series – U.S. Government/AAA-Rated Securities Fund, Class 1 | 4,530,491 | 736,682 | 782,785 | 4,484,388 | (273 | ) | (347 | ) | 1,085 | 53,544 | ||||||||||||||||||||||
| Total 96.44% | $ | 4,208 | $ | (55,129 | ) | $ | 7,264 | $ | 324,690 | |||||||||||||||||||||||
| 1 | Notional amount is calculated based on the number of contracts and notional contract size. |
| 2 | Value is calculated based on the notional amount and current market price. |
| 3 | Amount less than one thousand. |
Key to symbols
£ = British pounds
€ = Euros
¥ = Japanese yen
See notes to financial statements
| 122 | American Funds Insurance Series |
Managed Risk Growth-Income Fund
Investment portfolioDecember 31, 2018
| Growth-and-income funds 79.46% | Shares | Value (000) | ||||||
| American Funds Insurance Series – Growth-Income Fund, Class 1 | 33,123,343 | $ | 1,503,469 | |||||
| Total growth-and-income funds(cost: $1,522,773,000) | 1,503,469 | |||||||
| Fixed income funds 14.91% | ||||||||
| American Funds Insurance Series – Bond Fund, Class 1 | 26,945,898 | 282,124 | ||||||
| Total fixed income funds(cost: $281,542,000) | 282,124 | |||||||
| Short-term securities 3.54% | ||||||||
| Government Cash Management Fund | 66,924,852 | 66,925 | ||||||
| Total short-term securities(cost: $66,925,000) | 66,925 | |||||||
| Options purchased 0.46% | ||||||||
| Options purchased* | 8,674 | |||||||
| Total options purchased(cost: $7,663,000) | 8,674 | |||||||
| Total investment securities 98.37%(cost: $1,878,903,000) | 1,861,192 | |||||||
| Other assets less liabilities 1.63% | 30,910 | |||||||
| Net assets 100.00% | $ | 1,892,102 | ||||||
*Options purchased
Put
| Description | Number of contracts | Notional amount (000) | Exercise price | Expiration date | Value at 12/31/2018 (000) | |||||||||||||||
| S&P 500 Index | 4,360 | $1,092,987 | $1,850.00 | 6/21/2019 | $ | 6,178 | ||||||||||||||
| S&P 500 Index | 811 | 203,306 | 2,000.00 | 6/21/2019 | 2,064 | |||||||||||||||
| S&P 500 Index | 138 | 34,595 | 2,050.00 | 6/21/2019 | 432 | |||||||||||||||
| $ | 8,674 | |||||||||||||||||||
Futures contracts
| Contracts | Type | Number of contracts | Expiration | Notional amount (000) | 1 | Value at 12/31/2018 (000) | 2 | Unrealized appreciation (depreciation) at 12/31/2018 (000) | ||||||||||||||
| 5 Year U.S. Treasury Note Futures | Long | 7,323 | March 2019 | $ | 732,300 | $ | 839,857 | $ | 6,919 | |||||||||||||
| FTSE 100 Index Contracts | Short | 272 | March 2019 | £ | (3 | ) | (23,086 | ) | (39 | ) | ||||||||||||
| S&P Mid 400 E-mini Index Contracts | Short | 50 | March 2019 | $ | (5 | ) | (8,311 | ) | 127 | |||||||||||||
| Euro Stoxx 50 Index Contracts | Short | 1,107 | March 2019 | € | (11 | ) | (37,721 | ) | 466 | |||||||||||||
| Russell 2000 Mini Index Contracts | Short | 430 | March 2019 | $ | (21 | ) | (29,003 | ) | 435 | |||||||||||||
| Mini MSCI Emerging Market Index Contracts | Short | 532 | March 2019 | (27 | ) | (25,717 | ) | (62 | ) | |||||||||||||
| Nikkei 225 Index Contracts | Short | 27 | March 2019 | ¥ | (27 | ) | (4,927 | ) | 180 | |||||||||||||
| S&P 500 E-mini Index Contracts | Short | 3,478 | March 2019 | $ | (174 | ) | (435,654 | ) | 2,778 | |||||||||||||
| British Pound Currency Contracts | Short | 298 | March 2019 | (18,625 | ) | (23,821 | ) | (167 | ) | |||||||||||||
| Euro Currency Contracts | Short | 268 | March 2019 | (33,500 | ) | (38,600 | ) | (222 | ) | |||||||||||||
| Japanese Yen Currency Contracts | Short | 45 | March 2019 | (562,500 | ) | (5,159 | ) | (108 | ) | |||||||||||||
| $ | 10,307 | |||||||||||||||||||||
| American Funds Insurance Series | 123 |
Managed Risk Growth-Income Fund
Investments in affiliates
These holdings are affiliates of the fund under the Investment Company Act of 1940 since they are controlled by the same board of trustees as the series. Further details on these holdings and related transactions during the year ended December 31, 2018, appear below.
| Beginning shares | Additions | Reductions | Ending shares | Net realized loss (000) | Net unrealized (depreciation) appreciation (000) | Dividend income (000) | Value of affiliates at 12/31/2018 (000) | |||||||||||||||||||||||||
| Growth-and-income funds 79.46% | ||||||||||||||||||||||||||||||||
| American Funds Insurance Series – Growth-Income Fund, Class 1 | 3,331,787 | 30,474,528 | 682,972 | 33,123,343 | $ | (1,765 | ) | $(33,463 | ) | $3,205 | $1,503,469 | |||||||||||||||||||||
| Fixed income funds 14.91% | ||||||||||||||||||||||||||||||||
| American Funds Insurance Series – Bond Fund, Class 1 | 2,916,097 | 25,446,042 | 1,416,241 | 26,945,898 | (614 | ) | 951 | 958 | 282,124 | |||||||||||||||||||||||
| Total 94.37% | $ | (2,379 | ) | $(32,512 | ) | $4,163 | $1,785,593 | |||||||||||||||||||||||||
| 1 | Notional amount is calculated based on the number of contracts and notional contract size. |
| 2 | Value is calculated based on the notional amount and current market price. |
Key to symbols
£ = British pounds
€ = Euros
¥ = Japanese yen
See notes to financial statements
| 124 | American Funds Insurance Series |
Managed Risk Asset Allocation Fund
Investment portfolioDecember 31, 2018
| Asset allocation funds 96.69% | Shares | Value (000) | ||||||
| American Funds Insurance Series – Asset Allocation Fund, Class 1 | 115,468,223 | $ | 2,458,318 | |||||
| Total asset allocation funds(cost: $2,512,141,000) | 2,458,318 | |||||||
| Short-term securities 1.91% | ||||||||
| Government Cash Management Fund | 48,607,102 | 48,607 | ||||||
| Total short-term securities(cost: $48,607,000) | 48,607 | |||||||
| Total investment securities 98.60%(cost: $2,560,748,000) | 2,506,925 | |||||||
| Other assets less liabilities 1.40% | 35,572 | |||||||
| Net assets 100.00% | $ | 2,542,497 | ||||||
Futures contracts
| Contracts | Type | Number of contracts | Expiration | Notional amount (000) | 1 | Value at 12/31/2018 (000) | 2 | Unrealized appreciation (depreciation) at 12/31/2018 (000) | ||||||||||||||
| 5 Year U.S. Treasury Note Futures | Long | 7,806 | March 2019 | $ | 780,600 | $ | 895,251 | $ | 8,348 | |||||||||||||
| FTSE 100 Index Contracts | Short | 120 | March 2019 | £ | (1 | ) | (10,185 | ) | 46 | |||||||||||||
| S&P Mid 400 E-mini Index Contracts | Short | 33 | March 2019 | $ | (3 | ) | (5,485 | ) | 146 | |||||||||||||
| Euro Stoxx 50 Index Contracts | Short | 671 | March 2019 | € | (7 | ) | (22,864 | ) | 375 | |||||||||||||
| Nikkei 225 Index Contracts | Short | 7 | March 2019 | ¥ | (7 | ) | (1,277 | ) | 49 | |||||||||||||
| Russell 2000 Mini Index Contracts | Short | 895 | March 2019 | $ | (45 | ) | (60,368 | ) | 1,608 | |||||||||||||
| Mini MSCI Emerging Market Index Contracts | Short | 1,027 | March 2019 | (51 | ) | (49,645 | ) | 184 | ||||||||||||||
| S&P 500 E-mini Index Contracts | Short | 4,514 | March 2019 | (226 | ) | (565,424 | ) | 14,749 | ||||||||||||||
| British Pound Currency Contracts | Short | 131 | March 2019 | (8,188 | ) | (10,472 | ) | (63 | ) | |||||||||||||
| Euro Currency Contracts | Short | 165 | March 2019 | (20,625 | ) | (23,765 | ) | (88 | ) | |||||||||||||
| Japanese Yen Currency Contracts | Short | 12 | March 2019 | (150,000 | ) | (1,376 | ) | (31 | ) | |||||||||||||
| $ | 25,323 | |||||||||||||||||||||
Investment in affiliates
This holding is an affiliate of the fund under the Investment Company Act of 1940 since it is controlled by the same board of trustees as the series. Further details on this holding and related transactions during the year ended December 31, 2018, appear below.
| Beginning shares | Additions | Reductions | Ending shares | Net realized loss (000) | Net unrealized depreciation (000) | Dividend income (000) | Value of affiliate at 12/31/2018 (000) | |||||||||||||||||||||||||
| Asset allocation funds 96.69% | ||||||||||||||||||||||||||||||||
| American Funds Insurance Series – Asset Allocation Fund, Class 1 | 178,833,494 | 22,204,494 | 85,569,765 | 115,468,223 | $ | (39,223 | ) | $(392,470 | ) | $80,687 | $ | 2,458,318 | ||||||||||||||||||||
| 1 | Notional amount is calculated based on the number of contracts and notional contract size. |
| 2 | Value is calculated based on the notional amount and current market price. |
Key to symbols
£ = British pounds
€ = Euros
¥ = Japanese yen
See notes to financial statements
| American Funds Insurance Series | 125 |
Statements of assets and liabilities
at December 31, 2018
| Global Growth Fund | Global Small Capitalization Fund | Growth Fund | International Fund | New World Fund | ||||||||||||||||
| Assets: | ||||||||||||||||||||
| Investment securities, at value: | ||||||||||||||||||||
| Unaffiliated issuers | $ | 5,486,916 | $ | 3,673,913 | $ | 23,407,476 | $ | 8,996,441 | $ | 2,999,468 | ||||||||||
| Affiliated issuers | — | 29,982 | — | — | — | |||||||||||||||
| Cash | 178 | 156 | 1,343 | 131 | 4,433 | |||||||||||||||
| Cash pledged for securities on loan | — | 6,049 | — | — | — | |||||||||||||||
| Cash pledged for forward currency contracts | — | — | — | 330 | — | |||||||||||||||
| Cash denominated in currencies other than U.S. dollars | 1 | 80 | — | 1,626 | 712 | |||||||||||||||
| Unrealized appreciation on open forward currency contracts | — | — | — | — | 356 | |||||||||||||||
| Receivables for: | ||||||||||||||||||||
| Sales of investments | 319 | 3,233 | 21,198 | 1,944 | 4,847 | |||||||||||||||
| Sales of fund’s shares | 28,743 | 5,568 | 49,254 | 16,453 | 1,400 | |||||||||||||||
| Dividends and interest | 8,330 | 3,564 | 13,574 | 16,015 | 5,498 | |||||||||||||||
| Variation margin on futures contracts | — | — | — | — | — | |||||||||||||||
| Variation margin on swap contracts | — | — | — | — | — | |||||||||||||||
| Securities lending income | — | 160 | — | — | — | |||||||||||||||
| Other | 378 | 124 | 2 | 136 | 7 | |||||||||||||||
| 5,524,865 | 3,722,829 | 23,492,847 | 9,033,076 | 3,016,721 | ||||||||||||||||
| Liabilities: | ||||||||||||||||||||
| Collateral for securities on loan | — | 60,486 | — | — | — | |||||||||||||||
| Unrealized depreciation on open forward currency contracts | — | — | — | 525 | 53 | |||||||||||||||
| Payables for: | ||||||||||||||||||||
| Purchases of investments | 16,115 | 3,150 | 21,907 | 6,618 | 808 | |||||||||||||||
| Repurchases of fund’s shares | 2,128 | 605 | 11,254 | 4,966 | 1,595 | |||||||||||||||
| Investment advisory services | 2,473 | 2,214 | 6,602 | 3,815 | 1,833 | |||||||||||||||
| Insurance administrative fees | 163 | 95 | 706 | 193 | 293 | |||||||||||||||
| Services provided by related parties | 810 | 506 | 3,421 | 970 | 302 | |||||||||||||||
| Trustees’ deferred compensation | 72 | 48 | 503 | 213 | 32 | |||||||||||||||
| Variation margin on futures contracts | — | — | — | — | — | |||||||||||||||
| Variation margin on swap contracts | — | — | — | — | — | |||||||||||||||
| Non-U.S. taxes | 853 | 931 | 515 | 5,462 | 793 | |||||||||||||||
| Other | 98 | 280 | 78 | 204 | 133 | |||||||||||||||
| 22,712 | 68,315 | 44,986 | 22,966 | 5,842 | ||||||||||||||||
| Net assets at December 31, 2018 | $ | 5,502,153 | $ | 3,654,514 | $ | 23,447,861 | $ | 9,010,110 | $ | 3,010,879 | ||||||||||
| Net assets consist of: | ||||||||||||||||||||
| Capital paid in on shares of beneficial interest | $ | 3,889,612 | $ | 3,067,044 | $ | 14,176,248 | $ | 8,331,112 | $ | 2,702,017 | ||||||||||
| Total distributable earnings (accumulated loss) | 1,612,541 | 587,470 | 9,271,613 | 678,998 | 308,862 | |||||||||||||||
| Net assets at December 31, 2018 | $ | 5,502,153 | $ | 3,654,514 | $ | 23,447,861 | $ | 9,010,110 | $ | 3,010,879 | ||||||||||
| Investment securities, at cost: | ||||||||||||||||||||
| Unaffiliated issuers | $ | 4,224,241 | $ | 3,380,162 | $ | 16,925,576 | $ | 8,523,681 | $ | 2,819,850 | ||||||||||
| Affiliated issuers | — | 45,822 | — | — | — | |||||||||||||||
| Cash denominated in currencies other than U.S. dollars, at cost | 1 | 86 | — | 1,620 | 711 | |||||||||||||||
See end of statements of assets and liabilities for footnote.
See notes to financial statements
| 126 | American Funds Insurance Series |
(dollars in thousands)
| Blue Chip Income and Growth Fund | Global Growth and Income Fund | Growth- Income Fund | International Growth and Income Fund | Capital Income Builder | Asset Allocation Fund | Global Balanced Fund | Bond Fund | Global Bond Fund | ||||||||||||||||||||||||||
| $ | 8,018,033 | $ | 1,811,931 | $ | 29,638,729 | $ | 1,333,446 | $ | 679,748 | $ | 23,114,218 | $ | 368,422 | $ | 10,945,510 | $ | 2,123,592 | |||||||||||||||||
| — | — | 202,273 | — | — | 153,583 | — | — | — | ||||||||||||||||||||||||||
| 1,442 | 226 | 5,392 | 131 | 493 | 3,965 | 111 | 5,730 | 633 | ||||||||||||||||||||||||||
| — | — | — | — | — | — | — | — | — | ||||||||||||||||||||||||||
| — | — | — | — | — | — | — | — | — | ||||||||||||||||||||||||||
| — | — | 1 | 162 | 116 | 840 | 7 | 6,114 | 964 | ||||||||||||||||||||||||||
| — | 351 | — | — | — | — | 214 | 5,141 | 12,488 | ||||||||||||||||||||||||||
| — | — | 50,544 | — | 425 | 103,114 | 81 | 766,356 | 3,468 | ||||||||||||||||||||||||||
| 4,453 | 597 | 41,007 | 127 | 1,890 | 10,186 | 175 | 2,561 | 30 | ||||||||||||||||||||||||||
| 14,855 | 4,749 | 41,209 | 5,240 | 2,673 | 66,435 | 1,558 | 63,965 | 17,559 | ||||||||||||||||||||||||||
| — | — | — | — | 286 | 1,056 | 32 | 3,526 | 755 | ||||||||||||||||||||||||||
| — | — | — | — | — | 83 | 4 | 94 | 49 | ||||||||||||||||||||||||||
| — | — | — | — | — | — | — | — | — | ||||||||||||||||||||||||||
| — | 25 | — | 31 | 3 | 313 | 18 | 377 | 53 | ||||||||||||||||||||||||||
| 8,038,783 | 1,817,879 | 29,979,155 | 1,339,137 | 685,634 | 23,453,793 | 370,622 | 11,799,374 | 2,159,591 | ||||||||||||||||||||||||||
| — | — | — | — | — | — | — | — | — | ||||||||||||||||||||||||||
| — | — | — | — | — | — | 132 | 14,412 | 5,570 | ||||||||||||||||||||||||||
| — | — | 75,910 | 112 | 9,280 | 506,077 | 3,803 | 1,901,710 | 56,897 | ||||||||||||||||||||||||||
| 3,583 | 545 | 27,805 | 301 | 228 | 11,216 | 134 | 23,576 | 7,155 | ||||||||||||||||||||||||||
| 2,735 | 940 | 6,567 | 701 | 283 | 5,477 | 206 | 3,023 | 948 | ||||||||||||||||||||||||||
| 231 | 61 | 588 | 46 | 225 | 2,313 | 44 | 225 | 25 | ||||||||||||||||||||||||||
| 766 | 301 | 3,070 | 76 | 80 | 1,980 | 57 | 918 | 247 | ||||||||||||||||||||||||||
| 80 | 23 | 576 | 9 | 3 | 258 | 2 | 116 | 24 | ||||||||||||||||||||||||||
| — | — | — | — | 237 | 99 | — | 351 | 145 | ||||||||||||||||||||||||||
| — | — | — | — | — | 756 | 1 | 356 | 7 | ||||||||||||||||||||||||||
| 100 | 87 | 407 | 592 | 12 | 126 | 48 | — | 453 | ||||||||||||||||||||||||||
| 16 | 48 | 97 | 42 | 6 | 40 | 6 | — | 103 | ||||||||||||||||||||||||||
| 7,511 | 2,005 | 115,020 | 1,879 | 10,354 | 528,342 | 4,433 | 1,944,687 | 71,574 | ||||||||||||||||||||||||||
| $ | 8,031,272 | $ | 1,815,874 | $ | 29,864,135 | $ | 1,337,258 | $ | 675,280 | $ | 22,925,451 | $ | 366,189 | $ | 9,854,687 | $ | 2,088,017 | |||||||||||||||||
| $ | 6,594,985 | $ | 1,523,636 | $ | 21,925,796 | $ | 1,347,787 | $ | 710,885 | $ | 19,064,550 | $ | 341,847 | $ | 10,077,153 | $ | 2,124,152 | |||||||||||||||||
| 1,436,287 | 292,238 | 7,938,339 | (10,529 | ) | (35,605 | ) | 3,860,901 | 24,342 | (222,466 | ) | (36,135 | ) | ||||||||||||||||||||||
| $ | 8,031,272 | $ | 1,815,874 | $ | 29,864,135 | $ | 1,337,258 | $ | 675,280 | $ | 22,925,451 | $ | 366,189 | $ | 9,854,687 | $ | 2,088,017 | |||||||||||||||||
| $ | 7,325,397 | $ | 1,627,160 | $ | 25,100,577 | $ | 1,364,122 | $ | 702,114 | $ | 20,304,078 | $ | 345,235 | $ | 11,058,951 | $ | 2,167,128 | |||||||||||||||||
| — | — | 273,780 | — | — | 586,257 | — | — | — | ||||||||||||||||||||||||||
| — | — | 1 | 159 | 116 | 840 | 7 | 6,229 | 961 | ||||||||||||||||||||||||||
| American Funds Insurance Series | 127 |
Statements of assets and liabilities
at December 31, 2018
| High- Income Bond Fund | Mortgage Fund | Ultra-Short Bond Fund | U.S. Government/ AAA-Rated Securities Fund | Managed Risk Growth Fund | ||||||||||||||||
| Assets: | ||||||||||||||||||||
| Investment securities, at value: | ||||||||||||||||||||
| Unaffiliated issuers | $ | 1,182,891 | $ | 343,748 | $ | 306,746 | $ | 3,110,704 | $ | 5,144 | ||||||||||
| Affiliated issuers | — | — | — | — | 330,797 | |||||||||||||||
| Cash | 840 | 383 | 80 | 3,850 | — | |||||||||||||||
| Cash pledged for futures contracts | — | — | — | — | 8,181 | |||||||||||||||
| Cash denominated in currencies other than U.S. dollars | — | * | — | — | — | — | ||||||||||||||
| Receivables for: | ||||||||||||||||||||
| Sales of investments | 2,745 | 460 | — | 45,521 | — | |||||||||||||||
| Sales of fund’s shares | 77 | 204 | 48 | 642 | 596 | |||||||||||||||
| Dividends and interest | 21,205 | 877 | — | 11,543 | 22 | |||||||||||||||
| Variation margin on futures contracts | — | 249 | — | 4,583 | 394 | |||||||||||||||
| Variation margin on swap contracts | 40 | 170 | — | 2,783 | — | |||||||||||||||
| Other | 168 | 2 | — | 28 | — | |||||||||||||||
| 1,207,966 | 346,093 | 306,874 | 3,179,654 | 345,134 | ||||||||||||||||
| Liabilities: | ||||||||||||||||||||
| Payables for: | ||||||||||||||||||||
| Purchases of investments | 1,934 | 54,109 | — | 295,152 | 563 | |||||||||||||||
| Repurchases of fund’s shares | 1,312 | 356 | 301 | 8,565 | 3 | |||||||||||||||
| Investment advisory services | 498 | 105 | 82 | 830 | 29 | |||||||||||||||
| Insurance administrative fees | 22 | 13 | 10 | 49 | 215 | |||||||||||||||
| Services provided by related parties | 163 | 19 | 59 | 328 | 71 | |||||||||||||||
| Trustees’ deferred compensation | 50 | 3 | 18 | 60 | 1 | |||||||||||||||
| Variation margin on futures contracts | — | — | — | 594 | 979 | |||||||||||||||
| Variation margin on swap contracts | 87 | 313 | — | 4,772 | — | |||||||||||||||
| Other | 1 | — | — | 1 | — | |||||||||||||||
| 4,067 | 54,918 | 470 | 310,351 | 1,861 | ||||||||||||||||
| Net assets at December 31, 2018 | $ | 1,203,899 | $ | 291,175 | $ | 306,404 | $ | 2,869,303 | $ | 343,273 | ||||||||||
| Net assets consist of: | ||||||||||||||||||||
| Capital paid in on shares of beneficial interest | $ | 1,464,474 | $ | 295,903 | $ | 305,431 | $ | 2,910,880 | $ | 326,588 | ||||||||||
| Total distributable earnings (accumulated loss) | (260,575 | ) | (4,728 | ) | 973 | (41,577 | ) | 16,685 | ||||||||||||
| Net assets at December 31, 2018 | $ | 1,203,899 | $ | 291,175 | $ | 306,404 | $ | 2,869,303 | $ | 343,273 | ||||||||||
| Investment securities, at cost: | ||||||||||||||||||||
| Unaffiliated issuers | $ | 1,274,934 | $ | 344,748 | $ | 306,754 | $ | 3,124,841 | $ | 5,144 | ||||||||||
| Affiliated issuers | — | — | — | — | 334,489 | |||||||||||||||
| Cash denominated in currencies other than U.S. dollars, at cost | — | * | — | — | — | — | ||||||||||||||
See end of statements of assets and liabilities for footnote.
See notes to financial statements
| 128 | American Funds Insurance Series |
(dollars in thousands)
| Managed Risk International Fund | Managed Risk Blue Chip Income and Growth Fund | Managed Risk Growth- Income Fund | Managed Risk Asset Allocation Fund | |||||||||||
| $ | 5,178 | $ | 4,613 | $ | 75,599 | $ | 48,607 | |||||||
| 142,784 | 324,690 | 1,785,593 | 2,458,318 | |||||||||||
| — | — | — | — | |||||||||||
| 3,017 | 8,327 | 34,515 | 41,388 | |||||||||||
| — | — | — | — | |||||||||||
| — | — | 27,293 | 374 | |||||||||||
| 190 | 386 | 339 | 336 | |||||||||||
| 10 | 22 | 67 | 305 | |||||||||||
| 182 | 389 | 1,951 | 2,143 | |||||||||||
| — | — | — | — | |||||||||||
| — | — | — | — | |||||||||||
| 151,361 | 338,427 | 1,925,357 | 2,551,471 | |||||||||||
| 174 | 364 | — | — | |||||||||||
| 6 | 3 | 29,069 | 729 | |||||||||||
| 13 | 29 | 84 | 298 | |||||||||||
| 96 | 214 | 308 | 2,570 | |||||||||||
| 31 | 70 | 48 | 538 | |||||||||||
| 1 | 2 | 1 | 23 | |||||||||||
| 81 | 1,076 | 3,745 | 4,816 | |||||||||||
| — | — | — | — | |||||||||||
| — | — | — | — | |||||||||||
| 402 | 1,758 | 33,255 | 8,974 | |||||||||||
| $ | 150,959 | $ | 336,669 | $ | 1,892,102 | $ | 2,542,497 | |||||||
| $ | 157,470 | $ | 340,198 | $ | 1,895,504 | $ | 2,426,171 | |||||||
| (6,511 | ) | (3,529 | ) | (3,402 | ) | 116,326 | ||||||||
| $ | 150,959 | $ | 336,669 | $ | 1,892,102 | $ | 2,542,497 | |||||||
| $ | 5,178 | $ | 4,613 | $ | 74,588 | $ | 48,607 | |||||||
| 150,338 | 349,187 | 1,804,315 | 2,512,141 | |||||||||||
| — | — | — | — | |||||||||||
| American Funds Insurance Series | 129 |
Statements of assets and liabilities
at December 31, 2018
| Global Growth Fund | Global Small Capitalization Fund | Growth Fund | International Fund | New World Fund | ||||||||||||||||||
| Shares of beneficial interest issued and outstanding (no stated par value) — unlimited shares authorized | ||||||||||||||||||||||
| Class 1: | Net assets | $ | 1,942,639 | $ | 1,452,476 | $ | 8,474,126 | $ | 4,811,429 | $ | 1,701,716 | |||||||||||
| Shares outstanding | 75,457 | 66,791 | 121,126 | 272,408 | 81,098 | |||||||||||||||||
| Net asset value per share | $ | 25.74 | $ | 21.75 | $ | 69.96 | $ | 17.66 | $ | 20.98 | ||||||||||||
| Class 1A: | Net assets | $ | 4,778 | $ | 353 | $ | 9,862 | $ | 4,936 | $ | 2,363 | |||||||||||
| Shares outstanding | 186 | 16 | 141 | 280 | 113 | |||||||||||||||||
| Net asset value per share | $ | 25.69 | $ | 21.71 | $ | 69.77 | $ | 17.62 | $ | 20.92 | ||||||||||||
| Class 2: | Net assets | $ | 3,306,059 | $ | 2,055,787 | $ | 13,700,966 | $ | 3,875,242 | $ | 843,316 | |||||||||||
| Shares outstanding | 129,626 | 97,154 | 197,204 | 220,231 | 40,558 | |||||||||||||||||
| Net asset value per share | $ | 25.50 | $ | 21.16 | $ | 69.48 | $ | 17.60 | $ | 20.79 | ||||||||||||
| Class 3: | Net assets | $ | 187,003 | $ | 23,753 | |||||||||||||||||
| Shares outstanding | Not applicable | Not applicable | 2,655 | 1,342 | Not applicable | |||||||||||||||||
| Net asset value per share | $ | 70.44 | $ | 17.70 | ||||||||||||||||||
| Class 4: | Net assets | $ | 248,677 | $ | 145,898 | $ | 1,075,904 | $ | 294,750 | $ | 463,484 | |||||||||||
| Shares outstanding | 9,795 | 6,855 | 15,676 | 16,935 | 22,375 | |||||||||||||||||
| Net asset value per share | $ | 25.39 | $ | 21.28 | $ | 68.64 | $ | 17.40 | $ | 20.71 | ||||||||||||
| High- Income Bond Fund | Mortgage Fund | Ultra-Short Bond Fund | U.S. Government/ AAA-Rated Securities Fund | Managed Risk Growth Fund | ||||||||||||||||||
| Shares of beneficial interest issued and outstanding (no stated par value) — unlimited shares authorized | ||||||||||||||||||||||
| Class 1: | Net assets | $ | 501,284 | $ | 209,329 | $ | 36,869 | $ | 1,445,275 | |||||||||||||
| Shares outstanding | 53,676 | 20,330 | 3,259 | 121,022 | Not applicable | |||||||||||||||||
| Net asset value per share | $ | 9.34 | $ | 10.30 | $ | 11.31 | $ | 11.94 | ||||||||||||||
| Class 1A: | Net assets | $ | 644 | $ | 739 | $ | 10 | $ | 1,510 | |||||||||||||
| Shares outstanding | 69 | 72 | 1 | 127 | Not applicable | |||||||||||||||||
| Net asset value per share | $ | 9.33 | $ | 10.28 | $ | 11.31 | $ | 11.93 | ||||||||||||||
| Class 2: | Net assets | $ | 661,317 | $ | 56,871 | $ | 247,022 | $ | 1,322,968 | |||||||||||||
| Shares outstanding | 71,992 | 5,534 | 22,403 | 111,891 | Not applicable | |||||||||||||||||
| Net asset value per share | $ | 9.19 | $ | 10.28 | $ | 11.03 | $ | 11.82 | ||||||||||||||
| Class 3: | Net assets | $ | 9,485 | $ | 4,516 | $ | 8,900 | |||||||||||||||
| Shares outstanding | 1,011 | Not applicable | 405 | 743 | Not applicable | |||||||||||||||||
| Net asset value per share | $ | 9.38 | $ | 11.14 | $ | 11.97 | ||||||||||||||||
| Class 4: | Net assets | $ | 31,169 | $ | 24,236 | $ | 17,987 | $ | 90,650 | |||||||||||||
| Shares outstanding | 3,129 | 2,379 | 1,613 | 7,659 | Not applicable | |||||||||||||||||
| Net asset value per share | $ | 9.96 | $ | 10.19 | $ | 11.15 | $ | 11.84 | ||||||||||||||
| Class P1: | Net assets | $ | 2,850 | |||||||||||||||||||
| Shares outstanding | Not applicable | Not applicable | Not applicable | Not applicable | 232 | |||||||||||||||||
| Net asset value per share | $ | 12.30 | ||||||||||||||||||||
| Class P2: | Net assets | $ | 340,423 | |||||||||||||||||||
| Shares outstanding | Not applicable | Not applicable | Not applicable | Not applicable | 27,883 | |||||||||||||||||
| Net asset value per share | $ | 12.21 | ||||||||||||||||||||
| * | Amount less than one thousand. |
See notes to financial statements
| 130 | American Funds Insurance Series |
(dollars and shares in thousands, except per-share amounts)
| Blue Chip Income and Growth Fund | Global Growth and Income Fund | Growth- Income Fund | International Growth and Income Fund | Capital Income Builder | Asset Allocation Fund | Global Balanced Fund | Bond Fund | Global Bond Fund | ||||||||||||||||||||||||||
| $ | 4,809,964 | $ | 492,281 | $ | 16,782,983 | $ | 1,034,317 | $ | 316,763 | $ | 14,626,696 | $ | 109,776 | $ | 5,961,685 | $ | 1,015,292 | |||||||||||||||||
| 388,433 | 37,818 | 369,768 | 67,397 | 33,820 | 686,976 | 9,410 | 569,176 | 88,889 | ||||||||||||||||||||||||||
| $ | 12.38 | $ | 13.02 | $ | 45.39 | $ | 15.35 | $ | 9.37 | $ | 21.29 | $ | 11.67 | $ | 10.47 | $ | 11.42 | |||||||||||||||||
| $ | 3,162 | $ | 927 | $ | 6,733 | $ | 1,749 | $ | 2,686 | $ | 6,982 | $ | 2,007 | $ | 3,284 | $ | 400 | |||||||||||||||||
| 256 | 72 | 149 | 114 | 287 | 328 | 172 | 314 | 35 | ||||||||||||||||||||||||||
| $ | 12.35 | $ | 13.00 | $ | 45.28 | $ | 15.33 | $ | 9.36 | $ | 21.26 | $ | 11.65 | $ | 10.45 | $ | 11.41 | |||||||||||||||||
| $ | 2,850,294 | $ | 1,227,787 | $ | 12,035,441 | $ | 230,035 | $ | 3,719 | $ | 4,667,683 | $ | 184,786 | $ | 3,523,963 | $ | 1,032,370 | |||||||||||||||||
| 232,925 | 94,484 | 268,073 | 15,034 | 397 | 221,412 | 15,865 | 340,694 | 91,060 | ||||||||||||||||||||||||||
| $ | 12.24 | $ | 12.99 | $ | 44.90 | $ | 15.30 | $ | 9.36 | $ | 21.08 | $ | 11.65 | $ | 10.34 | $ | 11.34 | |||||||||||||||||
| $ | 140,465 | $ | 29,682 | |||||||||||||||||||||||||||||||
| Not applicable | Not applicable | 3,089 | Not applicable | Not applicable | 1,392 | Not applicable | Not applicable | Not applicable | ||||||||||||||||||||||||||
| $ | 45.47 | $ | 21.32 | |||||||||||||||||||||||||||||||
| $ | 367,852 | $ | 94,879 | $ | 898,513 | $ | 71,157 | $ | 352,112 | $ | 3,594,408 | $ | 69,620 | $ | 365,755 | $ | 39,955 | |||||||||||||||||
| 30,177 | 7,405 | 20,203 | 4,675 | 37,666 | 171,230 | 6,029 | 35,411 | 3,554 | ||||||||||||||||||||||||||
| $ | 12.19 | $ | 12.81 | $ | 44.47 | $ | 15.22 | $ | 9.35 | $ | 20.99 | $ | 11.55 | $ | 10.33 | $ | 11.24 | |||||||||||||||||
| Managed Risk International Fund | Managed Risk Blue Chip Income and Growth Fund | Managed Risk Growth- Income Fund | Managed Risk Asset Allocation Fund | |||||||||||||||||||||||||||||||
| Not applicable | Not applicable | Not applicable | Not applicable | |||||||||||||||||||||||||||||||
| Not applicable | Not applicable | Not applicable | Not applicable | |||||||||||||||||||||||||||||||
| Not applicable | Not applicable | Not applicable | Not applicable | |||||||||||||||||||||||||||||||
| Not applicable | Not applicable | Not applicable | Not applicable | |||||||||||||||||||||||||||||||
| Not applicable | Not applicable | Not applicable | Not applicable | |||||||||||||||||||||||||||||||
| $ | 379 | $ | 492 | $ | 1,661,806 | $ | 1,596 | |||||||||||||||||||||||||||
| 39 | 44 | 141,701 | 130 | |||||||||||||||||||||||||||||||
| $ | 9.82 | $ | 11.28 | $ | 11.73 | $ | 12.23 | |||||||||||||||||||||||||||
| $ | 150,580 | $ | 336,177 | $ | 230,296 | $ | 2,540,901 | |||||||||||||||||||||||||||
| 15,421 | 29,981 | 19,726 | 207,856 | |||||||||||||||||||||||||||||||
| $ | 9.76 | $ | 11.21 | $ | 11.67 | $ | 12.22 | |||||||||||||||||||||||||||
| American Funds Insurance Series | 131 |
Statements of operations
for the year ended December 31, 2018
| Global Growth Fund | Global Small Capitalization Fund | Growth Fund | International Fund | New World Fund | ||||||||||||||||
| Investment income: | ||||||||||||||||||||
| Income (net of non-U.S. taxes*): | ||||||||||||||||||||
| Dividends | $ | 89,435 | $ | 40,551 | $ | 266,249 | $ | 188,307 | $ | 47,131 | ||||||||||
| Interest | 6,142 | 7,378 | 28,788 | 23,999 | 16,421 | |||||||||||||||
| Securities lending income | — | 730 | — | — | — | |||||||||||||||
| 95,577 | 48,659 | 295,037 | 212,306 | 63,552 | ||||||||||||||||
| Fees and expenses*: | ||||||||||||||||||||
| Investment advisory services | 32,234 | 29,438 | 83,065 | 48,247 | 23,782 | |||||||||||||||
| Distribution services | 10,330 | 6,459 | 42,560 | 11,764 | 3,589 | |||||||||||||||
| Insurance administrative services | 633 | 367 | 2,750 | 790 | 1,164 | |||||||||||||||
| Transfer agent services | 1 | — | † | 3 | 1 | — | † | |||||||||||||
| Administrative services | 624 | 423 | 2,573 | 981 | 339 | |||||||||||||||
| Reports to shareholders | 218 | 136 | 900 | 342 | 127 | |||||||||||||||
| Registration statement and prospectus | 47 | 88 | 197 | 66 | 29 | |||||||||||||||
| Trustees’ compensation | 37 | 25 | 150 | 58 | 20 | |||||||||||||||
| Auditing and legal | 76 | 65 | 80 | 102 | 72 | |||||||||||||||
| Custodian | 964 | 643 | 502 | 1,867 | 1,253 | |||||||||||||||
| Other | 137 | 228 | 252 | 202 | 342 | |||||||||||||||
| Total fees and expenses before waivers | 45,301 | 37,872 | 133,032 | 64,420 | 30,717 | |||||||||||||||
| Less waivers of fees and expenses: | ||||||||||||||||||||
| Investment advisory services waivers | — | — | — | — | — | |||||||||||||||
| Total waivers of fees and expenses | — | — | — | — | — | |||||||||||||||
| Total fees and expenses after waivers | 45,301 | 37,872 | 133,032 | 64,420 | 30,717 | |||||||||||||||
| Net investment income | 50,276 | 10,787 | 162,005 | 147,886 | 32,835 | |||||||||||||||
| Net realized gain (loss) and unrealized (depreciation) appreciation: | ||||||||||||||||||||
| Net realized gain (loss) on: | ||||||||||||||||||||
| Investments | ||||||||||||||||||||
| Unaffiliated issuers | 344,211 | 244,684 | 2,850,252 | 248,667 | 125,246 | |||||||||||||||
| Affiliated issuers | — | 2,632 | — | — | — | |||||||||||||||
| Futures contracts | — | — | — | — | — | |||||||||||||||
| Forward currency contracts | (21 | ) | 94 | — | 1,317 | 649 | ||||||||||||||
| Swap contracts | — | — | — | — | — | |||||||||||||||
| Currency transactions | (648 | ) | (349 | ) | (1,358 | ) | (2,744 | ) | 308 | |||||||||||
| 343,542 | 247,061 | 2,848,894 | 247,240 | 126,203 | ||||||||||||||||
| Net unrealized (depreciation) appreciation on: | ||||||||||||||||||||
| Investments | ||||||||||||||||||||
| Unaffiliated issuers | (919,949 | ) | (654,311 | ) | (2,970,971 | ) | (1,741,395 | ) | (647,695 | ) | ||||||||||
| Affiliated issuers | — | (19,991 | ) | — | — | — | ||||||||||||||
| Futures contracts | — | — | — | — | — | |||||||||||||||
| Forward currency contracts | (15 | ) | 1,103 | — | (170 | ) | 626 | |||||||||||||
| Swap contracts | — | — | — | — | — | |||||||||||||||
| Currency translations | 288 | 41 | (119 | ) | (189 | ) | 36 | |||||||||||||
| (919,676 | ) | (673,158 | ) | (2,971,090 | ) | (1,741,754 | ) | (647,033 | ) | |||||||||||
| Net realized gain (loss) and unrealized (depreciation) appreciation | (576,134 | ) | (426,097 | ) | (122,196 | ) | (1,494,514 | ) | (520,830 | ) | ||||||||||
| Net (decrease) increase in net assets resulting from operations | $ | (525,858 | ) | $ | (415,310 | ) | $ | 39,809 | $ | (1,346,628 | ) | $ | (487,995 | ) | ||||||
See end of statements of operations for footnotes.
See notes to financial statements
| 132 | American Funds Insurance Series |
(dollars in thousands)
| Blue Chip Income and Growth Fund | Global Growth and Income Fund | Growth- Income Fund | International Growth and Income Fund | Capital Income Builder | Asset Allocation Fund | Global Balanced Fund | Bond Fund | Global Bond Fund | ||||||||||||||||||||||||||
| $ | 225,462 | $ | 47,619 | $ | 561,216 | $ | 42,953 | $ | 18,229 | $ | 330,664 | $ | 5,923 | $ | — | $ | — | |||||||||||||||||
| 5,328 | 5,256 | 43,954 | 4,649 | 5,121 | 270,199 | 3,763 | 319,829 | 71,425 | ||||||||||||||||||||||||||
| — | — | — | — | — | — | — | — | — | ||||||||||||||||||||||||||
| 230,790 | 52,875 | 605,170 | 47,602 | 23,350 | 600,863 | 9,686 | 319,829 | 71,425 | ||||||||||||||||||||||||||
| 35,312 | 12,167 | 81,100 | 8,812 | 3,229 | 68,775 | 2,520 | 37,656 | 12,085 | ||||||||||||||||||||||||||
| 9,118 | 3,848 | 36,914 | 840 | 885 | 22,505 | 680 | 10,220 | 2,901 | ||||||||||||||||||||||||||
| 794 | 233 | 2,300 | 183 | 884 | 9,354 | 167 | 835 | 97 | ||||||||||||||||||||||||||
| 1 | — | † | 4 | — | † | — | † | 3 | — | † | 1 | — | † | |||||||||||||||||||||
| 909 | 205 | 3,139 | 146 | 65 | 2,590 | 38 | 1,037 | 228 | ||||||||||||||||||||||||||
| 239 | 47 | 1,105 | 23 | 10 | 837 | 6 | 320 | 58 | ||||||||||||||||||||||||||
| 28 | 9 | 202 | 19 | 21 | 400 | 11 | 61 | 10 | ||||||||||||||||||||||||||
| 53 | 12 | 182 | 8 | 3 | 150 | 2 | 61 | 13 | ||||||||||||||||||||||||||
| 49 | 62 | 79 | 60 | 51 | 76 | 59 | 60 | 51 | ||||||||||||||||||||||||||
| 269 | 349 | 894 | 391 | 43 | 362 | 42 | 277 | 386 | ||||||||||||||||||||||||||
| 126 | 86 | 232 | 44 | 62 | 188 | 56 | 214 | 162 | ||||||||||||||||||||||||||
| 46,898 | 17,018 | 126,151 | 10,526 | 5,253 | 105,240 | 3,581 | 50,742 | 15,991 | ||||||||||||||||||||||||||
| — | — | — | 1 | 23 | — | — | — | — | ||||||||||||||||||||||||||
| — | — | — | 1 | 23 | — | — | — | — | ||||||||||||||||||||||||||
| 46,898 | 17,018 | 126,151 | 10,525 | 5,230 | 105,240 | 3,581 | 50,742 | 15,991 | ||||||||||||||||||||||||||
| 183,892 | 35,857 | 479,019 | 37,077 | 18,120 | 495,623 | 6,105 | 269,087 | 55,434 | ||||||||||||||||||||||||||
| 687,346 | 100,225 | 3,359,804 | 19,373 | (12,976 | ) | 1,252,346 | 4,175 | (159,911 | ) | 1,326 | ||||||||||||||||||||||||
| — | — | — | — | — | — | — | — | — | ||||||||||||||||||||||||||
| — | — | — | — | 242 | 677 | 23 | (38,790 | ) | (3,980 | ) | ||||||||||||||||||||||||
| — | (72 | ) | — | — | — | — | (541 | ) | 14,487 | (6,955 | ) | |||||||||||||||||||||||
| — | — | — | — | — | (2,209 | ) | (5 | ) | 16,367 | (44 | ) | |||||||||||||||||||||||
| 38 | (281 | ) | (2,288 | ) | 273 | (169 | ) | 85 | (76 | ) | (565 | ) | (2,076 | ) | ||||||||||||||||||||
| 687,384 | 99,872 | 3,357,516 | 19,646 | (12,903 | ) | 1,250,899 | 3,576 | (168,412 | ) | (11,729 | ) | |||||||||||||||||||||||
| (1,602,181 | ) | (325,794 | ) | (4,115,868 | ) | (222,546 | ) | (54,286 | ) | (2,657,935 | ) | (34,350 | ) | (164,246 | ) | (82,168 | ) | |||||||||||||||||
| — | — | (116,886 | ) | — | — | (230,161 | ) | — | — | — | ||||||||||||||||||||||||
| — | — | — | — | 429 | 5,914 | 180 | 23,764 | 4,630 | ||||||||||||||||||||||||||
| — | 351 | — | — | — | — | 207 | (16,813 | ) | 6,258 | |||||||||||||||||||||||||
| — | — | — | — | — | 2,691 | 5 | (7,301 | ) | 1,530 | |||||||||||||||||||||||||
| (41 | ) | (87 | ) | (237 | ) | (23 | ) | (10 | ) | (72 | ) | 1 | (246 | ) | (258 | ) | ||||||||||||||||||
| (1,602,222 | ) | (325,530 | ) | (4,232,991 | ) | (222,569 | ) | (53,867 | ) | (2,879,563 | ) | (33,957 | ) | (164,842 | ) | (70,008 | ) | |||||||||||||||||
| (914,838 | ) | (225,658 | ) | (875,475 | ) | (202,923 | ) | (66,770 | ) | (1,628,664 | ) | (30,381 | ) | (333,254 | ) | (81,737 | ) | |||||||||||||||||
| $ | (730,946 | ) | $ | (189,801 | ) | $ | (396,456 | ) | $ | (165,846 | ) | $ | (48,650 | ) | $ | (1,133,041 | ) | $ | (24,276 | ) | $ | (64,167 | ) | $ | (26,303 | ) | ||||||||
| American Funds Insurance Series | 133 |
Statements of operations
for the year ended December 31, 2018
| High- Income Bond Fund | Mortgage Fund | Ultra-Short Bond Fund | U.S. Government/ AAA-Rated Securities Fund | Managed Risk Growth Fund | ||||||||||||||||
| Investment income: | ||||||||||||||||||||
| Income (net of non-U.S. taxes*): | ||||||||||||||||||||
| Dividends | $ | — | $ | — | $ | — | $ | — | $ | 3,341 | ||||||||||
| Interest | 93,699 | 7,928 | 5,763 | 71,451 | 216 | |||||||||||||||
| 93,699 | 7,928 | 5,763 | 71,451 | 3,557 | ||||||||||||||||
| Fees and expenses*: | ||||||||||||||||||||
| Investment advisory services | 6,485 | 1,361 | 947 | 10,160 | 486 | |||||||||||||||
| Distribution services | 1,953 | 191 | 643 | 3,706 | 803 | |||||||||||||||
| Insurance administrative services | 86 | 42 | 37 | 171 | 809 | |||||||||||||||
| Transfer agent services | — | † | — | † | — | † | — | † | — | † | ||||||||||
| Administrative services | 137 | 32 | 30 | 300 | — | |||||||||||||||
| Accounting and administrative services | — | — | — | — | 43 | |||||||||||||||
| Reports to shareholders | 33 | 5 | 6 | 65 | 5 | |||||||||||||||
| Registration statement and prospectus | 9 | 2 | 3 | 15 | 7 | |||||||||||||||
| Trustees’ compensation | 8 | 2 | 2 | 18 | 2 | |||||||||||||||
| Auditing and legal | 49 | 44 | 42 | 46 | 23 | |||||||||||||||
| Custodian | 32 | 35 | 1 | 56 | 9 | |||||||||||||||
| Other | 95 | 66 | 16 | 129 | 23 | |||||||||||||||
| Total fees and expenses before waivers | 8,887 | 1,780 | 1,727 | 14,666 | 2,210 | |||||||||||||||
| Less waivers of fees and expenses: | ||||||||||||||||||||
| Investment advisory services waivers | — | — | — | — | 162 | |||||||||||||||
| Total waivers of fees and expenses | — | — | — | — | 162 | |||||||||||||||
| Total fees and expenses after waivers | 8,887 | 1,780 | 1,727 | 14,666 | 2,048 | |||||||||||||||
| Net investment income | 84,812 | 6,148 | 4,036 | 56,785 | 1,509 | |||||||||||||||
| Net realized gain (loss) and unrealized (depreciation) appreciation: | ||||||||||||||||||||
| Net realized gain (loss) on: | ||||||||||||||||||||
| Investments | ||||||||||||||||||||
| Unaffiliated issuers | (24,151 | ) | (3,538 | ) | — | (39,630 | ) | — | ||||||||||||
| Affiliated issuers | — | — | — | — | 2,012 | |||||||||||||||
| Futures contracts | 2 | (4,529 | ) | — | (45,333 | ) | (5,288 | ) | ||||||||||||
| Swap contracts | (390 | ) | 449 | — | (1,752 | ) | — | |||||||||||||
| Currency transactions | (5 | ) | — | — | — | 7 | ||||||||||||||
| Capital gain distributions received from affiliated issuers | — | — | — | — | 24,732 | |||||||||||||||
| (24,544 | ) | (7,618 | ) | — | (86,715 | ) | 21,463 | |||||||||||||
| Net unrealized (depreciation) appreciation on: | ||||||||||||||||||||
| Investments | ||||||||||||||||||||
| Unaffiliated issuers | (87,512 | ) | (1,970 | ) | 33 | (13,160 | ) | — | ||||||||||||
| Affiliated issuers | — | — | — | — | (32,846 | ) | ||||||||||||||
| Futures contracts | — | 2,531 | — | 34,895 | 5,929 | |||||||||||||||
| Swap contracts | 1,317 | 1,980 | — | 27,782 | — | |||||||||||||||
| Currency translations | (1 | ) | — | — | — | — | ||||||||||||||
| (86,196 | ) | 2,541 | 33 | 49,517 | (26,917 | ) | ||||||||||||||
| Net realized gain (loss) and unrealized (depreciation) appreciation | (110,740 | ) | (5,077 | ) | 33 | (37,198 | ) | (5,454 | ) | |||||||||||
| Net (decrease) increase in net assets resulting from operations | $ | (25,928 | ) | $ | 1,071 | $ | 4,069 | $ | 19,587 | $ | (3,945 | ) | ||||||||
| * | Additional information related to non-U.S. taxes, class-specific fees and expenses and affiliated income is included in the notes to financial statements. |
| † | Amount less than one thousand. |
See notes to financial statements
| 134 | American Funds Insurance Series |
(dollars in thousands)
| Managed Risk International Fund | Managed Risk Blue Chip Income and Growth Fund | Managed Risk Growth- Income Fund | Managed Risk Asset Allocation Fund | |||||||||||
| $ | 3,202 | $ | 7,264 | $ | 4,163 | $ | 80,686 | |||||||
| 112 | 246 | 195 | 2,846 | |||||||||||
| 3,314 | 7,510 | 4,358 | 83,532 | |||||||||||
| 234 | 530 | 439 | 6,609 | |||||||||||
| 389 | 883 | 564 | 6,862 | |||||||||||
| 389 | 883 | 731 | 11,015 | |||||||||||
| — | † | — | † | — | † | — | † | |||||||
| — | — | — | — | |||||||||||
| 40 | 43 | 42 | 114 | |||||||||||
| 3 | 6 | 4 | 73 | |||||||||||
| 5 | 7 | 5 | 70 | |||||||||||
| 1 | 2 | 1 | 26 | |||||||||||
| 23 | 23 | 33 | 28 | |||||||||||
| 9 | 9 | 9 | 9 | |||||||||||
| (18 | ) | 25 | (9 | ) | (1,637 | ) | ||||||||
| 1,075 | 2,411 | 1,819 | 23,169 | |||||||||||
| 78 | 177 | 146 | 2,203 | |||||||||||
| 78 | 177 | 146 | 2,203 | |||||||||||
| 997 | 2,234 | 1,673 | 20,966 | |||||||||||
| 2,317 | 5,276 | 2,685 | 62,566 | |||||||||||
| — | — | — | — | |||||||||||
| 170 | 4,208 | (2,379 | ) | (39,223 | ) | |||||||||
| (301 | ) | (7,698 | ) | (3,064 | ) | (49,333 | ) | |||||||
| — | — | — | — | |||||||||||
| (4 | ) | 7 | — | † | 62 | |||||||||
| 5,857 | 21,501 | 12,396 | 185,909 | |||||||||||
| 5,722 | 18,018 | 6,953 | 97,415 | |||||||||||
| — | — | 1,011 | — | |||||||||||
| (26,570 | ) | (55,129 | ) | (32,512 | ) | (392,470 | ) | |||||||
| 1,238 | 5,830 | 10,335 | 25,915 | |||||||||||
| — | — | — | — | |||||||||||
| — | — | — | — | |||||||||||
| (25,332 | ) | (49,299 | ) | (21,166 | ) | (366,555 | ) | |||||||
| (19,610 | ) | (31,281 | ) | (14,213 | ) | (269,140 | ) | |||||||
| $ | (17,293 | ) | $ | (26,005 | ) | $ | (11,528 | ) | $ | (206,574 | ) | |||
| American Funds Insurance Series | 135 |
Statements of changes in net assets
| Global Growth Fund | Global Small Capitalization Fund | Growth Fund | ||||||||||||||||||||||
| Year ended December 31 | Year ended December 31 | Year ended December 31 | ||||||||||||||||||||||
| 2018 | 2017 | 2018 | 2017 | 2018 | 2017 | |||||||||||||||||||
| Operations: | ||||||||||||||||||||||||
| Net investment income | $ | 50,276 | $ | 44,912 | $ | 10,787 | $ | 15,312 | $ | 162,005 | $ | 136,774 | ||||||||||||
| Net realized gain (loss) | 343,542 | 433,191 | 247,061 | 207,903 | 2,848,894 | 2,561,073 | ||||||||||||||||||
| Net unrealized (depreciation) appreciation | (919,676 | ) | 1,102,516 | (673,158 | ) | 731,086 | (2,971,090 | ) | 3,159,797 | |||||||||||||||
| Net (decrease) increase in net assets resulting from operations | (525,858 | ) | 1,580,619 | (415,310 | ) | 954,301 | 39,809 | 5,857,644 | ||||||||||||||||
| Distributions paid to shareholders* | (474,814 | ) | (196,135 | ) | (2,648,515 | ) | ||||||||||||||||||
| Dividends from net investment income | (42,742 | ) | (21,019 | ) | (136,164 | ) | ||||||||||||||||||
| Distributions from net realized gain on investments | (174,096 | ) | — | (2,251,429 | ) | |||||||||||||||||||
| Total dividends and distributions paid to shareholders | (216,838 | ) | (21,019 | ) | (2,387,593 | ) | ||||||||||||||||||
| Net capital share transactions | 267,749 | (335,425 | ) | (49,079 | ) | (495,098 | ) | 1,071,109 | (34,343 | ) | ||||||||||||||
| Total (decrease) increase in net assets | (732,923 | ) | 1,028,356 | (660,524 | ) | 438,184 | (1,537,597 | ) | 3,435,708 | |||||||||||||||
| Net assets: | ||||||||||||||||||||||||
| Beginning of year | 6,235,076 | 5,206,720 | 4,315,038 | 3,876,854 | 24,985,458 | 21,549,750 | ||||||||||||||||||
| End of year | $ | 5,502,153 | $ | 6,235,076 | $ | 3,654,514 | $ | 4,315,038 | $ | 23,447,861 | $ | 24,985,458 | ||||||||||||
| International Growth and Income Fund | Capital Income Builder | Asset Allocation Fund | ||||||||||||||||||||||
| Year ended December 31 | Year ended December 31 | Year ended December 31 | ||||||||||||||||||||||
| 2018 | 2017 | 2018 | 2017 | 2018 | 2017 | |||||||||||||||||||
| Operations: | ||||||||||||||||||||||||
| Net investment income | $ | 37,077 | $ | 35,259 | $ | 18,120 | $ | 14,607 | $ | 495,623 | $ | 419,292 | ||||||||||||
| Net realized gain (loss) | 19,646 | 5,636 | (12,903 | ) | 8,964 | 1,250,899 | 1,243,464 | |||||||||||||||||
| Net unrealized (depreciation) appreciation | (222,569 | ) | 242,768 | (53,867 | ) | 35,709 | (2,879,563 | ) | 1,880,231 | |||||||||||||||
| Net (decrease) increase in net assets resulting from operations | (165,846 | ) | 283,663 | (48,650 | ) | 59,280 | (1,133,041 | ) | 3,542,987 | |||||||||||||||
| Distributions paid to shareholders* | (35,982 | ) | (20,515 | ) | (1,587,775 | ) | ||||||||||||||||||
| Dividends from net investment income | (32,772 | ) | (14,010 | ) | (405,124 | ) | ||||||||||||||||||
| Distributions from net realized gain on investments | — | — | (1,069,604 | ) | ||||||||||||||||||||
| Total dividends and distributions paid to shareholders | (32,772 | ) | (14,010 | ) | (1,474,728 | ) | ||||||||||||||||||
| Net capital share transactions | 77,119 | 109,624 | 149,988 | 137,152 | (13,827 | ) | 2,543,934 | |||||||||||||||||
| Total (decrease) increase in net assets | (124,709 | ) | 360,515 | 80,823 | 182,422 | (2,734,643 | ) | 4,612,193 | ||||||||||||||||
| Net assets: | ||||||||||||||||||||||||
| Beginning of year | 1,461,967 | 1,101,452 | 594,457 | 412,035 | 25,660,094 | 21,047,901 | ||||||||||||||||||
| End of year | $ | 1,337,258 | $ | 1,461,967 | $ | 675,280 | $ | 594,457 | $ | 22,925,451 | $ | 25,660,094 | ||||||||||||
See end of statements of changes in net assets for footnote.
See notes to financial statements
| 136 | American Funds Insurance Series |
(dollars in thousands)
| International Fund | New World Fund | Blue Chip Income and Growth Fund | Global Growth and Income Fund | Growth-Income Fund | ||||||||||||||||||||||||||||||||||
| Year ended December 31 | Year ended December 31 | Year ended December 31 | Year ended December 31 | Year ended December 31 | ||||||||||||||||||||||||||||||||||
| 2018 | 2017 | 2018 | 2017 | 2018 | 2017 | 2018 | 2017 | 2018 | 2017 | |||||||||||||||||||||||||||||
| $ | 147,886 | $ | 105,868 | $ | 32,835 | $ | 32,918 | $ | 183,892 | $ | 195,270 | $ | 35,857 | $ | 44,369 | $ | 479,019 | $ | 445,666 | |||||||||||||||||||
| 247,240 | 438,684 | 126,203 | 236,990 | 687,384 | 686,720 | 99,872 | 151,286 | 3,357,516 | 2,102,617 | |||||||||||||||||||||||||||||
| (1,741,754 | ) | 1,850,536 | (647,033 | ) | 567,588 | (1,602,222 | ) | 550,461 | (325,530 | ) | 281,638 | (4,232,991 | ) | 3,222,646 | ||||||||||||||||||||||||
| (1,346,628 | ) | 2,395,088 | (487,995 | ) | 837,496 | (730,946 | ) | 1,432,451 | (189,801 | ) | 477,293 | (396,456 | ) | 5,770,929 | ||||||||||||||||||||||||
| (646,470 | ) | (126,412 | ) | (883,615 | ) | (186,991 | ) | (2,606,909 | ) | |||||||||||||||||||||||||||||
| (124,236 | ) | (34,131 | ) | (188,626 | ) | (42,795 | ) | (435,451 | ) | |||||||||||||||||||||||||||||
| (100,924 | ) | — | (328,660 | ) | (33,692 | ) | (1,807,557 | ) | ||||||||||||||||||||||||||||||
| (225,160 | ) | (34,131 | ) | (517,286 | ) | (76,487 | ) | (2,243,008 | ) | |||||||||||||||||||||||||||||
| 1,245,386 | 133,019 | 92,573 | (164,517 | ) | 265,984 | (178,554 | ) | 90,220 | (289,969 | ) | 2,175,138 | 1,071,251 | ||||||||||||||||||||||||||
| (747,712 | ) | 2,302,947 | (521,834 | ) | 638,848 | (1,348,577 | ) | 736,611 | (286,572 | ) | 110,837 | (828,227 | ) | 4,599,172 | ||||||||||||||||||||||||
| 9,757,822 | 7,454,875 | 3,532,713 | 2,893,865 | 9,379,849 | 8,643,238 | 2,102,446 | 1,991,609 | 30,692,362 | 26,093,190 | |||||||||||||||||||||||||||||
| $ | 9,010,110 | $ | 9,757,822 | $ | 3,010,879 | $ | 3,532,713 | $ | 8,031,272 | $ | 9,379,849 | $ | 1,815,874 | $ | 2,102,446 | $ | 29,864,135 | $ | 30,692,362 | |||||||||||||||||||
| Global Balanced Fund | Bond Fund | Global Bond Fund | High-Income Bond Fund | Mortgage Fund | ||||||||||||||||||||||||||||||||||
| Year ended December 31 | Year ended December 31 | Year ended December 31 | Year ended December 31 | Year ended December 31 | ||||||||||||||||||||||||||||||||||
| 2018 | 2017 | 2018 | 2017 | 2018 | 2017 | 2018 | 2017 | 2018 | 2017 | |||||||||||||||||||||||||||||
| $ | 6,105 | $ | 4,343 | $ | 269,087 | $ | 226,928 | $ | 55,434 | $ | 53,646 | $ | 84,812 | $ | 96,458 | $ | 6,148 | $ | 5,003 | |||||||||||||||||||
| 3,576 | 9,276 | (168,412 | ) | (10,510 | ) | (11,729 | ) | (26,825 | ) | (24,544 | ) | 24,442 | (7,618 | ) | 408 | |||||||||||||||||||||||
| (33,957 | ) | 38,239 | (164,842 | ) | 193,041 | (70,008 | ) | 132,187 | (86,196 | ) | (3,823 | ) | 2,541 | (431 | ) | |||||||||||||||||||||||
| (24,276 | ) | 51,858 | (64,167 | ) | 409,459 | (26,303 | ) | 159,008 | (25,928 | ) | 117,077 | 1,071 | 4,980 | |||||||||||||||||||||||||
| (9,700 | ) | (267,421 | ) | (56,130 | ) | (79,933 | ) | (6,505 | ) | |||||||||||||||||||||||||||||
| (3,252 | ) | (220,546 | ) | (11,164 | ) | (98,414 | ) | (5,571 | ) | |||||||||||||||||||||||||||||
| (10,070 | ) | (157,395 | ) | (14,449 | ) | — | (2,214 | ) | ||||||||||||||||||||||||||||||
| (13,322 | ) | (377,941 | ) | (25,613 | ) | (98,414 | ) | (7,785 | ) | |||||||||||||||||||||||||||||
| 46,266 | 63,483 | (511,419 | ) | (223,341 | ) | (297,128 | ) | 85,999 | (144,120 | ) | (346,424 | ) | (43,561 | ) | 2,570 | |||||||||||||||||||||||
| 12,290 | 102,019 | (843,007 | ) | (191,823 | ) | (379,561 | ) | 219,394 | (249,981 | ) | (327,761 | ) | (48,995 | ) | (235 | ) | ||||||||||||||||||||||
| 353,899 | 251,880 | 10,697,694 | 10,889,517 | 2,467,578 | 2,248,184 | 1,453,880 | 1,781,641 | 340,170 | 340,405 | |||||||||||||||||||||||||||||
| $ | 366,189 | $ | 353,899 | $ | 9,854,687 | $ | 10,697,694 | $ | 2,088,017 | $ | 2,467,578 | $ | 1,203,899 | $ | 1,453,880 | $ | 291,175 | $ | 340,170 | |||||||||||||||||||
| American Funds Insurance Series | 137 |
Statements of changes in net assets
| Ultra-Short Bond Fund | U.S. Government/ AAA-Rated Securities Fund | Managed Risk Growth Fund | ||||||||||||||||||||||
| Year ended December 31 | Year ended December 31 | Year ended December 31 | ||||||||||||||||||||||
| 2018 | 2017 | 2018 | 2017 | 2018 | 2017 | |||||||||||||||||||
| Operations: | ||||||||||||||||||||||||
| Net investment income | $ | 4,036 | $ | 1,388 | $ | 56,785 | $ | 46,503 | $ | 1,509 | $ | 859 | ||||||||||||
| Net realized gain (loss) | — | 9 | (86,715 | ) | 11,669 | 21,463 | 19,268 | |||||||||||||||||
| Net unrealized (depreciation) appreciation | 33 | (64 | ) | 49,517 | (6,874 | ) | (26,917 | ) | 35,360 | |||||||||||||||
| Net (decrease) increase in net assets resulting from operations | 4,069 | 1,333 | 19,587 | 51,298 | (3,945 | ) | 55,487 | |||||||||||||||||
| Distributions paid to shareholders* | (3,517 | ) | (55,819 | ) | (21,941 | ) | ||||||||||||||||||
| Dividends from net investment income | (906 | ) | (43,993 | ) | (734 | ) | ||||||||||||||||||
| Distributions from net realized gain on investments | — | — | (4,142 | ) | ||||||||||||||||||||
| Total dividends and distributions paid to shareholders | (906 | ) | (43,993 | ) | (4,876 | ) | ||||||||||||||||||
| Net capital share transactions | 1,047 | (46,638 | ) | (197,780 | ) | 58,286 | 81,200 | 36,220 | ||||||||||||||||
| Total (decrease) increase in net assets | 1,599 | (46,211 | ) | (234,012 | ) | 65,591 | 55,314 | 86,831 | ||||||||||||||||
| Net assets: | ||||||||||||||||||||||||
| Beginning of year | 304,805 | 351,016 | 3,103,315 | 3,037,724 | 287,959 | 201,128 | ||||||||||||||||||
| End of year | $ | 306,404 | $ | 304,805 | $ | 2,869,303 | $ | 3,103,315 | $ | 343,273 | $ | 287,959 | ||||||||||||
| * | Current year amounts reflect current presentation under new accounting standards. |
See notes to financial statements
| 138 | American Funds Insurance Series |
(dollars in thousands)
| Managed Risk International Fund | Managed Risk Blue Chip Income and Growth Fund | Managed Risk Growth-Income Fund | Managed Risk Asset Allocation Fund | |||||||||||||||||||||||||||
| Year ended December 31 | Year ended December 31 | Year ended December 31 | Year ended December 31 | |||||||||||||||||||||||||||
| 2018 | 2017 | 2018 | 2017 | 2018 | 2017 | 2018 | 2017 | |||||||||||||||||||||||
| $ | 2,317 | $ | 1,283 | $ | 5,276 | $ | 5,049 | $ | 2,685 | $ | 2,028 | $ | 62,566 | $ | 50,782 | |||||||||||||||
| 5,722 | 248 | 18,018 | 12,835 | 6,953 | 8,283 | 97,415 | 177,329 | |||||||||||||||||||||||
| (25,332 | ) | 28,741 | (49,299 | ) | 30,876 | (21,166 | ) | 24,060 | (366,555 | ) | 329,033 | |||||||||||||||||||
| (17,293 | ) | 30,272 | (26,005 | ) | 48,760 | (11,528 | ) | 34,371 | (206,574 | ) | 557,144 | |||||||||||||||||||
| (3,428 | ) | (23,525 | ) | (12,352 | ) | (242,968 | ) | |||||||||||||||||||||||
| (900 | ) | (5,161 | ) | (1,867 | ) | (31,722 | ) | |||||||||||||||||||||||
| (1,403 | ) | (5,568 | ) | (7,726 | ) | (38,742 | ) | |||||||||||||||||||||||
| (2,303 | ) | (10,729 | ) | (9,593 | ) | (70,464 | ) | |||||||||||||||||||||||
| 23,257 | 22,849 | 19,295 | 37,657 | 1,707,014 | 23,434 | (1,462,371 | ) | 408,750 | ||||||||||||||||||||||
| 2,536 | 50,818 | (30,235 | ) | 75,688 | 1,683,134 | 48,212 | (1,911,913 | ) | 895,430 | |||||||||||||||||||||
| 148,423 | 97,605 | 366,904 | 291,216 | 208,968 | 160,756 | 4,454,410 | 3,558,980 | |||||||||||||||||||||||
| $ | 150,959 | $ | 148,423 | $ | 336,669 | $ | 366,904 | $ | 1,892,102 | $ | 208,968 | $ | 2,542,497 | $ | 4,454,410 | |||||||||||||||
| American Funds Insurance Series | 139 |
Notes to financial statements
1. Organization
American Funds Insurance Series (the “series”) is registered under the Investment Company Act of 1940 as an open-end, diversified management investment company with 28 different funds (the “funds”). Twenty-three funds in the series are covered in this report. The other five funds in the series, American Funds Insurance Series - Portfolio Series, are covered in a separate report. The assets of each fund are segregated, with each fund accounted for separately. Capital Research and Management Company (“CRMC”) is the series’ investment adviser. Milliman Financial Risk Management LLC (“Milliman FRM”) is the subadviser for the risk management strategy for eight of the funds (the “managed risk funds”), five of which are covered in this report.
The managed risk funds covered in this report are Managed Risk Growth Fund, Managed Risk International Fund, Managed Risk Blue Chip Income and Growth Fund, Managed Risk Growth-Income Fund and Managed Risk Asset Allocation Fund. The managed risk funds invest in other funds within the series (the “underlying funds”) and employ Milliman FRM to implement the risk management strategy, which consists of using hedging instruments — primarily short positions on exchange-traded futures contracts — to attempt to stabilize the volatility of the funds around target volatility levels and reduce the downside exposure of the funds during periods of significant market declines.
In 2009, shareholders approved the reorganization of the series from a Massachusetts business trust to a Delaware statutory trust. The series reserved the right to delay implementing the reorganization and has elected to do so.
The investment objectives for each fund covered in this report are as follows:
Global Growth Fund— Seeks to provide long-term growth of capital.
Global Small Capitalization Fund— Seeks to provide long-term growth of capital.
Growth Fund— Seeks to provide growth of capital.
International Fund— Seeks to provide long-term growth of capital.
New World Fund— Seeks long-term capital appreciation.
Blue Chip Income and Growth Fund— Seeks to produce income exceeding the average yield on U.S. stocks generally and to provide an opportunity for growth of principal consistent with sound common stock investing.
Global Growth and Income Fund— Seeks to provide long-term growth of capital while providing current income.
Growth-Income Fund— Seeks to achieve long-term growth of capital and income.
International Growth and Income Fund— Seeks to provide long-term growth of capital while providing current income.
Capital Income Builder— Seeks to provide a level of current income that exceeds the average yield on U.S. stocks generally and to provide a growing stream of income over the years. Secondarily, seeks to provide growth of capital.
Asset Allocation Fund— Seeks to provide high total return consistent with preservation of capital over the long term.
Global Balanced Fund— Seeks the balanced accomplishment of three objectives: long-term growth of capital, conservation of principal and current income.
Bond Fund— Seeks to provide as high a level of current income as is consistent with the preservation of capital.
Global Bond Fund— Seeks to provide, over the long term, a high level of total return consistent with prudent investment management.
High-Income Bond Fund— Seeks to provide a high level of current income and, secondarily, capital appreciation.
Mortgage Fund— Seeks to provide current income and preservation of capital.
| 140 | American Funds Insurance Series |
Ultra-Short Bond Fund— Seeks to provide current income, consistent with the maturity and quality standards applicable to the fund, and preservation of capital and liquidity.
U.S. Government/AAA-Rated Securities Fund— Seeks to provide a high level of current income consistent with preservation of capital.
Managed Risk Growth Fund— Seeks to provide growth of capital while seeking to manage volatility and provide downside protection.
Managed Risk International Fund— Seeks to provide long-term growth of capital while seeking to manage volatility and provide downside protection.
Managed Risk Blue Chip Income and Growth Fund— Seeks to produce income exceeding the average yield on U.S. stocks generally and to provide an opportunity for growth of principal consistent with sound common stock investing, in each case while seeking to manage volatility and provide downside protection.
Managed Risk Growth-Income Fund— Seeks to achieve long-term growth of capital and income while seeking to manage volatility and provide downside protection.
Managed Risk Asset Allocation Fund— Seeks to provide high total return consistent with preservation of capital over the long term while seeking to manage volatility and provide downside protection.
Each fund in the series, except the managed risk funds, offers either four or five share classes (Classes 1, 1A, 2, 3 or 4); the managed risk funds offer two share classes (Classes P1 and P2). Holders of all share classes of each fund have equal pro rata rights to assets, dividends and liquidation proceeds of each fund held. Each share class of each fund has identical voting rights, except for the exclusive right to vote on matters affecting only its class. Share classes have different fees and expenses (“class-specific fees and expenses”), primarily due to different arrangements for certain distribution expenses. Differences in class-specific fees and expenses will result in differences in net investment income and, therefore, the payment of different per-share dividends by each class of each fund.
2. Significant accounting policies
Each fund is an investment company that applies the accounting and reporting guidance issued in Topic 946 by the U.S. Financial Accounting Standards Board. Each fund’s financial statements have been prepared to comply with U.S. generally accepted accounting principles (“U.S. GAAP”). These principles require the series’ investment adviser to make estimates and assumptions that affect reported amounts and disclosures. Actual results could differ from those estimates. Subsequent events, if any, have been evaluated through the date of issuance in the preparation of the financial statements. The funds follow the significant accounting policies described in this section, as well as the valuation policies described in the next section on valuation.
Security transactions and related investment income— Security transactions are recorded by the funds as of the date the trades are executed with brokers. Realized gains and losses from security transactions are determined based on the specific identified cost of the securities. In the event a security is purchased with a delayed payment date, the funds will segregate liquid assets sufficient to meet their payment obligations. Dividend income is recognized on the ex-dividend date and interest income is recognized on an accrual basis. Market discounts, premiums and original issue discounts on fixed-income securities are amortized daily over the expected life of the security.
Fees and expenses— The fees and expenses of the underlying funds held by the managed risk funds are not included in the fees and expenses reported for each of the managed risk funds; however, they are indirectly reflected in the valuation of each of the underlying funds. These fees are included in the net effective expense ratios that are provided as additional information in the financial highlights tables.
Class allocations— Income, fees and expenses (other than class-specific fees and expenses) and realized and unrealized gains and losses are allocated daily among the various share classes of each fund based on their relative net assets. Class-specific fees and expenses, such as distribution expenses, are accrued daily and charged directly to the respective share class of each fund.
Distributions paid to shareholders— Income dividends and capital gain distributions are recorded on each fund’s ex-dividend date.
| American Funds Insurance Series | 141 |
Currency translation— Assets and liabilities, including investment securities, denominated in currencies other than U.S. dollars are translated into U.S. dollars at the exchange rates supplied by one or more pricing vendors on the valuation date. Purchases and sales of investment securities and income and expenses are translated into U.S. dollars at the exchange rates on the dates of such transactions. The effects of changes in exchange rates on investment securities are included with the net realized gain or loss and net unrealized appreciation or depreciation on investments in the funds’ statements of operations. The realized gain or loss and unrealized appreciation or depreciation resulting from all other transactions denominated in currencies other than U.S. dollars are disclosed separately.
3. Valuation
CRMC, the series’ investment adviser, values the funds’ investments at fair value as defined by U.S. GAAP. The net asset value of each share class of each fund is generally determined as of approximately 4:00 p.m. New York time each day the New York Stock Exchange is open.
Methods and inputs— The series’ investment adviser uses the following methods and inputs to establish the fair value of each fund’s assets and liabilities. Use of particular methods and inputs may vary over time based on availability and relevance as market and economic conditions evolve.
Equity securities are generally valued at the official closing price of, or the last reported sale price on, the exchange or market on which such securities are traded, as of the close of business on the day the securities are being valued or, lacking any sales, at the last available bid price. Prices for each security are taken from the principal exchange or market on which the security trades. The value of an underlying fund is based on its reported net asset value.
Fixed-income securities, including short-term securities, are generally valued at prices obtained from one or more pricing vendors. Vendors value such securities based on one or more of the inputs described in the following table. The table provides examples of inputs that are commonly relevant for valuing particular classes of fixed-income securities in which the funds are authorized to invest. However, these classifications are not exclusive and any of the inputs may be used to value any other class of fixed-income security.
| Fixed-income class | Examples of standard inputs |
| All | Benchmark yields, transactions, bids, offers, quotations from dealers and trading systems, new issues, spreads and other relationships observed in the markets among comparable securities; and proprietary pricing models such as yield measures calculated using factors such as cash flows, financial or collateral performance and other reference data (collectively referred to as “standard inputs”) |
| Corporate bonds & notes; convertible securities | Standard inputs and underlying equity of the issuer |
| Bonds & notes of governments & government agencies | Standard inputs and interest rate volatilities |
| Mortgage-backed; asset-backed obligations | Standard inputs and cash flows, prepayment information, default rates, delinquency and loss assumptions, collateral characteristics, credit enhancements and specific deal information |
| Municipal securities | Standard inputs and, for certain distressed securities, cash flows or liquidation values using a net present value calculation based on inputs that include, but are not limited to, financial statements and debt contracts |
When the series’ investment adviser deems it appropriate to do so (such as when vendor prices are unavailable or not deemed to be representative), fixed-income securities will be valued in good faith at the mean quoted bid and ask prices that are reasonably and timely available (or bid prices, if ask prices are not available) or at prices for securities of comparable maturity, quality and type.
| 142 | American Funds Insurance Series |
Securities with both fixed-income and equity characteristics, or equity securities traded principally among fixed-income dealers, are generally valued in the manner described for either equity or fixed-income securities, depending on which method is deemed most appropriate by the series’ investment adviser. The Government Cash Management Fund held by the managed risk funds is managed to maintain a $1.00 net asset value per share. The net asset value of each share class of each managed risk fund is calculated based on the reported net asset values of the underlying funds in which each fund invests.
Exchange-traded options and futures are generally valued at the official closing price for options and official settlement price for futures of the exchange or market on which such instruments are traded, as of the close of business on the day such instruments are being valued. Forward currency contracts are valued at the mean of representative quoted bid and ask prices, generally based on prices supplied by one or more pricing vendors. Interest rate swaps and credit default swaps are generally valued by pricing vendors based on market inputs that include the index and term of index, reset frequency, payer/receiver, currency and pay frequency.
Securities and other assets for which representative market quotations are not readily available or are considered unreliable by the series’ investment adviser are fair valued as determined in good faith under fair value guidelines adopted by authority of the series’ board of trustees as further described. The investment adviser follows fair valuation guidelines, consistent with U.S. Securities and Exchange Commission rules and guidance, to consider relevant principles and factors when making fair value determinations. The investment adviser considers relevant indications of value that are reasonably and timely available to it in determining the fair value to be assigned to a particular security, such as the type and cost of the security; contractual or legal restrictions on resale of the security; relevant financial or business developments of the issuer; actively traded similar or related securities; conversion or exchange rights on the security; related corporate actions; significant events occurring after the close of trading in the security; and changes in overall market conditions. In addition, the closing prices of equity securities and futures that trade in markets outside U.S. time zones may be adjusted to reflect significant events that occur after the close of local trading but before the net asset value of each share class of each fund is determined. Fair valuations and valuations of investments and futures that are not actively trading involve judgment and may differ materially from valuations that would have been used had greater market activity occurred.
Processes and structure— The series’ board of trustees has delegated authority to the series’ investment adviser to make fair value determinations, subject to board oversight. The investment adviser has established a Joint Fair Valuation Committee (the “Fair Valuation Committee”) to administer, implement and oversee the fair valuation process, and to make fair value decisions. The Fair Valuation Committee regularly reviews its own fair value decisions, as well as decisions made under its standing instructions to the investment adviser’s valuation teams. The Fair Valuation Committee reviews changes in fair value measurements from period to period and may, as deemed appropriate, update the fair valuation guidelines to better reflect the results of back testing and address new or evolving issues. The Fair Valuation Committee reports any changes to the fair valuation guidelines to the board of trustees. The series’ board and audit committee also regularly review reports that describe fair value determinations and methods.
The series’ investment adviser has also established a Fixed-Income Pricing Review Group to administer and oversee the fixed-income valuation process, including the use of fixed-income pricing vendors. This group regularly reviews pricing vendor information and market data. Pricing decisions, processes and controls over security valuation are also subject to additional internal reviews, including an annual control self-evaluation program facilitated by the investment adviser’s compliance group.
Classifications— The series’ investment adviser classifies the funds’ assets and liabilities into three levels based on the inputs used to value the assets or liabilities. Level 1 values are based on quoted prices in active markets for identical securities. Level 2 values are based on significant observable market inputs, such as quoted prices for similar securities and quoted prices in inactive markets. Certain securities trading outside the U.S. may transfer between Level 1 and Level 2 due to valuation adjustments resulting from significant market movements following the close of local trading. Level 3 values are based on significant unobservable inputs that reflect the investment adviser’s determination of assumptions that market participants might reasonably use in valuing the securities.
| American Funds Insurance Series | 143 |
The valuation levels are not necessarily an indication of the risk or liquidity associated with the underlying investment. For example, U.S. government securities are reflected as Level 2 because the inputs used to determine fair value may not always be quoted prices in an active market. The following tables present the funds’ valuation levels as of December 31, 2018 (dollars in thousands):
| Global Growth Fund | ||||||||||||||||
| Investment securities | ||||||||||||||||
| Level 1 | Level 2 | Level 3 | Total | |||||||||||||
| Assets: | ||||||||||||||||
| Common stocks: | ||||||||||||||||
| Information technology | $ | 943,486 | $ | 395,499 | $ | — | $ | 1,338,985 | ||||||||
| Consumer discretionary | 902,718 | 87,222 | — | 989,940 | ||||||||||||
| Health care | 582,877 | 105,680 | — | 688,557 | ||||||||||||
| Communication services | 437,926 | 143,665 | — | 581,591 | ||||||||||||
| Financials | 518,235 | 53,532 | — | 571,767 | ||||||||||||
| Consumer staples | 294,556 | 86,992 | — | 381,548 | ||||||||||||
| Industrials | 209,141 | 129,438 | — | 338,579 | ||||||||||||
| Materials | 114,502 | 40,841 | — | 155,343 | ||||||||||||
| Energy | 146,233 | — | — | 146,233 | ||||||||||||
| Short-term securities | — | 294,373 | — | 294,373 | ||||||||||||
| Total | $ | 4,149,674 | $ | 1,337,242 | $ | — | $ | 5,486,916 | ||||||||
| Global Small Capitalization Fund | ||||||||||||||||
| Investment securities | ||||||||||||||||
| Level 1 | Level 2 | Level 3 | Total | |||||||||||||
| Assets: | ||||||||||||||||
| Common stocks: | ||||||||||||||||
| Health care | $ | 727,659 | $ | 48,979 | $ | — | $ | 776,638 | ||||||||
| Information technology | 452,675 | 117,663 | — | 570,338 | ||||||||||||
| Industrials | 267,672 | 261,949 | — | 529,621 | ||||||||||||
| Consumer discretionary | 404,803 | 84,793 | — | 489,596 | ||||||||||||
| Financials | 277,316 | 39,228 | 87 | 316,631 | ||||||||||||
| Materials | 113,426 | 29,243 | — | 142,669 | ||||||||||||
| Consumer staples | 64,850 | 56,057 | — | 120,907 | ||||||||||||
| Communication services | 71,742 | 20,881 | — | 92,623 | ||||||||||||
| Energy | 45,304 | 15,906 | 16,560 | 77,770 | ||||||||||||
| Real estate | 35,861 | 37,865 | — | 73,726 | ||||||||||||
| Utilities | 60,785 | — | — | 60,785 | ||||||||||||
| Bonds, notes & other debt instruments | — | 4,989 | — | 4,989 | ||||||||||||
| Short-term securities | 54,436 | 393,166 | — | 447,602 | ||||||||||||
| Total | $ | 2,576,529 | $ | 1,110,719 | $ | 16,647 | $ | 3,703,895 | ||||||||
| Growth Fund | ||||||||||||||||
| Investment securities | ||||||||||||||||
| Level 1 | Level 2 | Level 3 | Total | |||||||||||||
| Assets: | ||||||||||||||||
| Common stocks: | ||||||||||||||||
| Information technology | $ | 4,465,985 | $ | 524,865 | $ | — | $ | 4,990,850 | ||||||||
| Health care | 3,895,983 | — | 37,000 | 3,932,983 | ||||||||||||
| Communication services | 3,172,527 | — | — | 3,172,527 | ||||||||||||
| Consumer discretionary | 3,047,437 | 25,309 | — | 3,072,746 | ||||||||||||
| Financials | 2,280,002 | — | — | 2,280,002 | ||||||||||||
| Industrials | 1,068,310 | 136,234 | — | 1,204,544 | ||||||||||||
| Energy | 1,181,935 | — | — | 1,181,935 | ||||||||||||
| Materials | 545,792 | 83,260 | — | 629,052 | ||||||||||||
| Consumer staples | 519,278 | — | — | 519,278 | ||||||||||||
| Real estate | 371,749 | — | — | 371,749 | ||||||||||||
| Utilities | 94,291 | — | — | 94,291 | ||||||||||||
| Convertible stocks | — | — | 13,104 | 13,104 | ||||||||||||
| Short-term securities | — | 1,944,415 | — | 1,944,415 | ||||||||||||
| Total | $ | 20,643,289 | $ | 2,714,083 | $ | 50,104 | $ | 23,407,476 | ||||||||
| 144 | American Funds Insurance Series |
| International Fund | �� | |||||||||||||||
| Investment securities | ||||||||||||||||
| Level 1 | Level 2 | Level 3 | Total | |||||||||||||
| Assets: | ||||||||||||||||
| Common stocks: | ||||||||||||||||
| Financials | $ | 1,182,886 | $ | 188,734 | $ | — | $ | 1,371,620 | ||||||||
| Industrials | 801,285 | 454,063 | — | 1,255,348 | ||||||||||||
| Health care | 460,295 | 639,881 | — | 1,100,176 | ||||||||||||
| Consumer discretionary | 702,613 | 220,555 | — | 923,168 | ||||||||||||
| Consumer staples | 375,070 | 226,350 | — | 601,420 | ||||||||||||
| Communication services | 369,938 | 217,235 | — | 587,173 | ||||||||||||
| Information technology | 184,960 | 324,234 | — | 509,194 | ||||||||||||
| Materials | 343,320 | 165,561 | — | 508,881 | ||||||||||||
| Utilities | 376,043 | 102,071 | — | 478,114 | ||||||||||||
| Energy | 395,858 | 16,445 | — | 412,303 | ||||||||||||
| Real estate | 136,191 | 45,046 | — | 181,237 | ||||||||||||
| Rights & warrants | — | 13,046 | — | 13,046 | ||||||||||||
| Bonds, notes & other debt instruments | — | 77,908 | — | 77,908 | ||||||||||||
| Short-term securities | — | 976,853 | — | 976,853 | ||||||||||||
| Total | $ | 5,328,459 | $ | 3,667,982 | $ | — | $ | 8,996,441 | ||||||||
| Other investments* | ||||||||||||||||
| Level 1 | Level 2 | Level 3 | Total | |||||||||||||
| Liabilities: | ||||||||||||||||
| Unrealized depreciation on open forward currency contracts | $ | — | $ | (525 | ) | $ | — | $ | (525 | ) | ||||||
| * | Forward currency contracts are not included in the investment portfolio. |
| New World Fund | ||||||||||||||||
| Investment securities | ||||||||||||||||
| Level 1 | Level 2 | Level 3 | Total | |||||||||||||
| Assets: | ||||||||||||||||
| Common stocks: | ||||||||||||||||
| Information technology | $ | 326,284 | $ | 178,731 | $ | — | $ | 505,015 | ||||||||
| Financials | 305,640 | 23,740 | — | 329,380 | ||||||||||||
| Energy | 292,889 | — | — | 292,889 | ||||||||||||
| Consumer discretionary | 218,235 | 64,658 | — | 282,893 | ||||||||||||
| Health care | 175,401 | 75,887 | — | 251,288 | ||||||||||||
| Consumer staples | 119,696 | 70,170 | — | 189,866 | ||||||||||||
| Communication services | 167,031 | 5,804 | — | 172,835 | ||||||||||||
| Materials | 154,547 | 13,916 | — | 168,463 | ||||||||||||
| Industrials | 94,592 | 40,700 | — | 135,292 | ||||||||||||
| Real estate | 31,058 | 9,324 | 26 | 40,408 | ||||||||||||
| Utilities | 32,453 | — | — | 32,453 | ||||||||||||
| Rights & warrants | — | 3,502 | — | 3,502 | ||||||||||||
| Bonds, notes & other debt instruments | — | 92,867 | — | 92,867 | ||||||||||||
| Short-term securities | — | 502,317 | — | 502,317 | ||||||||||||
| Total | $ | 1,917,826 | $ | 1,081,616 | $ | 26 | $ | 2,999,468 | ||||||||
| Other investments* | ||||||||||||||||
| Level 1 | Level 2 | Level 3 | Total | |||||||||||||
| Assets: | ||||||||||||||||
| Unrealized appreciation on open forward currency contracts | $ | — | $ | 356 | $ | — | $ | 356 | ||||||||
| Liabilities: | ||||||||||||||||
| Unrealized depreciation on open forward currency contracts | — | (53 | ) | — | (53 | ) | ||||||||||
| Total | $ | — | $ | 303 | $ | — | $ | 303 | ||||||||
| * | Forward currency contracts are not included in the investment portfolio. |
| American Funds Insurance Series | 145 |
| Blue Chip Income and Growth Fund | ||||||||||||||||
| Investment securities | ||||||||||||||||
| Level 1 | Level 2 | Level 3 | Total | |||||||||||||
| Assets: | ||||||||||||||||
| Common stocks: | ||||||||||||||||
| Health care | $ | 2,027,452 | $ | — | $ | — | $ | 2,027,452 | ||||||||
| Information technology | 1,080,516 | — | — | 1,080,516 | ||||||||||||
| Consumer staples | 1,017,733 | — | — | 1,017,733 | ||||||||||||
| Energy | 758,203 | — | — | 758,203 | ||||||||||||
| Communication services | 731,501 | — | — | 731,501 | ||||||||||||
| Industrials | 687,517 | — | — | 687,517 | ||||||||||||
| Consumer discretionary | 650,987 | — | — | 650,987 | ||||||||||||
| Financials | 392,403 | — | — | 392,403 | ||||||||||||
| Materials | 134,904 | — | — | 134,904 | ||||||||||||
| Other | 143,876 | — | — | 143,876 | ||||||||||||
| Rights & warrants | 3,520 | — | — | 3,520 | ||||||||||||
| Short-term securities | — | 389,421 | — | 389,421 | ||||||||||||
| Total | $ | 7,628,612 | $ | 389,421 | $ | — | $ | 8,018,033 | ||||||||
| Global Growth and Income Fund | ||||||||||||||||
| Investment securities | ||||||||||||||||
| Level 1 | Level 2 | Level 3 | Total | |||||||||||||
| Assets: | ||||||||||||||||
| Common stocks: | ||||||||||||||||
| Information technology | $ | 182,049 | $ | 100,080 | $ | — | $ | 282,129 | ||||||||
| Health care | 185,566 | 15,542 | — | 201,108 | ||||||||||||
| Financials | 175,070 | 11,049 | — | 186,119 | ||||||||||||
| Communication services | 83,225 | 100,714 | — | 183,939 | ||||||||||||
| Industrials | 162,543 | 16,976 | — | 179,519 | ||||||||||||
| Consumer discretionary | 138,158 | 35,185 | — | 173,343 | ||||||||||||
| Materials | 104,115 | 14,434 | — | 118,549 | ||||||||||||
| Energy | 109,679 | — | — | 109,679 | ||||||||||||
| Consumer staples | 61,667 | 39,668 | — | 101,335 | ||||||||||||
| Real estate | 54,128 | 12,956 | — | 67,084 | ||||||||||||
| Utilities | 13,861 | 48,868 | — | 62,729 | ||||||||||||
| Bonds, notes & other debt instruments | — | 39,384 | — | 39,384 | ||||||||||||
| Short-term securities | — | 107,014 | — | 107,014 | ||||||||||||
| Total | $ | 1,270,061 | $ | 541,870 | $ | — | $ | 1,811,931 | ||||||||
| Other investments* | ||||||||||||||||
| Level 1 | Level 2 | Level 3 | Total | |||||||||||||
| Assets: | ||||||||||||||||
| Unrealized appreciation on open forward currency contracts | $ | — | $ | 351 | $ | — | $ | 351 | ||||||||
| * | Forward currency contracts are not included in the investment portfolio. |
| 146 | American Funds Insurance Series |
| Growth-Income Fund | ||||||||||||||||
| Investment securities | ||||||||||||||||
| Level 1 | Level 2 | Level 3 | Total | |||||||||||||
| Assets: | ||||||||||||||||
| Common stocks: | ||||||||||||||||
| Health care | $ | 4,572,074 | $ | 180,915 | $ | — | $ | 4,752,989 | ||||||||
| Information technology | 4,016,946 | 101,331 | — | 4,118,277 | ||||||||||||
| Financials | 3,123,284 | 164,961 | — | 3,288,245 | ||||||||||||
| Communication services | 3,068,997 | — | — | 3,068,997 | ||||||||||||
| Industrials | 2,744,773 | — | — | 2,744,773 | ||||||||||||
| Consumer staples | 2,202,506 | 457,337 | — | 2,659,843 | ||||||||||||
| Energy | 2,041,753 | — | — | 2,041,753 | ||||||||||||
| Consumer discretionary | 1,778,690 | 116,360 | — | 1,895,050 | ||||||||||||
| Materials | 1,394,285 | 6,362 | — | 1,400,647 | ||||||||||||
| Real estate | 535,725 | — | — | 535,725 | ||||||||||||
| Utilities | 447,523 | 55,293 | — | 502,816 | ||||||||||||
| Mutual funds | 45,729 | — | — | 45,729 | ||||||||||||
| Convertible stocks | 38,828 | — | — | 38,828 | ||||||||||||
| Convertible bonds | — | 27,617 | — | 27,617 | ||||||||||||
| Short-term securities | — | 2,719,713 | — | 2,719,713 | ||||||||||||
| Total | $ | 26,011,113 | $ | 3,829,889 | $ | — | $ | 29,841,002 | ||||||||
| International Growth and Income Fund | ||||||||||||||||
| Investment securities | ||||||||||||||||
| Level 1 | Level 2 | Level 3 | Total | |||||||||||||
| Assets: | ||||||||||||||||
| Common stocks: | ||||||||||||||||
| Financials | $ | 141,167 | $ | 108,491 | $ | — | $ | 249,658 | ||||||||
| Health care | 77,210 | 101,164 | — | 178,374 | ||||||||||||
| Industrials | 56,914 | 56,589 | — | 113,503 | ||||||||||||
| Energy | 94,813 | — | — | 94,813 | ||||||||||||
| Materials | 81,185 | 13,223 | — | 94,408 | ||||||||||||
| Real estate | 81,116 | 13,077 | — | 94,193 | ||||||||||||
| Consumer staples | 87,620 | 6,560 | — | 94,180 | ||||||||||||
| Communication services | 49,598 | 34,855 | — | 84,453 | ||||||||||||
| Utilities | 45,795 | 35,476 | — | 81,271 | ||||||||||||
| Consumer discretionary | 54,630 | 5,371 | — | 60,001 | ||||||||||||
| Information technology | 11,493 | 36,087 | — | 47,580 | ||||||||||||
| Bonds, notes & other debt instruments | — | 15,271 | — | 15,271 | ||||||||||||
| Short-term securities | — | 125,741 | — | 125,741 | ||||||||||||
| Total | $ | 781,541 | $ | 551,905 | $ | — | $ | 1,333,446 | ||||||||
| American Funds Insurance Series | 147 |
| Capital Income Builder | ||||||||||||||||
| Investment securities | ||||||||||||||||
| Level 1 | Level 2 | Level 3 | Total | |||||||||||||
| Assets: | ||||||||||||||||
| Common stocks: | ||||||||||||||||
| Financials | $ | 43,071 | $ | 25,510 | $ | — | $ | 68,581 | ||||||||
| Consumer staples | 52,008 | 10,413 | — | 62,421 | ||||||||||||
| Information technology | 44,754 | 15,593 | — | 60,347 | ||||||||||||
| Real estate | 51,257 | 1,451 | — | 52,708 | ||||||||||||
| Energy | 44,723 | — | — | 44,723 | ||||||||||||
| Communication services | 32,340 | 8,343 | — | 40,683 | ||||||||||||
| Health care | 36,507 | 1,889 | — | 38,396 | ||||||||||||
| Utilities | 29,843 | 7,422 | — | 37,265 | ||||||||||||
| Consumer discretionary | 23,778 | — | — | 23,778 | ||||||||||||
| Industrials | 19,005 | 2,067 | — | 21,072 | ||||||||||||
| Materials | 5,407 | 4,139 | — | 9,546 | ||||||||||||
| Convertible stocks | 6,127 | — | — | 6,127 | ||||||||||||
| Bonds, notes & other debt instruments: | ||||||||||||||||
| U.S. Treasury bonds & notes | — | 93,463 | — | 93,463 | ||||||||||||
| Mortgage-backed obligations | — | 46,958 | — | 46,958 | ||||||||||||
| Corporate bonds & notes | — | 26,817 | — | 26,817 | ||||||||||||
| Asset-backed obligations | — | 967 | — | 967 | ||||||||||||
| Short-term securities | — | 45,896 | — | 45,896 | ||||||||||||
| Total | $ | 388,820 | $ | 290,928 | $ | — | $ | 679,748 | ||||||||
| Other investments* | ||||||||||||||||
| Level 1 | Level 2 | Level 3 | Total | |||||||||||||
| Assets: | ||||||||||||||||
| Unrealized appreciation on futures contracts | $ | 2,467 | $ | — | $ | — | $ | 2,467 | ||||||||
| Liabilities: | ||||||||||||||||
| Unrealized depreciation on futures contracts | (2,038 | ) | — | — | (2,038 | ) | ||||||||||
| Total | $ | 429 | $ | — | $ | — | $ | 429 | ||||||||
| * | Futures contracts are not included in the investment portfolio. |
| 148 | American Funds Insurance Series |
| Asset Allocation Fund | ||||||||||||||||
| Investment securities | ||||||||||||||||
| Level 1 | Level 2 | Level 3 | Total | |||||||||||||
| Assets: | ||||||||||||||||
| Common stocks: | ||||||||||||||||
| Information technology | $ | 3,092,137 | $ | 35,434 | $ | 59 | $ | 3,127,630 | ||||||||
| Health care | 2,518,947 | 26,969 | 736 | 2,546,652 | ||||||||||||
| Financials | 2,175,115 | — | — | 2,175,115 | ||||||||||||
| Industrials | 1,002,104 | 4,784 | — | 1,006,888 | ||||||||||||
| Energy | 953,558 | 2,780 | — | 956,338 | ||||||||||||
| Consumer discretionary | 861,048 | 42,365 | — | 903,413 | ||||||||||||
| Communication services | 847,896 | 115 | — | 848,011 | ||||||||||||
| Consumer staples | 545,053 | 263,173 | — | 808,226 | ||||||||||||
| Materials | 739,608 | — | — | 739,608 | ||||||||||||
| Utilities | 215,899 | — | — | 215,899 | ||||||||||||
| Real estate | 184,779 | — | — | 184,779 | ||||||||||||
| Rights & warrants | — | — | 242 | 242 | ||||||||||||
| Convertible stocks | — | — | 6,074 | 6,074 | ||||||||||||
| Convertible bonds | — | 1,272 | — | 1,272 | ||||||||||||
| Bonds, notes & other debt instruments: | ||||||||||||||||
| U.S. Treasury bonds & notes | — | 2,820,469 | — | 2,820,469 | ||||||||||||
| Corporate bonds & notes | — | 2,275,813 | 10,755 | 2,286,568 | ||||||||||||
| Mortgage-backed obligations | — | 1,318,843 | — | 1,318,843 | ||||||||||||
| Federal agency bonds & notes | — | 15,031 | — | 15,031 | ||||||||||||
| Other | — | 190,115 | — | 190,115 | ||||||||||||
| Short-term securities | — | 3,116,628 | — | 3,116,628 | ||||||||||||
| Total | $ | 13,136,144 | $ | 10,113,791 | $ | 17,866 | $ | 23,267,801 | ||||||||
| Other investments* | ||||||||||||||||
| Level 1 | Level 2 | Level 3 | Total | |||||||||||||
| Assets: | ||||||||||||||||
| Unrealized appreciation on futures contracts | $ | 6,035 | $ | — | $ | — | $ | 6,035 | ||||||||
| Liabilities: | ||||||||||||||||
| Unrealized depreciation on futures contracts | (874 | ) | — | — | (874 | ) | ||||||||||
| Unrealized depreciation on interest rate swaps | — | (3,557 | ) | — | (3,557 | ) | ||||||||||
| Total | $ | 5,161 | $ | (3,557 | ) | $ | — | $ | 1,604 | |||||||
| * | Futures contracts and interest rate swaps are not included in the investment portfolio. |
| American Funds Insurance Series | 149 |
Global Balanced Fund
| Investment securities | ||||||||||||||||
| Level 1 | Level 2 | Level 3 | Total | |||||||||||||
| Assets: | ||||||||||||||||
| Common stocks: | ||||||||||||||||
| Information technology | $ | 29,939 | $ | 11,496 | $ | — | $ | 41,435 | ||||||||
| Financials | 26,524 | 3,203 | — | 29,727 | ||||||||||||
| Health care | 23,425 | 4,021 | — | 27,446 | ||||||||||||
| Industrials | 19,589 | 5,349 | — | 24,938 | ||||||||||||
| Energy | 18,129 | — | — | 18,129 | ||||||||||||
| Consumer staples | 14,100 | 3,677 | — | 17,777 | ||||||||||||
| Consumer discretionary | 13,799 | 1,034 | — | 14,833 | ||||||||||||
| Materials | 8,709 | 4,244 | — | 12,953 | ||||||||||||
| Communication services | 2,053 | 6,030 | — | 8,083 | ||||||||||||
| Real estate | 6,155 | 827 | — | 6,982 | ||||||||||||
| Utilities | 2,897 | 2,255 | — | 5,152 | ||||||||||||
| Bonds, notes & other debt instruments: | ||||||||||||||||
| Bonds & notes of governments & government agencies outside the U.S. | — | 59,146 | — | 59,146 | ||||||||||||
| U.S. Treasury bonds & notes | — | 45,770 | — | 45,770 | ||||||||||||
| Corporate bonds & notes | — | 23,532 | — | 23,532 | ||||||||||||
| Mortgage-backed obligations | — | 6,936 | — | 6,936 | ||||||||||||
| Short-term securities | — | 25,583 | — | 25,583 | ||||||||||||
| Total | $ | 165,319 | $ | 203,103 | $ | — | $ | 368,422 | ||||||||
| Other investments* | ||||||||||||||||
| Level 1 | Level 2 | Level 3 | Total | |||||||||||||
| Assets: | ||||||||||||||||
| Unrealized appreciation on futures contracts | $ | 180 | $ | — | $ | — | $ | 180 | ||||||||
| Unrealized appreciation on open forward currency contracts | — | 214 | — | 214 | ||||||||||||
| Unrealized appreciation on interest rate swaps | — | 24 | — | 24 | ||||||||||||
| Liabilities: | ||||||||||||||||
| Unrealized depreciation on open forward currency contracts | — | (132 | ) | — | (132 | ) | ||||||||||
| Unrealized depreciation on interest rate swaps | — | (19 | ) | — | (19 | ) | ||||||||||
| Total | $ | 180 | $ | 87 | $ | — | $ | 267 | ||||||||
| * | Futures contracts, forward currency contracts and interest rate swaps are not included in the investment portfolio. |
| Bond Fund | ||||||||||||||||
| Investment securities | ||||||||||||||||
| Level 1 | Level 2 | Level 3 | Total | |||||||||||||
| Assets: | ||||||||||||||||
| Bonds, notes & other debt instruments: | ||||||||||||||||
| Corporate bonds & notes | $ | — | $ | 3,603,650 | $ | — | $ | 3,603,650 | ||||||||
| U.S. Treasury bonds & notes | — | 2,852,297 | — | 2,852,297 | ||||||||||||
| Mortgage-backed obligations | — | 2,234,095 | — | 2,234,095 | ||||||||||||
| Bonds & notes of governments & government agencies outside the U.S. | — | 612,742 | — | 612,742 | ||||||||||||
| Asset-backed obligations | — | 197,268 | — | 197,268 | ||||||||||||
| Municipals | — | 189,941 | — | 189,941 | ||||||||||||
| Federal agency bonds & notes | — | 11,395 | — | 11,395 | ||||||||||||
| Common stocks | — | 396 | 26 | 422 | ||||||||||||
| Rights & warrants | — | — | 67 | 67 | ||||||||||||
| Short-term securities | — | 1,243,633 | — | 1,243,633 | ||||||||||||
| Total | $ | — | $ | 10,945,417 | $ | 93 | $ | 10,945,510 | ||||||||
| 150 | American Funds Insurance Series |
| Other investments* | ||||||||||||||||
| Level 1 | Level 2 | Level 3 | Total | |||||||||||||
| Assets: | ||||||||||||||||
| Unrealized appreciation on futures contracts | $ | 22,298 | $ | — | $ | — | $ | 22,298 | ||||||||
| Unrealized appreciation on open forward currency contracts | — | 5,141 | — | 5,141 | ||||||||||||
| Unrealized appreciation on interest rate swaps | — | 2,565 | — | 2,565 | ||||||||||||
| Liabilities: | ||||||||||||||||
| Unrealized depreciation on futures contracts | (2,690 | ) | — | — | (2,690 | ) | ||||||||||
| Unrealized depreciation on open forward currency contracts | — | (14,412 | ) | — | (14,412 | ) | ||||||||||
| Unrealized depreciation on interest rate swaps | — | (2,338 | ) | — | (2,338 | ) | ||||||||||
| Total | $ | 19,608 | $ | (9,044 | ) | $ | — | $ | 10,564 | |||||||
| * | Futures contracts, forward currency contracts and interest rate swaps are not included in the investment portfolio. |
| Global Bond Fund | ||||||||||||||||
| Investment securities | ||||||||||||||||
| Level 1 | Level 2 | Level 3 | Total | |||||||||||||
| Assets: | ||||||||||||||||
| Bonds, notes & other debt instruments: | ||||||||||||||||
| Japanese yen | $ | — | $ | 248,037 | $ | — | $ | 248,037 | ||||||||
| Euros | — | 235,404 | — | 235,404 | ||||||||||||
| Mexican pesos | — | 74,438 | — | 74,438 | ||||||||||||
| Polish zloty | — | 73,313 | — | 73,313 | ||||||||||||
| Danish kroner | — | 65,733 | — | 65,733 | ||||||||||||
| Indian rupees | — | 45,800 | — | 45,800 | ||||||||||||
| British pounds | — | 43,376 | — | 43,376 | ||||||||||||
| Brazilian reais | — | 33,036 | — | 33,036 | ||||||||||||
| Thai baht | — | 27,229 | — | 27,229 | ||||||||||||
| Israeli shekels | — | 18,320 | — | 18,320 | ||||||||||||
| Chilean pesos | — | 15,174 | — | 15,174 | ||||||||||||
| Malaysian ringgits | — | 15,129 | — | 15,129 | ||||||||||||
| Romanian leu | — | 14,495 | — | 14,495 | ||||||||||||
| Canadian dollars | — | 10,039 | — | 10,039 | ||||||||||||
| U.S. dollars | — | 914,227 | 487 | 914,714 | ||||||||||||
| Other | — | 90,558 | — | 90,558 | ||||||||||||
| Convertible bonds | — | 100 | — | 100 | ||||||||||||
| Convertible stocks | — | — | 1,033 | 1,033 | ||||||||||||
| Common stocks | 113 | 913 | 9 | 1,035 | ||||||||||||
| Rights & warrants | — | — | 41 | 41 | ||||||||||||
| Short-term securities | — | 196,588 | — | 196,588 | ||||||||||||
| Total | $ | 113 | $ | 2,121,909 | $ | 1,570 | $ | 2,123,592 | ||||||||
| Other investments* | ||||||||||||||||
| Level 1 | Level 2 | Level 3 | Total | |||||||||||||
| Assets: | ||||||||||||||||
| Unrealized appreciation on futures contracts | $ | 5,231 | $ | — | $ | — | $ | 5,231 | ||||||||
| Unrealized appreciation on open forward currency contracts | — | 12,488 | — | 12,488 | ||||||||||||
| Unrealized appreciation on interest rate swaps | — | 335 | — | 335 | ||||||||||||
| Liabilities: | ||||||||||||||||
| Unrealized depreciation on futures contracts | (960 | ) | — | — | (960 | ) | ||||||||||
| Unrealized depreciation on open forward currency contracts | — | (5,570 | ) | — | (5,570 | ) | ||||||||||
| Unrealized depreciation on interest rate swaps | — | (284 | ) | — | (284 | ) | ||||||||||
| Total | $ | 4,271 | $ | 6,969 | $ | — | $ | 11,240 | ||||||||
| * | Futures contracts, forward currency contracts and interest rate swaps are not included in the investment portfolio. |
| American Funds Insurance Series | 151 |
| High-Income Bond Fund | ||||||||||||||||
| Investment securities | ||||||||||||||||
| Level 1 | Level 2 | Level 3 | Total | |||||||||||||
| Assets: | ||||||||||||||||
| Bonds, notes & other debt instruments: | ||||||||||||||||
| Corporate bonds & notes | $ | — | $ | 1,129,425 | $ | 8,992 | $ | 1,138,417 | ||||||||
| Other | — | 3,083 | — | 3,083 | ||||||||||||
| Convertible bonds | — | 5,438 | — | 5,438 | ||||||||||||
| Convertible stocks | 629 | — | 5,892 | 6,521 | ||||||||||||
| Common stocks | 1,642 | 8,344 | 2,397 | 12,383 | ||||||||||||
| Rights & warrants | — | — | 256 | 256 | ||||||||||||
| Short-term securities | — | 16,793 | — | 16,793 | ||||||||||||
| Total | $ | 2,271 | $ | 1,163,083 | $ | 17,537 | $ | 1,182,891 | ||||||||
| Other investments1 | ||||||||||||||||
| Level 1 | Level 2 | Level 3 | Total | |||||||||||||
| Assets: | ||||||||||||||||
| Unrealized appreciation on interest rate swaps | $ | — | $ | 156 | $ | — | $ | 156 | ||||||||
| Unrealized appreciation on credit default swaps | — | 1,544 | — | 1,544 | ||||||||||||
| Liabilities: | ||||||||||||||||
| Unrealized depreciation on interest rate swaps | — | (380 | ) | — | (380 | ) | ||||||||||
| Total | $ | — | $ | 1,320 | $ | — | $ | 1,320 | ||||||||
| 1 | Interest rate swaps and credit default swaps are not included in the investment portfolio. |
The following table reconciles the valuation of the fund’s Level 3 investment securities and related transactions for the year ended December 31, 2018 (dollars in thousands):
| Beginning value at 1/1/2018 | Transfers into Level 32 | Purchases | Sales | Net realized gain3 | Unrealized appreciation3 | Transfers out of Level 32 | Ending value at 12/31/2018 | |||||||||||||||||||||||||
| Investment securities | $ | 23,741 | $ | — | $ | 17,504 | $ | (34,559 | ) | $ | 6,060 | $ | 9,202 | $ | (4,411 | ) | $ | 17,537 | ||||||||||||||
| Net unrealized appreciation during the period on Level 3 investment securities held at December 31, 2018 | $ | 1,603 | ||||||||||||||||||||||||||||||
| 2 | Transfers into or out of Level 3 are based on the beginning market value of the quarter in which they occurred. |
| 3 | Net realized gain and unrealized appreciation are included in the related amounts on investments in the statement of operations. |
| 152 | American Funds Insurance Series |
Unobservable inputs— Valuation of the fund’s Level 3 securities is based on significant unobservable inputs that reflect the investment adviser’s determination of assumptions that market participants might reasonably use in valuing the securities. The following table provides additional information used by the fund’s investment adviser to fair value the fund’s Level 3 securities (dollars in thousands):
| Impact to | |||||||||||||||||||
| valuation from | |||||||||||||||||||
| Value at | Valuation | Unobservable | Weighted | an increase in | |||||||||||||||
| 12/31/2018 | techniques | inputs | Range | average | input* | ||||||||||||||
| Bonds, notes & other debt instruments | $ | 8,992 | Yield analysis | Yield to maturity risk premium | 0-400 bps | 299 bps | Decrease | ||||||||||||
| Convertible securities | 5,892 | Market comparables | EBITDA multiple | 8.9 | x | 8.9x | Increase | ||||||||||||
| Recent market information | Market comparables | 25 | % | 25% | Decrease | ||||||||||||||
| Enterprise value | Revenue multiple | 1.3 | x | 1.3x | Increase | ||||||||||||||
| Common stocks | 2,397 | Expected proceeds | Discount to reflect timing of receipt and amount of proceeds | 50 | % | 50% | Decrease | ||||||||||||
| Black-Scholes | Implied volatility | 30 | % | 30% | Increase | ||||||||||||||
| Rights & warrants | 256 | Recent market information | Quoted price | N/A | N/A | N/A | |||||||||||||
| $ | 17,537 | ||||||||||||||||||
| * | This column represents the directional change in fair value of the Level 3 securities that would result in an increase from the corresponding input. A decrease to the unobservable input would have the opposite effect. Significant increases and decreases in these inputs in isolation could result in significantly higher or lower fair value measurements. |
Key to abbreviation
EBITDA = Earnings before income taxes, depreciation and amortization
Mortgage Fund
| Investment securities | ||||||||||||||||
| Level 1 | Level 2 | Level 3 | Total | |||||||||||||
| Assets: | ||||||||||||||||
| Bonds, notes & other debt instruments: | ||||||||||||||||
| Mortgage-backed obligations | $ | — | $ | 209,270 | $ | — | $ | 209,270 | ||||||||
| U.S. Treasury bonds & notes | — | 32,012 | — | 32,012 | ||||||||||||
| Federal agency bonds & notes | — | 18,483 | — | 18,483 | ||||||||||||
| Asset-backed obligations | — | 17,340 | — | 17,340 | ||||||||||||
| Corporate bonds & notes | — | — | 80 | 80 | ||||||||||||
| Short-term securities | — | 66,563 | — | 66,563 | ||||||||||||
| Total | $ | — | $ | 343,668 | $ | 80 | $ | 343,748 | ||||||||
| Other investments* | ||||||||||||||||
| Level 1 | Level 2 | Level 3 | Total | |||||||||||||
| Assets: | ||||||||||||||||
| Unrealized appreciation on futures contracts | $ | 1,899 | $ | — | $ | — | $ | 1,899 | ||||||||
| Unrealized appreciation on interest rate swaps | — | 3,261 | — | 3,261 | ||||||||||||
| Liabilities: | ||||||||||||||||
| Unrealized depreciation on interest rate swaps | — | (2,067 | ) | — | (2,067 | ) | ||||||||||
| Total | $ | 1,899 | $ | 1,194 | $ | — | $ | 3,093 | ||||||||
| * | Futures contracts and interest rate swaps are not included in the investment portfolio. |
Ultra-Short Bond Fund
At December 31, 2018, all of the fund’s investment securities were classified as Level 2.
| American Funds Insurance Series | 153 |
| U.S. Government/AAA-Rated Securities Fund | ||||||||||||||||
| Investment securities | ||||||||||||||||
| Level 1 | Level 2 | Level 3 | Total | |||||||||||||
| Assets: | ||||||||||||||||
| Bonds, notes & other debt instruments: | ||||||||||||||||
| U.S. Treasury bonds & notes | $ | — | $ | 1,369,410 | $ | — | $ | 1,369,410 | ||||||||
| Mortgage-backed obligations | — | 821,393 | — | 821,393 | ||||||||||||
| Federal agency bonds & notes | — | 601,074 | — | 601,074 | ||||||||||||
| Short-term securities | — | 318,827 | — | 318,827 | ||||||||||||
| Total | $ | — | $ | 3,110,704 | $ | — | $ | 3,110,704 | ||||||||
| Other investments* | ||||||||||||||||
| Level 1 | Level 2 | Level 3 | Total | |||||||||||||
| Assets: | ||||||||||||||||
| Unrealized appreciation on futures contracts | $ | 31,021 | $ | — | $ | — | $ | 31,021 | ||||||||
| Unrealized appreciation on interest rate swaps | — | 34,976 | — | 34,976 | ||||||||||||
| Liabilities: | ||||||||||||||||
| Unrealized depreciation on futures contracts | (3,571 | ) | — | — | (3,571 | ) | ||||||||||
| Unrealized depreciation on interest rate swaps | — | (15,622 | ) | — | (15,622 | ) | ||||||||||
| Total | $ | 27,450 | $ | 19,354 | $ | — | $ | 46,804 | ||||||||
| * | Futures contracts and interest rate swaps are not included in the investment portfolio. |
Managed Risk Growth Fund
At December 31, 2018, all of the fund’s investments were classified as Level 1.
Managed Risk International Fund
At December 31, 2018, all of the fund’s investments were classified as Level 1.
Managed Risk Blue Chip Income and Growth Fund
At December 31, 2018, all of the fund’s investments were classified as Level 1.
Managed Risk Growth-Income Fund
At December 31, 2018, all of the fund’s investments were classified as Level 1.
Managed Risk Asset Allocation Fund
At December 31, 2018, all of the fund’s investments were classified as Level 1.
4. Risk factors
Investing in the funds may involve certain risks including, but not limited to, those described below.
Market conditions— The prices of, and the income generated by, the common stocks, bonds and other securities held by a fund may decline — sometimes rapidly or unpredictably — due to various factors, including events or conditions affecting the general economy or particular industries; overall market changes; local, regional or global political, social or economic instability; governmental, governmental agency or central bank responses to economic conditions; and currency exchange rate, interest rate and commodity price fluctuations.
Issuer risks— The prices of, and the income generated by, securities held by a fund may decline in response to various factors directly related to the issuers of such securities, including reduced demand for an issuer’s goods or services, poor management performance, major litigation against the issuer, changes in government regulations affecting the issuer or its competitive environment and strategic initiatives such as mergers, acquisitions or dispositions and the market response to any such initiatives.
Investing in growth-oriented stocks— Growth-oriented common stocks and other equity-type securities (such as preferred stocks, convertible preferred stocks and convertible bonds) may involve larger price swings and greater potential for loss than other types of investments. These risks may be even greater in the case of smaller capitalization stocks.
| 154 | American Funds Insurance Series |
Investing in income-oriented stocks— The value of a fund’s securities and income provided by a fund may be reduced by changes in the dividend policies of, and the capital resources available for dividend payments at, the companies in which the fund invests.
Investing in small companies— Investing in smaller companies may pose additional risks. For example, it is often more difficult to value or dispose of small company stocks and more difficult to obtain information about smaller companies than about larger companies. Furthermore, smaller companies often have limited product lines, operating histories, markets and/or financial resources, may be dependent on one or a few key persons for management, and can be more susceptible to losses. Moreover, the prices of their stocks may be more volatile than stocks of larger, more established companies, particularly during times of market turmoil.
Investing outside the U.S.— Securities of issuers domiciled outside the U.S., or with significant operations or revenues outside the U.S., may lose value because of adverse political, social, economic or market developments (including social instability, regional conflicts, terrorism and war) in the countries or regions in which the issuers operate or generate revenue. These securities may also lose value due to changes in foreign currency exchange rates against the U.S. dollar and/or currencies of other countries. Issuers of these securities may be more susceptible to actions of foreign governments, such as nationalization, currency blockage or the imposition of price controls or punitive taxes, each of which could adversely impact the value of these securities. Securities markets in certain countries may be more volatile and/or less liquid than those in the U.S. Investments outside the U.S. may also be subject to different accounting practices and different regulatory, legal and reporting standards and practices, and may be more difficult to value, than those in the U.S. In addition, the value of investments outside the U.S. may be reduced by foreign taxes, including foreign withholding taxes on interest and dividends. Further, there may be increased risks of delayed settlement of securities purchased or sold by the fund. The risks of investing outside the U.S. may be heightened in connection with investments in emerging markets.
Investing in developing countries— Investing in countries with developing economies and/or markets may involve risks in addition to and greater than those generally associated with investing in developed countries. For instance, emerging market countries may have less developed legal and accounting systems than those in developed countries. The governments of these countries may be less stable and more likely to impose capital controls, nationalize a company or industry, place restrictions on foreign ownership and on withdrawing sale proceeds of securities from the country, and/or impose punitive taxes that could adversely affect the prices of securities. In addition, the economies of these countries may be dependent on relatively few industries that are more susceptible to local and global changes. Securities markets in these countries can also be relatively small and have substantially lower trading volumes. As a result, securities issued in these countries may be more volatile and less liquid, and may be more difficult to value, than securities issued in countries with more developed economies and/or markets. Less certainty with respect to security valuations may lead to additional challenges and risks in calculating the fund’s net asset value. Additionally, emerging markets are more likely to experience problems with the clearing and settling of trades and the holding of securities by banks, agents and depositories that are less established than those in developed countries.
Investing in emerging markets— Investing in emerging markets may involve risks in addition to and greater than those generally associated with investing in the securities markets of developed countries. For instance, emerging market countries may have less developed legal and accounting systems than those in developed countries. The governments of these countries may be less stable and more likely to impose capital controls, nationalize a company or industry, place restrictions on foreign ownership and on withdrawing sale proceeds of securities from the country, and/or impose punitive taxes that could adversely affect the prices of securities. In addition, the economies of these countries may be dependent on relatively few industries that are more susceptible to local and global changes. Securities markets in these countries can also be relatively small and have substantially lower trading volumes. As a result, securities issued in these countries may be more volatile and less liquid, and may be more difficult to value, than securities issued in countries with more developed economies and/or markets. Less certainty with respect to security valuations may lead to additional challenges and risks in calculating a fund’s net asset value. Additionally, emerging markets are more likely to experience problems with the clearing and settling of trades and the holding of securities by banks, agents and depositories that are less established than those in developed countries.
Investing in debt instruments— The prices of, and the income generated by, bonds and other debt securities held by a fund may be affected by changing interest rates and by changes in the effective maturities and credit ratings of these securities.
Rising interest rates will generally cause the prices of bonds and other debt securities to fall. A general rise in interest rates may cause investors to sell debt securities on a large scale, which could also adversely affect the price and liquidity of debt securities and could also result in increased redemptions from a fund. Falling interest rates may cause an issuer to redeem, call or refinance a debt security before its stated maturity, which may result in a fund failing to recoup the full amount of its initial investment and having to reinvest the proceeds in lower yielding securities. Longer maturity debt securities generally have greater sensitivity to changes in interest rates and may be subject to greater price fluctuations than shorter maturity debt securities.
| American Funds Insurance Series | 155 |
Bonds and other debt securities are also subject to credit risk, which is the possibility that the credit strength of an issuer or guarantor will weaken or be perceived to be weaker, and/or an issuer of a debt security will fail to make timely payments of principal or interest and the security will go into default. A downgrade or default affecting any of a fund’s securities could cause the value of a fund’s shares to decrease. Lower quality debt securities generally have higher rates of interest and may be subject to greater price fluctuations than higher quality debt securities. Credit risk is gauged, in part, by the credit ratings of the debt securities in which a fund invests. However, ratings are only the opinions of the rating agencies issuing them and are not guarantees as to credit quality or an evaluation of market risk. The funds’ investment adviser relies on its own credit analysts to research issuers and issues in seeking to assess credit and default risks.
Investing in lower rated debt instruments— Lower rated bonds and other lower rated debt securities generally have higher rates of interest and involve greater risk of default or price declines due to changes in the issuer’s creditworthiness than those of higher quality debt securities. The market prices of these securities may fluctuate more than the prices of higher quality debt securities and may decline significantly in periods of general economic difficulty. These risks may be increased with respect to investments in junk bonds.
Investing in derivatives— The use of derivatives involves a variety of risks, which may be different from, or greater than, the risks associated with investing in traditional securities, such as stocks and bonds. Changes in the value of a derivative may not correlate perfectly with, and may be more sensitive to market events than, the underlying asset, rate or index, and a derivative instrument may expose a fund to losses in excess of its initial investment. Derivatives may be difficult to value, difficult for a fund to buy or sell at an opportune time or price and difficult to terminate or otherwise offset. A fund’s use of derivatives may result in losses to the fund, and investing in derivatives may reduce a fund’s returns and increase a fund’s price volatility. A fund’s counterparty to a derivative transaction (including, if applicable, the fund’s clearing broker, the derivatives exchange or the clearinghouse) may be unable or unwilling to honor its financial obligations in respect of the transaction.
Currency— The prices of, and the income generated by, most debt securities held by a fund may also be affected by changes in relative currency values. If the U.S. dollar appreciates against foreign currencies, the value in U.S. dollars of a fund’s securities denominated in such currencies would generally fall and vice versa. U.S. dollar-denominated securities of foreign issuers may also be affected by changes in relative currency values.
Investing in mortgage-related and other asset-backed securities— Mortgage-related securities, such as mortgage-backed securities, and other asset-backed securities, include debt obligations that represent interests in pools of mortgages or other income-bearing assets, such as consumer loans or receivables. Such securities often involve risks that are different from or more acute than the risks associated with investing in other types of debt securities. Mortgage-backed and other asset-backed securities are subject to changes in the payment patterns of borrowers of the underlying debt, potentially increasing the volatility of the securities and a fund’s net asset value. When interest rates fall, borrowers are more likely to refinance or prepay their debt before its stated maturity. This may result in a fund having to reinvest the proceeds in lower yielding securities, effectively reducing a fund’s income. Conversely, if interest rates rise and borrowers repay their debt more slowly than expected, the time in which the mortgage-backed and other asset-backed securities are paid off could be extended, reducing a fund’s cash available for reinvestment in higher yielding securities. Mortgage-backed securities are also subject to the risk that underlying borrowers will be unable to meet their obligations and the value of property that secures the mortgages may decline in value and be insufficient, upon foreclosure, to repay the associated loans. Investments in asset-backed securities are subject to similar risks.
Investing in future delivery contracts— A fund may enter into contracts, such as to-be-announced contracts and mortgage dollar rolls, that involve a fund selling mortgage-related securities and simultaneously contracting to repurchase similar securities for delivery at a future date at a predetermined price. This can increase a fund’s market exposure, and the market price of the securities that the fund contracts to repurchase could drop below their purchase price. While a fund can preserve and generate capital through the use of such contracts by, for example, realizing the difference between the sale price and the future purchase price, the income generated by the fund may be reduced by engaging in such transactions. In addition, these transactions may increase the turnover rate of a fund.
Investing in inflation linked bonds— The values of inflation linked bonds generally fluctuate in response to changes in real interest rates — i.e., rates of interest after factoring in inflation. A rise in real interest rates may cause the prices of inflation linked securities to fall, while a decline in real interest rates may cause the prices to increase. Inflation linked bonds may experience greater losses than other debt securities with similar durations when real interest rates rise faster than nominal interest rates. There can be no assurance that the value of an inflation linked security will be directly correlated to changes in interest rates; for example, if interest rates rise for reasons other than inflation, the increase may not be reflected in the security’s inflation measure.
Investing in inflation linked bonds may also reduce a fund’s distributable income during periods of deflation. If prices for goods and services decline throughout the economy, the principal and income on inflation linked securities may decline and result in losses to a fund.
| 156 | American Funds Insurance Series |
Investing in securities backed by the U.S. government— Securities backed by the U.S. Treasury or the full faith and credit of the U.S. government are guaranteed only as to the timely payment of interest and principal when held to maturity. Accordingly, the current market values for these securities will fluctuate with changes in interest rates and the credit rating of the U.S. government. Securities issued by government-sponsored entities and federal agencies and instrumentalities that are not backed by the full faith and credit of the U.S. government are neither issued nor guaranteed by the U.S. government.
Investing in repurchase agreements— Upon entering into a repurchase agreement, a fund purchases a security from a bank or broker-dealer, which simultaneously commits to repurchase the security within a specified time at the fund’s cost with interest. The security purchased by the fund constitutes collateral for the seller’s repurchase obligation. If the party agreeing to repurchase should default, the fund may seek to sell the security it holds as collateral. The fund may incur a loss if the value of the collateral securing the repurchase obligation falls below the repurchase price. The fund may also incur disposition costs and encounter procedural delays in connection with liquidating the collateral.
Interest rate risk— The values and liquidity of the securities held by a fund may be affected by changing interest rates. For example, the values of these securities may decline when interest rates rise and increase when interest rates fall. Longer maturity debt securities generally have greater sensitivity to changes in interest rates and may be subject to greater price fluctuations than shorter maturity debt securities. A fund may invest in variable and floating rate securities. When a fund holds variable or floating rate securities, a decrease in market interest rates will adversely affect the income received from such securities and the net asset value of a fund’s shares. Although the values of such securities are generally less sensitive to interest rate changes than those of other debt securities, the value of variable and floating rate securities may decline if their interest rates do not rise as quickly, or as much, as market interest rates. Conversely, floating rate securities will not generally increase in value if interest rates decline. During periods of extremely low short-term interest rates, a fund may not be able to maintain a positive yield and, given the current low interest rate environment, risks associated with rising rates are currently heightened.
Credit and liquidity support— Changes in the credit quality of banks and financial institutions providing credit and liquidity support features with respect to securities held by a fund could cause the values of these securities to decline.
Asset allocation— A fund’s percentage allocation to equity securities, debt securities and money market instruments could cause the fund to underperform relative to relevant benchmarks and other funds with similar investment objectives.
Nondiversification risk — As nondiversified funds, certain funds have the ability to invest a larger percentage of their assets in the securities of a smaller number of issuers than diversified funds. Although the funds do not intend to limit their investments to the securities of a small number of issuers, if they were to do so, poor performance by a single large holding could adversely impact the funds’ investment results more than if the funds were invested in a larger number of issuers.
Liquidity risk— Certain fund holdings may be or become difficult or impossible to sell, particularly during times of market turmoil. Illiquidity may result from the lack of an active market for a holding, legal or contractual restrictions on resale, or the reduced number and capacity of market participants to make a market in such holding. Market prices for less liquid or illiquid holdings may be volatile, and reduced liquidity may have an adverse impact on the market price of such holdings. Additionally, the sale of less liquid or illiquid holdings may involve substantial delays (including delays in settlement) and additional costs and the fund may be unable to sell such holdings when necessary to meet its liquidity needs or may be forced to sell at a loss.
Management— The investment adviser to the funds actively manages the funds’ investments. Consequently, the funds are subject to the risk that the methods and analyses, including models, tools and data, employed by the investment adviser in this process may be flawed or incorrect and may not produce the desired results. This could cause the funds to lose value or their investment results to lag relevant benchmarks or other funds with similar objectives.
Investing in the managed risk funds may involve additional risks including, but not limited to, those described below.
Fund structure— The managed risk funds invest in underlying funds and incur expenses related to those underlying funds. In addition, investors in the managed risk funds will incur fees to pay for certain expenses related to the operations of the managed risk funds. An investor holding the underlying fund directly would incur lower overall expenses but would not receive the benefit of the managed risk strategy.
Management— The managed risk funds are subject to the risk that the managed risk strategy or the methods employed by the subadviser in implementing the managed risk strategy may not produce the desired results. This could cause the managed risk funds to lose value or their investment results to lag relevant benchmarks or other funds with similar objectives.
| American Funds Insurance Series | 157 |
Underlying fund risks— Because the managed risk funds’ investments consist of investments in underlying funds, the managed risk funds’ risks are directly related to the risks of the respective underlying fund in which each managed fund invests. For this reason, it is important to understand the risks associated with investing both in the managed risk fund and in each of the underlying funds.
Investing in options and futures contracts— In addition to the risks generally associated with investing in derivative instruments, options and futures contracts are subject to the creditworthiness of the clearing organizations, exchanges and, in the case of futures, futures commission merchants with which a fund transacts. Additionally, although futures require only a small initial investment in the form of a deposit of initial margin, the amount of a potential loss on a futures contract could greatly exceed the initial amount invested. While both options and futures contracts are generally liquid instruments, under certain market conditions, options and futures may be deemed to be illiquid. For example, a fund may be temporarily prohibited from closing out its position in an options or futures contract if intraday price change limits or limits on trading volume imposed by the applicable exchange are triggered. If a fund is unable to close out a position on an options or futures contract, the fund would remain subject to the risk of adverse price movements until the fund is able to close out the position in question. The ability of a fund to successfully utilize options and futures contracts may depend in part upon the ability of the fund’s investment adviser or subadviser to accurately forecast interest rates and other economic factors and to assess and predict the impact of such economic factors on the options and futures in which the fund invests. If the investment adviser or subadviser incorrectly forecasts economic developments or incorrectly predicts the impact of such developments on the options and futures in which it invests, a fund could be exposed to the risk of loss. Whereas the risk of loss on a put option purchased by the fund is limited to the initial cost of the option, the amount of a potential loss on a futures contract could greatly exceed the relatively small initial amount invested in entering the futures position.
Hedging— There may be imperfect or even negative correlation between the prices of the options and futures contracts in which a fund invests and the prices of the underlying securities or indexes which the fund seeks to hedge. For example, options and futures contracts may not provide an effective hedge because changes in options and futures contract prices may not track those of the underlying securities or indexes they are intended to hedge. In addition, there are significant differences between the securities market, on the one hand, and the options and futures markets, on the other, that could result in an imperfect correlation between the markets, causing a given hedge not to achieve its objectives. The degree of imperfection of correlation depends on circumstances such as variations in speculative market demand for options and futures, including technical influences in options and futures trading, and differences between the financial instruments being hedged and the instruments underlying the standard contracts available for trading. A decision as to whether, when and how to hedge involves the exercise of skill and judgment, and even a well-conceived hedge may be unsuccessful to some degree because of market behavior or unexpected interest rate trends. In addition, the fund’s investment in exchange-traded options and futures and their resulting costs could limit the fund’s gains in rising markets relative to those of the underlying funds, or to those of unhedged funds in general.
Short positions— A fund may suffer losses from short positions in futures contracts. Losses from short positions in futures contracts occur when the underlying index increases in value. As the underlying index increases in value, the holder of the short position in the corresponding futures contract is required to pay the difference in value of the futures contract resulting from the increase in the index on a daily basis. Losses from a short position in an index futures contract could potentially be very large if the value of the underlying index rises dramatically in a short period of time.
5. Certain investment techniques
Securities lending— One of the funds has entered into securities lending transactions in which the fund earns income by lending investment securities to brokers, dealers or other institutions. Each transaction involves three parties: the fund, acting as the lender of the securities, a borrower, and a lending agent that acts as an intermediary.
Securities lending transactions are entered into by the fund under the securities lending agreement with the lending agent. The lending agent facilitates the exchange of securities between the lender and the borrower, generally provides protection from borrower default, marks to market the value of collateral daily, secures additional collateral from the borrower if it falls below preset terms, and may reinvest the collateral on behalf of the fund according to agreed parameters. The lending agent has indemnified the fund against losses resulting from borrower default. Although risk is mitigated by the collateral and indemnification, the fund could experience a delay in recovering its securities and a potential loss of income or value if the borrower fails to return the securities, collateral investments decline in value or the lending agent fails to perform.
The borrower is required to post highly liquid assets, such as cash or U.S. government securities, as collateral for the loan in an amount at least equal to the value of the securities loaned. Investments made with cash collateral are recognized as assets in the fund’s investment portfolio. The same amount is recorded as a liability in the fund’s statement of assets and liabilities. While securities are on loan, the fund will continue to receive the equivalent of the interest, dividends or other distributions paid by the issuer, as well as a
| 158 | American Funds Insurance Series |
portion of the interest on the investment of the collateral. Additionally, although the fund does not have the right to vote on securities while they are on loan, the fund has a right to consent on corporate actions and a right to recall loaned securities to vote on proposals affecting them. The borrower is obligated to return the loaned security at the conclusion of the loan or, during the pendency of the loan, on demand from the fund.
As of December 31, 2018, the total value of securities on loan was $67,607,000, and the total value of collateral received was $72,379,000. Collateral received included cash of $60,486,000 and non-cash U.S. Government securities of $11,893,000. Investment securities purchased from cash collateral of $54,436,000 are disclosed in the summary investment portfolio as short-term securities. Securities received as collateral, if any, are not recognized as fund assets. The contractual maturity of collateral received under the securities lending agreement is classified as overnight and continuous.
Index-linked bonds— Some of the funds have invested in index-linked bonds, which are fixed-income securities whose principal value is periodically adjusted to a government price index. Over the life of an index-linked bond, interest is paid on the adjusted principal value. Increases or decreases in the principal value of index-linked bonds are recorded as interest income in the fund’s statement of operations.
Mortgage dollar rolls— Some of the funds have entered into mortgage dollar roll transactions in which the fund sells a mortgage-backed security to a counterparty and simultaneously enters into an agreement with the same counterparty to buy back a similar security on a specific future date at a predetermined price. Mortgage dollar rolls are accounted for as purchase and sale transactions, which may increase the funds’ portfolio turnover rates.
Loan transactions— Some of the funds have entered into loan transactions in which the fund acquires a loan either through an agent, by assignment from another holder, or as a participation interest in another holder’s portion of a loan. The loan is often administered by a financial institution that acts as agent for the holders of the loan, and the fund may be required to receive approval from the agent and/or borrower prior to the sale of the investment. The loan’s interest rate and maturity date may change based on the terms of the loan, including potential early payments of principal.
Short-term securities— The managed risk funds hold shares of the Government Cash Management Fund, a cash management vehicle offered by the Bank of New York Mellon (“BNY Mellon”), the funds’ custodian bank. The Government Cash Management Fund is managed by the Dreyfus Corporation.
Options contracts— The Managed Risk Growth-Income Fund has entered into options contracts, which give the holder of the option, in return for a premium payment, the right to buy from (in the case of a call) or sell to (in the case of a put) the writer of the option, the security underlying the option (or the cash value of the index underlying the option) at a specified price. As part of its managed risk strategy, the Managed Risk Growth-Income Fund will at times purchase put options on equity indexes in standardized contracts traded on foreign or domestic securities exchanges, boards of trade, or similar entities. By purchasing a put option on an equity index, the fund obtains the right (but not the obligation) to sell the cash value of the index underlying the option at a specified exercise price, and in return for this right, the fund pays the current market price, or the option premium, for the option.
The fund may terminate its position in a put option by allowing the option to expire or by exercising the option. If the option is allowed to expire, the fund will lose the entire premium. If the option is exercised, the fund completes the sale of the underlying instrument (or delivers the cash value of the index underlying the option) at the exercise price. The fund may also terminate a put option position by entering into opposing close-out transactions in advance of the option expiration date.
Premiums paid on options purchased, as well as the daily fluctuation in market value, are included in investment securities in the fund’s statement of assets and liabilities. Realized gains or losses are recorded at the time the option contract is closed or expires. Net realized gains or losses and net unrealized appreciation or depreciation from options contracts are recorded in the fund’s statement of operations.
Futures contracts— Some of the funds have entered into futures contracts, which provide for the future sale by one party and purchase by another party of a specified amount of a specific financial instrument for a specified price, date, time and place designated at the time the contract is made. Futures contracts are used to strategically manage the fund’s interest rate sensitivity by increasing or decreasing the duration of the fund or a portion of the fund’s portfolio. For the managed risk funds, futures contracts are used to strategically manage portfolio volatility and downside equity risk.
Upon entering into futures contracts, and to maintain the fund’s open positions in futures contracts, the fund is required to deposit with a futures broker, or FCM, in a segregated account in the name of the FCM an amount of cash, U.S. government securities or other liquid securities, known as initial margin. The margin required for a particular futures contract is set by the exchange on which the contract is
| American Funds Insurance Series | 159 |
traded to serve as collateral, and may be significantly modified from time to time by the exchange during the term of the contract. Securities deposited as initial margin, if any, are disclosed in the investment portfolio and cash deposited as initial margin, if any, is reflected as restricted cash pledged for futures contracts in the fund’s statement of assets and liabilities.
On a daily basis, each fund pays or receives variation margin based on the increase or decrease in the value of the futures contracts and records variation margin on futures contracts in each fund’s statement of assets and liabilities. In addition, each fund segregates liquid assets equivalent to the fund’s outstanding obligations under the contract in excess of the initial margin and variation margin, if any. Futures contracts may involve a risk of loss in excess of the variation margin shown on each fund’s statement of assets and liabilities. Each fund records realized gains or losses at the time the futures contract is closed or expires. Net realized gains or losses and net unrealized appreciation or depreciation from futures contracts are recorded in each fund’s statement of operations.
Forward currency contracts— Some of the funds have entered into forward currency contracts, which represent agreements to exchange currencies on specific future dates at predetermined rates. The series’ investment adviser uses forward currency contracts to manage the fund’s exposure to changes in exchange rates. Upon entering into these contracts, risks may arise from the potential inability of counterparties to meet the terms of their contracts and from possible movements in exchange rates.
On a daily basis, the series’ investment adviser values forward currency contracts based on the applicable exchange rates and records unrealized appreciation or depreciation for open forward currency contracts in each fund’s statement of assets and liabilities. Realized gains or losses are recorded at the time the forward contract is closed or offset by another contract with the same broker for the same settlement date and currency. Closed forward currency contracts that have not reached their settlement date are included in the respective receivables or payables for closed forward currency contracts in each fund’s statement of assets and liabilities. Net realized gains or losses from closed forward currency contracts and net unrealized appreciation or depreciation from open forward currency contracts are recorded in each fund’s statement of operations.
Interest rate swaps— Some of the funds have entered into interest rate swaps, which are agreements to exchange one stream of future interest payments for another based on a specified notional amount. Typically, interest rate swaps exchange a fixed interest rate for a payment that floats relative to a benchmark or vice versa. The series’ investment adviser uses interest rate swaps to manage the interest rate sensitivity of the fund by increasing or decreasing the duration of the fund or a portion of the fund’s portfolio. Risks may arise as a result of the series’ investment adviser incorrectly anticipating changes in interest rates, increased volatility, reduced liquidity and the potential inability of counterparties to meet the terms of their agreements.
Upon entering into an interest rate swap contract, the fund is required to deposit cash, U.S. government securities or other liquid securities, which is known as initial margin. Generally, the initial margin required for a particular interest rate swap is set and held as collateral by the clearinghouse on which the contract is cleared. The amount of initial margin required may be significantly modified from time to time by the clearinghouse during the term of the contract.
On a daily basis, the series’ investment adviser records daily interest accruals related to the exchange of future payments as a receivable and payable in each fund’s statement of assets and liabilities. Each fund also pays or receives a variation margin based on the increase or decrease in the value of the interest rate swaps, including accrued interest, and records variation margin on interest rate swaps in each fund’s statement of assets and liabilities. Each fund records realized gains and losses on both the net accrued interest and any gain or loss recognized at the time the interest rate swap is closed or expires. Net realized gains or losses, as well as any net unrealized appreciation or depreciation, from interest rate swaps are recorded in each fund’s statement of operations.
Credit default swap indices— Some of the funds have entered into centrally cleared credit default swap agreements on credit indices (“CDSI”) that involve one party (the protection buyer) making a stream of payments to another party (the protection seller) in exchange for the right to receive a specified return upon the occurrence of a credit event, such as a default or restructuring, with respect to any of the underlying issuers (reference obligations) in the referenced index. The series’ investment adviser uses credit default swaps to assume exposure to a diversified portfolio of credits or to hedge against existing credit risks.
CDSI are portfolios of credit instruments or exposures designed to be representative of some part of the credit market, such as the high-yield or investment-grade credit market. CDSI are generally traded using standardized terms, including a fixed spread and standard maturity dates, and reference all the names in the index. If there is a credit event, it is settled based on that name’s weight in the index. The composition of the underlying issuers or obligations within a particular index may change periodically, usually every six months. A specified credit event may affect all or individual underlying reference obligations included in the index, and will be settled based upon the relative weighting of the affected obligation(s) within the index. The value of each CDSI can be used as a measure of the current payment/performance risk of the CDSI and represents the likelihood of an expected liability or profit should the notional amount of the CDSI be closed or sold as of the period end. An increasing value, as compared to the notional amount of the CDSI, represents a deterioration of the referenced indices’ credit soundness and a greater likelihood of risk of default or other credit event
| 160 | American Funds Insurance Series |
occurring as defined under the terms of the agreement. When a fund provides sell protection, its maximum exposure is the notional amount of the credit default swap agreement.
Upon entering into a centrally cleared CDSI contract, the fund is required to deposit with a derivatives clearing member (“DCM”) in a segregated account in the name of the DCM an amount of cash, U.S. government securities or other liquid securities, which is known as initial margin. Generally, the initial margin required for a particular credit default swap is set and held as collateral by the clearinghouse on which the contract is cleared. The amount of initial margin required may be significantly modified from time to time by the clearinghouse during the term of the contract. Securities deposited as initial margin are designated on the investment portfolio.
On a daily basis, interest accruals related to the exchange of future payments are recorded as a receivable and payable in each fund’s statement of assets and liabilities. Each fund also pays or receives a variation margin based on the increase or decrease in the value of the centrally cleared swaps, and records variation margin in each fund’s statement of assets and liabilities. Each fund records realized gains and losses on both the net accrued interest and any gain or loss recognized at the time the swap is closed or expires. Net realized gains or losses, as well as any net unrealized appreciation or depreciation, from credit default swaps are recorded in each fund’s statement of operations.
The following table presents the average month-end notional amounts of options purchased, futures contracts, forward currency contracts, interest rate swaps and credit default swaps while held for each fund (dollars in thousands):
| Options purchased | Futures contracts | Forward currency contracts | Interest rate swaps | Credit default swaps | ||||||||||||||||
| Global Growth Fund | Not applicable | Not applicable | $6,220 | * | Not applicable | Not applicable | ||||||||||||||
| Global Small Capitalization Fund | Not applicable | Not applicable | 93,340 | * | Not applicable | Not applicable | ||||||||||||||
| International Fund | Not applicable | Not applicable | 35,647 | Not applicable | Not applicable | |||||||||||||||
| New World Fund | Not applicable | Not applicable | 15,738 | Not applicable | Not applicable | |||||||||||||||
| Global Growth and Income Fund | Not applicable | Not applicable | 7,640 | Not applicable | Not applicable | |||||||||||||||
| Capital Income Builder | Not applicable | $188,467 | Not applicable | Not applicable | Not applicable | |||||||||||||||
| Asset Allocation Fund | Not applicable | 375,571 | Not applicable | $2,197,665 | Not applicable | |||||||||||||||
| Global Balanced Fund | Not applicable | 6,967 | 24,260 | 86,959 | Not applicable | |||||||||||||||
| Bond Fund | Not applicable | 2,619,856 | 581,133 | 3,448,366 | $48,409 | * | ||||||||||||||
| Global Bond Fund | Not applicable | 197,591 | 772,080 | 823,223 | Not applicable | |||||||||||||||
| High-Income Bond Fund | Not applicable | 9,800 | * | Not applicable | 46,142 | 84,946 | ||||||||||||||
| Mortgage Fund | Not applicable | 153,475 | Not applicable | 366,044 | Not applicable | |||||||||||||||
| U.S. Government/AAA-Rated Securities Fund | Not applicable | 2,838,731 | Not applicable | 8,956,391 | Not applicable | |||||||||||||||
| Managed Risk Growth Fund | Not applicable | 57,567 | Not applicable | Not applicable | Not applicable | |||||||||||||||
| Managed Risk International Fund | Not applicable | 174,691 | Not applicable | Not applicable | Not applicable | |||||||||||||||
| Managed Risk Blue Chip Income and Growth Fund | Not applicable | 47,916 | Not applicable | Not applicable | Not applicable | |||||||||||||||
| Managed Risk Growth-Income Fund | $777,368 | 138,587 | Not applicable | Not applicable | Not applicable | |||||||||||||||
| Managed Risk Asset Allocation Fund | Not applicable | 399,717 | Not applicable | Not applicable | Not applicable | |||||||||||||||
| * | No contracts were held at the end of the reporting period; amount represents the average month-end notional amount of contracts while they were held. |
| American Funds Insurance Series | 161 |
The following tables present the financial statement impacts resulting from the funds’ use of options, futures contracts, forward currency contracts, interest rate swaps and/or credit default swaps as of, or for the year ended, December 31, 2018 (dollars in thousands):
Global Growth Fund
| Net realized loss | Net unrealized depreciation | |||||||||||||
| Contracts | Risk type | Location on statement of operations | Value | Location on statement of operations | Value | |||||||||
| Forward currency | Currency | Net realized loss on forward currency contracts | $ | (21 | ) | Net unrealized depreciation on forward currency contracts | $ | (15 | ) | |||||
| Global Small Capitalization Fund | ||||||||||||||
| Net realized gain | Net unrealized appreciation | |||||||||||||
| Contracts | Risk type | Location on statement of operations | Value | Location on statement of operations | Value | |||||||||
| Forward currency | Currency | Net realized gain on forward currency contracts | $ | 94 | Net unrealized appreciation on forward currency contracts | $ | 1,103 | |||||||
| International Fund | ||||||||||||||
| Assets | Liabilities | |||||||||||||
| Contracts | Risk type | Location on statement of assets and liabilities | Value | Location on statement of assets and liabilities | Value | |||||||||
| Forward currency | Currency | Unrealized appreciation on open forward currency contracts | $ | — | Unrealized depreciation on open forward currency contracts | $ | 525 | |||||||
| Net realized gain | Net unrealized depreciation | |||||||||||||
| Contracts | Risk type | Location on statement of operations | Value | Location on statement of operations | Value | |||||||||
| Forward currency | Currency | Net realized gain on forward currency contracts | $ | 1,317 | Net unrealized depreciation on forward currency contracts | $ | (170 | ) | ||||||
| New World Fund | ||||||||||||||
| Assets | Liabilities | |||||||||||||
| Contracts | Risk type | Location on statement of assets and liabilities | Value | Location on statement of assets and liabilities | Value | |||||||||
| Forward currency | Currency | Unrealized appreciation on open forward currency contracts | $ | 356 | Unrealized depreciation on open forward currency contracts | $ | 53 | |||||||
| Net realized gain | Net unrealized appreciation | |||||||||||||
| Contracts | Risk type | Location on statement of operations | Value | Location on statement of operations | Value | |||||||||
| Forward currency | Currency | Net realized gain on forward currency contracts | $ | 649 | Net unrealized appreciation on forward currency contracts | $ | 626 | |||||||
| 162 | American Funds Insurance Series |
Global Growth and Income Fund
| Assets | Liabilities | |||||||||||||
| Contracts | Risk type | Location on statement of assets and liabilities | Value | Location on statement of assets and liabilities | Value | |||||||||
| Forward currency | Currency | Unrealized appreciation on open forward currency contracts | $ | 351 | Unrealized depreciation on open forward currency contracts | $ | — | |||||||
| Net realized loss | Net unrealized appreciation | |||||||||||||
| Contracts | Risk type | Location on statement of operations | Value | Location on statement of operations | Value | |||||||||
| Forward currency | Currency | Net realized loss on forward currency contracts | $ | (72 | ) | Net unrealized appreciation on forward currency contracts | $ | 351 | ||||||
| Capital Income Builder | ||||||||||||||
| Assets | Liabilities | |||||||||||||
| Contracts | Risk type | Location on statement of assets and liabilities | Value | Location on statement of assets and liabilities | Value | |||||||||
| Futures | Interest | Unrealized appreciation1 | $ | 2,467 | Unrealized depreciation1 | $ | 2,038 | |||||||
| Net realized gain | Net unrealized appreciation | |||||||||||||
| Contracts | Risk type | Location on statement of operations | Value | Location on statement of operations | Value | |||||||||
| Futures | Interest | Net realized gain on futures contracts | $ | 242 | Net unrealized appreciation on futures contracts | $ | 429 | |||||||
| Asset Allocation Fund | ||||||||||||||
| Assets | Liabilities | |||||||||||||
| Contracts | Risk type | Location on statement of assets and liabilities | Value | Location on statement of assets and liabilities | Value | |||||||||
| Futures | Interest | Unrealized appreciation1 | $ | 6,035 | Unrealized depreciation1 | $ | 874 | |||||||
| Swaps | Interest | Unrealized appreciation1 | — | Unrealized depreciation1 | 3,557 | |||||||||
| $ | 6,035 | $ | 4,431 | |||||||||||
| Net realized gain (loss) | Net unrealized appreciation | |||||||||||||
| Contracts | Risk type | Location on statement of operations | Value | Location on statement of operations | Value | |||||||||
| Futures | Interest | Net realized gain on futures contracts | $ | 677 | Net unrealized appreciation on futures contracts | $ | 5,914 | |||||||
| Swaps | Interest | Net realized loss on swap contracts | (2,209 | ) | Net unrealized appreciation on swap contracts | 2,691 | ||||||||
| $ | (1,532 | ) | $ | 8,605 | ||||||||||
See end of tables for footnotes.
| American Funds Insurance Series | 163 |
Global Balanced Fund
| Assets | Liabilities | |||||||||||||
| Contracts | Risk type | Location on statement of assets and liabilities | Value | Location on statement of assets and liabilities | Value | |||||||||
| Futures | Interest | Unrealized appreciation1 | $ | 180 | Unrealized depreciation1 | $ | — | |||||||
| Forward currency | Currency | Unrealized appreciation on open forward currency contracts | 214 | Unrealized depreciation on open forward currency contracts | 132 | |||||||||
| Swaps | Interest | Unrealized appreciation1 | 24 | Unrealized depreciation1 | 19 | |||||||||
| $ | 418 | $ | 151 | |||||||||||
| Net realized gain (loss) | Net unrealized appreciation | |||||||||||||
| Contracts | Risk type | Location on statement of operations | Value | Location on statement of operations | Value | |||||||||
| Futures | Interest | Net realized gain on futures contracts | $ | 23 | Net unrealized appreciation on futures contracts | $ | 180 | |||||||
| Forward currency | Currency | Net realized loss on forward currency contracts | (541 | ) | Net unrealized appreciation on forward currency contracts | 207 | ||||||||
| Swaps | Interest | Net realized loss on swap contracts | (5 | ) | Net unrealized appreciation on swap contracts | 5 | ||||||||
| $ | (523 | ) | $ | 392 | ||||||||||
| Bond Fund | ||||||||||||||
| Assets | Liabilities | |||||||||||||
| Contracts | Risk type | Location on statement of assets and liabilities | Value | Location on statement of assets and liabilities | Value | |||||||||
| Futures | Interest | Unrealized appreciation1 | $ | 22,298 | Unrealized depreciation1 | $ | 2,690 | |||||||
| Forward currency | Currency | Unrealized appreciation on open forward currency contracts | 5,141 | Unrealized depreciation on open forward currency contracts | 14,412 | |||||||||
| Swaps | Interest | Unrealized appreciation1 | 2,565 | Unrealized depreciation1 | 2,338 | |||||||||
| $ | 30,004 | $ | 19,440 | |||||||||||
| Net realized (loss) gain | Net unrealized appreciation (depreciation) | |||||||||||||
| Contracts | Risk type | Location on statement of operations | Value | Location on statement of operations | Value | |||||||||
| Futures | Interest | Net realized loss on futures contracts | $ | (38,790 | ) | Net unrealized appreciation on futures contracts | $ | 23,764 | ||||||
| Forward currency | Currency | Net realized gain on forward currency contracts | 14,487 | Net unrealized depreciation on forward currency contracts | (16,813 | ) | ||||||||
| Swaps | Interest | Net realized gain on swap contracts | 16,325 | Net unrealized depreciation on swap contracts | (7,485 | ) | ||||||||
| Swaps | Credit | Net realized gain on swap contracts | 42 | Net unrealized appreciation on swap contracts | 184 | |||||||||
| $ | (7,936 | ) | $ | (350 | ) | |||||||||
| 164 | American Funds Insurance Series |
Global Bond Fund
| Assets | Liabilities | |||||||||||||
| Contracts | Risk type | Location on statement of assets and liabilities | Value | Location on statement of assets and liabilities | Value | |||||||||
| Futures | Interest | Unrealized appreciation1 | $ | 5,231 | Unrealized depreciation1 | $ | 960 | |||||||
| Forward currency | Currency | Unrealized appreciation on open forward currency contracts | 12,488 | Unrealized depreciation on open forward currency contracts | 5,570 | |||||||||
| Swaps | Interest | Unrealized appreciation1 | 335 | Unrealized depreciation1 | 284 | |||||||||
| $ | 18,054 | $ | 6,814 | |||||||||||
| Net realized loss | Net unrealized appreciation | |||||||||||||
| Contracts | Risk type | Location on statement of operations | Value | Location on statement of operations | Value | |||||||||
| Futures | Interest | Net realized loss on futures contracts | $ | (3,980 | ) | Net unrealized appreciation on futures contracts | $ | 4,630 | ||||||
| Forward currency | Currency | Net realized loss on forward currency contracts | (6,955 | ) | Net unrealized appreciation on forward currency contracts | 6,258 | ||||||||
| Swaps | Interest | Net realized loss on swap contracts | (44 | ) | Net unrealized appreciation on swap contracts | 1,530 | ||||||||
| $ | (10,979 | ) | $ | 12,418 | ||||||||||
| High-Income Bond Fund | ||||||||||||||
| Assets | Liabilities | |||||||||||||
| Contracts | Risk type | Location on statement of assets and liabilities | Value | Location on statement of assets and liabilities | Value | |||||||||
| Swaps | Interest | Unrealized appreciation1 | $ | 156 | Unrealized depreciation1 | $ | 380 | |||||||
| Swaps | Credit | Unrealized appreciation1 | 1,544 | Unrealized depreciation1 | — | |||||||||
| $ | 1,700 | $ | 380 | |||||||||||
| Net realized gain (loss) | Net unrealized appreciation (depreciation) | |||||||||||||
| Contracts | Risk type | Location on statement of operations | Value | Location on statement of operations | Value | |||||||||
| Futures | Interest | Net realized gain on futures contracts | $ | 2 | Net unrealized appreciation on futures contracts | $ | — | |||||||
| Swaps | Interest | Net realized gain on swap contracts | 743 | Net unrealized depreciation on swap contracts | (646 | ) | ||||||||
| Swaps | Credit | Net realized loss on swap contracts | (1,133 | ) | Net unrealized appreciation on swap contracts | 1,963 | ||||||||
| $ | (388 | ) | $ | 1,317 | ||||||||||
| Mortgage Fund | ||||||||||||||
| Assets | Liabilities | |||||||||||||
| Contracts | Risk type | Location on statement of assets and liabilities | Value | Location on statement of assets and liabilities | Value | |||||||||
| Futures | Interest | Unrealized appreciation1 | $ | 1,899 | Unrealized depreciation1 | $ | — | |||||||
| Swaps | Interest | Unrealized appreciation1 | 3,261 | Unrealized depreciation1 | 2,067 | |||||||||
| $ | 5,160 | $ | 2,067 | |||||||||||
See end of tables for footnotes.
| American Funds Insurance Series | 165 |
| Net realized (loss) gain | Net unrealized appreciation | |||||||||||||
| Contracts | Risk type | Location on statement of operations | Value | Location on statement of operations | Value | |||||||||
| Futures | Interest | Net realized loss on futures contracts | $ | (4,529 | ) | Net unrealized appreciation on futures contracts | $ | 2,531 | ||||||
| Swaps | Interest | Net realized gain on swap contracts | 449 | Net unrealized appreciation on swap contracts | 1,980 | |||||||||
| $ | (4,080 | ) | $ | 4,511 | ||||||||||
| U.S. Government/AAA-Rated Securities Fund | ||||||||||||||
| Assets | Liabilities | |||||||||||||
| Contracts | Risk type | Location on statement of assets and liabilities | Value | Location on statement of assets and liabilities | Value | |||||||||
| Futures | Interest | Unrealized appreciation1 | $ | 31,021 | Unrealized depreciation1 | $ | 3,571 | |||||||
| Swaps | Interest | Unrealized appreciation1 | 34,976 | Unrealized depreciation1 | 15,622 | |||||||||
| $ | 65,997 | $ | 19,193 | |||||||||||
| Net realized loss | Net unrealized appreciation | |||||||||||||
| Contracts | Risk type | Location on statement of operations | Value | Location on statement of operations | Value | |||||||||
| Futures | Interest | Net realized loss on futures contracts | $ | (45,333 | ) | Net unrealized appreciation on futures contracts | $ | 34,895 | ||||||
| Swaps | Interest | Net realized loss on swap contracts | (1,752 | ) | Net unrealized appreciation on swap contracts | 27,782 | ||||||||
| $ | (47,085 | ) | $ | 62,677 | ||||||||||
| Managed Risk Growth Fund | ||||||||||||||
| Assets | Liabilities | |||||||||||||
| Contracts | Risk type | Location on statement of assets and liabilities | Value | Location on statement of assets and liabilities | Value | |||||||||
| Futures | Currency | Unrealized appreciation1 | $ | — | Unrealized depreciation1 | $ | 45 | |||||||
| Futures | Equity | Unrealized appreciation1 | 4,022 | Unrealized depreciation1 | — | |||||||||
| Futures | Interest | Unrealized appreciation1 | 1,914 | Unrealized depreciation1 | — | |||||||||
| $ | 5,936 | $ | 45 | |||||||||||
| Net realized gain (loss) | Net unrealized (depreciation) appreciation | |||||||||||||
| Contracts | Risk type | Location on statement of operations | Value | Location on statement of operations | Value | |||||||||
| Futures | Currency | Net realized gain on futures contracts | $ | 118 | Net unrealized depreciation on futures contracts | $ | (45 | ) | ||||||
| Futures | Equity | Net realized loss on futures contracts | (4,716 | ) | Net unrealized appreciation on futures contracts | 4,022 | ||||||||
| Futures | Interest | Net realized loss on futures contracts | (690 | ) | Net unrealized appreciation on futures contracts | 1,952 | ||||||||
| $ | (5,288 | ) | $ | 5,929 | ||||||||||
| 166 | American Funds Insurance Series |
Managed Risk International Fund
| Assets | Liabilities | |||||||||||||
| Contracts | Risk type | Location on statement of assets and liabilities | Value | Location on statement of assets and liabilities | Value | |||||||||
| Futures | Currency | Unrealized appreciation1 | $ | — | Unrealized depreciation1 | $ | 278 | |||||||
| Futures | Equity | Unrealized appreciation1 | 882 | Unrealized depreciation1 | — | |||||||||
| Futures | Interest | Unrealized appreciation1 | 615 | Unrealized depreciation1 | — | |||||||||
| $ | 1,497 | $ | 278 | |||||||||||
| Net realized gain (loss) | Net unrealized (depreciation) appreciation | |||||||||||||
| Contracts | Risk type | Location on statement of operations | Value | Location on statement of operations | Value | |||||||||
| Futures | Currency | Net realized gain on futures contracts | $ | 356 | Net unrealized depreciation on futures contracts | $ | (278 | ) | ||||||
| Futures | Equity | Net realized loss on futures contracts | (600 | ) | Net unrealized appreciation on futures contracts | $ | 882 | |||||||
| Futures | Interest | Net realized loss on futures contracts | (57 | ) | Net unrealized appreciation on futures contracts | 634 | ||||||||
| $ | (301 | ) | $ | 1,238 | ||||||||||
| Managed Risk Blue Chip Income and Growth Fund | ||||||||||||||
| Assets | Liabilities | |||||||||||||
| Contracts | Risk type | Location on statement of assets and liabilities | Value | Location on statement of assets and liabilities | Value | |||||||||
| Futures | Currency | Unrealized appreciation1 | $ | — | Unrealized depreciation1 | $ | 30 | |||||||
| Futures | Equity | Unrealized appreciation1 | 3,946 | Unrealized depreciation1 | — | |||||||||
| Futures | Interest | Unrealized appreciation1 | 1,865 | Unrealized depreciation1 | — | |||||||||
| �� | $ | 5,811 | $ | 30 | ||||||||||
| Net realized gain (loss) | Net unrealized (depreciation) appreciation | |||||||||||||
| Contracts | Risk type | Location on statement of operations | Value | Location on statement of operations | Value | |||||||||
| Futures | Currency | Net realized gain on futures contracts | $ | 115 | Net unrealized depreciation on futures contracts | $ | (30 | ) | ||||||
| Futures | Equity | Net realized loss on futures contracts | (6,778 | ) | Net unrealized appreciation on futures contracts | $ | 3,946 | |||||||
| Futures | Interest | Net realized loss on futures contracts | (1,035 | ) | Net unrealized appreciation on futures contracts | 1,914 | ||||||||
| $ | (7,698 | ) | $ | 5,830 | ||||||||||
See end of tables for footnotes.
| American Funds Insurance Series | 167 |
Managed Risk Growth-Income Fund
| Assets | Liabilities | |||||||||||||
| Contracts | Risk type | Location on statement of assets and liabilities | Value | Location on statement of assets and liabilities | Value | |||||||||
| Options purchased | Equity | Investment securities from unaffiliated issuers2 | $ | 8,674 | Investment securities from unaffiliated issuers2 | $ | — | |||||||
| Futures | Currency | Unrealized appreciation1 | — | Unrealized depreciation1 | 497 | |||||||||
| Futures | Equity | Unrealized appreciation1 | 3,986 | Unrealized depreciation1 | 101 | |||||||||
| Futures | Interest | Unrealized appreciation1 | 6,919 | Unrealized depreciation1 | $ | — | ||||||||
| $ | 19,579 | $ | 598 | |||||||||||
| Net realized gain (loss) | Net unrealized appreciation (depreciation) | |||||||||||||
| Contracts | Risk type | Location on statement of operations | Value | Location on statement of operations | Value | |||||||||
| Options purchased | Equity | Net realized gain on options contracts3 | $ | — | Net unrealized appreciation on options contracts4 | $ | 1,011 | |||||||
| Futures | Currency | Net realized gain on futures contracts | $ | 28 | Net unrealized depreciation on futures contracts | (497 | ) | |||||||
| Futures | Equity | Net realized loss on futures contracts | (2,611 | ) | Net unrealized appreciation on futures contracts | $ | 3,885 | |||||||
| Futures | Interest | Net realized loss on futures contracts | (481 | ) | Net unrealized appreciation on futures contracts | 6,947 | ||||||||
| $ | (3,064 | ) | $ | 11,346 | ||||||||||
| Managed Risk Asset Allocation Fund | ||||||||||||||
| Assets | Liabilities | |||||||||||||
| Contracts | Risk type | Location on statement of assets and liabilities | Value | Location on statement of assets and liabilities | Value | |||||||||
| Futures | Currency | Unrealized appreciation1 | $ | — | Unrealized depreciation1 | $ | 182 | |||||||
| Futures | Equity | Unrealized appreciation1 | 17,157 | Unrealized depreciation1 | — | |||||||||
| Futures | Interest | Unrealized appreciation1 | 8,348 | Unrealized depreciation1 | — | |||||||||
| $ | 25,505 | $ | 182 | |||||||||||
| Net realized gain (loss) | Net unrealized (depreciation) appreciation | |||||||||||||
| Contracts | Risk type | Location on statement of operations | Value | Location on statement of operations | Value | |||||||||
| Futures | Currency | Net realized gain on futures contracts | $ | 420 | Net unrealized depreciation on futures contracts | $ | (182 | ) | ||||||
| Futures | Equity | Net realized loss on futures contracts | (43,889 | ) | Net unrealized appreciation on futures contracts | $ | 8,940 | |||||||
| Futures | Interest | Net realized loss on futures contracts | (5,864 | ) | Net unrealized appreciation on futures contracts | 17,157 | ||||||||
| $ | (49,333 | ) | $ | 25,915 | ||||||||||
| 1 | Includes cumulative appreciation/depreciation on futures contracts, interest rate swaps and credit default swaps as reported in the applicable table following each fund’s investment portfolio. Only current day’s variation margin is reported within the statements of assets and liabilities. |
| 2 | Includes options purchased as reported in the fund’s investment portfolio. |
| 3 | Options purchased are included in net realized gain (loss) on unaffiliated investments. |
| 4 | Options purchased are included in net unrealized (depreciation) appreciation on unaffiliated investments. |
| 168 | American Funds Insurance Series |
Collateral— Some funds participate in a collateral program that calls for the funds to either receive or pledge highly liquid assets, such as cash or U.S. government securities, as collateral due to securities lending and/or their use of futures contracts, forward currency contracts, interest rate swaps, credit default swaps and/or future delivery contracts. For securities lending, each participating fund receives collateral in exchange for lending investment securities. The purpose of the collateral is to cover potential losses that could occur in the event that the borrower cannot meet its contractual obligation. The lending agent may reinvest collateral from securities lending transactions according to agreed parameters. For futures contracts, interest rate swaps and credit default swaps, the program calls for each participating fund to pledge collateral for initial and variation margin by contract. For forward currency contracts, the program calls for each participating fund to either receive or pledge collateral based on the net gain or loss on unsettled forward currency contracts by counterparty. For future delivery contracts, the program calls for each participating fund to either receive or pledge collateral based on the net gain or loss on unsettled contracts by certain counterparties. The purpose of the collateral is to cover potential losses that could occur in the event that either party cannot meet its contractual obligation. Non-cash collateral pledged by each participating fund, if any, is disclosed in each fund’s investment portfolio, and cash collateral pledged by each participating fund, if any, is held in a segregated account with the fund’s custodian, which is reflected as pledged cash in each fund’s statement of assets and liabilities.
Rights of offset— Funds that hold forward currency contracts have enforceable master netting agreements with certain counterparties, where amounts payable by each party to the other in the same currency (with the same settlement date and with the same counter-party) are settled net of each party’s payment obligation. If an early termination date occurs under these agreements following an event of default or termination event, all obligations of each party to its counterparty are settled net through a single payment in a single currency (“close-out netting”). For financial reporting purposes, the funds do not offset financial assets and financial liabilities that are subject to these master netting arrangements in the statements of assets and liabilities.
The following tables present each fund’s forward currency contracts by counterparty that are subject to master netting agreements but that are not offset in the funds’ statements of assets and liabilities. The net amount column shows the impact of offsetting on the funds’ statement of assets and liabilities as of December 31, 2018, if close-out netting was exercised (dollars in thousands):
International Fund
| Gross amounts not offset in the | ||||||||||||||||||||
| Gross amounts | statement of assets and liabilities and | |||||||||||||||||||
| recognized in the | subject to a master netting agreement | |||||||||||||||||||
| statement of assets | Available | Non-cash | Cash | Net | ||||||||||||||||
| Counterparty | and liabilities | to offset | collateral* | collateral | amount | |||||||||||||||
| Liabilities: | ||||||||||||||||||||
| Goldman Sachs | $ | 525 | $ | — | $ | — | $ | (330 | ) | $ | 195 | |||||||||
| New World Fund | ||||||||||||||||||||
| Gross amounts not offset in the | ||||||||||||||||||||
| Gross amounts | statement of assets and liabilities and | |||||||||||||||||||
| recognized in the | subject to a master netting agreement | |||||||||||||||||||
| statement of assets | Available | Non-cash | Cash | Net | ||||||||||||||||
| Counterparty | and liabilities | to offset | collateral* | collateral | amount | |||||||||||||||
| Assets: | ||||||||||||||||||||
| Citibank | $ | 37 | $ | (28 | ) | $ | — | $ | — | $ | 9 | |||||||||
| Goldman Sachs | 82 | — | — | (82 | ) | — | ||||||||||||||
| HSBC Bank | 85 | (23 | ) | — | — | 62 | ||||||||||||||
| JPMorgan Chase | 128 | (2 | ) | (126 | ) | — | — | |||||||||||||
| Morgan Stanley | 24 | — | — | — | 24 | |||||||||||||||
| Total | $ | 356 | $ | (53 | ) | $ | (126 | ) | $ | (82 | ) | $ | 95 | |||||||
| Liabilities: | ||||||||||||||||||||
| Citibank | $ | 28 | $ | (28 | ) | $ | — | $ | — | $ | — | |||||||||
| HSBC Bank | 23 | (23 | ) | — | — | — | ||||||||||||||
| JPMorgan Chase | 2 | (2 | ) | — | — | — | ||||||||||||||
| Total | $ | 53 | $ | (53 | ) | $ | — | $ | — | $ | — | |||||||||
See end of tables for footnote.
| American Funds Insurance Series | 169 |
Global Growth and Income Fund
| Gross amounts not offset in the | ||||||||||||||||||||
| Gross amounts | statement of assets and liabilities and | |||||||||||||||||||
| recognized in the | subject to a master netting agreement | |||||||||||||||||||
| statement of assets | Available | Non-cash | Cash | Net | ||||||||||||||||
| Counterparty | and liabilities | to offset | collateral* | collateral | amount | |||||||||||||||
| Assets: | ||||||||||||||||||||
| Citibank | $ | 351 | $ | — | $ | — | $ | (280 | ) | $ | 71 | |||||||||
| Global Balanced Fund | ||||||||||||||||||||
| Gross amounts not offset in the | ||||||||||||||||||||
| Gross amounts | statement of assets and liabilities and | |||||||||||||||||||
| recognized in the | subject to a master netting agreement | |||||||||||||||||||
| statement of assets | Available | Non-cash | Cash | Net | ||||||||||||||||
| Counterparty | and liabilities | to offset | collateral* | collateral | amount | |||||||||||||||
| Assets: | ||||||||||||||||||||
| Citibank | $ | 42 | $ | (42 | ) | $ | — | $ | — | $ | — | |||||||||
| Goldman Sachs | 44 | (9 | ) | — | — | 35 | ||||||||||||||
| HSBC Bank | 26 | (18 | ) | — | — | 8 | ||||||||||||||
| JPMorgan Chase | 84 | (32 | ) | — | — | 52 | ||||||||||||||
| UBS AG | 18 | — | — | — | 18 | |||||||||||||||
| Total | $ | 214 | $ | (101 | ) | $ | — | $ | — | $ | 113 | |||||||||
| Liabilities: | ||||||||||||||||||||
| Bank of America, N.A. | $ | 2 | $ | — | $ | — | $ | — | $ | 2 | ||||||||||
| Bank of New York Mellon | 14 | — | — | — | 14 | |||||||||||||||
| Citibank | 46 | (42 | ) | — | — | 4 | ||||||||||||||
| Goldman Sachs | 9 | (9 | ) | — | — | — | ||||||||||||||
| HSBC Bank | 18 | (18 | ) | — | — | — | ||||||||||||||
| JPMorgan Chase | 32 | (32 | ) | — | — | — | ||||||||||||||
| Morgan Stanley | 11 | — | — | — | 11 | |||||||||||||||
| Total | $ | 132 | $ | (101 | ) | $ | — | $ | — | $ | 31 | |||||||||
| Bond Fund | ||||||||||||||||||||
| Gross amounts not offset in the | ||||||||||||||||||||
| Gross amounts | statement of assets and liabilities and | |||||||||||||||||||
| recognized in the | subject to a master netting agreement | |||||||||||||||||||
| statement of assets | Available | Non-cash | Cash | Net | ||||||||||||||||
| Counterparty | and liabilities | to offset | collateral* | collateral | amount | |||||||||||||||
| Assets: | ||||||||||||||||||||
| Bank of America, N.A. | $ | 781 | $ | (412 | ) | $ | (369 | ) | $ | — | $ | — | ||||||||
| Citibank | 443 | (443 | ) | — | — | — | ||||||||||||||
| Goldman Sachs | 3,183 | (770 | ) | — | (1,460 | ) | 953 | |||||||||||||
| HSBC Bank | 107 | (107 | ) | — | — | — | ||||||||||||||
| JPMorgan Chase | 380 | (33 | ) | — | — | 347 | ||||||||||||||
| Morgan Stanley | 247 | (247 | ) | — | — | — | ||||||||||||||
| Total | $ | 5,141 | $ | (2,012 | ) | $ | (369 | ) | $ | (1,460 | ) | $ | 1,300 | |||||||
| Liabilities: | ||||||||||||||||||||
| Bank of America, N.A. | $ | 412 | $ | (412 | ) | $ | — | $ | — | $ | — | |||||||||
| Citibank | 3,658 | (443 | ) | (2,831 | ) | — | 384 | |||||||||||||
| Goldman Sachs | 770 | (770 | ) | — | — | — | ||||||||||||||
| HSBC Bank | 3,431 | (107 | ) | (1,748 | ) | — | 1,576 | |||||||||||||
| JPMorgan Chase | 33 | (33 | ) | — | — | — | ||||||||||||||
| Morgan Stanley | 6,108 | (247 | ) | (4,788 | ) | — | 1,073 | |||||||||||||
| Total | $ | 14,412 | $ | (2,012 | ) | $ | (9,367 | ) | $ | — | $ | 3,033 | ||||||||
| 170 | American Funds Insurance Series |
Global Bond Fund
| Gross amounts not offset in the | ||||||||||||||||||||
| Gross amounts | statement of assets and liabilities and | |||||||||||||||||||
| recognized in the | subject to a master netting agreement | |||||||||||||||||||
| statement of assets | Available | Non-cash | Cash | Net | ||||||||||||||||
| Counterparty | and liabilities | to offset | collateral* | collateral | amount | |||||||||||||||
| Assets: | ||||||||||||||||||||
| Bank of America, N.A. | $ | 307 | $ | (50 | ) | $ | (257 | ) | $ | — | $ | — | ||||||||
| Citibank | 3,149 | (1,670 | ) | — | (1,479 | ) | — | |||||||||||||
| Goldman Sachs | 1,928 | (304 | ) | — | (1,370 | ) | 254 | |||||||||||||
| HSBC Bank | 822 | (822 | ) | — | — | — | ||||||||||||||
| JPMorgan Chase | 5,495 | (1,593 | ) | (3,646 | ) | — | 256 | |||||||||||||
| Morgan Stanley | 585 | (585 | ) | — | — | — | ||||||||||||||
| UBS AG | 202 | — | — | — | 202 | |||||||||||||||
| Total | $ | 12,488 | $ | (5,024 | ) | $ | (3,903 | ) | $ | (2,849 | ) | $ | 712 | |||||||
| Liabilities: | ||||||||||||||||||||
| Bank of America, N.A. | $ | 50 | $ | (50 | ) | $ | — | $ | — | $ | — | |||||||||
| Bank of New York Mellon | 446 | — | (319 | ) | — | 127 | ||||||||||||||
| Citibank | 1,670 | (1,670 | ) | ��� | — | — | ||||||||||||||
| Goldman Sachs | 304 | (304 | ) | — | — | — | ||||||||||||||
| HSBC Bank | 842 | (822 | ) | (20 | ) | — | — | |||||||||||||
| JPMorgan Chase | 1,593 | (1,593 | ) | — | — | — | ||||||||||||||
| Morgan Stanley | 665 | (585 | ) | — | — | 80 | ||||||||||||||
| Total | $ | 5,570 | $ | (5,024 | ) | $ | (339 | ) | $ | — | $ | 207 | ||||||||
| * | Non-cash collateral is shown on a settlement basis. |
6. Taxation and distributions
Federal income taxation— Each fund complies with the requirements under Subchapter M of the Internal Revenue Code applicable to mutual funds and intends to distribute substantially all of its net taxable income and net capital gains each year. The funds are not subject to income taxes to the extent such distributions are made. Therefore, no federal income tax provision is required.
As of and during the period ended December 31, 2018, none of the funds had a liability for any unrecognized tax benefits. Each fund recognizes interest and penalties, if any, related to unrecognized tax benefits as income tax expense in their respective statements of operations. During the period, none of the funds incurred any significant interest or penalties.
Each fund’s tax returns are not subject to examination by federal, state and, if applicable, non-U.S. tax authorities after the expiration of each jurisdiction’s statute of limitations, which is generally three years after the date of filing but can be extended in certain jurisdictions.
Non-U.S. taxation— Dividend and interest income, if any, are recorded net of non-U.S. taxes paid. The funds may file withholding tax reclaims in certain jurisdictions to recover a portion of amounts previously withheld. As a result of rulings from European courts, the funds filed for additional reclaims related to prior years. These reclaims are recorded when the amount is known and there are no significant uncertainties on collectability. Gains realized by the funds on the sale of securities in certain countries, if any, may be subject to non-U.S. taxes. If applicable, the funds record an estimated deferred tax liability based on unrealized gains to provide for potential non-U.S. taxes payable upon the sale of these securities.
Distributions— Distributions paid to shareholders are based on each fund’s net investment income and net realized gains determined on a tax basis, which may differ from net investment income and net realized gains for financial reporting purposes. These differences are due primarily to different treatment for items such as currency gains and losses; short-term capital gains and losses; capital losses related to sales of certain securities within 30 days of purchase; unrealized appreciation of certain investments in securities outside the U.S.; deferred expenses; cost of investments sold; paydowns on fixed-income securities; net capital losses; non-U.S. taxes on capital gains, amortization of premiums and discounts and income on certain investments. The fiscal year in which amounts are distributed may differ from the year in which the net investment income and net realized gains are recorded by the funds for financial reporting purposes.
| American Funds Insurance Series | 171 |
Additional tax basis disclosures for each fund as of December 31, 2018, were as follows (dollars in thousands):
| Global | Blue Chip | |||||||||||||||||||||||
| Global | Small | New | Income and | |||||||||||||||||||||
| Growth | Capitalization | Growth | International | World | Growth | |||||||||||||||||||
| Fund | Fund | Fund | Fund | Fund | Fund | |||||||||||||||||||
| Undistributed ordinary income | $ | 8,660 | $ | 49,672 | $ | 198,816 | $ | 15,101 | $ | 6,466 | $ | 36,690 | ||||||||||||
| Undistributed long-term capital gains | 343,497 | 226,394 | 2,617,605 | 244,466 | 127,685 | 688,634 | ||||||||||||||||||
| Gross unrealized appreciation on investments | 1,604,496 | 696,725 | 7,325,355 | 1,447,585 | 450,625 | 1,466,280 | ||||||||||||||||||
| Gross unrealized depreciation on investments | (343,672 | ) | (384,458 | ) | (869,582 | ) | (1,024,206 | ) | (275,197 | ) | (755,225 | ) | ||||||||||||
| Net unrealized (depreciation) appreciation on investments | 1,260,824 | 312,267 | 6,455,773 | 423,379 | 175,428 | 711,055 | ||||||||||||||||||
| Cost of investments | 4,226,092 | 3,337,191 | 16,951,703 | 8,572,537 | 2,824,343 | 7,306,978 | ||||||||||||||||||
| Reclassification from (to) total distributable earnings/accumulated loss to (from) capital paid in on shares of beneficial interest | — | — | — | (1 | ) | — | — | |||||||||||||||||
| Global | International | |||||||||||||||||||||||
| Growth | Growth- | Growth | Capital | Asset | Global | |||||||||||||||||||
| and Income | Income | and Income | Income | Allocation | Balanced | |||||||||||||||||||
| Fund | Fund | Fund | Builder | Fund | Fund | |||||||||||||||||||
| Undistributed ordinary income | $ | 6,636 | $ | 252,809 | $ | 21,126 | $ | 1,595 | $ | 110,523 | $ | 541 | ||||||||||||
| Undistributed long-term capital gains | 100,790 | 3,204,751 | — | — | 1,278,077 | 353 | ||||||||||||||||||
| Capital loss carryforward* | — | — | — | (13,776 | ) | — | — | |||||||||||||||||
| Capital loss carryforward utilized | — | — | 4,708 | — | — | — | ||||||||||||||||||
| Gross unrealized appreciation on investments | 301,662 | 6,581,607 | 116,642 | 32,592 | 4,196,275 | 44,069 | ||||||||||||||||||
| Gross unrealized depreciation on investments | (116,841 | ) | (2,100,241 | ) | (148,050 | ) | (55,480 | ) | (1,720,590 | ) | (20,622 | ) | ||||||||||||
| Net unrealized (depreciation) appreciation on investments | 184,821 | 4,481,366 | (31,408 | ) | (22,888 | ) | 2,475,685 | 23,447 | ||||||||||||||||
| Cost of investments | 1,627,461 | 25,359,635 | 1,364,854 | 703,065 | 20,793,720 | 345,242 | ||||||||||||||||||
| Reclassification from (to) total distributable earnings/accumulated loss to (from) capital paid in on shares of beneficial interest | — | (1 | ) | — | — | — | — | |||||||||||||||||
| U.S. | ||||||||||||||||||||||||
| High- | Government/ | |||||||||||||||||||||||
| Global | Income | Ultra-Short | AAA-Rated | |||||||||||||||||||||
| Bond | Bond | Bond | Mortgage | Bond | Securities | |||||||||||||||||||
| Fund | Fund | Fund | Fund | Fund | Fund | |||||||||||||||||||
| Undistributed ordinary income | $ | 56,980 | $ | 15,875 | $ | 15,462 | $ | 1,266 | $ | 999 | $ | 11,344 | ||||||||||||
| Capital loss carryforward* | (159,206 | ) | (3,784 | ) | (160,099 | ) | (6,175 | ) | — | (52,033 | ) | |||||||||||||
| Gross unrealized appreciation on investments | 101,569 | 34,171 | — | 4,698 | 6 | 51,575 | ||||||||||||||||||
| Gross unrealized depreciation on investments | (219,353 | ) | (80,326 | ) | (114,581 | ) | (4,505 | ) | (14 | ) | (47,613 | ) | ||||||||||||
| Net unrealized (depreciation) appreciation on investments | (117,784 | ) | (46,155 | ) | (114,581 | ) | 193 | (8 | ) | 3,962 | ||||||||||||||
| Cost of investments | 11,073,859 | 2,180,987 | 1,301,010 | 346,647 | 306,754 | 3,153,546 | ||||||||||||||||||
| Reclassification from (to) total distributable earnings/accumulated loss to (from) capital paid in on shares of beneficial interest | — | (1 | ) | — | — | — | — | |||||||||||||||||
| 172 | American Funds Insurance Series |
| Managed | Managed | Managed | ||||||||||||||||||
| Managed | Managed | Risk Blue | Risk | Risk | ||||||||||||||||
| Risk | Risk | Chip Income | Growth- | Asset | ||||||||||||||||
| Growth | International | and Growth | Income | Allocation | ||||||||||||||||
| Fund | Fund | Fund | Fund | Fund | ||||||||||||||||
| Undistributed ordinary income | $ | 2,543 | $ | 2,983 | $ | 5,577 | $ | 6,359 | $ | 62,616 | ||||||||||
| Undistributed long-term capital gains | 26,579 | 4,809 | 17,833 | 16,511 | 115,113 | |||||||||||||||
| Gross unrealized appreciation on investments | 10 | 297 | — | 884 | 49 | |||||||||||||||
| Gross unrealized depreciation on investments | (12,447 | ) | (14,600 | ) | (26,939 | ) | (27,155 | ) | (61,453 | ) | ||||||||||
| Net unrealized (depreciation) appreciation on investments | (12,437 | ) | (14,303 | ) | (26,939 | ) | (26,271 | ) | (61,404 | ) | ||||||||||
| Cost of investments | 354,269 | 163,484 | 362,023 | 1,897,770 | 2,593,652 | |||||||||||||||
| * | Capital loss carryforwards will be used to offset any capital gains realized by the fund in future years. The fund will not make distributions from capital gains while a capital loss carryforward remains. |
Distributions paid by each fund were characterized for tax purposes as follows (dollars in thousands):
Global Growth Fund
| Year ended December 31, 2018 | Year ended December 31, 2017 | |||||||||||||||||||||||
| Total | Total | |||||||||||||||||||||||
| Ordinary | Long-term | distributions | Ordinary | Long-term | distributions | |||||||||||||||||||
| Share class | income | capital gains | paid | income | capital gains | paid | ||||||||||||||||||
| Class 1 | $ | 28,611 | $ | 134,884 | $ | 163,495 | $ | 16,830 | $ | 55,298 | $ | 72,128 | ||||||||||||
| Class 1A* | 47 | 273 | 320 | 15 | 16 | 31 | ||||||||||||||||||
| Class 2 | 41,238 | 251,323 | 292,561 | 24,835 | 114,893 | 139,728 | ||||||||||||||||||
| Class 4 | 2,414 | 16,024 | 18,438 | 1,062 | 3,889 | 4,951 | ||||||||||||||||||
| Total | $ | 72,310 | $ | 402,504 | $ | 474,814 | $ | 42,742 | $ | 174,096 | $ | 216,838 | ||||||||||||
| Global Small Capitalization Fund | ||||||||||||||||||||||||
| Year ended December 31, 2018 | Year ended December 31, 2017 | |||||||||||||||||||||||
| Total | Total | |||||||||||||||||||||||
| Ordinary | Long-term | distributions | Ordinary | Long-term | distributions | |||||||||||||||||||
| Share class | income | capital gains | paid | income | capital gains | paid | ||||||||||||||||||
| Class 1 | $ | 21,329 | $ | 55,968 | $ | 77,297 | $ | 10,151 | $ | — | $ | 10,151 | ||||||||||||
| Class 1A* | 4 | 12 | 16 | 1 | — | 1 | ||||||||||||||||||
| Class 2 | 26,294 | 86,037 | 112,331 | 10,597 | — | 10,597 | ||||||||||||||||||
| Class 4 | 1,456 | 5,035 | 6,491 | 270 | — | 270 | ||||||||||||||||||
| Total | $ | 49,083 | $ | 147,052 | $ | 196,135 | $ | 21,019 | $ | — | $ | 21,019 | ||||||||||||
| Growth Fund | ||||||||||||||||||||||||
| Year ended December 31, 2018 | Year ended December 31, 2017 | |||||||||||||||||||||||
| Total | Total | |||||||||||||||||||||||
| Ordinary | Long-term | distributions | Ordinary | Long-term | distributions | |||||||||||||||||||
| Share class | income | capital gains | paid | income | capital gains | paid | ||||||||||||||||||
| Class 1 | $ | 88,940 | $ | 792,865 | $ | 881,805 | $ | 75,247 | $ | 713,987 | $ | 789,234 | ||||||||||||
| Class 1A* | 76 | 634 | 710 | 15 | 63 | 78 | ||||||||||||||||||
| Class 2 | 117,331 | 1,515,757 | 1,633,088 | 110,909 | 1,409,266 | 1,520,175 | ||||||||||||||||||
| Class 3 | 1,723 | 20,248 | 21,971 | 1,601 | 18,484 | 20,085 | ||||||||||||||||||
| Class 4 | 6,414 | 104,527 | 110,941 | 4,893 | 53,128 | 58,021 | ||||||||||||||||||
| Total | $ | 214,484 | $ | 2,434,031 | $ | 2,648,515 | $ | 192,665 | $ | 2,194,928 | $ | 2,387,593 | ||||||||||||
See end of tables for footnotes.
| American Funds Insurance Series | 173 |
International Fund
| Year ended December 31, 2018 | Year ended December 31, 2017 | |||||||||||||||||||||||
| Total | Total | |||||||||||||||||||||||
| Ordinary | Long-term | distributions | Ordinary | Long-term | distributions | |||||||||||||||||||
| Share class | income | capital gains | paid | income | capital gains | paid | ||||||||||||||||||
| Class 1 | $ | 174,418 | $ | 165,915 | $ | 340,333 | $ | 70,384 | $ | 49,783 | $ | 120,167 | ||||||||||||
| Class 1A* | 156 | 140 | 296 | 17 | 3 | 20 | ||||||||||||||||||
| Class 2 | 136,977 | 146,986 | 283,963 | 53,513 | 46,642 | 100,155 | ||||||||||||||||||
| Class 3 | 887 | 970 | 1,857 | 396 | 331 | 727 | ||||||||||||||||||
| Class 4 | 9,465 | 10,556 | 20,021 | 3,025 | 1,066 | 4,091 | ||||||||||||||||||
| Total | $ | 321,903 | $ | 324,567 | $ | 646,470 | $ | 127,335 | $ | 97,825 | $ | 225,160 | ||||||||||||
| New World Fund | ||||||||||||||||||||||||
| Year ended December 31, 2018 | Year ended December 31, 2017 | |||||||||||||||||||||||
| Total | Total | |||||||||||||||||||||||
| Ordinary | Long-term | distributions | Ordinary | Long-term | distributions | |||||||||||||||||||
| Share class | income | capital gains | paid | income | capital gains | paid | ||||||||||||||||||
| Class 1 | $ | 21,450 | $ | 54,023 | $ | 75,473 | $ | 21,960 | $ | — | $ | 21,960 | ||||||||||||
| Class 1A* | 24 | 50 | 74 | 6 | — | 6 | ||||||||||||||||||
| Class 2 | 8,194 | 26,593 | 34,787 | 9,149 | — | 9,149 | ||||||||||||||||||
| Class 4 | 3,419 | 12,659 | 16,078 | 3,016 | — | 3,016 | ||||||||||||||||||
| Total | $ | 33,087 | $ | 93,325 | $ | 126,412 | $ | 34,131 | $ | — | $ | 34,131 | ||||||||||||
| Blue Chip Income and Growth Fund | ||||||||||||||||||||||||
| Year ended December 31, 2018 | Year ended December 31, 2017 | |||||||||||||||||||||||
| Total | Total | |||||||||||||||||||||||
| Ordinary | Long-term | distributions | Ordinary | Long-term | distributions | |||||||||||||||||||
| Share class | income | capital gains | paid | income | capital gains | paid | ||||||||||||||||||
| Class 1 | $ | 232,769 | $ | 299,947 | $ | 532,716 | $ | 140,306 | $ | 170,748 | $ | 311,054 | ||||||||||||
| Class 1A* | 120 | 135 | 255 | 12 | 5 | 17 | ||||||||||||||||||
| Class 2 | 134,358 | 186,318 | 320,676 | 82,680 | 113,013 | 195,693 | ||||||||||||||||||
| Class 4 | 13,348 | 16,620 | 29,968 | 4,917 | 5,605 | 10,522 | ||||||||||||||||||
| Total | $ | 380,595 | $ | 503,020 | $ | 883,615 | $ | 227,915 | $ | 289,371 | $ | 517,286 | ||||||||||||
| Global Growth and Income Fund | ||||||||||||||||||||||||
| Year ended December 31, 2018 | Year ended December 31, 2017 | |||||||||||||||||||||||
| Total | Total | |||||||||||||||||||||||
| Ordinary | Long-term | distributions | Ordinary | Long-term | distributions | |||||||||||||||||||
| Share class | income | capital gains | paid | income | capital gains | paid | ||||||||||||||||||
| Class 1 | $ | 16,289 | $ | 31,541 | $ | 47,830 | $ | 10,516 | $ | 7,109 | $ | 17,625 | ||||||||||||
| Class 1A* | 28 | 53 | 81 | 2 | — | 2 | ||||||||||||||||||
| Class 2 | 40,436 | 90,173 | 130,609 | 30,799 | 26,178 | 56,977 | ||||||||||||||||||
| Class 4 | 2,682 | 5,789 | 8,471 | 1,478 | 405 | 1,883 | ||||||||||||||||||
| Total | $ | 59,435 | $ | 127,556 | $ | 186,991 | $ | 42,795 | $ | 33,692 | $ | 76,487 | ||||||||||||
| 174 | American Funds Insurance Series |
Growth-Income Fund
| Year ended December 31, 2018 | Year ended December 31, 2017 | |||||||||||||||||||||||
| Total | Total | |||||||||||||||||||||||
| Ordinary | Long-term | distributions | Ordinary | Long-term | distributions | |||||||||||||||||||
| Share class | income | capital gains | paid | income | capital gains | paid | ||||||||||||||||||
| Class 1 | $ | 341,172 | $ | 1,049,641 | $ | 1,390,813 | $ | 250,221 | $ | 884,958 | $ | 1,135,179 | ||||||||||||
| Class 1A* | 124 | 344 | 468 | 24 | 16 | 40 | ||||||||||||||||||
| Class 2 | 241,470 | 886,942 | 1,128,412 | 195,450 | 853,292 | 1,048,742 | ||||||||||||||||||
| Class 3 | 2,907 | 10,337 | 13,244 | 2,421 | 10,140 | 12,561 | ||||||||||||||||||
| Class 4 | 15,471 | 58,501 | 73,972 | 9,973 | 36,513 | 46,486 | ||||||||||||||||||
| Total | $ | 601,144 | $ | 2,005,765 | $ | 2,606,909 | $ | 458,089 | $ | 1,784,919 | $ | 2,243,008 | ||||||||||||
| International Growth and Income Fund | ||||||||||||||||||||||||
| Year ended December 31, 2018 | Year ended December 31, 2017 | |||||||||||||||||||||||
| Total | Total | |||||||||||||||||||||||
| Ordinary | Long-term | distributions | Ordinary | Long-term | distributions | |||||||||||||||||||
| Share class | income | capital gains | paid | income | capital gains | paid | ||||||||||||||||||
| Class 1 | $ | 28,476 | $ | — | $ | 28,476 | $ | 25,860 | $ | — | $ | 25,860 | ||||||||||||
| Class 1A* | 44 | — | 44 | 14 | — | 14 | ||||||||||||||||||
| Class 2 | 5,865 | — | 5,865 | 5,714 | — | 5,714 | ||||||||||||||||||
| Class 4 | 1,597 | — | 1,597 | 1,184 | — | 1,184 | ||||||||||||||||||
| Total | $ | 35,982 | $ | — | $ | 35,982 | $ | 32,772 | $ | — | $ | 32,772 | ||||||||||||
| Capital Income Builder | ||||||||||||||||||||||||
| Year ended December 31, 2018 | Year ended December 31, 2017 | |||||||||||||||||||||||
| Total | Total | |||||||||||||||||||||||
| Ordinary | Long-term | distributions | Ordinary | Long-term | distributions | |||||||||||||||||||
| Share class | income | capital gains | paid | income | capital gains | paid | ||||||||||||||||||
| Class 1 | $ | 9,421 | $ | 617 | $ | 10,038 | $ | 6,303 | $ | — | $ | 6,303 | ||||||||||||
| Class 1A* | 66 | 3 | 69 | 8 | — | 8 | ||||||||||||||||||
| Class 2 | 90 | 6 | 96 | 23 | — | 23 | ||||||||||||||||||
| Class 4 | 9,550 | 762 | 10,312 | 7,676 | — | 7,676 | ||||||||||||||||||
| Total | $ | 19,127 | $ | 1,388 | $ | 20,515 | $ | 14,010 | $ | — | $ | 14,010 | ||||||||||||
| Asset Allocation Fund | ||||||||||||||||||||||||
| Year ended December 31, 2018 | Year ended December 31, 2017 | |||||||||||||||||||||||
| Total | Total | |||||||||||||||||||||||
| Ordinary | Long-term | distributions | Ordinary | Long-term | distributions | |||||||||||||||||||
| Share class | income | capital gains | paid | income | capital gains | paid | ||||||||||||||||||
| Class 1 | $ | 386,982 | $ | 666,856 | $ | 1,053,838 | $ | 287,347 | $ | 666,425 | $ | 953,772 | ||||||||||||
| Class 1A* | 147 | 263 | 410 | 50 | 70 | 120 | ||||||||||||||||||
| Class 2 | 103,332 | 210,133 | 313,465 | 84,847 | 241,077 | 325,924 | ||||||||||||||||||
| Class 3 | 686 | 1,413 | 2,099 | 601 | 1,646 | 2,247 | ||||||||||||||||||
| Class 4 | 69,096 | 148,867 | 217,963 | 47,458 | 145,207 | 192,665 | ||||||||||||||||||
| Total | $ | 560,243 | $ | 1,027,532 | $ | 1,587,775 | $ | 420,303 | $ | 1,054,425 | $ | 1,474,728 | ||||||||||||
See end of tables for footnotes.
| American Funds Insurance Series | 175 |
Global Balanced Fund
| Year ended December 31, 2018 | Year ended December 31, 2017 | |||||||||||||||||||||||
| Total | Total | |||||||||||||||||||||||
| Ordinary | Long-term | distributions | Ordinary | Long-term | distributions | |||||||||||||||||||
| Share class | income | capital gains | paid | income | capital gains | paid | ||||||||||||||||||
| Class 1 | $ | 1,808 | $ | 1,346 | $ | 3,154 | $ | 1,298 | $ | 2,309 | $ | 3,607 | ||||||||||||
| Class 1A* | 30 | 25 | 55 | 3 | 5 | 8 | ||||||||||||||||||
| Class 2 | 2,555 | 2,290 | 4,845 | 2,516 | 5,414 | 7,930 | ||||||||||||||||||
| Class 4 | 804 | 842 | 1,646 | 582 | 1,195 | 1,777 | ||||||||||||||||||
| Total | $ | 5,197 | $ | 4,503 | $ | 9,700 | $ | 4,399 | $ | 8,923 | $ | 13,322 | ||||||||||||
| Bond Fund | ||||||||||||||||||||||||
| Year ended December 31, 2018 | Year ended December 31, 2017 | |||||||||||||||||||||||
| Total | Total | |||||||||||||||||||||||
| Ordinary | Long-term | distributions | Ordinary | Long-term | distributions | |||||||||||||||||||
| Share class | income | capital gains | paid | income | capital gains | paid | ||||||||||||||||||
| Class 1 | $ | 156,337 | $ | 8,915 | $ | 165,252 | $ | 211,473 | $ | 25,594 | $ | 237,067 | ||||||||||||
| Class 1A* | 76 | 4 | 80 | 19 | 1 | 20 | ||||||||||||||||||
| Class 2 | 88,266 | 5,217 | 93,483 | 119,175 | 15,280 | 134,455 | ||||||||||||||||||
| Class 4 | 8,153 | 453 | 8,606 | 5,958 | 441 | 6,399 | ||||||||||||||||||
| Total | $ | 252,832 | $ | 14,589 | $ | 267,421 | $ | 336,625 | $ | 41,316 | $ | 377,941 | ||||||||||||
| Global Bond Fund | ||||||||||||||||||||||||
| Year ended December 31, 2018 | Year ended December 31, 2017 | |||||||||||||||||||||||
| Total | Total | |||||||||||||||||||||||
| Ordinary | Long-term | distributions | Ordinary | Long-term | distributions | |||||||||||||||||||
| Share class | income | capital gains | paid | income | capital gains | paid | ||||||||||||||||||
| Class 1 | $ | 25,210 | $ | 3,256 | $ | 28,466 | $ | 14,181 | $ | 103 | $ | 14,284 | ||||||||||||
| Class 1A* | 9 | 1 | 10 | — | † | — | † | — | † | |||||||||||||||
| Class 2 | 23,308 | 3,412 | 26,720 | 11,033 | 99 | 11,132 | ||||||||||||||||||
| Class 4 | 816 | 118 | 934 | 196 | 1 | 197 | ||||||||||||||||||
| Total | $ | 49,343 | $ | 6,787 | $ | 56,130 | $ | 25,410 | $ | 203 | $ | 25,613 | ||||||||||||
| High-Income Bond Fund | ||||||||||||||||||||||||
| Year ended December 31, 2018 | Year ended December 31, 2017 | |||||||||||||||||||||||
| Total | Total | |||||||||||||||||||||||
| Ordinary | Long-term | distributions | Ordinary | Long-term | distributions | |||||||||||||||||||
| Share class | income | capital gains | paid | income | capital gains | paid | ||||||||||||||||||
| Class 1 | $ | 34,114 | $ | — | $ | 34,114 | $ | 43,976 | $ | — | $ | 43,976 | ||||||||||||
| Class 1A* | 40 | — | 40 | 12 | — | 12 | ||||||||||||||||||
| Class 2 | 43,382 | — | 43,382 | 51,640 | — | 51,640 | ||||||||||||||||||
| Class 3 | 664 | — | 664 | 805 | — | 805 | ||||||||||||||||||
| Class 4 | 1,733 | — | 1,733 | 1,981 | — | 1,981 | ||||||||||||||||||
| Total | $ | 79,933 | $ | — | $ | 79,933 | $ | 98,414 | $ | — | $ | 98,414 | ||||||||||||
| Mortgage Fund | ||||||||||||||||||||||||
| Year ended December 31, 2018 | Year ended December 31, 2017 | |||||||||||||||||||||||
| Total | Total | |||||||||||||||||||||||
| Ordinary | Long-term | distributions | Ordinary | Long-term | distributions | |||||||||||||||||||
| Share class | income | capital gains | paid | income | capital gains | paid | ||||||||||||||||||
| Class 1 | $ | 4,938 | $ | — | $ | 4,938 | $ | 5,106 | $ | 1,186 | $ | 6,292 | ||||||||||||
| Class 1A* | 15 | — | 15 | 2 | — | † | 2 | |||||||||||||||||
| Class 2 | 1,128 | — | 1,128 | 1,025 | 262 | 1,287 | ||||||||||||||||||
| Class 4 | 424 | — | 424 | 165 | 39 | 204 | ||||||||||||||||||
| Total | $ | 6,505 | $ | — | $ | 6,505 | $ | 6,298 | $ | 1,487 | $ | 7,785 | ||||||||||||
| 176 | American Funds Insurance Series |
Ultra-Short Bond Fund
| Year ended December 31, 2018 | Year ended December 31, 2017 | |||||||||||||||||||||||
| Total | Total | |||||||||||||||||||||||
| Ordinary | Long-term | distributions | Ordinary | Long-term | distributions | |||||||||||||||||||
| Share class | income | capital gains | paid | income | capital gains | paid | ||||||||||||||||||
| Class 1 | $ | 561 | $ | — | $ | 561 | $ | 184 | $ | — | $ | 184 | ||||||||||||
| Class 1A* | — | — | — | — | — | — | ||||||||||||||||||
| Class 2 | 2,762 | — | 2,762 | 697 | — | 697 | ||||||||||||||||||
| Class 3 | 41 | — | 41 | 15 | — | 15 | ||||||||||||||||||
| Class 4 | 153 | — | 153 | 10 | — | 10 | ||||||||||||||||||
| Total | $ | 3,517 | $ | — | $ | 3,517 | $ | 906 | $ | — | $ | 906 | ||||||||||||
| U.S. Government/AAA-Rated Securities Fund | ||||||||||||||||||||||||
| Year ended December 31, 2018 | Year ended December 31, 2017 | |||||||||||||||||||||||
| Total | Total | |||||||||||||||||||||||
| Ordinary | Long-term | distributions | Ordinary | Long-term | distributions | |||||||||||||||||||
| Share class | income | capital gains | paid | income | capital gains | paid | ||||||||||||||||||
| Class 1 | $ | 29,881 | $ | — | $ | 29,881 | $ | 23,690 | $ | — | $ | 23,690 | ||||||||||||
| Class 1A* | 29 | — | 29 | 1 | — | 1 | ||||||||||||||||||
| Class 2 | 24,431 | — | 24,431 | 19,498 | — | 19,498 | ||||||||||||||||||
| Class 3 | 165 | — | 165 | 141 | — | 141 | ||||||||||||||||||
| Class 4 | 1,313 | — | 1,313 | 663 | — | 663 | ||||||||||||||||||
| Total | $ | 55,819 | $ | — | $ | 55,819 | $ | 43,993 | $ | — | $ | 43,993 | ||||||||||||
| Managed Risk Growth Fund | ||||||||||||||||||||||||
| Year ended December 31, 2018 | Year ended December 31, 2017 | |||||||||||||||||||||||
| Total | Total | |||||||||||||||||||||||
| Ordinary | Long-term | distributions | Ordinary | Long-term | distributions | |||||||||||||||||||
| Share class | income | capital gains | paid | income | capital gains | paid | ||||||||||||||||||
| Class P1 | $ | 14 | $ | 135 | $ | 149 | $ | 7 | $ | 22 | $ | 29 | ||||||||||||
| Class P2 | 1,397 | 20,395 | 21,792 | 727 | 4,120 | 4,847 | ||||||||||||||||||
| Total | $ | 1,411 | $ | 20,530 | $ | 21,941 | $ | 734 | $ | 4,142 | $ | 4,876 | ||||||||||||
| Managed Risk International Fund | ||||||||||||||||||||||||
| Year ended December 31, 2018 | Year ended December 31, 2017 | |||||||||||||||||||||||
| Total | Total | |||||||||||||||||||||||
| Ordinary | Long-term | distributions | Ordinary | Long-term | distributions | |||||||||||||||||||
| Share class | income | capital gains | paid | income | capital gains | paid | ||||||||||||||||||
| Class P1 | $ | 8 | $ | 1 | $ | 9 | $ | 1 | $ | 1 | $ | 2 | ||||||||||||
| Class P2 | 2,681 | 738 | 3,419 | 899 | 1,402 | 2,301 | ||||||||||||||||||
| Total | $ | 2,689 | $ | 739 | $ | 3,428 | $ | 900 | $ | 1,403 | $ | 2,303 | ||||||||||||
| Managed Risk Blue Chip Income and Growth Fund | ||||||||||||||||||||||||
| Year ended December 31, 2018 | Year ended December 31, 2017 | |||||||||||||||||||||||
| Total | Total | |||||||||||||||||||||||
| Ordinary | Long-term | distributions | Ordinary | Long-term | distributions | |||||||||||||||||||
| Share class | income | capital gains | paid | income | capital gains | paid | ||||||||||||||||||
| Class P1 | $ | 15 | $ | 7 | $ | 22 | $ | 4 | $ | 3 | $ | 7 | ||||||||||||
| Class P2 | 11,391 | 12,112 | 23,503 | 5,157 | 5,565 | 10,722 | ||||||||||||||||||
| Total | $ | 11,406 | $ | 12,119 | $ | 23,525 | $ | 5,161 | $ | 5,568 | $ | 10,729 | ||||||||||||
See end of tables for footnotes.
| American Funds Insurance Series | 177 |
Managed Risk Growth-Income Fund
| Year ended December 31, 2018 | Year ended December 31, 2017 | |||||||||||||||||||||||
| Total | Total | |||||||||||||||||||||||
| Ordinary | Long-term | distributions | Ordinary | Long-term | distributions | |||||||||||||||||||
| Share class | income | capital gains | paid | income | capital gains | paid | ||||||||||||||||||
| Class P1 | $ | 42 | $ | 122 | $ | 164 | $ | 19 | $ | 73 | $ | 92 | ||||||||||||
| Class P2 | 2,374 | 9,814 | 12,188 | 1,848 | 7,653 | 9,501 | ||||||||||||||||||
| Total | $ | 2,416 | $ | 9,936 | $ | 12,352 | $ | 1,867 | $ | 7,726 | $ | 9,593 | ||||||||||||
| Managed Risk Asset Allocation Fund | ||||||||||||||||||||||||
| Year ended December 31, 2018 | Year ended December 31, 2017 | |||||||||||||||||||||||
| Total | Total | |||||||||||||||||||||||
| Ordinary | Long-term | distributions | Ordinary | Long-term | distributions | |||||||||||||||||||
| Share class | income | capital gains | paid | income | capital gains | paid | ||||||||||||||||||
| Class P1 | $ | 31,787 | $ | 66,960 | $ | 98,747 | $ | 11,453 | $ | 13,811 | $ | 25,264 | ||||||||||||
| Class P2 | 36,816 | 107,405 | 144,221 | 20,269 | 24,931 | 45,200 | ||||||||||||||||||
| Total | $ | 68,603 | $ | 174,365 | $ | 242,968 | $ | 31,722 | $ | 38,742 | $ | 70,464 | ||||||||||||
| * | Class 1A shares began investment operations on January 6, 2017. |
| † | Amount less than one thousand. |
| 178 | American Funds Insurance Series |
7. Fees and transactions
CRMC, the series’ investment adviser, is the parent company of American Funds Distributors,® Inc. (“AFD”), the distributor of the series’ shares, and American Funds Service Company® (“AFS”), the series’ transfer agent. CRMC, AFD and AFS are considered related parties to the series.
Investment advisory services— The series has an investment advisory and service agreement with CRMC that provides for monthly fees accrued daily. These fees are based on annual rates that generally decrease as net asset levels increase. CRMC receives investment advisory fees from the underlying funds held by the managed risk funds. These fees are included in the net effective expense ratios that are provided as additional information in the financial highlights tables. Subadvisory fees for the managed risk funds are paid by CRMC to Milliman FRM. The managed risk funds are not responsible for paying any subadvisory fees.
Investment advisory services waivers— On December 4, 2017, the series board of trustees approved amended agreements effective February 1, 2018, decreasing the annual rate to 0.580% on daily net assets in excess of $4 billion for New World Fund, decreasing the annual rate to 0.350% on daily net assets in excess of $10.5 billion for Blue Chip Income and Growth Fund, and decreasing the annual rate to 0.320% on daily net assets in excess of $13 billion for Bond Fund. During the year ended December 31, 2018, CRMC voluntarily reduced the investment advisory services fees to a proposed rate of 0.500% on daily net assets in excess of $1.5 billion for International Growth and Income Fund and a proposed rate of 0.450% and 0.410% on daily net assets in excess of $600 million and $1 billion, respectively, for Capital Income Builder. CRMC is also waiving a portion of its investment advisory services fees for each of the managed risk funds. Investment advisory services fees are presented in each fund’s statement of operations gross of the waivers from CRMC. For the year ended December 31, 2018, total investment advisory services fees waived by CRMC were $2,789,000.
The range of rates, net asset levels and the current annualized rates of average daily net assets for each fund before and after any investment advisory services waivers (if applicable), are as follows:
| For the | For the | |||||||||||||||||||||||
| Net asset level | year ended | year ended | ||||||||||||||||||||||
| Rates | (in billions) | December 31, | December 31, | |||||||||||||||||||||
| Beginning | Ending | In excess | 2018, | 2018, | ||||||||||||||||||||
| Fund | with | with | Up to | of | before waiver | after waiver | ||||||||||||||||||
| Global Growth Fund | .690 | % | .460 | % | $ | .6 | $ | 5.0 | .516 | % | .516 | % | ||||||||||||
| Global Small Capitalization Fund | .800 | .635 | .6 | 5.0 | .696 | .696 | ||||||||||||||||||
| Growth Fund | .500 | .280 | .6 | 34.0 | .323 | .323 | ||||||||||||||||||
| International Fund | .690 | .430 | .5 | 21.0 | .492 | .492 | ||||||||||||||||||
| New World Fund | .850 | .580 | .5 | 4.0 | .701 | .701 | ||||||||||||||||||
| Blue Chip Income and Growth Fund | .500 | .350 | .6 | 10.5 | .389 | .389 | ||||||||||||||||||
| Global Growth and Income Fund | .690 | .480 | .6 | 3.0 | .593 | .593 | ||||||||||||||||||
| Growth-Income Fund | .500 | .219 | .6 | 34.0 | .258 | .258 | ||||||||||||||||||
| International Growth and Income Fund | .690 | .530 | .5 | 1.0 | .606 | .606 | ||||||||||||||||||
| Capital Income Builder | .500 | all | .500 | .496 | ||||||||||||||||||||
| Asset Allocation Fund | .500 | .240 | .6 | 21.0 | .266 | .266 | ||||||||||||||||||
| Global Balanced Fund | .660 | .510 | .5 | 1.0 | .660 | .660 | ||||||||||||||||||
| Bond Fund | .480 | .320 | .6 | 13.0 | .363 | .363 | ||||||||||||||||||
| Global Bond Fund | .570 | .450 | 1.0 | 3.0 | .531 | .531 | ||||||||||||||||||
| High-Income Bond Fund | .500 | .420 | .6 | 2.0 | .472 | .472 | ||||||||||||||||||
| Mortgage Fund | .420 | .290 | .6 | 3.0 | .420 | .420 | ||||||||||||||||||
| Ultra-Short Bond Fund | .320 | .270 | 1.0 | 2.0 | .320 | .320 | ||||||||||||||||||
| U.S. Government/AAA-Rated Securities Fund | .420 | .290 | .6 | 3.0 | .339 | .339 | ||||||||||||||||||
| Managed Risk Growth Fund | .150 | all | .150 | .100 | ||||||||||||||||||||
| Managed Risk International Fund | .150 | all | .150 | .100 | ||||||||||||||||||||
| Managed Risk Blue Chip Income and Growth Fund | .150 | all | .150 | .100 | ||||||||||||||||||||
| Managed Risk Growth-Income Fund | .150 | all | .150 | .100 | ||||||||||||||||||||
| Managed Risk Asset Allocation Fund | .150 | all | .150 | .100 | ||||||||||||||||||||
| American Funds Insurance Series | 179 |
Distribution services— The series has plans of distribution for all share classes except Class 1. Under the plans, the board of trustees approves certain categories of expenses that are used to finance activities primarily intended to sell fund shares. The plans provide for payments to pay service fees to firms that have entered into agreements with the series. These payments, based on an annualized percentage of average daily net assets, range from 0.18% to 0.50% as noted in the table below. In some cases, the board of trustees has limited the amounts that may be paid to less than the maximum allowed by the plans.
| Share class | Currently approved limits | Plan limits | ||||||
| Class 1A | 0.00 | % | 0.25 | % | ||||
| Class 2 | 0.25 | 0.25 | ||||||
| Class 3 | 0.18 | 0.18 | ||||||
| Class 4 | 0.25 | 0.25 | ||||||
| Class P1 | 0.00 | 0.25 | ||||||
| Class P2 | 0.25 | 0.50 | ||||||
Insurance administrative services— The series has an insurance administrative services plan for Class 1A, 4, P1 and P2 shares. Under the plan, these share classes pay 0.25% of each insurance company’s respective average daily net assets in each share class to compensate the insurance companies for services provided to their separate accounts and contractholders for which the shares of the fund are beneficially owned as underlying investments of such contractholders’ annuities. These services include, but are not limited to, maintenance, shareholder communications and transactional services. The insurance companies are not related parties to the series.
Transfer agent services— The series has a shareholder services agreement with AFS under which the funds compensate AFS for providing transfer agent services to all of the funds’ share classes. These services include recordkeeping, shareholder communications and transaction processing. In addition, the managed risk funds reimburse AFS for amounts paid to third parties for performing transfer agent services on behalf of fund shareholders.
Administrative services— The series has an administrative services agreement with CRMC under which each fund compensates CRMC for providing administrative services to all of the funds’ share classes except Class P1 and P2 shares. Administrative services are provided by CRMC to help assist third parties providing non-distribution services to fund shareholders. These services include providing in depth information on each fund and market developments that impact fund investors. Administrative services also include, but are not limited to, coordinating, monitoring and overseeing third parties that provide services to fund shareholders. The agreement between the series and CRMC provides each fund, other than the managed risk funds, the ability to charge an administrative services fee of 0.05% of average daily net assets for all share classes. Currently all share classes pay an annual fee of 0.01% of average daily net assets (which could be increased as noted above). For the managed risk funds, CRMC receives administrative services fees of 0.01% of average daily net assets from Class 1 shares of the underlying funds for administrative services provided to the series.
Accounting and administrative services— The managed risk funds have a subadministration agreement with BNY Mellon under which the fund compensates BNY Mellon for providing accounting and administrative services to each of the managed risk funds’ share classes. These services include, but are not limited to, fund accounting (including calculation of net asset value), financial reporting and tax services. BNY Mellon is not a related party to the managed risk funds.
Class-specific expenses under the agreements described above were as follows (dollars in thousands):
Global Growth Fund
| Insurance | ||||||||||||
| Distribution | administrative | Administrative | ||||||||||
| Share class | services | services | services | |||||||||
| Class 1 | Not applicable | Not applicable | $ | 211 | ||||||||
| Class 1A | $ | — | $ | 10 | — | * | ||||||
| Class 2 | 9,707 | Not applicable | 388 | |||||||||
| Class 4 | 623 | 623 | 25 | |||||||||
| Total class-specific expenses | $ | 10,330 | $ | 633 | $ | 624 | ||||||
| Global Small Capitalization Fund | ||||||||||||
| Insurance | ||||||||||||
| Distribution | administrative | Administrative | ||||||||||
| Share class | services | services | services | |||||||||
| Class 1 | Not applicable | Not applicable | $ | 164 | ||||||||
| Class 1A | $ | — | $ | 1 | — | * | ||||||
| Class 2 | 6,093 | Not applicable | 244 | |||||||||
| Class 4 | 366 | 366 | 15 | |||||||||
| Total class-specific expenses | $ | 6,459 | $ | 367 | $ | 423 | ||||||
| 180 | American Funds Insurance Series |
Growth Fund
| Insurance | ||||||||||||
| Distribution | administrative | Administrative | ||||||||||
| Share class | services | services | services | |||||||||
| Class 1 | Not applicable | Not applicable | $ | 864 | ||||||||
| Class 1A | $ | — | $ | 17 | 1 | |||||||
| Class 2 | 39,441 | Not applicable | 1,578 | |||||||||
| Class 3 | 386 | Not applicable | 21 | |||||||||
| Class 4 | 2,733 | 2,733 | 109 | |||||||||
| Total class-specific expenses | $ | 42,560 | $ | 2,750 | $ | 2,573 | ||||||
| International Fund | ||||||||||||
| Insurance | ||||||||||||
| Distribution | administrative | Administrative | ||||||||||
| Share class | services | services | services | |||||||||
| Class 1 | Not applicable | Not applicable | $ | 510 | ||||||||
| Class 1A | $ | — | $ | 10 | — | * | ||||||
| Class 2 | 10,932 | Not applicable | 437 | |||||||||
| Class 3 | 52 | Not applicable | 3 | |||||||||
| Class 4 | 780 | 780 | 31 | |||||||||
| Total class-specific expenses | $ | 11,764 | $ | 790 | $ | 981 | ||||||
| New World Fund | ||||||||||||
| Insurance | ||||||||||||
| Distribution | administrative | Administrative | ||||||||||
| Share class | services | services | services | |||||||||
| Class 1 | Not applicable | Not applicable | $ | 196 | ||||||||
| Class 1A | $ | — | $ | 4 | — | * | ||||||
| Class 2 | 2,430 | Not applicable | 97 | |||||||||
| Class 4 | 1,159 | 1,160 | 46 | |||||||||
| Total class-specific expenses | $ | 3,589 | $ | 1,164 | $ | 339 | ||||||
| Blue Chip Income and Growth Fund | ||||||||||||
| Insurance | ||||||||||||
| Distribution | administrative | Administrative | ||||||||||
| Share class | services | services | services | |||||||||
| Class 1 | Not applicable | Not applicable | $ | 544 | ||||||||
| Class 1A | $ | — | $ | 6 | — | * | ||||||
| Class 2 | 8,330 | Not applicable | 333 | |||||||||
| Class 4 | 788 | 788 | 32 | |||||||||
| Total class-specific expenses | $ | 9,118 | $ | 794 | $ | 909 | ||||||
| Global Growth and Income Fund | ||||||||||||
| Insurance | ||||||||||||
| Distribution | administrative | Administrative | ||||||||||
| Share class | services | services | services | |||||||||
| Class 1 | Not applicable | Not applicable | $ | 51 | ||||||||
| Class 1A | $ | — | $ | 2 | — | * | ||||||
| Class 2 | 3,617 | Not applicable | 145 | |||||||||
| Class 4 | 231 | 231 | 9 | |||||||||
| Total class-specific expenses | $ | 3,848 | $ | 233 | $ | 205 | ||||||
| Growth-Income Fund | ||||||||||||
| Insurance | ||||||||||||
| Distribution | administrative | Administrative | ||||||||||
| Share class | services | services | services | |||||||||
| Class 1 | Not applicable | Not applicable | $ | 1,657 | ||||||||
| Class 1A | $ | — | $ | 13 | 1 | |||||||
| Class 2 | 34,335 | Not applicable | 1,373 | |||||||||
| Class 3 | 292 | Not applicable | 16 | |||||||||
| Class 4 | 2,287 | 2,287 | 92 | |||||||||
| Total class-specific expenses | $ | 36,914 | $ | 2,300 | $ | 3,139 | ||||||
| International Growth and Income Fund | ||||||||||||
| Insurance | ||||||||||||
| Distribution | administrative | Administrative | ||||||||||
| Share class | services | services | services | |||||||||
| Class 1 | Not applicable | Not applicable | $ | 112 | ||||||||
| Class 1A | $ | — | $ | 5 | — | * | ||||||
| Class 2 | 662 | Not applicable | 27 | |||||||||
| Class 4 | 178 | 178 | 7 | |||||||||
| Total class-specific expenses | $ | 840 | $ | 183 | $ | 146 | ||||||
| Capital Income Builder | ||||||||||||
| Insurance | ||||||||||||
| Distribution | administrative | Administrative | ||||||||||
| Share class | services | services | services | |||||||||
| Class 1 | Not applicable | Not applicable | $ | 29 | ||||||||
| Class 1A | $ | — | $ | 6 | — | * | ||||||
| Class 2 | 7 | Not applicable | 1 | |||||||||
| Class 4 | 878 | 878 | 35 | |||||||||
| Total class-specific expenses | $ | 885 | $ | 884 | $ | 65 | ||||||
See end of tables for footnotes.
| American Funds Insurance Series | 181 |
Asset Allocation Fund
| Insurance | ||||||||||||
| Distribution | administrative | Administrative | ||||||||||
| Share class | services | services | services | |||||||||
| Class 1 | Not applicable | Not applicable | $ | 1,688 | ||||||||
| Class 1A | $ | — | $ | 15 | 1 | |||||||
| Class 2 | 13,103 | Not applicable | 524 | |||||||||
| Class 3 | 63 | Not applicable | 3 | |||||||||
| Class 4 | 9,339 | 9,339 | 374 | |||||||||
| Total class-specific expenses | $ | 22,505 | $ | 9,354 | $ | 2,590 | ||||||
| Global Balanced Fund | ||||||||||||
| Insurance | ||||||||||||
| Distribution | administrative | Administrative | ||||||||||
| Share class | services | services | services | |||||||||
| Class 1 | Not applicable | Not applicable | $ | 11 | ||||||||
| Class 1A | $ | — | $ | 3 | — | * | ||||||
| Class 2 | 516 | Not applicable | 21 | |||||||||
| Class 4 | 164 | 164 | 6 | |||||||||
| Total class-specific expenses | $ | 680 | $ | 167 | $ | 38 | ||||||
| Bond Fund | ||||||||||||
| Insurance | ||||||||||||
| Distribution | administrative | Administrative | ||||||||||
| Share class | services | services | services | |||||||||
| Class 1 | Not applicable | Not applicable | $ | 628 | ||||||||
| Class 1A | $ | — | $ | 6 | — | * | ||||||
| Class 2 | 9,391 | Not applicable | 376 | |||||||||
| Class 4 | 829 | 829 | 33 | |||||||||
| Total class-specific expenses | $ | 10,220 | $ | 835 | $ | 1,037 | ||||||
| Global Bond Fund | ||||||||||||
| Insurance | ||||||||||||
| Distribution | administrative | Administrative | ||||||||||
| Share class | services | services | services | |||||||||
| Class 1 | Not applicable | Not applicable | $ | 112 | ||||||||
| Class 1A | $ | — | $ | 1 | — | * | ||||||
| Class 2 | 2,805 | Not applicable | 112 | |||||||||
| Class 4 | 96 | 96 | 4 | |||||||||
| Total class-specific expenses | $ | 2,901 | $ | 97 | $ | 228 | ||||||
| High-Income Bond Fund | ||||||||||||
| Insurance | ||||||||||||
| Distribution | administrative | Administrative | ||||||||||
| Share class | services | services | services | |||||||||
| Class 1 | Not applicable | Not applicable | $ | 59 | ||||||||
| Class 1A | $ | — | $ | 1 | — | * | ||||||
| Class 2 | 1,847 | Not applicable | 74 | |||||||||
| Class 3 | 21 | Not applicable | 1 | |||||||||
| Class 4 | 85 | 85 | 3 | |||||||||
| Total class-specific expenses | $ | 1,953 | $ | 86 | $ | 137 | ||||||
| Mortgage Fund | ||||||||||||
| Insurance | ||||||||||||
| Distribution | administrative | Administrative | ||||||||||
| Share class | services | services | services | |||||||||
| Class 1 | Not applicable | Not applicable | $ | 25 | ||||||||
| Class 1A | $ | — | $ | 1 | — | * | ||||||
| Class 2 | 151 | Not applicable | 6 | |||||||||
| Class 4 | 40 | 41 | 1 | |||||||||
| Total class-specific expenses | $ | 191 | $ | 42 | $ | 32 | ||||||
| Ultra-Short Bond Fund | ||||||||||||
| Insurance | ||||||||||||
| Distribution | administrative | Administrative | ||||||||||
| Share class | services | services | services | |||||||||
| Class 1 | Not applicable | Not applicable | $ | 4 | ||||||||
| Class 1A | $ | — | $ | — | — | * | ||||||
| Class 2 | 599 | Not applicable | 24 | |||||||||
| Class 3 | 7 | Not applicable | — | * | ||||||||
| Class 4 | 37 | 37 | 2 | |||||||||
| Total class-specific expenses | $ | 643 | $ | 37 | $ | 30 | ||||||
| U.S. Government/AAA-Rated Securities Fund | ||||||||||||
| Insurance | ||||||||||||
| Distribution | administrative | Administrative | ||||||||||
| Share class | services | services | services | |||||||||
| Class 1 | Not applicable | Not applicable | $ | 151 | ||||||||
| Class 1A | $ | — | $ | 2 | — | * | ||||||
| Class 2 | 3,520 | Not applicable | 141 | |||||||||
| Class 3 | 17 | Not applicable | 1 | |||||||||
| Class 4 | 169 | 169 | 7 | |||||||||
| Total class-specific expenses | $ | 3,706 | $ | 171 | $ | 300 | ||||||
| 182 | American Funds Insurance Series |
Managed Risk Growth Fund
| Insurance | ||||||||||||
| Distribution | administrative | |||||||||||
| Share class | services | services | ||||||||||
| Class P1 | Not applicable | $ | 6 | |||||||||
| Class P2 | $ | 803 | 803 | |||||||||
| Total class-specific expenses | $ | 803 | $ | 809 | ||||||||
| Managed Risk International Fund | ||||||||||||
| Insurance | ||||||||||||
| Distribution | administrative | |||||||||||
| Share class | services | services | ||||||||||
| Class P1 | Not applicable | $ | —* | |||||||||
| Class P2 | $ | 389 | 389 | |||||||||
| Total class-specific expenses | $ | 389 | $ | 389 | ||||||||
| Managed Risk Blue Chip Income and Growth Fund | ||||||||||||
| Insurance | ||||||||||||
| Distribution | administrative | |||||||||||
| Share class | services | services | ||||||||||
| Class P1 | Not applicable | $ | —* | |||||||||
| Class P2 | $ | 883 | 883 | |||||||||
| Total class-specific expenses | $ | 883 | $ | 883 | ||||||||
| Managed Risk Growth-Income Fund | ||||||||||||
| Insurance | ||||||||||||
| Distribution | administrative | |||||||||||
| Share class | services | services | ||||||||||
| Class P1 | Not applicable | $ | 167 | |||||||||
| Class P2 | $ | 564 | 564 | |||||||||
| Total class-specific expenses | $ | 564 | $ | 731 | ||||||||
| Managed Risk Asset Allocation Fund | ||||||||||||
| Insurance | ||||||||||||
| Distribution | administrative | |||||||||||
| Share class | services | services | ||||||||||
| Class P1 | Not applicable | $ | 4,153 | |||||||||
| Class P2 | $ | 6,862 | 6,862 | |||||||||
| Total class-specific expenses | $ | 6,862 | $ | 11,015 | ||||||||
| * | Amount less than one thousand. |
| American Funds Insurance Series | 183 |
Trustees’ deferred compensation— Trustees who are unaffiliated with CRMC may elect to defer the cash payment of part or all of their compensation. These deferred amounts, which remain as liabilities of the funds, are treated as if invested in one or more of the American Funds. These amounts represent general, unsecured liabilities of the funds and vary according to the total returns of the selected funds. Trustees’ compensation, shown on the accompanying financial statements, reflects current fees (either paid in cash or deferred) and a net increase in the value of the deferred amounts as follows (dollars in thousands):
| Fund | Current fees | Increase in value of deferred amounts | Total trustees’ compensation | |||||||||
| Global Growth Fund | $ | 36 | $ | 1 | $ | 37 | ||||||
| Global Small Capitalization Fund | 24 | 1 | 25 | |||||||||
| Growth Fund | 145 | 5 | 150 | |||||||||
| International Fund | 56 | 2 | 58 | |||||||||
| New World Fund | 19 | 1 | 20 | |||||||||
| Blue Chip Income and Growth Fund | 51 | 2 | 53 | |||||||||
| Global Growth and Income Fund | 12 | — | * | 12 | ||||||||
| Growth-Income Fund | 176 | 6 | 182 | |||||||||
| International Growth and Income Fund | 8 | — | * | 8 | ||||||||
| Capital Income Builder | 3 | — | * | 3 | ||||||||
| Asset Allocation Fund | 146 | 4 | 150 | |||||||||
| Global Balanced Fund | 2 | — | * | 2 | ||||||||
| Bond Fund | 59 | 2 | 61 | |||||||||
| Global Bond Fund | 13 | — | * | 13 | ||||||||
| High-Income Bond Fund | 8 | — | * | 8 | ||||||||
| Mortgage Fund | 2 | — | * | 2 | ||||||||
| Ultra-Short Bond Fund | 2 | — | * | 2 | ||||||||
| U.S. Government/AAA-Rated Securities Fund | 17 | 1 | 18 | |||||||||
| Managed Risk Growth Fund | 2 | — | * | 2 | ||||||||
| Managed Risk International Fund | 1 | — | * | 1 | ||||||||
| Managed Risk Blue Chip Income and Growth Fund | 2 | — | * | 2 | ||||||||
| Managed Risk Growth-Income Fund | 1 | — | * | 1 | ||||||||
| Managed Risk Asset Allocation Fund | 25 | 1 | 26 | |||||||||
| * | Amount less than one thousand. |
Affiliated officers and trustees— Officers and certain trustees of the series are or may be considered to be affiliated with CRMC, AFD and AFS. No affiliated officers or trustees received any compensation directly from any fund in the series.
Other expenses— The amounts of $(18,000), $(9,000) and $(1,637,000) for other expenses for Managed Risk International Fund, Managed Risk Growth-Income Fund and Managed Risk Asset Allocation Fund, respectively, are due to over accruals of prior year expenses.
Security transactions with related funds— The funds may purchase from, or sell securities to, other CRMC-managed funds (or funds managed by certain affiliates of CRMC) under procedures adopted by the fund’s board of trustees. The funds involved in such transactions are considered related by virtue of having a common investment adviser (or affiliated investment advisers), common trustees and/or common officers. When such transactions occur, each transaction is executed at the current market price of the security and no brokerage commissions or fees are paid in accordance with Rule 17a-7 of the 1940 Act.
| 184 | American Funds Insurance Series |
The following table presents purchase and sale transactions between each fund and related funds as of December 31, 2018 (dollars in thousands):
| Fund | Purchases | Sales | ||||||
| Global Growth Fund | $ 34,488 | $ 66,699 | ||||||
| Global Small Capitalization Fund | 27,363 | 116,375 | ||||||
| Growth Fund | 477,334 | 479,509 | ||||||
| International Fund | 147,908 | 108,039 | ||||||
| New World Fund | 33,742 | 113,253 | ||||||
| Blue Chip Income and Growth Fund | 110,841 | 190,265 | ||||||
| Global Growth and Income Fund | 19,946 | 54,312 | ||||||
| Growth-Income Fund | 391,036 | 317,478 | ||||||
| International Growth and Income Fund | 32,881 | 5,821 | ||||||
| Capital Income Builder | 8,337 | 2,999 | ||||||
| Asset Allocation Fund | 168,410 | 394,146 | ||||||
| Global Balanced Fund | 3,988 | 1,162 | ||||||
| Bond Fund | 45,398 | 583,734 | ||||||
| Global Bond Fund | 4,043 | 9,876 | ||||||
| High-Income Bond Fund | 22,019 | 22,312 | ||||||
| Mortgage Fund | — | — | ||||||
| Ultra-Short Bond Fund | — | — | ||||||
| U.S. Government/AAA-Rated Securities Fund | — | — | ||||||
| Managed Risk Growth Fund | — | — | ||||||
| Managed Risk International Fund | — | — | ||||||
| Managed Risk Blue Chip Income and Growth Fund | — | — | ||||||
| Managed Risk Growth-Income Fund | — | — | ||||||
| Managed Risk Asset Allocation Fund | — | — | ||||||
8. Committed line of credit
Global Small Capitalization Fund, New World Fund and High-Income Bond Fund participate with other funds managed by CRMC in a $1.5 billion credit facility (the “line of credit”) to be utilized for temporary purposes to fund shareholder redemptions. Each fund has agreed to pay commitment fees on its pro-rata portion of the line of credit, which are reflected in other expenses in each fund’s statement of operations. None of the funds borrowed on this line of credit at any time during the year ended December 31, 2018.
9. Capital share transactions
Capital share transactions in the funds were as follows (dollars and shares in thousands):
Global Growth Fund
| Sales1 | Reinvestments of distributions | Repurchases1 | Net increase (decrease) | |||||||||||||||||||||||||||||
| Share class | Amount | Shares | Amount | Shares | Amount | Shares | Amount | Shares | ||||||||||||||||||||||||
| Year ended December 31, 2018 | ||||||||||||||||||||||||||||||||
| Class 1 | $ | 318,393 | 10,738 | $ | 163,496 | 5,459 | $ | (199,573 | ) | (6,616 | ) | $ | 282,316 | 9,581 | ||||||||||||||||||
| Class 1A | 4,760 | 162 | 320 | 11 | (1,942 | ) | (64 | ) | 3,138 | 109 | ||||||||||||||||||||||
| Class 2 | 71,745 | 2,511 | 292,561 | 9,830 | (465,838 | ) | (15,407 | ) | (101,532 | ) | (3,066 | ) | ||||||||||||||||||||
| Class 4 | 94,068 | 3,163 | 18,437 | 622 | (28,678 | ) | (983 | ) | 83,827 | 2,802 | ||||||||||||||||||||||
| Total net increase (decrease) | $ | 488,966 | 16,574 | $ | 474,814 | 15,922 | $ | (696,031 | ) | (23,070 | ) | $ | 267,749 | 9,426 | ||||||||||||||||||
| Year ended December 31, 2017 | ||||||||||||||||||||||||||||||||
| Class 1 | $ | 202,598 | 7,210 | $ | 72,128 | 2,554 | $ | (331,323 | ) | (11,655 | ) | $ | (56,597 | ) | (1,891 | ) | ||||||||||||||||
| Class 1A2 | 2,333 | 80 | 31 | 1 | (125 | ) | (4 | ) | 2,239 | 77 | ||||||||||||||||||||||
| Class 2 | 55,435 | 2,042 | 139,728 | 5,015 | (563,057 | ) | (20,391 | ) | (367,894 | ) | (13,334 | ) | ||||||||||||||||||||
| Class 4 | 92,931 | 3,271 | 4,951 | 178 | (11,055 | ) | (400 | ) | 86,827 | 3,049 | ||||||||||||||||||||||
| Total net increase (decrease) | $ | 353,297 | 12,603 | $ | 216,838 | 7,748 | $ | (905,560 | ) | (32,450 | ) | $ | (335,425 | ) | (12,099 | ) | ||||||||||||||||
See end of tables for footnotes.
| American Funds Insurance Series | 185 |
Global Small Capitalization Fund
| Sales1 | Reinvestments of distributions | Repurchases1 | Net increase (decrease) | |||||||||||||||||||||||||||||
| Share class | Amount | Shares | Amount | Shares | Amount | Shares | Amount | Shares | ||||||||||||||||||||||||
| Year ended December 31, 2018 | ||||||||||||||||||||||||||||||||
| Class 1 | $ | 138,128 | 5,551 | $ | 76,990 | 2,920 | $ | (160,148 | ) | (6,253 | ) | $ | 54,970 | 2,218 | ||||||||||||||||||
| Class 1A | 318 | 12 | 16 | 1 | (110 | ) | (5 | ) | 224 | 8 | ||||||||||||||||||||||
| Class 2 | 47,093 | 2,015 | 112,331 | 4,349 | (309,646 | ) | (12,397 | ) | (150,222 | ) | (6,033 | ) | ||||||||||||||||||||
| Class 4 | 56,525 | 2,282 | 6,491 | 249 | (17,067 | ) | (693 | ) | 45,949 | 1,838 | ||||||||||||||||||||||
| Total net increase (decrease) | $ | 242,064 | 9,860 | $ | 195,828 | 7,519 | $ | (486,971 | ) | (19,348 | ) | $ | (49,079 | ) | (1,969 | ) | ||||||||||||||||
| Year ended December 31, 2017 | ||||||||||||||||||||||||||||||||
| Class 1 | $ | 128,448 | 5,651 | $ | 10,108 | 429 | $ | (396,272 | ) | (17,174 | ) | $ | (257,716 | ) | (11,094 | ) | ||||||||||||||||
| Class 1A2 | 169 | 8 | 1 | — | 3 | — | 3 | — | 3 | 170 | 8 | |||||||||||||||||||||
| Class 2 | 27,876 | 1,267 | 10,597 | 472 | (343,593 | ) | (15,314 | ) | (305,120 | ) | (13,575 | ) | ||||||||||||||||||||
| Class 4 | 73,197 | 3,126 | 270 | 12 | (5,899 | ) | (258 | ) | 67,568 | 2,880 | ||||||||||||||||||||||
| Total net increase (decrease) | $ | 229,690 | 10,052 | $ | 20,976 | 913 | $ | (745,764 | ) | (32,746 | ) | $ | (495,098 | ) | (21,781 | ) | ||||||||||||||||
| Growth Fund | ||||||||||||||||||||||||||||||||
| Sales1 | Reinvestments of distributions | Repurchases1 | Net increase (decrease) | |||||||||||||||||||||||||||||
| Share class | Amount | Shares | Amount | Shares | Amount | Shares | Amount | Shares | ||||||||||||||||||||||||
| Year ended December 31, 2018 | ||||||||||||||||||||||||||||||||
| Class 1 | $ | 1,574,676 | 19,928 | $ | 879,237 | 11,221 | $ | (1,126,624 | ) | (14,082 | ) | $ | 1,327,289 | 17,067 | ||||||||||||||||||
| Class 1A | 8,204 | 103 | 710 | 9 | (563 | ) | (7 | ) | 8,351 | 105 | ||||||||||||||||||||||
| Class 2 | 292,909 | 3,756 | 1,633,088 | 20,970 | (2,436,432 | ) | (30,703 | ) | (510,435 | ) | (5,977 | ) | ||||||||||||||||||||
| Class 3 | 1,809 | 22 | 21,971 | 279 | (27,844 | ) | (348 | ) | (4,064 | ) | (47 | ) | ||||||||||||||||||||
| Class 4 | 274,892 | 3,534 | 110,941 | 1,441 | (135,865 | ) | (1,758 | ) | 249,968 | 3,217 | ||||||||||||||||||||||
| Total net increase (decrease) | $ | 2,152,490 | 27,343 | $ | 2,645,947 | 33,920 | $ | (3,727,328 | ) | (46,898 | ) | $ | 1,071,109 | 14,365 | ||||||||||||||||||
| Year ended December 31, 2017 | ||||||||||||||||||||||||||||||||
| Class 1 | $ | 505,734 | 6,906 | $ | 786,807 | 11,094 | $ | (1,258,545 | ) | (16,930 | ) | $ | 33,996 | 1,070 | ||||||||||||||||||
| Class 1A2 | 2,708 | 36 | 78 | 1 | (94 | ) | (1 | ) | 2,692 | 36 | ||||||||||||||||||||||
| Class 2 | 206,092 | 2,819 | 1,520,175 | 21,621 | (2,205,078 | ) | (30,135 | ) | (478,811 | ) | (5,695 | ) | ||||||||||||||||||||
| Class 3 | 468 | 6 | 20,085 | 282 | (21,851 | ) | (295 | ) | (1,298 | ) | (7 | ) | ||||||||||||||||||||
| Class 4 | 407,312 | 5,509 | 58,020 | 832 | (56,254 | ) | (776 | ) | 409,078 | 5,565 | ||||||||||||||||||||||
| Total net increase (decrease) | $ | 1,122,314 | 15,276 | $ | 2,385,165 | 33,830 | $ | (3,541,822 | ) | (48,137 | ) | $ | (34,343 | ) | 969 | |||||||||||||||||
| 186 | American Funds Insurance Series |
International Fund
| Sales1 | Reinvestments of distributions | Repurchases1 | Net increase (decrease) | |||||||||||||||||||||||||||||
| Share class | Amount | Shares | Amount | Shares | Amount | Shares | Amount | Shares | ||||||||||||||||||||||||
| Year ended December 31, 2018 | ||||||||||||||||||||||||||||||||
| Class 1 | $ | 987,191 | 47,885 | $ | 339,738 | 16,682 | $ | (479,241 | ) | (23,102 | ) | $ | 847,688 | 41,465 | ||||||||||||||||||
| Class 1A | 4,302 | 204 | 296 | 14 | (269 | ) | (14 | ) | 4,329 | 204 | ||||||||||||||||||||||
| Class 2 | 481,518 | 22,952 | 283,963 | 13,909 | (441,465 | ) | (21,109 | ) | 324,016 | 15,752 | ||||||||||||||||||||||
| Class 3 | 506 | 23 | 1,857 | 91 | (4,389 | ) | (209 | ) | (2,026 | ) | (95 | ) | ||||||||||||||||||||
| Class 4 | 96,985 | 4,701 | 20,021 | 990 | (45,627 | ) | (2,234 | ) | 71,379 | 3,457 | ||||||||||||||||||||||
| Total net increase (decrease) | $ | 1,570,502 | 75,765 | $ | 645,875 | 31,686 | $ | (970,991 | ) | (46,668 | ) | $ | 1,245,386 | 60,783 | ||||||||||||||||||
| Year ended December 31, 2017 | ||||||||||||||||||||||||||||||||
| Class 1 | $ | 760,186 | 38,348 | $ | 119,937 | 5,881 | $ | (613,463 | ) | (30,471 | ) | $ | 266,660 | 13,758 | ||||||||||||||||||
| Class 1A2 | 1,638 | 80 | 20 | 1 | (119 | ) | (5 | ) | 1,539 | 76 | ||||||||||||||||||||||
| Class 2 | 174,876 | 8,941 | 100,155 | 4,954 | (605,647 | ) | (30,845 | ) | (330,616 | ) | (16,950 | ) | ||||||||||||||||||||
| Class 3 | 274 | 13 | 726 | 36 | (3,886 | ) | (197 | ) | (2,886 | ) | (148 | ) | ||||||||||||||||||||
| Class 4 | 209,217 | 10,089 | 4,092 | 200 | (14,987 | ) | (752 | ) | 198,322 | 9,537 | ||||||||||||||||||||||
| Total net increase (decrease) | $ | 1,146,191 | 57,471 | $ | 224,930 | 11,072 | $ | (1,238,102 | ) | (62,270 | ) | $ | 133,019 | 6,273 | ||||||||||||||||||
| New World Fund | ||||||||||||||||||||||||||||||||
| Sales1 | Reinvestments of distributions | Repurchases1 | Net increase (decrease) | |||||||||||||||||||||||||||||
| Share class | Amount | Shares | Amount | Shares | Amount | Shares | Amount | Shares | ||||||||||||||||||||||||
| Year ended December 31, 2018 | ||||||||||||||||||||||||||||||||
| Class 1 | $ | 169,684 | 6,947 | $ | 75,282 | 3,139 | $ | (240,756 | ) | (10,008 | ) | $ | 4,210 | 78 | ||||||||||||||||||
| Class 1A | 2,616 | 108 | 73 | 3 | (572 | ) | (24 | ) | 2,117 | 87 | ||||||||||||||||||||||
| Class 2 | 70,536 | 2,954 | 34,787 | 1,456 | (144,167 | ) | (5,934 | ) | (38,844 | ) | (1,524 | ) | ||||||||||||||||||||
| Class 4 | 140,212 | 5,922 | 16,079 | 674 | (31,201 | ) | (1,315 | ) | 125,090 | 5,281 | ||||||||||||||||||||||
| Total net increase (decrease) | $ | 383,048 | 15,931 | $ | 126,221 | 5,272 | $ | (416,696 | ) | (17,281 | ) | $ | 92,573 | 3,922 | ||||||||||||||||||
| Year ended December 31, 2017 | ||||||||||||||||||||||||||||||||
| Class 1 | $ | 280,518 | 12,105 | $ | 21,909 | 893 | $ | (475,480 | ) | (20,394 | ) | $ | (173,053 | ) | (7,396 | ) | ||||||||||||||||
| Class 1A2 | 629 | 27 | 6 | — | 3 | (13 | ) | (1 | ) | 622 | 26 | |||||||||||||||||||||
| Class 2 | 143,361 | 6,559 | 9,149 | 376 | (254,737 | ) | (11,445 | ) | (102,227 | ) | (4,510 | ) | ||||||||||||||||||||
| Class 4 | 127,556 | 5,560 | 3,016 | 124 | (20,431 | ) | (895 | ) | 110,141 | 4,789 | ||||||||||||||||||||||
| Total net increase (decrease) | $ | 552,064 | 24,251 | $ | 34,080 | 1,393 | $ | (750,661 | ) | (32,735 | ) | $ | (164,517 | ) | (7,091 | ) | ||||||||||||||||
See end of tables for footnotes.
| American Funds Insurance Series | 187 |
Blue Chip Income and Growth Fund
| Sales1 | Reinvestments of distributions | Repurchases1 | Net increase (decrease) | |||||||||||||||||||||||||||||
| Share class | Amount | Shares | Amount | Shares | Amount | Shares | Amount | Shares | ||||||||||||||||||||||||
| Year ended December 31, 2018 | ||||||||||||||||||||||||||||||||
| Class 1 | $ | 189,059 | 13,527 | $ | 528,528 | 38,135 | $ | (524,399 | ) | (36,270 | ) | $ | 193,188 | 15,392 | ||||||||||||||||||
| Class 1A | 2,957 | 203 | 254 | 19 | (106 | ) | (8 | ) | 3,105 | 214 | ||||||||||||||||||||||
| Class 2 | 34,615 | 2,528 | 320,676 | 23,381 | (472,476 | ) | (32,985 | ) | (117,185 | ) | (7,076 | ) | ||||||||||||||||||||
| Class 4 | 190,787 | 13,641 | 29,968 | 2,200 | (33,879 | ) | (2,399 | ) | 186,876 | 13,442 | ||||||||||||||||||||||
| Total net increase (decrease) | $ | 417,418 | 29,899 | $ | 879,426 | 63,735 | $ | (1,030,860 | ) | (71,662 | ) | $ | 265,984 | 21,972 | ||||||||||||||||||
| Year ended December 31, 2017 | ||||||||||||||||||||||||||||||||
| Class 1 | $ | 458,480 | 32,688 | $ | 309,238 | 21,989 | $ | (834,928 | ) | (58,499 | ) | $ | (67,210 | ) | (3,822 | ) | ||||||||||||||||
| Class 1A2 | 593 | 42 | 17 | 1 | (15 | ) | (1 | ) | 595 | 42 | ||||||||||||||||||||||
| Class 2 | 34,639 | 2,502 | 195,693 | 14,095 | (439,009 | ) | (31,376 | ) | (208,677 | ) | (14,779 | ) | ||||||||||||||||||||
| Class 4 | 129,429 | 9,259 | 10,522 | 756 | (43,213 | ) | (3,132 | ) | 96,738 | 6,883 | ||||||||||||||||||||||
| Total net increase (decrease) | $ | 623,141 | 44,491 | $ | 515,470 | 36,841 | $ | (1,317,165 | ) | (93,008 | ) | $ | (178,554 | ) | (11,676 | ) | ||||||||||||||||
Global Growth and Income Fund | ||||||||||||||||||||||||||||||||
| Sales1 | Reinvestments of distributions | Repurchases1 | Net increase (decrease) | |||||||||||||||||||||||||||||
| Share class | Amount | Shares | Amount | Shares | Amount | Shares | Amount | Shares | ||||||||||||||||||||||||
| Year ended December 31, 2018 | ||||||||||||||||||||||||||||||||
| Class 1 | $ | 105,981 | 7,092 | $ | 45,562 | 3,107 | $ | (46,619 | ) | (3,060 | ) | $ | 104,924 | 7,139 | ||||||||||||||||||
| Class 1A | 951 | 60 | 81 | 6 | (40 | ) | (2 | ) | 992 | 64 | ||||||||||||||||||||||
| Class 2 | 27,421 | 1,842 | 130,608 | 8,898 | (208,022 | ) | (13,672 | ) | (49,993 | ) | (2,932 | ) | ||||||||||||||||||||
| Class 4 | 42,459 | 2,827 | 8,471 | 586 | (16,633 | ) | (1,102 | ) | 34,297 | 2,311 | ||||||||||||||||||||||
| Total net increase (decrease) | $ | 176,812 | 11,821 | $ | 184,722 | 12,597 | $ | (271,314 | ) | (17,836 | ) | $ | 90,220 | 6,582 | ||||||||||||||||||
| Year ended December 31, 2017 | ||||||||||||||||||||||||||||||||
| Class 1 | $ | 133,943 | 8,899 | $ | 16,607 | 1,095 | $ | (345,498 | ) | (23,190 | ) | $ | (194,948 | ) | (13,196 | ) | ||||||||||||||||
| Class 1A2 | 125 | 8 | 3 | — | 3 | (3 | ) | — | 3 | 125 | 8 | |||||||||||||||||||||
| Class 2 | 25,134 | 1,709 | 56,976 | 3,780 | (236,596 | ) | (16,119 | ) | (154,486 | ) | (10,630 | ) | ||||||||||||||||||||
| Class 4 | 63,660 | 4,175 | 1,883 | 123 | (6,203 | ) | (417 | ) | 59,340 | 3,881 | ||||||||||||||||||||||
| Total net increase (decrease) | $ | 222,862 | 14,791 | $ | 75,469 | 4,998 | $ | (588,300 | ) | (39,726 | ) | $ | (289,969 | ) | (19,937 | ) | ||||||||||||||||
Growth-Income Fund | ||||||||||||||||||||||||||||||||
| Sales1 | Reinvestments of distributions | Repurchases1 | Net increase (decrease) | |||||||||||||||||||||||||||||
| Share class | Amount | Shares | Amount | Shares | Amount | Shares | Amount | Shares | ||||||||||||||||||||||||
| Year ended December 31, 2018 | ||||||||||||||||||||||||||||||||
| Class 1 | $ | 2,594,038 | 53,950 | $ | 1,388,000 | 27,742 | $ | (1,325,537 | ) | (25,872 | ) | $ | 2,656,501 | 55,820 | ||||||||||||||||||
| Class 1A | 5,817 | 114 | 467 | 10 | (933 | ) | (18 | ) | 5,351 | 106 | ||||||||||||||||||||||
| Class 2 | 128,833 | 2,587 | 1,128,412 | 22,770 | (1,901,203 | ) | (37,514 | ) | (643,958 | ) | (12,157 | ) | ||||||||||||||||||||
| Class 3 | 1,014 | 20 | 13,244 | 264 | (26,871 | ) | (525 | ) | (12,613 | ) | (241 | ) | ||||||||||||||||||||
| Class 4 | 193,427 | 3,881 | 73,971 | 1,507 | (97,541 | ) | (1,958 | ) | 169,857 | 3,430 | ||||||||||||||||||||||
| Total net increase (decrease) | $ | 2,923,129 | 60,552 | $ | 2,604,094 | 52,293 | $ | (3,352,085 | ) | (65,887 | ) | $ | 2,175,138 | 46,958 | ||||||||||||||||||
| Year ended December 31, 2017 | ||||||||||||||||||||||||||||||||
| Class 1 | $ | 1,521,886 | 32,100 | $ | 1,132,034 | 24,392 | $ | (1,241,004 | ) | (26,012 | ) | $ | 1,412,916 | 30,480 | ||||||||||||||||||
| Class 1A2 | 2,070 | 43 | 40 | 1 | (24 | ) | (1 | ) | 2,086 | 43 | ||||||||||||||||||||||
| Class 2 | 120,223 | 2,558 | 1,048,742 | 22,899 | (1,761,342 | ) | (37,375 | ) | (592,377 | ) | (11,918 | ) | ||||||||||||||||||||
| Class 3 | 473 | 10 | 12,561 | 271 | (21,746 | ) | (457 | ) | (8,712 | ) | (176 | ) | ||||||||||||||||||||
| Class 4 | 267,835 | 5,641 | 46,486 | 1,020 | (56,983 | ) | (1,217 | ) | 257,338 | 5,444 | ||||||||||||||||||||||
| Total net increase (decrease) | $ | 1,912,487 | 40,352 | $ | 2,239,863 | 48,583 | $ | (3,081,099 | ) | (65,062 | ) | $ | 1,071,251 | 23,873 | ||||||||||||||||||
| 188 | American Funds Insurance Series |
International Growth and Income Fund
| Sales1 | Reinvestments of distributions | Repurchases1 | Net increase (decrease) | |||||||||||||||||||||||||||||
| Share class | Amount | Shares | Amount | Shares | Amount | Shares | Amount | Shares | ||||||||||||||||||||||||
| Year ended December 31, 2018 | ||||||||||||||||||||||||||||||||
| Class 1 | $ | 102,396 | 5,829 | $ | 28,476 | 1,796 | $ | (62,238 | ) | (3,472 | ) | $ | 68,634 | 4,153 | ||||||||||||||||||
| Class 1A | 276 | 16 | 44 | 3 | (453 | ) | (27 | ) | (133 | ) | (8 | ) | ||||||||||||||||||||
| Class 2 | 13,046 | 753 | 5,865 | 371 | (28,666 | ) | (1,702 | ) | (9,755 | ) | (578 | ) | ||||||||||||||||||||
| Class 4 | 29,607 | 1,717 | 1,597 | 101 | (12,831 | ) | (752 | ) | 18,373 | 1,066 | ||||||||||||||||||||||
| Total net increase (decrease) | $ | 145,325 | 8,315 | $ | 35,982 | 2,271 | $ | (104,188 | ) | (5,953 | ) | $ | 77,119 | 4,633 | ||||||||||||||||||
| Year ended December 31, 2017 | ||||||||||||||||||||||||||||||||
| Class 1 | $ | 186,307 | 11,140 | $ | 25,860 | 1,487 | $ | (101,536 | ) | (6,072 | ) | $ | 110,631 | 6,555 | ||||||||||||||||||
| Class 1A2 | 2,100 | 121 | 14 | 1 | (1 | ) | — | 3 | 2,113 | 122 | ||||||||||||||||||||||
| Class 2 | 8,391 | 510 | 5,714 | 329 | (34,542 | ) | (2,118 | ) | (20,437 | ) | (1,279 | ) | ||||||||||||||||||||
| Class 4 | 19,465 | 1,164 | 1,184 | 69 | (3,332 | ) | (202 | ) | 17,317 | 1,031 | ||||||||||||||||||||||
| Total net increase (decrease) | $ | 216,263 | 12,935 | $ | 32,772 | 1,886 | $ | (139,411 | ) | (8,392 | ) | $ | 109,624 | 6,429 | ||||||||||||||||||
Capital Income Builder | ||||||||||||||||||||||||||||||||
| Sales1 | Reinvestments of distributions | Repurchases1 | Net increase | |||||||||||||||||||||||||||||
| Share class | Amount | Shares | Amount | Shares | Amount | Shares | Amount | Shares | ||||||||||||||||||||||||
| Year ended December 31, 2018 | ||||||||||||||||||||||||||||||||
| Class 1 | $ | 96,466 | 9,624 | $ | 10,037 | 1,010 | $ | (12,240 | ) | (1,241 | ) | $ | 94,263 | 9,393 | ||||||||||||||||||
| Class 1A | 2,709 | 270 | 70 | 7 | (761 | ) | (77 | ) | 2,018 | 200 | ||||||||||||||||||||||
| Class 2 | 2,658 | 264 | 96 | 10 | (180 | ) | (18 | ) | 2,574 | 256 | ||||||||||||||||||||||
| Class 4 | 66,457 | 6,627 | 10,312 | 1,037 | (25,636 | ) | (2,556 | ) | 51,133 | 5,108 | ||||||||||||||||||||||
| Total net increase (decrease) | $ | 168,290 | 16,785 | $ | 20,515 | 2,064 | $ | (38,817 | ) | (3,892 | ) | $ | 149,988 | 14,957 | ||||||||||||||||||
| Year ended December 31, 2017 | ||||||||||||||||||||||||||||||||
| Class 1 | $ | 84,130 | 8,355 | $ | 6,303 | 622 | $ | (9,923 | ) | (984 | ) | $ | 80,510 | 7,993 | ||||||||||||||||||
| Class 1A2 | 1,245 | 122 | 8 | 1 | (365 | ) | (36 | ) | 888 | 87 | ||||||||||||||||||||||
| Class 2 | 1,371 | 136 | 23 | 2 | (122 | ) | (12 | ) | 1,272 | 126 | ||||||||||||||||||||||
| Class 4 | 66,028 | 6,590 | 7,676 | 760 | (19,222 | ) | (1,922 | ) | 54,482 | 5,428 | ||||||||||||||||||||||
| Total net increase (decrease) | $ | 152,774 | 15,203 | $ | 14,010 | 1,385 | $ | (29,632 | ) | (2,954 | ) | $ | 137,152 | 13,634 | ||||||||||||||||||
See end of tables for footnotes.
| American Funds Insurance Series | 189 |
| Asset Allocation Fund | ||||||||||||||||||||||||||||||||
| Sales1 | Reinvestments of distributions | Repurchases1 | Net (decrease) increase | |||||||||||||||||||||||||||||
| Share class | Amount | Shares | Amount | Shares | Amount | Shares | Amount | Shares | ||||||||||||||||||||||||
| Year ended December 31, 2018 | ||||||||||||||||||||||||||||||||
| Class 1 | $ | 1,402,434 | 60,588 | $ | 1,053,838 | 46,034 | $ | (2,607,246 | ) | (117,896 | ) | $ | (150,974 | ) | (11,274 | ) | ||||||||||||||||
| Class 1A | 3,797 | 162 | 411 | 18 | (678 | ) | (30 | ) | 3,530 | 150 | ||||||||||||||||||||||
| Class 2 | 89,621 | 3,865 | 313,464 | 13,808 | (682,422 | ) | (29,567 | ) | (279,337 | ) | (11,894 | ) | ||||||||||||||||||||
| Class 3 | 897 | 38 | 2,098 | 91 | (7,614 | ) | (325 | ) | (4,619 | ) | (196 | ) | ||||||||||||||||||||
| Class 4 | 380,567 | 16,509 | 217,964 | 9,642 | (180,958 | ) | (7,998 | ) | 417,573 | 18,153 | ||||||||||||||||||||||
| Total net increase (decrease) | $ | 1,877,316 | 81,162 | $ | 1,587,775 | 69,593 | $ | (3,478,918 | ) | (155,816 | ) | $ | (13,827 | ) | (5,061 | ) | ||||||||||||||||
| Year ended December 31, 2017 | ||||||||||||||||||||||||||||||||
| Class 1 | $ | 1,929,702 | 84,102 | $ | 953,771 | 41,982 | $ | (641,572 | ) | (27,828 | ) | $ | 2,241,901 | 98,256 | ||||||||||||||||||
| Class 1A2 | 4,261 | 184 | 121 | 5 | (253 | ) | (11 | ) | 4,129 | 178 | ||||||||||||||||||||||
| Class 2 | 109,962 | 4,876 | 325,924 | 14,513 | (579,020 | ) | (25,433 | ) | (143,134 | ) | (6,044 | ) | ||||||||||||||||||||
| Class 3 | 1,400 | 61 | 2,246 | 99 | (4,469 | ) | (195 | ) | (823 | ) | (35 | ) | ||||||||||||||||||||
| Class 4 | 408,549 | 18,017 | 192,666 | 8,617 | (159,354 | ) | (7,104 | ) | 441,861 | 19,530 | ||||||||||||||||||||||
| Total net increase (decrease) | $ | 2,453,874 | 107,240 | $ | 1,474,728 | 65,216 | $ | (1,384,668 | ) | (60,571 | ) | $ | 2,543,934 | 111,885 | ||||||||||||||||||
Global Balanced Fund | ||||||||||||||||||||||||||||||||
| Sales1 | Reinvestments of distributions | Repurchases1 | Net increase (decrease) | |||||||||||||||||||||||||||||
| Share class | Amount | Shares | Amount | Shares | Amount | Shares | Amount | Shares | ||||||||||||||||||||||||
| Year ended December 31, 2018 | ||||||||||||||||||||||||||||||||
| Class 1 | $ | 24,581 | 1,901 | $ | 3,154 | 265 | $ | (847 | ) | (66 | ) | $ | 26,888 | 2,100 | ||||||||||||||||||
| Class 1A | 2,209 | 171 | 56 | 5 | (292 | ) | (24 | ) | 1,973 | 152 | ||||||||||||||||||||||
| Class 2 | 11,812 | 914 | 4,844 | 408 | (24,153 | ) | (1,905 | ) | (7,497 | ) | (583 | ) | ||||||||||||||||||||
| Class 4 | 35,652 | 2,821 | 1,646 | 140 | (12,396 | ) | (987 | ) | 24,902 | 1,974 | ||||||||||||||||||||||
| Total net increase (decrease) | $ | 74,254 | 5,807 | $ | 9,700 | 818 | $ | (37,688 | ) | (2,982 | ) | $ | 46,266 | 3,643 | ||||||||||||||||||
| Year ended December 31, 2017 | ||||||||||||||||||||||||||||||||
| Class 1 | $ | 22,241 | 1,783 | $ | 3,607 | 285 | $ | (6,039 | ) | (501 | ) | $ | 19,809 | 1,567 | ||||||||||||||||||
| Class 1A2 | 244 | 19 | 9 | 1 | — | 3 | — | 3 | 253 | 20 | ||||||||||||||||||||||
| Class 2 | 16,382 | 1,346 | 7,928 | 628 | (20,169 | ) | (1,671 | ) | 4,141 | 303 | ||||||||||||||||||||||
| Class 4 | 39,763 | 3,218 | 1,778 | 142 | (2,261 | ) | (182 | ) | 39,280 | 3,178 | ||||||||||||||||||||||
| Total net increase (decrease) | $ | 78,630 | 6,366 | $ | 13,322 | 1,056 | $ | (28,469 | ) | (2,354 | ) | $ | 63,483 | 5,068 | ||||||||||||||||||
| Bond Fund | ||||||||||||||||||||||||||||||||
| Sales1 | Reinvestments of distributions | Repurchases1 | Net (decrease) increase | |||||||||||||||||||||||||||||
| Share class | Amount | Shares | Amount | Shares | Amount | Shares | Amount | Shares | ||||||||||||||||||||||||
| Year ended December 31, 2018 | ||||||||||||||||||||||||||||||||
| Class 1 | $ | 856,250 | 80,879 | $ | 164,110 | 15,776 | $ | (1,296,873 | ) | (122,086 | ) | $ | (276,513 | ) | (25,431 | ) | ||||||||||||||||
| Class 1A | 2,864 | 271 | 80 | 8 | (674 | ) | (64 | ) | 2,270 | 215 | ||||||||||||||||||||||
| Class 2 | 107,831 | 10,281 | 93,483 | 9,101 | (518,189 | ) | (49,721 | ) | (316,875 | ) | (30,339 | ) | ||||||||||||||||||||
| Class 4 | �� | 118,851 | 11,386 | 8,606 | 839 | (47,758 | ) | (4,587 | ) | 79,699 | 7,638 | |||||||||||||||||||||
| Total net increase (decrease) | $ | 1,085,796 | 102,817 | $ | 266,279 | 25,724 | $ | (1,863,494 | ) | (176,458 | ) | $ | (511,419 | ) | (47,917 | ) | ||||||||||||||||
| Year ended December 31, 2017 | ||||||||||||||||||||||||||||||||
| Class 1 | $ | 967,669 | 88,718 | $ | 235,240 | 21,678 | $ | (1,624,503 | ) | (147,887 | ) | $ | (421,594 | ) | (37,491 | ) | ||||||||||||||||
| Class 1A2 | 1,338 | 122 | 21 | 2 | (272 | ) | (25 | ) | 1,087 | 99 | ||||||||||||||||||||||
| Class 2 | 138,965 | 12,898 | 134,455 | 12,545 | (273,010 | ) | (25,301 | ) | 410 | 142 | ||||||||||||||||||||||
| Class 4 | 212,848 | 19,725 | 6,398 | 597 | (22,490 | ) | (2,080 | ) | 196,756 | 18,242 | ||||||||||||||||||||||
| Total net increase (decrease) | $ | 1,320,820 | 121,463 | $ | 376,114 | 34,822 | $ | (1,920,275 | ) | (175,293 | ) | $ | (223,341 | ) | (19,008 | ) | ||||||||||||||||
| 190 | American Funds Insurance Series |
Global Bond Fund
| Sales1 | Reinvestments of distributions | Repurchases1 | Net (decrease) increase | |||||||||||||||||||||||||||||
| Share class | Amount | Shares | Amount | Shares | Amount | Shares | Amount | Shares | ||||||||||||||||||||||||
| Year ended December 31, 2018 | ||||||||||||||||||||||||||||||||
| Class 1 | $ | 126,990 | 10,666 | $ | 28,466 | 2,515 | $ | (375,280 | ) | (31,456 | ) | $ | (219,824 | ) | (18,275 | ) | ||||||||||||||||
| Class 1A | 575 | 49 | 10 | 1 | (241 | ) | (21 | ) | 344 | 29 | ||||||||||||||||||||||
| Class 2 | 41,190 | 3,507 | 26,720 | 2,377 | (156,625 | ) | (13,571 | ) | (88,715 | ) | (7,687 | ) | ||||||||||||||||||||
| Class 4 | 28,055 | 2,394 | 934 | 84 | (17,922 | ) | (1,548 | ) | 11,067 | 930 | ||||||||||||||||||||||
| Total net increase (decrease) | $ | 196,810 | 16,616 | $ | 56,130 | 4,977 | $ | (550,068 | ) | (46,596 | ) | $ | (297,128 | ) | (25,003 | ) | ||||||||||||||||
| Year ended December 31, 2017 | ||||||||||||||||||||||||||||||||
| Class 1 | $ | 177,200 | 15,155 | $ | 14,284 | 1,210 | $ | (100,697 | ) | (8,588 | ) | $ | 90,787 | 7,777 | ||||||||||||||||||
| Class 1A2 | 74 | 6 | — | 3 | — | 3 | — | 3 | — | 3 | 74 | 6 | ||||||||||||||||||||
| Class 2 | 45,841 | 3,978 | 11,132 | 952 | (79,734 | ) | (6,868 | ) | (22,761 | ) | (1,938 | ) | ||||||||||||||||||||
| Class 4 | 20,651 | 1,777 | 197 | 17 | (2,949 | ) | (255 | ) | 17,899 | 1,539 | ||||||||||||||||||||||
| Total net increase (decrease) | $ | 243,766 | 20,916 | $ | 25,613 | 2,179 | $ | (183,380 | ) | (15,711 | ) | $ | 85,999 | 7,384 | ||||||||||||||||||
| High-Income Bond Fund | ||||||||||||||||||||||||||||||||
| Sales1 | Reinvestments of distributions | Repurchases1 | Net (decrease) increase | |||||||||||||||||||||||||||||
| Share class | Amount | Shares | Amount | Shares | Amount | Shares | Amount | Shares | ||||||||||||||||||||||||
| Year ended December 31, 2018 | ||||||||||||||||||||||||||||||||
| Class 1 | $ | 15,126 | 1,484 | $ | 34,114 | 3,526 | $ | (136,193 | ) | (13,306 | ) | $ | (86,953 | ) | (8,296 | ) | ||||||||||||||||
| Class 1A | 621 | 61 | 40 | 5 | (365 | ) | (36 | ) | 296 | 30 | ||||||||||||||||||||||
| Class 2 | 12,354 | 1,231 | 43,383 | 4,563 | (111,276 | ) | (11,157 | ) | (55,539 | ) | (5,363 | ) | ||||||||||||||||||||
| Class 3 | 1,837 | 179 | 664 | 68 | (4,223 | ) | (418 | ) | (1,722 | ) | (171 | ) | ||||||||||||||||||||
| Class 4 | 51,449 | 4,747 | 1,733 | 168 | (53,384 | ) | (4,942 | ) | (202 | ) | (27 | ) | ||||||||||||||||||||
| Total net increase (decrease) | $ | 81,387 | 7,702 | $ | 79,934 | 8,330 | $ | (305,441 | ) | (29,859 | ) | $ | (144,120 | ) | (13,827 | ) | ||||||||||||||||
| Year ended December 31, 2017 | ||||||||||||||||||||||||||||||||
| Class 1 | $ | 43,584 | 4,162 | $ | 43,816 | 4,273 | $ | (422,269 | ) | (39,685 | ) | $ | (334,869 | ) | (31,250 | ) | ||||||||||||||||
| Class 1A2 | 400 | 39 | 12 | 1 | (7 | ) | (1 | ) | 405 | 39 | ||||||||||||||||||||||
| Class 2 | 15,931 | 1,540 | 51,640 | 5,121 | (92,969 | ) | (8,946 | ) | (25,398 | ) | (2,285 | ) | ||||||||||||||||||||
| Class 3 | 397 | 38 | 805 | 78 | (1,921 | ) | (181 | ) | (719 | ) | (65 | ) | ||||||||||||||||||||
| Class 4 | 84,996 | 7,657 | 1,981 | 182 | (72,820 | ) | (6,577 | ) | 14,157 | 1,262 | ||||||||||||||||||||||
| Total net increase (decrease) | $ | 145,308 | 13,436 | $ | 98,254 | 9,655 | $ | (589,986 | ) | (55,390 | ) | $ | (346,424 | ) | (32,299 | ) | ||||||||||||||||
See end of tables for footnotes.
| American Funds Insurance Series | 191 |
Mortgage Fund
| Sales1 | Reinvestments of distributions | Repurchases1 | Net (decrease) increase | |||||||||||||||||||||||||||||
| Share class | Amount | Shares | Amount | Shares | Amount | Shares | Amount | Shares | ||||||||||||||||||||||||
| Year ended December 31, 2018 | ||||||||||||||||||||||||||||||||
| Class 1 | $ | 17,819 | 1,730 | $ | 4,658 | 457 | $ | (74,088 | ) | (7,185 | ) | $ | (51,611 | ) | (4,998 | ) | ||||||||||||||||
| Class 1A | 732 | 71 | 15 | 2 | (111 | ) | (11 | ) | 636 | 62 | ||||||||||||||||||||||
| Class 2 | 4,682 | 456 | 1,128 | 111 | (10,509 | ) | (1,023 | ) | (4,699 | ) | (456 | ) | ||||||||||||||||||||
| Class 4 | 14,315 | 1,403 | 424 | 41 | (2,626 | ) | (257 | ) | 12,113 | 1,187 | ||||||||||||||||||||||
| Total net increase (decrease) | $ | 37,548 | 3,660 | $ | 6,225 | 611 | $ | (87,334 | ) | (8,476 | ) | $ | (43,561 | ) | (4,205 | ) | ||||||||||||||||
| Year ended December 31, 2017 | ||||||||||||||||||||||||||||||||
| Class 1 | $ | 52,151 | 4,904 | $ | 5,982 | 566 | $ | (59,926 | ) | (5,621 | ) | $ | (1,793 | ) | (151 | ) | ||||||||||||||||
| Class 1A2 | 109 | 10 | 2 | — | 3 | (6 | ) | — | 3 | 105 | 10 | |||||||||||||||||||||
| Class 2 | 7,132 | 672 | 1,287 | 122 | (8,011 | ) | (755 | ) | 408 | 39 | ||||||||||||||||||||||
| Class 4 | 8,522 | 808 | 204 | 20 | (4,876 | ) | (462 | ) | 3,850 | 366 | ||||||||||||||||||||||
| Total net increase (decrease) | $ | 67,914 | 6,394 | $ | 7,475 | 708 | $ | (72,819 | ) | (6,838 | ) | $ | 2,570 | 264 | ||||||||||||||||||
| Ultra-Short Bond Fund | ||||||||||||||||||||||||||||||||
| Sales1 | Reinvestments of distributions | Repurchases1 | Net (decrease) increase | |||||||||||||||||||||||||||||
| Share class | Amount | Shares | Amount | Shares | Amount | Shares | Amount | Shares | ||||||||||||||||||||||||
| Year ended December 31, 2018 | ||||||||||||||||||||||||||||||||
| Class 1 | $ | 25,371 | 2,233 | $ | 561 | 50 | $ | (26,198 | ) | (2,310 | ) | $ | (266 | ) | (27 | ) | ||||||||||||||||
| Class 1A | — | — | — | 3 | — | 3 | — | — | — | 3 | — | 3 | ||||||||||||||||||||
| Class 2 | 103,165 | 9,332 | 2,762 | 250 | (107,692 | ) | (9,741 | ) | (1,765 | ) | (159 | ) | ||||||||||||||||||||
| Class 3 | 4,222 | 378 | 42 | 4 | (3,944 | ) | (353 | ) | 320 | 29 | ||||||||||||||||||||||
| Class 4 | 16,908 | 1,513 | 153 | 14 | (14,303 | ) | (1,281 | ) | 2,758 | 246 | ||||||||||||||||||||||
| Total net increase (decrease) | $ | 149,666 | 13,456 | $ | 3,518 | 318 | $ | (152,137 | ) | (13,685 | ) | $ | 1,047 | 89 | ||||||||||||||||||
| Year ended December 31, 2017 | ||||||||||||||||||||||||||||||||
| Class 1 | $ | 14,832 | 1,312 | $ | 184 | 16 | $ | (15,478 | ) | (1,371 | ) | $ | (462 | ) | (43 | ) | ||||||||||||||||
| Class 1A2 | 10 | 1 | — | 3 | — | 3 | — | — | 10 | 1 | ||||||||||||||||||||||
| Class 2 | 62,145 | 5,646 | 697 | 63 | (111,628 | ) | (10,146 | ) | (48,786 | ) | (4,437 | ) | ||||||||||||||||||||
| Class 3 | 1,448 | 130 | 15 | 2 | (1,233 | ) | (111 | ) | 230 | 21 | ||||||||||||||||||||||
| Class 4 | 16,767 | 1,507 | 10 | 1 | (14,407 | ) | (1,294 | ) | 2,370 | 214 | ||||||||||||||||||||||
| Total net increase (decrease) | $ | 95,202 | 8,596 | $ | 906 | 82 | $ | (142,746 | ) | (12,922 | ) | $ | (46,638 | ) | (4,244 | ) | ||||||||||||||||
| 192 | American Funds Insurance Series |
U.S. Government/AAA-Rated Securities Fund
| Sales1 | Reinvestments of distributions | Repurchases1 | Net (decrease) increase | |||||||||||||||||||||||||||||
| Share class | Amount | Shares | Amount | Shares | Amount | Shares | Amount | Shares | ||||||||||||||||||||||||
| Year ended December 31, 2018 | ||||||||||||||||||||||||||||||||
| Class 1 | $ | 67,360 | 5,655 | $ | 29,446 | 2,499 | $ | (191,451 | ) | (16,111 | ) | $ | (94,645 | ) | (7,957 | ) | ||||||||||||||||
| Class 1A | 1,389 | 118 | 28 | 2 | (214 | ) | (18 | ) | 1,203 | 102 | ||||||||||||||||||||||
| Class 2 | 43,398 | 3,680 | 24,431 | 2,094 | (200,280 | ) | (17,045 | ) | (132,451 | ) | (11,271 | ) | ||||||||||||||||||||
| Class 3 | 628 | 53 | 165 | 14 | (1,997 | ) | (168 | ) | (1,204 | ) | (101 | ) | ||||||||||||||||||||
| Class 4 | 45,391 | 3,857 | 1,313 | 113 | (17,387 | ) | (1,474 | ) | 29,317 | 2,496 | ||||||||||||||||||||||
| Total net increase (decrease) | $ | 158,166 | 13,363 | $ | 55,383 | 4,722 | $ | (411,329 | ) | (34,816 | ) | $ | (197,780 | ) | (16,731 | ) | ||||||||||||||||
| Year ended December 31, 2017 | ||||||||||||||||||||||||||||||||
| Class 1 | $ | 291,253 | 23,702 | $ | 23,401 | 1,927 | $ | (226,514 | ) | (18,425 | ) | $ | 88,140 | 7,204 | ||||||||||||||||||
| Class 1A2 | 1,016 | 83 | 2 | — | 3 | (714 | ) | (58 | ) | 304 | 25 | |||||||||||||||||||||
| Class 2 | 49,410 | 4,091 | 19,498 | 1,621 | (103,407 | ) | (8,550 | ) | (34,499 | ) | (2,838 | ) | ||||||||||||||||||||
| Class 3 | 1,050 | 86 | 141 | 12 | (1,501 | ) | (123 | ) | (310 | ) | (25 | ) | ||||||||||||||||||||
| Class 4 | 27,872 | 2,299 | 663 | 55 | (23,884 | ) | (1,976 | ) | 4,651 | 378 | ||||||||||||||||||||||
| Total net increase (decrease) | $ | 370,601 | 30,261 | $ | 43,705 | 3,615 | $ | (356,020 | ) | (29,132 | ) | $ | 58,286 | 4,744 | ||||||||||||||||||
Managed Risk Growth Fund | ||||||||||||||||||||||||||||||||
| Sales1 | Reinvestment of distributions | Repurchases1 | Net increase | |||||||||||||||||||||||||||||
| Share class | Amount | Shares | Amount | Shares | Amount | Shares | Amount | Shares | ||||||||||||||||||||||||
| Year ended December 31, 2018 | ||||||||||||||||||||||||||||||||
| Class P1 | $ | 1,861 | 140 | $ | 150 | 11 | $ | (596 | ) | (45 | ) | $ | 1,415 | 106 | ||||||||||||||||||
| Class P2 | 79,190 | 6,025 | 21,792 | 1,658 | (21,197 | ) | (1,594 | ) | 79,785 | 6,089 | ||||||||||||||||||||||
| Total net increase (decrease) | $ | 81,051 | 6,165 | $ | 21,942 | 1,669 | $ | (21,793 | ) | (1,639 | ) | $ | 81,200 | 6,195 | ||||||||||||||||||
| Year ended December 31, 2017 | ||||||||||||||||||||||||||||||||
| Class P1 | $ | 836 | 70 | $ | 29 | 2 | $ | (230 | ) | (19 | ) | $ | 635 | 53 | ||||||||||||||||||
| Class P2 | 46,748 | 3,893 | 4,847 | 408 | (16,010 | ) | (1,330 | ) | 35,585 | 2,971 | ||||||||||||||||||||||
| Total net increase (decrease) | $ | 47,584 | 3,963 | $ | 4,876 | 410 | $ | (16,240 | ) | (1,349 | ) | $ | 36,220 | 3,024 | ||||||||||||||||||
Managed Risk International Fund | ||||||||||||||||||||||||||||||||
| Sales1 | Reinvestments of distributions | Repurchases1 | Net increase (decrease) | |||||||||||||||||||||||||||||
| Share class | Amount | Shares | Amount | Shares | Amount | Shares | Amount | Shares | ||||||||||||||||||||||||
| Year ended December 31, 2018 | ||||||||||||||||||||||||||||||||
| Class P1 | $ | 321 | 30 | $ | 9 | 1 | $ | (44 | ) | (4 | ) | $ | 286 | 27 | ||||||||||||||||||
| Class P2 | 33,085 | 3,040 | 3,419 | 323 | (13,533 | ) | (1,240 | ) | 22,971 | 2,123 | ||||||||||||||||||||||
| Total net increase (decrease) | $ | 33,406 | 3,070 | $ | 3,428 | 324 | $ | (13,577 | ) | (1,244 | ) | $ | 23,257 | 2,150 | ||||||||||||||||||
| Year ended December 31, 2017 | ||||||||||||||||||||||||||||||||
| Class P1 | $ | 130 | 14 | $ | 2 | — | 3 | $ | (166 | ) | (17 | ) | $ | (34 | ) | (3 | ) | |||||||||||||||
| Class P2 | 30,462 | 3,002 | 2,301 | 230 | (9,880 | ) | (967 | ) | 22,883 | 2,265 | ||||||||||||||||||||||
| Total net increase (decrease) | $ | 30,592 | 3,016 | $ | 2,303 | 230 | $ | (10,046 | ) | (984 | ) | $ | 22,849 | 2,262 | ||||||||||||||||||
See end of tables for footnotes.
| American Funds Insurance Series | 193 |
Managed Risk Blue Chip Income and Growth Fund
| Sales1 | Reinvestments of distributions | Repurchases1 | Net increase (decrease) | |||||||||||||||||||||||||||||
| Share class | Amount | Shares | Amount | Shares | Amount | Shares | Amount | Shares | ||||||||||||||||||||||||
| Year ended December 31, 2018 | ||||||||||||||||||||||||||||||||
| Class P1 | $ | 358 | 29 | $ | 22 | 2 | $ | (43 | ) | (4 | ) | $ | 337 | 27 | ||||||||||||||||||
| Class P2 | 31,213 | 2,567 | 23,504 | 1,964 | (35,759 | ) | (2,843 | ) | 18,958 | 1,688 | ||||||||||||||||||||||
| Total net increase (decrease) | $ | 31,571 | 2,596 | $ | 23,526 | 1,966 | $ | (35,802 | ) | (2,847 | ) | $ | 19,295 | 1,715 | ||||||||||||||||||
| Year ended December 31, 2017 | ||||||||||||||||||||||||||||||||
| Class P1 | $ | 59 | 5 | $ | 7 | 1 | $ | (136 | ) | (11 | ) | $ | (70 | ) | (5 | ) | ||||||||||||||||
| Class P2 | 83,072 | 6,949 | 10,722 | 898 | (56,067 | ) | (4,624 | ) | 37,727 | 3,223 | ||||||||||||||||||||||
| Total net increase (decrease) | $ | 83,131 | 6,954 | $ | 10,729 | 899 | $ | (56,203 | ) | (4,635 | ) | $ | 37,657 | 3,218 | ||||||||||||||||||
Managed Risk Growth-Income Fund | ||||||||||||||||||||||||||||||||
| Sales1 | Reinvestments of distributions | Repurchases1 | Net increase | |||||||||||||||||||||||||||||
| Share class | Amount | Shares | Amount | Shares | Amount | Shares | Amount | Shares | ||||||||||||||||||||||||
| Year ended December 31, 2018 | ||||||||||||||||||||||||||||||||
| Class P1 | $ | 1,696,532 | 144,131 | $ | 164 | 13 | $ | (30,979 | ) | (2,639 | ) | $ | 1,665,717 | 141,505 | ||||||||||||||||||
| Class P2 | 45,914 | 3,658 | 12,188 | 977 | (16,805 | ) | (1,320 | ) | 41,297 | 3,315 | ||||||||||||||||||||||
| Total net increase (decrease) | $ | 1,742,446 | 147,789 | $ | 12,352 | 990 | $ | (47,784 | ) | (3,959 | ) | $ | 1,707,014 | 144,820 | ||||||||||||||||||
| Year ended December 31, 2017 | ||||||||||||||||||||||||||||||||
| Class P1 | $ | 1,093 | 92 | $ | 92 | 8 | $ | (154 | ) | (13 | ) | $ | 1,031 | 87 | ||||||||||||||||||
| Class P2 | 27,997 | 2,382 | 9,501 | 835 | (15,095 | ) | (1,278 | ) | 22,403 | 1,939 | ||||||||||||||||||||||
| Total net increase (decrease) | $ | 29,090 | 2,474 | $ | 9,593 | 843 | $ | (15,249 | ) | (1,291 | ) | $ | 23,434 | 2,026 | ||||||||||||||||||
Managed Risk Asset Allocation Fund | ||||||||||||||||||||||||||||||||
| Sales1 | Reinvestments of distributions | Repurchases1 | Net (decrease) increase | |||||||||||||||||||||||||||||
| Share class | Amount | Shares | Amount | Shares | Amount | Shares | Amount | Shares | ||||||||||||||||||||||||
| Year ended December 31, 2018 | ||||||||||||||||||||||||||||||||
| Class P1 | $ | 158,125 | 11,883 | $ | 98,747 | 7,599 | $ | (1,735,518 | ) | (141,232 | ) | $ | (1,478,646 | ) | (121,750 | ) | ||||||||||||||||
| Class P2 | 122,897 | 9,265 | 144,221 | 11,089 | (250,843 | ) | (19,040 | ) | 16,275 | 1,314 | ||||||||||||||||||||||
| Total net increase (decrease) | $ | 281,022 | 21,148 | $ | 242,968 | 18,688 | $ | (1,986,361 | ) | (160,272 | ) | $ | (1,462,371 | ) | (120,436 | ) | ||||||||||||||||
| Year ended December 31, 2017 | ||||||||||||||||||||||||||||||||
| Class P1 | $ | 264,545 | 20,631 | $ | 25,264 | 1,986 | $ | (25,397 | ) | (1,973 | ) | $ | 264,412 | 20,644 | ||||||||||||||||||
| Class P2 | 253,137 | 19,936 | 45,200 | 3,559 | (153,999 | ) | (11,957 | ) | 144,338 | 11,538 | ||||||||||||||||||||||
| Total net increase (decrease) | $ | 517,682 | 40,567 | $ | 70,464 | 5,545 | $ | (179,396 | ) | (13,930 | ) | $ | 408,750 | 32,182 | ||||||||||||||||||
| 1 | Includes exchanges between share classes of the fund. |
| 2 | Class 1A shares began investment operations on January 6, 2017. |
| 3 | Amount less than one thousand. |
| 194 | American Funds Insurance Series |
10. Investment transactions and other disclosures
The following tables present additional information for each of the funds for the year ended December 31, 2018 (dollars in thousands):
| Global Growth Fund | Global Small Capitalization Fund | Growth Fund | International Fund | New World Fund | Blue Chip Income and Growth Fund | |||||||||||||||||||
| Purchases of investment securities* | $ | 1,467,874 | $ | 1,662,024 | $ | 8,417,701 | $ | 3,211,601 | $ | 1,739,953 | $ | 4,319,816 | ||||||||||||
| Sales of investment securities* | 1,724,252 | 2,030,293 | 9,996,481 | 2,598,799 | 2,109,957 | 4,791,714 | ||||||||||||||||||
| Non-U.S. taxes (refunded) paid on interest income | — | — | — | — | 43 | — | ||||||||||||||||||
| Non-U.S. taxes (refunded) paid on realized gains | — | 12 | — | (45 | ) | 112 | — | |||||||||||||||||
| Non-U.S. taxes provided on unrealized gains | 746 | 931 | — | 3,872 | 684 | — | ||||||||||||||||||
| Dividend income from affiliated issuers | — | 437 | — | — | — | — | ||||||||||||||||||
| Global Growth and Income Fund | Growth- Income Fund | International Growth and Income Fund | Capital Income Builder | Asset Allocation Fund | Global Balanced Fund | |||||||||||||||||||
| Purchases of investment securities* | $ | 956,577 | $ | 11,487,304 | $ | 556,700 | $ | 605,766 | $ | 18,403,385 | $ | 204,201 | ||||||||||||
| Sales of investment securities* | 1,040,568 | 12,435,378 | 512,739 | 476,357 | 19,811,470 | 172,949 | ||||||||||||||||||
| Non-U.S. taxes (refunded) paid on interest income | — | — | (8 | ) | — | — | 17 | |||||||||||||||||
| Non-U.S. taxes (refunded) paid on realized gains | 3 | — | 6 | — | — | 23 | ||||||||||||||||||
| Non-U.S. taxes provided on unrealized gains | — | — | 271 | — | 126 | 27 | ||||||||||||||||||
| Dividend income from affiliated issuers | — | 3,182 | — | — | 562 | — | ||||||||||||||||||
| Interest income from affiliated issuers | — | — | — | — | 2,196 | — | ||||||||||||||||||
| Bond Fund | Global Bond Fund | High- Income Bond Fund | Mortgage Fund | Ultra-Short Bond Fund | U.S. Government/ AAA-Rated Securities Fund | |||||||||||||||||||
| Purchases of investment securities* | $ | 44,757,939 | $ | 2,355,671 | $ | 880,471 | $ | 2,407,428 | $ | — | $ | 11,220,878 | ||||||||||||
| Sales of investment securities* | 45,098,034 | 2,481,042 | 976,663 | 2,426,692 | — | 11,103,888 | ||||||||||||||||||
| Non-U.S. taxes (refunded) paid on interest income | 7 | 396 | (2 | ) | — | — | — | |||||||||||||||||
| Non-U.S. taxes (refunded) paid on realized gains | (196 | ) | 578 | — | — | — | — | |||||||||||||||||
| Non-U.S. taxes provided on unrealized gains | — | 368 | — | — | — | — | ||||||||||||||||||
| Managed Risk Growth Fund | Managed Risk International Fund | Managed Risk Blue Chip Income and Growth Fund | Managed Risk Growth- Income Fund | Managed Risk Asset Allocation Fund | ||||||||||||||||||||
| Purchases of investment securities* | $ | 109,572 | $ | 39,805 | $ | 64,381 | $ | 1,669,137 | $ | 504,021 | ||||||||||||||
| Sales of investment securities* | 21,960 | 11,908 | 38,201 | 47,528 | 1,854,151 | |||||||||||||||||||
| Dividend income from affiliated issuers | 3,340 | 3,202 | 7,264 | 4,163 | 80,687 | |||||||||||||||||||
| * | Excludes short-term securities and U.S. government obligations, if any. |
11. Ownership concentration
At December 31, 2018, American Funds Insurance Series - Portfolio Series Managed Risk Growth and Income Portfolio held 36% and 11% of the outstanding shares of Capital Income Builder and Global Growth and Income Fund, respectively. In addition, American Funds Insurance Series - Portfolio Series Managed Risk Global Allocation Portfolio and Managed Risk Asset Allocation Fund held 22% and 11% of the outstanding shares of Global Balanced Fund and Asset Allocation Fund, respectively.
| American Funds Insurance Series | 195 |
Financial highlights
| (Loss) income from investment operations1 | Dividends and distributions | |||||||||||||||||||||||||||||||||||||||||||||||
| Period ended | Net asset value, beginning of period | Net investment income (loss) | Net (losses) gains on securities (both realized and unrealized) | Total from investment operations | Dividends (from net investment income) | Distributions (from capital gains) | Total dividends and distributions | Net asset value, end of period | Total return | Net assets, end of period (in millions) | Ratio of expenses to average net assets | Ratio of net income (loss) to average net assets | ||||||||||||||||||||||||||||||||||||
| Global Growth Fund | ||||||||||||||||||||||||||||||||||||||||||||||||
| Class 1: | ||||||||||||||||||||||||||||||||||||||||||||||||
| 12/31/2018 | $ | 30.51 | $ | .29 | $ | (2.65 | ) | $ | (2.36 | ) | $ | (.28 | ) | $ | (2.13 | ) | $ | (2.41 | ) | $ | 25.74 | (8.81 | )% | $ | 1,942 | .55 | % | .98 | % | |||||||||||||||||||
| 12/31/2017 | 24.05 | .26 | 7.30 | 7.56 | (.26 | ) | (.84 | ) | (1.10 | ) | 30.51 | 31.80 | 2,010 | .55 | .94 | |||||||||||||||||||||||||||||||||
| 12/31/2016 | 26.39 | .25 | (.14 | ) | .11 | (.29 | ) | (2.16 | ) | (2.45 | ) | 24.05 | .87 | 1,630 | .56 | 1.00 | ||||||||||||||||||||||||||||||||
| 12/31/2015 | 27.48 | .25 | 1.80 | 2.05 | (.35 | ) | (2.79 | ) | (3.14 | ) | 26.39 | 7.24 | 1,626 | .55 | .90 | |||||||||||||||||||||||||||||||||
| 12/31/2014 | 30.11 | .31 | 2 | .40 | .71 | (.40 | ) | (2.94 | ) | (3.34 | ) | 27.48 | 2.52 | 1,558 | .55 | 1.08 | 2 | |||||||||||||||||||||||||||||||
| Class 1A: | ||||||||||||||||||||||||||||||||||||||||||||||||
| 12/31/2018 | 30.46 | .23 | (2.66 | ) | (2.43 | ) | (.21 | ) | (2.13 | ) | (2.34 | ) | 25.69 | (9.02 | ) | 5 | .80 | .77 | ||||||||||||||||||||||||||||||
| 12/31/20173,4 | 24.50 | .11 | 6.94 | 7.05 | (.25 | ) | (.84 | ) | (1.09 | ) | 30.46 | 29.13 | 5 | 2 | .80 | 6 | .39 | 6 | ||||||||||||||||||||||||||||||
| Class 2: | ||||||||||||||||||||||||||||||||||||||||||||||||
| 12/31/2018 | 30.24 | .22 | (2.63 | ) | (2.41 | ) | (.20 | ) | (2.13 | ) | (2.33 | ) | 25.50 | (9.04 | ) | 3,306 | .80 | .73 | ||||||||||||||||||||||||||||||
| 12/31/2017 | 23.85 | .19 | 7.23 | 7.42 | (.19 | ) | (.84 | ) | (1.03 | ) | 30.24 | 31.47 | 4,012 | .80 | .69 | |||||||||||||||||||||||||||||||||
| 12/31/2016 | 26.19 | .18 | (.14 | ) | .04 | (.22 | ) | (2.16 | ) | (2.38 | ) | 23.85 | .62 | 3,483 | .81 | .76 | ||||||||||||||||||||||||||||||||
| 12/31/2015 | 27.30 | .18 | 1.78 | 1.96 | (.28 | ) | (2.79 | ) | (3.07 | ) | 26.19 | 6.94 | 3,817 | .80 | .66 | |||||||||||||||||||||||||||||||||
| 12/31/2014 | 29.92 | .24 | 2 | .41 | .65 | (.33 | ) | (2.94 | ) | (3.27 | ) | 27.30 | 2.31 | 3,992 | .80 | .85 | 2 | |||||||||||||||||||||||||||||||
| Class 4: | ||||||||||||||||||||||||||||||||||||||||||||||||
| 12/31/2018 | 30.13 | .14 | (2.60 | ) | (2.46 | ) | (.15 | ) | (2.13 | ) | (2.28 | ) | 25.39 | (9.24 | ) | 249 | 1.05 | .47 | ||||||||||||||||||||||||||||||
| 12/31/2017 | 23.81 | .10 | 7.22 | 7.32 | (.16 | ) | (.84 | ) | (1.00 | ) | 30.13 | 31.11 | 211 | 1.05 | .37 | |||||||||||||||||||||||||||||||||
| 12/31/2016 | 26.16 | .12 | (.14 | ) | (.02 | ) | (.17 | ) | (2.16 | ) | (2.33 | ) | 23.81 | .37 | 94 | 1.06 | .50 | |||||||||||||||||||||||||||||||
| 12/31/2015 | 27.34 | .09 | 1.81 | 1.90 | (.29 | ) | (2.79 | ) | (3.08 | ) | 26.16 | 6.69 | 91 | 1.05 | .34 | |||||||||||||||||||||||||||||||||
| 12/31/2014 | 30.07 | .07 | 2 | .50 | .57 | (.36 | ) | (2.94 | ) | (3.30 | ) | 27.34 | 2.01 | 19 | 1.05 | .26 | 2 | |||||||||||||||||||||||||||||||
| Global Small Capitalization Fund | ||||||||||||||||||||||||||||||||||||||||||||||||
| Class 1: | ||||||||||||||||||||||||||||||||||||||||||||||||
| 12/31/2018 | $ | 25.38 | $ | .11 | $ | (2.51 | ) | $ | (2.40 | ) | $ | (.09 | ) | $ | (1.14 | ) | $ | (1.23 | ) | $ | 21.75 | (10.31 | )% | $ | 1,453 | .73 | % | .42 | % | |||||||||||||||||||
| 12/31/2017 | 20.24 | .12 | 5.17 | 5.29 | (.15 | ) | — | (.15 | ) | 25.38 | 26.22 | 1,639 | .73 | .54 | ||||||||||||||||||||||||||||||||||
| 12/31/2016 | 24.41 | .12 | .17 | .29 | (.11 | ) | (4.35 | ) | (4.46 | ) | 20.24 | 2.35 | 1,532 | .74 | .57 | |||||||||||||||||||||||||||||||||
| 12/31/2015 | 26.09 | .04 | .36 | .40 | — | (2.08 | ) | (2.08 | ) | 24.41 | .50 | 1,706 | .73 | .15 | ||||||||||||||||||||||||||||||||||
| 12/31/2014 | 25.69 | .09 | .52 | .61 | (.09 | ) | (.12 | ) | (.21 | ) | 26.09 | 2.36 | 1,411 | .74 | .34 | |||||||||||||||||||||||||||||||||
| Class 1A: | ||||||||||||||||||||||||||||||||||||||||||||||||
| 12/31/2018 | 25.36 | .05 | (2.52 | ) | (2.47 | ) | (.04 | ) | (1.14 | ) | (1.18 | ) | 21.71 | (10.56 | ) | — | 7 | .98 | .21 | |||||||||||||||||||||||||||||
| 12/31/20173,4 | 20.70 | .08 | 4.71 | 4.79 | (.13 | ) | — | (.13 | ) | 25.36 | 23.19 | 5 | — | 7 | .96 | 6 | .35 | 6 | ||||||||||||||||||||||||||||||
| Class 2: | ||||||||||||||||||||||||||||||||||||||||||||||||
| 12/31/2018 | 24.72 | .04 | (2.44 | ) | (2.40 | ) | (.02 | ) | (1.14 | ) | (1.16 | ) | 21.16 | (10.55 | ) | 2,056 | .98 | .17 | ||||||||||||||||||||||||||||||
| 12/31/2017 | 19.72 | .06 | 5.04 | 5.10 | (.10 | ) | — | (.10 | ) | 24.72 | 25.89 | 2,551 | .98 | .27 | ||||||||||||||||||||||||||||||||||
| 12/31/2016 | 23.90 | .07 | .15 | .22 | (.05 | ) | (4.35 | ) | (4.40 | ) | 19.72 | 2.10 | 2,303 | .99 | .31 | |||||||||||||||||||||||||||||||||
| 12/31/2015 | 25.64 | (.03 | ) | .37 | .34 | — | (2.08 | ) | (2.08 | ) | 23.90 | .27 | 2,492 | .98 | (.10 | ) | ||||||||||||||||||||||||||||||||
| 12/31/2014 | 25.25 | .03 | .51 | .54 | (.03 | ) | (.12 | ) | (.15 | ) | 25.64 | 2.12 | 2,738 | .99 | .10 | |||||||||||||||||||||||||||||||||
| Class 4: | ||||||||||||||||||||||||||||||||||||||||||||||||
| 12/31/2018 | 24.91 | (.02 | ) | (2.46 | ) | (2.48 | ) | (.01 | ) | (1.14 | ) | (1.15 | ) | 21.28 | (10.80 | ) | 146 | 1.24 | (.08 | ) | ||||||||||||||||||||||||||||
| 12/31/2017 | 19.91 | — | 8 | 5.09 | 5.09 | (.09 | ) | — | (.09 | ) | 24.91 | 25.62 | 125 | 1.23 | — | 9 | ||||||||||||||||||||||||||||||||
| 12/31/2016 | 24.11 | .01 | .16 | .17 | (.02 | ) | (4.35 | ) | (4.37 | ) | 19.91 | 1.85 | 42 | 1.24 | .03 | |||||||||||||||||||||||||||||||||
| 12/31/2015 | 25.92 | (.10 | ) | .37 | .27 | — | (2.08 | ) | (2.08 | ) | 24.11 | (.02 | ) | 34 | 1.23 | (.37 | ) | |||||||||||||||||||||||||||||||
| 12/31/2014 | 25.57 | (.05 | ) | .54 | .49 | (.02 | ) | (.12 | ) | (.14 | ) | 25.92 | 1.88 | 12 | 1.24 | (.17 | ) | |||||||||||||||||||||||||||||||
| 196 | American Funds Insurance Series |
| (Loss) income from investment operations1 | Dividends and distributions | |||||||||||||||||||||||||||||||||||||||||||||||
| Period ended | Net asset value, beginning of period | Net investment income (loss) | Net (losses) gains on securities (both realized and unrealized) | Total from investment operations | Dividends (from net investment income) | Distributions (from capital gains) | Total dividends and distributions | Net asset value, end of period | Total return | Net assets, end of period (in millions) | Ratio of expenses to average net assets | Ratio of net income (loss) to average net assets | ||||||||||||||||||||||||||||||||||||
| Growth Fund | ||||||||||||||||||||||||||||||||||||||||||||||||
| Class 1: | ||||||||||||||||||||||||||||||||||||||||||||||||
| 12/31/2018 | $ | 77.85 | $ | .64 | $ | .25 | $ | .89 | $ | (.54 | ) | $ | (8.24 | ) | $ | (8.78 | ) | $ | 69.96 | (.01 | )% | $ | 8,474 | .34 | % | .81 | % | |||||||||||||||||||||
| 12/31/2017 | 67.29 | .55 | 17.89 | 18.44 | (.55 | ) | (7.33 | ) | (7.88 | ) | 77.85 | 28.62 | 8,100 | .35 | .75 | |||||||||||||||||||||||||||||||||
| 12/31/2016 | 68.02 | .67 | 5.40 | 6.07 | (.67 | ) | (6.13 | ) | (6.80 | ) | 67.29 | 9.77 | 6,931 | .35 | 1.03 | |||||||||||||||||||||||||||||||||
| 12/31/2015 | 80.15 | .64 | 5.08 | 5.72 | (.61 | ) | (17.24 | ) | (17.85 | ) | 68.02 | 7.12 | 6,796 | .35 | .87 | |||||||||||||||||||||||||||||||||
| 12/31/2014 | 78.54 | .88 | 2 | 5.79 | 6.67 | (1.16 | ) | (3.90 | ) | (5.06 | ) | 80.15 | 8.78 | 7,118 | .35 | 1.12 | 2 | |||||||||||||||||||||||||||||||
| Class 1A: | ||||||||||||||||||||||||||||||||||||||||||||||||
| 12/31/2018 | 77.74 | .47 | .24 | .71 | (.44 | ) | (8.24 | ) | (8.68 | ) | 69.77 | (.26 | ) | 10 | .59 | .60 | ||||||||||||||||||||||||||||||||
| 12/31/20173,4 | 68.84 | .35 | 16.38 | 16.73 | (.50 | ) | (7.33 | ) | (7.83 | ) | 77.74 | 25.47 | 5 | 3 | .59 | 6 | .47 | 6 | ||||||||||||||||||||||||||||||
| Class 2: | ||||||||||||||||||||||||||||||||||||||||||||||||
| 12/31/2018 | 77.35 | .44 | .27 | .71 | (.34 | ) | (8.24 | ) | (8.58 | ) | 69.48 | (.25 | ) | 13,701 | .59 | .55 | ||||||||||||||||||||||||||||||||
| 12/31/2017 | 66.92 | .37 | 17.76 | 18.13 | (.37 | ) | (7.33 | ) | (7.70 | ) | 77.35 | 28.28 | 15,716 | .60 | .50 | |||||||||||||||||||||||||||||||||
| 12/31/2016 | 67.69 | .51 | 5.36 | 5.87 | (.51 | ) | (6.13 | ) | (6.64 | ) | 66.92 | 9.49 | 13,978 | .60 | .78 | |||||||||||||||||||||||||||||||||
| 12/31/2015 | 79.84 | .46 | 5.06 | 5.52 | (.43 | ) | (17.24 | ) | (17.67 | ) | 67.69 | 6.86 | 14,414 | .60 | .62 | |||||||||||||||||||||||||||||||||
| 12/31/2014 | 77.94 | .68 | 2 | 5.75 | 6.43 | (.63 | ) | (3.90 | ) | (4.53 | ) | 79.84 | 8.51 | 15,413 | .60 | .87 | 2 | |||||||||||||||||||||||||||||||
| Class 3: | ||||||||||||||||||||||||||||||||||||||||||||||||
| 12/31/2018 | 78.32 | .50 | .26 | .76 | (.40 | ) | (8.24 | ) | (8.64 | ) | 70.44 | (.18 | ) | 187 | .52 | .62 | ||||||||||||||||||||||||||||||||
| 12/31/2017 | 67.67 | .42 | 17.98 | 18.40 | (.42 | ) | (7.33 | ) | (7.75 | ) | 78.32 | 28.39 | 212 | .53 | .57 | |||||||||||||||||||||||||||||||||
| 12/31/2016 | 68.37 | .56 | 5.42 | 5.98 | (.55 | ) | (6.13 | ) | (6.68 | ) | 67.67 | 9.56 | 183 | .53 | .85 | |||||||||||||||||||||||||||||||||
| 12/31/2015 | 80.47 | .51 | 5.11 | 5.62 | (.48 | ) | (17.24 | ) | (17.72 | ) | 68.37 | 6.92 | 194 | .53 | .69 | |||||||||||||||||||||||||||||||||
| 12/31/2014 | 78.62 | .74 | 2 | 5.79 | 6.53 | (.78 | ) | (3.90 | ) | (4.68 | ) | 80.47 | 8.58 | 208 | .53 | .94 | 2 | |||||||||||||||||||||||||||||||
| Class 4: | ||||||||||||||||||||||||||||||||||||||||||||||||
| 12/31/2018 | 76.56 | .24 | .28 | .52 | (.20 | ) | (8.24 | ) | (8.44 | ) | 68.64 | (.50 | ) | 1,076 | .84 | .31 | ||||||||||||||||||||||||||||||||
| 12/31/2017 | 66.41 | .18 | 17.61 | 17.79 | (.31 | ) | (7.33 | ) | (7.64 | ) | 76.56 | 27.99 | 954 | .85 | .25 | |||||||||||||||||||||||||||||||||
| 12/31/2016 | 67.26 | .34 | 5.32 | 5.66 | (.38 | ) | (6.13 | ) | (6.51 | ) | 66.41 | 9.22 | 458 | .85 | .53 | |||||||||||||||||||||||||||||||||
| 12/31/2015 | 79.74 | .29 | 5.02 | 5.31 | (.55 | ) | (17.24 | ) | (17.79 | ) | 67.26 | 6.59 | 394 | .85 | .42 | |||||||||||||||||||||||||||||||||
| 12/31/2014 | 78.32 | .37 | 2 | 5.87 | 6.24 | (.92 | ) | (3.90 | ) | (4.82 | ) | 79.74 | 8.25 | 24 | .85 | .47 | 2 | |||||||||||||||||||||||||||||||
See end of tables for footnotes.
| American Funds Insurance Series | 197 |
Financial highlights(continued)
| (Loss) income from investment operations1 | Dividends and distributions | |||||||||||||||||||||||||||||||||||||||||||||||
| Period ended | Net asset value, beginning of period | Net investment income (loss) | Net (losses) gains on securities (both realized and unrealized) | Total from investment operations | Dividends (from net investment income) | Distributions (from capital gains) | Total dividends and distributions | Net asset value, end of period | Total return | Net assets, end of period (in millions) | Ratio of expenses to average net assets | Ratio of net income (loss) to average net assets | ||||||||||||||||||||||||||||||||||||
| International Fund | ||||||||||||||||||||||||||||||||||||||||||||||||
| Class 1: | ||||||||||||||||||||||||||||||||||||||||||||||||
| 12/31/2018 | $ | 21.71 | $ | .34 | $ | (2.97 | ) | $ | (2.63 | ) | $ | (.40 | ) | $ | (1.02 | ) | $ | (1.42 | ) | $ | 17.66 | (12.94 | )% | $ | 4,811 | .53 | % | 1.62 | % | |||||||||||||||||||
| 12/31/2017 | 16.82 | .26 | 5.16 | 5.42 | (.30 | ) | (.23 | ) | (.53 | ) | 21.71 | 32.46 | 5,014 | .53 | 1.33 | |||||||||||||||||||||||||||||||||
| 12/31/2016 | 18.08 | .27 | .30 | .57 | (.28 | ) | (1.55 | ) | (1.83 | ) | 16.82 | 3.78 | 3,652 | .54 | 1.57 | |||||||||||||||||||||||||||||||||
| 12/31/2015 | 20.35 | .29 | (1.03 | ) | (.74 | ) | (.35 | ) | (1.18 | ) | (1.53 | ) | 18.08 | (4.25 | ) | 3,427 | .54 | 1.41 | ||||||||||||||||||||||||||||||
| 12/31/2014 | 21.22 | .30 | (.81 | ) | (.51 | ) | (.36 | ) | — | (.36 | ) | 20.35 | (2.41 | ) | 3,282 | .54 | 1.43 | |||||||||||||||||||||||||||||||
| Class 1A: | ||||||||||||||||||||||||||||||||||||||||||||||||
| 12/31/2018 | 21.67 | .27 | (2.93 | ) | (2.66 | ) | (.37 | ) | (1.02 | ) | (1.39 | ) | 17.62 | (13.11 | ) | 5 | .78 | 1.32 | ||||||||||||||||||||||||||||||
| 12/31/20173,4 | 17.17 | .09 | 4.93 | 5.02 | (.29 | ) | (.23 | ) | (.52 | ) | 21.67 | 29.46 | 5 | 2 | .77 | 6 | .43 | 6 | ||||||||||||||||||||||||||||||
| Class 2: | ||||||||||||||||||||||||||||||||||||||||||||||||
| 12/31/2018 | 21.63 | .29 | (2.95 | ) | (2.66 | ) | (.35 | ) | (1.02 | ) | (1.37 | ) | 17.60 | (13.13 | ) | 3,875 | .78 | 1.40 | ||||||||||||||||||||||||||||||
| 12/31/2017 | 16.76 | .22 | 5.13 | 5.35 | (.25 | ) | (.23 | ) | (.48 | ) | 21.63 | 32.14 | 4,422 | .78 | 1.10 | |||||||||||||||||||||||||||||||||
| 12/31/2016 | 18.02 | .23 | .30 | .53 | (.24 | ) | (1.55 | ) | (1.79 | ) | 16.76 | 3.53 | 3,710 | .79 | 1.35 | |||||||||||||||||||||||||||||||||
| 12/31/2015 | 20.29 | .24 | (1.03 | ) | (.79 | ) | (.30 | ) | (1.18 | ) | (1.48 | ) | 18.02 | (4.53 | ) | 3,978 | .79 | 1.17 | ||||||||||||||||||||||||||||||
| 12/31/2014 | 21.15 | .25 | (.81 | ) | (.56 | ) | (.30 | ) | — | (.30 | ) | 20.29 | (2.65 | ) | 4,374 | .79 | 1.19 | |||||||||||||||||||||||||||||||
| Class 3: | ||||||||||||||||||||||||||||||||||||||||||||||||
| 12/31/2018 | 21.75 | .31 | (2.98 | ) | (2.67 | ) | (.36 | ) | (1.02 | ) | (1.38 | ) | 17.70 | (13.10 | ) | 24 | .71 | 1.48 | ||||||||||||||||||||||||||||||
| 12/31/2017 | 16.85 | .23 | 5.17 | 5.40 | (.27 | ) | (.23 | ) | (.50 | ) | 21.75 | 32.23 | 31 | .71 | 1.17 | |||||||||||||||||||||||||||||||||
| 12/31/2016 | 18.11 | .24 | .30 | .54 | (.25 | ) | (1.55 | ) | (1.80 | ) | 16.85 | 3.57 | 27 | .72 | 1.42 | |||||||||||||||||||||||||||||||||
| 12/31/2015 | 20.38 | .25 | (1.03 | ) | (.78 | ) | (.31 | ) | (1.18 | ) | (1.49 | ) | 18.11 | (4.44 | ) | 32 | .72 | 1.24 | ||||||||||||||||||||||||||||||
| 12/31/2014 | 21.24 | .27 | (.82 | ) | (.55 | ) | (.31 | ) | — | (.31 | ) | 20.38 | (2.56 | ) | 38 | .72 | 1.28 | |||||||||||||||||||||||||||||||
| Class 4: | ||||||||||||||||||||||||||||||||||||||||||||||||
| 12/31/2018 | 21.42 | .23 | (2.93 | ) | (2.70 | ) | (.30 | ) | (1.02 | ) | (1.32 | ) | 17.40 | (13.41 | ) | 295 | 1.03 | 1.13 | ||||||||||||||||||||||||||||||
| 12/31/2017 | 16.64 | .11 | 5.16 | 5.27 | (.26 | ) | (.23 | ) | (.49 | ) | 21.42 | 31.89 | 289 | 1.03 | .55 | |||||||||||||||||||||||||||||||||
| 12/31/2016 | 17.93 | .18 | .29 | .47 | (.21 | ) | (1.55 | ) | (1.76 | ) | 16.64 | 3.21 | 66 | 1.04 | 1.03 | |||||||||||||||||||||||||||||||||
| 12/31/2015 | 20.23 | .17 | (1.00 | ) | (.83 | ) | (.29 | ) | (1.18 | ) | (1.47 | ) | 17.93 | (4.75 | ) | 46 | 1.04 | .88 | ||||||||||||||||||||||||||||||
| 12/31/2014 | 21.16 | .07 | (.68 | ) | (.61 | ) | (.32 | ) | — | (.32 | ) | 20.23 | (2.88 | ) | 18 | 1.04 | .31 | |||||||||||||||||||||||||||||||
| New World Fund | ||||||||||||||||||||||||||||||||||||||||||||||||
| Class 1: | ||||||||||||||||||||||||||||||||||||||||||||||||
| 12/31/2018 | $ | 25.30 | $ | .27 | $ | (3.65 | ) | $ | (3.38 | ) | $ | (.27 | ) | $ | (.67 | ) | $ | (.94 | ) | $ | 20.98 | (13.83 | )% | $ | 1,702 | .77 | % | 1.11 | % | |||||||||||||||||||
| 12/31/2017 | 19.72 | .26 | 5.59 | 5.85 | (.27 | ) | — | (.27 | ) | 25.30 | 29.73 | 2,050 | .77 | 1.14 | ||||||||||||||||||||||||||||||||||
| 12/31/2016 | 18.87 | .24 | .81 | 1.05 | (.20 | ) | — | (.20 | ) | 19.72 | 5.59 | 1,743 | .78 | 1.25 | ||||||||||||||||||||||||||||||||||
| 12/31/2015 | 20.72 | .19 | (.71 | ) | (.52 | ) | (.17 | ) | (1.16 | ) | (1.33 | ) | 18.87 | (2.96 | ) | 1,562 | .79 | .92 | ||||||||||||||||||||||||||||||
| 12/31/2014 | 25.08 | .29 | 2 | (1.92 | ) | (1.63 | ) | (.29 | ) | (2.44 | ) | (2.73 | ) | 20.72 | (7.63 | ) | 1,433 | .78 | 1.23 | 2 | ||||||||||||||||||||||||||||
| Class 1A: | ||||||||||||||||||||||||||||||||||||||||||||||||
| 12/31/2018 | 25.25 | .21 | (3.64 | ) | (3.43 | ) | (.23 | ) | (.67 | ) | (.90 | ) | 20.92 | (14.02 | ) | 2 | 1.02 | .91 | ||||||||||||||||||||||||||||||
| 12/31/20173,4 | 20.14 | .13 | 5.24 | 5.37 | (.26 | ) | — | (.26 | ) | 25.25 | 26.72 | 5 | 1 | 1.00 | 6 | .53 | 6 | |||||||||||||||||||||||||||||||
| Class 2: | ||||||||||||||||||||||||||||||||||||||||||||||||
| 12/31/2018 | 25.07 | .20 | (3.61 | ) | (3.41 | ) | (.20 | ) | (.67 | ) | (.87 | ) | 20.79 | (14.04 | ) | 843 | 1.02 | .85 | ||||||||||||||||||||||||||||||
| 12/31/2017 | 19.54 | .20 | 5.55 | 5.75 | (.22 | ) | — | (.22 | ) | 25.07 | 29.44 | 1,055 | 1.02 | .89 | ||||||||||||||||||||||||||||||||||
| 12/31/2016 | 18.71 | .19 | .79 | .98 | (.15 | ) | — | (.15 | ) | 19.54 | 5.26 | 911 | 1.03 | 1.00 | ||||||||||||||||||||||||||||||||||
| 12/31/2015 | 20.54 | .14 | (.69 | ) | (.55 | ) | (.12 | ) | (1.16 | ) | (1.28 | ) | 18.71 | (3.14 | ) | 961 | 1.04 | .68 | ||||||||||||||||||||||||||||||
| 12/31/2014 | 24.88 | .24 | 2 | (1.91 | ) | (1.67 | ) | (.23 | ) | (2.44 | ) | (2.67 | ) | 20.54 | (7.87 | ) | 1,084 | 1.03 | 1.01 | 2 | ||||||||||||||||||||||||||||
| Class 4: | ||||||||||||||||||||||||||||||||||||||||||||||||
| 12/31/2018 | 24.99 | .14 | (3.59 | ) | (3.45 | ) | (.16 | ) | (.67 | ) | (.83 | ) | 20.71 | (14.25 | ) | 464 | 1.27 | .61 | ||||||||||||||||||||||||||||||
| 12/31/2017 | 19.51 | .14 | 5.52 | 5.66 | (.18 | ) | — | (.18 | ) | 24.99 | 29.06 | 427 | 1.27 | .61 | ||||||||||||||||||||||||||||||||||
| 12/31/2016 | 18.69 | .14 | .80 | .94 | (.12 | ) | — | (.12 | ) | 19.51 | 5.04 | 240 | 1.28 | .75 | ||||||||||||||||||||||||||||||||||
| 12/31/2015 | 20.56 | .08 | (.68 | ) | (.60 | ) | (.11 | ) | (1.16 | ) | (1.27 | ) | 18.69 | (3.37 | ) | 171 | 1.29 | .39 | ||||||||||||||||||||||||||||||
| 12/31/2014 | 24.99 | .09 | 2 | (1.83 | ) | (1.74 | ) | (.25 | ) | (2.44 | ) | (2.69 | ) | 20.56 | (8.13 | ) | 64 | 1.28 | .40 | 2 | ||||||||||||||||||||||||||||
| 198 | American Funds Insurance Series |
| (Loss) income from investment operations1 | Dividends and distributions | |||||||||||||||||||||||||||||||||||||||||||||||
| Period ended | Net asset value, beginning of period | Net investment income (loss) | Net (losses) gains on securities (both realized and unrealized) | Total from investment operations | Dividends (from net investment income) | Distributions (from capital gains) | Total dividends and distributions | Net asset value, end of period | Total return | Net assets, end of period (in millions) | Ratio of expenses to average net assets | Ratio of net income (loss) to average net assets | ||||||||||||||||||||||||||||||||||||
| Blue Chip Income and Growth Fund | ||||||||||||||||||||||||||||||||||||||||||||||||
| �� | ||||||||||||||||||||||||||||||||||||||||||||||||
| Class 1: | ||||||||||||||||||||||||||||||||||||||||||||||||
| 12/31/2018 | $ | 14.96 | $ | .31 | $ | (1.44 | ) | $ | (1.13 | ) | $ | (.31 | ) | $ | (1.14 | ) | $ | (1.45 | ) | $ | 12.38 | (8.45 | )% | $ | 4,810 | .41 | % | 2.13 | % | |||||||||||||||||||
| 12/31/2017 | 13.53 | .32 | 1.96 | 2.28 | (.32 | ) | (.53 | ) | (.85 | ) | 14.96 | 17.30 | 5,581 | .41 | 2.27 | |||||||||||||||||||||||||||||||||
| 12/31/2016 | 12.62 | .31 | 1.97 | 2.28 | (.29 | ) | (1.08 | ) | (1.37 | ) | 13.53 | 19.06 | 5,099 | .41 | 2.39 | |||||||||||||||||||||||||||||||||
| 12/31/2015 | 14.69 | .31 | (.64 | ) | (.33 | ) | (.29 | ) | (1.45 | ) | (1.74 | ) | 12.62 | (2.72 | ) | 3,638 | .41 | 2.23 | ||||||||||||||||||||||||||||||
| 12/31/2014 | 13.12 | .46 | 2 | 1.59 | 2.05 | (.48 | ) | — | (.48 | ) | 14.69 | 15.69 | 3,542 | .42 | 3.31 | 2 | ||||||||||||||||||||||||||||||||
| Class 1A: | ||||||||||||||||||||||||||||||||||||||||||||||||
| 12/31/2018 | 14.94 | .26 | (1.42 | ) | (1.16 | ) | (.29 | ) | (1.14 | ) | (1.43 | ) | 12.35 | (8.67 | ) | 3 | .66 | 1.84 | ||||||||||||||||||||||||||||||
| 12/31/20173,4 | 13.75 | .28 | 1.75 | 2.03 | (.31 | ) | (.53 | ) | (.84 | ) | 14.94 | 15.21 | 5 | 1 | .65 | 6 | 2.01 | 6 | ||||||||||||||||||||||||||||||
| Class 2: | ||||||||||||||||||||||||||||||||||||||||||||||||
| 12/31/2018 | 14.80 | .27 | (1.42 | ) | (1.15 | ) | (.27 | ) | (1.14 | ) | (1.41 | ) | 12.24 | (8.66 | ) | 2,850 | .66 | 1.88 | ||||||||||||||||||||||||||||||
| 12/31/2017 | 13.39 | .28 | 1.94 | 2.22 | (.28 | ) | (.53 | ) | (.81 | ) | 14.80 | 17.04 | 3,551 | .66 | 2.02 | |||||||||||||||||||||||||||||||||
| 12/31/2016 | 12.51 | .28 | 1.94 | 2.22 | (.26 | ) | (1.08 | ) | (1.34 | ) | 13.39 | 18.70 | 3,412 | .66 | 2.16 | |||||||||||||||||||||||||||||||||
| 12/31/2015 | 14.57 | .27 | (.62 | ) | (.35 | ) | (.26 | ) | (1.45 | ) | (1.71 | ) | 12.51 | (2.93 | ) | 3,228 | .66 | 1.97 | ||||||||||||||||||||||||||||||
| 12/31/2014 | 13.02 | .44 | 2 | 1.55 | 1.99 | (.44 | ) | — | (.44 | ) | 14.57 | 15.36 | 3,722 | .67 | 3.14 | 2 | ||||||||||||||||||||||||||||||||
| Class 4: | ||||||||||||||||||||||||||||||||||||||||||||||||
| 12/31/2018 | 14.77 | .23 | (1.42 | ) | (1.19 | ) | (.25 | ) | (1.14 | ) | (1.39 | ) | 12.19 | (8.92 | ) | 368 | .91 | 1.62 | ||||||||||||||||||||||||||||||
| 12/31/2017 | 13.39 | .25 | 1.93 | 2.18 | (.27 | ) | (.53 | ) | (.80 | ) | 14.77 | 16.70 | 247 | .91 | 1.76 | |||||||||||||||||||||||||||||||||
| 12/31/2016 | 12.53 | .24 | 1.96 | 2.20 | (.26 | ) | (1.08 | ) | (1.34 | ) | 13.39 | 18.49 | 132 | .91 | 1.81 | |||||||||||||||||||||||||||||||||
| 12/31/2015 | 14.63 | .24 | (.63 | ) | (.39 | ) | (.26 | ) | (1.45 | ) | (1.71 | ) | 12.53 | (3.21 | ) | 32 | .91 | 1.75 | ||||||||||||||||||||||||||||||
| 12/31/2014 | 13.12 | .34 | 2 | 1.63 | 1.97 | (.46 | ) | — | (.46 | ) | 14.63 | 15.13 | 9 | .92 | 2.33 | 2 | ||||||||||||||||||||||||||||||||
| Global Growth and Income Fund | ||||||||||||||||||||||||||||||||||||||||||||||||
| Class 1: | ||||||||||||||||||||||||||||||||||||||||||||||||
| 12/31/2018 | $ | 15.81 | $ | .29 | $ | (1.62 | ) | $ | (1.33 | ) | $ | (.28 | ) | $ | (1.18 | ) | $ | (1.46 | ) | $ | 13.02 | (9.36 | )% | $ | 492 | .63 | % | 1.94 | % | |||||||||||||||||||
| 12/31/2017 | 13.02 | .35 | 3.06 | 3.41 | (.36 | ) | (.26 | ) | (.62 | ) | 15.81 | 26.40 | 485 | .63 | 2.43 | |||||||||||||||||||||||||||||||||
| 12/31/2016 | 12.35 | .28 | .66 | .94 | (.27 | ) | — | (.27 | ) | 13.02 | 7.61 | 571 | .63 | 2.18 | ||||||||||||||||||||||||||||||||||
| 12/31/2015 | 12.78 | .36 | (.50 | ) | (.14 | ) | (.29 | ) | — | (.29 | ) | 12.35 | (1.14 | ) | 293 | .64 | 2.79 | |||||||||||||||||||||||||||||||
| 12/31/2014 | 12.53 | .43 | 2 | .31 | .74 | (.49 | ) | — | (.49 | ) | 12.78 | 6.00 | 200 | .63 | 3.34 | 2 | ||||||||||||||||||||||||||||||||
| Class 1A: | ||||||||||||||||||||||||||||||||||||||||||||||||
| 12/31/2018 | 15.81 | .26 | �� | (1.63 | ) | (1.37 | ) | (.26 | ) | (1.18 | ) | (1.44 | ) | 13.00 | (9.62 | ) | 1 | .88 | 1.74 | |||||||||||||||||||||||||||||
| 12/31/20173,4 | 13.21 | .18 | 3.03 | 3.21 | (.35 | ) | (.26 | ) | (.61 | ) | 15.81 | 24.54 | 5 | — | 7 | .84 | 6 | 1.20 | 6 | |||||||||||||||||||||||||||||
| Class 2: | ||||||||||||||||||||||||||||||||||||||||||||||||
| 12/31/2018 | 15.78 | .26 | (1.63 | ) | (1.37 | ) | (.24 | ) | (1.18 | ) | (1.42 | ) | 12.99 | (9.63 | ) | 1,228 | .88 | 1.70 | ||||||||||||||||||||||||||||||
| 12/31/2017 | 13.00 | .31 | 3.05 | 3.36 | (.32 | ) | (.26 | ) | (.58 | ) | 15.78 | 26.06 | 1,538 | .88 | 2.11 | |||||||||||||||||||||||||||||||||
| 12/31/2016 | 12.33 | .25 | .65 | .90 | (.23 | ) | — | (.23 | ) | 13.00 | 7.34 | 1,405 | .88 | 1.98 | ||||||||||||||||||||||||||||||||||
| 12/31/2015 | 12.75 | .22 | (.39 | ) | (.17 | ) | (.25 | ) | — | (.25 | ) | 12.33 | (1.34 | ) | 1,479 | .89 | 1.73 | |||||||||||||||||||||||||||||||
| 12/31/2014 | 12.51 | .41 | 2 | .29 | .70 | (.46 | ) | — | (.46 | ) | 12.75 | 5.64 | 1,685 | .88 | 3.22 | 2 | ||||||||||||||||||||||||||||||||
| Class 4: | ||||||||||||||||||||||||||||||||||||||||||||||||
| 12/31/2018 | 15.60 | .21 | (1.60 | ) | (1.39 | ) | (.22 | ) | (1.18 | ) | (1.40 | ) | 12.81 | (9.89 | ) | 95 | 1.13 | 1.43 | ||||||||||||||||||||||||||||||
| 12/31/2017 | 12.89 | .22 | 3.08 | 3.30 | (.33 | ) | (.26 | ) | (.59 | ) | 15.60 | 25.83 | 79 | 1.14 | 1.49 | |||||||||||||||||||||||||||||||||
| 12/31/2016 | 12.26 | .21 | .65 | .86 | (.23 | ) | — | (.23 | ) | 12.89 | 7.04 | 16 | 1.13 | 1.63 | ||||||||||||||||||||||||||||||||||
| 12/31/2015 | 12.71 | .17 | (.37 | ) | (.20 | ) | (.25 | ) | — | (.25 | ) | 12.26 | (1.60 | ) | 5 | 1.14 | 1.32 | |||||||||||||||||||||||||||||||
| 12/31/2014 | 12.50 | .30 | 2 | .37 | .67 | (.46 | ) | — | (.46 | ) | 12.71 | 5.41 | 1 | 1.13 | 2.30 | 2 | ||||||||||||||||||||||||||||||||
See end of tables for footnotes.
| American Funds Insurance Series | 199 |
Financial highlights(continued)
| (Loss) income from investment operations1 | Dividends and distributions | |||||||||||||||||||||||||||||||||||||||||||||||
| Period ended | Net asset value, beginning of period | Net investment income (loss) | Net (losses) gains on securities (both realized and unrealized) | Total from investment operations | Dividends (from net investment income) | Distributions (from capital gains) | Total dividends and distributions | Net asset value, end of period | Total return | Net assets, end of period (in millions) | Ratio of expenses to average net assets | Ratio of net income (loss) to average net assets | ||||||||||||||||||||||||||||||||||||
| Growth-Income Fund | ||||||||||||||||||||||||||||||||||||||||||||||||
| Class 1: | ||||||||||||||||||||||||||||||||||||||||||||||||
| 12/31/2018 | $ | 50.22 | $ | .84 | $ | (1.25 | ) | $ | (.41 | ) | $ | (.84 | ) | $ | (3.58 | ) | $ | (4.42 | ) | $ | 45.39 | (1.55 | )% | $ | 16,783 | .28 | % | 1.65 | % | |||||||||||||||||||
| 12/31/2017 | 44.41 | .81 | 8.89 | 9.70 | (.78 | ) | (3.11 | ) | (3.89 | ) | 50.22 | 22.68 | 15,765 | .28 | 1.69 | |||||||||||||||||||||||||||||||||
| 12/31/2016 | 45.40 | .79 | 4.09 | 4.88 | (.75 | ) | (5.12 | ) | (5.87 | ) | 44.41 | 11.80 | 12,588 | .29 | 1.79 | |||||||||||||||||||||||||||||||||
| 12/31/2015 | 52.76 | .79 | .37 | 1.16 | (.75 | ) | (7.77 | ) | (8.52 | ) | 45.40 | 1.72 | 10,747 | .29 | 1.59 | |||||||||||||||||||||||||||||||||
| 12/31/2014 | 50.72 | .81 | 4.57 | 5.38 | (.80 | ) | (2.54 | ) | (3.34 | ) | 52.76 | 10.91 | 10,812 | .29 | 1.56 | |||||||||||||||||||||||||||||||||
| Class 1A: | ||||||||||||||||||||||||||||||||||||||||||||||||
| 12/31/2018 | 50.15 | .72 | (1.25 | ) | (.53 | ) | (.76 | ) | (3.58 | ) | (4.34 | ) | 45.28 | (1.78 | ) | 7 | .53 | 1.43 | ||||||||||||||||||||||||||||||
| 12/31/20173,4 | 45.39 | .67 | 7.96 | 8.63 | (.76 | ) | (3.11 | ) | (3.87 | ) | 50.15 | 19.83 | 5 | 2 | .52 | 6 | 1.41 | 6 | ||||||||||||||||||||||||||||||
| Class 2: | ||||||||||||||||||||||||||||||||||||||||||||||||
| 12/31/2018 | 49.71 | .71 | (1.23 | ) | (.52 | ) | (.71 | ) | (3.58 | ) | (4.29 | ) | 44.90 | (1.79 | ) | 12,035 | .53 | 1.40 | ||||||||||||||||||||||||||||||
| 12/31/2017 | 44.00 | .68 | 8.80 | 9.48 | (.66 | ) | (3.11 | ) | (3.77 | ) | 49.71 | 22.38 | 13,930 | .53 | 1.45 | |||||||||||||||||||||||||||||||||
| 12/31/2016 | 45.04 | .67 | 4.05 | 4.72 | (.64 | ) | (5.12 | ) | (5.76 | ) | 44.00 | 11.51 | 12,854 | .54 | 1.54 | |||||||||||||||||||||||||||||||||
| 12/31/2015 | 52.41 | .66 | .37 | 1.03 | (.63 | ) | (7.77 | ) | (8.40 | ) | 45.04 | 1.45 | 12,895 | .54 | 1.34 | |||||||||||||||||||||||||||||||||
| 12/31/2014 | 50.40 | .67 | 4.55 | 5.22 | (.67 | ) | (2.54 | ) | (3.21 | ) | 52.41 | 10.63 | 14,337 | .54 | 1.31 | |||||||||||||||||||||||||||||||||
| Class 3: | ||||||||||||||||||||||||||||||||||||||||||||||||
| 12/31/2018 | 50.29 | .75 | (1.25 | ) | (.50 | ) | (.74 | ) | (3.58 | ) | (4.32 | ) | 45.47 | (1.72 | ) | 140 | .46 | 1.47 | ||||||||||||||||||||||||||||||
| 12/31/2017 | 44.47 | .72 | 8.90 | 9.62 | (.69 | ) | (3.11 | ) | (3.80 | ) | 50.29 | 22.47 | 168 | .46 | 1.52 | |||||||||||||||||||||||||||||||||
| 12/31/2016 | 45.46 | .71 | 4.09 | 4.80 | (.67 | ) | (5.12 | ) | (5.79 | ) | 44.47 | 11.59 | 156 | .47 | 1.61 | |||||||||||||||||||||||||||||||||
| 12/31/2015 | 52.82 | .70 | .37 | 1.07 | (.66 | ) | (7.77 | ) | (8.43 | ) | 45.46 | 1.53 | 161 | .47 | 1.41 | |||||||||||||||||||||||||||||||||
| 12/31/2014 | 50.77 | .71 | 4.59 | 5.30 | (.71 | ) | (2.54 | ) | (3.25 | ) | 52.82 | 10.71 | 185 | .47 | 1.38 | |||||||||||||||||||||||||||||||||
| Class 4: | ||||||||||||||||||||||||||||||||||||||||||||||||
| 12/31/2018 | 49.31 | .58 | (1.23 | ) | (.65 | ) | (.61 | ) | (3.58 | ) | (4.19 | ) | 44.47 | (2.05 | ) | 899 | .78 | 1.15 | ||||||||||||||||||||||||||||||
| 12/31/2017 | 43.73 | .56 | 8.73 | 9.29 | (.60 | ) | (3.11 | ) | (3.71 | ) | 49.31 | 22.08 | 827 | .78 | 1.19 | |||||||||||||||||||||||||||||||||
| 12/31/2016 | 44.82 | .56 | 4.02 | 4.58 | (.55 | ) | (5.12 | ) | (5.67 | ) | 43.73 | 11.25 | 495 | .79 | 1.29 | |||||||||||||||||||||||||||||||||
| 12/31/2015 | 52.39 | .58 | .33 | .91 | (.71 | ) | (7.77 | ) | (8.48 | ) | 44.82 | 1.21 | 410 | .79 | 1.25 | |||||||||||||||||||||||||||||||||
| 12/31/2014 | 50.56 | .58 | 4.51 | 5.09 | (.72 | ) | (2.54 | ) | (3.26 | ) | 52.39 | 10.34 | 30 | .79 | 1.11 | |||||||||||||||||||||||||||||||||
| International Growth and Income Fund | ||||||||||||||||||||||||||||||||||||||||||||||||
| Class 1: | ||||||||||||||||||||||||||||||||||||||||||||||||
| 12/31/2018 | $ | 17.72 | $ | .45 | $ | (2.39 | ) | $ | (1.94 | ) | $ | (.43 | ) | $ | — | $ | (.43 | ) | $ | 15.35 | (11.00) | % | $ | 1,034 | .65 | % | 2.62 | % | ||||||||||||||||||||
| 12/31/2017 | 14.48 | .46 | 3.20 | 3.66 | (.42 | ) | — | (.42 | ) | 17.72 | 25.31 | 1,121 | .66 | 2.75 | ||||||||||||||||||||||||||||||||||
| 12/31/2016 | 14.72 | .43 | (.19 | ) | .24 | (.42 | ) | (.06 | ) | (.48 | ) | 14.48 | 1.71 | 820 | .68 | 2.93 | ||||||||||||||||||||||||||||||||
| 12/31/2015 | 16.27 | .42 | (1.25 | ) | (.83 | ) | (.38 | ) | (.34 | ) | (.72 | ) | 14.72 | (5.34 | ) | 707 | .68 | 2.60 | ||||||||||||||||||||||||||||||
| 12/31/2014 | 17.48 | .58 | 2 | (1.09 | ) | (.51 | ) | (.53 | ) | (.17 | ) | (.70 | ) | 16.27 | (2.93 | ) | 740 | .68 | 3.32 | 2 | ||||||||||||||||||||||||||||
| Class 1A: | ||||||||||||||||||||||||||||||||||||||||||||||||
| 12/31/2018 | 17.70 | .41 | (2.39 | ) | (1.98 | ) | (.39 | ) | — | (.39 | ) | 15.33 | (11.24 | ) | 2 | .90 | 2.35 | |||||||||||||||||||||||||||||||
| 12/31/20173,4 | 14.69 | .34 | 3.08 | 3.42 | (.41 | ) | — | (.41 | ) | 17.70 | 23.36 | 5 | 2 | .91 | 6 | 1.99 | 6 | |||||||||||||||||||||||||||||||
| Class 2: | ||||||||||||||||||||||||||||||||||||||||||||||||
| 12/31/2018 | 17.66 | .41 | (2.38 | ) | (1.97 | ) | (.39 | ) | — | (.39 | ) | 15.30 | (11.23 | ) | 230 | .90 | 2.38 | |||||||||||||||||||||||||||||||
| 12/31/2017 | 14.43 | .43 | 3.17 | 3.60 | (.37 | ) | — | (.37 | ) | 17.66 | 25.03 | 276 | .91 | 2.60 | ||||||||||||||||||||||||||||||||||
| 12/31/2016 | 14.68 | .40 | (.21 | ) | .19 | (.38 | ) | (.06 | ) | (.44 | ) | 14.43 | 1.44 | 244 | .93 | 2.72 | ||||||||||||||||||||||||||||||||
| 12/31/2015 | 16.22 | .38 | (1.24 | ) | (.86 | ) | (.34 | ) | (.34 | ) | (.68 | ) | 14.68 | (5.60 | ) | 254 | .93 | 2.32 | ||||||||||||||||||||||||||||||
| 12/31/2014 | 17.43 | .56 | 2 | (1.10 | ) | (.54 | ) | (.50 | ) | (.17 | ) | (.67 | ) | 16.22 | (3.15 | ) | 248 | .93 | 3.21 | 2 | ||||||||||||||||||||||||||||
| Class 4: | ||||||||||||||||||||||||||||||||||||||||||||||||
| 12/31/2018 | 17.58 | .36 | (2.36 | ) | (2.00 | ) | (.36 | ) | — | (.36 | ) | 15.22 | (11.46 | ) | 71 | 1.15 | 2.10 | |||||||||||||||||||||||||||||||
| 12/31/2017 | 14.38 | .37 | 3.18 | 3.55 | (.35 | ) | — | (.35 | ) | 17.58 | 24.72 | 63 | 1.16 | 2.24 | ||||||||||||||||||||||||||||||||||
| 12/31/2016 | 14.63 | .36 | (.19 | ) | .17 | (.36 | ) | (.06 | ) | (.42 | ) | 14.38 | 1.18 | 37 | 1.18 | 2.43 | ||||||||||||||||||||||||||||||||
| 12/31/2015 | 16.19 | .33 | (1.23 | ) | (.90 | ) | (.32 | ) | (.34 | ) | (.66 | ) | 14.63 | (5.82 | ) | 32 | 1.18 | 2.02 | ||||||||||||||||||||||||||||||
| 12/31/2014 | 17.45 | .26 | 2 | (.85 | ) | (.59 | ) | (.50 | ) | (.17 | ) | (.67 | ) | 16.19 | (3.39 | ) | 20 | 1.18 | 1.52 | 2 | ||||||||||||||||||||||||||||
| 200 | American Funds Insurance Series |
| (Loss) income from investment operations1 | Dividends and distributions | |||||||||||||||||||||||||||||||||||||||||||||||
| Period ended | Net asset value, beginning of period | Net investment income (loss) | Net (losses) gains on securities (both realized and unrealized) | Total from investment operations | Dividends (from net investment income) | Distributions (from capital gains) | Total dividends and distributions | Net asset value, end of period | Total return | Net assets, end of period (in millions) | Ratio of expenses to average net assets | Ratio of net income (loss) to average net assets | ||||||||||||||||||||||||||||||||||||
| Capital Income Builder | ||||||||||||||||||||||||||||||||||||||||||||||||
| Class 1: | ||||||||||||||||||||||||||||||||||||||||||||||||
| 12/31/2018 | $ | 10.40 | $ | .31 | $ | (1.00 | ) | $ | (.69 | ) | $ | (.32 | ) | $ | (.02 | ) | $ | (.34 | ) | $ | 9.37 | (6.77 | )% | $ | 317 | .54 | % | 3.08 | % | |||||||||||||||||||
| 12/31/2017 | 9.46 | .32 | .93 | 1.25 | (.31 | ) | — | (.31 | ) | 10.40 | 13.29 | 254 | .54 | 3.21 | ||||||||||||||||||||||||||||||||||
| 12/31/2016 | 9.40 | .32 | .07 | .39 | (.33 | ) | — | (.33 | ) | 9.46 | 4.17 | 156 | .54 | 3.39 | ||||||||||||||||||||||||||||||||||
| 12/31/2015 | 9.81 | .28 | (.40 | ) | (.12 | ) | (.29 | ) | — | (.29 | ) | 9.40 | (1.23 | ) | 80 | .56 | 2.88 | |||||||||||||||||||||||||||||||
| 12/31/20143,10 | 10.00 | .19 | (.18 | ) | .01 | (.19 | ) | (.01 | ) | (.20 | ) | 9.81 | .12 | 5 | 20 | .56 | 6 | 2.87 | 6 | |||||||||||||||||||||||||||||
| Class 1A: | ||||||||||||||||||||||||||||||||||||||||||||||||
| 12/31/2018 | 10.39 | .28 | (.99 | ) | (.71 | ) | (.30 | ) | (.02 | ) | (.32 | ) | 9.36 | (7.01 | ) | 2 | .79 | 2.82 | ||||||||||||||||||||||||||||||
| 12/31/20173,4 | 9.57 | .27 | .84 | 1.11 | (.29 | ) | — | (.29 | ) | 10.39 | 11.72 | 5 | 1 | .79 | 6 | 2.63 | 6 | |||||||||||||||||||||||||||||||
| Class 2: | ||||||||||||||||||||||||||||||||||||||||||||||||
| 12/31/2018 | 10.40 | .28 | (1.00 | ) | (.72 | ) | (.30 | ) | (.02 | ) | (.32 | ) | 9.36 | (7.08 | ) | 4 | .79 | 2.83 | ||||||||||||||||||||||||||||||
| 12/31/2017 | 9.46 | .29 | .93 | 1.22 | (.28 | ) | — | (.28 | ) | 10.40 | 13.04 | 1 | .79 | 2.82 | ||||||||||||||||||||||||||||||||||
| 12/31/2016 | 9.40 | .27 | .11 | .38 | (.32 | ) | — | (.32 | ) | 9.46 | 4.08 | — | 7 | .80 | 2.82 | |||||||||||||||||||||||||||||||||
| 12/31/2015 | 9.81 | .31 | (.43 | ) | (.12 | ) | (.29 | ) | — | (.29 | ) | 9.40 | (1.23 | )11 | — | 7 | .46 | 11 | 3.12 | 11 | ||||||||||||||||||||||||||||
| 12/31/20143,10 | 10.00 | .20 | (.19 | ) | .01 | (.19 | ) | (.01 | ) | (.20 | ) | 9.81 | .12 | 5,11 | — | 7 | .47 | 6,11 | 2.94 | 6,11 | ||||||||||||||||||||||||||||
| Class 4: | ||||||||||||||||||||||||||||||||||||||||||||||||
| 12/31/2018 | 10.38 | .26 | (1.00 | ) | (.74 | ) | (.27 | ) | (.02 | ) | (.29 | ) | 9.35 | (7.25 | ) | 352 | 1.04 | 2.58 | ||||||||||||||||||||||||||||||
| 12/31/2017 | 9.45 | .27 | .92 | 1.19 | (.26 | ) | — | (.26 | ) | 10.38 | 12.65 | 338 | 1.04 | 2.72 | ||||||||||||||||||||||||||||||||||
| 12/31/2016 | 9.38 | .27 | .08 | .35 | (.28 | ) | — | (.28 | ) | 9.45 | 3.78 | 256 | 1.04 | 2.88 | ||||||||||||||||||||||||||||||||||
| 12/31/2015 | 9.80 | .25 | (.42 | ) | (.17 | ) | (.25 | ) | — | (.25 | ) | 9.38 | (1.79 | ) | 157 | 1.05 | 2.55 | |||||||||||||||||||||||||||||||
| 12/31/20143,10 | 10.00 | .14 | (.16 | ) | (.02 | ) | (.17 | ) | (.01 | ) | (.18 | ) | 9.80 | (.21 | )5 | 55 | 1.06 | 6 | 2.08 | 6 | ||||||||||||||||||||||||||||
| Asset Allocation Fund | ||||||||||||||||||||||||||||||||||||||||||||||||
| Class 1: | ||||||||||||||||||||||||||||||||||||||||||||||||
| 12/31/2018 | $ | 23.71 | $ | .48 | $ | (1.43 | ) | $ | (.95 | ) | $ | (.44 | ) | $ | (1.03 | ) | $ | (1.47 | ) | $ | 21.29 | (4.35 | )% | $ | 14,627 | .28 | % | 2.04 | % | |||||||||||||||||||
| 12/31/2017 | 21.68 | .44 | 3.06 | 3.50 | (.41 | ) | (1.06 | ) | (1.47 | ) | 23.71 | 16.51 | 16,556 | .29 | 1.90 | |||||||||||||||||||||||||||||||||
| 12/31/2016 | 20.62 | .42 | 1.54 | 1.96 | (.39 | ) | (.51 | ) | (.90 | ) | 21.68 | 9.69 | 13,008 | .29 | 1.97 | |||||||||||||||||||||||||||||||||
| 12/31/2015 | 22.23 | .40 | (.02 | ) | .38 | (.40 | ) | (1.59 | ) | (1.99 | ) | 20.62 | 1.64 | 10,913 | .29 | 1.85 | ||||||||||||||||||||||||||||||||
| 12/31/2014 | 22.49 | .44 | .81 | 1.25 | (.39 | ) | (1.12 | ) | (1.51 | ) | 22.23 | 5.66 | 11,997 | .30 | 1.95 | |||||||||||||||||||||||||||||||||
| Class 1A: | ||||||||||||||||||||||||||||||||||||||||||||||||
| 12/31/2018 | 23.69 | .42 | (1.42 | ) | (1.00 | ) | (.40 | ) | (1.03 | ) | (1.43 | ) | 21.26 | (4.58 | ) | 7 | .53 | 1.82 | ||||||||||||||||||||||||||||||
| 12/31/20173,4 | 21.97 | .39 | 2.78 | 3.17 | (.39 | ) | (1.06 | ) | (1.45 | ) | 23.69 | 14.78 | 5 | 4 | .53 | 6 | 1.69 | 6 | ||||||||||||||||||||||||||||||
| Class 2: | ||||||||||||||||||||||||||||||||||||||||||||||||
| 12/31/2018 | 23.49 | .41 | (1.41 | ) | (1.00 | ) | (.38 | ) | (1.03 | ) | (1.41 | ) | 21.08 | (4.60 | ) | 4,668 | .53 | 1.78 | ||||||||||||||||||||||||||||||
| 12/31/2017 | 21.49 | .37 | 3.04 | 3.41 | (.35 | ) | (1.06 | ) | (1.41 | ) | 23.49 | 16.23 | 5,480 | .54 | 1.64 | |||||||||||||||||||||||||||||||||
| 12/31/2016 | 20.45 | .36 | 1.53 | 1.89 | (.34 | ) | (.51 | ) | (.85 | ) | 21.49 | 9.41 | 5,144 | .54 | 1.72 | |||||||||||||||||||||||||||||||||
| 12/31/2015 | 22.06 | .34 | (.01 | ) | .33 | (.35 | ) | (1.59 | ) | (1.94 | ) | 20.45 | 1.40 | 5,008 | .54 | 1.60 | ||||||||||||||||||||||||||||||||
| 12/31/2014 | 22.33 | .37 | .81 | 1.18 | (.33 | ) | (1.12 | ) | (1.45 | ) | 22.06 | 5.40 | 5,494 | .55 | 1.69 | |||||||||||||||||||||||||||||||||
| Class 3: | ||||||||||||||||||||||||||||||||||||||||||||||||
| 12/31/2018 | 23.73 | .43 | (1.41 | ) | (.98 | ) | (.40 | ) | (1.03 | ) | (1.43 | ) | 21.32 | (4.49 | ) | 29 | .46 | 1.85 | ||||||||||||||||||||||||||||||
| 12/31/2017 | 21.70 | .39 | 3.07 | 3.46 | (.37 | ) | (1.06 | ) | (1.43 | ) | 23.73 | 16.29 | 38 | .47 | 1.72 | |||||||||||||||||||||||||||||||||
| 12/31/2016 | 20.64 | .38 | 1.54 | 1.92 | (.35 | ) | (.51 | ) | (.86 | ) | 21.70 | 9.49 | 35 | .47 | 1.79 | |||||||||||||||||||||||||||||||||
| 12/31/2015 | 22.25 | .36 | (.02 | ) | .34 | (.36 | ) | (1.59 | ) | (1.95 | ) | 20.64 | 1.46 | 36 | .47 | 1.67 | ||||||||||||||||||||||||||||||||
| 12/31/2014 | 22.51 | .39 | .81 | 1.20 | (.34 | ) | (1.12 | ) | (1.46 | ) | 22.25 | 5.47 | 40 | .48 | 1.76 | |||||||||||||||||||||||||||||||||
| Class 4: | ||||||||||||||||||||||||||||||||||||||||||||||||
| 12/31/2018 | 23.40 | .35 | (1.40 | ) | (1.05 | ) | (.33 | ) | (1.03 | ) | (1.36 | ) | 20.99 | (4.83 | ) | 3,594 | .78 | 1.54 | ||||||||||||||||||||||||||||||
| 12/31/2017 | 21.43 | .32 | 3.02 | 3.34 | (.31 | ) | (1.06 | ) | (1.37 | ) | 23.40 | 15.91 | 3,582 | .79 | 1.40 | |||||||||||||||||||||||||||||||||
| 12/31/2016 | 20.40 | .31 | 1.53 | 1.84 | (.30 | ) | (.51 | ) | (.81 | ) | 21.43 | 9.16 | 2,861 | .79 | 1.47 | |||||||||||||||||||||||||||||||||
| 12/31/2015 | 22.11 | .30 | (.02 | ) | .28 | (.40 | ) | (1.59 | ) | (1.99 | ) | 20.40 | 1.14 | 2,414 | .79 | 1.45 | ||||||||||||||||||||||||||||||||
| 12/31/2014 | 22.46 | .34 | .79 | 1.13 | (.36 | ) | (1.12 | ) | (1.48 | ) | 22.11 | 5.16 | 32 | .80 | 1.55 | |||||||||||||||||||||||||||||||||
See end of tables for footnotes.
| American Funds Insurance Series | 201 |
Financial highlights(continued)
| (Loss) income from investment operations1 | Dividends and distributions | |||||||||||||||||||||||||||||||||||||||||||||||
| Period ended | Net asset value, beginning of period | Net investment income (loss) | Net (losses) gains on securities (both realized and unrealized) | Total from investment operations | Dividends (from net investment income) | Distributions (from capital gains) | Total dividends and distributions | Net asset value, end of period | Total return | Net assets, end of period (in millions) | Ratio of expenses to average net assets | Ratio of net income (loss) to average net assets | ||||||||||||||||||||||||||||||||||||
| Global Balanced Fund | ||||||||||||||||||||||||||||||||||||||||||||||||
| Class 1: | ||||||||||||||||||||||||||||||||||||||||||||||||
| 12/31/2018 | $ | 12.75 | $ | .23 | $ | (.96 | ) | $ | (.73 | ) | $ | (.20 | ) | $ | (.15 | ) | $ | (.35 | ) | $ | 11.67 | (5.81 | )% | $ | 110 | .72 | % | 1.82 | % | |||||||||||||||||||
| 12/31/2017 | 11.08 | .21 | 1.99 | 2.20 | (.15 | ) | (.38 | ) | (.53 | ) | 12.75 | 19.91 | 93 | .72 | 1.68 | |||||||||||||||||||||||||||||||||
| 12/31/2016 | 10.74 | .19 | .32 | .51 | (.17 | ) | — | (.17 | ) | 11.08 | 4.73 | 64 | .72 | 1.73 | ||||||||||||||||||||||||||||||||||
| 12/31/2015 | 11.11 | .20 | (.28 | ) | (.08 | ) | (.14 | ) | (.15 | ) | (.29 | ) | 10.74 | (.69 | ) | 47 | .72 | 1.80 | ||||||||||||||||||||||||||||||
| 12/31/2014 | 11.37 | .25 | 2 | (.03 | ) | .22 | (.18 | ) | (.30 | ) | (.48 | ) | 11.11 | 1.87 | 37 | .71 | 2.14 | 2 | ||||||||||||||||||||||||||||||
| Class 1A: | ||||||||||||||||||||||||||||||||||||||||||||||||
| 12/31/2018 | 12.74 | .18 | (.94 | ) | (.76 | ) | (.18 | ) | (.15 | ) | (.33 | ) | 11.65 | (6.03 | ) | 2 | .98 | 1.44 | ||||||||||||||||||||||||||||||
| 12/31/20173,4 | 11.18 | .16 | 1.92 | 2.08 | (.14 | ) | (.38 | ) | (.52 | ) | 12.74 | 18.71 | 5 | — | 7 | .94 | 6 | 1.27 | 6 | |||||||||||||||||||||||||||||
| Class 2: | ||||||||||||||||||||||||||||||||||||||||||||||||
| 12/31/2018 | 12.72 | .20 | (.96 | ) | (.76 | ) | (.16 | ) | (.15 | ) | (.31 | ) | 11.65 | (6.01 | ) | 185 | .97 | 1.57 | ||||||||||||||||||||||||||||||
| 12/31/2017 | 11.06 | .18 | 1.98 | 2.16 | (.12 | ) | �� | (.38 | ) | (.50 | ) | 12.72 | 19.57 | 210 | .96 | 1.43 | ||||||||||||||||||||||||||||||||
| 12/31/2016 | 10.72 | .16 | .32 | .48 | (.14 | ) | — | (.14 | ) | 11.06 | 4.48 | 178 | .97 | 1.48 | ||||||||||||||||||||||||||||||||||
| 12/31/2015 | 11.09 | .18 | (.28 | ) | (.10 | ) | (.12 | ) | (.15 | ) | (.27 | ) | 10.72 | (.95 | ) | 171 | .97 | 1.60 | ||||||||||||||||||||||||||||||
| 12/31/2014 | 11.35 | .22 | 2 | (.03 | ) | .19 | (.15 | ) | (.30 | ) | (.45 | ) | 11.09 | 1.63 | 179 | .96 | 1.88 | 2 | ||||||||||||||||||||||||||||||
| Class 4: | ||||||||||||||||||||||||||||||||||||||||||||||||
| 12/31/2018 | 12.63 | .17 | (.96 | ) | (.79 | ) | (.14 | ) | (.15 | ) | (.29 | ) | 11.55 | (6.31 | ) | 69 | 1.22 | 1.34 | ||||||||||||||||||||||||||||||
| 12/31/2017 | 11.00 | .13 | 1.99 | 2.12 | (.11 | ) | (.38 | ) | (.49 | ) | 12.63 | 19.38 | 51 | 1.22 | 1.07 | |||||||||||||||||||||||||||||||||
| 12/31/2016 | 10.69 | .12 | .33 | .45 | (.14 | ) | — | (.14 | ) | 11.00 | 4.21 | 10 | 1.24 | 1.12 | ||||||||||||||||||||||||||||||||||
| 12/31/2015 | 11.09 | .06 | (.17 | ) | (.11 | ) | (.14 | ) | (.15 | ) | (.29 | ) | 10.69 | (1.00 | ) | 1 | 1.34 | .58 | ||||||||||||||||||||||||||||||
| 12/31/2014 | 11.35 | .24 | 2 | (.02 | ) | .22 | (.18 | ) | (.30 | ) | (.48 | ) | 11.09 | 1.88 | 11 | — | 7 | .67 | 11 | 2.07 | 2,11 | |||||||||||||||||||||||||||
| Bond Fund | ||||||||||||||||||||||||||||||||||||||||||||||||
| Class 1: | ||||||||||||||||||||||||||||||||||||||||||||||||
| 12/31/2018 | $ | 10.82 | $ | .29 | $ | (.35 | ) | $ | (.06 | ) | $ | (.28 | ) | $ | (.01 | ) | $ | (.29 | ) | $ | 10.47 | (.45 | )% | $ | 5,962 | .38 | % | 2.70 | % | |||||||||||||||||||
| 12/31/2017 | 10.80 | .24 | .18 | .42 | (.24 | ) | (.16 | ) | (.40 | ) | 10.82 | 3.88 | 6,434 | .38 | 2.19 | |||||||||||||||||||||||||||||||||
| 12/31/2016 | 10.70 | .21 | .14 | .35 | (.21 | ) | (.04 | ) | (.25 | ) | 10.80 | 3.27 | 6,829 | .38 | 1.91 | |||||||||||||||||||||||||||||||||
| 12/31/2015 | 11.08 | .22 | (.17 | ) | .05 | (.21 | ) | (.22 | ) | (.43 | ) | 10.70 | .45 | 5,731 | .38 | 1.95 | ||||||||||||||||||||||||||||||||
| 12/31/2014 | 10.73 | .23 | .37 | .60 | (.25 | ) | — | 8 | (.25 | ) | 11.08 | 5.59 | 4,977 | .39 | 2.03 | |||||||||||||||||||||||||||||||||
| Class 1A: | ||||||||||||||||||||||||||||||||||||||||||||||||
| 12/31/2018 | 10.80 | .26 | (.33 | ) | (.07 | ) | (.27 | ) | (.01 | ) | (.28 | ) | 10.45 | (.60 | ) | 3 | .63 | 2.50 | ||||||||||||||||||||||||||||||
| 12/31/20173,4 | 10.82 | .22 | .15 | .37 | (.23 | ) | (.16 | ) | (.39 | ) | 10.80 | 3.46 | 5 | 1 | .62 | 6 | 2.01 | 6 | ||||||||||||||||||||||||||||||
| Class 2: | ||||||||||||||||||||||||||||||||||||||||||||||||
| 12/31/2018 | 10.69 | .26 | (.34 | ) | (.08 | ) | (.26 | ) | (.01 | ) | (.27 | ) | 10.34 | (.71 | ) | 3,524 | .63 | 2.45 | ||||||||||||||||||||||||||||||
| 12/31/2017 | 10.67 | .21 | .18 | .39 | (.21 | ) | (.16 | ) | (.37 | ) | 10.69 | 3.67 | 3,966 | .63 | 1.94 | |||||||||||||||||||||||||||||||||
| 12/31/2016 | 10.58 | .18 | .13 | .31 | (.18 | ) | (.04 | ) | (.22 | ) | 10.67 | 2.95 | 3,959 | .63 | 1.65 | |||||||||||||||||||||||||||||||||
| 12/31/2015 | 10.95 | .18 | (.15 | ) | .03 | (.18 | ) | (.22 | ) | (.40 | ) | 10.58 | .28 | 4,135 | .63 | 1.69 | ||||||||||||||||||||||||||||||||
| 12/31/2014 | 10.61 | .20 | .36 | .56 | (.22 | ) | — | 8 | (.22 | ) | 10.95 | 5.28 | 4,565 | .64 | 1.79 | |||||||||||||||||||||||||||||||||
| Class 4: | ||||||||||||||||||||||||||||||||||||||||||||||||
| 12/31/2018 | 10.68 | .23 | (.33 | ) | (.10 | ) | (.24 | ) | (.01 | ) | (.25 | ) | 10.33 | (.89 | ) | 366 | .88 | 2.22 | ||||||||||||||||||||||||||||||
| 12/31/2017 | 10.70 | .19 | .16 | .35 | (.21 | ) | (.16 | ) | (.37 | ) | 10.68 | 3.29 | 297 | .88 | 1.72 | |||||||||||||||||||||||||||||||||
| 12/31/2016 | 10.61 | .15 | .15 | .30 | (.17 | ) | (.04 | ) | (.21 | ) | 10.70 | 2.80 | 102 | .88 | 1.41 | |||||||||||||||||||||||||||||||||
| 12/31/2015 | 11.01 | .16 | (.16 | ) | — | (.18 | ) | (.22 | ) | (.40 | ) | 10.61 | (.08 | ) | 59 | .88 | 1.47 | |||||||||||||||||||||||||||||||
| 12/31/2014 | 10.69 | .16 | .39 | .55 | (.23 | ) | — | 8 | (.23 | ) | 11.01 | 5.15 | 29 | .89 | 1.43 | |||||||||||||||||||||||||||||||||
| 202 | American Funds Insurance Series |
| (Loss) income from investment operations1 | Dividends and distributions | |||||||||||||||||||||||||||||||||||||||||||||||
| Period ended | Net asset value, beginning of period | Net investment income (loss) | Net (losses) gains on securities (both realized and unrealized) | Total from investment operations | Dividends (from net investment income) | Distributions (from capital gains) | Total dividends and distributions | Net asset value, end of period | Total return | Net assets, end of period (in millions) | Ratio of expenses to average net assets | Ratio of net income (loss) to average net assets | ||||||||||||||||||||||||||||||||||||
| Global Bond Fund | ||||||||||||||||||||||||||||||||||||||||||||||||
| Class 1: | ||||||||||||||||||||||||||||||||||||||||||||||||
| 12/31/2018 | $ | 11.88 | $ | .30 | $ | (.44 | ) | $ | (.14 | ) | $ | (.28 | ) | $ | (.04 | ) | $ | (.32 | ) | $ | 11.42 | (1.14 | )% | $ | 1,015 | .57 | % | 2.56 | % | |||||||||||||||||||
| 12/31/2017 | 11.22 | .28 | .52 | .80 | (.07 | ) | (.07 | ) | (.14 | ) | 11.88 | 7.11 | 1,273 | .56 | 2.37 | |||||||||||||||||||||||||||||||||
| 12/31/2016 | 11.01 | .26 | .06 | .32 | (.09 | ) | (.02 | ) | (.11 | ) | 11.22 | 2.92 | 1,115 | .57 | 2.26 | |||||||||||||||||||||||||||||||||
| 12/31/2015 | 11.77 | .27 | (.71 | ) | (.44 | ) | (.01 | ) | (.31 | ) | (.32 | ) | 11.01 | (3.75 | ) | 1,032 | .57 | 2.34 | ||||||||||||||||||||||||||||||
| 12/31/2014 | 11.88 | .29 | (.08 | ) | .21 | (.21 | ) | (.11 | ) | (.32 | ) | 11.77 | 1.71 | 1,194 | .57 | 2.35 | ||||||||||||||||||||||||||||||||
| Class 1A: | ||||||||||||||||||||||||||||||||||||||||||||||||
| 12/31/2018 | 11.87 | .27 | (.43 | ) | (.16 | ) | (.26 | ) | (.04 | ) | (.30 | ) | 11.41 | (1.29 | ) | 1 | .82 | 2.36 | ||||||||||||||||||||||||||||||
| 12/31/20173,4 | 11.22 | .26 | .52 | .78 | (.06 | ) | (.07 | ) | (.13 | ) | 11.87 | 7.00 | 5 | — | 7 | .72 | 6 | 2.27 | 6 | |||||||||||||||||||||||||||||
| Class 2: | ||||||||||||||||||||||||||||||||||||||||||||||||
| 12/31/2018 | 11.79 | .27 | (.43 | ) | (.16 | ) | (.25 | ) | (.04 | ) | (.29 | ) | 11.34 | (1.33 | ) | 1,032 | .82 | 2.32 | ||||||||||||||||||||||||||||||
| 12/31/2017 | 11.14 | .25 | .51 | .76 | (.04 | ) | (.07 | ) | (.11 | ) | 11.79 | 6.86 | 1,164 | .81 | 2.12 | |||||||||||||||||||||||||||||||||
| 12/31/2016 | 10.93 | .23 | .07 | .30 | (.07 | ) | (.02 | ) | (.09 | ) | 11.14 | 2.71 | 1,121 | .82 | 2.01 | |||||||||||||||||||||||||||||||||
| 12/31/2015 | 11.72 | .24 | (.71 | ) | (.47 | ) | (.01 | ) | (.31 | ) | (.32 | ) | 10.93 | (4.07 | ) | 1,208 | .82 | 2.09 | ||||||||||||||||||||||||||||||
| 12/31/2014 | 11.81 | .26 | (.09 | ) | .17 | (.15 | ) | (.11 | ) | (.26 | ) | 11.72 | 1.39 | 1,386 | .82 | 2.11 | ||||||||||||||||||||||||||||||||
| Class 4: | ||||||||||||||||||||||||||||||||||||||||||||||||
| 12/31/2018 | 11.70 | .24 | (.43 | ) | (.19 | ) | (.23 | ) | (.04 | ) | (.27 | ) | 11.24 | (1.61 | ) | 40 | 1.07 | 2.09 | ||||||||||||||||||||||||||||||
| 12/31/2017 | 11.08 | .22 | .51 | .73 | (.04 | ) | (.07 | ) | (.11 | ) | 11.70 | 6.63 | 31 | 1.06 | 1.89 | |||||||||||||||||||||||||||||||||
| 12/31/2016 | 10.89 | .20 | .06 | .26 | (.05 | ) | (.02 | ) | (.07 | ) | 11.08 | 2.42 | 12 | 1.07 | 1.76 | |||||||||||||||||||||||||||||||||
| 12/31/2015 | 11.70 | .21 | (.71 | ) | (.50 | ) | — | 8 | (.31 | ) | (.31 | ) | 10.89 | (4.27 | ) | 6 | 1.07 | 1.86 | ||||||||||||||||||||||||||||||
| 12/31/2014 | 11.87 | .20 | (.05 | ) | .15 | (.21 | ) | (.11 | ) | (.32 | ) | 11.70 | 1.16 | 4 | 1.09 | 1.66 | ||||||||||||||||||||||||||||||||
| High-Income Bond Fund | ||||||||||||||||||||||||||||||||||||||||||||||||
| Class 1: | ||||||||||||||||||||||||||||||||||||||||||||||||
| 12/31/2018 | $ | 10.19 | $ | .64 | $ | (.84 | ) | $ | (.20 | ) | $ | (.65 | ) | $ | — | $ | (.65 | ) | $ | 9.34 | (2.15 | )% | $ | 501 | .50 | % | 6.32 | % | ||||||||||||||||||||
| 12/31/2017 | 10.18 | .63 | .10 | .73 | (.72 | ) | — | (.72 | ) | 10.19 | 7.25 | 632 | .49 | 5.98 | ||||||||||||||||||||||||||||||||||
| 12/31/2016 | 9.19 | .61 | 1.02 | 1.63 | (.64 | ) | — | (.64 | ) | 10.18 | 17.83 | 949 | .49 | 6.18 | ||||||||||||||||||||||||||||||||||
| 12/31/2015 | 10.54 | .64 | (1.36 | ) | (.72 | ) | (.63 | ) | — | (.63 | ) | 9.19 | (6.94 | ) | 1,017 | .48 | 6.12 | |||||||||||||||||||||||||||||||
| 12/31/2014 | 11.13 | .67 | (.59 | ) | .08 | (.67 | ) | — | (.67 | ) | 10.54 | .80 | 1,017 | .48 | 5.90 | |||||||||||||||||||||||||||||||||
| Class 1A: | ||||||||||||||||||||||||||||||||||||||||||||||||
| 12/31/2018 | 10.18 | .62 | (.84 | ) | (.22 | ) | (.63 | ) | — | (.63 | ) | 9.33 | (2.35 | ) | 1 | .75 | 6.11 | |||||||||||||||||||||||||||||||
| 12/31/20173,4 | 10.28 | .60 | .02 | .62 | (.72 | ) | — | (.72 | ) | 10.18 | 6.02 | 5 | — | 7 | .72 | 6 | 5.74 | 6 | ||||||||||||||||||||||||||||||
| Class 2: | ||||||||||||||||||||||||||||||||||||||||||||||||
| 12/31/2018 | 10.03 | .61 | (.83 | ) | (.22 | ) | (.62 | ) | — | (.62 | ) | 9.19 | (2.34 | ) | 661 | .75 | 6.07 | |||||||||||||||||||||||||||||||
| 12/31/2017 | 10.04 | .59 | .10 | .69 | (.70 | ) | — | (.70 | ) | 10.03 | 6.89 | 776 | .74 | 5.72 | ||||||||||||||||||||||||||||||||||
| 12/31/2016 | 9.06 | .58 | 1.01 | 1.59 | (.61 | ) | — | (.61 | ) | 10.04 | 17.69 | 799 | .74 | 5.92 | ||||||||||||||||||||||||||||||||||
| 12/31/2015 | 10.41 | .60 | (1.35 | ) | (.75 | ) | (.60 | ) | — | (.60 | ) | 9.06 | (7.30 | ) | 765 | .73 | 5.85 | |||||||||||||||||||||||||||||||
| 12/31/2014 | 10.99 | .63 | (.57 | ) | .06 | (.64 | ) | — | (.64 | ) | 10.41 | .63 | 929 | .73 | 5.67 | |||||||||||||||||||||||||||||||||
| Class 3: | ||||||||||||||||||||||||||||||||||||||||||||||||
| 12/31/2018 | 10.23 | .63 | (.85 | ) | (.22 | ) | (.63 | ) | — | (.63 | ) | 9.38 | (2.33 | ) | 10 | .68 | 6.14 | |||||||||||||||||||||||||||||||
| 12/31/2017 | 10.22 | .61 | .10 | .71 | (.70 | ) | — | (.70 | ) | 10.23 | 7.02 | 12 | .67 | 5.79 | ||||||||||||||||||||||||||||||||||
| 12/31/2016 | 9.22 | .59 | 1.03 | 1.62 | (.62 | ) | — | (.62 | ) | 10.22 | 17.68 | 13 | .67 | 5.99 | ||||||||||||||||||||||||||||||||||
| 12/31/2015 | 10.57 | .62 | (1.37 | ) | (.75 | ) | (.60 | ) | — | (.60 | ) | 9.22 | (7.13 | ) | 12 | .66 | 5.91 | |||||||||||||||||||||||||||||||
| 12/31/2014 | 11.16 | .65 | (.59 | ) | .06 | (.65 | ) | — | (.65 | ) | 10.57 | .59 | 16 | .66 | 5.74 | |||||||||||||||||||||||||||||||||
| Class 4: | ||||||||||||||||||||||||||||||||||||||||||||||||
| 12/31/2018 | 10.82 | .63 | (.90 | ) | (.27 | ) | (.59 | ) | — | (.59 | ) | 9.96 | (2.64 | ) | 31 | 1.00 | 5.83 | |||||||||||||||||||||||||||||||
| 12/31/2017 | 10.79 | .61 | .10 | .71 | (.68 | ) | — | (.68 | ) | 10.82 | 6.63 | 34 | .99 | 5.46 | ||||||||||||||||||||||||||||||||||
| 12/31/2016 | 9.73 | .60 | 1.07 | 1.67 | (.61 | ) | — | (.61 | ) | 10.79 | 17.29 | 21 | .99 | 5.55 | ||||||||||||||||||||||||||||||||||
| 12/31/2015 | 11.05 | .62 | (1.43 | ) | (.81 | ) | (.51 | ) | — | (.51 | ) | 9.73 | (7.42 | ) | 1 | .98 | 5.51 | |||||||||||||||||||||||||||||||
| 12/31/2014 | 11.12 | .63 | (.59 | ) | .04 | (.11 | ) | — | (.11 | ) | 11.05 | .35 | — | 7 | .98 | 5.49 | ||||||||||||||||||||||||||||||||
See end of tables for footnotes.
| American Funds Insurance Series | 203 |
Financial highlights(continued)
| (Loss) income from investment operations1 | Dividends and distributions | |||||||||||||||||||||||||||||||||||||||||||||||
| Period ended | Net asset value, beginning of period | Net investment income (loss) | Net (losses) gains on securities (both realized and unrealized) | Total from investment operations | Dividends (from net investment income) | Distributions (from capital gains) | Total dividends and distributions | Net asset value, end of period | Total return | Net assets, end of period (in millions) | Ratio of expenses to average net assets | Ratio of net income (loss) to average net assets | ||||||||||||||||||||||||||||||||||||
| Mortgage Fund | ||||||||||||||||||||||||||||||||||||||||||||||||
| Class 1: | ||||||||||||||||||||||||||||||||||||||||||||||||
| 12/31/2018 | $ | 10.47 | $ | .20 | $ | (.14 | ) | $ | .06 | $ | (.23 | ) | $ | — | $ | (.23 | ) | $ | 10.30 | .58 | % | $ | 209 | .48 | % | 1.97 | % | |||||||||||||||||||||
| 12/31/2017 | 10.56 | .16 | — | 8 | .16 | (.18 | ) | (.07 | ) | (.25 | ) | 10.47 | 1.47 | 265 | .47 | 1.52 | ||||||||||||||||||||||||||||||||
| 12/31/2016 | 10.61 | .15 | .11 | .26 | (.20 | ) | (.11 | ) | (.31 | ) | 10.56 | 2.50 | 269 | .46 | 1.39 | |||||||||||||||||||||||||||||||||
| 12/31/2015 | 10.70 | .10 | .13 | .23 | (.18 | ) | (.14 | ) | (.32 | ) | 10.61 | 2.09 | 272 | .45 | .89 | |||||||||||||||||||||||||||||||||
| 12/31/2014 | 10.23 | .12 | .45 | .57 | (.10 | ) | — | (.10 | ) | 10.70 | 5.54 | 292 | .45 | 1.12 | ||||||||||||||||||||||||||||||||||
| Class 1A: | ||||||||||||||||||||||||||||||||||||||||||||||||
| 12/31/2018 | 10.46 | .18 | (.14 | ) | .04 | (.22 | ) | — | (.22 | ) | 10.28 | .36 | 1 | .73 | 1.77 | |||||||||||||||||||||||||||||||||
| 12/31/20173,4 | 10.55 | .14 | — | 8 | .14 | (.16 | ) | (.07 | ) | (.23 | ) | 10.46 | 1.31 | 5 | — | 7 | .70 | 6 | 1.38 | 6 | ||||||||||||||||||||||||||||
| Class 2: | ||||||||||||||||||||||||||||||||||||||||||||||||
| 12/31/2018 | 10.45 | .18 | (.15 | ) | .03 | (.20 | ) | — | (.20 | ) | 10.28 | .32 | 57 | .73 | 1.72 | |||||||||||||||||||||||||||||||||
| 12/31/2017 | 10.54 | .14 | (.01 | ) | .13 | (.15 | ) | (.07 | ) | (.22 | ) | 10.45 | 1.22 | 63 | .72 | 1.27 | ||||||||||||||||||||||||||||||||
| 12/31/2016 | 10.59 | .12 | .12 | .24 | (.18 | ) | (.11 | ) | (.29 | ) | 10.54 | 2.25 | 63 | .71 | 1.14 | |||||||||||||||||||||||||||||||||
| 12/31/2015 | 10.68 | .07 | .13 | .20 | (.15 | ) | (.14 | ) | (.29 | ) | 10.59 | 1.86 | 59 | .70 | .65 | |||||||||||||||||||||||||||||||||
| 12/31/2014 | 10.22 | .10 | .44 | .54 | (.08 | ) | — | (.08 | ) | 10.68 | 5.23 | 52 | .70 | .91 | ||||||||||||||||||||||||||||||||||
| Class 4: | ||||||||||||||||||||||||||||||||||||||||||||||||
| 12/31/2018 | 10.38 | .15 | (.15 | ) | — | 8 | (.19 | ) | — | (.19 | ) | 10.19 | .07 | 24 | .98 | 1.49 | ||||||||||||||||||||||||||||||||
| 12/31/2017 | 10.48 | .11 | — | 8 | .11 | (.14 | ) | (.07 | ) | (.21 | ) | 10.38 | .97 | 12 | .97 | 1.03 | ||||||||||||||||||||||||||||||||
| 12/31/2016 | 10.52 | .09 | .12 | .21 | (.14 | ) | (.11 | ) | (.25 | ) | 10.48 | 2.01 | 8 | .96 | .86 | |||||||||||||||||||||||||||||||||
| 12/31/2015 | 10.65 | .04 | .14 | .18 | (.17 | ) | (.14 | ) | (.31 | ) | 10.52 | 1.62 | 11 | .97 | .37 | |||||||||||||||||||||||||||||||||
| 12/31/2014 | 10.23 | .05 | .46 | .51 | (.09 | ) | — | (.09 | ) | 10.65 | 4.98 | 1 | .94 | .47 | ||||||||||||||||||||||||||||||||||
| Ultra-Short Bond Fund | ||||||||||||||||||||||||||||||||||||||||||||||||
| Class 1: | ||||||||||||||||||||||||||||||||||||||||||||||||
| 12/31/2018 | $ | 11.29 | $ | .18 | $ | — | 8 | $ | .18 | $ | (.16 | ) | $ | — | $ | (.16 | ) | $ | 11.31 | 1.58 | % | $ | 37 | .35 | % | 1.60 | % | |||||||||||||||||||||
| 12/31/2017 | 11.27 | .08 | (.01 | ) | .07 | (.05 | ) | — | (.05 | ) | 11.29 | .66 | 37 | .35 | .68 | |||||||||||||||||||||||||||||||||
| 12/31/201612 | 11.26 | .01 | — | 8 | .01 | — | — | — | 11.27 | .09 | 37 | .35 | .11 | |||||||||||||||||||||||||||||||||||
| 12/31/2015 | 11.28 | (.03 | ) | .01 | (.02 | ) | — | — | — | 11.26 | (.18 | ) | 39 | .34 | (.24 | ) | ||||||||||||||||||||||||||||||||
| 12/31/2014 | 11.31 | (.03 | ) | — | (.03 | ) | — | — | — | 11.28 | (.27 | ) | 49 | .34 | (.26 | ) | ||||||||||||||||||||||||||||||||
| Class 1A: | ||||||||||||||||||||||||||||||||||||||||||||||||
| 12/31/2018 | 11.29 | .18 | — | 8 | .18 | (.16 | ) | — | (.16 | ) | 11.31 | 1.58 | 11 | — | 7 | .35 | 11 | 1.60 | 11 | |||||||||||||||||||||||||||||
| 12/31/20173,4 | 11.27 | .08 | — | 8 | .08 | (.06 | ) | — | (.06 | ) | 11.29 | .67 | 5,11 | — | 7 | .34 | 6,11 | .69 | 6,11 | |||||||||||||||||||||||||||||
| Class 2: | ||||||||||||||||||||||||||||||||||||||||||||||||
| 12/31/2018 | 11.01 | .15 | — | 8 | .15 | (.13 | ) | — | (.13 | ) | 11.03 | 1.36 | 247 | .60 | 1.34 | |||||||||||||||||||||||||||||||||
| 12/31/2017 | 10.99 | .05 | — | 8 | .05 | (.03 | ) | — | (.03 | ) | 11.01 | .46 | 249 | .60 | .42 | |||||||||||||||||||||||||||||||||
| 12/31/201612 | 11.01 | (.02 | ) | — | 8 | (.02 | ) | — | — | — | 10.99 | (.18 | ) | 297 | .60 | (.14 | ) | |||||||||||||||||||||||||||||||
| 12/31/2015 | 11.06 | (.05 | ) | — | 8 | (.05 | ) | — | — | — | 11.01 | (.45 | ) | 302 | .59 | (.49 | ) | |||||||||||||||||||||||||||||||
| 12/31/2014 | 11.12 | (.06 | ) | — | (.06 | ) | — | — | — | 11.06 | (.54 | ) | 331 | .59 | (.51 | ) | ||||||||||||||||||||||||||||||||
| Class 3: | ||||||||||||||||||||||||||||||||||||||||||||||||
| 12/31/2018 | 11.12 | .16 | (.01 | ) | .15 | (.13 | ) | — | (.13 | ) | 11.14 | 1.38 | 4 | .53 | 1.42 | |||||||||||||||||||||||||||||||||
| 12/31/2017 | 11.10 | .06 | — | 8 | .06 | (.04 | ) | — | (.04 | ) | 11.12 | .54 | 4 | .53 | .50 | |||||||||||||||||||||||||||||||||
| 12/31/201612 | 11.11 | (.01 | ) | — | 8 | (.01 | ) | — | — | — | 11.10 | (.09 | ) | 4 | .53 | (.08 | ) | |||||||||||||||||||||||||||||||
| 12/31/2015 | 11.16 | (.05 | ) | — | 8 | (.05 | ) | — | — | — | 11.11 | (.45 | ) | 6 | .52 | (.42 | ) | |||||||||||||||||||||||||||||||
| 12/31/2014 | 11.21 | (.05 | ) | — | (.05 | ) | — | — | — | 11.16 | (.45 | ) | 8 | .52 | (.44 | ) | ||||||||||||||||||||||||||||||||
| Class 4: | ||||||||||||||||||||||||||||||||||||||||||||||||
| 12/31/2018 | 11.13 | .12 | .01 | .13 | (.11 | ) | — | (.11 | ) | 11.15 | 1.14 | 18 | .86 | 1.11 | ||||||||||||||||||||||||||||||||||
| 12/31/2017 | 11.12 | .02 | — | 8 | .02 | (.01 | ) | — | (.01 | ) | 11.13 | .16 | 15 | .85 | .19 | |||||||||||||||||||||||||||||||||
| 12/31/201612 | 11.17 | (.04 | ) | (.01 | ) | (.05 | ) | — | — | — | 11.12 | (.45 | ) | 13 | .85 | (.40 | ) | |||||||||||||||||||||||||||||||
| 12/31/2015 | 11.25 | (.08 | ) | — | 8 | (.08 | ) | — | — | — | 11.17 | (.71 | ) | 16 | .85 | (.74 | ) | |||||||||||||||||||||||||||||||
| 12/31/2014 | 11.30 | (.09 | ) | .04 | (.05 | ) | — | — | — | 11.25 | (.44 | ) | 7 | .84 | (.77 | ) | ||||||||||||||||||||||||||||||||
| 204 | American Funds Insurance Series |
| (Loss) income from investment operations1 | Dividends and distributions | |||||||||||||||||||||||||||||||||||||||||||||||
| Period ended | Net asset value, beginning of period | Net investment income (loss) | Net (losses) gains on securities (both realized and unrealized) | Total from investment operations | Dividends (from net investment income) | Distributions (from capital gains) | Total dividends and distributions | Net asset value, end of period | Total return | Net assets, end of period (in millions) | Ratio of expenses to average net assets | Ratio of net income (loss) to average net assets | ||||||||||||||||||||||||||||||||||||
| U.S. Government/AAA-Rated Securities Fund | ||||||||||||||||||||||||||||||||||||||||||||||||
| Class 1: | ||||||||||||||||||||||||||||||||||||||||||||||||
| 12/31/2018 | $ | 12.08 | $ | .24 | $ | (.13 | ) | $ | .11 | $ | (.25 | ) | $ | — | $ | (.25 | ) | $ | 11.94 | .91 | % | $ | 1,445 | .36 | % | 2.02 | % | |||||||||||||||||||||
| 12/31/2017 | 12.05 | .21 | .01 | .22 | (.19 | ) | — | (.19 | ) | 12.08 | 1.83 | 1,558 | .36 | 1.68 | ||||||||||||||||||||||||||||||||||
| 12/31/2016 | 12.31 | .16 | .03 | .19 | (.20 | ) | (.25 | ) | (.45 | ) | 12.05 | 1.44 | 1,467 | .36 | 1.31 | |||||||||||||||||||||||||||||||||
| 12/31/2015 | 12.40 | .13 | .09 | .22 | (.21 | ) | (.10 | ) | (.31 | ) | 12.31 | 1.93 | 1,426 | .35 | 1.02 | |||||||||||||||||||||||||||||||||
| 12/31/2014 | 11.94 | .15 | .48 | .63 | (.17 | ) | — | (.17 | ) | 12.40 | 5.24 | 1,723 | .35 | 1.24 | ||||||||||||||||||||||||||||||||||
| Class 1A: | ||||||||||||||||||||||||||||||||||||||||||||||||
| 12/31/2018 | 12.08 | .22 | (.14 | ) | .08 | (.23 | ) | — | (.23 | ) | 11.93 | .70 | 1 | .61 | 1.82 | |||||||||||||||||||||||||||||||||
| 12/31/20173,4 | 12.05 | .18 | .03 | .21 | (.18 | ) | — | (.18 | ) | 12.08 | 1.73 | 5 | — | 7 | .58 | 6 | 1.53 | 6 | ||||||||||||||||||||||||||||||
| Class 2: | ||||||||||||||||||||||||||||||||||||||||||||||||
| 12/31/2018 | 11.96 | .21 | (.14 | ) | .07 | (.21 | ) | — | (.21 | ) | 11.82 | .73 | 1,323 | .61 | 1.77 | |||||||||||||||||||||||||||||||||
| 12/31/2017 | 11.93 | .17 | .02 | .19 | (.16 | ) | — | (.16 | ) | 11.96 | 1.59 | 1,473 | .61 | 1.43 | ||||||||||||||||||||||||||||||||||
| 12/31/2016 | 12.20 | .13 | .02 | .15 | (.17 | ) | (.25 | ) | (.42 | ) | 11.93 | 1.19 | 1,503 | .61 | 1.05 | |||||||||||||||||||||||||||||||||
| 12/31/2015 | 12.29 | .10 | .09 | .19 | (.18 | ) | (.10 | ) | (.28 | ) | 12.20 | 1.59 | 1,579 | .60 | .79 | |||||||||||||||||||||||||||||||||
| 12/31/2014 | 11.83 | .12 | .47 | .59 | (.13 | ) | — | (.13 | ) | 12.29 | 5.01 | 1,717 | .60 | 1.00 | ||||||||||||||||||||||||||||||||||
| Class 3: | ||||||||||||||||||||||||||||||||||||||||||||||||
| 12/31/2018 | 12.11 | .22 | (.14 | ) | .08 | (.22 | ) | — | (.22 | ) | 11.97 | .71 | 9 | .54 | 1.84 | |||||||||||||||||||||||||||||||||
| 12/31/2017 | 12.07 | .18 | .03 | .21 | (.17 | ) | — | (.17 | ) | 12.11 | 1.72 | 10 | .54 | 1.50 | ||||||||||||||||||||||||||||||||||
| 12/31/2016 | 12.34 | .14 | .02 | .16 | (.18 | ) | (.25 | ) | (.43 | ) | 12.07 | 1.24 | 11 | .54 | 1.12 | |||||||||||||||||||||||||||||||||
| 12/31/2015 | 12.43 | .11 | .09 | .20 | (.19 | ) | (.10 | ) | (.29 | ) | 12.34 | 1.64 | 11 | .53 | .85 | |||||||||||||||||||||||||||||||||
| 12/31/2014 | 11.96 | .13 | .48 | .61 | (.14 | ) | — | (.14 | ) | 12.43 | 5.11 | 13 | .53 | 1.08 | ||||||||||||||||||||||||||||||||||
| Class 4: | ||||||||||||||||||||||||||||||||||||||||||||||||
| 12/31/2018 | 11.98 | .18 | (.12 | ) | .06 | (.20 | ) | — | (.20 | ) | 11.84 | .50 | 91 | .86 | 1.53 | |||||||||||||||||||||||||||||||||
| 12/31/2017 | 11.96 | .14 | .01 | .15 | (.13 | ) | — | (.13 | ) | 11.98 | 1.28 | 62 | .86 | 1.18 | ||||||||||||||||||||||||||||||||||
| 12/31/2016 | 12.22 | .10 | .03 | .13 | (.14 | ) | (.25 | ) | (.39 | ) | 11.96 | .99 | 57 | .86 | .82 | |||||||||||||||||||||||||||||||||
| 12/31/2015 | 12.34 | .07 | .08 | .15 | (.17 | ) | (.10 | ) | (.27 | ) | 12.22 | 1.29 | 46 | .85 | .56 | |||||||||||||||||||||||||||||||||
| 12/31/2014 | 11.93 | .06 | .51 | .57 | (.16 | ) | — | (.16 | ) | 12.34 | 4.76 | 21 | .85 | .50 | ||||||||||||||||||||||||||||||||||
See end of tables for footnotes.
| American Funds Insurance Series | 205 |
Financial highlights(continued)
| Income from investment operations1 | Dividends and distributions | Ratio of expenses | Ratio of expenses | ||||||||||||||||||||||||||||||||||||||||||||||||||||
| Period ended | Net asset value, beginning of period | Net investment income (loss) | Net gains (losses) on securities (both realized and unrealized) | Total from investment operations | Dividends (from net investment income) | Distribu- tions (from capital gains) | Total dividends and distribu- tions | Net asset value, end of period | Total return13 | Net assets, end of period (in millions) | to average net assets before waivers/ reimburse- ments | to average net assets after waivers/ reimburse- ments13 | Net effective expense ratio13,14 | Ratio of net income to average net assets13 | |||||||||||||||||||||||||||||||||||||||||
| Managed Risk Growth Fund | |||||||||||||||||||||||||||||||||||||||||||||||||||||||
| Class P1: | |||||||||||||||||||||||||||||||||||||||||||||||||||||||
| 12/31/2018 | $ | 13.22 | $ | .11 | $ | (.04 | ) | $ | .07 | $ | (.10 | ) | $ | (.89 | ) | $ | (.99 | ) | $ | 12.30 | (.04 | )%11 | $ | 3 | .42 | %11 | .37 | %11 | .71 | %11 | .82 | %11 | |||||||||||||||||||||||
| 12/31/2017 | 10.71 | .08 | 2.70 | 2.78 | (.07 | ) | (.20 | ) | (.27 | ) | 13.22 | 26.23 | 11 | 2 | .42 | 11 | .36 | 11 | .70 | 11 | .69 | 11 | |||||||||||||||||||||||||||||||||
| 12/31/2016 | 11.49 | .08 | .20 | .28 | (.05 | ) | (1.01 | ) | (1.06 | ) | 10.71 | 2.89 | 11 | 1 | .50 | 11 | .34 | 11 | .68 | 11 | .79 | 11 | |||||||||||||||||||||||||||||||||
| 12/31/2015 | 11.37 | .09 | .03 | .12 | — | — | — | 11.49 | 1.06 | 11 | — | 7 | .53 | 11 | .29 | 11 | .63 | 11 | .80 | 11 | |||||||||||||||||||||||||||||||||||
| 12/31/2014 | 11.43 | .31 | (.06 | ) | .25 | (.12 | ) | (.19 | ) | (.31 | ) | 11.37 | 2.18 | 11 | — | 7 | .50 | 11 | .32 | 11 | .65 | 11 | 2.71 | 11 | |||||||||||||||||||||||||||||||
| Class P2: | |||||||||||||||||||||||||||||||||||||||||||||||||||||||
| 12/31/2018 | 13.14 | .06 | (.04 | ) | .02 | (.06 | ) | (.89 | ) | (.95 | ) | 12.21 | (.37 | ) | 340 | .68 | .63 | .97 | .46 | ||||||||||||||||||||||||||||||||||||
| 12/31/2017 | 10.64 | .04 | 2.70 | 2.74 | (.04 | ) | (.20 | ) | (.24 | ) | 13.14 | 25.99 | 286 | .69 | .63 | .97 | .34 | ||||||||||||||||||||||||||||||||||||||
| 12/31/2016 | 11.43 | .05 | .19 | .24 | (.02 | ) | (1.01 | ) | (1.03 | ) | 10.64 | 2.52 | 200 | .79 | .63 | .97 | .43 | ||||||||||||||||||||||||||||||||||||||
| 12/31/2015 | 11.35 | .04 | .04 | .08 | — | — | — | 11.43 | .71 | 146 | .89 | .66 | 1.00 | .31 | |||||||||||||||||||||||||||||||||||||||||
| 12/31/2014 | 11.43 | .12 | .08 | .20 | (.09 | ) | (.19 | ) | (.28 | ) | 11.35 | 1.77 | 79 | .87 | .69 | 1.02 | 1.01 | ||||||||||||||||||||||||||||||||||||||
| Managed Risk International Fund | |||||||||||||||||||||||||||||||||||||||||||||||||||||||
| Class P1: | |||||||||||||||||||||||||||||||||||||||||||||||||||||||
| 12/31/2018 | $ | 11.25 | $ | .32 | $ | (1.44 | ) | $ | (1.12 | ) | $ | (.26 | ) | $ | (.05 | ) | $ | (.31 | ) | $ | 9.82 | (10.11 | )%11 | $ | — | 7 | .33 | %11 | .28 | %11 | .77 | %11 | 3.02 | %11 | |||||||||||||||||||||
| 12/31/2017 | 8.89 | .11 | 2.47 | 2.58 | (.10 | ) | (.12 | ) | (.22 | ) | 11.25 | 29.28 | 11 | — | 7 | .28 | 11 | .20 | 11 | .69 | 11 | 1.13 | 11 | ||||||||||||||||||||||||||||||||
| 12/31/2016 | 9.48 | .10 | (.35 | ) | (.25 | ) | (.12 | ) | (.22 | ) | (.34 | ) | 8.89 | (2.59 | )11 | — | 7 | .39 | 11 | .23 | 11 | .74 | 11 | 1.15 | 11 | ||||||||||||||||||||||||||||||
| 12/31/2015 | 10.10 | .18 | (.80 | ) | (.62 | ) | — | 8 | — | — | 8 | 9.48 | (6.12 | )11 | — | 7 | .45 | 11 | .21 | 11 | .72 | 11 | 1.75 | 11 | |||||||||||||||||||||||||||||||
| 12/31/2014 | 10.82 | .14 | (.71 | ) | (.57 | ) | (.15 | ) | — | (.15 | ) | 10.10 | (5.31 | )11 | — | 7 | .50 | 11 | .25 | 11 | .76 | 11 | 1.33 | 11 | |||||||||||||||||||||||||||||||
| Class P2: | |||||||||||||||||||||||||||||||||||||||||||||||||||||||
| 12/31/2018 | 11.15 | .16 | (1.32 | ) | (1.16 | ) | (.18 | ) | (.05 | ) | (.23 | ) | 9.76 | (10.50 | ) | 151 | .69 | .64 | 1.13 | 1.49 | |||||||||||||||||||||||||||||||||||
| 12/31/2017 | 8.83 | .11 | 2.41 | 2.52 | (.08 | ) | (.12 | ) | (.20 | ) | 11.15 | 28.69 | 148 | .71 | .63 | 1.12 | 1.03 | ||||||||||||||||||||||||||||||||||||||
| 12/31/2016 | 9.43 | .09 | (.38 | ) | (.29 | ) | (.09 | ) | (.22 | ) | (.31 | ) | 8.83 | (3.05 | ) | 97 | .79 | .63 | 1.14 | .97 | |||||||||||||||||||||||||||||||||||
| 12/31/2015 | 10.09 | .13 | (.79 | ) | (.66 | ) | — | 8 | — | — | 8 | 9.43 | (6.52 | ) | 83 | .90 | .66 | 1.17 | 1.30 | ||||||||||||||||||||||||||||||||||||
| 12/31/2014 | 10.82 | .16 | (.77 | ) | (.61 | ) | (.12 | ) | — | (.12 | ) | 10.09 | (5.68 | ) | 46 | .91 | .67 | 1.18 | 1.51 | ||||||||||||||||||||||||||||||||||||
| Managed Risk Blue Chip Income and Growth Fund | |||||||||||||||||||||||||||||||||||||||||||||||||||||||
| Class P1: | |||||||||||||||||||||||||||||||||||||||||||||||||||||||
| 12/31/2018 | $ | 13.04 | $ | .40 | $ | (1.27 | ) | $ | (.87 | ) | $ | (.45 | ) | $ | (.44 | ) | $ | (.89 | ) | $ | 11.28 | (6.99 | )%11 | $ | — | 7 | .33 | %11 | .28 | %11 | .67 | %11 | 3.21 | %11 | |||||||||||||||||||||
| 12/31/2017 | 11.67 | .19 | 1.59 | 1.78 | (.22 | ) | (.19 | ) | (.41 | ) | 13.04 | 15.48 | 11 | — | 7 | .30 | 11 | .25 | 11 | .64 | 11 | 1.59 | 11 | ||||||||||||||||||||||||||||||||
| 12/31/2016 | 10.80 | .20 | 1.25 | 1.45 | (.21 | ) | (.37 | ) | (.58 | ) | 11.67 | 13.77 | 11 | — | 7 | .43 | 11 | .27 | 11 | .67 | 11 | 1.83 | 11 | ||||||||||||||||||||||||||||||||
| 12/31/2015 | 11.70 | .19 | (1.02 | ) | (.83 | ) | (.07 | ) | — | (.07 | ) | 10.80 | (7.07 | )11 | — | 7 | .50 | 11 | .27 | 11 | .66 | 11 | 1.64 | 11 | |||||||||||||||||||||||||||||||
| 12/31/2014 | 11.05 | .40 | .55 | .95 | (.30 | ) | — | (.30 | ) | 11.70 | 8.58 | 11 | — | 7 | .50 | 11 | .31 | 11 | .70 | 11 | 3.43 | 11 | |||||||||||||||||||||||||||||||||
| Class P2: | |||||||||||||||||||||||||||||||||||||||||||||||||||||||
| 12/31/2018 | 12.96 | .19 | (1.10 | ) | (.91 | ) | (.40 | ) | (.44 | ) | (.84 | ) | 11.21 | (7.38 | ) | 336 | .68 | .63 | 1.02 | 1.49 | |||||||||||||||||||||||||||||||||||
| 12/31/2017 | 11.61 | .17 | 1.55 | 1.72 | (.18 | ) | (.19 | ) | (.37 | ) | 12.96 | 15.03 | 367 | .68 | .63 | 1.02 | 1.43 | ||||||||||||||||||||||||||||||||||||||
| 12/31/2016 | 10.76 | .23 | 1.18 | 1.41 | (.19 | ) | (.37 | ) | (.56 | ) | 11.61 | 13.39 | 291 | .79 | .63 | 1.03 | 2.04 | ||||||||||||||||||||||||||||||||||||||
| 12/31/2015 | 11.67 | .18 | (1.05 | ) | (.87 | ) | (.04 | ) | — | (.04 | ) | 10.76 | (7.43 | ) | 137 | .89 | .66 | 1.05 | 1.57 | ||||||||||||||||||||||||||||||||||||
| 12/31/2014 | 11.05 | .50 | .40 | .90 | (.28 | ) | — | (.28 | ) | 11.67 | 8.10 | 98 | .88 | .69 | 1.08 | 4.27 | |||||||||||||||||||||||||||||||||||||||
| Managed Risk Growth-Income Fund | |||||||||||||||||||||||||||||||||||||||||||||||||||||||
| Class P1: | |||||||||||||||||||||||||||||||||||||||||||||||||||||||
| 12/31/2018 | $ | 12.66 | $ | (.02 | ) | $ | (.15 | ) | $ | (.17 | ) | $ | (.19 | ) | $ | (.57 | ) | $ | (.76 | ) | $ | 11.73 | (1.66) | %11 | $ | 1,662 | .40 | %11 | .35 | %11 | .64 | %11 | (.20) | %11 | |||||||||||||||||||||
| 12/31/2017 | 11.07 | .19 | 2.03 | 2.22 | (.13 | ) | (.50 | ) | (.63 | ) | 12.66 | 20.64 | 11 | 2 | .44 | 11 | .37 | 11 | .66 | 11 | 1.61 | 11 | |||||||||||||||||||||||||||||||||
| 12/31/2016 | 11.25 | .16 | .52 | .68 | (.16 | ) | (.70 | ) | (.86 | ) | 11.07 | 6.49 | 11 | 1 | .52 | 11 | .36 | 11 | .64 | 11 | 1.46 | 11 | |||||||||||||||||||||||||||||||||
| 12/31/2015 | 11.67 | .25 | (.63 | ) | (.38 | ) | (.04 | ) | — | (.04 | ) | 11.25 | (3.27 | )11 | 1 | .56 | 11 | .31 | 11 | .59 | 11 | 2.17 | 11 | ||||||||||||||||||||||||||||||||
| 12/31/2014 | 11.50 | .35 | .21 | .56 | (.14 | ) | (.25 | ) | (.39 | ) | 11.67 | 4.85 | 11 | — | 7 | .45 | 11 | .25 | 11 | .52 | 11 | 2.94 | 11 | ||||||||||||||||||||||||||||||||
| Class P2: | |||||||||||||||||||||||||||||||||||||||||||||||||||||||
| 12/31/2018 | 12.58 | .16 | (.36 | ) | (.20 | ) | (.14 | ) | (.57 | ) | (.71 | ) | 11.67 | (1.97 | ) | 230 | .69 | .64 | .93 | 1.25 | |||||||||||||||||||||||||||||||||||
| 12/31/2017 | 11.02 | .13 | 2.05 | 2.18 | (.12 | ) | (.50 | ) | (.62 | ) | 12.58 | 20.40 | 206 | .70 | .63 | .92 | 1.08 | ||||||||||||||||||||||||||||||||||||||
| 12/31/2016 | 11.22 | .12 | .52 | .64 | (.14 | ) | (.70 | ) | (.84 | ) | 11.02 | 6.08 | 160 | .79 | .63 | .91 | 1.13 | ||||||||||||||||||||||||||||||||||||||
| 12/31/2015 | 11.65 | .12 | (.54 | ) | (.42 | ) | (.01 | ) | — | (.01 | ) | 11.22 | (3.64 | ) | 122 | .89 | .66 | .94 | 1.04 | ||||||||||||||||||||||||||||||||||||
| 12/31/2014 | 11.50 | .16 | .35 | .51 | (.11 | ) | (.25 | ) | (.36 | ) | 11.65 | 4.42 | 76 | .87 | .69 | .96 | 1.38 | ||||||||||||||||||||||||||||||||||||||
| 206 | American Funds Insurance Series |
| Income from investment operations1 | Dividends and distributions | Ratio of expenses | Ratio of expenses | ||||||||||||||||||||||||||||||||||||||||||||||||||||
| Period ended | Net asset value, beginning of period | Net investment income (loss) | Net gains (losses) on securities (both realized and unrealized) | Total from investment operations | Dividends (from net investment income) | Distribu- tions (from capital gains) | Total dividends and distribu- tions | Net asset value, end of period | Total return13 | Net assets, end of period (in millions) | to average net assets before waivers/ reimburse- ments | to average net assets after waivers/ reimburse- ments13 | Net effective expense ratio13,14 | Ratio of net income to average net assets13 | |||||||||||||||||||||||||||||||||||||||||
| Managed Risk Asset Allocation Fund | |||||||||||||||||||||||||||||||||||||||||||||||||||||||
| Class P1: | |||||||||||||||||||||||||||||||||||||||||||||||||||||||
| 12/31/2018 | $ | 13.59 | $ | .22 | $ | (.80 | ) | $ | (.58 | ) | $ | (.25 | ) | $ | (.53 | ) | $ | (.78 | ) | $ | 12.23 | (4.63 | )% | $ | 2 | .37 | % | .32 | % | .59 | % | 1.67 | % | ||||||||||||||||||||||
| 12/31/2017 | 12.02 | .19 | 1.60 | 1.79 | (.10 | ) | (.12 | ) | (.22 | ) | 13.59 | 15.06 | 1,656 | .43 | .38 | .66 | 1.45 | ||||||||||||||||||||||||||||||||||||||
| 12/31/2016 | 11.72 | .19 | .67 | .86 | (.19 | ) | (.37 | ) | (.56 | ) | 12.02 | 7.57 | 1,217 | .43 | .38 | .66 | 1.65 | ||||||||||||||||||||||||||||||||||||||
| 12/31/2015 | 12.29 | .25 | (.34 | ) | (.09 | ) | (.22 | ) | (.26 | ) | (.48 | ) | 11.72 | (.83 | ) | 712 | .54 | .40 | .68 | 2.06 | |||||||||||||||||||||||||||||||||||
| 12/31/2014 | 11.93 | .13 | .26 | .39 | (.03 | ) | — | (.03 | ) | 12.29 | 3.24 | 277 | .53 | .48 | .76 | 1.04 | |||||||||||||||||||||||||||||||||||||||
| Class P2: | |||||||||||||||||||||||||||||||||||||||||||||||||||||||
| 12/31/2018 | 13.55 | .17 | (.79 | ) | (.62 | ) | (.18 | ) | (.53 | ) | (.71 | ) | 12.22 | (4.89 | ) | 2,541 | .62 | .57 | .84 | 1.27 | |||||||||||||||||||||||||||||||||||
| 12/31/2017 | 12.01 | .15 | 1.61 | 1.76 | (.10 | ) | (.12 | ) | (.22 | ) | 13.55 | 14.80 | 2,798 | .68 | .63 | .91 | 1.13 | ||||||||||||||||||||||||||||||||||||||
| 12/31/2016 | 11.71 | .14 | .69 | .83 | (.16 | ) | (.37 | ) | (.53 | ) | 12.01 | 7.27 | 2,342 | .68 | .63 | .91 | 1.20 | ||||||||||||||||||||||||||||||||||||||
| 12/31/2015 | 12.27 | .14 | (.26 | ) | (.12 | ) | (.18 | ) | (.26 | ) | (.44 | ) | 11.71 | (1.07 | ) | 1,953 | .79 | .66 | .94 | 1.16 | |||||||||||||||||||||||||||||||||||
| 12/31/2014 | 11.93 | .16 | .19 | .35 | (.01 | ) | — | (.01 | ) | 12.27 | 2.91 | 1,780 | .79 | .73 | 1.01 | 1.33 | |||||||||||||||||||||||||||||||||||||||
See end of tables for footnotes.
| American Funds Insurance Series | 207 |
| Portfolio turnover rate for all share classes | Year ended December 31 | |||||||||||||||||||
| excluding mortgage dollar roll transactions15 | 2018 | 2017 | 2016 | 2015 | 2014 | |||||||||||||||
| Capital Income Builder | 42 | % | 59 | % | 41 | % | 38 | % | 24 | % | ||||||||||
| Asset Allocation Fund | 34 | 39 | 43 | 28 | 42 | |||||||||||||||
| Global Balanced Fund | 30 | 28 | 43 | 36 | 40 | |||||||||||||||
| Bond Fund | 98 | 153 | 108 | 141 | 121 | |||||||||||||||
| Global Bond Fund | 78 | 74 | 70 | 88 | 134 | |||||||||||||||
| Mortgage Fund | 60 | 98 | 113 | 138 | 108 | |||||||||||||||
| U.S. Government/AAA-Rated Securities Fund | 76 | 120 | 273 | 352 | 88 | |||||||||||||||
| Portfolio turnover rate for all share classes | Year ended December 31 | |||||||||||||||||||
| including mortgage dollar roll transactions, if applicable15 | 2018 | 2017 | 2016 | 2015 | 2014 | |||||||||||||||
| Global Growth Fund | 25 | % | 31 | % | 27 | % | 29 | % | 22 | % | ||||||||||
| Global Small Capitalization Fund | 43 | 33 | 40 | 36 | 28 | |||||||||||||||
| Growth Fund | 35 | 24 | 26 | 20 | 29 | |||||||||||||||
| International Fund | 29 | 29 | 31 | 37 | 18 | |||||||||||||||
| New World Fund | 58 | 56 | 32 | 39 | 36 | |||||||||||||||
| Blue Chip Income and Growth Fund | 49 | 34 | 30 | 26 | 37 | |||||||||||||||
| Global Growth and Income Fund | 49 | 41 | 57 | 37 | 28 | |||||||||||||||
| Growth-Income Fund | 39 | 27 | 27 | 25 | 25 | |||||||||||||||
| International Growth and Income Fund | 38 | 51 | 32 | 35 | 34 | |||||||||||||||
| Capital Income Builder Fund | 98 | 88 | 53 | 128 | 35 | 5,10 | ||||||||||||||
| Asset Allocation Fund | 86 | 85 | 83 | 76 | 88 | |||||||||||||||
| Global Balanced Fund | 51 | 41 | 65 | 76 | 73 | |||||||||||||||
| Bond Fund | 514 | 502 | 375 | 434 | 365 | |||||||||||||||
| Global Bond Fund | 125 | 105 | 154 | 159 | 200 | |||||||||||||||
| High-Income Bond Fund | 67 | 78 | 89 | 66 | 54 | |||||||||||||||
| Mortgage Fund | 811 | 680 | 713 | 1103 | 790 | |||||||||||||||
| U.S. Government/AAA-Rated Securities Fund | 446 | 551 | 539 | 901 | 387 | |||||||||||||||
| Ultra-Short Bond Fund | — | 16 | — | 16 | — | 12,16 | N/A | N/A | ||||||||||||
| Managed Risk Growth Fund | 7 | 25 | 15 | 16 | 22 | |||||||||||||||
| Managed Risk International Fund | 8 | 25 | 26 | 15 | 22 | |||||||||||||||
| Managed Risk Blue Chip Income and Growth Fund | 11 | 32 | 9 | 20 | 22 | |||||||||||||||
| Managed Risk Growth-Income Fund | 14 | 26 | 14 | 11 | 28 | |||||||||||||||
| Managed Risk Asset Allocation Fund | 12 | 1 | 3 | 3 | 3 | |||||||||||||||
| 1 | Based on average shares outstanding. |
| 2 | For the year ended December 31, 2014, reflects the impact of a corporate action event that resulted in a one-time increase to net investment income. If the corporate action event had not occurred, the net investment income per share and ratio of net income to average net assets would have been lower for all share classes. |
| 3 | Based on operations for a period that is less than a full year. |
| 4 | Class 1A shares began investment operations on January 6, 2017. |
| 5 | Not annualized. |
| 6 | Annualized. |
| 7 | Amount less than $1 million. |
| 8 | Amount less than $.01. |
| 9 | Amount less than .01%. |
| 10 | For the period May 1, 2014, commencement of operations, through December 31, 2014. |
| 11 | All or a significant portion of assets in this class consisted of seed capital invested by CRMC and/or its affiliates. Certain fees (including, where applicable, fees for distribution services) are not charged or accrued on these seed capital assets. If such fees were paid by the fund on seed capital assets, fund expenses would have been higher and net income and total return would have been lower. |
| 12 | On May 1, 2016, the fund converted from a cash fund to an ultra-short-term bond fund and changed its name from Cash Management Fund to Ultra-Short Bond Fund. |
| 13 | This column reflects the impact of certain waivers/reimbursements by CRMC. CRMC waived a portion of investment advisory services and reimbursed a portion of miscellaneous fees and expenses for the managed risk funds. |
| 14 | This column reflects the net effective expense ratios for each fund and class, which are unaudited. These ratios include each class’s expense ratio combined with the weighted average net expense ratio of the underlying funds for the periods presented. See expense example for further information regarding fees and expenses. |
| 15 | Refer to Note 5 for further information on mortgage dollar rolls. |
| 16 | Amount is either less than 1% or there is no turnover. |
See notes to financial statements
| 208 | American Funds Insurance Series |
Report of Independent Registered Public Accounting Firm
To the Board of Trustees of American Funds Insurance Series and Shareholders of Global Growth Fund, Global Small Capitalization Fund, Growth Fund, International Fund, New World Fund®, Blue Chip Income and Growth Fund, Global Growth and Income Fund, Growth-Income Fund, International Growth and Income Fund, Capital Income Builder®, Asset Allocation Fund, Global Balanced Fund, Bond Fund, Global Bond Fund, High-Income Bond Fund, Mortgage Fund, Ultra-Short Bond Fund, U.S. Government/AAA-Rated Securities Fund, Managed Risk Growth Fund, Managed Risk International Fund, Managed Risk Blue Chip Income and Growth Fund, Managed Risk Growth-Income Fund and Managed Risk Asset Allocation Fund
Opinions on the Financial Statements
We have audited the accompanying statements of assets and liabilities, including summary investment portfolios of Global Growth Fund, Global Small Capitalization Fund, Growth Fund, International Fund, New World Fund®, Blue Chip Income and Growth Fund, Global Growth and Income Fund, Growth-Income Fund, International Growth and Income Fund, Capital Income Builder®, Asset Allocation Fund, Global Balanced Fund, Bond Fund, Global Bond Fund, High-Income Bond Fund, Mortgage Fund and U.S. Government/AAA-Rated Securities Fund and investment portfolios of Ultra-Short Bond Fund, Managed Risk Growth Fund, Managed Risk International Fund, Managed Risk Blue Chip Income and Growth Fund, Managed Risk Growth-Income Fund and Managed Risk Asset Allocation Fund, (twenty-three of the funds constituting American Funds Insurance Series, hereafter collectively referred to as the “Funds”) as of December 31, 2018, the related statements of operations for the year ended December 31, 2018, the statements of changes in net assets for each of the two years in the period ended December 31, 2018, including the related notes, and the financial highlights for each of the periods indicated therein (collectively referred to as the “financial statements”). In our opinion, the financial statements present fairly, in all material respects, the financial position of each of the Funds as of December 31, 2018, the results of each of their operations for the year then ended, the changes in each of their net assets for each of the two years in the period ended December 31, 2018 and each of the financial highlights for each of the periods indicated therein in conformity with accounting principles generally accepted in the United States of America.
Basis for Opinions
These financial statements are the responsibility of the Funds’ management. Our responsibility is to express an opinion on the Funds’ financial statements based on our audits. We are a public accounting firm registered with the Public Company Accounting Oversight Board (United States) (“PCAOB”) and are required to be independent with respect to the Funds in accordance with the U.S. federal securities laws and the applicable rules and regulations of the Securities and Exchange Commission and the PCAOB.
We conducted our audits of these financial statements in accordance with the standards of the PCAOB. Those standards require that we plan and perform the audit to obtain reasonable assurance about whether the financial statements are free of material misstatement, whether due to error or fraud.
Our audits included performing procedures to assess the risks of material misstatement of the financial statements, whether due to error or fraud, and performing procedures that respond to those risks. Such procedures included examining, on a test basis, evidence regarding the amounts and disclosures in the financial statements. Our audits also included evaluating the accounting principles used and significant estimates made by management, as well as evaluating the overall presentation of the financial statements. Our procedures included confirmation of securities owned as of December 31, 2018 by correspondence with the custodians, transfer agent and brokers; when replies were not received from brokers, we performed other auditing procedures. We believe that our audits provide a reasonable basis for our opinions.
/s/PricewaterhouseCoopers LLP
Los Angeles, California
February 12, 2019
We have served as the auditor of one or more investment companies in The Capital Group Companies Investment Company Complex since 1934.
| American Funds Insurance Series | 209 |
| Expense example | unaudited |
The funds in American Funds Insurance Series serve as the underlying investment vehicle for various insurance products. As an owner of an insurance contract that invests in one of the funds in the series, you incur two types of costs: (1) transaction costs, such as initial sales charges on purchase payments and contingent deferred sales charges on redemptions (loads), and (2) ongoing costs, including management fees, distribution and service (12b-1) fees, and other expenses. Additional fees are charged by the insurance companies related to the various benefits they provide. This example is intended to help you understand your ongoing costs (in dollars) of investing in the underlying funds so you can compare these costs with the ongoing costs of investing in other mutual funds that serve a similar function in other annuity products. The example is based on an investment of $1,000 invested at the beginning of the period and held for the entire six-month period (July 1, 2018, through December 31, 2018).
Actual expenses:
The first line of each share class in the table on the following pages provides information about actual account values and actual expenses. You may use the information in this line, together with the amount you invested, to estimate the expenses that you paid over the period. Simply divide your account value by $1,000 (for example, an $8,600 account value divided by $1,000 = 8.6), then multiply the result by the number in the first line under the heading titled “Expenses paid during period” to estimate the expenses you paid on your account during this period.
Hypothetical example for comparison purposes:
The second line of each share class in the table on the following pages provides information about hypothetical account values and hypothetical expenses based on the actual expense ratio for the share class and an assumed rate of return of 5.00% per year before expenses, which is not the actual return of the share class. The hypothetical account values and expenses may not be used to estimate the actual ending account balance or expenses you paid for the period. You may use this information to compare the ongoing costs of investing in the fund and other funds. To do so, compare this 5.00% hypothetical example with the 5.00% hypothetical examples that appear in the shareholder reports of the other funds.
Notes:
Additional fees are charged by the insurance companies related to the various benefits they provide. You can estimate the impact of these fees by adding the amount of the fees to the total estimated expenses you paid on your account during the period as calculated above. In addition, your ending account value would be lower by the amount of these fees.
Note that the expenses shown in the table on the following pages are meant to highlight your ongoing costs only and do not reflect any transactional costs. Therefore, the second line of each share class in the table is useful in comparing ongoing costs only and will not help you determine the relative total costs of owning different funds. In addition, if these transactional costs were included, your costs would have been higher.
| 210 | American Funds Insurance Series |
| Beginning account value 7/1/2018 | Ending account value 12/31/2018 | Expenses paid during period1 | Annualized expense ratio | |||||||||||||
| Global Growth Fund | ||||||||||||||||
| Class 1 – actual return | $ | 1,000.00 | $ | 883.81 | $ | 2.66 | .56 | % | ||||||||
| Class 1 – assumed 5% return | 1,000.00 | 1,022.38 | 2.85 | .56 | ||||||||||||
| Class 1A – actual return | 1,000.00 | 882.71 | 3.84 | .81 | ||||||||||||
| Class 1A – assumed 5% return | 1,000.00 | 1,021.12 | 4.13 | .81 | ||||||||||||
| Class 2 – actual return | 1,000.00 | 882.86 | 3.84 | .81 | ||||||||||||
| Class 2 – assumed 5% return | 1,000.00 | 1,021.12 | 4.13 | .81 | ||||||||||||
| Class 4 – actual return | 1,000.00 | 881.92 | 5.03 | 1.06 | ||||||||||||
| Class 4 – assumed 5% return | 1,000.00 | 1,019.86 | 5.40 | 1.06 | ||||||||||||
| Global Small Capitalization Fund | ||||||||||||||||
| Class 1 – actual return | $ | 1,000.00 | $ | 857.65 | $ | 3.46 | .74 | % | ||||||||
| Class 1 – assumed 5% return | 1,000.00 | 1,021.48 | 3.77 | .74 | ||||||||||||
| Class 1A – actual return | 1,000.00 | 856.00 | 4.58 | .98 | ||||||||||||
| Class 1A – assumed 5% return | 1,000.00 | 1,020.27 | 4.99 | .98 | ||||||||||||
| Class 2 – actual return | 1,000.00 | 856.32 | 4.63 | .99 | ||||||||||||
| Class 2 – assumed 5% return | 1,000.00 | 1,020.21 | 5.04 | .99 | ||||||||||||
| Class 4 – actual return | 1,000.00 | 854.97 | 5.80 | 1.24 | ||||||||||||
| Class 4 – assumed 5% return | 1,000.00 | 1,018.95 | 6.31 | 1.24 | ||||||||||||
| Growth Fund | ||||||||||||||||
| Class 1 – actual return | $ | 1,000.00 | $ | 909.41 | $ | 1.64 | .34 | % | ||||||||
| Class 1 – assumed 5% return | 1,000.00 | 1,023.49 | 1.73 | .34 | ||||||||||||
| Class 1A – actual return | 1,000.00 | 908.27 | 2.84 | .59 | ||||||||||||
| Class 1A – assumed 5% return | 1,000.00 | 1,022.23 | 3.01 | .59 | ||||||||||||
| Class 2 – actual return | 1,000.00 | 908.31 | 2.84 | .59 | ||||||||||||
| Class 2 – assumed 5% return | 1,000.00 | 1,022.23 | 3.01 | .59 | ||||||||||||
| Class 3 – actual return | 1,000.00 | 908.54 | 2.50 | .52 | ||||||||||||
| Class 3 – assumed 5% return | 1,000.00 | 1,022.58 | 2.65 | .52 | ||||||||||||
| Class 4 – actual return | 1,000.00 | 907.21 | 4.04 | .84 | ||||||||||||
| Class 4 – assumed 5% return | 1,000.00 | 1,020.97 | 4.28 | .84 | ||||||||||||
| International Fund | ||||||||||||||||
| Class 1 – actual return | $ | 1,000.00 | $ | 870.74 | $ | 2.50 | .53 | % | ||||||||
| Class 1 – assumed 5% return | 1,000.00 | 1,022.53 | 2.70 | .53 | ||||||||||||
| Class 1A – actual return | 1,000.00 | 870.06 | 3.68 | .78 | ||||||||||||
| Class 1A – assumed 5% return | 1,000.00 | 1,021.27 | 3.97 | .78 | ||||||||||||
| Class 2 – actual return | 1,000.00 | 870.02 | 3.68 | .78 | ||||||||||||
| Class 2 – assumed 5% return | 1,000.00 | 1,021.27 | 3.97 | .78 | ||||||||||||
| Class 3 – actual return | 1,000.00 | 869.83 | 3.35 | .71 | ||||||||||||
| Class 3 – assumed 5% return | 1,000.00 | 1,021.63 | 3.62 | .71 | ||||||||||||
| Class 4 – actual return | 1,000.00 | 868.31 | 4.85 | 1.03 | ||||||||||||
| Class 4 – assumed 5% return | 1,000.00 | 1,020.01 | 5.24 | 1.03 | ||||||||||||
| New World Fund | ||||||||||||||||
| Class 1 – actual return | $ | 1,000.00 | $ | 896.60 | $ | 3.73 | .78 | % | ||||||||
| Class 1 – assumed 5% return | 1,000.00 | 1,021.27 | 3.97 | .78 | ||||||||||||
| Class 1A – actual return | 1,000.00 | 895.48 | 4.92 | 1.03 | ||||||||||||
| Class 1A – assumed 5% return | 1,000.00 | 1,020.01 | 5.24 | 1.03 | ||||||||||||
| Class 2 – actual return | 1,000.00 | 895.53 | 4.92 | 1.03 | ||||||||||||
| Class 2 – assumed 5% return | 1,000.00 | 1,020.01 | 5.24 | 1.03 | ||||||||||||
| Class 4 – actual return | 1,000.00 | 894.44 | 6.11 | 1.28 | ||||||||||||
| Class 4 – assumed 5% return | 1,000.00 | 1,018.75 | 6.51 | 1.28 | ||||||||||||
See end of tables for footnotes.
| American Funds Insurance Series | 211 |
| Beginning account value 7/1/2018 | Ending account value 12/31/2018 | Expenses paid during period1 | Annualized expense ratio | |||||||||||||
| Blue Chip Income and Growth Fund | ||||||||||||||||
| Class 1 – actual return | $ | 1,000.00 | $ | 911.16 | $ | 1.98 | .41 | % | ||||||||
| Class 1 – assumed 5% return | 1,000.00 | 1,023.14 | 2.09 | .41 | ||||||||||||
| Class 1A – actual return | 1,000.00 | 910.38 | 3.18 | .66 | ||||||||||||
| Class 1A – assumed 5% return | 1,000.00 | 1,021.88 | 3.36 | .66 | ||||||||||||
| Class 2 – actual return | 1,000.00 | 910.78 | 3.18 | .66 | ||||||||||||
| Class 2 – assumed 5% return | 1,000.00 | 1,021.88 | 3.36 | .66 | ||||||||||||
| Class 4 – actual return | 1,000.00 | 909.57 | 4.38 | .91 | ||||||||||||
| Class 4 – assumed 5% return | 1,000.00 | 1,020.62 | 4.63 | .91 | ||||||||||||
| Global Growth and Income Fund | ||||||||||||||||
| Class 1 – actual return | $ | 1,000.00 | $ | 913.67 | $ | 3.09 | .64 | % | ||||||||
| Class 1 – assumed 5% return | 1,000.00 | 1,021.98 | 3.26 | .64 | ||||||||||||
| Class 1A – actual return | 1,000.00 | 912.85 | 4.29 | .89 | ||||||||||||
| Class 1A – assumed 5% return | 1,000.00 | 1,020.72 | 4.53 | .89 | ||||||||||||
| Class 2 – actual return | 1,000.00 | 911.89 | 4.29 | .89 | ||||||||||||
| Class 2 – assumed 5% return | 1,000.00 | 1,020.72 | 4.53 | .89 | ||||||||||||
| Class 4 – actual return | 1,000.00 | 911.37 | 5.49 | 1.14 | ||||||||||||
| Class 4 – assumed 5% return | 1,000.00 | 1,019.46 | 5.80 | 1.14 | ||||||||||||
| Growth-Income Fund | ||||||||||||||||
| Class 1 – actual return | $ | 1,000.00 | $ | 923.69 | $ | 1.36 | .28 | % | ||||||||
| Class 1 – assumed 5% return | 1,000.00 | 1,023.79 | 1.43 | .28 | ||||||||||||
| Class 1A – actual return | 1,000.00 | 922.58 | 2.57 | .53 | ||||||||||||
| Class 1A – assumed 5% return | 1,000.00 | 1,022.53 | 2.70 | .53 | ||||||||||||
| Class 2 – actual return | 1,000.00 | 922.65 | 2.57 | .53 | ||||||||||||
| Class 2 – assumed 5% return | 1,000.00 | 1,022.53 | 2.70 | .53 | ||||||||||||
| Class 3 – actual return | 1,000.00 | 922.81 | 2.23 | .46 | ||||||||||||
| Class 3 – assumed 5% return | 1,000.00 | 1,022.89 | 2.35 | .46 | ||||||||||||
| Class 4 – actual return | 1,000.00 | 921.20 | 3.78 | .78 | ||||||||||||
| Class 4 – assumed 5% return | 1,000.00 | 1,021.27 | 3.97 | .78 | ||||||||||||
| International Growth and Income Fund | ||||||||||||||||
| Class 1 – actual return | $ | 1,000.00 | $ | 906.95 | $ | 3.17 | .66 | % | ||||||||
| Class 1 – assumed 5% return | 1,000.00 | 1,021.88 | 3.36 | .66 | ||||||||||||
| Class 1A – actual return | 1,000.00 | 905.76 | 4.37 | .91 | ||||||||||||
| Class 1A – assumed 5% return | 1,000.00 | 1,020.62 | 4.63 | .91 | ||||||||||||
| Class 2 – actual return | 1,000.00 | 905.61 | 4.37 | .91 | ||||||||||||
| Class 2 – assumed 5% return | 1,000.00 | 1,020.62 | 4.63 | .91 | ||||||||||||
| Class 4 – actual return | 1,000.00 | 904.62 | 5.57 | 1.16 | ||||||||||||
| Class 4 – assumed 5% return | 1,000.00 | 1,019.36 | 5.90 | 1.16 | ||||||||||||
| Capital Income Builder | ||||||||||||||||
| Class 1 – actual return | $ | 1,000.00 | $ | 952.39 | $ | 2.71 | .55 | % | ||||||||
| Class 1 – assumed 5% return | 1,000.00 | 1,022.43 | 2.80 | .55 | ||||||||||||
| Class 1A – actual return | 1,000.00 | 951.11 | 3.89 | .79 | ||||||||||||
| Class 1A – assumed 5% return | 1,000.00 | 1,021.22 | 4.02 | .79 | ||||||||||||
| Class 2 – actual return | 1,000.00 | 951.20 | 3.93 | .80 | ||||||||||||
| Class 2 – assumed 5% return | 1,000.00 | 1,021.17 | 4.08 | .80 | ||||||||||||
| Class 4 – actual return | 1,000.00 | 949.90 | 5.11 | 1.04 | ||||||||||||
| Class 4 – assumed 5% return | 1,000.00 | 1,019.96 | 5.30 | 1.04 | ||||||||||||
| 212 | American Funds Insurance Series |
| Beginning account value 7/1/2018 | Ending account value 12/31/2018 | Expenses paid during period1 | Annualized expense ratio | |||||||||||||
| Asset Allocation Fund | ||||||||||||||||
| Class 1 – actual return | $ | 1,000.00 | $ | 945.68 | $ | 1.37 | .28 | % | ||||||||
| Class 1 – assumed 5% return | 1,000.00 | 1,023.79 | 1.43 | .28 | ||||||||||||
| Class 1A – actual return | 1,000.00 | 944.75 | 2.60 | .53 | ||||||||||||
| Class 1A – assumed 5% return | 1,000.00 | 1,022.53 | 2.70 | .53 | ||||||||||||
| Class 2 – actual return | 1,000.00 | 944.68 | 2.60 | .53 | ||||||||||||
| Class 2 – assumed 5% return | 1,000.00 | 1,022.53 | 2.70 | .53 | ||||||||||||
| Class 3 – actual return | 1,000.00 | 944.92 | 2.26 | .46 | ||||||||||||
| Class 3 – assumed 5% return | 1,000.00 | 1,022.89 | 2.35 | .46 | ||||||||||||
| Class 4 – actual return | 1,000.00 | 943.52 | 3.82 | .78 | ||||||||||||
| Class 4 – assumed 5% return | 1,000.00 | 1,021.27 | 3.97 | .78 | ||||||||||||
| Global Balanced Fund | ||||||||||||||||
| Class 1 – actual return | $ | 1,000.00 | $ | 946.36 | $ | 3.58 | .73 | % | ||||||||
| Class 1 – assumed 5% return | 1,000.00 | 1,021.53 | 3.72 | .73 | ||||||||||||
| Class 1A – actual return | 1,000.00 | 944.87 | 4.80 | .98 | ||||||||||||
| Class 1A – assumed 5% return | 1,000.00 | 1,020.27 | 4.99 | .98 | ||||||||||||
| Class 2 – actual return | 1,000.00 | 945.15 | 4.80 | .98 | ||||||||||||
| Class 2 – assumed 5% return | 1,000.00 | 1,020.27 | 4.99 | .98 | ||||||||||||
| Class 4 – actual return | 1,000.00 | 943.60 | 6.03 | 1.23 | ||||||||||||
| Class 4 – assumed 5% return | 1,000.00 | 1,019.00 | 6.26 | 1.23 | ||||||||||||
| Bond Fund | ||||||||||||||||
| Class 1 – actual return | $ | 1,000.00 | $ | 1,013.36 | $ | 1.98 | .39 | % | ||||||||
| Class 1 – assumed 5% return | 1,000.00 | 1,023.24 | 1.99 | .39 | ||||||||||||
| Class 1A – actual return | 1,000.00 | 1,012.94 | 3.20 | .63 | ||||||||||||
| Class 1A – assumed 5% return | 1,000.00 | 1,022.03 | 3.21 | .63 | ||||||||||||
| Class 2 – actual return | 1,000.00 | 1,012.27 | 3.25 | .64 | ||||||||||||
| Class 2 – assumed 5% return | 1,000.00 | 1,021.98 | 3.26 | .64 | ||||||||||||
| Class 4 – actual return | 1,000.00 | 1,010.76 | 4.51 | .89 | ||||||||||||
| Class 4 – assumed 5% return | 1,000.00 | 1,020.72 | 4.53 | .89 | ||||||||||||
| Global Bond Fund | ||||||||||||||||
| Class 1 – actual return | $ | 1,000.00 | $ | 1,004.05 | $ | 2.93 | .58 | % | ||||||||
| Class 1 – assumed 5% return | 1,000.00 | 1,022.28 | 2.96 | .58 | ||||||||||||
| Class 1A – actual return | 1,000.00 | 1,002.59 | 4.14 | .82 | ||||||||||||
| Class 1A – assumed 5% return | 1,000.00 | 1,021.07 | 4.18 | .82 | ||||||||||||
| Class 2 – actual return | 1,000.00 | 1,002.66 | 4.19 | .83 | ||||||||||||
| Class 2 – assumed 5% return | 1,000.00 | 1,021.02 | 4.23 | .83 | ||||||||||||
| Class 4 – actual return | 1,000.00 | 1,001.01 | 5.45 | 1.08 | ||||||||||||
| Class 4 – assumed 5% return | 1,000.00 | 1,019.76 | 5.50 | 1.08 | ||||||||||||
See end of tables for footnotes.
| American Funds Insurance Series | 213 |
| Beginning account value 7/1/2018 | Ending account value 12/31/2018 | Expenses paid during period1 | Annualized expense ratio | |||||||||||||
| High-Income Bond Fund | ||||||||||||||||
| Class 1 – actual return | $ | 1,000.00 | $ | 973.84 | $ | 2.54 | .51 | % | ||||||||
| Class 1 – assumed 5% return | 1,000.00 | 1,022.63 | 2.60 | .51 | ||||||||||||
| Class 1A – actual return | 1,000.00 | 972.85 | 3.73 | .75 | ||||||||||||
| Class 1A – assumed 5% return | 1,000.00 | 1,021.42 | 3.82 | .75 | ||||||||||||
| Class 2 – actual return | 1,000.00 | 973.23 | 3.78 | .76 | ||||||||||||
| Class 2 – assumed 5% return | 1,000.00 | 1,021.37 | 3.87 | .76 | ||||||||||||
| Class 3 – actual return | 1,000.00 | 973.26 | 3.43 | .69 | ||||||||||||
| Class 3 – assumed 5% return | 1,000.00 | 1,021.73 | 3.52 | .69 | ||||||||||||
| Class 4 – actual return | 1,000.00 | 970.96 | 5.02 | 1.01 | ||||||||||||
| Class 4 – assumed 5% return | 1,000.00 | 1,020.11 | 5.14 | 1.01 | ||||||||||||
| Mortgage Fund | ||||||||||||||||
| Class 1 – actual return | $ | 1,000.00 | $ | 1,018.13 | $ | 2.54 | .50 | % | ||||||||
| Class 1 – assumed 5% return | 1,000.00 | 1,022.68 | 2.55 | .50 | ||||||||||||
| Class 1A – actual return | 1,000.00 | 1,016.98 | 3.81 | .75 | ||||||||||||
| Class 1A – assumed 5% return | 1,000.00 | 1,021.42 | 3.82 | .75 | ||||||||||||
| Class 2 – actual return | 1,000.00 | 1,015.95 | 3.81 | .75 | ||||||||||||
| Class 2 – assumed 5% return | 1,000.00 | 1,021.42 | 3.82 | .75 | ||||||||||||
| Class 4 – actual return | 1,000.00 | 1,014.64 | 5.13 | 1.01 | ||||||||||||
| Class 4 – assumed 5% return | 1,000.00 | 1,020.11 | 5.14 | 1.01 | ||||||||||||
| Ultra-Short Bond Fund | ||||||||||||||||
| Class 1 – actual return | $ | 1,000.00 | $ | 1,009.21 | $ | 1.92 | .38 | % | ||||||||
| Class 1 – assumed 5% return | 1,000.00 | 1,023.29 | 1.94 | .38 | ||||||||||||
| Class 1A – actual return | 1,000.00 | 1,009.23 | 1.87 | .37 | ||||||||||||
| Class 1A – assumed 5% return | 1,000.00 | 1,023.34 | 1.89 | .37 | ||||||||||||
| Class 2 – actual return | 1,000.00 | 1,008.25 | 3.14 | .62 | ||||||||||||
| Class 2 – assumed 5% return | 1,000.00 | 1,022.08 | 3.16 | .62 | ||||||||||||
| Class 3 – actual return | 1,000.00 | 1,007.42 | 2.78 | .55 | ||||||||||||
| Class 3 – assumed 5% return | 1,000.00 | 1,022.43 | 2.80 | .55 | ||||||||||||
| Class 4 – actual return | 1,000.00 | 1,006.62 | 4.40 | .87 | ||||||||||||
| Class 4 – assumed 5% return | 1,000.00 | 1,020.82 | 4.43 | .87 | ||||||||||||
| U.S. Government/AAA-Rated Securities Fund | ||||||||||||||||
| Class 1 – actual return | $ | 1,000.00 | $ | 1,020.09 | $ | 1.83 | .36 | % | ||||||||
| Class 1 – assumed 5% return | 1,000.00 | 1,023.39 | 1.84 | .36 | ||||||||||||
| Class 1A – actual return | 1,000.00 | 1,019.74 | 3.11 | .61 | ||||||||||||
| Class 1A – assumed 5% return | 1,000.00 | 1,022.13 | 3.11 | .61 | ||||||||||||
| Class 2 – actual return | 1,000.00 | 1,019.76 | 3.11 | .61 | ||||||||||||
| Class 2 – assumed 5% return | 1,000.00 | 1,022.13 | 3.11 | .61 | ||||||||||||
| Class 3 – actual return | 1,000.00 | 1,019.28 | 2.75 | .54 | ||||||||||||
| Class 3 – assumed 5% return | 1,000.00 | 1,022.48 | 2.75 | .54 | ||||||||||||
| Class 4 – actual return | 1,000.00 | 1,018.62 | 4.38 | .86 | ||||||||||||
| Class 4 – assumed 5% return | 1,000.00 | 1,020.87 | 4.38 | .86 | ||||||||||||
| 214 | American Funds Insurance Series |
| Beginning account value 7/1/2018 | Ending account value 12/31/2018 | Expenses paid during period1,2 | Annualized expense ratio2 | Effective expenses paid during period3 | Effective annualized expense ratio4 | |||||||||||||||||||
| Managed Risk Growth Fund | ||||||||||||||||||||||||
| Class P1 – actual return | $ | 1,000.00 | $ | 948.34 | $ | 1.92 | .39 | % | $ | 3.49 | .71 | % | ||||||||||||
| Class P1 – assumed 5% return | 1,000.00 | 1,023.24 | 1.99 | .39 | 3.62 | .71 | ||||||||||||||||||
| Class P2 – actual return | 1,000.00 | 946.51 | 3.19 | .65 | 4.76 | .97 | ||||||||||||||||||
| Class P2 – assumed 5% return | 1,000.00 | 1,021.93 | 3.31 | .65 | 4.94 | .97 | ||||||||||||||||||
| Managed Risk International Fund | ||||||||||||||||||||||||
| Class P1 – actual return | $ | 1,000.00 | $ | 903.38 | $ | 1.54 | .32 | % | $ | 3.69 | .77 | % | ||||||||||||
| Class P1 – assumed 5% return | 1,000.00 | 1,023.59 | 1.63 | .32 | 3.92 | .77 | ||||||||||||||||||
| Class P2 – actual return | 1,000.00 | 901.89 | 3.16 | .66 | 5.42 | 1.13 | ||||||||||||||||||
| Class P2 – assumed 5% return | 1,000.00 | 1,021.88 | 3.36 | .66 | 5.75 | 1.13 | ||||||||||||||||||
| Managed Risk Blue Chip Income and Growth Fund | ||||||||||||||||||||||||
| Class P1 – actual return | $ | 1,000.00 | $ | 947.22 | $ | 1.52 | .31 | % | $ | 3.29 | .67 | % | ||||||||||||
| Class P1 – assumed 5% return | 1,000.00 | 1,023.64 | 1.58 | .31 | 3.41 | .67 | ||||||||||||||||||
| Class P2 – actual return | 1,000.00 | 945.53 | 3.14 | .64 | 5.00 | 1.02 | ||||||||||||||||||
| Class P2 – assumed 5% return | 1,000.00 | 1,021.98 | 3.26 | .64 | 5.19 | 1.02 | ||||||||||||||||||
| Managed Risk Growth-Income Fund | ||||||||||||||||||||||||
| Class P1 – actual return | $ | 1,000.00 | $ | 950.38 | $ | 1.72 | .35 | % | $ | 3.15 | .64 | % | ||||||||||||
| Class P1 – assumed 5% return | 1,000.00 | 1,023.44 | 1.79 | .35 | 3.26 | .64 | ||||||||||||||||||
| Class P2 – actual return | 1,000.00 | 948.19 | 3.19 | .65 | 4.57 | .93 | ||||||||||||||||||
| Class P2 – assumed 5% return | 1,000.00 | 1,021.93 | 3.31 | .65 | 4.74 | .93 | ||||||||||||||||||
| Managed Risk Asset Allocation Fund | ||||||||||||||||||||||||
| Class P1 – actual return | $ | 1,000.00 | $ | 955.05 | $ | 1.38 | .28 | % | $ | 2.91 | .59 | % | ||||||||||||
| Class P1 – assumed 5% return | 1,000.00 | 1,023.79 | 1.43 | .28 | 3.01 | .59 | ||||||||||||||||||
| Class P2 – actual return | 1,000.00 | 953.49 | 2.66 | .54 | 4.14 | .84 | ||||||||||||||||||
| Class P2 – assumed 5% return | 1,000.00 | 1,022.48 | 2.75 | .54 | 4.28 | .84 | ||||||||||||||||||
| 1 | The “expenses paid during period” are equal to the “annualized expense ratio,” multiplied by the average account value over the period, multiplied by the number of days in the period, and divided by 365 (to reflect the one-half year period). |
| 2 | The “expenses paid during period” and “annualized expense ratio” do not include the expenses of the underlying funds in which each fund invests. |
| 3 | The “effective expenses paid during period” are equal to the “effective annualized expense ratio,” multiplied by the average account value over the period, multiplied by the number of days in the period, and divided by 365 (to reflect the period). |
| 4 | The “effective annualized expense ratio” reflects the net annualized expense ratio of the class plus the class’s pro-rata share of the weighted average expense ratio of the underlying funds in which it invests. |
| American Funds Insurance Series | 215 |
This page intentionally left blank.
| 216 | American Funds Insurance Series |
Board of trustees and other officers
Independent trustees1
| Name and year of birth | Year first elected a trustee of the series2 | Principal occupation(s) during past five years | Number of portfolios in fund complex overseen by trustee | Other directorships3 held by trustee | ||||
| William H. Baribault,1945 | 2009 | CEO and President, Richard Nixon Foundation; Chairman of the Board and CEO, Oakwood Enterprises (private investment and consulting) | 81 | General Finance Corporation | ||||
| James G. Ellis,1947 | 2010 | Dean and Professor of Marketing, Marshall School of Business, University of Southern California | 91 | Mercury General Corporation | ||||
| Nariman Farvardin,1956 | 2018 | President, Stevens Institute of Technology | 78 | None | ||||
| Mary Davis Holt,1950 | 2015–2016 2017 | Principal, Mary Davis Holt Enterprises, LLC (leadership development consulting); former Partner, Flynn Heath Holt Leadership, LLC (leadership consulting); former COO, Time Life Inc. (1993–2003) | 78 | None | ||||
| R. Clark Hooper,1946 | 2010 | Private investor | 81 | None | ||||
| Merit E. Janow,1958 | 2007 | Dean and Professor, Columbia University, School of International and Public Affairs | 80 | Mastercard Incorporated; Trimble Inc. | ||||
| Laurel B. Mitchell, PhD,1955 | 2010 | Chair, California Jump$tart Coalition for Personal Financial Literacy; Part-time faculty, Pomona College; former Distinguished Professor of Accounting, University of Redlands; former Director, Accounting Program, University of Redlands | 78 | None | ||||
| Margaret Spellings,1957 Chairman of the Board (Independent and Non-Executive) | 2010 | President, The University of North Carolina; former President, George W. Bush Foundation | 82 | None | ||||
| Alexandra Trower,1964 | 2018 | Executive Vice President, Global Communications and Corporate Officer, The Estée Lauder Companies | 77 | None |
Leonard R. Fuller and Frank M. Sanchez retired from the board on December 31, 2018. The trustees thank Mr. Fuller and Mr. Sanchez for their dedication and service to the fund.
Interested trustee4,5
| Name, year of birth and position with series | Year first elected a trustee or officer of the series2 | Principal occupation(s) during past five years and positions held with affiliated entities or the principal underwriter of the series | Number of portfolios in fund complex overseen by trustee | Other directorships3 held by trustee | ||||
| Donald D. O’Neal,1960 Co-President | 1998 | Partner — Capital International Investors, Capital Research and Management Company; Director, Capital Research and Management Company | 31 | None | ||||
| Michael C. Gitlin,1970 | 2019 | Partner — Capital Fixed Income Investors, Capital Research and Management Company; Director, The Capital Group Companies, Inc.;6served as Head of Fixed Income at a large investment management firm prior to joining Capital Research and Management Company in 2015 | 77 | None |
The series statement of additional information includes further details about the series trustees and is available without charge upon request by calling American Funds Service Company at (800) 421-4225 or by visiting the American Funds website at americanfunds.com. The address for all trustees and officers of the series is 333 South Hope Street, Los Angeles, CA 90071, Attention: Secretary.
| American Funds Insurance Series | 217 |
Board of trustees and other officers(continued)
Other officers5
| Name, year of birth and position with series | Year first elected an officer of the series2 | Principal occupation(s) during past five years and positions held with affiliated entities or the principal underwriter of the series | ||
| Alan N. Berro,1960 Co-President | 1998 | Partner — Capital World Investors, Capital Research and Management Company; Director, Capital Research and Management Company | ||
| Maria Manotok Pathria,1974 Executive Vice President | 2012 | Senior Vice President and Senior Counsel — Fund Business Management Group, Capital Research and Management Company; Director, Capital Guardian Trust Company6 | ||
| John H. Smet,1956 Senior Vice President | 1994 | Partner — Capital Fixed Income Investors, Capital Research and Management Company; Director, Capital Research and Management Company | ||
| Martin Jacobs,1962 Vice President | 2016 | Partner — Capital World Investors, Capital Research and Management Company | ||
| Carl M. Kawaja,1964 Vice President | 2008 | Partner — Capital World Investors, Capital Research and Management Company; Director, The Capital Group Companies, Inc.6 | ||
| Sung Lee,1966 Vice President | 2008 | Partner — Capital Research Global Investors, Capital International, Inc.6 | ||
| S. Keiko McKibben,1969 Vice President | 2010 | Partner — Capital Research Global Investors, Capital Research and Management Company | ||
| Renaud H. Samyn,1974 Vice President | 2010 | Partner — Capital Research Global Investors, Capital International, Inc.6 | ||
| Dylan Yolles,1969 Vice President | 2012 | Partner — Capital International Investors, Capital Research and Management Company | ||
| Steven I. Koszalka,1964 Secretary | 2003 | Vice President — Fund Business Management Group, Capital Research and Management Company | ||
| Gregory F. Niland,1971 Treasurer | 2008 | Vice President — Investment Operations, Capital Research and Management Company | ||
| Susan K. Countess,1966 Assistant Secretary | 2014 | Associate — Fund Business Management Group, Capital Research and Management Company | ||
| Brian C. Janssen,1972 Assistant Treasurer | 2015 | Vice President — Investment Operations, Capital Research and Management Company | ||
| Dori Laskin,1951 Assistant Treasurer | 2010 | Vice President — Investment Operations, Capital Research and Management Company |
| 1 | The term independent trustee refers to a trustee who is not an “interested person” of the series within the meaning of the Investment Company Act of 1940. |
| 2 | Trustees and officers of the series serve until their resignation, removal or retirement. |
| 3 | This includes all directorships/trusteeships (other than those in the American Funds or other funds managed by Capital Research and Management Company or its affiliates) that are held by each trustee as a trustee or director of a public company or a registered investment company. |
| 4 | The term interested trustee refers to a trustee who is an “interested person” within the meaning of the Investment Company Act of 1940, on the basis of their affiliation with the series’ investment adviser, Capital Research and Management Company, or affiliated entities (including the series’ principal underwriter). |
| 5 | All of the trustees and/or officers listed, with the exception of Martin Jacobs, S. Keiko McKibben and Renaud H. Samyn, are officers and/or directors/trustees of one or more of the other funds for which Capital Research and Management Company serves as investment adviser. |
| 6 | Company affiliated with Capital Research and Management Company. |
| 218 | American Funds Insurance Series |
Results of special meeting of shareholders
Held November 28, 2018
Shares outstanding (all classes) on August 31, 2018 (record date)
6,347,216,058
Total shares voting on November 28, 2018
4,343,768,464 (68.4% of shares outstanding)
The proposal: to elect board members:
| Votes for | Percent of shares voting for | Votes withheld | Percent of shares withheld | |||||||||
| William H. Baribault | 4,208,852,644 | 96.9 | % | 134,915,821 | 3.1 | % | ||||||
| James G. Ellis | 4,216,149,993 | 97.1 | 127,618,471 | 2.9 | ||||||||
| Nariman Farvardin | 4,218,959,298 | 97.1 | 124,809,166 | 2.9 | ||||||||
| Michael C. Gitlin | 4,222,232,502 | 97.2 | 121,535,962 | 2.8 | ||||||||
| Mary Davis Holt | 4,224,279,601 | 97.2 | 119,488,863 | 2.8 | ||||||||
| R. Clark Hooper | 4,216,559,229 | 97.1 | 127,209,235 | 2.9 | ||||||||
| Merit E. Janow | 4,220,194,031 | 97.2 | 123,574,433 | 2.8 | ||||||||
| Laurel B. Mitchell | 4,224,436,631 | 97.3 | 119,331,833 | 2.7 | ||||||||
| Donald D. O’Neal | 4,220,647,956 | 97.2 | 123,120,508 | 2.8 | ||||||||
| Margaret Spellings | 4,219,675,934 | 97.1 | 124,092,530 | 2.9 | ||||||||
| Alexandra Trower | 4,225,223,365 | 97.3 | 118,545,099 | 2.7 | ||||||||
| American Funds Insurance Series | 219 |
Offices of the series and of the investment adviser
Capital Research and Management Company
333 South Hope Street
Los Angeles, CA 90071-1406
6455 Irvine Center Drive
Irvine, CA 92618-4518
Investment subadviser
Milliman Financial Risk Management LLC
(Managed Risk Funds only)
71 South Wacker Drive, 31st Floor
Chicago, IL 60606
Custodians of assets
State Street Bank and Trust Company
One Lincoln Street
Boston, MA 02111
Bank of New York Mellon
(Managed Risk Funds only)
One Wall Street
New York, NY 10286
Counsel
Morgan, Lewis & Bockius LLP
One Federal Street
Boston, MA 02110-1726
Independent registered public accounting firm
PricewaterhouseCoopers LLP
601 South Figueroa Street
Los Angeles, CA 90017-3874
| 220 | American Funds Insurance Series |
Investors should carefully consider investment objectives, risks, charges and expenses. This and other important information is contained in the series prospectuses and summary prospectuses, which can be obtained from your financial professional and should be read carefully before investing. You may also call American Funds Service Company (AFS) at (800) 421-4225 or visit the American Funds website at americanfunds.com. Fund shares offered through American Funds Distributors, Inc.
“American Funds Proxy Voting Procedures and Principles” — which describes how we vote proxies relating to portfolio securities — is available on the American Funds website or upon request by calling AFS. The series files its proxy voting record with the U.S. Securities and Exchange Commission (SEC) for the 12 months ended June 30 by August 31. The proxy voting record is available free of charge on the SEC website at sec.gov and on the American Funds website.
Complete December 31, 2018, portfolios of American Funds Insurance Series’ investments are available free of charge by calling AFS or visiting the SEC website (where they are part of Form N-CSR).
American Funds Insurance Series files a complete list of its portfolio holdings with the SEC for the first and third quarters of each fiscal year on Form N-Q. This filing is available free of charge on the SEC website. Additionally, the list of portfolio holdings is available by calling AFS.
This report is for the information of American Funds Insurance Series investors, but it also may be used as sales literature when preceded or accompanied by the current prospectuses or summary prospectuses for American Funds Insurance Series and the prospectus for the applicable insurance contract, which give details about charges, expenses, investment objectives and operating policies of the series. If used as sales material after March 31, 2019, this report must be accompanied by a statistical update for the most recently completed calendar quarter.
Fund attribution data was produced using FactSet, a third-party software system, based on daily portfolios. Securities in their initial period of acquisition may not be included in this analysis. The analysis includes equity investments only and excludes forward contracts and fixed income investments, if applicable. It does not account for buy-and-sell transactions that might have occurred intraday. As a result, average portfolio weight percentages are approximate, and the actual average portfolio weight percentages might be higher or lower. Data elements, such as pricing, income, market cap, etc., were provided by FactSet. The indexes provided for attribution are based on FactSet’s methodology. The indexes are broad-based market benchmarks and may not be used by Capital Group® as the sole comparative index for the funds. Capital Group believes the software and information from FactSet to be reliable. However, Capital Group cannot be responsible for inaccuracies, incomplete information or updating of information by FactSet.
Futures may not provide an effective hedge of the underlying securities because changes in the prices of futures may not track those of the securities they are intended to hedge. In addition, the managed risk strategy may not effectively protect the fund from market declines and will limit the fund’s participation in market gains. The use of the managed risk strategy could cause the fund’s return to lag that of the underlying fund in certain market conditions.
Bloomberg® is a trademark and service mark of Bloomberg Finance L.P. (collectively with its affiliates, “Bloomberg”). Barclays® is a trademark and service mark of Barclays Bank Plc (collectively with its affiliates, “Barclays”), used under license. Bloomberg or Bloomberg’s licensors, including Barclays, own all proprietary rights in the Bloomberg Barclays Indices. Neither Bloomberg nor Barclays approve or endorse this material, or guarantees the accuracy or completeness of any information herein, or makes any warranty, express or implied, as to the results to be obtained therefrom and, to the maximum extent allowed by law, neither shall have any liability or responsibility for injury or damages arising in connection therewith. This report, and any product, index or fund referred to herein, is not sponsored, endorsed or promoted in any way by J.P. Morgan or any of its affiliates who provide no warranties whatsoever, express or implied, and shall have no liability to any prospective investor in connection with this report. J.P. Morgan disclaimer: http://www.jpmorgan.com/pages/jpmorgan/ib/girg. MSCI has not approved, reviewed or produced this report, makes no express or implied warranties or representations and is not liable whatsoever for any data in the report. You may not redistribute the MSCI data or use it as a basis for other indices or investment products. The S&P 500 is a product of S&P Dow Jones Indices LLC and/or its affiliates and has been licensed for use by Capital Group. Copyright © 2019 S&P Dow Jones Indices LLC, a division of S&P Global, and/or its affiliates. All rights reserved. Redistribution or reproduction in whole or in part is prohibited without written permission of S&P Dow Jones Indices LLC.

The Capital Advantage®
Since 1931, Capital Group, home of American Funds, has helped investors pursue long-term investment success. Our consistent approach — in combination with The Capital SystemSM— has resulted in a superior long-term track record for American Funds Insurance Series®.
| Aligned with investor success | |
| We base our decisions on a long-term perspective, which we believe aligns our goals with the interests of our clients. American Funds Insurance Series portfolio managers average 26 years of investment experience, including 21 years at our company, reflecting a career commitment to our long-term approach.1 | |
| The Capital System | |
| The Capital System combines individual accountability with teamwork. Funds using The Capital System are divided into portions that are managed independently by investment professionals with diverse backgrounds, ages and investment approaches. An extensive global research effort is the backbone of our system. | |
| Superior long-term track record | |
| American Funds Insurance Series equity funds have beaten their Lipper peer indexes in 91% of 10-year periods and 100% of 20-year periods. Fixed income funds have beaten their Lipper indexes in 65% of 10-year periods and 81% of 20-year periods.2Fund management fees have been among the lowest in the industry.3 |
| 1 | Portfolio manager experience as of the American Funds Insurance Series prospectus dated May 1, 2018, as supplemented January 1, 2019. | |
| 2 | Based on Class 1 share results for rolling periods through December 31, 2018. Periods covered are the shorter of the fund’s lifetime or since the comparable Lipper index inception date. The comparable Lipper indexes are: Global Funds Index (Global Growth Fund), Growth Funds Index (Growth Fund), International Funds Index (International Fund), Emerging Markets Funds Index (New World Fund), Growth & Income Funds Index (Blue Chip Income and Growth Fund, Growth-Income Fund), Balanced Portfolio Funds Index (Asset Allocation Fund), Core Bond Funds Index (Bond Fund), High Yield Funds Index (High-Income Bond Fund) and General U.S. Government Funds Index (U.S. Government/AAA-Rated Securities Fund). The Lipper Global Small-/Mid-Cap Funds Average was used for Global Small Capitalization Fund. | |
| 3 | Based on management fees for the 20-year period ended December 31, 2018, versus comparable Lipper categories, excluding funds of funds. | |
| All Capital Group trademarks referenced are registered trademarks owned by The Capital Group Companies, Inc. or an affiliated company. All other company and product names mentioned are the trademarks or registered trademarks of their respective companies. | ||

American Funds Insurance Series®
Annual report |
![]()
Portfolios that invest
in global companies
for the long term.
Beginning on January 1, 2021, as permitted by regulations adopted by the U.S. Securities and Exchange Commission, you may not receive paper copies of the fund’s shareholder reports from the insurance company that offers your contract unless you specifically request paper copies from the insurance company or from your financial intermediary. Instead, the shareholder reports will be made available on a website, and the insurance company will notify you by mail each time a report is posted and provide you with a website link to access the report. Instructions for requesting paper copies will be provided by your insurance company.
If you have already elected to receive shareholder reports electronically, you will not be affected by this change and do not need to take any action. You may elect to receive shareholder reports and other communications from the insurance company electronically by following the instructions provided by the insurance company.
You may elect to receive paper copies of all future reports free of charge from the insurance company. You can inform the insurance company that you wish to continue receiving paper copies of your shareholder reports by following the instructions provided by the insurance company. Your election to receive paper reports will apply to all investment options available under your contract.
American Funds Insurance Series — Portfolio Series, from Capital Group, serves as an underlying investment vehicle for variable annuities and insurance products. For more than 85 years, Capital has invested with a long-term focus based on thorough research and attention to risk.
American Funds Global Growth PortfolioSMseeks to provide long-term growth of capital.
American Funds Growth and Income PortfolioSMseeks to provide long-term growth of capital while providing current income.
American Funds Managed Risk Growth PortfolioSMseeks to provide long-term growth of capital while seeking to manage volatility and provide downside protection.
American Funds Managed Risk Growth and Income PortfolioSMseeks to provide long-term growth of capital and current income while seeking to manage volatility and provide downside protection.
American Funds Managed Risk Global Allocation PortfolioSMseeks to provide high total return (including income and capital gains) consistent with preservation of capital over the long term while seeking to manage volatility and provide downside protection.
Investing for short periods makes losses more likely. For current information and month-end results, visit americanfunds.com/afis. For information about your insurance contract and month-end results, go to the website of the company that issued your contract.
Here are the average annual total returns on a $1,000 investment with all distributions reinvested for periods ended December 31, 2018. Also shown are the estimated gross and net expense ratios as of the series prospectus dated May 1, 2019 (unaudited):
| 1 year | Lifetime (since 5/1/15) | Gross expense ratio | Net expense ratio | |||||||||||||
| American Funds Global Growth Portfolio, Class 4 | –9.77 | % | 3.65 | % | 1.21 | % | 1.18 | % | ||||||||
| American Funds Growth and Income Portfolio, Class 4 | –3.51 | 3.62 | 0.97 | 0.97 | ||||||||||||
| American Funds Managed Risk Growth Portfolio, Class P2 | –3.98 | 3.06 | 1.06 | 1.01 | ||||||||||||
| American Funds Managed Risk Growth and Income Portfolio, Class P2 | –4.72 | 2.33 | 1.12 | 1.07 | ||||||||||||
| American Funds Managed Risk Global Allocation Portfolio, Class P2 | –6.90 | 1.21 | 1.25 | 1.20 | ||||||||||||
Investment results assume all distributions are reinvested and reflect applicable fees and expenses. The investment adviser is currently waiving a portion of its management fee equal to 0.05% of the fund’s net assets for the three managed risk portfolios. In addition, the investment adviser is currently reimbursing a portion of the other expenses for American Funds Global Growth Portfolio. Investment results and net expense ratios shown reflect the waiver and reimbursement, without which the results would have been lower and the expenses would have been higher. This waiver and reimbursement will be in effect through at least May 1, 2020, unless modified or terminated by the series board. The adviser may elect at its discretion to extend, modify or terminate the reimbursement at that time. The waiver may only be modified or terminated with the approval of the series board. Please see the fund’s most recent prospectus for details.
Investment allocations may not achieve fund objectives. There are expenses associated with the underlying funds in addition to fund of funds expenses. The funds’ risks are directly related to the risks of the underlying funds. Underlying fund allocations are as of December 31, 2018. Allocation percentages and underlying funds are subject to the Portfolio Oversight Committee’s discretion and will evolve over time. Underlying funds may be added or removed during the year. Investing outside the United States involves risks such as currency fluctuations, periods of illiquidity and price volatility, as more fully described in the funds’ prospectuses. These risks may be heightened in connection with investments in developing countries. Small-company stocks entail additional risks, and they can fluctuate in price more than larger company stocks. The return of principal for bond funds and funds with significant underlying bond holdings is not guaranteed. Fund shares are subject to the same interest rate, inflation and credit risks associated with the underlying bond holdings. Lower rated bonds are subject to greater fluctuations in value and risk of loss of income and principal than higher rated bonds. Futures contracts may not provide an effective hedge of the underlying securities because changes in the prices of futures contracts may not track those of the securities they are intended to hedge. In addition, the managed risk strategy may not effectively protect the funds from market declines and will limit the funds’ participation in market gains. The use of the managed risk strategy could cause the funds’ returns to lag those of the applicable underlying funds in certain rising market conditions. Refer to the funds’ prospectuses and the Risk Factors section of this report for more information on these and other risks associated with investing in the funds.
Investments are not FDIC-insured, nor are they deposits of or guaranteed by a bank or any other entity, so they may lose value.
| Contents |
We are pleased to present this annual report for American Funds Insurance Series (AFIS) — Portfolio Series, a suite of funds that offers variable annuity investors objective-based portfolios to help meet retirement goals. The series was created by the American Funds Portfolio Oversight Committee, a group of seasoned investment professionals with varied backgrounds, diverse investment approaches and decades of experience. In creating the series, the Committee carefully chose a mix of individual American Funds Insurance Series funds, employing an objective-based process and rigorous analysis. The Committee regularly monitors each fund in the series.
Global equity markets declined on an annual basis for the first time since 2015, pressured by rising interest rates and a slowing global economy. Tighter U.S. monetary policy and a brewing trade war involving the U.S., China and Europe reverberated around the world, halting one of the longest-running bull markets in history.
U.S. equities struggled late in the year as trade-related conflicts, decelerating global growth and high valuations fueled volatility. While growth-oriented stocks on the whole proved stronger than defensive stocks, many companies experienced wild swings throughout the year. Energy and materials companies were further pressured by falling commodity prices. In a turbulent year, a fourth-quarter rally helped bonds outperform other asset classes. Meanwhile, the Federal Reserve continued on its path to reducing the size of its balance sheet, raising rates by a quarter percentage point four times over the calendar year. While not unexpected, December’s hike, which brought the rate to a range of 2.25% to 2.50%, provoked unease among investors.
For the fiscal year, Standard & Poor’s 500 Composite Index1, a market capitalization-weighted index based on the results of approximately 500 widely held common stocks, declined 4.38%. Bloomberg Barclays U.S. Aggregate Index2, which measures investment-grade U.S. bonds (rated BBB/Baa and above)3, returned 0.01%, while the Bloomberg Barclays Global Aggregate Index2, a measure of global investment-grade bonds (rated BBB/Baa and above)3, slipped 1.20%.
See page 2 for footnotes.
| American Funds Insurance Series – Portfolio Series | 1 |
American Funds Global Growth Portfoliotumbled 9.77%. By comparison, the MSCI ACWI (All Country World Index)4, a free float-adjusted, market capitalization-weighted index designed to measure the results of more than 40 developed and emerging equity markets, declined 9.42%. The Morningstar U.S. Insurance World Large Stock Category Average,5a peer fund comparison for the insurance industry that includes portfolios which invest the majority of their assets in the U.S., Europe and Japan and typically have 20%–60% of assets in the U.S., fell 9.88%.
American Funds Growth and Income Portfoliolost 3.51%. The 70%/30% Blended Index6trailed 2.82%. The Morningstar U.S. Insurance 50%/70% Equity Allocation Category Average,5a peer fund comparison for the insurance industry that includes funds that seek to provide both income and capital appreciation by investing in multiple asset classes, including stocks, bonds and cash, declined by 5.30%.
American Funds Managed Risk Growth Portfoliodropped 3.98%. In comparison, Standard & Poor’s 500 Managed Risk Index — Moderate7fell 2.13%.
American Funds Managed Risk Growth and Income Portfolioslid 4.72%. Standard & Poor’s 500 Managed Risk Index — Moderate7declined 2.13%.
American Funds Managed Risk Global Allocation Portfoliofinished down 6.90%. Standard & Poor’s Global LargeMidCap Managed Risk Index — Moderate7fell 6.16%.
Historically, stock markets have experienced periods of volatility. It is important to note that the managed risk portfolios employ a risk-management overlay. As such, they may lag in a strong market environment, but have been designed to buffer the effects of volatility and provide a measure of downside protection, particularly in instances of infrequent large drawdowns, which can be very beneficial to certain investors.
Thank you for your interest in AFIS — Portfolio Series. We look forward to reporting to you again in six months’ time.
Sincerely,

Donald D. O’Neal
Co-President

Alan N. Berro
Co-President
February 14, 2019
The market indexes shown are unmanaged and, therefore, have no expenses. Investors cannot invest directly in an index.
| 1 | S&P 500 source: S&P Dow Jones Indices LLC. |
| 2 | Bloomberg Barclays source: Bloomberg Index Services Ltd. |
| 3 | Bond ratings, which typically range from AAA/Aaa (highest) to D (lowest) are assigned by credit rating agencies such as Standard & Poor’s, Moody’s and/or Fitch as an indication of an issuer’s creditworthiness. |
| 4 | MSCI index results reflect dividends net of withholding taxes. Source: MSCI. |
| 5 | Source: Morningstar, Inc. © 2019 All rights reserved. The information contained herein: (1) is proprietary to Morningstar and/or its content providers; (2) may not be copied or distributed; (3) does not constitute investment advice offered by Morningstar; and (4) is not warranted to be accurate, complete or timely. Neither Morningstar nor its content providers are responsible for any damages or losses arising from this information. Past performance is no guarantee of future results. |
| 6 | The 70%/30% Blended Index weights the total returns of the S&P 500 and Bloomberg Barclays U.S. Aggregate indexes at the corresponding percentages. |
| 7 | Source: S&P Dow Jones Indices LLC. The Standard & Poor’s Managed Risk Index Series is designed to simulate a dynamic protective portfolio that allocates between the underlying equity index and cash, based on realized volatilities of the underlying equity and bond indexes, while maintaining a fixed allocation to the underlying bond index. These indices are generated and published under agreements between Standard and Poor’s Dow Jones Indices and Milliman Financial Risk Management LLC. |
| 2 | American Funds Insurance Series – Portfolio Series |
The value of a $10,000 investment
(for the year ended December 31, 2018, with all distributions reinvested)
Fund results shown are for past periods and are not predictive of results for future periods. Current and future results may be lower or higher than those shown. Unit prices and returns will vary, so investors may lose money. For current information and month-end results, visit americanfunds.com/afis. For information about your insurance contract and month-end results, go to the website of the company that issued your contract.
Global Growth Portfolio

Average annual total returns4based on a $1,000 investment
(for the periods ended December 31, 2018)
| 1 year | Lifetime (since 5/1/15) | |
| Class 4 shares | –9.77% | 3.65% |
Growth and Income Portfolio
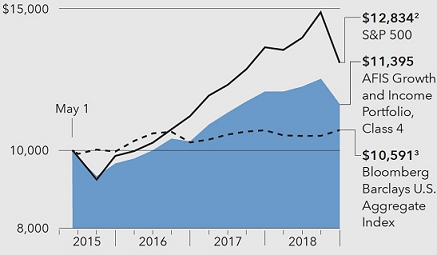
Average annual total returns4based on a $1,000 investment
(for the periods ended December 31, 2018)
| 1 year | Lifetime (since 5/1/15) | |
| Class 4 shares | –3.51% | 3.62% |
The market indexes shown are unmanaged and, therefore, have no expenses. Investors cannot invest directly in an index.
See page 4 for footnotes.
| American Funds Insurance Series – Portfolio Series | 3 |
Managed Risk Growth Portfolio

Average annual total returns4based on a $1,000 investment
(for the periods ended December 31, 2018)
| 1 year | Lifetime (since 5/1/15) | |
| Class P2 shares | –3.98% | 3.06% |
Managed Risk Growth and Income Portfolio

Average annual total returns4based on a $1,000 investment
(for the periods ended December 31, 2018)
| 1 year | Lifetime (since 5/1/15) | |
| Class P2 shares | –4.72% | 2.33% |
Managed Risk Global Allocation Portfolio

Average annual total returns4 based on a $1,000 investment
(for the periods ended December 31, 2018)
| 1 year | Lifetime (since 5/1/15) | |
| Class P2 shares | –6.90% | 1.21% |
The market indexes shown are unmanaged and, therefore, have no expenses. Investors cannot invest directly in an index.
| 1 | Results reflect dividends net of withholding taxes. Source: MSCI. |
| 2 | Source: S&P Dow Jones Indices. |
| 3 | Source: Bloomberg Index Services. |
| 4 | Investment results assume all distributions are reinvested and reflect applicable fees and expenses. The investment adviser is currently waiving a portion of its management fee equal to 0.05% of the fund’s net assets for the three managed risk portfolios. In addition, the investment adviser is currently reimbursing a portion of the other expenses for American Funds Global Growth Portfolio. Investment results shown reflect the waiver and reimbursement, without which the results would have been lower. This waiver and reimbursement will be in effect through at least May 1, 2020, unless modified or terminated by the series board. The adviser may elect at its discretion to extend, modify or terminate the reimbursement at that time. The waiver may only be modified or terminated with the approval of the series board. Please see the fund’s most recent prospectus for details. |
| 5 | Source: S&P Dow Jones Indices LLC. Standard & Poor’s Managed Risk Index Series is designed to simulate a dynamic protective portfolio that allocates between the underlying equity index and cash, based on realized volatilities of the underlying equity and bond indexes, while maintaining a fixed allocation to the underlying bond index. These indexes are generated and published under agreements between Standard & Poor’s Dow Jones Indices and Milliman Financial Risk Management LLC. |
Milliman Financial Risk Management LLC serves as the subadviser with respect to the management of the fund’s managed risk strategy.
| 4 | American Funds Insurance Series – Portfolio Series |
American Funds Global Growth Portfolio
| Underlying allocations as of 12/31/18: | ||
| 30.0% | Global Growth Fund | |
| 20.0% | New World Fund® | |
| 10.0% | Growth Fund | |
| 10.0% | Global Small Capitalization Fund | |
| 30.0% | Global Growth and Income Fund | |
The fund’s investment objective is to provide long-term growth of capital. The fund will attempt to achieve its investment objective by investing in a mix of American Funds Insurance Series funds (AFIS) in different combinations and weightings. The underlying AFIS funds will primarily consist of growth funds. The fund may also invest in growth-and-income funds. Through its investments in the underlying funds, the fund will have significant exposure to growth-oriented common stocks.
For the 12 months ended December 31, 2018, the fund’s shares fell 9.77%.
American Funds Growth and Income Portfolio
| Underlying allocations as of 12/31/18: | ||
| 14.8% | Growth Fund | |
| 19.8% | Growth-Income Fund | |
| 9.8% | Global Growth and Income Fund | |
| 24.8% | Capital Income Builder® | |
| 20.4% | Bond Fund | |
| 10.4% | Global Bond Fund | |
The fund’s investment objective is to provide long-term growth of capital while providing current income. The fund will attempt to achieve its investment objective by investing in a mix of AFIS funds in different combinations and weightings. The underlying AFIS funds will primarily consist of equity funds in the growth, growth-and-income and equity-income categories. However, the fund may also invest in fixed income funds.
For the 12 months ended December 31, 2018, the fund’s shares fell 3.51%.
American Funds Managed Risk Growth Portfolio
| Underlying allocations as of 12/31/18: | ||
| 25.4% | Growth Fund | |
| 10.0% | Global Small Capitalization Fund | |
| 10.0% | International Fund | |
| 20.1% | Growth-Income Fund | |
| 10.0% | Blue Chip Income and Growth Fund | |
| 20.5% | Bond Fund | |
| 4.0% | Cash & equivalents in support of managed risk strategy*,† | |
The fund’s investment objective is to provide long-term growth of capital while seeking to manage volatility and provide downside protection. The fund will attempt to achieve its investment objective by investing in a mix of AFIS funds in different combinations and weightings, while seeking to manage portfolio volatility and provide downside protection primarily through the use of exchange-traded futures contracts. The underlying AFIS funds will primarily consist of growth funds. The fund may also invest in growth-and-income and fixed income funds.
For the 12 months ended December 31, 2018, the fund’s shares fell 3.98%.
See page 6 for footnotes.
| American Funds Insurance Series – Portfolio Series | 5 |
American Funds Managed Risk Growth and Income Portfolio
| Underlying allocations as of 12/31/18: | ||
| 15.3% | Growth Fund | |
| 20.2% | Growth-Income Fund | |
| 20.1% | Global Growth and Income Fund | |
| 24.9% | Capital Income Builder® | |
| 7.7% | Global Bond Fund | |
| 7.7% | Bond Fund | |
| 4.1% | Cash & equivalents in support of managed risk strategy*,† | |
The fund’s investment objective is to provide long-term growth of capital and current income while seeking to manage volatility and provide downside protection. The fund will attempt to achieve its investment objective by investing in a mix of AFIS funds in different combinations and weightings, while seeking to manage portfolio volatility and provide downside protection primarily through the use of exchange-traded futures contracts. The underlying AFIS funds will primarily consist of equity funds in the growth, growth-and-income and equity-income categories. However, the fund may also invest in fixed income funds.
For the 12 months ended December 31, 2018, the fund’s shares fell 4.72%.
American Funds Managed Risk Global Allocation Portfolio
| Underlying allocations as of 12/31/18: | ||
| 15.0% | Global Growth Fund | |
| 9.9% | International Fund | |
| 19.9% | Global Growth and Income Fund | |
| 9.9% | Asset Allocation Fund | |
| 25.0% | Global Balanced Fund | |
| 15.4% | Global Bond Fund | |
| 4.9% | Cash & equivalents in support of managed risk strategy*,† | |
The fund’s investment objective is to provide high total return (including income and capital gains) consistent with preservation of capital over the long term while seeking to manage volatility and provide downside protection. The fund will attempt to achieve its investment objective by investing in a mix of AFIS funds in different combinations and weightings, while seeking to manage portfolio volatility and provide downside protection primarily through the use of exchange-traded futures contracts. The underlying AFIS funds may include growth, growth-and-income, equity-income, balanced, asset allocation and fixed income funds.
For the 12 months ended December 31, 2018, the fund’s shares fell 6.90%.
The Portfolio Series funds are actively monitored; allocations and funds may change.
| * | Cash and equivalents include short-term securities, accrued income, futures contracts and other assets less liabilities. |
| † | The managed risk strategy is operated by Milliman Financial Risk Management LLC. Futures contracts may not provide an effective hedge of the underlying securities because changes in the prices of futures contracts may not track those of the securities they are intended to hedge. In addition, the managed risk strategy may not effectively protect the fund from market declines and will limit the fund’s participation in market gains. The use of the managed risk strategy could cause the fund’s return to lag that of the underlying funds in certain rising market conditions. |
| 6 | American Funds Insurance Series – Portfolio Series |
American Funds Global Growth Portfolio
Investment portfolioDecember 31, 2018
| Growth funds 70.08% | Shares | Value (000) | ||||||
| American Funds Insurance Series - Global Growth Fund, Class 1 | 414,266 | $ | 10,663 | |||||
| American Funds Insurance Series - New World Fund, Class 1 | 338,771 | 7,107 | ||||||
| American Funds Insurance Series - Growth Fund, Class 1 | 51,065 | 3,573 | ||||||
| American Funds Insurance Series - Global Small Capitalization Fund, Class 1 | 163,807 | 3,563 | ||||||
| Total growth funds (cost: $26,459,000) | 24,906 | |||||||
| Growth-and-income funds 30.00% | ||||||||
| American Funds Insurance Series - Global Growth and Income Fund, Class 1 | 819,083 | 10,664 | ||||||
| Total growth-and-income funds (cost: $11,660,000) | 10,664 | |||||||
| Total investment securities 100.08% (cost: $38,119,000) | 35,570 | |||||||
| Other assets less liabilities (0.08)% | (30 | ) | ||||||
| Net assets 100.00% | $ | 35,540 | ||||||
Investments in affiliates
These holdings are affiliates of the fund under the Investment Company Act of 1940 since they are controlled by the same board of trustees as the series. Further details on these holdings and related transactions during the year ended December 31, 2018, appear below.
| Beginning shares | Additions | Reductions | Ending shares | Net realized loss (000) | Net unrealized depreciation (000) | Dividend income (000) | Value of affiliates at 12/31/2018 (000) | |||||||||||||||||||||||||
| Growth funds 70.08% | ||||||||||||||||||||||||||||||||
| American Funds Insurance Series - Global Growth Fund, Class 1 | 293,679 | 160,059 | 39,472 | 414,266 | $ | (21 | ) | $ | (1,880 | ) | $ | 109 | $ | 10,663 | ||||||||||||||||||
| American Funds Insurance Series - New World Fund, Class 1 | 236,744 | 137,182 | 35,155 | 338,771 | (35 | ) | (1,371 | ) | 86 | 7,107 | ||||||||||||||||||||||
| American Funds Insurance Series - Growth Fund, Class 1 | 38,188 | 20,627 | 7,750 | 51,065 | (2 | ) | (387 | ) | 26 | 3,573 | ||||||||||||||||||||||
| American Funds Insurance Series - Global Small Capitalization Fund, Class 1 | 117,487 | 62,153 | 15,833 | 163,807 | (5 | ) | (572 | ) | 13 | 3,563 | ||||||||||||||||||||||
| 24,906 | ||||||||||||||||||||||||||||||||
| Growth-and-income funds 30.00% | ||||||||||||||||||||||||||||||||
| American Funds Insurance Series - Global Growth and Income Fund,Class 1 | 567,886 | 324,888 | 73,691 | 819,083 | (24 | ) | (2,128 | ) | 218 | 10,664 | ||||||||||||||||||||||
| Total 100.08% | $ | (87 | ) | $ | (6,338 | ) | $ | 452 | $ | 35,570 | ||||||||||||||||||||||
See notes to financial statements
| American Funds Insurance Series – Portfolio Series | 7 |
American Funds Growth and Income Portfolio
Investment portfolioDecember 31, 2018
| Growth funds 14.86% | Shares | Value (000) | ||||||
| American Funds Insurance Series - Growth Fund, Class 1 | 357,569 | $ | 25,015 | |||||
| Total growth funds (cost: $25,587,000) | 25,015 | |||||||
| Growth-and-income funds 29.63% | ||||||||
| American Funds Insurance Series - Growth-Income Fund, Class 1 | 735,529 | 33,386 | ||||||
| American Funds Insurance Series - Global Growth and Income Fund, Class 1 | 1,267,630 | 16,504 | ||||||
| Total growth-and-income funds(cost: $52,324,000) | 49,890 | |||||||
| Equity-income and Balanced funds 24.81% | ||||||||
| American Funds Insurance - Capital Income Builder, Series 1 | 4,458,865 | 41,780 | ||||||
| Total equity-income and balanced funds (cost: $44,004,000) | 41,780 | |||||||
| Fixed income funds 30.78% | ||||||||
| American Funds Insurance Series - Bond Fund, Class 1 | 3,282,224 | 34,365 | ||||||
| American Funds Insurance Series - Global Bond Fund, Class 1 | 1,528,939 | 17,461 | ||||||
| Total fixed income funds (cost: $53,517,000) | 51,826 | |||||||
| Total investment securities 100.08% (cost: $175,432,000) | 168,511 | |||||||
| Other assets less liabilities (0.08)% | (140 | ) | ||||||
| Net assets 100.00% | $ | 168,371 | ||||||
| 8 | American Funds Insurance Series – Portfolio Series |
American Funds Growth and Income Portfolio
Investments in affiliates
These holdings are affiliates of the fund under the Investment Company Act of 1940 since they are controlled by the same board of trustees as the series. Further details on these holdings and related transactions during the year ended December 31, 2018, appear below.
| Beginning shares | Additions | Reductions | Ending shares | Net realized loss (000) | Net unrealized depreciation (000) | Dividend income (000) | Value of affiliates at 12/31/2018 (000) | |||||||||||||||||||||||||
| Growth funds 14.86% | ||||||||||||||||||||||||||||||||
| American Funds Insurance Series - Growth Fund, Class 1 | 258,406 | 121,962 | 22,799 | 357,569 | $ | (1 | ) | $ | (2,719 | ) | $ | 178 | $ | 25,015 | ||||||||||||||||||
| Growth-and-income funds 29.63% | ||||||||||||||||||||||||||||||||
| American Funds Insurance Series - Growth-Income Fund, Class 1 | 534,210 | 224,154 | 22,835 | 735,529 | (1 | ) | (3,484 | ) | 568 | 33,386 | ||||||||||||||||||||||
| American Funds Insurance Series - Global Growth and Income Fund, Class 1 | 848,766 | 434,856 | 15,992 | 1,267,630 | (4 | ) | (3,191 | ) | 333 | 16,504 | ||||||||||||||||||||||
| 49,890 | ||||||||||||||||||||||||||||||||
| Equity-income and Balanced funds 24.81% | ||||||||||||||||||||||||||||||||
| American Funds Insurance Series - Capital Income Builder, Class 1 | 3,226,866 | 1,353,824 | 121,825 | 4,458,865 | (17 | ) | (4,234 | ) | 1,284 | 41,780 | ||||||||||||||||||||||
| Fixed income funds 30.78% | ||||||||||||||||||||||||||||||||
| American Funds Insurance Series - Bond Fund, Class 1 | 2,482,578 | 1,093,074 | 293,428 | 3,282,224 | (65 | ) | (925 | ) | 910 | 34,365 | ||||||||||||||||||||||
| American Funds Insurance Series - Global Bond Fund, Class 1 | 1,132,056 | 449,618 | 52,735 | 1,528,939 | (4 | ) | (641 | ) | 415 | 17,461 | ||||||||||||||||||||||
| 51,826 | ||||||||||||||||||||||||||||||||
| Total 100.08% | $ | (92 | ) | $ | (15,194 | ) | $ | 3,688 | $ | 168,511 | ||||||||||||||||||||||
See notes to financial statements
| American Funds Insurance Series – Portfolio Series | 9 |
American Funds Managed Risk Growth Portfolio
Investment portfolioDecember 31, 2018
| Growth funds 45.36% | Shares | Value (000) | ||||||
| American Funds Insurance Series – Growth Fund, Class 1 | 3,900,112 | $ | 272,852 | |||||
| American Funds Insurance Series – Global Small Capitalization Fund, Class 1 | 4,924,077 | 107,099 | ||||||
| American Funds Insurance Series – International Fund, Class 1 | 6,058,851 | 106,999 | ||||||
| Total growth funds(cost: $502,555,000) | 486,950 | |||||||
| Growth-and-income funds 30.12% | ||||||||
| American Funds Insurance Series – Growth-Income Fund, Class 1 | 4,765,212 | 216,293 | ||||||
| American Funds Insurance Series – Blue Chip Income and Growth Fund, Class 1 | 8,642,917 | 106,999 | ||||||
| Total growth-and-income funds(cost: $337,840,000) | 323,292 | |||||||
| Fixed income funds 20.54% | ||||||||
| American Funds Insurance Series – Bond Fund, Class 1 | 21,057,734 | 220,474 | ||||||
| Total fixed income funds (cost: $228,767,000) | 220,474 | |||||||
| Short-term securities 2.00% | ||||||||
| Government Cash Management Fund | 21,441,623 | 21,442 | ||||||
| Total short-term securities(cost: $21,442,000) | 21,442 | |||||||
| Total investment securities 98.02% (cost: $1,090,604,000) | 1,052,158 | |||||||
| Other assets less liabilities 1.98% | 21,283 | |||||||
| Net assets 100.00% | $ | 1,073,441 | ||||||
Futures contracts
| Contracts | Type | Number of contracts | Expiration | Notional amount1 (000) | Value at 12/31/20182 (000) | Unrealized appreciation (depreciation) at 12/31/2018 (000) | ||||||||||||||
| 5 Year U.S. Treasury Note Futures | Long | 4,031 | March 2019 | $ | 403,100 | $ | 462,305 | $ | 5,160 | |||||||||||
| FTSE 100 Index Contracts | Short | 160 | March 2019 | £ | (2 | ) | (13,580 | ) | 94 | |||||||||||
| S&P Mid 400 E-mini Index Contracts | Short | 46 | March 2019 | $ | (4 | ) | (7,646 | ) | 259 | |||||||||||
| Euro Stoxx 50 Index Contracts | Short | 867 | March 2019 | € | (9 | ) | (29,543 | ) | 483 | |||||||||||
| Russell 2000 Mini Index Contracts | Short | 588 | March 2019 | $ | (29 | ) | (39,660 | ) | 1,537 | |||||||||||
| Mini MSCI Emerging Market Index Contracts | Short | 921 | March 2019 | (46 | ) | (44,521 | ) | 260 | ||||||||||||
| Nikkei 225 Index Contracts | Short | 65 | March 2019 | ¥ | (65 | ) | (11,861 | ) | 418 | |||||||||||
| S&P 500 E-mini Index Contracts | Short | 1,873 | March 2019 | $ | (94 | ) | (234,612 | ) | 6,174 | |||||||||||
| British Pound Currency Contracts | Short | 176 | March 2019 | (11,000 | ) | (14,069 | ) | (95 | ) | |||||||||||
| Euro Currency Contracts | Short | 219 | March 2019 | (27,375 | ) | (31,543 | ) | (131 | ) | |||||||||||
| Japanese Yen Currency Contracts | Short | 104 | March 2019 | (1,300,000 | ) | (11,922 | ) | (254 | ) | |||||||||||
| $ | 13,905 | |||||||||||||||||||
| 10 | American Funds Insurance Series – Portfolio Series |
American Funds Managed Risk Growth Portfolio
Investments in affiliates
These holdings are affiliates of the fund under the Investment Company Act of 1940 since they are controlled by the same board of trustees as the series. Further details on these holdings and related transactions during the year ended December 31, 2018, appear below.
| Beginning shares | Additions | Reductions | Ending shares | Net realized gain (loss) (000) | Net unrealized depreciation (000) | Dividend income (000) | Value of affiliates at 12/31/2018 (000) | |||||||||||||||||||||||||
| Growth funds 45.36% | ||||||||||||||||||||||||||||||||
| American Funds Insurance Series – Growth Fund, Class 1 | 2,900,062 | 1,177,804 | 177,754 | 3,900,112 | $ | 1,962 | $ | (30,226 | ) | $ | 1,903 | $ | 272,852 | |||||||||||||||||||
| American Funds Insurance Series – Global Small Capitalization Fund, Class 1 | 3,558,907 | 1,474,772 | 109,602 | 4,924,077 | (283 | ) | (16,518 | ) | 377 | 107,099 | ||||||||||||||||||||||
| American Funds Insurance Series – International Fund, Class 1 | 4,185,102 | 1,955,746 | 81,997 | 6,058,851 | (51 | ) | (21,997 | ) | 2,241 | 106,999 | ||||||||||||||||||||||
| 486,950 | ||||||||||||||||||||||||||||||||
| Growth-and-income funds 30.12% | ||||||||||||||||||||||||||||||||
| American Funds Insurance Series – Growth-Income Fund, Class 1 | 3,605,094 | 1,242,240 | 82,122 | 4,765,212 | 337 | (22,149 | ) | 3,645 | 216,293 | |||||||||||||||||||||||
| American Funds Insurance Series – Blue Chip Income and Growth Fund, Class 1 | 6,018,449 | 2,743,633 | 119,165 | 8,642,917 | 97 | (19,410 | ) | 2,365 | 106,999 | |||||||||||||||||||||||
| 323,292 | ||||||||||||||||||||||||||||||||
| Fixed income funds 20.54% | ||||||||||||||||||||||||||||||||
| American Funds Insurance Series – Bond Fund, Class 1 | 16,821,550 | 5,901,955 | 1,665,771 | 21,057,734 | (596 | ) | (6,014 | ) | 5,856 | 220,474 | ||||||||||||||||||||||
| Total 96.02% | $ | 1,466 | $ | (116,314 | ) | $ | 16,387 | $ | 1,030,716 | |||||||||||||||||||||||
| 1 | Notional amount is calculated based on the number of contracts and notional contract size. |
| 2 | Value is calculated based on the notional amount and current market price. |
Key to symbols
£ = British pounds
€ = Euros
¥ = Japanese yen
See notes to financial statements
| American Funds Insurance Series – Portfolio Series | 11 |
American Funds Managed Risk Growth and Income Portfolio
Investment portfolioDecember 31, 2018
| Growth funds 15.25% | Shares | Value (000) | ||||||
| American Funds Insurance Series – Growth Fund, Class 1 | 2,122,993 | $ | 148,524 | |||||
| Total growth funds (cost: $149,133,000) | 148,524 | |||||||
| Growth-and-income funds 40.26% | ||||||||
| American Funds Insurance Series – Growth-Income Fund, Class 1 | 4,331,416 | 196,603 | ||||||
| American Funds Insurance Series – Global Growth and Income Fund, Class 1 | 15,008,970 | 195,417 | ||||||
| Total growth-and-income funds (cost: $405,216,000) | 392,020 | |||||||
| Equity-income and Balanced funds 24.95% | ||||||||
| American Funds Insurance Series – Capital Income Builder Fund, Class 1 | 25,927,865 | 242,944 | ||||||
| Total equity-income and balanced funds (cost: $254,889,000) | 242,944 | |||||||
| Fixed income funds 15.40% | ||||||||
| American Funds Insurance Series – Global Bond Fund, Class 1 | 6,567,342 | 74,999 | ||||||
| American Funds Insurance Series – Bond Fund, Class 1 | 7,154,050 | 74,903 | ||||||
| Total fixed income funds (cost: $154,697,000) | 149,902 | |||||||
| Short-term securities 2.22% | ||||||||
| Government Cash Management Fund | 21,638,056 | 21,638 | ||||||
| Total short-term securities (cost: $21,638,000) | 21,638 | |||||||
| Total investment securities 98.08% (cost: $985,573,000) | 955,028 | |||||||
| Other assets less liabilities 1.92% | 18,708 | |||||||
| Net assets 100.00% | $ | 973,736 | ||||||
Futures contracts
| Contracts | Type | Number of contracts | Expiration | Notional amount1 (000) | Value at 12/31/20182 (000) | Unrealized appreciation (depreciation) at 12/31/2018 (000) | ||||||||||||||
| 5 Year U.S. Treasury Note Futures | Long | 3,394 | March 2019 | $ | 339,400 | $ | 389,249 | $ | 4,359 | |||||||||||
| S&P Mid 400 E-mini Index Contracts | Short | 14 | March 2019 | (1 | ) | (2,327 | ) | 84 | ||||||||||||
| FTSE 100 Index Contracts | Short | 264 | March 2019 | £ | (3 | ) | (22,407 | ) | 127 | |||||||||||
| Euro Stoxx 50 Index Contracts | Short | 1,197 | March 2019 | € | (12 | ) | (40,787 | ) | 737 | |||||||||||
| Russell 2000 Mini Index Contracts | Short | 259 | March 2019 | $ | (13 | ) | (17,469 | ) | 721 | |||||||||||
| Mini MSCI Emerging Market Index Contracts | Short | 749 | March 2019 | (37 | ) | (36,207 | ) | 225 | ||||||||||||
| Nikkei 225 Index Contracts | Short | 59 | March 2019 | ¥ | (59 | ) | (10,766 | ) | 385 | |||||||||||
| S&P 500 E-mini Index Contracts | Short | 1,493 | March 2019 | $ | (75 | ) | (187,013 | ) | 5,113 | |||||||||||
| British Pound Currency Contracts | Short | 287 | March 2019 | (17,938 | ) | (22,942 | ) | (144 | ) | |||||||||||
| Euro Currency Contracts | Short | 296 | March 2019 | (37,000 | ) | (42,633 | ) | (172 | ) | |||||||||||
| Japanese Yen Currency Contracts | Short | 95 | March 2019 | (1,187,500 | ) | (10,891 | ) | (234 | ) | |||||||||||
| $ | 11,201 | |||||||||||||||||||
| 12 | American Funds Insurance Series – Portfolio Series |
American Funds Managed Risk Growth and Income Portfolio
Investments in affiliates
These holdings are affiliates of the fund under the Investment Company Act of 1940 since they are controlled by the same board of trustees as the series. Further details on these holdings and related transactions during the year ended December 31, 2018, appear below.
| Beginning shares | Additions | Reductions | Ending shares | Net realized gain (loss) (000) | Net unrealized depreciation (000) | Dividend income (000) | Value of affiliates at 12/31/2018 (000) | |||||||||||||||||||||||||
| Growth funds 15.25% | ||||||||||||||||||||||||||||||||
| American Funds Insurance Series – Growth Fund, Class 1 | 1,639,050 | 589,182 | 105,239 | 2,122,993 | $ | 1,553 | $ | (16,596 | ) | $ | 1,036 | $ | 148,524 | |||||||||||||||||||
| Growth-and-income funds 40.26% | ||||||||||||||||||||||||||||||||
| American Funds Insurance Series – Growth-Income Fund, Class 1 | 3,387,876 | 1,026,243 | 82,703 | 4,331,416 | 309 | (19,804 | ) | 3,302 | 196,603 | |||||||||||||||||||||||
| American Funds Insurance Series – Global Growth and Income Fund, Class 1 | 10,798,048 | 4,595,700 | 384,778 | 15,008,970 | 580 | (37,720 | ) | 3,859 | 195,417 | |||||||||||||||||||||||
| 392,020 | ||||||||||||||||||||||||||||||||
| Equity-income and Balanced funds 24.95% | ||||||||||||||||||||||||||||||||
| American Funds Insurance Series – Capital Income Builder, Class 1 | 20,529,514 | 6,444,664 | 1,046,313 | 25,927,865 | (53 | ) | (25,284 | ) | 7,682 | 242,944 | ||||||||||||||||||||||
| Fixed income funds 15.40% | ||||||||||||||||||||||||||||||||
| American Funds Insurance Series – Global Bond Fund, Class 1 | 5,404,346 | 1,631,534 | 468,538 | 6,567,342 | 248 | (3,140 | ) | 1,804 | 74,999 | |||||||||||||||||||||||
| American Funds Insurance Series – Bond Fund, Class 1 | 5,924,284 | 1,802,379 | 572,613 | 7,154,050 | (156 | ) | (2,137 | ) | 1,986 | 74,903 | ||||||||||||||||||||||
| 149,902 | ||||||||||||||||||||||||||||||||
| Total 95.86% | $ | 2,481 | $ | (104,681 | ) | $ | 19,669 | $ | 933,390 | |||||||||||||||||||||||
| 1 | Notional amount is calculated based on the number of contracts and notional contract size. |
| 2 | Value is calculated based on the notional amount and current market price. |
Key to symbols
£ = British pounds
€ = Euros
¥ = Japanese yen
See notes to financial statements
| American Funds Insurance Series – Portfolio Series | 13 |
American Funds Managed Risk Global Allocation Portfolio
Investment portfolioDecember 31, 2018
| Growth funds 24.86% | Shares | Value (000) | ||||||
| American Funds Insurance Series – Global Growth Fund, Class 1 | 1,885,673 | $ | 48,537 | |||||
| American Funds Insurance Series – International Fund, Class 1 | 1,821,293 | 32,164 | ||||||
| Total growth funds (cost: $87,398,000) | 80,701 | |||||||
| Growth-and-income funds 19.94% | ||||||||
| American Funds Insurance Series – Global Growth and Income Fund, Class 1 | 4,971,241 | 64,726 | ||||||
| Total growth-and-income funds (cost: $70,298,000) | 64,726 | |||||||
| Asset allocation funds 9.87% | ||||||||
| American Funds Insurance Series – Asset Allocation Fund, Class 1 | 1,504,731 | 32,036 | ||||||
| Total asset allocation funds (cost: $33,677,000) | 32,036 | |||||||
| Equity-income and Balanced funds 24.99% | ||||||||
| American Funds Insurance Series – Global Balanced Fund, Class 1 | 6,949,481 | 81,100 | ||||||
| Total equity-income and balanced funds (cost: $83,136,000) | 81,100 | |||||||
| Fixed income funds 15.42% | ||||||||
| American Funds Insurance Series – Global Bond Fund, Class 1 | 4,381,941 | 50,042 | ||||||
| Total fixed income funds (cost: $51,485,000) | 50,042 | |||||||
| Short-term securities 3.36% | ||||||||
| Government Cash Management Fund | 10,901,405 | 10,901 | ||||||
| Total short-term securities(cost: $10,901,000) | 10,901 | |||||||
| Total investment securities 98.44% (cost: $336,895,000) | 319,506 | |||||||
| Other assets less liabilities 1.56% | 5,075 | |||||||
| Net assets 100.00% | $ | 324,581 | ||||||
Futures contracts
| Contracts | Type | Number of contracts | Expiration | Notional amount1 (000) | Value at 12/31/20182 (000) | Unrealized appreciation (depreciation) at 12/31/2018 (000) | ||||||||||||||
| 5 Year U.S. Treasury Note Futures | Long | 903 | March 2019 | $ | 90,300 | $ | 103,563 | $ | 1,057 | |||||||||||
| FTSE 100 Index Contracts | Short | 75 | March 2019 | £ | (1 | ) | (6,366 | ) | 49 | |||||||||||
| Russell 2000 Mini Index Contracts | Short | 56 | March 2019 | $ | (3 | ) | (3,777 | ) | 145 | |||||||||||
| Euro Stoxx 50 Index Contracts | Short | 469 | March 2019 | € | (4 | ) | (15,981 | ) | 290 | |||||||||||
| S&P 500 E-mini Index Contracts | Short | 240 | March 2019 | $ | (12 | ) | (30,062 | ) | 893 | |||||||||||
| Mini MSCI Emerging Market Index Contracts | Short | 345 | March 2019 | (17 | ) | (16,677 | ) | 109 | ||||||||||||
| Nikkei 225 Index Contracts | Short | 34 | March 2019 | ¥ | (34 | ) | (6,204 | ) | 222 | |||||||||||
| British Pound Currency Contracts | Short | 78 | March 2019 | $ | (4,875 | ) | (6,235 | ) | (40 | ) | ||||||||||
| Euro Currency Contracts | Short | 115 | March 2019 | (14,375 | ) | (16,564 | ) | (65 | ) | |||||||||||
| Japanese Yen Currency Contracts | Short | 54 | March 2019 | (675,000 | ) | (6,191 | ) | (139 | ) | |||||||||||
| $ | 2,521 | |||||||||||||||||||
| 14 | American Funds Insurance Series – Portfolio Series |
American Funds Managed Risk Global Allocation Portfolio
Investments in affiliates
These holdings are affiliates of the fund under the Investment Company Act of 1940 since they are controlled by the same board of trustees as the series. Further details on these holdings and related transactions during the year ended December 31, 2018, appear below.
| Beginning shares | Additions | Reductions | Ending shares | Net realized gain (000) | Net unrealized depreciation (000) | Dividend income (000) | Value of affiliates at 12/31/2018 (000) | |||||||||||||||||||||||||
| Growth funds 24.86% | ||||||||||||||||||||||||||||||||
| American Funds Insurance Series – Global Growth Fund, Class 1 | 1,234,700 | 718,655 | 67,682 | 1,885,673 | $ | 276 | $ | (8,854 | ) | $ | 491 | $ | 48,537 | |||||||||||||||||||
| American Funds Insurance Series – International Fund, Class 1 | 1,154,138 | 679,608 | 12,453 | 1,821,293 | — | 3 | (6,848 | ) | 688 | 32,164 | ||||||||||||||||||||||
| 80,701 | ||||||||||||||||||||||||||||||||
| Growth-and-income funds 19.94% | ||||||||||||||||||||||||||||||||
| American Funds Insurance Series – Global Growth and Income Fund, Class 1 | 3,182,280 | 1,879,368 | 90,407 | 4,971,241 | 155 | (12,967 | ) | 1,312 | 64,726 | |||||||||||||||||||||||
| Asset allocation funds 9.87% | ||||||||||||||||||||||||||||||||
| American Funds Insurance Series – Asset Allocation Fund, Class 1 | 1,055,652 | 468,432 | 19,353 | 1,504,731 | 48 | (3,635 | ) | 638 | 32,036 | |||||||||||||||||||||||
| Equity-income and Balanced funds 24.99% | ||||||||||||||||||||||||||||||||
| American Funds Insurance Series – Global Balanced Fund, Class 1 | 4,918,785 | 2,096,479 | 65,783 | 6,949,481 | 97 | (7,779 | ) | 1,334 | 81,100 | |||||||||||||||||||||||
| Fixed income funds 15.42% | ||||||||||||||||||||||||||||||||
| American Funds Insurance Series – Global Bond Fund, Class 1 | 3,175,896 | 1,604,059 | 398,014 | 4,381,941 | 44 | (2,041 | ) | 1,202 | 50,042 | |||||||||||||||||||||||
| Total 95.08% | $ | 620 | $ | (42,124 | ) | $ | 5,665 | $ | 308,605 | |||||||||||||||||||||||
| 1 | Notional amount is calculated based on the number of contracts and notional contract size. |
| 2 | Value is calculated based on the notional amount and current market price. |
| 3 | Amount less than one thousand. |
Key to symbols
£ = British pounds
€ = Euros
¥ = Japanese yen
See notes to financial statements
| American Funds Insurance Series – Portfolio Series | 15 |
| Financial statements | |
| Statements of assets and liabilities | |
| at December 31, 2018 | (dollars and shares in thousands, except per-share amounts) |
| Global Growth Portfolio | Growth and Income Portfolio | Managed Risk Growth Portfolio | Managed Risk Growth and Income Portfolio | Managed Risk Global Allocation Portfolio | ||||||||||||||||||
| Assets: | ||||||||||||||||||||||
| Investment securities, at value: | ||||||||||||||||||||||
| Unaffiliated issuers | $ | — | $ | — | $ | 21,442 | $ | 21,638 | $ | 10,901 | ||||||||||||
| Affiliated issuers | 35,570 | 168,511 | 1,030,716 | 933,390 | 308,605 | |||||||||||||||||
| Cash | — | — | — | 73 | — | |||||||||||||||||
| Cash pledged for futures contracts | — | — | 23,158 | 20,144 | 5,384 | |||||||||||||||||
| Receivables for: | ||||||||||||||||||||||
| Sales of investments | — | — | — | — | 7 | |||||||||||||||||
| Sales of fund’s shares | 95 | 199 | 2,131 | 1,030 | 104 | |||||||||||||||||
| Dividends and interest | — | — | 84 | 76 | 23 | |||||||||||||||||
| Variation margin on futures contracts | — | — | 1,187 | 1,008 | 295 | |||||||||||||||||
| 35,665 | 168,710 | 1,078,718 | 977,359 | 325,319 | ||||||||||||||||||
| Liabilities: | ||||||||||||||||||||||
| Payables for: | ||||||||||||||||||||||
| Purchases of investments | 94 | 197 | 2,020 | 974 | 84 | |||||||||||||||||
| Repurchases of fund’s shares | — | * | 2 | 4 | 5 | 23 | ||||||||||||||||
| Investment advisory services | — | — | 91 | 83 | 28 | |||||||||||||||||
| Insurance administrative fees | 23 | 105 | 672 | 610 | 205 | |||||||||||||||||
| Services provided by related parties | 8 | 35 | 221 | 200 | 67 | |||||||||||||||||
| Trustees’ deferred compensation | — | * | — | * | 4 | 3 | 1 | |||||||||||||||
| Variation margin on futures contracts | — | — | 2,265 | 1,748 | 330 | |||||||||||||||||
| 125 | 339 | 5,277 | 3,623 | 738 | ||||||||||||||||||
| Net assets at December 31, 2018 | $ | 35,540 | $ | 168,371 | $ | 1,073,441 | $ | 973,736 | $ | 324,581 | ||||||||||||
| Net assets consist of: | ||||||||||||||||||||||
| Capital paid in on shares of beneficial interest | $ | 35,841 | $ | 167,841 | $ | 1,052,880 | $ | 957,024 | $ | 326,931 | ||||||||||||
| Total (accumulated loss) distributable earnings | (301 | ) | 530 | 20,561 | 16,712 | (2,350 | ) | |||||||||||||||
| Net assets at December 31, 2018 | $ | 35,540 | $ | 168,371 | $ | 1,073,441 | $ | 973,736 | $ | 324,581 | ||||||||||||
| Investment securities, at cost: | ||||||||||||||||||||||
| Unaffiliated issuers | $ | — | $ | — | $ | 21,442 | $ | 21,638 | $ | 10,901 | ||||||||||||
| Affiliated issuers | 38,119 | 175,432 | 1,069,162 | 963,935 | 325,994 | |||||||||||||||||
| Shares of beneficial interest issued and outstanding (no stated par value) – unlimited shares authorized | ||||||||||||||||||||||
| Class 4: | Net assets | $ | 35,540 | $ | 168,371 | |||||||||||||||||
| Shares outstanding | 3,328 | 15,905 | Not applicable | Not applicable | Not applicable | |||||||||||||||||
| Net asset value per share | $ | 10.68 | $ | 10.59 | ||||||||||||||||||
| Class P2: | Net assets | $ | 1,073,441 | $ | 973,736 | $ | 324,581 | |||||||||||||||
| Shares outstanding | Not applicable | Not applicable | 104,409 | 95,627 | 32,247 | |||||||||||||||||
| Net asset value per share | $ | 10.28 | $ | 10.18 | $ | 10.07 | ||||||||||||||||
| * | Amount less than one thousand. |
See notes to financial statements
| 16 | American Funds Insurance Series – Portfolio Series |
| Statements of operations | |
| for the year ended December 31, 2018 | (dollars in thousands) |
| Global Growth Portfolio | Growth and Income Portfolio | Managed Risk Growth Portfolio | Managed Risk Growth and Income Portfolio | Managed Risk Global Allocation Portfolio | ||||||||||||||||
| Investment income: | ||||||||||||||||||||
| Income: | ||||||||||||||||||||
| Dividends from affiliated issuers | $ | 452 | $ | 3,688 | $ | 16,387 | $ | 19,669 | $ | 5,665 | ||||||||||
| Interest | — | — | 631 | 579 | 229 | |||||||||||||||
| 452 | 3,688 | 17,018 | 20,248 | 5,894 | ||||||||||||||||
| Fees and expenses: | ||||||||||||||||||||
| Investment advisory services | — | — | 1,531 | 1,413 | 466 | |||||||||||||||
| Distribution services | 89 | 395 | 2,552 | 2,354 | 777 | |||||||||||||||
| Insurance administrative services | 89 | 395 | 2,552 | 2,354 | 777 | |||||||||||||||
| Transfer agent services | — | * | — | * | — | * | — | * | — | * | ||||||||||
| Accounting and administrative services | — | — | 55 | 54 | 43 | |||||||||||||||
| Reports to shareholders | 2 | 6 | 32 | 30 | 10 | |||||||||||||||
| Registration statement and prospectus | 3 | 9 | 31 | 25 | 11 | |||||||||||||||
| Trustees’ compensation | — | * | 1 | 6 | 5 | 2 | ||||||||||||||
| Auditing and legal | 19 | 18 | 26 | 26 | 25 | |||||||||||||||
| Custodian | 6 | 6 | 9 | 9 | 9 | |||||||||||||||
| Other | 3 | 3 | (57 | ) | (50 | ) | (2 | ) | ||||||||||||
| Total fees and expenses before waivers/reimbursements | 211 | 833 | 6,737 | 6,220 | 2,118 | |||||||||||||||
| Less waivers/reimbursements of fees and expenses: | ||||||||||||||||||||
| Investment advisory services waivers | — | — | 510 | 471 | 155 | |||||||||||||||
| Miscellaneous fee reimbursements | 4 | — | — | — | — | |||||||||||||||
| Total waivers/reimbursements of fees and expenses | 4 | — | 510 | 471 | 155 | |||||||||||||||
| Total fees and expenses after waivers/reimbursements | 207 | 833 | 6,227 | 5,749 | 1,963 | |||||||||||||||
| Net investment income | 245 | 2,855 | 10,791 | 14,499 | 3,931 | |||||||||||||||
| Net realized gain and unrealized depreciation: | ||||||||||||||||||||
| Net realized (loss) gain on: | ||||||||||||||||||||
| Investments in affiliated issuers | (87 | ) | (92 | ) | 1,466 | 2,481 | 620 | |||||||||||||
| Futures contracts | — | — | (13,922 | ) | (13,955 | ) | (1,955 | ) | ||||||||||||
| Currency transactions | — | — | (20 | ) | (46 | ) | 2 | |||||||||||||
| Capital gain distributions received from affiliated issuers | 2,240 | 5,712 | 55,738 | 41,469 | 11,780 | |||||||||||||||
| 2,153 | 5,620 | 43,262 | 29,949 | 10,447 | ||||||||||||||||
| Net unrealized (depreciation) appreciation on: | ||||||||||||||||||||
| Investments in affiliated issuers | (6,338 | ) | (15,194 | ) | (116,314 | ) | (104,681 | ) | (42,124 | ) | ||||||||||
| Futures contracts | — | — | 14,017 | 11,306 | 2,553 | |||||||||||||||
| (6,338 | ) | (15,194 | ) | (102,297 | ) | (93,375 | ) | (39,571 | ) | |||||||||||
| Net realized gain and unrealized depreciation | (4,185 | ) | (9,574 | ) | (59,035 | ) | (63,426 | ) | (29,124 | ) | ||||||||||
| Net decrease in net assets resulting from operations | $ | (3,940 | ) | $ | (6,719 | ) | $ | (48,244 | ) | $ | (48,927 | ) | $ | (25,193 | ) | |||||
| * | Amount less than one thousand. |
See notes to financial statements
| American Funds Insurance Series – Portfolio Series | 17 |
| Statements of changes in net assets | (dollars in thousands) |
| Global Growth Portfolio | Growth and Income Portfolio | Managed Risk Growth Portfolio | ||||||||||||||||||||||
| Year ended December 31 | Year ended December 31 | Year ended December 31 | ||||||||||||||||||||||
| 2018 | 2017 | 2018 | 2017 | 2018 | 2017 | |||||||||||||||||||
| Operations: | ||||||||||||||||||||||||
| Net investment income | $ | 245 | $ | 230 | $ | 2,855 | $ | 1,688 | $ | 10,791 | $ | 7,122 | ||||||||||||
| Net realized gain | 2,153 | 651 | 5,620 | 4,037 | 43,262 | 31,639 | ||||||||||||||||||
| Net unrealized (depreciation) appreciation | (6,338 | ) | 4,188 | (15,194 | ) | 8,763 | (102,297 | ) | 82,325 | |||||||||||||||
| Net (decrease) increase in net assets resulting from operations | (3,940 | ) | 5,069 | (6,719 | ) | 14,488 | (48,244 | ) | 121,086 | |||||||||||||||
| Distributions paid to shareholders* | (1,014 | ) | (6,019 | ) | (41,982 | ) | ||||||||||||||||||
| Dividends from net investment income | (117 | ) | (1,380 | ) | (6,769 | ) | ||||||||||||||||||
| Distributions from net realized gain on investments | (461 | ) | (1,424 | ) | (16,589 | ) | ||||||||||||||||||
| Total dividends and distributions paid to shareholders | (578 | ) | (2,804 | ) | (23,358 | ) | ||||||||||||||||||
| Net capital share transactions | 10,636 | 12,183 | 46,992 | 56,254 | 260,046 | 237,525 | ||||||||||||||||||
| Total increase in net assets | 5,682 | 16,674 | 34,254 | 67,938 | 169,820 | 335,253 | ||||||||||||||||||
| Net assets: | ||||||||||||||||||||||||
| Beginning of year | 29,858 | 13,184 | 134,117 | 66,179 | 903,621 | 568,368 | ||||||||||||||||||
| End of year | $ | 35,540 | $ | 29,858 | $ | 168,371 | $ | 134,117 | $ | 1,073,441 | $ | 903,621 | ||||||||||||
| Managed Risk Growth and Income Portfolio | Managed Risk Global Allocation Portfolio | |||||||||||||||||||||||
| Year ended December 31 | Year ended December 31 | |||||||||||||||||||||||
| 2018 | 2017 | 2018 | 2017 | |||||||||||||||||||||
| Operations: | ||||||||||||||||||||||||
| Net investment income | $ | 14,499 | $ | 9,844 | $ | 3,931 | $ | 1,796 | ||||||||||||||||
| Net realized gain | 29,949 | 24,588 | 10,447 | 5,001 | ||||||||||||||||||||
| Net unrealized (depreciation) appreciation | (93,375 | ) | 71,947 | (39,571 | ) | 24,831 | ||||||||||||||||||
| Net (decrease) increase in net assets resulting from operations | (48,927 | ) | 106,379 | (25,193 | ) | 31,628 | ||||||||||||||||||
| Distributions paid to shareholders* | (38,256 | ) | (6,441 | ) | ||||||||||||||||||||
| Dividends from net investment income | (8,603 | ) | (1,285 | ) | ||||||||||||||||||||
| Distributions from net realized gain on investments | (1,336 | ) | — | |||||||||||||||||||||
| Total dividends and distributions paid to shareholders | (9,939 | ) | (1,285 | ) | ||||||||||||||||||||
| Net capital share transactions | 209,432 | 185,598 | 105,547 | 76,579 | ||||||||||||||||||||
| Total increase in net assets | 122,249 | 282,038 | 73,913 | 106,922 | ||||||||||||||||||||
| Net assets: | ||||||||||||||||||||||||
| Beginning of year | 851,487 | 569,449 | 250,668 | 143,746 | ||||||||||||||||||||
| End of year | $ | 973,736 | $ | 851,487 | $ | 324,581 | $ | 250,668 | ||||||||||||||||
| * | Current year amounts reflect current presentation under new accounting standards. |
See notes to financial statements
| 18 | American Funds Insurance Series – Portfolio Series |
Notes to financial statements
1. Organization
American Funds Insurance Series (the “series”) is registered under the Investment Company Act of 1940 as an open-end, diversified management investment company with 28 different funds, including the Global Growth Portfolio, Growth and Income Portfolio, Managed Risk Growth Portfolio, Managed Risk Growth and Income Portfolio and Managed Risk Global Allocation Portfolio (the “funds”). The other 23 funds in the series are covered in a separate report. The assets of each fund are segregated, with each fund accounted for separately. Capital Research and Management Company (“CRMC”) is the series’ investment adviser. Milliman Financial Risk Management LLC (“Milliman FRM”) is the subadviser for the risk management strategy for eight of the funds (the “managed risk funds”), three of which are covered in this report.
The managed risk funds covered in this report are Managed Risk Growth Portfolio, Managed Risk Growth and Income Portfolio and Managed Risk Global Allocation Portfolio. The managed risk funds invest in other funds within the series (the “underlying funds”) and employ Milliman FRM to implement the risk management strategy, which consists of using hedging instruments — primarily short positions on exchange-traded futures contracts — to attempt to stabilize the volatility of the funds around target volatility levels and reduce the downside exposure of the funds during periods of significant market declines.
Shareholders approved a proposal to reorganize the series from a Massachusetts business trust to a Delaware statutory trust. The reorganization may be completed in the next 12 months; however, the series reserves the right to delay the implementation.
The investment objectives for each fund covered in this report are as follows:
Global Growth Portfolio— Seeks to provide long-term growth of capital.
Growth and Income Portfolio— Seeks to provide long-term growth of capital while providing current income.
Managed Risk Growth Portfolio— Seeks to provide long-term growth of capital while seeking to manage volatility and provide downside protection.
Managed Risk Growth and Income Portfolio— Seeks to provide long-term growth of capital and current income while seeking to manage volatility and provide downside protection.
Managed Risk Global Allocation Portfolio— Seeks to provide high total return (including income and capital gains) consistent with preservation of capital over the long term while seeking to manage volatility and provide downside protection.
Each fund offers one share class (Class 4 for Global Growth Portfolio and Growth and Income Portfolio, and Class P2 for the three managed risk funds). Share classes have different fees and expenses (“class-specific fees and expenses”), primarily due to different arrangements for certain distribution expenses. Differences in class-specific fees and expenses will result in differences in net investment income and, therefore, the payment of different per-share dividends by each class of each fund.
2. Significant accounting policies
Each fund is an investment company that applies the accounting and reporting guidance issued in Topic 946 by the U.S. Financial Accounting Standards Board. Each fund’s financial statements have been prepared to comply with U.S. generally accepted accounting principles (“U.S. GAAP”). These principles require the series’ investment adviser to make estimates and assumptions that affect reported amounts and disclosures. Actual results could differ from those estimates. Subsequent events, if any, have been evaluated through the date of issuance in the preparation of the financial statements. The funds follow the significant accounting policies described in this section, as well as the valuation policies described in the next section on valuation.
Security transactions and related investment income— Security transactions are recorded by the funds as of the date the trades are executed with brokers. Realized gains and losses from security transactions are determined based on the specific identified cost of the securities. In the event a security is purchased with a delayed payment date, the funds will segregate liquid assets sufficient to meet their payment obligations. Dividend income is recognized on the ex-dividend date and interest income is recognized on an accrual basis.
| American Funds Insurance Series – Portfolio Series | 19 |
Fees and expenses— The fees and expenses of the underlying funds are not included in the fees and expenses reported for each of the managed risk funds; however, they are indirectly reflected in the valuation of each of the underlying funds. These fees are included in the net effective expense ratios that are provided as additional information in the financial highlights tables.
Distributions paid to shareholders— Income dividends and capital gain distributions paid to shareholders are recorded on each fund’s ex-dividend date.
Currency translation— Assets and liabilities, including investment securities, denominated in currencies other than U.S. dollars are translated into U.S. dollars at the exchange rates supplied by one or more pricing vendors on the valuation date. Purchases and sales of investment securities and income and expenses are translated into U.S. dollars at the exchange rates on the dates of such transactions. The effects of changes in exchange rates on investment securities are included with the net realized gain or loss and net unrealized appreciation or depreciation on investments in the fund’s statement of operations. The realized gain or loss and unrealized appreciation or depreciation resulting from all other transactions denominated in currencies other than U.S. dollars are disclosed separately.
3. Valuation
Security valuation— The net asset value of each share class of each fund is calculated based on the reported net asset values of the underlying funds in which each fund invests. The net asset value of each underlying fund is calculated based on the policies and procedures of the underlying fund contained in each underlying fund’s statement of additional information. Generally, the funds and the underlying funds determine the net asset value of each share class as of approximately 4:00 p.m. New York time each day the New York Stock Exchange is open. Exchange-traded futures are generally valued at the official settlement price of, or the last reported sale price on, the exchange or market on which such instruments are traded, as of the close of business on the day the futures are being valued or, lacking any sales, at the last available bid price. Prices for each future are taken from the exchange or market on which the security trades.
Processes and structure— The series’ board of trustees has delegated authority to the series’ investment adviser to make fair value determinations, subject to board oversight. The investment adviser has established a Joint Fair Valuation Committee (the “Fair Valuation Committee”) to administer, implement and oversee the fair valuation process, and to make fair value decisions. The Fair Valuation Committee regularly reviews its own fair value decisions, as well as decisions made under its standing instructions to the investment adviser’s valuation teams. The Fair Valuation Committee reviews changes in fair value measurements from period to period and may, as deemed appropriate, update the fair valuation guidelines to better reflect the results of back testing and address new or evolving issues. The Fair Valuation Committee reports any changes to the fair valuation guidelines to the board of trustees. The series’ board and audit committee also regularly review reports that describe fair value determinations and methods. Pricing decisions, processes and controls over security valuation are also subject to additional internal reviews, including an annual control self-evaluation program facilitated by the investment adviser’s compliance group.
Classifications— The series’ investment adviser classifies each fund’s assets and liabilities into three levels based on the method used to value the assets or liabilities. Level 1 values are based on quoted prices in active markets for identical securities. Level 2 values are based on significant observable market inputs, such as quoted prices for similar securities and quoted prices in inactive markets. Level 3 values are based on significant unobservable inputs that reflect the investment adviser’s determination of assumptions that market participants might reasonably use in valuing the securities. The valuation levels are not necessarily an indication of the risk or liquidity associated with the underlying investment. At December 31, 2018, all of the investment securities held by each fund were classified as Level 1.
4. Risk factors
Investing in the funds may involve certain risks including, but not limited to, those described below.
Allocation risk— Investments in a fund are subject to risks related to the investment adviser’s allocation choices. The selection of the underlying funds and the allocation of a fund’s assets could cause the fund to lose value or its results to lag relevant benchmarks or other funds with similar objectives. Certain of the funds may invest in an underlying fixed-income fund that is a non-diversified investment company under the Investment Company Act of 1940. Poor performance by a single large holding in a non-diversified underlying fund would adversely affect such a fund’s investment results more than if the underlying fund were invested in a larger number of issuers.
| 20 | American Funds Insurance Series – Portfolio Series |
Fund structure— Each fund invests in underlying funds and incurs expenses related to the underlying funds. In addition, investors in each fund will incur fees to pay for certain expenses related to the operations of the fund. An investor holding the underlying funds directly and in the same proportions as a fund would incur lower overall expenses but would not receive the benefit of the portfolio management and other services provided by the fund, including the managed risk strategy.
Underlying fund risks— Because a fund’s investments consist of underlying funds, the fund’s risks are directly related to the risks of the underlying funds. For this reason, it is important to understand the risks associated with investing both in a fund and the applicable underlying funds.
Market conditions— The prices of, and the income generated by, the securities held by the underlying funds may decline — sometimes rapidly or unpredictably — due to various factors, including events or conditions affecting the general economy or particular industries; overall market changes; local, regional or global political, social or economic instability; governmental, governmental agency or central bank responses to economic conditions; and currency exchange rate, interest rate and commodity price fluctuations.
Issuer risks— The prices of, and the income generated by, securities held by the underlying funds may decline in response to various factors directly related to the issuers of such securities, including reduced demand for an issuer’s goods or services, poor management performance, major litigation against the issuer, changes in government regulations affecting the issuer or its competitive environment and strategic initiatives such as mergers, acquisitions or dispositions and the market response to any such initiatives.
Investing in growth-oriented stocks— Growth-oriented common stocks and other equity-type securities (such as preferred stocks, convertible preferred stocks and convertible bonds) may involve larger price swings and greater potential for loss than other types of investments. These risks may be even greater in the case of smaller capitalization stocks.
Investing in income-oriented stocks— The value of an underlying fund’s securities and income provided by an underlying fund may be reduced by changes in the dividend policies of, and the capital resources available for dividend payments at, the companies in which the underlying fund invests.
Investing outside the U.S.— Securities of issuers domiciled outside the U.S., or with significant operations or revenues outside the U.S., may lose value because of adverse political, social, economic or market developments (including social instability, regional conflicts, terrorism and war) in the countries or regions in which the issuers operate or generate revenue. These securities may also lose value due to changes in foreign currency exchange rates against the U.S. dollar and/or currencies of other countries. Issuers of these securities may be more susceptible to actions of foreign governments, such as nationalization, currency blockage or the imposition of price controls or punitive taxes, each of which could adversely impact the value of these securities. Securities markets in certain countries may be more volatile and/or less liquid than those in the U.S. Investments outside the U.S. may also be subject to different accounting practices and different regulatory, legal and reporting standards and practices, and may be more difficult to value, than those in the U.S. In addition, the value of investments outside the U.S. may be reduced by foreign taxes, including foreign withholding taxes on interest and dividends. Further, there may be increased risks of delayed settlement of securities purchased or sold by the underlying funds. The risks of investing outside the U.S. may be heightened in connection with investments in emerging markets.
Investing in emerging markets— Investing in emerging markets may involve risks in addition to and greater than those generally associated with investing in the securities markets of developed countries. For instance, emerging market countries may have less developed legal and accounting systems than those in developed countries. The governments of these countries may be less stable and more likely to impose capital controls, nationalize a company or industry, place restrictions on foreign ownership and on withdrawing sale proceeds of securities from the country, and/or impose punitive taxes that could adversely affect the prices of securities. In addition, the economies of these countries may be dependent on relatively few industries that are more susceptible to local and global changes. Securities markets in these countries can also be relatively small and have substantially lower trading volumes. As a result, securities issued in these countries may be more volatile and less liquid, and may be more difficult to value, than securities issued in countries with more developed economies and/or markets. Less certainty with respect to security valuations may lead to additional challenges and risks in calculating an underlying fund’s net asset value and, accordingly, in calculating the underlying fund’s net asset value. Additionally, emerging markets are more likely to experience problems with the clearing and settling of trades and the holding of securities by banks, agents and depositories that are less established than those in developed countries.
Investing in small companies— Investing in smaller companies may pose additional risks. For example, it is often more difficult to value or dispose of small company stocks and more difficult to obtain information about smaller companies than about larger companies. Furthermore, smaller companies often have limited product lines, operating histories, markets and/or financial resources, may be
| American Funds Insurance Series – Portfolio Series | 21 |
dependent on one or a few key persons for management, and can be more susceptible to losses. Moreover, the prices of their stocks may be more volatile than stocks of larger, more established companies, particularly during times of market turmoil.
Investing in debt instruments— The prices of, and the income generated by, bonds and other debt securities held by an underlying fund may be affected by changing interest rates and by changes in the effective maturities and credit ratings of these securities.
Rising interest rates will generally cause the prices of bonds and other debt securities to fall. A general rise in interest rates may cause investors to sell debt securities on a large scale, which could also adversely affect the price and liquidity of debt securities and could also result in increased redemptions from the fund. Falling interest rates may cause an issuer to redeem, call or refinance a debt security before its stated maturity, which may result in the fund failing to recoup the full amount of its initial investment and having to reinvest the proceeds in lower yielding securities. Longer maturity debt securities generally have greater sensitivity to changes in interest rates and may be subject to greater price fluctuations than shorter maturity debt securities.
Bonds and other debt securities are also subject to credit risk, which is the possibility that the credit strength of an issuer or guarantor will weaken or be perceived to be weaker, and/or an issuer of a debt security will fail to make timely payments of principal or interest and the security will go into default. A downgrade or default affecting any of the underlying funds’ securities could cause the value of the underlying funds’ shares to decrease. Lower quality debt securities generally have higher rates of interest and may be subject to greater price fluctuations than higher quality debt securities. Credit risk is gauged, in part, by the credit ratings of the debt securities in which an underlying fund invests. However, ratings are only the opinions of the rating agencies issuing them and are not guarantees as to credit quality or an evaluation of market risk. The underlying funds’ investment adviser relies on its own credit analysts to research issuers and issues in seeking to assess credit and default risks.
Investing in lower rated debt instruments— Lower rated bonds and other lower rated debt securities generally have higher rates of interest and involve greater risk of default or price declines due to changes in the issuer’s creditworthiness than those of higher quality debt securities. The market prices of these securities may fluctuate more than the prices of higher quality debt securities and may decline significantly in periods of general economic difficulty. These risks may be increased with respect to investments in junk bonds.
Investing in mortgage-related and other asset-backed securities— Mortgage-related securities, such as mortgage-backed securities, and other asset-backed securities, include debt obligations that represent interests in pools of mortgages or other income-bearing assets, such as consumer loans or receivables. Such securities often involve risks that are different from or more acute than the risks associated with investing in other types of debt securities. Mortgage-backed and other asset-backed securities are subject to changes in the payment patterns of borrowers of the underlying debt, potentially increasing the volatility of the securities and an underlying fund’s net asset value. When interest rates fall, borrowers are more likely to refinance or prepay their debt before its stated maturity. This may result in an underlying fund having to reinvest the proceeds in lower yielding securities, effectively reducing the underlying fund’s income. Conversely, if interest rates rise and borrowers repay their debt more slowly than expected, the time in which the mortgage-backed and other asset-backed securities are paid off could be extended, reducing the underlying fund’s cash available for reinvestment in higher yielding securities. Mortgage-backed securities are also subject to the risk that underlying borrowers will be unable to meet their obligations and the value of property that secures the mortgages may decline in value and be insufficient, upon foreclosure, to repay the associated loans. Investments in asset-backed securities are subject to similar risks.
Investing in future delivery contracts— The underlying funds may enter into contracts, such as to-be-announced contracts and mortgage dollar rolls, that involve the underlying fund selling mortgage-related securities and simultaneously contracting to repurchase similar securities for delivery at a future date at a predetermined price. This can increase the underlying fund’s market exposure, and the market price of the securities that the underlying fund contracts to repurchase could drop below their purchase price. While the underlying fund can preserve and generate capital through the use of such contracts by, for example, realizing the difference between the sale price and the future purchase price, the income generated by the underlying fund may be reduced by engaging in such transactions. In addition, these transactions may increase the turnover rate of the underlying fund.
Investing in securities backed by the U.S. government— Securities backed by the U.S. Treasury or the full faith and credit of the U.S. government are guaranteed only as to the timely payment of interest and principal when held to maturity. Accordingly, the current market values for these securities will fluctuate with changes in interest rates and the credit rating of the U.S. government. Securities issued by government-sponsored entities and federal agencies and instrumentalities that are not backed by the full faith and credit of the U.S. government are neither issued nor guaranteed by the U.S. government.
| 22 | American Funds Insurance Series – Portfolio Series |
Asset allocation— A certain fund’s percentage allocation to equity securities, debt securities and money market instruments (through its investments in the underlying funds) could cause the fund to underperform relative to relevant benchmarks and other funds with similar investment objectives.
Currency— The prices of, and the income generated by, most debt securities held by the underlying funds may also be affected by changes in relative currency values. If the U.S. dollar appreciates against foreign currencies, the value in U.S. dollars of an underlying fund’s securities denominated in such currencies would generally fall and vice versa. U.S. dollar-denominated securities of foreign issuers may also be affected by changes in relative currency values.
Liquidity risk— Certain underlying fund holdings may be or become difficult or impossible to sell, particularly during times of market turmoil. Illiquidity may result from the lack of an active market for a holding, legal or contractual restrictions on resale, or the reduced number and capacity of market participants to make a market in such holding. Market prices for less liquid or illiquid holdings may be volatile, and reduced liquidity may have an adverse impact on the market price of such holdings. Additionally, the sale of less liquid or illiquid holdings may involve substantial delays (including delays in settlement) and additional costs and the underlying fund may be unable to sell such holdings when necessary to meet its liquidity needs or may be forced to sell at a loss.
Management— The investment adviser to the funds and to the underlying funds actively manages each underlying fund’s investments. Consequently, the underlying funds are subject to the risk that the methods and analyses, including models, tools and data, employed by the investment adviser in this process may be flawed or incorrect and may not produce the desired results. This could cause an underlying fund to lose value or its investment results to lag relevant benchmarks or other funds with similar objectives.
Investing in the managed risk funds may involve additional risks including, but not limited to, those described below.
Investing in futures contracts— In addition to the risks generally associated with investing in derivative instruments, futures contracts are subject to the creditworthiness of the clearing organizations, exchanges and futures commission merchants with which a fund transacts. Additionally, although futures require only a small initial investment in the form of a deposit of initial margin, the amount of a potential loss on a futures contract could greatly exceed the initial amount invested. While futures contracts are generally liquid instruments, under certain market conditions, futures may be deemed to be illiquid. For example, a fund may be temporarily prohibited from closing out its position in a futures contract if intraday price change limits or limits on trading volume imposed by the applicable futures exchange are triggered. If a fund is unable to close out a position on a futures contract, the fund would remain subject to the risk of adverse price movements until the fund is able to close out the futures position. The ability of a fund to successfully utilize futures contracts may depend in part upon the ability of the fund’s investment adviser or subadviser to accurately forecast interest rates and other economic factors and to assess and predict the impact of such economic factors on the futures in which the fund invests. If the investment adviser or subadviser incorrectly forecasts economic developments or incorrectly predicts the impact of such developments on the futures in which it invests, a fund could be exposed to the risk of loss.
Hedging— There may be imperfect or even negative correlation between the prices of the futures contracts and the prices of the underlying securities. For example, futures contracts may not provide an effective hedge because changes in futures contract prices may not track those of the underlying securities or indexes they are intended to hedge. In addition, there are significant differences between the securities and futures markets that could result in an imperfect correlation between the markets, causing a given hedge not to achieve its objectives. The degree of imperfection of correlation depends on circumstances such as variations in speculative market demand for futures, including technical influences in futures trading, and differences between the financial instruments being hedged and the instruments underlying the standard contracts available for trading. A decision as to whether, when and how to hedge involves the exercise of skill and judgment, and even a well-conceived hedge may be unsuccessful to some degree because of market behavior or unexpected interest rate trends. In addition, a fund’s investment in exchange-traded futures and their resulting costs could limit the fund’s gains in rising markets relative to those of the underlying fund, or to those of unhedged funds in general.
Short positions— Losses from short positions in futures contracts occur when the underlying index increases in value. As the underlying index increases in value, the holder of the short position in the corresponding futures contract is required to pay the difference in value of the futures contract resulting from the increase in the index on a daily basis. Losses from a short position in an index futures contract could potentially be very large if the value of the underlying index rises dramatically in a short period of time.
Nondiversification risk— As nondiversified funds, the managed risk funds have the ability to invest a larger percentage of their assets in the securities of a smaller number of issuers than a diversified fund. Therefore, poor performance by a single large holding could adversely impact a managed risk fund’s investment results more than if the fund were invested in a larger number of issuers.
| American Funds Insurance Series – Portfolio Series | 23 |
Management— The managed risk funds are subject to the risk that the methods employed by the subadviser in implementing the managed risk strategy may not produce the desired results. This could cause the managed risk funds to lose value or their investment results to lag relevant benchmarks or other funds with similar objectives.
5. Certain investment techniques
Futures contracts— The managed risk funds have entered into futures contracts, which provide for the future sale by one party and purchase by another party of a specified amount of a specific financial instrument for a specified price, date, time and place designated at the time the contract is made. Futures contracts are used to strategically manage portfolio volatility and downside equity risk.
Upon entering into futures contracts, and to maintain the fund’s open positions in futures contracts, the fund is required to deposit with a futures broker, or futures commission merchant (“FCM”), in a segregated account in the name of the FCM an amount of cash, U.S. government securities, suitable money market instruments, or other liquid securities, known as initial margin. The margin required for a particular futures contract is set by the exchange on which the contract is traded to serve as collateral, and may be significantly modified from time to time by the exchange during the term of the contract. When initial margin is deposited with brokers, a receivable is recorded in each fund’s statement of assets and liabilities.
On a daily basis, each fund pays or receives variation margin based on the increase or decrease in the value of the futures contracts and records variation margin on futures contracts in the statement of assets and liabilities. In addition, each fund segregates liquid assets equivalent to the fund’s outstanding obligations under the contract in excess of the initial margin and variation margin, if any. Futures contracts may involve a risk of loss in excess of the variation margin shown on each fund’s statement of assets and liabilities. Each fund records realized gains or losses at the time the futures contract is closed or expires. Net realized gains or losses and net unrealized appreciation or depreciation from futures contracts are recorded in each fund’s statement of operations. The average month-end notional amount of futures contracts while held by Managed Risk Growth Portfolio, Managed Risk Growth and Income Portfolio and Managed Risk Global Allocation Portfolio was $393,894,000, $372,795,000 and $143,076,000, respectively.
The following tables present the financial statement impacts resulting from the managed risk funds’ use of futures contracts as of December 31, 2018 (dollars in thousands):
Managed Risk Growth Portfolio
| Assets | Liabilities | |||||||||||||
| Contracts | Risk type | Location on statement of assets and liabilities | Value | Location on statement of assets and liabilities | Value | |||||||||
| Futures | Currency | Unrealized appreciation* | $ | — | Unrealized depreciation* | $ | 480 | |||||||
| Futures | Equity | Unrealized appreciation* | 9,225 | Unrealized depreciation* | — | |||||||||
| Futures | Interest | Unrealized appreciation* | 5,160 | Unrealized depreciation* | — | |||||||||
| $ | 14,385 | $ | 480 | |||||||||||
| Net realized gain (loss) | Net unrealized (depreciation) appreciation | |||||||||||||
| Contracts | Risk type | Location on statement of operations | Value | Location on statement of operations | Value | |||||||||
| Futures | Currency | Net realized gain on futures contracts | $ | 675 | Net unrealized depreciation on futures contracts | $ | (480 | ) | ||||||
| Futures | Equity | Net realized loss on futures contracts | (12,844 | ) | Net unrealized appreciation on futures contracts | 9,225 | ||||||||
| Futures | Interest | Net realized loss on futures contracts | (1,753 | ) | Net unrealized appreciation on futures contracts | 5,272 | ||||||||
| $ | (13,922 | ) | $ | 14,017 | ||||||||||
| 24 | American Funds Insurance Series – Portfolio Series |
Managed Risk Growth and Income Portfolio
| Assets | Liabilities | |||||||||||||
| Contracts | Risk type | Location on statement of assets and liabilities | Value | Location on statement of assets and liabilities | Value | |||||||||
| Futures | Currency | Unrealized appreciation* | $ | — | Unrealized depreciation* | $ | 550 | |||||||
| Futures | Equity | Unrealized appreciation* | 7,392 | Unrealized depreciation* | — | |||||||||
| Futures | Interest | Unrealized appreciation* | 4,359 | Unrealized depreciation* | — | |||||||||
| $ | 11,751 | $ | 550 | |||||||||||
| Net realized gain (loss) | Net unrealized (depreciation) appreciation | |||||||||||||
| Contracts | Risk type | Location on statement of operations | Value | Location on statement of operations | Value | |||||||||
| Futures | Currency | Net realized gain on futures contracts | $ | 1,041 | Net unrealized depreciation on futures contracts | $ | (550 | ) | ||||||
| Futures | Equity | Net realized loss on futures contracts | (13,240 | ) | Net unrealized appreciation on futures contracts | 7,392 | ||||||||
| Futures | Interest | Net realized loss on futures contracts | (1,756 | ) | Net unrealized appreciation on futures contracts | 4,464 | ||||||||
| $ | (13,955 | ) | $ | 11,306 | ||||||||||
Managed Risk Global Allocation Portfolio
| Assets | Liabilities | |||||||||||||
| Contracts | Risk type | Location on statement of assets and liabilities | Value | Location on statement of assets and liabilities | Value | |||||||||
| Futures | Currency | Unrealized appreciation* | $ | — | Unrealized depreciation* | $ | 244 | |||||||
| Futures | Equity | Unrealized appreciation* | 1,708 | Unrealized depreciation* | — | |||||||||
| Futures | Interest | Unrealized appreciation* | 1,057 | Unrealized depreciation* | — | |||||||||
| $ | 2,765 | $ | 244 | |||||||||||
| Net realized gain (loss) | Net unrealized (depreciation) appreciation | |||||||||||||
| Contracts | Risk type | Location on statement of operations | Value | Location on statement of operations | Value | |||||||||
| Futures | Currency | Net realized gain on futures contracts | $ | 154 | Net unrealized depreciation on futures contracts | $ | (244 | ) | ||||||
| Futures | Equity | Net realized loss on futures contracts | (1,846 | ) | Net unrealized appreciation on futures contracts | 1,708 | ||||||||
| Futures | Interest | Net realized loss on futures contracts | (263 | ) | Net unrealized appreciation on futures contracts | 1,089 | ||||||||
| $ | (1,955 | ) | $ | 2,553 | ||||||||||
| * | Includes cumulative appreciation (depreciation) on futures contracts as reported in the applicable table after each fund’s investment portfolio. Only current day’s variation margin is reported within the statements of assets and liabilities. |
Collateral— Funds that invest in futures contracts participate in a collateral program. The program calls for the fund to pledge highly liquid assets, such as cash or U.S. government securities, as collateral for initial and variation margin by contract. The purpose of the collateral is to cover potential losses that could occur in the event that either party cannot meet its contractual obligations. Non-cash collateral pledged by the fund, if any, is disclosed in the fund’s investment portfolio, and cash collateral pledged by the fund, if any, is held in a segregated account with the fund’s custodian, which is reflected as restricted cash in the fund’s statement of assets and liabilities.
| American Funds Insurance Series – Portfolio Series | 25 |
6. Taxation and distributions
Federal income taxation— Each fund complies with the requirements under Subchapter M of the Internal Revenue Code applicable to mutual funds and intends to distribute substantially all of its net taxable income and net capital gains each year. The funds are not subject to income taxes to the extent such distributions are made. Therefore, no federal income tax provision is required.
As of and during the period ended December 31, 2018, none of the funds had a liability for any unrecognized tax benefits. Each fund recognizes interest and penalties, if any, related to unrecognized tax benefits as income tax expense in their respective statements of operations. During the period, none of the funds incurred any significant interest or penalties.
Each fund’s tax returns are not subject to examination by federal, state and, if applicable, non-U.S. tax authorities after the expiration of each jurisdiction’s statute of limitations, which is generally three years after the date of filing but can be extended in certain jurisdictions.
Distributions— Distributions paid to shareholders are based on each fund’s net investment income and net realized gains determined on a tax basis, which may differ from net investment income and net realized gains for financial reporting purposes. These differences are due primarily to different treatment for items such as short-term capital gains and losses and capital losses related to sales of certain securities within 30 days of purchase. The fiscal year in which amounts are distributed may differ from the year in which the net investment income and net realized gains are recorded by the funds for financial reporting purposes.
Additional tax basis disclosures for each fund as of December 31, 2018, were as follows (dollars in thousands):
| Global Growth Portfolio | Growth and Income Portfolio | Managed Risk Growth Portfolio | Managed Risk Growth and Income Portfolio | Managed Risk Global Allocation Portfolio | ||||||||||||||||
| Undistributed ordinary income | $ | 346 | $ | 2,293 | $ | 12,914 | $ | 11,467 | $ | 4,937 | ||||||||||
| Undistributed long-term capital gains | 2,016 | 5,307 | 51,611 | 37,401 | 11,182 | |||||||||||||||
| Gross unrealized appreciation on investments | — | — | 418 | 385 | 221 | |||||||||||||||
| Gross unrealized depreciation on investments | (2,662 | ) | (7,069 | ) | (44,382 | ) | (32,542 | ) | (18,690 | ) | ||||||||||
| Net unrealized depreciation on investments | (2,662 | ) | (7,069 | ) | (43,964 | ) | (32,157 | ) | (18,469 | ) | ||||||||||
| Cost of investments | 38,232 | 175,580 | 1,110,027 | 998,386 | 340,496 | |||||||||||||||
| Reclassification from total distributable earnings to capital paid in on shares of beneficial interest | — | 1 | — | — | — | |||||||||||||||
Distributions paid by each fund were characterized for tax purposes as follows (dollars in thousands):
Global Growth Portfolio
| Year ended December 31, 2018 | Year ended December 31, 2017 | |||||||||||||||||||||||
| Share class | Ordinary income | Long-term capital gains | Total distributions paid | Ordinary income | Long-term capital gains | Total distributions paid | ||||||||||||||||||
| Class 4 | $ | 454 | $ | 560 | $ | 1,014 | $ | 180 | $ | 398 | $ | 578 | ||||||||||||
Growth and Income Portfolio
| Year ended December 31, 2018 | Year ended December 31, 2017 | |||||||||||||||||||||||
| Share class | Ordinary income | Long-term capital gains | Total distributions paid | Ordinary income | Long-term capital gains | Total distributions paid | ||||||||||||||||||
| Class 4 | $ | 2,701 | $ | 3,318 | $ | 6,019 | $ | 1,842 | $ | 962 | $ | 2,804 | ||||||||||||
| 26 | American Funds Insurance Series – Portfolio Series |
Managed Risk Growth Portfolio
| Year ended December 31, 2018 | Year ended December 31, 2017 | |||||||||||||||||||||||
| Share class | Ordinary income | Long-term capital gains | Total distributions paid | Ordinary income | Long-term capital gains | Total distributions paid | ||||||||||||||||||
| Class P2 | $ | 12,573 | $ | 29,409 | $ | 41,982 | $ | 6,769 | $ | 16,589 | $ | 23,358 | ||||||||||||
Managed Risk Growth and Income Portfolio
| Year ended December 31, 2018 | Year ended December 31, 2017 | |||||||||||||||||||||||
| Share class | Ordinary income | Long-term capital gains | Total distributions paid | Ordinary income | Long-term capital gains | Total distributions paid | ||||||||||||||||||
| Class P2 | $ | 15,105 | $ | 23,151 | $ | 38,256 | $ | 8,603 | $ | 1,336 | $ | 9,939 | ||||||||||||
Managed Risk Global Allocation Portfolio
| Year ended December 31, 2018 | Year ended December 31, 2017 | |||||||||||||||||||||||
| Share class | Ordinary income | Long-term capital gains | Total distributions paid | Ordinary income | Long-term capital gains | Total distributions paid | ||||||||||||||||||
| Class P2 | $ | 2,830 | $ | 3,611 | $ | 6,441 | $ | 1,285 | $ | — | $ | 1,285 | ||||||||||||
7. Fees and transactions
CRMC, the series’ investment adviser, is the parent company of American Funds Distributors,® Inc. (“AFD”), the distributor of the series’ shares, and American Funds Service Company® (“AFS”), the series’ transfer agent. CRMC, AFD and AFS are considered related parties to the series.
Investment advisory services— The series has an investment advisory and service agreement with CRMC that provides for monthly fees accrued daily. These fees are based on an annual rate of 0.150% of daily net assets for the three managed risk funds. CRMC receives investment advisory fees from the underlying funds. These fees are included in the net effective expense ratios that are provided as additional information in the financial highlights tables. Subadvisory fees for the managed risk funds are paid by CRMC to Milliman FRM. The managed risk funds are not responsible for paying any subadvisory fees.
Investment advisory services waivers— CRMC has agreed to waive a portion of the investment advisory services fees for the three managed risk funds. Investment advisory services fees are presented in each fund’s statement of operations gross of the waivers from CRMC. For the year ended December 31, 2018, total investment advisory services fees waived by CRMC were $1,136,000.
Distribution services— The series has plans of distribution for all share classes. Under the plans, the board of trustees approves certain categories of expenses that are used to finance activities primarily intended to sell fund shares. The plans provide for payments to pay service fees to firms that have entered into agreements with the series. These payments, based on an annualized percentage of average daily net assets, range from 0.25% to 0.50% as noted in the table below. In some cases, the board of trustees has limited the amounts that may be paid to less than the maximum allowed by the plans.
| Share class | Currently approved limits | Plan limits | ||||||
| Class 4 | 0.25 | % | 0.25 | % | ||||
| Class P2 | 0.25 | 0.50 | ||||||
Insurance administrative services— The series has an insurance administrative services plan for all share classes. Under the plan, each share class pays 0.25% of each insurance company’s respective average daily net assets to compensate the insurance companies for services provided to their separate accounts and contractholders for which the shares of the fund are beneficially owned as underlying investments of such contractholders’ annuities. These services include, but are not limited to, maintenance, shareholder communications and transactional services. The insurance companies are not related parties to the series.
| American Funds Insurance Series – Portfolio Series | 27 |
Transfer agent services— The series has a shareholder services agreement with AFS under which the funds compensate AFS for providing transfer agent services to the funds. These services include recordkeeping, shareholder communications and transaction processing. In addition, the managed risk funds reimburse AFS for amounts paid to third parties for performing transfer agent services on behalf of fund shareholders.
Administrative services— The series has an administrative services agreement with CRMC under which each underlying fund compensates CRMC for providing administrative services to all of the underlying funds’ share classes except Class P1 and P2 shares. Administrative services are provided by CRMC to help assist third parties providing non-distribution services to fund shareholders. These services include providing in depth information on each fund and market developments that impact fund investors. Administrative services also include, but are not limited to, coordinating, monitoring and overseeing third parties that provide services to fund shareholders. The agreement between the series and CRMC provides each underlying fund the ability to charge an administrative services fee of 0.05% of average daily net assets for all share classes. Currently, all underlying funds’ share classes pay an annual fee of 0.01% of average daily net assets (which could be increased as noted above). CRMC receives administrative services fees of 0.01% of average daily net assets from the Class 1 shares of the underlying funds for administrative services provided to the series.
Accounting and administrative services— The three managed risk funds have a subadministration agreement with BNY Mellon under which each fund compensates BNY Mellon for providing accounting and administrative services. These services include, but are not limited to, fund accounting (including calculation of net asset value), financial reporting and tax services. BNY Mellon is not a related party to the managed risk funds.
Miscellaneous fee reimbursements— CRMC is currently reimbursing a portion of miscellaneous fees and expenses for Global Growth Portfolio. Miscellaneous expenses exclude investment advisory services and distribution services fees. For the year ended December 31, 2018, total expenses reimbursed by CRMC were $4,000.
Trustees’ deferred compensation— Trustees who are unaffiliated with CRMC may elect to defer the cash payment of part or all of their compensation. These deferred amounts, which remain as liabilities of the funds, are treated as if invested in one or more of the American Funds. These amounts represent general, unsecured liabilities of the funds and vary according to the total returns of the selected funds. Trustees’ compensation in the fund’s statement of operations reflects the current fees (either paid in cash or deferred) and the net increase or decrease in the value of the deferred amounts.
Affiliated officers and trustees— Officers and certain trustees of the series are or may be considered to be affiliated with CRMC, AFD and AFS. No affiliated officers or trustees received any compensation directly from any fund in the series.
Other expenses— The amounts of $(57,000), $(50,000) and $(2,000) for other expenses for Managed Risk Growth Portfolio, Managed Risk Growth and Income Portfolio and Managed Risk Global Allocation Portfolio, respectively, are due to over accruals of prior year expenses.
Security transactions with related funds— The funds may purchase from, or sell securities to, other CRMC-managed funds (or funds managed by certain affiliates of CRMC) under procedures adopted by the fund’s board of trustees. The funds involved in such transactions are considered related by virtue of having a common investment adviser (or affiliated investment advisers), common trustees and/or common officers. When such transactions occur, each transaction is executed at the current market price of the security and no brokerage commissions or fees are paid in accordance with Rule 17a-7 of the 1940 Act.
| 28 | American Funds Insurance Series – Portfolio Series |
8. Capital share transactions
Capital share transactions in the funds were as follows (dollars and shares in thousands):
Global Growth Portfolio
| Sales | Reinvestments of distributions | Repurchases | Net increase | |||||||||||||||||||||||||||||
| Share class | Amount | Shares | Amount | Shares | Amount | Shares | Amount | Shares | ||||||||||||||||||||||||
| Year ended December 31, 2018 | ||||||||||||||||||||||||||||||||
| Class 4 | $ | 13,835 | 1,138 | $ | 1,014 | 83 | $ | (4,213 | ) | (346 | ) | $ | 10,636 | 875 | ||||||||||||||||||
| Year ended December 31, 2017 | ||||||||||||||||||||||||||||||||
| Class 4 | $ | 13,946 | 1,261 | $ | 578 | 53 | $ | (2,341 | ) | (211 | ) | $ | 12,183 | 1,103 | ||||||||||||||||||
Growth and Income Portfolio
| Sales | Reinvestments of distributions | Repurchases | Net increase | |||||||||||||||||||||||||||||
| Share class | Amount | Shares | Amount | Shares | Amount | Shares | Amount | Shares | ||||||||||||||||||||||||
| Year ended December 31, 2018 | ||||||||||||||||||||||||||||||||
| Class 4 | $ | 49,508 | 4,353 | $ | 6,019 | 537 | $ | (8,535 | ) | (752 | ) | $ | 46,992 | 4,138 | ||||||||||||||||||
| Year ended December 31, 2017 | ||||||||||||||||||||||||||||||||
| Class 4 | $ | 64,274 | 5,981 | $ | 2,804 | 257 | $ | (10,824 | ) | (1,003 | ) | $ | 56,254 | 5,235 | ||||||||||||||||||
Managed Risk Growth Portfolio
| Sales | Reinvestments of distributions | Repurchases | Net increase | |||||||||||||||||||||||||||||
| Share class | Amount | Shares | Amount | Shares | Amount | Shares | Amount | Shares | ||||||||||||||||||||||||
| Year ended December 31, 2018 | ||||||||||||||||||||||||||||||||
| Class P2 | $ | 241,331 | 21,764 | $ | 41,982 | 3,782 | $ | (23,267 | ) | (2,104 | ) | $ | 260,046 | 23,442 | ||||||||||||||||||
| Year ended December 31, 2017 | ||||||||||||||||||||||||||||||||
| Class P2 | $ | 234,896 | 22,474 | $ | 23,358 | 2,255 | $ | (20,729 | ) | (1,977 | ) | $ | 237,525 | 22,752 | ||||||||||||||||||
Managed Risk Growth and Income Portfolio
| Sales | Reinvestments of distributions | Repurchases | Net increase | |||||||||||||||||||||||||||||
| Share class | Amount | Shares | Amount | Shares | Amount | Shares | Amount | Shares | ||||||||||||||||||||||||
| Year ended December 31, 2018 | ||||||||||||||||||||||||||||||||
| Class P2 | $ | 193,826 | 17,670 | $ | 38,256 | 3,541 | $ | (22,650 | ) | (2,083 | ) | $ | 209,432 | 19,128 | ||||||||||||||||||
| Year ended December 31, 2017 | ||||||||||||||||||||||||||||||||
| Class P2 | $ | 200,646 | 19,165 | $ | 9,939 | 937 | $ | (24,987 | ) | (2,414 | ) | $ | 185,598 | 17,688 | ||||||||||||||||||
| American Funds Insurance Series – Portfolio Series | 29 |
Managed Risk Global Allocation Portfolio
| Sales | Reinvestments of distributions | Repurchases | Net increase | |||||||||||||||||||||||||||||
| Share class | Amount | Shares | Amount | Shares | Amount | Shares | Amount | Shares | ||||||||||||||||||||||||
| Year ended December 31, 2018 | ||||||||||||||||||||||||||||||||
| Class P2 | $ | 109,675 | 9,938 | $ | 6,441 | 591 | $ | (10,569 | ) | (986 | ) | $ | 105,547 | 9,543 | ||||||||||||||||||
| Year ended December 31, 2017 | ||||||||||||||||||||||||||||||||
| Class P2 | $ | 82,444 | 7,903 | $ | 1,285 | 125 | $ | (7,150 | ) | (714 | ) | $ | 76,579 | 7,314 | ||||||||||||||||||
9. Investment transactions
Each fund made purchases and sales of investment securities during the year ended December 31, 2018, as follows (dollars in thousands):
| Global Growth Portfolio | Growth and Income Portfolio | Managed Risk Growth Portfolio | Managed Risk Growth and Income Portfolio | Managed Risk Global Allocation Portfolio | ||||||||||||||||
| Purchases of investment securities* | $ | 16,275 | $ | 57,838 | $ | 327,439 | $ | 265,411 | $ | 121,115 | ||||||||||
| Sales of investment securities* | 4,162 | 8,276 | 41,922 | 40,088 | 9,518 | |||||||||||||||
| * | Excludes short-term securities and U.S. government obligations, if any. |
| 30 | American Funds Insurance Series – Portfolio Series |
Financial highlights
| (Loss) income from investment operations1 | Dividends and distributions | Ratio of expenses | Ratio of expenses | |||||||||||||||||||||||||||||||||||||||||||||||||||||
| Period ended | Net asset value, beginning of period | Net investment income | Net (losses) gains on securities (both realized and unrealized) | Total from investment operations | Dividends (from net investment income) | Distributions (from capital gains) | Total dividends and distribu- tions | Net asset value, end of period | Total return2 | Net assets, end of period (in millions) | to average net assets before waivers/ reimburse- ments3 | to average net assets after waivers/ reimburse- ments2,3 | Net effective expense ratio2,4 | Ratio of net income to average net assets2 | ||||||||||||||||||||||||||||||||||||||||||
| Global Growth Portfolio | ||||||||||||||||||||||||||||||||||||||||||||||||||||||||
| Class 4: | ||||||||||||||||||||||||||||||||||||||||||||||||||||||||
| 12/31/2018 | $ | 12.17 | $ | .08 | $ | (1.22 | ) | $ | (1.14 | ) | $ | (.12 | ) | $ | (.23 | ) | $ | (.35 | ) | $ | 10.68 | (9.77 | )% | $ | 36 | .59 | % | .58 | % | 1.20 | % | .69 | % | |||||||||||||||||||||||
| 12/31/2017 | 9.77 | .12 | 2.59 | 2.71 | (.06 | ) | (.25 | ) | (.31 | ) | 12.17 | 28.11 | 30 | .62 | .56 | 1.18 | 1.05 | |||||||||||||||||||||||||||||||||||||||
| 12/31/2016 | 9.45 | .12 | .29 | .41 | (.05 | ) | (.04 | ) | (.09 | ) | 9.77 | 4.42 | 13 | .75 | .56 | 1.18 | 1.30 | |||||||||||||||||||||||||||||||||||||||
| 12/31/20155,6 | 10.00 | .12 | (.67 | ) | (.55 | ) | — | — | — | 9.45 | (5.50 | )7 | 6 | 1.02 | 8 | .58 | 8 | 1.20 | 8 | 1.91 | 8 | |||||||||||||||||||||||||||||||||||
| Growth and Income Portfolio | ||||||||||||||||||||||||||||||||||||||||||||||||||||||||
| Class 4: | ||||||||||||||||||||||||||||||||||||||||||||||||||||||||
| 12/31/2018 | $ | 11.40 | $ | .20 | $ | (.58 | ) | $ | (.38 | ) | $ | (.16 | ) | $ | (.27 | ) | $ | (.43 | ) | $ | 10.59 | (3.51 | )% | $ | 168 | .53 | % | .53 | % | .97 | % | 1.81 | % | |||||||||||||||||||||||
| 12/31/2017 | 10.13 | .17 | 1.38 | 1.55 | (.13 | ) | (.15 | ) | (.28 | ) | 11.40 | 15.43 | 134 | .53 | .53 | .97 | 1.59 | |||||||||||||||||||||||||||||||||||||||
| 12/31/2016 | 9.61 | .23 | .38 | .61 | (.07 | ) | (.02 | ) | (.09 | ) | 10.13 | 6.41 | 66 | .57 | .55 | .99 | 2.31 | |||||||||||||||||||||||||||||||||||||||
| 12/31/20155,6 | 10.00 | .20 | (.58 | ) | (.38 | ) | (.01 | ) | — | (.01 | ) | 9.61 | (3.85 | )7 | 15 | .79 | 8 | .58 | 8 | 1.05 | 8 | 3.14 | 8 | |||||||||||||||||||||||||||||||||
| Managed Risk Growth Portfolio | ||||||||||||||||||||||||||||||||||||||||||||||||||||||||
| Class P2: | ||||||||||||||||||||||||||||||||||||||||||||||||||||||||
| 12/31/2018 | $ | 11.16 | $ | .12 | $ | (.53 | ) | $ | (.41 | ) | $ | (.14 | ) | $ | (.33 | ) | $ | (.47 | ) | $ | 10.28 | (3.98 | )% | $ | 1,073 | .66 | % | .61 | % | 1.00 | % | 1.06 | % | |||||||||||||||||||||||
| 12/31/2017 | 9.76 | .10 | 1.63 | 1.73 | (.09 | ) | (.24 | ) | (.33 | ) | 11.16 | 18.00 | 904 | .68 | .63 | 1.03 | .95 | |||||||||||||||||||||||||||||||||||||||
| 12/31/2016 | 9.39 | .11 | .26 | .37 | — | 9 | — | — | 9 | 9.76 | 3.97 | 568 | .77 | .63 | 1.02 | 1.12 | ||||||||||||||||||||||||||||||||||||||||
| 12/31/20155,6 | 10.00 | .18 | (.70 | ) | (.52 | ) | (.09 | ) | — | (.09 | ) | 9.39 | (5.20 | )7 | 254 | .86 | 8 | .61 | 8 | 1.01 | 8 | 2.77 | 8 | |||||||||||||||||||||||||||||||||
| Managed Risk Growth and Income Portfolio | ||||||||||||||||||||||||||||||||||||||||||||||||||||||||
| Class P2: | ||||||||||||||||||||||||||||||||||||||||||||||||||||||||
| 12/31/2018 | $ | 11.13 | $ | .17 | $ | (.67 | ) | $ | (.50 | ) | $ | (.17 | ) | $ | (.28 | ) | $ | (.45 | ) | $ | 10.18 | (4.72 | )% | $ | 974 | .66 | % | .61 | % | 1.07 | % | 1.54 | % | |||||||||||||||||||||||
| 12/31/2017 | 9.68 | .15 | 1.44 | 1.59 | (.12 | ) | (.02 | ) | (.14 | ) | 11.13 | 16.55 | 851 | .68 | .63 | 1.08 | 1.38 | |||||||||||||||||||||||||||||||||||||||
| 12/31/2016 | 9.36 | .16 | .19 | .35 | (.03 | ) | — | (.03 | ) | 9.68 | 3.70 | 569 | .77 | .63 | 1.08 | 1.68 | ||||||||||||||||||||||||||||||||||||||||
| 12/31/20155,6 | 10.00 | .18 | (.73 | ) | (.55 | ) | (.09 | ) | — | (.09 | ) | 9.36 | (5.50 | )7 | 231 | .86 | 8 | .61 | 8 | 1.08 | 8 | 2.85 | 8 | |||||||||||||||||||||||||||||||||
| Managed Risk Global Allocation Portfolio | ||||||||||||||||||||||||||||||||||||||||||||||||||||||||
| Class P2: | ||||||||||||||||||||||||||||||||||||||||||||||||||||||||
| 12/31/2018 | $ | 11.04 | $ | .14 | $ | (.88 | ) | $ | (.74 | ) | $ | (.10 | ) | $ | (.13 | ) | $ | (.23 | ) | $ | 10.07 | (6.90 | )% | $ | 325 | .68 | % | .63 | % | 1.20 | % | 1.27 | % | |||||||||||||||||||||||
| 12/31/2017 | 9.34 | .10 | 1.67 | 1.77 | (.07 | ) | — | (.07 | ) | 11.04 | 19.03 | 251 | .70 | .63 | 1.19 | .94 | ||||||||||||||||||||||||||||||||||||||||
| 12/31/2016 | 9.24 | .10 | — | 9 | .10 | — | — | — | 9.34 | 1.08 | 144 | .77 | .63 | 1.20 | 1.08 | |||||||||||||||||||||||||||||||||||||||||
| 12/31/20155,6 | 10.00 | .14 | (.81 | ) | (.67 | ) | (.09 | ) | — | (.09 | ) | 9.24 | (6.71 | )7 | 65 | .90 | 8 | .56 | 8 | 1.13 | 8 | 2.22 | 8 | |||||||||||||||||||||||||||||||||
See next page for footnotes.
| American Funds Insurance Series – Portfolio Series | 31 |
Financial highlights (continued)
| Year ended December 31 | For the period ended | |||||||||||||||
| Portfolio turnover rate for all share classes | 2018 | 2017 | 2016 | December 31, 20155,6,7 | ||||||||||||
| Global Growth Portfolio | 12 | % | 10 | % | 17 | % | 32 | % | ||||||||
| Growth and Income Portfolio | 5 | 10 | 18 | 10 | ||||||||||||
| Managed Risk Growth Portfolio | 4 | 7 | 6 | 4 | ||||||||||||
| Managed Risk Growth and Income Portfolio | 4 | 10 | 3 | 4 | ||||||||||||
| Managed Risk Global Allocation Portfolio | 3 | 8 | 13 | 15 | ||||||||||||
| 1 | Based on average shares outstanding. |
| 2 | This column reflects the impact of certain waivers/reimbursements by CRMC. During some of the periods shown, CRMC waived a portion of investment advisory services fees and reimbursed a portion of miscellaneous fees and expenses. |
| 3 | This column does not include expenses of the underlying funds in which each fund invests. |
| 4 | This column reflects the net effective expense ratios for each fund and class, which are unaudited. These ratios include each class’s expense ratio combined with the weighted average net expense ratio of the underlying funds for the periods presented. See expense example for further information regarding fees and expenses. |
| 5 | Based on operations for a period that is less than a full year. |
| 6 | For the period May 1, 2015, commencement of operations, through December 31, 2015. |
| 7 | Not annualized. |
| 8 | Annualized. |
| 9 | Amount less than $.01. |
| 32 | American Funds Insurance Series – Portfolio Series |
Report of Independent Registered Public Accounting Firm
To the Board of Trustees of American Funds Insurance Series and Shareholders of American Funds Global Growth Portfolio, American Funds Growth and Income Portfolio, American Funds Managed Risk Growth Portfolio, American Funds Managed Risk Growth and Income Portfolio and American Funds Managed Risk Global Allocation Portfolio
Opinions on the Financial Statements
We have audited the accompanying statements of assets and liabilities, including the investment portfolios, of American Funds Global Growth Portfolio, American Funds Growth and Income Portfolio, American Funds Managed Risk Growth Portfolio, American Funds Managed Risk Growth and Income Portfolio and American Funds Managed Risk Global Allocation Portfolio (five of the funds constituting American Funds Insurance Series, hereafter collectively referred to as the “Funds”) as of December 31, 2018, the related statements of operations for the year ended December 31, 2018, the statements of changes in net assets for each of the two years in the period ended December 31, 2018, including the related notes, and the financial highlights for each of the periods indicated therein (collectively referred to as the “financial statements”). In our opinion, the financial statements present fairly, in all material respects, the financial position of each of the Funds as of December 31, 2018, the results of each of their operations for the year then ended, the changes in each of their net assets for each of the two years in the period ended December 31, 2018 and each of the financial highlights for each of the periods indicated therein in conformity with accounting principles generally accepted in the United States of America.
Basis for Opinions
These financial statements are the responsibility of the Funds’ management. Our responsibility is to express an opinion on the Funds’ financial statements based on our audits. We are a public accounting firm registered with the Public Company Accounting Oversight Board (United States) (“PCAOB”) and are required to be independent with respect to the Funds in accordance with the U.S. federal securities laws and the applicable rules and regulations of the Securities and Exchange Commission and the PCAOB.
We conducted our audits of these financial statements in accordance with the standards of the PCAOB. Those standards require that we plan and perform the audit to obtain reasonable assurance about whether the financial statements are free of material misstatement, whether due to error or fraud.
Our audits included performing procedures to assess the risks of material misstatement of the financial statements, whether due to error or fraud, and performing procedures that respond to those risks. Such procedures included examining, on a test basis, evidence regarding the amounts and disclosures in the financial statements. Our audits also included evaluating the accounting principles used and significant estimates made by management, as well as evaluating the overall presentation of the financial statements. Our procedures included confirmation of securities owned as of December 31, 2018 by correspondence with the custodians, transfer agent and brokers; when replies were not received from brokers, we performed other auditing procedures. We believe that our audits provide a reasonable basis for our opinions.
/s/ PricewaterhouseCoopers LLP
Los Angeles, California
February 14, 2019
We have served as the auditor of one or more investment companies in The Capital Group Companies Investment Companies Complex since 1934.
| American Funds Insurance Series – Portfolio Series | 33 |
| Expense example | unaudited |
The funds in American Funds Insurance Series serve as the underlying investment vehicle for various insurance products. As an owner of an insurance contract that invests in one of the funds in the series, you incur two types of costs: (1) transaction costs, such as initial sales charges on purchase payments and contingent deferred sales charges on redemptions (loads), and (2) ongoing costs, including management fees, distribution and service (12b-1) fees, and other expenses. Additional fees are charged by the insurance companies related to the various benefits they provide. This example is intended to help you understand your ongoing costs (in dollars) of investing in the underlying funds so you can compare these costs with the ongoing costs of investing in other mutual funds that serve a similar function in other annuity products. The example is based on an investment of $1,000 invested at the beginning of the period and held for the entire six-month period (July 1, 2018, through December 31, 2018).
Actual expenses:
The first line of each share class in the table on the following page provides information about actual account values and actual expenses. You may use the information in this line, together with the amount you invested, to estimate the expenses that you paid over the period. Simply divide your account value by $1,000 (for example, an $8,600 account value divided by $1,000 = 8.6), then multiply the result by the number in the first line under the heading titled “Expenses paid during period” to estimate the expenses you paid on your account during this period.
Hypothetical example for comparison purposes:
The second line of each share class in the table on the following page provides information about hypothetical account values and hypothetical expenses based on the actual expense ratio for the share class and an assumed rate of return of 5.00% per year before expenses, which is not the actual return of the share class. The hypothetical account values and expenses may not be used to estimate the actual ending account balance or expenses you paid for the period. You may use this information to compare the ongoing costs of investing in the fund and other funds. To do so, compare this 5.00% hypothetical example with the 5.00% hypothetical examples that appear in the shareholder reports of the other funds.
Notes:
Additional fees are charged by the insurance companies related to the various benefits they provide. You can estimate the impact of these fees by adding the amount of the fees to the total estimated expenses you paid on your account during the period as calculated above. In addition, your ending account value would be lower by the amount of these fees.
Note that the expenses shown in the table on the following page are meant to highlight your ongoing costs only and do not reflect any transactional costs. Therefore, the second line of each share class in the table is useful in comparing ongoing costs only and will not help you determine the relative total costs of owning different funds. In addition, if these transactional costs were included, your costs would have been higher.
| 34 | American Funds Insurance Series – Portfolio Series |
| Beginning account value 7/1/2018 | Ending account value 12/31/2018 | Expenses paid during period1,2 | Annualized expense ratio2 | Effective expenses paid during period3 | Effective annualized expense ratio4 | |||||||||||||||||||
| Global Growth Portfolio | ||||||||||||||||||||||||
| Class 4 – actual return | $ | 1,000.00 | $ | 892.32 | $ | 2.96 | .62 | % | $ | 5.91 | 1.24 | % | ||||||||||||
| Class 4 – assumed 5% return | 1,000.00 | 1,022.08 | 3.16 | .62 | 6.31 | 1.24 | ||||||||||||||||||
| Growth and Income Portfolio | ||||||||||||||||||||||||
| Class 4 – actual return | $ | 1,000.00 | $ | 951.86 | $ | 2.61 | .53 | % | $ | 4.77 | .97 | % | ||||||||||||
| Class 4 – assumed 5% return | 1,000.00 | 1,022.53 | 2.70 | .53 | 4.94 | .97 | ||||||||||||||||||
| Managed Risk Growth Portfolio | ||||||||||||||||||||||||
| Class P2 – actual return | $ | 1,000.00 | $ | 939.69 | $ | 2.93 | .60 | % | $ | 4.89 | 1.00 | % | ||||||||||||
| Class P2 – assumed 5% return | 1,000.00 | 1,022.18 | 3.06 | .60 | 5.09 | 1.00 | ||||||||||||||||||
| Managed Risk Growth and Income Portfolio | ||||||||||||||||||||||||
| Class P2 – actual return | $ | 1,000.00 | $ | 952.45 | $ | 2.95 | .60 | % | $ | 5.27 | 1.07 | % | ||||||||||||
| Class P2 – assumed 5% return | 1,000.00 | 1,022.18 | 3.06 | .60 | 5.45 | 1.07 | ||||||||||||||||||
| Managed Risk Global Allocation Portfolio | ||||||||||||||||||||||||
| Class P2 – actual return | $ | 1,000.00 | $ | 935.02 | $ | 3.12 | .64 | % | $ | 5.85 | 1.20 | % | ||||||||||||
| Class P2 – assumed 5% return | 1,000.00 | 1,021.98 | 3.26 | .64 | 6.11 | 1.20 | ||||||||||||||||||
| 1 | The “expenses paid during period” are equal to the “annualized expense ratio,” multiplied by the average account value over the period, multiplied by the number of days in the period, and divided by 365 (to reflect the one-half year period). |
| 2 | The “expenses paid during period” and “annualized expense ratio” do not include the expenses of the underlying funds in which each fund invests. |
| 3 | The “effective expenses paid during period” are equal to the “effective annualized expense ratio,” multiplied by the average account value over the period, multiplied by the number of days in the period, and divided by 365 (to reflect the period). |
| 4 | The “effective annualized expense ratio” reflects the net annualized expense ratio of the class plus the class’s pro-rata share of the weighted average expense ratio of the underlying funds in which it invests. |
| American Funds Insurance Series – Portfolio Series | 35 |
This page intentionally left blank.
| 36 | American Funds Insurance Series – Portfolio Series |
This page intentionally left blank.
| American Funds Insurance Series – Portfolio Series | 37 |
This page intentionally left blank.
| 38 | American Funds Insurance Series – Portfolio Series |
This page intentionally left blank.
| American Funds Insurance Series – Portfolio Series | 39 |
This page intentionally left blank.
| 40 | American Funds Insurance Series – Portfolio Series |
Board of trustees and other officers
Independent trustees1
| Name and year of birth | Year first elected a trustee of the series2 | Principal occupation(s) during past five years | Number of portfolios in fund complex overseen by trustee | Other directorships3 held by trustee | ||||
| William H. Baribault,1945 | 2009 | CEO and President, Richard Nixon Foundation; Chairman of the Board and CEO, Oakwood Enterprises (private investment and consulting) | 81 | General Finance Corporation | ||||
| James G. Ellis,1947 | 2010 | Dean and Professor of Marketing, Marshall School of Business, University of Southern California | 91 | Mercury General Corporation | ||||
| Nariman Farvadin,1956 | 2018 | President, Stevens Institute of Technology | 78 | None | ||||
| Mary Davis Holt,1950 | 2015–2016; 2017 | Principal, Mary Davis Holt Enterprises, LLC (leadership development consulting); former Partner, Flynn Heath Holt Leadership, LLC (leadership consulting); former COO, Time Life Inc. (1993–2003) | 78 | None | ||||
| R. Clark Hooper,1946 | 2010 | Private investor | 81 | None | ||||
| Merit E. Janow,1958 | 2007 | Dean and Professor, Columbia University, School of International and Public Affairs | 80 | Mastercard Incorporated; Trimble Inc. | ||||
| Laurel B. Mitchell, PhD,1955 | 2010 | Chair, California Jump$tart Coalition for Personal Financial Literacy; part-time faculty, Pomona College; Professor Emerita, University of Redlands; former Distinguished Professor of Accounting, University of Redlands; former Director, Accounting Program, University of Redlands | 78 | None | ||||
| Margaret Spellings,1957 Chairman of the Board (Independent and Non-Executive) | 2010 | President, The University of North Carolina; former President, George W. Bush Foundation | 82 | None | ||||
| Alexandra Trower,1964 | 2018 | Executive Vice President, Global Communications and Corporate Officer, The Estée Lauder Companies | 77 | None |
Leonard R. Fuller and Frank M. Sanchez retired from the board on December 31, 2018. The trustees thank Mr. Fuller and Mr. Sanchez for their dedication and service to the series.
Interested trustees4,5
| Name, year of birth and position with series | Year first elected a trustee or officer of the series2 | Principal occupation(s) during past five years and positions held with affiliated entities or the principal underwriter of the series | Number of portfolios in fund complex overseen by trustee | Other directorships3 held by trustee | ||||
| Donald D. O’Neal,1960 Co-President | 1998 | Partner — Capital International Investors, Capital Research and Management Company; Director, Capital Research and Management Company | 29 | None | ||||
| Michael C. Gitlin,1970 | 2019 | Partner — Capital Fixed Income Investors, Capital Research and Management Company; Director, The Capital Group Companies, Inc.;6served as Head of Fixed Income at a large investment management firm prior to joining Capital Research and Management Company in 2015 | 77 | None |
The series statement of additional information includes further details about the series trustees and is available without charge upon request by calling American Funds Service Company at (800) 421-4225 or by visiting the American Funds website at americanfunds.com. The address for all trustees and officers of the series is 333 South Hope Street, Los Angeles, CA 90071,Attention: Secretary.
| American Funds Insurance Series – Portfolio Series | 41 |
Other officers5
| Name, year of birth and position with series | Year first elected an officer of the series2 | Principal occupation(s) during past five years and positions held with affiliated entities or the principal underwriter of the series | ||
| Alan N. Berro,1960 Co-President | 1998 | Partner — Capital World Investors, Capital Research and Management Company; Director, Capital Research and Management Company | ||
| Maria Manotok,1974 Executive Vice President | 2012 | Senior Vice President and Senior Counsel — Fund Business Management Group, Capital Research and Management Company; Director, Capital Guardian Trust Company6 | ||
| John H. Smet,1956 Senior Vice President | 1994 | Partner — Capital Fixed Income Investors, Capital Research and Management Company; Director, Capital Research and Management Company | ||
| Martin Jacobs,1962 Vice President | 2016 | Partner — Capital World Investors, Capital Research and Management Company | ||
| Carl M. Kawaja,1964 Vice President | 2008 | Partner — Capital World Investors, Capital Research and Management Company; Director, The Capital Group Companies, Inc.6 | ||
| Sung Lee,1966 Vice President | 2008 | Partner — Capital Research Global Investors, Capital International, Inc.6 | ||
| S. Keiko McKibben,1969 Vice President | 2010 | Partner — Capital Research Global Investors, Capital Research and Management Company | ||
| Renaud H. Samyn,1974 Vice President | 2010 | Partner — Capital Research Global Investors, Capital International, Inc.6 | ||
| Dylan Yolles,1969 Vice President | 2012 | Partner — Capital International Investors, Capital Research and Management Company | ||
| Steven I. Koszalka,1964 Secretary | 2003 | Vice President — Fund Business Management Group, Capital Research and Management Company | ||
| Gregory F. Niland,1971 Treasurer | 2008 | Vice President — Investment Operations, Capital Research and Management Company | ||
| Susan K. Countess,1966 Assistant Secretary | 2014 | Associate — Fund Business Management Group, Capital Research and Management Company | ||
| Brian C. Janssen,1972 Assistant Treasurer | 2015 | Vice President — Investment Operations, Capital Research and Management Company | ||
| Dori Laskin,1951 Assistant Treasurer | 2010 | Vice President — Investment Operations, Capital Research and Management Company |
| 1 | The term independent trustee refers to a trustee who is not an “interested person” of the series within the meaning of the Investment Company Act of 1940. |
| 2 | Trustees and officers of the series serve until their resignation, removal or retirement. |
| 3 | This includes all directorships/trusteeships (other than those in the American Funds or other funds managed by Capital Research and Management Company or its affiliates) that are held by each trustee as a trustee or director of a public company or a registered investment company. |
| 4 | The term interested trustee refers to a trustee who is an “interested person” within the meaning of the Investment Company Act of 1940, on the basis of their affiliation with the series investment adviser, Capital Research and Management Company, or affiliated entities (including the series principal underwriter). |
| 5 | All of the trustees and/or officers listed, with the exception of Martin Jacobs, S. Keiko McKibben and Renaud H. Samyn, are officers and/or directors/trustees of one or more of the other funds for which Capital Research and Management Company serves as investment adviser. |
| 6 | Company affiliated with Capital Research and Management Company. |
| 42 | American Funds Insurance Series – Portfolio Series |
Board of trustees and other officers(continued)
Results of special meeting of shareholders
held November 28, 2018
Shares outstanding (all classes) on August 31, 2018 (record date)
6,347,216,058
Total shares voting on November 28, 2018
4,343,768,464 (68.4% of shares outstanding)
The proposal: to elect board members
| Votes for | Percent of shares voting for | Votes withheld | Percent of shares withheld | |||||||
| William H. Baribault | 4,208,852,644 | 96.9 | % | 134,915,821 | 3.1 | % | ||||
| James G. Ellis | 4,216,149,993 | 97.1 | 127,618,471 | 2.9 | ||||||
| Nariman Farvardin | 4,218,959,298 | 97.1 | 124,809,166 | 2.9 | ||||||
| Michael C. Gitlin | 4,222,232,502 | 97.2 | 121,535,962 | 2.8 | ||||||
| Mary Davis Holt | 4,224,279,601 | 97.2 | 119,488,863 | 2.8 | ||||||
| R. Clark Hooper | 4,216,559,229 | 97.1 | 127,209,235 | 2.9 | ||||||
| Merit E. Janow | 4,220,194,031 | 97.2 | 123,574,433 | 2.8 | ||||||
| Laurel B. Mitchell | 4,224,436,631 | 97.3 | 119,331,833 | 2.7 | ||||||
| Donald D. O’Neal | 4,220,647,956 | 97.2 | 123,120,508 | 2.8 | ||||||
| Margaret Spellings | 4,219,675,934 | 97.1 | 124,092,530 | 2.9 | ||||||
| Alexandra Trower | 4,225,223,365 | 97.3 | 118,545,099 | 2.7 | ||||||
| American Funds Insurance Series – Portfolio Series | 43 |
Offices of the series and of the investment adviser
Capital Research and Management Company
333 South Hope Street
Los Angeles, CA 90071-1406
6455 Irvine Center Drive
Irvine, CA 92618-4518
Investment subadviser
Milliman Financial Risk Management LLC
(Managed Risk Funds only)
71 South Wacker Drive, 31st Floor
Chicago, IL 60606
Custodians of assets
State Street Bank and Trust Company
One Lincoln Street
Boston, MA 02111
Bank of New York Mellon
(Managed Risk Funds only)
One Wall Street
New York, NY 10286
Counsel
Morgan, Lewis & Bockius LLP
One Federal Street
Boston, MA 02110-1726
Independent registered public accounting firm
PricewaterhouseCoopers LLP
601 South Figueroa Street
Los Angeles, CA 90017-3874
| 44 | American Funds Insurance Series – Portfolio Series |
Investors should carefully consider investment objectives, risks, charges and expenses. This and other important information is contained in the series prospectuses and summary prospectuses, which can be obtained from your financial professional and should be read carefully before investing. You may also call American Funds Service Company (AFS) at (800) 421-4225 or visit the American Funds website at americanfunds.com. Fund shares offered through American Funds Distributors, Inc.
“Proxy Voting Guidelines for American Funds Insurance Series — Portfolio Series” — which describes how we vote proxies relating to the underlying funds held in the portfolios — is available on the American Funds website or upon request by calling AFS. The series files its proxy voting record with the U.S. Securities and Exchange Commission (SEC) for the 12 months ended June 30 by August 31. The proxy voting record is available free of charge on the SEC website at sec.gov and on the American Funds website.
American Funds Insurance Series — Portfolio Series files a complete list of its portfolio holdings with the SEC for the first and third quarters of each fiscal year on Form N-Q. This filing is available free of charge on the SEC website. Additionally, the list of portfolio holdings is available by calling AFS.
This report is for the information of American Funds Insurance Series — Portfolio Series investors, but it also may be used as sales literature when preceded or accompanied by the current prospectuses or summary prospectuses for American Funds Insurance Series — Portfolio Series and the prospectus for the applicable insurance contract, which give details about charges, expenses, investment objectives and operating policies of the series. If used as sales material after March 31, 2019, this report must be accompanied by a statistical update for the most recently completed calendar quarter.
Bloomberg® is a trademark of Bloomberg Finance L.P. (collectively with its affiliates, “Bloomberg”). Barclays® is a trademark of Barclays Bank Plc (collectively with its affiliates, “Barclays”), used under license. Neither Bloomberg nor Barclays approves or endorses this material, guarantees the accuracy or completeness of any information herein and, to the maximum extent allowed by law, neither shall have any liability or responsibility for injury or damages arising in connection therewith.
MSCI has not approved, reviewed or produced this report, makes no express or implied warranties or representations and is not liable whatsoever for any data in the report. You may not redistribute the MSCI data or use it as a basis for other indices or investment products.
Standard & Poor’s 500 Composite Index is a product of S&P Dow Jones Indices LLC and/or its affiliates and has been licensed for use by Capital Group. Copyright © 2019 S&P Dow Jones Indices LLC, a division of S&P Global, and/or its affiliates. All rights reserved. Redistribution or reproduction in whole or in part is prohibited without written permission of S&P Dow Jones Indices LLC.

The Capital Advantage®
Since 1931, Capital Group, home of American Funds, has helped investors pursue long-term investment success. Our consistent approach — in combination with The Capital SystemSM— has resulted in a superior long-term track record for American Funds Insurance Series®.
Aligned with investor success
We base our decisions on a long-term perspective, which we believe aligns our goals with the interests of our clients. American Funds Insurance Series portfolio managers average 26 years of investment experience, including 21 years at our company, reflecting a career commitment to our long-term approach.1
The Capital System
The Capital System combines individual accountability with teamwork. Funds using The Capital System are divided into portions that are managed independently by investment professionals with diverse backgrounds, ages and investment approaches. An extensive global research effort is the backbone of our system.
Superior long-term track record
American Funds Insurance Series equity funds have beaten their Lipper peer indexes in 91% of 10-year periods and 100% of 20-year periods. Fixed income funds have beaten their Lipper indexes in 65% of 10-year periods and 81% of 20-year periods.2Fund management fees have been among the lowest in the industry.3
| 1 | Portfolio manager experience as of the American Funds Insurance Series prospectus dated May 1, 2018, as supplemented January 1, 2019. |
| 2 | Based on Class 1 share results for rolling periods through December 31, 2018. Periods covered are the shorter of the fund’s lifetime or since the comparable Lipper index inception date. The comparable Lipper indexes are: Global Funds Index (Global Growth Fund), Growth Funds Index (Growth Fund), International Funds Index (International Fund), Emerging Markets Funds Index (New World Fund), Growth & Income Funds Index (Blue Chip Income and Growth Fund, Growth-Income Fund), Balanced Portfolio Funds Index (Asset Allocation Fund), Core Bond Funds Index (Bond Fund), High Yield Funds Index (High-Income Bond Fund) and General U.S. Government Funds Index (U.S. Government/AAA-Rated Securities Fund). The Lipper Global Small-/Mid-Cap Funds Average was used for Global Small Capitalization Fund. |
| 3 | Based on management fees for the 20-year period ended December 31, 2018, versus comparable Lipper categories, excluding funds of funds. |
All Capital Group trademarks referenced are registered trademarks owned by The Capital Group Companies, Inc. or an affiliated company. All other company and product names mentioned are the trademarks or registered trademarks of their respective companies.

ITEM 2 – Code of Ethics
The Registrant has adopted a Code of Ethics that applies to its Principal Executive Officer and Principal Financial Officer. The Registrant undertakes to provide to any person without charge, upon request, a copy of the Code of Ethics. Such request can be made by calling 800/421-4225 or to the Secretary of the Registrant, 333 South Hope Street, Los Angeles, California 90071.
ITEM 3 – Audit Committee Financial Expert
The Registrant’s board has determined that Laurel B. Mitchell, a member of the Registrant’s audit committee, is an “audit committee financial expert” and "independent," as such terms are defined in this Item. This designation will not increase the designee’s duties, obligations or liability as compared to his or her duties, obligations and liability as a member of the audit committee and of the board, nor will it reduce the responsibility of the other audit committee members. There may be other individuals who, through education or experience, would qualify as "audit committee financial experts" if the board had designated them as such. Most importantly, the board believes each member of the audit committee contributes significantly to the effective oversight of the Registrant’s financial statements and condition.
| ITEM 4 – Principal Accountant Fees and Services | AFIS | |
| Registrant: | ||
| a) Audit Fees: | ||
| 2017 | $701,000 | |
| 2018 | $760,000 | |
| b) Audit-Related Fees: | ||
| 2017 | None | |
| 2018 | $19,000 | |
| c) Tax Fees: | ||
| 2017 | $168,000 | |
| 2018 | $179,000 | |
| The tax fees consist of professional services relating to the preparation of the Registrant’s tax returns. | ||
| d) All Other Fees: | ||
| 2017 | None | |
| 2018 | None | |
| Adviser and affiliates (includes only fees for non-audit services billed to the adviser and affiliates for engagements that relate directly to the operations and financial reporting of the Registrant and were subject to the pre-approval policies described below): | ||
| a) Audit Fees: | ||
| Not Applicable | ||
| b) Audit-Related Fees: | ||
| 2017 | None | |
| 2018 | $684,000 | |
| The audit-related fees consist of assurance and related services relating to the examination of the Registrant’s transfer agent, principal underwriter and investment adviser conducted in accordance with Statement on Standards for Attestation Engagements Number 16 issued by the American Institute of Certified Public Accountants. | ||
| c) Tax Fees: | ||
| 2017 | None | |
| 2018 | None | |
| The tax fees consist of consulting services relating to the Registrant’s investments. | ||
| d) All Other Fees: | ||
| 2017 | None | |
| 2018 | None | |
| The other fees consist of subscription services related to an accounting research tool. | ||
| All audit and permissible non-audit services that the Registrant’s audit committee considers compatible with maintaining the independent registered public accounting firm’s independence are required to be pre-approved by the committee. The pre-approval requirement will extend to all non-audit services provided to the Registrant, the investment adviser, and any entity controlling, controlled by, or under common control with the investment adviser that provides ongoing services to the Registrant, if the engagement relates directly to the operations and financial reporting of the Registrant. The committee will not delegate its responsibility to pre-approve these services to the investment adviser. The committee may delegate to one or more committee members the authority to review and pre-approve audit and permissible non-audit services. Actions taken under any such delegation will be reported to the full committee at its next meeting. The pre-approval requirement is waived with respect to non-audit services if certain conditions are met. The pre-approval requirement was not waived for any of the non-audit services listed above provided to the Registrant, adviser and affiliates. | ||
ITEM 5 – Audit Committee of Listed Registrants
Not applicable to this Registrant, insofar as the Registrant is not a listed issuer as defined in Rule 10A-3 under the Securities Exchange Act of 1934.
ITEM 6 – Schedule of Investments

| Common stocks 94.37% Information technology 24.34% | Shares | Value (000) |
| Taiwan Semiconductor Manufacturing Co., Ltd.1 | 27,188,000 | $197,997 |
| Taiwan Semiconductor Manufacturing Co., Ltd. (ADR) | 335,000 | 12,365 |
| ASML Holding NV | 648,442 | 101,904 |
| ASML Holding NV (New York registered) | 517,300 | 80,502 |
| Microsoft Corp. | 1,583,100 | 160,795 |
| Visa Inc., Class A | 1,142,800 | 150,781 |
| Broadcom Inc. | 487,050 | 123,847 |
| Temenos AG1 | 637,000 | 76,403 |
| Paycom Software, Inc.2 | 357,000 | 43,715 |
| Amadeus IT Group SA, Class A, non-registered shares | 486,200 | 33,892 |
| Adobe Inc.2 | 135,000 | 30,542 |
| Amphenol Corp., Class A | 373,500 | 30,261 |
| SimCorp AS1 | 425,000 | 29,083 |
| Intel Corp. | 598,500 | 28,088 |
| Adyen NV2 | 49,300 | 26,833 |
| Largan Precision Co., Ltd.1 | 255,000 | 26,576 |
| PagSeguro Digital Ltd., Class A2 | 1,340,900 | 25,115 |
| AAC Technologies Holdings Inc. | 3,926,540 | 22,791 |
| Samsung Electronics Co., Ltd., nonvoting preferred1 | 792,250 | 22,460 |
| Hexagon AB, Class B1 | 477,200 | 21,967 |
| Murata Manufacturing Co., Ltd.1 | 155,000 | 21,013 |
| Zendesk, Inc.2 | 326,000 | 19,029 |
| Mastercard Inc., Class A | 76,500 | 14,432 |
| EPAM Systems, Inc.2 | 122,000 | 14,153 |
| Jack Henry & Associates, Inc. | 98,000 | 12,399 |
| Autodesk, Inc.2 | 77,000 | 9,903 |
| StoneCo Ltd., Class A2 | 116,000 | 2,139 |
| 1,338,985 | ||
| Consumer discretionary 17.99% | ||
| Amazon.com, Inc.2 | 228,600 | 343,350 |
| Alibaba Group Holding Ltd. (ADR)2 | 931,050 | 127,619 |
| NIKE, Inc., Class B | 562,500 | 41,704 |
| Home Depot, Inc. | 236,800 | 40,687 |
| Just Eat PLC2 | 5,292,000 | 39,581 |
| Booking Holdings Inc.2 | 22,700 | 39,099 |
| Ocado Group PLC2 | 3,115,000 | 31,366 |
| Moncler SpA1 | 915,000 | 30,352 |
| Wynn Macau, Ltd. | 9,846,400 | 21,477 |
| Tiffany & Co. | 259,700 | 20,908 |
| Cie. Financière Richemont SA, Class A1 | 296,650 | 19,007 |
| MGM China Holdings, Ltd. | 10,962,000 | 18,395 |
| LVMH Moët Hennessy-Louis Vuitton SE | 59,000 | 17,454 |
| Nitori Holdings Co., Ltd.1 | 135,000 | 16,868 |
| McDonald’s Corp. | 93,000 | 16,514 |
| EssilorLuxottica | 124,835 | 15,798 |
| Burberry Group PLC | 692,400 | 15,316 |
| Common stocks (continued) Consumer discretionary (continued) | Shares | Value (000) |
| GVC Holdings PLC | 1,559,000 | $13,393 |
| Maruti Suzuki India Ltd. | 120,000 | 12,832 |
| Sodexo SA | 122,000 | 12,510 |
| Meituan Dianping, Class B2 | 2,180,200 | 12,223 |
| Sony Corp.1 | 243,000 | 11,755 |
| ASOS PLC2 | 370,000 | 10,738 |
| Melco Resorts & Entertainment Ltd. (ADR) | 606,000 | 10,678 |
| Suzuki Motor Corp.1 | 182,000 | 9,240 |
| Ctrip.com International, Ltd. (ADR)2 | 330,000 | 8,930 |
| Marriott International, Inc., Class A | 74,000 | 8,033 |
| MGM Resorts International | 320,000 | 7,763 |
| Cairn Homes PLC2 | 5,615,000 | 6,884 |
| Valeo SA, non-registered shares | 175,000 | 5,115 |
| Brilliance China Automotive Holdings Ltd. | 5,844,000 | 4,351 |
| 989,940 | ||
| Health care 12.51% | ||
| UnitedHealth Group Inc. | 324,200 | 80,765 |
| Merck & Co., Inc. | 886,000 | 67,699 |
| Boston Scientific Corp.2 | 1,638,200 | 57,894 |
| Elanco Animal Health Inc.2 | 1,799,658 | 56,743 |
| AstraZeneca PLC | 721,300 | 53,995 |
| Sartorius AG, nonvoting preferred, non-registered shares1 | 381,500 | 47,577 |
| Mettler-Toledo International Inc.2 | 65,000 | 36,763 |
| Cigna Corp. | 177,511 | 33,713 |
| Hologic, Inc.2 | 800,000 | 32,880 |
| Fisher & Paykel Healthcare Corp. Ltd. | 3,680,000 | 32,110 |
| Pfizer Inc. | 555,000 | 24,226 |
| Regeneron Pharmaceuticals, Inc.2 | 64,200 | 23,979 |
| Bayer AG1 | 309,860 | 21,509 |
| CSL Ltd. | 147,000 | 19,171 |
| DexCom, Inc.2 | 160,000 | 19,168 |
| Novartis AG1 | 189,000 | 16,145 |
| Vertex Pharmaceuticals Inc.2 | 89,000 | 14,748 |
| Straumann Holding AG1 | 22,200 | 13,955 |
| Sanofi | 135,000 | 11,703 |
| bioMérieux SA | 135,000 | 8,894 |
| Biogen Inc.2 | 28,000 | 8,426 |
| William Demant Holding A/S1,2 | 228,540 | 6,494 |
| 688,557 | ||
| Communication services 10.57% | ||
| Alphabet Inc., Class A2 | 116,500 | 121,738 |
| Alphabet Inc., Class C2 | 71,052 | 73,582 |
| Nintendo Co., Ltd.1 | 345,600 | 92,022 |
| Naspers Ltd., Class N | 379,000 | 76,189 |
| Tencent Holdings Ltd. | 1,800,000 | 72,179 |
| Facebook, Inc., Class A2 | 408,000 | 53,485 |
| SoftBank Group Corp.1 | 776,000 | 51,643 |
| CBS Corp., Class B | 334,850 | 14,639 |
| Altice USA, Inc., Class A | 800,000 | 13,216 |
| BT Group PLC | 4,250,000 | 12,898 |
| 581,591 |
| Common stocks (continued) Financials 10.39% | Shares | Value (000) |
| AIA Group Ltd. | 15,004,900 | $124,554 |
| JPMorgan Chase & Co. | 853,600 | 83,328 |
| Kotak Mahindra Bank Ltd. | 3,471,000 | 62,470 |
| MarketAxess Holdings Inc. | 211,000 | 44,586 |
| Société Générale | 1,234,350 | 39,345 |
| Prudential PLC | 1,604,962 | 28,681 |
| GT Capital Holdings, Inc.1 | 1,295,075 | 24,006 |
| HSBC Holdings PLC (GBP denominated) | 2,330,000 | 19,212 |
| CME Group Inc., Class A | 97,200 | 18,285 |
| Berkshire Hathaway Inc., Class A2 | 54 | 16,524 |
| SunTrust Banks, Inc. | 317,000 | 15,990 |
| ORIX Corp.1 | 1,017,000 | 14,832 |
| Moscow Exchange MICEX-RTS PJSC1 | 12,640,000 | 14,694 |
| AXA SA | 656,000 | 14,174 |
| Banco Santander, SA | 2,946,020 | 13,410 |
| BlackRock, Inc. | 30,600 | 12,020 |
| Macquarie Group Ltd. | 125,000 | 9,566 |
| Grupo Financiero Galicia SA, Class B (ADR) | 327,000 | 9,015 |
| Sberbank of Russia PJSC (ADR) | 645,500 | 7,075 |
| 571,767 | ||
| Consumer staples 6.94% | ||
| Nestlé SA1 | 739,650 | 60,038 |
| Coca-Cola European Partners PLC | 1,194,500 | 54,768 |
| British American Tobacco PLC | 1,710,800 | 54,514 |
| Philip Morris International Inc. | 602,200 | 40,203 |
| Walgreens Boots Alliance, Inc. | 417,700 | 28,541 |
| Uni-Charm Corp.1 | 832,000 | 26,954 |
| Keurig Dr Pepper Inc. | 893,000 | 22,896 |
| General Mills, Inc. | 514,000 | 20,015 |
| Shoprite Holdings Ltd. | 1,432,000 | 18,926 |
| Costco Wholesale Corp. | 59,500 | 12,121 |
| Coca-Cola FEMSA, SAB de CV, Series L | 1,965,000 | 11,914 |
| Associated British Foods PLC | 428,000 | 11,145 |
| Coca-Cola HBC AG (CDI) | 336,700 | 10,523 |
| Lenta Ltd. (GDR)2 | 1,702,100 | 5,251 |
| Lenta Ltd. (GDR)2,3 | 1,211,900 | 3,739 |
| 381,548 | ||
| Industrials 6.15% | ||
| Airbus SE, non-registered shares | 1,093,500 | 105,192 |
| MTU Aero Engines AG1 | 167,000 | 30,290 |
| ASSA ABLOY AB, Class B1 | 1,677,000 | 29,919 |
| General Electric Co. | 3,778,000 | 28,600 |
| Geberit AG1 | 65,000 | 25,277 |
| Alliance Global Group, Inc.1 | 111,060,000 | 25,129 |
| Ryanair Holdings PLC (ADR)2 | 307,000 | 21,901 |
| Caterpillar Inc. | 168,800 | 21,450 |
| Boeing Co. | 51,300 | 16,544 |
| IDEX Corp. | 122,400 | 15,454 |
| DSV A/S1 | 158,500 | 10,435 |
| NIBE Industrier AB, Class B1 | 817,914 | 8,388 |
| 338,579 |
| Common stocks (continued) Materials 2.82% | Shares | Value (000) |
| Sherwin-Williams Co. | 155,500 | $61,183 |
| Glencore PLC | 6,150,000 | 22,838 |
| Randgold Resources Ltd.1 | 250,000 | 20,682 |
| CCL Industries Inc., Class B, nonvoting | 375,000 | 13,751 |
| Linde PLC1 | 65,000 | 10,318 |
| Koninklijke DSM NV | 124,000 | 10,150 |
| Air Liquide SA, bonus shares1 | 79,200 | 9,841 |
| DowDuPont Inc. | 123,027 | 6,580 |
| 155,343 | ||
| Energy 2.66% | ||
| Royal Dutch Shell PLC, Class B | 1,042,000 | 31,078 |
| Reliance Industries Ltd. | 1,795,200 | 28,831 |
| LUKOIL Oil Co. PJSC (ADR) | 306,700 | 21,923 |
| Gazprom PJSC (ADR) | 4,173,000 | 18,482 |
| Concho Resources Inc.2 | 111,500 | 11,461 |
| CNOOC Ltd. | 6,600,000 | 10,199 |
| Baker Hughes, a GE Co., Class A | 470,000 | 10,105 |
| Occidental Petroleum Corp. | 153,000 | 9,391 |
| Schlumberger Ltd. | 132,000 | 4,763 |
| 146,233 | ||
| Total common stocks (cost: $3,929,871,000) | 5,192,543 | |
| Short-term securities 5.35% | Principal amount (000) | |
| Canada Bill 2.32%due 1/3/2019 | $20,000 | 19,996 |
| Canadian Imperial Bank of Commerce 2.47%due 1/3/20193 | 15,000 | 14,997 |
| Fairway Finance Corp. 2.65%due 2/5/20193 | 10,000 | 9,974 |
| Federal Home Loan Bank 2.15%–2.29%due 1/2/2019–1/10/2019 | 60,100 | 60,080 |
| Nestle Capital Corp. 2.68%due 3/19/20193 | 40,000 | 39,778 |
| Québec (Province of) 2.52%due 1/22/20193 | 20,000 | 19,970 |
| Siemens Capital Co. LLC 2.50%due 2/19/20193 | 30,000 | 29,895 |
| Toronto-Dominion Bank 2.65%due 2/20/20193 | 50,000 | 49,815 |
| U.S. Treasury Bills 2.37%due 2/12/2019 | 50,000 | 49,868 |
| Total short-term securities (cost: $294,370,000) | 294,373 | |
| Total investment securities99.72% (cost: $4,224,241,000) | 5,486,916 | |
| Other assets less liabilities 0.28% | 15,237 | |
| Net assets100.00% | $5,502,153 |
| 1 | Valued under fair value procedures adopted by authority of the board of trustees. The total value of all such securities was $1,042,869,000, which represented 18.95% of the net assets of the fund. This amount includes $1,012,346,000 related to certain securities trading outside the U.S. whose values were adjusted as a result of significant market movements following the close of local trading. |
| 2 | Security did not produce income during the last 12 months. |
| 3 | Acquired in a transaction exempt from registration under Rule 144A or Section 4(2) of the Securities Act of 1933. May be resold in the U.S. in transactions exempt from registration, normally to qualified institutional buyers. The total value of all such securities was $168,168,000, which represented 3.06% of the net assets of the fund. |
| Key to abbreviations | |
| ADR = American Depositary Receipts | GBP = British pounds |
| CDI = CREST Depository Interest | GDR = Global Depositary Receipts |
| Common stocks 88.97% Health care 21.25% | Shares | Value (000) |
| GW Pharmaceuticals PLC (ADR)1 | 823,718 | $80,222 |
| Insulet Corp.1 | 860,355 | 68,243 |
| Allakos Inc.1,2 | 886,580 | 46,341 |
| Molina Healthcare, Inc.1 | 381,000 | 44,280 |
| iRhythm Technologies, Inc.1 | 614,905 | 42,724 |
| Integra LifeSciences Holdings Corp.1 | 926,365 | 41,779 |
| Evolent Health, Inc., Class A1 | 1,545,000 | 30,823 |
| Illumina, Inc.1 | 100,200 | 30,053 |
| NuCana PLC (ADR)1,2,3 | 2,067,724 | 29,982 |
| China Biologic Products Holdings, Inc.1,2 | 360,000 | 27,328 |
| Haemonetics Corp.1 | 242,825 | 24,295 |
| CONMED Corp. | 332,500 | 21,346 |
| Wright Medical Group NV1 | 753,400 | 20,508 |
| Allogene Therapeutics, Inc.1,4,5 | 653,594 | 15,137 |
| Allogene Therapeutics, Inc.1,2 | 193,700 | 5,216 |
| Madrigal Pharmaceuticals, Inc.1,2 | 177,800 | 20,042 |
| PRA Health Sciences, Inc.1 | 215,800 | 19,845 |
| Osstem Implant Co., Ltd.1,4 | 412,245 | 19,722 |
| WuXi Biologics (Cayman) Inc.1 | 2,883,676 | 18,468 |
| CryoLife, Inc.1 | 640,500 | 18,177 |
| BioMarin Pharmaceutical Inc.1 | 172,000 | 14,646 |
| Nakanishi Inc.4 | 829,000 | 14,120 |
| Encompass Health Corp. | 219,000 | 13,512 |
| Bluebird Bio, Inc.1 | 135,415 | 13,433 |
| Notre Dame Intermédica Participações S.A.1 | 1,725,000 | 12,943 |
| Hikma Pharmaceuticals PLC | 580,000 | 12,686 |
| Divi’s Laboratories Ltd. | 584,864 | 12,421 |
| Fleury SA, ordinary nominative | 2,354,000 | 12,014 |
| Tabula Rasa HealthCare, Inc.1 | 176,790 | 11,272 |
| NuVasive, Inc.1 | 200,000 | 9,912 |
| Ultragenyx Pharmaceutical Inc.1 | 203,374 | 8,843 |
| LivaNova PLC1 | 58,000 | 5,305 |
| Piramal Enterprises Ltd. | 127,741 | 4,358 |
| Guardant Health, Inc.1 | 91,376 | 3,435 |
| Genomma Lab Internacional, SAB de CV, Series B1,2 | 5,400,000 | 3,207 |
| 776,638 | ||
| Information technology 15.61% | ||
| Paycom Software, Inc.1 | 428,885 | 52,517 |
| Mellanox Technologies, Ltd.1 | 389,200 | 35,954 |
| Qorvo, Inc.1 | 510,300 | 30,991 |
| Cree, Inc.1 | 711,507 | 30,435 |
| HubSpot, Inc.1 | 229,100 | 28,805 |
| Ceridian HCM Holding Inc.1,2 | 801,777 | 27,653 |
| Zebra Technologies Corp., Class A1 | 121,800 | 19,394 |
| SimCorp AS4 | 240,295 | 16,444 |
| Common stocks (continued) Information technology (continued) | Shares | Value (000) |
| Kingdee International Software Group Co. Ltd. | 18,273,374 | $16,149 |
| Bechtle AG, non-registered shares4 | 199,105 | 15,478 |
| Hamamatsu Photonics KK4 | 455,053 | 15,345 |
| Topcon Corp.4 | 1,071,510 | 14,230 |
| Everbridge, Inc.1 | 245,000 | 13,906 |
| Inphi Corp.1 | 405,000 | 13,021 |
| VTech Holdings Ltd. | 1,525,500 | 12,624 |
| Lumentum Holdings Inc.1 | 264,400 | 11,107 |
| Net One Systems Co., Ltd.4 | 623,000 | 10,931 |
| WIN Semiconductors Corp.4 | 2,868,489 | 10,911 |
| DocuSign, Inc.1,2 | 266,067 | 10,664 |
| MACOM Technology Solutions Holdings, Inc.1 | 724,800 | 10,517 |
| Yangtze Optical Fibre and Cable Joint Stock Ltd. Co., Class H2 | 3,786,000 | 10,347 |
| Cognex Corp. | 250,000 | 9,668 |
| Silicon Laboratories Inc.1 | 122,000 | 9,615 |
| Endurance International Group Holdings, Inc.1 | 1,296,000 | 8,618 |
| Carel Industries SpA1,4 | 830,651 | 8,600 |
| Vanguard International Semiconductor Corp.4 | 4,265,000 | 8,159 |
| Avast PLC1 | 2,205,000 | 7,982 |
| Coupa Software Inc.1 | 126,000 | 7,920 |
| Cypress Semiconductor Corp. | 600,000 | 7,632 |
| AAC Technologies Holdings Inc. | 1,305,561 | 7,578 |
| X-FAB Silicon Foundries SE1 | 1,528,947 | 7,463 |
| Faraday Technology Corp.4 | 5,197,000 | 7,084 |
| Maxlinear, Inc.1 | 400,000 | 7,040 |
| Viavi Solutions Inc.1 | 694,000 | 6,975 |
| Kingboard Holdings Ltd. | 2,039,000 | 5,442 |
| InterXion Holding NV, non-registered shares1 | 100,000 | 5,416 |
| Verint Systems Inc.1 | 123,000 | 5,204 |
| j2 Global, Inc. | 70,000 | 4,857 |
| Nuance Communications, Inc.1 | 356,632 | 4,718 |
| SUNeVision Holdings Ltd. | 7,500,000 | 4,444 |
| Instructure, Inc.1 | 106,000 | 3,976 |
| Jenoptik AG4 | 127,500 | 3,328 |
| Megaport Ltd.1 | 1,250,000 | 3,222 |
| Nohmi Bosai Ltd.4 | 184,800 | 3,099 |
| RIB Software SE2,4 | 173,788 | 2,358 |
| MongoDB, Inc., Class A1 | 25,000 | 2,094 |
| AGTech Holdings Ltd.1 | 28,892,000 | 1,789 |
| Okta, Inc., Class A1 | 27,263 | 1,739 |
| Maruwa Co Ltd4 | 33,200 | 1,696 |
| Tenable Holdings, Inc.1 | 72,667 | 1,612 |
| Talend SA (ADR)1,2 | 41,800 | 1,550 |
| Anaplan, Inc.1 | 46,033 | 1,222 |
| Elastic NV, non-registered shares1,2 | 11,400 | 815 |
| 570,338 | ||
| Industrials 14.49% | ||
| International Container Terminal Services, Inc.4 | 22,581,620 | 42,947 |
| Nihon M&A Center Inc.4 | 1,667,392 | 33,670 |
| frontdoor, inc.1 | 903,000 | 24,029 |
| Bravida Holding AB4 | 3,229,000 | 22,319 |
| Curtiss-Wright Corp. | 185,484 | 18,942 |
| Advanced Disposal Services, Inc.1 | 712,501 | 17,057 |
| Rheinmetall AG4 | 185,400 | 16,402 |
| Common stocks (continued) Industrials (continued) | Shares | Value (000) |
| Tomra Systems ASA4 | 726,334 | $16,354 |
| Azul SA, preference shares (ADR)1 | 480,400 | 13,302 |
| Azul SA, preference shares1 | 154,000 | 1,431 |
| Nolato AB, Class B4 | 348,000 | 14,383 |
| Nabtesco Corp.4 | 592,796 | 12,939 |
| Grafton Group PLC, units | 1,557,000 | 12,761 |
| Matson, Inc. | 397,000 | 12,712 |
| Tsubaki Nakashima Co., Ltd.4 | 828,361 | 12,238 |
| Cía. de Distribución Integral Logista Holdings, SA, non-registered shares | 453,000 | 11,346 |
| Marel hf., non-registered shares4 | 3,469,503 | 11,041 |
| NORMA Group SE, non-registered shares4 | 215,718 | 10,677 |
| Johnson Electric Holdings Ltd. | 5,162,000 | 10,521 |
| ManpowerGroup Inc. | 160,000 | 10,368 |
| Amara Raja Batteries Ltd. | 969,766 | 10,319 |
| Havells India Ltd. | 977,874 | 9,686 |
| Meggitt PLC | 1,580,000 | 9,485 |
| BWX Technologies, Inc. | 235,665 | 9,009 |
| Carborundum Universal Ltd. | 1,740,000 | 8,849 |
| Trust Tech Inc.4 | 339,200 | 8,547 |
| Generac Holdings Inc.1 | 168,800 | 8,389 |
| Aalberts Industries NV, non-registered shares | 250,000 | 8,321 |
| Fujitec Co., Ltd.4 | 771,300 | 8,280 |
| Coor Service Management Holding AB4 | 955,000 | 7,585 |
| IMCD NV | 115,000 | 7,379 |
| Greaves Cotton Ltd. | 4,244,540 | 7,207 |
| Nexans SA2 | 257,706 | 7,184 |
| AKR Corporindo Tbk PT4 | 22,895,800 | 6,818 |
| Instalco Intressenter AB (publ)4 | 857,000 | 6,672 |
| Bossard Holding AG4 | 44,100 | 6,263 |
| J. Kumar Infraprojects Ltd. | 2,901,000 | 5,524 |
| Kratos Defense & Security Solutions, Inc.1 | 389,500 | 5,488 |
| Europcar Mobility Group SA | 604,040 | 5,443 |
| Fluidra, SA, non-registered shares1 | 480,060 | 5,385 |
| KeyW Holding Corp.1,2 | 750,000 | 5,017 |
| PayPoint PLC | 476,000 | 4,908 |
| Klingelnberg AG1,4 | 122,000 | 4,796 |
| VAT Group AG4 | 53,700 | 4,713 |
| eHi Car Services Limited (ADR)1,2 | 443,100 | 4,653 |
| Sunny Friend Environmental Technology Co., Ltd.4 | 660,000 | 4,355 |
| Avon Rubber PLC | 270,000 | 4,302 |
| Aerojet Rocketdyne Holdings, Inc.1 | 120,000 | 4,228 |
| Lifco AB, Class B4 | 100,000 | 3,692 |
| Middleby Corp.1 | 31,000 | 3,185 |
| King Slide Works Co., Ltd.4 | 294,000 | 3,058 |
| VARTA AG, non-registered shares1,4 | 97,461 | 2,778 |
| va-Q-tec AG1,2,4 | 239,699 | 1,422 |
| Upwork Inc.1,2 | 68,560 | 1,242 |
| 529,621 | ||
| Consumer discretionary 13.40% | ||
| Five Below, Inc.1 | 423,000 | 43,281 |
| Melco International Development Ltd. | 15,579,000 | 31,753 |
| Mattel, Inc.1,2 | 2,583,800 | 25,812 |
| Domino’s Pizza, Inc. | 100,000 | 24,799 |
| ServiceMaster Global Holdings, Inc.1 | 658,750 | 24,202 |
| Common stocks (continued) Consumer discretionary (continued) | Shares | Value (000) |
| Cedar Fair, LP | 500,000 | $23,650 |
| Hilton Grand Vacations Inc.1 | 851,000 | 22,458 |
| Seria Co., Ltd.4 | 619,426 | 21,039 |
| GVC Holdings PLC | 2,371,000 | 20,369 |
| Vivo Energy PLC | 9,610,000 | 15,311 |
| Grand Canyon Education, Inc.1 | 141,000 | 13,556 |
| Texas Roadhouse, Inc. | 210,000 | 12,537 |
| National Vision Holdings, Inc.1 | 397,500 | 11,198 |
| Xinyi Glass Holdings Ltd. | 9,585,000 | 10,600 |
| Belmond Ltd., Class A1 | 421,000 | 10,538 |
| CVC Brasil Operadora e Agência de Viagens SA, ordinary nominative | 664,000 | 10,481 |
| Vail Resorts, Inc. | 49,673 | 10,472 |
| Brunello Cucinelli SpA4 | 280,865 | 9,673 |
| Casio Computer Co., Ltd.4 | 814,000 | 9,652 |
| Brembo SpA4 | 790,000 | 8,034 |
| zooplus AG, non-registered shares1,4 | 55,600 | 7,578 |
| Melco Resorts & Entertainment Ltd. (ADR) | 425,000 | 7,488 |
| Tongcheng-Elong Holdings Ltd.1 | 4,666,000 | 7,448 |
| Cie. Plastic Omnium SA | 297,000 | 6,864 |
| Zhongsheng Group Holdings Ltd. | 3,419,000 | 6,776 |
| Dine Brands Global, Inc. | 84,920 | 5,719 |
| Paddy Power Betfair PLC | 69,393 | 5,697 |
| Man Wah Holdings Ltd.2 | 14,118,400 | 5,679 |
| Gestamp Automocion SA, non-registered shares2 | 945,000 | 5,381 |
| Thor Industries, Inc. | 103,000 | 5,356 |
| Mercari, Inc.1,4 | 297,691 | 4,981 |
| Shop Apotheke Europe NV, non-registered shares1,4 | 112,000 | 4,831 |
| Cuckoo Homesys Co., Ltd.1,4 | 28,563 | 4,531 |
| Stamps.com Inc.1 | 29,000 | 4,514 |
| Just Eat PLC1 | 575,000 | 4,301 |
| Hyundai Wia Corp.4 | 131,600 | 4,262 |
| William Hill PLC | 2,031,000 | 4,012 |
| Hoteles City Express SAB de CV1 | 3,027,300 | 3,702 |
| Cuckoo Holdings Co., Ltd.4 | 33,836 | 3,593 |
| Cairn Homes PLC1 | 2,869,100 | 3,517 |
| Cox & Kings Ltd. | 1,420,000 | 3,382 |
| ASOS PLC1 | 113,700 | 3,300 |
| ElringKlinger AG2,4 | 379,633 | 2,957 |
| Taiwan Paiho Ltd.4 | 1,804,303 | 2,882 |
| TopBuild Corp.1 | 63,000 | 2,835 |
| Viomi Technology Co., Ltd. (ADR)1,2 | 361,700 | 2,821 |
| Chow Sang Sang Holdings International Ltd. | 1,622,000 | 2,407 |
| WE Solutions Ltd.1 | 36,348,000 | 2,321 |
| POLYTEC Holding AG, non-registered shares2,4 | 81,244 | 780 |
| China Zenix Auto International Ltd. (ADR)1 | 428,500 | 266 |
| 489,596 | ||
| Financials 8.66% | ||
| Kotak Mahindra Bank Ltd. | 3,135,263 | 56,427 |
| Essent Group Ltd.1 | 1,018,841 | 34,824 |
| Trupanion, Inc.1,2 | 1,140,800 | 29,045 |
| Cannae Holdings, Inc.1 | 1,625,000 | 27,820 |
| Bharat Financial Inclusion Ltd.1 | 1,897,444 | 27,523 |
| Webster Financial Corp. | 423,000 | 20,850 |
| Avanza Bank Holding AB2,4 | 413,640 | 19,772 |
| Common stocks (continued) Financials (continued) | Shares | Value (000) |
| NMI Holdings, Inc.1 | 928,075 | $16,566 |
| EFG International AG4 | 2,231,703 | 13,050 |
| Close Brothers Group PLC | 500,000 | 9,177 |
| Shriram Transport Finance Co. Ltd. | 502,000 | 8,916 |
| City Union Bank Ltd. | 2,761,825 | 7,716 |
| Indian Energy Exchange Ltd. | 3,150,000 | 7,481 |
| Fanhua Inc. (ADR)2 | 330,000 | 7,243 |
| HDFC Asset Management Co., Ltd.1 | 314,111 | 6,771 |
| Texas Capital Bancshares, Inc.1 | 110,000 | 5,620 |
| VZ Holding AG4 | 19,766 | 5,328 |
| L&T Finance Holdings Ltd. | 2,184,954 | 4,776 |
| Eagle Bancorp, Inc.1 | 62,000 | 3,020 |
| Bank of Ireland Group PLC | 469,984 | 2,623 |
| BPER Banca SpA4 | 280,377 | 1,078 |
| Bolsa Mexicana de Valores, SAB de CV, Series A | 528,500 | 901 |
| Cox & Kings Financial Service Ltd.1,4,6 | 473,333 | 87 |
| GRUH Finance Ltd. | 2,443 | 11 |
| ICRA Ltd. | 122 | 6 |
| 316,631 | ||
| Materials 3.90% | ||
| Lundin Mining Corp. | 6,820,000 | 28,175 |
| Allegheny Technologies Inc.1 | 1,200,950 | 26,145 |
| Taiyo Nippon Sanso Corp.4 | 782,900 | 12,800 |
| Sirius Minerals PLC1,2 | 44,273,655 | 11,738 |
| Valvoline Inc. | 489,000 | 9,462 |
| PolyOne Corp. | 250,000 | 7,150 |
| SIG Combibloc Group AG1,4 | 639,000 | 6,790 |
| Scapa Group PLC | 1,715,000 | 6,711 |
| Indorama Ventures PCL, foreign registered4 | 3,658,000 | 6,106 |
| CPMC Holdings Ltd.2 | 11,300,000 | 5,426 |
| UPL Ltd. | 460,789 | 5,005 |
| Navin Fluorine International Ltd. | 445,388 | 4,459 |
| Steel Dynamics, Inc. | 148,300 | 4,455 |
| Tokai Carbon Co., Ltd.4 | 312,000 | 3,547 |
| Arkema SA | 27,400 | 2,353 |
| Nevada Copper Corp.1 | 7,120,000 | 2,008 |
| Loma Negra Compania Industrial Argentina SA (ADR)1 | 30,500 | 339 |
| 142,669 | ||
| Consumer staples 3.31% | ||
| Treasury Wine Estates Ltd. | 1,834,975 | 19,129 |
| Varun Beverages Ltd. | 1,544,987 | 17,359 |
| GRUMA, SAB de CV, Series B | 1,162,293 | 13,172 |
| Sligro Food Group NV, non-registered shares | 260,000 | 10,367 |
| Century Pacific Food, Inc.4 | 32,693,000 | 9,449 |
| MTG Co., Ltd.4 | 156,600 | 7,536 |
| BGFretail Co., Ltd.4 | 37,400 | 6,839 |
| Kernel Holding SA4 | 493,041 | 6,458 |
| Emperador Inc.4 | 45,300,000 | 6,130 |
| Philip Morris CR AS4 | 8,362 | 5,242 |
| CCL Products (India) Ltd. | 1,250,000 | 4,823 |
| HITEJINRO Co., Ltd.4 | 305,000 | 4,529 |
| Morinaga & Co., Ltd.4 | 80,000 | 3,451 |
| Common stocks (continued) Consumer staples (continued) | Shares | Value (000) |
| COSMOS Pharmaceutical Corp.4 | 19,500 | $3,257 |
| Chongqing Fuling Zhacai Group Co., Ltd., Class A4 | 999,945 | 3,166 |
| 120,907 | ||
| Communication services 2.54% | ||
| Entertainment One Ltd. | 5,114,389 | 23,246 |
| Care.com, Inc.1 | 914,100 | 17,651 |
| Elang Mahkota Teknologi Tbk PT4 | 13,385,800 | 7,824 |
| Tele Columbus AG1,4 | 2,000,500 | 6,647 |
| TalkTalk Telecom Group PLC2 | 4,380,000 | 6,359 |
| ProSiebenSat.1 Media SE4 | 295,000 | 5,257 |
| Euskaltel, SA, non-registered shares | 630,178 | 5,047 |
| HKBN Ltd. | 3,000,000 | 4,552 |
| YY Inc., Class A (ADR)1 | 76,000 | 4,549 |
| Bandwidth Inc., Class A1 | 100,500 | 4,095 |
| Lions Gate Entertainment Corp., Class A2 | 250,000 | 4,025 |
| Eventbrite, Inc., Class A1,2 | 79,757 | 2,218 |
| Indosat Tbk PT4 | 9,032,600 | 1,059 |
| Tower Bersama Infrastructure Tbk PT4 | 376,400 | 94 |
| 92,623 | ||
| Energy 2.13% | ||
| Venture Global LNG, Inc., Series C1,4,5,6,7 | 2,760 | 16,560 |
| SM Energy Co. | 1,056,000 | 16,347 |
| Saipem SpA, Class S1,4 | 3,216,000 | 11,995 |
| Whitecap Resources Inc. | 3,450,880 | 10,996 |
| Altus Midstream Co., Class A1,5 | 917,000 | 7,089 |
| Altus Midstream Co., Class A1,2 | 100,000 | 773 |
| NuVista Energy Ltd.1 | 1,325,000 | 3,960 |
| Schoeller-Bleckmann Oilfield Equipment AG4 | 59,800 | 3,911 |
| Concho Resources Inc.1 | 35,200 | 3,618 |
| Independence Contract Drilling, Inc.1 | 808,071 | 2,521 |
| 77,770 | ||
| Real estate 2.02% | ||
| WHA Corp. PCL4 | 229,577,250 | 30,221 |
| MGM Growth Properties LLC REIT, Class A | 892,500 | 23,571 |
| KKR Real Estate Finance Trust Inc. REIT | 423,700 | 8,114 |
| DoubleDragon Properties Corp.1,4 | 22,531,700 | 7,644 |
| K. Wah International Holdings Ltd. | 8,789,639 | 4,176 |
| 73,726 | ||
| Utilities 1.66% | ||
| ENN Energy Holdings Ltd. | 4,686,900 | 41,569 |
| REN - Redes Energéticas Nacionais, SGPS, SA, non-registered shares | 5,692,633 | 15,875 |
| EDP - Energias do Brasil SA | 877,900 | 3,341 |
| 60,785 | ||
| Total common stocks (cost: $2,973,377,000) | 3,251,304 |
| Bonds, notes & other debt instruments 0.13% U.S. Treasury bonds & notes 0.13% U.S. Treasury 0.13% | Principal amount (000) | Value (000) |
| U.S. Treasury 1.125% 2019 | $5,000 | $4,989 |
| Total bonds, notes & other debt instruments (cost: $4,991,000) | 4,989 | |
| Short-term securities 12.25% Commercial paper 8.31% | ||
| Canadian Imperial Bank of Commerce 2.56%due 1/15/20195 | 32,000 | 31,967 |
| ExxonMobil Corp. 2.36%due 1/4/2019 | 50,000 | 49,987 |
| Mizuho Bank, Ltd. 2.50%due 2/1/20195 | 62,400 | 62,261 |
| National Australia Bank Ltd. 2.34%due 1/16/20195 | 40,000 | 39,957 |
| Sumitomo Mitsui Banking Corp. 2.57%due 2/15/20195 | 50,000 | 49,837 |
| Swedbank AB 2.60%due 3/15/2019 | 20,000 | 19,894 |
| United Overseas Bank Ltd. 2.71%due 3/4/20195 | 50,000 | 49,764 |
| 303,667 | ||
| Money market investments 1.49% | Shares | |
| Fidelity Institutional Money Market Funds - Government Portfolio8 | 6,646 | 6,647 |
| Goldman Sachs Financial Square Government Fund8 | 16,023 | 16,023 |
| Invesco Short-Term Investments Trust - Government & Agency Portfolio8 | 29,254 | 29,254 |
| Morgan Stanley Institutional Liquidity Funds - Government Portfolio8 | 2,513 | 2,513 |
| 54,437 | ||
| Bonds & notes of governments & government agencies outside the U.S. 1.00% | Principal amount (000) | |
| KfW 2.43%due 1/11/20195 | $28,600 | 28,580 |
| Québec (Province of) 2.52%due 1/22/20195 | 7,900 | 7,888 |
| 36,468 | ||
| Federal agency discount notes 0.82% | ||
| Federal Home Loan Bank 2.29%due 1/10/2019 | 30,000 | 29,984 |
| U.S. Treasury bonds & notes 0.63% | ||
| U.S. Treasury Bills 2.35%due 2/7/2019 | 23,100 | 23,046 |
| Total short-term securities (cost: $447,616,000) | 447,602 | |
| Total investment securities101.35% (cost: $3,425,984,000) | 3,703,895 | |
| Other assets less liabilities (1.35)% | (49,381) | |
| Net assets100.00% | $3,654,514 |
| 1 | Security did not produce income during the last 12 months. |
| 2 | All or a portion of this security was on loan. The total value of all such securities was $67,607,000, which represented 1.85% of the net assets of the fund. |
| 3 | Represents an affiliated company as defined under the Investment Company Act of 1940. |
| 4 | Valued under fair value procedures adopted by authority of the board of trustees. The total value of all such securities was $729,211,000, which represented 19.95% of the net assets of the fund. This amount includes $697,427,000 related to certain securities trading outside the U.S. whose values were adjusted as a result of significant market movements following the close of local trading. |
| 5 | Acquired in a transaction exempt from registration under Rule 144A or Section 4(2) of the Securities Act of 1933. May be resold in the U.S. in transactions exempt from registration, normally to qualified institutional buyers. The total value of all such securities was $309,041,000, which represented 8.46% of the net assets of the fund. |
| 6 | Value determined using significant unobservable inputs. |
| 7 | Acquired through a private placement transaction exempt from registration under the Securities Act of 1933. May be subject to legal or contractual restrictions on resale. Further details on this holding appear below. |
| 8 | Security purchased with cash collateral from securities on loan. |
| Private placement security | Acquisition date | Cost (000) | Value (000) | Percent of net assets |
| Venture Global LNG, Inc., Series C | 5/1/2015 | $8,280 | $16,560 | .45% |
| Key to abbreviation | |
| ADR = American Depositary Receipts |
| Common stocks 91.48% Information technology 21.29% | Shares | Value (000) |
| Microsoft Corp. | 10,468,400 | $1,063,275 |
| Broadcom Inc. | 3,414,000 | 868,112 |
| ASML Holding NV (New York registered) | 1,278,400 | 198,944 |
| ASML Holding NV | 985,000 | 154,794 |
| Visa Inc., Class A | 2,650,400 | 349,694 |
| Taiwan Semiconductor Manufacturing Co., Ltd.1 | 31,814,000 | 231,687 |
| Taiwan Semiconductor Manufacturing Co., Ltd. (ADR) | 2,419,592 | 89,307 |
| ServiceNow, Inc.2 | 1,653,000 | 294,317 |
| Intel Corp. | 4,769,400 | 223,828 |
| Workday, Inc., Class A2 | 1,123,000 | 179,321 |
| Samsung Electronics Co., Ltd.1 | 3,901,400 | 134,758 |
| Paycom Software, Inc.2 | 1,028,500 | 125,940 |
| RingCentral, Inc., Class A2 | 1,433,100 | 118,145 |
| Square, Inc., Class A2 | 1,716,400 | 96,273 |
| Hexagon AB, Class B1 | 1,788,300 | 82,319 |
| Jack Henry & Associates, Inc. | 549,000 | 69,459 |
| Autodesk, Inc.2 | 516,000 | 66,363 |
| Mastercard Inc., Class A | 313,000 | 59,047 |
| Fiserv, Inc.2 | 740,400 | 54,412 |
| FleetCor Technologies, Inc.2 | 271,000 | 50,330 |
| Keyence Corp.1 | 88,000 | 44,653 |
| PayPal Holdings, Inc.2 | 513,000 | 43,138 |
| MongoDB, Inc., Class A2 | 508,521 | 42,583 |
| Analog Devices, Inc. | 490,000 | 42,057 |
| Apple Inc. | 251,500 | 39,672 |
| Amphenol Corp., Class A | 440,000 | 35,649 |
| SK hynix, Inc.1 | 579,000 | 31,448 |
| 2U, Inc.2 | 600,000 | 29,832 |
| Texas Instruments Inc. | 300,500 | 28,397 |
| Alteryx, Inc., Class A2 | 437,213 | 26,001 |
| Global Payments Inc. | 228,100 | 23,524 |
| DocuSign, Inc.2 | 510,000 | 20,441 |
| NetApp, Inc. | 289,900 | 17,298 |
| VeriSign, Inc.2 | 112,000 | 16,608 |
| QUALCOMM Inc. | 208,800 | 11,883 |
| Adobe Inc.2 | 37,300 | 8,439 |
| Intuit Inc. | 42,000 | 8,268 |
| Trimble Inc.2 | 230,400 | 7,582 |
| LiveRamp Holdings, Inc.2 | 79,000 | 3,052 |
| 4,990,850 | ||
| Health care 16.77% | ||
| UnitedHealth Group Inc. | 3,377,000 | 841,278 |
| Regeneron Pharmaceuticals, Inc.2 | 1,341,000 | 500,864 |
| Intuitive Surgical, Inc.2 | 940,500 | 450,424 |
| Humana Inc. | 1,056,200 | 302,580 |
| Common stocks (continued) Health care (continued) | Shares | Value (000) |
| Centene Corp.2 | 2,014,700 | $232,295 |
| Vertex Pharmaceuticals Inc.2 | 1,400,900 | 232,143 |
| Boston Scientific Corp.2 | 4,791,000 | 169,314 |
| Cigna Corp. | 739,902 | 140,522 |
| Thermo Fisher Scientific Inc. | 622,100 | 139,220 |
| Pfizer Inc. | 1,975,000 | 86,209 |
| Hologic, Inc.2 | 2,095,000 | 86,105 |
| ResMed Inc. | 755,000 | 85,972 |
| Johnson & Johnson | 648,100 | 83,637 |
| Merck & Co., Inc. | 930,000 | 71,061 |
| Eli Lilly and Co. | 550,800 | 63,739 |
| CVS Health Corp. | 862,934 | 56,539 |
| DexCom, Inc.2 | 368,900 | 44,194 |
| Biogen Inc.2 | 135,000 | 40,624 |
| Verily Life Sciences LLC1,2,3,4 | 300,178 | 37,000 |
| Bluebird Bio, Inc.2 | 346,600 | 34,383 |
| Teva Pharmaceutical Industries Ltd. (ADR) | 2,053,000 | 31,657 |
| Abbott Laboratories | 375,900 | 27,189 |
| Danaher Corp. | 242,600 | 25,017 |
| Amgen Inc. | 120,000 | 23,360 |
| AstraZeneca PLC | 290,900 | 21,776 |
| Illumina, Inc.2 | 66,600 | 19,975 |
| Neurocrine Biosciences, Inc.2 | 223,800 | 15,982 |
| Incyte Corp.2 | 227,000 | 14,435 |
| Stryker Corp. | 84,000 | 13,167 |
| Seattle Genetics, Inc.2 | 178,500 | 10,114 |
| BioMarin Pharmaceutical Inc.2 | 91,800 | 7,817 |
| Ultragenyx Pharmaceutical Inc.2 | 175,400 | 7,626 |
| Molina Healthcare, Inc.2 | 58,100 | 6,752 |
| Agios Pharmaceuticals, Inc.2 | 132,000 | 6,087 |
| Allogene Therapeutics, Inc.2 | 145,800 | 3,926 |
| 3,932,983 | ||
| Communication services 13.53% | ||
| Facebook, Inc., Class A2 | 7,518,400 | 985,587 |
| Alphabet Inc., Class C2 | 532,700 | 551,670 |
| Alphabet Inc., Class A2 | 157,500 | 164,581 |
| Netflix, Inc.2 | 2,401,060 | 642,668 |
| Charter Communications, Inc., Class A2 | 997,380 | 284,223 |
| Comcast Corp., Class A | 7,616,400 | 259,339 |
| Activision Blizzard, Inc. | 3,895,800 | 181,427 |
| T-Mobile US, Inc.2 | 1,017,000 | 64,691 |
| CBS Corp., Class B | 461,600 | 20,181 |
| Spotify Technology SA2 | 160,000 | 18,160 |
| 3,172,527 | ||
| Consumer discretionary 13.10% | ||
| Amazon.com, Inc.2 | 531,016 | 797,570 |
| Tesla, Inc.2 | 1,813,000 | 603,366 |
| Home Depot, Inc. | 2,568,237 | 441,274 |
| NIKE, Inc., Class B | 2,479,800 | 183,852 |
| Ulta Beauty, Inc.2 | 700,000 | 171,388 |
| LKQ Corp.2 | 3,200,000 | 75,936 |
| MGM Resorts International | 2,435,000 | 59,073 |
| McDonald’s Corp. | 325,000 | 57,710 |
| Common stocks (continued) Consumer discretionary (continued) | Shares | Value (000) |
| Grand Canyon Education, Inc.2 | 500,000 | $48,070 |
| General Motors Co. | 1,250,000 | 41,813 |
| LVMH Moët Hennessy-Louis Vuitton SE | 140,000 | 41,417 |
| Booking Holdings Inc.2 | 24,000 | 41,338 |
| Bright Horizons Family Solutions Inc.2 | 350,000 | 39,008 |
| Hermès International | 69,000 | 38,327 |
| Alibaba Group Holding Ltd. (ADR)2 | 275,000 | 37,694 |
| Restaurant Brands International Inc. | 700,000 | 36,610 |
| Ollie’s Bargain Outlet Holdings, Inc.2 | 500,000 | 33,255 |
| Domino’s Pizza, Inc. | 131,000 | 32,487 |
| Etsy, Inc.2 | 650,000 | 30,921 |
| Norwegian Cruise Line Holdings Ltd.2 | 670,000 | 28,401 |
| Hilton Worldwide Holdings Inc. | 372,200 | 26,724 |
| Marriott International, Inc., Class A | 235,000 | 25,512 |
| Cie. Financière Richemont SA, Class A1 | 395,000 | 25,309 |
| Toll Brothers, Inc. | 737,000 | 24,269 |
| Five Below, Inc.2 | 195,000 | 19,952 |
| Sturm, Ruger & Co., Inc. | 357,788 | 19,041 |
| Paddy Power Betfair PLC | 220,000 | 18,060 |
| ServiceMaster Global Holdings, Inc.2 | 457,000 | 16,790 |
| Wynn Resorts, Ltd. | 141,200 | 13,966 |
| Ross Stores, Inc. | 153,800 | 12,796 |
| YUM! Brands, Inc. | 92,000 | 8,457 |
| Las Vegas Sands Corp. | 152,000 | 7,912 |
| Chipotle Mexican Grill, Inc.2 | 17,400 | 7,513 |
| EssilorLuxottica | 54,800 | 6,935 |
| 3,072,746 | ||
| Financials 9.72% | ||
| Wells Fargo & Co. | 7,294,754 | 336,142 |
| Berkshire Hathaway Inc., Class A2 | 410 | 125,460 |
| Berkshire Hathaway Inc., Class B2 | 413,434 | 84,415 |
| BlackRock, Inc. | 494,000 | 194,053 |
| JPMorgan Chase & Co. | 1,683,000 | 164,294 |
| PNC Financial Services Group, Inc. | 1,133,600 | 132,529 |
| Intercontinental Exchange, Inc. | 1,699,900 | 128,054 |
| Goldman Sachs Group, Inc. | 752,400 | 125,688 |
| Legal & General Group PLC | 40,158,246 | 118,239 |
| Bank of America Corp. | 4,015,000 | 98,930 |
| First Republic Bank | 939,000 | 81,599 |
| CME Group Inc., Class A | 394,400 | 74,195 |
| Onex Corp. | 1,342,800 | 73,130 |
| Moody’s Corp. | 503,000 | 70,440 |
| Capital One Financial Corp. | 911,100 | 68,870 |
| T. Rowe Price Group, Inc. | 627,500 | 57,931 |
| SVB Financial Group2 | 286,700 | 54,450 |
| Oaktree Capital Group, LLC | 1,162,000 | 46,190 |
| Marsh & McLennan Companies, Inc. | 575,000 | 45,856 |
| MarketAxess Holdings Inc. | 180,000 | 38,036 |
| State Street Corp. | 460,900 | 29,069 |
| Chubb Ltd. | 216,000 | 27,903 |
| Fifth Third Bancorp | 980,000 | 23,059 |
| Bank of New York Mellon Corp. | 467,000 | 21,982 |
| Morgan Stanley | 411,000 | 16,296 |
| Nasdaq, Inc. | 198,000 | 16,151 |
| Common stocks (continued) Financials (continued) | Shares | Value (000) |
| Aon PLC, Class A | 110,000 | $15,990 |
| RenaissanceRe Holdings Ltd. | 57,100 | 7,634 |
| London Stock Exchange Group PLC | 66,000 | 3,417 |
| 2,280,002 | ||
| Industrials 5.14% | ||
| TransDigm Group Inc.2 | 717,100 | 243,857 |
| MTU Aero Engines AG1 | 751,103 | 136,234 |
| CSX Corp. | 1,369,700 | 85,099 |
| Boeing Co. | 232,000 | 74,820 |
| Norfolk Southern Corp. | 490,200 | 73,305 |
| Raytheon Co. | 458,025 | 70,238 |
| Northrop Grumman Corp. | 282,500 | 69,184 |
| ASGN Inc.2 | 1,074,125 | 58,540 |
| Grafton Group PLC, units | 5,926,200 | 48,569 |
| Airbus SE, non-registered shares | 462,900 | 44,530 |
| Union Pacific Corp. | 320,000 | 44,234 |
| Safran SA | 339,375 | 40,984 |
| Waste Connections, Inc. | 506,900 | 37,637 |
| Equifax Inc. | 363,900 | 33,890 |
| Parker-Hannifin Corp. | 225,000 | 33,556 |
| Fortive Corp. | 403,000 | 27,267 |
| Westinghouse Air Brake Technologies Corp. | 314,300 | 22,080 |
| Masco Corp. | 722,000 | 21,111 |
| Lockheed Martin Corp. | 80,000 | 20,947 |
| Deere & Co. | 70,100 | 10,457 |
| Spirit Airlines, Inc.2 | 138,200 | 8,005 |
| 1,204,544 | ||
| Energy 5.04% | ||
| Concho Resources Inc.2 | 2,421,560 | 248,912 |
| EOG Resources, Inc. | 2,182,000 | 190,292 |
| Diamondback Energy, Inc. | 1,189,000 | 110,220 |
| Chevron Corp. | 1,000,000 | 108,790 |
| Suncor Energy Inc. | 3,588,116 | 100,216 |
| Halliburton Co. | 3,296,300 | 87,616 |
| Noble Energy, Inc. | 4,449,000 | 83,463 |
| Royal Dutch Shell PLC, Class B (ADR) | 760,100 | 45,560 |
| Royal Dutch Shell PLC, Class B | 632,900 | 18,877 |
| Royal Dutch Shell PLC, Class A (ADR) | 70,279 | 4,095 |
| Cabot Oil & Gas Corp. | 1,850,900 | 41,368 |
| Murphy Oil Corp. | 1,043,200 | 24,400 |
| Enbridge Inc. (CAD denominated) | 722,200 | 22,435 |
| Schlumberger Ltd. | 607,800 | 21,929 |
| Pioneer Natural Resources Co. | 111,500 | 14,665 |
| Peyto Exploration & Development Corp. | 2,344,000 | 12,156 |
| Centennial Resource Development, Inc., Class A2 | 901,500 | 9,935 |
| Parsley Energy, Inc., Class A2 | 567,000 | 9,061 |
| Seven Generations Energy Ltd., Class A2 | 1,060,000 | 8,650 |
| Canadian Natural Resources, Ltd. (CAD denominated) | 329,100 | 7,941 |
| Williams Companies, Inc. | 329,000 | 7,254 |
| Ensco PLC, Class A | 1,151,800 | 4,100 |
| 1,181,935 |
| Common stocks (continued) Materials 2.68% | Shares | Value (000) |
| Linde PLC | 705,000 | $110,008 |
| Sherwin-Williams Co. | 255,600 | 100,568 |
| Alcoa Corp.2 | 2,520,200 | 66,987 |
| DowDuPont Inc. | 1,149,510 | 61,476 |
| Goldcorp Inc. | 5,095,000 | 49,931 |
| Randgold Resources Ltd. (ADR)1 | 580,000 | 49,685 |
| Franco-Nevada Corp. | 660,270 | 46,299 |
| LyondellBasell Industries NV | 451,000 | 37,505 |
| Norsk Hydro ASA1 | 7,388,468 | 33,575 |
| Grupo México, SAB de CV, Series B | 13,785,000 | 28,367 |
| Celanese Corp. | 287,300 | 25,849 |
| Vale SA, ordinary nominative (ADR) | 1,425,500 | 18,802 |
| 629,052 | ||
| Consumer staples 2.22% | ||
| Costco Wholesale Corp. | 627,500 | 127,828 |
| Kerry Group PLC, Class A | 1,100,000 | 109,018 |
| Philip Morris International Inc. | 924,000 | 61,686 |
| Altria Group, Inc. | 1,175,700 | 58,068 |
| British American Tobacco PLC | 1,563,800 | 49,831 |
| Coca-Cola Co. | 525,000 | 24,859 |
| Coca-Cola European Partners PLC | 540,000 | 24,759 |
| Constellation Brands, Inc., Class A | 145,000 | 23,319 |
| Walgreens Boots Alliance, Inc. | 285,500 | 19,508 |
| Mondelez International, Inc. | 395,000 | 15,812 |
| Church & Dwight Co., Inc. | 69,800 | 4,590 |
| 519,278 | ||
| Real estate 1.59% | ||
| Equinix, Inc. REIT | 433,500 | 152,835 |
| American Tower Corp. REIT | 600,400 | 94,977 |
| Iron Mountain Inc. REIT | 2,000,000 | 64,820 |
| Crown Castle International Corp. REIT | 303,900 | 33,012 |
| Digital Realty Trust, Inc. REIT | 245,000 | 26,105 |
| 371,749 | ||
| Utilities 0.40% | ||
| Exelon Corp. | 1,705,000 | 76,896 |
| Public Service Enterprise Group Inc. | 334,200 | 17,395 |
| 94,291 | ||
| Total common stocks (cost: $14,970,485,000) | 21,449,957 | |
| Convertible stocks 0.06% Consumer discretionary 0.06% | ||
| Uber Technologies, Inc., Series F, noncumulative convertible preferred1,3,4 | 268,677 | 13,104 |
| Total convertible stocks (cost: $10,650,000) | 13,104 | |
| Short-term securities 8.29% | Principal amount (000) | |
| Apple Inc. 2.41%due 1/24/20195 | $106,100 | 105,923 |
| Coca-Cola Co. 2.30%–2.40%due 1/4/2019–1/25/20195 | 92,400 | 92,312 |
| Emerson Electric Co. 2.40%due 1/9/20195 | 15,000 | 14,991 |
| Short-term securities (continued) | Principal amount (000) | Value (000) |
| Fannie Mae 2.23%due 1/7/2019 | $31,200 | $31,190 |
| Federal Home Loan Bank 2.22%–2.39%due 1/7/2019–2/21/2019 | 728,800 | 727,650 |
| Freddie Mac 2.27%due 1/18/2019 | 25,000 | 24,973 |
| IBM Credit LLC 2.42%due 1/16/20195 | 100,000 | 99,892 |
| Merck & Co. Inc. 2.46%–2.48%due 2/4/2019–2/19/20195 | 83,000 | 82,747 |
| National Rural Utilities Cooperative Finance Corp. 2.52%due 2/7/2019 | 46,500 | 46,376 |
| Pfizer Inc. 2.31%due 1/15/20195 | 31,800 | 31,767 |
| U.S. Treasury Bills 2.16%–2.43%due 1/2/2019–5/2/2019 | 689,200 | 686,594 |
| Total short-term securities (cost: $1,944,441,000) | 1,944,415 | |
| Total investment securities99.83% (cost: $16,925,576,000) | 23,407,476 | |
| Other assets less liabilities 0.17% | 40,385 | |
| Net assets100.00% | $23,447,861 |
| 1 | Valued under fair value procedures adopted by authority of the board of trustees. The total value of all such securities was $819,772,000, which represented 3.50% of the net assets of the fund. This amount includes $719,983,000 related to certain securities trading outside the U.S. whose values were adjusted as a result of significant market movements following the close of local trading. |
| 2 | Security did not produce income during the last 12 months. |
| 3 | Value determined using significant unobservable inputs. |
| 4 | Acquired through a private placement transaction exempt from registration under the Securities Act of 1933. May be subject to legal or contractual restrictions on resale. Further details on these holdings appear below. |
| 5 | Acquired in a transaction exempt from registration under Rule 144A or Section 4(2) of the Securities Act of 1933. May be resold in the U.S. in transactions exempt from registration, normally to qualified institutional buyers. The total value of all such securities was $427,632,000, which represented 1.82% of the net assets of the fund. |
| Private placement securities | Acquisition date | Cost (000) | Value (000) | Percent of net assets |
| Verily Life Sciences LLC | 12/21/2018 | $37,000 | $37,000 | .16% |
| Uber Technologies, Inc., Series F, noncumulative convertible preferred | 5/22/2015 | 10,650 | 13,104 | .05 |
| Total private placement securities | $ 47,650 | $ 50,104 | .21% |
| Key to abbreviations |
| ADR = American Depositary Receipts |
| CAD = Canadian dollars |
| Common stocks 88.00% Financials 15.22% | Shares | Value (000) |
| AIA Group Ltd. | 40,985,700 | $340,217 |
| HDFC Bank Ltd. | 7,804,100 | 237,169 |
| HDFC Bank Ltd. (ADR) | 498,647 | 51,655 |
| Kotak Mahindra Bank Ltd. | 6,186,048 | 111,334 |
| Axis Bank Ltd.1 | 7,399,300 | 65,700 |
| Axis Bank Ltd.1,2,3,4 | 3,222,055 | 26,034 |
| Prudential PLC | 3,810,265 | 68,089 |
| Credit Suisse Group AG2 | 5,523,789 | 60,403 |
| BNP Paribas SA | 1,037,058 | 46,905 |
| Barclays PLC | 24,303,805 | 46,627 |
| China Construction Bank Corp., Class H | 40,808,000 | 33,666 |
| Sberbank of Russia PJSC (ADR) | 2,593,300 | 28,423 |
| HSBC Holdings PLC (HKD denominated) | 3,157,616 | 26,130 |
| Banco Santander, SA | 5,205,000 | 23,693 |
| UBS Group AG2 | 1,827,927 | 22,761 |
| Metropolitan Bank & Trust Co.2 | 13,415,804 | 20,681 |
| Hana Financial Group Inc.2 | 534,000 | 17,383 |
| Bank of China Ltd., Class H | 35,810,000 | 15,457 |
| Itaú Unibanco Holding SA, preferred nominative (ADR) | 1,575,000 | 14,395 |
| KB Financial Group Inc.2 | 272,000 | 11,382 |
| London Stock Exchange Group PLC | 217,000 | 11,235 |
| Intesa Sanpaolo SpA2 | 4,735,000 | 10,528 |
| UniCredit SpA2 | 927,000 | 10,475 |
| RSA Insurance Group PLC | 1,542,100 | 10,095 |
| PICC Property and Casualty Co. Ltd., Class H | 9,250,000 | 9,462 |
| Royal Bank of Canada | 135,000 | 9,240 |
| FinecoBank SpA2 | 850,000 | 8,527 |
| Société Générale | 245,575 | 7,828 |
| Bharat Financial Inclusion Ltd.1 | 513,464 | 7,448 |
| Hiscox Ltd. | 272,000 | 5,620 |
| St. James’s Place PLC | 390,000 | 4,693 |
| Türkiye Garanti Bankasi AS | 2,690,000 | 4,046 |
| Akbank TAS | 2,900,000 | 3,759 |
| Unione di Banche Italiane SpA2 | 193,524 | 560 |
| 1,371,620 | ||
| Industrials 13.93% | ||
| Airbus SE, non-registered shares | 2,926,849 | 281,555 |
| Yamato Holdings Co., Ltd.2 | 4,239,395 | 116,573 |
| Rolls-Royce Holdings PLC1 | 10,833,188 | 114,606 |
| Adani Ports & Special Economic Zone Ltd. | 14,643,483 | 81,319 |
| SMC Corp.2 | 266,100 | 80,325 |
| Ryanair Holdings PLC (ADR)1 | 991,700 | 70,748 |
| Melrose Industries PLC | 33,132,733 | 69,196 |
| Safran SA | 549,000 | 66,298 |
| Komatsu Ltd.2 | 2,435,500 | 52,340 |
| Common stocks (continued) Industrials (continued) | Shares | Value (000) |
| Jardine Matheson Holdings Ltd. | 646,600 | $44,990 |
| Nidec Corp.2 | 377,200 | 42,780 |
| Airports of Thailand PCL, foreign registered2 | 18,157,000 | 35,735 |
| Recruit Holdings Co., Ltd.2 | 1,405,300 | 33,990 |
| Thales | 276,000 | 32,255 |
| Eiffage SA | 326,000 | 27,252 |
| International Container Terminal Services, Inc.2 | 12,890,350 | 24,516 |
| Knorr-Bremse AG, non-registered shares1,2 | 236,105 | 21,226 |
| Rheinmetall AG2 | 174,400 | 15,429 |
| Shanghai International Airport Co., Ltd., Class A2 | 1,840,685 | 13,670 |
| Babcock International Group PLC | 1,574,000 | 9,816 |
| Geberit AG2 | 16,800 | 6,533 |
| Kawasaki Heavy Industries, Ltd.2 | 300,000 | 6,421 |
| Alliance Global Group, Inc.2 | 20,000,000 | 4,525 |
| BAE Systems PLC | 555,300 | 3,250 |
| 1,255,348 | ||
| Health care 12.21% | ||
| Novartis AG2 | 3,279,000 | 280,111 |
| Shire PLC | 3,360,150 | 195,726 |
| Teva Pharmaceutical Industries Ltd. (ADR) | 7,166,598 | 110,509 |
| Grifols, SA, Class B, preferred nonvoting, non-registered shares | 3,026,230 | 55,962 |
| Grifols, SA, Class A, non-registered shares | 881,000 | 23,116 |
| Grifols, SA, Class B (ADR) | 793,690 | 14,572 |
| Fresenius SE & Co. KGaA2 | 1,819,000 | 88,503 |
| Chugai Pharmaceutical Co., Ltd.2 | 1,434,500 | 83,302 |
| Daiichi Sankyo Co., Ltd.2 | 2,160,000 | 69,011 |
| Hikma Pharmaceuticals PLC | 2,761,980 | 60,410 |
| Merck KGaA2 | 420,900 | 43,382 |
| Takeda Pharmaceutical Co. Ltd.2 | 966,000 | 32,599 |
| Fresenius Medical Care AG & Co. KGaA2 | 351,000 | 22,832 |
| Sysmex Corp.2 | 230,700 | 11,089 |
| Aier Eye Hospital Group Co., Ltd., Class A2 | 2,350,700 | 9,052 |
| 1,100,176 | ||
| Consumer discretionary 10.25% | ||
| Alibaba Group Holding Ltd. (ADR)1 | 1,104,000 | 151,325 |
| Galaxy Entertainment Group Ltd. | 18,284,000 | 116,282 |
| Kering SA | 176,551 | 83,260 |
| Hyundai Motor Co.2 | 682,393 | 72,333 |
| Industria de Diseño Textil, SA | 2,566,027 | 65,710 |
| Ryohin Keikaku Co., Ltd.2 | 248,400 | 59,976 |
| EssilorLuxottica | 399,340 | 50,536 |
| Sands China Ltd. | 11,098,000 | 48,613 |
| Melco Resorts & Entertainment Ltd. (ADR) | 2,152,400 | 37,925 |
| Nitori Holdings Co., Ltd.2 | 281,600 | 35,185 |
| Meituan Dianping, Class B1 | 5,258,200 | 29,479 |
| Merlin Entertainments PLC | 5,390,000 | 21,812 |
| Toyota Motor Corp.2 | 316,300 | 18,515 |
| LVMH Moët Hennessy-Louis Vuitton SE | 57,050 | 16,877 |
| Sony Corp.2 | 329,500 | 15,939 |
| MercadoLibre, Inc. | 53,000 | 15,521 |
| Kingfisher PLC | 5,851,000 | 15,475 |
| William Hill PLC | 6,980,000 | 13,790 |
| Ctrip.com International, Ltd. (ADR)1 | 393,400 | 10,645 |
| Common stocks (continued) Consumer discretionary (continued) | Shares | Value (000) |
| Midea Group Co., Ltd., Class A2 | 1,907,940 | $10,302 |
| Li & Fung Ltd. | 60,242,000 | 9,463 |
| Hyundai Mobis Co., Ltd.2 | 48,600 | 8,305 |
| Just Eat PLC1 | 1,039,000 | 7,771 |
| Petrobras Distribuidora S.A. | 658,000 | 4,363 |
| Global Brands Group Holding Ltd.1 | 83,074,000 | 3,766 |
| 923,168 | ||
| Consumer staples 6.67% | ||
| Pernod Ricard SA | 929,337 | 152,584 |
| Nestlé SA2 | 1,003,500 | 81,454 |
| Kirin Holdings Co., Ltd.2 | 3,139,000 | 65,793 |
| British American Tobacco PLC | 1,862,200 | 59,339 |
| Meiji Holdings Co., Ltd.2 | 479,200 | 39,156 |
| Thai Beverage PCL | 79,160,000 | 35,429 |
| Treasury Wine Estates Ltd. | 3,244,300 | 33,820 |
| Philip Morris International Inc. | 363,694 | 24,280 |
| Imperial Brands PLC | 760,000 | 23,026 |
| JBS SA, ordinary nominative | 7,072,000 | 21,148 |
| LG Household & Health Care Ltd.2 | 19,000 | 18,742 |
| Glanbia PLC | 750,000 | 14,093 |
| Kao Corp.2 | 184,000 | 13,655 |
| Wal-Mart de México, SAB de CV, Series V | 4,463,900 | 11,351 |
| KOSÉ Corp.2 | 48,000 | 7,550 |
| 601,420 | ||
| Communication services 6.52% | ||
| Tencent Holdings Ltd. | 4,992,087 | 200,181 |
| SoftBank Group Corp.2 | 1,283,900 | 85,443 |
| Nintendo Co., Ltd.2 | 216,239 | 57,577 |
| Altice USA, Inc., Class A | 3,195,600 | 52,791 |
| Nippon Telegraph and Telephone Corp.2 | 883,500 | 36,106 |
| Altice Europe NV, Class A1 | 16,758,527 | 32,623 |
| Altice Europe NV, Class B1 | 1,077,927 | 2,099 |
| Naspers Ltd., Class N | 133,200 | 26,777 |
| BT Group PLC | 7,523,000 | 22,831 |
| United Internet AG2 | 444,983 | 19,476 |
| ITV PLC | 8,441,291 | 13,433 |
| América Móvil, SAB de CV, Series L (ADR) | 667,857 | 9,517 |
| América Móvil, SAB de CV, Series L | 2,139,900 | 1,521 |
| TalkTalk Telecom Group PLC | 5,624,000 | 8,165 |
| Intouch Holdings PCL, foreign registered2 | 4,631,000 | 6,779 |
| ProSiebenSat.1 Media SE2 | 368,600 | 6,569 |
| LG Uplus Corp.2 | 334,216 | 5,285 |
| 587,173 | ||
| Information technology 5.65% | ||
| Samsung Electronics Co., Ltd.2 | 4,945,950 | 170,838 |
| ASML Holding NV | 507,174 | 79,703 |
| Worldpay, Inc., Class A (GBP denominated)1 | 512,797 | 39,543 |
| Keyence Corp.2 | 65,900 | 33,439 |
| SK hynix, Inc.2 | 536,000 | 29,113 |
| Tokyo Electron Ltd.2 | 212,200 | 24,198 |
| Hamamatsu Photonics KK2 | 702,688 | 23,696 |
| Lenovo Group Ltd. | 35,002,000 | 23,646 |
| Common stocks (continued) Information technology (continued) | Shares | Value (000) |
| PagSeguro Digital Ltd., Class A1 | 1,150,000 | $21,540 |
| Taiwan Semiconductor Manufacturing Co., Ltd.2 | 2,640,000 | 19,226 |
| Murata Manufacturing Co., Ltd.2 | 124,000 | 16,810 |
| Xiaomi Corp., Class B1 | 9,538,400 | 15,738 |
| United Microelectronics Corp.2 | 19,000,000 | 6,914 |
| AAC Technologies Holdings Inc. | 825,246 | 4,790 |
| 509,194 | ||
| Materials 5.65% | ||
| Asahi Kasei Corp.2 | 11,328,780 | 116,444 |
| Vale SA, ordinary nominative (ADR) | 6,875,266 | 90,685 |
| Vale SA, ordinary nominative | 102,481 | 1,348 |
| Teck Resources Ltd., Class B | 3,152,000 | 67,856 |
| Glencore PLC | 14,640,827 | 54,370 |
| First Quantum Minerals Ltd. | 5,407,000 | 43,725 |
| ArcelorMittal SA | 1,582,000 | 32,880 |
| Linde PLC2 | 146,300 | 23,224 |
| CRH PLC | 532,291 | 14,088 |
| BASF SE2 | 160,500 | 11,118 |
| Akzo Nobel NV | 133,401 | 10,760 |
| Fortescue Metals Group Ltd. | 2,860,000 | 8,441 |
| LafargeHolcim Ltd.2 | 196,000 | 8,073 |
| Grasim Industries Ltd. | 617,928 | 7,307 |
| Hindalco Industries Ltd. | 2,167,000 | 7,021 |
| Evonik Industries AG2 | 268,010 | 6,702 |
| Aluminum Corp. of China Ltd., Class H1 | 15,036,000 | 4,839 |
| 508,881 | ||
| Utilities 5.31% | ||
| ENN Energy Holdings Ltd. | 14,004,000 | 124,204 |
| China Gas Holdings Ltd. | 24,134,000 | 85,989 |
| Ørsted AS2 | 1,235,208 | 82,426 |
| ENGIE SA | 2,775,757 | 39,833 |
| ENGIE SA, bonus shares2 | 302,758 | 4,345 |
| China Resources Gas Group Ltd. | 9,516,000 | 37,673 |
| Naturgy Energy Group, SA | 1,382,000 | 35,247 |
| Suez | 2,480,000 | 32,762 |
| SSE PLC | 1,475,155 | 20,335 |
| E.ON SE2 | 1,549,000 | 15,300 |
| 478,114 | ||
| Energy 4.58% | ||
| Royal Dutch Shell PLC, Class B | 3,191,000 | 95,174 |
| Royal Dutch Shell PLC, Class A | 1,440,256 | 42,360 |
| Oil Search Ltd. | 8,643,000 | 43,588 |
| Suncor Energy Inc. | 1,433,000 | 40,024 |
| TOTAL SA | 751,031 | 39,738 |
| Canadian Natural Resources, Ltd. (CAD denominated) | 1,380,000 | 33,297 |
| Reliance Industries Ltd. | 2,023,000 | 32,490 |
| Cenovus Energy Inc. | 3,412,000 | 23,993 |
| Enbridge Inc. (CAD denominated) | 460,595 | 14,308 |
| Enbridge Inc. (CAD denominated)4 | 160,859 | 4,997 |
| BP PLC | 2,728,761 | 17,249 |
| Saipem SpA, Class S1,2 | 4,409,000 | 16,445 |
| Common stocks (continued) Energy (continued) | Shares | Value (000) |
| Petróleo Brasileiro SA (Petrobras), preferred nominative (ADR) | 472,400 | $5,475 |
| Ultrapar Participacoes SA, ordinary nominative | 230,600 | 3,165 |
| 412,303 | ||
| Real estate 2.01% | ||
| China Overseas Land & Investment Ltd. | 19,930,217 | 68,466 |
| Ayala Land, Inc.2 | 58,363,700 | 45,046 |
| Sun Hung Kai Properties Ltd. | 2,951,666 | 42,067 |
| China Resources Land Ltd. | 3,930,000 | 15,106 |
| CK Asset Holdings Ltd. | 1,442,000 | 10,552 |
| 181,237 | ||
| Total common stocks (cost: $7,462,877,000) | 7,928,634 | |
| Rights & warrants 0.14% Financials 0.07% | ||
| Axis Bank Ltd., warrants, expire 20191,2 | 2,466,000 | 6,664 |
| Real estate 0.07% | ||
| Vinhomes JSC, warrants, expire 20191,2 | 2,008,487 | 6,382 |
| Total rights & warrants (cost: $13,714,000) | 13,046 | |
| Bonds, notes & other debt instruments 0.87% Corporate bonds & notes 0.50% Materials 0.31% | Principal amount (000) | |
| First Quantum Minerals Ltd. 7.00% 20214 | $3,725 | 3,583 |
| First Quantum Minerals Ltd. 7.25% 20224 | 25,720 | 23,951 |
| 27,534 | ||
| Financials 0.10% | ||
| Turkiye Garanti Bankasi AS 5.875% 2023 | 1,700 | 1,610 |
| Turkiye Garanti Bankasi AS 6.125% 20275 | 9,000 | 7,755 |
| 9,365 | ||
| Consumer staples 0.09% | ||
| JBS ESAL LLC 6.25% 2023 | 6,155 | 6,124 |
| JBS SA 7.25% 2024 | 1,845 | 1,867 |
| 7,991 | ||
| Total corporate bonds & notes | 44,890 | |
| Bonds & notes of governments & government agencies outside the U.S. 0.37% | ||
| Brazil (Federative Republic of) 0% 2021 | BRL42,802 | 9,171 |
| Brazil (Federative Republic of) 0% 2022 | 4,000 | 818 |
| Brazil (Federative Republic of) 10.00% 2027 | 8,345 | 2,255 |
| Turkey (Republic of) 7.10% 2023 | TRY71,125 | 9,434 |
| Turkey (Republic of) 9.00% 2024 | 9,100 | 1,250 |
| United Mexican States, Series M, 8.00% 2023 | MXN203,000 | 10,090 |
| 33,018 | ||
| Total bonds, notes & other debt instruments (cost: $70,215,000) | 77,908 |
| Short-term securities 10.84% | Principal amount (000) | Value (000) |
| American Honda Finance Corp. 2.58%due 2/19/2019 | $50,000 | $49,820 |
| BASF SE 2.50%due 1/11/20194 | 30,000 | 29,978 |
| British Columbia (Province of) 2.48%due 1/28/2019 | 35,000 | 34,932 |
| Canadian Imperial Bank of Commerce 2.31%–2.50%due 1/22/2019–1/25/20194 | 100,000 | 99,839 |
| Federal Home Loan Bank 2.15%–2.41%due 1/2/2019–3/21/2019 | 314,475 | 313,688 |
| KfW 2.51%due 2/13/20194 | 25,000 | 24,922 |
| Mizuho Bank, Ltd. 2.61%due 2/25/20194 | 75,000 | 74,694 |
| Nestle Capital Corp. 2.68%due 3/19/20194 | 20,000 | 19,889 |
| Nordea Bank AB 2.78%due 3/18/20194 | 25,000 | 24,855 |
| Siemens Capital Co. LLC 2.50%due 2/19/20194 | 55,000 | 54,808 |
| Starbird Funding Corp. 2.42%due 1/2/2019–1/9/20194 | 35,000 | 34,984 |
| Toronto-Dominion Bank 2.50%due 1/7/20194 | 20,000 | 19,991 |
| Total Capital Canada Ltd. 2.51%due 2/1/20194 | 20,000 | 19,954 |
| Toyota Motor Credit Corp. 2.55%due 2/1/2019 | 50,000 | 49,891 |
| U.S. Treasury Bill 2.38%due 2/19/2019 | 125,000 | 124,608 |
| Total short-term securities (cost: $976,875,000) | 976,853 | |
| Total investment securities99.85% (cost: $8,523,681,000) | 8,996,441 | |
| Other assets less liabilities 0.15% | 13,669 | |
| Net assets100.00% | $9,010,110 |
| Contract amount | Counterparty | Settlement date | Unrealized depreciation at 12/31/2018 (000) | |
| Purchases (000) | Sales (000) | |||
| USD39,858 | INR2,825,000 | Goldman Sachs | 1/17/2019 | $(525) |
| 1 | Security did not produce income during the last 12 months. |
| 2 | Valued under fair value procedures adopted by authority of the board of trustees. The total value of all such securities was $2,613,221,000, which represented 29.00% of the net assets of the fund. This amount includes $2,569,796,000 related to certain securities trading outside the U.S. whose values were adjusted as a result of significant market movements following the close of local trading. |
| 3 | Acquired through a private placement transaction exempt from registration under the Securities Act of 1933. May be subject to legal or contractual restrictions on resale. Further details on this holding appear below. |
| 4 | Acquired in a transaction exempt from registration under Rule 144A or Section 4(2) of the Securities Act of 1933. May be resold in the U.S. in transactions exempt from registration, normally to qualified institutional buyers. The total value of all such securities was $462,479,000, which represented 5.13% of the net assets of the fund. |
| 5 | Step bond; coupon rate may change at a later date. |
| Private placement security | Acquisition date | Cost (000) | Value (000) | Percent of net assets |
| Axis Bank Ltd. | 11/14/2017 | $17,232 | $26,034 | .29% |
| Key to abbreviations and symbol | ||
| ADR = American Depositary Receipts | GBP = British pounds | MXN = Mexican pesos |
| BRL = Brazilian reais | HKD = Hong Kong dollars | TRY = Turkish lira |
| CAD = Canadian dollars | INR = Indian rupees | USD/$ = U.S. dollars |
| Common stocks 79.74% Information technology 16.77% | Shares | Value (000) |
| Taiwan Semiconductor Manufacturing Co., Ltd.1 | 9,901,000 | $72,104 |
| Taiwan Semiconductor Manufacturing Co., Ltd. (ADR) | 400,000 | 14,764 |
| PagSeguro Digital Ltd., Class A2 | 2,813,223 | 52,692 |
| Broadcom Inc. | 167,150 | 42,503 |
| Temenos AG1 | 204,800 | 24,564 |
| Microsoft Corp. | 232,100 | 23,574 |
| StoneCo Ltd., Class A2 | 1,275,126 | 23,513 |
| Kingdee International Software Group Co. Ltd. | 22,463,000 | 19,851 |
| Keyence Corp.1 | 38,300 | 19,434 |
| EPAM Systems, Inc.2 | 167,200 | 19,397 |
| Samsung Electronics Co., Ltd.1 | 430,000 | 14,853 |
| Samsung Electronics Co., Ltd., nonvoting preferred1 | 149,500 | 4,238 |
| Visa Inc., Class A | 132,000 | 17,416 |
| Murata Manufacturing Co., Ltd.1 | 123,800 | 16,783 |
| Mastercard Inc., Class A | 85,500 | 16,129 |
| Amphenol Corp., Class A | 190,000 | 15,394 |
| Amadeus IT Group SA, Class A, non-registered shares | 191,300 | 13,335 |
| Infineon Technologies AG1 | 493,600 | 9,821 |
| TravelSky Technology Ltd., Class H | 3,818,448 | 9,777 |
| AAC Technologies Holdings Inc. | 1,628,100 | 9,450 |
| Largan Precision Co., Ltd.1 | 73,000 | 7,608 |
| Halma PLC | 357,600 | 6,217 |
| ASML Holding NV | 38,400 | 6,035 |
| Globant SA2 | 105,000 | 5,914 |
| Hexagon AB, Class B1 | 124,840 | 5,747 |
| NVIDIA Corp. | 42,000 | 5,607 |
| Acacia Communications, Inc.2 | 138,000 | 5,244 |
| Sunny Optical Technology (Group) Co., Ltd. | 469,000 | 4,169 |
| VeriSign, Inc.2 | 18,000 | 2,669 |
| Intel Corp. | 56,460 | 2,650 |
| Tokyo Electron Ltd.1 | 21,000 | 2,395 |
| Mellanox Technologies, Ltd.2 | 24,000 | 2,217 |
| Western Union Co. | 124,000 | 2,115 |
| Inphi Corp.2 | 65,000 | 2,090 |
| TE Connectivity Ltd. | 27,500 | 2,080 |
| Xiaomi Corp., Class B2 | 898,000 | 1,482 |
| Renesas Electronics Corp.1,2 | 259,000 | 1,184 |
| 505,015 | ||
| Financials 10.94% | ||
| HDFC Bank Ltd. | 2,688,876 | 81,716 |
| AIA Group Ltd. | 6,477,600 | 53,770 |
| B3 SA - Brasil, Bolsa, Balcao | 6,435,200 | 44,515 |
| IndusInd Bank Ltd. | 906,300 | 20,761 |
| Shriram Transport Finance Co. Ltd. | 1,150,000 | 20,425 |
| Sberbank of Russia PJSC (ADR) | 1,551,500 | 17,004 |
| Common stocks (continued) Financials (continued) | Shares | Value (000) |
| Kotak Mahindra Bank Ltd. | 820,842 | $14,773 |
| Bank Central Asia Tbk PT1 | 5,704,000 | 10,292 |
| Credicorp Ltd. | 44,900 | 9,953 |
| Capitec Bank Holdings Ltd. | 127,876 | 9,937 |
| PICC Property and Casualty Co. Ltd., Class H | 8,320,000 | 8,511 |
| Vietnam Technological and Commercial Joint-stock Bank (The)1,2 | 5,805,516 | 6,971 |
| Grupo Financiero Galicia SA, Class B (ADR) | 235,000 | 6,479 |
| China Construction Bank Corp., Class H | 4,281,535 | 3,532 |
| Prudential PLC | 197,000 | 3,520 |
| Bank of China Ltd., Class H | 6,952,000 | 3,001 |
| Metropolitan Bank & Trust Co.1 | 1,797,000 | 2,770 |
| Türkiye Garanti Bankasi AS | 1,570,000 | 2,361 |
| Akbank TAS | 1,700,000 | 2,204 |
| Agricultural Bank of China Ltd., Class H | 3,992,000 | 1,749 |
| Ayala Corp.1 | 89,000 | 1,524 |
| Bharat Financial Inclusion Ltd.2 | 98,544 | 1,429 |
| UniCredit SpA1 | 112,637 | 1,273 |
| Moscow Exchange MICEX-RTS PJSC1 | 783,000 | 910 |
| 329,380 | ||
| Energy 9.73% | ||
| Reliance Industries Ltd. | 11,548,513 | 185,473 |
| Royal Dutch Shell PLC, Class B | 1,284,000 | 38,296 |
| Royal Dutch Shell PLC, Class A | 68,628 | 2,019 |
| LUKOIL Oil Co. PJSC (ADR) | 303,000 | 21,658 |
| Novatek PJSC (GDR) | 55,000 | 9,405 |
| Ultrapar Participacoes SA, ordinary nominative | 595,500 | 8,174 |
| CNOOC Ltd. | 4,303,000 | 6,649 |
| Occidental Petroleum Corp. | 87,000 | 5,340 |
| China Petroleum & Chemical Corp., Class H | 6,830,000 | 4,876 |
| Baker Hughes, a GE Co., Class A | 190,000 | 4,085 |
| Exxon Mobil Corp. | 32,000 | 2,182 |
| Noble Energy, Inc. | 82,000 | 1,538 |
| Oil Search Ltd. | 251,000 | 1,266 |
| TOTAL SA | 20,000 | 1,058 |
| Chevron Corp. | 8,000 | 870 |
| 292,889 | ||
| Consumer discretionary 9.40% | ||
| Alibaba Group Holding Ltd. (ADR)2 | 386,237 | 52,941 |
| Sony Corp.1 | 767,000 | 37,102 |
| General Motors Co. | 542,000 | 18,130 |
| Melco Resorts & Entertainment Ltd. (ADR) | 931,500 | 16,413 |
| MakeMyTrip Ltd., non-registered shares2 | 672,500 | 16,362 |
| Marriott International, Inc., Class A | 144,800 | 15,719 |
| Galaxy Entertainment Group Ltd. | 2,395,000 | 15,232 |
| Maruti Suzuki India Ltd. | 132,500 | 14,169 |
| Domino’s Pizza, Inc. | 42,100 | 10,440 |
| Volkswagen AG, nonvoting preferred1 | 63,000 | 10,029 |
| Meituan Dianping, Class B2 | 1,322,800 | 7,416 |
| Meituan Dianping, Class B1,2,3 | 239,754 | 1,183 |
| Ferrari NV1 | 81,300 | 8,088 |
| Hermès International | 11,700 | 6,499 |
| Booking Holdings Inc.2 | 3,320 | 5,718 |
| Pinduoduo Inc. (ADR)2 | 212,600 | 4,771 |
| Common stocks (continued) Consumer discretionary (continued) | Shares | Value (000) |
| NIKE, Inc., Class B | 54,000 | $4,004 |
| Samsonite International SA | 1,221,000 | 3,469 |
| Kering SA | 6,700 | 3,160 |
| LVMH Moët Hennessy-Louis Vuitton SE | 10,400 | 3,077 |
| Ctrip.com International, Ltd. (ADR)2 | 92,000 | 2,489 |
| Suzuki Motor Corp.1 | 47,000 | 2,386 |
| MercadoLibre, Inc. | 8,000 | 2,343 |
| Industria de Diseño Textil, SA | 89,000 | 2,279 |
| InterContinental Hotels Group PLC | 41,000 | 2,214 |
| Eicher Motors Ltd. | 6,100 | 2,023 |
| Toyota Motor Corp.1 | 33,000 | 1,932 |
| Motherson Sumi Systems Ltd. | 801,061 | 1,914 |
| Zhongsheng Group Holdings Ltd. | 840,000 | 1,665 |
| Hyundai Motor Co.1 | 15,000 | 1,590 |
| Hyundai Mobis Co., Ltd.1 | 9,000 | 1,538 |
| MGM Resorts International | 60,000 | 1,456 |
| Accor SA | 29,488 | 1,254 |
| Vivo Energy PLC | 670,000 | 1,067 |
| Valeo SA, non-registered shares | 35,000 | 1,023 |
| GVC Holdings PLC | 115,000 | 988 |
| Midea Group Co., Ltd., Class A1 | 150,067 | 810 |
| 282,893 | ||
| Health care 8.35% | ||
| Yunnan Baiyao Group Co., Ltd., Class A1 | 2,730,912 | 29,419 |
| BioMarin Pharmaceutical Inc.2 | 318,000 | 27,078 |
| AstraZeneca PLC | 268,500 | 20,099 |
| CSL Ltd. | 125,431 | 16,358 |
| Carl Zeiss Meditec AG, non-registered shares1 | 202,318 | 15,832 |
| Abbott Laboratories | 213,000 | 15,406 |
| Asahi Intecc Co., Ltd.1 | 270,300 | 11,403 |
| Thermo Fisher Scientific Inc. | 49,200 | 11,011 |
| Ping An Healthcare and Technology Co. Ltd., Class H2 | 3,008,000 | 10,602 |
| Koninklijke Philips NV | 294,500 | 10,437 |
| AbbVie Inc. | 111,000 | 10,233 |
| Novartis AG1 | 107,600 | 9,192 |
| bioMérieux SA | 134,200 | 8,841 |
| Hypera SA, ordinary nominative | 1,111,800 | 8,663 |
| Teva Pharmaceutical Industries Ltd. (ADR) | 465,000 | 7,170 |
| Straumann Holding AG1 | 10,200 | 6,412 |
| Merck & Co., Inc. | 62,000 | 4,737 |
| Notre Dame Intermédica Participações S.A.2 | 525,000 | 3,939 |
| Zoetis Inc., Class A | 40,000 | 3,422 |
| Grifols, SA, Class B, preferred nonvoting, non-registered shares | 172,000 | 3,181 |
| HOYA Corp.1 | 52,000 | 3,128 |
| NMC Health PLC | 85,000 | 2,964 |
| Pfizer Inc. | 55,000 | 2,401 |
| IHH Healthcare Bhd. | 1,608,000 | 2,097 |
| Hikma Pharmaceuticals PLC | 87,000 | 1,903 |
| WuXi AppTec Co., Ltd. Class H2 | 218,000 | 1,893 |
| China Biologic Products Holdings, Inc.2 | 22,000 | 1,670 |
| PerkinElmer, Inc. | 16,500 | 1,296 |
| Berry Genomics Co., Ltd., Class A1,2 | 107,500 | 501 |
| 251,288 |
| Common stocks (continued) Consumer staples 6.31% | Shares | Value (000) |
| British American Tobacco PLC | 1,529,000 | $48,722 |
| JBS SA, ordinary nominative | 9,930,600 | 29,696 |
| Nestlé SA1 | 258,196 | 20,958 |
| Kweichow Moutai Co., Ltd., Class A1 | 225,899 | 19,388 |
| Kirin Holdings Co., Ltd.1 | 621,000 | 13,016 |
| Godrej Consumer Products Ltd. | 997,650 | 11,584 |
| Pigeon Corp.1 | 230,600 | 9,850 |
| a2 Milk Co. Ltd.2 | 713,228 | 5,184 |
| GRUMA, SAB de CV, Series B | 415,645 | 4,710 |
| Herbalife Nutrition Ltd.2 | 77,000 | 4,539 |
| Pernod Ricard SA | 22,330 | 3,666 |
| Chongqing Fuling Zhacai Group Co., Ltd., Class A1 | 1,122,000 | 3,553 |
| Thai Beverage PCL | 6,250,000 | 2,797 |
| Fomento Económico Mexicano, SAB de CV | 302,000 | 2,593 |
| Coca-Cola HBC AG (CDI) | 67,000 | 2,094 |
| Coca-Cola FEMSA, SAB de CV, Series L | 329,000 | 1,995 |
| Kao Corp.1 | 24,000 | 1,781 |
| CP ALL PCL, foreign registered1 | 768,000 | 1,624 |
| Wal-Mart de México, SAB de CV, Series V | 455,000 | 1,157 |
| Anheuser-Busch InBev SA/NV | 14,500 | 959 |
| 189,866 | ||
| Communication services 5.74% | ||
| Alphabet Inc., Class C2 | 47,300 | 48,984 |
| Alphabet Inc., Class A2 | 16,900 | 17,660 |
| Tencent Holdings Ltd. | 591,600 | 23,723 |
| Facebook, Inc., Class A2 | 162,200 | 21,263 |
| YY Inc., Class A (ADR)2 | 274,000 | 16,402 |
| Activision Blizzard, Inc. | 328,300 | 15,289 |
| Naspers Ltd., Class N | 30,500 | 6,131 |
| HUYA, Inc. (ADR)2 | 329,600 | 5,102 |
| SoftBank Group Corp.1 | 61,000 | 4,059 |
| América Móvil, SAB de CV, Series L (ADR) | 150,000 | 2,138 |
| América Móvil, SAB de CV, Series L | 525,000 | 373 |
| Baidu, Inc., Class A (ADR)2 | 15,800 | 2,506 |
| Twenty-First Century Fox, Inc., Class A | 51,200 | 2,464 |
| Electronic Arts Inc.2 | 26,700 | 2,107 |
| Intouch Holdings PCL, foreign registered1 | 1,192,000 | 1,745 |
| Yandex NV, Class A2 | 60,000 | 1,641 |
| Spotify Technology SA2 | 11,000 | 1,248 |
| 172,835 | ||
| Materials 5.59% | ||
| Vale SA, ordinary nominative | 3,595,086 | 47,307 |
| Vale SA, ordinary nominative (ADR) | 395,000 | 5,210 |
| First Quantum Minerals Ltd. | 3,305,000 | 26,727 |
| Rio Tinto PLC | 290,000 | 13,787 |
| En+ Group PLC (GDR)1,3 | 1,886,800 | 11,344 |
| CCL Industries Inc., Class B, nonvoting | 295,000 | 10,817 |
| Tata Steel Ltd. | 1,400,000 | 10,449 |
| China Hongqiao Group Ltd. | 15,552,000 | 8,838 |
| UPL Ltd. | 789,790 | 8,578 |
| Koninklijke DSM NV | 89,000 | 7,285 |
| Glencore PLC | 999,000 | 3,710 |
| Air Products and Chemicals, Inc. | 17,000 | 2,721 |
| Common stocks (continued) Materials (continued) | Shares | Value (000) |
| International Flavors & Fragrances Inc. | 20,000 | $2,685 |
| Teck Resources Ltd., Class B | 121,000 | 2,605 |
| SIG Combibloc Group AG1,2 | 242,000 | 2,572 |
| Celanese Corp. | 22,000 | 1,979 |
| Klabin SA, units | 451,400 | 1,849 |
| 168,463 | ||
| Industrials 4.49% | ||
| Azul SA, preference shares (ADR)2 | 866,446 | 23,992 |
| Azul SA, preference shares2 | 838,500 | 7,788 |
| Airbus SE, non-registered shares | 280,229 | 26,957 |
| Nidec Corp.1 | 151,400 | 17,171 |
| Shanghai International Airport Co., Ltd., Class A1 | 2,200,532 | 16,343 |
| Rumo SA2 | 2,038,000 | 8,939 |
| Edenred SA | 211,700 | 7,789 |
| Boeing Co. | 21,500 | 6,934 |
| Safran SA | 41,000 | 4,951 |
| MTU Aero Engines AG1 | 20,500 | 3,718 |
| Odisha Cement Ltd.2 | 181,606 | 2,861 |
| Ryanair Holdings PLC (ADR)2 | 30,000 | 2,140 |
| SMC Corp.1 | 6,000 | 1,811 |
| Komatsu Ltd.1 | 67,000 | 1,440 |
| Caterpillar Inc. | 9,000 | 1,144 |
| Johnson Controls International PLC | 37,000 | 1,097 |
| Guangzhou Baiyun International Airport Co. Ltd., Class A1 | 147,950 | 217 |
| 135,292 | ||
| Real estate 1.34% | ||
| American Tower Corp. REIT | 176,800 | 27,968 |
| Vinhomes JSC1,2 | 1,706,225 | 5,421 |
| Ayala Land, Inc.1 | 2,614,000 | 2,017 |
| Ayala Land, Inc., preference shares1,2,4 | 15,000,000 | 26 |
| Central Pattana PCL, foreign registered1 | 820,000 | 1,886 |
| Fibra Uno Administración, SA de CV REIT | 1,297,496 | 1,442 |
| China Overseas Land & Investment Ltd. | 270,000 | 928 |
| Longfor Group Holdings Ltd. | 241,000 | 720 |
| 40,408 | ||
| Utilities 1.08% | ||
| ENN Energy Holdings Ltd. | 1,580,000 | 14,013 |
| Pampa Energía SA (ADR)2 | 310,000 | 9,861 |
| China Resources Gas Group Ltd. | 1,602,000 | 6,342 |
| Infraestructura Energética Nova, SAB de CV | 599,863 | 2,237 |
| 32,453 | ||
| Total common stocks (cost: $2,216,498,000) | 2,400,782 | |
| Rights & warrants 0.11% Consumer staples 0.11% | ||
| Foshan Haitian Flavouring and Food Co., Ltd., Class A, warrants, expire 20221,3 | 348,300 | 3,502 |
| Total rights & warrants (cost: $3,452,000) | 3,502 |
| Bonds, notes & other debt instruments 3.09% Bonds & notes of governments & government agencies outside the U.S. 2.61% | Principal amount (000) | Value (000) |
| Argentine Republic (Badlar Private Banks ARS Index + 2.50%) 49.529% 20195 | ARS30,797 | $819 |
| Argentine Republic (Argentina Central Bank 7D Repo Reference Rate) 65.509% 20205 | 4,162 | 119 |
| Argentine Republic 6.875% 2021 | $700 | 635 |
| Argentine Republic (Badlar Private Banks ARS Index + 2.00%) 37.717% 20225 | ARS14,766 | 375 |
| Argentine Republic 7.50% 2026 | $525 | 422 |
| Argentine Republic 8.28% 20336,7 | 1,318 | 1,035 |
| Argentine Republic 0% 2035 | 5,800 | 247 |
| Bahrain (Kingdom of) 6.75% 20293 | 1,000 | 982 |
| Brazil (Federative Republic of) 10.00% 2023 | BRL1,000 | 270 |
| Brazil (Federative Republic of) 10.00% 2025 | 3,820 | 1,030 |
| Brazil (Federative Republic of) Global 5.625% 2047 | $1,995 | 1,889 |
| Buenos Aires (City of) 8.95% 20216 | 1,055 | 1,054 |
| Colombia (Republic of) 4.50% 2026 | 250 | 250 |
| Columbia (Republic of) 4.50% 2029 | 1,000 | 990 |
| Cote d’Ivoire (Republic of) 5.25% 20306 | €1,100 | 1,115 |
| Cote d’Ivoire (Republic of) 5.75% 20326,8 | $905 | 801 |
| Dominican Republic 7.50% 20216 | 800 | 828 |
| Dominican Republic 5.50% 20253 | 970 | 964 |
| Dominican Republic 10.375% 2026 | DOP24,000 | 469 |
| Dominican Republic 8.625% 20273,6 | $575 | 660 |
| Dominican Republic 11.25% 2027 | DOP22,900 | 471 |
| Dominican Republic 7.45% 20443 | $1,125 | 1,173 |
| Dominican Republic 7.45% 2044 | 1,100 | 1,147 |
| Dominican Republic 6.85% 20453 | 500 | 494 |
| Egypt (Arab Republic of) 5.577% 20233 | 500 | 475 |
| Egypt (Arab Republic of) 7.50% 20273 | 640 | 612 |
| Egypt (Arab Republic of) 6.588% 20283 | 500 | 448 |
| Egypt (Arab Republic of) 8.50% 2047 | 1,000 | 906 |
| Egypt (Arab Republic of) 8.50% 20473 | 490 | 444 |
| Guatemala (Republic of) 4.375% 2027 | 1,100 | 1,018 |
| Honduras (Republic of) 7.50% 20246 | 500 | 527 |
| Honduras (Republic of) 6.25% 2027 | 1,000 | 993 |
| Indonesia (Republic of) 4.875% 2021 | 1,500 | 1,535 |
| Indonesia (Republic of) 3.75% 2022 | 2,100 | 2,083 |
| Indonesia (Republic of) 4.75% 20263 | 2,100 | 2,132 |
| Indonesia (Republic of) 5.25% 2042 | 550 | 554 |
| Iraq (Republic of) 6.752% 2023 | 1,520 | 1,451 |
| Iraq (Republic of) 5.80% 20286 | 455 | 409 |
| Jordan (Hashemite Kingdom of) 6.125% 20263 | 230 | 221 |
| Jordan (Hashemite Kingdom of) 5.75% 20273 | 1,530 | 1,409 |
| Kazahkstan (Republic of) 1.55% 2023 | €110 | 127 |
| Kazakhstan (Republic of) 5.125% 20253 | $900 | 954 |
| Kazakhstan (Republic of) 2.375% 2028 | €295 | 336 |
| Kazakhstan (Republic of) 6.50% 20453 | $800 | 961 |
| Kenya (Republic of) 6.875% 2024 | 1,350 | 1,272 |
| Kenya (Republic of) 6.875% 20243 | 900 | 848 |
| Kuwait (State of) 2.75% 20223 | 550 | 541 |
| Morocco (Kingdom of) 4.25% 2022 | 1,400 | 1,407 |
| Morocco (Kingdom of) 4.25% 20223 | 250 | 251 |
| Morocco (Kingdom of) 5.50% 2042 | 2,200 | 2,257 |
| Nigeria (Republic of) 6.375% 2023 | 1,525 | 1,467 |
| Pakistan (Islamic Republic of) 5.50% 20213 | 900 | 871 |
| Pakistan (Islamic Republic of) 8.25% 2024 | 300 | 303 |
| Pakistan (Islamic Republic of) 8.25% 20253 | 410 | 413 |
| Pakistan (Islamic Republic of) 6.875% 20273 | 500 | 455 |
| Bonds, notes & other debt instruments (continued) Bonds & notes of governments & government agencies outside the U.S. (continued) | Principal amount (000) | Value (000) |
| Panama (Republic of) 4.50% 20476 | $2,075 | $2,023 |
| Paraguay (Republic of) 4.625% 2023 | 250 | 252 |
| Paraguay (Republic of) 5.00% 20263 | 500 | 507 |
| Paraguay (Republic of) 5.00% 2026 | 500 | 507 |
| Paraguay (Republic of) 4.70% 20273 | 800 | 794 |
| Paraguay (Republic of) 4.70% 2027 | 500 | 496 |
| Paraguay (Republic of) 5.60% 20483 | 230 | 227 |
| Peru (Republic of) 2.75% 2026 | €855 | 1,064 |
| Peru (Republic of) 6.55% 20376 | $382 | 484 |
| Peru (Republic of) 5.625% 2050 | 130 | 153 |
| Poland (Republic of) 3.25% 2026 | 300 | 294 |
| Qatar (State of) 4.50% 20283 | 1,500 | 1,569 |
| Romania 2.875% 2029 | €600 | 668 |
| Romania 5.125% 20483 | $1,500 | 1,449 |
| Russian Federation 4.375% 20293 | 1,000 | 949 |
| Saudi Arabia (Kingdom of) 2.375% 20213 | 375 | 362 |
| Saudi Arabia (Kingdom of) 2.894% 20223 | 1,000 | 976 |
| Saudi Arabia (Kingdom of) 3.25% 20263 | 810 | 759 |
| Saudi Arabia (Kingdom of) 3.625% 20283 | 800 | 759 |
| Senegal (Republic of) 4.75% 20286 | €1,000 | 1,058 |
| South Africa (Republic of), Series R-186, 10.50% 2026 | ZAR6,600 | 500 |
| South Africa (Republic of), Series R-214, 6.50% 2041 | 14,450 | 701 |
| Sri Lanka (Democratic Socialist Republic of) 6.00% 2019 | $400 | 399 |
| Sri Lanka (Democratic Socialist Republic of) 5.75% 2022 | 250 | 236 |
| Sri Lanka (Democratic Socialist Republic of) 5.875% 2022 | 200 | 188 |
| Sri Lanka (Democratic Socialist Republic of) 6.125% 2025 | 410 | 370 |
| Sri Lanka (Democratic Socialist Republic of) 6.85% 2025 | 200 | 188 |
| Sri Lanka (Democratic Socialist Republic of) 6.825% 2026 | 1,010 | 937 |
| Sri Lanka (Democratic Socialist Republic of) 6.20% 2027 | 600 | 531 |
| Sri Lanka (Democratic Socialist Republic of) 6.20% 20273 | 200 | 177 |
| Turkey (Republic of) 10.70% 2022 | TRY1,030 | 159 |
| Turkey (Republic of) 7.10% 2023 | 2,120 | 281 |
| Turkey (Republic of) 7.25% 2023 | $900 | 927 |
| Turkey (Republic of) 8.80% 2023 | TRY1,850 | 257 |
| Turkey (Republic of) 4.875% 2026 | $1,820 | 1,617 |
| Turkey (Republic of) 6.75% 2040 | 1,000 | 919 |
| Turkey (Republic of) 6.00% 2041 | 650 | 550 |
| Turkey (Republic of) 4.875% 2043 | 300 | 224 |
| Ukraine Government 7.75% 2022 | 2,000 | 1,843 |
| Ukraine Government 7.75% 2027 | 1,100 | 934 |
| Ukraine Government 7.375% 20326 | 1,200 | 956 |
| United Mexican States 4.00% 2023 | 932 | 929 |
| United Mexican States 4.15% 2027 | 700 | 678 |
| United Mexican States 4.35% 2047 | 540 | 465 |
| United Mexican States 5.75% 2110 | 140 | 132 |
| United Mexican States, Series M20, 10.00% 2024 | MXN11,000 | 595 |
| United Mexican States, Series M, 5.75% 2026 | 10,000 | 430 |
| Venezuela (Bolivarian Republic of) 7.75% 20199 | $1,149 | 267 |
| Venezuela (Bolivarian Republic of) 6.00% 20209 | 950 | 220 |
| Venezuela (Bolivarian Republic of) 12.75% 20226,9 | 85 | 20 |
| Venezuela (Bolivarian Republic of) 9.00% 20239 | 1,383 | 314 |
| Venezuela (Bolivarian Republic of) 8.25% 20249 | 299 | 70 |
| Venezuela (Bolivarian Republic of) 7.65% 20259 | 129 | 30 |
| Venezuela (Bolivarian Republic of) 11.75% 20269 | 64 | 16 |
| Venezuela (Bolivarian Republic of) 9.25% 20279 | 170 | 40 |
| Bonds, notes & other debt instruments (continued) Bonds & notes of governments & government agencies outside the U.S. (continued) | Principal amount (000) | Value (000) |
| Venezuela (Bolivarian Republic of) 7.00% 20289 | $64 | $14 |
| Venezuela (Bolivarian Republic of) 9.25% 20289 | 319 | 74 |
| Venezuela (Bolivarian Republic of) 11.95% 20316,9 | 106 | 25 |
| Venezuela (Bolivarian Republic of) 7.00% 20389 | 107 | 25 |
| 78,507 | ||
| Corporate bonds & notes 0.48% Energy 0.23% | ||
| Gazprom OJSC 6.51% 20223 | 600 | 628 |
| Pemex Project Funding Master Trust, Series 13, 6.625% 2035 | 300 | 263 |
| Petrobras Global Finance Co. 6.125% 2022 | 218 | 224 |
| Petrobras Global Finance Co. 4.375% 2023 | 310 | 296 |
| Petrobras Global Finance Co. 6.25% 2024 | 90 | 92 |
| Petrobras Global Finance Co. 8.75% 2026 | 850 | 955 |
| Petrobras Global Finance Co. 5.75% 2029 | 1,095 | 1,016 |
| Petrobras Global Finance Co. 6.85% 2115 | 314 | 282 |
| Petróleos Mexicanos 6.375% 2021 | 505 | 512 |
| Petróleos Mexicanos 3.50% 2023 | 1,045 | 948 |
| Petróleos Mexicanos 6.875% 2026 | 600 | 585 |
| Petróleos Mexicanos 6.35% 2048 | 612 | 491 |
| YPF SA 8.50% 20253 | 860 | 775 |
| 7,067 | ||
| Financials 0.08% | ||
| BBVA Bancomer SA 6.50% 20213 | 525 | 546 |
| HSBK (Europe) BV 7.25% 20213 | 1,125 | 1,177 |
| VEB Finance Ltd. 6.902% 2020 | 600 | 614 |
| 2,337 | ||
| Utilities 0.08% | ||
| Cemig Geração e Transmissão SA 9.25% 20243 | 480 | 513 |
| Eskom Holdings Ltd. 5.75% 20213 | 985 | 931 |
| State Grid Overseas Investment Ltd. 3.50% 20273 | 900 | 868 |
| 2,312 | ||
| Industrials 0.04% | ||
| DP World Crescent 4.848% 20283 | 835 | 819 |
| Lima Metro Line Finance Ltd. 5.875% 20343,6 | 335 | 335 |
| 1,154 | ||
| Other mortgage-backed securities 0.02% | ||
| Export Credit Bank of Turkey 5.375% 20213 | 590 | 572 |
| Health care 0.02% | ||
| Teva Pharmaceutical Finance Co. BV 3.15% 2026 | 700 | 535 |
| Communication services 0.01% | ||
| Digicel Group Ltd. 6.00% 20213 | 350 | 316 |
| Grupo Televisa, SAB 7.25% 2043 | MXN2,000 | 67 |
| 383 | ||
| Total corporate bonds & notes | 14,360 | |
| Total bonds, notes & other debt instruments (cost: $97,609,000) | 92,867 |
| Short-term securities 16.68% | Principal amount (000) | Value (000) |
| American Honda Finance Corp. 2.35%due 1/10/2019 | $25,000 | $24,983 |
| ANZ New Zealand (International) Ltd. 2.72%due 3/13/20193 | 20,000 | 19,893 |
| Argentinian Treasury Bills (10.94%)–5.59%due 2/28/2019–4/30/2020 | ARS693,021 | 20,848 |
| Bank of Nova Scotia 2.62%due 2/19/20193 | $50,000 | 49,820 |
| Colgate-Palmolive Co. 2.39%due 1/14/20193 | 20,000 | 19,981 |
| Commonwealth Bank of Australia 2.50%due 1/23/20193 | 49,600 | 49,522 |
| Egyptian Treasury Bills 17.25%due 6/4/2019 | EGP39,100 | 2,028 |
| ExxonMobil Corp. 2.38%due 1/8/2019 | $40,000 | 39,979 |
| Federal Home Loan Bank 2.37%due 2/22/2019 | 95,500 | 95,169 |
| Mizuho Bank, Ltd. 2.51%due 2/1/20193 | 69,800 | 69,645 |
| Nigerian Treasury Bills 11.30%–11.71%due 1/3/2019–2/14/2019 | NGN240,330 | 654 |
| Swedbank AB 2.56%due 2/1/2019 | $88,900 | 88,705 |
| Toronto-Dominion Bank 2.39%due 1/7/20193 | 21,100 | 21,090 |
| Total short-term securities (cost: $502,291,000) | 502,317 | |
| Total investment securities99.62% (cost: $2,819,850,000) | 2,999,468 | |
| Other assets less liabilities 0.38% | 11,411 | |
| Net assets100.00% | $3,010,879 |
| Contract amount | Counterparty | Settlement date | Unrealized appreciation (depreciation) at 12/31/2018 (000) | |
| Purchases (000) | Sales (000) | |||
| INR120,000 | USD1,673 | HSBC Bank | 1/10/2019 | $44 |
| USD1,689 | INR120,000 | Citibank | 1/10/2019 | (28) |
| EUR590 | USD672 | Morgan Stanley | 1/14/2019 | 5 |
| USD674 | EUR590 | JPMorgan Chase | 1/14/2019 | (2) |
| INR112,350 | USD1,565 | HSBC Bank | 1/15/2019 | 41 |
| USD1,586 | INR112,350 | HSBC Bank | 1/15/2019 | (20) |
| EUR385 | USD439 | Morgan Stanley | 1/18/2019 | 3 |
| USD439 | EUR385 | HSBC Bank | 1/18/2019 | (3) |
| USD406 | EUR320 | Citibank | 3/6/2019 | 37 |
| EUR320 | USD366 | Morgan Stanley | 3/6/2019 | 2 |
| USD531 | EUR415 | Goldman Sachs | 3/8/2019 | 53 |
| USD323 | EUR255 | Goldman Sachs | 3/8/2019 | 29 |
| EUR670 | USD767 | Morgan Stanley | 3/8/2019 | 5 |
| USD1,397 | EUR1,100 | JPMorgan Chase | 3/15/2019 | 128 |
| EUR1,100 | USD1,259 | Morgan Stanley | 3/15/2019 | 9 |
| $303 | ||||
| 1 | Valued under fair value procedures adopted by authority of the board of trustees. The total value of all such securities was $486,458,000, which represented 16.16% of the net assets of the fund. This amount includes $463,432,000 related to certain securities trading outside the U.S. whose values were adjusted as a result of significant market movements following the close of local trading. |
| 2 | Security did not produce income during the last 12 months. |
| 3 | Acquired in a transaction exempt from registration under Rule 144A or Section 4(2) of the Securities Act of 1933. May be resold in the U.S. in transactions exempt from registration, normally to qualified institutional buyers. The total value of all such securities was $277,296,000, which represented 9.21% of the net assets of the fund. |
| 4 | Value determined using significant unobservable inputs. |
| 5 | Coupon rate may change periodically. |
| 6 | Principal payments may be made periodically. Therefore, the effective maturity date may be earlier than the stated maturity date. |
| 7 | Payment in kind; the issuer has the option of paying additional securities in lieu of cash. Most recent payment was 100% cash unless otherwise noted. |
| 8 | Step bond; coupon rate may change at a later date. |
| 9 | Scheduled interest and/or principal payment was not received. |
| Key to abbreviations and symbols | |
| ADR = American Depositary Receipts | |
| ARS = Argentine pesos | |
| BRL = Brazilian reais | |
| CDI = CREST Depository Interest | |
| DOP = Dominican pesos | |
| EGP = Egyptian pounds | |
| EUR/€ = Euros | |
| GDR = Global Depositary Receipts | |
| INR = Indian rupees | |
| MXN = Mexican pesos | |
| NGN = Nigerian naira | |
| TRY = Turkish lira | |
| USD/$ = U.S. dollars | |
| ZAR = South African rand |
| Common stocks 94.94% Health care 25.24% | Shares | Value (000) |
| AbbVie Inc. | 6,711,500 | $618,733 |
| Abbott Laboratories | 5,764,000 | 416,910 |
| Amgen Inc. | 1,416,510 | 275,752 |
| Gilead Sciences, Inc. | 3,761,212 | 235,264 |
| Teva Pharmaceutical Industries Ltd. (ADR) | 10,833,800 | 167,057 |
| Medtronic PLC | 900,000 | 81,864 |
| UnitedHealth Group Inc. | 211,000 | 52,564 |
| Thermo Fisher Scientific Inc. | 209,600 | 46,907 |
| Stryker Corp. | 250,800 | 39,313 |
| Merck & Co., Inc. | 500,000 | 38,205 |
| Humana Inc. | 119,000 | 34,091 |
| Bristol-Myers Squibb Co. | 400,000 | 20,792 |
| 2,027,452 | ||
| Information technology 13.45% | ||
| Microsoft Corp. | 2,612,000 | 265,301 |
| Intel Corp. | 5,515,000 | 258,819 |
| QUALCOMM Inc. | 3,845,300 | 218,836 |
| Broadcom Inc. | 385,000 | 97,898 |
| Texas Instruments Inc. | 780,000 | 73,710 |
| Mastercard Inc., Class A | 337,000 | 63,575 |
| Apple Inc. | 400,000 | 63,096 |
| Automatic Data Processing, Inc. | 160,000 | 20,979 |
| Applied Materials, Inc. | 559,000 | 18,302 |
| 1,080,516 | ||
| Consumer staples 12.67% | ||
| Philip Morris International Inc. | 3,349,900 | 223,639 |
| Coca-Cola Co. | 3,558,000 | 168,471 |
| Altria Group, Inc. | 2,872,800 | 141,888 |
| Costco Wholesale Corp. | 591,255 | 120,444 |
| British American Tobacco PLC (ADR) | 3,723,112 | 118,618 |
| Kimberly-Clark Corp. | 500,000 | 56,970 |
| Kellogg Co. | 792,000 | 45,152 |
| PepsiCo, Inc. | 400,000 | 44,192 |
| Mondelez International, Inc. | 887,000 | 35,507 |
| Kraft Heinz Co. | 776,666 | 33,428 |
| Lamb Weston Holdings, Inc. | 400,000 | 29,424 |
| 1,017,733 | ||
| Energy 9.44% | ||
| EOG Resources, Inc. | 2,713,800 | 236,671 |
| Exxon Mobil Corp. | 2,699,800 | 184,099 |
| Royal Dutch Shell PLC, Class B (ADR) | 1,737,000 | 104,116 |
| Halliburton Co. | 2,844,730 | 75,613 |
| Canadian Natural Resources, Ltd. | 2,673,000 | 64,499 |
| Common stocks (continued) Energy (continued) | Shares | Value (000) |
| Noble Energy, Inc. | 2,862,000 | $53,691 |
| Williams Companies, Inc. | 1,792,000 | 39,514 |
| 758,203 | ||
| Communication services 9.11% | ||
| Alphabet Inc., Class A1 | 184,550 | 192,847 |
| Alphabet Inc., Class C1 | 20,500 | 21,230 |
| Verizon Communications Inc. | 3,306,480 | 185,890 |
| Facebook, Inc., Class A1 | 1,089,000 | 142,757 |
| CBS Corp., Class B | 2,886,400 | 126,194 |
| Viacom Inc., Class B | 2,435,136 | 62,583 |
| 731,501 | ||
| Industrials 8.56% | ||
| General Dynamics Corp. | 1,206,000 | 189,595 |
| CSX Corp. | 2,726,000 | 169,366 |
| Illinois Tool Works Inc. | 650,000 | 82,349 |
| Union Pacific Corp. | 400,000 | 55,292 |
| United Technologies Corp. | 500,000 | 53,240 |
| Northrop Grumman Corp. | 174,300 | 42,686 |
| J.B. Hunt Transport Services, Inc. | 427,500 | 39,775 |
| Airbus Group SE (ADR) | 1,401,000 | 33,316 |
| General Electric Co. | 2,400,000 | 18,168 |
| Rolls-Royce Holdings PLC (ADR) | 356,800 | 3,730 |
| 687,517 | ||
| Consumer discretionary 8.11% | ||
| Lowe’s Companies, Inc. | 3,111,572 | 287,385 |
| Marriott International, Inc., Class A | 952,500 | 103,403 |
| McDonald’s Corp. | 500,000 | 88,785 |
| General Motors Co. | 1,752,800 | 58,631 |
| Williams-Sonoma, Inc. | 705,000 | 35,567 |
| NIKE, Inc., Class B | 450,000 | 33,363 |
| Newell Brands Inc. | 1,300,000 | 24,167 |
| TJX Companies, Inc. | 440,000 | 19,686 |
| 650,987 | ||
| Financials 4.89% | ||
| JPMorgan Chase & Co. | 1,579,000 | 154,142 |
| Charles Schwab Corp. | 2,655,000 | 110,262 |
| U.S. Bancorp | 1,000,000 | 45,700 |
| PNC Financial Services Group, Inc. | 230,000 | 26,889 |
| AIA Group Ltd. (ADR) | 782,000 | 25,712 |
| Wells Fargo & Co. | 403,300 | 18,584 |
| American International Group, Inc. | 282,000 | 11,114 |
| 392,403 | ||
| Materials 1.68% | ||
| Linde PLC | 665,700 | 103,876 |
| Vale SA, ordinary nominative (ADR) | 1,219,000 | 16,079 |
| Freeport-McMoRan Inc. | 1,450,000 | 14,949 |
| 134,904 |
| Common stocks (continued) Real estate 1.24% | Shares | Value (000) |
| Kimco Realty Corp. REIT | 2,844,000 | $41,664 |
| SBA Communications Corp. REIT1 | 180,000 | 29,140 |
| Crown Castle International Corp. REIT | 263,000 | 28,570 |
| 99,374 | ||
| Utilities 0.55% | ||
| Sempra Energy | 331,000 | 35,811 |
| NextEra Energy, Inc. | 50,000 | 8,691 |
| 44,502 | ||
| Total common stocks (cost: $6,925,880,000) | 7,625,092 | |
| Rights & warrants 0.05% Financials 0.05% | ||
| American International Group, Inc., warrants, expire 20211 | 647,000 | 3,520 |
| Total rights & warrants (cost: $10,088,000) | 3,520 | |
| Short-term securities 4.85% | Principal amount (000) | |
| Coca-Cola Co. 2.40%due 1/23/20192 | $15,000 | 14,976 |
| Fannie Mae 2.23%due 1/2/2019 | 30,000 | 29,992 |
| Federal Home Loan Bank 2.33%–2.36%due 1/18/2019–2/14/2019 | 154,500 | 154,194 |
| Freddie Mac 2.36%due 2/20/2019 | 15,200 | 15,149 |
| National Rural Utilities Cooperative Finance Corp. 2.40%–2.52%due 1/3/2019–2/7/2019 | 36,000 | 35,978 |
| U.S. Treasury Bills 2.24%–2.38%due 1/2/2019–2/19/2019 | 99,300 | 99,160 |
| United Parcel Service Inc. 2.38%due 1/11/20192 | 40,000 | 39,972 |
| Total short-term securities (cost: $389,429,000) | 389,421 | |
| Total investment securities99.84% (cost: $7,325,397,000) | 8,018,033 | |
| Other assets less liabilities 0.16% | 13,239 | |
| Net assets100.00% | $8,031,272 |
| 1 | Security did not produce income during the last 12 months. |
| 2 | Acquired in a transaction exempt from registration under Rule 144A or Section 4(2) of the Securities Act of 1933. May be resold in the U.S. in transactions exempt from registration, normally to qualified institutional buyers. The total value of all such securities was $54,948,000, which represented .68% of the net assets of the fund. |
| Key to abbreviation |
| ADR = American Depositary Receipts |
| Common stocks 91.72% Information technology 15.54% | Shares | Value (000) |
| Taiwan Semiconductor Manufacturing Co., Ltd.1 | 9,589,800 | $69,838 |
| Microsoft Corp. | 416,000 | 42,253 |
| Broadcom Inc. | 145,500 | 36,998 |
| Murata Manufacturing Co., Ltd.1 | 170,000 | 23,046 |
| Apple Inc. | 119,000 | 18,771 |
| PagSeguro Digital Ltd., Class A2 | 998,752 | 18,707 |
| Tableau Software, Inc., Class A2 | 104,000 | 12,480 |
| ASML Holding NV | 70,000 | 11,001 |
| Halma PLC | 610,000 | 10,605 |
| GoDaddy Inc., Class A2 | 142,000 | 9,318 |
| Temenos AG1 | 60,000 | 7,196 |
| Amadeus IT Group SA, Class A, non-registered shares | 83,500 | 5,821 |
| Intel Corp. | 120,600 | 5,660 |
| TravelSky Technology Ltd., Class H | 2,065,000 | 5,287 |
| AAC Technologies Holdings Inc. | 593,500 | 3,445 |
| Afterpay Touch Group Ltd.2 | 195,000 | 1,703 |
| 282,129 | ||
| Health care 11.07% | ||
| UnitedHealth Group Inc. | 272,825 | 67,966 |
| Merck & Co., Inc. | 282,000 | 21,548 |
| Hologic, Inc.2 | 400,000 | 16,440 |
| Novartis AG1 | 148,000 | 12,643 |
| AstraZeneca PLC | 167,000 | 12,501 |
| Boston Scientific Corp.2 | 351,000 | 12,404 |
| Centene Corp.2 | 101,000 | 11,645 |
| AbbVie Inc. | 90,000 | 8,297 |
| Fleury SA, ordinary nominative | 1,500,000 | 7,655 |
| Hikma Pharmaceuticals PLC | 340,000 | 7,437 |
| Eli Lilly and Co. | 45,000 | 5,207 |
| Hypera SA, ordinary nominative | 562,000 | 4,379 |
| CSL Ltd. | 32,300 | 4,213 |
| Koninklijke Philips NV | 100,000 | 3,544 |
| William Demant Holding A/S1,2 | 102,000 | 2,899 |
| Teladoc Health, Inc.2 | 47,000 | 2,330 |
| 201,108 | ||
| Financials 10.25% | ||
| AIA Group Ltd. | 3,005,000 | 24,944 |
| CME Group Inc., Class A | 75,000 | 14,109 |
| HDFC Bank Ltd. | 444,000 | 13,493 |
| DBS Group Holdings Ltd. | 705,000 | 12,254 |
| Blackstone Group LP | 355,000 | 10,583 |
| Ping An Insurance (Group) Co. of China, Ltd., Class H | 1,195,000 | 10,553 |
| B3 SA - Brasil, Bolsa, Balcao | 1,500,000 | 10,376 |
| Sberbank of Russia PJSC (ADR) | 905,000 | 9,919 |
| Common stocks (continued) Financials (continued) | Shares | Value (000) |
| JPMorgan Chase & Co. | 92,000 | $8,981 |
| Bank Central Asia Tbk PT1 | 4,775,000 | 8,616 |
| Bank Leumi le-Israel BM | 1,409,898 | 8,521 |
| CIT Group Inc. | 201,750 | 7,721 |
| Wells Fargo & Co. | 122,000 | 5,622 |
| BB Seguridade Participações SA | 765,000 | 5,446 |
| BlackRock, Inc. | 13,500 | 5,303 |
| Itaú Unibanco Holding SA, preferred nominative (ADR) | 562,500 | 5,141 |
| Toronto-Dominion Bank (CAD denominated) | 102,000 | 5,070 |
| ABN AMRO Group NV, depository receipts | 197,000 | 4,636 |
| Macquarie Group Ltd. | 46,000 | 3,520 |
| National Australia Bank Ltd. | 194,394 | 3,296 |
| Prudential PLC | 177,000 | 3,163 |
| Capital One Financial Corp. | 32,000 | 2,419 |
| Unione di Banche Italiane SpA1 | 621,000 | 1,797 |
| UniCredit SpA1 | 56,319 | 636 |
| 186,119 | ||
| Communication services 10.13% | ||
| Nintendo Co., Ltd.1 | 289,000 | 76,951 |
| Alphabet Inc., Class A2 | 26,500 | 27,691 |
| Alphabet Inc., Class C2 | 9,000 | 9,321 |
| Vivendi SA | 715,200 | 17,438 |
| Comcast Corp., Class A | 296,000 | 10,079 |
| SK Telecom Co., Ltd.1 | 37,500 | 9,067 |
| Nexon Co., Ltd.1,2 | 585,000 | 7,532 |
| Advanced Info Service PCL, foreign registered1 | 1,350,000 | 7,164 |
| Verizon Communications Inc. | 110,000 | 6,184 |
| Facebook, Inc., Class A2 | 41,800 | 5,479 |
| Activision Blizzard, Inc. | 101,000 | 4,704 |
| Netflix, Inc.2 | 8,700 | 2,329 |
| 183,939 | ||
| Industrials 9.89% | ||
| Airbus SE, non-registered shares | 589,200 | 56,679 |
| Boeing Co. | 97,400 | 31,411 |
| Safran SA | 143,000 | 17,269 |
| Lockheed Martin Corp. | 45,000 | 11,783 |
| CCR SA, ordinary nominative | 4,025,000 | 11,631 |
| Fosun International Ltd. | 6,310,000 | 9,186 |
| Stanley Black & Decker, Inc. | 75,000 | 8,981 |
| Rheinmetall AG1 | 80,500 | 7,122 |
| ACS, Actividades de Construcción y Servicios, SA | 153,846 | 5,963 |
| Flughafen Zürich AG1 | 22,000 | 3,638 |
| DCC PLC | 45,600 | 3,479 |
| Watsco, Inc. | 23,500 | 3,270 |
| Rockwool International A/S, Class B1 | 12,500 | 3,260 |
| MTU Aero Engines AG1 | 16,300 | 2,956 |
| VINCI SA | 35,033 | 2,891 |
| 179,519 | ||
| Consumer discretionary 9.55% | ||
| Home Depot, Inc. | 146,000 | 25,086 |
| LVMH Moët Hennessy-Louis Vuitton SE | 56,200 | 16,626 |
| Carnival Corp., units | 319,000 | 15,727 |
| Common stocks (continued) Consumer discretionary (continued) | Shares | Value (000) |
| Alibaba Group Holding Ltd. (ADR)2 | 93,500 | $12,816 |
| Daimler AG1 | 222,000 | 11,680 |
| Norwegian Cruise Line Holdings Ltd.2 | 275,000 | 11,657 |
| Bayerische Motoren Werke AG1 | 114,000 | 9,236 |
| General Motors Co. | 275,000 | 9,199 |
| Restaurant Brands International Inc. (CAD denominated) | 175,000 | 9,142 |
| Royal Caribbean Cruises Ltd. | 93,000 | 9,094 |
| Sony Corp.1 | 174,000 | 8,417 |
| Paddy Power Betfair PLC | 90,000 | 7,388 |
| Accor SA | 163,500 | 6,952 |
| NIKE, Inc., Class B | 80,000 | 5,931 |
| adidas AG1 | 28,000 | 5,852 |
| Amazon.com, Inc.2 | 3,400 | 5,107 |
| Melco Resorts & Entertainment Ltd. (ADR) | 193,000 | 3,401 |
| Fosun Tourism Group2 | 15,775 | 32 |
| 173,343 | ||
| Materials 6.53% | ||
| Vale SA, ordinary nominative | 2,925,000 | 38,489 |
| Vale SA, ordinary nominative (ADR) | 505,000 | 6,661 |
| Allegheny Technologies Inc.2 | 415,000 | 9,035 |
| Koninklijke DSM NV | 109,000 | 8,922 |
| DowDuPont Inc. | 144,544 | 7,730 |
| James Hardie Industries PLC (CDI) | 700,000 | 7,455 |
| BHP Group PLC | 350,000 | 7,368 |
| CCL Industries Inc., Class B, nonvoting | 192,500 | 7,059 |
| PPG Industries, Inc. | 58,000 | 5,929 |
| Covestro AG, non-registered shares1 | 119,000 | 5,891 |
| Rio Tinto PLC | 115,000 | 5,467 |
| LafargeHolcim Ltd.1 | 110,000 | 4,531 |
| Randgold Resources Ltd.1 | 48,500 | 4,012 |
| 118,549 | ||
| Energy 6.04% | ||
| Reliance Industries Ltd. | 3,195,148 | 51,315 |
| Royal Dutch Shell PLC, Class B | 450,000 | 13,422 |
| Galp Energia, SGPS, SA, Class B | 708,000 | 11,190 |
| ConocoPhillips | 156,000 | 9,727 |
| BP PLC | 1,330,000 | 8,407 |
| Canadian Natural Resources, Ltd. (CAD denominated) | 136,000 | 3,281 |
| Canadian Natural Resources, Ltd. | 120,000 | 2,896 |
| Chevron Corp. | 51,000 | 5,548 |
| WorleyParsons Ltd. | 483,919 | 3,893 |
| 109,679 | ||
| Consumer staples 5.58% | ||
| Nestlé SA1 | 488,700 | 39,668 |
| British American Tobacco PLC | 937,000 | 29,858 |
| Walgreens Boots Alliance, Inc. | 100,000 | 6,833 |
| Keurig Dr Pepper Inc. | 235,000 | 6,025 |
| Coca-Cola European Partners PLC | 95,000 | 4,356 |
| Coca-Cola FEMSA, SAB de CV, Series L | 710,000 | 4,305 |
| Coca-Cola Co. | 90,000 | 4,261 |
| Common stocks (continued) Consumer staples (continued) | Shares | Value (000) |
| Sysco Corp. | 62,000 | $3,885 |
| a2 Milk Co. Ltd.2 | 295,000 | 2,144 |
| 101,335 | ||
| Real estate 3.69% | ||
| MGM Growth Properties LLC REIT, Class A | 676,200 | 17,858 |
| Gaming and Leisure Properties, Inc. REIT | 425,000 | 13,732 |
| Daito Trust Construction Co., Ltd.1 | 60,000 | 8,216 |
| Digital Realty Trust, Inc. REIT | 72,000 | 7,672 |
| Crown Castle International Corp. REIT | 53,000 | 5,757 |
| Prologis, Inc. REIT | 90,000 | 5,285 |
| Vonovia SE1 | 104,442 | 4,740 |
| Iron Mountain Inc. REIT | 118,000 | 3,824 |
| 67,084 | ||
| Utilities 3.45% | ||
| Ørsted AS1 | 491,552 | 32,802 |
| Enel SpA1 | 2,780,000 | 16,066 |
| Naturgy Energy Group, SA | 370,000 | 9,437 |
| Public Service Enterprise Group Inc. | 85,000 | 4,424 |
| 62,729 | ||
| Total common stocks (cost: $1,481,838,000) | 1,665,533 | |
| Bonds, notes & other debt instruments 2.17% Corporate bonds & notes 2.17% Communication services 1.87% | Principal amount (000) | |
| Sprint Corp. 7.25% 2021 | $ 33,000 | 33,858 |
| Health care 0.30% | ||
| Teva Pharmaceutical Finance Co. BV 3.15% 2026 | 7,225 | 5,526 |
| Total bonds, notes & other debt instruments (cost: $38,299,000) | 39,384 | |
| Short-term securities 5.89% | ||
| BASF SE 2.50%due 1/11/20193 | 15,000 | 14,989 |
| Federal Home Loan Bank 2.15%–2.38%due 1/2/2019–2/19/2019 | 57,200 | 57,104 |
| KfW 2.51%due 2/13/20193 | 25,000 | 24,922 |
| Starbird Funding Corp. 2.42%due 1/2/20193 | 10,000 | 9,999 |
| Total short-term securities (cost: $107,023,000) | 107,014 | |
| Total investment securities99.78% (cost: $1,627,160,000) | 1,811,931 | |
| Other assets less liabilities 0.22% | 3,943 | |
| Net assets100.00% | $1,815,874 |
| Contract amount | Counterparty | Settlement date | Unrealized appreciation at 12/31/2018 (000) | |
| Purchases (000) | Sales (000) | |||
| USD7,748 | AUD10,500 | Citibank | 1/11/2019 | $351 |
| 1 | Valued under fair value procedures adopted by authority of the board of trustees. The total value of all such securities was $395,472,000, which represented 21.78% of the net assets of the fund. This amount includes $391,460,000 related to certain securities trading outside the U.S. whose values were adjusted as a result of significant market movements following the close of local trading. |
| 2 | Security did not produce income during the last 12 months. |
| 3 | Acquired in a transaction exempt from registration under Rule 144A or Section 4(2) of the Securities Act of 1933. May be resold in the U.S. in transactions exempt from registration, normally to qualified institutional buyers. The total value of all such securities was $49,910,000, which represented 2.75% of the net assets of the fund. |
| Key to abbreviations |
| ADR = American Depositary Receipts |
| AUD = Australian dollars |
| CAD = Canadian dollars |
| CDI = CREST Depository Interest |
| USD/$ = U.S. dollars |
| Common stocks 90.59% Health care 15.91% | Shares | Value (000) |
| AbbVie Inc. | 7,288,241 | $671,903 |
| UnitedHealth Group Inc. | 2,286,268 | 569,555 |
| Gilead Sciences, Inc. | 7,114,800 | 445,031 |
| Amgen Inc. | 2,283,200 | 444,470 |
| Abbott Laboratories | 4,812,269 | 348,071 |
| Merck & Co., Inc. | 3,714,380 | 283,816 |
| Cigna Corp. | 1,277,418 | 242,607 |
| Eli Lilly and Co. | 1,567,600 | 181,403 |
| Johnson & Johnson | 1,013,000 | 130,728 |
| Stryker Corp. | 821,523 | 128,774 |
| Hologic, Inc.1 | 2,573,300 | 105,763 |
| AstraZeneca PLC | 747,200 | 55,934 |
| AstraZeneca PLC (ADR) | 1,228,600 | 46,662 |
| Thermo Fisher Scientific Inc. | 458,000 | 102,496 |
| Novartis AG2 | 1,199,821 | 102,496 |
| Edwards Lifesciences Corp.1 | 580,000 | 88,839 |
| Seattle Genetics, Inc.1 | 1,536,306 | 87,047 |
| Incyte Corp.1 | 1,330,900 | 84,632 |
| Illumina, Inc.1 | 280,500 | 84,130 |
| Pfizer Inc. | 1,877,251 | 81,942 |
| Humana Inc. | 282,000 | 80,787 |
| PerkinElmer, Inc. | 1,000,000 | 78,550 |
| Elanco Animal Health Inc.1 | 1,598,610 | 50,404 |
| Daiichi Sankyo Co., Ltd.2 | 1,392,000 | 44,474 |
| Bluebird Bio, Inc.1 | 412,200 | 40,890 |
| Novo Nordisk A/S, Class B2 | 740,242 | 33,945 |
| Ultragenyx Pharmaceutical Inc.1 | 741,800 | 32,253 |
| Agios Pharmaceuticals, Inc.1 | 612,920 | 28,262 |
| GlaxoSmithKline PLC | 1,482,100 | 28,170 |
| Allakos Inc.1 | 306,100 | 16,000 |
| Allogene Therapeutics, Inc.1 | 458,500 | 12,347 |
| CVS Health Corp. | 161,300 | 10,568 |
| Neurocrine Biosciences, Inc.1 | 140,600 | 10,040 |
| 4,752,989 | ||
| Information technology 13.79% | ||
| Microsoft Corp. | 9,710,500 | 986,297 |
| Broadcom Inc. | 1,985,134 | 504,780 |
| Intel Corp. | 9,945,900 | 466,761 |
| Texas Instruments Inc. | 3,188,582 | 301,321 |
| Accenture PLC, Class A | 1,490,900 | 210,232 |
| QUALCOMM Inc. | 3,500,275 | 199,201 |
| Visa Inc., Class A | 1,160,200 | 153,077 |
| Mastercard Inc., Class A | 804,100 | 151,693 |
| GoDaddy Inc., Class A1 | 1,644,970 | 107,943 |
| Amphenol Corp., Class A | 1,143,000 | 92,606 |
| Common stocks (continued) Information technology (continued) | Shares | Value (000) |
| Xilinx, Inc. | 1,017,000 | $86,618 |
| Taiwan Semiconductor Manufacturing Co., Ltd.2 | 10,637,000 | 77,464 |
| Euronet Worldwide, Inc.1 | 744,400 | 76,212 |
| NetApp, Inc. | 1,244,000 | 74,229 |
| Ceridian HCM Holding Inc.1 | 1,862,700 | 64,245 |
| Teradata Corp.1 | 1,587,757 | 60,906 |
| International Business Machines Corp. | 500,000 | 56,835 |
| Global Payments Inc. | 498,100 | 51,369 |
| Automatic Data Processing, Inc. | 390,000 | 51,137 |
| Atlassian Corporation PLC, Class A1 | 553,200 | 49,224 |
| Fiserv, Inc.1 | 536,700 | 39,442 |
| Motorola Solutions, Inc. | 300,000 | 34,512 |
| Apple Inc. | 190,500 | 30,049 |
| TE Connectivity Ltd. | 391,000 | 29,571 |
| Arista Networks, Inc.1 | 138,200 | 29,119 |
| ON Semiconductor Corp.1 | 1,491,600 | 24,626 |
| SAP SE2 | 239,500 | 23,867 |
| First Data Corp., Class A1 | 1,399,541 | 23,666 |
| ASML Holding NV (New York registered) | 112,700 | 17,538 |
| StoneCo Ltd., Class A1 | 797,000 | 14,697 |
| Trimble Inc.1 | 413,300 | 13,602 |
| Worldpay, Inc., Class A1 | 175,000 | 13,375 |
| Carbon Black, Inc.1 | 153,723 | 2,063 |
| 4,118,277 | ||
| Financials 11.01% | ||
| JPMorgan Chase & Co. | 4,986,230 | 486,756 |
| Bank of New York Mellon Corp. | 6,217,700 | 292,667 |
| CME Group Inc., Class A | 1,464,600 | 275,521 |
| Wells Fargo & Co. | 5,210,100 | 240,081 |
| Intercontinental Exchange, Inc. | 3,183,555 | 239,817 |
| Aon PLC, Class A | 1,214,800 | 176,583 |
| Berkshire Hathaway Inc., Class B1 | 814,500 | 166,305 |
| Chubb Ltd. | 1,095,100 | 141,465 |
| American International Group, Inc. | 3,207,141 | 126,393 |
| Marsh & McLennan Companies, Inc. | 1,580,200 | 126,021 |
| Moody’s Corp. | 817,558 | 114,491 |
| State Street Corp. | 1,795,500 | 113,242 |
| Willis Towers Watson PLC | 739,000 | 112,225 |
| Exor NV2 | 1,600,000 | 86,439 |
| Banco Santander, SA | 16,095,805 | 73,269 |
| UniCredit SpA2 | 5,468,000 | 61,791 |
| Kotak Mahindra Bank Ltd. | 3,417,778 | 61,512 |
| Nasdaq, Inc. | 703,300 | 57,368 |
| M&T Bank Corp. | 333,600 | 47,748 |
| HDFC Bank Ltd. | 1,290,000 | 39,204 |
| Toronto-Dominion Bank | 750,000 | 37,290 |
| AIA Group Ltd. | 4,300,000 | 35,694 |
| London Stock Exchange Group PLC | 665,000 | 34,430 |
| Bank of Montreal | 461,200 | 30,131 |
| Charles Schwab Corp. | 566,000 | 23,506 |
| PNC Financial Services Group, Inc. | 162,000 | 18,939 |
| Huntington Bancshares Inc. | 1,505,700 | 17,948 |
| UBS Group AG2 | 1,343,666 | 16,731 |
| SunTrust Banks, Inc. | 172,700 | 8,711 |
| Common stocks (continued) Financials (continued) | Shares | Value (000) |
| OFG Bancorp | 518,535 | $8,535 |
| Progressive Corp. | 119,100 | 7,185 |
| SVB Financial Group1 | 33,200 | 6,305 |
| BB&T Corp. | 91,000 | 3,942 |
| 3,288,245 | ||
| Communication services 10.28% | ||
| Alphabet Inc., Class C1 | 348,784 | 361,204 |
| Alphabet Inc., Class A1 | 317,250 | 331,514 |
| Facebook, Inc., Class A1 | 4,975,927 | 652,294 |
| Netflix, Inc.1 | 1,266,777 | 339,066 |
| Verizon Communications Inc. | 4,588,600 | 257,971 |
| Twenty-First Century Fox, Inc., Class A | 4,796,000 | 230,784 |
| Comcast Corp., Class A | 5,903,800 | 201,024 |
| Charter Communications, Inc., Class A1 | 430,969 | 122,813 |
| CBS Corp., Class B | 2,481,600 | 108,496 |
| Vodafone Group PLC | 52,726,321 | 102,756 |
| Viacom Inc., Class B | 3,516,900 | 90,384 |
| Activision Blizzard, Inc. | 1,727,800 | 80,464 |
| IAC/InterActiveCorp1 | 438,800 | 80,318 |
| Tencent Holdings Ltd. | 1,295,500 | 51,949 |
| Electronic Arts Inc.1 | 473,000 | 37,324 |
| Inmarsat PLC | 4,268,510 | 20,636 |
| 3,068,997 | ||
| Industrials 9.19% | ||
| General Dynamics Corp. | 2,033,000 | 319,608 |
| Airbus SE, non-registered shares | 2,559,564 | 246,223 |
| BWX Technologies, Inc.3 | 5,290,948 | 202,273 |
| Textron Inc. | 3,831,077 | 176,191 |
| TransDigm Group Inc.1 | 485,800 | 165,201 |
| Equifax Inc. | 1,406,200 | 130,959 |
| Norfolk Southern Corp. | 840,000 | 125,614 |
| CSX Corp. | 1,996,600 | 124,049 |
| L3 Technologies, Inc. | 707,000 | 122,778 |
| Safran SA | 989,103 | 119,446 |
| Waste Connections, Inc. | 1,309,600 | 97,238 |
| Union Pacific Corp. | 620,077 | 85,713 |
| United Technologies Corp. | 787,300 | 83,832 |
| Harris Corp. | 600,000 | 80,790 |
| Waste Management, Inc. | 767,700 | 68,318 |
| BAE Systems PLC | 11,317,000 | 66,238 |
| Northrop Grumman Corp. | 250,000 | 61,225 |
| Middleby Corp.1 | 497,000 | 51,057 |
| Westinghouse Air Brake Technologies Corp. | 722,300 | 50,741 |
| Deere & Co. | 280,326 | 41,816 |
| General Electric Co. | 5,227,900 | 39,575 |
| Old Dominion Freight Line, Inc. | 270,000 | 33,342 |
| Stanley Black & Decker, Inc. | 271,000 | 32,449 |
| Huntington Ingalls Industries, Inc. | 163,500 | 31,116 |
| Boeing Co. | 95,450 | 30,783 |
| Lockheed Martin Corp. | 109,900 | 28,776 |
| Masco Corp. | 954,000 | 27,895 |
| Covanta Holding Corp. | 2,019,800 | 27,106 |
| Meggitt PLC | 4,499,152 | 27,010 |
| Common stocks (continued) Industrials (continued) | Shares | Value (000) |
| Nielsen Holdings PLC | 856,400 | $19,980 |
| Caterpillar Inc. | 129,000 | 16,392 |
| RELX PLC | 535,800 | 11,039 |
| 2,744,773 | ||
| Consumer staples 8.91% | ||
| Coca-Cola Co. | 8,433,100 | 399,307 |
| Philip Morris International Inc. | 3,686,270 | 246,095 |
| British American Tobacco PLC | 6,830,460 | 217,653 |
| British American Tobacco PLC (ADR) | 479,440 | 15,275 |
| Pernod Ricard SA | 1,233,233 | 202,480 |
| Costco Wholesale Corp. | 807,200 | 164,435 |
| Carlsberg A/S, Class B2 | 1,390,224 | 147,718 |
| Mondelez International, Inc. | 3,567,400 | 142,803 |
| Nestlé SA2 | 1,606,846 | 130,428 |
| Walgreens Boots Alliance, Inc. | 1,845,600 | 126,110 |
| Herbalife Nutrition Ltd.1 | 2,137,000 | 125,976 |
| Procter & Gamble Co. | 1,353,178 | 124,384 |
| L’Oréal SA, bonus shares2 | 470,000 | 108,347 |
| Lamb Weston Holdings, Inc. | 1,370,000 | 100,777 |
| Altria Group, Inc. | 1,950,000 | 96,311 |
| Kirin Holdings Co., Ltd.2 | 3,380,000 | 70,844 |
| PepsiCo, Inc. | 498,419 | 55,065 |
| Keurig Dr Pepper Inc. | 1,998,615 | 51,244 |
| Diageo PLC | 1,220,000 | 43,463 |
| Church & Dwight Co., Inc. | 446,400 | 29,355 |
| Reckitt Benckiser Group PLC | 300,000 | 22,993 |
| Avon Products, Inc.1 | 13,199,000 | 20,062 |
| Kroger Co. | 360,000 | 9,900 |
| Hormel Foods Corp. | 206,600 | 8,818 |
| 2,659,843 | ||
| Energy 6.84% | ||
| Exxon Mobil Corp. | 5,277,700 | 359,886 |
| Chevron Corp. | 2,725,900 | 296,551 |
| EOG Resources, Inc. | 2,406,800 | 209,897 |
| Enbridge Inc. (CAD denominated) | 5,120,559 | 159,071 |
| Enbridge Inc. (CAD denominated)4 | 1,340,553 | 41,644 |
| Royal Dutch Shell PLC, Class B (ADR) | 1,415,800 | 84,863 |
| Royal Dutch Shell PLC, Class B | 1,800,000 | 53,686 |
| Royal Dutch Shell PLC, Class A (ADR) | 305,348 | 17,793 |
| Schlumberger Ltd. | 4,270,400 | 154,076 |
| Canadian Natural Resources, Ltd. (CAD denominated) | 4,464,200 | 107,714 |
| ConocoPhillips | 1,644,010 | 102,504 |
| Concho Resources Inc.1 | 893,800 | 91,874 |
| Williams Companies, Inc. | 4,043,200 | 89,152 |
| Baker Hughes, a GE Co., Class A | 2,522,600 | 54,236 |
| TOTAL SA | 1,001,197 | 52,974 |
| Kinder Morgan, Inc. | 3,264,200 | 50,203 |
| ONEOK, Inc. | 500,000 | 26,975 |
| Ensco PLC, Class A | 7,215,100 | 25,686 |
| Occidental Petroleum Corp. | 285,200 | 17,506 |
| Noble Energy, Inc. | 540,000 | 10,130 |
| Whitecap Resources Inc. | 2,849,000 | 9,078 |
| Tullow Oil PLC1 | 3,674,051 | 8,387 |
| Common stocks (continued) Energy (continued) | Shares | Value (000) |
| TransCanada Corp. | 168,534 | $6,018 |
| Suncor Energy Inc. | 213,650 | 5,967 |
| Halliburton Co. | 202,800 | 5,390 |
| Golar LNG Ltd. | 22,600 | 492 |
| 2,041,753 | ||
| Consumer discretionary 6.35% | ||
| Amazon.com, Inc.1 | 350,400 | 526,290 |
| Lowe’s Companies, Inc. | 2,000,000 | 184,720 |
| Marriott International, Inc., Class A | 1,323,700 | 143,701 |
| NIKE, Inc., Class B | 1,819,000 | 134,861 |
| Home Depot, Inc. | 725,420 | 124,642 |
| Booking Holdings Inc.1 | 57,000 | 98,178 |
| Toyota Motor Corp.2 | 1,325,000 | 77,563 |
| Hilton Worldwide Holdings Inc. | 1,032,720 | 74,149 |
| Hasbro, Inc. | 800,000 | 65,000 |
| Starbucks Corp. | 992,930 | 63,945 |
| McDonald’s Corp. | 300,000 | 53,271 |
| Signet Jewelers Ltd. | 1,674,500 | 53,199 |
| Wynn Resorts, Ltd. | 490,966 | 48,561 |
| Tiffany & Co. | 561,900 | 45,239 |
| Ferrari NV2 | 390,000 | 38,797 |
| Newell Brands Inc. | 1,725,000 | 32,068 |
| InterContinental Hotels Group PLC | 517,400 | 27,942 |
| Ross Stores, Inc. | 334,200 | 27,805 |
| Chipotle Mexican Grill, Inc.1 | 59,710 | 25,782 |
| YUM! Brands, Inc. | 205,630 | 18,901 |
| Cedar Fair, LP | 358,675 | 16,965 |
| Aramark | 465,000 | 13,471 |
| 1,895,050 | ||
| Materials 4.69% | ||
| Celanese Corp. | 3,329,233 | 299,531 |
| Vale SA, ordinary nominative (ADR) | 14,557,884 | 192,018 |
| Vale SA, ordinary nominative | 3,570,848 | 46,988 |
| DowDuPont Inc. | 3,404,500 | 182,073 |
| Linde PLC | 1,152,000 | 179,758 |
| International Flavors & Fragrances Inc. | 1,267,500 | 170,187 |
| Freeport-McMoRan Inc. | 9,055,000 | 93,357 |
| Mosaic Co. | 2,522,400 | 73,679 |
| Tata Steel Ltd. | 6,775,000 | 50,564 |
| Rio Tinto PLC | 1,020,655 | 48,525 |
| Allegheny Technologies Inc.1 | 1,092,000 | 23,773 |
| Centerra Gold Inc.1 | 2,917,909 | 12,525 |
| PPG Industries, Inc. | 111,700 | 11,419 |
| Alcoa Corp.1 | 372,000 | 9,888 |
| Asahi Kasei Corp.2 | 619,000 | 6,362 |
| 1,400,647 | ||
| Real estate 1.79% | ||
| Crown Castle International Corp. REIT | 1,827,000 | 198,467 |
| American Tower Corp. REIT | 699,900 | 110,717 |
| Iron Mountain Inc. REIT | 3,310,321 | 107,288 |
| Equinix, Inc. REIT | 131,600 | 46,397 |
| Common stocks (continued) Real estate (continued) | Shares | Value (000) |
| Weyerhaeuser Co. REIT1 | 1,952,541 | $42,683 |
| MGM Growth Properties LLC REIT, Class A | 1,142,500 | 30,173 |
| 535,725 | ||
| Utilities 1.68% | ||
| Sempra Energy | 1,840,000 | 199,070 |
| American Electric Power Co., Inc. | 1,628,000 | 121,677 |
| Edison International | 1,524,900 | 86,569 |
| E.ON SE2 | 5,598,029 | 55,293 |
| AES Corp. | 2,780,600 | 40,207 |
| 502,816 | ||
| Mutual funds 0.15% | ||
| Altaba Inc.1 | 789,243 | 45,729 |
| Total common stocks (cost: $22,571,835,000) | 27,054,844 | |
| Convertible stocks 0.13% Real estate 0.13% | ||
| Crown Castle International Corp. REIT, Series A, 6.875% convertible preferred 2020 | 36,900 | 38,828 |
| Total convertible stocks (cost: $39,390,000) | 38,828 | |
| Convertible bonds 0.09% Energy 0.09% | Principal amount (000) | |
| Weatherford International PLC, convertible notes, 5.875% 2021 | $ 43,359 | 27,617 |
| Total convertible bonds (cost: $43,359,000) | 27,617 | |
| Short-term securities 9.11% | ||
| 3M Co. 2.40%due 1/7/20194 | 40,000 | 39,982 |
| Apple Inc. 2.41%–2.47%due 2/5/2019–2/8/20194 | 150,000 | 149,601 |
| Chariot Funding, LLC 2.61%–2.68%due 2/19/2019–3/6/20194 | 86,500 | 86,122 |
| Chevron Corp. 2.50%due 2/11/20194 | 30,000 | 29,913 |
| Coca-Cola Co. 2.27%due 1/3/20194 | 20,000 | 19,996 |
| ExxonMobil Corp. 2.46%due 2/5/2019 | 100,000 | 99,752 |
| Federal Home Loan Bank 2.20%–2.41%due 1/4/2019–3/26/2019 | 1,219,600 | 1,215,496 |
| Freddie Mac 2.27%due 1/22/2019 | 50,000 | 49,932 |
| General Dynamics Corp. 2.52%due 1/10/20194 | 45,000 | 44,970 |
| Jupiter Securitization Co., LLC 2.67%due 3/1/20194 | 25,000 | 24,889 |
| Merck & Co. Inc. 2.35%–2.50%due 1/29/2019–2/27/20194 | 126,900 | 126,512 |
| Paccar Financial Corp. 2.43%due 1/16/2019 | 20,000 | 19,978 |
| Pfizer Inc. 2.45%due 2/11/20194 | 17,961 | 17,907 |
| Procter & Gamble Co. 2.30%due 1/15/20194 | 50,000 | 49,948 |
| U.S. Treasury Bills 2.27%–2.43%due 1/17/2019–5/2/2019 | 672,600 | 669,783 |
| Wal-Mart Stores, Inc. 2.46%–2.50%due 1/7/2019–1/22/20194 | 75,000 | 74,932 |
| Total short-term securities (cost: $2,719,773,000) | 2,719,713 | |
| Total investment securities99.92% (cost: $25,374,357,000) | 29,841,002 | |
| Other assets less liabilities 0.08% | 23,133 | |
| Net assets100.00% | $29,864,135 |
| 1 | Security did not produce income during the last 12 months. |
| 2 | Valued under fair value procedures adopted by authority of the board of trustees. The total value of all such securities was $1,082,559,000, which represented 3.62% of the net assets of the fund. This amount includes $974,212,000 related to certain securities trading outside the U.S. whose values were adjusted as a result of significant market movements following the close of local trading. |
| 3 | Represents an affiliated company as defined under the Investment Company Act of 1940. |
| 4 | Acquired in a transaction exempt from registration under Rule 144A or Section 4(2) of the Securities Act of 1933. May be resold in the U.S. in transactions exempt from registration, normally to qualified institutional buyers. The total value of all such securities was $706,416,000, which represented 2.37% of the net assets of the fund. |
| Key to abbreviations | |
| ADR = American Depositary Receipts | |
| CAD = Canadian dollars |
| Common stocks 89.17% Financials 18.67% | Shares | Value (000) |
| HDFC Bank Ltd. | 1,228,800 | $37,344 |
| Zurich Insurance Group AG1 | 92,200 | 27,498 |
| AIA Group Ltd. | 1,833,000 | 15,215 |
| KB Financial Group Inc.1 | 356,500 | 14,918 |
| Swedbank AB, Class A1 | 611,000 | 13,631 |
| GT Capital Holdings, Inc.1 | 733,589 | 13,598 |
| Itaú Unibanco Holding SA, preferred nominative (ADR) | 1,486,950 | 13,591 |
| Prudential PLC | 738,000 | 13,188 |
| Banco Santander, SA | 2,611,538 | 11,888 |
| Sumitomo Mitsui Financial Group, Inc.1 | 308,000 | 10,218 |
| Haci Ömer Sabanci Holding AS | 6,520,900 | 9,265 |
| PICC Property and Casualty Co. Ltd., Class H | 7,905,000 | 8,086 |
| St. James’s Place PLC | 524,000 | 6,305 |
| Credit Suisse Group AG1 | 576,077 | 6,299 |
| BNP Paribas SA | 137,300 | 6,210 |
| Banco Bilbao Vizcaya Argentaria, SA | 825,000 | 4,382 |
| Banco Bilbao Vizcaya Argentaria, SA (ADR) | 337,643 | 1,786 |
| Sampo Oyj, Class A1 | 138,000 | 6,075 |
| Bank Rakyat Indonesia (Persero) Tbk PT1 | 20,420,000 | 5,179 |
| Axis Bank Ltd.2 | 565,899 | 5,025 |
| Moscow Exchange MICEX-RTS PJSC1 | 4,172,000 | 4,850 |
| Sony Financial Holdings Inc.1 | 250,000 | 4,672 |
| Lloyds Banking Group PLC | 6,746,000 | 4,458 |
| ABN AMRO Group NV, depository receipts | 188,000 | 4,424 |
| Banca Mediolanum SpA1 | 266,912 | 1,553 |
| 249,658 | ||
| Health care 13.34% | ||
| Shire PLC | 927,000 | 53,997 |
| Novartis AG1 | 426,145 | 36,404 |
| Fresenius SE & Co. KGaA1 | 551,600 | 26,838 |
| Daiichi Sankyo Co., Ltd.1 | 561,000 | 17,924 |
| Teva Pharmaceutical Industries Ltd. (ADR) | 662,000 | 10,208 |
| Takeda Pharmaceutical Co. Ltd.1 | 266,000 | 8,976 |
| China Biologic Products Holdings, Inc.2 | 91,000 | 6,908 |
| Merck KGaA1 | 63,950 | 6,591 |
| Hikma Pharmaceuticals PLC | 278,771 | 6,097 |
| Chugai Pharmaceutical Co., Ltd.1 | 76,300 | 4,431 |
| 178,374 | ||
| Industrials 8.49% | ||
| Airbus SE, non-registered shares | 253,960 | 24,430 |
| Shanghai International Airport Co., Ltd., Class A1 | 2,855,033 | 21,203 |
| ASSA ABLOY AB, Class B1 | 681,100 | 12,151 |
| Adani Ports & Special Economic Zone Ltd. | 2,008,779 | 11,155 |
| Airports of Thailand PCL, foreign registered1 | 5,250,000 | 10,333 |
| Common stocks (continued) Industrials (continued) | Shares | Value (000) |
| Rolls-Royce Holdings PLC2 | 838,400 | $8,870 |
| SMC Corp.1 | 23,300 | 7,033 |
| Aena SME, SA, non-registered shares | 40,800 | 6,346 |
| ALD SA | 513,000 | 6,113 |
| Komatsu Ltd.1 | 184,600 | 3,967 |
| International Container Terminal Services, Inc.1 | 1,000,000 | 1,902 |
| 113,503 | ||
| Energy 7.09% | ||
| Royal Dutch Shell PLC, Class A | 1,933,691 | 56,872 |
| Royal Dutch Shell PLC, Class B | 138,000 | 4,116 |
| TOTAL SA | 399,350 | 21,130 |
| Canadian Natural Resources, Ltd. (CAD denominated) | 197,000 | 4,753 |
| Cenovus Energy Inc. | 645,000 | 4,536 |
| Petróleo Brasileiro SA (Petrobras), preferred nominative (ADR) | 221,700 | 2,569 |
| Petróleo Brasileiro SA (Petrobras), preferred nominative | 143,000 | 837 |
| 94,813 | ||
| Materials 7.06% | ||
| Rio Tinto PLC | 874,100 | 41,557 |
| Vale SA, ordinary nominative (ADR) | 1,386,000 | 18,281 |
| Yara International ASA1 | 343,000 | 13,223 |
| Akzo Nobel NV | 105,700 | 8,526 |
| Glencore PLC | 1,880,000 | 6,981 |
| Air Liquide SA, non-registered shares | 47,000 | 5,840 |
| 94,408 | ||
| Real estate 7.04% | ||
| Sun Hung Kai Properties Ltd. | 2,227,000 | 31,739 |
| CK Asset Holdings Ltd. | 3,939,348 | 28,826 |
| Daito Trust Construction Co., Ltd.1 | 95,500 | 13,077 |
| China Resources Land Ltd. | 3,162,000 | 12,155 |
| China Overseas Land & Investment Ltd. | 2,444,000 | 8,396 |
| 94,193 | ||
| Consumer staples 7.04% | ||
| British American Tobacco PLC | 1,075,402 | 34,268 |
| Pernod Ricard SA | 128,650 | 21,123 |
| Coca-Cola Icecek AS, Class C | 2,631,000 | 15,351 |
| Imperial Brands PLC | 316,016 | 9,574 |
| Philip Morris International Inc. | 109,400 | 7,304 |
| Kirin Holdings Co., Ltd.1 | 313,000 | 6,560 |
| 94,180 | ||
| Communication services 6.31% | ||
| Tencent Holdings Ltd. | 440,700 | 17,672 |
| BT Group PLC | 4,859,461 | 14,748 |
| Yandex NV, Class A2 | 470,000 | 12,855 |
| 1&1 Drillisch AG1 | 172,000 | 8,773 |
| SoftBank Group Corp.1 | 85,000 | 5,657 |
| LG Uplus Corp.1 | 356,595 | 5,639 |
| Nippon Telegraph and Telephone Corp.1 | 125,800 | 5,141 |
| ProSiebenSat.1 Media SE1 | 282,000 | 5,025 |
| Singapore Telecommunications Ltd. | 2,011,000 | 4,323 |
| Common stocks (continued) Communication services (continued) | Shares | Value (000) |
| Intouch Holdings PCL, foreign registered1 | 1,983,000 | $2,903 |
| RTL Group SA, non-registered shares1 | 32,100 | 1,717 |
| 84,453 | ||
| Utilities 6.08% | ||
| Ørsted AS1 | 441,200 | 29,441 |
| ENN Energy Holdings Ltd. | 1,658,000 | 14,705 |
| Naturgy Energy Group, SA | 400,000 | 10,202 |
| ENGIE SA | 498,000 | 7,147 |
| Iberdrola, SA, non-registered shares | 807,869 | 6,496 |
| E.ON SE1 | 611,000 | 6,035 |
| SSE PLC | 281,100 | 3,875 |
| National Grid PLC | 345,970 | 3,370 |
| 81,271 | ||
| Consumer discretionary 4.49% | ||
| LVMH Moët Hennessy-Louis Vuitton SE | 48,000 | 14,200 |
| EssilorLuxottica | 105,000 | 13,288 |
| Kering SA | 16,600 | 7,828 |
| Galaxy Entertainment Group Ltd. | 1,100,000 | 6,996 |
| Sands China Ltd. | 972,000 | 4,258 |
| Inchcape PLC | 589,000 | 4,140 |
| Alibaba Group Holding Ltd. (ADR)2 | 28,600 | 3,920 |
| Hyundai Motor Co.1 | 28,300 | 3,000 |
| Hyundai Mobis Co., Ltd.1 | 13,875 | 2,371 |
| 60,001 | ||
| Information technology 3.56% | ||
| Samsung Electronics Co., Ltd.1 | 417,500 | 14,421 |
| Tokyo Electron Ltd.1 | 96,500 | 11,004 |
| Taiwan Semiconductor Manufacturing Co., Ltd.1 | 1,464,000 | 10,662 |
| ASML Holding NV | 37,500 | 5,893 |
| Lenovo Group Ltd. | 8,290,000 | 5,600 |
| 47,580 | ||
| Total common stocks (cost: $1,222,804,000) | 1,192,434 | |
| Bonds, notes & other debt instruments 1.14% Bonds & notes of governments & government agencies outside the U.S. 0.61% | Principal amount (000) | |
| Brazil (Federative Republic of) 10.00% 2025 | BRL22,000 | 5,932 |
| Portuguese Republic 3.875% 2030 | €1,640 | 2,237 |
| 8,169 | ||
| Corporate bonds & notes 0.53% Energy 0.29% | ||
| Petróleos Mexicanos 6.875% 2026 | $3,617 | 3,525 |
| Petróleos Mexicanos 6.35% 2048 | 454 | 364 |
| 3,889 |
| Bonds, notes & other debt instruments (continued) Corporate bonds & notes (continued) Health care 0.24% | Principal amount (000) | Value (000) |
| Teva Pharmaceutical Finance Co. BV 3.15% 2026 | $1,060 | $811 |
| Teva Pharmaceutical Finance Co. BV 4.10% 2046 | 1,160 | 770 |
| Valeant Pharmaceuticals International, Inc. 6.125% 20253 | 1,865 | 1,632 |
| 3,213 | ||
| Total corporate bonds & notes | 7,102 | |
| Total bonds, notes & other debt instruments (cost: $15,574,000) | 15,271 | |
| Short-term securities 9.40% | ||
| BASF SE 2.62%due 2/5/20193 | 10,000 | 9,975 |
| Federal Home Loan Bank 2.22%–2.41%due 1/2/2019–3/21/2019 | 49,700 | 49,556 |
| KfW 2.43%due 1/11/20193 | 23,200 | 23,183 |
| L’Oréal USA, Inc. 2.50%due 1/16/20193 | 10,000 | 9,989 |
| National Rural Utilities Cooperative Finance Corp. 2.50%due 2/6/2019 | 18,100 | 18,054 |
| Siemens Capital Corp. 2.50%due 1/16/20193 | 15,000 | 14,984 |
| Total short-term securities (cost: $125,744,000) | 125,741 | |
| Total investment securities99.71% (cost: $1,364,122,000) | 1,333,446 | |
| Other assets less liabilities 0.29% | 3,812 | |
| Net assets100.00% | $1,337,258 |
| 1 | Valued under fair value procedures adopted by authority of the board of trustees. The total value of all such securities was $410,893,000, which represented 30.73% of the net assets of the fund. This entire amount relates to certain securities trading outside the U.S. whose values were adjusted as a result of significant market movements following the close of local trading. |
| 2 | Security did not produce income during the last 12 months. |
| 3 | Acquired in a transaction exempt from registration under Rule 144A or Section 4(2) of the Securities Act of 1933. May be resold in the U.S. in transactions exempt from registration, normally to qualified institutional buyers. The total value of all such securities was $59,763,000, which represented 4.47% of the net assets of the fund. |
| Key to abbreviations and symbol | |||
| ADR = American Depositary Receipts | |||
| BRL = Brazilian reais | |||
| € = Euros |
| Common stocks 68.05% Financials 10.16% | Shares | Value (000) |
| CME Group Inc., Class A | 73,016 | $13,736 |
| Zurich Insurance Group AG1 | 23,867 | 7,118 |
| Wells Fargo & Co. | 148,000 | 6,820 |
| Sampo Oyj, Class A1 | 130,569 | 5,747 |
| Svenska Handelsbanken AB, Class A1 | 475,408 | 5,274 |
| DBS Group Holdings Ltd. | 293,600 | 5,103 |
| Swedbank AB, Class A1 | 201,038 | 4,485 |
| JPMorgan Chase & Co. | 38,000 | 3,710 |
| Huntington Bancshares Inc. | 247,700 | 2,953 |
| Lloyds Banking Group PLC | 4,434,000 | 2,930 |
| Oversea-Chinese Banking Corp. Ltd. | 327,796 | 2,708 |
| Intesa Sanpaolo SpA1 | 1,099,089 | 2,444 |
| KBC Groep NV | 25,141 | 1,633 |
| Société Générale | 42,000 | 1,339 |
| Nasdaq, Inc. | 16,200 | 1,321 |
| Bank of China Ltd., Class H | 1,894,000 | 818 |
| MONETA Money Bank, AS, non-registered shares1 | 137,053 | 442 |
| 68,581 | ||
| Consumer staples 9.24% | ||
| Philip Morris International Inc. | 145,220 | 9,695 |
| Coca-Cola Co. | 177,700 | 8,414 |
| Diageo PLC | 233,000 | 8,301 |
| Altria Group, Inc. | 150,370 | 7,427 |
| British American Tobacco PLC | 189,300 | 6,032 |
| Nestlé SA1 | 69,277 | 5,623 |
| Imperial Brands PLC | 141,500 | 4,287 |
| Carlsberg A/S, Class B1 | 31,721 | 3,370 |
| Danone SA | 39,903 | 2,812 |
| Walgreens Boots Alliance, Inc. | 41,000 | 2,802 |
| Reckitt Benckiser Group PLC | 29,200 | 2,238 |
| Japan Tobacco Inc.1 | 59,500 | 1,420 |
| 62,421 | ||
| Information technology 8.94% | ||
| Broadcom Inc. | 47,700 | 12,129 |
| Microsoft Corp. | 99,520 | 10,108 |
| Taiwan Semiconductor Manufacturing Co., Ltd.1 | 1,277,800 | 9,306 |
| Intel Corp. | 176,700 | 8,292 |
| QUALCOMM Inc. | 140,900 | 8,019 |
| HP Inc. | 170,500 | 3,488 |
| Vanguard International Semiconductor Corp.1 | 1,510,700 | 2,890 |
| VTech Holdings Ltd. | 328,400 | 2,718 |
| Delta Electronics, Inc.1 | 482,200 | 2,025 |
| MediaTek Inc.1 | 185,300 | 1,372 |
| 60,347 |
| Common stocks (continued) Real estate 7.81% | Shares | Value (000) |
| Crown Castle International Corp. REIT | 118,400 | $12,862 |
| American Tower Corp. REIT | 68,369 | 10,815 |
| Link Real Estate Investment Trust REIT | 582,500 | 5,899 |
| Unibail-Rodamco-Westfield, non-registered shares REIT | 32,500 | 5,042 |
| Digital Realty Trust, Inc. REIT | 43,000 | 4,582 |
| Iron Mountain Inc. REIT | 124,500 | 4,035 |
| Nexity SA, Class A, non-registered shares | 81,189 | 3,665 |
| CK Asset Holdings Ltd. | 332,500 | 2,433 |
| Longfor Group Holdings Ltd. | 644,000 | 1,924 |
| TAG Immobilien AG1 | 63,600 | 1,451 |
| 52,708 | ||
| Energy 6.62% | ||
| Enbridge Inc. (CAD denominated) | 335,970 | 10,437 |
| Royal Dutch Shell PLC, Class B | 321,740 | 9,596 |
| Royal Dutch Shell PLC, Class B (ADR) | 8,500 | 509 |
| Royal Dutch Shell PLC, Class A | 101 | 3 |
| Williams Companies, Inc. | 231,200 | 5,098 |
| Occidental Petroleum Corp. | 82,400 | 5,058 |
| Helmerich & Payne, Inc. | 90,500 | 4,338 |
| Inter Pipeline Ltd. | 297,600 | 4,216 |
| Schlumberger Ltd. | 83,400 | 3,009 |
| Chevron Corp. | 22,600 | 2,459 |
| 44,723 | ||
| Communication services 6.02% | ||
| Vodafone Group PLC | 5,377,800 | 10,481 |
| Verizon Communications Inc. | 119,950 | 6,743 |
| Koninklijke KPN NV | 2,175,375 | 6,381 |
| HKT Trust and HKT Ltd., units | 3,699,240 | 5,329 |
| Modern Times Group MTG AB, Class B1 | 104,880 | 3,469 |
| NTT DoCoMo, Inc.1 | 121,700 | 2,744 |
| SES SA, Class A (FDR) | 118,666 | 2,272 |
| Nintendo Co., Ltd.1 | 8,000 | 2,130 |
| Gannett Co., Inc. | 132,999 | 1,134 |
| 40,683 | ||
| Health care 5.69% | ||
| AstraZeneca PLC | 105,100 | 7,867 |
| AstraZeneca PLC (ADR) | 145,100 | 5,511 |
| Johnson & Johnson | 60,200 | 7,769 |
| Pfizer Inc. | 158,900 | 6,936 |
| Eli Lilly and Co. | 26,600 | 3,078 |
| Gilead Sciences, Inc. | 43,800 | 2,740 |
| GlaxoSmithKline PLC | 137,100 | 2,606 |
| Roche Holding AG, nonvoting, non-registered shares1 | 7,627 | 1,889 |
| 38,396 | ||
| Utilities 5.52% | ||
| Edison International | 135,100 | 7,670 |
| Enel SpA1 | 1,284,246 | 7,422 |
| SSE PLC | 477,689 | 6,585 |
| Iberdrola, SA, non-registered shares | 495,604 | 3,985 |
| National Grid PLC | 357,100 | 3,478 |
| Infratil Ltd. | 1,291,737 | 3,165 |
| Common stocks (continued) Utilities (continued) | Shares | Value (000) |
| Exelon Corp. | 55,800 | $2,516 |
| AES Corp. | 169,000 | 2,444 |
| 37,265 | ||
| Consumer discretionary 3.52% | ||
| Las Vegas Sands Corp. | 154,300 | 8,031 |
| Sands China Ltd. | 1,128,000 | 4,941 |
| Greene King PLC | 610,500 | 4,108 |
| InterContinental Hotels Group PLC | 68,100 | 3,678 |
| Burberry Group PLC | 78,200 | 1,730 |
| BCA Marketplace PLC | 460,000 | 1,290 |
| 23,778 | ||
| Industrials 3.12% | ||
| Airbus SE, non-registered shares | 73,714 | 7,091 |
| Boeing Co. | 17,900 | 5,773 |
| Air New Zealand Ltd. | 1,738,359 | 3,617 |
| United Technologies Corp. | 23,700 | 2,524 |
| Kühne + Nagel International AG1 | 16,085 | 2,067 |
| 21,072 | ||
| Materials 1.41% | ||
| DowDuPont Inc. | 58,900 | 3,150 |
| Givaudan SA1 | 1,202 | 2,783 |
| Nutrien Ltd. | 48,020 | 2,257 |
| Asahi Kasei Corp.1 | 131,900 | 1,356 |
| 9,546 | ||
| Total common stocks (cost: $480,374,000) | 459,520 | |
| Rights & warrants 0.00% Energy 0.00% | ||
| Ultra Petroleum Corp., warrants, expire 20251,2,3 | 1,750 | — |
| Total rights & warrants (cost: $1,000) | — | |
| Convertible stocks 0.91% Utilities 0.61% | ||
| Sempra Energy, Series A, 6.00% convertible preferred 2021 | 43,400 | 4,128 |
| Real estate 0.30% | ||
| Crown Castle International Corp. REIT, Series A, 6.875% convertible preferred 2020 | 1,900 | 1,999 |
| Total convertible stocks (cost: $6,292,000) | 6,127 | |
| Bonds, notes & other debt instruments 24.91% U.S. Treasury bonds & notes 13.84% U.S. Treasury 13.02% | Principal amount (000) | |
| U.S. Treasury 2.625% 2021 | $215 | 216 |
| U.S. Treasury 2.875% 2021 | 3,000 | 3,034 |
| U.S. Treasury 1.625% 2022 | 6,050 | 5,872 |
| Bonds, notes & other debt instruments (continued) U.S. Treasury bonds & notes (continued) U.S. Treasury (continued) | Principal amount (000) | Value (000) |
| U.S. Treasury 1.875% 2022 | $4,900 | $4,801 |
| U.S. Treasury 1.875% 2022 | 1,000 | 979 |
| U.S. Treasury 2.00% 2022 | 15,000 | 14,741 |
| U.S. Treasury 2.00% 2022 | 3,000 | 2,947 |
| U.S. Treasury 2.125% 2022 | 8,800 | 8,681 |
| U.S. Treasury 1.75% 2023 | 4,000 | 3,877 |
| U.S. Treasury 2.625% 2023 | 4,060 | 4,082 |
| U.S. Treasury 2.625% 2023 | 1,886 | 1,896 |
| U.S. Treasury 2.75% 2023 | 3,770 | 3,810 |
| U.S. Treasury 2.875% 2023 | 3,100 | 3,152 |
| U.S. Treasury 2.00% 2025 | 13,200 | 12,729 |
| U.S. Treasury 2.625% 2025 | 5 | 5 |
| U.S. Treasury 2.00% 2026 | 7,500 | 7,160 |
| U.S. Treasury 2.875% 2028 | 1,500 | 1,525 |
| U.S. Treasury 3.125% 2028 | 41 | 43 |
| U.S. Treasury 2.875% 2045 | 200 | 195 |
| U.S. Treasury, principal only, 0% 2047 | 12,400 | 5,188 |
| U.S. Treasury 3.00% 2048 | 981 | 977 |
| U.S. Treasury 3.125% 20484 | 2,000 | 2,041 |
| 87,951 | ||
| U.S. Treasury inflation-protected securities 0.82% | ||
| U.S. Treasury Inflation-Protected Security 0.625% 20235 | 5,599 | 5,512 |
| Total U.S. Treasury bonds & notes | 93,463 | |
| Mortgage-backed obligations 6.96% Federal agency mortgage-backed obligations 6.72% | ||
| Fannie Mae 4.00% 20466 | 1,051 | 1,073 |
| Fannie Mae 4.00% 20476 | 9,196 | 9,385 |
| Fannie Mae 4.00% 20476 | 793 | 809 |
| Fannie Mae 4.50% 20486,7 | 6,846 | 7,099 |
| Fannie Mae 4.50% 20486 | 5,816 | 6,033 |
| Fannie Mae 4.50% 20486 | 5,689 | 5,901 |
| Fannie Mae 3.50% 20496,7 | 500 | 500 |
| Freddie Mac 2.50% 20326 | 96 | 93 |
| Freddie Mac 2.50% 20336 | 142 | 138 |
| Freddie Mac Seasoned Credit Risk Transfer Trust, Series 2017-2, Class HA, 2.50% 20566 | 517 | 508 |
| Freddie Mac Seasoned Credit Risk Transfer Trust, Series 2017-1, Class HA, 2.75% 20566,8 | 255 | 248 |
| Freddie Mac Seasoned Credit Risk Transfer Trust, Series 2017-2, Class MA, 3.00% 20566 | 492 | 476 |
| Freddie Mac Seasoned Credit Risk Transfer Trust, Series 2017-4, Class HT, 2.50% 20576,8 | 202 | 197 |
| Freddie Mac Seasoned Credit Risk Transfer Trust, Series 2018-2, Class MT, 3.50% 20576 | 3,052 | 3,019 |
| Freddie Mac Seasoned Credit Risk Transfer Trust, Series 2017-4, Class MT, 3.50% 20576 | 158 | 157 |
| Freddie Mac Seasoned Loan Structured Transaction, Series 2018-2, Class A1, 3.50% 20286,8 | 1,956 | 1,923 |
| Government National Mortgage Assn. 4.50% 20496,7 | 4,525 | 4,683 |
| Government National Mortgage Assn. 5.00% 20496,7 | 2,190 | 2,278 |
| Government National Mortgage Assn. 5.00% 20496,7 | 311 | 323 |
| Government National Mortgage Assn. 5.647% 20596 | 1 | 1 |
| Government National Mortgage Assn. 5.46% 20606 | 42 | 43 |
| Government National Mortgage Assn. 4.362% 20616 | 8 | 8 |
| Government National Mortgage Assn. 4.81% 20616 | 1 | 1 |
| Government National Mortgage Assn. 6.87% 20616 | 7 | 7 |
| Government National Mortgage Assn. 4.575% 20626 | 32 | 32 |
| Government National Mortgage Assn. 4.605% 20626 | 171 | 173 |
| Government National Mortgage Assn. 4.302% 20636 | 106 | 107 |
| Bonds, notes & other debt instruments (continued) Mortgage-backed obligations (continued) Federal agency mortgage-backed obligations (continued) | Principal amount (000) | Value (000) |
| Government National Mortgage Assn. 4.443% 20636 | $45 | $46 |
| Government National Mortgage Assn. 4.561% 20636 | 114 | 115 |
| 45,376 | ||
| Collateralized mortgage-backed obligations (privately originated) 0.24% | ||
| Arroyo Mortgage Trust, Series 2018-1, Class A1, 3.763% 20486,8,9 | 881 | 882 |
| Finance of America Structured Securities Trust, Series 2017-HB1, Class A, 2.321% 20271,6,8,9 | 141 | 141 |
| Homeward Opportunities Fund Trust, Series 2018-1, 3.766% 20486,9 | 309 | 309 |
| Nationstar HECM Loan Trust, Series 2018-2, Class A, 3.188% 20281,6,9 | 250 | 250 |
| 1,582 | ||
| Total mortgage-backed obligations | 46,958 | |
| Corporate bonds & notes 3.97% Financials 0.98% | ||
| American Express Co. 3.70% 2021 | 440 | 444 |
| American International Group, Inc. 4.20% 2028 | 30 | 29 |
| American International Group, Inc. 4.75% 2048 | 100 | 92 |
| Bank of America Corp. 4.271% 2029 (3-month USD-LIBOR + 1.31% on 7/23/2028)10 | 206 | 205 |
| Barclays Bank PLC 4.972% 2029 (3-month USD-LIBOR + 1.902% on 5/16/2028)10 | 200 | 193 |
| BB&T Corp. 6.85% 2019 | 100 | 101 |
| BNP Paribas 3.375% 20259 | 250 | 236 |
| Citigroup Inc. 4.075% 2029 (3-month USD-LIBOR + 1.192% on 4/23/2028)10 | 266 | 260 |
| CME Group Inc. 4.15% 2048 | 100 | 102 |
| Cooperatieve Rabobank UA 2.75% 2023 | 250 | 242 |
| Danske Bank AS 2.80% 20219 | 250 | 244 |
| Goldman Sachs Group, Inc. 4.223% 2029 (3-month USD-LIBOR + 1.301% on 5/1/2028)10 | 303 | 292 |
| Groupe BPCE SA 2.75% 20239 | 250 | 240 |
| Groupe BPCE SA 4.00% 2024 | 285 | 287 |
| HSBC Holdings PLC 3.64% 20248 | 250 | 244 |
| Intesa Sanpaolo SpA 5.71% 20269 | 375 | 344 |
| Intesa Sanpaolo SpA 3.875% 20279 | 200 | 173 |
| JPMorgan Chase & Co. 6.30% 2019 | 200 | 202 |
| JPMorgan Chase & Co. 4.25% 2020 | 300 | 305 |
| JPMorgan Chase & Co. 4.203% 2029 (3-month USD-LIBOR + 1.26% on 7/23/2028)10 | 266 | 266 |
| JPMorgan Chase & Co. 4.452% 2029 (3-month USD-LIBOR + 1.33% on 12/5/2028)10 | 609 | 621 |
| Metropolitan Life Global Funding I 2.40% 20219 | 225 | 222 |
| Morgan Stanley 5.50% 2020 | 300 | 309 |
| Morgan Stanley 3.875% 2026 | 51 | 50 |
| Morgan Stanley 3.625% 2027 | 99 | 94 |
| New York Life Global Funding 3.00% 20289 | 150 | 144 |
| Nuveen, LLC 4.00% 20289 | 45 | 47 |
| Wells Fargo & Co. 4.60% 2021 | 300 | 307 |
| Wells Fargo & Co. 3.55% 2023 | 300 | 299 |
| 6,594 | ||
| Utilities 0.83% | ||
| AEP Transmission Co. LLC 4.25% 2048 | 45 | 46 |
| American Electric Power Co., Inc. 3.65% 2021 | 300 | 302 |
| American Electric Power Co., Inc. 4.30% 2028 | 530 | 540 |
| CenterPoint Energy, Inc. 3.85% 2024 | 160 | 161 |
| Consolidated Edison Co. of New York, Inc. 4.65% 2048 | 140 | 146 |
| Consumers Energy Co. 4.35% 2049 | 255 | 266 |
| DTE Energy Co. 3.70% 2023 | 203 | 202 |
| Bonds, notes & other debt instruments (continued) Corporate bonds & notes (continued) Utilities (continued) | Principal amount (000) | Value (000) |
| Duke Energy Corp. 2.65% 2026 | $115 | $105 |
| Emera Inc. 6.75% 2076 (3-month USD-LIBOR + 5.44% on 6/15/2026)10 | 120 | 121 |
| Emera US Finance LP 4.75% 2046 | 120 | 116 |
| Enel Finance International SA 3.625% 20279 | 215 | 190 |
| Entergy Corp. 5.125% 2020 | 200 | 204 |
| Entergy Corp. 2.95% 2026 | 280 | 259 |
| Eversource Energy 4.25% 2029 | 125 | 128 |
| Mississippi Power Co. 4.25% 2042 | 335 | 311 |
| Pacific Gas and Electric Co. 2.45% 2022 | 210 | 187 |
| Pacific Gas and Electric Co. 4.65% 20289 | 284 | 251 |
| Public Service Co. of Colorado 4.10% 2048 | 100 | 99 |
| SCANA Corp. 6.25% 2020 | 400 | 410 |
| SCANA Corp. 4.75% 2021 | 350 | 354 |
| SCANA Corp. 4.125% 2022 | 160 | 160 |
| South Carolina Electric & Gas Co. 3.50% 2021 | 500 | 502 |
| South Carolina Electric & Gas Co. 4.25% 2028 | 225 | 234 |
| South Carolina Electric & Gas Co. 4.35% 2042 | 50 | 49 |
| Southern California Edison Co. 4.65% 2043 | 100 | 101 |
| Tampa Electric Co. 4.45% 2049 | 30 | 29 |
| Virginia Electric and Power Co. 4.60% 2048 | 110 | 115 |
| 5,588 | ||
| Health care 0.54% | ||
| AbbVie Inc. 4.45% 2046 | 102 | 90 |
| AstraZeneca PLC 3.50% 2023 | 270 | 269 |
| AstraZeneca PLC 3.375% 2025 | 200 | 194 |
| Bayer US Finance II LLC 4.25% 20259 | 350 | 341 |
| Becton, Dickinson and Co. 3.70% 2027 | 220 | 208 |
| Centene Corp. 5.375% 20269 | 100 | 98 |
| Cigna Corp. 4.375% 20289 | 100 | 101 |
| Cigna Corp. 4.80% 20389 | 130 | 129 |
| Cigna Corp. 4.90% 20489 | 60 | 59 |
| CVS Health Corp. 4.30% 2028 | 223 | 219 |
| CVS Health Corp. 4.78% 2038 | 197 | 190 |
| EMD Finance LLC 3.25% 20259 | 300 | 288 |
| Takeda Pharmaceutical Co., Ltd. 4.40% 20239 | 360 | 364 |
| Takeda Pharmaceutical Co., Ltd. 5.00% 20289 | 800 | 819 |
| UnitedHealth Group Inc. 3.875% 2028 | 215 | 218 |
| UnitedHealth Group Inc. 4.45% 2048 | 70 | 72 |
| 3,659 | ||
| Communication services 0.38% | ||
| AT&T Inc. (3-month USD-LIBOR + 1.18%) 3.956% 20248 | 260 | 252 |
| CCO Holdings LLC and CCO Holdings Capital Corp. 4.20% 2028 | 310 | 291 |
| CCO Holdings LLC and CCO Holdings Capital Corp. 5.75% 2048 | 180 | 169 |
| Comcast Corp. 3.95% 2025 | 60 | 61 |
| Comcast Corp. 4.60% 2038 | 60 | 61 |
| Comcast Corp. 4.00% 2047 | 100 | 90 |
| Comcast Corp. 4.00% 2048 | 50 | 46 |
| Comcast Corp. 4.70% 2048 | 240 | 245 |
| Deutsche Telekom International Finance BV 4.375% 20289 | 150 | 148 |
| NBCUniversal Enterprise, Inc. 5.25% 20499 | 300 | 305 |
| Verizon Communications Inc. 4.329% 2028 | 312 | 314 |
| Vodafone Group PLC 3.75% 2024 | 300 | 296 |
| Bonds, notes & other debt instruments (continued) Corporate bonds & notes (continued) Communication services (continued) | Principal amount (000) | Value (000) |
| Vodafone Group PLC 4.375% 2028 | $100 | $97 |
| Vodafone Group PLC 5.25% 2048 | 200 | 189 |
| 2,564 | ||
| Consumer staples 0.36% | ||
| Anheuser-Busch Co./InBev Worldwide 4.70% 20369 | 20 | 19 |
| Anheuser-Busch Co./InBev Worldwide 4.90% 20469 | 200 | 186 |
| British American Tobacco PLC 3.557% 2027 | 600 | 534 |
| British American Tobacco PLC 4.54% 2047 | 150 | 120 |
| Conagra Brands, Inc. 4.60% 2025 | 30 | 30 |
| Conagra Brands, Inc. 4.85% 2028 | 100 | 99 |
| Constellation Brands, Inc. 3.20% 2023 | 230 | 223 |
| Constellation Brands, Inc. 3.60% 2028 | 105 | 97 |
| Keurig Dr Pepper Inc. 4.057% 20239 | 620 | 618 |
| Keurig Dr Pepper Inc. 4.417% 20259 | 30 | 30 |
| Keurig Dr Pepper Inc. 5.085% 20489 | 64 | 61 |
| Molson Coors Brewing Co. 4.20% 2046 | 65 | 54 |
| Philip Morris International Inc. 2.625% 2022 | 243 | 235 |
| Philip Morris International Inc. 3.60% 2023 | 30 | 30 |
| Wal-Mart Stores, Inc. 3.70% 2028 | 130 | 132 |
| 2,468 | ||
| Energy 0.26% | ||
| BP Capital Markets PLC 4.234% 2028 | 250 | 258 |
| Cenovus Energy Inc. 4.25% 2027 | 105 | 96 |
| Cenovus Energy Inc. 5.40% 2047 | 215 | 186 |
| Concho Resources Inc. 4.30% 2028 | 155 | 152 |
| Enbridge Energy Partners, LP 7.375% 2045 | 106 | 132 |
| Energy Transfer Partners, LP 6.00% 2048 | 231 | 226 |
| EnLink Midstream Partners, LP 5.45% 2047 | 75 | 61 |
| Equinor ASA 3.625% 2028 | 195 | 195 |
| Kinder Morgan, Inc. 5.55% 2045 | 120 | 119 |
| Petróleos Mexicanos 6.50% 2029 | 80 | 75 |
| Shell International Finance BV 3.50% 2023 | 100 | 101 |
| TransCanada PipeLines Ltd. 4.25% 2028 | 60 | 59 |
| Ultra Petroleum Corp. 11.00% 202411 | 90 | 70 |
| 1,730 | ||
| Consumer discretionary 0.25% | ||
| DaimlerChrysler North America Holding Corp. 3.35% 20239 | 350 | 345 |
| General Motors Co. 5.95% 2049 | 90 | 81 |
| Home Depot, Inc. 3.90% 2028 | 50 | 51 |
| Home Depot, Inc. 4.50% 2048 | 217 | 225 |
| Starbucks Corp. 3.80% 2025 | 435 | 431 |
| Starbucks Corp. 4.00% 2028 | 35 | 35 |
| Volkswagen Group of America Finance, LLC 4.00% 20219 | 290 | 291 |
| Volkswagen Group of America Finance, LLC 4.25% 20239 | 200 | 199 |
| 1,658 | ||
| Industrials 0.19% | ||
| 3M Co. 2.25% 2023 | 92 | 89 |
| 3M Co. 3.625% 2028 | 62 | 63 |
| CSX Corp. 3.80% 2028 | 145 | 143 |
| CSX Corp. 4.25% 2029 | 35 | 36 |
| Bonds, notes & other debt instruments (continued) Corporate bonds & notes (continued) Industrials (continued) | Principal amount (000) | Value (000) |
| CSX Corp. 4.75% 2048 | $50 | $51 |
| General Dynamics Corp. 3.375% 2023 | 65 | 65 |
| Union Pacific Corp. 3.95% 2028 | 50 | 50 |
| Union Pacific Corp. 4.50% 2048 | 80 | 79 |
| United Technologies Corp. 3.65% 2023 | 130 | 130 |
| United Technologies Corp. 3.95% 2025 | 55 | 55 |
| United Technologies Corp. 4.125% 2028 | 165 | 164 |
| Westinghouse Air Brake Technologies Corp. 4.15% 2024 | 360 | 348 |
| 1,273 | ||
| Materials 0.10% | ||
| Dow Chemical Co. 4.80% 20289 | 300 | 306 |
| DowDuPont Inc. 4.725% 2028 | 110 | 114 |
| DowDuPont Inc. 5.419% 2048 | 60 | 63 |
| Sherwin-Williams Co. 3.45% 2027 | 230 | 215 |
| 698 | ||
| Real estate 0.04% | ||
| Equinix, Inc. 5.375% 2027 | 300 | 294 |
| Information technology 0.04% | ||
| Broadcom Ltd. 3.875% 2027 | 200 | 180 |
| Broadcom Ltd. 3.50% 2028 | 128 | 111 |
| 291 | ||
| Total corporate bonds & notes | 26,817 | |
| Asset-backed obligations 0.14% | ||
| Westlake Automobile Receivables Trust, Series 2017-2A, Class A2A, 1.80% 20206,9 | 198 | 197 |
| Westlake Automobile Receivables Trust, Series 2018-3A, Class A2A, 2.98% 20226,9 | 770 | 770 |
| 967 | ||
| Total bonds, notes & other debt instruments (cost: $169,549,000) | 168,205 | |
| Short-term securities 6.79% | ||
| Chevron Corp. 2.39% due 1/28/20199 | 10,000 | 9,981 |
| Federal Home Loan Bank 2.33%–2.38% due 1/18/2019–2/21/2019 | 22,200 | 22,140 |
| National Rural Utilities Cooperative Finance Corp. 2.52% due 1/31/2019 | 9,600 | 9,579 |
| Pfizer Inc. 2.31% due 1/15/20199 | 4,200 | 4,196 |
| Total short-term securities (cost: $45,898,000) | 45,896 | |
| Total investment securities100.66% (cost: $702,114,000) | 679,748 | |
| Other assets less liabilities (0.66)% | (4,468) | |
| Net assets100.00% | $675,280 |
| Contracts | Type | Number of contracts | Expiration | Notional amount12 (000) | Value at 12/31/201813 (000) | Unrealized appreciation (depreciation) at 12/31/2018 (000) |
| 90 Day Euro Dollar Futures | Long | 100 | December 2019 | $25,000 | $24,338 | $151 |
| 2 Year U.S. Treasury Note Futures | Long | 49 | April 2019 | 9,800 | 10,403 | 67 |
| 5 Year U.S. Treasury Note Futures | Long | 988 | April 2019 | 98,800 | 113,311 | 1,810 |
| 10 Year Ultra U.S. Treasury Note Futures | Short | 473 | March 2019 | (47,300) | (61,527) | (1,820) |
| 20 Year U.S. Treasury Bond Futures | Long | 64 | March 2019 | 6,400 | 9,344 | 439 |
| 30 Year Ultra U.S. Treasury Bond Futures | Short | 26 | March 2019 | (2,600) | (4,177) | (218) |
| $429 |
| 1 | Valued under fair value procedures adopted by authority of the board of trustees. The total value of all such securities was $77,218,000, which represented 11.43% of the net assets of the fund. This amount includes $76,827,000 related to certain securities trading outside the U.S. whose values were adjusted as a result of significant market movements following the close of local trading. |
| 2 | Value determined using significant unobservable inputs. |
| 3 | Security did not produce income during the last 12 months. |
| 4 | All or a portion of this security was pledged as collateral. The total value of pledged collateral was $284,000, which represented .04% of the net assets of the fund. |
| 5 | Index-linked bond whose principal amount moves with a government price index. |
| 6 | Principal payments may be made periodically. Therefore, the effective maturity date may be earlier than the stated maturity date. |
| 7 | Purchased on a TBA basis. |
| 8 | Coupon rate may change periodically. |
| 9 | Acquired in a transaction exempt from registration under Rule 144A or Section 4(2) of the Securities Act of 1933. May be resold in the U.S. in transactions exempt from registration, normally to qualified institutional buyers. The total value of all such securities was $23,524,000, which represented 3.48% of the net assets of the fund. |
| 10 | Step bond; coupon rate may change at a later date. |
| 11 | Payment in kind; the issuer has the option of paying additional securities in lieu of cash. Most recent payment was 100% cash unless otherwise noted. |
| 12 | Notional amount is calculated based on the number of contracts and notional contract size. |
| 13 | Value is calculated based on the notional amount and current market price. |
| Key to abbreviations and symbol |
| ADR = American Depositary Receipts |
| CAD = Canadian dollars |
| FDR = Fiduciary Depositary Receipts |
| LIBOR = London Interbank Offered Rate |
| TBA = To-be-announced |
| USD/$ = U.S. dollars |
| Common stocks 58.94% Information technology 13.64% | Shares | Value (000) |
| Microsoft Corp. | 6,500,000 | $660,205 |
| Taiwan Semiconductor Manufacturing Co., Ltd. (ADR) | 14,016,000 | 517,331 |
| Broadcom Inc. | 1,995,000 | 507,289 |
| VeriSign, Inc.1 | 2,000,000 | 296,580 |
| ASML Holding NV (New York registered) | 1,865,000 | 290,231 |
| Intel Corp. | 5,820,000 | 273,133 |
| Intuit Inc. | 1,100,000 | 216,535 |
| Visa Inc., Class A | 1,032,000 | 136,162 |
| Mastercard Inc., Class A | 451,000 | 85,081 |
| RingCentral, Inc., Class A1 | 652,300 | 53,776 |
| HP Inc. | 1,908,100 | 39,040 |
| Largan Precision Co., Ltd.2 | 340,000 | 35,434 |
| AAC Technologies Holdings Inc. | 2,890,000 | 16,774 |
| Corporate Risk Holdings I, Inc.1,2,3 | 168,812 | 59 |
| Corporate Risk Holdings Corp.1,2,3,4 | 854 | —5 |
| 3,127,630 | ||
| Health care 11.11% | ||
| UnitedHealth Group Inc. | 2,016,300 | 502,301 |
| Johnson & Johnson | 3,472,000 | 448,062 |
| Cigna Corp. | 1,689,540 | 320,877 |
| Humana Inc. | 965,000 | 276,453 |
| AbbVie Inc. | 2,675,300 | 246,636 |
| Merck & Co., Inc. | 2,420,300 | 184,935 |
| Bluebird Bio, Inc.1 | 1,617,100 | 160,416 |
| Gilead Sciences, Inc. | 1,500,000 | 93,825 |
| Pfizer Inc. | 1,815,000 | 79,225 |
| Eli Lilly and Co. | 474,700 | 54,932 |
| Thermo Fisher Scientific Inc. | 200,000 | 44,758 |
| Vertex Pharmaceuticals Inc.1 | 260,000 | 43,085 |
| Diplomat Pharmacy, Inc.1 | 3,060,400 | 41,193 |
| Daiichi Sankyo Co., Ltd.2 | 752,400 | 24,039 |
| Seattle Genetics, Inc.1 | 378,800 | 21,463 |
| Advanz Pharma Corp.1,2,4,6 | 175,310 | 2,930 |
| Advanz Pharma Corp.1 | 41,857 | 786 |
| Rotech Healthcare Inc.1,2,3,4 | 184,138 | 736 |
| 2,546,652 | ||
| Financials 9.49% | ||
| Chubb Ltd. | 2,450,000 | 316,491 |
| Arch Capital Group Ltd.1 | 8,595,000 | 229,658 |
| First Republic Bank | 2,580,000 | 224,202 |
| Wells Fargo & Co. | 3,500,000 | 161,280 |
| JPMorgan Chase & Co. | 1,600,000 | 156,192 |
| Bank of America Corp. | 6,000,000 | 147,840 |
| CME Group Inc., Class A | 738,200 | 138,870 |
| Common stocks (continued) Financials (continued) | Shares | Value (000) |
| Citigroup Inc. | 2,500,000 | $130,150 |
| Capital One Financial Corp. | 1,500,000 | 113,385 |
| Oaktree Capital Group, LLC | 2,610,000 | 103,747 |
| BlackRock, Inc. | 229,000 | 89,956 |
| PNC Financial Services Group, Inc. | 733,000 | 85,695 |
| Intercontinental Exchange, Inc. | 800,000 | 60,264 |
| Nasdaq, Inc. | 638,000 | 52,042 |
| Apollo Global Management, LLC, Class A | 2,083,000 | 51,117 |
| RenaissanceRe Holdings Ltd. | 357,000 | 47,731 |
| Aon PLC, Class A | 205,000 | 29,799 |
| Berkshire Hathaway Inc., Class A1 | 61 | 18,666 |
| HDFC Bank Ltd. | 297,000 | 9,026 |
| First Hawaiian, Inc. | 400,000 | 9,004 |
| 2,175,115 | ||
| Industrials 4.39% | ||
| Boeing Co. | 1,140,000 | 367,650 |
| Northrop Grumman Corp. | 1,249,400 | 305,978 |
| Lockheed Martin Corp. | 847,200 | 221,831 |
| Airbus SE, non-registered shares | 436,214 | 41,962 |
| General Electric Co. | 4,007,400 | 30,336 |
| Waste Management, Inc. | 214,000 | 19,044 |
| TransDigm Group Inc.1 | 45,000 | 15,303 |
| CEVA Logistics AG1,2 | 157,127 | 4,769 |
| NCI Building Systems, Inc.1,2,4,6 | 2,283 | 15 |
| 1,006,888 | ||
| Energy 4.17% | ||
| Noble Energy, Inc. | 10,500,000 | 196,980 |
| Cenovus Energy Inc. | 27,000,000 | 189,862 |
| Royal Dutch Shell PLC, Class B (ADR) | 2,745,000 | 164,535 |
| Cabot Oil & Gas Corp. | 5,000,000 | 111,750 |
| Suncor Energy Inc. | 4,000,000 | 111,720 |
| Chevron Corp. | 875,000 | 95,191 |
| Weatherford International PLC1,7 | 60,000,000 | 33,540 |
| ConocoPhillips | 335,000 | 20,887 |
| Diamondback Energy, Inc. | 175,000 | 16,223 |
| Extraction Oil & Gas, Inc.1 | 3,000,000 | 12,870 |
| Tribune Resources, Inc.1,2 | 926,514 | 2,780 |
| 956,338 | ||
| Consumer discretionary 3.94% | ||
| Home Depot, Inc. | 1,125,000 | 193,297 |
| Amazon.com, Inc.1 | 103,000 | 154,703 |
| General Motors Co. | 4,100,000 | 137,145 |
| VF Corp. | 1,600,000 | 114,144 |
| Dillard’s, Inc., Class A (USA)7 | 1,700,000 | 102,527 |
| NIKE, Inc., Class B | 980,000 | 72,657 |
| Starbucks Corp. | 710,500 | 45,756 |
| Kindred Group PLC (SDR)2 | 4,602,522 | 42,365 |
| Marriott International, Inc., Class A | 376,000 | 40,819 |
| 903,413 |
| Common stocks (continued) Communication services 3.70% | Shares | Value (000) |
| Comcast Corp., Class A | 7,550,000 | $257,077 |
| Alphabet Inc., Class C1 | 108,600 | 112,467 |
| Alphabet Inc., Class A1 | 90,800 | 94,883 |
| Facebook, Inc., Class A1 | 1,332,000 | 174,612 |
| Verizon Communications Inc. | 2,040,000 | 114,689 |
| Activision Blizzard, Inc. | 1,000,000 | 46,570 |
| Netflix, Inc.1 | 148,600 | 39,774 |
| Charter Communications, Inc., Class A1 | 27,126 | 7,730 |
| Cumulus Media Inc., Class B1,2 | 10,599 | 115 |
| Cumulus Media Inc., Class A1 | 8,723 | 94 |
| 848,011 | ||
| Consumer staples 3.52% | ||
| Philip Morris International Inc. | 5,430,000 | 362,507 |
| Nestlé SA2 | 3,242,230 | 263,173 |
| Nestlé SA (ADR) | 900,000 | 72,864 |
| Coca-Cola Co. | 975,000 | 46,166 |
| Walgreens Boots Alliance, Inc. | 521,500 | 35,634 |
| British American Tobacco PLC | 875,000 | 27,882 |
| 808,226 | ||
| Materials 3.23% | ||
| DowDuPont Inc. | 7,753,100 | 414,636 |
| LyondellBasell Industries NV | 1,200,000 | 99,792 |
| Alcoa Corp.1 | 2,500,000 | 66,450 |
| Royal Gold, Inc. | 695,000 | 59,527 |
| First Quantum Minerals Ltd. | 3,861,222 | 31,225 |
| WestRock Co. | 825,200 | 31,159 |
| Franco-Nevada Corp. | 292,832 | 20,534 |
| Newmont Mining Corp. | 470,000 | 16,285 |
| 739,608 | ||
| Utilities 0.94% | ||
| CMS Energy Corp. | 2,284,700 | 113,435 |
| Edison International | 843,800 | 47,903 |
| Sempra Energy | 273,900 | 29,633 |
| DTE Energy Co. | 226,000 | 24,928 |
| 215,899 | ||
| Real estate 0.81% | ||
| Crown Castle International Corp. REIT | 755,000 | 82,016 |
| Digital Realty Trust, Inc. REIT | 525,000 | 55,939 |
| American Tower Corp. REIT | 296,000 | 46,824 |
| 184,779 | ||
| Total common stocks (cost: $10,995,856,000) | 13,512,559 |
| Rights & warrants 0.00% Energy 0.00% | Shares | Value (000) |
| Tribune Resources, Inc., Class A, warrants, expire 20231,2,3 | 311,755 | $107 |
| Tribune Resources, Inc., Class B, warrants, expire 20231,2,3 | 242,476 | 64 |
| Tribune Resources, Inc., Class C, warrants, expire 20231,2,3 | 227,540 | 48 |
| Ultra Petroleum Corp., warrants, expire 20251,2,3 | 92,890 | 23 |
| 242 | ||
| Industrials 0.00% | ||
| Associated Materials, LLC, warrants, expire 20231,2,3 | 71,030 | —5 |
| Total rights & warrants (cost: $70,000) | 242 | |
| Convertible stocks 0.03% Industrials 0.03% | ||
| Associated Materials, LLC, 14.00% convertible preferred 20202,3 | 5,000 | 6,074 |
| Total convertible stocks (cost: $4,800,000) | 6,074 | |
| Convertible bonds 0.00% Communication services 0.00% | Principal amount (000) | |
| Gogo Inc., convertible notes, 6.00% 20226 | 1,390 | 1,272 |
| Total convertible bonds (cost: $1,390,000) | 1,272 | |
| Bonds, notes & other debt instruments 28.92% U.S. Treasury bonds & notes 12.30% U.S. Treasury 9.54% | ||
| U.S. Treasury 1.125% 2019 | $35,000 | 34,925 |
| U.S. Treasury 1.50% 2019 | 400,000 | 399,688 |
| U.S. Treasury 1.50% 2019 | 39,825 | 39,420 |
| U.S. Treasury 1.75% 2019 | 3,800 | 3,776 |
| U.S. Treasury 1.25% 20208 | 298,117 | 293,842 |
| U.S. Treasury 1.25% 2020 | 78,000 | 76,812 |
| U.S. Treasury 1.375% 2020 | 46,500 | 45,835 |
| U.S. Treasury 1.375% 2020 | 35,000 | 34,520 |
| U.S. Treasury 1.50% 2020 | 500 | 493 |
| U.S. Treasury 1.625% 2020 | 125,000 | 123,238 |
| U.S. Treasury 1.625% 2020 | 10,000 | 9,890 |
| U.S. Treasury 2.50% 2020 | 15,000 | 14,990 |
| U.S. Treasury 1.125% 2021 | 42,000 | 40,558 |
| U.S. Treasury 1.375% 2021 | 49,410 | 48,296 |
| U.S. Treasury 1.75% 2021 | 9,500 | 9,312 |
| U.S. Treasury 2.25% 2021 | 9,730 | 9,680 |
| U.S. Treasury 2.750% 2021 | 19,232 | 19,373 |
| U.S. Treasury 1.875% 2022 | 100,000 | 98,228 |
| U.S. Treasury 1.875% 2022 | 8,000 | 7,831 |
| U.S. Treasury 1.875% 2022 | 5,000 | 4,899 |
| U.S. Treasury 2.00% 2022 | 25,000 | 24,559 |
| U.S. Treasury 2.125% 2022 | 37,000 | 36,498 |
| U.S. Treasury 1.375% 2023 | 8,000 | 7,597 |
| U.S. Treasury 1.375% 2023 | 5,000 | 4,754 |
| U.S. Treasury 1.625% 2023 | 18,000 | 17,362 |
| U.S. Treasury 1.625% 2023 | 5,000 | 4,818 |
| Bonds, notes & other debt instruments (continued) U.S. Treasury bonds & notes (continued) U.S. Treasury (continued) | Principal amount (000) | Value (000) |
| U.S. Treasury 2.25% 2023 | $5,000 | $4,938 |
| U.S. Treasury 2.375% 2023 | 5,000 | 4,978 |
| U.S. Treasury 2.50% 2023 | 29,000 | 29,009 |
| U.S. Treasury 2.75% 2023 | 76,600 | 77,432 |
| U.S. Treasury 2.75% 2023 | 31,326 | 31,655 |
| U.S. Treasury 2.00% 2024 | 12,000 | 11,686 |
| U.S. Treasury 2.00% 2024 | 7,500 | 7,295 |
| U.S. Treasury 2.125% 2024 | 52,500 | 51,505 |
| U.S. Treasury 2.125% 2024 | 10,250 | 10,019 |
| U.S. Treasury 2.125% 2024 | 10,000 | 9,805 |
| U.S. Treasury 2.125% 2024 | 5,000 | 4,892 |
| U.S. Treasury 2.25% 2024 | 5,000 | 4,937 |
| U.S. Treasury 2.375% 2024 | 70,000 | 69,382 |
| U.S. Treasury 2.50% 2024 | 700 | 699 |
| U.S. Treasury 2.00% 2025 | 44,800 | 43,202 |
| U.S. Treasury 2.50% 2025 | 3,500 | 3,487 |
| U.S. Treasury 2.625% 2025 | 27,300 | 27,368 |
| U.S. Treasury 2.625% 2025 | 4,966 | 4,981 |
| U.S. Treasury 2.75% 2025 | 3,229 | 3,262 |
| U.S. Treasury 1.50% 2026 | 500 | 461 |
| U.S. Treasury 1.625% 2026 | 7,000 | 6,554 |
| U.S. Treasury 1.625% 2026 | 1,500 | 1,401 |
| U.S. Treasury 2.00% 2026 | 8,000 | 7,638 |
| U.S. Treasury 2.25% 2027 | 126,075 | 122,452 |
| U.S. Treasury 2.375% 2027 | 880 | 862 |
| U.S. Treasury 2.875% 2028 | 5,217 | 5,302 |
| U.S. Treasury 3.125% 2028 | 239 | 248 |
| U.S. Treasury 4.75% 2041 | 15,000 | 19,402 |
| U.S. Treasury 2.50% 20468 | 5,000 | 4,520 |
| U.S. Treasury 2.875% 20468 | 103,550 | 100,827 |
| U.S. Treasury 3.00% 2047 | 70,000 | 69,894 |
| U.S. Treasury 3.00% 2047 | 12,460 | 12,425 |
| U.S. Treasury 3.00% 2048 | 22,432 | 22,360 |
| U.S. Treasury 3.00% 2048 | 451 | 449 |
| 2,186,521 | ||
| U.S. Treasury inflation-protected securities 2.76% | ||
| U.S. Treasury Inflation-Protected Security 0.125% 20219 | 39,903 | 38,815 |
| U.S. Treasury Inflation-Protected Security 0.625% 20239 | 76,352 | 75,161 |
| U.S. Treasury Inflation-Protected Security 0.125% 20249 | 692 | 664 |
| U.S. Treasury Inflation-Protected Security 0.625% 20249 | 221,289 | 217,968 |
| U.S. Treasury Inflation-Protected Security 0.25% 20259 | 1,703 | 1,631 |
| U.S. Treasury Inflation-Protected Security 2.375% 20259 | 201 | 218 |
| U.S. Treasury Inflation-Protected Security 0.125% 20269 | 21,099 | 19,813 |
| U.S. Treasury Inflation-Protected Security 0.375% 20279 | 18,581 | 17,654 |
| U.S. Treasury Inflation-Protected Security 0.375% 20279 | 5,169 | 4,913 |
| U.S. Treasury Inflation-Protected Security 0.50% 20289 | 61,510 | 58,733 |
| U.S. Treasury Inflation-Protected Security 0.75% 20289 | 17,629 | 17,267 |
| U.S. Treasury Inflation-Protected Security 0.75% 20429 | 19,237 | 17,489 |
| U.S. Treasury Inflation-Protected Security 1.375% 20448,9 | 139,180 | 144,107 |
| Bonds, notes & other debt instruments (continued) U.S. Treasury bonds & notes (continued) U.S. Treasury inflation-protected securities (continued) | Principal amount (000) | Value (000) |
| U.S. Treasury Inflation-Protected Security 1.00% 20469 | $5,336 | $5,068 |
| U.S. Treasury Inflation-Protected Security 0.875% 20479 | 15,713 | 14,447 |
| 633,948 | ||
| Total U.S. Treasury bonds & notes | 2,820,469 | |
| Corporate bonds & notes 9.97% Energy 1.60% | ||
| American Energy (Permian Basin) (3-month USD-LIBOR + 6.50%) 9.082% 20196,10 | 825 | 289 |
| American Energy (Permian Basin) 7.125% 20206 | 7,948 | 1,828 |
| American Energy (Permian Basin) 7.375% 20216 | 5,970 | 1,343 |
| Anadarko Petroleum Corp. 4.85% 2021 | 2,751 | 2,818 |
| Anadarko Petroleum Corp. 5.55% 2026 | 2,250 | 2,361 |
| Ascent Resources Marcellus Holdings, Inc., Term Loan B, (3-month USD-LIBOR + 6.50%) 8.887% 202310,11,12 | 1,223 | 1,228 |
| Blackstone CQP Holdco LP 6.00% 20214,6 | 5,700 | 5,737 |
| Blackstone CQP Holdco LP 6.50% 20214,6 | 21,325 | 21,486 |
| BP Capital Markets PLC 4.234% 2028 | 3,000 | 3,092 |
| Canadian Natural Resources Ltd. 2.95% 2023 | 4,975 | 4,760 |
| Canadian Natural Resources Ltd. 4.95% 2047 | 1,000 | 964 |
| Cenovus Energy Inc. 3.80% 2023 | 3,970 | 3,834 |
| Cenovus Energy Inc. 4.25% 2027 | 6,625 | 6,048 |
| Cenovus Energy Inc. 5.25% 2037 | 2,000 | 1,769 |
| Cenovus Energy Inc. 5.40% 2047 | 8,000 | 6,937 |
| Chesapeake Energy Corp. (3-month USD-LIBOR + 3.25%) 5.686% 201910 | 3,200 | 3,192 |
| Chesapeake Energy Corp. 4.875% 2022 | 7,225 | 6,340 |
| Chesapeake Energy Corp. 5.75% 2023 | 75 | 65 |
| Chesapeake Energy Corp. 8.00% 2025 | 4,475 | 3,972 |
| Chesapeake Energy Corp. 8.00% 2027 | 4,365 | 3,688 |
| Chevron Corp. 2.566% 2023 | 2,000 | 1,949 |
| Chevron Corp. 3.326% 2025 | 1,165 | 1,157 |
| Comstock Resources, Inc. 9.75% 20266 | 4,225 | 3,591 |
| Concho Resources Inc. 4.30% 2028 | 6,425 | 6,301 |
| Concho Resources Inc. 4.85% 2048 | 1,500 | 1,443 |
| CONSOL Energy Inc. 5.875% 2022 | 23,140 | 22,272 |
| Convey Park Energy LLC 7.50% 20256 | 2,000 | 1,730 |
| DCP Midstream Operating LP 4.95% 2022 | 4,775 | 4,739 |
| Diamond Offshore Drilling, Inc. 7.875% 2025 | 2,550 | 2,129 |
| Diamond Offshore Drilling, Inc. 4.875% 2043 | 4,685 | 2,647 |
| Enbridge Energy Partners, LP 5.20% 2020 | 120 | 123 |
| Enbridge Energy Partners, LP 5.875% 2025 | 3,825 | 4,152 |
| Enbridge Energy Partners, LP, Series B, 7.50% 2038 | 2,000 | 2,531 |
| Enbridge Inc. 4.00% 2023 | 2,500 | 2,515 |
| Enbridge Inc. 3.70% 2027 | 3,897 | 3,700 |
| Energy Transfer Partners, LP 4.15% 2020 | 3,500 | 3,522 |
| Energy Transfer Partners, LP 7.50% 2020 | 1,175 | 1,225 |
| Energy Transfer Partners, LP 5.875% 2024 | 2,775 | 2,840 |
| Energy Transfer Partners, LP 4.75% 2026 | 4,000 | 3,895 |
| Energy Transfer Partners, LP 4.20% 2027 | 185 | 173 |
| Energy Transfer Partners, LP 4.95% 2028 | 282 | 277 |
| Energy Transfer Partners, LP 5.30% 2047 | 1,247 | 1,104 |
| Energy Transfer Partners, LP 5.40% 2047 | 1,300 | 1,170 |
| Energy Transfer Partners, LP 6.00% 2048 | 3,056 | 2,990 |
| EnLink Midstream Partners, LP 5.45% 2047 | 1,964 | 1,597 |
| Ensco PLC 7.75% 2026 | 3,650 | 2,719 |
| Bonds, notes & other debt instruments (continued) Corporate bonds & notes (continued) Energy (continued) | Principal amount (000) | Value (000) |
| Ensco PLC 5.75% 2044 | $7,820 | $4,410 |
| Enterprise Products Operating LLC 4.90% 2046 | 1,000 | 973 |
| EOG Resources, Inc. 4.15% 2026 | 2,980 | 3,065 |
| EQT Corp. 3.00% 2022 | 975 | 925 |
| EQT Corp. 3.90% 2027 | 1,810 | 1,564 |
| Equinor ASA 3.625% 2028 | 9,735 | 9,736 |
| Extraction Oil & Gas, Inc. 5.625% 20266 | 2,900 | 2,131 |
| Exxon Mobil Corp. 2.222% 2021 | 5,070 | 4,998 |
| Exxon Mobil Corp. 2.726% 2023 | 3,000 | 2,952 |
| Exxon Mobil Corp. 3.043% 2026 | 2,250 | 2,198 |
| Genesis Energy, LP 6.75% 2022 | 4,425 | 4,336 |
| Genesis Energy, LP 6.50% 2025 | 2,725 | 2,412 |
| Halliburton Co. 3.80% 2025 | 535 | 520 |
| Jonah Energy LLC 7.25% 20256 | 2,950 | 1,917 |
| Kinder Morgan Energy Partners, LP 3.50% 2021 | 40 | 40 |
| Kinder Morgan Energy Partners, LP 5.40% 2044 | 1,380 | 1,325 |
| Kinder Morgan Energy Partners, LP 5.50% 2044 | 3,578 | 3,475 |
| Kinder Morgan, Inc. 3.05% 2019 | 2,520 | 2,506 |
| Kinder Morgan, Inc. 4.30% 2028 | 5,750 | 5,656 |
| Kinder Morgan, Inc. 5.05% 2046 | 1,500 | 1,377 |
| Kinder Morgan, Inc. 5.20% 2048 | 3,362 | 3,230 |
| Marathon Oil Corp. 4.40% 2027 | 2,030 | 1,933 |
| MPLX LP 4.125% 2027 | 1,000 | 954 |
| MPLX LP 4.50% 2038 | 3,000 | 2,631 |
| NGL Energy Partners LP 6.125% 2025 | 7,435 | 6,431 |
| Noble Corp. PLC 7.95% 202513 | 3,175 | 2,401 |
| Noble Corp. PLC 8.95% 204513 | 3,525 | 2,697 |
| Noble Energy, Inc. 4.95% 2047 | 2,000 | 1,739 |
| Peabody Energy Corp. 6.00% 20226 | 2,150 | 2,094 |
| Peabody Energy Corp. 6.375% 20256 | 600 | 559 |
| Petróleos Mexicanos 5.35% 2028 | 1,820 | 1,592 |
| Petróleos Mexicanos 6.75% 2047 | 2,495 | 2,069 |
| Petróleos Mexicanos 6.35% 2048 | 1,230 | 986 |
| Phillips 66 3.90% 2028 | 1,645 | 1,593 |
| Phillips 66 Partners LP 3.55% 2026 | 335 | 314 |
| Phillips 66 Partners LP 3.75% 2028 | 1,055 | 977 |
| Phillips 66 Partners LP 4.68% 2045 | 800 | 724 |
| Phillips 66 Partners LP 4.90% 2046 | 550 | 504 |
| Pioneer Natural Resources Co. 3.45% 2021 | 3,345 | 3,336 |
| QGOG Constellation SA 9.50% 2024 (5.26% PIK)6,12,14,15 | 856 | 355 |
| Sabine Pass Liquefaction, LLC 5.875% 2026 | 1,235 | 1,310 |
| Sabine Pass Liquefaction, LLC 4.20% 2028 | 1,745 | 1,673 |
| Schlumberger BV 3.625% 20226 | 2,800 | 2,790 |
| Schlumberger BV 4.00% 20256 | 2,636 | 2,607 |
| Shell International Finance BV 2.25% 2020 | 1,965 | 1,942 |
| Shell International Finance BV 1.875% 2021 | 2,000 | 1,949 |
| Shell International Finance BV 3.50% 2023 | 6,895 | 6,976 |
| Shell International Finance BV 3.875% 2028 | 4,125 | 4,247 |
| Statoil ASA 2.75% 2021 | 1,925 | 1,910 |
| Statoil ASA 3.25% 2024 | 2,850 | 2,840 |
| Statoil ASA 4.25% 2041 | 2,000 | 1,991 |
| Sunoco LP 4.875% 2023 | 990 | 968 |
| Targa Resources Partners LP 4.125% 2019 | 6,255 | 6,216 |
| Targa Resources Partners LP 6.75% 2024 | 2,065 | 2,104 |
| Bonds, notes & other debt instruments (continued) Corporate bonds & notes (continued) Energy (continued) | Principal amount (000) | Value (000) |
| Teekay Corp. 8.50% 2020 | $17,530 | $16,807 |
| Teekay Offshore Partners LP 8.50% 20236 | 3,400 | 3,332 |
| Total Capital SA 3.883% 2028 | 7,500 | 7,722 |
| TransCanada PipeLines Ltd. 4.25% 2028 | 2,190 | 2,174 |
| TransCanada PipeLines Ltd. 4.75% 2038 | 8,000 | 7,743 |
| TransCanada PipeLines Ltd. 4.875% 2048 | 3,000 | 2,938 |
| Transocean Inc. 9.00% 20236 | 3,454 | 3,450 |
| Ultra Petroleum Corp. 11.00% 202415 | 4,670 | 3,619 |
| Vine Oil & Gas LP 8.75% 20236 | 2,500 | 1,987 |
| Weatherford International PLC 4.50% 20227 | 6,365 | 3,755 |
| Weatherford International PLC 8.25% 20237 | 5,800 | 3,523 |
| Weatherford International PLC 9.875% 20247 | 1,000 | 620 |
| Weatherford International PLC 9.875% 20256,7 | 2,550 | 1,562 |
| Weatherford International PLC 6.50% 20367 | 7,595 | 3,987 |
| Weatherford International PLC 6.75% 20407 | 7,825 | 4,069 |
| Western Gas Partners LP 4.65% 2026 | 925 | 896 |
| Williams Partners LP 3.60% 2022 | 1,500 | 1,474 |
| Williams Partners LP 4.30% 2024 | 160 | 160 |
| 367,218 | ||
| Financials 1.56% | ||
| ACE INA Holdings Inc. 2.30% 2020 | 1,345 | 1,326 |
| ACE INA Holdings Inc. 2.875% 2022 | 3,880 | 3,849 |
| ACE INA Holdings Inc. 3.35% 2026 | 880 | 862 |
| ACE INA Holdings Inc. 4.35% 2045 | 800 | 827 |
| American Express Co. 2.20% 2020 | 6,000 | 5,893 |
| American International Group, Inc. 4.20% 2028 | 2,080 | 2,012 |
| Bank of America Corp. 2.625% 2020 | 4,037 | 3,995 |
| Bank of America Corp. 3.55% 2024 (3-month USD-LIBOR + 0.78% on 3/5/2023)13 | 7,250 | 7,166 |
| Bank of America Corp. 3.248% 2027 | 1,500 | 1,389 |
| Bank of America Corp. 3.593% 2028 (3-month USD-LIBOR + 1.37% on 7/21/2027)13 | 3,000 | 2,850 |
| Bank of America Corp. 4.271% 2029 (3-month USD-LIBOR + 1.31% on 7/23/2028)13 | 3,080 | 3,071 |
| BB&T Corp. 2.45% 2020 | 6,000 | 5,959 |
| BB&T Corp. 2.625% 2022 | 2,500 | 2,455 |
| BB&T Corp. 2.75% 2022 | 3,050 | 3,000 |
| Berkshire Hathaway Finance Corp. 1.30% 2019 | 1,070 | 1,059 |
| Berkshire Hathaway Finance Corp. 4.20% 2048 | 7,145 | 7,127 |
| Berkshire Hathaway Inc. 2.20% 2021 | 1,000 | 987 |
| Berkshire Hathaway Inc. 2.75% 2023 | 2,615 | 2,568 |
| Berkshire Hathaway Inc. 3.125% 2026 | 1,000 | 971 |
| BNP Paribas 3.375% 20256 | 3,225 | 3,040 |
| Citigroup Inc. 2.35% 2021 | 8,855 | 8,607 |
| Citigroup Inc. 2.90% 2021 | 2,000 | 1,969 |
| Citigroup Inc. 2.876% 2023 (3-month USD-LIBOR + 0.95% on 7/24/2022)13 | 1,725 | 1,670 |
| Citigroup Inc. 4.65% 2048 | 2,430 | 2,388 |
| CME Group Inc. 3.75% 2028 | 6,000 | 6,091 |
| CME Group Inc. 4.15% 2048 | 1,500 | 1,525 |
| Commonwealth Bank of Australia 2.25% 20206 | 1,000 | 991 |
| Compass Diversified Holdings 8.00% 20266 | 2,775 | 2,752 |
| Crédit Agricole SA 4.375% 20256 | 1,700 | 1,648 |
| Credit Suisse Group AG 3.00% 2021 | 250 | 247 |
| Credit Suisse Group AG 3.80% 2023 | 1,625 | 1,596 |
| Credit Suisse Group AG 3.869% 2029 (3-month USD-LIBOR + 1.41% on 1/12/2028)6,13 | 800 | 746 |
| Danske Bank AS 2.70% 20226 | 2,000 | 1,917 |
| Bonds, notes & other debt instruments (continued) Corporate bonds & notes (continued) Financials (continued) | Principal amount (000) | Value (000) |
| DNB ASA 2.375% 20216 | $3,000 | $2,929 |
| Ford Motor Credit Co. 1.897% 2019 | 2,500 | 2,476 |
| FS Energy and Power Fund 7.50% 20236 | 2,020 | 1,924 |
| General Motors Financial Co. 3.45% 2022 | 3,625 | 3,508 |
| General Motors Financial Co. 4.30% 2025 | 1,250 | 1,186 |
| Goldman Sachs Group, Inc. 2.55% 2019 | 4,000 | 3,976 |
| Goldman Sachs Group, Inc. 5.25% 2021 | 200 | 208 |
| Goldman Sachs Group, Inc. 3.00% 2022 | 4,750 | 4,602 |
| Goldman Sachs Group, Inc. 2.905% 2023 (3-month USD-LIBOR + 0.99% on 7/24/2022)13 | 5,872 | 5,597 |
| Goldman Sachs Group, Inc. 3.691% 2028 (3-month USD-LIBOR + 1.51% on 6/5/2027)13 | 2,000 | 1,862 |
| Goldman Sachs Group, Inc. 4.223% 2029 (3-month USD-LIBOR + 1.301% on 5/1/2028)13 | 755 | 728 |
| Groupe BPCE SA 2.75% 20236 | 1,200 | 1,152 |
| Groupe BPCE SA 5.70% 20236 | 4,460 | 4,626 |
| Groupe BPCE SA 5.15% 20246 | 3,000 | 3,016 |
| HSBC Holdings PLC 3.262% 2023 (3-month USD-LIBOR + 1.055% on 3/13/2022)13 | 3,000 | 2,937 |
| HSBC Holdings PLC 3.64% 202410 | 1,500 | 1,462 |
| HSBC Holdings PLC 3.95% 2024 (3-month USD-LIBOR + 0.987% on 5/18/2023)13 | 1,250 | 1,244 |
| HSBC Holdings PLC 4.25% 2024 | 3,000 | 2,980 |
| HSBC Holdings PLC 4.30% 2026 | 200 | 198 |
| HSBC Holdings PLC 4.583% 2029 (3-month USD-LIBOR + 1.535% on 6/19/2028)13 | 5,250 | 5,213 |
| HUB International Ltd. 7.00% 20266 | 165 | 150 |
| Icahn Enterprises Finance Corp. 6.25% 2022 | 5,675 | 5,618 |
| Intesa Sanpaolo SpA 3.375% 20236 | 1,500 | 1,391 |
| Intesa Sanpaolo SpA 5.017% 20246 | 3,980 | 3,605 |
| Intesa Sanpaolo SpA 3.875% 20286 | 1,500 | 1,284 |
| JPMorgan Chase & Co. 2.55% 2021 | 497 | 490 |
| JPMorgan Chase & Co. 3.25% 2022 | 180 | 179 |
| JPMorgan Chase & Co. 2.70% 2023 | 125 | 120 |
| JPMorgan Chase & Co. 3.559% 2024 (3-month USD-LIBOR + 0.73% on 4/23/2023)13 | 4,725 | 4,692 |
| JPMorgan Chase & Co. 4.023% 2024 (3-month USD-LIBOR + 1.00% on 12/5/2023)13 | 6,026 | 6,081 |
| JPMorgan Chase & Co. 3.54% 2028 (3-month USD-LIBOR + 1.38% on 5/1/2027)13 | 3,000 | 2,865 |
| JPMorgan Chase & Co. 4.203% 2029 (3-month USD-LIBOR + 1.26% on 7/23/2028)13 | 9,000 | 8,989 |
| JPMorgan Chase & Co., Series Z, junior subordinated 5.30% (undated) (3-month USD-LIBOR + 3.80% on 5/1/2020)13 | 3,200 | 3,168 |
| Lloyds Banking Group PLC 3.00% 2022 | 4,000 | 3,872 |
| Lloyds Banking Group PLC 2.907% 2023 (3-month USD-LIBOR + 0.81% on 11/7/2022)13 | 1,525 | 1,443 |
| Lloyds Banking Group PLC 4.45% 2025 | 1,600 | 1,592 |
| Lloyds Banking Group PLC 4.582% 2025 | 1,500 | 1,423 |
| Lloyds Banking Group PLC 4.375% 2028 | 2,150 | 2,045 |
| Metropolitan Life Global Funding I 2.50% 20206 | 8,000 | 7,905 |
| Metropolitan Life Global Funding I 1.95% 20216 | 2,500 | 2,415 |
| Morgan Stanley 2.50% 2021 | 3,000 | 2,941 |
| Morgan Stanley 3.737% 2024 (3-month USD-LIBOR + 0.847% on 4/24/2023)13 | 4,500 | 4,470 |
| Morgan Stanley 3.125% 2026 | 675 | 624 |
| Morgan Stanley 3.875% 2026 | 2,650 | 2,588 |
| Morgan Stanley 3.625% 2027 | 2,775 | 2,641 |
| Morgan Stanley 3.772% 2029 (3-month USD-LIBOR + 1.14% on 1/24/2028)13 | 2,325 | 2,228 |
| National Australia Bank Ltd. 1.375% 2019 | 975 | 967 |
| National Australia Bank Ltd. 1.875% 2021 | 975 | 939 |
| Navient Corp. 4.875% 2019 | 5,381 | 5,364 |
| Navient Corp. 6.50% 2022 | 3,675 | 3,429 |
| Navient Corp. 5.50% 2023 | 7,015 | 6,164 |
| Navient Corp. 6.125% 2024 | 3,225 | 2,782 |
| New York Life Global Funding 1.70% 20216 | 1,500 | 1,446 |
| Bonds, notes & other debt instruments (continued) Corporate bonds & notes (continued) Financials (continued) | Principal amount (000) | Value (000) |
| New York Life Global Funding 2.35% 20266 | $1,190 | $1,093 |
| Nordea Bank AB 2.50% 20206 | 4,450 | 4,389 |
| PNC Bank 1.45% 2019 | 3,340 | 3,312 |
| PNC Bank 2.30% 2020 | 250 | 247 |
| PNC Bank 2.55% 2021 | 8,000 | 7,808 |
| PNC Financial Services Group, Inc. 2.854% 202213 | 1,445 | 1,417 |
| PNC Financial Services Group, Inc. 3.90% 2024 | 2,000 | 1,985 |
| Prudential Financial, Inc. 3.50% 2024 | 4,000 | 4,027 |
| Rabobank Nederland 2.75% 2022 | 2,825 | 2,771 |
| Rabobank Nederland 4.375% 2025 | 5,500 | 5,412 |
| Skandinaviska Enskilda Banken AB 1.875% 2021 | 3,350 | 3,221 |
| Skandinaviska Enskilda Banken AB 2.625% 2021 | 250 | 247 |
| Skandinaviska Enskilda Banken AB 2.80% 2022 | 1,400 | 1,372 |
| Starwood Property Trust, Inc. 5.00% 2021 | 2,700 | 2,659 |
| Travelers Companies, Inc. 4.00% 2047 | 1,735 | 1,672 |
| UBS Group AG 4.125% 20256 | 2,750 | 2,735 |
| UniCredit SpA 3.75% 20226 | 8,350 | 8,045 |
| UniCredit SpA 4.625% 20276 | 1,250 | 1,146 |
| UniCredit SpA 5.861% 20326,13 | 4,800 | 4,229 |
| US Bancorp 2.625% 2022 | 1,805 | 1,775 |
| US Bancorp 3.40% 2023 | 5,675 | 5,681 |
| US Bancorp 3.70% 2024 | 7,000 | 7,113 |
| US Bancorp 2.375% 2026 | 4,000 | 3,654 |
| Wells Fargo & Co. 2.50% 2021 | 7,500 | 7,382 |
| Wells Fargo & Co. 3.069% 2023 | 3,750 | 3,654 |
| Wells Fargo & Co. 3.55% 2023 | 8,000 | 7,976 |
| Wells Fargo & Co. 3.00% 2026 | 4,500 | 4,199 |
| Wells Fargo & Co. 3.00% 2026 | 1,750 | 1,623 |
| Wells Fargo & Co. 3.584% 2028 (3-month USD-LIBOR + 1.31% on 5/15/2027)13 | 434 | 417 |
| Westpac Banking Corp. 2.15% 2020 | 12,000 | 11,872 |
| Westpac Banking Corp. 2.75% 2023 | 3,500 | 3,398 |
| 356,818 | ||
| Health care 1.52% | ||
| Abbott Laboratories 2.90% 2021 | 1,130 | 1,120 |
| Abbott Laboratories 3.40% 2023 | 189 | 189 |
| Abbott Laboratories 3.75% 2026 | 2,094 | 2,073 |
| Abbott Laboratories 4.75% 2036 | 460 | 482 |
| Abbott Laboratories 4.90% 2046 | 500 | 528 |
| AbbVie Inc. 4.25% 2028 | 3,050 | 2,969 |
| AbbVie Inc. 4.30% 2036 | 604 | 541 |
| AbbVie Inc. 4.45% 2046 | 5,850 | 5,143 |
| AbbVie Inc. 4.875% 2048 | 1,900 | 1,782 |
| Allergan PLC 3.00% 2020 | 1,050 | 1,046 |
| Allergan PLC 3.45% 2022 | 7,645 | 7,533 |
| Allergan PLC 3.80% 2025 | 406 | 397 |
| Allergan PLC 4.75% 2045 | 6,000 | 5,724 |
| AstraZeneca PLC 3.375% 2025 | 11,390 | 11,024 |
| Bayer AG 2.375% 20196 | 2,750 | 2,729 |
| Bayer US Finance II LLC 3.875% 20236 | 3,360 | 3,302 |
| Bayer US Finance II LLC 4.25% 20256 | 8,729 | 8,512 |
| Bayer US Finance II LLC 4.375% 20286 | 1,254 | 1,200 |
| Bayer US Finance II LLC 4.625% 20386 | 1,525 | 1,391 |
| Becton, Dickinson and Co. 2.133% 2019 | 2,250 | 2,237 |
| Bonds, notes & other debt instruments (continued) Corporate bonds & notes (continued) Health care (continued) | Principal amount (000) | Value (000) |
| Becton, Dickinson and Co. 2.404% 2020 | $2,250 | $2,216 |
| Becton, Dickinson and Co. 2.894% 2022 | 1,170 | 1,134 |
| Becton, Dickinson and Co. 3.363% 2024 | 860 | 827 |
| Boston Scientific Corp. 3.85% 2025 | 5,500 | 5,421 |
| Centene Corp. 4.75% 2022 | 8,770 | 8,693 |
| Centene Corp. 4.75% 2025 | 2,825 | 2,705 |
| Cigna Corp. 3.40% 20216 | 1,800 | 1,797 |
| Cigna Corp. 3.75% 20236 | 1,955 | 1,950 |
| Cigna Corp. 4.125% 20256 | 1,865 | 1,866 |
| Cigna Corp. 4.375% 20286 | 2,175 | 2,193 |
| Cigna Corp. 4.80% 20386 | 9,140 | 9,092 |
| Cigna Corp. 4.90% 20486 | 1,650 | 1,623 |
| Concordia International Corp., Term Loan, (3-month USD-LIBOR + 5.50%) 7.887% 202410,11,12 | 980 | 934 |
| Concordia International Corp. 8.00% 2024 | 357 | 337 |
| CVS Health Corp. 3.35% 2021 | 740 | 738 |
| CVS Health Corp. 3.70% 2023 | 1,005 | 995 |
| CVS Health Corp. 4.10% 2025 | 1,119 | 1,111 |
| CVS Health Corp. 4.30% 2028 | 5,747 | 5,638 |
| CVS Health Corp. 4.78% 2038 | 1,037 | 998 |
| DaVita HealthCare Partners Inc. 5.00% 2025 | 3,875 | 3,531 |
| Eli Lilly and Co. 3.95% 2047 | 1,500 | 1,472 |
| EMD Finance LLC 2.40% 20206 | 210 | 208 |
| EMD Finance LLC 2.95% 20226 | 1,010 | 996 |
| EMD Finance LLC 3.25% 20256 | 1,020 | 980 |
| Endo International PLC 5.75% 20226 | 5,865 | 4,912 |
| Endo International PLC 6.00% 20256,13 | 3,945 | 2,850 |
| GlaxoSmithKline PLC 3.625% 2025 | 3,585 | 3,613 |
| HCA Inc. 5.875% 2023 | 2,125 | 2,157 |
| HealthSouth Corp. 5.75% 2024 | 6,850 | 6,807 |
| HealthSouth Corp. 5.75% 2025 | 3,285 | 3,219 |
| Jaguar Holding Co. 6.375% 20236 | 1,600 | 1,533 |
| Johnson & Johnson 2.45% 2026 | 5,285 | 4,970 |
| Kinetic Concepts, Inc. 12.50% 20216 | 2,370 | 2,548 |
| Mallinckrodt PLC 4.875% 20206 | 10,990 | 10,660 |
| Medtronic, Inc. 3.50% 2025 | 3,000 | 2,992 |
| Medtronic, Inc. 4.375% 2035 | 4,537 | 4,658 |
| Medtronic, Inc. 4.625% 2045 | 3,260 | 3,430 |
| Molina Healthcare, Inc. 5.375% 2022 | 12,235 | 11,853 |
| Molina Healthcare, Inc. 4.875% 20256 | 5,242 | 4,803 |
| Owens & Minor, Inc. 3.875% 2021 | 5,920 | 4,440 |
| Owens & Minor, Inc., Term Loan B, (3-month USD-LIBOR + 4.50%) 7.308% 202510,11,12 | 1,905 | 1,477 |
| Roche Holdings, Inc. 2.875% 20216 | 8,625 | 8,576 |
| Roche Holdings, Inc. 1.75% 20226 | 2,340 | 2,246 |
| Roche Holdings, Inc. 3.35% 20246 | 1,200 | 1,205 |
| Roche Holdings, Inc. 3.00% 20256 | 6,000 | 5,825 |
| Rotech Healthcare Inc., Term Loan, (3-month USD-LIBOR + 11.00%) 13.34% 2023 (100% PIK)2,3,10,11,12,15 | 7,838 | 7,130 |
| Rotech Healthcare Inc., Term Loan B, (3-month USD-LIBOR + 3.75%) 6.087% 20232,3,10,11,12 | 3,655 | 3,625 |
| Shire PLC 2.40% 2021 | 4,498 | 4,352 |
| Shire PLC 2.875% 2023 | 3,413 | 3,230 |
| Shire PLC 3.20% 2026 | 1,500 | 1,360 |
| Takeda Pharmaceutical Co., Ltd. 4.40% 20236 | 13,370 | 13,530 |
| Takeda Pharmaceutical Co., Ltd. 5.00% 20286 | 3,750 | 3,840 |
| Team Health Holdings, Inc. 6.375% 20256 | 4,660 | 3,827 |
| Bonds, notes & other debt instruments (continued) Corporate bonds & notes (continued) Health care (continued) | Principal amount (000) | Value (000) |
| Tenet Healthcare Corp. 4.75% 2020 | $3,290 | $3,294 |
| Tenet Healthcare Corp. 6.00% 2020 | 11,580 | 11,768 |
| Tenet Healthcare Corp. 4.375% 2021 | 3,650 | 3,550 |
| Tenet Healthcare Corp. 4.50% 2021 | 4,500 | 4,399 |
| Tenet Healthcare Corp. 4.625% 2024 | 3,153 | 2,944 |
| Teva Pharmaceutical Finance Co. BV 2.20% 2021 | 7,965 | 7,326 |
| Teva Pharmaceutical Finance Co. BV 2.80% 2023 | 6,896 | 5,945 |
| Teva Pharmaceutical Finance Co. BV 6.00% 2024 | 1,780 | 1,719 |
| Teva Pharmaceutical Finance Co. BV 3.15% 2026 | 27,048 | 20,688 |
| Teva Pharmaceutical Finance Co. BV 4.10% 2046 | 3,550 | 2,357 |
| Thermo Fisher Scientific Inc. 4.15% 2024 | 2,000 | 2,028 |
| Valeant Pharmaceuticals International, Inc. 6.125% 20256 | 22,525 | 19,709 |
| Valeant Pharmaceuticals International, Inc. 9.00% 20256 | 800 | 799 |
| Valeant Pharmaceuticals International, Inc. 9.25% 20266 | 4,060 | 4,070 |
| Zimmer Holdings, Inc. 3.15% 2022 | 6,070 | 5,939 |
| 349,580 | ||
| Communication services 1.07% | ||
| Alphabet Inc. 1.998% 2026 | 3,000 | 2,732 |
| AT&T Inc. (3-month USD-LIBOR + 1.18%) 3.956% 202410 | 4,700 | 4,562 |
| AT&T Inc. 4.10% 2028 | 1,250 | 1,205 |
| British Telecommunications PLC 9.625% 203013 | 1,905 | 2,581 |
| Cablevision Systems Corp. 6.75% 2021 | 9,575 | 9,838 |
| CCO Holdings LLC and CCO Holdings Capital Corp. 5.125% 20236 | 2,650 | 2,584 |
| CCO Holdings LLC and CCO Holdings Capital Corp. 4.50% 2024 | 3,000 | 2,999 |
| CCO Holdings LLC and CCO Holdings Capital Corp. 4.908% 2025 | 1,000 | 995 |
| CCO Holdings LLC and CCO Holdings Capital Corp. 5.75% 20266 | 5,850 | 5,748 |
| CCO Holdings LLC and CCO Holdings Capital Corp. 5.00% 20286 | 4,250 | 3,921 |
| CCO Holdings LLC and CCO Holdings Capital Corp. 6.484% 2045 | 585 | 606 |
| CenturyLink, Inc. 6.75% 2023 | 8,475 | 8,189 |
| CenturyLink, Inc., Series T, 5.80% 2022 | 2,625 | 2,540 |
| Clear Channel Worldwide Holdings, Inc. 7.625% 2020 | 16,260 | 15,914 |
| Comcast Corp. 3.95% 2025 | 5,795 | 5,871 |
| Comcast Corp. 2.35% 2027 | 4,000 | 3,584 |
| Comcast Corp. 4.15% 2028 | 3,040 | 3,092 |
| Comcast Corp. 3.20% 2036 | 750 | 647 |
| Comcast Corp. 3.90% 2038 | 1,500 | 1,393 |
| Comcast Corp. 4.60% 2038 | 6,000 | 6,077 |
| Comcast Corp. 4.70% 2048 | 3,354 | 3,421 |
| Cumulus Media New Holdings Inc., Term Loan, (3-month USD-LIBOR + 4.50%) 7.03% 202210,11,12 | 1,496 | 1,420 |
| Deutsche Telekom International Finance BV 1.95% 20216 | 1,000 | 960 |
| Deutsche Telekom International Finance BV 2.82% 20226 | 2,535 | 2,481 |
| Deutsche Telekom International Finance BV 3.60% 20276 | 3,750 | 3,545 |
| Deutsche Telekom International Finance BV 9.25% 2032 | 3,570 | 5,088 |
| France Télécom 4.125% 2021 | 5,000 | 5,103 |
| Frontier Communications Corp. 10.50% 2022 | 4,790 | 3,353 |
| Frontier Communications Corp. 11.00% 2025 | 22,250 | 13,961 |
| Gogo Inc. 12.50% 20226 | 21,905 | 23,506 |
| Inmarsat PLC 4.875% 20226 | 9,000 | 8,516 |
| Inmarsat PLC 6.50% 20246 | 2,550 | 2,391 |
| Intelsat Jackson Holding Co. 6.625% 202411,12 | 1,400 | 1,389 |
| Intelsat Jackson Holding Co. 8.00% 20246 | 3,075 | 3,175 |
| Intelsat Jackson Holding Co. 8.50% 20246 | 9,225 | 8,994 |
| Liberty Global PLC 5.50% 20286 | 2,725 | 2,473 |
| Bonds, notes & other debt instruments (continued) Corporate bonds & notes (continued) Communication services (continued) | Principal amount (000) | Value (000) |
| Ligado Networks, Term Loan, (3-month USD-LIBOR + 8.75%) 11.07% 2020 (100% PIK)10,11,12,15 | $14,162 | $9,701 |
| Meredith Corp. 6.875% 20266 | 825 | 808 |
| NBCUniversal Enterprise, Inc. 1.974% 20196 | 100 | 100 |
| Orange SA 5.50% 2044 | 3,000 | 3,223 |
| Sirius XM Radio Inc. 3.875% 20226 | 3,450 | 3,319 |
| Time Warner Inc. 3.80% 2027 | 605 | 569 |
| Trilogy International Partners, LLC 8.875% 20226 | 10,350 | 10,039 |
| Verizon Communications Inc. 4.50% 2033 | 2,000 | 1,981 |
| Verizon Communications Inc. 4.40% 2034 | 1,959 | 1,895 |
| Verizon Communications Inc. 4.862% 2046 | 2,250 | 2,222 |
| Vodafone Group PLC 3.75% 2024 | 5,550 | 5,476 |
| Vodafone Group PLC 4.125% 2025 | 11,500 | 11,382 |
| Vodafone Group PLC 4.375% 2028 | 2,250 | 2,188 |
| Vodafone Group PLC 5.00% 2038 | 1,500 | 1,411 |
| Vodafone Group PLC 5.25% 2048 | 1,500 | 1,415 |
| Wind Tre SpA 5.00% 20266 | 6,500 | 5,387 |
| Ziggo Bond Finance BV 5.50% 20276 | 9,325 | 8,369 |
| 244,339 | ||
| Utilities 0.93% | ||
| AEP Transmission Co. LLC 3.75% 2047 | 2,390 | 2,201 |
| AEP Transmission Co. LLC 4.25% 2048 | 1,630 | 1,649 |
| AES Corp. 5.50% 2025 | 6,673 | 6,656 |
| Ameren Corp. 3.70% 2047 | 1,500 | 1,373 |
| Ameren Corp. 4.50% 2049 | 2,250 | 2,389 |
| American Electric Power Co., Inc. 2.95% 2022 | 4,020 | 3,945 |
| American Electric Power Co., Inc. 3.20% 2027 | 1,275 | 1,212 |
| Berkshire Hathaway Energy Co. 2.40% 2020 | 1,245 | 1,237 |
| Calpine Corp. 5.25% 20266 | 5,970 | 5,470 |
| Centerpoint Energy, Inc. 2.50% 2022 | 900 | 861 |
| CenterPoint Energy, Inc. 3.85% 2024 | 3,275 | 3,294 |
| Comision Federal de Electricidad 4.75% 20276 | 1,270 | 1,200 |
| Commonwealth Edison Co. 4.35% 2045 | 2,085 | 2,106 |
| Commonwealth Edison Co. 3.65% 2046 | 2,000 | 1,818 |
| Commonwealth Edison Co. 4.00% 2048 | 2,600 | 2,518 |
| Consolidated Edison Co. of New York, Inc. 4.50% 2058 | 6,100 | 5,925 |
| Consumers Energy Co. 3.375% 2023 | 475 | 477 |
| Consumers Energy Co. 3.125% 2024 | 3,785 | 3,741 |
| Consumers Energy Co. 3.25% 2046 | 940 | 799 |
| Consumers Energy Co. 4.05% 2048 | 6,285 | 6,223 |
| Dominion Resources, Inc. 1.60% 2019 | 890 | 880 |
| Dominion Resources, Inc. 2.962% 201913 | 300 | 299 |
| Dominion Resources, Inc. 2.579% 202013 | 950 | 935 |
| Dominion Resources, Inc. 2.00% 2021 | 790 | 759 |
| Dominion Resources, Inc. 2.75% 2022 | 800 | 780 |
| Dominion Resources, Inc. 2.85% 2026 | 1,500 | 1,385 |
| Duke Energy Carolinas, Inc. 3.95% 2028 | 2,500 | 2,565 |
| Duke Energy Corp. 3.75% 2024 | 150 | 150 |
| Duke Energy Corp. 2.65% 2026 | 4,325 | 3,946 |
| Duke Energy Florida, LLC 3.20% 2027 | 2,420 | 2,346 |
| Duke Energy Ohio, Inc. 3.70% 2046 | 1,950 | 1,762 |
| Duke Energy Progress Inc. 4.15% 2044 | 3,020 | 2,947 |
| Duke Energy Progress Inc. 3.70% 2046 | 4,350 | 3,945 |
| Duke Energy Progress, LLC 3.375% 2023 | 2,040 | 2,050 |
| Bonds, notes & other debt instruments (continued) Corporate bonds & notes (continued) Utilities (continued) | Principal amount (000) | Value (000) |
| EDP Finance BV 4.125% 20206 | $3,402 | $3,415 |
| EDP Finance BV 3.625% 20246 | 12,250 | 11,492 |
| Electricité de France SA 2.35% 20206 | 650 | 641 |
| Electricité de France SA 4.875% 20386 | 1,425 | 1,306 |
| Electricité de France SA 6.95% 20396 | 2,050 | 2,394 |
| Electricité de France SA 5.60% 2040 | 525 | 531 |
| Emera US Finance LP 2.15% 2019 | 300 | 298 |
| Emera US Finance LP 2.70% 2021 | 770 | 751 |
| Emera US Finance LP 3.55% 2026 | 645 | 613 |
| Enel Finance International SA 4.25% 20236 | 4,500 | 4,404 |
| Enel Finance International SA 4.625% 20256 | 4,500 | 4,326 |
| Enel Finance International SA 3.50% 20286 | 5,800 | 4,985 |
| Enel Finance International SA 4.875% 20296 | 3,750 | 3,587 |
| Enersis Américas SA 4.00% 2026 | 495 | 464 |
| Entergy Corp. 2.95% 2026 | 1,160 | 1,073 |
| Entergy Louisiana, LLC 4.20% 2048 | 4,200 | 4,162 |
| Eversource Energy 3.80% 2023 | 2,730 | 2,759 |
| Exelon Corp. 3.497% 202213 | 2,150 | 2,103 |
| Exelon Corp. 3.40% 2026 | 200 | 191 |
| FirstEnergy Corp. 3.90% 2027 | 3,660 | 3,553 |
| FirstEnergy Corp. 4.85% 2047 | 3,375 | 3,394 |
| FirstEnergy Corp., Series B, 4.25% 2023 | 1,540 | 1,566 |
| Great Plains Energy Inc. 4.20% 2047 | 2,100 | 2,035 |
| MidAmerican Energy Holdings Co. 2.40% 2019 | 1,500 | 1,498 |
| MidAmerican Energy Holdings Co. 3.10% 2027 | 2,000 | 1,950 |
| National Rural Utilities Cooperative Finance Corp. 3.05% 2027 | 6,000 | 5,759 |
| NiSource Finance Corp. 2.65% 2022 | 675 | 647 |
| Northern States Power Co. 4.125% 2044 | 6,000 | 6,079 |
| Pacific Gas and Electric Co. 2.45% 2022 | 1,500 | 1,337 |
| Pacific Gas and Electric Co. 4.25% 20236 | 1,500 | 1,397 |
| Pacific Gas and Electric Co. 3.40% 2024 | 1,198 | 1,045 |
| Pacific Gas and Electric Co. 3.30% 2027 | 2,740 | 2,270 |
| Pacific Gas and Electric Co. 3.30% 2027 | 1,009 | 829 |
| Pacific Gas and Electric Co. 4.65% 20286 | 2,620 | 2,320 |
| PacifiCorp., First Mortgage Bonds, 3.60% 2024 | 6,695 | 6,762 |
| PacifiCorp., First Mortgage Bonds, 4.125% 2049 | 7,000 | 6,917 |
| Public Service Co. of Colorado 2.25% 2022 | 2,000 | 1,928 |
| Public Service Enterprise Group Inc. 2.65% 2022 | 1,900 | 1,830 |
| Public Service Enterprise Group Inc. 2.25% 2026 | 385 | 352 |
| Puget Energy, Inc. 6.50% 2020 | 1,245 | 1,316 |
| Puget Energy, Inc. 6.00% 2021 | 1,823 | 1,930 |
| Puget Energy, Inc. 5.625% 2022 | 1,965 | 2,082 |
| Puget Energy, Inc. 3.65% 2025 | 3,135 | 3,070 |
| Sierra Pacific Power Co., General and Refunding Mortgage Notes, Series T, 3.375% 2023 | 3,500 | 3,499 |
| South Carolina Electric & Gas Co. 4.10% 2046 | 2,595 | 2,436 |
| Talen Energy Corp. 9.50% 20226 | 2,795 | 2,823 |
| Talen Energy Corp. 10.50% 20266 | 675 | 577 |
| Tampa Electric Co. 4.35% 2044 | 3,805 | 3,680 |
| Virginia Electric and Power Co. 2.95% 2026 | 1,700 | 1,615 |
| Virginia Electric and Power Co. 3.50% 2027 | 4,300 | 4,245 |
| Virginia Electric and Power Co. 4.60% 2048 | 2,650 | 2,779 |
| 212,858 |
| Bonds, notes & other debt instruments (continued) Corporate bonds & notes (continued) Materials 0.73% | Principal amount (000) | Value (000) |
| Ball Corp. 4.375% 2020 | $2,450 | $2,465 |
| CF Industries, Inc. 4.95% 2043 | 4,130 | 3,216 |
| Chemours Co. 6.625% 2023 | 6,090 | 6,174 |
| Chevron Phillips Chemical Co. LLC 3.30% 20236 | 1,170 | 1,158 |
| Chevron Phillips Chemical Co. LLC 3.70% 20286 | 3,000 | 2,960 |
| Cleveland-Cliffs Inc. 4.875% 20246 | 3,025 | 2,821 |
| Cleveland-Cliffs Inc. 5.75% 2025 | 18,995 | 17,143 |
| Consolidated Energy Finance SA 6.50% 20266 | 2,685 | 2,584 |
| CVR Partners, LP 9.25% 20236 | 3,325 | 3,471 |
| Dow Chemical Co. 4.55% 20256 | 8,394 | 8,556 |
| DowDuPont Inc. 4.205% 2023 | 3,015 | 3,086 |
| DowDuPont Inc. 4.493% 2025 | 10,095 | 10,413 |
| DowDuPont Inc. 4.725% 2028 | 3,015 | 3,133 |
| Eastman Chemical Co. 2.70% 2020 | 2,188 | 2,172 |
| First Quantum Minerals Ltd. 7.00% 20216 | 5,602 | 5,388 |
| First Quantum Minerals Ltd. 7.25% 20226 | 8,175 | 7,613 |
| First Quantum Minerals Ltd. 7.50% 20256 | 11,350 | 9,406 |
| First Quantum Minerals Ltd. 6.875% 20266 | 4,275 | 3,447 |
| Freeport-McMoRan Inc. 3.55% 2022 | 13,160 | 12,486 |
| Georgia-Pacific Corp. 2.539% 20196 | 7,000 | 6,948 |
| H.I.G. Capital, LLC 6.75% 20246 | 2,366 | 2,088 |
| Holcim Ltd. 5.15% 20236 | 7,395 | 7,622 |
| Huntsman International LLC 4.875% 2020 | 2,210 | 2,227 |
| International Paper Co. 7.30% 2039 | 2,005 | 2,373 |
| LSB Industries, Inc. 9.625% 20236 | 2,860 | 2,917 |
| Mosaic Co. 3.25% 2022 | 2,250 | 2,199 |
| Mosaic Co. 4.05% 2027 | 2,125 | 2,020 |
| Nova Chemicals Corp. 5.25% 20276 | 4,275 | 3,799 |
| Novelis Corp. 5.875% 20266 | 2,600 | 2,308 |
| Platform Specialty Products Corp. 5.875% 20256 | 1,675 | 1,575 |
| Rayonier Advanced Materials Inc. 5.50% 20246 | 3,304 | 2,924 |
| Ryerson Inc. 11.00% 20226 | 7,690 | 7,767 |
| Sherwin-Williams Co. 2.25% 2020 | 2,250 | 2,216 |
| Sherwin-Williams Co. 2.75% 2022 | 1,185 | 1,148 |
| Sherwin-Williams Co. 3.125% 2024 | 550 | 526 |
| Sherwin-Williams Co. 3.45% 2027 | 1,395 | 1,303 |
| Tronox Ltd. 6.50% 20266 | 1,550 | 1,292 |
| Venator Materials Corp. 5.75% 20256 | 3,310 | 2,665 |
| Warrior Met Coal, Inc. 8.00% 20246 | 1,975 | 1,965 |
| Westlake Chemical Corp. 4.375% 2047 | 2,915 | 2,455 |
| 168,029 | ||
| Consumer discretionary 0.70% | ||
| Amazon.com, Inc. 2.40% 2023 | 3,000 | 2,906 |
| Amazon.com, Inc. 2.80% 2024 | 3,000 | 2,918 |
| American Axle & Manufacturing Holdings, Inc. 6.50% 2027 | 3,275 | 2,943 |
| American Honda Finance Corp. 3.50% 2028 | 1,500 | 1,478 |
| Bayerische Motoren Werke AG 2.25% 20236 | 600 | 560 |
| Bayerische Motoren Werke AG 3.45% 20236 | 8,685 | 8,627 |
| DaimlerChrysler North America Holding Corp. 2.25% 20196 | 6,000 | 5,962 |
| DaimlerChrysler North America Holding Corp. 2.25% 20206 | 2,765 | 2,728 |
| DaimlerChrysler North America Holding Corp. 2.00% 20216 | 200 | 193 |
| DaimlerChrysler North America Holding Corp. 3.35% 20236 | 1,200 | 1,184 |
| DaimlerChrysler North America Holding Corp. 3.75% 20286 | 397 | 374 |
| Bonds, notes & other debt instruments (continued) Corporate bonds & notes (continued) Consumer discretionary (continued) | Principal amount (000) | Value (000) |
| Ford Motor Credit Co. 2.597% 2019 | $3,000 | $2,968 |
| Ford Motor Credit Co. 2.343% 2020 | 7,635 | 7,347 |
| Ford Motor Credit Co. 3.157% 2020 | 1,000 | 980 |
| Ford Motor Credit Co. 3.20% 2021 | 2,250 | 2,181 |
| General Motors Co. 6.75% 2046 | 250 | 243 |
| General Motors Co. 5.40% 2048 | 2,600 | 2,224 |
| General Motors Financial Co. 2.35% 2019 | 3,500 | 3,470 |
| General Motors Financial Co. 3.70% 2020 | 6,355 | 6,331 |
| General Motors Financial Co. 3.45% 2022 | 2,000 | 1,939 |
| General Motors Financial Co. 3.50% 2024 | 6,600 | 6,014 |
| General Motors Financial Co. 4.35% 2027 | 1,000 | 923 |
| Hanesbrands Inc. 4.625% 20246 | 660 | 622 |
| Hanesbrands Inc. 4.875% 20266 | 2,700 | 2,447 |
| Home Depot, Inc. 1.80% 2020 | 3,290 | 3,243 |
| Home Depot, Inc. 3.25% 2022 | 2,350 | 2,375 |
| Home Depot, Inc. 3.90% 2028 | 1,325 | 1,360 |
| Home Depot, Inc. 4.25% 2046 | 3,500 | 3,502 |
| Home Depot, Inc. 4.50% 2048 | 1,600 | 1,660 |
| Limited Brands, Inc. 5.25% 2028 | 1,160 | 993 |
| Limited Brands, Inc. 6.875% 2035 | 885 | 744 |
| Lowe’s Companies, Inc. 2.50% 2026 | 2,720 | 2,418 |
| McDonald’s Corp. 3.35% 2023 | 820 | 817 |
| McDonald’s Corp. 3.50% 2027 | 830 | 808 |
| McDonald’s Corp. 4.875% 2045 | 1,600 | 1,624 |
| Meritage Homes Corp. 5.125% 2027 | 2,675 | 2,280 |
| MGM Resorts International 7.75% 2022 | 1,700 | 1,813 |
| Newell Rubbermaid Inc. 2.60% 2019 | 188 | 188 |
| Petsmart, Inc., Term Loan B-2, (3-month USD-LIBOR + 3.00%) 5.38% 202210,11,12 | 5,994 | 4,750 |
| Petsmart, Inc. 5.875% 20256 | 17,985 | 13,084 |
| Petsmart, Inc. 8.875% 20256 | 8,790 | 5,142 |
| Sally Holdings LLC and Sally Capital Inc. 5.50% 2023 | 340 | 329 |
| Sally Holdings LLC and Sally Capital Inc. 5.625% 2025 | 5,400 | 4,988 |
| Starbucks Corp. 3.10% 2023 | 2,688 | 2,650 |
| Starbucks Corp. 4.50% 2048 | 1,745 | 1,633 |
| Toyota Motor Credit Corp. 3.05% 2028 | 2,430 | 2,349 |
| Uber Technologies, Inc. 8.00% 20266 | 5,075 | 4,910 |
| Volkswagen Group of America Finance, LLC 4.00% 20216 | 4,988 | 5,001 |
| Volkswagen Group of America Finance, LLC 4.25% 20236 | 8,955 | 8,891 |
| Volkswagen Group of America Finance, LLC 4.625% 20256 | 6,735 | 6,671 |
| Wynn Las Vegas, LLC and Wynn Capital Corp. 4.25% 20236 | 4,918 | 4,641 |
| Wynn Las Vegas, LLC and Wynn Capital Corp. 5.50% 20256 | 4,425 | 4,137 |
| Wynn Las Vegas, LLC and Wynn Capital Corp. 5.25% 20276 | 1,400 | 1,234 |
| 161,797 | ||
| Industrials 0.63% | ||
| 3M Co. 2.25% 2026 | 1,000 | 926 |
| 3M Co. 3.625% 2028 | 2,515 | 2,564 |
| ADT Corp. 3.50% 2022 | 4,750 | 4,412 |
| Allison Transmission Holdings, Inc. 5.00% 20246 | 3,205 | 3,089 |
| Associated Materials, LLC 9.00% 20246 | 8,905 | 8,638 |
| Avis Budget Group, Inc. 5.50% 2023 | 6,125 | 5,934 |
| Bohai Financial Investment Holding Co., Ltd. 5.50% 20246 | 2,250 | 2,177 |
| CSX Corp. 3.80% 2028 | 6,985 | 6,870 |
| CSX Corp. 4.25% 2029 | 2,137 | 2,175 |
| Bonds, notes & other debt instruments (continued) Corporate bonds & notes (continued) Industrials (continued) | Principal amount (000) | Value (000) |
| CSX Corp. 4.30% 2048 | $2,250 | $2,154 |
| CSX Corp. 4.75% 2048 | 3,756 | 3,825 |
| Euramax International, Inc. 12.00% 20206 | 4,550 | 4,681 |
| General Dynamics Corp. 3.375% 2023 | 3,106 | 3,129 |
| General Dynamics Corp. 3.50% 2025 | 4,804 | 4,790 |
| General Electric Co. 2.70% 2022 | 6,535 | 6,069 |
| General Electric Co. 4.125% 2042 | 2,500 | 1,957 |
| Hardwoods Acquisition Inc. 7.50% 20216 | 2,328 | 1,676 |
| Hertz Global Holdings Inc. 7.625% 20226 | 9,150 | 8,647 |
| Lockheed Martin Corp. 2.50% 2020 | 6,015 | 5,951 |
| Lockheed Martin Corp. 3.10% 2023 | 545 | 541 |
| Lockheed Martin Corp. 3.55% 2026 | 3,490 | 3,470 |
| LSC Communications, Inc. 8.75% 20236 | 3,475 | 3,584 |
| Northrop Grumman Corp. 2.93% 2025 | 3,645 | 3,465 |
| Northrop Grumman Corp. 3.25% 2028 | 4,495 | 4,211 |
| Pisces Parent LLC 8.00% 20266 | 4,345 | 3,992 |
| R.R. Donnelley & Sons Co. 7.875% 2021 | 1,428 | 1,435 |
| R.R. Donnelley & Sons Co. 6.50% 2023 | 3,310 | 3,285 |
| Rockwell Collins, Inc. 1.95% 2019 | 1,125 | 1,117 |
| Rockwell Collins, Inc. 2.80% 2022 | 3,025 | 2,942 |
| Roper Technologies, Inc. 2.80% 2021 | 2,065 | 2,024 |
| Roper Technologies, Inc. 3.80% 2026 | 835 | 816 |
| Siemens AG 2.70% 20226 | 5,360 | 5,261 |
| Staples Inc. 8.50% 20256 | 1,915 | 1,737 |
| Union Pacific Corp. 3.75% 2025 | 5,030 | 5,087 |
| Union Pacific Corp. 3.95% 2028 | 3,750 | 3,755 |
| United Technologies Corp. 3.65% 2023 | 3,069 | 3,060 |
| United Technologies Corp. 3.95% 2025 | 5,306 | 5,275 |
| United Technologies Corp. 3.125% 2027 | 7,000 | 6,481 |
| United Technologies Corp. 4.125% 2028 | 1,355 | 1,348 |
| Virgin Australia Holdings Ltd. 8.50% 20196 | 2,500 | 2,529 |
| 145,079 | ||
| Consumer staples 0.59% | ||
| Altria Group, Inc. 4.50% 2043 | 3,000 | 2,507 |
| Anheuser-Busch Co./InBev Worldwide 3.65% 20266 | 4,985 | 4,716 |
| Anheuser-Busch Co./InBev Worldwide 4.70% 20366 | 895 | 836 |
| Anheuser-Busch Co./InBev Worldwide 4.90% 20466 | 1,655 | 1,540 |
| Anheuser-Busch InBev NV 3.30% 2023 | 4,925 | 4,800 |
| Anheuser-Busch InBev NV 3.50% 2024 | 890 | 871 |
| Anheuser-Busch InBev NV 4.00% 2028 | 5,815 | 5,576 |
| Avon Products, Inc. 7.875% 20226 | 3,780 | 3,742 |
| B&G Foods, Inc. 4.625% 2021 | 440 | 431 |
| B&G Foods, Inc. 5.25% 2025 | 1,660 | 1,550 |
| British American Tobacco International Finance PLC 3.95% 20256 | 5,500 | 5,149 |
| British American Tobacco PLC 3.222% 2024 | 5,000 | 4,611 |
| British American Tobacco PLC 4.39% 2037 | 5,500 | 4,520 |
| British American Tobacco PLC 4.54% 2047 | 3,250 | 2,600 |
| Conagra Brands, Inc. 4.30% 2024 | 2,685 | 2,672 |
| Conagra Brands, Inc. 4.85% 2028 | 1,935 | 1,908 |
| Conagra Brands, Inc. 5.30% 2038 | 5,000 | 4,744 |
| Conagra Brands, Inc. 5.40% 2048 | 1,662 | 1,538 |
| Constellation Brands, Inc. 2.65% 2022 | 4,835 | 4,634 |
| Constellation Brands, Inc. 2.70% 2022 | 395 | 382 |
| Bonds, notes & other debt instruments (continued) Corporate bonds & notes (continued) Consumer staples (continued) | Principal amount (000) | Value (000) |
| Constellation Brands, Inc. 3.20% 2023 | $1,650 | $1,601 |
| Constellation Brands, Inc. 3.60% 2028 | 1,250 | 1,154 |
| Constellation Brands, Inc. 4.50% 2047 | 445 | 408 |
| Costco Wholesale Corp. 2.75% 2024 | 12,250 | 11,923 |
| General Mills, Inc. (3-month USD-LIBOR + 0.54%) 2.976% 202110 | 1,795 | 1,768 |
| General Mills, Inc. 3.70% 2023 | 395 | 393 |
| Imperial Tobacco Finance PLC 3.50% 20236 | 4,000 | 3,889 |
| Keurig Dr Pepper Inc. 4.597% 20286 | 1,691 | 1,682 |
| Keurig Dr Pepper Inc. 4.985% 20386 | 5,351 | 5,151 |
| Keurig Dr Pepper Inc. 5.085% 20486 | 1,779 | 1,700 |
| Molson Coors Brewing Co. 1.45% 2019 | 425 | 421 |
| Molson Coors Brewing Co. 1.90% 2019 | 2,015 | 2,009 |
| Molson Coors Brewing Co. 2.25% 2020 | 1,725 | 1,702 |
| Molson Coors Brewing Co. 2.10% 2021 | 165 | 159 |
| Molson Coors Brewing Co. 3.00% 2026 | 460 | 411 |
| Molson Coors Brewing Co. 4.20% 2046 | 2,250 | 1,879 |
| Nestle Holdings, Inc. 3.50% 20256 | 4,500 | 4,526 |
| Philip Morris International Inc. 2.00% 2020 | 2,000 | 1,975 |
| Philip Morris International Inc. 1.875% 2021 | 2,000 | 1,944 |
| Philip Morris International Inc. 2.375% 2022 | 1,960 | 1,884 |
| Philip Morris International Inc. 2.625% 2022 | 2,395 | 2,319 |
| Philip Morris International Inc. 3.25% 2024 | 5,000 | 4,818 |
| Philip Morris International Inc. 4.25% 2044 | 2,050 | 1,876 |
| Procter & Gamble Co. 1.70% 2021 | 825 | 804 |
| Reckitt Benckiser Group PLC 2.375% 20226 | 2,275 | 2,186 |
| Reynolds American Inc. 4.45% 2025 | 5,705 | 5,511 |
| Reynolds American Inc. 5.70% 2035 | 755 | 740 |
| Reynolds American Inc. 5.85% 2045 | 2,030 | 1,894 |
| Wal-Mart Stores, Inc. 3.40% 2023 | 6,580 | 6,651 |
| Wal-Mart Stores, Inc. 3.70% 2028 | 2,769 | 2,814 |
| 135,519 | ||
| Real estate 0.35% | ||
| Alexandria Real Estate Equities, Inc. 3.95% 2028 | 1,220 | 1,181 |
| American Campus Communities, Inc. 3.35% 2020 | 1,765 | 1,759 |
| American Campus Communities, Inc. 3.75% 2023 | 3,055 | 3,036 |
| American Campus Communities, Inc. 4.125% 2024 | 6,075 | 6,108 |
| American Campus Communities, Inc. 3.625% 2027 | 5,745 | 5,413 |
| American Tower Corp. 3.55% 2027 | 1,425 | 1,340 |
| American Tower Corp. 3.60% 2028 | 2,000 | 1,873 |
| Brandywine Operating Partnership, LP 3.95% 2023 | 1,070 | 1,065 |
| Corporate Office Properties LP 3.60% 2023 | 765 | 743 |
| Corporate Office Properties LP 5.25% 2024 | 3,595 | 3,731 |
| EPR Properties 4.75% 2026 | 6,070 | 6,017 |
| EPR Properties 4.50% 2027 | 3,240 | 3,130 |
| Essex Portfolio LP 3.875% 2024 | 1,000 | 1,004 |
| Essex Portfolio LP 3.50% 2025 | 5,865 | 5,711 |
| Hospitality Properties Trust 4.50% 2023 | 2,295 | 2,316 |
| Hospitality Properties Trust 4.50% 2025 | 325 | 317 |
| Hospitality Properties Trust 4.95% 2027 | 1,000 | 982 |
| Hospitality Properties Trust 3.95% 2028 | 3,825 | 3,456 |
| Host Hotels & Resorts LP 4.50% 2026 | 705 | 702 |
| Iron Mountain Inc. 4.875% 20276 | 1,780 | 1,562 |
| Public Storage 2.37% 2022 | 1,115 | 1,077 |
| Bonds, notes & other debt instruments (continued) Corporate bonds & notes (continued) Real estate (continued) | Principal amount (000) | Value (000) |
| Realogy Corp. 5.25% 20216 | $3,075 | $2,925 |
| Realogy Corp. 4.875% 20236 | 1,090 | 954 |
| Scentre Group 3.25% 20256 | 2,000 | 1,905 |
| Scentre Group 3.50% 20256 | 4,075 | 3,953 |
| Scentre Group 3.75% 20276 | 2,930 | 2,833 |
| UDR, Inc. 2.95% 2026 | 1,510 | 1,395 |
| WEA Finance LLC 2.70% 20196 | 200 | 199 |
| WEA Finance LLC 3.25% 20206 | 4,805 | 4,799 |
| Welltower Inc. 3.95% 2023 | 2,675 | 2,684 |
| Westfield Corp. Ltd. 3.15% 20226 | 5,615 | 5,533 |
| 79,703 | ||
| Information technology 0.29% | ||
| Almonde Inc., Term Loan, (3-month USD-LIBOR + 7.25%) 10.053% 202510,11,12 | 4,200 | 3,880 |
| Apple Inc. 2.75% 2025 | 6,000 | 5,793 |
| Apple Inc. 2.90% 2027 | 9,000 | 8,488 |
| Apple Inc. 3.35% 2027 | 90 | 88 |
| Apple Inc. 3.00% 2024 | 1,250 | 1,235 |
| Applied Systems, Inc., Term Loan, (3-month USD-LIBOR + 7.00%) 9.522% 202510,11,12 | 600 | 595 |
| Broadcom Ltd. 3.00% 2022 | 755 | 727 |
| Broadcom Ltd. 3.625% 2024 | 745 | 706 |
| Broadcom Ltd. 3.50% 2028 | 4,777 | 4,149 |
| Diebold Nixdorf AG, Term Loan B, (3-month USD-LIBOR + 2.75%) 5.188% 202310,11,12 | 1,436 | 1,221 |
| First Data Corp. 5.375% 20236 | 2,850 | 2,807 |
| First Data Corp. 5.00% 20246 | 2,400 | 2,319 |
| Infor Software 7.125% 20216,15 | 4,300 | 4,203 |
| Kronos Inc., Term Loan B, (3-month USD-LIBOR + 8.25%) 9.25% 202410,11,12 | 3,000 | 2,971 |
| McAfee, LLC, Term Loan, (3-month USD-LIBOR + 3.75%) 6.272% 202410,11,12 | 2,947 | 2,882 |
| Microsoft Corp. 4.20% 2035 | 6,000 | 6,238 |
| Microsoft Corp. 4.10% 2037 | 1,000 | 1,030 |
| Unisys Corp. 10.75% 20226 | 3,125 | 3,434 |
| Veritas Holdings Ltd. 7.50% 20236 | 1,275 | 1,045 |
| Visa Inc. 2.80% 2022 | 2,000 | 1,976 |
| Visa Inc. 3.15% 2025 | 10,000 | 9,841 |
| 65,628 | ||
| Total corporate bonds & notes | 2,286,568 | |
| Mortgage-backed obligations 5.75% Federal agency mortgage-backed obligations 5.59% | ||
| Fannie Mae 6.00% 202112 | 15 | 15 |
| Fannie Mae 6.00% 202612 | 262 | 281 |
| Fannie Mae 5.50% 203312 | 484 | 521 |
| Fannie Mae 5.50% 203312 | 324 | 350 |
| Fannie Mae 4.00% 203412,16 | 30,000 | 30,700 |
| Fannie Mae 3.00% 203612 | 20,447 | 20,256 |
| Fannie Mae 5.50% 203612 | 762 | 821 |
| Fannie Mae 6.00% 203612 | 1,664 | 1,804 |
| Fannie Mae 6.00% 203612 | 517 | 563 |
| Fannie Mae 6.00% 203612 | 93 | 101 |
| Fannie Mae 5.50% 203712 | 265 | 284 |
| Fannie Mae 5.50% 203712 | 142 | 153 |
| Fannie Mae 6.00% 203712 | 1,752 | 1,911 |
| Fannie Mae 6.00% 203712 | 1,374 | 1,497 |
| Bonds, notes & other debt instruments (continued) Mortgage-backed obligations (continued) Federal agency mortgage-backed obligations (continued) | Principal amount (000) | Value (000) |
| Fannie Mae 6.00% 203712 | $182 | $199 |
| Fannie Mae 6.00% 203712 | 24 | 26 |
| Fannie Mae 6.00% 203812 | 2,437 | 2,661 |
| Fannie Mae 6.00% 203812 | 1,714 | 1,872 |
| Fannie Mae 6.00% 203812 | 819 | 894 |
| Fannie Mae 6.00% 203812 | 733 | 800 |
| Fannie Mae 6.00% 203812 | 428 | 467 |
| Fannie Mae 6.00% 203812 | 402 | 437 |
| Fannie Mae 6.00% 203812 | 50 | 54 |
| Fannie Mae 6.00% 203812 | 44 | 48 |
| Fannie Mae 6.00% 203812 | 31 | 34 |
| Fannie Mae 6.00% 203912 | 1 | 1 |
| Fannie Mae 6.00% 204012 | 457 | 499 |
| Fannie Mae 6.00% 204012 | 147 | 161 |
| Fannie Mae 4.00% 204112 | 3,368 | 3,466 |
| Fannie Mae 4.00% 204112 | 2,646 | 2,723 |
| Fannie Mae 6.00% 204112 | 926 | 1,010 |
| Fannie Mae 6.00% 204112 | 584 | 638 |
| Fannie Mae 3.50% 204212 | 9,330 | 9,408 |
| Fannie Mae 4.00% 204312 | 3,678 | 3,803 |
| Fannie Mae 4.00% 204312 | 2,168 | 2,242 |
| Fannie Mae 4.00% 204312 | 1,968 | 2,027 |
| Fannie Mae 3.50% 204512 | 15,005 | 15,131 |
| Fannie Mae 3.50% 204512 | 3,689 | 3,709 |
| Fannie Mae 3.00% 204612 | 34,370 | 33,569 |
| Fannie Mae 3.50% 204612 | 7,092 | 7,125 |
| Fannie Mae 3.50% 204612 | 2,885 | 2,893 |
| Fannie Mae 4.00% 204612 | 2,533 | 2,588 |
| Fannie Mae 4.00% 204612 | 954 | 978 |
| Fannie Mae 3.50% 204712 | 60,918 | 60,960 |
| Fannie Mae 3.50% 204712 | 6,385 | 6,390 |
| Fannie Mae 3.50% 204712 | 5,439 | 5,456 |
| Fannie Mae 4.00% 204712 | 22,957 | 23,533 |
| Fannie Mae 4.00% 204712 | 14,100 | 14,400 |
| Fannie Mae 7.00% 204712 | 13 | 14 |
| Fannie Mae 7.00% 204712 | 2 | 2 |
| Fannie Mae 3.50% 204812 | 25,686 | 25,704 |
| Fannie Mae 4.00% 204812 | 10,000 | 10,204 |
| Fannie Mae 4.00% 204812 | 8,000 | 8,163 |
| Fannie Mae 4.00% 204812 | 3,000 | 3,061 |
| Fannie Mae 4.00% 204812 | 2,000 | 2,041 |
| Fannie Mae 4.00% 204812 | 897 | 915 |
| Fannie Mae 4.00% 204812 | 453 | 463 |
| Fannie Mae 4.00% 204812 | 129 | 132 |
| Fannie Mae 4.00% 204812 | 60 | 61 |
| Fannie Mae 4.00% 204812 | 44 | 45 |
| Fannie Mae 3.50% 204912,16 | 15,480 | 15,483 |
| Fannie Mae 4.00% 204912,16 | 88,367 | 90,116 |
| Fannie Mae 4.50% 204912,16 | 50,565 | 52,393 |
| Fannie Mae 4.50% 204912,16 | 46,970 | 48,624 |
| Fannie Mae, Series 2001-T10, Class A1, 7.00% 204112 | 176 | 201 |
| Fannie Mae, Series 2002-W3, Class A5, 7.50% 204112 | 43 | 49 |
| Fannie Mae, Series 2012-M14, Class A2, Multi Family, 2.301% 202210,12 | 2,145 | 2,108 |
| Fannie Mae, Series 2012-M9, Class A2, Multi Family, 2.482% 202212 | 4,203 | 4,163 |
| Bonds, notes & other debt instruments (continued) Mortgage-backed obligations (continued) Federal agency mortgage-backed obligations (continued) | Principal amount (000) | Value (000) |
| Fannie Mae, Series 2012-M5, Class A2, Multi Family, 2.715% 202212 | $3,820 | $3,799 |
| Fannie Mae, Series 2014-M1, Class A2, Multi Family, 3.214% 202310,12 | 8,512 | 8,641 |
| Fannie Mae, Series 2013-M14, Class A2, Multi Family, 3.329% 202310,12 | 7,320 | 7,507 |
| Fannie Mae, Series 2014-M2, Class A2, Multi Family, 3.513% 202310,12 | 6,316 | 6,471 |
| Fannie Mae, Series 2014-M9, Class A2, Multi Family, 3.103% 202410,12 | 6,215 | 6,265 |
| Fannie Mae, Series 2014-M3, Class A2, Multi Family, 3.46% 202410,12 | 7,000 | 7,176 |
| Fannie Mae, Series 2017-M3, Class A2, Multi Family, 2.485% 202610,12 | 9,665 | 9,149 |
| Fannie Mae, Series 2017-M7, Class A2, Multi Family, 2.961% 202710,12 | 2,891 | 2,820 |
| Fannie Mae, Series 2006-43, Class JO, principal only, 0% 203612 | 96 | 81 |
| Freddie Mac 3.00% 203712 | 30,375 | 30,057 |
| Freddie Mac 5.00% 203812 | 1,083 | 1,147 |
| Freddie Mac 6.50% 203812 | 131 | 146 |
| Freddie Mac 4.50% 203912 | 201 | 211 |
| Freddie Mac 5.00% 204012 | 1,920 | 2,034 |
| Freddie Mac 4.00% 204212 | 4,336 | 4,463 |
| Freddie Mac 4.00% 204312 | 5,928 | 6,090 |
| Freddie Mac 4.00% 204312 | 2,424 | 2,501 |
| Freddie Mac 4.00% 204312 | 2,172 | 2,233 |
| Freddie Mac 3.203% 204510,12 | 1,183 | 1,192 |
| Freddie Mac 4.00% 204512 | 13,935 | 14,315 |
| Freddie Mac 4.00% 204512 | 13,611 | 13,982 |
| Freddie Mac 3.00% 204612 | 8,629 | 8,486 |
| Freddie Mac 4.50% 204612 | 2,147 | 2,227 |
| Freddie Mac 4.50% 204612 | 1,160 | 1,203 |
| Freddie Mac 3.50% 204712 | 45,314 | 45,332 |
| Freddie Mac 3.50% 204712 | 43,179 | 43,196 |
| Freddie Mac 3.50% 204712 | 23,780 | 23,789 |
| Freddie Mac 3.50% 204712 | 12,188 | 12,193 |
| Freddie Mac 3.50% 204712 | 4,297 | 4,305 |
| Freddie Mac 4.00% 204812 | 50,003 | 51,009 |
| Freddie Mac 4.00% 204812 | 34,856 | 35,558 |
| Freddie Mac 4.00% 204812 | 6,029 | 6,150 |
| Freddie Mac 4.50% 204912,16 | 2,000 | 2,071 |
| Freddie Mac, Series T-041, Class 3A, 5.487% 203210,12 | 296 | 316 |
| Freddie Mac, Series KS01, Class A1, Multi Family, 1.693% 202212 | 1,296 | 1,277 |
| Freddie Mac, Series K019, Class A2, Multi Family, 2.272% 202212 | 4,000 | 3,935 |
| Freddie Mac, Series K021, Class A2, Multi Family, 2.396% 202212 | 3,680 | 3,627 |
| Freddie Mac, Series K723, Class A2, Multi Family, 2.454% 202312 | 3,025 | 2,963 |
| Freddie Mac, Series K034, Class A1, Multi Family, 2.669% 202312 | 1,495 | 1,492 |
| Freddie Mac, Series K725, Class A2, Multi Family, 3.002% 202412 | 5,555 | 5,566 |
| Freddie Mac, Series K044, Class A2, Multi Family, 2.811% 202512 | 4,265 | 4,213 |
| Freddie Mac, Series K047, Class A2, Multi Family, 3.329% 202512 | 4,000 | 4,060 |
| Freddie Mac, Series K733, Class A2, Multi Family, 3.75% 202510,12 | 13,000 | 13,482 |
| Freddie Mac, Series K057, Class A2, Multi Family, 2.57% 202612 | 4,855 | 4,670 |
| Freddie Mac, Series K055, Class A2, Multi Family, 2.673% 202612 | 10,050 | 9,759 |
| Freddie Mac, Series K066, Class A2, Multi Family, 3.117% 202712 | 4,755 | 4,713 |
| Freddie Mac, Series K067, Class A2, Multi Family, 3.194% 202712 | 17,070 | 16,994 |
| Freddie Mac, Series K069, Class A2, Multi Family, 3.187% 202710,12 | 2,280 | 2,264 |
| Freddie Mac, Series K070, Class A2, Multi Family, 3.303% 202710,12 | 6,465 | 6,471 |
| Freddie Mac, Series K063, Class A2, Multi Family, 3.43% 202712 | 4,375 | 4,439 |
| Freddie Mac, Series K072, Class A2, Multi Family, 3.444% 202712 | 1,980 | 2,003 |
| Freddie Mac, Series K073, Class A2, Multi Family, 3.35% 202812 | 3,571 | 3,586 |
| Freddie Mac, Series K075, Class A2, Multi Family, 3.65% 202810,12 | 5,900 | 6,061 |
| Freddie Mac, Series K085, Class A2, Multi Family, 3.75% 202810,12 | 5,042 | 5,334 |
| Bonds, notes & other debt instruments (continued) Mortgage-backed obligations (continued) Federal agency mortgage-backed obligations (continued) | Principal amount (000) | Value (000) |
| Freddie Mac, Series K077, Class A2, Multi Family, 3.85% 202812 | $3,840 | $4,004 |
| Freddie Mac, Series K076, Class A2, Multi Family, 3.90% 202812 | 16,930 | 17,715 |
| Freddie Mac, Series K080, Class A2, Multi Family, 3.926% 202810,12 | 13,970 | 14,646 |
| Freddie Mac Seasoned Credit Risk Transfer Trust, Series 2017-2, Class HA, 2.50% 205612 | 11,266 | 11,075 |
| Freddie Mac Seasoned Credit Risk Transfer Trust, Series 2017-3, Class HA, 2.50% 205612 | 2,541 | 2,523 |
| Freddie Mac Seasoned Credit Risk Transfer Trust, Series 2017-1, Class HA, 2.75% 205610,12 | 5,865 | 5,710 |
| Freddie Mac Seasoned Credit Risk Transfer Trust, Series 2017-2, Class MA, 3.00% 205612 | 10,708 | 10,343 |
| Freddie Mac Seasoned Credit Risk Transfer Trust, Series 2017-4, Class HT, 2.50% 205710,12 | 1,904 | 1,855 |
| Freddie Mac Seasoned Credit Risk Transfer Trust, Series 2018-2, Class MT, 3.50% 205712 | 3,736 | 3,697 |
| Freddie Mac Seasoned Credit Risk Transfer Trust, Series 2017-4, Class MT, 3.50% 205712 | 1,481 | 1,472 |
| Freddie Mac Seasoned Loan Structured Transaction, Series 2018-2, Class A1, 3.50% 202810,12 | 4,568 | 4,491 |
| Government National Mortgage Assn. 4.00% 204812 | 15,781 | 16,216 |
| Government National Mortgage Assn. 4.00% 204812 | 1,792 | 1,842 |
| Government National Mortgage Assn. 3.50% 204912,16 | 47,750 | 48,079 |
| Government National Mortgage Assn. 4.00% 204912,16 | 58,304 | 59,712 |
| Government National Mortgage Assn. 4.00% 204912,16 | 38,946 | 39,853 |
| Government National Mortgage Assn. 4.50% 204912,16 | 30,730 | 31,803 |
| 1,281,461 | ||
| Collateralized mortgage-backed obligations (privately originated) 0.07% | ||
| Arroyo Mortgage Trust, Series 2018-1, Class A1, 3.763% 20486,10,12 | 3,085 | 3,085 |
| Cascade Funding Mortgage Trust, Series 2018-RM2, Class A, 4.00% 20682,6,12 | 2,961 | 2,976 |
| Connecticut Avenue Securities, Series 2014-C02, Class 1M1, (1-month USD-LIBOR + 0.95%) 3.456% 202410,12 | 12 | 12 |
| CS First Boston Mortgage Securities Corp., Series 2004-5, Class IVA1, 6.00% 203412 | 356 | 364 |
| MASTR Alternative Loan Trust, Series 2004-2, Class 2A1, 6.00% 203412 | 753 | 792 |
| Mello Warehouse Securitization Trust, 2018-W1, Class A (1-month USD-LIBOR + 0.85%) 3.356% 20516,10,12 | 1,690 | 1,694 |
| Nationstar HECM Loan Trust, Series 2018-1A, Class A, 2.76% 20286,12 | 441 | 442 |
| Sequoia Mortgage Trust, Series 2018-CH1, Class A1, 4.00% 20486,10,12 | 4,468 | 4,520 |
| Towd Point Mortgage Trust, Series 2017-1, Class A1, 2.75% 20566,10,12 | 4,229 | 4,153 |
| 18,038 | ||
| Commercial mortgage-backed securities 0.06% | ||
| Citigroup Commercial Mortgage Trust, Series 2015-GC29, Class AAB, 2.984% 204812 | 1,185 | 1,178 |
| Commercial Mortgage Trust, Series 2015-PC1, Class A5, 3.902% 205012 | 4,735 | 4,839 |
| CSAIL Commercial Mortgage Trust, Series 2015-C4, Class ASB, 3.6167% 204812 | 1,400 | 1,417 |
| LB-UBS Commercial Mortgage Trust, Series 2007-C6, Class AM, 6.114% 204010,12 | 130 | 130 |
| Morgan Stanley Bank of America Merrill Lynch Trust, Series 2015-C27, Class ASB, 3.557% 204712 | 1,000 | 1,018 |
| Morgan Stanley Bank of America Merrill Lynch Trust, Series 2015-C22, Class ASB, 3.04% 204812 | 1,180 | 1,177 |
| Morgan Stanley Capital I Trust, Series 2014-CPT, Class A, 3.35% 20296,12 | 2,650 | 2,658 |
| 12,417 | ||
| Bonds & notes of governments & government agency outside the U.S. 0.03% | ||
| Royal Bank of Canada 1.875% 202012 | 7,000 | 6,927 |
| Total mortgage-backed obligations | 1,318,843 | |
| Asset-backed obligations 0.63% | ||
| AmeriCredit Automobile Receivables Trust, Series 2016-3, Class A3, 1.46% 202112 | 609 | 606 |
| AmeriCredit Automobile Receivables Trust, Series 2016-3, Class B, 1.80% 202112 | 500 | 495 |
| AmeriCredit Automobile Receivables Trust, Series 2015-3, Class C, 2.73% 202112 | 3,455 | 3,446 |
| Angel Oak Capital Advisors LLC, CLO, Series 2013-9A, Class A1R, (3-month USD-LIBOR + 1.01%) 3.479% 20256,10,12 | 1,721 | 1,716 |
| Citibank Credit Card Issuance Trust, Series 2014-A6, Class A6, 2.15% 202112 | 275 | 274 |
| CPS Auto Receivables Trust, Series 2017-B, Class A, 1.75% 20206,12 | 104 | 104 |
| Bonds, notes & other debt instruments (continued) Asset-backed obligations (continued) | Principal amount (000) | Value (000) |
| Drive Auto Receivables Trust, Series 2016-CA, Class C, 3.02% 20216,12 | $1,403 | $1,402 |
| Drive Auto Receivables Trust, Series 2017-1, Class C, 2.84% 202212 | 1,075 | 1,074 |
| Drive Auto Receivables Trust, Series 2017-AA, Class C, 2.98% 20226,12 | 1,685 | 1,683 |
| Drive Auto Receivables Trust, Series 2017-2, Class C, 2.75% 202312 | 1,075 | 1,073 |
| Drivetime Auto Owner Trust, Series 2016-3A, Class C, 3.15% 20226,12 | 669 | 669 |
| Drivetime Auto Owner Trust, Series 2017-4A, Class C, 2.86% 20236,12 | 4,000 | 3,989 |
| Drivetime Auto Owner Trust, Series 2017-3A, Class C, 3.01% 20236,12 | 3,850 | 3,845 |
| Enterprise Fleet Financing LLC, Series 2016-2, Class A2, 1.74% 20226,12 | 221 | 220 |
| Enterprise Fleet Financing LLC, Series 2017-1, Class A2, 2.13% 20226,12 | 337 | 335 |
| Enterprise Fleet Financing LLC, Series 2017-1, Class A3, 2.60% 20226,12 | 655 | 651 |
| Exeter Automobile Receivables Trust, Series 2018-1A, Class C, 3.03% 20236,12 | 3,000 | 2,982 |
| Ford Credit Auto Owner Trust, Series 2016-2, Class A, 2.03% 20276,12 | 2,900 | 2,830 |
| Ford Credit Auto Owner Trust, Series 2017-1, Class A, 2.62% 20286,12 | 3,330 | 3,284 |
| Ford Credit Auto Owner Trust, Series 2018-2, Class A, 3.47% 20306,12 | 13,095 | 13,228 |
| Ford Credit Auto Owner Trust, Series 2018-1, Class A, 3.19% 20316,12 | 14,965 | 14,871 |
| Ford Credit Floorplan Master Owner Trust, Series 2016-3, Class A1, 1.55% 202112 | 3,500 | 3,473 |
| Global SC Finance II SRL, Series 2013-1A, Class A, 2.98% 20286,12 | 108 | 107 |
| Global SC Finance II SRL, Series 2014-1A, Class A1, 3.19% 20296,12 | 248 | 246 |
| Global SC Finance II SRL, Series 2017-1A, Class A, 3.85% 20376,12 | 1,659 | 1,662 |
| Santander Drive Auto Receivables Trust, Series 2017-1, Class B, 2.10% 202112 | 664 | 662 |
| Santander Drive Auto Receivables Trust, Series 2016-2, Class C, 2.66% 202112 | 525 | 523 |
| Santander Drive Auto Receivables Trust, Series 2015-3, Class C, 2.74% 202112 | 1,505 | 1,505 |
| Santander Drive Auto Receivables Trust, Series 2015-4, Class C, 2.97% 202112 | 135 | 135 |
| Santander Drive Auto Receivables Trust, Series 2017-1, Class C, 2.58% 202212 | 1,718 | 1,709 |
| Symphony Ltd., CLO, Series 2013-12A, Class AR, (3-month USD-LIBOR + 1.03%) 3.466% 20256,10,12 | 8,181 | 8,155 |
| Synchrony Credfit Card Master Note Trust, Series 2018-A1, Class A1, 3.38% 202412 | 8,930 | 9,015 |
| TAL Advantage V LLC, Series 2013-2A, Class A, 3.55% 20386,12 | 1,288 | 1,283 |
| TAL Advantage V LLC, Series 2014-1A, Class A, 3.51% 20396,12 | 1,188 | 1,183 |
| Triton Container Finance LLC, Series 2017-1A, Class A, 3.52% 20426,12 | 2,081 | 2,054 |
| Triton Container Finance LLC, Series 2017-2A, Class A, 3.62% 20426,12 | 1,797 | 1,766 |
| Verizon Owner Trust, Series 2016-2A, Class A, 1.68% 20216,12 | 5,275 | 5,245 |
| Verizon Owner Trust, Series 2017-2A, Class A, 1.92% 20216,12 | 7,900 | 7,821 |
| Verizon Owner Trust, Series 2017-1A, Class A, 2.06% 20216,12 | 8,215 | 8,155 |
| Wheels SPV 2 LLC, Series 2016-1A, Class A2, 1.59% 20256,12 | 128 | 128 |
| World Financial Network Credit Card Master Note Trust, Series 2012-A, Class A, 3.14% 202312 | 14,170 | 14,169 |
| World Financial Network Credit Card Master Note Trust, Series 2018-A, Class A, 3.07% 202412 | 7,000 | 6,983 |
| World Financial Network Credit Card Master Note Trust, Series 2018-B, Class A, 3.46% 202512 | 8,275 | 8,366 |
| 143,122 | ||
| Bonds & notes of governments & government agencies outside the U.S. 0.18% | ||
| CPPIB Capital Inc. 1.25% 20196 | 3,900 | 3,859 |
| CPPIB Capital Inc. 2.375% 20216 | 6,000 | 5,964 |
| CPPIB Capital Inc. 2.25% 20226 | 4,286 | 4,220 |
| CPPIB Capital Inc. 2.75% 20276 | 6,600 | 6,374 |
| KfW 2.125% 2022 | 375 | 369 |
| Manitoba (Province of) 3.05% 2024 | 2,600 | 2,613 |
| Qatar (State of) 3.875% 20236 | 1,490 | 1,509 |
| Quebec (Province of) 2.375% 2022 | 6,232 | 6,163 |
| Quebec (Province of) 2.75% 2027 | 9,000 | 8,692 |
| Saudi Arabia (Kingdom of) 3.625% 20286 | 2,060 | 1,953 |
| 41,716 |
| Bonds, notes & other debt instruments (continued) Federal agency bonds & notes 0.07% | Principal amount (000) | Value (000) |
| Fannie Mae 2.00% 2022 | $3,000 | $2,957 |
| Fannie Mae 1.875% 2026 | 13,000 | 12,074 |
| 15,031 | ||
| Municipals 0.02% Illinois 0.02% | ||
| G.O. Bonds, Pension Funding Series 2003, 5.10% 203312 | 5,000 | 4,775 |
| Minnesota 0.00% | ||
| Housing Fin. Agcy., Residential Housing Fin. Bonds, Series 2013-A, AMT, 3.00% 2031 | 5 | 5 |
| Housing Fin. Agcy., Residential Housing Fin. Bonds, Series 2014-A, 4.00% 2038 | 180 | 187 |
| 192 | ||
| Connecticut 0.00% | ||
| Housing Fin. Auth., Housing Mortgage Fin. Program Bonds, Series 2014-A-1, 4.00% 2044 | 50 | 52 |
| Housing Fin. Auth., Housing Mortgage Fin. Program Bonds, Series 2014-C-1, 4.00% 2044 | 70 | 72 |
| 124 | ||
| Maryland 0.00% | ||
| Community Dev. Administration, Dept. of Housing and Community Dev., Residential Rev. Ref. Bonds, Series 2014-E, 2.857% 2040 | 70 | 69 |
| South Carolina 0.00% | ||
| Housing Fin. Auth., Mortgage Rev. Ref. Bonds, Series 2014, AMT, 4.00% 2041 | 55 | 57 |
| Nebraska 0.00% | ||
| Investment Fin. Auth., Single Family Housing Rev. Bonds, Series 2013-A, 3.00% 2043 | 15 | 15 |
| Investment Fin. Auth., Single Family Housing Rev. Bonds, Series 2013-C, 4.50% 2043 | 10 | 10 |
| 25 | ||
| Tennessee 0.00% | ||
| Housing Dev. Agcy., Residential Fin. Program Bonds, Series 2013-2-A, AMT, 4.00% 2043 | 20 | 20 |
| South Dakota 0.00% | ||
| Housing Dev. Auth., Homeownership Mortgage Bonds, Series 2014-F, 4.00% 2034 | 10 | 10 |
| Massachusetts 0.00% | ||
| Housing Fin. Agcy., Single Family Housing Rev. Bonds, Series 167, 4.00% 2043 | 5 | 5 |
| Total municipals | 5,277 | |
| Total bonds, notes & other debt instruments (cost: $6,771,429,000) | 6,631,026 | |
| Short-term securities 13.60% | ||
| Apple Inc. 2.33% due 1/9/20196 | 40,000 | 39,975 |
| Army and Air Force Exchange Service 2.41% due 1/8/20196 | 28,000 | 27,985 |
| Chariot Funding, LLC 2.68% due 3/6/20196 | 50,000 | 49,756 |
| CHARTA, LLC 2.45% due 1/15/20196 | 50,000 | 49,947 |
| Chevron Corp. 2.38% due 1/14/20196 | 48,600 | 48,554 |
| Emerson Electric Co. 2.42% due 1/10/20196 | 50,000 | 49,967 |
| Short-term securities (continued) | Principal amount (000) | Value (000) |
| Federal Home Loan Bank 2.13%–2.41% due 1/2/2019–3/15/2019 | $1,506,150 | $1,501,682 |
| Freddie Mac 2.27%–2.36% due 1/22/2019–2/20/2019 | 100,000 | 99,767 |
| Merck & Co. Inc. 2.37%–2.50% due 1/23/2019–2/27/20196 | 149,000 | 148,526 |
| National Rural Utilities Cooperative Finance Corp. 2.46%–2.50% due 1/11/2019–2/6/2019 | 42,900 | 42,845 |
| Pfizer Inc. 2.33% due 2/11/20196 | 75,000 | 74,775 |
| Private Export Funding Corp. 2.57% due 3/11/2019 | 25,000 | 24,870 |
| Procter & Gamble Co. 2.30%–2.50% due 1/15/2019–2/6/20196 | 70,000 | 69,896 |
| U.S. Treasury Bills 2.12%–2.38% due 1/15/2019–3/7/2019 | 660,200 | 658,327 |
| United Parcel Service Inc. 2.34%–2.40% due 1/14/2019–1/22/20196 | 175,000 | 174,804 |
| Wal-Mart Stores, Inc. 2.35%–2.42% due 1/7/2019–1/14/20196 | 55,000 | 54,952 |
| Total short-term securities (cost: $3,116,790,000) | 3,116,628 | |
| Total investment securities101.49% (cost: $20,890,335,000) | 23,267,801 | |
| Other assets less liabilities (1.49)% | (342,350) | |
| Net assets100.00% | $22,925,451 |
| Contracts | Type | Number of contracts | Expiration | Notional amount17 (000) | Value at 12/31/201818 (000) | Unrealized appreciation (depreciation) at 12/31/2018 (000) |
| 2 Year U.S. Treasury Note Futures | Long | 2,898 | April 2019 | $579,600 | $615,282 | $2,012 |
| 5 Year U.S. Treasury Note Futures | Long | 1,317 | April 2019 | 131,700 | 151,043 | 2,659 |
| 10 Year U.S. Treasury Note Futures | Long | 817 | March 2019 | 81,700 | 99,687 | 1,364 |
| 10 Year Ultra U.S. Treasury Note Futures | Short | 211 | March 2019 | (21,100) | (27,447) | (874) |
| $5,161 |
| Receive | Pay | Expiration date | Notional (000) | Value at 12/31/2018 (000) | Upfront payments/ receipts (000) | Unrealized depreciation at 12/31/2018 (000) |
| 1.6365% | 3-month USD-LIBOR | 10/16/2019 | $124,000 | $(1,066) | $— | $(1,066) |
| U.S. EFFR | 2.4435% | 12/20/2023 | 17,844 | (137) | — | (137) |
| U.S. EFFR | 2.45375% | 12/20/2023 | 159,848 | (1,304) | — | (1,304) |
| U.S. EFFR | 2.4225% | 12/24/2023 | 73,206 | (490) | — | (490) |
| 3-month USD-LIBOR | 2.945% | 10/16/2044 | 28,000 | (560) | — | (560) |
| $— | $(3,557) |
| 1 | Security did not produce income during the last 12 months. |
| 2 | Valued under fair value procedures adopted by authority of the board of trustees. The total value of all such securities was $396,462,000, which represented 1.73% of the net assets of the fund. This amount includes $369,780,000 related to certain securities trading outside the U.S. whose values were adjusted as a result of significant market movements following the close of local trading. |
| 3 | Value determined using significant unobservable inputs. |
| 4 | Acquired through a private placement transaction exempt from registration under the Securities Act of 1933. May be subject to legal or contractual restrictions on resale. Further details on these holdings appear below. |
| 5 | Amount less than one thousand. |
| 6 | Acquired in a transaction exempt from registration under Rule 144A or Section 4(2) of the Securities Act of 1933. May be resold in the U.S. in transactions exempt from registration, normally to qualified institutional buyers. The total value of all such securities was $1,612,443,000, which represented 7.03% of the net assets of the fund. |
| 7 | Represents an affiliated company as defined under the Investment Company Act of 1940. |
| 8 | All or a portion of this security was pledged as collateral. The total value of pledged collateral was $10,162,000, which represented .04% of the net assets of the fund. |
| 9 | Index-linked bond whose principal amount moves with a government price index. |
| 10 | Coupon rate may change periodically. |
| 11 | Loan participations and assignments; may be subject to legal or contractual restrictions on resale. The total value of all such loans was $43,203,000, which represented .19% of the net assets of the fund. |
| 12 | Principal payments may be made periodically. Therefore, the effective maturity date may be earlier than the stated maturity date. |
| 13 | Step bond; coupon rate may change at a later date. |
| 14 | Scheduled interest and/or principal payment was not received. |
| 15 | Payment in kind; the issuer has the option of paying additional securities in lieu of cash. Most recent payment was 100% cash unless otherwise noted. |
| 16 | Purchased on a TBA basis. |
| 17 | Notional amount is calculated based on the number of contracts and notional contract size. |
| 18 | Value is calculated based on the notional amount and current market price. |
| Private placement securities | Acquisition date(s) | Cost (000) | Value (000) | Percent of net assets |
| Blackstone CQP Holdco LP 6.50% 2021 | 3/6/2017 | $21,325 | $21,486 | .09% |
| Blackstone CQP Holdco LP 6.00% 2021 | 8/9/2017 | 5,700 | 5,737 | .03 |
| Advanz Pharma Corp. | 8/31/2018-9/4/2018 | 2,219 | 2,930 | .01 |
| Rotech Healthcare Inc. | 9/26/2013 | 6,949 | 736 | .00 |
| NCI Building Systems, Inc. | 11/16/2018 | 48 | 15 | .00 |
| Corporate Risk Holdings Corp. | 8/31/2015-4/21/2017 | — | — | .00 |
| Total private placement securities | $36,241 | $30,904 | .13% |
| Key to abbreviations and symbol |
| ADR = American Depositary Receipts |
| Agcy. = Agency |
| AMT = Alternative Minimum Tax |
| Auth. = Authority |
| CLO = Collateralized Loan Obligations |
| Dept. = Department |
| Dev. = Development |
| EFFR = Effective Federal Funds Rate |
| Fin. = Finance |
| G.O. = General Obligation |
| LIBOR = London Interbank Offered Rate |
| Ref. = Refunding |
| Rev. = Revenue |
| SDR = Swedish Depositary Receipts |
| TBA = To-be-announced |
| USD/$ = U.S. dollars |
| Common stocks 56.65% Information technology 11.31% | Shares | Value (000) |
| ASML Holding NV | 35,800 | $5,626 |
| Taiwan Semiconductor Manufacturing Co., Ltd.1 | 732,000 | 5,331 |
| Microsoft Corp. | 48,500 | 4,926 |
| PagSeguro Digital Ltd., Class A2 | 220,528 | 4,130 |
| Broadcom Inc. | 15,150 | 3,852 |
| Temenos AG1 | 25,000 | 2,999 |
| Keyence Corp.1 | 4,400 | 2,233 |
| Intel Corp. | 44,000 | 2,065 |
| Amphenol Corp., Class A | 24,000 | 1,944 |
| Visa Inc., Class A | 14,600 | 1,926 |
| Amadeus IT Group SA, Class A, non-registered shares | 25,700 | 1,791 |
| Mastercard Inc., Class A | 9,200 | 1,736 |
| TravelSky Technology Ltd., Class H | 610,000 | 1,562 |
| Samsung Electronics Co., Ltd.1 | 27,000 | 933 |
| Infosys Ltd. | 40,350 | 381 |
| 41,435 | ||
| Financials 8.12% | ||
| JPMorgan Chase & Co. | 48,270 | 4,712 |
| HSBC Holdings PLC (GBP denominated) | 539,633 | 4,449 |
| Berkshire Hathaway Inc., Class A2 | 12 | 3,672 |
| B3 SA - Brasil, Bolsa, Balcao | 376,000 | 2,601 |
| HDFC Bank Ltd. (ADR) | 21,605 | 2,238 |
| Credicorp Ltd. | 10,050 | 2,228 |
| Wells Fargo & Co. | 47,900 | 2,207 |
| AIA Group Ltd. | 250,000 | 2,075 |
| Bank Central Asia Tbk PT1 | 1,080,000 | 1,949 |
| Sberbank of Russia PJSC (ADR) | 123,000 | 1,348 |
| FinecoBank SpA1 | 125,000 | 1,254 |
| BNP Paribas SA | 18,200 | 823 |
| BlackRock, Inc. | 434 | 171 |
| 29,727 | ||
| Health care 7.49% | ||
| Merck & Co., Inc. | 66,870 | 5,110 |
| Humana Inc. | 16,330 | 4,678 |
| UnitedHealth Group Inc. | 8,985 | 2,238 |
| AstraZeneca PLC | 26,600 | 1,991 |
| Mettler-Toledo International Inc.2 | 3,500 | 1,980 |
| Cigna Corp. | 10,310 | 1,958 |
| Fisher & Paykel Healthcare Corp. Ltd. | 204,000 | 1,780 |
| Carl Zeiss Meditec AG, non-registered shares1 | 19,500 | 1,526 |
| Coloplast A/S, Class B1 | 16,000 | 1,487 |
| Medtronic PLC | 15,000 | 1,364 |
| Gilead Sciences, Inc. | 17,500 | 1,095 |
| Novartis AG1 | 11,800 | 1,008 |
| Common stocks (continued) Health care (continued) | Shares | Value (000) |
| Teva Pharmaceutical Industries Ltd. (ADR) | 50,000 | $771 |
| GlaxoSmithKline PLC | 24,200 | 460 |
| 27,446 | ||
| Industrials 6.81% | ||
| Boeing Co. | 15,250 | 4,918 |
| Edenred SA | 65,000 | 2,391 |
| Spirax-Sarco Engineering PLC | 24,000 | 1,909 |
| Watsco, Inc. | 13,000 | 1,809 |
| MTU Aero Engines AG1 | 9,000 | 1,632 |
| Caterpillar Inc. | 12,000 | 1,525 |
| Ryanair Holdings PLC (ADR)2 | 20,600 | 1,470 |
| Nidec Corp.1 | 12,800 | 1,452 |
| ASSA ABLOY AB, Class B1 | 66,000 | 1,178 |
| NIBE Industrier AB, Class B1 | 106,000 | 1,087 |
| Cummins Inc. | 8,000 | 1,069 |
| BAE Systems PLC | 170,000 | 995 |
| International Consolidated Airlines Group, SA (CDI) | 120,000 | 945 |
| United Parcel Service, Inc., Class B | 9,300 | 907 |
| Northrop Grumman Corp. | 3,450 | 845 |
| Lockheed Martin Corp. | 3,080 | 806 |
| 24,938 | ||
| Energy 4.95% | ||
| ConocoPhillips | 56,006 | 3,492 |
| Royal Dutch Shell PLC, Class B | 114,200 | 3,406 |
| LUKOIL Oil Co. PJSC (ADR) | 39,800 | 2,845 |
| Enbridge Inc. (CAD denominated) | 62,117 | 1,929 |
| Enbridge Inc. (CAD denominated)3 | 16,157 | 502 |
| TOTAL SA | 45,200 | 2,391 |
| Occidental Petroleum Corp. | 21,500 | 1,320 |
| Chevron Corp. | 10,000 | 1,088 |
| Schlumberger Ltd. | 20,400 | 736 |
| CNOOC Ltd. | 175,000 | 270 |
| Canadian Natural Resources, Ltd. (CAD denominated) | 6,200 | 150 |
| 18,129 | ||
| Consumer staples 4.85% | ||
| Nestlé SA1 | 45,300 | 3,677 |
| Philip Morris International Inc. | 50,800 | 3,391 |
| British American Tobacco PLC | 78,900 | 2,514 |
| Coca-Cola European Partners PLC | 48,000 | 2,201 |
| Walgreens Boots Alliance, Inc. | 25,000 | 1,708 |
| Coca-Cola Co. | 29,000 | 1,373 |
| Procter & Gamble Co. | 11,000 | 1,011 |
| Anheuser-Busch InBev SA/NV | 15,000 | 992 |
| Coca-Cola FEMSA, SAB de CV, Series L | 150,000 | 910 |
| 17,777 | ||
| Consumer discretionary 4.05% | ||
| Amazon.com, Inc.2 | 2,500 | 3,755 |
| Ocado Group PLC2 | 259,500 | 2,613 |
| LVMH Moët Hennessy-Louis Vuitton SE | 6,100 | 1,805 |
| General Motors Co. | 50,000 | 1,672 |
| Home Depot, Inc. | 9,000 | 1,546 |
| Common stocks (continued) Consumer discretionary (continued) | Shares | Value (000) |
| Wynn Resorts, Ltd. | 13,000 | $1,286 |
| Peugeot SA | 52,500 | 1,122 |
| Nokian Renkaat Oyj1 | 33,634 | 1,034 |
| 14,833 | ||
| Materials 3.54% | ||
| DowDuPont Inc. | 40,738 | 2,179 |
| Linde PLC1 | 13,706 | 2,176 |
| Randgold Resources Ltd.1 | 25,000 | 2,068 |
| Akzo Nobel NV | 15,500 | 1,250 |
| LyondellBasell Industries NV | 12,000 | 998 |
| Koninklijke DSM NV | 12,000 | 982 |
| WestRock Co. | 24,570 | 928 |
| Rio Tinto PLC | 18,000 | 856 |
| Croda International PLC | 13,100 | 782 |
| Boral Ltd. | 185,000 | 644 |
| The Chemours Co. | 3,200 | 90 |
| 12,953 | ||
| Communication services 2.21% | ||
| Nintendo Co., Ltd.1 | 21,300 | 5,671 |
| Alphabet Inc., Class C2 | 1,705 | 1,766 |
| SK Telecom Co., Ltd.1 | 1,484 | 359 |
| Publicis Groupe SA | 5,000 | 287 |
| 8,083 | ||
| Real estate 1.91% | ||
| Link Real Estate Investment Trust REIT | 211,697 | 2,144 |
| Gaming and Leisure Properties, Inc. REIT | 59,720 | 1,929 |
| Equinix, Inc. REIT | 4,240 | 1,495 |
| Nippon Prologis, Inc. REIT1 | 391 | 827 |
| Crown Castle International Corp. REIT | 5,400 | 587 |
| 6,982 | ||
| Utilities 1.41% | ||
| Ørsted AS1 | 33,800 | 2,255 |
| ENN Energy Holdings Ltd. | 232,000 | 2,058 |
| Power Assets Holdings Ltd. | 120,500 | 839 |
| 5,152 | ||
| Total common stocks (cost: $181,317,000) | 207,455 | |
| Bonds, notes & other debt instruments 36.97% Bonds & notes of governments & government agencies outside the U.S. 16.15% | Principal amount (000) | |
| Abu Dhabi (Emirate of) 2.50% 20223 | $200 | 194 |
| Abu Dhabi (Emirate of) 3.125% 20273 | 200 | 191 |
| Australia (Commonwealth of), Series 128, 5.75% 2022 | A$1,120 | 894 |
| Australia (Commonwealth of), Series 133, 5.50% 2023 | 425 | 344 |
| Bank of Thailand 1.50% 2019 | THB11,780 | 362 |
| Belgium (Kingdom of), Series 77, 1.00% 2026 | €135 | 161 |
| Belgium (Kingdom of), Series 85, 0.80% 2028 | 360 | 414 |
| Brazil (Federative Republic of) 0% 2021 | BRL3,000 | 643 |
| Brazil (Federative Republic of) 10.00% 2025 | 3,368 | 908 |
| Canada 1.00% 2022 | C$300 | 213 |
| Bonds, notes & other debt instruments (continued) Bonds & notes of governments & government agencies outside the U.S. (continued) | Principal amount (000) | Value (000) |
| Canada 2.25% 2025 | C$1,700 | $1,271 |
| Chile (Republic of) 5.50% 2020 | CLP50,000 | 74 |
| China Development Bank Corp. 4.73% 2025 | CNY3,600 | 553 |
| Colombia (Republic of) 4.375% 2021 | $200 | 203 |
| European Financial Stability Facility 0.40% 2025 | €425 | 490 |
| European Financial Stability Facility 0.95% 2028 | 300 | 351 |
| European Investment Bank 2.25% 2022 | $225 | 222 |
| French Republic O.A.T. 1.00% 2025 | €420 | 505 |
| French Republic O.A.T. 0.75% 2028 | 450 | 518 |
| French Republic O.A.T. 3.25% 2045 | 260 | 410 |
| French Republic O.A.T. 2.00% 2048 | 150 | 187 |
| Germany (Federal Republic of) 2.25% 2021 | 60 | 74 |
| Germany (Federal Republic of) 1.75% 2024 | 300 | 380 |
| Germany (Federal Republic of) 0.50% 2026 | 200 | 238 |
| Germany (Federal Republic of) 0.50% 2028 | 1,300 | 1,534 |
| Germany (Federal Republic of) 2.50% 2046 | 315 | 509 |
| Germany (Federal Republic of) 1.25% 2048 | 550 | 692 |
| Greece (Hellenic Republic of) 3.375% 2025 | 110 | 122 |
| India (Republic of) 7.80% 2021 | INR32,200 | 468 |
| India (Republic of) 7.68% 2023 | 15,900 | 232 |
| India (Republic of) 8.83% 2023 | 10,400 | 159 |
| India (Republic of) 7.35% 2024 | 10,000 | 143 |
| India (Republic of) 6.97% 2026 | 74,000 | 1,034 |
| Indonesia (Republic of) 3.75% 2022 | $410 | 407 |
| Indonesia (Republic of) 3.85% 20273 | 400 | 381 |
| Indonesia (Republic of), Series 64, 6.125% 2028 | IDR778,000 | 48 |
| Indonesia (Republic of), Series 78, 8.25% 2029 | 6,768,000 | 483 |
| Indonesia (Republic of), Series 74, 7.50% 2032 | 3,000,000 | 196 |
| Ireland (Republic of) 3.40% 2024 | €50 | 67 |
| Ireland (Republic of) 1.00% 2026 | 500 | 590 |
| Ireland (Republic of) 0.90% 2028 | 1,090 | 1,250 |
| Ireland (Republic of) 2.40% 2030 | 30 | 39 |
| Israel (State of) 3.15% 2023 | $400 | 399 |
| Israel (State of) 2.00% 2027 | ILS2,100 | 558 |
| Israel (State of) 5.50% 2042 | 1,000 | 369 |
| Italy (Republic of) 0.95% 2023 | €150 | 168 |
| Italy (Republic of) 4.75% 2023 | 100 | 130 |
| Italy (Republic of) 4.50% 2024 | 200 | 258 |
| Italy (Republic of) 1.45% 2025 | 185 | 203 |
| Italy (Republic of) 2.05% 2027 | 550 | 607 |
| Japan, Series 395, 0.10% 2020 | ¥251,100 | 2,301 |
| Japan, Series 394, 0.10% 2020 | 106,000 | 971 |
| Japan, Series 134, 0.10% 2022 | 95,000 | 875 |
| Japan, Series 17, 0.10% 20234 | 10,480 | 98 |
| Japan, Series 19, 0.10% 20244 | 30,420 | 285 |
| Japan, Series 18, 0.10% 20244 | 20,840 | 195 |
| Japan, Series 337, 0.30% 2024 | 162,100 | 1,518 |
| Japan, Series 340, 0.40% 2025 | 20,000 | 189 |
| Japan, Series 344, 0.10% 2026 | 70,000 | 650 |
| Japan, Series 21, 0.10% 20264 | 40,591 | 383 |
| Japan, Series 346, 0.10% 2027 | 380,450 | 3,529 |
| Japan, Series 22, 0.10% 20274 | 25,444 | 240 |
| Japan, Series 145, 1.70% 2033 | 150,000 | 1,650 |
| Japan, Series 161, 0.60% 2037 | 190,000 | 1,779 |
| Japan, Series 42, 1.70% 2044 | 53,000 | 603 |
| Bonds, notes & other debt instruments (continued) Bonds & notes of governments & government agencies outside the U.S. (continued) | Principal amount (000) | Value (000) |
| Japan, Series 53, 0.60% 2046 | ¥45,000 | $400 |
| KfW 2.125% 2022 | $250 | 246 |
| Kuwait (State of) 2.75% 20223 | 200 | 197 |
| Lithuania (Republic of) 7.375% 2020 | 100 | 105 |
| Malaysia (Federation of), Series 0116, 3.80% 2023 | MYR2,950 | 712 |
| Malaysia (Federation of), Series 0316, 3.90% 2026 | 1,233 | 294 |
| Malaysia (Federation of), Series 0310, 4.498% 2030 | 1,600 | 391 |
| Morocco (Kingdom of) 4.25% 2022 | $200 | 201 |
| National Highways Authority of India 7.17% 2021 | INR30,000 | 419 |
| Netherlands (Kingdom of the) 5.50% 2028 | €100 | 168 |
| Norway (Kingdom of) 3.75% 2021 | NKr2,200 | 270 |
| Peru (Republic of) 6.15% 2032 | PEN3,275 | 991 |
| Peru (Republic of) 5.625% 2050 | $20 | 24 |
| Poland (Republic of), Series 1020, 5.25% 2020 | PLN2,850 | 815 |
| Poland (Republic of), Series 1021, 5.75% 2021 | 2,670 | 792 |
| Poland (Republic of), Series 0922, 5.75% 2022 | 870 | 264 |
| Poland (Republic of), Series 1023, 4.00% 2023 | 2,800 | 812 |
| Poland (Republic of), Series 0725, 3.25% 2025 | 4,950 | 1,385 |
| Portuguese Republic 5.125% 2024 | $250 | 262 |
| Portuguese Republic 2.875% 2025 | €600 | 766 |
| Qatar (State of) 4.50% 20283 | $900 | 942 |
| Quebec (Province of) 2.375% 2022 | 114 | 113 |
| Romania 2.30% 2020 | RON1,405 | 337 |
| Romania 3.375% 2038 | €80 | 82 |
| Romania 5.125% 20483 | $150 | 145 |
| Saskatchewan (Province of) 3.05% 2028 | C$250 | 186 |
| Saudi Arabia (Kingdom of) 2.894% 20223 | $200 | 195 |
| Saudi Arabia (Kingdom of) 3.625% 20283 | 200 | 190 |
| Saudi Arabia (Kingdom of) 4.50% 20303 | 240 | 239 |
| Saudi Arabia (Kingdom of) 5.00% 2049 | 200 | 193 |
| South Africa (Republic of), Series R-2023, 7.75% 2023 | ZAR1,950 | 134 |
| South Africa (Republic of), Series R-214, 6.50% 2041 | 11,550 | 561 |
| South Korea (Republic of), Series 2106, 4.25% 2021 | KRW262,000 | 248 |
| South Korea (Republic of), Series 2203, 1.875% 2022 | 260,000 | 233 |
| South Korea (Republic of), Series 2209, 2.00% 2022 | 560,000 | 504 |
| Spain (Kingdom of) 1.40% 2028 | €270 | 311 |
| Spain (Kingdom of) 2.90% 2046 | 130 | 160 |
| Spain (Kingdom of) 2.70% 2048 | 600 | 701 |
| Sweden (Kingdom of) 1.125% 20193 | $200 | 198 |
| Thailand (Kingdom of) 1.875% 2022 | THB14,100 | 431 |
| Thailand (Kingdom of) 3.85% 2025 | 7,300 | 245 |
| Thailand (Kingdom of) 2.125% 2026 | 37,300 | 1,121 |
| Thailand (Kingdom of) 3.775% 2032 | 4,900 | 166 |
| United Kingdom 3.75% 2020 | £75 | 100 |
| United Kingdom 1.75% 2022 | 280 | 369 |
| United Kingdom 2.75% 2024 | 260 | 364 |
| United Kingdom 4.25% 2027 | 50 | 80 |
| United Kingdom 4.25% 2040 | 50 | 92 |
| United Kingdom 3.25% 2044 | 250 | 408 |
| United Kingdom 3.50% 2045 | 50 | 85 |
| United Kingdom 1.50% 2047 | 520 | 613 |
| United Mexican States 4.15% 2027 | $400 | 387 |
| United Mexican States 4.60% 2046 | 200 | 178 |
| United Mexican States, Series M, 8.00% 2020 | MXN2,000 | 101 |
| United Mexican States, Series M, 6.50% 2021 | 9,000 | 438 |
| Bonds, notes & other debt instruments (continued) Bonds & notes of governments & government agencies outside the U.S. (continued) | Principal amount (000) | Value (000) |
| United Mexican States, Series M, 6.50% 2022 | MXN11,500 | $550 |
| United Mexican States, Series M20, 10.00% 2024 | 9,300 | 503 |
| United Mexican States, Series M, 5.75% 2026 | 26,000 | 1,119 |
| United Mexican States, Series M30, 10.00% 2036 | 2,500 | 140 |
| United Mexican States, Series M, 7.75% 2042 | 3,200 | 144 |
| Uruguay (Oriental Republic of) 9.875% 2022 | UYU1,050 | 32 |
| Uruguay (Oriental Republic of) 8.50% 2028 | 6,963 | 182 |
| 59,146 | ||
| U.S. Treasury bonds & notes 12.50% U.S. Treasury 10.13% | ||
| U.S. Treasury 1.00% 2019 | $1,000 | 986 |
| U.S. Treasury 1.25% 2019 | 50 | 50 |
| U.S. Treasury 1.625% 2019 | 300 | 298 |
| U.S. Treasury 1.75% 2019 | 600 | 596 |
| U.S. Treasury 3.125% 2019 | 225 | 225 |
| U.S. Treasury 1.375% 2020 | 900 | 886 |
| U.S. Treasury 1.50% 2020 | 350 | 344 |
| U.S. Treasury 1.75% 2020 | 564 | 556 |
| U.S. Treasury 2.125% 2020 | 200 | 199 |
| U.S. Treasury 2.50% 2020 | 420 | 420 |
| U.S. Treasury 2.625% 2020 | 100 | 100 |
| U.S. Treasury 2.875% 2020 | 927 | 933 |
| U.S. Treasury 1.125% 2021 | 1,025 | 991 |
| U.S. Treasury 1.375% 2021 | 550 | 536 |
| U.S. Treasury 2.00% 2021 | 108 | 107 |
| U.S. Treasury 2.625% 2021 | 1,020 | 1,024 |
| U.S. Treasury 2.875% 2021 | 2,250 | 2,276 |
| U.S. Treasury 1.625% 2022 | 2,850 | 2,766 |
| U.S. Treasury 1.875% 2022 | 700 | 688 |
| U.S. Treasury 1.875% 2022 | 600 | 588 |
| U.S. Treasury 2.00% 2022 | 455 | 447 |
| U.S. Treasury 2.00% 2022 | 75 | 74 |
| U.S. Treasury 1.375% 2023 | 300 | 286 |
| U.S. Treasury 1.75% 2023 | 100 | 97 |
| U.S. Treasury 2.375% 20235 | 750 | 747 |
| U.S. Treasury 2.625% 2023 | 800 | 804 |
| U.S. Treasury 2.75% 2023 | 420 | 425 |
| U.S. Treasury 2.75% 2023 | 101 | 102 |
| U.S. Treasury 2.875% 2023 | 2,250 | 2,288 |
| U.S. Treasury 2.00% 2024 | 750 | 730 |
| U.S. Treasury 2.125% 2024 | 2,025 | 1,981 |
| U.S. Treasury 2.125% 2024 | 500 | 489 |
| U.S. Treasury 2.25% 2024 | 200 | 197 |
| U.S. Treasury 2.125% 2025 | 200 | 195 |
| U.S. Treasury 2.75% 2025 | 720 | 727 |
| U.S. Treasury 2.875% 2025 | 750 | 763 |
| U.S. Treasury 3.00% 2025 | 900 | 923 |
| U.S. Treasury 1.625% 2026 | 535 | 501 |
| U.S. Treasury 1.625% 2026 | 440 | 411 |
| U.S. Treasury 2.25% 2027 | 2,800 | 2,711 |
| U.S. Treasury 2.25% 2027 | 700 | 680 |
| U.S. Treasury 2.25% 2027 | 500 | 483 |
| U.S. Treasury 2.375% 2027 | 1,500 | 1,469 |
| U.S. Treasury 2.875% 20285 | 2,170 | 2,205 |
| Bonds, notes & other debt instruments (continued) U.S. Treasury bonds & notes (continued) U.S. Treasury (continued) | Principal amount (000) | Value (000) |
| U.S. Treasury 2.875% 2028 | $612 | $622 |
| U.S. Treasury 3.125% 2028 | 900 | 935 |
| U.S. Treasury 3.00% 20445 | 355 | 355 |
| U.S. Treasury 2.50% 2045 | 315 | 286 |
| U.S. Treasury 3.00% 2045 | 100 | 100 |
| U.S. Treasury 2.875% 2046 | 500 | 487 |
| 37,089 | ||
| U.S. Treasury inflation-protected securities 2.37% | ||
| U.S. Treasury Inflation-Protected Security 0.125% 20224 | 220 | 212 |
| U.S. Treasury Inflation-Protected Security 0.125% 20244 | 799 | 767 |
| U.S. Treasury Inflation-Protected Security 0.625% 20244 | 1,815 | 1,788 |
| U.S. Treasury Inflation-Protected Security 0.25% 20254 | 865 | 828 |
| U.S. Treasury Inflation-Protected Security 0.375% 20254 | 240 | 231 |
| U.S. Treasury Inflation-Protected Security 2.375% 20254 | 67 | 73 |
| U.S. Treasury Inflation-Protected Security 0.625% 20264 | 851 | 830 |
| U.S. Treasury Inflation-Protected Security 0.375% 20274 | 1,727 | 1,641 |
| U.S. Treasury Inflation-Protected Security 0.375% 20274 | 222 | 211 |
| U.S. Treasury Inflation-Protected Security 0.50% 20284 | 1,640 | 1,566 |
| U.S. Treasury Inflation-Protected Security 1.375% 20444 | 516 | 534 |
| 8,681 | ||
| Total U.S. Treasury bonds & notes | 45,770 | |
| Corporate bonds & notes 6.43% Financials 1.61% | ||
| ACE INA Holdings Inc. 2.875% 2022 | 20 | 20 |
| ACE INA Holdings Inc. 3.35% 2026 | 20 | 20 |
| ACE INA Holdings Inc. 4.35% 2045 | 20 | 21 |
| Allianz SE 4.75% (undated) (3-month EUR-EURIBOR + 3.60% on 10/24/2023)6 | €100 | 126 |
| Aviva PLC, junior subordinated 6.875% 20586 | £75 | 107 |
| AXA SA, junior subordinated 5.453% (undated)6 | 100 | 129 |
| Banco Bilbao Vizcaya Argentaria SA 3.50% 2024 (5 year EURO Mid Swap + 2.55% on 4/11/2019)6 | €100 | 115 |
| Banco del Estado de Chile 2.668% 20213 | $500 | 489 |
| Banco Nacional de Comercio Exterior SNC 3.80% 2026 (UST Yield Curve Rate T Note Constant Maturity 5 year + 3.00% on 8/11/2021)3,6 | 200 | 191 |
| Bank of America Corp. 3.55% 2024 (3-month USD-LIBOR + 0.78% on 3/5/2023)6 | 100 | 99 |
| Bank of America Corp. 3.419% 2028 (3-month USD-LIBOR + 1.04% on 12/20/2027)6 | 394 | 369 |
| Barclays Bank PLC 10.00% 2021 | £100 | 147 |
| Berkshire Hathaway Inc. 3.00% 2022 | $75 | 75 |
| Goldman Sachs Group, Inc. 5.75% 2022 | 70 | 73 |
| Goldman Sachs Group, Inc. 2.905% 2023 (3-month USD-LIBOR + 0.99% on 7/24/2022)6 | 130 | 124 |
| Goldman Sachs Group, Inc. 3.50% 2025 | 210 | 199 |
| Goldman Sachs Group, Inc. 3.75% 2026 | 25 | 24 |
| Goldman Sachs Group, Inc. 4.75% 2045 | 70 | 67 |
| Groupe BPCE SA 5.70% 20233 | 200 | 207 |
| HSBC Holdings PLC 3.033% 2023 (3-month USD-LIBOR + 0.923% on 11/12/2022)6 | 200 | 194 |
| HSBC Holdings PLC 3.375% 2024 (5 year EURO Mid Swap + 1.95% on 1/10/2019)6 | €100 | 115 |
| HSBC Holdings PLC 3.90% 2026 | $200 | 192 |
| HSBC Holdings PLC 4.292% 2026 (3-month USD-LIBOR + 1.348% on 9/12/2025)6 | 250 | 247 |
| Intesa Sanpaolo SpA 6.625% 2023 | €125 | 163 |
| JPMorgan Chase & Co. 2.55% 2021 | $76 | 75 |
| JPMorgan Chase & Co. 3.25% 2022 | 28 | 28 |
| JPMorgan Chase & Co. 2.70% 2023 | 150 | 144 |
| Bonds, notes & other debt instruments (continued) Corporate bonds & notes (continued) Financials (continued) | Principal amount (000) | Value (000) |
| JPMorgan Chase & Co., Series S, junior subordinated, perpetual, 6.75% (undated) (3-month USD-LIBOR + 3.78% on 2/1/2024)6 | $135 | $140 |
| JPMorgan Chase Bank NA (3-month USD-LIBOR + 0.34%) 2.848% 20217 | 300 | 297 |
| Lloyds Banking Group PLC 6.50% 2020 | €210 | 257 |
| Morgan Stanley 3.125% 2026 | $110 | 102 |
| Morgan Stanley 3.875% 2026 | 75 | 73 |
| NN Group NV 4.50% (undated) (3-month EUR-LIBOR + 4.00% on 1/15/2026)6 | €100 | 115 |
| PNC Financial Services Group, Inc. 2.854% 20226 | $100 | 98 |
| Rabobank Nederland 3.875% 2023 | €100 | 128 |
| Skandinaviska Enskilda Banken AB 2.80% 2022 | $250 | 245 |
| UniCredit SpA 4.625% 20273 | 200 | 183 |
| US Bancorp 2.85% 2023 | 300 | 295 |
| VEB Finance Ltd. 6.902% 20203 | 100 | 102 |
| Wells Fargo & Co. 3.584% 2028 (3-month USD-LIBOR + 1.31% on 5/15/2027)6 | 100 | 96 |
| 5,891 | ||
| Utilities 0.98% | ||
| Abu Dhabi National Energy Co. PJSC (TAQA) 3.625% 20233 | 200 | 196 |
| American Electric Power Co., Inc. 2.15% 2020 | 215 | 211 |
| CMS Energy Corp. 3.00% 2026 | 150 | 141 |
| Duke Energy Carolinas, Inc. 3.05% 2023 | 280 | 278 |
| Duke Energy Carolinas, Inc. 3.70% 2047 | 50 | 46 |
| Duke Energy Corp. 3.75% 2024 | 110 | 110 |
| Duke Energy Corp. 2.65% 2026 | 225 | 205 |
| Duke Energy Progress, LLC 3.70% 2028 | 75 | 76 |
| Enel Finance International SA 2.75% 20233 | 200 | 185 |
| Enel Finance International SA 3.625% 20273 | 200 | 177 |
| Enel Finance International SA 3.50% 20283 | 400 | 344 |
| Enersis Américas SA 4.00% 2026 | 110 | 103 |
| Exelon Corp. 3.497% 20226 | 25 | 24 |
| Exelon Corp. 3.40% 2026 | 150 | 143 |
| FirstEnergy Corp. 3.90% 2027 | 250 | 243 |
| FirstEnergy Corp. 3.50% 20283 | 65 | 62 |
| FirstEnergy Corp. 4.85% 2047 | 60 | 60 |
| Niagara Mohawk Power Corp. 3.508% 20243 | 85 | 86 |
| NiSource Finance Corp. 2.65% 2022 | 50 | 48 |
| Pacific Gas and Electric Co. 3.85% 2023 | 70 | 63 |
| Pacific Gas and Electric Co. 2.95% 2026 | 25 | 21 |
| Pacific Gas and Electric Co. 3.30% 2027 | 150 | 123 |
| Pacific Gas and Electric Co. 4.65% 20283 | 114 | 101 |
| Pacific Gas and Electric Co. 6.35% 2038 | 62 | 59 |
| Sierra Pacific Power Co., General and Refunding Mortgage Notes, Series T, 3.375% 2023 | 72 | 72 |
| State Grid Overseas Investment Ltd. 3.50% 20273 | 450 | 434 |
| 3,611 | ||
| Health care 0.92% | ||
| Abbott Laboratories 3.75% 2026 | 51 | 51 |
| AbbVie Inc. 2.50% 2020 | 180 | 178 |
| AbbVie Inc. 2.90% 2022 | 60 | 58 |
| AbbVie Inc. 3.20% 2026 | 73 | 68 |
| AbbVie Inc. 4.50% 2035 | 15 | 14 |
| Aetna Inc. 2.75% 2022 | 50 | 48 |
| Aetna Inc. 2.80% 2023 | 10 | 10 |
| Allergan PLC 3.00% 2020 | 30 | 30 |
| Bonds, notes & other debt instruments (continued) Corporate bonds & notes (continued) Health care (continued) | Principal amount (000) | Value (000) |
| Allergan PLC 3.80% 2025 | $173 | $169 |
| Allergan PLC 4.75% 2045 | 3 | 3 |
| Amgen Inc. 1.85% 2021 | 20 | 19 |
| AstraZeneca PLC 2.375% 2022 | 110 | 106 |
| AstraZeneca PLC 3.50% 2023 | 150 | 149 |
| Baxalta Inc. 4.00% 2025 | 18 | 18 |
| Bayer US Finance II LLC 3.875% 20233 | 200 | 197 |
| Bayer US Finance II LLC 4.40% 20443 | 100 | 86 |
| Becton, Dickinson and Co. 2.894% 2022 | 55 | 53 |
| Becton, Dickinson and Co. 3.734% 2024 | 35 | 34 |
| Becton, Dickinson and Co. 3.70% 2027 | 65 | 62 |
| Cigna Corp. 4.125% 20253 | 80 | 80 |
| Cigna Corp. 4.375% 20283 | 120 | 121 |
| CVS Health Corp. 4.30% 2028 | 85 | 83 |
| CVS Health Corp. 4.78% 2038 | 20 | 19 |
| CVS Health Corp. 5.05% 2048 | 215 | 210 |
| EMD Finance LLC 2.40% 20203 | 200 | 198 |
| EMD Finance LLC 3.25% 20253 | 250 | 240 |
| Humana Inc. 3.15% 2022 | 100 | 98 |
| Medtronic, Inc. 3.50% 2025 | 100 | 100 |
| Roche Holdings, Inc. 3.35% 20243 | 200 | 201 |
| Shire PLC 2.40% 2021 | 153 | 148 |
| Shire PLC 2.875% 2023 | 69 | 65 |
| Shire PLC 3.20% 2026 | 25 | 23 |
| Takeda Pharmaceutical Co., Ltd. 4.40% 20233 | 200 | 202 |
| Takeda Pharmaceutical Co., Ltd. 2.25% 2026 | €200 | 234 |
| 3,375 | ||
| Consumer discretionary 0.56% | ||
| Amazon.com, Inc. 2.80% 2024 | $170 | 165 |
| Amazon.com, Inc. 3.15% 2027 | 50 | 48 |
| DaimlerChrysler North America Holding Corp. 2.00% 20213 | 200 | 193 |
| Hyundai Capital America 2.55% 20203 | 135 | 133 |
| Hyundai Capital America 3.25% 20223 | 65 | 63 |
| Hyundai Capital Services Inc. 3.75% 20233 | 250 | 247 |
| McDonald’s Corp. 3.50% 2020 | 50 | 51 |
| McDonald’s Corp. 3.80% 2028 | 110 | 108 |
| Nissan Motor Co., Ltd. 2.15% 20203 | 120 | 117 |
| Nissan Motor Co., Ltd. 2.60% 20223 | 115 | 110 |
| President & Fellows of Harvard College 3.619% 2037 | 150 | 148 |
| Toyota Motor Credit Corp. 2.25% 2023 | 85 | 81 |
| Volkswagen Group of America Finance, LLC 4.25% 20233 | 380 | 377 |
| Volkswagen Group of America Finance, LLC 4.625% 20253 | 200 | 198 |
| 2,039 | ||
| Consumer staples 0.55% | ||
| Altria Group, Inc. 2.625% 2020 | 100 | 99 |
| Altria Group, Inc. 4.25% 2042 | 150 | 122 |
| Anheuser-Busch InBev NV 3.30% 2023 | 35 | 34 |
| Anheuser-Busch InBev NV 3.50% 2024 | 340 | 333 |
| Anheuser-Busch InBev NV 4.00% 2028 | 100 | 96 |
| British American Tobacco PLC 3.557% 2027 | 105 | 93 |
| British American Tobacco PLC 4.39% 2037 | 80 | 66 |
| Conagra Brands, Inc. 4.30% 2024 | 210 | 209 |
| Bonds, notes & other debt instruments (continued) Corporate bonds & notes (continued) Consumer staples (continued) | Principal amount (000) | Value (000) |
| Keurig Dr Pepper Inc. 4.597% 20283 | $175 | $174 |
| Keurig Dr Pepper Inc. 5.085% 20483 | 100 | 96 |
| Kraft Heinz Co. 3.50% 2022 | 100 | 99 |
| Kroger Co. 3.50% 2026 | 140 | 133 |
| Pernod Ricard SA 4.45% 20223 | 150 | 153 |
| Philip Morris International Inc. 2.00% 2020 | 55 | 54 |
| Philip Morris International Inc. 2.90% 2021 | 100 | 99 |
| Philip Morris International Inc. 2.625% 2022 | 15 | 14 |
| Philip Morris International Inc. 4.25% 2044 | 25 | 23 |
| Reynolds American Inc. 4.00% 2022 | 15 | 15 |
| Reynolds American Inc. 4.45% 2025 | 105 | 101 |
| 2,013 | ||
| Energy 0.53% | ||
| Cenovus Energy Inc. 4.25% 2027 | 65 | 59 |
| El Paso Pipeline Partners Operating Co., LLC 4.70% 2042 | 75 | 66 |
| Enbridge Inc. 4.25% 2026 | 70 | 69 |
| Enbridge Inc. 3.70% 2027 | 132 | 125 |
| Energy Transfer Partners, LP 4.00% 2027 | 67 | 62 |
| Energy Transfer Partners, LP 4.20% 2027 | 15 | 14 |
| Energy Transfer Partners, LP 6.00% 2048 | 20 | 20 |
| Halliburton Co. 3.80% 2025 | 35 | 34 |
| Kinder Morgan Energy Partners, LP 3.50% 2021 | 30 | 30 |
| Kinder Morgan, Inc. 4.30% 2028 | 150 | 148 |
| Petróleos Mexicanos 7.47% 2026 | MXN4,000 | 150 |
| Petróleos Mexicanos 6.50% 2027 | $130 | 122 |
| Petróleos Mexicanos 6.35% 2048 | 357 | 286 |
| Schlumberger BV 4.00% 20253 | 50 | 49 |
| Shell International Finance BV 3.50% 2023 | 330 | 334 |
| Statoil ASA 3.15% 2022 | 160 | 160 |
| Statoil ASA 3.70% 2024 | 50 | 51 |
| Total Capital International 2.875% 2022 | 150 | 148 |
| 1,927 | ||
| Communication services 0.52% | ||
| AT&T Inc. 4.10% 2028 | 55 | 53 |
| Comcast Corp. 3.95% 2025 | 80 | 81 |
| Comcast Corp. 4.15% 2028 | 160 | 163 |
| Deutsche Telekom International Finance BV 1.95% 20213 | 150 | 144 |
| Deutsche Telekom International Finance BV 9.25% 2032 | 45 | 64 |
| France Télécom 9.00% 20316 | 65 | 90 |
| France Télécom 5.375% 2050 | £50 | 86 |
| Myriad International Holdings 6.00% 2020 | $250 | 257 |
| Myriad International Holdings 5.50% 2025 | 250 | 253 |
| NBCUniversal Media, LLC 4.375% 2021 | 50 | 51 |
| Orange SA 2.75% 2019 | 140 | 140 |
| Time Warner Inc. 4.75% 2021 | 150 | 154 |
| Verizon Communications Inc. 4.329% 2028 | 120 | 121 |
| Verizon Communications Inc. 4.272% 2036 | 248 | 233 |
| 1,890 |
| Bonds, notes & other debt instruments (continued) Corporate bonds & notes (continued) Information technology 0.31% | Principal amount (000) | Value (000) |
| Apple Inc. 2.50% 2022 | $75 | $74 |
| Apple Inc. 3.35% 2027 | 65 | 64 |
| Broadcom Ltd. 3.875% 2027 | 190 | 171 |
| Microsoft Corp. 2.40% 2026 | 297 | 278 |
| Microsoft Corp. 3.30% 2027 | 355 | 352 |
| Oracle Corp. 2.65% 2026 | 216 | 200 |
| 1,139 | ||
| Real estate 0.23% | ||
| American Campus Communities, Inc. 3.35% 2020 | 15 | 15 |
| American Campus Communities, Inc. 3.75% 2023 | 100 | 99 |
| American Campus Communities, Inc. 4.125% 2024 | 90 | 91 |
| Corporate Office Properties LP 3.60% 2023 | 65 | 63 |
| Essex Portfolio LP 3.50% 2025 | 120 | 117 |
| Essex Portfolio LP 3.375% 2026 | 40 | 38 |
| Scentre Group 3.75% 20273 | 20 | 19 |
| WEA Finance LLC 2.70% 20193 | 200 | 199 |
| WEA Finance LLC 3.75% 20243 | 200 | 199 |
| 840 | ||
| Industrials 0.22% | ||
| General Electric Capital Corp. 3.15% 2022 | 50 | 47 |
| Lima Metro Line Finance Ltd. 5.875% 20343,8 | 200 | 200 |
| Red de Carreteras de Occidente 9.00% 20288 | MXN2,000 | 93 |
| Thomson Reuters Corp. 4.30% 2023 | $75 | 76 |
| Union Pacific Corp. 2.95% 2023 | 100 | 98 |
| Union Pacific Corp. 4.50% 2048 | 20 | 20 |
| United Technologies Corp. 3.10% 2022 | 106 | 104 |
| United Technologies Corp. 4.125% 2028 | 170 | 169 |
| 807 | ||
| Total corporate bonds & notes | 23,532 | |
| Mortgage-backed obligations 1.89% | ||
| Core Industrial Trust, Series 2015-CALW, Class A, 3.04% 20343,8 | 47 | 47 |
| Fannie Mae 4.00% 20418 | 71 | 73 |
| Fannie Mae 4.00% 20488 | 336 | 343 |
| Fannie Mae 4.00% 20488 | 148 | 151 |
| Fannie Mae 4.00% 20498,9 | 1,995 | 2,035 |
| Fannie Mae 4.50% 20498,9 | 1,225 | 1,269 |
| Freddie Mac 3.50% 20498,9 | 300 | 300 |
| Government National Mortgage Assn. 4.00% 20498,9 | 90 | 92 |
| Government National Mortgage Assn. 4.00% 20498,9 | 80 | 82 |
| Korea Housing Finance Corp. 2.50% 20203,8 | 250 | 246 |
| Korea Housing Finance Corp. 2.00% 20213,8 | 250 | 241 |
| Nykredit Realkredit AS, Series 01E, 1.50% 20378 | DKr1,730 | 268 |
| Nykredit Realkredit AS, Series 01E, 2.00% 20378 | 2,780 | 444 |
| Nykredit Realkredit AS, Series 01E, 1.50% 20408 | 8,810 | 1,345 |
| 6,936 | ||
| Total bonds, notes & other debt instruments (cost: $138,335,000) | 135,384 |
| Short-term securities 6.99% | Principal amount (000) | Value (000) |
| Canada Bill 2.32%due 1/3/2019 | $6,000 | $6,000 |
| Federal Home Loan Bank 2.15%–2.39%due 1/2/2019–1/22/2019 | 9,600 | 9,592 |
| National Rural Utilities Cooperative Finance Corp. 2.55%due 1/14/2019 | 5,000 | 4,995 |
| U.S. Treasury Bills 2.28%due 1/15/2019 | 5,000 | 4,996 |
| Total short-term securities (cost: $25,583,000) | 25,583 | |
| Total investment securities100.61% (cost: $345,235,000) | 368,422 | |
| Other assets less liabilities (0.61)% | (2,233) | |
| Net assets100.00% | $366,189 |
| Contracts | Type | Number of contracts | Expiration | Notional amount10 (000) | Value at 12/31/201811 (000) | Unrealized appreciation at 12/31/2018 (000) |
| 2 Year U.S. Treasury Note Futures | Long | 6 | April 2019 | $1,200 | $1,274 | $6 |
| 5 Year U.S. Treasury Note Futures | Long | 97 | April 2019 | 9,700 | 11,124 | 116 |
| 10 Year Ultra U.S. Treasury Note Futures | Long | 9 | March 2019 | 900 | 1,171 | 38 |
| 10 Year U.S. Treasury Note Futures | Long | 7 | March 2019 | 700 | 854 | 20 |
| $180 |
| Contract amount | Counterparty | Settlement date | Unrealized (depreciation) appreciation at 12/31/2018 (000) | |
| Purchases (000) | Sales (000) | |||
| USD500 | MYR2,100 | JPMorgan Chase | 1/4/2019 | $(8) |
| USD482 | THB15,900 | HSBC Bank | 1/8/2019 | (6) |
| USD1,367 | EUR1,200 | Citibank | 1/8/2019 | (9) |
| JPY57,806 | EUR450 | HSBC Bank | 1/9/2019 | 12 |
| JPY42,300 | USD374 | Citibank | 1/9/2019 | 12 |
| EUR534 | USD606 | Goldman Sachs | 1/9/2019 | 6 |
| USD354 | JPY40,000 | Bank of New York Mellon | 1/9/2019 | (11) |
| USD513 | BRL2,000 | Citibank | 1/10/2019 | (3) |
| USD350 | INR24,900 | Citibank | 1/10/2019 | (6) |
| JPY9,730 | USD86 | JPMorgan Chase | 1/11/2019 | 3 |
| JPY9,730 | USD86 | Goldman Sachs | 1/11/2019 | 3 |
| USD162 | ILS600 | Goldman Sachs | 1/11/2019 | 1 |
| USD497 | PLN1,870 | JPMorgan Chase | 1/11/2019 | (3) |
| USD172 | JPY19,459 | Goldman Sachs | 1/11/2019 | (6) |
| USD356 | INR25,000 | Citibank | 1/14/2019 | (1) |
| USD378 | MYR1,580 | JPMorgan Chase | 1/14/2019 | (4) |
| USD692 | INR49,000 | HSBC Bank | 1/15/2019 | (9) |
| JPY116,594 | USD1,033 | JPMorgan Chase | 1/17/2019 | 32 |
| USD871 | CAD1,165 | Citibank | 1/17/2019 | 17 |
| EUR938 | USD1,068 | Goldman Sachs | 1/17/2019 | 9 |
| KRW900,000 | USD802 | JPMorgan Chase | 1/17/2019 | 5 |
| USD259 | THB8,500 | Bank of America, N.A. | 1/17/2019 | (2) |
| USD796 | KRW900,000 | Morgan Stanley | 1/17/2019 | (11) |
| USD740 | JPY83,520 | Citibank | 1/17/2019 | (23) |
| Contract amount | Counterparty | Settlement date | Unrealized (depreciation) appreciation at 12/31/2018 (000) | |
| Purchases (000) | Sales (000) | |||
| JPY110,281 | EUR860 | Goldman Sachs | 1/18/2019 | $21 |
| USD520 | AUD725 | JPMorgan Chase | 1/18/2019 | 10 |
| USD113 | CAD150 | Goldman Sachs | 1/18/2019 | 4 |
| KRW532,100 | USD475 | HSBC Bank | 1/18/2019 | 2 |
| GBP190 | USD243 | Citibank | 1/18/2019 | (1) |
| USD474 | KRW532,100 | Goldman Sachs | 1/18/2019 | (3) |
| USD116 | INR8,300 | Citibank | 1/22/2019 | (3) |
| USD588 | BRL2,300 | JPMorgan Chase | 1/22/2019 | (5) |
| GBP1,476 | USD1,871 | Citibank | 1/24/2019 | 13 |
| EUR1,565 | USD1,787 | JPMorgan Chase | 1/24/2019 | 10 |
| GBP270 | EUR300 | Bank of America, N.A. | 1/24/2019 | —12 |
| NOK2,700 | USD316 | Bank of New York Mellon | 1/24/2019 | (3) |
| USD699 | AUD970 | UBS AG | 1/25/2019 | 15 |
| USD462 | INR32,718 | JPMorgan Chase | 1/25/2019 | (6) |
| EUR717 | USD812 | HSBC Bank | 1/28/2019 | 11 |
| EUR400 | USD459 | HSBC Bank | 1/28/2019 | 1 |
| NOK3,054 | USD351 | UBS AG | 1/29/2019 | 3 |
| USD143 | MXN2,900 | HSBC Bank | 1/29/2019 | (3) |
| JPY85,000 | USD754 | JPMorgan Chase | 2/13/2019 | 24 |
| USD504 | CNH3,500 | JPMorgan Chase | 2/28/2019 | (6) |
| USD62 | BRL250 | HSBC Bank | 12/20/2019 | —12 |
| $82 | ||||
| Receive | Pay | Expiration date | Notional (000) | Value at 12/31/2018 (000) | Upfront payments/ receipts (000) | Unrealized (depreciation) appreciation at 12/31/2018 (000) |
| U.S. EFFR | 2.521% | 5/1/2019 | $153,000 | $(19) | $— | $(19) |
| (0.0385)% | EONIA | 12/4/2021 | €4,300 | 12 | — | 12 |
| (0.0405)% | EONIA | 12/4/2021 | 4,400 | 12 | — | 12 |
| $— | $5 |
| 1 | Valued under fair value procedures adopted by authority of the board of trustees. The total value of all such securities was $42,136,000, which represented 11.51% of the net assets of the fund. This amount includes $40,068,000 related to certain securities trading outside the U.S. whose values were adjusted as a result of significant market movements following the close of local trading. |
| 2 | Security did not produce income during the last 12 months. |
| 3 | Acquired in a transaction exempt from registration under Rule 144A of the Securities Act of 1933. May be resold in the U.S. in transactions exempt from registration, normally to qualified institutional buyers. The total value of all such securities was $10,661,000, which represented 2.91% of the net assets of the fund. |
| 4 | Index-linked bond whose principal amount moves with a government price index. |
| 5 | All or a portion of this security was pledged as collateral. The total value of pledged collateral was $154,000, which represented .04% of the net assets of the fund. |
| 6 | Step bond; coupon rate may change at a later date. |
| 7 | Coupon rate may change periodically. |
| 8 | Principal payments may be made periodically. Therefore, the effective maturity date may be earlier than the stated maturity date. |
| 9 | Purchased on a TBA basis. |
| 10 | Notional amount is calculated based on the number of contracts and notional contract size. |
| 11 | Value is calculated based on the notional amount and current market price. |
| 12 | Amount less than one thousand. |
| Key to abbreviations and symbols | |
| ADR = American Depositary Receipts | JPY/¥ = Japanese yen |
| AUD/A$ = Australian dollars | KRW = South Korean won |
| BRL = Brazilian reais | LIBOR = London Interbank Offered Rate |
| CAD/C$ = Canadian dollars | MXN = Mexican pesos |
| CDI = CREST Depository Interest | MYR = Malaysian ringgits |
| CLP = Chilean pesos | NOK/NKr = Norwegian kroner |
| CNH = Chinese yuan renminbi | PEN = Peruvian nuevos soles |
| CNY = Chinese yuan renminbi | PLN = Polish zloty |
| DKr = Danish kroner | RON = Romanian leu |
| EUR/€ = Euros | TBA = To-be-announced |
| EURIBOR = Euro Interbank Offered Rate | THB = Thai baht |
| GBP/£ = British pounds | USD/$ = U.S. dollars |
| IDR = Indonesian rupiah | UYU = Uruguayan pesos |
| ILS = Israeli shekels | ZAR = South African rand |
| INR = Indian rupees |
| Bonds, notes & other debt instruments 98.44% Corporate bonds & notes 36.57% Financials 10.49% | Principal amount (000) | Value (000) |
| ABN AMRO Bank NV 2.65% 20211 | $3,000 | $2,961 |
| ACE INA Holdings Inc. 2.30% 2020 | 2,005 | 1,977 |
| ACE INA Holdings Inc. 2.875% 2022 | 3,625 | 3,596 |
| ACE INA Holdings Inc. 3.35% 2026 | 2,525 | 2,474 |
| ACE INA Holdings Inc. 4.35% 2045 | 2,220 | 2,294 |
| Ally Financial Inc. 4.25% 2021 | 34,100 | 33,594 |
| Ally Financial Inc. 5.125% 2024 | 25,300 | 25,173 |
| Ally Financial Inc. 8.00% 2031 | 12,895 | 14,346 |
| Ally Financial Inc. 8.00% 2031 | 9,120 | 10,169 |
| American Express Co. 2.20% 2020 | 14,400 | 14,144 |
| American Express Co. 3.70% 2021 | 2,840 | 2,867 |
| American International Group, Inc. 4.20% 2028 | 11,595 | 11,215 |
| American International Group, Inc. 4.75% 2048 | 10,525 | 9,681 |
| Assicurazioni Generali SpA 7.75% 2042 (3-month EUR-EURIBOR + 7.113% on 12/12/2022)2 | €3,100 | 4,145 |
| Assicurazioni Generali SpA 10.125% 2042 (3-month EUR-EURIBOR + 9.181% on 7/10/2022)2 | 3,800 | 5,400 |
| AXA Equitable Holdings, Inc. 3.90% 20231 | $2,215 | 2,190 |
| AXA Equitable Holdings, Inc. 4.35% 20281 | 250 | 237 |
| AXA SA 5.00% 20481 | 7,740 | 6,816 |
| Bank of America Corp. 2.816% 2023 (3-month USD-LIBOR + 0.93% on 7/21/2022)2 | 39,485 | 38,210 |
| Bank of America Corp. 3.124% 2023 (3-month USD-LIBOR + 1.16% on 1/20/2022)2 | 37,000 | 36,391 |
| Bank of America Corp. 3.55% 2024 (3-month USD-LIBOR + 0.78% on 3/5/2023)2 | 876 | 866 |
| Bank of America Corp. 3.419% 2028 (3-month USD-LIBOR + 1.04% on 12/20/2027)2 | 10,129 | 9,478 |
| Bank of America Corp. 3.97% 2029 (3-month USD-LIBOR + 1.07% on 3/5/2028)2 | 14,400 | 14,022 |
| Bank of America Corp. 4.271% 2029 (3-month USD-LIBOR + 1.31% on 7/23/2028)2 | 9,976 | 9,947 |
| Barclays Bank PLC 4.972% 2029 (3-month USD-LIBOR + 1.902% on 5/16/2028)2 | 2,800 | 2,706 |
| BB&T Corp. 2.45% 2020 | 5,000 | 4,966 |
| Berkshire Hathaway Finance Corp. 4.20% 2048 | 9,095 | 9,073 |
| BNP Paribas 3.50% 20231 | 16,275 | 15,793 |
| BNP Paribas 3.375% 20251 | 525 | 495 |
| Capital One Financial Corp. 2.40% 2020 | 10,150 | 9,939 |
| Capital One Financial Corp. 2.50% 2020 | 39,100 | 38,601 |
| Capital One Financial Corp. 3.45% 2021 | 4,500 | 4,493 |
| Capital One Financial Corp. 4.25% 2025 | 8,000 | 7,955 |
| Citigroup Inc. 2.35% 2021 | 1,000 | 972 |
| Citigroup Inc. 2.90% 2021 | 3,200 | 3,150 |
| Citigroup Inc. 2.75% 2022 | 21,000 | 20,377 |
| Citigroup Inc. 2.876% 2023 (3-month USD-LIBOR + 0.95% on 7/24/2022)2 | 26,643 | 25,797 |
| Citigroup Inc. 3.875% 2023 | 2,925 | 2,936 |
| Citigroup Inc. 4.044% 2024 (3-month USD-LIBOR + 1.023% on 6/1/2023)2 | 250 | 251 |
| Citigroup Inc. 3.52% 2028 (3-month USD-LIBOR + 1.151% on 10/27/2027)2 | 475 | 444 |
| Citigroup Inc. 3.668% 20282 | 1,678 | 1,588 |
| Citigroup Inc. 4.075% 2029 (3-month USD-LIBOR + 1.192% on 4/23/2028)2 | 1,849 | 1,807 |
| CME Group Inc. 4.15% 2048 | 575 | 585 |
| Cooperatieve Rabobank UA 2.75% 2023 | 500 | 484 |
| Credit Suisse Group AG 2.997% 2023 (3-month USD-LIBOR + 1.20% on 12/14/2022)1,2 | 12,000 | 11,429 |
| Bonds, notes & other debt instruments (continued) Corporate bonds & notes (continued) Financials (continued) | Principal amount (000) | Value (000) |
| Credit Suisse Group AG 3.80% 2023 | $12,925 | $12,695 |
| Credit Suisse Group AG 4.207% 2024 (3-month USD-LIBOR + 1.24% on 6/12/2023)1,2 | 500 | 499 |
| Danske Bank AS 2.80% 20211 | 750 | 733 |
| Danske Bank AS 3.875% 20231 | 1,800 | 1,735 |
| Deutsche Bank AG 2.85% 2019 | 5,700 | 5,666 |
| Deutsche Bank AG 3.15% 2021 | 24,175 | 23,375 |
| Deutsche Bank AG 4.25% 2021 | 20,000 | 19,716 |
| Deutsche Bank AG 3.95% 2023 | 8,500 | 8,032 |
| Discover Financial Services 10.25% 2019 | 2,200 | 2,275 |
| Discover Financial Services 3.35% 2023 | 15,850 | 15,441 |
| Discover Financial Services 4.65% 2028 | 13,000 | 12,696 |
| DNB ASA 2.375% 20211 | 250 | 244 |
| Ford Motor Credit Co. 3.81% 2024 | 5,050 | 4,665 |
| General Motors Financial Co. 4.20% 2021 | 12,600 | 12,602 |
| Goldman Sachs Group, Inc. 5.75% 2022 | 4,800 | 5,028 |
| Goldman Sachs Group, Inc. 2.905% 2023 (3-month USD-LIBOR + 0.99% on 7/24/2022)2 | 41,656 | 39,706 |
| Goldman Sachs Group, Inc. 3.814% 2029 (3-month USD-LIBOR + 1.158% on 4/23/2028)2 | 9,600 | 8,979 |
| Goldman Sachs Group, Inc. 4.223% 2029 (3-month USD-LIBOR + 1.301% on 5/1/2028)2 | 13,718 | 13,235 |
| Goldman Sachs Group, Inc. 5.30% (undated) (3-month USD-LIBOR + 3.834% on 11/10/2026)2 | 1,750 | 1,571 |
| Groupe BPCE SA 2.75% 20231 | 6,875 | 6,598 |
| Groupe BPCE SA 5.70% 20231 | 27,166 | 28,179 |
| Groupe BPCE SA 5.15% 20241 | 4,711 | 4,736 |
| HSBC Holdings PLC 3.033% 2023 (3-month USD-LIBOR + 0.923% on 11/12/2022)2 | 450 | 436 |
| HSBC Holdings PLC 3.64% 20243 | 750 | 731 |
| HSBC Holdings PLC 3.95% 2024 (3-month USD-LIBOR + 0.987% on 5/18/2023)2 | 625 | 622 |
| HSBC Holdings PLC 4.583% 2029 (3-month USD-LIBOR + 1.535% on 6/19/2028)2 | 13,000 | 12,908 |
| Intesa Sanpaolo SpA 3.375% 20231 | 8,400 | 7,788 |
| Intesa Sanpaolo SpA 5.017% 20241 | 70,790 | 64,129 |
| Intesa Sanpaolo SpA 5.71% 20261 | 16,915 | 15,534 |
| Intesa Sanpaolo SpA 3.875% 20271 | 6,870 | 5,923 |
| Intesa Sanpaolo SpA 3.875% 20281 | 645 | 552 |
| JPMorgan Chase & Co. 2.70% 2023 | 14,825 | 14,248 |
| JPMorgan Chase & Co. 2.776% 2023 (3-month USD-LIBOR + 0.935% on 4/25/2022)2 | 10,500 | 10,186 |
| JPMorgan Chase & Co. 3.559% 2024 (3-month USD-LIBOR + 0.73% on 4/23/2023)2 | 10,825 | 10,749 |
| JPMorgan Chase & Co. 4.023% 2024 (3-month USD-LIBOR + 1.00% on 12/5/2023)2 | 11,550 | 11,655 |
| JPMorgan Chase & Co. 3.509% 2029 (3-month USD-LIBOR + 0.945% on 1/23/2028)2 | 9,600 | 9,103 |
| JPMorgan Chase & Co. 4.005% 2029 (3-month USD-LIBOR + 1.12% on 4/23/2028)2 | 2,316 | 2,280 |
| JPMorgan Chase & Co. 4.203% 2029 (3-month USD-LIBOR + 1.26% on 7/23/2028)2 | 14,084 | 14,066 |
| JPMorgan Chase & Co. 4.452% 2029 (3-month USD-LIBOR + 1.33% on 12/5/2028)2 | 8,676 | 8,841 |
| Lloyds Banking Group PLC 2.907% 2023 (3-month USD-LIBOR + 0.81% on 11/7/2022)2 | 8,550 | 8,092 |
| Lloyds Banking Group PLC 4.375% 2028 | 8,825 | 8,393 |
| MetLife Capital Trust IV 7.875% 2067 (3-month USD-LIBOR + 3.96% on 12/1/2037)1,2 | 1,405 | 1,598 |
| Metlife, Inc. 3.60% 2025 | 3,490 | 3,448 |
| Metropolitan Life Global Funding I 2.30% 20191 | 675 | 674 |
| Metropolitan Life Global Funding I 2.00% 20201 | 6,785 | 6,689 |
| Morgan Stanley 2.50% 2021 | 28,111 | 27,555 |
| Morgan Stanley 2.75% 2022 | 6,200 | 6,034 |
| Morgan Stanley 3.125% 2023 | 46,621 | 45,553 |
| Morgan Stanley 3.70% 2024 | 3,700 | 3,641 |
| Morgan Stanley 3.125% 2026 | 7,653 | 7,071 |
| Morgan Stanley 3.875% 2026 | 8,472 | 8,275 |
| Morgan Stanley 3.625% 2027 | 628 | 598 |
| Morgan Stanley 3.591% 20283 | 575 | 544 |
| Morgan Stanley 3.772% 2029 (3-month USD-LIBOR + 1.14% on 1/24/2028)2 | 345 | 331 |
| Bonds, notes & other debt instruments (continued) Corporate bonds & notes (continued) Financials (continued) | Principal amount (000) | Value (000) |
| Morgan Stanley, Series F, 3.875% 2024 | $925 | $921 |
| New York Life Global Funding 2.10% 20191 | 1,000 | 1,000 |
| New York Life Global Funding 1.95% 20201 | 145 | 143 |
| New York Life Global Funding 1.70% 20211 | 1,250 | 1,205 |
| New York Life Global Funding 2.30% 20221 | 500 | 482 |
| Nordea Bank AB 2.50% 20201 | 7,125 | 7,027 |
| Nuveen, LLC 4.00% 20281 | 305 | 315 |
| PNC Bank 2.55% 2021 | 1,000 | 976 |
| PNC Financial Services Group, Inc. 2.854% 20222 | 5,850 | 5,736 |
| PNC Funding Corp. 3.30% 2022 | 8,700 | 8,684 |
| Prudential Financial, Inc. 3.878% 2028 | 500 | 504 |
| Prudential Financial, Inc. 4.418% 2048 | 250 | 243 |
| Standard Chartered PLC 3.885% 2024 (3-month USD-LIBOR + 1.08% on 3/15/2023)1,2 | 1,500 | 1,453 |
| Svenska Handelsbanken AB 1.875% 2021 | 250 | 241 |
| Synchrony Bank 3.65% 2021 | 5,775 | 5,653 |
| Synchrony Financial 3.75% 2021 | 2,249 | 2,190 |
| Travelers Companies, Inc. 4.00% 2047 | 290 | 279 |
| UniCredit SpA 5.861% 20321,2 | 1,000 | 881 |
| Unum Group 3.00% 2021 | 520 | 514 |
| US Bancorp 3.40% 2023 | 550 | 551 |
| Wells Fargo & Co. 2.10% 2021 | 16,800 | 16,281 |
| Wells Fargo & Co. 2.625% 2022 | 1,000 | 965 |
| Wells Fargo & Co. 3.55% 2023 | 1,225 | 1,221 |
| Wells Fargo & Co. 3.00% 2026 | 3,220 | 2,985 |
| Wells Fargo & Co. 3.00% 2026 | 820 | 765 |
| 1,033,902 | ||
| Health care 6.53% | ||
| Abbott Laboratories 2.90% 2021 | 23,405 | 23,188 |
| Abbott Laboratories 3.40% 2023 | 1,006 | 1,004 |
| Abbott Laboratories 3.75% 2026 | 2,642 | 2,615 |
| Abbott Laboratories 4.75% 2036 | 4,565 | 4,781 |
| AbbVie Inc. 2.50% 2020 | 16,315 | 16,163 |
| AbbVie Inc. 2.90% 2022 | 5,565 | 5,419 |
| AbbVie Inc. 3.20% 2022 | 11,070 | 10,914 |
| AbbVie Inc. 2.85% 2023 | 4,300 | 4,147 |
| AbbVie Inc. 3.20% 2026 | 500 | 464 |
| AbbVie Inc. 4.45% 2046 | 1,615 | 1,420 |
| Allergan PLC 3.00% 2020 | 7,275 | 7,248 |
| Allergan PLC 3.45% 2022 | 9,560 | 9,420 |
| Allergan PLC 3.80% 2025 | 3,849 | 3,764 |
| Allergan, Inc. 5.00% 20211 | 1,694 | 1,744 |
| Anthem, Inc. 4.101% 2028 | 8,000 | 7,861 |
| AstraZeneca PLC 2.375% 2022 | 370 | 355 |
| AstraZeneca PLC 3.50% 2023 | 1,080 | 1,075 |
| AstraZeneca PLC 3.375% 2025 | 3,330 | 3,223 |
| AstraZeneca PLC 4.00% 2029 | 5,920 | 5,843 |
| Baxalta Inc. 4.00% 2025 | 116 | 114 |
| Bayer US Finance II LLC 3.875% 20231 | 23,658 | 23,253 |
| Bayer US Finance II LLC 4.25% 20251 | 10,565 | 10,303 |
| Bayer US Finance II LLC 4.375% 20281 | 12,841 | 12,292 |
| Becton, Dickinson and Co. 2.894% 2022 | 1,040 | 1,008 |
| Becton, Dickinson and Co. 3.734% 2024 | 903 | 873 |
| Becton, Dickinson and Co. 3.70% 2027 | 1,240 | 1,174 |
| Bonds, notes & other debt instruments (continued) Corporate bonds & notes (continued) Health care (continued) | Principal amount (000) | Value (000) |
| Becton, Dickinson and Co. 4.669% 2047 | $3,395 | $3,210 |
| Boston Scientific Corp. 2.85% 2020 | 470 | 467 |
| Boston Scientific Corp. 6.00% 2020 | 3,575 | 3,666 |
| Boston Scientific Corp. 3.375% 2022 | 700 | 696 |
| Boston Scientific Corp. 3.85% 2025 | 500 | 493 |
| Cardinal Health, Inc. 4.368% 2047 | 199 | 170 |
| Centene Corp. 5.625% 2021 | 1,780 | 1,789 |
| Centene Corp. 4.75% 2022 | 200 | 198 |
| Centene Corp. 6.125% 2024 | 375 | 385 |
| Centene Corp. 4.75% 2025 | 325 | 311 |
| Centene Corp. 5.375% 20261 | 16,685 | 16,268 |
| Cigna Corp. 3.40% 20211 | 7,765 | 7,752 |
| Cigna Corp. 3.75% 20231 | 8,430 | 8,410 |
| Cigna Corp. 4.125% 20251 | 2,645 | 2,646 |
| Cigna Corp. 4.375% 20281 | 8,675 | 8,746 |
| Cigna Corp. 4.80% 20381 | 1,330 | 1,323 |
| Cigna Corp. 4.90% 20481 | 2,575 | 2,533 |
| CVS Health Corp. 2.125% 2021 | 9,810 | 9,496 |
| CVS Health Corp. 3.70% 2023 | 698 | 691 |
| CVS Health Corp. 4.10% 2025 | 5,916 | 5,872 |
| CVS Health Corp. 4.30% 2028 | 49,171 | 48,238 |
| CVS Health Corp. 4.78% 2038 | 1,883 | 1,812 |
| CVS Health Corp. 5.05% 2048 | 3,302 | 3,228 |
| EMD Finance LLC 2.40% 20201 | 13,295 | 13,162 |
| EMD Finance LLC 2.95% 20221 | 2,100 | 2,070 |
| EMD Finance LLC 3.25% 20251 | 1,970 | 1,893 |
| GlaxoSmithKline PLC 3.375% 2023 | 16,800 | 16,873 |
| HCA Inc. 6.50% 2020 | 1,550 | 1,593 |
| Johnson & Johnson 2.45% 2026 | 4,255 | 4,002 |
| Johnson & Johnson 2.90% 2028 | 6,960 | 6,683 |
| Laboratory Corp. of America Holdings 3.60% 2027 | 500 | 477 |
| Laboratory Corp. of America Holdings 4.70% 2045 | 4,160 | 3,892 |
| Medtronic, Inc. 4.625% 2045 | 4,815 | 5,067 |
| Pfizer Inc. 7.20% 2039 | 100 | 138 |
| Shire PLC 1.90% 2019 | 22,100 | 21,795 |
| Shire PLC 2.40% 2021 | 26,279 | 25,427 |
| Shire PLC 2.875% 2023 | 11,084 | 10,489 |
| Shire PLC 3.20% 2026 | 19,102 | 17,324 |
| Takeda Pharmaceutical Co., Ltd. 3.80% 20201 | 17,220 | 17,328 |
| Takeda Pharmaceutical Co., Ltd. 4.00% 20211 | 500 | 507 |
| Takeda Pharmaceutical Co., Ltd. 4.40% 20231 | 2,665 | 2,697 |
| Takeda Pharmaceutical Co., Ltd. 5.00% 20281 | 6,810 | 6,973 |
| Tenet Healthcare Corp. 6.00% 2020 | 1,240 | 1,260 |
| Teva Pharmaceutical Finance Co. BV 2.20% 2021 | 20,214 | 18,591 |
| Teva Pharmaceutical Finance Co. BV 2.80% 2023 | 77,814 | 67,082 |
| Teva Pharmaceutical Finance Co. BV 6.00% 2024 | 3,557 | 3,435 |
| Teva Pharmaceutical Finance Co. BV 3.15% 2026 | 51,528 | 39,412 |
| Teva Pharmaceutical Finance Co. BV 6.75% 2028 | 11,574 | 11,239 |
| Teva Pharmaceutical Finance Co. BV 4.10% 2046 | 46,666 | 30,989 |
| UnitedHealth Group Inc. 3.35% 2022 | 4,385 | 4,407 |
| UnitedHealth Group Inc. 3.75% 2025 | 5,410 | 5,484 |
| UnitedHealth Group Inc. 3.375% 2027 | 500 | 490 |
| UnitedHealth Group Inc. 3.875% 2028 | 4,375 | 4,440 |
| UnitedHealth Group Inc. 4.45% 2048 | 240 | 248 |
| Bonds, notes & other debt instruments (continued) Corporate bonds & notes (continued) Health care (continued) | Principal amount (000) | Value (000) |
| WellPoint, Inc. 2.25% 2019 | $1,250 | $1,244 |
| Zimmer Holdings, Inc. 3.15% 2022 | 8,845 | 8,654 |
| 643,430 | ||
| Energy 5.02% | ||
| Anadarko Petroleum Corp. 4.85% 2021 | 3,349 | 3,431 |
| Anadarko Petroleum Corp. 5.55% 2026 | 9,920 | 10,409 |
| Anadarko Petroleum Corp. 6.60% 2046 | 9,005 | 9,987 |
| Ascent Resources Marcellus Holdings, Inc., Term Loan B, (3-month USD-LIBOR + 6.50%) 8.887% 20233,4,5 | 92 | 92 |
| Baker Hughes, a GE Co. 3.337% 2027 | 1,000 | 922 |
| Baker Hughes, a GE Co. 4.08% 2047 | 335 | 277 |
| Boardwalk Pipeline Partners, LP 3.375% 2023 | 1,900 | 1,848 |
| BP Capital Markets PLC 4.234% 2028 | 2,900 | 2,989 |
| Canadian Natural Resources Ltd. 2.95% 2023 | 190 | 182 |
| Canadian Natural Resources Ltd. 3.80% 2024 | 180 | 178 |
| Canadian Natural Resources Ltd. 4.95% 2047 | 655 | 631 |
| Cenovus Energy Inc. 3.80% 2023 | 1,120 | 1,081 |
| Cenovus Energy Inc. 4.25% 2027 | 16,430 | 14,998 |
| Cenovus Energy Inc. 5.25% 2037 | 193 | 171 |
| Cenovus Energy Inc. 5.40% 2047 | 24,893 | 21,586 |
| Cheniere Energy, Inc. 7.00% 2024 | 410 | 434 |
| Chevron Corp. 2.355% 2022 | 4,800 | 4,651 |
| Chevron Corp. 2.498% 2022 | 605 | 594 |
| Columbia Pipeline Partners LP 5.80% 2045 | 1,410 | 1,519 |
| Concho Resources Inc. 4.30% 2028 | 8,660 | 8,493 |
| Concho Resources Inc. 4.85% 2048 | 11,973 | 11,516 |
| ConocoPhillips 4.95% 2026 | 454 | 486 |
| DCP Midstream Operating LP 4.95% 2022 | 500 | 496 |
| Devon Energy Corp. 5.00% 2045 | 2,500 | 2,224 |
| Diamond Offshore Drilling, Inc. 4.875% 2043 | 3,375 | 1,907 |
| Enbridge Energy Partners, LP 9.875% 2019 | 9,000 | 9,093 |
| Enbridge Energy Partners, LP 4.375% 2020 | 6,700 | 6,780 |
| Enbridge Energy Partners, LP 5.20% 2020 | 5,055 | 5,164 |
| Enbridge Energy Partners, LP 4.20% 2021 | 6,325 | 6,414 |
| Enbridge Energy Partners, LP 5.875% 2025 | 12,660 | 13,741 |
| Enbridge Energy Partners, LP 7.375% 2045 | 27,526 | 34,243 |
| Enbridge Inc. 4.00% 2023 | 1,500 | 1,509 |
| Energy Transfer Partners, LP 4.15% 2020 | 1,000 | 1,006 |
| Energy Transfer Partners, LP 4.20% 2023 | 2,860 | 2,821 |
| Energy Transfer Partners, LP 4.20% 2027 | 45 | 42 |
| Energy Transfer Partners, LP 4.95% 2028 | 4,559 | 4,478 |
| Energy Transfer Partners, LP 6.125% 2045 | 11,780 | 11,571 |
| Energy Transfer Partners, LP 5.30% 2047 | 10,534 | 9,327 |
| Energy Transfer Partners, LP 5.40% 2047 | 5,940 | 5,346 |
| Energy Transfer Partners, LP 6.00% 2048 | 1,118 | 1,094 |
| Energy Transfer Partners, LP 6.25% (undated) (3-month USD-LIBOR + 4.028% on 2/15/2023)2 | 7,850 | 6,584 |
| Energy Transfer Partners, LP 6.625% 2049 (3-month USD-LIBOR + 4.155% on 2/15/2028)2 | 500 | 413 |
| EnLink Midstream Partners, LP 2.70% 2019 | 1,850 | 1,839 |
| EnLink Midstream Partners, LP 5.05% 2045 | 1,015 | 797 |
| EnLink Midstream Partners, LP 5.45% 2047 | 475 | 386 |
| Ensco PLC, 5.20% 2025 | 340 | 228 |
| Ensco PLC 5.75% 2044 | 80 | 45 |
| EQT Corp. 2.50% 2020 | 4,910 | 4,802 |
| EQT Corp. 3.00% 2022 | 1,700 | 1,613 |
| Bonds, notes & other debt instruments (continued) Corporate bonds & notes (continued) Energy (continued) | Principal amount (000) | Value (000) |
| EQT Corp. 3.90% 2027 | $455 | $393 |
| Equinor ASA 3.625% 2028 | 9,835 | 9,836 |
| Exxon Mobil Corp. 3.043% 2026 | 4,625 | 4,519 |
| Exxon Mobil Corp. 4.114% 2046 | 1,948 | 1,990 |
| Husky Energy Inc. 7.25% 2019 | 3,390 | 3,501 |
| Kinder Morgan Energy Partners, LP 6.85% 2020 | 6,650 | 6,887 |
| Kinder Morgan Energy Partners, LP 6.50% 2037 | 900 | 973 |
| Kinder Morgan Energy Partners, LP 5.40% 2044 | 5,070 | 4,868 |
| Kinder Morgan Energy Partners, LP 5.50% 2044 | 925 | 898 |
| Kinder Morgan, Inc. 4.30% 2025 | 257 | 256 |
| Kinder Morgan, Inc. 4.30% 2028 | 250 | 246 |
| Kinder Morgan, Inc. 5.30% 2034 | 760 | 748 |
| Kinder Morgan, Inc. 5.55% 2045 | 6,000 | 5,970 |
| Kinder Morgan, Inc. 5.05% 2046 | 248 | 228 |
| Marathon Oil Corp. 4.40% 2027 | 10,000 | 9,524 |
| MPLX LP 4.00% 2028 | 4,665 | 4,383 |
| Noble Corp. PLC 7.95% 20252 | 1,595 | 1,206 |
| Noble Corp. PLC 8.95% 20452 | 1,260 | 964 |
| Odebrecht Drilling Norbe 6.72% 20221,5 | 81 | 76 |
| Odebrecht Drilling Norbe 7.35% 2026 (86.39% PIK)1,5,6 | 34 | 19 |
| Odebrecht Drilling Norbe 7.72% 2026 (87.05% PIK)1,5,6 | 302 | 81 |
| Odebrecht Drilling Norbe 0% 20491 | 1,195 | 21 |
| Petrobras Global Finance Co. 8.75% 2026 | 19,450 | 21,852 |
| Petrobras Global Finance Co. 7.375% 2027 | 190 | 196 |
| Petrobras Global Finance Co. 5.999% 2028 | 203 | 192 |
| Petrobras Global Finance Co. 5.75% 2029 | 7,290 | 6,761 |
| Petrobras Global Finance Co. 7.25% 2044 | 45 | 44 |
| Petróleos Mexicanos 5.375% 2022 | 4,175 | 4,110 |
| Petróleos Mexicanos 4.625% 2023 | 9,705 | 9,132 |
| Petróleos Mexicanos 7.47% 2026 | MXN295,000 | 11,075 |
| Petróleos Mexicanos 6.50% 2027 | $9,480 | 8,935 |
| Petróleos Mexicanos 5.35% 2028 | 18,950 | 16,581 |
| Petróleos Mexicanos 6.50% 2029 | 570 | 532 |
| Petróleos Mexicanos 6.75% 2047 | 260 | 216 |
| Petróleos Mexicanos 6.35% 2048 | 21,895 | 17,549 |
| Phillips 66 3.90% 2028 | 5,575 | 5,399 |
| Plains All American Pipeline, LP 4.50% 2026 | 1,250 | 1,207 |
| QEP Resources, Inc. 5.25% 2023 | 3,420 | 3,044 |
| Ras Laffan Liquefied Natural Gas II 5.298% 20205 | 242 | 245 |
| Sabine Pass Liquefaction, LLC 5.625% 20212 | 1,100 | 1,134 |
| Sabine Pass Liquefaction, LLC 6.25% 2022 | 2,300 | 2,420 |
| Sabine Pass Liquefaction, LLC 5.625% 20232 | 1,000 | 1,054 |
| Sabine Pass Liquefaction, LLC 5.75% 2024 | 8,000 | 8,394 |
| Sabine Pass Liquefaction, LLC 5.625% 2025 | 10,000 | 10,402 |
| Sabine Pass Liquefaction, LLC 5.875% 2026 | 15,700 | 16,655 |
| Schlumberger BV 3.00% 20201 | 600 | 595 |
| Schlumberger BV 4.00% 20251 | 8,791 | 8,694 |
| Shell International Finance BV 3.50% 2023 | 835 | 845 |
| Shell International Finance BV 3.875% 2028 | 17,400 | 17,914 |
| Southwestern Energy Co. 6.20% 20252 | 920 | 827 |
| Targa Resources Partners LP 5.125% 2025 | 175 | 165 |
| Targa Resources Partners LP 5.375% 2027 | 175 | 165 |
| TC PipeLines, LP 4.375% 2025 | 405 | 405 |
| Total Capital Canada Ltd. 2.75% 2023 | 2,140 | 2,094 |
| Bonds, notes & other debt instruments (continued) Corporate bonds & notes (continued) Energy (continued) | Principal amount (000) | Value (000) |
| Total Capital SA 3.883% 2028 | $2,130 | $2,193 |
| TransCanada PipeLines Ltd. 4.25% 2028 | 12,398 | 12,309 |
| Transocean Inc. 5.80% 20222 | 2,195 | 1,943 |
| Transocean Inc. 9.00% 20231 | 5,000 | 4,994 |
| Ultra Petroleum Corp. 11.00% 20246 | 450 | 349 |
| Western Gas Partners LP 3.95% 2025 | 275 | 260 |
| Western Gas Partners LP 4.65% 2026 | 1,325 | 1,284 |
| Williams Partners LP 5.25% 2020 | 2,900 | 2,957 |
| Williams Partners LP 4.50% 2023 | 500 | 503 |
| Williams Partners LP 4.30% 2024 | 595 | 594 |
| 494,244 | ||
| Utilities 3.49% | ||
| Abu Dhabi National Energy Co. PJSC (TAQA) 4.375% 20251 | 10,000 | 9,942 |
| Abu Dhabi National Energy Co. PJSC (TAQA) 4.875% 20301 | 2,870 | 2,883 |
| AEP Transmission Co. LLC 4.25% 2048 | 165 | 167 |
| AES Corp. 4.00% 2021 | 2,600 | 2,561 |
| Alliant Energy Finance LLC 3.75% 20231 | 750 | 755 |
| Alliant Energy Finance LLC 4.25% 20281 | 500 | 498 |
| Ameren Corp. 4.50% 2049 | 2,875 | 3,052 |
| American Electric Power Co., Inc. 4.30% 2028 | 5,679 | 5,785 |
| Atlantic City Electric Co. 4.00% 2028 | 420 | 433 |
| Berkshire Hathaway Energy Co. 4.50% 2045 | 5,895 | 5,908 |
| CenterPoint Energy, Inc. 3.85% 2024 | 1,160 | 1,167 |
| CenterPoint Energy, Inc. 4.25% 2028 | 150 | 152 |
| CMS Energy Corp. 5.05% 2022 | 2,569 | 2,683 |
| Consolidated Edison Co. of New York, Inc. 3.875% 2047 | 9,200 | 8,518 |
| Consolidated Edison Co. of New York, Inc. 4.65% 2048 | 340 | 354 |
| Consolidated Edison Co. of New York, Inc. 4.50% 2058 | 500 | 486 |
| Consumers Energy Co. 3.25% 2046 | 3,665 | 3,115 |
| Consumers Energy Co. 4.05% 2048 | 8,270 | 8,188 |
| Consumers Energy Co. 4.35% 2049 | 1,891 | 1,972 |
| Dominion Resources, Inc. 2.579% 20202 | 20,575 | 20,257 |
| DTE Energy Co. 3.70% 2023 | 1,268 | 1,260 |
| Duke Energy Carolinas, Inc. 3.95% 2028 | 725 | 744 |
| Duke Energy Corp. 3.75% 2024 | 3,826 | 3,836 |
| Duke Energy Corp. 2.65% 2026 | 5,240 | 4,781 |
| Duke Energy Florida, LLC 3.80% 2028 | 780 | 788 |
| Duke Energy Florida, LLC 3.40% 2046 | 6,445 | 5,585 |
| Duke Energy Progress, LLC 3.70% 2028 | 4,225 | 4,276 |
| EDP Finance BV 3.625% 20241 | 21,650 | 20,311 |
| Electricité de France SA 2.15% 20191 | 145 | 145 |
| Emera Inc. 6.75% 2076 (3-month USD-LIBOR + 5.44% on 6/15/2026)2 | 1,950 | 1,963 |
| Emera US Finance LP 2.70% 2021 | 954 | 930 |
| Emera US Finance LP 3.55% 2026 | 495 | 470 |
| Emera US Finance LP 4.75% 2046 | 2,495 | 2,411 |
| Enel Finance International SA 2.75% 20231 | 800 | 739 |
| Enel Finance International SA 3.625% 20271 | 3,369 | 2,979 |
| Enel Finance International SA 4.875% 20291 | 10,960 | 10,483 |
| Enel Società per Azioni 8.75% 20731,2 | 1,000 | 1,025 |
| Entergy Corp. 2.95% 2026 | 415 | 384 |
| Entergy Louisiana, LLC 4.20% 2048 | 6,325 | 6,267 |
| Eversource Energy 2.75% 2022 | 527 | 516 |
| Eversource Energy 2.80% 2023 | 1,038 | 1,014 |
| Bonds, notes & other debt instruments (continued) Corporate bonds & notes (continued) Utilities (continued) | Principal amount (000) | Value (000) |
| Eversource Energy 3.80% 2023 | $5,414 | $5,472 |
| Eversource Energy 4.25% 2029 | 5,590 | 5,706 |
| Exelon Corp. 3.40% 2026 | 1,570 | 1,496 |
| FirstEnergy Corp. 2.85% 2022 | 4,281 | 4,176 |
| FirstEnergy Corp. 3.90% 2027 | 17,503 | 16,992 |
| FirstEnergy Corp. 3.50% 20281 | 2,400 | 2,292 |
| FirstEnergy Corp. 7.375% 2031 | 5,150 | 6,526 |
| FirstEnergy Corp. 4.85% 2047 | 12,205 | 12,275 |
| Great Plains Energy Inc. 4.20% 2048 | 20 | 20 |
| Gulf Power Co. 3.30% 2027 | 1,000 | 971 |
| Iberdrola Finance Ireland 5.00% 20191 | 1,825 | 1,843 |
| Interstate Power and Light Co. 3.25% 2024 | 1,000 | 976 |
| IPALCO Enterprises, Inc. 3.70% 2024 | 200 | 195 |
| Mississippi Power Co. 4.25% 2042 | 11,247 | 10,433 |
| National Grid PLC 3.15% 20271 | 275 | 263 |
| Niagara Mohawk Power Corp. 3.508% 20241 | 7,575 | 7,619 |
| Niagara Mohawk Power Corp. 4.278% 20341 | 1,000 | 1,007 |
| NiSource Finance Corp. 2.65% 2022 | 275 | 264 |
| NV Energy, Inc. 6.25% 2020 | 2,850 | 2,995 |
| Pacific Gas and Electric Co. 2.45% 2022 | 8,707 | 7,760 |
| Pacific Gas and Electric Co. 3.25% 2023 | 6,316 | 5,619 |
| Pacific Gas and Electric Co. 4.25% 20231 | 147 | 137 |
| Pacific Gas and Electric Co. 3.40% 2024 | 850 | 741 |
| Pacific Gas and Electric Co. 3.50% 2025 | 301 | 260 |
| Pacific Gas and Electric Co. 2.95% 2026 | 165 | 137 |
| Pacific Gas and Electric Co. 3.30% 2027 | 4,218 | 3,495 |
| Pacific Gas and Electric Co. 3.30% 2027 | 1,319 | 1,084 |
| Pacific Gas and Electric Co. 4.65% 20281 | 10,057 | 8,904 |
| Pacific Gas and Electric Co. 3.75% 2042 | 97 | 73 |
| Pacific Gas and Electric Co. 4.75% 2044 | 336 | 278 |
| Pacific Gas and Electric Co. 3.95% 2047 | 240 | 184 |
| Progress Energy, Inc. 7.75% 2031 | 1,820 | 2,428 |
| Public Service Co. of Colorado 4.10% 2048 | 600 | 592 |
| Public Service Enterprise Group Inc. 2.65% 2022 | 1,000 | 963 |
| Puget Energy, Inc. 6.50% 2020 | 5,294 | 5,594 |
| Puget Energy, Inc. 6.00% 2021 | 8,186 | 8,664 |
| Puget Energy, Inc. 5.625% 2022 | 8,004 | 8,482 |
| Puget Energy, Inc. 3.65% 2025 | 3,000 | 2,938 |
| SCANA Corp. 4.75% 2021 | 6,367 | 6,448 |
| SCANA Corp. 4.125% 2022 | 970 | 971 |
| South Carolina Electric & Gas Co. 3.50% 2021 | 7,850 | 7,877 |
| South Carolina Electric & Gas Co. 4.25% 2028 | 8,775 | 9,110 |
| South Carolina Electric & Gas Co. 5.30% 2033 | 515 | 556 |
| South Carolina Electric & Gas Co. 5.45% 2041 | 768 | 882 |
| South Carolina Electric & Gas Co. 4.35% 2042 | 724 | 713 |
| South Carolina Electric & Gas Co. 4.10% 2046 | 685 | 643 |
| Southern California Edison Co. 4.05% 2042 | 1,667 | 1,568 |
| Southern California Edison Co. 4.65% 2043 | 2,257 | 2,276 |
| Southern California Edison Co. 4.00% 2047 | 500 | 460 |
| Tampa Electric Co. 2.60% 2022 | 4,350 | 4,221 |
| Tampa Electric Co. 4.45% 2049 | 460 | 451 |
| Teco Finance, Inc. 5.15% 2020 | 2,091 | 2,139 |
| Virginia Electric and Power Co. 4.45% 2044 | 7,995 | 8,080 |
| Virginia Electric and Power Co. 4.60% 2048 | 932 | 977 |
| Bonds, notes & other debt instruments (continued) Corporate bonds & notes (continued) Utilities (continued) | Principal amount (000) | Value (000) |
| Xcel Energy Inc. 4.70% 2020 | $1,700 | $1,721 |
| Xcel Energy Inc. 3.30% 2025 | 5,650 | 5,532 |
| 344,262 | ||
| Consumer discretionary 3.03% | ||
| Bayerische Motoren Werke AG 1.45% 20191 | 13,110 | 12,980 |
| DaimlerChrysler North America Holding Corp. 3.00% 20211 | 500 | 495 |
| DaimlerChrysler North America Holding Corp. 2.85% 20221 | 500 | 489 |
| DaimlerChrysler North America Holding Corp. 3.35% 20231 | 2,000 | 1,974 |
| DaimlerChrysler North America Holding Corp. 3.25% 20241 | 755 | 728 |
| DaimlerChrysler North America Holding Corp. 3.30% 20251 | 5,300 | 4,991 |
| Ford Motor Credit Co. 2.681% 2020 | 14,907 | 14,662 |
| Ford Motor Credit Co. 3.157% 2020 | 8,133 | 7,972 |
| Ford Motor Credit Co. 3.336% 2021 | 300 | 291 |
| Ford Motor Credit Co. 3.47% 2021 | 15,400 | 14,975 |
| Ford Motor Credit Co. 3.813% 2021 | 7,676 | 7,459 |
| Ford Motor Credit Co. 3.219% 2022 | 7,785 | 7,315 |
| Ford Motor Credit Co. 3.339% 2022 | 13,345 | 12,605 |
| Ford Motor Credit Co. 4.14% 2023 | 12,000 | 11,416 |
| General Motors Co. 4.35% 2025 | 11,255 | 10,679 |
| General Motors Co. 5.20% 2045 | 1,060 | 883 |
| General Motors Co. 5.40% 2048 | 7,200 | 6,160 |
| General Motors Co. 5.95% 2049 | 750 | 679 |
| General Motors Financial Co. 3.70% 2020 | 15,295 | 15,238 |
| General Motors Financial Co. 3.15% 2022 | 11,000 | 10,494 |
| General Motors Financial Co. 3.45% 2022 | 3,400 | 3,297 |
| General Motors Financial Co. 3.25% 2023 | 15,500 | 14,615 |
| General Motors Financial Co. 3.70% 2023 | 10,000 | 9,523 |
| General Motors Financial Co. 3.50% 2024 | 9,575 | 8,724 |
| General Motors Financial Co. 3.95% 2024 | 6,269 | 5,960 |
| Home Depot, Inc. 4.40% 2021 | 7,200 | 7,417 |
| Home Depot, Inc. 3.90% 2028 | 1,625 | 1,667 |
| Home Depot, Inc. 3.90% 2047 | 500 | 474 |
| Home Depot, Inc. 4.50% 2048 | 8,369 | 8,685 |
| Hyundai Capital America 2.55% 20201 | 4,200 | 4,148 |
| Hyundai Capital America 2.60% 20201 | 325 | 321 |
| Hyundai Capital America 2.75% 20201 | 3,321 | 3,271 |
| Hyundai Capital America 3.75% 20211 | 8,500 | 8,479 |
| Hyundai Capital America 3.25% 20221 | 1,521 | 1,480 |
| Lowe’s Companies, Inc. 4.05% 2047 | 500 | 433 |
| McDonald’s Corp. 3.35% 2023 | 110 | 110 |
| McDonald’s Corp. 3.50% 2027 | 7,085 | 6,897 |
| McDonald’s Corp. 4.875% 2045 | 7,065 | 7,170 |
| McDonald’s Corp. 4.45% 2047 | 4,100 | 3,941 |
| MGM Resorts International 7.75% 2022 | 2,000 | 2,133 |
| NIKE, Inc. 3.875% 2045 | 6,845 | 6,572 |
| Nissan Motor Co., Ltd. 2.60% 20221 | 1,415 | 1,348 |
| S.A.C.I. Falabella 3.75% 20271 | 660 | 597 |
| Sally Holdings LLC and Sally Capital Inc. 5.625% 2025 | 300 | 277 |
| Sands China Ltd. 4.60% 20231 | 2,000 | 1,992 |
| Sands China Ltd. 5.40% 20281 | 1,500 | 1,452 |
| Starbucks Corp. 3.80% 2025 | 2,454 | 2,431 |
| Starbucks Corp. 4.00% 2028 | 425 | 421 |
| Starbucks Corp. 3.75% 2047 | 3,785 | 3,152 |
| Bonds, notes & other debt instruments (continued) Corporate bonds & notes (continued) Consumer discretionary (continued) | Principal amount (000) | Value (000) |
| Starbucks Corp. 4.50% 2048 | $8,220 | $7,693 |
| Toyota Motor Credit Corp. 2.125% 2019 | 500 | 497 |
| Toyota Motor Credit Corp. 2.70% 2023 | 1,000 | 973 |
| Volkswagen Group of America Finance, LLC 2.45% 20191 | 520 | 515 |
| Volkswagen Group of America Finance, LLC 2.40% 20201 | 2,855 | 2,811 |
| Volkswagen Group of America Finance, LLC 4.00% 20211 | 5,850 | 5,866 |
| Volkswagen Group of America Finance, LLC 4.25% 20231 | 16,670 | 16,550 |
| Volkswagen International Finance NV 4.00% 20201 | 4,000 | 4,027 |
| 298,404 | ||
| Consumer staples 2.82% | ||
| Altria Group, Inc. 2.85% 2022 | 4,800 | 4,611 |
| Altria Group, Inc. 4.50% 2043 | 2,900 | 2,424 |
| Anheuser-Busch Co./InBev Worldwide 3.65% 20261 | 18,335 | 17,347 |
| Anheuser-Busch Co./InBev Worldwide 4.70% 20361 | 160 | 149 |
| Anheuser-Busch Co./InBev Worldwide 4.90% 20461 | 1,195 | 1,112 |
| Anheuser-Busch InBev NV 2.65% 2021 | 2,723 | 2,678 |
| Anheuser-Busch InBev NV 3.50% 2024 | 1,070 | 1,046 |
| Anheuser-Busch InBev NV 4.60% 2048 | 4,341 | 3,912 |
| British American Tobacco International Finance PLC 2.75% 20201 | 5,050 | 4,963 |
| British American Tobacco International Finance PLC 3.50% 20221 | 3,520 | 3,446 |
| British American Tobacco International Finance PLC 3.95% 20251 | 15,629 | 14,631 |
| British American Tobacco PLC 2.764% 2022 | 465 | 440 |
| British American Tobacco PLC 3.222% 2024 | 8,511 | 7,848 |
| British American Tobacco PLC 3.557% 2027 | 11,560 | 10,287 |
| British American Tobacco PLC 4.39% 2037 | 1,500 | 1,233 |
| British American Tobacco PLC 4.54% 2047 | 2,100 | 1,680 |
| Conagra Brands, Inc. 4.30% 2024 | 15,248 | 15,173 |
| Conagra Brands, Inc. 4.60% 2025 | 440 | 442 |
| Conagra Brands, Inc. 4.85% 2028 | 1,850 | 1,824 |
| Conagra Brands, Inc. 5.40% 2048 | 200 | 185 |
| Constellation Brands, Inc. 2.25% 2020 | 8,000 | 7,849 |
| Constellation Brands, Inc. 2.65% 2022 | 2,285 | 2,190 |
| Constellation Brands, Inc. 3.20% 2023 | 540 | 524 |
| Constellation Brands, Inc. 3.50% 2027 | 7,500 | 6,961 |
| Constellation Brands, Inc. 3.60% 2028 | 1,280 | 1,182 |
| Constellation Brands, Inc. 4.10% 2048 | 4,500 | 3,813 |
| General Mills, Inc. (3-month USD-LIBOR + 0.54%) 2.976% 20213 | 10,620 | 10,459 |
| General Mills, Inc. 3.20% 2021 | 2,170 | 2,160 |
| Imperial Tobacco Finance PLC 3.50% 20231 | 2,335 | 2,270 |
| Keurig Dr Pepper Inc. 4.057% 20231 | 16,125 | 16,074 |
| Keurig Dr Pepper Inc. 4.417% 20251 | 5,207 | 5,192 |
| Keurig Dr Pepper Inc. 4.597% 20281 | 15,822 | 15,742 |
| Keurig Dr Pepper Inc. 5.085% 20481 | 9,759 | 9,327 |
| Kroger Co. 2.60% 2021 | 8,000 | 7,850 |
| Molson Coors Brewing Co. 1.90% 2019 | 125 | 125 |
| Molson Coors Brewing Co. 2.25% 2020 | 4,525 | 4,464 |
| Molson Coors Brewing Co. 2.10% 2021 | 2,415 | 2,330 |
| Molson Coors Brewing Co. 3.00% 2026 | 5,530 | 4,936 |
| Molson Coors Brewing Co. 4.20% 2046 | 4,530 | 3,783 |
| Mondelez International, Inc. 1.625% 20191 | 16,100 | 15,879 |
| Nestle Holdings, Inc. 3.35% 20231 | 750 | 758 |
| Philip Morris International Inc. 2.625% 2022 | 1,515 | 1,467 |
| Philip Morris International Inc. 3.60% 2023 | 188 | 188 |
| Bonds, notes & other debt instruments (continued) Corporate bonds & notes (continued) Consumer staples (continued) | Principal amount (000) | Value (000) |
| Philip Morris International Inc. 4.25% 2044 | $9,550 | $8,741 |
| Reynolds American Inc. 3.25% 2022 | 1,750 | 1,700 |
| Reynolds American Inc. 4.00% 2022 | 4,230 | 4,187 |
| Reynolds American Inc. 4.85% 2023 | 5,830 | 5,905 |
| Reynolds American Inc. 4.45% 2025 | 21,900 | 21,155 |
| Reynolds American Inc. 5.85% 2045 | 125 | 117 |
| Wal-Mart Stores, Inc. 2.35% 2022 | 1,000 | 975 |
| Wal-Mart Stores, Inc. 3.70% 2028 | 780 | 793 |
| WM. Wrigley Jr. Co. 3.375% 20201 | 13,005 | 13,042 |
| 277,569 | ||
| Communication services 2.07% | ||
| AT&T Inc. (3-month USD-LIBOR + 1.18%) 3.956% 20243 | 3,560 | 3,456 |
| AT&T Inc. 4.125% 2026 | 11,300 | 11,057 |
| CCO Holdings LLC and CCO Holdings Capital Corp. 3.579% 2020 | 6,505 | 6,499 |
| CCO Holdings LLC and CCO Holdings Capital Corp. 4.50% 2024 | 500 | 500 |
| CCO Holdings LLC and CCO Holdings Capital Corp. 5.125% 20271 | 4,800 | 4,483 |
| CCO Holdings LLC and CCO Holdings Capital Corp. 3.75% 2028 | 750 | 680 |
| CCO Holdings LLC and CCO Holdings Capital Corp. 4.20% 2028 | 985 | 925 |
| CCO Holdings LLC and CCO Holdings Capital Corp. 5.375% 2047 | 6,515 | 5,931 |
| CCO Holdings LLC and CCO Holdings Capital Corp. 5.75% 2048 | 12,670 | 11,919 |
| CenturyLink, Inc. 7.50% 2024 | 5,000 | 4,837 |
| Comcast Corp. 3.00% 2024 | 500 | 488 |
| Comcast Corp. 3.70% 2024 | 2,245 | 2,260 |
| Comcast Corp. 3.95% 2025 | 770 | 780 |
| Comcast Corp. 3.30% 2027 | 240 | 229 |
| Comcast Corp. 3.15% 2028 | 7,870 | 7,405 |
| Comcast Corp. 4.15% 2028 | 5,325 | 5,417 |
| Comcast Corp. 4.60% 2038 | 7,985 | 8,088 |
| Comcast Corp. 4.00% 2047 | 670 | 605 |
| Comcast Corp. 4.00% 2048 | 11,100 | 10,154 |
| Comcast Corp. 4.70% 2048 | 7,670 | 7,823 |
| Cumulus Media New Holdings Inc., Term Loan, (3-month USD-LIBOR + 4.50%) 7.03% 20223,4,5 | 1,212 | 1,151 |
| Deutsche Telekom International Finance BV 1.95% 20211 | 14,364 | 13,790 |
| Deutsche Telekom International Finance BV 3.60% 20271 | 295 | 279 |
| Deutsche Telekom International Finance BV 4.375% 20281 | 1,325 | 1,308 |
| Discovery Communications, Inc. 2.95% 2023 | 4,185 | 4,011 |
| France Télécom 9.00% 20312 | 1,480 | 2,055 |
| Frontier Communications Corp. 11.00% 2025 | 300 | 188 |
| NBCUniversal Enterprise, Inc. 5.25% 20491 | 5,170 | 5,248 |
| NBCUniversal Media, LLC 5.15% 2020 | 9,600 | 9,856 |
| Netflix, Inc. 6.375% 20291 | 7,162 | 7,081 |
| News America Inc. 4.00% 2023 | 1,100 | 1,130 |
| Orange SA 2.75% 2019 | 3,470 | 3,468 |
| SoftBank Group Corp. 3.36% 20231,5 | 7,975 | 7,895 |
| Time Warner Inc. 3.80% 2027 | 4,335 | 4,077 |
| Verizon Communications Inc. 4.125% 2027 | 4,476 | 4,490 |
| Verizon Communications Inc. 4.50% 2033 | 12,740 | 12,619 |
| Verizon Communications Inc. 4.40% 2034 | 5,080 | 4,915 |
| Vodafone Group PLC 3.75% 2024 | 1,500 | 1,480 |
| Vodafone Group PLC 4.375% 2028 | 20,141 | 19,587 |
| Bonds, notes & other debt instruments (continued) Corporate bonds & notes (continued) Communication services (continued) | Principal amount (000) | Value (000) |
| Vodafone Group PLC 5.25% 2048 | $1,543 | $1,456 |
| Walt Disney Co. 5.50% 2019 | 4,800 | 4,823 |
| 204,443 | ||
| Industrials 1.04% | ||
| 3M Co. 2.25% 2023 | 542 | 526 |
| 3M Co. 3.625% 2028 | 7,315 | 7,457 |
| Airbus Group SE 2.70% 20231 | 2,120 | 2,065 |
| ARAMARK Corp. 5.125% 2024 | 1,200 | 1,191 |
| BNSF Funding Trust I 6.613% 2055 (3-month USD-LIBOR + 2.35% on 1/15/2026)2 | 1,680 | 1,814 |
| Continental Airlines, Inc., Series 1999-1, Class A, 6.545% 20205 | 160 | 161 |
| Continental Airlines, Inc., Series 1999-2, Class B, 7.566% 20215 | —7 | —7 |
| Continental Airlines, Inc., Series 2001-1, Class A1, 6.703% 20225 | 50 | 53 |
| Continental Airlines, Inc., Series 2000-2, Class A1, 7.707% 20225 | 547 | 571 |
| Continental Airlines, Inc., Series 2000-1, Class A1, 8.048% 20225 | 357 | 369 |
| CSX Corp. 3.80% 2028 | 1,490 | 1,466 |
| CSX Corp. 4.25% 2029 | 380 | 387 |
| CSX Corp. 4.30% 2048 | 1,500 | 1,436 |
| CSX Corp. 4.75% 2048 | 705 | 718 |
| Deck Chassis Acquisition Inc. 10.00% 20231 | 3,000 | 2,895 |
| General Dynamics Corp. 3.375% 2023 | 425 | 428 |
| General Dynamics Corp. 3.75% 2028 | 720 | 729 |
| General Electric Capital Corp. 2.342% 2020 | 4,588 | 4,429 |
| General Electric Capital Corp. 3.10% 2023 | 1,750 | 1,634 |
| General Electric Capital Corp. 3.373% 2025 | 4,615 | 4,108 |
| General Electric Co. 2.70% 2022 | 4,800 | 4,458 |
| Harris Corp. 2.70% 2020 | 1,300 | 1,289 |
| Harris Corp. 3.832% 2025 | 945 | 929 |
| Lockheed Martin Corp. 2.50% 2020 | 3,055 | 3,022 |
| Lockheed Martin Corp. 3.10% 2023 | 1,155 | 1,146 |
| Lockheed Martin Corp. 3.55% 2026 | 2,445 | 2,431 |
| Lockheed Martin Corp. 4.50% 2036 | 2,055 | 2,129 |
| Lockheed Martin Corp. 4.70% 2046 | 5,169 | 5,420 |
| Northrop Grumman Corp. 3.25% 2028 | 13,670 | 12,806 |
| NXP BV and NXP Funding LLC 4.125% 20211 | 2,000 | 1,980 |
| Republic Services, Inc. 5.00% 2020 | 4,800 | 4,899 |
| Rockwell Collins, Inc. 2.80% 2022 | 245 | 238 |
| Roper Technologies, Inc. 2.80% 2021 | 175 | 172 |
| Thomson Reuters Corp. 4.30% 2023 | 240 | 245 |
| Union Pacific Corp. 3.95% 2028 | 1,851 | 1,853 |
| Union Pacific Corp. 4.50% 2048 | 872 | 865 |
| United Rentals, Inc. 5.50% 2027 | 5,000 | 4,650 |
| United Technologies Corp. 3.65% 2023 | 850 | 847 |
| United Technologies Corp. 3.95% 2025 | 335 | 333 |
| United Technologies Corp. 3.125% 2027 | 9,525 | 8,818 |
| United Technologies Corp. 4.125% 2028 | 6,885 | 6,850 |
| United Technologies Corp. 4.625% 2048 | 1,090 | 1,058 |
| Westinghouse Air Brake Technologies Corp. 4.15% 2024 | 3,351 | 3,242 |
| 102,117 | ||
| Information technology 1.00% | ||
| Apple Inc. 1.55% 2021 | 11,630 | 11,280 |
| Apple Inc. 2.90% 2027 | 12,500 | 11,789 |
| Apple Inc. 3.20% 2027 | 510 | 493 |
| Bonds, notes & other debt instruments (continued) Corporate bonds & notes (continued) Information technology (continued) | Principal amount (000) | Value (000) |
| Apple Inc. 3.35% 2027 | $502 | $492 |
| Apple Inc. 3.00% 2024 | 170 | 168 |
| Broadcom Ltd. 3.00% 2022 | 18,032 | 17,353 |
| Broadcom Ltd. 3.625% 2024 | 20,168 | 19,101 |
| Broadcom Ltd. 3.875% 2027 | 22,685 | 20,399 |
| Broadcom Ltd. 3.50% 2028 | 975 | 847 |
| Infor (US), Inc. 5.75% 20201 | 225 | 226 |
| Microsoft Corp. 4.25% 2047 | 10,250 | 10,802 |
| Oracle Corp. 4.00% 2046 | 250 | 234 |
| VMware, Inc. 2.95% 2022 | 4,000 | 3,816 |
| Xerox Corp. 3.50% 2020 | 1,500 | 1,456 |
| 98,456 | ||
| Real estate 0.65% | ||
| Alexandria Real Estate Equities, Inc. 2.75% 2020 | 1,575 | 1,563 |
| Alexandria Real Estate Equities, Inc. 3.95% 2028 | 1,485 | 1,438 |
| Alexandria Real Estate Equities, Inc. 4.50% 2029 | 150 | 150 |
| American Campus Communities, Inc. 3.35% 2020 | 2,810 | 2,801 |
| American Campus Communities, Inc. 3.75% 2023 | 2,900 | 2,882 |
| American Campus Communities, Inc. 3.625% 2027 | 305 | 287 |
| American Tower Corp. 3.40% 2019 | 7,225 | 7,229 |
| Corporate Office Properties LP 5.25% 2024 | 10 | 10 |
| Corporate Office Properties LP 5.00% 2025 | 130 | 133 |
| Equinix, Inc. 5.375% 2027 | 1,750 | 1,715 |
| Essex Portfolio LP 3.25% 2023 | 335 | 328 |
| Essex Portfolio LP 3.875% 2024 | 1,000 | 1,004 |
| Hospitality Properties Trust 4.25% 2021 | 4,250 | 4,264 |
| Hospitality Properties Trust 5.00% 2022 | 1,270 | 1,298 |
| Hospitality Properties Trust 4.50% 2025 | 855 | 834 |
| Hospitality Properties Trust 3.95% 2028 | 1,710 | 1,545 |
| Iron Mountain Inc. 4.875% 20271 | 1,830 | 1,606 |
| Iron Mountain Inc. 5.25% 20281 | 6,295 | 5,587 |
| Kimco Realty Corp. 3.40% 2022 | 1,045 | 1,029 |
| Omega Healthcare Investors, Inc. 4.375% 2023 | 900 | 905 |
| Piedmont Operating Partnership LP 4.45% 2024 | 1,000 | 1,009 |
| Scentre Group 2.375% 20191 | 2,365 | 2,343 |
| Scentre Group 2.375% 20211 | 175 | 171 |
| Scentre Group 3.50% 20251 | 4,565 | 4,428 |
| WEA Finance LLC 2.70% 20191 | 5,475 | 5,451 |
| WEA Finance LLC 3.25% 20201 | 13,875 | 13,857 |
| 63,867 | ||
| Materials 0.36% | ||
| BHP Billiton Finance Ltd. 6.25% 2075 (USD Semi Annual 30/360 (vs. 3M LIBOR) 5Y + 4.971% on 10/19/2020)1,2 | 4,765 | 4,877 |
| Dow Chemical Co. 4.55% 20251 | 300 | 306 |
| Dow Chemical Co. 4.80% 20281 | 2,610 | 2,662 |
| Dow Chemical Co. 5.55% 20481 | 700 | 710 |
| DowDuPont Inc. 4.205% 2023 | 750 | 768 |
| DowDuPont Inc. 4.725% 2028 | 14,610 | 15,181 |
| DowDuPont Inc. 5.419% 2048 | 860 | 898 |
| Holcim Ltd. 5.15% 20231 | 1,560 | 1,608 |
| Sherwin-Williams Co. 2.75% 2022 | 250 | 242 |
| Sherwin-Williams Co. 3.125% 2024 | 145 | 139 |
| Bonds, notes & other debt instruments (continued) Corporate bonds & notes (continued) Materials (continued) | Principal amount (000) | Value (000) |
| Sherwin-Williams Co. 3.45% 2027 | $3,385 | $3,163 |
| Sherwin-Williams Co. 4.50% 2047 | 235 | 213 |
| Vale SA 6.25% 2026 | 4,035 | 4,368 |
| Westlake Chemical Corp. 5.00% 2046 | 415 | 381 |
| Westlake Chemical Corp. 4.375% 2047 | 90 | 76 |
| 35,592 | ||
| Bonds & notes of governments & government agency outside the U.S. 0.07% | ||
| PT Indonesia Asahan Aluminium Tbk 5.23% 20211 | 1,862 | 1,889 |
| PT Indonesia Asahan Aluminium Tbk 5.71% 20231 | 1,020 | 1,039 |
| PT Indonesia Asahan Aluminium Tbk 6.53% 20281 | 525 | 552 |
| PT Indonesia Asahan Aluminium Tbk 6.757% 20481 | 3,780 | 3,884 |
| 7,364 | ||
| Total corporate bonds & notes | 3,603,650 | |
| U.S. Treasury bonds & notes 28.94% U.S. Treasury 23.96% | ||
| U.S. Treasury 2.50% 2020 | 63 | 63 |
| U.S. Treasury 8.75% 2020 | 38,500 | 42,272 |
| U.S. Treasury 2.625% 2021 | 2,968 | 2,978 |
| U.S. Treasury 2.625% 2021 | 2,553 | 2,563 |
| U.S. Treasury 2.75% 2021 | 448 | 451 |
| U.S. Treasury 2.875% 2021 | 369 | 373 |
| U.S. Treasury 2.25% 2023 | 110,600 | 109,231 |
| U.S. Treasury 2.375% 2023 | 48,100 | 47,888 |
| U.S. Treasury 2.50% 2023 | 57,200 | 57,218 |
| U.S. Treasury 2.625% 2023 | 297,846 | 299,451 |
| U.S. Treasury 2.75% 2023 | 173,600 | 175,425 |
| U.S. Treasury 2.125% 20248 | 250,100 | 245,361 |
| U.S. Treasury 2.125% 20248 | 72,100 | 70,548 |
| U.S. Treasury 2.125% 2024 | 72,100 | 70,475 |
| U.S. Treasury 2.25% 2024 | 65,000 | 64,175 |
| U.S. Treasury 2.625% 2025 | 76,884 | 77,076 |
| U.S. Treasury 2.75% 2025 | 132,000 | 133,361 |
| U.S. Treasury 2.875% 2025 | 162,218 | 165,056 |
| U.S. Treasury 2.875% 2025 | 96,200 | 97,906 |
| U.S. Treasury 2.25% 2027 | 120,200 | 116,223 |
| U.S. Treasury 2.25% 2027 | 73,175 | 71,072 |
| U.S. Treasury 6.125% 2027 | 24,000 | 30,529 |
| U.S. Treasury 2.875% 2028 | 48,847 | 49,652 |
| U.S. Treasury 3.125% 2028 | 125,656 | 130,492 |
| U.S. Treasury 2.875% 2045 | 413 | 403 |
| U.S. Treasury 3.00% 2045 | 28,900 | 28,872 |
| U.S. Treasury 3.00% 20488 | 72,499 | 72,268 |
| U.S. Treasury 3.125% 20488 | 85,768 | 87,519 |
| U.S. Treasury 3.375% 20488 | 105,392 | 112,851 |
| 2,361,752 | ||
| U.S. Treasury inflation-protected securities 4.98% | ||
| U.S. Treasury Inflation-Protected Security 0.625% 20239 | 50,902 | 50,107 |
| U.S. Treasury Inflation-Protected Security 0.375% 20259 | 54,409 | 52,483 |
| U.S. Treasury Inflation-Protected Security 0.375% 20279 | 155,061 | 147,380 |
| U.S. Treasury Inflation-Protected Security 0.50% 20289 | 128,145 | 122,360 |
| Bonds, notes & other debt instruments (continued) U.S. Treasury bonds & notes (continued) U.S. Treasury inflation-protected securities (continued) | Principal amount (000) | Value (000) |
| U.S. Treasury Inflation-Protected Security 0.75% 20289 | $71,633 | $70,160 |
| U.S. Treasury Inflation-Protected Security 0.875% 20478,9 | 27,048 | 24,869 |
| U.S. Treasury Inflation-Protected Security 1.00% 20489 | 30,354 | 23,186 |
| 490,545 | ||
| Total U.S. Treasury bonds & notes | 2,852,297 | |
| Mortgage-backed obligations 22.67% Federal agency mortgage-backed obligations 22.65% | ||
| Fannie Mae 5.50% 20235 | 417 | 427 |
| Fannie Mae 4.50% 20255 | 305 | 314 |
| Fannie Mae 6.00% 20375 | 1,036 | 1,129 |
| Fannie Mae 6.00% 20375 | 74 | 80 |
| Fannie Mae 5.50% 20385 | 2,302 | 2,469 |
| Fannie Mae 5.50% 20385 | 354 | 379 |
| Fannie Mae 5.00% 20405 | 448 | 477 |
| Fannie Mae 5.00% 20415 | 3,018 | 3,206 |
| Fannie Mae 5.00% 20415 | 2,503 | 2,642 |
| Fannie Mae 5.00% 20415 | 2,039 | 2,180 |
| Fannie Mae 5.00% 20415 | 1,363 | 1,457 |
| Fannie Mae 5.00% 20415 | 1,080 | 1,155 |
| Fannie Mae 5.00% 20415 | 754 | 805 |
| Fannie Mae 4.00% 20455 | 202 | 206 |
| Fannie Mae 3.00% 20465 | 25,700 | 25,101 |
| Fannie Mae 3.50% 20465 | 2,264 | 2,275 |
| Fannie Mae 4.00% 20465 | 3,432 | 3,514 |
| Fannie Mae 4.00% 20465 | 1,362 | 1,395 |
| Fannie Mae 4.00% 20465 | 615 | 629 |
| Fannie Mae 3.50% 20475 | 94,234 | 94,300 |
| Fannie Mae 3.50% 20475 | 65,315 | 65,360 |
| Fannie Mae 3.50% 20475 | 19,697 | 19,711 |
| Fannie Mae 3.50% 20475 | 13,789 | 13,799 |
| Fannie Mae 3.50% 20475 | 10,275 | 10,283 |
| Fannie Mae 4.00% 20475 | 590 | 605 |
| Fannie Mae 4.00% 20475 | 259 | 265 |
| Fannie Mae 3.50% 20485 | 3,068 | 3,070 |
| Fannie Mae 4.00% 20485 | 16,000 | 16,326 |
| Fannie Mae 4.00% 20485 | 14,004 | 14,290 |
| Fannie Mae 4.00% 20485 | 12,046 | 12,291 |
| Fannie Mae 4.00% 20485 | 7,498 | 7,650 |
| Fannie Mae 4.00% 20485 | 6,168 | 6,294 |
| Fannie Mae 4.00% 20485 | 6,000 | 6,122 |
| Fannie Mae 4.00% 20485 | 3,266 | 3,333 |
| Fannie Mae 4.00% 20485 | 2,122 | 2,165 |
| Fannie Mae 4.00% 20485 | 1,325 | 1,352 |
| Fannie Mae 4.00% 20485 | 1,249 | 1,275 |
| Fannie Mae 4.00% 20485 | 1,000 | 1,020 |
| Fannie Mae 4.00% 20485 | 868 | 886 |
| Fannie Mae 4.00% 20485 | 688 | 702 |
| Fannie Mae 3.50% 20495,10 | 538,377 | 538,494 |
| Fannie Mae 4.00% 20495,10 | 225,210 | 229,666 |
| Fannie Mae 4.00% 20495 | 485 | 494 |
| Fannie Mae 4.50% 20495,10 | 98,000 | 101,542 |
| Fannie Mae Pool #924866 3.89% 20373,5 | 782 | 805 |
| Bonds, notes & other debt instruments (continued) Mortgage-backed obligations (continued) Federal agency mortgage-backed obligations (continued) | Principal amount (000) | Value (000) |
| Fannie Mae, Series 2001-4, Class GA, 9.193% 20253,5 | $2 | $2 |
| Fannie Mae, Series 2001-50, Class BA, 7.00% 20415 | 15 | 17 |
| Fannie Mae, Series 2002-W3, Class A5, 7.50% 20415 | 31 | 36 |
| Fannie Mae, Series 2002-W1, Class 2A, 7.50% 20423,5 | 39 | 42 |
| Freddie Mac 5.50% 20335 | 132 | 141 |
| Freddie Mac 5.50% 20385 | 128 | 137 |
| Freddie Mac 5.50% 20385 | 97 | 105 |
| Freddie Mac 5.50% 20395 | 184 | 197 |
| Freddie Mac 4.50% 20405 | 446 | 468 |
| Freddie Mac 5.50% 20405 | 689 | 737 |
| Freddie Mac 4.50% 20415 | 510 | 534 |
| Freddie Mac 5.50% 20415 | 1,007 | 1,083 |
| Freddie Mac 3.50% 20455 | 33,591 | 33,849 |
| Freddie Mac 3.00% 20465 | 40,271 | 39,599 |
| Freddie Mac 3.50% 20475 | 111,522 | 111,566 |
| Freddie Mac 3.50% 20475 | 61,286 | 61,335 |
| Freddie Mac 3.50% 20475 | 8,031 | 8,034 |
| Freddie Mac 4.00% 20475 | 3,516 | 3,592 |
| Freddie Mac 3.50% 20485 | 34,768 | 34,814 |
| Freddie Mac 3.50% 20485 | 33,634 | 33,746 |
| Freddie Mac 4.00% 20485 | 63,344 | 64,620 |
| Freddie Mac 4.00% 20485 | 58,724 | 59,906 |
| Freddie Mac 4.00% 20485 | 50,769 | 51,791 |
| Freddie Mac 4.00% 20485 | 8,616 | 8,789 |
| Freddie Mac 4.00% 20485 | 5,937 | 6,057 |
| Freddie Mac 4.00% 20485 | 2,391 | 2,440 |
| Freddie Mac 4.00% 20485 | 93 | 95 |
| Freddie Mac 4.50% 20485 | 12,124 | 12,561 |
| Freddie Mac, Series 3061, Class PN, 5.50% 20355 | 129 | 142 |
| Freddie Mac, Series 3318, Class JT, 5.50% 20375 | 323 | 346 |
| Freddie Mac, Series K716, Class A2, Multi Family, 3.13% 20215 | 6,575 | 6,602 |
| Freddie Mac, Series K020, Class A2, Multi Family, 2.373% 20225 | 4,300 | 4,239 |
| Freddie Mac, Series K718, Class A2, Multi Family, 2.791% 20225 | 9,240 | 9,210 |
| Freddie Mac, Series 3146, Class PO, principal only, 0% 20365 | 282 | 239 |
| Freddie Mac, Series 3156, Class PO, principal only, 0% 20365 | 262 | 224 |
| Government National Mortgage Assn. 4.00% 20495,10 | 78,661 | 80,560 |
| Government National Mortgage Assn. 4.00% 20495,10 | 69,539 | 71,158 |
| Government National Mortgage Assn. 4.50% 20495,10 | 117,450 | 121,553 |
| Government National Mortgage Assn. 5.00% 20495,10 | 168,137 | 174,944 |
| Government National Mortgage Assn. 5.00% 20495,10 | 23,839 | 24,782 |
| 2,232,232 | ||
| Collateralized mortgage-backed obligations 0.01% | ||
| Nationstar HECM Loan Trust, Series 2017-2A, Class M1, 2.815% 20271,5,11 | 1,115 | 1,102 |
| Commercial mortgage-backed securities 0.01% | ||
| L.A. Arena Funding, LLC, Series 1, Class A, 7.656% 20261,5 | 418 | 448 |
| LB-UBS Commercial Mortgage Trust, Series 2007-C6, Class AM, 6.114% 20403,5 | 313 | 313 |
| 761 | ||
| Total mortgage-backed obligations | 2,234,095 |
| Bonds, notes & other debt instruments (continued) Bonds & notes of governments & government agencies outside the U.S. 6.22% | Principal amount (000) | Value (000) |
| Dominican Republic 5.95% 20271 | $8,100 | $8,100 |
| Italy (Republic of) 0.95% 2023 | €45,000 | 50,312 |
| Italy (Republic of) 2.00% 2028 | 21,000 | 23,045 |
| Japan, Series 20, 0.10% 20259 | ¥11,430,000 | 107,256 |
| Malaysia (Federation of), Series 0315, 3.659% 2020 | MYR49,000 | 11,884 |
| Malaysia (Federation of), Series 0416, 3.62% 2021 | 42,750 | 10,339 |
| Portuguese Republic 5.125% 2024 | $89,175 | 93,569 |
| Portuguese Republic 5.65% 2024 | €20,000 | 28,714 |
| Portuguese Republic 4.10% 2045 | 375 | 523 |
| Qatar (State of) 3.875% 20231 | $4,975 | 5,039 |
| Qatar (State of) 4.50% 20281 | 10,885 | 11,388 |
| Qatar (State of) 5.103% 20481 | 7,900 | 8,316 |
| Saudi Arabia (Kingdom of) 2.875% 20231 | 4,780 | 4,603 |
| Saudi Arabia (Kingdom of) 4.00% 20251 | 4,485 | 4,455 |
| Saudi Arabia (Kingdom of) 3.628% 20271 | 5,000 | 4,832 |
| Saudi Arabia (Kingdom of) 3.625% 20281 | 11,435 | 10,842 |
| Spain (Kingdom of) 2.70% 2048 | €37,250 | 43,518 |
| United Mexican States 3.60% 2025 | $11,500 | 10,994 |
| United Mexican States, Series M, 6.50% 2021 | MXN3,132,700 | 152,312 |
| United Mexican States, Series M, 5.75% 2026 | 527,500 | 22,701 |
| 612,742 | ||
| Asset-backed obligations 2.00% | ||
| AmeriCredit Automobile Receivables Trust, Series 2017-1, Class C, 2.71% 20225 | $5,970 | 5,917 |
| AmeriCredit Automobile Receivables Trust, Series 2016-1, Class C, 2.89% 20225 | 1,985 | 1,979 |
| CenterPoint Energy Transition Bond Co. III, LLC, Series 2008, Class A2, 5.234% 20235 | 639 | 648 |
| CPS Auto Receivables Trust, Series 2017-B, Class C, 2.92% 20221,5 | 5,700 | 5,672 |
| Drive Auto Receivables Trust, Series 2017-BA, Class C, 2.61% 20211,5 | 10,803 | 10,799 |
| Drive Auto Receivables Trust, Series 2016-CA, Class C, 3.02% 20211,5 | 1,538 | 1,537 |
| Drive Auto Receivables Trust, Series 2015-DA, Class C, 3.38% 20211,5 | 475 | 475 |
| Drive Auto Receivables Trust, Series 2016-AA, Class C, 3.91% 20211,5 | 2,455 | 2,460 |
| Drive Auto Receivables Trust, Series 2017-1, Class C, 2.84% 20225 | 10,000 | 9,988 |
| Drive Auto Receivables Trust, Series 2017-AA, Class C, 2.98% 20221,5 | 7,624 | 7,617 |
| Drive Auto Receivables Trust, Series 2017-2, Class C, 2.75% 20235 | 3,000 | 2,994 |
| Drivetime Auto Owner Trust, Series 2017-1A, Class C, 2.70% 20221,5 | 5,739 | 5,725 |
| Drivetime Auto Owner Trust, Series 2016-3A, Class C, 3.15% 20221,5 | 601 | 600 |
| Drivetime Auto Owner Trust, Series 2017-4A, Class C, 2.86% 20231,5 | 4,440 | 4,428 |
| Drivetime Auto Owner Trust, Series 2017-3A, Class C, 3.01% 20231,5 | 6,000 | 5,992 |
| Enterprise Fleet Financing LLC, Series 2017-1, Class A2, 2.13% 20221,5 | 5,827 | 5,794 |
| Exeter Automobile Receivables Trust, Series 2015-1A, Class C, 4.10% 20201,5 | 3,145 | 3,151 |
| Exeter Automobile Receivables Trust, Series 2015-3A, Class C, 4.83% 20211,5 | 934 | 941 |
| Exeter Automobile Receivables Trust, Series 2017-3A, Class B, 2.81% 20221,5 | 8,100 | 8,047 |
| Ford Credit Auto Owner Trust, Series 2018-2, Class A, 3.47% 20301,5 | 17,675 | 17,854 |
| Ford Credit Auto Owner Trust, Series 2018-1, Class A, 3.19% 20311,5 | 31,410 | 31,212 |
| GM Financial Consumer Automobile Receivables Trust, Series 2018-1, Class B, 2.57% 20235 | 520 | 514 |
| GM Financial Consumer Automobile Receivables Trust, Series 2018-1, Class C, 2.77% 20235 | 360 | 356 |
| Home Equity Mortgage Trust, Series 2006-6, Class 2A1, (1-month USD-LIBOR + 0.10%) 2.706% 20373,5 | 1,351 | 96 |
| Santander Drive Auto Receivables Trust, Series 2016-3, Class C, 2.46% 20225 | 700 | 695 |
| Santander Drive Auto Receivables Trust, Series 2017-1, Class C, 2.58% 20225 | 11,605 | 11,543 |
| Santander Drive Auto Receivables Trust, Series 2017-3, Class C, 2.76% 20225 | 3,955 | 3,933 |
| Santander Drive Auto Receivables Trust, Series 2016-1, Class C, 3.09% 20225 | 8,816 | 8,815 |
| Social Professional Loan Program LLC, Series 2015-C, Class A2, 2.51% 20331,5 | 1,745 | 1,721 |
| Verizon Owner Trust, Series 2016-1A, Class A, 1.42% 20211,5 | 242 | 241 |
| Verizon Owner Trust, Series 2017-1A, Class A, 2.06% 20211,5 | 17,555 | 17,427 |
| Verizon Owner Trust, Series 2017-1A, Class B, 2.45% 20211,5 | 1,500 | 1,489 |
| Bonds, notes & other debt instruments (continued) Asset-backed obligations (continued) | Principal amount (000) | Value (000) |
| Verizon Owner Trust, Series 2017-1A, Class C, 2.65% 20211,5 | $2,000 | $1,988 |
| Verizon Owner Trust, Series 2017-3A, Class A1A, 2.06% 20221,5 | 4,735 | 4,684 |
| Verizon Owner Trust, Series 2017-3A, Class B, 2.38% 20221,5 | 2,450 | 2,427 |
| Voya Ltd., CLO, Series 2014-3A, Class A1R, (3-month USD-LIBOR + 0.72%) 3.210% 20261,3,5 | 4,981 | 4,961 |
| Westlake Automobile Receivables Trust, Series 2017-1A, Class C, 2.70% 20221,5 | 2,500 | 2,488 |
| Wheels SPV 2 LLC, Series 2016-1A, Class A2, 1.59% 20251,5 | 60 | 60 |
| 197,268 | ||
| Municipals 1.93% Illinois 1.64% | ||
| City of Chicago, Board of Education, Unlimited Tax G.O. Bonds (Dedicated Rev.), Series 2009-E, 6.138% 2039 | 28,100 | 26,755 |
| City of Chicago, Board of Education, Unlimited Tax G.O. Bonds (Dedicated Rev.), Series 2010-D, 6.519% 2040 | 4,500 | 4,358 |
| G.O. Bonds, Pension Funding Series 2003, 4.95% 2023 | 27,060 | 27,489 |
| G.O. Bonds, Pension Funding Series 2003, 5.10% 20335 | 86,885 | 82,973 |
| G.O. Bonds, Pension Funding Series 2013, 5.877% 2019 | 400 | 402 |
| G.O. Bonds, Series 2013-B, 3.65% 2020 | 1,825 | 1,826 |
| G.O. Bonds, Series 2013-B, 4.11% 2022 | 750 | 748 |
| G.O. Bonds, Series 2013-B, 4.31% 2023 | 2,125 | 2,101 |
| G.O. Bonds, Taxable Build America Bonds, Series 2010-2, 5.65% 2020 | 250 | 256 |
| G.O. Bonds, Taxable Build America Bonds, Series 2010-2, 5.85% 2022 | 2,370 | 2,487 |
| G.O. Bonds, Taxable Build America Bonds, Series 2010-2, 5.95% 2023 | 3,210 | 3,376 |
| G.O. Bonds, Taxable Build America Bonds, Series 2010-3, 5.547% 2019 | 335 | 337 |
| G.O. Bonds, Taxable Build America Bonds, Series 2010-3, 5.727% 2020 | 2,400 | 2,462 |
| G.O. Bonds, Taxable Build America Bonds, Series 2010-5, 6.20% 20215 | 5,838 | 6,050 |
| 161,620 | ||
| Florida 0.15% | ||
| Hurricane Catastrophe Fund Fin. Corp., Rev. Bonds, Series 2013-A, 2.995% 2020 | 14,400 | 14,423 |
| California 0.07% | ||
| High-Speed Passenger Train G.O. Rev. Ref. Bonds, Series 2017-A, 2.367% 2022 | 3,775 | 3,722 |
| Various Purpose G.O. Bonds, Series 2009, 7.50% 2034 | 2,100 | 2,867 |
| 6,589 | ||
| South Carolina 0.05% | ||
| Public Service Auth., Rev. Obligations (Santee Cooper), Series 2014-A, 5.50% 2054 | 875 | 936 |
| Public Service Auth., Rev. Obligations (Santee Cooper), Series 2015-A, 5.00% 2050 | 840 | 881 |
| Public Service Auth., Rev. Obligations (Santee Cooper), Series 2015-E, 5.25% 2055 | 2,765 | 2,953 |
| 4,770 | ||
| New Jersey 0.02% | ||
| Econ. Dev. Auth., School Facs. Construction Rev. Ref. Bonds, Series 2015-YY, 4.447% 2020 | 2,500 | 2,539 |
| Total municipals | 189,941 | |
| Federal agency bonds & notes 0.11% | ||
| Fannie Mae 2.125% 2026 | 11,910 | 11,395 |
| Total bonds, notes & other debt instruments (cost: $9,812,916,000) | 9,701,388 |
| Common stocks 0.01% Energy 0.01% | Shares | Value (000) |
| Tribune Resources, Inc.11,12 | 83,079 | $249 |
| Communication services 0.00% | ||
| Cumulus Media Inc., Class B11,12 | 13,561 | 147 |
| Adelphia Recovery Trust, Series ACC-111,12,13 | 2,409,545 | 1 |
| 148 | ||
| Information technology 0.00% | ||
| Corporate Risk Holdings I, Inc.11,12,13 | 70,193 | 25 |
| Corporate Risk Holdings Corp.11,12,13,14 | 355 | —7 |
| 25 | ||
| Total common stocks (cost: $1,854,000) | 422 | |
| Rights & warrants 0.00% Energy 0.00% | ||
| Tribune Resources, Inc., Class A, warrants, expire 202311,12,13 | 112,665 | 39 |
| Tribune Resources, Inc., Class B, warrants, expire 202311,12,13 | 87,629 | 23 |
| Tribune Resources, Inc., Class C, warrants, expire 202311,12,13 | 17,050 | 3 |
| Ultra Petroleum Corp., warrants, expire 202511,12,13 | 8,750 | 2 |
| Total rights & warrants (cost: $18,000) | 67 | |
| Short-term securities 12.62% | Principal amount (000) | |
| Chariot Funding, LLC 2.51%due 2/19/20191 | $10,800 | 10,760 |
| Chevron Corp. 2.49%due 2/4/20191 | 75,000 | 74,819 |
| Coca-Cola Co. 2.40%due 1/14/20191 | 25,000 | 24,976 |
| ExxonMobil Corp. 2.39%due 1/8/2019 | 40,000 | 39,979 |
| Fannie Mae 2.23%due 1/2/2019 | 3,200 | 3,199 |
| Federal Home Loan Bank 2.23%–2.39%due 1/11/2019–3/6/2019 | 483,800 | 482,671 |
| Freddie Mac 2.36%due 2/20/2019 | 44,900 | 44,751 |
| Italian Treasury Bill 0.53%due 8/14/2019 | €46,400 | 53,030 |
| Merck & Co. Inc. 2.38%due 1/25/2019–1/29/20191 | $80,000 | 79,849 |
| U.S. Treasury Bills 2.19%–2.44%due 1/17/2019–5/16/2019 | 366,500 | 364,843 |
| Wal-Mart Stores, Inc. 2.46%–2.49%due 1/7/2019–1/14/20191 | 64,800 | 64,756 |
| Total short-term securities (cost: $1,244,163,000) | 1,243,633 | |
| Total investment securities111.07% (cost: $11,058,951,000) | 10,945,510 | |
| Other assets less liabilities (11.07)% | (1,090,823) | |
| Net assets100.00% | $9,854,687 |
| Contracts | Type | Number of contracts | Expiration | Notional amount15 (000) | Value at 12/31/201816 (000) | Unrealized appreciation (depreciation) at 12/31/2018 (000) |
| 2 Year U.S. Treasury Note Futures | Long | 3,076 | April 2019 | $615,200 | $653,073 | $2,119 |
| 5 Year Euro-Bobl Futures | Short | 2,022 | March 2019 | €(202,200) | (307,010) | (813) |
| 5 Year U.S. Treasury Note Futures | Long | 10,571 | April 2019 | $1,057,100 | 1,212,362 | 17,566 |
| Contracts | Type | Number of contracts | Expiration | Notional amount15 (000) | Value at 12/31/201816 (000) | Unrealized appreciation (depreciation) at 12/31/2018 (000) |
| 10 Year Euro-Bund Futures | Short | 715 | March 2019 | €(71,500) | $(133,974) | $(934) |
| 10 Year U.S. Treasury Note Futures | Long | 579 | March 2019 | $57,900 | 70,647 | 1,495 |
| 10 Year Ultra U.S. Treasury Note Futures | Short | 171 | March 2019 | (17,100) | (22,243) | (666) |
| 30 Year Euro-Buxl Futures | Long | 268 | March 2019 | €26,800 | 55,462 | 1,118 |
| 30 Year Ultra U.S. Treasury Bond Futures | Short | 33 | March 2019 | $(3,300) | (5,302) | (277) |
| $19,608 |
| Contract amount | Counterparty | Settlement date | Unrealized (depreciation) appreciation at 12/31/2018 (000) | |
| Purchases (000) | Sales (000) | |||
| USD25,523 | EUR22,400 | Citibank | 1/8/2019 | $(159) |
| USD12,784 | JPY1,445,000 | Bank of America, N.A. | 1/11/2019 | (412) |
| USD60,130 | MXN1,220,000 | Citibank | 1/11/2019 | (1,853) |
| KRW44,456,000 | USD39,480 | JPMorgan Chase | 1/14/2019 | 380 |
| USD40,106 | KRW44,456,000 | Morgan Stanley | 1/14/2019 | 247 |
| USD53,016 | EUR46,600 | HSBC Bank | 1/17/2019 | (456) |
| USD117,705 | MXN2,400,000 | Morgan Stanley | 1/17/2019 | (4,095) |
| JPY13,203,300 | USD117,462 | Goldman Sachs | 1/18/2019 | 3,183 |
| EUR34,400 | USD39,182 | Citibank | 1/18/2019 | 294 |
| CNH273,100 | USD39,613 | Citibank | 1/18/2019 | 149 |
| USD39,868 | CNH273,100 | HSBC Bank | 1/18/2019 | 107 |
| USD439 | EUR385 | HSBC Bank | 1/18/2019 | (3) |
| USD39,223 | EUR34,400 | HSBC Bank | 1/18/2019 | (253) |
| USD39,249 | JPY4,444,800 | Citibank | 1/18/2019 | (1,365) |
| USD78,055 | JPY8,758,500 | HSBC Bank | 1/18/2019 | (1,976) |
| USD5,622 | EUR4,925 | JPMorgan Chase | 1/24/2019 | (33) |
| USD12,492 | MXN252,000 | Citibank | 1/24/2019 | (281) |
| USD124,696 | EUR109,250 | HSBC Bank | 1/24/2019 | (743) |
| USD64,722 | JPY7,300,000 | Morgan Stanley | 1/24/2019 | (2,013) |
| USD30,599 | JPY3,430,000 | Goldman Sachs | 1/29/2019 | (770) |
| USD54,526 | EUR46,000 | Bank of America, N.A. | 8/14/2019 | 781 |
| $(9,271) | ||||
| Receive | Pay | Expiration date | Notional (000) | Value at 12/31/2018 (000) | Upfront payments/ receipts (000) | Unrealized (depreciation) appreciation at 12/31/2018 (000) |
| 1.6915% | 3-month USD-LIBOR | 6/3/2020 | $1,600 | $(23) | $— | $(23) |
| 3-month USD-LIBOR | 1.975% | 4/27/2022 | 15,000 | 288 | — | 288 |
| U.S. EFFR | 2.4435% | 12/20/2023 | 5,508 | (42) | — | (42) |
| U.S. EFFR | 2.45375% | 12/20/2023 | 49,336 | (403) | — | (403) |
| U.S. EFFR | 2.4225% | 12/24/2023 | 22,594 | (151) | — | (152) |
| Receive | Pay | Expiration date | Notional (000) | Value at 12/31/2018 (000) | Upfront payments/ receipts (000) | Unrealized (depreciation) appreciation at 12/31/2018 (000) |
| 6-month EURIBOR | 0.9852% | 10/17/2024 | €25,000 | $(1,119) | $— | $(1,119) |
| 3-month USD-LIBOR | 2.438% | 11/19/2024 | $750 | 6 | — | 6 |
| 3-month USD-LIBOR | 2.0475% | 3/23/2025 | 450 | 14 | — | 14 |
| 3-month USD-LIBOR | 2.3175% | 5/8/2025 | 1,500 | 25 | — | 25 |
| 3-month USD-LIBOR | 2.339% | 5/13/2025 | 375 | 6 | — | 6 |
| 3-month USD-LIBOR | 2.351% | 5/15/2025 | 590 | 9 | — | 9 |
| 3-month USD-LIBOR | 2.287% | 5/20/2025 | 500 | 9 | — | 9 |
| 3-month USD-LIBOR | 2.227% | 5/28/2025 | 260 | 6 | — | 6 |
| 3-month USD-LIBOR | 2.2125% | 5/29/2025 | 465 | 11 | — | 11 |
| 3-month USD-LIBOR | 2.451% | 6/5/2025 | 650 | 6 | — | 6 |
| 3-month USD-LIBOR | 2.46% | 6/10/2025 | 2,536 | 22 | — | 22 |
| 3-month USD-LIBOR | 2.455% | 6/24/2025 | 235 | 2 | — | 2 |
| 3-month USD-LIBOR | 2.397% | 7/13/2025 | 900 | 11 | — | 11 |
| 3-month USD-LIBOR | 2.535% | 7/15/2025 | 800 | 4 | — | 4 |
| 3-month USD-LIBOR | 2.4615% | 7/22/2025 | 1,300 | 12 | — | 12 |
| 3-month USD-LIBOR | 2.312% | 7/29/2025 | 1,000 | 18 | — | 18 |
| 3-month USD-LIBOR | 2.331% | 7/30/2025 | 435 | 7 | — | 7 |
| 3-month USD-LIBOR | 2.228% | 9/4/2025 | 12,000 | 285 | — | 285 |
| 6-month JPY-LIBOR | 0.0875% | 3/10/2026 | ¥11,100,000 | (92) | — | (92) |
| 3-month USD-LIBOR | 1.595% | 5/12/2026 | $8,500 | 593 | — | 593 |
| 3-month USD-LIBOR | 1.592% | 5/12/2026 | 4,000 | 280 | — | 280 |
| 3.0865% | 3-month USD-LIBOR | 8/18/2034 | 2,250 | 80 | — | 80 |
| 2.844% | 3-month USD-LIBOR | 6/11/2035 | 3,250 | 11 | — | 11 |
| 2.773% | 3-month USD-LIBOR | 7/13/2035 | 500 | (3) | — | (3) |
| 2.589% | 3-month USD-LIBOR | 9/4/2035 | 3,100 | (98) | — | (98) |
| 2.377% | 3-month USD-LIBOR | 4/29/2045 | 1,910 | (169) | — | (169) |
| 6-month JPY-LIBOR | 0.58295% | 3/23/2046 | ¥2,000,000 | 518 | — | 518 |
| 0.64355% | 6-month JPY-LIBOR | 4/27/2046 | 2,000,000 | (237) | — | (237) |
| 3-month USD-LIBOR | 2.1155% | 5/13/2046 | $2,400 | 342 | — | 342 |
| $— | $227 |
| 1 | Acquired in a transaction exempt from registration under Rule 144A or Section 4(2) of the Securities Act of 1933. May be resold in the U.S. in transactions exempt from registration, normally to qualified institutional buyers. The total value of all such securities was $1,180,984,000, which represented 11.98% of the net assets of the fund. |
| 2 | Step bond; coupon rate may change at a later date. |
| 3 | Coupon rate may change periodically. |
| 4 | Loan participations and assignments; may be subject to legal or contractual restrictions on resale. The total value of all such loans was $1,243,000, which represented .01% of the net assets of the fund. |
| 5 | Principal payments may be made periodically. Therefore, the effective maturity date may be earlier than the stated maturity date. |
| 6 | Payment in kind; the issuer has the option of paying additional securities in lieu of cash. Most recent payment was 100% cash unless otherwise noted. |
| 7 | Amount less than one thousand. |
| 8 | All or a portion of this security was pledged as collateral. The total value of pledged collateral was $25,155,000, which represented .26% of the net assets of the fund. |
| 9 | Index-linked bond whose principal amount moves with a government price index. |
| 10 | Purchased on a TBA basis. |
| 11 | Valued under fair value procedures adopted by authority of the board of trustees. The total value of all such securities was $1,591,000, which represented .02% of the net assets of the fund. |
| 12 | Security did not produce income during the last 12 months. |
| 13 | Value determined using significant unobservable inputs. |
| 14 | Acquired through a private placement transaction exempt from registration under the Securities Act of 1933. May be subject to legal or contractual restrictions on resale. Further details on this holding appear below. |
| 15 | Notional amount is calculated based on the number of contracts and notional contract size. |
| 16 | Value is calculated based on the notional amount and current market price. |
| Private placement security | Acquisition date | Cost (000) | Value (000) | Percent of net assets |
| Corporate Risk Holdings Corp. | 8/31/2015 | $— | $— | .00% |
| Key to abbreviations and symbols | |
| Auth. = Authority | G.O. = General Obligation |
| CLO = Collateralized Loan Obligations | JPY/¥ = Japanese yen |
| CNH = Chinese yuan renminbi | KRW = South Korean won |
| Dev. = Development | LIBOR = London Interbank Offered Rate |
| Econ. = Economic | MXN = Mexican pesos |
| EFFR = Effective Federal Funds Rate | MYR = Malaysian ringgits |
| EUR/€ = Euros | Ref. = Refunding |
| EURIBOR = Euro Interbank Offered Rate | Rev. = Revenue |
| Facs. = Facilities | TBA = To-be-announced |
| Fin. = Finance | USD/$ = U.S. dollars |
| Bonds, notes & other debt instruments 92.18% Japanese yen 11.88% | Principal amount (000) | Value (000) |
| Japan, Series 395, 0.10% 2020 | ¥5,380,000 | $49,306 |
| Japan, Series 394, 0.10% 2020 | 840,000 | 7,698 |
| Japan, Series 134, 0.10% 2022 | 550,000 | 5,068 |
| Japan, Series 19, 0.10% 20241 | 2,428,632 | 22,734 |
| Japan, Series 18, 0.10% 20241 | 1,958,856 | 18,301 |
| Japan, Series 337, 0.30% 2024 | 354,600 | 3,321 |
| Japan, Series 336, 0.50% 2024 | 800,000 | 7,581 |
| Japan, Series 20, 0.10% 20251 | 680,720 | 6,388 |
| Japan, Series 340, 0.40% 2025 | 435,000 | 4,113 |
| Japan, Series 21, 0.10% 20261 | 989,420 | 9,329 |
| Japan, Series 344, 0.10% 2026 | 605,000 | 5,617 |
| Japan, Series 346, 0.10% 2027 | 3,125,000 | 28,990 |
| Japan, Series 116, 2.20% 2030 | 1,735,000 | 19,560 |
| Japan, Series 145, 1.70% 2033 | 2,210,000 | 24,308 |
| Japan, Series 21, 2.30% 2035 | 720,000 | 8,637 |
| Japan, Series 42, 1.70% 2044 | 450,000 | 5,124 |
| Japan, Series 53, 0.60% 2046 | 501,600 | 4,464 |
| Japan, Series 57, 0.80% 2047 | 969,050 | 9,049 |
| Japan, Series 59, 0.70% 2048 | 930,000 | 8,449 |
| 248,037 | ||
| Euros 11.27% | ||
| Allianz SE 4.75% (undated) (3-month EUR-EURIBOR + 3.60% on 10/24/2023)2 | €4,200 | 5,297 |
| Assicurazioni Generali SpA 7.75% 2042 (3-month EUR-EURIBOR + 7.113% on 12/12/2022)2 | 1,500 | 2,005 |
| Aviva PLC, junior subordinated 6.125% 2043 (5 year EURO Mid Swap + 5.13% on 7/5/2023)2 | 1,500 | 1,915 |
| Banco Bilbao Vizcaya Argentaria SA 3.50% 2024 (5 year EURO Mid Swap + 2.55% on 4/11/2019)2 | 3,300 | 3,805 |
| Banque Centrale de Tunisie 6.75% 2023 | 2,295 | 2,524 |
| Barclays Bank PLC 6.00% 2021 | 1,000 | 1,235 |
| Barclays Bank PLC 6.625% 2022 | 1,070 | 1,376 |
| CaixaBank, SA 3.50% 2027 (5 year EURO Mid Swap + 3.35% on 2/15/2022)2 | 1,300 | 1,534 |
| Canada 3.50% 2020 | 2,500 | 2,983 |
| Cote d’Ivoire (Republic of) 5.25% 20303 | 900 | 912 |
| Deutsche Telekom International Finance BV 7.50% 2033 | 200 | 381 |
| Egypt (Arab Republic of) 5.625% 2030 | 745 | 741 |
| European Financial Stability Facility 0.40% 2025 | 6,000 | 6,920 |
| French Republic O.A.T. 1.00% 2025 | 4,750 | 5,714 |
| French Republic O.A.T. 2.00% 2048 | 1,490 | 1,856 |
| Germany (Federal Republic of) 1.75% 2024 | 5,270 | 6,671 |
| Germany (Federal Republic of) 0.50% 2027 | 12,360 | 14,640 |
| Germany (Federal Republic of) 0.50% 2028 | 11,000 | 12,976 |
| Germany (Federal Republic of) 6.25% 2030 | 1,800 | 3,402 |
| Germany (Federal Republic of) 4.75% 2040 | 200 | 415 |
| Germany (Federal Republic of) 2.50% 2046 | 2,400 | 3,875 |
| Germany (Federal Republic of) 1.25% 20484 | 8,750 | 11,016 |
| Greece (Hellenic Republic of) 3.50% 2023 | 1,605 | 1,856 |
| Greece (Hellenic Republic of) 3.375% 2025 | 2,650 | 2,938 |
| Bonds, notes & other debt instruments (continued) Euros (continued) | Principal amount (000) | Value (000) |
| Greece (Hellenic Republic of) 3.75% 2028 | €684 | $749 |
| Greece (Hellenic Republic of) 3.90% 2033 | 3,615 | 3,776 |
| Greece (Hellenic Republic of) 4.00% 2037 | 3,770 | 3,809 |
| Greece (Hellenic Republic of) 4.20% 2042 | 3,759 | 3,791 |
| Groupe BPCE SA 4.625% 2023 | 1,200 | 1,561 |
| Groupe BPCE SA 2.75% 2026 (5 year EURO Mid Swap + 1.83% on 7/8/2021)2 | 3,300 | 3,905 |
| HSBC Holdings PLC 3.375% 2024 (5 year EURO Mid Swap + 1.95% on 1/10/2019)2 | 1,700 | 1,949 |
| Hungary 3.875% 2020 | 1,000 | 1,198 |
| Intesa Sanpaolo SpA 6.625% 2023 | 1,885 | 2,453 |
| Ireland (Republic of) 0.90% 2028 | 8,090 | 9,275 |
| Italy (Republic of) 1.35% 2022 | 12,950 | 14,891 |
| Italy (Republic of) 4.75% 2023 | 2,900 | 3,774 |
| Italy (Republic of) 4.50% 2024 | 2,500 | 3,222 |
| Italy (Republic of) 2.05% 2027 | 7,330 | 8,093 |
| Kazahkstan (Republic of) 1.55% 2023 | 1,245 | 1,436 |
| Lloyds Banking Group PLC 6.50% 2020 | 1,090 | 1,332 |
| NN Group NV 4.625% 2044 (3-month EUR-LIBOR + 3.95% on 4/8/2024)2 | 1,320 | 1,593 |
| NN Group NV 4.50% (undated) (3-month EUR-LIBOR + 4.00% on 1/15/2026)2 | 350 | 401 |
| Portuguese Republic 2.875% 2025 | 6,500 | 8,296 |
| Rabobank Nederland 2.50% 2026 (5 year EURO Mid Swap + 1.40% on 5/26/2021)2 | 2,400 | 2,849 |
| Romania 2.875% 2029 | 5,170 | 5,754 |
| Romania 3.875% 2035 | 2,810 | 3,143 |
| Romania 3.375% 2038 | 4,170 | 4,273 |
| Spain (Kingdom of) 1.45% 2027 | 18,230 | 21,194 |
| Spain (Kingdom of) 1.50% 2027 | 10,350 | 12,131 |
| Spain (Kingdom of) 2.90% 2046 | 1,120 | 1,376 |
| Spain (Kingdom of) 2.70% 2048 | 6,025 | 7,039 |
| Svenska Handelsbanken AB 2.656% 2024 (5 year EURO Mid Swap + 1.43% on 1/15/2019)2 | 2,170 | 2,488 |
| Takeda Pharmaceutical Co., Ltd. 2.25% 2026 | 2,275 | 2,666 |
| 235,404 | ||
| Mexican pesos 3.57% | ||
| Petróleos Mexicanos 7.47% 2026 | MXN59,000 | 2,215 |
| United Mexican States, Series M, 8.00% 2020 | 92,500 | 4,676 |
| United Mexican States, Series M, 6.50% 2022 | 171,100 | 8,180 |
| United Mexican States, Series M, 8.00% 2023 | 301,000 | 14,960 |
| United Mexican States, Series M20, 10.00% 2024 | 162,000 | 8,764 |
| United Mexican States, Series M, 5.75% 2026 | 611,500 | 26,316 |
| United Mexican States, Series M, 7.50% 2027 | 113,000 | 5,345 |
| United Mexican States, Series M30, 10.00% 2036 | 35,000 | 1,962 |
| United Mexican States, Series M, 7.75% 2042 | 44,900 | 2,020 |
| 74,438 | ||
| Polish zloty 3.51% | ||
| Poland (Republic of), Series 0420, 1.50% 2020 | PLN27,750 | 7,449 |
| Poland (Republic of), Series 1020, 5.25% 2020 | 23,200 | 6,633 |
| Poland (Republic of), Series 1021, 5.75% 2021 | 101,030 | 29,970 |
| Poland (Republic of), Series 0922, 5.75% 2022 | 34,600 | 10,513 |
| Poland (Republic of), Series 1023, 4.00% 2023 | 31,140 | 9,027 |
| Poland (Republic of), Series 0725, 3.25% 2025 | 34,750 | 9,721 |
| 73,313 |
| Bonds, notes & other debt instruments (continued) Danish kroner 3.15% | Principal amount (000) | Value (000) |
| Nykredit Realkredit AS, Series 01E, 1.50% 20373 | DKr107,828 | $16,675 |
| Nykredit Realkredit AS, Series 01E, 2.00% 20373 | 22,078 | 3,529 |
| Nykredit Realkredit AS, Series 01E, 1.50% 20403 | 284,656 | 43,453 |
| Nykredit Realkredit AS, Series 01E, 2.50% 20473 | 12,937 | 2,076 |
| 65,733 | ||
| Indian rupees 2.19% | ||
| India (Republic of) 7.80% 2021 | INR236,600 | 3,440 |
| India (Republic of) 8.83% 2023 | 884,200 | 13,507 |
| India (Republic of) 7.35% 2024 | 30,000 | 430 |
| India (Republic of) 6.97% 2026 | 431,000 | 6,024 |
| India (Republic of) 7.59% 2026 | 438,600 | 6,354 |
| India (Republic of) 6.79% 2027 | 589,000 | 8,114 |
| India (Republic of) 7.59% 2029 | 95,800 | 1,377 |
| India (Republic of) 7.61% 2030 | 167,270 | 2,408 |
| India (Republic of) 7.88% 2030 | 25,000 | 367 |
| National Highways Authority of India 7.17% 2021 | 220,000 | 3,076 |
| National Highways Authority of India 7.27% 2022 | 50,000 | 703 |
| 45,800 | ||
| British pounds 2.08% | ||
| Aviva PLC, junior subordinated 6.875% 20582 | £470 | 668 |
| AXA SA, junior subordinated 5.453% (undated)2 | 300 | 389 |
| France Télécom 5.375% 2050 | 300 | 514 |
| Lloyds Banking Group PLC 7.625% 2025 | 655 | 1,038 |
| United Kingdom 1.75% 2022 | 5,700 | 7,506 |
| United Kingdom 2.25% 2023 | 1,550 | 2,097 |
| United Kingdom 2.75% 2024 | 1,210 | 1,694 |
| United Kingdom 1.25% 2027 | 5,925 | 7,591 |
| United Kingdom 4.25% 2027 | 2,800 | 4,501 |
| United Kingdom 3.25% 2044 | 6,500 | 10,597 |
| United Kingdom 3.50% 2045 | 890 | 1,519 |
| United Kingdom 1.50% 2047 | 4,460 | 5,262 |
| 43,376 | ||
| Brazilian reais 1.58% | ||
| Brazil (Federative Republic of) 0% 2021 | BRL14,000 | 3,000 |
| Brazil (Federative Republic of) 0% 2022 | 75,000 | 14,641 |
| Brazil (Federative Republic of) 10.00% 2025 | 57,090 | 15,395 |
| 33,036 | ||
| Thai baht 1.30% | ||
| Bank of Thailand 1.50% 2019 | THB168,310 | 5,168 |
| Bank of Thailand 1.34% 2020 | 35,000 | 1,069 |
| Thailand (Kingdom of) 1.875% 2022 | 258,200 | 7,898 |
| Thailand (Kingdom of) 3.85% 2025 | 65,000 | 2,186 |
| Thailand (Kingdom of) 2.125% 2026 | 317,750 | 9,552 |
| Thailand (Kingdom of) 3.775% 2032 | 40,000 | 1,356 |
| 27,229 | ||
| Israeli shekels 0.88% | ||
| Israel (State of) 2.00% 2027 | ILS28,300 | 7,518 |
| Israel (State of) 5.50% 2042 | 29,300 | 10,802 |
| 18,320 |
| Bonds, notes & other debt instruments (continued) South African rand 0.84% | Principal amount (000) | Value (000) |
| South Africa (Republic of), Series R-186, 10.50% 2026 | ZAR19,900 | $1,506 |
| South Africa (Republic of), Series R-214, 6.50% 2041 | 168,450 | 8,175 |
| South Africa (Republic of), Series 2044, 8.75% 2044 | 126,800 | 7,849 |
| 17,530 | ||
| Chilean pesos 0.73% | ||
| Chile (Banco Central de) 4.00% 2023 | CLP6,765,000 | 9,796 |
| Chile (Banco Central de) 4.50% 2026 | 3,660,000 | 5,378 |
| 15,174 | ||
| Malaysian ringgits 0.72% | ||
| Malaysia (Federation of), Series 0314, 4.048% 2021 | MYR7,600 | 1,859 |
| Malaysia (Federation of), Series 0215, 3.795% 2022 | 6,000 | 1,454 |
| Malaysia (Federation of), Series 0316, 3.90% 2026 | 6,250 | 1,489 |
| Malaysia (Federation of), Series 0310, 4.498% 2030 | 42,250 | 10,327 |
| 15,129 | ||
| Romanian leu 0.69% | ||
| Romania 2.30% 2020 | RON28,650 | 6,871 |
| Romania 3.25% 2021 | 11,910 | 2,899 |
| Romania 5.95% 2021 | 15,290 | 3,941 |
| Romania 3.40% 2022 | 3,250 | 784 |
| 14,495 | ||
| Australian dollars 0.65% | ||
| Australia (Commonwealth of), Series 128, 5.75% 2022 | A$10,150 | 8,104 |
| Australia (Commonwealth of), Series 133, 5.50% 2023 | 6,625 | 5,355 |
| 13,459 | ||
| Canadian dollars 0.48% | ||
| Canada 1.00% 2022 | C$1,050 | 745 |
| Canada 2.25% 2025 | 9,450 | 7,063 |
| Saskatchewan (Province of) 3.05% 2028 | 3,000 | 2,231 |
| 10,039 | ||
| Chinese yuan renminbi 0.43% | ||
| China Development Bank Corp. 4.73% 2025 | CNY49,000 | 7,528 |
| China Development Bank Corp. 4.04% 2028 | 10,000 | 1,487 |
| 9,015 | ||
| Peruvian nuevos soles 0.42% | ||
| Peru (Republic of) 6.15% 2032 | PEN29,300 | 8,865 |
| South Korean won 0.42% | ||
| South Korea (Republic of), Series 2203, 1.875% 2022 | KRW1,540,000 | 1,380 |
| South Korea (Republic of), Series 2209, 2.00% 2022 | 8,274,200 | 7,446 |
| 8,826 | ||
| Indonesian rupiah 0.42% | ||
| Indonesia (Republic of), Series 64, 6.125% 2028 | IDR18,142,000 | 1,113 |
| Indonesia (Republic of), Series 78, 8.25% 2029 | 80,188,000 | 5,719 |
| Indonesia (Republic of), Series 74, 7.50% 2032 | 28,000,000 | 1,828 |
| 8,660 |
| Bonds, notes & other debt instruments (continued) Colombian pesos 0.36% | Principal amount (000) | Value (000) |
| Colombia (Republic of), Series B, 6.25% 2025 | COP24,560,000 | $7,509 |
| Turkish lira 0.24% | ||
| Turkey (Republic of) 9.50% 2022 | TRY540 | 82 |
| Turkey (Republic of) 10.70% 2022 | 9,240 | 1,424 |
| Turkey (Republic of) 11.00% 2022 | 22,320 | 3,543 |
| 5,049 | ||
| Czech korunas 0.18% | ||
| Czech Republic 0.45% 2023 | CZK91,820 | 3,850 |
| Norwegian kroner 0.14% | ||
| Norway (Kingdom of) 3.75% 2021 | NKr23,500 | 2,886 |
| Uruguayan pesos 0.12% | ||
| Uruguay (Oriental Republic of) 8.50% 2028 | UYU95,641 | 2,507 |
| Argentine pesos 0.12% | ||
| Argentine Republic 2.50% 20211 | ARS100,242 | 2,092 |
| Buenos Aires (City of) (Badlar Private Banks ARS Index + 3.75%) 47.661% 20285 | 13,568 | 310 |
| 2,402 | ||
| U.S. dollars 43.81% | ||
| Abbott Laboratories 2.90% 2021 | $420 | 416 |
| Abbott Laboratories 3.40% 2023 | 137 | 137 |
| Abbott Laboratories 3.75% 2026 | 793 | 785 |
| AbbVie Inc. 2.50% 2020 | 3,155 | 3,126 |
| AbbVie Inc. 2.90% 2022 | 1,170 | 1,139 |
| AbbVie Inc. 3.20% 2022 | 200 | 197 |
| AbbVie Inc. 3.20% 2026 | 2,007 | 1,864 |
| AbbVie Inc. 4.50% 2035 | 410 | 381 |
| ACE INA Holdings Inc. 2.30% 2020 | 180 | 177 |
| ACE INA Holdings Inc. 2.875% 2022 | 365 | 362 |
| ACE INA Holdings Inc. 3.35% 2026 | 365 | 358 |
| ACE INA Holdings Inc. 4.35% 2045 | 425 | 439 |
| ADT Corp. 3.50% 2022 | 400 | 371 |
| AES Corp. 5.50% 2025 | 350 | 349 |
| Aetna Inc. 2.80% 2023 | 340 | 324 |
| Alexandria Real Estate Equities, Inc. 2.75% 2020 | 180 | 179 |
| Allergan PLC 3.00% 2020 | 2,820 | 2,810 |
| Allergan PLC 3.80% 2025 | 2,809 | 2,747 |
| Allergan PLC 4.75% 2045 | 130 | 124 |
| Allison Transmission Holdings, Inc. 5.00% 20246 | 430 | 414 |
| Almonde Inc., Term Loan, (3-month USD-LIBOR + 7.25%) 10.053% 20253,5,7 | 650 | 600 |
| Altria Group, Inc. 4.50% 2043 | 350 | 293 |
| Amazon.com, Inc. 2.80% 2024 | 2,920 | 2,840 |
| Amazon.com, Inc. 3.15% 2027 | 980 | 947 |
| American Axle & Manufacturing Holdings, Inc. 6.50% 2027 | 350 | 315 |
| American Campus Communities, Inc. 3.75% 2023 | 1,810 | 1,799 |
| American Campus Communities, Inc. 4.125% 2024 | 1,195 | 1,202 |
| American Energy (Permian Basin) (3-month USD-LIBOR + 6.50%) 9.082% 20195,6 | 150 | 53 |
| Bonds, notes & other debt instruments (continued) U.S. dollars (continued) | Principal amount (000) | Value (000) |
| American Energy (Permian Basin) 7.125% 20206 | $1,295 | $298 |
| American Energy (Permian Basin) 7.375% 20216 | 340 | 76 |
| Amgen Inc. 1.85% 2021 | 420 | 405 |
| Anheuser-Busch InBev NV 3.75% 2022 | 775 | 776 |
| Anheuser-Busch InBev NV 3.30% 2023 | 635 | 619 |
| Anheuser-Busch InBev NV 3.50% 2024 | 1,545 | 1,511 |
| Anheuser-Busch InBev NV 4.00% 2028 | 1,050 | 1,007 |
| Apple Inc. 2.50% 2022 | 1,200 | 1,182 |
| Apple Inc. 3.35% 2027 | 1,075 | 1,053 |
| Applied Systems, Inc., Term Loan, (3-month USD-LIBOR + 7.00%) 9.522% 20253,5,7 | 80 | 79 |
| Argentine Republic 6.875% 2021 | 3,575 | 3,243 |
| Argentine Republic 7.50% 2026 | 2,200 | 1,770 |
| Argentine Republic 6.875% 2048 | 1,695 | 1,189 |
| Ascent Resources Marcellus Holdings, Inc., Term Loan B, (3-month USD-LIBOR + 6.50%) 8.887% 20233,5,7 | 210 | 211 |
| Associated Materials, LLC 9.00% 20246 | 465 | 451 |
| AstraZeneca PLC 3.50% 2023 | 1,700 | 1,693 |
| AT&T Inc. 4.250% 2027 | 3,775 | 3,704 |
| Autoridad del Canal de Panama 4.95% 20353,6 | 1,000 | 1,023 |
| Avis Budget Group, Inc. 5.50% 2023 | 490 | 475 |
| Avon Products, Inc. 7.875% 20226 | 355 | 351 |
| B&G Foods, Inc. 4.625% 2021 | 50 | 49 |
| B&G Foods, Inc. 5.25% 2025 | 225 | 210 |
| Ball Corp. 4.375% 2020 | 300 | 302 |
| Banco Nacional de Comercio Exterior SNC 3.80% 2026 (UST Yield Curve Rate T Note Constant Maturity 5 year + 3.00% on 8/11/2021)2,6 | 880 | 843 |
| Bank of America Corp. 2.625% 2020 | 1,550 | 1,534 |
| Bank of America Corp. 3.55% 2024 (3-month USD-LIBOR + 0.78% on 3/5/2023)2 | 1,400 | 1,384 |
| Bayer AG 3.375% 20246 | 840 | 793 |
| Bayer US Finance II LLC 3.875% 20236 | 900 | 885 |
| Bayer US Finance II LLC 4.25% 20256 | 203 | 198 |
| Becton, Dickinson and Co. 2.675% 2019 | 353 | 350 |
| Becton, Dickinson and Co. 3.70% 2027 | 1,430 | 1,354 |
| Blackstone CQP Holdco LP 6.50% 20216,8 | 2,595 | 2,615 |
| Bohai Financial Investment Holding Co., Ltd. 5.50% 20246 | 150 | 145 |
| Brandywine Operating Partnership, LP 3.95% 2023 | 190 | 189 |
| British American Tobacco International Finance PLC 2.75% 20206 | 530 | 521 |
| British American Tobacco International Finance PLC 3.50% 20226 | 385 | 377 |
| British American Tobacco PLC 3.557% 2027 | 1,545 | 1,375 |
| British American Tobacco PLC 4.39% 2037 | 1,190 | 978 |
| Cablevision Systems Corp. 6.75% 2021 | 625 | 642 |
| Calpine Corp. 5.25% 20266 | 455 | 417 |
| CCO Holdings LLC and CCO Holdings Capital Corp. 5.125% 20236 | 625 | 609 |
| CCO Holdings LLC and CCO Holdings Capital Corp. 5.75% 20266 | 475 | 467 |
| Centene Corp. 4.75% 2022 | 540 | 535 |
| Centene Corp. 4.75% 2025 | 425 | 407 |
| CenterPoint Energy Transition Bond Co. III, LLC, Series 2008, Class A2, 5.234% 20233 | 183 | 185 |
| CenturyLink, Inc. 6.75% 2023 | 800 | 773 |
| CenturyLink, Inc., Series T, 5.80% 2022 | 150 | 145 |
| CF Industries, Inc. 4.95% 2043 | 545 | 424 |
| Chemours Co. 6.625% 2023 | 330 | 335 |
| Chesapeake Energy Corp. 4.875% 2022 | 690 | 605 |
| Chesapeake Energy Corp. 5.75% 2023 | 460 | 399 |
| Chesapeake Energy Corp. 8.00% 2025 | 325 | 288 |
| Chesapeake Energy Corp. 8.00% 2027 | 190 | 161 |
| Cigna Corp. 3.40% 20216 | 750 | 749 |
| Bonds, notes & other debt instruments (continued) U.S. dollars (continued) | Principal amount (000) | Value (000) |
| Cigna Corp. 4.125% 20256 | $1,365 | $1,366 |
| Cigna Corp. 4.375% 20286 | 1,370 | 1,381 |
| Citigroup Inc. 2.55% 2019 | 2,800 | 2,796 |
| Citigroup Inc. 2.35% 2021 | 1,500 | 1,458 |
| Clear Channel Worldwide Holdings, Inc. 7.625% 2020 | 1,415 | 1,385 |
| Cleveland-Cliffs Inc. 4.875% 20246 | 775 | 723 |
| Cleveland-Cliffs Inc. 5.75% 2025 | 1,050 | 948 |
| CMS Energy Corp. 5.05% 2022 | 392 | 409 |
| CMS Energy Corp. 3.875% 2024 | 100 | 100 |
| CMS Energy Corp. 3.00% 2026 | 1,200 | 1,131 |
| Colombia (Republic of) 3.875% 2027 | 350 | 335 |
| Columbia (Republic of) 4.50% 2029 | 830 | 822 |
| Columbia Pipeline Partners LP 3.30% 2020 | 85 | 85 |
| Comcast Corp. 3.95% 2025 | 920 | 932 |
| Comcast Corp. 4.15% 2028 | 1,825 | 1,856 |
| Compass Diversified Holdings 8.00% 20266 | 315 | 312 |
| Comstock Resources, Inc. 9.75% 20266 | 500 | 425 |
| Conagra Brands, Inc. 4.30% 2024 | 2,380 | 2,368 |
| Concordia International Corp., Term Loan, (3-month USD-LIBOR + 5.50%) 7.887% 20243,5,7 | 132 | 126 |
| Concordia International Corp. 8.00% 2024 | 47 | 44 |
| CONSOL Energy Inc. 5.875% 2022 | 1,917 | 1,845 |
| Consolidated Energy Finance SA 6.50% 20266 | 185 | 178 |
| Consumers Energy Co. 3.375% 2023 | 345 | 346 |
| Continental Airlines, Inc., Series 1999-1, Class A, 6.545% 20203 | 8 | 8 |
| Continental Airlines, Inc., Series 2000-2, Class A1, 7.707% 20223 | 13 | 13 |
| Continental Airlines, Inc., Series 2000-1, Class A1, 8.048% 20223 | 45 | 46 |
| Convey Park Energy LLC 7.50% 20256 | 275 | 238 |
| Core Industrial Trust, Series 2015-CALW, Class A, 3.04% 20343,6 | 1,385 | 1,381 |
| Crédit Agricole SA 4.375% 20256 | 1,100 | 1,066 |
| CVR Partners, LP 9.25% 20236 | 275 | 287 |
| CVS Health Corp. 2.80% 2020 | 430 | 426 |
| CVS Health Corp. 3.125% 2020 | 1,000 | 998 |
| CVS Health Corp. 3.35% 2021 | 520 | 519 |
| CVS Health Corp. 3.50% 2022 | 430 | 427 |
| CVS Health Corp. 3.70% 2023 | 710 | 703 |
| CVS Health Corp. 4.10% 2025 | 670 | 665 |
| CVS Health Corp. 4.30% 2028 | 2,670 | 2,619 |
| CVS Health Corp. 5.05% 2048 | 2,410 | 2,356 |
| DaimlerChrysler North America Holding Corp. 2.25% 20206 | 2,000 | 1,973 |
| DaimlerChrysler North America Holding Corp. 2.00% 20216 | 2,100 | 2,021 |
| DaimlerChrysler North America Holding Corp. 2.875% 20216 | 2,275 | 2,248 |
| DaimlerChrysler North America Holding Corp. 3.00% 20216 | 6,425 | 6,357 |
| DaVita HealthCare Partners Inc. 5.00% 2025 | 280 | 255 |
| DCP Midstream Operating LP 4.95% 2022 | 390 | 387 |
| Deutsche Telekom International Finance BV 1.95% 20216 | 575 | 552 |
| Deutsche Telekom International Finance BV 2.82% 20226 | 1,675 | 1,639 |
| Deutsche Telekom International Finance BV 4.375% 20286 | 890 | 879 |
| Deutsche Telekom International Finance BV 9.25% 2032 | 1,930 | 2,751 |
| Devon Energy Corp. 3.25% 2022 | 170 | 166 |
| Diamond Offshore Drilling, Inc. 7.875% 2025 | 350 | 292 |
| Diamond Offshore Drilling, Inc. 4.875% 2043 | 675 | 381 |
| Diebold Nixdorf AG, Term Loan B, (3-month USD-LIBOR + 2.75%) 5.188% 20233,5,7 | 116 | 99 |
| Dominican Republic 7.50% 20213,6 | 2,000 | 2,070 |
| Dominican Republic 5.50% 20256 | 1,375 | 1,366 |
| Dominican Republic 8.625% 20273,6 | 225 | 258 |
| Bonds, notes & other debt instruments (continued) U.S. dollars (continued) | Principal amount (000) | Value (000) |
| DP World Crescent 4.848% 20286 | $550 | $540 |
| Duke Energy Corp. 3.75% 2024 | 550 | 551 |
| Duke Energy Corp. 2.65% 2026 | 2,695 | 2,459 |
| Duke Energy Progress, LLC 3.70% 2028 | 1,225 | 1,240 |
| Egypt (Arab Republic of) 5.75% 2020 | 1,800 | 1,820 |
| Egypt (Arab Republic of) 7.50% 20276 | 2,200 | 2,105 |
| Electricité de France SA 6.95% 20396 | 625 | 730 |
| EMD Finance LLC 2.40% 20206 | 1,485 | 1,470 |
| EMD Finance LLC 2.95% 20226 | 225 | 222 |
| EMD Finance LLC 3.25% 20256 | 2,950 | 2,834 |
| Enbridge Energy Partners, LP 9.875% 2019 | 750 | 758 |
| Enbridge Energy Partners, LP 4.375% 2020 | 480 | 486 |
| Enbridge Energy Partners, LP 5.20% 2020 | 1,535 | 1,568 |
| Enbridge Inc. 4.00% 2023 | 600 | 604 |
| Enbridge Inc. 4.25% 2026 | 655 | 649 |
| Enbridge Inc. 3.70% 2027 | 754 | 716 |
| Endo International PLC 5.75% 20226 | 830 | 695 |
| Enel Finance International SA 2.75% 20236 | 5,000 | 4,617 |
| Enel Finance International SA 3.625% 20276 | 2,375 | 2,100 |
| Enel Finance International SA 3.50% 20286 | 1,800 | 1,547 |
| Energy Transfer Partners, LP 5.875% 2024 | 325 | 333 |
| Energy Transfer Partners, LP 4.00% 2027 | 1,054 | 969 |
| Energy Transfer Partners, LP 4.20% 2027 | 260 | 243 |
| Energy Transfer Partners, LP 6.00% 2048 | 230 | 225 |
| Enersis Américas SA 4.00% 2026 | 1,960 | 1,836 |
| Ensco PLC 7.75% 2026 | 475 | 354 |
| Ensco PLC 5.75% 2044 | 455 | 257 |
| Essex Portfolio LP 3.50% 2025 | 2,835 | 2,760 |
| Essex Portfolio LP 3.375% 2026 | 885 | 848 |
| Euramax International, Inc. 12.00% 20206 | 300 | 309 |
| European Investment Bank 2.25% 2022 | 2,067 | 2,042 |
| Exelon Corp. 3.497% 20222 | 525 | 513 |
| Exelon Corp. 3.40% 2026 | 1,465 | 1,396 |
| Extraction Oil & Gas, Inc. 5.625% 20266 | 400 | 294 |
| Exxon Mobil Corp. 2.222% 2021 | 570 | 562 |
| Fannie Mae 3.50% 20423 | 710 | 716 |
| Fannie Mae 3.50% 20423 | 340 | 343 |
| Fannie Mae 3.50% 20423 | 233 | 234 |
| Fannie Mae 4.00% 20483 | 4,668 | 4,765 |
| Fannie Mae 4.00% 20483 | 152 | 155 |
| Fannie Mae 3.50% 20493,9 | 15,500 | 15,503 |
| Fannie Mae 4.00% 20493,9 | 17,329 | 17,672 |
| Fannie Mae 4.50% 20493,9 | 13,050 | 13,522 |
| Fannie Mae, Series 2012-M17, Class A2, Multi Family, 2.184% 20223 | 1,931 | 1,897 |
| First Data Corp. 5.375% 20236 | 175 | 172 |
| First Data Corp. 5.00% 20246 | 125 | 121 |
| First Quantum Minerals Ltd. 7.50% 20256 | 1,050 | 870 |
| First Quantum Minerals Ltd. 6.875% 20266 | 525 | 423 |
| FirstEnergy Corp. 3.90% 2027 | 3,915 | 3,801 |
| FirstEnergy Corp. 3.50% 20286 | 645 | 616 |
| FirstEnergy Corp. 4.85% 2047 | 380 | 382 |
| Ford Motor Credit Co. 2.375% 2019 | 2,550 | 2,546 |
| Ford Motor Credit Co. 2.597% 2019 | 2,020 | 1,998 |
| France Télécom 9.00% 20312 | 1,824 | 2,533 |
| Freddie Mac, Series 3213, Class OG, principal only, 0% 20363 | 11 | 10 |
| Bonds, notes & other debt instruments (continued) U.S. dollars (continued) | Principal amount (000) | Value (000) |
| Freddie Mac, Series 3292, Class BO, principal only, 0% 20373 | $45 | $39 |
| Freeport-McMoRan Inc. 3.55% 2022 | 1,100 | 1,044 |
| Frontier Communications Corp. 10.50% 2022 | 600 | 420 |
| Frontier Communications Corp. 11.00% 2025 | 1,700 | 1,067 |
| FS Energy and Power Fund 7.50% 20236 | 175 | 167 |
| General Mills, Inc. 3.20% 2021 | 455 | 453 |
| Genesis Energy, LP 6.75% 2022 | 475 | 465 |
| Genesis Energy, LP 6.50% 2025 | 150 | 133 |
| Gogo Inc. 12.50% 20226 | 2,035 | 2,184 |
| Goldman Sachs Group, Inc. 2.00% 2019 | 850 | 847 |
| Goldman Sachs Group, Inc. 2.875% 2021 | 2,152 | 2,116 |
| Goldman Sachs Group, Inc. 2.905% 2023 (3-month USD-LIBOR + 0.99% on 7/24/2022)2 | 1,200 | 1,144 |
| Goldman Sachs Group, Inc. 3.50% 2025 | 5,190 | 4,926 |
| Goldman Sachs Group, Inc. 3.75% 2026 | 580 | 550 |
| Goldman Sachs Group, Inc. 4.75% 2045 | 1,805 | 1,727 |
| Government National Mortgage Assn. 4.00% 20493,9 | 3,843 | 3,936 |
| Government National Mortgage Assn. 4.00% 20493,9 | 3,398 | 3,477 |
| Groupe BPCE SA 5.70% 20236 | 1,800 | 1,867 |
| H.I.G. Capital, LLC 6.75% 20246 | 318 | 281 |
| Halliburton Co. 3.80% 2025 | 870 | 845 |
| Hanesbrands Inc. 4.625% 20246 | 85 | 80 |
| Hanesbrands Inc. 4.875% 20266 | 350 | 317 |
| Hardwoods Acquisition Inc. 7.50% 20216 | 228 | 164 |
| Harris Corp. 2.70% 2020 | 155 | 154 |
| HCA Inc. 5.875% 2023 | 250 | 254 |
| HealthSouth Corp. 5.75% 2025 | 620 | 608 |
| Hertz Global Holdings Inc. 7.625% 20226 | 795 | 751 |
| Holcim Ltd. 5.15% 20236 | 1,290 | 1,330 |
| Honduras (Republic of) 8.75% 2020 | 2,155 | 2,297 |
| HSBC Holdings PLC 3.033% 2023 (3-month USD-LIBOR + 0.923% on 11/12/2022)2 | 1,180 | 1,143 |
| HSBC Holdings PLC 3.95% 2024 (3-month USD-LIBOR + 0.987% on 5/18/2023)2 | 305 | 304 |
| HSBC Holdings PLC 3.90% 2026 | 4,200 | 4,030 |
| HSBC Holdings PLC 4.292% 2026 (3-month USD-LIBOR + 1.348% on 9/12/2025)2 | 2,300 | 2,273 |
| HUB International Ltd. 7.00% 20266 | 20 | 18 |
| Humana Inc. 3.85% 2024 | 1,000 | 1,000 |
| Huntsman International LLC 4.875% 2020 | 145 | 146 |
| Husky Energy Inc. 7.25% 2019 | 250 | 258 |
| Hyundai Capital America 2.55% 20206 | 2,580 | 2,548 |
| Hyundai Capital America 3.25% 20226 | 658 | 640 |
| Hyundai Capital Services Inc. 2.625% 20206 | 500 | 491 |
| Hyundai Capital Services Inc. 3.75% 20236 | 2,450 | 2,420 |
| Icahn Enterprises Finance Corp. 6.25% 2022 | 400 | 396 |
| Imperial Tobacco Finance PLC 3.50% 20236 | 2,000 | 1,944 |
| Indonesia (Republic of) 3.75% 2022 | 1,110 | 1,101 |
| Indonesia (Republic of) 4.75% 2026 | 3,500 | 3,553 |
| Infor Software 7.125% 20216,10 | 325 | 318 |
| Inmarsat PLC 4.875% 20226 | 1,000 | 946 |
| Intelsat Jackson Holding Co. 8.50% 20246 | 900 | 877 |
| International Paper Co. 7.30% 2039 | 600 | 710 |
| Intesa Sanpaolo SpA 5.017% 20246 | 2,510 | 2,274 |
| Iraq (Republic of) 6.752% 20236 | 545 | 520 |
| Iron Mountain Inc. 4.875% 20276 | 135 | 118 |
| Jaguar Holding Co. 6.375% 20236 | 225 | 216 |
| Jonah Energy LLC 7.25% 20256 | 350 | 227 |
| Jordan (Hashemite Kingdom of) 5.75% 20276 | 1,035 | 953 |
| Bonds, notes & other debt instruments (continued) U.S. dollars (continued) | Principal amount (000) | Value (000) |
| JPMorgan Chase & Co. 2.55% 2021 | $6,039 | $5,955 |
| JPMorgan Chase & Co. 2.604% 2021 (3-month USD-LIBOR + 0.28% on 2/1/2020)2 | 1,700 | 1,687 |
| JPMorgan Chase & Co. 3.25% 2022 | 1,000 | 993 |
| Kenya (Republic of) 5.875% 2019 | 700 | 702 |
| Keurig Dr Pepper Inc. 4.597% 20286 | 2,050 | 2,040 |
| Keurig Dr Pepper Inc. 5.085% 20486 | 1,075 | 1,027 |
| KfW 2.125% 2022 | 3,955 | 3,890 |
| Kinder Morgan Energy Partners, LP 3.50% 2021 | 175 | 175 |
| Kinder Morgan Energy Partners, LP 3.50% 2023 | 525 | 514 |
| Kinder Morgan, Inc. 4.30% 2028 | 2,185 | 2,149 |
| Kinetic Concepts, Inc. 12.50% 20216 | 310 | 333 |
| Korea Housing Finance Corp. 2.50% 20203,6 | 2,250 | 2,215 |
| Korea Housing Finance Corp. 2.00% 20213,6 | 2,525 | 2,435 |
| Kraft Heinz Co. 4.375% 2046 | 825 | 683 |
| Kronos Inc., Term Loan B, (3-month USD-LIBOR + 8.25%) 9.25% 20243,5,7 | 425 | 421 |
| Kuwait (State of) 2.75% 20226 | 3,550 | 3,490 |
| Liberty Global PLC 5.50% 20286 | 375 | 340 |
| Ligado Networks, Term Loan, (3-month USD-LIBOR + 8.75%) 11.07% 2020 (100% PIK)3,5,7,10 | 797 | 546 |
| Lima Metro Line Finance Ltd. 5.875% 20343,6 | 2,000 | 1,997 |
| Limited Brands, Inc. 5.25% 2028 | 160 | 137 |
| Limited Brands, Inc. 6.875% 2035 | 50 | 42 |
| Lockheed Martin Corp. 2.50% 2020 | 205 | 203 |
| LSB Industries, Inc. 9.625% 20236 | 185 | 189 |
| LSC Communications, Inc. 8.75% 20236 | 275 | 284 |
| Mallinckrodt PLC 4.875% 20206 | 960 | 931 |
| McAfee, LLC, Term Loan, (3-month USD-LIBOR + 3.75%) 6.272% 20243,5,7 | 392 | 383 |
| McDonald’s Corp. 3.35% 2023 | 1,420 | 1,414 |
| Medtronic, Inc. 3.50% 2025 | 3,500 | 3,491 |
| Meredith Corp. 6.875% 20266 | 75 | 74 |
| Meritage Homes Corp. 5.125% 2027 | 250 | 213 |
| MGM Resorts International 7.75% 2022 | 200 | 213 |
| Microsoft Corp. 2.40% 2026 | 2,688 | 2,518 |
| Molina Healthcare, Inc. 5.375% 2022 | 925 | 896 |
| Molina Healthcare, Inc. 4.875% 20256 | 482 | 442 |
| Morgan Stanley 3.875% 2026 | 1,580 | 1,543 |
| Morocco (Kingdom of) 5.50% 2042 | 3,100 | 3,181 |
| Navient Corp. 5.50% 2023 | 1,670 | 1,468 |
| Navient Corp. 6.125% 2024 | 175 | 151 |
| NGL Energy Partners LP 6.125% 2025 | 860 | 744 |
| Niagara Mohawk Power Corp. 3.508% 20246 | 180 | 181 |
| Nigeria (Republic of) 6.50% 20276 | 465 | 413 |
| Noble Corp. PLC 7.95% 20252 | 250 | 189 |
| Noble Corp. PLC 8.95% 20452 | 400 | 306 |
| Nova Chemicals Corp. 5.25% 20276 | 500 | 444 |
| Novelis Corp. 5.875% 20266 | 175 | 155 |
| Odebrecht Drilling Norbe 7.72% 2026 (87.05% PIK)3,6,10 | 12 | 3 |
| Oracle Corp. 2.65% 2026 | 2,327 | 2,160 |
| Oracle Corp. 3.25% 2027 | 1,880 | 1,816 |
| Owens & Minor, Inc. 3.875% 2021 | 400 | 300 |
| Owens & Minor, Inc., Term Loan B, (3-month USD-LIBOR + 4.50%) 7.308% 20253,5,7 | 234 | 182 |
| Pacific Gas and Electric Co. 3.25% 2023 | 580 | 516 |
| Pacific Gas and Electric Co. 3.85% 2023 | 300 | 270 |
| Pacific Gas and Electric Co. 2.95% 2026 | 590 | 488 |
| Pacific Gas and Electric Co. 3.30% 2027 | 2,409 | 1,996 |
| Pacific Gas and Electric Co. 3.30% 2027 | 750 | 616 |
| Bonds, notes & other debt instruments (continued) U.S. dollars (continued) | Principal amount (000) | Value (000) |
| Pacific Gas and Electric Co. 4.65% 20286 | $542 | $480 |
| Pacific Gas and Electric Co. 6.35% 2038 | 1,566 | 1,488 |
| Pacific Gas and Electric Co. 3.75% 2042 | 630 | 471 |
| Pacific Gas and Electric Co. 3.95% 2047 | 1,250 | 957 |
| Pakistan (Islamic Republic of) 6.75% 2019 | 1,900 | 1,889 |
| Pakistan (Islamic Republic of) 5.50% 20216 | 3,535 | 3,422 |
| Pakistan (Islamic Republic of) 8.25% 2024 | 2,240 | 2,265 |
| Panama (Republic of) 4.50% 20503 | 1,230 | 1,181 |
| Paraguay (Republic of) 4.625% 2023 | 947 | 953 |
| Paraguay (Republic of) 5.00% 2026 | 235 | 238 |
| Paraguay (Republic of) 4.70% 20276 | 350 | 347 |
| Paraguay (Republic of) 5.60% 20486 | 2,340 | 2,311 |
| Peabody Energy Corp. 6.00% 20226 | 150 | 146 |
| Peabody Energy Corp. 6.375% 20256 | 50 | 47 |
| Pernod Ricard SA 4.45% 20226 | 730 | 745 |
| Peru (Republic of) 5.625% 2050 | 280 | 329 |
| Petrobras Global Finance Co. 6.125% 2022 | 657 | 676 |
| Petrobras Global Finance Co. 5.299% 2025 | 1,650 | 1,580 |
| Petróleos Mexicanos 6.50% 2027 | 2,675 | 2,521 |
| Petróleos Mexicanos 6.35% 2048 | 927 | 743 |
| Petsmart, Inc., Term Loan B-2, (3-month USD-LIBOR + 3.00%) 5.38% 20223,5,7 | 721 | 572 |
| Petsmart, Inc. 5.875% 20256 | 1,545 | 1,124 |
| Petsmart, Inc. 8.875% 20256 | 365 | 214 |
| Philip Morris International Inc. 2.00% 2020 | 950 | 938 |
| Philip Morris International Inc. 2.625% 2022 | 280 | 271 |
| Philip Morris International Inc. 4.25% 2044 | 475 | 435 |
| Pisces Parent LLC 8.00% 20266 | 250 | 230 |
| Platform Specialty Products Corp. 5.875% 20256 | 200 | 188 |
| PNC Bank 2.40% 2019 | 1,225 | 1,218 |
| PNC Bank 2.30% 2020 | 865 | 853 |
| PNC Bank 2.60% 2020 | 275 | 273 |
| Poland (Republic of) 4.00% 2024 | 980 | 1,005 |
| Poland (Republic of) 3.25% 2026 | 4,590 | 4,503 |
| Progress Energy, Inc. 7.05% 2019 | 910 | 917 |
| Progress Energy, Inc. 7.75% 2031 | 550 | 734 |
| Prologis, Inc. 4.25% 2023 | 2,075 | 2,144 |
| PT Indonesia Asahan Aluminium Tbk 5.23% 20216 | 1,020 | 1,035 |
| PT Indonesia Asahan Aluminium Tbk 5.71% 20236 | 385 | 392 |
| Puget Energy, Inc. 6.50% 2020 | 335 | 354 |
| Puget Energy, Inc. 6.00% 2021 | 1,023 | 1,083 |
| Puget Energy, Inc. 5.625% 2022 | 480 | 509 |
| Qatar (State of) 3.875% 20236 | 475 | 481 |
| Qatar (State of) 4.50% 20286 | 3,205 | 3,353 |
| Qatar (State of) 5.103% 20486 | 530 | 558 |
| QGOG Constellation SA 9.50% 2024 (5.26% PIK)3,6,10,11 | 2,164 | 898 |
| Quebec (Province of) 2.375% 2022 | 1,748 | 1,729 |
| R.R. Donnelley & Sons Co. 7.875% 2021 | 93 | 93 |
| R.R. Donnelley & Sons Co. 6.50% 2023 | 225 | 223 |
| Rabobank Nederland 4.625% 2023 | 2,180 | 2,213 |
| Rayonier Advanced Materials Inc. 5.50% 20246 | 225 | 199 |
| Realogy Corp. 5.25% 20216 | 225 | 214 |
| Realogy Corp. 4.875% 20236 | 80 | 70 |
| Reynolds American Inc. 3.25% 2020 | 640 | 636 |
| Reynolds American Inc. 4.00% 2022 | 455 | 450 |
| Reynolds American Inc. 4.45% 2025 | 2,115 | 2,043 |
| Bonds, notes & other debt instruments (continued) U.S. dollars (continued) | Principal amount (000) | Value (000) |
| Roche Holdings, Inc. 2.875% 20216 | $1,250 | $1,243 |
| Roche Holdings, Inc. 3.35% 20246 | 3,050 | 3,062 |
| Romania 5.125% 20486 | 6,200 | 5,991 |
| Rotech Healthcare Inc., Term Loan B, (3-month USD-LIBOR + 3.75%) 6.087% 20233,5,7,12,13 | 491 | 487 |
| Ryerson Inc. 11.00% 20226 | 685 | 692 |
| Sally Holdings LLC and Sally Capital Inc. 5.625% 2025 | 500 | 462 |
| Santander Holdings USA, Inc. 4.45% 2021 | 3,750 | 3,817 |
| Santander Holdings USA, Inc. 3.70% 2022 | 4,475 | 4,398 |
| Saudi Arabia (Kingdom of) 2.894% 20226 | 1,900 | 1,854 |
| Saudi Arabia (Kingdom of) 3.628% 20276 | 1,900 | 1,836 |
| Saudi Arabia (Kingdom of) 3.625% 20286 | 3,840 | 3,641 |
| Saudi Arabia (Kingdom of) 4.50% 20306 | 3,115 | 3,104 |
| Saudi Arabia (Kingdom of) 5.00% 2049 | 1,620 | 1,565 |
| Scentre Group 3.50% 20256 | 600 | 582 |
| Scentre Group 3.75% 20276 | 300 | 290 |
| Schlumberger BV 4.00% 20256 | 935 | 925 |
| Shell International Finance BV 1.375% 2019 | 2,000 | 1,978 |
| Shell International Finance BV 1.75% 2021 | 1,740 | 1,682 |
| Shell International Finance BV 3.50% 2023 | 3,808 | 3,853 |
| Shire PLC 1.90% 2019 | 2,000 | 1,972 |
| Shire PLC 2.40% 2021 | 3,930 | 3,803 |
| Shire PLC 2.875% 2023 | 818 | 774 |
| Shire PLC 3.20% 2026 | 405 | 367 |
| Sierra Pacific Power Co., General and Refunding Mortgage Notes, Series T, 3.375% 2023 | 2,004 | 2,004 |
| Sirius XM Radio Inc. 3.875% 20226 | 425 | 409 |
| Skandinaviska Enskilda Banken AB 2.625% 2021 | 2,250 | 2,222 |
| Skandinaviska Enskilda Banken AB 2.80% 2022 | 2,100 | 2,058 |
| South Africa (Republic of) 5.50% 2020 | 1,900 | 1,929 |
| Sri Lanka (Democratic Socialist Republic of) 6.25% 2020 | 1,900 | 1,853 |
| Sri Lanka (Democratic Socialist Republic of) 5.75% 2022 | 1,600 | 1,512 |
| Staples Inc. 8.50% 20256 | 260 | 236 |
| Starwood Property Trust, Inc. 5.00% 2021 | 350 | 345 |
| State Grid Overseas Investment Ltd. 3.50% 20276 | 5,600 | 5,403 |
| Statoil ASA 3.70% 2024 | 1,950 | 1,988 |
| Statoil ASA 4.25% 2041 | 1,000 | 995 |
| Sunoco LP 4.875% 2023 | 130 | 127 |
| Sweden (Kingdom of) 1.125% 20196 | 3,000 | 2,966 |
| Takeda Pharmaceutical Co., Ltd. 3.80% 20206 | 1,625 | 1,635 |
| Takeda Pharmaceutical Co., Ltd. 4.40% 20236 | 2,075 | 2,100 |
| Talen Energy Corp. 9.50% 20226 | 360 | 364 |
| Talen Energy Corp. 10.50% 20266 | 85 | 73 |
| Targa Resources Partners LP 6.75% 2024 | 190 | 194 |
| Team Health Holdings, Inc. 6.375% 20256 | 620 | 509 |
| Teco Finance, Inc. 5.15% 2020 | 75 | 77 |
| Teekay Corp. 8.50% 2020 | 1,325 | 1,270 |
| Teekay Offshore Partners LP 8.50% 20236 | 400 | 392 |
| Tenet Healthcare Corp. 4.75% 2020 | 175 | 175 |
| Tenet Healthcare Corp. 6.00% 2020 | 430 | 437 |
| Tenet Healthcare Corp. 4.375% 2021 | 250 | 243 |
| Tenet Healthcare Corp. 4.50% 2021 | 825 | 806 |
| Tenet Healthcare Corp. 4.625% 2024 | 421 | 393 |
| Teva Pharmaceutical Finance Co. BV 2.20% 2021 | 270 | 248 |
| Teva Pharmaceutical Finance Co. BV 2.80% 2023 | 1,280 | 1,103 |
| Teva Pharmaceutical Finance Co. BV 6.00% 2024 | 230 | 222 |
| Teva Pharmaceutical Finance Co. BV 3.15% 2026 | 2,420 | 1,851 |
| Bonds, notes & other debt instruments (continued) U.S. dollars (continued) | Principal amount (000) | Value (000) |
| Transocean Inc. 9.00% 20236 | $219 | $219 |
| Trilogy International Partners, LLC 8.875% 20226 | 800 | 776 |
| Tronox Ltd. 6.50% 20266 | 125 | 104 |
| Turkey (Republic of) 7.00% 2020 | 1,800 | 1,841 |
| Turkey (Republic of) 6.25% 2022 | 1,880 | 1,897 |
| Turkey (Republic of) 7.25% 2023 | 1,085 | 1,117 |
| U.S. Treasury 2.50% 2020 | 7,900 | 7,895 |
| U.S. Treasury 2.125% 2022 | 8,555 | 8,439 |
| U.S. Treasury 2.375% 2023 | 3,175 | 3,161 |
| U.S. Treasury 2.625% 2023 | 6,900 | 6,937 |
| U.S. Treasury 2.75% 2023 | 4,800 | 4,852 |
| U.S. Treasury 1.875% 20244 | 9,400 | 9,076 |
| U.S. Treasury 2.75% 2025 | 10,140 | 10,244 |
| U.S. Treasury 2.875% 2025 | 5,400 | 5,497 |
| U.S. Treasury 2.00% 20264 | 33,560 | 32,039 |
| U.S. Treasury 2.25% 2027 | 27,700 | 26,783 |
| U.S. Treasury 2.75% 20284 | 62,500 | 62,881 |
| U.S. Treasury 2.875% 2028 | 43,500 | 44,217 |
| U.S. Treasury 2.875% 2028 | 19,850 | 20,171 |
| U.S. Treasury 2.75% 20474 | 17,800 | 16,872 |
| U.S. Treasury 3.00% 20484 | 23,800 | 23,724 |
| U.S. Treasury 3.00% 2048 | 10,600 | 10,559 |
| U.S. Treasury Inflation-Protected Security 0.625% 20231 | 6,962 | 6,854 |
| U.S. Treasury Inflation-Protected Security 0.125% 20241 | 7,242 | 6,949 |
| U.S. Treasury Inflation-Protected Security 0.625% 20241 | 27,337 | 26,927 |
| U.S. Treasury Inflation-Protected Security 0.25% 20251 | 11,851 | 11,349 |
| U.S. Treasury Inflation-Protected Security 0.375% 20251 | 5,865 | 5,657 |
| U.S. Treasury Inflation-Protected Security 2.375% 20251,4 | 1,543 | 1,668 |
| U.S. Treasury Inflation-Protected Security 0.625% 20261 | 10,323 | 10,059 |
| U.S. Treasury Inflation-Protected Security 0.375% 20271 | 3,821 | 3,630 |
| U.S. Treasury Inflation-Protected Security 0.50% 20281 | 1,845 | 1,762 |
| U.S. Treasury Inflation-Protected Security 0.75% 20421 | 699 | 636 |
| U.S. Treasury Inflation-Protected Security 0.625% 20431,4 | 1,320 | 1,159 |
| U.S. Treasury Inflation-Protected Security 1.375% 20441,4 | 5,751 | 5,954 |
| U.S. Treasury Inflation-Protected Security 1.00% 20461 | 4,770 | 4,530 |
| Uber Technologies, Inc. 8.00% 20266 | 375 | 363 |
| Ultra Petroleum Corp. 11.00% 202410 | 618 | 479 |
| UniCredit SpA 3.75% 20226 | 1,750 | 1,686 |
| UniCredit SpA 4.625% 20276 | 2,150 | 1,972 |
| Union Pacific Corp. 4.50% 2048 | 260 | 258 |
| Unisys Corp. 10.75% 20226 | 225 | 247 |
| United Mexican States 4.15% 2027 | 1,910 | 1,850 |
| United Technologies Corp. 4.125% 2028 | 1,900 | 1,890 |
| UnitedHealth Group Inc. 2.70% 2020 | 520 | 518 |
| Valeant Pharmaceuticals International, Inc. 6.125% 20256 | 1,350 | 1,181 |
| Valeant Pharmaceuticals International, Inc. 9.00% 20256 | 110 | 110 |
| Valeant Pharmaceuticals International, Inc. 9.25% 20266 | 670 | 672 |
| Venator Materials Corp. 5.75% 20256 | 245 | 197 |
| Veritas Holdings Ltd. 7.50% 20236 | 200 | 164 |
| Verizon Communications Inc. 4.125% 2046 | 1,814 | 1,609 |
| Vine Oil & Gas LP 8.75% 20236 | 175 | 139 |
| Virgin Australia Holdings Ltd. 8.50% 20196 | 100 | 101 |
| Volkswagen Group of America Finance, LLC 2.45% 20196 | 545 | 540 |
| Volkswagen Group of America Finance, LLC 3.875% 20206 | 1,900 | 1,910 |
| Volkswagen Group of America Finance, LLC 4.00% 20216 | 1,900 | 1,905 |
| Bonds, notes & other debt instruments (continued) U.S. dollars (continued) | Principal amount (000) | Value (000) |
| Volkswagen Group of America Finance, LLC 4.25% 20236 | $4,400 | $4,368 |
| Volkswagen Group of America Finance, LLC 4.625% 20256 | 1,280 | 1,268 |
| Warrior Met Coal, Inc. 8.00% 20246 | 250 | 249 |
| WEA Finance LLC 2.70% 20196 | 1,185 | 1,180 |
| WEA Finance LLC 3.25% 20206 | 530 | 529 |
| WEA Finance LLC 3.75% 20246 | 535 | 532 |
| Weatherford International PLC 4.50% 2022 | 160 | 94 |
| Weatherford International PLC 8.25% 2023 | 500 | 304 |
| Weatherford International PLC 9.875% 2024 | 525 | 325 |
| Weatherford International PLC 9.875% 20256 | 325 | 199 |
| Weatherford International PLC 6.50% 2036 | 650 | 341 |
| Wells Fargo & Co. 3.584% 2028 (3-month USD-LIBOR + 1.31% on 5/15/2027)2 | 900 | 865 |
| Westfield Corp. Ltd. 3.15% 20226 | 245 | 241 |
| Williams Partners LP 4.125% 2020 | 375 | 378 |
| Williams Partners LP 4.30% 2024 | 820 | 818 |
| Wind Tre SpA 5.00% 20266 | 400 | 332 |
| WM. Wrigley Jr. Co. 3.375% 20206 | 515 | 516 |
| Wynn Las Vegas, LLC and Wynn Capital Corp. 4.25% 20236 | 768 | 725 |
| Wynn Las Vegas, LLC and Wynn Capital Corp. 5.50% 20256 | 175 | 164 |
| Ziggo Bond Finance BV 5.50% 20276 | 850 | 763 |
| Zimmer Holdings, Inc. 3.15% 2022 | 790 | 773 |
| 914,714 | ||
| Total bonds, notes & other debt instruments (cost: $1,967,091,000) | 1,924,795 | |
| Convertible bonds 0.00% U.S. dollars 0.00% | ||
| Gogo Inc., convertible notes, 6.00% 20226 | 110 | 100 |
| Total convertible bonds (cost: $110,000) | 100 | |
| Convertible stocks 0.05% U.S. dollars 0.05% | Shares | |
| Associated Materials, LLC, 14.00% convertible preferred 202012,13 | 850 | 1,033 |
| Total convertible stocks (cost: $816,000) | 1,033 | |
| Common stocks 0.05% Swiss francs 0.01% | ||
| CEVA Logistics AG12,14 | 9,337 | 283 |
| U.S. dollars 0.04% | ||
| Tribune Resources, Inc.12,14 | 158,988 | 477 |
| Advanz Pharma Corp.6,8,12,14 | 9,130 | 153 |
| Advanz Pharma Corp.14 | 6,028 | 113 |
| Corporate Risk Holdings I, Inc.12,13,14 | 25,840 | 9 |
| Corporate Risk Holdings Corp.8,12,13,14 | 131 | —15 |
| NCI Building Systems, Inc.6,8,12,14 | 9 | —15 |
| 752 | ||
| Total common stocks (cost: $3,196,000) | 1,035 |
| Rights & warrants 0.00% U.S. dollars 0.00% | Shares | Value (000) |
| Tribune Resources, Inc., Class A, warrants, expire 202312,13,14 | 53,128 | $19 |
| Tribune Resources, Inc., Class B, warrants, expire 202312,13,14 | 41,322 | 11 |
| Tribune Resources, Inc., Class C, warrants, expire 202312,13,14 | 39,060 | 8 |
| Ultra Petroleum Corp., warrants, expire 202512,13,14 | 12,320 | 3 |
| Associated Materials, LLC, warrants, expire 202312,13,14 | 12,075 | —15 |
| Total rights & warrants (cost: $11,000) | 41 | |
| Short-term securities 9.42% | Principal amount (000) | |
| Argentinian Treasury Bills (6.40%)–2.81%due 2/28/2019–4/30/2020 | ARS206,330 | 6,195 |
| Bank of New York Mellon Corp. 2.30%due 1/2/2019 | $17,600 | 17,598 |
| Canada Bill 2.32%due 1/3/2019 | 20,000 | 19,996 |
| Egyptian Treasury Bills 16.62%–17.52%due 1/15/2019–6/18/2019 | EGP230,100 | 12,177 |
| Federal Home Loan Bank 2.29%due 1/10/2019 | $10,000 | 9,995 |
| Japanese Treasury Discount Bill (0.14)%due 5/20/2019 | ¥11,900,000 | 108,639 |
| Nigerian Treasury Bills 11.30%–13.04%due 2/7/2019–9/19/2019 | NGN2,701,000 | 7,010 |
| Québec (Province of) 2.52%due 1/22/20196 | $15,000 | 14,978 |
| Total short-term securities (cost: $195,904,000) | 196,588 | |
| Total investment securities101.70% (cost: $2,167,128,000) | 2,123,592 | |
| Other assets less liabilities (1.70)% | (35,575) | |
| Net assets100.00% | $2,088,017 |
| Contracts | Type | Number of contracts | Expiration | Notional amount16 (000) | Value at 12/31/201817 (000) | Unrealized (depreciation) appreciation at 12/31/2018 (000) |
| 90 Day Euro Dollar Futures | Short | 224 | September 2019 | $(56,000) | $(54,510) | $(171) |
| 5 Year U.S. Treasury Note Futures | Long | 2,309 | April 2019 | 230,900 | 264,813 | 3,348 |
| 10 Year Euro-Bund Futures | Long | 149 | March 2019 | €14,900 | 27,919 | 193 |
| 10 Year Ultra U.S. Treasury Note Futures | Long | 232 | March 2019 | $23,200 | 30,178 | 972 |
| 10 Year U.S. Treasury Note Futures | Long | 175 | March 2019 | 17,500 | 21,353 | 493 |
| 30 Year Euro-Buxl Futures | Long | 54 | March 2019 | €5,400 | 11,175 | 225 |
| 30 Year Ultra U.S. Treasury Bond Futures | Short | 94 | March 2019 | $(9,400) | (15,102) | (789) |
| $4,271 |
| Contract amount | Counterparty | Settlement date | Unrealized (depreciation) appreciation at 12/31/2018 (000) | |
| Purchases (000) | Sales (000) | |||
| USD1,415 | EUR1,235 | Morgan Stanley | 1/4/2019 | $(1) |
| GBP5,400 | USD6,935 | Citibank | 1/4/2019 | (51) |
| USD5,236 | MYR22,000 | JPMorgan Chase | 1/4/2019 | (87) |
| EUR23,161 | DKK172,900 | Morgan Stanley | 1/7/2019 | 3 |
| USD8,200 | CNH57,000 | Citibank | 1/7/2019 | (100) |
| USD8,990 | ILS33,250 | Bank of America, N.A. | 1/8/2019 | 92 |
| Contract amount | Counterparty | Settlement date | Unrealized (depreciation) appreciation at 12/31/2018 (000) | |
| Purchases (000) | Sales (000) | |||
| EUR6,815 | USD7,765 | Citibank | 1/8/2019 | $48 |
| USD11,166 | EUR9,800 | Citibank | 1/8/2019 | (69) |
| USD7,414 | THB244,600 | HSBC Bank | 1/8/2019 | (98) |
| JPY1,402,472 | USD12,401 | Citibank | 1/9/2019 | 405 |
| JPY898,800 | USD7,932 | HSBC Bank | 1/9/2019 | 274 |
| JPY616,594 | EUR4,800 | HSBC Bank | 1/9/2019 | 126 |
| EUR10,070 | USD11,427 | Goldman Sachs | 1/9/2019 | 120 |
| GBP2,900 | USD3,707 | Goldman Sachs | 1/9/2019 | (9) |
| NOK32,228 | DKK24,600 | Citibank | 1/9/2019 | (49) |
| USD3,560 | JPY400,000 | Morgan Stanley | 1/9/2019 | (92) |
| USD3,479 | JPY392,473 | JPMorgan Chase | 1/9/2019 | (105) |
| USD3,933 | JPY445,000 | Bank of New York Mellon | 1/9/2019 | (131) |
| USD8,751 | JPY988,000 | Bank of New York Mellon | 1/9/2019 | (270) |
| USD8,438 | BRL32,900 | Citibank | 1/10/2019 | (44) |
| USD7,107 | INR504,900 | Citibank | 1/10/2019 | (116) |
| JPY652,169 | USD5,766 | JPMorgan Chase | 1/11/2019 | 190 |
| JPY652,169 | USD5,766 | Goldman Sachs | 1/11/2019 | 190 |
| USD5,171 | CAD6,810 | Bank of America, N.A. | 1/11/2019 | 181 |
| JPY429,000 | USD3,818 | HSBC Bank | 1/11/2019 | 100 |
| EUR4,100 | USD4,676 | Bank of America, N.A. | 1/11/2019 | 26 |
| USD2,787 | ILS10,350 | Goldman Sachs | 1/11/2019 | 17 |
| EUR3,810 | USD4,362 | Citibank | 1/11/2019 | 7 |
| USD1,439 | CNH10,000 | Bank of America, N.A. | 1/11/2019 | (17) |
| USD5,584 | PLN21,020 | JPMorgan Chase | 1/11/2019 | (34) |
| USD9,031 | EUR7,910 | HSBC Bank | 1/11/2019 | (40) |
| NOK34,715 | USD4,070 | HSBC Bank | 1/11/2019 | (53) |
| USD2,787 | JPY314,337 | JPMorgan Chase | 1/11/2019 | (84) |
| USD6,138 | JPY693,000 | Morgan Stanley | 1/11/2019 | (191) |
| USD6,420 | JPY726,000 | Goldman Sachs | 1/11/2019 | (210) |
| USD11,983 | INR852,700 | HSBC Bank | 1/11/2019 | (215) |
| USD7,733 | COP24,598,000 | Goldman Sachs | 1/14/2019 | 164 |
| EUR14,620 | USD16,744 | Citibank | 1/14/2019 | 27 |
| DKK49,300 | USD7,562 | Morgan Stanley | 1/14/2019 | 13 |
| COP24,598,000 | USD7,574 | Citibank | 1/14/2019 | (5) |
| GBP3,000 | USD3,842 | Bank of America, N.A. | 1/14/2019 | (15) |
| USD5,446 | EUR4,765 | JPMorgan Chase | 1/14/2019 | (20) |
| USD7,641 | INR536,000 | Citibank | 1/14/2019 | (24) |
| USD3,515 | MYR14,700 | JPMorgan Chase | 1/14/2019 | (42) |
| USD7,492 | DKK49,300 | HSBC Bank | 1/14/2019 | (83) |
| JPY925,000 | AUD11,424 | Morgan Stanley | 1/15/2019 | 401 |
| USD7,602 | CLP5,210,800 | Goldman Sachs | 1/15/2019 | 91 |
| USD2,613 | INR185,000 | Goldman Sachs | 1/15/2019 | (32) |
| USD2,612 | INR185,000 | Citibank | 1/15/2019 | (34) |
| CLP5,210,800 | USD7,816 | HSBC Bank | 1/15/2019 | (305) |
| JPY2,838,652 | USD25,158 | Goldman Sachs | 1/17/2019 | 778 |
| JPY2,613,753 | USD23,167 | JPMorgan Chase | 1/17/2019 | 715 |
| EUR29,522 | USD33,592 | Goldman Sachs | 1/17/2019 | 283 |
| KRW10,400,000 | USD9,265 | JPMorgan Chase | 1/17/2019 | 61 |
| USD365 | JPY41,240 | Morgan Stanley | 1/17/2019 | (11) |
| USD2,369 | THB77,700 | Bank of America, N.A. | 1/17/2019 | (18) |
| USD9,204 | KRW10,400,000 | Morgan Stanley | 1/17/2019 | (122) |
| Contract amount | Counterparty | Settlement date | Unrealized (depreciation) appreciation at 12/31/2018 (000) | |
| Purchases (000) | Sales (000) | |||
| USD23,182 | JPY2,613,753 | JPMorgan Chase | 1/17/2019 | $(699) |
| USD22,776 | AUD31,600 | JPMorgan Chase | 1/18/2019 | 510 |
| JPY1,061,774 | EUR8,280 | Goldman Sachs | 1/18/2019 | 200 |
| USD3,805 | AUD5,300 | JPMorgan Chase | 1/18/2019 | 71 |
| KRW8,289,700 | USD7,397 | HSBC Bank | 1/18/2019 | 37 |
| GBP2,890 | USD3,693 | Citibank | 1/18/2019 | (6) |
| USD7,381 | KRW8,289,700 | Goldman Sachs | 1/18/2019 | (53) |
| AUD31,600 | USD23,270 | Citibank | 1/18/2019 | (1,004) |
| USD7,968 | ZAR114,700 | Citibank | 1/22/2019 | 18 |
| USD2,044 | BRL8,000 | JPMorgan Chase | 1/22/2019 | (18) |
| USD4,171 | INR299,650 | Citibank | 1/22/2019 | (110) |
| TRY13,100 | USD1,928 | Citibank | 1/24/2019 | 512 |
| GBP19,649 | USD24,901 | Citibank | 1/24/2019 | 175 |
| GBP6,123 | USD7,757 | HSBC Bank | 1/24/2019 | 57 |
| GBP4,430 | EUR4,917 | Bank of America, N.A. | 1/24/2019 | 8 |
| EUR13,105 | PLN56,400 | HSBC Bank | 1/24/2019 | (30) |
| NOK37,200 | USD4,352 | Bank of New York Mellon | 1/24/2019 | (45) |
| USD2,192 | TRY13,100 | Morgan Stanley | 1/24/2019 | (248) |
| USD9,370 | AUD13,010 | UBS AG | 1/25/2019 | 202 |
| USD2,300 | INR163,000 | JPMorgan Chase | 1/25/2019 | (28) |
| EUR12,479 | USD14,143 | HSBC Bank | 1/28/2019 | 190 |
| EUR6,600 | USD7,570 | HSBC Bank | 1/28/2019 | 11 |
| GBP2,580 | USD3,267 | HSBC Bank | 1/29/2019 | 27 |
| USD6,286 | CNH44,000 | JPMorgan Chase | 1/31/2019 | (119) |
| JPY964,000 | USD8,549 | JPMorgan Chase | 2/13/2019 | 277 |
| USD5,553 | CNH38,600 | JPMorgan Chase | 2/28/2019 | (66) |
| USD5,778 | BRL19,300 | Citibank | 3/11/2019 | 824 |
| BRL19,300 | USD5,077 | JPMorgan Chase | 3/11/2019 | (123) |
| USD16,793 | BRL56,500 | JPMorgan Chase | 3/15/2019 | 2,296 |
| BRL28,900 | USD7,207 | Citibank | 3/15/2019 | 208 |
| USD1,143 | EUR900 | JPMorgan Chase | 3/15/2019 | 105 |
| BRL27,600 | USD7,227 | JPMorgan Chase | 3/15/2019 | (145) |
| USD3,620 | BRL14,200 | JPMorgan Chase | 3/18/2019 | (23) |
| USD947 | EUR745 | Goldman Sachs | 4/12/2019 | 85 |
| USD4,015 | BRL15,125 | Morgan Stanley | 4/30/2019 | 148 |
| JPY4,675,000 | USD41,886 | JPMorgan Chase | 5/20/2019 | 1,270 |
| USD110,652 | JPY11,900,000 | Citibank | 5/20/2019 | 801 |
| JPY445,496 | USD3,988 | Citibank | 5/20/2019 | 124 |
| USD2,780 | BRL11,000 | Morgan Stanley | 12/16/2019 | 20 |
| USD10,781 | BRL43,200 | Citibank | 12/18/2019 | (58) |
| USD2,365 | BRL9,500 | HSBC Bank | 12/20/2019 | (18) |
| $6,918 | ||||
| Receive | Pay | Expiration date | Notional (000) | Value at 12/31/2018 (000) | Upfront payments/ receipts (000) | Unrealized (depreciation) appreciation at 12/31/2018 (000) |
| U.S. EFFR | 2.521% | 5/1/2019 | $2,284,000 | $(284) | $— | $(284) |
| (0.025)% | EONIA | 12/3/2021 | €48,000 | 152 | — | 152 |
| (0.0385)% | EONIA | 12/4/2021 | 64,600 | 183 | — | 183 |
| $— | $51 |
| 1 | Index-linked bond whose principal amount moves with a government price index. |
| 2 | Step bond; coupon rate may change at a later date. |
| 3 | Principal payments may be made periodically. Therefore, the effective maturity date may be earlier than the stated maturity date. |
| 4 | All or a portion of this security was pledged as collateral. The total value of pledged collateral was $4,216,000, which represented .20% of the net assets of the fund. |
| 5 | Coupon rate may change periodically. |
| 6 | Acquired in a transaction exempt from registration under Rule 144A or Section 4(2) of the Securities Act of 1933. May be resold in the U.S. in transactions exempt from registration, normally to qualified institutional buyers. The total value of all such securities was $188,658,000, which represented 9.04% of the net assets of the fund. |
| 7 | Loan participations and assignments; may be subject to legal or contractual restrictions on resale. The total value of all such loans was $3,706,000, which represented .18% of the net assets of the fund. |
| 8 | Acquired through a private placement transaction exempt from registration under the Securities Act of 1933. May be subject to legal or contractual restrictions on resale. Further details on these holdings appear below. |
| 9 | Purchased on a TBA basis. |
| 10 | Payment in kind; the issuer has the option of paying additional securities in lieu of cash. Most recent payment was 100% cash unless otherwise noted. |
| 11 | Scheduled interest and/or principal payment was not received. |
| 12 | Valued under fair value procedures adopted by authority of the board of trustees. The total value of all such securities was $2,483,000, which represented .12% of the net assets of the fund. This amount includes $283,000 related to certain securities trading outside the U.S. whose values were adjusted as a result of significant market movements following the close of local trading. |
| 13 | Value determined using significant unobservable inputs. |
| 14 | Security did not produce income during the last 12 months. |
| 15 | Amount less than one thousand. |
| 16 | Notional amount is calculated based on the number of contracts and notional contract size. |
| 17 | Value is calculated based on the notional amount and current market price. |
| Private placement securities | Acquisition date | Cost (000) | Value (000) | Percent of net assets |
| Blackstone CQP Holdco LP 6.50% 2021 | 3/6/2017 | $2,595 | $2,615 | .12% |
| Advanz Pharma Corp. | 8/31/2018 | 116 | 153 | .01 |
| Corporate Risk Holdings Corp. | 8/31/2015 | — | — | .00 |
| NCI Building Systems, Inc. | 11/16/2018 | — | — | .00 |
| Total private placement securities | $2,711 | $2,768 | .13% |
| Key to abbreviations and symbols | |
| ARS = Argentine pesos | INR = Indian rupees |
| AUD/A$ = Australian dollars | JPY/¥ = Japanese yen |
| BRL = Brazilian reais | KRW = South Korean won |
| CAD/C$ = Canadian dollars | LIBOR = London Interbank Offered Rate |
| CLP = Chilean pesos | MXN = Mexican pesos |
| CNH/CNY = Chinese yuan renminbi | MYR = Malaysian ringgits |
| COP = Colombian pesos | NGN = Nigerian naira |
| CZK = Czech korunas | NOK/NKr = Norwegian kroner |
| DKK/DKr = Danish kroner | PEN = Peruvian nuevos soles |
| EFFR = Effective Federal Funds Rate | PLN = Polish zloty |
| EGP = Egyptian pounds | RON = Romanian leu |
| EONIA = Euro Overnight Index Average | TBA = To-be-announced |
| EUR/€ = Euros | THB = Thai baht |
| EURIBOR = Euro Interbank Offered Rate | TRY = Turkish lira |
| GBP/£ = British pounds | USD/$ = U.S. dollars |
| IDR = Indonesian rupiah | UYU = Uruguayan pesos |
| ILS = Israeli shekels | ZAR = South African rand |
| Bonds, notes & other debt instruments 94.82% Corporate bonds & notes 94.56% Communication services 15.62% | Principal amount (000) | Value (000) |
| Altice Finco SA 8.125% 20241 | $505 | $472 |
| Altice France SA 8.125% 20271 | 1,575 | 1,488 |
| Altice NV 6.625% 20231 | 835 | 804 |
| Altice NV 7.50% 20261 | 1,250 | 1,144 |
| Altice SA 7.625% 20251 | 1,075 | 808 |
| Cablevision Systems Corp. 5.125% 20211 | 725 | 712 |
| Cablevision Systems Corp. 6.75% 2021 | 5,025 | 5,163 |
| CBS Outdoor Americas Inc. 5.25% 2022 | 400 | 400 |
| CCO Holdings LLC and CCO Holdings Capital Corp. 4.00% 20231 | 3,525 | 3,296 |
| CCO Holdings LLC and CCO Holdings Capital Corp. 5.125% 20231 | 2,025 | 1,974 |
| CCO Holdings LLC and CCO Holdings Capital Corp. 5.875% 20241 | 350 | 349 |
| CCO Holdings LLC and CCO Holdings Capital Corp. 5.375% 20251 | 225 | 216 |
| CCO Holdings LLC and CCO Holdings Capital Corp. 5.50% 20261 | 825 | 795 |
| CCO Holdings LLC and CCO Holdings Capital Corp. 5.75% 20261 | 6,450 | 6,337 |
| CCO Holdings LLC and CCO Holdings Capital Corp. 5.125% 20271 | 300 | 280 |
| CCO Holdings LLC and CCO Holdings Capital Corp. 5.00% 20281 | 3,150 | 2,906 |
| CenturyLink, Inc. 6.75% 2023 | 7,100 | 6,860 |
| CenturyLink, Inc., Series T, 5.80% 2022 | 800 | 774 |
| Clear Channel Worldwide Holdings, Inc. 7.625% 2020 | 18,500 | 18,107 |
| CSC Holdings, LLC 5.125% 20211 | 500 | 491 |
| CSC Holdings, LLC 5.50% 20261 | 1,300 | 1,229 |
| Cumulus Media New Holdings Inc., Term Loan, (3-month USD-LIBOR + 4.50%) 7.03% 20222,3,4 | 1,943 | 1,844 |
| DISH DBS Corp. 5.125% 2020 | 1,000 | 990 |
| DISH DBS Corp. 6.75% 2021 | 1,100 | 1,091 |
| Frontier Communications Corp. 7.125% 2019 | 450 | 439 |
| Frontier Communications Corp. 9.25% 2021 | 1,300 | 937 |
| Frontier Communications Corp. 10.50% 2022 | 9,440 | 6,608 |
| Frontier Communications Corp. 11.00% 2025 | 16,975 | 10,651 |
| Frontier Communications Corp. 8.50% 20261 | 4,000 | 3,510 |
| Gogo Inc. 12.50% 20221 | 13,925 | 14,943 |
| Gray Television, Inc. 7.00% 20271 | 2,100 | 2,053 |
| iHeartCommunications, Inc. 9.00% 20195 | 1,025 | 692 |
| iHeartCommunications, Inc., Term Loan D, (3-month USD-LIBOR + 6.75%) 9.272% 20192,3,4,5 | 1,725 | 1,154 |
| Inmarsat PLC 4.875% 20221 | 4,415 | 4,178 |
| Inmarsat PLC 6.50% 20241 | 500 | 469 |
| Intelsat Jackson Holding Co. 5.50% 2023 | 4,925 | 4,309 |
| Intelsat Jackson Holding Co. 6.625% 20242,3 | 2,050 | 2,034 |
| Intelsat Jackson Holding Co. 8.00% 20241 | 250 | 258 |
| Intelsat Jackson Holding Co. 8.50% 20241 | 6,625 | 6,459 |
| Liberty Global PLC 5.50% 20281 | 1,875 | 1,702 |
| Ligado Networks, Term Loan, (3-month USD-LIBOR + 8.75%) 11.07% 2020 (100% PIK)2,3,4,6 | 6,123 | 4,195 |
| Live Nation Entertainment, Inc. 4.875% 20241 | 450 | 429 |
| Live Nation Entertainment, Inc. 5.625% 20261 | 425 | 417 |
| Match Group, Inc. 6.375% 2024 | 1,050 | 1,072 |
| MDC Partners Inc. 6.50% 20241 | 5,030 | 4,602 |
| Bonds, notes & other debt instruments (continued) Corporate bonds & notes (continued) Communication services (continued) | Principal amount (000) | Value (000) |
| Meredith Corp. 6.875% 20261 | $9,015 | $8,835 |
| Neptune Finco Corp. (Altice NV) 6.625% 20251 | 1,250 | 1,269 |
| Numericable Group SA 7.375% 20261 | 2,775 | 2,553 |
| Sirius XM Radio Inc. 3.875% 20221 | 2,650 | 2,550 |
| Sirius XM Radio Inc. 4.625% 20231 | 900 | 866 |
| Sprint Corp. 7.25% 2021 | 1,240 | 1,272 |
| Sprint Corp. 11.50% 2021 | 7,130 | 8,110 |
| Sprint Corp. 7.875% 2023 | 1,855 | 1,908 |
| Sprint Corp. 6.875% 2028 | 2,700 | 2,558 |
| Sprint Corp. 8.75% 2032 | 1,025 | 1,084 |
| T-Mobile US, Inc. 6.375% 2025 | 2,150 | 2,182 |
| T-Mobile US, Inc. 6.50% 2026 | 900 | 920 |
| Trilogy International Partners, LLC 8.875% 20221 | 3,950 | 3,831 |
| Univision Communications Inc. 5.125% 20231 | 1,000 | 900 |
| Univision Communications Inc. 5.125% 20251 | 3,725 | 3,278 |
| Warner Music Group 5.625% 20221 | 1,887 | 1,889 |
| Warner Music Group 5.00% 20231 | 1,200 | 1,172 |
| Warner Music Group 4.875% 20241 | 1,000 | 953 |
| Warner Music Group 5.50% 20261 | 1,000 | 958 |
| Wind Tre SpA 5.00% 20261 | 4,700 | 3,895 |
| Zayo Group Holdings, Inc. 6.00% 2023 | 900 | 856 |
| Zayo Group Holdings, Inc. 6.375% 2025 | 900 | 840 |
| Zayo Group Holdings, Inc. 5.75% 20271 | 200 | 179 |
| Ziggo Bond Finance BV 5.875% 20251 | 950 | 862 |
| Ziggo Bond Finance BV 5.50% 20271 | 5,250 | 4,712 |
| 188,073 | ||
| Energy 14.89% | ||
| American Energy (Permian Basin) 7.125% 20201 | 7,445 | 1,712 |
| American Energy (Permian Basin) 7.375% 20211 | 6,770 | 1,523 |
| Antero Resources Corp. 5.375% 2024 | 1,140 | 1,069 |
| Ascent Resources Marcellus Holdings, Inc., Term Loan B, (3-month USD-LIBOR + 6.50%) 8.887% 20232,3,4 | 1,329 | 1,334 |
| Ascent Resources-Utica LLC 10.00% 20221 | 185 | 190 |
| Ascent Resources-Utica LLC 7.00% 20261 | 3,050 | 2,775 |
| Berry Petroleum Corporation 7.00% 20261 | 1,050 | 950 |
| Blackstone CQP Holdco LP 6.00% 20211,7 | 1,600 | 1,610 |
| Blackstone CQP Holdco LP 6.50% 20211,7 | 17,430 | 17,561 |
| Blue Racer Midstream LLC and Blue Racer Finance Corp. 6.125% 20221 | 1,300 | 1,261 |
| Bruin E&P Partners, LLC 8.875% 20231 | 900 | 804 |
| California Resources Corp., Term Loan B, (3-month USD-LIBOR + 4.75%) 7.256% 20222,3,4 | 950 | 917 |
| Cheniere Energy Partners, LP 5.25% 2025 | 950 | 889 |
| Cheniere Energy, Inc. 7.00% 2024 | 1,575 | 1,666 |
| Cheniere Energy, Inc. 5.875% 2025 | 1,600 | 1,596 |
| Chesapeake Energy Corp. 4.875% 2022 | 4,500 | 3,949 |
| Chesapeake Energy Corp. 8.00% 2025 | 3,725 | 3,306 |
| Chesapeake Energy Corp. 8.00% 2027 | 1,795 | 1,517 |
| Comstock Resources, Inc. 9.75% 20261 | 4,425 | 3,761 |
| CONSOL Energy Inc. 5.875% 2022 | 9,824 | 9,456 |
| Convey Park Energy LLC 7.50% 20251 | 1,150 | 995 |
| DCP Midstream Operating LP 4.95% 2022 | 1,880 | 1,866 |
| Denbury Resources Inc. 9.00% 20211 | 1,381 | 1,298 |
| Denbury Resources Inc. 7.50% 20241 | 1,040 | 842 |
| Diamond Offshore Drilling, Inc. 7.875% 2025 | 2,325 | 1,941 |
| Diamond Offshore Drilling, Inc. 4.875% 2043 | 3,260 | 1,842 |
| Bonds, notes & other debt instruments (continued) Corporate bonds & notes (continued) Energy (continued) | Principal amount (000) | Value (000) |
| Energy Transfer Partners, LP 4.25% 2023 | $750 | $724 |
| Energy Transfer Partners, LP 5.875% 2024 | 1,450 | 1,484 |
| Energy Transfer Partners, LP 5.50% 2027 | 750 | 733 |
| Energy Transfer Partners, LP 6.25% (undated) (3-month USD-LIBOR + 4.028% on 2/15/2023)8 | 1,000 | 839 |
| Ensco PLC 7.75% 2026 | 2,975 | 2,216 |
| Ensco PLC 5.75% 2044 | 3,170 | 1,787 |
| Extraction Oil & Gas, Inc. 7.375% 20241 | 100 | 83 |
| Extraction Oil & Gas, Inc. 5.625% 20261 | 2,090 | 1,536 |
| Genesis Energy, LP 6.75% 2022 | 3,075 | 3,013 |
| Genesis Energy, LP 6.50% 2025 | 2,490 | 2,204 |
| Indigo Natural Resources LLC 6.875% 20261 | 885 | 766 |
| Jonah Energy LLC 7.25% 20251 | 4,400 | 2,860 |
| Kcad Holdings I Ltd. 7.25% 20211 | 1,220 | 994 |
| Kcad Holdings I Ltd. 9.625% 20231 | 320 | 259 |
| Laredo Petroleum, Inc. 5.625% 2022 | 650 | 587 |
| Matador Resources Co. 5.875% 2026 | 1,550 | 1,430 |
| McDermott International, Inc. 10.625% 20241 | 3,250 | 2,754 |
| McDermott International, Term Loan B, (3-month USD-LIBOR + 5.00%) 7.522% 20252,3,4 | 499 | 467 |
| Murphy Oil Corp. 6.875% 2024 | 1,000 | 997 |
| Murphy Oil Corp. 5.75% 2025 | 1,690 | 1,583 |
| Nabors Industries Inc. 5.75% 2025 | 1,300 | 988 |
| NGL Energy Partners LP 7.50% 2023 | 250 | 241 |
| NGL Energy Partners LP 6.125% 2025 | 3,665 | 3,170 |
| Noble Corp. PLC 7.95% 20258 | 1,425 | 1,078 |
| Noble Corp. PLC 8.95% 20458 | 2,250 | 1,721 |
| Oasis Petroleum Inc. 6.25% 20261 | 1,360 | 1,146 |
| ONEOK, Inc. 7.50% 2023 | 1,250 | 1,422 |
| Pacific Drilling SA 8.375% 20231 | 1,595 | 1,527 |
| Parsley Energy, Inc. 6.25% 20241 | 320 | 311 |
| Parsley Energy, Inc. 5.25% 20251 | 500 | 455 |
| Parsley Energy, Inc. 5.375% 20251 | 520 | 481 |
| PDC Energy Inc. 5.75% 2026 | 1,600 | 1,428 |
| Peabody Energy Corp. 6.00% 20221 | 1,300 | 1,266 |
| Peabody Energy Corp. 6.375% 20251 | 100 | 93 |
| QEP Resources, Inc. 5.625% 2026 | 1,155 | 963 |
| QGOG Constellation SA 9.50% 2024 (5.26% PIK)1,3,5,6 | 6,144 | 2,550 |
| Range Resources Corp. 5.00% 2023 | 425 | 376 |
| Range Resources Corp. 4.875% 2025 | 2,200 | 1,815 |
| Rockpoint Gas Storage Canada Ltd. 7.00% 20231 | 1,450 | 1,370 |
| Sanchez Energy Corp. 7.25% 20231 | 825 | 677 |
| Seven Generations Energy Ltd. 5.375% 20251 | 1,175 | 1,056 |
| SM Energy Co. 6.125% 2022 | 761 | 723 |
| SM Energy Co. 5.625% 2025 | 1,555 | 1,361 |
| SM Energy Co. 6.625% 2027 | 850 | 761 |
| Southwestern Energy Co. 6.20% 20258 | 750 | 674 |
| Southwestern Energy Co. 7.50% 2026 | 3,545 | 3,368 |
| Southwestern Energy Co. 7.75% 2027 | 475 | 454 |
| Sunoco LP 4.875% 2023 | 3,625 | 3,543 |
| Sunoco LP 5.50% 2026 | 825 | 784 |
| Tallgrass Energy Partners, LP 5.50% 20241 | 1,000 | 988 |
| Tapstone Energy Inc. 9.75% 20221 | 1,050 | 835 |
| Targa Resources Corp. 5.875% 20261 | 125 | 122 |
| Targa Resources Partners LP 6.75% 2024 | 1,285 | 1,309 |
| Teekay Corp. 8.50% 2020 | 10,418 | 9,988 |
| Bonds, notes & other debt instruments (continued) Corporate bonds & notes (continued) Energy (continued) | Principal amount (000) | Value (000) |
| Teekay Offshore Partners LP 8.50% 20231 | $3,250 | $3,185 |
| Transocean Guardian Ltd., 5.875% 20241,3 | 2,090 | 2,012 |
| Transocean Inc. 8.375% 20218 | 2,705 | 2,698 |
| Transocean Inc. 9.00% 20231 | 2,366 | 2,363 |
| Transocean Inc. 7.75% 20241,3 | 1,000 | 1,000 |
| Transocean Inc. 6.125% 20251,3 | 3,590 | 3,482 |
| Transocean Inc. 7.50% 20261 | 350 | 309 |
| Ultra Petroleum Corp. 11.00% 20246 | 4,050 | 3,139 |
| USA Compression Partners, LP 6.875% 20261 | 400 | 386 |
| Vine Oil & Gas LP 8.75% 20231 | 2,450 | 1,948 |
| Vine Oil & Gas LP 9.75% 20231 | 1,550 | 1,248 |
| W&T Offshore, Inc. 9.75% 20231 | 1,500 | 1,327 |
| Weatherford International PLC 7.75% 2021 | 450 | 340 |
| Weatherford International PLC 4.50% 2022 | 1,890 | 1,115 |
| Weatherford International PLC 8.25% 2023 | 225 | 137 |
| Weatherford International PLC 9.875% 2024 | 2,725 | 1,689 |
| Weatherford International PLC 9.875% 20251 | 2,725 | 1,669 |
| Weatherford International PLC 6.50% 2036 | 5,615 | 2,948 |
| Weatherford International PLC 6.75% 2040 | 5,355 | 2,785 |
| Whiting Petroleum Corp. 6.625% 2026 | 1,050 | 906 |
| WPX Energy Inc. 6.00% 2022 | 516 | 504 |
| WPX Energy Inc. 5.75% 2026 | 1,250 | 1,138 |
| 179,318 | ||
| Health care 14.79% | ||
| Auris Luxembourg III SARL, Term Loan, (3-month USD-LIBOR + 3.75%) 6.558% 20252,3,4 | 860 | 839 |
| Centene Corp. 4.75% 2022 | 4,780 | 4,738 |
| Centene Corp. 6.125% 2024 | 1,500 | 1,539 |
| Centene Corp. 4.75% 2025 | 2,250 | 2,154 |
| Centene Corp. 5.375% 20261 | 2,920 | 2,847 |
| Charles River Laboratories International, Inc. 5.50% 20261 | 885 | 874 |
| Community Health Systems Inc. 6.25% 2023 | 1,225 | 1,118 |
| Concordia International Corp., Term Loan, (3-month USD-LIBOR + 5.50%) 7.887% 20242,3,4 | 707 | 674 |
| Concordia International Corp. 8.00% 2024 | 257 | 243 |
| DaVita HealthCare Partners Inc. 5.125% 2024 | 2,090 | 1,965 |
| DaVita HealthCare Partners Inc. 5.00% 2025 | 1,865 | 1,699 |
| Eagle Holding Co II LLC 7.625% 20221,6 | 1,250 | 1,197 |
| Endo International PLC 5.75% 20221 | 4,275 | 3,580 |
| Endo International PLC 5.375% 20231,8 | 600 | 459 |
| Endo International PLC 6.00% 20231 | 4,135 | 3,174 |
| Endo International PLC 5.875% 20241 | 2,450 | 2,327 |
| Endo International PLC 6.00% 20251,8 | 2,005 | 1,449 |
| Envision Healthcare Corp. 8.75% 20261 | 1,330 | 1,154 |
| Envision Healthcare Corp., Term Loan, (3-month USD-LIBOR + 3.75%) 6.272% 20252,3,4 | 1,150 | 1,077 |
| HCA Inc. 6.50% 2020 | 800 | 822 |
| HCA Inc. 7.50% 2022 | 360 | 383 |
| HCA Inc. 5.875% 2023 | 1,925 | 1,954 |
| HCA Inc 5.375% 2026 | 1,175 | 1,146 |
| HCA Inc. 5.875% 2026 | 2,055 | 2,050 |
| HCA Inc. 4.50% 2027 | 1,825 | 1,729 |
| HCA Inc. 5.625% 2028 | 4,325 | 4,184 |
| HCA Inc. 5.50% 2047 | 2,200 | 2,090 |
| HealthSouth Corp. 5.75% 2024 | 1,275 | 1,267 |
| HealthSouth Corp. 5.75% 2025 | 1,380 | 1,352 |
| Bonds, notes & other debt instruments (continued) Corporate bonds & notes (continued) Health care (continued) | Principal amount (000) | Value (000) |
| Hologic, Inc. 4.375% 20251 | $1,275 | $1,192 |
| IMS Health Holdings, Inc. 5.00% 20261 | 2,350 | 2,253 |
| inVentiv Health, Inc. 7.50% 20241 | 3,040 | 3,177 |
| Jaguar Holding Co. 6.375% 20231 | 2,625 | 2,515 |
| Kinetic Concepts, Inc. 7.875% 20211 | 2,800 | 2,838 |
| Kinetic Concepts, Inc. 12.50% 20211 | 7,628 | 8,200 |
| Mallinckrodt PLC 4.875% 20201 | 4,600 | 4,462 |
| Molina Healthcare, Inc. 5.375% 2022 | 11,060 | 10,714 |
| Molina Healthcare, Inc. 4.875% 20251 | 2,919 | 2,675 |
| Multiplan, Inc. 8.50% 20221,6 | 750 | 687 |
| Multiplan, Inc. 7.125% 20241 | 1,005 | 940 |
| NVA Holdings Inc. 6.875% 20261 | 2,175 | 1,957 |
| Owens & Minor, Inc. 3.875% 2021 | 2,450 | 1,838 |
| Owens & Minor, Inc., Term Loan B, (3-month USD-LIBOR + 4.50%) 7.308% 20252,3,4 | 1,746 | 1,353 |
| PAREXEL International Corp. 6.375% 20251 | 2,305 | 2,051 |
| Prestige Brands International Inc. 6.375% 20241 | 1,565 | 1,518 |
| Quintiles Transnational Corp. 4.875% 20231 | 2,150 | 2,118 |
| Rotech Healthcare Inc., Term Loan, (3-month USD-LIBOR + 11.00%) 13.34% 2023 (100% PIK)2,3,4,6,9,10 | 7,398 | 6,730 |
| Rotech Healthcare Inc., Term Loan B, (3-month USD-LIBOR + 3.75%) 6.087% 20232,3,4,9,10 | 2,281 | 2,262 |
| Team Health Holdings, Inc. 6.375% 20251 | 2,230 | 1,831 |
| Tenet Healthcare Corp. 4.75% 2020 | 2,310 | 2,313 |
| Tenet Healthcare Corp. 6.00% 2020 | 4,315 | 4,385 |
| Tenet Healthcare Corp. 4.375% 2021 | 5,755 | 5,597 |
| Tenet Healthcare Corp. 4.50% 2021 | 905 | 885 |
| Tenet Healthcare Corp. 8.125% 2022 | 4,050 | 4,075 |
| Tenet Healthcare Corp. 6.75% 2023 | 2,600 | 2,450 |
| Tenet Healthcare Corp. 4.625% 2024 | 4,042 | 3,774 |
| Tenet Healthcare Corp. 5.125% 2025 | 450 | 421 |
| Teva Pharmaceutical Finance Co. BV 2.20% 2021 | 875 | 805 |
| Teva Pharmaceutical Finance Co. BV 2.80% 2023 | 2,768 | 2,386 |
| Teva Pharmaceutical Finance Co. BV 6.00% 2024 | 4,302 | 4,154 |
| Teva Pharmaceutical Finance Co. BV 3.15% 2026 | 2,260 | 1,729 |
| Teva Pharmaceutical Finance Co. BV 6.75% 2028 | 1,225 | 1,190 |
| Teva Pharmaceutical Industries Ltd. 4.50% 2025 | €270 | 314 |
| Valeant Pharmaceuticals International, Inc. 5.625% 20211 | $1,175 | 1,158 |
| Valeant Pharmaceuticals International, Inc. 5.875% 20231 | 10,610 | 9,854 |
| Valeant Pharmaceuticals International, Inc. 6.125% 20251 | 11,130 | 9,739 |
| Valeant Pharmaceuticals International, Inc. 9.00% 20251 | 2,290 | 2,287 |
| Valeant Pharmaceuticals International, Inc. 9.25% 20261 | 6,210 | 6,226 |
| Valeant Pharmaceuticals International, Inc., Term Loan B, (3-month USD-LIBOR + 3.00%) 5.379% 20252,3,4 | 1,612 | 1,548 |
| Verscend Holding Corp., Term Loan B, (3-month USD-LIBOR + 4.50%) 7.022% 20252,3,4 | 930 | 902 |
| WellCare Health Plans, Inc. 5.375% 20261 | 500 | 484 |
| 178,071 | ||
| Materials 12.38% | ||
| AK Steel Holding Corp. 7.625% 2021 | 2,425 | 2,201 |
| AK Steel Holding Corp. 7.00% 2027 | 450 | 353 |
| ARD Securities Finance SARL 8.75% 2023 (100% PIK)1,6 | 949 | 807 |
| Ardagh Group SA 7.125% 20236 | 450 | 406 |
| Ardagh Packaging Finance 6.00% 20251 | 4,830 | 4,471 |
| Axalta Coating Systems LLC 4.875% 20241 | 1,450 | 1,378 |
| Ball Corp. 4.375% 2020 | 450 | 453 |
| Bonds, notes & other debt instruments (continued) Corporate bonds & notes (continued) Materials (continued) | Principal amount (000) | Value (000) |
| Ball Corp. 5.00% 2022 | $825 | $831 |
| Berry Plastics Corp. 5.50% 2022 | 820 | 819 |
| Blue Cube Spinco Inc. (Olin Corp.) 10.00% 2025 | 1,000 | 1,135 |
| BWAY Parent Co. Inc. 5.50% 20241 | 2,840 | 2,680 |
| BWAY Parent Co. Inc. 7.25% 20251 | 3,475 | 3,132 |
| Carlyle Group LP 8.75% 20231,6 | 2,400 | 2,310 |
| CF Industries, Inc. 4.95% 2043 | 2,565 | 1,997 |
| Chemours Co. 6.625% 2023 | 3,010 | 3,051 |
| Cleveland-Cliffs Inc. 4.875% 20241 | 5,500 | 5,129 |
| Cleveland-Cliffs Inc. 5.75% 2025 | 13,250 | 11,958 |
| Consolidated Energy Finance SA 6.875% 20251 | 950 | 908 |
| Consolidated Energy Finance SA 6.50% 20261 | 2,395 | 2,305 |
| Constellium NV 5.875% 20261 | 1,450 | 1,294 |
| CVR Partners, LP 9.25% 20231 | 1,100 | 1,148 |
| First Quantum Minerals Ltd. 7.00% 20211 | 3,495 | 3,362 |
| First Quantum Minerals Ltd. 7.25% 20221 | 3,025 | 2,817 |
| First Quantum Minerals Ltd. 7.25% 20231 | 2,650 | 2,342 |
| First Quantum Minerals Ltd. 6.50% 20241 | 1,400 | 1,167 |
| First Quantum Minerals Ltd. 7.50% 20251 | 10,200 | 8,453 |
| First Quantum Minerals Ltd. 6.875% 20261 | 4,900 | 3,951 |
| Freeport-McMoRan Inc. 3.55% 2022 | 5,315 | 5,043 |
| Freeport-McMoRan Inc. 6.875% 2023 | 1,000 | 1,035 |
| FXI Holdings, Inc. 7.875% 20241 | 1,445 | 1,243 |
| H.I.G. Capital, LLC 6.75% 20241 | 4,284 | 3,781 |
| Hexion Inc. 6.625% 2020 | 1,150 | 920 |
| Hexion Inc. 10.375% 20221 | 1,275 | 1,023 |
| INEOS Group Holdings SA 5.625% 20241 | 2,375 | 2,112 |
| LSB Industries, Inc. 9.625% 20231 | 3,625 | 3,697 |
| Nova Chemicals Corp. 4.875% 20241 | 1,675 | 1,518 |
| Nova Chemicals Corp. 5.25% 20271 | 4,050 | 3,599 |
| Novelis Corp. 6.25% 20241 | 860 | 811 |
| Novelis Corp. 5.875% 20261 | 2,795 | 2,481 |
| OCI NV 6.625% 20231 | 860 | 849 |
| Olin Corp. 5.125% 2027 | 300 | 278 |
| Olin Corp. 5.00% 2030 | 1,000 | 880 |
| Owens-Illinois, Inc. 5.00% 20221 | 560 | 557 |
| Owens-Illinois, Inc. 5.875% 20231 | 2,530 | 2,546 |
| Owens-Illinois, Inc. 6.375% 20251 | 705 | 701 |
| Plastipak Holdings, Inc. 6.25% 20251 | 695 | 619 |
| Platform Specialty Products Corp. 6.50% 20221 | 2,450 | 2,459 |
| Platform Specialty Products Corp. 5.875% 20251 | 6,435 | 6,049 |
| Rayonier Advanced Materials Inc. 5.50% 20241 | 1,210 | 1,071 |
| Reynolds Group Inc. 5.75% 2020 | 315 | 315 |
| Reynolds Group Inc. 7.00% 20241 | 3,650 | 3,483 |
| Ryerson Inc. 11.00% 20221 | 7,186 | 7,258 |
| Scotts Miracle-Gro Co. 5.25% 2026 | 750 | 684 |
| Sealed Air Corp. 4.875% 20221 | 1,000 | 994 |
| Sealed Air Corp. 5.25% 20231 | 405 | 408 |
| S.P.C.M. SA 4.875% 20251 | 1,675 | 1,461 |
| Standard Industries Inc. 6.00% 20251 | 1,750 | 1,685 |
| Starfruit US Holdco LLC 8.00% 20261 | 3,255 | 3,019 |
| Starfruit US Holdco LLC, Term Loan B, (3-month USD-LIBOR + 3.25%) 5.599% 20252,3,4 | 700 | 672 |
| Summit Materials, Inc. 6.125% 2023 | 1,720 | 1,711 |
| Summit Materials, Inc. 5.125% 20251 | 1,390 | 1,268 |
| Bonds, notes & other debt instruments (continued) Corporate bonds & notes (continued) Materials (continued) | Principal amount (000) | Value (000) |
| Tronox Ltd. 5.75% 20251 | $1,625 | $1,322 |
| Tronox Ltd. 6.50% 20261 | 1,650 | 1,376 |
| United States Steel Corp. 6.875% 2025 | 650 | 598 |
| Venator Materials Corp. 5.75% 20251 | 5,525 | 4,448 |
| Warrior Met Coal, Inc. 8.00% 20241 | 3,325 | 3,308 |
| Zekelman Industries Inc. 9.875% 20231 | 820 | 867 |
| 149,007 | ||
| Industrials 9.44% | ||
| ACCO Brands Corp. 5.25% 20241 | 1,190 | 1,068 |
| ADT Corp. 3.50% 2022 | 3,355 | 3,116 |
| ADT Corp. 4.125% 2023 | 190 | 174 |
| Advanced Disposal Services, Inc. 5.625% 20241 | 1,550 | 1,523 |
| Allison Transmission Holdings, Inc. 5.00% 20241 | 4,385 | 4,226 |
| ARAMARK Corp. 5.125% 2024 | 2,435 | 2,417 |
| Associated Materials, LLC 9.00% 20241 | 3,800 | 3,686 |
| Avis Budget Group, Inc. 5.50% 2023 | 4,300 | 4,166 |
| Beacon Roofing Supply, Inc. 4.875% 20251 | 3,050 | 2,692 |
| Bohai Financial Investment Holding Co., Ltd. 5.25% 20221 | 2,075 | 2,015 |
| Bohai Financial Investment Holding Co., Ltd. 4.50% 20231 | 2,350 | 2,203 |
| Bohai Financial Investment Holding Co., Ltd. 5.125% 20231 | 1,000 | 957 |
| Bohai Financial Investment Holding Co., Ltd. 5.50% 20241 | 1,625 | 1,572 |
| Brand Energy 8.50% 20251 | 4,205 | 3,606 |
| Brookfield WEC Holdings Inc., Term Loan, (3-month USD-LIBOR + 3.75%) 6.272% 20252,3,4 | 1,450 | 1,408 |
| Brookfield WEC Holdings Inc., Term Loan, (3-month USD-LIBOR + 6.75%) 9.272% 20262,3,4 | 1,580 | 1,559 |
| Builders FirstSource, Inc. 5.625% 20241 | 8,310 | 7,739 |
| BWX Technologies, Inc. 5.375% 20261 | 195 | 189 |
| CD&R Waterworks Merger Sub, LLC 6.125% 20251 | 685 | 611 |
| Continental Airlines, Inc., Series 1999-1, Class A, 6.545% 20203 | 98 | 98 |
| Covanta Holding Corp. 5.875% 2024 | 1,200 | 1,131 |
| Covanta Holding Corp. 5.875% 2025 | 1,300 | 1,201 |
| DAE Aviation Holdings, Inc. 10.00% 20231 | 7,790 | 8,335 |
| Deck Chassis Acquisition Inc. 10.00% 20231 | 6,615 | 6,383 |
| Euramax International, Inc. 12.00% 20201 | 1,850 | 1,903 |
| Hardwoods Acquisition Inc. 7.50% 20211 | 1,810 | 1,303 |
| HD Supply, Inc. 5.375% 20261 | 1,825 | 1,777 |
| HDTFS Inc. 5.875% 2020 | 2,650 | 2,580 |
| Hertz Global Holdings Inc. 7.625% 20221 | 5,669 | 5,357 |
| JELD-WEN Holding, Inc. 4.875% 20271 | 1,700 | 1,441 |
| KAR Auction Services, Inc. 5.125% 20251 | 2,035 | 1,847 |
| Kratos Defense & Security Solutions, Inc. 6.50% 20251 | 1,305 | 1,329 |
| LSC Communications, Inc. 8.75% 20231 | 4,810 | 4,960 |
| Multi-Color Corp. 4.875% 20251 | 4,085 | 3,503 |
| Navistar International Corp. 6.625% 20251 | 970 | 941 |
| Olympus Merger Sub, Inc. 8.50% 20251 | 1,025 | 815 |
| Pisces Parent LLC, Term Loan B, (3-month USD-LIBOR + 3.75%) 6.175% 20252,3,4,9 | 2,230 | 2,040 |
| Pisces Parent LLC 8.00% 20261 | 5,170 | 4,750 |
| PrimeSource Building Products Inc. 9.00% 20231 | 650 | 661 |
| R.R. Donnelley & Sons Co., Term Loan B, (3-month USD-LIBOR + 5.00%) 7.506% 20242,3,4 | 1,350 | 1,330 |
| R.R. Donnelley & Sons Co. 7.875% 2021 | 525 | 528 |
| R.R. Donnelley & Sons Co. 6.50% 2023 | 1,375 | 1,365 |
| Resideo Funding Inc. 6.125% 20261 | 1,475 | 1,457 |
| Rexnord Corp. 4.875% 20251 | 2,610 | 2,382 |
| Sensata Technologies Holding BV 4.875% 20231 | 125 | 122 |
| Bonds, notes & other debt instruments (continued) Corporate bonds & notes (continued) Industrials (continued) | Principal amount (000) | Value (000) |
| Standard Aero Holdings, Inc., Term Loan B, 6.27% 20222,3,4 | $746 | $739 |
| Staples Inc. 8.50% 20251 | 990 | 898 |
| TransDigm Inc. 5.50% 2020 | 1,075 | 1,068 |
| United Continental Holdings, Inc. 6.00% 2020 | 400 | 412 |
| United Rentals, Inc. 5.75% 2024 | 1,250 | 1,208 |
| United Rentals, Inc. 4.625% 2025 | 1,630 | 1,459 |
| Virgin Australia Holdings Ltd. 8.50% 20191 | 1,875 | 1,897 |
| Virgin Australia Holdings Ltd. 7.875% 20211 | 1,600 | 1,564 |
| 113,711 | ||
| Consumer discretionary 9.33% | ||
| American Axle & Manufacturing Holdings, Inc. 6.50% 2027 | 1,850 | 1,663 |
| Churchill Downs Inc. 4.75% 20281 | 1,375 | 1,251 |
| Cirsa Gaming Corporation SA 7.875% 20231 | 5,860 | 5,827 |
| CRC Escrow Issuer LLC 5.25% 20251 | 3,250 | 2,803 |
| Fertitta Entertainment, Inc. 6.75% 20241 | 1,500 | 1,417 |
| Fertitta Entertainment, Inc. 8.75% 20251 | 1,325 | 1,279 |
| Goodyear Tire & Rubber Co. 4.875% 2027 | 750 | 661 |
| Hanesbrands Inc. 4.625% 20241 | 2,680 | 2,526 |
| Hanesbrands Inc. 4.875% 20261 | 1,695 | 1,536 |
| International Game Technology 6.50% 20251 | 1,600 | 1,584 |
| IRB Holding Corp. 6.75% 20261 | 2,085 | 1,830 |
| Laureate Education, Inc. 8.25% 20251 | 1,060 | 1,118 |
| Levi Strauss & Co. 5.00% 2025 | 1,280 | 1,258 |
| Limited Brands, Inc. 6.625% 2021 | 750 | 773 |
| Limited Brands, Inc. 5.25% 2028 | 745 | 638 |
| Limited Brands, Inc. 6.875% 2035 | 175 | 147 |
| McGraw-Hill Global Education Holdings, LLC, Term Loan B, (3-month USD-LIBOR + 4.00%) 6.522% 20222,3,4 | 1,295 | 1,177 |
| Meritage Homes Corp. 5.125% 2027 | 1,300 | 1,108 |
| Merlin Entertainment 5.75% 20261 | 1,200 | 1,190 |
| MGM Growth Properties LLC 5.625% 2024 | 200 | 199 |
| MGM Resorts International 7.75% 2022 | 1,800 | 1,919 |
| MGM Resorts International 6.00% 2023 | 1,450 | 1,461 |
| Neiman Marcus Group Ltd. Inc. 8.00% 20211 | 4,635 | 1,935 |
| Neiman Marcus Group Ltd. Inc., Term Loan B, (3-month USD-LIBOR + 3.25%) 5.630% 20202,3,4 | 1,843 | 1,571 |
| Neiman Marcus Group Ltd. Inc. 9.50% 2021 (100% PIK)1,6 | 4,080 | 1,734 |
| NMG Finco PLC 5.75% 20221 | 1,780 | 1,620 |
| Petsmart, Inc., Term Loan B-2, (3-month USD-LIBOR + 3.00%) 5.38% 20222,3,4 | 5,571 | 4,415 |
| Petsmart, Inc. 7.125% 20231 | 7,620 | 4,477 |
| Petsmart, Inc. 5.875% 20251 | 15,240 | 11,087 |
| Petsmart, Inc. 8.875% 20251 | 4,655 | 2,723 |
| Sally Holdings LLC and Sally Capital Inc. 5.50% 2023 | 1,770 | 1,710 |
| Sally Holdings LLC and Sally Capital Inc. 5.625% 2025 | 6,555 | 6,055 |
| Scientific Games Corp. 6.25% 2020 | 1,065 | 1,028 |
| Scientific Games Corp. 10.00% 2022 | 2,112 | 2,146 |
| Scientific Games Corp. 5.00% 20251 | 3,090 | 2,766 |
| ServiceMaster Global Holdings, Inc. 5.125% 20241 | 1,300 | 1,232 |
| Six Flags Entertainment Corp. 4.875% 20241 | 5,475 | 5,174 |
| Sotheby’s 4.875% 20251 | 5,795 | 5,273 |
| Stars Group Holdings BV, 7.00% 20261 | 975 | 951 |
| Stars Group Holdings BV, Term Loan, (3-month USD-LIBOR + 3.50%) 6.303% 20252,3,4 | 721 | 701 |
| Uber Technologies, Inc. 7.50% 20231 | 4,225 | 4,098 |
| Uber Technologies, Inc. 8.00% 20261 | 6,950 | 6,724 |
| Wyndham Worldwide Corp. 5.375% 20261 | 1,000 | 965 |
| Bonds, notes & other debt instruments (continued) Corporate bonds & notes (continued) Consumer discretionary (continued) | Principal amount (000) | Value (000) |
| Wynn Las Vegas, LLC and Wynn Capital Corp. 4.25% 20231 | $2,823 | $2,664 |
| Wynn Las Vegas, LLC and Wynn Capital Corp. 5.50% 20251 | 3,950 | 3,693 |
| Wynn Las Vegas, LLC and Wynn Capital Corp. 5.25% 20271 | 2,700 | 2,379 |
| Wynn Macau, Ltd. 4.875% 20241 | 2,025 | 1,807 |
| 112,293 | ||
| Information technology 7.37% | ||
| Alcatel-Lucent USA Inc. 6.45% 2029 | 1,800 | 1,768 |
| Almonde Inc., Term Loan, (3-month USD-LIBOR + 7.25%) 10.053% 20252,3,4 | 7,150 | 6,605 |
| Applied Systems, Inc., Term Loan, (3-month USD-LIBOR + 7.00%) 9.522% 20252,3,4 | 1,825 | 1,811 |
| Banff Merger Sub Inc. 9.75% 20261 | 1,275 | 1,170 |
| Blackboard Inc., Term Loan B4, (3-month USD-LIBOR + 5.00%) 7.445% 20212,3,4 | 1,694 | 1,578 |
| Camelot Finance SA 7.875% 20241 | 7,405 | 7,200 |
| CDW Corp. 5.00% 2025 | 1,150 | 1,105 |
| Colorado Buyer Inc., Term Loan, (3-month USD-LIBOR + 7.25%) 9.63% 20252,3,4 | 638 | 587 |
| CommScope Holding Co., Inc. 6.00% 20251 | 1,000 | 915 |
| CommScope Holding Co., Inc. 5.00% 20271 | 950 | 772 |
| Dell Inc. 7.125% 20241 | 1,100 | 1,120 |
| Diebold Nixdorf AG, Term Loan A1, (3-month USD-LIBOR + 9.25%) 11.813% 20222,3,4 | 2,030 | 2,139 |
| Diebold Nixdorf AG, Term Loan B, (3-month USD-LIBOR + 2.75%) 5.188% 20232,3,4 | 811 | 689 |
| Ellucian, Inc. 9.00% 20231 | 450 | 452 |
| Financial & Risk US Holdings, Inc. 6.25% 20261 | 1,811 | 1,750 |
| Financial & Risk US Holdings, Inc. 8.25% 20261 | 3,750 | 3,436 |
| Financial & Risk US Holdings, Inc., Term Loan B, (3-month USD-LIBOR + 3.75%) 6.272% 20252,3,4 | 950 | 892 |
| First Data Corp. 5.375% 20231 | 1,100 | 1,083 |
| First Data Corp. 5.00% 20241 | 2,350 | 2,271 |
| First Data Corp. 5.75% 20241 | 2,525 | 2,475 |
| Genesys Telecommunications Laboratories, Inc. 10.00% 20241 | 4,895 | 5,140 |
| Genesys Telecommunications Laboratories, Inc., Term Loan B3, (3-month USD-LIBOR + 3.50%) 5.772% 20232,3,4 | 571 | 547 |
| Infor (US), Inc. 6.50% 2022 | 4,675 | 4,539 |
| Infor Software 7.125% 20211,6 | 6,935 | 6,779 |
| Informatica Corp. 7.125% 20231 | 1,850 | 1,811 |
| Internet Brands, Inc., Term Loan, (3-month USD-LIBOR + 7.50%) 10.004% 20252,3,4,9 | 3,075 | 2,875 |
| Kronos Inc., Term Loan B, (3-month USD-LIBOR + 8.25%) 9.25% 20242,3,4 | 8,645 | 8,563 |
| McAfee, LLC, Term Loan, (3-month USD-LIBOR + 3.75%) 6.272% 20242,3,4 | 1,372 | 1,342 |
| McAfee, LLC, Term Loan, (3-month USD-LIBOR + 8.50%) 11.006% 20252,3,4 | 802 | 799 |
| Mitchell International, Inc., Term Loan B, (3-month USD-LIBOR + 7.25%) 9.772% 20252,3,4 | 1,150 | 1,124 |
| Solera Holdings, Inc. 10.50% 20241 | 1,100 | 1,177 |
| Tempo Acquisition LLC 6.75% 20251 | 1,650 | 1,534 |
| Unisys Corp. 10.75% 20221 | 6,600 | 7,252 |
| VeriSign, Inc. 4.625% 2023 | 650 | 642 |
| VeriSign, Inc. 5.25% 2025 | 200 | 199 |
| VeriSign, Inc. 4.75% 2027 | 1,850 | 1,742 |
| Veritas Holdings Ltd. 7.50% 20231 | 1,655 | 1,357 |
| Vertafore Inc., Term Loan, (3-month USD-LIBOR + 7.25%) 10.053% 20262,3,4 | 1,500 | 1,445 |
| 88,685 | ||
| Financials 3.48% | ||
| Acrisure LLC 7.00% 20251 | 870 | 746 |
| Alliant Holdings Intermediate LLC 8.25% 20231 | 1,000 | 997 |
| Ally Financial Inc. 8.00% 2020 | 1,540 | 1,598 |
| Ally Financial Inc. 8.00% 2031 | 900 | 1,003 |
| CIT Group Inc. 4.125% 2021 | 950 | 938 |
| Bonds, notes & other debt instruments (continued) Corporate bonds & notes (continued) Financials (continued) | Principal amount (000) | Value (000) |
| Compass Diversified Holdings 8.00% 20261 | $5,710 | $5,664 |
| FS Energy and Power Fund 7.50% 20231 | 5,765 | 5,491 |
| General Motors Acceptance Corp. 7.50% 2020 | 1,920 | 1,997 |
| HUB International Ltd. 7.00% 20261 | 6,155 | 5,601 |
| Icahn Enterprises Finance Corp. 6.25% 2022 | 2,800 | 2,772 |
| iStar Financial Inc. 6.50% 2021 | 700 | 695 |
| MSCI Inc. 4.75% 20261 | 200 | 190 |
| Navient Corp. 6.50% 2022 | 4,440 | 4,143 |
| Navient Corp. 5.50% 2023 | 4,060 | 3,568 |
| Navient Corp. 6.125% 2024 | 500 | 431 |
| OneMain Holdings, Inc. 7.125% 2026 | 1,105 | 988 |
| Solenis International, LP, Term Loan, (3-month USD-LIBOR + 8.50%) 11.207% 20242,3,4 | 1,340 | 1,273 |
| Solenis International, LP, Term Loan, (3-month USD-LIBOR + 4.00%) 6.601% 20252,3,4 | 480 | 463 |
| Springleaf Finance Corp. 8.25% 2020 | 450 | 467 |
| Springleaf Finance Corp. 6.875% 2025 | 1,325 | 1,189 |
| Starwood Property Trust, Inc. 5.00% 2021 | 1,710 | 1,684 |
| 41,898 | ||
| Utilities 3.00% | ||
| AES Corp. 4.00% 2021 | 1,000 | 985 |
| AES Corp. 4.875% 2023 | 600 | 588 |
| AES Corp. 7.75% 20241 | 500 | 409 |
| AES Corp. 5.50% 2025 | 4,682 | 4,670 |
| AES Corp. 6.00% 2026 | 2,165 | 2,208 |
| AmeriGas Partners, LP 5.50% 2025 | 700 | 644 |
| AmeriGas Partners, LP 5.75% 2027 | 975 | 868 |
| Calpine Corp. 6.00% 20221 | 425 | 423 |
| Calpine Corp. 5.375% 2023 | 2,450 | 2,303 |
| Calpine Corp. 5.875% 20241 | 2,420 | 2,378 |
| Calpine Corp. 5.75% 2025 | 300 | 275 |
| Calpine Corp. 5.25% 20261 | 3,245 | 2,973 |
| Dynegy Finance Inc. 7.375% 2022 | 1,985 | 2,055 |
| Dynegy Finance Inc. 7.625% 2024 | 754 | 797 |
| Emera Inc. 6.75% 2076 (3-month USD-LIBOR + 5.44% on 6/15/2026)8 | 3,914 | 3,941 |
| Enel Società per Azioni 8.75% 20731,8 | 2,000 | 2,050 |
| NRG Energy, Inc. 7.25% 2026 | 500 | 523 |
| NRG Energy, Inc. 6.625% 2027 | 300 | 303 |
| Pacific Gas and Electric Co. 4.25% 20231 | 875 | 815 |
| Talen Energy Corp. 4.60% 2021 | 177 | 160 |
| Talen Energy Corp. 9.50% 20221 | 3,270 | 3,303 |
| Talen Energy Corp. 10.50% 20261 | 3,070 | 2,625 |
| TEX Operations Co. LLC, Term Loan B, (3-month USD-LIBOR + 2.00%) 4.522% 20232,3,4 | 875 | 843 |
| 36,139 | ||
| Consumer staples 2.17% | ||
| Avon Products, Inc. 7.875% 20221 | 1,900 | 1,881 |
| B&G Foods, Inc. 4.625% 2021 | 365 | 357 |
| B&G Foods, Inc. 5.25% 2025 | 5,758 | 5,377 |
| Cott Beverages Inc. 5.50% 20251 | 2,470 | 2,337 |
| Darling Ingredients Inc. 5.375% 2022 | 1,000 | 996 |
| Energizer Gamma Acquisition Inc. 6.375% 20261 | 1,530 | 1,408 |
| Energizer SpinCo Inc. 5.50% 20251 | 625 | 566 |
| First Quality Enterprises, Inc. 5.00% 20251 | 1,995 | 1,791 |
| Lamb Weston Holdings, Inc. 4.625% 20241 | 1,085 | 1,058 |
| Bonds, notes & other debt instruments (continued) Corporate bonds & notes (continued) Consumer staples (continued) | Principal amount (000) | Value (000) |
| Pilgrim’s Pride Corp. 5.75% 20251 | $795 | $749 |
| Post Holdings, Inc. 8.00% 20251 | 1,550 | 1,627 |
| Post Holdings, Inc. 5.00% 20261 | 2,865 | 2,621 |
| Post Holdings, Inc. 5.625% 20281 | 2,830 | 2,614 |
| Prestige Brands International Inc. 5.375% 20211 | 150 | 147 |
| Spectrum Brands Inc. 5.75% 2025 | 800 | 764 |
| TreeHouse Foods, Inc. 6.00% 20241 | 1,800 | 1,789 |
| 26,082 | ||
| Real estate 2.09% | ||
| Communications Sales & Leasing, Inc. 6.00% 20231 | 450 | 408 |
| Communications Sales & Leasing, Inc. 7.125% 20241 | 400 | 330 |
| Equinix, Inc. 5.75% 2025 | 200 | 202 |
| Equinix, Inc. 5.875% 2026 | 575 | 581 |
| Equinix, Inc. 5.375% 2027 | 1,000 | 980 |
| Five Point Holdings LLC 7.875% 20251 | 1,950 | 1,887 |
| Howard Hughes Corp. 5.375% 20251 | 6,520 | 6,161 |
| Iron Mountain Inc. 5.75% 2024 | 4,800 | 4,572 |
| Iron Mountain Inc. 4.875% 20271 | 1,695 | 1,487 |
| Iron Mountain Inc. 5.25% 20281 | 2,215 | 1,966 |
| Medical Properties Trust, Inc. 5.00% 2027 | 2,020 | 1,852 |
| Realogy Corp. 4.50% 20191 | 590 | 589 |
| Realogy Corp. 4.875% 20231 | 2,820 | 2,468 |
| SBA Communications Corp. 4.00% 2022 | 1,010 | 967 |
| SBA Communications Corp. 4.875% 2022 | 700 | 690 |
| 25,140 | ||
| Total corporate bonds & notes | 1,138,417 | |
| U.S. Treasury bonds & notes 0.25% U.S. Treasury 0.25% | ||
| U.S. Treasury 1.125% 201911 | 3,004 | 2,998 |
| Total U.S. Treasury bonds & notes | 2,998 | |
| Municipals 0.01% Puerto Rico 0.01% | ||
| Aqueduct and Sewer Auth., Rev. Bonds, Series 2012-B, 4.90% 2020 | 95 | 85 |
| Total bonds, notes & other debt instruments (cost: $1,229,811,000) | 1,141,500 | |
| Convertible bonds 0.45% Communication services 0.23% | ||
| DISH DBS Corp., convertible notes, 3.375% 2026 | 1,010 | 818 |
| Gogo Inc., convertible notes, 6.00% 20221 | 2,140 | 1,958 |
| 2,776 | ||
| Energy 0.12% | ||
| Golar LNG Ltd., convertible notes, 2.75% 2022 | 450 | 415 |
| Teekay Corp., convertible notes, 5.00% 20231 | 750 | 585 |
| Weatherford International PLC, convertible notes, 5.875% 2021 | 650 | 414 |
| 1,414 |
| Convertible bonds (continued) Health care 0.10% | Principal amount (000) | Value (000) |
| Teva Pharmaceutical Finance Co. BV, Series C, convertible bonds, 0.25% 2026 | $1,375 | $1,248 |
| Total convertible bonds (cost: $6,098,000) | 5,438 | |
| Convertible stocks 0.54% Industrials 0.49% | Shares | |
| Associated Materials, LLC, 14.00% convertible preferred 20209,10 | 4,850 | 5,892 |
| Utilities 0.05% | ||
| Vistra Energy Corp., 7.00% convertible preferred 2019 | 6,900 | 629 |
| Total convertible stocks (cost: $5,288,000) | 6,521 | |
| Common stocks 1.03% Energy 0.38% | ||
| Tribune Resources, Inc.9,12 | 1,006,339 | 3,019 |
| Ascent Resources - Utica, LLC, Class A7,9,10,12 | 6,297,894 | 1,511 |
| 4,530 | ||
| Industrials 0.33% | ||
| CEVA Logistics AG9,12 | 129,342 | 3,926 |
| NCI Building Systems, Inc.1,7,9,12 | 1,541 | 10 |
| 3,936 | ||
| Health care 0.22% | ||
| Advanz Pharma Corp.1,7,9,12 | 80,350 | 1,343 |
| Advanz Pharma Corp.12 | 29,684 | 558 |
| Rotech Healthcare Inc.7,9,10,12 | 201,793 | 807 |
| 2,708 | ||
| Materials 0.08% | ||
| International Flavors & Fragrances Inc. | 20,000 | 1,014 |
| Communication services 0.01% | ||
| Cumulus Media Inc., Class B9,12 | 4,291 | 46 |
| Cumulus Media Inc., Class A12 | 3,531 | 38 |
| Frontier Communications Corp. | 13,333 | 32 |
| Adelphia Recovery Trust, Series Arahova9,10,12 | 388,601 | 2 |
| Adelphia Recovery Trust, Series ACC-19,10,12 | 449,306 | —13 |
| 118 | ||
| Information technology 0.01% | ||
| Corporate Risk Holdings I, Inc.9,10,12 | 218,504 | 77 |
| Corporate Risk Holdings Corp.7,9,10,12 | 1,104 | —13 |
| 77 | ||
| Total common stocks (cost: $16,871,000) | 12,383 |
| Rights & warrants 0.02% Energy 0.02% | Shares | Value (000) |
| Tribune Resources, Inc., Class A, warrants, expire 20239,10,12 | 336,564 | $115 |
| Tribune Resources, Inc., Class B, warrants, expire 20239,10,12 | 261,772 | 69 |
| Tribune Resources, Inc., Class C, warrants, expire 20239,10,12 | 247,225 | 52 |
| Ultra Petroleum Corp., warrants, expire 20259,10,12 | 80,710 | 20 |
| 256 | ||
| Industrials 0.00% | ||
| Associated Materials, LLC, warrants, expire 20239,10,12 | 68,899 | —13 |
| Communication services 0.00% | ||
| Liberman Broadcasting, Inc., warrants, expire 20227,9,10,12 | 1 | —13 |
| Total rights & warrants (cost: $71,000) | 256 | |
| Short-term securities 1.40% | Principal amount (000) | |
| ADP Tax Services, Inc. 2.38% due 1/2/2019 | $6,800 | 6,799 |
| Apple Inc. 2.33% due 1/9/2019 | 10,000 | 9,994 |
| Total short-term securities (cost: $16,795,000) | 16,793 | |
| Total investment securities98.26% (cost: $1,274,934,000) | 1,182,891 | |
| Other assets less liabilities 1.74% | 21,008 | |
| Net assets100.00% | $1,203,899 |
| Receive | Pay | Expiration date | Notional (000) | Value at 12/31/2018 (000) | Upfront payments/ receipts (000) | Unrealized (depreciation) appreciation at 12/31/2018 (000) |
| 3-month USD-LIBOR | 2.772% | 2/28/2025 | $7,200 | $(71) | $— | $(71) |
| 3-month USD-LIBOR | 2.2825% | 4/13/2027 | 5,300 | 149 | — | 149 |
| 2.2865% | 3-month USD-LIBOR | 10/2/2027 | 10,100 | (309) | — | (309) |
| 3-month USD-LIBOR | 2.6475% | 1/25/2028 | 2,500 | 7 | — | 7 |
| $— | $(224) |
| Receive | Pay/ Payment frequency | Expiration date | Notional (000) | Value at 12/31/2018 (000) | Upfront payments (000) | Unrealized appreciation at 12/31/2018 (000) |
| CDX.NA.HY.31 | 5.00%/Quarterly | 12/20/2023 | $24,200 | $(482) | $(1,706) | $1,224 |
| CDX.NA.IG.31 | 1.00%/Quarterly | 12/20/2023 | 34,525 | (192) | (512) | 320 |
| $(2,218) | $1,544 |
| 1 | Acquired in a transaction exempt from registration under Rule 144A or Section 4(2) of the Securities Act of 1933. May be resold in the U.S. in transactions exempt from registration, normally to qualified institutional buyers. The total value of all such securities was $681,560,000, which represented 56.61% of the net assets of the fund. |
| 2 | Loan participations and assignments; may be subject to legal or contractual restrictions on resale. The total value of all such loans was $76,517,000, which represented 6.36% of the net assets of the fund. |
| 3 | Principal payments may be made periodically. Therefore, the effective maturity date may be earlier than the stated maturity date. |
| 4 | Coupon rate may change periodically. |
| 5 | Scheduled interest and/or principal payment was not received. |
| 6 | Payment in kind; the issuer has the option of paying additional securities in lieu of cash. Most recent payment was 100% cash unless otherwise noted. |
| 7 | Acquired through a private placement transaction exempt from registration under the Securities Act of 1933. May be subject to legal or contractual restrictions on resale. Further details on these holdings appear below. |
| 8 | Step bond; coupon rate may change at a later date. |
| 9 | Valued under fair value procedures adopted by authority of the board of trustees. The total value of all such securities was $30,796,000, which represented 2.56% of the net assets of the fund. This amount includes $3,926,000 related to certain securities trading outside the U.S. whose values were adjusted as a result of significant market movements following the close of local trading. |
| 10 | Value determined using significant unobservable inputs. |
| 11 | All or a portion of this security was pledged as collateral. The total value of pledged collateral was $1,233,000, which represented .10% of the net assets of the fund. |
| 12 | Security did not produce income during the last 12 months. |
| 13 | Amount less than one thousand. |
| Private placement securities | Acquisition date(s) | Cost (000) | Value (000) | Percent of net assets |
| Blackstone CQP Holdco LP 6.50% 2021 | 3/6/2017-2/5/2018 | $17,430 | $17,561 | 1.46% |
| Blackstone CQP Holdco LP 6.00% 2021 | 8/9/2017 | 1,600 | 1,610 | .13 |
| Ascent Resources - Utica, LLC, Class A | 11/15/2016 | 302 | 1,511 | .13 |
| Advanz Pharma Corp. | 8/31/2018-9/4/2018 | 1,017 | 1,343 | .11 |
| Rotech Healthcare Inc. | 9/26/2013 | 4,331 | 807 | .07 |
| NCI Building Systems, Inc. | 11/16/2018 | 33 | 10 | .00 |
| Liberman Broadcasting, Inc., warrants, expire 2022 | 12/13/2012-11/26/2014 | — | — | — |
| Corporate Risk Holdings Corp. | 8/31/2015 | — | — | — |
| Total private placement securities | $24,713 | $22,842 | 1.90% |
| Key to abbreviations and symbols |
| Auth. = Authority |
| € = Euros |
| LIBOR = London Interbank Offered Rate |
| Rev. = Revenue |
| USD/$ = U.S. dollars |
| Bonds, notes & other debt instruments 95.20% Mortgage-backed obligations 71.87% Federal agency mortgage-backed obligations 68.28% | Principal amount (000) | Value (000) |
| Fannie Mae 4.00% 20361 | $484 | $499 |
| Fannie Mae 4.00% 20361 | 404 | 417 |
| Fannie Mae 5.00% 20361 | 38 | 39 |
| Fannie Mae 4.00% 20471 | 7,103 | 7,249 |
| Fannie Mae 4.00% 20471 | 4,751 | 4,848 |
| Fannie Mae 4.00% 20481 | 531 | 542 |
| Fannie Mae 4.00% 20481 | 469 | 478 |
| Fannie Mae 4.00% 20481 | 436 | 445 |
| Fannie Mae 4.50% 20481 | 14,594 | 15,132 |
| Fannie Mae 4.50% 20481 | 7,755 | 8,044 |
| Fannie Mae 4.50% 20481 | 4,339 | 4,501 |
| Fannie Mae 4.50% 20481,2 | 1,663 | 1,724 |
| Fannie Mae 4.50% 20481 | 93 | 97 |
| Fannie Mae 3.50% 20491,2 | 3,200 | 3,201 |
| Fannie Mae 4.00% 20491,2 | 5,163 | 5,265 |
| Freddie Mac 5.00% 20341 | 1,255 | 1,332 |
| Freddie Mac 4.00% 20361 | 5,020 | 5,180 |
| Freddie Mac 4.00% 20361 | 1,042 | 1,076 |
| Freddie Mac 3.203% 20451,3 | 2,217 | 2,234 |
| Freddie Mac 3.00% 20461 | 7,155 | 7,036 |
| Freddie Mac 4.00% 20481 | 1,857 | 1,895 |
| Freddie Mac 4.00% 20481 | 1,842 | 1,880 |
| Freddie Mac, Series KJ02, Class A2, Multi Family, 2.597% 20201 | 1,539 | 1,532 |
| Freddie Mac, Series K031, Class A2, Multi Family, 3.30% 20231 | 4,722 | 4,795 |
| Freddie Mac, Series K032, Class A2, Multi Family, 3.31% 20231 | 1,250 | 1,269 |
| Freddie Mac Seasoned Credit Risk Transfer Trust, Series 2017-2, Class HA, 2.50% 20561 | 1,671 | 1,642 |
| Freddie Mac Seasoned Credit Risk Transfer Trust, Series 2017-1, Class HA, 2.75% 20561,3 | 1,360 | 1,324 |
| Freddie Mac Seasoned Credit Risk Transfer Trust, Series 2017-2, Class MA, 3.00% 20561 | 1,588 | 1,533 |
| Freddie Mac Seasoned Credit Risk Transfer Trust, Series 2017-4, Class HT, 2.50% 20571,3 | 12,143 | 11,833 |
| Freddie Mac Seasoned Credit Risk Transfer Trust, Series 2018-2, Class MT, 3.50% 20571 | 10,978 | 10,862 |
| Freddie Mac Seasoned Credit Risk Transfer Trust, Series 2017-4, Class MT, 3.50% 20571 | 7,496 | 7,448 |
| Freddie Mac Seasoned Loan Structured Transaction, Series 2018-2, Class A1, 3.50% 20281,3 | 7,830 | 7,698 |
| Freddie Mac Seasoned Loan Structured Transaction, Series 2018-1, Class A1, 3.50% 20281 | 2,101 | 2,093 |
| Government National Mortgage Assn. 3.75% 20341 | 1,184 | 1,209 |
| Government National Mortgage Assn. 3.75% 20381 | 785 | 805 |
| Government National Mortgage Assn. 3.75% 20391 | 833 | 854 |
| Government National Mortgage Assn. 4.00% 20391 | 450 | 448 |
| Government National Mortgage Assn. 6.00% 20391 | 230 | 250 |
| Government National Mortgage Assn. 4.00% 20401 | 382 | 380 |
| Government National Mortgage Assn. 5.50% 20401 | 1,797 | 1,900 |
| Government National Mortgage Assn. 4.50% 20411 | 30 | 31 |
| Government National Mortgage Assn. 5.00% 20411 | 1,038 | 1,082 |
| Government National Mortgage Assn. 5.00% 20411 | 666 | 698 |
| Government National Mortgage Assn. 6.50% 20411 | 453 | 497 |
| Bonds, notes & other debt instruments (continued) Mortgage-backed obligations (continued) Federal agency mortgage-backed obligations (continued) | Principal amount (000) | Value (000) |
| Government National Mortgage Assn. 3.50% 20421 | $461 | $453 |
| Government National Mortgage Assn. 3.50% 20421 | 221 | 222 |
| Government National Mortgage Assn. 3.50% 20421 | 222 | 217 |
| Government National Mortgage Assn. 3.50% 20431 | 2,015 | 2,042 |
| Government National Mortgage Assn. 3.50% 20431 | 1,573 | 1,593 |
| Government National Mortgage Assn. 3.50% 20431 | 1,415 | 1,425 |
| Government National Mortgage Assn. 3.50% 20431 | 1,063 | 1,071 |
| Government National Mortgage Assn. 3.50% 20431 | 884 | 890 |
| Government National Mortgage Assn. 3.50% 20431 | 250 | 244 |
| Government National Mortgage Assn. 3.50% 20431 | 213 | 214 |
| Government National Mortgage Assn. 3.75% 20441 | 765 | 783 |
| Government National Mortgage Assn. 4.25% 20441 | 1,724 | 1,796 |
| Government National Mortgage Assn. 4.00% 20461 | 948 | 963 |
| Government National Mortgage Assn. 4.00% 20491,2 | 6,200 | 6,350 |
| Government National Mortgage Assn. 4.50% 20491,2 | 34,750 | 35,964 |
| Government National Mortgage Assn. 5.00% 20491,2 | 2,627 | 2,734 |
| Government National Mortgage Assn. 5.00% 20491,2 | 373 | 387 |
| Government National Mortgage Assn. 4.607% 20651 | 602 | 618 |
| Government National Mortgage Assn. 4.624% 20651 | 370 | 379 |
| Government National Mortgage Assn. 4.653% 20651 | 1,040 | 1,071 |
| Government National Mortgage Assn. 4.56% 20661 | 1,335 | 1,396 |
| Government National Mortgage Assn. 5.20% 20661 | 84 | 85 |
| Vendee Mortgage Trust, Series 2011-2, Class V, 3.75% 20281 | 4,166 | 4,131 |
| Vendee Mortgage Trust, Series 2010-1, Class DA, 4.25% 20351 | 478 | 484 |
| 198,809 | ||
| Collateralized mortgage-backed obligations (privately originated) 3.59% | ||
| Arroyo Mortgage Trust, Series 2018-1, Class A1, 3.763% 20481,3,4 | 881 | 882 |
| Connecticut Avenue Securities, Series 2014-C02, Class 1M1, (1-month USD-LIBOR + 0.95%) 3.456% 20241,3 | 6 | 7 |
| Finance of America Structured Securities Trust, Series 2017-HB1, Class A, 2.321% 20271,3,4,5 | 876 | 875 |
| Finance of America Structured Securities Trust, Series 2018-HB1, Class A, 3.375% 20281,3,4 | 2,287 | 2,293 |
| Nationstar HECM Loan Trust, Series 2017-2A, Class A1, 2.038% 20271,3,4 | 777 | 775 |
| Nationstar HECM Loan Trust, Series 2018-1A, Class A, 2.76% 20281,4 | 604 | 604 |
| Nationstar HECM Loan Trust, Series 2018-2, Class A, 3.188% 20281,4,5 | 987 | 986 |
| Nationstar HECM Loan Trust, Series 2018-3A, Class A, 3.555% 20281,3,4,5 | 922 | 922 |
| Reverse Mortgage Investment Trust, Series RBIT 18-1, Class A, 3.436% 20281,3,4 | 374 | 374 |
| Towd Point Mortgage Trust, Series 2017-1, Class A1, 2.75% 20561,3,4 | 1,203 | 1,182 |
| Towd Point Mortgage Trust, Series 2015-2, Class 2A11, 3.00% 20571,4 | 1,366 | 1,356 |
| Towd Point Mortgage Trust, Series 2017-5, Class A1, 3.106% 20571,3,4 | 206 | 205 |
| 10,461 | ||
| Total mortgage-backed obligations | 209,270 | |
| U.S. Treasury bonds & notes 10.99% U.S. Treasury 6.63% | ||
| U.S. Treasury 1.50% 2020 | 444 | 438 |
| U.S. Treasury 2.00% 2022 | 2,400 | 2,359 |
| U.S. Treasury 2.125% 2022 | 1,000 | 986 |
| U.S. Treasury 1.75% 2023 | 3,500 | 3,393 |
| U.S. Treasury 2.75% 2023 | 224 | 226 |
| U.S. Treasury 2.875% 2023 | 4,350 | 4,423 |
| Bonds, notes & other debt instruments (continued) U.S. Treasury bonds & notes (continued) U.S. Treasury (continued) | Principal amount (000) | Value (000) |
| U.S. Treasury 2.50% 2024 | $2,500 | $2,496 |
| U.S. Treasury 3.00% 20486 | 5,000 | 4,981 |
| 19,302 | ||
| U.S. Treasury inflation-protected securities 4.36% | ||
| U.S. Treasury Inflation-Protected Security 0.625% 20237 | 6,108 | 6,013 |
| U.S. Treasury Inflation-Protected Security 2.125% 20417 | 127 | 150 |
| U.S. Treasury Inflation-Protected Security 0.75% 20426,7 | 7,201 | 6,547 |
| 12,710 | ||
| Total U.S. Treasury bonds & notes | 32,012 | |
| Federal agency bonds & notes 6.35% | ||
| Fannie Mae 2.00% 2022 | 5,800 | 5,716 |
| Federal Home Loan Bank 1.375% 2021 | 3,000 | 2,933 |
| Federal Home Loan Bank 1.875% 2021 | 10,000 | 9,834 |
| 18,483 | ||
| Asset-backed obligations 5.96% | ||
| AmeriCredit Automobile Receivables Trust, Series 2017-2, Class A2A, 1.65% 20201 | 65 | 65 |
| AmeriCredit Automobile Receivables Trust, Series 2018-1, Class A2A, 2.71% 20211 | 738 | 737 |
| Angel Oak Capital Advisors LLC, CLO, Series 2013-9A, Class A1R, (3-month USD-LIBOR + 1.01%) 3.479% 20251,3,4 | 117 | 117 |
| Chase Issuance Trust, Series 2016-A5, Class A5, 1.27% 20211 | 115 | 114 |
| Citibank Credit Card Issuance Trust, Series 2016-A1, Class A1, 1.75% 20211 | 355 | 351 |
| CPS Auto Receivables Trust, Series 2017-A, Class A, 1.68% 20201,4 | 37 | 37 |
| CPS Auto Receivables Trust, Series 2017-C, Class A, 1.78% 20201,4 | 14 | 14 |
| CPS Auto Receivables Trust, Series 2018-B, Class A, 2.72% 20211,4 | 376 | 374 |
| Drive Auto Receivables Trust, Series 2018-2, Class A2, 2.64% 20201 | 456 | 456 |
| Drive Auto Receivables Trust, Series 2018-3, Class A2, 2.75% 20201 | 1,585 | 1,584 |
| Drive Auto Receivables Trust, Series 2017-3, Class C, 2.80% 20221 | 490 | 489 |
| Drivetime Auto Owner Trust, Series 2018-2, Class A, 2.84% 20211,4 | 892 | 889 |
| Emerson Park Ltd., CLO, Series 2013-1A, Class A1AR, (3-month USD-LIBOR + 0.98%) 3.416% 20251,3,4 | 38 | 38 |
| Exeter Automobile Receivables Trust, Series 2017-3A, Class A, 2.05% 20211,4 | 342 | 340 |
| Exeter Automobile Receivables Trust, Series 2018-2A, Class A, 2.79% 20211,4 | 1,235 | 1,233 |
| Ford Credit Auto Owner Trust, Series 2014-1A, 2.26% 20251,4 | 1,390 | 1,386 |
| Ford Credit Auto Owner Trust, Series 2014-2A, 2.31% 20261,4 | 530 | 526 |
| Hertz Vehicle Financing LLC, Rental Car Asset-Backed Notes, Series 2015-1, Class A, 2.73% 20211,4 | 1,823 | 1,808 |
| Santander Drive Auto Receivables Trust, Series 2018-4, Class A2A, 3.07% 20211 | 805 | 803 |
| SLM Private Credit Student Loan Trust, Series 2010-1, Class A, (1-month USD-LIBOR + 0.40%) 2.906% 20251,3 | 2,629 | 2,573 |
| Symphony Ltd., CLO, Series 2013-12A, Class AR, (3-month USD-LIBOR + 1.03%) 3.466% 20251,3,4 | 336 | 335 |
| Toyota Auto Receivables Owner Trust, Series 2018-B, Class A2A, 2.64% 20211 | 1,330 | 1,327 |
| Westlake Automobile Receivables Trust, Series 2017-2A, Class A2A, 1.80% 20201,4 | 147 | 147 |
| Westlake Automobile Receivables Trust, Series 2018-2A, Class A2A, 2.84% 20211,4 | 1,330 | 1,328 |
| Westlake Automobile Receivables Trust, Series 2017-1A, Class C, 2.70% 20221,4 | 270 | 269 |
| 17,340 | ||
| Corporate bonds & notes 0.03% Financials 0.03% | ||
| Carlyle Investment Management (1-month USD-LIBOR + 2.00%) 4.436% 20191,3,4,5,8 | 80 | 80 |
| Total bonds, notes & other debt instruments (cost: $278,182,000) | 277,185 |
| Short-term securities 22.86% | Principal amount (000) | Value (000) |
| ADP Tax Services, Inc. 2.38%due 1/2/20194 | $8,700 | $8,699 |
| Emerson Electric Co. 2.37%due 1/4/20194 | 3,300 | 3,299 |
| ExxonMobil Corp. 2.43%due 1/10/2019 | 5,000 | 4,997 |
| Federal Home Loan Bank 2.23%–2.27%due 1/4/2019–1/11/2019 | 15,000 | 14,993 |
| Kimberly-Clark Corp. 2.47%due 1/11/20194 | 2,100 | 2,098 |
| Mizuho Bank, Ltd. 2.42%due 1/4/20194 | 10,000 | 9,997 |
| National Rural Utilities Cooperative Finance Corp. 2.50%due 1/8/2019 | 11,000 | 10,994 |
| Paccar Financial Corp. 2.50%due 1/29/2019 | 2,600 | 2,595 |
| Pfizer Inc. 2.43%due 1/10/20194 | 5,100 | 5,097 |
| Québec (Province of) 2.53%due 1/22/20194 | 3,800 | 3,794 |
| Total short-term securities (cost: $66,566,000) | 66,563 | |
| Total investment securities118.06% (cost: $344,748,000) | 343,748 | |
| Other assets less liabilities (18.06)% | (52,573) | |
| Net assets100.00% | $291,175 |
| Contracts | Type | Number of contracts | Expiration | Notional amount9 (000) | Value at 12/31/201810 (000) | Unrealized appreciation at 12/31/2018 (000) |
| 90 Day Euro Dollar Futures | Long | 108 | December 2019 | $27,000 | $26,285 | $163 |
| 2 Year U.S. Treasury Note Futures | Long | 374 | April 2019 | 74,800 | 79,405 | 188 |
| 5 Year U.S. Treasury Note Futures | Long | 464 | April 2019 | 46,400 | 53,215 | 741 |
| 10 Year Ultra U.S. Treasury Note Futures | Long | 102 | March 2019 | 10,200 | 13,268 | 427 |
| 20 Year U.S. Treasury Bond Futures | Long | 56 | March 2019 | 5,600 | 8,176 | 338 |
| 30 Year Ultra U.S. Treasury Bond Futures | Long | 5 | March 2019 | 500 | 803 | 42 |
| $1,899 |
| Receive | Pay | Expiration date | Notional (000) | Value at 12/31/2018 (000) | Upfront payments/ receipts (000) | Unrealized appreciation (depreciation) at 12/31/2018 (000) |
| 2.5215% | U.S. EFFR | 8/29/2020 | $16,490 | $47 | $— | $47 |
| 3-month USD-LIBOR | 2.806% | 8/29/2020 | 300 | (1) | — | (1) |
| 2.622% | U.S. EFFR | 9/14/2020 | 7,500 | 34 | — | 34 |
| 2.729% | U.S. EFFR | 10/22/2020 | 22,900 | 152 | — | 152 |
| 2.4825% | U.S. EFFR | 12/26/2020 | 41,000 | 104 | — | 104 |
| 3-month USD-LIBOR | 1.217% | 9/22/2021 | 11,500 | 421 | — | 421 |
| 3-month USD-LIBOR | 1.225% | 9/22/2021 | 11,500 | 418 | — | 418 |
| 3-month USD-LIBOR | 1.2796% | 10/11/2021 | 14,500 | 513 | — | 513 |
| 2.0135% | 3-month USD-LIBOR | 10/20/2021 | 30,000 | (473) | — | (473) |
| 2.012% | 3-month USD-LIBOR | 10/4/2022 | 9,000 | (182) | — | (182) |
| 2.00% | 3-month USD-LIBOR | 10/5/2022 | 41,500 | (857) | — | (856) |
| 2.1045% | 3-month USD-LIBOR | 10/31/2022 | 4,000 | (68) | — | (68) |
| 3-month USD-LIBOR | 2.2835% | 1/5/2023 | 36,000 | 398 | — | 398 |
| 3-month USD-LIBOR | 2.24% | 12/5/2026 | 10,500 | 310 | — | 310 |
| 3-month USD-LIBOR | 2.27% | 12/5/2026 | 8,500 | 232 | — | 232 |
| 3-month USD-LIBOR | 3.206% | 7/31/2044 | 1,000 | (69) | — | (69) |
| Receive | Pay | Expiration date | Notional (000) | Value at 12/31/2018 (000) | Upfront payments/ receipts (000) | Unrealized appreciation (depreciation) at 12/31/2018 (000) |
| 3-month USD-LIBOR | 3.238% | 8/8/2044 | $2,000 | $(150) | $— | $(150) |
| 3-month USD-LIBOR | 3.2265% | 9/25/2044 | 3,000 | (219) | — | (219) |
| U.S. EFFR | 2.145% | 11/9/2047 | 2,200 | 167 | — | 167 |
| U.S. EFFR | 2.153% | 11/10/2047 | 2,200 | 163 | — | 163 |
| U.S. EFFR | 2.155% | 11/10/2047 | 1,280 | 95 | — | 95 |
| U.S. EFFR | 2.17% | 11/13/2047 | 2,320 | 164 | — | 164 |
| U.S. EFFR | 2.5635% | 2/12/2048 | 4,528 | (49) | — | (49) |
| 2.98% | 3-month USD-LIBOR | 3/15/2048 | 300 | 9 | — | 9 |
| 2.9625% | 3-month USD-LIBOR | 3/15/2048 | 300 | 8 | — | 8 |
| U.S. EFFR | 2.4615% | 3/15/2048 | 300 | 3 | — | 3 |
| U.S. EFFR | 2.485% | 3/15/2048 | 300 | 2 | — | 2 |
| U.S. EFFR | 2.425% | 3/16/2048 | 600 | 11 | — | 11 |
| 2.917% | 3-month USD-LIBOR | 3/16/2048 | 600 | 10 | — | 10 |
| $— | $1,194 |
| 1 | Principal payments may be made periodically. Therefore, the effective maturity date may be earlier than the stated maturity date. |
| 2 | Purchased on a TBA basis. |
| 3 | Coupon rate may change periodically. |
| 4 | Acquired in a transaction exempt from registration under Rule 144A or Section 4(2) of the Securities Act of 1933. May be resold in the U.S. in transactions exempt from registration, normally to qualified institutional buyers. The total value of all such securities was $52,359,000, which represented 17.98% of the net assets of the fund. |
| 5 | Valued under fair value procedures adopted by authority of the board of trustees. The total value of all such securities was $2,863,000, which represented .98% of the net assets of the fund. |
| 6 | All or a portion of this security was pledged as collateral. The total value of pledged collateral was $2,758,000, which represented .95% of the net assets of the fund. |
| 7 | Index-linked bond whose principal amount moves with a government price index. |
| 8 | Value determined using significant unobservable inputs. |
| 9 | Notional amount is calculated based on the number of contracts and notional contract size. |
| 10 | Value is calculated based on the notional amount and current market price. |
| Key to abbreviations and symbol |
| CLO = Collateralized Loan Obligations |
| EFFR = Effective Federal Funds Rate |
| LIBOR = London Interbank Offered Rate |
| TBA = To-be-announced |
| USD/$ = U.S. dollars |
| Short-term securities 100.11% Commercial paper 69.84% | Principal amount (000) | Value (000) |
| 3M Co. 2.40%due 1/7/20191 | $10,000 | $9,996 |
| Alberta (Province of) 2.48%due 1/22/20191 | 10,000 | 9,985 |
| Apple Inc. 2.45%due 2/5/20191 | 10,000 | 9,975 |
| Bank of New York Mellon Corp. 2.34%due 1/22/2019 | 8,000 | 7,988 |
| BASF SE 2.56%due 2/1/20191 | 8,750 | 8,730 |
| CHARTA, LLC 2.85%due 3/26/20191 | 8,022 | 7,968 |
| Coca-Cola Co. 2.30%due 1/4/20191 | 10,000 | 9,997 |
| Emerson Electric Co. 2.52%due 1/17/20191 | 10,000 | 9,989 |
| IBM Credit LLC 2.47%due 1/22/20191 | 10,000 | 9,985 |
| Intel Corp. 2.40%due 1/10/20191 | 7,000 | 6,995 |
| John Deere Capital Corp. 2.40%due 1/16/20191 | 10,000 | 9,989 |
| KfW 2.46%due 1/18/20191 | 8,400 | 8,390 |
| Merck & Co. Inc. 2.50%due 2/27/20191 | 10,000 | 9,960 |
| Mizuho Bank, Ltd. 2.48%due 1/15/20191 | 10,000 | 9,990 |
| National Australia Bank Ltd. 2.65%due 2/25/20191 | 10,000 | 9,959 |
| National Rural Utilities Cooperative Finance Corp. 2.40%due 1/4/2019 | 6,000 | 5,998 |
| Nordea Bank AB 2.77%due 3/18/20191 | 10,000 | 9,942 |
| Paccar Financial Corp. 2.39%due 1/2/2019 | 8,000 | 7,999 |
| Pfizer Inc. 2.28%due 1/14/20191 | 7,400 | 7,393 |
| Procter & Gamble Co. 2.30%due 1/14/20191 | 10,000 | 9,991 |
| Siemens Capital Corp. 2.50%due 1/16/20191 | 4,700 | 4,695 |
| Simon Property Group, LP 2.51%due 1/14/20191 | 8,100 | 8,092 |
| United Overseas Bank Ltd. 2.55%due 1/8/20191 | 5,000 | 4,997 |
| United Parcel Service Inc. 2.34%due 1/22/20191 | 5,000 | 4,993 |
| Wal-Mart Stores, Inc. 2.37%due 1/7/20191 | 10,000 | 9,995 |
| 213,991 | ||
| U.S. Treasury 24.41% | ||
| U.S. Treasury Bills 2.23%–2.38%due 1/8/2019–2/19/2019 | 74,900 | 74,797 |
| Federal agency discount notes 5.86% | ||
| Fannie Mae 2.29%due 1/23/2019 | 3,000 | 2,996 |
| Federal Home Loan Bank 2.38%due 2/8/2019 | 15,000 | 14,962 |
| 17,958 | ||
| Total short-term securities (cost: $306,754,000) | 306,746 | |
| Total investment securities100.11% (cost: $306,754,000) | 306,746 | |
| Other assets less liabilities (0.11)% | (342) | |
| Net assets100.00% | $306,404 |
| 1 | Acquired in a transaction exempt from registration under Rule 144A or Section 4(2) of the Securities Act of 1933. May be resold in the U.S. in transactions exempt from registration, normally to qualified institutional buyers. The total value of all such securities was $192,006,000, which represented 62.66% of the net assets of the fund. |
| Bonds, notes & other debt instruments 97.30% U.S. Treasury bonds & notes 47.72% U.S. Treasury 39.27% | Principal amount (000) | Value (000) |
| U.S. Treasury 2.25% 2020 | $29,900 | $29,789 |
| U.S. Treasury 2.50% 2020 | 78,000 | 77,950 |
| U.S. Treasury 2.75% 2020 | 12,300 | 12,349 |
| U.S. Treasury 1.125% 2021 | 31,950 | 30,853 |
| U.S. Treasury 1.75% 20211 | 33,540 | 32,877 |
| U.S. Treasury 2.00% 2021 | 46,300 | 45,692 |
| U.S. Treasury 2.00% 2021 | 5,350 | 5,286 |
| U.S. Treasury 2.125% 2021 | 23,450 | 23,241 |
| U.S. Treasury 2.25% 2021 | 23,580 | 23,459 |
| U.S. Treasury 2.875% 2021 | 6,500 | 6,571 |
| U.S. Treasury 1.625% 2022 | 100 | 97 |
| U.S. Treasury 1.75% 2022 | 174,300 | 170,261 |
| U.S. Treasury 1.75% 2022 | 11,700 | 11,444 |
| U.S. Treasury 1.875% 2022 | 63,000 | 61,823 |
| U.S. Treasury 1.875% 2022 | 25,000 | 24,496 |
| U.S. Treasury 1.875% 2022 | 23,000 | 22,513 |
| U.S. Treasury 2.00% 2022 | 69,500 | 68,300 |
| U.S. Treasury 2.00% 2022 | 16,010 | 15,728 |
| U.S. Treasury 1.375% 2023 | 7,000 | 6,647 |
| U.S. Treasury 1.625% 2023 | 10,000 | 9,645 |
| U.S. Treasury 1.75% 2023 | 11,500 | 11,147 |
| U.S. Treasury 2.125% 20231 | 64,095 | 62,954 |
| U.S. Treasury 2.50% 2023 | 49,894 | 49,910 |
| U.S. Treasury 2.625% 2023 | 31,000 | 31,170 |
| U.S. Treasury 2.625% 2023 | 17,255 | 17,347 |
| U.S. Treasury 2.75% 2023 | 17,800 | 17,987 |
| U.S. Treasury 2.875% 2023 | 43,000 | 43,721 |
| U.S. Treasury 2.875% 2023 | 22,500 | 22,896 |
| U.S. Treasury 2.125% 2024 | 55,975 | 54,713 |
| U.S. Treasury 2.25% 2024 | 6,500 | 6,417 |
| U.S. Treasury 2.50% 2024 | 44,000 | 43,931 |
| U.S. Treasury 2.75% 2025 | 38,000 | 38,392 |
| U.S. Treasury 2.875% 2025 | 25,000 | 25,434 |
| U.S. Treasury 2.00% 2026 | 8,000 | 7,638 |
| U.S. Treasury 2.875% 2028 | 14,000 | 14,231 |
| 1,126,909 | ||
| U.S. Treasury inflation-protected securities 8.45% | ||
| U.S. Treasury Inflation-Protected Security 0.125% 20222 | 11,508 | 11,168 |
| U.S. Treasury Inflation-Protected Security 0.625% 20232 | 36,140 | 35,576 |
| U.S. Treasury Inflation-Protected Security 0.25% 20252 | 23,637 | 22,636 |
| U.S. Treasury Inflation-Protected Security 0.375% 20272 | 13,128 | 12,478 |
| U.S. Treasury Inflation-Protected Security 0.75% 20282 | 39,288 | 38,480 |
| U.S. Treasury Inflation-Protected Security 2.125% 20412 | 358 | 424 |
| U.S. Treasury Inflation-Protected Security 0.75% 20421,2 | 22,035 | 20,033 |
| Bonds, notes & other debt instruments (continued) U.S. Treasury bonds & notes (continued) U.S. Treasury inflation-protected securities (continued) | Principal amount (000) | Value (000) |
| U.S. Treasury Inflation-Protected Security 1.375% 20441,2 | $46,878 | $48,537 |
| U.S. Treasury Inflation-Protected Security 1.00% 20462 | 2,833 | 2,691 |
| U.S. Treasury Inflation-Protected Security 0.875% 20472 | 18,751 | 17,240 |
| U.S. Treasury Inflation-Protected Security 1.00% 20481,2 | 43,513 | 33,238 |
| 242,501 | ||
| Total U.S. Treasury bonds & notes | 1,369,410 | |
| Mortgage-backed obligations 28.63% Federal agency mortgage-backed obligations 28.63% | ||
| Fannie Mae 6.50% 20283 | 153 | 167 |
| Fannie Mae 4.00% 20343,4 | 40,000 | 40,933 |
| Fannie Mae 3.00% 20363 | 26,454 | 26,207 |
| Fannie Mae 4.00% 20363 | 7,736 | 7,994 |
| Fannie Mae 4.00% 20363 | 6,039 | 6,241 |
| Fannie Mae 4.00% 20363 | 1,981 | 2,047 |
| Fannie Mae 3.00% 20373 | 16,705 | 16,549 |
| Fannie Mae 6.50% 20373 | 32 | 35 |
| Fannie Mae 7.00% 20373 | 56 | 62 |
| Fannie Mae 7.00% 20373 | 6 | 7 |
| Fannie Mae 6.00% 20383 | 17 | 17 |
| Fannie Mae 4.50% 20413 | 1,088 | 1,141 |
| Fannie Mae 5.00% 20413 | 797 | 852 |
| Fannie Mae 5.00% 20413 | 532 | 569 |
| Fannie Mae 5.00% 20413 | 422 | 451 |
| Fannie Mae 5.00% 20413 | 294 | 314 |
| Fannie Mae 3.00% 20463 | 7,606 | 7,428 |
| Fannie Mae 3.50% 20473 | 15,311 | 15,322 |
| Fannie Mae 4.00% 20473 | 31,328 | 31,969 |
| Fannie Mae 4.00% 20473 | 5,304 | 5,413 |
| Fannie Mae 4.00% 20483 | 14,000 | 14,285 |
| Fannie Mae 4.00% 20483 | 13,363 | 13,635 |
| Fannie Mae 4.00% 20483 | 12,000 | 12,245 |
| Fannie Mae 4.00% 20483 | 11,000 | 11,224 |
| Fannie Mae 4.00% 20483 | 6,000 | 6,122 |
| Fannie Mae 4.00% 20483 | 3,434 | 3,504 |
| Fannie Mae 4.00% 20483 | 1,000 | 1,020 |
| Fannie Mae 4.00% 20483 | 1,000 | 1,020 |
| Fannie Mae 4.00% 20483 | 988 | 1,008 |
| Fannie Mae 4.00% 20483 | 513 | 523 |
| Fannie Mae 4.00% 20483 | 297 | 303 |
| Fannie Mae 4.00% 20483 | 25 | 25 |
| Fannie Mae 4.00% 20483,4 | —5 | —5 |
| Fannie Mae 4.50% 20483,4 | 44,012 | 45,636 |
| Fannie Mae 4.50% 20483 | 42,653 | 44,240 |
| Fannie Mae 4.50% 20483 | 4,922 | 5,105 |
| Fannie Mae 4.50% 20483 | 187 | 194 |
| Fannie Mae 3.50% 20493,4 | 69,981 | 69,997 |
| Fannie Mae 4.00% 20493,4 | 20 | 20 |
| Fannie Mae, Series 2001-4, Class NA, 9.073% 20253,6 | 1 | 1 |
| Fannie Mae, Series 2001-4, Class GA, 9.193% 20253,6 | —5 | 1 |
| Fannie Mae, Series 2001-T10, Class A1, 7.00% 20413 | 70 | 80 |
| Fannie Mae, Series 2012-M2, Class A2, Multi Family, 2.717% 20223 | 2,047 | 2,044 |
| Fannie Mae, Series 2012-M3, Class 1A2, Multi Family, 3.044% 20223 | 1,968 | 1,983 |
| Bonds, notes & other debt instruments (continued) Mortgage-backed obligations (continued) Federal agency mortgage-backed obligations (continued) | Principal amount (000) | Value (000) |
| Fannie Mae, Series 2014-M1, Class A2, Multi Family, 3.214% 20233,6 | $1,912 | $1,941 |
| Fannie Mae, Series 2014-M3, Class A2, Multi Family, 3.46% 20243,6 | 3,825 | 3,921 |
| Fannie Mae, Series 2006-56, Class OG, principal only, 0% 20363 | 129 | 109 |
| Freddie Mac 5.50% 20243 | 352 | 363 |
| Freddie Mac 3.50% 20333 | 25,000 | 25,333 |
| Freddie Mac 4.627% 20363,6 | 247 | 260 |
| Freddie Mac 5.00% 20403 | 935 | 991 |
| Freddie Mac 5.00% 20413 | 1,774 | 1,896 |
| Freddie Mac 4.00% 20433 | 416 | 427 |
| Freddie Mac 3.203% 20453,6 | 1,774 | 1,787 |
| Freddie Mac 3.50% 20473 | 16,960 | 16,966 |
| Freddie Mac 3.50% 20473 | 13,512 | 13,518 |
| Freddie Mac 4.50% 20483 | 14,250 | 14,763 |
| Freddie Mac 4.50% 20483 | 3,277 | 3,396 |
| Freddie Mac 4.50% 20493,4 | 19,344 | 20,032 |
| Freddie Mac, Series 1567, Class A, (1-month USD-LIBOR + 0.40%) 2.855% 20233,6 | 31 | 31 |
| Freddie Mac, Series KGRP, Class A, Multi Family, (1-month USD-LIBOR + 0.38%) 2.727% 20203,6 | 1,007 | 1,007 |
| Freddie Mac, Series K013, Class A1, Multi Family, 2.902% 20203 | 327 | 326 |
| Freddie Mac, Series K010, Class A1, Multi Family, 3.32% 20203 | 53 | 53 |
| Freddie Mac, Series K019, Class A1, Multi Family, 1.459% 20213 | 576 | 570 |
| Freddie Mac, Series K031, Class A1, Multi Family, 2.778% 20223 | 801 | 798 |
| Freddie Mac, Series KS01, Class A2, Multi Family, 2.522% 20233 | 1,735 | 1,711 |
| Freddie Mac, Series K029, Class A2, Multi Family, 3.32% 20233 | 400 | 406 |
| Freddie Mac, Series K070, Class A2, Multi Family, 3.303% 20273,6 | 5,765 | 5,771 |
| Freddie Mac, Series 3213, Class OG, principal only, 0% 20363 | 222 | 199 |
| Freddie Mac Seasoned Credit Risk Transfer Trust, Series 2017-2, Class HA, 2.50% 20563 | 12,273 | 12,066 |
| Freddie Mac Seasoned Credit Risk Transfer Trust, Series 2017-1, Class HA, 2.75% 20563,6 | 11,476 | 11,171 |
| Freddie Mac Seasoned Credit Risk Transfer Trust, Series 2017-2, Class MA, 3.00% 20563 | 11,670 | 11,272 |
| Freddie Mac Seasoned Credit Risk Transfer Trust, Series 2017-4, Class HT, 2.50% 20573,6 | 2,313 | 2,254 |
| Freddie Mac Seasoned Credit Risk Transfer Trust, Series 2018-2, Class MT, 3.50% 20573 | 42,088 | 41,644 |
| Freddie Mac Seasoned Credit Risk Transfer Trust, Series 2017-4, Class MT, 3.50% 20573 | 1,801 | 1,789 |
| Freddie Mac Seasoned Loan Structured Transaction, Series 2018-2, Class A1, 3.50% 20283,6 | 45,026 | 44,268 |
| Freddie Mac Seasoned Loan Structured Transaction, Series 2018-1, Class A1, 3.50% 20283 | 10,284 | 10,249 |
| Government National Mortgage Assn. 3.75% 20343 | 1,200 | 1,225 |
| Government National Mortgage Assn. 5.50% 20383 | 320 | 341 |
| Government National Mortgage Assn. 5.50% 20383 | 136 | 145 |
| Government National Mortgage Assn. 5.50% 20383 | 129 | 137 |
| Government National Mortgage Assn. 5.50% 20383 | 76 | 80 |
| Government National Mortgage Assn. 6.00% 20383 | 227 | 244 |
| Government National Mortgage Assn. 6.50% 20383 | 385 | 437 |
| Government National Mortgage Assn. 6.50% 20383 | 116 | 131 |
| Government National Mortgage Assn. 5.00% 20393 | 616 | 653 |
| Government National Mortgage Assn. 6.00% 20393 | 231 | 250 |
| Government National Mortgage Assn. 4.50% 20403 | 451 | 474 |
| Government National Mortgage Assn. 5.50% 20403 | 6,597 | 6,975 |
| Government National Mortgage Assn. 4.50% 20413 | 1,314 | 1,365 |
| Government National Mortgage Assn. 5.00% 20413 | 2,332 | 2,431 |
| Government National Mortgage Assn. 3.00% 20423 | 52 | 51 |
| Government National Mortgage Assn. 3.50% 20433 | 1,771 | 1,793 |
| Government National Mortgage Assn. 3.50% 20493,4 | 25,000 | 25,172 |
| Government National Mortgage Assn. 4.00% 20493,4 | 40,200 | 41,171 |
| Government National Mortgage Assn. 4.50% 20493,4 | 34,075 | 35,265 |
| Government National Mortgage Assn. 5.00% 20493,4 | 14,889 | 15,492 |
| Bonds, notes & other debt instruments (continued) Mortgage-backed obligations (continued) Federal agency mortgage-backed obligations (continued) | Principal amount (000) | Value (000) |
| Government National Mortgage Assn. 5.00% 20493,4 | $2,111 | $2,195 |
| Government National Mortgage Assn. 3.909% 20603,6 | 1,222 | 1,250 |
| Government National Mortgage Assn. 4.422% 20613 | 139 | 140 |
| Government National Mortgage Assn. 4.595% 20613 | 398 | 399 |
| Government National Mortgage Assn. 4.636% 20613 | 394 | 394 |
| Government National Mortgage Assn. 4.70% 20613 | 53 | 54 |
| Government National Mortgage Assn. 4.70% 20613 | 25 | 26 |
| Government National Mortgage Assn. 4.72% 20613 | 4 | 4 |
| Government National Mortgage Assn. 4.787% 20613 | 70 | 71 |
| Government National Mortgage Assn. 4.81% 20613 | 9 | 9 |
| Government National Mortgage Assn. 5.179% 20613 | 584 | 594 |
| Government National Mortgage Assn. 4.651% 20623 | 587 | 590 |
| Government National Mortgage Assn. 4.711% 20623 | 24 | 24 |
| Government National Mortgage Assn. 4.947% 20623 | 39 | 40 |
| Government National Mortgage Assn. 5.163% 20623 | 50 | 50 |
| Government National Mortgage Assn. 4.542% 20633,6 | 3,566 | 3,740 |
| Government National Mortgage Assn. 4.615% 20633 | 39 | 39 |
| Government National Mortgage Assn. 5.079% 20633 | 19 | 20 |
| Government National Mortgage Assn. 3.333% 20643,6 | 400 | 406 |
| Government National Mortgage Assn. 4.551% 20643,6 | 4,978 | 5,228 |
| Government National Mortgage Assn. 4.625% 20643 | 375 | 379 |
| Government National Mortgage Assn. 5.027% 20643 | 120 | 121 |
| Government National Mortgage Assn. 5.082% 20643 | 67 | 68 |
| Government National Mortgage Assn. 5.159% 20643 | 259 | 262 |
| Government National Mortgage Assn. 5.165% 20643 | 239 | 242 |
| Government National Mortgage Assn. 5.379% 20643 | 3 | 3 |
| Government National Mortgage Assn. 6.64% 20643 | 806 | 832 |
| Government National Mortgage Assn. 6.64% 20643 | 56 | 56 |
| Government National Mortgage Assn. 4.645% 20653 | 236 | 237 |
| Government National Mortgage Assn. Pool #AG8156 3.798% 20643,6 | 546 | 557 |
| Government National Mortgage Assn., Series 2010-H23, Class PT, 5.399% 20603,6 | 4,454 | 4,492 |
| Government National Mortgage Assn., Series 2012-H12, Class FT, (1 Year CMT Weekly Rate + 0.70%) 3.36% 20623,6 | 2,173 | 2,187 |
| Government National Mortgage Assn., Series 2012-H20, Class PT, 3.451% 20623,6 | 2,607 | 2,630 |
| National Credit Union Administration, Series 2011-R2, Class 1A, (1-month USD-LIBOR + 0.40%) 2.78% 20203,6 | 83 | 83 |
| National Credit Union Administration, Series 2011-R3, Class 1A, (1-month USD-LIBOR + 0.40%) 2.80% 20203,6 | 266 | 266 |
| National Credit Union Administration, Series 2011-R1, Class 1A, (1-month USD-LIBOR + 0.45%) 2.83% 20203,6 | 167 | 168 |
| Vendee Mortgage Trust, Series 2011-2, Class DA, 3.75% 20333 | 4,998 | 5,022 |
| Vendee Mortgage Trust, Series 2010-1, Class DA, 4.25% 20353 | 5,393 | 5,462 |
| Total mortgage-backed obligations | 821,393 | |
| Federal agency bonds & notes 20.95% | ||
| Export-Import Bank of the United States-Guaranteed, VCK Lease SA 2.591% 20263 | 909 | 903 |
| Export-Import Bank of the United States-Guaranteed, Ethiopian Leasing 2012 LLC 2.646% 20263 | 652 | 646 |
| Fannie Mae 1.75% 2019 | 16,000 | 15,873 |
| Fannie Mae 1.25% 2021 | 2,900 | 2,810 |
| Fannie Mae 2.75% 2021 | 26,500 | 26,642 |
| Fannie Mae 2.875% 2023 | 36,000 | 36,427 |
| Fannie Mae 7.125% 2030 | 4,000 | 5,508 |
| Federal Home Loan Bank 3.375% 2023 | 16,715 | 17,268 |
| Federal Home Loan Bank 3.25% 2028 | 13,000 | 13,252 |
| Bonds, notes & other debt instruments (continued) Federal agency bonds & notes (continued) | Principal amount (000) | Value (000) |
| Federal Home Loan Bank 5.50% 2036 | $600 | $776 |
| Freddie Mac 3.75% 2019 | 12,750 | 12,789 |
| Freddie Mac 2.375% 2021 | 100,000 | 99,680 |
| Private Export Funding Corp. 1.45% 2019 | 17,500 | 17,383 |
| Private Export Funding Corp. 2.25% 2020 | 5,000 | 4,979 |
| Private Export Funding Corp. 3.55% 2024 | 6,340 | 6,595 |
| Small Business Administration, Series 2001-20K, 5.34% 20213 | 33 | 33 |
| Small Business Administration, Series 2001-20J, 5.76% 20213 | 13 | 13 |
| Small Business Administration, Series 2001-20F, 6.44% 20213 | 53 | 55 |
| Small Business Administration, Series 2003-20B, 4.84% 20233 | 140 | 144 |
| Tennessee Valley Authority 2.875% 2027 | 10,000 | 9,935 |
| Tennessee Valley Authority 4.65% 2035 | 2,330 | 2,682 |
| Tennessee Valley Authority 5.88% 2036 | 1,750 | 2,292 |
| Tennessee Valley Authority, Series A, 3.875% 2021 | 32,975 | 33,835 |
| Tennessee Valley Authority, Series A, 4.625% 2060 | 250 | 304 |
| TVA Southaven 3.846% 20333 | 1,320 | 1,333 |
| U.S. Department of Housing and Urban Development, Series 2015-A-6, 1.98% 2020 | 11,510 | 11,411 |
| U.S. Department of Housing and Urban Development, Series 2015-A-7, 2.35% 2021 | 5,000 | 4,968 |
| U.S. Department of Housing and Urban Development, Series 2015-A-8, 2.45% 2022 | 8,000 | 7,951 |
| U.S. Department of Housing and Urban Development, Series 2015-A-9, 2.80% 2023 | 2,000 | 2,015 |
| U.S. Department of Housing and Urban Development, Series 2015-A-10, 2.85% 2024 | 3,000 | 3,024 |
| U.S. Department of Housing and Urban Development, Series 2015-A-11, 2.95% 2025 | 3,515 | 3,536 |
| U.S. Department of Housing and Urban Development, Series 2015-A-12, 3.10% 2026 | 3,500 | 3,528 |
| U.S. Department of Housing and Urban Development, Series 2015-A-13, 3.15% 2027 | 15,332 | 15,424 |
| U.S. Department of Housing and Urban Development, Series 2015-A-14, 3.25% 2028 | 5,106 | 5,141 |
| U.S. Department of Housing and Urban Development, Series 2015-A-15, 3.35% 2029 | 3,500 | 3,536 |
| U.S. Department of Housing and Urban Development, Series 2015-A-16, 3.50% 2030 | 3,307 | 3,360 |
| U.S. Department of Housing and Urban Development, Series 2015-A-17, 3.55% 2031 | 3,300 | 3,301 |
| U.S. Department of Housing and Urban Development, Series 2015-A-18, 3.60% 2032 | 3,177 | 3,154 |
| U.S. Department of Housing and Urban Development, Series 2015-A-19, 3.65% 2033 | 2,734 | 2,772 |
| U.S. Department of Housing and Urban Development, Series 2015-A-20, 3.70% 2034 | 651 | 656 |
| United States Agency for International Development, Iraq (State of), 2.149% 2022 | 6,670 | 6,566 |
| United States Agency for International Development, Jordan (Kingdom of) 1.945% 2019 | 19,750 | 19,709 |
| United States Agency for International Development, Jordan (Kingdom of) 2.503% 2020 | 88,000 | 87,784 |
| United States Agency for International Development, Jordan (Kingdom of) 2.578% 2022 | 43,000 | 42,736 |
| United States Agency for International Development, Jordan (Kingdom of) 3.00% 2025 | 43,250 | 43,295 |
| United States Agency for International Development, Morocco (Kingdom of) 7.55% 20263 | 3,328 | 3,838 |
| United States Agency for International Development, Tunisia (Kingdom of) 1.416% 2021 | 3,000 | 2,907 |
| United States Agency for International Development, Ukraine, 1.844% 2019 | 1,445 | 1,442 |
| United States Agency for International Development, Ukraine 1.471% 2021 | 4,410 | 4,270 |
| United States Government-Guaranteed Certificates of Participation, Overseas Private Investment Corp., 3.49% 20293 | 815 | 836 |
| United States Government-Guaranteed Certificates of Participation, Overseas Private Investment Corp., 3.82% 20323 | 928 | 963 |
| United States Government-Guaranteed Certificates of Participation, Overseas Private Investment Corp., 3.938% 20323 | 759 | 794 |
| 601,074 | ||
| Total bonds, notes & other debt instruments (cost: $2,805,986,000) | 2,791,877 | |
| Short-term securities 11.11% | ||
| ADP Tax Services, Inc. 2.38%due 1/2/20197 | 9,500 | 9,499 |
| Apple Inc. 2.36%due 1/23/20197 | 25,000 | 24,960 |
| Bank of New York Mellon Corp. 2.34%due 1/22/2019 | 50,000 | 49,924 |
| Short-term securities (continued) | Principal amount (000) | Value (000) |
| Chevron Corp. 2.38%–2.49%due 1/9/2019–2/4/20197 | $51,900 | $51,815 |
| Federal Farm Credit Banks 2.38%due 2/28/2019 | 20,000 | 19,921 |
| National Rural Utilities Cooperative Finance Corp. 2.50%due 2/5/2019 | 60,000 | 59,850 |
| Procter & Gamble Co. 2.50%due 2/7/20197 | 25,000 | 24,933 |
| Tennessee Valley Authority 2.31%due 1/15/2019 | 38,000 | 37,966 |
| Wal-Mart Stores, Inc. 2.42%due 1/15/20197 | 40,000 | 39,959 |
| Total short-term securities (cost: $318,855,000) | 318,827 | |
| Total investment securities108.41% (cost: $3,124,841,000) | 3,110,704 | |
| Other assets less liabilities (8.41)% | (241,401) | |
| Net assets100.00% | $2,869,303 |
| Contracts | Type | Number of contracts | Expiration | Notional amount8 (000) | Value at 12/31/20189 (000) | Unrealized appreciation (depreciation) at 12/31/2018 (000) |
| 90 Day Euro Dollar Futures | Long | 623 | December 2019 | $155,750 | $151,623 | $941 |
| 90 Day Euro Dollar Futures | Long | 316 | December 2021 | 79,000 | 77,029 | 431 |
| 2 Year U.S. Treasury Note Futures | Long | 3,850 | April 2019 | 770,000 | 817,403 | 4,332 |
| 5 Year U.S. Treasury Note Futures | Long | 11,518 | April 2019 | 1,151,800 | 1,320,970 | 20,231 |
| 10 Year U.S. Treasury Note Futures | Long | 2,675 | March 2019 | 267,500 | 326,392 | 4,968 |
| 10 Year Ultra U.S. Treasury Note Futures | Short | 1,050 | March 2019 | (105,000) | (136,582) | (3,030) |
| 20 Year U.S. Treasury Bond Futures | Long | 108 | March 2019 | 10,800 | 15,768 | 118 |
| 30 Year Ultra U.S. Treasury Bond Futures | Short | 172 | March 2019 | (17,200) | (27,633) | (541) |
| $27,450 |
| Receive | Pay | Expiration date | Notional (000) | Value at 12/31/2018 (000) | Upfront payments/ receipts (000) | Unrealized appreciation (depreciation) at 12/31/2018 (000) |
| 2.40625% | U.S. EFFR | 3/20/2019 | $3,420,000 | $9 | $— | $9 |
| 2.426% | U.S. EFFR | 5/1/2019 | 1,625,200 | 24 | — | 24 |
| 2.414% | U.S. EFFR | 5/1/2019 | 2,374,800 | 1 | — | 1 |
| 2.782% | U.S. EFFR | 9/18/2019 | 884,184 | 438 | — | 438 |
| U.S. EFFR | 2.405% | 1/29/2020 | 1,463,000 | (67) | — | (67) |
| U.S. EFFR | 2.403% | 1/29/2020 | 2,027,000 | (88) | — | (88) |
| 1.997% | U.S. EFFR | 2/13/2020 | 60,900 | (257) | — | (257) |
| 1.989% | U.S. EFFR | 2/13/2020 | 61,000 | (263) | — | (263) |
| 3-month USD-LIBOR | 2.761% | 4/27/2020 | 100,000 | (63) | — | (63) |
| 3-month USD-LIBOR | 2.8025% | 8/15/2020 | 101,840 | (194) | — | (194) |
| 2.5045% | U.S. EFFR | 8/29/2020 | 133,910 | 344 | — | 344 |
| 2.5215% | U.S. EFFR | 8/29/2020 | 98,090 | 279 | — | 279 |
| 3-month USD-LIBOR | 2.806% | 8/29/2020 | 34,300 | (68) | — | (68) |
| 2.48% | U.S. EFFR | 12/20/2020 | 82,528 | 200 | — | 200 |
| 2.4825% | U.S. EFFR | 12/26/2020 | 665,000 | 1,684 | — | 1,684 |
| 3-month USD-LIBOR | 1.217% | 9/22/2021 | 60,000 | 2,195 | — | 2,195 |
| 3-month USD-LIBOR | 1.225% | 9/22/2021 | 60,000 | 2,182 | — | 2,182 |
| Receive | Pay | Expiration date | Notional (000) | Value at 12/31/2018 (000) | Upfront payments/ receipts (000) | Unrealized appreciation (depreciation) at 12/31/2018 (000) |
| 3-month USD-LIBOR | 1.2255% | 9/23/2021 | $5,000 | $182 | $— | $182 |
| 3-month USD-LIBOR | 1.9665% | 2/2/2022 | 50,000 | 921 | — | 921 |
| 3-month USD-LIBOR | 2.2175% | 3/17/2022 | 52,000 | 592 | — | 592 |
| 3-month USD-LIBOR | 1.8675% | 4/19/2022 | 70,000 | 1,577 | — | 1,577 |
| 3-month USD-LIBOR | 1.75918% | 4/29/2022 | 58,000 | 1,514 | — | 1,514 |
| 2.5775% | U.S. EFFR | 7/16/2022 | 181,639 | 671 | — | 671 |
| 3-month USD-LIBOR | 1.948% | 7/28/2022 | 20,000 | 427 | — | 427 |
| 2.80% | 3-month USD-LIBOR | 9/2/2022 | 280,000 | 1,670 | — | 1,670 |
| 2.75% | 3-month USD-LIBOR | 9/2/2022 | 280,000 | 1,408 | — | 1,408 |
| 2.009% | 3-month USD-LIBOR | 10/4/2022 | 50,000 | (1,017) | — | (1,017) |
| 2.08934% | 3-month USD-LIBOR | 11/17/2022 | 40,700 | (723) | — | (723) |
| 2.2025% | 3-month USD-LIBOR | 12/4/2022 | 20,000 | (276) | — | (276) |
| 3-month USD-LIBOR | 2.2455% | 12/21/2022 | 25,000 | 310 | — | 310 |
| 2.27403% | 3-month USD-LIBOR | 12/29/2022 | 60,000 | (683) | — | (683) |
| 3-month USD-LIBOR | 2.6778% | 2/12/2023 | 51,000 | (213) | — | (213) |
| 2.7435% | 3-month USD-LIBOR | 2/16/2023 | 41,000 | 278 | — | 278 |
| 3-month USD-LIBOR | 2.8655% | 4/23/2023 | 55,000 | (668) | — | (668) |
| 2.5815% | U.S. EFFR | 5/25/2023 | 80,000 | 1,099 | — | 1,099 |
| 2.9075% | 3-month USD-LIBOR | 9/7/2023 | 50,000 | 734 | — | 734 |
| 3-month USD-LIBOR | 3.09009% | 10/31/2023 | 46,320 | (1,095) | — | (1,095) |
| 3-month USD-LIBOR | 3.0965% | 10/31/2023 | 46,055 | (1,102) | — | (1,102) |
| U.S. EFFR | 2.4435% | 12/20/2023 | 7,589 | (58) | — | (58) |
| U.S. EFFR | 2.45375% | 12/20/2023 | 67,985 | (555) | — | (555) |
| U.S. EFFR | 2.4325% | 12/21/2023 | 24,000 | (172) | — | (172) |
| 3-month USD-LIBOR | 2.0815% | 2/10/2024 | 28,700 | 683 | — | 683 |
| 3-month USD-LIBOR | 2.0955% | 2/10/2024 | 14,300 | 331 | — | 331 |
| 3-month USD-LIBOR | 2.3875% | 3/17/2024 | 160,700 | 1,520 | — | 1,520 |
| 3-month USD-LIBOR | 2.12813% | 10/3/2024 | 65,000 | 1,617 | — | 1,617 |
| 3-month USD-LIBOR | 2.4595% | 1/12/2025 | 26,400 | 203 | — | 203 |
| 3-month USD-LIBOR | 2.588% | 1/26/2025 | 15,600 | 7 | — | 7 |
| 2.8775% | 3-month USD-LIBOR | 3/23/2025 | 29,800 | 473 | — | 473 |
| 3-month USD-LIBOR | 2.24% | 12/5/2026 | 55,100 | 1,625 | — | 1,625 |
| 3-month USD-LIBOR | 2.27% | 12/5/2026 | 44,900 | 1,227 | — | 1,227 |
| 2.579% | 3-month USD-LIBOR | 3/14/2027 | 53,000 | (306) | — | (306) |
| 2.333% | 3-month USD-LIBOR | 3/29/2027 | 42,000 | (1,020) | — | (1,020) |
| 2.91% | 3-month USD-LIBOR | 2/1/2028 | 16,000 | 84 | — | 84 |
| 2.908% | 3-month USD-LIBOR | 2/1/2028 | 16,000 | 83 | — | 83 |
| 2.925% | 3-month USD-LIBOR | 2/1/2028 | 12,800 | 75 | — | 75 |
| 2.92% | 3-month USD-LIBOR | 2/2/2028 | 12,200 | 69 | — | 69 |
| U.S. EFFR | 2.5065% | 3/22/2028 | 8,700 | (92) | — | (92) |
| U.S. EFFR | 2.535% | 3/23/2028 | 6,700 | (87) | — | (87) |
| U.S. EFFR | 2.471% | 3/27/2028 | 8,100 | (62) | — | (62) |
| U.S. EFFR | 2.4575% | 3/29/2028 | 9,638 | (62) | — | (62) |
| U.S. EFFR | 2.424% | 3/30/2028 | 8,160 | (30) | — | (30) |
| U.S. EFFR | 2.412% | 4/5/2028 | 3,702 | (10) | — | (10) |
| 3-month USD-LIBOR | 2.97125% | 9/2/2030 | 62,000 | (1,081) | — | (1,081) |
| 3-month USD-LIBOR | 3.005% | 9/2/2030 | 62,000 | (1,259) | — | (1,259) |
| 3-month USD-LIBOR | 2.9625% | 2/1/2038 | 9,800 | 30 | — | 30 |
| 3-month USD-LIBOR | 2.963% | 2/1/2038 | 9,800 | 30 | — | 30 |
| 3-month USD-LIBOR | 2.986% | 2/1/2038 | 7,800 | 11 | — | 11 |
| Receive | Pay | Expiration date | Notional (000) | Value at 12/31/2018 (000) | Upfront payments/ receipts (000) | Unrealized appreciation (depreciation) at 12/31/2018 (000) |
| 3-month USD-LIBOR | 2.967% | 2/2/2038 | $7,600 | $21 | $— | $21 |
| 3-month USD-LIBOR | 3.34% | 6/27/2044 | 10,000 | (937) | — | (937) |
| 3-month USD-LIBOR | 3.206% | 7/31/2044 | 16,000 | (1,108) | — | (1,108) |
| 3-month USD-LIBOR | 3.238% | 8/8/2044 | 16,000 | (1,201) | — | (1,201) |
| 3-month USD-LIBOR | 2.7045% | 1/2/2045 | 12,000 | 310 | — | 310 |
| 3-month USD-LIBOR | 2.5055% | 1/9/2045 | 11,000 | 700 | — | 700 |
| 3-month USD-LIBOR | 2.4945% | 1/9/2045 | 2,000 | 131 | — | 131 |
| 3-month USD-LIBOR | 2.52822% | 11/23/2045 | 4,390 | 266 | — | 266 |
| U.S. EFFR | 2.166% | 10/23/2047 | 10,000 | 714 | — | 714 |
| U.S. EFFR | 2.145% | 11/9/2047 | 15,400 | 1,169 | — | 1,169 |
| U.S. EFFR | 2.153% | 11/10/2047 | 15,300 | 1,137 | — | 1,137 |
| U.S. EFFR | 2.155% | 11/10/2047 | 8,640 | 638 | — | 638 |
| U.S. EFFR | 2.17% | 11/13/2047 | 15,660 | 1,109 | — | 1,109 |
| U.S. EFFR | 2.5635% | 2/12/2048 | 33,204 | (358) | — | (358) |
| U.S. EFFR | 2.4615% | 3/15/2048 | 2,000 | 20 | — | 20 |
| U.S. EFFR | 2.485% | 3/15/2048 | 2,000 | 11 | — | 11 |
| U.S. EFFR | 2.425% | 3/16/2048 | 4,100 | 73 | — | 73 |
| U.S. EFFR | 2.505% | 3/22/2048 | 4,300 | 5 | — | 5 |
| U.S. EFFR | 2.51375% | 3/22/2048 | 4,700 | (3) | — | (3) |
| U.S. EFFR | 2.625% | 5/25/2048 | 18,000 | (435) | — | (435) |
| U.S. EFFR | 2.445% | 6/4/2048 | 6,700 | 90 | — | 90 |
| U.S. EFFR | 2.52% | 8/24/2048 | 4,500 | (9) | — | (9) |
| 3.236% | 3-month USD-LIBOR | 10/31/2048 | 10,650 | 896 | — | 896 |
| 3.22859% | 3-month USD-LIBOR | 10/31/2048 | 10,645 | 879 | — | 879 |
| $— | $19,354 |
| 1 | All or a portion of this security was pledged as collateral. The total value of pledged collateral was $36,486,000, which represented 1.27% of the net assets of the fund. |
| 2 | Index-linked bond whose principal amount moves with a government price index. |
| 3 | Principal payments may be made periodically. Therefore, the effective maturity date may be earlier than the stated maturity date. |
| 4 | Purchased on a TBA basis. |
| 5 | Amount less than one thousand. |
| 6 | Coupon rate may change periodically. |
| 7 | Acquired in a transaction exempt from registration under Rule 144A or Section 4(2) of the Securities Act of 1933. May be resold in the U.S. in transactions exempt from registration, normally to qualified institutional buyers. The total value of all such securities was $151,166,000, which represented 5.27% of the net assets of the fund. |
| 8 | Notional amount is calculated based on the number of contracts and notional contract size. |
| 9 | Value is calculated based on the notional amount and current market price. |
| Key to abbreviations and symbol |
| CMT = Constant Maturity Treasury |
| EFFR = Effective Federal Funds Rate |
| LIBOR = London Interbank Offered Rate |
| TBA = To-be-announced |
| USD/$ = U.S. dollars |
| Growth funds 80.77% | Shares | Value (000) |
| American Funds Insurance Series – Growth Fund, Class 1 | 3,963,500 | $277,286 |
| Total growth funds (cost: $279,168,000) | 277,286 | |
| Fixed income funds 15.59% | ||
| American Funds Insurance Series – Bond Fund, Class 1 | 5,110,855 | 53,511 |
| Total fixed income funds (cost: $55,321,000) | 53,511 | |
| Short-term securities 1.50% | ||
| Government Cash Management Fund | 5,144,216 | 5,144 |
| Total short-term securities (cost: $5,144,000) | 5,144 | |
| Total investment securities 97.86% (cost: $339,633,000) | 335,941 | |
| Other assets less liabilities 2.14% | 7,332 | |
| Net assets 100.00% | $343,273 |
| Contracts | Type | Number of contracts | Expiration | Notional amount1 (000) | Value at 12/31/20182 (000) | Unrealized appreciation (depreciation) at 12/31/2018 (000) |
| 5 Year U.S. Treasury Note Futures | Long | 1,474 | March 2019 | $147,400 | $169,049 | $1,914 |
| FTSE 100 Index Contracts | Short | 33 | March 2019 | £—3 | (2,801) | 18 |
| Euro Stoxx 50 Index Contracts | Short | 131 | March 2019 | €(1) | (4,464) | 86 |
| Nikkei 225 Index Contracts | Short | 1 | March 2019 | ¥(1) | (182) | 10 |
| S&P Mid 400 E-mini Index Contracts | Short | 7 | March 2019 | $(1) | (1,164) | 49 |
| Mini MSCI Emerging Market Index Contracts | Short | 123 | March 2019 | (6) | (5,946) | 37 |
| Russell 2000 Mini Index Contracts | Short | 229 | March 2019 | (12) | (15,446) | 629 |
| S&P 500 E-mini Index Contracts | Short | 895 | March 2019 | (45) | (112,108) | 3,193 |
| British Pound Currency Contracts | Short | 36 | March 2019 | (2,250) | (2,878) | (18) |
| Euro Currency Contracts | Short | 33 | March 2019 | (4,125) | (4,753) | (20) |
| Japanese Yen Currency Contracts | Short | 2 | March 2019 | (25,000) | (229) | (7) |
| $5,891 |
| 1 | Notional amount is calculated based on the number of contracts and notional contract size. |
| 2 | Value is calculated based on the notional amount and current market price. |
| 3 | Amount less than one thousand. |
| Key to symbols | ||
| £ = British pounds | ||
| € = Euros | ||
| ¥ = Japanese yen |
| Growth funds 79.58% | Shares | Value (000) |
| American Funds Insurance Series – International Fund, Class 1 | 6,802,836 | $120,138 |
| Total growth funds (cost: $126,861,000) | 120,138 | |
| Fixed income funds 15.00% | ||
| American Funds Insurance Series – Bond Fund, Class 1 | 2,162,908 | 22,646 |
| Total fixed income funds (cost: $23,477,000) | 22,646 | |
| Short-term securities 3.43% | ||
| Government Cash Management Fund | 5,178,097 | 5,178 |
| Total short-term securities (cost: $5,178,000) | 5,178 | |
| Total investment securities 98.01% (cost: $155,516,000) | 147,962 | |
| Other assets less liabilities 1.99% | 2,997 | |
| Net assets 100.00% | $150,959 |
| Contracts | Type | Number of contracts | Expiration | Notional amount1 (000) | Value at 12/31/20182 (000) | Unrealized appreciation (depreciation) at 12/31/2018 (000) |
| 5 Year U.S. Treasury Note Futures | Long | 472 | March 2019 | $47,200 | $54,133 | $615 |
| S&P 500 E-mini Index Contracts | Short | 3 | March 2019 | —3 | (376) | 23 |
| FTSE 100 Index Contracts | Short | 55 | March 2019 | £(1) | (4,668) | 65 |
| Russell 2000 Mini Index Contracts | Short | 13 | March 2019 | $(1) | (877) | 44 |
| Euro Stoxx 50 Index Contracts | Short | 353 | March 2019 | €(4) | (12,028) | 268 |
| Mini MSCI Emerging Market Index Contracts | Short | 323 | March 2019 | $(16) | (15,614) | 186 |
| Nikkei 225 Index Contracts | Short | 37 | March 2019 | ¥(37) | (6,751) | 296 |
| British Pound Currency Contracts | Short | 60 | March 2019 | $(3,750) | (4,796) | (35) |
| Euro Currency Contracts | Short | 88 | March 2019 | (11,000) | (12,675) | (61) |
| Japanese Yen Currency Contracts | Short | 61 | March 2019 | (762,500) | (6,993) | (182) |
| $1,219 |
| 1 | Notional amount is calculated based on the number of contracts and notional contract size. |
| 2 | Value is calculated based on the notional amount and current market price. |
| 3 | Amount less than one thousand. |
| Key to symbols | ||
| £ = British pounds | € = Euros | ¥ = Japanese yen |
Income and Growth Fund
| Growth-and-income funds 80.54% | Shares | Value (000) |
| American Funds Insurance Series – Blue Chip Income and Growth Fund, Class 1 | 21,901,978 | $271,146 |
| Total growth-and-income funds (cost: $294,629,000) | 271,146 | |
| Fixed income funds 15.90% | ||
| American Funds Insurance Series – U.S. Government/AAA-Rated Securities Fund, Class 1 | 4,484,388 | 53,544 |
| Total fixed income funds (cost: $54,558,000) | 53,544 | |
| Short-term securities 1.37% | ||
| Government Cash Management Fund | 4,613,010 | 4,613 |
| Total short-term securities (cost: $4,613,000) | 4,613 | |
| Total investment securities 97.81% (cost: $353,800,000) | 329,303 | |
| Other assets less liabilities 2.19% | 7,366 | |
| Net assets 100.00% | $336,669 |
| Contracts | Type | Number of contracts | Expiration | Notional amount1 (000) | Value at 12/31/20182 (000) | Unrealized appreciation (depreciation) at 12/31/2018 (000) |
| 5 Year U.S. Treasury Note Futures | Long | 1,512 | March 2019 | $151,200 | $173,408 | $1,865 |
| FTSE 100 Index Contracts | Short | 24 | March 2019 | £—3 | (2,037) | 10 |
| S&P Mid 400 E-mini Index Contracts | Short | 4 | March 2019 | $—3 | (665) | 18 |
| Euro Stoxx 50 Index Contracts | Short | 117 | March 2019 | €(1) | (3,987) | 74 |
| Mini MSCI Emerging Market Index Contracts | Short | 42 | March 2019 | $(2) | (2,030) | 13 |
| Russell 2000 Mini Index Contracts | Short | 34 | March 2019 | (2) | (2,293) | 81 |
| S&P 500 E-mini Index Contracts | Short | 1,088 | March 2019 | (54) | (136,283) | 3,750 |
| British Pound Currency Contracts | Short | 27 | March 2019 | (1,688) | (2,158) | (13) |
| Euro Currency Contracts | Short | 29 | March 2019 | (3,625) | (4,177) | (17) |
| $5,781 |
| 1 | Notional amount is calculated based on the number of contracts and notional contract size. |
| 2 | Value is calculated based on the notional amount and current market price. |
| 3 | Amount less than one thousand. |
| Key to symbols | ||
| £ = British pounds | € = Euros | ¥ = Japanese yen |
| Growth-and-income funds 79.46% | Shares | Value (000) |
| American Funds Insurance Series – Growth-Income Fund, Class 1 | 33,123,343 | $1,503,469 |
| Total growth-and-income funds (cost: $1,522,773,000) | 1,503,469 | |
| Fixed income funds 14.91% | ||
| American Funds Insurance Series – Bond Fund, Class 1 | 26,945,898 | 282,124 |
| Total fixed income funds (cost: $281,542,000) | 282,124 | |
| Short-term securities 3.54% | ||
| Government Cash Management Fund | 66,924,852 | 66,925 |
| Total short-term securities (cost: $66,925,000) | 66,925 | |
| Options purchased 0.46% | ||
| Options purchased* | 8,674 | |
| Total options purchased (cost: $7,663,000) | 8,674 | |
| Total investment securities 98.37% (cost: $1,878,903,000) | 1,861,192 | |
| Other assets less liabilities 1.63% | 30,910 | |
| Net assets 100.00% | $1,892,102 |
| Description | Number of contracts | Notional amount (000) | Exercise price | Expiration date | Value at 12/31/2018 (000) |
| S&P 500 Index | 4,360 | $1,092,987 | $1,850.00 | 6/21/2019 | $6,178 |
| S&P 500 Index | 811 | 203,306 | 2,000.00 | 6/21/2019 | 2,064 |
| S&P 500 Index | 138 | 34,595 | 2,050.00 | 6/21/2019 | 432 |
| $8,674 |
| Contracts | Type | Number of contracts | Expiration | Notional amount1 (000) | Value at 12/31/20182 (000) | Unrealized appreciation (depreciation) at 12/31/2018 (000) |
| 5 Year U.S. Treasury Note Futures | Long | 7,323 | March 2019 | $732,300 | $839,857 | $6,919 |
| FTSE 100 Index Contracts | Short | 272 | March 2019 | £(3) | (23,086) | (39) |
| S&P Mid 400 E-mini Index Contracts | Short | 50 | March 2019 | $(5) | (8,311) | 127 |
| Euro Stoxx 50 Index Contracts | Short | 1,107 | March 2019 | €(11) | (37,721) | 466 |
| Russell 2000 Mini Index Contracts | Short | 430 | March 2019 | $(21) | (29,003) | 435 |
| Mini MSCI Emerging Market Index Contracts | Short | 532 | March 2019 | (27) | (25,717) | (62) |
| Nikkei 225 Index Contracts | Short | 27 | March 2019 | ¥(27) | (4,927) | 180 |
| S&P 500 E-mini Index Contracts | Short | 3,478 | March 2019 | $(174) | (435,654) | 2,778 |
| British Pound Currency Contracts | Short | 298 | March 2019 | (18,625) | (23,821) | (167) |
| Euro Currency Contracts | Short | 268 | March 2019 | (33,500) | (38,600) | (222) |
| Japanese Yen Currency Contracts | Short | 45 | March 2019 | (562,500) | (5,159) | (108) |
| $10,307 |
| 1 | Notional amount is calculated based on the number of contracts and notional contract size. |
| 2 | Value is calculated based on the notional amount and current market price. |
| Key to symbols |
| £ = British pounds |
| € = Euros |
| ¥ = Japanese yen |
| Asset allocation funds 96.69% | Shares | Value (000) |
| American Funds Insurance Series – Asset Allocation Fund, Class 1 | 115,468,223 | $2,458,318 |
| Total asset allocation funds (cost: $2,512,141,000) | 2,458,318 | |
| Short-term securities 1.91% | ||
| Government Cash Management Fund | 48,607,102 | 48,607 |
| Total short-term securities (cost: $48,607,000) | 48,607 | |
| Total investment securities 98.60% (cost: $2,560,748,000) | 2,506,925 | |
| Other assets less liabilities 1.40% | 35,572 | |
| Net assets 100.00% | $2,542,497 |
| Contracts | Type | Number of contracts | Expiration | Notional amount1 (000) | Value at 12/31/20182 (000) | Unrealized appreciation (depreciation) at 12/31/2018 (000) |
| 5 Year U.S. Treasury Note Futures | Long | 7,806 | March 2019 | $780,600 | $895,251 | $8,348 |
| FTSE 100 Index Contracts | Short | 120 | March 2019 | £(1) | (10,185) | 46 |
| S&P Mid 400 E-mini Index Contracts | Short | 33 | March 2019 | $(3) | (5,485) | 146 |
| Euro Stoxx 50 Index Contracts | Short | 671 | March 2019 | €(7) | (22,864) | 375 |
| Nikkei 225 Index Contracts | Short | 7 | March 2019 | ¥(7) | (1,277) | 49 |
| Russell 2000 Mini Index Contracts | Short | 895 | March 2019 | $(45) | (60,368) | 1,608 |
| Mini MSCI Emerging Market Index Contracts | Short | 1,027 | March 2019 | (51) | (49,645) | 184 |
| S&P 500 E-mini Index Contracts | Short | 4,514 | March 2019 | (226) | (565,424) | 14,749 |
| British Pound Currency Contracts | Short | 131 | March 2019 | (8,188) | (10,472) | (63) |
| Euro Currency Contracts | Short | 165 | March 2019 | (20,625) | (23,765) | (88) |
| Japanese Yen Currency Contracts | Short | 12 | March 2019 | (150,000) | (1,376) | (31) |
| $25,323 |
| 1 | Notional amount is calculated based on the number of contracts and notional contract size. |
| 2 | Value is calculated based on the notional amount and current market price. |
| Key to symbols | ||
| £ = British pounds | € = Euros | ¥ = Japanese yen |
| INGEFPX-998-0219O-S66095 | American Funds Insurance Series — Managed Risk Asset Allocation Fund — Page 179 of 179 |
Report of Independent Registered Public Accounting Firm
To the Board of Trustees of American Funds Insurance Series and Shareholders of Global Growth Fund, Global Small Capitalization Fund, Growth Fund, International Fund, New World Fund®, Blue Chip Income and Growth Fund, Global Growth and Income Fund, Growth-Income Fund, International Growth and Income Fund, Capital Income Builder®, Asset Allocation Fund, Global Balanced Fund, Bond Fund, Global Bond Fund, High-Income Bond Fund, Mortgage Fund and U.S. Government/AAA-Rated Securities Fund
Opinions on the Financial Statements
We have audited the accompanying statements of assets and liabilities, including the summary investment portfolios, of Global Growth Fund, Global Small Capitalization Fund, Growth Fund, International Fund, New World Fund®, Blue Chip Income and Growth Fund, Global Growth and Income Fund, Growth-Income Fund, International Growth and Income Fund, Capital Income Builder®, Asset Allocation Fund, Global Balanced Fund, Bond Fund, Global Bond Fund, High-Income Bond Fund, Mortgage Fund and U.S. Government/AAA-Rated Securities Fund (seventeen of the funds constituting American Funds Insurance Series, hereafter collectively referred to as the "Funds") as of December 31, 2018, the related statements of operations for the year ended December 31, 2018, the statements of changes in net assets for each of the two years in the period ended December 31, 2018, including the related notes, and the financial highlights for each of the periods indicated therein (included in Item 1 of this Form N-CSR) and the investment portfolios (included in Item 6 of this Form N-CSR) as of December 31, 2018 (collectively referred to as the “financial statements”). In our opinion, the financial statements present fairly, in all material respects, the financial position of each of the Funds as of December 31, 2018, the results of each of their operations for the year then ended, the changes in each of their net assets for each of the two years in the period ended December 31, 2018 and each of the financial highlights for each of the periods indicated therein in conformity with accounting principles generally accepted in the United States of America.
Basis for Opinions
These financial statements are the responsibility of the Funds’ management. Our responsibility is to express an opinion on the Funds’ financial statements based on our audits. We are a public accounting firm registered with the Public Company Accounting Oversight Board (United States) (“PCAOB”) and are required to be independent with respect to the Funds in accordance with the U.S. federal securities laws and the applicable rules and regulations of the Securities and Exchange Commission and the PCAOB.
We conducted our audits of these financial statements in accordance with the standards of the PCAOB. Those standards require that we plan and perform the audit to obtain reasonable assurance about whether the financial statements are free of material misstatement, whether due to error or fraud.
Our audits included performing procedures to assess the risks of material misstatement of the financial statements, whether due to error or fraud, and performing procedures that respond to those risks. Such procedures included examining, on a test basis, evidence regarding the amounts and disclosures in the financial statements. Our audits also included evaluating the accounting principles used and significant estimates made by management, as well as evaluating the overall presentation of the financial statements. Our procedures included confirmation of securities owned as of December 31, 2018 by correspondence with the custodians, transfer agent and brokers; when replies were not received from brokers, we performed other auditing procedures. We believe that our audits provide a reasonable basis for our opinions.
/s/ PricewaterhouseCoopers LLP
Los Angeles, California
February 12, 2019
We have served as the auditor of one or more investment companies in The Capital Group Companies Investment Company Complex since 1934.
ITEM 7 – Disclosure of Proxy Voting Policies and Procedures for Closed-End Management Investment Companies
Not applicable to this Registrant, insofar as the Registrant is not a closed-end management investment company.
ITEM 8 – Portfolio Managers of Closed-End Management Investment Companies
Not applicable to this Registrant, insofar as the Registrant is not a closed-end management investment company.
ITEM 9 – Purchases of Equity Securities by Closed-End Management Investment Company and Affiliated Purchasers
Not applicable to this Registrant, insofar as the Registrant is not a closed-end management investment company.
ITEM 10 – Submission of Matters to a Vote of Security Holders
There have been no material changes to the procedures by which shareholders may recommend nominees to the Registrant’s board of trustees since the Registrant last submitted a proxy statement to its shareholders. The procedures are as follows. The Registrant has a nominating and governance committee comprised solely of persons who are not considered ‘‘interested persons’’ of the Registrant within the meaning of the Investment Company Act of 1940, as amended. The committee periodically reviews such issues as the board’s composition, responsibilities, committees, compensation and other relevant issues, and recommends any appropriate changes to the full board of trustees. While the committee normally is able to identify from its own resources an ample number of qualified candidates, it will consider shareholder suggestions of persons to be considered as nominees to fill future vacancies on the board. Such suggestions must be sent in writing to the nominating and governance committee of the Registrant, c/o the Registrant’s Secretary, and must be accompanied by complete biographical and occupational data on the prospective nominee, along with a written consent of the prospective nominee for consideration of his or her name by the nominating and governance committee.
ITEM 11 – Controls and Procedures
| (a) | The Registrant’s Principal Executive Officer and Principal Financial Officer have concluded, based on their evaluation of the Registrant’s disclosure controls and procedures (as such term is defined in Rule 30a-3 under the Investment Company Act of 1940), that such controls and procedures are adequate and reasonably designed to achieve the purposes described in paragraph (c) of such rule. |
| (b) | Effective May 28, 2018, the American Funds Insurance Series investment adviser implemented a new fixed income order management, trading, and compliance system. In connection with introducing this new system, additional automated and manual controls were implemented and some existing controls were modified. None of these changes were in response to any identified deficiency or weakness in the American Funds Insurance Series internal control over financial reporting. |
ITEM 12 – Exhibits
| (a)(1) | The Code of Ethics that is the subject of the disclosure required by Item 2 is attached as an exhibit hereto. |
| (a)(2) | The certifications required by Rule 30a-2 of the Investment Company Act of 1940 and Sections 302 and 906 of the Sarbanes-Oxley Act of 2002 are attached as exhibits hereto. |
SIGNATURES
Pursuant to the requirements of the Securities Exchange Act of 1934 and the Investment Company Act of 1940, the Registrant has duly caused this report to be signed on its behalf by the undersigned, thereunto duly authorized.
| AMERICAN FUNDS INSURANCE SERIES | |
| By/s/ Maria Manotok | |
Maria Manotok, Executive Vice President and Principal Executive Officer | |
| Date: February 28, 2019 |
Pursuant to the requirements of the Securities Exchange Act of 1934 and the Investment Company Act of 1940, this report has been signed below by the following persons on behalf of the Registrant and in the capacities and on the dates indicated.
| By/s/ Maria Manotok |
Maria Manotok, Executive Vice President and Principal Executive Officer |
| Date: February 28, 2019 |
| By/s/ Gregory F. Niland |
Gregory F. Niland, Treasurer and Principal Financial Officer |
| Date: February 28, 2019 |