UNITED STATES
SECURITIES AND EXCHANGE COMMISSION
Washington, D.C. 20549
FORM N-CSR
Certified Shareholder Report of
Registered Management Investment Companies
Investment Company Act File Number: 811-03857
American Funds Insurance Series
(Exact Name of Registrant as Specified in Charter)
333 South Hope Street
Los Angeles, California 90071
(Address of Principal Executive Offices)
Registrant's telephone number, including area code: (949) 975-5000
Date of fiscal year end: December 31
Date of reporting period: December 31, 2019
Gregory F. Niland
American Funds Insurance Series
5300 Robin Hood Road
Norfolk, Virginia 23513
(Name and Address of Agent for Service)
ITEM 1 – Reports to Stockholders
| American Funds Insurance Series® | |
| Annual report for the year ended December 31, 2019 | |

We believe in
investing in global
companies for
the long term
Beginning on January 1, 2021, as permitted by regulations adopted by the U.S. Securities and Exchange Commission, you may not receive paper copies of the fund’s shareholder reports from the insurance company that offers your contract unless you specifically request paper copies from the insurance company or from your financial intermediary. Instead, the shareholder reports will be made available on a website, and the insurance company will notify you by mail each time a report is posted and provide you with a website link to access the report. Instructions for requesting paper copies will be provided by your insurance company.
If you have already elected to receive shareholder reports electronically, you will not be affected by this change and do not need to take any action. You may elect to receive shareholder reports and other communications from the insurance company electronically by following the instructions provided by the insurance company.
You may elect to receive paper copies of all future reports free of charge from the insurance company. You can inform the insurance company that you wish to continue receiving paper copies of your shareholder reports by following the instructions provided by the insurance company. Your election to receive paper reports will apply to all investment options available under your contract.
American Funds Insurance Series, by Capital Group, is the underlying investment vehicle for many variable annuities and insurance products. For nearly 90 years, Capital Group has invested with a long-term focus based on thorough research and attention to risk.
Investing for short periods makes losses more likely. For current information and month-end results, visit capitalgroup.com/afis. For information about your insurance contract and month-end results, go to the website of the company that issued your contract.
Investing outside the United States involves risks, such as currency fluctuations, periods of illiquidity and price volatility, as more fully described in the prospectus. These risks may be heightened in connection with investments in developing countries. Investing in small-capitalization stocks can involve greater risk than is customarily associated with investing in stocks of larger, more established companies. The return of principal for bond funds and for funds with significant underlying bond holdings is not guaranteed. Fund shares are subject to the same interest rate, inflation and credit risks associated with the underlying bond holdings. High-yield bonds are subject to greater fluctuations in value and risk of loss of income and principal than investment-grade bonds. Bond ratings, which typically range from AAA/Aaa (highest) to D (lowest), are assigned by credit rating agencies such as Standard & Poor’s, Moody’s and/or Fitch as an indication of an issuer’s creditworthiness. Futures may not provide an effective hedge of the underlying securities because changes in the prices of futures may not track those of the securities they are intended to hedge. In addition, the managed risk strategy may not effectively protect the funds from market declines and will limit the funds’ participation in market gains. The use of the managed risk strategy could cause the funds’ returns to lag those of the applicable underlying funds in certain rising market conditions. Refer to the funds’ prospectuses and the Risk Factors section of this report for more information on these and other risks associated with investing in the funds.
Investments are not FDIC-insured, nor are they deposits of or guaranteed by a bank or any other entity, so they may lose value.
Contents
Global stocks generated the best one-year returns in a decade as measured by the 26.60% gain in the MSCI ACWI (All Country World Index)1,2boosted by aggressive central bank stimulus measures and easing trade tensions toward the end of the year. These returns were assisted by a low starting point for 2019, after sharp market declines in the last quarter of 2018. Information technology companies posted the highest returns, with a gain of nearly 48% (as measured by the MSCI World Index). The sector was driven by strong growth from U.S. tech giants such as Apple, Microsoft and Facebook. The next best sector, industrials, rose 28% amid an improving outlook for trade activity and global economic growth.
U.S. equities had their strongest annual gains since 2013, ending the year near all-time highs, with an increase of 31.64% recorded by the MSCI USA Index1,3. The current economic expansion became the longest in U.S. history, surpassing the 10-year boom from the 1990s. For the first 11 months of the year, average hourly earnings topped at least 3% annualized growth. In November, the unemployment rate fell to 3.5%, matching its lowest level in 50 years. The robust labor market supported consumer spending, more than offsetting weaker business sentiment and manufacturing. The U.S. trade war with China occasionally caused volatility, but the resilient U.S. economy and the Federal Reserve’s return to accommodative policies helped steer markets higher. The central bank cut its policy rate three times in 2019 amid concerns over slowing economic growth, which perhaps helped prevent further slowing. In addition, potential bubbles like WeWork and certain billion-dollar tech “unicorns” were deflated without broad damage to the rest of the market.
European stocks rallied despite signs of slowing economic growth, a near-recession in Germany and Brexit-related uncertainty in the U.K. that remained unresolved until the very last month of the year. Boosted by easy monetary policy, European investors cheered aggressive interest rate cuts by the European Central Bank. The MSCI Europe Index1,4gained 23.77% for the year. The progress of U.S.-China trade negotiations heavily influenced European markets throughout the year as share prices moved sharply higher or lower on the tenor of trade-related headlines. Germany’s auto industry was particularly hard hit. With Europe’s economy highly dependent on global trade, the announcement of a “phase one” trade deal between the U.S. and China in December helped to bolster investor sentiment heading into the new year. Elsewhere among developed markets, the Japanese economy expanded modestly through the first three quarters of 2019 despite a manufacturing slowdown driven largely by the U.S.-China trade dispute. The MSCI Japan Index1,5rose 19.61% over the year.
All market returns referenced in this report are unmanaged and, therefore, have no expenses. Investors cannot invest directly in an index. Country returns are based on MSCI indexes, which reflect reinvestment of distributions and dividends net of withholding taxes, except for the MSCI USA Index, which reflects dividends gross of withholding taxes. Source: MSCI.
| 1 | Source: MSCI. |
| 2 | The MSCI ACWI is a free float-adjusted market capitalization-weighted index that is designed to measure equity market results in the global developed and emerging markets, consisting of more than 40 developed and emerging market country indexes. |
| 3 | The MSCI USA Index is a free float-adjusted, market capitalization-weighted index that is designed to measure the U.S. portion of the world market. |
| 4 | MSCI Europe Index is a free float-adjusted market capitalization-weighted index that is designed to measure results of more than 10 developed equity markets in Europe. Results reflect dividends net of withholding taxes. |
| American Funds Insurance Series | 1 |
Emerging markets stocks advanced, overcoming bouts of volatility tied to global trade tensions, China’s economic slowdown and a strong U.S. dollar. Growth stocks outpaced more defensive parts of the market, led by the information technology and consumer discretionary sectors. Overall, the MSCI Emerging Markets Investable Market Index1,6gained 17.64% for the year. Chinese stocks rose despite slower growth and trade tensions with the U.S. Indian equities lagged most other emerging markets while Brazilian stocks posted their best annual return since 2016.
Bonds advanced as central banks around the world cut interest rates in an attempt to blunt concerns about a slowing economy. The Fed paused rate hikes for the first half of the year and cut three times in the second half and the federal funds rate ended the year between 1.50% and 1.75%. Credit saw very sizable returns, with the Bloomberg Barclays U.S. Corporate Investment Grade Index7,8and the Bloomberg Barclays U.S. Corporate High Yield 2% Issuer Capped Index7,9gaining 14.54% and 14.32%, respectively. More broadly, the Bloomberg Barclays Global Aggregate Index7,10was up 6.84%, while the Bloomberg Barclays U.S. Aggregate Index7,11advanced 8.72%. The J.P. Morgan Emerging Markets Bond Index7,12– Global gained 14.42%.
In foreign exchange markets, the U.S. dollar rose nearly 2% against the euro while declining 1% against the yen. Meanwhile, the British pound ended the year with a historic rally after U.K. voters gave the Conservative Party a strong majority in Parliament, increasing the likelihood that the U.K. will be able to begin the Brexit process and leave the European Union.
Looking ahead
The current environment is rife with uncertainty, from trade-related disputes to geopolitical tensions to an upcoming U.S. presidential election. We will be following and analyzing each of these issues closely. In this environment, it would be reasonable to expect some volatility. Valuation measures are also giving mixed signals – some look high, some look just fine. So, we will continue to focus on individual securities and bring our research and judgment to bear. With our long-term approach, we welcome opportunities to see past short-term trends and invest our shareholder’s money for the long run.
Our time-tested process — based on extensive research, a long-term outlook and close attention to valuation — has served investors well over time. As always, we thank you for your continued support of our efforts and we look forward to reporting to you again in six months.
Sincerely,

Donald D. O’Neal
Co-President

Alan N. Berro
Co-President
February 11, 2020
| 5 | MSCI Japan Index is a free float-adjusted market capitalization-weighted index that is designed to measure the equity market results of Japan. |
| 6 | MSCI Emerging Markets Investable Market Index (IMI) is a free float-adjusted market capitalization weighted index that is designed to measure results of the large-, mid-, and small-capitalization segments of more than 20 emerging equity markets. |
| 7 | Source: Bloomberg Index Services Ltd. |
| 8 | Bloomberg Barclays U.S. Corporate Investment Grade Index represents the universe of investment grade, publicly issued U.S. corporate and specified foreign debentures and secured notes that meet the specified maturity, liquidity, and quality requirements. |
| 9 | Bloomberg Barclays U.S. Corporate High Yield 2% Issuer Capped Index covers the universe of fixed-rate, non-investment-grade debt. The index limits the maximum exposure of any one issuer to 2%. |
| 10 | Bloomberg Barclays Global Aggregate Index represents the global investment-grade fixed income markets. |
| 11 | Bloomberg Barclays U.S. Aggregate Index represents the U.S. investment-grade fixed-rate bond market. |
| 12 | JP Morgan Emerging Markets Bond Index – Global tracks total returns for U.S. dollar-denominated debt instruments issued by emerging markets sovereign and quasi-sovereign entities, including Brady bonds, loans and Eurobonds. |
| 2 | American Funds Insurance Series |
Summary investment portfolios
Summary investment portfolios are designed to streamline this report and help investors better focus on the funds’ principal holdings. Ultra-Short Bond Fund, Managed Risk Growth Fund, Managed Risk International Fund, Managed Risk Blue Chip Income and Growth Fund, Managed Risk Growth-Income Fund and Managed Risk Asset Allocation Fund show a complete listing of portfolio holdings. See the inside back cover for details on how to obtain a complete schedule of portfolio holdings for each fund in the series.
Unless otherwise indicated, American Funds Insurance Series investment results are for Class 1 shares (Class P1 shares for managed risk funds). Class 1A shares began operations on January 6, 2017. Class 2 shares began operations on April 30, 1997. Class 3 shares began operations on January 16, 2004. Class 4 shares began operations on December 14, 2012. Results encompassing periods prior to those dates assume a hypothetical investment in Class 1 shares and include the deduction of additional annual expenses (0.25% for Class 1A shares, 0.25% for Class 2 shares, 0.18% for Class 3 shares and 0.50% for Class 4 shares).
The variable annuities and life insurance contracts that use the series funds contain certain fees and expenses not reflected in this report. Investment results assume all distributions are reinvested and reflect applicable fees and expenses. When applicable, investment results reflect fee waivers and/or expense reimbursements, without which results would have been lower. Visit capitalgroup.com for more information.
For the managed risk funds, the investment adviser is currently waiving a portion of its management fee equal to 0.05% of the funds’ net assets. In addition, the investment adviser is currently reimbursing a portion of other expenses for Managed Risk International Fund. The waivers and reimbursement will be in effect through at least May 1, 2021, unless modified or terminated by the series board. After that time, the investment adviser may elect to extend, modify or terminate the reimbursement. The waivers may only be modified or terminated with the approval of the series board. Applicable fund results shown reflect the waivers and reimbursement, without which results would have been lower. See the Financial Highlights tables in this report for details.
The Managed Risk Growth Fund pursues its objective by investing in shares of American Funds Insurance Series – Growth FundSMand American Funds Insurance Series – Bond FundSM. The Managed Risk International Fund pursues its objective by investing in shares of American Funds Insurance Series –International FundSMand American Funds Insurance Series – Bond FundSM. The Managed Risk Blue Chip Income and Growth Fund pursues its objective by investing in shares of American Funds Insurance Series –Blue Chip Income and Growth FundSMand American Funds Insurance Series – U.S. Government/AAA-Rated Securities FundSM. The Managed Risk Growth-Income Fund pursues its objective by investing in shares of American Funds Insurance Series – Growth-Income FundSMand American Funds Insurance Series – Bond FundSM. The Managed Risk Asset Allocation Fund pursues its objective by investing in shares of American Funds Insurance Series – Asset Allocation Fund.SMThe funds seek to manage portfolio volatility and provide downside protection, primarily through the use of exchange-traded futures. The benefit of the funds’ managed risk strategy should be most apparent during periods of high volatility and in down markets. In steady or rising markets, the funds’ results can be expected to lag those of the underlying fund.
Funds are listed in the report as follows: equity, balanced, fixed income and managed risk.
| American Funds Insurance Series | 3 |
Fund results shown are for past periods and are not predictive of results for future periods. Current and future results may be lower or higher than those shown. Share prices and returns will vary, so investors may lose money. Investing for short periods makes losses more likely. For current information and month-end results, visit capitalgroup.com/afis. For information about your insurance contract and month-end results, go to the website of the company that issued your contract.
Global Growth Fund rose 35.61% for the 12 months ended December 31, 2019, compared with a 26.60% increase for the MSCI ACWI (All Country World Index),1a free float-adjusted market capitalization-weighted index that is designed to measure equity market results in the global developed and emerging markets, consisting of more than 40 developed and emerging market country indexes.
Global stocks generated the best returns in a decade, boosted by aggressive central bank stimulus measures and easing trade tensions toward the end of the year. U.S. stocks soared to near record highs in December as the U.S. and China agreed to a limited trade war truce with the aim of avoiding the imposition of new tariffs and other protectionist measures. Information technology stocks posted the highest returns with a gain of nearly 48% in aggregate. Outside the U.S., European stocks advanced despite signs of slowing economic growth, a near-recession in Germany and Brexit-related uncertainty in the U.K. that remained unresolved until the very last month of the year. Emerging markets stocks advanced, overcoming bouts of volatility tied to global trade tensions, China’s economic slowdown and a strong U.S. dollar.
The fund’s higher-than-index position relative to the top performing information technology sector as well as individual stock selection in that sector boosted the fund’s returns compared with the index. The fund’s relative weightings in ASML and TSMC benefitted the fund as both outpaced the wider market and were among the top contributors to the fund’s relative returns. Consumer discretionary stock Alibaba Group also helped the fund’s relative returns, as its returns outpaced the market.
The biggest drag on relative results was Apple – a stock the fund didn’t own – as it proved to be one of the strongest performers for the year.
On a geographic basis, stocks of companies domiciled in the Netherlands and Taiwan were additive to results, while stocks of companies based in the Philippines and Belgium lagged.
The fund’s portfolio managers are optimistic they will continue to find good companies globally that offer high-quality products, and whose values are not yet fully reflected in their share prices.
| Country diversification | Percent of net assets | |||
| The Americas | ||||
| United States | 45.0 | % | ||
| Other | 1.7 | |||
| 46.7 | ||||
| Europe | ||||
| Netherlands | 7.6 | |||
| United Kingdom | 6.6 | |||
| France | 5.8 | |||
| Switzerland | 4.0 | |||
| Germany | 2.3 | |||
| Russian Federation | 1.4 | |||
| Denmark | 1.2 | |||
| Sweden | 1.0 | |||
| Other | 1.9 | |||
| 31.8 | ||||
| Asia/Pacific Basin | ||||
| China | 4.8 | |||
| Taiwan | 4.7 | |||
| Hong Kong | 3.0 | |||
| Japan | 2.7 | |||
| India | 1.9 | |||
| Other | 2.2 | |||
| 19.3 | ||||
| Other regions | ||||
| Other | .7 | |||
| Short-term securities & other assets less liabilities | 1.5 | |||
| Total | 100.0 | % | ||
| Largest equity securities2 | Percent of net assets | |||
| ASML | 5.06 | % | ||
| Amazon | 4.72 | |||
| TSMC | 4.71 | |||
| Microsoft | 4.64 | |||
| Alphabet | 3.67 | |||
| Visa | 3.16 | |||
| Alibaba Group | 2.68 | |||
| Airbus | 2.36 | |||
| Broadcom | 2.26 | |||
| AIA Group | 2.04 | |||
| 4 | American Funds Insurance Series |
Global Growth Fund
How a hypothetical $10,000 investment has grown

| Total returns based on a $1,000 investment | ||||||||||||||||||||
| For periods ended December 31, 20193 | ||||||||||||||||||||
| 1 year | 5 years | 10 years | Lifetime (since April 30, 1997) | Expense ratio | ||||||||||||||||
| Class 1 | 35.61 | % | 12.01 | % | 11.40 | % | 10.21 | % | .57 | % | ||||||||||
| Class 1A | 35.22 | 11.74 | 11.13 | 9.94 | .82 | |||||||||||||||
| Class 2 | 35.28 | 11.72 | 11.12 | 9.94 | .82 | |||||||||||||||
| Class 4 | 34.87 | 11.44 | 10.89 | 9.68 | 1.07 | |||||||||||||||
Investment results assume all distributions are reinvested and reflect applicable fees and expenses. When applicable, investment results reflect fee waivers and/or expense reimbursements, without which results would have been lower. Visit capitalgroup.com for more information. Expense ratios are as of the fund’s prospectus dated May 1, 2020 (unaudited). See the Financial Highlights table in this report for details.
Any market index shown is unmanaged and, therefore, has no expenses. Investors cannot invest directly in an index.
| 1 | Source: MSCI. The MSCI index result reflects dividends net of withholding taxes and reinvestment of distributions. |
| 2 | The information shown does not include cash and cash equivalents, which includes shares of money market or similar funds managed by the investment adviser or its affiliates that are not offered to the public. |
| 3 | Periods greater than one year are annualized. |
| Where the fund’s assets were invested as of December 31, 2019 | Percent of net assets |

| American Funds Insurance Series | 5 |
Global Small Capitalization Fund
Fund results shown are for past periods and are not predictive of results for future periods. Current and future results may be lower or higher than those shown. Share prices and returns will vary, so investors may lose money. Investing for short periods makes losses more likely. For current information and month-end results, visit capitalgroup.com/afis. For information about your insurance contract and month-end results, go to the website of the company that issued your contract.
Global Small Capitalization Fund increased 31.84% for the 12 months ended December 31, 2019. Its benchmark, the MSCI All Country World Small Cap Index,1a free float-adjusted market capitalization-weighted index designed to measure equity market results of smaller capitalization companies in both developed and emerging markets, gained 24.65%.
U.S. equities had their strongest annual gains since 2013, ending the year near all-time highs. Stocks rose steadily, posting gains in 10 of 12 months. The U.S. trade war with China occasionally caused volatility, but the resilient U.S. economy and the Federal Reserve’s return to accommodative policies helped steer markets higher. Information technology companies posted the highest returns, with a gain of nearly 48% in aggregate. Outside the U.S., European stocks advanced despite signs of slowing economic growth, a near-recession in Germany and Brexit-related uncertainty in the U.K. that remained unresolved until the very last month of the year. Emerging markets stocks advanced, overcoming bouts of volatility tied to global trade tensions, China’s economic slowdown and a strong U.S. dollar.
Fund holdings in the information technology sector contributed the most to relative returns. Information technology stock Paycom widely outpaced the broader market and was among the fund’s top contributors over the period. However, the fund’s holdings of health care companies NuCana and Evolent Health detracted from returns.
While investments in U.S. companies were additive to returns, investments in companies domiciled in the U.K. detracted.
The fund’s portfolio managers continue to seek investment opportunities in undervalued companies that have the potential to change industries and benefit shareholders. They believe rigorous bottom-up research into each potential equity investment can help achieve this goal. The fund currently holds nearly 300 companies diversified across geographies and industries. As always, we maintain our commitment to investing for the long term.
| Country diversification | Percent of net assets | |||
| The Americas | ||||
| United States | 42.9 | % | ||
| Brazil | 3.9 | |||
| Canada | 2.2 | |||
| Other | .7 | |||
| 49.7 | ||||
| Asia/Pacific Basin | ||||
| India | 5.9 | |||
| Japan | 5.4 | |||
| China | 5.2 | |||
| Hong Kong | 1.9 | |||
| Philippines | 1.7 | |||
| Australia | 1.4 | |||
| Taiwan | 1.1 | |||
| Other | .7 | |||
| 23.3 | ||||
| Europe | ||||
| United Kingdom | 6.7 | |||
| Germany | 3.6 | |||
| Italy | 3.1 | |||
| Netherlands | 2.6 | |||
| Sweden | 1.7 | |||
| Switzerland | 1.4 | |||
| Other | 3.5 | |||
| 22.6 | ||||
| Other regions | ||||
| Other | .3 | |||
| Short-term securities & other assets less liabilities | 4.1 | |||
| Total | 100.0 | % | ||
| Largest equity securities2 | Percent of net assets | |||
| Insulet | 3.02 | % | ||
| GW Pharmaceuticals | 1.86 | |||
| Notre Dame Intermédica Participações | 1.55 | |||
| Haemonetics | 1.54 | |||
| Allakos | 1.41 | |||
| CONMED | 1.41 | |||
| frontdoor | 1.39 | |||
| International Container Terminal Services | 1.32 | |||
| Cannae Holdings | 1.31 | |||
| Nihon M&A Center | 1.28 | |||
| 6 | American Funds Insurance Series |
Global Small Capitalization Fund
How a hypothetical $10,000 investment has grown

| Total returns based on a $1,000 investment | ||||||||||||||||||||
| For periods ended December 31, 20193 | ||||||||||||||||||||
| 1 year | 5 years | 10 years | Lifetime (since April 30, 1998) | Expense ratio | ||||||||||||||||
| Class 1 | 31.84 | % | 8.95 | % | 9.07 | % | 9.70 | % | .76 | % | ||||||||||
| Class 1A | 31.56 | 8.70 | 8.81 | 9.43 | 1.01 | |||||||||||||||
| Class 2 | 31.52 | 8.68 | 8.80 | 9.43 | 1.01 | |||||||||||||||
| Class 4 | 31.24 | 8.41 | 8.54 | 9.16 | 1.26 | |||||||||||||||
Investment results assume all distributions are reinvested and reflect applicable fees and expenses. When applicable, investment results reflect fee waivers and/or expense reimbursements, without which results would have been lower. Visit capitalgroup.com for more information. Expense ratios are as of the fund’s prospectus dated May 1, 2020 (unaudited). See the Financial Highlights table in this report for details.
Any market index shown is unmanaged and, therefore, has no expenses. Investors cannot invest directly in an index.
| 1 | Source: MSCI. The MSCI index result reflects dividends net of withholding taxes and reinvestment of distributions. |
| 2 | The information shown does not include cash and cash equivalents, which includes shares of money market or similar funds managed by the investment adviser or its affiliates that are not offered to the public. |
| 3 | Periods greater than one year are annualized. |
| Where the fund’s assets were invested as of December 31, 2019 | Percent of net assets |

| American Funds Insurance Series | 7 |
Growth Fund
Fund results shown are for past periods and are not predictive of results for future periods. Current and future results may be lower or higher than those shown. Share prices and returns will vary, so investors may lose money. Investing for short periods makes losses more likely. For current information and month-end results, visit capitalgroup.com/afis. For information about your insurance contract and month-end results, go to the website of the company that issued your contract.
Growth Fund gained 31.11% for the 12 months ended December 31, 2019, compared with a 31.49% increase in its benchmark index, Standard & Poor’s 500 Composite Index,1a market capitalization-weighted index based on the results of approximately 500 widely held common stocks.
U.S. equities had their strongest annual gains since 2013, ending the year near all-time highs. Stocks rose steadily, posting gains in 10 of 12 months. The U.S. trade war with China occasionally caused volatility, but the resilient U.S. economy and the Federal Reserve’s return to accommodative policies helped steer markets higher. Information technology companies posted the highest returns, with a gain of nearly 48% in aggregate. Outside the U.S., European stocks advanced despite signs of slowing economic growth, a near-recession in Germany and Brexit-related uncertainty in the U.K. that remained unresolved until the very last month of the year. Emerging markets stocks advanced, overcoming bouts of volatility tied to global trade tensions, China’s economic slowdown and a strong U.S. dollar.
Companies in the communication services sector contributed to relative results, led by Facebook, which was boosted by strong user and revenue growth. Investments in the consumer discretionary and health care sectors detracted from the fund’s relative results. The fund’s top detractor to relative returns was information technology company Apple. The fund had a significantly lower investment in Apple compared to the index and Apple proved to be one of the top performers for the year.
Although U.S. economic growth remained solid, the fund’s portfolio managers are keeping a close watch on near-term economic indicators, such as wage growth, monetary policy and trade relations. Portfolio managers continue to favor well-positioned, growth-oriented companies that are capable of generating free cash flow in myriad near-term economic environments and remain optimistic that our global research will help us identify attractive long-term investment opportunities.
| Largest equity securities2 | Percent of net assets | |||
| Microsoft | 5.80 | % | ||
| 5.46 | ||||
| Netflix | 3.70 | |||
| Amazon | 3.62 | |||
| Alphabet | 3.33 | |||
| UnitedHealth Group | 3.30 | |||
| Tesla | 2.80 | |||
| Broadcom | 2.70 | |||
| ASML | 2.24 | |||
| Intuitive Surgical | 2.18 | |||
| 8 | American Funds Insurance Series |
Growth Fund
How a hypothetical $10,000 investment has grown
![]()
| Total returns based on a $1,000 investment | ||||||||||||||||||||
| For periods ended December 31, 20193 | ||||||||||||||||||||
| 1 year | 5 years | 10 years | Lifetime (since February 8, 1984) | Expense ratio | ||||||||||||||||
| Class 1 | 31.11 | % | 14.67 | % | 14.27 | % | 12.92 | % | .36 | % | ||||||||||
| Class 1A | 30.79 | 14.39 | 13.99 | 12.64 | .61 | |||||||||||||||
| Class 2 | 30.77 | 14.38 | 13.98 | 12.64 | .61 | |||||||||||||||
| Class 3 | 30.86 | 14.46 | 14.06 | 12.72 | .54 | |||||||||||||||
| Class 4 | 30.44 | 14.10 | 13.72 | 12.37 | .86 | |||||||||||||||
Investment results assume all distributions are reinvested and reflect applicable fees and expenses. When applicable, investment results reflect fee waivers and/or expense reimbursements, without which results would have been lower. Visit capitalgroup.com for more information. Expense ratios are as of the fund’s prospectus dated May 1, 2020 (unaudited). See the Financial Highlights table in this report for details.
Any market index shown is unmanaged and, therefore, has no expenses. Investors cannot invest directly in an index.
| 1 | Source: S&P Dow Jones Indices LLC. |
| 2 | The information shown does not include cash and cash equivalents, which includes shares of money market or similar funds managed by the investment adviser or its affiliates that are not offered to the public. |
| 3 | Periods greater than one year are annualized. |
| Where the fund’s assets were invested as of December 31, 2019 | Percent of net assets |

| American Funds Insurance Series | 9 |
International Fund
Fund results shown are for past periods and are not predictive of results for future periods. Current and future results may be lower or higher than those shown. Share prices and returns will vary, so investors may lose money. Investing for short periods makes losses more likely. For current information and month-end results, visit capitalgroup.com/afis. For information about your insurance contract and month-end results, go to the website of the company that issued your contract.
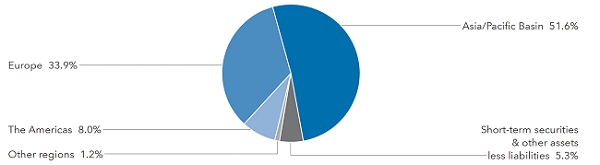
International Fund gained 23.21% for the 12 months ended December 31, 2019. Its benchmark, the MSCI ACWI (All Country World Index) ex USA,1a free float-adjusted market capitalization-weighted index that is designed to measure equity market results in the global developed and emerging markets (consisting of more than 40 developed and emerging market country indexes excluding the U.S.), increased 21.51%.
Global stocks generated the best returns in a decade, boosted by aggressive central bank stimulus measures and easing trade tensions toward the end of the year. U.S. stocks soared to near record highs in December as the U.S. and China agreed to a limited trade war truce with the aim of avoiding the imposition of new tariffs and other protectionist measures. Information technology stocks posted the highest returns with a gain of nearly 48% in aggregate. Outside the U.S., European stocks advanced despite signs of slowing economic growth, a near-recession in Germany and Brexit-related uncertainty in the U.K. that remained unresolved until the very last month of the year. Emerging markets stocks advanced, overcoming bouts of volatility tied to global trade tensions, China’s economic slowdown and a strong U.S. dollar.
Investments in the communication services and financials sectors boosted relative returns with Amsterdam-based Altice Europe among the top contributors thanks to better than expected growth. One of the biggest detractors to relative returns was health-care sector stock Teva Pharmaceutical, whose stock price suffered amid continued opioid litigation.
The fund’s portfolio managers continue to monitor volatility and potential headwinds brought about by political and trade uncertainty. Given how late it may be in the current bull market, they seek opportunities in particular within those regions, countries and sectors less affected by these global headlines. Their focus on a company’s fundamental growth drivers and intrinsic worth is critical to helping them identify investments that they believe represent the best value over the long term.
| Country diversification | Percent of net assets | |||
| Asia/Pacific Basin | ||||
| Japan | 16.2 | % | ||
| China | 12.1 | |||
| India | 8.7 | |||
| Hong Kong | 7.2 | |||
| South Korea | 2.8 | |||
| Australia | 1.3 | |||
| Taiwan | 1.1 | |||
| Philippines | 1.0 | |||
| Other | 1.2 | |||
| 51.6 | ||||
| Europe | ||||
| France | 9.5 | |||
| United Kingdom | 6.7 | |||
| Switzerland | 5.1 | |||
| Germany | 4.4 | |||
| Netherlands | 3.5 | |||
| Spain | 2.6 | |||
| Other | 2.1 | |||
| 33.9 | ||||
| The Americas | ||||
| Brazil | 4.0 | |||
| Canada | 2.1 | |||
| United States | 1.5 | |||
| Other | .4 | |||
| 8.0 | ||||
| Other regions | ||||
| Other | 1.2 | |||
| Short-term securities & other assets less liabilities | 5.3 | |||
| Total | 100.0 | % | ||
| Largest equity securities2 | Percent of net assets | |||
| AIA Group | 4.28 | % | ||
| Airbus Group | 3.97 | |||
| Alibaba Group Holding | 3.44 | |||
| HDFC Bank | 3.36 | |||
| Novartis | 2.47 | |||
| Vale | 2.03 | |||
| ASML | 2.02 | |||
| Kotak Mahindra Bank | 1.90 | |||
| Grifols | 1.81 | |||
| SoftBank | 1.80 | |||
| 10 | American Funds Insurance Series |
International Fund
How a hypothetical $10,000 investment has grown

| Total returns based on a $1,000 investment | ||||||||||||||||||||
| For periods ended December 31, 20193 | ||||||||||||||||||||
| 1 year | 5 years | 10 years | Lifetime (since May 1, 1990) | Expense ratio | ||||||||||||||||
| Class 1 | 23.21 | % | 7.14 | % | 6.29 | % | 8.21 | % | .55 | % | ||||||||||
| Class 1A | 22.90 | 6.89 | 6.04 | 7.94 | .80 | |||||||||||||||
| Class 2 | 22.88 | 6.87 | 6.03 | 7.94 | .80 | |||||||||||||||
| Class 3 | 23.05 | 6.95 | 6.10 | 8.02 | .73 | |||||||||||||||
| Class 4 | 22.67 | 6.61 | 5.79 | 7.68 | 1.05 | |||||||||||||||
Investment results assume all distributions are reinvested and reflect applicable fees and expenses. When applicable, investment results reflect fee waivers and/or expense reimbursements, without which results would have been lower. Visit capitalgroup.com for more information. Expense ratios are as of the fund’s prospectus dated May 1, 2020 (unaudited). See the Financial Highlights table in this report for details.
Any market index shown is unmanaged and, therefore, has no expenses. Investors cannot invest directly in an index.
| 1 | Source: MSCI. The MSCI index result reflects dividends net of withholding taxes and reinvestment of distributions. |
| 2 | The information shown does not include cash and cash equivalents, which includes shares of money market or similar funds managed by the investment adviser or its affiliates that are not offered to the public. |
| 3 | Periods greater than one year are annualized. |
| Where the fund’s assets were invested as of December 31, 2019 | Percent of net assets |
| American Funds Insurance Series | 11 |
New World Fund®
Fund results shown are for past periods and are not predictive of results for future periods. Current and future results may be lower or higher than those shown. Share prices and returns will vary, so investors may lose money. Investing for short periods makes losses more likely. For current information and month-end results, visit capitalgroup.com/afis. For information about your insurance contract and month-end results, go to the website of the company that issued your contract.
New World Fund was up 29.47% for the 12 months ended December 31, 2019. Its benchmark index, the MSCI ACWI (All Country World Index),1a free float-adjusted market capitalization-weighted index that is designed to measure equity market results in the global developed and emerging markets (consisting of more than 40 developed and emerging market country indexes), was up 26.60%. The MSCI Emerging Markets (EM) Index,1a free float-adjusted market capitalization-weighted index that is designed to measure equity market results in the global emerging markets (consisting of more than 20 emerging market country indexes), increased by 18.42%.
Global stocks generated the best returns in a decade, boosted by aggressive central bank stimulus measures and easing trade tensions toward the end of the year. U.S. stocks soared to near record highs in December as the U.S. and China agreed to a limited trade war truce with the aim of avoiding the imposition of new tariffs and other protectionist measures. Technology stocks posted the highest returns with a gain of nearly 48% in aggregate. Outside the U.S., European stocks advanced despite signs of slowing economic growth, a near-recession in Germany and Brexit-related uncertainty in the U.K. that remained unresolved until the very last month of the year. Emerging markets stocks advanced, overcoming bouts of volatility tied to global trade tensions, China’s economic slowdown and a strong U.S. dollar.
The fund’s relative returns outpaced emerging markets in general. Investments in the information technology and financial sectors were beneficial to the fund. Payment processing company PagSeguro contributed to relative returns as its stock price rose on the back of strong revenue growth. Among detractors, the fund’s lower investment in Apple compared with the MSCI ACWI hurt relative results as it outpaced the overall market.
The fund’s portfolio managers continue to pursue a bottom-up approach to investing and search for undervalued companies with solid foundations around the world, as well as stocks that are domestically focused and more insulated from geopolitical events given increased volatility at this point in the market cycle.
| Country diversification | Percent of net assets | |||
| Asia/Pacific Basin | ||||
| India | 13.4 | % | ||
| China | 8.6 | |||
| Taiwan | 4.0 | |||
| Japan | 3.8 | |||
| Hong Kong | 2.8 | |||
| Australia | 2.1 | |||
| Other | 2.4 | |||
| 37.1 | ||||
| The Americas | ||||
| United States | 22.6 | |||
| Brazil | 12.4 | |||
| Canada | 1.0 | |||
| Other | 1.0 | |||
| 37.0 | ||||
| Europe | ||||
| United Kingdom | 4.0 | |||
| France | 2.8 | |||
| Russian Federation | 2.5 | |||
| Germany | 2.2 | |||
| Switzerland | 2.1 | |||
| Other | 3.8 | |||
| 17.4 | ||||
| Other regions | ||||
| Other | 2.0 | |||
| Short-term securities & other assets less liabilities | 6.5 | |||
| Total | 100.0 | % | ||
| Largest equity securities2 | Percent of net assets | |||
| Reliance Industries | 6.52 | % | ||
| TSMC | 3.16 | |||
| PagSeguro | 2.65 | |||
| Microsoft | 2.26 | |||
| HDFC Bank | 2.09 | |||
| StoneCo | 1.89 | |||
| Kotak Mahindra Bank | 1.85 | |||
| Vale | 1.71 | |||
| B3 | 1.59 | |||
| Kweichow Moutai | 1.51 | |||
| 12 | American Funds Insurance Series |
New World Fund
How a hypothetical $10,000 investment has grown

Total returns based on a $1,000 investment
For periods ended December 31, 20193
| 1 year | 5 years | 10 years | Lifetime (since June 17, 1999) | Gross expense ratio | Net expense ratio | |||||||||||||||||||
| Class 1 | 29.47 | % | 8.20 | % | 6.30 | % | 8.49 | % | .77 | % | .59 | % | ||||||||||||
| Class 1A | 29.11 | 7.93 | 6.04 | 8.22 | 1.02 | .84 | ||||||||||||||||||
| Class 2 | 29.15 | 7.94 | 6.03 | 8.22 | 1.02 | .84 | ||||||||||||||||||
| Class 4 | 28.82 | 7.67 | 5.78 | 7.95 | 1.27 | 1.09 | ||||||||||||||||||
Investment results assume all distributions are reinvested and reflect applicable fees and expenses. The investment adviser intends to waive a portion of its management fees beginning May 1, 2020. This waiver will be in effect through at least May 1, 2021. The waiver may only be modified or terminated with the approval of the fund’s board. When applicable, investment results reflect fee waivers and/or expense reimbursements, without which results would have been lower. Visit capitalgroup.com for more information. Expense ratios are as of the fund’s prospectus dated May 1, 2020 (unaudited). See the Financial Highlights table in this report for details.
Any market index shown is unmanaged and, therefore, has no expenses. Investors cannot invest directly in an index.
| 1 | Source: MSCI. Results for MSCI indexes reflect dividends net of withholding taxes and reinvestment of distributions. |
| 2 | The information shown does not include cash and cash equivalents, which includes shares of money market or similar funds managed by the investment adviser or its affiliates that are not offered to the public. |
| 3 | Periods greater than one year are annualized. |
| Where the fund’s assets were invested as of December 31, 2019 | Percent of net assets |

| American Funds Insurance Series | 13 |
Blue Chip Income and Growth Fund
Fund results shown are for past periods and are not predictive of results for future periods. Current and future results may be lower or higher than those shown. Share prices and returns will vary, so investors may lose money. Investing for short periods makes losses more likely. For current information and month-end results, visit capitalgroup.com/afis. For information about your insurance contract and month-end results, go to the website of the company that issued your contract.
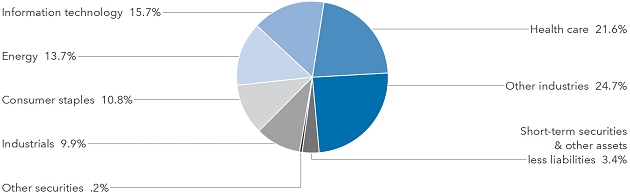
Blue Chip Income and Growth Fund gained 21.66% for the 12 months ended December 31, 2019, trailing the 31.49% rise in its benchmark index, Standard & Poor’s 500 Composite Index,1a market capitalization-weighted index based on the results of approximately 500 widely held common stocks.
U.S. equities had their strongest annual gains since 2013, ending the year near all-time highs. Stocks rose steadily, posting gains in 10 of 12 months. The U.S. trade war with China occasionally caused volatility, but the resilient U.S. economy and the Federal Reserve’s return to accommodative policies helped steer markets higher. Information technology companies posted the highest returns, with a gain of nearly 48% in aggregate. Outside the U.S., European stocks advanced despite signs of slowing economic growth, a near-recession in Germany and Brexit-related uncertainty in the U.K. that remained unresolved until the very last month of the year. Emerging markets stocks advanced, overcoming bouts of volatility tied to global trade tensions, China’s economic slowdown and a strong U.S. dollar.
Certain investments in health care helped the fund’s results relative to the index. Among the fund’s top contributors to relative returns within health care was UnitedHealth Group, as it consistently surpassed earnings estimates each quarter throughout the year. Another top contributor was QUALCOMM, where an improved relationship with Apple and the prospect of a 5G wireless network bolstered both earnings prospects and the company’s valuation.
Other holdings in the health care sector hindered relative returns. Investments in pharmaceutical companies, such as AbbVie and Teva Pharmaceutical, hurt results relative to the index. Overall, this proved to be a relatively disappointing year for the fund, but we continue to believe the focus on dividend-paying stocks will pay off over the long term.
Nearer term, the fund’s portfolio managers are aware that the market is keeping a close watch on U.S. monetary policy, our trade relationships and the current shape of the yield curve and their implications on the U.S. economy. Portfolio managers continue to favor well-managed, high-quality companies that are capable of paying dividends in myriad economic environments. We remain optimistic that this focus, supported by our global research, will help us to identify attractive long-term investment opportunities.
| Largest equity securities2 | Percent of net assets | |||
| Abbott Laboratories | 4.93 | % | ||
| Microsoft | 4.19 | |||
| Exxon Mobil | 3.67 | |||
| UnitedHealth Group | 3.60 | |||
| AbbVie | 3.44 | |||
| Amgen | 3.10 | |||
| 2.96 | ||||
| EOG Resources | 2.90 | |||
| CSX | 2.83 | |||
| Philip Morris International | 2.75 | |||
| 14 | American Funds Insurance Series |
Blue Chip Income and Growth Fund
How a hypothetical $10,000 investment has grown

Total returns based on a $1,000 investment
For periods ended December 31, 20194
| 1 year | 5 years | 10 years | Lifetime (since July 5, 2001) | Expense ratio | ||||||||||||||||
| Class 1 | 21.66 | % | 8.63 | % | 11.54 | % | 6.71 | % | .43 | % | ||||||||||
| Class 1A | 21.35 | 8.38 | 11.27 | 6.44 | .68 | |||||||||||||||
| Class 2 | 21.38 | 8.38 | 11.27 | 6.44 | .68 | |||||||||||||||
| Class 4 | 21.03 | 8.09 | 11.04 | 6.20 | .93 | |||||||||||||||
Investment results assume all distributions are reinvested and reflect applicable fees and expenses. When applicable, investment results reflect fee waivers and/or expense reimbursements, without which results would have been lower. Visit capitalgroup.com for more information. Expense ratios are as of the fund’s prospectus dated May 1, 2020 (unaudited). See the Financial Highlights table in this report for details.
Any market index shown is unmanaged and, therefore, has no expenses. Investors cannot invest directly in an index.
| 1 | Source: S&P Dow Jones Indices LLC. |
| 2 | The information shown does not include cash and cash equivalents, which includes shares of money market or similar funds managed by the investment adviser or its affiliates that are not offered to the public. |
| 3 | Source: Refinitiv Lipper. Lipper averages reflect the current composition of all eligible mutual funds (all share classes) within a given category. Lipper categories are dynamic and averages may have few funds, especially over longer periods. To see the number of funds included in the Lipper category for each fund’s lifetime, please see the Quarterly Statistical Update, available on our website. |
| 4 | Periods greater than one year are annualized. |
| Where the fund’s assets were invested as of December 31, 2019 | Percent of net assets |
| American Funds Insurance Series | 15 |
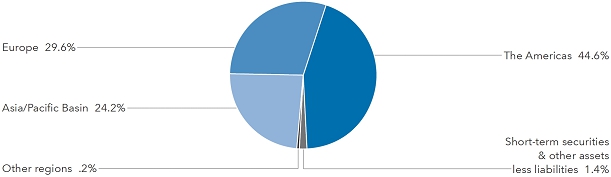
Global Growth and Income Fund
Fund results shown are for past periods and are not predictive of results for future periods. Current and future results may be lower or higher than those shown. Share prices and returns will vary, so investors may lose money. Investing for short periods makes losses more likely. For current information and month-end results, visit capitalgroup.com/afis. For information about your insurance contract and month-end results, go to the website of the company that issued your contract.
Global Growth and Income Fund advanced 31.39% for the 12 months ended December 31, 2019, compared with a 26.60% increase in its benchmark index, MSCI ACWI (All Country World Index),1a free float-adjusted market capitalization-weighted index that is designed to measure equity market results in the global developed and emerging markets, consisting of more than 40 developed and emerging market country indexes.
Global stocks generated the best returns in a decade, boosted by aggressive central bank stimulus measures and easing trade tensions toward the end of the year. U.S. stocks soared to near record highs in December as the U.S. and China agreed to a limited trade war truce with the aim of avoiding the imposition of new tariffs and other protectionist measures. Technology stocks posted the highest returns with a gain of nearly 48% in aggregate. Outside the U.S., European stocks advanced despite signs of slowing economic growth, a near-recession in Germany and Brexit-related uncertainty in the U.K. that remained unresolved until the very last month of the year. Emerging markets stocks advanced, overcoming bouts of volatility tied to global trade tensions, China’s economic slowdown and a strong U.S. dollar.
The fund’s relative performance benefited from specific stock selection, particularly within the industrials and energy sectors. Industrial company Airbus rallied on positive tail winds from strong global demand, and likely benefited from Boeing’s troubles with its 737MAX. On the downside, some investments in the materials sector hindered relative returns. In particular, Brazil’s Vale was a top relative detractor.
On a country basis, holdings in Japan and France contributed the most to relative returns, and holdings in the U.S. and Canada were a drag on returns (the former due to a lower-than-index position).
The fund’s portfolio managers recognize that we are experiencing a slowdown in global economic growth. With dovish monetary strategy back under consideration in the U.S. and Europe, the fund’s managers remain cautiously optimistic about the prospects for the global economy and are monitoring the potential impact on global growth. Portfolio managers continue to invest based on a bottom-up approach to long-term investing and believe they can uncover promising companies with strong positions in their industries, sustainable growth and income opportunities globally – including emerging markets.
| Country diversification | Percent of net assets | |||
| The Americas | ||||
| United States | 35.5 | % | ||
| Brazil | 6.9 | |||
| Canada | 2.0 | |||
| Other | .2 | |||
| 44.6 | ||||
| Europe | ||||
| France | 7.1 | |||
| Germany | 4.8 | |||
| United Kingdom | 4.3 | |||
| Switzerland | 2.7 | |||
| Russian Federation | 2.6 | |||
| Netherlands | 2.1 | |||
| Denmark | 1.7 | |||
| Italy | 1.4 | |||
| Ireland | 1.2 | |||
| Other | 1.7 | |||
| 29.6 | ||||
| Asia/Pacific Basin | ||||
| Japan | 6.9 | |||
| Taiwan | 4.5 | |||
| India | 4.0 | |||
| Australia | 3.5 | |||
| China | 1.9 | |||
| Hong Kong | 1.5 | |||
| Other | 1.9 | |||
| 24.2 | ||||
| Other regions | ||||
| Other | .2 | |||
| Short-term securities & other assets less liabilities | 1.4 | |||
| Total | 100.0 | % | ||
| Largest equity securities2 | Percent of net assets | |||
| TSMC | 4.48 | % | ||
| Nintendo | 4.45 | |||
| Airbus Group | 4.28 | |||
| Reliance Industries | 2.70 | |||
| Microsoft | 2.07 | |||
| E.ON | 1.82 | |||
| Alphabet | 1.81 | |||
| PagSeguro | 1.80 | |||
| Broadcom | 1.79 | |||
| CCR | 1.69 | |||
| 16 | American Funds Insurance Series |
Global Growth and Income Fund
How a hypothetical $10,000 investment has grown
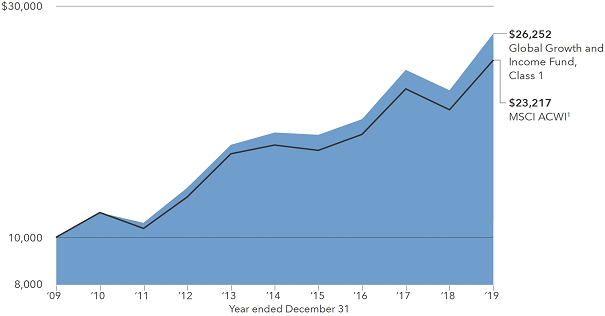
Total returns based on a $1,000 investment
For periods ended December 31, 20193
| 1 year | 5 years | 10 years | Lifetime (since May 1, 2006) | Expense ratio | ||||||||||||||||
| Class 1 | 31.39 | % | 9.88 | % | 10.13 | % | 7.56 | % | .66 | % | ||||||||||
| Class 1A | 31.04 | 9.64 | 9.87 | 7.30 | .91 | |||||||||||||||
| Class 2 | 31.14 | 9.61 | 9.86 | 7.29 | .91 | |||||||||||||||
| Class 4 | 30.73 | 9.32 | 9.60 | 7.04 | 1.16 | |||||||||||||||
Investment results assume all distributions are reinvested and reflect applicable fees and expenses. When applicable, investment results reflect fee waivers and/or expense reimbursements, without which results would have been lower. Visit capitalgroup.com for more information. Expense ratios are as of the fund’s prospectus dated May 1, 2020 (unaudited). See the Financial Highlights table in this report for details.
Any market index shown is unmanaged and, therefore, has no expenses. Investors cannot invest directly in an index.
| 1 | Source MSCI. The MSCI index result reflects dividends net of withholding taxes and reinvestment of distributions. |
| 2 | The information shown does not include cash and cash equivalents, which includes shares of money market or similar funds managed by the investment adviser or its affiliates that are not offered to the public. |
| 3 | Periods greater than one year are annualized. |
| Where the fund’s assets were invested as of December 31, 2019 | Percent of net assets |
| American Funds Insurance Series | 17 |
Growth-Income Fund
Fund results shown are for past periods and are not predictive of results for future periods. Current and future results may be lower or higher than those shown. Share prices and returns will vary, so investors may lose money. Investing for short periods makes losses more likely. For current information and month-end results, visit capitalgroup.com/afis. For information about your insurance contract and month-end results, go to the website of the company that issued your contract.
Growth-Income Fund gained 26.46% for the 12 months ended December 31, 2019. Standard & Poor’s 500 Composite Index,1a market capitalization-weighted index based on the results of approximately 500 widely held common stocks, rose 31.49%.
U.S. equities had their strongest annual gains since 2013, ending the year near all-time highs. Stocks rose steadily, posting gains in 10 of 12 months. The U.S. trade war with China occasionally caused volatility, but the resilient U.S. economy and the Federal Reserve’s return to accommodative policies helped steer markets higher. Information technology companies posted the highest returns, with a gain of nearly 48% in aggregate. Outside the U.S., European stocks advanced despite signs of slowing economic growth, a near-recession in Germany and Brexit-related uncertainty in the U.K. that remained unresolved until the very last month of the year. Emerging markets stocks advanced, overcoming bouts of volatility tied to global trade tensions, China’s economic slowdown and a strong U.S. dollar.
Regarding the fund, investments in the industrials sector contributed the most to the fund’s relative returns. Among industrials, aircraft component manufacturer TransDigm Group added the most to the fund’s relative results. On the downside, the fund’s lower-than-index position in information technology stocks, a sector that performed strongly over the period, weighed on relative returns. In particular, the fund’s lower-than-index investment in Apple hindered sector results the most as Apple shares outperformed the broader market over the period.
The fund’s portfolio managers continue to look for compelling investment opportunities, buying stocks they believe represent the best value over the long term.
| Largest equity securities2 | Percent of net assets | |||
| Microsoft | 4.14 | % | ||
| 3.89 | ||||
| UnitedHealth Group | 2.56 | |||
| Netflix | 2.11 | |||
| Alphabet | 2.02 | |||
| Broadcom | 2.00 | |||
| Abbott Laboratories | 1.64 | |||
| JPMorgan Chase | 1.55 | |||
| Amazon | 1.52 | |||
| Amgen | 1.34 | |||
| 18 | American Funds Insurance Series |
Growth-Income Fund
How a hypothetical $10,000 investment has grown
![]()
Total returns based on a $1,000 investment
For periods ended December 31, 20193
| 1 year | 5 years | 10 years | Lifetime (since February 8, 1984) | Expense ratio | ||||||||||||||||
| Class 1 | 26.46 | % | 11.68 | % | 12.81 | % | 11.46 | % | .30 | % | ||||||||||
| Class 1A | 26.14 | 11.42 | 12.54 | 11.18 | .55 | |||||||||||||||
| Class 2 | 26.14 | 11.40 | 12.53 | 11.18 | .55 | |||||||||||||||
| Class 3 | 26.24 | 11.48 | 12.61 | 11.26 | .48 | |||||||||||||||
| Class 4 | 25.86 | 11.12 | 12.26 | 10.91 | .80 | |||||||||||||||
Investment results assume all distributions are reinvested and reflect applicable fees and expenses. When applicable, investment results reflect fee waivers and/or expense reimbursements, without which results would have been lower. Visit capitalgroup.com for more information. Expense ratios are as of the fund’s prospectus dated May 1, 2020 (unaudited). See the Financial Highlights table in this report for details.
Any market index shown is unmanaged and, therefore, has no expenses. Investors cannot invest directly in an index.
| 1 | Source: S&P Dow Jones Indices LLC. |
| 2 | The information shown does not include cash and cash equivalents, which includes shares of money market or similar funds managed by the investment adviser or its affiliates that are not offered to the public. |
| 3 | Periods greater than one year are annualized. |
| Where the fund’s assets were invested as of December 31, 2019 | Percent of net assets |

| American Funds Insurance Series | 19 |
International Growth and Income Fund
Fund results shown are for past periods and are not predictive of results for future periods. Current and future results may be lower or higher than those shown. Share prices and returns will vary, so investors may lose money. Investing for short periods makes losses more likely. For current information and month-end results, visit capitalgroup.com/afis. For information about your insurance contract and month-end results, go to the website of the company that issued your contract.
International Growth and Income Fund gained 23.06% for the 12 months ended December 31, 2019, compared to the 21.51% increase in its benchmark index, the MSCI ACWI (All Country World Index) ex USA,1 a free float-adjusted market capitalization-weighted index that is designed to measure equity market results in the global developed and emerging markets (consisting of more than 40 developed and emerging market country indexes excluding the U.S.).
Global stocks generated the best returns in a decade, boosted by aggressive central bank stimulus measures and easing trade tensions toward the end of the year. U.S. stocks soared to near record highs in December as the U.S. and China agreed to a limited trade war truce with the aim of avoiding the imposition of new tariffs and other protectionist measures. Technology stocks posted the highest returns with a gain of nearly 48% in aggregate. Outside the U.S., European stocks advanced despite signs of slowing economic growth, a near-recession in Germany and Brexit-related uncertainty in the U.K. that remained unresolved until the very last month of the year. Emerging markets stocks advanced, overcoming bouts of volatility tied to global trade tensions, China’s economic slowdown and a strong U.S. dollar.
The top contributors to the fund’s relative returns were the consumer discretionary and utilities sectors due in part to good stock selection. Luckin Coffee was the top contributor to the fund’s relative returns as it benefited from strong growth in the Chinese retail coffee market. Health care stock Daiichi Sankyo also contributed strong relative returns.
On the downside, investments in the energy and real estate sectors detracted from the fund’s relative returns. Among energy stocks, Royal Dutch Shell was one of the fund’s biggest drags on returns as a result of lower oil prices and market volatility.
The fund’s portfolio managers follow signs of some economic weakness in Europe and parts of emerging markets, as well as a number of geopolitical uncertainties, with an aim to preserve value in any potential market correction while being in a position to take advantage of buying opportunities, should they present themselves later in the year.
| Country diversification | Percent of net assets | |||
| Europe | ||||
| United Kingdom | 12.1 | % | ||
| France | 9.5 | |||
| Switzerland | 5.9 | |||
| Germany | 3.5 | |||
| Netherlands | 3.0 | |||
| Spain | 3.0 | |||
| Russian Federation | 2.5 | |||
| Sweden | 1.1 | |||
| Other | 1.9 | |||
| 42.5 | ||||
| Asia/Pacific Basin | ||||
| Japan | 14.0 | |||
| China | 9.7 | |||
| Hong Kong | 6.5 | |||
| India | 3.6 | |||
| Singapore | 2.3 | |||
| Taiwan | 2.1 | |||
| South Korea | 1.0 | |||
| Other | 2.5 | |||
| 41.7 | ||||
| The Americas | ||||
| Brazil | 3.3 | |||
| Canada | 1.6 | |||
| Mexico | .3 | |||
| 5.2 | ||||
| Other regions | ||||
| Turkey | 1.8 | |||
| Israel | .4 | |||
| 2.2 | ||||
| Short-term securities & other assets less liabilities | 8.4 | |||
| Total | 100.0 | % | ||
| Largest equity securities2 | Percent of net assets | |||
| Royal Dutch Shell | 4.53 | % | ||
| Novartis | 3.18 | |||
| HDFC Bank | 2.92 | |||
| Rio Tinto | 2.61 | |||
| Luckin Coffee | 2.59 | |||
| Zurich | 2.52 | |||
| E.ON | 2.49 | |||
| Daiichi Sankyo | 2.47 | |||
| Airbus Group | 2.11 | |||
| Sun Hung Kai Properties | 2.11 | |||
| 20 | American Funds Insurance Series |
International Growth and Income Fund
How a hypothetical $10,000 investment has grown

Total returns based on a $1,000 investment
For periods ended December 31, 20193
| 1 year | 5 years | 10 years | Lifetime (since November 18, 2008) | Expense ratio | ||||||||||||||||
| Class 1 | 23.06 | % | 5.73 | % | 5.79 | % | 9.32 | % | .67 | % | ||||||||||
| Class 1A | 22.76 | 5.49 | 5.53 | 9.06 | .92 | |||||||||||||||
| Class 2 | 22.76 | 5.46 | 5.52 | 9.04 | .92 | |||||||||||||||
| Class 4 | 22.47 | 5.20 | 5.30 | 8.81 | 1.17 | |||||||||||||||
Investment results assume all distributions are reinvested and reflect applicable fees and expenses. When applicable, investment results reflect fee waivers and/or expense reimbursements, without which results would have been lower. Visit capitalgroup.com for more information. Expense ratios are as of the fund’s prospectus dated May 1, 2020 (unaudited). See the Financial Highlights table in this report for details.
Any market index shown is unmanaged and, therefore, has no expenses. Investors cannot invest directly in an index.
| 1 | Source: MSCI. The MSCI index result reflects dividends net of withholding taxes and reinvestment of distributions. |
| 2 | The information shown does not include cash and cash equivalents, which includes shares of money market or similar funds managed by the investment adviser or its affiliates that are not offered to the public. |
| 3 | Periods greater than one year are annualized. |
| Where the fund’s assets were invested as of December 31, 2019 | Percent of net assets |

| American Funds Insurance Series | 21 |
Capital Income Builder®
Fund results shown are for past periods and are not predictive of results for future periods. Current and future results may be lower or higher than those shown. Share prices and returns will vary, so investors may lose money. Investing for short periods makes losses more likely. For current information and month-end results, visit capitalgroup.com/afis. For information about your insurance contract and month-end results, go to the website of the company that issued your contract.
Capital Income Builder, which invests in a mix of stocks and bonds, gained 18.16% for the 12 months ended December 31, 2019. During the same period, the MSCI ACWI (All Country World Index)1, free float-adjusted market capitalization-weighted index that is designed to measure equity market results in the global developed and emerging markets (consisting of more than 40 developed and emerging market country indexes), gained 26.60%. The Bloomberg Barclays U.S. Aggregate Index2, which represents the U.S. investment-grade (rated BBB/Baa and above) fixed-rate bond market, gained 8.72%. The index blend of 70%/30% MSCI ACWI/Bloomberg Barclays U.S. Aggregate Index3gained 21.21%. The Lipper Global Equity Income Funds Average4, a measure of similar funds, was up 21.01%.
U.S. equities had their strongest annual gains since 2013, ending the year near all-time highs. Stocks rose steadily, posting gains in 10 of 12 months. The U.S. trade war with China occasionally caused volatility, but the resilient U.S. economy and the Federal Reserve’s return to accommodative policies helped steer markets higher. Information technology companies posted the highest returns, with a gain of nearly 48% in aggregate. Outside the U.S., European stocks advanced despite signs of slowing economic growth, a near-recession in Germany and Brexit-related uncertainty in the U.K. that remained unresolved until the very last month of the year. Emerging markets stocks advanced, overcoming bouts of volatility tied to global trade tensions, China’s economic slowdown and a strong U.S. dollar.
In the equity portfolio, the top contributors in relative terms were the utilities and consumer discretionary sectors. American Tower added the most to the fund’s relative returns as it notched higher returns than the general market.
On the downside, the information technology sector, which comprised the second-largest share of the fund’s equity holdings, detracted from returns. The fund’s top detractor to relative returns was information technology company Apple. The fund had a significantly lower investment in Apple compared to the index and Apple proved to be one of the top performers for the year. The fund’s fixed income portfolio was a drag on relative results.
The current market environment is rife with uncertainty. Given that the U.S. is late in the economic cycle, the fund’s portfolio managers are paying close attention to companies’ leverage and are more sharply focused on monitoring balance sheets. They seek to avoid companies that take on debt to pay dividends, and are focused on identifying companies with strong business models and a commitment to paying and growing dividends over time. Higher interest rates should also allow portfolio managers to reinvest bond coupon payments into higher yielding securities, thereby generating more income from the bond portfolio.
| Country diversification | Percent of net assets | |||
| The Americas | ||||
| United States | 52.8 | % | ||
| Canada | 2.5 | |||
| 55.3 | ||||
| Europe | ||||
| United Kingdom | 12.4 | |||
| France | 3.3 | |||
| Switzerland | 2.9 | |||
| Italy | 1.6 | |||
| Sweden | 1.2 | |||
| Denmark | 1.1 | |||
| Netherlands | 1.0 | |||
| Other | 1.4 | |||
| 24.9 | ||||
| Asia/Pacific Basin | ||||
| Hong Kong | 4.0 | |||
| Taiwan | 2.6 | |||
| Japan | 2.3 | |||
| China | 1.6 | |||
| Other | .8 | |||
| 11.3 | ||||
| Short-term securities & other assets less liabilities | 8.5 | |||
| Total | 100.0 | % | ||
| 22 | American Funds Insurance Series |
Capital Income Builder
How a hypothetical $10,000 investment has grown

Total returns based on a $1,000 investment
For periods ended December 31, 20195
| 1 year | 5 years | Lifetime (since May 1, 2014) | Gross expense ratio | Net | ||||||||||||||||
| Class 1 | 18.16 | % | 5.13 | % | 4.53 | % | .54 | % | .28 | % | ||||||||||
| Class 1A | 17.90 | 4.87 | 4.28 | .79 | .53 | |||||||||||||||
| Class 2 | 17.89 | 4.94 | 4.37 | .79 | .53 | |||||||||||||||
| Class 4 | 17.62 | 4.61 | 4.01 | 1.04 | .78 | |||||||||||||||
Investment results assume all distributions are reinvested and reflect applicable fees and expenses. The investment adviser intends to waive a portion of its management fees beginning May 1, 2020. This waiver will be in effect through at least May 1, 2021. The waiver may only be modified or terminated with the approval of the fund’s board. When applicable, investment results reflect fee waivers and/or expense reimbursements, without which results would have been lower. Visit capitalgroup.com for more information. Expense ratios are as of the fund’s prospectus dated May 1, 2020 (unaudited). See the Financial Highlights table in this report for details.
Any market index shown is unmanaged and, therefore, has no expenses. Investors cannot invest directly in an index.
| 1 | Source: MSCI. The MSCI index result reflects dividends net of withholding taxes and reinvestment of distributions. |
| 2 | Source: Bloomberg Index Services Ltd. |
| 3 | Data Sources: MSCI and Bloomberg Index Services Ltd. The 70%/30% MSCI ACWI/Bloomberg Barclays U.S. Aggregate Index blends the MSCI ACWI (All Country World Index) with the Bloomberg Barclays U.S. Aggregate Index by weighting their total returns at 70% and 30%, respectively. Its result assumes the blend is rebalanced monthly. |
| 4 | Source: Refinitiv Lipper. Lipper averages reflect the current composition of all eligible mutual funds (all share classes) within a given category. Lipper categories are dynamic and averages may have few funds, especially over longer periods. To see the number of funds included in the Lipper category for each fund’s lifetime, please see the Quarterly Statistical Update, available on our website. |
| 5 | Periods greater than one year are annualized. |
| Where the fund’s assets were invested as of December 31, 2019 | Percent of net assets |

| American Funds Insurance Series | 23 |
Asset Allocation Fund
Fund results shown are for past periods and are not predictive of results for future periods. Current and future results may be lower or higher than those shown. Share prices and returns will vary, so investors may lose money. Investing for short periods makes losses more likely. For current information and month-end results, visit capitalgroup.com/afis. For information about your insurance contract and month-end results, go to the website of the company that issued your contract.
Asset Allocation Fund, which is a mix of stocks and bonds, gained 21.54% for the 12 months ended December 31, 2019. Standard & Poor’s 500 Composite Index1, a market capitalization-weighted index based on the results of approximately 500 widely held common stocks, was up 31.49% over the same period, while the Bloomberg Barclays U.S. Aggregate Index2, which represents the U.S. investment-grade (rated BBB/Baa and above) fixed-rate bond market, returned 8.72%.A blend of the two indexes, the 60%/40% S&P 500 Index/Bloomberg Barclays U.S. Aggregate Index3, gained 22.18%. Effective May 1, 2020, the fund has elected to use the 60%/40% S&P 500 Index/Bloomberg Barclays U.S. Aggregate Index as its primary benchmark, because it comes closest to reflecting its investment universe and best measures its long-term results and portfolio managers’ success over time.
U.S. equities had their strongest annual gains since 2013, ending the year near all-time highs. Stocks rose steadily, posting gains in 10 of 12 months. The U.S. trade war with China occasionally caused volatility, but the resilient U.S. economy and the Federal Reserve’s return to accommodative policies helped steer markets higher. Information technology companies posted the highest returns, with a gain of nearly 48% in aggregate. Outside the U.S., European stocks advanced despite signs of slowing economic growth, a near-recession in Germany and Brexit-related uncertainty in the U.K. that remained unresolved until the very last month of the year. Emerging markets stocks advanced, overcoming bouts of volatility tied to global trade tensions, China’s economic slowdown and a strong U.S. dollar.
Investments in the financials sector — one of the fund’s largest sector holdings — contributed to the fund’s relative returns. Within financials, Arch Capital Group, Berkshire Hathaway and Apollo boosted results, as all three companies had at least double-digit returns that outpaced the general market. On the downside, health care stock AbbVie detracted from relative returns as its best-selling drug Humira faced generic competition. The fund’s fixed income investments somewhat detracted from relative returns due to duration positioning and security selection.
The fund’s portfolio managers continue to evaluate the economic and market-sector implications of the current administration’s decisions regarding trade. The fund’s cash position allows portfolio managers to remain flexible and better navigate uncertainty by focusing on opportunities when stock prices are favorable.
| Largest equity securities4 | Percent of net assets | |||
| Microsoft | 3.96 | % | ||
| Broadcom | 2.42 | |||
| UnitedHealth Group | 2.16 | |||
| ASML | 2.09 | |||
| Philip Morris International | 1.94 | |||
| Northrop Grumman | 1.82 | |||
| Johnson & Johnson | 1.70 | |||
| Humana | 1.69 | |||
| Boeing | 1.68 | |||
| Charter Communications | 1.67 | |||
| 24 | American Funds Insurance Series |
Asset Allocation Fund
How a hypothetical $10,000 investment has grown

Total returns based on a $1,000 investment
For periods ended December 31, 20195
| 1 year | 5 years | 10 years | Lifetime (since August 1,1989) | Expense ratio | ||||||||||||||||
| Class 1 | 21.54 | % | 8.59 | % | 10.19 | % | 8.63 | % | .31 | % | ||||||||||
| Class 1A | 21.19 | 8.33 | 9.92 | 8.36 | .56 | |||||||||||||||
| Class 2 | 21.23 | 8.32 | 9.92 | 8.36 | .56 | |||||||||||||||
| Class 3 | 21.30 | 8.40 | 10.00 | 8.44 | .49 | |||||||||||||||
| Class 4 | 20.92 | 8.05 | 9.69 | 8.11 | .81 | |||||||||||||||
Investment results assume all distributions are reinvested and reflect applicable fees and expenses. When applicable, investment results reflect fee waivers and/or expense reimbursements, without which results would have been lower. Visit capitalgroup.com for more information. Expense ratios are as of the fund’s prospectus dated May 1, 2020 (unaudited). See the Financial Highlights table in this report for details.
Any market index shown is unmanaged and, therefore, has no expenses. Investors cannot invest directly in an index.
| 1 | Source: S&P Dow Jones Indices LLC. |
| 2 | Source: Bloomberg Index Services Ltd. |
| 3 | Sources: Bloomberg Index Services Ltd. and S&P Dow Jones Indices LLC. Blends the S&P 500 with the Bloomberg Barclays U.S. Aggregate Index by weighting their total returns at 60% and 40%, respectively. Results assume the blend is rebalanced monthly. |
| 4 | The information shown does not include cash and cash equivalents, which includes shares of money market or similar funds managed by the investment adviser or its affiliates that are not offered to the public. |
| 5 | Periods greater than one year are annualized. |
| Where the fund’s assets were invested as of December 31, 2019 | Percent of net assets |
| American Funds Insurance Series | 25 |
Global Balanced Fund
Fund results shown are for past periods and are not predictive of results for future periods. Current and future results may be lower or higher than those shown. Share prices and returns will vary, so investors may lose money. Investing for short periods makes losses more likely. For current information and month-end results, visit capitalgroup.com/afis. For information about your insurance contract and month-end results, go to the website of the company that issued your contract.
Global Balanced Fund gained 20.79% for the 12 months ended December 31, 2019. The MSCI ACWI (All Country World Index),1a free float-adjusted market capitalization-weighted index that is designed to measure equity market results in the global developed and emerging markets (consisting of more than 40 developed and emerging market country indexes), increased by 26.60%, while the Bloomberg Barclays Global Aggregate Index,2a measure of global investment-grade bonds (rated BBB/Baa and above), increased 6.84%. The 60%/40% MSCI ACWI/Bloomberg Barclays Global Aggregate Index,3a blend of the two indexes, gained 18.55%.
Global stocks generated the best returns in a decade, boosted by aggressive central bank stimulus measures and easing trade tensions toward the end of the year. U.S. stocks soared near record highs in December as the U.S. and China agreed to a limited trade war truce. Outside the U.S., European stocks advanced despite signs of slowing economic growth, a near-recession in Germany and Brexit-related uncertainty in the U.K. that remained unresolved until the very last month of the year. Emerging markets stocks advanced, overcoming bouts of volatility tied to global trade tensions.
The fund’s higher-than-index position relative to the top performing information technology sector as well as individual stock selection in that sector boosted the fund’s returns compared with the index. The fund’s fixed income investments also helped relative returns. On the downside, investments in tobacco company Altria detracted from the fund’s relative returns as its share price dipped lower than the broader market.
The fund’s portfolio managers exercise caution and continue to monitor cross-border trade discussions that could lead to further tensions on the one hand and central bank activity on the other, which could result in lower rates. Rate reductions could help mitigate some of the negative economic impacts of a reduction in global trade. Portfolio managers continue to stay the course of focusing on global research and stock-by-stock, bottom-up analysis.
| Largest sectors in common stock holdings | Percent of net assets | |||
| Information technology | 13.8 | % | ||
| Health care | 11.0 | |||
| Financials | 9.5 | |||
| Consumer staples | 9.0 | |||
| Industrials | 7.4 | |||
| Largest fixed income holdings (by issuer)4 | ||||
| U.S. Treasury | 11.7 | |||
| Japanese Government | 4.0 | |||
| Fannie Mae | .8 | |||
| Italian Government | .8 | |||
| Greek Government | .7 | |||
| Currency diversification | Percent of net assets |
| Equity securities | Bonds & notes | Forward currency contracts | Short–term securities & other assets less liabilities | Total | ||||||||||||||||
| U.S. dollars | 32.6 | % | 18.5 | % | (1.0 | )% | 3.2 | % | 53.3 | % | ||||||||||
| Euros | 8.6 | 3.8 | 1.4 | — | 13.8 | |||||||||||||||
| British pounds | 7.3 | .3 | .8 | .1 | 8.5 | |||||||||||||||
| Japanese yen | 2.8 | 4.4 | — | — | 7.2 | |||||||||||||||
| Swiss francs | 4.4 | — | — | — | 4.4 | |||||||||||||||
| New Taiwan dollars | 2.2 | — | — | — | 2.2 | |||||||||||||||
| Hong Kong dollars | 2.0 | — | — | — | 2.0 | |||||||||||||||
| Danish krone | 1.3 | .2 | — | — | 1.5 | |||||||||||||||
| Canadian dollars | .6 | .3 | — | .3 | 1.2 | |||||||||||||||
| Brazilian Real | 1.1 | .2 | (.2 | ) | — | 1.1 | ||||||||||||||
| Other currencies | 1.3 | 4.5 | (1.0 | ) | — | 4.8 | ||||||||||||||
| 100.0 | % | |||||||||||||||||||
| Largest equity securities4 | Percent of net assets | |||
| Merck | 2.42 | % | ||
| ASML | 2.35 | |||
| AstraZeneca | 2.34 | |||
| TSMC | 2.18 | |||
| Broadcom | 1.94 | |||
| Microsoft | 1.79 | |||
| Nestlé | 1.59 | |||
| British American Tobacco | 1.52 | |||
| Altria | 1.40 | |||
| JPMorgan Chase | 1.40 | |||
| 26 | American Funds Insurance Series |
Global Balanced Fund
How a hypothetical $10,000 investment has grown
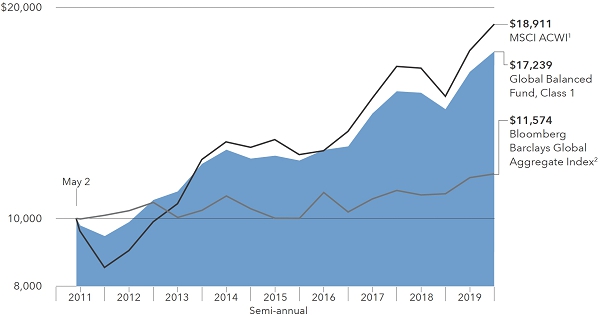
Total returns based on a $1,000 investment
For periods ended December 31, 20195
| 1 year | 5 years | Lifetime (since May 2, 2011) | Expense ratio | |||||||||||||
| Class 1 | 20.79 | % | 7.25 | % | 6.49 | % | .73 | % | ||||||||
| Class 1A | 20.54 | 7.02 | 6.24 | .98 | ||||||||||||
| Class 2 | 20.44 | 6.97 | 6.21 | .98 | ||||||||||||
| Class 4 | 20.21 | 6.76 | 6.09 | 1.23 | ||||||||||||
Investment results assume all distributions are reinvested and reflect applicable fees and expenses. Expense ratios are as of the fund’s prospectus dated May 1, 2020 (unaudited). See the Financial Highlights table in this report for details.
Any market index shown is unmanaged and, therefore, has no expenses. Investors cannot invest directly in an index.
| 1 | Source: MSCI. The MSCI index results reflect dividends net of withholding taxes and reinvestment of distributions. |
| 2 | Source: Bloomberg Index Services Ltd. |
| 3 | Data sources: MSCI and Bloomberg Index Services Ltd. The 60%/40% MSCI ACWI/Bloomberg Barclays Global Aggregate Index blends the MSCI ACWI (All Country World Index) with the Bloomberg Barclays Global Aggregate Index by weighting their cumulative total returns at 60% and 40%, respectively. Its result assumes the blend is rebalanced monthly. |
| 4 | The information shown includes affiliates of the same issuer when applicable. It does not include cash and cash equivalents or shares of money market or similar funds managed by the investment adviser or its affiliates that are not offered to the public. |
| 5 | Periods greater than one year are annualized. |
| Where the fund’s assets were invested as of December 31, 2019 | Percent of net assets |

| American Funds Insurance Series | 27 |
Bond Fund
Fund results shown are for past periods and are not predictive of results for future periods. Current and future results may be lower or higher than those shown. Share prices and returns will vary, so investors may lose money. Investing for short periods makes losses more likely. For current information and month-end results, visit capitalgroup.com/afis. For information about your insurance contract and month-end results, go to the website of the company that issued your contract.
Bond Fund gained 9.70% for the 12 months ended December 31, 2019. In comparison, the fund’s benchmark, the Bloomberg Barclays U.S. Aggregate Index1, which represents the U.S. investment-grade (rated BBB/Baa and above) fixed-rate bond market, returned 8.72%.
The Federal Reserve began the year by pausing its rate hike campaign in response to market turbulence at the end of 2018. It then began to cut the federal funds rate over the summer. It reduced the rate three times to end the year with the target in a range of 1.50%-1.75%.
Security selection within agency mortgage backed pass-through securities was the primary detractor from relative results over the period. On the positive side, the fund benefitted from active duration management as interest rates declined over the period. Sector selection was also a positive factor as out-of-benchmark investments in Treasury Inflation Protected Securities (TIPS), investment grade corporate bonds, high yield, and emerging markets all helped results.
With the current economic expansion now more than 10 years old, it is the longest in the post-war period. While we expect the expansion to continue in 2020, late cycle economies may be susceptible to risks or idiosyncratic problems throwing them off balance. For that reason, we feel strongly that a core bond fund like Bond Fund should remain conservatively positioned with a long-term focus. Managers remain committed to pursuing all four roles of fixed income: income, diversification from equities, capital preservation and inflation protection. We aim to manage a fund that will help to provide stability for your portfolio in any market environment.
| Largest holdings (by issuer)2 | Percent of net assets | |||
| U.S. Treasury | 28.74 | % | ||
| Fannie Mae | 14.84 | |||
| Freddie Mac | 10.61 | |||
| Ginnie Mae | 3.84 | |||
| UMBS | 2.73 | |||
| Teva Pharmaceutical | 1.92 | |||
| State of Illinois | 1.52 | |||
| Broadcom | 1.31 | |||
| Southern California Edison | 1.02 | |||
| Japanese Government | 1.02 | |||
| 28 | American Funds Insurance Series |
Bond Fund
How a hypothetical $10,000 investment has grown
![]()
Total returns based on a $1,000 investment
For periods ended December 31, 20193
| 1 year | 5 years | 10 years | Lifetime (since January 2, 1996) | Expense ratio | ||||||||||||||||
| Class 1 | 9.70 | % | 3.31 | % | 3.87 | % | 4.72 | % | .40 | % | ||||||||||
| Class 1A | 9.36 | 3.06 | 3.62 | 4.46 | .65 | |||||||||||||||
| Class 2 | 9.36 | 3.05 | 3.60 | 4.46 | .65 | |||||||||||||||
| Class 4 | 9.08 | 2.78 | 3.36 | 4.21 | .90 | |||||||||||||||
Investment results assume all distributions are reinvested and reflect applicable fees and expenses. When applicable, investment results reflect fee waivers and/or expense reimbursements, without which results would have been lower. Visit capitalgroup.com for more information. Expense ratios are as of the fund’s prospectus dated May 1, 2020 (unaudited). See the Financial Highlights table in this report for details.
Any market index shown is unmanaged and, therefore, has no expenses. Investors cannot invest directly in an index.
| 1 | Source: Bloomberg Index Services Ltd. |
| 2 | The information shown includes affiliates of the same issuer when applicable. It does not include cash and cash equivalents or shares of money market or similar funds managed by the investment adviser or its affiliates that are not offered to the public. |
| 3 | Periods greater than one year are annualized. |
| Where the fund’s assets were invested as of December 31, 2019 | Percent of net assets |

| American Funds Insurance Series | 29 |
Global Bond Fund
Fund results shown are for past periods and are not predictive of results for future periods. Current and future results may be lower or higher than those shown. Share prices and returns will vary, so investors may lose money. Investing for short periods makes losses more likely. For current information and month-end results, visit capitalgroup.com/afis. For information about your insurance contract and month-end results, go to the website of the company that issued your contract.
Global Bond Fund gained 8.08% for the 12 months ended December 31, 2019. This outpaced the fund’s benchmark, the Bloomberg Barclays Global Aggregate Index1, which measures global investment-grade bonds (rated BBB/Baa and above) and increased 6.84%.
Government bonds advanced as central banks around the world cut interest rates in an attempt to blunt the negative effects of a trade war. After raising rates in 2018, the U.S. Federal Reserve abruptly changed course and cut rates three times in 2019. Many other central banks followed the same path, while the European Central Bank took rates further into negative territory. The Treasury curve ultimately steepened after some flattening amid declining yields. Credit saw very sizable returns, with investment-grade and high-yield bonds gaining more than 14%. U.S. corporate spreads tightened sharply, by 60 basis points, to end at 93 basis points on an option-adjusted basis. The federal funds rate ended the year between 1.50% and 1.75%.
Sector/industry allocation helped results relative to the market index, as did careful security selection and the fund’s chosen exposure to countries. Investments in government bonds from Greece and Mexico were the largest individual contributors to relative results while Argentine government bonds were among the larger individual detractors.
As growth in the U.S. moderates, the fund’s portfolio managers seek to identify long-term investments around the world such as in emerging markets where corporate and high-yield debt may present opportunities. Given the fund’s core objective is to provide a high-level of total return over the long term, the fund’s portfolio managers maintain a cautious approach to investing in different sectors of the bond market, such as high-yield debt.
| Percent of net assets | ||||||||
| Currency weighting (after hedging) by country | ||||||||
| United States2 | 42.7 | % | ||||||
| Eurozone3 | 20.7 | |||||||
| Japan | 15.8 | |||||||
| United Kingdom | 4.9 | |||||||
| Canada | 2.2 | |||||||
| China | 2.2 | |||||||
| Malaysia | 1.6 | |||||||
| Denmark | 1.4 | |||||||
| India | 1.2 | |||||||
| Australia | 1.0 | |||||||
| Other | 6.3 | |||||||
| Total | 100.0 | % | ||||||
| Non-U.S. government bonds by country | ||||||||
| Japan | 12.4 | % | ||||||
| Eurozone3: | ||||||||
| Italy | 4.2 | |||||||
| Greece | 3.9 | |||||||
| Germany | 1.3 | |||||||
| France | 1.1 | |||||||
| Other | 1.6 | 12.1 | ||||||
| China | 3.3 | |||||||
| India | 1.8 | |||||||
| Malaysia | 1.8 | |||||||
| Brazil | 1.6 | |||||||
| South Africa | 1.5 | |||||||
| Romania | 1.5 | |||||||
| Canada | 1.4 | |||||||
| Mexico | 1.4 | |||||||
| United Kingdom | 1.3 | |||||||
| Israel | 1.2 | |||||||
| Norway | 1.2 | |||||||
| Other | 9.7 | |||||||
| Total | 52.2 | % | ||||||
| Largest holdings (by issuer)4 | Percent of net assets | |||
| U.S. Treasury | 13.81 | % | ||
| Japanese Government | 12.38 | |||
| Greek Government | 4.25 | |||
| Italian Government | 4.24 | |||
| Fannie Mae | 2.93 | |||
| Canadian Government | 2.29 | |||
| Freddie Mac | 2.21 | |||
| Chinese Government | 1.97 | |||
| Malaysian Government | 1.83 | |||
| China Development Bank | 1.72 | |||
| 30 | American Funds Insurance Series |
Global Bond Fund
How a hypothetical $10,000 investment has grown

Total returns based on a $1,000 investment
For periods ended December 31, 20196
| 1 year | 5 years | 10 years | Lifetime (since October 4, 2006) | Gross expense ratio | Net expense ratio | |||||||||||||||||||
| Class 1 | 8.08 | % | 2.54 | % | 2.85 | % | 4.07 | % | .59 | % | .50 | % | ||||||||||||
| Class 1A | 7.75 | 2.33 | 2.61 | 3.82 | .84 | .75 | ||||||||||||||||||
| Class 27 | 7.77 | 2.29 | 2.59 | 3.81 | .84 | .75 | ||||||||||||||||||
| Class 4 | 7.54 | 2.04 | 2.38 | 3.58 | 1.09 | 1.00 | ||||||||||||||||||
Investment results assume all distributions are reinvested and reflect applicable fees and expenses. The investment adviser intends to waive a portion of its management fees beginning May 1, 2020. This waiver will be in effect through at least May 1, 2021. The waiver may only be modified or terminated with the approval of the fund’s board. When applicable, investment results reflect fee waivers and/or expense reimbursements, without which results would have been lower. Visit capitalgroup.com for more information. Expense ratios are as of the fund’s prospectus dated May 1, 2020 (unaudited). See the Financial Highlights table in this report for details.
Any market index shown is unmanaged and, therefore, has no expenses. Investors cannot invest directly in an index.
| 1 | Source: Bloomberg Index Services Ltd. |
| 2 | Includes U.S. dollar-denominated debt of other countries, totaling 10.9%. |
| 3 | Countries using the euro as a common currency; those represented in the fund’s portfolio are France, Germany, Greece, Italy, Luxembourg, Portugal, the Netherlands and Spain. |
| 4 | The information shown includes affiliates of the same issuer when applicable. It does not include cash and cash equivalents or shares of money market or similar funds managed by the investment adviser or its affiliates that are not offered to the public. |
| 5 | Source: Refinitiv Lipper. Lipper averages reflect the current composition of all eligible mutual funds (all share classes) within a given category. Lipper categories are dynamic and averages may have few funds, especially over longer periods. To see the number of funds included in the Lipper category for each fund’s lifetime, please see the Quarterly Statistical Update, available on our website. |
| 6 | Periods greater than one year are annualized. |
| 7 | Global Bond Fund Class 2 shares were first sold on November 6, 2006. Results prior to that date are hypothetical based on Class 1 share results adjusted for estimated additional annual expenses of 0.25%. |
| Where the fund’s assets were invested as of December 31, 2019 | Percent of net assets |

| American Funds Insurance Series | 31 |
High-Income Bond Fund
Fund results shown are for past periods and are not predictive of results for future periods. Current and future results may be lower or higher than those shown. Share prices and returns will vary, so investors may lose money. Investing for short periods makes losses more likely. For current information and month-end results, visit capitalgroup.com/afis. For information about your insurance contract and month-end results, go to the website of the company that issued your contract.
High-Income Bond Fund gained 12.85% for the 12 months ended December 31, 2019. In comparison, the fund’s benchmark, the Bloomberg Barclays U.S. Corporate High Yield 2% Issuer Capped Index,1which measures fixed-rate non-investment-grade bonds and limits the exposure of an issuer to 2% was up 14.32%.
Bond returns were strong during the period. The Federal Reserve maintained its target rate for the first half of the year, but then reduced the target rate three times in the second half. The federal funds rate ended the year between 1.50% and 1.75%. The Treasury curve ultimately steepened after some flattening amid declining yields.
The fund’s portfolio managers continue to believe current fundamentals support a mildly constructive outlook for the high yield market. We continue to monitor global central bank monetary policy actions, and believe that the higher yields and relatively short duration of high yield bonds should help mitigate any impact should rates begin to rise from current levels.
| Largest holdings (by issuer)2 | Percent of net assets | |||
| Valeant Pharmaceuticals International | 2.54 | % | ||
| First Quantum Minerals | 2.42 | |||
| Petsmart | 2.19 | |||
| Teva Pharmaceutical | 1.90 | |||
| Centene | 1.86 | |||
| Cleveland-Cliffs | 1.65 | |||
| Tenet Healthcare | 1.53 | |||
| Sprint Nextel | 1.39 | |||
| Endo International | 1.39 | |||
| CCO Holdings LLC and CCO Holdings Capital | 1.37 | |||
| 32 | American Funds Insurance Series |
High-Income Bond Fund
How a hypothetical $10,000 investment has grown
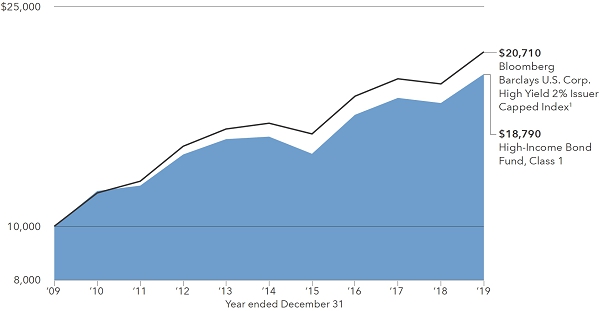
Total returns based on a $1,000 investment
For periods ended December 31, 20193
| 1 year | 5 years | 10 years | Lifetime (since February 8, 1984) | Expense ratio | ||||||||||||||||
| Class 1 | 12.85 | % | 5.36 | % | 6.51 | % | 8.67 | % | .51 | % | ||||||||||
| Class 1A | 12.61 | 5.13 | 6.26 | 8.40 | .76 | |||||||||||||||
| Class 2 | 12.55 | 5.09 | 6.25 | 8.40 | .76 | |||||||||||||||
| Class 3 | 12.70 | 5.18 | 6.32 | 8.47 | .69 | |||||||||||||||
| Class 4 | 12.27 | 4.82 | 6.03 | 8.14 | 1.01 | |||||||||||||||
Investment results assume all distributions are reinvested and reflect applicable fees and expenses. When applicable, investment results reflect fee waivers and/or expense reimbursements, without which results would have been lower. Visit capitalgroup.com for more information. Expense ratios are as of the fund’s prospectus dated May 1, 2020 (unaudited). See the Financial Highlights table in this report for details.
Any market index shown is unmanaged and, therefore, has no expenses. Investors cannot invest directly in an index.
| 1 | Source: Bloomberg Index Services Ltd. |
| 2 | The information shown includes affiliates of the same issuer when applicable. It does not include cash and cash equivalents or shares of money market or similar funds managed by the investment adviser or its affiliates that are not offered to the public. |
| 3 | Periods greater than one year are annualized. |
| Where the fund’s assets were invested as of December 31, 2019 | Percent of net assets |

| American Funds Insurance Series | 33 |
Mortgage Fund
Fund results shown are for past periods and are not predictive of results for future periods. Current and future results may be lower or higher than those shown. Share prices and returns will vary, so investors may lose money. Investing for short periods makes losses more likely. For current information and month-end results, visit capitalgroup.com/afis. For information about your insurance contract and month-end results, go to the website of the company that issued your contract.
Mortgage Fund gained 5.30% for the 12 months ended December 31, 2019, while the Bloomberg Barclays U.S. Mortgage-Backed Securities Index,1which covers the mortgage-backed pass-through securities of Ginnie Mae, Fannie Mae and Freddie Mac, rose 6.35%.
Bond returns were strong. The Federal Reserve paused rate hikes for the first half of the year and cut three times in the second half. The federal funds target rate ended the year between 1.50% and 1.75%. The Treasury curve ultimately steepened after some flattening amid declining yields.
Sector and security selection detracted from relative results, including holdings in U.S. Treasuries and interest rate swaps.
The fund’s portfolio managers remain focused on meeting the core objectives of the fund providing current income and protecting capital. The fund’s relatively low allocation to MBS Pass-Through securities, combined with an interest rate stance that anticipates that the yield curve will steepen, are positions that the portfolio managers expect will contribute to relative results in the future as markets evolve. More attractive valuations for mortgage investments are expected to emerge going forward amid a transition from our extended period of extremely low volatility to a more normal period of economic and asset price uncertainty.
| 34 | American Funds Insurance Series |
Mortgage Fund
How a hypothetical $10,000 investment has grown

Total returns based on a $1,000 investment
For periods ended December 31, 20192
| 1 year | 5 years | Lifetime (since May 2, 2011) | Gross expense ratio | Net expense ratio | ||||||||||||||||
| Class 1 | 5.30 | % | 2.38 | % | 2.68 | % | .48 | % | .30 | % | ||||||||||
| Class 1A | 5.09 | 2.14 | 2.43 | .73 | .55 | |||||||||||||||
| Class 2 | 5.04 | 2.12 | 2.43 | .73 | .55 | |||||||||||||||
| Class 4 | 4.80 | 1.88 | 2.24 | .98 | .80 | |||||||||||||||
Investment results assume all distributions are reinvested and reflect applicable fees and expenses. The investment adviser intends to waive a portion of its management fees beginning May 1, 2020. This waiver will be in effect through at least May 1, 2021. The waiver may only be modified or terminated with the approval of the fund’s board. When applicable, investment results reflect fee waivers and/or expense reimbursements, without which results would have been lower. Visit capitalgroup.com for more information. Expense ratios are as of the fund’s prospectus dated May 1, 2020 (unaudited). See the Financial Highlights table in this report for details.
Any market index shown is unmanaged and, therefore, has no expenses. Investors cannot invest directly in an index.
| 1 | Source: Bloomberg Index Services Ltd. |
| 2 | Periods greater than one year are annualized. |
| Where the fund’s assets were invested as of December 31, 2019 | Percent of net assets |
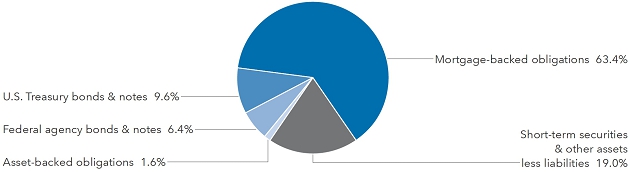
| American Funds Insurance Series | 35 |
Ultra-Short Bond Fund
Fund results shown are for past periods and are not predictive of results for future periods. Current and future results may be lower or higher than those shown. Share prices and returns will vary, so investors may lose money. Investing for short periods makes losses more likely. For current information and month-end results, visit capitalgroup.com/afis. For information about your insurance contract and month-end results, go to the website of the company that issued your contract.
Ultra-Short Bond Fund gained 1.92% for the 12 months ended December 31, 2019, compared with a 2.69% rise in the Bloomberg Barclays Short-Term Government/Corporate Index1, which consists of investment-grade (rated BBB/Baa and above), fixed-rate, publicly placed, dollar-denominated and non-convertible securities with remaining maturity from one up to (but not including) 12 months within either the government or corporate sector. With a focus on capital preservation and liquidity, the fund continues to be managed in a relatively conservative manner compared to the above-described index.
The fund’s returns were higher than in 2018 even as the Federal Reserve paused rate hikes for the first half of the year and cut three times in the second half. The federal funds rate ended the year between 1.50% and 1.75%. The Treasury curve ultimately steepened after some flattening amid declining yields. Assuming the current interest rate environment and solid U.S. economic conditions persist, the fund has the potential to continue to provide income.
| 36 | American Funds Insurance Series |
Ultra-Short Bond Fund
Total returns based on a $1,000 investment
For periods ended December 31, 20192
| 1 year | 5 years | 10 years | Lifetime (since February 8, 1984) | Expense ratio | ||||||||||||||||
| Class 1 | 1.92 | % | 0.81 | % | 0.30 | % | 3.39 | % | .37 | % | ||||||||||
| Class 1A | 1.92 | 0.71 | 0.12 | 3.16 | .62 | |||||||||||||||
| Class 2 | 1.62 | 0.56 | 0.05 | 3.14 | .62 | |||||||||||||||
| Class 3 | 1.76 | 0.62 | 0.12 | 3.21 | .55 | |||||||||||||||
| Class 4 | 1.40 | 0.30 | -0.13 | 2.90 | .87 | |||||||||||||||
Investment results assume all distributions are reinvested and reflect applicable fees and expenses. When applicable, investment results reflect fee waivers and/or expense reimbursements, without which results would have been lower. Visit capitalgroup.com for more information. Expense ratios are as of the fund’s prospectus dated May 1, 2020 (unaudited). See the Financial Highlights table in this report for details.
Any market index shown is unmanaged and, therefore, has no expenses. Investors cannot invest directly in an index.
| 1 | Source: Bloomberg Index Services Ltd. |
| 2 | Periods greater than one year are annualized. |
| Where the fund’s assets were invested as of December 31, 2019 | Percent of net assets | |||
| Commercial paper | 71.7 | % | ||
| Federal agency discount notes | 14.7 | |||
| Bonds & notes of governments & government agencies outside the U.S. | 10.0 | |||
| U.S. Treasury bills | 3.5 | |||
| Other assets less liabilities | .1 | |||
| Total | 100.0 | % | ||
| American Funds Insurance Series | 37 |
U.S. Government/AAA-Rated Securities Fund
Fund results shown are for past periods and are not predictive of results for future periods. Current and future results may be lower or higher than those shown. Share prices and returns will vary, so investors may lose money. Investing for short periods makes losses more likely. For current information and month-end results, visit capitalgroup.com/afis. For information about your insurance contract and month-end results, go to the website of the company that issued your contract.
U.S. Government/AAA-Rated Securities Fund rose 5.69% for the 12 months ended December 31, 2019, while the Bloomberg Barclays U.S. Government/Mortgage-Backed Securities Index,1which covers obligations issued by the U.S. Treasury and U.S. government agencies, increased by 6.63%.
Bond returns were strong during the period. The Federal Reserve maintained its target rate for the first half of the year, but then reduced the target rate three times in the second half. The federal funds rate ended the year between 1.50% and 1.75%. The Treasury curve ultimately steepened after some flattening amid declining yields.
During the period, the fund’s interest rate positioning detracted from relative returns, including investments in interest rate swaps.
The fund strives to meet its objective of providing a high level of current income consistent with the preservation of capital. The fund’s portfolio managers have positioned the fund with the expectation that rate hikes in the near future are unlikely as the Federal Reserve wants to extend the economic expansion and to also raise inflation closer to its stated “strong commitment” to a symmetric target of 2%. We believe this stance by the Federal Reserve can lead to a steepening yield curve and potentially higher inflation expectations.
| 38 | American Funds Insurance Series |
U.S. Government/AAA-Rated Securities Fund
How a hypothetical $10,000 investment has grown
![]()
Total returns based on a $1,000 investment
For periods ended December 31, 20192
| 1 year | 5 years | 10 years | Lifetime (since December 2, 1985) | Expense ratio | ||||||||||||||||
| Class 1 | 5.69 | % | 2.35 | % | 2.97 | % | 5.71 | % | .38 | % | ||||||||||
| Class 1A | 5.42 | 2.13 | 2.74 | 5.45 | .63 | |||||||||||||||
| Class 2 | 5.31 | 2.07 | 2.72 | 5.45 | .63 | |||||||||||||||
| Class 3 | 5.49 | 2.15 | 2.79 | 5.52 | .56 | |||||||||||||||
| Class 4 | 5.14 | 1.83 | 2.51 | 5.20 | .88 | |||||||||||||||
Investment results assume all distributions are reinvested and reflect applicable fees and expenses. When applicable, investment results reflect fee waivers and/or expense reimbursements, without which results would have been lower. Visit capitalgroup.com for more information. Expense ratios are as of the fund’s prospectus dated May 1, 2020 (unaudited). See the Financial Highlights table in this report for details.
Any market index shown is unmanaged and, therefore, has no expenses. Investors cannot invest directly in an index.
| 1 | Source: Bloomberg Index Services Ltd. |
| 2 | Periods greater than one year are annualized. |
| Where the fund’s assets were invested as of December 31, 2019 | Percent of net assets |

| American Funds Insurance Series | 39 |
Managed Risk Growth Fund
Fund results shown are for past periods and are not predictive of results for future periods. Current and future results may be lower or higher than those shown. Share prices and returns will vary, so investors may lose money. Investing for short periods makes losses more likely. For current information and month-end results, visit capitalgroup.com/afis. For information about your insurance contract and month-end results, go to the website of the company that issued your contract.
The fund gained 22.01% for the 12 months ended December 31, 2019. S&P 500 Managed Risk Index – Moderate Aggressive1 was up 20.47%. Standard & Poor’s 500 Composite Index2, a market capitalization-weighted index based on the results of approximately 500 widely held common stocks, increased 31.49%.
The fund pursues its objective by investing in shares of American Funds Insurance Series – Growth FundSMand American Funds Insurance Series – Bond FundSM while seeking to manage portfolio volatility and provide downside protection, primarily through the use of exchange-traded futures. The benefit of the fund’s managed risk strategy should be most apparent during periods of high volatility and in down markets. In steady or rising markets, the fund’s results can be expected to lag those of the underlying fund.
The underlying Growth Fund’s investments in communication services added to relative returns, while investments in consumer discretionary detracted from the fund’s relative results.
How a hypothetical $10,000 investment has grown

Total returns based on a $1,000 investment
For periods ended December 31, 20193
| 1 year | 5 years | Lifetime (since May 1, 2013) | Gross expense ratio | Net expense ratio | ||||||||||||||||
| Class P1 | 22.01 | % | 9.87 | % | 9.94 | % | .79 | % | .74 | % | ||||||||||
| Class P2 | 21.74 | 9.55 | 9.62 | 1.04 | .99 | |||||||||||||||
The investment adviser is currently waiving a portion of its management fee. This waiver will be in effect through at least May 1, 2021. The waiver may only be modified or terminated with the approval of the fund’s board. When applicable, investment results reflect fee waivers and/or expense reimbursements, without which results would have been lower. Visit capitalgroup.com for more information. Expense ratios are restated to reflect current fees and are as of the fund’s prospectus dated May 1, 2020 (unaudited).
Any market index shown is unmanaged and, therefore, has no expenses. Investors cannot invest directly in an index.
| 1 | Source: S&P Dow Jones Indices LLC. Standard & Poor’s Managed Risk Index Series is designed to simulate a dynamic protective portfolio that allocates between the underlying equity index and cash, based on realized volatilities of the underlying equity and bond indexes, while maintaining a fixed allocation to the underlying bond index. |
| 2 | Source: S&P Dow Jones Indices LLC. |
| 3 | Periods greater than one year are annualized. |
Milliman Financial Risk Management LLC serves as the subadviser with respect to the management of the fund’s managed risk strategy.
| 40 | American Funds Insurance Series |
Managed Risk International Fund
Fund results shown are for past periods and are not predictive of results for future periods. Current and future results may be lower or higher than those shown. Share prices and returns will vary, so investors may lose money. Investing for short periods makes losses more likely. For current information and month-end results, visit capitalgroup.com/afis. For information about your insurance contract and month-end results, go to the website of the company that issued your contract.
The fund gained 17.91% for the 12 months ended December 31, 2019, compared to the S&P EPAC Ex. Korea LargeMidCap Managed Risk Index – Moderate Aggressive1, which increased 18.78%. The MSCI ACWI (All Country World Index) ex USA2increased by 21.51%.
The fund pursues its objective by investing in shares of American Funds Insurance Series – International FundSMand American Funds Insurance Series – Bond FundSM while seeking to manage portfolio volatility and provide downside protection, primarily through the use of exchange-traded futures. The benefit of the fund’s managed risk strategy should be most apparent during periods of high volatility and in down markets. In steady or rising markets, the fund’s results can be expected to lag those of the underlying fund.
The underlying International Fund’s security selection and a lower-than-index position in the communication services sector added to relative returns, while stock selection in the materials sector detracted from relative results.
How a hypothetical $10,000 investment has grown

Total returns based on a $1,000 investment
For periods ended December 31, 20193
| 1 year | 5 years | Lifetime (since May 1, 2013) | Gross expense ratio | Net expense ratio | ||||||||||||||||
| Class P1 | 17.91 | % | 4.62 | % | 3.94 | % | .97 | % | .89 | % | ||||||||||
| Class P2 | 17.64 | 4.19 | 3.55 | 1.22 | 1.14 | |||||||||||||||
The investment adviser is currently waiving a portion of its management fee. This waiver will be in effect through at least May 1, 2021. The waiver may only be modified or terminated with the approval of the fund’s board. When applicable, investment results reflect fee waivers and/or expense reimbursements, without which results would have been lower. Visit capitalgroup.com for more information. Expense ratios are restated to reflect current fees and are as of the fund’s prospectus dated May 1, 2020 (unaudited).
Any market index shown is unmanaged and, therefore, has no expenses. Investors cannot invest directly in an index.
| 1 | Source: S&P Dow Jones Indices LLC. Standard & Poor’s Managed Risk Index Series is designed to simulate a dynamic protective portfolio that allocates between the underlying equity index and cash, based on realized volatilities of the underlying equity and bond indexes, while maintaining a fixed allocation to the underlying bond index. |
| 2 | Source: MSCI. The MSCI index result reflects reinvestment of distributions and dividends net of withholding taxes. |
| 3 | Periods greater than one year are annualized. |
Milliman Financial Risk Management LLC serves as the subadviser with respect to the management of the fund’s managed risk strategy.
| American Funds Insurance Series | 41 |
Managed Risk Blue Chip Income and Growth Fund
Fund results shown are for past periods and are not predictive of results for future periods. Current and future results may be lower or higher than those shown. Share prices and returns will vary, so investors may lose money. Investing for short periods makes losses more likely. For current information and month-end results, visit capitalgroup.com/afis. For information about your insurance contract and month-end results, go to the website of the company that issued your contract.
The fund gained 14.14% for the 12 months ended December 31, 2019. S&P 500 Managed Risk Index – Moderate1was up 19.14%. Standard & Poor’s 500 Composite Index2, a market capitalization-weighted index based on the results of approximately 500 widely held common stocks, increased 31.49%.
The fund pursues its objective by investing in shares of American Funds Insurance Series – Blue Chip Income and Growth FundSMand American Funds Insurance Series – U.S. Government/AAA-Rated Securities FundSMwhile seeking to manage portfolio volatility and provide downside protection, primarily through the use of exchange-traded futures. The benefit of the fund’s managed risk strategy should be most apparent during periods of high volatility and in down markets. In steady or rising markets, the fund’s results can be expected to lag those of the underlying fund.
The underlying Blue Chip Income and Growth Fund’s investments in the real estate sector added to relative returns, while investments in health care detracted from the fund’s relative results.
How a hypothetical $10,000 investment has grown
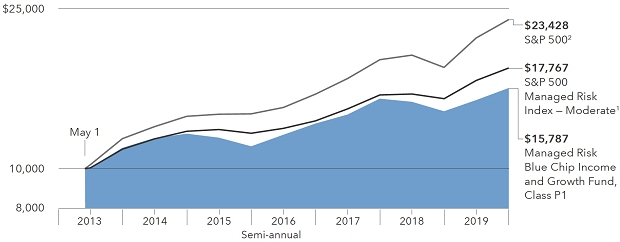
Total returns based on a $1,000 investment
For periods ended December 31, 20193
| 1 year | 5 years | Lifetime (since May 1, 2013) | Gross expense ratio | Net expense ratio | ||||||||||||||||
| Class P1 | 14.14 | % | 5.33 | % | 7.09 | % | .84 | % | .79 | % | ||||||||||
| Class P2 | 13.88 | 4.96 | 6.72 | 1.09 | 1.04 | |||||||||||||||
The investment adviser is currently waiving a portion of its management fee. This waiver will be in effect through at least May 1, 2021. The waiver may only be modified or terminated with the approval of the fund’s board. When applicable, investment results reflect fee waivers and/or expense reimbursements, without which results would have been lower. Visit capitalgroup.com for more information. Expense ratios are restated to reflect current fees and are as of the fund’s prospectus dated May 1, 2020 (unaudited).
Any market index shown is unmanaged and, therefore, has no expenses. Investors cannot invest directly in an index.
| 1 | Source: S&P Dow Jones Indices LLC. Standard & Poor’s Managed Risk Index Series is designed to simulate a dynamic protective portfolio that allocates between the underlying equity index and cash, based on realized volatilities of the underlying equity and bond indexes, while maintaining a fixed allocation to the underlying bond index. |
| 2 | Source: S&P Dow Jones Indices LLC. |
| 3 | Periods greater than one year are annualized. |
Milliman Financial Risk Management LLC serves as the subadviser with respect to the management of the fund’s managed risk strategy.
| 42 | American Funds Insurance Series |
Managed Risk Growth-Income Fund
Fund results shown are for past periods and are not predictive of results for future periods. Current and future results may be lower or higher than those shown. Share prices and returns will vary, so investors may lose money. Investing for short periods makes losses more likely. For current information and month-end results, visit capitalgroup.com/afis. For information about your insurance contract and month-end results, go to the website of the company that issued your contract.
The fund gained 19.14% for the 12 months ended December 31, 2019. S&P 500 Managed Risk Index – Moderate1was up 19.14%. Standard & Poor’s 500 Composite Index2, a market capitalization-weighted index based on the results of approximately 500 widely held common stocks, increased 31.49%.
The fund pursues its objective by investing in shares of American Funds Insurance Series – Growth-Income FundSMand American Funds Insurance Series – Bond FundSMwhile seeking to manage portfolio volatility and provide downside protection, primarily through the use of exchange-traded futures. The benefit of the fund’s managed risk strategy should be most apparent during periods of high volatility and in down markets. In steady or rising markets, the fund’s results can be expected to lag those of the underlying fund.
The underlying Growth-Income Fund’s investments in industrials added to relative returns, while investments in materials detracted from the fund’s relative results. At the security level within the materials sector, a top detractor from relative results included Vale in the metals and mining industry.
How a hypothetical $10,000 investment has grown
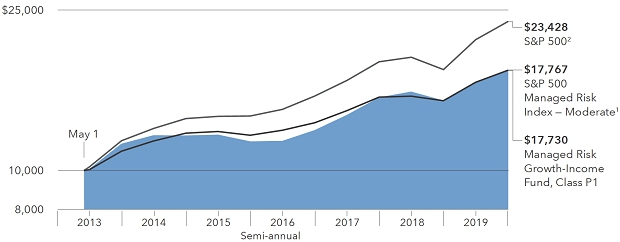
Total returns based on a $1,000 investment
For periods ended December 31, 20193
| 1 year | 5 years | Lifetime (since May 1, 2013) | Gross expense ratio | Net expense ratio | ||||||||||||||||
| Class P1 | 19.14 | % | 7.80 | % | 8.97 | % | .73 | % | .68 | % | ||||||||||
| Class P2 | 18.84 | 7.47 | 8.63 | .98 | .93 | |||||||||||||||
The investment adviser is currently waiving a portion of its management fee. This waiver will be in effect through at least May 1, 2021. The waiver may only be modified or terminated with the approval of the fund’s board. When applicable, investment results reflect fee waivers and/or expense reimbursements, without which results would have been lower. Visit capitalgroup.com for more information. Expense ratios are restated to reflect current fees and are as of the fund’s prospectus dated May 1, 2020 (unaudited).
Any market index shown is unmanaged and, therefore, has no expenses. Investors cannot invest directly in an index.
| 1 | Source: S&P Dow Jones Indices LLC. Standard & Poor’s Managed Risk Index Series is designed to simulate a dynamic protective portfolio that allocates between the underlying equity index and cash, based on realized volatilities of the underlying equity and bond indexes, while maintaining a fixed allocation to the underlying bond index. |
| 2 | Source: S&P Dow Jones Indices LLC. |
| 3 | Periods greater than one year are annualized. |
Milliman Financial Risk Management LLC serves as the subadviser with respect to the management of the fund’s managed risk strategy.
| American Funds Insurance Series | 43 |
Managed Risk Asset Allocation Fund
Fund results shown are for past periods and are not predictive of results for future periods. Current and future results may be lower or higher than those shown. Share prices and returns will vary, so investors may lose money. Investing for short periods makes losses more likely. For current information and month-end results, visit capitalgroup.com/afis. For information about your insurance contract and month-end results, go to the website of the company that issued your contract.
The fund gained 18.25% for the 12 months ended December 31, 2019. S&P 500 Managed Risk Index – Moderate Conservative1was up 18.05%. Standard & Poor’s 500 Composite Index2, a market capitalization-weighted index based on the results of approximately 500 widely held common stocks, increased 31.49%.
The fund pursues its objective by investing in shares of American Funds Insurance Series – Asset Allocation FundSM while seeking to manage portfolio volatility and provide downside protection, primarily through the use of exchange-traded futures. The benefit of the fund’s managed risk strategy should be most apparent during periods of high volatility and in down markets. In steady or rising markets, the fund’s results can be expected to lag those of the underlying fund.
The underlying Asset Allocation Fund’s investments in the financials sector added to relative returns, while investments in health care detracted from the fund’s relative results.
| 44 | American Funds Insurance Series |
Managed Risk Asset Allocation Fund
How a hypothetical $10,000 investment has grown

Total returns based on a $1,000 investment
For periods ended December 31, 20194
| 1 year | 5 years | Lifetime (since September 28, 2012) | Gross expense ratio | Net expense ratio | ||||||||||||||||
| Class P1 | 18.25 | % | 6.72 | % | 8.00 | % | .71 | % | .66 | % | ||||||||||
| Class P2 | 17.98 | 6.45 | 7.73 | .96 | .91 | |||||||||||||||
The investment adviser is currently waiving a portion of its management fee. This waiver will be in effect through at least May 1, 2021. The waiver may only be modified or terminated with the approval of the fund’s board. When applicable, investment results reflect fee waivers and/or expense reimbursements, without which results would have been lower. Visit capitalgroup.com for more information. Expense ratios are restated to reflect current fees and are as of the fund’s prospectus dated May 1, 2020 (unaudited).
Any market index shown is unmanaged and, therefore, has no expenses. Investors cannot invest directly in an index.
| 1 | Source: S&P Dow Jones Indices LLC. Standard & Poor’s Managed Risk Index Series is designed to simulate a dynamic protective portfolio that allocates between the underlying equity index and cash, based on realized volatilities of the underlying equity and bond indexes, while maintaining a fixed allocation to the underlying bond index. |
| 2 | Source: S&P Dow Jones Indices LLC. |
| 3 | Source: Bloomberg Index Services Ltd. |
| 4 | Periods greater than one year are annualized. |
Milliman Financial Risk Management LLC serves as the subadviser with respect to the management of the fund’s managed risk strategy.
| American Funds Insurance Series | 45 |
Summary investment portfolioDecember 31, 2019
| Common stocks 96.83% | Shares | Value (000) | ||||||
| Information technology 29.11% | ||||||||
| ASML Holding NV1 | 648,442 | $ | 193,113 | |||||
| ASML Holding NV (New York registered) | 510,500 | 151,077 | ||||||
| Taiwan Semiconductor Manufacturing Co., Ltd.1 | 27,188,000 | 301,093 | ||||||
| Taiwan Semiconductor Manufacturing Co., Ltd. (ADR) | 335,000 | 19,463 | ||||||
| Microsoft Corp. | 1,999,800 | 315,368 | ||||||
| Visa Inc., Class A | 1,142,800 | 214,732 | ||||||
| Broadcom Inc. | 487,050 | 153,918 | ||||||
| Temenos AG1 | 637,000 | 100,711 | ||||||
| Paycom Software, Inc.2 | 357,000 | 94,519 | ||||||
| SimCorp AS1 | 425,000 | 48,292 | ||||||
| Adyen NV1,2 | 56,700 | 46,656 | ||||||
| PagSeguro Digital Ltd., Class A2 | 1,340,900 | 45,805 | ||||||
| Adobe Inc.2 | 135,000 | 44,524 | ||||||
| Amphenol Corp., Class A | 373,500 | 40,424 | ||||||
| Other securities | 209,884 | |||||||
| 1,979,579 | ||||||||
| Consumer discretionary 17.93% | ||||||||
| Amazon.com, Inc.2 | 173,800 | 321,155 | ||||||
| Alibaba Group Holding Ltd.1,2 | 6,844,000 | 181,984 | ||||||
| Takeaway.com NV1,2 | 740,000 | 68,355 | ||||||
| Just Eat PLC1,2 | 5,292,000 | 58,725 | ||||||
| Ocado Group PLC1,2 | 3,115,000 | 52,890 | ||||||
| Naspers Ltd., Class N1 | 277,000 | 45,276 | ||||||
| Moncler SpA1 | 915,000 | 41,155 | ||||||
| NIKE, Inc., Class B | 370,500 | 37,535 | ||||||
| Other securities | 412,427 | |||||||
| 1,219,502 | ||||||||
| Health care 10.91% | ||||||||
| UnitedHealth Group Inc. | 324,200 | 95,308 | ||||||
| AstraZeneca PLC1 | 721,300 | 72,165 | ||||||
| Merck & Co., Inc. | 775,600 | 70,541 | ||||||
| Boston Scientific Corp.2 | 1,373,700 | 62,119 | ||||||
| Pfizer Inc. | 1,424,000 | 55,792 | ||||||
| DexCom, Inc.2 | 253,000 | 55,341 | ||||||
| Fisher & Paykel Healthcare Corp. Ltd.1 | 3,680,000 | 55,222 | ||||||
| Mettler-Toledo International Inc.2 | 65,000 | 51,563 | ||||||
| Other securities | 224,092 | |||||||
| 742,143 | ||||||||
| Financials 10.30% | ||||||||
| AIA Group Ltd.1 | 13,206,300 | 138,952 | ||||||
| Kotak Mahindra Bank Ltd.1 | 3,917,000 | 92,383 | ||||||
| JPMorgan Chase & Co. | 614,600 | 85,675 | ||||||
| MarketAxess Holdings Inc. | 211,000 | 79,992 | ||||||
| Tradeweb Markets Inc., Class A | 1,501,303 | 69,586 | ||||||
| Other securities | 233,882 | |||||||
| 700,470 | ||||||||
| Consumer staples 8.12% | ||||||||
| British American Tobacco PLC1 | 2,970,800 | 126,572 | ||||||
| Nestlé SA1 | 739,650 | 80,131 | ||||||
| Philip Morris International Inc. | 919,500 | 78,240 | ||||||
| Altria Group, Inc. | 1,125,000 | 56,149 | ||||||
| Keurig Dr Pepper Inc. | 1,624,000 | 47,015 | ||||||
| Other securities | 163,686 | |||||||
| 551,793 | ||||||||
| 46 | American Funds Insurance Series |
Global Growth Fund
| Common stocks | Shares | Value (000) | ||||||
| Communication services 7.87% | ||||||||
| Alphabet Inc., Class A2 | 115,600 | $ | 154,833 | |||||
| Alphabet Inc., Class C2 | 71,052 | 94,998 | ||||||
| Tencent Holdings Ltd.1 | 2,230,000 | 107,572 | ||||||
| Facebook, Inc., Class A2 | 421,640 | 86,542 | ||||||
| Nintendo Co., Ltd.1 | 137,400 | 55,461 | ||||||
| Other securities | 35,926 | |||||||
| 535,332 | ||||||||
| Industrials 7.76% | ||||||||
| Airbus SE, non-registered shares1 | 1,093,500 | 160,436 | ||||||
| MTU Aero Engines AG1 | 167,000 | 47,688 | ||||||
| Geberit AG1 | 65,000 | 36,490 | ||||||
| Other securities | 282,712 | |||||||
| 527,326 | ||||||||
| Materials 2.73% | ||||||||
| Sherwin-Williams Co. | 155,500 | 90,740 | ||||||
| Other securities | 95,059 | |||||||
| 185,799 | ||||||||
| Energy 2.02% | ||||||||
| Reliance Industries Ltd.1 | 1,795,200 | 38,132 | ||||||
| Other securities | 99,232 | |||||||
| 137,364 | ||||||||
| Utilities 0.08% | ||||||||
| Other securities | 5,646 | |||||||
| Total common stocks (cost: $3,768,489,000) | 6,584,954 | |||||||
| Preferred securities 1.66% | ||||||||
| Health care 1.20% | ||||||||
| Sartorius AG, nonvoting preferred, non-registered shares1 | 381,500 | 81,675 | ||||||
| Information technology 0.46% | ||||||||
| Other securities | 30,909 | |||||||
| Total preferred securities (cost: $43,479,000) | 112,584 | |||||||
| Short-term securities 2.01% | ||||||||
| Money market investments 2.01% | ||||||||
| Capital Group Central Cash Fund 1.73%3 | 1,371,403 | 137,140 | ||||||
| Total short-term securities (cost: $136,878,000) | 137,140 | |||||||
| Total investment securities 100.50% (cost: $3,948,846,000) | 6,834,678 | |||||||
| Other assets less liabilities (0.50)% | (34,231 | ) | ||||||
| Net assets 100.00% | $ | 6,800,447 | ||||||
| American Funds Insurance Series | 47 |
Global Growth Fund
This summary investment portfolio is designed to streamline the report and help investors better focus on the fund’s principal holdings. See the inside back cover for details on how to obtain a complete schedule of portfolio holdings.
“Other securities” includes all issues that are not disclosed separately in the summary investment portfolio.
| 1 | Valued under fair value procedures adopted by authority of the board of trustees. The total value of all such securities, including those in “Other securities,” was $3,312,961,000, which represented 48.72% of the net assets of the fund. This amount includes $3,300,466,000 related to certain securities trading outside the U.S. whose values were adjusted as a result of significant market movements following the close of local trading. |
| 2 | Security did not produce income during the last 12 months. |
| 3 | Rate represents the seven-day yield at 12/31/2019. |
Key to abbreviation
ADR = American Depositary Receipts
See notes to financial statements.
| 48 | American Funds Insurance Series |
Global Small Capitalization Fund
Summary investment portfolioDecember 31, 2019
| Common stocks 94.84% | Shares | Value (000) | ||||||
| Health care 22.15% | ||||||||
| Insulet Corp.1 | 815,300 | $ | 139,579 | |||||
| GW Pharmaceuticals PLC (ADR)1 | 823,718 | 86,128 | ||||||
| Notre Dame Intermédica Participações SA | 4,228,500 | 71,742 | ||||||
| Haemonetics Corp.1 | 619,200 | 71,146 | ||||||
| Allakos Inc.1,2 | 683,880 | 65,215 | ||||||
| CONMED Corp. | 581,200 | 64,996 | ||||||
| Integra LifeSciences Holdings Corp.1 | 906,825 | 52,850 | ||||||
| Mani, Inc.3 | 1,632,529 | 46,675 | ||||||
| Cortexyme, Inc.1,2 | 695,324 | 39,035 | ||||||
| iRhythm Technologies, Inc.1 | 515,500 | 35,100 | ||||||
| PRA Health Sciences, Inc.1 | 306,100 | 34,023 | ||||||
| New Frontier Health Corp., Class A1,3,4 | 2,680,000 | 26,666 | ||||||
| Other securities | 290,189 | |||||||
| 1,023,344 | ||||||||
| Information technology 18.84% | ||||||||
| Cree, Inc.1 | 1,199,900 | 55,375 | ||||||
| Ceridian HCM Holding Inc.1 | 799,400 | 54,263 | ||||||
| Net One Systems Co., Ltd.3 | 1,556,965 | 40,002 | ||||||
| Network International Holdings PLC1,3 | 4,570,562 | 38,792 | ||||||
| Avast PLC3 | 5,839,000 | 35,104 | ||||||
| Alteryx, Inc., Class A1 | 340,000 | 34,024 | ||||||
| SimCorp AS3 | 297,250 | 33,776 | ||||||
| Bechtle AG, non-registered shares3 | 226,305 | 31,756 | ||||||
| Carel Industries SpA2,3 | 1,947,251 | 30,292 | ||||||
| Qorvo, Inc.1 | 241,800 | 28,104 | ||||||
| Appfolio, Inc., Class A1 | 251,270 | 27,627 | ||||||
| Other securities | 461,432 | |||||||
| 870,547 | ||||||||
| Industrials 14.87% | ||||||||
| International Container Terminal Services, Inc.3 | 23,981,620 | 60,824 | ||||||
| Nihon M&A Center Inc.3 | 1,710,692 | 59,090 | ||||||
| VARTA AG, non-registered shares1,3 | 280,402 | 38,232 | ||||||
| Meggitt PLC3 | 3,321,300 | 28,942 | ||||||
| Tomra Systems ASA3 | 857,587 | 27,197 | ||||||
| Marel hf., non-registered shares (ISK denominated)3 | 4,899,903 | 24,908 | ||||||
| Marel hf., non-registered shares (EUR denominated)1,3 | 333,333 | 1,705 | ||||||
| Other securities | 445,981 | |||||||
| 686,879 | ||||||||
| Consumer discretionary 14.63% | ||||||||
| frontdoor, inc.1 | 1,355,200 | 64,264 | ||||||
| Luckin Coffee Inc., Class A (ADR)1,2 | 1,472,220 | 57,947 | ||||||
| Helen of Troy Ltd.1 | 283,000 | 50,881 | ||||||
| Mattel, Inc.1,2 | 3,338,800 | 45,241 | ||||||
| Wyndham Hotels & Resorts, Inc. | 631,500 | 39,664 | ||||||
| Five Below, Inc.1 | 305,000 | 38,997 | ||||||
| Melco International Development Ltd.3 | 12,619,000 | 35,517 | ||||||
| GVC Holdings PLC3 | 2,934,000 | 34,409 | ||||||
| Thor Industries, Inc. | 446,000 | 33,133 | ||||||
| Other securities | 275,830 | |||||||
| 675,883 | ||||||||
| American Funds Insurance Series | 49 |
Global Small Capitalization Fund
| Common stocks (continued) | Shares | Value (000) | ||||||
| Financials 7.69% | ||||||||
| Cannae Holdings, Inc.1 | 1,625,000 | $ | 60,434 | |||||
| Kotak Mahindra Bank Ltd.3 | 2,448,225 | 57,742 | ||||||
| Essent Group Ltd. | 750,841 | 39,036 | ||||||
| Trupanion, Inc.1,2 | 973,800 | 36,479 | ||||||
| IndusInd Bank Ltd.3 | 1,579,646 | 33,434 | ||||||
| Other securities | 128,424 | |||||||
| 355,549 | ||||||||
| Real estate 3.98% | ||||||||
| Altus Group Ltd. | 932,800 | 27,268 | ||||||
| MGM Growth Properties LLC REIT, Class A | 864,500 | 26,773 | ||||||
| Embassy Office Parks REIT3 | 4,509,000 | 26,767 | ||||||
| Other securities | 102,925 | |||||||
| 183,733 | ||||||||
| Materials 3.89% | ||||||||
| Allegheny Technologies Inc.1 | 1,413,900 | 29,211 | ||||||
| Other securities | 150,334 | |||||||
| 179,545 | ||||||||
| Communication services 3.16% | ||||||||
| Altice Europe NV, Class A1,3 | 4,363,000 | 28,195 | ||||||
| Other securities | 117,732 | |||||||
| 145,927 | ||||||||
| Consumer staples 2.66% | ||||||||
| Other securities | 123,044 | |||||||
| Energy 1.58% | ||||||||
| Other securities | 73,080 | |||||||
| Utilities 1.39% | ||||||||
| ENN Energy Holdings Ltd.3 | 4,262,900 | 46,609 | ||||||
| Other securities | 17,485 | |||||||
| 64,094 | ||||||||
| Total common stocks (cost: $3,225,972,000) | 4,381,625 | |||||||
| Preferred securities 1.02% | ||||||||
| Other 1.02% | ||||||||
| Other securities | 47,209 | |||||||
| Total preferred securities (cost: $36,660,000) | 47,209 | |||||||
| Rights & warrants 0.00% | ||||||||
| Health care 0.00% | ||||||||
| Other securities | 53 | |||||||
| Total rights & warrants (cost: $0) | 53 | |||||||
| 50 | American Funds Insurance Series |
Global Small Capitalization Fund
| Short-term securities 6.03% | Shares | Value (000) | ||||||
| Money market investments 6.03% | ||||||||
| Capital Group Central Cash Fund 1.73%5 | 1,926,005 | $ | 192,600 | |||||
| Fidelity Institutional Money Market Funds - Government Portfolio 1.49%5,6 | 11,671,469 | 11,672 | ||||||
| Goldman Sachs Financial Square Government Fund 1.50%5,6 | 9,901,092 | 9,901 | ||||||
| Invesco - Short-term Investments Trust - Government & Agency Portfolio 1.50%5,6 | 13,138,720 | 13,139 | ||||||
| Morgan Stanley Institutional Liquidity Funds - Government Portfolio 1.51%5,6 | 51,521,183 | 51,521 | ||||||
| 278,833 | ||||||||
| Total short-term securities (cost: $278,593,000) | 278,833 | |||||||
| Total investment securities 101.89% (cost: $3,541,225,000) | 4,707,720 | |||||||
| Other assets less liabilities (1.89)% | (87,447 | ) | ||||||
| Net assets 100.00% | $ | 4,620,273 | ||||||
This summary investment portfolio is designed to streamline the report and help investors better focus on the fund’s principal holdings. See the inside back cover for details on how to obtain a complete schedule of portfolio holdings.
“Other securities” includes all issues that are not disclosed separately in the summary investment portfolio. Some securities in “Other securities” (with an aggregate value of $44,058,000, an aggregate cost of $37,986,000, and which represented .95% of the net assets of the fund) were acquired from 5/1/2015 to 12/26/2019 through private placement transactions exempt from registration under the Securities Act of 1933, which may subject them to legal or contractual restrictions on resale.
Investments in affiliates
A company is an affiliate of the fund under the Investment Company Act of 1940 if the fund’s holdings represent 5% or more of the outstanding voting shares of that company. The value of the fund’s affiliated-company holding is included in “Other securities” under the respective industry sector in the summary investment portfolio. Further details on this holding and related transactions during the year ended December 31, 2019, appear below.
| Beginning shares | Additions | Reductions | Ending shares | Net realized gain (000) | Net unrealized depreciation (000) | Dividend income (000) | Value of affiliates at 12/31/2019 (000) | |||||||||||||||||
| Common stocks 0.28% | ||||||||||||||||||||||||
| Health care 0.28% | ||||||||||||||||||||||||
| NuCana PLC (ADR)1,2 | 2,067,724 | 15,980 | — | 2,083,704 | $ | — | $ | (17,366 | ) | $ | — | $ | 12,711 | |||||||||||
| 1 | Security did not produce income during the last 12 months. |
| 2 | All or a portion of this security was on loan. The total value of all such securities, including those in “Other securities,” was $102,111,000, which represented 2.21% of the net assets of the fund. Refer to Note 5 for more information on securities lending. |
| 3 | Valued under fair value procedures adopted by authority of the board of trustees. The total value of all such securities, including those in “Other securities,” was $1,960,603,000, which represented 42.43% of the net assets of the fund. This amount includes $1,889,826,000 related to certain securities trading outside the U.S. whose values were adjusted as a result of significant market movements following the close of local trading. |
| 4 | Acquired in a transaction exempt from registration under Section 4(2) of the Securities Act of 1933. May be resold in the U.S. in transactions exempt from registration, normally to qualified institutional buyers. The total value of all such securities, including those in “Other securities,” was $41,018,000, which represented .89% of the net assets of the fund. |
| 5 | Rate represents the seven-day yield at 12/31/2019. |
| 6 | Security purchased with cash collateral from securities on loan. Refer to Note 5 for more information on securities lending. |
Key to abbreviations
ADR = American Depositary Receipts
EUR = Euros
ISK = Icelandic kronor
See notes to financial statements.
| American Funds Insurance Series | 51 |
Summary investment portfolioDecember 31, 2019
| Common stocks 96.25% | Shares | Value (000) | ||||||
| Information technology 25.15% | ||||||||
| Microsoft Corp. | 10,468,400 | $ | 1,650,867 | |||||
| Broadcom Inc. | 2,430,100 | 767,960 | ||||||
| ASML Holding NV (New York registered) | 1,161,800 | 343,823 | ||||||
| ASML Holding NV1 | 985,000 | 293,343 | ||||||
| Taiwan Semiconductor Manufacturing Co., Ltd.1 | 30,792,000 | 341,005 | ||||||
| Taiwan Semiconductor Manufacturing Co., Ltd. (ADR) | 2,419,592 | 140,578 | ||||||
| Visa Inc., Class A | 2,256,600 | 424,015 | ||||||
| RingCentral, Inc., Class A2 | 1,557,200 | 262,653 | ||||||
| ServiceNow, Inc.2 | 921,500 | 260,158 | ||||||
| Intel Corp. | 4,013,000 | 240,178 | ||||||
| Autodesk, Inc.2 | 1,096,000 | 201,072 | ||||||
| Fiserv, Inc.2 | 1,573,600 | 181,955 | ||||||
| Workday, Inc., Class A2 | 987,000 | 162,312 | ||||||
| Mastercard Inc., Class A | 538,000 | 160,641 | ||||||
| Other securities | 1,729,830 | |||||||
| 7,160,390 | ||||||||
| Communication services 18.20% | ||||||||
| Facebook, Inc., Class A2 | 7,578,400 | 1,555,467 | ||||||
| Netflix, Inc.2 | 3,251,160 | 1,051,978 | ||||||
| Alphabet Inc., Class C2 | 552,300 | 738,436 | ||||||
| Alphabet Inc., Class A2 | 157,500 | 210,954 | ||||||
| Charter Communications, Inc., Class A2 | 946,280 | 459,021 | ||||||
| T-Mobile US, Inc.2 | 4,885,000 | 383,082 | ||||||
| Activision Blizzard, Inc. | 6,317,500 | 375,386 | ||||||
| Comcast Corp., Class A | 5,135,900 | 230,961 | ||||||
| Other securities | 175,162 | |||||||
| 5,180,447 | ||||||||
| Health care 16.70% | ||||||||
| UnitedHealth Group Inc. | 3,190,800 | 938,031 | ||||||
| Intuitive Surgical, Inc.2 | 1,049,100 | 620,176 | ||||||
| Regeneron Pharmaceuticals, Inc.2 | 1,341,000 | 503,519 | ||||||
| Humana Inc. | 1,269,500 | 465,297 | ||||||
| Vertex Pharmaceuticals Inc.2 | 1,434,579 | 314,101 | ||||||
| Boston Scientific Corp.2 | 5,085,000 | 229,944 | ||||||
| Centene Corp.2 | 3,484,800 | 219,089 | ||||||
| Thermo Fisher Scientific Inc. | 534,500 | 173,643 | ||||||
| Cigna Corp. | 739,902 | 151,303 | ||||||
| Seattle Genetics, Inc.2 | 1,248,154 | 142,614 | ||||||
| Other securities | 995,508 | |||||||
| 4,753,225 | ||||||||
| Consumer discretionary 11.29% | ||||||||
| Amazon.com, Inc.2 | 557,016 | 1,029,276 | ||||||
| Tesla, Inc.2 | 1,908,500 | 798,383 | ||||||
| Home Depot, Inc. | 1,206,000 | 263,366 | ||||||
| Other securities | 1,122,701 | |||||||
| 3,213,726 | ||||||||
| Financials 8.49% | ||||||||
| Goldman Sachs Group, Inc. | 1,052,400 | 241,978 | ||||||
| JPMorgan Chase & Co. | 1,343,000 | 187,214 | ||||||
| Wells Fargo & Co. | 3,011,800 | 162,035 | ||||||
| Legal & General Group PLC1 | 40,158,246 | 161,788 | ||||||
| First Republic Bank | 1,376,000 | 161,611 | ||||||
| PNC Financial Services Group, Inc. | 919,800 | 146,828 | ||||||
| Bank of America Corp. | 4,015,000 | 141,408 | ||||||
| Intercontinental Exchange, Inc. | 1,490,900 | 137,983 | ||||||
| Other securities | 1,075,635 | |||||||
| 2,416,480 | ||||||||
| 52 | American Funds Insurance Series |
Growth Fund
| Common stocks | Shares | Value (000) | ||||||
| Industrials 6.44% | ||||||||
| TransDigm Group Inc. | 689,000 | $ | 385,840 | |||||
| MTU Aero Engines AG1 | 1,034,033 | 295,275 | ||||||
| CSX Corp. | 1,882,200 | 136,196 | ||||||
| Airbus SE, non-registered shares1 | 920,327 | 135,028 | ||||||
| Other securities | 882,578 | |||||||
| 1,834,917 | ||||||||
| Materials 2.83% | ||||||||
| Other securities | 806,455 | |||||||
| Consumer staples 2.72% | ||||||||
| Altria Group, Inc. | 3,140,182 | 156,727 | ||||||
| Costco Wholesale Corp. | 522,900 | 153,691 | ||||||
| Kerry Group PLC, Class A1 | 1,100,000 | 136,951 | ||||||
| Other securities | 326,896 | |||||||
| 774,265 | ||||||||
| Energy 2.45% | ||||||||
| Other securities | 698,230 | |||||||
| Real estate 1.71% | ||||||||
| Equinix, Inc. REIT | 440,100 | 256,887 | ||||||
| Other securities | 229,970 | |||||||
| 486,857 | ||||||||
| Utilities 0.27% | ||||||||
| Other securities | 77,731 | |||||||
| Total common stocks (cost: $14,882,833,000) | 27,402,723 | |||||||
| Convertible bonds 0.09% | Principal amount (000) | |||||||
| Consumer staples 0.09% | ||||||||
| Other securities | 25,000 | |||||||
| Total convertible bonds (cost: $25,000,000) | 25,000 | |||||||
| Short-term securities 3.87% | Shares | |||||||
| Money market investments 3.87% | ||||||||
| Capital Group Central Cash Fund 1.73%3 | 11,024,924 | 1,102,492 | ||||||
| Total short-term securities (cost: $1,102,383,000) | 1,102,492 | |||||||
| Total investment securities 100.21% (cost: $16,010,216,000) | 28,530,215 | |||||||
| Other assets less liabilities (0.21)% | (60,556 | ) | ||||||
| Net assets 100.00% | $ | 28,469,659 | ||||||
| American Funds Insurance Series | 53 |
Growth Fund
This summary investment portfolio is designed to streamline the report and help investors better focus on the fund’s principal holdings. See the inside back cover for details on how to obtain a complete schedule of portfolio holdings.
“Other securities” includes all issues that are not disclosed separately in the summary investment portfolio. One security in “Other securities” (with a value of $38,849,000, an aggregate cost of $37,000,000, and which represented .14% of the net assets of the fund) was acquired on 12/21/2018 through private placement transactions exempt from registration under the Securities Act of 1933, which may subject it to legal or contractual restrictions on resale.
| 1 | Valued under fair value procedures adopted by authority of the board of trustees. The total value of all such securities, including those in “Other securities,” was $2,186,070,000, which represented 7.68% of the net assets of the fund. This amount includes $2,122,221,000 related to certain securities trading outside the U.S. whose values were adjusted as a result of significant market movements following the close of local trading. |
| 2 | Security did not produce income during the last 12 months. |
| 3 | Rate represents the seven-day yield at 12/31/2019. |
Key to abbreviation
ADR = American Depositary Receipts
See notes to financial statements.
| 54 | American Funds Insurance Series |
Summary investment portfolioDecember 31, 2019
| Common stocks 92.87% | Shares | Value (000) | ||||||
| Financials 16.40% | ||||||||
| AIA Group Ltd.1 | 40,985,700 | $ | 431,237 | |||||
| HDFC Bank Ltd.1 | 17,086,200 | 304,509 | ||||||
| HDFC Bank Ltd. (ADR) | 531,294 | 33,668 | ||||||
| Kotak Mahindra Bank Ltd.1 | 8,121,048 | 191,537 | ||||||
| Axis Bank Ltd.1 | 7,270,300 | 75,310 | ||||||
| Axis Bank Ltd.1,2 | 3,222,055 | 34,069 | ||||||
| BNP Paribas SA1 | 1,722,058 | 102,509 | ||||||
| Ping An Insurance (Group) Co. of China, Ltd., Class H1 | 6,867,600 | 81,355 | ||||||
| Other securities | 398,032 | |||||||
| 1,652,226 | ||||||||
| Consumer discretionary 13.95% | ||||||||
| Alibaba Group Holding Ltd. (ADR)3 | 1,635,100 | 346,805 | ||||||
| Sony Corp.1 | 2,051,700 | 139,653 | ||||||
| MercadoLibre, Inc.3 | 190,000 | 108,669 | ||||||
| Meituan Dianping, Class B1,3 | 7,500,347 | 98,223 | ||||||
| Kering SA1 | 139,238 | 91,726 | ||||||
| Galaxy Entertainment Group Ltd.1 | 11,306,000 | 83,334 | ||||||
| Ryohin Keikaku Co., Ltd.1 | 3,319,000 | 77,413 | ||||||
| Other securities | 460,340 | |||||||
| 1,406,163 | ||||||||
| Industrials 13.85% | ||||||||
| Airbus SE, non-registered shares1 | 2,723,949 | 399,652 | ||||||
| Recruit Holdings Co., Ltd.1 | 3,871,300 | 145,678 | ||||||
| Melrose Industries PLC1 | 37,984,233 | 121,412 | ||||||
| Safran SA1 | 523,100 | 81,088 | ||||||
| Rheinmetall AG1 | 639,400 | 73,528 | ||||||
| Rolls-Royce Holdings PLC1,3 | 8,080,688 | 73,172 | ||||||
| Knorr-Bremse AG, non-registered shares1 | 703,099 | 71,566 | ||||||
| Komatsu Ltd.1 | 2,880,500 | 69,061 | ||||||
| Other securities | 360,594 | |||||||
| 1,395,751 | ||||||||
| Health care 12.43% | ||||||||
| Novartis AG1 | 2,624,133 | 248,617 | ||||||
| Daiichi Sankyo Co., Ltd.1 | 2,160,000 | 142,631 | ||||||
| Chugai Pharmaceutical Co., Ltd.1 | 1,243,500 | 114,531 | ||||||
| Takeda Pharmaceutical Co. Ltd.1 | 2,859,865 | 113,302 | ||||||
| Grifols, SA, Class A, non-registered shares1 | 2,656,981 | 93,813 | ||||||
| Grifols, SA, Class B (ADR) | 793,690 | 18,485 | ||||||
| Alcon Inc.1,3 | 1,903,239 | 107,818 | ||||||
| Fresenius SE & Co. KGaA1 | 1,819,000 | 102,675 | ||||||
| Teva Pharmaceutical Industries Ltd. (ADR)3 | 7,216,598 | 70,723 | ||||||
| Other securities | 239,573 | |||||||
| 1,252,168 | ||||||||
| Information technology 7.24% | ||||||||
| ASML Holding NV1 | 682,174 | 203,158 | ||||||
| Samsung Electronics Co., Ltd.1 | 3,702,250 | 178,390 | ||||||
| Taiwan Semiconductor Manufacturing Co., Ltd.1 | 6,183,000 | 68,474 | ||||||
| Other securities | 279,537 | |||||||
| 729,559 | ||||||||
| Materials 6.73% | ||||||||
| Vale SA, ordinary nominative (ADR) | 15,349,717 | 202,616 | ||||||
| Vale SA, ordinary nominative | 102,481 | 1,358 | ||||||
| Asahi Kasei Corp.1 | 12,779,780 | 143,397 | ||||||
| Other securities | 330,520 | |||||||
| 677,891 | ||||||||
| American Funds Insurance Series | 55 |
International Fund
| Common stocks (continued) | Shares | Value (000) | ||||||
| Consumer staples 6.72% | ||||||||
| Pernod Ricard SA1 | 785,326 | $ | 140,578 | |||||
| Nestlé SA1 | 1,142,100 | 123,731 | ||||||
| Kirin Holdings Co., Ltd.1 | 4,041,800 | 88,154 | ||||||
| KOSÉ Corp.1 | 458,100 | 66,954 | ||||||
| Other securities | 257,726 | |||||||
| 677,143 | ||||||||
| Communication services 4.91% | ||||||||
| SoftBank Group Corp.1 | 4,168,200 | 181,469 | ||||||
| Tencent Holdings Ltd.1 | 2,555,987 | 123,297 | ||||||
| Altice Europe NV, Class A1,3 | 13,236,760 | 85,540 | ||||||
| Other securities | 104,327 | |||||||
| 494,633 | ||||||||
| Energy 4.86% | ||||||||
| Reliance Industries Ltd.1 | 5,591,364 | 118,767 | ||||||
| Royal Dutch Shell PLC, Class B1 | 2,148,307 | 64,014 | ||||||
| Oil Search Ltd.1 | 13,449,600 | 68,611 | ||||||
| Other securities | 238,598 | |||||||
| 489,990 | ||||||||
| Utilities 3.56% | ||||||||
| ENN Energy Holdings Ltd.1 | 14,004,000 | 153,115 | ||||||
| China Gas Holdings Ltd.1 | 24,134,000 | 90,467 | ||||||
| E.ON SE1 | 7,101,000 | 75,944 | ||||||
| Other securities | 39,455 | |||||||
| 358,981 | ||||||||
| Real estate 2.22% | ||||||||
| China Overseas Land & Investment Ltd.1 | 23,746,000 | 92,741 | ||||||
| Other securities | 130,568 | |||||||
| 223,309 | ||||||||
| Total common stocks (cost: $6,922,555,000) | 9,357,814 | |||||||
| Preferred securities 1.20% | ||||||||
| Health care 0.70% | ||||||||
| Grifols, SA, Class B, nonvoting preferred, non-registered shares1 | 3,026,230 | 70,526 | ||||||
| Financials 0.50% | ||||||||
| Other securities | 50,234 | |||||||
| Total preferred securities (cost: $99,792,000) | 120,760 | |||||||
| Rights & warrants 0.23% | ||||||||
| Health care 0.23% | ||||||||
| Other securities | 22,939 | |||||||
| Total rights & warrants (cost: $13,238,000) | 22,939 | |||||||
| Bonds, notes & other debt instruments 0.44% | Principal amount (000) | |||||||
| Corporate bonds & notes 0.33% | ||||||||
| Other 0.33% | ||||||||
| Other securities | 33,135 | |||||||
| 56 | American Funds Insurance Series |
International Fund
| Bonds, notes & other debt instruments | Principal amount (000) | Value (000) | ||||||
| Bonds & notes of governments outside the U.S. 0.11% | ||||||||
| Bonds & notes of governments & government agencies outside the U.S. 0.11% | ||||||||
| Other securities | $ | 11,194 | ||||||
| Total bonds, notes & other debt instruments (cost: $38,713,000) | 44,329 | |||||||
| Short-term securities 5.41% | Shares | |||||||
| Money market investments 5.41% | ||||||||
| Capital Group Central Cash Fund 1.73%4 | 5,444,569 | 544,457 | ||||||
| Total short-term securities (cost: $544,206,000) | 544,457 | |||||||
| Total investment securities 100.15% (cost: $7,618,504,000) | 10,090,299 | |||||||
| Other assets less liabilities (0.15)% | (14,868 | ) | ||||||
| Net assets 100.00% | $ | 10,075,431 | ||||||
This summary investment portfolio is designed to streamline the report and help investors better focus on the fund’s principal holdings. See the inside back cover for details on how to obtain a complete schedule of portfolio holdings.
“Other securities” includes all issues that are not disclosed separately in the summary investment portfolio. “Other securities” also includes securities (with an aggregate value of $49,827,000, which represented .49% of the net assets of the fund) which were acquired in transactions exempt from registration under Rule 144A of the Securities Act of 1933 and may be resold in the U.S. in transactions exempt from registration, normally to qualified institutional buyers.
Forward currency contracts
| Unrealized | |||||||||||
| Contract amount | depreciation | ||||||||||
| Purchases | Sales | Settlement | at 12/31/2019 | ||||||||
| (000) | (000) | Counterparty | date | (000) | |||||||
| USD17,024 | GBP12,948 | Barclays Bank PLC | 1/9/2020 | $(131 | ) | ||||||
| 1 | Valued under fair value procedures adopted by authority of the board of trustees. The total value of all such securities, including those in “Other securities,” was $8,247,137,000, which represented 81.85% of the net assets of the fund. This amount includes $8,199,688,000 related to certain securities trading outside the U.S. whose values were adjusted as a result of significant market movements following the close of local trading. |
| 2 | Acquired through a private placement transaction exempt from registration under the Securities Act of 1933. May be subject to legal or contractual restrictions on resale. Further details on this holding appear below. |
| 3 | Security did not produce income during the last 12 months. |
| 4 | Rate represents the seven-day yield at 12/31/2019. |
| Percent | ||||||||||
| Acquisition | Cost | Value | of net | |||||||
| Private placement security | date | (000) | (000) | assets | ||||||
| Axis Bank Ltd. | 11/14/2017 | $17,232 | $34,069 | .34 | % | |||||
Key to abbreviations and symbol
ADR = American Depositary Receipts
GBP = British pounds
USD/$ = U.S. dollars
See notes to financial statements.
| American Funds Insurance Series | 57 |
Summary investment portfolioDecember 31, 2019
| Common stocks 88.36% | Shares | Value (000) | ||||||
| Information technology 23.02% | ||||||||
| Taiwan Semiconductor Manufacturing Co., Ltd.1 | 9,405,000 | $ | 104,155 | |||||
| Taiwan Semiconductor Manufacturing Co., Ltd. (ADR) | 250,000 | 14,525 | ||||||
| PagSeguro Digital Ltd., Class A2 | 2,921,023 | 99,782 | ||||||
| Microsoft Corp. | 538,524 | 84,925 | ||||||
| StoneCo Ltd., Class A2 | 1,780,826 | 71,037 | ||||||
| Keyence Corp.1 | 140,000 | 49,553 | ||||||
| Broadcom Inc. | 156,350 | 49,410 | ||||||
| Visa Inc., Class A | 223,400 | 41,977 | ||||||
| PayPal Holdings, Inc.2 | 353,000 | 38,184 | ||||||
| EPAM Systems, Inc.2 | 158,100 | 33,543 | ||||||
| Adobe Inc.2 | 100,400 | 33,113 | ||||||
| Largan Precision Co., Ltd.1 | 181,000 | 30,243 | ||||||
| Autodesk, Inc.2 | 146,100 | 26,804 | ||||||
| Mastercard Inc., Class A | 79,800 | 23,827 | ||||||
| Halma PLC1 | 843,000 | 23,666 | ||||||
| Other securities | 140,773 | |||||||
| 865,517 | ||||||||
| Financials 13.11% | ||||||||
| HDFC Bank Ltd.1 | 4,410,200 | 78,598 | ||||||
| Kotak Mahindra Bank Ltd.1 | 2,942,900 | 69,409 | ||||||
| B3 SA - Brasil, Bolsa, Balcao | 5,593,400 | 59,748 | ||||||
| AIA Group Ltd.1 | 5,316,600 | 55,939 | ||||||
| Sberbank of Russia PJSC (ADR)1 | 1,371,100 | 22,560 | ||||||
| Sberbank of Russia PJSC (ADR) | 682,500 | 11,193 | ||||||
| HDFC Life Insurance Co. Ltd.1 | 3,387,520 | 29,718 | ||||||
| XP Inc., Class A2 | 725,900 | 27,962 | ||||||
| Bank Central Asia Tbk PT1 | 9,869,000 | 23,709 | ||||||
| Other securities | 114,102 | |||||||
| 492,938 | ||||||||
| Energy 9.90% | ||||||||
| Reliance Industries Ltd.1 | 11,548,513 | 245,304 | ||||||
| Royal Dutch Shell PLC, Class B1 | 1,126,400 | 33,564 | ||||||
| Petróleo Brasileiro SA (Petrobras), ordinary nominative (ADR) | 1,429,000 | 22,778 | ||||||
| Other securities | 70,542 | |||||||
| 372,188 | ||||||||
| Health care 9.15% | ||||||||
| Notre Dame Intermédica Participações SA | 2,800,868 | 47,520 | ||||||
| BioMarin Pharmaceutical Inc.2 | 389,600 | 32,941 | ||||||
| Carl Zeiss Meditec AG, non-registered shares1 | 216,552 | 27,619 | ||||||
| AstraZeneca PLC1 | 269,800 | 26,993 | ||||||
| Yunnan Baiyao Group Co., Ltd., Class A1 | 2,000,000 | 25,699 | ||||||
| Abbott Laboratories | 263,000 | 22,844 | ||||||
| Illumina, Inc.2 | 67,000 | 22,227 | ||||||
| Other securities | 138,229 | |||||||
| 344,072 | ||||||||
| Materials 8.32% | ||||||||
| Vale SA, ordinary nominative | 2,881,660 | 38,182 | ||||||
| Vale SA, ordinary nominative (ADR) | 1,976,000 | 26,083 | ||||||
| Freeport-McMoRan Inc. | 3,945,000 | 51,758 | ||||||
| Fortescue Metals Group Ltd.1 | 4,618,395 | 34,809 | ||||||
| UPM-Kymmene Oyj1 | 894,000 | 30,984 | ||||||
| First Quantum Minerals Ltd. | 2,305,000 | 23,377 | ||||||
| Other securities | 107,595 | |||||||
| 312,788 | ||||||||
| 58 | American Funds Insurance Series |
New World Fund
| Common stocks | Shares | Value (000) | ||||||
| Consumer discretionary 7.02% | ||||||||
| Alibaba Group Holding Ltd.1,2 | 1,355,096 | $ | 36,032 | |||||
| Alibaba Group Holding Ltd. (ADR)2 | 30,300 | 6,427 | ||||||
| Melco Resorts & Entertainment Ltd. (ADR) | 931,500 | 22,514 | ||||||
| Marriott International, Inc., Class A | 144,800 | 21,927 | ||||||
| Other securities | 177,095 | |||||||
| 263,995 | ||||||||
| Communication services 5.88% | ||||||||
| Facebook, Inc., Class A2 | 268,000 | 55,007 | ||||||
| Alphabet Inc., Class C2 | 23,220 | 31,046 | ||||||
| Alphabet Inc., Class A2 | 10,000 | 13,394 | ||||||
| Other securities | 121,865 | |||||||
| 221,312 | ||||||||
| Consumer staples 5.58% | ||||||||
| Kweichow Moutai Co., Ltd., Class A1 | 334,161 | 56,813 | ||||||
| Nestlé SA1 | 333,296 | 36,108 | ||||||
| Treasury Wine Estates Ltd.1 | 2,885,454 | 32,974 | ||||||
| Other securities | 83,858 | |||||||
| 209,753 | ||||||||
| Industrials 4.40% | ||||||||
| Airbus SE, non-registered shares1 | 276,729 | 40,601 | ||||||
| Shanghai International Airport Co., Ltd., Class A1 | 2,014,760 | 22,791 | ||||||
| Nidec Corp.1 | 165,000 | 22,540 | ||||||
| Other securities | 79,556 | |||||||
| 165,488 | ||||||||
| Real estate 1.09% | ||||||||
| Other securities | 41,216 | |||||||
| Utilities 0.89% | ||||||||
| Other securities | 33,336 | |||||||
| Total common stocks (cost: $2,372,140,000) | 3,322,603 | |||||||
| Preferred securities 1.90% | ||||||||
| Industrials 0.65% | ||||||||
| Azul SA, preferred nominative (ADR)2 | 433,223 | 18,542 | ||||||
| Azul SA, preferred nominative2 | 419,250 | 6,074 | ||||||
| 24,616 | ||||||||
| Other 1.25% | ||||||||
| Other securities | 46,788 | |||||||
| Total preferred securities (cost: $50,498,000) | 71,404 | |||||||
| Rights & warrants 0.70% | ||||||||
| Other 0.70% | ||||||||
| Other securities | 26,479 | |||||||
| Total rights & warrants (cost: $15,629,000) | 26,479 | |||||||
| Bonds, notes & other debt instruments 2.57% | Principal amount (000) | |||||||
| Bonds & notes of governments & government agencies outside the U.S. 2.35% | ||||||||
| Other securities | 88,624 | |||||||
| American Funds Insurance Series | 59 |
New World Fund
| Bonds, notes & other debt instruments(continued) | Principal amount (000) | Value (000) | ||||||
| Corporate bonds & notes 0.22% | ||||||||
| Other 0.22% | ||||||||
| Other securities | $ | 8,190 | ||||||
| Total corporate bonds & notes | 8,190 | |||||||
| Total bonds, notes & other debt instruments (cost: $92,583,000) | 96,814 | |||||||
| Short-term securities 6.56% | Shares | |||||||
| Money market investments 6.35% | ||||||||
| Capital Group Central Cash Fund 1.73%3 | 2,386,731 | 238,673 | ||||||
| Principal amount (000) | ||||||||
| Other short-term securities 0.21% | ||||||||
| Other securities | 7,930 | |||||||
| Total short-term securities (cost: $251,630,000) | 246,603 | |||||||
| Total investment securities 100.09% (cost: $2,782,480,000) | 3,763,903 | |||||||
| Other assets less liabilities (0.09)% | (3,492 | ) | ||||||
| Net assets 100.00% | $ | 3,760,411 | ||||||
This summary investment portfolio is designed to streamline the report and help investors better focus on the fund’s principal holdings. See the inside back cover for details on how to obtain a complete schedule of portfolio holdings.
“Other securities” includes all issues that are not disclosed separately in the summary investment portfolio. “Other securities” also includes securities (with an aggregate value of $61,434,000, which represented 1.63% of the net assets of the fund) which were acquired in transactions exempt from registration under Rule 144A of the Securities Act of 1933 and may be resold in the U.S. in transactions exempt from registration, normally to qualified institutional buyers.
“Other securities” also includes securities on loan. The total value of securities on loan was $2,679,000, which represented .07% of the net assets of the fund. Refer to Note 5 for more information on securities lending.
| 1 | Valued under fair value procedures adopted by authority of the board of trustees. The total value of all such securities, including those in “Other securities,” was $1,928,580,000, which represented 51.29% of the net assets of the fund. This amount includes $1,899,554,000 related to certain securities trading outside the U.S. whose values were adjusted as a result of significant market movements following the close of local trading. |
| 2 | Security did not produce income during the last 12 months. |
| 3 | Rate represents the seven-day yield at 12/31/2019. |
Key to abbreviation
ADR = American Depositary Receipts
See notes to financial statements.
| 60 | American Funds Insurance Series |
Blue Chip Income and Growth Fund
Summary investment portfolioDecember 31, 2019
| Common stocks 96.37% | Shares | Value (000) | ||||||
| Health care 21.60% | ||||||||
| Abbott Laboratories | 5,266,500 | $ | 457,448 | |||||
| UnitedHealth Group Inc. | 1,137,000 | 334,255 | ||||||
| AbbVie Inc. | 3,603,660 | 319,068 | ||||||
| Amgen Inc. | 1,194,510 | 287,961 | ||||||
| Gilead Sciences, Inc. | 2,845,712 | 184,914 | ||||||
| Teva Pharmaceutical Industries Ltd. (ADR)1 | 10,333,800 | 101,271 | ||||||
| Humana Inc. | 259,000 | 94,929 | ||||||
| Medtronic PLC | 700,000 | 79,415 | ||||||
| Other securities | 146,171 | |||||||
| 2,005,432 | ||||||||
| Information technology 15.66% | ||||||||
| Microsoft Corp. | 2,469,200 | 389,393 | ||||||
| QUALCOMM Inc. | 2,846,800 | 251,173 | ||||||
| Broadcom Inc. | 575,100 | 181,743 | ||||||
| Apple Inc. | 400,000 | 117,460 | ||||||
| Mastercard Inc., Class A | 337,000 | 100,625 | ||||||
| Intel Corp. | 1,680,000 | 100,548 | ||||||
| Texas Instruments Inc. | 780,000 | 100,066 | ||||||
| Accenture PLC, Class A | 400,000 | 84,228 | ||||||
| Automatic Data Processing, Inc. | 338,500 | 57,715 | ||||||
| Other securities | 70,326 | |||||||
| 1,453,277 | ||||||||
| Energy 13.73% | ||||||||
| Exxon Mobil Corp. | 4,883,200 | 340,750 | ||||||
| EOG Resources, Inc. | 3,208,800 | 268,769 | ||||||
| Diamondback Energy, Inc. | 1,320,033 | 122,578 | ||||||
| Schlumberger Ltd. | 2,602,000 | 104,600 | ||||||
| Baker Hughes Co., Class A | 3,942,000 | 101,034 | ||||||
| Concho Resources Inc. | 859,500 | 75,266 | ||||||
| TC Energy Corp. | 1,350,000 | 71,969 | ||||||
| Royal Dutch Shell PLC, Class B (ADR) | 1,134,000 | 68,006 | ||||||
| Other securities | 121,236 | |||||||
| 1,274,208 | ||||||||
| Consumer staples 10.82% | ||||||||
| Philip Morris International Inc. | 3,005,600 | 255,747 | ||||||
| British American Tobacco PLC (ADR) | 4,935,830 | 209,575 | ||||||
| Constellation Brands, Inc., Class A | 793,100 | 150,491 | ||||||
| Costco Wholesale Corp. | 273,000 | 80,240 | ||||||
| Coca-Cola Co. | 1,387,000 | 76,770 | ||||||
| Altria Group, Inc. | 1,500,000 | 74,865 | ||||||
| Other securities | 156,377 | |||||||
| 1,004,065 | ||||||||
| Industrials 9.91% | ||||||||
| CSX Corp. | 3,628,500 | 262,558 | ||||||
| General Dynamics Corp. | 1,421,634 | 250,705 | ||||||
| Illinois Tool Works Inc. | 650,000 | 116,760 | ||||||
| Airbus Group SE (ADR) | 2,639,000 | 96,983 | ||||||
| United Technologies Corp. | 500,000 | 74,880 | ||||||
| Union Pacific Corp. | 400,000 | 72,316 | ||||||
| Other securities | 45,917 | |||||||
| 920,119 | ||||||||
| American Funds Insurance Series | 61 |
Blue Chip Income and Growth Fund
| Common stocks (continued) | Shares | Value (000) | ||||||
| Communication services 6.88% | ||||||||
| Facebook, Inc., Class A1 | 1,339,800 | $ | 274,994 | |||||
| Alphabet Inc., Class A1 | 103,775 | 138,995 | ||||||
| Alphabet Inc., Class C1 | 3,000 | 4,011 | ||||||
| Verizon Communications Inc. | 1,604,500 | 98,516 | ||||||
| Comcast Corp., Class A | 1,970,000 | 88,591 | ||||||
| Other securities | 33,749 | |||||||
| 638,856 | ||||||||
| Financials 5.12% | ||||||||
| JPMorgan Chase & Co. | 1,309,000 | 182,475 | ||||||
| Wells Fargo & Co. | 1,500,000 | 80,700 | ||||||
| U.S. Bancorp | 1,000,000 | 59,290 | ||||||
| Other securities | 152,813 | |||||||
| 475,278 | ||||||||
| Consumer discretionary 4.87% | ||||||||
| Lowe’s Cos., Inc. | 1,314,975 | 157,481 | ||||||
| McDonald’s Corp. | 500,000 | 98,805 | ||||||
| Other securities | 196,078 | |||||||
| 452,364 | ||||||||
| Utilities 3.10% | ||||||||
| Public Service Enterprise Group Inc. | 2,594,000 | 153,176 | ||||||
| American Electric Power Co., Inc. | 600,000 | 56,706 | ||||||
| Other securities | 78,146 | |||||||
| 288,028 | ||||||||
| Real estate 2.35% | ||||||||
| Other securities | 217,896 | |||||||
| Materials 2.33% | ||||||||
| Linde PLC | 884,700 | 188,353 | ||||||
| Other securities | 27,638 | |||||||
| 215,991 | ||||||||
| Total common stocks (cost: $6,823,043,000) | 8,945,514 | |||||||
| Rights & warrants 0.14% | ||||||||
| Financials 0.14% | ||||||||
| Other securities | 13,179 | |||||||
| Total rights & warrants (cost: $19,905,000) | 13,179 | |||||||
| Convertible stocks 0.06% | ||||||||
| Health care 0.06% | ||||||||
| Other securities | 5,777 | |||||||
| Total convertible stocks (cost: $4,979,000) | 5,777 | |||||||
| 62 | American Funds Insurance Series |
Blue Chip Income and Growth Fund
| Short-term securities 3.37% | Shares | Value (000) | ||||||
| Money market investments 3.37% | ||||||||
| Capital Group Central Cash Fund 1.73%2 | 3,124,623 | $ | 312,462 | |||||
| Total short-term securities (cost: $312,432,000) | 312,462 | |||||||
| Total investment securities 99.94% (cost: $7,160,359,000) | 9,276,932 | |||||||
| Other assets less liabilities 0.06% | 5,429 | |||||||
| Net assets 100.00% | $ | 9,282,361 | ||||||
This summary investment portfolio is designed to streamline the report and help investors better focus on the fund’s principal holdings. See the inside back cover for details on how to obtain a complete schedule of portfolio holdings.
“Other securities” includes all issues that are not disclosed separately in the summary investment portfolio.
| 1 | Security did not produce income during the last 12 months. |
| 2 | Rate represents the seven-day yield at 12/31/2019. |
Key to abbreviation
ADR = American Depositary Receipts
See notes to financial statements.
| American Funds Insurance Series | 63 |
Summary investment portfolioDecember 31, 2019
| Common stocks 96.65% | Shares | Value (000) | ||||||
| Information technology 15.69% | ||||||||
| Taiwan Semiconductor Manufacturing Co., Ltd.1 | 8,650,800 | $ | 95,803 | |||||
| Microsoft Corp. | 281,000 | 44,314 | ||||||
| PagSeguro Digital Ltd., Class A2 | 1,128,752 | 38,558 | ||||||
| Broadcom Inc. | 121,200 | 38,302 | ||||||
| Apple Inc. | 112,390 | 33,003 | ||||||
| ASML Holding NV1 | 70,000 | 20,847 | ||||||
| Other securities | 64,750 | |||||||
| 335,577 | ||||||||
| Industrials 12.59% | ||||||||
| Airbus SE, non-registered shares1 | 623,200 | 91,434 | ||||||
| CCR SA, ordinary nominative | 7,680,800 | 36,240 | ||||||
| Lockheed Martin Corp. | 66,000 | 25,699 | ||||||
| Safran SA1 | 123,500 | 19,144 | ||||||
| Rheinmetall AG1 | 151,500 | 17,422 | ||||||
| Boeing Co. | 49,400 | 16,093 | ||||||
| Other securities | 63,201 | |||||||
| 269,233 | ||||||||
| Financials 11.87% | ||||||||
| Sberbank of Russia PJSC (ADR)1 | 1,710,000 | 28,136 | ||||||
| AIA Group Ltd.1 | 2,503,000 | 26,336 | ||||||
| HDFC Bank Ltd.1 | 1,288,000 | 22,955 | ||||||
| Toronto-Dominion Bank (CAD denominated) | 300,700 | 16,865 | ||||||
| DBS Group Holdings Ltd.1 | 803,000 | 15,478 | ||||||
| Ping An Insurance (Group) Co. of China, Ltd., Class H1 | 1,195,000 | 14,156 | ||||||
| CME Group Inc., Class A | 70,000 | 14,050 | ||||||
| Sony Financial Holdings Inc.1 | 550,000 | 13,165 | ||||||
| Other securities | 102,601 | |||||||
| 253,742 | ||||||||
| Consumer discretionary 9.58% | ||||||||
| LVMH Moët Hennessy-Louis Vuitton SE1 | 56,200 | 26,174 | ||||||
| Home Depot, Inc. | 75,500 | 16,488 | ||||||
| Norwegian Cruise Line Holdings Ltd.2 | 275,000 | 16,063 | ||||||
| Flutter Entertainment PLC1 | 124,000 | 15,143 | ||||||
| Alibaba Group Holding Ltd.1,2 | 558,400 | 14,848 | ||||||
| Other securities | 116,164 | |||||||
| 204,880 | ||||||||
| Health care 9.36% | ||||||||
| UnitedHealth Group Inc. | 86,300 | 25,370 | ||||||
| AstraZeneca PLC1 | 167,000 | 16,708 | ||||||
| Boston Scientific Corp.2 | 351,000 | 15,872 | ||||||
| Merck & Co., Inc. | 169,850 | 15,448 | ||||||
| Abbott Laboratories | 171,000 | 14,853 | ||||||
| Novartis AG1 | 148,000 | 14,022 | ||||||
| Fleury SA, ordinary nominative | 1,750,000 | 13,281 | ||||||
| Other securities | 84,510 | |||||||
| 200,064 | ||||||||
| Communication services 8.45% | ||||||||
| Nintendo Co., Ltd.1 | 235,700 | 95,140 | ||||||
| Alphabet Inc., Class A2 | 21,800 | 29,199 | ||||||
| Alphabet Inc., Class C2 | 7,000 | 9,359 | ||||||
| Comcast Corp., Class A | 296,000 | 13,311 | ||||||
| Other securities | 33,697 | |||||||
| 180,706 | ||||||||
| 64 | American Funds Insurance Series |
Global Growth and Income Fund
| Common stocks | Shares | Value (000) | ||||||
| Materials 7.57% | ||||||||
| Fortescue Metals Group Ltd.1 | 4,763,816 | $ | 35,905 | |||||
| Freeport-McMoRan Inc. | 2,499,000 | 32,787 | ||||||
| Vale SA, ordinary nominative | 2,220,000 | 29,415 | ||||||
| Koninklijke DSM NV1 | 109,000 | 14,228 | ||||||
| Other securities | 49,629 | |||||||
| 161,964 | ||||||||
| Energy 6.53% | ||||||||
| Reliance Industries Ltd.1 | 2,714,148 | 57,652 | ||||||
| Gazprom PJSC (ADR)1 | 3,431,000 | 28,254 | ||||||
| Other securities | 53,777 | |||||||
| 139,683 | ||||||||
| Utilities 5.79% | ||||||||
| E.ON SE1 | 3,644,000 | 38,972 | ||||||
| Ørsted AS1 | 345,482 | 35,794 | ||||||
| Enel SpA1 | 3,539,000 | 28,154 | ||||||
| Other securities | 20,931 | |||||||
| 123,851 | ||||||||
| Real estate 5.19% | ||||||||
| MGM Growth Properties LLC REIT, Class A | 1,101,200 | 34,104 | ||||||
| Gaming and Leisure Properties, Inc. REIT | 425,000 | 18,296 | ||||||
| Alexandria Real Estate Equities, Inc. REIT | 103,000 | 16,643 | ||||||
| Other securities | 42,014 | |||||||
| 111,057 | ||||||||
| Consumer staples 4.03% | ||||||||
| Nestlé SA1 | 324,275 | 35,131 | ||||||
| Other securities | 50,996 | |||||||
| 86,127 | ||||||||
| Total common stocks (cost: $1,433,746,000) | 2,066,884 | |||||||
| Preferred securities 0.37% | ||||||||
| Financials 0.37% | ||||||||
| Other securities | 7,892 | |||||||
| Total preferred securities (cost: $6,929,000) | 7,892 | |||||||
| Bonds, notes & other debt instruments 1.63% | Principal amount (000) | |||||||
| Corporate bonds & notes 1.63% | ||||||||
| Communication services 1.63% | ||||||||
| Sprint Corp. 7.25% 2021 | $ | 33,000 | 34,957 | |||||
| Total bonds, notes & other debt instruments (cost: $32,020,000) | 34,957 | |||||||
| Short-term securities 1.34% | Shares | |||||||
| Money market investments 1.34% | ||||||||
| Capital Group Central Cash Fund 1.73%3 | 285,611 | 28,561 | ||||||
| Total short-term securities (cost: $28,489,000) | 28,561 | |||||||
| Total investment securities 99.99% (cost: $1,501,184,000) | 2,138,294 | |||||||
| Other assets less liabilities 0.01% | 189 | |||||||
| Net assets 100.00% | $ | 2,138,483 | ||||||
| American Funds Insurance Series | 65 |
Global Growth and Income Fund
This summary investment portfolio is designed to streamline the report and help investors better focus on the fund’s principal holdings. See the inside back cover for details on how to obtain a complete schedule of portfolio holdings.
“Other securities” includes all issues that are not disclosed separately in the summary investment portfolio.
Forward currency contracts
| Contract amount | Unrealized depreciation | ||||||||||
| Purchases (000) | Sales (000) | Counterparty | Settlement date | at 12/31/2019 (000) | |||||||
| USD7,235 | AUD10,500 | Citibank | 1/17/2020 | $ | (137 | ) | |||||
| 1 | Valued under fair value procedures adopted by authority of the board of trustees. The total value of all such securities, including those in “Other securities,” was $1,146,095,000, which represented 53.59% of the net assets of the fund. This entire amount relates to certain securities trading outside the U.S. whose values were adjusted as a result of significant market movements following the close of local trading. |
| 2 | Security did not produce income during the last 12 months. |
| 3 | Rate represents the seven-day yield at 12/31/2019. |
Key to abbreviations and symbol
ADR = American Depositary Receipts
AUD = Australian dollars
CAD = Canadian dollars
USD/$ = U.S. dollars
See notes to financial statements.
| 66 | American Funds Insurance Series |
Summary investment portfolioDecember 31, 2019
| Common stocks 94.10% | Shares | Value (000) | ||||||
| Health care 16.21% | ||||||||
| UnitedHealth Group Inc. | 3,133,668 | $ | 921,236 | |||||
| Abbott Laboratories | 6,789,069 | 589,698 | ||||||
| Amgen Inc. | 2,000,500 | 482,261 | ||||||
| Gilead Sciences, Inc. | 6,917,600 | 449,506 | ||||||
| Eli Lilly and Co. | 2,892,600 | 380,174 | ||||||
| Merck & Co., Inc. | 3,338,880 | 303,671 | ||||||
| Cigna Corp. | 1,327,418 | 271,444 | ||||||
| AstraZeneca PLC1 | 1,643,500 | 164,430 | ||||||
| AstraZeneca PLC (ADR) | 1,228,600 | 61,258 | ||||||
| Other securities | 2,215,742 | |||||||
| 5,839,420 | ||||||||
| Information technology 15.04% | ||||||||
| Microsoft Corp. | 9,454,500 | 1,490,975 | ||||||
| Broadcom Inc. | 2,152,434 | 680,212 | ||||||
| Intel Corp. | 6,651,600 | 398,098 | ||||||
| Texas Instruments Inc. | 2,127,082 | 272,883 | ||||||
| Accenture PLC, Class A | 1,067,900 | 224,868 | ||||||
| Visa Inc., Class A | 1,160,200 | 218,002 | ||||||
| Mastercard Inc., Class A | 710,000 | 211,999 | ||||||
| Other securities | 1,923,211 | |||||||
| 5,420,248 | ||||||||
| Communication services 12.02% | ||||||||
| Facebook, Inc., Class A2 | 6,826,100 | 1,401,057 | ||||||
| Netflix, Inc.2 | 2,352,425 | 761,174 | ||||||
| Alphabet Inc., Class C2 | 296,784 | 396,806 | ||||||
| Alphabet Inc., Class A2 | 247,980 | 332,142 | ||||||
| Comcast Corp., Class A | 6,693,400 | 301,002 | ||||||
| Charter Communications, Inc., Class A2 | 438,369 | 212,644 | ||||||
| Verizon Communications Inc. | 3,379,400 | 207,495 | ||||||
| Other securities | 719,670 | |||||||
| 4,331,990 | ||||||||
| Financials 10.86% | ||||||||
| JPMorgan Chase & Co. | 4,005,030 | 558,301 | ||||||
| CME Group Inc., Class A | 1,642,100 | 329,602 | ||||||
| Intercontinental Exchange, Inc. | 3,183,555 | 294,638 | ||||||
| Willis Towers Watson PLC | 1,314,000 | 265,349 | ||||||
| Aon PLC, Class A | 1,214,800 | 253,031 | ||||||
| Nasdaq, Inc. | 2,129,600 | 228,080 | ||||||
| Bank of New York Mellon Corp. | 4,159,300 | 209,338 | ||||||
| Other securities | 1,773,710 | |||||||
| 3,912,049 | ||||||||
| Industrials 10.57% | ||||||||
| Airbus SE, non-registered shares1 | 2,904,564 | 426,151 | ||||||
| BWX Technologies, Inc.3 | 5,414,670 | 336,143 | ||||||
| TransDigm Group Inc. | 578,800 | 324,128 | ||||||
| Northrop Grumman Corp. | 733,200 | 252,199 | ||||||
| General Dynamics Corp. | 1,381,600 | 243,645 | ||||||
| Equifax Inc. | 1,386,600 | 194,290 | ||||||
| Other securities | 2,031,239 | |||||||
| 3,807,795 | ||||||||
| American Funds Insurance Series | 67 |
Growth-Income Fund
| Common stocks (continued) | Shares | Value (000) | ||||||
| Consumer staples 7.10% | ||||||||
| Coca-Cola Co. | 7,316,100 | $ | 404,946 | |||||
| British American Tobacco PLC1 | 8,069,260 | 343,793 | ||||||
| British American Tobacco PLC (ADR) | 479,440 | 20,357 | ||||||
| Keurig Dr Pepper Inc. | 7,241,735 | 209,648 | ||||||
| Carlsberg A/S, Class B1 | 1,390,224 | 207,388 | ||||||
| Other securities | 1,372,011 | |||||||
| 2,558,143 | ||||||||
| Energy 6.94% | ||||||||
| Exxon Mobil Corp. | 6,274,200 | 437,814 | ||||||
| EOG Resources, Inc. | 3,943,800 | 330,333 | ||||||
| Chevron Corp. | 2,485,800 | 299,564 | ||||||
| Enbridge Inc. (CAD denominated) | 7,486,412 | 297,658 | ||||||
| Canadian Natural Resources, Ltd. (CAD denominated) | 8,803,800 | 284,748 | ||||||
| Other securities | 849,638 | |||||||
| 2,499,755 | ||||||||
| Consumer discretionary 5.06% | ||||||||
| Amazon.com, Inc.2 | 297,400 | 549,548 | ||||||
| Other securities | 1,274,385 | |||||||
| 1,823,933 | ||||||||
| Materials 4.83% | ||||||||
| Celanese Corp. | 3,243,233 | 399,307 | ||||||
| Linde PLC | 1,152,000 | 245,261 | ||||||
| Other securities | 1,096,901 | |||||||
| 1,741,469 | ||||||||
| Real estate 2.97% | ||||||||
| Equinix, Inc. REIT | 533,800 | 311,579 | ||||||
| Crown Castle International Corp. REIT | 2,071,500 | 294,464 | ||||||
| Other securities | 462,520 | |||||||
| 1,068,563 | ||||||||
| Utilities 2.45% | ||||||||
| Sempra Energy | 1,784,000 | 270,241 | ||||||
| Other securities | 610,705 | |||||||
| 880,946 | ||||||||
| Mutual funds 0.05% | ||||||||
| Other securities | 16,337 | |||||||
| Total common stocks (cost: $23,281,968,000) | 33,900,648 | |||||||
| Convertible stocks 0.51% | ||||||||
| Real estate 0.24% | ||||||||
| Crown Castle International Corp. REIT, Series A, convertible preferred, 6.875% 2020 | 67,900 | 87,030 | ||||||
| Health care 0.16% | ||||||||
| Other securities | 58,952 | |||||||
| Information technology 0.11% | ||||||||
| Broadcom Inc., Series A, cumulative convertible preferred, 8.00% 2022 | 32,900 | 38,755 | ||||||
| Total convertible stocks (cost: $162,141,000) | 184,737 | |||||||
| 68 | American Funds Insurance Series |
Growth-Income Fund
| Bonds, notes & other debt instruments 0.02% | Principal amount (000) | Value (000) | ||||||
| Corporate bonds & notes 0.02% | ||||||||
| Energy 0.02% | ||||||||
| Other securities | $ | 5,722 | ||||||
| Total bonds, notes & other debt instruments (cost: $5,266,000) | 5,722 | |||||||
| Short-term securities 5.39% | Shares | |||||||
| Money market investments 5.39% | ||||||||
| Capital Group Central Cash Fund 1.73%4 | 19,405,997 | 1,940,600 | ||||||
| Total short-term securities (cost: $1,939,508,000) | 1,940,600 | |||||||
| Total investment securities 100.02% (cost: $25,388,883,000) | 36,031,707 | |||||||
| Other assets less liabilities (0.02)% | (5,441 | ) | ||||||
| Net assets 100.00% | $ | 36,026,266 | ||||||
This summary investment portfolio is designed to streamline the report and help investors better focus on the fund’s principal holdings. See the inside back cover for details on how to obtain a complete schedule of portfolio holdings.
“Other securities” includes all issues that are not disclosed separately in the summary investment portfolio. “Other securities“ also includes a security (with a value of $5,722,000, which represented .02% of the net assets of the fund) which was acquired in transactions exempt from registration under Rule 144A of the Securities Act of 1933 and may be resold in the U.S. in transactions exempt from registration, normally to qualified institutional buyers.
Investments in affiliates
A company is an affiliate of the fund under the Investment Company Act of 1940 if the fund’s holdings represent 5% or more of the outstanding voting shares of that company. The value of the fund’s affiliated-company holding is shown in the summary investment portfolio. Further details on this holding and related transactions during the year ended December 31, 2019, appear below.
| Beginning shares | Additions | Reductions | Ending shares | Net realized loss (000) | Net unrealized appreciation (000) | Dividend income (000) | Value of affiliates at 12/31/2019 (000) | |||||||||||||||||||||||||
| Common stocks 0.93% | ||||||||||||||||||||||||||||||||
| Industrials 0.93% | ||||||||||||||||||||||||||||||||
| BWX Technologies, Inc. | 5,290,948 | 489,900 | 366,178 | 5,414,670 | $ | (1,021 | ) | $ | 128,124 | $ | 3,592 | $ | 336,143 | |||||||||||||||||||
| 1 | Valued under fair value procedures adopted by authority of the board of trustees. The total value of all such securities, including those in “Other securities,” was $3,637,561,000, which represented 10.10% of the net assets of the fund. This amount includes $3,621,224,000 related to certain securities trading outside the U.S. whose values were adjusted as a result of significant market movements following the close of local trading. |
| 2 | Security did not produce income during the last 12 months. |
| 3 | Represents an affiliated company as defined under the Investment Company Act of 1940. |
| 4 | Rate represents the seven-day yield at 12/31/2019. |
Key to abbreviations
ADR = American Depositary Receipts
CAD = Canadian dollars
See notes to financial statements.
| American Funds Insurance Series | 69 |
International Growth and Income Fund
Summary investment portfolioDecember 31, 2019
| Common stocks 88.41% | Shares | Value (000) | ||||||
| Financials 16.74% | ||||||||
| HDFC Bank Ltd.1 | 2,457,600 | $ | 43,799 | |||||
| Zurich Insurance Group AG1 | 92,200 | 37,815 | ||||||
| AIA Group Ltd.1 | 2,338,600 | 24,606 | ||||||
| Banco Santander, SA1 | 4,834,538 | 20,413 | ||||||
| ING Groep NV1 | 1,367,000 | 16,429 | ||||||
| Sony Financial Holdings Inc.1 | 660,400 | 15,808 | ||||||
| Prudential PLC1 | 738,000 | 14,200 | ||||||
| Bank Rakyat Indonesia (Persero) Tbk PT1 | 43,843,000 | 13,837 | ||||||
| DBS Group Holdings Ltd.1 | 558,000 | 10,756 | ||||||
| Haci Ömer Sabanci Holding AS1 | 6,520,900 | 10,463 | ||||||
| Other securities | 43,052 | |||||||
| 251,178 | ||||||||
| Industrials 10.95% | ||||||||
| Airbus SE, non-registered shares1 | 216,160 | 31,715 | ||||||
| Shanghai International Airport Co., Ltd., Class A1 | 2,590,033 | 29,298 | ||||||
| ASSA ABLOY AB, Class B1 | 681,100 | 15,916 | ||||||
| Komatsu Ltd.1 | 629,600 | 15,095 | ||||||
| Airports of Thailand PCL, foreign registered1 | 5,250,000 | 12,974 | ||||||
| SMC Corp.1 | 23,300 | 10,651 | ||||||
| Adani Ports & Special Economic Zone Ltd.1 | 1,975,327 | 10,135 | ||||||
| Other securities | 38,511 | |||||||
| 164,295 | ||||||||
| Consumer discretionary 10.51% | ||||||||
| Luckin Coffee Inc., Class A (ADR)2 | 987,340 | 38,862 | ||||||
| Sony Corp.1 | 430,000 | 29,269 | ||||||
| LVMH Moët Hennessy-Louis Vuitton SE1 | 48,000 | 22,355 | ||||||
| Kering SA1 | 29,000 | 19,104 | ||||||
| Galaxy Entertainment Group Ltd.1 | 2,365,000 | 17,432 | ||||||
| Alibaba Group Holding Ltd. (ADR)2 | 79,100 | 16,777 | ||||||
| Other securities | 13,788 | |||||||
| 157,587 | ||||||||
| Health care 9.46% | ||||||||
| Novartis AG1 | 502,545 | 47,612 | ||||||
| Daiichi Sankyo Co., Ltd.1 | 561,000 | 37,044 | ||||||
| Takeda Pharmaceutical Co. Ltd.1 | 518,353 | 20,536 | ||||||
| Fresenius SE & Co. KGaA1 | 275,800 | 15,568 | ||||||
| Other securities | 21,085 | |||||||
| 141,845 | ||||||||
| Energy 7.44% | ||||||||
| Royal Dutch Shell PLC, Class A (GBP denominated)1 | 2,147,691 | 63,839 | ||||||
| Royal Dutch Shell PLC, Class B1 | 138,000 | 4,112 | ||||||
| TOTAL SA1 | 404,534 | 22,356 | ||||||
| Canadian Natural Resources, Ltd. (CAD denominated) | 272,500 | 8,814 | ||||||
| Canadian Natural Resources, Ltd. | 92,000 | 2,976 | ||||||
| Other securities | 9,504 | |||||||
| 111,601 | ||||||||
| Utilities 6.31% | ||||||||
| E.ON SE1 | 3,488,000 | 37,304 | ||||||
| ENN Energy Holdings Ltd.1 | 1,658,000 | 18,128 | ||||||
| Other securities | 39,281 | |||||||
| 94,713 | ||||||||
| 70 | American Funds Insurance Series |
International Growth and Income Fund
| Common stocks | Shares | Value (000) | ||||||
| Materials 6.11% | ||||||||
| Rio Tinto PLC1 | 658,800 | $ | 39,144 | |||||
| Kansai Paint Co., Ltd.1 | 512,000 | 12,514 | ||||||
| Air Liquide SA, non-registered shares1 | 79,200 | 11,256 | ||||||
| Other securities | 28,698 | |||||||
| 91,612 | ||||||||
| Information technology 5.64% | ||||||||
| Taiwan Semiconductor Manufacturing Co., Ltd.1 | 2,804,000 | 31,053 | ||||||
| Tokyo Electron Ltd.1 | 96,500 | 21,206 | ||||||
| ASML Holding NV1 | 47,800 | 14,235 | ||||||
| Samsung Electronics Co., Ltd.1 | 259,000 | 12,480 | ||||||
| Other securities | 5,577 | |||||||
| 84,551 | ||||||||
| Consumer staples 5.21% | ||||||||
| British American Tobacco PLC1 | 548,402 | 23,365 | ||||||
| Pernod Ricard SA1 | 128,650 | 23,029 | ||||||
| Coca-Cola Icecek AS, Class C1 | 2,631,000 | 17,131 | ||||||
| Other securities | 14,657 | |||||||
| 78,182 | ||||||||
| Communication services 5.15% | ||||||||
| Singapore Telecommunications Ltd.1 | 9,429,449 | 23,646 | ||||||
| SoftBank Group Corp.1 | 487,600 | 21,229 | ||||||
| Yandex NV, Class A2 | 470,000 | 20,440 | ||||||
| Other securities | 12,003 | |||||||
| 77,318 | ||||||||
| Real estate 4.89% | ||||||||
| Sun Hung Kai Properties Ltd.1 | 2,061,500 | 31,622 | ||||||
| CK Asset Holdings Ltd.1 | 2,626,000 | 19,032 | ||||||
| China Overseas Land & Investment Ltd.1 | 3,944,000 | 15,403 | ||||||
| Other securities | 7,322 | |||||||
| 73,379 | ||||||||
| Total common stocks (cost: $1,069,560,000) | 1,326,261 | |||||||
| Preferred securities 2.10% | ||||||||
| Financials 1.83% | ||||||||
| Itaú Unibanco Holding SA, preferred nominative (ADR) | 2,993,550 | 27,391 | ||||||
| Energy 0.27% | ||||||||
| Other securities | 4,072 | |||||||
| Total preferred securities (cost: $26,377,000) | 31,463 | |||||||
| Bonds, notes & other debt instruments 1.12% | Principal amount (000) | |||||||
| Bonds & notes of governments & government agencies outside the U.S. 0.58% | ||||||||
| Bonds & notes of governments & government agencies outside the U.S. 0.58% | ||||||||
| Other securities | 8,743 | |||||||
| Corporate bonds & notes 0.54% | ||||||||
| Other 0.54% | ||||||||
| Other securities | 8,076 | |||||||
| Total bonds, notes & other debt instruments (cost: $15,646,000) | 16,819 | |||||||
| American Funds Insurance Series | 71 |
International Growth and Income Fund
| Short-term securities 8.54% | Shares | Value (000) | ||||||
| Money market investments 8.54% | ||||||||
| Capital Group Central Cash Fund 1.73%3 | 1,280,263 | $ | 128,026 | |||||
| Total short-term securities (cost: $127,980,000) | 128,026 | |||||||
| Total investment securities 100.17% (cost: $1,239,563,000) | 1,502,569 | |||||||
| Other assets less liabilities (0.17)% | (2,483 | ) | ||||||
| Net assets 100.00% | $ | 1,500,086 | ||||||
This summary investment portfolio is designed to streamline the report and help investors better focus on the fund’s principal holdings. See the inside back cover for details on how to obtain a complete schedule of portfolio holdings.
“Other securities” includes all issues that are not disclosed separately in the summary investment portfolio. “Other securities“ also includes a security (with a value of $1,931,000, which represented .13% of the net assets of the fund) which was acquired in transactions exempt from registration under Rule 144A of the Securities Act of 1933 and may be resold in the U.S. in transactions exempt from registration, normally to qualified institutional buyers.
Forward currency contracts
| Contract amount | Unrealized depreciation | ||||||||||
| Purchases (000) | Sales (000) | Counterparty | Settlement date | at 12/31/2019 (000) | |||||||
| USD1,609 | GBP1,223 | Bank of America | 1/9/2020 | $ | (11 | ) | |||||
| 1 | Valued under fair value procedures adopted by authority of the board of trustees. The total value of all such securities, including those in “Other securities,” was $1,211,171,000, which represented 80.74% of the net assets of the fund. This entire amount relates to certain securities trading outside the U.S. whose values were adjusted as a result of significant market movements following the close of local trading. |
| 2 | Security did not produce income during the last 12 months. |
| 3 | Rate represents the seven-day yield at 12/31/2019. |
Key to abbreviations and symbol
ADR = American Depositary Receipts
CAD = Canadian dollars
GBP = British pounds
USD/$ = U.S. dollars
See notes to financial statements.
| 72 | American Funds Insurance Series |
Summary investment portfolioDecember 31, 2019
| Common stocks 68.57% | Shares | Value (000) | ||||||
| Consumer staples 10.33% | ||||||||
| Philip Morris International Inc. | 188,220 | $ | 16,016 | |||||
| British American Tobacco PLC1 | 307,500 | 13,101 | ||||||
| Diageo PLC1 | 303,200 | 12,777 | ||||||
| Coca-Cola Co. | 225,000 | 12,454 | ||||||
| Carlsberg A/S, Class B1 | 72,426 | 10,804 | ||||||
| Altria Group, Inc. | 205,470 | 10,255 | ||||||
| Nestlé SA1 | 69,277 | 7,505 | ||||||
| Imperial Brands PLC1 | 291,600 | 7,225 | ||||||
| Other securities | 13,015 | |||||||
| 103,152 | ||||||||
| Information technology 9.62% | ||||||||
| Microsoft Corp. | 119,020 | 18,769 | ||||||
| Broadcom Inc. | 51,500 | 16,275 | ||||||
| Taiwan Semiconductor Manufacturing Co., Ltd.1 | 1,366,800 | 15,137 | ||||||
| Intel Corp. | 221,100 | 13,233 | ||||||
| QUALCOMM Inc. | 123,400 | 10,888 | ||||||
| Other securities | 21,730 | |||||||
| 96,032 | ||||||||
| Financials 8.43% | ||||||||
| CME Group Inc., Class A | 66,166 | 13,281 | ||||||
| Zurich Insurance Group AG1 | 31,098 | 12,755 | ||||||
| JPMorgan Chase & Co. | 72,900 | 10,162 | ||||||
| Truist Financial Corp. | 152,006 | 8,561 | ||||||
| Sampo Oyj, Class A1 | 153,061 | 6,678 | ||||||
| Swedbank AB, Class A1 | 419,333 | 6,254 | ||||||
| Other securities | 26,516 | |||||||
| 84,207 | ||||||||
| Real estate 7.88% | ||||||||
| American Tower Corp. REIT | 81,369 | 18,700 | ||||||
| Crown Castle International Corp. REIT | 130,300 | 18,522 | ||||||
| Link Real Estate Investment Trust REIT1 | 848,000 | 9,003 | ||||||
| CK Asset Holdings Ltd.1 | 971,500 | 7,041 | ||||||
| Other securities | 25,386 | |||||||
| 78,652 | ||||||||
| Energy 6.06% | ||||||||
| Royal Dutch Shell PLC, Class B1 | 661,840 | 19,721 | ||||||
| Royal Dutch Shell PLC, Class B (ADR) | 8,500 | 510 | ||||||
| Royal Dutch Shell PLC, Class A (GBP denominated)1 | 101 | 3 | ||||||
| Enbridge Inc. (CAD denominated) | 458,570 | 18,233 | ||||||
| Chevron Corp. | 57,700 | 6,953 | ||||||
| Other securities | 15,110 | |||||||
| 60,530 | ||||||||
| Health care 5.32% | ||||||||
| AstraZeneca PLC1 | 123,900 | 12,396 | ||||||
| AstraZeneca PLC (ADR) | 145,100 | 7,235 | ||||||
| GlaxoSmithKline PLC1 | 541,100 | 12,730 | ||||||
| Pfizer Inc. | 207,500 | 8,130 | ||||||
| Other securities | 12,654 | |||||||
| 53,145 | ||||||||
| Communication services 4.89% | ||||||||
| Vodafone Group PLC1 | 6,536,800 | 12,690 | ||||||
| Koninklijke KPN NV1 | 2,808,662 | 8,299 | ||||||
| Nippon Telegraph and Telephone Corp.1 | 263,000 | 6,662 | ||||||
| Other securities | 21,142 | |||||||
| 48,793 | ||||||||
| American Funds Insurance Series | 73 |
Capital Income Builder
| Common stocks (continued) | Shares | Value (000) | ||||||
| Utilities 4.80% | ||||||||
| Enel SpA1 | 2,008,308 | $ | 15,977 | |||||
| Edison International | 159,800 | 12,050 | ||||||
| SSE PLC1 | 339,756 | 6,510 | ||||||
| Other securities | 13,413 | |||||||
| 47,950 | ||||||||
| Industrials 4.52% | ||||||||
| Airbus SE, non-registered shares1 | 92,765 | 13,610 | ||||||
| Boeing Co. | 21,750 | 7,085 | ||||||
| BOC Aviation Ltd.1 | 646,700 | 6,570 | ||||||
| Other securities | 17,891 | |||||||
| 45,156 | ||||||||
| Consumer discretionary 4.07% | ||||||||
| Las Vegas Sands Corp. | 195,000 | 13,463 | ||||||
| Sands China Ltd.1 | 1,782,000 | 9,556 | ||||||
| Other securities | 17,667 | |||||||
| 40,686 | ||||||||
| Materials 2.65% | ||||||||
| Dow Inc. | 164,133 | 8,983 | ||||||
| Other securities | 17,517 | |||||||
| 26,500 | ||||||||
| Total common stocks (cost: $597,003,000) | 684,803 | |||||||
| Rights & warrants 0.00% | ||||||||
| Energy 0.00% | ||||||||
| Other securities | — | 2 | ||||||
| Total rights & warrants (cost: $1,000) | — | 2 | ||||||
| Convertible stocks 1.61% | ||||||||
| Utilities 0.74% | ||||||||
| Sempra Energy, Series A, convertible preferred, 6.00% 2021 | 61,600 | 7,393 | ||||||
| Information technology 0.46% | ||||||||
| Broadcom Inc., Series A, cumulative convertible preferred, 8.00% 2022 | 3,900 | 4,594 | ||||||
| Real estate 0.41% | ||||||||
| Crown Castle International Corp. REIT, Series A, convertible preferred, 6.875% 2020 | 3,150 | 4,038 | ||||||
| Total convertible stocks (cost: $13,498,000) | 16,025 | |||||||
| Bonds, notes & other debt instruments 21.35% | Principal amount (000) | |||||||
| U.S. Treasury bonds & notes 10.37% | ||||||||
| U.S. Treasury 9.79% | ||||||||
| U.S. Treasury 1.75% 2020 | $ | 8,000 | 8,008 | |||||
| U.S. Treasury 2.00% 20223 | 15,000 | 15,159 | ||||||
| U.S. Treasury 2.125% 2022 | 8,800 | 8,931 | ||||||
| U.S. Treasury 2.00% 2025 | 13,200 | 13,384 | ||||||
| U.S. Treasury 1.875% 2026 | 6,300 | 6,331 | ||||||
| U.S. Treasury 2.00% 2026 | 7,500 | 7,588 | ||||||
| U.S. Treasury 0%–3.13% 2021–20493 | 40,841 | 38,435 | ||||||
| 97,836 | ||||||||
| 74 | American Funds Insurance Series |
Capital Income Builder
| Bonds, notes & other debt instruments | Principal amount (000) | Value (000) | ||||||
| U.S. Treasury inflation-protected securities 0.58% | ||||||||
| U.S. Treasury Inflation-Protected Securities 0.50%–0.63% 2023–20284 | $ | 5,698 | $ | 5,788 | ||||
| Total U.S. Treasury bonds & notes | 103,624 | |||||||
| Corporate bonds & notes 4.87% | ||||||||
| Utilities 0.85% | ||||||||
| Edison International 3.55%–5.75% 2024–2028 | 865 | 903 | ||||||
| Southern California Edison Co. 3.60%–4.13% 2028–2048 | 694 | 720 | ||||||
| Other securities | 6,900 | |||||||
| 8,523 | ||||||||
| Consumer staples 0.69% | ||||||||
| Altria Group, Inc. 5.95% 2049 | 327 | 396 | ||||||
| British American Tobacco PLC 3.22%–4.76% 2026–2049 | 1,190 | 1,211 | ||||||
| Philip Morris International Inc. 3.375% 2029 | 450 | 472 | ||||||
| Other securities | 4,829 | |||||||
| 6,908 | ||||||||
| Financials 0.68% | ||||||||
| JPMorgan Chase & Co. 2.739% 2030 (USD-SOFR + 1.51% on 10/15/2029)5 | 246 | 246 | ||||||
| Other securities | 6,580 | |||||||
| 6,826 | ||||||||
| Information technology 0.65% | ||||||||
| Broadcom Inc. 4.75% 20296 | 490 | 536 | ||||||
| Broadcom Ltd. 3.875% 2027 | 370 | 384 | ||||||
| Microsoft Corp. 1.55%–2.40% 2021–2022 | 1,505 | 1,519 | ||||||
| Other securities | 4,008 | |||||||
| 6,447 | ||||||||
| Health care 0.53% | ||||||||
| AstraZeneca PLC 3.375% 2025 | 200 | 212 | ||||||
| Other securities | 5,106 | |||||||
| 5,318 | ||||||||
| Energy 0.41% | ||||||||
| Enbridge Energy Partners, LP 7.375% 2045 | 73 | 109 | ||||||
| Shell International Finance BV 2.00% 2024 | 420 | 419 | ||||||
| Other securities | 3,548 | |||||||
| 4,076 | ||||||||
| Communication services 0.30% | ||||||||
| Vodafone Group PLC 4.25% 2050 | 75 | 79 | ||||||
| Other securities | 2,904 | |||||||
| 2,983 | ||||||||
| Other 0.76% | ||||||||
| Other securities | 7,557 | |||||||
| Total corporate bonds & notes | 48,638 | |||||||
| Mortgage-backed obligations 4.64% | ||||||||
| Federal agency mortgage-backed obligations 4.13% | ||||||||
| Freddie Mac 3.01%–3.50% 2045–20497,8 | 13,624 | 13,995 | ||||||
| Other securities | 27,245 | |||||||
| 41,240 | ||||||||
| American Funds Insurance Series | 75 |
Capital Income Builder
| Bonds, notes & other debt instruments (continued) | Principal amount (000) | Value (000) | ||||||
| Mortgage-backed obligations (continued) | ||||||||
| Collateralized mortgage-backed obligations (privately originated) 0.51% | ||||||||
| Other securities | $ | 5,082 | ||||||
| Total mortgage-backed obligations | 46,322 | |||||||
| Asset-backed obligations 1.43% | ||||||||
| Ford Credit Auto Owner Trust, Series 2015-1, Class A, 2.12% 20266,7 | $ | 6,959 | 6,959 | |||||
| Other securities | 7,310 | |||||||
| Total asset-backed obligations | 14,269 | |||||||
| Municipals 0.04% | ||||||||
| Other securities | 415 | |||||||
| Total bonds, notes & other debt instruments (cost: $208,835,000) | 213,268 | |||||||
| Short-term securities 7.66% | Shares | |||||||
| Money market investments 7.66% | ||||||||
| Capital Group Central Cash Fund 1.73%9 | 765,198 | 76,520 | ||||||
| Total short-term securities (cost: $76,393,000) | 76,520 | |||||||
| Total investment securities 99.19% (cost: $895,730,000) | 990,616 | |||||||
| Other assets less liabilities 0.81% | 8,100 | |||||||
| Net assets 100.00% | $ | 998,716 | ||||||
This summary investment portfolio is designed to streamline the report and help investors better focus on the fund’s principal holdings. See the inside back cover for details on how to obtain a complete schedule of portfolio holdings.
“Other securities” includes all issues that are not disclosed separately in the summary investment portfolio.
Futures contracts
| Contracts | Type | Number of contracts | Expiration | Notional amount (000) | 10 | Value at 12/31/2019 (000) | 11 | Unrealized (depreciation) appreciation at 12/31/2019 (000) | |||||||
| 2 Year U.S. Treasury Note Futures | Long | 422 | April 2020 | $84,400 | $90,941 | $ | (41 | ) | |||||||
| 5 Year U.S. Treasury Note Futures | Short | 50 | April 2020 | (5,000 | ) | (5,930 | ) | 27 | |||||||
| 10 Year U.S. Treasury Note Futures | Long | 37 | March 2020 | 3,700 | 4,752 | (40 | ) | ||||||||
| 10 Year Ultra U.S. Treasury Note Futures | Short | 6 | March 2020 | (600 | ) | (844 | ) | 10 | |||||||
| 20 Year U.S. Treasury Bond Futures | Long | 49 | March 2020 | 4,900 | 7,639 | (162 | ) | ||||||||
| 30 Year Ultra U.S. Treasury Bond Futures | Long | 23 | March 2020 | 2,300 | 4,178 | (125 | ) | ||||||||
| $ | (331 | ) | |||||||||||||
| 76 | American Funds Insurance Series |
Capital Income Builder
Swap contracts
Interest rate swaps
| Receive | Pay | Expiration date | Notional (000) | Value at 12/31/2019 (000) | Upfront payments/ receipts (000) | Unrealized appreciation (depreciation) at 12/31/2019 (000) | ||||||||||||||
| 2.197% | U.S. EFFR | 4/15/2021 | $ | 31,000 | $253 | $ | — | $ | 253 | |||||||||||
| 1.6325% | U.S. EFFR | 7/18/2021 | 40,000 | 75 | — | 75 | ||||||||||||||
| 1.3615% | U.S. EFFR | 11/1/2021 | 23,500 | (36 | ) | — | (36 | ) | ||||||||||||
| 1.281% | U.S. EFFR | 11/4/2021 | 23,500 | (70 | ) | — | (70 | ) | ||||||||||||
| U.S. EFFR | 1.335% | 11/26/2021 | 38,000 | 77 | — | 77 | ||||||||||||||
| 2.21875% | U.S. EFFR | 3/14/2024 | 9,000 | 271 | — | 271 | ||||||||||||||
| U.S. EFFR | 1.485% | 10/23/2029 | 5,000 | 76 | — | 76 | ||||||||||||||
| U.S. EFFR | 1.4869% | 10/23/2029 | 4,600 | 69 | — | 69 | ||||||||||||||
| U.S. EFFR | 1.453% | 10/24/2029 | 5,800 | 105 | — | 105 | ||||||||||||||
| U.S. EFFR | 1.4741% | 10/24/2029 | 5,800 | 94 | — | 94 | ||||||||||||||
| U.S. EFFR | 1.4495% | 10/24/2029 | 4,200 | 78 | — | 78 | ||||||||||||||
| U.S. EFFR | 1.446% | 10/24/2029 | 600 | 11 | — | 11 | ||||||||||||||
| 1.419% | U.S. EFFR | 11/26/2029 | 8,000 | (174 | ) | — | (174 | ) | ||||||||||||
| $ | — | $ | 829 | |||||||||||||||||
The following footnotes apply to either the individual securities noted or one or more of the securities aggregated and listed as a single line item.
| 1 | Valued under fair value procedures adopted by authority of the board of trustees. The total value of all such securities, including those in “Other securities,” was $345,473,000, which represented 34.59% of the net assets of the fund. This amount includes $345,261,000 related to certain securities trading outside the U.S. whose values were adjusted as a result of significant market movements following the close of local trading. |
| 2 | Amount less than one thousand. |
| 3 | All or a portion of this security was pledged as collateral. The total value of pledged collateral was $1,180,000, which represented .12% of the net assets of the fund. |
| 4 | Index-linked bond whose principal amount moves with a government price index. |
| 5 | Step bond; coupon rate may change at a later date. |
| 6 | Acquired in a transaction exempt from registration under Rule 144A of the Securities Act of 1933. May be resold in the U.S. in transactions exempt from registration, normally to qualified institutional buyers. The total value of all such securities, including those in “Other securities,” was $21,329,000, which represented 2.14% of the net assets of the fund. |
| 7 | Principal payments may be made periodically. Therefore, the effective maturity date may be earlier than the stated maturity date. |
| 8 | Coupon rate may change periodically. Reference rate and spread are as of the most recent information available. Some coupon rates are determined by the issuer or agent based on current market conditions; therefore, the reference rate and spread are not available. |
| 9 | Rate represents the seven-day yield at 12/31/2019. |
| 10 | Notional amount is calculated based on the number of contracts and notional contract size. |
| 11 | Value is calculated based on the notional amount and current market price. |
Key to abbreviations and symbol
ADR = American Depositary Receipts
CAD = Canadian dollars
EFFR = Effective Federal Funds Rate
GBP = British pounds
SOFR = Secured Overnight Financing Rate
USD/$ = U.S. dollars
See notes to financial statements.
| American Funds Insurance Series | 77 |
Summary investment portfolioDecember 31, 2019
| Common stocks 64.44% | Shares | Value (000) | ||||||
| Information technology 15.65% | ||||||||
| Microsoft Corp. | 6,891,900 | $ | 1,086,852 | |||||
| Broadcom Inc. | 2,097,200 | 662,757 | ||||||
| ASML Holding NV (New York registered) | 1,865,000 | 551,928 | ||||||
| ASML Holding NV1 | 70,000 | 20,847 | ||||||
| Taiwan Semiconductor Manufacturing Co., Ltd. (ADR) | 6,806,700 | 395,469 | ||||||
| MKS Instruments, Inc.2 | 2,800,000 | 308,028 | ||||||
| VeriSign, Inc.3 | 1,400,000 | 269,752 | ||||||
| Intel Corp. | 3,500,000 | 209,475 | ||||||
| Visa Inc., Class A | 1,032,000 | 193,913 | ||||||
| Dell Technologies Inc., Class C3 | 3,387,100 | 174,063 | ||||||
| Mastercard Inc., Class A | 451,000 | 134,664 | ||||||
| Other securities | 284,508 | |||||||
| 4,292,256 | ||||||||
| Financials 11.02% | ||||||||
| First Republic Bank | 3,380,000 | 396,981 | ||||||
| Chubb Ltd. | 2,375,000 | 369,693 | ||||||
| Arch Capital Group Ltd.3 | 7,331,500 | 314,448 | ||||||
| JPMorgan Chase & Co. | 1,600,000 | 223,040 | ||||||
| Bank of America Corp. | 6,000,000 | 211,320 | ||||||
| Capital One Financial Corp. | 2,000,000 | 205,820 | ||||||
| Citigroup Inc. | 2,500,000 | 199,725 | ||||||
| CME Group Inc., Class A | 977,200 | 196,144 | ||||||
| Apollo Global Management, Inc., Class A | 3,090,000 | 147,424 | ||||||
| Other securities | 758,031 | |||||||
| 3,022,626 | ||||||||
| Health care 10.65% | ||||||||
| UnitedHealth Group Inc. | 2,016,300 | 592,752 | ||||||
| Johnson & Johnson | 3,200,000 | 466,784 | ||||||
| Humana Inc. | 1,265,000 | 463,648 | ||||||
| Abbott Laboratories | 3,000,000 | 260,580 | ||||||
| Cigna Corp. | 1,250,000 | 255,612 | ||||||
| Merck & Co., Inc. | 2,420,300 | 220,126 | ||||||
| Other securities | 660,419 | |||||||
| 2,919,921 | ||||||||
| Industrials 5.90% | ||||||||
| Northrop Grumman Corp. | 1,449,400 | 498,550 | ||||||
| Boeing Co. | 1,417,300 | 461,700 | ||||||
| Lockheed Martin Corp. | 847,200 | 329,883 | ||||||
| CSX Corp. | 1,875,000 | 135,675 | ||||||
| Other securities | 191,830 | |||||||
| 1,617,638 | ||||||||
| Consumer discretionary 4.89% | ||||||||
| Home Depot, Inc. | 1,188,000 | 259,435 | ||||||
| Amazon.com, Inc.3 | 103,000 | 190,328 | ||||||
| Suzuki Motor Corp.1 | 4,500,000 | 188,490 | ||||||
| Aramark | 4,300,000 | 186,620 | ||||||
| General Motors Co. | 4,100,000 | 150,060 | ||||||
| VF Corp. | 1,400,000 | 139,524 | ||||||
| Kontoor Brands, Inc.2 | 3,250,000 | 136,467 | ||||||
| Other securities | 90,610 | |||||||
| 1,341,534 | ||||||||
| 78 | American Funds Insurance Series |
Asset Allocation Fund
| Common stocks | Shares | Value (000) | ||||||
| Communication services 4.32% | ||||||||
| Charter Communications, Inc., Class A3 | 942,126 | $ | 457,006 | |||||
| Alphabet Inc., Class C3 | 133,600 | 178,626 | ||||||
| Alphabet Inc., Class A3 | 111,200 | 148,940 | ||||||
| Facebook, Inc., Class A3 | 1,077,100 | 221,075 | ||||||
| Other securities | 178,690 | |||||||
| 1,184,337 | ||||||||
| Consumer staples 4.20% | ||||||||
| Philip Morris International Inc. | 6,243,000 | 531,217 | ||||||
| Nestlé SA1 | 3,006,689 | 325,734 | ||||||
| Nestlé SA (ADR) | 900,000 | 97,434 | ||||||
| Altria Group, Inc. | 3,200,000 | 159,712 | ||||||
| Other securities | 37,280 | |||||||
| 1,151,377 | ||||||||
| Energy 3.76% | ||||||||
| Noble Energy, Inc. | 13,500,000 | 335,340 | ||||||
| Cenovus Energy Inc. (CAD denominated) | 29,000,000 | 294,790 | ||||||
| Royal Dutch Shell PLC, Class B (ADR) | 2,745,000 | 164,618 | ||||||
| Other securities | 234,790 | |||||||
| 1,029,538 | ||||||||
| Materials 2.55% | ||||||||
| Dow Inc. | 5,416,666 | 296,454 | ||||||
| Other securities | 401,213 | |||||||
| 697,667 | ||||||||
| Real estate 0.87% | ||||||||
| Other securities | 238,213 | |||||||
| Utilities 0.63% | ||||||||
| CMS Energy Corp. | 2,284,700 | 143,570 | ||||||
| Other securities | 29,351 | |||||||
| 172,921 | ||||||||
| Total common stocks (cost: $11,151,198,000) | 17,668,028 | |||||||
| Rights & warrants 0.00% | ||||||||
| Other 0.00% | ||||||||
| Other securities | 1,070 | |||||||
| Total rights & warrants (cost: $3,366,000) | 1,070 | |||||||
| Convertible stocks 0.52% | ||||||||
| Information technology 0.26% | ||||||||
| Broadcom Inc., Series A, cumulative convertible preferred, 8.00% 20224 | 60,000 | 70,678 | ||||||
| Other 0.26% | ||||||||
| Other securities | 72,133 | |||||||
| Total convertible stocks (cost: $126,588,000) | 142,811 | |||||||
| Convertible bonds 0.00% | Principal amount (000) | |||||||
| Communication services 0.00% | ||||||||
| Other securities | 127 | |||||||
| Total convertible bonds (cost: $101,000) | 127 | |||||||
| American Funds Insurance Series | 79 |
Asset Allocation Fund
| Bonds, notes & other debt instruments 29.78% | Principal amount (000) | Value (000) | ||||||
| U.S. Treasury bonds & notes 11.77% | ||||||||
| U.S. Treasury 9.68% | ||||||||
| U.S. Treasury 2.50% 2021 | $ | 200,000 | $ | 201,868 | ||||
| U.S. Treasury 1.75% 2024 | 155,150 | 155,659 | ||||||
| U.S. Treasury 2.50% 20245 | 225,000 | 232,461 | ||||||
| U.S. Treasury 1.13%–3.00% 2020–20495 | 2,040,982 | 2,063,170 | ||||||
| 2,653,158 | ||||||||
| U.S. Treasury inflation-protected securities 2.09% | ||||||||
| U.S. Treasury Inflation-Protected Securities 0.13%–1.38% 2024–20495,6 | 545,525 | 573,509 | ||||||
| Total U.S. Treasury bonds & notes | 3,226,667 | |||||||
| Corporate bonds & notes 10.36% | ||||||||
| Health care 1.67% | ||||||||
| UnitedHealth Group Inc. 2.38%–4.45% 2024–2048 | 14,455 | 16,075 | ||||||
| Other securities | 441,912 | |||||||
| 457,987 | ||||||||
| Financials 1.52% | ||||||||
| ACE INA Holdings Inc. 2.30%–4.35% 2020–2045 | 7,405 | 7,765 | ||||||
| Other securities | 410,159 | |||||||
| 417,924 | ||||||||
| Energy 1.34% | ||||||||
| Cenovus Energy Inc. 3.80%–5.40% 2023–2047 | 11,635 | 12,381 | ||||||
| Noble Energy, Inc. 3.25%–4.95% 2028–2047 | 9,438 | 9,703 | ||||||
| Other securities | 344,613 | |||||||
| 366,697 | ||||||||
| Communication services 1.07% | ||||||||
| Alphabet Inc. 1.998% 2026 | 3,000 | 2,984 | ||||||
| CCO Holdings LLC and CCO Holdings Capital Corp. 4.50%–6.48% 2023–20507 | 37,855 | 41,961 | ||||||
| Other securities | 248,604 | |||||||
| 293,549 | ||||||||
| Industrials 0.82% | ||||||||
| Boeing Co. 2.70%–3.90% 2022–2049 | 17,781 | 18,552 | ||||||
| Lockheed Martin Corp. 2.50%–3.55% 2020–2026 | 10,935 | 11,243 | ||||||
| Northrop Grumman Corp. 2.55%–3.25% 2022–2028 | 16,052 | 16,535 | ||||||
| Other securities | 179,446 | |||||||
| 225,776 | ||||||||
| Consumer discretionary 0.72% | ||||||||
| Home Depot, Inc. 2.95%–4.50% 2028–2048 | 14,113 | 15,332 | ||||||
| Other securities | 180,639 | |||||||
| 195,971 | ||||||||
| Consumer staples 0.64% | ||||||||
| Nestlé Holdings, Inc. 3.35% 20237 | 750 | 785 | ||||||
| Philip Morris International Inc. 1.88%–3.38% 2020–2029 | 12,186 | 12,513 | ||||||
| Other securities | 162,290 | |||||||
| 175,588 | ||||||||
| Information technology 0.47% | ||||||||
| Broadcom Inc. 3.13%–4.75% 2022–20297 | 26,670 | 28,598 | ||||||
| Broadcom Ltd. 3.50%–3.88% 2024–2028 | 7,524 | 7,700 | ||||||
| Microsoft Corp. 1.55%–4.25% 2021–2047 | 20,985 | 22,758 | ||||||
| Other securities | 71,003 | |||||||
| 130,059 | ||||||||
| 80 | American Funds Insurance Series |
Asset Allocation Fund
| Bonds, notes & other debt instruments | Principal amount (000) | Value (000) | ||||||
| Other 2.11% | ||||||||
| Other securities | $ | 577,127 | ||||||
| Total corporate bonds & notes | 2,840,678 | |||||||
| Mortgage-backed obligations 6.93% | ||||||||
| Federal agency mortgage-backed obligations 6.68% | ||||||||
| Fannie Mae 0%–7.50% 2021–20508,9 | $ | 628,513 | 649,074 | |||||
| Freddie Mac 2.45%–5.42% 2023–20498,9 | 289,392 | 299,107 | ||||||
| Government National Mortgage Assn. 3.50%–4.50% 2048–20508,10 | 535,819 | 556,289 | ||||||
| Other securities | 327,651 | |||||||
| 1,832,121 | ||||||||
| Other 0.25% | ||||||||
| Other securities | 68,092 | |||||||
| Total mortgage-backed obligations | 1,900,213 | |||||||
| Federal agency bonds & notes 0.05% | ||||||||
| Fannie Mae 1.875% 2026 | 13,000 | 12,974 | ||||||
| Other 0.67% | ||||||||
| Other securities | 186,876 | |||||||
| Total bonds, notes & other debt instruments (cost: $8,000,047,000) | 8,167,408 | |||||||
| Short-term securities 5.80% | Shares | |||||||
| Money market investments 5.80% | ||||||||
| Capital Group Central Cash Fund 1.73%11 | 15,848,444 | 1,584,844 | ||||||
| Fidelity Institutional Money Market Funds - Government Portfolio 1.49%11,12 | 997,009 | 997 | ||||||
| Goldman Sachs Financial Square Government Fund 1.50%11,12 | 960,737 | 961 | ||||||
| Morgan Stanley Institutional Liquidity Funds - Government Portfolio 1.51%11,12 | 2,634,650 | 2,635 | ||||||
| 1,589,437 | ||||||||
| Total short-term securities (cost: $1,588,867,000) | 1,589,437 | |||||||
| Total investment securities 100.54% (cost: $20,870,167,000) | 27,568,881 | |||||||
| Other assets less liabilities (0.54)% | (149,226 | ) | ||||||
| Net assets 100.00% | $ | 27,419,655 | ||||||
This summary investment portfolio is designed to streamline the report and help investors better focus on the fund’s principal holdings. See the inside back cover for details on how to obtain a complete schedule of portfolio holdings.
“Other securities” includes all issues that are not disclosed separately in the summary investment portfolio. “Other securities” also includes loan participations and assignments, which may be subject to legal or contractual restrictions on resale. The total value of all such loans was $40,104,000, which represented ..15% of the net assets of the fund. Some securities in “Other securities” (with an aggregate value of $4,194,000, an aggregate cost of $9,168,000, and which represented .02% of the net assets of the fund) were acquired from 9/26/2013 to 9/4/2018 through private placement transactions exempt from registration under the Securities Act of 1933, which may subject them to legal or contractual restrictions on resale.
| American Funds Insurance Series | 81 |
Asset Allocation Fund
Futures contracts
| Contracts | Type | Number of contracts | Expiration | Notional amount (000) | 13 | Value at 12/31/2019 (000) | 14 | Unrealized (depreciation) appreciation at 12/31/2019 (000) | ||||||||||||
| 2 Year U.S. Treasury Note Futures | Long | 5,773 | April 2020 | $ | 1,154,600 | $ | 1,244,082 | $ | (625 | ) | ||||||||||
| 5 Year U.S. Treasury Note Futures | Long | 5,836 | April 2020 | 583,600 | 692,204 | (2,360 | ) | |||||||||||||
| 10 Year U.S. Treasury Note Futures | Short | 214 | March 2020 | (21,400 | ) | (27,482 | ) | 290 | ||||||||||||
| 10 Year Ultra U.S. Treasury Note Futures | Short | 836 | March 2020 | (83,600 | ) | (117,628 | ) | 1,420 | ||||||||||||
| 30 Year Ultra U.S. Treasury Bond Futures | Long | 291 | March 2020 | 29,100 | 52,862 | (1,687 | ) | |||||||||||||
| $ | (2,962 | ) | ||||||||||||||||||
Swap contracts
Interest rate swaps
| Receive | Pay | Expiration date | Notional (000) | Value at 12/31/2019 (000) | Upfront payments/ receipts (000) | Unrealized (depreciation) appreciation at 12/31/2019 (000) | ||||||||||||||
| 3-month USD-LIBOR | 2.18075% | 3/29/2024 | $ | 26,400 | $ | (518 | ) | $ | — | $ | (518 | ) | ||||||||
| 3-month USD-LIBOR | 2.194% | 3/29/2024 | 101,900 | (2,056 | ) | — | (2,056 | ) | ||||||||||||
| 3-month USD-LIBOR | 2.21875% | 3/29/2024 | 107,250 | (2,273 | ) | — | (2,273 | ) | ||||||||||||
| 3-month USD-LIBOR | 1.5615% | 11/27/2024 | 130,000 | 1,035 | — | 1,035 | ||||||||||||||
| $ | — | $ | (3,812 | ) | ||||||||||||||||
Investments in affiliates
A company is an affiliate of the fund under the Investment Company Act of 1940 if the fund’s holdings represent 5% or more of the outstanding voting shares of that company. The value of the fund’s affiliated-company holdings is either shown in the summary investment portfolio or included in the value of “Other securities” under the respective industry sectors. Further details on these holdings and related transactions during the year ended December 31, 2019, appear below.
| Beginning shares or principal amount | Additions | Reductions | Ending shares or principal amount | Net realized loss (000) | Net unrealized appreciation (000) | Dividend or interest income (000) | Value of affiliates at 12/31/2019 (000) | |||||||||||||||||||||||||
| Common stocks 1.62% | ||||||||||||||||||||||||||||||||
| Information technology 1.12% | ||||||||||||||||||||||||||||||||
| MKS Instruments, Inc. | — | 2,800,000 | — | 2,800,000 | $ | — | $ | 70,752 | $ | 1,510 | $ | 308,028 | ||||||||||||||||||||
| Consumer discretionary 0.50% | ||||||||||||||||||||||||||||||||
| Kontoor Brands, Inc. | — | 3,250,000 | — | 3,250,000 | — | 45,066 | 3,548 | 136,467 | ||||||||||||||||||||||||
| Dillard’s, Inc., Class A (USA)15 | 1,700,000 | — | 1,700,000 | — | (5,248 | ) | 7,584 | 340 | — | |||||||||||||||||||||||
| 136,467 | ||||||||||||||||||||||||||||||||
| Energy 0.00% | ||||||||||||||||||||||||||||||||
| Weatherford International PLC3,15 | 60,000,000 | — | 60,000,000 | — | (446,158 | ) | 415,322 | — | — | |||||||||||||||||||||||
| Total common stocks | 444,495 | |||||||||||||||||||||||||||||||
| Bonds, notes & other debt instruments 0.00% | ||||||||||||||||||||||||||||||||
| Energy 0.00% | ||||||||||||||||||||||||||||||||
| Weatherford International LLC 9.875% 202515,16 | — | $ | 2,550,000 | $ | 2,550,000 | — | (1,906 | ) | — | 108 | — | |||||||||||||||||||||
| Weatherford International PLC 4.50% 202215,16 | $ | 6,365,000 | — | $ | 6,365,000 | — | (4,097 | ) | 1,849 | 198 | — | |||||||||||||||||||||
| Weatherford International PLC 8.25% 202315,16 | $ | 5,800,000 | — | $ | 5,800,000 | — | (4,441 | ) | 2,224 | 243 | — | |||||||||||||||||||||
| Weatherford International PLC 9.875% 202415,16 | $ | 1,000,000 | — | $ | 1,000,000 | — | (778 | ) | 391 | 49 | — | |||||||||||||||||||||
| Weatherford International PLC 9.875% 20257,15 | $ | 2,550,000 | — | $ | 2,550,000 | — | — | 973 | 19 | — | ||||||||||||||||||||||
| 82 | American Funds Insurance Series |
Asset Allocation Fund
| Beginning shares or principal amount | Additions | Reductions | Ending shares or principal amount | Net realized loss (000) | Net unrealized appreciation (000) | Dividend or interest income (000) | Value of affiliates at 12/31/2019 (000) | |||||||||||||||||||||||||
| Weatherford International PLC 6.50% 203615,16 | $ | 7,595,000 | — | $ | 7,595,000 | — | $ | (4,703 | ) | $ | 2,519 | $ | 249 | $ | — | |||||||||||||||||
| Weatherford International PLC 6.75% 204015,16 | $ | 7,825,000 | — | $ | 7,825,000 | — | (3,983 | ) | 1,811 | 270 | — | |||||||||||||||||||||
| — | ||||||||||||||||||||||||||||||||
| Total 1.62% | $ | (471,314 | ) | $ | 548,491 | $ | 6,534 | $ | 444,495 | |||||||||||||||||||||||
The following footnotes apply to either the individual securities noted or one or more of the securities aggregated and listed as a single line item.
| 1 | Valued under fair value procedures adopted by authority of the board of trustees. The total value of all such securities, including those in “Other securities,” was $923,930,000, which represented 3.37% of the net assets of the fund. This amount includes $906,137,000 related to certain securities trading outside the U.S. whose values were adjusted as a result of significant market movements following the close of local trading. |
| 2 | Represents an affiliated company as defined under the Investment Company Act of 1940. |
| 3 | Security did not produce income during the last 12 months. |
| 4 | All or a portion of this security was on loan. The total value of all such securities, including those in “Other securities,” was $5,211,000, which represented .02% of the net assets of the fund. Refer to Note 5 for more information on securities lending. |
| 5 | All or a portion of this security was pledged as collateral. The total value of pledged collateral was $15,999,000, which represented .06% of the net assets of the fund. |
| 6 | Index-linked bond whose principal amount moves with a government price index. |
| 7 | Acquired in a transaction exempt from registration under Rule 144A of the Securities Act of 1933. May be resold in the U.S. in transactions exempt from registration, normally to qualified institutional buyers. The total value of all such securities, including those in “Other securities,” was $975,763,000, which represented 3.56% of the net assets of the fund. |
| 8 | Principal payments may be made periodically. Therefore, the effective maturity date may be earlier than the stated maturity date. |
| 9 | Coupon rate may change periodically. Reference rate and spread are as of the most recent information available. Some coupon rates are determined by the issuer or agent based on current market conditions; therefore, the reference rate and spread are not available. |
| 10 | Purchased on a TBA basis. |
| 11 | Rate represents the seven-day yield at 12/31/2019. |
| 12 | Security purchased with cash collateral from securities on loan. Refer to Note 5 for more information on securities lending. |
| 13 | Notional amount is calculated based on the number of contracts and notional contract size. |
| 14 | Value is calculated based on the notional amount and current market price. |
| 15 | Unaffiliated issuer at 12/31/2019. |
| 16 | Scheduled interest and/or principal payment was not received. |
Key to abbreviations and symbol
ADR = American Depositary Receipts
CAD = Canadian dollars
LIBOR = London Interbank Offered Rate
TBA = To-be-announced
USD/$ = U.S. dollars
See notes to financial statements.
| American Funds Insurance Series | 83 |
Summary investment portfolioDecember 31, 2019
| Common stocks 64.17% | Shares | Value (000) | ||||||
| Information technology 13.78% | ||||||||
| ASML Holding NV1 | 34,500 | $ | 10,275 | |||||
| Taiwan Semiconductor Manufacturing Co., Ltd.1 | 860,000 | 9,524 | ||||||
| Broadcom Inc. | 26,895 | 8,500 | ||||||
| Microsoft Corp. | 49,620 | 7,825 | ||||||
| PagSeguro Digital Ltd., Class A2 | 154,528 | 5,279 | ||||||
| Temenos AG1 | 18,000 | 2,846 | ||||||
| Visa Inc., Class A | 14,600 | 2,743 | ||||||
| Tokyo Electron Ltd.1 | 11,800 | 2,593 | ||||||
| Other securities | 10,638 | |||||||
| 60,223 | ||||||||
| Health care 11.01% | ||||||||
| Merck & Co., Inc. | 116,325 | 10,580 | ||||||
| AstraZeneca PLC1 | 102,050 | 10,210 | ||||||
| Humana Inc. | 16,330 | 5,985 | ||||||
| Coloplast A/S, Class B1 | 23,150 | 2,878 | ||||||
| Mettler-Toledo International Inc.2 | 3,500 | 2,776 | ||||||
| Other securities | 15,696 | |||||||
| 48,125 | ||||||||
| Financials 9.46% | ||||||||
| JPMorgan Chase & Co. | 43,800 | 6,106 | ||||||
| Zurich Insurance Group AG1 | 13,940 | 5,717 | ||||||
| Sberbank of Russia PJSC (ADR)1 | 331,000 | 5,446 | ||||||
| Berkshire Hathaway Inc., Class A2 | 16 | 5,434 | ||||||
| AIA Group Ltd.1 | 426,000 | 4,482 | ||||||
| B3 SA - Brasil, Bolsa, Balcao | 376,000 | 4,016 | ||||||
| BlackRock, Inc. | 5,730 | 2,881 | ||||||
| Other securities | 7,260 | |||||||
| 41,342 | ||||||||
| Consumer staples 8.98% | ||||||||
| Nestlé SA1 | 64,100 | 6,944 | ||||||
| British American Tobacco PLC1 | 156,300 | 6,659 | ||||||
| Altria Group, Inc. | 122,500 | 6,114 | ||||||
| Philip Morris International Inc. | 59,300 | 5,046 | ||||||
| Anheuser-Busch InBev SA/NV1 | 47,200 | 3,871 | ||||||
| Keurig Dr Pepper Inc. | 106,000 | 3,069 | ||||||
| Other securities | 7,540 | |||||||
| 39,243 | ||||||||
| Industrials 7.38% | ||||||||
| Boeing Co. | 12,700 | 4,137 | ||||||
| Edenred SA1 | 66,528 | 3,442 | ||||||
| MTU Aero Engines AG1 | 9,800 | 2,798 | ||||||
| Other securities | 21,883 | |||||||
| 32,260 | ||||||||
| Consumer discretionary 4.48% | ||||||||
| Home Depot, Inc. | 21,275 | 4,646 | ||||||
| General Motors Co. | 110,500 | 4,044 | ||||||
| Alibaba Group Holding Ltd.1,2 | 109,600 | 2,915 | ||||||
| LVMH Moët Hennessy-Louis Vuitton SE1 | 5,765 | 2,685 | ||||||
| Other securities | 5,264 | |||||||
| 19,554 | ||||||||
| Materials 2.71% | ||||||||
| Givaudan SA1 | 815 | 2,551 | ||||||
| Other securities | 9,273 | |||||||
| 11,824 | ||||||||
| 84 | American Funds Insurance Series |
Global Balanced Fund
| Common stocks | Shares | Value (000) | ||||||
| Real estate 2.39% | ||||||||
| Crown Castle International Corp. REIT | 23,940 | $ | 3,403 | |||||
| Gaming and Leisure Properties, Inc. REIT | 59,720 | 2,571 | ||||||
| Other securities | 4,444 | |||||||
| 10,418 | ||||||||
| Communication services 1.65% | ||||||||
| Alphabet Inc., Class C2 | 3,579 | 4,785 | ||||||
| Other securities | 2,422 | |||||||
| 7,207 | ||||||||
| Energy 1.64% | ||||||||
| Canadian Natural Resources, Ltd. (CAD denominated) | 89,000 | 2,878 | ||||||
| Other securities | 4,303 | |||||||
| 7,181 | ||||||||
| Utilities 0.69% | ||||||||
| Ørsted AS1 | 29,100 | 3,015 | ||||||
| Total common stocks (cost: $202,304,000) | 280,392 | |||||||
| Bonds, notes & other debt instruments 32.18% | Principal amount (000) | |||||||
| Bonds & notes of governments & government agencies outside the U.S. 13.76% | ||||||||
| Japan, Series 346, 0.10% 2027 | ¥ | 304,250 | 2,842 | |||||
| Japan, Series 356, 0.10% 2029 | 420,000 | 3,911 | ||||||
| Japan 0.10%–1.70% 2020–20443 | 1,089,927 | 10,551 | ||||||
| Other securities | 42,821 | |||||||
| 60,125 | ||||||||
| U.S. Treasury bonds & notes 11.68% | ||||||||
| U.S. Treasury 9.42% | ||||||||
| U.S. Treasury 2.25% 2021 | $ | 5,000 | 5,043 | |||||
| U.S. Treasury 1.625% 20224 | 2,850 | 2,851 | ||||||
| U.S. Treasury 2.25% 2024 | 3,055 | 3,129 | ||||||
| U.S. Treasury 2.25% 2027 | 2,800 | 2,880 | ||||||
| U.S. Treasury 1.13%–3.13% 2020–20484 | 26,442 | 27,242 | ||||||
| 41,145 | ||||||||
| U.S. Treasury inflation-protected securities 2.26% | ||||||||
| U.S. Treasury Inflation-Protected Security 0.875% 20293 | 4,306 | 4,575 | ||||||
| U.S. Treasury Inflation-Protected Security 1.00% 20493,4 | 2,301 | 2,561 | ||||||
| U.S. Treasury Inflation-Protected Securities 0.13%–1.38% 2022–20443,4 | 2,643 | 2,761 | ||||||
| 9,897 | ||||||||
| Total U.S. Treasury bonds & notes | 51,042 | |||||||
| Corporate bonds & notes 4.82% | ||||||||
| Financials 1.07% | ||||||||
| JPMorgan Chase & Co. 2.55%–3.25% 2021–2023 | 254 | 259 | ||||||
| JPMorgan Chase & Co., Series S, junior subordinated, 6.75% (3-month USD-LIBOR + 3.78% on 2/1/2024)5 | 135 | 153 | ||||||
| JPMorgan Chase Bank NA (3-month USD-LIBOR + 0.34%) 2.276% 20216 | 300 | 300 | ||||||
| Other securities | 3,955 | |||||||
| 4,667 | ||||||||
| Health care 0.68% | ||||||||
| AstraZeneca PLC 2.38%–3.50% 2022–2023 | 260 | 268 | ||||||
| Humana Inc. 3.15% 2022 | 100 | 103 | ||||||
| Other securities | 2,621 | |||||||
| 2,992 | ||||||||
| American Funds Insurance Series | 85 |
Global Balanced Fund
| Bonds, notes & other debt instruments(continued) | Principal amount (000) | Value (000) | ||||||
| Corporate bonds & notes (continued) | ||||||||
| Consumer staples 0.53% | ||||||||
| Altria Group, Inc. 2.63%–5.80% 2020–2039 | $ | 225 | $ | 247 | ||||
| Altria Group, Inc. 1.00%–2.20% 2023–2027 | € | 380 | 447 | |||||
| British American Tobacco PLC 2.79%–4.76% 2024–2049 | $ | 455 | 462 | |||||
| Philip Morris International Inc. 2.00%–2.63% 2020–2022 | 70 | 70 | ||||||
| Reynolds American Inc. 4.00%–4.45% 2022–2025 | 120 | 129 | ||||||
| Other securities | 951 | |||||||
| 2,306 | ||||||||
| Information technology 0.25% | ||||||||
| Broadcom Ltd. 3.875% 2027 | 190 | 198 | ||||||
| Microsoft Corp. 2.40%–3.30% 2026–2027 | 577 | 600 | ||||||
| Other securities | 297 | |||||||
| 1,095 | ||||||||
| Other 2.29% | ||||||||
| Other securities | 10,014 | |||||||
| Total corporate bonds & notes | 21,074 | |||||||
| Mortgage-backed obligations 1.92% | ||||||||
| Federal agency mortgage-backed obligations 1.63% | ||||||||
| Other securities | 7,162 | |||||||
| Other mortgage-backed securities 0.29% | ||||||||
| Other securities | 1,205 | |||||||
| Total mortgage-backed obligations | 8,367 | |||||||
| Total bonds, notes & other debt instruments (cost: $136,525,000) | 140,608 | |||||||
| Short-term securities 3.41% | ||||||||
| Other short-term securities 2.77% | ||||||||
| Alberta (Province of) 1.77% due 1/8/20207 | 5,750 | 5,748 | ||||||
| Toronto-Dominion Bank 1.91% due 1/22/20207 | 4,250 | 4,245 | ||||||
| Other securities | 2,102 | |||||||
| 12,095 | ||||||||
| Shares | ||||||||
| Money market investments 0.64% | ||||||||
| Capital Group Central Cash Fund 1.73%8 | 28,249 | 2,825 | ||||||
| Total short-term securities (cost: $14,874,000) | 14,920 | |||||||
| Total investment securities 99.76% (cost: $353,703,000) | 435,920 | |||||||
| Other assets less liabilities 0.24% | 1,030 | |||||||
| Net assets 100.00% | $ | 436,950 | ||||||
| 86 | American Funds Insurance Series |
Global Balanced Fund
This summary investment portfolio is designed to streamline the report and help investors better focus on the fund’s principal holdings. See the inside back cover for details on how to obtain a complete schedule of portfolio holdings.
“Other securities” includes all issues that are not disclosed separately in the summary investment portfolio.
Futures contracts
| Contracts | Type | Number of contracts | Expiration | Notional amount (000) | 9 | Value at 12/31/2019 (000) | 10 | Unrealized depreciation at 12/31/2019 (000) | |||||||||
| 2 Year U.S. Treasury Note Futures | Long | 53 | April 2020 | $10,600 | $ | 11,421 | $ | (7 | ) | ||||||||
| 5 Year U.S. Treasury Note Futures | Long | 21 | April 2020 | 2,100 | 2,491 | (9 | ) | ||||||||||
| $ | (16 | ) | |||||||||||||||
Forward currency contracts
| Contract amount | Unrealized appreciation (depreciation) | |||||||||||||
| Purchases (000) | Sales (000) | Counterparty | Settlement date | at 12/31/2019 (000) | ||||||||||
| EUR375 | USD417 | Standard Chartered Bank | 1/6/2020 | $ 4 | ||||||||||
| USD857 | ILS2,960 | JPMorgan Chase | 1/6/2020 | — | 11 | |||||||||
| USD257 | ZAR3,800 | Citibank | 1/6/2020 | (14 | ) | |||||||||
| USD636 | JPY69,000 | UBS AG | 1/7/2020 | 1 | ||||||||||
| USD173 | ILS600 | UBS AG | 1/7/2020 | (1 | ) | |||||||||
| JPY90,700 | USD838 | JPMorgan Chase | 1/7/2020 | (3 | ) | |||||||||
| CZK11,700 | EUR458 | Goldman Sachs | 1/8/2020 | 2 | ||||||||||
| USD113 | CNH800 | HSBC Bank | 1/8/2020 | (2 | ) | |||||||||
| CLP875,800 | USD1,101 | Morgan Stanley | 1/9/2020 | 64 | ||||||||||
| EUR300 | USD335 | Citibank | 1/9/2020 | 2 | ||||||||||
| USD334 | EUR300 | Morgan Stanley | 1/9/2020 | (3 | ) | |||||||||
| USD123 | CLP98,800 | Bank of America | 1/9/2020 | (8 | ) | |||||||||
| USD143 | CLP114,114 | Citibank | 1/9/2020 | (9 | ) | |||||||||
| USD344 | CLP275,886 | Citibank | 1/9/2020 | (24 | ) | |||||||||
| USD569 | BRL2,396 | Goldman Sachs | 1/9/2020 | (26 | ) | |||||||||
| USD474 | CLP387,000 | HSBC Bank | 1/9/2020 | (41 | ) | |||||||||
| USD107 | INR7,675 | JPMorgan Chase | 1/10/2020 | (1 | ) | |||||||||
| EUR1,540 | USD1,710 | HSBC Bank | 1/13/2020 | 19 | ||||||||||
| GBP526 | USD693 | Bank of America | 1/13/2020 | 4 | ||||||||||
| USD335 | EUR300 | Citibank | 1/13/2020 | (2 | ) | |||||||||
| USD525 | THB15,900 | Standard Chartered Bank | 1/13/2020 | (6 | ) | |||||||||
| USD564 | JPY61,000 | Bank of New York Mellon | 1/14/2020 | 2 | ||||||||||
| JPY61,000 | USD560 | Bank of New York Mellon | 1/14/2020 | 1 | ||||||||||
| EUR217 | USD242 | Bank of New York Mellon | 1/15/2020 | 1 | ||||||||||
| GBP200 | USD264 | JPMorgan Chase | 1/15/2020 | 1 | ||||||||||
| KRW175,200 | USD151 | Standard Chartered Bank | 1/15/2020 | 1 | ||||||||||
| GBP730 | EUR864 | Goldman Sachs | 1/15/2020 | (3 | ) | |||||||||
| ILS2,600 | USD745 | Bank of America | 1/16/2020 | 9 | ||||||||||
| GBP900 | USD1,185 | HSBC Bank | 1/16/2020 | 8 | ||||||||||
| CAD10 | USD8 | JPMorgan Chase | 1/16/2020 | — | 11 | |||||||||
| USD517 | MXN9,900 | Citibank | 1/16/2020 | (6 | ) | |||||||||
| EUR1,456 | NOK14,752 | Bank of America | 1/16/2020 | (45 | ) | |||||||||
| EUR700 | USD783 | Bank of America | 1/17/2020 | 3 | ||||||||||
| EUR410 | USD459 | Citibank | 1/17/2020 | 2 | ||||||||||
| EUR400 | USD448 | Standard Chartered Bank | 1/17/2020 | 1 | ||||||||||
| AUD1,450 | USD1,000 | Citibank | 1/21/2020 | 18 | ||||||||||
| USD55 | JPY6,000 | UBS AG | 1/21/2020 | — | 11 | |||||||||
| GBP370 | USD495 | Standard Chartered Bank | 1/21/2020 | (4 | ) | |||||||||
| EUR155 | USD173 | Citibank | 1/23/2020 | 1 | ||||||||||
| American Funds Insurance Series | 87 |
Global Balanced Fund
Forward currency contracts(continued)
| Contract amount | Unrealized appreciation (depreciation) | ||||||||||||||
| Purchases (000) | Sales (000) | Counterparty | Settlement date | at 12/31/2019 (000) | |||||||||||
| USD250 | INR17,800 | HSBC Bank | 1/23/2020 | $ | 1 | ||||||||||
| USD290 | MXN5,515 | UBS AG | 1/23/2020 | — | 11 | ||||||||||
| USD235 | CNH1,645 | JPMorgan Chase | 1/23/2020 | (1 | ) | ||||||||||
| EUR1,804 | USD2,011 | Standard Chartered Bank | 1/27/2020 | 16 | |||||||||||
| USD117 | INR8,300 | Standard Chartered Bank | 1/27/2020 | — | 11 | ||||||||||
| USD73 | BRL300 | JPMorgan Chase | 1/27/2020 | (1 | ) | ||||||||||
| CNH4,000 | USD565 | Standard Chartered Bank | 2/10/2020 | 9 | |||||||||||
| CNH1,550 | USD220 | Standard Chartered Bank | 2/10/2020 | 3 | |||||||||||
| USD284 | CNH2,000 | HSBC Bank | 2/10/2020 | (4 | ) | ||||||||||
| USD1,456 | CNH10,410 | Standard Chartered Bank | 2/10/2020 | (38 | ) | ||||||||||
| USD510 | MXN10,100 | JPMorgan Chase | 3/4/2020 | (19 | ) | ||||||||||
| USD365 | JPY39,400 | Bank of New York Mellon | 6/15/2020 | (1 | ) | ||||||||||
| USD212 | BRL900 | JPMorgan Chase | 7/1/2020 | (10 | ) | ||||||||||
| $ | (99 | ) | |||||||||||||
Swap contracts
| Interest rate swaps | ||||||||||||||||||||
| Receive | Pay | Expiration date | Notional (000) | Value at 12/31/2019 (000) | Upfront payments/ receipts (000) | Unrealized (depreciation) appreciation at 12/31/2019 (000) | ||||||||||||||
| (0.0955)% | 6-month EURIBOR | 7/22/2024 | € | 4,400 | $ | (11 | ) | $ | — | $ | (11 | ) | ||||||||
| 6-month HUF-BUBOR | 1.39% | 11/11/2029 | HUF | 161,000 | 8 | — | 8 | |||||||||||||
| 6-month PLN-WIBOR | 1.90% | 11/12/2029 | PLN | 2,100 | (2 | ) | — | (2 | ) | |||||||||||
| 6-month PLN-WIBOR | 1.88% | 11/20/2029 | 2,120 | (1 | ) | — | (1 | ) | ||||||||||||
| 3-month USD-LIBOR | 2.0105% | 12/18/2049 | $ | 215 | 4 | — | 4 | |||||||||||||
| $ | — | $ | (2 | ) | ||||||||||||||||
The following footnotes apply to either the individual securities noted or one or more of the securities aggregated and listed as a single line item.
| 1 | Valued under fair value procedures adopted by authority of the board of trustees. The total value of all such securities, including those in “Other securities,” was $134,619,000, which represented 30.81% of the net assets of the fund. This entire amount relates to certain securities trading outside the U.S. whose values were adjusted as a result of significant market movements following the close of local trading. |
| 2 | Security did not produce income during the last 12 months. |
| 3 | Index-linked bond whose principal amount moves with a government price index. |
| 4 | All or a portion of this security was pledged as collateral. The total value of pledged collateral was $133,000, which represented .03% of the net assets of the fund. |
| 5 | Step bond; coupon rate may change at a later date. |
| 6 | Coupon rate may change periodically. Reference rate and spread are as of the most recent information available. Some coupon rates are determined by the issuer or agent based on current market conditions; therefore, the reference rate and spread are not available. |
| 7 | Acquired in a transaction exempt from registration under Rule 144A or Section 4(2) of the Securities Act of 1933. May be resold in the U.S. in transactions exempt from registration, normally to qualified institutional buyers. The total value of all such securities, including those in “Other securities,” was $18,373,000, which represented 4.20% of the net assets of the fund. |
| 8 | Rate represents the seven-day yield at 12/31/2019. |
| 9 | Notional amount is calculated based on the number of contracts and notional contract size. |
| 10 | Value is calculated based on the notional amount and current market price. |
| 11 | Amount less than one thousand. |
| 88 | American Funds Insurance Series |
Global Balanced Fund
Key to abbreviations and symbols
ADR = American Depositary Receipts
AUD = Australian dollars
BRL = Brazilian reais
BUBOR = Budapest Interbank Offered Rate
CAD = Canadian dollars
CLP = Chilean pesos
CNH = Chinese yuan renminbi
CZK = Czech korunas
EUR/€ = Euros
EURIBOR = Euro Interbank Offered Rate
GBP = British pounds
HUF = Hungarian forints
ILS = Israeli shekels
INR = Indian rupees
JPY/¥ = Japanese yen
KRW = South Korean won
LIBOR = London Interbank Offered Rate
MXN = Mexican pesos
NOK = Norwegian kroner
PLN = Polish zloty
THB = Thai baht
USD/$ = U.S. dollars
WIBOR = Warsaw Interbank Offer Rate
ZAR = South African rand
See notes to financial statements.
| American Funds Insurance Series | 89 |
Summary investment portfolioDecember 31, 2019
| Bonds, notes & other debt instruments 97.76% | Principal amount (000) | Value (000) | ||||||
| Mortgage-backed obligations 31.88% | ||||||||
| Federal agency mortgage-backed obligations 31.62% | ||||||||
| Fannie Mae Pool #AJ9355 3.00% 20271 | $ | 125 | $ | 128 | ||||
| Fannie Mae Pool #MA3827 2.50% 20341 | 162,370 | 163,798 | ||||||
| Fannie Mae Pool #MA3764 2.50% 20341 | 70,404 | 71,022 | ||||||
| Fannie Mae Pool #BM5632 3.00% 20471 | 73,142 | 74,824 | ||||||
| Fannie Mae Pool #CA0858 3.50% 20471 | 58,233 | 60,512 | ||||||
| Fannie Mae Pool #MA3495 4.00% 20481 | 74,668 | 77,777 | ||||||
| Fannie Mae Pool #MA3803 3.50% 20491 | 103,395 | 106,391 | ||||||
| Fannie Mae Pool #MA3775 3.50% 20491 | 61,937 | 63,696 | ||||||
| Fannie Mae Pool #MA3905 3.00% 20501 | 270,650 | 274,433 | ||||||
| Fannie Mae 2.50%–9.16% 2023–20581,2 | 599,696 | 623,075 | ||||||
| Freddie Mac 3.50% 20471 | 95,958 | 99,954 | ||||||
| Freddie Mac 3.50% 20471 | 53,152 | 55,281 | ||||||
| Freddie Mac Pool #G08799 3.00% 20481 | 56,530 | 57,578 | ||||||
| Freddie Mac Pool #SD8010 3.00% 20491 | 74,000 | 75,069 | ||||||
| Freddie Mac Pool #SD7509 3.00% 20491 | 60,137 | 61,702 | ||||||
| Freddie Mac Pool #SD8011 3.50% 20491 | 126,986 | 130,515 | ||||||
| Freddie Mac 0%–5.50% 2021–20491 | 615,958 | 639,781 | ||||||
| Government National Mortgage Assn. 3.50% 20501,3 | 77,460 | 79,824 | ||||||
| Government National Mortgage Assn. Pool #MA5817 4.00% 20491 | 83,163 | 86,151 | ||||||
| Government National Mortgage Assn. Pool #MA5878 5.00% 20491 | 104,318 | 109,869 | ||||||
| Government National Mortgage Assn. 4.00%–5.00% 2049–20501,3 | 123,889 | 129,464 | ||||||
| Uniform Mortgage-Backed Security 3.00% 20351,3 | 275,708 | 282,323 | ||||||
| Uniform Mortgage-Backed Securities 3.00%–4.50% 2035–20501,3 | 5,537 | 5,750 | ||||||
| Other securities | 7,317 | |||||||
| 3,336,234 | ||||||||
| Other 0.26% | ||||||||
| Other securities | 27,735 | |||||||
| Total mortgage-backed obligations | 3,363,969 | |||||||
| Corporate bonds & notes 29.59% | ||||||||
| Financials 6.30% | ||||||||
| Intesa Sanpaolo SpA 5.017% 20244 | 67,843 | 71,278 | ||||||
| Intesa Sanpaolo SpA 3.38%–5.71% 2023–20284 | 33,400 | 34,861 | ||||||
| Other securities | 558,756 | |||||||
| 664,895 | ||||||||
| Health care 5.18% | ||||||||
| Teva Pharmaceutical Finance Co. BV 2.80% 2023 | 86,064 | 80,004 | ||||||
| Teva Pharmaceutical Finance Co. BV 2.20%–6.75% 2021–2046 | 141,821 | 122,608 | ||||||
| Other securities | 343,751 | |||||||
| 546,363 | ||||||||
| Energy 4.46% | ||||||||
| Petróleos Mexicanos 6.50%–6.88% 2026–2027 | 73,343 | 79,670 | ||||||
| Other securities | 390,604 | |||||||
| 470,274 | ||||||||
| Utilities 3.58% | ||||||||
| Edison International 3.13%–5.75% 2022–2028 | 11,700 | 12,239 | ||||||
| Southern California Edison Co. 2.85%–6.05% 2021–2048 | 87,298 | 95,762 | ||||||
| Other securities | 269,642 | |||||||
| 377,643 | ||||||||
| Consumer discretionary 3.54% | ||||||||
| Other securities | 373,697 | |||||||
| 90 | American Funds Insurance Series |
Bond Fund
| Bonds, notes & other debt instruments | Principal amount (000) | Value (000) | ||||||
| Consumer staples 2.33% | ||||||||
| Other securities | $ | 246,148 | ||||||
| Information technology 1.59% | ||||||||
| Broadcom Inc. 4.25% 20264 | $ | 41,375 | 43,995 | |||||
| Broadcom Inc. 4.75% 20294 | 61,009 | 66,768 | ||||||
| Broadcom Ltd. 3.00%–3.88% 2022–2027 | 26,822 | 27,566 | ||||||
| Other securities | 28,982 | |||||||
| 167,311 | ||||||||
| Industrials 1.18% | ||||||||
| Other securities | 124,948 | |||||||
| Other 1.43% | ||||||||
| Other securities | 151,141 | |||||||
| Total corporate bonds & notes | 3,122,420 | |||||||
| U.S. Treasury bonds & notes 28.74% | ||||||||
| U.S. Treasury 24.36% | ||||||||
| U.S. Treasury 1.625% 2022 | 70,000 | 70,022 | ||||||
| U.S. Treasury 2.50% 2023 | 57,200 | 58,775 | ||||||
| U.S. Treasury 2.625% 2023 | 70,000 | 72,625 | ||||||
| U.S. Treasury 2.75% 2023 | 173,600 | 179,831 | ||||||
| U.S. Treasury 1.50% 2024 | 75,423 | 74,802 | ||||||
| U.S. Treasury 2.125% 2024 | 72,100 | 73,554 | ||||||
| U.S. Treasury 2.125% 20245 | 72,100 | 73,520 | ||||||
| U.S. Treasury 2.25% 2024 | 65,000 | 66,521 | ||||||
| U.S. Treasury 2.75% 2025 | 132,000 | 138,843 | ||||||
| U.S. Treasury 2.875% 20255 | 96,200 | 102,032 | ||||||
| U.S. Treasury 2.875% 2025 | 72,100 | 76,361 | ||||||
| U.S. Treasury 1.375% 2026 | 150,000 | 145,940 | ||||||
| U.S. Treasury 1.625% 2026 | 75,000 | 74,118 | ||||||
| U.S. Treasury 2.25% 2026 | 146,369 | 150,433 | ||||||
| U.S. Treasury 2.375% 2026 | 67,586 | 69,975 | ||||||
| U.S. Treasury 2.25% 20275 | 120,200 | 123,645 | ||||||
| U.S. Treasury 2.25% 20275 | 72,100 | 74,148 | ||||||
| U.S. Treasury 2.875% 2028 | 72,100 | 77,679 | ||||||
| U.S. Treasury 1.75% 2029 | 69,308 | 68,252 | ||||||
| U.S. Treasury 2.25% 20495 | 364,471 | 353,646 | ||||||
| U.S. Treasury 3.00% 20495 | 182,915 | 206,346 | ||||||
| U.S. Treasury 1.63%–8.75% 2020–20495 | 227,943 | 239,298 | ||||||
| 2,570,366 | ||||||||
| U.S. Treasury inflation-protected securities 4.38% | ||||||||
| U.S. Treasury Inflation-Protected Security 0.125% 20246 | 25,074 | 25,235 | ||||||
| U.S. Treasury Inflation-Protected Security 0.375% 20256 | 55,368 | 56,544 | ||||||
| U.S. Treasury Inflation-Protected Security 0.375% 20275,6 | 105,195 | 107,342 | ||||||
| U.S. Treasury Inflation-Protected Security 0.50% 20285,6 | 130,403 | 133,824 | ||||||
| U.S. Treasury Inflation-Protected Security 1.00% 20496 | 124,504 | 138,576 | ||||||
| 461,521 | ||||||||
| Total U.S. Treasury bonds & notes | 3,031,887 | |||||||
| Bonds & notes of governments & government agencies outside the U.S. 3.03% | ||||||||
| Italy (Republic of) 0.95% 2023 | € | 45,000 | 51,635 | |||||
| Japan, Series 20, 0.10% 20256 | ¥ | 11,475,000 | 107,563 | |||||
| United Mexican States, Series M, 5.75% 2026 | MXN | 527,500 | 26,459 | |||||
| Other securities | 134,251 | |||||||
| 319,908 | ||||||||
| American Funds Insurance Series | 91 |
Bond Fund
| Bonds, notes & other debt instruments(continued) | Principal amount (000) | Value (000) | ||||||
| Asset-backed obligations 2.26% | ||||||||
| Other securities | $ | 238,376 | ||||||
| Municipals 2.14% | ||||||||
| Illinois 1.91% | ||||||||
| G.O. Bonds, Pension Funding, Series 2003, 4.95% 2023 | $ | 27,639 | 28,850 | |||||
| G.O. Bonds, Pension Funding, Series 2003, 5.10% 2033 | 106,125 | 114,494 | ||||||
| G.O. Bonds, Series 2013-B, 3.65% 2020 | 1,825 | 1,831 | ||||||
| G.O. Bonds, Series 2013-B, 4.11% 2022 | 750 | 762 | ||||||
| G.O. Bonds, Series 2013-B, 4.31% 2023 | 2,125 | 2,167 | ||||||
| G.O. Bonds, Taxable Build America Bonds, Series 2010-2, 5.65% 2020 | 250 | 251 | ||||||
| G.O. Bonds, Taxable Build America Bonds, Series 2010-2, 5.85% 2022 | 2,370 | 2,504 | ||||||
| G.O. Bonds, Taxable Build America Bonds, Series 2010-2, 5.95% 2023 | 3,210 | 3,447 | ||||||
| G.O. Bonds, Taxable Build America Bonds, Series 2010-3, 5.727% 2020 | 2,400 | 2,419 | ||||||
| G.O. Bonds, Taxable Build America Bonds, Series 2010-5, 6.20% 2021 | 3,892 | 4,034 | ||||||
| Other securities | 41,384 | |||||||
| 202,143 | ||||||||
| Other 0.23% | ||||||||
| Other securities | 24,014 | |||||||
| Total municipals | 226,157 | |||||||
| Federal agency bonds & notes 0.12% | ||||||||
| Fannie Mae 2.125% 2026 | 11,910 | 12,086 | ||||||
| Total bonds, notes & other debt instruments (cost: $9,994,467,000) | 10,314,803 | |||||||
| Common stocks 0.00% | Shares | |||||||
| Other 0.00% | ||||||||
| Other securities | 144 | |||||||
| Total common stocks (cost: $605,000) | 144 | |||||||
| Rights & warrants 0.00% | ||||||||
| Energy 0.00% | ||||||||
| Other securities | 3 | |||||||
| Total rights & warrants (cost: $18,000) | 3 | |||||||
| Short-term securities 5.71% | ||||||||
| Money market investments 5.71% | ||||||||
| Capital Group Central Cash Fund 1.73%7 | 6,024,511 | 602,451 | ||||||
| Total short-term securities (cost: $602,341,000) | 602,451 | |||||||
| Total investment securities 103.47% (cost: $10,597,431,000) | 10,917,401 | |||||||
| Other assets less liabilities (3.47)% | (366,241 | ) | ||||||
| Net assets 100.00% | $ | 10,551,160 | ||||||
This summary investment portfolio is designed to streamline the report and help investors better focus on the fund’s principal holdings. See the inside back cover for details on how to obtain a complete schedule of portfolio holdings.
“Other securities” includes all issues that are not disclosed separately in the summary investment portfolio. “Other securities” includes securities that were valued under fair value procedures adopted by authority of the board of trustees. The total value of securities that were valued under fair value procedures was $3,541,000, which represented .03% of the net assets of the fund. “Other securities“ also includes loan participations and assignments, which may be subject to legal or contractual restrictions on resale. The total value of all such loans was $87,000, which represented less than .01% of the net assets of the fund.
| 92 | American Funds Insurance Series |
Bond Fund
| Futures contracts | |||||||||||||||||||||
| Contracts | Type | Number of contracts | Expiration | Notional amount (000) | 8 | Value at 12/31/2019 (000) | 9 | Unrealized (depreciation) appreciation at 12/31/2019 (000) | |||||||||||||
| 2 Year U.S. Treasury Note Futures | Long | 9,081 | April 2020 | $ | 1,816,200 | $ | 1,956,956 | $ | (375 | ) | |||||||||||
| 5 Year Euro-Bobl Futures | Short | 1,633 | March 2020 | € | (163,300 | ) | (244,775 | ) | 804 | ||||||||||||
| 5 Year U.S. Treasury Note Futures | Long | 11,307 | April 2020 | $ | 1,130,700 | 1,341,116 | (5,279 | ) | |||||||||||||
| 10 Year Euro-Bund Futures | Short | 532 | March 2020 | € | (53,200 | ) | (101,739 | ) | 972 | ||||||||||||
| 10 Year U.S. Treasury Note Futures | Short | 489 | March 2020 | $ | (48,900 | ) | (62,798 | ) | 663 | ||||||||||||
| 10 Year Ultra U.S. Treasury Note Futures | Short | 3,335 | March 2020 | (333,500 | ) | (469,245 | ) | 5,934 | |||||||||||||
| 30 Year Euro-Buxl Futures | Long | 272 | March 2020 | € | 27,200 | 60,526 | (1,684 | ) | |||||||||||||
| 30 Year Ultra U.S. Treasury Bond Futures | Long | 924 | March 2020 | $ | 92,400 | 167,850 | (5,114 | ) | |||||||||||||
| $ | (4,079 | ) | |||||||||||||||||||
| Forward currency contracts | |||||||||||
| Contract amount | Unrealized appreciation (depreciation) | ||||||||||
| Purchases (000) | Sales (000) | Counterparty | Settlement date | at 12/31/2019 (000) | |||||||
| EUR69,777 | USD77,714 | Citibank | 1/6/2020 | $ | 584 | ||||||
| EUR3,926 | USD4,371 | Bank of New York Mellon | 1/6/2020 | 35 | |||||||
| USD81,563 | EUR73,700 | Morgan Stanley | 1/6/2020 | (1,137 | ) | ||||||
| USD38,670 | MXN755,000 | Barclays Bank PLC | 1/7/2020 | (1,224 | ) | ||||||
| KRW96,758,000 | USD82,788 | Citibank | 1/9/2020 | 899 | |||||||
| KRW96,758,000 | USD82,809 | JPMorgan Chase | 1/9/2020 | 878 | |||||||
| USD104 | MXN2,000 | Barclays Bank PLC | 1/13/2020 | (2 | ) | ||||||
| USD121,292 | EUR109,250 | HSBC Bank | 1/13/2020 | (1,355 | ) | ||||||
| USD99,139 | JPY10,730,000 | Citibank | 1/14/2020 | 306 | |||||||
| USD13,351 | JPY1,445,000 | Goldman Sachs | 1/15/2020 | 41 | |||||||
| USD51,458 | EUR46,000 | Morgan Stanley | 1/23/2020 | (216 | ) | ||||||
| $ | (1,191 | ) | |||||||||
| American Funds Insurance Series | 93 |
Bond Fund
| Swap contracts | ||||||
| Interest rate swaps |
| Receive | Pay | Expiration date | Notional (000) | Value at 12/31/2019 (000) | Upfront payments/ receipts (000) | Unrealized (depreciation) appreciation at 12/31/2019 (000) | ||||||||||||||
| 1.355% | U.S. EFFR | 10/24/2021 | $ | 95,600 | $ | (160 | ) | $ | — | $ | (160 | ) | ||||||||
| 1.339% | U.S. EFFR | 10/24/2021 | 173,700 | (341 | ) | — | (341 | ) | ||||||||||||
| 3-month USD-LIBOR | 2.18075% | 3/29/2024 | 31,600 | (621 | ) | — | (621 | ) | ||||||||||||
| 3-month USD-LIBOR | 2.194% | 3/29/2024 | 31,900 | (644 | ) | — | (644 | ) | ||||||||||||
| 3-month USD-LIBOR | 2.21875% | 3/29/2024 | 33,500 | (710 | ) | — | (710 | ) | ||||||||||||
| 3-month USD-LIBOR | 2.3105% | 5/3/2024 | 275,590 | (7,009 | ) | — | (7,009 | ) | ||||||||||||
| 6-month EURIBOR | 0.9852% | 10/17/2024 | € | 25,000 | (1,512 | ) | — | (1,512 | ) | |||||||||||
| 3-month USD-LIBOR | 1.556% | 11/27/2024 | $ | 148,600 | 1,222 | — | 1,222 | |||||||||||||
| 3-month USD-LIBOR | 1.561% | 11/27/2024 | 148,600 | 1,187 | — | 1,187 | ||||||||||||||
| 3-month USD-LIBOR | 1.554% | 11/27/2024 | 126,300 | 1,051 | — | 1,051 | ||||||||||||||
| 3-month USD-LIBOR | 1.5335% | 11/29/2024 | 148,500 | 1,373 | — | 1,373 | ||||||||||||||
| 6-month JPY-LIBOR | 0.0875% | 3/10/2026 | ¥ | 11,100,000 | (228 | ) | — | (228 | ) | |||||||||||
| 6-month JPY-LIBOR | 0.58295% | 3/23/2046 | 2,000,000 | (760 | ) | — | (760 | ) | ||||||||||||
| 0.64355% | 6-month JPY-LIBOR | 4/27/2046 | 2,000,000 | 1,046 | — | 1,046 | ||||||||||||||
| $ | — | $ | (6,106 | ) | ||||||||||||||||
The following footnotes apply to either the individual securities noted or one or more of the securities aggregated and listed as a single line item.
| 1 | Principal payments may be made periodically. Therefore, the effective maturity date may be earlier than the stated maturity date. |
| 2 | Coupon rate may change periodically. Reference rate and spread are as of the most recent information available. Some coupon rates are determined by the issuer or agent based on current market conditions; therefore, the reference rate and spread are not available. |
| 3 | Purchased on a TBA basis. |
| 4 | Acquired in a transaction exempt from registration under Rule 144A of the Securities Act of 1933. May be resold in the U.S. in transactions exempt from registration, normally to qualified institutional buyers. The total value of all such securities, including those in “Other securities,” was $1,120,890,000, which represented 10.62% of the net assets of the fund. |
| 5 | All or a portion of this security was pledged as collateral. The total value of pledged collateral was $40,365,000, which represented .38% of the net assets of the fund. |
| 6 | Index-linked bond whose principal amount moves with a government price index. |
| 7 | Rate represents the seven-day yield at 12/31/2019. |
| 8 | Notional amount is calculated based on the number of contracts and notional contract size. |
| 9 | Value is calculated based on the notional amount and current market price. |
Key to abbreviations and symbols
EFFR = Effective Federal Funds Rate
EUR/€ = Euros
EURIBOR = Euro Interbank Offered Rate
G.O. = General Obligation
JPY/¥ = Japanese yen
KRW = South Korean won
LIBOR = London Interbank Offered Rate
MXN = Mexican pesos
TBA = To-be-announced
USD/$ = U.S. dollars
See notes to financial statements.
| 94 | American Funds Insurance Series |
Summary investment portfolioDecember 31, 2019
| Bonds, notes & other debt instruments 93.61% | Principal amount (000) | Value (000) | ||||||
| Euros 17.85% | ||||||||
| Canada 3.50% 2020 | € | 2,500 | $ | 2,807 | ||||
| China (People’s Republic of) 0.125% 2026 | 1,400 | 1,565 | ||||||
| French Republic O.A.T. 0.50% 2029 | 14,440 | 16,845 | ||||||
| French Republic O.A.T. 0%–2.00% 2029–2048 | 6,215 | 7,390 | ||||||
| Germany (Federal Republic of) 0% 2029 | 12,440 | 14,209 | ||||||
| Germany (Federal Republic of) 0.10%–1.25% 2026–20481 | 9,753 | 12,574 | ||||||
| Greece (Hellenic Republic of) 3.45% 2024 | 11,275 | 14,205 | ||||||
| Greece (Hellenic Republic of) 3.75% 2028 | 12,204 | 16,210 | ||||||
| Greece (Hellenic Republic of) 3.875% 2029 | 24,005 | 32,521 | ||||||
| Greece (Hellenic Republic of) 3.38%–4.20% 2025–2042 | 14,304 | 19,355 | ||||||
| Israel (State of) 1.50%–1.50% 2027–2029 | 1,500 | 1,834 | ||||||
| Italy (Republic of) 0.10% 20231 | 22,007 | 25,004 | ||||||
| Italy (Republic of) 2.80% 2028 | 32,938 | 41,841 | ||||||
| Italy (Republic of) 3.00% 2029 | 7,440 | 9,620 | ||||||
| Italy (Republic of) 1.35%–3.85% 2022–2049 | 10,995 | 13,803 | ||||||
| Portuguese Republic 2.875% 2025 | 7,625 | 9,934 | ||||||
| Romania 4.625% 2049 | 12,905 | 17,913 | ||||||
| Romania 2.88%–4.63% 2029–2049 | 11,085 | 14,042 | ||||||
| Serbia (Republic of) 1.50% 2029 | 9,729 | 11,127 | ||||||
| Spain (Kingdom of) 1.45% 2027 | 8,975 | 10,990 | ||||||
| State Grid Europe Development (2014) PLC 1.50% 2022 | 194 | 224 | ||||||
| State Grid Overseas Investment Ltd. 1.25%–2.13% 2022–2030 | 1,406 | 1,646 | ||||||
| Other securities | 84,217 | |||||||
| 379,876 | ||||||||
| Japanese yen 13.35% | ||||||||
| Export-Import Bank of India 0.59% 2022 | ¥ | 400,000 | 3,667 | |||||
| Japan, Series 19, 0.10% 20241 | 2,438,212 | 22,821 | ||||||
| Japan, Series 18, 0.10% 20241 | 1,966,375 | 18,378 | ||||||
| Japan, Series 346, 0.10% 2027 | 3,125,000 | 29,185 | ||||||
| Japan, Series 23, 0.10% 20281 | 2,001,246 | 18,953 | ||||||
| Japan, Series 356, 0.10% 2029 | 6,560,000 | 61,085 | ||||||
| Japan, Series 24, 0.10% 20291 | 1,614,981 | 15,294 | ||||||
| Japan, Series 116, 2.20% 2030 | 1,735,000 | 19,571 | ||||||
| Japan, Series 145, 1.70% 2033 | 2,210,000 | 24,705 | ||||||
| Japan, Series 42, 1.70% 2044 | 911,900 | 11,047 | ||||||
| Japan 0.10%–2.30% 2025–20481 | 4,244,123 | 42,504 | ||||||
| United Mexican States 0.62%–0.70% 2021–2022 | 700,000 | 6,468 | ||||||
| Other securities | 10,438 | |||||||
| 284,116 | ||||||||
| Chinese yuan renminbi 3.25% | ||||||||
| China (People’s Republic of), Series 1906, 3.29% 2029 | CNY | 49,600 | 7,199 | |||||
| China (People’s Republic of), Series 1910, 3.86% 2049 | 172,240 | 25,394 | ||||||
| China Development Bank Corp., Series 1905, 3.48% 2029 | 203,200 | 28,709 | ||||||
| China Development Bank Corp. 4.04%–4.15% 2025–2028 | 53,900 | 7,966 | ||||||
| 69,268 | ||||||||
| Malaysian ringgits 1.83% | ||||||||
| Malaysia (Federation of), Series 0319, 3.478% 2024 | MYR | 61,900 | 15,312 | |||||
| Malaysia (Federation of), Series 0418, 4.893% 2038 | 61,226 | 17,060 | ||||||
| Malaysia (Federation of) 4.06%–4.92% 2024–2048 | 24,420 | 6,472 | ||||||
| 38,844 | ||||||||
| Indian rupees 1.66% | ||||||||
| India (Republic of) 6.79%–8.83% 2023–2029 | INR | 2,171,550 | 31,489 | |||||
| Other securities | 3,807 | |||||||
| 35,296 | ||||||||
| American Funds Insurance Series | 95 |
Global Bond Fund
| Bonds, notes & other debt instruments(continued) | Principal amount (000) | Value (000) | ||||||
| Brazilian reais 1.58% | ||||||||
| Brazil (Federative Republic of) 0% 2020 | BRL | 91,700 | $ | 22,329 | ||||
| Brazil (Federative Republic of) 0%–10.00% 2020–2025 | 43,700 | 11,304 | ||||||
| 33,633 | ||||||||
| South African rand 1.46% | ||||||||
| South Africa (Republic of), Series R-214, 6.50% 2041 | ZAR | 168,450 | 8,383 | |||||
| South Africa (Republic of), Series R-2044, 8.75% 2044 | 192,925 | 12,121 | ||||||
| South Africa (Republic of), Series R-2048, 8.75% 2048 | 167,350 | 10,554 | ||||||
| 31,058 | ||||||||
| Danish kroner 1.45% | ||||||||
| Nykredit Realkredit AS, Series 01E, 1.50% 20402 | DKr | 134,552 | 20,876 | |||||
| Nykredit Realkredit AS 1.50%–2.50% 2037–20472 | 64,600 | 10,069 | ||||||
| 30,945 | ||||||||
| British pounds 1.37% | ||||||||
| United Kingdom 1.50%–4.25% 2023–2047 | £ | 17,380 | 27,482 | |||||
| Other securities | 1,731 | |||||||
| 29,213 | ||||||||
| Canadian dollars 1.29% | ||||||||
| Canada 2.25% 2025 | C$ | 29,450 | 23,346 | |||||
| Canada 1.00%–2.75% 2022–2048 | 4,550 | 4,093 | ||||||
| 27,439 | ||||||||
| Mexican pesos 1.26% | ||||||||
| Petróleos Mexicanos 7.19%–7.47% 2024–2026 | MXN | 99,000 | 4,619 | |||||
| United Mexican States, Series M, 7.50% 2027 | 291,520 | 16,028 | ||||||
| United Mexican States, Series M20, 8.50% 2029 | 106,000 | 6,244 | ||||||
| 26,891 | ||||||||
| Norwegian kroner 1.16% | ||||||||
| Norway (Kingdom of) 3.75% 2021 | NKr | 111,851 | 13,170 | |||||
| Norway (Kingdom of) 2.00% 2023 | 99,579 | 11,570 | ||||||
| 24,740 | ||||||||
| Israeli shekels 1.11% | ||||||||
| Israel (State of) 2.00% 2027 | ILS | 42,900 | 13,547 | |||||
| Israel (State of) 5.50% 2042 | 20,200 | 10,041 | ||||||
| 23,588 | ||||||||
| Polish zloty 0.82% | ||||||||
| Poland (Republic of), Series 0922, 5.75% 2022 | PLN | 36,700 | 10,733 | |||||
| Poland (Republic of) 2.75%–5.75% 2021–2029 | 24,080 | 6,804 | ||||||
| 17,537 | ||||||||
| U.S. dollars 41.38% | ||||||||
| Electricité de France SA 4.875% 20383 | $ | 795 | 934 | |||||
| Fannie Mae Pool #MA3692 3.50% 20492 | 21,336 | 21,926 | ||||||
| Fannie Mae Pool #MA3776 4.00% 20492 | 9,182 | 9,583 | ||||||
| Fannie Mae 2.18%–4.00% 2022–20492 | 29,820 | 30,981 | ||||||
| Freddie Mac Pool #ZT1545 4.00% 20482 | 21,875 | 22,779 | ||||||
| Freddie Mac 0%–4.00% 2030–20492,4 | 23,510 | 24,327 | ||||||
| Government National Mortgage Assn. Pool #MA5987 4.50% 20492 | 9,195 | 9,643 | ||||||
| Petróleos Mexicanos 6.35% 2048 | 927 | 898 | ||||||
| Poland (Republic of) 3.25%–4.00% 2024–2026 | 5,570 | 5,932 | ||||||
| South Africa (Republic of) 5.50% 2020 | 1,900 | 1,913 | ||||||
| State Grid Overseas Investment Ltd. 3.50% 20273 | 5,600 | 5,865 | ||||||
| Statoil ASA 3.70%–4.25% 2024–2041 | 2,950 | 3,235 | ||||||
| U.S. Treasury 1.50% 20245 | 38,920 | 38,608 | ||||||
| U.S. Treasury 2.75% 2025 | 10,140 | 10,683 | ||||||
| 96 | American Funds Insurance Series |
Global Bond Fund
| Bonds, notes & other debt instruments | Principal amount (000) | Value (000) | ||||||
| U.S. Treasury 2.875% 20285 | $ | 19,850 | $ | 21,358 | ||||
| U.S. Treasury 1.625% 2029 | 12,500 | 12,176 | ||||||
| U.S. Treasury 3.00% 20485 | 8,325 | 9,378 | ||||||
| U.S. Treasury 1.50%–3.00% 2020–20495 | 54,050 | 56,040 | ||||||
| U.S. Treasury Inflation-Protected Security 0.25% 20291,5 | 13,782 | 13,935 | ||||||
| U.S. Treasury Inflation-Protected Security 0.875% 20291,5 | 78,843 | 83,772 | ||||||
| U.S. Treasury Inflation-Protected Security 1.00% 20491,5 | 29,605 | 32,951 | ||||||
| U.S. Treasury Inflation-Protected Securities 0.38%–1.38% 2025–20441,5 | 13,875 | 15,113 | ||||||
| Other securities | 448,836 | |||||||
| 880,866 | ||||||||
| Other 2.79% | ||||||||
| Other securities | 59,257 | |||||||
| Total bonds, notes & other debt instruments (cost: $1,932,196,000) | 1,992,567 | |||||||
| Convertible bonds 0.00% | ||||||||
| U.S. dollars 0.00% | ||||||||
| Other securities | 10 | |||||||
| Total convertible bonds (cost: $8,000) | 10 | |||||||
| Convertible stocks 0.04% | Shares | |||||||
| U.S. dollars 0.04% | ||||||||
| Other securities | 847 | |||||||
| Total convertible stocks (cost: $816,000) | 847 | |||||||
| Common stocks 0.05% | ||||||||
| U.S. dollars 0.05% | ||||||||
| Other securities | 1,142 | |||||||
| Total common stocks (cost: $2,504,000) | 1,142 | |||||||
| Rights & warrants 0.01% | ||||||||
| U.S. dollars 0.01% | ||||||||
| Other securities | 130 | |||||||
| Total rights & warrants (cost: $427,000) | 130 | |||||||
| Short-term securities 5.83% | ||||||||
| Money market investments 3.65% | ||||||||
| Capital Group Central Cash Fund 1.73%6 | 777,446 | 77,745 | ||||||
| American Funds Insurance Series | 97 |
Global Bond Fund
| Short-term securities (continued) | Principal amount (000) | Value (000) | ||||||
| Other short-term securities 2.18% | ||||||||
| Canadian Treasury Bills 1.67%–1.68% due 9/17/2020–10/15/2020 | C$ | 24,270 | $ | 18,446 | ||||
| Greek Treasury Bills (0.03)% due 6/5/2020 | € | 7,275 | 8,167 | |||||
| Other securities | 19,839 | |||||||
| 46,452 | ||||||||
| Total short-term securities (cost: $125,174,000) | 124,197 | |||||||
| Total investment securities 99.54% (cost: $2,061,125,000) | 2,118,893 | |||||||
| Other assets less liabilities 0.46% | 9,751 | |||||||
| Net assets 100.00% | $ | 2,128,644 | ||||||
This summary investment portfolio is designed to streamline the report and help investors better focus on the fund’s principal holdings. See the inside back cover for details on how to obtain a complete schedule of portfolio holdings.
“Other securities” includes all issues that are not disclosed separately in the summary investment portfolio. “Other securities” includes securities that were valued under fair value procedures adopted by authority of the board of trustees. The total value of securities that were valued under fair value procedures was $2,425,000, which represented .11% of the net assets of the fund. “Other securities” also includes loan participations and assignments, which may be subject to legal or contractual restrictions on resale. The total value of all such loans was $3,927,000, which represented .18% of the net assets of the fund. One security in “Other securities” (with a value of $27,000, an aggregate cost of $116,000, and which represented less than .01% of the net assets of the fund) was acquired on 8/31/2018 through private placement transactions exempt from registration under the Securities Act of 1933, which may subject it to legal or contractual restrictions on resale.
Futures contracts
| Contracts | Type | Number of contracts | Expiration | Notional amount (000) | 7 | Value at 12/31/2019 (000) | 8 | Unrealized (depreciation) appreciation at 12/31/2019 (000) | |||||||||||||
| 2 Year U.S. Treasury Note Futures | Long | 410 | April 2020 | $ | 82,000 | $ | 88,355 | $ | (46 | ) | |||||||||||
| 5 Year U.S. Treasury Note Futures | Long | 922 | April 2020 | 92,200 | 109,358 | (407 | ) | ||||||||||||||
| 10 Year Euro-Bund Futures | Short | 92 | March 2020 | € | (9,200 | ) | (17,594 | ) | 76 | ||||||||||||
| 10 Year U.S. Treasury Note Futures | Long | 165 | March 2020 | $ | 16,500 | 21,189 | (197 | ) | |||||||||||||
| 20 Year U.S. Treasury Bond Futures | Long | 37 | March 2020 | 3,700 | 5,768 | (129 | ) | ||||||||||||||
| 30 Year Euro-Buxl Futures | Long | 42 | March 2020 | € | 4,200 | 9,346 | (260 | ) | |||||||||||||
| 30 Year Ultra U.S. Treasury Bond Futures | Short | 28 | March 2020 | $ | (2,800 | ) | (5,086 | ) | 158 | ||||||||||||
| $ | (805 | ) | |||||||||||||||||||
Forward currency contracts
| Contract amount | Unrealized appreciation (depreciation) | ||||||||||
| Purchases (000) | Sales (000) | Counterparty | Settlement date | at 12/31/2019 (000) | |||||||
| AUD10,600 | USD7,267 | Goldman Sachs | 1/6/2020 | $ | 173 | ||||||
| EUR2,575 | USD2,859 | JPMorgan Chase | 1/6/2020 | 31 | |||||||
| EUR2,800 | USD3,113 | Standard Chartered Bank | 1/6/2020 | 29 | |||||||
| THB20 | USD1 | JPMorgan Chase | 1/6/2020 | — | 9 | ||||||
| USD11,342 | ILS39,170 | JPMorgan Chase | 1/6/2020 | (4 | ) | ||||||
| USD3,598 | ZAR53,200 | Citibank | 1/6/2020 | (198 | ) | ||||||
| USD10,597 | JPY1,149,000 | UBS AG | 1/7/2020 | 18 | |||||||
| USD592 | ZAR8,780 | Morgan Stanley | 1/7/2020 | (35 | ) | ||||||
| JPY1,496,000 | USD13,823 | JPMorgan Chase | 1/7/2020 | (48 | ) | ||||||
| USD2,740 | MXN54,000 | Goldman Sachs | 1/7/2020 | (113 | ) | ||||||
| USD10,625 | EUR9,610 | HSBC Bank | 1/7/2020 | (159 | ) | ||||||
| 98 | American Funds Insurance Series |
Global Bond Fund
| Contract amount | Unrealized appreciation (depreciation) | ||||||||||
| Purchases (000) | Sales (000) | Counterparty | Settlement date | at 12/31/2019 (000) | |||||||
| USD5,087 | ZAR74,900 | Bank of America | 1/7/2020 | $ | (256 | ) | |||||
| USD5,533 | ZAR82,000 | JPMorgan Chase | 1/7/2020 | (317 | ) | ||||||
| EUR6,400 | USD7,142 | Citibank | 1/8/2020 | 41 | |||||||
| CZK165,000 | EUR6,461 | Goldman Sachs | 1/8/2020 | 28 | |||||||
| USD11,470 | JPY1,244,630 | UBS AG | 1/8/2020 | 10 | |||||||
| USD1,516 | CNH10,700 | HSBC Bank | 1/8/2020 | (21 | ) | ||||||
| USD7,105 | EUR6,400 | Goldman Sachs | 1/8/2020 | (77 | ) | ||||||
| CLP12,189,000 | USD15,324 | Morgan Stanley | 1/9/2020 | 888 | |||||||
| AUD5,850 | USD3,994 | Citibank | 1/9/2020 | 112 | |||||||
| EUR6,815 | USD7,578 | Morgan Stanley | 1/9/2020 | 71 | |||||||
| GBP2,800 | USD3,683 | Bank of America | 1/9/2020 | 27 | |||||||
| USD7,142 | EUR6,400 | Citibank | 1/9/2020 | (41 | ) | ||||||
| USD1,225 | CLP982,000 | Bank of America | 1/9/2020 | (82 | ) | ||||||
| USD2,071 | CLP1,654,653 | Citibank | 1/9/2020 | (130 | ) | ||||||
| USD7,386 | BRL31,080 | Goldman Sachs | 1/9/2020 | (338 | ) | ||||||
| USD4,981 | CLP4,000,347 | Citibank | 1/9/2020 | (340 | ) | ||||||
| USD6,794 | CLP5,552,000 | HSBC Bank | 1/9/2020 | (591 | ) | ||||||
| USD1,522 | INR109,575 | JPMorgan Chase | 1/10/2020 | (12 | ) | ||||||
| EUR7,100 | USD7,883 | HSBC Bank | 1/13/2020 | 88 | |||||||
| GBP7,659 | USD10,086 | Bank of America | 1/13/2020 | 63 | |||||||
| USD829 | EUR745 | Standard Chartered Bank | 1/13/2020 | (8 | ) | ||||||
| USD4,717 | EUR4,249 | HSBC Bank | 1/13/2020 | (53 | ) | ||||||
| EUR9,079 | USD10,137 | Bank of New York Mellon | 1/15/2020 | 56 | |||||||
| KRW10,058,500 | USD8,651 | Standard Chartered Bank | 1/15/2020 | 50 | |||||||
| GBP15,670 | EUR18,547 | Goldman Sachs | 1/15/2020 | (59 | ) | ||||||
| CLP10,219,000 | USD13,139 | Goldman Sachs | 1/16/2020 | 454 | |||||||
| GBP18,640 | USD24,544 | HSBC Bank | 1/16/2020 | 159 | |||||||
| ILS12,500 | USD3,581 | Bank of America | 1/16/2020 | 42 | |||||||
| JPY1,900,496 | USD17,468 | Citibank | 1/16/2020 | 40 | |||||||
| CHF1,000 | USD1,019 | Citibank | 1/16/2020 | 15 | |||||||
| CAD880 | USD668 | JPMorgan Chase | 1/16/2020 | 10 | |||||||
| USD818 | INR58,300 | Standard Chartered Bank | 1/16/2020 | 2 | |||||||
| USD7,771 | CLP5,841,270 | Goldman Sachs | 1/16/2020 | 1 | |||||||
| USD9,358 | ILS32,500 | UBS AG | 1/16/2020 | (61 | ) | ||||||
| USD7,864 | MXN150,700 | Citibank | 1/16/2020 | (87 | ) | ||||||
| EUR21,331 | NOK216,090 | Bank of America | 1/16/2020 | (664 | ) | ||||||
| JPY2,842,160 | USD26,002 | Barclays Bank PLC | 1/17/2020 | 181 | |||||||
| EUR7,460 | USD8,345 | Bank of America | 1/17/2020 | 32 | |||||||
| EUR6,190 | USD6,925 | Citibank | 1/17/2020 | 26 | |||||||
| EUR3,200 | USD3,582 | Standard Chartered Bank | 1/17/2020 | 11 | |||||||
| USD20,818 | EUR18,600 | Morgan Stanley | 1/17/2020 | (68 | ) | ||||||
| AUD21,200 | USD14,619 | Citibank | 1/21/2020 | 266 | |||||||
| MXN172,760 | USD9,081 | Standard Chartered Bank | 1/21/2020 | 26 | |||||||
| JPY398,400 | USD3,649 | UBS AG | 1/21/2020 | 22 | |||||||
| USD9,099 | MXN172,760 | UBS AG | 1/21/2020 | (8 | ) | ||||||
| USD4,856 | MYR20,120 | HSBC Bank | 1/21/2020 | (59 | ) | ||||||
| GBP5,460 | USD7,302 | Standard Chartered Bank | 1/21/2020 | (65 | ) | ||||||
| EUR23,977 | USD26,822 | Citibank | 1/23/2020 | 113 | |||||||
| JPY1,354,660 | USD12,395 | Goldman Sachs | 1/23/2020 | 89 | |||||||
| USD3,582 | INR254,800 | HSBC Bank | 1/23/2020 | 20 | |||||||
| USD3,158 | MXN59,979 | UBS AG | 1/23/2020 | (2 | ) | ||||||
| USD3,400 | CNH23,800 | JPMorgan Chase | 1/23/2020 | (18 | ) | ||||||
| USD4,756 | CNH33,330 | UBS AG | 1/23/2020 | (30 | ) | ||||||
| USD33,503 | EUR29,950 | Morgan Stanley | 1/23/2020 | (141 | ) | ||||||
| USD1,658 | COP5,509,000 | Citibank | 1/24/2020 | (16 | ) | ||||||
| USD7,324 | AUD10,670 | Citibank | 1/24/2020 | (169 | ) | ||||||
| EUR25,135 | USD28,021 | Standard Chartered Bank | 1/27/2020 | 221 | |||||||
| American Funds Insurance Series | 99 |
Global Bond Fund
Forward currency contracts(continued)
| Contract amount | Unrealized appreciation (depreciation) | ||||||||||
| Purchases (000) | Sales (000) | Counterparty | Settlement date | at 12/31/2019 (000) | |||||||
| USD4,205 | INR299,650 | Standard Chartered Bank | 1/27/2020 | $ | 19 | ||||||
| USD514 | BRL2,100 | JPMorgan Chase | 1/27/2020 | (7 | ) | ||||||
| USD5,822 | EUR5,220 | JPMorgan Chase | 1/27/2020 | (44 | ) | ||||||
| EUR5,010 | USD5,594 | Standard Chartered Bank | 1/30/2020 | 36 | |||||||
| CNH60,800 | USD8,591 | Standard Chartered Bank | 2/10/2020 | 135 | |||||||
| CNH18,800 | USD2,668 | Standard Chartered Bank | 2/10/2020 | 30 | |||||||
| USD3,927 | CNH27,700 | HSBC Bank | 2/10/2020 | (48 | ) | ||||||
| USD19,976 | CNH142,790 | Standard Chartered Bank | 2/10/2020 | (517 | ) | ||||||
| USD7,131 | MXN141,260 | JPMorgan Chase | 3/4/2020 | (269 | ) | ||||||
| EUR27,760 | USD31,090 | HSBC Bank | 3/17/2020 | 200 | |||||||
| USD4,553 | EUR3,940 | Bank of America | 3/26/2020 | 109 | |||||||
| EUR2,580 | USD2,888 | HSBC Bank | 3/26/2020 | 22 | |||||||
| USD393 | EUR340 | JPMorgan Chase | 3/26/2020 | 10 | |||||||
| USD2,937 | BRL12,100 | JPMorgan Chase | 4/1/2020 | (59 | ) | ||||||
| USD21,630 | BRL91,700 | Citibank | 7/1/2020 | (972 | ) | ||||||
| $ | (2,210 | ) | |||||||||
Swap contracts
Interest rate swaps
| Receive | Pay | Expiration date | Notional (000) | Value at 12/31/2019 (000) | Upfront payments/ receipts (000) | Unrealized (depreciation) appreciation at 12/31/2019 (000) | |||||||||||||||||
| (0.0955)% | 6-month EURIBOR | 7/22/2024 | € | 64,700 | $ | (156 | ) | $ | — | $ | (156 | ) | |||||||||||
| (0.356)% | 6-month EURIBOR | 8/9/2024 | 60,000 | (511 | ) | — | (511 | ) | |||||||||||||||
| 6-month HUF-BUBOR | 1.39% | 11/11/2029 | HUF | 2,335,000 | 106 | — | 106 | ||||||||||||||||
| 6-month PLN-WIBOR | 1.90% | 11/12/2029 | PLN | 30,800 | (26 | ) | — | (26 | ) | ||||||||||||||
| 6-month PLN-WIBOR | 1.88% | 11/20/2029 | 30,710 | (11 | ) | — | (11 | ) | |||||||||||||||
| 3-month USD-LIBOR | 2.0105% | 12/18/2049 | $ | 3,125 | 59 | — | 59 | ||||||||||||||||
| $ | — | $ | (539 | ) | |||||||||||||||||||
Credit default swaps
Centrally cleared credit default swaps on credit indices — sell protection
| Receive/ | Expiration | Notional | Value at 12/31/2019 | Upfront receipts | Unrealized appreciation at 12/31/2019 | |||||||
| Payment frequency | Pay | date | (000) | (000) | (000) | (000) | ||||||
| 1.00%/Quarterly | CDX.NA.IG.33 | 12/20/2024 | $130,250 | $3,377 | $2,646 | $731 |
| 100 | American Funds Insurance Series |
Global Bond Fund
The following footnotes apply to either the individual securities noted or one or more of the securities aggregated and listed as a single line item.
| 1 | Index-linked bond whose principal amount moves with a government price index. |
| 2 | Principal payments may be made periodically. Therefore, the effective maturity date may be earlier than the stated maturity date. |
| 3 | Acquired in a transaction exempt from registration under Rule 144A of the Securities Act of 1933. May be resold in the U.S. in transactions exempt from registration, normally to qualified institutional buyers. The total value of all such securities, including those in “Other securities,” was $185,840,000, which represented 8.73% of the net assets of the fund. |
| 4 | Coupon rate may change periodically. Reference rate and spread are as of the most recent information available. Some coupon rates are determined by the issuer or agent based on current market conditions; therefore, the reference rate and spread are not available. |
| 5 | All or a portion of this security was pledged as collateral. The total value of pledged collateral was $9,498,000, which represented .45% of the net assets of the fund. |
| 6 | Rate represents the seven-day yield at 12/31/2019. |
| 7 | Notional amount is calculated based on the number of contracts and notional contract size. |
| 8 | Value is calculated based on the notional amount and current market price. |
| 9 | Amount less than one thousand. |
Key to abbreviations and symbols
AUD = Australian dollars
BRL = Brazilian reais
BUBOR = Budapest Interbank Offered Rate
CAD/C$ = Canadian dollars
CHF = Swiss francs
CLP = Chilean pesos
CNH/CNY = Chinese yuan renminbi
COP = Colombian pesos
CZK = Czech korunas
DKr = Danish kroner
EUR/€ = Euros
EURIBOR = Euro Interbank Offered Rate
GBP/£ = British pounds
HUF = Hungarian forints
ILS = Israeli shekels
INR = Indian rupees
JPY/¥ = Japanese yen
KRW = South Korean won
MXN = Mexican pesos
MYR = Malaysian ringgits
NOK/NKr = Norwegian kroner
PLN = Polish zloty
THB = Thai baht
WIBOR = Warsaw Interbank Offer Rate
ZAR = South African rand
See notes to financial statements.
| American Funds Insurance Series | 101 |
Summary investment portfolioDecember 31, 2019
| Bonds, notes & other debt instruments 92.80% | Principal amount (000) | Value (000) | ||||||
| Corporate bonds & notes 92.80% | ||||||||
| Communication services 16.19% | ||||||||
| Cablevision Systems Corp. 6.75% 2021 | $ | 5,025 | $ | 5,419 | ||||
| CCO Holdings LLC and CCO Holdings Capital Corp. 5.75% 20261 | 6,450 | 6,817 | ||||||
| CCO Holdings LLC and CCO Holdings Capital Corp. 4.00%–5.88% 2023–20301 | 10,165 | 10,491 | ||||||
| CenturyLink, Inc. 6.75% 2023 | 7,100 | 7,940 | ||||||
| CenturyLink, Inc. 5.13%–7.50% 2022–20261 | 3,875 | 4,037 | ||||||
| Embarq Corp. 7.995% 2036 | 1,275 | 1,351 | ||||||
| Frontier Communications Corp. 11.00% 2025 | 16,070 | 7,834 | ||||||
| Frontier Communications Corp. 8.00%–10.50% 2020–20271 | 12,790 | 9,411 | ||||||
| Gogo Inc. 9.875% 20241 | 14,750 | 15,610 | ||||||
| Intelsat Jackson Holding Co. 8.50% 20241 | 6,100 | 5,569 | ||||||
| Level 3 Communications, Inc. 3.875% 20291 | 1,450 | 1,464 | ||||||
| MDC Partners Inc. 6.50% 20241 | 9,510 | 8,630 | ||||||
| Qwest Capital Funding, Inc. 6.875% 2028 | 1,100 | 1,087 | ||||||
| Sprint Corp. 6.875% 2028 | 5,395 | 5,823 | ||||||
| Sprint Corp. 7.13%–11.50% 2021–2032 | 10,350 | 11,813 | ||||||
| Univision Communications Inc. 5.125% 20231 | 6,200 | 6,200 | ||||||
| Other securities | 95,517 | |||||||
| 205,013 | ||||||||
| Health care 15.42% | ||||||||
| Bausch Health Cos. Inc. 5.00%–7.00% 2028–20301 | 6,955 | 7,296 | ||||||
| Centene Corp. 4.625% 20291 | 6,985 | 7,374 | ||||||
| Centene Corp. 4.25%–6.13% 2022–20271 | 15,605 | 16,182 | ||||||
| Endo International PLC 5.75%–6.00% 2022–20251,2 | 15,759 | 11,863 | ||||||
| Kinetic Concepts, Inc. 12.50% 20211 | 6,573 | 6,781 | ||||||
| Mallinckrodt PLC 4.875% 20201 | 11,135 | 8,610 | ||||||
| Molina Healthcare, Inc. 5.375% 2022 | 10,235 | 10,898 | ||||||
| Molina Healthcare, Inc. 4.875% 20251 | 1,744 | 1,797 | ||||||
| Par Pharmaceutical Cos. Inc. 7.50% 20271 | 5,755 | 5,741 | ||||||
| Rotech Healthcare Inc., Term Loan, (3-month USD-LIBOR + 11.00%) 13.31% 2023 (100% PIK)3,4,5,6,7 | 5,665 | 5,721 | ||||||
| Tenet Healthcare Corp. 4.875% 20261 | 9,600 | 10,067 | ||||||
| Tenet Healthcare Corp. 4.63%–8.13% 2022–20271 | 8,717 | 9,359 | ||||||
| Teva Pharmaceutical Finance Co. BV 2.80% 2023 | 6,891 | 6,406 | ||||||
| Teva Pharmaceutical Finance Co. BV 6.00% 2024 | 8,192 | 8,307 | ||||||
| Teva Pharmaceutical Finance Co. BV 2.20%–7.13% 2021–20281 | 8,526 | 8,079 | ||||||
| Valeant Pharmaceuticals International, Inc. 6.125% 20251 | 12,430 | 12,869 | ||||||
| Valeant Pharmaceuticals International, Inc. 9.25% 20261 | 4,670 | 5,373 | ||||||
| Valeant Pharmaceuticals International, Inc. 5.88%–9.00% 2023–20271 | 6,235 | 6,642 | ||||||
| Other securities | 45,896 | |||||||
| 195,261 | ||||||||
| Materials 12.07% | ||||||||
| Cleveland-Cliffs Inc. 4.875% 20241 | 5,375 | 5,505 | ||||||
| Cleveland-Cliffs Inc. 5.75% 2025 | 6,831 | 6,758 | ||||||
| Cleveland-Cliffs Inc. 5.875% 20271 | 8,285 | 7,969 | ||||||
| First Quantum Minerals Ltd. 7.25% 20231 | 8,150 | 8,455 | ||||||
| First Quantum Minerals Ltd. 7.50% 20251 | 11,100 | 11,373 | ||||||
| First Quantum Minerals Ltd. 6.875% 20261 | 5,075 | 5,148 | ||||||
| First Quantum Minerals Ltd. 6.50%–7.25% 2021–20241 | 5,665 | 5,696 | ||||||
| LSB Industries, Inc. 9.625% 20231 | 5,010 | 5,159 | ||||||
| Ryerson Inc. 11.00% 20221 | 5,191 | 5,489 | ||||||
| Venator Materials Corp. 5.75% 20251 | 6,535 | 6,045 | ||||||
| Other securities | 85,249 | |||||||
| 152,846 | ||||||||
| 102 | American Funds Insurance Series |
High-Income Bond Fund
| Bonds, notes & other debt instruments | Principal amount (000) | Value (000) | ||||||
| Energy 10.52% | ||||||||
| CONSOL Energy Inc. 5.875% 2022 | $ | 7,366 | $ | 7,390 | ||||
| Weatherford International PLC 11.00% 20241 | 6,660 | 7,218 | ||||||
| Other securities | 118,661 | |||||||
| 133,269 | ||||||||
| Consumer discretionary 9.69% | ||||||||
| PetSmart, Inc. 7.125% 20231 | 10,565 | 10,380 | ||||||
| PetSmart, Inc. 5.875% 20251 | 8,093 | 8,265 | ||||||
| PetSmart, Inc. 8.875% 20251 | 9,205 | 9,113 | ||||||
| Scientific Games Corp. 8.25% 20261 | 5,130 | 5,665 | ||||||
| Staples, Inc. 7.50% 20261 | 8,100 | 8,419 | ||||||
| Other securities | 80,879 | |||||||
| 122,721 | ||||||||
| Industrials 8.71% | ||||||||
| Builders FirstSource, Inc. 5.625% 20241 | 5,958 | 6,209 | ||||||
| Dun & Bradstreet Corp. 10.25% 20271 | 5,303 | 6,108 | ||||||
| FXI Holdings, Inc. 12.25% 20261 | 5,155 | 5,377 | ||||||
| LSC Communications, Inc. 8.75% 20231 | 9,510 | 5,163 | ||||||
| Other securities | 87,400 | |||||||
| 110,257 | ||||||||
| Information technology 6.29% | ||||||||
| Almonde Inc., Term Loan, (3-month USD-LIBOR + 7.25%) 9.446% 20255,7 | 5,370 | 5,263 | ||||||
| Genesys Telecommunications Laboratories, Inc. 10.00% 20241 | 7,370 | 7,984 | ||||||
| Infor (US), Inc. 6.50% 2022 | 5,400 | 5,491 | ||||||
| Kronos Inc., Term Loan B, (3-month USD-LIBOR + 8.25%) 10.159% 20245,7 | 8,645 | 8,883 | ||||||
| Unisys Corp. 10.75% 20221 | 6,600 | 7,113 | ||||||
| Other securities | 44,854 | |||||||
| 79,588 | ||||||||
| Financials 5.68% | ||||||||
| Compass Diversified Holdings 8.00% 20261 | 5,260 | 5,709 | ||||||
| FS Energy and Power Fund 7.50% 20231 | 7,115 | 7,308 | ||||||
| Other securities | 58,955 | |||||||
| 71,972 | ||||||||
| Utilities 2.96% | ||||||||
| Talen Energy Corp. 10.50% 20261 | 5,425 | 5,173 | ||||||
| Other securities | 32,249 | |||||||
| 37,422 | ||||||||
| Real estate 2.64% | ||||||||
| Howard Hughes Corp. 5.375% 20251 | 6,070 | 6,343 | ||||||
| Other securities | 27,139 | |||||||
| 33,482 | ||||||||
| Consumer staples 2.63% | ||||||||
| Other securities | 33,285 | |||||||
| Total corporate bonds & notes | 1,175,116 | |||||||
| Municipals 0.00% | ||||||||
| Other securities | 5 | |||||||
| Total bonds, notes & other debt instruments (cost: $1,171,836,000) | 1,175,121 | |||||||
| American Funds Insurance Series | 103 |
High-Income Bond Fund
| Convertible bonds 0.37% | Principal amount (000) | Value (000) | ||||||
| Communication services 0.22% | ||||||||
| Gogo Inc., convertible notes, 6.00% 2022 | $ | 797 | $ | 1,001 | ||||
| Other securities | 1,784 | |||||||
| 2,785 | ||||||||
| Health care 0.10% | ||||||||
| Teva Pharmaceutical Finance Co. BV, Series C, convertible bonds, 0.25% 2026 | 1,375 | 1,310 | ||||||
| Materials 0.05% | ||||||||
| Cleveland-Cliffs Inc., convertible notes, 1.50% 2025 | 500 | 599 | ||||||
| Total convertible bonds (cost: $4,531,000) | 4,694 | |||||||
| Convertible stocks 0.63% | Shares | |||||||
| Other 0.63% | ||||||||
| Other securities | 8,057 | |||||||
| Total convertible stocks (cost: $7,673,000) | 8,057 | |||||||
| Preferred securities 0.17% | ||||||||
| Consumer discretionary 0.17% | ||||||||
| Other securities | 2,187 | |||||||
| Total preferred securities (cost: $1,656,000) | 2,187 | |||||||
| Common stocks 1.11% | ||||||||
| Communication services 0.03% | ||||||||
| Frontier Communications Corp.8 | 13,333 | 12 | ||||||
| Other securities | 384 | |||||||
| 396 | ||||||||
| Other 1.08% | ||||||||
| Other securities | 13,639 | |||||||
| Total common stocks (cost: $19,328,000) | 14,035 | |||||||
| Rights & warrants 0.06% | ||||||||
| Energy 0.06% | ||||||||
| Other securities | 711 | |||||||
| Total rights & warrants(cost: $2,287,000) | 711 | |||||||
| Short-term securities 3.09% | ||||||||
| Money market investments 3.09% | ||||||||
| Capital Group Central Cash Fund 1.73%9 | 391,124 | 39,112 | ||||||
| Total short-term securities(cost: $38,979,000) | 39,112 | |||||||
| Total investment securities 98.23% (cost: $1,246,290,000) | 1,243,917 | |||||||
| Other assets less liabilities 1.77% | 22,376 | |||||||
| Net assets 100.00% | $ | 1,266,293 | ||||||
| 104 | American Funds Insurance Series |
High-Income Bond Fund
This summary investment portfolio is designed to streamline the report and help investors better focus on the fund’s principal holdings. See the inside back cover for details on how to obtain a complete schedule of portfolio holdings.
“Other securities” includes all issues that are not disclosed separately in the summary investment portfolio. Some securities in “Other securities” (with an aggregate value of $5,152,000, an aggregate cost of $5,650,000, and which represented .41% of the net assets of the fund) were acquired from 9/26/2013 to 8/31/2018 through private placement transactions exempt from registration under the Securities Act of 1933, which may subject them to legal or contractual restrictions on resale.
Futures contracts
| Contracts | Type | Number of contracts | Expiration | Notional amount (000) | 10 | Value at 12/31/2019 (000) | 11 | Unrealized (depreciation) appreciation at 12/31/2019 (000) | |||||||||||||
| 2 Year U.S. Treasury Note Futures | Long | 295 | April 2020 | $ | 59,000 | $ | 63,572 | $ | (33 | ) | |||||||||||
| 10 Year Ultra U.S. Treasury Note Futures | Short | 113 | March 2020 | (11,300 | ) | (15,899 | ) | 192 | |||||||||||||
| $ | 159 | ||||||||||||||||||||
Swap contracts
Credit default swaps
Centrally cleared credit default swaps on credit indices — buy protection
| Receive | Pay/ Payment frequency | Expiration date | Notional (000) | Value at 12/31/2019 (000) | Upfront payments (000) | Unrealized depreciation at 12/31/2019 (000) | |||||||||||||||||
| CDX.NA.IG.33 | 1.00%/Quarterly | 12/20/2024 | $ | 41,200 | $ | (1,068 | ) | $ | (970 | ) | $ | (98 | ) | ||||||||||
| CDX.NA.HY.33 | 5.00%/Quarterly | 12/20/2024 | 53,680 | (5,171 | ) | (3,691 | ) | (1,480 | ) | ||||||||||||||
| $ | (4,661 | ) | $ | (1,578 | ) | ||||||||||||||||||
The following footnotes apply to either the individual securities noted or one or more of the securities aggregated and listed as a single line item.
| 1 | Acquired in a transaction exempt from registration under Rule 144A of the Securities Act of 1933. May be resold in the U.S. in transactions exempt from registration, normally to qualified institutional buyers. The total value of all such securities, including those in “Other securities,” was $792,983,000, which represented 62.62% of the net assets of the fund. |
| 2 | Step bond; coupon rate may change at a later date. |
| 3 | Valued under fair value procedures adopted by authority of the board of trustees. The total value of all such securities, including those in “Other securities,” was $23,174,000, which represented 1.83% of the net assets of the fund. |
| 4 | Value determined using significant unobservable inputs. |
| 5 | Loan participations and assignments; may be subject to legal or contractual restrictions on resale. The total value of all such loans, including those in “Other securities,” was $64,996,000, which represented 5.13% of the net assets of the fund. |
| 6 | Payment in kind; the issuer has the option of paying additional securities in lieu of cash. Most recent payment was 100% cash unless otherwise noted. |
| 7 | Coupon rate may change periodically. Reference rate and spread are as of the most recent information available. Some coupon rates are determined by the issuer or agent based on current market conditions; therefore, the reference rate and spread are not available. |
| 8 | Security did not produce income during the last 12 months. |
| 9 | Rate represents the seven-day yield at 12/31/2019. |
| 10 | Notional amount is calculated based on the number of contracts and notional contract size. |
| 11 | Value is calculated based on the notional amount and current market price. |
Key to abbreviations and symbol
LIBOR = London Interbank Offered Rate
USD/$ = U.S. dollars
See notes to financial statements.
| American Funds Insurance Series | 105 |
Summary investment portfolioDecember 31, 2019
| Bonds, notes & other debt instruments 81.04% | Principal amount (000) | Value (000) | ||||||
| Mortgage-backed obligations 63.38% | ||||||||
| Federal agency mortgage-backed obligations 59.31% | ||||||||
| Fannie Mae Pool #AL3803 3.00% 20281 | $ | 13 | $ | 13 | ||||
| Fannie Mae Pool #BJ9590 3.00% 20341 | 1,855 | 1,901 | ||||||
| Fannie Mae Pool #BM4488 3.435% 20481,2 | 1,690 | 1,730 | ||||||
| Fannie Mae Pool #MA3692 3.50% 20491 | 3,160 | 3,247 | ||||||
| Fannie Mae Pool #CA4566 3.50% 20491 | 2,992 | 3,077 | ||||||
| Fannie Mae Pool #FM0020 3.50% 20491 | 1,296 | 1,336 | ||||||
| Fannie Mae 3.00%–5.00% 2026–20491,2 | 3,840 | 3,958 | ||||||
| Freddie Mac 4.00% 20361 | 4,219 | 4,497 | ||||||
| Freddie Mac Pool #SB8002 3.00% 20341 | 1,750 | 1,794 | ||||||
| Freddie Mac Pool #SB8027 3.00% 20351 | 1,278 | 1,313 | ||||||
| Freddie Mac Pool #760014 3.486% 20451,2 | 1,595 | 1,627 | ||||||
| Freddie Mac Pool #SD8005 3.50% 20491 | 4,462 | 4,585 | ||||||
| Freddie Mac Pool #SD8001 3.50% 20491 | 3,325 | 3,417 | ||||||
| Freddie Mac, Series K031, Class A2, Multi Family, 3.30% 20231 | 4,722 | 4,908 | ||||||
| Freddie Mac, Series K032, Class A2, Multi Family, 3.31% 20231 | 1,250 | 1,301 | ||||||
| Freddie Mac 2.60%–5.00% 2020–20491,2 | 5,214 | 5,423 | ||||||
| Freddie Mac Seasoned Credit Risk Transfer Trust, Series 2017-2, Class HA, 3.00% 20561,3 | 1,490 | 1,515 | ||||||
| Freddie Mac Seasoned Credit Risk Transfer Trust, Series 2017-2, Class MA, 3.00% 20561 | 1,437 | 1,464 | ||||||
| Freddie Mac Seasoned Credit Risk Transfer Trust, Series 2017-4, Class HT, 3.25% 20571,3 | 10,713 | 11,041 | ||||||
| Freddie Mac Seasoned Credit Risk Transfer Trust, Series 2018-2, Class MT, 3.50% 20571 | 9,853 | 10,390 | ||||||
| Freddie Mac Seasoned Credit Risk Transfer Trust, Series 2017-4, Class MT, 3.50% 20571 | 6,803 | 7,063 | ||||||
| Freddie Mac Seasoned Credit Risk Transfer Trust, Series 2019-4, Class MA, 3.00% 20591 | 3,737 | 3,808 | ||||||
| Freddie Mac Seasoned Loan Structured Transaction Trust, Series 2019-3, Class A1C, 2.75% 20291 | 9,962 | 10,100 | ||||||
| Freddie Mac Seasoned Loan Structured Transaction Trust, Series 2018-2, Class A1, 3.50% 20281 | 6,847 | 7,090 | ||||||
| Freddie Mac Seasoned Loan Structured Transaction Trust, Series 2018-1, Class A1, 3.50% 20281 | 1,873 | 1,934 | ||||||
| Government National Mortgage Assn. 5.50% 20401 | 1,469 | 1,640 | ||||||
| Government National Mortgage Assn. 3.50% 20431 | 1,887 | 1,973 | ||||||
| Government National Mortgage Assn. 3.50% 20431 | 1,535 | 1,605 | ||||||
| Government National Mortgage Assn. 3.50% 20431 | 1,214 | 1,275 | ||||||
| Government National Mortgage Assn. 4.25% 20441 | 1,574 | 1,682 | ||||||
| Government National Mortgage Assn. 4.50% 20491 | 16,600 | 17,345 | ||||||
| Government National Mortgage Assn. 4.00% 20501,4 | 4,760 | 4,927 | ||||||
| Government National Mortgage Assn. 4.50% 20501,4 | 2,639 | 2,759 | ||||||
| Government National Mortgage Assn. Pool #MA5877 4.50% 20491 | 1,727 | 1,804 | ||||||
| Government National Mortgage Assn. 3.50%–6.50% 2034–20661 | 16,007 | 16,733 | ||||||
| Uniform Mortgage-Backed Security 3.00% 20351,4 | 15,493 | 15,864 | ||||||
| Uniform Mortgage-Backed Security 3.00% 20351,4 | 17 | 17 | ||||||
| Uniform Mortgage-Backed Security 4.50% 20501,4 | 3,000 | 3,159 | ||||||
| Vendee Mortgage Trust, Series 2011-2, Class V, 3.75% 20281 | 3,774 | 3,806 | ||||||
| Vendee Mortgage Trust, Series 2010-1, Class DA, 4.25% 20351 | 292 | 298 | ||||||
| Other securities | 1,252 | |||||||
| 174,671 | ||||||||
| Collateralized mortgage-backed obligations (privately originated) 4.07% | ||||||||
| Finance of America HECM Buyout, Series 2019-AB1, Class A, 2.656% 20491,5,6 | 1,271 | 1,270 | ||||||
| Other securities | 10,709 | |||||||
| 11,979 | ||||||||
| Total mortgage-backed obligations | 186,650 | |||||||
| 106 | American Funds Insurance Series |
Mortgage Fund
| Bonds, notes & other debt instruments | Principal amount (000) | Value (000) | ||||||
| U.S. Treasury bonds & notes 9.65% | ||||||||
| U.S. Treasury 4.86% | ||||||||
| U.S. Treasury 2.00% 2022 | $ | 2,400 | $ | 2,425 | ||||
| U.S. Treasury 1.75% 2023 | 3,500 | 3,513 | ||||||
| U.S. Treasury 2.875% 2023 | 4,350 | 4,547 | ||||||
| U.S. Treasury 2.50% 2024 | 2,500 | 2,588 | ||||||
| U.S. Treasury 2.13%–2.75% 2022–2023 | 1,224 | 1,247 | ||||||
| 14,320 | ||||||||
| U.S. Treasury inflation-protected securities 4.79% | ||||||||
| U.S. Treasury Inflation-Protected Security 0.625% 20237 | 6,216 | 6,315 | ||||||
| U.S. Treasury Inflation-Protected Security 2.125% 20417 | 129 | 170 | ||||||
| U.S. Treasury Inflation-Protected Security 0.75% 20427,8 | 7,328 | 7,629 | ||||||
| 14,114 | ||||||||
| Total U.S. Treasury bonds & notes | 28,434 | |||||||
| Federal agency bonds & notes 6.42% | ||||||||
| Fannie Mae 2.00% 2022 | 5,800 | 5,849 | ||||||
| Federal Home Loan Bank 1.375% 2021 | 3,000 | 2,992 | ||||||
| Federal Home Loan Bank 1.875% 2021 | 10,000 | 10,055 | ||||||
| 18,896 | ||||||||
| Asset-backed obligations 1.59% | ||||||||
| Hertz Vehicle Financing LLC, Rental Car Asset-Backed Notes, Series 2015-1, Class A, 2.73% 20211,6 | 1,823 | 1,825 | ||||||
| Other securities | 2,856 | |||||||
| 4,681 | ||||||||
| Total bonds, notes & other debt instruments (cost: $234,202,000) | 238,661 | |||||||
| Short-term securities 13.90% | ||||||||
| Federal agency discount notes 13.05% | ||||||||
| Fannie Mae 1.50%–1.55% due 1/22/2020–1/23/2020 | 12,500 | 12,489 | ||||||
| Federal Farm Credit Banks 1.57% due 1/30/2020 | 8,000 | 7,990 | ||||||
| Federal Home Loan Bank 1.55%–1.59% due 1/3/2020–2/18/2020 | 13,000 | 12,988 | ||||||
| Freddie Mac 1.64% due 3/18/2020 | 5,000 | 4,984 | ||||||
| 38,451 | ||||||||
| Commercial paper 0.85% | ||||||||
| Starbird Funding Corp. 1.58% due 1/2/20206 | 2,500 | 2,500 | ||||||
| Total short-term securities (cost: $40,948,000) | 40,951 | |||||||
| Total investment securities 94.94% (cost: $275,150,000) | 279,612 | |||||||
| Other assets less liabilities 5.06% | 14,898 | |||||||
| Net assets 100.00% | $ | 294,510 | ||||||
This summary investment portfolio is designed to streamline the report and help investors better focus on the fund’s principal holdings. See the inside back cover for details on how to obtain a complete schedule of portfolio holdings.
“Other securities” includes all issues that are not disclosed separately in the summary investment portfolio.
| American Funds Insurance Series | 107 |
Mortgage Fund
Futures contracts
| Contracts | Type | Number of contracts | Expiration | Notional amount (000) | 9 | Value at 12/31/2019 (000) | 10 | Unrealized depreciation at 12/31/2019 (000) | |||||||
| 2 Year U.S. Treasury Note Futures | Long | 425 | April 2020 | $85,000 | $91,588 | $ | (49 | ) | |||||||
| 5 Year U.S. Treasury Note Futures | Long | 427 | April 2020 | 42,700 | 50,646 | (176 | ) | ||||||||
| 10 Year Ultra U.S. Treasury Note Futures | Long | 126 | March 2020 | 12,600 | 17,729 | (213 | ) | ||||||||
| 10 Year U.S. Treasury Note Futures | Long | 79 | March 2020 | 7,900 | 10,145 | (95 | ) | ||||||||
| 20 Year U.S. Treasury Bond Futures | Long | 56 | March 2020 | 5,600 | 8,731 | (186 | ) | ||||||||
| 30 Year Ultra U.S. Treasury Bond Futures | Long | 5 | March 2020 | 500 | 908 | (27 | ) | ||||||||
| $ | (746 | ) | |||||||||||||
Swap contracts
Interest rate swaps
| Receive | Pay | Expiration date | Notional (000) | Value at 12/31/2019 (000) | Upfront payments/ receipts (000) | Unrealized (depreciation) appreciation at 12/31/2019 (000) | ||||||||||||
| 1.553% | U.S. EFFR | 1/29/2020 | $102,700 | $ — | 11 | $ | — | $ | — | 11 | ||||||||
| 1.5365% | U.S. EFFR | 1/29/2020 | 81,500 | (1 | ) | — | (1 | ) | ||||||||||
| 1.535% | U.S. EFFR | 1/29/2020 | 85,500 | (1 | ) | — | (1 | ) | ||||||||||
| 1.531% | U.S. EFFR | 3/18/2020 | 95,000 | (4 | ) | — | (4 | ) | ||||||||||
| 1.515% | U.S. EFFR | 3/18/2020 | 86,100 | (6 | ) | — | (6 | ) | ||||||||||
| 1.5155% | U.S. EFFR | 3/18/2020 | 182,000 | (12 | ) | — | (12 | ) | ||||||||||
| 1.5135% | U.S. EFFR | 3/18/2020 | 181,900 | (13 | ) | — | (13 | ) | ||||||||||
| 3-month USD-LIBOR | 2.806% | 8/29/2020 | 300 | (2 | ) | — | (2 | ) | ||||||||||
| 1.4555% | U.S. EFFR | 12/10/2020 | 16,900 | (10 | ) | — | (10 | ) | ||||||||||
| 1.454% | U.S. EFFR | 12/10/2020 | 20,100 | (12 | ) | — | (12 | ) | ||||||||||
| 1.487% | U.S. EFFR | 12/16/2020 | 18,375 | (5 | ) | — | (5 | ) | ||||||||||
| 1.491% | U.S. EFFR | 12/16/2020 | 18,625 | (5 | ) | — | (5 | ) | ||||||||||
| 1.34% | U.S. EFFR | 10/18/2021 | 21,000 | (42 | ) | — | (42 | ) | ||||||||||
| 2.0135% | 3-month USD-LIBOR | 10/20/2021 | 30,000 | 171 | — | 171 | ||||||||||||
| 1.3615% | U.S. EFFR | 11/1/2021 | 29,500 | (45 | ) | — | (45 | ) | ||||||||||
| 1.281% | U.S. EFFR | 11/4/2021 | 29,500 | (88 | ) | — | (88 | ) | ||||||||||
| U.S. EFFR | 1.335% | 11/26/2021 | 30,000 | 61 | — | 61 | ||||||||||||
| 2.012% | 3-month USD-LIBOR | 10/4/2022 | 9,000 | 82 | — | 82 | ||||||||||||
| 2.00% | 3-month USD-LIBOR | 10/5/2022 | 41,500 | 364 | — | 364 | ||||||||||||
| 2.1045% | 3-month USD-LIBOR | 10/31/2022 | 4,000 | 48 | — | 48 | ||||||||||||
| 3-month USD-LIBOR | 2.2835% | 1/5/2023 | 36,000 | (640 | ) | — | (640 | ) | ||||||||||
| 2.21875% | U.S. EFFR | 3/14/2024 | 9,000 | 271 | — | 271 | ||||||||||||
| 3-month USD-LIBOR | 2.322% | 5/2/2024 | 10,100 | (262 | ) | — | (262 | ) | ||||||||||
| 3-month USD-LIBOR | 2.325% | 5/2/2024 | 23,300 | (606 | ) | — | (606 | ) | ||||||||||
| 3-month USD-LIBOR | 2.24% | 12/5/2026 | 10,500 | (313 | ) | — | (313 | ) | ||||||||||
| 3-month USD-LIBOR | 2.05% | 7/18/2029 | 6,000 | (92 | ) | — | (92 | ) | ||||||||||
| U.S. EFFR | 1.485% | 10/23/2029 | 2,100 | 32 | — | 32 | ||||||||||||
| U.S. EFFR | 1.4869% | 10/23/2029 | 1,900 | 29 | — | 29 | ||||||||||||
| U.S. EFFR | 1.453% | 10/24/2029 | 2,500 | 45 | — | 45 | ||||||||||||
| U.S. EFFR | 1.4741% | 10/24/2029 | 2,500 | 41 | — | 41 | ||||||||||||
| U.S. EFFR | 1.4495% | 10/24/2029 | 1,800 | 33 | — | 33 | ||||||||||||
| U.S. EFFR | 1.446% | 10/24/2029 | 200 | 4 | — | 4 | ||||||||||||
| 1.419% | U.S. EFFR | 11/26/2029 | 6,000 | (130 | ) | — | (130 | ) | ||||||||||
| 3-month USD-LIBOR | 3.206% | 7/31/2044 | 1,000 | (222 | ) | — | (222 | ) | ||||||||||
| 3-month USD-LIBOR | 3.238% | 8/8/2044 | 2,000 | (457 | ) | — | (457 | ) | ||||||||||
| 3-month USD-LIBOR | 3.2265% | 9/25/2044 | 3,000 | (682 | ) | — | (682 | ) | ||||||||||
| U.S. EFFR | 2.155% | 11/10/2047 | 1,280 | (86 | ) | — | (86 | ) | ||||||||||
| U.S. EFFR | 2.5635% | 2/12/2048 | 4,528 | (714 | ) | — | (714 | ) | ||||||||||
| 2.98% | 3-month USD-LIBOR | 3/15/2048 | 300 | 59 | — | 59 | ||||||||||||
| 108 | American Funds Insurance Series |
Mortgage Fund
| Receive | Pay | Expiration date | Notional (000) | Value at 12/31/2019 (000) | Upfront payments/ receipts (000) | Unrealized (depreciation) appreciation at 12/31/2019 (000) | ||||||||||||
| 2.9625% | 3-month USD-LIBOR | 3/15/2048 | $ 300 | $ 57 | $ | — | $ | 57 | ||||||||||
| 2.917% | 3-month USD-LIBOR | 3/16/2048 | 600 | 109 | — | 109 | ||||||||||||
| 3-month USD-LIBOR | 1.934% | 12/12/2049 | 2,200 | 80 | — | 80 | ||||||||||||
| 3-month USD-LIBOR | 1.935% | 12/17/2049 | 2,480 | 90 | — | 90 | ||||||||||||
| 3-month USD-LIBOR | 2.007% | 12/19/2049 | 900 | 18 | — | 18 | ||||||||||||
| 3-month USD-LIBOR | 2.045% | 12/27/2049 | 2,200 | 24 | — | 24 | ||||||||||||
| $ | — | $ | (2,832 | ) | ||||||||||||||
The following footnotes apply to either the individual securities noted or one or more of the securities aggregated and listed as a single line item.
| 1 | Principal payments may be made periodically. Therefore, the effective maturity date may be earlier than the stated maturity date. |
| 2 | Coupon rate may change periodically. Reference rate and spread are as of the most recent information available. Some coupon rates are determined by the issuer or agent based on current market conditions; therefore, the reference rate and spread are not available. |
| 3 | Step bond; coupon rate may change at a later date. |
| 4 | Purchased on a TBA basis. |
| 5 | Valued under fair value procedures adopted by authority of the board of trustees. The total value of the security was $1,270,000, which represented .43% of the net assets of the fund. |
| 6 | Acquired in a transaction exempt from registration under Rule 144A or Section 4(2) of the Securities Act of 1933. May be resold in the U.S. in transactions exempt from registration, normally to qualified institutional buyers. The total value of all such securities, including those in “Other securities,” was $17,782,000, which represented 6.04% of the net assets of the fund. |
| 7 | Index-linked bond whose principal amount moves with a government price index. |
| 8 | All or a portion of this security was pledged as collateral. The total value of pledged collateral was $4,195,000, which represented 1.42% of the net assets of the fund. |
| 9 | Notional amount is calculated based on the number of contracts and notional contract size. |
| 10 | Value is calculated based on the notional amount and current market price. |
| 11 | Amount less than one thousand. |
Key to abbreviations and symbol
EFFR = Effective Federal Funds Rate
LIBOR = London Interbank Offered Rate
TBA = To-be-announced
USD/$ = U.S. dollars
See notes to financial statements.
| American Funds Insurance Series | 109 |
Investment portfolioDecember 31, 2019
| Short-term securities 99.86% | Principal amount (000) | Value (000) | ||||||
| Commercial paper 71.65% | ||||||||
| Alberta (Province of) 1.78% due 1/8/20201 | $ | 9,000 | $ | 8,997 | ||||
| American Honda Finance Corp. 1.84% due 1/6/2020 | 11,000 | 10,997 | ||||||
| BMW U.S. Capital LLC 1.61% due 1/8/20201 | 7,000 | 6,997 | ||||||
| Chariot Funding, LLC 2.00% due 1/7/20201 | 9,300 | 9,297 | ||||||
| CHARTA, LLC 1.78% due 1/16/20201 | 10,000 | 9,992 | ||||||
| Eli Lilly and Co. 1.66% due 1/6/20201 | 10,000 | 9,997 | ||||||
| ExxonMobil Corp. 1.65% due 2/18/2020 | 10,000 | 9,977 | ||||||
| Henkel of America, Inc. 1.75% due 2/4/20201 | 7,000 | 6,989 | ||||||
| LVMH Moët Hennessy Louis Vuitton Inc. 1.70% due 2/13/20201 | 10,000 | 9,980 | ||||||
| National Rural Utilities Cooperative Finance Corp. 1.72% due 1/13/2020 | 8,100 | 8,095 | ||||||
| Nederlandse Waterschapsbank N.V. 1.84% due 3/18/20201 | 10,000 | 9,961 | ||||||
| New York Life Capital Corp. 1.60% due 2/12/20201 | 10,000 | 9,980 | ||||||
| NRW.BANK 1.90% due 1/21/20201 | 9,000 | 8,991 | ||||||
| OMERS Finance Trust 1.87% due 1/22/20201 | 10,000 | 9,990 | ||||||
| Oversea-Chinese Banking Corp. Ltd. 1.87% due 1/24/20201 | 10,800 | 10,787 | ||||||
| Pfizer Inc. 2.04% due 1/23/20201 | 11,700 | 11,688 | ||||||
| Simon Property Group, LP 1.70% due 1/13/20201 | 8,100 | 8,095 | ||||||
| ST Engineering North America, Inc. 1.87% due 1/21/20201 | 2,000 | 1,998 | ||||||
| Starbird Funding Corp. 1.58% due 1/2/20201 | 6,000 | 6,000 | ||||||
| United Overseas Bank Ltd. 1.83% due 2/25/20201 | 10,000 | 9,974 | ||||||
| United Parcel Service Inc. 1.62% due 1/13/20201 | 10,200 | 10,195 | ||||||
| Victory Receivables Corp. 1.82% due 2/3/20201 | 10,000 | 9,983 | ||||||
| Walt Disney Co. 1.69% due 2/26/20201 | 5,000 | 4,986 | ||||||
| 203,946 | ||||||||
| Federal agency discount notes 14.73% | ||||||||
| Fannie Mae 1.53% due 1/10/2020 | 10,000 | 9,996 | ||||||
| Federal Farm Credit Banks 1.55% due 3/4/2020 | 7,000 | 6,981 | ||||||
| Federal Home Loan Bank 1.57% due 1/31/2020 | 15,000 | 14,982 | ||||||
| Freddie Mac 1.55% due 3/10/2020 | 10,000 | 9,971 | ||||||
| 41,930 | ||||||||
| Bonds & notes of governments & government agencies outside the U.S. 9.97% | ||||||||
| CPPIB Capital Inc. 1.82% due 1/24/2020 | 10,000 | 9,989 | ||||||
| Ontario (Province of) 1.74% due 2/3/2020 | 7,400 | 7,389 | ||||||
| Québec (Province of) 1.85% due 1/16/20201 | 11,000 | 10,992 | ||||||
| 28,370 | ||||||||
| U.S. Treasury bonds & notes 3.51% | ||||||||
| U.S. Treasury Bill 1.50% due 2/11/2020 | 10,000 | 9,983 | ||||||
| Total short-term securities (cost: $284,222,000) | 284,229 | |||||||
| Total investment securities 99.86% (cost: $284,222,000) | 284,229 | |||||||
| Other assets less liabilities 0.14% | 401 | |||||||
| Net assets 100.00% | $ | 284,630 | ||||||
| 1 | Acquired in a transaction exempt from registration under Rule 144A or Section 4(2) of the Securities Act of 1933. May be resold in the U.S. in transactions exempt from registration, normally to qualified institutional buyers. The total value of all such securities was $185,869,000, which represented 65.30% of the net assets of the fund. |
See notes to financial statements.
| 110 | American Funds Insurance Series |
U.S. Government/AAA-Rated Securities Fund
Summary investment portfolioDecember 31, 2019
| Bonds, notes & other debt instruments 96.81% | Principal amount (000) | Value (000) | ||||||
| U.S. Treasury bonds & notes 51.15% | ||||||||
| U.S. Treasury 43.49% | ||||||||
| U.S. Treasury 1.75% 20211 | $ | 33,540 | $ | 33,641 | ||||
| U.S. Treasury (3-month U.S. Treasury Bill Yield + 0.30%) 1.826% 20212 | 51,589 | 51,671 | ||||||
| U.S. Treasury 2.00% 2021 | 46,300 | 46,669 | ||||||
| U.S. Treasury 2.125% 2021 | 23,450 | 23,661 | ||||||
| U.S. Treasury 2.25% 2021 | 23,580 | 23,820 | ||||||
| U.S. Treasury 1.75% 2022 | 174,300 | 174,930 | ||||||
| U.S. Treasury 1.875% 2022 | 63,000 | 63,391 | ||||||
| U.S. Treasury 1.875% 2022 | 25,000 | 25,170 | ||||||
| U.S. Treasury 1.875% 2022 | 23,000 | 23,167 | ||||||
| U.S. Treasury 2.00% 2022 | 69,500 | 70,238 | ||||||
| U.S. Treasury 2.125% 20231 | 57,739 | 58,782 | ||||||
| U.S. Treasury 2.875% 2023 | 43,000 | 44,952 | ||||||
| U.S. Treasury 2.875% 2023 | 22,500 | 23,538 | ||||||
| U.S. Treasury 1.50% 2024 | 47,000 | 46,623 | ||||||
| U.S. Treasury 2.00% 2024 | 30,050 | 30,469 | ||||||
| U.S. Treasury 2.125% 20241 | 31,975 | 32,620 | ||||||
| U.S. Treasury 2.50% 2024 | 44,000 | 45,540 | ||||||
| U.S. Treasury 2.75% 2025 | 38,000 | 39,970 | ||||||
| U.S. Treasury 1.625% 2026 | 77,000 | 76,037 | ||||||
| U.S. Treasury 1.875% 2026 | 86,000 | 86,393 | ||||||
| U.S. Treasury 1.75% 2029 | 35,000 | 34,467 | ||||||
| U.S. Treasury 2.25% 20491 | 25,700 | 24,937 | ||||||
| U.S. Treasury 2.875% 20491 | 26,000 | 28,663 | ||||||
| U.S. Treasury 1.50%–2.88% 2021–20491 | 148,885 | 150,278 | ||||||
| 1,259,627 | ||||||||
| U.S. Treasury inflation-protected securities 7.66% | ||||||||
| U.S. Treasury Inflation-Protected Security 0.625% 20233 | 36,777 | 37,362 | ||||||
| U.S. Treasury Inflation-Protected Security 0.125% 20243 | 72,013 | 72,476 | ||||||
| U.S. Treasury Inflation-Protected Security 0.25% 20253 | 24,054 | 24,283 | ||||||
| U.S. Treasury Inflation-Protected Security 0.75% 20421,3 | 22,423 | 23,344 | ||||||
| U.S. Treasury Inflation-Protected Securities 0.13%–2.13% 2022–20493 | 61,709 | 64,292 | ||||||
| 221,757 | ||||||||
| Total U.S. Treasury bonds & notes | 1,481,384 | |||||||
| Mortgage-backed obligations 27.67% | ||||||||
| Federal agency mortgage-backed obligations 27.67% | ||||||||
| Fannie Mae Pool #BH2597 4.00% 20474 | 25,092 | 26,390 | ||||||
| Fannie Mae Pool #MA3775 3.50% 20494 | 44,907 | 46,182 | ||||||
| Fannie Mae 0%–9.16% 2022–20492,4 | 75,935 | 79,030 | ||||||
| Freddie Mac Pool #SD8001 3.50% 20494 | 90,895 | 93,422 | ||||||
| Freddie Mac Pool #SD8005 3.50% 20494 | 34,320 | 35,264 | ||||||
| Freddie Mac 0%–5.50% 2020–20492,4 | 79,149 | 81,942 | ||||||
| Freddie Mac Seasoned Credit Risk Transfer Trust, Series 2018-2, Class MT, 3.50% 20574 | 37,774 | 39,835 | ||||||
| Freddie Mac Seasoned Loan Structured Transaction Trust, Series 2018-2, Class A1, 3.50% 20284 | 39,374 | 40,773 | ||||||
| Government National Mortgage Assn. 3.50% 20504,5 | 40,000 | 41,221 | ||||||
| Government National Mortgage Assn. 4.00% 20504,5 | 30,870 | 31,952 | ||||||
| Government National Mortgage Assn. 2.26%–6.64% 2034–20652,4,5 | 81,733 | 85,971 | ||||||
| Uniform Mortgage-Backed Security 3.00% 20354,5 | 76,804 | 78,695 | ||||||
| Uniform Mortgage-Backed Security 3.00% 20354,5 | 28,225 | 28,903 | ||||||
| Uniform Mortgage-Backed Security 4.50% 20504,5 | 16 | 17 | ||||||
| Other securities | 91,827 | |||||||
| 801,424 | ||||||||
| American Funds Insurance Series | 111 |
U.S. Government/AAA-Rated Securities Fund
| Bonds, notes & other debt instruments(continued) | Principal amount (000) | Value (000) | ||||||
| Federal agency bonds & notes 17.99% | ||||||||
| Fannie Mae 2.75% 2021 | $ | 26,500 | $ | 26,938 | ||||
| Fannie Mae 2.875% 2023 | 36,000 | 37,533 | ||||||
| Fannie Mae 1.25%–7.13% 2021–2030 | 6,900 | 8,673 | ||||||
| Federal Home Loan Bank 3.25%–5.50% 2023–2036 | 30,315 | 32,747 | ||||||
| Freddie Mac 2.375% 2021 | 40,000 | 40,340 | ||||||
| Private Export Funding Corp. 3.266% 20216 | 34,000 | 34,994 | ||||||
| Private Export Funding Corp. 2.25%–3.55% 2020–2024 | 11,340 | 11,768 | ||||||
| Tennessee Valley Authority, Series A, 3.875% 2021 | 32,975 | 33,756 | ||||||
| Tennessee Valley Authority 2.88%–5.88% 2027–2060 | 14,330 | 16,251 | ||||||
| U.S. Agency for International Development, Iraq (State of) 2.149% 2022 | 6,670 | 6,749 | ||||||
| U.S. Agency for International Development, Jordan (Kingdom of) 2.503% 2020 | 88,000 | 88,693 | ||||||
| U.S. Agency for International Development, Jordan (Kingdom of) 2.578% 2022 | 43,000 | 43,884 | ||||||
| U.S. Agency for International Development, Jordan (Kingdom of) 3.00% 2025 | 43,250 | 45,794 | ||||||
| U.S. Agency for International Development, Morocco (Kingdom of) 7.55% 2026 | 3,010 | 3,549 | ||||||
| U.S. Agency for International Development, Tunisia (Kingdom of) 1.416% 2021 | 3,000 | 2,990 | ||||||
| U.S. Agency for International Development, Ukraine 1.471% 2021 | 4,410 | 4,397 | ||||||
| U.S. Department of Housing and Urban Development 1.98%–3.70% 2020–2034 | 73,632 | 76,567 | ||||||
| Other securities | 5,422 | |||||||
| 521,045 | ||||||||
| Total bonds, notes & other debt instruments (cost: $2,765,266,000) | 2,803,853 | |||||||
| Short-term securities 8.05% | ||||||||
| Commercial paper 7.88% | ||||||||
| Bank of New York Co., Inc. 1.60% due 1/2/2020 | 26,700 | 26,698 | ||||||
| Exxon Mobil Corp. 1.62% due 2/3/2020 | 50,000 | 49,923 | ||||||
| Pfizer Inc. 1.67% due 1/16/20206 | 64,800 | 64,755 | ||||||
| Starbird Funding Corp. 1.58% due 1/2/20206 | 28,100 | 28,098 | ||||||
| Toronto-Dominion Bank 1.70% due 1/7/20206 | 50,000 | 49,983 | ||||||
| Other securities | 8,695 | |||||||
| 228,152 | ||||||||
| Federal agency discount notes 0.17% | ||||||||
| Other securities | 4,994 | |||||||
| Total short-term securities (cost: $233,152,000) | 233,146 | |||||||
| Total investment securities 104.86% (cost: $2,998,418,000) | 3,036,999 | |||||||
| Other assets less liabilities (4.86)% | (140,665 | ) | ||||||
| Net assets 100.00% | $ | 2,896,334 | ||||||
This summary investment portfolio is designed to streamline the report and help investors better focus on the fund’s principal holdings. See the inside back cover for details on how to obtain a complete schedule of portfolio holdings.
“Other securities” includes all issues that are not disclosed separately in the summary investment portfolio.
| 112 | American Funds Insurance Series |
U.S. Government/AAA-Rated Securities Fund
Futures contracts
| Contracts | Type | Number of contracts | Expiration | Notional amount (000) | 7 | Value at 12/31/2019 (000) | 8 | Unrealized (depreciation) appreciation at 12/31/2019 (000) | ||||||||||
| 30 Day Federal Funds Futures | Long | 451 | January 2020 | $ | 187,932 | $ | 185,014 | $ | (118 | ) | ||||||||
| 90 Day Euro Dollar Futures | Long | 565 | March 2020 | 141,250 | 138,799 | 543 | ||||||||||||
| 2 Year U.S. Treasury Note Futures | Long | 4,270 | April 2020 | 854,000 | 920,185 | 90 | ||||||||||||
| 5 Year U.S. Treasury Note Futures | Long | 6,935 | April 2020 | 693,500 | 822,556 | (3,396 | ) | |||||||||||
| 10 Year U.S. Treasury Note Futures | Long | 1,481 | March 2020 | 148,100 | 190,193 | (1,498 | ) | |||||||||||
| 10 Year Ultra U.S. Treasury Note Futures | Short | 32 | March 2020 | (3,200 | ) | (4,502 | ) | 54 | ||||||||||
| 20 Year U.S. Treasury Bond Futures | Long | 219 | March 2020 | 21,900 | 34,144 | (596 | ) | |||||||||||
| 30 Year Ultra U.S. Treasury Bond Futures | Long | 569 | March 2020 | 56,900 | 103,362 | (3,027 | ) | |||||||||||
| $ | (7,948 | ) | ||||||||||||||||
Swap contracts
Interest rate swaps
| Receive | Pay | Expiration date | Notional (000) | Value at 12/31/2019 (000) | Upfront payments/ receipts (000) | Unrealized appreciation (depreciation) at 12/31/2019 (000) | ||||||||||||
| 1.553% | U.S. EFFR | 1/29/2020 | $1,624,100 | $ 1 | $ | — | $ | 1 | ||||||||||
| 1.5365% | U.S. EFFR | 1/29/2020 | 1,288,300 | (16 | ) | — | (16 | ) | ||||||||||
| 1.535% | U.S. EFFR | 1/29/2020 | 1,351,500 | (18 | ) | — | (18 | ) | ||||||||||
| 1.531% | U.S. EFFR | 3/18/2020 | 741,200 | (33 | ) | — | (33 | ) | ||||||||||
| 1.515% | U.S. EFFR | 3/18/2020 | 671,100 | (45 | ) | — | (45 | ) | ||||||||||
| 1.5155% | U.S. EFFR | 3/18/2020 | 1,419,000 | (93 | ) | — | (93 | ) | ||||||||||
| 1.5135% | U.S. EFFR | 3/18/2020 | 1,418,700 | (97 | ) | — | (97 | ) | ||||||||||
| 1.5435% | U.S. EFFR | 4/29/2020 | 770,000 | (9 | ) | — | (9 | ) | ||||||||||
| 1.535% | U.S. EFFR | 4/29/2020 | 1,187,700 | (25 | ) | — | (25 | ) | ||||||||||
| 3-month USD-LIBOR | 2.806% | 8/29/2020 | 34,300 | (223 | ) | — | (223 | ) | ||||||||||
| 1.4555% | U.S. EFFR | 12/10/2020 | 129,200 | (77 | ) | — | (77 | ) | ||||||||||
| 1.454% | U.S. EFFR | 12/10/2020 | 152,800 | (94 | ) | — | (94 | ) | ||||||||||
| 1.4995% | U.S. EFFR | 12/20/2020 | 283,000 | (43 | ) | — | (43 | ) | ||||||||||
| 2.197% | U.S. EFFR | 4/15/2021 | 174,000 | 1,418 | — | 1,418 | ||||||||||||
| 1.605% | U.S. EFFR | 6/20/2021 | 116,816 | 124 | — | 124 | ||||||||||||
| 1.6325% | U.S. EFFR | 7/18/2021 | 243,000 | 453 | — | 453 | ||||||||||||
| 1.34% | U.S. EFFR | 10/18/2021 | 50,000 | (99 | ) | — | (99 | ) | ||||||||||
| 1.355% | U.S. EFFR | 10/24/2021 | 34,100 | (57 | ) | — | (57 | ) | ||||||||||
| 1.339% | U.S. EFFR | 10/24/2021 | 62,000 | (122 | ) | — | (122 | ) | ||||||||||
| 1.3065% | U.S. EFFR | 10/25/2021 | 83,800 | (213 | ) | — | (213 | ) | ||||||||||
| 1.39% | U.S. EFFR | 10/31/2021 | 116,000 | (116 | ) | — | (116 | ) | ||||||||||
| 1.3615% | U.S. EFFR | 11/1/2021 | 252,400 | (383 | ) | — | (383 | ) | ||||||||||
| 1.281% | U.S. EFFR | 11/4/2021 | 252,700 | (756 | ) | — | (756 | ) | ||||||||||
| 1.411% | U.S. EFFR | 11/7/2021 | 56,875 | (35 | ) | — | (35 | ) | ||||||||||
| 1.3925% | U.S. EFFR | 11/7/2021 | 56,875 | (54 | ) | — | (54 | ) | ||||||||||
| U.S. EFFR | 1.335% | 11/26/2021 | 222,000 | 451 | — | 451 | ||||||||||||
| 1.433% | U.S. EFFR | 12/16/2021 | 137,600 | (21 | ) | — | (21 | ) | ||||||||||
| 3-month USD-LIBOR | 2.2175% | 3/17/2022 | 52,000 | (612 | ) | — | (612 | ) | ||||||||||
| 2.197% | U.S. EFFR | 4/18/2022 | 47,400 | 768 | — | 768 | ||||||||||||
| 3-month USD-LIBOR | 1.75918% | 4/29/2022 | 58,000 | (111 | ) | — | (111 | ) | ||||||||||
| 1.8475% | 3-month USD-LIBOR | 7/11/2022 | 34,900 | 150 | — | 150 | ||||||||||||
| 2.5775% | U.S. EFFR | 7/16/2022 | 181,639 | 2,107 | — | 2,107 | ||||||||||||
| 3-month USD-LIBOR | 1.948% | 7/28/2022 | 20,000 | (139 | ) | — | (139 | ) | ||||||||||
| 2.80% | 3-month USD-LIBOR | 9/2/2022 | 280,000 | 6,379 | — | 6,379 | ||||||||||||
| 2.75% | 3-month USD-LIBOR | 9/2/2022 | 280,000 | 6,107 | — | 6,107 | ||||||||||||
| 2.009% | 3-month USD-LIBOR | 10/4/2022 | 50,000 | 450 | — | 450 | ||||||||||||
| American Funds Insurance Series | 113 |
U.S. Government/AAA-Rated Securities Fund
Swap contracts(continued)
Interest rate swaps (continued)
| Receive | Pay | Expiration date | Notional (000) | Value at 12/31/2019 (000) | Upfront payments/ receipts (000) | Unrealized appreciation (depreciation) at 12/31/2019 (000) | ||||||||||||
| 3-month USD-LIBOR | 2.0815% | 2/10/2024 | $ 28,700 | $ (441 | ) | $ | — | $ | (441 | ) | ||||||||
| 2.21875% | U.S. EFFR | 3/14/2024 | 54,000 | 1,627 | — | 1,627 | ||||||||||||
| 3-month USD-LIBOR | 2.21079% | 3/27/2024 | 48,318 | (1,010 | ) | — | (1,010 | ) | ||||||||||
| 3-month USD-LIBOR | 2.33% | 5/2/2024 | 48,460 | (1,272 | ) | — | (1,272 | ) | ||||||||||
| 3-month USD-LIBOR | 2.588% | 1/26/2025 | 15,600 | (647 | ) | — | (647 | ) | ||||||||||
| 3-month USD-LIBOR | 1.867% | 7/11/2025 | 49,400 | (84 | ) | — | (84 | ) | ||||||||||
| 3-month USD-LIBOR | 2.27% | 12/5/2026 | 44,900 | (1,426 | ) | — | (1,426 | ) | ||||||||||
| 2.91% | 3-month USD-LIBOR | 2/1/2028 | 16,000 | 723 | — | 723 | ||||||||||||
| 2.908% | 3-month USD-LIBOR | 2/1/2028 | 16,000 | 721 | — | 721 | ||||||||||||
| 2.925% | 3-month USD-LIBOR | 2/1/2028 | 12,800 | 587 | — | 587 | ||||||||||||
| 2.92% | 3-month USD-LIBOR | 2/2/2028 | 12,200 | 556 | — | 556 | ||||||||||||
| U.S. EFFR | 2.5065% | 3/22/2028 | 8,700 | (610 | ) | — | (610 | ) | ||||||||||
| U.S. EFFR | 2.535% | 3/23/2028 | 6,700 | (484 | ) | — | (484 | ) | ||||||||||
| U.S. EFFR | 2.471% | 3/27/2028 | 8,100 | (546 | ) | — | (546 | ) | ||||||||||
| U.S. EFFR | 2.4575% | 3/29/2028 | 9,638 | (639 | ) | — | (639 | ) | ||||||||||
| U.S. EFFR | 2.424% | 3/30/2028 | 8,160 | (520 | ) | — | (520 | ) | ||||||||||
| U.S. EFFR | 2.412% | 4/5/2028 | 3,702 | (233 | ) | — | (233 | ) | ||||||||||
| 3-month USD-LIBOR | 1.9675% | 6/21/2029 | 50,700 | (418 | ) | — | (418 | ) | ||||||||||
| 3-month USD-LIBOR | 2.05% | 7/18/2029 | 41,000 | (629 | ) | — | (629 | ) | ||||||||||
| 3-month USD-LIBOR | 1.995% | 7/19/2029 | 25,400 | (266 | ) | — | (266 | ) | ||||||||||
| U.S. EFFR | 1.485% | 10/23/2029 | 16,000 | 244 | — | 244 | ||||||||||||
| U.S. EFFR | 1.4869% | 10/23/2029 | 14,600 | 220 | — | 220 | ||||||||||||
| U.S. EFFR | 1.453% | 10/24/2029 | 18,500 | 336 | — | 336 | ||||||||||||
| U.S. EFFR | 1.4741% | 10/24/2029 | 18,500 | 300 | — | 300 | ||||||||||||
| U.S. EFFR | 1.4495% | 10/24/2029 | 13,600 | 251 | — | 251 | ||||||||||||
| U.S. EFFR | 1.446% | 10/24/2029 | 1,800 | 34 | — | 34 | ||||||||||||
| 1.419% | U.S. EFFR | 11/26/2029 | 47,000 | (1,021 | ) | — | (1,021 | ) | ||||||||||
| 3-month USD-LIBOR | 2.97125% | 9/2/2030 | 62,000 | (5,923 | ) | — | (5,923 | ) | ||||||||||
| 3-month USD-LIBOR | 3.005% | 9/2/2030 | 62,000 | (6,114 | ) | — | (6,114 | ) | ||||||||||
| 3-month USD-LIBOR | 2.986% | 2/1/2038 | 7,800 | (449 | ) | — | (449 | ) | ||||||||||
| 3-month USD-LIBOR | 2.9625% | 2/1/2038 | 9,800 | (545 | ) | — | (545 | ) | ||||||||||
| 3-month USD-LIBOR | 2.963% | 2/1/2038 | 9,800 | (546 | ) | — | (546 | ) | ||||||||||
| 3-month USD-LIBOR | 2.967% | 2/2/2038 | 7,600 | (426 | ) | — | (426 | ) | ||||||||||
| 3-month USD-LIBOR | 3.34% | 6/27/2044 | 10,000 | (2,481 | ) | — | (2,481 | ) | ||||||||||
| 3-month USD-LIBOR | 3.206% | 7/31/2044 | 16,000 | (3,559 | ) | — | (3,559 | ) | ||||||||||
| 3-month USD-LIBOR | 3.238% | 8/8/2044 | 16,000 | (3,659 | ) | — | (3,659 | ) | ||||||||||
| 3-month USD-LIBOR | 2.7045% | 1/2/2045 | 12,000 | (1,489 | ) | — | (1,489 | ) | ||||||||||
| 3-month USD-LIBOR | 2.4945% | 1/9/2045 | 2,000 | (164 | ) | — | (164 | ) | ||||||||||
| 3-month USD-LIBOR | 2.5055% | 1/9/2045 | 11,000 | (925 | ) | — | (925 | ) | ||||||||||
| 3-month USD-LIBOR | 2.52822% | 11/23/2045 | 4,390 | (398 | ) | — | (398 | ) | ||||||||||
| U.S. EFFR | 2.155% | 11/10/2047 | 8,640 | (580 | ) | — | (580 | ) | ||||||||||
| U.S. EFFR | 2.5635% | 2/12/2048 | 33,204 | (5,234 | ) | — | (5,234 | ) | ||||||||||
| 3-month USD-LIBOR | 1.934% | 12/12/2049 | 19,300 | 704 | — | 704 | ||||||||||||
| 3-month USD-LIBOR | 1.935% | 12/17/2049 | 17,280 | 627 | — | 627 | ||||||||||||
| 3-month USD-LIBOR | 2.007% | 12/19/2049 | 21,500 | 423 | — | 423 | ||||||||||||
| 3-month USD-LIBOR | 2.045% | 12/27/2049 | 15,100 | 166 | — | 166 | ||||||||||||
| $ | — | $ | (20,302 | ) | ||||||||||||||
| 114 | American Funds Insurance Series |
U.S. Government/AAA-Rated Securities Fund
The following footnotes apply to either the individual securities noted or one or more of the securities aggregated and listed as a single line item.
| 1 | All or a portion of this security was pledged as collateral. The total value of pledged collateral was $46,115,000, which represented 1.59% of the net assets of the fund. |
| 2 | Coupon rate may change periodically. Reference rate and spread are as of the most recent information available. Some coupon rates are determined by the issuer or agent based on current market conditions; therefore, the reference rate and spread are not available. |
| 3 | Index-linked bond whose principal amount moves with a government price index. |
| 4 | Principal payments may be made periodically. Therefore, the effective maturity date may be earlier than the stated maturity date. |
| 5 | Purchased on a TBA basis. |
| 6 | Acquired in a transaction exempt from registration under Rule 144A or Section 4(2) of the Securities Act of 1933. May be resold in the U.S. in transactions exempt from registration, normally to qualified institutional buyers. The total value of all such securities was $177,830,000, which represented 6.14% of the net assets of the fund. |
| 7 | Notional amount is calculated based on the number of contracts and notional contract size. |
| 8 | Value is calculated based on the notional amount and current market price. |
Key to abbreviations and symbol
EFFR = Effective Federal Funds Rate
LIBOR = London Interbank Offered Rate
TBA = To-be-announced
USD/$ = U.S. dollars
See notes to financial statements.
| American Funds Insurance Series | 115 |
Investment portfolioDecember 31, 2019
| Growth funds 81.52% | Shares | Value (000) | ||||||
| American Funds Insurance Series – Growth Fund, Class 1 | 4,413,020 | $ | 358,426 | |||||
| Total growth funds (cost: $314,327,000) | 358,426 | |||||||
| Fixed income funds 15.17% | ||||||||
| American Funds Insurance Series – Bond Fund, Class 1 | 5,970,036 | 66,685 | ||||||
| Total fixed income funds (cost: $64,788,000) | 66,685 | |||||||
| Short-term securities 3.38% | ||||||||
| Government Cash Management Fund 1.51%1 | 14,836,148 | 14,836 | ||||||
| Total short-term securities (cost: $14,836,000) | 14,836 | |||||||
| Total investment securities 100.07% (cost: $393,951,000) | 439,947 | |||||||
| Other assets less liabilities (0.07)% | (297 | ) | ||||||
| Net assets 100.00% | $ | 439,650 | ||||||
Futures contracts
| Contracts | Type | Number of contracts | Expiration | Notional amount (000) | 2 | Value at 12/31/2019 (000) | 3 | Unrealized depreciation at 12/31/2019 (000) | ||||||||||
| 5 Year U.S. Treasury Note Futures | Long | 142 | March 2020 | $ | 14,200 | $ | 16,843 | $ | (61 | ) | ||||||||
Investments in affiliates
These holdings are affiliates of the fund under the Investment Company Act of 1940 since they are controlled by the same board of trustees as the series. Further details on these holdings and related transactions during the year ended December 31, 2019, appear below.
| Beginning shares | Additions | Reductions | Ending shares | Net realized gain (loss) (000) | Net unrealized appreciation (000) | Dividend income (000) | Value of affiliates at 12/31/2019 (000) | |||||||||||||||||||||||||
| Growth funds 81.52% | ||||||||||||||||||||||||||||||||
| American Funds Insurance Series – Growth Fund, Class 1 | 3,963,500 | 841,360 | 391,840 | 4,413,020 | $ | 3,636 | $ | 45,980 | $ | 3,243 | $ | 358,426 | ||||||||||||||||||||
| Fixed income funds 15.17% | ||||||||||||||||||||||||||||||||
| American Funds Insurance Series – Bond Fund, Class 1 | 5,110,855 | 1,716,104 | 856,923 | 5,970,036 | (16 | ) | 3,708 | 1,763 | 66,685 | |||||||||||||||||||||||
| Total 96.69% | $ | 3,620 | $ | 49,688 | $ | 5,006 | $ | 425,111 | ||||||||||||||||||||||||
| 1 | Rate represents the seven-day yield at 12/31/2019. |
| 2 | Notional amount is calculated based on the number of contracts and notional contract size. |
| 3 | Value is calculated based on the notional amount and current market price. |
See notes to financial statements.
| 116 | American Funds Insurance Series |
Managed Risk International Fund
Investment portfolioDecember 31, 2019
| Growth funds 80.75% | Shares | Value (000) | ||||||
| American Funds Insurance Series – International Fund, Class 1 | 6,417,163 | $ | 133,862 | |||||
| Total growth funds (cost: $119,729,000) | 133,862 | |||||||
| Fixed income funds 14.76% | ||||||||
| American Funds Insurance Series – Bond Fund, Class 1 | 2,190,172 | 24,465 | ||||||
| Total fixed income funds (cost: $23,789,000) | 24,465 | |||||||
| Short-term securities 4.55% | ||||||||
| Government Cash Management Fund 1.51%1 | 7,541,294 | 7,541 | ||||||
| Total short-term securities (cost: $7,541,000) | 7,541 | |||||||
| Total investment securities 100.06% (cost: $151,059,000) | 165,868 | |||||||
| Other assets less liabilities (0.06)% | (99 | ) | ||||||
| Net assets 100.00% | $ | 165,769 | ||||||
Futures contracts
| Contracts | Type | Number of contracts | Expiration | Notional amount (000) | 2 | Value at 12/31/2019 (000) | 3 | Unrealized depreciation at 12/31/2019 (000) | ||||||||||
| 5 Year U.S. Treasury Note Futures | Long | 72 | March 2020 | $ | 7,200 | $ | 8,540 | $ | (30 | ) | ||||||||
Investments in affiliates
These holdings are affiliates of the fund under the Investment Company Act of 1940 since they are controlled by the same board of trustees as the series. Further details on these holdings and related transactions during the year ended December 31, 2019, appear below.
| Beginning shares | Additions | Reductions | Ending shares | Net realized gain (000) | Net unrealized appreciation (000) | Dividend income (000) | Value of affiliates at 12/31/2019 (000) | |||||||||||||||||||||||||
| Growth funds 80.75% | ||||||||||||||||||||||||||||||||
| American Funds Insurance Series – International Fund, Class 1 | 6,802,836 | 422,276 | 807,949 | 6,417,163 | $ | 553 | $ | 20,856 | $ | 2,158 | $ | 133,862 | ||||||||||||||||||||
| Fixed income funds 14.76% | ||||||||||||||||||||||||||||||||
| American Funds Insurance Series – Bond Fund, Class 1 | 2,162,908 | 382,186 | 354,922 | 2,190,172 | 64 | 1,507 | 667 | 24,465 | ||||||||||||||||||||||||
| Total 95.51% | $ | 617 | $ | 22,363 | $ | 2,825 | $ | 158,327 | ||||||||||||||||||||||||
| 1 | Rate represents the seven-day yield at 12/31/2019. |
| 2 | Notional amount is calculated based on the number of contracts and notional contract size. |
| 3 | Value is calculated based on the notional amount and current market price. |
See notes to financial statements.
| American Funds Insurance Series | 117 |
Managed Risk Blue Chip Income and Growth Fund
Investment portfolioDecember 31, 2019
| Growth-and-income funds 81.97% | Shares | Value (000) | ||||||
| American Funds Insurance Series – Blue Chip Income and Growth Fund, Class 1 | 22,089,727 | $ | 299,536 | |||||
| Total growth-and-income funds(cost: $295,807,000) | 299,536 | |||||||
| Fixed income funds 14.64% | ||||||||
| American Funds Insurance Series – U.S. Government/AAA-Rated Securities Fund, Class 1 | 4,337,434 | 53,524 | ||||||
| Total fixed income funds (cost: $52,792,000) | 53,524 | |||||||
| Short-term securities 3.45% | ||||||||
| Government Cash Management Fund 1.51%1 | 12,608,727 | 12,609 | ||||||
| Total short-term securities (cost: $12,609,000) | 12,609 | |||||||
| Total investment securities 100.06% (cost: $361,208,000) | 365,669 | |||||||
| Other assets less liabilities (0.06)% | (234 | ) | ||||||
| Net assets 100.00% | $ | 365,435 | ||||||
Futures contracts
| Contracts | Type | Number of contracts | Expiration | Notional amount (000) | 2 | Value at 12/31/2019 (000) | 3 | Unrealized depreciation at 12/31/2019 (000) | ||||||||||
| 5 Year U.S. Treasury Note Futures | Long | 121 | March 2020 | $ | 12,100 | $ | 14,352 | $(52 | ) | |||||||||
Investments in affiliates
These holdings are affiliates of the fund under the Investment Company Act of 1940 since they are controlled by the same board of trustees as the series. Further details on these holdings and related transactions during the year ended December 31, 2019, appear below.
| Beginning shares | Additions | Reductions | Ending shares | Net realized gain (000) | Net unrealized appreciation (000) | Dividend income (000) | Value of affiliates at 12/31/2019 (000) | |||||||||||||||||||||||||
| Growth-and-income funds 81.97% | ||||||||||||||||||||||||||||||||
| American Funds Insurance Series – Blue Chip Income and Growth Fund, Class 1 | 21,901,978 | 2,725,657 | 2,537,908 | 22,089,727 | $ | 139 | $ | 27,211 | $ | 6,403 | $ | 299,536 | ||||||||||||||||||||
| Fixed income funds 14.64% | ||||||||||||||||||||||||||||||||
| American Funds Insurance Series – U.S. Government/AAA-Rated Securities Fund, Class 1 | 4,484,388 | 702,066 | 849,020 | 4,337,434 | 30 | 1,747 | 1,181 | 53,524 | ||||||||||||||||||||||||
| Total 96.61% | $ | 169 | $ | 28,958 | $ | 7,584 | $ | 353,060 | ||||||||||||||||||||||||
| 1 | Rate represents the seven-day yield at 12/31/2019. |
| 2 | Notional amount is calculated based on the number of contracts and notional contract size. |
| 3 | Value is calculated based on the notional amount and current market price. |
See notes to financial statements.
| 118 | American Funds Insurance Series |
Managed Risk Growth-Income Fund
Investment portfolioDecember 31, 2019
| Growth-and-income funds 81.15% | Shares | Value (000) | ||||||
| American Funds Insurance Series – Growth-Income Fund, Class 1 | 36,320,774 | $ | 1,841,827 | |||||
| Total growth-and-income funds(cost: $1,679,355,000) | 1,841,827 | |||||||
| Fixed income funds 14.86% | ||||||||
| American Funds Insurance Series – Bond Fund, Class 1 | 30,186,789 | 337,186 | ||||||
| Total fixed income funds (cost: $317,192,000) | 337,186 | |||||||
| Short-term securities 3.81% | ||||||||
| Government Cash Management Fund 1.51%1 | 86,525,815 | 86,526 | ||||||
| Total short-term securities (cost: $86,526,000) | 86,526 | |||||||
| Options purchased 0.19% | ||||||||
| Options purchased* | 4,322 | |||||||
| Total options purchased (cost: $14,443,000) | 4,322 | |||||||
| Total investment securities 100.01% (cost: $2,097,516,000) | 2,269,861 | |||||||
| Other assets less liabilities (0.01)% | (137 | ) | ||||||
| Net assets 100.00% | $ | 2,269,724 | ||||||
* Options purchased
Put
| Description | Number of contracts | Notional amount (000) | Exercise price | Expiration date | Value at 12/31/2019 (000) | |||||||||||||
| S&P 500 Index | 110 | $ | 355 | $ | 2,050.00 | 3/20/2020 | $ | 8 | ||||||||||
| S&P 500 Index | 2,720 | 8,788 | 2,100.00 | 3/20/2020 | 231 | |||||||||||||
| S&P 500 Index | 1,200 | 3,877 | 2,150.00 | 3/20/2020 | 144 | |||||||||||||
| S&P 500 Index | 50 | 162 | 2,175.00 | 3/20/2020 | 5 | |||||||||||||
| S&P 500 Index | 715 | 2,310 | 2,200.00 | 3/20/2020 | 82 | |||||||||||||
| S&P 500 Index | 135 | 436 | 2,225.00 | 3/20/2020 | 17 | |||||||||||||
| S&P 500 Index | 170 | 549 | 2,250.00 | 3/20/2020 | 25 | |||||||||||||
| S&P 500 Index | 95 | 307 | 2,225.00 | 6/19/2020 | 50 | |||||||||||||
| S&P 500 Index | 250 | 808 | 2,250.00 | 6/19/2020 | 148 | |||||||||||||
| S&P 500 Index | 130 | 420 | 2,275.00 | 6/19/2020 | 92 | |||||||||||||
| S&P 500 Index | 3,520 | 11,372 | 2,325.00 | 6/19/2020 | 3,041 | |||||||||||||
| S&P 500 Index | 160 | 517 | 2,350.00 | 6/19/2020 | 130 | |||||||||||||
| S&P 500 Index | 180 | 582 | 2,375.00 | 6/19/2020 | 160 | |||||||||||||
| S&P 500 Index | 70 | 226 | 2,400.00 | 6/19/2020 | 78 | |||||||||||||
| S&P 500 Index | 65 | 210 | 2,450.00 | 6/19/2020 | 86 | |||||||||||||
| S&P 500 Index | 15 | 48 | 2,325.00 | 9/18/2020 | 25 | |||||||||||||
| $ | 4,322 | |||||||||||||||||
| American Funds Insurance Series | 119 |
Managed Risk Growth-Income Fund
Futures contracts
| Contracts | Type | Number of contracts | Expiration | Notional amount (000) | 2 | Value at 12/31/2019 (000) | 3 | Unrealized (depreciation) appreciation at 12/31/2019 (000) | ||||||||||
| 5 Year U.S. Treasury Note Futures | Long | 876 | March 2020 | $ | 87,600 | $ | 103,902 | $ | (375 | ) | ||||||||
| S&P 500 E-mini Index Contracts | Long | 380 | March 2020 | 19 | 61,391 | 1,045 | ||||||||||||
| $ | 670 | |||||||||||||||||
Investments in affiliates
These holdings are affiliates of the fund under the Investment Company Act of 1940 since they are controlled by the same board of trustees as the series. Further details on these holdings and related transactions during the year ended December 31, 2019, appear below.
| Beginning shares | Additions | Reductions | Ending shares | Net realized gain (000) | Net unrealized appreciation (000) | Dividend income (000) | Value of affiliates at 12/31/2019 (000) | |||||||||||||||||||||||||
| Growth-and-income funds 81.15% | ||||||||||||||||||||||||||||||||
| American Funds Insurance Series – Growth-Income Fund, Class 1 | 33,123,343 | 5,204,328 | 2,006,897 | 36,320,774 | $ | 10,843 | $ | 181,776 | $ | 32,844 | $ | 1,841,827 | ||||||||||||||||||||
| Fixed income funds 14.86% | ||||||||||||||||||||||||||||||||
| American Funds Insurance Series – Bond Fund, Class 1 | 26,945,898 | 5,339,384 | 2,098,493 | 30,186,789 | 551 | 19,412 | 9,121 | 337,186 | ||||||||||||||||||||||||
| Total 96.01% | $ | 11,394 | $ | 201,188 | $ | 41,965 | $ | 2,179,013 | ||||||||||||||||||||||||
| 1 | Rate represents the seven-day yield at 12/31/2019. |
| 2 | Notional amount is calculated based on the number of contracts and notional contract size. |
| 3 | Value is calculated based on the notional amount and current market price. |
See notes to financial statements.
| 120 | American Funds Insurance Series |
Managed Risk Asset Allocation Fund
Investment portfolioDecember 31, 2019
| Asset allocation funds 95.49% | Shares | Value (000) | ||||||
| American Funds Insurance Series – Asset Allocation Fund, Class 1 | 112,462,863 | $ | 2,704,731 | |||||
| Total asset allocation funds(cost: $2,461,096,000) | 2,704,731 | |||||||
| Short-term securities 4.57% | ||||||||
| Government Cash Management Fund 1.51%1 | 129,388,605 | 129,389 | ||||||
| Total short-term securities (cost: $129,389,000) | 129,389 | |||||||
| Total investment securities 100.06% (cost: $2,590,485,000) | 2,834,120 | |||||||
| Other assets less liabilities (0.06)% | (1,616 | ) | ||||||
| Net assets 100.00% | $ | 2,832,504 | ||||||
Futures contracts
| Contracts | Type | Number of contracts | Expiration | Notional amount (000) | 2 | Value at 12/31/2019 (000) | 3 | Unrealized depreciation at 12/31/2019 (000) | ||||||||||
| 5 Year U.S. Treasury Note Futures | Long | 1,222 | March 2020 | $ | 122,200 | $ | 144,941 | $ | (525 | ) | ||||||||
Investment in affiliates
This holding is an affiliate of the fund under the Investment Company Act of 1940 since it is controlled by the same board of trustees as the series. Further details on this holding and related transactions during the year ended December 31, 2019, appear below.
| Beginning shares | Additions | Reductions | Ending shares | Net realized gain (000) | Net unrealized appreciation (000) | Dividend income (000) | Value of affiliates at 12/31/2019 (000) | |||||||||||||||||||||||||
| Asset allocation funds 95.49% | ||||||||||||||||||||||||||||||||
| American Funds Insurance Series – Asset Allocation Fund, Class 1 | 115,468,223 | 9,622,390 | 12,627,750 | 112,462,863 | $ | 18,556 | $ | 297,458 | $ | 55,061 | $ | 2,704,731 | ||||||||||||||||||||
| 1 | Rate represents the seven-day yield at 12/31/2019. |
| 2 | Notional amount is calculated based on the number of contracts and notional contract size. |
| 3 | Value is calculated based on the notional amount and current market price. |
See notes to financial statements.
| American Funds Insurance Series | 121 |
Statements of assets and liabilities
at December 31, 2019
| Global Growth Fund | Global Small Capitalization Fund | Growth Fund | International Fund | New World Fund | ||||||||||||||||
| Assets: | ||||||||||||||||||||
| Investment securities, at value: | ||||||||||||||||||||
| Unaffiliated issuers | $ | 6,834,678 | $ | 4,695,009 | $ | 28,530,215 | $ | 10,090,299 | $ | 3,763,903 | ||||||||||
| Affiliated issuers | — | 12,711 | — | — | — | |||||||||||||||
| Cash | 77 | 984 | 961 | 1,558 | 5,500 | |||||||||||||||
| Cash collateral received for securities on loan | — | 9,581 | — | — | — | |||||||||||||||
| Cash denominated in currencies other than U.S. dollars | 187 | 5,130 | 822 | 3,548 | 730 | |||||||||||||||
| Unrealized appreciation on open forward currency contracts | — | — | — | — | — | |||||||||||||||
| Receivables for: | ||||||||||||||||||||
| Sales of investments | — | 2,285 | 7,836 | 2,831 | 261 | |||||||||||||||
| Sales of fund’s shares | 2,516 | 3,547 | 5,850 | 1,503 | 1,370 | |||||||||||||||
| Dividends and interest | 12,553 | 3,331 | 40,016 | 17,475 | 6,799 | |||||||||||||||
| Closed forward currency contracts | — | — | — | — | — | |||||||||||||||
| Variation margin on futures contracts | — | — | — | — | — | |||||||||||||||
| Variation margin on swap contracts | — | — | — | — | — | |||||||||||||||
| Securities lending income | — | 384 | — | — | 9 | |||||||||||||||
| Other | 468 | 226 | 53 | 96 | 1,978 | |||||||||||||||
| 6,850,479 | 4,733,188 | 28,585,753 | 10,117,310 | 3,780,550 | ||||||||||||||||
| Liabilities: | ||||||||||||||||||||
| Collateral for securities on loan | — | 95,814 | — | — | — | |||||||||||||||
| Unrealized depreciation on open forward currency contracts | — | — | — | 131 | — | |||||||||||||||
| Payables for: | ||||||||||||||||||||
| Purchases of investments | 218 | 2,571 | 19,404 | 1,808 | 841 | |||||||||||||||
| Repurchases of fund’s shares | 40,573 | 4,821 | 82,386 | 18,480 | 3,083 | |||||||||||||||
| Investment advisory services | 2,924 | 2,682 | 7,647 | 4,148 | 2,180 | |||||||||||||||
| Insurance administrative fees | 226 | 121 | 897 | 230 | 382 | |||||||||||||||
| Services provided by related parties | 1,061 | 653 | 4,372 | 1,231 | 429 | |||||||||||||||
| Trustees’ deferred compensation | 77 | 52 | 497 | 207 | 36 | |||||||||||||||
| Closed forward currency contracts | — | — | — | — | — | |||||||||||||||
| Variation margin on futures contracts | — | — | — | — | — | |||||||||||||||
| Variation margin on swap contracts | — | — | — | — | — | |||||||||||||||
| Non-U.S. taxes | 4,857 | 6,103 | 811 | 15,406 | 13,045 | |||||||||||||||
| Other | 96 | 98 | 80 | 238 | 143 | |||||||||||||||
| 50,032 | 112,915 | 116,094 | 41,879 | 20,139 | ||||||||||||||||
| Net assets at December 31, 2019 | $ | 6,800,447 | $ | 4,620,273 | $ | 28,469,659 | $ | 10,075,431 | $ | 3,760,411 | ||||||||||
| Net assets consist of: | ||||||||||||||||||||
| Capital paid in on shares of beneficial interest | $ | 3,735,844 | $ | 3,169,995 | $ | 15,151,170 | $ | 7,794,312 | $ | 2,756,659 | ||||||||||
| Total distributable earnings | 3,064,603 | 1,450,278 | 13,318,489 | 2,281,119 | 1,003,752 | |||||||||||||||
| Net assets at December 31, 2019 | $ | 6,800,447 | $ | 4,620,273 | $ | 28,469,659 | $ | 10,075,431 | $ | 3,760,411 | ||||||||||
| Investment securities on loan, at value | $ | — | $ | 102,111 | $ | — | $ | — | $ | 2,679 | ||||||||||
| Investment securities, at cost: | ||||||||||||||||||||
| Unaffiliated issuers | 3,948,846 | 3,495,309 | 16,010,216 | 7,618,504 | 2,782,480 | |||||||||||||||
| Affiliated issuers | — | 45,916 | — | — | — | |||||||||||||||
| Cash denominated in currencies other than U.S. dollars, at cost | 186 | 5,130 | 822 | 3,531 | 745 | |||||||||||||||
See end of statements of assets and liabilities for footnote.
See notes to financial statements.
| 122 | American Funds Insurance Series |
(dollars in thousands)
| Blue Chip Income and Growth Fund | Global Growth and Income Fund | Growth- Income Fund | International Growth and Income Fund | Capital Income Builder | Asset Allocation Fund | Global Balanced Fund | Bond Fund | Global Bond Fund | ||||||||||||||||||||||||||
| $ | 9,276,932 | $ | 2,138,294 | $ | 35,695,564 | $ | 1,502,569 | $ | 990,616 | $ | 27,124,386 | $ | 435,920 | $ | 10,917,401 | $ | 2,118,893 | |||||||||||||||||
| — | — | 336,143 | — | — | 444,495 | — | — | — | ||||||||||||||||||||||||||
| 199 | 226 | 2,015 | 48 | 114 | 5,535 | 62 | 7,258 | 459 | ||||||||||||||||||||||||||
| — | — | — | — | — | 510 | — | — | — | ||||||||||||||||||||||||||
| 170 | 299 | 180 | 427 | 278 | 1,146 | 3 | 64 | 94 | ||||||||||||||||||||||||||
| — | — | — | — | — | — | 173 | 2,743 | 3,976 | ||||||||||||||||||||||||||
| — | 112 | 88 | 131 | 22,405 | 213,442 | 1 | 669,867 | 18,110 | ||||||||||||||||||||||||||
| 1,708 | 662 | 5,285 | 300 | 1,104 | 9,829 | 140 | 7,295 | 2,121 | ||||||||||||||||||||||||||
| 15,592 | 5,398 | 71,629 | 4,137 | 3,549 | 83,460 | 1,682 | 63,827 | 18,545 | ||||||||||||||||||||||||||
| — | — | — | — | — | — | — | — | 53 | ||||||||||||||||||||||||||
| — | — | — | — | 22 | 437 | 2 | 2,378 | 167 | ||||||||||||||||||||||||||
| — | — | — | — | 97 | 292 | 13 | 948 | 200 | ||||||||||||||||||||||||||
| — | — | — | — | — | 126 | — | — | — | ||||||||||||||||||||||||||
| 10 | 393 | 394 | 40 | 22 | 160 | 32 | 61 | 162 | ||||||||||||||||||||||||||
| 9,294,611 | 2,145,384 | 36,111,298 | 1,507,652 | 1,018,207 | 27,883,818 | 438,028 | 11,671,842 | 2,162,780 | ||||||||||||||||||||||||||
| — | — | — | — | — | 5,103 | — | — | — | ||||||||||||||||||||||||||
| — | 137 | — | 11 | — | — | 272 | 3,934 | 6,186 | ||||||||||||||||||||||||||
| 509 | 44 | 12,801 | 184 | 18,310 | 434,944 | 264 | 1,108,141 | 25,517 | ||||||||||||||||||||||||||
| 7,089 | 2,594 | 57,734 | 6,267 | 235 | 11,152 | 104 | 1,500 | 294 | ||||||||||||||||||||||||||
| 3,021 | 1,056 | 7,672 | 755 | 397 | 6,088 | 242 | 3,237 | 954 | ||||||||||||||||||||||||||
| 365 | 86 | 724 | 60 | 275 | 2,677 | 57 | 303 | 30 | ||||||||||||||||||||||||||
| 1,007 | 369 | 4,017 | 111 | 118 | 2,703 | 73 | 1,126 | 276 | ||||||||||||||||||||||||||
| 91 | 24 | 579 | 12 | 4 | 284 | 3 | 125 | 26 | ||||||||||||||||||||||||||
| — | — | — | — | — | — | — | — | 66 | ||||||||||||||||||||||||||
| — | — | — | — | 48 | 473 | 1 | 2,265 | 196 | ||||||||||||||||||||||||||
| — | — | — | — | 56 | 17 | 7 | 51 | 218 | ||||||||||||||||||||||||||
| 164 | 2,545 | 1,411 | 112 | 38 | 586 | 49 | — | 273 | ||||||||||||||||||||||||||
| 4 | 46 | 94 | 54 | 10 | 136 | 6 | — | 100 | ||||||||||||||||||||||||||
| 12,250 | 6,901 | 85,032 | 7,566 | 19,491 | 464,163 | 1,078 | 1,120,682 | 34,136 | ||||||||||||||||||||||||||
| $ | 9,282,361 | $ | 2,138,483 | $ | 36,026,266 | $ | 1,500,086 | $ | 998,716 | $ | 27,419,655 | $ | 436,950 | $ | 10,551,160 | $ | 2,128,644 | |||||||||||||||||
| $ | 7,024,809 | $ | 1,446,699 | $ | 24,318,085 | $ | 1,269,718 | $ | 924,094 | $ | 20,498,664 | $ | 354,288 | $ | 10,126,847 | $ | 2,039,155 | |||||||||||||||||
| 2,257,552 | 691,784 | 11,708,181 | 230,368 | 74,622 | 6,920,991 | 82,662 | 424,313 | 89,489 | ||||||||||||||||||||||||||
| $ | 9,282,361 | $ | 2,138,483 | $ | 36,026,266 | $ | 1,500,086 | $ | 998,716 | $ | 27,419,655 | $ | 436,950 | $ | 10,551,160 | $ | 2,128,644 | |||||||||||||||||
| $ | — | $ | — | $ | — | $ | — | $ | — | $ | 5,211 | $ | — | $ | — | $ | — | |||||||||||||||||
| 7,160,359 | 1,501,184 | 25,109,357 | 1,239,563 | 895,730 | 20,541,489 | 353,703 | 10,597,431 | 2,061,125 | ||||||||||||||||||||||||||
| — | — | 279,526 | — | — | 328,678 | — | — | — | ||||||||||||||||||||||||||
| 170 | 298 | 180 | 426 | 278 | 1,146 | 3 | 64 | 94 | ||||||||||||||||||||||||||
| American Funds Insurance Series | 123 |
Statements of assets and liabilities
at December 31, 2019
| High- Income Bond Fund | Mortgage Fund | Ultra-Short Bond Fund | U.S. Government/ AAA-Rated Securities Fund | Managed Risk Growth Fund | ||||||||||||||||
| Assets: | ||||||||||||||||||||
| Investment securities, at value: | ||||||||||||||||||||
| Unaffiliated issuers | $ | 1,243,917 | $ | 279,612 | $ | 284,229 | $ | 3,036,999 | $ | 14,836 | ||||||||||
| Affiliated issuers | — | — | — | — | 425,111 | |||||||||||||||
| Cash | 726 | 262 | 109 | 2,199 | 99 | |||||||||||||||
| Cash collateral pledged for futures contracts | 154 | — | — | — | — | |||||||||||||||
| Cash collateral pledged for swap contracts | 2,100 | — | — | — | — | |||||||||||||||
| Cash denominated in currencies other than U.S. dollars | — | * | — | — | — | — | ||||||||||||||
| Receivables for: | ||||||||||||||||||||
| Sales of investments | 2,727 | 83,408 | — | 298,428 | 447 | |||||||||||||||
| Sales of fund’s shares | 209 | 235 | 696 | 1,934 | 32 | |||||||||||||||
| Dividends and interest | 20,007 | 732 | — | 10,545 | 21 | |||||||||||||||
| Variation margin on futures contracts | 33 | 20 | — | 217 | — | |||||||||||||||
| Variation margin on swap contracts | 41 | 329 | — | 3,682 | — | |||||||||||||||
| Other | 3 | 1 | — | — | — | |||||||||||||||
| 1,269,917 | 364,599 | 285,034 | 3,354,004 | 440,546 | ||||||||||||||||
| Liabilities: | ||||||||||||||||||||
| Payables for: | ||||||||||||||||||||
| Purchases of investments | 2,150 | 69,602 | — | 453,440 | 29 | |||||||||||||||
| Repurchases of fund’s shares | 686 | 164 | 234 | 637 | 472 | |||||||||||||||
| Investment advisory services | 506 | 105 | 78 | 835 | 37 | |||||||||||||||
| Insurance administrative fees | 38 | 17 | 14 | 78 | 264 | |||||||||||||||
| Services provided by related parties | 188 | 25 | 62 | 386 | 89 | |||||||||||||||
| Trustees’ deferred compensation | 46 | 3 | 16 | 58 | 2 | |||||||||||||||
| Variation margin on futures contracts | — | 65 | — | 1,058 | — | |||||||||||||||
| Variation margin on swap contracts | 9 | 108 | — | 1,177 | 3 | |||||||||||||||
| Other | 1 | — | — | 1 | — | |||||||||||||||
| 3,624 | 70,089 | 404 | 457,670 | 896 | ||||||||||||||||
| Net assets at December 31, 2019 | $ | 1,266,293 | $ | 294,510 | $ | 284,630 | $ | 2,896,334 | $ | 439,650 | ||||||||||
| Net assets consist of: | ||||||||||||||||||||
| Capital paid in on shares of beneficial interest | $ | 1,456,035 | $ | 291,684 | $ | 283,903 | $ | 2,843,203 | $ | 375,936 | ||||||||||
| Total (accumulated loss) distributable earnings | (189,742 | ) | 2,826 | 727 | 53,131 | 63,714 | ||||||||||||||
| Net assets at December 31, 2019 | $ | 1,266,293 | $ | 294,510 | $ | 284,630 | $ | 2,896,334 | $ | 439,650 | ||||||||||
| Investment securities on loan, at value | $ | — | $ | — | $ | — | $ | — | $ | — | ||||||||||
| Investment securities, at cost: | ||||||||||||||||||||
| Unaffiliated issuers | 1,246,290 | 275,150 | 284,222 | 2,998,418 | 14,836 | |||||||||||||||
| Affiliated issuers | — | — | — | — | 379,115 | |||||||||||||||
| Cash denominated in currencies other than U.S. dollars, at cost | — | * | — | — | — | — | ||||||||||||||
See end of statements of assets and liabilities for footnote.
See notes to financial statements.
| 124 | American Funds Insurance Series |
(dollars in thousands)
| Managed Risk International Fund | Managed Risk Blue Chip Income and Growth Fund | Managed Risk Growth- Income Fund | Managed Risk Asset Allocation Fund | |||||||||||
| $ | 7,541 | $ | 12,609 | $ | 90,848 | $ | 129,389 | |||||||
| 158,327 | 353,060 | 2,179,013 | 2,704,731 | |||||||||||
| 50 | 85 | 2,356 | 856 | |||||||||||
| — | — | — | — | |||||||||||
| — | — | — | — | |||||||||||
| — | — | — | — | |||||||||||
| 134 | 89 | 21,241 | 649 | |||||||||||
| 3 | — | 1,026 | 590 | |||||||||||
| 10 | 18 | 117 | 178 | |||||||||||
| — | — | — | — | |||||||||||
| — | — | 126 | — | |||||||||||
| — | — | — | — | |||||||||||
| 166,065 | 365,861 | 2,294,727 | 2,836,393 | |||||||||||
| — | — | 754 | — | |||||||||||
| 144 | 94 | 22,617 | 1,273 | |||||||||||
| 14 | 31 | 192 | 238 | |||||||||||
| 101 | 221 | 1,376 | 1,735 | |||||||||||
| 34 | 75 | 58 | 588 | |||||||||||
| 1 | 2 | 6 | 26 | |||||||||||
| — | — | — | — | |||||||||||
| 2 | 3 | — | 29 | |||||||||||
| — | — | — | — | |||||||||||
| 296 | 426 | 25,003 | 3,889 | |||||||||||
| $ | 165,769 | $ | 365,435 | $ | 2,269,724 | $ | 2,832,504 | |||||||
| $ | 154,345 | $ | 346,751 | $ | 1,940,147 | $ | 2,449,900 | |||||||
| 11,424 | 18,684 | 329,577 | 382,604 | |||||||||||
| $ | 165,769 | $ | 365,435 | $ | 2,269,724 | $ | 2,832,504 | |||||||
| $ | — | $ | — | $ | — | $ | — | |||||||
| 7,541 | 12,609 | 100,969 | 129,389 | |||||||||||
| 143,518 | 348,599 | 1,996,547 | 2,461,096 | |||||||||||
| — | — | — | — | |||||||||||
| American Funds Insurance Series | 125 |
Statements of assets and liabilities
at December 31, 2019
| Global Growth Fund | Global Small Capitalization Fund | Growth Fund | International Fund | New World Fund | ||||||||||||||||||
| Shares of beneficial interest issued and outstanding (no stated par value) — unlimited shares authorized | ||||||||||||||||||||||
| Class 1: | Net assets | $ | 2,515,595 | $ | 2,050,138 | $ | 10,840,676 | $ | 5,353,248 | $ | 2,128,928 | |||||||||||
| Shares outstanding | 77,246 | 76,500 | 133,471 | 256,566 | 82,393 | |||||||||||||||||
| Net asset value per share | $ | 32.57 | $ | 26.80 | $ | 81.22 | $ | 20.86 | $ | 25.84 | ||||||||||||
| Class 1A: | Net assets | $ | 7,914 | $ | 575 | $ | 18,051 | $ | 7,041 | $ | 4,461 | |||||||||||
| Shares outstanding | 244 | 22 | 223 | 339 | 173 | |||||||||||||||||
| Net asset value per share | $ | 32.47 | $ | 26.74 | $ | 80.92 | $ | 20.80 | $ | 25.74 | ||||||||||||
| Class 2: | Net assets | $ | 3,894,942 | $ | 2,363,250 | $ | 15,884,538 | $ | 4,310,970 | $ | 981,055 | |||||||||||
| Shares outstanding | 120,828 | 90,815 | 197,149 | 207,441 | 38,339 | |||||||||||||||||
| Net asset value per share | $ | 32.24 | $ | 26.02 | $ | 80.57 | $ | 20.78 | $ | 25.59 | ||||||||||||
| Class 3: | Net assets | $ | 213,515 | $ | 24,708 | |||||||||||||||||
| Shares outstanding | Not applicable | Not applicable | 2,609 | 1,181 | Not applicable | |||||||||||||||||
| Net asset value per share | $ | 81.84 | $ | 20.92 | ||||||||||||||||||
| Class 4: | Net assets | $ | 381,996 | $ | 206,310 | $ | 1,512,879 | $ | 379,464 | $ | 645,967 | |||||||||||
| Shares outstanding | 11,917 | 7,887 | 19,051 | 18,478 | 25,360 | |||||||||||||||||
| Net asset value per share | $ | 32.05 | $ | 26.16 | $ | 79.41 | $ | 20.54 | $ | 25.47 | ||||||||||||
| High- Income Bond Fund | Mortgage Fund | Ultra-Short Bond Fund | U.S. Government/ AAA-Rated Securities Fund | Managed Risk Growth Fund | ||||||||||||||||||
| Shares of beneficial interest issued and outstanding (no stated par value) — unlimited shares authorized | ||||||||||||||||||||||
| Class 1: | Net assets | $ | 524,749 | $ | 210,225 | $ | 29,304 | $ | 1,418,254 | |||||||||||||
| Shares outstanding | 53,157 | 19,906 | 2,592 | 114,937 | Not applicable | |||||||||||||||||
| Net asset value per share | $ | 9.87 | $ | 10.56 | $ | 11.30 | $ | 12.34 | ||||||||||||||
| Class 1A: | Net assets | $ | 726 | $ | 493 | $ | 10 | $ | 2,474 | |||||||||||||
| Shares outstanding | 74 | 47 | 1 | 201 | Not applicable | |||||||||||||||||
| Net asset value per share | $ | 9.86 | $ | 10.55 | $ | 11.30 | $ | 12.32 | ||||||||||||||
| Class 2: | Net assets | $ | 667,518 | $ | 56,269 | $ | 230,044 | $ | 1,343,065 | |||||||||||||
| Shares outstanding | 68,819 | 5,338 | 20,889 | 109,962 | Not applicable | |||||||||||||||||
| Net asset value per share | $ | 9.70 | $ | 10.54 | $ | 11.01 | $ | 12.21 | ||||||||||||||
| Class 3: | Net assets | $ | 9,941 | $ | 3,187 | $ | 8,818 | |||||||||||||||
| Shares outstanding | 1,002 | Not applicable | 286 | 713 | Not applicable | |||||||||||||||||
| Net asset value per share | $ | 9.92 | $ | 11.13 | $ | 12.37 | ||||||||||||||||
| Class 4: | Net assets | $ | 63,359 | $ | 27,523 | $ | 22,085 | $ | 123,723 | |||||||||||||
| Shares outstanding | 5,997 | 2,637 | 1,984 | 10,128 | Not applicable | |||||||||||||||||
| Net asset value per share | $ | 10.56 | $ | 10.44 | $ | 11.13 | $ | 12.22 | ||||||||||||||
| Class P1: | Net assets | $ | 5,745 | |||||||||||||||||||
| Shares outstanding | Not applicable | Not applicable | Not applicable | Not applicable | 417 | |||||||||||||||||
| Net asset value per share | $ | 13.78 | ||||||||||||||||||||
| Class P2: | Net assets | $ | 433,905 | |||||||||||||||||||
| Shares outstanding | Not applicable | Not applicable | Not applicable | Not applicable | 31,656 | |||||||||||||||||
| Net asset value per share | $ | 13.71 | ||||||||||||||||||||
| * | Amount less than one thousand. |
See notes to financial statements.
| 126 | American Funds Insurance Series |
(dollars and shares in thousands, except per-share amounts)
| Blue Chip Income and Growth Fund | Global Growth and Income Fund | Growth- Income Fund | International Growth and Income Fund | Capital Income Builder | Asset Allocation Fund | Global Balanced Fund | Bond Fund | Global Bond Fund | ||||||||||||||||||||||||||
| $ | 5,558,836 | $ | 624,992 | $ | 21,056,972 | $ | 1,140,298 | $ | 533,359 | $ | 17,729,567 | $ | 133,417 | $ | 6,481,599 | $ | 1,077,241 | |||||||||||||||||
| 409,812 | 39,269 | 415,250 | 62,738 | 49,708 | 737,257 | 9,877 | 580,461 | 88,893 | ||||||||||||||||||||||||||
| $ | 13.56 | $ | 15.92 | $ | 50.71 | $ | 18.18 | $ | 10.73 | $ | 24.05 | $ | 13.51 | $ | 11.17 | $ | 12.12 | |||||||||||||||||
| $ | 9,073 | $ | 1,904 | $ | 10,901 | $ | 2,475 | $ | 5,710 | $ | 10,719 | $ | 2,284 | $ | 6,646 | $ | 456 | |||||||||||||||||
| 671 | 120 | 215 | 137 | 533 | 447 | 169 | 598 | 38 | ||||||||||||||||||||||||||
| $ | 13.51 | $ | 15.88 | $ | 50.54 | $ | 18.15 | $ | 10.72 | $ | 23.99 | $ | 13.49 | $ | 11.13 | $ | 12.10 | |||||||||||||||||
| $ | 3,092,785 | $ | 1,366,688 | $ | 13,585,491 | $ | 256,730 | $ | 5,567 | $ | 5,153,699 | $ | 207,099 | $ | 3,561,089 | $ | 1,001,945 | |||||||||||||||||
| 231,052 | 86,034 | 271,274 | 14,170 | 519 | 216,630 | 15,358 | 323,062 | 83,303 | ||||||||||||||||||||||||||
| $ | 13.39 | $ | 15.89 | $ | 50.08 | $ | 18.12 | $ | 10.72 | $ | 23.79 | $ | 13.48 | $ | 11.02 | $ | 12.03 | |||||||||||||||||
| $ | 156,432 | $ | 32,567 | |||||||||||||||||||||||||||||||
| Not applicable | Not applicable | 3,079 | Not applicable | Not applicable | 1,352 | Not applicable | Not applicable | Not applicable | ||||||||||||||||||||||||||
| $ | 50.81 | $ | 24.08 | |||||||||||||||||||||||||||||||
| $ | 621,667 | $ | 144,899 | $ | 1,216,470 | $ | 100,583 | $ | 454,080 | $ | 4,493,103 | $ | 94,150 | $ | 501,826 | $ | 49,002 | |||||||||||||||||
| 46,696 | 9,268 | 24,567 | 5,586 | 42,408 | 189,815 | 7,048 | 45,627 | 4,112 | ||||||||||||||||||||||||||
| $ | 13.31 | $ | 15.63 | $ | 49.52 | $ | 18.01 | $ | 10.71 | $ | 23.67 | $ | 13.36 | $ | 11.00 | $ | 11.92 | |||||||||||||||||
| Managed Risk International Fund | Managed Risk Blue Chip Income and Growth Fund | Managed Risk Growth- Income Fund | Managed Risk Asset Allocation Fund | |||||||||||||||||||||||||||||||
| Not applicable | Not applicable | Not applicable | Not applicable | |||||||||||||||||||||||||||||||
| Not applicable | Not applicable | Not applicable | Not applicable | |||||||||||||||||||||||||||||||
| Not applicable | Not applicable | Not applicable | Not applicable | |||||||||||||||||||||||||||||||
| Not applicable | Not applicable | Not applicable | Not applicable | |||||||||||||||||||||||||||||||
| Not applicable | Not applicable | Not applicable | Not applicable | |||||||||||||||||||||||||||||||
| $ | 683 | $ | 805 | $ | 1,987,005 | $ | 2,174 | |||||||||||||||||||||||||||
| 62 | 67 | 144,442 | 157 | |||||||||||||||||||||||||||||||
| $ | 11.01 | $ | 12.01 | $ | 13.76 | $ | 13.81 | |||||||||||||||||||||||||||
| $ | 165,086 | $ | 364,630 | $ | 282,719 | $ | 2,830,330 | |||||||||||||||||||||||||||
| 15,122 | 30,625 | 20,645 | 210,242 | |||||||||||||||||||||||||||||||
| $ | 10.92 | $ | 11.91 | $ | 13.69 | $ | 13.46 | |||||||||||||||||||||||||||
| American Funds Insurance Series | 127 |
Statements of operations
for the year ended December 31, 2019
| Global Growth Fund | Global Small Capitalization Fund | Growth Fund | International Fund | New World Fund | ||||||||||||||||
| Investment income: | ||||||||||||||||||||
| Income (net of non-U.S. taxes*): | ||||||||||||||||||||
| Dividends | $ | 100,513 | $ | 44,813 | $ | 367,210 | $ | 188,002 | $ | 50,154 | ||||||||||
| Interest | 1,513 | 1,993 | 10,907 | 12,319 | 15,536 | |||||||||||||||
| Securities lending income | — | 5,572 | — | — | 9 | |||||||||||||||
| 102,026 | 52,378 | 378,117 | 200,321 | 65,699 | ||||||||||||||||
| Fees and expenses*: | ||||||||||||||||||||
| Investment advisory services | 32,238 | 29,892 | 84,702 | 47,450 | 23,766 | |||||||||||||||
| Distribution services | 9,991 | 6,096 | 41,091 | 11,232 | 3,708 | |||||||||||||||
| Insurance administrative services | 810 | 445 | 3,298 | 867 | 1,405 | |||||||||||||||
| Transfer agent services | 1 | 1 | 3 | 1 | — | † | ||||||||||||||
| Administrative services | 1,268 | 873 | 5,329 | 1,937 | 689 | |||||||||||||||
| Reports to shareholders | 218 | 163 | 948 | 351 | 132 | |||||||||||||||
| Registration statement and prospectus | 159 | 142 | 557 | 292 | 117 | |||||||||||||||
| Trustees’ compensation | 42 | 28 | 175 | 64 | 23 | |||||||||||||||
| Auditing and legal | 78 | 102 | 72 | 94 | 98 | |||||||||||||||
| Custodian | 869 | 796 | 492 | 1,634 | 933 | |||||||||||||||
| Other | 20 | 110 | 140 | 92 | 96 | |||||||||||||||
| Total fees and expenses before waivers/reimbursements | 45,694 | 38,648 | 136,807 | 64,014 | 30,967 | |||||||||||||||
| Less waivers/reimbursements of fees and expenses: | ||||||||||||||||||||
| Investment advisory services waivers | — | — | — | — | — | |||||||||||||||
| Miscellaneous fee reimbursements | — | — | — | — | — | |||||||||||||||
| Total waivers/reimbursements of fees and expenses | — | — | — | — | — | |||||||||||||||
| Total fees and expenses after waivers/reimbursements | 45,694 | 38,648 | 136,807 | 64,014 | 30,967 | |||||||||||||||
| Net investment income | 56,332 | 13,730 | 241,310 | 136,307 | 34,732 | |||||||||||||||
| Net realized gain (loss) and unrealized appreciation (depreciation): | ||||||||||||||||||||
| Net realized gain (loss) on: | ||||||||||||||||||||
| Investments | ||||||||||||||||||||
| Unaffiliated issuers | 194,169 | 251,392 | 746,022 | (125,118 | ) | 33,329 | ||||||||||||||
| Affiliated issuers | — | — | — | — | — | |||||||||||||||
| Futures contracts | — | — | — | — | — | |||||||||||||||
| Forward currency contracts | — | — | — | (981 | ) | 303 | ||||||||||||||
| Swap contracts | — | — | — | — | — | |||||||||||||||
| Currency transactions | (251 | ) | (122 | ) | (486 | ) | (1,893 | ) | (681 | ) | ||||||||||
| 193,918 | 251,270 | 745,536 | (127,992 | ) | 32,951 | |||||||||||||||
| Net unrealized appreciation (depreciation) on: | ||||||||||||||||||||
| Investments | ||||||||||||||||||||
| Unaffiliated issuers | 1,619,656 | 899,816 | 6,038,099 | 1,988,055 | 789,738 | |||||||||||||||
| Affiliated issuers | — | (17,366 | ) | — | — | — | ||||||||||||||
| Futures contracts | — | — | — | — | — | |||||||||||||||
| Forward currency contracts | — | — | — | 394 | (303 | ) | ||||||||||||||
| Swap contracts | — | — | — | — | — | |||||||||||||||
| Currency translations | 91 | 109 | 133 | (22 | ) | 1,965 | ||||||||||||||
| 1,619,747 | 882,559 | 6,038,232 | 1,988,427 | 791,400 | ||||||||||||||||
| Net realized gain (loss) and unrealized appreciation (depreciation) | 1,813,665 | 1,133,829 | 6,783,768 | 1,860,435 | 824,351 | |||||||||||||||
| Net increase in net assets resulting from operations | $ | 1,869,997 | $ | 1,147,559 | $ | 7,025,078 | $ | 1,996,742 | $ | 859,083 | ||||||||||
See end of statements of operations for footnotes.
See notes to financial statements.
| 128 | American Funds Insurance Series |
(dollars in thousands)
| Blue Chip Income and Growth Fund | Global Growth and Income Fund | Growth- Income Fund | International Growth and Income Fund | Capital Income Builder | Asset Allocation Fund | Global Balanced Fund | Bond Fund | Global Bond Fund | ||||||||||||||||||||||||||
| $ | 234,613 | $ | 51,517 | $ | 766,259 | $ | 45,191 | $ | 25,475 | $ | 375,876 | $ | 6,913 | $ | 16,529 | $ | 1,213 | |||||||||||||||||
| 1,841 | 3,480 | 16,017 | 2,742 | 5,377 | 258,983 | 3,712 | 306,813 | 66,060 | ||||||||||||||||||||||||||
| — | — | — | — | — | 126 | — | — | — | ||||||||||||||||||||||||||
| 236,454 | 54,997 | 782,276 | 47,933 | 30,852 | 634,985 | 10,625 | 323,342 | 67,273 | ||||||||||||||||||||||||||
| 34,092 | 11,970 | 85,788 | 8,588 | 4,075 | 67,563 | 2,697 | 37,299 | 11,276 | ||||||||||||||||||||||||||
| 8,746 | 3,618 | 35,549 | 821 | 1,026 | 22,631 | 700 | 9,950 | 2,662 | ||||||||||||||||||||||||||
| 1,255 | 304 | 2,707 | 218 | 1,025 | 10,170 | 211 | 1,084 | 114 | ||||||||||||||||||||||||||
| 1 | — | † | 4 | — | † | — | † | 3 | — | † | 1 | — | † | |||||||||||||||||||||
| 1,765 | 408 | 6,796 | 284 | 174 | 5,173 | 83 | 2,083 | 426 | ||||||||||||||||||||||||||
| 355 | 60 | 1,336 | 27 | 17 | 1,018 | 7 | 286 | 68 | ||||||||||||||||||||||||||
| 157 | 65 | 509 | 38 | 44 | 331 | 19 | 225 | 64 | ||||||||||||||||||||||||||
| 59 | 13 | 221 | 9 | 6 | 170 | 3 | 68 | 14 | ||||||||||||||||||||||||||
| 47 | 55 | 89 | 80 | 51 | 74 | 57 | 56 | 52 | ||||||||||||||||||||||||||
| 237 | 443 | 598 | 330 | 77 | 257 | 64 | 211 | 404 | ||||||||||||||||||||||||||
| 39 | 22 | 124 | 8 | 5 | 55 | 7 | 56 | 35 | ||||||||||||||||||||||||||
| 46,753 | 16,958 | 133,721 | 10,403 | 6,500 | 107,445 | 3,848 | 51,319 | 15,115 | ||||||||||||||||||||||||||
| — | — | — | — | 24 | — | — | — | — | ||||||||||||||||||||||||||
| — | — | — | — | — | — | — | — | — | ||||||||||||||||||||||||||
| — | — | — | — | 24 | — | — | — | — | ||||||||||||||||||||||||||
| 46,753 | 16,958 | 133,721 | 10,403 | 6,476 | 107,445 | 3,848 | 51,319 | 15,115 | ||||||||||||||||||||||||||
| 189,701 | 38,039 | 648,555 | 37,530 | 24,376 | 527,540 | 6,777 | 272,023 | 52,158 | ||||||||||||||||||||||||||
| 85,832 | 51,401 | 903,747 | (35,910 | ) | (7,360 | ) | 488,583 | 9,817 | 195,373 | 11,564 | ||||||||||||||||||||||||
| — | — | (1,021 | ) | — | — | (471,314 | ) | — | — | — | ||||||||||||||||||||||||
| — | — | — | — | (501 | ) | 22,485 | 557 | 72,397 | 13,348 | |||||||||||||||||||||||||
| — | 579 | — | (14 | ) | — | — | (440 | ) | 58 | (2,623 | ) | |||||||||||||||||||||||
| — | — | — | — | 985 | (18,948 | ) | 31 | (25,282 | ) | 1,525 | ||||||||||||||||||||||||
| (3 | ) | (143 | ) | (250 | ) | (1,100 | ) | (2 | ) | 103 | (139 | ) | 786 | (2,149 | ) | |||||||||||||||||||
| 85,829 | 51,837 | 902,476 | (37,024 | ) | (6,878 | ) | 20,909 | 9,826 | 243,332 | 21,665 | ||||||||||||||||||||||||
| 1,423,937 | 449,977 | 6,047,455 | 293,943 | 117,252 | 3,772,779 | 59,030 | 433,411 | 101,447 | ||||||||||||||||||||||||||
| — | — | 128,124 | — | — | 548,491 | — | — | — | ||||||||||||||||||||||||||
| — | — | — | — | (760 | ) | (8,123 | ) | (196 | ) | (23,687 | ) | (5,076 | ) | |||||||||||||||||||||
| — | (488 | ) | — | (12 | ) | — | — | (181 | ) | 8,081 | (9,128 | ) | ||||||||||||||||||||||
| — | — | — | — | 829 | (255 | ) | (7 | ) | (6,333 | ) | 141 | |||||||||||||||||||||||
| 23 | 379 | 406 | 8 | 22 | 86 | 17 | 153 | 173 | ||||||||||||||||||||||||||
| 1,423,960 | 449,868 | 6,175,985 | 293,939 | 117,343 | 4,312,978 | 58,663 | 411,625 | 87,557 | ||||||||||||||||||||||||||
| 1,509,789 | 501,705 | 7,078,461 | 256,915 | 110,465 | 4,333,887 | 68,489 | 654,957 | 109,222 | ||||||||||||||||||||||||||
| $ | 1,699,490 | $ | 539,744 | $ | 7,727,016 | $ | 294,445 | $ | 134,841 | $ | 4,861,427 | $ | 75,266 | $ | 926,980 | $ | 161,380 | |||||||||||||||||
| American Funds Insurance Series | 129 |
Statements of operations
for the year ended December 31, 2019
| High- Income Bond Fund | Mortgage Fund | Ultra-Short Bond Fund | U.S. Government/ AAA-Rated Securities Fund | Managed Risk Growth Fund | ||||||||||||||||
| Investment income: | ||||||||||||||||||||
| Income (net of non-U.S. taxes*): | ||||||||||||||||||||
| Dividends | $ | 994 | $ | — | $ | — | $ | — | † | $ | 5,338 | |||||||||
| Interest | 90,296 | 7,989 | 6,571 | 70,374 | — | |||||||||||||||
| 91,290 | 7,989 | 6,571 | 70,374 | 5,338 | ||||||||||||||||
| Fees and expenses*: | ||||||||||||||||||||
| Investment advisory services | 6,009 | 1,231 | 925 | 9,824 | 590 | |||||||||||||||
| Distribution services | 1,855 | 202 | 640 | 3,611 | 974 | |||||||||||||||
| Insurance administrative services | 143 | 60 | 51 | 276 | 984 | |||||||||||||||
| Transfer agent services | — | † | — | † | — | † | — | † | — | † | ||||||||||
| Administrative services | 253 | 59 | 58 | 582 | — | |||||||||||||||
| Accounting and administrative services | — | — | — | — | 54 | |||||||||||||||
| Reports to shareholders | 28 | 5 | 7 | 63 | 8 | |||||||||||||||
| Registration statement and prospectus | 34 | 15 | 10 | 55 | 21 | |||||||||||||||
| Trustees’ compensation | 8 | 2 | 1 | 20 | 2 | |||||||||||||||
| Auditing and legal | 50 | 45 | 43 | 46 | 15 | |||||||||||||||
| Custodian | 17 | 21 | 1 | 37 | 11 | |||||||||||||||
| Other | 32 | 3 | 2 | 8 | 3 | |||||||||||||||
| Total fees and expenses before waivers/reimbursements | 8,429 | 1,643 | 1,738 | 14,522 | 2,662 | |||||||||||||||
| Less waivers/reimbursements of fees and expenses: | ||||||||||||||||||||
| Investment advisory services waivers | — | — | — | — | 197 | |||||||||||||||
| Miscellaneous fee reimbursements | — | — | — | — | 13 | |||||||||||||||
| Total waivers/reimbursements of fees and expenses | — | — | — | — | 210 | |||||||||||||||
| Total fees and expenses after waivers/reimbursements | 8,429 | 1,643 | 1,738 | 14,522 | 2,452 | |||||||||||||||
| Net investment income | 82,861 | 6,346 | 4,833 | 55,852 | 2,886 | |||||||||||||||
| Net realized gain (loss) and unrealized appreciation (depreciation): | ||||||||||||||||||||
| Net realized gain (loss) on: | ||||||||||||||||||||
| Investments | ||||||||||||||||||||
| Unaffiliated issuers | (18,671 | ) | 2,660 | (1 | ) | 43,914 | — | |||||||||||||
| Affiliated issuers | — | — | — | — | 3,620 | |||||||||||||||
| Futures contracts | (236 | ) | 6,233 | — | 85,989 | (5,811 | ) | |||||||||||||
| Swap contracts | (986 | ) | 1,047 | — | (7,749 | ) | — | |||||||||||||
| Currency transactions | — | † | — | — | — | † | 30 | |||||||||||||
| Capital gain distributions received from affiliated issuers | — | — | — | — | 32,790 | |||||||||||||||
| (19,893 | ) | 9,940 | (1 | ) | 122,154 | 30,629 | ||||||||||||||
| Net unrealized appreciation (depreciation) on: | ||||||||||||||||||||
| Investments | ||||||||||||||||||||
| Unaffiliated issuers | 89,670 | 5,462 | 15 | 52,718 | — | |||||||||||||||
| Affiliated issuers | — | — | — | — | 49,688 | |||||||||||||||
| Futures contracts | 159 | (2,645 | ) | — | (35,398 | ) | (5,952 | ) | ||||||||||||
| Swap contracts | (2,898 | ) | (4,026 | ) | — | (39,656 | ) | — | ||||||||||||
| 86,931 | (1,209 | ) | 15 | (22,336 | ) | 43,736 | ||||||||||||||
| Net realized gain (loss) and unrealized appreciation (depreciation) | 67,038 | 8,731 | 14 | 99,818 | 74,365 | |||||||||||||||
| Net increase in net assets resulting from operations | $ | 149,899 | $ | 15,077 | $ | 4,847 | $ | 155,670 | $ | 77,251 | ||||||||||
| * | Additional information related to non-U.S. taxes, class-specific fees and expenses and affiliated income is included in the notes to financial statements. |
| † | Amount less than one thousand. |
See notes to financial statements.
| 130 | American Funds Insurance Series |
(dollars in thousands)
| Managed Risk International Fund | Managed Risk Blue Chip Income and Growth Fund | Managed Risk Growth- Income Fund | Managed Risk Asset Allocation Fund | |||||||||||
| $ | 2,945 | $ | 7,880 | $ | 43,834 | $ | 57,102 | |||||||
| — | — | — | — | |||||||||||
| 2,945 | 7,880 | 43,834 | 57,102 | |||||||||||
| 239 | 527 | 3,162 | 4,046 | |||||||||||
| 398 | 877 | 647 | 6,739 | |||||||||||
| 399 | 878 | 5,270 | 6,744 | |||||||||||
| — | † | — | † | — | † | — | † | |||||||
| — | — | — | — | |||||||||||
| 50 | 53 | 80 | 110 | |||||||||||
| 4 | 7 | 30 | 49 | |||||||||||
| 12 | 17 | 223 | 49 | |||||||||||
| 1 | 2 | 12 | 21 | |||||||||||
| 15 | 15 | 16 | 18 | |||||||||||
| 11 | 11 | 12 | 11 | |||||||||||
| 3 | 3 | 3 | 11 | |||||||||||
| 1,132 | 2,390 | 9,455 | 17,798 | |||||||||||
| 80 | 176 | 1,054 | 1,349 | |||||||||||
| 47 | 14 | — | — | |||||||||||
| 127 | 190 | 1,054 | 1,349 | |||||||||||
| 1,005 | 2,200 | 8,401 | 16,449 | |||||||||||
| 1,940 | 5,680 | 35,433 | 40,653 | |||||||||||
| — | — | (21,805 | ) | — | ||||||||||
| 617 | 169 | 11,394 | 18,556 | |||||||||||
| (1,246 | ) | (5,543 | ) | (7,635 | ) | (17,863 | ) | |||||||
| — | — | — | — | |||||||||||
| (4 | ) | 26 | 114 | 117 | ||||||||||
| 3,310 | 22,171 | 167,499 | 131,016 | |||||||||||
| 2,677 | 16,823 | 149,567 | 131,826 | |||||||||||
| — | — | (11,132 | ) | — | ||||||||||
| 22,363 | 28,958 | 201,188 | 297,458 | |||||||||||
| (1,249 | ) | (5,833 | ) | (9,637 | ) | (25,848 | ) | |||||||
| — | — | — | — | |||||||||||
| 21,114 | 23,125 | 180,419 | 271,610 | |||||||||||
| 23,791 | 39,948 | 329,986 | 403,436 | |||||||||||
| $ | 25,731 | $ | 45,628 | $ | 365,419 | $ | 444,089 | |||||||
| American Funds Insurance Series | 131 |
Statements of changes in net assets
| Global Growth Fund | Global Small Capitalization Fund | Growth Fund | ||||||||||||||||||||||
| Year ended December 31, | Year ended December 31, | Year ended December 31, | ||||||||||||||||||||||
| 2019 | 2018 | 2019 | 2018 | 2019 | 2018 | |||||||||||||||||||
| Operations: | ||||||||||||||||||||||||
| Net investment income | $ | 56,332 | $ | 50,276 | $ | 13,730 | $ | 10,787 | $ | 241,310 | $ | 162,005 | ||||||||||||
| Net realized gain (loss) | 193,918 | 343,542 | 251,270 | 247,061 | 745,536 | 2,848,894 | ||||||||||||||||||
| Net unrealized appreciation (depreciation) | 1,619,747 | (919,676 | ) | 882,559 | (673,158 | ) | 6,038,232 | (2,971,090 | ) | |||||||||||||||
| Net increase (decrease) in net assets resulting from operations | 1,869,997 | (525,858 | ) | 1,147,559 | (415,310 | ) | 7,025,078 | 39,809 | ||||||||||||||||
| Distributions paid to shareholders | (417,934 | ) | (474,814 | ) | (284,752 | ) | (196,135 | ) | (2,978,202 | ) | (2,648,515 | ) | ||||||||||||
| Net capital share transactions | (153,769 | ) | 267,749 | 102,952 | (49,079 | ) | 974,922 | 1,071,109 | ||||||||||||||||
| Total increase (decrease) in net assets | 1,298,294 | (732,923 | ) | 965,759 | (660,524 | ) | 5,021,798 | (1,537,597 | ) | |||||||||||||||
| Net assets: | ||||||||||||||||||||||||
| Beginning of year | 5,502,153 | 6,235,076 | 3,654,514 | 4,315,038 | 23,447,861 | 24,985,458 | ||||||||||||||||||
| End of year | $ | 6,800,447 | $ | 5,502,153 | $ | 4,620,273 | $ | 3,654,514 | $ | 28,469,659 | $ | 23,447,861 | ||||||||||||
| International Growth and Income Fund | Capital Income Builder | Asset Allocation Fund | ||||||||||||||||||||||
| Year ended December 31, | Year ended December 31, | Year ended December 31, | ||||||||||||||||||||||
| 2019 | 2018 | 2019 | 2018 | 2019 | 2018 | |||||||||||||||||||
| Operations: | ||||||||||||||||||||||||
| Net investment income | $ | 37,530 | $ | 37,077 | $ | 24,376 | $ | 18,120 | $ | 527,540 | $ | 495,623 | ||||||||||||
| Net realized gain (loss) | (37,024 | ) | 19,646 | (6,878 | ) | (12,903 | ) | 20,909 | 1,250,899 | |||||||||||||||
| Net unrealized appreciation (depreciation) | 293,939 | (222,569 | ) | 117,343 | (53,867 | ) | 4,312,978 | (2,879,563 | ) | |||||||||||||||
| Net increase (decrease) in net assets resulting from operations | 294,445 | (165,846 | ) | 134,841 | (48,650 | ) | 4,861,427 | (1,133,041 | ) | |||||||||||||||
| Distributions paid to shareholders | (53,548 | ) | (35,982 | ) | (24,614 | ) | (20,515 | ) | (1,801,337 | ) | (1,587,775 | ) | ||||||||||||
| Net capital share transactions | (78,069 | ) | 77,119 | 213,209 | 149,988 | 1,434,114 | (13,827 | ) | ||||||||||||||||
| Total increase (decrease) in net assets | 162,828 | (124,709 | ) | 323,436 | 80,823 | 4,494,204 | (2,734,643 | ) | ||||||||||||||||
| Net assets: | ||||||||||||||||||||||||
| Beginning of year | 1,337,258 | 1,461,967 | 675,280 | 594,457 | 22,925,451 | 25,660,094 | ||||||||||||||||||
| End of year | $ | 1,500,086 | $ | 1,337,258 | $ | 998,716 | $ | 675,280 | $ | 27,419,655 | $ | 22,925,451 | ||||||||||||
See end of statements of changes in net assets for footnote.
See notes to financial statements.
| 132 | American Funds Insurance Series |
(dollars in thousands)
| International Fund | New World Fund | Blue Chip Income and Growth Fund | Global Growth and Income Fund | Growth-Income Fund | ||||||||||||||||||||||||||||||||||
| Year ended December 31, | Year ended December 31, | Year ended December 31, | Year ended December 31, | Year ended December 31, | ||||||||||||||||||||||||||||||||||
| 2019 | 2018 | 2019 | 2018 | 2019 | 2018 | 2019 | 2018 | 2019 | 2018 | |||||||||||||||||||||||||||||
| $ | 136,307 | $ | 147,886 | $ | 34,732 | $ | 32,835 | $ | 189,701 | $ | 183,892 | $ | 38,039 | $ | 35,857 | $ | 648,555 | $ | 479,019 | |||||||||||||||||||
| (127,992 | ) | 247,240 | 32,951 | 126,203 | 85,829 | 687,384 | 51,837 | 99,872 | 902,476 | 3,357,516 | ||||||||||||||||||||||||||||
| 1,988,427 | (1,741,754 | ) | 791,400 | (647,033 | ) | 1,423,960 | (1,602,222 | ) | 449,868 | (325,530 | ) | 6,175,985 | (4,232,991 | ) | ||||||||||||||||||||||||
| 1,996,742 | (1,346,628 | ) | 859,083 | (487,995 | ) | 1,699,490 | (730,946 | ) | 539,744 | (189,801 | ) | 7,727,016 | (396,456 | ) | ||||||||||||||||||||||||
| (394,620 | ) | (646,470 | ) | (164,192 | ) | (126,412 | ) | (878,225 | ) | (883,615 | ) | (140,198 | ) | (186,991 | ) | (3,957,175 | ) | (2,606,909 | ) | |||||||||||||||||||
| (536,801 | ) | 1,245,386 | 54,641 | 92,573 | 429,824 | 265,984 | (76,937 | ) | 90,220 | 2,392,290 | 2,175,138 | |||||||||||||||||||||||||||
| 1,065,321 | (747,712 | ) | 749,532 | (521,834 | ) | 1,251,089 | (1,348,577 | ) | 322,609 | (286,572 | ) | 6,162,131 | (828,227 | ) | ||||||||||||||||||||||||
| 9,010,110 | 9,757,822 | 3,010,879 | 3,532,713 | 8,031,272 | 9,379,849 | 1,815,874 | 2,102,446 | 29,864,135 | 30,692,362 | |||||||||||||||||||||||||||||
| $ | 10,075,431 | $ | 9,010,110 | $ | 3,760,411 | $ | 3,010,879 | $ | 9,282,361 | $ | 8,031,272 | $ | 2,138,483 | $ | 1,815,874 | $ | 36,026,266 | $ | 29,864,135 | |||||||||||||||||||
| Global Balanced Fund | Bond Fund | Global Bond Fund | High-Income Bond Fund | Mortgage Fund | ||||||||||||||||||||||||||||||||||
| Year ended December 31, | Year ended December 31, | Year ended December 31, | Year ended December 31, | Year ended December 31, | ||||||||||||||||||||||||||||||||||
| 2019 | 2018 | 2019 | 2018 | 2019 | 2018 | 2019 | 2018 | 2019 | 2018 | |||||||||||||||||||||||||||||
| $ | 6,777 | $ | 6,105 | $ | 272,023 | $ | 269,087 | $ | 52,158 | $ | 55,434 | $ | 82,861 | $ | 84,812 | $ | 6,346 | $ | 6,148 | |||||||||||||||||||
| 9,826 | 3,576 | 243,332 | (168,412 | ) | 21,665 | (11,729 | ) | (19,893 | ) | (24,544 | ) | 9,940 | (7,618 | ) | ||||||||||||||||||||||||
| 58,663 | (33,957 | ) | 411,625 | (164,842 | ) | 87,557 | (70,008 | ) | 86,931 | (86,196 | ) | (1,209 | ) | 2,541 | ||||||||||||||||||||||||
| 75,266 | (24,276 | ) | 926,980 | (64,167 | ) | 161,380 | (26,303 | ) | 149,899 | (25,928 | ) | 15,077 | 1,071 | |||||||||||||||||||||||||
| (16,934 | ) | (9,700 | ) | (280,200 | ) | (267,421 | ) | (35,756 | ) | (56,130 | ) | (79,066 | ) | (79,933 | ) | (7,525 | ) | (6,505 | ) | |||||||||||||||||||
| 12,429 | 46,266 | 49,693 | (511,419 | ) | (84,997 | ) | (297,128 | ) | (8,439 | ) | (144,120 | ) | (4,217 | ) | (43,561 | ) | ||||||||||||||||||||||
| 70,761 | 12,290 | 696,473 | (843,007 | ) | 40,627 | (379,561 | ) | 62,394 | (249,981 | ) | 3,335 | (48,995 | ) | |||||||||||||||||||||||||
| 366,189 | 353,899 | 9,854,687 | 10,697,694 | 2,088,017 | 2,467,578 | 1,203,899 | 1,453,880 | 291,175 | 340,170 | |||||||||||||||||||||||||||||
| $ | 436,950 | $ | 366,189 | $ | 10,551,160 | $ | 9,854,687 | $ | 2,128,644 | $ | 2,088,017 | $ | 1,266,293 | $ | 1,203,899 | $ | 294,510 | $ | 291,175 | |||||||||||||||||||
| American Funds Insurance Series | 133 |
Statements of changes in net assets
| Ultra-Short Bond Fund | U.S. Government/ AAA-Rated Securities Fund | Managed Risk Growth Fund | ||||||||||||||||||||||
| Year ended December 31, | Year ended December 31, | Year ended December 31, | ||||||||||||||||||||||
| 2019 | 2018 | 2019 | 2018 | 2019 | 2018 | |||||||||||||||||||
| Operations: | ||||||||||||||||||||||||
| Net investment income | $ | 4,833 | $ | 4,036 | $ | 55,852 | $ | 56,785 | $ | 2,886 | $ | 1,509 | ||||||||||||
| Net realized gain (loss) | (1 | ) | — | 122,154 | (86,715 | ) | 30,629 | 21,463 | ||||||||||||||||
| Net unrealized appreciation (depreciation) | 15 | 33 | (22,336 | ) | 49,517 | 43,736 | (26,917 | ) | ||||||||||||||||
| Net increase (decrease) in net assets resulting from operations | 4,847 | 4,069 | 155,670 | 19,587 | 77,251 | (3,945 | ) | |||||||||||||||||
| Distributions paid to shareholders | (5,093 | ) | (3,517 | ) | (60,961 | ) | (55,819 | ) | (30,222 | ) | (21,941 | ) | ||||||||||||
| Net capital share transactions | (21,528 | ) | 1,047 | (67,678 | ) | (197,780 | ) | 49,348 | 81,200 | |||||||||||||||
| Total increase (decrease) in net assets | (21,774 | ) | 1,599 | 27,031 | (234,012 | ) | 96,377 | 55,314 | ||||||||||||||||
| Net assets: | ||||||||||||||||||||||||
| Beginning of year | 306,404 | 304,805 | 2,869,303 | 3,103,315 | 343,273 | 287,959 | ||||||||||||||||||
| End of year | $ | 284,630 | $ | 306,404 | $ | 2,896,334 | $ | 2,869,303 | $ | 439,650 | $ | 343,273 | ||||||||||||
See notes to financial statements.
| 134 | American Funds Insurance Series |
(dollars in thousands)
| Managed Risk International Fund | Managed Risk Blue Chip Income and Growth Fund | Managed Risk Growth-Income Fund | Managed Risk Asset Allocation Fund | |||||||||||||||||||||||||||
| Year ended December 31, | Year ended December 31, | Year ended December 31, | Year ended December 31, | |||||||||||||||||||||||||||
| 2019 | 2018 | 2019 | 2018 | 2019 | 2018 | 2019 | 2018 | |||||||||||||||||||||||
| $ | 1,940 | $ | 2,317 | $ | 5,680 | $ | 5,276 | $ | 35,433 | $ | 2,685 | $ | 40,653 | $ | 62,566 | |||||||||||||||
| 2,677 | 5,722 | 16,823 | 18,018 | 149,567 | 6,953 | 131,826 | 97,415 | |||||||||||||||||||||||
| 21,114 | (25,332 | ) | 23,125 | (49,299 | ) | 180,419 | (21,166 | ) | 271,610 | (366,555 | ) | |||||||||||||||||||
| 25,731 | (17,293 | ) | 45,628 | (26,005 | ) | 365,419 | (11,528 | ) | 444,089 | (206,574 | ) | |||||||||||||||||||
| (7,796 | ) | (3,428 | ) | (23,415 | ) | (23,525 | ) | (32,440 | ) | (12,352 | ) | (177,811 | ) | (242,968 | ) | |||||||||||||||
| (3,125 | ) | 23,257 | 6,553 | 19,295 | 44,643 | 1,707,014 | 23,729 | (1,462,371 | ) | |||||||||||||||||||||
| 14,810 | 2,536 | 28,766 | (30,235 | ) | 377,622 | 1,683,134 | 290,007 | (1,911,913 | ) | |||||||||||||||||||||
| 150,959 | 148,423 | 336,669 | 366,904 | 1,892,102 | 208,968 | 2,542,497 | 4,454,410 | |||||||||||||||||||||||
| $ | 165,769 | $ | 150,959 | $ | 365,435 | $ | 336,669 | $ | 2,269,724 | $ | 1,892,102 | $ | 2,832,504 | $ | 2,542,497 | |||||||||||||||
| American Funds Insurance Series | 135 |
Notes to financial statements
1. Organization
American Funds Insurance Series (the “series”) is registered under the Investment Company Act of 1940 as an open-end, diversified management investment company with 34 different funds (“the funds”), including 23 funds in the series covered in this report. The other 11 funds in the series are covered in separate reports. Six funds in the series are covered in the American Funds Insurance Series -Target Date Series report and five funds in the series are covered in the American Funds Insurance Series - Portfolio Series report. The assets of each fund are segregated, with each fund accounted for separately. Capital Research and Management Company (“CRMC”) is the series’ investment adviser. Milliman Financial Risk Management LLC (“Milliman FRM”) is the subadviser for the risk management strategy for eight of the funds (the “managed risk funds”), five of which are covered in this report.
The managed risk funds covered in this report are Managed Risk Growth Fund, Managed Risk International Fund, Managed Risk Blue Chip Income and Growth Fund, Managed Risk Growth-Income Fund and Managed Risk Asset Allocation Fund. The managed risk funds invest in other funds within the series (the “underlying funds”) and employ Milliman FRM to implement the risk management strategy, which consists of using hedging instruments — primarily short positions on exchange-traded futures contracts — to attempt to stabilize the volatility of the funds around target volatility levels and reduce the downside exposure of the funds during periods of significant market declines.
Shareholders approved a proposal to reorganize the series from a Massachusetts business trust to a Delaware statutory trust. The series reserved the right to delay implementing the reorganization and has elected to do so.
The investment objectives for each fund covered in this report are as follows:
Global Growth Fund — To provide long-term growth of capital.
Global Small Capitalization Fund — To provide long-term growth of capital.
Growth Fund — To provide growth of capital.
International Fund — To provide long-term growth of capital.
New World Fund — To provide long-term capital appreciation.
Blue Chip Income and Growth Fund — To produce income exceeding the average yield on U.S. stocks generally and to provide an opportunity for growth of principal consistent with sound common stock investing.
Global Growth and Income Fund — To provide long-term growth of capital while providing current income.
Growth-Income Fund — To achieve long-term growth of capital and income.
International Growth and Income Fund — To provide long-term growth of capital while providing current income.
Capital Income Builder — The two primary objectives are (1) to provide a level of current income that exceeds the average yield on U.S. stocks generally and (2) to provide a growing stream of income over the years. The secondary objective is to provide growth of capital.
Asset Allocation Fund — To provide high total return (including income and capital gains) consistent with preservation of capital over the long term.
Global Balanced Fund — Seeks the balanced accomplishment of three objectives: long-term growth of capital, conservation of principal and current income.
Bond Fund — To provide as high a level of current income as is consistent with the preservation of capital.
Global Bond Fund — To provide, over the long term, a high level of total return consistent with prudent investment management.
High-Income Bond Fund — The primary objective is to provide a high level of current income. The secondary objective is capital appreciation.
| 136 | American Funds Insurance Series |
Mortgage Fund — To provide current income and preservation of capital.
Ultra-Short Bond Fund — To provide current income, consistent with the maturity and quality standards applicable to the fund, and preservation of capital and liquidity.
U.S. Government/AAA-Rated Securities Fund — To provide a high level of current income consistent with preservation of capital.
Managed Risk Growth Fund — To provide growth of capital while seeking to manage volatility and provide downside protection.
Managed Risk International Fund — To provide long-term growth of capital while seeking to manage volatility and provide downside protection.
Managed Risk Blue Chip Income and Growth Fund — To produce income exceeding the average yield on U.S. stocks generally and to provide an opportunity for growth of principal consistent with sound common stock investing, in each case while seeking to manage volatility and provide downside protection.
Managed Risk Growth-Income Fund — To achieve long-term growth of capital and income while seeking to manage volatility and provide downside protection.
Managed Risk Asset Allocation Fund — To provide high total return (including income and capital gains) consistent with preservation of capital over the long term while seeking to manage volatility and provide downside protection.
Each fund in the series, except the managed risk funds, offers either four or five share classes (Classes 1, 1A, 2, 3 or 4); the managed risk funds offer two share classes (Classes P1 and P2). Holders of all share classes of each fund have equal pro rata rights to assets, dividends and liquidation proceeds of each fund held. Each share class of each fund has identical voting rights, except for the exclusive right to vote on matters affecting only its class. Share classes have different fees and expenses (“class-specific fees and expenses”), primarily due to different arrangements for certain distribution expenses. Differences in class-specific fees and expenses will result in differences in net investment income and, therefore, the payment of different per-share dividends by each class of each fund.
2. Significant accounting policies
Each fund is an investment company that applies the accounting and reporting guidance issued in Topic 946 by the U.S. Financial Accounting Standards Board. Each fund’s financial statements have been prepared to comply with U.S. generally accepted accounting principles (“U.S. GAAP”). These principles require the series’ investment adviser to make estimates and assumptions that affect reported amounts and disclosures. Actual results could differ from those estimates. Subsequent events, if any, have been evaluated through the date of issuance in the preparation of the financial statements. The funds follow the significant accounting policies described in this section, as well as the valuation policies described in the next section on valuation.
Security transactions and related investment income — Security transactions are recorded by the funds as of the date the trades are executed with brokers. Realized gains and losses from security transactions are determined based on the specific identified cost of the securities. In the event a security is purchased with a delayed payment date, the funds will segregate liquid assets sufficient to meet their payment obligations. Dividend income is recognized on the ex-dividend date and interest income is recognized on an accrual basis. Market discounts, premiums and original issue discounts on fixed-income securities are amortized daily over the expected life of the security.
Fees and expenses — The fees and expenses of the underlying funds held by the managed risk funds are not included in the fees and expenses reported for each of the managed risk funds; however, they are indirectly reflected in the valuation of each of the underlying funds. These fees are included in the net effective expense ratios that are provided as additional information in the financial highlights tables.
Class allocations — Income, fees and expenses (other than class-specific fees and expenses) and realized and unrealized gains and losses are allocated daily among the various share classes of each fund based on their relative net assets. Class-specific fees and expenses, such as distribution expenses, are accrued daily and charged directly to the respective share class of each fund.
Distributions paid to shareholders — Income dividends and capital gain distributions are recorded on each fund’s ex-dividend date.
| American Funds Insurance Series | 137 |
Currency translation — Assets and liabilities, including investment securities, denominated in currencies other than U.S. dollars are translated into U.S. dollars at the exchange rates supplied by one or more pricing vendors on the valuation date. Purchases and sales of investment securities and income and expenses are translated into U.S. dollars at the exchange rates on the dates of such transactions. The effects of changes in exchange rates on investment securities are included with the net realized gain or loss and net unrealized appreciation or depreciation on investments in the funds’ statements of operations. The realized gain or loss and unrealized appreciation or depreciation resulting from all other transactions denominated in currencies other than U.S. dollars are disclosed separately.
3. Valuation
CRMC, the series’ investment adviser, values the funds’ investments at fair value as defined by U.S. GAAP. The net asset value of each share class of each fund is generally determined as of approximately 4:00 p.m. New York time each day the New York Stock Exchange is open.
Methods and inputs — The series’ investment adviser uses the following methods and inputs to establish the fair value of each fund’s assets and liabilities. Use of particular methods and inputs may vary over time based on availability and relevance as market and economic conditions evolve.
Equity securities are generally valued at the official closing price of, or the last reported sale price on, the exchange or market on which such securities are traded, as of the close of business on the day the securities are being valued or, lacking any sales, at the last available bid price. Prices for each security are taken from the principal exchange or market on which the security trades. The value of an underlying fund is based on its reported net asset value.
Fixed-income securities, including short-term securities, are generally valued at prices obtained from one or more pricing vendors. Vendors value such securities based on one or more of the inputs described in the following table. The table provides examples of inputs that are commonly relevant for valuing particular classes of fixed-income securities in which the funds are authorized to invest. However, these classifications are not exclusive and any of the inputs may be used to value any other class of fixed-income security.
| Fixed-income class | Examples of standard inputs |
| All | Benchmark yields, transactions, bids, offers, quotations from dealers and trading systems, new issues, spreads and other relationships observed in the markets among comparable securities; and proprietary pricing models such as yield measures calculated using factors such as cash flows, financial or collateral performance and other reference data (collectively referred to as “standard inputs”) |
| Corporate bonds & notes; convertible securities | Standard inputs and underlying equity of the issuer |
| Bonds & notes of governments & government agencies | Standard inputs and interest rate volatilities |
| Mortgage-backed; asset-backed obligations | Standard inputs and cash flows, prepayment information, default rates, delinquency and loss assumptions, collateral characteristics, credit enhancements and specific deal information |
| Municipal securities | Standard inputs and, for certain distressed securities, cash flows or liquidation values using a net present value calculation based on inputs that include, but are not limited to, financial statements and debt contracts |
When the series’ investment adviser deems it appropriate to do so (such as when vendor prices are unavailable or not deemed to be representative), fixed-income securities will be valued in good faith at the mean quoted bid and ask prices that are reasonably and timely available (or bid prices, if ask prices are not available) or at prices for securities of comparable maturity, quality and type.
| 138 | American Funds Insurance Series |
Securities with both fixed-income and equity characteristics, or equity securities traded principally among fixed-income dealers, are generally valued in the manner described for either equity or fixed-income securities, depending on which method is deemed most appropriate by the series’ investment adviser. The Government Cash Management Fund held by the managed risk funds is managed to maintain a $1.00 net asset value per share. The Capital Group Central Cash Fund (“CCF”) is valued based upon a floating net asset value, which fluctuates with changes in the value of CCF’s portfolio securities. The underlying securities are valued based on the policies and procedures in CCF’s statement of additional information. The net asset value of each share class of each managed risk fund is calculated based on the reported net asset values of the underlying funds in which each fund invests.
Exchange-traded options and futures are generally valued at the official closing price for options and official settlement price for futures of the exchange or market on which such instruments are traded, as of the close of business on the day such instruments are being valued. Forward currency contracts are valued at the mean of representative quoted bid and ask prices, generally based on prices supplied by one or more pricing vendors. Interest rate swaps and credit default swaps are generally valued by pricing vendors based on market inputs that include the index and term of index, reset frequency, payer/receiver, currency and pay frequency.
Securities and other assets for which representative market quotations are not readily available or are considered unreliable by the series’ investment adviser are fair valued as determined in good faith under fair value guidelines adopted by authority of the series’ board of trustees as further described. The investment adviser follows fair valuation guidelines, consistent with U.S. Securities and Exchange Commission rules and guidance, to consider relevant principles and factors when making fair value determinations. The investment adviser considers relevant indications of value that are reasonably and timely available to it in determining the fair value to be assigned to a particular security, such as the type and cost of the security; contractual or legal restrictions on resale of the security; relevant financial or business developments of the issuer; actively traded similar or related securities; conversion or exchange rights on the security; related corporate actions; significant events occurring after the close of trading in the security; and changes in overall market conditions. In addition, the closing prices of equity securities and futures that trade in markets outside U.S. time zones may be adjusted to reflect significant events that occur after the close of local trading but before the net asset value of each share class of each fund is determined. Fair valuations and valuations of investments and futures that are not actively trading involve judgment and may differ materially from valuations that would have been used had greater market activity occurred.
Processes and structure — The series’ board of trustees has delegated authority to the series’ investment adviser to make fair value determinations, subject to board oversight. The investment adviser has established a Joint Fair Valuation Committee (the “Fair Valuation Committee”) to administer, implement and oversee the fair valuation process, and to make fair value decisions. The Fair Valuation Committee regularly reviews its own fair value decisions, as well as decisions made under its standing instructions to the investment adviser’s valuation teams. The Fair Valuation Committee reviews changes in fair value measurements from period to period and may, as deemed appropriate, update the fair valuation guidelines to better reflect the results of back testing and address new or evolving issues. The Fair Valuation Committee reports any changes to the fair valuation guidelines to the board of trustees. The series’ board and audit committee also regularly review reports that describe fair value determinations and methods.
The series’ investment adviser has also established a Fixed-Income Pricing Review Group to administer and oversee the fixed-income valuation process, including the use of fixed-income pricing vendors. This group regularly reviews pricing vendor information and market data. Pricing decisions, processes and controls over security valuation are also subject to additional internal reviews, including an annual control self-evaluation program facilitated by the investment adviser’s compliance group.
Classifications — The series’ investment adviser classifies the funds’ assets and liabilities into three levels based on the inputs used to value the assets or liabilities. Level 1 values are based on quoted prices in active markets for identical securities. Level 2 values are based on significant observable market inputs, such as quoted prices for similar securities and quoted prices in inactive markets. Certain securities trading outside the U.S. may transfer between Level 1 and Level 2 due to valuation adjustments resulting from significant market movements following the close of local trading. Level 3 values are based on significant unobservable inputs that reflect the investment adviser’s determination of assumptions that market participants might reasonably use in valuing the securities.
| American Funds Insurance Series | 139 |
The valuation levels are not necessarily an indication of the risk or liquidity associated with the underlying investment. For example, U.S. government securities are reflected as Level 2 because the inputs used to determine fair value may not always be quoted prices in an active market. The following tables present the funds’ valuation levels as of December 31, 2019 (dollars in thousands):
| Global Growth Fund | ||||||||||||||||
| Investment securities | ||||||||||||||||
| Level 1 | Level 2 | Level 3 | Total | |||||||||||||
| Assets: | ||||||||||||||||
| Common stocks: | ||||||||||||||||
| Information technology | $ | 1,185,255 | $ | 794,324 | $ | — | $ | 1,979,579 | ||||||||
| Consumer discretionary | 474,696 | 744,806 | — | 1,219,502 | ||||||||||||
| Health care | 527,781 | 214,362 | — | 742,143 | ||||||||||||
| Financials | 302,133 | 398,337 | — | 700,470 | ||||||||||||
| Consumer staples | 291,919 | 259,874 | — | 551,793 | ||||||||||||
| Communication services | 372,299 | 163,033 | — | 535,332 | ||||||||||||
| Industrials | 73,839 | 453,487 | — | 527,326 | ||||||||||||
| Materials | 144,609 | 41,190 | — | 185,799 | ||||||||||||
| Energy | 12,046 | 125,318 | — | 137,364 | ||||||||||||
| Utilities | — | 5,646 | — | 5,646 | ||||||||||||
| Preferred securities | — | 112,584 | — | 112,584 | ||||||||||||
| Short-term securities | 137,140 | — | — | 137,140 | ||||||||||||
| Total | $ | 3,521,717 | $ | 3,312,961 | $ | — | $ | 6,834,678 | ||||||||
Global Small Capitalization Fund | ||||||||||||||||
| Investment securities | ||||||||||||||||
| Level 1 | Level 2 | Level 3 | Total | |||||||||||||
| Assets: | ||||||||||||||||
| Common stocks: | ||||||||||||||||
| Health care | $ | 832,166 | $ | 191,178 | $ | — | $ | 1,023,344 | ||||||||
| Information technology | 472,972 | 397,575 | — | 870,547 | ||||||||||||
| Industrials | 128,020 | 558,859 | — | 686,879 | ||||||||||||
| Consumer discretionary | 450,887 | 224,996 | — | 675,883 | ||||||||||||
| Financials | 194,307 | 161,242 | — | 355,549 | ||||||||||||
| Real estate | 121,286 | 62,447 | — | 183,733 | ||||||||||||
| Materials | 98,936 | 80,609 | — | 179,545 | ||||||||||||
| Communication services | 56,064 | 89,863 | — | 145,927 | ||||||||||||
| Consumer staples | 46,475 | 76,569 | — | 123,044 | ||||||||||||
| Energy | 32,183 | 26,545 | 14,352 | 73,080 | ||||||||||||
| Utilities | 17,485 | 46,609 | — | 64,094 | ||||||||||||
| Preferred securities | 17,503 | — | 29,706 | 47,209 | ||||||||||||
| Rights & warrants | — | 53 | — | 53 | ||||||||||||
| Short-term securities | 278,833 | — | — | 278,833 | ||||||||||||
| Total | $ | 2,747,117 | $ | 1,916,545 | $ | 44,058 | $ | 4,707,720 | ||||||||
| 140 | American Funds Insurance Series |
Growth Fund
| Investment securities | ||||||||||||||||
| Level 1 | Level 2 | Level 3 | Total | |||||||||||||
| Assets: | ||||||||||||||||
| Common stocks: | ||||||||||||||||
| Information technology | $ | 6,232,866 | $ | 927,524 | $ | — | $ | 7,160,390 | ||||||||
| Communication services | 5,180,447 | — | — | 5,180,447 | ||||||||||||
| Health care | 4,685,272 | 29,104 | 38,849 | 4,753,225 | ||||||||||||
| Consumer discretionary | 3,070,193 | 143,533 | — | 3,213,726 | ||||||||||||
| Financials | 2,245,437 | 171,043 | — | 2,416,480 | ||||||||||||
| Industrials | 1,283,561 | 551,356 | — | 1,834,917 | ||||||||||||
| Materials | 758,550 | 47,905 | — | 806,455 | ||||||||||||
| Consumer staples | 522,509 | 251,756 | — | 774,265 | ||||||||||||
| Energy | 698,230 | — | — | 698,230 | ||||||||||||
| Real estate | 486,857 | — | — | 486,857 | ||||||||||||
| Utilities | 77,731 | — | — | 77,731 | ||||||||||||
| Convertible bonds | — | — | 25,000 | 25,000 | ||||||||||||
| Short-term securities | 1,102,492 | — | — | 1,102,492 | ||||||||||||
| Total | $ | 26,344,145 | $ | 2,122,221 | $ | 63,849 | $ | 28,530,215 | ||||||||
International Fund | ||||||||||||||||
| Investment securities | ||||||||||||||||
| Level 1 | Level 2 | Level 3 | Total | |||||||||||||
| Assets: | ||||||||||||||||
| Common stocks: | ||||||||||||||||
| Financials | $ | 63,111 | $ | 1,589,115 | $ | — | $ | 1,652,226 | ||||||||
| Consumer discretionary | 549,505 | 856,658 | — | 1,406,163 | ||||||||||||
| Industrials | 31,330 | 1,364,421 | — | 1,395,751 | ||||||||||||
| Health care | 89,208 | 1,162,960 | — | 1,252,168 | ||||||||||||
| Information technology | 47,551 | 682,008 | — | 729,559 | ||||||||||||
| Materials | 297,118 | 380,773 | — | 677,891 | ||||||||||||
| Consumer staples | 22,274 | 654,869 | — | 677,143 | ||||||||||||
| Communication services | 12,395 | 482,238 | — | 494,633 | ||||||||||||
| Energy | 91,650 | 398,340 | — | 489,990 | ||||||||||||
| Utilities | — | 358,981 | — | 358,981 | ||||||||||||
| Real estate | — | 223,309 | — | 223,309 | ||||||||||||
| Preferred securities | 50,234 | 70,526 | — | 120,760 | ||||||||||||
| Rights & warrants | — | 22,939 | — | 22,939 | ||||||||||||
| Bonds, notes & other debt instruments | — | 44,329 | — | 44,329 | ||||||||||||
| Short-term securities | 544,457 | — | — | 544,457 | ||||||||||||
| Total | $ | 1,798,833 | $ | 8,291,466 | $ | — | $ | 10,090,299 | ||||||||
| Other investments* | ||||||||||||||||
| Level 1 | Level 2 | Level 3 | Total | |||||||||||||
| Liabilities: | ||||||||||||||||
| Unrealized depreciation on open forward currency contracts | $ | — | $ | (131 | ) | $ | — | $ | (131 | ) | ||||||
| * | Forward currency contracts are not included in the investment portfolio. |
| American Funds Insurance Series | 141 |
New World Fund
| Investment securities | ||||||||||||||||
| Level 1 | Level 2 | Level 3 | Total | |||||||||||||
| Assets: | ||||||||||||||||
| Common stocks: | ||||||||||||||||
| Information technology | $ | 585,583 | $ | 279,934 | $ | — | $ | 865,517 | ||||||||
| Financials | 118,563 | 374,375 | — | 492,938 | ||||||||||||
| Energy | 41,325 | 330,863 | — | 372,188 | ||||||||||||
| Health care | 186,827 | 157,245 | — | 344,072 | ||||||||||||
| Materials | 161,739 | 151,049 | — | 312,788 | ||||||||||||
| Consumer discretionary | 111,867 | 152,128 | — | 263,995 | ||||||||||||
| Communication services | 181,968 | 39,344 | — | 221,312 | ||||||||||||
| Consumer staples | 10,237 | 199,516 | — | 209,753 | ||||||||||||
| Industrials | 13,319 | 152,169 | — | 165,488 | ||||||||||||
| Real estate | 20,109 | 21,107 | — | 41,216 | ||||||||||||
| Utilities | 17,612 | 15,724 | — | 33,336 | ||||||||||||
| Preferred securities | 42,757 | 28,620 | 27 | 71,404 | ||||||||||||
| Rights & warrants | — | 26,479 | — | 26,479 | ||||||||||||
| Bonds, notes & other debt instruments | — | 96,814 | — | 96,814 | ||||||||||||
| Short-term securities | 238,673 | 7,930 | — | 246,603 | ||||||||||||
| Total | $ | 1,730,579 | $ | 2,033,297 | $ | 27 | $ | 3,763,903 | ||||||||
Blue Chip Income and Growth Fund At December 31, 2019, all of the fund’s investment securities were classified as Level 1.
Global Growth and Income Fund | ||||||||||||||||
| Investment securities | ||||||||||||||||
| Level 1 | Level 2 | Level 3 | Total | |||||||||||||
| Assets: | ||||||||||||||||
| Common stocks: | ||||||||||||||||
| Information technology | $ | 177,115 | $ | 158,462 | $ | — | $ | 335,577 | ||||||||
| Industrials | 116,335 | 152,898 | — | 269,233 | ||||||||||||
| Financials | 87,217 | 166,525 | — | 253,742 | ||||||||||||
| Consumer discretionary | 90,534 | 114,346 | — | 204,880 | ||||||||||||
| Health care | 137,436 | 62,628 | — | 200,064 | ||||||||||||
| Communication services | 72,048 | 108,658 | — | 180,706 | ||||||||||||
| Materials | 82,829 | 79,135 | — | 161,964 | ||||||||||||
| Energy | 25,886 | 113,797 | — | 139,683 | ||||||||||||
| Utilities | 13,510 | 110,341 | — | 123,851 | ||||||||||||
| Real estate | 95,121 | 15,936 | — | 111,057 | ||||||||||||
| Consumer staples | 22,758 | 63,369 | — | 86,127 | ||||||||||||
| Preferred securities | 7,892 | — | — | 7,892 | ||||||||||||
| Bonds, notes & other debt instruments | — | 34,957 | — | 34,957 | ||||||||||||
| Short-term securities | 28,561 | — | — | 28,561 | ||||||||||||
| Total | $ | 957,242 | $ | 1,181,052 | $ | — | $ | 2,138,294 | ||||||||
| Other investments* | ||||||||||||||||
| Level 1 | Level 2 | Level 3 | Total | |||||||||||||
| Liabilities: | ||||||||||||||||
| Unrealized depreciation on open forward currency contracts | $ | — | $ | (137 | ) | $ | — | $ | (137 | ) | ||||||
| * | Forward currency contracts are not included in the investment portfolio. |
| 142 | American Funds Insurance Series |
Growth-Income Fund
| Investment securities | ||||||||||||||||
| Level 1 | Level 2 | Level 3 | Total | |||||||||||||
| Assets: | ||||||||||||||||
| Common stocks: | ||||||||||||||||
| Health care | $ | 5,175,002 | $ | 664,418 | $ | — | $ | 5,839,420 | ||||||||
| Information technology | 5,204,952 | 215,296 | — | 5,420,248 | ||||||||||||
| Communication services | 4,182,848 | 149,142 | — | 4,331,990 | ||||||||||||
| Financials | 3,510,960 | 401,089 | — | 3,912,049 | ||||||||||||
| Industrials | 3,108,920 | 698,875 | — | 3,807,795 | ||||||||||||
| Consumer staples | 1,541,333 | 1,016,810 | — | 2,558,143 | ||||||||||||
| Energy | 2,399,987 | 99,768 | — | 2,499,755 | ||||||||||||
| Consumer discretionary | 1,775,002 | 48,931 | — | 1,823,933 | ||||||||||||
| Materials | 1,577,903 | 163,566 | — | 1,741,469 | ||||||||||||
| Real estate | 1,068,563 | — | — | 1,068,563 | ||||||||||||
| Utilities | 717,617 | 163,329 | — | 880,946 | ||||||||||||
| Mutual funds | — | 16,337 | — | 16,337 | ||||||||||||
| Convertible stocks | 184,737 | — | — | 184,737 | ||||||||||||
| Bonds, notes & other debt instruments | — | 5,722 | — | 5,722 | ||||||||||||
| Short-term securities | 1,940,600 | — | — | 1,940,600 | ||||||||||||
| Total | $ | 32,388,424 | $ | 3,643,283 | $ | — | $ | 36,031,707 | ||||||||
International Growth and Income Fund | ||||||||||||||||
| Investment securities | ||||||||||||||||
| Level 1 | Level 2 | Level 3 | Total | |||||||||||||
| Assets: | ||||||||||||||||
| Common stocks: | ||||||||||||||||
| Financials | $ | 4,550 | $ | 246,628 | $ | — | $ | 251,178 | ||||||||
| Industrials | — | 164,295 | — | 164,295 | ||||||||||||
| Consumer discretionary | 55,639 | 101,948 | — | 157,587 | ||||||||||||
| Health care | 6,488 | 135,357 | — | 141,845 | ||||||||||||
| Energy | 21,294 | 90,307 | — | 111,601 | ||||||||||||
| Utilities | — | 94,713 | — | 94,713 | ||||||||||||
| Materials | 6,679 | 84,933 | — | 91,612 | ||||||||||||
| Information technology | — | 84,551 | — | 84,551 | ||||||||||||
| Consumer staples | — | 78,182 | — | 78,182 | ||||||||||||
| Communication services | 20,440 | 56,878 | — | 77,318 | ||||||||||||
| Real estate | — | 73,379 | — | 73,379 | ||||||||||||
| Preferred securities | 31,463 | — | — | 31,463 | ||||||||||||
| Bonds, notes & other debt instruments | — | 16,819 | — | 16,819 | ||||||||||||
| Short-term securities | 128,026 | — | — | 128,026 | ||||||||||||
| Total | $ | 274,579 | $ | 1,227,990 | $ | — | $ | 1,502,569 | ||||||||
| Other investments* | ||||||||||||||||
| Level 1 | Level 2 | Level 3 | Total | |||||||||||||
| Liabilities: | ||||||||||||||||
| Unrealized depreciation on open forward currency contracts | $ | — | $ | (11 | ) | $ | — | $ | (11 | ) | ||||||
| * | Forward currency contracts are not included in the investment portfolio. |
| American Funds Insurance Series | 143 |
Capital Income Builder
| Investment securities | ||||||||||||||||
| Level 1 | Level 2 | Level 3 | Total | |||||||||||||
| Assets: | ||||||||||||||||
| Common stocks: | ||||||||||||||||
| Consumer staples | $ | 38,725 | $ | 64,427 | $ | — | $ | 103,152 | ||||||||
| Information technology | 66,952 | 29,080 | — | 96,032 | ||||||||||||
| Financials | 45,772 | 38,435 | — | 84,207 | ||||||||||||
| Real estate | 47,566 | 31,086 | — | 78,652 | ||||||||||||
| Energy | 40,806 | 19,724 | — | 60,530 | ||||||||||||
| Health care | 23,819 | 29,326 | — | 53,145 | ||||||||||||
| Communication services | 4,574 | 44,219 | — | 48,793 | ||||||||||||
| Utilities | 14,681 | 33,269 | — | 47,950 | ||||||||||||
| Industrials | 17,339 | 27,817 | — | 45,156 | ||||||||||||
| Consumer discretionary | 21,286 | 19,400 | — | 40,686 | ||||||||||||
| Materials | 18,022 | 8,478 | — | 26,500 | ||||||||||||
| Rights & warrants | — | — | * | — | — | * | ||||||||||
| Convertible stocks | 16,025 | — | — | 16,025 | ||||||||||||
| Bonds, notes & other debt instruments: | ||||||||||||||||
| U.S. Treasury bonds & notes | — | 103,624 | — | 103,624 | ||||||||||||
| Corporate bonds & notes | — | 48,638 | — | 48,638 | ||||||||||||
| Mortgage-backed obligations | — | 46,322 | — | 46,322 | ||||||||||||
| Asset-backed obligations | — | 14,269 | — | 14,269 | ||||||||||||
| Municipals | — | 415 | — | 415 | ||||||||||||
| Short-term securities | 76,520 | — | — | 76,520 | ||||||||||||
| Total | $ | 432,087 | $ | 558,529 | $ | — | $ | 990,616 | ||||||||
| Other investments† | ||||||||||||||||
| Level 1 | Level 2 | Level 3 | Total | |||||||||||||
| Assets: | ||||||||||||||||
| Unrealized appreciation on futures contracts | $ | 37 | $ | — | $ | — | $ | 37 | ||||||||
| Unrealized appreciation on interest rate swaps | — | 1,109 | — | 1,109 | ||||||||||||
| Liabilities: | ||||||||||||||||
| Unrealized depreciation on futures contracts | (368 | ) | — | — | (368 | ) | ||||||||||
| Unrealized depreciation on interest rate swaps | — | (280 | ) | — | (280 | ) | ||||||||||
| Total | $ | (331 | ) | $ | 829 | $ | — | $ | 498 | |||||||
| * | Amount less than one thousand. |
| † | Futures contracts and interest rate swaps are not included in the investment portfolio. |
| 144 | American Funds Insurance Series |
Asset Allocation Fund
| Investment securities | ||||||||||||||||
| Level 1 | Level 2 | Level 3 | Total | |||||||||||||
| Assets: | ||||||||||||||||
| Common stocks: | ||||||||||||||||
| Information technology | $ | 4,271,389 | $ | 20,847 | $ | 20 | $ | 4,292,256 | ||||||||
| Financials | 2,943,889 | 78,737 | — | 3,022,626 | ||||||||||||
| Health care | 2,830,970 | 85,268 | 3,683 | 2,919,921 | ||||||||||||
| Industrials | 1,502,299 | 115,339 | — | 1,617,638 | ||||||||||||
| Consumer discretionary | 1,098,602 | 242,932 | — | 1,341,534 | ||||||||||||
| Communication services | 1,184,337 | — | — | 1,184,337 | ||||||||||||
| Consumer staples | 788,363 | 363,014 | — | 1,151,377 | ||||||||||||
| Energy | 1,028,032 | 1,506 | — | 1,029,538 | ||||||||||||
| Materials | 697,667 | — | — | 697,667 | ||||||||||||
| Real estate | 238,213 | — | — | 238,213 | ||||||||||||
| Utilities | 172,921 | — | — | 172,921 | ||||||||||||
| Rights & warrants | — | — | 1,070 | 1,070 | ||||||||||||
| Convertible stocks | 137,828 | — | 4,983 | 142,811 | ||||||||||||
| Convertible bonds | — | 127 | — | 127 | ||||||||||||
| Bonds, notes & other debt instruments: | ||||||||||||||||
| U.S. Treasury bonds & notes | — | 3,226,667 | — | 3,226,667 | ||||||||||||
| Corporate bonds & notes | — | 2,834,147 | 6,531 | 2,840,678 | ||||||||||||
| Mortgage-backed obligations | — | 1,900,213 | — | 1,900,213 | ||||||||||||
| Federal agency bonds & notes | — | 12,974 | — | 12,974 | ||||||||||||
| Other | — | 186,876 | — | 186,876 | ||||||||||||
| Short-term securities | 1,589,437 | — | — | 1,589,437 | ||||||||||||
| Total | $ | 18,483,947 | $ | 9,068,647 | $ | 16,287 | $ | 27,568,881 | ||||||||
| Other investments* | ||||||||||||||||
| Level 1 | Level 2 | Level 3 | Total | |||||||||||||
| Assets: | ||||||||||||||||
| Unrealized appreciation on futures contracts | $ | 1,710 | $ | — | $ | — | $ | 1,710 | ||||||||
| Unrealized appreciation on interest rate swaps | — | 1,035 | — | 1,035 | ||||||||||||
| Liabilities: | ||||||||||||||||
| Unrealized depreciation on futures contracts | (4,672 | ) | — | — | (4,672 | ) | ||||||||||
| Unrealized depreciation on interest rate swaps | — | (4,847 | ) | — | (4,847 | ) | ||||||||||
| Total | $ | (2,962 | ) | $ | (3,812 | ) | $ | — | $ | (6,774 | ) | |||||
| * | Futures contracts and interest rate swaps are not included in the investment portfolio. |
| American Funds Insurance Series | 145 |
Global Balanced Fund
| Investment securities | ||||||||||||||||
| Level 1 | Level 2 | Level 3 | Total | |||||||||||||
| Assets: | ||||||||||||||||
| Common stocks: | ||||||||||||||||
| Information technology | $ | 30,609 | $ | 29,614 | $ | — | $ | 60,223 | ||||||||
| Health care | 26,812 | 21,313 | — | 48,125 | ||||||||||||
| Financials | 22,318 | 19,024 | — | 41,342 | ||||||||||||
| Consumer staples | 20,634 | 18,609 | — | 39,243 | ||||||||||||
| Industrials | 11,263 | 20,997 | — | 32,260 | ||||||||||||
| Consumer discretionary | 12,095 | 7,459 | — | 19,554 | ||||||||||||
| Materials | 2,530 | 9,294 | — | 11,824 | ||||||||||||
| Real estate | 10,418 | — | — | 10,418 | ||||||||||||
| Communication services | 4,785 | 2,422 | — | 7,207 | ||||||||||||
| Energy | 4,309 | 2,872 | — | 7,181 | ||||||||||||
| Utilities | — | 3,015 | — | 3,015 | ||||||||||||
| Bonds, notes & other debt instruments: | ||||||||||||||||
| Bonds & notes of governments & government agencies outside the U.S. | — | 60,125 | — | 60,125 | ||||||||||||
| U.S. Treasury bonds & notes | — | 51,042 | — | 51,042 | ||||||||||||
| Corporate bonds & notes | — | 21,074 | — | 21,074 | ||||||||||||
| Mortgage-backed obligations | — | 8,367 | — | 8,367 | ||||||||||||
| Short-term securities | 2,825 | 12,095 | — | 14,920 | ||||||||||||
| Total | $ | 148,598 | $ | 287,322 | $ | — | $ | 435,920 | ||||||||
| Other investments* | ||||||||||||||||
| Level 1 | Level 2 | Level 3 | Total | |||||||||||||
| Assets: | ||||||||||||||||
| Unrealized appreciation on open forward currency contracts | $ | — | $ | 173 | $ | — | $ | 173 | ||||||||
| Unrealized appreciation on interest rate swaps | — | 12 | — | 12 | ||||||||||||
| Liabilities: | ||||||||||||||||
| Unrealized depreciation on futures contracts | (16 | ) | — | — | (16 | ) | ||||||||||
| Unrealized depreciation on open forward currency contracts | — | (272 | ) | — | (272 | ) | ||||||||||
| Unrealized depreciation on interest rate swaps | — | (14 | ) | — | (14 | ) | ||||||||||
| Total | $ | (16 | ) | $ | (101 | ) | $ | — | $ | (117 | ) | |||||
| * | Futures contracts, forward currency contracts and interest rate swaps are not included in the investment portfolio. |
Bond Fund
| Investment securities | ||||||||||||||||
| Level 1 | Level 2 | Level 3 | Total | |||||||||||||
| Assets: | ||||||||||||||||
| Bonds, notes & other debt instruments: | ||||||||||||||||
| Mortgage-backed obligations | $ | — | $ | 3,363,969 | $ | — | $ | 3,363,969 | ||||||||
| Corporate bonds & notes | — | 3,122,420 | — | 3,122,420 | ||||||||||||
| U.S. Treasury bonds & notes | — | 3,031,887 | — | 3,031,887 | ||||||||||||
| Bonds & notes of governments & government agencies outside the U.S. | — | 319,908 | — | 319,908 | ||||||||||||
| Asset-backed obligations | — | 238,376 | — | 238,376 | ||||||||||||
| Municipals | — | 226,157 | — | 226,157 | ||||||||||||
| Federal agency bonds & notes | — | 12,086 | — | 12,086 | ||||||||||||
| Common stocks | — | 135 | 9 | 144 | ||||||||||||
| Rights & warrants | — | 1 | 2 | 3 | ||||||||||||
| Short-term securities | 602,451 | — | — | 602,451 | ||||||||||||
| Total | $ | 602,451 | $ | 10,314,939 | $ | 11 | $ | 10,917,401 | ||||||||
| 146 | American Funds Insurance Series |
| Other investments* | ||||||||||||||||
| Level 1 | Level 2 | Level 3 | Total | |||||||||||||
| Assets: | ||||||||||||||||
| Unrealized appreciation on futures contracts | $ | 8,373 | $ | — | $ | — | $ | 8,373 | ||||||||
| Unrealized appreciation on open forward currency contracts | — | 2,743 | — | 2,743 | ||||||||||||
| Unrealized appreciation on interest rate swaps | — | 5,879 | — | 5,879 | ||||||||||||
| Liabilities: | ||||||||||||||||
| Unrealized depreciation on futures contracts | (12,452 | ) | — | — | (12,452 | ) | ||||||||||
| Unrealized depreciation on open forward currency contracts | — | (3,934 | ) | — | (3,934 | ) | ||||||||||
| Unrealized depreciation on interest rate swaps | — | (11,985 | ) | — | (11,985 | ) | ||||||||||
| Total | $ | (4,079 | ) | $ | (7,297 | ) | $ | — | $ | (11,376 | ) | |||||
| * | Futures contracts, forward currency contracts and interest rate swaps are not included in the investment portfolio. |
Global Bond Fund
| Investment securities | ||||||||||||||||
| Level 1 | Level 2 | Level 3 | Total | |||||||||||||
| Assets: | ||||||||||||||||
| Bonds, notes & other debt instruments: | ||||||||||||||||
| Euros | $ | — | $ | 379,876 | $ | — | $ | 379,876 | ||||||||
| Japanese yen | — | 284,116 | — | 284,116 | ||||||||||||
| Chinese yuan renminbi | — | 69,268 | — | 69,268 | ||||||||||||
| Malaysian ringgits | — | 38,844 | — | 38,844 | ||||||||||||
| Indian rupees | — | 35,296 | — | 35,296 | ||||||||||||
| Brazilian reais | — | 33,633 | — | 33,633 | ||||||||||||
| South African rand | — | 31,058 | — | 31,058 | ||||||||||||
| Danish kroner | — | 30,945 | — | 30,945 | ||||||||||||
| British pounds | — | 29,213 | — | 29,213 | ||||||||||||
| Canadian dollars | — | 27,439 | — | 27,439 | ||||||||||||
| Mexican pesos | — | 26,891 | — | 26,891 | ||||||||||||
| Norwegian kroner | — | 24,740 | — | 24,740 | ||||||||||||
| Israeli shekels | — | 23,588 | — | 23,588 | ||||||||||||
| Polish zloty | — | 17,537 | — | 17,537 | ||||||||||||
| U.S. dollars | — | 879,679 | 1,187 | 880,866 | ||||||||||||
| Other | — | 59,257 | — | 59,257 | ||||||||||||
| Convertible bonds | — | 10 | — | 10 | ||||||||||||
| Convertible stocks | — | — | 847 | 847 | ||||||||||||
| Common stocks | 881 | 258 | 3 | 1,142 | ||||||||||||
| Rights & warrants | — | — | 130 | 130 | ||||||||||||
| Short-term securities | 77,745 | 46,452 | — | 124,197 | ||||||||||||
| Total | $ | 78,626 | $ | 2,038,100 | $ | 2,167 | $ | 2,118,893 | ||||||||
| Other investments* | ||||||||||||||||
| Level 1 | Level 2 | Level 3 | Total | |||||||||||||
| Assets: | ||||||||||||||||
| Unrealized appreciation on futures contracts | $ | 234 | $ | — | $ | — | $ | 234 | ||||||||
| Unrealized appreciation on open forward currency contracts | — | 3,976 | — | 3,976 | ||||||||||||
| Unrealized appreciation on interest rate swaps | — | 165 | — | 165 | ||||||||||||
| Unrealized appreciation on credit default swaps | — | 731 | — | 731 | ||||||||||||
| Liabilities: | ||||||||||||||||
| Unrealized depreciation on futures contracts | (1,039 | ) | — | — | (1,039 | ) | ||||||||||
| Unrealized depreciation on open forward currency contracts | — | (6,186 | ) | — | (6,186 | ) | ||||||||||
| Unrealized depreciation on interest rate swaps | — | (704 | ) | — | (704 | ) | ||||||||||
| Total | $ | (805 | ) | $ | (2,018 | ) | $ | — | $ | (2,823 | ) | |||||
| * | Futures contracts, forward currency contracts, interest rate swaps and credit default swaps are not included in the investment portfolio. |
| American Funds Insurance Series | 147 |
High-Income Bond Fund
| Investment securities | ||||||||||||||||
| Level 1 | Level 2 | Level 3 | Total | |||||||||||||
| Assets: | ||||||||||||||||
| Bonds, notes & other debt instruments: | ||||||||||||||||
| Corporate bonds & notes | $ | — | $ | 1,165,929 | $ | 9,187 | $ | 1,175,116 | ||||||||
| Municipals | — | 5 | — | 5 | ||||||||||||
| Convertible bonds | — | 4,694 | — | 4,694 | ||||||||||||
| Convertible stocks | 3,223 | — | 4,834 | 8,057 | ||||||||||||
| Preferred securities | — | 2,187 | — | 2,187 | ||||||||||||
| Common stocks | 7,454 | 1,635 | 4,946 | 14,035 | ||||||||||||
| Rights & warrants | — | 3 | 708 | 711 | ||||||||||||
| Short-term securities | 39,112 | — | — | 39,112 | ||||||||||||
| Total | $ | 49,789 | $ | 1,174,453 | $ | 19,675 | $ | 1,243,917 | ||||||||
| Other investments1 | ||||||||||||||||
| Level 1 | Level 2 | Level 3 | Total | |||||||||||||
| Assets: | ||||||||||||||||
| Unrealized appreciation on futures contracts | $ | 192 | $ | — | $ | — | $ | 192 | ||||||||
| Liabilities: | ||||||||||||||||
| Unrealized depreciation on futures contracts | (33 | ) | — | — | (33 | ) | ||||||||||
| Unrealized depreciation on credit default swaps | — | (1,578 | ) | — | (1,578 | ) | ||||||||||
| Total | $ | 159 | $ | (1,578 | ) | $ | — | $ | (1,419 | ) | ||||||
| 1 | Futures contracts and credit default swaps are not included in the investment portfolio. |
The following table reconciles the valuation of the fund’s Level 3 investment securities and related transactions for the year ended December 31, 2019 (dollars in thousands):
| Beginning value at 1/1/2019 | Transfers into Level 3 | 2 | Purchases | Sales | Net realized gain | 3 | Unrealized depreciation | 3 | Transfers out of Level 3 | 2 | Ending value at 12/31/2019 | |||||||||||||||||||||
| Investment securities | $ | 17,537 | $ | — | $ | 10,278 | $ | (5,076 | ) | $ | 6 | $ | (3,050 | ) | $ | (20 | ) | $ | 19,675 | |||||||||||||
| Net unrealized depreciation during the period on Level 3 investment securities held at December 31, 2019 | $ | (3,075 | ) | |||||||||||||||||||||||||||||
| 2 | Transfers into or out of Level 3 are based on the beginning market value of the quarter in which they occurred. |
| 3 | Net realized gain and unrealized depreciation are included in the related amounts on investments in the statement of operations. |
| 148 | American Funds Insurance Series |
Unobservable inputs — Valuation of the fund’s Level 3 securities is based on significant unobservable inputs that reflect the investment adviser’s determination of assumptions that market participants might reasonably use in valuing the securities. The following table provides additional information used by the fund’s investment adviser to fair value the fund’s Level 3 securities (dollars in thousands):
| Value at 12/31/2019 | Valuation techniques | Unobservable inputs | Range (if appropriate) | Weighted average | Impact to valuation from an increase in input* | |||||||||
| Bonds, notes & other debt instruments | $ | 9,187 | Yield analysis | Yield to maturity risk premium | N/A | N/A | Decrease | |||||||
| Redemption value | N/A | N/A | N/A | N/A | ||||||||||
| Market comparable security | N/A | N/A | N/A | N/A | ||||||||||
| Convertible stocks | 4,834 | Multiple of revenue | Revenue multiple | 0.85x | 0.85x | Increase | ||||||||
| Market comparable companies | EBITDA multiple | 4.8x | 4.8x | Increase | ||||||||||
| Discount for lack of marketability | 20% | 20% | Decrease | |||||||||||
| Common stocks | 4,946 | Multiple of revenue | Revenue multiple | 1.4x | 1.4x | Increase | ||||||||
| Expected proceeds | Discount to reflect timing of receipt and amount of proceeds | 50% | 50% | Decrease | ||||||||||
| Black-Scholes | Implied volatility | 30% | 30% | Increase | ||||||||||
| Rights & warrants | 708 | Market comparables | $ per acre | $4.5K | $4.5K | Increase | ||||||||
| $ per thousand barrels of oil equivalent per day | $25K | $25K | Increase | |||||||||||
| $ | 19,675 | |||||||||||||
| * | This column represents the directional change in fair value of the Level 3 securities that would result in an increase from the corresponding input. A decrease to the unobservable input would have the opposite effect. Significant increases and decreases in these inputs in isolation could result in significantly higher or lower fair value measurements. |
Key to abbreviation
EBITDA = Earnings before income taxes, depreciation and amortization
Mortgage Fund
| Investment securities | ||||||||||||||||
| Level 1 | Level 2 | Level 3 | Total | |||||||||||||
| Assets: | ||||||||||||||||
| Bonds, notes & other debt instruments: | ||||||||||||||||
| Mortgage-backed obligations | $ | — | $ | 186,650 | $ | — | $ | 186,650 | ||||||||
| U.S. Treasury bonds & notes | — | 28,434 | — | 28,434 | ||||||||||||
| Federal agency bonds & notes | — | 18,896 | — | 18,896 | ||||||||||||
| Asset-backed obligations | — | 4,681 | — | 4,681 | ||||||||||||
| Short-term securities | — | 40,951 | — | 40,951 | ||||||||||||
| Total | $ | — | $ | 279,612 | $ | — | $ | 279,612 | ||||||||
| Other investments* | ||||||||||||||||
| Level 1 | Level 2 | Level 3 | Total | |||||||||||||
| Assets: | ||||||||||||||||
| Unrealized appreciation on interest rate swaps | $ | — | $ | 1,618 | $ | — | $ | 1,618 | ||||||||
| Liabilities: | ||||||||||||||||
| Unrealized depreciation on futures contracts | (746 | ) | — | — | (746 | ) | ||||||||||
| Unrealized depreciation on interest rate swaps | — | (4,450 | ) | — | (4,450 | ) | ||||||||||
| Total | $ | (746 | ) | $ | (2,832 | ) | $ | — | $ | (3,578 | ) | |||||
| * | Futures contracts and interest rate swaps are not included in the investment portfolio. |
Ultra-Short Bond Fund
At December 31, 2019, all of the fund’s investment securities were classified as Level 2.
| American Funds Insurance Series | 149 |
U.S. Government/AAA-Rated Securities Fund
| Investment securities | ||||||||||||||||
| Level 1 | Level 2 | Level 3 | Total | |||||||||||||
| Assets: | ||||||||||||||||
| Bonds, notes & other debt instruments: | ||||||||||||||||
| U.S. Treasury bonds & notes | $ | — | $ | 1,481,384 | $ | — | $ | 1,481,384 | ||||||||
| Mortgage-backed obligations | — | 801,424 | — | 801,424 | ||||||||||||
| Federal agency bonds & notes | — | 521,045 | — | 521,045 | ||||||||||||
| Short-term securities | — | 233,146 | — | 233,146 | ||||||||||||
| Total | $ | — | $ | 3,036,999 | $ | — | $ | 3,036,999 | ||||||||
| Other investments* | ||||||||||||||||
| Level 1 | Level 2 | Level 3 | Total | |||||||||||||
| Assets: | ||||||||||||||||
| Unrealized appreciation on futures contracts | $ | 687 | $ | — | $ | — | $ | 687 | ||||||||
| Unrealized appreciation on interest rate swaps | — | 25,927 | — | 25,927 | ||||||||||||
| Liabilities: | ||||||||||||||||
| Unrealized depreciation on futures contracts | (8,635 | ) | — | — | (8,635 | ) | ||||||||||
| Unrealized depreciation on interest rate swaps | — | (46,229 | ) | — | (46,229 | ) | ||||||||||
| Total | $ | (7,948 | ) | $ | (20,302 | ) | $ | — | $ | (28,250 | ) | |||||
| * | Futures contracts and interest rate swaps are not included in the investment portfolio. |
Managed Risk Growth Fund
At December 31, 2019, all of the fund’s investments were classified as Level 1.
Managed Risk International Fund
At December 31, 2019, all of the fund’s investments were classified as Level 1.
Managed Risk Blue Chip Income and Growth Fund
At December 31, 2019, all of the fund’s investments were classified as Level 1.
Managed Risk Growth-Income Fund
At December 31, 2019, all of the fund’s investments were classified as Level 1.
Managed Risk Asset Allocation Fund
At December 31, 2019, all of the fund’s investments were classified as Level 1.
4. Risk factors
Investing in the funds may involve certain risks including, but not limited to, those described below.
Market conditions— The prices of, and the income generated by, the common stocks, bonds and other securities held by a fund may decline — sometimes rapidly or unpredictably — due to various factors, including events or conditions affecting the general economy or particular industries; overall market changes; local, regional or global political, social or economic instability; governmental, governmental agency or central bank responses to economic conditions; and currency exchange rate, interest rate and commodity price fluctuations.
Issuer risks — The prices of, and the income generated by, securities held by a fund may decline in response to various factors directly related to the issuers of such securities, including reduced demand for an issuer’s goods or services, poor management performance, major litigation related to the issuer, changes in government regulations affecting the issuer or its competitive environment and strategic initiatives such as mergers, acquisitions or dispositions and the market response to any such initiatives.
Investing in stocks — Investing in stocks may involve larger price swings and greater potential for loss than other types of investments. As a result, the value of a fund may be subject to sharp declines in value. Income provided by a fund may be reduced by changes in the dividend policies of, and the capital resources available at, the companies in which the fund invests. These risks may be even greater in the case of smaller capitalization stocks.
| 150 | American Funds Insurance Series |
Investing in small companies — Investing in smaller companies may pose additional risks. For example, it is often more difficult to value or dispose of small company stocks and more difficult to obtain information about smaller companies than about larger companies. Furthermore, smaller companies often have limited product lines, operating histories, markets and/or financial resources, may be dependent on one or a few key persons for management, and can be more susceptible to losses. Moreover, the prices of their stocks may be more volatile than stocks of larger, more established companies, particularly during times of market turmoil.
Investing outside the U.S. — Securities of issuers domiciled outside the U.S., or with significant operations or revenues outside the U.S., may lose value because of adverse political, social, economic or market developments (including social instability, regional conflicts, terrorism and war) in the countries or regions in which the issuers operate or generate revenue. These securities may also lose value due to changes in foreign currency exchange rates against the U.S. dollar and/or currencies of other countries. Issuers of these securities may be more susceptible to actions of foreign governments, such as nationalization, currency blockage or the imposition of price controls or punitive taxes, each of which could adversely impact the value of these securities. Securities markets in certain countries may be more volatile and/or less liquid than those in the U.S. Investments outside the U.S. may also be subject to different accounting practices and different regulatory, legal and reporting standards and practices, and may be more difficult to value, than those in the U.S. In addition, the value of investments outside the U.S. may be reduced by foreign taxes, including foreign withholding taxes on interest and dividends. Further, there may be increased risks of delayed settlement of securities purchased or sold by the fund. The risks of investing outside the U.S. may be heightened in connection with investments in emerging markets.
Investing in developing countries — Investing in countries with developing economies and/or markets may involve risks in addition to and greater than those generally associated with investing in developed countries. For instance, emerging market countries may have less developed legal and accounting systems than those in developed countries. The governments of these countries may be less stable and more likely to impose capital controls, nationalize a company or industry, place restrictions on foreign ownership and on withdrawing sale proceeds of securities from the country, and/or impose punitive taxes that could adversely affect the prices of securities. In addition, the economies of these countries may be dependent on relatively few industries that are more susceptible to local and global changes. Securities markets in these countries can also be relatively small and have substantially lower trading volumes. As a result, securities issued in these countries may be more volatile and less liquid, and may be more difficult to value, than securities issued in countries with more developed economies and/or markets. Less certainty with respect to security valuations may lead to additional challenges and risks in calculating the fund’s net asset value. Additionally, emerging markets are more likely to experience problems with the clearing and settling of trades and the holding of securities by banks, agents and depositories that are less established than those in developed countries.
Investing in emerging markets — Investing in emerging markets may involve risks in addition to and greater than those generally associated with investing in the securities markets of developed countries. For instance, emerging market countries may have less developed legal and accounting systems than those in developed countries. The governments of these countries may be less stable and more likely to impose capital controls, nationalize a company or industry, place restrictions on foreign ownership and on withdrawing sale proceeds of securities from the country, and/or impose punitive taxes that could adversely affect the prices of securities. In addition, the economies of these countries may be dependent on relatively few industries that are more susceptible to local and global changes. Securities markets in these countries can also be relatively small and have substantially lower trading volumes. As a result, securities issued in these countries may be more volatile and less liquid, and may be more difficult to value, than securities issued in countries with more developed economies and/or markets. Less certainty with respect to security valuations may lead to additional challenges and risks in calculating a fund’s net asset value. Additionally, emerging markets are more likely to experience problems with the clearing and settling of trades and the holding of securities by banks, agents and depositories that are less established than those in developed countries.
Investing in debt instruments — The prices of, and the income generated by, bonds and other debt securities held by a fund may be affected by changing interest rates and by changes in the effective maturities and credit ratings of these securities.
Rising interest rates will generally cause the prices of bonds and other debt securities to fall. A general rise in interest rates may cause investors to sell debt securities on a large scale, which could also adversely affect the price and liquidity of debt securities and could also result in increased redemptions from a fund. Falling interest rates may cause an issuer to redeem, call or refinance a debt security before its stated maturity, which may result in a fund failing to recoup the full amount of its initial investment and having to reinvest the proceeds in lower yielding securities. Longer maturity debt securities generally have greater sensitivity to changes in interest rates and may be subject to greater price fluctuations than shorter maturity debt securities.
Bonds and other debt securities are also subject to credit risk, which is the possibility that the credit strength of an issuer or guarantor will weaken or be perceived to be weaker, and/or an issuer of a debt security will fail to make timely payments of principal or interest and the security will go into default. A downgrade or default affecting any of a fund’s securities could cause the value of a fund’s shares to decrease. Lower quality debt securities generally have higher rates of interest and may be subject to greater price fluctuations than
| American Funds Insurance Series | 151 |
higher quality debt securities. Credit risk is gauged, in part, by the credit ratings of the debt securities in which a fund invests. However, ratings are only the opinions of the rating agencies issuing them and are not guarantees as to credit quality or an evaluation of market risk. The fund’s investment adviser relies on its own credit analysts to research issuers and issues in seeking to assess credit and default risks.
Investing in lower rated debt instruments — Lower rated bonds and other lower rated debt securities generally have higher rates of interest and involve greater risk of default or price declines due to changes in the issuer’s creditworthiness than those of higher quality debt securities. The market prices of these securities may fluctuate more than the prices of higher quality debt securities and may decline significantly in periods of general economic difficulty. These risks may be increased with respect to investments in junk bonds.
Investing in derivatives — The use of derivatives involves a variety of risks, which may be different from, or greater than, the risks associated with investing in traditional securities, such as stocks and bonds. Changes in the value of a derivative may not correlate perfectly with, and may be more sensitive to market events than, the underlying asset, rate or index, and a derivative instrument may expose a fund to losses in excess of its initial investment. Derivatives may be difficult to value, difficult for a fund to buy or sell at an opportune time or price and difficult, or even impossible, to terminate or otherwise offset. A fund’s use of derivatives may result in losses to the fund, and investing in derivatives may reduce a fund’s returns and increase a fund’s price volatility. A fund’s counterparty to a derivative transaction (including, if applicable, the fund’s clearing broker, the derivatives exchange or the clearinghouse) may be unable or unwilling to honor its financial obligations in respect of the transaction. In certain cases, the fund may be hindered or delayed in exercising remedies against or closing out derivative instruments with a counterparty, which may result additional losses.
Currency— The prices of, and the income generated by, most debt securities held by a fund may also be affected by changes in relative currency values. If the U.S. dollar appreciates against foreign currencies, the value in U.S. dollars of a fund’s securities denominated in such currencies would generally fall and vice versa. U.S. dollar-denominated securities of foreign issuers may also be affected by changes in relative currency values.
Investing in mortgage-related and other asset-backed securities— Mortgage-related securities, such as mortgage-backed securities, and other asset-backed securities, include debt obligations that represent interests in pools of mortgages or other income-bearing assets, such as consumer loans or receivables. Such securities often involve risks that are different from or more acute than the risks associated with investing in other types of debt securities. Mortgage-backed and other asset-backed securities are subject to changes in the payment patterns of borrowers of the underlying debt, potentially increasing the volatility of the securities and a fund’s net asset value. When interest rates fall, borrowers are more likely to refinance or prepay their debt before its stated maturity. This may result in a fund having to reinvest the proceeds in lower yielding securities, effectively reducing a fund’s income. Conversely, if interest rates rise and borrowers repay their debt more slowly than expected, the time in which the mortgage-backed and other asset-backed securities are paid off could be extended, reducing a fund’s cash available for reinvestment in higher yielding securities. Mortgage-backed securities are also subject to the risk that underlying borrowers will be unable to meet their obligations and the value of property that secures the mortgages may decline in value and be insufficient, upon foreclosure, to repay the associated loans. Investments in asset-backed securities are subject to similar risks.
Investing in future delivery contracts— A fund may enter into contracts, such as to-be-announced contracts and mortgage dollar rolls, that involve a fund selling mortgage-related securities and simultaneously contracting to repurchase similar securities for delivery at a future date at a predetermined price. This can increase a fund’s market exposure, and the market price of the securities that the fund contracts to repurchase could drop below their purchase price. While a fund can preserve and generate capital through the use of such contracts by, for example, realizing the difference between the sale price and the future purchase price, the income generated by the fund may be reduced by engaging in such transactions. In addition, these transactions may increase the turnover rate of a fund.
Investing in inflation linked bonds — The values of inflation linked bonds generally fluctuate in response to changes in real interest rates — i.e., rates of interest after factoring in inflation. A rise in real interest rates may cause the prices of inflation linked securities to fall, while a decline in real interest rates may cause the prices to increase. Inflation linked bonds may experience greater losses than other debt securities with similar durations when real interest rates rise faster than nominal interest rates. There can be no assurance that the value of an inflation linked security will be directly correlated to changes in interest rates; for example, if interest rates rise for reasons other than inflation, the increase may not be reflected in the security’s inflation measure.
Investing in inflation linked bonds may also reduce a fund’s distributable income during periods of deflation. If prices for goods and services decline throughout the economy, the principal and income on inflation linked securities may decline and result in losses to a fund.
Investing in securities backed by the U.S. government— Securities backed by the U.S. Treasury or the full faith and credit of the U.S. government are guaranteed only as to the timely payment of interest and principal when held to maturity. Accordingly, the current market values for these securities will fluctuate with changes in interest rates and the credit rating of the U.S. government. Securities
| 152 | American Funds Insurance Series |
issued by government-sponsored entities and federal agencies and instrumentalities that are not backed by the full faith and credit of the U.S. government are neither issued nor guaranteed by the U.S. government.
Investing in repurchase agreements— Upon entering into a repurchase agreement, a fund purchases a security from a bank or broker-dealer, which simultaneously commits to repurchase the security within a specified time at the fund’s cost with interest. The security purchased by the fund constitutes collateral for the seller’s repurchase obligation. If the party agreeing to repurchase should default, the fund may seek to sell the security it holds as collateral. The fund may incur a loss if the value of the collateral securing the repurchase obligation falls below the repurchase price. The fund may also incur disposition costs and encounter procedural delays in connection with liquidating the collateral.
Interest rate risk — The values and liquidity of the securities held by a fund may be affected by changing interest rates. For example, the values of these securities may decline when interest rates rise and increase when interest rates fall. Longer maturity debt securities generally have greater sensitivity to changes in interest rates and may be subject to greater price fluctuations than shorter maturity debt securities. A fund may invest in variable and floating rate securities. When a fund holds variable or floating rate securities, a decrease in market interest rates will adversely affect the income received from such securities and the net asset value of a fund’s shares. Although the values of such securities are generally less sensitive to interest rate changes than those of other debt securities, the value of variable and floating rate securities may decline if their interest rates do not rise as quickly, or as much, as market interest rates. Conversely, floating rate securities will not generally increase in value if interest rates decline. During periods of extremely low short-term interest rates, a fund may not be able to maintain a positive yield and, given the current low interest rate environment, risks associated with rising rates are currently heightened.
Credit and liquidity support — Changes in the credit quality of banks and financial institutions providing credit and liquidity support features with respect to securities held by a fund could cause the values of these securities to decline.
Asset allocation — A fund’s percentage allocation to equity securities, debt securities and money market instruments could cause the fund to underperform relative to relevant benchmarks and other funds with similar investment objectives.
Nondiversification risk— As nondiversified funds, certain funds have the ability to invest a larger percentage of their assets in the securities of a smaller number of issuers than diversified funds. Although the funds do not intend to limit their investments to the securities of a small number of issuers, if they were to do so, poor performance by a single large holding could adversely impact the funds’ investment results more than if the funds were invested in a larger number of issuers.
Liquidity risk — Certain fund holdings may be or may become difficult or impossible to sell, particularly during times of market turmoil. Liquidity may be impacted by the lack of an active market for a holding, legal or contractual restrictions on resale, or the reduced number and capacity of market participants to make a market in such holding. Market prices for less liquid or illiquid holdings may be volatile, and reduced liquidity may have an adverse impact on the market price of such holdings. Additionally, the sale of less liquid or illiquid holdings may involve substantial delays (including delays in settlement) and additional costs and the fund may be unable to sell such holdings when necessary to meet its liquidity needs or may be forced to sell at a loss.
Management — The investment adviser to the funds actively manages the funds’ investments. Consequently, the funds are subject to the risk that the methods and analyses, including models, tools and data, employed by the investment adviser in this process may be flawed or incorrect and may not produce the desired results. This could cause the funds to lose value or their investment results to lag relevant benchmarks or other funds with similar objectives.
Investing in the managed risk funds may involve additional risks including, but not limited to, those described below.
Fund structure — The managed risk funds invest in underlying funds and incur expenses related to those underlying funds. In addition, investors in the managed risk funds will incur fees to pay for certain expenses related to the operations of the managed risk funds. An investor holding the underlying fund directly would incur lower overall expenses but would not receive the benefit of the managed risk strategy. Additionally, in accordance with an exemption under the Investment Company Act of 1940, as amended, the investment adviser considers only proprietary funds when selecting underlying investment options and allocations. This means that the fund’s investment adviser did not, nor does it expect to, consider any unaffiliated funds as underlying investment options for the fund. This strategy could raise certain conflicts of interest when choosing underlying investments for the fund, including the selection of funds that result in greater compensation to the adviser or funds with relatively lower historical investment results. The investment adviser has policies and procedures designed to mitigate material conflicts of interest that may arise in connection with its management of the fund.
| American Funds Insurance Series | 153 |
Management — The managed risk funds are subject to the risk that the managed risk strategy or the methods employed by the subadviser in implementing the managed risk strategy may not produce the desired results. This could cause the managed risk funds to lose value or their investment results to lag relevant benchmarks or other funds with similar objectives.
Underlying fund risks — Because the managed risk funds’ investments consist of investments in underlying funds, the managed risk funds’ risks are directly related to the risks of the respective underlying fund in which each managed risk fund invests. For this reason, it is important to understand the risks associated with investing both in the managed risk fund and in each of the underlying funds.
Investing in options and futures contracts — In addition to the risks generally associated with investing in derivative instruments, options and futures contracts are subject to the creditworthiness of the clearing organizations, exchanges and, in the case of futures, futures commission merchants with which a fund transacts. Additionally, although futures require only a small initial investment in the form of a deposit of initial margin, the amount of a potential loss on a futures contract could greatly exceed the initial amount invested. While both options and futures contracts are generally liquid instruments, under certain market conditions, options and futures may be deemed to be illiquid. For example, a fund may be temporarily prohibited from closing out its position in an options or futures contract if intraday price change limits or limits on trading volume imposed by the applicable exchange are triggered. If a fund is unable to close out a position on an options or futures contract, the fund would remain subject to the risk of adverse price movements until the fund is able to close out the position in question. The ability of a fund to successfully utilize options and futures contracts may depend in part upon the ability of the fund’s investment adviser or subadviser to accurately forecast interest rates and other economic factors and to assess and predict the impact of such economic factors on the options and futures in which the fund invests. If the investment adviser or subadviser incorrectly forecasts economic developments or incorrectly predicts the impact of such developments on the options and futures in which it invests, a fund could be exposed to the risk of loss. Whereas the risk of loss on a put option purchased by the fund is limited to the initial cost of the option, the amount of a potential loss on a futures contract could greatly exceed the relatively small initial amount invested in entering the futures position.
Hedging — There may be imperfect or even negative correlation between the prices of the options and futures contracts in which a fund invests and the prices of the underlying securities or indexes which the fund seeks to hedge. For example, options and futures contracts may not provide an effective hedge because changes in options and futures contract prices may not track those of the underlying securities or indexes they are intended to hedge. In addition, there are significant differences between the securities market, on the one hand, and the options and futures markets, on the other, that could result in an imperfect correlation between the markets, causing a given hedge not to achieve its objectives. The degree of imperfection of correlation depends on circumstances such as variations in speculative market demand for options and futures, including technical influences in options and futures trading, and differences between the financial instruments being hedged and the instruments underlying the standard contracts available for trading. A decision as to whether, when and how to hedge involves the exercise of skill and judgment, and even a well-conceived hedge may be unsuccessful to some degree because of market behavior or unexpected interest rate trends. In addition, the fund’s investment in exchange-traded options and futures and their resulting costs could limit the fund’s gains in rising markets relative to those of the underlying funds, or to those of unhedged funds in general.
Short positions — Losses from short positions in futures contracts occur when the underlying index increases in value. As the underlying index increases in value, the holder of the short position in the corresponding futures contract is required to pay the difference in value of the futures contract resulting from the increase in the index on a daily basis. Losses from a short position in an index futures contract could potentially be very large if the value of the underlying index rises dramatically in a short period of time.
5. Certain investment techniques
Securities lending — Some of the funds have entered into securities lending transactions in which the funds earn income by lending investment securities to brokers, dealers or other institutions. Each transaction involves three parties: the fund, acting as the lender of the securities, a borrower, and a lending agent that acts as an intermediary.
Securities lending transactions are entered into by the fund under the securities lending agreement with the lending agent. The lending agent facilitates the exchange of securities between the lender and the borrower, generally provides protection from borrower default, marks to market the value of collateral daily, secures additional collateral from the borrower if it falls below preset terms, and may reinvest the collateral on behalf of the fund according to agreed parameters. The lending agent has indemnified the fund against losses resulting from borrower default. Although risk is mitigated by the collateral and indemnification, the fund could experience a delay in recovering its securities and a potential loss of income or value if the borrower fails to return the securities, collateral investments decline in value or the lending agent fails to perform.
| 154 | American Funds Insurance Series |
The borrower is required to post highly liquid assets, such as cash or U.S. government securities, as collateral for the loan in an amount at least equal to the value of the securities loaned. Investments made with cash collateral are recognized as assets in the fund’s investment portfolio. The same amount is recorded as a liability in the fund’s statement of assets and liabilities. While securities are on loan, the fund will continue to receive the equivalent of the interest, dividends or other distributions paid by the issuer, as well as a portion of the interest on the investment of the collateral. Additionally, although the fund does not have the right to vote on securities while they are on loan, the fund has a right to consent on corporate actions and a right to recall loaned securities to vote on proposals affecting them. The borrower is obligated to return the loaned security at the conclusion of the loan or, during the pendency of the loan, on demand from the fund.
The following table presents the value of the securities on loan, the type and value of collateral received and the value of the investment securities purchased, if any, from the cash collateral received by each fund (dollars in thousands):
| Collateral type | ||||||||||||||||
| Fund | Value of securities on loan | Cash | U.S. government securities | Value of investment securities purchased | ||||||||||||
| Global Small Capitalization Fund | $ | 102,111 | $ | 95,814 | $ 11,588 | $ 86,233 | ||||||||||
| New World Fund | 2,679 | — | 2,733 | — | ||||||||||||
| Asset Allocation Fund | 5,211 | 5,103 | 232 | 4,593 | ||||||||||||
Investment securities purchased from cash collateral are disclosed in the summary investment portfolio as short-term securities. Securities received as collateral, if any, are not recognized as fund assets. The contractual maturity of collateral received under the securities lending agreement is classified as overnight and continuous.
Index-linked bonds — Some of the funds have invested in index-linked bonds, which are fixed-income securities whose principal value is periodically adjusted to a government price index. Over the life of an index-linked bond, interest is paid on the adjusted principal value. Increases or decreases in the principal value of index-linked bonds are recorded as interest income in the fund’s statement of operations.
Mortgage dollar rolls — Some of the funds have entered into mortgage dollar roll transactions in which the fund sells a mortgage-backed security to a counterparty and simultaneously enters into an agreement with the same counterparty to buy back a similar security on a specific future date at a predetermined price. Mortgage dollar rolls are accounted for as purchase and sale transactions, which may increase the funds’ portfolio turnover rates.
Loan transactions — Some of the funds have entered into loan transactions in which the fund acquires a loan either through an agent, by assignment from another holder, or as a participation interest in another holder’s portion of a loan. The loan is often administered by a financial institution that acts as agent for the holders of the loan, and the fund may be required to receive approval from the agent and/or borrower prior to the sale of the investment. The loan’s interest rate and maturity date may change based on the terms of the loan, including potential early payments of principal.
Short-term securities — The managed risk funds hold shares of the Government Cash Management Fund, a cash management vehicle offered by the Bank of New York Mellon (“BNY Mellon”), the funds’ custodian bank. The Government Cash Management Fund is managed by the Dreyfus Corporation.
Unfunded commitments — High-Income Bond Fund has participated in transactions that involve unfunded commitments, which may obligate the fund to purchase new or additional bonds if certain contingencies are met. As of December 31, 2019, the maximum exposure of unfunded loan commitments for High-Income Bond Fund was $131,000, which would represent 0.01% of the net assets of the fund should such commitments become due.
Options contracts — The Managed Risk Growth-Income Fund has entered into options contracts, which give the holder of the option, in return for a premium payment, the right to buy from (in the case of a call) or sell to (in the case of a put) the writer of the option, the security underlying the option (or the cash value of the index underlying the option) at a specified price. As part of its managed risk strategy, the Managed Risk Growth-Income Fund will at times purchase put options on equity indexes in standardized contracts traded on foreign or domestic securities exchanges, boards of trade, or similar entities. By purchasing a put option on an equity index, the fund obtains the right (but not the obligation) to sell the cash value of the index underlying the option at a specified exercise price, and in return for this right, the fund pays the current market price, or the option premium, for the option.
| American Funds Insurance Series | 155 |
The fund may terminate its position in a put option by allowing the option to expire or by exercising the option. If the option is allowed to expire, the fund will lose the entire premium. If the option is exercised, the fund completes the sale of the underlying instrument (or delivers the cash value of the index underlying the option) at the exercise price. The fund may also terminate a put option position by entering into opposing close-out transactions in advance of the option expiration date.
Premiums paid on options purchased, as well as the daily fluctuation in market value, are included in investment securities in the fund’s statement of assets and liabilities. Realized gains or losses are recorded at the time the option contract is closed or expires. Net realized gains or losses and net unrealized appreciation or depreciation from options contracts are recorded in the fund’s statement of operations.
Futures contracts — Some of the funds have entered into futures contracts, which provide for the future sale by one party and purchase by another party of a specified amount of a specific financial instrument for a specified price, date, time and place designated at the time the contract is made. Futures contracts are used to strategically manage the fund’s interest rate sensitivity by increasing or decreasing the duration of the fund or a portion of the fund’s portfolio. For the managed risk funds, futures contracts are used to strategically manage portfolio volatility and downside equity risk.
Upon entering into futures contracts, and to maintain the fund’s open positions in futures contracts, the fund is required to deposit with a futures broker, known as a futures commission merchant (“FCM”), in a segregated account in the name of the FCM an amount of cash, U.S. government securities or other liquid securities, known as initial margin. The margin required for a particular futures contract is set by the exchange on which the contract is traded to serve as collateral, and may be significantly modified from time to time by the exchange during the term of the contract. Securities deposited as initial margin, if any, are disclosed in the investment portfolio and cash deposited as initial margin, if any, is reflected as cash pledged for futures contracts in the fund’s statement of assets and liabilities.
On a daily basis, each fund pays or receives variation margin based on the increase or decrease in the value of the futures contracts and records variation margin on futures contracts in each fund’s statement of assets and liabilities. In addition, each fund segregates liquid assets equivalent to the fund’s outstanding obligations under the contract in excess of the initial margin and variation margin, if any. Futures contracts may involve a risk of loss in excess of the variation margin shown on each fund’s statement of assets and liabilities. Each fund records realized gains or losses at the time the futures contract is closed or expires. Net realized gains or losses and net unrealized appreciation or depreciation from futures contracts are recorded in each fund’s statement of operations.
Forward currency contracts — Some of the funds have entered into forward currency contracts, which represent agreements to exchange currencies on specific future dates at predetermined rates. The series’ investment adviser uses forward currency contracts to manage the fund’s exposure to changes in exchange rates. Upon entering into these contracts, risks may arise from the potential inability of counterparties to meet the terms of their contracts and from possible movements in exchange rates.
On a daily basis, the series’ investment adviser values forward currency contracts based on the applicable exchange rates and records unrealized appreciation or depreciation for open forward currency contracts in each fund’s statement of assets and liabilities. Realized gains or losses are recorded at the time the forward contract is closed or offset by another contract with the same broker for the same settlement date and currency. Closed forward currency contracts that have not reached their settlement date are included in the respective receivables or payables for closed forward currency contracts in each fund’s statement of assets and liabilities. Net realized gains or losses from closed forward currency contracts and net unrealized appreciation or depreciation from open forward currency contracts are recorded in each fund’s statement of operations.
Interest rate swaps — Some of the funds have entered into interest rate swaps, which are agreements to exchange one stream of future interest payments for another based on a specified notional amount. Typically, interest rate swaps exchange a fixed interest rate for a payment that floats relative to a benchmark or vice versa. The series’ investment adviser uses interest rate swaps to manage the interest rate sensitivity of the fund by increasing or decreasing the duration of the fund or a portion of the fund’s portfolio. Risks may arise as a result of the series’ investment adviser incorrectly anticipating changes in interest rates, increased volatility, reduced liquidity and the potential inability of counterparties to meet the terms of their agreements.
Upon entering into an interest rate swap contract, the fund is required to deposit cash, U.S. government securities or other liquid securities, which is known as initial margin. Generally, the initial margin required for a particular interest rate swap is set and held as collateral by the clearinghouse on which the contract is cleared. The amount of initial margin required may be significantly modified from time to time by the clearinghouse during the term of the contract.
On a daily basis, the series’ investment adviser records daily interest accruals related to the exchange of future payments as a receivable and payable in each fund’s statement of assets and liabilities. Each fund also pays or receives a variation margin based on the increase or decrease in the value of the interest rate swaps, including accrued interest, and records variation margin on interest rate swaps in
| 156 | American Funds Insurance Series |
each fund’s statement of assets and liabilities. Each fund records realized gains and losses on both the net accrued interest and any gain or loss recognized at the time the interest rate swap is closed or expires. Net realized gains or losses, as well as any net unrealized appreciation or depreciation, from interest rate swaps are recorded in each fund’s statement of operations.
Credit default swap indices — Some of the funds have entered into centrally cleared credit default swap agreements on credit indices (“CDSI”) that involve one party (the protection buyer) making a stream of payments to another party (the protection seller) in exchange for the right to receive a specified return upon the occurrence of a credit event, such as a default or restructuring, with respect to any of the underlying issuers (reference obligations) in the referenced index. The series’ investment adviser uses credit default swaps to assume exposure to a diversified portfolio of credits or to hedge against existing credit risks.
CDSI are portfolios of credit instruments or exposures designed to be representative of some part of the credit market, such as the high-yield or investment-grade credit market. CDSI are generally traded using standardized terms, including a fixed spread and standard maturity dates, and reference all the names in the index. If there is a credit event, it is settled based on that name’s weight in the index. The composition of the underlying issuers or obligations within a particular index may change periodically, usually every six months. A specified credit event may affect all or individual underlying reference obligations included in the index, and will be settled based upon the relative weighting of the affected obligation(s) within the index. The value of each CDSI can be used as a measure of the current payment/performance risk of the CDSI and represents the likelihood of an expected liability or profit should the notional amount of the CDSI be closed or sold as of the period end. An increasing value, as compared to the notional amount of the CDSI, represents a deterioration of the referenced indices’ credit soundness and a greater likelihood of risk of default or other credit event occurring as defined under the terms of the agreement. When a fund provides sell protection, its maximum exposure is the notional amount of the credit default swap agreement.
Upon entering into a centrally cleared CDSI contract, the fund is required to deposit with a derivatives clearing member (“DCM”) in a segregated account in the name of the DCM an amount of cash, U.S. government securities or other liquid securities, which is known as initial margin. Generally, the initial margin required for a particular credit default swap is set and held as collateral by the clearinghouse on which the contract is cleared. The amount of initial margin required may be significantly modified from time to time by the clearinghouse during the term of the contract. Securities deposited as initial margin are designated on the investment portfolio.
On a daily basis, interest accruals related to the exchange of future payments are recorded as a receivable and payable in each fund’s statement of assets and liabilities. Each fund also pays or receives a variation margin based on the increase or decrease in the value of the centrally cleared swaps, and records variation margin in each fund’s statement of assets and liabilities. Each fund records realized gains and losses on both the net accrued interest and any gain or loss recognized at the time the swap is closed or expires. Net realized gains or losses, as well as any net unrealized appreciation or depreciation, from credit default swaps are recorded in each fund’s statement of operations.
The following table presents the average month-end notional amounts of options contracts purchased, futures contracts, forward currency contracts, interest rate swaps and credit default swaps while held for each fund (dollars in thousands):
| Options contracts purchased | Futures contracts | Forward currency contracts | Interest rate swaps | Credit default swaps | |||||||||||
| International Fund | Not applicable | Not applicable | $79,279 | Not applicable | Not applicable | ||||||||||
| New World Fund | Not applicable | Not applicable | 5,048 | * | Not applicable | Not applicable | |||||||||
| Global Growth and Income Fund | Not applicable | Not applicable | 7,314 | Not applicable | Not applicable | ||||||||||
| International Growth and Income Fund | Not applicable | Not applicable | 1,564 | Not applicable | Not applicable | ||||||||||
| Capital Income Builder | Not applicable | $117,725 | Not applicable | $229,667 | Not applicable | ||||||||||
| Asset Allocation Fund | Not applicable | 2,471,967 | Not applicable | 503,101 | Not applicable | ||||||||||
| Global Balanced Fund | Not applicable | 11,883 | 23,258 | 29,983 | Not applicable | ||||||||||
| Bond Fund | Not applicable | 4,367,285 | 671,642 | 1,344,692 | Not applicable | ||||||||||
| Global Bond Fund | Not applicable | 470,248 | 678,676 | 532,130 | $130,250 | ||||||||||
| High-Income Bond Fund | Not applicable | 75,400 | Not applicable | 31,175 | * | 61,207 | |||||||||
| Mortgage Fund | Not applicable | 158,792 | Not applicable | 587,735 | Not applicable | ||||||||||
| U.S. Government/AAA-Rated Securities Fund | Not applicable | 2,472,410 | Not applicable | 13,841,522 | Not applicable | ||||||||||
| Managed Risk Growth Fund | Not applicable | 27,364 | Not applicable | Not applicable | Not applicable | ||||||||||
| Managed Risk International Fund | Not applicable | 46,121 | Not applicable | Not applicable | Not applicable | ||||||||||
| Managed Risk Blue Chip Income and Growth Fund | Not applicable | 23,146 | Not applicable | Not applicable | Not applicable | ||||||||||
| Managed Risk Growth-Income Fund | $29,328 | 130,576 | Not applicable | Not applicable | Not applicable | ||||||||||
| Managed Risk Asset Allocation Fund | Not applicable | 139,336 | Not applicable | Not applicable | Not applicable |
| * | No contracts were held at the end of the reporting period; amount represents the average month-end notional amount of contracts while they were held. |
| American Funds Insurance Series | 157 |
The following tables identify the location and fair value amounts on the funds’ statements of assets and liabilities and the effect on the funds’ statements of operations resulting from the funds’ use of options, futures contracts, forward currency contracts, interest rate swaps and/or credit default swaps as of, or for the year ended, December 31, 2019 (dollars in thousands):
| International Fund | ||||||||||||||
| Assets | Liabilities | |||||||||||||
| Contracts | Risk type | Location on statement of assets and liabilities | Value | Location on statement of assets and liabilities | Value | |||||||||
| Forward currency | Currency | Unrealized appreciation on open forward currency contracts | $ | — | Unrealized depreciation on open forward currency contracts | $ | 131 | |||||||
| Net realized loss | Net unrealized appreciation | |||||||||||||
| Contracts | Risk type | Location on statement of operations | Value | Location on statement of operations | Value | |||||||||
| Forward currency | Currency | Net realized loss on forward currency contracts | $ | (981 | ) | Net unrealized appreciation on forward currency contracts | $ | 394 | ||||||
| New World Fund | ||||||||||||||
| Net realized gain | Net unrealized depreciation | |||||||||||||
| Contracts | Risk type | Location on statement of operations | Value | Location on statement of operations | Value | |||||||||
| Forward currency | Currency | Net realized gain on forward currency contracts | $ | 303 | Net unrealized depreciation on forward currency contracts | $ | (303 | ) | ||||||
| Global Growth and Income Fund | ||||||||||||||
| Assets | Liabilities | |||||||||||||
| Contracts | Risk type | Location on statement of assets and liabilities | Value | Location on statement of assets and liabilities | Value | |||||||||
| Forward currency | Currency | Unrealized appreciation on open forward currency contracts | $ | — | Unrealized depreciation on open forward currency contracts | $ | 137 | |||||||
| Net realized gain | Net unrealized depreciation | |||||||||||||
| Contracts | Risk type | Location on statement of operations | Value | Location on statement of operations | Value | |||||||||
| Forward currency | Currency | Net realized gain on forward currency contracts | $ | 579 | Net unrealized depreciation on forward currency contracts | $ | (488 | ) | ||||||
| International Growth and Income Fund | ||||||||||||||
| Assets | Liabilities | |||||||||||||
| Contracts | Risk type | Location on statement of assets and liabilities | Value | Location on statement of assets and liabilities | Value | |||||||||
| Forward currency | Currency | Unrealized appreciation on open forward currency contracts | $ | — | Unrealized depreciation on open forward currency contracts | $ | 11 | |||||||
| 158 | American Funds Insurance Series |
| Net realized loss | Net unrealized depreciation | |||||||||||||
| Contracts | Risk type | Location on statement of operations | Value | Location on statement of operations | Value | |||||||||
| Forward currency | Currency | Net realized loss on forward currency contracts | $ | (14 | ) | Net unrealized depreciation on forward currency contracts | $ | (12 | ) | |||||
| Capital Income Builder | ||||||||||||||
| Assets | Liabilities | |||||||||||||
| Contracts | Risk type | Location on statement of assets and liabilities | Value | Location on statement of assets and liabilities | Value | |||||||||
| Futures | Interest | Unrealized appreciation1 | $ | 37 | Unrealized depreciation1 | $ | 368 | |||||||
| Swap | Interest | Unrealized appreciation1 | 1,109 | Unrealized depreciation1 | 280 | |||||||||
| $ | 1,146 | $ | 648 | |||||||||||
| Net realized (loss) gain | Net unrealized (depreciation) appreciation | |||||||||||||
| Contracts | Risk type | Location on statement of operations | Value | Location on statement of operations | Value | |||||||||
| Futures | Interest | Net realized loss on futures contracts | $ | (501 | ) | Net unrealized depreciation on futures contracts | $ | (760 | ) | |||||
| Swap | Interest | Net realized gain on swap contracts | 985 | Net unrealized appreciation on swap contracts | 829 | |||||||||
| $ | 484 | $ | 69 | |||||||||||
| Asset Allocation Fund | ||||||||||||||
| Assets | Liabilities | |||||||||||||
| Contracts | Risk type | Location on statement of assets and liabilities | Value | Location on statement of assets and liabilities | Value | |||||||||
| Futures | Interest | Unrealized appreciation1 | $ | 1,710 | Unrealized depreciation1 | $ | 4,672 | |||||||
| Swap | Interest | Unrealized appreciation1 | 1,035 | Unrealized depreciation1 | 4,847 | |||||||||
| $ | 2,745 | $ | 9,519 | |||||||||||
| Net realized gain (loss) | Net unrealized depreciation | |||||||||||||
| Contracts | Risk type | Location on statement of operations | Value | Location on statement of operations | Value | |||||||||
| Futures | Interest | Net realized gain on futures contracts | $ | 22,485 | Net unrealized depreciation on futures contracts | $ | (8,123 | ) | ||||||
| Swap | Interest | Net realized loss on swap contracts | (18,948 | ) | Net unrealized depreciation on swap contracts | (255 | ) | |||||||
| $ | 3,537 | $ | (8,378 | ) | ||||||||||
See end of tables for footnotes.
| American Funds Insurance Series | 159 |
| Global Balanced Fund | ||||||||||||||
| Assets | Liabilities | |||||||||||||
| Contracts | Risk type | Location on statement of assets and liabilities | Value | Location on statement of assets and liabilities | Value | |||||||||
| Futures | Interest | Unrealized appreciation1 | $ | — | Unrealized depreciation1 | $ | 16 | |||||||
| Forward currency | Currency | Unrealized appreciation on open forward currency contracts | 173 | Unrealized depreciation on open forward currency contracts | 272 | |||||||||
| Swap | Interest | Unrealized appreciation1 | 12 | Unrealized depreciation1 | 14 | |||||||||
| $ | 185 | $ | 302 | |||||||||||
| Net realized gain (loss) | Net unrealized depreciation | |||||||||||||
| Contracts | Risk type | Location on statement of operations | Value | Location on statement of operations | Value | |||||||||
| Futures | Interest | Net realized gain on futures contracts | $ | 557 | Net unrealized depreciation on futures contracts | $ | (196 | ) | ||||||
| Forward currency | Currency | Net realized loss on forward currency contracts | (440 | ) | Net unrealized depreciation on forward currency contracts | (181 | ) | |||||||
| Swap | Interest | Net realized gain on swap contracts | 31 | Net unrealized depreciation on swap contracts | (7 | ) | ||||||||
| $ | 148 | $ | (384 | ) | ||||||||||
| Bond Fund | ||||||||||||||
| Assets | Liabilities | |||||||||||||
| Contracts | Risk type | Location on statement of assets and liabilities | Value | Location on statement of assets and liabilities | Value | |||||||||
| Futures | Interest | Unrealized appreciation1 | $ | 8,373 | Unrealized depreciation1 | $ | 12,452 | |||||||
| Forward currency | Currency | Unrealized appreciation on open forward currency contracts | 2,743 | Unrealized depreciation on open forward currency contracts | 3,934 | |||||||||
| Swap | Interest | Unrealized appreciation1 | 5,879 | Unrealized depreciation1 | 11,985 | |||||||||
| $ | 16,995 | $ | 28,371 | |||||||||||
| Net realized gain (loss) | Net unrealized (depreciation) appreciation | |||||||||||||
| Contracts | Risk type | Location on statement of operations | Value | Location on statement of operations | Value | |||||||||
| Futures | Interest | Net realized gain on futures contracts | $ | 72,397 | Net unrealized depreciation on futures contracts | $ | (23,687 | ) | ||||||
| Forward currency | Currency | Net realized gain on forward currency contracts | 58 | Net unrealized appreciation on forward currency contracts | 8,081 | |||||||||
| Swap | Interest | Net realized loss on swap contracts | (24,940 | ) | Net unrealized depreciation on swap contracts | (6,333 | ) | |||||||
| Swap | Credit | Net realized loss on swap contracts | (342 | ) | Net unrealized appreciation on swap contracts | — | ||||||||
| $ | 47,173 | $ | (21,939 | ) | ||||||||||
| 160 | American Funds Insurance Series |
| Global Bond Fund | ||||||||||||||
| Assets | Liabilities | |||||||||||||
| Contracts | Risk type | Location on statement of assets and liabilities | Value | Location on statement of assets and liabilities | Value | |||||||||
| Futures | Interest | Unrealized appreciation1 | $ | 234 | Unrealized depreciation1 | $ | 1,039 | |||||||
| Forward currency | Currency | Unrealized appreciation on open forward currency contracts | 3,976 | Unrealized depreciation on open forward currency contracts | 6,186 | |||||||||
| Forward currency | Currency | Receivables for closed forward currency contracts | 53 | Payables for closed forward currency contracts | 66 | |||||||||
| Swap | Interest | Unrealized appreciation1 | 165 | Unrealized depreciation1 | 704 | |||||||||
| Swap | Credit | Unrealized appreciation1 | 731 | Unrealized depreciation1 | — | |||||||||
| $ | 5,159 | $ | 7,995 | |||||||||||
| Net realized gain (loss) | Net unrealized (depreciation) appreciation | |||||||||||||
| Contracts | Risk type | Location on statement of operations | Value | Location on statement of operations | Value | |||||||||
| Futures | Interest | Net realized gain on futures contracts | $ | 13,348 | Net unrealized depreciation on futures contracts | $ | (5,076 | ) | ||||||
| Forward currency | Currency | Net realized loss on forward currency contracts | (2,623 | ) | Net unrealized depreciation on forward currency contracts | (9,128 | ) | |||||||
| Swap | Interest | Net realized gain on swap contracts | 1,160 | Net unrealized depreciation on swap contracts | (590 | ) | ||||||||
| Swap | Credit | Net realized gain on swap contracts | 365 | Net unrealized appreciation on swap contracts | 731 | |||||||||
| $ | 12,250 | $ | (14,063 | ) | ||||||||||
| High-Income Bond Fund | ||||||||||||||
| Assets | Liabilities | |||||||||||||
| Contracts | Risk type | Location on statement of assets and liabilities | Value | Location on statement of assets and liabilities | Value | |||||||||
| Futures | Interest | Unrealized appreciation1 | $ | 192 | Unrealized depreciation1 | $ | 33 | |||||||
| Swap | Credit | Unrealized appreciation1 | — | Unrealized depreciation1 | 1,578 | |||||||||
| $ | 192 | $ | 1,611 | |||||||||||
| Net realized loss | Net unrealized appreciation (depreciation) | |||||||||||||
| Contracts | Risk type | Location on statement of operations | Value | Location on statement of operations | Value | |||||||||
| Futures | Interest | Net realized loss on futures contracts | $ | (236 | ) | Net unrealized appreciation on futures contracts | $ | 159 | ||||||
| Swap | Interest | Net realized loss on swap contracts | (268 | ) | Net unrealized appreciation on swap contracts | 224 | ||||||||
| Swap | Credit | Net realized loss on swap contracts | (718 | ) | Net unrealized depreciation on swap contracts | (3,122 | ) | |||||||
| $ | (1,222 | ) | $ | (2,739 | ) | |||||||||
See end of tables for footnotes.
| American Funds Insurance Series | 161 |
| Mortgage Fund | ||||||||||||||
| Assets | Liabilities | |||||||||||||
| Contracts | Risk type | Location on statement of assets and liabilities | Value | Location on statement of assets and liabilities | Value | |||||||||
| Futures | Interest | Unrealized appreciation1 | $ | — | Unrealized depreciation1 | $ | 746 | |||||||
| Swap | Interest | Unrealized appreciation1 | 1,618 | Unrealized depreciation1 | 4,450 | |||||||||
| $ | 1,618 | $ | 5,196 | |||||||||||
| Net realized gain | Net unrealized depreciation | |||||||||||||
| Contracts | Risk type | Location on statement of operations | Value | Location on statement of operations | Value | |||||||||
| Futures | Interest | Net realized gain on futures contracts | $ | 6,233 | Net unrealized depreciation on futures contracts | $ | (2,645 | ) | ||||||
| Swap | Interest | Net realized gain on swap contracts | 1,047 | Net unrealized depreciation on swap contracts | (4,026 | ) | ||||||||
| $ | 7,280 | $ | (6,671 | ) | ||||||||||
| U.S. Government/AAA-Rated Securities Fund | ||||||||||||||
| Assets | Liabilities | |||||||||||||
| Contracts | Risk type | Location on statement of assets and liabilities | Value | Location on statement of assets and liabilities | Value | |||||||||
| Futures | Interest | Unrealized appreciation1 | $ | 687 | Unrealized depreciation1 | $ | 8,635 | |||||||
| Swap | Interest | Unrealized appreciation1 | 25,927 | Unrealized depreciation1 | 46,229 | |||||||||
| $ | 26,614 | $ | 54,864 | |||||||||||
| Net realized gain (loss) | Net unrealized depreciation | |||||||||||||
| Contracts | Risk type | Location on statement of operations | Value | Location on statement of operations | Value | |||||||||
| Futures | Interest | Net realized gain on futures contracts | $ | 85,989 | Net unrealized depreciation on futures contracts | $ | (35,398 | ) | ||||||
| Swap | Interest | Net realized loss on swap contracts | (7,749 | ) | Net unrealized depreciation on swap contracts | (39,656 | ) | |||||||
| $ | 78,240 | $ | (75,054 | ) | ||||||||||
| Managed Risk Growth Fund | ||||||||||||||
| Assets | Liabilities | |||||||||||||
| Contracts | Risk type | Location on statement of assets and liabilities | Value | Location on statement of assets and liabilities | Value | |||||||||
| Futures | Interest | Unrealized appreciation1 | $ | — | Unrealized depreciation1 | $ | 61 | |||||||
| 162 | American Funds Insurance Series |
| Net realized (loss) gain | Net unrealized appreciation (depreciation) | |||||||||||||
| Contracts | Risk type | Location on statement of operations | Value | Location on statement of operations | Value | |||||||||
| Futures | Currency | Net realized loss on futures contracts | $ | (111 | ) | Net unrealized appreciation on futures contracts | $ | 45 | ||||||
| Futures | Equity | Net realized loss on futures contracts | (7,821 | ) | Net unrealized depreciation on futures contracts | (4,022 | ) | |||||||
| Futures | Interest | Net realized gain on futures contracts | 2,121 | Net unrealized depreciation on futures contracts | (1,975 | ) | ||||||||
| $ | (5,811 | ) | $ | (5,952 | ) | |||||||||
| Managed Risk International Fund | ||||||||||||||
| Assets | Liabilities | |||||||||||||
| Contracts | Risk type | Location on statement of assets and liabilities | Value | Location on statement of assets and liabilities | Value | |||||||||
| Futures | Interest | Unrealized appreciation1 | $ | — | Unrealized depreciation1 | $ | 30 | |||||||
| Net realized (loss) gain | Net unrealized appreciation (depreciation) | |||||||||||||
| Contracts | Risk type | Location on statement of operations | Value | Location on statement of operations | Value | |||||||||
| Futures | Currency | Net realized loss on futures contracts | $ | (228 | ) | Net unrealized appreciation on futures contracts | $ | 278 | ||||||
| Futures | Equity | Net realized loss on futures contracts | (1,772 | ) | Net unrealized depreciation on futures contracts | (882 | ) | |||||||
| Futures | Interest | Net realized gain on futures contracts | 754 | Net unrealized depreciation on futures contracts | (645 | ) | ||||||||
| $ | (1,246 | ) | $ | (1,249 | ) | |||||||||
| Managed Risk Blue Chip Income and Growth Fund | ||||||||||||||
| Assets | Liabilities | |||||||||||||
| Contracts | Risk type | Location on statement of assets and liabilities | Value | Location on statement of assets and liabilities | Value | |||||||||
| Futures | Interest | Unrealized appreciation1 | $ | — | Unrealized depreciation1 | $ | 52 | |||||||
| Net realized (loss) gain | Net unrealized appreciation (depreciation) | |||||||||||||
| Contracts | Risk type | Location on statement of operations | Value | Location on statement of operations | Value | |||||||||
| Futures | Currency | Net realized loss on futures contracts | $ | (51 | ) | Net unrealized appreciation on futures contracts | $ | 30 | ||||||
| Futures | Equity | Net realized loss on futures contracts | (7,602 | ) | Net unrealized depreciation on futures contracts | (3,946 | ) | |||||||
| Futures | Interest | Net realized gain on futures contracts | 2,110 | Net unrealized depreciation on futures contracts | (1,917 | ) | ||||||||
| $ | (5,543 | ) | $ | (5,833 | ) | |||||||||
See end of tables for footnotes.
| American Funds Insurance Series | 163 |
| Managed Risk Growth-Income Fund | ||||||||||||||
| Assets | Liabilities | |||||||||||||
| Contracts | Risk type | Location on statement of assets and liabilities | Value | Location on statement of assets and liabilities | Value | |||||||||
| Options | Equity | Investment securities from unaffiliated issuers2 | $ | 4,322 | Investment securities from unaffiliated issuers2 | $ | — | |||||||
| Futures | Equity | Unrealized appreciation1 | 1,045 | Unrealized depreciation1 | — | |||||||||
| Futures | Interest | Unrealized appreciation1 | — | Unrealized depreciation1 | 375 | |||||||||
| $ | 5,367 | $ | 375 | |||||||||||
| Net realized (loss) gain | Net unrealized (depreciation) appreciation | |||||||||||||
| Contracts | Risk type | Location on statement of operations | Value | Location on statement of operations | Value | |||||||||
| Options purchased | Equity | Net realized loss on options purchased contracts3 | $ | (21,805 | ) | Net unrealized depreciation on options purchased contracts4 | $ | (11,132 | ) | |||||
| Futures | Currency | Net realized loss on futures contracts | (698 | ) | Net unrealized appreciation on futures contracts | 497 | ||||||||
| Futures | Equity | Net realized loss on futures contracts | (15,325 | ) | Net unrealized depreciation on futures contracts | (2,840 | ) | |||||||
| Futures | Interest | Net realized gain on futures contracts | 8,388 | Net unrealized depreciation on futures contracts | (7,294 | ) | ||||||||
| $ | (29,440 | ) | $ | (20,769 | ) | |||||||||
| Managed Risk Asset Allocation Fund | ||||||||||||||
| Assets | Liabilities | |||||||||||||
| Contracts | Risk type | Location on statement of assets and liabilities | Value | Location on statement of assets and liabilities | Value | |||||||||
| Futures | Interest | Unrealized appreciation1 | $ | — | Unrealized depreciation1 | $ | 525 | |||||||
| Net realized (loss) gain | Net unrealized appreciation (depreciation) | |||||||||||||
| Contracts | Risk type | Location on statement of operations | Value | Location on statement of operations | Value | |||||||||
| Futures | Currency | Net realized loss on futures contracts | $ | (252 | ) | Net unrealized appreciation on futures contracts | $ | 182 | ||||||
| Futures | Equity | Net realized loss on futures contracts | (27,273 | ) | Net unrealized depreciation on futures contracts | (17,157 | ) | |||||||
| Futures | Interest | Net realized gain on futures contracts | 9,662 | Net unrealized depreciation on futures contracts | (8,873 | ) | ||||||||
| $ | (17,863 | ) | $ | (25,848 | ) | |||||||||
| 1 | Includes cumulative appreciation/depreciation on futures contracts, interest rate swaps and/or credit default swaps as reported in the applicable table following each fund’s investment portfolio. Only current day’s variation margin is reported within the statements of assets and liabilities. |
| 2 | Includes options purchased as reported in the fund’s investment portfolio. |
| 3 | Options purchased are included in net realized gain (loss) on unaffiliated investments. |
| 4 | Options purchased are included in net unrealized appreciation (depreciation) on unaffiliated investments. |
| 164 | American Funds Insurance Series |
Collateral — Some funds participate in a collateral program that calls for the funds to either receive or pledge highly liquid assets, such as cash or U.S. government securities, as collateral due to securities lending and/or their use of futures contracts, forward currency contracts, interest rate swaps, credit default swaps and/or future delivery contracts. For securities lending, each participating fund receives collateral in exchange for lending investment securities. The purpose of the collateral is to cover potential losses that could occur in the event that the borrower cannot meet its contractual obligation. The lending agent may reinvest collateral from securities lending transactions according to agreed parameters. For futures contracts, interest rate swaps and credit default swaps, the program calls for each participating fund to pledge collateral for initial and variation margin by contract. For forward currency contracts, the program calls for each participating fund to either receive or pledge collateral based on the net gain or loss on unsettled forward currency contracts by counterparty. For future delivery contracts, the program calls for each participating fund to either receive or pledge collateral based on the net gain or loss on unsettled contracts by certain counterparties. The purpose of the collateral is to cover potential losses that could occur in the event that either party cannot meet its contractual obligation. Non-cash collateral pledged by each participating fund, if any, is disclosed in each fund’s investment portfolio, and cash collateral pledged by each participating fund, if any, is held in a segregated account with the fund’s custodian, which is reflected as pledged cash in each fund’s statement of assets and liabilities.
Rights of offset — Funds that hold forward currency contracts have enforceable master netting agreements with certain counterparties, where amounts payable by each party to the other in the same currency (with the same settlement date and with the same counterparty) are settled net of each party’s payment obligation. If an early termination date occurs under these agreements following an event of default or termination event, all obligations of each party to its counterparty are settled net through a single payment in a single currency (“close-out netting”). For financial reporting purposes, the funds do not offset financial assets and financial liabilities that are subject to these master netting arrangements in the statements of assets and liabilities.
The following tables present each fund’s forward currency contracts by counterparty that are subject to master netting agreements but that are not offset in the funds’ statements of assets and liabilities. The net amount column shows the impact of offsetting on the funds’ statement of assets and liabilities as of December 31, 2019, if close-out netting was exercised (dollars in thousands):
| International Fund | ||||||||||||||||||||
| Gross amounts not offset in the | ||||||||||||||||||||
| Gross amounts | statement of assets and liabilities and | |||||||||||||||||||
| recognized in the | subject to a master netting agreement | |||||||||||||||||||
| statement of assets | Available | Non-cash | Cash | Net | ||||||||||||||||
| Counterparty | and liabilities | to offset | collateral* | collateral* | amount | |||||||||||||||
| Liabilities: | ||||||||||||||||||||
| Barclays Bank PLC | $ | 131 | $ | — | $ | — | $ | — | $ | 131 | ||||||||||
| Global Growth and Income Fund | ||||||||||||||||||||
| Gross amounts not offset in the | ||||||||||||||||||||
| Gross amounts | statement of assets and liabilities and | |||||||||||||||||||
| recognized in the | subject to a master netting agreement | |||||||||||||||||||
| statement of assets | Available | Non-cash | Cash | Net | ||||||||||||||||
| Counterparty | and liabilities | to offset | collateral* | collateral* | amount | |||||||||||||||
| Liabilities: | ||||||||||||||||||||
| Citibank | $ | 137 | $ | — | $ | — | $ | — | $ | 137 | ||||||||||
| International Growth and Income Fund | ||||||||||||||||||||
| Gross amounts not offset in the | ||||||||||||||||||||
| Gross amounts | statement of assets and liabilities and | |||||||||||||||||||
| recognized in the | subject to a master netting agreement | |||||||||||||||||||
| statement of assets | Available | Non-cash | Cash | Net | ||||||||||||||||
| Counterparty | and liabilities | to offset | collateral* | collateral* | amount | |||||||||||||||
| Liabilities: | ||||||||||||||||||||
| Bank of America | $ | 11 | $ | — | $ | — | $ | — | $ | 11 | ||||||||||
See end of tables for footnote.
| American Funds Insurance Series | 165 |
| Global Balanced Fund | ||||||||||||||||||||
| Gross amounts not offset in the | ||||||||||||||||||||
| Gross amounts | statement of assets and liabilities and | |||||||||||||||||||
| recognized in the | subject to a master netting agreement | |||||||||||||||||||
| statement of assets | Available | Non-cash | Cash | Net | ||||||||||||||||
| Counterparty | and liabilities | to offset | collateral* | collateral* | amount | |||||||||||||||
| Assets: | ||||||||||||||||||||
| Bank of America | $ | 16 | $ | (16 | ) | $ | — | $ | — | $ | — | |||||||||
| Bank of New York Mellon | 4 | (1 | ) | — | — | 3 | ||||||||||||||
| Citibank | 23 | (23 | ) | — | — | — | ||||||||||||||
| Goldman Sachs | 2 | (2 | ) | — | — | — | ||||||||||||||
| HSBC Bank | 28 | (28 | ) | — | — | — | ||||||||||||||
| JPMorgan Chase | 1 | (1 | ) | — | — | — | ||||||||||||||
| Morgan Stanley | 64 | (3 | ) | — | — | 61 | ||||||||||||||
| Standard Chartered Bank | 34 | (34 | ) | — | — | — | ||||||||||||||
| UBS AG | 1 | (1 | ) | — | — | — | ||||||||||||||
| Total | $ | 173 | $ | (109 | ) | $ | — | $ | — | $ | 64 | |||||||||
| Liabilities: | ||||||||||||||||||||
| Bank of America | $ | 53 | $ | (16 | ) | $ | — | $ | — | $ | 37 | |||||||||
| Bank of New York Mellon | 1 | (1 | ) | — | — | — | ||||||||||||||
| Citibank | 55 | (23 | ) | — | — | 32 | ||||||||||||||
| Goldman Sachs | 29 | (2 | ) | — | — | 27 | ||||||||||||||
| HSBC Bank | 47 | (28 | ) | — | — | 19 | ||||||||||||||
| JPMorgan Chase | 35 | (1 | ) | — | — | 34 | ||||||||||||||
| Morgan Stanley | 3 | (3 | ) | — | — | — | ||||||||||||||
| Standard Chartered Bank | 48 | (34 | ) | — | — | 14 | ||||||||||||||
| UBS AG | 1 | (1 | ) | — | — | — | ||||||||||||||
| Total | $ | 272 | $ | (109 | ) | $ | — | $ | — | $ | 163 | |||||||||
| Bond Fund | ||||||||||||||||||||
| Gross amounts not offset in the | ||||||||||||||||||||
| Gross amounts | statement of assets and liabilities and | |||||||||||||||||||
| recognized in the | subject to a master netting agreement | |||||||||||||||||||
| statement of assets | Available | Non-cash | Cash | Net | ||||||||||||||||
| Counterparty | and liabilities | to offset | collateral* | collateral* | amount | |||||||||||||||
| Assets: | ||||||||||||||||||||
| Bank of New York Mellon | $ | 35 | $ | — | $ | — | $ | — | $ | 35 | ||||||||||
| Citibank | 1,789 | — | — | (1,789 | ) | — | ||||||||||||||
| Goldman Sachs | 41 | — | — | — | 41 | |||||||||||||||
| JPMorgan Chase | 878 | — | (825 | ) | — | 53 | ||||||||||||||
| Total | $ | 2,743 | $ | — | $ | (825 | ) | $ | (1,789 | ) | $ | 129 | ||||||||
| Liabilities: | ||||||||||||||||||||
| Barclays Bank PLC | $ | 1,226 | $ | — | $ | (1,226 | ) | $ | — | $ | — | |||||||||
| HSBC Bank | 1,355 | — | (1,186 | ) | — | 169 | ||||||||||||||
| Morgan Stanley | 1,353 | — | (1,156 | ) | — | 197 | ||||||||||||||
| Total | $ | 3,934 | $ | — | $ | (3,568 | ) | $ | — | $ | 366 | |||||||||
| 166 | American Funds Insurance Series |
| Global Bond Fund | ||||||||||||||||||||
| Gross amounts not offset in the | ||||||||||||||||||||
| Gross amounts | statement of assets and liabilities and | |||||||||||||||||||
| recognized in the | subject to a master netting agreement | |||||||||||||||||||
| statement of assets | Available | Non-cash | Cash | Net | ||||||||||||||||
| Counterparty | and liabilities | to offset | collateral* | collateral* | amount | |||||||||||||||
| Assets: | ||||||||||||||||||||
| Bank of America | $ | 273 | $ | (273 | ) | $ | — | $ | — | $ | — | |||||||||
| Bank of New York Mellon | 56 | — | — | — | 56 | |||||||||||||||
| Barclays Bank PLC | 181 | — | — | — | 181 | |||||||||||||||
| Citibank | 613 | (613 | ) | — | — | — | ||||||||||||||
| Goldman Sachs | 745 | (587 | ) | — | — | 158 | ||||||||||||||
| HSBC Bank | 489 | (489 | ) | — | — | — | ||||||||||||||
| JPMorgan Chase | 104 | (104 | ) | — | — | — | ||||||||||||||
| Morgan Stanley | 959 | (244 | ) | — | (715 | ) | — | |||||||||||||
| Standard Chartered Bank | 559 | (559 | ) | — | — | — | ||||||||||||||
| UBS AG | 50 | (50 | ) | — | — | — | ||||||||||||||
| Total | $ | 4,029 | $ | (2,919 | ) | $ | — | $ | (715 | ) | $ | 395 | ||||||||
| Liabilities: | ||||||||||||||||||||
| Bank of America | $ | 1,002 | $ | (273 | ) | $ | (729 | ) | $ | — | $ | — | ||||||||
| Citibank | 2,019 | (613 | ) | (1,406 | ) | — | — | |||||||||||||
| Goldman Sachs | 587 | (587 | ) | — | — | — | ||||||||||||||
| HSBC Bank | 931 | (489 | ) | (442 | ) | — | — | |||||||||||||
| JPMorgan Chase | 778 | (104 | ) | (548 | ) | — | 126 | |||||||||||||
| Morgan Stanley | 244 | (244 | ) | — | — | — | ||||||||||||||
| Standard Chartered Bank | 590 | (559 | ) | (31 | ) | — | — | |||||||||||||
| UBS AG | 101 | (50 | ) | — | — | 51 | ||||||||||||||
| Total | $ | 6,252 | $ | (2,919 | ) | $ | (3,156 | ) | $ | — | $ | 177 | ||||||||
| * | Collateral is shown on a settlement basis. |
6. Taxation and distributions
Federal income taxation — Each fund complies with the requirements under Subchapter M of the Internal Revenue Code applicable to mutual funds and intends to distribute substantially all of its net taxable income and net capital gains each year. The funds are not subject to income taxes to the extent such distributions are made. Therefore, no federal income tax provision is required.
As of and during the period ended December 31, 2019, none of the funds had a liability for any unrecognized tax benefits. Each fund recognizes interest and penalties, if any, related to unrecognized tax benefits as income tax expense in their respective statements of operations. During the period, none of the funds incurred any significant interest or penalties.
Each fund’s tax returns are not subject to examination by federal, state and, if applicable, non-U.S. tax authorities after the expiration of each jurisdiction’s statute of limitations, which is generally three years after the date of filing but can be extended in certain jurisdictions.
Non-U.S. taxation — Dividend and interest income, if any, are recorded net of non-U.S. taxes paid. The funds may file withholding tax reclaims in certain jurisdictions to recover a portion of amounts previously withheld. As a result of rulings from European courts, the funds filed for additional reclaims related to prior years. These reclaims are recorded when the amount is known and there are no significant uncertainties on collectability. Gains realized by the funds on the sale of securities in certain countries, if any, may be subject to non-U.S. taxes. If applicable, the funds record an estimated deferred tax liability based on unrealized gains to provide for potential non-U.S. taxes payable upon the sale of these securities.
| American Funds Insurance Series | 167 |
Distributions — Distributions paid to shareholders are based on each fund’s net investment income and net realized gains determined on a tax basis, which may differ from net investment income and net realized gains for financial reporting purposes. These differences are due primarily to different treatment for items such as currency gains and losses; short-term capital gains and losses; capital losses related to sales of certain securities within 30 days of purchase; unrealized appreciation of certain investments in securities outside the U.S.; deferred expenses; cost of investments sold; paydowns on fixed-income securities; net capital losses; non-U.S. taxes on capital gains; amortization of premiums and discounts and income on certain investments. The fiscal year in which amounts are distributed may differ from the year in which the net investment income and net realized gains are recorded by the funds for financial reporting purposes.
Additional tax basis disclosures for each fund as of December 31, 2019, were as follows (dollars in thousands):
| Global | Blue Chip | |||||||||||||||||||||||
| Global | Small | New | Income and | |||||||||||||||||||||
| Growth | Capitalization | Growth | International | World | Growth | |||||||||||||||||||
| Fund | Fund | Fund | Fund | Fund | Fund | |||||||||||||||||||
| Undistributed ordinary income | $ | 13,148 | $ | 11,186 | $ | 76,916 | $ | 19,253 | $ | 25,462 | $ | 37,136 | ||||||||||||
| Undistributed long-term capital gains | 194,055 | 273,289 | 738,170 | — | 16,027 | 104,256 | ||||||||||||||||||
| Capital loss carryforward* | — | — | — | (149,822 | ) | — | — | |||||||||||||||||
| Gross unrealized appreciation on investments | 2,976,734 | 1,338,057 | 12,680,487 | 2,723,168 | 1,025,046 | 2,435,492 | ||||||||||||||||||
| Gross unrealized depreciation on investments | (115,480 | ) | (165,363 | ) | (176,640 | ) | (296,533 | ) | (51,959 | ) | (319,251 | ) | ||||||||||||
| Net unrealized appreciation on investments | 2,861,254 | 1,172,694 | 12,503,847 | 2,426,635 | 973,087 | 2,116,241 | ||||||||||||||||||
| Cost of investments | 3,973,424 | 3,535,026 | 16,026,368 | 7,663,533 | 2,790,816 | 7,160,691 | ||||||||||||||||||
| Reclassification from (to) total distributable earnings/accumulated loss to (from) capital paid in on shares of beneficial interest | 1 | (1 | ) | — | 1 | 1 | — | |||||||||||||||||
| Global | International | |||||||||||||||||||||||
| Growth | Growth- | Growth | Capital | Asset | Global | |||||||||||||||||||
| and Income | Income | and Income | Income | Allocation | Balanced | |||||||||||||||||||
| Fund | Fund | Fund | Builder | Fund | Fund | |||||||||||||||||||
| Undistributed ordinary income | $ | 6,550 | $ | 238,333 | $ | 3,236 | $ | 1,926 | $ | 118,751 | $ | 17 | ||||||||||||
| Undistributed long-term capital gains | 51,450 | 820,299 | — | — | 123,690 | 1,437 | ||||||||||||||||||
| Capital loss carryforward* | — | — | (35,828 | ) | (19,754 | ) | �� | — | — | |||||||||||||||
| Gross unrealized appreciation on investments | 657,067 | 11,402,210 | 307,883 | 119,069 | 7,134,453 | 85,707 | ||||||||||||||||||
| Gross unrealized depreciation on investments | (21,291 | ) | (751,877 | ) | (44,941 | ) | (23,709 | ) | (431,268 | ) | (4,511 | ) | ||||||||||||
| Net unrealized appreciation on investments | 635,776 | 10,650,333 | 262,942 | 95,360 | 6,703,185 | 81,196 | ||||||||||||||||||
| Cost of investments | 1,502,381 | 25,381,374 | 1,239,616 | 895,754 | 20,858,922 | 354,608 | ||||||||||||||||||
| Reclassification from (to) total distributable earnings/accumulated loss to (from) capital paid in on shares of beneficial interest | — | (1 | ) | — | — | — | 12 | |||||||||||||||||
| 168 | American Funds Insurance Series |
| U.S. | ||||||||||||||||||||||||
| High- | Government/ | |||||||||||||||||||||||
| Global | Income | Ultra-Short | AAA-Rated | |||||||||||||||||||||
| Bond | Bond | Bond | Mortgage | Bond | Securities | |||||||||||||||||||
| Fund | Fund | Fund | Fund | Fund | Fund | |||||||||||||||||||
| Undistributed ordinary income | $ | 101,879 | $ | 31,468 | $ | 12,900 | $ | 1,209 | $ | 737 | $ | 33,112 | ||||||||||||
| Undistributed long-term capital gains | 42,007 | 8,412 | — | 390 | — | 16,400 | ||||||||||||||||||
| Capital loss carryforward* | — | — | (190,113 | ) | — | (1 | ) | — | ||||||||||||||||
| Capital loss carryforward utilized | 159,206 | 3,784 | — | 6,175 | — | 52,033 | ||||||||||||||||||
| Gross unrealized appreciation on investments | 359,213 | 92,798 | 49,688 | 6,927 | 12 | 78,457 | ||||||||||||||||||
| Gross unrealized depreciation on investments | (49,858 | ) | (37,745 | ) | (61,045 | ) | (5,296 | ) | (5 | ) | (60,713 | ) | ||||||||||||
| Net unrealized appreciation (depreciation) on investments | 309,355 | 55,053 | (11,357 | ) | 1,631 | 7 | 17,744 | |||||||||||||||||
| Cost of investments | 10,596,670 | 2,058,371 | 1,258,516 | 274,404 | 284,222 | 2,991,005 | ||||||||||||||||||
| Reclassification from (to) total distributable earnings/accumulated loss to (from) capital paid in on shares of beneficial interest | 1 | — | — | (2 | ) | — | 1 | |||||||||||||||||
| Managed | Managed | Managed | ||||||||||||||||||||||
| Managed | Managed | Risk Blue | Risk | Risk | ||||||||||||||||||||
| Risk | Risk | Chip Income | Growth- | Asset | ||||||||||||||||||||
| Growth | International | and Growth | Income | Allocation | ||||||||||||||||||||
| Fund | Fund | Fund | Fund | Fund | ||||||||||||||||||||
| Undistributed ordinary income | $ | 3,505 | $ | 1,934 | $ | 5,703 | $ | 33,307 | $ | 40,690 | ||||||||||||||
| Undistributed long-term capital gains | 21,766 | 1,312 | 10,865 | 118,369 | 105,973 | |||||||||||||||||||
| Gross unrealized appreciation on investments | 46,058 | 14,843 | 4,513 | 192,587 | 244,160 | |||||||||||||||||||
| Gross unrealized depreciation on investments | (7,615 | ) | (6,664 | ) | (2,398 | ) | (14,687 | ) | (8,220 | ) | ||||||||||||||
| Net unrealized appreciation on investments | 38,443 | 8,179 | 2,115 | 177,900 | 235,940 | |||||||||||||||||||
| Cost of investments | 401,443 | 157,659 | 363,502 | 2,092,631 | 2,597,655 | |||||||||||||||||||
| * | Capital loss carryforwards will be used to offset any capital gains realized by the funds in future years. The funds will not make distributions from capital gains while a capital loss carryforward remains. |
Distributions paid by each fund were characterized for tax purposes as follows (dollars in thousands):
Global Growth Fund
| Year ended December 31, 2019 | Year ended December 31, 2018 | |||||||||||||||||||||||
| Total | Total | |||||||||||||||||||||||
| Ordinary | Long-term | distributions | Ordinary | Long-term | distributions | |||||||||||||||||||
| Share class | income | capital gains | paid | income | capital gains | paid | ||||||||||||||||||
| Class 1 | $ | 31,022 | $ | 121,251 | $ | 152,273 | $ | 28,611 | $ | 134,884 | $ | 163,495 | ||||||||||||
| Class 1A | 82 | 367 | 449 | 47 | 273 | 320 | ||||||||||||||||||
| Class 2 | 40,119 | 204,481 | 244,600 | 41,238 | 251,323 | 292,561 | ||||||||||||||||||
| Class 4 | 3,204 | 17,408 | 20,612 | 2,414 | 16,024 | 18,438 | ||||||||||||||||||
| Total | $ | 74,427 | $ | 343,507 | $ | 417,934 | $ | 72,310 | $ | 402,504 | $ | 474,814 | ||||||||||||
See end of tables for footnote.
| American Funds Insurance Series | 169 |
Global Small Capitalization Fund
| Year ended December 31, 2019 | Year ended December 31, 2018 | |||||||||||||||||||||||
| Total | Total | |||||||||||||||||||||||
| Ordinary | Long-term | distributions | Ordinary | Long-term | distributions | |||||||||||||||||||
| Share class | income | capital gains | paid | income | capital gains | paid | ||||||||||||||||||
| Class 1 | $ | 28,009 | $ | 97,912 | $ | 125,921 | $ | 21,329 | $ | 55,968 | $ | 77,297 | ||||||||||||
| Class 1A | 6 | 23 | 29 | 4 | 12 | 16 | ||||||||||||||||||
| Class 2 | 28,406 | 119,280 | 147,686 | 26,294 | 86,037 | 112,331 | ||||||||||||||||||
| Class 4 | 1,932 | 9,184 | 11,116 | 1,456 | 5,035 | 6,491 | ||||||||||||||||||
| Total | $ | 58,353 | $ | 226,399 | $ | 284,752 | $ | 49,083 | $ | 147,052 | $ | 196,135 | ||||||||||||
Growth Fund
| Year ended December 31, 2019 | Year ended December 31, 2018 | |||||||||||||||||||||||
| Total | Total | |||||||||||||||||||||||
| Ordinary | Long-term | distributions | Ordinary | Long-term | distributions | |||||||||||||||||||
| Share class | income | capital gains | paid | income | capital gains | paid | ||||||||||||||||||
| Class 1 | $ | 150,838 | $ | 964,757 | $ | 1,115,595 | $ | 88,940 | $ | 792,865 | $ | 881,805 | ||||||||||||
| Class 1A | 193 | 1,290 | 1,483 | 76 | 634 | 710 | ||||||||||||||||||
| Class 2 | 192,058 | 1,500,212 | 1,692,270 | 117,331 | 1,515,757 | 1,633,088 | ||||||||||||||||||
| Class 3 | 2,713 | 20,442 | 23,155 | 1,723 | 20,248 | 21,971 | ||||||||||||||||||
| Class 4 | 14,770 | 130,929 | 145,699 | 6,414 | 104,527 | 110,941 | ||||||||||||||||||
| Total | $ | 360,572 | $ | 2,617,630 | $ | 2,978,202 | $ | 214,484 | $ | 2,434,031 | $ | 2,648,515 | ||||||||||||
International Fund
| Year ended December 31, 2019 | Year ended December 31, 2018 | |||||||||||||||||||||||
| Total | Total | |||||||||||||||||||||||
| Ordinary | Long-term | distributions | Ordinary | Long-term | distributions | |||||||||||||||||||
| Share class | income | capital gains | paid | income | capital gains | paid | ||||||||||||||||||
| Class 1 | $ | 85,943 | $ | 130,060 | $ | 216,003 | $ | 174,418 | $ | 165,915 | $ | 340,333 | ||||||||||||
| Class 1A | 95 | 141 | 236 | 156 | 140 | 296 | ||||||||||||||||||
| Class 2 | 59,246 | 104,778 | 164,024 | 136,977 | 146,986 | 283,963 | ||||||||||||||||||
| Class 3 | 354 | 637 | 991 | 887 | 970 | 1,857 | ||||||||||||||||||
| Class 4 | 4,496 | 8,870 | 13,366 | 9,465 | 10,556 | 20,021 | ||||||||||||||||||
| Total | $ | 150,134 | $ | 244,486 | $ | 394,620 | $ | 321,903 | $ | 324,567 | $ | 646,470 | ||||||||||||
New World Fund
| Year ended December 31, 2019 | Year ended December 31, 2018 | |||||||||||||||||||||||
| Total | Total | |||||||||||||||||||||||
| Ordinary | Long-term | distributions | Ordinary | Long-term | distributions | |||||||||||||||||||
| Share class | income | capital gains | paid | income | capital gains | paid | ||||||||||||||||||
| Class 1 | $ | 23,315 | $ | 71,500 | $ | 94,815 | $ | 21,450 | $ | 54,023 | $ | 75,473 | ||||||||||||
| Class 1A | 39 | 132 | 171 | 24 | 50 | 74 | ||||||||||||||||||
| Class 2 | 8,693 | 34,958 | 43,651 | 8,194 | 26,593 | 34,787 | ||||||||||||||||||
| Class 4 | 4,452 | 21,103 | 25,555 | 3,419 | 12,659 | 16,078 | ||||||||||||||||||
| Total | $ | 36,499 | $ | 127,693 | $ | 164,192 | $ | 33,087 | $ | 93,325 | $ | 126,412 | ||||||||||||
| 170 | American Funds Insurance Series |
Blue Chip Income and Growth Fund
| Year ended December 31, 2019 | Year ended December 31, 2018 | |||||||||||||||||||||||
| Total | Total | |||||||||||||||||||||||
| Ordinary | Long-term | distributions | Ordinary | Long-term | distributions | |||||||||||||||||||
| Share class | income | capital gains | paid | income | capital gains | paid | ||||||||||||||||||
| Class 1 | $ | 118,657 | $ | 410,713 | $ | 529,370 | $ | 232,769 | $ | 299,947 | $ | 532,716 | ||||||||||||
| Class 1A | 163 | 435 | 598 | 120 | 135 | 255 | ||||||||||||||||||
| Class 2 | 60,118 | 238,793 | 298,911 | 134,358 | 186,318 | 320,676 | ||||||||||||||||||
| Class 4 | 10,646 | 38,700 | 49,346 | 13,348 | 16,620 | 29,968 | ||||||||||||||||||
| Total | $ | 189,584 | $ | 688,641 | $ | 878,225 | $ | 380,595 | $ | 503,020 | $ | 883,615 | ||||||||||||
Global Growth and Income Fund
| Year ended December 31, 2019 | Year ended December 31, 2018 | |||||||||||||||||||||||
| Total | Total | |||||||||||||||||||||||
| Ordinary | Long-term | distributions | Ordinary | Long-term | distributions | |||||||||||||||||||
| Share class | income | capital gains | paid | income | capital gains | paid | ||||||||||||||||||
| Class 1 | $ | 12,475 | $ | 27,971 | $ | 40,446 | $ | 16,289 | $ | 31,541 | $ | 47,830 | ||||||||||||
| Class 1A | 33 | 66 | 99 | 28 | 53 | 81 | ||||||||||||||||||
| Class 2 | 24,591 | 66,794 | 91,385 | 40,436 | 90,173 | 130,609 | ||||||||||||||||||
| Class 4 | 2,298 | 5,970 | 8,268 | 2,682 | 5,789 | 8,471 | ||||||||||||||||||
| Total | $ | 39,397 | $ | 100,801 | $ | 140,198 | $ | 59,435 | $ | 127,556 | $ | 186,991 | ||||||||||||
Growth-Income Fund
| Year ended December 31, 2019 | Year ended December 31, 2018 | |||||||||||||||||||||||
| Total | Total | |||||||||||||||||||||||
| Ordinary | Long-term | distributions | Ordinary | Long-term | distributions | |||||||||||||||||||
| Share class | income | capital gains | paid | income | capital gains | paid | ||||||||||||||||||
| Class 1 | $ | 455,391 | $ | 1,825,184 | $ | 2,280,575 | $ | 341,172 | $ | 1,049,641 | $ | 1,390,813 | ||||||||||||
| Class 1A | 206 | 825 | 1,031 | 124 | 344 | 468 | ||||||||||||||||||
| Class 2 | 272,097 | 1,260,360 | 1,532,457 | 241,470 | 886,942 | 1,128,412 | ||||||||||||||||||
| Class 3 | 3,204 | 14,500 | 17,704 | 2,907 | 10,337 | 13,244 | ||||||||||||||||||
| Class 4 | 21,474 | 103,934 | 125,408 | 15,471 | 58,501 | 73,972 | ||||||||||||||||||
| Total | $ | 752,372 | $ | 3,204,803 | $ | 3,957,175 | $ | 601,144 | $ | 2,005,765 | $ | 2,606,909 | ||||||||||||
International Growth and Income Fund
| Year ended December 31, 2019 | Year ended December 31, 2018 | |||||||||||||||||||||||
| Total | Total | |||||||||||||||||||||||
| Ordinary | Long-term | distributions | Ordinary | Long-term | distributions | |||||||||||||||||||
| Share class | income | capital gains | paid | income | capital gains | paid | ||||||||||||||||||
| Class 1 | $ | 41,626 | $ | — | $ | 41,626 | $ | 28,476 | $ | — | $ | 28,476 | ||||||||||||
| Class 1A | 84 | — | 84 | 44 | — | 44 | ||||||||||||||||||
| Class 2 | 8,726 | — | 8,726 | 5,865 | — | 5,865 | ||||||||||||||||||
| Class 4 | 3,112 | — | 3,112 | 1,597 | — | 1,597 | ||||||||||||||||||
| Total | $ | 53,548 | $ | — | $ | 53,548 | $ | 35,982 | $ | — | $ | 35,982 | ||||||||||||
See end of tables for footnote.
| American Funds Insurance Series | 171 |
Capital Income Builder
| Year ended December 31, 2019 | Year ended December 31, 2018 | |||||||||||||||||||||||
| Total | Total | |||||||||||||||||||||||
| Ordinary | Long-term | distributions | Ordinary | Long-term | distributions | |||||||||||||||||||
| Share class | income | capital gains | paid | income | capital gains | paid | ||||||||||||||||||
| Class 1 | $ | 13,476 | $ | — | $ | 13,476 | $ | 9,421 | $ | 617 | $ | 10,038 | ||||||||||||
| Class 1A | 126 | — | 126 | 66 | 3 | 69 | ||||||||||||||||||
| Class 2 | 137 | — | 137 | 90 | 6 | 96 | ||||||||||||||||||
| Class 4 | 10,875 | — | 10,875 | 9,550 | 762 | 10,312 | ||||||||||||||||||
| Total | $ | 24,614 | $ | — | $ | 24,614 | $ | 19,127 | $ | 1,388 | $ | 20,515 | ||||||||||||
Asset Allocation Fund
| Year ended December 31, 2019 | Year ended December 31, 2018 | |||||||||||||||||||||||
| Total | Total | |||||||||||||||||||||||
| Ordinary | Long-term | distributions | Ordinary | Long-term | distributions | |||||||||||||||||||
| Share class | income | capital gains | paid | income | capital gains | paid | ||||||||||||||||||
| Class 1 | $ | 356,589 | $ | 816,841 | $ | 1,173,430 | $ | 386,982 | $ | 666,856 | $ | 1,053,838 | ||||||||||||
| Class 1A | 189 | 416 | 605 | 147 | 263 | 410 | ||||||||||||||||||
| Class 2 | 94,178 | 253,101 | 347,279 | 103,332 | 210,133 | 313,465 | ||||||||||||||||||
| Class 3 | 608 | 1,581 | 2,189 | 686 | 1,413 | 2,099 | ||||||||||||||||||
| Class 4 | 71,682 | 206,152 | 277,834 | 69,096 | 148,867 | 217,963 | ||||||||||||||||||
| Total | $ | 523,246 | $ | 1,278,091 | $ | 1,801,337 | $ | 560,243 | $ | 1,027,532 | $ | 1,587,775 | ||||||||||||
Global Balanced Fund
| Year ended December 31, 2019 | Year ended December 31, 2018 | |||||||||||||||||||||||
| Total | Total | |||||||||||||||||||||||
| Ordinary | Long-term | distributions | Ordinary | Long-term | distributions | |||||||||||||||||||
| Share class | income | capital gains | paid | income | capital gains | paid | ||||||||||||||||||
| Class 1 | $ | 1,912 | $ | 3,479 | $ | 5,391 | $ | 1,808 | $ | 1,346 | $ | 3,154 | ||||||||||||
| Class 1A | 28 | 61 | 89 | 30 | 25 | 55 | ||||||||||||||||||
| Class 2 | 2,521 | 5,487 | 8,008 | 2,555 | 2,290 | 4,845 | ||||||||||||||||||
| Class 4 | 954 | 2,492 | 3,446 | 804 | 842 | 1,646 | ||||||||||||||||||
| Total | $ | 5,415 | $ | 11,519 | $ | 16,934 | $ | 5,197 | $ | 4,503 | $ | 9,700 | ||||||||||||
Bond Fund
| Year ended December 31, 2019 | Year ended December 31, 2018 | |||||||||||||||||||||||
| Total | Total | |||||||||||||||||||||||
| Ordinary | Long-term | distributions | Ordinary | Long-term | distributions | |||||||||||||||||||
| Share class | income | capital gains | paid | income | capital gains | paid | ||||||||||||||||||
| Class 1 | $ | 177,855 | $ | — | $ | 177,855 | $ | 156,337 | $ | 8,915 | $ | 165,252 | ||||||||||||
| Class 1A | 165 | — | 165 | 76 | 4 | 80 | ||||||||||||||||||
| Class 2 | 90,796 | — | 90,796 | 88,266 | 5,217 | 93,483 | ||||||||||||||||||
| Class 4 | 11,384 | — | 11,384 | 8,153 | 453 | 8,606 | ||||||||||||||||||
| Total | $ | 280,200 | $ | — | $ | 280,200 | $ | 252,832 | $ | 14,589 | $ | 267,421 | ||||||||||||
Global Bond Fund
| Year ended December 31, 2019 | Year ended December 31, 2018 | |||||||||||||||||||||||
| Total | Total | |||||||||||||||||||||||
| Ordinary | Long-term | distributions | Ordinary | Long-term | distributions | |||||||||||||||||||
| Share class | income | capital gains | paid | income | capital gains | paid | ||||||||||||||||||
| Class 1 | $ | 19,173 | $ | — | $ | 19,173 | $ | 25,210 | $ | 3,256 | $ | 28,466 | ||||||||||||
| Class 1A | 7 | — | 7 | 9 | 1 | 10 | ||||||||||||||||||
| Class 2 | 15,927 | — | 15,927 | 23,308 | 3,412 | 26,720 | ||||||||||||||||||
| Class 4 | 649 | — | 649 | 816 | 118 | 934 | ||||||||||||||||||
| Total | $ | 35,756 | $ | — | $ | 35,756 | $ | 49,343 | $ | 6,787 | $ | 56,130 | ||||||||||||
| 172 | American Funds Insurance Series |
High-Income Bond Fund
| Year ended December 31, 2019 | Year ended December 31, 2018 | |||||||||||||||||||||||
| Total | Total | |||||||||||||||||||||||
| Ordinary | Long-term | distributions | Ordinary | Long-term | distributions | |||||||||||||||||||
| Share class | income | capital gains | paid | income | capital gains | paid | ||||||||||||||||||
| Class 1 | $ | 33,304 | $ | — | $ | 33,304 | $ | 34,114 | $ | — | $ | 34,114 | ||||||||||||
| Class 1A | 45 | — | 45 | 40 | — | 40 | ||||||||||||||||||
| Class 2 | 41,753 | — | 41,753 | 43,382 | — | 43,382 | ||||||||||||||||||
| Class 3 | 611 | — | 611 | 664 | — | 664 | ||||||||||||||||||
| Class 4 | 3,353 | — | 3,353 | 1,733 | — | 1,733 | ||||||||||||||||||
| Total | $ | 79,066 | $ | — | $ | 79,066 | $ | 79,933 | $ | — | $ | 79,933 | ||||||||||||
Mortgage Fund
| Year ended December 31, 2019 | Year ended December 31, 2018 | |||||||||||||||||||||||
| Total | Total | |||||||||||||||||||||||
| Ordinary | Long-term | distributions | Ordinary | Long-term | distributions | |||||||||||||||||||
| Share class | income | capital gains | paid | income | capital gains | paid | ||||||||||||||||||
| Class 1 | $ | 5,573 | $ | — | $ | 5,573 | $ | 4,938 | $ | — | $ | 4,938 | ||||||||||||
| Class 1A | 12 | — | 12 | 15 | — | 15 | ||||||||||||||||||
| Class 2 | 1,355 | — | 1,355 | 1,128 | — | 1,128 | ||||||||||||||||||
| Class 4 | 585 | — | 585 | 424 | — | 424 | ||||||||||||||||||
| Total | $ | 7,525 | $ | — | $ | 7,525 | $ | 6,505 | $ | — | $ | 6,505 | ||||||||||||
Ultra-Short Bond Fund
| Year ended December 31, 2019 | Year ended December 31, 2018 | |||||||||||||||||||||||
| Total | Total | |||||||||||||||||||||||
| Ordinary | Long-term | distributions | Ordinary | Long-term | distributions | |||||||||||||||||||
| Share class | income | capital gains | paid | income | capital gains | paid | ||||||||||||||||||
| Class 1 | $ | 604 | $ | — | $ | 604 | $ | 561 | $ | — | $ | 561 | ||||||||||||
| Class 1A | — | * | — | — | * | — | — | — | ||||||||||||||||
| Class 2 | 4,088 | — | 4,088 | 2,762 | — | 2,762 | ||||||||||||||||||
| Class 3 | 59 | — | 59 | 41 | — | 41 | ||||||||||||||||||
| Class 4 | 342 | — | 342 | 153 | — | 153 | ||||||||||||||||||
| Total | $ | 5,093 | $ | — | $ | 5,093 | $ | 3,517 | $ | — | $ | 3,517 | ||||||||||||
U.S. Government/AAA-Rated Securities Fund
| Year ended December 31, 2019 | Year ended December 31, 2018 | |||||||||||||||||||||||
| Total | Total | |||||||||||||||||||||||
| Ordinary | Long-term | distributions | Ordinary | Long-term | distributions | |||||||||||||||||||
| Share class | income | capital gains | paid | income | capital gains | paid | ||||||||||||||||||
| Class 1 | $ | 31,700 | $ | — | $ | 31,700 | $ | 29,881 | $ | — | $ | 29,881 | ||||||||||||
| Class 1A | 50 | — | 50 | 29 | — | 29 | ||||||||||||||||||
| Class 2 | 26,790 | — | 26,790 | 24,431 | — | 24,431 | ||||||||||||||||||
| Class 3 | 180 | — | 180 | 165 | — | 165 | ||||||||||||||||||
| Class 4 | 2,241 | — | 2,241 | 1,313 | — | 1,313 | ||||||||||||||||||
| Total | $ | 60,961 | $ | — | $ | 60,961 | $ | 55,819 | $ | — | $ | 55,819 | ||||||||||||
See end of tables for footnote.
| American Funds Insurance Series | 173 |
Managed Risk Growth Fund
| Year ended December 31, 2019 | Year ended December 31, 2018 | |||||||||||||||||||||||
| Total | Total | |||||||||||||||||||||||
| Ordinary | Long-term | distributions | Ordinary | Long-term | distributions | |||||||||||||||||||
| Share class | income | capital gains | paid | income | capital gains | paid | ||||||||||||||||||
| Class P1 | $ | 61 | $ | 256 | $ | 317 | $ | 14 | $ | 135 | $ | 149 | ||||||||||||
| Class P2 | 3,581 | 26,324 | 29,905 | 1,397 | 20,395 | 21,792 | ||||||||||||||||||
| Total | $ | 3,642 | $ | 26,580 | $ | 30,222 | $ | 1,411 | $ | 20,530 | $ | 21,941 | ||||||||||||
Managed Risk International Fund
| Year ended December 31, 2019 | Year ended December 31, 2018 | |||||||||||||||||||||||
| Total | Total | |||||||||||||||||||||||
| Ordinary | Long-term | distributions | Ordinary | Long-term | distributions | |||||||||||||||||||
| Share class | income | capital gains | paid | income | capital gains | paid | ||||||||||||||||||
| Class P1 | $ | 11 | $ | 16 | $ | 27 | $ | 8 | $ | 1 | $ | 9 | ||||||||||||
| Class P2 | 2,974 | 4,795 | 7,769 | 2,681 | 738 | 3,419 | ||||||||||||||||||
| Total | $ | 2,985 | $ | 4,811 | $ | 7,796 | $ | 2,689 | $ | 739 | $ | 3,428 | ||||||||||||
Managed Risk Blue Chip Income and Growth Fund
| Year ended December 31, 2019 | Year ended December 31, 2018 | |||||||||||||||||||||||
| Total | Total | |||||||||||||||||||||||
| Ordinary | Long-term | distributions | Ordinary | Long-term | distributions | |||||||||||||||||||
| Share class | income | capital gains | paid | income | capital gains | paid | ||||||||||||||||||
| Class P1 | $ | 13 | $ | 40 | $ | 53 | $ | 15 | $ | 7 | $ | 22 | ||||||||||||
| Class P2 | 5,566 | 17,796 | 23,362 | 11,391 | 12,112 | 23,503 | ||||||||||||||||||
| Total | $ | 5,579 | $ | 17,836 | $ | 23,415 | $ | 11,406 | $ | 12,119 | $ | 23,525 | ||||||||||||
Managed Risk Growth-Income Fund
| Year ended December 31, 2019 | Year ended December 31, 2018 | |||||||||||||||||||||||
| Total | Total | |||||||||||||||||||||||
| Ordinary | Long-term | distributions | Ordinary | Long-term | distributions | |||||||||||||||||||
| Share class | income | capital gains | paid | income | capital gains | paid | ||||||||||||||||||
| Class P1 | $ | 14,564 | $ | 14,505 | $ | 29,069 | $ | 42 | $ | 122 | $ | 164 | ||||||||||||
| Class P2 | 1,352 | 2,019 | 3,371 | 2,374 | 9,814 | 12,188 | ||||||||||||||||||
| Total | $ | 15,916 | $ | 16,524 | $ | 32,440 | $ | 2,416 | $ | 9,936 | $ | 12,352 | ||||||||||||
Managed Risk Asset Allocation Fund
| Year ended December 31, 2019 | Year ended December 31, 2018 | |||||||||||||||||||||||
| Total | Total | |||||||||||||||||||||||
| Ordinary | Long-term | distributions | Ordinary | Long-term | distributions | |||||||||||||||||||
| Share class | income | capital gains | paid | income | capital gains | paid | ||||||||||||||||||
| Class P1 | $ | 5 | $ | 65 | $ | 70 | $ | 31,787 | $ | 66,960 | $ | 98,747 | ||||||||||||
| Class P2 | 62,691 | 115,050 | 177,741 | 36,816 | 107,405 | 144,221 | ||||||||||||||||||
| Total | $ | 62,696 | $ | 115,115 | $ | 177,811 | $ | 68,603 | $ | 174,365 | $ | 242,968 | ||||||||||||
| * | Amount less than one thousand. |
7. Fees and transactions
CRMC, the series’ investment adviser, is the parent company of American Funds Distributors®, Inc. (“AFD”), the distributor of the series’ shares, and American Funds Service Company® (“AFS”), the series’ transfer agent. CRMC, AFD and AFS are considered related parties to the series.
| 174 | American Funds Insurance Series |
Investment advisory services — The series has an investment advisory and service agreement with CRMC that provides for monthly fees accrued daily. These fees are based on annual rates that generally decrease as net asset levels increase. CRMC receives investment advisory fees from the underlying funds held by the managed risk funds. These fees are included in the net effective expense ratios that are provided as additional information in the financial highlights tables. Subadvisory fees for the managed risk funds are paid by CRMC to Milliman FRM. The managed risk funds are not responsible for paying any subadvisory fees.
Investment advisory services waivers — On March 4, 2019, the series board of trustees approved amended agreements effective May 1, 2019, decreasing the annual rate to 0.500% on daily net assets in excess of $1.5 billion for International Growth and Income Fund, and decreasing the annual rate to 0.410% on daily net assets in excess of $1 billion for Capital Income Builder. CRMC voluntarily reduced the investment advisory services fees to the approved rates in advance of the effective date. CRMC is also waiving a portion of its investment advisory services fees for each of the managed risk funds. Investment advisory services fees are presented in each fund’s statement of operations gross of the waivers from CRMC. For the year ended December 31, 2019, total investment advisory services fees waived by CRMC were $2,880,000.
The range of rates, net asset levels and the current annualized rates of average daily net assets for each fund before and after any investment advisory services waivers (if applicable), are as follows:
| For the | For the | |||||||||||||||||||||||
| Net asset level | year ended | year ended | ||||||||||||||||||||||
| Rates | (in billions) | December 31, | December 31, | |||||||||||||||||||||
| Beginning | Ending | In excess | 2019, | 2019, | ||||||||||||||||||||
| Fund | with | with | Up to | of | before waiver | after waiver | ||||||||||||||||||
| Global Growth Fund | .690 | % | .460 | % | $ | .6 | $ | 5.0 | .516 | % | .516 | % | ||||||||||||
| Global Small Capitalization Fund | .800 | .635 | .6 | 5.0 | .696 | .696 | ||||||||||||||||||
| Growth Fund | .500 | .280 | .6 | 34.0 | .322 | .322 | ||||||||||||||||||
| International Fund | .690 | .430 | .5 | 21.0 | .492 | .492 | ||||||||||||||||||
| New World Fund | .850 | .580 | .5 | 4.0 | .701 | .701 | ||||||||||||||||||
| Blue Chip Income and Growth Fund | .500 | .350 | .6 | 10.5 | .390 | .390 | ||||||||||||||||||
| Global Growth and Income Fund | .690 | .480 | .6 | 3.0 | .595 | .595 | ||||||||||||||||||
| Growth-Income Fund | .500 | .219 | .6 | 34.0 | .256 | .256 | ||||||||||||||||||
| International Growth and Income Fund | .690 | .500 | .5 | 1.5 | .608 | .608 | ||||||||||||||||||
| Capital Income Builder | .500 | .410 | .6 | 1.0 | .489 | .486 | ||||||||||||||||||
| Asset Allocation Fund | .500 | .240 | .6 | 21.0 | .266 | .266 | ||||||||||||||||||
| Global Balanced Fund | .660 | .510 | .5 | 1.0 | .660 | .660 | ||||||||||||||||||
| Bond Fund | .480 | .320 | .6 | 13.0 | .364 | .364 | ||||||||||||||||||
| Global Bond Fund | .570 | .450 | 1.0 | 3.0 | .533 | .533 | ||||||||||||||||||
| High-Income Bond Fund | .500 | .420 | .6 | 2.0 | .475 | .475 | ||||||||||||||||||
| Mortgage Fund | .420 | .290 | .6 | 3.0 | .420 | .420 | ||||||||||||||||||
| Ultra-Short Bond Fund | .320 | .270 | 1.0 | 2.0 | .320 | .320 | ||||||||||||||||||
| U.S. Government/AAA-Rated Securities Fund | .420 | .290 | .6 | 3.0 | .340 | .340 | ||||||||||||||||||
| Managed Risk Growth Fund | .150 | all | .150 | .100 | ||||||||||||||||||||
| Managed Risk International Fund | .150 | all | .150 | .100 | ||||||||||||||||||||
| Managed Risk Blue Chip Income and Growth Fund | .150 | all | .150 | .100 | ||||||||||||||||||||
| Managed Risk Growth-Income Fund | .150 | all | .150 | .100 | ||||||||||||||||||||
| Managed Risk Asset Allocation Fund | .150 | all | .150 | .100 | ||||||||||||||||||||
Distribution services — The series has plans of distribution for all share classes except Class 1. Under the plans, the board of trustees approves certain categories of expenses that are used to finance activities primarily intended to sell fund shares. The plans provide for payments to pay service fees to firms that have entered into agreements with the series. These payments, based on an annualized percentage of average daily net assets, range from 0.18% to 0.50% as noted in the table below. In some cases, the board of trustees has limited the amounts that may be paid to less than the maximum allowed by the plans.
| Share class | Currently approved limits | Plan limits | ||||||
| Class 1A | 0.00 | % | 0.25 | % | ||||
| Class 2 | 0.25 | 0.25 | ||||||
| Class 3 | 0.18 | 0.18 | ||||||
| Class 4 | 0.25 | 0.25 | ||||||
| Class P1 | 0.00 | 0.25 | ||||||
| Class P2 | 0.25 | 0.50 | ||||||
| American Funds Insurance Series | 175 |
Insurance administrative services — The series has an insurance administrative services plan for Class 1A, 4, P1 and P2 shares. Under the plan, these share classes pay 0.25% of each insurance company’s respective average daily net assets in each share class to compensate the insurance companies for services provided to their separate accounts and contractholders for which the shares of the fund are beneficially owned as underlying investments of such contractholders’ annuities. These services include, but are not limited to, maintenance, shareholder communications and transactional services. The insurance companies are not related parties to the series.
Transfer agent services — The series has a shareholder services agreement with AFS under which the funds compensate AFS for providing transfer agent services to all of the funds’ share classes. These services include recordkeeping, shareholder communications and transaction processing. In addition, the managed risk funds reimburse AFS for amounts paid to third parties for performing transfer agent services on behalf of fund shareholders.
Administrative services — The series has an administrative services agreement with CRMC under which each fund compensates CRMC for providing administrative services to all of the funds’ share classes except Class P1 and P2 shares. Administrative services are provided by CRMC and its affiliates to help assist third parties providing non-distribution services to fund shareholders. These services include providing in depth information on each fund and market developments that impact fund investments. Administrative services also include, but are not limited to, coordinating, monitoring and overseeing third parties that provide services to fund shareholders. The agreement provides each fund, other than the managed risk funds, the ability to charge an administrative services fee at the annual rate of 0.05% of daily net assets attributable to each share class. Prior to July 1, 2019, all share classes of each fund, other than the managed-risk funds, paid CRMC an administrative services fee at the annual rate of 0.01% of daily net assets. The series board of trustees authorized the funds, other than the managed risk funds, to pay CRMC effective July 1, 2019, an administrative services fee at the annual rate of 0.03% of the daily net assets of each share class for CRMC’s provision of administrative services. For the managed risk funds, CRMC receives administrative services fees at an annual rate of 0.03% of daily net assets from Class 1 shares of the underlying funds for administrative services provided to the series.
Accounting and administrative services — The managed risk funds have a subadministration agreement with BNY Mellon under which the fund compensates BNY Mellon for providing accounting and administrative services to each of the managed risk funds’ share classes. These services include, but are not limited to, fund accounting (including calculation of net asset value), financial reporting and tax services. BNY Mellon is not a related party to the managed risk funds.
Class-specific expenses under the agreements described above were as follows (dollars in thousands):
Global Growth Fund
| Insurance | ||||||||||||
| Distribution | administrative | Administrative | ||||||||||
| Share class | services | services | services | |||||||||
| Class 1 | Not applicable | Not applicable | $ | 458 | ||||||||
| Class 1A | $ | — | $ | 17 | 2 | |||||||
| Class 2 | 9,198 | Not applicable | 742 | |||||||||
| Class 4 | 793 | 793 | 66 | |||||||||
| Total class-specific expenses | $ | 9,991 | $ | 810 | $ | 1,268 | ||||||
| Global Small Capitalization Fund | ||||||||||||
| Insurance | ||||||||||||
| Distribution | administrative | Administrative | ||||||||||
| Share class | services | services | services | |||||||||
| Class 1 | Not applicable | Not applicable | $ | 382 | ||||||||
| Class 1A | $ | — | $ | 1 | — | * | ||||||
| Class 2 | 5,652 | Not applicable | 454 | |||||||||
| Class 4 | 444 | 444 | 37 | |||||||||
| Total class-specific expenses | $ | 6,096 | $ | 445 | $ | 873 | ||||||
| Growth Fund | ||||||||||||
| Insurance | ||||||||||||
| Distribution | administrative | Administrative | ||||||||||
| Share class | services | services | services | |||||||||
| Class 1 | Not applicable | Not applicable | $ | 1,999 | ||||||||
| Class 1A | $ | — | $ | 35 | 3 | |||||||
| Class 2 | 37,459 | Not applicable | 3,017 | |||||||||
| Class 3 | 369 | Not applicable | 41 | |||||||||
| Class 4 | 3,263 | 3,263 | 269 | |||||||||
| Total class-specific expenses | $ | 41,091 | $ | 3,298 | $ | 5,329 | ||||||
| International Fund | ||||||||||||
| Insurance | ||||||||||||
| Distribution | administrative | Administrative | ||||||||||
| Share class | services | services | services | |||||||||
| Class 1 | Not applicable | Not applicable | $ | 1,031 | ||||||||
| Class 1A | $ | — | $ | 15 | 1 | |||||||
| Class 2 | 10,335 | Not applicable | 830 | |||||||||
| Class 3 | 45 | Not applicable | 5 | |||||||||
| Class 4 | 852 | 852 | 70 | |||||||||
| Total class-specific expenses | $ | 11,232 | $ | 867 | $ | 1,937 | ||||||
| 176 | American Funds Insurance Series |
New World Fund
| Insurance | ||||||||||||
| Distribution | administrative | Administrative | ||||||||||
| Share class | services | services | services | |||||||||
| Class 1 | Not applicable | Not applicable | $ | 386 | ||||||||
| Class 1A | $ | — | $ | 9 | 1 | |||||||
| Class 2 | 2,312 | Not applicable | 187 | |||||||||
| Class 4 | 1,396 | 1,396 | 115 | |||||||||
| Total class-specific expenses | $ | 3,708 | $ | 1,405 | $ | 689 | ||||||
| Blue Chip Income and Growth Fund | ||||||||||||
| Insurance | ||||||||||||
| Distribution | administrative | Administrative | ||||||||||
| Share class | services | services | services | |||||||||
| Class 1 | Not applicable | Not applicable | $ | 1,058 | ||||||||
| Class 1A | $ | — | $ | 16 | 1 | |||||||
| Class 2 | 7,507 | Not applicable | 601 | |||||||||
| Class 4 | 1,239 | 1,239 | 105 | |||||||||
| Total class-specific expenses | $ | 8,746 | $ | 1,255 | $ | 1,765 | ||||||
| Global Growth and Income Fund | ||||||||||||
| Insurance | ||||||||||||
| Distribution | administrative | Administrative | ||||||||||
| Share class | services | services | services | |||||||||
| Class 1 | Not applicable | Not applicable | $ | 115 | ||||||||
| Class 1A | $ | — | $ | 4 | 1 | |||||||
| Class 2 | 3,318 | Not applicable | 267 | |||||||||
| Class 4 | 300 | 300 | 25 | |||||||||
| Total class-specific expenses | $ | 3,618 | $ | 304 | $ | 408 | ||||||
| Growth-Income Fund | ||||||||||||
| Insurance | ||||||||||||
| Distribution | administrative | Administrative | ||||||||||
| Share class | services | services | services | |||||||||
| Class 1 | Not applicable | Not applicable | $ | 3,919 | ||||||||
| Class 1A | $ | — | $ | 22 | 2 | |||||||
| Class 2 | 32,591 | Not applicable | 2,624 | |||||||||
| Class 3 | 273 | Not applicable | 30 | |||||||||
| Class 4 | 2,685 | 2,685 | 221 | |||||||||
| Total class-specific expenses | $ | 35,549 | $ | 2,707 | $ | 6,796 | ||||||
| International Growth and Income Fund | ||||||||||||
| Insurance | ||||||||||||
| Distribution | administrative | Administrative | ||||||||||
| Share class | services | services | services | |||||||||
| Class 1 | Not applicable | Not applicable | $ | 217 | ||||||||
| Class 1A | $ | — | $ | 5 | — | * | ||||||
| Class 2 | 608 | Not applicable | 49 | |||||||||
| Class 4 | 213 | 213 | 18 | |||||||||
| Total class-specific expenses | $ | 821 | $ | 218 | $ | 284 | ||||||
| Capital Income Builder | ||||||||||||
| Insurance | ||||||||||||
| Distribution | administrative | Administrative | ||||||||||
| Share class | services | services | services | |||||||||
| Class 1 | Not applicable | Not applicable | $ | 89 | ||||||||
| Class 1A | $ | — | $ | 11 | 1 | |||||||
| Class 2 | 12 | Not applicable | 1 | |||||||||
| Class 4 | 1,014 | 1,014 | 83 | |||||||||
| Total class-specific expenses | $ | 1,026 | $ | 1,025 | $ | 174 | ||||||
| Asset Allocation Fund | ||||||||||||
| Insurance | ||||||||||||
| Distribution | administrative | Administrative | ||||||||||
| Share class | services | services | services | |||||||||
| Class 1 | Not applicable | Not applicable | $ | 3,332 | ||||||||
| Class 1A | $ | — | $ | 22 | 2 | |||||||
| Class 2 | 12,426 | Not applicable | 1,002 | |||||||||
| Class 3 | 57 | Not applicable | 6 | |||||||||
| Class 4 | 10,148 | 10,148 | 831 | |||||||||
| Total class-specific expenses | $ | 22,631 | $ | 10,170 | $ | 5,173 | ||||||
| Global Balanced Fund | ||||||||||||
| Insurance | ||||||||||||
| Distribution | administrative | Administrative | ||||||||||
| Share class | services | services | services | |||||||||
| Class 1 | Not applicable | Not applicable | $ | 26 | ||||||||
| Class 1A | $ | — | $ | 5 | — | * | ||||||
| Class 2 | 495 | Not applicable | 40 | |||||||||
| Class 4 | 205 | 206 | 17 | |||||||||
| Total class-specific expenses | $ | 700 | $ | 211 | $ | 83 | ||||||
See end of tables for footnote.
| American Funds Insurance Series | 177 |
Bond Fund
| Insurance | ||||||||||||
| Distribution | administrative | Administrative | ||||||||||
| Share class | services | services | services | |||||||||
| Class 1 | Not applicable | Not applicable | $ | 1,277 | ||||||||
| Class 1A | $ | — | $ | 12 | 1 | |||||||
| Class 2 | 8,877 | Not applicable | 715 | |||||||||
| Class 4 | 1,073 | 1,072 | 90 | |||||||||
| Total class-specific expenses | $ | 9,950 | $ | 1,084 | $ | 2,083 | ||||||
| Global Bond Fund | ||||||||||||
| Insurance | ||||||||||||
| Distribution | administrative | Administrative | ||||||||||
| Share class | services | services | services | |||||||||
| Class 1 | Not applicable | Not applicable | $ | 212 | ||||||||
| Class 1A | $ | — | $ | 1 | — | * | ||||||
| Class 2 | 2,549 | Not applicable | 204 | |||||||||
| Class 4 | 113 | 113 | 10 | |||||||||
| Total class-specific expenses | $ | 2,662 | $ | 114 | $ | 426 | ||||||
| High-Income Bond Fund | ||||||||||||
| Insurance | ||||||||||||
| Distribution | administrative | Administrative | ||||||||||
| Share class | services | services | services | |||||||||
| Class 1 | Not applicable | Not applicable | $ | 104 | ||||||||
| Class 1A | $ | — | $ | 2 | — | * | ||||||
| Class 2 | 1,696 | Not applicable | 135 | |||||||||
| Class 3 | 18 | Not applicable | 2 | |||||||||
| Class 4 | 141 | 141 | 12 | |||||||||
| Total class-specific expenses | $ | 1,855 | $ | 143 | $ | 253 | ||||||
| Mortgage Fund | ||||||||||||
| Insurance | ||||||||||||
| Distribution | administrative | Administrative | ||||||||||
| Share class | services | services | services | |||||||||
| Class 1 | Not applicable | Not applicable | $ | 42 | ||||||||
| Class 1A | $ | — | $ | 1 | — | * | ||||||
| Class 2 | 143 | Not applicable | 12 | |||||||||
| Class 4 | 59 | 59 | 5 | |||||||||
| Total class-specific expenses | $ | 202 | $ | 60 | $ | 59 | ||||||
| Ultra-Short Bond Fund | ||||||||||||
| Insurance | ||||||||||||
| Distribution | administrative | Administrative | ||||||||||
| Share class | services | services | services | |||||||||
| Class 1 | Not applicable | Not applicable | $ | 6 | ||||||||
| Class 1A | $ | — | $ | —* | — | * | ||||||
| Class 2 | 583 | Not applicable | 47 | |||||||||
| Class 3 | 6 | Not applicable | 1 | |||||||||
| Class 4 | 51 | 51 | 4 | |||||||||
| Total class-specific expenses | $ | 640 | $ | 51 | $ | 58 | ||||||
| U.S. Government/AAA-Rated Securities Fund | ||||||||||||
| Insurance | ||||||||||||
| Distribution | administrative | Administrative | ||||||||||
| Share class | services | services | services | |||||||||
| Class 1 | Not applicable | Not applicable | $ | 288 | ||||||||
| Class 1A | $ | — | $ | 5 | — | * | ||||||
| Class 2 | 3,325 | Not applicable | 269 | |||||||||
| Class 3 | 16 | Not applicable | 2 | |||||||||
| Class 4 | 270 | 271 | 23 | |||||||||
| Total class-specific expenses | $ | 3,611 | $ | 276 | $ | 582 | ||||||
| Managed Risk Growth Fund | ||||||||||||
| Insurance | ||||||||||||
| Distribution | administrative | |||||||||||
| Share class | services | services | ||||||||||
| Class P1 | Not applicable | $ | 10 | |||||||||
| Class P2 | $ | 974 | 974 | |||||||||
| Total class-specific expenses | $ | 974 | $ | 984 | ||||||||
| Managed Risk International Fund | ||||||||||||
| Insurance | ||||||||||||
| Distribution | administrative | |||||||||||
| Share class | services | services | ||||||||||
| Class P1 | Not applicable | $ | 1 | |||||||||
| Class P2 | $ | 398 | 398 | |||||||||
| Total class-specific expenses | $ | 398 | $ | 399 | ||||||||
| Managed Risk Blue Chip Income and Growth Fund | ||||||||||||
| Insurance | ||||||||||||
| Distribution | administrative | |||||||||||
| Share class | services | services | ||||||||||
| Class P1 | Not applicable | $ | 1 | |||||||||
| Class P2 | $ | 877 | 877 | |||||||||
| Total class-specific expenses | $ | 877 | $ | 878 | ||||||||
| Managed Risk Growth-Income Fund | ||||||||||||
| Insurance | ||||||||||||
| Distribution | administrative | |||||||||||
| Share class | services | services | ||||||||||
| Class P1 | Not applicable | $ | 4,623 | |||||||||
| Class P2 | $ | 647 | 647 | |||||||||
| Total class-specific expenses | $ | 647 | $ | 5,270 | ||||||||
| 178 | American Funds Insurance Series |
Managed Risk Asset Allocation Fund
| Insurance | ||||||||||||
| Distribution | administrative | |||||||||||
| Share class | services | services | ||||||||||
| Class P1 | Not applicable | $ | 5 | |||||||||
| Class P2 | $ | 6,739 | 6,739 | |||||||||
| Total class-specific expenses | $ | 6,739 | $ | 6,744 | ||||||||
| * | Amount less than one thousand. |
Miscellaneous fee reimbursements — CRMC has agreed to reimburse a portion of miscellaneous fees and expenses of Managed Risk Growth Fund, Managed Risk International Fund and Managed Risk Blue Chip Income and Growth Fund. Miscellaneous expenses exclude investment advisory services and distribution services fees. These reimbursements may be adjusted or discontinued by CRMC, subject to any restrictions in the series’ prospectus. For the year ended December 31, 2019, total fees and expenses reimbursed by CRMC were $74,000. Fees and expenses in each fund’s statement of operations are presented gross of any reimbursements from CRMC.
Trustees’ deferred compensation — Trustees who are unaffiliated with CRMC may elect to defer the cash payment of part or all of their compensation. These deferred amounts, which remain as liabilities of the funds, are treated as if invested in one or more of the American Funds. These amounts represent general, unsecured liabilities of the funds and vary according to the total returns of the selected funds. Trustees’ compensation, shown on the accompanying financial statements, reflects current fees (either paid in cash or deferred) and a net increase in the value of the deferred amounts as follows (dollars in thousands):
| Increase in value of | Total trustees’ | |||||||||||
| Fund | Current fees | deferred amounts | compensation | |||||||||
| Global Growth Fund | $ | 31 | $ | 11 | $ | 42 | ||||||
| Global Small Capitalization Fund | 21 | 7 | 28 | |||||||||
| Growth Fund | 130 | 45 | 175 | |||||||||
| International Fund | 48 | 16 | 64 | |||||||||
| New World Fund | 17 | 6 | 23 | |||||||||
| Blue Chip Income and Growth Fund | 44 | 15 | 59 | |||||||||
| Global Growth and Income Fund | 10 | 3 | 13 | |||||||||
| Growth-Income Fund | 164 | 57 | 221 | |||||||||
| International Growth and Income Fund | 7 | 2 | 9 | |||||||||
| Capital Income Builder | 4 | 2 | 6 | |||||||||
| Asset Allocation Fund | 127 | 43 | 170 | |||||||||
| Global Balanced Fund | 2 | 1 | 3 | |||||||||
| Bond Fund | 51 | 17 | 68 | |||||||||
| Global Bond Fund | 11 | 3 | 14 | |||||||||
| High-Income Bond Fund | 6 | 2 | 8 | |||||||||
| Mortgage Fund | 1 | 1 | 2 | |||||||||
| Ultra-Short Bond Fund | 1 | — | * | 1 | ||||||||
| U.S. Government/AAA-Rated Securities Fund | 15 | 5 | 20 | |||||||||
| Managed Risk Growth Fund | 1 | 1 | 2 | |||||||||
| Managed Risk International Fund | 1 | — | * | 1 | ||||||||
| Managed Risk Blue Chip Income and Growth Fund | 1 | 1 | 2 | |||||||||
| Managed Risk Growth-Income Fund | 8 | 4 | 12 | |||||||||
| Managed Risk Asset Allocation Fund | 16 | 5 | 21 | |||||||||
| * | Amount less than one thousand. |
Affiliated officers and trustees — Officers and certain trustees of the series are or may be considered to be affiliated with CRMC, AFD and AFS. No affiliated officers or trustees received any compensation directly from any fund in the series.
Investment in CCF — Some of the funds hold shares of CCF, an institutional prime money market fund managed by CRMC. CCF invests in high-quality, short-term money market instruments. CCF is used as the primary investment vehicle for each fund’s short-term investments. CCF shares are only available for purchase by CRMC, its affiliates, and other funds managed by CRMC. CCF shares are not available to the public. CRMC does not receive an investment advisory services fee from CCF.
| American Funds Insurance Series | 179 |
Security transactions with related funds — The funds may purchase from, or sell securities to, other CRMC-managed funds (or funds managed by certain affiliates of CRMC) under procedures adopted by the fund’s board of trustees. The funds involved in such transactions are considered related by virtue of having a common investment adviser (or affiliated investment advisers), common trustees and/or common officers. When such transactions occur, each transaction is executed at the current market price of the security and no brokerage commissions or fees are paid in accordance with Rule 17a-7 of the 1940 Act.
The following table presents purchase and sale transactions between each fund and related funds as of December 31, 2019 (dollars in thousands):
| Fund | Purchases | Sales | Net realized gain (loss) | |||||||||
| Global Growth Fund | $ | 24,083 | $ | 81,665 | $ | 14,006 | ||||||
| Global Small Capitalization Fund | 36,878 | 122,208 | 33,693 | |||||||||
| Growth Fund | 268,036 | 905,939 | 9,860 | |||||||||
| International Fund | 81,543 | 407,486 | 47,090 | |||||||||
| New World Fund | 13,140 | 16,223 | 457 | |||||||||
| Blue Chip Income and Growth Fund | 99,516 | 104,771 | 10,930 | |||||||||
| Global Growth and Income Fund | 14,247 | 26,182 | 572 | |||||||||
| Growth-Income Fund | 200,557 | 806,347 | (8,638 | ) | ||||||||
| International Growth and Income Fund | 10,521 | 12,522 | (737 | ) | ||||||||
| Capital Income Builder | 27,947 | 2,175 | (137 | ) | ||||||||
| Asset Allocation Fund | 404,052 | 977,305 | (21,921 | ) | ||||||||
| Global Balanced Fund | 1,871 | 906 | (25 | ) | ||||||||
| Bond Fund | 51,636 | 102,897 | (719 | ) | ||||||||
| Global Bond Fund | 4,273 | 1,394 | (2 | ) | ||||||||
| High-Income Bond Fund | 4,365 | 9,431 | (2,079 | ) | ||||||||
8. Committed line of credit
Global Small Capitalization Fund, New World Fund and High-Income Bond Fund participate with other funds managed by CRMC in a $1.5 billion credit facility (the “line of credit”) to be utilized for temporary purposes to fund shareholder redemptions. Each fund has agreed to pay commitment fees on its pro-rata portion of the line of credit, which are reflected in other expenses in each fund’s statement of operations. None of the funds borrowed on this line of credit at any time during the year ended December 31, 2019.
9. Capital share transactions
Capital share transactions in the funds were as follows (dollars and shares in thousands):
| Global Growth Fund | ||||||||||||||||||||||||||||||||
| Sales* | Reinvestments of distributions | Repurchases* | Net increase (decrease) | |||||||||||||||||||||||||||||
| Share class | Amount | Shares | Amount | Shares | Amount | Shares | Amount | Shares | ||||||||||||||||||||||||
| Year ended December 31, 2019 | ||||||||||||||||||||||||||||||||
| Class 1 | $ | 230,089 | 7,777 | $ | 152,273 | 5,192 | $ | (333,318 | ) | (11,180 | ) | $ | 49,044 | 1,789 | ||||||||||||||||||
| Class 1A | 1,744 | 62 | 449 | 15 | (572 | ) | (19 | ) | 1,621 | 58 | ||||||||||||||||||||||
| Class 2 | 44,842 | 1,552 | 244,600 | 8,453 | (555,704 | ) | (18,803 | ) | (266,262 | ) | (8,798 | ) | ||||||||||||||||||||
| Class 4 | 70,615 | 2,415 | 20,612 | 716 | (29,399 | ) | (1,009 | ) | 61,828 | 2,122 | ||||||||||||||||||||||
| Total net increase (decrease) | $ | 347,290 | 11,806 | $ | 417,934 | 14,376 | $ | (918,993 | ) | (31,011 | ) | $ | (153,769 | ) | (4,829 | ) | ||||||||||||||||
| Year ended December 31, 2018 | ||||||||||||||||||||||||||||||||
| Class 1 | $ | 318,393 | 10,738 | $ | 163,496 | 5,459 | $ | (199,573 | ) | (6,616 | ) | $ | 282,316 | 9,581 | ||||||||||||||||||
| Class 1A | 4,760 | 162 | 320 | 11 | (1,942 | ) | (64 | ) | 3,138 | 109 | ||||||||||||||||||||||
| Class 2 | 71,745 | 2,511 | 292,561 | 9,830 | (465,838 | ) | (15,407 | ) | (101,532 | ) | (3,066 | ) | ||||||||||||||||||||
| Class 4 | 94,068 | 3,163 | 18,437 | 622 | (28,678 | ) | (983 | ) | 83,827 | 2,802 | ||||||||||||||||||||||
| Total net increase (decrease) | $ | 488,966 | 16,574 | $ | 474,814 | 15,922 | $ | (696,031 | ) | (23,070 | ) | $ | 267,749 | 9,426 | ||||||||||||||||||
| 180 | American Funds Insurance Series |
| Global Small Capitalization Fund | ||||||||||||||||||||||||||||||||
| Sales* | Reinvestments of distributions | Repurchases* | Net increase (decrease) | |||||||||||||||||||||||||||||
| Share class | Amount | Shares | Amount | Shares | Amount | Shares | Amount | Shares | ||||||||||||||||||||||||
| Year ended December 31, 2019 | ||||||||||||||||||||||||||||||||
| Class 1 | $ | 337,817 | 13,612 | $ | 125,498 | 5,216 | $ | (226,381 | ) | (9,119 | ) | $ | 236,934 | 9,709 | ||||||||||||||||||
| Class 1A | 196 | 8 | 28 | 2 | (96 | ) | (4 | ) | 128 | 6 | ||||||||||||||||||||||
| Class 2 | 21,553 | 917 | 147,687 | 6,340 | (327,909 | ) | (13,596 | ) | (158,669 | ) | (6,339 | ) | ||||||||||||||||||||
| Class 4 | 35,449 | 1,468 | 11,115 | 475 | (22,005 | ) | (911 | ) | 24,559 | 1,032 | ||||||||||||||||||||||
| Total net increase (decrease) | $ | 395,015 | 16,005 | $ | 284,328 | 12,033 | $ | (576,391 | ) | (23,630 | ) | $ | 102,952 | 4,408 | ||||||||||||||||||
| Year ended December 31, 2018 | ||||||||||||||||||||||||||||||||
| Class 1 | $ | 138,128 | 5,551 | $ | 76,990 | 2,920 | $ | (160,148 | ) | (6,253 | ) | $ | 54,970 | 2,218 | ||||||||||||||||||
| Class 1A | 318 | 12 | 16 | 1 | (110 | ) | (5 | ) | 224 | 8 | ||||||||||||||||||||||
| Class 2 | 47,093 | 2,015 | 112,331 | 4,349 | (309,646 | ) | (12,397 | ) | (150,222 | ) | (6,033 | ) | ||||||||||||||||||||
| Class 4 | 56,525 | 2,282 | 6,491 | 249 | (17,067 | ) | (693 | ) | 45,949 | 1,838 | ||||||||||||||||||||||
| Total net increase (decrease) | $ | 242,064 | 9,860 | $ | 195,828 | 7,519 | $ | (486,971 | ) | (19,348 | ) | $ | (49,079 | ) | (1,969 | ) | ||||||||||||||||
| Growth Fund | ||||||||||||||||||||||||||||||||
| Sales* | Reinvestments of distributions | Repurchases* | Net increase (decrease) | |||||||||||||||||||||||||||||
| Share class | Amount | Shares | Amount | Shares | Amount | Shares | Amount | Shares | ||||||||||||||||||||||||
| Year ended December 31, 2019 | ||||||||||||||||||||||||||||||||
| Class 1 | $ | 896,700 | 11,839 | $ | 1,112,851 | 15,532 | $ | (1,155,174 | ) | (15,026 | ) | $ | 854,377 | 12,345 | ||||||||||||||||||
| Class 1A | 6,106 | 81 | 1,482 | 21 | (1,574 | ) | (20 | ) | 6,014 | 82 | ||||||||||||||||||||||
| Class 2 | 294,401 | 3,907 | 1,692,272 | 23,866 | (2,108,133 | ) | (27,828 | ) | (121,460 | ) | (55 | ) | ||||||||||||||||||||
| Class 3 | 1,763 | 23 | 23,154 | 321 | (29,706 | ) | (390 | ) | (4,789 | ) | (46 | ) | ||||||||||||||||||||
| Class 4 | 227,023 | 3,055 | 145,699 | 2,087 | (131,942 | ) | (1,767 | ) | 240,780 | 3,375 | ||||||||||||||||||||||
| Total net increase (decrease) | $ | 1,425,993 | 18,905 | $ | 2,975,458 | 41,827 | $ | (3,426,529 | ) | (45,031 | ) | $ | 974,922 | 15,701 | ||||||||||||||||||
| Year ended December 31, 2018 | ||||||||||||||||||||||||||||||||
| Class 1 | $ | 1,574,676 | 19,928 | $ | 879,237 | 11,221 | $ | (1,126,624 | ) | (14,082 | ) | $ | 1,327,289 | 17,067 | ||||||||||||||||||
| Class 1A | 8,204 | 103 | 710 | 9 | (563 | ) | (7 | ) | 8,351 | 105 | ||||||||||||||||||||||
| Class 2 | 292,909 | 3,756 | 1,633,088 | 20,970 | (2,436,432 | ) | (30,703 | ) | (510,435 | ) | (5,977 | ) | ||||||||||||||||||||
| Class 3 | 1,809 | 22 | 21,971 | 279 | (27,844 | ) | (348 | ) | (4,064 | ) | (47 | ) | ||||||||||||||||||||
| Class 4 | 274,892 | 3,534 | 110,941 | 1,441 | (135,865 | ) | (1,758 | ) | 249,968 | 3,217 | ||||||||||||||||||||||
| Total net increase (decrease) | $ | 2,152,490 | 27,343 | $ | 2,645,947 | 33,920 | $ | (3,727,328 | ) | (46,898 | ) | $ | 1,071,109 | 14,365 | ||||||||||||||||||
See end of tables for footnotes.
| American Funds Insurance Series | 181 |
| International Fund | ||||||||||||||||||||||||||||||||
| Sales* | Reinvestments of distributions | Repurchases* | Net (decrease) increase | |||||||||||||||||||||||||||||
| Share class | Amount | Shares | Amount | Shares | Amount | Shares | Amount | Shares | ||||||||||||||||||||||||
| Year ended December 31, 2019 | ||||||||||||||||||||||||||||||||
| Class 1 | $ | 171,233 | 8,812 | $ | 215,640 | 10,988 | $ | (699,395 | ) | (35,642 | ) | $ | (312,522 | ) | (15,842 | ) | ||||||||||||||||
| Class 1A | 2,060 | 106 | 236 | 12 | (1,174 | ) | (59 | ) | 1,122 | 59 | ||||||||||||||||||||||
| Class 2 | 175,514 | 9,064 | 164,024 | 8,407 | (591,706 | ) | (30,261 | ) | (252,168 | ) | (12,790 | ) | ||||||||||||||||||||
| Class 3 | 238 | 13 | 991 | 50 | (4,348 | ) | (224 | ) | (3,119 | ) | (161 | ) | ||||||||||||||||||||
| Class 4 | 60,129 | 3,112 | 13,366 | 694 | (43,609 | ) | (2,263 | ) | 29,886 | 1,543 | ||||||||||||||||||||||
| Total net increase (decrease) | $ | 409,174 | 21,107 | $ | 394,257 | 20,151 | $ | (1,340,232 | ) | (68,449 | ) | $ | (536,801 | ) | (27,191 | ) | ||||||||||||||||
| Year ended December 31, 2018 | ||||||||||||||||||||||||||||||||
| Class 1 | $ | 987,191 | 47,885 | $ | 339,738 | 16,682 | $ | (479,241 | ) | (23,102 | ) | $ | 847,688 | 41,465 | ||||||||||||||||||
| Class 1A | 4,302 | 204 | 296 | 14 | (269 | ) | (14 | ) | 4,329 | 204 | ||||||||||||||||||||||
| Class 2 | 481,518 | 22,952 | 283,963 | 13,909 | (441,465 | ) | (21,109 | ) | 324,016 | 15,752 | ||||||||||||||||||||||
| Class 3 | 506 | 23 | 1,857 | 91 | (4,389 | ) | (209 | ) | (2,026 | ) | (95 | ) | ||||||||||||||||||||
| Class 4 | 96,985 | 4,701 | 20,021 | 990 | (45,627 | ) | (2,234 | ) | 71,379 | 3,457 | ||||||||||||||||||||||
| Total net increase (decrease) | $ | 1,570,502 | 75,765 | $ | 645,875 | 31,686 | $ | (970,991 | ) | (46,668 | ) | $ | 1,245,386 | 60,783 | ||||||||||||||||||
| New World Fund | ||||||||||||||||||||||||||||||||
| Sales* | Reinvestments of distributions | Repurchases* | Net increase (decrease) | |||||||||||||||||||||||||||||
| Share class | Amount | Shares | Amount | Shares | Amount | Shares | Amount | Shares | ||||||||||||||||||||||||
| Year ended December 31, 2019 | ||||||||||||||||||||||||||||||||
| Class 1 | $ | 149,338 | 6,057 | $ | 94,601 | 3,981 | $ | (207,841 | ) | (8,743 | ) | $ | 36,098 | 1,295 | ||||||||||||||||||
| Class 1A | 1,685 | 70 | 171 | 7 | (408 | ) | (17 | ) | 1,448 | 60 | ||||||||||||||||||||||
| Class 2 | 68,793 | 2,911 | 43,651 | 1,861 | (165,106 | ) | (6,991 | ) | (52,662 | ) | (2,219 | ) | ||||||||||||||||||||
| Class 4 | 83,946 | 3,576 | 25,555 | 1,096 | (39,744 | ) | (1,687 | ) | 69,757 | 2,985 | ||||||||||||||||||||||
| Total net increase (decrease) | $ | 303,762 | 12,614 | $ | 163,978 | 6,945 | $ | (413,099 | ) | (17,438 | ) | $ | 54,641 | 2,121 | ||||||||||||||||||
| Year ended December 31, 2018 | ||||||||||||||||||||||||||||||||
| Class 1 | $ | 169,684 | 6,947 | $ | 75,282 | 3,139 | $ | (240,756 | ) | (10,008 | ) | $ | 4,210 | 78 | ||||||||||||||||||
| Class 1A | 2,616 | 108 | 73 | 3 | (572 | ) | (24 | ) | 2,117 | 87 | ||||||||||||||||||||||
| Class 2 | 70,536 | 2,954 | 34,787 | 1,456 | (144,167 | ) | (5,934 | ) | (38,844 | ) | (1,524 | ) | ||||||||||||||||||||
| Class 4 | 140,212 | 5,922 | 16,079 | 674 | (31,201 | ) | (1,315 | ) | 125,090 | 5,281 | ||||||||||||||||||||||
| Total net increase (decrease) | $ | 383,048 | 15,931 | $ | 126,221 | 5,272 | $ | (416,696 | ) | (17,281 | ) | $ | 92,573 | 3,922 | ||||||||||||||||||
| Blue Chip Income and Growth Fund | ||||||||||||||||||||||||||||||||
| Sales* | Reinvestments of distributions | Repurchases* | Net increase (decrease) | |||||||||||||||||||||||||||||
| Share class | Amount | Shares | Amount | Shares | Amount | Shares | Amount | Shares | ||||||||||||||||||||||||
| Year ended December 31, 2019 | ||||||||||||||||||||||||||||||||
| Class 1 | $ | 213,624 | 16,737 | $ | 525,212 | 41,913 | $ | (484,978 | ) | (37,271 | ) | $ | 253,858 | 21,379 | ||||||||||||||||||
| Class 1A | 5,177 | 403 | 598 | 47 | (451 | ) | (35 | ) | 5,324 | 415 | ||||||||||||||||||||||
| Class 2 | 28,815 | 2,244 | 298,911 | 24,211 | (366,595 | ) | (28,328 | ) | (38,869 | ) | (1,873 | ) | ||||||||||||||||||||
| Class 4 | 198,327 | 15,485 | 49,345 | 4,013 | (38,161 | ) | (2,979 | ) | 209,511 | 16,519 | ||||||||||||||||||||||
| Total net increase (decrease) | $ | 445,943 | 34,869 | $ | 874,066 | 70,184 | $ | (890,185 | ) | (68,613 | ) | $ | 429,824 | 36,440 | ||||||||||||||||||
| Year ended December 31, 2018 | ||||||||||||||||||||||||||||||||
| Class 1 | $ | 189,059 | 13,527 | $ | 528,528 | 38,135 | $ | (524,399 | ) | (36,270 | ) | $ | 193,188 | 15,392 | ||||||||||||||||||
| Class 1A | 2,957 | 203 | 254 | 19 | (106 | ) | (8 | ) | 3,105 | 214 | ||||||||||||||||||||||
| Class 2 | 34,615 | 2,528 | 320,676 | 23,381 | (472,476 | ) | (32,985 | ) | (117,185 | ) | (7,076 | ) | ||||||||||||||||||||
| Class 4 | 190,787 | 13,641 | 29,968 | 2,200 | (33,879 | ) | (2,399 | ) | 186,876 | 13,442 | ||||||||||||||||||||||
| Total net increase (decrease) | $ | 417,418 | 29,899 | $ | 879,426 | 63,735 | $ | (1,030,860 | ) | (71,662 | ) | $ | 265,984 | 21,972 | ||||||||||||||||||
| 182 | American Funds Insurance Series |
| Global Growth and Income Fund | ||||||||||||||||||||||||||||||||
| Sales* | Reinvestments of distributions | Repurchases* | Net increase (decrease) | |||||||||||||||||||||||||||||
| Share class | Amount | Shares | Amount | Shares | Amount | Shares | Amount | Shares | ||||||||||||||||||||||||
| Year ended December 31, 2019 | ||||||||||||||||||||||||||||||||
| Class 1 | $ | 43,801 | 2,986 | $ | 38,762 | 2,639 | $ | (61,157 | ) | (4,174 | ) | $ | 21,406 | 1,451 | ||||||||||||||||||
| Class 1A | 809 | 55 | 100 | 7 | (205 | ) | (14 | ) | 704 | 48 | ||||||||||||||||||||||
| Class 2 | 15,277 | 1,057 | 91,385 | 6,251 | (232,647 | ) | (15,758 | ) | (125,985 | ) | (8,450 | ) | ||||||||||||||||||||
| Class 4 | 34,845 | 2,405 | 8,268 | 574 | (16,175 | ) | (1,116 | ) | 26,938 | 1,863 | ||||||||||||||||||||||
| Total net increase (decrease) | $ | 94,732 | 6,503 | $ | 138,515 | 9,471 | $ | (310,184 | ) | (21,062 | ) | $ | (76,937 | ) | (5,088 | ) | ||||||||||||||||
| Year ended December 31, 2018 | ||||||||||||||||||||||||||||||||
| Class 1 | $ | 105,981 | 7,092 | $ | 45,562 | 3,107 | $ | (46,619 | ) | (3,060 | ) | $ | 104,924 | 7,139 | ||||||||||||||||||
| Class 1A | 951 | 60 | 81 | 6 | (40 | ) | (2 | ) | 992 | 64 | ||||||||||||||||||||||
| Class 2 | 27,421 | 1,842 | 130,608 | 8,898 | (208,022 | ) | (13,672 | ) | (49,993 | ) | (2,932 | ) | ||||||||||||||||||||
| Class 4 | 42,459 | 2,827 | 8,471 | 586 | (16,633 | ) | (1,102 | ) | 34,297 | 2,311 | ||||||||||||||||||||||
| Total net increase (decrease) | $ | 176,812 | 11,821 | $ | 184,722 | 12,597 | $ | (271,314 | ) | (17,836 | ) | $ | 90,220 | 6,582 | ||||||||||||||||||
| Growth-Income Fund | ||||||||||||||||||||||||||||||||
| Sales* | Reinvestments of distributions | Repurchases* | Net increase (decrease) | |||||||||||||||||||||||||||||
| Share class | Amount | Shares | Amount | Shares | Amount | Shares | Amount | Shares | ||||||||||||||||||||||||
| Year ended December 31, 2019 | ||||||||||||||||||||||||||||||||
| Class 1 | $ | 1,061,581 | 21,810 | $ | 2,276,758 | 48,690 | $ | (1,229,398 | ) | (25,018 | ) | $ | 2,108,941 | 45,482 | ||||||||||||||||||
| Class 1A | 3,121 | 63 | 1,031 | 22 | (929 | ) | (19 | ) | 3,223 | 66 | ||||||||||||||||||||||
| Class 2 | 173,237 | 3,593 | 1,532,457 | 33,240 | (1,626,668 | ) | (33,632 | ) | 79,026 | 3,201 | ||||||||||||||||||||||
| Class 3 | 2,080 | 42 | 17,705 | 379 | (21,190 | ) | (431 | ) | (1,405 | ) | (10 | ) | ||||||||||||||||||||
| Class 4 | 180,857 | 3,787 | 125,407 | 2,752 | (103,759 | ) | (2,175 | ) | 202,505 | 4,364 | ||||||||||||||||||||||
| Total net increase (decrease) | $ | 1,420,876 | 29,295 | $ | 3,953,358 | 85,083 | $ | (2,981,944 | ) | (61,275 | ) | $ | 2,392,290 | 53,103 | ||||||||||||||||||
| Year ended December 31, 2018 | ||||||||||||||||||||||||||||||||
| Class 1 | $ | 2,594,038 | 53,950 | $ | 1,388,000 | 27,742 | $ | (1,325,537 | ) | (25,872 | ) | $ | 2,656,501 | 55,820 | ||||||||||||||||||
| Class 1A | 5,817 | 114 | 467 | 10 | (933 | ) | (18 | ) | 5,351 | 106 | ||||||||||||||||||||||
| Class 2 | 128,833 | 2,587 | 1,128,412 | 22,770 | (1,901,203 | ) | (37,514 | ) | (643,958 | ) | (12,157 | ) | ||||||||||||||||||||
| Class 3 | 1,014 | 20 | 13,244 | 264 | (26,871 | ) | (525 | ) | (12,613 | ) | (241 | ) | ||||||||||||||||||||
| Class 4 | 193,427 | 3,881 | 73,971 | 1,507 | (97,541 | ) | (1,958 | ) | 169,857 | 3,430 | ||||||||||||||||||||||
| Total net increase (decrease) | $ | 2,923,129 | 60,552 | $ | 2,604,094 | 52,293 | $ | (3,352,085 | ) | (65,887 | ) | $ | 2,175,138 | 46,958 | ||||||||||||||||||
See end of tables for footnotes.
| American Funds Insurance Series | 183 |
| International Growth and Income Fund | ||||||||||||||||||||||||||||||||
| Sales* | Reinvestments of distributions | Repurchases* | Net (decrease) increase | |||||||||||||||||||||||||||||
| Share class | Amount | Shares | Amount | Shares | Amount | Shares | Amount | Shares | ||||||||||||||||||||||||
| Year ended December 31, 2019 | ||||||||||||||||||||||||||||||||
| Class 1 | $ | 9,331 | 555 | $ | 41,626 | 2,406 | $ | (130,370 | ) | (7,620 | ) | $ | (79,413 | ) | (4,659 | ) | ||||||||||||||||
| Class 1A | 364 | 22 | 83 | 5 | (75 | ) | (4 | ) | 372 | 23 | ||||||||||||||||||||||
| Class 2 | 14,448 | 831 | 8,726 | 507 | (37,612 | ) | (2,202 | ) | (14,438 | ) | (864 | ) | ||||||||||||||||||||
| Class 4 | 20,154 | 1,195 | 3,113 | 182 | (7,857 | ) | (466 | ) | 15,410 | 911 | ||||||||||||||||||||||
| Total net increase (decrease) | $ | 44,297 | 2,603 | $ | 53,548 | 3,100 | $ | (175,914 | ) | (10,292 | ) | $ | (78,069 | ) | (4,589 | ) | ||||||||||||||||
| Year ended December 31, 2018 | ||||||||||||||||||||||||||||||||
| Class 1 | $ | 102,396 | 5,829 | $ | 28,476 | 1,796 | $ | (62,238 | ) | (3,472 | ) | $ | 68,634 | 4,153 | ||||||||||||||||||
| Class 1A | 276 | 16 | 44 | 3 | (453 | ) | (27 | ) | (133 | ) | (8 | ) | ||||||||||||||||||||
| Class 2 | 13,046 | 753 | 5,865 | 371 | (28,666 | ) | (1,702 | ) | (9,755 | ) | (578 | ) | ||||||||||||||||||||
| Class 4 | 29,607 | 1,717 | 1,597 | 101 | (12,831 | ) | (752 | ) | 18,373 | 1,066 | ||||||||||||||||||||||
| Total net increase (decrease) | $ | 145,325 | 8,315 | $ | 35,982 | 2,271 | $ | (104,188 | ) | (5,953 | ) | $ | 77,119 | 4,633 | ||||||||||||||||||
| Capital Income Builder | ||||||||||||||||||||||||||||||||
| Sales* | Reinvestments of distributions | Repurchases* | Net increase | |||||||||||||||||||||||||||||
| Share class | Amount | Shares | Amount | Shares | Amount | Shares | Amount | Shares | ||||||||||||||||||||||||
| Year ended December 31, 2019 | ||||||||||||||||||||||||||||||||
| Class 1 | $ | 160,592 | 15,806 | $ | 13,476 | 1,322 | $ | (12,510 | ) | (1,240 | ) | $ | 161,558 | 15,888 | ||||||||||||||||||
| Class 1A | 2,709 | 268 | 126 | 12 | (345 | ) | (34 | ) | 2,490 | 246 | ||||||||||||||||||||||
| Class 2 | 1,661 | 165 | 137 | 13 | (567 | ) | (56 | ) | 1,231 | 122 | ||||||||||||||||||||||
| Class 4 | 66,462 | 6,575 | 10,875 | 1,070 | (29,407 | ) | (2,903 | ) | 47,930 | 4,742 | ||||||||||||||||||||||
| Total net increase (decrease) | $ | 231,424 | 22,814 | $ | 24,614 | 2,417 | $ | (42,829 | ) | (4,233 | ) | $ | 213,209 | 20,998 | ||||||||||||||||||
| Year ended December 31, 2018 | ||||||||||||||||||||||||||||||||
| Class 1 | $ | 96,466 | 9,624 | $ | 10,037 | 1,010 | $ | (12,240 | ) | (1,241 | ) | $ | 94,263 | 9,393 | ||||||||||||||||||
| Class 1A | 2,709 | 270 | 70 | 7 | (761 | ) | (77 | ) | 2,018 | 200 | ||||||||||||||||||||||
| Class 2 | 2,658 | 264 | 96 | 10 | (180 | ) | (18 | ) | 2,574 | 256 | ||||||||||||||||||||||
| Class 4 | 66,457 | 6,627 | 10,312 | 1,037 | (25,636 | ) | (2,556 | ) | 51,133 | 5,108 | ||||||||||||||||||||||
| Total net increase (decrease) | $ | 168,290 | 16,785 | $ | 20,515 | 2,064 | $ | (38,817 | ) | (3,892 | ) | $ | 149,988 | 14,957 | ||||||||||||||||||
| Asset Allocation Fund | ||||||||||||||||||||||||||||||||
| Sales* | Reinvestments of distributions | Repurchases* | Net increase (decrease) | |||||||||||||||||||||||||||||
| Share class | Amount | Shares | Amount | Shares | Amount | Shares | Amount | Shares | ||||||||||||||||||||||||
| Year ended December 31, 2019 | ||||||||||||||||||||||||||||||||
| Class 1 | $ | 1,081,611 | 47,062 | $ | 1,173,430 | 52,076 | $ | (1,121,605 | ) | (48,857 | ) | $ | 1,133,436 | 50,281 | ||||||||||||||||||
| Class 1A | 2,765 | 122 | 605 | 27 | (689 | ) | (30 | ) | 2,681 | 119 | ||||||||||||||||||||||
| Class 2 | 111,154 | 4,871 | 347,279 | 15,613 | (575,603 | ) | (25,266 | ) | (117,170 | ) | (4,782 | ) | ||||||||||||||||||||
| Class 3 | 991 | 43 | 2,189 | 97 | (4,150 | ) | (180 | ) | (970 | ) | (40 | ) | ||||||||||||||||||||
| Class 4 | 356,681 | 15,732 | 277,834 | 12,559 | (218,378 | ) | (9,706 | ) | 416,137 | 18,585 | ||||||||||||||||||||||
| Total net increase (decrease) | $ | 1,553,202 | 67,830 | $ | 1,801,337 | 80,372 | $ | (1,920,425 | ) | (84,039 | ) | $ | 1,434,114 | 64,163 | ||||||||||||||||||
| Year ended December 31, 2018 | ||||||||||||||||||||||||||||||||
| Class 1 | $ | 1,402,434 | 60,588 | $ | 1,053,838 | 46,034 | $ | (2,607,246 | ) | (117,896 | ) | $ | (150,974 | ) | (11,274 | ) | ||||||||||||||||
| Class 1A | 3,797 | 162 | 411 | 18 | (678 | ) | (30 | ) | 3,530 | 150 | ||||||||||||||||||||||
| Class 2 | 89,621 | 3,865 | 313,464 | 13,808 | (682,422 | ) | (29,567 | ) | (279,337 | ) | (11,894 | ) | ||||||||||||||||||||
| Class 3 | 897 | 38 | 2,098 | 91 | (7,614 | ) | (325 | ) | (4,619 | ) | (196 | ) | ||||||||||||||||||||
| Class 4 | 380,567 | 16,509 | 217,964 | 9,642 | (180,958 | ) | (7,998 | ) | 417,573 | 18,153 | ||||||||||||||||||||||
| Total net increase (decrease) | $ | 1,877,316 | 81,162 | $ | 1,587,775 | 69,593 | $ | (3,478,918 | ) | (155,816 | ) | $ | (13,827 | ) | (5,061 | ) | ||||||||||||||||
| 184 | American Funds Insurance Series |
| Global Balanced Fund | ||||||||||||||||||||||||||||||||
| Sales* | Reinvestments of distributions | Repurchases* | Net increase (decrease) | |||||||||||||||||||||||||||||
| Share class | Amount | Shares | Amount | Shares | Amount | Shares | Amount | Shares | ||||||||||||||||||||||||
| Year ended December 31, 2019 | ||||||||||||||||||||||||||||||||
| Class 1 | $ | 10,073 | 777 | $ | 5,390 | 408 | $ | (9,768 | ) | (718 | ) | $ | 5,695 | 467 | ||||||||||||||||||
| Class 1A | 111 | 9 | 89 | 7 | (237 | ) | (19 | ) | (37 | ) | (3 | ) | ||||||||||||||||||||
| Class 2 | 7,858 | 607 | 8,009 | 608 | (22,255 | ) | (1,722 | ) | (6,388 | ) | (507 | ) | ||||||||||||||||||||
| Class 4 | 15,727 | 1,225 | 3,446 | 264 | (6,014 | ) | (470 | ) | 13,159 | 1,019 | ||||||||||||||||||||||
| Total net increase (decrease) | $ | 33,769 | 2,618 | $ | 16,934 | 1,287 | $ | (38,274 | ) | (2,929 | ) | $ | 12,429 | 976 | ||||||||||||||||||
| Year ended December 31, 2018 | ||||||||||||||||||||||||||||||||
| Class 1 | $ | 24,581 | 1,901 | $ | 3,154 | 265 | $ | (847 | ) | (66 | ) | $ | 26,888 | 2,100 | ||||||||||||||||||
| Class 1A | 2,209 | 171 | 56 | 5 | (292 | ) | (24 | ) | 1,973 | 152 | ||||||||||||||||||||||
| Class 2 | 11,812 | 914 | 4,844 | 408 | (24,153 | ) | (1,905 | ) | (7,497 | ) | (583 | ) | ||||||||||||||||||||
| Class 4 | 35,652 | 2,821 | 1,646 | 140 | (12,396 | ) | (987 | ) | 24,902 | 1,974 | ||||||||||||||||||||||
| Total net increase (decrease) | $ | 74,254 | 5,807 | $ | 9,700 | 818 | $ | (37,688 | ) | (2,982 | ) | $ | 46,266 | 3,643 | ||||||||||||||||||
| Bond Fund | ||||||||||||||||||||||||||||||||
| Sales* | Reinvestments of distributions | Repurchases* | Net increase (decrease) | |||||||||||||||||||||||||||||
| Share class | Amount | Shares | Amount | Shares | Amount | Shares | Amount | Shares | ||||||||||||||||||||||||
| Year ended December 31, 2019 | ||||||||||||||||||||||||||||||||
| Class 1 | $ | 562,508 | 51,468 | $ | 176,372 | 15,842 | $ | (614,303 | ) | (56,025 | ) | $ | 124,577 | 11,285 | ||||||||||||||||||
| Class 1A | 3,719 | 336 | 165 | 15 | (744 | ) | (67 | ) | 3,140 | 284 | ||||||||||||||||||||||
| Class 2 | 133,036 | 12,239 | 90,797 | 8,262 | (413,489 | ) | (38,133 | ) | (189,656 | ) | (17,632 | ) | ||||||||||||||||||||
| Class 4 | 149,767 | 13,753 | 11,384 | 1,037 | (49,519 | ) | (4,574 | ) | 111,632 | 10,216 | ||||||||||||||||||||||
| Total net increase (decrease) | $ | 849,030 | 77,796 | $ | 278,718 | 25,156 | $ | (1,078,055 | ) | (98,799 | ) | $ | 49,693 | 4,153 | ||||||||||||||||||
| Year ended December 31, 2018 | ||||||||||||||||||||||||||||||||
| Class 1 | $ | 856,250 | 80,879 | $ | 164,110 | 15,776 | $ | (1,296,873 | ) | (122,086 | ) | $ | (276,513 | ) | (25,431 | ) | ||||||||||||||||
| Class 1A | 2,864 | 271 | 80 | 8 | (674 | ) | (64 | ) | 2,270 | 215 | ||||||||||||||||||||||
| Class 2 | 107,831 | 10,281 | 93,483 | 9,101 | (518,189 | ) | (49,721 | ) | (316,875 | ) | (30,339 | ) | ||||||||||||||||||||
| Class 4 | 118,851 | 11,386 | 8,606 | 839 | (47,758 | ) | (4,587 | ) | 79,699 | 7,638 | ||||||||||||||||||||||
| Total net increase (decrease) | $ | 1,085,796 | 102,817 | $ | 266,279 | 25,724 | $ | (1,863,494 | ) | (176,458 | ) | $ | (511,419 | ) | (47,917 | ) | ||||||||||||||||
| Global Bond Fund | ||||||||||||||||||||||||||||||||
| Sales* | Reinvestments of distributions | Repurchases* | Net increase (decrease) | |||||||||||||||||||||||||||||
| Share class | Amount | Shares | Amount | Shares | Amount | Shares | Amount | Shares | ||||||||||||||||||||||||
| Year ended December 31, 2019 | ||||||||||||||||||||||||||||||||
| Class 1 | $ | 94,035 | 7,945 | $ | 19,056 | 1,588 | $ | (113,011 | ) | (9,529 | ) | $ | 80 | 4 | ||||||||||||||||||
| Class 1A | 84 | 7 | 7 | 1 | (59 | ) | (5 | ) | 32 | 3 | ||||||||||||||||||||||
| Class 2 | 33,181 | 2,816 | 15,927 | 1,338 | (140,715 | ) | (11,911 | ) | (91,607 | ) | (7,757 | ) | ||||||||||||||||||||
| Class 4 | 13,230 | 1,132 | 649 | 55 | (7,381 | ) | (629 | ) | 6,498 | 558 | ||||||||||||||||||||||
| Total net increase (decrease) | $ | 140,530 | 11,900 | $ | 35,639 | 2,982 | $ | (261,166 | ) | (22,074 | ) | $ | (84,997 | ) | (7,192 | ) | ||||||||||||||||
| Year ended December 31, 2018 | ||||||||||||||||||||||||||||||||
| Class 1 | $ | 126,990 | 10,666 | $ | 28,466 | 2,515 | $ | (375,280 | ) | (31,456 | ) | $ | (219,824 | ) | (18,275 | ) | ||||||||||||||||
| Class 1A | 575 | 49 | 10 | 1 | (241 | ) | (21 | ) | 344 | 29 | ||||||||||||||||||||||
| Class 2 | 41,190 | 3,507 | 26,720 | 2,377 | (156,625 | ) | (13,571 | ) | (88,715 | ) | (7,687 | ) | ||||||||||||||||||||
| Class 4 | 28,055 | 2,394 | 934 | 84 | (17,922 | ) | (1,548 | ) | 11,067 | 930 | ||||||||||||||||||||||
| Total net increase (decrease) | $ | 196,810 | 16,616 | $ | 56,130 | 4,977 | $ | (550,068 | ) | (46,596 | ) | $ | (297,128 | ) | (25,003 | ) | ||||||||||||||||
See end of tables for footnotes.
| American Funds Insurance Series | 185 |
| High-Income Bond Fund | ||||||||||||||||||||||||||||||||
| Sales* | Reinvestments of distributions | Repurchases* | Net (decrease) increase | |||||||||||||||||||||||||||||
| Share class | Amount | Shares | Amount | Shares | Amount | Shares | Amount | Shares | ||||||||||||||||||||||||
| Year ended December 31, 2019 | ||||||||||||||||||||||||||||||||
| Class 1 | $ | 9,412 | 933 | $ | 33,027 | 3,374 | $ | (48,250 | ) | (4,826 | ) | $ | (5,811 | ) | (519 | ) | ||||||||||||||||
| Class 1A | 353 | 35 | 45 | 5 | (350 | ) | (35 | ) | 48 | 5 | ||||||||||||||||||||||
| Class 2 | 10,165 | 1,039 | 41,753 | 4,340 | (84,344 | ) | (8,552 | ) | (32,426 | ) | (3,173 | ) | ||||||||||||||||||||
| Class 3 | 613 | 61 | 611 | 62 | (1,328 | ) | (132 | ) | (104 | ) | (9 | ) | ||||||||||||||||||||
| Class 4 | 64,302 | 6,070 | 3,353 | 321 | (37,801 | ) | (3,523 | ) | 29,854 | 2,868 | ||||||||||||||||||||||
| Total net increase (decrease) | $ | 84,845 | 8,138 | $ | 78,789 | 8,102 | $ | (172,073 | ) | (17,068 | ) | $ | (8,439 | ) | (828 | ) | ||||||||||||||||
| Year ended December 31, 2018 | ||||||||||||||||||||||||||||||||
| Class 1 | $ | 15,126 | 1,484 | $ | 34,114 | 3,526 | $ | (136,193 | ) | (13,306 | ) | $ | (86,953 | ) | (8,296 | ) | ||||||||||||||||
| Class 1A | 621 | 61 | 40 | 5 | (365 | ) | (36 | ) | 296 | 30 | ||||||||||||||||||||||
| Class 2 | 12,354 | 1,231 | 43,383 | 4,563 | (111,276 | ) | (11,157 | ) | (55,539 | ) | (5,363 | ) | ||||||||||||||||||||
| Class 3 | 1,837 | 179 | 664 | 68 | (4,223 | ) | (418 | ) | (1,722 | ) | (171 | ) | ||||||||||||||||||||
| Class 4 | 51,449 | 4,747 | 1,733 | 168 | (53,384 | ) | (4,942 | ) | (202 | ) | (27 | ) | ||||||||||||||||||||
| Total net increase (decrease) | $ | 81,387 | 7,702 | $ | 79,934 | 8,330 | $ | (305,441 | ) | (29,859 | ) | $ | (144,120 | ) | (13,827 | ) | ||||||||||||||||
| Mortgage Fund | ||||||||||||||||||||||||||||||||
| Sales* | Reinvestments of distributions | Repurchases* | Net (decrease) increase | |||||||||||||||||||||||||||||
| Share class | Amount | Shares | Amount | Shares | Amount | Shares | Amount | Shares | ||||||||||||||||||||||||
| Year ended December 31, 2019 | ||||||||||||||||||||||||||||||||
| Class 1 | $ | 31,595 | 3,007 | $ | 5,573 | 528 | $ | (41,843 | ) | (3,959 | ) | $ | (4,675 | ) | (424 | ) | ||||||||||||||||
| Class 1A | 166 | 16 | 12 | 1 | (444 | ) | (42 | ) | (266 | ) | (25 | ) | ||||||||||||||||||||
| Class 2 | 4,351 | 413 | 1,355 | 129 | (7,802 | ) | (738 | ) | (2,096 | ) | (196 | ) | ||||||||||||||||||||
| Class 4 | 11,996 | 1,146 | 585 | 56 | (9,761 | ) | (944 | ) | 2,820 | 258 | ||||||||||||||||||||||
| Total net increase (decrease) | $ | 48,108 | 4,582 | $ | 7,525 | 714 | $ | (59,850 | ) | (5,683 | ) | $ | (4,217 | ) | (387 | ) | ||||||||||||||||
| Year ended December 31, 2018 | ||||||||||||||||||||||||||||||||
| Class 1 | $ | 17,819 | 1,730 | $ | 4,658 | 457 | $ | (74,088 | ) | (7,185 | ) | $ | (51,611 | ) | (4,998 | ) | ||||||||||||||||
| Class 1A | 732 | 71 | 15 | 2 | (111 | ) | (11 | ) | 636 | 62 | ||||||||||||||||||||||
| Class 2 | 4,682 | 456 | 1,128 | 111 | (10,509 | ) | (1,023 | ) | (4,699 | ) | (456 | ) | ||||||||||||||||||||
| Class 4 | 14,315 | 1,403 | 424 | 41 | (2,626 | ) | (257 | ) | 12,113 | 1,187 | ||||||||||||||||||||||
| Total net increase (decrease) | $ | 37,548 | 3,660 | $ | 6,225 | 611 | $ | (87,334 | ) | (8,476 | ) | $ | (43,561 | ) | (4,205 | ) | ||||||||||||||||
| 186 | American Funds Insurance Series |
| Ultra-Short Bond Fund | ||||||||||||||||||||||||||||||||
| Sales* | Reinvestments of distributions | Repurchases* | Net (decrease) increase | |||||||||||||||||||||||||||||
| Share class | Amount | Shares | Amount | Shares | Amount | Shares | Amount | Shares | ||||||||||||||||||||||||
| Year ended December 31, 2019 | ||||||||||||||||||||||||||||||||
| Class 1 | $ | 9,753 | 856 | $ | 604 | 53 | $ | (17,930 | ) | (1,576 | ) | $ | (7,573 | ) | (667 | ) | ||||||||||||||||
| Class 1A | — | — | — | † | — | † | — | — | — | † | — | † | ||||||||||||||||||||
| Class 2 | 85,259 | 7,676 | 4,088 | 371 | (106,127 | ) | (9,561 | ) | (16,780 | ) | (1,514 | ) | ||||||||||||||||||||
| Class 3 | 714 | 64 | 59 | 5 | (2,101 | ) | (188 | ) | (1,328 | ) | (119 | ) | ||||||||||||||||||||
| Class 4 | 21,513 | 1,920 | 342 | 31 | (17,702 | ) | (1,580 | ) | 4,153 | 371 | ||||||||||||||||||||||
| Total net increase (decrease) | $ | 117,239 | 10,516 | $ | 5,093 | 460 | $ | (143,860 | ) | (12,905 | ) | $ | (21,528 | ) | (1,929 | ) | ||||||||||||||||
| Year ended December 31, 2018 | ||||||||||||||||||||||||||||||||
| Class 1 | $ | 25,371 | 2,233 | $ | 561 | 50 | $ | (26,198 | ) | (2,310 | ) | $ | (266 | ) | (27 | ) | ||||||||||||||||
| Class 1A | — | — | — | † | — | † | — | — | — | † | — | † | ||||||||||||||||||||
| Class 2 | 103,165 | 9,332 | 2,762 | 250 | (107,692 | ) | (9,741 | ) | (1,765 | ) | (159 | ) | ||||||||||||||||||||
| Class 3 | 4,222 | 378 | 42 | 4 | (3,944 | ) | (353 | ) | 320 | 29 | ||||||||||||||||||||||
| Class 4 | 16,908 | 1,513 | 153 | 14 | (14,303 | ) | (1,281 | ) | 2,758 | 246 | ||||||||||||||||||||||
| Total net increase (decrease) | $ | 149,666 | 13,456 | $ | 3,518 | 318 | $ | (152,137 | ) | (13,685 | ) | $ | 1,047 | 89 | ||||||||||||||||||
| U.S. Government/AAA-Rated Securities Fund | ||||||||||||||||||||||||||||||||
| Sales* | Reinvestments of distributions | Repurchases* | Net (decrease) increase | |||||||||||||||||||||||||||||
| Share class | Amount | Shares | Amount | Shares | Amount | Shares | Amount | Shares | ||||||||||||||||||||||||
| Year ended December 31, 2019 | ||||||||||||||||||||||||||||||||
| Class 1 | $ | 63,401 | 5,184 | $ | 31,462 | 2,550 | $ | (170,411 | ) | (13,819 | ) | $ | (75,548 | ) | (6,085 | ) | ||||||||||||||||
| Class 1A | 1,348 | 110 | 50 | 4 | (488 | ) | (40 | ) | 910 | 74 | ||||||||||||||||||||||
| Class 2 | 105,457 | 8,638 | 26,789 | 2,193 | (155,177 | ) | (12,760 | ) | (22,931 | ) | (1,929 | ) | ||||||||||||||||||||
| Class 3 | 975 | 79 | 180 | 15 | (1,521 | ) | (124 | ) | (366 | ) | (30 | ) | ||||||||||||||||||||
| Class 4 | 69,032 | 5,652 | 2,241 | 183 | (41,016 | ) | (3,366 | ) | 30,257 | 2,469 | ||||||||||||||||||||||
| Total net increase (decrease) | $ | 240,213 | 19,663 | $ | 60,722 | 4,945 | $ | (368,613 | ) | (30,109 | ) | $ | (67,678 | ) | (5,501 | ) | ||||||||||||||||
| Year ended December 31, 2018 | ||||||||||||||||||||||||||||||||
| Class 1 | $ | 67,360 | 5,655 | $ | 29,446 | 2,499 | $ | (191,451 | ) | (16,111 | ) | $ | (94,645 | ) | (7,957 | ) | ||||||||||||||||
| Class 1A | 1,389 | 118 | 28 | 2 | (214 | ) | (18 | ) | 1,203 | 102 | ||||||||||||||||||||||
| Class 2 | 43,398 | 3,680 | 24,431 | 2,094 | (200,280 | ) | (17,045 | ) | (132,451 | ) | (11,271 | ) | ||||||||||||||||||||
| Class 3 | 628 | 53 | 165 | 14 | (1,997 | ) | (168 | ) | (1,204 | ) | (101 | ) | ||||||||||||||||||||
| Class 4 | 45,391 | 3,857 | 1,313 | 113 | (17,387 | ) | (1,474 | ) | 29,317 | 2,496 | ||||||||||||||||||||||
| Total net increase (decrease) | $ | 158,166 | 13,363 | $ | 55,383 | 4,722 | $ | (411,329 | ) | (34,816 | ) | $ | (197,780 | ) | (16,731 | ) | ||||||||||||||||
| Managed Risk Growth Fund | ||||||||||||||||||||||||||||||||
| Sales* | Reinvestments of distributions | Repurchases* | Net increase | |||||||||||||||||||||||||||||
| Share class | Amount | Shares | Amount | Shares | Amount | Shares | Amount | Shares | ||||||||||||||||||||||||
| Year ended December 31, 2019 | ||||||||||||||||||||||||||||||||
| Class P1 | $ | 2,619 | 201 | $ | 317 | 25 | $ | (523 | ) | (41 | ) | $ | 2,413 | 185 | ||||||||||||||||||
| Class P2 | 47,485 | 3,690 | 29,905 | 2,419 | (30,455 | ) | (2,336 | ) | 46,935 | 3,773 | ||||||||||||||||||||||
| Total net increase (decrease) | $ | 50,104 | 3,891 | $ | 30,222 | 2,444 | $ | (30,978 | ) | (2,377 | ) | $ | 49,348 | 3,958 | ||||||||||||||||||
| Year ended December 31, 2018 | ||||||||||||||||||||||||||||||||
| Class P1 | $ | 1,861 | 140 | $ | 150 | 11 | $ | (596 | ) | (45 | ) | $ | 1,415 | 106 | ||||||||||||||||||
| Class P2 | 79,190 | 6,025 | 21,792 | 1,658 | (21,197 | ) | (1,594 | ) | 79,785 | 6,089 | ||||||||||||||||||||||
| Total net increase (decrease) | $ | 81,051 | 6,165 | $ | 21,942 | 1,669 | $ | (21,793 | ) | (1,639 | ) | $ | 81,200 | 6,195 | ||||||||||||||||||
See end of tables for footnotes.
| American Funds Insurance Series | 187 |
| Managed Risk International Fund | ||||||||||||||||||||||||||||||||
| Sales* | Reinvestments of distributions | Repurchases* | Net increase (decrease) | |||||||||||||||||||||||||||||
| Share class | Amount | Shares | Amount | Shares | Amount | Shares | Amount | Shares | ||||||||||||||||||||||||
| Year ended December 31, 2019 | ||||||||||||||||||||||||||||||||
| Class P1 | $ | 357 | 34 | $ | 27 | 3 | $ | (140 | ) | (14 | ) | $ | 244 | 23 | ||||||||||||||||||
| Class P2 | 7,251 | 702 | 7,769 | 772 | (18,389 | ) | (1,773 | ) | (3,369 | ) | (299 | ) | ||||||||||||||||||||
| Total net increase (decrease) | $ | 7,608 | 736 | $ | 7,796 | 775 | $ | (18,529 | ) | (1,787 | ) | $ | (3,125 | ) | (276 | ) | ||||||||||||||||
| Year ended December 31, 2018 | ||||||||||||||||||||||||||||||||
| Class P1 | $ | 321 | 30 | $ | 9 | 1 | $ | (44 | ) | (4 | ) | $ | 286 | 27 | ||||||||||||||||||
| Class P2 | 33,085 | 3,040 | 3,419 | 323 | (13,533 | ) | (1,240 | ) | 22,971 | 2,123 | ||||||||||||||||||||||
| Total net increase (decrease) | $ | 33,406 | 3,070 | $ | 3,428 | 324 | $ | (13,577 | ) | (1,244 | ) | $ | 23,257 | 2,150 | ||||||||||||||||||
| Managed Risk Blue Chip Income and Growth Fund | ||||||||||||||||||||||||||||||||
| Sales* | Reinvestments of distributions | Repurchases* | Net increase | |||||||||||||||||||||||||||||
| Share class | Amount | Shares | Amount | Shares | Amount | Shares | Amount | Shares | ||||||||||||||||||||||||
| Year ended December 31, 2019 | ||||||||||||||||||||||||||||||||
| Class P1 | $ | 547 | 46 | $ | 53 | 5 | $ | (313 | ) | (28 | ) | $ | 287 | 23 | ||||||||||||||||||
| Class P2 | 16,518 | 1,448 | 23,362 | 2,128 | (33,614 | ) | (2,932 | ) | 6,266 | 644 | ||||||||||||||||||||||
| Total net increase (decrease) | $ | 17,065 | 1,494 | $ | 23,415 | 2,133 | $ | (33,927 | ) | (2,960 | ) | $ | 6,553 | 667 | ||||||||||||||||||
| Year ended December 31, 2018 | ||||||||||||||||||||||||||||||||
| Class P1 | $ | 358 | 29 | $ | 22 | 2 | $ | (43 | ) | (4 | ) | $ | 337 | 27 | ||||||||||||||||||
| Class P2 | 31,213 | 2,567 | 23,504 | 1,964 | (35,759 | ) | (2,843 | ) | 18,958 | 1,688 | ||||||||||||||||||||||
| Total net increase (decrease) | $ | 31,571 | 2,596 | $ | 23,526 | 1,966 | $ | (35,802 | ) | (2,847 | ) | $ | 19,295 | 1,715 | ||||||||||||||||||
| Managed Risk Growth-Income Fund | ||||||||||||||||||||||||||||||||
| Sales* | Reinvestments of distributions | Repurchases* | Net increase | |||||||||||||||||||||||||||||
| Share class | Amount | Shares | Amount | Shares | Amount | Shares | Amount | Shares | ||||||||||||||||||||||||
| Year ended December 31, 2019 | ||||||||||||||||||||||||||||||||
| Class P1 | $ | 86,511 | 6,809 | $ | 29,069 | 2,244 | $ | (82,465 | ) | (6,312 | ) | $ | 33,115 | 2,741 | ||||||||||||||||||
| Class P2 | 28,190 | 2,218 | 3,371 | 263 | (20,033 | ) | (1,562 | ) | 11,528 | 919 | ||||||||||||||||||||||
| Total net increase (decrease) | $ | 114,701 | 9,027 | $ | 32,440 | 2,507 | $ | (102,498 | ) | (7,874 | ) | $ | 44,643 | 3,660 | ||||||||||||||||||
| Year ended December 31, 2018 | ||||||||||||||||||||||||||||||||
| Class P1 | $ | 1,696,532 | 144,131 | $ | 164 | 13 | $ | (30,979 | ) | (2,639 | ) | $ | 1,665,717 | 141,505 | ||||||||||||||||||
| Class P2 | 45,914 | 3,658 | 12,188 | 977 | (16,805 | ) | (1,320 | ) | 41,297 | 3,315 | ||||||||||||||||||||||
| Total net increase (decrease) | $ | 1,742,446 | 147,789 | $ | 12,352 | 990 | $ | (47,784 | ) | (3,959 | ) | $ | 1,707,014 | 144,820 | ||||||||||||||||||
| 188 | American Funds Insurance Series |
| Managed Risk Asset Allocation Fund | ||||||||||||||||||||||||||||||||
| Sales* | Reinvestments of distributions | Repurchases* | Net increase (decrease) | |||||||||||||||||||||||||||||
| Share class | Amount | Shares | Amount | Shares | Amount | Shares | Amount | Shares | ||||||||||||||||||||||||
| Year ended December 31, 2019 | ||||||||||||||||||||||||||||||||
| Class P1 | $ | 626 | 47 | $ | 70 | 5 | $ | (334 | ) | (25 | ) | $ | 362 | 27 | ||||||||||||||||||
| Class P2 | 106,039 | 8,229 | 177,741 | 14,380 | (260,413 | ) | (20,223 | ) | 23,367 | 2,386 | ||||||||||||||||||||||
| Total net increase (decrease) | $ | 106,665 | 8,276 | $ | 177,811 | 14,385 | $ | (260,747 | ) | (20,248 | ) | $ | 23,729 | 2,413 | ||||||||||||||||||
| Year ended December 31, 2018 | ||||||||||||||||||||||||||||||||
| Class P1 | $ | 158,125 | 11,883 | $ | 98,747 | 7,599 | $ | (1,735,518 | ) | (141,232 | ) | $ | (1,478,646 | ) | (121,750 | ) | ||||||||||||||||
| Class P2 | 122,897 | 9,265 | 144,221 | 11,089 | (250,843 | ) | (19,040 | ) | 16,275 | 1,314 | ||||||||||||||||||||||
| Total net increase (decrease) | $ | 281,022 | 21,148 | $ | 242,968 | 18,688 | $ | (1,986,361 | ) | (160,272 | ) | $ | (1,462,371 | ) | (120,436 | ) | ||||||||||||||||
| * | Includes exchanges between share classes of the fund. |
| † | Amount less than one thousand. |
| American Funds Insurance Series | 189 |
10. Investment transactions and other disclosures
The following tables present additional information for each of the funds for the year ended December 31, 2019 (dollars in thousands):
| Global Growth Fund | Global Small Capitalization Fund | Growth Fund | International Fund | New World Fund | Blue Chip Income and Growth Fund | |||||||||||||||||||
| Purchases of investment securities* | $ | 849,859 | $ | 2,016,867 | $ | 5,239,850 | $ | 2,829,700 | $ | 1,380,037 | $ | 3,114,494 | ||||||||||||
| Sales of investment securities* | 1,161,452 | 1,978,561 | 6,056,342 | 2,959,294 | 1,201,958 | 3,287,588 | ||||||||||||||||||
| Non-U.S. taxes paid on dividend income | 6,906 | 2,961 | 8,895 | 15,544 | 3,090 | 740 | ||||||||||||||||||
| Non-U.S. taxes (refunded) paid on interest income | — | 9 | — | — | 24 | — | ||||||||||||||||||
| Non-U.S. taxes (refunded) paid on realized gains | — | — | — | 2 | 95 | — | ||||||||||||||||||
| Non-U.S. taxes provided on unrealized gains | 4,247 | 7,065 | — | 14,853 | 12,751 | — | ||||||||||||||||||
| Global Growth and Income Fund | Growth- Income Fund | International Growth and Income Fund | Capital Income Builder | Asset Allocation Fund | Global Balanced Fund | |||||||||||||||||||
| Purchases of investment securities* | $ | 566,776 | $ | 8,540,898 | $ | 367,762 | $ | 617,629 | $ | 16,313,978 | $ | 256,445 | ||||||||||||
| Sales of investment securities* | 665,217 | 8,266,596 | 406,434 | 454,046 | 15,144,557 | 250,980 | ||||||||||||||||||
| Non-U.S. taxes paid on dividend income | 3,365 | 11,677 | 3,815 | 1,062 | 7,745 | 315 | ||||||||||||||||||
| Non-U.S. taxes (refunded) paid on interest income | — | (1 | ) | — | — | — | 17 | |||||||||||||||||
| Non-U.S. taxes (refunded) paid on realized gains | — | 515 | 152 | — | — | 8 | ||||||||||||||||||
| Non-U.S. taxes provided on unrealized gains | 2,362 | 600 | 10 | — | 104 | 27 | ||||||||||||||||||
| Dividend income from affiliated issuers | — | 3,592 | — | — | 5,398 | — | ||||||||||||||||||
| Interest income from affiliated issuers | — | — | — | — | 1,136 | — | ||||||||||||||||||
| Bond Fund | Global Bond Fund | High- Income Bond Fund | Mortgage Fund | Ultra-Short Bond Fund | U.S. Government/ AAA-Rated Securities Fund | |||||||||||||||||||
| Purchases of investment securities* | $ | 31,591,809 | $ | 2,815,896 | $ | 692,973 | $ | 924,220 | $ | — | $ | 5,774,305 | ||||||||||||
| Sales of investment securities* | 33,147,847 | 2,894,376 | 734,772 | 1,047,226 | 74,850 | 6,141,505 | ||||||||||||||||||
| Non-U.S. taxes (refunded) paid on interest income | (6 | ) | 416 | — | — | — | — | |||||||||||||||||
| Non-U.S. taxes (refunded) paid on realized gains | (2 | ) | 369 | — | — | — | — | |||||||||||||||||
| Non-U.S. taxes provided on unrealized gains | — | 225 | — | — | — | — | ||||||||||||||||||
| Managed Risk Growth Fund | Managed Risk International Fund | Managed Risk Blue Chip Income and Growth Fund | Managed Risk Growth- Income Fund | Managed Risk Asset Allocation Fund | ||||||||||||||||||||
| Purchases of investment securities* | $ | 80,311 | $ | 12,427 | $ | 42,893 | $ | 303,447 | $ | 217,416 | ||||||||||||||
| Sales of investment securities* | 39,304 | 19,864 | 43,650 | 122,609 | 287,016 | |||||||||||||||||||
| Dividend income from affiliated issuers | 5,006 | 2,825 | 7,584 | 41,965 | 55,061 |
| * | Excludes short-term securities and U.S. government obligations, if any. |
| 190 | American Funds Insurance Series |
11. Ownership concentration
At December 31, 2019, American Funds Insurance Series - Portfolio Series Managed Risk Growth and Income Portfolio held 33% and 12% of the outstanding shares of Capital Income Builder and Global Growth and Income Fund, respectively. In addition, American Funds Insurance Series - Portfolio Series Managed Risk Global Allocation Portfolio held 24% of the outstanding shares of Global Balanced Fund.
| American Funds Insurance Series | 191 |
Financial highlights
| Income (loss) from investment operations1 | Dividends and distributions | |||||||||||||||||||||||||||||||||||||||||||||||
| Period ended | Net asset value, beginning of period | Net investment income (loss) | Net gains (losses) on securities (both realized and unrealized) | Total from investment operations | Dividends (from net investment income) | Distributions (from capital gains) | Total dividends and distributions | Net asset value, end of period | Total return | Net assets, end of period (in millions) | Ratio of expenses to average net assets2 | Ratio of net income (loss) to average net assets | ||||||||||||||||||||||||||||||||||||
| Global Growth Fund | ||||||||||||||||||||||||||||||||||||||||||||||||
| Class 1: | ||||||||||||||||||||||||||||||||||||||||||||||||
| 12/31/2019 | $ | 25.74 | $ | .32 | $ | 8.60 | $ | 8.92 | $ | (.41 | ) | $ | (1.68 | ) | $ | (2.09 | ) | $ | 32.57 | 35.61 | % | $ | 2,515 | .56 | % | 1.07 | % | |||||||||||||||||||||
| 12/31/2018 | 30.51 | .29 | (2.65 | ) | (2.36 | ) | (.28 | ) | (2.13 | ) | (2.41 | ) | 25.74 | (8.81 | ) | 1,942 | .55 | .98 | ||||||||||||||||||||||||||||||
| 12/31/2017 | 24.05 | .26 | 7.30 | 7.56 | (.26 | ) | (.84 | ) | (1.10 | ) | 30.51 | 31.80 | 2,010 | .55 | .94 | |||||||||||||||||||||||||||||||||
| 12/31/2016 | 26.39 | .25 | (.14 | ) | .11 | (.29 | ) | (2.16 | ) | (2.45 | ) | 24.05 | .87 | 1,630 | .56 | 1.00 | ||||||||||||||||||||||||||||||||
| 12/31/2015 | 27.48 | .25 | 1.80 | 2.05 | (.35 | ) | (2.79 | ) | (3.14 | ) | 26.39 | 7.24 | 1,626 | .55 | .90 | |||||||||||||||||||||||||||||||||
| Class 1A: | ||||||||||||||||||||||||||||||||||||||||||||||||
| 12/31/2019 | 25.69 | .25 | 8.55 | 8.80 | (.34 | ) | (1.68 | ) | (2.02 | ) | 32.47 | 35.22 | 8 | .81 | .83 | |||||||||||||||||||||||||||||||||
| 12/31/2018 | 30.46 | .23 | (2.66 | ) | (2.43 | ) | (.21 | ) | (2.13 | ) | (2.34 | ) | 25.69 | (9.02 | ) | 5 | .80 | .77 | ||||||||||||||||||||||||||||||
| 12/31/20173,4 | 24.50 | .11 | 6.94 | 7.05 | (.25 | ) | (.84 | ) | (1.09 | ) | 30.46 | 29.13 | 5 | 2 | .80 | 6 | .39 | 6 | ||||||||||||||||||||||||||||||
| Class 2: | ||||||||||||||||||||||||||||||||||||||||||||||||
| 12/31/2019 | 25.50 | .24 | 8.51 | 8.75 | (.33 | ) | (1.68 | ) | (2.01 | ) | 32.24 | 35.28 | 3,895 | .81 | .83 | |||||||||||||||||||||||||||||||||
| 12/31/2018 | 30.24 | .22 | (2.63 | ) | (2.41 | ) | (.20 | ) | (2.13 | ) | (2.33 | ) | 25.50 | (9.04 | ) | 3,306 | .80 | .73 | ||||||||||||||||||||||||||||||
| 12/31/2017 | 23.85 | .19 | 7.23 | 7.42 | (.19 | ) | (.84 | ) | (1.03 | ) | 30.24 | 31.47 | 4,012 | .80 | .69 | |||||||||||||||||||||||||||||||||
| 12/31/2016 | 26.19 | .18 | (.14 | ) | .04 | (.22 | ) | (2.16 | ) | (2.38 | ) | 23.85 | .62 | 3,483 | .81 | .76 | ||||||||||||||||||||||||||||||||
| 12/31/2015 | 27.30 | .18 | 1.78 | 1.96 | (.28 | ) | (2.79 | ) | (3.07 | ) | 26.19 | 6.94 | 3,817 | .80 | .66 | |||||||||||||||||||||||||||||||||
| Class 4: | ||||||||||||||||||||||||||||||||||||||||||||||||
| 12/31/2019 | 25.39 | .17 | 8.45 | 8.62 | (.28 | ) | (1.68 | ) | (1.96 | ) | 32.05 | 34.87 | 382 | 1.06 | .57 | |||||||||||||||||||||||||||||||||
| 12/31/2018 | 30.13 | .14 | (2.60 | ) | (2.46 | ) | (.15 | ) | (2.13 | ) | (2.28 | ) | 25.39 | (9.24 | ) | 249 | 1.05 | .47 | ||||||||||||||||||||||||||||||
| 12/31/2017 | 23.81 | .10 | 7.22 | 7.32 | (.16 | ) | (.84 | ) | (1.00 | ) | 30.13 | 31.11 | 211 | 1.05 | .37 | |||||||||||||||||||||||||||||||||
| 12/31/2016 | 26.16 | .12 | (.14 | ) | (.02 | ) | (.17 | ) | (2.16 | ) | (2.33 | ) | 23.81 | .37 | 94 | 1.06 | .50 | |||||||||||||||||||||||||||||||
| 12/31/2015 | 27.34 | .09 | 1.81 | 1.90 | (.29 | ) | (2.79 | ) | (3.08 | ) | 26.16 | 6.69 | 91 | 1.05 | .34 | |||||||||||||||||||||||||||||||||
| Global Small Capitalization Fund | ||||||||||||||||||||||||||||||||||||||||||||||||
| Class 1: | ||||||||||||||||||||||||||||||||||||||||||||||||
| 12/31/2019 | $ | 21.75 | $ | .12 | $ | 6.61 | $ | 6.73 | $ | (.10 | ) | $ | (1.58 | ) | $ | (1.68 | ) | $ | 26.80 | 31.84 | % | $ | 2,050 | .75 | % | .48 | % | |||||||||||||||||||||
| 12/31/2018 | 25.38 | .11 | (2.51 | ) | (2.40 | ) | (.09 | ) | (1.14 | ) | (1.23 | ) | 21.75 | (10.31 | ) | 1,453 | .73 | .42 | ||||||||||||||||||||||||||||||
| 12/31/2017 | 20.24 | .12 | 5.17 | 5.29 | (.15 | ) | — | (.15 | ) | 25.38 | 26.22 | 1,639 | .73 | .54 | ||||||||||||||||||||||||||||||||||
| 12/31/2016 | 24.41 | .12 | .17 | .29 | (.11 | ) | (4.35 | ) | (4.46 | ) | 20.24 | 2.35 | 1,532 | .74 | .57 | |||||||||||||||||||||||||||||||||
| 12/31/2015 | 26.09 | .04 | .36 | .40 | — | (2.08 | ) | (2.08 | ) | 24.41 | .50 | 1,706 | .73 | .15 | ||||||||||||||||||||||||||||||||||
| Class 1A: | ||||||||||||||||||||||||||||||||||||||||||||||||
| 12/31/2019 | 21.71 | .05 | 6.61 | 6.66 | (.05 | ) | (1.58 | ) | (1.63 | ) | 26.74 | 31.56 | 1 | .99 | .22 | |||||||||||||||||||||||||||||||||
| 12/31/2018 | 25.36 | .05 | (2.52 | ) | (2.47 | ) | (.04 | ) | (1.14 | ) | (1.18 | ) | 21.71 | (10.56 | ) | — | 7 | .98 | .21 | |||||||||||||||||||||||||||||
| 12/31/20173,4 | 20.70 | .08 | 4.71 | 4.79 | (.13 | ) | — | (.13 | ) | 25.36 | 23.19 | 5 | — | 7 | .96 | 6 | .35 | 6 | ||||||||||||||||||||||||||||||
| Class 2: | ||||||||||||||||||||||||||||||||||||||||||||||||
| 12/31/2019 | 21.16 | .05 | 6.43 | 6.48 | (.04 | ) | (1.58 | ) | (1.62 | ) | 26.02 | 31.52 | 2,363 | 1.00 | .22 | |||||||||||||||||||||||||||||||||
| 12/31/2018 | 24.72 | .04 | (2.44 | ) | (2.40 | ) | (.02 | ) | (1.14 | ) | (1.16 | ) | 21.16 | (10.55 | ) | 2,056 | .98 | .17 | ||||||||||||||||||||||||||||||
| 12/31/2017 | 19.72 | .06 | 5.04 | 5.10 | (.10 | ) | — | (.10 | ) | 24.72 | 25.89 | 2,551 | .98 | .27 | ||||||||||||||||||||||||||||||||||
| 12/31/2016 | 23.90 | .07 | .15 | .22 | (.05 | ) | (4.35 | ) | (4.40 | ) | 19.72 | 2.10 | 2,303 | .99 | .31 | |||||||||||||||||||||||||||||||||
| 12/31/2015 | 25.64 | (.03 | ) | .37 | .34 | — | (2.08 | ) | (2.08 | ) | 23.90 | .27 | 2,492 | .98 | (.10 | ) | ||||||||||||||||||||||||||||||||
| Class 4: | ||||||||||||||||||||||||||||||||||||||||||||||||
| 12/31/2019 | 21.28 | (.01 | ) | 6.47 | 6.46 | — | 8 | (1.58 | ) | (1.58 | ) | 26.16 | 31.24 | 206 | 1.25 | (.04 | ) | |||||||||||||||||||||||||||||||
| 12/31/2018 | 24.91 | (.02 | ) | (2.46 | ) | (2.48 | ) | (.01 | ) | (1.14 | ) | (1.15 | ) | 21.28 | (10.80 | ) | 146 | 1.24 | (.08 | ) | ||||||||||||||||||||||||||||
| 12/31/2017 | 19.91 | — | 8 | 5.09 | 5.09 | (.09 | ) | — | (.09 | ) | 24.91 | 25.62 | 125 | 1.23 | — | 9 | ||||||||||||||||||||||||||||||||
| 12/31/2016 | 24.11 | .01 | .16 | .17 | (.02 | ) | (4.35 | ) | (4.37 | ) | 19.91 | 1.85 | 42 | 1.24 | .03 | |||||||||||||||||||||||||||||||||
| 12/31/2015 | 25.92 | (.10 | ) | .37 | .27 | — | (2.08 | ) | (2.08 | ) | 24.11 | (.02 | ) | 34 | 1.23 | (.37 | ) | |||||||||||||||||||||||||||||||
| 192 | American Funds Insurance Series |
| Income (loss) from investment operations1 | Dividends and distributions | |||||||||||||||||||||||||||||||||||||||||||||||
| Period ended | Net asset value, beginning of period | Net investment income (loss) | Net gains (losses) on securities (both realized and unrealized) | Total from investment operations | Dividends (from net investment income) | Distributions (from capital gains) | Total dividends and distributions | Net asset value, end of period | Total return | Net assets, end of period (in millions) | Ratio of expenses to average net assets2 | Ratio of net income (loss) to average net assets | ||||||||||||||||||||||||||||||||||||
| Growth Fund | ||||||||||||||||||||||||||||||||||||||||||||||||
| Class 1: | ||||||||||||||||||||||||||||||||||||||||||||||||
| 12/31/2019 | $ | 69.96 | $ | .83 | $ | 19.63 | $ | 20.46 | $ | (.76 | ) | $ | (8.44 | ) | $ | (9.20 | ) | $ | 81.22 | 31.11 | % | $ | 10,841 | .35 | % | 1.09 | % | |||||||||||||||||||||
| 12/31/2018 | 77.85 | .64 | .25 | .89 | (.54 | ) | (8.24 | ) | (8.78 | ) | 69.96 | (.01 | ) | 8,474 | .34 | .81 | ||||||||||||||||||||||||||||||||
| 12/31/2017 | 67.29 | .55 | 17.89 | 18.44 | (.55 | ) | (7.33 | ) | (7.88 | ) | 77.85 | 28.62 | 8,100 | .35 | .75 | |||||||||||||||||||||||||||||||||
| 12/31/2016 | 68.02 | .67 | 5.40 | 6.07 | (.67 | ) | (6.13 | ) | (6.80 | ) | 67.29 | 9.77 | 6,931 | .35 | 1.03 | |||||||||||||||||||||||||||||||||
| 12/31/2015 | 80.15 | .64 | 5.08 | 5.72 | (.61 | ) | (17.24 | ) | (17.85 | ) | 68.02 | 7.12 | 6,796 | .35 | .87 | |||||||||||||||||||||||||||||||||
| Class 1A: | ||||||||||||||||||||||||||||||||||||||||||||||||
| 12/31/2019 | 69.77 | .65 | 19.55 | 20.20 | (.61 | ) | (8.44 | ) | (9.05 | ) | 80.92 | 30.79 | 18 | .60 | .85 | |||||||||||||||||||||||||||||||||
| 12/31/2018 | 77.74 | .47 | .24 | .71 | (.44 | ) | (8.24 | ) | (8.68 | ) | 69.77 | (.26 | ) | 10 | .59 | .60 | ||||||||||||||||||||||||||||||||
| 12/31/20173,4 | 68.84 | .35 | 16.38 | 16.73 | (.50 | ) | (7.33 | ) | (7.83 | ) | 77.74 | 25.47 | 5 | 3 | .59 | 6 | .47 | 6 | ||||||||||||||||||||||||||||||
| Class 2: | ||||||||||||||||||||||||||||||||||||||||||||||||
| 12/31/2019 | 69.48 | .63 | 19.47 | 20.10 | (.57 | ) | (8.44 | ) | (9.01 | ) | 80.57 | 30.77 | 15,885 | .60 | .83 | |||||||||||||||||||||||||||||||||
| 12/31/2018 | 77.35 | .44 | .27 | .71 | (.34 | ) | (8.24 | ) | (8.58 | ) | 69.48 | (.25 | ) | 13,701 | .59 | .55 | ||||||||||||||||||||||||||||||||
| 12/31/2017 | 66.92 | .37 | 17.76 | 18.13 | (.37 | ) | (7.33 | ) | (7.70 | ) | 77.35 | 28.28 | 15,716 | .60 | .50 | |||||||||||||||||||||||||||||||||
| 12/31/2016 | 67.69 | .51 | 5.36 | 5.87 | (.51 | ) | (6.13 | ) | (6.64 | ) | 66.92 | 9.49 | 13,978 | .60 | .78 | |||||||||||||||||||||||||||||||||
| 12/31/2015 | 79.84 | .46 | 5.06 | 5.52 | (.43 | ) | (17.24 | ) | (17.67 | ) | 67.69 | 6.86 | 14,414 | .60 | .62 | |||||||||||||||||||||||||||||||||
| Class 3: | ||||||||||||||||||||||||||||||||||||||||||||||||
| 12/31/2019 | 70.44 | .69 | 19.77 | 20.46 | (.62 | ) | (8.44 | ) | (9.06 | ) | 81.84 | 30.86 | 213 | .53 | .90 | |||||||||||||||||||||||||||||||||
| 12/31/2018 | 78.32 | .50 | .26 | .76 | (.40 | ) | (8.24 | ) | (8.64 | ) | 70.44 | (.18 | ) | 187 | .52 | .62 | ||||||||||||||||||||||||||||||||
| 12/31/2017 | 67.67 | .42 | 17.98 | 18.40 | (.42 | ) | (7.33 | ) | (7.75 | ) | 78.32 | 28.39 | 212 | .53 | .57 | |||||||||||||||||||||||||||||||||
| 12/31/2016 | 68.37 | .56 | 5.42 | 5.98 | (.55 | ) | (6.13 | ) | (6.68 | ) | 67.67 | 9.56 | 183 | .53 | .85 | |||||||||||||||||||||||||||||||||
| 12/31/2015 | 80.47 | .51 | 5.11 | 5.62 | (.48 | ) | (17.24 | ) | (17.72 | ) | 68.37 | 6.92 | 194 | .53 | .69 | |||||||||||||||||||||||||||||||||
| Class 4: | ||||||||||||||||||||||||||||||||||||||||||||||||
| 12/31/2019 | 68.64 | .44 | 19.19 | 19.63 | (.42 | ) | (8.44 | ) | (8.86 | ) | 79.41 | 30.44 | 1,513 | .85 | .59 | |||||||||||||||||||||||||||||||||
| 12/31/2018 | 76.56 | .24 | .28 | .52 | (.20 | ) | (8.24 | ) | (8.44 | ) | 68.64 | (.50 | ) | 1,076 | .84 | .31 | ||||||||||||||||||||||||||||||||
| 12/31/2017 | 66.41 | .18 | 17.61 | 17.79 | (.31 | ) | (7.33 | ) | (7.64 | ) | 76.56 | 27.99 | 954 | .85 | .25 | |||||||||||||||||||||||||||||||||
| 12/31/2016 | 67.26 | .34 | 5.32 | 5.66 | (.38 | ) | (6.13 | ) | (6.51 | ) | 66.41 | 9.22 | 458 | .85 | .53 | |||||||||||||||||||||||||||||||||
| 12/31/2015 | 79.74 | .29 | 5.02 | 5.31 | (.55 | ) | (17.24 | ) | (17.79 | ) | 67.26 | 6.59 | 394 | .85 | .42 | |||||||||||||||||||||||||||||||||
See end of tables for footnotes.
| American Funds Insurance Series | 193 |
Financial highlights(continued)
| Income (loss) from investment operations1 | Dividends and distributions | |||||||||||||||||||||||||||||||||||||||||||||||
| Period ended | Net asset value, beginning of period | Net investment income (loss) | Net gains (losses) on securities (both realized and unrealized) | Total from investment operations | Dividends (from net investment income) | Distributions (from capital gains) | Total dividends and distributions | Net asset value, end of period | Total return | Net assets, end of period (in millions) | Ratio of expenses to average net assets2 | Ratio of net income (loss) to average net assets | ||||||||||||||||||||||||||||||||||||
| International Fund | ||||||||||||||||||||||||||||||||||||||||||||||||
| Class 1: | ||||||||||||||||||||||||||||||||||||||||||||||||
| 12/31/2019 | $ | 17.66 | $ | .30 | $ | 3.74 | $ | 4.04 | $ | (.34 | ) | $ | (.50 | ) | $ | (.84 | ) | $ | 20.86 | 23.21 | % | $ | 5,353 | .54 | % | 1.54 | % | |||||||||||||||||||||
| 12/31/2018 | 21.71 | .34 | (2.97 | ) | (2.63 | ) | (.40 | ) | (1.02 | ) | (1.42 | ) | 17.66 | (12.94 | ) | 4,811 | .53 | 1.62 | ||||||||||||||||||||||||||||||
| 12/31/2017 | 16.82 | .26 | 5.16 | 5.42 | (.30 | ) | (.23 | ) | (.53 | ) | 21.71 | 32.46 | 5,014 | .53 | 1.33 | |||||||||||||||||||||||||||||||||
| 12/31/2016 | 18.08 | .27 | .30 | .57 | (.28 | ) | (1.55 | ) | (1.83 | ) | 16.82 | 3.78 | 3,652 | .54 | 1.57 | |||||||||||||||||||||||||||||||||
| 12/31/2015 | 20.35 | .29 | (1.03 | ) | (.74 | ) | (.35 | ) | (1.18 | ) | (1.53 | ) | 18.08 | (4.25 | ) | 3,427 | .54 | 1.41 | ||||||||||||||||||||||||||||||
| Class 1A: | ||||||||||||||||||||||||||||||||||||||||||||||||
| 12/31/2019 | 17.62 | .25 | 3.72 | 3.97 | (.29 | ) | (.50 | ) | (.79 | ) | 20.80 | 22.90 | 7 | .79 | 1.27 | |||||||||||||||||||||||||||||||||
| 12/31/2018 | 21.67 | .27 | (2.93 | ) | (2.66 | ) | (.37 | ) | (1.02 | ) | (1.39 | ) | 17.62 | (13.11 | ) | 5 | .78 | 1.32 | ||||||||||||||||||||||||||||||
| 12/31/20173,4 | 17.17 | .09 | 4.93 | 5.02 | (.29 | ) | (.23 | ) | (.52 | ) | 21.67 | 29.46 | 5 | 2 | .77 | 6 | .43 | 6 | ||||||||||||||||||||||||||||||
| Class 2: | ||||||||||||||||||||||||||||||||||||||||||||||||
| 12/31/2019 | 17.60 | .25 | 3.72 | 3.97 | (.29 | ) | (.50 | ) | (.79 | ) | 20.78 | 22.88 | 4,311 | .79 | 1.29 | |||||||||||||||||||||||||||||||||
| 12/31/2018 | 21.63 | .29 | (2.95 | ) | (2.66 | ) | (.35 | ) | (1.02 | ) | (1.37 | ) | 17.60 | (13.13 | ) | 3,875 | .78 | 1.40 | ||||||||||||||||||||||||||||||
| 12/31/2017 | 16.76 | .22 | 5.13 | 5.35 | (.25 | ) | (.23 | ) | (.48 | ) | 21.63 | 32.14 | 4,422 | .78 | 1.10 | |||||||||||||||||||||||||||||||||
| 12/31/2016 | 18.02 | .23 | .30 | .53 | (.24 | ) | (1.55 | ) | (1.79 | ) | 16.76 | 3.53 | 3,710 | .79 | 1.35 | |||||||||||||||||||||||||||||||||
| 12/31/2015 | 20.29 | .24 | (1.03 | ) | (.79 | ) | (.30 | ) | (1.18 | ) | (1.48 | ) | 18.02 | (4.53 | ) | 3,978 | .79 | 1.17 | ||||||||||||||||||||||||||||||
| Class 3: | ||||||||||||||||||||||||||||||||||||||||||||||||
| 12/31/2019 | 17.70 | .27 | 3.75 | 4.02 | (.30 | ) | (.50 | ) | (.80 | ) | 20.92 | 23.05 | 25 | .72 | 1.37 | |||||||||||||||||||||||||||||||||
| 12/31/2018 | 21.75 | .31 | (2.98 | ) | (2.67 | ) | (.36 | ) | (1.02 | ) | (1.38 | ) | 17.70 | (13.10 | ) | 24 | .71 | 1.48 | ||||||||||||||||||||||||||||||
| 12/31/2017 | 16.85 | .23 | 5.17 | 5.40 | (.27 | ) | (.23 | ) | (.50 | ) | 21.75 | 32.23 | 31 | .71 | 1.17 | |||||||||||||||||||||||||||||||||
| 12/31/2016 | 18.11 | .24 | .30 | .54 | (.25 | ) | (1.55 | ) | (1.80 | ) | 16.85 | 3.57 | 27 | .72 | 1.42 | |||||||||||||||||||||||||||||||||
| 12/31/2015 | 20.38 | .25 | (1.03 | ) | (.78 | ) | (.31 | ) | (1.18 | ) | (1.49 | ) | 18.11 | (4.44 | ) | 32 | .72 | 1.24 | ||||||||||||||||||||||||||||||
| Class 4: | ||||||||||||||||||||||||||||||||||||||||||||||||
| 12/31/2019 | 17.40 | .20 | 3.69 | 3.89 | (.25 | ) | (.50 | ) | (.75 | ) | 20.54 | 22.67 | 379 | 1.04 | 1.03 | |||||||||||||||||||||||||||||||||
| 12/31/2018 | 21.42 | .23 | (2.93 | ) | (2.70 | ) | (.30 | ) | (1.02 | ) | (1.32 | ) | 17.40 | (13.41 | ) | 295 | 1.03 | 1.13 | ||||||||||||||||||||||||||||||
| 12/31/2017 | 16.64 | .11 | 5.16 | 5.27 | (.26 | ) | (.23 | ) | (.49 | ) | 21.42 | 31.89 | 289 | 1.03 | .55 | |||||||||||||||||||||||||||||||||
| 12/31/2016 | 17.93 | .18 | .29 | .47 | (.21 | ) | (1.55 | ) | (1.76 | ) | 16.64 | 3.21 | 66 | 1.04 | 1.03 | |||||||||||||||||||||||||||||||||
| 12/31/2015 | 20.23 | .17 | (1.00 | ) | (.83 | ) | (.29 | ) | (1.18 | ) | (1.47 | ) | 17.93 | (4.75 | ) | 46 | 1.04 | .88 | ||||||||||||||||||||||||||||||
| New World Fund | ||||||||||||||||||||||||||||||||||||||||||||||||
| Class 1: | ||||||||||||||||||||||||||||||||||||||||||||||||
| 12/31/2019 | $ | 20.98 | $ | .28 | $ | 5.79 | $ | 6.07 | $ | (.29 | ) | $ | (.92 | ) | $ | (1.21 | ) | $ | 25.84 | 29.47 | % | $ | 2,129 | .76 | % | 1.18 | % | |||||||||||||||||||||
| 12/31/2018 | 25.30 | .27 | (3.65 | ) | (3.38 | ) | (.27 | ) | (.67 | ) | (.94 | ) | 20.98 | (13.83 | ) | 1,702 | .77 | 1.11 | ||||||||||||||||||||||||||||||
| 12/31/2017 | 19.72 | .26 | 5.59 | 5.85 | (.27 | ) | — | (.27 | ) | 25.30 | 29.73 | 2,050 | .77 | 1.14 | ||||||||||||||||||||||||||||||||||
| 12/31/2016 | 18.87 | .24 | .81 | 1.05 | (.20 | ) | — | (.20 | ) | 19.72 | 5.59 | 1,743 | .78 | 1.25 | ||||||||||||||||||||||||||||||||||
| 12/31/2015 | 20.72 | .19 | (.71 | ) | (.52 | ) | (.17 | ) | (1.16 | ) | (1.33 | ) | 18.87 | (2.96 | ) | 1,562 | .79 | .92 | ||||||||||||||||||||||||||||||
| Class 1A: | ||||||||||||||||||||||||||||||||||||||||||||||||
| 12/31/2019 | 20.92 | .22 | 5.76 | 5.98 | (.24 | ) | (.92 | ) | (1.16 | ) | 25.74 | 29.11 | 4 | 1.01 | .92 | |||||||||||||||||||||||||||||||||
| 12/31/2018 | 25.25 | .21 | (3.64 | ) | (3.43 | ) | (.23 | ) | (.67 | ) | (.90 | ) | 20.92 | (14.02 | ) | 2 | 1.02 | .91 | ||||||||||||||||||||||||||||||
| 12/31/20173,4 | 20.14 | .13 | 5.24 | 5.37 | (.26 | ) | — | (.26 | ) | 25.25 | 26.72 | 5 | 1 | 1.00 | 6 | .53 | 6 | |||||||||||||||||||||||||||||||
| Class 2: | ||||||||||||||||||||||||||||||||||||||||||||||||
| 12/31/2019 | 20.79 | .22 | 5.73 | 5.95 | (.23 | ) | (.92 | ) | (1.15 | ) | 25.59 | 29.15 | 981 | �� | 1.01 | .93 | ||||||||||||||||||||||||||||||||
| 12/31/2018 | 25.07 | .20 | (3.61 | ) | (3.41 | ) | (.20 | ) | (.67 | ) | (.87 | ) | 20.79 | (14.04 | ) | 843 | 1.02 | .85 | ||||||||||||||||||||||||||||||
| 12/31/2017 | 19.54 | .20 | 5.55 | 5.75 | (.22 | ) | — | (.22 | ) | 25.07 | 29.44 | 1,055 | 1.02 | .89 | ||||||||||||||||||||||||||||||||||
| 12/31/2016 | 18.71 | .19 | .79 | .98 | (.15 | ) | — | (.15 | ) | 19.54 | 5.26 | 911 | 1.03 | 1.00 | ||||||||||||||||||||||||||||||||||
| 12/31/2015 | 20.54 | .14 | (.69 | ) | (.55 | ) | (.12 | ) | (1.16 | ) | (1.28 | ) | 18.71 | (3.14 | ) | 961 | 1.04 | .68 | ||||||||||||||||||||||||||||||
| Class 4: | ||||||||||||||||||||||||||||||||||||||||||||||||
| 12/31/2019 | 20.71 | .16 | 5.70 | 5.86 | (.18 | ) | (.92 | ) | (1.10 | ) | 25.47 | 28.82 | 646 | 1.26 | .67 | |||||||||||||||||||||||||||||||||
| 12/31/2018 | 24.99 | .14 | (3.59 | ) | (3.45 | ) | (.16 | ) | (.67 | ) | (.83 | ) | 20.71 | (14.25 | ) | 464 | 1.27 | .61 | ||||||||||||||||||||||||||||||
| 12/31/2017 | 19.51 | .14 | 5.52 | 5.66 | (.18 | ) | — | (.18 | ) | 24.99 | 29.06 | 427 | 1.27 | .61 | ||||||||||||||||||||||||||||||||||
| 12/31/2016 | 18.69 | .14 | .80 | .94 | (.12 | ) | — | (.12 | ) | 19.51 | 5.04 | 240 | 1.28 | .75 | ||||||||||||||||||||||||||||||||||
| 12/31/2015 | 20.56 | .08 | (.68 | ) | (.60 | ) | (.11 | ) | (1.16 | ) | (1.27 | ) | 18.69 | (3.37 | ) | 171 | 1.29 | .39 | ||||||||||||||||||||||||||||||
| 194 | American Funds Insurance Series |
| Income (loss) from investment operations1 | Dividends and distributions | |||||||||||||||||||||||||||||||||||||||||||||||
| Period ended | Net asset value, beginning of period | Net investment income (loss) | Net gains (losses) on securities (both realized and unrealized) | Total from investment operations | Dividends (from net investment income) | Distributions (from capital gains) | Total dividends and distributions | Net asset value, end of period | Total return | Net assets, end of period (in millions) | Ratio of expenses to average net assets2 | Ratio of net income (loss) to average net assets | ||||||||||||||||||||||||||||||||||||
| Blue Chip Income and Growth Fund | ||||||||||||||||||||||||||||||||||||||||||||||||
| Class 1: | ||||||||||||||||||||||||||||||||||||||||||||||||
| 12/31/2019 | $ | 12.38 | $ | .30 | $ | 2.25 | $ | 2.55 | $ | (.30 | ) | $ | (1.07 | ) | $ | (1.37 | ) | $ | 13.56 | 21.66 | % | $ | 5,559 | .42 | % | 2.28 | % | |||||||||||||||||||||
| 12/31/2018 | 14.96 | .31 | (1.44 | ) | (1.13 | ) | (.31 | ) | (1.14 | ) | (1.45 | ) | 12.38 | (8.45 | ) | 4,810 | .41 | 2.13 | ||||||||||||||||||||||||||||||
| 12/31/2017 | 13.53 | .32 | 1.96 | 2.28 | (.32 | ) | (.53 | ) | (.85 | ) | 14.96 | 17.30 | 5,581 | .41 | 2.27 | |||||||||||||||||||||||||||||||||
| 12/31/2016 | 12.62 | .31 | 1.97 | 2.28 | (.29 | ) | (1.08 | ) | (1.37 | ) | 13.53 | 19.06 | 5,099 | .41 | 2.39 | |||||||||||||||||||||||||||||||||
| 12/31/2015 | 14.69 | .31 | (.64 | ) | (.33 | ) | (.29 | ) | (1.45 | ) | (1.74 | ) | 12.62 | (2.72 | ) | 3,638 | .41 | 2.23 | ||||||||||||||||||||||||||||||
| Class 1A: | ||||||||||||||||||||||||||||||||||||||||||||||||
| 12/31/2019 | 12.35 | .26 | 2.24 | 2.50 | (.27 | ) | (1.07 | ) | (1.34 | ) | 13.51 | 21.35 | 9 | .67 | 2.03 | |||||||||||||||||||||||||||||||||
| 12/31/2018 | 14.94 | .26 | (1.42 | ) | (1.16 | ) | (.29 | ) | (1.14 | ) | (1.43 | ) | 12.35 | (8.67 | ) | 3 | .66 | 1.84 | ||||||||||||||||||||||||||||||
| 12/31/20173,4 | 13.75 | .28 | 1.75 | 2.03 | (.31 | ) | (.53 | ) | (.84 | ) | 14.94 | 15.21 | 5 | 1 | .65 | 6 | 2.01 | 6 | ||||||||||||||||||||||||||||||
| Class 2: | ||||||||||||||||||||||||||||||||||||||||||||||||
| 12/31/2019 | 12.24 | .26 | 2.22 | 2.48 | (.26 | ) | (1.07 | ) | (1.33 | ) | 13.39 | 21.38 | 3,093 | .67 | 2.03 | |||||||||||||||||||||||||||||||||
| 12/31/2018 | 14.80 | .27 | (1.42 | ) | (1.15 | ) | (.27 | ) | (1.14 | ) | (1.41 | ) | 12.24 | (8.66 | ) | 2,850 | .66 | 1.88 | ||||||||||||||||||||||||||||||
| 12/31/2017 | 13.39 | .28 | 1.94 | 2.22 | (.28 | ) | (.53 | ) | (.81 | ) | 14.80 | 17.04 | 3,551 | .66 | 2.02 | |||||||||||||||||||||||||||||||||
| 12/31/2016 | 12.51 | .28 | 1.94 | 2.22 | (.26 | ) | (1.08 | ) | (1.34 | ) | 13.39 | 18.70 | 3,412 | .66 | 2.16 | |||||||||||||||||||||||||||||||||
| 12/31/2015 | 14.57 | .27 | (.62 | ) | (.35 | ) | (.26 | ) | (1.45 | ) | (1.71 | ) | 12.51 | (2.93 | ) | 3,228 | .66 | 1.97 | ||||||||||||||||||||||||||||||
| Class 4: | ||||||||||||||||||||||||||||||||||||||||||||||||
| 12/31/2019 | 12.19 | .23 | 2.20 | 2.43 | (.24 | ) | (1.07 | ) | (1.31 | ) | 13.31 | 21.03 | 621 | .92 | 1.78 | |||||||||||||||||||||||||||||||||
| 12/31/2018 | 14.77 | .23 | (1.42 | ) | (1.19 | ) | (.25 | ) | (1.14 | ) | (1.39 | ) | 12.19 | (8.92 | ) | 368 | .91 | 1.62 | ||||||||||||||||||||||||||||||
| 12/31/2017 | 13.39 | .25 | 1.93 | 2.18 | (.27 | ) | (.53 | ) | (.80 | ) | 14.77 | 16.70 | 247 | .91 | 1.76 | |||||||||||||||||||||||||||||||||
| 12/31/2016 | 12.53 | .24 | 1.96 | 2.20 | (.26 | ) | (1.08 | ) | (1.34 | ) | 13.39 | 18.49 | 132 | .91 | 1.81 | |||||||||||||||||||||||||||||||||
| 12/31/2015 | 14.63 | .24 | (.63 | ) | (.39 | ) | (.26 | ) | (1.45 | ) | (1.71 | ) | 12.53 | (3.21 | ) | 32 | .91 | 1.75 | ||||||||||||||||||||||||||||||
| Global Growth and Income Fund | ||||||||||||||||||||||||||||||||||||||||||||||||
| Class 1: | ||||||||||||||||||||||||||||||||||||||||||||||||
| 12/31/2019 | $ | 13.02 | $ | .31 | $ | 3.67 | $ | 3.98 | $ | (.32 | ) | $ | (.76 | ) | $ | (1.08 | ) | $ | 15.92 | 31.39 | % | $ | 625 | .65 | % | 2.08 | % | |||||||||||||||||||||
| 12/31/2018 | 15.81 | .29 | (1.62 | ) | (1.33 | ) | (.28 | ) | (1.18 | ) | (1.46 | ) | 13.02 | (9.36 | ) | 492 | .63 | 1.94 | ||||||||||||||||||||||||||||||
| 12/31/2017 | 13.02 | .35 | 3.06 | 3.41 | (.36 | ) | (.26 | ) | (.62 | ) | 15.81 | 26.40 | 485 | .63 | 2.43 | |||||||||||||||||||||||||||||||||
| 12/31/2016 | 12.35 | .28 | .66 | .94 | (.27 | ) | — | (.27 | ) | 13.02 | 7.61 | 571 | .63 | 2.18 | ||||||||||||||||||||||||||||||||||
| 12/31/2015 | 12.78 | .36 | (.50 | ) | (.14 | ) | (.29 | ) | — | (.29 | ) | 12.35 | (1.14 | ) | 293 | .64 | 2.79 | |||||||||||||||||||||||||||||||
| Class 1A: | ||||||||||||||||||||||||||||||||||||||||||||||||
| 12/31/2019 | 13.00 | .26 | 3.68 | 3.94 | (.30 | ) | (.76 | ) | (1.06 | ) | 15.88 | 31.04 | 2 | .90 | 1.77 | |||||||||||||||||||||||||||||||||
| 12/31/2018 | 15.81 | .26 | (1.63 | ) | (1.37 | ) | (.26 | ) | (1.18 | ) | (1.44 | ) | 13.00 | (9.62 | ) | 1 | .88 | 1.74 | ||||||||||||||||||||||||||||||
| 12/31/20173,4 | 13.21 | .18 | 3.03 | 3.21 | (.35 | ) | (.26 | ) | (.61 | ) | 15.81 | 24.54 | 5 | — | 7 | .84 | 6 | 1.20 | 6 | |||||||||||||||||||||||||||||
| Class 2: | ||||||||||||||||||||||||||||||||||||||||||||||||
| 12/31/2019 | 12.99 | .27 | 3.68 | 3.95 | (.29 | ) | (.76 | ) | (1.05 | ) | 15.89 | 31.14 | 1,366 | .90 | 1.84 | |||||||||||||||||||||||||||||||||
| 12/31/2018 | 15.78 | .26 | (1.63 | ) | (1.37 | ) | (.24 | ) | (1.18 | ) | (1.42 | ) | 12.99 | (9.63 | ) | 1,228 | .88 | 1.70 | ||||||||||||||||||||||||||||||
| 12/31/2017 | 13.00 | .31 | 3.05 | 3.36 | (.32 | ) | (.26 | ) | (.58 | ) | 15.78 | 26.06 | 1,538 | .88 | 2.11 | |||||||||||||||||||||||||||||||||
| 12/31/2016 | 12.33 | .25 | .65 | .90 | (.23 | ) | — | (.23 | ) | 13.00 | 7.34 | 1,405 | .88 | 1.98 | ||||||||||||||||||||||||||||||||||
| 12/31/2015 | 12.75 | .22 | (.39 | ) | (.17 | ) | (.25 | ) | — | (.25 | ) | 12.33 | (1.34 | ) | 1,479 | .89 | 1.73 | |||||||||||||||||||||||||||||||
| Class 4: | ||||||||||||||||||||||||||||||||||||||||||||||||
| 12/31/2019 | 12.81 | .23 | 3.61 | 3.84 | (.26 | ) | (.76 | ) | (1.02 | ) | 15.63 | 30.73 | 145 | 1.15 | 1.56 | |||||||||||||||||||||||||||||||||
| 12/31/2018 | 15.60 | .21 | (1.60 | ) | (1.39 | ) | (.22 | ) | (1.18 | ) | (1.40 | ) | 12.81 | (9.89 | ) | 95 | 1.13 | 1.43 | ||||||||||||||||||||||||||||||
| 12/31/2017 | 12.89 | .22 | 3.08 | 3.30 | (.33 | ) | (.26 | ) | (.59 | ) | 15.60 | 25.83 | 79 | 1.14 | 1.49 | |||||||||||||||||||||||||||||||||
| 12/31/2016 | 12.26 | .21 | .65 | .86 | (.23 | ) | — | (.23 | ) | 12.89 | 7.04 | 16 | 1.13 | 1.63 | ||||||||||||||||||||||||||||||||||
| 12/31/2015 | 12.71 | .17 | (.37 | ) | (.20 | ) | (.25 | ) | — | (.25 | ) | 12.26 | (1.60 | ) | 5 | 1.14 | 1.32 | |||||||||||||||||||||||||||||||
See end of tables for footnotes.
| American Funds Insurance Series | 195 |
Financial highlights (continued)
| Income (loss) from investment operations1 | Dividends and distributions | |||||||||||||||||||||||||||||||||||||||||||||||
| Period ended | Net asset value, beginning of period | Net investment income (loss) | Net gains (losses) on securities (both realized and unrealized) | Total from investment operations | Dividends (from net investment income) | Distributions (from capital gains) | Total dividends and distributions | Net asset value, end of period | Total return | Net assets, end of period (in millions) | Ratio of expenses to average net assets2 | Ratio of net income (loss) to average net assets | ||||||||||||||||||||||||||||||||||||
| Growth-Income Fund | ||||||||||||||||||||||||||||||||||||||||||||||||
| Class 1: | ||||||||||||||||||||||||||||||||||||||||||||||||
| 12/31/2019 | $ | 45.39 | $ | 1.00 | $ | 10.40 | $ | 11.40 | $ | (.92 | ) | $ | (5.16 | ) | $ | (6.08 | ) | $ | 50.71 | 26.46 | % | $ | 21,057 | .29 | % | 2.05 | % | |||||||||||||||||||||
| 12/31/2018 | 50.22 | .84 | (1.25 | ) | (.41 | ) | (.84 | ) | (3.58 | ) | (4.42 | ) | 45.39 | (1.55 | ) | 16,783 | .28 | 1.65 | ||||||||||||||||||||||||||||||
| 12/31/2017 | 44.41 | .81 | 8.89 | 9.70 | (.78 | ) | (3.11 | ) | (3.89 | ) | 50.22 | 22.68 | 15,765 | .28 | 1.69 | |||||||||||||||||||||||||||||||||
| 12/31/2016 | 45.40 | .79 | 4.09 | 4.88 | (.75 | ) | (5.12 | ) | (5.87 | ) | 44.41 | 11.80 | 12,588 | .29 | 1.79 | |||||||||||||||||||||||||||||||||
| 12/31/2015 | 52.76 | .79 | .37 | 1.16 | (.75 | ) | (7.77 | ) | (8.52 | ) | 45.40 | 1.72 | 10,747 | .29 | 1.59 | |||||||||||||||||||||||||||||||||
| Class 1A: | ||||||||||||||||||||||||||||||||||||||||||||||||
| 12/31/2019 | 45.28 | .89 | 10.36 | 11.25 | (.83 | ) | (5.16 | ) | (5.99 | ) | 50.54 | 26.14 | 11 | .54 | 1.82 | |||||||||||||||||||||||||||||||||
| 12/31/2018 | 50.15 | .72 | (1.25 | ) | (.53 | ) | (.76 | ) | (3.58 | ) | (4.34 | ) | 45.28 | (1.78 | ) | 7 | .53 | 1.43 | ||||||||||||||||||||||||||||||
| 12/31/20173,4 | 45.39 | .67 | 7.96 | 8.63 | (.76 | ) | (3.11 | ) | (3.87 | ) | 50.15 | 19.83 | 5 | 2 | .52 | 6 | 1.41 | 6 | ||||||||||||||||||||||||||||||
| Class 2: | ||||||||||||||||||||||||||||||||||||||||||||||||
| 12/31/2019 | 44.90 | .87 | 10.27 | 11.14 | (.80 | ) | (5.16 | ) | (5.96 | ) | 50.08 | 26.14 | 13,586 | .53 | 1.80 | |||||||||||||||||||||||||||||||||
| 12/31/2018 | 49.71 | .71 | (1.23 | ) | (.52 | ) | (.71 | ) | (3.58 | ) | (4.29 | ) | 44.90 | (1.79 | ) | 12,035 | .53 | 1.40 | ||||||||||||||||||||||||||||||
| 12/31/2017 | 44.00 | .68 | 8.80 | 9.48 | (.66 | ) | (3.11 | ) | (3.77 | ) | 49.71 | 22.38 | 13,930 | .53 | 1.45 | |||||||||||||||||||||||||||||||||
| 12/31/2016 | 45.04 | .67 | 4.05 | 4.72 | (.64 | ) | (5.12 | ) | (5.76 | ) | 44.00 | 11.51 | 12,854 | .54 | 1.54 | |||||||||||||||||||||||||||||||||
| 12/31/2015 | 52.41 | .66 | .37 | 1.03 | (.63 | ) | (7.77 | ) | (8.40 | ) | 45.04 | 1.45 | 12,895 | .54 | 1.34 | |||||||||||||||||||||||||||||||||
| Class 3: | ||||||||||||||||||||||||||||||||||||||||||||||||
| 12/31/2019 | 45.47 | .91 | 10.43 | 11.34 | (.84 | ) | (5.16 | ) | (6.00 | ) | 50.81 | 26.24 | 156 | .46 | 1.87 | |||||||||||||||||||||||||||||||||
| 12/31/2018 | 50.29 | .75 | (1.25 | ) | (.50 | ) | (.74 | ) | (3.58 | ) | (4.32 | ) | 45.47 | (1.72 | ) | 140 | .46 | 1.47 | ||||||||||||||||||||||||||||||
| 12/31/2017 | 44.47 | .72 | 8.90 | 9.62 | (.69 | ) | (3.11 | ) | (3.80 | ) | 50.29 | 22.47 | 168 | .46 | 1.52 | |||||||||||||||||||||||||||||||||
| 12/31/2016 | 45.46 | .71 | 4.09 | 4.80 | (.67 | ) | (5.12 | ) | (5.79 | ) | 44.47 | 11.59 | 156 | .47 | 1.61 | |||||||||||||||||||||||||||||||||
| 12/31/2015 | 52.82 | .70 | .37 | 1.07 | (.66 | ) | (7.77 | ) | (8.43 | ) | 45.46 | 1.53 | 161 | .47 | 1.41 | |||||||||||||||||||||||||||||||||
| Class 4: | ||||||||||||||||||||||||||||||||||||||||||||||||
| 12/31/2019 | 44.47 | .74 | 10.18 | 10.92 | (.71 | ) | (5.16 | ) | (5.87 | ) | 49.52 | 25.86 | 1,216 | .79 | 1.56 | |||||||||||||||||||||||||||||||||
| 12/31/2018 | 49.31 | .58 | (1.23 | ) | (.65 | ) | (.61 | ) | (3.58 | ) | (4.19 | ) | 44.47 | (2.05 | ) | 899 | .78 | 1.15 | ||||||||||||||||||||||||||||||
| 12/31/2017 | 43.73 | .56 | 8.73 | 9.29 | (.60 | ) | (3.11 | ) | (3.71 | ) | 49.31 | 22.08 | 827 | .78 | 1.19 | |||||||||||||||||||||||||||||||||
| 12/31/2016 | 44.82 | .56 | 4.02 | 4.58 | (.55 | ) | (5.12 | ) | (5.67 | ) | 43.73 | 11.25 | 495 | .79 | 1.29 | |||||||||||||||||||||||||||||||||
| 12/31/2015 | 52.39 | .58 | .33 | .91 | (.71 | ) | (7.77 | ) | (8.48 | ) | 44.82 | 1.21 | 410 | .79 | 1.25 | |||||||||||||||||||||||||||||||||
| International Growth and Income Fund | ||||||||||||||||||||||||||||||||||||||||||||||||
| Class 1: | ||||||||||||||||||||||||||||||||||||||||||||||||
| 12/31/2019 | $ | 15.35 | $ | .46 | $ | 3.03 | $ | 3.49 | $ | (.47 | ) | $ | (.19 | ) | $ | (.66 | ) | $ | 18.18 | 23.06 | % | $ | 1,140 | .66 | % | 2.73 | % | |||||||||||||||||||||
| 12/31/2018 | 17.72 | .45 | (2.39 | ) | (1.94 | ) | (.43 | ) | — | (.43 | ) | 15.35 | (11.00 | ) | 1,034 | .65 | 2.62 | |||||||||||||||||||||||||||||||
| 12/31/2017 | 14.48 | .46 | 3.20 | 3.66 | (.42 | ) | — | (.42 | ) | 17.72 | 25.31 | 1,121 | .66 | 2.75 | ||||||||||||||||||||||||||||||||||
| 12/31/2016 | 14.72 | .43 | (.19 | ) | .24 | (.42 | ) | (.06 | ) | (.48 | ) | 14.48 | 1.71 | 820 | .68 | 2.93 | ||||||||||||||||||||||||||||||||
| 12/31/2015 | 16.27 | .42 | (1.25 | ) | (.83 | ) | (.38 | ) | (.34 | ) | (.72 | ) | 14.72 | (5.34 | ) | 707 | .68 | 2.60 | ||||||||||||||||||||||||||||||
| Class 1A: | ||||||||||||||||||||||||||||||||||||||||||||||||
| 12/31/2019 | 15.33 | .41 | 3.04 | 3.45 | (.44 | ) | (.19 | ) | (.63 | ) | 18.15 | 22.76 | 2 | .91 | 2.41 | |||||||||||||||||||||||||||||||||
| 12/31/2018 | 17.70 | .41 | (2.39 | ) | (1.98 | ) | (.39 | ) | — | (.39 | ) | 15.33 | (11.24 | ) | 2 | .90 | 2.35 | |||||||||||||||||||||||||||||||
| 12/31/20173,4 | 14.69 | .34 | 3.08 | 3.42 | (.41 | ) | — | (.41 | ) | 17.70 | 23.36 | 5 | 2 | .91 | 6 | 1.99 | 6 | |||||||||||||||||||||||||||||||
| Class 2: | ||||||||||||||||||||||||||||||||||||||||||||||||
| 12/31/2019 | 15.30 | .42 | 3.02 | 3.44 | (.43 | ) | (.19 | ) | (.62 | ) | 18.12 | 22.76 | 257 | .91 | 2.49 | |||||||||||||||||||||||||||||||||
| 12/31/2018 | 17.66 | .41 | (2.38 | ) | (1.97 | ) | (.39 | ) | — | (.39 | ) | 15.30 | (11.23 | ) | 230 | .90 | 2.38 | |||||||||||||||||||||||||||||||
| 12/31/2017 | 14.43 | .43 | 3.17 | 3.60 | (.37 | ) | — | (.37 | ) | 17.66 | 25.03 | 276 | .91 | 2.60 | ||||||||||||||||||||||||||||||||||
| 12/31/2016 | 14.68 | .40 | (.21 | ) | .19 | (.38 | ) | (.06 | ) | (.44 | ) | 14.43 | 1.44 | 244 | .93 | 2.72 | ||||||||||||||||||||||||||||||||
| 12/31/2015 | 16.22 | .38 | (1.24 | ) | (.86 | ) | (.34 | ) | (.34 | ) | (.68 | ) | 14.68 | (5.60 | ) | 254 | .93 | 2.32 | ||||||||||||||||||||||||||||||
| Class 4: | ||||||||||||||||||||||||||||||||||||||||||||||||
| 12/31/2019 | 15.22 | .37 | 3.01 | 3.38 | (.40 | ) | (.19 | ) | (.59 | ) | 18.01 | 22.47 | 101 | 1.16 | 2.18 | |||||||||||||||||||||||||||||||||
| 12/31/2018 | 17.58 | .36 | (2.36 | ) | (2.00 | ) | (.36 | ) | — | (.36 | ) | 15.22 | (11.46 | ) | 71 | 1.15 | 2.10 | |||||||||||||||||||||||||||||||
| 12/31/2017 | 14.38 | .37 | 3.18 | 3.55 | (.35 | ) | — | (.35 | ) | 17.58 | 24.72 | 63 | 1.16 | 2.24 | ||||||||||||||||||||||||||||||||||
| 12/31/2016 | 14.63 | .36 | (.19 | ) | .17 | (.36 | ) | (.06 | ) | (.42 | ) | 14.38 | 1.18 | 37 | 1.18 | 2.43 | ||||||||||||||||||||||||||||||||
| 12/31/2015 | 16.19 | .33 | (1.23 | ) | (.90 | ) | (.32 | ) | (.34 | ) | (.66 | ) | 14.63 | (5.82 | ) | 32 | 1.18 | 2.02 | ||||||||||||||||||||||||||||||
| 196 | American Funds Insurance Series |
| Income (loss) from investment operations1 | Dividends and distributions | |||||||||||||||||||||||||||||||||||||||||||||||
| Period ended | Net asset value, beginning of period | Net investment income (loss) | Net gains (losses) on securities (both realized and unrealized) | Total from investment operations | Dividends (from net investment income) | Distributions (from capital gains) | Total dividends and distributions | Net asset value, end of period | Total return | Net assets, end of period (in millions) | Ratio of expenses to average net assets2 | Ratio of net income (loss) to average net assets | ||||||||||||||||||||||||||||||||||||
| Capital Income Builder | ||||||||||||||||||||||||||||||||||||||||||||||||
| Class 1: | ||||||||||||||||||||||||||||||||||||||||||||||||
| 12/31/2019 | $ | 9.37 | $ | .32 | $ | 1.36 | $ | 1.68 | $ | (.32 | ) | $ | — | $ | (.32 | ) | $ | 10.73 | 18.16 | % | $ | 533 | .53 | % | 3.17 | % | ||||||||||||||||||||||
| 12/31/2018 | 10.40 | .31 | (1.00 | ) | (.69 | ) | (.32 | ) | (.02 | ) | (.34 | ) | 9.37 | (6.77 | ) | 317 | .54 | 3.08 | ||||||||||||||||||||||||||||||
| 12/31/2017 | 9.46 | .32 | .93 | 1.25 | (.31 | ) | — | (.31 | ) | 10.40 | 13.29 | 254 | .54 | 3.21 | ||||||||||||||||||||||||||||||||||
| 12/31/2016 | 9.40 | .32 | .07 | .39 | (.33 | ) | — | (.33 | ) | 9.46 | 4.17 | 156 | .54 | 3.39 | ||||||||||||||||||||||||||||||||||
| 12/31/2015 | 9.81 | .28 | (.40 | ) | (.12 | ) | (.29 | ) | — | (.29 | ) | 9.40 | (1.23 | ) | 80 | .56 | 2.88 | |||||||||||||||||||||||||||||||
| Class 1A: | ||||||||||||||||||||||||||||||||||||||||||||||||
| 12/31/2019 | 9.36 | .29 | 1.37 | 1.66 | (.30 | ) | — | (.30 | ) | 10.72 | 17.90 | 6 | .78 | 2.84 | ||||||||||||||||||||||||||||||||||
| 12/31/2018 | 10.39 | .28 | (.99 | ) | (.71 | ) | (.30 | ) | (.02 | ) | (.32 | ) | 9.36 | (7.01 | ) | 2 | .79 | 2.82 | ||||||||||||||||||||||||||||||
| 12/31/20173,4 | 9.57 | .27 | .84 | 1.11 | (.29 | ) | — | (.29 | ) | 10.39 | 11.72 | 5 | 1 | .79 | 6 | 2.63 | 6 | |||||||||||||||||||||||||||||||
| Class 2: | ||||||||||||||||||||||||||||||||||||||||||||||||
| 12/31/2019 | 9.36 | .30 | 1.35 | 1.65 | (.29 | ) | — | (.29 | ) | 10.72 | 17.89 | 6 | .78 | 2.91 | ||||||||||||||||||||||||||||||||||
| 12/31/2018 | 10.40 | .28 | (1.00 | ) | (.72 | ) | (.30 | ) | (.02 | ) | (.32 | ) | 9.36 | (7.08 | ) | 4 | .79 | 2.83 | ||||||||||||||||||||||||||||||
| 12/31/2017 | 9.46 | .29 | .93 | 1.22 | (.28 | ) | — | (.28 | ) | 10.40 | 13.04 | 1 | .79 | 2.82 | ||||||||||||||||||||||||||||||||||
| 12/31/2016 | 9.40 | .27 | .11 | .38 | (.32 | ) | — | (.32 | ) | 9.46 | 4.08 | — | 7 | .80 | 2.82 | |||||||||||||||||||||||||||||||||
| 12/31/2015 | 9.81 | .31 | (.43 | ) | (.12 | ) | (.29 | ) | — | (.29 | ) | 9.40 | (1.23 | )10 | — | 7 | .46 | 10 | 3.12 | 10 | ||||||||||||||||||||||||||||
| Class 4: | ||||||||||||||||||||||||||||||||||||||||||||||||
| 12/31/2019 | 9.35 | .27 | 1.36 | 1.63 | (.27 | ) | — | (.27 | ) | 10.71 | 17.62 | 454 | 1.03 | 2.68 | ||||||||||||||||||||||||||||||||||
| 12/31/2018 | 10.38 | .26 | (1.00 | ) | (.74 | ) | (.27 | ) | (.02 | ) | (.29 | ) | 9.35 | (7.25 | ) | 352 | 1.04 | 2.58 | ||||||||||||||||||||||||||||||
| 12/31/2017 | 9.45 | .27 | .92 | 1.19 | (.26 | ) | — | (.26 | ) | 10.38 | 12.65 | 338 | 1.04 | 2.72 | ||||||||||||||||||||||||||||||||||
| 12/31/2016 | 9.38 | .27 | .08 | .35 | (.28 | ) | — | (.28 | ) | 9.45 | 3.78 | 256 | 1.04 | 2.88 | ||||||||||||||||||||||||||||||||||
| 12/31/2015 | 9.80 | .25 | (.42 | ) | (.17 | ) | (.25 | ) | — | (.25 | ) | 9.38 | (1.79 | ) | 157 | 1.05 | 2.55 | |||||||||||||||||||||||||||||||
| Asset Allocation Fund | ||||||||||||||||||||||||||||||||||||||||||||||||
| Class 1: | ||||||||||||||||||||||||||||||||||||||||||||||||
| 12/31/2019 | $ | 21.29 | $ | .51 | $ | 3.94 | $ | 4.45 | $ | (.50 | ) | $ | (1.19 | ) | $ | (1.69 | ) | $ | 24.05 | 21.54 | % | $ | 17,730 | .29 | % | 2.21 | % | |||||||||||||||||||||
| 12/31/2018 | 23.71 | .48 | (1.43 | ) | (.95 | ) | (.44 | ) | (1.03 | ) | (1.47 | ) | 21.29 | (4.35 | ) | 14,627 | .28 | 2.04 | ||||||||||||||||||||||||||||||
| 12/31/2017 | 21.68 | .44 | 3.06 | 3.50 | (.41 | ) | (1.06 | ) | (1.47 | ) | 23.71 | 16.51 | 16,556 | .29 | 1.90 | |||||||||||||||||||||||||||||||||
| 12/31/2016 | 20.62 | .42 | 1.54 | 1.96 | (.39 | ) | (.51 | ) | (.90 | ) | 21.68 | 9.69 | 13,008 | .29 | 1.97 | |||||||||||||||||||||||||||||||||
| 12/31/2015 | 22.23 | .40 | (.02 | ) | .38 | (.40 | ) | (1.59 | ) | (1.99 | ) | 20.62 | 1.64 | 10,913 | .29 | 1.85 | ||||||||||||||||||||||||||||||||
| Class 1A: | ||||||||||||||||||||||||||||||||||||||||||||||||
| 12/31/2019 | 21.26 | .45 | 3.92 | 4.37 | (.45 | ) | (1.19 | ) | (1.64 | ) | 23.99 | 21.19 | 11 | .54 | 1.95 | |||||||||||||||||||||||||||||||||
| 12/31/2018 | 23.69 | .42 | (1.42 | ) | (1.00 | ) | (.40 | ) | (1.03 | ) | (1.43 | ) | 21.26 | (4.58 | ) | 7 | .53 | 1.82 | ||||||||||||||||||||||||||||||
| 12/31/20173,4 | 21.97 | .39 | 2.78 | 3.17 | (.39 | ) | (1.06 | ) | (1.45 | ) | 23.69 | 14.78 | 5 | 4 | .53 | 6 | 1.69 | 6 | ||||||||||||||||||||||||||||||
| Class 2: | ||||||||||||||||||||||||||||||||||||||||||||||||
| 12/31/2019 | 21.08 | .45 | 3.89 | 4.34 | (.44 | ) | (1.19 | ) | (1.63 | ) | 23.79 | 21.23 | 5,154 | .54 | 1.96 | |||||||||||||||||||||||||||||||||
| 12/31/2018 | 23.49 | .41 | (1.41 | ) | (1.00 | ) | (.38 | ) | (1.03 | ) | (1.41 | ) | 21.08 | (4.60 | ) | 4,668 | .53 | 1.78 | ||||||||||||||||||||||||||||||
| 12/31/2017 | 21.49 | .37 | 3.04 | 3.41 | (.35 | ) | (1.06 | ) | (1.41 | ) | 23.49 | 16.23 | 5,480 | .54 | 1.64 | |||||||||||||||||||||||||||||||||
| 12/31/2016 | 20.45 | .36 | 1.53 | 1.89 | (.34 | ) | (.51 | ) | (.85 | ) | 21.49 | 9.41 | 5,144 | .54 | 1.72 | |||||||||||||||||||||||||||||||||
| 12/31/2015 | 22.06 | .34 | (.01 | ) | .33 | (.35 | ) | (1.59 | ) | (1.94 | ) | 20.45 | 1.40 | 5,008 | .54 | 1.60 | ||||||||||||||||||||||||||||||||
| Class 3: | ||||||||||||||||||||||||||||||||||||||||||||||||
| 12/31/2019 | 21.32 | .47 | 3.93 | 4.40 | (.45 | ) | (1.19 | ) | (1.64 | ) | 24.08 | 21.30 | 32 | .47 | 2.02 | |||||||||||||||||||||||||||||||||
| 12/31/2018 | 23.73 | .43 | (1.41 | ) | (.98 | ) | (.40 | ) | (1.03 | ) | (1.43 | ) | 21.32 | (4.49 | ) | 29 | .46 | 1.85 | ||||||||||||||||||||||||||||||
| 12/31/2017 | 21.70 | .39 | 3.07 | 3.46 | (.37 | ) | (1.06 | ) | (1.43 | ) | 23.73 | 16.29 | 38 | .47 | 1.72 | |||||||||||||||||||||||||||||||||
| 12/31/2016 | 20.64 | .38 | 1.54 | 1.92 | (.35 | ) | (.51 | ) | (.86 | ) | 21.70 | 9.49 | 35 | .47 | 1.79 | |||||||||||||||||||||||||||||||||
| 12/31/2015 | 22.25 | .36 | (.02 | ) | .34 | (.36 | ) | (1.59 | ) | (1.95 | ) | 20.64 | 1.46 | 36 | .47 | 1.67 | ||||||||||||||||||||||||||||||||
| Class 4: | ||||||||||||||||||||||||||||||||||||||||||||||||
| 12/31/2019 | 20.99 | .39 | 3.87 | 4.26 | (.39 | ) | (1.19 | ) | (1.58 | ) | 23.67 | 20.92 | 4,493 | .79 | 1.71 | |||||||||||||||||||||||||||||||||
| 12/31/2018 | 23.40 | .35 | (1.40 | ) | (1.05 | ) | (.33 | ) | (1.03 | ) | (1.36 | ) | 20.99 | (4.83 | ) | 3,594 | .78 | 1.54 | ||||||||||||||||||||||||||||||
| 12/31/2017 | 21.43 | .32 | 3.02 | 3.34 | (.31 | ) | (1.06 | ) | (1.37 | ) | 23.40 | 15.91 | 3,582 | .79 | 1.40 | |||||||||||||||||||||||||||||||||
| 12/31/2016 | 20.40 | .31 | 1.53 | 1.84 | (.30 | ) | (.51 | ) | (.81 | ) | 21.43 | 9.16 | 2,861 | .79 | 1.47 | |||||||||||||||||||||||||||||||||
| 12/31/2015 | 22.11 | .30 | (.02 | ) | .28 | (.40 | ) | (1.59 | ) | (1.99 | ) | 20.40 | 1.14 | 2,414 | .79 | 1.45 | ||||||||||||||||||||||||||||||||
See end of tables for footnotes.
| American Funds Insurance Series | 197 |
Financial highlights (continued)
| Income (loss) from investment operations1 | Dividends and distributions | |||||||||||||||||||||||||||||||||||||||||||||||
| Period ended | Net asset value, beginning of period | Net investment income (loss) | Net gains (losses) on securities (both realized and unrealized) | Total from investment operations | Dividends (from net investment income) | Distributions (from capital gains) | Total dividends and distributions | Net asset value, end of period | Total return | Net assets, end of period (in millions) | Ratio of expenses to average net assets2 | Ratio of net income (loss) to average net assets | ||||||||||||||||||||||||||||||||||||
| Global Balanced Fund | ||||||||||||||||||||||||||||||||||||||||||||||||
| Class 1: | ||||||||||||||||||||||||||||||||||||||||||||||||
| 12/31/2019 | $ | 11.67 | $ | .24 | $ | 2.17 | $ | 2.41 | $ | (.20 | ) | $ | (.37 | ) | $ | (.57 | ) | $ | 13.51 | 20.79 | % | $ | 134 | .72 | % | 1.88 | % | |||||||||||||||||||||
| 12/31/2018 | 12.75 | .23 | (.96 | ) | (.73 | ) | (.20 | ) | (.15 | ) | (.35 | ) | 11.67 | (5.81 | ) | 110 | .72 | 1.82 | ||||||||||||||||||||||||||||||
| 12/31/2017 | 11.08 | .21 | 1.99 | 2.20 | (.15 | ) | (.38 | ) | (.53 | ) | 12.75 | 19.91 | 93 | .72 | 1.68 | |||||||||||||||||||||||||||||||||
| 12/31/2016 | 10.74 | .19 | .32 | .51 | (.17 | ) | — | (.17 | ) | 11.08 | 4.73 | 64 | .72 | 1.73 | ||||||||||||||||||||||||||||||||||
| 12/31/2015 | 11.11 | .20 | (.28 | ) | (.08 | ) | (.14 | ) | (.15 | ) | (.29 | ) | 10.74 | (.69 | ) | 47 | .72 | 1.80 | ||||||||||||||||||||||||||||||
| Class 1A: | ||||||||||||||||||||||||||||||||||||||||||||||||
| 12/31/2019 | 11.65 | .21 | 2.17 | 2.38 | (.17 | ) | (.37 | ) | (.54 | ) | 13.49 | 20.54 | 2 | .97 | 1.63 | |||||||||||||||||||||||||||||||||
| 12/31/2018 | 12.74 | .18 | (.94 | ) | (.76 | ) | (.18 | ) | (.15 | ) | (.33 | ) | 11.65 | (6.03 | ) | 2 | .98 | 1.44 | ||||||||||||||||||||||||||||||
| 12/31/20173,4 | 11.18 | .16 | 1.92 | 2.08 | (.14 | ) | (.38 | ) | (.52 | ) | 12.74 | 18.71 | 5 | — | 7 | .94 | 6 | 1.27 | 6 | |||||||||||||||||||||||||||||
| Class 2: | ||||||||||||||||||||||||||||||||||||||||||||||||
| 12/31/2019 | 11.65 | .21 | 2.16 | 2.37 | (.17 | ) | (.37 | ) | (.54 | ) | 13.48 | 20.44 | 207 | .97 | 1.64 | |||||||||||||||||||||||||||||||||
| 12/31/2018 | 12.72 | .20 | (.96 | ) | (.76 | ) | (.16 | ) | (.15 | ) | (.31 | ) | 11.65 | (6.01 | ) | 185 | .97 | 1.57 | ||||||||||||||||||||||||||||||
| 12/31/2017 | 11.06 | .18 | 1.98 | 2.16 | (.12 | ) | (.38 | ) | (.50 | ) | 12.72 | 19.57 | 210 | .96 | 1.43 | |||||||||||||||||||||||||||||||||
| 12/31/2016 | 10.72 | .16 | .32 | .48 | (.14 | ) | — | (.14 | ) | 11.06 | 4.48 | 178 | .97 | 1.48 | ||||||||||||||||||||||||||||||||||
| 12/31/2015 | 11.09 | .18 | (.28 | ) | (.10 | ) | (.12 | ) | (.15 | ) | (.27 | ) | 10.72 | (.95 | ) | 171 | .97 | 1.60 | ||||||||||||||||||||||||||||||
| Class 4: | ||||||||||||||||||||||||||||||||||||||||||||||||
| 12/31/2019 | 11.55 | .18 | 2.14 | 2.32 | (.14 | ) | (.37 | ) | (.51 | ) | 13.36 | 20.21 | 94 | 1.22 | 1.37 | |||||||||||||||||||||||||||||||||
| 12/31/2018 | 12.63 | .17 | (.96 | ) | (.79 | ) | (.14 | ) | (.15 | ) | (.29 | ) | 11.55 | (6.31 | ) | 69 | 1.22 | 1.34 | ||||||||||||||||||||||||||||||
| 12/31/2017 | 11.00 | .13 | 1.99 | 2.12 | (.11 | ) | (.38 | ) | (.49 | ) | 12.63 | 19.38 | 51 | 1.22 | 1.07 | |||||||||||||||||||||||||||||||||
| 12/31/2016 | 10.69 | .12 | .33 | .45 | (.14 | ) | — | (.14 | ) | 11.00 | 4.21 | 10 | 1.24 | 1.12 | ||||||||||||||||||||||||||||||||||
| 12/31/2015 | 11.09 | .06 | (.17 | ) | (.11 | ) | (.14 | ) | (.15 | ) | (.29 | ) | 10.69 | (1.00 | ) | 1 | 1.34 | .58 | ||||||||||||||||||||||||||||||
| Bond Fund | ||||||||||||||||||||||||||||||||||||||||||||||||
| Class 1: | ||||||||||||||||||||||||||||||||||||||||||||||||
| 12/31/2019 | $ | 10.47 | $ | .30 | $ | .71 | $ | 1.01 | $ | (.31 | ) | $ | — | $ | (.31 | ) | $ | 11.17 | 9.70 | % | $ | 6,481 | .39 | % | 2.76 | % | ||||||||||||||||||||||
| 12/31/2018 | 10.82 | .29 | (.35 | ) | (.06 | ) | (.28 | ) | (.01 | ) | (.29 | ) | 10.47 | (.45 | ) | 5,962 | .38 | 2.70 | ||||||||||||||||||||||||||||||
| 12/31/2017 | 10.80 | .24 | .18 | .42 | (.24 | ) | (.16 | ) | (.40 | ) | 10.82 | 3.88 | 6,434 | .38 | 2.19 | |||||||||||||||||||||||||||||||||
| 12/31/2016 | 10.70 | .21 | .14 | .35 | (.21 | ) | (.04 | ) | (.25 | ) | 10.80 | 3.27 | 6,829 | .38 | 1.91 | |||||||||||||||||||||||||||||||||
| 12/31/2015 | 11.08 | .22 | (.17 | ) | .05 | (.21 | ) | (.22 | ) | (.43 | ) | 10.70 | .45 | 5,731 | .38 | 1.95 | ||||||||||||||||||||||||||||||||
| Class 1A: | ||||||||||||||||||||||||||||||||||||||||||||||||
| 12/31/2019 | 10.45 | .27 | .71 | .98 | (.30 | ) | — | (.30 | ) | 11.13 | 9.36 | 7 | .64 | 2.48 | ||||||||||||||||||||||||||||||||||
| 12/31/2018 | 10.80 | .26 | (.33 | ) | (.07 | ) | (.27 | ) | (.01 | ) | (.28 | ) | 10.45 | (.60 | ) | 3 | .63 | 2.50 | ||||||||||||||||||||||||||||||
| 12/31/20173,4 | 10.82 | .22 | .15 | .37 | (.23 | ) | (.16 | ) | (.39 | ) | 10.80 | 3.46 | 5 | 1 | .62 | 6 | 2.01 | 6 | ||||||||||||||||||||||||||||||
| Class 2: | ||||||||||||||||||||||||||||||||||||||||||||||||
| 12/31/2019 | 10.34 | .27 | .70 | .97 | (.29 | ) | — | (.29 | ) | 11.02 | 9.36 | 3,561 | .64 | 2.51 | ||||||||||||||||||||||||||||||||||
| 12/31/2018 | 10.69 | .26 | (.34 | ) | (.08 | ) | (.26 | ) | (.01 | ) | (.27 | ) | 10.34 | (.71 | ) | 3,524 | .63 | 2.45 | ||||||||||||||||||||||||||||||
| 12/31/2017 | 10.67 | .21 | .18 | .39 | (.21 | ) | (.16 | ) | (.37 | ) | 10.69 | 3.67 | 3,966 | .63 | 1.94 | |||||||||||||||||||||||||||||||||
| 12/31/2016 | 10.58 | .18 | .13 | .31 | (.18 | ) | (.04 | ) | (.22 | ) | 10.67 | 2.95 | 3,959 | .63 | 1.65 | |||||||||||||||||||||||||||||||||
| 12/31/2015 | 10.95 | .18 | (.15 | ) | .03 | (.18 | ) | (.22 | ) | (.40 | ) | 10.58 | .28 | 4,135 | .63 | 1.69 | ||||||||||||||||||||||||||||||||
| Class 4: | ||||||||||||||||||||||||||||||||||||||||||||||||
| 12/31/2019 | 10.33 | .24 | .70 | .94 | (.27 | ) | — | (.27 | ) | 11.00 | 9.08 | 502 | .89 | 2.25 | ||||||||||||||||||||||||||||||||||
| 12/31/2018 | 10.68 | .23 | (.33 | ) | (.10 | ) | (.24 | ) | (.01 | ) | (.25 | ) | 10.33 | (.89 | ) | 366 | .88 | 2.22 | ||||||||||||||||||||||||||||||
| 12/31/2017 | 10.70 | .19 | .16 | .35 | (.21 | ) | (.16 | ) | (.37 | ) | 10.68 | 3.29 | 297 | .88 | 1.72 | |||||||||||||||||||||||||||||||||
| 12/31/2016 | 10.61 | .15 | .15 | .30 | (.17 | ) | (.04 | ) | (.21 | ) | 10.70 | 2.80 | 102 | .88 | 1.41 | |||||||||||||||||||||||||||||||||
| 12/31/2015 | 11.01 | .16 | (.16 | ) | — | (.18 | ) | (.22 | ) | (.40 | ) | 10.61 | (.08 | ) | 59 | .88 | 1.47 | |||||||||||||||||||||||||||||||
| 198 | American Funds Insurance Series |
| Income (loss) from investment operations1 | Dividends and distributions | |||||||||||||||||||||||||||||||||||||||||||||||
| Period ended | Net asset value, beginning of period | Net investment income (loss) | Net gains (losses) on securities (both realized and unrealized) | Total from investment operations | Dividends (from net investment income) | Distributions (from capital gains) | Total dividends and distributions | Net asset value, end of period | Total return | Net assets, end of period (in millions) | Ratio of expenses to average net assets2 | Ratio of net income (loss) to average net assets | ||||||||||||||||||||||||||||||||||||
| Global Bond Fund | ||||||||||||||||||||||||||||||||||||||||||||||||
| Class 1: | ||||||||||||||||||||||||||||||||||||||||||||||||
| 12/31/2019 | $ | 11.42 | $ | .31 | $ | .61 | $ | .92 | $ | (.22 | ) | $ | — | $ | (.22 | ) | $ | 12.12 | 8.08 | % | $ | 1,077 | .58 | % | 2.60 | % | ||||||||||||||||||||||
| 12/31/2018 | 11.88 | .30 | (.44 | ) | (.14 | ) | (.28 | ) | (.04 | ) | (.32 | ) | 11.42 | (1.14 | ) | 1,015 | .57 | 2.56 | ||||||||||||||||||||||||||||||
| 12/31/2017 | 11.22 | .28 | .52 | .80 | (.07 | ) | (.07 | ) | (.14 | ) | 11.88 | 7.11 | 1,273 | .56 | 2.37 | |||||||||||||||||||||||||||||||||
| 12/31/2016 | 11.01 | .26 | .06 | .32 | (.09 | ) | (.02 | ) | (.11 | ) | 11.22 | 2.92 | 1,115 | .57 | 2.26 | |||||||||||||||||||||||||||||||||
| 12/31/2015 | 11.77 | .27 | (.71 | ) | (.44 | ) | (.01 | ) | (.31 | ) | (.32 | ) | 11.01 | (3.75 | ) | 1,032 | .57 | 2.34 | ||||||||||||||||||||||||||||||
| Class 1A: | ||||||||||||||||||||||||||||||||||||||||||||||||
| 12/31/2019 | 11.41 | .28 | .60 | .88 | (.19 | ) | — | (.19 | ) | 12.10 | 7.75 | 1 | .83 | 2.35 | ||||||||||||||||||||||||||||||||||
| 12/31/2018 | 11.87 | .27 | (.43 | ) | (.16 | ) | (.26 | ) | (.04 | ) | (.30 | ) | 11.41 | (1.29 | ) | 1 | .82 | 2.36 | ||||||||||||||||||||||||||||||
| 12/31/20173,4 | 11.22 | .26 | .52 | .78 | (.06 | ) | (.07 | ) | (.13 | ) | 11.87 | 7.00 | 5 | — | 7 | .72 | 6 | 2.27 | 6 | |||||||||||||||||||||||||||||
| Class 2: | ||||||||||||||||||||||||||||||||||||||||||||||||
| 12/31/2019 | 11.34 | .28 | .60 | .88 | (.19 | ) | — | (.19 | ) | 12.03 | 7.77 | 1,002 | .83 | 2.35 | ||||||||||||||||||||||||||||||||||
| 12/31/2018 | 11.79 | .27 | (.43 | ) | (.16 | ) | (.25 | ) | (.04 | ) | (.29 | ) | 11.34 | (1.33 | ) | 1,032 | .82 | 2.32 | ||||||||||||||||||||||||||||||
| 12/31/2017 | 11.14 | .25 | .51 | .76 | (.04 | ) | (.07 | ) | (.11 | ) | 11.79 | 6.86 | 1,164 | .81 | 2.12 | |||||||||||||||||||||||||||||||||
| 12/31/2016 | 10.93 | .23 | .07 | .30 | (.07 | ) | (.02 | ) | (.09 | ) | 11.14 | 2.71 | 1,121 | .82 | 2.01 | |||||||||||||||||||||||||||||||||
| 12/31/2015 | 11.72 | .24 | (.71 | ) | (.47 | ) | (.01 | ) | (.31 | ) | (.32 | ) | 10.93 | (4.07 | ) | 1,208 | .82 | 2.09 | ||||||||||||||||||||||||||||||
| Class 4: | ||||||||||||||||||||||||||||||||||||||||||||||||
| 12/31/2019 | 11.24 | .24 | .60 | .84 | (.16 | ) | — | (.16 | ) | 11.92 | 7.54 | 49 | 1.08 | 2.09 | ||||||||||||||||||||||||||||||||||
| 12/31/2018 | 11.70 | .24 | (.43 | ) | (.19 | ) | (.23 | ) | (.04 | ) | (.27 | ) | 11.24 | (1.61 | ) | 40 | 1.07 | 2.09 | ||||||||||||||||||||||||||||||
| 12/31/2017 | 11.08 | .22 | .51 | .73 | (.04 | ) | (.07 | ) | (.11 | ) | 11.70 | 6.63 | 31 | 1.06 | 1.89 | |||||||||||||||||||||||||||||||||
| 12/31/2016 | 10.89 | .20 | .06 | .26 | (.05 | ) | (.02 | ) | (.07 | ) | 11.08 | 2.42 | 12 | 1.07 | 1.76 | |||||||||||||||||||||||||||||||||
| 12/31/2015 | 11.70 | .21 | (.71 | ) | (.50 | ) | — | 8 | (.31 | ) | (.31 | ) | 10.89 | (4.27 | ) | 6 | 1.07 | 1.86 | ||||||||||||||||||||||||||||||
| High-Income Bond Fund | ||||||||||||||||||||||||||||||||||||||||||||||||
| Class 1: | ||||||||||||||||||||||||||||||||||||||||||||||||
| 12/31/2019 | $ | 9.34 | $ | .67 | $ | .52 | $ | 1.19 | $ | (.66 | ) | $ | — | $ | (.66 | ) | $ | 9.87 | 12.85 | % | $ | 525 | .51 | % | 6.71 | % | ||||||||||||||||||||||
| 12/31/2018 | 10.19 | .64 | (.84 | ) | (.20 | ) | (.65 | ) | — | (.65 | ) | 9.34 | (2.15 | ) | 501 | .50 | 6.32 | |||||||||||||||||||||||||||||||
| 12/31/2017 | 10.18 | .63 | .10 | .73 | (.72 | ) | — | (.72 | ) | 10.19 | 7.25 | 632 | .49 | 5.98 | ||||||||||||||||||||||||||||||||||
| 12/31/2016 | 9.19 | .61 | 1.02 | 1.63 | (.64 | ) | — | (.64 | ) | 10.18 | 17.83 | 949 | .49 | 6.18 | ||||||||||||||||||||||||||||||||||
| 12/31/2015 | 10.54 | .64 | (1.36 | ) | (.72 | ) | (.63 | ) | — | (.63 | ) | 9.19 | (6.94 | ) | 1,017 | .48 | 6.12 | |||||||||||||||||||||||||||||||
| Class 1A: | ||||||||||||||||||||||||||||||||||||||||||||||||
| 12/31/2019 | 9.33 | .65 | .51 | 1.16 | (.63 | ) | — | (.63 | ) | 9.86 | 12.61 | 1 | .75 | 6.47 | ||||||||||||||||||||||||||||||||||
| 12/31/2018 | 10.18 | .62 | (.84 | ) | (.22 | ) | (.63 | ) | — | (.63 | ) | 9.33 | (2.35 | ) | 1 | .75 | 6.11 | |||||||||||||||||||||||||||||||
| 12/31/20173,4 | 10.28 | .60 | .02 | .62 | (.72 | ) | — | (.72 | ) | 10.18 | 6.02 | 5 | — | 7 | .72 | 6 | 5.74 | 6 | ||||||||||||||||||||||||||||||
| Class 2: | ||||||||||||||||||||||||||||||||||||||||||||||||
| 12/31/2019 | 9.19 | .64 | .50 | 1.14 | (.63 | ) | — | (.63 | ) | 9.70 | 12.55 | 667 | .76 | 6.45 | ||||||||||||||||||||||||||||||||||
| 12/31/2018 | 10.03 | .61 | (.83 | ) | (.22 | ) | (.62 | ) | — | (.62 | ) | 9.19 | (2.34 | ) | 661 | .75 | 6.07 | |||||||||||||||||||||||||||||||
| 12/31/2017 | 10.04 | .59 | .10 | .69 | (.70 | ) | — | (.70 | ) | 10.03 | 6.89 | 776 | .74 | 5.72 | ||||||||||||||||||||||||||||||||||
| 12/31/2016 | 9.06 | .58 | 1.01 | 1.59 | (.61 | ) | — | (.61 | ) | 10.04 | 17.69 | 799 | .74 | 5.92 | ||||||||||||||||||||||||||||||||||
| 12/31/2015 | 10.41 | .60 | (1.35 | ) | (.75 | ) | (.60 | ) | — | (.60 | ) | 9.06 | (7.30 | ) | 765 | .73 | 5.85 | |||||||||||||||||||||||||||||||
| Class 3: | ||||||||||||||||||||||||||||||||||||||||||||||||
| 12/31/2019 | 9.38 | .66 | .52 | 1.18 | (.64 | ) | — | (.64 | ) | 9.92 | 12.70 | 10 | .69 | 6.52 | ||||||||||||||||||||||||||||||||||
| 12/31/2018 | 10.23 | .63 | (.85 | ) | (.22 | ) | (.63 | ) | — | (.63 | ) | 9.38 | (2.33 | ) | 10 | .68 | 6.14 | |||||||||||||||||||||||||||||||
| 12/31/2017 | 10.22 | .61 | .10 | .71 | (.70 | ) | — | (.70 | ) | 10.23 | 7.02 | 12 | .67 | 5.79 | ||||||||||||||||||||||||||||||||||
| 12/31/2016 | 9.22 | .59 | 1.03 | 1.62 | (.62 | ) | — | (.62 | ) | 10.22 | 17.68 | 13 | .67 | 5.99 | ||||||||||||||||||||||||||||||||||
| 12/31/2015 | 10.57 | .62 | (1.37 | ) | (.75 | ) | (.60 | ) | — | (.60 | ) | 9.22 | (7.13 | ) | 12 | .66 | 5.91 | |||||||||||||||||||||||||||||||
| Class 4: | ||||||||||||||||||||||||||||||||||||||||||||||||
| 12/31/2019 | 9.96 | .67 | .54 | 1.21 | (.61 | ) | — | (.61 | ) | 10.56 | 12.27 | 63 | 1.01 | 6.21 | ||||||||||||||||||||||||||||||||||
| 12/31/2018 | 10.82 | .63 | (.90 | ) | (.27 | ) | (.59 | ) | — | (.59 | ) | 9.96 | (2.64 | ) | 31 | 1.00 | 5.83 | |||||||||||||||||||||||||||||||
| 12/31/2017 | 10.79 | .61 | .10 | .71 | (.68 | ) | — | (.68 | ) | 10.82 | 6.63 | 34 | .99 | 5.46 | ||||||||||||||||||||||||||||||||||
| 12/31/2016 | 9.73 | .60 | 1.07 | 1.67 | (.61 | ) | — | (.61 | ) | 10.79 | 17.29 | 21 | .99 | 5.55 | ||||||||||||||||||||||||||||||||||
| 12/31/2015 | 11.05 | .62 | (1.43 | ) | (.81 | ) | (.51 | ) | — | (.51 | ) | 9.73 | (7.42 | ) | 1 | .98 | 5.51 | |||||||||||||||||||||||||||||||
See end of tables for footnotes.
| American Funds Insurance Series | 199 |
Financial highlights(continued)
| Income (loss) from investment operations1 | Dividends and distributions | |||||||||||||||||||||||||||||||||||||||||||||||
| Period ended | Net asset value, beginning of period | Net investment income (loss) | Net gains (losses) on securities (both realized and unrealized) | Total from investment operations | Dividends (from net investment income) | Distributions (from capital gains) | Total dividends and distributions | Net asset value, end of period | Total return | Net assets, end of period (in millions) | Ratio of expenses to average net assets2 | Ratio of net income (loss) to average net assets | ||||||||||||||||||||||||||||||||||||
| Mortgage Fund | ||||||||||||||||||||||||||||||||||||||||||||||||
| Class 1: | ||||||||||||||||||||||||||||||||||||||||||||||||
| 12/31/2019 | $ | 10.30 | $ | .24 | $ | .30 | $ | .54 | $ | (.28 | ) | $ | — | $ | (.28 | ) | $ | 10.56 | 5.30 | % | $ | 210 | .47 | % | 2.26 | % | ||||||||||||||||||||||
| 12/31/2018 | 10.47 | .20 | (.14 | ) | .06 | (.23 | ) | — | (.23 | ) | 10.30 | .58 | 209 | .48 | 1.97 | |||||||||||||||||||||||||||||||||
| 12/31/2017 | 10.56 | .16 | — | 8 | .16 | (.18 | ) | (.07 | ) | (.25 | ) | 10.47 | 1.47 | 265 | .47 | 1.52 | ||||||||||||||||||||||||||||||||
| 12/31/2016 | 10.61 | .15 | .11 | .26 | (.20 | ) | (.11 | ) | (.31 | ) | 10.56 | 2.50 | 269 | .46 | 1.39 | |||||||||||||||||||||||||||||||||
| 12/31/2015 | 10.70 | .10 | .13 | .23 | (.18 | ) | (.14 | ) | (.32 | ) | 10.61 | 2.09 | 272 | .45 | .89 | |||||||||||||||||||||||||||||||||
| Class 1A: | ||||||||||||||||||||||||||||||||||||||||||||||||
| 12/31/2019 | 10.28 | .22 | .30 | .52 | (.25 | ) | — | (.25 | ) | 10.55 | 5.09 | 1 | .71 | 2.04 | ||||||||||||||||||||||||||||||||||
| 12/31/2018 | 10.46 | .18 | (.14 | ) | .04 | (.22 | ) | — | (.22 | ) | 10.28 | .36 | 1 | .73 | 1.77 | |||||||||||||||||||||||||||||||||
| 12/31/20173,4 | 10.55 | .14 | — | 8 | .14 | (.16 | ) | (.07 | ) | (.23 | ) | 10.46 | 1.31 | 5 | — | 7 | .70 | 6 | 1.38 | 6 | ||||||||||||||||||||||||||||
| Class 2: | ||||||||||||||||||||||||||||||||||||||||||||||||
| 12/31/2019 | 10.28 | .21 | .31 | .52 | (.26 | ) | — | (.26 | ) | 10.54 | 5.04 | 56 | .72 | 2.01 | ||||||||||||||||||||||||||||||||||
| 12/31/2018 | 10.45 | .18 | (.15 | ) | .03 | (.20 | ) | — | (.20 | ) | 10.28 | .32 | 57 | .73 | 1.72 | |||||||||||||||||||||||||||||||||
| 12/31/2017 | 10.54 | .14 | (.01 | ) | .13 | (.15 | ) | (.07 | ) | (.22 | ) | 10.45 | 1.22 | 63 | .72 | 1.27 | ||||||||||||||||||||||||||||||||
| 12/31/2016 | 10.59 | .12 | .12 | .24 | (.18 | ) | (.11 | ) | (.29 | ) | 10.54 | 2.25 | 63 | .71 | 1.14 | |||||||||||||||||||||||||||||||||
| 12/31/2015 | 10.68 | .07 | .13 | .20 | (.15 | ) | (.14 | ) | (.29 | ) | 10.59 | 1.86 | 59 | .70 | .65 | |||||||||||||||||||||||||||||||||
| Class 4: | ||||||||||||||||||||||||||||||||||||||||||||||||
| 12/31/2019 | 10.19 | .18 | .31 | .49 | (.24 | ) | — | (.24 | ) | 10.44 | 4.80 | 28 | .97 | 1.71 | ||||||||||||||||||||||||||||||||||
| 12/31/2018 | 10.38 | .15 | (.15 | ) | — | 8 | (.19 | ) | — | (.19 | ) | 10.19 | .07 | 24 | .98 | 1.49 | ||||||||||||||||||||||||||||||||
| 12/31/2017 | 10.48 | .11 | — | 8 | .11 | (.14 | ) | (.07 | ) | (.21 | ) | 10.38 | .97 | 12 | .97 | 1.03 | ||||||||||||||||||||||||||||||||
| 12/31/2016 | 10.52 | .09 | .12 | .21 | (.14 | ) | (.11 | ) | (.25 | ) | 10.48 | 2.01 | 8 | .96 | .86 | |||||||||||||||||||||||||||||||||
| 12/31/2015 | 10.65 | .04 | .14 | .18 | (.17 | ) | (.14 | ) | (.31 | ) | 10.52 | 1.62 | 11 | .97 | .37 | |||||||||||||||||||||||||||||||||
| Ultra-Short Bond Fund | ||||||||||||||||||||||||||||||||||||||||||||||||
| �� | ||||||||||||||||||||||||||||||||||||||||||||||||
| Class 1: | ||||||||||||||||||||||||||||||||||||||||||||||||
| 12/31/2019 | $ | 11.31 | $ | .22 | $ | — | 8 | $ | .22 | $ | (.23 | ) | $ | — | $ | (.23 | ) | $ | 11.30 | 1.92 | % | $ | 30 | .36 | % | 1.92 | % | |||||||||||||||||||||
| 12/31/2018 | 11.29 | .18 | — | 8 | .18 | (.16 | ) | — | (.16 | ) | 11.31 | 1.58 | 37 | .35 | 1.60 | |||||||||||||||||||||||||||||||||
| 12/31/2017 | 11.27 | .08 | (.01 | ) | .07 | (.05 | ) | — | (.05 | ) | 11.29 | .66 | 37 | .35 | .68 | |||||||||||||||||||||||||||||||||
| 12/31/201611 | 11.26 | .01 | — | 8 | .01 | — | — | — | 11.27 | .09 | 37 | .35 | .11 | |||||||||||||||||||||||||||||||||||
| 12/31/2015 | 11.28 | (.03 | ) | .01 | (.02 | ) | — | — | — | 11.26 | (.18 | ) | 39 | .34 | (.24 | ) | ||||||||||||||||||||||||||||||||
| Class 1A: | ||||||||||||||||||||||||||||||||||||||||||||||||
| 12/31/2019 | 11.31 | .22 | — | 8 | .22 | (.23 | ) | — | (.23 | ) | 11.30 | 1.92 | 10 | — | 7 | .37 | 10 | 1.90 | 10 | |||||||||||||||||||||||||||||
| 12/31/2018 | 11.29 | .18 | — | 8 | .18 | (.16 | ) | — | (.16 | ) | 11.31 | 1.58 | 10 | — | 7 | .35 | 10 | 1.60 | 10 | |||||||||||||||||||||||||||||
| 12/31/20173,4 | 11.27 | .08 | — | 8 | .08 | (.06 | ) | — | (.06 | ) | 11.29 | .67 | 5,10 | — | 7 | .34 | 6,10 | .69 | 6,10 | |||||||||||||||||||||||||||||
| Class 2: | ||||||||||||||||||||||||||||||||||||||||||||||||
| 12/31/2019 | 11.03 | .18 | — | 8 | .18 | (.20 | ) | — | (.20 | ) | 11.01 | 1.62 | 230 | .61 | 1.66 | |||||||||||||||||||||||||||||||||
| 12/31/2018 | 11.01 | .15 | — | 8 | .15 | (.13 | ) | — | (.13 | ) | 11.03 | 1.36 | 247 | .60 | 1.34 | |||||||||||||||||||||||||||||||||
| 12/31/2017 | 10.99 | .05 | — | 8 | .05 | (.03 | ) | — | (.03 | ) | 11.01 | .46 | 249 | .60 | .42 | |||||||||||||||||||||||||||||||||
| 12/31/201611 | 11.01 | (.02 | ) | — | 8 | (.02 | ) | — | — | — | 10.99 | (.18 | ) | 297 | .60 | (.14 | ) | |||||||||||||||||||||||||||||||
| 12/31/2015 | 11.06 | (.05 | ) | — | 8 | (.05 | ) | — | — | — | 11.01 | (.45 | ) | 302 | .59 | (.49 | ) | |||||||||||||||||||||||||||||||
| Class 3: | ||||||||||||||||||||||||||||||||||||||||||||||||
| 12/31/2019 | 11.14 | .20 | — | 8 | .20 | (.21 | ) | — | (.21 | ) | 11.13 | 1.76 | 3 | .54 | 1.74 | |||||||||||||||||||||||||||||||||
| 12/31/2018 | 11.12 | .16 | (.01 | ) | .15 | (.13 | ) | — | (.13 | ) | 11.14 | 1.38 | 4 | .53 | 1.42 | |||||||||||||||||||||||||||||||||
| 12/31/2017 | 11.10 | .06 | — | 8 | .06 | (.04 | ) | — | (.04 | ) | 11.12 | .54 | 4 | .53 | .50 | |||||||||||||||||||||||||||||||||
| 12/31/201611 | 11.11 | (.01 | ) | — | 8 | (.01 | ) | — | — | — | 11.10 | (.09 | ) | 4 | .53 | (.08 | ) | |||||||||||||||||||||||||||||||
| 12/31/2015 | 11.16 | (.05 | ) | — | 8 | (.05 | ) | — | — | — | 11.11 | (.45 | ) | 6 | .52 | (.42 | ) | |||||||||||||||||||||||||||||||
| Class 4: | ||||||||||||||||||||||||||||||||||||||||||||||||
| 12/31/2019 | 11.15 | .16 | — | 8 | .16 | (.18 | ) | — | (.18 | ) | 11.13 | 1.40 | 22 | .86 | 1.40 | |||||||||||||||||||||||||||||||||
| 12/31/2018 | 11.13 | .12 | .01 | .13 | (.11 | ) | — | (.11 | ) | 11.15 | 1.14 | 18 | .86 | 1.11 | ||||||||||||||||||||||||||||||||||
| 12/31/2017 | 11.12 | .02 | — | 8 | .02 | (.01 | ) | — | (.01 | ) | 11.13 | .16 | 15 | .85 | .19 | |||||||||||||||||||||||||||||||||
| 12/31/201611 | 11.17 | (.04 | ) | (.01 | ) | (.05 | ) | — | — | — | 11.12 | (.45 | ) | 13 | .85 | (.40 | ) | |||||||||||||||||||||||||||||||
| 12/31/2015 | 11.25 | (.08 | ) | — | 8 | (.08 | ) | — | — | — | 11.17 | (.71 | ) | 16 | .85 | (.74 | ) | |||||||||||||||||||||||||||||||
| 200 | American Funds Insurance Series |
| Income (loss) from investment operations1 | Dividends and distributions | |||||||||||||||||||||||||||||||||||||||||||||||
| Period ended | Net asset value, beginning of period | Net investment income (loss) | Net gains (losses) on securities (both realized and unrealized) | Total from investment operations | Dividends (from net investment income) | Distributions (from capital gains) | Total dividends and distributions | Net asset value, end of period | Total return | Net assets, end of period (in millions) | Ratio of expenses to average net assets2 | Ratio of net income (loss) to average net assets | ||||||||||||||||||||||||||||||||||||
| U.S. Government/AAA-Rated Securities Fund | ||||||||||||||||||||||||||||||||||||||||||||||||
| Class 1: | ||||||||||||||||||||||||||||||||||||||||||||||||
| 12/31/2019 | $ | 11.94 | $ | .25 | $ | .43 | $ | .68 | $ | (.28 | ) | $ | — | $ | (.28 | ) | $ | 12.34 | 5.69 | % | $ | 1,418 | .37 | % | 2.07 | % | ||||||||||||||||||||||
| 12/31/2018 | 12.08 | .24 | (.13 | ) | .11 | (.25 | ) | — | (.25 | ) | 11.94 | .91 | 1,445 | .36 | 2.02 | |||||||||||||||||||||||||||||||||
| 12/31/2017 | 12.05 | .21 | .01 | .22 | (.19 | ) | — | (.19 | ) | 12.08 | 1.83 | 1,558 | .36 | 1.68 | ||||||||||||||||||||||||||||||||||
| 12/31/2016 | 12.31 | .16 | .03 | .19 | (.20 | ) | (.25 | ) | (.45 | ) | 12.05 | 1.44 | 1,467 | .36 | 1.31 | |||||||||||||||||||||||||||||||||
| 12/31/2015 | 12.40 | .13 | .09 | .22 | (.21 | ) | (.10 | ) | (.31 | ) | 12.31 | 1.93 | 1,426 | .35 | 1.02 | |||||||||||||||||||||||||||||||||
| Class 1A: | ||||||||||||||||||||||||||||||||||||||||||||||||
| 12/31/2019 | 11.93 | .22 | .43 | .65 | (.26 | ) | — | (.26 | ) | 12.32 | 5.42 | 2 | .62 | 1.82 | ||||||||||||||||||||||||||||||||||
| 12/31/2018 | 12.08 | .22 | (.14 | ) | .08 | (.23 | ) | — | (.23 | ) | 11.93 | .70 | 1 | .61 | 1.82 | |||||||||||||||||||||||||||||||||
| 12/31/20173,4 | 12.05 | .18 | .03 | .21 | (.18 | ) | — | (.18 | ) | 12.08 | 1.73 | 5 | — | 7 | .58 | 6 | 1.53 | 6 | ||||||||||||||||||||||||||||||
| Class 2: | ||||||||||||||||||||||||||||||||||||||||||||||||
| 12/31/2019 | 11.82 | .22 | .42 | .64 | (.25 | ) | — | (.25 | ) | 12.21 | 5.31 | 1,343 | .62 | 1.82 | ||||||||||||||||||||||||||||||||||
| 12/31/2018 | 11.96 | .21 | (.14 | ) | .07 | (.21 | ) | — | (.21 | ) | 11.82 | .73 | 1,323 | .61 | 1.77 | |||||||||||||||||||||||||||||||||
| 12/31/2017 | 11.93 | .17 | .02 | .19 | (.16 | ) | — | (.16 | ) | 11.96 | 1.59 | 1,473 | .61 | 1.43 | ||||||||||||||||||||||||||||||||||
| 12/31/2016 | 12.20 | .13 | .02 | .15 | (.17 | ) | (.25 | ) | (.42 | ) | 11.93 | 1.19 | 1,503 | .61 | 1.05 | |||||||||||||||||||||||||||||||||
| 12/31/2015 | 12.29 | .10 | .09 | .19 | (.18 | ) | (.10 | ) | (.28 | ) | 12.20 | 1.59 | 1,579 | .60 | .79 | |||||||||||||||||||||||||||||||||
| Class 3: | ||||||||||||||||||||||||||||||||||||||||||||||||
| 12/31/2019 | 11.97 | .23 | .43 | .66 | (.26 | ) | — | (.26 | ) | 12.37 | 5.49 | 9 | .55 | 1.88 | ||||||||||||||||||||||||||||||||||
| 12/31/2018 | 12.11 | .22 | (.14 | ) | .08 | (.22 | ) | — | (.22 | ) | 11.97 | .71 | 9 | .54 | 1.84 | |||||||||||||||||||||||||||||||||
| 12/31/2017 | 12.07 | .18 | .03 | .21 | (.17 | ) | — | (.17 | ) | 12.11 | 1.72 | 10 | .54 | 1.50 | ||||||||||||||||||||||||||||||||||
| 12/31/2016 | 12.34 | .14 | .02 | .16 | (.18 | ) | (.25 | ) | (.43 | ) | 12.07 | 1.24 | 11 | .54 | 1.12 | |||||||||||||||||||||||||||||||||
| 12/31/2015 | 12.43 | .11 | .09 | .20 | (.19 | ) | (.10 | ) | (.29 | ) | 12.34 | 1.64 | 11 | .53 | .85 | |||||||||||||||||||||||||||||||||
| Class 4: | ||||||||||||||||||||||||||||||||||||||||||||||||
| 12/31/2019 | 11.84 | .19 | .42 | .61 | (.23 | ) | — | (.23 | ) | 12.22 | 5.14 | 124 | .87 | 1.56 | ||||||||||||||||||||||||||||||||||
| 12/31/2018 | 11.98 | .18 | (.12 | ) | .06 | (.20 | ) | — | (.20 | ) | 11.84 | .50 | 91 | .86 | 1.53 | |||||||||||||||||||||||||||||||||
| 12/31/2017 | 11.96 | .14 | .01 | .15 | (.13 | ) | — | (.13 | ) | 11.98 | 1.28 | 62 | .86 | 1.18 | ||||||||||||||||||||||||||||||||||
| 12/31/2016 | 12.22 | .10 | .03 | .13 | (.14 | ) | (.25 | ) | (.39 | ) | 11.96 | .99 | 57 | .86 | .82 | |||||||||||||||||||||||||||||||||
| 12/31/2015 | 12.34 | .07 | .08 | .15 | (.17 | ) | (.10 | ) | (.27 | ) | 12.22 | 1.29 | 46 | .85 | .56 | |||||||||||||||||||||||||||||||||
See end of tables for footnotes.
| American Funds Insurance Series | 201 |
Financial highlights(continued)
| Income from investment operations1 | Dividends and distributions | Ratio of expenses | Ratio of expenses | |||||||||||||||||||||||||||||||||||||||||||||||||||||
| Period ended | Net asset value, beginning of period | Net investment income (loss) | Net gains (losses) on securities (both realized and unrealized) | Total from investment operations | Dividends (from net investment income) | Distribu- tions (from capital gains) | Total dividends and distribu- tions | Net asset value, end of period | Total return12 | Net assets, end of period (in millions) | to average net assets before waivers/ reimburse- ments | to average net assets after waivers/ reimburse- ments12 | Net effective expense ratio12,13 | Ratio of net income to average net assets12 | ||||||||||||||||||||||||||||||||||||||||||
| Managed Risk Growth Fund | ||||||||||||||||||||||||||||||||||||||||||||||||||||||||
| Class P1: | ||||||||||||||||||||||||||||||||||||||||||||||||||||||||
| 12/31/2019 | $ | 12.30 | $ | .15 | $ | 2.44 | $ | 2.59 | $ | (.19 | ) | $ | (.92 | ) | $ | (1.11 | ) | $ | 13.78 | 22.01 | % | $ | 6 | .42 | % | .37 | % | .73 | % | 1.19 | % | |||||||||||||||||||||||||
| 12/31/2018 | 13.22 | .11 | (.04 | ) | .07 | (.10 | ) | (.89 | ) | (.99 | ) | 12.30 | (.04 | )10 | 3 | .42 | 10 | .37 | 10 | .71 | 10 | .82 | 10 | |||||||||||||||||||||||||||||||||
| 12/31/2017 | 10.71 | .08 | 2.70 | 2.78 | (.07 | ) | (.20 | ) | (.27 | ) | 13.22 | 26.23 | 10 | 2 | .42 | 10 | .36 | 10 | .70 | 10 | .69 | 10 | ||||||||||||||||||||||||||||||||||
| 12/31/2016 | 11.49 | .08 | .20 | .28 | (.05 | ) | (1.01 | ) | (1.06 | ) | 10.71 | 2.89 | 10 | 1 | .50 | 10 | .34 | 10 | .68 | 10 | .79 | 10 | ||||||||||||||||||||||||||||||||||
| 12/31/2015 | 11.37 | .09 | .03 | .12 | — | — | — | 11.49 | 1.06 | 10 | — | 7 | .53 | 10 | .29 | 10 | .63 | 10 | .80 | 10 | ||||||||||||||||||||||||||||||||||||
| Class P2: | ||||||||||||||||||||||||||||||||||||||||||||||||||||||||
| 12/31/2019 | 12.21 | .09 | 2.45 | 2.54 | (.12 | ) | (.92 | ) | (1.04 | ) | 13.71 | 21.74 | 434 | .68 | .63 | .99 | .73 | |||||||||||||||||||||||||||||||||||||||
| 12/31/2018 | 13.14 | .06 | (.04 | ) | .02 | (.06 | ) | (.89 | ) | (.95 | ) | 12.21 | (.37 | ) | 340 | .68 | .63 | .97 | .46 | |||||||||||||||||||||||||||||||||||||
| 12/31/2017 | 10.64 | .04 | 2.70 | 2.74 | (.04 | ) | (.20 | ) | (.24 | ) | 13.14 | 25.99 | 286 | .69 | .63 | .97 | .34 | |||||||||||||||||||||||||||||||||||||||
| 12/31/2016 | 11.43 | .05 | .19 | .24 | (.02 | ) | (1.01 | ) | (1.03 | ) | 10.64 | 2.52 | 200 | .79 | .63 | .97 | .43 | |||||||||||||||||||||||||||||||||||||||
| 12/31/2015 | 11.35 | .04 | .04 | .08 | — | — | — | 11.43 | .71 | 146 | .89 | .66 | 1.00 | .31 | ||||||||||||||||||||||||||||||||||||||||||
| Managed Risk International Fund | ||||||||||||||||||||||||||||||||||||||||||||||||||||||||
| Class P1: | ||||||||||||||||||||||||||||||||||||||||||||||||||||||||
| 12/31/2019 | $ | 9.82 | $ | .17 | $ | 1.54 | $ | 1.71 | $ | (.20 | ) | $ | (.32 | ) | $ | (.52 | ) | $ | 11.01 | 17.91 | %10 | $ | 1 | .41 | %10 | .33 | %10 | .84 | %10 | 1.64 | %10 | |||||||||||||||||||||||||
| 12/31/2018 | 11.25 | .32 | (1.44 | ) | (1.12 | ) | (.26 | ) | (.05 | ) | (.31 | ) | 9.82 | (10.11 | )10 | — | 7 | .33 | 10 | .28 | 10 | .77 | 10 | 3.02 | 10 | |||||||||||||||||||||||||||||||
| 12/31/2017 | 8.89 | .11 | 2.47 | 2.58 | (.10 | ) | (.12 | ) | (.22 | ) | 11.25 | 29.28 | 10 | — | 7 | .28 | 10 | .20 | 10 | .69 | 10 | 1.13 | 10 | |||||||||||||||||||||||||||||||||
| 12/31/2016 | 9.48 | .10 | (.35 | ) | (.25 | ) | (.12 | ) | (.22 | ) | (.34 | ) | 8.89 | (2.59 | )10 | — | 7 | .39 | 10 | .23 | 10 | .74 | 10 | 1.15 | 10 | |||||||||||||||||||||||||||||||
| 12/31/2015 | 10.10 | .18 | (.80 | ) | (.62 | ) | — | 8 | — | — | 8 | 9.48 | (6.12 | )10 | — | 7 | .45 | 10 | .21 | 10 | .72 | 10 | 1.75 | 10 | ||||||||||||||||||||||||||||||||
| Class P2: | ||||||||||||||||||||||||||||||||||||||||||||||||||||||||
| 12/31/2019 | 9.76 | .13 | 1.55 | 1.68 | (.20 | ) | (.32 | ) | (.52 | ) | 10.92 | 17.64 | 165 | .71 | .63 | 1.14 | 1.21 | |||||||||||||||||||||||||||||||||||||||
| 12/31/2018 | 11.15 | .16 | (1.32 | ) | (1.16 | ) | (.18 | ) | (.05 | ) | (.23 | ) | 9.76 | (10.50 | ) | 151 | .69 | .64 | 1.13 | 1.49 | ||||||||||||||||||||||||||||||||||||
| 12/31/2017 | 8.83 | .11 | 2.41 | 2.52 | (.08 | ) | (.12 | ) | (.20 | ) | 11.15 | 28.69 | 148 | .71 | .63 | 1.12 | 1.03 | |||||||||||||||||||||||||||||||||||||||
| 12/31/2016 | 9.43 | .09 | (.38 | ) | (.29 | ) | (.09 | ) | (.22 | ) | (.31 | ) | 8.83 | (3.05 | ) | 97 | .79 | .63 | 1.14 | .97 | ||||||||||||||||||||||||||||||||||||
| 12/31/2015 | 10.09 | .13 | (.79 | ) | (.66 | ) | — | 8 | — | — | 8 | 9.43 | (6.52 | ) | 83 | .90 | .66 | 1.17 | 1.30 | |||||||||||||||||||||||||||||||||||||
| Managed Risk Blue Chip Income and Growth Fund | ||||||||||||||||||||||||||||||||||||||||||||||||||||||||
| Class P1: | ||||||||||||||||||||||||||||||||||||||||||||||||||||||||
| 12/31/2019 | $ | 11.28 | $ | .25 | $ | 1.28 | $ | 1.53 | $ | (.20 | ) | $ | (.60 | ) | $ | (.80 | ) | $ | 12.01 | 14.14 | %10 | $ | 1 | .38 | %10 | .33 | %10 | .74 | %10 | 2.14 | %10 | |||||||||||||||||||||||||
| 12/31/2018 | 13.04 | .40 | (1.27 | ) | (.87 | ) | (.45 | ) | (.44 | ) | (.89 | ) | 11.28 | (6.99 | )10 | — | 7 | .33 | 10 | .28 | 10 | .67 | 10 | 3.21 | 10 | |||||||||||||||||||||||||||||||
| 12/31/2017 | 11.67 | .19 | 1.59 | 1.78 | (.22 | ) | (.19 | ) | (.41 | ) | 13.04 | 15.48 | 10 | — | 7 | .30 | 10 | .25 | 10 | .64 | 10 | 1.59 | 10 | |||||||||||||||||||||||||||||||||
| 12/31/2016 | 10.80 | .20 | 1.25 | 1.45 | (.21 | ) | (.37 | ) | (.58 | ) | 11.67 | 13.77 | 10 | — | 7 | .43 | 10 | .27 | 10 | .67 | 10 | 1.83 | 10 | |||||||||||||||||||||||||||||||||
| 12/31/2015 | 11.70 | .19 | (1.02 | ) | (.83 | ) | (.07 | ) | — | (.07 | ) | 10.80 | (7.07 | )10 | — | 7 | .50 | 10 | .27 | 10 | .66 | 10 | 1.64 | 10 | ||||||||||||||||||||||||||||||||
| Class P2: | ||||||||||||||||||||||||||||||||||||||||||||||||||||||||
| 12/31/2019 | 11.21 | .18 | 1.31 | 1.49 | (.19 | ) | (.60 | ) | (.79 | ) | 11.91 | 13.88 | 365 | .68 | .63 | 1.04 | 1.62 | |||||||||||||||||||||||||||||||||||||||
| 12/31/2018 | 12.96 | .19 | (1.10 | ) | (.91 | ) | (.40 | ) | (.44 | ) | (.84 | ) | 11.21 | (7.38 | ) | 336 | .68 | .63 | 1.02 | 1.49 | ||||||||||||||||||||||||||||||||||||
| 12/31/2017 | 11.61 | .17 | 1.55 | 1.72 | (.18 | ) | (.19 | ) | (.37 | ) | 12.96 | 15.03 | 367 | .68 | .63 | 1.02 | 1.43 | |||||||||||||||||||||||||||||||||||||||
| 12/31/2016 | 10.76 | .23 | 1.18 | 1.41 | (.19 | ) | (.37 | ) | (.56 | ) | 11.61 | 13.39 | 291 | .79 | .63 | 1.03 | 2.04 | |||||||||||||||||||||||||||||||||||||||
| 12/31/2015 | 11.67 | .18 | (1.05 | ) | (.87 | ) | (.04 | ) | — | (.04 | ) | 10.76 | (7.43 | ) | 137 | .89 | .66 | 1.05 | 1.57 | |||||||||||||||||||||||||||||||||||||
| Managed Risk Growth-Income Fund | ||||||||||||||||||||||||||||||||||||||||||||||||||||||||
| Class P1: | ||||||||||||||||||||||||||||||||||||||||||||||||||||||||
| 12/31/2019 | $ | 11.73 | $ | .22 | $ | 2.01 | $ | 2.23 | $ | (.10 | ) | $ | (.10 | ) | $ | (.20 | ) | $ | 13.76 | 19.14 | % | $ | 1,987 | .42 | % | .37 | % | .67 | % | 1.71 | % | |||||||||||||||||||||||||
| 12/31/2018 | 12.66 | (.02 | ) | (.15 | ) | (.17 | ) | (.19 | ) | (.57 | ) | (.76 | ) | 11.73 | (1.66 | ) | 1,662 | .40 | .35 | .64 | (.20 | ) | ||||||||||||||||||||||||||||||||||
| 12/31/2017 | 11.07 | .19 | 2.03 | 2.22 | (.13 | ) | (.50 | ) | (.63 | ) | 12.66 | 20.64 | 10 | 2 | .44 | 10 | .37 | 10 | .66 | 10 | 1.61 | 10 | ||||||||||||||||||||||||||||||||||
| 12/31/2016 | 11.25 | .16 | .52 | .68 | (.16 | ) | (.70 | ) | (.86 | ) | 11.07 | 6.49 | 10 | 1 | .52 | 10 | .36 | 10 | .64 | 10 | 1.46 | 10 | ||||||||||||||||||||||||||||||||||
| 12/31/2015 | 11.67 | .25 | (.63 | ) | (.38 | ) | (.04 | ) | — | (.04 | ) | 11.25 | (3.27 | )10 | 1 | .56 | 10 | .31 | 10 | .59 | 10 | 2.17 | 10 | |||||||||||||||||||||||||||||||||
| Class P2: | ||||||||||||||||||||||||||||||||||||||||||||||||||||||||
| 12/31/2019 | 11.67 | .19 | 2.00 | 2.19 | (.07 | ) | (.10 | ) | (.17 | ) | 13.69 | 18.84 | 283 | .67 | .62 | .92 | 1.47 | |||||||||||||||||||||||||||||||||||||||
| 12/31/2018 | 12.58 | .16 | (.36 | ) | (.20 | ) | (.14 | ) | (.57 | ) | (.71 | ) | 11.67 | (1.97 | ) | 230 | .69 | .64 | .93 | 1.25 | ||||||||||||||||||||||||||||||||||||
| 12/31/2017 | 11.02 | .13 | 2.05 | 2.18 | (.12 | ) | (.50 | ) | (.62 | ) | 12.58 | 20.40 | 206 | .70 | .63 | .92 | 1.08 | |||||||||||||||||||||||||||||||||||||||
| 12/31/2016 | 11.22 | .12 | .52 | .64 | (.14 | ) | (.70 | ) | (.84 | ) | 11.02 | 6.08 | 160 | .79 | .63 | .91 | 1.13 | |||||||||||||||||||||||||||||||||||||||
| 12/31/2015 | 11.65 | .12 | (.54 | ) | (.42 | ) | (.01 | ) | — | (.01 | ) | 11.22 | (3.64 | ) | 122 | .89 | .66 | .94 | 1.04 | |||||||||||||||||||||||||||||||||||||
| 202 | American Funds Insurance Series |
| Income from investment operations1 | Dividends and distributions | Ratio of expenses | Ratio of expenses | |||||||||||||||||||||||||||||||||||||||||||||||||||||
| Period ended | Net asset value, beginning of period | Net investment income (loss) | Net gains (losses) on securities (both realized and unrealized) | Total from investment operations | Dividends (from net investment income) | Distribu- tions (from capital gains) | Total dividends and distribu- tions | Net asset value, end of period | Total return12 | Net assets, end of period (in millions) | to average net assets before waivers/ reimburse- ments | to average net assets after waivers/ reimburse- ments12 | Net effective expense ratio12,13 | Ratio of net income to average net assets12 | ||||||||||||||||||||||||||||||||||||||||||
| Managed Risk Asset Allocation Fund | ||||||||||||||||||||||||||||||||||||||||||||||||||||||||
| Class P1: | ||||||||||||||||||||||||||||||||||||||||||||||||||||||||
| 12/31/2019 | $ | 12.23 | $ | .26 | $ | 1.92 | $ | 2.18 | $ | (.03 | ) | $ | (.57 | ) | $ | (.60 | ) | $ | 13.81 | 18.25 | % | $ | 2 | .41 | % | .36 | % | .65 | % | 2.01 | % | |||||||||||||||||||||||||
| 12/31/2018 | 13.59 | .22 | (.80 | ) | (.58 | ) | (.25 | ) | (.53 | ) | (.78 | ) | 12.23 | (4.63 | ) | 2 | .37 | .32 | .59 | 1.67 | ||||||||||||||||||||||||||||||||||||
| 12/31/2017 | 12.02 | .19 | 1.60 | 1.79 | (.10 | ) | (.12 | ) | (.22 | ) | 13.59 | 15.06 | 1,656 | .43 | .38 | .66 | 1.45 | |||||||||||||||||||||||||||||||||||||||
| 12/31/2016 | 11.72 | .19 | .67 | .86 | (.19 | ) | (.37 | ) | (.56 | ) | 12.02 | 7.57 | 1,217 | .43 | .38 | .66 | 1.65 | |||||||||||||||||||||||||||||||||||||||
| 12/31/2015 | 12.29 | .25 | (.34 | ) | (.09 | ) | (.22 | ) | (.26 | ) | (.48 | ) | 11.72 | (.83 | ) | 712 | .54 | .40 | .68 | 2.06 | ||||||||||||||||||||||||||||||||||||
| Class P2: | ||||||||||||||||||||||||||||||||||||||||||||||||||||||||
| 12/31/2019 | 12.22 | .19 | 1.93 | 2.12 | (.31 | ) | (.57 | ) | (.88 | ) | 13.46 | 17.98 | 2,830 | .66 | .61 | .90 | 1.51 | |||||||||||||||||||||||||||||||||||||||
| 12/31/2018 | 13.55 | .17 | (.79 | ) | (.62 | ) | (.18 | ) | (.53 | ) | (.71 | ) | 12.22 | (4.89 | ) | 2,541 | .62 | .57 | .84 | 1.27 | ||||||||||||||||||||||||||||||||||||
| 12/31/2017 | 12.01 | .15 | 1.61 | 1.76 | (.10 | ) | (.12 | ) | (.22 | ) | 13.55 | 14.80 | 2,798 | .68 | .63 | .91 | 1.13 | |||||||||||||||||||||||||||||||||||||||
| 12/31/2016 | 11.71 | .14 | .69 | .83 | (.16 | ) | (.37 | ) | (.53 | ) | 12.01 | 7.27 | 2,342 | .68 | .63 | .91 | 1.20 | |||||||||||||||||||||||||||||||||||||||
| 12/31/2015 | 12.27 | .14 | (.26 | ) | (.12 | ) | (.18 | ) | (.26 | ) | (.44 | ) | 11.71 | (1.07 | ) | 1,953 | .79 | .66 | .94 | 1.16 | ||||||||||||||||||||||||||||||||||||
See end of tables for footnotes.
| American Funds Insurance Series | 203 |
| Portfolio turnover rate for all share classes | Period ended December 31, | |||||||||||||||||||
| excluding mortgage dollar roll transactions14,15 | 2019 | 2018 | 2017 | 2016 | 2015 | |||||||||||||||
| Capital Income Builder | 44 | % | 42 | % | 59 | % | 41 | % | 38 | % | ||||||||||
| Asset Allocation Fund | 47 | 34 | 39 | 43 | 28 | |||||||||||||||
| Global Balanced Fund | 60 | 30 | 28 | 43 | 36 | |||||||||||||||
| Bond Fund | 146 | 98 | 153 | 108 | 141 | |||||||||||||||
| Global Bond Fund | 110 | 78 | 74 | 70 | 88 | |||||||||||||||
| Mortgage Fund | 84 | 60 | 98 | 113 | 138 | |||||||||||||||
| U.S. Government/AAA-Rated Securities Fund | 103 | 76 | 120 | 273 | 352 | |||||||||||||||
| Portfolio turnover rate for all share classes | Period ended December 31, | |||||||||||||||||||
| including mortgage dollar roll14,15 | 2019 | 2018 | 2017 | 2016 | 2015 | |||||||||||||||
| Global Growth Fund | 14 | % | 25 | % | 31 | % | 27 | % | 29 | % | ||||||||||
| Global Small Capitalization Fund | 50 | 43 | 33 | 40 | 36 | |||||||||||||||
| Growth Fund | 21 | 35 | 24 | 26 | 20 | |||||||||||||||
| International Fund | 32 | 29 | 29 | 31 | 37 | |||||||||||||||
| New World Fund | 38 | 58 | 56 | 32 | 39 | |||||||||||||||
| Blue Chip Income and Growth Fund | 37 | 49 | 34 | 30 | 26 | |||||||||||||||
| Global Growth and Income Fund | 29 | 49 | 41 | 57 | 37 | |||||||||||||||
| Growth-Income Fund | 27 | 39 | 27 | 27 | 25 | |||||||||||||||
| International Growth and Income Fund | 28 | 38 | 51 | 32 | 35 | |||||||||||||||
| Capital Income Builder Fund | 72 | 98 | 88 | 53 | 128 | |||||||||||||||
| Asset Allocation Fund | 79 | 86 | 85 | 83 | 76 | |||||||||||||||
| Global Balanced Fund | 74 | 51 | 41 | 65 | 76 | |||||||||||||||
| Bond Fund | 373 | 514 | 502 | 375 | 434 | |||||||||||||||
| Global Bond Fund | 159 | 125 | 105 | 154 | 159 | |||||||||||||||
| High-Income Bond Fund | 58 | 67 | 78 | 89 | 66 | |||||||||||||||
| Mortgage Fund | 350 | 811 | 680 | 713 | 1103 | |||||||||||||||
| U.S. Government/AAA-Rated Securities Fund | 277 | 446 | 551 | 539 | 901 | |||||||||||||||
| Ultra-Short Bond Fund | — | 16 | — | 16 | — | 16 | — | 11,16 | N/A | |||||||||||
| Managed Risk Growth Fund | 10 | 7 | 25 | 15 | 16 | |||||||||||||||
| Managed Risk International Fund | 8 | 8 | 25 | 26 | 15 | |||||||||||||||
| Managed Risk Blue Chip Income and Growth Fund | 13 | 11 | 32 | 9 | 20 | |||||||||||||||
| Managed Risk Growth-Income Fund | 6 | 14 | 26 | 14 | 11 | |||||||||||||||
| Managed Risk Asset Allocation Fund | 8 | 12 | 1 | 3 | 3 | |||||||||||||||
| 1 | Based on average shares outstanding. |
| 2 | Ratios do not include expenses of any Central Funds. The fund indirectly bears its proportionate share of the expenses of any Central Funds, if applicable. |
| 3 | Based on operations for a period that is less than a full year. |
| 4 | Class 1A shares began investment operations on January 6, 2017. |
| 5 | Not annualized. |
| 6 | Annualized. |
| 7 | Amount less than $1 million. |
| 8 | Amount less than $.01. |
| 9 | Amount less than .01%. |
| 10 | All or a significant portion of assets in this class consisted of seed capital invested by CRMC and/or its affiliates. Certain fees (including, where applicable, fees for distribution services) are not charged or accrued on these seed capital assets. If such fees were paid by the fund on seed capital assets, fund expenses would have been higher and net income and total return would have been lower. |
| 11 | On May 1, 2016, the fund converted from a cash fund to an ultra-short-term bond fund and changed its name from Cash Management Fund to Ultra-Short Bond Fund. |
| 12 | This column reflects the impact of certain waivers/reimbursements by CRMC. CRMC waived a portion of investment advisory services and reimbursed a portion of miscellaneous fees and expenses for the managed risk funds. |
| 13 | This column reflects the net effective expense ratios for each fund and class, which are unaudited. These ratios include each class’s expense ratio combined with the weighted average net expense ratio of the underlying funds for the periods presented. See expense example for further information regarding fees and expenses. |
| 14 | Refer to Note 5 for further information on mortgage dollar rolls. |
| 15 | Rates do not include the fund’s portfolio activity with respect to any Central Funds, if applicable. |
| 16 | Amount is either less than 1% or there is no turnover. |
See notes to financial statements.
| 204 | American Funds Insurance Series |
Report of Independent Registered Public Accounting Firm
To the Board of Trustees of American Funds Insurance Series and Shareholders of Global Growth Fund, Global Small Capitalization Fund, Growth Fund, International Fund, New World Fund®, Blue Chip Income and Growth Fund, Global Growth and Income Fund, Growth-Income Fund, International Growth and Income Fund, Capital Income Builder®, Asset Allocation Fund, Global Balanced Fund, Bond Fund, Global Bond Fund, High-Income Bond Fund, Mortgage Fund, Ultra-Short Bond Fund, U.S. Government/AAA-Rated Securities Fund, Managed Risk Growth Fund, Managed Risk International Fund, Managed Risk Blue Chip Income and Growth Fund, Managed Risk Growth-Income Fund and Managed Risk Asset Allocation Fund
Opinions on the Financial Statements
We have audited the accompanying statements of assets and liabilities, including summary investment portfolios of Global Growth Fund, Global Small Capitalization Fund, Growth Fund, International Fund, New World Fund®, Blue Chip Income and Growth Fund, Global Growth and Income Fund, Growth-Income Fund, International Growth and Income Fund, Capital Income Builder®, Asset Allocation Fund, Global Balanced Fund, Bond Fund, Global Bond Fund, High-Income Bond Fund, Mortgage Fund and U.S. Government/AAA-Rated Securities Fund and investment portfolios of Ultra-Short Bond Fund, Managed Risk Growth Fund, Managed Risk International Fund, Managed Risk Blue Chip Income and Growth Fund, Managed Risk Growth-Income Fund and Managed Risk Asset Allocation Fund, (twenty-three of the funds constituting American Funds Insurance Series, hereafter collectively referred to as the “Funds”) as of December 31, 2019, the related statements of operations for the year ended December 31, 2019, the statements of changes in net assets for each of the two years in the period ended December 31, 2019, including the related notes, and the financial highlights for each of the periods indicated therein (collectively referred to as the “financial statements”). In our opinion, the financial statements present fairly, in all material respects, the financial position of each of the Funds as of December 31, 2019, the results of each of their operations for the year then ended, the changes in each of their net assets for each of the two years in the period ended December 31, 2019 and each of the financial highlights for each of the periods indicated therein in conformity with accounting principles generally accepted in the United States of America.
Basis for Opinions
These financial statements are the responsibility of the Funds’ management. Our responsibility is to express an opinion on the Funds’ financial statements based on our audits. We are a public accounting firm registered with the Public Company Accounting Oversight Board (United States) (PCAOB) and are required to be independent with respect to the Funds in accordance with the U.S. federal securities laws and the applicable rules and regulations of the Securities and Exchange Commission and the PCAOB.
We conducted our audits of these financial statements in accordance with the standards of the PCAOB. Those standards require that we plan and perform the audit to obtain reasonable assurance about whether the financial statements are free of material misstatement, whether due to error or fraud.
Our audits included performing procedures to assess the risks of material misstatement of the financial statements, whether due to error or fraud, and performing procedures that respond to those risks. Such procedures included examining, on a test basis, evidence regarding the amounts and disclosures in the financial statements. Our audits also included evaluating the accounting principles used and significant estimates made by management, as well as evaluating the overall presentation of the financial statements. Our procedures included confirmation of securities owned as of December 31, 2019 by correspondence with the custodians, transfer agent and brokers; when replies were not received from the transfer agent and brokers, we performed other auditing procedures. We believe that our audits provide a reasonable basis for our opinions.
/s/PricewaterhouseCoopers LLP
Los Angeles, California
February 11, 2020
We have served as the auditor of one or more investment companies in The Capital Group Companies Investment Company Complex since 1934.
| American Funds Insurance Series | 205 |
| Expense example | unaudited |
The funds in American Funds Insurance Series serve as the underlying investment vehicle for various insurance products. As an owner of an insurance contract that invests in one of the funds in the series, you incur two types of costs: (1) transaction costs, such as initial sales charges on purchase payments and contingent deferred sales charges on redemptions (loads), and (2) ongoing costs, including management fees, distribution and service (12b-1) fees, and other expenses. Additional fees are charged by the insurance companies related to the various benefits they provide. This example is intended to help you understand your ongoing costs (in dollars) of investing in the underlying funds so you can compare these costs with the ongoing costs of investing in other mutual funds that serve a similar function in other annuity products. The example is based on an investment of $1,000 invested at the beginning of the period and held for the entire six-month period (July 1, 2019, through December 31, 2019).
Actual expenses:
The first line of each share class in the tables on the following pages provides information about actual account values and actual expenses. You may use the information in this line, together with the amount you invested, to estimate the expenses that you paid over the period. Simply divide your account value by $1,000 (for example, an $8,600 account value divided by $1,000 = 8.6), then multiply the result by the number in the first line under the heading titled “Expenses paid during period” to estimate the expenses you paid on your account during this period.
Hypothetical example for comparison purposes:
The second line of each share class in the tables on the following pages provides information about hypothetical account values and hypothetical expenses based on the actual expense ratio for the share class and an assumed rate of return of 5.00% per year before expenses, which is not the actual return of the share class. The hypothetical account values and expenses may not be used to estimate the actual ending account balance or expenses you paid for the period. You may use this information to compare the ongoing costs of investing in the fund and other funds. To do so, compare this 5.00% hypothetical example with the 5.00% hypothetical examples that appear in the shareholder reports of the other funds.
Notes:
Additional fees are charged by the insurance companies related to the various benefits they provide. You can estimate the impact of these fees by adding the amount of the fees to the total estimated expenses you paid on your account during the period as calculated above. In addition, your ending account value would be lower by the amount of these fees.
Note that the expenses shown in the tables on the following pages are meant to highlight your ongoing costs only and do not reflect any transactional costs. Therefore, the second line of each share class in the table is useful in comparing ongoing costs only and will not help you determine the relative total costs of owning different funds. In addition, if these transactional costs were included, your costs would have been higher.
| 206 | American Funds Insurance Series |
| Beginning account value 7/1/2019 | Ending account value 12/31/2019 | Expenses paid during period1 | Annualized expense ratio | |||||||||||||
| Global Growth Fund | ||||||||||||||||
| Class 1 – actual return | $ | 1,000.00 | $ | 1,116.96 | $ | 3.04 | .57 | % | ||||||||
| Class 1 – assumed 5% return | 1,000.00 | 1,022.33 | 2.91 | .57 | ||||||||||||
| Class 1A – actual return | 1,000.00 | 1,115.38 | 4.37 | .82 | ||||||||||||
| Class 1A – assumed 5% return | 1,000.00 | 1,021.07 | 4.18 | .82 | ||||||||||||
| Class 2 – actual return | 1,000.00 | 1,115.67 | 4.37 | .82 | ||||||||||||
| Class 2 – assumed 5% return | 1,000.00 | 1,021.07 | 4.18 | .82 | ||||||||||||
| Class 4 – actual return | 1,000.00 | 1,113.99 | 5.70 | 1.07 | ||||||||||||
| Class 4 – assumed 5% return | 1,000.00 | 1,019.81 | 5.45 | 1.07 | ||||||||||||
| Global Small Capitalization Fund | ||||||||||||||||
| Class 1 – actual return | $ | 1,000.00 | $ | 1,095.88 | $ | 4.01 | .76 | % | ||||||||
| Class 1 – assumed 5% return | 1,000.00 | 1,021.37 | 3.87 | .76 | ||||||||||||
| Class 1A – actual return | 1,000.00 | 1,094.41 | 5.28 | 1.00 | ||||||||||||
| Class 1A – assumed 5% return | 1,000.00 | 1,020.16 | 5.09 | 1.00 | ||||||||||||
| Class 2 – actual return | 1,000.00 | 1,094.51 | 5.33 | 1.01 | ||||||||||||
| Class 2 – assumed 5% return | 1,000.00 | 1,020.11 | 5.14 | 1.01 | ||||||||||||
| Class 4 – actual return | 1,000.00 | 1,093.20 | 6.65 | 1.26 | ||||||||||||
| Class 4 – assumed 5% return | 1,000.00 | 1,018.85 | 6.41 | 1.26 | ||||||||||||
| Growth Fund | ||||||||||||||||
| Class 1 – actual return | $ | 1,000.00 | $ | 1,122.54 | $ | 1.93 | .36 | % | ||||||||
| Class 1 – assumed 5% return | 1,000.00 | 1,023.39 | 1.84 | .36 | ||||||||||||
| Class 1A – actual return | 1,000.00 | 1,121.15 | 3.26 | .61 | ||||||||||||
| Class 1A – assumed 5% return | 1,000.00 | 1,022.13 | 3.11 | .61 | ||||||||||||
| Class 2 – actual return | 1,000.00 | 1,121.13 | 3.26 | .61 | ||||||||||||
| Class 2 – assumed 5% return | 1,000.00 | 1,022.13 | 3.11 | .61 | ||||||||||||
| Class 3 – actual return | 1,000.00 | 1,121.54 | 2.89 | .54 | ||||||||||||
| Class 3 – assumed 5% return | 1,000.00 | 1,022.48 | 2.75 | .54 | ||||||||||||
| Class 4 – actual return | 1,000.00 | 1,119.60 | 4.59 | .86 | ||||||||||||
| Class 4 – assumed 5% return | 1,000.00 | 1,020.87 | 4.38 | .86 | ||||||||||||
| International Fund | ||||||||||||||||
| Class 1 – actual return | $ | 1,000.00 | $ | 1,071.97 | $ | 2.87 | .55 | % | ||||||||
| Class 1 – assumed 5% return | 1,000.00 | 1,022.43 | 2.80 | .55 | ||||||||||||
| Class 1A – actual return | 1,000.00 | 1,070.89 | 4.18 | .80 | ||||||||||||
| Class 1A – assumed 5% return | 1,000.00 | 1,021.17 | 4.08 | .80 | ||||||||||||
| Class 2 – actual return | 1,000.00 | 1,070.65 | 4.18 | .80 | ||||||||||||
| Class 2 – assumed 5% return | 1,000.00 | 1,021.17 | 4.08 | .80 | ||||||||||||
| Class 3 – actual return | 1,000.00 | 1,071.19 | 3.81 | .73 | ||||||||||||
| Class 3 – assumed 5% return | 1,000.00 | 1,021.53 | 3.72 | .73 | ||||||||||||
| Class 4 – actual return | 1,000.00 | 1,069.66 | 5.48 | 1.05 | ||||||||||||
| Class 4 – assumed 5% return | 1,000.00 | 1,019.91 | 5.35 | 1.05 | ||||||||||||
| New World Fund | ||||||||||||||||
| Class 1 – actual return | $ | 1,000.00 | $ | 1,085.93 | $ | 4.05 | .77 | % | ||||||||
| Class 1 – assumed 5% return | 1,000.00 | 1,021.32 | 3.92 | .77 | ||||||||||||
| Class 1A – actual return | 1,000.00 | 1,084.04 | 5.36 | 1.02 | ||||||||||||
| Class 1A – assumed 5% return | 1,000.00 | 1,020.06 | 5.19 | 1.02 | ||||||||||||
| Class 2 – actual return | 1,000.00 | 1,084.63 | 5.36 | 1.02 | ||||||||||||
| Class 2 – assumed 5% return | 1,000.00 | 1,020.06 | 5.19 | 1.02 | ||||||||||||
| Class 4 – actual return | 1,000.00 | 1,082.83 | 6.67 | 1.27 | ||||||||||||
| Class 4 – assumed 5% return | 1,000.00 | 1,018.80 | 6.46 | 1.27 | ||||||||||||
See end of tables for footnotes.
| American Funds Insurance Series | 207 |
| Beginning account value 7/1/2019 | Ending account value 12/31/2019 | Expenses paid during period1 | Annualized expense ratio | |||||||||||||
| Blue Chip Income and Growth Fund | ||||||||||||||||
| Class 1 – actual return | $ | 1,000.00 | $ | 1,094.67 | $ | 2.27 | .43 | % | ||||||||
| Class 1 – assumed 5% return | 1,000.00 | 1,023.04 | 2.19 | .43 | ||||||||||||
| Class 1A – actual return | 1,000.00 | 1,094.36 | 3.59 | .68 | ||||||||||||
| Class 1A – assumed 5% return | 1,000.00 | 1,021.78 | 3.47 | .68 | ||||||||||||
| Class 2 – actual return | 1,000.00 | 1,094.61 | 3.59 | .68 | ||||||||||||
| Class 2 – assumed 5% return | 1,000.00 | 1,021.78 | 3.47 | .68 | ||||||||||||
| Class 4 – actual return | 1,000.00 | 1,092.10 | 4.90 | .93 | ||||||||||||
| Class 4 – assumed 5% return | 1,000.00 | 1,020.52 | 4.74 | .93 | ||||||||||||
| Global Growth and Income Fund | ||||||||||||||||
| Class 1 – actual return | $ | 1,000.00 | $ | 1,099.74 | $ | 3.49 | .66 | % | ||||||||
| Class 1 – assumed 5% return | 1,000.00 | 1,021.88 | 3.36 | .66 | ||||||||||||
| Class 1A – actual return | 1,000.00 | 1,098.34 | 4.81 | .91 | ||||||||||||
| Class 1A – assumed 5% return | 1,000.00 | 1,020.62 | 4.63 | .91 | ||||||||||||
| Class 2 – actual return | 1,000.00 | 1,098.41 | 4.81 | .91 | ||||||||||||
| Class 2 – assumed 5% return | 1,000.00 | 1,020.62 | 4.63 | .91 | ||||||||||||
| Class 4 – actual return | 1,000.00 | 1,096.37 | 6.13 | 1.16 | ||||||||||||
| Class 4 – assumed 5% return | 1,000.00 | 1,019.36 | 5.90 | 1.16 | ||||||||||||
| Growth-Income Fund | ||||||||||||||||
| Class 1 – actual return | $ | 1,000.00 | $ | 1,088.69 | $ | 1.53 | .29 | % | ||||||||
| Class 1 – assumed 5% return | 1,000.00 | 1,023.74 | 1.48 | .29 | ||||||||||||
| Class 1A – actual return | 1,000.00 | 1,087.42 | 2.84 | .54 | ||||||||||||
| Class 1A – assumed 5% return | 1,000.00 | 1,022.48 | 2.75 | .54 | ||||||||||||
| Class 2 – actual return | 1,000.00 | 1,087.19 | 2.84 | .54 | ||||||||||||
| Class 2 – assumed 5% return | 1,000.00 | 1,022.48 | 2.75 | .54 | ||||||||||||
| Class 3 – actual return | 1,000.00 | 1,087.79 | 2.47 | .47 | ||||||||||||
| Class 3 – assumed 5% return | 1,000.00 | 1,022.84 | 2.40 | .47 | ||||||||||||
| Class 4 – actual return | 1,000.00 | 1,085.97 | 4.15 | .79 | ||||||||||||
| Class 4 – assumed 5% return | 1,000.00 | 1,021.22 | 4.02 | .79 | ||||||||||||
| International Growth and Income Fund | ||||||||||||||||
| Class 1 – actual return | $ | 1,000.00 | $ | 1,071.75 | $ | 3.50 | .67 | % | ||||||||
| Class 1 – assumed 5% return | 1,000.00 | 1,021.83 | 3.41 | .67 | ||||||||||||
| Class 1A – actual return | 1,000.00 | 1,069.92 | 4.80 | .92 | ||||||||||||
| Class 1A – assumed 5% return | 1,000.00 | 1,020.57 | 4.69 | .92 | ||||||||||||
| Class 2 – actual return | 1,000.00 | 1,069.79 | 4.80 | .92 | ||||||||||||
| Class 2 – assumed 5% return | 1,000.00 | 1,020.57 | 4.69 | .92 | ||||||||||||
| Class 4 – actual return | 1,000.00 | 1,068.59 | 6.10 | 1.17 | ||||||||||||
| Class 4 – assumed 5% return | 1,000.00 | 1,019.31 | 5.96 | 1.17 | ||||||||||||
| Capital Income Builder | ||||||||||||||||
| Class 1 – actual return | $ | 1,000.00 | $ | 1,073.57 | $ | 2.82 | .54 | % | ||||||||
| Class 1 – assumed 5% return | 1,000.00 | 1,022.48 | 2.75 | .54 | ||||||||||||
| Class 1A – actual return | 1,000.00 | 1,072.29 | 4.13 | .79 | ||||||||||||
| Class 1A – assumed 5% return | 1,000.00 | 1,021.22 | 4.02 | .79 | ||||||||||||
| Class 2 – actual return | 1,000.00 | 1,071.26 | 4.12 | .79 | ||||||||||||
| Class 2 – assumed 5% return | 1,000.00 | 1,021.22 | 4.02 | .79 | ||||||||||||
| Class 4 – actual return | 1,000.00 | 1,071.03 | 5.43 | 1.04 | ||||||||||||
| Class 4 – assumed 5% return | 1,000.00 | 1,019.96 | 5.30 | 1.04 | ||||||||||||
| 208 | American Funds Insurance Series |
| Beginning account value 7/1/2019 | Ending account value 12/31/2019 | Expenses paid during period1 | Annualized expense ratio | |||||||||||||
| Asset Allocation Fund | ||||||||||||||||
| Class 1 – actual return | $ | 1,000.00 | $ | 1,084.13 | $ | 1.58 | .30 | % | ||||||||
| Class 1 – assumed 5% return | 1,000.00 | 1,023.69 | 1.53 | .30 | ||||||||||||
| Class 1A – actual return | 1,000.00 | 1,082.52 | 2.89 | .55 | ||||||||||||
| Class 1A – assumed 5% return | 1,000.00 | 1,022.43 | 2.80 | .55 | ||||||||||||
| Class 2 – actual return | 1,000.00 | 1,082.42 | 2.89 | .55 | ||||||||||||
| Class 2 – assumed 5% return | 1,000.00 | 1,022.43 | 2.80 | .55 | ||||||||||||
| Class 3 – actual return | 1,000.00 | 1,082.90 | 2.52 | .48 | ||||||||||||
| Class 3 – assumed 5% return | 1,000.00 | 1,022.79 | 2.45 | .48 | ||||||||||||
| Class 4 – actual return | 1,000.00 | 1,080.99 | 4.20 | .80 | ||||||||||||
| Class 4 – assumed 5% return | 1,000.00 | 1,021.17 | 4.08 | .80 | ||||||||||||
| Global Balanced Fund | ||||||||||||||||
| Class 1 – actual return | $ | 1,000.00 | $ | 1,068.79 | $ | 3.86 | .74 | % | ||||||||
| Class 1 – assumed 5% return | 1,000.00 | 1,021.48 | 3.77 | .74 | ||||||||||||
| Class 1A – actual return | 1,000.00 | 1,067.15 | 5.11 | .98 | ||||||||||||
| Class 1A – assumed 5% return | 1,000.00 | 1,020.27 | 4.99 | .98 | ||||||||||||
| Class 2 – actual return | 1,000.00 | 1,067.14 | 5.16 | .99 | ||||||||||||
| Class 2 – assumed 5% return | 1,000.00 | 1,020.21 | 5.04 | .99 | ||||||||||||
| Class 4 – actual return | 1,000.00 | 1,065.63 | 6.46 | 1.24 | ||||||||||||
| Class 4 – assumed 5% return | 1,000.00 | 1,018.95 | 6.31 | 1.24 | ||||||||||||
| Bond Fund | ||||||||||||||||
| Class 1 – actual return | $ | 1,000.00 | $ | 1,027.08 | $ | 2.04 | .40 | % | ||||||||
| Class 1 – assumed 5% return | 1,000.00 | 1,023.19 | 2.04 | .40 | ||||||||||||
| Class 1A – actual return | 1,000.00 | 1,025.83 | 3.32 | .65 | ||||||||||||
| Class 1A – assumed 5% return | 1,000.00 | 1,021.93 | 3.31 | .65 | ||||||||||||
| Class 2 – actual return | 1,000.00 | 1,025.29 | 3.32 | .65 | ||||||||||||
| Class 2 – assumed 5% return | 1,000.00 | 1,021.93 | 3.31 | .65 | ||||||||||||
| Class 4 – actual return | 1,000.00 | 1,023.86 | 4.59 | .90 | ||||||||||||
| Class 4 – assumed 5% return | 1,000.00 | 1,020.67 | 4.58 | .90 | ||||||||||||
| Global Bond Fund | ||||||||||||||||
| Class 1 – actual return | $ | 1,000.00 | $ | 1,013.93 | $ | 2.99 | .59 | % | ||||||||
| Class 1 – assumed 5% return | 1,000.00 | 1,022.23 | 3.01 | .59 | ||||||||||||
| Class 1A – actual return | 1,000.00 | 1,012.09 | 4.26 | .84 | ||||||||||||
| Class 1A – assumed 5% return | 1,000.00 | 1,020.97 | 4.28 | .84 | ||||||||||||
| Class 2 – actual return | 1,000.00 | 1,012.71 | 4.26 | .84 | ||||||||||||
| Class 2 – assumed 5% return | 1,000.00 | 1,020.97 | 4.28 | .84 | ||||||||||||
| Class 4 – actual return | 1,000.00 | 1,011.15 | 5.53 | 1.09 | ||||||||||||
| Class 4 – assumed 5% return | 1,000.00 | 1,019.71 | 5.55 | 1.09 | ||||||||||||
| High-Income Bond Fund | ||||||||||||||||
| Class 1 – actual return | $ | 1,000.00 | $ | 1,027.67 | $ | 2.66 | .52 | % | ||||||||
| Class 1 – assumed 5% return | 1,000.00 | 1,022.58 | 2.65 | .52 | ||||||||||||
| Class 1A – actual return | 1,000.00 | 1,026.78 | 3.93 | .77 | ||||||||||||
| Class 1A – assumed 5% return | 1,000.00 | 1,021.32 | 3.92 | .77 | ||||||||||||
| Class 2 – actual return | 1,000.00 | 1,025.96 | 3.93 | .77 | ||||||||||||
| Class 2 – assumed 5% return | 1,000.00 | 1,021.32 | 3.92 | .77 | ||||||||||||
| Class 3 – actual return | 1,000.00 | 1,027.04 | 3.58 | .70 | ||||||||||||
| Class 3 – assumed 5% return | 1,000.00 | 1,021.68 | 3.57 | .70 | ||||||||||||
| Class 4 – actual return | 1,000.00 | 1,024.88 | 5.21 | 1.02 | ||||||||||||
| Class 4 – assumed 5% return | 1,000.00 | 1,020.06 | 5.19 | 1.02 | ||||||||||||
See end of tables for footnotes.
| American Funds Insurance Series | 209 |
| Beginning account value 7/1/2019 | Ending account value 12/31/2019 | Expenses paid during period1 | Annualized expense ratio | |||||||||||||
| Mortgage Fund | ||||||||||||||||
| Class 1 – actual return | $ | 1,000.00 | $ | 1,010.94 | $ | 2.48 | .49 | % | ||||||||
| Class 1 – assumed 5% return | 1,000.00 | 1,022.74 | 2.50 | .49 | ||||||||||||
| Class 1A – actual return | 1,000.00 | 1,010.25 | 3.75 | .74 | ||||||||||||
| Class 1A – assumed 5% return | 1,000.00 | 1,021.48 | 3.77 | .74 | ||||||||||||
| Class 2 – actual return | 1,000.00 | 1,009.74 | 3.75 | .74 | ||||||||||||
| Class 2 – assumed 5% return | 1,000.00 | 1,021.48 | 3.77 | .74 | ||||||||||||
| Class 4 – actual return | 1,000.00 | 1,008.46 | 5.01 | .99 | ||||||||||||
| Class 4 – assumed 5% return | 1,000.00 | 1,020.21 | 5.04 | .99 | ||||||||||||
| Ultra-Short Bond Fund | ||||||||||||||||
| Class 1 – actual return | $ | 1,000.00 | $ | 1,008.13 | $ | 1.92 | .38 | % | ||||||||
| Class 1 – assumed 5% return | 1,000.00 | 1,023.29 | 1.94 | .38 | ||||||||||||
| Class 1A – actual return | 1,000.00 | 1,008.13 | 2.08 | .41 | ||||||||||||
| Class 1A – assumed 5% return | 1,000.00 | 1,023.14 | 2.09 | .41 | ||||||||||||
| Class 2 – actual return | 1,000.00 | 1,007.15 | 3.19 | .63 | ||||||||||||
| Class 2 – assumed 5% return | 1,000.00 | 1,022.03 | 3.21 | .63 | ||||||||||||
| Class 3 – actual return | 1,000.00 | 1,007.58 | 2.88 | .57 | ||||||||||||
| Class 3 – assumed 5% return | 1,000.00 | 1,022.33 | 2.91 | .57 | ||||||||||||
| Class 4 – actual return | 1,000.00 | 1,006.17 | 4.45 | .88 | ||||||||||||
| Class 4 – assumed 5% return | 1,000.00 | 1,020.77 | 4.48 | .88 | ||||||||||||
| U.S. Government/AAA-Rated Securities Fund | ||||||||||||||||
| Class 1 – actual return | $ | 1,000.00 | $ | 1,009.49 | $ | 1.92 | .38 | % | ||||||||
| Class 1 – assumed 5% return | 1,000.00 | 1,023.29 | 1.94 | .38 | ||||||||||||
| Class 1A – actual return | 1,000.00 | 1,008.69 | 3.19 | .63 | ||||||||||||
| Class 1A – assumed 5% return | 1,000.00 | 1,022.03 | 3.21 | .63 | ||||||||||||
| Class 2 – actual return | 1,000.00 | 1,008.33 | 3.19 | .63 | ||||||||||||
| Class 2 – assumed 5% return | 1,000.00 | 1,022.03 | 3.21 | .63 | ||||||||||||
| Class 3 – actual return | 1,000.00 | 1,008.76 | 2.84 | .56 | ||||||||||||
| Class 3 – assumed 5% return | 1,000.00 | 1,022.38 | 2.85 | .56 | ||||||||||||
| Class 4 – actual return | 1,000.00 | 1,007.70 | 4.45 | .88 | ||||||||||||
| Class 4 – assumed 5% return | 1,000.00 | 1,020.77 | 4.48 | .88 | ||||||||||||
| 210 | American Funds Insurance Series |
| Beginning account value 7/1/2019 | Ending account value 12/31/2019 | Expenses paid during period1,2 | Annualized expense ratio2 | Effective expenses paid during period3 | Effective annualized expense ratio4 | |||||||||||||||||||
| Managed Risk Growth Fund | ||||||||||||||||||||||||
| Class P1 – actual return | $ | 1,000.00 | $ | 1,093.69 | $ | 2.01 | .38 | % | $ | 3.85 | .73 | % | ||||||||||||
| Class P1 – assumed 5% return | 1,000.00 | 1,023.29 | 1.94 | .38 | 3.72 | .73 | ||||||||||||||||||
| Class P2 – actual return | 1,000.00 | 1,092.56 | 3.32 | .63 | 5.22 | .99 | ||||||||||||||||||
| Class P2 – assumed 5% return | 1,000.00 | 1,022.03 | 3.21 | .63 | 5.04 | .99 | ||||||||||||||||||
| Managed Risk International Fund | ||||||||||||||||||||||||
| Class P1 – actual return | $ | 1,000.00 | $ | 1,059.67 | $ | 1.71 | .33 | % | $ | 4.36 | .84 | % | ||||||||||||
| Class P1 – assumed 5% return | 1,000.00 | 1,023.54 | 1.68 | .33 | 4.28 | .84 | ||||||||||||||||||
| Class P2 – actual return | 1,000.00 | 1,058.14 | 3.32 | .64 | 5.91 | 1.14 | ||||||||||||||||||
| Class P2 – assumed 5% return | 1,000.00 | 1,021.98 | 3.26 | .64 | 5.80 | 1.14 | ||||||||||||||||||
| Managed Risk Blue Chip Income and Growth Fund | ||||||||||||||||||||||||
| Class P1 – actual return | $ | 1,000.00 | $ | 1,070.42 | $ | 1.77 | .34 | % | $ | 3.86 | .74 | % | ||||||||||||
| Class P1 – assumed 5% return | 1,000.00 | 1,023.49 | 1.73 | .34 | 3.77 | .74 | ||||||||||||||||||
| Class P2 – actual return | 1,000.00 | 1,069.12 | 3.34 | .64 | 5.42 | 1.04 | ||||||||||||||||||
| Class P2 – assumed 5% return | 1,000.00 | 1,021.98 | 3.26 | .64 | 5.30 | 1.04 | ||||||||||||||||||
| Managed Risk Growth-Income Fund | ||||||||||||||||||||||||
| Class P1 – actual return | $ | 1,000.00 | $ | 1,069.78 | $ | 1.88 | .36 | % | $ | 3.50 | .67 | % | ||||||||||||
| Class P1 – assumed 5% return | 1,000.00 | 1,023.39 | 1.84 | .36 | 3.41 | .67 | ||||||||||||||||||
| Class P2 – actual return | 1,000.00 | 1,068.16 | 3.18 | .61 | 4.80 | .92 | ||||||||||||||||||
| Class P2 – assumed 5% return | 1,000.00 | 1,022.13 | 3.11 | .61 | 4.69 | .92 | ||||||||||||||||||
| Managed Risk Asset Allocation Fund | ||||||||||||||||||||||||
| Class P1 – actual return | $ | 1,000.00 | $ | 1,077.11 | $ | 1.88 | .36 | % | $ | 3.40 | .65 | % | ||||||||||||
| Class P1 – assumed 5% return | 1,000.00 | 1,023.39 | 1.84 | .36 | 3.31 | .65 | ||||||||||||||||||
| Class P2 – actual return | 1,000.00 | 1,075.10 | 3.19 | .61 | 4.71 | .90 | ||||||||||||||||||
| Class P2 – assumed 5% return | 1,000.00 | 1,022.13 | 3.11 | .61 | 4.58 | .90 | ||||||||||||||||||
| 1 | The “expenses paid during period” are equal to the “annualized expense ratio,” multiplied by the average account value over the period, multiplied by the number of days in the period, and divided by 365 (to reflect the one-half year period). |
| 2 | The “expenses paid during period” and “annualized expense ratio” do not include the expenses of the underlying funds in which each fund invests. |
| 3 | The “effective expenses paid during period” are equal to the “effective annualized expense ratio,” multiplied by the average account value over the period, multiplied by the number of days in the period, and divided by 365 (to reflect the period). |
| 4 | The “effective annualized expense ratio” reflects the net annualized expense ratio of the class plus the class’s pro-rata share of the weighted average expense ratio of the underlying funds in which it invests. |
| American Funds Insurance Series | 211 |
Liquidity Risk Management Program
The series has adopted a liquidity risk management program (the “program”). The series’ board has designated Capital Research and Management Company (“CRMC”) as the administrator of the program. Personnel of CRMC or its affiliates conduct the day-to-day operation of the program pursuant to policies and procedures administered by the Capital Group Liquidity Risk Management Committee.
Under the program, CRMC manages each fund’s liquidity risk, which is the risk that the fund could not meet shareholder redemption requests without significant dilution of remaining shareholders’ interests in the fund. This risk is managed by monitoring the degree of liquidity of each fund’s investments, limiting the amount of each fund’s illiquid investments, and utilizing various risk management tools and facilities available to each fund for meeting shareholder redemptions, among other means. CRMC’s process of determining the degree of liquidity of each fund’s investments is supported by one or more third-party liquidity assessment vendors.
The series’ board reviewed a report prepared by CRMC regarding the operation and effectiveness of the program for the period December 1, 2018, through September 30, 2019. No significant liquidity events impacting any of the funds were noted in the report. In addition, CRMC provided its assessment that the program had been effective in managing each fund’s liquidity risk.
| 212 | American Funds Insurance Series |
This page intentionally left blank.
| American Funds Insurance Series | 213 |
This page intentionally left blank.
| 214 | American Funds Insurance Series |
This page intentionally left blank.
| American Funds Insurance Series | 215 |
This page intentionally left blank.
| 216 | American Funds Insurance Series |
This page intentionally left blank.
| American Funds Insurance Series | 217 |
This page intentionally left blank.
| 218 | American Funds Insurance Series |
This page intentionally left blank.
| American Funds Insurance Series | 219 |
This page intentionally left blank.
| 220 | American Funds Insurance Series |
This page intentionally left blank.
| American Funds Insurance Series | 221 |
Board of trustees and other officers
Independent trustees1
| Name and year of birth | Year first elected a trustee of the series2 | Principal occupation(s) during past five years | Number of portfolios in fund complex overseen by trustee | Other directorships3 held by trustee | ||||
| William H. Baribault, 1945 | 2009 | Chairman of the Board and CEO, Oakwood Advisors (private investment and consulting); former CEO and President, Richard Nixon Foundation | 89 | General Finance Corporation | ||||
| James G. Ellis, 1947 | 2010 | Professor of Marketing and former Dean, Marshall School of Business, University of Southern California | 99 | Mercury General Corporation | ||||
| Nariman Farvardin, 1956 | 2018 | President, Stevens Institute of Technology | 86 | None | ||||
| Mary Davis Holt, 1950 | 2015–2016; 2017 | Principal, Mary Davis Holt Enterprises, LLC (leadership development consulting); former Partner, Flynn Heath Holt Leadership, LLC (leadership consulting); former COO, Time Life Inc. (1993–2003) | 86 | None | ||||
| R. Clark Hooper, 1946 | 2010 | Private investor | 89 | None | ||||
| Merit E. Janow, 1958 | 2007 | Dean and Professor, Columbia University, School of International and Public Affairs | 88 | Mastercard Incorporated; Trimble Inc. | ||||
| Margaret Spellings, 1957 Chairman of the Board (Independent and Non-Executive) | 2010 | CEO, Texas 2036; former President, Margaret Spellings & Company (public policy and strategic consulting); former President, The University of North Carolina; former President, George W. Bush Foundation | 90 | None | ||||
| Alexandra Trower, 1964 | 2018 | Executive Vice President, Global Communications and Corporate Officer, The Estée Lauder Companies | 85 | None |
Interested trustees4,5
| Name, year of birth and position with series | Year first elected a trustee or officer of the series2 | Principal occupation(s) during past five years and positions held with affiliated entities or the principal underwriter of the series | Number of portfolios in fund complex overseen by trustee | Other directorships3 held by trustee | ||||
| Donald D. O’Neal, 1960 Co-President | 1998 | Partner — Capital International Investors, Capital Research and Management Company; Partner — Capital International Investors, Capital Bank and Trust Company;6Director, Capital Research and Management Company | 35 | None | ||||
| Michael C. Gitlin, 1970 | 2019 | Vice Chairman and Director, Capital Research and Management Company; Partner — Capital Fixed Income Investors, Capital Research and Management Company; Director, The Capital Group Companies, Inc.;6served as Head of Fixed Income at a large investment management firm prior to joining Capital Research and Management Company in 2015 | 85 | None |
The series statement of additional information includes further details about the series trustees and is available without charge upon request by calling American Funds Service Company at (800) 421-4225 or by visiting the Capital Group website at capitalgroup.com. The address for all trustees and officers of the series is 333 South Hope Street, Los Angeles, CA 90071, Attention: Secretary.
| 222 | American Funds Insurance Series |
Other officers5
| Name, year of birth and position with series | Year first elected an officer of the series2 | Principal occupation(s) during past five years and positions held with affiliated entities or the principal underwriter of the series | ||
| Alan N. Berro, 1960 Co-President | 1998 | Partner — Capital World Investors, Capital Research and Management Company; Partner — Capital World Investors, Capital Bank and Trust Company;6Director, The Capital Group Companies, Inc.6 | ||
| Maria Manotok, 1974 Executive Vice President | 2012 | Senior Vice President and Senior Counsel — Fund Business Management Group, Capital Research and Management Company; Senior Vice President, Senior Counsel and Director, Capital International, Inc.;6 Director, Capital Group Investment Management Limited6 | ||
| John H. Smet, 1956 Senior Vice President | 1994 | Partner — Capital Fixed Income Investors, Capital Research and Management Company | ||
| Martin Jacobs, 1962 Vice President | 2016 | Partner — Capital Research Global Investors, Capital Research and Management Company | ||
| Carl M. Kawaja, 1964 Vice President | 2008 | Partner — Capital World Investors, Capital Research and Management Company; Chairman and Director, Capital Research and Management Company; Partner — Capital World Investors, Capital Bank and Trust Company;6Director, The Capital Group Companies, Inc.6 | ||
| Sung Lee, 1966 Vice President | 2008 | Partner — Capital Research Global Investors, Capital International, Inc.6 | ||
| Keiko McKibben, 1969 Vice President | 2010 | Partner — Capital Research Global Investors, Capital Research and Management Company | ||
| Renaud H. Samyn, 1974 Vice President | 2010 | Partner — Capital Research Global Investors, Capital International, Inc.6 | ||
| Dylan Yolles, 1969 Vice President | 2012 | Partner — Capital International Investors, Capital Research and Management Company | ||
| Steven I. Koszalka, 1964 Secretary | 2003 | Vice President — Fund Business Management Group, Capital Research and Management Company | ||
| Gregory F. Niland, 1971 Treasurer | 2008 | Vice President — Investment Operations, Capital Research and Management Company | ||
| Susan K. Countess, 1966 Assistant Secretary | 2014 | Associate — Fund Business Management Group, Capital Research and Management Company | ||
| Sandra Chuon, 1972 Assistant Treasurer | 2019 | Assistant Vice President — Investment Operations, Capital Research and Management Company | ||
| Brian C. Janssen, 1972 Assistant Treasurer | 2015 | Vice President — Investment Operations, Capital Research and Management Company |
| 1 | The term independent trustee refers to a trustee who is not an “interested person” of the series within the meaning of the Investment Company Act of 1940. |
| 2 | Trustees and officers of the series serve until their resignation, removal or retirement. |
| 3 | This includes all directorships/trusteeships (other than those in the American Funds or other funds managed by Capital Research and Management Company or its affiliates) that are held by each trustee as a trustee or director of a public company or a registered investment company. |
| 4 | The term interested trustee refers to a trustee who is an “interested person” within the meaning of the Investment Company Act of 1940, on the basis of their affiliation with the series investment adviser, Capital Research and Management Company, or affiliated entities (including the series principal underwriter). |
| 5 | All of the trustees and/or officers listed, with the exception of Martin Jacobs, Keiko McKibben and Renaud H. Samyn, are officers and/or directors/trustees of one or more of the other funds for which Capital Research and Management Company serves as investment adviser. |
| 6 | Company affiliated with Capital Research and Management Company. |
| American Funds Insurance Series | 223 |
Office of the series
333 South Hope Street
Los Angeles, CA 90071-1406
Investment adviser
Capital Research and Management Company
333 South Hope Street
Los Angeles, CA 90071-1406
Investment subadviser
Milliman Financial Risk Management LLC
(Managed Risk Funds only)
71 South Wacker Drive, 31st Floor
Chicago, IL 60606
Custodians of assets
State Street Bank and Trust Company
One Lincoln Street
Boston, MA 02111
Bank of New York Mellon
(Managed Risk Funds only)
One Wall Street
New York, NY 10286
Counsel
Morgan, Lewis & Bockius LLP
One Federal Street
Boston, MA 02110-1726
Independent registered public accounting firm
PricewaterhouseCoopers LLP
601 South Figueroa Street
Los Angeles, CA 90017-3874
| 224 | American Funds Insurance Series |
Investors should carefully consider investment objectives, risks, charges and expenses. This and other important information is contained in the series prospectuses and summary prospectuses, which can be obtained from your financial professional and should be read carefully before investing. You may also call American Funds Service Company (AFS) at (800) 421-4225 or visit the Capital Group website at capitalgroup.com.
“American Funds Proxy Voting Procedures and Principles” — which describes how we vote proxies relating to portfolio securities — is available on the Capital Group website or upon request by calling AFS. The series files its proxy voting record with the U.S. Securities and Exchange Commission (SEC) for the 12 months ended June 30 by August 31. The proxy voting record is available free of charge on the SEC website at sec.gov and on the Capital Group website.
Complete December 31, 2019, portfolios of American Funds Insurance Series’ investments are available free of charge by calling AFS or visiting the SEC website (where they are part of Form N-CSR).
American Funds Insurance Series files a complete list of its portfolio holdings with the SEC for the first and third quarters of each fiscal year on Form NPORT-P. This filing is available free of charge on the SEC website. Additionally, the list of portfolio holdings is available by calling AFS.
This report is for the information of American Funds Insurance Series investors, but it also may be used as sales literature when preceded or accompanied by the current prospectuses or summary prospectuses for American Funds Insurance Series and the prospectus for the applicable insurance contract, which give details about charges, expenses, investment objectives and operating policies of the series. If used as sales material after March 31, 2020, this report must be accompanied by a statistical update for the most recently completed calendar quarter.
Fund attribution data was produced using FactSet, a third-party software system, based on daily portfolios. Securities in their initial period of acquisition may not be included in this analysis. The analysis includes equity investments only and excludes forward contracts and fixed income investments, if applicable. It does not account for buy-and-sell transactions that might have occurred intraday. As a result, average portfolio weight percentages are approximate, and the actual average portfolio weight percentages might be higher or lower. Data elements, such as pricing, income, market cap, etc., were provided by FactSet. The indexes provided for attribution are based on FactSet’s methodology. The indexes are broad-based market benchmarks and may not be used by Capital Group® as the sole comparative index for the funds. Capital Group believes the software and information from FactSet to be reliable. However, Capital Group cannot be responsible for inaccuracies, incomplete information or updating of information by FactSet.
Futures may not provide an effective hedge of the underlying securities because changes in the prices of futures may not track those of the securities they are intended to hedge. In addition, the managed risk strategy may not effectively protect the fund from market declines and will limit the fund’s participation in market gains. The use of the managed risk strategy could cause the fund’s return to lag that of the underlying fund in certain market conditions.
Bloomberg® is a trademark and service mark of Bloomberg Finance L.P. (collectively with its affiliates, “Bloomberg”). Barclays® is a trademark and service mark of Barclays Bank Plc (collectively with its affiliates, “Barclays”), used under license. Bloomberg or Bloomberg’s licensors, including Barclays, own all proprietary rights in the Bloomberg Barclays Indices. Neither Bloomberg nor Barclays approve or endorse this material, or guarantees the accuracy or completeness of any information herein, or makes any warranty, express or implied, as to the results to be obtained therefrom and, to the maximum extent allowed by law, neither shall have any liability or responsibility for injury or damages arising in connection therewith. This report, and any product, index or fund referred to herein, is not sponsored, endorsed or promoted in any way by J.P. Morgan or any of its affiliates who provide no warranties whatsoever, express or implied, and shall have no liability to any prospective investor in connection with this report. J.P. Morgan disclaimer: http://www.jpmorgan.com/pages/jpmorgan/ib/girg. MSCI has not approved, reviewed or produced this report, makes no express or implied warranties or representations and is not liable whatsoever for any data in the report. You may not redistribute the MSCI data or use it as a basis for other indices or investment products. The S&P 500 is a product of S&P Dow Jones Indices LLC and/or its affiliates and has been licensed for use by Capital Group. Copyright © 2019 S&P Dow Jones Indices LLC, a division of S&P Global, and/or its affiliates. All rights reserved. Redistribution or reproduction in whole or in part is prohibited without written permission of S&P Dow Jones Indices LLC.
American Funds Distributors, Inc., member FINRA.

The Capital Advantage®
Since 1931, Capital Group, home of American Funds, has helped investors pursue long-term investment success. Our consistent approach — in combination with The Capital SystemSM— has resulted in superior outcomes.
| Aligned with investor success | |
| We base our decisions on a long-term perspective, which we believe aligns our goals with the interests of our clients. American Funds Insurance Series portfolio managers average 28 years of investment experience, including 23 years at our company, reflecting a career commitment to our long-term approach.1 | |
| The Capital System | |
| The Capital System combines individual accountability with teamwork. Funds using The Capital System are divided into portions that are managed independently by investment professionals with diverse backgrounds, ages and investment approaches. An extensive global research effort is the backbone of our system. | |
| American Funds Insurance Series superior outcomes | |
| American Funds Insurance Series equity funds have beaten their comparable Lipper indexes in 90% of 10-year periods and 100% of 20-year periods.2Our fixed income funds have helped investors achieve diversification through attention to correlation between bonds and equities.3We strive to keep management fees competitive. Over the past 20 years, most funds’ fees have been below industry averages.4 |
| 1 | Portfolio manager experience as of the American Funds Insurance Series prospectus dated May 1, 2020. | |
| 2 | Based on Class 1 share results for rolling periods through December 31, 2019. Periods covered are the shorter of the fund’s lifetime or since the inception date of the comparable Lipper index or average. The comparable Lipper indexes are: Global Funds Index (Global Growth Fund, Global Growth and Income Fund), Growth Funds Index (Growth Fund), International Funds Index (International Fund), Emerging Markets Funds Index (New World Fund), Growth & Income Funds Index (Blue Chip Income and Growth Fund, Growth-Income Fund) and Balanced Funds Index (Asset Allocation Fund). The Lipper Global Small-/Mid-Cap Funds Average was used for Global Small Capitalization Fund. Lipper source: Refinitiv Lipper. There have been periods when the fund has lagged the index. | |
| 3 | Based on Class 1 share results as of December 31, 2019. Four of our five fixed income funds showed a three-year correlation below 0.1. Standard & Poor’s 500 Composite Index was used as an equity market proxy. Correlation based on monthly total returns. Correlation is a statistical measure of how two securities move in relation to each other. A correlation ranges from –1 to 1. A positive correlation close to 1 implies that as one security moves, either up or down, the other security will move in “lockstep,” in the same direction. A negative correlation close to –1 indicates that the securities have moved in the opposite direction. | |
| 4 | Based on management fees for the 20-year period ended December 31, 2019, versus comparable Lipper categories, excluding funds of funds. |
All Capital Group trademarks mentioned are owned by The Capital Group Companies, Inc., an affiliated company or fund. All other company and product names mentioned are the property of their respective companies.

American Funds Insurance Series®
Annual report |  |

Portfolios that invest
in global companies
for the long term
Beginning on January 1, 2021, as permitted by regulations adopted by the U.S. Securities and Exchange Commission, you may not receive paper copies of the fund’s shareholder reports from the insurance company that offers your contract unless you specifically request paper copies from the insurance company or from your financial intermediary. Instead, the shareholder reports will be made available on a website, and the insurance company will notify you by mail each time a report is posted and provide you with a website link to access the report. Instructions for requesting paper copies will be provided by your insurance company.
If you have already elected to receive shareholder reports electronically, you will not be affected by this change and do not need to take any action. You may elect to receive shareholder reports and other communications from the insurance company electronically by following the instructions provided by the insurance company.
You may elect to receive paper copies of all future reports free of charge from the insurance company. You can inform the insurance company that you wish to continue receiving paper copies of your shareholder reports by following the instructions provided by the insurance company. Your election to receive paper reports will apply to all investment options available under your contract.
American Funds Insurance Series — Portfolio Series, from Capital Group, serves as an underlying investment vehicle for variable annuities and insurance products. For nearly 90 years, Capital has invested with a long-term focus based on thorough research and attention to risk.
American Funds Global Growth PortfolioSM seeks to provide long-term growth of capital.
American Funds Growth and Income PortfolioSM seeks to provide long-term growth of capital while providing current income.
American Funds Managed Risk Growth PortfolioSM seeks to provide long-term growth of capital while seeking to manage volatility and provide downside protection.
American Funds Managed Risk Growth and Income PortfolioSMseeks to provide long-term growth of capital and current income while seeking to manage volatility and provide downside protection.
American Funds Managed Risk Global Allocation PortfolioSMseeks to provide high total return (including income and capital gains) consistent with preservation of capital over the long term while seeking to manage volatility and provide downside protection.
Investing for short periods makes losses more likely. For current information and month-end results, visit capitalgroup.com/afis. For information about your insurance contract and month-end results, go to the website of the company that issued your contract.
Here are the average annual total returns on a $1,000 investment with all distributions reinvested for periods ended December 31, 2019. Also shown are the estimated gross and net expense ratios as of the series prospectus dated May 1, 2020 (unaudited):
| 1 year | Lifetime (since 5/1/15) | Gross expense ratio | Net expense ratio | |||||||||||||
| American Funds Global Growth Portfolio, Class 4 | 31.67 | % | 9.10 | % | 1.24 | % | 1.19 | % | ||||||||
| American Funds Growth and Income Portfolio, Class 4 | 19.57 | 6.85 | 0.97 | 0.97 | ||||||||||||
| American Funds Managed Risk Growth Portfolio, Class P2 | 19.26 | 6.33 | 1.08 | 1.03 | ||||||||||||
| American Funds Managed Risk Growth and Income Portfolio, Class P2 | 19.29 | 5.75 | 1.14 | 1.09 | ||||||||||||
| American Funds Managed Risk Global Allocation Portfolio, Class P2 | 20.44 | 5.05 | 1.27 | 1.22 | ||||||||||||
Expense ratios are restated to reflect current fees. Investment results assume all distributions are reinvested and reflect applicable fees and expenses. The investment adviser is currently waiving a portion of its management fee equal to 0.05% of the funds’ net assets for the three managed risk portfolios. In addition, the investment adviser is currently reimbursing a portion of the other expenses for American Funds Global Growth Portfolio. Investment results and net expense ratios shown reflect the waiver and reimbursement, without which the results would have been lower and the expenses would have been higher. This waiver and reimbursement will be in effect through at least May 1, 2021, unless modified or terminated by the series board. The adviser may elect at its discretion to extend, modify or terminate the reimbursement at that time. The waiver may only be modified or terminated with the approval of the series board. Refer to the funds’ most recent prospectuses for details.
Investment allocations may not achieve fund objectives. There are expenses associated with the underlying funds in addition to fund of funds expenses. The funds’ risks are directly related to the risks of the underlying funds. Underlying fund allocations are as of December 31, 2019. Allocation percentages and underlying funds are subject to the Portfolio Solutions Committee’s discretion and will evolve over time. Underlying funds may be added or removed during the year. Investing outside the United States involves risks such as currency fluctuations, periods of illiquidity and price volatility, as more fully described in the funds’ prospectuses. These risks may be heightened in connection with investments in developing countries. Small-company stocks entail additional risks, and they can fluctuate in price more than larger company stocks. The return of principal for bond funds and funds with significant underlying bond holdings is not guaranteed. Fund shares are subject to the same interest rate, inflation and credit risks associated with the underlying bond holdings. Lower rated bonds are subject to greater fluctuations in value and risk of loss of income and principal than higher rated bonds. Futures contracts may not provide an effective hedge of the underlying securities because changes in the prices of futures contracts may not track those of the securities they are intended to hedge. In addition, the managed risk strategy may not effectively protect the funds from market declines and will limit the funds’ participation in market gains. The use of the managed risk strategy could cause the funds’ returns to lag those of the applicable underlying funds in certain rising market conditions. Refer to the funds’ prospectuses and the Risk Factors section of this report for more information on these and other risks associated with investing in the funds.
Investments are not FDIC-insured, nor are they deposits of or guaranteed by a bank or any other entity, so they may lose value.
| Contents | |
| 1 | Letter to investors |
| 3 | The value of a hypothetical $10,000 investment |
| Investment portfolios | |
| 7 | American Funds Global Growth Portfolio |
| 8 | American Funds Growth and Income Portfolio |
| 10 | American Funds Managed Risk Growth Portfolio |
| 12 | American Funds Managed Risk Growth and Income Portfolio |
| 14 | American Funds Managed Risk Global Allocation Portfolio |
| 16 | Financial statements |
| 42 | Board of trustees and other officers |
Fellow investors:
We are pleased to present this annual report for American Funds Insurance Series (AFIS) — Portfolio Series, a suite of funds that offers variable annuity investors objective-based portfolios to help meet retirement goals. The investment adviser’s Portfolio Solutions Committee develops the allocation approach and selects the underlying funds in which the fund invests. The members of the Portfolio Solutions Committee, who are jointly and primarily responsible for the portfolio management of the fund, include Michelle J. Black, Samir Mathur, Wesley K. Phoa, John R. Queen, William L. Robbins and Andrew B. Suzman.
Global stocks generated the best one-year returns in a decade, boosted by aggressive central bank stimulus measures and easing trade tensions toward the end of the year. The trade war with China occasionally caused volatility, but the resilient U.S. economy and the Federal Reserve and European Central Bank’s return to accommodative policies helped steer markets higher. Technology stocks posted the strongest returns for the year, driven by solid earnings reports from U.S. tech giants such as Apple, Microsoft and Facebook.
U.S. equities had their best annual gains since 2013, ending the year near all-time highs. Stocks rose steadily following the steep selloff in late 2018, posting positive gains in 10 of 12 months. The central bank cut its policy rate three times in 2019 amid concerns over slowing economic growth. Cyclical stocks generally outpaced defensive sectors, and large caps bested small caps. Government bonds advanced as central banks around the world cut interest rates in an effort to blunt the negative effects of a trade war. The Fed paused rate hikes for the first half of the year and cut three times in the second. At the close of December, the rate stood between 1.50% and 1.75%.
For the fiscal year, Standard & Poor’s 500 Composite Index1, a market capitalization-weighted index based on the results of approximately 500 widely held common stocks, gained 31.49%. Bloomberg Barclays U.S. Aggregate Index2, which measures investment-grade U.S. bonds (rated BBB/Baa and above3), returned 8.72%, while Bloomberg Barclays Global Aggregate Index2, a measure of global investment-grade bonds (rated BBB/Baa and above3), gained 6.84%.
American Funds Global Growth Portfolio gained 31.67%. By comparison, the MSCI ACWI (All Country World Index)4, a free float-adjusted, market capitalization-weighted index designed to measure the results of more than 40 developed and emerging equity markets, increased 26.60%. The Morningstar U.S. Insurance World Large Stock Category Average5, a peer fund comparison for the insurance industry that includes portfolios that invest the majority of their assets in the
See page 2 for footnotes.
| American Funds Insurance Series – Portfolio Series | 1 |
U.S., Europe and Japan (and typically have 20%–60% of assets in the U.S.), climbed 26.43%.
American Funds Growth and Income Portfolio increased 19.57%. The 70%/30% Blended Index6rose 24.48%. The Morningstar U.S. Insurance 50% to 70% Equity Allocation Category Average5, a peer fund comparison for the insurance industry that includes funds that seek to provide both income and capital appreciation by investing in multiple asset classes including stocks, bonds and cash, returned 19.06%.
American Funds Managed Risk Growth Portfolio advanced 19.26%. In comparison, Standard & Poor’s 500 Managed Risk Index — Moderate7gained 19.14%.
American Funds Managed Risk Growth and Income Portfolio climbed 19.29%, while Standard & Poor’s 500 Managed Risk Index — Moderate7increased 19.14%.
American Funds Managed Risk Global Allocation Portfolio finished up 20.44%. In comparison, Standard & Poor’s Global LargeMidCap Managed Risk Index — Moderate7advanced 19.60%.
Historically, stock markets have experienced periods of volatility. It is important to note that the managed risk portfolios employ a risk-management overlay. As such, they may lag in a strong market environment, but have been designed to buffer the effects of volatility and provide a measure of downside protection, particularly in instances of infrequent large drawdowns, which can be very beneficial to certain investors.
Thank you for your interest in AFIS — Portfolio Series. We look forward to reporting to you again in six months’ time.
Sincerely,

Donald D. O’Neal
Co-President

Alan N. Berro
Co-President
February 14, 2020
The market indexes shown are unmanaged and, therefore, have no expenses. Investors cannot invest directly in an index.
| 1 | Source: S&P Dow Jones Indices LLC. |
| 2 | Source: Bloomberg Index Services Ltd. |
| 3 | Bond ratings, which typically range from AAA/Aaa (highest) to D (lowest) are assigned by credit rating agencies such as Standard & Poor’s, Moody’s and/or Fitch as an indication of an issuer’s creditworthiness. |
| 4 | MSCI index results reflect dividends net of withholding taxes. Source: MSCI. |
| 5 | Source: Morningstar, Inc. © 2020 All rights reserved. The information contained herein: (1) is proprietary to Morningstar and/or its content providers; (2) may not be copied or distributed; (3) does not constitute investment advice offered by Morningstar; and (4) is not warranted to be accurate, complete or timely. Neither Morningstar nor its content providers are responsible for any damages or losses arising from this information. Past performance is no guarantee of future results. |
| 6 | The 70%/30% Blended Index weights the total returns of the S&P 500 and Bloomberg Barclays U.S. Aggregate indexes at the corresponding percentages. |
| 7 | Source: S&P Dow Jones Indices LLC. The Standard & Poor’s Managed Risk Index Series is designed to simulate a dynamic protective portfolio that allocates between the underlying equity index and cash, based on realized volatilities of the underlying equity and bond indices, while maintaining a fixed allocation to the underlying bond index. These indices are generated and published under agreements between Standard & Poor’s Dow Jones Indices and Milliman Financial Risk Management LLC. |
| 2 | American Funds Insurance Series – Portfolio Series |
The value of a hypothetical $10,000 investment
(for the year ended December 31, 2019, with all distributions reinvested)
Fund results shown are for past periods and are not predictive of results for future periods. Current and future results may be lower or higher than those shown. Unit prices and returns will vary, so investors may lose money. Investing for short periods makes losses more likely. For current information and month-end results, visit capitalgroup.com/afis. For information about your insurance contract and month-end results, go to the website of the company that issued your contract.
Global Growth Portfolio

Average annual total returns4based on a $1,000 investment
(for the year ended December 31, 2019)
| 1 year | Lifetime (since 5/1/15) | |
| Class 4 shares | 31.67% | 9.10% |
Growth and Income Portfolio

Average annual total returns4based on a $1,000 investment
(for the year ended December 31, 2019)
| 1 year | Lifetime (since 5/1/15) | |
| Class 4 shares | 19.57% | 6.85% |
The market indexes shown are unmanaged and, therefore, have no expenses. Investors cannot invest directly in an index.
See page 4 for footnotes.
| American Funds Insurance Series – Portfolio Series | 3 |
Managed Risk Growth Portfolio
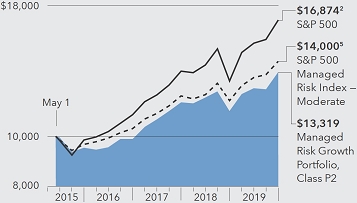
Average annual total returns4based on a $1,000 investment
(for the year ended December 31, 2019)
| 1 year | Lifetime (since 5/1/15) | |
| Class P2 shares | 19.26% | 6.33% |
Managed Risk Global Allocation Portfolio

Average annual total returns4based on a $1,000 investment
(for the year ended December 31, 2019)
| 1 year | Lifetime (since 5/1/15) | |
| Class P2 shares | 20.44% | 5.05% |
Managed Risk Growth and Income Portfolio
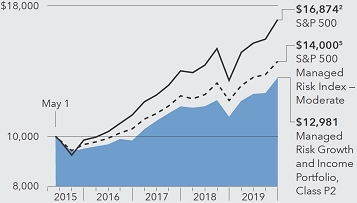
Average annual total returns4based on a $1,000 investment
(for the year ended December 31, 2019)
| 1 year | Lifetime (since 5/1/15) | |
| Class P2 shares | 19.29% | 5.75% |
The market indexes shown are unmanaged and, therefore, have no expenses. Investors cannot invest directly in an index.
| 1 | Results reflect dividends net of withholding taxes. Source: MSCI. |
| 2 | Source: S&P Dow Jones Indices. |
| 3 | Source: Bloomberg Index Services. |
| 4 | Investment results assume all distributions are reinvested and reflect applicable fees and expenses. The investment adviser is currently waiving a portion of its management fee equal to 0.05% of the funds’ net assets for the three managed risk portfolios. In addition, the investment adviser is currently reimbursing a portion of the other expenses for American Funds Global Growth Portfolio. Investment results shown reflect the waiver and reimbursement, without which the results would have been lower. This waiver and reimbursement will be in effect through at least May 1, 2021, unless modified or terminated by the series board. The adviser may elect at its discretion to extend, modify or terminate the reimbursement at that time. The waiver may only be modified or terminated with the approval of the series board. Refer to the funds’ most recent prospectuses for details. |
| 5 | Source: S&P Dow Jones Indices LLC. Standard & Poor’s Managed Risk Index Series is designed to simulate a dynamic protective portfolio that allocates between the underlying equity index and cash, based on realized volatilities of the underlying equity and bond indexes, while maintaining a fixed allocation to the underlying bond index. These indexes are generated and published under agreements between Standard & Poor’s Dow Jones Indices and Milliman Financial Risk Management LLC. |
Milliman Financial Risk Management LLC serves as the subadviser with respect to the management of the managed risk strategy for the managed risk funds.
| 4 | American Funds Insurance Series – Portfolio Series |
American Funds Global Growth Portfolio
| Underlying allocations as of 12/31/19: | ||
| 30.0% | Global Growth Fund | |
| 20.0% | New World Fund® | |
| 10.0% | Global Small Capitalization Fund | |
| 10.0% | Growth Fund | |
| 30.0% | Global Growth and Income Fund | |
The fund’s investment objective is to provide long-term growth of capital. The fund will attempt to achieve its investment objective by investing in a mix of American Funds Insurance Series (AFIS) Funds in different combinations and weightings. The underlying AFIS funds will primarily consist of growth funds. The fund may also invest in growth-and-income funds. Through its investments in the underlying funds, the fund will have significant exposure to growth-oriented common stocks.
For the 12 months ended December 31, 2019, the fund’s shares had a return of 31.67%. All the underlying funds returned positive results, led by Global Growth Fund, Global Small Capitalization Fund and Global Growth and Income Fund.
American Funds Growth and Income Portfolio
| Underlying allocations as of 12/31/19: | ||
| 15.0% | Growth Fund | |
| 20.0% | Growth-Income Fund | |
| 10.0% | Global Growth and Income Fund | |
| 25.0% | Capital Income Builder® | |
| 20.0% | Bond Fund | |
| 10.0% | Global Bond Fund | |
The fund’s investment objective is to provide long-term growth of capital while providing current income. The fund will attempt to achieve its investment objective by investing in a mix of AFIS funds in different combinations and weightings. The underlying AFIS funds will primarily consist of equity funds in the growth, growth-and-income and equity-income categories. However, the fund may also invest in fixed income funds.
For the 12 months ended December 31, 2019, the fund’s shares had a return of 19.57%. All the underlying funds returned positive results, led by Global Growth and Income Fund, Growth Fund and Growth-Income Fund.
American Funds Managed Risk Growth Portfolio
| Underlying allocations as of 12/31/19: | ||
| 25.0% | Growth Fund | |
| 10.0% | Global Small Capitalization Fund | |
| 10.0% | International Fund | |
| 20.1% | Growth-Income Fund | |
| 10.0% | Blue Chip Income and Growth Fund | |
| 20.1% | Bond Fund | |
| 4.8% | Cash & equivalents in support of managed risk strategy*,† | |
The fund’s investment objective is to provide long-term growth of capital while seeking to manage volatility and provide downside protection. The fund will attempt to achieve its investment objective by investing in a mix of AFIS funds in different combinations and weightings, while seeking to manage portfolio volatility and to provide downside protection primarily through the use of exchange-traded futures contracts. The underlying AFIS funds will primarily consist of growth funds. The fund may also invest in growth-and-income and fixed income funds.
For the 12 months ended December 31, 2019, the fund’s shares had a return of 19.26%. All the underlying funds returned positive results, led by Global Small Capitalization Fund, Growth Fund and Growth-Income Fund.
See page 6 for footnotes.
| American Funds Insurance Series – Portfolio Series | 5 |
American Funds Managed Risk Growth and Income Portfolio
| Underlying allocations as of 12/31/19: | ||
| 15.3% | Growth Fund | |
| 20.4% | Global Growth and Income Fund | |
| 20.4% | Growth-Income Fund | |
| 25.4% | Capital Income Builder® | |
| 7.6% | Global Bond Fund | |
| 7.6% | Bond Fund | |
| 3.3% | Cash & equivalents in support of managed risk strategy*,† | |
The fund’s investment objective is to provide long-term growth of capital and current income while seeking to manage volatility and provide downside protection. The fund will attempt to achieve its investment objective by investing in a mix of AFIS funds in different combinations and weightings, while seeking to manage portfolio volatility and to provide downside protection primarily through the use of exchange-traded futures contracts. The underlying AFIS funds will primarily consist of equity funds in the growth, growth-and-income and equity-income categories. However, the fund may also invest in fixed income funds.
For the 12 months ended December 31, 2019, the fund’s shares had a return of 19.29%. All the underlying funds returned positive results, led by Global Growth and Income Fund, Growth Fund and Growth-Income Fund.
American Funds Managed Risk Global Allocation Portfolio
| Underlying allocations as of 12/31/19: | ||
| 15.1% | Global Growth Fund | |
| 10.0% | International Fund | |
| 20.1% | Global Growth and Income Fund | |
| 9.9% | Asset Allocation Fund | |
| 25.0% | Global Balanced Fund | |
| 15.1% | Global Bond Fund | |
| 4.8% | Cash & equivalents in support of managed risk strategy*,† | |
The fund’s investment objective is to provide high total return (including income and capital gains) consistent with preservation of capital over the long term while seeking to manage volatility and provide downside protection. The fund will attempt to achieve its investment objective by investing in a mix of AFIS funds in different combinations and weightings, while seeking to manage portfolio volatility and to provide downside protection primarily through the use of exchange-traded futures contracts. The underlying AFIS funds may include growth, growth-and-income, equity-income, balanced, asset allocation and fixed income funds.
For the 12 months ended December 31, 2019, the fund’s shares had a return of 20.44%. All the underlying funds returned positive results, led by Global Growth Fund, Global Growth and Income Fund and International Fund.
The Portfolio Series funds are actively monitored; allocations and funds may change.
| * | Cash and equivalents includes short-term securities, accrued income and other assets less liabilities. It also may include investments in money market or similar funds managed by the investment adviser or its affiliates that are not offered to the public. |
| † | The managed risk strategy is operated by Milliman Financial Risk Management LLC. Futures contracts may not provide an effective hedge of the underlying securities because changes in the prices of futures contracts may not track those of the securities they are intended to hedge. In addition, the managed risk strategy may not effectively protect the fund from market declines and will limit the fund’s participation in market gains. The use of the managed risk strategy could cause the fund’s return to lag that of the underlying funds in certain rising market conditions. |
| 6 | American Funds Insurance Series – Portfolio Series |
American Funds Global Growth Portfolio
Investment portfolioDecember 31, 2019
| Growth funds 70.04% | Shares | Value (000) | ||||||
| American Funds Insurance Series - Global Growth Fund, Class 1 | 501,745 | $ | 16,342 | |||||
| American Funds Insurance Series - New World Fund, Class 1 | 420,394 | 10,863 | ||||||
| American Funds Insurance Series - Global Small Capitalization Fund, Class 1 | 203,535 | 5,455 | ||||||
| American Funds Insurance Series - Growth Fund, Class 1 | 66,914 | 5,435 | ||||||
| Total growth funds (cost: $32,966,000) | 38,095 | |||||||
| Growth-and-income funds 30.05% | ||||||||
| American Funds Insurance Series - Global Growth and Income Fund, Class 1 | 1,026,415 | 16,340 | ||||||
| Total growth-and-income funds (cost: $14,620,000) | 16,340 | |||||||
| Total investment securities 100.09% (cost: $47,586,000) | 54,435 | |||||||
| Other assets less liabilities (0.09)% | (51 | ) | ||||||
| Net assets 100.00% | $ | 54,384 | ||||||
Investments in affiliates
These holdings are affiliates of the fund under the Investment Company Act of 1940 since they are controlled by the same board of trustees as the series. Further details on these holdings and related transactions during the year ended December 31, 2019, appear below.
| Beginning shares | Additions | Reductions | Ending shares | Net realized loss (000) | Net unrealized appreciation (000) | Dividend income (000) | Value of affiliates at 12/31/2019 (000) | |||||||||||||||||||||||||
| Growth funds 70.04% | ||||||||||||||||||||||||||||||||
| American Funds Insurance Series - Global Growth Fund, Class 1 | 414,266 | 152,719 | 65,240 | 501,745 | $ | (32 | ) | $ | 3,182 | $ | 200 | $ | 16,342 | |||||||||||||||||||
| American Funds Insurance Series - New World Fund, Class 1 | 338,771 | 127,418 | 45,795 | 420,394 | (8 | ) | 1,847 | 118 | 10,863 | |||||||||||||||||||||||
| American Funds Insurance Series - Global Small Capitalization Fund, Class 1 | 163,807 | 75,263 | 35,535 | 203,535 | (19 | ) | 954 | 19 | 5,455 | |||||||||||||||||||||||
| American Funds Insurance Series - Growth Fund, Class 1 | 51,065 | 24,838 | 8,989 | 66,914 | (14 | ) | 699 | 49 | 5,435 | |||||||||||||||||||||||
| 38,095 | ||||||||||||||||||||||||||||||||
| Growth-and-income funds 30.05% | ||||||||||||||||||||||||||||||||
| American Funds Insurance Series - Global Growth and Income Fund, Class 1 | 819,083 | 331,295 | 123,963 | 1,026,415 | (63 | ) | 2,716 | 323 | 16,340 | |||||||||||||||||||||||
| Total 100.09% | $ | (136 | ) | $ | 9,398 | $ | 709 | $ | 54,435 | |||||||||||||||||||||||
See notes to financial statements.
| American Funds Insurance Series – Portfolio Series | 7 |
American Funds Growth and Income Portfolio
Investment portfolioDecember 31, 2019
| Growth funds 15.02% | Shares | Value (000) | ||||||
| American Funds Insurance Series - Growth Fund, Class 1 | 474,591 | $ | 38,546 | |||||
| Total growth funds (cost: $34,074,000) | 38,546 | |||||||
| Growth-and-income funds 30.03% | ||||||||
| American Funds Insurance Series - Growth-Income Fund, Class 1 | 1,013,452 | 51,392 | ||||||
| American Funds Insurance Series - Global Growth and Income Fund, Class 1 | 1,614,347 | 25,701 | ||||||
| Total growth-and-income funds (cost: $70,368,000) | 77,093 | |||||||
| Equity-income and Balanced funds 25.02% | ||||||||
| American Funds Insurance Series - Capital Income Builder, Series 1 | 5,986,989 | 64,240 | ||||||
| Total equity-income and balanced funds (cost: $59,395,000) | 64,240 | |||||||
| Fixed income funds 30.01% | ||||||||
| American Funds Insurance Series - Bond Fund, Class 1 | 4,595,645 | 51,333 | ||||||
| American Funds Insurance Series - Global Bond Fund, Class 1 | 2,120,840 | 25,705 | ||||||
| Total fixed income funds (cost: $75,024,000) | 77,038 | |||||||
| Total investment securities 100.08% (cost: $238,861,000) | 256,917 | |||||||
| Other assets less liabilities (0.08)% | (203 | ) | ||||||
| Net assets 100.00% | $ | 256,714 | ||||||
| 8 | American Funds Insurance Series – Portfolio Series |
American Funds Growth and Income Portfolio
Investments in affiliates
These holdings are affiliates of the fund under the Investment Company Act of 1940 since they are controlled by the same board of trustees as the series. Further details on these holdings and related transactions during the year ended December 31, 2019, appear below.
| Beginning shares | Additions | Reductions | Ending shares | Net realized loss (000) | Net unrealized appreciation (000) | Dividend income (000) | Value of affiliates at 12/31/2019 (000) | |||||||||||||||||||||||||
| Growth funds 15.02% | ||||||||||||||||||||||||||||||||
| American Funds Insurance Series - Growth Fund, Class 1 | 357,569 | 159,634 | 42,612 | 474,591 | $ | (62 | ) | $ | 5,044 | $ | 342 | $ | 38,546 | |||||||||||||||||||
| Growth-and-income funds 30.03% | ||||||||||||||||||||||||||||||||
| American Funds Insurance Series - Growth-Income Fund, Class 1 | 735,529 | 334,622 | 56,699 | 1,013,452 | (109 | ) | 4,876 | 889 | 51,392 | |||||||||||||||||||||||
| American Funds Insurance Series - Global Growth and Income Fund, Class 1 | 1,267,630 | 469,734 | 123,017 | 1,614,347 | (122 | ) | 4,283 | 505 | 25,701 | |||||||||||||||||||||||
| 77,093 | ||||||||||||||||||||||||||||||||
| Equity-income and Balanced funds 25.02% | ||||||||||||||||||||||||||||||||
| American Funds Insurance Series - Capital Income Builder, Class 1 | 4,458,865 | 1,748,721 | 220,597 | 5,986,989 | (25 | ) | 7,068 | 1,695 | 64,240 | |||||||||||||||||||||||
| Fixed income funds 30.01% | ||||||||||||||||||||||||||||||||
| American Funds Insurance Series - Bond Fund, Class 1 | 3,282,224 | 1,556,346 | 242,925 | 4,595,645 | (54 | ) | 2,527 | 1,327 | 51,333 | |||||||||||||||||||||||
| American Funds Insurance Series - Global Bond Fund, Class 1 | 1,528,939 | 644,903 | 53,002 | 2,120,840 | (3 | ) | 1,179 | 418 | 25,705 | |||||||||||||||||||||||
| 77,038 | ||||||||||||||||||||||||||||||||
| Total 100.08% | $ | (375 | ) | $ | 24,977 | $ | 5,176 | $ | 256,917 | |||||||||||||||||||||||
See notes to financial statements.
| American Funds Insurance Series – Portfolio Series | 9 |
American Funds Managed Risk Growth Portfolio
Investment portfolioDecember 31, 2019
| Growth funds 45.06% | Shares | Value (000) | ||||||
| American Funds Insurance Series – Growth Fund, Class 1 | 4,544,435 | $ | 369,099 | |||||
| American Funds Insurance Series – Global Small Capitalization Fund, Class 1 | 5,511,249 | 147,702 | ||||||
| American Funds Insurance Series – International Fund, Class 1 | 7,062,821 | 147,330 | ||||||
| Total growth funds (cost: $586,318,000) | 664,131 | |||||||
| Growth-and-income funds 30.11% | ||||||||
| American Funds Insurance Series – Growth-Income Fund, Class 1 | 5,844,466 | 296,373 | ||||||
| American Funds Insurance Series – Blue Chip Income and Growth Fund, Class 1 | 10,870,297 | 147,401 | ||||||
| Total growth-and-income funds (cost: $417,845,000) | 443,774 | |||||||
| Fixed income funds 20.05% | ||||||||
| American Funds Insurance Series – Bond Fund, Class 1 | 26,459,809 | 295,556 | ||||||
| Total fixed income funds (cost: $288,340,000) | 295,556 | |||||||
| Short-term securities 4.83% | ||||||||
| Government Cash Management Fund 1.51%1 | 71,151,884 | 71,152 | ||||||
| Total short-term securities (cost: $71,152,000) | 71,152 | |||||||
| Total investment securities 100.05% (cost: $1,363,655,000) | 1,474,613 | |||||||
| Other assets less liabilities (0.05)% | (719 | ) | ||||||
| Net assets 100.00% | $ | 1,473,894 | ||||||
Futures contracts
| Contracts | Type | Number of contracts | Expiration | Notional amount (000) | 2 | Value at 12/31/2019 (000) | 3 | Unrealized depreciation at 12/31/2019 (000) | |||||
| 5 Year U.S. Treasury Note Futures | Long | 660 | March 2020 | $66,000 | $78,282 | $(212 | ) |
| 10 | American Funds Insurance Series – Portfolio Series |
American Funds Managed Risk Growth Portfolio
Investments in affiliates
These holdings are affiliates of the fund under the Investment Company Act of 1940 since they are controlled by the same board of trustees as the series. Further details on these holdings and related transactions during the year ended December 31, 2019, appear below.
| Beginning shares | Additions | Reductions | Ending shares | Net realized gain (loss) (000) | Net unrealized appreciation (000) | Dividend income (000) | Value of affiliates at 12/31/2019 (000) | |||||||||||||||||||||||||
| Growth funds 45.06% | ||||||||||||||||||||||||||||||||
| American Funds Insurance Series – Growth Fund, Class 1 | 3,900,112 | 1,011,909 | 367,586 | 4,544,435 | $ | 3,635 | $ | 46,197 | $ | 3,316 | $ | 369,099 | ||||||||||||||||||||
| American Funds Insurance Series – Global Small Capitalization Fund, Class 1 | 4,924,077 | 896,439 | 309,267 | 5,511,249 | (206 | ) | 26,619 | 535 | 147,702 | |||||||||||||||||||||||
| American Funds Insurance Series – International Fund, Class 1 | 6,058,851 | 1,278,697 | 274,727 | 7,062,821 | 221 | 20,602 | 2,332 | 147,330 | ||||||||||||||||||||||||
| 664,131 | ||||||||||||||||||||||||||||||||
| Growth-and-income funds 30.11% | ||||||||||||||||||||||||||||||||
| American Funds Insurance Series – Growth-Income Fund, Class 1 | 4,765,212 | 1,285,228 | 205,974 | 5,844,466 | 300 | 28,491 | 5,162 | 296,373 | ||||||||||||||||||||||||
| American Funds Insurance Series – Blue Chip Income and Growth Fund, Class 1 | 8,642,917 | 2,524,998 | 297,618 | 10,870,297 | (54 | ) | 11,986 | 3,082 | 147,401 | |||||||||||||||||||||||
| 443,774 | ||||||||||||||||||||||||||||||||
| Fixed income funds 20.05% | ||||||||||||||||||||||||||||||||
| American Funds Insurance Series – Bond Fund, Class 1 | 21,057,734 | 7,042,905 | 1,640,830 | 26,459,809 | 334 | 15,509 | 7,758 | 295,556 | ||||||||||||||||||||||||
| Total 95.22% | $ | 4,230 | $ | 149,404 | $ | 22,185 | $ | 1,403,461 | ||||||||||||||||||||||||
| 1 | Rate represents the seven-day yield at 12/31/2019. |
| 2 | Notional amount is calculated based on the number of contracts and notional contract size. |
| 3 | Value is calculated based on the notional amount and current market price. |
See notes to financial statements.
| American Funds Insurance Series – Portfolio Series | 11 |
American Funds Managed Risk Growth and Income Portfolio
Investment portfolioDecember 31, 2019
| Growth funds 15.29% | Shares | Value (000) | ||||||
| American Funds Insurance Series – Growth Fund, Class 1 | 2,426,184 | $ | 197,055 | |||||
| Total growth funds (cost: $172,621,000) | 197,055 | |||||||
| Growth-and-income funds 40.79% | ||||||||
| American Funds Insurance Series – Global Growth and Income Fund, Class 1 | 16,522,951 | 263,045 | ||||||
| American Funds Insurance Series – Growth-Income Fund, Class 1 | 5,175,228 | 262,436 | ||||||
| Total growth-and-income funds (cost: $469,936,000) | 525,481 | |||||||
| Equity-income and Balanced funds 25.45% | ||||||||
| American Funds Insurance Series – Capital Income Builder Fund, Class 1 | 30,554,859 | 327,853 | ||||||
| Total equity-income and balanced funds (cost: $302,150,000) | 327,853 | |||||||
| Fixed income funds 15.24% | ||||||||
| American Funds Insurance Series – Global Bond Fund, Class 1 | 8,110,354 | 98,298 | ||||||
| American Funds Insurance Series – Bond Fund, Class 1 | 8,779,705 | 98,069 | ||||||
| Total fixed income funds (cost: $191,165,000) | 196,367 | |||||||
| Short-term securities 3.29% | ||||||||
| Government Cash Management Fund 1.51%1 | 42,325,177 | 42,325 | ||||||
| Total short-term securities (cost: $42,325,000) | 42,325 | |||||||
| Total investment securities 100.06% (cost: $1,178,197,000) | 1,289,081 | |||||||
| Other assets less liabilities (0.06)% | (767 | ) | ||||||
| Net assets 100.00% | $ | 1,288,314 | ||||||
Futures contracts
| Contracts | Type | Number of contracts | Expiration | Notional amount (000) | 2 | Value at 12/31/2019 (000) | 3 | Unrealized depreciation at 12/31/2019 (000) | |||||
| 5 Year U.S. Treasury Note Futures | Long | 394 | March 2020 | $39,400 | $46,732 | $(167 | ) |
| 12 | American Funds Insurance Series – Portfolio Series |
American Funds Managed Risk Growth and Income Portfolio
Investments in affiliates
These holdings are affiliates of the fund under the Investment Company Act of 1940 since they are controlled by the same board of trustees as the series. Further details on these holdings and related transactions during the year ended December 31, 2019, appear below.
| Beginning shares | Additions | Reductions | Ending shares | Net realized gain (000) | Net unrealized appreciation (000) | Dividend income (000) | Value of affiliates at 12/31/2019 (000) | |||||||||||||||||||||||||
| Growth funds 15.29% | ||||||||||||||||||||||||||||||||
| American Funds Insurance Series – Growth Fund, Class 1 | 2,122,993 | 494,155 | 190,964 | 2,426,184 | $ | 1,580 | $ | 25,042 | $ | 1,774 | $ | 197,055 | ||||||||||||||||||||
| Growth-and-income funds 40.79% | ||||||||||||||||||||||||||||||||
| American Funds Insurance Series – Global Growth and Income Fund, Class 1 | 15,008,970 | 2,417,521 | 903,540 | 16,522,951 | 1,705 | 43,390 | 5,208 | 263,045 | ||||||||||||||||||||||||
| American Funds Insurance Series – Growth-Income Fund, Class 1 | 4,331,416 | 1,009,578 | 165,766 | 5,175,228 | 408 | 25,351 | 4,575 | 262,436 | ||||||||||||||||||||||||
| 525,481 | ||||||||||||||||||||||||||||||||
| Equity-income and Balanced funds 25.45% | ||||||||||||||||||||||||||||||||
| American Funds Insurance Series – Capital Income Builder, Class 1 | 25,927,865 | 4,990,467 | 363,473 | 30,554,859 | 215 | 37,648 | 9,050 | 327,853 | ||||||||||||||||||||||||
| Fixed income funds 15.24% | ||||||||||||||||||||||||||||||||
| American Funds Insurance Series – Global Bond Fund, Class 1 | 6,567,342 | 1,898,592 | 355,580 | 8,110,354 | 142 | 4,758 | 1,639 | 98,298 | ||||||||||||||||||||||||
| American Funds Insurance Series – Bond Fund, Class 1 | 7,154,050 | 2,161,950 | 536,295 | 8,779,705 | 4 | 5,240 | 2,556 | 98,069 | ||||||||||||||||||||||||
| 196,367 | ||||||||||||||||||||||||||||||||
| Total 96.77% | $ | 4,054 | $ | 141,429 | $ | 24,802 | $ | 1,246,756 | ||||||||||||||||||||||||
| 1 | Rate represents the seven-day yield at 12/31/2019. |
| 2 | Notional amount is calculated based on the number of contracts and notional contract size. |
| 3 | Value is calculated based on the notional amount and current market price. |
See notes to financial statements.
| American Funds Insurance Series – Portfolio Series | 13 |
American Funds Managed Risk Global Allocation Portfolio
Investment portfolioDecember 31, 2019
| Growth funds 25.07% | Shares | Value (000) | ||||||
| American Funds Insurance Series – Global Growth Fund, Class 1 | 1,965,772 | $ | 64,025 | |||||
| American Funds Insurance Series – International Fund, Class 1 | 2,030,948 | 42,366 | ||||||
| Total growth funds (cost: $94,708,000) | 106,391 | |||||||
| Growth-and-income funds 20.16% | ||||||||
| American Funds Insurance Series – Global Growth and Income Fund, Class 1 | 5,374,576 | 85,563 | ||||||
| Total growth-and-income funds (cost: $77,039,000) | 85,563 | |||||||
| Asset allocation funds 9.96% | ||||||||
| American Funds Insurance Series – Asset Allocation Fund, Class 1 | 1,756,934 | 42,254 | ||||||
| Total asset allocation funds (cost: $39,489,000) | 42,254 | |||||||
| Equity-income and Balanced funds 25.02% | ||||||||
| American Funds Insurance Series – Global Balanced Fund, Class 1 | 7,858,698 | 106,171 | ||||||
| Total equity-income and balanced funds (cost: $95,316,000) | 106,171 | |||||||
| Fixed income funds 15.07% | ||||||||
| American Funds Insurance Series – Global Bond Fund, Class 1 | 5,278,411 | 63,975 | ||||||
| Total fixed income funds (cost: $62,237,000) | 63,975 | |||||||
| Short-term securities 4.77% | ||||||||
| Government Cash Management Fund 1.51%1 | 20,232,381 | 20,232 | ||||||
| Total short-term securities (cost: $20,232,000) | 20,232 | |||||||
| Total investment securities 100.05% (cost: $389,021,000) | 424,586 | |||||||
| Other assets less liabilities (0.05)% | (201 | ) | ||||||
| Net assets 100.00% | $ | 424,385 | ||||||
Futures contracts
| Contracts | Type | Number of contracts | Expiration | Notional amount (000) | 2 | Value at 12/31/2019 (000) | 3 | Unrealized depreciation at 12/31/2019 (000) | |||||
| 5 Year U.S. Treasury Note Futures | Long | 189 | March 2020 | $18,900 | $22,417 | $(81 | ) |
| 14 | American Funds Insurance Series – Portfolio Series |
American Funds Managed Risk Global Allocation Portfolio
Investments in affiliates
These holdings are affiliates of the fund under the Investment Company Act of 1940 since they are controlled by the same board of trustees as the series. Further details on these holdings and related transactions during the year ended December 31, 2019, appear below.
| Beginning shares | Additions | Reductions | Ending shares | Net realized gain (000) | Net unrealized appreciation (000) | Dividend income (000) | Value of affiliates at 12/31/2019 (000) | |||||||||||||||||||||||||
| Growth funds 25.07% | ||||||||||||||||||||||||||||||||
| American Funds Insurance Series – Global Growth Fund, Class 1 | 1,885,673 | 288,546 | 208,447 | 1,965,772 | $ | 890 | $ | 12,386 | $ | 788 | $ | 64,025 | ||||||||||||||||||||
| American Funds Insurance Series – International Fund, Class 1 | 1,821,293 | 366,354 | 156,699 | 2,030,948 | 213 | 5,994 | 672 | 42,366 | ||||||||||||||||||||||||
| 106,391 | ||||||||||||||||||||||||||||||||
| Growth-and-income funds 20.16% | ||||||||||||||||||||||||||||||||
| American Funds Insurance Series – Global Growth and Income Fund, Class 1 | 4,971,241 | 771,626 | 368,291 | 5,374,576 | 931 | 14,097 | 1,699 | 85,563 | ||||||||||||||||||||||||
| Asset allocation funds 9.96% | ||||||||||||||||||||||||||||||||
| American Funds Insurance Series – Asset Allocation Fund, Class 1 | 1,504,731 | 294,481 | 42,278 | 1,756,934 | 105 | 4,406 | 838 | 42,254 | ||||||||||||||||||||||||
| Equity-income and Balanced funds 25.02% | ||||||||||||||||||||||||||||||||
| American Funds Insurance Series – Global Balanced Fund, Class 1 | 6,949,481 | 1,092,062 | 182,845 | 7,858,698 | 389 | 12,890 | 1,511 | 106,171 | ||||||||||||||||||||||||
| Fixed income funds 15.07% | ||||||||||||||||||||||||||||||||
| American Funds Insurance Series – Global Bond Fund, Class 1 | 4,381,941 | 1,290,793 | 394,323 | 5,278,411 | 95 | 3,181 | 1,078 | 63,975 | ||||||||||||||||||||||||
| Total 95.28% | $ | 2,623 | $ | 52,954 | $ | 6,586 | $ | 404,354 | ||||||||||||||||||||||||
| 1 | Rate represents the seven-day yield at 12/31/2019. |
| 2 | Notional amount is calculated based on the number of contracts and notional contract size. |
| 3 | Value is calculated based on the notional amount and current market price. |
See notes to financial statements.
| American Funds Insurance Series – Portfolio Series | 15 |
Financial statements
| Statements of assets and liabilities | |
| at December 31, 2019 | (dollars and shares in thousands, except per-share amounts) |
| Global Growth Portfolio | Growth and Income Portfolio | Managed Risk Growth Portfolio | Managed Risk Growth and Income Portfolio | Managed Risk Global Allocation Portfolio | ||||||||||||||||||
| Assets: | ||||||||||||||||||||||
| Investment securities, at value: | ||||||||||||||||||||||
| Unaffiliated issuers | $ | — | $ | — | $ | 71,152 | $ | 42,325 | $ | 20,232 | ||||||||||||
| Affiliated issuers | 54,435 | 256,917 | 1,403,461 | 1,246,756 | 404,354 | |||||||||||||||||
| Cash collateral pledged for futures contracts | — | — | 508 | 303 | 145 | |||||||||||||||||
| Receivables for: | ||||||||||||||||||||||
| Sales of investments | 74 | 205 | 212 | — | — | |||||||||||||||||
| Sales of fund’s shares | — | * | 472 | 73 | 365 | 107 | ||||||||||||||||
| Dividends and interest | — | — | 93 | 58 | 28 | |||||||||||||||||
| 54,509 | 257,594 | 1,475,499 | 1,289,807 | 424,866 | ||||||||||||||||||
| Liabilities: | ||||||||||||||||||||||
| Payables for: | ||||||||||||||||||||||
| Purchases of investments | — | 470 | 66 | 333 | 96 | |||||||||||||||||
| Repurchases of fund’s shares | 74 | 207 | 226 | 14 | 6 | |||||||||||||||||
| Investment advisory services | — | — | 123 | 107 | 35 | |||||||||||||||||
| Insurance administrative fees | 32 | 150 | 870 | 763 | 252 | |||||||||||||||||
| Services provided by related parties | 19 | 52 | 299 | 261 | 86 | |||||||||||||||||
| Trustees’ deferred compensation | — | * | 1 | 6 | 6 | 2 | ||||||||||||||||
| Variation margin on futures contracts | — | — | 15 | 9 | 4 | |||||||||||||||||
| 125 | 880 | 1,605 | 1,493 | 481 | ||||||||||||||||||
| Net assets at December 31, 2019 | $ | 54,384 | $ | 256,714 | $ | 1,473,894 | $ | 1,288,314 | $ | 424,385 | ||||||||||||
| Net assets consist of: | ||||||||||||||||||||||
| Capital paid in on shares of beneficial interest | $ | 44,740 | $ | 228,010 | $ | 1,297,880 | $ | 1,130,191 | $ | 373,825 | ||||||||||||
| Total distributable earnings | 9,644 | 28,704 | 176,014 | 158,123 | 50,560 | |||||||||||||||||
| Net assets at December 31, 2019 | $ | 54,384 | $ | 256,714 | $ | 1,473,894 | $ | 1,288,314 | $ | 424,385 | ||||||||||||
| Investment securities, at cost: | ||||||||||||||||||||||
| Unaffiliated issuers | $ | — | $ | — | $ | 71,152 | $ | 42,325 | $ | 20,232 | ||||||||||||
| Affiliated issuers | 47,586 | 238,861 | 1,292,503 | 1,135,872 | 368,789 | |||||||||||||||||
| Shares of beneficial interest issued and outstanding (no stated par value) — unlimited shares authorized | ||||||||||||||||||||||
| Class 4: | Net assets | $ | 54,384 | $ | 256,714 | |||||||||||||||||
| Shares outstanding | 4,075 | 21,165 | Not applicable | Not applicable | Not applicable | |||||||||||||||||
| Net asset value per share | $ | 13.35 | $ | 12.13 | ||||||||||||||||||
| Class P2: | Net assets | $ | 1,473,894 | $ | 1,288,314 | $ | 424,385 | |||||||||||||||
| Shares outstanding | Not applicable | Not applicable | 126,916 | 111,587 | 36,577 | |||||||||||||||||
| Net asset value per share | $ | 11.61 | $ | 11.55 | $ | 11.60 | ||||||||||||||||
| * | Amount less than one thousand. |
See notes to financial statements.
| 16 | American Funds Insurance Series – Portfolio Series |
| Statements of operations | |
| for the year ended December 31, 2019 | (dollars in thousands) |
| Global Growth Portfolio | Growth and Income Portfolio | Managed Risk Growth Portfolio | Managed Risk Growth and Income Portfolio | Managed Risk Global Allocation Portfolio | ||||||||||||||||
| Investment income: | ||||||||||||||||||||
| Income: | ||||||||||||||||||||
| Dividends: | ||||||||||||||||||||
| Unaffiliated issuers | $ | — | $ | — | $ | 917 | $ | 866 | $ | 267 | ||||||||||
| Affiliated issuers | 709 | 5,176 | 22,185 | 24,802 | 6,586 | |||||||||||||||
| 709 | 5,176 | 23,102 | 25,668 | 6,853 | ||||||||||||||||
| Fees and expenses: | ||||||||||||||||||||
| Investment advisory services | — | — | 1,909 | 1,694 | 562 | |||||||||||||||
| Distribution services | 116 | 530 | 3,181 | 2,822 | 936 | |||||||||||||||
| Insurance administrative services | 116 | 530 | 3,181 | 2,822 | 936 | |||||||||||||||
| Transfer agent services | — | * | — | * | — | * | — | * | — | * | ||||||||||
| Accounting and administrative services | — | — | 71 | 68 | 53 | |||||||||||||||
| Reports to shareholders | 2 | 6 | 33 | 29 | 11 | |||||||||||||||
| Registration statement and prospectus | 4 | 9 | 44 | 37 | 18 | |||||||||||||||
| Trustees’ compensation | — | * | 1 | 8 | 8 | 2 | ||||||||||||||
| Auditing and legal | 19 | 19 | 17 | 17 | 16 | |||||||||||||||
| Custodian | 6 | 6 | 11 | 11 | 11 | |||||||||||||||
| Other | 20 | — | * | 1 | 1 | 1 | ||||||||||||||
| Total fees and expenses before waivers/reimbursements | 283 | 1,101 | 8,456 | 7,509 | 2,546 | |||||||||||||||
| Less waivers/reimbursements of fees and expenses: | ||||||||||||||||||||
| Investment advisory services waivers | — | — | 636 | 564 | 187 | |||||||||||||||
| Miscellaneous fee reimbursements | 23 | — | — | — | 1 | |||||||||||||||
| Total waivers/reimbursements of fees and expenses | 23 | — | 636 | 564 | 188 | |||||||||||||||
| Total fees and expenses after waivers/reimbursements | 260 | 1,101 | 7,820 | 6,945 | 2,358 | |||||||||||||||
| Net investment income | 449 | 4,075 | 15,282 | 18,723 | 4,495 | |||||||||||||||
| Net realized gain and unrealized appreciation: | ||||||||||||||||||||
| Net realized (loss) gain on: | ||||||||||||||||||||
| Investments in affiliated issuers | (136 | ) | (375 | ) | 4,230 | 4,054 | 2,623 | |||||||||||||
| Futures contracts | — | — | (12,107 | ) | (7,590 | ) | (919 | ) | ||||||||||||
| Currency transactions | — | — | 44 | 40 | 8 | |||||||||||||||
| Capital gain distributions received from affiliated issuers | 2,596 | 8,474 | 79,836 | 51,791 | 12,481 | |||||||||||||||
| 2,460 | 8,099 | 72,003 | 48,295 | 14,193 | ||||||||||||||||
| Net unrealized appreciation (depreciation) on: | ||||||||||||||||||||
| Investments in affiliated issuers | 9,398 | 24,977 | 149,404 | 141,429 | 52,954 | |||||||||||||||
| Futures contracts | — | — | (14,117 | ) | (11,368 | ) | (2,602 | ) | ||||||||||||
| 9,398 | 24,977 | 135,287 | 130,061 | 50,352 | ||||||||||||||||
| Net realized gain and unrealized appreciation | 11,858 | 33,076 | 207,290 | 178,356 | 64,545 | |||||||||||||||
| Net increase in net assets resulting from operations | $ | 12,307 | $ | 37,151 | $ | 222,572 | $ | 197,079 | $ | 69,040 | ||||||||||
| * | Amount less than one thousand. |
See notes to financial statements.
| American Funds Insurance Series – Portfolio Series | 17 |
| Statements of changes in net assets | (dollars in thousands) |
| Global Growth Portfolio | Growth and Income Portfolio | Managed Risk Growth Portfolio | ||||||||||||||||||||||
| Year ended December 31, | Year ended December 31, | Year ended December 31, | ||||||||||||||||||||||
| 2019 | 2018 | 2019 | 2018 | 2019 | 2018 | |||||||||||||||||||
| Operations: | ||||||||||||||||||||||||
| Net investment income | $ | 449 | $ | 245 | $ | 4,075 | $ | 2,855 | $ | 15,282 | $ | 10,791 | ||||||||||||
| Net realized gain | 2,460 | 2,153 | 8,099 | 5,620 | 72,003 | 43,262 | ||||||||||||||||||
| Net unrealized appreciation (depreciation) | 9,398 | (6,338 | ) | 24,977 | (15,194 | ) | 135,287 | (102,297 | ) | |||||||||||||||
| Net increase (decrease) in net assets resulting from operations | 12,307 | (3,940 | ) | 37,151 | (6,719 | ) | 222,572 | (48,244 | ) | |||||||||||||||
| Distributions paid to shareholders | (2,363 | ) | (1,014 | ) | (8,978 | ) | (6,019 | ) | (67,119 | ) | (41,982 | ) | ||||||||||||
| Net capital share transactions | 8,900 | 10,636 | 60,170 | 46,992 | 245,000 | 260,046 | ||||||||||||||||||
| Total increase in net assets | 18,844 | 5,682 | 88,343 | 34,254 | 400,453 | 169,820 | ||||||||||||||||||
| Net assets: | ||||||||||||||||||||||||
| Beginning of year | 35,540 | 29,858 | 168,371 | 134,117 | 1,073,441 | 903,621 | ||||||||||||||||||
| End of year | $ | 54,384 | $ | 35,540 | $ | 256,714 | $ | 168,371 | $ | 1,473,894 | $ | 1,073,441 | ||||||||||||
| Managed Risk Growth and Income Portfolio | Managed Risk Global Allocation Portfolio | |||||||||||||||||||||||
| Year ended December 31, | Year ended December 31, | |||||||||||||||||||||||
| 2019 | 2018 | 2019 | 2018 | |||||||||||||||||||||
| Operations: | ||||||||||||||||||||||||
| Net investment income | $ | 18,723 | $ | 14,499 | $ | 4,495 | $ | 3,931 | ||||||||||||||||
| Net realized gain | 48,295 | 29,949 | 14,193 | 10,447 | ||||||||||||||||||||
| Net unrealized appreciation (depreciation) | 130,061 | (93,375 | ) | 50,352 | (39,571 | ) | ||||||||||||||||||
| Net increase (decrease) in net assets resulting from operations | 197,079 | (48,927 | ) | 69,040 | (25,193 | ) | ||||||||||||||||||
| Distributions paid to shareholders | (55,668 | ) | (38,256 | ) | (16,130 | ) | (6,441 | ) | ||||||||||||||||
| Net capital share transactions | 173,167 | 209,432 | 46,894 | 105,547 | ||||||||||||||||||||
| Total increase in net assets | 314,578 | 122,249 | 99,804 | 73,913 | ||||||||||||||||||||
| Net assets: | ||||||||||||||||||||||||
| Beginning of year | 973,736 | 851,487 | 324,581 | 250,668 | ||||||||||||||||||||
| End of year | $ | 1,288,314 | $ | 973,736 | $ | 424,385 | $ | 324,581 | ||||||||||||||||
See notes to financial statements.
| 18 | American Funds Insurance Series – Portfolio Series |
Notes to financial statements
1. Organization
American Funds Insurance Series (the “series”) is registered under the Investment Company Act of 1940 as an open-end, diversified management investment company with 34 different funds (the “funds”), including five funds in the series covered in this report. The other 29 funds in the series are covered in separate reports. Twenty-three funds in the series are covered in the American Funds Insurance Series report and six funds in the series are covered in the American Funds Insurance Series — Target Date Series report. The assets of each fund are segregated, with each fund accounted for separately. Capital Research and Management Company (“CRMC”) is the series’ investment adviser. Milliman Financial Risk Management LLC (“Milliman FRM”) is the subadviser for the risk management strategy for eight of the funds (the “managed risk funds”), three of which are covered in this report.
The managed risk funds covered in this report are Managed Risk Growth Portfolio, Managed Risk Growth and Income Portfolio and Managed Risk Global Allocation Portfolio. The managed risk funds invest in other funds within the series (the “underlying funds”) and employ Milliman FRM to implement the risk management strategy, which consists of using hedging instruments — primarily short positions on exchange-traded futures contracts — to attempt to stabilize the volatility of the funds around target volatility levels and reduce the downside exposure of the funds during periods of significant market declines.
Shareholders approved a proposal to reorganize the series from a Massachusetts business trust to a Delaware statutory trust. The series reserved the right to delay implementing the reorganization and has elected to do so.
The investment objectives for each fund in the American Funds Insurance Series – Portfolio Series are as follows:
Global Growth Portfolio — Seeks to provide long-term growth of capital.
Growth and Income Portfolio — Seeks to provide long-term growth of capital while providing current income.
Managed Risk Growth Portfolio — Seeks to provide long-term growth of capital while seeking to manage volatility and provide downside protection.
Managed Risk Growth and Income Portfolio — Seeks to provide long-term growth of capital and current income while seeking to manage volatility and provide downside protection.
Managed Risk Global Allocation Portfolio — Seeks to provide high total return (including income and capital gains) consistent with preservation of capital over the long term while seeking to manage volatility and provide downside protection.
Each fund offers one share class (Class 4 for Global Growth Portfolio and Growth and Income Portfolio, and Class P2 for the three managed risk funds). Share classes have different fees and expenses (“class-specific fees and expenses”), primarily due to different arrangements for certain distribution expenses. Differences in class-specific fees and expenses will result in differences in net investment income and, therefore, the payment of different per-share dividends by each class of each fund.
2. Significant accounting policies
Each fund is an investment company that applies the accounting and reporting guidance issued in Topic 946 by the U.S. Financial Accounting Standards Board. Each fund’s financial statements have been prepared to comply with U.S. generally accepted accounting principles (“U.S. GAAP”). These principles require the series’ investment adviser to make estimates and assumptions that affect reported amounts and disclosures. Actual results could differ from those estimates. Subsequent events, if any, have been evaluated through the date of issuance in the preparation of the financial statements. The funds follow the significant accounting policies described in this section, as well as the valuation policies described in the next section on valuation.
Security transactions and related investment income — Security transactions are recorded by the funds as of the date the trades are executed with brokers. Realized gains and losses from security transactions are determined based on the specific identified cost of the securities. In the event a security is purchased with a delayed payment date, the funds will segregate liquid assets sufficient to meet their payment obligations. Dividend income is recognized on the ex-dividend date and interest income is recognized on an accrual basis.
| American Funds Insurance Series – Portfolio Series | 19 |
Fees and expenses — The fees and expenses of the underlying funds are not included in the fees and expenses reported for each of the managed risk funds; however, they are indirectly reflected in the valuation of each of the underlying funds. These fees are included in the net effective expense ratios that are provided as additional information in the financial highlights tables.
Distributions paid to shareholders — Income dividends and capital gain distributions paid to shareholders are recorded on each fund’s ex-dividend date.
Currency translation — Assets and liabilities, including investment securities, denominated in currencies other than U.S. dollars are translated into U.S. dollars at the exchange rates supplied by one or more pricing vendors on the valuation date. Purchases and sales of investment securities and income and expenses are translated into U.S. dollars at the exchange rates on the dates of such transactions. The effects of changes in exchange rates on investment securities are included with the net realized gain or loss and net unrealized appreciation or depreciation on investments in the fund’s statement of operations. The realized gain or loss and unrealized appreciation or depreciation resulting from all other transactions denominated in currencies other than U.S. dollars are disclosed separately.
3. Valuation
Security valuation — The net asset value of each share class of each fund is calculated based on the reported net asset values of the underlying funds in which each fund invests. The net asset value of each underlying fund is calculated based on the policies and procedures of the underlying fund contained in each underlying fund’s statement of additional information. Generally, the funds and the underlying funds determine the net asset value of each share class as of approximately 4:00 p.m. New York time each day the New York Stock Exchange is open. Exchange-traded futures are generally valued at the official settlement price of the exchange or market on which such instruments are traded, as of the close of business on the day the futures are being valued.
Processes and structure — The series’ board of trustees has delegated authority to the series’ investment adviser to make fair value determinations, subject to board oversight. The investment adviser has established a Joint Fair Valuation Committee (the “Fair Valuation Committee”) to administer, implement and oversee the fair valuation process, and to make fair value decisions. The Fair Valuation Committee regularly reviews its own fair value decisions, as well as decisions made under its standing instructions to the investment adviser’s valuation teams. The Fair Valuation Committee reviews changes in fair value measurements from period to period and may, as deemed appropriate, update the fair valuation guidelines to better reflect the results of back testing and address new or evolving issues. The Fair Valuation Committee reports any changes to the fair valuation guidelines to the board of trustees. The series’ board and audit committee also regularly review reports that describe fair value determinations and methods. Pricing decisions, processes and controls over security valuation are also subject to additional internal reviews, including an annual control self-evaluation program facilitated by the investment adviser’s compliance group.
Classifications— The series’ investment adviser classifies each fund’s assets and liabilities into three levels based on the method used to value the assets or liabilities. Level 1 values are based on quoted prices in active markets for identical securities. Level 2 values are based on significant observable market inputs, such as quoted prices for similar securities and quoted prices in inactive markets. Level 3 values are based on significant unobservable inputs that reflect the investment adviser’s determination of assumptions that market participants might reasonably use in valuing the securities. The valuation levels are not necessarily an indication of the risk or liquidity associated with the underlying investment. At December 31, 2019, all of the investment securities held by each fund were classified as Level 1.
4. Risk factors
Investing in the funds may involve certain risks including, but not limited to, those described below.
Allocation risk— Investments in a fund are subject to risks related to the investment adviser’s allocation choices. The selection of the underlying funds and the allocation of a fund’s assets could cause the fund to lose value or its results to lag relevant benchmarks or other funds with similar objectives. Certain of the funds may invest in an underlying fixed-income fund that is a non-diversified investment company under the Investment Company Act of 1940. Poor performance by a single large holding in a non-diversified underlying fund would adversely affect such a fund’s investment results more than if the underlying fund were invested in a larger number of issuers.
| 20 | American Funds Insurance Series – Portfolio Series |
Fund structure — Each fund invests in underlying funds and incurs expenses related to the underlying funds. In addition, investors in each fund will incur fees to pay for certain expenses related to the operations of the fund. An investor holding the underlying funds directly and in the same proportions as a fund would incur lower overall expenses but would not receive the benefit of the portfolio management and other services provided by a fund. Additionally, in accordance with an exemption under the Investment Company Act of 1940, as amended, the investment adviser considers only proprietary funds when selecting underlying investment options and allocations. This means that each fund’s investment adviser did not, nor does it expect to, consider any unaffiliated funds as underlying investment options for each fund. This strategy could raise certain conflicts of interest when choosing underlying investments for each fund, including the selection of funds that result in greater compensation to the adviser or funds with relatively lower historical investment results. The investment adviser has policies and procedures designed to mitigate material conflicts of interest that may arise in connection with its management of each fund.
Underlying fund risks — Because a fund’s investments consist of underlying funds, a fund’s risks are directly related to the risks of the underlying funds. For this reason, it is important to understand the risks associated with investing both in a fund and the applicable underlying funds.
Market conditions — The prices of, and the income generated by, the common stocks, bonds and other securities held by the underlying funds may decline — sometimes rapidly or unpredictably — due to various factors, including events or conditions affecting the general economy or particular industries; overall market changes; local, regional or global political, social or economic instability; governmental, governmental agency or central bank responses to economic conditions; and currency exchange rate, interest rate and commodity price fluctuations.
Issuer risks — The prices of, and the income generated by, securities held by the underlying funds may decline in response to various factors directly related to the issuers of such securities, including reduced demand for an issuer’s goods or services, poor management performance, major litigation related to the issuer, changes in government regulations affecting the issuer or its competitive environment and strategic initiatives such as mergers, acquisitions or dispositions and the market response to any such initiatives.
Investing in stocks — Investing in stocks may involve larger price swings and greater potential for loss than other types of investments. As a result, the value of the underlying funds may be subject to sharp declines in value. The value of the underlying fund’s securities and income provided by an underlying fund may be reduced by changes in the dividend policies of, and the capital resources available at, the companies in which the underlying fund invests. These risks may be even greater in the case of smaller capitalization stocks.
Investing outside the U.S. — Securities of issuers domiciled outside the U.S., or with significant operations or revenues outside the U.S., may lose value because of adverse political, social, economic or market developments (including social instability, regional conflicts, terrorism and war) in the countries or regions in which the issuers operate or generate revenue. These securities may also lose value due to changes in foreign currency exchange rates against the U.S. dollar and/or currencies of other countries. Issuers of these securities may be more susceptible to actions of foreign governments, such as nationalization, currency blockage or the imposition of price controls or punitive taxes, each of which could adversely impact the value of these securities. Securities markets in certain countries may be more volatile and/or less liquid than those in the U.S. Investments outside the U.S. may also be subject to different accounting practices and different regulatory, legal and reporting standards and practices, and may be more difficult to value, than those in the U.S. In addition, the value of investments outside the U.S. may be reduced by foreign taxes, including foreign withholding taxes on interest and dividends. Further, there may be increased risks of delayed settlement of securities purchased or sold by the underlying funds. The risks of investing outside the U.S. may be heightened in connection with investments in emerging markets.
Investing in emerging markets — Investing in emerging markets may involve risks in addition to and greater than those generally associated with investing in the securities markets of developed countries. For instance, emerging market countries may have less developed legal and accounting systems than those in developed countries. The governments of these countries may be less stable and more likely to impose capital controls, nationalize a company or industry, place restrictions on foreign ownership and on withdrawing sale proceeds of securities from the country, and/or impose punitive taxes that could adversely affect the prices of securities. In addition, the economies of these countries may be dependent on relatively few industries that are more susceptible to local and global changes. Securities markets in these countries can also be relatively small and have substantially lower trading volumes. As a result, securities issued in these countries may be more volatile and less liquid, and may be more difficult to value, than securities issued in countries with more developed economies and/or markets. Less certainty with respect to security valuations may lead to additional challenges and risks in calculating an underlying fund’s net asset value and, accordingly, in
| American Funds Insurance Series – Portfolio Series | 21 |
calculating the underlying fund’s net asset value. Additionally, emerging markets are more likely to experience problems with the clearing and settling of trades and the holding of securities by banks, agents and depositories that are less established than those in developed countries.
Investing in small companies — Investing in smaller companies may pose additional risks. For example, it is often more difficult to value or dispose of small company stocks and more difficult to obtain information about smaller companies than about larger companies. Furthermore, smaller companies often have limited product lines, operating histories, markets and/or financial resources, may be dependent on one or a few key persons for management, and can be more susceptible to losses. Moreover, the prices of their stocks may be more volatile than stocks of larger, more established companies, particularly during times of market turmoil.
Investing in debt instruments — The prices of, and the income generated by, bonds and other debt securities held by an underlying fund may be affected by changing interest rates and by changes in the effective maturities and credit ratings of these securities.
Rising interest rates will generally cause the prices of bonds and other debt securities to fall. A general rise in interest rates may cause investors to sell debt securities on a large scale, which could also adversely affect the price and liquidity of debt securities and could also result in increased redemptions from the fund. Falling interest rates may cause an issuer to redeem, call or refinance a debt security before its stated maturity, which may result in the fund failing to recoup the full amount of its initial investment and having to reinvest the proceeds in lower yielding securities. Longer maturity debt securities generally have greater sensitivity to changes in interest rates and may be subject to greater price fluctuations than shorter maturity debt securities.
Bonds and other debt securities are also subject to credit risk, which is the possibility that the credit strength of an issuer or guarantor will weaken or be perceived to be weaker, and/or an issuer of a debt security will fail to make timely payments of principal or interest and the security will go into default. A downgrade or default affecting any of the underlying funds’ securities could cause the value of the underlying funds’ shares to decrease. Lower quality debt securities generally have higher rates of interest and may be subject to greater price fluctuations than higher quality debt securities. Credit risk is gauged, in part, by the credit ratings of the debt securities in which an underlying fund invests. However, ratings are only the opinions of the rating agencies issuing them and are not guarantees as to credit quality or an evaluation of market risk. The underlying funds’ investment adviser relies on its own credit analysts to research issuers and issues in seeking to assess credit and default risks.
Investing in lower rated debt instruments — Lower rated bonds and other lower rated debt securities generally have higher rates of interest and involve greater risk of default or price declines due to changes in the issuer’s creditworthiness than those of higher quality debt securities. The market prices of these securities may fluctuate more than the prices of higher quality debt securities and may decline significantly in periods of general economic difficulty. These risks may be increased with respect to investments in junk bonds.
Liquidity risk — Certain underlying fund holdings may be or may become difficult or impossible to sell, particularly during times of market turmoil. Liquidity may be impacted by the lack of an active market for a holding, legal or contractual restrictions on resale, or the reduced number and capacity of market participants to make a market in such holding. Market prices for less liquid or illiquid holdings may be volatile, and reduced liquidity may have an adverse impact on the market price of such holdings. Additionally, the sale of less liquid or illiquid holdings may involve substantial delays (including delays in settlement) and additional costs and the underlying fund may be unable to sell such holdings when necessary to meet its liquidity needs or may be forced to sell at a loss.
Management — The investment adviser to the funds and to the underlying funds actively manages each underlying fund’s investments. Consequently, the underlying funds are subject to the risk that the methods and analyses, including models, tools and data, employed by the investment adviser in this process may be flawed or incorrect and may not produce the desired results. This could cause an underlying fund to lose value or its investment results to lag relevant benchmarks or other funds with similar objectives.
Investing in the managed risk funds may involve additional risks including, but not limited to, those described below.
Investing in futures contracts — In addition to the risks generally associated with investing in derivative instruments, futures contracts are subject to the creditworthiness of the clearing organizations, exchanges and futures commission merchants with which a fund transacts. Additionally, although futures require only a small initial investment in the form of a deposit of initial margin, the amount of a potential
| 22 | American Funds Insurance Series – Portfolio Series |
loss on a futures contract could greatly exceed the initial amount invested. While futures contracts are generally liquid instruments, under certain market conditions, futures may be deemed to be illiquid. For example, a fund may be temporarily prohibited from closing out its position in a futures contract if intraday price change limits or limits on trading volume imposed by the applicable futures exchange are triggered. If a fund is unable to close out a position on a futures contract, the fund would remain subject to the risk of adverse price movements until the fund is able to close out the futures position. The ability of a fund to successfully utilize futures contracts may depend in part upon the ability of the fund’s investment adviser or subadviser to accurately forecast interest rates and other economic factors and to assess and predict the impact of such economic factors on the futures in which the fund invests. If the investment adviser or subadviser incorrectly forecasts economic developments or incorrectly predicts the impact of such developments on the futures in which it invests, a fund could be exposed to the risk of loss.
Hedging — There may be imperfect or even negative correlation between the prices of the futures contracts and the prices of the underlying securities. For example, futures contracts may not provide an effective hedge because changes in futures contract prices may not track those of the underlying securities or indexes they are intended to hedge. In addition, there are significant differences between the securities and futures markets that could result in an imperfect correlation between the markets, causing a given hedge not to achieve its objectives. The degree of imperfection of correlation depends on circumstances such as variations in speculative market demand for futures, including technical influences in futures trading, and differences between the financial instruments being hedged and the instruments underlying the standard contracts available for trading. A decision as to whether, when and how to hedge involves the exercise of skill and judgment, and even a well-conceived hedge may be unsuccessful to some degree because of market behavior or unexpected interest rate trends. In addition, a fund’s investment in exchange-traded futures and their resulting costs could limit the fund’s gains in rising markets relative to those of the underlying fund, or to those of unhedged funds in general.
Short positions — Losses from short positions in futures contracts occur when the underlying index increases in value. As the underlying index increases in value, the holder of the short position in the corresponding futures contract is required to pay the difference in value of the futures contract resulting from the increase in the index on a daily basis. Losses from a short position in an index futures contract could potentially be very large if the value of the underlying index rises dramatically in a short period of time.
Investing in mortgage-related and other asset-backed securities — Mortgage-related securities, such as mortgage-backed securities, and other asset-backed securities, include debt obligations that represent interests in pools of mortgages or other income-bearing assets, such as consumer loans or receivables. Such securities often involve risks that are different from or more acute than the risks associated with investing in other types of debt securities. Mortgage-backed and other asset-backed securities are subject to changes in the payment patterns of borrowers of the underlying debt, potentially increasing the volatility of the securities and an underlying fund’s net asset value. When interest rates fall, borrowers are more likely to refinance or prepay their debt before its stated maturity. This may result in an underlying fund having to reinvest the proceeds in lower yielding securities, effectively reducing the underlying fund’s income. Conversely, if interest rates rise and borrowers repay their debt more slowly than expected, the time in which the mortgage-backed and other asset-backed securities are paid off could be extended, reducing the underlying fund’s cash available for reinvestment in higher yielding securities. Mortgage-backed securities are also subject to the risk that underlying borrowers will be unable to meet their obligations and the value of property that secures the mortgages may decline in value and be insufficient, upon foreclosure, to repay the associated loans. Investments in asset-backed securities are subject to similar risks.
Investing in future delivery contracts — The underlying funds may enter into contracts, such as to-be-announced contracts and mortgage dollar rolls, that involve the underlying fund selling mortgage-related securities and simultaneously contracting to repurchase similar securities for delivery at a future date at a predetermined price. This can increase the underlying fund’s market exposure, and the market price of the securities that the underlying fund contracts to repurchase could drop below their purchase price. While the underlying fund can preserve and generate capital through the use of such contracts by, for example, realizing the difference between the sale price and the future purchase price, the income generated by the underlying fund may be reduced by engaging in such transactions. In addition, these transactions may increase the turnover rate of the underlying fund.
Investing in securities backed by the U.S. government — Securities backed by the U.S. Treasury or the full faith and credit of the U.S. government are guaranteed only as to the timely payment of interest and principal when held to maturity. Accordingly, the current market values for these securities will fluctuate with changes in interest rates and the credit rating of the U.S. government. Securities issued by government-sponsored entities and federal agencies and instrumentalities that are not backed by the full faith and credit of the U.S. government are neither issued nor guaranteed by the U.S. government.
Asset allocation — A certain fund’s percentage allocation to equity securities, debt securities and money market instruments (through its investments in the underlying funds) could cause the fund to underperform relative to relevant benchmarks and other funds with similar investment objectives.
| American Funds Insurance Series – Portfolio Series | 23 |
Currency — The prices of, and the income generated by, most debt securities held by the underlying funds may also be affected by changes in relative currency values. If the U.S. dollar appreciates against foreign currencies, the value in U.S. dollars of an underlying fund’s securities denominated in such currencies would generally fall and vice versa. U.S. dollar-denominated securities of foreign issuers may also be affected by changes in relative currency values.
Nondiversification risk — As nondiversified funds, the managed risk funds have the ability to invest a larger percentage of their assets in the securities of a smaller number of issuers than a diversified fund. Therefore, poor performance by a single large holding could adversely impact a managed risk fund’s investment results more than if the fund were invested in a larger number of issuers.
Management — The managed risk funds are subject to the risk that the managed risk strategy or the methods employed by the subadviser in implementing the managed risk strategy may not produce the desired results. This could cause the managed risk funds to lose value or their investment results to lag relevant benchmarks or other funds with similar objectives.
5. Certain investment techniques
Futures contracts — The managed risk funds have entered into futures contracts, which provide for the future sale by one party and purchase by another party of a specified amount of a specific financial instrument for a specified price, date, time and place designated at the time the contract is made. Futures contracts are used to strategically manage portfolio volatility and downside equity risk.
Upon entering into futures contracts, and to maintain the fund’s open positions in futures contracts, the fund is required to deposit with a futures broker, known as a futures commission merchant (“FCM”), in a segregated account in the name of the FCM an amount of cash, U.S. government securities, suitable money market instruments, or other liquid securities, known as initial margin. The margin required for a particular futures contract is set by the exchange on which the contract is traded to serve as collateral, and may be significantly modified from time to time by the exchange during the term of the contract. When initial margin is deposited with brokers, a receivable is recorded in each fund’s statement of assets and liabilities.
On a daily basis, each fund pays or receives variation margin based on the increase or decrease in the value of the futures contracts and records variation margin on futures contracts in the statement of assets and liabilities. In addition, each fund segregates liquid assets equivalent to the fund’s outstanding obligations under the contract in excess of the initial margin and variation margin, if any. Futures contracts may involve a risk of loss in excess of the variation margin shown on each fund’s statement of assets and liabilities. Each fund records realized gains or losses at the time the futures contract is closed or expires. Net realized gains or losses and net unrealized appreciation or depreciation from futures contracts are recorded in each fund’s statement of operations. The average month-end notional amount of futures contracts while held by Managed Risk Growth Portfolio, Managed Risk Growth and Income Portfolio and Managed Risk Global Allocation Portfolio was $126,301,000, $108,215,000 and $17,775,000, respectively.
| 24 | American Funds Insurance Series – Portfolio Series |
The following tables identify the location and fair value amounts on each fund’s statement of assets and liabilities and the effect on each fund’s statement of operations resulting from the managed risk funds’ use of futures contracts as of December 31, 2019 (dollars in thousands):
Managed Risk Growth Portfolio
| Assets | Liabilities | |||||||||||||
| Contracts | Risk type | Location on statement of assets and liabilities | Value | Location on statement of assets and liabilities | Value | |||||||||
| Futures | Interest | Unrealized appreciation* | $ | — | Unrealized depreciation* | $ | 212 | |||||||
| Net realized (loss) gain | Net unrealized appreciation (depreciation) | |||||||||||||
| Contracts | Risk type | Location on statement of operations | Value | Location on statement of operations | Value | |||||||||
| Futures | Currency | Net realized loss on futures contracts | $ | (623 | ) | Net unrealized appreciation on futures contracts | $ | 480 | ||||||
| Futures | Equity | Net realized loss on futures contracts | (17,129 | ) | Net unrealized depreciation on futures contracts | (9,225 | ) | |||||||
| Futures | Interest | Net realized gain on futures contracts | 5,645 | Net unrealized depreciation on futures contracts | (5,372 | ) | ||||||||
| $ | (12,107 | ) | $ | (14,117 | ) | |||||||||
Managed Risk Growth and Income Portfolio
| Assets | Liabilities | |||||||||||||
| Contracts | Risk type | Location on statement of assets and liabilities | Value | Location on statement of assets and liabilities | Value | |||||||||
| Futures | Interest | Unrealized appreciation* | $ | — | Unrealized depreciation* | $ | 167 | |||||||
| Net realized (loss) gain | Net unrealized appreciation (depreciation) | |||||||||||||
| Contracts | Risk type | Location on statement of operations | Value | Location on statement of operations | Value | |||||||||
| Futures | Currency | Net realized loss on futures contracts | $ | (693 | ) | Net unrealized appreciation on futures contracts | $ | 550 | ||||||
| Futures | Equity | Net realized loss on futures contracts | (12,047 | ) | Net unrealized depreciation on futures contracts | (7,392 | ) | |||||||
| Futures | Interest | Net realized gain on futures contracts | 5,150 | Net unrealized depreciation on futures contracts | (4,526 | ) | ||||||||
| $ | (7,590 | ) | $ | (11,368 | ) | |||||||||
| American Funds Insurance Series – Portfolio Series | 25 |
Managed Risk Global Allocation Portfolio
| Assets | Liabilities | |||||||||||||
| Contracts | Risk type | Location on statement of assets and liabilities | Value | Location on statement of assets and liabilities | Value | |||||||||
| Futures | Interest | Unrealized appreciation* | $ | — | Unrealized depreciation* | $ | 81 | |||||||
| Net realized (loss) gain | Net unrealized appreciation (depreciation) | |||||||||||||
| Contracts | Risk type | Location on statement of operations | Value | Location on statement of operations | Value | |||||||||
| Futures | Currency | Net realized loss on futures contracts | $ | (294 | ) | Net unrealized appreciation on futures contracts | $ | 244 | ||||||
| Futures | Equity | Net realized loss on futures contracts | (1,894 | ) | Net unrealized depreciation on futures contracts | (1,708 | ) | |||||||
| Futures | Interest | Net realized gain on futures contracts | 1,269 | Net unrealized depreciation on futures contracts | (1,138 | ) | ||||||||
| $ | (919 | ) | $ | (2,602 | ) | |||||||||
| * | Includes cumulative appreciation/depreciation on futures contracts as reported in the applicable table following each fund’s investment portfolio. Only current day’s variation margin is reported within the statements of assets and liabilities. |
Collateral — Funds that invest in futures contracts participate in a collateral program. The program calls for each fund to pledge highly liquid assets, such as cash or U.S. government securities, as collateral for initial and variation margin by contract. The purpose of the collateral is to cover potential losses that could occur in the event that either party cannot meet its contractual obligations. Non-cash collateral pledged by the fund, if any, is disclosed in the fund’s investment portfolio, and cash collateral pledged by the fund, if any, is held in a segregated account with the fund’s custodian, which is reflected as restricted cash in the fund’s statement of assets and liabilities.
6. Taxation and distributions
Federal income taxation — Each fund complies with the requirements under Subchapter M of the Internal Revenue Code applicable to mutual funds and intends to distribute substantially all of its net taxable income and net capital gains each year. The funds are not subject to income taxes to the extent such distributions are made. Therefore, no federal income tax provision is required.
As of and during the period ended December 31, 2019, none of the funds had a liability for any unrecognized tax benefits. Each fund recognizes interest and penalties, if any, related to unrecognized tax benefits as income tax expense in their respective statements of operations. During the period, none of the funds incurred any significant interest or penalties.
Each fund’s tax returns are not subject to examination by federal, state and, if applicable, non-U.S. tax authorities after the expiration of each jurisdiction’s statute of limitations, which is generally three years after the date of filing but can be extended in certain jurisdictions.
Distributions — Distributions paid to shareholders are based on each fund’s net investment income and net realized gains determined on a tax basis, which may differ from net investment income and net realized gains for financial reporting purposes. These differences are due primarily to different treatment for items such as short-term capital gains and losses and capital losses related to sales of certain securities within 30 days of purchase. The fiscal year in which amounts are distributed may differ from the year in which the net investment income and net realized gains are recorded by the funds for financial reporting purposes.
| 26 | American Funds Insurance Series – Portfolio Series |
Additional tax basis disclosures for each fund as of December 31, 2019, were as follows (dollars in thousands):
| Global Growth Portfolio | Growth and Income Portfolio | Managed Risk Growth Portfolio | Managed Risk Growth and Income Portfolio | Managed Risk Global Allocation Portfolio | ||||||||||||||||
| Undistributed ordinary income | $ | 527 | $ | 3,052 | $ | 16,919 | $ | 13,883 | $ | 4,496 | ||||||||||
| Undistributed long-term capital gains | 2,499 | 8,130 | 54,508 | 35,238 | 11,706 | |||||||||||||||
| Gross unrealized appreciation on investments | 6,618 | 17,522 | 111,171 | 111,050 | 35,647 | |||||||||||||||
| Gross unrealized depreciation on investments | — | — | (6,583 | ) | (2,048 | ) | (1,289 | ) | ||||||||||||
| Net unrealized appreciation on investments | 6,618 | 17,522 | 104,588 | 109,002 | 34,358 | |||||||||||||||
| Cost of investments | 47,817 | 239,395 | 1,369,813 | 1,179,912 | 390,147 | |||||||||||||||
| Reclassification from (to) total distributable earnings from capital paid in on shares of beneficial interest | (1 | ) | (1 | ) | — | — | — | |||||||||||||
Distributions paid by each fund were characterized for tax purposes as follows (dollars in thousands):
| Global Growth Portfolio | ||||||||||||||||||||||||
| Year ended December 31, 2019 | Year ended December 31, 2018 | |||||||||||||||||||||||
| Share class | Ordinary income | Long-term capital gains | Total distributions paid | Ordinary income | Long-term capital gains | Total distributions paid | ||||||||||||||||||
| Class 4 | $ | 347 | $ | 2,016 | $ | 2,363 | $ | 454 | $ | 560 | $ | 1,014 | ||||||||||||
| Growth and Income Portfolio | ||||||||||||||||||||||||
| Year ended December 31, 2019 | Year ended December 31, 2018 | |||||||||||||||||||||||
| Share class | Ordinary income | Long-term capital gains | Total distributions paid | Ordinary income | Long-term capital gains | Total distributions paid | ||||||||||||||||||
| Class 4 | $ | 3,669 | $ | 5,309 | $ | 8,978 | $ | 2,701 | $ | 3,318 | $ | 6,019 | ||||||||||||
| Managed Risk Growth Portfolio | ||||||||||||||||||||||||
| Year ended December 31, 2019 | Year ended December 31, 2018 | |||||||||||||||||||||||
| Share class | Ordinary income | Long-term capital gains | Total distributions paid | Ordinary income | Long-term capital gains | Total distributions paid | ||||||||||||||||||
| Class P2 | $ | 15,501 | $ | 51,618 | $ | 67,119 | $ | 12,573 | $ | 29,409 | $ | 41,982 | ||||||||||||
| Managed Risk Growth and Income Portfolio | ||||||||||||||||||||||||
| Year ended December 31, 2019 | Year ended December 31, 2018 | |||||||||||||||||||||||
| Share class | Ordinary income | Long-term capital gains | Total distributions paid | Ordinary income | Long-term capital gains | Total distributions paid | ||||||||||||||||||
| Class P2 | $ | 18,256 | $ | 37,412 | $ | 55,668 | $ | 15,105 | $ | 23,151 | $ | 38,256 | ||||||||||||
| American Funds Insurance Series – Portfolio Series | 27 |
Managed Risk Global Allocation Portfolio
| Year ended December 31, 2019 | Year ended December 31, 2018 | |||||||||||||||||||||||
| Share class | Ordinary income | Long-term capital gains | Total distributions paid | Ordinary income | Long-term capital gains | Total distributions paid | ||||||||||||||||||
| Class P2 | $ | 4,944 | $ | 11,186 | $ | 16,130 | $ | 2,830 | $ | 3,611 | $ | 6,441 | ||||||||||||
7. Fees and transactions
CRMC, the series’ investment adviser, is the parent company of American Funds Distributors®, Inc. (“AFD”), the distributor of the series’ shares, and American Funds Service Company® (“AFS”), the series’ transfer agent. CRMC, AFD and AFS are considered related parties to the series.
Investment advisory services — The series has an investment advisory and service agreement with CRMC that provides for monthly fees accrued daily. These fees are based on an annual rate of 0.150% of daily net assets for the three managed risk funds. CRMC receives investment advisory fees from the underlying funds. These fees are included in the net effective expense ratios that are provided as additional information in the financial highlights tables. Subadvisory fees for the managed risk funds are paid by CRMC to Milliman FRM. The managed risk funds are not responsible for paying any subadvisory fees.
Investment advisory services waivers— CRMC has agreed to waive a portion of the investment advisory services fees for the three managed risk funds. Investment advisory services fees are presented in each fund’s statement of operations gross of the waivers from CRMC. For the year ended December 31, 2019, total investment advisory services fees waived by CRMC were $1,387,000.
Distribution services— The series has plans of distribution for all share classes. Under the plans, the board of trustees approves certain categories of expenses that are used to finance activities primarily intended to sell fund shares. The plans provide for payments to pay service fees to firms that have entered into agreements with the series. These payments, based on an annualized percentage of average daily net assets, range from 0.25% to 0.50% as noted in the table below. In some cases, the board of trustees has limited the amounts that may be paid to less than the maximum allowed by the plans.
| Share class | Currently approved limits | Plan limits | ||||||
| Class 4 | 0.25 | % | 0.25 | % | ||||
| Class P2 | 0.25 | 0.50 | ||||||
Insurance administrative services — The series has an insurance administrative services plan for all share classes. Under the plan, each share class pays 0.25% of each insurance company’s respective average daily net assets to compensate the insurance companies for services provided to their separate accounts and contractholders for which the shares of the fund are beneficially owned as underlying investments of such contractholders’ annuities. These services include, but are not limited to, maintenance, shareholder communications and transactional services. The insurance companies are not related parties to the series.
Transfer agent services — The series has a shareholder services agreement with AFS under which the funds compensate AFS for providing transfer agent services to the funds. These services include recordkeeping, shareholder communications and transaction processing. In addition, the managed risk funds reimburse AFS for amounts paid to third parties for performing transfer agent services on behalf of fund shareholders.
Administrative services — The series has an administrative services agreement with CRMC to provide administrative services to all of the funds. Administrative services are provided by CRMC and its affiliates to help assist third parties providing non-distribution services to fund shareholders. These services include providing in depth information on each fund and market developments that impact fund investments. Administrative services also include, but are not limited to, coordinating, monitoring and overseeing third parties that provide services to fund shareholders. Prior to July 1, 2019, CRMC received administrative services fees at the annual rate of 0.01% of daily net assets from the Class 1 shares of the underlying funds for administrative services provided to the series. The series board of trustees authorized the underlying funds to pay CRMC effective July 1, 2019, an administrative services fee at the annual rate of 0.03% of daily net assets for its provision of administrative services.
| 28 | American Funds Insurance Series – Portfolio Series |
Accounting and administrative services — The three managed risk funds have a subadministration agreement with BNY Mellon under which each fund compensates BNY Mellon for providing accounting and administrative services. These services include, but are not limited to, fund accounting (including calculation of net asset value), financial reporting and tax services. BNY Mellon is not a related party to the managed risk funds.
Miscellaneous fee reimbursements — CRMC has agreed to reimburse a portion of miscellaneous fees and expenses of Global Growth Portfolio and Managed Risk Global Allocation Portfolio. Miscellaneous expenses exclude investment advisory services and distribution services fees. These reimbursements may be adjusted or discontinued by CRMC, subject to any restrictions in the series’ prospectus. For the year ended December 31, 2019, total fees and expenses reimbursed by CRMC were $24,000. Fees and expenses in each fund’s statement of operations are presented gross of any reimbursements from CRMC.
Trustees’ deferred compensation — Trustees who are unaffiliated with CRMC may elect to defer the cash payment of part or all of their compensation. These deferred amounts, which remain as liabilities of the funds, are treated as if invested in one or more of the American Funds. These amounts represent general, unsecured liabilities of the funds and vary according to the total returns of the selected funds. Trustees’ compensation in the fund’s statement of operations reflects the current fees (either paid in cash or deferred) and the net increase or decrease in the value of the deferred amounts.
Affiliated officers and trustees — Officers and certain trustees of the series are or may be considered to be affiliated with CRMC, AFD and AFS. No affiliated officers or trustees received any compensation directly from any fund in the series.
Security transactions with related funds — The funds may purchase from, or sell securities to, other CRMC-managed funds (or funds managed by certain affiliates of CRMC) under procedures adopted by the fund’s board of trustees. The funds involved in such transactions are considered related by virtue of having a common investment adviser (or affiliated investment advisers), common trustees and/or common officers. When such transactions occur, each transaction is executed at the current market price of the security and no brokerage commissions or fees are paid in accordance with Rule 17a-7 of the 1940 Act.
8. Capital share transactions
Capital share transactions in the funds were as follows (dollars and shares in thousands):
Global Growth Portfolio
| Reinvestments of | ||||||||||||||||||||||||||||||||
| Sales | distributions | Repurchases | Net increase | |||||||||||||||||||||||||||||
| Share class | Amount | Shares | Amount | Shares | Amount | Shares | Amount | Shares | ||||||||||||||||||||||||
| Year ended December 31, 2019 | ||||||||||||||||||||||||||||||||
| Class 4 | $ | 12,836 | 1,062 | $ | 2,363 | 199 | $ | (6,299 | ) | (514 | ) | $ | 8,900 | 747 | ||||||||||||||||||
| Year ended December 31, 2018 | ||||||||||||||||||||||||||||||||
| Class 4 | $ | 13,835 | 1,138 | $ | 1,014 | 83 | $ | (4,213 | ) | (346 | ) | $ | 10,636 | 875 | ||||||||||||||||||
| Growth and Income Portfolio | ||||||||||||||||||||||||||||||||
| Reinvestments of | ||||||||||||||||||||||||||||||||
| Sales | distributions | Repurchases | Net increase | |||||||||||||||||||||||||||||
| Share class | Amount | Shares | Amount | Shares | Amount | Shares | Amount | Shares | ||||||||||||||||||||||||
| Year ended December 31, 2019 | ||||||||||||||||||||||||||||||||
| Class 4 | $ | 65,000 | 5,668 | $ | 8,978 | 792 | $ | (13,808 | ) | (1,200 | ) | $ | 60,170 | 5,260 | ||||||||||||||||||
| Year ended December 31, 2018 | ||||||||||||||||||||||||||||||||
| Class 4 | $ | 49,508 | 4,353 | $ | 6,019 | 537 | $ | (8,535 | ) | (752 | ) | $ | 46,992 | 4,138 | ||||||||||||||||||
| American Funds Insurance Series – Portfolio Series | 29 |
| Managed Risk Growth Portfolio | ||||||||||||||||||||||||||||||||
| Reinvestments of | ||||||||||||||||||||||||||||||||
| Sales | distributions | Repurchases | Net increase | |||||||||||||||||||||||||||||
| Share class | Amount | Shares | Amount | Shares | Amount | Shares | Amount | Shares | ||||||||||||||||||||||||
| Year ended December 31, 2019 | ||||||||||||||||||||||||||||||||
| Class P2 | $ | 202,246 | 18,442 | $ | 67,119 | 6,291 | $ | (24,365 | ) | (2,226 | ) | $ | 245,000 | 22,507 | ||||||||||||||||||
| Year ended December 31, 2018 | ||||||||||||||||||||||||||||||||
| Class P2 | $ | 241,331 | 21,764 | $ | 41,982 | 3,782 | $ | (23,267 | ) | (2,104 | ) | $ | 260,046 | 23,442 | ||||||||||||||||||
| Managed Risk Growth and Income Portfolio | ||||||||||||||||||||||||||||||||
| Reinvestments of | ||||||||||||||||||||||||||||||||
| Sales | distributions | Repurchases | Net increase | |||||||||||||||||||||||||||||
| Share class | Amount | Shares | Amount | Shares | Amount | Shares | Amount | Shares | ||||||||||||||||||||||||
| Year ended December 31, 2019 | ||||||||||||||||||||||||||||||||
| Class P2 | $ | 150,357 | 13,776 | $ | 55,668 | 5,193 | $ | (32,858 | ) | (3,009 | ) | $ | 173,167 | 15,960 | ||||||||||||||||||
| Year ended December 31, 2018 | ||||||||||||||||||||||||||||||||
| Class P2 | $ | 193,826 | 17,670 | $ | 38,256 | 3,541 | $ | (22,650 | ) | (2,083 | ) | $ | 209,432 | 19,128 | ||||||||||||||||||
| Managed Risk Global Allocation Portfolio | ||||||||||||||||||||||||||||||||
| Reinvestments of | ||||||||||||||||||||||||||||||||
| Sales | distributions | Repurchases | Net increase | |||||||||||||||||||||||||||||
| Share class | Amount | Shares | Amount | Shares | Amount | Shares | Amount | Shares | ||||||||||||||||||||||||
| Year ended December 31, 2019 | ||||||||||||||||||||||||||||||||
| Class P2 | $ | 47,167 | 4,329 | $ | 16,130 | 1,516 | $ | (16,403 | ) | (1,515 | ) | $ | 46,894 | 4,330 | ||||||||||||||||||
| Year ended December 31, 2018 | ||||||||||||||||||||||||||||||||
| Class P2 | $ | 109,675 | 9,938 | $ | 6,441 | 591 | $ | (10,569 | ) | (986 | ) | $ | 105,547 | 9,543 | ||||||||||||||||||
9. Investment transactions
Each fund made purchases and sales of investment securities during the year ended December 31, 2019, as follows (dollars in thousands):
| Global Growth Portfolio | Growth and Income Portfolio | Managed Risk Growth Portfolio | Managed Risk Growth and Income Portfolio | Managed Risk Global Allocation Portfolio | ||||||||||||||||
| Purchases of investment securities* | $ | 16,062 | $ | 76,862 | $ | 292,254 | $ | 216,849 | $ | 63,244 | ||||||||||
| Sales of investment securities* | 6,458 | 13,435 | 73,143 | 48,967 | 23,073 | |||||||||||||||
| * | Excludes short-term securities and U.S. government obligations, if any. |
| 30 | American Funds Insurance Series – Portfolio Series |
Financial highlights
| Income (loss) from investment operations1 | Dividends and distributions | Ratio of expenses | Ratio of expenses | |||||||||||||||||||||||||||||||||||||||||||||||||||||
| Period ended | Net asset value, beginning of period | Net investment income | Net gains (losses) on securities (both realized and unrealized) | Total from investment operations | Dividends (from net investment income) | Distributions (from capital gains) | Total dividends and distribu- tions | Net asset value, end of period | Total return2 | Net assets, end of period (in millions) | to average net assets before waivers/ reimburse- ments3 | to average net assets after waivers/ reimburse- ments2,3 | Net effective expense ratio2,4 | Ratio of net income to average net assets2 | ||||||||||||||||||||||||||||||||||||||||||
| Global Growth Portfolio | ||||||||||||||||||||||||||||||||||||||||||||||||||||||||
| Class 4: | ||||||||||||||||||||||||||||||||||||||||||||||||||||||||
| 12/31/2019 | $ | 10.68 | $ | .12 | $ | 3.18 | $ | 3.30 | $ | (.09 | ) | $ | (.54 | ) | $ | (.63 | ) | $ | 13.35 | 31.67 | % | $ | 54 | .61 | % | .56 | % | 1.18 | % | .97 | % | |||||||||||||||||||||||||
| 12/31/2018 | 12.17 | .08 | (1.22 | ) | (1.14 | ) | (.12 | ) | (.23 | ) | (.35 | ) | 10.68 | (9.77 | ) | 36 | .59 | .58 | 1.20 | .69 | ||||||||||||||||||||||||||||||||||||
| 12/31/2017 | 9.77 | .12 | 2.59 | 2.71 | (.06 | ) | (.25 | ) | (.31 | ) | 12.17 | 28.11 | 30 | .62 | .56 | 1.18 | 1.05 | |||||||||||||||||||||||||||||||||||||||
| 12/31/2016 | 9.45 | .12 | .29 | .41 | (.05 | ) | (.04 | ) | (.09 | ) | 9.77 | 4.42 | 13 | .75 | .56 | 1.18 | 1.30 | |||||||||||||||||||||||||||||||||||||||
| 12/31/20155,6 | 10.00 | .12 | (.67 | ) | (.55 | ) | — | — | — | 9.45 | (5.50 | )7 | 6 | 1.02 | 8 | .58 | 8 | 1.20 | 8 | 1.91 | 8 | |||||||||||||||||||||||||||||||||||
| Growth and Income Portfolio | ||||||||||||||||||||||||||||||||||||||||||||||||||||||||
| Class 4: | ||||||||||||||||||||||||||||||||||||||||||||||||||||||||
| 12/31/2019 | $ | 10.59 | $ | .22 | $ | 1.81 | $ | 2.03 | $ | (.19 | ) | $ | (.30 | ) | $ | (.49 | ) | $ | 12.13 | 19.57 | % | $ | 257 | .52 | % | .52 | % | .96 | % | 1.92 | % | |||||||||||||||||||||||||
| 12/31/2018 | 11.40 | .20 | (.58 | ) | (.38 | ) | (.16 | ) | (.27 | ) | (.43 | ) | 10.59 | (3.51 | ) | 168 | .53 | .53 | .97 | 1.81 | ||||||||||||||||||||||||||||||||||||
| 12/31/2017 | 10.13 | .17 | 1.38 | 1.55 | (.13 | ) | (.15 | ) | (.28 | ) | 11.40 | 15.43 | 134 | .53 | .53 | .97 | 1.59 | |||||||||||||||||||||||||||||||||||||||
| 12/31/2016 | 9.61 | .23 | .38 | .61 | (.07 | ) | (.02 | ) | (.09 | ) | 10.13 | 6.41 | 66 | .57 | .55 | .99 | 2.31 | |||||||||||||||||||||||||||||||||||||||
| 12/31/20155,6 | 10.00 | .20 | (.58 | ) | (.38 | ) | (.01 | ) | — | (.01 | ) | 9.61 | (3.85 | )7 | 15 | .79 | 8 | .58 | 8 | 1.05 | 8 | 3.14 | 8 | |||||||||||||||||||||||||||||||||
| Managed Risk Growth Portfolio | ||||||||||||||||||||||||||||||||||||||||||||||||||||||||
| Class P2: | ||||||||||||||||||||||||||||||||||||||||||||||||||||||||
| 12/31/2019 | $ | 10.28 | $ | .13 | $ | 1.80 | $ | 1.93 | $ | (.14 | ) | $ | (.46 | ) | $ | (.60 | ) | $ | 11.61 | 19.26 | % | $ | 1,474 | .66 | % | .61 | % | 1.02 | % | 1.20 | % | |||||||||||||||||||||||||
| 12/31/2018 | 11.16 | .12 | (.53 | ) | (.41 | ) | (.14 | ) | (.33 | ) | (.47 | ) | 10.28 | (3.98 | ) | 1,073 | .66 | .61 | 1.00 | 1.06 | ||||||||||||||||||||||||||||||||||||
| 12/31/2017 | 9.76 | .10 | 1.63 | 1.73 | (.09 | ) | (.24 | ) | (.33 | ) | 11.16 | 18.00 | 904 | .68 | .63 | 1.03 | .95 | |||||||||||||||||||||||||||||||||||||||
| 12/31/2016 | 9.39 | .11 | .26 | .37 | — | 9 | — | — | 9 | 9.76 | 3.97 | 568 | .77 | .63 | 1.02 | 1.12 | ||||||||||||||||||||||||||||||||||||||||
| 12/31/20155,6 | 10.00 | .18 | (.70 | ) | (.52 | ) | (.09 | ) | — | (.09 | ) | 9.39 | (5.20 | )7 | 254 | .86 | 8 | .61 | 8 | 1.01 | 8 | 2.77 | 8 | |||||||||||||||||||||||||||||||||
| Managed Risk Growth and Income Portfolio | ||||||||||||||||||||||||||||||||||||||||||||||||||||||||
| Class P2: | ||||||||||||||||||||||||||||||||||||||||||||||||||||||||
| 12/31/2019 | $ | 10.18 | $ | .18 | $ | 1.74 | $ | 1.92 | $ | (.18 | ) | $ | (.37 | ) | $ | (.55 | ) | $ | 11.55 | 19.29 | % | $ | 1,288 | .67 | % | .62 | % | 1.08 | % | 1.66 | % | |||||||||||||||||||||||||
| 12/31/2018 | 11.13 | .17 | (.67 | ) | (.50 | ) | (.17 | ) | (.28 | ) | (.45 | ) | 10.18 | (4.72 | ) | 974 | .66 | .61 | 1.07 | 1.54 | ||||||||||||||||||||||||||||||||||||
| 12/31/2017 | 9.68 | .15 | 1.44 | 1.59 | (.12 | ) | (.02 | ) | (.14 | ) | 11.13 | 16.55 | 851 | .68 | .63 | 1.08 | 1.38 | |||||||||||||||||||||||||||||||||||||||
| 12/31/2016 | 9.36 | .16 | .19 | .35 | (.03 | ) | — | (.03 | ) | 9.68 | 3.70 | 569 | .77 | .63 | 1.08 | 1.68 | ||||||||||||||||||||||||||||||||||||||||
| 12/31/20155,6 | 10.00 | .18 | (.73 | ) | (.55 | ) | (.09 | ) | — | (.09 | ) | 9.36 | (5.50 | )7 | 231 | .86 | 8 | .61 | 8 | 1.08 | 8 | 2.85 | 8 | |||||||||||||||||||||||||||||||||
| Managed Risk Global Allocation Portfolio | ||||||||||||||||||||||||||||||||||||||||||||||||||||||||
| Class P2: | ||||||||||||||||||||||||||||||||||||||||||||||||||||||||
| 12/31/2019 | $ | 10.07 | $ | .13 | $ | 1.89 | $ | 2.02 | $ | (.15 | ) | $ | (.34 | ) | $ | (.49 | ) | $ | 11.60 | 20.44 | % | $ | 424 | .68 | % | .63 | % | 1.20 | % | 1.20 | % | |||||||||||||||||||||||||
| 12/31/2018 | 11.04 | .14 | (.88 | ) | (.74 | ) | (.10 | ) | (.13 | ) | (.23 | ) | 10.07 | (6.90 | ) | 325 | .68 | .63 | 1.20 | 1.27 | ||||||||||||||||||||||||||||||||||||
| 12/31/2017 | 9.34 | .10 | 1.67 | 1.77 | (.07 | ) | — | (.07 | ) | 11.04 | 19.03 | 251 | .70 | .63 | 1.19 | .94 | ||||||||||||||||||||||||||||||||||||||||
| 12/31/2016 | 9.24 | .10 | — | 9 | .10 | — | — | — | 9.34 | 1.08 | 144 | .77 | .63 | 1.20 | 1.08 | |||||||||||||||||||||||||||||||||||||||||
| 12/31/20155,6 | 10.00 | .14 | (.81 | ) | (.67 | ) | (.09 | ) | — | (.09 | ) | 9.24 | (6.71 | )7 | 65 | .90 | 8 | .56 | 8 | 1.13 | 8 | 2.22 | 8 | |||||||||||||||||||||||||||||||||
See next page for footnotes.
| American Funds Insurance Series – Portfolio Series | 31 |
Financial highlights(continued)
| Year ended December 31, | For the period ended | |||||||||||||||||||
| Portfolio turnover rate | 2019 | 2018 | 2017 | 2016 | December 31, 20155,6,7 | |||||||||||||||
| Global Growth Portfolio | 14 | % | 12 | % | 10 | % | 17 | % | 32 | % | ||||||||||
| Growth and Income Portfolio | 6 | 5 | 10 | 18 | 10 | |||||||||||||||
| Managed Risk Growth Portfolio | 6 | 4 | 7 | 6 | 4 | |||||||||||||||
| Managed Risk Growth and Income Portfolio | 5 | 4 | 10 | 3 | 4 | |||||||||||||||
| Managed Risk Global Allocation Portfolio | 6 | 3 | 8 | 13 | 15 | |||||||||||||||
| 1 | Based on average shares outstanding. |
| 2 | This column reflects the impact of certain waivers/reimbursements by CRMC. During some of the periods shown, CRMC waived a portion of investment advisory services fees and/or reimbursed a portion of miscellaneous fees and expenses. |
| 3 | This column does not include expenses of the underlying funds in which each fund invests. |
| 4 | This column reflects the net effective expense ratios for each fund and class, which are unaudited. These ratios include each class’s expense ratio combined with the weighted average net expense ratio of the underlying funds for the periods presented. See expense example for further information regarding fees and expenses. |
| 5 | Based on operations for a period that is less than a full year. |
| 6 | For the period May 1, 2015, commencement of operations, through December 31, 2015. |
| 7 | Not annualized. |
| 8 | Annualized. |
| 9 | Amount less than $.01. |
| 32 | American Funds Insurance Series – Portfolio Series |
Report of Independent Registered Public Accounting Firm
To the Board of Trustees of American Funds Insurance Series and Shareholders of American Funds Global Growth Portfolio, American Funds Growth and Income Portfolio, American Funds Managed Risk Growth Portfolio, American Funds Managed Risk Growth and Income Portfolio and American Funds Managed Risk Global Allocation Portfolio
Opinions on the Financial Statements
We have audited the accompanying statements of assets and liabilities, including the investment portfolios, of American Funds Global Growth Portfolio, American Funds Growth and Income Portfolio, American Funds Managed Risk Growth Portfolio, American Funds Managed Risk Growth and Income Portfolio and American Funds Managed Risk Global Allocation Portfolio (five of the funds constituting American Funds Insurance Series, hereafter collectively referred to as the “Funds”) as of December 31, 2019, the related statements of operations for the year ended December 31, 2019, the statements of changes in net assets for each of the two years in the period ended December 31, 2019, including the related notes, and the financial highlights for each of the periods indicated therein (collectively referred to as the “financial statements”). In our opinion, the financial statements present fairly, in all material respects, the financial position of each of the Funds as of December 31, 2019, the results of each of their operations for the year then ended, the changes in each of their net assets for each of the two years in the period ended December 31, 2019 and each of the financial highlights for each of the periods indicated therein in conformity with accounting principles generally accepted in the United States of America.
Basis for Opinions
These financial statements are the responsibility of the Funds’ management. Our responsibility is to express an opinion on the Funds’ financial statements based on our audits. We are a public accounting firm registered with the Public Company Accounting Oversight Board (United States) (PCAOB) and are required to be independent with respect to the Funds in accordance with the U.S. federal securities laws and the applicable rules and regulations of the Securities and Exchange Commission and the PCAOB.
We conducted our audits of these financial statements in accordance with the standards of the PCAOB. Those standards require that we plan and perform the audit to obtain reasonable assurance about whether the financial statements are free of material misstatement, whether due to error or fraud.
Our audits included performing procedures to assess the risks of material misstatement of the financial statements, whether due to error or fraud, and performing procedures that respond to those risks. Such procedures included examining, on a test basis, evidence regarding the amounts and disclosures in the financial statements. Our audits also included evaluating the accounting principles used and significant estimates made by management, as well as evaluating the overall presentation of the financial statements. Our procedures included confirmation of securities owned as of December 31, 2019 by correspondence with the custodians, transfer agent and brokers; when replies were not received from the transfer agent and brokers, we performed other auditing procedures. We believe that our audits provide a reasonable basis for our opinions.
/s/ PricewaterhouseCoopers LLP
Los Angeles, California
February 14, 2020
We have served as the auditor of one or more investment companies in The Capital Group Companies Investment Company Complex since 1934.
| American Funds Insurance Series – Portfolio Series | 33 |
| Expense example | unaudited |
The funds in American Funds Insurance Series serve as the underlying investment vehicle for various insurance products. As an owner of an insurance contract that invests in one of the funds in the series, you incur two types of costs: (1) transaction costs, such as initial sales charges on purchase payments and contingent deferred sales charges on redemptions (loads), and (2) ongoing costs, including management fees, distribution and service (12b-1) fees, and other expenses. Additional fees are charged by the insurance companies related to the various benefits they provide. This example is intended to help you understand your ongoing costs (in dollars) of investing in the underlying funds so you can compare these costs with the ongoing costs of investing in other mutual funds that serve a similar function in other annuity products. The example is based on an investment of $1,000 invested at the beginning of the period and held for the entire six-month period (July 1, 2019, through December 31, 2019).
Actual expenses:
The first line of each share class in the tables on the following page provides information about actual account values and actual expenses. You may use the information in this line, together with the amount you invested, to estimate the expenses that you paid over the period. Simply divide your account value by $1,000 (for example, an $8,600 account value divided by $1,000 = 8.6), then multiply the result by the number in the first line under the heading titled “Expenses paid during period” to estimate the expenses you paid on your account during this period.
Hypothetical example for comparison purposes:
The second line of each share class in the tables on the following page provides information about hypothetical account values and hypothetical expenses based on the actual expense ratio for the share class and an assumed rate of return of 5.00% per year before expenses, which is not the actual return of the share class. The hypothetical account values and expenses may not be used to estimate the actual ending account balance or expenses you paid for the period. You may use this information to compare the ongoing costs of investing in the fund and other funds. To do so, compare this 5.00% hypothetical example with the 5.00% hypothetical examples that appear in the shareholder reports of the other funds.
Notes:
Additional fees are charged by the insurance companies related to the various benefits they provide. You can estimate the impact of these fees by adding the amount of the fees to the total estimated expenses you paid on your account during the period as calculated above. In addition, your ending account value would be lower by the amount of these fees.
Note that the expenses shown in the tables on the following page are meant to highlight your ongoing costs only and do not reflect any transactional costs. Therefore, the second line of each share class in the table is useful in comparing ongoing costs only and will not help you determine the relative total costs of owning different funds. In addition, if these transactional costs were included, your costs would have been higher.
| 34 | American Funds Insurance Series – Portfolio Series |
| Beginning account value 7/1/2019 | Ending account value 12/31/2019 | Expenses paid during period1,2 | Annualized expense ratio2 | Effective expenses paid during period3 | Effective annualized expense ratio4 | |||||||||||||||||||
| Global Growth Portfolio | ||||||||||||||||||||||||
| Class 4 – actual return | $ | 1,000.00 | $ | 1,101.48 | $ | 3.18 | .60 | % | $ | 6.46 | 1.22 | % | ||||||||||||
| Class 4 – assumed 5% return | 1,000.00 | 1,022.18 | 3.06 | .60 | 6.21 | 1.22 | ||||||||||||||||||
| Growth and Income Portfolio | ||||||||||||||||||||||||
| Class 4 – actual return | $ | 1,000.00 | $ | 1,068.96 | $ | 2.71 | .52 | % | $ | 5.01 | .96 | % | ||||||||||||
| Class 4 – assumed 5% return | 1,000.00 | 1,022.58 | 2.65 | .52 | 4.89 | .96 | ||||||||||||||||||
| Managed Risk Growth Portfolio | ||||||||||||||||||||||||
| Class P2 – actual return | $ | 1,000.00 | $ | 1,073.95 | $ | 3.24 | .62 | % | $ | 5.33 | 1.02 | % | ||||||||||||
| Class P2 – assumed 5% return | 1,000.00 | 1,022.08 | 3.16 | .62 | 5.19 | 1.02 | ||||||||||||||||||
| Managed Risk Growth and Income Portfolio | ||||||||||||||||||||||||
| Class P2 – actual return | $ | 1,000.00 | $ | 1,074.25 | $ | 3.24 | .62 | % | $ | 5.65 | 1.08 | % | ||||||||||||
| Class P2 – assumed 5% return | 1,000.00 | 1,022.08 | 3.16 | .62 | 5.50 | 1.08 | ||||||||||||||||||
| Managed Risk Global Allocation Portfolio | ||||||||||||||||||||||||
| Class P2 – actual return | $ | 1,000.00 | $ | 1,070.11 | $ | 3.34 | .64 | % | $ | 6.26 | 1.20 | % | ||||||||||||
| Class P2 – assumed 5% return | 1,000.00 | 1,021.98 | 3.26 | .64 | 6.11 | 1.20 | ||||||||||||||||||
| 1 | The “expenses paid during period” are equal to the “annualized expense ratio,” multiplied by the average account value over the period, multiplied by the number of days in the period, and divided by 365 (to reflect the one-half year period). |
| 2 | The “expenses paid during period” and “annualized expense ratio” do not include the expenses of the underlying funds in which each fund invests. |
| 3 | The “effective expenses paid during period” are equal to the “effective annualized expense ratio,” multiplied by the average account value over the period, multiplied by the number of days in the period, and divided by 365 (to reflect the period). |
| 4 | The “effective annualized expense ratio” reflects the net annualized expense ratio of the class plus the class’s pro-rata share of the weighted average expense ratio of the underlying funds in which it invests. |
| American Funds Insurance Series – Portfolio Series | 35 |
Liquidity Risk Management Program
The series has adopted a liquidity risk management program (the “program”). The series’ board has designated Capital Research and Management Company (“CRMC”) as the administrator of the program. Personnel of CRMC or its affiliates conduct the day-to-day operation of the program pursuant to policies and procedures administered by the Capital Group Liquidity Risk Management Committee.
Under the program, CRMC manages each fund’s liquidity risk, which is the risk that the fund could not meet shareholder redemption requests without significant dilution of remaining shareholders’ interests in the fund. This risk is managed by monitoring the degree of liquidity of each fund’s investments, limiting the amount of each fund’s illiquid investments, and utilizing various risk management tools and facilities available to each fund for meeting shareholder redemptions, among other means. CRMC’s process of determining the degree of liquidity of each fund’s investments is supported by one or more third-party liquidity assessment vendors.
The series’ board reviewed a report prepared by CRMC regarding the operation and effectiveness of the program for the period December 1, 2018, through September 30, 2019. No significant liquidity events impacting any of the funds were noted in the report. In addition, CRMC provided its assessment that the program had been effective in managing each fund’s liquidity risk.
| 36 | American Funds Insurance Series – Portfolio Series |
This page intentionally left blank.
| American Funds Insurance Series – Portfolio Series | 37 |
This page intentionally left blank.
| 38 | American Funds Insurance Series – Portfolio Series |
This page intentionally left blank.
| American Funds Insurance Series – Portfolio Series | 39 |
This page intentionally left blank.
| 40 | American Funds Insurance Series – Portfolio Series |
This page intentionally left blank.
| American Funds Insurance Series – Portfolio Series | 41 |
Board of trustees and other officers
| Independent trustees1 | ||||||||
| Name and year of birth | Year first elected a trustee of the series2 | Principal occupation(s) during past five years | Number of portfolios in fund complex overseen by trustee | Other directorships3 held by trustee | ||||
| William H. Baribault, 1945 | 2009 | Chairman of the Board and CEO, Oakwood Advisors (private investment and consulting); former CEO and President, Richard Nixon Foundation | 89 | General Finance Corporation | ||||
| James G. Ellis, 1947 | 2010 | Professor of Marketing and former Dean, Marshall School of Business, University of Southern California | 99 | Mercury General Corporation | ||||
| Nariman Farvardin, 1956 | 2018 | President, Stevens Institute of Technology | 86 | None | ||||
| Mary Davis Holt, 1950 | 2015–2016; 2017 | Principal, Mary Davis Holt Enterprises, LLC (leadership development consulting); former Partner, Flynn Heath Holt Leadership, LLC (leadership consulting); former COO, Time Life Inc. (1993–2003) | 86 | None | ||||
| R. Clark Hooper, 1946 | 2010 | Private investor | 89 | None | ||||
| Merit E. Janow, 1958 | 2007 | Dean and Professor, Columbia University, School of International and Public Affairs | 88 | Mastercard Incorporated; Trimble Inc. | ||||
| Margaret Spellings, 1957 Chairman of the Board (Independent and Non-Executive) | 2010 | CEO, Texas 2036; former President, Margaret Spellings & Company (public policy and strategic consulting); former President, The University of North Carolina; former President, George W. Bush Foundation | 90 | None | ||||
| Alexandra Trower, 1964 | 2018 | Executive Vice President, Global Communications and Corporate Officer, The Estée Lauder Companies | 85 | None | ||||
| Interested trustees4,5 | ||||||||
| Name, year of birth and position with series | Year first elected a trustee or officer of the series2 | Principal occupation(s) during past five years and positions held with affiliated entities or the principal underwriter of the series | Number of portfolios in fund complex overseen by trustee | Other directorships3 held by trustee | ||||
| Donald D. O’Neal, 1960 Co-President | 1998 | Partner — Capital International Investors, Capital Research and Management Company; Partner — Capital International Investors, Capital Bank and Trust Company;6Director, Capital Research and Management Company | 35 | None | ||||
| Michael C. Gitlin, 1970 | 2019 | Vice Chairman and Director, Capital Research and Management Company; Partner — Capital Fixed Income Investors, Capital Research and Management Company; Director, The Capital Group Companies, Inc.;6served as Head of Fixed Income at a large investment management firm prior to joining Capital Research and Management Company in 2015 | 85 | None | ||||
The series statement of additional information includes further details about the series trustees and is available without charge upon request by calling American Funds Service Company at (800) 421-4225 or by visiting the Capital Group website at capitalgroup.com. The address for all trustees and officers of the series is 333 South Hope Street, Los Angeles, CA 90071,Attention: Secretary.
| 42 | American Funds Insurance Series – Portfolio Series |
Other officers5
| Name, year of birth and position with series | Year first elected an officer of the series2 | Principal occupation(s) during past five years and positions held with affiliated entities or the principal underwriter of the series | ||
| Alan N. Berro, 1960 Co-President | 1998 | Partner — Capital World Investors, Capital Research and Management Company; Partner — Capital World Investors, Capital Bank and Trust Company;6Director, The Capital Group Companies, Inc.6 | ||
| Maria Manotok,1974 Executive Vice President | 2012 | Senior Vice President and Senior Counsel — Fund Business Management Group, Capital Research and Management Company; Senior Vice President, Senior Counsel and Director, Capital International, Inc.;6 Director, Capital Group Investment Management Limited6 | ||
| John H. Smet, 1956 Senior Vice President | 1994 | Partner — Capital Fixed Income Investors, Capital Research and Management Company | ||
| Martin Jacobs,1962 Vice President | 2016 | Partner — Capital Research Global Investors, Capital Research and Management Company | ||
| Carl M. Kawaja, 1964 Vice President | 2008 | Partner — Capital World Investors, Capital Research and Management Company; Chairman and Director, Capital Research and Management Company; Partner — Capital World Investors, Capital Bank and Trust Company;6Director, The Capital Group Companies, Inc.6 | ||
| Sung Lee,1966 Vice President | 2008 | Partner — Capital Research Global Investors, Capital International, Inc.6 | ||
| Keiko McKibben, 1969 Vice President | 2010 | Partner — Capital Research Global Investors, Capital Research and Management Company | ||
| Renaud H. Samyn, 1974 Vice President | 2010 | Partner — Capital Research Global Investors, Capital International, Inc.6 | ||
| Dylan Yolles, 1969 Vice President | 2012 | Partner — Capital International Investors, Capital Research and Management Company | ||
| Steven I. Koszalka, 1964 Secretary | 2003 | Vice President — Fund Business Management Group, Capital Research and Management Company | ||
| Gregory F. Niland, 1971 Treasurer | 2008 | Vice President — Investment Operations, Capital Research and Management Company | ||
| Susan K. Countess, 1966 Assistant Secretary | 2014 | Associate — Fund Business Management Group, Capital Research and Management Company | ||
| Sandra Chuon, 1972 Assistant Treasurer | 2019 | Assistant Vice President — Investment Operations, Capital Research and Management Company | ||
| Brian C. Janssen, 1972 Assistant Treasurer | 2015 | Vice President — Investment Operations, Capital Research and Management Company |
| 1 | The term independent trustee refers to a trustee who is not an “interested person” of the series within the meaning of the Investment Company Act of 1940. |
| 2 | Trustees and officers of the series serve until their resignation, removal or retirement. |
| 3 | This includes all directorships/trusteeships (other than those in the American Funds or other funds managed by Capital Research and Management Company or its affiliates) that are held by each trustee as a trustee or director of a public company or a registered investment company. |
| 4 | The term interested trustee refers to a trustee who is an “interested person” within the meaning of the Investment Company Act of 1940, on the basis of their affiliation with the series investment adviser, Capital Research and Management Company, or affiliated entities (including the series principal underwriter). |
| 5 | All of the trustees and/or officers listed, with the exception of Martin Jacobs, Keiko McKibben and Renaud H. Samyn, are officers and/or directors/trustees of one or more of the other funds for which Capital Research and Management Company serves as investment adviser. |
| 6 | Company affiliated with Capital Research and Management Company. |
| American Funds Insurance Series – Portfolio Series | 43 |
Office of the series
333 South Hope Street
Los Angeles, CA 90071-1406
Investment adviser
Capital Research and Management Company
333 South Hope Street
Los Angeles, CA 90071-1406
Investment subadviser
Milliman Financial Risk Management LLC
(Managed Risk Funds only)
71 South Wacker Drive, 31st Floor
Chicago, IL 60606
Custodians of assets
State Street Bank and Trust Company
One Lincoln Street
Boston, MA 02111
Bank of New York Mellon
(Managed Risk Funds only)
One Wall Street
New York, NY 10286
Counsel
Morgan, Lewis & Bockius LLP
One Federal Street
Boston, MA 02110-1726
Independent registered public accounting firm
PricewaterhouseCoopers LLP
601 South Figueroa Street
Los Angeles, CA 90017-3874
| 44 | American Funds Insurance Series – Portfolio Series |
Investors should carefully consider investment objectives, risks, charges and expenses. This and other important information is contained in the series prospectuses and summary prospectuses, which can be obtained from your financial professional and should be read carefully before investing. You may also call American Funds Service Company (AFS) at (800) 421-4225 or visit the Capital Group website at capitalgroup.com.
“Proxy Voting Guidelines for American Funds Insurance Series — Portfolio Series” — which describes how we vote proxies relating to the underlying funds held in the portfolios — is available on our website or upon request by calling AFS. The series files its proxy voting record with the U.S. Securities and Exchange Commission (SEC) for the 12 months ended June 30 by August 31. The proxy voting record is available free of charge on the SEC website at sec.gov and on our website.
American Funds Insurance Series — Portfolio Series files a complete list of its portfolio holdings with the SEC for the first and third quarters of each fiscal year on Form NPORT-P. This filing is available free of charge on the SEC website. Additionally, the list of portfolio holdings is available by calling AFS.
This report is for the information of American Funds Insurance Series — Portfolio Series investors, but it also may be used as sales literature when preceded or accompanied by the current prospectuses or summary prospectuses for American Funds Insurance Series — Portfolio Series and the prospectus for the applicable insurance contract, which give details about charges, expenses, investment objectives and operating policies of the series. If used as sales material after March 31, 2020, this report must be accompanied by a statistical update for the most recently completed calendar quarter.
Bloomberg® is a trademark of Bloomberg Finance L.P. (collectively with its affiliates, “Bloomberg”). Barclays® is a trademark of Barclays Bank Plc (collectively with its affiliates, “Barclays”), used under license. Neither Bloomberg nor Barclays approves or endorses this material, guarantees the accuracy or completeness of any information herein and, to the maximum extent allowed by law, neither shall have any liability or responsibility for injury or damages arising in connection therewith.
MSCI has not approved, reviewed or produced this report, makes no express or implied warranties or representations and is not liable whatsoever for any data in the report. You may not redistribute the MSCI data or use it as a basis for other indices or investment products.
Standard & Poor’s 500 Composite Index is a product of S&P Dow Jones Indices LLC and/or its affiliates and has been licensed for use by Capital Group. Copyright © 2020 S&P Dow Jones Indices LLC, a division of S&P Global, and/or its affiliates. All rights reserved. Redistribution or reproduction in whole or in part are prohibited without written permission of S&P Dow Jones Indices LLC.
American Funds Distributors, Inc., member FINRA.
© 2020 Capital Group. All rights reserved.
The Capital Advantage®
Since 1931, Capital Group, home of American Funds, has helped investors pursue long-term investment success. Our consistent approach — in combination with The Capital SystemSM— has resulted in superior outcomes.
| Aligned with investor success | |
| We base our decisions on a long-term perspective, which we believe aligns our goals with the interests of our clients. American Funds Insurance Series portfolio managers average 28 years of investment experience, including 23 years at our company, reflecting a career commitment to our long-term approach.1 | |
| The Capital System | |
| The Capital System combines individual accountability with teamwork. Funds using The Capital System are divided into portions that are managed independently by investment professionals with diverse backgrounds, ages and investment approaches. An extensive global research effort is the backbone of our system. | |
| American Funds Insurance Series superior outcomes | |
| American Funds Insurance Series equity funds have beaten their comparable Lipper indexes in 90% of 10-year periods and 100% of 20-year periods.2Our fixed income funds have helped investors achieve diversification through attention to correlation between bonds and equities.3We strive to keep management fees competitive. Over the past 20 years, most funds’ fees have been below industry averages.4 |
| 1 | Portfolio manager experience as of the American Funds Insurance Series prospectus dated May 1, 2020. | |
| 2 | Based on Class 1 share results for rolling periods through December 31, 2019. Periods covered are the shorter of the fund’s lifetime or since the inception date of the comparable Lipper index or average. The comparable Lipper indexes are: Global Funds Index (Global Growth Fund, Global Growth and Income Fund), Growth Funds Index (Growth Fund), International Funds Index (International Fund), Emerging Markets Funds Index (New World Fund), Growth & Income Funds Index (Blue Chip Income and Growth Fund, Growth-Income Fund) and Balanced Funds Index (Asset Allocation Fund). The Lipper Global Small-/Mid-Cap Funds Average was used for Global Small Capitalization Fund. Lipper source: Refinitiv Lipper. There have been periods when the fund has lagged the index. | |
| 3 | Based on Class 1 share results as of December 31, 2019. Four of our five fixed income funds showed a three-year correlation below 0.1. Standard & Poor’s 500 Composite Index was used as an equity market proxy. Correlation based on monthly total returns. Correlation is a statistical measure of how two securities move in relation to each other. A correlation ranges from –1 to 1. A positive correlation close to 1 implies that as one security moves, either up or down, the other security will move in “lockstep,” in the same direction. A negative correlation close to –1 indicates that the securities have moved in the opposite direction. | |
| 4 | Based on management fees for the 20-year period ended December 31, 2019, versus comparable Lipper categories, excluding funds of funds. |
All Capital Group trademarks mentioned are owned by The Capital Group Companies, Inc., an affiliated company or fund. All other company and product names mentioned are the property of their respective companies.

American Funds Insurance Series®
Introductory report |  |

Offering variable
annuity investors
objective-based
retirement funds
Beginning on January 1, 2021, as permitted by regulations adopted by the U.S. Securities and Exchange Commission, you may not receive paper copies of the fund’s shareholder reports from the insurance company that offers your contract unless you specifically request paper copies from the insurance company or from your financial intermediary. Instead, the shareholder reports will be made available on a website, and the insurance company will notify you by mail each time a report is posted and provide you with a website link to access the report. Instructions for requesting paper copies will be provided by your insurance company.
If you have already elected to receive shareholder reports electronically, you will not be affected by this change and do not need to take any action. You may elect to receive shareholder reports and other communications from the insurance company electronically by following the instructions provided by the insurance company.
You may elect to receive paper copies of all future reports free of charge from the insurance company. You can inform the insurance company that you wish to continue receiving paper copies of your shareholder reports by following the instructions provided by the insurance company. Your election to receive paper reports will apply to all investment options available under your contract.
Depending on the proximity to its target date, each fund will seek to achieve the following objectives to varying degrees: growth, income and conservation of capital. Each fund will increasingly emphasize income and conservation of capital by investing a greater portion of its assets in fixed income, equity-income and balanced funds as it approaches and passes its target date. In this way, each fund seeks to balance total return and stability over time.
American Funds, by Capital Group, is one of the nation’s largest mutual fund families. For nearly 90 years, Capital Group has invested with a long-term focus based on thorough research and attention to risk.
Fund results shown are for past periods and are not predictive of future periods. Current and future results may be lower or higher than those shown. Share prices and returns will vary, so investors may lose money. Investing for short periods makes losses more likely. For current information and month-end results, visit capitalgroup.com/afis. For information about your insurance contract and month-end results, go to the website of the company that issued your contract.
Here are the average annual total returns on a $1,000 investment with all distributions reinvested for the period ended December 31, 2019. Also shown are the estimated gross and net expense ratios as of the series prospectus dated May 1, 2020 (unaudited):
| Class 4 shares | Average annual total returns Lifetime* | Gross expense ratio | Net expense ratio | |||||||||
| American Funds® IS 2035 Target Date Fund | 2.70 | % | 0.93 | % | 0.92 | % | ||||||
| American Funds® IS 2030 Target Date Fund | 2.28 | 0.91 | 0.90 | |||||||||
| American Funds® IS 2025 Target Date Fund | 1.98 | 0.89 | 0.88 | |||||||||
| American Funds® IS 2020 Target Date Fund | 1.68 | 0.87 | 0.86 | |||||||||
| American Funds® IS 2015 Target Date Fund | 1.69 | 0.86 | 0.85 | |||||||||
| American Funds® IS 2010 Target Date Fund | 1.54 | 0.86 | 0.85 | |||||||||
| * | Since December 6, 2019, for all funds. |
The target date funds invest in Class R-6 shares of the underlying funds.
Expense ratios are restated to reflect current fees. The investment adviser is currently reimbursing a portion of the other expenses for each fund. This reimbursement will be in effect through at least May 1, 2021. The adviser may elect at its discretion to extend, modify or terminate the reimbursement at that time.
Each target date fund is composed of a mix of the American Funds and is subject to the risks and returns of the underlying funds. Investing outside the United States involves risks such as currency fluctuations, periods of illiquidity and price volatility. These risks may be heightened in connection with investments in developing countries. Small company stocks entail additional risks, and they can fluctuate in price more than larger company stocks. Lower rated bonds are subject to greater fluctuations in value and risk of loss of income and principal than higher rated bonds. The return of principal for bond funds and for funds with significant underlying bond holdings is not guaranteed. Fund shares are subject to the same interest rate, inflation and credit risks associated with the underlying bond holdings. Shares of U.S. Government Securities Fund® are not guaranteed by the U.S. government.
The funds’ allocation strategy does not guarantee that investors’ retirement savings goals will be met. The allocation strategy promotes asset accumulation prior to retirement, but it is also intended to provide equity exposure throughout retirement to deliver capital growth potential. The funds may seek dividend income to help dampen risk while maintaining equity exposure, and may invest in fixed income securities to help provide current income, capital preservation and inflation protection.The funds’ risks are directly related to the risks of the underlying funds. Refer to the series prospectus and the Risk Factors section of this report for more information on these and other risks associated with investing in the series.
Investments are not FDIC-insured, nor are they deposits of or guaranteed by a bank or any other entity, so they may lose value.
Contents
| 1 | Letter to investors |
| 3 | Investment approach for American Funds Insurance Series Target Date Series |
| Investment portfolios | |
| 4 | American Funds IS 2035 Target Date Fund |
| 5 | American Funds IS 2030 Target Date Fund |
| 6 | American Funds IS 2025 Target Date Fund |
| 7 | American Funds IS 2020 Target Date Fund |
| 8 | American Funds IS 2015 Target Date Fund |
| 9 | American Funds IS 2010 Target Date Fund |
| 10 | Financial statements |
| 30 | Board of trustees and other officers |
Fellow investors:
It is our pleasure to present the first annual report for American Funds Insurance Series® — Target Date Series for the period ended December 31, 2019.
About the series
Launched December 6, 2019, the Series offers a suite of funds that offer variable annuity investors objective-based portfolios to help meet retirement goals. It is managed by the Target Date Solutions Committee (“the Committee”), a group of seasoned investment professionals with varied backgrounds, diverse investment approaches and decades of experience. In managing the series, the Committee carefully selects a mix of individual American Funds, employing an objective-based framework supported by rigorous analysis. The Committee regularly monitors each fund in the series. During this brief reporting period, all six funds registered positive results (as shown on the facing page), led by the 2035 fund’s 2.70% return.
Investment objectives
Depending on the proximity to its target date, which we define as the year that corresponds roughly to the year in which the investor expects to retire, each fund will seek to achieve the following objectives to varying degrees: growth, income and conservation of capital. Each fund will increasingly emphasize income and conservation of capital by investing a greater portion of its assets in fixed income, equity-income and balanced funds as it approaches and passes its target date. In this way, the funds seek to balance total return and stability over time.
The investment environment
Global stocks generated the best one-year returns in a decade, boosted by aggressive central bank stimulus measures in the United States and Europe. Worries over the trade war with China prompted occasional volatility, but a resilient U.S. economy and expected trade deal between Beijing and Washington helped steer markets higher. Technology stocks posted the strongest returns for the year, driven by solid earnings reports from U.S. tech giants such as Apple, Microsoft and Facebook.
U.S. equities had their best annual gains since 2013, ending the year near all-time highs. Stocks rose steadily following the steep selloff in late 2018, posting positive gains in 10 out of 12 months. The Federal Reserve cut its policy rate three times in 2019 amid concerns over slowing economic growth. At the close of December, the rate stood between 1.50% and 1.75%. Cyclical stocks generally outpaced defensive sectors, and large caps bested small caps. Government bonds advanced as central banks around the world cut interest rates in an effort to blunt the negative effects of a trade war. Policymakers also actively worked to support short-term credit markets.
| American Funds Insurance Series – Target Date Series | 1 |
Markets review
For the fiscal year, Standard & Poor’s 500 Composite Index1, a market capitalization-weighted index based on the results of approximately 500 widely held common stocks, gained 31.49%. The MSCI ACWI2, a free float-adjusted market capitalization-weighted index designed to measure equity market results in more than 40 developed and emerging market country indexes, rose 26.60%.Bloomberg Barclays U.S. Aggregate Index3, which measures investment-grade U.S. bonds (rated BBB/Baa and above4), returned 8.72%, while the Bloomberg Barclays Global Aggregate Index3, a measure of global investment-grade bonds (rated BBB/Baa and above4), gained 6.84%.
Looking ahead
The current environment is rife with uncertainty, from ongoing trade-related disputes to geopolitical tensions to an upcoming U.S. presidential election.
Valuation measures are also sending mixed signals. We will be following each of these issues closely.
Thank you for investing in American Funds Insurance Series — Target Date Series. We look forward to reporting to you again in six months.
Sincerely,

Donald D. O’Neal
Co-President

Alan N. Berro
Co-President
February 25, 2020
The market indexes shown are unmanaged and, therefore, have no expenses. Investors cannot invest directly in an index.
| 1 | Source: S&P Dow Jones Indices LLC. |
| 2 | Source: MSCI. |
| 3 | Source: Bloomberg Index Services Ltd. |
| 4 | Bond ratings, which typically range from AAA/Aaa (highest) to D (lowest) are assigned by credit rating agencies such as Standard & Poor’s, Moody’s and/or Fitch as an indication of an issuer’s creditworthiness. |
| 2 | American Funds Insurance Series – Target Date Series |
Investment approach for
American Funds Insurance Series Target Date Series
The glide path illustrates the investment approach of the funds by showing how investments in the various fund categories will change over time. Each fund’s asset mix becomes relatively more conservative — both prior to and after retirement — as time elapses. As you can see, even into retirement a fairly substantial portion will remain invested in funds that concentrate on stocks. We believe that with retirement lasting two decades or longer for many people, an equity component makes sense, particularly in the early years of retirement. The allocations shown reflect the target allocations as of December 6, 2019.
American Funds Insurance Series — Target Date Series glide path

The Target Date Solutions Committee continually monitors the funds in the series. Each target date fund will continue to be managed for approximately 30 years after the fund reaches its target date. The target date is the year that corresponds roughly to the year in which an investor is assumed to retire and begin taking withdrawals. The funds may be subject to an allocation approach that will not meet an investor’s retirement goals. The funds’ investment adviser anticipates that the funds will invest their assets within a range that deviates no more than 10% above or below these allocations. The investment adviser may make modifications to either the investment approach or the underlying fund allocations that the investment adviser believes could benefit shareholders.
| American Funds Insurance Series – Target Date Series | 3 |
American Funds IS 2035 Target Date Fund
Investment portfolioDecember 31, 2019
| Growth funds 36.58% | Shares | Value (000) | ||||||
| AMCAP Fund, Class R-6 | 73 | $ | 3 | |||||
| New Perspective Fund, Class R-6 | 61 | 3 | ||||||
| The Growth Fund of America, Class R-6 | 48 | 3 | ||||||
| EuroPacific Growth Fund, Class R-6 | 30 | 2 | ||||||
| SMALLCAP World Fund, Inc., Class R-6 | 41 | 2 | ||||||
| New World Fund, Inc., Class R-6 | 18 | 1 | ||||||
| The New Economy Fund, Class R-6 | 27 | 1 | ||||||
| Total growth funds (cost: $15,000) | 15 | |||||||
| Growth-and-income funds 34.14% | ||||||||
| Fundamental Investors, Class R-6 | 40 | 3 | ||||||
| The Investment Company of America, Class R-6 | 73 | 3 | ||||||
| Washington Mutual Investors Fund, Class R-6 | 68 | 3 | ||||||
| American Mutual Fund, Class R-6 | 56 | 2 | ||||||
| Capital World Growth and Income Fund, Class R-6 | 40 | 2 | ||||||
| International Growth and Income Fund, Class R-6 | 35 | 1 | ||||||
| Total growth-and-income funds (cost: $14,000) | 14 | |||||||
| Equity-income and Balanced funds 19.52% | ||||||||
| American Balanced Fund, Class R-6 | 86 | 2 | ||||||
| American Funds Global Balanced Fund, Class R-6 | 72 | 2 | ||||||
| Capital Income Builder, Class R-6 | 26 | 2 | ||||||
| The Income Fund of America, Class R-6 | 70 | 2 | ||||||
| Total equity-income and balanced funds (cost: $8,000) | 8 | |||||||
| Fixed income funds 9.76% | ||||||||
| U.S. Government Securities Fund, Class R-6 | 232 | 3 | ||||||
| American Funds Inflation Linked Bond Fund, Class R-6 | 81 | 1 | ||||||
| Total fixed income funds (cost: $4,000) | 4 | |||||||
| Total investment securities 100.00% (cost: $41,000) | 41 | |||||||
| Other assets less liabilities 0.00% | — | |||||||
| Net assets 100.00% | $ | 41 | ||||||
See notes to financial statements.
| 4 | American Funds Insurance Series – Target Date Series |
American Funds IS 2030 Target Date Fund
Investment portfolioDecember 31, 2019
| Growth funds 19.52% | Shares | Value (000) | ||||||
| AMCAP Fund, Class R-6 | 49 | $ | 2 | |||||
| New Perspective Fund, Class R-6 | 44 | 2 | ||||||
| The Growth Fund of America, Class R-6 | 32 | 2 | ||||||
| EuroPacific Growth Fund, Class R-6 | 22 | 1 | ||||||
| SMALLCAP World Fund, Inc., Class R-6 | 20 | 1 | ||||||
| New World Fund, Inc., Class R-6 | 6 | — | 1 | |||||
| Total growth funds (cost: $8,000) | 8 | |||||||
| Growth-and-income funds 34.14% | ||||||||
| Fundamental Investors, Class R-6 | 40 | 3 | ||||||
| The Investment Company of America, Class R-6 | 73 | 3 | ||||||
| Washington Mutual Investors Fund, Class R-6 | 68 | 3 | ||||||
| American Mutual Fund, Class R-6 | 56 | 2 | ||||||
| Capital World Growth and Income Fund, Class R-6 | 40 | 2 | ||||||
| International Growth and Income Fund, Class R-6 | 35 | 1 | ||||||
| Total growth-and-income funds (cost: $15,000) | 14 | |||||||
| Equity-income and Balanced funds 21.95% | ||||||||
| American Funds Global Balanced Fund, Class R-6 | 72 | 3 | ||||||
| American Balanced Fund, Class R-6 | 86 | 2 | ||||||
| Capital Income Builder, Class R-6 | 26 | 2 | ||||||
| The Income Fund of America, Class R-6 | 70 | 2 | ||||||
| Total equity-income and balanced funds (cost: $8,000) | 9 | |||||||
| Fixed income funds 24.39% | ||||||||
| U.S. Government Securities Fund, Class R-6 | 203 | 3 | ||||||
| American Funds Inflation Linked Bond Fund, Class R-6 | 162 | 2 | ||||||
| American Funds Mortgage Fund, Class R-6 | 199 | 2 | ||||||
| Capital World Bond Fund, Class R-6 | 100 | 2 | ||||||
| Intermediate Bond Fund of America, Class R-6 | 119 | 1 | ||||||
| Total fixed income funds (cost: $10,000) | 10 | |||||||
| Total investment securities 100.00% (cost: $41,000) | 41 | |||||||
| Other assets less liabilities 0.00% | — | |||||||
| Net assets 100.00% | $ | 41 | ||||||
| 1 | Amount less than one thousand. |
See notes to financial statements.
| American Funds Insurance Series – Target Date Series | 5 |
American Funds IS 2025 Target Date Fund
Investment portfolioDecember 31, 2019
| Growth funds 14.63% | Shares | Value (000) | ||||||
| AMCAP Fund, Class R-6 | 49 | $ | 2 | |||||
| New Perspective Fund, Class R-6 | 44 | 2 | ||||||
| EuroPacific Growth Fund, Class R-6 | 22 | 1 | ||||||
| The Growth Fund of America, Class R-6 | 24 | 1 | ||||||
| Total growth funds (cost: $6,000) | 6 | |||||||
| Growth-and-income funds 29.27% | ||||||||
| The Investment Company of America, Class R-6 | 63 | 3 | ||||||
| American Mutual Fund, Class R-6 | 56 | 2 | ||||||
| Capital World Growth and Income Fund, Class R-6 | 40 | 2 | ||||||
| Fundamental Investors, Class R-6 | 33 | 2 | ||||||
| Washington Mutual Investors Fund, Class R-6 | 51 | 2 | ||||||
| International Growth and Income Fund, Class R-6 | 23 | 1 | ||||||
| Total growth-and-income funds (cost: $13,000) | 12 | |||||||
| Equity-income and Balanced funds 21.95% | ||||||||
| American Funds Global Balanced Fund, Class R-6 | 72 | 3 | ||||||
| American Balanced Fund, Class R-6 | 86 | 2 | ||||||
| Capital Income Builder, Class R-6 | 26 | 2 | ||||||
| The Income Fund of America, Class R-6 | 70 | 2 | ||||||
| Total equity-income and balanced funds (cost: $8,000) | 9 | |||||||
| Fixed income funds 34.15% | ||||||||
| Intermediate Bond Fund of America, Class R-6 | 268 | 4 | ||||||
| American Funds Inflation Linked Bond Fund, Class R-6 | 203 | 2 | ||||||
| American Funds Mortgage Fund, Class R-6 | 199 | 2 | ||||||
| Capital World Bond Fund, Class R-6 | 100 | 2 | ||||||
| The Bond Fund of America, Class R-6 | 153 | 2 | ||||||
| U.S. Government Securities Fund, Class R-6 | 174 | 2 | ||||||
| Total fixed income funds (cost: $14,000) | 14 | |||||||
| Total investment securities 100.00% (cost: $41,000) | 41 | |||||||
| Other assets less liabilities 0.00% | — | |||||||
| Net assets 100.00% | $ | 41 | ||||||
See notes to financial statements.
| 6 | American Funds Insurance Series – Target Date Series |
American Funds IS 2020 Target Date Fund
Investment portfolioDecember 31, 2019
| Growth funds 4.88% | Shares | Value (000) | ||||||
| AMCAP Fund, Class R-6 | 24 | $ | 1 | |||||
| New Perspective Fund, Class R-6 | 17 | 1 | ||||||
| The Growth Fund of America, Class R-6 | 8 | — | 1 | |||||
| Total growth funds (cost: $2,000) | 2 | |||||||
| Growth-and-income funds 24.40% | ||||||||
| American Mutual Fund, Class R-6 | 56 | 2 | ||||||
| Capital World Growth and Income Fund, Class R-6 | 32 | 2 | ||||||
| Fundamental Investors, Class R-6 | 27 | 2 | ||||||
| The Investment Company of America, Class R-6 | 52 | 2 | ||||||
| Washington Mutual Investors Fund, Class R-6 | 43 | 2 | ||||||
| International Growth and Income Fund, Class R-6 | 12 | — | 1 | |||||
| Total growth-and-income funds (cost: $10,000) | 10 | |||||||
| Equity-income and Balanced funds 26.82% | ||||||||
| Capital Income Builder, Class R-6 | 58 | 4 | ||||||
| The Income Fund of America, Class R-6 | 158 | 4 | ||||||
| American Balanced Fund, Class R-6 | 57 | 2 | ||||||
| American Funds Global Balanced Fund, Class R-6 | 36 | 1 | ||||||
| Total equity-income and balanced funds (cost: $11,000) | 11 | |||||||
| Fixed income funds 43.90% | ||||||||
| Intermediate Bond Fund of America, Class R-6 | 268 | 4 | ||||||
| American Funds Inflation Linked Bond Fund, Class R-6 | 284 | 3 | ||||||
| The Bond Fund of America, Class R-6 | 245 | 3 | ||||||
| American Funds Mortgage Fund, Class R-6 | 239 | 2 | ||||||
| American High-Income Trust, Class R-6 | 203 | 2 | ||||||
| Capital World Bond Fund, Class R-6 | 100 | 2 | ||||||
| U.S. Government Securities Fund, Class R-6 | 145 | 2 | ||||||
| Total fixed income funds (cost: $18,000) | 18 | |||||||
| Total investment securities 100.00% (cost: $41,000) | 41 | |||||||
| Other assets less liabilities 0.00% | — | |||||||
| Net assets 100.00% | $ | 41 | ||||||
| 1 | Amount less than one thousand. |
See notes to financial statements.
| American Funds Insurance Series – Target Date Series | 7 |
American Funds IS 2015 Target Date Fund
Investment portfolioDecember 31, 2019
| Growth-and-income funds 26.84% | Shares | Value (000) | ||||||
| American Mutual Fund, Class R-6 | 56 | $ | 3 | |||||
| Capital World Growth and Income Fund, Class R-6 | 32 | 2 | ||||||
| Fundamental Investors, Class R-6 | 27 | 2 | ||||||
| The Investment Company of America, Class R-6 | 52 | 2 | ||||||
| Washington Mutual Investors Fund, Class R-6 | 42 | 2 | ||||||
| International Growth and Income Fund, Class R-6 | 11 | — | 1 | |||||
| Total growth-and-income funds (cost: $11,000) | 11 | |||||||
| Equity-income and Balanced funds 29.26% | ||||||||
| Capital Income Builder, Class R-6 | 78 | 5 | ||||||
| The Income Fund of America, Class R-6 | 211 | 5 | ||||||
| American Balanced Fund, Class R-6 | 43 | 1 | ||||||
| American Funds Global Balanced Fund, Class R-6 | 36 | 1 | ||||||
| Total equity-income and balanced funds (cost: $12,000) | 12 | |||||||
| Fixed income funds 43.90% | ||||||||
| Intermediate Bond Fund of America, Class R-6 | 268 | 4 | ||||||
| American Funds Inflation Linked Bond Fund, Class R-6 | 284 | 3 | ||||||
| The Bond Fund of America, Class R-6 | 245 | 3 | ||||||
| American Funds Mortgage Fund, Class R-6 | 239 | 2 | ||||||
| American High-Income Trust, Class R-6 | 203 | 2 | ||||||
| Capital World Bond Fund, Class R-6 | 100 | 2 | ||||||
| U.S. Government Securities Fund, Class R-6 | 145 | 2 | ||||||
| Total fixed income funds (cost: $18,000) | 18 | |||||||
| Total investment securities 100.00% (cost: $41,000) | 41 | |||||||
| Other assets less liabilities 0.00% | — | |||||||
| Net assets 100.00% | $ | 41 | ||||||
| 1 | Amount less than one thousand. |
See notes to financial statements.
| 8 | American Funds Insurance Series – Target Date Series |
American Funds IS 2010 Target Date Fund
Investment portfolioDecember 31, 2019
| Growth-and-income funds 21.96% | Shares | Value (000) | ||||||
| American Mutual Fund, Class R-6 | 47 | $ | 2 | |||||
| Capital World Growth and Income Fund, Class R-6 | 32 | 2 | ||||||
| The Investment Company of America, Class R-6 | 42 | 2 | ||||||
| Washington Mutual Investors Fund, Class R-6 | 34 | 2 | ||||||
| Fundamental Investors, Class R-6 | 20 | 1 | ||||||
| Total growth-and-income funds (cost: $9,000) | 9 | |||||||
| Equity-income and Balanced funds 29.26% | ||||||||
| Capital Income Builder, Class R-6 | 77 | 5 | ||||||
| The Income Fund of America, Class R-6 | 211 | 5 | ||||||
| American Balanced Fund, Class R-6 | 43 | 1 | ||||||
| American Funds Global Balanced Fund, Class R-6 | 36 | 1 | ||||||
| Total equity-income and balanced funds (cost: $12,000) | 12 | |||||||
| Fixed income funds 48.78% | ||||||||
| Intermediate Bond Fund of America, Class R-6 | 418 | 6 | ||||||
| American Funds Inflation Linked Bond Fund, Class R-6 | 284 | 3 | ||||||
| The Bond Fund of America, Class R-6 | 245 | 3 | ||||||
| American Funds Mortgage Fund, Class R-6 | 239 | 2 | ||||||
| American High-Income Trust, Class R-6 | 202 | 2 | ||||||
| Capital World Bond Fund, Class R-6 | 100 | 2 | ||||||
| Short-Term Bond Fund of America, Class R-6 | 201 | 2 | ||||||
| Total fixed income funds (cost: $20,000) | 20 | |||||||
| Total investment securities 100.00% (cost: $41,000) | 41 | |||||||
| Other assets less liabilities 0.00% | — | |||||||
| Net assets 100.00% | $ | 41 |
See notes to financial statements.
| American Funds Insurance Series – Target Date Series | 9 |
Financial statements
| Statements of assets and liabilities at December 31, 2019 | (dollars and shares in thousands, except per-share amounts) |
| IS 2035 Target Date Fund | IS 2030 Target Date Fund | IS 2025 Target Date Fund | IS 2020 Target Date Fund | IS 2015 Target Date Fund | IS 2010 Target Date Fund | |||||||||||||||||||||
| Assets: | ||||||||||||||||||||||||||
| Investment securities from unaffiliated issuers, at value | $ | 41 | $ | 41 | $ | 41 | $ | 41 | $ | 41 | $ | 41 | ||||||||||||||
| Receivables for: | ||||||||||||||||||||||||||
| Sales of investments | — | — | — | — | — | — | ||||||||||||||||||||
| Sales of fund’s shares | — | — | — | — | — | — | ||||||||||||||||||||
| Dividends | — | * | — | * | — | * | — | * | — | * | — | * | ||||||||||||||
| Total assets | 41 | 41 | 41 | 41 | 41 | 41 | ||||||||||||||||||||
| Liabilities: | ||||||||||||||||||||||||||
| Payables for: | ||||||||||||||||||||||||||
| Purchases of investments | — | * | — | * | — | * | — | * | — | * | — | * | ||||||||||||||
| Repurchases of fund’s shares | — | — | — | — | — | — | ||||||||||||||||||||
| Insurance administrative fees | — | — | — | — | — | — | ||||||||||||||||||||
| Services provided by related parties | — | — | — | — | — | — | ||||||||||||||||||||
| Trustees’ deferred compensation | — | — | — | — | — | — | ||||||||||||||||||||
| Total liabilities | — | * | — | * | — | * | — | * | — | * | — | * | ||||||||||||||
| Net assets at December 31, 2019 | $ | 41 | $ | 41 | $ | 41 | $ | 41 | $ | 41 | $ | 41 | ||||||||||||||
| Net assets consist of: | ||||||||||||||||||||||||||
| Capital paid in on shares of beneficial interest | $ | 40 | $ | 40 | $ | 40 | $ | 40 | $ | 40 | $ | 40 | ||||||||||||||
| Total distributable earnings | 1 | 1 | 1 | 1 | 1 | 1 | ||||||||||||||||||||
| Net assets at December 31, 2019 | $ | 41 | $ | 41 | $ | 41 | $ | 41 | $ | 41 | $ | 41 | ||||||||||||||
| Investment securities from unaffiliated issuers, at cost | $ | 41 | $ | 41 | $ | 41 | $ | 41 | $ | 41 | $ | 41 | ||||||||||||||
| Shares of beneficial interest issued and outstanding (no stated par value) – unlimited shares authorized | ||||||||||||||||||||||||||
| Class 1: | Net assets | $ | 10 | $ | 10 | $ | 10 | $ | 10 | $ | 10 | $ | 10 | |||||||||||||
| Shares outstanding | 1 | 1 | 1 | 1 | 1 | 1 | ||||||||||||||||||||
| Net asset value per share | $ | 10.19 | $ | 10.15 | $ | 10.12 | $ | 10.09 | $ | 10.09 | $ | 10.08 | ||||||||||||||
| Class 1A: | Net assets | $ | 10 | $ | 10 | $ | 10 | $ | 10 | $ | 10 | $ | 10 | |||||||||||||
| Shares outstanding | 1 | 1 | 1 | 1 | 1 | 1 | ||||||||||||||||||||
| Net asset value per share | $ | 10.19 | $ | 10.15 | $ | 10.12 | $ | 10.09 | $ | 10.09 | $ | 10.08 | ||||||||||||||
| Class 2: | Net assets | $ | 10 | $ | 10 | $ | 10 | $ | 10 | $ | 10 | $ | 10 | |||||||||||||
| Shares outstanding | 1 | 1 | 1 | 1 | 1 | 1 | ||||||||||||||||||||
| Net asset value per share | $ | 10.19 | $ | 10.15 | $ | 10.12 | $ | 10.09 | $ | 10.09 | $ | 10.08 | ||||||||||||||
| Class 4: | Net assets | $ | 11 | $ | 11 | $ | 11 | $ | 11 | $ | 11 | $ | 11 | |||||||||||||
| Shares outstanding | 1 | 1 | 1 | 1 | 1 | 1 | ||||||||||||||||||||
| Net asset value per share | $ | 10.19 | $ | 10.15 | $ | 10.12 | $ | 10.09 | $ | 10.09 | $ | 10.08 | ||||||||||||||
| * | Amount less than one thousand. |
See notes to financial statements.
| 10 | American Funds Insurance Series – Target Date Series |
| Statements of operations for the period December 6, 2019* to December 31, 2019 | (dollars in thousands) |
| IS 2035 Target Date Fund | IS 2030 Target Date Fund | IS 2025 Target Date Fund | IS 2020 Target Date Fund | IS 2015 Target Date Fund | IS 2010 Target Date Fund | |||||||||||||||||||
| Investment income: | ||||||||||||||||||||||||
| Income: | ||||||||||||||||||||||||
| Dividends from unaffiliated issuers | $ | — | † | $ | — | † | $ | — | † | $ | — | † | $ | — | † | $ | — | † | ||||||
| Fees and expenses: | ||||||||||||||||||||||||
| Investment advisory services | — | — | — | — | — | — | ||||||||||||||||||
| Distribution services | — | — | — | — | — | — | ||||||||||||||||||
| Insurance administrative services | — | — | — | — | — | — | ||||||||||||||||||
| Transfer agent services | — | — | — | — | — | — | ||||||||||||||||||
| Reports to shareholders | — | — | — | — | — | — | ||||||||||||||||||
| Registration statement and prospectus | — | — | — | — | — | — | ||||||||||||||||||
| Trustees’ compensation | — | — | — | — | — | — | ||||||||||||||||||
| Auditing and legal | — | — | — | — | — | — | ||||||||||||||||||
| Custodian | — | — | — | — | — | — | ||||||||||||||||||
| Other | — | — | — | — | — | — | ||||||||||||||||||
| Net investment income | — | † | — | † | — | † | — | † | — | † | — | † | ||||||||||||
| Net realized gain and unrealized depreciation: | ||||||||||||||||||||||||
| Net realized gain on investments in unaffiliated issuers | — | — | — | — | — | — | ||||||||||||||||||
| Capital gain distributions received from unaffiliated issuers | 1 | 1 | 1 | 1 | 1 | 1 | ||||||||||||||||||
| 1 | 1 | 1 | 1 | 1 | 1 | |||||||||||||||||||
| Net unrealized depreciation on investments in unaffiliated issuers | — | † | — | † | — | † | — | † | — | † | — | † | ||||||||||||
| Net realized gain and unrealized depreciation | 1 | 1 | 1 | 1 | 1 | 1 | ||||||||||||||||||
| Net increase in net assets resulting from operations | $ | 1 | $ | 1 | $ | 1 | $ | 1 | $ | 1 | $ | 1 | ||||||||||||
| * | Commencement of operations. |
| † | Amount less than one thousand. |
See notes to financial statements.
| American Funds Insurance Series – Target Date Series | 11 |
| Statements of changes in net assets | (dollars in thousands) |
| IS 2035 Target Date Fund | IS 2030 Target Date Fund | IS 2025 Target Date Fund | IS 2020 Target Date Fund | IS 2015 Target Date Fund | IS 2010 Target Date Fund | |||||||||||||||||||
| Period ended December 31, 2019* | Period ended December 31, 2019* | Period ended December 31, 2019* | Period ended December 31, 2019* | Period ended December 31, 2019* | Period ended December 31, 2019* | |||||||||||||||||||
| Operations: | ||||||||||||||||||||||||
| Net investment income | $ | — | † | $ | — | † | $ | — | † | $ | — | † | $ | — | † | $ | — | † | ||||||
| Net realized gain | 1 | 1 | 1 | 1 | 1 | 1 | ||||||||||||||||||
| Net unrealized depreciation | — | † | — | † | — | † | — | † | — | † | — | † | ||||||||||||
| Net increase in net assets resulting from operations | 1 | 1 | 1 | 1 | 1 | 1 | ||||||||||||||||||
| Distributions paid to shareholders | — | † | — | † | — | † | — | † | — | † | — | † | ||||||||||||
| Net capital share transactions | 40 | 40 | 40 | 40 | 40 | 40 | ||||||||||||||||||
| Total increase in net assets | 41 | 41 | 41 | 41 | 41 | 41 | ||||||||||||||||||
| Net assets: | ||||||||||||||||||||||||
| Beginning of period | — | — | — | — | — | — | ||||||||||||||||||
| End of period | $ | 41 | $ | 41 | $ | 41 | $ | 41 | $ | 41 | $ | 41 | ||||||||||||
| * | For the period December 6, 2019, commencement of operations, to December 31, 2019. |
| † | Amount less than one thousand. |
See notes to financial statements.
| 12 | American Funds Insurance Series – Target Date Series |
Notes to financial statements
1. Organization
American Funds Insurance Series (the “series”) is registered under the Investment Company Act of 1940 as an open-end, diversified management investment company with 34 different funds (the “funds”), including six funds in the American Funds Insurance Series — Target Date Series covered in this report. The other 28 funds in the series are covered in separate reports. Twenty-three funds in the series are covered in the American Funds Insurance Series report and five funds in the series are covered in the American Funds Insurance Series — Portfolio Series report. The assets of each fund are segregated, with each fund accounted for separately. Capital Research and Management Company (“CRMC”) is the series’ investment adviser.
Shareholders approved a proposal to reorganize the series from a Massachusetts business trust to a Delaware statutory trust. The series reserved the right to delay implementing the reorganization and has elected to do so.
Each fund in the American Funds Insurance Series — Target Date Series is designed for investors who plan to retire in, or close to, the year designated in the fund’s name. Depending on its proximity to its target date, each fund seeks to achieve the following objectives to varying degrees: growth, income and conservation of capital. As each fund approaches and passes its target date, it will increasingly emphasize income and conservation of capital by investing a greater portion of its assets in fixed income, equity-income and balanced funds. Each fund will attempt to achieve its investment objectives by investing in a mix of American Funds (the “underlying funds”) in different combinations and weightings. Capital Research and Management Company (“CRMC”), the series’ investment adviser, is also the investment adviser of the underlying funds.
Each fund offers four share classes (Classes 1, 1A, 2 and 4). Share classes have different fees and expenses (“class-specific fees and expenses”), primarily due to different arrangements for certain distribution expenses. Differences in class-specific fees and expenses will result in differences in net investment income and, therefore, the payment of different per-share dividends by each class of each fund.
2. Significant accounting policies
Each fund is an investment company that applies the accounting and reporting guidance issued in Topic 946 by the U.S. Financial Accounting Standards Board. Each fund’s financial statements have been prepared to comply with U.S. generally accepted accounting principles (“U.S. GAAP”). These principles require the series’ investment adviser to make estimates and assumptions that affect reported amounts and disclosures. Actual results could differ from those estimates. Subsequent events, if any, have been evaluated through the date of issuance in the preparation of the financial statements. The funds follow the significant accounting policies described in this section, as well as the valuation policies described in the next section on valuation.
Security transactions and related investment income — Security transactions are recorded by the funds as of the date the trades are executed with brokers. Realized gains and losses from security transactions are determined based on the specific identified cost of the securities. In the event a security is purchased with a delayed payment date, the funds will segregate liquid assets sufficient to meet their payment obligations. Dividend income is recognized on the ex-dividend date and interest income is recognized on an accrual basis.
Fees and expenses — The fees and expenses of the underlying funds are not included in the fees and expenses reported for each of the funds; however, they are indirectly reflected in the valuation of each of the underlying funds. These fees are included in the net effective expense ratios that are provided as additional information in the financial highlights tables.
Class allocations — Income, fees and expenses (other than class-specific fees and expenses) and realized and unrealized gains and losses are allocated daily among the various share classes of each fund based on their relative net assets. Class-specific fees and expenses, such as distribution expenses, are accrued daily and charged directly to the respective share class of each fund.
Distributions paid to shareholders — Income dividends and capital gain distributions paid to shareholders are recorded on each fund’s ex-dividend date.
| American Funds Insurance Series – Target Date Series | 13 |
3. Valuation
Security valuation — The net asset value of each share class of each fund is calculated based on the reported net asset values of the underlying funds in which each fund invests. The net asset value of each underlying fund is calculated based on the policies and procedures of the underlying fund contained in each underlying fund’s statement of additional information. Generally, the funds and the underlying funds determine the net asset value of each share class as of approximately 4:00 p.m. New York time each day the New York Stock Exchange is open.
Processes and structure — The series’ board of trustees has delegated authority to the series’ investment adviser to make fair value determinations, subject to board oversight. The investment adviser has established a Joint Fair Valuation Committee (the “Fair Valuation Committee”) to administer, implement and oversee the fair valuation process, and to make fair value decisions. The Fair Valuation Committee regularly reviews its own fair value decisions, as well as decisions made under its standing instructions to the investment adviser’s valuation teams. The Fair Valuation Committee reviews changes in fair value measurements from period to period and may, as deemed appropriate, update the fair valuation guidelines to better reflect the results of back testing and address new or evolving issues. The Fair Valuation Committee reports any changes to the fair valuation guidelines to the board of trustees. The series’ board and audit committee also regularly review reports that describe fair value determinations and methods. Pricing decisions, processes and controls over security valuation are also subject to additional internal reviews, including an annual control self-evaluation program facilitated by the investment adviser’s compliance group.
Classifications — The series’ investment adviser classifies each fund’s assets and liabilities into three levels based on the method used to value the assets or liabilities. Level 1 values are based on quoted prices in active markets for identical securities. Level 2 values are based on significant observable market inputs, such as quoted prices for similar securities and quoted prices in inactive markets. Level 3 values are based on significant unobservable inputs that reflect the investment adviser’s determination of assumptions that market participants might reasonably use in valuing the securities. The valuation levels are not necessarily an indication of the risk or liquidity associated with the underlying investment. At December 31, 2019, all of the investment securities held by each fund were classified as Level 1.
4. Risk factors
Investing in the funds may involve certain risks including, but not limited to, those described below.
Allocation risk — Investments in a fund are subject to risks related to the investment adviser’s allocation choices. The selection of the underlying funds and the allocation of a fund’s assets could cause the fund to lose value or its results to lag relevant benchmarks or other funds with similar objectives. For investors who are close to or in retirement, a fund’s equity exposure may result in investment volatility that could reduce an investor’s available retirement assets at a time when the investor has a need to withdraw funds. For investors who are farther from retirement, there is a risk each fund may invest too much in investments designed to ensure capital conservation and current income, which may prevent the investor from meeting his or her retirement goals.
Fund structure — Each fund invests in underlying funds and incurs expenses related to the underlying funds. In addition, investors in each fund will incur fees to pay for certain expenses related to the operations of the fund. An investor holding the underlying funds directly and in the same proportions as a fund would incur lower overall expenses but would not receive the benefit of the portfolio management and other services provided by the fund. Additionally, in accordance with an exemption under the Investment Company Act of 1940, as amended, the investment adviser considers only proprietary funds when selecting underlying investment options and allocations. This means that each fund’s investment adviser did not, nor does it expect to, consider any unaffiliated funds as underlying investment options for each fund. This strategy could raise certain conflicts of interest when choosing underlying investments for each fund, including the selection of funds that result in greater compensation to the adviser or funds with relatively lower historical investment results. The investment adviser has policies and procedures designed to mitigate material conflicts of interest that may arise in connection with its management of each fund.
Underlying fund risks — Because a fund’s investments consist of underlying funds, the fund’s risks are directly related to the risks of the underlying funds. For this reason, it is important to understand the risks associated with investing both in a fund and the applicable underlying funds.
Market conditions — The prices of, and the income generated by, the common stocks, bonds and other securities held by the underlying funds may decline — sometimes rapidly or unpredictably — due to various factors, including events or conditions
| 14 | American Funds Insurance Series – Target Date Series |
affecting the general economy or particular industries; overall market changes; local, regional or global political, social or economic instability; governmental, governmental agency or central bank responses to economic conditions; and currency exchange rate, interest rate and commodity price fluctuations.
Issuer risks — The prices of, and the income generated by, securities held by the underlying funds may decline in response to various factors directly related to the issuers of such securities, including reduced demand for an issuer’s goods or services, poor management performance, major litigation related to the issuer, changes in government regulations affecting the issuer or its competitive environment and strategic initiatives such as mergers, acquisitions or dispositions and the market response to any such initiatives.
Investing in stocks — Investing in stocks may involve larger price swings and greater potential for loss than other types of investments. As a result, the value of the underlying funds may be subject to sharp declines in value. The value of the underlying fund’s securities and income provided by an underlying fund may be reduced by changes in the dividend policies of, and the capital resources available at, the companies in which the underlying fund invests. These risks may be even greater in the case of smaller capitalization stocks. As the fund nears its target date, a decreasing proportion of the fund’s assets will be invested in underlying funds that invest primarily in stocks. Accordingly, these risks are expected to be more significant the further the fund is removed from its target date and are expected to lessen as the fund approaches its target date.
Investing outside the U.S. — Securities of issuers domiciled outside the U.S., or with significant operations or revenues outside the U.S., may lose value because of adverse political, social, economic or market developments (including social instability, regional conflicts, terrorism and war) in the countries or regions in which the issuers operate or generate revenue. These securities may also lose value due to changes in foreign currency exchange rates against the U.S. dollar and/or currencies of other countries. Issuers of these securities may be more susceptible to actions of foreign governments, such as nationalization, currency blockage or the imposition of price controls or punitive taxes, each of which could adversely impact the value of these securities. Securities markets in certain countries may be more volatile and/or less liquid than those in the U.S. Investments outside the U.S. may also be subject to different accounting practices and different regulatory, legal and reporting standards and practices, and may be more difficult to value, than those in the U.S. In addition, the value of investments outside the U.S. may be reduced by foreign taxes, including foreign withholding taxes on interest and dividends. Further, there may be increased risks of delayed settlement of securities purchased or sold by the underlying funds. The risks of investing outside the U.S. may be heightened in connection with investments in emerging markets.
Investing in debt instruments — The prices of, and the income generated by, bonds and other debt securities held by an underlying fund may be affected by changing interest rates and by changes in the effective maturities and credit ratings of these securities.
Rising interest rates will generally cause the prices of bonds and other debt securities to fall. A general rise in interest rates may cause investors to sell debt securities on a large scale, which could also adversely affect the price and liquidity of debt securities and could also result in increased redemptions from the fund. Falling interest rates may cause an issuer to redeem, call or refinance a debt security before its stated maturity, which may result in the fund failing to recoup the full amount of its initial investment and having to reinvest the proceeds in lower yielding securities. Longer maturity debt securities generally have greater sensitivity to changes in interest rates and may be subject to greater price fluctuations than shorter maturity debt securities.
Bonds and other debt securities are also subject to credit risk, which is the possibility that the credit strength of an issuer or guarantor will weaken or be perceived to be weaker, and/or an issuer of a debt security will fail to make timely payments of principal or interest and the security will go into default. A downgrade or default affecting any of the underlying funds’ securities could cause the value of the underlying funds’ shares to decrease. Lower quality debt securities generally have higher rates of interest and may be subject to greater price fluctuations than higher quality debt securities. Credit risk is gauged, in part, by the credit ratings of the debt securities in which an underlying fund invests. However, ratings are only the opinions of the rating agencies issuing them and are not guarantees as to credit quality or an evaluation of market risk. The underlying funds’ investment adviser relies on its own credit analysts to research issuers and issues in seeking to assess credit and default risks. These risks will be more significant as the fund approaches and passes its target date because a greater proportion of the fund’s assets will consist of underlying funds that primarily invest in bonds.
Investing in lower rated debt instruments — Lower rated bonds and other lower rated debt securities generally have higher rates of interest and involve greater risk of default or price declines due to changes in the issuer’s creditworthiness than those of higher
| American Funds Insurance Series – Target Date Series | 15 |
quality debt securities. The market prices of these securities may fluctuate more than the prices of higher quality debt securities and may decline significantly in periods of general economic difficulty. These risks may be increased with respect to investments in junk bonds.
Investing in mortgage-related and other asset-backed securities — Mortgage-related securities, such as mortgage-backed securities, and other asset-backed securities, include debt obligations that represent interests in pools of mortgages or other income-bearing assets, such as consumer loans or receivables. Such securities often involve risks that are different from or more acute than the risks associated with investing in other types of debt securities. Mortgage-backed and other asset-backed securities are subject to changes in the payment patterns of borrowers of the underlying debt, potentially increasing the volatility of the securities and an underlying fund’s net asset value. When interest rates fall, borrowers are more likely to refinance or prepay their debt before its stated maturity. This may result in an underlying fund having to reinvest the proceeds in lower yielding securities, effectively reducing the underlying fund’s income. Conversely, if interest rates rise and borrowers repay their debt more slowly than expected, the time in which the mortgage-backed and other asset-backed securities are paid off could be extended, reducing the underlying fund’s cash available for reinvestment in higher yielding securities. Mortgage-backed securities are also subject to the risk that underlying borrowers will be unable to meet their obligations and the value of property that secures the mortgages may decline in value and be insufficient, upon foreclosure, to repay the associated loans. Investments in asset-backed securities are subject to similar risks.
Investing in securities backed by the U.S. government— Securities backed by the U.S. Treasury or the full faith and credit of the U.S. government are guaranteed only as to the timely payment of interest and principal when held to maturity. Accordingly, the current market values for these securities will fluctuate with changes in interest rates and the credit rating of the U.S. government. Securities issued by government-sponsored entities and federal agencies and instrumentalities that are not backed by the full faith and credit of the U.S. government are neither issued nor guaranteed by the U.S. government.
Investing in inflation-linked bonds — The values of inflation-linked bonds generally fluctuate in response to changes in real interest rates — i.e., rates of interest after factoring in inflation. A rise in real interest rates may cause the prices of inflation-linked securities to fall, while a decline in real interest rates may cause the prices to increase. Inflation-linked bonds may experience greater losses than other debt securities with similar durations when real interest rates rise faster than nominal interest rates. There can be no assurance that the value of an inflation-linked security will be directly correlated to changes in interest rates; for example, if interest rates rise for reasons other than inflation, the increase may not be reflected in the security’s inflation measure.
Investing in inflation-linked bonds may also reduce an underlying fund’s distributable income during periods of deflation. If prices for goods and services decline throughout the economy, the principal and income on inflation-linked securities may decline and result in losses to the underlying fund.
Investing in derivatives — The use of derivatives involves a variety of risks, which may be different from, or greater than, the risks associated with investing in traditional securities, such as stocks and bonds. Changes in the value of a derivative may not correlate perfectly with, and may be more sensitive to market events than, the underlying asset, rate or index, and a derivative instrument may expose the underlying fund to losses in excess of its initial investment. Derivatives may be difficult to value, difficult for the underlying fund to buy or sell at an opportune time or price and difficult, or even impossible, to terminate or otherwise offset. The underlying fund’s use of derivatives may result in losses to the underlying fund, and investing in derivatives may reduce the underlying fund’s returns and increase the underlying fund’s price volatility. The underlying fund’s counterparty to a derivative transaction (including, if applicable, the underlying fund’s clearing broker, the derivatives exchange or the clearinghouse) may be unable or unwilling to honor its financial obligations in respect of the transaction. In certain cases, the underlying fund may be hindered or delayed in exercising remedies against or closing out derivative instruments with a counterparty, which may result in additional losses.
Interest rate risk — The values and liquidity of the securities held by the underlying fund may be affected by changing interest rates. For example, the values of these securities may decline when interest rates rise and increase when interest rates fall. Longer maturity debt securities generally have greater sensitivity to changes in interest rates and may be subject to greater price fluctuations than shorter maturity debt securities. The underlying fund may invest in variable and floating rate securities. When the underlying fund holds variable or floating rate securities, a decrease in market interest rates will adversely affect the income received from such securities and the net asset value of the fund’s shares. Although the values of such securities are generally less sensitive to interest rate changes than those of other debt securities, the value of variable and floating rate securities may decline if their interest rates do not rise as quickly, or as much, as market interest rates. Conversely, floating rate securities will not generally
| 16 | American Funds Insurance Series – Target Date Series |
increase in value if interest rates decline. During periods of extremely low short-term interest rates, the underlying fund may not be able to maintain a positive yield and, given the current low interest rate environment, risks associated with rising rates are currently heightened.
Liquidity risk — Certain underlying fund holdings may be or may become difficult or impossible to sell, particularly during times of market turmoil. Liquidity may be impacted by the lack of an active market for a holding, legal or contractual restrictions on resale, or the reduced number and capacity of market participants to make a market in such holding. Market prices for less liquid or illiquid holdings may be volatile, and reduced liquidity may have an adverse impact on the market price of such holdings. Additionally, the sale of less liquid or illiquid holdings may involve substantial delays (including delays in settlement) and additional costs and the underlying fund may be unable to sell such holdings when necessary to meet its liquidity needs or may be forced to sell at a loss.
Management — The investment adviser to the funds and to the underlying funds actively manages each underlying fund’s investments. Consequently, the underlying funds are subject to the risk that the methods and analyses, including models, tools and data, employed by the investment adviser in this process may be flawed or incorrect and may not produce the desired results. This could cause an underlying fund to lose value or its investment results to lag relevant benchmarks or other funds with similar objectives.
5. Taxation and distributions
Federal income taxation — Each fund complies with the requirements under Subchapter M of the Internal Revenue Code applicable to mutual funds and intends to distribute substantially all of its net taxable income and net capital gains each year. The funds are not subject to income taxes to the extent such distributions are made. Therefore, no federal income tax provision is required.
As of and during the period ended December 31, 2019, none of the funds had a liability for any unrecognized tax benefits. Each fund recognizes interest and penalties, if any, related to unrecognized tax benefits as income tax expense in their respective statements of operations. During the period, none of the funds incurred any significant interest or penalties.
Each fund’s tax returns are not subject to examination by federal, state and, if applicable, non-U.S. tax authorities after the expiration of each jurisdiction’s statute of limitations, which is generally three years after the date of filing but can be extended in certain jurisdictions.
Distributions — Distributions paid to shareholders are based on each fund’s net investment income and net realized gains determined on a tax basis, which may differ from net investment income and net realized gains for financial reporting purposes. These differences are due primarily to different treatment for items such as short-term capital gains and losses. The fiscal year in which amounts are distributed may differ from the year in which the net investment income and net realized gains are recorded by the funds for financial reporting purposes.
Additional tax basis disclosures for each fund as of December 31, 2019, were as follows (dollars in thousands):
| IS 2035 | IS 2030 | IS 2025 | IS 2020 | IS 2015 | IS 2010 | |||||||||||||||||||
| Target Date Fund | Target Date Fund | Target Date Fund | Target Date Fund | Target Date Fund | Target Date Fund | |||||||||||||||||||
| Undistributed long-term capital gain | $ | 1 | $ | 1 | $ | 1 | $ | 1 | $ | 1 | $ | 1 | ||||||||||||
| Gross unrealized appreciation on investments | — | * | — | * | — | * | — | * | — | * | — | * | ||||||||||||
| Gross unrealized depreciation on investments | — | * | — | * | — | * | — | * | — | * | — | * | ||||||||||||
| Net unrealized depreciation on investments | — | * | — | * | — | * | — | * | — | * | — | * | ||||||||||||
| Cost of investments | 41 | 41 | 41 | 41 | 41 | 41 | ||||||||||||||||||
| * | Amount less than one thousand. |
| American Funds Insurance Series – Target Date Series | 17 |
Distributions paid by each fund were characterized for tax purposes as follows (dollars in thousands):
| IS 2035 Target Date Fund | ||||||||||||
| For the period December 6, 2019* to | ||||||||||||
| December 31, 2019 | ||||||||||||
| Total | ||||||||||||
| Ordinary | Long-term | distributions | ||||||||||
| Share class | income | capital gains | paid | |||||||||
| Class 1 | $ | — | † | $ | — | $ | — | † | ||||
| Class 1A | — | † | — | — | † | |||||||
| Class 2 | — | † | — | — | † | |||||||
| Class 4 | — | † | — | — | † | |||||||
| Total | $ | — | † | $ | — | $ | — | † | ||||
| IS 2030 Target Date Fund | ||||||||||||
| For the period December 6, 2019* to | ||||||||||||
| December 31, 2019 | ||||||||||||
| Total | ||||||||||||
| Ordinary | Long-term | distributions | ||||||||||
| Share class | income | capital gains | paid | |||||||||
| Class 1 | $ | — | † | $ | — | $ | — | † | ||||
| Class 1A | — | † | — | — | † | |||||||
| Class 2 | — | † | — | — | † | |||||||
| Class 4 | — | † | — | — | † | |||||||
| Total | $ | — | † | $ | — | $ | — | † | ||||
| IS 2025 Target Date Fund | ||||||||||||
| For the period December 6, 2019* to | ||||||||||||
| December 31, 2019 | ||||||||||||
| Total | ||||||||||||
| Ordinary | Long-term | distributions | ||||||||||
| Share class | income | capital gains | paid | |||||||||
| Class 1 | $ | — | † | $ | — | $ | — | † | ||||
| Class 1A | — | † | — | — | † | |||||||
| Class 2 | — | † | — | — | † | |||||||
| Class 4 | — | † | — | — | † | |||||||
| Total | $ | — | † | $ | — | $ | — | † | ||||
| IS 2020 Target Date Fund | ||||||||||||
| For the period December 6, 2019* to | ||||||||||||
| December 31, 2019 | ||||||||||||
| Total | ||||||||||||
| Ordinary | Long-term | distributions | ||||||||||
| Share class | income | capital gains | paid | |||||||||
| Class 1 | $ | — | † | $ | — | $ | — | † | ||||
| Class 1A | — | † | — | — | † | |||||||
| Class 2 | — | † | — | — | † | |||||||
| Class 4 | — | † | — | — | † | |||||||
| Total | $ | — | † | $ | — | $ | — | † | ||||
| 18 | American Funds Insurance Series – Target Date Series |
| IS 2015 Target Date Fund | ||||||||||||
| For the period December 6, 2019* to | ||||||||||||
| December 31, 2019 | ||||||||||||
| Total | ||||||||||||
| Ordinary | Long-term | distributions | ||||||||||
| Share class | income | capital gains | paid | |||||||||
| Class 1 | $ | — | † | $ | — | $ | — | † | ||||
| Class 1A | — | † | — | — | † | |||||||
| Class 2 | — | † | — | — | † | |||||||
| Class 4 | — | † | — | — | † | |||||||
| Total | $ | — | † | $ | — | $ | — | † | ||||
| IS 2010 Target Date Fund | ||||||||||||
| For the period December 6, 2019* to | ||||||||||||
| December 31, 2019 | ||||||||||||
| Total | ||||||||||||
| Ordinary | Long-term | distributions | ||||||||||
| Share class | income | capital gains | paid | |||||||||
| Class 1 | $ | — | † | $ | — | $ | — | † | ||||
| Class 1A | — | † | — | — | † | |||||||
| Class 2 | — | † | — | — | † | |||||||
| Class 4 | — | † | — | — | † | |||||||
| Total | $ | — | † | $ | — | $ | — | † | ||||
| * | Commencement of operations. |
| † | Amount less than one thousand. |
6. Fees and transactions
CRMC, the series’ investment adviser, is the parent company of American Funds Distributors®, Inc. (“AFD”), the distributor of the series’ shares, and American Funds Service Company® (“AFS”), the series’ transfer agent. CRMC, AFD and AFS are considered related parties to the series.
Investment advisory services — The series has an investment advisory and service agreement with CRMC that provides for monthly fees accrued daily. CRMC receives investment advisory fees from the underlying funds. These fees are included in the net effective expense ratios that are provided as additional information in the financial highlights tables.
Distribution services — The series has plans of distribution for all share classes except Class 1. Under the plans, the board of trustees approves certain categories of expenses that are used to finance activities primarily intended to sell fund shares. The plans provide for payments to pay service fees to firms that have entered into agreements with the series. These payments, based on an annualized percentage of average net assets as noted in the table below. In some cases, the board of trustees has limited the amounts that may be paid to less than the maximum allowed by the plans.
| Share class | Currently approved limits | Plan limits | |||||||
| Class 1A | 0.00 | % | 0.25 | % | |||||
| Class 2 | 0.25 | 0.25 | |||||||
| Class 4 | 0.25 | 0.25 | |||||||
Insurance administrative services — The series has an insurance administrative services plan for Class 1A and 4 shares. Under the plan, each share class pays 0.25% of each insurance company’s respective average daily net assets to compensate the insurance companies for services provided to their separate accounts and contractholders for which the shares of the fund are beneficially owned as underlying investments of such contractholders’ annuities. These services include, but are not limited to, maintenance, shareholder communications and transactional services. The insurance companies are not related parties to the series.
| American Funds Insurance Series – Target Date Series | 19 |
Transfer agent services — The series has a shareholder services agreement with AFS under which the funds compensate AFS for providing transfer agent services to the funds. These services include recordkeeping, shareholder communications and transaction processing. In addition, the funds reimburse AFS for amounts paid to third parties for performing transfer agent services on behalf of fund shareholders.
Administrative services — The series has an administrative services agreement with CRMC under which each fund compensates CRMC for providing administrative services to all of the funds’ share classes. Administrative services are provided by CRMC and its affiliates to help assist third parties providing non-distribution services to fund shareholders. These services include providing in depth information on each fund and market developments that impact fund investments. Administrative services also include, but are not limited to, coordinating, monitoring and overseeing third parties that provide services to fund shareholders. The agreement provides each fund the ability to charge an administrative services fee at the annual rate of 0.05% of daily net assets attributable to each share class. Currently each fund pays CRMC an administrative services fee at the annual rate of 0.03% of daily net assets of each share class for CRMC’s provision of administrative services.
Trustees’ deferred compensation — Trustees who are unaffiliated with CRMC may elect to defer the cash payment of part or all of their compensation. These deferred amounts, which remain as liabilities of the funds, are treated as if invested in one or more of the American Funds. These amounts represent general, unsecured liabilities of the funds and vary according to the total returns of the selected funds. Trustees’ compensation in the fund’s statement of operations reflects the current fees (either paid in cash or deferred) and the net increase or decrease in the value of the deferred amounts.
Affiliated officers and trustees — Officers and certain trustees of the series are or may be considered to be affiliated with CRMC, AFD and AFS. No affiliated officers or trustees received any compensation directly from any fund in the series.
Security transactions with related funds — The funds may purchase from, or sell securities to, other CRMC-managed funds (or funds managed by certain affiliates of CRMC) under procedures adopted by the fund’s board of trustees. The funds involved in such transactions are considered related by virtue of having a common investment adviser (or affiliated investment advisers), common trustees and/or common officers. When such transactions occur, each transaction is executed at the current market price of the security and no brokerage commissions or fees are paid in accordance with Rule 17a-7 of the 1940 Act.
| 20 | American Funds Insurance Series – Target Date Series |
7. Capital share transactions
Capital share transactions in the funds were as follows (dollars and shares in thousands):
| IS 2035 Target Date Fund | ||||||||||||||||||||||||||||||||
| Sales | Reinvestments of distributions | Repurchases | Net increase | |||||||||||||||||||||||||||||
| Share class | Amount | Shares | Amount | Shares | Amount | Shares | Amount | Shares | ||||||||||||||||||||||||
| For the period December 6, 2019* to December 31, 2019 | ||||||||||||||||||||||||||||||||
| Class 1 | $ | 10 | 1 | $ | — | † | — | † | $ | — | — | $ | 10 | 1 | ||||||||||||||||||
| Class 1A | 10 | 1 | — | † | — | † | — | — | 10 | 1 | ||||||||||||||||||||||
| Class 2 | 10 | 1 | — | † | — | † | — | — | 10 | 1 | ||||||||||||||||||||||
| Class 4 | 10 | 1 | — | † | — | † | — | — | 10 | 1 | ||||||||||||||||||||||
| Total net increase | $ | 40 | 4 | $ | — | † | — | † | $ | — | — | $ | 40 | 4 | ||||||||||||||||||
| IS 2030 Target Date Fund | ||||||||||||||||||||||||||||||||
| Sales | Reinvestments of distributions | Repurchases | Net increase | |||||||||||||||||||||||||||||
| Share class | Amount | Shares | Amount | Shares | Amount | Shares | Amount | Shares | ||||||||||||||||||||||||
| For the period December 6, 2019* to December 31, 2019 | ||||||||||||||||||||||||||||||||
| Class 1 | $ | 10 | 1 | $ | — | † | — | † | $ | — | — | $ | 10 | 1 | ||||||||||||||||||
| Class 1A | 10 | 1 | — | † | — | † | — | — | 10 | 1 | ||||||||||||||||||||||
| Class 2 | 10 | 1 | — | † | — | † | — | — | 10 | 1 | ||||||||||||||||||||||
| Class 4 | 10 | 1 | — | † | — | † | — | — | 10 | 1 | ||||||||||||||||||||||
| Total net increase | $ | 40 | 4 | $ | — | † | — | † | $ | — | — | $ | 40 | 4 | ||||||||||||||||||
| IS 2025 Target Date Fund | ||||||||||||||||||||||||||||||||
| Sales | Reinvestments of distributions | Repurchases | Net increase | |||||||||||||||||||||||||||||
| Share class | Amount | Shares | Amount | Shares | Amount | Shares | Amount | Shares | ||||||||||||||||||||||||
| For the period December 6, 2019* to December 31, 2019 | ||||||||||||||||||||||||||||||||
| Class 1 | $ | 10 | 1 | $ | — | † | — | † | $ | — | — | $ | 10 | 1 | ||||||||||||||||||
| Class 1A | 10 | 1 | — | † | — | † | — | — | 10 | 1 | ||||||||||||||||||||||
| Class 2 | 10 | 1 | — | † | — | † | — | — | 10 | 1 | ||||||||||||||||||||||
| Class 4 | 10 | 1 | — | † | — | † | — | — | 10 | 1 | ||||||||||||||||||||||
| Total net increase | $ | 40 | 4 | $ | — | † | — | † | $ | — | — | $ | 40 | 4 | ||||||||||||||||||
| IS 2020 Target Date Fund | ||||||||||||||||||||||||||||||||
| Sales | Reinvestments of distributions | Repurchases | Net increase | |||||||||||||||||||||||||||||
| Share class | Amount | Shares | Amount | Shares | Amount | Shares | Amount | Shares | ||||||||||||||||||||||||
| For the period December 6, 2019* to December 31, 2019 | ||||||||||||||||||||||||||||||||
| Class 1 | $ | 10 | 1 | $ | — | † | — | † | $ | — | — | $ | 10 | 1 | ||||||||||||||||||
| Class 1A | 10 | 1 | — | † | — | † | — | — | 10 | 1 | ||||||||||||||||||||||
| Class 2 | 10 | 1 | — | † | — | † | — | — | 10 | 1 | ||||||||||||||||||||||
| Class 4 | 10 | 1 | — | † | — | † | — | — | 10 | 1 | ||||||||||||||||||||||
| Total net increase | $ | 40 | 4 | $ | — | † | — | † | $ | — | — | $ | 40 | 4 | ||||||||||||||||||
See end of tables for footnotes.
| American Funds Insurance Series – Target Date Series | 21 |
| IS 2015 Target Date Fund | ||||||||||||||||||||||||||||||||
| Sales | Reinvestments of distributions | Repurchases | Net increase | |||||||||||||||||||||||||||||
| Share class | Amount | Shares | Amount | Shares | Amount | Shares | Amount | Shares | ||||||||||||||||||||||||
| For the period December 6, 2019* to December 31, 2019 | ||||||||||||||||||||||||||||||||
| Class 1 | $ | 10 | 1 | $ | — | † | — | † | $ | — | — | $ | 10 | 1 | ||||||||||||||||||
| Class 1A | 10 | 1 | — | † | — | † | — | — | 10 | 1 | ||||||||||||||||||||||
| Class 2 | 10 | 1 | — | † | — | † | — | — | 10 | 1 | ||||||||||||||||||||||
| Class 4 | 10 | 1 | — | † | — | † | — | — | 10 | 1 | ||||||||||||||||||||||
| Total net increase | $ | 40 | 4 | $ | — | † | — | † | $ | — | — | $ | 40 | 4 | ||||||||||||||||||
| IS 2010 Target Date Fund | ||||||||||||||||||||||||||||||||
| Sales | Reinvestments of distributions | Repurchases | Net increase | |||||||||||||||||||||||||||||
| Share class | Amount | Shares | Amount | Shares | Amount | Shares | Amount | Shares | ||||||||||||||||||||||||
| For the period December 6, 2019* to December 31, 2019 | ||||||||||||||||||||||||||||||||
| Class 1 | $ | 10 | 1 | $ | — | † | — | † | $ | — | — | $ | 10 | 1 | ||||||||||||||||||
| Class 1A | 10 | 1 | — | † | — | † | — | — | 10 | 1 | ||||||||||||||||||||||
| Class 2 | 10 | 1 | — | † | — | † | — | — | 10 | 1 | ||||||||||||||||||||||
| Class 4 | 10 | 1 | — | † | — | † | — | — | 10 | 1 | ||||||||||||||||||||||
| Total net increase | $ | 40 | 4 | $ | — | † | — | † | $ | — | — | $ | 40 | 4 | ||||||||||||||||||
| * | Commencement of operations. |
| † | Amount less than one thousand. |
8. Investment transactions
The following table presents each fund’s investment transactions for the period December 6, 2019, commencement of operations, to December 31, 2019 (dollars in thousands):
| IS 2035 Target Date Fund | IS 2030 Target Date Fund | IS 2025 Target Date Fund | IS 2020 Target Date Fund | IS 2015 Target Date Fund | IS 2010 Target Date Fund | |||||||||||||||||||
| Purchases of investment securities* | $ | 41 | $ | 41 | $ | 41 | $ | 41 | $ | 41 | $ | 41 | ||||||||||||
| Sales of investment securities* | — | — | — | — | — | — | ||||||||||||||||||
| * | Excludes short-term securities and U.S. government obligations, if any. |
| 22 | American Funds Insurance Series – Target Date Series |
Financial highlights
| Income from investment operations1 | ||||||||||||||||||||||||||||||||||||||||||||
| Period ended | Net asset value, beginning of period | Net investment income | Net gains on securities (both realized and unrealized) | Total from investment operations | Dividends (from net investment income) | Net asset value, end of period | Total return2,3 | Net assets, end of period (in millions) | Ratio of expenses to average net assets2,3,4 | Net effective expense ratio3,5,6 | Ratio of net income to average net assets2,3 | |||||||||||||||||||||||||||||||||
| IS 2035 Target Date Fund | ||||||||||||||||||||||||||||||||||||||||||||
| Class 1: | ||||||||||||||||||||||||||||||||||||||||||||
| 12/31/20197,8 | $ | 10.00 | $ | .08 | $ | .19 | $ | .27 | $ | (.08 | ) | $ | 10.19 | 2.70 | % | $ | — | 9 | — | % | .37 | % | .75 | % | ||||||||||||||||||||
| Class 1A: | ||||||||||||||||||||||||||||||||||||||||||||
| 12/31/20197,8 | 10.00 | .08 | .19 | .27 | (.08 | ) | 10.19 | 2.70 | — | 9 | — | .37 | .75 | |||||||||||||||||||||||||||||||
| Class 2: | ||||||||||||||||||||||||||||||||||||||||||||
| 12/31/20197,8 | 10.00 | .08 | .19 | .27 | (.08 | ) | 10.19 | 2.70 | — | 9 | — | .37 | .75 | |||||||||||||||||||||||||||||||
| Class 4: | ||||||||||||||||||||||||||||||||||||||||||||
| 12/31/20197,8 | 10.00 | .08 | .19 | .27 | (.08 | ) | 10.19 | 2.70 | — | 9 | — | .37 | .75 | |||||||||||||||||||||||||||||||
| IS 2030 Target Date Fund | ||||||||||||||||||||||||||||||||||||||||||||
| Class 1: | ||||||||||||||||||||||||||||||||||||||||||||
| 12/31/20197,8 | $ | 10.00 | $ | .07 | $ | .16 | $ | .23 | $ | (.08 | ) | $ | 10.15 | 2.28 | % | $ | — | 9 | — | % | .35 | % | .69 | % | ||||||||||||||||||||
| Class 1A: | ||||||||||||||||||||||||||||||||||||||||||||
| 12/31/20197,8 | 10.00 | .07 | .16 | .23 | (.08 | ) | 10.15 | 2.28 | — | 9 | — | .35 | .69 | |||||||||||||||||||||||||||||||
| Class 2: | ||||||||||||||||||||||||||||||||||||||||||||
| 12/31/20197,8 | 10.00 | .07 | .16 | .23 | (.08 | ) | 10.15 | 2.28 | — | 9 | — | .35 | .69 | |||||||||||||||||||||||||||||||
| Class 4: | ||||||||||||||||||||||||||||||||||||||||||||
| 12/31/20197,8 | 10.00 | .07 | .16 | .23 | (.08 | ) | 10.15 | 2.28 | — | 9 | — | .35 | .69 | |||||||||||||||||||||||||||||||
| IS 2025 Target Date Fund | ||||||||||||||||||||||||||||||||||||||||||||
| Class 1: | ||||||||||||||||||||||||||||||||||||||||||||
| 12/31/20197,8 | $ | 10.00 | $ | .07 | $ | .13 | $ | .20 | $ | (.08 | ) | $ | 10.12 | 1.98 | % | $ | — | 9 | — | % | .33 | % | .66 | % | ||||||||||||||||||||
| Class 1A: | ||||||||||||||||||||||||||||||||||||||||||||
| 12/31/20197,8 | 10.00 | .07 | .13 | .20 | (.08 | ) | 10.12 | 1.98 | — | 9 | — | .33 | .66 | |||||||||||||||||||||||||||||||
| Class 2: | ||||||||||||||||||||||||||||||||||||||||||||
| 12/31/20197,8 | 10.00 | .07 | .13 | .20 | (.08 | ) | 10.12 | 1.98 | — | 9 | — | .33 | .66 | |||||||||||||||||||||||||||||||
| Class 4: | ||||||||||||||||||||||||||||||||||||||||||||
| 12/31/20197,8 | 10.00 | .07 | .13 | .20 | (.08 | ) | 10.12 | 1.98 | — | 9 | — | .33 | .66 | |||||||||||||||||||||||||||||||
| IS 2020 Target Date Fund | ||||||||||||||||||||||||||||||||||||||||||||
| Class 1: | ||||||||||||||||||||||||||||||||||||||||||||
| 12/31/20197,8 | $ | 10.00 | $ | .07 | $ | .10 | $ | .17 | $ | (.08 | ) | $ | 10.09 | 1.68 | % | $ | — | 9 | — | % | .31 | % | .65 | % | ||||||||||||||||||||
| Class 1A: | ||||||||||||||||||||||||||||||||||||||||||||
| 12/31/20197,8 | 10.00 | .07 | .10 | .17 | (.08 | ) | 10.09 | 1.68 | — | 9 | — | .31 | .65 | |||||||||||||||||||||||||||||||
| Class 2: | ||||||||||||||||||||||||||||||||||||||||||||
| 12/31/20197,8 | 10.00 | .07 | .10 | .17 | (.08 | ) | 10.09 | 1.68 | — | 9 | — | .31 | .65 | |||||||||||||||||||||||||||||||
| Class 4: | ||||||||||||||||||||||||||||||||||||||||||||
| 12/31/20197,8 | 10.00 | .07 | .10 | .17 | (.08 | ) | 10.09 | 1.68 | — | 9 | — | .31 | .65 | |||||||||||||||||||||||||||||||
See end of tables for footnotes.
| American Funds Insurance Series – Target Date Series | 23 |
Financial highlights(continued)
| Income from investment operations1 | ||||||||||||||||||||||||||||||||||||||||||||
| Period ended | Net asset value, beginning of period | Net investment income | Net gains on securities (both realized and unrealized) | Total from investment operations | Dividends (from net investment income) | Net asset value, end of period | Total return2,3 | Net assets, end of period (in millions) | Ratio of expenses to average net assets2,3,4 | Net effective expense ratio3,5,6 | Ratio of net income to average net assets2,3 | |||||||||||||||||||||||||||||||||
| IS 2015 Target Date Fund | ||||||||||||||||||||||||||||||||||||||||||||
| Class 1: | ||||||||||||||||||||||||||||||||||||||||||||
| 12/31/20197,8 | $ | 10.00 | $ | .07 | $ | .10 | $ | .17 | $ | (.08 | ) | $ | 10.09 | 1.69 | % | $ | — | 9 | — | % | .30 | % | .65 | % | ||||||||||||||||||||
| Class 1A: | ||||||||||||||||||||||||||||||||||||||||||||
| 12/31/20197,8 | 10.00 | .07 | .10 | .17 | (.08 | ) | 10.09 | 1.69 | — | 9 | — | .30 | .65 | |||||||||||||||||||||||||||||||
| Class 2: | ||||||||||||||||||||||||||||||||||||||||||||
| 12/31/20197,8 | 10.00 | .07 | .10 | .17 | (.08 | ) | 10.09 | 1.69 | — | 9 | — | .30 | .65 | |||||||||||||||||||||||||||||||
| Class 4: | ||||||||||||||||||||||||||||||||||||||||||||
| 12/31/20197,8 | 10.00 | .07 | .10 | .17 | (.08 | ) | 10.09 | 1.69 | — | 9 | — | .30 | .65 | |||||||||||||||||||||||||||||||
| IS 2010 Target Date Fund | ||||||||||||||||||||||||||||||||||||||||||||
| Class 1: | ||||||||||||||||||||||||||||||||||||||||||||
| 12/31/20197,8 | $ | 10.00 | $ | .06 | $ | .09 | $ | .15 | $ | (.07 | ) | $ | 10.08 | 1.54 | % | $ | — | 9 | — | % | .30 | % | .62 | % | ||||||||||||||||||||
| Class 1A: | ||||||||||||||||||||||||||||||||||||||||||||
| 12/31/20197,8 | 10.00 | .06 | .09 | .15 | (.07 | ) | 10.08 | 1.54 | — | 9 | — | .30 | .62 | |||||||||||||||||||||||||||||||
| Class 2: | ||||||||||||||||||||||||||||||||||||||||||||
| 12/31/20197,8 | 10.00 | .06 | .09 | .15 | (.07 | ) | 10.08 | 1.54 | — | 9 | — | .30 | .62 | |||||||||||||||||||||||||||||||
| Class 4: | ||||||||||||||||||||||||||||||||||||||||||||
| 12/31/20197,8 | 10.00 | .06 | .09 | .15 | (.07 | ) | 10.08 | 1.54 | — | 9 | — | .30 | .62 | |||||||||||||||||||||||||||||||
| Portfolio turnover rate for all share classes | For the period 12/6/2019 to 12/31/20197,8 | |||
| IS 2035 Target Date Fund | — | %10 | ||
| IS 2030 Target Date Fund | — | 10 | ||
| IS 2025 Target Date Fund | — | 10 | ||
| IS 2020 Target Date Fund | — | 10 | ||
| IS 2015 Target Date Fund | — | 10 | ||
| IS 2010 Target Date Fund | — | 10 | ||
| 1 | Based on average shares outstanding. |
| 2 | Not annualized. |
| 3 | All assets in each class of each fund consisted of seed capital invested by CRMC and/or its affiliates. Certain fees (including, where applicable, fees for distribution services) are not charged or accrued on these seed capital assets. If such fees were paid by the fund on seed capital assets, fund expenses for each class would have been higher and net income and total return for each class would have been lower. |
| 4 | This column does not include expenses of the underlying funds in which each fund invests. No expenses were accrued on any of the funds during the period December 6, 2019, commencement of operations, to December 31, 2019. |
| 5 | Annualized. |
| 6 | This column reflects the net effective expense ratios for each fund and class, which are unaudited. These ratios include each class’s expense ratio combined with the weighted average net expense ratio of the underlying funds for the periods presented. See expense example for further information regarding fees and expenses. |
| 7 | Based on operations for a period that is less than a full year. |
| 8 | For the period December 6, 2019, commencement of operations, to December 31, 2019. |
| 9 | Amount less than $1 million. |
| 10 | There is no turnover. |
| 24 | American Funds Insurance Series – Target Date Series |
Report of Independent Registered Public Accounting Firm
To the Board of Trustees of American Funds Insurance Series and Shareholders of American Funds IS 2035 Target Date Fund, American Funds IS 2030 Target Date Fund, American Funds IS 2025 Target Date Fund, American Funds IS 2020 Target Date Fund, American Funds IS 2015 Target Date Fund and American Funds IS 2010 Target Date Fund
Opinions on the Financial Statements
We have audited the accompanying statements of assets and liabilities, including the investment portfolios, of American Funds IS 2035 Target Date Fund, American Funds IS 2030 Target Date Fund, American Funds IS 2025 Target Date Fund, American Funds IS 2020 Target Date Fund, American Funds IS 2015 Target Date Fund and American Funds IS 2010 Target Date Fund (six of the funds constituting American Funds Insurance Series, hereafter collectively referred to as the “Funds”) as of December 31, 2019, the related statements of operations and changes in net assets, including the related notes, and the financial highlights for the period December 6, 2019 (commencement of operations) through December 31, 2019 (collectively referred to as the “financial statements”). In our opinion, the financial statements present fairly, in all material respects, the financial position of each of the Funds as of December 31, 2019, and the results of each of their operations, changes in each of their net assets, and each of the financial highlights for the period December 6, 2019 (commencement of operations) through December 31, 2019 in conformity with accounting principles generally accepted in the United States of America.
Basis for Opinions
These financial statements are the responsibility of the Funds’ management. Our responsibility is to express an opinion on the Funds’ financial statements based on our audits. We are a public accounting firm registered with the Public Company Accounting Oversight Board (United States) (PCAOB) and are required to be independent with respect to the Funds in accordance with the U.S. federal securities laws and the applicable rules and regulations of the Securities and Exchange Commission and the PCAOB.
We conducted our audits of these financial statements in accordance with the standards of the PCAOB. Those standards require that we plan and perform the audit to obtain reasonable assurance about whether the financial statements are free of material misstatement, whether due to error or fraud.
Our audits included performing procedures to assess the risks of material misstatement of the financial statements, whether due to error or fraud, and performing procedures that respond to those risks. Such procedures included examining, on a test basis, evidence regarding the amounts and disclosures in the financial statements. Our audits also included evaluating the accounting principles used and significant estimates made by management, as well as evaluating the overall presentation of the financial statements. Our procedures included confirmation of securities owned as of December 31, 2019 by correspondence with the custodian and transfer agent; when replies were not received from the transfer agent, we performed other auditing procedures. We believe that our audits provide a reasonable basis for our opinions.
/s/ PricewaterhouseCoopers LLP
Los Angeles, California
February 25, 2020
We have served as the auditor of one or more investment companies in The Capital Group Companies Investment Company Complex since 1934.
| American Funds Insurance Series – Target Date Series | 25 |
| Expense example | unaudited |
The funds in American Funds Insurance Series serve as the underlying investment vehicle for various insurance products. As an owner of an insurance contract that invests in one of the funds in the series, you incur two types of costs: (1) transaction costs, such as initial sales charges on purchase payments and contingent deferred sales charges on redemptions (loads), and (2) ongoing costs, including management fees, distribution and service (12b-1) fees, and other expenses. Additional fees are charged by the insurance companies related to the various benefits they provide. This example is intended to help you understand your ongoing costs (in dollars) of investing in the underlying funds so you can compare these costs with the ongoing costs of investing in other mutual funds that serve a similar function in other annuity products. The example is based on an investment of $1,000 invested at the beginning of the period and held for the entire period.
Actual expenses:
The first line of each share class in the tables on the following pages provides information about actual account values and actual expenses. You may use the information in this line, together with the amount you invested, to estimate the expenses that you paid over the period. Simply divide your account value by $1,000 (for example, an $8,600 account value divided by $1,000 = 8.6), then multiply the result by the number in the first line under the heading entitled “Expenses paid during period” to estimate the expenses you paid on your account during this period.
Hypothetical example for comparison purposes:
The second line of each share class in the tables on the following pages provides information about hypothetical account values and hypothetical expenses based on the actual expense ratio for the share class and an assumed rate of return of 5.00% per year before expenses, which is not the actual return of the share class. The hypothetical account values and expenses may not be used to estimate the actual ending account balance or expenses you paid for the period. You may use this information to compare the ongoing costs of investing in the fund and other funds. To do so, compare this 5.00% hypothetical example with the 5.00% hypothetical examples that appear in the shareholder reports of the other funds.
Notes:
Additional fees are charged by the insurance companies related to the various benefits they provide. You can estimate the impact of these fees by adding the amount of the fees to the total estimated expenses you paid on your account during the period as calculated above. In addition, your ending account value would be lower by the amount of these fees.
Note that the expenses shown in the tables on the following pages are meant to highlight your ongoing costs only and do not reflect any transactional costs. Therefore, the second line of each share class in the tables is useful in comparing ongoing costs only and will not help you determine the relative total costs of owning different funds. In addition, if these transactional costs were included, your costs would have been higher.
| 26 | American Funds Insurance Series – Target Date Series |
| Beginning account value | Ending account value 12/31/2019 | Expenses paid during period1,2 | Annualized expense ratio2 | Effective expenses paid during period3 | Effective annualized expense ratio4 | |||||||||||||||||||
| IS 2035 Target Date Fund | ||||||||||||||||||||||||
| Class 1 – actual return5 | $ | 1,000.00 | $ | 1,026.96 | $ | .00 | — | % | $ | .26 | .37 | % | ||||||||||||
| Class 1 – assumed 5% return5 | 1,000.00 | 1,025.21 | .00 | — | 1.89 | .37 | ||||||||||||||||||
| Class 1A – actual return5 | 1,000.00 | 1,026.96 | .00 | — | .26 | .37 | ||||||||||||||||||
| Class 1A – assumed 5% return5 | 1,000.00 | 1,025.21 | .00 | — | 1.89 | .37 | ||||||||||||||||||
| Class 2 – actual return5 | 1,000.00 | 1,026.96 | .00 | — | .26 | .37 | ||||||||||||||||||
| Class 2 – assumed 5% return5 | 1,000.00 | 1,025.21 | .00 | — | 1.89 | .37 | ||||||||||||||||||
| Class 4 – actual return5 | 1,000.00 | 1,026.96 | .00 | — | .26 | .37 | ||||||||||||||||||
| Class 4 – assumed 5% return5 | 1,000.00 | 1,025.21 | .00 | — | 1.89 | .37 | ||||||||||||||||||
| IS 2030 Target Date Fund | ||||||||||||||||||||||||
| Class 1 – actual return5 | $ | 1,000.00 | $ | 1,022.81 | $ | .00 | — | % | $ | .24 | .35 | % | ||||||||||||
| Class 1 – assumed 5% return5 | 1,000.00 | 1,025.21 | .00 | — | 1.79 | .35 | ||||||||||||||||||
| Class 1A – actual return5 | 1,000.00 | 1,022.81 | .00 | — | .24 | .35 | ||||||||||||||||||
| Class 1A – assumed 5% return5 | 1,000.00 | 1,025.21 | .00 | — | 1.79 | .35 | ||||||||||||||||||
| Class 2 – actual return5 | 1,000.00 | 1,022.81 | .00 | — | .24 | .35 | ||||||||||||||||||
| Class 2 – assumed 5% return5 | 1,000.00 | 1,025.21 | .00 | — | 1.79 | .35 | ||||||||||||||||||
| Class 4 – actual return5 | 1,000.00 | 1,022.81 | .00 | — | .24 | .35 | ||||||||||||||||||
| Class 4 – assumed 5% return5 | 1,000.00 | 1,025.21 | .00 | — | 1.79 | .35 | ||||||||||||||||||
| IS 2025 Target Date Fund | ||||||||||||||||||||||||
| Class 1 – actual return5 | $ | 1,000.00 | $ | 1,019.84 | $ | .00 | — | % | $ | .23 | .33 | % | ||||||||||||
| Class 1 – assumed 5% return5 | 1,000.00 | 1,025.21 | .00 | — | 1.68 | .33 | ||||||||||||||||||
| Class 1A – actual return5 | 1,000.00 | 1,019.84 | .00 | — | .23 | .33 | ||||||||||||||||||
| Class 1A – assumed 5% return5 | 1,000.00 | 1,025.21 | .00 | — | 1.68 | .33 | ||||||||||||||||||
| Class 2 – actual return5 | 1,000.00 | 1,019.84 | .00 | — | .23 | .33 | ||||||||||||||||||
| Class 2 – assumed 5% return5 | 1,000.00 | 1,025.21 | .00 | — | 1.68 | .33 | ||||||||||||||||||
| Class 4 – actual return5 | 1,000.00 | 1,019.84 | .00 | — | .23 | .33 | ||||||||||||||||||
| Class 4 – assumed 5% return5 | 1,000.00 | 1,025.21 | .00 | — | 1.68 | .33 | ||||||||||||||||||
| IS 2020 Target Date Fund | ||||||||||||||||||||||||
| Class 1 – actual return5 | $ | 1,000.00 | $ | 1,016.84 | $ | .00 | — | % | $ | .21 | .31 | % | ||||||||||||
| Class 1 – assumed 5% return5 | 1,000.00 | 1,025.21 | .00 | — | 1.58 | .31 | ||||||||||||||||||
| Class 1A – actual return5 | 1,000.00 | 1,016.84 | .00 | — | .21 | .31 | ||||||||||||||||||
| Class 1A – assumed 5% return5 | 1,000.00 | 1,025.21 | .00 | — | 1.58 | .31 | ||||||||||||||||||
| Class 2 – actual return5 | 1,000.00 | 1,016.84 | .00 | — | .21 | .31 | ||||||||||||||||||
| Class 2 – assumed 5% return5 | 1,000.00 | 1,025.21 | .00 | — | 1.58 | .31 | ||||||||||||||||||
| Class 4 – actual return5 | 1,000.00 | 1,016.84 | .00 | — | .21 | .31 | ||||||||||||||||||
| Class 4 – assumed 5% return5 | 1,000.00 | 1,025.21 | .00 | — | 1.58 | .31 | ||||||||||||||||||
| IS 2015 Target Date Fund | ||||||||||||||||||||||||
| Class 1 – actual return5 | $ | 1,000.00 | $ | 1,016.88 | $ | .00 | — | % | $ | .21 | .30 | % | ||||||||||||
| Class 1 – assumed 5% return5 | 1,000.00 | 1,025.21 | .00 | — | 1.53 | .30 | ||||||||||||||||||
| Class 1A – actual return5 | 1,000.00 | 1,016.88 | .00 | — | .21 | .30 | ||||||||||||||||||
| Class 1A – assumed 5% return5 | 1,000.00 | 1,025.21 | .00 | — | 1.53 | .30 | ||||||||||||||||||
| Class 2 – actual return5 | 1,000.00 | 1,016.88 | .00 | — | .21 | .30 | ||||||||||||||||||
| Class 2 – assumed 5% return5 | 1,000.00 | 1,025.21 | .00 | — | 1.53 | .30 | ||||||||||||||||||
| Class 4 – actual return5 | 1,000.00 | 1,016.88 | .00 | — | .21 | .30 | ||||||||||||||||||
| Class 4 – assumed 5% return5 | 1,000.00 | 1,025.21 | .00 | — | 1.53 | .30 | ||||||||||||||||||
See next page for footnotes.
| American Funds Insurance Series – Target Date Series | 27 |
| Beginning account value | Ending account value 12/31/2019 | Expenses paid during period1,2 | Annualized expense ratio2 | Effective expenses paid during period3 | Effective annualized expense ratio4 | |||||||||||||||||||
| IS 2010 Target Date Fund | ||||||||||||||||||||||||
| Class 1 – actual return5 | $ | 1,000.00 | $ | 1,015.43 | $ | .00 | — | % | $ | .21 | .30 | % | ||||||||||||
| Class 1 – assumed 5% return5 | 1,000.00 | 1,025.21 | .00 | — | 1.53 | .30 | ||||||||||||||||||
| Class 1A – actual return5 | 1,000.00 | 1,015.43 | .00 | — | .21 | .30 | ||||||||||||||||||
| Class 1A – assumed 5% return5 | 1,000.00 | 1,025.21 | .00 | — | 1.53 | .30 | ||||||||||||||||||
| Class 2 – actual return5 | 1,000.00 | 1,015.43 | .00 | — | .21 | .30 | ||||||||||||||||||
| Class 2 – assumed 5% return5 | 1,000.00 | 1,025.21 | .00 | — | 1.53 | .30 | ||||||||||||||||||
| Class 4 – actual return5 | 1,000.00 | 1,015.43 | .00 | — | .21 | .30 | ||||||||||||||||||
| Class 4 – assumed 5% return5 | 1,000.00 | 1,025.21 | .00 | — | 1.53 | .30 | ||||||||||||||||||
| 1 | The “expenses paid during period” are equal to the “annualized expense ratio,” multiplied by the average account value over the period, multiplied by the number of days in the period, and divided by 365 (to reflect the one-half year period). |
| 2 | The “expenses paid during period” and “annualized expense ratio” do not include the expenses of the underlying funds in which each fund invests. |
| 3 | The “effective expenses paid during period” are equal to the “effective annualized expense ratio,” multiplied by the average account value over the period, multiplied by the number of days in the period, and divided by 365 (to reflect the period). |
| 4 | The “effective annualized expense ratio” reflects the net annualized expense ratio of the class plus the class’s pro-rata share of the weighted average expense ratio of the underlying funds in which it invests. |
| 5 | The period for the “annualized expense ratio” and “actual return” line is based on the number of days since the initial sale of the share class on December 6, 2019. The “assumed 5% return” line is based on 184 days. |
| 28 | American Funds Insurance Series – Target Date Series |
Liquidity Risk Management Program
The series has adopted a liquidity risk management program (the “program”). The series’ board has designated Capital Research and Management Company (“CRMC”) as the administrator of the program. Personnel of CRMC or its affiliates conduct the day-today operation of the program pursuant to policies and procedures administered by the Capital Group Liquidity Risk Management Committee.
Under the program, CRMC manages each fund’s liquidity risk, which is the risk that the fund could not meet shareholder redemption requests without significant dilution of remaining shareholders’ interests in the fund. This risk is managed by monitoring the degree of liquidity of each fund’s investments, limiting the amount of each fund’s illiquid investments, and utilizing various risk management tools and facilities available to each fund for meeting shareholder redemptions, among other means. CRMC’s process of determining the degree of liquidity of each fund’s investments is supported by one or more third-party liquidity assessment vendors.
The series’ board reviewed a report prepared by CRMC regarding the operation and effectiveness of the program for the period December 1, 2018, through September 30, 2019. No significant liquidity events impacting any of the funds were noted in the report. In addition, CRMC provided its assessment that the program had been effective in managing each fund’s liquidity risk.
| American Funds Insurance Series – Target Date Series | 29 |
Board of trustees and other officers
Independent trustees1
| Name and year of birth | Year first elected a trustee of the series2 | Principal occupation(s) during past five years | Number of portfolios in fund complex overseen by trustee | Other directorships3 held by trustee | ||||
| William H. Baribault, 1945 | 2009 | Chairman of the Board and CEO, Oakwood Advisors (private investment and consulting); former CEO and President, Richard Nixon Foundation | 89 | General Finance Corporation | ||||
| James G. Ellis, 1947 | 2010 | Professor of Marketing and former Dean, Marshall School of Business, University of Southern California | 99 | Mercury General Corporation | ||||
| Nariman Farvardin, 1956 | 2018 | President, Stevens Institute of Technology | 86 | None | ||||
| Mary Davis Holt, 1950 | 2015–2016; 2017 | Principal, Mary Davis Holt Enterprises, LLC (leadership development consulting); former Partner, Flynn Heath Holt Leadership, LLC (leadership consulting); former COO, Time Life Inc. (1993–2003) | 86 | None | ||||
| R. Clark Hooper, 1946 | 2010 | Private investor | 89 | None | ||||
| Merit E. Janow, 1958 | 2007 | Dean and Professor, Columbia University, School of International and Public Affairs | 88 | Mastercard Incorporated; Trimble Inc. | ||||
| Margaret Spellings, 1957 Chairman of the Board (Independent and Non-Executive) | 2010 | CEO, Texas 2036; former President, Margaret Spellings & Company (public policy and strategic consulting); former President, The University of North Carolina; former President, George W. Bush Foundation | 90 | None | ||||
| Alexandra Trower, 1964 | 2018 | Executive Vice President, Global Communications and Corporate Officer, The Estée Lauder Companies | 85 | None |
Interested trustees4,5
| Name, year of birth and position with series | Year first elected a trustee or officer of the series2 | Principal occupation(s) during past five years and positions held with affiliated entities or the principal underwriter of the series | Number of portfolios in fund complex overseen by trustee | Other directorships3 held by trustee | ||||
| Donald D. O’Neal, 1960 Co-President | 1998 | Partner — Capital International Investors, Capital Research and Management Company; Partner — Capital International Investors, Capital Bank and Trust Company;6Director, Capital Research and Management Company | 35 | None | ||||
| Michael C. Gitlin, 1970 | 2019 | Vice Chairman and Director, Capital Research and Management Company; Partner — Capital Fixed Income Investors, Capital Research and Management Company; Director, The Capital Group Companies, Inc.;6served as Head of Fixed Income at a large investment management firm prior to joining Capital Research and Management Company in 2015 | 85 | None |
The series statement of additional information includes further details about the series trustees and is available without charge upon request by calling American Funds Service Company at (800) 421-4225 or by visiting the Capital Group website at capitalgroup.com. The address for all trustees and officers of the series is 333 South Hope Street, Los Angeles, CA 90071, Attention: Secretary.
| 30 | American Funds Insurance Series – Target Date Series |
Other officers5
| Name, year of birth and position with series | Year first elected an officer of the series2 | Principal occupation(s) during past five years and positions held with affiliated entities or the principal underwriter of the series | ||
| Alan N. Berro, 1960 Co-President | 1998 | Partner — Capital World Investors, Capital Research and Management Company; Partner — Capital World Investors, Capital Bank and Trust Company;6Director, The Capital Group Companies, Inc.6 | ||
| Maria Manotok,1974 Executive Vice President | 2012 | Senior Vice President and Senior Counsel — Fund Business Management Group, Capital Research and Management Company; Senior Vice President, Senior Counsel and Director, Capital International, Inc.;6 Director, Capital Group Investment Management Limited6 | ||
| John H. Smet, 1956 Senior Vice President | 1994 | Partner — Capital Fixed Income Investors, Capital Research and Management Company | ||
| Martin Jacobs,1962 Vice President | 2016 | Partner — Capital Research Global Investors, Capital Research and Management Company | ||
| Carl M. Kawaja, 1964 Vice President | 2008 | Partner — Capital World Investors, Capital Research and Management Company; Chairman and Director, Capital Research and Management Company; Partner — Capital World Investors, Capital Bank and Trust Company;6Director, The Capital Group Companies, Inc.6 | ||
| Sung Lee,1966 Vice President | 2008 | Partner — Capital Research Global Investors, Capital International, Inc.6 | ||
| Keiko McKibben, 1969 Vice President | 2010 | Partner — Capital Research Global Investors, Capital Research and Management Company | ||
| Renaud H. Samyn, 1974 Vice President | 2010 | Partner — Capital Research Global Investors, Capital International, Inc.6 | ||
| Dylan Yolles, 1969 Vice President | 2012 | Partner — Capital International Investors, Capital Research and Management Company | ||
| Steven I. Koszalka, 1964 Secretary | 2003 | Vice President — Fund Business Management Group, Capital Research and Management Company | ||
| Gregory F. Niland, 1971 Treasurer | 2008 | Vice President — Investment Operations, Capital Research and Management Company | ||
| Susan K. Countess, 1966 Assistant Secretary | 2014 | Associate — Fund Business Management Group, Capital Research and Management Company | ||
| Sandra Chuon, 1972 Assistant Treasurer | 2019 | Assistant Vice President — Investment Operations, Capital Research and Management Company | ||
| Brian C. Janssen, 1972 Assistant Treasurer | 2015 | Vice President — Investment Operations, Capital Research and Management Company |
| 1 | The term independent trustee refers to a trustee who is not an “interested person” of the series within the meaning of the Investment Company Act of 1940. |
| 2 | Trustees and officers of the series serve until their resignation, removal or retirement. |
| 3 | This includes all directorships/trusteeships (other than those in the American Funds or other funds managed by Capital Research and Management Company or its affiliates) that are held by each trustee as a trustee or director of a public company or a registered investment company. |
| 4 | The term interested trustee refers to a trustee who is an “interested person” within the meaning of the Investment Company Act of 1940, on the basis of their affiliation with the series investment adviser, Capital Research and Management Company, or affiliated entities (including the series principal underwriter). |
| 5 | All of the trustees and/or officers listed, with the exception of Martin Jacobs, Keiko McKibben and Renaud H. Samyn, are officers and/or directors/trustees of one or more of the other funds for which Capital Research and Management Company serves as investment adviser. |
| 6 | Company affiliated with Capital Research and Management Company. |
| American Funds Insurance Series – Target Date Series | 31 |
Office of the series
333 South Hope Street
Los Angeles, CA 90071-1406
Investment adviser
Capital Research and Management Company
333 South Hope Street
Los Angeles, CA 90071-1406
Custodians of assets
State Street Bank and Trust Company
One Lincoln Street
Boston, MA 02111
Counsel
Morgan, Lewis & Bockius LLP
One Federal Street
Boston, MA 02110-1726
Independent registered public accounting firm
PricewaterhouseCoopers LLP
601 South Figueroa Street
Los Angeles, CA 90017-3874
| 32 | American Funds Insurance Series – Target Date Series |
Investors should carefully consider investment objectives, risks, charges and expenses. This and other important information is contained in the series prospectuses and summary prospectuses, which can be obtained from your financial professional and should be read carefully before investing. You may also call American Funds Service Company (AFS) at (800) 421-4225 or visit the Capital Group website at capitalgroup.com.
“Proxy Voting Guidelines for American Funds Insurance Series — Target Date Series” — which describes how we vote proxies relating to the underlying funds held in the portfolios — is available on our website or upon request by calling AFS. The series files its proxy voting record with the U.S. Securities and Exchange Commission (SEC) for the 12 months ended June 30 by August 31. The proxy voting record is available free of charge on the SEC website at sec.gov and on our website.
American Funds Insurance Series — Target Date Series files a complete list of its portfolio holdings with the SEC for the first and third quarters of each fiscal year on Form NPORT-P. This filing is available free of charge on the SEC website. Additionally, the list of portfolio holdings is available by calling AFS.
This report is for the information of American Funds Insurance Series — Target Date Series investors, but it also may be used as sales literature when preceded or accompanied by the current prospectuses or summary prospectuses for American Funds Insurance Series — Target Date Series and the prospectus for the applicable insurance contract, which give details about charges, expenses, investment objectives and operating policies of the series. If used as sales material after March 31, 2020, this report must be accompanied by a statistical update for the most recently completed calendar quarter.
Bloomberg® is a trademark of Bloomberg Finance L.P. (collectively with its affiliates, “Bloomberg”). Barclays® is a trademark of Barclays Bank Plc (collectively with its affiliates, “Barclays”), used under license. Neither Bloomberg nor Barclays approves or endorses this material, guarantees the accuracy or completeness of any information herein and, to the maximum extent allowed by law, neither shall have any liability or responsibility for injury or damages arising in connection therewith.
MSCI has not approved, reviewed or produced this report, makes no express or implied warranties or representations and is not liable whatsoever for any data in the report. You may not redistribute the MSCI data or use it as a basis for other indices or investment products.
Standard & Poor’s 500 Composite Index is a product of S&P Dow Jones Indices LLC and/or its affiliates and has been licensed for use by Capital Group. Copyright © 2020 S&P Dow Jones Indices LLC, a division of S&P Global, and/or its affiliates. All rights reserved. Redistribution or reproduction in whole or in part are prohibited without written permission of S&P Dow Jones Indices LLC.
American Funds Distributors, Inc., member FINRA.
© 2020 Capital Group. All rights reserved.
| American Funds Insurance Series – Target Date Series | 33 |
The Capital Advantage®
Since 1931, Capital Group, home of American Funds, has helped investors pursue long-term investment success. Our consistent approach — in combination with The Capital SystemSM— has resulted in superior outcomes.
| Aligned with investor success | |
| We base our decisions on a long-term perspective, which we believe aligns our goals with the interests of our clients. American Funds Insurance Series portfolio managers average 28 years of investment experience, including 23 years at our company, reflecting a career commitment to our long-term approach.1 | |
| The Capital System | |
| The Capital System combines individual accountability with teamwork. Funds using The Capital System are divided into portions that are managed independently by investment professionals with diverse backgrounds, ages and investment approaches. An extensive global research effort is the backbone of our system. | |
| American Funds Insurance Series superior outcomes | |
| American Funds Insurance Series equity funds have beaten their comparable Lipper indexes in 90% of 10-year periods and 100% of 20-year periods.2Our fixed income funds have helped investors achieve diversification through attention to correlation between bonds and equities.3We strive to keep management fees competitive. Over the past 20 years, most funds’ fees have been below industry averages.4 |
| 1 | Portfolio manager experience as of the American Funds Insurance Series prospectus dated May 1, 2020. | |
| 2 | Based on Class 1 share results for rolling periods through December 31, 2019. Periods covered are the shorter of the fund’s lifetime or since the inception date of the comparable Lipper index or average. The comparable Lipper indexes are: Global Funds Index (Global Growth Fund, Global Growth and Income Fund), Growth Funds Index (Growth Fund), International Funds Index (International Fund), Emerging Markets Funds Index (New World Fund), Growth & Income Funds Index (Blue Chip Income and Growth Fund, Growth-Income Fund) and Balanced Funds Index (Asset Allocation Fund). The Lipper Global Small-/Mid-Cap Funds Average was used for Global Small Capitalization Fund. Lipper source: Refinitiv Lipper. There have been periods when the fund has lagged the index. | |
| 3 | Based on Class 1 share results as of December 31, 2019. Four of our five fixed income funds showed a three-year correlation below 0.1. Standard & Poor’s 500 Composite Index was used as an equity market proxy. Correlation based on monthly total returns. Correlation is a statistical measure of how two securities move in relation to each other. A correlation ranges from –1 to 1. A positive correlation close to 1 implies that as one security moves, either up or down, the other security will move in “lockstep,” in the same direction. A negative correlation close to –1 indicates that the securities have moved in the opposite direction. | |
| 4 | Based on management fees for the 20-year period ended December 31, 2019, versus comparable Lipper categories, excluding funds of funds. |
All Capital Group trademarks mentioned are owned by The Capital Group Companies, Inc., an affiliated company or fund. All other company and product names mentioned are the property of their respective companies.

ITEM 2 – Code of Ethics
The Registrant has adopted a Code of Ethics that applies to its Principal Executive Officer and Principal Financial Officer. The Registrant undertakes to provide to any person without charge, upon request, a copy of the Code of Ethics. Such request can be made by calling 800/421-4225 or to the Secretary of the Registrant, 333 South Hope Street, Los Angeles, California 90071.
ITEM 3 – Audit Committee Financial Expert
The Registrant’s board has determined that James G. Ellis, a member of the Registrant’s audit committee, is an “audit committee financial expert” and "independent," as such terms are defined in this Item. This designation will not increase the designee’s duties, obligations or liability as compared to his or her duties, obligations and liability as a member of the audit committee and of the board, nor will it reduce the responsibility of the other audit committee members. There may be other individuals who, through education or experience, would qualify as "audit committee financial experts" if the board had designated them as such. Most importantly, the board believes each member of the audit committee contributes significantly to the effective oversight of the Registrant’s financial statements and condition.
ITEM 4 – Principal Accountant Fees and Services
| AFIS | ||
| Registrant: | ||
| a) Audit Fees: | ||
| Audit | 2018 | 760,000 |
| 2019 | 770,000 | |
| b) Audit-Related Fees: | ||
| 2018 | 19,000 | |
| 2019 | 15,000 | |
| c) Tax Fees: | ||
| 2018 | 179,000 | |
| 2019 | 179,000 | |
| The tax fees consist of professional services relating to the preparation of the Registrant’s tax returns. | ||
| d) All Other Fees: | ||
| 2018 | None | |
| 2019 | None | |
| Adviser and affiliates (includes only fees for non-audit services billed to the adviser and affiliates for engagements that relate directly to the operations and financial reporting of the Registrant and were subject to the pre-approval policies described below): | ||
| a) Audit Fees: | ||
| Not Applicable | ||
| b) Audit-Related Fees: | ||
| 2018 | None | |
| 2019 | None | |
| The audit-related fees consist of assurance and related services relating to the examination of the Registrant’s transfer agent, principal underwriter and investment adviser conducted in accordance with Statement on Standards for Attestation Engagements Number 18 issued by the American Institute of Certified Public Accountants. | ||
| c) Tax Fees: | ||
| 2018 | None | |
| 2019 | None |
| The tax fees consist of consulting services relating to the Registrant’s investments. | ||
| d) All Other Fees: | ||
| 2018 | None | |
| 2019 | 9,000 | |
| The other fees consist of subscription services related to an accounting research tool. | ||
| All audit and permissible non-audit services that the Registrant’s audit committee considers compatible with maintaining the independent registered public accounting firm’s independence are required to be pre-approved by the committee. The pre-approval requirement will extend to all non-audit services provided to the Registrant, the investment adviser, and any entity controlling, controlled by, or under common control with the investment adviser that provides ongoing services to the Registrant, if the engagement relates directly to the operations and financial reporting of the Registrant. The committee will not delegate its responsibility to pre-approve these services to the investment adviser. The committee may delegate to one or more committee members the authority to review and pre-approve audit and permissible non-audit services. Actions taken under any such delegation will be reported to the full committee at its next meeting. The pre-approval requirement is waived with respect to non-audit services if certain conditions are met. The pre-approval requirement was not waived for any of the non-audit services listed above provided to the Registrant, adviser and affiliates. | ||
| Aggregate non-audit fees paid to the Registrant’s auditors, including fees for all services billed to the Registrant, adviser and affiliates that provide ongoing services to the Registrant, were $197,000 for fiscal year 2018 and $202,000 for fiscal year 2019. The non-audit services represented by these amounts were brought to the attention of the committee and considered to be compatible with maintaining the auditors’ independence. |
ITEM 5 – Audit Committee of Listed Registrants
Not applicable to this Registrant, insofar as the Registrant is not a listed issuer as defined in Rule 10A-3 under the Securities Exchange Act of 1934.
ITEM 6 – Schedule of Investments

American Funds Insurance Series®
Global Growth Fund
Investment portfolio
December 31, 2019
| Common stocks 96.83% Information technology 29.11% | Shares | Value (000) |
| ASML Holding NV1 | 648,442 | $193,113 |
| ASML Holding NV (New York registered) | 510,500 | 151,077 |
| Taiwan Semiconductor Manufacturing Co., Ltd.1 | 27,188,000 | 301,093 |
| Taiwan Semiconductor Manufacturing Co., Ltd. (ADR) | 335,000 | 19,463 |
| Microsoft Corp. | 1,999,800 | 315,368 |
| Visa Inc., Class A | 1,142,800 | 214,732 |
| Broadcom Inc. | 487,050 | 153,918 |
| Temenos AG1 | 637,000 | 100,711 |
| Paycom Software, Inc.2 | 357,000 | 94,519 |
| SimCorp AS1 | 425,000 | 48,292 |
| Adyen NV1,2 | 56,700 | 46,656 |
| PagSeguro Digital Ltd., Class A2 | 1,340,900 | 45,805 |
| Adobe Inc.2 | 135,000 | 44,524 |
| Amphenol Corp., Class A | 373,500 | 40,424 |
| Network International Holdings PLC1,2 | 3,173,000 | 26,931 |
| Hexagon AB, Class B1 | 477,200 | 26,737 |
| EPAM Systems, Inc.2 | 122,000 | 25,884 |
| Keyence Corp.1 | 73,000 | 25,839 |
| Mastercard Inc., Class A | 76,500 | 22,842 |
| Zendesk, Inc.2 | 261,000 | 20,000 |
| Jack Henry & Associates, Inc. | 98,000 | 14,276 |
| Autodesk, Inc.2 | 77,000 | 14,126 |
| Amadeus IT Group SA, Class A, non-registered shares1 | 164,200 | 13,454 |
| Worldline SA, non-registered shares1,2 | 162,000 | 11,498 |
| StoneCo Ltd., Class A2 | 208,000 | 8,297 |
| 1,979,579 | ||
| Consumer discretionary 17.93% | ||
| Amazon.com, Inc.2 | 173,800 | 321,155 |
| Alibaba Group Holding Ltd.1,2 | 6,844,000 | 181,984 |
| Takeaway.com NV1,2 | 740,000 | 68,355 |
| Just Eat PLC1,2 | 5,292,000 | 58,725 |
| Ocado Group PLC1,2 | 3,115,000 | 52,890 |
| Naspers Ltd., Class N1 | 277,000 | 45,276 |
| Moncler SpA1 | 915,000 | 41,155 |
| NIKE, Inc., Class B | 370,500 | 37,535 |
| Tiffany & Co. | 259,700 | 34,709 |
| LVMH Moët Hennessy-Louis Vuitton SE1 | 59,000 | 27,478 |
| Meituan Dianping, Class B1,2 | 2,027,700 | 26,554 |
| Wynn Macau, Ltd.1 | 10,510,400 | 25,999 |
| Valeo SA, non-registered shares1 | 727,000 | 25,741 |
| Cie. Financière Richemont SA, Class A1 | 320,350 | 25,147 |
| MGM China Holdings, Ltd.1 | 12,708,000 | 20,827 |
| Prosus NV1,2 | 277,000 | 20,727 |
| Home Depot, Inc. | 92,275 | 20,151 |
| Peugeot SA1 | 814,995 | 19,519 |
| EssilorLuxottica1 | 124,835 | 19,070 |
American Funds Insurance Series — Global Growth Fund — Page 1 of 184
| Common stocks (continued) Consumer discretionary (continued) | Shares | Value (000) |
| ASOS PLC1,2 | 370,000 | $16,599 |
| Sony Corp.1 | 243,000 | 16,540 |
| Melco Resorts & Entertainment Ltd. (ADR) | 606,000 | 14,647 |
| MGM Resorts International | 437,000 | 14,539 |
| Sodexo SA1 | 122,000 | 14,470 |
| Flutter Entertainment PLC1 | 103,300 | 12,615 |
| Marriott International, Inc., Class A | 74,000 | 11,206 |
| Domino’s Pizza, Inc. | 37,000 | 10,870 |
| Restaurant Brands International Inc. | 155,000 | 9,884 |
| Fast Retailing Co., Ltd.1 | 16,100 | 9,543 |
| Cairn Homes PLC1 | 5,615,000 | 7,969 |
| Suzuki Motor Corp.1 | 182,000 | 7,623 |
| 1,219,502 | ||
| Health care 10.91% | ||
| UnitedHealth Group Inc. | 324,200 | 95,308 |
| AstraZeneca PLC1 | 721,300 | 72,165 |
| Merck & Co., Inc. | 775,600 | 70,541 |
| Boston Scientific Corp.2 | 1,373,700 | 62,119 |
| Pfizer Inc. | 1,424,000 | 55,792 |
| DexCom, Inc.2 | 253,000 | 55,341 |
| Fisher & Paykel Healthcare Corp. Ltd.1 | 3,680,000 | 55,222 |
| Mettler-Toledo International Inc.2 | 65,000 | 51,563 |
| Cigna Corp. | 177,511 | 36,299 |
| Bayer AG1 | 363,860 | 29,742 |
| Regeneron Pharmaceuticals, Inc.2 | 64,200 | 24,106 |
| Zoetis Inc., Class A | 155,000 | 20,514 |
| Humana Inc. | 55,000 | 20,159 |
| Vertex Pharmaceuticals Inc.2 | 89,000 | 19,487 |
| Novartis AG1 | 189,000 | 17,906 |
| Intuitive Surgical, Inc.2 | 28,000 | 16,552 |
| Straumann Holding AG1 | 14,000 | 13,742 |
| Sanofi1 | 135,000 | 13,559 |
| bioMérieux SA1 | 135,000 | 12,026 |
| 742,143 | ||
| Financials 10.30% | ||
| AIA Group Ltd.1 | 13,206,300 | 138,952 |
| Kotak Mahindra Bank Ltd.1 | 3,917,000 | 92,383 |
| JPMorgan Chase & Co. | 614,600 | 85,675 |
| MarketAxess Holdings Inc. | 211,000 | 79,992 |
| Tradeweb Markets Inc., Class A | 1,501,303 | 69,586 |
| CME Group Inc., Class A | 165,200 | 33,159 |
| Société Générale1 | 818,650 | 28,604 |
| AXA SA1 | 966,000 | 27,253 |
| Prudential PLC1 | 1,141,962 | 21,973 |
| Moscow Exchange MICEX-RTS PJSC1 | 12,640,000 | 21,943 |
| Berkshire Hathaway Inc., Class A2 | 54 | 18,338 |
| ORIX Corp.1 | 1,017,000 | 16,929 |
| BlackRock, Inc. | 30,600 | 15,383 |
| Banco Santander, SA1 | 2,946,020 | 12,439 |
| Macquarie Group Ltd.1 | 125,000 | 12,124 |
| FinecoBank SpA1 | 960,000 | 11,523 |
American Funds Insurance Series — Global Growth Fund — Page 2 of 184
| Common stocks (continued) Financials (continued) | Shares | Value (000) |
| Sberbank of Russia PJSC (ADR)1 | 645,500 | $10,621 |
| M&G PLC1,2 | 1,141,962 | 3,593 |
| 700,470 | ||
| Consumer staples 8.12% | ||
| British American Tobacco PLC1 | 2,970,800 | 126,572 |
| Nestlé SA1 | 739,650 | 80,131 |
| Philip Morris International Inc. | 919,500 | 78,240 |
| Altria Group, Inc. | 1,125,000 | 56,149 |
| Keurig Dr Pepper Inc. | 1,624,000 | 47,015 |
| General Mills, Inc. | 514,000 | 27,530 |
| Walgreens Boots Alliance, Inc. | 459,700 | 27,104 |
| Associated British Foods PLC1 | 595,000 | 20,612 |
| Anheuser-Busch InBev SA/NV1 | 250,000 | 20,500 |
| Coca-Cola European Partners PLC | 397,000 | 20,199 |
| Costco Wholesale Corp. | 44,800 | 13,168 |
| Uni-Charm Corp.1 | 357,000 | 12,059 |
| Coca-Cola FEMSA, SAB de CV, units | 1,965,000 | 11,939 |
| Mondelez International, Inc. | 192,000 | 10,575 |
| 551,793 | ||
| Communication services 7.87% | ||
| Alphabet Inc., Class A2 | 115,600 | 154,833 |
| Alphabet Inc., Class C2 | 71,052 | 94,998 |
| Tencent Holdings Ltd.1 | 2,230,000 | 107,572 |
| Facebook, Inc., Class A2 | 421,640 | 86,542 |
| Nintendo Co., Ltd.1 | 137,400 | 55,461 |
| Altice USA, Inc., Class A2 | 800,000 | 21,872 |
| ViacomCBS Inc., Class B | 334,850 | 14,054 |
| 535,332 | ||
| Industrials 7.76% | ||
| Airbus SE, non-registered shares1 | 1,093,500 | 160,436 |
| MTU Aero Engines AG1 | 167,000 | 47,688 |
| Geberit AG1 | 65,000 | 36,490 |
| DSV Panalpina A/S1 | 248,500 | 28,766 |
| ASSA ABLOY AB, Class B1 | 1,170,000 | 27,340 |
| Bunzl PLC1 | 956,000 | 26,157 |
| Alliance Global Group, Inc.1,2 | 111,060,000 | 25,546 |
| Safran SA1 | 164,000 | 25,422 |
| GT Capital Holdings, Inc.1 | 1,398,681 | 23,413 |
| Middleby Corp.2 | 201,000 | 22,013 |
| IDEX Corp. | 122,400 | 21,053 |
| Boeing Co. | 51,300 | 16,711 |
| SMC Corp.1 | 34,000 | 15,542 |
| Recruit Holdings Co., Ltd.1 | 390,000 | 14,676 |
| NIBE Industrier AB, Class B1 | 817,914 | 14,184 |
| General Electric Co. | 1,260,000 | 14,062 |
| Nidec Corp.1 | 57,300 | 7,827 |
| 527,326 | ||
| Materials 2.73% | ||
| Sherwin-Williams Co. | 155,500 | 90,740 |
| Barrick Gold Corp. (GBP denominated) | 1,532,000 | 28,456 |
| Koninklijke DSM NV1 | 124,000 | 16,187 |
American Funds Insurance Series — Global Growth Fund — Page 3 of 184
| Common stocks (continued) Materials (continued) | Shares | Value (000) |
| CCL Industries Inc., Class B, nonvoting shares | 375,000 | $15,976 |
| Glencore PLC1 | 4,000,000 | 12,508 |
| Air Liquide SA1 | 87,912 | 12,495 |
| DuPont de Nemours Inc. | 147,000 | 9,437 |
| 185,799 | ||
| Energy 2.02% | ||
| Reliance Industries Ltd.1 | 1,795,200 | 38,132 |
| Gazprom PJSC (ADR)1 | 4,173,000 | 34,365 |
| LUKOIL Oil Co. PJSC (ADR)1 | 306,700 | 30,468 |
| Baker Hughes Co., Class A | 470,000 | 12,046 |
| Royal Dutch Shell PLC, Class B1 | 381,000 | 11,353 |
| CNOOC Ltd.1 | 6,600,000 | 11,000 |
| 137,364 | ||
| Utilities 0.08% | ||
| Ørsted AS1 | 54,500 | 5,646 |
| Total common stocks(cost: $3,768,489,000) | 6,584,954 | |
| Preferred securities 1.66% Health care 1.20% | ||
| Sartorius AG, nonvoting preferred, non-registered shares1 | 381,500 | 81,675 |
| Information technology 0.46% | ||
| Samsung Electronics Co., Ltd., nonvoting preferred shares1 | 792,250 | 30,909 |
| Total preferred securities(cost: $43,479,000) | 112,584 | |
| Short-term securities 2.01% Money market investments 2.01% | ||
| Capital Group Central Cash Fund 1.73%3 | 1,371,403 | 137,140 |
| Total short-term securities(cost: $136,878,000) | 137,140 | |
| Total investment securities 100.50%(cost: $3,948,846,000) | 6,834,678 | |
| Other assets less liabilities (0.50)% | (34,231) | |
| Net assets 100.00% | $6,800,447 |
| 1 | Valued under fair value procedures adopted by authority of the board of trustees. The total value of all such securities was $3,312,961,000, which represented 48.72% of the net assets of the fund. This amount includes $3,300,466,000 related to certain securities trading outside the U.S. whose values were adjusted as a result of significant market movements following the close of local trading. |
| 2 | Security did not produce income during the last 12 months. |
| 3 | Rate represents the seven-day yield at 12/31/2019. |
| Key to abbreviations | |
| ADR = American Depositary Receipts | |
| GBP = British pounds |
American Funds Insurance Series — Global Growth Fund — Page 4 of 184
Global Small Capitalization Fund
Investment portfolio
December 31, 2019
| Common stocks 94.84% Health care 22.15% | Shares | Value (000) |
| Insulet Corp.1 | 815,300 | $139,579 |
| GW Pharmaceuticals PLC (ADR)1 | 823,718 | 86,128 |
| Notre Dame Intermédica Participações SA | 4,228,500 | 71,742 |
| Haemonetics Corp.1 | 619,200 | 71,146 |
| Allakos Inc.1,2 | 683,880 | 65,215 |
| CONMED Corp. | 581,200 | 64,996 |
| Integra LifeSciences Holdings Corp.1 | 906,825 | 52,850 |
| Mani, Inc.3 | 1,632,529 | 46,675 |
| Cortexyme, Inc.1,2 | 695,324 | 39,035 |
| iRhythm Technologies, Inc.1 | 515,500 | 35,100 |
| PRA Health Sciences, Inc.1 | 306,100 | 34,023 |
| New Frontier Health Corp., Class A1,3,4 | 2,680,000 | 26,666 |
| Allogene Therapeutics, Inc.1 | 653,594 | 16,980 |
| Allogene Therapeutics, Inc.1,2 | 280,589 | 7,290 |
| Nakanishi Inc.3 | 1,024,000 | 19,497 |
| WuXi Biologics (Cayman) Inc.1,3 | 1,412,000 | 17,909 |
| Medacta Group SA1,3 | 212,200 | 15,875 |
| CompuGroup Medical SE3 | 203,400 | 14,551 |
| BioMarin Pharmaceutical Inc.1 | 172,000 | 14,543 |
| Encompass Health Corp. | 206,000 | 14,270 |
| Fleury SA, ordinary nominative | 1,860,000 | 14,116 |
| Cansino Biologics Inc., Class H1,2,3 | 1,857,200 | 14,083 |
| CryoLife, Inc.1 | 483,550 | 13,099 |
| NuCana PLC (ADR)1,2,5 | 2,083,704 | 12,711 |
| Madrigal Pharmaceuticals, Inc.1 | 134,425 | 12,247 |
| Ultragenyx Pharmaceutical Inc.1 | 283,374 | 12,103 |
| Amplifon SpA3 | 420,000 | 12,084 |
| Bluebird Bio, Inc.1 | 135,415 | 11,883 |
| Sarepta Therapeutics, Inc.1 | 89,900 | 11,601 |
| LivaNova PLC1 | 125,000 | 9,429 |
| Guardant Health, Inc.1 | 114,927 | 8,980 |
| NuVasive, Inc.1 | 110,000 | 8,507 |
| Hikma Pharmaceuticals PLC3 | 280,000 | 7,417 |
| Divi’s Laboratories Ltd.3 | 260,000 | 6,725 |
| AddLife AB, Class B3 | 176,889 | 5,463 |
| Hutchison China MediTech Ltd. (ADR)1 | 124,000 | 3,109 |
| Piramal Enterprises Ltd.3 | 127,741 | 2,733 |
| Genomma Lab Internacional, SAB de CV, Series B1 | 1,000,000 | 990 |
| NMC Health PLC3 | 38,929 | 914 |
| Clinuvel Pharmaceuticals Ltd.3 | 29,278 | 586 |
| Neuronetics, Inc.1 | 110,119 | 494 |
| 1,023,344 |
American Funds Insurance Series — Global Small Capitalization Fund — Page 5 of 184
| Common stocks (continued) Information technology 18.84% | Shares | Value (000) |
| Cree, Inc.1 | 1,199,900 | $55,375 |
| Ceridian HCM Holding Inc.1 | 799,400 | 54,263 |
| Net One Systems Co., Ltd.3 | 1,556,965 | 40,002 |
| Network International Holdings PLC1,3 | 4,570,562 | 38,792 |
| Avast PLC3 | 5,839,000 | 35,104 |
| Alteryx, Inc., Class A1 | 340,000 | 34,024 |
| SimCorp AS3 | 297,250 | 33,776 |
| Bechtle AG, non-registered shares3 | 226,305 | 31,756 |
| Carel Industries SpA2,3 | 1,947,251 | 30,292 |
| Qorvo, Inc.1 | 241,800 | 28,104 |
| Appfolio, Inc., Class A1 | 251,270 | 27,627 |
| BE Semiconductor Industries NV3 | 666,800 | 25,896 |
| Kingdee International Software Group Co. Ltd.3 | 24,670,374 | 24,685 |
| Inphi Corp.1 | 315,900 | 23,383 |
| Jenoptik AG3 | 706,152 | 20,180 |
| Paycom Software, Inc.1 | 75,000 | 19,857 |
| Pegasystems Inc. | 242,491 | 19,314 |
| MACOM Technology Solutions Holdings, Inc.1 | 721,000 | 19,179 |
| Euronet Worldwide, Inc.1 | 120,800 | 19,033 |
| Anaplan, Inc.1 | 341,133 | 17,875 |
| HubSpot, Inc.1 | 110,300 | 17,483 |
| Nuance Communications, Inc.1 | 946,232 | 16,871 |
| DocuSign, Inc.1 | 210,067 | 15,568 |
| Silergy Corp.3 | 451,740 | 14,324 |
| Silicon Laboratories Inc.1 | 122,000 | 14,150 |
| Cognex Corp. | 250,000 | 14,010 |
| Oneconnect Financial Technology Co., Ltd. (ADR)1,2 | 1,372,000 | 13,761 |
| Vanguard International Semiconductor Corp.3 | 4,877,000 | 12,907 |
| Megaport Ltd.1,3 | 1,500,000 | 11,309 |
| Elastic NV, non-registered shares1 | 151,651 | 9,751 |
| Yangtze Optical Fibre and Cable Joint Stock Ltd. Co., Class H2,3 | 4,296,500 | 8,546 |
| InterXion Holding NV, non-registered shares1 | 100,000 | 8,381 |
| Sansan, Inc.1,3 | 160,800 | 8,198 |
| Nordic Semiconductor ASA1,3 | 1,250,000 | 7,931 |
| RAKUS Co., Ltd.3 | 428,600 | 7,888 |
| Endurance International Group Holdings, Inc.1 | 1,597,556 | 7,509 |
| ASM Pacific Technology Ltd.3 | 497,000 | 6,909 |
| Topcon Corp.3 | 523,710 | 6,749 |
| Faraday Technology Corp.3 | 3,402,000 | 6,393 |
| INFICON Holding AG3 | 7,397 | 5,873 |
| Maxlinear, Inc.1 | 270,000 | 5,729 |
| Kingboard Holdings Ltd.3 | 1,733,000 | 5,502 |
| Semtech Corp.1 | 100,000 | 5,290 |
| SUNeVision Holdings Ltd.3 | 6,170,000 | 4,174 |
| Siltronic AG3 | 38,500 | 3,876 |
| CDK Global, Inc. | 69,000 | 3,773 |
| Ping Identity Holding Corp.1,2 | 154,000 | 3,742 |
| X-FAB Silicon Foundries SE1,3 | 765,130 | 3,595 |
| Computer Services, Inc. | 79,800 | 3,551 |
| MongoDB, Inc., Class A1 | 25,000 | 3,290 |
| Okta, Inc., Class A1 | 27,263 | 3,145 |
| Tyro Payments Ltd.1,3 | 1,181,338 | 2,918 |
| Coupa Software Inc.1 | 18,000 | 2,633 |
| QAD Inc., Class A | 44,400 | 2,261 |
American Funds Insurance Series — Global Small Capitalization Fund — Page 6 of 184
| Common stocks (continued) Information technology (continued) | Shares | Value (000) |
| PagerDuty, Inc.1 | 86,800 | $2,030 |
| Medallia, Inc.1,2 | 64,600 | 2,010 |
| 870,547 | ||
| Industrials 14.87% | ||
| International Container Terminal Services, Inc.3 | 23,981,620 | 60,824 |
| Nihon M&A Center Inc.3 | 1,710,692 | 59,090 |
| VARTA AG, non-registered shares1,3 | 280,402 | 38,232 |
| Meggitt PLC3 | 3,321,300 | 28,942 |
| Tomra Systems ASA3 | 857,587 | 27,197 |
| Marel hf., non-registered shares (ISK denominated)3 | 4,899,903 | 24,908 |
| Marel hf., non-registered shares (EUR denominated)1,3 | 333,333 | 1,705 |
| I.M.A. Industria Macchine Automatiche SpA2,3 | 365,840 | 26,316 |
| Curtiss-Wright Corp. | 185,484 | 26,133 |
| IMCD NV3 | 293,600 | 25,697 |
| Bingo Industries Ltd.2,3 | 12,741,516 | 25,449 |
| Boyd Group Services Inc.2 | 158,006 | 24,579 |
| BWX Technologies, Inc. | 339,407 | 21,070 |
| Bravida Holding AB3 | 1,940,000 | 18,841 |
| VAT Group AG3 | 103,000 | 17,425 |
| Rheinmetall AG3 | 145,900 | 16,778 |
| Centre Testing International Group Co., Ltd.3 | 7,259,332 | 15,541 |
| ManpowerGroup Inc. | 160,000 | 15,536 |
| Matson, Inc. | 347,000 | 14,158 |
| Avon Rubber PLC3 | 508,000 | 14,123 |
| Instalco AB3 | 857,000 | 12,366 |
| BELIMO Holding AG3 | 1,628 | 12,275 |
| Imperial Logistics Ltd.3 | 2,775,406 | 11,584 |
| Cleanaway Waste Management Ltd.3 | 8,161,470 | 11,547 |
| Nolato AB, Class B3 | 194,800 | 11,442 |
| BeNEXT Group Inc.3 | 944,400 | 11,019 |
| Granite Construction Inc. | 388,500 | 10,750 |
| Aalberts NV, non-registered shares3 | 225,100 | 10,127 |
| Interpump Group SpA3 | 297,000 | 9,409 |
| easyJet PLC3 | 473,100 | 8,999 |
| Tsubaki Nakashima Co., Ltd.3 | 580,461 | 8,514 |
| Greaves Cotton Ltd.3 | 4,244,540 | 7,968 |
| The Brink’s Co. | 73,800 | 6,692 |
| PayPoint PLC3 | 476,000 | 6,390 |
| Carborundum Universal Ltd.3 | 1,380,000 | 6,211 |
| Diploma PLC3 | 221,000 | 5,925 |
| Aerojet Rocketdyne Holdings, Inc.1 | 125,000 | 5,707 |
| Sunny Friend Environmental Technology Co., Ltd.3 | 660,000 | 5,154 |
| Coor Service Management Holding AB3 | 530,000 | 4,663 |
| Addtech AB, Class B3 | 124,300 | 4,020 |
| Middleby Corp.1 | 31,000 | 3,395 |
| J. Kumar Infraprojects Ltd.3 | 1,517,000 | 3,002 |
| Klingelnberg AG3 | 86,463 | 2,179 |
| Europcar Mobility Group SA2,3 | 434,260 | 2,113 |
| Polypipe Group PLC3 | 210,000 | 1,503 |
| Nitto Boseki Co., Ltd.3 | 32,600 | 1,381 |
| 686,879 |
American Funds Insurance Series — Global Small Capitalization Fund — Page 7 of 184
| Common stocks (continued) Consumer discretionary 14.63% | Shares | Value (000) |
| frontdoor, inc.1 | 1,355,200 | $64,264 |
| Luckin Coffee Inc., Class A (ADR)1,2 | 1,472,220 | 57,947 |
| Helen of Troy Ltd.1 | 283,000 | 50,881 |
| Mattel, Inc.1,2 | 3,338,800 | 45,241 |
| Wyndham Hotels & Resorts, Inc. | 631,500 | 39,664 |
| Five Below, Inc.1 | 305,000 | 38,997 |
| Melco International Development Ltd.3 | 12,619,000 | 35,517 |
| GVC Holdings PLC3 | 2,934,000 | 34,409 |
| Thor Industries, Inc. | 446,000 | 33,133 |
| ServiceMaster Global Holdings, Inc.1 | 658,000 | 25,438 |
| Takeaway.com NV1,2,3 | 236,700 | 21,864 |
| Freni Brembo SpA3 | 1,484,087 | 18,430 |
| Tongcheng-Elong Holdings Ltd.1,3 | 9,447,600 | 16,973 |
| YETI Holdings, Inc.1,2 | 426,400 | 14,830 |
| zooplus AG, non-registered shares1,2,3 | 138,900 | 13,305 |
| International Game Technology PLC | 876,285 | 13,118 |
| Shop Apotheke Europe NV, non-registered shares1,2,3 | 268,700 | 13,111 |
| Trainline PLC1,3 | 1,906,877 | 12,850 |
| B2W - Cia. Digital, ordinary nominative1 | 791,193 | 12,363 |
| Melco Resorts & Entertainment Ltd. (ADR) | 425,000 | 10,272 |
| Brunello Cucinelli SpA3 | 280,865 | 9,948 |
| TopBuild Corp.1 | 96,100 | 9,906 |
| Thule Group AB3 | 401,700 | 9,270 |
| Cie. Plastic Omnium SA3 | 308,912 | 8,660 |
| Elior Group SA3 | 533,000 | 7,841 |
| Bloomin’ Brands, Inc. | 324,000 | 7,151 |
| Dine Brands Global, Inc. | 84,920 | 7,092 |
| Canada Goose Holdings Inc., subordinate voting shares1,2 | 156,500 | 5,672 |
| Cedar Fair, LP | 100,000 | 5,544 |
| William Hill PLC3 | 2,059,300 | 5,148 |
| Zhongsheng Group Holdings Ltd.3 | 1,173,000 | 4,771 |
| Everi Holdings Inc.1 | 325,000 | 4,365 |
| Casio Computer Co., Ltd.3 | 200,000 | 4,019 |
| Viomi Technology Co., Ltd. (ADR)2 | 361,700 | 2,908 |
| Dalata Hotel Group PLC3 | 455,560 | 2,748 |
| Tube Investments of India Ltd.3 | 330,837 | 2,235 |
| Delta Corp Ltd.3 | 750,000 | 2,082 |
| Del Taco Restaurants, Inc.1 | 244,200 | 1,930 |
| Relaxo Footwears Ltd.3 | 210,000 | 1,815 |
| China Zenix Auto International Ltd. (ADR)1 | 428,500 | 171 |
| 675,883 | ||
| Financials 7.69% | ||
| Cannae Holdings, Inc.1 | 1,625,000 | 60,434 |
| Kotak Mahindra Bank Ltd.3 | 2,448,225 | 57,742 |
| Essent Group Ltd. | 750,841 | 39,036 |
| Trupanion, Inc.1,2 | 973,800 | 36,479 |
| IndusInd Bank Ltd.3 | 1,579,646 | 33,434 |
| Eurobank Ergasias SA1,3 | 12,234,000 | 12,666 |
| Moelis & Co., Class A | 380,800 | 12,155 |
| HDFC Asset Management Co., Ltd.3 | 269,651 | 12,106 |
| Janus Henderson Group PLC | 470,000 | 11,491 |
| IIFL Wealth Management Ltd.3 | 677,558 | 10,754 |
| Fanhua Inc. (ADR)2 | 303,211 | 7,874 |
| NMI Holdings, Inc.1 | 228,075 | 7,568 |
American Funds Insurance Series — Global Small Capitalization Fund — Page 8 of 184
| Common stocks (continued) Financials (continued) | Shares | Value (000) |
| Webster Financial Corp. | 140,000 | $7,470 |
| Close Brothers Group PLC3 | 350,000 | 7,426 |
| Cholamandalam Investment and Finance Co., Ltd.3 | 1,534,000 | 6,568 |
| Indian Energy Exchange Ltd.1,3 | 3,150,000 | 6,305 |
| Texas Capital Bancshares, Inc.1 | 110,000 | 6,245 |
| L&T Finance Holdings Ltd.3 | 3,404,200 | 5,672 |
| Bolsa Mexicana de Valores, SAB de CV, Series A | 2,540,800 | 5,555 |
| AU Small Finance Bank Ltd.3 | 490,000 | 5,518 |
| City Union Bank Ltd.3 | 929,648 | 3,051 |
| 355,549 | ||
| Real estate 3.98% | ||
| Altus Group Ltd. | 932,800 | 27,268 |
| MGM Growth Properties LLC REIT, Class A | 864,500 | 26,773 |
| Embassy Office Parks REIT3 | 4,509,000 | 26,767 |
| WHA Corp. PCL3 | 169,183,421 | 21,860 |
| BR Properties SA, ordinary nominative1 | 5,406,800 | 19,462 |
| Two Harbors Investment Corp. REIT | 1,293,000 | 18,904 |
| JHSF Participacoes SA | 9,038,300 | 16,020 |
| Cyrela Commercial Properties SA, ordinary nominative1 | 2,035,666 | 12,859 |
| DoubleDragon Properties Corp.1,3 | 25,217,700 | 9,414 |
| K. Wah International Holdings Ltd.3 | 7,884,639 | 4,406 |
| 183,733 | ||
| Materials 3.89% | ||
| Allegheny Technologies Inc.1 | 1,413,900 | 29,211 |
| Lundin Mining Corp. | 3,825,000 | 22,858 |
| Kansai Paint Co., Ltd.3 | 584,900 | 14,295 |
| Loma Negra Compania Industrial Argentina SA (ADR)1 | 1,770,282 | 13,844 |
| UPL Ltd.3 | 1,370,683 | 11,228 |
| SIG Combibloc Group AG3 | 600,000 | 9,580 |
| Ingevity Corp.1 | 102,500 | 8,956 |
| Valvoline Inc. | 390,000 | 8,350 |
| PI Industries Ltd.3 | 396,200 | 8,030 |
| Steel Dynamics, Inc. | 235,000 | 7,999 |
| Vidrala, SA, non-registered shares3 | 73,892 | 7,791 |
| Taiyo Nippon Sanso Corp.3 | 346,900 | 7,685 |
| Navin Fluorine International Ltd.3 | 445,388 | 6,290 |
| Ramco Cements Ltd.3 | 411,000 | 4,356 |
| LANXESS AG3 | 64,200 | 4,314 |
| Nevada Copper Corp.1,2 | 13,859,000 | 3,896 |
| United States Steel Corp. | 335,000 | 3,822 |
| Vinati Organics Ltd.3 | 128,280 | 3,570 |
| Arkema SA3 | 24,700 | 2,635 |
| Indorama Ventures PCL, foreign registered3 | 708,100 | 819 |
| Sirius Minerals PLC1,2,3 | 343,600 | 16 |
| 179,545 | ||
| Communication services 3.16% | ||
| Altice Europe NV, Class A1,3 | 4,363,000 | 28,195 |
| Bandwidth Inc., Class A1 | 335,830 | 21,510 |
| Vonage Holdings Corp.1 | 2,471,700 | 18,315 |
| Zee Entertainment Enterprises Ltd.3 | 4,217,293 | 17,284 |
| Kamakura Shinsho, Ltd.2,3 | 656,000 | 10,410 |
| New York Times Co., Class A | 321,900 | 10,355 |
American Funds Insurance Series — Global Small Capitalization Fund — Page 9 of 184
| Common stocks (continued) Communication services (continued) | Shares | Value (000) |
| JCDecaux SA3 | 334,634 | $10,327 |
| ProSiebenSat.1 Media SE3 | 508,000 | 7,944 |
| Euskaltel, SA, non-registered shares3 | 630,178 | 6,355 |
| Megacable Holdings, SAB de CV, ordinary participation certificates | 1,436,600 | 5,884 |
| Elang Mahkota Teknologi Tbk PT3 | 13,385,800 | 5,377 |
| RPA Holdings, Inc.1,2,3 | 371,000 | 3,971 |
| 145,927 | ||
| Consumer staples 2.66% | ||
| Varun Beverages Ltd.3 | 1,948,807 | 19,369 |
| Grocery Outlet Holding Corp.1 | 532,800 | 17,289 |
| Freshpet, Inc.1 | 258,600 | 15,281 |
| Treasury Wine Estates Ltd.3 | 1,246,230 | 14,241 |
| TCI Co., Ltd.3 | 1,433,493 | 13,653 |
| Primo Water Corp.1 | 1,135,000 | 12,740 |
| AAK AB3 | 650,000 | 12,355 |
| Emperador Inc.1,3 | 45,300,000 | 6,435 |
| Kernel Holding SA3 | 493,041 | 5,880 |
| CCL Products (India) Ltd.3 | 1,237,068 | 3,490 |
| Vector Group Ltd. | 87,000 | 1,165 |
| Chongqing Fuling Zhacai Group Co., Ltd., Class A3 | 298,645 | 1,146 |
| 123,044 | ||
| Energy 1.58% | ||
| Saipem SpA, Class S1,3 | 4,823,000 | 23,582 |
| Venture Global LNG, Inc., Series C1,3,4,6,7 | 2,760 | 14,352 |
| NuVista Energy Ltd.1,2 | 4,450,000 | 10,932 |
| SM Energy Co. | 970,000 | 10,903 |
| Whitecap Resources Inc. | 1,700,000 | 7,266 |
| Concho Resources Inc. | 35,200 | 3,082 |
| Oil & Gas Development Co. Ltd.3 | 3,222,051 | 2,963 |
| 73,080 | ||
| Utilities 1.39% | ||
| ENN Energy Holdings Ltd.3 | 4,262,900 | 46,609 |
| Neoenergia SA | 2,827,000 | 17,485 |
| 64,094 | ||
| Total common stocks(cost: $3,225,972,000) | 4,381,625 | |
| Preferred securities 1.02% Information technology 0.64% | ||
| Avidxchange, Inc., Series F, preferred shares1,3,6,7 | 492,864 | 24,156 |
| Gitlab Inc., Series E, preferred shares1,3,6,7 | 297,916 | 5,550 |
| 29,706 | ||
| Industrials 0.38% | ||
| Azul SA, preferred nominative (ADR)1 | 356,816 | 15,272 |
| Azul SA, preferred nominative1 | 154,000 | 2,231 |
| 17,503 | ||
| Total preferred securities(cost: $36,660,000) | 47,209 |
American Funds Insurance Series — Global Small Capitalization Fund — Page 10 of 184
| Rights & warrants 0.00% Health care 0.00% | Shares | Value (000) |
| Piramal Enterprises Ltd., rights, expire 20201,3 | 16,929 | $53 |
| Total rights & warrants(cost: $0) | 53 | |
| Short-term securities 6.03% Money market investments 6.03% | ||
| Capital Group Central Cash Fund 1.73%8 | 1,926,005 | 192,600 |
| Morgan Stanley Institutional Liquidity Funds - Government Portfolio 1.51%8,9 | 51,521,183 | 51,521 |
| Invesco - Short-term Investments Trust - Government & Agency Portfolio 1.50%8,9 | 13,138,720 | 13,139 |
| Fidelity Institutional Money Market Funds - Government Portfolio 1.49%8,9 | 11,671,469 | 11,672 |
| Goldman Sachs Financial Square Government Fund 1.50%8,9 | 9,901,092 | 9,901 |
| 278,833 | ||
| Total short-term securities(cost: $278,593,000) | 278,833 | |
| Total investment securities 101.89%(cost: $3,541,225,000) | 4,707,720 | |
| Other assets less liabilities (1.89)% | (87,447) | |
| Net assets 100.00% | $4,620,273 |
| 1 | Security did not produce income during the last 12 months. |
| 2 | All or a portion of this security was on loan. The total value of all such securities was $102,111,000, which represented 2.21% of the net assets of the fund. |
| 3 | Valued under fair value procedures adopted by authority of the board of trustees. The total value of all such securities was $1,960,603,000, which represented 42.43% of the net assets of the fund. This amount includes $1,889,826,000 related to certain securities trading outside the U.S. whose values were adjusted as a result of significant market movements following the close of local trading. |
| 4 | Acquired in a transaction exempt from registration under Section 4(2) of the Securities Act of 1933. May be resold in the U.S. in transactions exempt from registration, normally to qualified institutional buyers. The total value of all such securities was $41,018,000, which represented .89% of the net assets of the fund. |
| 5 | Represents an affiliated company as defined under the Investment Company Act of 1940. |
| 6 | Value determined using significant unobservable inputs. |
| 7 | Acquired through a private placement transaction exempt from registration under the Securities Act of 1933. May be subject to legal or contractual restrictions on resale. Further details on these holdings appear below. |
| 8 | Rate represents the seven-day yield at 12/31/2019. |
| 9 | Security purchased with cash collateral from securities on loan. |
| Private placement securities | Acquisition date | Cost (000) | Value (000) | Percent of net assets |
| Avidxchange, Inc., series F, preferred shares | 12/26/2019 | $24,156 | $24,156 | .52% |
| Venture Global LNG, Inc., Series C | 5/1/2015 | 8,280 | 14,352 | .31 |
| Gitlab Inc., Series E, preferred shares | 9/11/2019 | 5,550 | 5,550 | .12 |
| Total private placement securities | $ 37,986 | $ 44,058 | .95% |
| Key to abbreviations | |
| ADR = American Depositary Receipts | |
| EUR = Euros | |
| ISK = Icelandic kronor |
American Funds Insurance Series — Global Small Capitalization Fund — Page 11 of 184
Growth Fund
Investment portfolio
December 31, 2019
| Common stocks 96.25% Information technology 25.15% | Shares | Value (000) |
| Microsoft Corp. | 10,468,400 | $1,650,867 |
| Broadcom Inc. | 2,430,100 | 767,960 |
| ASML Holding NV (New York registered) | 1,161,800 | 343,823 |
| ASML Holding NV1 | 985,000 | 293,343 |
| Taiwan Semiconductor Manufacturing Co., Ltd.1 | 30,792,000 | 341,005 |
| Taiwan Semiconductor Manufacturing Co., Ltd. (ADR) | 2,419,592 | 140,578 |
| Visa Inc., Class A | 2,256,600 | 424,015 |
| RingCentral, Inc., Class A2 | 1,557,200 | 262,653 |
| ServiceNow, Inc.2 | 921,500 | 260,158 |
| Intel Corp. | 4,013,000 | 240,178 |
| Autodesk, Inc.2 | 1,096,000 | 201,072 |
| Fiserv, Inc.2 | 1,573,600 | 181,955 |
| Workday, Inc., Class A2 | 987,000 | 162,312 |
| Mastercard Inc., Class A | 538,000 | 160,641 |
| PayPal Holdings, Inc.2 | 1,207,700 | 130,637 |
| Shopify Inc., Class A, subordinate voting shares2 | 289,500 | 115,099 |
| Applied Materials, Inc. | 1,840,700 | 112,356 |
| Paycom Software, Inc.2 | 417,100 | 110,431 |
| Square, Inc., Class A2 | 1,635,000 | 102,286 |
| Hexagon AB, Class B1 | 1,788,300 | 100,196 |
| Keyence Corp.1 | 236,800 | 83,816 |
| MongoDB, Inc., Class A2 | 627,521 | 82,588 |
| FleetCor Technologies, Inc.2 | 252,000 | 72,506 |
| SK hynix, Inc.1 | 844,000 | 68,593 |
| Analog Devices, Inc. | 563,000 | 66,907 |
| Guidewire Software, Inc.2 | 585,000 | 64,216 |
| Global Payments Inc. | 319,100 | 58,255 |
| VMware, Inc., Class A2 | 300,000 | 45,537 |
| Jack Henry & Associates, Inc. | 287,000 | 41,807 |
| Samsung Electronics Co., Ltd.1 | 842,000 | 40,571 |
| Adobe Inc.2 | 115,700 | 38,159 |
| HubSpot, Inc.2 | 239,900 | 38,024 |
| Advanced Micro Devices, Inc.2 | 805,000 | 36,917 |
| Alteryx, Inc., Class A2 | 361,000 | 36,125 |
| Dell Technologies Inc., Class C2 | 649,000 | 33,352 |
| Atlassian Corp. PLC, Class A2 | 267,300 | 32,167 |
| Tyler Technologies, Inc.2 | 101,900 | 30,572 |
| Micron Technology, Inc.2 | 564,200 | 30,343 |
| DocuSign, Inc.2 | 386,000 | 28,607 |
| MKS Instruments, Inc. | 199,200 | 21,914 |
| Texas Instruments Inc. | 157,000 | 20,142 |
| Apple Inc. | 64,700 | 18,999 |
| NetApp, Inc. | 289,900 | 18,046 |
| SYNNEX Corp. | 115,500 | 14,876 |
| Elastic NV, non-registered shares2 | 159,000 | 10,224 |
| Trimble Inc.2 | 217,000 | 9,047 |
American Funds Insurance Series — Growth Fund — Page 12 of 184
| Common stocks (continued) Information technology (continued) | Shares | Value (000) |
| LiveRamp Holdings, Inc.2 | 187,800 | $9,028 |
| SVMK Inc.2 | 226,700 | 4,051 |
| Datadog, Inc., Class A2 | 46,500 | 1,757 |
| Cloudflare, Inc., Class A2 | 98,400 | 1,679 |
| 7,160,390 | ||
| Communication services 18.20% | ||
| Facebook, Inc., Class A2 | 7,578,400 | 1,555,467 |
| Netflix, Inc.2 | 3,251,160 | 1,051,978 |
| Alphabet Inc., Class C2 | 552,300 | 738,436 |
| Alphabet Inc., Class A2 | 157,500 | 210,954 |
| Charter Communications, Inc., Class A2 | 946,280 | 459,021 |
| T-Mobile US, Inc.2 | 4,885,000 | 383,082 |
| Activision Blizzard, Inc. | 6,317,500 | 375,386 |
| Comcast Corp., Class A | 5,135,900 | 230,961 |
| Snap Inc., Class A2 | 7,800,000 | 127,374 |
| ViacomCBS Inc., Class B | 461,600 | 19,373 |
| Cable One, Inc. | 10,600 | 15,778 |
| Pinterest, Inc., Class A2 | 642,100 | 11,969 |
| Zillow Group, Inc., Class A2 | 14,600 | 668 |
| 5,180,447 | ||
| Health care 16.70% | ||
| UnitedHealth Group Inc. | 3,190,800 | 938,031 |
| Intuitive Surgical, Inc.2 | 1,049,100 | 620,176 |
| Regeneron Pharmaceuticals, Inc.2 | 1,341,000 | 503,519 |
| Humana Inc. | 1,269,500 | 465,297 |
| Vertex Pharmaceuticals Inc.2 | 1,434,579 | 314,101 |
| Boston Scientific Corp.2 | 5,085,000 | 229,944 |
| Centene Corp.2 | 3,484,800 | 219,089 |
| Thermo Fisher Scientific Inc. | 534,500 | 173,643 |
| Cigna Corp. | 739,902 | 151,303 |
| Seattle Genetics, Inc.2 | 1,248,154 | 142,614 |
| ResMed Inc. | 755,000 | 117,002 |
| DexCom, Inc.2 | 421,000 | 92,090 |
| Allakos Inc.2 | 910,000 | 86,778 |
| Pfizer Inc. | 2,191,000 | 85,843 |
| Eli Lilly and Co. | 523,300 | 68,777 |
| CVS Health Corp. | 862,934 | 64,107 |
| Insulet Corp.2 | 276,000 | 47,251 |
| Align Technology, Inc.2 | 155,000 | 43,251 |
| Incyte Corp.2 | 492,100 | 42,970 |
| Abbott Laboratories | 481,200 | 41,797 |
| Verily Life Sciences LLC1,2,3,4 | 300,178 | 38,849 |
| Neurocrine Biosciences, Inc.2 | 330,600 | 35,536 |
| AstraZeneca PLC1 | 290,900 | 29,104 |
| Amgen Inc. | 120,000 | 28,929 |
| Danaher Corp. | 183,200 | 28,118 |
| Merck & Co., Inc. | 296,000 | 26,921 |
| Biohaven Pharmaceutical Holding Co. Ltd.2 | 449,600 | 24,476 |
| Edwards Lifesciences Corp.2 | 84,100 | 19,620 |
| BioMarin Pharmaceutical Inc.2 | 191,800 | 16,217 |
| Allogene Therapeutics, Inc.2 | 589,500 | 15,315 |
| Anthem, Inc. | 40,400 | 12,202 |
| Sage Therapeutics, Inc.2 | 120,200 | 8,677 |
American Funds Insurance Series — Growth Fund — Page 13 of 184
| Common stocks (continued) Health care (continued) | Shares | Value (000) |
| Molina Healthcare, Inc.2 | 58,100 | $7,884 |
| Ultragenyx Pharmaceutical Inc.2 | 175,400 | 7,491 |
| Agios Pharmaceuticals, Inc.2 | 132,000 | 6,303 |
| 4,753,225 | ||
| Consumer discretionary 11.29% | ||
| Amazon.com, Inc.2 | 557,016 | 1,029,276 |
| Tesla, Inc.2 | 1,908,500 | 798,383 |
| Home Depot, Inc. | 1,206,000 | 263,366 |
| Domino’s Pizza, Inc. | 409,800 | 120,391 |
| Grand Canyon Education, Inc.2 | 1,083,700 | 103,808 |
| Burlington Stores, Inc.2 | 350,000 | 79,811 |
| Booking Holdings Inc.2 | 35,800 | 73,524 |
| LVMH Moët Hennessy-Louis Vuitton SE1 | 154,000 | 71,723 |
| NIKE, Inc., Class B | 639,300 | 64,767 |
| Toll Brothers, Inc. | 1,551,000 | 61,280 |
| Hermès International1 | 81,000 | 60,616 |
| MGM Resorts International | 1,610,000 | 53,565 |
| Bright Horizons Family Solutions Inc.2 | 350,000 | 52,602 |
| Dollar General Corp. | 295,000 | 46,014 |
| Restaurant Brands International Inc. | 700,000 | 44,639 |
| Floor & Decor Holdings, Inc., Class A2 | 769,300 | 39,088 |
| Norwegian Cruise Line Holdings Ltd.2 | 605,000 | 35,338 |
| Hilton Worldwide Holdings Inc. | 306,800 | 34,027 |
| Marriott International, Inc., Class A | 210,000 | 31,800 |
| Five Below, Inc.2 | 195,000 | 24,933 |
| Wynn Resorts, Ltd. | 141,200 | 19,608 |
| Chipotle Mexican Grill, Inc.2 | 21,100 | 17,663 |
| Sturm, Ruger & Co., Inc. | 357,788 | 16,827 |
| Ollie’s Bargain Outlet Holdings, Inc.2 | 254,600 | 16,628 |
| Ross Stores, Inc. | 137,100 | 15,961 |
| Las Vegas Sands Corp. | 152,000 | 10,494 |
| Royal Caribbean Cruises Ltd. | 65,800 | 8,785 |
| EssilorLuxottica1 | 54,800 | 8,371 |
| YUM! Brands, Inc. | 75,600 | 7,615 |
| Westwing Group AG, non-registered shares1,2 | 707,000 | 2,823 |
| 3,213,726 | ||
| Financials 8.49% | ||
| Goldman Sachs Group, Inc. | 1,052,400 | 241,978 |
| JPMorgan Chase & Co. | 1,343,000 | 187,214 |
| Wells Fargo & Co. | 3,011,800 | 162,035 |
| Legal & General Group PLC1 | 40,158,246 | 161,788 |
| First Republic Bank | 1,376,000 | 161,611 |
| Berkshire Hathaway Inc., Class B2 | 353,000 | 79,955 |
| Berkshire Hathaway Inc., Class A2 | 226 | 76,747 |
| PNC Financial Services Group, Inc. | 919,800 | 146,828 |
| Bank of America Corp. | 4,015,000 | 141,408 |
| Intercontinental Exchange, Inc. | 1,490,900 | 137,983 |
| BlackRock, Inc. | 250,000 | 125,675 |
| The Blackstone Group Inc., Class A | 1,583,200 | 88,564 |
| Onex Corp. | 1,342,800 | 84,970 |
| T. Rowe Price Group, Inc. | 627,500 | 76,455 |
| CME Group Inc., Class A | 370,100 | 74,287 |
| Capital One Financial Corp. | 672,000 | 69,156 |
American Funds Insurance Series — Growth Fund — Page 14 of 184
| Common stocks (continued) Financials (continued) | Shares | Value (000) |
| Marsh & McLennan Cos., Inc. | 587,700 | $65,476 |
| SVB Financial Group2 | 253,900 | 63,739 |
| Discover Financial Services | 605,000 | 51,316 |
| Fifth Third Bancorp | 980,000 | 30,125 |
| Bank of New York Mellon Corp. | 559,000 | 28,134 |
| S&P Global Inc. | 88,000 | 24,028 |
| Aon PLC, Class A | 110,000 | 22,912 |
| Moody’s Corp. | 90,700 | 21,533 |
| Morgan Stanley | 411,000 | 21,010 |
| State Street Corp. | 244,800 | 19,364 |
| RenaissanceRe Holdings Ltd. | 57,100 | 11,193 |
| Ares Management Corp., Class A | 310,500 | 11,082 |
| Arch Capital Group Ltd.2 | 240,900 | 10,332 |
| MSCI Inc. | 40,000 | 10,327 |
| London Stock Exchange Group PLC1 | 89,600 | 9,255 |
| 2,416,480 | ||
| Industrials 6.44% | ||
| TransDigm Group Inc. | 689,000 | 385,840 |
| MTU Aero Engines AG1 | 1,034,033 | 295,275 |
| CSX Corp. | 1,882,200 | 136,196 |
| Airbus SE, non-registered shares1 | 920,327 | 135,028 |
| Boeing Co. | 347,100 | 113,071 |
| Northrop Grumman Corp. | 265,100 | 91,186 |
| ASGN Inc.2 | 1,074,125 | 76,231 |
| Honeywell International Inc. | 400,000 | 70,800 |
| Grafton Group PLC, units1 | 5,926,200 | 68,445 |
| Norfolk Southern Corp. | 311,300 | 60,433 |
| Union Pacific Corp. | 306,000 | 55,322 |
| Safran SA1 | 339,375 | 52,608 |
| Lockheed Martin Corp. | 130,000 | 50,619 |
| Parker-Hannifin Corp. | 225,000 | 46,309 |
| Waste Connections, Inc. | 506,900 | 46,021 |
| Equifax Inc. | 247,800 | 34,722 |
| Masco Corp. | 722,000 | 34,649 |
| BWX Technologies, Inc. | 375,400 | 23,305 |
| Old Dominion Freight Line, Inc. | 85,400 | 16,207 |
| Stericycle, Inc.2 | 193,100 | 12,322 |
| Westinghouse Air Brake Technologies Corp. | 123,044 | 9,573 |
| Deere & Co. | 53,400 | 9,252 |
| Armstrong World Industries, Inc. | 74,500 | 7,001 |
| Uber Technologies, Inc.2 | 151,367 | 4,502 |
| 1,834,917 | ||
| Materials 2.83% | ||
| Franco-Nevada Corp. | 1,082,007 | 111,730 |
| Sherwin-Williams Co. | 174,700 | 101,944 |
| Barrick Gold Corp. | 4,058,000 | 75,438 |
| LyondellBasell Industries NV | 776,500 | 73,364 |
| Newmont Goldcorp Corp. | 1,671,160 | 72,612 |
| Linde PLC | 259,300 | 55,205 |
| Vale SA, ordinary nominative (ADR) | 3,787,200 | 49,991 |
| Norsk Hydro ASA1 | 12,831,823 | 47,905 |
| Allegheny Technologies Inc.2 | 2,070,860 | 42,784 |
| Grupo México, SAB de CV, Series B | 15,245,000 | 41,814 |
American Funds Insurance Series — Growth Fund — Page 15 of 184
| Common stocks (continued) Materials (continued) | Shares | Value (000) |
| Celanese Corp. | 287,300 | $35,372 |
| DuPont de Nemours Inc. | 469,436 | 30,138 |
| Dow Inc. | 530,000 | 29,007 |
| Royal Gold, Inc. | 161,000 | 19,682 |
| CCL Industries Inc., Class B, nonvoting shares | 457,000 | 19,469 |
| 806,455 | ||
| Consumer staples 2.72% | ||
| Altria Group, Inc. | 3,140,182 | 156,727 |
| Costco Wholesale Corp. | 522,900 | 153,691 |
| Kerry Group PLC, Class A1 | 1,100,000 | 136,951 |
| British American Tobacco PLC1 | 2,153,800 | 91,763 |
| Philip Morris International Inc. | 955,200 | 81,278 |
| Keurig Dr Pepper Inc. | 1,118,800 | 32,389 |
| Coca-Cola European Partners PLC | 516,000 | 26,254 |
| Anheuser-Busch InBev SA/NV1 | 281,000 | 23,042 |
| Mondelez International, Inc. | 395,000 | 21,757 |
| Constellation Brands, Inc., Class A | 89,000 | 16,888 |
| Walgreens Boots Alliance, Inc. | 285,500 | 16,833 |
| Estée Lauder Cos. Inc., Class A | 43,800 | 9,046 |
| Church & Dwight Co., Inc. | 108,700 | 7,646 |
| 774,265 | ||
| Energy 2.45% | ||
| Chevron Corp. | 1,000,000 | 120,510 |
| Suncor Energy Inc. | 3,588,116 | 117,601 |
| EOG Resources, Inc. | 1,034,400 | 86,641 |
| Noble Energy, Inc. | 3,235,000 | 80,357 |
| Diamondback Energy, Inc. | 751,000 | 69,738 |
| Concho Resources Inc. | 360,700 | 31,587 |
| Enbridge Inc. (CAD denominated) | 722,200 | 28,715 |
| Murphy Oil Corp. | 1,043,200 | 27,958 |
| Royal Dutch Shell PLC, Class B (ADR) | 419,100 | 25,133 |
| Pioneer Natural Resources Co. | 140,400 | 21,252 |
| Viper Energy Partners LP | 859,900 | 21,205 |
| Parsley Energy, Inc., Class A | 927,700 | 17,543 |
| Schlumberger Ltd. | 363,800 | 14,625 |
| ConocoPhillips | 222,100 | 14,443 |
| Canadian Natural Resources, Ltd. (CAD denominated) | 329,100 | 10,644 |
| Equitrans Midstream Corp. | 769,342 | 10,278 |
| 698,230 | ||
| Real estate 1.71% | ||
| Equinix, Inc. REIT | 440,100 | 256,887 |
| American Tower Corp. REIT | 573,100 | 131,710 |
| Crown Castle International Corp. REIT | 284,500 | 40,442 |
| Digital Realty Trust, Inc. REIT | 245,000 | 29,336 |
| Iron Mountain Inc. REIT | 893,700 | 28,482 |
| 486,857 | ||
| Utilities 0.27% | ||
| Exelon Corp. | 1,705,000 | 77,731 |
| Total common stocks(cost: $14,882,833,000) | 27,402,723 |
American Funds Insurance Series — Growth Fund — Page 16 of 184
| Convertible bonds 0.09% Consumer staples 0.09% | Principal amount (000) | Value (000) |
| JUUL Labs, Inc. 7.00% 20241,3 | $ 25,000 | $25,000 |
| Total convertible bonds(cost: $25,000,000) | 25,000 | |
| Short-term securities 3.87% Money market investments 3.87% | Shares | |
| Capital Group Central Cash Fund 1.73%5 | 11,024,924 | 1,102,492 |
| Total short-term securities(cost: $1,102,383,000) | 1,102,492 | |
| Total investment securities 100.21%(cost: $16,010,216,000) | 28,530,215 | |
| Other assets less liabilities (0.21)% | (60,556) | |
| Net assets 100.00% | $28,469,659 |
| 1 | Valued under fair value procedures adopted by authority of the board of trustees. The total value of all such securities was $2,186,070,000, which represented 7.68% of the net assets of the fund. This amount includes $2,122,221,000 related to certain securities trading outside the U.S. whose values were adjusted as a result of significant market movements following the close of local trading. |
| 2 | Security did not produce income during the last 12 months. |
| 3 | Value determined using significant unobservable inputs. |
| 4 | Acquired through a private placement transaction exempt from registration under the Securities Act of 1933. May be subject to legal or contractual restrictions on resale. Further details on this holding appear below. |
| 5 | Rate represents the seven-day yield at 12/31/2019. |
| Private placement security | Acquisition date | Cost (000) | Value (000) | Percent of net assets |
| Verily Life Sciences LLC | 12/21/2018 | $37,000 | $38,849 | .14% |
| Key to abbreviations |
| ADR = American Depositary Receipts |
| CAD = Canadian dollars |
American Funds Insurance Series — Growth Fund — Page 17 of 184
International Fund
Investment portfolio
December 31, 2019
| Common stocks 92.87% Financials 16.40% | Shares | Value (000) |
| AIA Group Ltd.1 | 40,985,700 | $431,237 |
| HDFC Bank Ltd.1 | 17,086,200 | 304,509 |
| HDFC Bank Ltd. (ADR) | 531,294 | 33,668 |
| Kotak Mahindra Bank Ltd.1 | 8,121,048 | 191,537 |
| Axis Bank Ltd.1 | 7,270,300 | 75,310 |
| Axis Bank Ltd.1,2 | 3,222,055 | 34,069 |
| BNP Paribas SA1 | 1,722,058 | 102,509 |
| Ping An Insurance (Group) Co. of China, Ltd., Class H1 | 6,867,600 | 81,355 |
| Ping An Insurance (Group) Co. of China, Ltd., Class A1 | 612,202 | 7,515 |
| Sberbank of Russia PJSC (ADR)1 | 2,593,300 | 42,670 |
| The People’s Insurance Co. (Group) of China Ltd., Class H1 | 92,051,000 | 38,327 |
| PICC Property and Casualty Co. Ltd., Class H1 | 25,490,000 | 30,735 |
| London Stock Exchange Group PLC1 | 217,000 | 22,414 |
| Banco Santander, SA1 | 5,205,000 | 21,978 |
| B3 SA - Brasil, Bolsa, Balcao | 1,756,300 | 18,761 |
| ING Groep NV1 | 1,486,000 | 17,859 |
| UniCredit SpA1 | 1,212,711 | 17,730 |
| Sony Financial Holdings Inc.1 | 730,000 | 17,474 |
| Zurich Insurance Group AG1 | 38,905 | 15,956 |
| IndusInd Bank Ltd.1 | 750,510 | 15,885 |
| FinecoBank SpA1 | 1,037,559 | 12,454 |
| Royal Bank of Canada | 135,000 | 10,682 |
| Hiscox Ltd.1 | 561,134 | 10,612 |
| ICICI Bank Ltd.1 | 1,375,000 | 10,416 |
| Capitec Bank Holdings Ltd.1 | 99,000 | 10,231 |
| Metropolitan Bank & Trust Co.1 | 7,419,516 | 9,683 |
| Standard Chartered PLC (GBP denominated)1 | 654,500 | 6,181 |
| Standard Chartered PLC (HKD denominated)1 | 358,950 | 3,349 |
| Bank Rakyat Indonesia (Persero) Tbk PT1 | 29,695,000 | 9,372 |
| Türkiye Garanti Bankasi AS1,3 | 4,881,000 | 9,148 |
| Prudential PLC1 | 455,700 | 8,768 |
| DBS Group Holdings Ltd.1 | 450,000 | 8,674 |
| Barclays PLC1 | 3,373,000 | 8,055 |
| Akbank TAS1,3 | 5,252,000 | 7,165 |
| Hargreaves Lansdown PLC1 | 230,600 | 5,938 |
| 1,652,226 | ||
| Consumer discretionary 13.95% | ||
| Alibaba Group Holding Ltd. (ADR)3 | 1,635,100 | 346,805 |
| Sony Corp.1 | 2,051,700 | 139,653 |
| MercadoLibre, Inc.3 | 190,000 | 108,669 |
| Meituan Dianping, Class B1,3 | 7,500,347 | 98,223 |
| Kering SA1 | 139,238 | 91,726 |
| Galaxy Entertainment Group Ltd.1 | 11,306,000 | 83,334 |
| Ryohin Keikaku Co., Ltd.1 | 3,319,000 | 77,413 |
| Fast Retailing Co., Ltd.1 | 105,400 | 62,474 |
American Funds Insurance Series — International Fund — Page 18 of 184
| Common stocks (continued) Consumer discretionary (continued) | Shares | Value (000) |
| Sands China Ltd.1 | 11,098,000 | $59,514 |
| Melco Resorts & Entertainment Ltd. (ADR) | 2,334,881 | 56,434 |
| EssilorLuxottica1 | 304,840 | 46,567 |
| Maruti Suzuki India Ltd.1 | 422,000 | 43,582 |
| B2W - Cia. Digital, ordinary nominative3 | 2,406,000 | 37,597 |
| Prosus NV1,3 | 287,200 | 21,490 |
| Hyundai Motor Co.1 | 196,200 | 20,401 |
| Industria de Diseño Textil, SA1 | 511,000 | 18,101 |
| William Hill PLC1 | 6,980,000 | 17,448 |
| LVMH Moët Hennessy-Louis Vuitton SE1 | 35,550 | 16,557 |
| Naspers Ltd., Class N1 | 86,996 | 14,220 |
| Hyundai Mobis Co., Ltd.1 | 60,951 | 13,478 |
| Nitori Holdings Co., Ltd.1 | 83,000 | 13,115 |
| Toyota Motor Corp.1 | 180,000 | 12,674 |
| adidas AG1 | 17,466 | 5,676 |
| Burberry Group PLC1 | 34,600 | 1,012 |
| 1,406,163 | ||
| Industrials 13.85% | ||
| Airbus SE, non-registered shares1 | 2,723,949 | 399,652 |
| Recruit Holdings Co., Ltd.1 | 3,871,300 | 145,678 |
| Melrose Industries PLC1 | 37,984,233 | 121,412 |
| Safran SA1 | 523,100 | 81,088 |
| Rheinmetall AG1 | 639,400 | 73,528 |
| Rolls-Royce Holdings PLC1,3 | 8,080,688 | 73,172 |
| Knorr-Bremse AG, non-registered shares1 | 703,099 | 71,566 |
| Komatsu Ltd.1 | 2,880,500 | 69,061 |
| Airports of Thailand PCL, foreign registered1 | 18,157,000 | 44,872 |
| Adani Ports & Special Economic Zone Ltd.1 | 8,695,437 | 44,613 |
| NIBE Industrier AB, Class B1 | 2,474,315 | 42,908 |
| Jardine Matheson Holdings Ltd.1 | 646,600 | 35,954 |
| A.P. Møller - Mærsk A/S, Class B1 | 23,500 | 33,909 |
| International Container Terminal Services, Inc.1 | 12,890,350 | 32,694 |
| CCR SA, ordinary nominative | 6,640,200 | 31,330 |
| easyJet PLC1 | 1,561,800 | 29,708 |
| Shanghai International Airport Co., Ltd., Class A1 | 2,032,685 | 22,994 |
| Nidec Corp.1 | 118,700 | 16,215 |
| DP World PLC1 | 824,337 | 10,788 |
| Thales SA1 | 96,200 | 10,009 |
| Alliance Global Group, Inc.1,3 | 20,000,000 | 4,600 |
| 1,395,751 | ||
| Health care 12.43% | ||
| Novartis AG1 | 2,624,133 | 248,617 |
| Daiichi Sankyo Co., Ltd.1 | 2,160,000 | 142,631 |
| Chugai Pharmaceutical Co., Ltd.1 | 1,243,500 | 114,531 |
| Takeda Pharmaceutical Co. Ltd.1 | 2,859,865 | 113,302 |
| Grifols, SA, Class A, non-registered shares1 | 2,656,981 | 93,813 |
| Grifols, SA, Class B (ADR) | 793,690 | 18,485 |
| Alcon Inc.1,3 | 1,903,239 | 107,818 |
| Fresenius SE & Co. KGaA1 | 1,819,000 | 102,675 |
| Teva Pharmaceutical Industries Ltd. (ADR)3 | 7,216,598 | 70,723 |
| Hikma Pharmaceuticals PLC1 | 2,371,000 | 62,808 |
| Bayer AG1 | 520,000 | 42,505 |
| M3, Inc.1 | 1,084,200 | 32,740 |
American Funds Insurance Series — International Fund — Page 19 of 184
| Common stocks (continued) Health care (continued) | Shares | Value (000) |
| NMC Health PLC1 | 1,353,000 | $31,762 |
| Fresenius Medical Care AG & Co. KGaA1 | 351,000 | 26,033 |
| Aier Eye Hospital Group Co., Ltd., Class A1 | 3,055,910 | 17,373 |
| Merck KGaA1 | 142,000 | 16,804 |
| HOYA Corp.1 | 100,000 | 9,548 |
| 1,252,168 | ||
| Information technology 7.24% | ||
| ASML Holding NV1 | 682,174 | 203,158 |
| Samsung Electronics Co., Ltd.1 | 3,702,250 | 178,390 |
| Taiwan Semiconductor Manufacturing Co., Ltd.1 | 6,183,000 | 68,474 |
| PagSeguro Digital Ltd., Class A3 | 1,392,000 | 47,551 |
| SK hynix, Inc.1 | 536,000 | 43,562 |
| Amadeus IT Group SA, Class A, non-registered shares1 | 475,000 | 38,920 |
| MediaTek Inc.1 | 2,314,000 | 34,249 |
| Keyence Corp.1 | 95,200 | 33,696 |
| OBIC Co., Ltd.1 | 172,600 | 23,315 |
| Tokyo Electron Ltd.1 | 81,400 | 17,888 |
| Lenovo Group Ltd.1 | 17,502,000 | 11,774 |
| Largan Precision Co., Ltd.1 | 66,000 | 11,028 |
| Nomura Research Institute, Ltd.1 | 434,300 | 9,344 |
| Infineon Technologies AG1 | 358,000 | 8,210 |
| 729,559 | ||
| Materials 6.73% | ||
| Vale SA, ordinary nominative (ADR) | 15,349,717 | 202,616 |
| Vale SA, ordinary nominative | 102,481 | 1,358 |
| Asahi Kasei Corp.1 | 12,779,780 | 143,397 |
| First Quantum Minerals Ltd. | 5,407,000 | 54,838 |
| Shin-Etsu Chemical Co., Ltd.1 | 377,200 | 41,355 |
| Teck Resources Ltd., Class B | 2,208,800 | 38,306 |
| Linde PLC (EUR denominated)1 | 146,300 | 31,406 |
| ArcelorMittal SA1 | 1,582,000 | 27,945 |
| Rio Tinto PLC1 | 460,000 | 27,332 |
| Fortescue Metals Group Ltd.1 | 3,281,789 | 24,735 |
| CRH PLC1 | 476,091 | 19,097 |
| Akzo Nobel NV1 | 118,578 | 12,090 |
| LafargeHolcim Ltd.1 | 204,693 | 11,351 |
| BASF SE1 | 135,600 | 10,283 |
| Evonik Industries AG1 | 331,710 | 10,168 |
| Koninklijke DSM NV1 | 54,300 | 7,088 |
| Hindalco Industries Ltd.1 | 1,726,000 | 5,235 |
| Aluminum Corp. of China Ltd., Class H1,3 | 15,036,000 | 5,155 |
| UPL Ltd.1 | 504,889 | 4,136 |
| 677,891 | ||
| Consumer staples 6.72% | ||
| Pernod Ricard SA1 | 785,326 | 140,578 |
| Nestlé SA1 | 1,142,100 | 123,731 |
| Kirin Holdings Co., Ltd.1 | 4,041,800 | 88,154 |
| KOSÉ Corp.1 | 458,100 | 66,954 |
| British American Tobacco PLC1 | 1,246,000 | 53,086 |
| Thai Beverage PCL1 | 73,038,000 | 48,345 |
| Treasury Wine Estates Ltd.1 | 3,570,043 | 40,797 |
| Imperial Brands PLC1 | 1,630,000 | 40,389 |
American Funds Insurance Series — International Fund — Page 20 of 184
| Common stocks (continued) Consumer staples (continued) | Shares | Value (000) |
| LG Household & Health Care Ltd.1 | 19,000 | $20,698 |
| Kweichow Moutai Co., Ltd., Class A1 | 99,000 | 16,832 |
| Wal-Mart de México, SAB de CV, Series V | 4,123,000 | 11,808 |
| Philip Morris International Inc. | 123,000 | 10,466 |
| Shiseido Co., Ltd.1 | 108,900 | 7,787 |
| Glanbia PLC1 | 504,504 | 5,839 |
| Chocoladefabriken Lindt & Sprüngli AG1 | 19 | 1,679 |
| 677,143 | ||
| Communication services 4.91% | ||
| SoftBank Group Corp.1 | 4,168,200 | 181,469 |
| Tencent Holdings Ltd.1 | 2,555,987 | 123,297 |
| Altice Europe NV, Class A1,3 | 13,236,760 | 85,540 |
| Altice Europe NV, Class B1,3 | 1,077,927 | 6,903 |
| Nintendo Co., Ltd.1 | 101,500 | 40,970 |
| ITV PLC1 | 9,500,415 | 19,069 |
| América Móvil, SAB de CV, Series L (ADR) | 667,857 | 10,686 |
| América Móvil, SAB de CV, Series L | 2,139,900 | 1,709 |
| Nippon Telegraph and Telephone Corp.1 | 365,200 | 9,251 |
| TalkTalk Telecom Group PLC1 | 5,624,000 | 8,661 |
| LG Uplus Corp.1 | 577,000 | 7,078 |
| 494,633 | ||
| Energy 4.86% | ||
| Reliance Industries Ltd.1 | 5,591,364 | 118,767 |
| Royal Dutch Shell PLC, Class B1 | 2,148,307 | 64,014 |
| Royal Dutch Shell PLC, Class A (GBP denominated)1 | 786,310 | 23,373 |
| Oil Search Ltd.1 | 13,449,600 | 68,611 |
| Canadian Natural Resources, Ltd. (CAD denominated) | 1,481,000 | 47,901 |
| TOTAL SA1 | 795,780 | 43,977 |
| BP PLC1 | 6,504,863 | 40,833 |
| Cenovus Energy Inc. (CAD denominated) | 2,482,000 | 25,230 |
| Saipem SpA, Class S1,3 | 4,409,000 | 21,558 |
| Neste Oyj1 | 494,500 | 17,207 |
| Ultrapar Participacoes SA, ordinary nominative | 1,485,800 | 9,411 |
| Suncor Energy Inc. | 277,900 | 9,108 |
| 489,990 | ||
| Utilities 3.56% | ||
| ENN Energy Holdings Ltd.1 | 14,004,000 | 153,115 |
| China Gas Holdings Ltd.1 | 24,134,000 | 90,467 |
| E.ON SE1 | 7,101,000 | 75,944 |
| China Resources Gas Group Ltd.1 | 7,178,000 | 39,455 |
| 358,981 | ||
| Real estate 2.22% | ||
| China Overseas Land & Investment Ltd.1 | 23,746,000 | 92,741 |
| Ayala Land, Inc.1 | 58,363,700 | 52,341 |
| Sun Hung Kai Properties Ltd.1 | 2,951,666 | 45,276 |
| China Resources Land Ltd.1 | 3,040,000 | 15,147 |
| CK Asset Holdings Ltd.1 | 1,442,000 | 10,451 |
| Vinhomes JSC1 | 2,008,487 | 7,353 |
| 223,309 | ||
| Total common stocks(cost: $6,922,555,000) | 9,357,814 |
American Funds Insurance Series — International Fund — Page 21 of 184
| Preferred securities 1.20% Health care 0.70% | Shares | Value (000) |
| Grifols, SA, Class B, nonvoting preferred, non-registered shares1 | 3,026,230 | $70,526 |
| Financials 0.50% | ||
| Itaú Unibanco Holding SA, preferred nominative (ADR) | 5,490,000 | 50,234 |
| Total preferred securities(cost: $99,792,000) | 120,760 | |
| Rights & warrants 0.23% Health care 0.23% | ||
| WuXi AppTec Co., Ltd., Class A, warrants, expire 20201,4 | 1,733,200 | 22,939 |
| Total rights & warrants(cost: $13,238,000) | 22,939 | |
| Bonds, notes & other debt instruments 0.44% Corporate bonds & notes 0.33% Materials 0.27% | Principal amount (000) | |
| First Quantum Minerals Ltd. 7.00% 20214 | $997 | 1,001 |
| First Quantum Minerals Ltd. 7.25% 20224 | 25,720 | 25,887 |
| 26,888 | ||
| Consumer staples 0.06% | ||
| JBS Investments GmbH II 6.25% 2023 | 6,155 | 6,247 |
| Total corporate bonds & notes | 33,135 | |
| Bonds & notes of governments outside the U.S. 0.11% | ||
| United Mexican States, Series M, 8.00% 2023 | MXN203,000 | 11,194 |
| Total bonds, notes & other debt instruments(cost: $38,713,000) | 44,329 | |
| Short-term securities 5.41% Money market investments 5.41% | Shares | |
| Capital Group Central Cash Fund 1.73%5 | 5,444,569 | 544,457 |
| Total short-term securities(cost: $544,206,000) | 544,457 | |
| Total investment securities 100.15%(cost: $7,618,504,000) | 10,090,299 | |
| Other assets less liabilities (0.15)% | (14,868) | |
| Net assets 100.00% | $10,075,431 |
Forward currency contracts
| Contract amount | Counterparty | Settlement date | Unrealized depreciation at 12/31/2019 (000) | |
| Purchases (000) | Sales (000) | |||
| USD17,024 | GBP12,948 | Barclays Bank PLC | 1/9/2020 | $(131) |
American Funds Insurance Series — International Fund — Page 22 of 184
| 1 | Valued under fair value procedures adopted by authority of the board of trustees. The total value of all such securities was $8,247,137,000, which represented 81.85% of the net assets of the fund. This amount includes $8,199,688,000 related to certain securities trading outside the U.S. whose values were adjusted as a result of significant market movements following the close of local trading. |
| 2 | Acquired through a private placement transaction exempt from registration under the Securities Act of 1933. May be subject to legal or contractual restrictions on resale. Further details on this holding appear below. |
| 3 | Security did not produce income during the last 12 months. |
| 4 | Acquired in a transaction exempt from registration under Rule 144A of the Securities Act of 1933. May be resold in the U.S. in transactions exempt from registration, normally to qualified institutional buyers. The total value of all such securities was $49,827,000, which represented .49% of the net assets of the fund. |
| 5 | Rate represents the seven-day yield at 12/31/2019. |
| Private placement security | Acquisition date | Cost (000) | Value (000) | Percent of net assets |
| Axis Bank Ltd. | 11/14/2017 | $17,232 | $34,069 | .34% |
| Key to abbreviations and symbol |
| ADR = American Depositary Receipts |
| CAD = Canadian dollars |
| EUR = Euros |
| GBP = British pounds |
| HKD = Hong Kong dollars |
| MXN = Mexican pesos |
| USD/$ = U.S. dollars |
American Funds Insurance Series — International Fund — Page 23 of 184
New World Fund®
Investment portfolio
December 31, 2019
| Common stocks 88.36% Information technology 23.02% | Shares | Value (000) |
| Taiwan Semiconductor Manufacturing Co., Ltd.1 | 9,405,000 | $104,155 |
| Taiwan Semiconductor Manufacturing Co., Ltd. (ADR) | 250,000 | 14,525 |
| PagSeguro Digital Ltd., Class A2 | 2,921,023 | 99,782 |
| Microsoft Corp. | 538,524 | 84,925 |
| StoneCo Ltd., Class A2 | 1,780,826 | 71,037 |
| Keyence Corp.1 | 140,000 | 49,553 |
| Broadcom Inc. | 156,350 | 49,410 |
| Visa Inc., Class A | 223,400 | 41,977 |
| PayPal Holdings, Inc.2 | 353,000 | 38,184 |
| EPAM Systems, Inc.2 | 158,100 | 33,543 |
| Adobe Inc.2 | 100,400 | 33,113 |
| Largan Precision Co., Ltd.1 | 181,000 | 30,243 |
| Autodesk, Inc.2 | 146,100 | 26,804 |
| Mastercard Inc., Class A | 79,800 | 23,827 |
| Halma PLC1 | 843,000 | 23,666 |
| Amphenol Corp., Class A | 190,000 | 20,564 |
| Accenture PLC, Class A | 86,500 | 18,214 |
| Network International Holdings PLC1,2 | 1,521,182 | 12,911 |
| TravelSky Technology Ltd., Class H1 | 4,640,448 | 11,340 |
| ASML Holding NV1 | 33,500 | 9,977 |
| Globant SA2 | 83,000 | 8,802 |
| Hexagon AB, Class B1 | 152,940 | 8,569 |
| Temenos AG1 | 52,700 | 8,332 |
| Hangzhou Hikvision Digital Technology Co., Ltd., Class A1 | 1,501,982 | 7,072 |
| WiseTech Global Ltd.1 | 408,518 | 6,707 |
| Inphi Corp.2 | 65,000 | 4,811 |
| Tokyo Electron Ltd.1 | 16,400 | 3,604 |
| Apple Inc. | 11,800 | 3,465 |
| Micron Technology, Inc.2 | 63,700 | 3,426 |
| ON Semiconductor Corp.2 | 121,000 | 2,950 |
| Cree, Inc.2 | 60,000 | 2,769 |
| Samsung Electronics Co., Ltd.1 | 47,000 | 2,265 |
| Kingdee International Software Group Co. Ltd.1 | 1,539,000 | 1,540 |
| Advanced Micro Devices, Inc.2 | 32,000 | 1,468 |
| TE Connectivity Ltd. | 11,000 | 1,054 |
| Atlassian Corp. PLC, Class A2 | 7,750 | 933 |
| 865,517 | ||
| Financials 13.11% | ||
| HDFC Bank Ltd.1 | 4,410,200 | 78,598 |
| Kotak Mahindra Bank Ltd.1 | 2,942,900 | 69,409 |
| B3 SA - Brasil, Bolsa, Balcao | 5,593,400 | 59,748 |
| AIA Group Ltd.1 | 5,316,600 | 55,939 |
| Sberbank of Russia PJSC (ADR)1 | 1,371,100 | 22,560 |
| Sberbank of Russia PJSC (ADR) | 682,500 | 11,193 |
| HDFC Life Insurance Co. Ltd.1 | 3,387,520 | 29,718 |
American Funds Insurance Series — New World Fund — Page 24 of 184
| Common stocks (continued) Financials (continued) | Shares | Value (000) |
| XP Inc., Class A2 | 725,900 | $27,962 |
| Bank Central Asia Tbk PT1 | 9,869,000 | 23,709 |
| S&P Global Inc. | 72,000 | 19,660 |
| IndusInd Bank Ltd.1 | 832,000 | 17,610 |
| Capitec Bank Holdings Ltd.1 | 153,526 | 15,865 |
| UniCredit SpA1 | 1,048,005 | 15,322 |
| PICC Property and Casualty Co. Ltd., Class H1 | 9,880,000 | 11,913 |
| The People’s Insurance Co. (Group) of China Ltd., Class H1 | 20,226,000 | 8,421 |
| Türkiye Garanti Bankasi AS1,2 | 3,054,700 | 5,725 |
| Ping An Insurance (Group) Co. of China, Ltd., Class H1 | 234,300 | 2,776 |
| Ping An Insurance (Group) Co. of China, Ltd., Class A1 | 173,400 | 2,128 |
| ICICI Bank Ltd.1 | 469,800 | 3,559 |
| Akbank TAS1,2 | 2,210,000 | 3,015 |
| Vietnam Technological and Commercial Joint Stock Bank1,2 | 2,368,674 | 2,520 |
| Standard Chartered PLC (GBP denominated)1 | 125,100 | 1,182 |
| Standard Chartered PLC (HKD denominated)1 | 68,650 | 640 |
| Prudential PLC1 | 85,000 | 1,635 |
| Moscow Exchange MICEX-RTS PJSC1 | 783,000 | 1,359 |
| Bank Rakyat Indonesia (Persero) Tbk PT1 | 2,444,700 | 772 |
| 492,938 | ||
| Energy 9.90% | ||
| Reliance Industries Ltd.1 | 11,548,513 | 245,304 |
| Royal Dutch Shell PLC, Class B1 | 1,126,400 | 33,564 |
| Royal Dutch Shell PLC, Class A (GBP denominated)1 | 58,128 | 1,728 |
| Petróleo Brasileiro SA (Petrobras), ordinary nominative (ADR) | 1,429,000 | 22,778 |
| LUKOIL Oil Co. PJSC (ADR)1 | 158,000 | 15,696 |
| Novatek PJSC (GDR)1 | 73,700 | 14,966 |
| Ultrapar Participacoes SA, ordinary nominative | 1,720,106 | 10,895 |
| BP PLC1 | 1,408,000 | 8,839 |
| CNOOC Ltd.1 | 4,303,000 | 7,172 |
| Baker Hughes Co., Class A | 151,000 | 3,870 |
| Oil Search Ltd.1 | 432,000 | 2,204 |
| Noble Energy, Inc. | 82,000 | 2,037 |
| Exxon Mobil Corp. | 25,000 | 1,745 |
| TOTAL SA1 | 25,159 | 1,390 |
| 372,188 | ||
| Health care 9.15% | ||
| Notre Dame Intermédica Participações SA | 2,800,868 | 47,520 |
| BioMarin Pharmaceutical Inc.2 | 389,600 | 32,941 |
| Carl Zeiss Meditec AG, non-registered shares1 | 216,552 | 27,619 |
| AstraZeneca PLC1 | 269,800 | 26,993 |
| Yunnan Baiyao Group Co., Ltd., Class A1 | 2,000,000 | 25,699 |
| Abbott Laboratories | 263,000 | 22,844 |
| Illumina, Inc.2 | 67,000 | 22,227 |
| Asahi Intecc Co., Ltd.1 | 698,600 | 20,569 |
| Thermo Fisher Scientific Inc. | 55,700 | 18,095 |
| bioMérieux SA1 | 184,000 | 16,391 |
| OdontoPrev SA, ordinary nominative | 2,385,000 | 10,002 |
| Pharmaron Beijing Co., Ltd., Class H1,2 | 1,184,000 | 6,610 |
| Pharmaron Beijing Co., Ltd., Class A1 | 358,000 | 2,650 |
| Novartis AG1 | 86,850 | 8,228 |
| Pfizer Inc. | 166,800 | 6,535 |
| Zoetis Inc., Class A | 40,000 | 5,294 |
American Funds Insurance Series — New World Fund — Page 25 of 184
| Common stocks (continued) Health care (continued) | Shares | Value (000) |
| HOYA Corp.1 | 52,000 | $4,965 |
| Boston Scientific Corp.2 | 109,000 | 4,929 |
| Teva Pharmaceutical Industries Ltd. (ADR)2 | 465,000 | 4,557 |
| Aier Eye Hospital Group Co., Ltd., Class A1 | 791,000 | 4,497 |
| WuXi AppTec Co., Ltd., Class H1 | 305,200 | 3,787 |
| Align Technology, Inc.2 | 12,000 | 3,349 |
| PerkinElmer, Inc. | 34,210 | 3,322 |
| Koninklijke Philips NV (EUR denominated)1 | 65,000 | 3,178 |
| Merck & Co., Inc. | 33,000 | 3,001 |
| Alcon Inc.1,2 | 46,500 | 2,634 |
| Hypera SA, ordinary nominative | 249,200 | 2,211 |
| NMC Health PLC1 | 83,200 | 1,953 |
| Straumann Holding AG1 | 1,500 | 1,472 |
| 344,072 | ||
| Materials 8.32% | ||
| Vale SA, ordinary nominative | 2,881,660 | 38,182 |
| Vale SA, ordinary nominative (ADR) | 1,976,000 | 26,083 |
| Freeport-McMoRan Inc. | 3,945,000 | 51,758 |
| Fortescue Metals Group Ltd.1 | 4,618,395 | 34,809 |
| UPM-Kymmene Oyj1 | 894,000 | 30,984 |
| First Quantum Minerals Ltd. | 2,305,000 | 23,377 |
| Rio Tinto PLC1 | 290,000 | 17,231 |
| Givaudan SA1 | 5,300 | 16,587 |
| CCL Industries Inc., Class B, nonvoting shares | 367,000 | 15,635 |
| UPL Ltd.1 | 1,732,500 | 14,192 |
| Shree Cement Ltd.1 | 47,758 | 13,647 |
| Koninklijke DSM NV1 | 89,000 | 11,618 |
| Air Products and Chemicals, Inc. | 17,000 | 3,995 |
| SIG Combibloc Group AG1 | 242,000 | 3,864 |
| Arkema SA1 | 26,100 | 2,784 |
| Kansai Paint Co., Ltd.1 | 113,000 | 2,762 |
| Celanese Corp. | 22,000 | 2,709 |
| BASF SE1 | 33,900 | 2,571 |
| 312,788 | ||
| Consumer discretionary 7.02% | ||
| Alibaba Group Holding Ltd.1,2 | 1,355,096 | 36,032 |
| Alibaba Group Holding Ltd. (ADR)2 | 30,300 | 6,427 |
| Melco Resorts & Entertainment Ltd. (ADR) | 931,500 | 22,514 |
| Marriott International, Inc., Class A | 144,800 | 21,927 |
| General Motors Co. | 542,000 | 19,837 |
| Galaxy Entertainment Group Ltd.1 | 2,395,000 | 17,653 |
| MercadoLibre, Inc.2 | 27,850 | 15,929 |
| Ferrari NV1 | 93,800 | 15,558 |
| Hermès International1 | 19,100 | 14,293 |
| MakeMyTrip Ltd., non-registered shares2 | 594,000 | 13,603 |
| Naspers Ltd., Class N1 | 75,835 | 12,395 |
| Meituan Dianping, Class B1,2 | 908,656 | 11,900 |
| Fast Retailing Co., Ltd.1 | 10,800 | 6,402 |
| Ryohin Keikaku Co., Ltd.1 | 173,000 | 4,035 |
| Domino’s Pizza, Inc. | 12,100 | 3,555 |
| Zhongsheng Group Holdings Ltd.1 | 828,000 | 3,367 |
| Prosus NV1,2 | 44,636 | 3,340 |
| NIKE, Inc., Class B | 31,000 | 3,141 |
American Funds Insurance Series — New World Fund — Page 26 of 184
| Common stocks (continued) Consumer discretionary (continued) | Shares | Value (000) |
| LVMH Moët Hennessy-Louis Vuitton SE1 | 6,700 | $3,120 |
| Trip.com Group Ltd. (ADR)2 | 92,000 | 3,086 |
| Kering SA1 | 4,100 | 2,701 |
| InterContinental Hotels Group PLC1 | 38,950 | 2,683 |
| IDP Education Ltd.1 | 214,000 | 2,585 |
| EssilorLuxottica1 | 14,500 | 2,215 |
| Hyundai Motor Co.1 | 20,000 | 2,080 |
| Suzuki Motor Corp.1 | 47,000 | 1,969 |
| Eicher Motors Ltd.1 | 6,100 | 1,926 |
| Booking Holdings Inc.2 | 900 | 1,848 |
| Li Ning Co. Ltd.1 | 582,000 | 1,745 |
| Peugeot SA1 | 72,196 | 1,729 |
| Valeo SA, non-registered shares1 | 35,000 | 1,239 |
| adidas AG1 | 3,702 | 1,203 |
| Vivo Energy PLC1 | 670,000 | 1,098 |
| Maruti Suzuki India Ltd.1 | 8,332 | 860 |
| 263,995 | ||
| Communication services 5.88% | ||
| Facebook, Inc., Class A2 | 268,000 | 55,007 |
| Alphabet Inc., Class C2 | 23,220 | 31,046 |
| Alphabet Inc., Class A2 | 10,000 | 13,394 |
| Activision Blizzard, Inc. | 366,400 | 21,772 |
| Yandex NV, Class A2 | 456,500 | 19,853 |
| Sea Ltd., Class A (ADR)2 | 493,500 | 19,849 |
| Tencent Holdings Ltd.1 | 353,100 | 17,033 |
| Vodafone Idea Ltd.1,2 | 107,441,068 | 9,289 |
| JOYY Inc., Class A (ADR)2 | 174,000 | 9,186 |
| Electronic Arts Inc.2 | 38,400 | 4,128 |
| América Móvil, SAB de CV, Series L (ADR) | 150,000 | 2,400 |
| América Móvil, SAB de CV, Series L | 525,000 | 419 |
| SoftBank Group Corp.1 | 61,000 | 2,656 |
| HUYA, Inc. (ADR)2,3 | 147,600 | 2,649 |
| Z Holding Corp.1 | 586,700 | 2,458 |
| Intouch Holdings PCL, foreign registered1 | 1,192,000 | 2,274 |
| Netflix, Inc.2 | 7,000 | 2,265 |
| Perusahaan Perseroan (Persero) Telekomunikasi Indonesia Tbk PT, Class B1 | 6,526,000 | 1,859 |
| Ubisoft Entertainment SA1,2 | 21,454 | 1,484 |
| JCDecaux SA1 | 38,373 | 1,184 |
| Bharti Infratel Ltd.1 | 312,492 | 1,107 |
| 221,312 | ||
| Consumer staples 5.58% | ||
| Kweichow Moutai Co., Ltd., Class A1 | 334,161 | 56,813 |
| Nestlé SA1 | 333,296 | 36,108 |
| Treasury Wine Estates Ltd.1 | 2,885,454 | 32,974 |
| AAK AB1 | 1,110,000 | 21,098 |
| Kirin Holdings Co., Ltd.1 | 778,000 | 16,969 |
| British American Tobacco PLC1 | 335,000 | 14,273 |
| Jonjee Hi-Tech Industrial and Commercial Holding Co., Ltd., Class A1 | 1,090,885 | 6,163 |
| Pernod Ricard SA1 | 22,330 | 3,997 |
| Herbalife Nutrition Ltd.2 | 77,000 | 3,671 |
| Bid Corp. Ltd.1 | 153,000 | 3,609 |
| Mondelez International, Inc. | 52,000 | 2,864 |
| Thai Beverage PCL1 | 3,681,000 | 2,436 |
American Funds Insurance Series — New World Fund — Page 27 of 184
| Common stocks (continued) Consumer staples (continued) | Shares | Value (000) |
| Coca-Cola FEMSA, SAB de CV, units | 310,000 | $1,884 |
| CP ALL PCL, foreign registered1 | 768,000 | 1,847 |
| Estée Lauder Cos. Inc., Class A | 8,800 | 1,818 |
| Shiseido Co., Ltd.1 | 24,000 | 1,716 |
| Budweiser Brewing Co., APAC Ltd.1,2 | 448,000 | 1,513 |
| 209,753 | ||
| Industrials 4.40% | ||
| Airbus SE, non-registered shares1 | 276,729 | 40,601 |
| Shanghai International Airport Co., Ltd., Class A1 | 2,014,760 | 22,791 |
| Nidec Corp.1 | 165,000 | 22,540 |
| Rational AG1 | 19,400 | 15,603 |
| DSV Panalpina A/S1 | 85,722 | 9,923 |
| Knorr-Bremse AG, non-registered shares1 | 93,000 | 9,466 |
| Edenred SA1 | 151,689 | 7,849 |
| MTU Aero Engines AG1 | 24,800 | 7,082 |
| Safran SA1 | 36,000 | 5,580 |
| Boeing Co. | 13,000 | 4,235 |
| International Container Terminal Services, Inc.1 | 1,669,300 | 4,234 |
| SMC Corp.1 | 8,600 | 3,931 |
| TransDigm Group Inc. | 7,000 | 3,920 |
| CCR SA, ordinary nominative | 819,300 | 3,866 |
| Experian PLC1 | 65,000 | 2,198 |
| Fortive Corp. | 17,000 | 1,298 |
| Guangzhou Baiyun International Airport Co. Ltd., Class A1 | 147,950 | 371 |
| 165,488 | ||
| Real estate 1.09% | ||
| American Tower Corp. REIT | 87,500 | 20,109 |
| ESR Cayman Ltd.1,2 | 3,335,800 | 7,534 |
| Embassy Office Parks REIT1 | 717,600 | 4,260 |
| China Overseas Land & Investment Ltd.1 | 970,000 | 3,789 |
| Longfor Group Holdings Ltd.1 | 677,000 | 3,180 |
| Ayala Land, Inc.1 | 2,614,000 | 2,344 |
| 41,216 | ||
| Utilities 0.89% | ||
| AES Corp. | 885,000 | 17,612 |
| China Resources Gas Group Ltd.1 | 2,274,000 | 12,499 |
| ENN Energy Holdings Ltd.1 | 295,000 | 3,225 |
| 33,336 | ||
| Total common stocks(cost: $2,372,140,000) | 3,322,603 | |
| Preferred securities 1.90% Industrials 0.65% | ||
| Azul SA, preferred nominative (ADR)2 | 433,223 | 18,542 |
| Azul SA, preferred nominative2 | 419,250 | 6,074 |
| 24,616 | ||
| Consumer discretionary 0.50% | ||
| Volkswagen AG, nonvoting preferred shares1 | 95,000 | 18,780 |
American Funds Insurance Series — New World Fund — Page 28 of 184
| Preferred securities (continued) Financials 0.48% | Shares | Value (000) |
| Itaú Unibanco Holding SA, preferred nominative (ADR) | 1,522,000 | $13,926 |
| Itaú Unibanco Holding SA, preferred nominative | 457,000 | 4,215 |
| 18,141 | ||
| Information technology 0.16% | ||
| Samsung Electronics Co., Ltd., nonvoting preferred shares1 | 149,500 | 5,832 |
| Health care 0.11% | ||
| Grifols, SA, Class B, nonvoting preferred, non-registered shares1 | 172,000 | 4,008 |
| Real estate 0.00% | ||
| Ayala Land, Inc., preference shares1,2,4 | 15,000,000 | 27 |
| Total preferred securities(cost: $50,498,000) | 71,404 | |
| Rights & warrants 0.70% Health care 0.56% | ||
| WuXi AppTec Co., Ltd., Class A, warrants, expire 20201,5 | 1,594,320 | 21,101 |
| Consumer staples 0.14% | ||
| Foshan Haitian Flavouring and Food Co., Ltd., Class A, warrants, expire 20221,5 | 348,300 | 5,378 |
| Total rights & warrants(cost: $15,629,000) | 26,479 | |
| Bonds, notes & other debt instruments 2.57% Bonds & notes of governments & government agencies outside the U.S. 2.35% | Principal amount (000) | |
| Abu Dhabi (Emirate of) 2.50% 20295 | $ 1,400 | 1,397 |
| Angola (Republic of) 8.00% 20295 | 2,000 | 2,139 |
| Argentine Republic (Argentina Central Bank 7D Repo Reference Rate) 70.253% 20206 | ARS4,162 | 36 |
| Argentine Republic (Badlar Private Banks ARS Index + 2.00%) 55.469% 20226 | 13,621 | 128 |
| Argentine Republic 8.28% 20337 | $1,318 | 815 |
| Argentine Republic 3.75% 2038 (5.25% on 3/31/2029)8 | 1,700 | 835 |
| Argentine Republic 6.875% 2048 | 2,595 | 1,251 |
| Bahrain (Kingdom of) 6.75% 20295 | 500 | 585 |
| Banque Centrale de Tunisie 6.75% 2023 | €110 | 128 |
| Banque Centrale de Tunisie 5.625% 2024 | 365 | 408 |
| Banque Centrale de Tunisie 5.75% 2025 | $425 | 398 |
| Belarus (Republic of) 6.875% 2023 | 500 | 535 |
| Brazil (Federative Republic of) Global 5.625% 2047 | 1,995 | 2,260 |
| Buenos Aires (City of) 8.95% 2021 | 707 | 735 |
| Cameroon (Republic of) 9.50% 2025 | 1,750 | 1,969 |
| Colombia (Republic of) 4.50% 2026 | 1,250 | 1,363 |
| Costa Rica (Republic of) 6.125% 20315 | 1,000 | 1,065 |
| Dominican Republic 7.50% 2021 | 533 | 555 |
| Dominican Republic 5.50% 20255 | 970 | 1,047 |
| Dominican Republic 10.375% 2026 | DOP24,000 | 466 |
| Dominican Republic 11.00% 2026 | 7,900 | 158 |
| Dominican Republic 11.00% 2026 | 4,000 | 80 |
| Dominican Republic 8.625% 20275 | $575 | 700 |
| Dominican Republic 11.25% 2027 | DOP22,900 | 458 |
American Funds Insurance Series — New World Fund — Page 29 of 184
| Bonds, notes & other debt instruments (continued) Bonds & notes of governments & government agencies outside the U.S. (continued) | Principal amount (000) | Value (000) |
| Dominican Republic 11.375% 2029 | DOP12,800 | $260 |
| Dominican Republic 7.45% 20445 | $1,125 | 1,361 |
| Dominican Republic 7.45% 2044 | 1,100 | 1,331 |
| Dominican Republic 6.85% 20455 | 500 | 572 |
| Egypt (Arab Republic of) 16.00% 2022 | EGP7,800 | 505 |
| Egypt (Arab Republic of) 5.625% 2030 | €900 | 1,044 |
| Egypt (Arab Republic of) 8.50% 2047 | $1,000 | 1,113 |
| Egypt (Arab Republic of) 8.15% 20595 | 1,300 | 1,393 |
| Ethiopia (Federal Democratic Republic of) 6.625% 2024 | 1,400 | 1,515 |
| Gabonese Republic 6.375% 2024 | 2,000 | 2,094 |
| Guatemala (Republic of) 4.375% 2027 | 1,100 | 1,142 |
| Honduras (Republic of) 7.50% 2024 | 500 | 558 |
| Honduras (Republic of) 6.25% 2027 | 1,000 | 1,094 |
| Indonesia (Republic of) 4.75% 20265 | 2,100 | 2,337 |
| Indonesia (Republic of) 6.625% 2037 | 603 | 820 |
| Indonesia (Republic of) 7.75% 2038 | 707 | 1,064 |
| Indonesia (Republic of) 5.25% 2042 | 840 | 1,014 |
| Iraq (Republic of) 6.752% 2023 | 1,520 | 1,559 |
| Jordan (Hashemite Kingdom of) 6.125% 20265 | 230 | 247 |
| Jordan (Hashemite Kingdom of) 5.75% 20275 | 1,530 | 1,618 |
| Kazakhstan (Republic of) 6.50% 20455 | 800 | 1,182 |
| Kenya (Republic of) 6.875% 2024 | 1,350 | 1,465 |
| Kenya (Republic of) 6.875% 20245 | 900 | 976 |
| Kenya (Republic of) 8.25% 20485 | 500 | 537 |
| Malaysia (Federation of), Series 0419, 3.828% 2034 | MYR2,000 | 500 |
| Malaysia (Federation of), Series 0619, 4.119% 2034 | 3,000 | 762 |
| Malaysia (Federation of), Series 0418, 4.893% 2038 | 2,300 | 641 |
| Nigeria (Republic of) 6.375% 2023 | $1,025 | 1,098 |
| Oman (Sultanate of) 5.625% 2028 | 1,900 | 1,970 |
| Pakistan (Islamic Republic of) 5.50% 20215 | 900 | 922 |
| Pakistan (Islamic Republic of) 5.625% 2022 | 500 | 514 |
| Pakistan (Islamic Republic of) 8.25% 2024 | 300 | 335 |
| Pakistan (Islamic Republic of) 8.25% 20255 | 410 | 460 |
| Pakistan (Islamic Republic of) 6.875% 20275 | 1,500 | 1,567 |
| Panama (Republic of) 3.75% 20265 | 980 | 1,034 |
| Panama (Republic of) 4.50% 2047 | 1,555 | 1,853 |
| Panama (Republic of) 4.30% 2053 | 400 | 466 |
| Paraguay (Republic of) 5.00% 20265 | 500 | 554 |
| Paraguay (Republic of) 4.70% 20275 | 800 | 882 |
| Paraguay (Republic of) 4.70% 2027 | 500 | 551 |
| Peru (Republic of) 6.55% 2037 | 700 | 1,026 |
| Poland (Republic of) 3.25% 2026 | 300 | 319 |
| Qatar (State of) 4.50% 20285 | 3,000 | 3,443 |
| Romania 2.875% 2029 | €1,350 | 1,713 |
| Romania 5.125% 20485 | $1,500 | 1,732 |
| Russian Federation 6.50% 2024 | RUB70,000 | 1,155 |
| Russian Federation 4.375% 20295 | $1,000 | 1,114 |
| Russian Federation 6.90% 2029 | RUB73,500 | 1,249 |
| Russian Federation 5.10% 2035 | $1,000 | 1,200 |
| Senegal (Republic of) 4.75% 2028 | €1,000 | 1,186 |
| South Africa (Republic of) 5.875% 2030 | $1,800 | 1,950 |
| Sri Lanka (Democratic Socialist Republic of) 5.75% 2022 | 250 | 251 |
| Sri Lanka (Democratic Socialist Republic of) 5.875% 2022 | 1,000 | 1,003 |
| Sri Lanka (Democratic Socialist Republic of) 6.125% 2025 | 410 | 400 |
| Sri Lanka (Democratic Socialist Republic of) 6.85% 2025 | 700 | 703 |
American Funds Insurance Series — New World Fund — Page 30 of 184
| Bonds, notes & other debt instruments (continued) Bonds & notes of governments & government agencies outside the U.S. (continued) | Principal amount (000) | Value (000) |
| Sri Lanka (Democratic Socialist Republic of) 6.825% 2026 | $1,010 | $999 |
| Sri Lanka (Democratic Socialist Republic of) 7.55% 20305 | 500 | 497 |
| Turkey (Republic of) 4.875% 2043 | 1,295 | 1,071 |
| Turkey (Republic of) 5.75% 2047 | 2,005 | 1,782 |
| Ukraine Government 7.75% 2027 | 2,700 | 2,963 |
| Ukraine Government 7.375% 2032 | 1,750 | 1,871 |
| Venezuela (Bolivarian Republic of) 7.00% 20189 | 64 | 8 |
| Venezuela (Bolivarian Republic of) 7.75% 20199 | 1,149 | 135 |
| Venezuela (Bolivarian Republic of) 6.00% 20209 | 950 | 114 |
| Venezuela (Bolivarian Republic of) 12.75% 20229 | 85 | 10 |
| Venezuela (Bolivarian Republic of) 9.00% 20239 | 1,383 | 166 |
| Venezuela (Bolivarian Republic of) 8.25% 20249 | 299 | 36 |
| Venezuela (Bolivarian Republic of) 7.65% 20259 | 129 | 15 |
| Venezuela (Bolivarian Republic of) 11.75% 20269 | 64 | 8 |
| Venezuela (Bolivarian Republic of) 9.25% 20279 | 170 | 20 |
| Venezuela (Bolivarian Republic of) 9.25% 20289 | 319 | 38 |
| Venezuela (Bolivarian Republic of) 11.95% 20319 | 106 | 13 |
| Venezuela (Bolivarian Republic of) 7.00% 20389 | 107 | 13 |
| 88,624 | ||
| Corporate bonds & notes 0.22% Utilities 0.06% | ||
| Empresas Publicas de Medellin E.S.P. 4.25% 20295 | 665 | 693 |
| State Grid Overseas Investment Ltd. 3.50% 20275 | 900 | 942 |
| State Grid Overseas Investment Ltd. 4.25% 2028 | 500 | 554 |
| 2,189 | ||
| Energy 0.05% | ||
| Gazprom OJSC 6.51% 20225 | 600 | 653 |
| Petrobras Global Finance Co. 5.093% 20305 | 827 | 887 |
| Petrobras Global Finance Co. 6.85% 2115 | 314 | 360 |
| 1,900 | ||
| Financials 0.05% | ||
| HSBK (Europe) BV 7.25% 20215 | 1,125 | 1,181 |
| VEB Finance Ltd. 6.902% 2020 | 600 | 614 |
| 1,795 | ||
| Materials 0.04% | ||
| Braskem Idesa Sapi 7.45% 20295 | 300 | 320 |
| CSN Resources SA 7.625% 2023 | 1,000 | 1,068 |
| 1,388 | ||
| Industrials 0.02% | ||
| DP World Crescent 4.848% 20285 | 835 | 918 |
| Total corporate bonds & notes | 8,190 | |
| Total bonds, notes & other debt instruments(cost: $92,583,000) | 96,814 | |
| Short-term securities 6.56% Money market investments 6.35% | Shares | |
| Capital Group Central Cash Fund 1.73%10 | 2,386,731 | 238,673 |
American Funds Insurance Series — New World Fund — Page 31 of 184
| Short-term securities (continued) Other short-term securities 0.21% | Principal amount (000) | Value (000) |
| Argentinian Treasury Bills (10.54%)–65.81% due 9/30/2019–7/31/20209 | ARS469,721 | $5,995 |
| Nigerian Treasury Bills 12.40%due 1/9/2020 | NGN700,000 | 1,935 |
| 7,930 | ||
| Total short-term securities(cost: $251,630,000) | 246,603 | |
| Total investment securities 100.09%(cost: $2,782,480,000) | 3,763,903 | |
| Other assets less liabilities (0.09)% | (3,492) | |
| Net assets 100.00% | $3,760,411 |
| 1 | Valued under fair value procedures adopted by authority of the board of trustees. The total value of all such securities was $1,928,580,000, which represented 51.29% of the net assets of the fund. This amount includes $1,899,554,000 related to certain securities trading outside the U.S. whose values were adjusted as a result of significant market movements following the close of local trading. |
| 2 | Security did not produce income during the last 12 months. |
| 3 | All or a portion of this security was on loan. The total value of all such securities was $2,679,000, which represented .07% of the net assets of the fund. |
| 4 | Value determined using significant unobservable inputs. |
| 5 | Acquired in a transaction exempt from registration under Rule 144A of the Securities Act of 1933. May be resold in the U.S. in transactions exempt from registration, normally to qualified institutional buyers. The total value of all such securities was $61,434,000, which represented 1.63% of the net assets of the fund. |
| 6 | Coupon rate may change periodically. Reference rate and spread are as of the most recent information available. Some coupon rates are determined by the issuer or agent based on current market conditions; therefore, the reference rate and spread are not available. |
| 7 | Payment in kind; the issuer has the option of paying additional securities in lieu of cash. Most recent payment was 100% cash unless otherwise noted. |
| 8 | Step bond; coupon rate may change at a later date. |
| 9 | Scheduled interest and/or principal payment was not received. |
| 10 | Rate represents the seven-day yield at 12/31/2019. |
| Key to abbreviations and symbol | |
| ADR = American Depositary Receipts | |
| ARS = Argentine pesos | |
| DOP = Dominican pesos | |
| EGP = Egyptian pounds | |
| EUR/€ = Euros | |
| GBP = British pounds | |
| GDR = Global Depositary Receipts | |
| HKD = Hong Kong dollars | |
| MYR = Malaysian ringgits | |
| NGN = Nigerian naira | |
| RUB = Russian rubles |
American Funds Insurance Series — New World Fund — Page 32 of 184
Blue Chip Income and Growth Fund
Investment portfolio
December 31, 2019
| Common stocks 96.37% Health care 21.60% | Shares | Value (000) |
| Abbott Laboratories | 5,266,500 | $457,448 |
| UnitedHealth Group Inc. | 1,137,000 | 334,255 |
| AbbVie Inc. | 3,603,660 | 319,068 |
| Amgen Inc. | 1,194,510 | 287,961 |
| Gilead Sciences, Inc. | 2,845,712 | 184,914 |
| Teva Pharmaceutical Industries Ltd. (ADR)1 | 10,333,800 | 101,271 |
| Humana Inc. | 259,000 | 94,929 |
| Medtronic PLC | 700,000 | 79,415 |
| Merck & Co., Inc. | 500,000 | 45,475 |
| Thermo Fisher Scientific Inc. | 87,000 | 28,264 |
| Stryker Corp. | 125,400 | 26,326 |
| Bristol-Myers Squibb Co. | 400,000 | 25,676 |
| PerkinElmer, Inc. | 210,400 | 20,430 |
| 2,005,432 | ||
| Information technology 15.66% | ||
| Microsoft Corp. | 2,469,200 | 389,393 |
| QUALCOMM Inc. | 2,846,800 | 251,173 |
| Broadcom Inc. | 575,100 | 181,743 |
| Apple Inc. | 400,000 | 117,460 |
| Mastercard Inc., Class A | 337,000 | 100,625 |
| Intel Corp. | 1,680,000 | 100,548 |
| Texas Instruments Inc. | 780,000 | 100,066 |
| Accenture PLC, Class A | 400,000 | 84,228 |
| Automatic Data Processing, Inc. | 338,500 | 57,715 |
| Fidelity National Information Services, Inc. | 212,000 | 29,487 |
| Applied Materials, Inc. | 479,000 | 29,238 |
| ASML Holding NV (New York registered) | 39,200 | 11,601 |
| 1,453,277 | ||
| Energy 13.73% | ||
| Exxon Mobil Corp. | 4,883,200 | 340,750 |
| EOG Resources, Inc. | 3,208,800 | 268,769 |
| Diamondback Energy, Inc. | 1,320,033 | 122,578 |
| Schlumberger Ltd. | 2,602,000 | 104,600 |
| Baker Hughes Co., Class A | 3,942,000 | 101,034 |
| Concho Resources Inc. | 859,500 | 75,266 |
| TC Energy Corp. | 1,350,000 | 71,969 |
| Royal Dutch Shell PLC, Class B (ADR) | 1,134,000 | 68,006 |
| Williams Companies, Inc. | 1,792,000 | 42,506 |
| Cenovus Energy Inc. | 4,136,000 | 41,980 |
| Canadian Natural Resources, Ltd. | 1,136,000 | 36,750 |
| 1,274,208 |
American Funds Insurance Series — Blue Chip Income and Growth Fund — Page 33 of 184
| Common stocks (continued) Consumer staples 10.82% | Shares | Value (000) |
| Philip Morris International Inc. | 3,005,600 | $255,747 |
| British American Tobacco PLC (ADR) | 4,935,830 | 209,575 |
| Constellation Brands, Inc., Class A | 793,100 | 150,491 |
| Costco Wholesale Corp. | 273,000 | 80,240 |
| Coca-Cola Co. | 1,387,000 | 76,770 |
| Altria Group, Inc. | 1,500,000 | 74,865 |
| PepsiCo, Inc. | 400,000 | 54,668 |
| Keurig Dr Pepper Inc. | 1,594,000 | 46,146 |
| Lamb Weston Holdings, Inc. | 400,000 | 34,412 |
| Mondelez International, Inc. | 384,000 | 21,151 |
| 1,004,065 | ||
| Industrials 9.91% | ||
| CSX Corp. | 3,628,500 | 262,558 |
| General Dynamics Corp. | 1,421,634 | 250,705 |
| Illinois Tool Works Inc. | 650,000 | 116,760 |
| Airbus Group SE (ADR) | 2,639,000 | 96,983 |
| United Technologies Corp. | 500,000 | 74,880 |
| Union Pacific Corp. | 400,000 | 72,316 |
| Northrop Grumman Corp. | 70,300 | 24,181 |
| L3Harris Technologies, Inc. | 93,600 | 18,521 |
| Rolls-Royce Holdings PLC (ADR) | 356,800 | 3,215 |
| 920,119 | ||
| Communication services 6.88% | ||
| Facebook, Inc., Class A1 | 1,339,800 | 274,994 |
| Alphabet Inc., Class A1 | 103,775 | 138,995 |
| Alphabet Inc., Class C1 | 3,000 | 4,011 |
| Verizon Communications Inc. | 1,604,500 | 98,516 |
| Comcast Corp., Class A | 1,970,000 | 88,591 |
| Netflix, Inc.1 | 104,300 | 33,749 |
| 638,856 | ||
| Financials 5.12% | ||
| JPMorgan Chase & Co. | 1,309,000 | 182,475 |
| Wells Fargo & Co. | 1,500,000 | 80,700 |
| U.S. Bancorp | 1,000,000 | 59,290 |
| American International Group, Inc. | 1,010,000 | 51,843 |
| AIA Group Ltd. (ADR) | 1,006,000 | 42,342 |
| Nasdaq, Inc. | 311,000 | 33,308 |
| CME Group Inc., Class A | 69,000 | 13,850 |
| Willis Towers Watson PLC | 56,800 | 11,470 |
| 475,278 | ||
| Consumer discretionary 4.87% | ||
| Lowe’s Cos., Inc. | 1,314,975 | 157,481 |
| McDonald’s Corp. | 500,000 | 98,805 |
| Hasbro, Inc. | 515,000 | 54,389 |
| Williams-Sonoma, Inc. | 705,000 | 51,775 |
| Marriott International, Inc., Class A | 309,500 | 46,868 |
| NIKE, Inc., Class B | 225,000 | 22,795 |
| Carnival Corp., units | 249,000 | 12,657 |
| Las Vegas Sands Corp. | 110,000 | 7,594 |
| 452,364 |
American Funds Insurance Series — Blue Chip Income and Growth Fund — Page 34 of 184
| Common stocks (continued) Utilities 3.10% | Shares | Value (000) |
| Public Service Enterprise Group Inc. | 2,594,000 | $153,176 |
| American Electric Power Co., Inc. | 600,000 | 56,706 |
| Sempra Energy | 331,000 | 50,140 |
| E.ON SE (ADR) | 1,490,000 | 15,898 |
| NextEra Energy, Inc. | 50,000 | 12,108 |
| 288,028 | ||
| Real estate 2.35% | ||
| Kimco Realty Corp. REIT | 2,677,000 | 55,441 |
| Crown Castle International Corp. REIT | 384,000 | 54,586 |
| Simon Property Group, Inc. REIT | 290,000 | 43,198 |
| Healthpeak Properties, Inc. REIT | 954,000 | 32,884 |
| Alexandria Real Estate Equities, Inc. REIT | 148,000 | 23,914 |
| Equinix, Inc. REIT | 10,000 | 5,837 |
| Digital Realty Trust, Inc. REIT | 17,000 | 2,036 |
| 217,896 | ||
| Materials 2.33% | ||
| Linde PLC | 884,700 | 188,353 |
| Freeport-McMoRan Inc. | 2,106,600 | 27,638 |
| 215,991 | ||
| Total common stocks(cost: $6,823,043,000) | 8,945,514 | |
| Rights & warrants 0.14% Financials 0.14% | ||
| American International Group, Inc., warrants, expire 20211 | 1,282,000 | 13,179 |
| Total rights & warrants(cost: $19,905,000) | 13,179 | |
| Convertible stocks 0.06% Health care 0.06% | ||
| Danaher Corp., Series A, cumulative convertible preferred, 4.75% 2022 | 4,900 | 5,777 |
| Total convertible stocks(cost: $4,979,000) | 5,777 | |
| Short-term securities 3.37% Money market investments 3.37% | ||
| Capital Group Central Cash Fund 1.73%2 | 3,124,623 | 312,462 |
| Total short-term securities(cost: $312,432,000) | 312,462 | |
| Total investment securities 99.94%(cost: $7,160,359,000) | 9,276,932 | |
| Other assets less liabilities 0.06% | 5,429 | |
| Net assets 100.00% | $9,282,361 |
| 1 | Security did not produce income during the last 12 months. |
| 2 | Rate represents the seven-day yield at 12/31/2019. |
American Funds Insurance Series — Blue Chip Income and Growth Fund — Page 35 of 184
| Key to abbreviation |
| ADR = American Depositary Receipts |
American Funds Insurance Series — Blue Chip Income and Growth Fund — Page 36 of 184
Global Growth and Income Fund
Investment portfolio
December 31, 2019
| Common stocks 96.65% Information technology 15.69% | Shares | Value (000) |
| Taiwan Semiconductor Manufacturing Co., Ltd.1 | 8,650,800 | $95,803 |
| Microsoft Corp. | 281,000 | 44,314 |
| PagSeguro Digital Ltd., Class A2 | 1,128,752 | 38,558 |
| Broadcom Inc. | 121,200 | 38,302 |
| Apple Inc. | 112,390 | 33,003 |
| ASML Holding NV1 | 70,000 | 20,847 |
| Tokyo Electron Ltd.1 | 49,000 | 10,768 |
| Fiserv, Inc.2 | 88,000 | 10,175 |
| GoDaddy Inc., Class A2 | 142,000 | 9,645 |
| Temenos AG1 | 60,000 | 9,486 |
| SAP SE1 | 68,500 | 9,232 |
| Afterpay Ltd.1,2 | 288,000 | 5,933 |
| Murata Manufacturing Co., Ltd.1 | 67,000 | 4,142 |
| Advanced Micro Devices, Inc.2 | 68,000 | 3,118 |
| WiseTech Global Ltd.1 | 137,100 | 2,251 |
| 335,577 | ||
| Industrials 12.59% | ||
| Airbus SE, non-registered shares1 | 623,200 | 91,434 |
| CCR SA, ordinary nominative | 7,680,800 | 36,240 |
| Lockheed Martin Corp. | 66,000 | 25,699 |
| Safran SA1 | 123,500 | 19,144 |
| Rheinmetall AG1 | 151,500 | 17,422 |
| Boeing Co. | 49,400 | 16,093 |
| International Consolidated Airlines Group, SA (CDI)1 | 1,462,994 | 12,149 |
| General Dynamics Corp. | 65,000 | 11,463 |
| Illinois Tool Works Inc. | 54,000 | 9,700 |
| Honeywell International Inc. | 48,000 | 8,496 |
| MTU Aero Engines AG1 | 16,300 | 4,655 |
| Union Pacific Corp. | 24,400 | 4,411 |
| Watsco, Inc. | 23,500 | 4,233 |
| VINCI SA1 | 37,128 | 4,125 |
| DCC PLC1 | 45,600 | 3,969 |
| 269,233 | ||
| Financials 11.87% | ||
| Sberbank of Russia PJSC (ADR)1 | 1,710,000 | 28,136 |
| AIA Group Ltd.1 | 2,503,000 | 26,336 |
| HDFC Bank Ltd.1 | 1,288,000 | 22,955 |
| Toronto-Dominion Bank (CAD denominated) | 300,700 | 16,865 |
| DBS Group Holdings Ltd.1 | 803,000 | 15,478 |
| Ping An Insurance (Group) Co. of China, Ltd., Class H1 | 1,195,000 | 14,156 |
| CME Group Inc., Class A | 70,000 | 14,050 |
| Sony Financial Holdings Inc.1 | 550,000 | 13,165 |
| JPMorgan Chase & Co. | 92,000 | 12,825 |
| Bank Central Asia Tbk PT1 | 4,775,000 | 11,471 |
American Funds Insurance Series — Global Growth and Income Fund — Page 37 of 184
| Common stocks (continued) Financials (continued) | Shares | Value (000) |
| Macquarie Group Ltd.1 | 114,700 | $11,125 |
| The Blackstone Group Inc., Class A | 192,500 | 10,769 |
| B3 SA - Brasil, Bolsa, Balcao | 1,000,000 | 10,682 |
| CIT Group Inc. | 181,750 | 8,293 |
| Barclays PLC1 | 3,365,000 | 8,036 |
| BB Seguridade Participações SA | 765,000 | 7,169 |
| HDFC Life Insurance Co. Ltd.1 | 773,990 | 6,790 |
| Truist Financial Corp. | 116,550 | 6,564 |
| AXA SA1 | 145,000 | 4,091 |
| Prudential PLC1 | 177,000 | 3,406 |
| UniCredit SpA1 | 56,319 | 823 |
| M&G PLC1,2 | 177,000 | 557 |
| 253,742 | ||
| Consumer discretionary 9.58% | ||
| LVMH Moët Hennessy-Louis Vuitton SE1 | 56,200 | 26,174 |
| Home Depot, Inc. | 75,500 | 16,488 |
| Norwegian Cruise Line Holdings Ltd.2 | 275,000 | 16,063 |
| Flutter Entertainment PLC1 | 124,000 | 15,143 |
| Alibaba Group Holding Ltd.1,2 | 558,400 | 14,848 |
| Royal Caribbean Cruises Ltd. | 93,000 | 12,416 |
| Daimler AG1 | 222,000 | 12,308 |
| Nokian Renkaat Oyj1 | 363,000 | 10,463 |
| General Motors Co. | 275,000 | 10,065 |
| Restaurant Brands International Inc. (CAD denominated) | 148,000 | 9,435 |
| Bayerische Motoren Werke AG1 | 114,000 | 9,385 |
| NIKE, Inc., Class B | 80,000 | 8,105 |
| Accor SA1 | 163,500 | 7,675 |
| Carnival Corp., units | 138,000 | 7,014 |
| Amazon.com, Inc.2 | 3,400 | 6,283 |
| adidas AG1 | 18,500 | 6,013 |
| Trainline PLC1,2 | 707,300 | 4,766 |
| Melco Resorts & Entertainment Ltd. (ADR) | 193,000 | 4,665 |
| Naspers Ltd., Class N1 | 27,000 | 4,413 |
| Aston Martin Lagonda Global Holdings PLC1,2 | 457,000 | 3,158 |
| 204,880 | ||
| Health care 9.36% | ||
| UnitedHealth Group Inc. | 86,300 | 25,370 |
| AstraZeneca PLC1 | 167,000 | 16,708 |
| Boston Scientific Corp.2 | 351,000 | 15,872 |
| Merck & Co., Inc. | 169,850 | 15,448 |
| Abbott Laboratories | 171,000 | 14,853 |
| Novartis AG1 | 148,000 | 14,022 |
| Fleury SA, ordinary nominative | 1,750,000 | 13,281 |
| Centene Corp.2 | 202,000 | 12,700 |
| Illumina, Inc.2 | 34,000 | 11,279 |
| HOYA Corp.1 | 117,000 | 11,171 |
| Hikma Pharmaceuticals PLC1 | 340,000 | 9,007 |
| CSL Ltd.1 | 35,200 | 6,831 |
| Eli Lilly and Co. | 45,000 | 5,914 |
| Biogen Inc.2 | 17,500 | 5,193 |
| Hypera SA, ordinary nominative | 562,000 | 4,986 |
| Koninklijke Philips NV (EUR denominated)1 | 100,000 | 4,889 |
| DexCom, Inc.2 | 22,025 | 4,818 |
American Funds Insurance Series — Global Growth and Income Fund — Page 38 of 184
| Common stocks (continued) Health care (continued) | Shares | Value (000) |
| Pfizer Inc. | 104,000 | $4,075 |
| Insulet Corp.2 | 21,300 | 3,647 |
| 200,064 | ||
| Communication services 8.45% | ||
| Nintendo Co., Ltd.1 | 235,700 | 95,140 |
| Alphabet Inc., Class A2 | 21,800 | 29,199 |
| Alphabet Inc., Class C2 | 7,000 | 9,359 |
| Comcast Corp., Class A | 296,000 | 13,311 |
| Facebook, Inc., Class A2 | 44,000 | 9,031 |
| SK Telecom Co., Ltd.1 | 37,500 | 7,714 |
| Activision Blizzard, Inc. | 101,000 | 6,001 |
| Advanced Info Service PCL, foreign registered1 | 820,000 | 5,804 |
| New York Times Co., Class A | 160,000 | 5,147 |
| 180,706 | ||
| Materials 7.57% | ||
| Fortescue Metals Group Ltd.1 | 4,763,816 | 35,905 |
| Freeport-McMoRan Inc. | 2,499,000 | 32,787 |
| Vale SA, ordinary nominative | 2,220,000 | 29,415 |
| Koninklijke DSM NV1 | 109,000 | 14,228 |
| Rio Tinto PLC1 | 165,000 | 9,804 |
| Allegheny Technologies Inc.2 | 415,000 | 8,574 |
| CCL Industries Inc., Class B, nonvoting shares | 192,500 | 8,201 |
| Shin-Etsu Chemical Co., Ltd.1 | 63,000 | 6,907 |
| RHI Magnesita NV1 | 125,700 | 6,433 |
| BHP Group PLC1 | 248,000 | 5,858 |
| DuPont de Nemours Inc. | 60,000 | 3,852 |
| 161,964 | ||
| Energy 6.53% | ||
| Reliance Industries Ltd.1 | 2,714,148 | 57,652 |
| Gazprom PJSC (ADR)1 | 3,431,000 | 28,254 |
| EOG Resources, Inc. | 150,000 | 12,564 |
| Galp Energia, SGPS, SA, Class B1 | 708,000 | 11,842 |
| Royal Dutch Shell PLC, Class B1 | 325,000 | 9,684 |
| Canadian Natural Resources, Ltd. (CAD denominated) | 279,200 | 9,030 |
| Worley Ltd.1 | 590,000 | 6,365 |
| ConocoPhillips | 66,000 | 4,292 |
| 139,683 | ||
| Utilities 5.79% | ||
| E.ON SE1 | 3,644,000 | 38,972 |
| Ørsted AS1 | 345,482 | 35,794 |
| Enel SpA1 | 3,539,000 | 28,154 |
| Brookfield Infrastructure Partners LP | 170,000 | 8,491 |
| China Resources Gas Group Ltd.1 | 1,350,000 | 7,421 |
| Public Service Enterprise Group Inc. | 85,000 | 5,019 |
| 123,851 | ||
| Real estate 5.19% | ||
| MGM Growth Properties LLC REIT, Class A | 1,101,200 | 34,104 |
| Gaming and Leisure Properties, Inc. REIT | 425,000 | 18,296 |
| Alexandria Real Estate Equities, Inc. REIT | 103,000 | 16,643 |
| Digital Realty Trust, Inc. REIT | 72,000 | 8,621 |
American Funds Insurance Series — Global Growth and Income Fund — Page 39 of 184
| Common stocks (continued) Real estate (continued) | Shares | Value (000) |
| Prologis, Inc. REIT | 90,000 | $8,023 |
| Vonovia SE1 | 104,442 | 5,623 |
| Daito Trust Construction Co., Ltd.1 | 44,400 | 5,499 |
| Crown Castle International Corp. REIT | 37,000 | 5,259 |
| Longfor Group Holdings Ltd.1 | 1,025,000 | 4,814 |
| Iron Mountain Inc. REIT | 131,000 | 4,175 |
| 111,057 | ||
| Consumer staples 4.03% | ||
| Nestlé SA1 | 324,275 | 35,131 |
| British American Tobacco PLC1 | 252,000 | 10,737 |
| C&C Group PLC1 | 1,946,900 | 10,465 |
| Treasury Wine Estates Ltd.1 | 615,672 | 7,036 |
| Philip Morris International Inc. | 80,000 | 6,807 |
| Keurig Dr Pepper Inc. | 235,000 | 6,803 |
| Coca-Cola European Partners PLC | 95,000 | 4,834 |
| Coca-Cola FEMSA, SAB de CV, units | 710,000 | 4,314 |
| 86,127 | ||
| Total common stocks(cost: $1,433,746,000) | 2,066,884 | |
| Preferred securities 0.37% Financials 0.37% | ||
| Itaú Unibanco Holding SA, preferred nominative (ADR) | 862,500 | 7,892 |
| Total preferred securities(cost: $6,929,000) | 7,892 | |
| Bonds, notes & other debt instruments 1.63% Corporate bonds & notes 1.63% Communication services 1.63% | Principal amount (000) | |
| Sprint Corp. 7.25% 2021 | $ 33,000 | 34,957 |
| Total bonds, notes & other debt instruments(cost: $32,020,000) | 34,957 | |
| Short-term securities 1.34% Money market investments 1.34% | Shares | |
| Capital Group Central Cash Fund 1.73%3 | 285,611 | 28,561 |
| Total short-term securities(cost: $28,489,000) | 28,561 | |
| Total investment securities 99.99%(cost: $1,501,184,000) | 2,138,294 | |
| Other assets less liabilities 0.01% | 189 | |
| Net assets 100.00% | $2,138,483 |
Forward currency contracts
| Contract amount | Counterparty | Settlement date | Unrealized depreciation at 12/31/2019 (000) | |
| Purchases (000) | Sales (000) | |||
| USD7,235 | AUD10,500 | Citibank | 1/17/2020 | $(137) |
American Funds Insurance Series — Global Growth and Income Fund — Page 40 of 184
| 1 | Valued under fair value procedures adopted by authority of the board of trustees. The total value of all such securities was $1,146,095,000, which represented 53.59% of the net assets of the fund. This entire amount relates to certain securities trading outside the U.S. whose values were adjusted as a result of significant market movements following the close of local trading. |
| 2 | Security did not produce income during the last 12 months. |
| 3 | Rate represents the seven-day yield at 12/31/2019. |
| Key to abbreviations and symbol |
| ADR = American Depositary Receipts |
| AUD = Australian dollars |
| CAD = Canadian dollars |
| CDI = CREST Depository Interest |
| EUR = Euros |
| USD/$ = U.S. dollars |
American Funds Insurance Series — Global Growth and Income Fund — Page 41 of 184
Growth-Income Fund
Investment portfolio
December 31, 2019
| Common stocks 94.10% Health care 16.21% | Shares | Value (000) |
| UnitedHealth Group Inc. | 3,133,668 | $921,236 |
| Abbott Laboratories | 6,789,069 | 589,698 |
| Amgen Inc. | 2,000,500 | 482,261 |
| Gilead Sciences, Inc. | 6,917,600 | 449,506 |
| Eli Lilly and Co. | 2,892,600 | 380,174 |
| Merck & Co., Inc. | 3,338,880 | 303,671 |
| Cigna Corp. | 1,327,418 | 271,444 |
| AstraZeneca PLC1 | 1,643,500 | 164,430 |
| AstraZeneca PLC (ADR) | 1,228,600 | 61,258 |
| AbbVie Inc. | 2,025,936 | 179,376 |
| Seattle Genetics, Inc.2 | 1,536,306 | 175,538 |
| Illumina, Inc.2 | 459,500 | 152,434 |
| Thermo Fisher Scientific Inc. | 458,000 | 148,790 |
| GlaxoSmithKline PLC1 | 5,307,600 | 124,865 |
| Humana Inc. | 328,000 | 120,219 |
| Incyte Corp.2 | 1,330,900 | 116,214 |
| Alcon Inc.1,2 | 1,837,147 | 104,074 |
| Anthem, Inc. | 342,000 | 103,294 |
| Stryker Corp. | 448,733 | 94,207 |
| Novo Nordisk A/S, Class B1 | 1,611,056 | 93,441 |
| Daiichi Sankyo Co., Ltd.1 | 1,392,000 | 91,918 |
| Johnson & Johnson | 613,000 | 89,418 |
| Pfizer Inc. | 1,877,251 | 73,551 |
| PerkinElmer, Inc. | 700,000 | 67,970 |
| Allakos Inc.2 | 511,000 | 48,729 |
| Medtronic PLC | 425,000 | 48,216 |
| Baxter International Inc. | 538,000 | 44,988 |
| Novartis AG1 | 470,000 | 44,529 |
| Elanco Animal Health Inc.2 | 1,501,355 | 44,215 |
| Chugai Pharmaceutical Co., Ltd.1 | 446,900 | 41,161 |
| Ultragenyx Pharmaceutical Inc.2 | 822,800 | 35,142 |
| Biohaven Pharmaceutical Holding Co. Ltd.2 | 618,100 | 33,649 |
| Edwards Lifesciences Corp.2 | 131,500 | 30,678 |
| Vertex Pharmaceuticals Inc.2 | 102,187 | 22,374 |
| Gossamer Bio, Inc.2 | 1,325,000 | 20,710 |
| Neurocrine Biosciences, Inc.2 | 140,600 | 15,113 |
| CVS Health Corp. | 161,300 | 11,983 |
| Allogene Therapeutics, Inc.2 | 458,500 | 11,912 |
| Bluebird Bio, Inc.2 | 109,400 | 9,600 |
| Sage Therapeutics, Inc.2 | 123,300 | 8,901 |
| Agios Pharmaceuticals, Inc.2 | 178,700 | 8,533 |
| 5,839,420 |
American Funds Insurance Series — Growth-Income Fund — Page 42 of 184
| Common stocks (continued) Information technology 15.04% | Shares | Value (000) |
| Microsoft Corp. | 9,454,500 | $1,490,975 |
| Broadcom Inc. | 2,152,434 | 680,212 |
| Intel Corp. | 6,651,600 | 398,098 |
| Texas Instruments Inc. | 2,127,082 | 272,883 |
| Accenture PLC, Class A | 1,067,900 | 224,868 |
| Visa Inc., Class A | 1,160,200 | 218,002 |
| Mastercard Inc., Class A | 710,000 | 211,999 |
| QUALCOMM Inc. | 2,034,252 | 179,482 |
| Taiwan Semiconductor Manufacturing Co., Ltd.1 | 10,637,000 | 117,799 |
| Adobe Inc.2 | 335,900 | 110,783 |
| ASML Holding NV1 | 219,000 | 65,220 |
| ASML Holding NV (New York registered) | 147,800 | 43,740 |
| Autodesk, Inc.2 | 538,000 | 98,702 |
| Euronet Worldwide, Inc.2 | 618,000 | 97,372 |
| NetApp, Inc. | 1,513,000 | 94,184 |
| Automatic Data Processing, Inc. | 545,000 | 92,923 |
| Global Payments Inc. | 498,100 | 90,933 |
| Amphenol Corp., Class A | 826,000 | 89,398 |
| CDK Global, Inc. | 1,563,096 | 85,470 |
| Ceridian HCM Holding Inc.2 | 1,210,702 | 82,182 |
| Motorola Solutions, Inc. | 415,000 | 66,873 |
| Fiserv, Inc.2 | 536,700 | 62,059 |
| GoDaddy Inc., Class A2 | 819,100 | 55,633 |
| MKS Instruments, Inc. | 481,000 | 52,915 |
| SYNNEX Corp. | 367,700 | 47,360 |
| International Business Machines Corp. | 350,000 | 46,914 |
| Apple Inc. | 151,900 | 44,605 |
| StoneCo Ltd., Class A2 | 1,085,500 | 43,301 |
| ServiceNow, Inc.2 | 142,500 | 40,231 |
| TE Connectivity Ltd. | 391,000 | 37,473 |
| Atlassian Corp. PLC, Class A2 | 304,800 | 36,680 |
| SAP SE1 | 239,500 | 32,277 |
| Teradata Corp.2 | 1,056,057 | 28,271 |
| Analog Devices, Inc. | 213,400 | 25,360 |
| Fidelity National Information Services, Inc. | 162,522 | 22,605 |
| Trimble Inc.2 | 413,300 | 17,230 |
| Applied Materials, Inc. | 249,600 | 15,236 |
| 5,420,248 | ||
| Communication services 12.02% | ||
| Facebook, Inc., Class A2 | 6,826,100 | 1,401,057 |
| Netflix, Inc.2 | 2,352,425 | 761,174 |
| Alphabet Inc., Class C2 | 296,784 | 396,806 |
| Alphabet Inc., Class A2 | 247,980 | 332,142 |
| Comcast Corp., Class A | 6,693,400 | 301,002 |
| Charter Communications, Inc., Class A2 | 438,369 | 212,644 |
| Verizon Communications Inc. | 3,379,400 | 207,495 |
| Activision Blizzard, Inc. | 2,457,100 | 146,001 |
| ViacomCBS Inc., Class B | 3,003,083 | 126,039 |
| Fox Corp., Class A | 2,537,000 | 94,047 |
| IAC/InterActiveCorp2 | 353,700 | 88,110 |
| Vodafone Group PLC1 | 44,633,021 | 86,649 |
| Electronic Arts Inc.2 | 599,000 | 64,399 |
| Tencent Holdings Ltd.1 | 1,295,500 | 62,493 |
American Funds Insurance Series — Growth-Income Fund — Page 43 of 184
| Common stocks (continued) Communication services (continued) | Shares | Value (000) |
| Cable One, Inc. | 33,300 | $49,566 |
| Walt Disney Co. | 16,358 | 2,366 |
| 4,331,990 | ||
| Financials 10.86% | ||
| JPMorgan Chase & Co. | 4,005,030 | 558,301 |
| CME Group Inc., Class A | 1,642,100 | 329,602 |
| Intercontinental Exchange, Inc. | 3,183,555 | 294,638 |
| Willis Towers Watson PLC | 1,314,000 | 265,349 |
| Aon PLC, Class A | 1,214,800 | 253,031 |
| Nasdaq, Inc. | 2,129,600 | 228,080 |
| Bank of New York Mellon Corp. | 4,159,300 | 209,338 |
| Moody’s Corp. | 817,558 | 194,096 |
| Marsh & McLennan Cos., Inc. | 1,580,200 | 176,050 |
| Chubb Ltd. | 1,120,100 | 174,355 |
| American International Group, Inc. | 2,907,141 | 149,224 |
| Wells Fargo & Co. | 2,610,300 | 140,434 |
| EXOR NV1 | 1,275,000 | 98,879 |
| State Street Corp. | 1,170,500 | 92,587 |
| UniCredit SpA1 | 5,138,000 | 75,119 |
| Power Financial Corp. | 2,500,000 | 67,267 |
| PNC Financial Services Group, Inc. | 410,900 | 65,592 |
| Kotak Mahindra Bank Ltd.1 | 2,687,778 | 63,392 |
| Banco Santander, SA1 | 13,490,805 | 56,964 |
| M&T Bank Corp. | 333,600 | 56,629 |
| S&P Global Inc. | 186,000 | 50,787 |
| B3 SA - Brasil, Bolsa, Balcao | 4,750,000 | 50,739 |
| HDFC Bank Ltd.1 | 2,580,000 | 45,981 |
| BlackRock, Inc. | 90,000 | 45,243 |
| London Stock Exchange Group PLC1 | 424,000 | 43,796 |
| Bank of Montreal | 461,200 | 35,744 |
| Truist Financial Corp. | 554,519 | 31,230 |
| Charles Schwab Corp. | 566,000 | 26,919 |
| UBS Group AG1 | 1,343,666 | 16,958 |
| Fannie Mae2 | 4,398,800 | 13,724 |
| Federal Home Loan Mortgage Corp.2 | 666,200 | 2,001 |
| 3,912,049 | ||
| Industrials 10.57% | ||
| Airbus SE, non-registered shares1 | 2,904,564 | 426,151 |
| BWX Technologies, Inc.3 | 5,414,670 | 336,143 |
| TransDigm Group Inc. | 578,800 | 324,128 |
| Northrop Grumman Corp. | 733,200 | 252,199 |
| General Dynamics Corp. | 1,381,600 | 243,645 |
| Equifax Inc. | 1,386,600 | 194,290 |
| Norfolk Southern Corp. | 964,300 | 187,199 |
| L3Harris Technologies, Inc. | 918,100 | 181,664 |
| Safran SA1 | 1,094,103 | 169,602 |
| CSX Corp. | 2,306,600 | 166,906 |
| Waste Connections, Inc. | 1,309,600 | 118,899 |
| Lockheed Martin Corp. | 274,900 | 107,041 |
| Boeing Co. | 311,350 | 101,425 |
| Waste Management, Inc. | 767,700 | 87,487 |
| Westinghouse Air Brake Technologies Corp. | 1,113,758 | 86,650 |
| Meggitt PLC1 | 9,624,952 | 83,871 |
American Funds Insurance Series — Growth-Income Fund — Page 44 of 184
| Common stocks (continued) Industrials (continued) | Shares | Value (000) |
| Middleby Corp.2 | 732,000 | $80,169 |
| United Technologies Corp. | 494,300 | 74,026 |
| Union Pacific Corp. | 392,677 | 70,992 |
| CAE Inc. | 2,499,000 | 66,163 |
| General Electric Co. | 5,227,900 | 58,343 |
| Old Dominion Freight Line, Inc. | 270,000 | 51,241 |
| Air Lease Corp., Class A | 1,058,100 | 50,281 |
| Masco Corp. | 954,000 | 45,782 |
| Textron Inc. | 1,000,000 | 44,600 |
| Caterpillar Inc. | 276,000 | 40,760 |
| Woodward, Inc | 319,214 | 37,808 |
| Covanta Holding Corp. | 2,019,800 | 29,974 |
| Boyd Group Services Inc. | 192,300 | 29,914 |
| Deere & Co. | 137,400 | 23,806 |
| RELX PLC1 | 763,100 | 19,251 |
| Nielsen Holdings PLC | 856,400 | 17,385 |
| 3,807,795 | ||
| Consumer staples 7.10% | ||
| Coca-Cola Co. | 7,316,100 | 404,946 |
| British American Tobacco PLC1 | 8,069,260 | 343,793 |
| British American Tobacco PLC (ADR) | 479,440 | 20,357 |
| Keurig Dr Pepper Inc. | 7,241,735 | 209,648 |
| Carlsberg A/S, Class B1 | 1,390,224 | 207,388 |
| Costco Wholesale Corp. | 621,800 | 182,760 |
| Nestlé SA1 | 1,606,846 | 174,080 |
| Philip Morris International Inc. | 2,033,640 | 173,043 |
| Pernod Ricard SA1 | 944,574 | 169,084 |
| Mondelez International, Inc. | 2,867,900 | 157,964 |
| Walgreens Boots Alliance, Inc. | 1,441,200 | 84,973 |
| Procter & Gamble Co. | 653,178 | 81,582 |
| Lamb Weston Holdings, Inc. | 842,000 | 72,437 |
| Reckitt Benckiser Group PLC1 | 875,000 | 71,055 |
| PepsiCo, Inc. | 498,419 | 68,119 |
| Diageo PLC1 | 1,220,000 | 51,410 |
| Herbalife Nutrition Ltd.2 | 849,000 | 40,472 |
| Church & Dwight Co., Inc. | 446,400 | 31,400 |
| Hormel Foods Corp. | 302,200 | 13,632 |
| 2,558,143 | ||
| Energy 6.94% | ||
| Exxon Mobil Corp. | 6,274,200 | 437,814 |
| EOG Resources, Inc. | 3,943,800 | 330,333 |
| Chevron Corp. | 2,485,800 | 299,564 |
| Enbridge Inc. (CAD denominated) | 7,486,412 | 297,658 |
| Canadian Natural Resources, Ltd. (CAD denominated) | 8,803,800 | 284,748 |
| Royal Dutch Shell PLC, Class B (ADR) | 1,974,300 | 118,399 |
| Royal Dutch Shell PLC, Class B1 | 1,800,000 | 53,636 |
| Royal Dutch Shell PLC, Class A (ADR) | 305,348 | 18,009 |
| Schlumberger Ltd. | 4,641,800 | 186,600 |
| ConocoPhillips | 2,100,810 | 136,616 |
| Equitrans Midstream Corp. | 8,625,300 | 115,234 |
| TC Energy Corp. (CAD denominated) | 1,168,019 | 62,208 |
| Concho Resources Inc. | 653,000 | 57,183 |
| Baker Hughes Co., Class A | 2,017,600 | 51,711 |
American Funds Insurance Series — Growth-Income Fund — Page 45 of 184
| Common stocks (continued) Energy (continued) | Shares | Value (000) |
| BP PLC1 | 4,388,542 | $27,548 |
| TOTAL SA1 | 279,375 | 15,439 |
| Weatherford International2 | 128,424 | 3,589 |
| Tullow Oil PLC1 | 3,674,051 | 3,145 |
| Golar LNG Ltd. | 22,600 | 321 |
| 2,499,755 | ||
| Consumer discretionary 5.06% | ||
| Amazon.com, Inc.2 | 297,400 | 549,548 |
| Marriott International, Inc., Class A | 943,700 | 142,904 |
| Lowe’s Cos., Inc. | 1,160,900 | 139,029 |
| Royal Caribbean Cruises Ltd. | 942,000 | 125,766 |
| Hasbro, Inc. | 1,150,000 | 121,452 |
| Home Depot, Inc. | 527,000 | 115,086 |
| Hilton Worldwide Holdings Inc. | 753,720 | 83,595 |
| Six Flags Entertainment Corp. | 1,640,799 | 74,016 |
| Wynn Resorts, Ltd. | 490,966 | 68,180 |
| Chipotle Mexican Grill, Inc.2 | 59,710 | 49,984 |
| Ferrari NV1 | 295,000 | 48,931 |
| NIKE, Inc., Class B | 443,000 | 44,880 |
| Wyndham Hotels & Resorts, Inc. | 665,000 | 41,769 |
| Las Vegas Sands Corp. | 598,000 | 41,286 |
| Ross Stores, Inc. | 334,200 | 38,908 |
| Signet Jewelers Ltd. | 1,674,500 | 36,404 |
| Newell Brands Inc. | 1,725,000 | 33,155 |
| General Motors Co. | 720,000 | 26,352 |
| Booking Holdings Inc.2 | 10,700 | 21,975 |
| YUM! Brands, Inc. | 205,630 | 20,713 |
| 1,823,933 | ||
| Materials 4.83% | ||
| Celanese Corp. | 3,243,233 | 399,307 |
| Linde PLC | 1,152,000 | 245,261 |
| Vale SA, ordinary nominative (ADR) | 9,977,221 | 131,699 |
| Vale SA, ordinary nominative | 3,404,848 | 45,114 |
| Dow Inc. | 2,559,700 | 140,092 |
| International Flavors & Fragrances Inc. | 1,075,000 | 138,696 |
| LyondellBasell Industries NV | 1,321,800 | 124,884 |
| DuPont de Nemours Inc. | 1,609,700 | 103,343 |
| Rio Tinto PLC1 | 1,544,655 | 91,779 |
| Air Products and Chemicals, Inc. | 312,100 | 73,340 |
| Mosaic Co. | 2,522,400 | 54,585 |
| Freeport-McMoRan Inc. | 4,073,000 | 53,438 |
| Tata Steel Ltd.1 | 6,775,000 | 44,944 |
| Asahi Kasei Corp.1 | 2,392,300 | 26,843 |
| Sherwin-Williams Co. | 40,000 | 23,341 |
| Centerra Gold Inc.2 | 2,917,909 | 23,212 |
| Corteva, Inc. | 459,700 | 13,589 |
| Alcoa Corp.2 | 372,000 | 8,002 |
| 1,741,469 | ||
| Real estate 2.97% | ||
| Equinix, Inc. REIT | 533,800 | 311,579 |
| Crown Castle International Corp. REIT | 2,071,500 | 294,464 |
| MGM Growth Properties LLC REIT, Class A | 5,613,000 | 173,835 |
American Funds Insurance Series — Growth-Income Fund — Page 46 of 184
| Common stocks (continued) Real estate (continued) | Shares | Value (000) |
| American Tower Corp. REIT | 448,900 | $103,166 |
| VICI Properties Inc. REIT | 3,046,000 | 77,825 |
| SBA Communications Corp. REIT | 210,000 | 50,608 |
| Weyerhaeuser Co. REIT2 | 712,541 | 21,519 |
| Digital Realty Trust, Inc. REIT | 170,000 | 20,356 |
| Kimco Realty Corp. REIT | 734,500 | 15,211 |
| 1,068,563 | ||
| Utilities 2.45% | ||
| Sempra Energy | 1,784,000 | 270,241 |
| Edison International | 2,074,500 | 156,438 |
| American Electric Power Co., Inc. | 1,449,000 | 136,945 |
| E.ON SE1 | 8,791,029 | 94,019 |
| Exelon Corp. | 1,615,600 | 73,655 |
| Enel SpA1 | 8,712,341 | 69,310 |
| Public Service Enterprise Group Inc. | 686,500 | 40,538 |
| AES Corp. | 2,000,000 | 39,800 |
| 880,946 | ||
| Mutual funds 0.05% | ||
| Altaba Inc.1 | 789,243 | 16,337 |
| Total common stocks(cost: $23,281,968,000) | 33,900,648 | |
| Convertible stocks 0.51% Real estate 0.24% | ||
| Crown Castle International Corp. REIT, Series A, convertible preferred, 6.875% 2020 | 67,900 | 87,030 |
| Health care 0.16% | ||
| Danaher Corp., Series A, cumulative convertible preferred, 4.75% 2022 | 50,000 | 58,952 |
| Information technology 0.11% | ||
| Broadcom Inc., Series A, cumulative convertible preferred, 8.00% 2022 | 32,900 | 38,755 |
| Total convertible stocks(cost: $162,141,000) | 184,737 | |
| Bonds, notes & other debt instruments 0.02% Corporate bonds & notes 0.02% Energy 0.02% | Principal amount (000) | |
| Weatherford International PLC 11.00% 20244 | $ 5,280 | 5,722 |
| Total bonds, notes & other debt instruments(cost: $5,266,000) | 5,722 |
American Funds Insurance Series — Growth-Income Fund — Page 47 of 184
| Short-term securities 5.39% Money market investments 5.39% | Shares | Value (000) |
| Capital Group Central Cash Fund 1.73%5 | 19,405,997 | $1,940,600 |
| Total short-term securities(cost: $1,939,508,000) | 1,940,600 | |
| Total investment securities 100.02%(cost: $25,388,883,000) | 36,031,707 | |
| Other assets less liabilities (0.02)% | (5,441) | |
| Net assets 100.00% | $36,026,266 |
| 1 | Valued under fair value procedures adopted by authority of the board of trustees. The total value of all such securities was $3,637,561,000, which represented 10.10% of the net assets of the fund. This amount includes $3,621,224,000 related to certain securities trading outside the U.S. whose values were adjusted as a result of significant market movements following the close of local trading. |
| 2 | Security did not produce income during the last 12 months. |
| 3 | Represents an affiliated company as defined under the Investment Company Act of 1940. |
| 4 | Acquired in a transaction exempt from registration under Rule 144A of the Securities Act of 1933. May be resold in the U.S. in transactions exempt from registration, normally to qualified institutional buyers. The total value of all such securities was $5,722,000, which represented .02% of the net assets of the fund. |
| 5 | Rate represents the seven-day yield at 12/31/2019. |
| Key to abbreviations | |
| ADR = American Depositary Receipts | |
| CAD = Canadian dollars |
American Funds Insurance Series — Growth-Income Fund — Page 48 of 184
International Growth and Income Fund
Investment portfolio
December 31, 2019
| Common stocks 88.41% Financials 16.74% | Shares | Value (000) |
| HDFC Bank Ltd.1 | 2,457,600 | $43,799 |
| Zurich Insurance Group AG1 | 92,200 | 37,815 |
| AIA Group Ltd.1 | 2,338,600 | 24,606 |
| Banco Santander, SA1 | 4,834,538 | 20,413 |
| ING Groep NV1 | 1,367,000 | 16,429 |
| Sony Financial Holdings Inc.1 | 660,400 | 15,808 |
| Prudential PLC1 | 738,000 | 14,200 |
| Bank Rakyat Indonesia (Persero) Tbk PT1 | 43,843,000 | 13,837 |
| DBS Group Holdings Ltd.1 | 558,000 | 10,756 |
| Haci Ömer Sabanci Holding AS1 | 6,520,900 | 10,463 |
| Moscow Exchange MICEX-RTS PJSC1 | 5,665,000 | 9,834 |
| PICC Property and Casualty Co. Ltd., Class H1 | 7,905,000 | 9,532 |
| UniCredit SpA1 | 630,000 | 9,211 |
| Sberbank of Russia PJSC (ADR)1 | 394,479 | 6,491 |
| B3 SA - Brasil, Bolsa, Balcao | 426,000 | 4,550 |
| ABN AMRO Bank NV, depository receipts1 | 188,000 | 3,434 |
| 251,178 | ||
| Industrials 10.95% | ||
| Airbus SE, non-registered shares1 | 216,160 | 31,715 |
| Shanghai International Airport Co., Ltd., Class A1 | 2,590,033 | 29,298 |
| ASSA ABLOY AB, Class B1 | 681,100 | 15,916 |
| Komatsu Ltd.1 | 629,600 | 15,095 |
| Airports of Thailand PCL, foreign registered1 | 5,250,000 | 12,974 |
| SMC Corp.1 | 23,300 | 10,651 |
| Adani Ports & Special Economic Zone Ltd.1 | 1,975,327 | 10,135 |
| Aena SME, SA, non-registered shares1 | 52,450 | 10,064 |
| ALD SA1 | 513,000 | 7,977 |
| GT Capital Holdings, Inc.1 | 438,662 | 7,343 |
| Recruit Holdings Co., Ltd.1 | 156,000 | 5,870 |
| Rolls-Royce Holdings PLC1,2 | 521,400 | 4,721 |
| International Container Terminal Services, Inc.1 | 1,000,000 | 2,536 |
| 164,295 | ||
| Consumer discretionary 10.51% | ||
| Luckin Coffee Inc., Class A (ADR)2 | 987,340 | 38,862 |
| Sony Corp.1 | 430,000 | 29,269 |
| LVMH Moët Hennessy-Louis Vuitton SE1 | 48,000 | 22,355 |
| Kering SA1 | 29,000 | 19,104 |
| Galaxy Entertainment Group Ltd.1 | 2,365,000 | 17,432 |
| Alibaba Group Holding Ltd. (ADR)2 | 79,100 | 16,777 |
| Inchcape PLC1 | 589,000 | 5,507 |
| Sands China Ltd.1 | 972,000 | 5,213 |
| Hyundai Mobis Co., Ltd.1 | 13,875 | 3,068 |
| 157,587 |
American Funds Insurance Series — International Growth and Income Fund — Page 49 of 184
| Common stocks (continued) Health care 9.46% | Shares | Value (000) |
| Novartis AG1 | 502,545 | $47,612 |
| Daiichi Sankyo Co., Ltd.1 | 561,000 | 37,044 |
| Takeda Pharmaceutical Co. Ltd.1 | 518,353 | 20,536 |
| Fresenius SE & Co. KGaA1 | 275,800 | 15,568 |
| Chugai Pharmaceutical Co., Ltd.1 | 76,300 | 7,028 |
| Teva Pharmaceutical Industries Ltd. (ADR)2 | 662,000 | 6,488 |
| NMC Health PLC1 | 205,000 | 4,812 |
| Alcon Inc.1,2 | 48,672 | 2,757 |
| 141,845 | ||
| Energy 7.44% | ||
| Royal Dutch Shell PLC, Class A (GBP denominated)1 | 2,147,691 | 63,839 |
| Royal Dutch Shell PLC, Class B1 | 138,000 | 4,112 |
| TOTAL SA1 | 404,534 | 22,356 |
| Canadian Natural Resources, Ltd. (CAD denominated) | 272,500 | 8,814 |
| Canadian Natural Resources, Ltd. | 92,000 | 2,976 |
| Cenovus Energy Inc. (CAD denominated) | 935,000 | 9,504 |
| 111,601 | ||
| Utilities 6.31% | ||
| E.ON SE1 | 3,488,000 | 37,304 |
| ENN Energy Holdings Ltd.1 | 1,658,000 | 18,128 |
| Ørsted AS1 | 92,807 | 9,615 |
| Iberdrola, SA, non-registered shares1 | 807,869 | 8,320 |
| Naturgy Energy Group, SA1 | 265,000 | 6,671 |
| SSE PLC1 | 320,000 | 6,131 |
| National Grid PLC1 | 359,664 | 4,520 |
| ENGIE SA1 | 249,000 | 4,024 |
| 94,713 | ||
| Materials 6.11% | ||
| Rio Tinto PLC1 | 658,800 | 39,144 |
| Kansai Paint Co., Ltd.1 | 512,000 | 12,514 |
| Air Liquide SA, non-registered shares1 | 79,200 | 11,256 |
| Akzo Nobel NV1 | 93,955 | 9,580 |
| Yara International ASA1 | 228,000 | 9,500 |
| Vale SA, ordinary nominative (ADR) | 506,000 | 6,679 |
| Glencore PLC1 | 940,000 | 2,939 |
| 91,612 | ||
| Information technology 5.64% | ||
| Taiwan Semiconductor Manufacturing Co., Ltd.1 | 2,804,000 | 31,053 |
| Tokyo Electron Ltd.1 | 96,500 | 21,206 |
| ASML Holding NV1 | 47,800 | 14,235 |
| Samsung Electronics Co., Ltd.1 | 259,000 | 12,480 |
| Lenovo Group Ltd.1 | 8,290,000 | 5,577 |
| 84,551 | ||
| Consumer staples 5.21% | ||
| British American Tobacco PLC1 | 548,402 | 23,365 |
| Pernod Ricard SA1 | 128,650 | 23,029 |
| Coca-Cola Icecek AS, Class C1 | 2,631,000 | 17,131 |
American Funds Insurance Series — International Growth and Income Fund — Page 50 of 184
| Common stocks (continued) Consumer staples (continued) | Shares | Value (000) |
| Imperial Brands PLC1 | 316,016 | $7,830 |
| Kirin Holdings Co., Ltd.1 | 313,000 | 6,827 |
| 78,182 | ||
| Communication services 5.15% | ||
| Singapore Telecommunications Ltd.1 | 9,429,449 | 23,646 |
| SoftBank Group Corp.1 | 487,600 | 21,229 |
| Yandex NV, Class A2 | 470,000 | 20,440 |
| Nippon Telegraph and Telephone Corp.1 | 251,600 | 6,373 |
| Tencent Holdings Ltd.1 | 116,700 | 5,630 |
| 77,318 | ||
| Real estate 4.89% | ||
| Sun Hung Kai Properties Ltd.1 | 2,061,500 | 31,622 |
| CK Asset Holdings Ltd.1 | 2,626,000 | 19,032 |
| China Overseas Land & Investment Ltd.1 | 3,944,000 | 15,403 |
| China Resources Land Ltd.1 | 1,308,000 | 6,517 |
| Daito Trust Construction Co., Ltd.1 | 6,500 | 805 |
| 73,379 | ||
| Total common stocks(cost: $1,069,560,000) | 1,326,261 | |
| Preferred securities 2.10% Financials 1.83% | ||
| Itaú Unibanco Holding SA, preferred nominative (ADR) | 2,993,550 | 27,391 |
| Energy 0.27% | ||
| Petróleo Brasileiro SA (Petrobras), preferred nominative (ADR) | 201,000 | 2,999 |
| Petróleo Brasileiro SA (Petrobras), preferred nominative | 143,000 | 1,073 |
| 4,072 | ||
| Total preferred securities(cost: $26,377,000) | 31,463 | |
| Bonds, notes & other debt instruments 1.12% Bonds & notes of governments & government agencies outside the U.S. 0.58% | Principal amount (000) | |
| Brazil (Federative Republic of) 10.00% 2025 | BRL 22,000 | 6,288 |
| Portuguese Republic 3.875% 2030 | €1,640 | 2,455 |
| 8,743 | ||
| Corporate bonds & notes 0.54% Energy 0.30% | ||
| Petróleos Mexicanos 6.875% 2026 | $3,617 | 3,982 |
| Petróleos Mexicanos 6.35% 2048 | 454 | 440 |
| 4,422 |
American Funds Insurance Series — International Growth and Income Fund — Page 51 of 184
| Bonds, notes & other debt instruments (continued) Corporate bonds & notes (continued) Health care 0.24% | Principal amount (000) | Value (000) |
| Teva Pharmaceutical Finance Co. BV 3.15% 2026 | $1,060 | $885 |
| Teva Pharmaceutical Finance Co. BV 4.10% 2046 | 1,160 | 838 |
| Valeant Pharmaceuticals International, Inc. 6.125% 20253 | 1,865 | 1,931 |
| 3,654 | ||
| Total corporate bonds & notes | 8,076 | |
| Total bonds, notes & other debt instruments(cost: $15,646,000) | 16,819 | |
| Short-term securities 8.54% Money market investments 8.54% | Shares | |
| Capital Group Central Cash Fund 1.73%4 | 1,280,263 | 128,026 |
| Total short-term securities(cost: $127,980,000) | 128,026 | |
| Total investment securities 100.17%(cost: $1,239,563,000) | 1,502,569 | |
| Other assets less liabilities (0.17)% | (2,483) | |
| Net assets 100.00% | $1,500,086 |
Forward currency contracts
| Contract amount | Counterparty | Settlement date | Unrealized depreciation at 12/31/2019 (000) | |
| Purchases (000) | Sales (000) | |||
| USD1,609 | GBP1,223 | Bank of America | 1/9/2020 | $(11) |
| 1 | Valued under fair value procedures adopted by authority of the board of trustees. The total value of all such securities was $1,211,171,000, which represented 80.74% of the net assets of the fund. This entire amount relates to certain securities trading outside the U.S. whose values were adjusted as a result of significant market movements following the close of local trading. |
| 2 | Security did not produce income during the last 12 months. |
| 3 | Acquired in a transaction exempt from registration under Rule 144A of the Securities Act of 1933. May be resold in the U.S. in transactions exempt from registration, normally to qualified institutional buyers. The total value of all such securities was $1,931,000, which represented .13% of the net assets of the fund. |
| 4 | Rate represents the seven-day yield at 12/31/2019. |
| Key to abbreviations and symbols | |||
| ADR = American Depositary Receipts | |||
| BRL = Brazilian reais | |||
| CAD = Canadian dollars | |||
| € = Euros | |||
| GBP = British pounds | |||
| USD/$ = U.S. dollars |
American Funds Insurance Series — International Growth and Income Fund — Page 52 of 184
Capital Income Builder®
Investment portfolio
December 31, 2019
| Common stocks 68.57% Consumer staples 10.33% | Shares | Value (000) |
| Philip Morris International Inc. | 188,220 | $16,016 |
| British American Tobacco PLC1 | 307,500 | 13,101 |
| Diageo PLC1 | 303,200 | 12,777 |
| Coca-Cola Co. | 225,000 | 12,454 |
| Carlsberg A/S, Class B1 | 72,426 | 10,804 |
| Altria Group, Inc. | 205,470 | 10,255 |
| Nestlé SA1 | 69,277 | 7,505 |
| Imperial Brands PLC1 | 291,600 | 7,225 |
| Danone SA1 | 72,020 | 5,978 |
| Reckitt Benckiser Group PLC1 | 60,000 | 4,872 |
| Japan Tobacco Inc.1 | 97,100 | 2,165 |
| 103,152 | ||
| Information technology 9.62% | ||
| Microsoft Corp. | 119,020 | 18,769 |
| Broadcom Inc. | 51,500 | 16,275 |
| Taiwan Semiconductor Manufacturing Co., Ltd.1 | 1,366,800 | 15,137 |
| Intel Corp. | 221,100 | 13,233 |
| QUALCOMM Inc. | 123,400 | 10,888 |
| Vanguard International Semiconductor Corp.1 | 2,070,700 | 5,480 |
| Delta Electronics, Inc.1 | 805,200 | 4,071 |
| NetApp, Inc. | 62,700 | 3,903 |
| KLA Corp. | 21,800 | 3,884 |
| VTech Holdings Ltd.1 | 328,400 | 3,248 |
| MediaTek Inc.1 | 77,300 | 1,144 |
| 96,032 | ||
| Financials 8.43% | ||
| CME Group Inc., Class A | 66,166 | 13,281 |
| Zurich Insurance Group AG1 | 31,098 | 12,755 |
| JPMorgan Chase & Co. | 72,900 | 10,162 |
| Truist Financial Corp. | 152,006 | 8,561 |
| Sampo Oyj, Class A1 | 153,061 | 6,678 |
| Swedbank AB, Class A1 | 419,333 | 6,254 |
| PNC Financial Services Group, Inc. | 37,900 | 6,050 |
| Svenska Handelsbanken AB, Class A1 | 553,166 | 5,956 |
| Lloyds Banking Group PLC1 | 4,434,000 | 3,701 |
| Nasdaq, Inc. | 19,800 | 2,121 |
| Everest Re Group, Ltd. | 7,572 | 2,096 |
| The Blackstone Group Inc., Class A | 36,500 | 2,042 |
| Hong Kong Exchanges and Clearing Ltd.1 | 54,500 | 1,766 |
| Marsh & McLennan Cos., Inc. | 13,100 | 1,459 |
| Bank of China Ltd., Class H1 | 1,894,000 | 811 |
| MONETA Money Bank, AS, non-registered shares1 | 137,053 | 514 |
| 84,207 |
American Funds Insurance Series — Capital Income Builder — Page 53 of 184
| Common stocks (continued) Real estate 7.88% | Shares | Value (000) |
| American Tower Corp. REIT | 81,369 | $18,700 |
| Crown Castle International Corp. REIT | 130,300 | 18,522 |
| Link Real Estate Investment Trust REIT1 | 848,000 | 9,003 |
| CK Asset Holdings Ltd.1 | 971,500 | 7,041 |
| Digital Realty Trust, Inc. REIT | 49,000 | 5,867 |
| Unibail-Rodamco-Westfield, non-registered shares REIT1 | 36,483 | 5,764 |
| Nexity SA, Class A, non-registered shares1 | 81,189 | 4,081 |
| Longfor Group Holdings Ltd.1 | 770,000 | 3,616 |
| Iron Mountain Inc. REIT | 78,200 | 2,492 |
| Equinix, Inc. REIT | 3,400 | 1,985 |
| TAG Immobilien AG1 | 63,600 | 1,581 |
| 78,652 | ||
| Energy 6.06% | ||
| Royal Dutch Shell PLC, Class B1 | 661,840 | 19,721 |
| Royal Dutch Shell PLC, Class B (ADR) | 8,500 | 510 |
| Royal Dutch Shell PLC, Class A (GBP denominated)1 | 101 | 3 |
| Enbridge Inc. (CAD denominated) | 458,570 | 18,233 |
| Chevron Corp. | 57,700 | 6,953 |
| Equitrans Midstream Corp. | 460,500 | 6,152 |
| Schlumberger Ltd. | 149,300 | 6,002 |
| Inter Pipeline Ltd. | 170,300 | 2,956 |
| 60,530 | ||
| Health care 5.32% | ||
| AstraZeneca PLC1 | 123,900 | 12,396 |
| AstraZeneca PLC (ADR) | 145,100 | 7,235 |
| GlaxoSmithKline PLC1 | 541,100 | 12,730 |
| Pfizer Inc. | 207,500 | 8,130 |
| Eli Lilly and Co. | 37,200 | 4,889 |
| Merck & Co., Inc. | 39,200 | 3,565 |
| Roche Holding AG, nonvoting, non-registered shares1 | 7,627 | 2,473 |
| Koninklijke Philips NV (EUR denominated)1 | 35,323 | 1,727 |
| 53,145 | ||
| Communication services 4.89% | ||
| Vodafone Group PLC1 | 6,536,800 | 12,690 |
| Koninklijke KPN NV1 | 2,808,662 | 8,299 |
| Nippon Telegraph and Telephone Corp.1 | 263,000 | 6,662 |
| HKT Trust and HKT Ltd., units1 | 3,699,240 | 5,215 |
| Nintendo Co., Ltd.1 | 12,200 | 4,924 |
| Verizon Communications Inc. | 67,000 | 4,114 |
| BT Group PLC1 | 1,330,100 | 3,409 |
| HKBN Ltd.1 | 1,801,500 | 3,020 |
| Gannett Co., Inc. | 72,178 | 460 |
| 48,793 | ||
| Utilities 4.80% | ||
| Enel SpA1 | 2,008,308 | 15,977 |
| Edison International | 159,800 | 12,050 |
| SSE PLC1 | 339,756 | 6,510 |
| Iberdrola, SA, non-registered shares1 | 565,238 | 5,821 |
American Funds Insurance Series — Capital Income Builder — Page 54 of 184
| Common stocks (continued) Utilities (continued) | Shares | Value (000) |
| Infratil Ltd.1 | 1,464,892 | $4,961 |
| Exelon Corp. | 57,700 | 2,631 |
| 47,950 | ||
| Industrials 4.52% | ||
| Airbus SE, non-registered shares1 | 92,765 | 13,610 |
| Boeing Co. | 21,750 | 7,085 |
| BOC Aviation Ltd.1 | 646,700 | 6,570 |
| United Technologies Corp. | 36,600 | 5,481 |
| Union Pacific Corp. | 26,400 | 4,773 |
| Air New Zealand Ltd.1 | 1,738,359 | 3,433 |
| RELX PLC1 | 91,900 | 2,318 |
| Kühne + Nagel International AG1 | 11,185 | 1,886 |
| 45,156 | ||
| Consumer discretionary 4.07% | ||
| Las Vegas Sands Corp. | 195,000 | 13,463 |
| Sands China Ltd.1 | 1,782,000 | 9,556 |
| Gree Electric Appliances, Inc. of Zhuhai, Class A1 | 533,700 | 5,015 |
| Royal Caribbean Cruises Ltd. | 34,100 | 4,553 |
| Darden Restaurants, Inc. | 30,000 | 3,270 |
| Kering SA1 | 3,856 | 2,540 |
| Burberry Group PLC1 | 78,200 | 2,289 |
| 40,686 | ||
| Materials 2.65% | ||
| Dow Inc. | 164,133 | 8,983 |
| Asahi Kasei Corp.1 | 420,300 | 4,716 |
| Givaudan SA1 | 1,202 | 3,762 |
| Air Products and Chemicals, Inc. | 15,700 | 3,689 |
| Nutrien Ltd. | 75,220 | 3,604 |
| Linde PLC | 8,200 | 1,746 |
| 26,500 | ||
| Total common stocks(cost: $597,003,000) | 684,803 | |
| Rights & warrants 0.00% Energy 0.00% | ||
| Ultra Petroleum Corp., warrants, expire 20252 | 1,750 | —3 |
| Total rights & warrants(cost: $1,000) | —3 | |
| Convertible stocks 1.61% Utilities 0.74% | ||
| Sempra Energy, Series A, convertible preferred, 6.00% 2021 | 61,600 | 7,393 |
| Information technology 0.46% | ||
| Broadcom Inc., Series A, cumulative convertible preferred, 8.00% 2022 | 3,900 | 4,594 |
American Funds Insurance Series — Capital Income Builder — Page 55 of 184
| Convertible stocks (continued) Real estate 0.41% | Shares | Value (000) |
| Crown Castle International Corp. REIT, Series A, convertible preferred, 6.875% 2020 | 3,150 | $4,038 |
| Total convertible stocks(cost: $13,498,000) | 16,025 | |
| Bonds, notes & other debt instruments 21.35% U.S. Treasury bonds & notes 10.37% U.S. Treasury 9.79% | Principal amount (000) | |
| U.S. Treasury 1.75% 2020 | $8,000 | 8,008 |
| U.S. Treasury 2.25% 2021 | 3,590 | 3,621 |
| U.S. Treasury 1.625% 2022 | 157 | 157 |
| U.S. Treasury 2.00% 20224 | 15,000 | 15,159 |
| U.S. Treasury 2.00% 2022 | 3,000 | 3,033 |
| U.S. Treasury 2.125% 2022 | 8,800 | 8,931 |
| U.S. Treasury 1.75% 2023 | 4,000 | 4,015 |
| U.S. Treasury 2.625% 2023 | 4,060 | 4,184 |
| U.S. Treasury 2.75% 2023 | 3,770 | 3,905 |
| U.S. Treasury 2.875% 2023 | 3,100 | 3,241 |
| U.S. Treasury 1.25% 2024 | 1,271 | 1,247 |
| U.S. Treasury 1.75% 2024 | 900 | 903 |
| U.S. Treasury 2.00% 2025 | 13,200 | 13,384 |
| U.S. Treasury 1.75% 2026 | 610 | 607 |
| U.S. Treasury 1.875% 2026 | 6,300 | 6,331 |
| U.S. Treasury 2.00% 2026 | 7,500 | 7,588 |
| U.S. Treasury 2.875% 2028 | 1,500 | 1,616 |
| U.S. Treasury 1.75% 2029 | 4,143 | 4,080 |
| U.S. Treasury 2.875% 2045 | 200 | 219 |
| U.S. Treasury, principal only, 0% 20474 | 6,535 | 3,360 |
| U.S. Treasury 3.125% 20484 | 2,000 | 2,303 |
| U.S. Treasury 2.25% 2049 | 2,004 | 1,944 |
| 97,836 | ||
| U.S. Treasury inflation-protected securities 0.58% | ||
| U.S. Treasury Inflation-Protected Security 0.625% 20235 | 5,698 | 5,788 |
| U.S. Treasury Inflation-Protected Security 0.50% 20285 | —3 | —3 |
| 5,788 | ||
| Total U.S. Treasury bonds & notes | 103,624 | |
| Corporate bonds & notes 4.87% Utilities 0.85% | ||
| AEP Transmission Co. LLC 3.15% 2049 | 60 | 58 |
| AEP Transmission Co. LLC 3.80% 2049 | 45 | 48 |
| Ameren Corp. 2.50% 2024 | 600 | 605 |
| American Electric Power Co., Inc. 3.65% 2021 | 300 | 310 |
| CenterPoint Energy, Inc. 3.85% 2024 | 100 | 106 |
| CenterPoint Energy, Inc. 2.95% 2030 | 345 | 340 |
| Connecticut Light and Power Co. 3.20% 2027 | 445 | 470 |
| Consumers Energy Co. 3.10% 2050 | 150 | 150 |
| DTE Energy Co. 3.95% 2049 | 35 | 40 |
| Duke Energy Florida, LLC 2.50% 2029 | 430 | 430 |
| Duke Energy Progress, LLC 3.60% 2047 | 14 | 15 |
| Edison International 3.55% 2024 | 375 | 384 |
| Edison International 5.75% 2027 | 158 | 178 |
| Edison International 4.125% 2028 | 332 | 341 |
| Emera Inc. 6.75% 2076 (3-month USD-LIBOR + 5.44% on 6/15/2026)6 | 120 | 136 |
American Funds Insurance Series — Capital Income Builder — Page 56 of 184
| Bonds, notes & other debt instruments (continued) Corporate bonds & notes (continued) Utilities (continued) | Principal amount (000) | Value (000) |
| Entergy Corp. 5.125% 2020 | $200 | $203 |
| Entergy Corp. 2.95% 2026 | 280 | 284 |
| FirstEnergy Corp. 3.90% 2027 | 490 | 524 |
| Jersey Central Power & Light Co. 4.30% 20267 | 115 | 125 |
| MidAmerican Energy Holdings Co. 3.65% 2029 | 350 | 383 |
| Mississippi Power Co. 4.25% 2042 | 335 | 360 |
| Pacific Gas and Electric Co. 2.45% 20228 | 210 | 210 |
| Pacific Gas and Electric Co. 4.65% 20287,8 | 284 | 294 |
| Public Service Electric and Gas Co. 3.20% 2029 | 445 | 469 |
| San Diego Gas & Electric Co. 3.75% 2047 | 227 | 236 |
| San Diego Gas & Electric Co. 4.10% 2049 | 115 | 127 |
| SCANA Corp. 6.25% 2020 | 176 | 177 |
| SCANA Corp. 4.75% 2021 | 108 | 110 |
| SCANA Corp. 4.125% 2022 | 71 | 73 |
| Southern California Edison Co. 3.65% 2028 | 28 | 30 |
| Southern California Edison Co. 4.125% 2048 | 410 | 437 |
| Southern California Edison Co., Series C, 3.60% 2045 | 256 | 253 |
| Virginia Electric and Power Co. 4.00% 2046 | 85 | 94 |
| Virginia Electric and Power Co. 3.30% 2049 | 175 | 177 |
| Xcel Energy Inc. 2.60% 2029 | 175 | 173 |
| Xcel Energy Inc. 3.50% 2049 | 170 | 173 |
| 8,523 | ||
| Consumer staples 0.69% | ||
| Altria Group, Inc. 5.95% 2049 | 327 | 396 |
| Anheuser-Busch Co./InBev Worldwide 4.90% 2046 | 420 | 497 |
| British American Tobacco PLC 3.215% 2026 | 250 | 252 |
| British American Tobacco PLC 3.557% 2027 | 660 | 674 |
| British American Tobacco PLC 4.54% 2047 | 150 | 151 |
| British American Tobacco PLC 4.758% 2049 | 130 | 134 |
| Conagra Brands, Inc. 5.40% 2048 | 50 | 61 |
| Costco Wholesale Corp. 2.30% 2022 | 884 | 895 |
| Keurig Dr Pepper Inc. 5.085% 2048 | 64 | 77 |
| Molson Coors Brewing Co. 4.20% 2046 | 65 | 65 |
| Philip Morris International Inc. 3.375% 2029 | 450 | 472 |
| Wal-Mart Stores, Inc. 3.125% 2021 | 2,146 | 2,192 |
| Wal-Mart Stores, Inc. 2.55% 2023 | 510 | 521 |
| Wal-Mart Stores, Inc. 2.85% 2024 | 210 | 218 |
| WM. Wrigley Jr. Co. 3.375% 20207 | 300 | 303 |
| 6,908 | ||
| Financials 0.68% | ||
| Allstate Corp. 3.85% 2049 | 170 | 189 |
| AON Corp. 2.20% 2022 | 249 | 250 |
| Bank of America Corp. 3.458% 2025 (3-month USD-LIBOR + 0.97% on 3/15/2024)6 | 259 | 271 |
| Bank of America Corp. 2.88% 2030 (3-month USD-LIBOR + 1.19% on 10/22/2029)6 | 72 | 73 |
| Bank of Montreal 2.50% 2024 | 350 | 354 |
| CCCI Treasure Ltd., 3.50% (UST Yield Curve Rate T Note Constant Maturity 5-year + 7.192% on 4/21/2020)6 | 600 | 602 |
| Citigroup Inc. 2.976% 2030 (USD-SOFR + 1.422% on 11/5/2029)6 | 162 | 164 |
| Goldman Sachs Group, Inc. 5.375% 2020 | 890 | 896 |
| Hartford Financial Services Group, Inc. 2.80% 2029 | 300 | 304 |
| HSBC Holdings PLC 2.633% 2025 (3-month USD-LIBOR + 1.14% on 11/7/2024)6 | 500 | 502 |
| HSBC Holdings PLC 3.973% 2030 (3-month USD-LIBOR + 1.61% on 5/22/2029)6 | 250 | 269 |
American Funds Insurance Series — Capital Income Builder — Page 57 of 184
| Bonds, notes & other debt instruments (continued) Corporate bonds & notes (continued) Financials (continued) | Principal amount (000) | Value (000) |
| JPMorgan Chase & Co. 2.739% 2030 (USD-SOFR + 1.51% on 10/15/2029)6 | $246 | $246 |
| Metropolitan Life Global Funding I 2.40% 20217 | 225 | 226 |
| Mitsubishi UFJ Financial Group, Inc. 3.195% 2029 | 290 | 301 |
| Morgan Stanley 5.75% 2021 | 590 | 613 |
| New York Life Global Funding 3.00% 20287 | 150 | 155 |
| Sumitomo Mitsui Financial Group, Inc. 2.696% 2024 | 520 | 527 |
| Travelers Cos., Inc. 4.10% 2049 | 130 | 149 |
| Wells Fargo & Co. 2.15% 2020 | 425 | 425 |
| Wells Fargo & Co. 4.60% 2021 | 300 | 310 |
| 6,826 | ||
| Information technology 0.65% | ||
| Broadcom Inc. 4.75% 20297 | 490 | 536 |
| Broadcom Ltd. 3.875% 2027 | 370 | 384 |
| Fiserv, Inc. 3.50% 2029 | 870 | 915 |
| Microsoft Corp. 1.55% 2021 | 505 | 505 |
| Microsoft Corp. 2.40% 2022 | 1,000 | 1,014 |
| PayPal Holdings, Inc. 2.85% 2029 | 536 | 540 |
| Visa Inc. 2.15% 2022 | 2,525 | 2,553 |
| 6,447 | ||
| Health care 0.53% | ||
| Abbott Laboratories 3.75% 2026 | 240 | 262 |
| AbbVie Inc. 2.95% 20267 | 159 | 162 |
| AbbVie Inc. 3.20% 20297 | 314 | 320 |
| AbbVie Inc. 4.25% 20497 | 262 | 277 |
| AstraZeneca PLC 3.375% 2025 | 200 | 212 |
| Bristol-Myers Squibb Co. 2.90% 20247 | 580 | 599 |
| Bristol-Myers Squibb Co. 3.40% 20297 | 670 | 717 |
| Centene Corp. 5.375% 20267 | 100 | 106 |
| Centene Corp. 4.625% 20297 | 530 | 560 |
| Eli Lilly and Co. 2.35% 2022 | 560 | 567 |
| Merck & Co., Inc. 2.90% 2024 | 108 | 112 |
| Pfizer Inc. 4.00% 2049 | 50 | 57 |
| Takeda Pharmaceutical Co., Ltd. 4.40% 2023 | 780 | 838 |
| Takeda Pharmaceutical Co., Ltd. 5.00% 2028 | 250 | 291 |
| UnitedHealth Group Inc. 2.375% 2024 | 35 | 35 |
| UnitedHealth Group Inc. 4.45% 2048 | 170 | 203 |
| 5,318 | ||
| Energy 0.41% | ||
| Apache Corp. 4.25% 2030 | 385 | 399 |
| Apache Corp. 5.35% 2049 | 180 | 189 |
| BP Capital Markets PLC 4.234% 2028 | 175 | 198 |
| Cenovus Energy Inc. 5.25% 2037 | 300 | 332 |
| Cheniere Energy, Inc. 3.70% 20297 | 252 | 257 |
| Concho Resources Inc. 4.30% 2028 | 210 | 229 |
| Enbridge Energy Partners, LP 7.375% 2045 | 73 | 109 |
| Energy Transfer Partners, LP 5.30% 2047 | 60 | 64 |
| Energy Transfer Partners, LP 6.00% 2048 | 161 | 188 |
| Energy Transfer Partners, LP 6.25% 2049 | 150 | 181 |
| Equinor ASA 3.625% 2028 | 105 | 115 |
| Equinor ASA 3.25% 2049 | 121 | 122 |
| Noble Energy, Inc. 3.25% 2029 | 250 | 252 |
American Funds Insurance Series — Capital Income Builder — Page 58 of 184
| Bonds, notes & other debt instruments (continued) Corporate bonds & notes (continued) Energy (continued) | Principal amount (000) | Value (000) |
| Occidental Petroleum Corp. 3.20% 2026 | $28 | $28 |
| Occidental Petroleum Corp. 3.50% 2029 | 393 | 401 |
| Occidental Petroleum Corp. 4.40% 2049 | 110 | 114 |
| Shell International Finance BV 2.00% 2024 | 420 | 419 |
| Total Capital International 2.434% 2025 | 175 | 177 |
| Total Capital International 3.455% 2029 | 265 | 287 |
| Ultra Petroleum Corp. 11.00% 2024 (18.18% PIK)9 | 91 | 15 |
| 4,076 | ||
| Industrials 0.33% | ||
| Boeing Co. 2.70% 2022 | 300 | 305 |
| Boeing Co. 3.10% 2026 | 88 | 91 |
| Boeing Co. 3.60% 2034 | 90 | 96 |
| Boeing Co. 3.25% 2035 | 140 | 143 |
| CSX Corp. 4.75% 2048 | 50 | 60 |
| CSX Corp. 3.35% 2049 | 310 | 306 |
| Honeywell International Inc. 2.15% 2022 | 305 | 308 |
| Honeywell International Inc. 2.30% 2024 | 175 | 177 |
| Honeywell International Inc. 2.70% 2029 | 70 | 72 |
| Lockheed Martin Corp. 2.50% 2020 | 821 | 825 |
| Norfolk Southern Corp. 3.00% 2022 | 224 | 229 |
| Union Pacific Corp. 3.70% 2029 | 430 | 470 |
| Union Pacific Corp. 4.30% 2049 | 110 | 127 |
| Union Pacific Corp. 3.95% 2059 | 45 | 47 |
| Westinghouse Air Brake Technologies Corp. 4.40% 20246 | 74 | 79 |
| 3,335 | ||
| Communication services 0.30% | ||
| AT&T Inc. (3-month USD-LIBOR + 0.65%) 2.651% 202010 | 600 | 600 |
| CCO Holdings LLC and CCO Holdings Capital Corp. 5.75% 2048 | 200 | 233 |
| CCO Holdings LLC and CCO Holdings Capital Corp. 5.125% 2049 | 475 | 516 |
| Comcast Corp. 2.65% 2030 | 520 | 522 |
| Comcast Corp. 4.00% 2047 | 100 | 110 |
| Comcast Corp. 4.00% 2048 | 100 | 111 |
| NBCUniversal Enterprise, Inc., junior subordinated, 5.25%7 | 630 | 651 |
| Verizon Communications Inc. 4.329% 2028 | 142 | 161 |
| Vodafone Group PLC 4.25% 2050 | 75 | 79 |
| 2,983 | ||
| Consumer discretionary 0.27% | ||
| General Motors Co. 5.95% 2049 | 90 | 100 |
| General Motors Financial Co. 3.55% 2022 | 140 | 144 |
| Home Depot, Inc. 2.95% 2029 | 275 | 286 |
| Toyota Motor Credit Corp. 2.15% 2020 | 758 | 758 |
| Toyota Motor Credit Corp. 2.15% 2022 | 505 | 509 |
| Toyota Motor Credit Corp. 2.60% 2022 | 856 | 869 |
| 2,666 |
American Funds Insurance Series — Capital Income Builder — Page 59 of 184
| Bonds, notes & other debt instruments (continued) Corporate bonds & notes (continued) Real estate 0.12% | Principal amount (000) | Value (000) |
| American Campus Communities, Inc. 3.30% 2026 | $318 | $330 |
| Equinix, Inc. 2.90% 2026 | 266 | 267 |
| Equinix, Inc. 3.20% 2029 | 288 | 290 |
| Westfield Corp. Ltd. 3.50% 20297 | 260 | 269 |
| 1,156 | ||
| Materials 0.04% | ||
| Dow Chemical Co. 4.80% 2049 | 67 | 78 |
| Praxair, Inc. 3.00% 2021 | 316 | 322 |
| 400 | ||
| Total corporate bonds & notes | 48,638 | |
| Mortgage-backed obligations 4.64% Federal agency mortgage-backed obligations 4.13% | ||
| Fannie Mae Pool #AE0311 3.50% 204011 | 24 | 26 |
| Fannie Mae Pool #BM4488 3.435% 204810,11 | 1,479 | 1,514 |
| Fannie Mae Pool #CA4566 3.50% 204911 | 2,038 | 2,096 |
| Fannie Mae Pool #MA3686 3.50% 204911 | 1,552 | 1,595 |
| Fannie Mae Pool #MA3692 3.50% 204911 | 784 | 806 |
| Fannie Mae Pool #MA3775 3.50% 204911 | 245 | 252 |
| Fannie Mae Pool #FM1596 3.50% 204911 | 97 | 100 |
| Fannie Mae Pool #BJ8402 3.549% 204910,11 | 260 | 268 |
| Freddie Mac 2.50% 203211 | 82 | 81 |
| Freddie Mac 2.50% 203311 | 121 | 121 |
| Freddie Mac Pool #760012 3.01% 204510,11 | 116 | 117 |
| Freddie Mac Pool #760013 3.009% 204510,11 | 91 | 92 |
| Freddie Mac Pool #760015 3.238% 204710,11 | 228 | 229 |
| Freddie Mac Pool #ZS4784 3.50% 204811 | 39 | 41 |
| Freddie Mac Pool #SD8005 3.50% 204911 | 5,253 | 5,397 |
| Freddie Mac Pool #SD8001 3.50% 204911 | 4,041 | 4,153 |
| Freddie Mac Pool #ZT1863 3.50% 204911 | 1,546 | 1,589 |
| Freddie Mac Pool #ZA7047 3.50% 204911 | 878 | 906 |
| Freddie Mac Pool #ZT1776 3.50% 204911 | 870 | 894 |
| Freddie Mac Pool #ZT1951 3.50% 204911 | 454 | 466 |
| Freddie Mac Pool #RA1824 3.50% 204911 | 108 | 111 |
| Freddie Mac Seasoned Credit Risk Transfer Trust, Series 2017-2, Class HA, 3.00% 20566,11 | 461 | 469 |
| Freddie Mac Seasoned Credit Risk Transfer Trust, Series 2017-2, Class MA, 3.00% 205611 | 446 | 454 |
| Freddie Mac Seasoned Credit Risk Transfer Trust, Series 2017-1, Class HA, 3.00% 205610,11 | 230 | 235 |
| Freddie Mac Seasoned Credit Risk Transfer Trust, Series 2017-4, Class HT, 3.25% 20576,11 | 178 | 184 |
| Freddie Mac Seasoned Credit Risk Transfer Trust, Series 2018-3, Class MA, 3.50% 205711 | 3,312 | 3,424 |
| Freddie Mac Seasoned Credit Risk Transfer Trust, Series 2018-2, Class MT, 3.50% 205711 | 2,739 | 2,888 |
| Freddie Mac Seasoned Credit Risk Transfer Trust, Series 2017-4, Class MT, 3.50% 205711 | 143 | 148 |
| Freddie Mac Seasoned Credit Risk Transfer Trust, Series 2019-4, Class MA, 3.00% 205911 | 2,077 | 2,116 |
| Freddie Mac Seasoned Loan Structured Transaction Trust, Series 2018-2, Class A1, 3.50% 202811 | 1,711 | 1,771 |
| Freddie Mac Seasoned Loan Structured Transaction Trust, Series 2019-3, Class A1C, 2.75% 202911 | 2,480 | 2,514 |
| Freddie Mac Seasoned Loan Structured Transaction Trust, Series 2019-2, Class A1C, 2.75% 202911 | 2,387 | 2,403 |
| Government National Mortgage Assn. 4.50% 204911 | 3,004 | 3,140 |
| Government National Mortgage Assn. 4.50% 205011,12 | 86 | 90 |
| Government National Mortgage Assn. Pool #MA5877 4.50% 204911 | 364 | 381 |
| Government National Mortgage Assn. Pool #694836 5.644% 205911 | 1 | 1 |
| Government National Mortgage Assn. Pool #725975 5.46% 206011 | —3 | —3 |
| Government National Mortgage Assn. Pool #765152 4.14% 206111 | —3 | —3 |
| Government National Mortgage Assn. Pool #721640 4.81% 206111 | —3 | —3 |
American Funds Insurance Series — Capital Income Builder — Page 60 of 184
| Bonds, notes & other debt instruments (continued) Mortgage-backed obligations (continued) Federal agency mortgage-backed obligations (continued) | Principal amount (000) | Value (000) |
| Government National Mortgage Assn. Pool #766524 4.251% 206211 | $21 | $21 |
| Government National Mortgage Assn. Pool #766525 4.524% 206211 | 13 | 13 |
| Government National Mortgage Assn. Pool #777452 4.166% 206311 | 43 | 43 |
| Government National Mortgage Assn. Pool #767639 4.409% 206311 | 33 | 33 |
| Government National Mortgage Assn. Pool #AA1709 4.538% 206311 | 51 | 52 |
| Government National Mortgage Assn. Pool #725893 5.20% 206411 | 1 | 1 |
| Government National Mortgage Assn. Pool #AA7554 6.64% 206411 | 4 | 5 |
| 41,240 | ||
| Collateralized mortgage-backed obligations (privately originated) 0.51% | ||
| Arroyo Mortgage Trust, Series 2018-1, Class A1, 3.763% 20487,10,11 | 662 | 671 |
| Arroyo Mortgage Trust, Series 2019-1, Class A1, 3.805% 20497,10,11 | 487 | 496 |
| Cascade Funding Mortgage Trust, Series 2019-HB1, Class A, 2.386% 20297,10,11 | 437 | 438 |
| Finance of America HECM Buyout, Series 2019-AB1, Class A, 2.656% 20491,7,11 | 212 | 212 |
| Finance of America Structured Securities Trust, Series 2019-HB1, Class A, 3.279% 20297,10,11 | 272 | 274 |
| Homeward Opportunities Fund Trust, Series 2018-1, 3.766% 20487,10,11 | 155 | 156 |
| Mello Warehouse Securitization Trust, Series 2019-2, Class A, (1-month USD-LIBOR + 0.75%) 2.573% 20527,10,11 | 1,000 | 1,000 |
| Nationstar HECM Loan Trust, Series 2018-2, Class A, 3.188% 20287,10,11 | 68 | 68 |
| Nationstar HECM Loan Trust, Series 2019-2A, Class A, 2.575% 20297,10,11 | 140 | 140 |
| Nationstar HECM Loan Trust, Series 2019-1A, Class A, 2.651% 20297,10,11 | 122 | 122 |
| Station Place Securitization Trust, Series 2019-WL1, Class A, (1-month USD-LIBOR + 0.65%) 2.442% 20527,10,11 | 1,501 | 1,505 |
| 5,082 | ||
| Total mortgage-backed obligations | 46,322 | |
| Asset-backed obligations 1.43% | ||
| Cloud Pass-Through Trust, Series 2019-1A, Class CLOU, 3.554% 20227,10,11 | 592 | 599 |
| Drivetime Auto Owner Trust, Series 2019-3, Class A, 2.55% 20227,11 | 296 | 297 |
| Exeter Automobile Receivables Trust, Series 2019-4A, Class A, 2.18% 20237,11 | 720 | 721 |
| Ford Credit Auto Owner Trust, Series 2015-1, Class A, 2.12% 20267,11 | 6,959 | 6,959 |
| Ford Credit Floorplan Master Owner Trust, Series 2019-3, Class A1, 2.23% 202411 | 2,729 | 2,736 |
| Global SC Finance V SRL, Series 2019-1A, Class B, 4.81% 20397,11 | 195 | 192 |
| Volkswagen Auto Lease Trust, Series 2019-A, Class A2A, 2.00% 202211 | 842 | 843 |
| Westlake Automobile Receivables Trust, Series 2018-3A, Class A2A, 2.98% 20227,11 | 337 | 338 |
| Westlake Automobile Receivables Trust, Series 2019-3A, Class A2, 2.15% 20237,11 | 1,582 | 1,584 |
| 14,269 | ||
| Municipals 0.04% South Carolina 0.04% | ||
| Public Service Auth., Rev. Ref. Obligations (Santee Cooper), Series 2016-C, 5.00% 2035 | 350 | 415 |
| Total municipals | 415 | |
| Total bonds, notes & other debt instruments(cost: $208,835,000) | 213,268 |
American Funds Insurance Series — Capital Income Builder — Page 61 of 184
| Short-term securities 7.66% Money market investments 7.66% | Shares | Value (000) |
| Capital Group Central Cash Fund 1.73%13 | 765,198 | $76,520 |
| Total short-term securities(cost: $76,393,000) | 76,520 | |
| Total investment securities 99.19%(cost: $895,730,000) | 990,616 | |
| Other assets less liabilities 0.81% | 8,100 | |
| Net assets 100.00% | $998,716 |
Futures contracts
| Contracts | Type | Number of contracts | Expiration | Notional amount14 (000) | Value at 12/31/201915 (000) | Unrealized (depreciation) appreciation at 12/31/2019 (000) |
| 2 Year U.S. Treasury Note Futures | Long | 422 | April 2020 | $84,400 | $90,941 | $(41) |
| 5 Year U.S. Treasury Note Futures | Short | 50 | April 2020 | (5,000) | (5,930) | 27 |
| 10 Year U.S. Treasury Note Futures | Long | 37 | March 2020 | 3,700 | 4,752 | (40) |
| 10 Year Ultra U.S. Treasury Note Futures | Short | 6 | March 2020 | (600) | (844) | 10 |
| 20 Year U.S. Treasury Bond Futures | Long | 49 | March 2020 | 4,900 | 7,639 | (162) |
| 30 Year Ultra U.S. Treasury Bond Futures | Long | 23 | March 2020 | 2,300 | 4,178 | (125) |
| $(331) |
Swap contracts
Interest rate swaps
| Receive | Pay | Expiration date | Notional (000) | Value at 12/31/2019 (000) | Upfront payments/ receipts (000) | Unrealized appreciation (depreciation) at 12/31/2019 (000) |
| 2.197% | U.S. EFFR | 4/15/2021 | $31,000 | $253 | $— | $253 |
| 1.6325% | U.S. EFFR | 7/18/2021 | 40,000 | 75 | — | 75 |
| 1.3615% | U.S. EFFR | 11/1/2021 | 23,500 | (36) | — | (36) |
| 1.281% | U.S. EFFR | 11/4/2021 | 23,500 | (70) | — | (70) |
| U.S. EFFR | 1.335% | 11/26/2021 | 38,000 | 77 | — | 77 |
| 2.21875% | U.S. EFFR | 3/14/2024 | 9,000 | 271 | — | 271 |
| U.S. EFFR | 1.485% | 10/23/2029 | 5,000 | 76 | — | 76 |
| U.S. EFFR | 1.4869% | 10/23/2029 | 4,600 | 69 | — | 69 |
| U.S. EFFR | 1.453% | 10/24/2029 | 5,800 | 105 | — | 105 |
| U.S. EFFR | 1.4741% | 10/24/2029 | 5,800 | 94 | — | 94 |
| U.S. EFFR | 1.4495% | 10/24/2029 | 4,200 | 78 | — | 78 |
| U.S. EFFR | 1.446% | 10/24/2029 | 600 | 11 | — | 11 |
| 1.419% | U.S. EFFR | 11/26/2029 | 8,000 | (174) | — | (174) |
| $— | $829 |
American Funds Insurance Series — Capital Income Builder — Page 62 of 184
| 1 | Valued under fair value procedures adopted by authority of the board of trustees. The total value of all such securities was $345,473,000, which represented 34.59% of the net assets of the fund. This amount includes $345,261,000 related to certain securities trading outside the U.S. whose values were adjusted as a result of significant market movements following the close of local trading. |
| 2 | Security did not produce income during the last 12 months. |
| 3 | Amount less than one thousand. |
| 4 | All or a portion of this security was pledged as collateral. The total value of pledged collateral was $1,180,000, which represented .12% of the net assets of the fund. |
| 5 | Index-linked bond whose principal amount moves with a government price index. |
| 6 | Step bond; coupon rate may change at a later date. |
| 7 | Acquired in a transaction exempt from registration under Rule 144A of the Securities Act of 1933. May be resold in the U.S. in transactions exempt from registration, normally to qualified institutional buyers. The total value of all such securities was $21,329,000, which represented 2.14% of the net assets of the fund. |
| 8 | Scheduled interest and/or principal payment was not received. |
| 9 | Payment in kind; the issuer has the option of paying additional securities in lieu of cash. Most recent payment was 100% cash unless otherwise noted. |
| 10 | Coupon rate may change periodically. Reference rate and spread are as of the most recent information available. Some coupon rates are determined by the issuer or agent based on current market conditions; therefore, the reference rate and spread are not available. |
| 11 | Principal payments may be made periodically. Therefore, the effective maturity date may be earlier than the stated maturity date. |
| 12 | Purchased on a TBA basis. |
| 13 | Rate represents the seven-day yield at 12/31/2019. |
| 14 | Notional amount is calculated based on the number of contracts and notional contract size. |
| 15 | Value is calculated based on the notional amount and current market price. |
| Key to abbreviations and symbol |
| ADR = American Depositary Receipts |
| Auth. = Authority |
| CAD = Canadian dollars |
| EFFR = Effective Federal Funds Rate |
| EUR = Euros |
| GBP = British pounds |
| LIBOR = London Interbank Offered Rate |
| Ref. = Refunding |
| Rev. = Revenue |
| SOFR = Secured Overnight Financing Rate |
| TBA = To-be-announced |
| USD/$ = U.S. dollars |
American Funds Insurance Series — Capital Income Builder — Page 63 of 184
Asset Allocation Fund
Investment portfolio
December 31, 2019
| Common stocks 64.44% Information technology 15.65% | Shares | Value (000) |
| Microsoft Corp. | 6,891,900 | $1,086,852 |
| Broadcom Inc. | 2,097,200 | 662,757 |
| ASML Holding NV (New York registered) | 1,865,000 | 551,928 |
| ASML Holding NV1 | 70,000 | 20,847 |
| Taiwan Semiconductor Manufacturing Co., Ltd. (ADR) | 6,806,700 | 395,469 |
| MKS Instruments, Inc.2 | 2,800,000 | 308,028 |
| VeriSign, Inc.3 | 1,400,000 | 269,752 |
| Intel Corp. | 3,500,000 | 209,475 |
| Visa Inc., Class A | 1,032,000 | 193,913 |
| Dell Technologies Inc., Class C3 | 3,387,100 | 174,063 |
| Mastercard Inc., Class A | 451,000 | 134,664 |
| Intuit Inc. | 300,000 | 78,579 |
| ServiceNow, Inc.3 | 260,600 | 73,573 |
| RingCentral, Inc., Class A3 | 361,700 | 61,008 |
| MongoDB, Inc., Class A3 | 282,003 | 37,114 |
| PayPal Holdings, Inc.3 | 316,300 | 34,214 |
| Corporate Risk Holdings I, Inc.1,3,4 | 168,812 | 20 |
| 4,292,256 | ||
| Financials 11.02% | ||
| First Republic Bank | 3,380,000 | 396,981 |
| Chubb Ltd. | 2,375,000 | 369,693 |
| Arch Capital Group Ltd.3 | 7,331,500 | 314,448 |
| JPMorgan Chase & Co. | 1,600,000 | 223,040 |
| Bank of America Corp. | 6,000,000 | 211,320 |
| Capital One Financial Corp. | 2,000,000 | 205,820 |
| Citigroup Inc. | 2,500,000 | 199,725 |
| CME Group Inc., Class A | 977,200 | 196,144 |
| Apollo Global Management, Inc., Class A | 3,090,000 | 147,424 |
| BlackRock, Inc. | 229,000 | 115,118 |
| Aon PLC, Class A | 502,000 | 104,562 |
| PNC Financial Services Group, Inc. | 500,000 | 79,815 |
| Intercontinental Exchange, Inc. | 800,000 | 74,040 |
| RenaissanceRe Holdings Ltd. | 357,000 | 69,979 |
| Nasdaq, Inc. | 638,000 | 68,330 |
| MSCI Inc. | 225,200 | 58,142 |
| TISCO Financial Group PCL, foreign registered1 | 12,675,900 | 41,960 |
| Ares Management Corp., Class A | 1,015,403 | 36,240 |
| The Blackstone Group Inc., Class A | 600,000 | 33,564 |
| AURELIUS Equity Opportunities SE & Co. KGaA, non-registered shares1,5 | 598,761 | 26,191 |
| Berkshire Hathaway Inc., Class A3 | 61 | 20,715 |
| First Hawaiian, Inc. | 400,000 | 11,540 |
| HDFC Bank Ltd.1 | 594,000 | 10,586 |
| Tradeweb Markets Inc., Class A | 156,400 | 7,249 |
| 3,022,626 |
American Funds Insurance Series — Asset Allocation Fund — Page 64 of 184
| Common stocks (continued) Health care 10.65% | Shares | Value (000) |
| UnitedHealth Group Inc. | 2,016,300 | $592,752 |
| Johnson & Johnson | 3,200,000 | 466,784 |
| Humana Inc. | 1,265,000 | 463,648 |
| Abbott Laboratories | 3,000,000 | 260,580 |
| Cigna Corp. | 1,250,000 | 255,612 |
| Merck & Co., Inc. | 2,420,300 | 220,126 |
| Vertex Pharmaceuticals Inc.3 | 460,000 | 100,717 |
| Gilead Sciences, Inc. | 1,500,000 | 97,470 |
| Thermo Fisher Scientific Inc. | 296,000 | 96,162 |
| Daiichi Sankyo Co., Ltd.1 | 1,291,300 | 85,268 |
| Pfizer Inc. | 1,815,000 | 71,112 |
| WellCare Health Plans, Inc.3 | 166,500 | 54,980 |
| Bluebird Bio, Inc.3 | 558,700 | 49,026 |
| Allakos Inc.3 | 506,700 | 48,319 |
| Cortexyme, Inc.3,5 | 815,700 | 45,793 |
| NuCana PLC (ADR)3,5 | 1,189,677 | 7,257 |
| Rotech Healthcare Inc.1,3,4,6 | 184,138 | 3,683 |
| Advanz Pharma Corp.3,6 | 175,310 | 511 |
| Advanz Pharma Corp.3 | 41,657 | 121 |
| 2,919,921 | ||
| Industrials 5.90% | ||
| Northrop Grumman Corp. | 1,449,400 | 498,550 |
| Boeing Co. | 1,417,300 | 461,700 |
| Lockheed Martin Corp. | 847,200 | 329,883 |
| CSX Corp. | 1,875,000 | 135,675 |
| Airbus SE, non-registered shares1 | 786,130 | 115,339 |
| Honeywell International Inc. | 152,000 | 26,904 |
| TransDigm Group Inc. | 45,000 | 25,200 |
| Waste Management, Inc. | 214,000 | 24,387 |
| 1,617,638 | ||
| Consumer discretionary 4.89% | ||
| Home Depot, Inc. | 1,188,000 | 259,435 |
| Amazon.com, Inc.3 | 103,000 | 190,328 |
| Suzuki Motor Corp.1 | 4,500,000 | 188,490 |
| Aramark | 4,300,000 | 186,620 |
| General Motors Co. | 4,100,000 | 150,060 |
| VF Corp. | 1,400,000 | 139,524 |
| Kontoor Brands, Inc.2 | 3,250,000 | 136,467 |
| LVMH Moët Hennessy-Louis Vuitton SE1 | 116,896 | 54,442 |
| NIKE, Inc., Class B | 357,000 | 36,168 |
| 1,341,534 | ||
| Communication services 4.32% | ||
| Charter Communications, Inc., Class A3 | 942,126 | 457,006 |
| Alphabet Inc., Class C3 | 133,600 | 178,626 |
| Alphabet Inc., Class A3 | 111,200 | 148,940 |
| Facebook, Inc., Class A3 | 1,077,100 | 221,075 |
| Netflix, Inc.3 | 226,700 | 73,353 |
| Verizon Communications Inc. | 810,000 | 49,734 |
| Activision Blizzard, Inc. | 519,500 | 30,869 |
| Comcast Corp., Class A | 550,000 | 24,734 |
| 1,184,337 |
American Funds Insurance Series — Asset Allocation Fund — Page 65 of 184
| Common stocks (continued) Consumer staples 4.20% | Shares | Value (000) |
| Philip Morris International Inc. | 6,243,000 | $531,217 |
| Nestlé SA1 | 3,006,689 | 325,734 |
| Nestlé SA (ADR) | 900,000 | 97,434 |
| Altria Group, Inc. | 3,200,000 | 159,712 |
| British American Tobacco PLC1 | 875,000 | 37,280 |
| 1,151,377 | ||
| Energy 3.76% | ||
| Noble Energy, Inc. | 13,500,000 | 335,340 |
| Cenovus Energy Inc. (CAD denominated) | 29,000,000 | 294,790 |
| Royal Dutch Shell PLC, Class B (ADR) | 2,745,000 | 164,618 |
| Suncor Energy Inc. | 4,000,000 | 131,100 |
| Chevron Corp. | 600,000 | 72,306 |
| ConocoPhillips | 335,000 | 21,785 |
| Weatherford International3 | 289,548 | 8,093 |
| Tribune Resources, Inc.1,3 | 926,514 | 1,506 |
| 1,029,538 | ||
| Materials 2.55% | ||
| Dow Inc. | 5,416,666 | 296,454 |
| LyondellBasell Industries NV | 1,250,000 | 118,100 |
| Royal Gold, Inc. | 695,000 | 84,964 |
| DuPont de Nemours Inc. | 916,666 | 58,850 |
| Alcoa Corp.3 | 2,500,000 | 53,775 |
| Franco-Nevada Corp. | 293,737 | 30,332 |
| First Quantum Minerals Ltd. | 2,775,000 | 28,144 |
| Barrick Gold Corp. | 1,455,000 | 27,048 |
| 697,667 | ||
| Real estate 0.87% | ||
| Crown Castle International Corp. REIT | 755,000 | 107,323 |
| American Tower Corp. REIT | 296,000 | 68,027 |
| Digital Realty Trust, Inc. REIT | 525,000 | 62,863 |
| 238,213 | ||
| Utilities 0.63% | ||
| CMS Energy Corp. | 2,284,700 | 143,570 |
| DTE Energy Co. | 226,000 | 29,351 |
| 172,921 | ||
| Total common stocks(cost: $11,151,198,000) | 17,668,028 | |
| Rights & warrants 0.00% Energy 0.00% | ||
| Sable Permian Resources, LLC, warrants, expire 20241,3,4,7 | 14,743 | 1,063 |
| Tribune Resources, Inc., Class A, warrants, expire 20231,3,4 | 311,755 | 4 |
| Tribune Resources, Inc., Class B, warrants, expire 20231,3,4 | 242,476 | 2 |
| Tribune Resources, Inc., Class C, warrants, expire 20231,3,4 | 227,540 | 1 |
| 1,070 | ||
| Industrials 0.00% | ||
| Associated Materials, LLC, warrants, expire 20231,3,4 | 71,030 | —8 |
| Total rights & warrants(cost: $3,366,000) | 1,070 |
American Funds Insurance Series — Asset Allocation Fund — Page 66 of 184
| Convertible stocks 0.52% Information technology 0.26% | Shares | Value (000) |
| Broadcom Inc., Series A, cumulative convertible preferred, 8.00% 20225 | 60,000 | $70,678 |
| Real estate 0.14% | ||
| Crown Castle International Corp. REIT, Series A, convertible preferred, 6.875% 2020 | 31,500 | 40,375 |
| Health care 0.10% | ||
| Danaher Corp., Series A, cumulative convertible preferred, 4.75% 2022 | 22,709 | 26,775 |
| Industrials 0.02% | ||
| Associated Materials, LLC, convertible preferred, 14.00% 20201,4 | 5,000 | 4,983 |
| Total convertible stocks(cost: $126,588,000) | 142,811 | |
| Convertible bonds 0.00% Communication services 0.00% | Principal amount (000) | |
| Gogo Inc., convertible notes, 6.00% 2022 | $ 101 | 127 |
| Total convertible bonds(cost: $101,000) | 127 | |
| Bonds, notes & other debt instruments 29.78% U.S. Treasury bonds & notes 11.77% U.S. Treasury 9.68% | ||
| U.S. Treasury 1.25% 2020 | 78,000 | 77,960 |
| U.S. Treasury 1.25% 2020 | 46,117 | 46,108 |
| U.S. Treasury 1.375% 2020 | 35,000 | 34,991 |
| U.S. Treasury 1.50% 2020 | 500 | 500 |
| U.S. Treasury 1.625% 2020 | 125,000 | 125,020 |
| U.S. Treasury 1.625% 2020 | 10,000 | 10,002 |
| U.S. Treasury 2.50% 2020 | 15,000 | 15,067 |
| U.S. Treasury 1.125% 2021 | 32,000 | 31,753 |
| U.S. Treasury 1.375% 2021 | 49,410 | 49,283 |
| U.S. Treasury 1.50% 2021 | 3,777 | 3,771 |
| U.S. Treasury 1.625% 2021 | 3,704 | 3,706 |
| U.S. Treasury 1.625% 2021 | 98 | 98 |
| U.S. Treasury 1.75% 2021 | 9,500 | 9,529 |
| U.S. Treasury 2.125% 2021 | 20,000 | 20,147 |
| U.S. Treasury 2.25% 20219 | 115,000 | 115,986 |
| U.S. Treasury 2.25% 2021 | 9,730 | 9,829 |
| U.S. Treasury 2.50% 2021 | 200,000 | 201,868 |
| U.S. Treasury 2.75% 2021 | 19,232 | 19,601 |
| U.S. Treasury 1.375% 2022 | 280 | 278 |
| U.S. Treasury 1.50% 2022 | 9,407 | 9,382 |
| U.S. Treasury 1.625% 2022 | 94 | 94 |
| U.S. Treasury 1.875% 2022 | 100,000 | 100,606 |
| U.S. Treasury 1.875% 2022 | 8,000 | 8,058 |
| U.S. Treasury 1.875% 2022 | 5,000 | 5,034 |
| U.S. Treasury 2.00% 2022 | 25,000 | 25,274 |
| U.S. Treasury 2.125% 2022 | 37,000 | 37,549 |
| U.S. Treasury 1.625% 2023 | 18,000 | 17,994 |
| U.S. Treasury 2.25% 2023 | 5,000 | 5,115 |
American Funds Insurance Series — Asset Allocation Fund — Page 67 of 184
| Bonds, notes & other debt instruments (continued) U.S. Treasury bonds & notes (continued) U.S. Treasury (continued) | Principal amount (000) | Value (000) |
| U.S. Treasury 2.375% 2023 | $5,000 | $5,112 |
| U.S. Treasury 2.50% 2023 | 29,000 | 29,798 |
| U.S. Treasury 2.75% 20239 | 76,600 | 79,562 |
| U.S. Treasury 2.75% 2023 | 31,326 | 32,450 |
| U.S. Treasury 1.25% 2024 | 11,879 | 11,654 |
| U.S. Treasury 1.50% 2024 | 63,500 | 62,977 |
| U.S. Treasury 1.50% 2024 | 6,392 | 6,339 |
| U.S. Treasury 1.75% 2024 | 155,150 | 155,659 |
| U.S. Treasury 1.75% 2024 | 90,961 | 91,259 |
| U.S. Treasury 1.75% 2024 | 17,707 | 17,766 |
| U.S. Treasury 2.125% 2024 | 5,000 | 5,098 |
| U.S. Treasury 2.125% 2024 | 5,000 | 5,094 |
| U.S. Treasury 2.25% 2024 | 5,400 | 5,531 |
| U.S. Treasury 2.25% 2024 | 5,000 | 5,117 |
| U.S. Treasury 2.375% 2024 | 70,000 | 72,157 |
| U.S. Treasury 2.50% 20249 | 225,000 | 232,461 |
| U.S. Treasury 2.50% 2024 | 700 | 725 |
| U.S. Treasury 2.00% 2025 | 44,800 | 45,425 |
| U.S. Treasury 2.50% 2025 | 3,500 | 3,638 |
| U.S. Treasury 2.625% 2025 | 26,900 | 28,216 |
| U.S. Treasury 2.625% 2025 | 4,966 | 5,195 |
| U.S. Treasury 2.75% 2025 | 3,229 | 3,402 |
| U.S. Treasury 1.50% 2026 | 500 | 490 |
| U.S. Treasury 1.625% 2026 | 60,000 | 59,250 |
| U.S. Treasury 1.625% 2026 | 27,000 | 26,668 |
| U.S. Treasury 1.625% 2026 | 7,000 | 6,939 |
| U.S. Treasury 1.625% 2026 | 1,500 | 1,485 |
| U.S. Treasury 1.75% 2026 | 1,755 | 1,745 |
| U.S. Treasury 1.875% 2026 | 77,925 | 78,315 |
| U.S. Treasury 2.00% 2026 | 8,000 | 8,093 |
| U.S. Treasury 2.25% 2026 | 7,072 | 7,268 |
| U.S. Treasury 2.25% 2027 | 103,250 | 106,182 |
| U.S. Treasury 2.375% 2027 | 880 | 913 |
| U.S. Treasury 2.875% 2028 | 5,217 | 5,613 |
| U.S. Treasury 1.75% 2029 | 94,626 | 93,185 |
| U.S. Treasury 2.50% 2046 | 5,000 | 5,109 |
| U.S. Treasury 2.875% 20469 | 88,550 | 97,217 |
| U.S. Treasury 3.00% 20479 | 12,460 | 14,012 |
| U.S. Treasury 3.00% 2048 | 451 | 507 |
| U.S. Treasury 2.25% 2049 | 133,377 | 129,416 |
| U.S. Treasury 2.375% 2049 | 103,000 | 102,662 |
| U.S. Treasury 3.00% 20499 | 16,710 | 18,851 |
| 2,653,158 | ||
| U.S. Treasury inflation-protected securities 2.09% | ||
| U.S. Treasury Inflation-Protected Security 0.125% 202410 | 100,297 | 100,942 |
| U.S. Treasury Inflation-Protected Security 0.50% 202410 | 35,710 | 36,305 |
| U.S. Treasury Inflation-Protected Security 0.625% 202410 | 114,905 | 117,393 |
| U.S. Treasury Inflation-Protected Security 0.375% 202710 | 8,256 | 8,386 |
| U.S. Treasury Inflation-Protected Security 0.50% 202810 | 62,593 | 64,235 |
| U.S. Treasury Inflation-Protected Security 0.75% 202810 | 17,940 | 18,884 |
| U.S. Treasury Inflation-Protected Security 0.25% 202910 | 24,295 | 24,564 |
| U.S. Treasury Inflation-Protected Security 0.875% 202910 | 20,224 | 21,488 |
| U.S. Treasury Inflation-Protected Security 1.375% 20449,10 | 31,219 | 36,893 |
American Funds Insurance Series — Asset Allocation Fund — Page 68 of 184
| Bonds, notes & other debt instruments (continued) U.S. Treasury bonds & notes (continued) U.S. Treasury inflation-protected securities (continued) | Principal amount (000) | Value (000) |
| U.S. Treasury Inflation-Protected Security 1.00% 204610 | $5,430 | $5,985 |
| U.S. Treasury Inflation-Protected Security 0.875% 20479,10 | 7,995 | 8,587 |
| U.S. Treasury Inflation-Protected Security 1.00% 20499,10 | 116,661 | 129,847 |
| 573,509 | ||
| Total U.S. Treasury bonds & notes | 3,226,667 | |
| Corporate bonds & notes 10.36% Health care 1.67% | ||
| Abbott Laboratories 3.40% 2023 | 185 | 195 |
| Abbott Laboratories 3.75% 2026 | 5,012 | 5,477 |
| Abbott Laboratories 4.75% 2036 | 460 | 575 |
| Abbott Laboratories 4.90% 2046 | 500 | 657 |
| AbbVie Inc. 2.60% 20247 | 3,000 | 3,021 |
| AbbVie Inc. 2.95% 20267 | 2,936 | 2,984 |
| AbbVie Inc. 3.20% 20297 | 4,841 | 4,928 |
| AbbVie Inc. 4.25% 20497 | 3,852 | 4,071 |
| Allergan PLC 3.00% 2020 | 525 | 525 |
| Allergan PLC 3.45% 2022 | 3,250 | 3,324 |
| Allergan PLC 3.80% 2025 | 206 | 216 |
| Anthem, Inc. 2.375% 2025 | 818 | 819 |
| AstraZeneca PLC 2.375% 2022 | 4,072 | 4,119 |
| AstraZeneca PLC 3.375% 2025 | 13,290 | 14,122 |
| Bausch Health Cos. Inc. 5.00% 20287 | 735 | 756 |
| Bayer US Finance II LLC 3.875% 20237 | 1,685 | 1,769 |
| Bayer US Finance II LLC 4.25% 20257 | 425 | 458 |
| Bayer US Finance II LLC 4.375% 20287 | 312 | 340 |
| Bayer US Finance II LLC 4.20% 20347 | 460 | 477 |
| Becton, Dickinson and Co. 2.404% 2020 | 1,688 | 1,690 |
| Becton, Dickinson and Co. 2.894% 2022 | 5,077 | 5,161 |
| Becton, Dickinson and Co. 3.363% 2024 | 647 | 674 |
| Becton, Dickinson and Co. 3.70% 2027 | 146 | 156 |
| Boston Scientific Corp. 3.45% 2024 | 3,100 | 3,243 |
| Boston Scientific Corp. 3.85% 2025 | 2,289 | 2,459 |
| Boston Scientific Corp. 3.75% 2026 | 2,595 | 2,781 |
| Boston Scientific Corp. 4.00% 2029 | 2,550 | 2,821 |
| Boston Scientific Corp. 4.70% 2049 | 515 | 626 |
| Bristol-Myers Squibb Co. 2.90% 20247 | 5,070 | 5,234 |
| Bristol-Myers Squibb Co. 3.40% 20297 | 9,070 | 9,701 |
| Bristol-Myers Squibb Co. 4.25% 20497 | 1,293 | 1,532 |
| Centene Corp. 4.75% 2022 | 8,770 | 8,961 |
| Centene Corp. 4.75% 2025 | 1,250 | 1,301 |
| Centene Corp. 4.25% 20277 | 565 | 582 |
| Centene Corp. 4.625% 20297 | 10,990 | 11,602 |
| Cigna Corp. 3.40% 2021 | 1,350 | 1,382 |
| Cigna Corp. 3.75% 2023 | 2,762 | 2,897 |
| Cigna Corp. 4.125% 2025 | 2,000 | 2,171 |
| Cigna Corp. 4.375% 2028 | 1,075 | 1,192 |
| Cigna Corp. 4.80% 2038 | 5,015 | 5,854 |
| Community Health Systems Inc. 5.125% 2021 | 1,300 | 1,303 |
| CVS Health Corp. 3.35% 2021 | 194 | 197 |
| CVS Health Corp. 3.70% 2023 | 505 | 526 |
| CVS Health Corp. 4.30% 2028 | 2,722 | 2,973 |
| DaVita HealthCare Partners Inc. 5.00% 2025 | 2,100 | 2,165 |
American Funds Insurance Series — Asset Allocation Fund — Page 69 of 184
| Bonds, notes & other debt instruments (continued) Corporate bonds & notes (continued) Health care (continued) | Principal amount (000) | Value (000) |
| Eli Lilly and Co. 2.35% 2022 | $5,050 | $5,114 |
| Eli Lilly and Co. 3.375% 2029 | 3,330 | 3,590 |
| Eli Lilly and Co. 3.95% 2049 | 1,000 | 1,156 |
| Encompass Health Corp. 4.50% 2028 | 799 | 829 |
| Endo International PLC 5.75% 20227 | 7,340 | 5,468 |
| Endo International PLC 6.00% 20257,11 | 10,240 | 6,934 |
| GlaxoSmithKline PLC 3.125% 2021 | 4,680 | 4,761 |
| GlaxoSmithKline PLC 3.00% 2024 | 4,195 | 4,375 |
| GlaxoSmithKline PLC 3.625% 2025 | 3,585 | 3,849 |
| HCA Inc. 5.875% 2023 | 2,125 | 2,353 |
| HCA Inc. 4.125% 2029 | 2,250 | 2,389 |
| HealthSouth Corp. 5.75% 2024 | 3,996 | 4,049 |
| HealthSouth Corp. 5.75% 2025 | 3,285 | 3,451 |
| Jaguar Holding Co. 6.375% 20237 | 1,600 | 1,655 |
| Mallinckrodt PLC 4.875% 20207 | 20,045 | 15,499 |
| Mallinckrodt PLC 5.75% 20227 | 1,860 | 767 |
| Medtronic, Inc. 3.50% 2025 | 1,002 | 1,074 |
| Merck & Co., Inc. 2.90% 2024 | 1,696 | 1,765 |
| Merck & Co., Inc. 3.40% 2029 | 3,240 | 3,508 |
| Molina Healthcare, Inc. 5.375% 2022 | 12,235 | 13,027 |
| Molina Healthcare, Inc. 4.875% 20257 | 5,242 | 5,401 |
| Owens & Minor, Inc. 3.875% 2021 | 8,910 | 8,602 |
| Owens & Minor, Inc. 4.375% 2024 | 300 | 229 |
| Owens & Minor, Inc., Term Loan B, (3-month USD-LIBOR + 4.50%) 6.191% 202512,13 | 1,886 | 1,693 |
| Par Pharmaceutical Cos. Inc. 7.50% 20277 | 5,335 | 5,322 |
| Pfizer Inc. 2.80% 2022 | 3,000 | 3,063 |
| Pfizer Inc. 2.95% 2024 | 3,825 | 3,971 |
| Pfizer Inc. 3.45% 2029 | 11,000 | 11,848 |
| Pfizer Inc. 4.00% 2049 | 370 | 425 |
| Rotech Healthcare Inc., Term Loan, (3-month USD-LIBOR + 11.00%) 13.31% 2023 (100% PIK)1,4,12,13,14 | 6,002 | 6,062 |
| Shire PLC 2.40% 2021 | 4,498 | 4,524 |
| Shire PLC 2.875% 2023 | 3,413 | 3,478 |
| Shire PLC 3.20% 2026 | 14,140 | 14,569 |
| Takeda Pharmaceutical Co., Ltd. 4.40% 2023 | 9,633 | 10,343 |
| Takeda Pharmaceutical Co., Ltd. 5.00% 2028 | 937 | 1,091 |
| Team Health Holdings, Inc. 6.375% 20257 | 11,090 | 7,435 |
| Team Health Holdings, Inc., Term Loan B, 4.549% 202412,13 | 200 | 162 |
| Tenet Healthcare Corp. 4.625% 2024 | 3,553 | 3,645 |
| Tenet Healthcare Corp. 4.875% 20267 | 17,450 | 18,299 |
| Teva Pharmaceutical Finance Co. BV 2.20% 2021 | 274 | 266 |
| Teva Pharmaceutical Finance Co. BV 2.80% 2023 | 29,086 | 27,038 |
| Teva Pharmaceutical Finance Co. BV 6.00% 2024 | 12,016 | 12,185 |
| Teva Pharmaceutical Finance Co. BV 7.125% 20257 | 1,935 | 1,992 |
| Teva Pharmaceutical Finance Co. BV 3.15% 2026 | 27,048 | 22,586 |
| Teva Pharmaceutical Finance Co. BV 4.10% 2046 | 3,550 | 2,565 |
| UnitedHealth Group Inc. 2.375% 2024 | 590 | 598 |
| UnitedHealth Group Inc. 3.50% 2024 | 4,500 | 4,750 |
| UnitedHealth Group Inc. 3.375% 2027 | 500 | 534 |
| UnitedHealth Group Inc. 3.875% 2028 | 2,500 | 2,767 |
| UnitedHealth Group Inc. 2.875% 2029 | 1,050 | 1,080 |
| UnitedHealth Group Inc. 4.45% 2048 | 5,315 | 6,346 |
| Valeant Pharmaceuticals International, Inc. 6.125% 20257 | 22,525 | 23,320 |
American Funds Insurance Series — Asset Allocation Fund — Page 70 of 184
| Bonds, notes & other debt instruments (continued) Corporate bonds & notes (continued) Health care (continued) | Principal amount (000) | Value (000) |
| Valeant Pharmaceuticals International, Inc. 9.25% 20267 | $18,210 | $20,950 |
| Zimmer Holdings, Inc. 3.15% 2022 | 7,070 | 7,218 |
| 457,987 | ||
| Financials 1.52% | ||
| ACE INA Holdings Inc. 2.30% 2020 | 1,345 | 1,350 |
| ACE INA Holdings Inc. 2.875% 2022 | 3,880 | 3,980 |
| ACE INA Holdings Inc. 3.35% 2026 | 1,380 | 1,467 |
| ACE INA Holdings Inc. 4.35% 2045 | 800 | 968 |
| AG Merger Sub II, Inc. 10.75% 20277 | 1,904 | 1,909 |
| Allstate Corp. 3.85% 2049 | 950 | 1,053 |
| American Express Co. 2.20% 2020 | 6,000 | 6,013 |
| American Express Co. 3.00% 2021 | 4,000 | 4,048 |
| American International Group, Inc. 4.20% 2028 | 565 | 622 |
| AON Corp. 2.20% 2022 | 2,236 | 2,247 |
| Bank of America Corp. 3.55% 2024 (3-month USD-LIBOR + 0.78% on 3/5/2023)11 | 6,000 | 6,230 |
| Bank of America Corp. 3.458% 2025 (3-month USD-LIBOR + 0.97% on 3/15/2024)11 | 4,815 | 5,029 |
| Bank of America Corp. 3.419% 2028 (3-month USD-LIBOR + 1.04% on 12/20/2027)11 | 5,293 | 5,555 |
| Bank of America Corp. 2.88% 2030 (3-month USD-LIBOR + 1.19% on 10/22/2029)11 | 1,986 | 2,003 |
| Bank of America Corp. 3.194% 2030 (3-month USD-LIBOR + 1.18% on 7/23/2029)11 | 1,025 | 1,060 |
| Bank of Montreal 2.50% 2024 | 4,660 | 4,717 |
| BB&T Corp. 2.625% 2022 | 2,500 | 2,534 |
| BB&T Corp. 2.75% 2022 | 762 | 775 |
| Berkshire Hathaway Finance Corp. 4.20% 2048 | 7,520 | 8,887 |
| Berkshire Hathaway Finance Corp. 4.25% 2049 | 1,125 | 1,332 |
| Berkshire Hathaway Inc. 2.20% 2021 | 750 | 753 |
| Berkshire Hathaway Inc. 2.75% 2023 | 2,115 | 2,169 |
| Berkshire Hathaway Inc. 3.125% 2026 | 1,000 | 1,054 |
| BNP Paribas 3.375% 20257 | 3,225 | 3,349 |
| CCCI Treasure Ltd., 3.50% (UST Yield Curve Rate T Note Constant Maturity 5-year + 7.192% on 4/21/2020)11 | 5,000 | 5,013 |
| Citigroup Inc. 2.312% 2022 (USD-SOFR + 0.867% on 11/4/2021)11 | 9,000 | 9,029 |
| Citigroup Inc. 2.876% 2023 (3-month USD-LIBOR + 0.95% on 7/24/2022)11 | 875 | 891 |
| Citigroup Inc. 2.976% 2030 (USD-SOFR + 1.422% on 11/5/2029)11 | 3,444 | 3,497 |
| Citigroup Inc. 3.98% 2030 (3-month USD-LIBOR + 1.023% on 3/20/2029)11 | 1,400 | 1,532 |
| CME Group Inc. 3.75% 2028 | 3,425 | 3,782 |
| Commonwealth Bank of Australia 2.25% 20207 | 500 | 500 |
| Compass Diversified Holdings 8.00% 20267 | 2,775 | 3,012 |
| Crédit Agricole SA 4.375% 20257 | 850 | 914 |
| Credit Suisse Group AG 3.80% 2023 | 1,625 | 1,701 |
| Credit Suisse Group AG 3.869% 2029 (3-month USD-LIBOR + 1.41% on 1/12/2028)7,11 | 800 | 852 |
| Danske Bank AS 2.70% 20227 | 1,000 | 1,007 |
| DNB Bank ASA 2.375% 20217 | 2,000 | 2,013 |
| FS Energy and Power Fund 7.50% 20237 | 2,995 | 3,076 |
| Goldman Sachs Group, Inc. 5.375% 2020 | 2,720 | 2,739 |
| Goldman Sachs Group, Inc. 5.25% 2021 | 8,155 | 8,559 |
| Goldman Sachs Group, Inc. 2.905% 2023 (3-month USD-LIBOR + 0.99% on 7/24/2022)11 | 2,936 | 2,989 |
| Goldman Sachs Group, Inc. 3.272% 2025 (3-month USD-LIBOR + 1.201% on 9/29/2024)11 | 1,800 | 1,863 |
| Goldman Sachs Group, Inc. 3.691% 2028 (3-month USD-LIBOR + 1.51% on 6/5/2027)11 | 2,000 | 2,125 |
| Goldman Sachs Group, Inc. 3.814% 2029 (3-month USD-LIBOR + 1.158% on 4/23/2028)11 | 390 | 418 |
| Groupe BPCE SA 2.75% 20237 | 600 | 610 |
| Groupe BPCE SA 5.70% 20237 | 3,460 | 3,831 |
| Groupe BPCE SA 5.15% 20247 | 2,500 | 2,744 |
| Hartford Financial Services Group, Inc. 2.80% 2029 | 3,480 | 3,523 |
American Funds Insurance Series — Asset Allocation Fund — Page 71 of 184
| Bonds, notes & other debt instruments (continued) Corporate bonds & notes (continued) Financials (continued) | Principal amount (000) | Value (000) |
| Hartford Financial Services Group, Inc. 3.60% 2049 | $1,000 | $1,031 |
| HSBC Holdings PLC 3.262% 2023 (3-month USD-LIBOR + 1.055% on 3/13/2022)11 | 1,500 | 1,534 |
| HSBC Holdings PLC 4.25% 2024 | 3,000 | 3,187 |
| HSBC Holdings PLC 2.633% 2025 (3-month USD-LIBOR + 1.14% on 11/7/2024)11 | 3,915 | 3,930 |
| HSBC Holdings PLC 4.583% 2029 (3-month USD-LIBOR + 1.535% on 6/19/2028)11 | 4,500 | 5,029 |
| HSBC Holdings PLC 3.973% 2030 (3-month USD-LIBOR + 1.61% on 5/22/2029)11 | 7,200 | 7,759 |
| Icahn Enterprises Finance Corp. 6.25% 2022 | 5,675 | 5,793 |
| Icahn Enterprises Finance Corp. 5.25% 20277 | 2,060 | 2,112 |
| Intesa Sanpaolo SpA 3.375% 20237 | 750 | 763 |
| Intesa Sanpaolo SpA 3.25% 20247 | 750 | 754 |
| Intesa Sanpaolo SpA 5.017% 20247 | 1,730 | 1,818 |
| Intesa Sanpaolo SpA 3.875% 20277 | 1,550 | 1,551 |
| JPMorgan Chase & Co. 2.55% 2020 | 5,000 | 5,023 |
| JPMorgan Chase & Co. (3-month USD-LIBOR + 0.955%) 2.889% 202013 | 3,986 | 3,988 |
| JPMorgan Chase & Co. 3.559% 2024 (3-month USD-LIBOR + 0.73% on 4/23/2023)11 | 11,213 | 11,684 |
| JPMorgan Chase & Co. 3.797% 2024 (3-month USD-LIBOR + 0.89% on 7/23/2023)11 | 3,276 | 3,453 |
| JPMorgan Chase & Co. 2.739% 2030 (USD-SOFR + 1.51% on 10/15/2029)11 | 8,624 | 8,623 |
| JPMorgan Chase & Co., Series Z, junior subordinated, 5.30% (3-month USD-LIBOR + 3.80% on 5/1/2020)11 | 500 | 504 |
| Lloyds Banking Group PLC 2.907% 2023 (3-month USD-LIBOR + 0.81% on 11/7/2022)11 | 750 | 761 |
| Lloyds Banking Group PLC 4.05% 2023 | 2,000 | 2,121 |
| Lloyds Banking Group PLC 4.45% 2025 | 800 | 874 |
| Lloyds Banking Group PLC 4.375% 2028 | 2,150 | 2,370 |
| LPL Financial Holdings Inc. 4.625% 20277 | 1,800 | 1,841 |
| Marsh & McLennan Cos., Inc. 3.875% 2024 | 1,420 | 1,515 |
| Marsh & McLennan Cos., Inc. 4.375% 2029 | 1,705 | 1,943 |
| Marsh & McLennan Cos., Inc. 4.90% 2049 | 1,539 | 1,951 |
| Metropolitan Life Global Funding I 2.50% 20207 | 7,000 | 7,035 |
| Metropolitan Life Global Funding I 1.95% 20217 | 1,875 | 1,877 |
| Mitsubishi UFJ Financial Group, Inc. 2.623% 2022 | 1,610 | 1,632 |
| Mitsubishi UFJ Financial Group, Inc. 2.801% 2024 | 1,610 | 1,642 |
| Mitsubishi UFJ Financial Group, Inc. 3.195% 2029 | 5,000 | 5,181 |
| Morgan Stanley 2.50% 2021 | 3,000 | 3,023 |
| Morgan Stanley 5.75% 2021 | 5,000 | 5,194 |
| Morgan Stanley 3.737% 2024 (3-month USD-LIBOR + 0.847% on 4/24/2023)11 | 3,825 | 3,998 |
| Morgan Stanley 2.72% 2025 (USD-SOFR + 1.152% on 7/22/2024)11 | 450 | 456 |
| Morgan Stanley 3.125% 2026 | 325 | 336 |
| Morgan Stanley 4.431% 2030 (3-month USD-LIBOR + 1.628% on 1/23/2029)11 | 6,215 | 7,025 |
| National Rural Utilities Cooperative Finance Corp. 3.70% 2029 | 2,640 | 2,887 |
| Navient Corp. 6.50% 2022 | 3,675 | 3,992 |
| Navient Corp. 5.50% 2023 | 9,110 | 9,748 |
| Navient Corp. 7.25% 2023 | 725 | 821 |
| Navient Corp. 6.125% 2024 | 7,530 | 8,189 |
| New York Life Global Funding 1.70% 20217 | 1,125 | 1,124 |
| New York Life Global Funding 2.30% 20227 | 250 | 252 |
| New York Life Global Funding 2.35% 20267 | 890 | 891 |
| Nordea Bank AB 2.50% 20207 | 2,450 | 2,461 |
| Owl Rock Capital Corp. 4.625% 20247 | 2,150 | 2,175 |
| PNC Bank 2.30% 2020 | 250 | 250 |
| PNC Bank 2.55% 2021 | 6,500 | 6,578 |
| PNC Financial Services Group, Inc. 2.854% 202211 | 1,445 | 1,480 |
| PNC Financial Services Group, Inc. 3.50% 2024 | 3,850 | 4,054 |
| PNC Financial Services Group, Inc. 3.90% 2024 | 2,000 | 2,128 |
| Prudential Financial, Inc. 3.50% 2024 | 4,000 | 4,256 |
| Prudential Financial, Inc. 3.878% 2028 | 500 | 548 |
American Funds Insurance Series — Asset Allocation Fund — Page 72 of 184
| Bonds, notes & other debt instruments (continued) Corporate bonds & notes (continued) Financials (continued) | Principal amount (000) | Value (000) |
| Prudential Financial, Inc. 4.418% 2048 | $250 | $290 |
| Prudential Financial, Inc. 4.35% 2050 | 10,000 | 11,509 |
| Rabobank Nederland 2.75% 2022 | 2,250 | 2,288 |
| Rabobank Nederland 4.375% 2025 | 4,500 | 4,882 |
| Royal Bank of Canada 3.20% 2021 | 10,000 | 10,179 |
| Skandinaviska Enskilda Banken AB 1.875% 2021 | 1,675 | 1,670 |
| Skandinaviska Enskilda Banken AB 2.625% 2021 | 250 | 252 |
| Skandinaviska Enskilda Banken AB 2.80% 2022 | 700 | 711 |
| Springleaf Finance Corp. 6.125% 2024 | 5,825 | 6,393 |
| Starwood Property Trust, Inc. 5.00% 2021 | 2,700 | 2,807 |
| Swiss Re Finance (Luxembourg) SA 5.00% 2049 (UST Yield Curve Rate T Note Constant Maturity 5-year + 3.582% on 4/2/2029)7,11 | 2,800 | 3,129 |
| Toronto-Dominion Bank 2.65% 2024 | 3,100 | 3,175 |
| Travelers Cos., Inc. 4.00% 2047 | 1,588 | 1,797 |
| Travelers Cos., Inc. 4.10% 2049 | 3,910 | 4,496 |
| U.S. Bancorp 2.625% 2022 | 1,805 | 1,833 |
| U.S. Bancorp 3.40% 2023 | 5,675 | 5,928 |
| U.S. Bancorp 2.40% 2024 | 2,000 | 2,027 |
| U.S. Bancorp 3.70% 2024 | 5,000 | 5,319 |
| U.S. Bancorp 2.375% 2026 | 4,000 | 4,011 |
| U.S. Bank NA 3.00% 2021 | 3,000 | 3,036 |
| UBS Group AG 4.125% 20257 | 2,750 | 2,991 |
| UniCredit SpA 3.75% 20227 | 7,175 | 7,352 |
| UniCredit SpA 6.572% 20227 | 475 | 510 |
| UniCredit SpA 4.625% 20277 | 625 | 662 |
| UniCredit SpA 5.861% 20327,11 | 2,400 | 2,508 |
| Wells Fargo & Co. 2.15% 2020 | 4,025 | 4,026 |
| Wells Fargo & Co. 2.406% 2025 (3-month USD-LIBOR + 0.82% on 10/30/2024)11 | 4,325 | 4,328 |
| Wells Fargo & Co. 3.584% 2028 (3-month USD-LIBOR + 1.31% on 5/15/2027)11 | 217 | 231 |
| Wells Fargo & Co. 2.879% 2030 (3-month USD-LIBOR + 1.17% on 10/30/2029)11 | 6,288 | 6,330 |
| Westpac Banking Corp. 2.15% 2020 | 5,000 | 5,002 |
| Westpac Banking Corp. 2.75% 2023 | 1,750 | 1,783 |
| 417,924 | ||
| Energy 1.34% | ||
| American Energy-Permian Basin, LLC/AEPB Finance Corp. 12.00% 20247 | 2,935 | 2,040 |
| Apache Corp. 4.25% 2030 | 2,555 | 2,650 |
| Apache Corp. 5.35% 2049 | 6,000 | 6,279 |
| Ascent Resources Marcellus Holdings, Inc., Term Loan B, (3-month USD-LIBOR + 6.50%) 8.245% 202312,13 | 1,223 | 1,159 |
| BP Capital Markets PLC 3.41% 2026 | 3,460 | 3,686 |
| BP Capital Markets PLC 4.234% 2028 | 9,710 | 10,977 |
| Canadian Natural Resources Ltd. 2.95% 2023 | 2,700 | 2,754 |
| Carrizo Oil & Gas Inc. 6.25% 2023 | 2,725 | 2,772 |
| Cenovus Energy Inc. 3.80% 2023 | 3,970 | 4,107 |
| Cenovus Energy Inc. 4.25% 2027 | 5,690 | 6,027 |
| Cenovus Energy Inc. 5.25% 2037 | 975 | 1,080 |
| Cenovus Energy Inc. 5.40% 2047 | 1,000 | 1,167 |
| Cheniere Energy, Inc. 3.70% 20297 | 6,082 | 6,210 |
| Chesapeake Energy Corp. 4.875% 2022 | 7,225 | 5,728 |
| Chesapeake Energy Corp. 5.75% 2023 | 75 | 51 |
| Chesapeake Energy Corp. 11.50% 20257 | 4,122 | 3,906 |
| Chesapeake Energy Corp., Term Loan, (3-month USD-LIBOR + 8.00%) 9.928% 202412,13 | 1,990 | 2,056 |
| Chevron Corp. 2.498% 2022 | 4,000 | 4,065 |
| Chevron Corp. 3.326% 2025 | 1,165 | 1,244 |
American Funds Insurance Series — Asset Allocation Fund — Page 73 of 184
| Bonds, notes & other debt instruments (continued) Corporate bonds & notes (continued) Energy (continued) | Principal amount (000) | Value (000) |
| Chevron Corp. 2.954% 2026 | $1,600 | $1,672 |
| Comstock Resources, Inc. 9.75% 2026 | 3,475 | 3,162 |
| Concho Resources Inc. 4.30% 2028 | 6,615 | 7,210 |
| Concho Resources Inc. 4.85% 2048 | 750 | 874 |
| CONSOL Energy Inc. 5.875% 2022 | 18,199 | 18,257 |
| Constellation Oil Services Holding SA 10.00% 20241,4,7,14 | 988 | 469 |
| Convey Park Energy LLC 7.50% 20257 | 1,100 | 949 |
| DCP Midstream Operating LP 4.95% 2022 | 3,350 | 3,485 |
| Diamond Offshore Drilling, Inc. 4.875% 2043 | 5,610 | 3,077 |
| Enbridge Energy Partners, LP 5.875% 2025 | 3,200 | 3,732 |
| Enbridge Energy Partners, LP 7.375% 2045 | 1,075 | 1,604 |
| Enbridge Energy Partners, LP, Series B, 7.50% 2038 | 2,000 | 2,867 |
| Enbridge Inc. 4.00% 2023 | 1,678 | 1,773 |
| Enbridge Inc. 3.70% 2027 | 162 | 171 |
| Energy Transfer Partners, LP 4.15% 2020 | 2,182 | 2,205 |
| Energy Transfer Partners, LP 4.50% 2024 | 1,210 | 1,288 |
| Energy Transfer Partners, LP 4.75% 2026 | 2,494 | 2,700 |
| Energy Transfer Partners, LP 5.25% 2029 | 5,757 | 6,466 |
| Energy Transfer Partners, LP 5.40% 2047 | 650 | 706 |
| Energy Transfer Partners, LP 6.00% 2048 | 774 | 902 |
| Energy Transfer Partners, LP 6.25% 2049 | 9,257 | 11,156 |
| Enterprise Products Operating LLC 4.90% 2046 | 500 | 586 |
| EOG Resources, Inc. 4.15% 2026 | 2,980 | 3,275 |
| EQT Corp. 3.00% 2022 | 475 | 467 |
| EQT Corp. 3.90% 2027 | 910 | 852 |
| Equinor ASA 3.625% 2028 | 6,865 | 7,534 |
| Equinor ASA 3.25% 2049 | 7,006 | 7,059 |
| Extraction Oil & Gas, Inc. 5.625% 20267 | 4,125 | 2,487 |
| Exxon Mobil Corp. 2.222% 2021 | 8,070 | 8,122 |
| Exxon Mobil Corp. 2.019% 2024 | 5,780 | 5,798 |
| Exxon Mobil Corp. 2.275% 2026 | 1,500 | 1,508 |
| Exxon Mobil Corp. 3.043% 2026 | 1,125 | 1,180 |
| Exxon Mobil Corp. 2.44% 2029 | 9,841 | 9,905 |
| Exxon Mobil Corp. 3.095% 2049 | 2,000 | 1,995 |
| Genesis Energy, LP 6.75% 2022 | 4,977 | 5,036 |
| Genesis Energy, LP 6.50% 2025 | 2,725 | 2,643 |
| Halliburton Co. 3.80% 2025 | 260 | 277 |
| Hess Midstream Partners LP 5.125% 20287 | 1,305 | 1,323 |
| Jonah Energy LLC 7.25% 20257 | 1,825 | 543 |
| Kinder Morgan, Inc. 4.30% 2028 | 4,359 | 4,754 |
| Kinder Morgan, Inc. 5.20% 2048 | 756 | 877 |
| Marathon Oil Corp. 4.40% 2027 | 1,005 | 1,093 |
| McDermott International, Inc. 10.625% 20247,15 | 3,705 | 325 |
| MPLX LP 4.125% 2027 | 500 | 525 |
| MPLX LP 4.50% 2038 | 750 | 763 |
| Murphy Oil Corp. 5.875% 2027 | 491 | 516 |
| NGL Energy Partners LP 7.50% 2023 | 1,440 | 1,449 |
| NGL Energy Partners LP 6.125% 2025 | 7,420 | 7,015 |
| Noble Corp. PLC 7.95% 202511 | 1,725 | 893 |
| Noble Corp. PLC 8.95% 204511 | 3,125 | 1,359 |
| Noble Energy, Inc. 3.85% 2028 | 3,000 | 3,169 |
| Noble Energy, Inc. 3.25% 2029 | 6,063 | 6,119 |
| Noble Energy, Inc. 4.95% 2047 | 375 | 415 |
| Oasis Petroleum Inc. 6.875% 2022 | 4,290 | 4,140 |
American Funds Insurance Series — Asset Allocation Fund — Page 74 of 184
| Bonds, notes & other debt instruments (continued) Corporate bonds & notes (continued) Energy (continued) | Principal amount (000) | Value (000) |
| Occidental Petroleum Corp. 4.85% 2021 | $2,751 | $2,834 |
| Occidental Petroleum Corp. 2.70% 2022 | 3,000 | 3,032 |
| Occidental Petroleum Corp. 2.90% 2024 | 1,734 | 1,763 |
| Occidental Petroleum Corp. 3.20% 2026 | 788 | 798 |
| Occidental Petroleum Corp. 5.55% 2026 | 1,125 | 1,278 |
| Occidental Petroleum Corp. 3.50% 2029 | 4,425 | 4,514 |
| Occidental Petroleum Corp. 4.40% 2049 | 4,112 | 4,240 |
| Peabody Energy Corp. 6.00% 20227 | 2,150 | 2,102 |
| Petróleos Mexicanos 5.35% 2028 | 1,870 | 1,866 |
| Phillips 66 Partners LP 3.55% 2026 | 160 | 168 |
| Phillips 66 Partners LP 4.68% 2045 | 400 | 434 |
| Phillips 66 Partners LP 4.90% 2046 | 275 | 312 |
| Pioneer Natural Resources Co. 3.45% 2021 | 3,345 | 3,388 |
| Sabine Pass Liquefaction, LLC 5.875% 2026 | 923 | 1,060 |
| Sabine Pass Liquefaction, LLC 4.20% 2028 | 1,307 | 1,385 |
| Saudi Arabian Oil Co. 3.50% 20297 | 2,060 | 2,135 |
| Schlumberger BV 3.75% 20247 | 495 | 522 |
| Schlumberger BV 4.00% 20257 | 70 | 75 |
| Shell International Finance BV 2.25% 2020 | 1,965 | 1,972 |
| Shell International Finance BV 1.875% 2021 | 1,000 | 1,001 |
| Shell International Finance BV 3.50% 2023 | 2,235 | 2,354 |
| Shell International Finance BV 2.00% 2024 | 5,930 | 5,918 |
| Shell International Finance BV 2.50% 2026 | 1,890 | 1,916 |
| Shell International Finance BV 3.875% 2028 | 4,590 | 5,089 |
| Shell International Finance BV 3.125% 2049 | 2,000 | 1,974 |
| Statoil ASA 2.75% 2021 | 1,925 | 1,959 |
| Statoil ASA 3.25% 2024 | 2,850 | 3,003 |
| Statoil ASA 4.25% 2041 | 2,000 | 2,315 |
| Targa Resources Partners LP 5.875% 2026 | 1,750 | 1,863 |
| Targa Resources Partners LP 5.50% 20307 | 3,485 | 3,585 |
| Teekay Corp. 9.25% 20227 | 4,825 | 5,092 |
| Teekay Offshore Partners LP 8.50% 20237 | 3,550 | 3,521 |
| Total Capital International 2.434% 2025 | 5,010 | 5,072 |
| Total Capital International 3.455% 2029 | 13,010 | 14,098 |
| Total Capital International 3.461% 2049 | 835 | 878 |
| Total Capital SA 3.883% 2028 | 4,000 | 4,478 |
| TransCanada PipeLines Ltd. 4.25% 2028 | 1,090 | 1,210 |
| TransCanada PipeLines Ltd. 4.75% 2038 | 3,000 | 3,426 |
| TransCanada PipeLines Ltd. 4.875% 2048 | 700 | 826 |
| Transocean Inc. 9.00% 20237 | 2,454 | 2,597 |
| Ultra Petroleum Corp. 11.00% 2024 (18.18% PIK)14 | 4,408 | 727 |
| Valaris PLC 7.75% 2026 | 2,575 | 1,461 |
| Valaris PLC 5.75% 2044 | 7,095 | 3,217 |
| Valero Energy Corp. 4.00% 2029 | 4,000 | 4,317 |
| Vine Oil & Gas LP 8.75% 20237 | 2,500 | 1,233 |
| Weatherford International PLC 11.00% 20247 | 11,915 | 12,913 |
| Williams Partners LP 4.30% 2024 | 85 | 91 |
| 366,697 | ||
| Utilities 1.17% | ||
| AEP Transmission Co. LLC 3.75% 2047 | 2,390 | 2,568 |
| AEP Transmission Co. LLC 4.25% 2048 | 1,524 | 1,748 |
| AES Corp. 5.50% 2025 | 2,448 | 2,534 |
| Ameren Corp. 2.50% 2024 | 1,969 | 1,986 |
American Funds Insurance Series — Asset Allocation Fund — Page 75 of 184
| Bonds, notes & other debt instruments (continued) Corporate bonds & notes (continued) Utilities (continued) | Principal amount (000) | Value (000) |
| Ameren Corp. 4.50% 2049 | $425 | $524 |
| Ameren Corp. 3.25% 2050 | 750 | 759 |
| American Electric Power Co., Inc. 2.95% 2022 | 3,020 | 3,078 |
| American Electric Power Co., Inc. 3.20% 2027 | 1,275 | 1,315 |
| Berkshire Hathaway Energy Co. 2.40% 2020 | 1,245 | 1,245 |
| Calpine Corp. 5.25% 20267 | 960 | 1,002 |
| Centerpoint Energy, Inc. 2.50% 2022 | 900 | 907 |
| CenterPoint Energy, Inc. 3.85% 2024 | 6,077 | 6,410 |
| CenterPoint Energy, Inc. 2.95% 2030 | 3,400 | 3,354 |
| CenterPoint Energy, Inc. 3.70% 2049 | 2,775 | 2,735 |
| CMS Energy Corp. 3.00% 2026 | 3,000 | 3,082 |
| CMS Energy Corp. 4.875% 2044 | 2,000 | 2,385 |
| Comision Federal de Electricidad 4.75% 20277 | 645 | 682 |
| Commonwealth Edison Co. 4.35% 2045 | 1,585 | 1,857 |
| Commonwealth Edison Co. 4.00% 2048 | 2,600 | 2,923 |
| Connecticut Light and Power Co. 3.20% 2027 | 1,525 | 1,611 |
| Consolidated Edison Co. of New York, Inc. 4.50% 2058 | 6,100 | 7,078 |
| Consumers Energy Co. 3.375% 2023 | 395 | 413 |
| Consumers Energy Co. 3.125% 2024 | 3,785 | 3,937 |
| Consumers Energy Co. 3.25% 2046 | 465 | 467 |
| Consumers Energy Co. 4.05% 2048 | 3,882 | 4,472 |
| Consumers Energy Co. 3.10% 2050 | 3,410 | 3,401 |
| Consumers Energy Co. 3.75% 2050 | 1,193 | 1,318 |
| Dominion Resources, Inc. 2.00% 2021 | 665 | 665 |
| Dominion Resources, Inc. 2.75% 2022 | 800 | 811 |
| Dominion Resources, Inc. 2.85% 2026 | 1,500 | 1,515 |
| Dominion Resources, Inc., junior subordinated, 2.579% 202011 | 713 | 715 |
| Dominion Resources, Inc., junior subordinated, 3.071% 202411 | 1,775 | 1,829 |
| DTE Electric Co. 3.75% 2047 | 2,000 | 2,185 |
| DTE Energy Co. 3.95% 2049 | 2,865 | 3,273 |
| Duke Energy Carolinas, Inc. 3.95% 2028 | 1,250 | 1,393 |
| Duke Energy Carolinas, LLC 2.95% 2026 | 4,000 | 4,131 |
| Duke Energy Corp. 3.75% 2024 | 150 | 159 |
| Duke Energy Corp. 2.65% 2026 | 3,150 | 3,165 |
| Duke Energy Florida, LLC 3.20% 2027 | 2,420 | 2,530 |
| Duke Energy Florida, LLC 2.50% 2029 | 5,960 | 5,959 |
| Duke Energy Indiana, Inc. 3.25% 2049 | 1,225 | 1,224 |
| Duke Energy Progress Inc. 4.15% 2044 | 2,020 | 2,280 |
| Duke Energy Progress Inc. 3.70% 2046 | 3,975 | 4,249 |
| Duke Energy Progress, LLC 3.375% 2023 | 2,040 | 2,132 |
| Duke Energy Progress, LLC 3.60% 2047 | 3,167 | 3,316 |
| Edison International 3.125% 2022 | 1,575 | 1,600 |
| Edison International 3.55% 2024 | 3,850 | 3,945 |
| Edison International 5.75% 2027 | 1,452 | 1,631 |
| Edison International 4.125% 2028 | 3,230 | 3,313 |
| EDP Finance BV 4.125% 20207 | 3,402 | 3,402 |
| EDP Finance BV 3.625% 20247 | 6,425 | 6,689 |
| Electricité de France SA 2.35% 20207 | 650 | 651 |
| Electricité de France SA 4.75% 20357 | 1,250 | 1,430 |
| Electricité de France SA 4.875% 20387 | 2,750 | 3,231 |
| Electricité de France SA 5.60% 2040 | 525 | 662 |
| Emera US Finance LP 3.55% 2026 | 4,183 | 4,345 |
| Enel Finance International SA 4.25% 20237 | 4,339 | 4,594 |
| Enel Finance International SA 3.50% 20287 | 3,085 | 3,157 |
American Funds Insurance Series — Asset Allocation Fund — Page 76 of 184
| Bonds, notes & other debt instruments (continued) Corporate bonds & notes (continued) Utilities (continued) | Principal amount (000) | Value (000) |
| Enersis Américas SA 4.00% 2026 | $245 | $254 |
| Entergy Corp. 2.95% 2026 | 1,160 | 1,178 |
| Entergy Louisiana, LLC 4.20% 2048 | 4,200 | 4,853 |
| Eversource Energy 3.80% 2023 | 2,730 | 2,875 |
| Eversource Energy 3.30% 2028 | 573 | 590 |
| Eversource Energy 4.25% 2029 | 4,000 | 4,450 |
| Exelon Corp. 3.40% 2026 | 100 | 104 |
| Exelon Corp., junior subordinated, 3.497% 202211 | 1,075 | 1,104 |
| FirstEnergy Corp. 3.90% 2027 | 5,105 | 5,459 |
| FirstEnergy Corp. 4.85% 2047 | 4,500 | 5,345 |
| FirstEnergy Corp., Series B, 4.25% 2023 | 2,000 | 2,109 |
| Florida Power & Light Co. 3.70% 20477 | 1,036 | 1,129 |
| Florida Power & Light Co. 3.15% 2049 | 3,475 | 3,512 |
| Gulf Power Co. 3.30% 2027 | 4,500 | 4,688 |
| Jersey Central Power & Light Co. 4.30% 20267 | 1,790 | 1,949 |
| MidAmerican Energy Holdings Co. 3.10% 2027 | 2,000 | 2,085 |
| MidAmerican Energy Holdings Co. 3.65% 2029 | 5,220 | 5,705 |
| MidAmerican Energy Holdings Co. 3.15% 2050 | 2,000 | 1,974 |
| Mississippi Power Co. 3.95% 2028 | 2,814 | 3,065 |
| National Grid PLC 3.15% 20277 | 275 | 285 |
| National Rural Utilities Cooperative Finance Corp. 3.05% 2027 | 4,000 | 4,146 |
| NiSource Finance Corp. 2.65% 2022 | 325 | 329 |
| Northern States Power Co. 4.125% 2044 | 6,000 | 6,889 |
| Northern States Power Co. 2.90% 2050 | 3,700 | 3,535 |
| Oncor Electric Delivery Co. LLC 2.75% 2024 | 1,525 | 1,544 |
| Pacific Gas and Electric Co. 4.25% 20237,15 | 7,445 | 7,653 |
| Pacific Gas and Electric Co. 2.95% 202615 | 250 | 251 |
| Pacific Gas and Electric Co. 4.65% 20287,15 | 750 | 776 |
| PacifiCorp., First Mortgage Bonds, 3.60% 2024 | 5,695 | 6,011 |
| PacifiCorp., First Mortgage Bonds, 4.125% 2049 | 5,500 | 6,279 |
| Public Service Co. of Colorado 2.25% 2022 | 2,000 | 2,016 |
| Public Service Electric and Gas Co. 3.20% 2029 | 4,223 | 4,453 |
| Public Service Electric and Gas Co. 3.60% 2047 | 548 | 593 |
| Public Service Enterprise Group Inc. 2.65% 2022 | 1,900 | 1,930 |
| Public Service Enterprise Group Inc. 2.25% 2026 | 345 | 342 |
| Public Service Enterprise Group Inc. 3.00% 2027 | 2,935 | 3,036 |
| Public Service Enterprise Group Inc. 3.20% 2049 | 2,000 | 2,020 |
| Puget Energy, Inc. 6.00% 2021 | 1,823 | 1,936 |
| Puget Energy, Inc. 5.625% 2022 | 1,965 | 2,108 |
| Puget Sound Energy, Inc. 3.25% 2049 | 3,000 | 2,987 |
| San Diego Gas & Electric Co. 3.75% 2047 | 2,331 | 2,422 |
| San Diego Gas & Electric Co. 4.10% 2049 | 1,607 | 1,778 |
| SCANA Corp. 6.25% 2020 | 3,785 | 3,814 |
| Southern California Edison Co. 3.40% 2023 | 150 | 156 |
| Southern California Edison Co. 3.50% 2023 | 700 | 730 |
| Southern California Edison Co. 3.65% 2028 | 423 | 453 |
| Southern California Edison Co. 2.85% 2029 | 1,000 | 1,000 |
| Southern California Edison Co. 6.00% 2034 | 5,000 | 6,155 |
| Southern California Edison Co. 5.35% 2035 | 3,000 | 3,515 |
| Southern California Edison Co. 5.75% 2035 | 675 | 823 |
| Southern California Edison Co. 4.125% 2048 | 5,108 | 5,449 |
| Southern California Edison Co. 4.875% 2049 | 3,745 | 4,436 |
| Southern California Edison Co., Series C, 3.60% 2045 | 5,714 | 5,648 |
| Southern California Gas Co. 3.95% 2050 | 2,000 | 2,238 |
American Funds Insurance Series — Asset Allocation Fund — Page 77 of 184
| Bonds, notes & other debt instruments (continued) Corporate bonds & notes (continued) Utilities (continued) | Principal amount (000) | Value (000) |
| Talen Energy Corp. 10.50% 20267 | $885 | $844 |
| Talen Energy Corp. 7.25% 20277 | 2,330 | 2,456 |
| Virginia Electric and Power Co. 3.80% 2028 | 2,000 | 2,175 |
| Virginia Electric and Power Co. 4.00% 2043 | 1,000 | 1,105 |
| Virginia Electric and Power Co. 4.00% 2046 | 1,737 | 1,914 |
| Virginia Electric and Power Co. 4.60% 2048 | 2,650 | 3,243 |
| Virginia Electric and Power Co. 3.30% 2049 | 5,575 | 5,636 |
| Xcel Energy Inc. 3.35% 2026 | 3,110 | 3,264 |
| Xcel Energy Inc. 2.60% 2029 | 3,600 | 3,566 |
| Xcel Energy Inc. 3.50% 2049 | 2,120 | 2,158 |
| 320,497 | ||
| Communication services 1.07% | ||
| Alphabet Inc. 1.998% 2026 | 3,000 | 2,984 |
| Altice NV 7.50% 20267 | 2,650 | 2,854 |
| Altice SA 7.625% 20257 | 4,200 | 4,378 |
| AMC Networks Inc. 5.00% 2024 | 425 | 435 |
| AMC Networks Inc. 4.75% 2025 | 2,175 | 2,188 |
| AT&T Inc. (3-month USD-LIBOR + 0.65%) 2.651% 202013 | 5,680 | 5,681 |
| AT&T Inc. 3.80% 2027 | 305 | 325 |
| AT&T Inc. 4.35% 2029 | 3,125 | 3,475 |
| Cablevision Systems Corp. 6.75% 2021 | 9,575 | 10,327 |
| CCO Holdings LLC and CCO Holdings Capital Corp. 5.125% 20237 | 2,650 | 2,710 |
| CCO Holdings LLC and CCO Holdings Capital Corp. 4.50% 2024 | 500 | 538 |
| CCO Holdings LLC and CCO Holdings Capital Corp. 4.908% 2025 | 500 | 551 |
| CCO Holdings LLC and CCO Holdings Capital Corp. 5.75% 20267 | 5,050 | 5,337 |
| CCO Holdings LLC and CCO Holdings Capital Corp. 5.05% 2029 | 2,303 | 2,612 |
| CCO Holdings LLC and CCO Holdings Capital Corp. 4.75% 20307 | 2,500 | 2,555 |
| CCO Holdings LLC and CCO Holdings Capital Corp. 6.484% 2045 | 6,035 | 7,537 |
| CCO Holdings LLC and CCO Holdings Capital Corp. 5.75% 2048 | 5,250 | 6,124 |
| CCO Holdings LLC and CCO Holdings Capital Corp. 5.125% 2049 | 7,067 | 7,681 |
| CCO Holdings LLC and CCO Holdings Capital Corp. 4.80% 2050 | 6,000 | 6,316 |
| CenturyLink, Inc. 6.75% 2023 | 8,475 | 9,478 |
| CenturyLink, Inc. 7.50% 2024 | 1,500 | 1,694 |
| CenturyLink, Inc. 5.125% 20267 | 2,050 | 2,091 |
| CenturyLink, Inc., Series T, 5.80% 2022 | 2,625 | 2,764 |
| Comcast Corp. 3.00% 2024 | 500 | 518 |
| Comcast Corp. 3.70% 2024 | 2,245 | 2,393 |
| Comcast Corp. 3.95% 2025 | 5,365 | 5,855 |
| Comcast Corp. 2.35% 2027 | 4,000 | 3,996 |
| Comcast Corp. 4.15% 2028 | 2,858 | 3,217 |
| Comcast Corp. 2.65% 2030 | 6,530 | 6,556 |
| Comcast Corp. 3.20% 2036 | 750 | 767 |
| Comcast Corp. 3.90% 2038 | 1,000 | 1,107 |
| Comcast Corp. 4.60% 2038 | 4,000 | 4,766 |
| Comcast Corp. 4.00% 2048 | 250 | 278 |
| Comcast Corp. 4.70% 2048 | 1,049 | 1,293 |
| Deutsche Telekom International Finance BV 1.95% 20217 | 500 | 500 |
| Deutsche Telekom International Finance BV 2.82% 20227 | 784 | 796 |
| Deutsche Telekom International Finance BV 9.25% 2032 | 3,570 | 5,674 |
| Embarq Corp. 7.995% 2036 | 3,075 | 3,257 |
| Fox Corp. 4.03% 20247 | 1,120 | 1,194 |
| France Télécom 4.125% 2021 | 2,500 | 2,591 |
| Frontier Communications Corp. 11.00% 2025 | 31,655 | 15,432 |
American Funds Insurance Series — Asset Allocation Fund — Page 78 of 184
| Bonds, notes & other debt instruments (continued) Corporate bonds & notes (continued) Communication services (continued) | Principal amount (000) | Value (000) |
| Frontier Communications Corp. 8.00% 20277 | $2,150 | $2,251 |
| Gogo Inc. 9.875% 20247 | 39,520 | 41,825 |
| iHeartCommunications, Inc. 5.25% 20277 | 2,493 | 2,613 |
| Inmarsat PLC 4.875% 20227 | 3,475 | 3,525 |
| Intelsat Jackson Holding Co. 8.00% 20247 | 3,075 | 3,162 |
| Intelsat Jackson Holding Co. 8.50% 20247 | 10,475 | 9,563 |
| Intelsat Jackson Holding Co., Term Loan, 6.625% 202412 | 1,400 | 1,421 |
| Liberty Global PLC 5.50% 20287 | 2,075 | 2,107 |
| Ligado Networks, Term Loan, (3-month USD-LIBOR + 8.75%) 10.85% 2020 (100% PIK)12,13,14 | 6,128 | 3,909 |
| MDC Partners Inc. 6.50% 20247 | 2,950 | 2,677 |
| NBCUniversal Enterprise, Inc., junior subordinated, 5.25%7 | 4,630 | 4,782 |
| Orange SA 5.50% 2044 | 1,500 | 1,989 |
| Sirius XM Radio Inc. 3.875% 20227 | 3,450 | 3,532 |
| Sirius XM Radio Inc. 4.625% 20247 | 3,345 | 3,519 |
| Sprint Corp. 7.625% 2026 | 2,825 | 3,121 |
| Sprint Corp. 6.875% 2028 | 9,125 | 9,849 |
| Trilogy International Partners, LLC 8.875% 20227 | 12,800 | 12,068 |
| Univision Communications Inc. 5.125% 20237 | 7,250 | 7,250 |
| Verizon Communications Inc. 4.50% 2033 | 2,000 | 2,336 |
| Vodafone Group PLC 3.75% 2024 | 3,788 | 4,006 |
| Vodafone Group PLC 4.125% 2025 | 2,500 | 2,715 |
| Vodafone Group PLC 4.375% 2028 | 350 | 388 |
| Vodafone Group PLC 5.25% 2048 | 500 | 602 |
| Vodafone Group PLC 4.25% 2050 | 7,000 | 7,314 |
| Ziggo Bond Finance BV 5.50% 20277 | 5,825 | 6,200 |
| 293,549 | ||
| Industrials 0.82% | ||
| ADT Corp. 3.50% 2022 | 5,625 | 5,741 |
| Allison Transmission Holdings, Inc. 5.00% 20247 | 3,205 | 3,289 |
| Ashtead Group PLC 4.00% 20287 | 1,169 | 1,184 |
| Ashtead Group PLC 4.25% 20297 | 433 | 443 |
| Associated Materials, LLC 9.00% 20247 | 10,036 | 8,832 |
| Avis Budget Group, Inc. 5.50% 2023 | 1,815 | 1,852 |
| Avis Budget Group, Inc. 5.25% 20257 | 1,275 | 1,315 |
| Avolon Holdings Funding Ltd. 3.625% 20227 | 1,254 | 1,286 |
| Avolon Holdings Funding Ltd. 3.95% 20247 | 1,587 | 1,656 |
| Avolon Holdings Funding Ltd 4.375% 20267 | 1,975 | 2,089 |
| Boeing Co. 2.70% 2022 | 4,400 | 4,468 |
| Boeing Co. 2.80% 2024 | 875 | 895 |
| Boeing Co. 3.10% 2026 | 1,508 | 1,556 |
| Boeing Co. 3.20% 2029 | 215 | 224 |
| Boeing Co. 2.95% 2030 | 3,033 | 3,104 |
| Boeing Co. 3.60% 2034 | 7,500 | 8,034 |
| Boeing Co. 3.90% 2049 | 250 | 271 |
| Burlington Northern Santa Fe, LLC 4.40% 2042 | 5,000 | 5,787 |
| CSX Corp. 3.80% 2028 | 6,060 | 6,611 |
| CSX Corp. 4.25% 2029 | 5,062 | 5,699 |
| CSX Corp. 4.30% 2048 | 1,125 | 1,277 |
| CSX Corp. 4.75% 2048 | 1,875 | 2,271 |
| CSX Corp. 3.35% 2049 | 1,125 | 1,111 |
| CSX Corp. 4.50% 2049 | 4,795 | 5,611 |
| Dun & Bradstreet Corp. 6.875% 20267 | 1,780 | 1,968 |
| Dun & Bradstreet Corp., Term Loan B, (3-month USD-LIBOR + 5.00%) 6.792% 202612,13 | 2,155 | 2,174 |
American Funds Insurance Series — Asset Allocation Fund — Page 79 of 184
| Bonds, notes & other debt instruments (continued) Corporate bonds & notes (continued) Industrials (continued) | Principal amount (000) | Value (000) |
| Euramax International, Inc. 12.00% 20207 | $4,550 | $4,518 |
| FXI Holdings, Inc. 12.25% 20267 | 3,470 | 3,620 |
| General Dynamics Corp. 3.00% 2021 | 4,000 | 4,067 |
| General Dynamics Corp. 3.375% 2023 | 2,550 | 2,664 |
| General Dynamics Corp. 3.50% 2025 | 4,804 | 5,147 |
| General Dynamics Corp. 3.75% 2028 | 720 | 792 |
| General Electric Co. 2.70% 2022 | 6,535 | 6,624 |
| Hardwoods Acquisition Inc. 7.50% 20217 | 2,328 | 1,187 |
| Hertz Global Holdings Inc. 7.625% 20227 | 2,991 | 3,118 |
| Honeywell International Inc. 2.15% 2022 | 4,400 | 4,443 |
| Honeywell International Inc. 2.30% 2024 | 6,925 | 7,020 |
| Honeywell International Inc. 2.70% 2029 | 4,330 | 4,433 |
| Icahn Enterprises Finance Corp. 4.75% 20247 | 2,130 | 2,191 |
| Lockheed Martin Corp. 2.50% 2020 | 6,900 | 6,937 |
| Lockheed Martin Corp. 3.10% 2023 | 545 | 562 |
| Lockheed Martin Corp. 3.55% 2026 | 3,490 | 3,744 |
| LSC Communications, Inc. 8.75% 20237 | 4,005 | 2,174 |
| Nielsen Finance LLC and Nielsen Finance Co. 5.00% 20257 | 2,175 | 2,246 |
| Norfolk Southern Corp. 3.00% 2022 | 2,056 | 2,099 |
| Norfolk Southern Corp. 2.55% 2029 | 5,530 | 5,519 |
| Norfolk Southern Corp. 3.40% 2049 | 1,312 | 1,305 |
| Northrop Grumman Corp. 2.55% 2022 | 5,400 | 5,481 |
| Northrop Grumman Corp. 2.93% 2025 | 4,732 | 4,878 |
| Northrop Grumman Corp. 3.25% 2028 | 5,920 | 6,176 |
| Pisces Parent LLC 8.00% 20267 | 4,965 | 5,189 |
| R.R. Donnelley & Sons Co. 6.50% 2023 | 3,310 | 3,394 |
| Rockwell Collins, Inc. 2.80% 2022 | 3,745 | 3,811 |
| Roper Technologies, Inc. 2.80% 2021 | 1,815 | 1,842 |
| Roper Technologies, Inc. 3.80% 2026 | 410 | 441 |
| Siemens AG 2.70% 20227 | 2,685 | 2,732 |
| Union Pacific Corp. 3.15% 2024 | 1,287 | 1,340 |
| Union Pacific Corp. 3.75% 2025 | 4,643 | 4,977 |
| Union Pacific Corp. 3.95% 2028 | 1,875 | 2,071 |
| Union Pacific Corp. 3.70% 2029 | 8,500 | 9,287 |
| Union Pacific Corp. 4.30% 2049 | 3,690 | 4,256 |
| Union Pacific Corp. 3.95% 2059 | 1,365 | 1,434 |
| United Technologies Corp. 3.65% 2023 | 1,544 | 1,628 |
| United Technologies Corp. 3.95% 2025 | 5,155 | 5,623 |
| United Technologies Corp. 4.125% 2028 | 1,960 | 2,208 |
| Vinci SA 3.75% 20297 | 2,237 | 2,440 |
| Wesco Aircraft Holdings, Inc. 9.00% 20267 | 3,250 | 3,410 |
| 225,776 | ||
| Consumer discretionary 0.72% | ||
| Amazon.com, Inc. 2.40% 2023 | 1,500 | 1,527 |
| Amazon.com, Inc. 2.80% 2024 | 1,500 | 1,553 |
| American Honda Finance Corp. 3.50% 2028 | 1,125 | 1,212 |
| Bayerische Motoren Werke AG 2.25% 20237 | 300 | 301 |
| Bayerische Motoren Werke AG 3.45% 20237 | 1,870 | 1,940 |
| Bayerische Motoren Werke AG 3.15% 20247 | 8,510 | 8,802 |
| Boyd Gaming Corp. 4.75% 20277 | 2,545 | 2,648 |
| DaimlerChrysler North America Holding Corp. 2.25% 20207 | 2,765 | 2,766 |
| DaimlerChrysler North America Holding Corp. 3.35% 20237 | 300 | 308 |
| Ford Motor Credit Co. 2.343% 2020 | 4,635 | 4,627 |
American Funds Insurance Series — Asset Allocation Fund — Page 80 of 184
| Bonds, notes & other debt instruments (continued) Corporate bonds & notes (continued) Consumer discretionary (continued) | Principal amount (000) | Value (000) |
| Ford Motor Credit Co. 3.157% 2020 | $500 | $502 |
| Ford Motor Credit Co. 3.20% 2021 | 2,250 | 2,263 |
| General Motors Co. 4.35% 2025 | 1,920 | 2,057 |
| General Motors Co. 6.25% 2043 | 359 | 403 |
| General Motors Co. 5.40% 2048 | 500 | 517 |
| General Motors Financial Co. 3.70% 2020 | 6,355 | 6,431 |
| General Motors Financial Co. 3.45% 2022 | 3,625 | 3,707 |
| General Motors Financial Co. 3.45% 2022 | 2,000 | 2,045 |
| General Motors Financial Co. 3.55% 2022 | 5,285 | 5,441 |
| General Motors Financial Co. 3.50% 2024 | 5,008 | 5,160 |
| General Motors Financial Co. 4.30% 2025 | 1,025 | 1,096 |
| General Motors Financial Co. 4.35% 2027 | 500 | 525 |
| Hanesbrands Inc. 4.625% 20247 | 860 | 909 |
| Hanesbrands Inc. 4.875% 20267 | 2,700 | 2,864 |
| Home Depot, Inc. 3.90% 2028 | 825 | 926 |
| Home Depot, Inc. 2.95% 2029 | 9,360 | 9,737 |
| Home Depot, Inc. 4.25% 2046 | 3,500 | 4,141 |
| Home Depot, Inc. 4.50% 2048 | 428 | 528 |
| Hyundai Capital America 3.25% 20227 | 480 | 489 |
| Lowe’s Cos., Inc. 3.65% 2029 | 3,574 | 3,820 |
| Lowe’s Cos., Inc. 4.55% 2049 | 385 | 454 |
| Mattel, Inc. 6.75% 20257 | 3,225 | 3,473 |
| Melco International Development Ltd. 5.375% 20297 | 435 | 447 |
| MGM Resorts International 7.75% 2022 | 1,700 | 1,898 |
| PetSmart, Inc. 5.875% 20257 | 29,965 | 30,602 |
| PetSmart, Inc. 8.875% 20257 | 14,515 | 14,370 |
| PetSmart, Inc., Term Loan, (3-month USD-LIBOR + 3.00%) 4.74% 202212,13 | 5,932 | 5,806 |
| Sally Holdings LLC and Sally Capital Inc. 5.50% 2023 | 340 | 347 |
| Sally Holdings LLC and Sally Capital Inc. 5.625% 2025 | 5,400 | 5,666 |
| Scientific Games Corp. 8.25% 20267 | 3,885 | 4,290 |
| Scientific Games Corp. 7.00% 20287 | 565 | 606 |
| Scientific Games Corp. 7.25% 20297 | 740 | 806 |
| Staples, Inc. 7.50% 20267 | 14,450 | 15,019 |
| Toyota Motor Credit Corp. 2.15% 2020 | 817 | 817 |
| Toyota Motor Credit Corp. 1.90% 2021 | 2,945 | 2,949 |
| Toyota Motor Credit Corp. 2.15% 2022 | 545 | 549 |
| Toyota Motor Credit Corp. 2.60% 2022 | 924 | 938 |
| Toyota Motor Credit Corp. 3.05% 2028 | 2,430 | 2,562 |
| Volkswagen Group of America Finance, LLC 4.00% 20217 | 4,988 | 5,159 |
| Volkswagen Group of America Finance, LLC 4.25% 20237 | 5,320 | 5,669 |
| Volkswagen Group of America Finance, LLC 4.625% 20257 | 3,845 | 4,256 |
| Volkswagen Group of America Finance, LLC 3.20% 20267 | 4,757 | 4,880 |
| Wynn Las Vegas, LLC and Wynn Capital Corp. 4.25% 20237 | 4,918 | 5,163 |
| 195,971 | ||
| Consumer staples 0.64% | ||
| Albertsons Cos. LLC 4.625% 20277 | 4,350 | 4,353 |
| Altria Group, Inc. 3.80% 2024 | 2,630 | 2,768 |
| Altria Group, Inc. 4.40% 2026 | 445 | 483 |
| Altria Group, Inc. 4.80% 2029 | 2,508 | 2,794 |
| Altria Group, Inc. 5.80% 2039 | 5,960 | 7,009 |
| Altria Group, Inc. 4.50% 2043 | 3,000 | 3,065 |
| Altria Group, Inc. 5.95% 2049 | 3,824 | 4,630 |
| Anheuser-Busch InBev NV 4.15% 2025 | 8,000 | 8,709 |
American Funds Insurance Series — Asset Allocation Fund — Page 81 of 184
| Bonds, notes & other debt instruments (continued) Corporate bonds & notes (continued) Consumer staples (continued) | Principal amount (000) | Value (000) |
| Anheuser-Busch InBev NV 4.00% 2028 | $4,345 | $4,780 |
| Anheuser-Busch InBev NV 4.75% 2029 | 886 | 1,026 |
| Anheuser-Busch InBev NV 5.45% 2039 | 7,900 | 9,935 |
| Anheuser-Busch InBev NV 5.55% 2049 | 2,500 | 3,243 |
| B&G Foods, Inc. 5.25% 2025 | 1,660 | 1,710 |
| British American Tobacco International Finance PLC 3.95% 20257 | 4,250 | 4,495 |
| British American Tobacco PLC 2.789% 2024 | 4,000 | 4,034 |
| British American Tobacco PLC 3.222% 2024 | 2,826 | 2,890 |
| British American Tobacco PLC 3.215% 2026 | 5,143 | 5,184 |
| British American Tobacco PLC 3.557% 2027 | 1,000 | 1,021 |
| British American Tobacco PLC 3.462% 2029 | 2,000 | 2,024 |
| British American Tobacco PLC 4.39% 2037 | 5,500 | 5,568 |
| British American Tobacco PLC 4.54% 2047 | 4,820 | 4,842 |
| Conagra Brands, Inc. 3.80% 2021 | 5,000 | 5,160 |
| Conagra Brands, Inc. 4.30% 2024 | 4,685 | 5,045 |
| Conagra Brands, Inc. 5.40% 2048 | 1,015 | 1,238 |
| Constellation Brands, Inc. 2.65% 2022 | 7,846 | 7,957 |
| Constellation Brands, Inc. 2.70% 2022 | 195 | 197 |
| Constellation Brands, Inc. 3.20% 2023 | 1,340 | 1,377 |
| Constellation Brands, Inc. 3.60% 2028 | 938 | 992 |
| Constellation Brands, Inc. 4.50% 2047 | 220 | 240 |
| Costco Wholesale Corp. 2.30% 2022 | 954 | 966 |
| Costco Wholesale Corp. 2.75% 2024 | 10,000 | 10,352 |
| Imperial Tobacco Finance PLC 3.50% 20237 | 4,000 | 4,095 |
| Keurig Dr Pepper Inc. 4.057% 2023 | 2,000 | 2,109 |
| Keurig Dr Pepper Inc. 4.597% 2028 | 2,000 | 2,247 |
| Keurig Dr Pepper Inc. 4.985% 2038 | 4,001 | 4,728 |
| Keurig Dr Pepper Inc. 5.085% 2048 | 75 | 90 |
| Molson Coors Brewing Co. 2.25% 2020 | 1,140 | 1,140 |
| Molson Coors Brewing Co. 4.20% 2046 | 2,695 | 2,687 |
| Nestlé Holdings, Inc. 3.35% 20237 | 750 | 785 |
| Philip Morris International Inc. 2.00% 2020 | 1,000 | 1,000 |
| Philip Morris International Inc. 1.875% 2021 | 1,500 | 1,500 |
| Philip Morris International Inc. 2.375% 2022 | 1,960 | 1,981 |
| Philip Morris International Inc. 2.625% 2022 | 1,670 | 1,691 |
| Philip Morris International Inc. 2.875% 2024 | 788 | 811 |
| Philip Morris International Inc. 3.25% 2024 | 2,000 | 2,100 |
| Philip Morris International Inc. 3.375% 2029 | 3,268 | 3,430 |
| Procter & Gamble Co. 1.70% 2021 | 400 | 401 |
| Reckitt Benckiser Group PLC 2.375% 20227 | 1,125 | 1,133 |
| Reynolds American Inc. 4.45% 2025 | 2,850 | 3,068 |
| Reynolds American Inc. 5.85% 2045 | 2,030 | 2,327 |
| Wal-Mart Stores, Inc. 3.125% 2021 | 2,317 | 2,367 |
| Wal-Mart Stores, Inc. 2.35% 2022 | 1,000 | 1,018 |
| Wal-Mart Stores, Inc. 2.55% 2023 | 5,660 | 5,783 |
| Wal-Mart Stores, Inc. 3.40% 2023 | 5,665 | 5,956 |
| Wal-Mart Stores, Inc. 2.85% 2024 | 1,805 | 1,872 |
| Wal-Mart Stores, Inc. 3.05% 2026 | 2,060 | 2,172 |
| Wal-Mart Stores, Inc. 3.70% 2028 | 687 | 758 |
| WM. Wrigley Jr. Co. 3.375% 20207 | 250 | 252 |
| 175,588 |
American Funds Insurance Series — Asset Allocation Fund — Page 82 of 184
| Bonds, notes & other debt instruments (continued) Corporate bonds & notes (continued) Materials 0.59% | Principal amount (000) | Value (000) |
| Air Liquide SA 2.25% 20297 | $1,381 | $1,355 |
| AK Steel Holding Corp. 7.625% 2021 | 2,175 | 2,198 |
| Braskem SA 4.50% 20307 | 1,255 | 1,251 |
| Chemours Co. 6.625% 2023 | 7,360 | 7,404 |
| Chevron Phillips Chemical Co. LLC 3.30% 20237 | 595 | 613 |
| Cleveland-Cliffs Inc. 4.875% 20247 | 3,025 | 3,098 |
| Cleveland-Cliffs Inc. 5.75% 2025 | 9,456 | 9,356 |
| Cleveland-Cliffs Inc. 5.875% 20277 | 12,075 | 11,614 |
| Consolidated Energy Finance SA 6.50% 20267 | 2,685 | 2,525 |
| CVR Partners, LP 9.25% 20237 | 1,750 | 1,832 |
| Dow Chemical Co. 3.15% 2024 | 1,565 | 1,623 |
| Dow Chemical Co. 4.55% 2025 | 1,405 | 1,552 |
| Dow Chemical Co. 3.625% 2026 | 1,884 | 1,982 |
| Dow Chemical Co. 4.80% 2049 | 627 | 726 |
| First Quantum Minerals Ltd. 7.25% 20227 | 7,175 | 7,221 |
| First Quantum Minerals Ltd. 7.25% 20237 | 1,200 | 1,245 |
| First Quantum Minerals Ltd. 6.50% 20247 | 4,704 | 4,726 |
| First Quantum Minerals Ltd. 7.50% 20257 | 30,400 | 31,147 |
| First Quantum Minerals Ltd. 6.875% 20267 | 3,625 | 3,677 |
| Freeport-McMoRan Inc. 3.55% 2022 | 12,118 | 12,291 |
| FXI Holdings, Inc. 7.875% 20247 | 1,215 | 1,169 |
| Glencore Funding LLC 4.125% 20247 | 945 | 990 |
| H.I.G. Capital, LLC 6.75% 20247 | 1,291 | 1,204 |
| Hexion Inc. 7.875% 20277 | 765 | 797 |
| Holcim Ltd. 5.15% 20237 | 2,395 | 2,573 |
| International Paper Co. 7.30% 2039 | 2,005 | 2,776 |
| LSB Industries, Inc. 9.625% 20237 | 4,890 | 5,036 |
| Mosaic Co. 3.25% 2022 | 1,788 | 1,835 |
| Mosaic Co. 4.05% 2027 | 1,587 | 1,647 |
| Nova Chemicals Corp. 5.25% 20277 | 2,900 | 2,985 |
| Praxair, Inc. 3.00% 2021 | 340 | 347 |
| Rayonier Advanced Materials Inc. 5.50% 20247 | 5,124 | 3,871 |
| Ryerson Inc. 11.00% 20227 | 6,615 | 6,995 |
| Sherwin-Williams Co. 2.75% 2022 | 264 | 269 |
| Sherwin-Williams Co. 3.125% 2024 | 275 | 284 |
| Sherwin-Williams Co. 2.95% 2029 | 4,000 | 4,054 |
| Sherwin-Williams Co. 3.80% 2049 | 5,208 | 5,315 |
| TPC Group Inc. 10.50% 20247 | 418 | 422 |
| Tronox Ltd. 6.50% 20267 | 2,880 | 2,974 |
| Venator Materials Corp. 5.75% 20257 | 5,900 | 5,457 |
| Warrior Met Coal, Inc. 8.00% 20247 | 3,024 | 3,071 |
| Westlake Chemical Corp. 4.375% 2047 | 500 | 505 |
| 162,012 | ||
| Information technology 0.47% | ||
| Almonde Inc., Term Loan, (3-month USD-LIBOR + 7.25%) 9.446% 202512,13 | 5,150 | 5,047 |
| Apple Inc. 3.35% 2027 | 40 | 43 |
| Apple Inc. 3.00% 2024 | 625 | 649 |
| Applied Systems, Inc., Term Loan, (3-month USD-LIBOR + 7.00%) 8.945% 202512,13 | 600 | 616 |
| Broadcom Inc. 3.125% 20227 | 1,575 | 1,604 |
| Broadcom Inc. 3.625% 20247 | 1,575 | 1,638 |
| Broadcom Inc. 4.25% 20267 | 12,370 | 13,153 |
| Broadcom Inc. 4.75% 20297 | 11,150 | 12,203 |
| Broadcom Ltd. 3.625% 2024 | 937 | 971 |
American Funds Insurance Series — Asset Allocation Fund — Page 83 of 184
| Bonds, notes & other debt instruments (continued) Corporate bonds & notes (continued) Information technology (continued) | Principal amount (000) | Value (000) |
| Broadcom Ltd. 3.875% 2027 | $3,060 | $3,178 |
| Broadcom Ltd. 3.50% 2028 | 3,527 | 3,551 |
| CommScope Finance LLC 6.00% 20267 | 2,425 | 2,584 |
| Diebold Nixdorf AG, Term Loan B, (3-month USD-LIBOR + 2.75%) 4.50% 202312,13 | 1,405 | 1,368 |
| Diebold, Inc. 8.50% 2024 | 3,100 | 3,001 |
| Fidelity National Information Services, Inc. 3.75% 2029 | 990 | 1,083 |
| Fiserv, Inc. 2.75% 2024 | 1,600 | 1,629 |
| Fiserv, Inc. 3.20% 2026 | 7,455 | 7,722 |
| Fiserv, Inc. 3.50% 2029 | 10,430 | 10,969 |
| Fiserv, Inc. 4.40% 2049 | 1,800 | 2,046 |
| Genesys Telecommunications Laboratories, Inc. 10.00% 20247 | 875 | 948 |
| Kronos Inc., Term Loan B, (3-month USD-LIBOR + 8.25%) 10.159% 202412,13 | 4,375 | 4,495 |
| McAfee, LLC, Term Loan, (3-month USD-LIBOR + 3.75%) 5.555% 202412,13 | 2,917 | 2,934 |
| Microsoft Corp. 1.55% 2021 | 545 | 544 |
| Microsoft Corp. 2.40% 2022 | 9,190 | 9,319 |
| Microsoft Corp. 3.30% 2027 | 4,000 | 4,276 |
| Microsoft Corp. 4.20% 2035 | 6,000 | 7,132 |
| Microsoft Corp. 4.10% 2037 | 1,000 | 1,181 |
| Microsoft Corp. 4.25% 2047 | 250 | 306 |
| PayPal Holdings, Inc. 2.65% 2026 | 2,364 | 2,398 |
| PayPal Holdings, Inc. 2.85% 2029 | 2,770 | 2,790 |
| Unisys Corp. 10.75% 20227 | 3,125 | 3,368 |
| Veritas Holdings Ltd. 7.50% 20237 | 3,350 | 3,351 |
| Veritas Holdings Ltd. 10.50% 20247 | 1,285 | 1,192 |
| Veritas US Inc., Term Loan B, (3-month USD-LIBOR + 4.50%) 6.299% 202312,13 | 1,244 | 1,202 |
| Visa Inc. 2.15% 2022 | 2,725 | 2,756 |
| Visa Inc. 2.80% 2022 | 2,000 | 2,058 |
| Visa Inc. 3.15% 2025 | 5,500 | 5,813 |
| Xerox Corp. 4.125% 2023 | 906 | 941 |
| 130,059 | ||
| Real estate 0.35% | ||
| Alexandria Real Estate Equities, Inc. 3.80% 2026 | 315 | 337 |
| Alexandria Real Estate Equities, Inc. 3.95% 2028 | 1,220 | 1,310 |
| Alexandria Real Estate Equities, Inc. 2.75% 2029 | 2,910 | 2,875 |
| Alexandria Real Estate Equities, Inc. 3.375% 2031 | 2,375 | 2,479 |
| Alexandria Real Estate Equities, Inc. 4.85% 2049 | 410 | 500 |
| American Campus Communities, Inc. 3.35% 2020 | 500 | 504 |
| American Campus Communities, Inc. 3.75% 2023 | 3,055 | 3,184 |
| American Campus Communities, Inc. 4.125% 2024 | 2,075 | 2,213 |
| American Campus Communities, Inc. 3.30% 2026 | 1,698 | 1,760 |
| American Campus Communities, Inc. 3.625% 2027 | 6,050 | 6,380 |
| American Tower Corp. 3.55% 2027 | 1,425 | 1,494 |
| American Tower Corp. 3.60% 2028 | 1,000 | 1,050 |
| Brandywine Operating Partnership, LP 3.95% 2023 | 1,070 | 1,110 |
| Brookfield Property REIT Inc. 5.75% 20267 | 5,750 | 6,077 |
| Corporate Office Properties LP 3.60% 2023 | 390 | 401 |
| Corporate Office Properties LP 5.25% 2024 | 3,595 | 3,869 |
| EPR Properties 4.75% 2026 | 1,000 | 1,093 |
| Equinix, Inc. 2.90% 2026 | 6,087 | 6,109 |
| Equinix, Inc. 3.20% 2029 | 6,170 | 6,204 |
| Essex Portfolio LP 3.875% 2024 | 1,000 | 1,057 |
| Essex Portfolio LP 3.50% 2025 | 5,865 | 6,156 |
| Essex Portfolio LP 4.00% 2029 | 1,800 | 1,955 |
American Funds Insurance Series — Asset Allocation Fund — Page 84 of 184
| Bonds, notes & other debt instruments (continued) Corporate bonds & notes (continued) Real estate (continued) | Principal amount (000) | Value (000) |
| Gaming and Leisure Properties, Inc. 3.35% 2024 | $1,263 | $1,293 |
| Hospitality Properties Trust 4.50% 2023 | 1,945 | 2,022 |
| Hospitality Properties Trust 4.50% 2025 | 150 | 154 |
| Hospitality Properties Trust 4.95% 2027 | 500 | 518 |
| Hospitality Properties Trust 3.95% 2028 | 1,950 | 1,902 |
| Host Hotels & Resorts LP 4.50% 2026 | 355 | 384 |
| Public Storage 2.37% 2022 | 565 | 571 |
| Realogy Corp. 5.25% 20217 | 1,750 | 1,771 |
| Realogy Corp. 4.875% 20237 | 4,625 | 4,556 |
| Realogy Corp. 9.375% 20277 | 2,595 | 2,714 |
| Scentre Group 3.25% 20257 | 1,000 | 1,023 |
| Scentre Group 3.50% 20257 | 3,075 | 3,191 |
| Scentre Group 3.75% 20277 | 2,430 | 2,542 |
| UDR, Inc. 2.95% 2026 | 760 | 774 |
| WEA Finance LLC 3.25% 20207 | 5,055 | 5,096 |
| Welltower Inc. 3.95% 2023 | 1,325 | 1,398 |
| Westfield Corp. Ltd. 3.15% 20227 | 4,290 | 4,385 |
| Westfield Corp. Ltd. 3.50% 20297 | 2,130 | 2,207 |
| 94,618 | ||
| Total corporate bonds & notes | 2,840,678 | |
| Mortgage-backed obligations 6.93% Federal agency mortgage-backed obligations 6.68% | ||
| Fannie Mae 7.00% 204716 | 12 | 14 |
| Fannie Mae 7.00% 204716 | 2 | 2 |
| Fannie Mae Pool #885290 6.00% 202116 | 7 | 8 |
| Fannie Mae Pool #MA1104 2.50% 202216 | 92 | 93 |
| Fannie Mae Pool #MA1278 2.50% 202216 | 74 | 75 |
| Fannie Mae Pool #MA1370 2.50% 202316 | 1,282 | 1,293 |
| Fannie Mae Pool #MA1460 2.50% 202316 | 1,278 | 1,289 |
| Fannie Mae Pool #AE0375 4.00% 202516 | 768 | 802 |
| Fannie Mae Pool #AD7072 4.00% 202516 | 8 | 8 |
| Fannie Mae Pool #AE3069 4.00% 202516 | 4 | 4 |
| Fannie Mae Pool #AE2321 4.00% 202516 | 2 | 2 |
| Fannie Mae Pool #AD8204 4.00% 202516 | 2 | 2 |
| Fannie Mae Pool #AL5448 4.00% 202616 | 781 | 815 |
| Fannie Mae Pool #890297 4.00% 202616 | 778 | 812 |
| Fannie Mae Pool #AH9695 4.00% 202616 | 759 | 791 |
| Fannie Mae Pool #AH6431 4.00% 202616 | 624 | 653 |
| Fannie Mae Pool #890329 4.00% 202616 | 103 | 108 |
| Fannie Mae Pool #AJ3010 4.00% 202616 | 56 | 59 |
| Fannie Mae Pool #AH8174 4.00% 202616 | 7 | 7 |
| Fannie Mae Pool #AH5618 4.00% 202616 | 6 | 6 |
| Fannie Mae Pool #AL3908 4.00% 202616 | 5 | 5 |
| Fannie Mae Pool #AH0829 4.00% 202616 | 4 | 5 |
| Fannie Mae Pool #AH8275 4.00% 202616 | 4 | 4 |
| Fannie Mae Pool #888204 6.00% 202616 | 191 | 211 |
| Fannie Mae Pool #AL7299 4.00% 202716 | 387 | 404 |
| Fannie Mae Pool #MA1109 4.00% 202716 | 7 | 7 |
| Fannie Mae Pool #MA3653 3.00% 202916 | 75 | 76 |
| Fannie Mae Pool #AL8347 4.00% 202916 | 785 | 820 |
| Fannie Mae Pool #MA3547 3.00% 203316 | 20 | 21 |
| Fannie Mae Pool #254767 5.50% 203316 | 408 | 458 |
American Funds Insurance Series — Asset Allocation Fund — Page 85 of 184
| Bonds, notes & other debt instruments (continued) Mortgage-backed obligations (continued) Federal agency mortgage-backed obligations (continued) | Principal amount (000) | Value (000) |
| Fannie Mae Pool #555956 5.50% 203316 | $271 | $305 |
| Fannie Mae Pool #MA3764 2.50% 203416 | 21,549 | 21,738 |
| Fannie Mae Pool #MA3827 2.50% 203416 | 9,668 | 9,753 |
| Fannie Mae Pool #BP0121 2.50% 203416 | 1,896 | 1,913 |
| Fannie Mae Pool #BP0082 2.50% 203416 | 1,461 | 1,474 |
| Fannie Mae Pool #MA3797 2.50% 203416 | 770 | 777 |
| Fannie Mae Pool #MA3674 2.50% 203416 | 407 | 410 |
| Fannie Mae Pool #BJ9733 2.50% 203416 | 179 | 181 |
| Fannie Mae Pool #MA3709 2.50% 203416 | 103 | 104 |
| Fannie Mae Pool #MA3657 3.00% 203416 | 6,526 | 6,687 |
| Fannie Mae Pool #BN1085 4.00% 203416 | 1,560 | 1,627 |
| Fannie Mae Pool #BN3172 4.00% 203416 | 686 | 716 |
| Fannie Mae Pool #MA3896 2.50% 203516 | 57,829 | 58,338 |
| Fannie Mae Pool #AS8554 3.00% 203616 | 17,985 | 18,458 |
| Fannie Mae Pool #929185 5.50% 203616 | 662 | 744 |
| Fannie Mae Pool #893641 6.00% 203616 | 1,496 | 1,712 |
| Fannie Mae Pool #893688 6.00% 203616 | 386 | 434 |
| Fannie Mae Pool #907239 6.00% 203616 | 77 | 87 |
| Fannie Mae Pool #AD0249 5.50% 203716 | 224 | 249 |
| Fannie Mae Pool #190379 5.50% 203716 | 119 | 133 |
| Fannie Mae Pool #924952 6.00% 203716 | 1,587 | 1,818 |
| Fannie Mae Pool #888292 6.00% 203716 | 1,113 | 1,277 |
| Fannie Mae Pool #928031 6.00% 203716 | 166 | 190 |
| Fannie Mae Pool #888637 6.00% 203716 | 20 | 23 |
| Fannie Mae Pool #AD0119 6.00% 203816 | 1,943 | 2,224 |
| Fannie Mae Pool #AD0095 6.00% 203816 | 1,396 | 1,602 |
| Fannie Mae Pool #995674 6.00% 203816 | 677 | 778 |
| Fannie Mae Pool #AE0021 6.00% 203816 | 601 | 691 |
| Fannie Mae Pool #AB0538 6.00% 203816 | 375 | 430 |
| Fannie Mae Pool #AL7164 6.00% 203816 | 341 | 389 |
| Fannie Mae Pool #995391 6.00% 203816 | 40 | 46 |
| Fannie Mae Pool #889983 6.00% 203816 | 37 | 42 |
| Fannie Mae Pool #995224 6.00% 203816 | 22 | 25 |
| Fannie Mae Pool #AD0833 6.00% 203916 | 1 | 1 |
| Fannie Mae Pool #AL0013 6.00% 204016 | 375 | 431 |
| Fannie Mae Pool #AL0309 6.00% 204016 | 122 | 141 |
| Fannie Mae Pool #AB4536 6.00% 204116 | 630 | 720 |
| Fannie Mae Pool #AL7228 6.00% 204116 | 482 | 552 |
| Fannie Mae Pool #AP2131 3.50% 204216 | 8,310 | 8,757 |
| Fannie Mae Pool #AU8813 4.00% 204316 | 3,378 | 3,689 |
| Fannie Mae Pool #AU9348 4.00% 204316 | 1,968 | 2,146 |
| Fannie Mae Pool #AU9350 4.00% 204316 | 1,782 | 1,924 |
| Fannie Mae Pool #AL8773 3.50% 204516 | 13,150 | 13,856 |
| Fannie Mae Pool #AL8354 3.50% 204516 | 3,185 | 3,369 |
| Fannie Mae Pool #BC4764 3.00% 204616 | 30,681 | 31,413 |
| Fannie Mae Pool #AL8522 3.50% 204616 | 6,228 | 6,588 |
| Fannie Mae Pool #BD9699 3.50% 204616 | 2,642 | 2,770 |
| Fannie Mae Pool #BD9307 4.00% 204616 | 1,946 | 2,073 |
| Fannie Mae Pool #BC7611 4.00% 204616 | 635 | 675 |
| Fannie Mae Pool #BH4084 3.50% 204716 | 33,375 | 34,697 |
| Fannie Mae Pool #CA0770 3.50% 204716 | 5,387 | 5,601 |
| Fannie Mae Pool #BE1290 3.50% 204716 | 4,821 | 5,054 |
| Fannie Mae Pool #MA3211 4.00% 204716 | 11,446 | 12,014 |
| Fannie Mae Pool #BJ3775 3.50% 204816 | 22,695 | 23,558 |
American Funds Insurance Series — Asset Allocation Fund — Page 86 of 184
| Bonds, notes & other debt instruments (continued) Mortgage-backed obligations (continued) Federal agency mortgage-backed obligations (continued) | Principal amount (000) | Value (000) |
| Fannie Mae Pool #CA2622 3.50% 204816 | $30 | $31 |
| Fannie Mae Pool #BK7655 3.926% 204813,16 | 1,458 | 1,513 |
| Fannie Mae Pool #MA3467 4.00% 204816 | 13,020 | 13,565 |
| Fannie Mae Pool #FM1437 4.00% 204816 | 7,598 | 7,922 |
| Fannie Mae Pool #BJ9256 4.00% 204816 | 6,085 | 6,336 |
| Fannie Mae Pool #MA3521 4.00% 204816 | 2,062 | 2,146 |
| Fannie Mae Pool #BK4764 4.00% 204816 | 1,473 | 1,535 |
| Fannie Mae Pool #BK6971 4.00% 204816 | 671 | 699 |
| Fannie Mae Pool #BK0920 4.00% 204816 | 339 | 353 |
| Fannie Mae Pool #MA3536 4.00% 204816 | 235 | 245 |
| Fannie Mae Pool #MA3443 4.00% 204816 | 92 | 96 |
| Fannie Mae Pool #MA3277 4.00% 204816 | 48 | 51 |
| Fannie Mae Pool #BK5255 4.00% 204816 | 38 | 40 |
| Fannie Mae Pool #MA3496 4.50% 204816 | 217 | 229 |
| Fannie Mae Pool #CA4756 3.00% 204916 | 11,416 | 11,713 |
| Fannie Mae Pool #MA3691 3.00% 204916 | 7,051 | 7,153 |
| Fannie Mae Pool #MA3775 3.50% 204916 | 27,277 | 28,051 |
| Fannie Mae Pool #MA3692 3.50% 204916 | 26,830 | 27,572 |
| Fannie Mae Pool #CA4813 3.50% 204916 | 22,281 | 22,970 |
| Fannie Mae Pool #MA3803 3.50% 204916 | 13,955 | 14,359 |
| Fannie Mae Pool #CA4566 3.50% 204916 | 13,554 | 13,938 |
| Fannie Mae Pool #BN5402 3.50% 204916 | 4,704 | 4,841 |
| Fannie Mae Pool #MA3663 3.50% 204916 | 496 | 510 |
| Fannie Mae Pool #MA3597 3.50% 204916 | 197 | 203 |
| Fannie Mae Pool #CA3663 3.50% 204916 | 99 | 102 |
| Fannie Mae Pool #MA3776 4.00% 204916 | 18,155 | 18,949 |
| Fannie Mae Pool #MA3804 4.00% 204916 | 2,491 | 2,602 |
| Fannie Mae Pool #BO2188 4.00% 204916 | 2,404 | 2,506 |
| Fannie Mae Pool #BN4333 4.00% 204916 | 372 | 387 |
| Fannie Mae Pool #CA4574 4.00% 204916 | 333 | 347 |
| Fannie Mae Pool #FM1389 4.50% 204916 | 15,107 | 15,876 |
| Fannie Mae Pool #BN6006 4.50% 204916 | 13,285 | 14,041 |
| Fannie Mae Pool #MA3593 4.50% 204916 | 5,515 | 5,802 |
| Fannie Mae Pool #MA3905 3.00% 205016 | 64,706 | 65,610 |
| Fannie Mae, Series 2001-T10, Class A1, 7.00% 204116 | 143 | 163 |
| Fannie Mae, Series 2002-W3, Class A5, 7.50% 204116 | 35 | 42 |
| Fannie Mae, Series 2012-M14, Class A2, Multi Family, 2.301% 202213,16 | 1,715 | 1,725 |
| Fannie Mae, Series 2012-M9, Class A2, Multi Family, 2.482% 202216 | 3,059 | 3,078 |
| Fannie Mae, Series 2012-M5, Class A2, Multi Family, 2.715% 202216 | 2,969 | 3,002 |
| Fannie Mae, Series 2014-M1, Class A2, Multi Family, 3.188% 202313,16 | 7,136 | 7,351 |
| Fannie Mae, Series 2013-M14, Class A2, Multi Family, 3.329% 202313,16 | 6,383 | 6,669 |
| Fannie Mae, Series 2014-M2, Class A2, Multi Family, 3.513% 202313,16 | 5,266 | 5,518 |
| Fannie Mae, Series 2014-M9, Class A2, Multi Family, 3.103% 202413,16 | 6,215 | 6,442 |
| Fannie Mae, Series 2014-M3, Class A2, Multi Family, 3.48% 202413,16 | 5,420 | 5,672 |
| Fannie Mae, Series 2017-M3, Class A2, Multi Family, 2.483% 202613,16 | 9,665 | 9,786 |
| Fannie Mae, Series 2017-M7, Class A2, Multi Family, 2.961% 202713,16 | 2,891 | 3,004 |
| Fannie Mae, Series 2006-43, Class JO, principal only, 0% 203616 | 80 | 71 |
| Freddie Mac 3.00% 203716 | 26,744 | 27,463 |
| Freddie Mac 5.00% 203816 | 912 | 1,007 |
| Freddie Mac 6.50% 203816 | 101 | 112 |
| Freddie Mac 4.50% 203916 | 169 | 183 |
| Freddie Mac 5.00% 204016 | 1,702 | 1,879 |
| Freddie Mac 4.00% 204216 | 3,760 | 4,037 |
| Freddie Mac 4.00% 204316 | 1,850 | 1,999 |
American Funds Insurance Series — Asset Allocation Fund — Page 87 of 184
| Bonds, notes & other debt instruments (continued) Mortgage-backed obligations (continued) Federal agency mortgage-backed obligations (continued) | Principal amount (000) | Value (000) |
| Freddie Mac 4.00% 204516 | $12,096 | $13,011 |
| Freddie Mac 3.00% 204616 | 7,616 | 7,860 |
| Freddie Mac 4.50% 204616 | 1,504 | 1,595 |
| Freddie Mac 4.50% 204616 | 986 | 1,051 |
| Freddie Mac 3.50% 204716 | 37,153 | 38,700 |
| Freddie Mac 3.50% 204716 | 21,544 | 22,410 |
| Freddie Mac 3.50% 204716 | 4,851 | 5,046 |
| Freddie Mac 3.50% 204716 | 3,667 | 3,845 |
| Freddie Mac 3.50% 204816 | 1,878 | 1,936 |
| Freddie Mac 4.00% 204816 | 34,887 | 36,349 |
| Freddie Mac 4.00% 204816 | 17,238 | 17,969 |
| Freddie Mac Pool #ZS6898 2.50% 202316 | 1,277 | 1,287 |
| Freddie Mac Pool #ZK7598 3.00% 202716 | 15,000 | 15,393 |
| Freddie Mac Pool #ZK7580 3.00% 202716 | 6,353 | 6,541 |
| Freddie Mac Pool #ZS8710 3.00% 203316 | 3,887 | 3,988 |
| Freddie Mac Pool #SB0023 3.00% 203316 | 2,474 | 2,538 |
| Freddie Mac Pool #SB8015 2.50% 203416 | 8,292 | 8,365 |
| Freddie Mac Pool #ZT2094 2.50% 203416 | 6,820 | 6,880 |
| Freddie Mac Pool #SB0105 2.50% 203416 | 1,401 | 1,413 |
| Freddie Mac Pool #SB8020 2.50% 203416 | 983 | 992 |
| Freddie Mac Pool #QN1174 2.50% 203416 | 926 | 934 |
| Freddie Mac Pool #SB8013 2.50% 203416 | 908 | 916 |
| Freddie Mac Pool #SB8010 2.50% 203416 | 568 | 573 |
| Freddie Mac Pool #G18729 3.00% 203416 | 4,318 | 4,429 |
| Freddie Mac Pool #G18732 3.00% 203416 | 4,195 | 4,303 |
| Freddie Mac Pool #J40154 3.00% 203416 | 544 | 558 |
| Freddie Mac Pool #SB8026 2.50% 203516 | 625 | 631 |
| Freddie Mac Pool #Q23185 4.00% 204316 | 2,203 | 2,403 |
| Freddie Mac Pool #760014 3.486% 204513,16 | 851 | 868 |
| Freddie Mac Pool #G60344 4.00% 204516 | 11,566 | 12,441 |
| Freddie Mac Pool #760015 3.238% 204713,16 | 1,593 | 1,605 |
| Freddie Mac Pool #ZT1545 4.00% 204816 | 46,609 | 48,535 |
| Freddie Mac Pool #SI2002 4.00% 204816 | 11,058 | 11,598 |
| Freddie Mac Pool #ZA6124 4.50% 204816 | 12,545 | 13,211 |
| Freddie Mac Pool #ZT1546 4.50% 204816 | 3,945 | 4,151 |
| Freddie Mac Pool #SD7507 3.00% 204916 | 38,394 | 39,511 |
| Freddie Mac Pool #SD8010 3.00% 204916 | 3,243 | 3,290 |
| Freddie Mac Pool #SD8005 3.50% 204916 | 51,841 | 53,266 |
| Freddie Mac Pool #SD8001 3.50% 204916 | 5,134 | 5,276 |
| Freddie Mac Pool #RA1824 3.50% 204916 | 4,000 | 4,123 |
| Freddie Mac Pool #ZT1776 3.50% 204916 | 2,735 | 2,812 |
| Freddie Mac Pool #ZA7047 3.50% 204916 | 496 | 511 |
| Freddie Mac Pool #ZT2086 3.50% 204916 | 466 | 479 |
| Freddie Mac Pool #ZT1952 4.00% 204916 | 5,010 | 5,206 |
| Freddie Mac Pool #ZN4802 4.00% 204916 | 2,507 | 2,614 |
| Freddie Mac Pool #ZT1864 4.00% 204916 | 1,149 | 1,195 |
| Freddie Mac Pool #ZA6548 4.00% 204916 | 469 | 487 |
| Freddie Mac Pool #ZT1595 4.50% 204916 | 5,777 | 6,079 |
| Freddie Mac, Series T041, Class 3A, 5.416% 203213,16 | 261 | 287 |
| Freddie Mac, Series K723, Class A2, Multi Family, 2.454% 202316 | 3,025 | 3,064 |
| Freddie Mac, Series K725, Class A2, Multi Family, 3.002% 202416 | 5,555 | 5,739 |
| Freddie Mac, Series K044, Class A2, Multi Family, 2.811% 202516 | 4,265 | 4,397 |
| Freddie Mac, Series K047, Class A2, Multi Family, 3.329% 202516 | 4,000 | 4,230 |
| Freddie Mac, Series K733, Class A2, Multi Family, 3.75% 202513,16 | 9,778 | 10,497 |
American Funds Insurance Series — Asset Allocation Fund — Page 88 of 184
| Bonds, notes & other debt instruments (continued) Mortgage-backed obligations (continued) Federal agency mortgage-backed obligations (continued) | Principal amount (000) | Value (000) |
| Freddie Mac, Series K055, Class A2, Multi Family, 2.673% 202616 | $10,050 | $10,321 |
| Freddie Mac, Series K734, Class A2, Multi Family, 3.208% 202616 | 7,370 | 7,757 |
| Freddie Mac, Series K066, Class A2, Multi Family, 3.117% 202716 | 4,755 | 5,007 |
| Freddie Mac, Series K067, Class A2, Multi Family, 3.194% 202716 | 5,770 | 6,106 |
| Freddie Mac, Series K070, Class A2, Multi Family, 3.303% 202713,16 | 3,145 | 3,352 |
| Freddie Mac, Series K063, Class A2, Multi Family, 3.43% 202716 | 4,375 | 4,688 |
| Freddie Mac, Series K076, Class A2, Multi Family, 3.90% 202816 | 7,864 | 8,700 |
| Freddie Mac Seasoned Credit Risk Transfer Trust, Series 2017-2, Class HA, 3.00% 205611,16 | 10,051 | 10,216 |
| Freddie Mac Seasoned Credit Risk Transfer Trust, Series 2017-2, Class MA, 3.00% 205616 | 9,692 | 9,872 |
| Freddie Mac Seasoned Credit Risk Transfer Trust, Series 2017-1, Class HA, 3.00% 205613,16 | 5,294 | 5,400 |
| Freddie Mac Seasoned Credit Risk Transfer Trust, Series 2017-3, Class HA, 3.25% 205611,16 | 2,263 | 2,327 |
| Freddie Mac Seasoned Credit Risk Transfer Trust, Series 2017-4, Class HT, 3.25% 205711,16 | 1,679 | 1,731 |
| Freddie Mac Seasoned Credit Risk Transfer Trust, Series 2018-2, Class MT, 3.50% 205716 | 3,353 | 3,536 |
| Freddie Mac Seasoned Credit Risk Transfer Trust, Series 2017-4, Class MT, 3.50% 205716 | 1,344 | 1,396 |
| Freddie Mac Seasoned Credit Risk Transfer Trust, Series 2019-2, Class MA, 3.50% 205816 | 17,972 | 18,674 |
| Freddie Mac Seasoned Credit Risk Transfer Trust, Series 2019-4, Class MA, 3.00% 205916 | 2,907 | 2,962 |
| Freddie Mac Seasoned Loan Structured Transaction Trust, Series 2018-2, Class A1, 3.50% 202816 | 3,994 | 4,136 |
| Freddie Mac Seasoned Loan Structured Transaction Trust, Series 2019-3, Class A1C, 2.75% 202916 | 4,958 | 5,027 |
| Freddie Mac Seasoned Loan Structured Transaction Trust, Series 2019-1, Class A1, 3.50% 202916 | 8,022 | 8,328 |
| Freddie Mac Seasoned Loan Structured Transaction Trust, Series 2019-1, Class A2, 3.50% 202916 | 2,455 | 2,554 |
| Government National Mortgage Assn. 4.00% 204816 | 13,222 | 13,898 |
| Government National Mortgage Assn. 4.00% 204816 | 1,515 | 1,583 |
| Government National Mortgage Assn. 4.50% 204916 | 6,752 | 7,055 |
| Government National Mortgage Assn. 3.50% 205016,17 | 102,786 | 105,923 |
| Government National Mortgage Assn. 4.00% 205016,17 | 94,680 | 97,999 |
| Government National Mortgage Assn. 4.50% 205016,17 | 3,005 | 3,143 |
| Government National Mortgage Assn. Pool #MA5263 3.50% 204816 | 15,142 | 15,619 |
| Government National Mortgage Assn. Pool #MA6339 3.50% 204916 | 108,775 | 112,710 |
| Government National Mortgage Assn. Pool #MA6284 3.50% 204916 | 26,812 | 27,782 |
| Government National Mortgage Assn. Pool #MA5986 4.00% 204916 | 29,605 | 30,683 |
| Government National Mortgage Assn. Pool #MA6220 4.00% 204916 | 24,854 | 25,921 |
| Government National Mortgage Assn. Pool #MA5931 4.00% 204916 | 4,659 | 4,832 |
| Government National Mortgage Assn. Pool #MA6155 4.00% 204916 | 3,249 | 3,384 |
| Government National Mortgage Assn. Pool #MA5987 4.50% 204916 | 44,989 | 47,180 |
| Government National Mortgage Assn. Pool #MA6041 4.50% 204916 | 22,424 | 23,565 |
| Government National Mortgage Assn. Pool #MA6092 4.50% 204916 | 12,546 | 13,199 |
| Government National Mortgage Assn. Pool #MA6156 4.50% 204916 | 11,620 | 12,217 |
| Government National Mortgage Assn. Pool #MA5877 4.50% 204916 | 9,184 | 9,596 |
| Uniform Mortgage-Backed Security 2.50% 203516,17 | 1,003 | 1,011 |
| Uniform Mortgage-Backed Security 3.00% 203516,17 | 9,172 | 9,392 |
| Uniform Mortgage-Backed Security 4.50% 205016,17 | 187 | 197 |
| 1,832,121 | ||
| Collateralized mortgage-backed obligations (privately originated) 0.18% | ||
| Arroyo Mortgage Trust, Series 2018-1, Class A1, 3.763% 20487,13,16 | 2,316 | 2,350 |
| Bellemeade Re Ltd., Series 2019-3A, Class M1B, (1-month USD-LIBOR + 1.60%) 3.392% 20297,13,16 | 3,810 | 3,819 |
| Cascade Funding Mortgage Trust, Series 2018-RM2, Class A, 4.00% 20687,13,16 | 2,543 | 2,611 |
| CS First Boston Mortgage Securities Corp., Series 2004-5, Class IVA1, 6.00% 203416 | 275 | 287 |
| Finance of America Structured Securities Trust, Series 2019-JR2, Class A1, 2.00% 20697,16 | 11,754 | 12,255 |
| Finance of America Structured Securities Trust, Series 2019-JR1, Class A, 2.00% 20697,16 | 4,111 | 4,266 |
| JPMorgan Mortgage Trust, Series 2019-INV3, Class A13, 3.50% 20507,13,16 | 1,659 | 1,694 |
| JPMorgan Mortgage Trust, Series 2019-INV3, Class A3, 3.50% 20507,13,16 | 1,583 | 1,617 |
| Legacy Mortgage Asset Trust, Series 2019-GS5, Class A1, 3.20% 20597,13,16 | 6,070 | 6,091 |
American Funds Insurance Series — Asset Allocation Fund — Page 89 of 184
| Bonds, notes & other debt instruments (continued) Mortgage-backed obligations (continued) Collateralized mortgage-backed obligations (privately originated) (continued) | Principal amount (000) | Value (000) |
| Legacy Mortgage Asset Trust, Series 2019-GS7, Class A1, 3.25% 20597,13,16 | $1,493 | $1,497 |
| Legacy Mortgage Asset Trust, Series 2019-GS2, Class A1, 3.75% 20597,13,16 | 927 | 936 |
| MASTR Alternative Loan Trust, Series 2004-2, Class 2A1, 6.00% 203416 | 640 | 662 |
| Mello Warehouse Securitization Trust, Series 2018-W1, Class A, (1-month USD-LIBOR + 0.85%) 2.642% 20517,13,16 | 1,127 | 1,130 |
| Mello Warehouse Securitization Trust, Series 2019-2, Class A, (1-month USD-LIBOR + 0.75%) 2.573% 20527,13,16 | 3,001 | 3,001 |
| RMF Proprietary Issuance Trust, Series 2019-1, Class A, 2.75% 20637,13,16 | 1,153 | 1,143 |
| Sequoia Mortgage Trust, Series 2018-CH1, Class A1, 4.00% 20487,13,16 | 3,155 | 3,212 |
| Towd Point Mortgage Trust, Series 2019-SJ1, Class A1, 3.75% 20587,13,16 | 1,866 | 1,882 |
| 48,453 | ||
| Commercial mortgage-backed securities 0.05% | ||
| Citigroup Commercial Mortgage Trust, Series 2015-GC29, Class AAB, 2.984% 204816 | 1,185 | 1,207 |
| Commercial Mortgage Trust, Series 2015-PC1, Class A5, 3.902% 205016 | 4,735 | 5,045 |
| CSAIL Commercial Mortgage Trust, Series 2015-C4, Class ASB, 3.617% 204816 | 1,400 | 1,455 |
| Morgan Stanley Bank of America Merrill Lynch Trust, Series 2015-C27, Class ASB, 3.557% 204716 | 1,000 | 1,040 |
| Morgan Stanley Bank of America Merrill Lynch Trust, Series 2015-C22, Class ASB, 3.04% 204816 | 1,180 | 1,204 |
| Morgan Stanley Capital I Trust, Series 2014-CPT, Class A, 3.35% 20297,16 | 2,650 | 2,689 |
| 12,640 | ||
| Other mortgage-backed securities 0.02% | ||
| Royal Bank of Canada 1.875% 202016 | 7,000 | 6,999 |
| Total mortgage-backed obligations | 1,900,213 | |
| Asset-backed obligations 0.48% | ||
| AmeriCredit Automobile Receivables Trust, Series 2016-3, Class B, 1.80% 202116 | 143 | 143 |
| Angel Oak Capital Advisors LLC, CLO, Series 2013-9A, Class A1R, (3-month USD-LIBOR + 1.01%) 2.976% 20257,13,16 | 432 | 432 |
| Cloud Pass-Through Trust, Series 2019-1A, Class CLOU, 3.554% 20227,13,16 | 2,367 | 2,395 |
| Drive Auto Receivables Trust, Series 2017-1, Class C, 2.84% 202216 | 33 | 33 |
| Drive Auto Receivables Trust, Series 2017-AA, Class C, 2.98% 20227,16 | 115 | 115 |
| Drive Auto Receivables Trust, Series 2019-3, Class A3, 2.49% 202316 | 3,330 | 3,346 |
| Drive Auto Receivables Trust, Series 2017-2, Class C, 2.75% 202316 | 82 | 82 |
| Drive Auto Receivables Trust, Series 2019-3, Class B, 2.65% 202416 | 595 | 599 |
| Drive Auto Receivables Trust, Series 2019-3, Class C, 2.90% 202516 | 820 | 829 |
| Drivetime Auto Owner Trust, Series 2019-3, Class A, 2.55% 20227,16 | 296 | 297 |
| Drivetime Auto Owner Trust, Series 2019-2A, Class A, 2.85% 20227,16 | 495 | 497 |
| Drivetime Auto Owner Trust, Series 2019-3, Class B, 2.60% 20237,16 | 285 | 286 |
| Drivetime Auto Owner Trust, Series 2017-4A, Class C, 2.86% 20237,16 | 276 | 276 |
| Drivetime Auto Owner Trust, Series 2017-3A, Class C, 3.01% 20237,16 | 922 | 923 |
| Drivetime Auto Owner Trust, Series 2019-3, Class C, 2.74% 20257,16 | 110 | 111 |
| Enterprise Fleet Financing LLC, Series 2017-1, Class A2, 2.13% 20227,16 | 56 | 56 |
| Enterprise Fleet Financing LLC, Series 2017-1, Class A3, 2.60% 20227,16 | 655 | 656 |
| Exeter Automobile Receivables Trust, Series 2019-2A, Class A, 2.93% 20227,16 | 2,171 | 2,178 |
| Exeter Automobile Receivables Trust, Series 2018-1A, Class C, 3.03% 20237,16 | 3,000 | 3,011 |
| Ford Credit Auto Owner Trust, Series 2016-2, Class A, 2.03% 20277,16 | 2,900 | 2,901 |
| Ford Credit Auto Owner Trust, Series 2017-1, Class A, 2.62% 20287,16 | 3,330 | 3,369 |
| Ford Credit Auto Owner Trust, Series 2018-2, Class A, 3.47% 20307,16 | 13,095 | 13,682 |
| Ford Credit Auto Owner Trust, Series 2018-1, Class A, 3.52% 20307,16 | 12,000 | 12,602 |
| Ford Credit Auto Owner Trust, Series 2018-1, Class A, 3.19% 20317,16 | 11,965 | 12,445 |
| Global SC Finance II SRL, Series 2013-1A, Class A, 2.98% 20287,16 | 83 | 83 |
| Global SC Finance II SRL, Series 2014-1A, Class A1, 3.19% 20297,16 | 204 | 204 |
| Global SC Finance II SRL, Series 2017-1A, Class A, 3.85% 20377,16 | 1,494 | 1,518 |
American Funds Insurance Series — Asset Allocation Fund — Page 90 of 184
| Bonds, notes & other debt instruments (continued) Asset-backed obligations (continued) | Principal amount (000) | Value (000) |
| Global SC Finance V SRL, Series 2019-1A, Class B, 4.81% 20397,16 | $3,564 | $3,517 |
| Hertz Vehicle Financing LLC, Rental Car Asset-Backed Notes, Series 2019-3A, Class A, 2.67% 20257,16 | 2,545 | 2,539 |
| Santander Drive Auto Receivables Trust, Series 2016-2, Class C, 2.66% 202116 | 97 | 97 |
| Santander Drive Auto Receivables Trust, Series 2017-1, Class C, 2.58% 202216 | 780 | 780 |
| Symphony Ltd., CLO, Series 2013-12A, Class AR, (3-month USD-LIBOR + 1.03%) 3.031% 20257,13,16 | 5,108 | 5,108 |
| Synchrony Credit Card Master Note Trust, Series 2018-A1, Class A1, 3.38% 202416 | 3,310 | 3,384 |
| Synchrony Credit Card Master Note Trust, Series 2019-1, Class A, 2.95% 202516 | 5,400 | 5,507 |
| TAL Advantage V LLC, Series 2013-2A, Class A, 3.55% 20387,16 | 1,026 | 1,025 |
| TAL Advantage V LLC, Series 2014-1A, Class A, 3.51% 20397,16 | 958 | 956 |
| Toyota Auto Loan Extended Note Trust, Series 2019-1, Class A, 2.56% 20317,16 | 3,250 | 3,302 |
| Triton Container Finance LLC, Series 2017-1A, Class A, 3.52% 20427,16 | 1,836 | 1,830 |
| Triton Container Finance LLC, Series 2017-2A, Class A, 3.62% 20427,16 | 1,605 | 1,603 |
| Verizon Owner Trust, Series 2016-2A, Class A, 1.68% 20217,16 | 148 | 148 |
| Verizon Owner Trust, Series 2017-2A, Class A, 1.92% 20217,16 | 3,414 | 3,414 |
| Verizon Owner Trust, Series 2017-1A, Class A, 2.06% 20217,16 | 1,942 | 1,942 |
| Westlake Automobile Receivables Trust, Series 2019-2A, Class A2, 2.57% 20237,16 | 3,330 | 3,339 |
| Westlake Automobile Receivables Trust, Series 2019-2A, Class B, 2.62% 20247,16 | 870 | 874 |
| Westlake Automobile Receivables Trust, Series 2019-2A, Class C, 2.84% 20247,16 | 1,390 | 1,399 |
| World Financial Network Credit Card Master Note Trust, Series 2018-A, Class A, 3.07% 202416 | 7,000 | 7,079 |
| World Financial Network Credit Card Master Note Trust, Series 2019-A, Class A, 3.14% 202516 | 5,375 | 5,496 |
| World Financial Network Credit Card Master Note Trust, Series 2018-B, Class A, 3.46% 202516 | 8,275 | 8,465 |
| World Financial Network Credit Card Master Note Trust, Series 2019-C, Class A, 2.21% 202616 | 6,000 | 6,010 |
| 130,883 | ||
| Bonds & notes of governments & government agencies outside the U.S. 0.14% | ||
| CPPIB Capital Inc. 2.375% 20217 | 6,000 | 6,038 |
| CPPIB Capital Inc. 2.25% 20227 | 4,286 | 4,326 |
| CPPIB Capital Inc. 2.75% 20277 | 6,600 | 6,891 |
| KfW 2.125% 2022 | 375 | 379 |
| Manitoba (Province of) 3.05% 2024 | 2,600 | 2,723 |
| Qatar (State of) 3.375% 20247 | 2,315 | 2,426 |
| Qatar (State of) 4.00% 20297 | 745 | 833 |
| Qatar (State of) 4.817% 20497 | 750 | 930 |
| Quebec (Province of) 2.375% 2022 | 5,057 | 5,122 |
| Quebec (Province of) 2.75% 2027 | 9,000 | 9,418 |
| Saudi Arabia (Kingdom of) 5.25% 20507 | 1,000 | 1,245 |
| 40,331 | ||
| Municipals 0.05% South Carolina 0.05% | ||
| Housing Fin. Auth., Mortgage Rev. Ref. Bonds, Series 2014, AMT, 4.00% 2041 | 35 | 37 |
| Public Service Auth., Rev. Obligations (Santee Cooper), Series 2013-E, 5.00% 2048 | 20 | 22 |
| Public Service Auth., Rev. Obligations (Santee Cooper), Series 2014-A, 5.50% 2054 | 1,350 | 1,525 |
| Public Service Auth., Rev. Obligations (Santee Cooper), Series 2015-A, 5.00% 2050 | 1,390 | 1,567 |
| Public Service Auth., Rev. Obligations (Santee Cooper), Series 2015-A, 5.00% 2055 | 2,955 | 3,323 |
| Public Service Auth., Rev. Obligations (Santee Cooper), Series 2015-E, 5.25% 2055 | 3,020 | 3,470 |
| Public Service Auth., Rev. Obligations (Santee Cooper), Series 2016-B, 5.00% 2035 | 410 | 486 |
| Public Service Auth., Rev. Obligations (Santee Cooper), Series 2016-B, 5.00% 2036 | 1,685 | 1,993 |
| Public Service Auth., Rev. Ref. Obligations (Santee Cooper), Series 2016-C, 5.00% 2035 | 650 | 770 |
| 13,193 | ||
| Illinois 0.00% | ||
| G.O. Bonds, Pension Funding, Series 2003, Assured Guaranty Municipal insured, 5.10% 2033 | 1,920 | 2,147 |
American Funds Insurance Series — Asset Allocation Fund — Page 91 of 184
| Bonds, notes & other debt instruments (continued) Municipals (continued) Minnesota 0.00% | Principal amount (000) | Value (000) |
| Housing Fin. Agcy., Residential Housing Fin. Bonds, Series 2014-A, 4.00% 2038 | $125 | $132 |
| Connecticut 0.00% | ||
| Housing Fin. Auth., Housing Mortgage Fin. Program Bonds, Series 2014-A-1, 4.00% 2044 | 35 | 37 |
| Housing Fin. Auth., Housing Mortgage Fin. Program Bonds, Series 2014-C-1, 4.00% 2044 | 50 | 52 |
| 89 | ||
| Maryland 0.00% | ||
| Community Dev. Administration, Dept. of Housing and Community Dev., Residential Rev. Ref. Bonds, Series 2014-E, 2.857% 2040 | 50 | 50 |
| Tennessee 0.00% | ||
| Housing Dev. Agcy., Residential Fin. Program Bonds, Series 2013-2-A, AMT, 4.00% 2043 | 20 | 21 |
| Nebraska 0.00% | ||
| Investment Fin. Auth., Single Family Housing Rev. Bonds, Series 2013-A, 3.00% 2043 | 15 | 15 |
| South Dakota 0.00% | ||
| Housing Dev. Auth., Homeownership Mortgage Bonds, Series 2014-F, 4.00% 2034 | 10 | 10 |
| Massachusetts 0.00% | ||
| Housing Fin. Agcy., Single Family Housing Rev. Bonds, Series 167, 4.00% 2043 | 5 | 5 |
| Total municipals | 15,662 | |
| Federal agency bonds & notes 0.05% | ||
| Fannie Mae 1.875% 2026 | 13,000 | 12,974 |
| Total bonds, notes & other debt instruments(cost: $8,000,047,000) | 8,167,408 | |
| Short-term securities 5.80% Money market investments 5.80% | Shares | |
| Capital Group Central Cash Fund 1.73%18 | 15,848,444 | 1,584,844 |
| Fidelity Institutional Money Market Funds - Government Portfolio 1.49%18,19 | 997,009 | 997 |
| Goldman Sachs Financial Square Government Fund 1.50%18,19 | 960,737 | 961 |
| Morgan Stanley Institutional Liquidity Funds - Government Portfolio 1.51%18,19 | 2,634,650 | 2,635 |
| Total short-term securities(cost: $1,588,867,000) | 1,589,437 | |
| Total investment securities 100.54%(cost: $20,870,167,000) | 27,568,881 | |
| Other assets less liabilities (0.54)% | (149,226) | |
| Net assets 100.00% | $27,419,655 |
American Funds Insurance Series — Asset Allocation Fund — Page 92 of 184
Futures contracts
| Contracts | Type | Number of contracts | Expiration | Notional amount20 (000) | Value at 12/31/201921 (000) | Unrealized (depreciation) appreciation at 12/31/2019 (000) |
| 2 Year U.S. Treasury Note Futures | Long | 5,773 | April 2020 | $1,154,600 | $1,244,082 | $(625) |
| 5 Year U.S. Treasury Note Futures | Long | 5,836 | April 2020 | 583,600 | 692,204 | (2,360) |
| 10 Year U.S. Treasury Note Futures | Short | 214 | March 2020 | (21,400) | (27,482) | 290 |
| 10 Year Ultra U.S. Treasury Note Futures | Short | 836 | March 2020 | (83,600) | (117,628) | 1,420 |
| 30 Year Ultra U.S. Treasury Bond Futures | Long | 291 | March 2020 | 29,100 | 52,862 | (1,687) |
| $(2,962) |
Swap contracts
Interest rate swaps
| Receive | Pay | Expiration date | Notional (000) | Value at 12/31/2019 (000) | Upfront payments/ receipts (000) | Unrealized (depreciation) appreciation at 12/31/2019 (000) |
| 3-month USD-LIBOR | 2.18075% | 3/29/2024 | $26,400 | $(518) | $— | $(518) |
| 3-month USD-LIBOR | 2.194% | 3/29/2024 | 101,900 | (2,056) | — | (2,056) |
| 3-month USD-LIBOR | 2.21875% | 3/29/2024 | 107,250 | (2,273) | — | (2,273) |
| 3-month USD-LIBOR | 1.5615% | 11/27/2024 | 130,000 | 1,035 | — | 1,035 |
| $— | $(3,812) |
| 1 | Valued under fair value procedures adopted by authority of the board of trustees. The total value of all such securities was $923,930,000, which represented 3.37% of the net assets of the fund. This amount includes $906,137,000 related to certain securities trading outside the U.S. whose values were adjusted as a result of significant market movements following the close of local trading. |
| 2 | Represents an affiliated company as defined under the Investment Company Act of 1940. |
| 3 | Security did not produce income during the last 12 months. |
| 4 | Value determined using significant unobservable inputs. |
| 5 | All or a portion of this security was on loan. The total value of all such securities was $5,211,000, which represented .02% of the net assets of the fund. |
| 6 | Acquired through a private placement transaction exempt from registration under the Securities Act of 1933. May be subject to legal or contractual restrictions on resale. Further details on these holdings appear below. |
| 7 | Acquired in a transaction exempt from registration under Rule 144A of the Securities Act of 1933. May be resold in the U.S. in transactions exempt from registration, normally to qualified institutional buyers. The total value of all such securities was $975,763,000, which represented 3.56% of the net assets of the fund. |
| 8 | Amount less than one thousand. |
| 9 | All or a portion of this security was pledged as collateral. The total value of pledged collateral was $15,999,000, which represented .06% of the net assets of the fund. |
| 10 | Index-linked bond whose principal amount moves with a government price index. |
| 11 | Step bond; coupon rate may change at a later date. |
| 12 | Loan participations and assignments; may be subject to legal or contractual restrictions on resale. The total value of all such loans was $40,104,000, which represented .15% of the net assets of the fund. |
| 13 | Coupon rate may change periodically. Reference rate and spread are as of the most recent information available. Some coupon rates are determined by the issuer or agent based on current market conditions; therefore, the reference rate and spread are not available. |
| 14 | Payment in kind; the issuer has the option of paying additional securities in lieu of cash. Most recent payment was 100% cash unless otherwise noted. |
| 15 | Scheduled interest and/or principal payment was not received. |
| 16 | Principal payments may be made periodically. Therefore, the effective maturity date may be earlier than the stated maturity date. |
| 17 | Purchased on a TBA basis. |
| 18 | Rate represents the seven-day yield at 12/31/2019. |
| 19 | Security purchased with cash collateral from securities on loan. |
| 20 | Notional amount is calculated based on the number of contracts and notional contract size. |
| 21 | Value is calculated based on the notional amount and current market price. |
| Private placement securities | Acquisition date(s) | Cost (000) | Value (000) | Percent of net assets |
| Rotech Healthcare Inc. | 9/26/2013 | $6,949 | $3,683 | .01% |
| Advanz Pharma Corp. | 8/31/2018–9/4/2018 | 2,219 | 511 | .01 |
| Total private placement securities | $9,168 | $4,194 | .02% |
American Funds Insurance Series — Asset Allocation Fund — Page 93 of 184
| Key to abbreviations and symbol |
| ADR = American Depositary Receipts |
| Agcy. = Agency |
| AMT = Alternative Minimum Tax |
| Auth. = Authority |
| CAD = Canadian dollars |
| CLO = Collateralized Loan Obligations |
| Dept. = Department |
| Dev. = Development |
| Fin. = Finance |
| G.O. = General Obligation |
| LIBOR = London Interbank Offered Rate |
| Ref. = Refunding |
| Rev. = Revenue |
| SOFR = Secured Overnight Financing Rate |
| TBA = To-be-announced |
| USD/$ = U.S. dollars |
American Funds Insurance Series — Asset Allocation Fund — Page 94 of 184
Global Balanced Fund
Investment portfolio
December 31, 2019
| Common stocks 64.17% Information technology 13.78% | Shares | Value (000) |
| ASML Holding NV1 | 34,500 | $10,275 |
| Taiwan Semiconductor Manufacturing Co., Ltd.1 | 860,000 | 9,524 |
| Broadcom Inc. | 26,895 | 8,500 |
| Microsoft Corp. | 49,620 | 7,825 |
| PagSeguro Digital Ltd., Class A2 | 154,528 | 5,279 |
| Temenos AG1 | 18,000 | 2,846 |
| Visa Inc., Class A | 14,600 | 2,743 |
| Tokyo Electron Ltd.1 | 11,800 | 2,593 |
| Mastercard Inc., Class A | 7,600 | 2,269 |
| Amphenol Corp., Class A | 19,200 | 2,078 |
| Keyence Corp.1 | 5,800 | 2,053 |
| Intel Corp. | 32,000 | 1,915 |
| Murata Manufacturing Co., Ltd.1 | 23,200 | 1,434 |
| Atea ASA1 | 60,500 | 889 |
| 60,223 | ||
| Health care 11.01% | ||
| Merck & Co., Inc. | 116,325 | 10,580 |
| AstraZeneca PLC1 | 102,050 | 10,210 |
| Humana Inc. | 16,330 | 5,985 |
| Coloplast A/S, Class B1 | 23,150 | 2,878 |
| Mettler-Toledo International Inc.2 | 3,500 | 2,776 |
| UnitedHealth Group Inc. | 8,045 | 2,365 |
| GlaxoSmithKline PLC1 | 93,300 | 2,195 |
| Cigna Corp. | 10,310 | 2,108 |
| Fisher & Paykel Healthcare Corp. Ltd.1 | 134,000 | 2,011 |
| Carl Zeiss Meditec AG, non-registered shares1 | 14,700 | 1,875 |
| Pfizer Inc. | 47,500 | 1,861 |
| Koninklijke Philips NV (EUR denominated)1 | 23,500 | 1,149 |
| Gilead Sciences, Inc. | 17,500 | 1,137 |
| Novartis AG1 | 10,500 | 995 |
| 48,125 | ||
| Financials 9.46% | ||
| JPMorgan Chase & Co. | 43,800 | 6,106 |
| Zurich Insurance Group AG1 | 13,940 | 5,717 |
| Sberbank of Russia PJSC (ADR)1 | 331,000 | 5,446 |
| Berkshire Hathaway Inc., Class A2 | 16 | 5,434 |
| AIA Group Ltd.1 | 426,000 | 4,482 |
| B3 SA - Brasil, Bolsa, Balcao | 376,000 | 4,016 |
| BlackRock, Inc. | 5,730 | 2,881 |
| S&P Global Inc. | 8,000 | 2,184 |
| Bank Central Asia Tbk PT1 | 782,000 | 1,879 |
| HDFC Bank Ltd. (ADR) | 26,780 | 1,697 |
| FinecoBank SpA1 | 125,000 | 1,500 |
| 41,342 |
American Funds Insurance Series — Global Balanced Fund — Page 95 of 184
| Common stocks (continued) Consumer staples 8.98% | Shares | Value (000) |
| Nestlé SA1 | 64,100 | $6,944 |
| British American Tobacco PLC1 | 156,300 | 6,659 |
| Altria Group, Inc. | 122,500 | 6,114 |
| Philip Morris International Inc. | 59,300 | 5,046 |
| Anheuser-Busch InBev SA/NV1 | 47,200 | 3,871 |
| Keurig Dr Pepper Inc. | 106,000 | 3,069 |
| Coca-Cola European Partners PLC | 30,000 | 1,526 |
| Coca-Cola Co. | 27,000 | 1,495 |
| Walgreens Boots Alliance, Inc. | 25,000 | 1,474 |
| Budweiser Brewing Co., APAC Ltd.1,2 | 336,000 | 1,135 |
| Procter & Gamble Co. | 8,000 | 999 |
| Coca-Cola FEMSA, SAB de CV, units | 150,000 | 911 |
| 39,243 | ||
| Industrials 7.38% | ||
| Boeing Co. | 12,700 | 4,137 |
| Edenred SA1 | 66,528 | 3,442 |
| MTU Aero Engines AG1 | 9,800 | 2,798 |
| Airbus SE, non-registered shares1 | 16,400 | 2,406 |
| SMC Corp.1 | 5,000 | 2,286 |
| Rational AG1 | 2,800 | 2,252 |
| CSX Corp. | 30,000 | 2,171 |
| Lockheed Martin Corp. | 5,450 | 2,122 |
| Spirax-Sarco Engineering PLC1 | 17,700 | 2,096 |
| Watsco, Inc. | 9,680 | 1,744 |
| Bunzl PLC1 | 60,600 | 1,658 |
| BAE Systems PLC1 | 210,000 | 1,573 |
| Nidec Corp.1 | 10,900 | 1,489 |
| United Parcel Service, Inc., Class B | 9,300 | 1,089 |
| International Consolidated Airlines Group, SA (CDI)1 | 120,000 | 997 |
| 32,260 | ||
| Consumer discretionary 4.48% | ||
| Home Depot, Inc. | 21,275 | 4,646 |
| General Motors Co. | 110,500 | 4,044 |
| Alibaba Group Holding Ltd.1,2 | 109,600 | 2,915 |
| LVMH Moët Hennessy-Louis Vuitton SE1 | 5,765 | 2,685 |
| Amazon.com, Inc.2 | 1,375 | 2,541 |
| Ocado Group PLC1,2 | 109,500 | 1,859 |
| Carnival Corp., units | 17,000 | 864 |
| 19,554 | ||
| Materials 2.71% | ||
| Givaudan SA1 | 815 | 2,551 |
| Croda International PLC1 | 32,288 | 2,193 |
| Akzo Nobel NV1 | 18,777 | 1,914 |
| Koninklijke DSM NV1 | 12,000 | 1,566 |
| LyondellBasell Industries NV | 12,000 | 1,134 |
| Rio Tinto PLC1 | 18,000 | 1,070 |
| Vale SA, ordinary nominative | 60,000 | 795 |
| Dow Inc. | 10,982 | 601 |
| 11,824 |
American Funds Insurance Series — Global Balanced Fund — Page 96 of 184
| Common stocks (continued) Real estate 2.39% | Shares | Value (000) |
| Crown Castle International Corp. REIT | 23,940 | $3,403 |
| Gaming and Leisure Properties, Inc. REIT | 59,720 | 2,571 |
| American Tower Corp. REIT | 9,800 | 2,252 |
| Equinix, Inc. REIT | 3,755 | 2,192 |
| 10,418 | ||
| Communication services 1.65% | ||
| Alphabet Inc., Class C2 | 3,579 | 4,785 |
| Nintendo Co., Ltd.1 | 6,000 | 2,422 |
| 7,207 | ||
| Energy 1.64% | ||
| Canadian Natural Resources, Ltd. (CAD denominated) | 89,000 | 2,878 |
| TOTAL SA1 | 30,400 | 1,680 |
| ConocoPhillips | 22,000 | 1,431 |
| Royal Dutch Shell PLC, Class B1 | 40,000 | 1,192 |
| 7,181 | ||
| Utilities 0.69% | ||
| Ørsted AS1 | 29,100 | 3,015 |
| Total common stocks(cost: $202,304,000) | 280,392 | |
| Bonds, notes & other debt instruments 32.18% Bonds & notes of governments & government agencies outside the U.S. 13.76% | Principal amount (000) | |
| Abu Dhabi (Emirate of) 2.50% 20223 | $200 | 203 |
| Abu Dhabi (Emirate of) 3.125% 20273 | 200 | 210 |
| Austrian Government 0% 2024 | €200 | 228 |
| Brazil (Federative Republic of) 0% 2020 | BRL900 | 219 |
| Brazil (Federative Republic of) 0% 2021 | 3,000 | 695 |
| Canada 2.25% 2025 | C$1,400 | 1,110 |
| China (People’s Republic of), Series 1906, 3.29% 2029 | CNY3,500 | 508 |
| China (People’s Republic of), Series 1910, 3.86% 2049 | 2,000 | 295 |
| China Development Bank Corp., Series 1805, 4.04% 2028 | 4,000 | 588 |
| China Development Bank Corp., Series 1905, 3.48% 2029 | 14,980 | 2,116 |
| Colombia (Republic of) 4.375% 2021 | $200 | 207 |
| Colombia (Republic of), Series B, 10.00% 2024 | COP545,200 | 197 |
| French Republic O.A.T. 0.75% 2028 | €325 | 388 |
| French Republic O.A.T. 0% 2029 | 325 | 360 |
| French Republic O.A.T. 3.25% 2045 | 160 | 281 |
| Germany (Federal Republic of) 2.25% 2021 | 60 | 71 |
| Germany (Federal Republic of) 0.10% 20264 | 296 | 362 |
| Germany (Federal Republic of) 0.50% 2026 | 200 | 237 |
| Germany (Federal Republic of) 0.25% 2029 | 205 | 240 |
| Germany (Federal Republic of) 0.50% 20304 | 292 | 388 |
| Germany (Federal Republic of) 2.50% 2046 | 315 | 554 |
| Germany (Federal Republic of) 1.25% 2048 | 100 | 141 |
| Greece (Hellenic Republic of) 3.375% 2025 | 430 | 549 |
| Greece (Hellenic Republic of) 3.75% 2028 | 500 | 664 |
| Greece (Hellenic Republic of) 3.875% 2029 | 915 | 1,240 |
| Greece (Hellenic Republic of) 3.90% 2033 | 180 | 248 |
| Greece (Hellenic Republic of) 4.00% 2037 | 170 | 239 |
| Greece (Hellenic Republic of) 4.20% 2042 | 170 | 252 |
| India (Republic of) 7.68% 2023 | INR15,900 | 232 |
American Funds Insurance Series — Global Balanced Fund — Page 97 of 184
| Bonds, notes & other debt instruments (continued) Bonds & notes of governments & government agencies outside the U.S. (continued) | Principal amount (000) | Value (000) |
| India (Republic of) 8.83% 2023 | INR10,400 | $158 |
| India (Republic of) 7.72% 2025 | 4,000 | 59 |
| India (Republic of) 6.97% 2026 | 52,300 | 741 |
| India (Republic of) 7.17% 2028 | 15,700 | 225 |
| Indonesia (Republic of) 3.75% 2022 | $410 | 424 |
| Indonesia (Republic of) 3.85% 20273 | 400 | 427 |
| Indonesia (Republic of), Series 64, 6.125% 2028 | IDR344,000 | 23 |
| Indonesia (Republic of), Series 78, 8.25% 2029 | 7,203,000 | 561 |
| Ireland (Republic of) 3.40% 2024 | €50 | 65 |
| Ireland (Republic of) 0.90% 2028 | 350 | 421 |
| Ireland (Republic of) 2.40% 2030 | 30 | 41 |
| Israel (State of) 3.15% 2023 | $400 | 417 |
| Israel (State of) 1.50% 2027 | €100 | 122 |
| Israel (State of) 2.00% 2027 | ILS2,600 | 821 |
| Israel (State of) 5.50% 2042 | 700 | 348 |
| Israel (State of) 4.125% 2048 | $205 | 238 |
| Italy (Republic of) 1.35% 2022 | €180 | 208 |
| Italy (Republic of) 0.10% 20234 | 1,586 | 1,802 |
| Italy (Republic of) 1.75% 2024 | 50 | 59 |
| Italy (Republic of) 2.80% 2028 | 200 | 254 |
| Italy (Republic of) 3.00% 2029 | 615 | 795 |
| Italy (Republic of) 3.85% 2049 | 180 | 262 |
| Japan, Series 395, 0.10% 2020 | ¥204,500 | 1,886 |
| Japan, Series 394, 0.10% 2020 | 34,200 | 315 |
| Japan, Series 134, 0.10% 2022 | 31,900 | 296 |
| Japan, Series 17, 0.10% 20234 | 10,520 | 98 |
| Japan, Series 19, 0.10% 20244 | 30,540 | 286 |
| Japan, Series 18, 0.10% 20244 | 20,920 | 196 |
| Japan, Series 340, 0.40% 2025 | 20,000 | 190 |
| Japan, Series 21, 0.10% 20264 | 40,748 | 383 |
| Japan, Series 346, 0.10% 2027 | 304,250 | 2,842 |
| Japan, Series 22, 0.10% 20274 | 25,541 | 241 |
| Japan, Series 23, 0.10% 20284 | 192,277 | 1,821 |
| Japan, Series 356, 0.10% 2029 | 420,000 | 3,911 |
| Japan, Series 24, 0.10% 20294 | 214,681 | 2,033 |
| Japan, Series 161, 0.60% 2037 | 170,000 | 1,666 |
| Japan, Series 42, 1.70% 2044 | 94,100 | 1,140 |
| Kuwait (State of) 2.75% 20223 | $200 | 203 |
| Lithuania (Republic of) 7.375% 2020 | 100 | 101 |
| Malaysia (Federation of), Series 0319, 3.478% 2024 | MYR4,100 | 1,014 |
| Malaysia (Federation of), Series 0217, 4.059% 2024 | 400 | 101 |
| Malaysia (Federation of), Series 0119, 3.906% 2026 | 1,380 | 349 |
| Malaysia (Federation of), Series 0418, 4.893% 2038 | 2,800 | 780 |
| Morocco (Kingdom of) 4.25% 2022 | $200 | 211 |
| Morocco (Kingdom of) 3.50% 2024 | €100 | 128 |
| Morocco (Kingdom of) 1.50% 2031 | 100 | 113 |
| National Highways Authority of India 7.17% 2021 | INR30,000 | 424 |
| Netherlands (Kingdom of the) 5.50% 2028 | €100 | 164 |
| Norway (Kingdom of) 3.75% 2021 | NKr7,651 | 901 |
| Norway (Kingdom of) 2.00% 2023 | 6,599 | 767 |
| Nova Scotia (Province of) 3.15% 2051 | C$170 | 148 |
| Panama (Republic of) 3.16% 2030 | $265 | 273 |
| Peru (Republic of) 6.15% 2032 | PEN675 | 231 |
| Peru (Republic of) 5.625% 2050 | $20 | 29 |
| Poland (Republic of), Series 1021, 5.75% 2021 | PLN1,710 | 485 |
American Funds Insurance Series — Global Balanced Fund — Page 98 of 184
| Bonds, notes & other debt instruments (continued) Bonds & notes of governments & government agencies outside the U.S. (continued) | Principal amount (000) | Value (000) |
| Poland (Republic of), Series 0922, 5.75% 2022 | PLN1,770 | $518 |
| Poland (Republic of), Series 1023, 4.00% 2023 | 400 | 114 |
| Portuguese Republic 5.125% 2024 | $250 | 281 |
| Portuguese Republic 2.875% 2025 | €525 | 684 |
| Qatar (State of) 4.50% 20283 | $500 | 574 |
| Romania 2.875% 2029 | €100 | 127 |
| Romania 3.50% 2034 | 65 | 82 |
| Romania 3.875% 2035 | 170 | 222 |
| Romania 3.375% 2038 | 250 | 306 |
| Romania 4.125% 2039 | 125 | 163 |
| Romania 4.625% 2049 | 700 | 972 |
| Romania 4.625% 2049 | 60 | 83 |
| Russian Federation 7.00% 2023 | RUB8,000 | 134 |
| Russian Federation 2.875% 2025 | €200 | 256 |
| Russian Federation 2.875% 2025 | 100 | 128 |
| Russian Federation 6.90% 2029 | RUB16,250 | 276 |
| Russian Federation 8.50% 2031 | 5,530 | 105 |
| Russian Federation 7.70% 2033 | 1,530 | 28 |
| Russian Federation 7.25% 2034 | 8,140 | 141 |
| Saudi Arabia (Kingdom of) 2.894% 20223 | $200 | 203 |
| Saudi Arabia (Kingdom of) 3.625% 20283 | 200 | 212 |
| South Africa (Republic of), Series R-214, 6.50% 2041 | ZAR10,150 | 505 |
| South Africa (Republic of), Series R-2044, 8.75% 2044 | 6,975 | 438 |
| South Africa (Republic of), Series R-2048, 8.75% 2048 | 6,300 | 397 |
| South Korea (Republic of), Series 2106, 4.25% 2021 | KRW262,000 | 236 |
| South Korea (Republic of), Series 2209, 2.00% 2022 | 560,000 | 492 |
| South Korea (Republic of), Series 2812, 2.375% 2028 | 850,610 | 777 |
| South Korea (Republic of), Series 3809, 2.375% 2038 | 803,510 | 771 |
| Spain (Kingdom of) 1.45% 2027 | €625 | 765 |
| Spain (Kingdom of) 1.40% 2028 | 270 | 330 |
| Sri Lanka (Democratic Socialist Republic of) 6.25% 2021 | $250 | 255 |
| Thailand (Kingdom of) 2.125% 2026 | THB16,450 | 577 |
| Ukraine Government 6.75% 2026 | €150 | 189 |
| United Kingdom 3.75% 2020 | £75 | 101 |
| United Kingdom 1.75% 2022 | 280 | 383 |
| United Kingdom 2.75% 2024 | 50 | 73 |
| United Kingdom 4.25% 2040 | 50 | 102 |
| United Kingdom 3.25% 2044 | 250 | 461 |
| United Mexican States 0.70% 2021 | ¥100,000 | 924 |
| United Mexican States, Series M, 7.50% 2027 | MXN14,620 | 804 |
| United Mexican States, Series M20, 8.50% 2029 | 9,000 | 530 |
| Uruguay (Oriental Republic of) 9.875% 2022 | UYU1,050 | 27 |
| Uruguay (Oriental Republic of) 8.50% 2028 | 6,963 | 160 |
| 60,125 | ||
| U.S. Treasury bonds & notes 11.68% U.S. Treasury 9.42% | ||
| U.S. Treasury 1.375% 2020 | $150 | 150 |
| U.S. Treasury 1.50% 2020 | 350 | 350 |
| U.S. Treasury 1.75% 2020 | 414 | 415 |
| U.S. Treasury 2.50% 2020 | 420 | 422 |
| U.S. Treasury 2.50% 2020 | 120 | 121 |
| U.S. Treasury 2.625% 2020 | 100 | 101 |
| U.S. Treasury 2.875% 2020 | 927 | 937 |
| U.S. Treasury 1.125% 2021 | 1,025 | 1,017 |
American Funds Insurance Series — Global Balanced Fund — Page 99 of 184
| Bonds, notes & other debt instruments (continued) U.S. Treasury bonds & notes (continued) U.S. Treasury (continued) | Principal amount (000) | Value (000) |
| U.S. Treasury 1.375% 2021 | $550 | $548 |
| U.S. Treasury 2.00% 2021 | 108 | 109 |
| U.S. Treasury 2.25% 2021 | 5,000 | 5,043 |
| U.S. Treasury 2.50% 2021 | 1,945 | 1,963 |
| U.S. Treasury 2.875% 2021 | 2,250 | 2,303 |
| U.S. Treasury 1.625% 20225 | 2,850 | 2,851 |
| U.S. Treasury 1.875% 2022 | 700 | 704 |
| U.S. Treasury 1.875% 2022 | 600 | 604 |
| U.S. Treasury 2.00% 2022 | 455 | 460 |
| U.S. Treasury 2.00% 2022 | 75 | 76 |
| U.S. Treasury 1.375% 2023 | 300 | 297 |
| U.S. Treasury 1.75% 2023 | 100 | 100 |
| U.S. Treasury 2.625% 2023 | 800 | 825 |
| U.S. Treasury 2.625% 2023 | 105 | 109 |
| U.S. Treasury 2.75% 2023 | 420 | 435 |
| U.S. Treasury 2.75% 2023 | 101 | 105 |
| U.S. Treasury 2.875% 2023 | 2,250 | 2,352 |
| U.S. Treasury 2.125% 2024 | 2,025 | 2,065 |
| U.S. Treasury 2.25% 2024 | 3,055 | 3,129 |
| U.S. Treasury 2.25% 2024 | 200 | 205 |
| U.S. Treasury 2.125% 2025 | 200 | 204 |
| U.S. Treasury 3.00% 2025 | 900 | 962 |
| U.S. Treasury 1.625% 2026 | 535 | 530 |
| U.S. Treasury 1.625% 2026 | 440 | 436 |
| U.S. Treasury 2.25% 2027 | 2,800 | 2,880 |
| U.S. Treasury 2.25% 2027 | 1,000 | 1,029 |
| U.S. Treasury 2.25% 2027 | 700 | 720 |
| U.S. Treasury 2.375% 2027 | 1,500 | 1,556 |
| U.S. Treasury 2.875% 20285 | 1,695 | 1,824 |
| U.S. Treasury 2.875% 2028 | 700 | 754 |
| U.S. Treasury 3.125% 2028 | 900 | 990 |
| U.S. Treasury 1.625% 2029 | 200 | 195 |
| U.S. Treasury 2.625% 2029 | 282 | 299 |
| U.S. Treasury 2.50% 20455 | 315 | 322 |
| U.S. Treasury 2.875% 2046 | 400 | 439 |
| U.S. Treasury 3.00% 2048 | 185 | 209 |
| 41,145 | ||
| U.S. Treasury inflation-protected securities 2.26% | ||
| U.S. Treasury Inflation-Protected Security 0.125% 20224 | 223 | 223 |
| U.S. Treasury Inflation-Protected Security 0.125% 20244 | 391 | 393 |
| U.S. Treasury Inflation-Protected Security 0.375% 20274 | 373 | 379 |
| U.S. Treasury Inflation-Protected Security 0.375% 20274 | 226 | 231 |
| U.S. Treasury Inflation-Protected Security 0.25% 20294 | 905 | 915 |
| U.S. Treasury Inflation-Protected Security 0.875% 20294 | 4,306 | 4,575 |
| U.S. Treasury Inflation-Protected Security 1.375% 20444,5 | 525 | 620 |
| U.S. Treasury Inflation-Protected Security 1.00% 20494,5 | 2,301 | 2,561 |
| 9,897 | ||
| Total U.S. Treasury bonds & notes | 51,042 |
American Funds Insurance Series — Global Balanced Fund — Page 100 of 184
| Bonds, notes & other debt instruments (continued) Corporate bonds & notes 4.82% Financials 1.07% | Principal amount (000) | Value (000) |
| ACE INA Holdings Inc. 2.875% 2022 | $10 | $10 |
| ACE INA Holdings Inc. 3.35% 2026 | 10 | 11 |
| ACE INA Holdings Inc. 4.35% 2045 | 20 | 24 |
| Allianz SE 4.75% (3-month EUR-EURIBOR + 3.60% on 10/24/2023)6 | €100 | 130 |
| Banco del Estado de Chile 2.668% 20213 | $500 | 502 |
| Bank of America Corp. 3.55% 2024 (3-month USD-LIBOR + 0.78% on 3/5/2023)6 | 100 | 104 |
| Bank of America Corp. 3.419% 2028 (3-month USD-LIBOR + 1.04% on 12/20/2027)6 | 236 | 248 |
| Barclays Bank PLC 10.00% 2021 | £100 | 148 |
| CaixaBank, SA 3.50% 2027 (5-year EUR Mid-Swap + 3.35% on 2/15/2022)6 | €100 | 119 |
| Goldman Sachs Group, Inc. 5.75% 2022 | $70 | 75 |
| Goldman Sachs Group, Inc. 2.905% 2023 (3-month USD-LIBOR + 0.99% on 7/24/2022)6 | 130 | 132 |
| Goldman Sachs Group, Inc. 3.50% 2025 | 210 | 220 |
| Goldman Sachs Group, Inc. 4.75% 2045 | 70 | 85 |
| Groupe BPCE SA 5.70% 20233 | 200 | 221 |
| Groupe BPCE SA 1.00% 2025 | €200 | 231 |
| HSBC Holdings PLC 4.292% 2026 (3-month USD-LIBOR + 1.348% on 9/12/2025)6 | $200 | 216 |
| JPMorgan Chase & Co. 2.55% 2021 | 76 | 77 |
| JPMorgan Chase & Co. 3.25% 2022 | 28 | 29 |
| JPMorgan Chase & Co. 2.70% 2023 | 150 | 153 |
| JPMorgan Chase & Co., Series S, junior subordinated, 6.75% (3-month USD-LIBOR + 3.78% on 2/1/2024)6 | 135 | 153 |
| JPMorgan Chase Bank NA (3-month USD-LIBOR + 0.34%) 2.276% 20217 | 300 | 300 |
| Mizuho Financial Group, Ltd. 2.721% 2023 (3-month USD-LIBOR on 7/16/2022)6 | 271 | 274 |
| Morgan Stanley 3.125% 2026 | 110 | 114 |
| Morgan Stanley 4.431% 2030 (3-month USD-LIBOR + 1.628% on 1/23/2029)6 | 73 | 83 |
| PNC Financial Services Group, Inc. 2.854% 20226 | 100 | 102 |
| Rabobank Nederland 3.875% 2023 | €100 | 126 |
| Skandinaviska Enskilda Banken AB 2.80% 2022 | $250 | 254 |
| U.S. Bancorp 2.85% 2023 | 300 | 307 |
| UniCredit SpA 5.75% 20256 | €100 | 117 |
| VEB Finance Ltd. 6.902% 20203 | $100 | 102 |
| 4,667 | ||
| Utilities 0.92% | ||
| Abu Dhabi National Energy Co. PJSC (TAQA) 3.625% 20233 | 200 | 206 |
| American Electric Power Co., Inc. 2.15% 2020 | 215 | 215 |
| CMS Energy Corp. 3.00% 2026 | 150 | 154 |
| Duke Energy Carolinas, Inc. 3.05% 2023 | 280 | 289 |
| Duke Energy Carolinas, Inc. 3.70% 2047 | 50 | 54 |
| Duke Energy Corp. 3.75% 2024 | 110 | 117 |
| Duke Energy Corp. 2.65% 2026 | 225 | 226 |
| Duke Energy Florida, LLC 2.50% 2029 | 280 | 280 |
| Duke Energy Progress, LLC 3.70% 2028 | 75 | 82 |
| Enel Finance International SA 2.75% 20233 | 200 | 201 |
| Enel Finance International SA 3.625% 20273 | 200 | 207 |
| Enel Finance International SA 3.50% 20283 | 400 | 409 |
| Enersis Américas SA 4.00% 2026 | 110 | 114 |
| Exelon Corp. 3.40% 2026 | 150 | 157 |
| Exelon Corp., junior subordinated, 3.497% 20226 | 25 | 26 |
| FirstEnergy Corp. 3.90% 2027 | 250 | 267 |
| FirstEnergy Corp. 3.50% 20283 | 65 | 68 |
| Niagara Mohawk Power Corp. 3.508% 20243 | 85 | 89 |
| NiSource Finance Corp. 2.65% 2022 | 50 | 51 |
| Pacific Gas and Electric Co. 2.95% 20268 | 25 | 25 |
American Funds Insurance Series — Global Balanced Fund — Page 101 of 184
| Bonds, notes & other debt instruments (continued) Corporate bonds & notes (continued) Utilities (continued) | Principal amount (000) | Value (000) |
| Pacific Gas and Electric Co. 4.65% 20283,8 | $114 | $118 |
| Pacific Gas and Electric Co. 6.35% 20388 | 62 | 66 |
| State Grid Overseas Investment Ltd. 1.25% 2022 | €100 | 115 |
| State Grid Overseas Investment Ltd. 3.50% 20273 | $450 | 471 |
| 4,007 | ||
| Health care 0.68% | ||
| Abbott Laboratories 3.75% 2026 | 51 | 56 |
| AbbVie Inc. 2.50% 2020 | 180 | 180 |
| AbbVie Inc. 3.20% 2026 | 73 | 76 |
| AbbVie Inc. 4.50% 2035 | 15 | 17 |
| Aetna Inc. 2.75% 2022 | 50 | 51 |
| Aetna Inc. 2.80% 2023 | 10 | 10 |
| Allergan PLC 3.00% 2020 | 30 | 30 |
| Allergan PLC 4.75% 2045 | 3 | 3 |
| Amgen Inc. 1.85% 2021 | 20 | 20 |
| AstraZeneca PLC 2.375% 2022 | 110 | 111 |
| AstraZeneca PLC 3.50% 2023 | 150 | 157 |
| Bayer US Finance II LLC 3.875% 20233 | 200 | 210 |
| Bayer US Finance II LLC 4.40% 20443 | 100 | 101 |
| Becton, Dickinson and Co. 2.894% 2022 | 55 | 56 |
| Becton, Dickinson and Co. 3.734% 2024 | 35 | 37 |
| Becton, Dickinson and Co. 3.70% 2027 | 43 | 46 |
| Bristol-Myers Squibb Co. 2.90% 20243 | 178 | 184 |
| Cigna Corp. 4.125% 2025 | 80 | 87 |
| EMD Finance LLC 2.40% 20203 | 200 | 200 |
| EMD Finance LLC 3.25% 20253 | 250 | 257 |
| Humana Inc. 3.15% 2022 | 100 | 103 |
| Medtronic, Inc. 3.50% 2025 | 45 | 48 |
| Shire PLC 2.40% 2021 | 153 | 154 |
| Shire PLC 2.875% 2023 | 69 | 70 |
| Shire PLC 3.20% 2026 | 25 | 26 |
| Stryker Corp. 0.75% 2029 | €210 | 236 |
| Takeda Pharmaceutical Co., Ltd. 4.40% 2023 | $200 | 215 |
| Takeda Pharmaceutical Co., Ltd. 2.25% 2026 | €200 | 251 |
| 2,992 | ||
| Consumer staples 0.53% | ||
| Altria Group, Inc. 2.625% 2020 | $100 | 100 |
| Altria Group, Inc. 1.00% 2023 | €110 | 126 |
| Altria Group, Inc. 2.20% 2027 | 270 | 321 |
| Altria Group, Inc. 5.80% 2039 | $125 | 147 |
| Anheuser-Busch InBev NV 4.00% 2028 | 100 | 110 |
| British American Tobacco PLC 2.789% 2024 | 75 | 76 |
| British American Tobacco PLC 3.215% 2026 | 62 | 62 |
| British American Tobacco PLC 3.557% 2027 | 105 | 107 |
| British American Tobacco PLC 3.462% 2029 | 75 | 76 |
| British American Tobacco PLC 4.39% 2037 | 80 | 81 |
| British American Tobacco PLC 4.758% 2049 | 58 | 60 |
| Conagra Brands, Inc. 4.30% 2024 | 210 | 226 |
| Keurig Dr Pepper Inc. 4.597% 2028 | 175 | 197 |
| Kroger Co. 3.50% 2026 | 140 | 147 |
| Pernod Ricard SA 4.45% 20223 | 150 | 157 |
| Philip Morris International Inc. 2.00% 2020 | 55 | 55 |
American Funds Insurance Series — Global Balanced Fund — Page 102 of 184
| Bonds, notes & other debt instruments (continued) Corporate bonds & notes (continued) Consumer staples (continued) | Principal amount (000) | Value (000) |
| Philip Morris International Inc. 2.625% 2022 | $15 | $15 |
| Reynolds American Inc. 4.00% 2022 | 15 | 16 |
| Reynolds American Inc. 4.45% 2025 | 105 | 113 |
| Wal-Mart Stores, Inc. 2.85% 2024 | 110 | 114 |
| 2,306 | ||
| Consumer discretionary 0.45% | ||
| Amazon.com, Inc. 2.80% 2024 | 170 | 176 |
| Amazon.com, Inc. 3.15% 2027 | 50 | 53 |
| Bayerische Motoren Werke AG 2.95% 20223 | 250 | 255 |
| DaimlerChrysler North America Holding Corp. 2.00% 20213 | 200 | 199 |
| Hyundai Capital America 2.55% 20203 | 135 | 135 |
| Hyundai Capital America 3.25% 20223 | 65 | 66 |
| Hyundai Capital Services Inc. 3.75% 20233 | 250 | 258 |
| McDonald’s Corp. 3.80% 2028 | 110 | 120 |
| Nissan Motor Co., Ltd. 2.15% 20203 | 120 | 120 |
| Nissan Motor Co., Ltd. 2.60% 20223 | 115 | 115 |
| Toyota Motor Credit Corp. 2.25% 2023 | 85 | 86 |
| Volkswagen Group of America Finance, LLC 4.25% 20233 | 380 | 405 |
| 1,988 | ||
| Communication services 0.40% | ||
| AT&T Inc. 4.10% 2028 | 55 | 60 |
| Comcast Corp. 3.95% 2025 | 80 | 87 |
| Deutsche Telekom International Finance BV 1.95% 20213 | 150 | 150 |
| Deutsche Telekom International Finance BV 9.25% 2032 | 45 | 72 |
| France Télécom 9.00% 20316 | 65 | 101 |
| KT Corp. 0.30% 2020 | ¥100,000 | 920 |
| Verizon Communications Inc. 4.329% 2028 | $72 | 82 |
| Verizon Communications Inc. 4.272% 2036 | 248 | 280 |
| 1,752 | ||
| Information technology 0.25% | ||
| Apple Inc. 2.50% 2022 | 75 | 76 |
| Broadcom Ltd. 3.875% 2027 | 190 | 198 |
| Microsoft Corp. 2.40% 2026 | 297 | 301 |
| Microsoft Corp. 3.30% 2027 | 280 | 299 |
| Oracle Corp. 2.65% 2026 | 216 | 221 |
| 1,095 | ||
| Energy 0.25% | ||
| Cenovus Energy Inc. 4.25% 2027 | 65 | 69 |
| El Paso Pipeline Partners Operating Co., LLC 4.70% 2042 | 75 | 80 |
| Enbridge Inc. 4.25% 2026 | 70 | 77 |
| Enbridge Inc. 3.70% 2027 | 132 | 140 |
| Halliburton Co. 3.80% 2025 | 35 | 37 |
| Petróleos Mexicanos 7.19% 2024 | MXN535 | 26 |
| Petróleos Mexicanos 7.47% 2026 | 5,270 | 245 |
| Shell International Finance BV 3.50% 2023 | $330 | 348 |
| Statoil ASA 3.70% 2024 | 50 | 53 |
| 1,075 |
American Funds Insurance Series — Global Balanced Fund — Page 103 of 184
| Bonds, notes & other debt instruments (continued) Corporate bonds & notes (continued) Real estate 0.15% | Principal amount (000) | Value (000) |
| American Campus Communities, Inc. 3.35% 2020 | $15 | $15 |
| American Campus Communities, Inc. 3.75% 2023 | 100 | 104 |
| American Campus Communities, Inc. 4.125% 2024 | 90 | 96 |
| Corporate Office Properties LP 3.60% 2023 | 65 | 67 |
| Essex Portfolio LP 3.50% 2025 | 120 | 126 |
| Essex Portfolio LP 3.375% 2026 | 40 | 42 |
| WEA Finance LLC 3.75% 20243 | 200 | 210 |
| 660 | ||
| Industrials 0.12% | ||
| Lima Metro Line 2 Finance Ltd. 5.875% 20343 | 200 | 232 |
| United Technologies Corp. 3.10% 2022 | 106 | 109 |
| United Technologies Corp. 4.125% 2028 | 170 | 191 |
| 532 | ||
| Total corporate bonds & notes | 21,074 | |
| Mortgage-backed obligations 1.92% | ||
| Fannie Mae Pool #MA3467 4.00% 20489 | 427 | 444 |
| Fannie Mae Pool #FM1437 4.00% 20489 | 249 | 260 |
| Fannie Mae Pool #MA3521 4.00% 20489 | 67 | 70 |
| Fannie Mae Pool #MA3692 3.50% 20499 | 429 | 441 |
| Fannie Mae Pool #MA3775 3.50% 20499 | 249 | 256 |
| Fannie Mae Pool #MA3693 4.00% 20499 | 900 | 936 |
| Fannie Mae Pool #MA3776 4.00% 20499 | 596 | 623 |
| Fannie Mae Pool #CA4574 4.00% 20499 | 273 | 284 |
| Fannie Mae Pool #MA3804 4.00% 20499 | 82 | 85 |
| Fannie Mae Pool #BO2188 4.00% 20499 | 79 | 82 |
| Freddie Mac Pool #ZT1545 4.00% 20489 | 1,527 | 1,590 |
| Freddie Mac Pool #SI2002 4.00% 20489 | 412 | 432 |
| Freddie Mac Pool #2B7343 3.767% 20497,9 | 328 | 338 |
| Government National Mortgage Assn. 4.50% 20499 | 5 | 5 |
| Government National Mortgage Assn. 4.00% 20509,10 | 130 | 135 |
| Government National Mortgage Assn. 4.50% 20509,10 | 24 | 25 |
| Government National Mortgage Assn. Pool #MA5986 4.00% 20499 | 28 | 29 |
| Government National Mortgage Assn. Pool #MA5931 4.00% 20499 | 4 | 5 |
| Government National Mortgage Assn. Pool #MA5987 4.50% 20499 | 687 | 721 |
| Government National Mortgage Assn. Pool #MA6041 4.50% 20499 | 345 | 362 |
| Government National Mortgage Assn. Pool #MA5877 4.50% 20499 | 38 | 39 |
| Korea Housing Finance Corp. 2.50% 20203,9 | 250 | 251 |
| Korea Housing Finance Corp. 2.00% 20213,9 | 250 | 249 |
| Nykredit Realkredit AS, Series 01E, 1.50% 20379 | DKr1,298 | 202 |
| Nykredit Realkredit AS, Series 01E, 1.50% 20409 | 3,241 | 503 |
| 8,367 | ||
| Total bonds, notes & other debt instruments(cost: $136,525,000) | 140,608 | |
| Short-term securities 3.41% Other short-term securities 2.77% | ||
| Alberta (Province of) 1.77%due 1/8/20203 | $5,750 | 5,748 |
| Canadian Treasury Bills 1.67%–1.68%due 9/17/2020–10/15/2020 | C$1,680 | 1,277 |
| Egyptian Treasury Bills 14.11%due 4/7/2020 | EGP2,200 | 132 |
| Nigerian Treasury Bills 13.04%due 2/27/2020 | NGN46,000 | 125 |
American Funds Insurance Series — Global Balanced Fund — Page 104 of 184
| Short-term securities (continued) Other short-term securities (continued) | Principal amount (000) | Value (000) |
| Toronto-Dominion Bank 1.91%due 1/22/20203 | $4,250 | $4,245 |
| United Kingdom Treasury Bill 0.71%due 4/14/2020 | £430 | 568 |
| 12,095 | ||
| Money market investments 0.64% | Shares | |
| Capital Group Central Cash Fund 1.73%11 | 28,249 | 2,825 |
| Total short-term securities(cost: $14,874,000) | 14,920 | |
| Total investment securities 99.76%(cost: $353,703,000) | 435,920 | |
| Other assets less liabilities 0.24% | 1,030 | |
| Net assets 100.00% | $436,950 |
Futures contracts
| Contracts | Type | Number of contracts | Expiration | Notional amount12 (000) | Value at 12/31/201913 (000) | Unrealized depreciation at 12/31/2019 (000) |
| 2 Year U.S. Treasury Note Futures | Long | 53 | April 2020 | $10,600 | $11,421 | $(7) |
| 5 Year U.S. Treasury Note Futures | Long | 21 | April 2020 | 2,100 | 2,491 | (9) |
| $(16) |
Forward currency contracts
| Contract amount | Counterparty | Settlement date | Unrealized appreciation (depreciation) at 12/31/2019 (000) | |
| Purchases (000) | Sales (000) | |||
| EUR375 | USD417 | Standard Chartered Bank | 1/6/2020 | $4 |
| USD857 | ILS2,960 | JPMorgan Chase | 1/6/2020 | —14 |
| USD257 | ZAR3,800 | Citibank | 1/6/2020 | (14) |
| USD636 | JPY69,000 | UBS AG | 1/7/2020 | 1 |
| USD173 | ILS600 | UBS AG | 1/7/2020 | (1) |
| JPY90,700 | USD838 | JPMorgan Chase | 1/7/2020 | (3) |
| CZK11,700 | EUR458 | Goldman Sachs | 1/8/2020 | 2 |
| USD113 | CNH800 | HSBC Bank | 1/8/2020 | (2) |
| CLP875,800 | USD1,101 | Morgan Stanley | 1/9/2020 | 64 |
| EUR300 | USD335 | Citibank | 1/9/2020 | 2 |
| USD334 | EUR300 | Morgan Stanley | 1/9/2020 | (3) |
| USD123 | CLP98,800 | Bank of America | 1/9/2020 | (8) |
| USD143 | CLP114,114 | Citibank | 1/9/2020 | (9) |
| USD344 | CLP275,886 | Citibank | 1/9/2020 | (24) |
| USD569 | BRL2,396 | Goldman Sachs | 1/9/2020 | (26) |
| USD474 | CLP387,000 | HSBC Bank | 1/9/2020 | (41) |
| USD107 | INR7,675 | JPMorgan Chase | 1/10/2020 | (1) |
| EUR1,540 | USD1,710 | HSBC Bank | 1/13/2020 | 19 |
| GBP526 | USD693 | Bank of America | 1/13/2020 | 4 |
| USD335 | EUR300 | Citibank | 1/13/2020 | (2) |
| USD525 | THB15,900 | Standard Chartered Bank | 1/13/2020 | (6) |
| USD564 | JPY61,000 | Bank of New York Mellon | 1/14/2020 | 2 |
| JPY61,000 | USD560 | Bank of New York Mellon | 1/14/2020 | 1 |
| EUR217 | USD242 | Bank of New York Mellon | 1/15/2020 | 1 |
American Funds Insurance Series — Global Balanced Fund — Page 105 of 184
Forward currency contracts (continued)
| Contract amount | Counterparty | Settlement date | Unrealized appreciation (depreciation) at 12/31/2019 (000) | |
| Purchases (000) | Sales (000) | |||
| GBP200 | USD264 | JPMorgan Chase | 1/15/2020 | $1 |
| KRW175,200 | USD151 | Standard Chartered Bank | 1/15/2020 | 1 |
| GBP730 | EUR864 | Goldman Sachs | 1/15/2020 | (3) |
| ILS2,600 | USD745 | Bank of America | 1/16/2020 | 9 |
| GBP900 | USD1,185 | HSBC Bank | 1/16/2020 | 8 |
| CAD10 | USD8 | JPMorgan Chase | 1/16/2020 | —14 |
| USD517 | MXN9,900 | Citibank | 1/16/2020 | (6) |
| EUR1,456 | NOK14,752 | Bank of America | 1/16/2020 | (45) |
| EUR700 | USD783 | Bank of America | 1/17/2020 | 3 |
| EUR410 | USD459 | Citibank | 1/17/2020 | 2 |
| EUR400 | USD448 | Standard Chartered Bank | 1/17/2020 | 1 |
| AUD1,450 | USD1,000 | Citibank | 1/21/2020 | 18 |
| USD55 | JPY6,000 | UBS AG | 1/21/2020 | —14 |
| GBP370 | USD495 | Standard Chartered Bank | 1/21/2020 | (4) |
| EUR155 | USD173 | Citibank | 1/23/2020 | 1 |
| USD250 | INR17,800 | HSBC Bank | 1/23/2020 | 1 |
| USD290 | MXN5,515 | UBS AG | 1/23/2020 | —14 |
| USD235 | CNH1,645 | JPMorgan Chase | 1/23/2020 | (1) |
| EUR1,804 | USD2,011 | Standard Chartered Bank | 1/27/2020 | 16 |
| USD117 | INR8,300 | Standard Chartered Bank | 1/27/2020 | —14 |
| USD73 | BRL300 | JPMorgan Chase | 1/27/2020 | (1) |
| CNH4,000 | USD565 | Standard Chartered Bank | 2/10/2020 | 9 |
| CNH1,550 | USD220 | Standard Chartered Bank | 2/10/2020 | 3 |
| USD284 | CNH2,000 | HSBC Bank | 2/10/2020 | (4) |
| USD1,456 | CNH10,410 | Standard Chartered Bank | 2/10/2020 | (38) |
| USD510 | MXN10,100 | JPMorgan Chase | 3/4/2020 | (19) |
| USD365 | JPY39,400 | Bank of New York Mellon | 6/15/2020 | (1) |
| USD212 | BRL900 | JPMorgan Chase | 7/1/2020 | (10) |
| $(99) | ||||
Swap contracts
Interest rate swaps
| Receive | Pay | Expiration date | Notional (000) | Value at 12/31/2019 (000) | Upfront payments/ receipts (000) | Unrealized (depreciation) appreciation at 12/31/2019 (000) |
| (0.0955)% | 6-month EURIBOR | 7/22/2024 | €4,400 | $(11) | $— | $(11) |
| 6-month HUF-BUBOR | 1.39% | 11/11/2029 | HUF161,000 | 8 | — | 8 |
| 6-month PLN-WIBOR | 1.90% | 11/12/2029 | PLN2,100 | (2) | — | (2) |
| 6-month PLN-WIBOR | 1.88% | 11/20/2029 | 2,120 | (1) | — | (1) |
| 3-month USD-LIBOR | 2.0105% | 12/18/2049 | $215 | 4 | — | 4 |
| $— | $(2) |
American Funds Insurance Series — Global Balanced Fund — Page 106 of 184
| 1 | Valued under fair value procedures adopted by authority of the board of trustees. The total value of all such securities was $134,619,000, which represented 30.81% of the net assets of the fund. This entire amount relates to certain securities trading outside the U.S. whose values were adjusted as a result of significant market movements following the close of local trading. |
| 2 | Security did not produce income during the last 12 months. |
| 3 | Acquired in a transaction exempt from registration under Rule 144A or Section 4(2) of the Securities Act of 1933. May be resold in the U.S. in transactions exempt from registration, normally to qualified institutional buyers. The total value of all such securities was $18,373,000, which represented 4.20% of the net assets of the fund. |
| 4 | Index-linked bond whose principal amount moves with a government price index. |
| 5 | All or a portion of this security was pledged as collateral. The total value of pledged collateral was $133,000, which represented .03% of the net assets of the fund. |
| 6 | Step bond; coupon rate may change at a later date. |
| 7 | Coupon rate may change periodically. Reference rate and spread are as of the most recent information available. Some coupon rates are determined by the issuer or agent based on current market conditions; therefore, the reference rate and spread are not available. |
| 8 | Scheduled interest and/or principal payment was not received. |
| 9 | Principal payments may be made periodically. Therefore, the effective maturity date may be earlier than the stated maturity date. |
| 10 | Purchased on a TBA basis. |
| 11 | Rate represents the seven-day yield at 12/31/2019. |
| 12 | Notional amount is calculated based on the number of contracts and notional contract size. |
| 13 | Value is calculated based on the notional amount and current market price. |
| 14 | Amount less than one thousand. |
| Key to abbreviations and symbols | |
| ADR = American Depositary Receipts | INR = Indian rupees |
| AUD = Australian dollars | JPY/¥ = Japanese yen |
| BRL = Brazilian reais | KRW = South Korean won |
| BUBOR = Budapest Interbank Offered Rate | LIBOR = London Interbank Offered Rate |
| CAD/C$ = Canadian dollars | MXN = Mexican pesos |
| CDI = CREST Depository Interest | MYR = Malaysian ringgits |
| CLP = Chilean pesos | NOK/NKr = Norwegian kroner |
| CNH/CNY = Chinese yuan renminbi | PEN = Peruvian nuevos soles |
| COP = Colombian pesos | PLN = Polish zloty |
| CZK = Czech korunas | RUB = Russian rubles |
| DKr = Danish kroner | TBA = To-be-announced |
| EUR/€ = Euros | THB = Thai baht |
| EURIBOR = Euro Interbank Offered Rate | USD/$ = U.S. dollars |
| GBP/£ = British pounds | UYU = Uruguayan pesos |
| HUF = Hungarian forints | WIBOR = Warsaw Interbank Offer Rate |
| IDR = Indonesian rupiah | ZAR = South African rand |
| ILS = Israeli shekels |
American Funds Insurance Series — Global Balanced Fund — Page 107 of 184
Bond Fund
Investment portfolio
December 31, 2019
| Bonds, notes & other debt instruments 97.76% Mortgage-backed obligations 31.88% Federal agency mortgage-backed obligations 31.62% | Principal amount (000) | Value (000) |
| Bunker Hill Loan Depositary Trust, Series 2019-1, Class A1, 3.613% 20481,2,3 | $1,405 | $1,424 |
| Bunker Hill Loan Depositary Trust, Series 2019-1, Class A3, 3.919% 20481,2,3 | 2,094 | 2,100 |
| Fannie Mae 6.00% 20371 | 72 | 79 |
| Fannie Mae Pool #976945 5.50% 20231 | 230 | 235 |
| Fannie Mae Pool #AB1068 4.50% 20251 | 217 | 227 |
| Fannie Mae Pool #AB4088 3.00% 20261 | 930 | 955 |
| Fannie Mae Pool #AJ9156 3.00% 20261 | 455 | 467 |
| Fannie Mae Pool #AS6695 3.00% 20261 | 449 | 460 |
| Fannie Mae Pool #AJ6967 3.00% 20261 | 212 | 217 |
| Fannie Mae Pool #AJ7495 3.00% 20261 | 43 | 45 |
| Fannie Mae Pool #AJ5522 3.00% 20261 | 5 | 6 |
| Fannie Mae Pool #256133 4.50% 20261 | 191 | 201 |
| Fannie Mae Pool #AK5394 3.00% 20271 | 1,000 | 1,026 |
| Fannie Mae Pool #AL5603 3.00% 20271 | 983 | 1,009 |
| Fannie Mae Pool #AL4641 3.00% 20271 | 438 | 450 |
| Fannie Mae Pool #AX3597 3.00% 20271 | 432 | 444 |
| Fannie Mae Pool #AP4746 3.00% 20271 | 262 | 270 |
| Fannie Mae Pool #AB4281 3.00% 20271 | 194 | 199 |
| Fannie Mae Pool #AJ9355 3.00% 20271 | 125 | 128 |
| Fannie Mae Pool #AB4486 3.00% 20271 | 99 | 102 |
| Fannie Mae Pool #MA3131 3.00% 20271 | 87 | 90 |
| Fannie Mae Pool #AB5236 3.00% 20271 | 40 | 41 |
| Fannie Mae Pool #AO0800 3.00% 20271 | 33 | 34 |
| Fannie Mae Pool #AK3260 3.00% 20271 | 30 | 31 |
| Fannie Mae Pool #AK0971 3.00% 20271 | 17 | 17 |
| Fannie Mae Pool #AL3802 3.00% 20281 | 1,334 | 1,369 |
| Fannie Mae Pool #MA3286 3.00% 20281 | 844 | 869 |
| Fannie Mae Pool #BM3239 3.00% 20281 | 545 | 564 |
| Fannie Mae Pool #AR3058 3.00% 20281 | 121 | 124 |
| Fannie Mae Pool #MA3407 3.00% 20281 | 81 | 83 |
| Fannie Mae Pool #AL8241 3.00% 20291 | 1,242 | 1,274 |
| Fannie Mae Pool #BM4299 3.00% 20301 | 3,832 | 3,926 |
| Fannie Mae Pool #AL9573 3.00% 20311 | 152 | 156 |
| Fannie Mae Pool #AS8018 3.00% 20311 | 102 | 105 |
| Fannie Mae Pool #BO0119 3.00% 20321 | 7,027 | 7,235 |
| Fannie Mae Pool #BM4741 3.00% 20321 | 93 | 95 |
| Fannie Mae Pool #MA3409 3.00% 20331 | 1,251 | 1,283 |
| Fannie Mae Pool #BK9262 3.00% 20331 | 920 | 944 |
| Fannie Mae Pool #BK9015 3.00% 20331 | 488 | 502 |
| Fannie Mae Pool #MA3516 3.00% 20331 | 93 | 95 |
| Fannie Mae Pool #MA3461 3.00% 20331 | 80 | 82 |
| Fannie Mae Pool #MA3827 2.50% 20341 | 162,370 | 163,798 |
| Fannie Mae Pool #MA3764 2.50% 20341 | 70,404 | 71,022 |
| Fannie Mae Pool #BO0122 3.00% 20341 | 2,730 | 2,799 |
| Fannie Mae Pool #BP0113 3.00% 20341 | 1,910 | 1,958 |
American Funds Insurance Series — Bond Fund — Page 108 of 184
| Bonds, notes & other debt instruments (continued) Mortgage-backed obligations (continued) Federal agency mortgage-backed obligations (continued) | Principal amount (000) | Value (000) |
| Fannie Mae Pool #BO3606 3.00% 20341 | $1,000 | $1,025 |
| Fannie Mae Pool #BN3975 3.00% 20341 | 973 | 997 |
| Fannie Mae Pool #MA3657 3.00% 20341 | 957 | 981 |
| Fannie Mae Pool #BO0940 3.00% 20341 | 938 | 962 |
| Fannie Mae Pool #MA3681 3.00% 20341 | 709 | 727 |
| Fannie Mae Pool #MA3768 3.00% 20341 | 326 | 335 |
| Fannie Mae Pool #MA3738 3.00% 20341 | 42 | 43 |
| Fannie Mae Pool #924866 3.64% 20371,3 | 757 | 778 |
| Fannie Mae Pool #945680 6.00% 20371 | 905 | 1,036 |
| Fannie Mae Pool #889982 5.50% 20381 | 1,902 | 2,135 |
| Fannie Mae Pool #988588 5.50% 20381 | 339 | 380 |
| Fannie Mae Pool #AB1297 5.00% 20401 | 395 | 436 |
| Fannie Mae Pool #AH9479 5.00% 20411 | 2,341 | 2,582 |
| Fannie Mae Pool #AH8144 5.00% 20411 | 2,234 | 2,464 |
| Fannie Mae Pool #AI1862 5.00% 20411 | 1,802 | 2,008 |
| Fannie Mae Pool #AI3510 5.00% 20411 | 1,150 | 1,282 |
| Fannie Mae Pool #AJ0704 5.00% 20411 | 952 | 1,061 |
| Fannie Mae Pool #AJ5391 5.00% 20411 | 636 | 709 |
| Fannie Mae Pool #AS6127 3.50% 20451 | 115 | 120 |
| Fannie Mae Pool #AS4536 3.50% 20451 | 116 | 120 |
| Fannie Mae Pool #AZ3904 4.00% 20451 | 130 | 137 |
| Fannie Mae Pool #AL8522 3.50% 20461 | 1,988 | 2,103 |
| Fannie Mae Pool #AS6467 3.50% 20461 | 85 | 89 |
| Fannie Mae Pool #BD1968 4.00% 20461 | 2,856 | 3,042 |
| Fannie Mae Pool #BE0592 4.00% 20461 | 1,270 | 1,326 |
| Fannie Mae Pool #BD5477 4.00% 20461 | 602 | 636 |
| Fannie Mae Pool #BM5632 3.00% 20471 | 73,142 | 74,824 |
| Fannie Mae Pool #MA3147 3.00% 20471 | 9,587 | 9,781 |
| Fannie Mae Pool #CA0377 3.00% 20471 | 1,990 | 2,034 |
| Fannie Mae Pool #CA0858 3.50% 20471 | 58,233 | 60,512 |
| Fannie Mae Pool #CA0770 3.50% 20471 | 16,619 | 17,277 |
| Fannie Mae Pool #BJ2524 3.50% 20471 | 11,624 | 12,085 |
| Fannie Mae Pool #BJ1910 3.50% 20471 | 8,968 | 9,319 |
| Fannie Mae Pool #CA0487 3.50% 20471 | 219 | 228 |
| Fannie Mae Pool #CA0706 4.00% 20471 | 486 | 511 |
| Fannie Mae Pool #MA3058 4.00% 20471 | 207 | 217 |
| Fannie Mae Pool #BM4413 4.50% 20471 | 10,990 | 11,625 |
| Fannie Mae Pool #BF0293 3.00% 20481 | 17,034 | 17,440 |
| Fannie Mae Pool #CA2690 3.00% 20481 | 8,581 | 8,765 |
| Fannie Mae Pool #BJ9251 3.50% 20481 | 18,820 | 19,478 |
| Fannie Mae Pool #BF0318 3.50% 20481 | 17,472 | 18,299 |
| Fannie Mae Pool #CA1189 3.50% 20481 | 4,987 | 5,175 |
| Fannie Mae Pool #BJ3790 3.50% 20481 | 2,647 | 2,750 |
| Fannie Mae Pool #CA2622 3.50% 20481 | 659 | 680 |
| Fannie Mae Pool #MA3276 3.50% 20481 | 24 | 25 |
| Fannie Mae Pool #MA3495 4.00% 20481 | 74,668 | 77,777 |
| Fannie Mae Pool #MA3443 4.00% 20481 | 17,974 | 18,682 |
| Fannie Mae Pool #BK7608 4.00% 20481 | 14,760 | 15,362 |
| Fannie Mae Pool #MA3467 4.00% 20481 | 14,160 | 14,753 |
| Fannie Mae Pool #BK4764 4.00% 20481 | 5,523 | 5,754 |
| Fannie Mae Pool #FM1437 4.00% 20481 | 4,079 | 4,253 |
| Fannie Mae Pool #MA3384 4.00% 20481 | 3,736 | 3,901 |
| Fannie Mae Pool #MA3521 4.00% 20481 | 1,107 | 1,152 |
| Fannie Mae Pool #BJ9256 4.00% 20481 | 761 | 792 |
American Funds Insurance Series — Bond Fund — Page 109 of 184
| Bonds, notes & other debt instruments (continued) Mortgage-backed obligations (continued) Federal agency mortgage-backed obligations (continued) | Principal amount (000) | Value (000) |
| Fannie Mae Pool #BN0594 4.00% 20481 | $419 | $437 |
| Fannie Mae Pool #BJ0639 4.00% 20481 | 365 | 384 |
| Fannie Mae Pool #BJ9169 4.00% 20481 | 368 | 384 |
| Fannie Mae Pool #BJ5749 4.00% 20481 | 38 | 40 |
| Fannie Mae Pool #BM4676 4.00% 20481 | 34 | 36 |
| Fannie Mae Pool #BK9758 4.00% 20481 | 33 | 34 |
| Fannie Mae Pool #CA2056 4.50% 20481 | 1,649 | 1,743 |
| Fannie Mae Pool #MA3496 4.50% 20481 | 400 | 423 |
| Fannie Mae Pool #BN3309 4.50% 20481 | 74 | 78 |
| Fannie Mae Pool #BN0315 4.50% 20481 | 18 | 19 |
| Fannie Mae Pool #MA3833 2.50% 20491 | 25,000 | 24,718 |
| Fannie Mae Pool #CA4299 3.00% 20491 | 25,840 | 26,234 |
| Fannie Mae Pool #CA4534 3.00% 20491 | 18,818 | 19,308 |
| Fannie Mae Pool #CA3807 3.00% 20491 | 2,926 | 3,012 |
| Fannie Mae Pool #CA3806 3.00% 20491 | 1,480 | 1,525 |
| Fannie Mae Pool #MA3691 3.00% 20491 | 160 | 162 |
| Fannie Mae Pool #MA3803 3.50% 20491 | 103,395 | 106,391 |
| Fannie Mae Pool #MA3775 3.50% 20491 | 61,937 | 63,696 |
| Fannie Mae Pool #FM0007 3.50% 20491 | 43,725 | 45,689 |
| Fannie Mae Pool #CA4802 3.50% 20491 | 35,721 | 37,599 |
| Fannie Mae Pool #FM1954 3.50% 20491 | 19,250 | 20,017 |
| Fannie Mae Pool #FM1886 3.50% 20491 | 18,350 | 18,943 |
| Fannie Mae Pool #FM1589 3.50% 20491 | 13,090 | 13,622 |
| Fannie Mae Pool #FM2092 3.50% 20491 | 10,298 | 10,798 |
| Fannie Mae Pool #BN7491 3.50% 20491 | 3,596 | 3,711 |
| Fannie Mae Pool #BN6407 3.50% 20491 | 3,491 | 3,599 |
| Fannie Mae Pool #BN7823 3.50% 20491 | 863 | 890 |
| Fannie Mae Pool #BM5446 3.50% 20491 | 529 | 544 |
| Fannie Mae Pool #CA3084 4.00% 20491 | 42,619 | 44,322 |
| Fannie Mae Pool #MA3776 4.00% 20491 | 9,748 | 10,175 |
| Fannie Mae Pool #MA3804 4.00% 20491 | 1,338 | 1,397 |
| Fannie Mae Pool #BO2188 4.00% 20491 | 1,291 | 1,346 |
| Fannie Mae Pool #BN6408 4.00% 20491 | 132 | 137 |
| Fannie Mae Pool #MA3615 4.00% 20491 | 23 | 23 |
| Fannie Mae Pool #FM1389 4.50% 20491 | 26,189 | 27,523 |
| Fannie Mae Pool #MA3639 4.50% 20491 | 16,529 | 17,385 |
| Fannie Mae Pool #MA3593 4.50% 20491 | 8,357 | 8,793 |
| Fannie Mae Pool #CA2963 4.50% 20491 | 676 | 711 |
| Fannie Mae Pool #BN6006 4.50% 20491 | 478 | 505 |
| Fannie Mae Pool #BN8753 4.50% 20491 | 473 | 499 |
| Fannie Mae Pool #MA3616 4.50% 20491 | 326 | 342 |
| Fannie Mae Pool #BN8777 4.50% 20491 | 146 | 154 |
| Fannie Mae Pool #MA3905 3.00% 20501 | 270,650 | 274,433 |
| Fannie Mae Pool #BF0264 3.50% 20581 | 16,964 | 17,813 |
| Fannie Mae, Series 2001-4, Class GA, 9.16% 20251,3 | 1 | 1 |
| Fannie Mae, Series 2001-50, Class BA, 7.00% 20411 | 13 | 14 |
| Fannie Mae, Series 2002-W3, Class A5, 7.50% 20411 | 26 | 30 |
| Fannie Mae, Series 2002-W1, Class 2A, 5.638% 20421,3 | 34 | 36 |
| Freddie Mac 5.50% 20331 | 75 | 81 |
| Freddie Mac 5.50% 20381 | 104 | 116 |
| Freddie Mac 5.50% 20381 | 81 | 91 |
| Freddie Mac 5.50% 20391 | 155 | 175 |
| Freddie Mac 4.50% 20401 | 364 | 396 |
| Freddie Mac 5.50% 20401 | 581 | 653 |
American Funds Insurance Series — Bond Fund — Page 110 of 184
| Bonds, notes & other debt instruments (continued) Mortgage-backed obligations (continued) Federal agency mortgage-backed obligations (continued) | Principal amount (000) | Value (000) |
| Freddie Mac 4.50% 20411 | $416 | $452 |
| Freddie Mac 5.50% 20411 | 852 | 957 |
| Freddie Mac 3.50% 20451 | 29,183 | 31,131 |
| Freddie Mac 3.00% 20461 | 35,539 | 36,681 |
| Freddie Mac 3.50% 20471 | 95,958 | 99,954 |
| Freddie Mac 3.50% 20471 | 53,152 | 55,281 |
| Freddie Mac 3.50% 20471 | 7,048 | 7,331 |
| Freddie Mac 4.00% 20471 | 2,855 | 3,006 |
| Freddie Mac 3.50% 20481 | 30,941 | 32,413 |
| Freddie Mac 3.50% 20481 | 30,182 | 31,867 |
| Freddie Mac 3.50% 20481 | 14,464 | 14,910 |
| Freddie Mac 3.50% 20481 | 915 | 960 |
| Freddie Mac 4.00% 20481 | 43,858 | 45,717 |
| Freddie Mac 4.00% 20481 | 20,002 | 20,850 |
| Freddie Mac 4.00% 20481 | 12,557 | 13,084 |
| Freddie Mac 4.00% 20481 | 5,190 | 5,417 |
| Freddie Mac 4.00% 20481 | 1,864 | 1,942 |
| Freddie Mac 4.00% 20481 | 800 | 832 |
| Freddie Mac 4.00% 20491 | 67 | 69 |
| Freddie Mac Pool #ZA2657 3.00% 20261 | 673 | 691 |
| Freddie Mac Pool #ZK3537 3.00% 20261 | 129 | 133 |
| Freddie Mac Pool #ZK4277 3.00% 20271 | 817 | 839 |
| Freddie Mac Pool #ZK3836 3.00% 20271 | 290 | 298 |
| Freddie Mac Pool #ZK3970 3.00% 20271 | 256 | 263 |
| Freddie Mac Pool #ZS6521 3.00% 20271 | 163 | 167 |
| Freddie Mac Pool #ZK7581 3.00% 20271 | 137 | 141 |
| Freddie Mac Pool #ZK3893 3.00% 20271 | 87 | 89 |
| Freddie Mac Pool #ZK4162 3.00% 20271 | 62 | 64 |
| Freddie Mac Pool #ZS8452 3.00% 20271 | 21 | 22 |
| Freddie Mac Pool #ZK4039 3.00% 20271 | 9 | 9 |
| Freddie Mac Pool #ZS8463 3.00% 20271 | 8 | 8 |
| Freddie Mac Pool #ZS8507 3.00% 20281 | 307 | 316 |
| Freddie Mac Pool #ZK7590 3.00% 20291 | 6,000 | 6,149 |
| Freddie Mac Pool #ZK7593 3.00% 20291 | 308 | 316 |
| Freddie Mac Pool #ZS8710 3.00% 20331 | 11,193 | 11,483 |
| Freddie Mac Pool #ZS8715 3.00% 20331 | 2,437 | 2,499 |
| Freddie Mac Pool #ZT1344 3.00% 20331 | 1,078 | 1,106 |
| Freddie Mac Pool #ZK9250 3.00% 20331 | 485 | 498 |
| Freddie Mac Pool #ZT1931 3.00% 20331 | 431 | 442 |
| Freddie Mac Pool #SB0023 3.00% 20331 | 39 | 40 |
| Freddie Mac Pool #SB8015 2.50% 20341 | 11,772 | 11,875 |
| Freddie Mac Pool #SB8002 3.00% 20341 | 23,979 | 24,583 |
| Freddie Mac Pool #ZT2019 3.00% 20341 | 3,664 | 3,756 |
| Freddie Mac Pool #SB8021 3.00% 20341 | 2,309 | 2,368 |
| Freddie Mac Pool #ZT1731 3.00% 20341 | 1,000 | 1,025 |
| Freddie Mac Pool #QN0182 3.00% 20341 | 854 | 876 |
| Freddie Mac Pool #ZT1871 3.00% 20341 | 721 | 740 |
| Freddie Mac Pool #QN0170 3.00% 20341 | 515 | 528 |
| Freddie Mac Pool #ZT1798 3.00% 20341 | 406 | 417 |
| Freddie Mac Pool #SB8011 3.00% 20341 | 400 | 410 |
| Freddie Mac Pool #QN0248 3.00% 20341 | 388 | 398 |
| Freddie Mac Pool #ZT2091 3.00% 20341 | 347 | 355 |
| Freddie Mac Pool #QN1073 3.00% 20341 | 194 | 200 |
| Freddie Mac Pool #QN0031 3.00% 20341 | 51 | 53 |
American Funds Insurance Series — Bond Fund — Page 111 of 184
| Bonds, notes & other debt instruments (continued) Mortgage-backed obligations (continued) Federal agency mortgage-backed obligations (continued) | Principal amount (000) | Value (000) |
| Freddie Mac Pool #SB8027 3.00% 20351 | $5,402 | $5,547 |
| Freddie Mac Pool #G67701 3.00% 20461 | 49,618 | 51,093 |
| Freddie Mac Pool #G61733 3.00% 20471 | 9,078 | 9,348 |
| Freddie Mac Pool #G08799 3.00% 20481 | 56,530 | 57,578 |
| Freddie Mac Pool #ZS4784 3.50% 20481 | 139 | 143 |
| Freddie Mac Pool #ZT1545 4.00% 20481 | 25,025 | 26,060 |
| Freddie Mac Pool #SI2002 4.00% 20481 | 5,950 | 6,241 |
| Freddie Mac Pool #ZT1546 4.50% 20481 | 3,696 | 3,889 |
| Freddie Mac Pool #ZA6124 4.50% 20481 | 1,486 | 1,565 |
| Freddie Mac Pool #SD8010 3.00% 20491 | 74,000 | 75,069 |
| Freddie Mac Pool #SD7509 3.00% 20491 | 60,137 | 61,702 |
| Freddie Mac Pool #QA4673 3.00% 20491 | 47,395 | 48,774 |
| Freddie Mac Pool #SD7507 3.00% 20491 | 32,912 | 33,870 |
| Freddie Mac Pool #SD8011 3.50% 20491 | 126,986 | 130,515 |
| Freddie Mac Pool #QA5125 3.50% 20491 | 32,909 | 34,640 |
| Freddie Mac Pool #SD7508 3.50% 20491 | 25,001 | 26,315 |
| Freddie Mac Pool #SD8001 3.50% 20491 | 8,247 | 8,476 |
| Freddie Mac Pool #RA1369 3.50% 20491 | 6,565 | 6,852 |
| Freddie Mac Pool #ZN4842 3.50% 20491 | 2,351 | 2,456 |
| Freddie Mac Pool #ZA7047 3.50% 20491 | 759 | 783 |
| Freddie Mac Pool #ZT1776 3.50% 20491 | 450 | 463 |
| Freddie Mac Pool #SD8005 3.50% 20491 | 271 | 279 |
| Freddie Mac Pool #ZT1593 3.50% 20491 | 174 | 179 |
| Freddie Mac Pool #ZT1864 4.00% 20491 | 2,308 | 2,399 |
| Freddie Mac Pool #ZA6548 4.00% 20491 | 1,638 | 1,704 |
| Freddie Mac Pool #ZN4802 4.00% 20491 | 1,272 | 1,327 |
| Freddie Mac Pool #ZT1595 4.50% 20491 | 20,672 | 21,752 |
| Freddie Mac Pool #ZA7009 4.50% 20491 | 1,514 | 1,598 |
| Freddie Mac Pool #ZA6269 4.50% 20491 | 272 | 286 |
| Freddie Mac Pool #ZT1711 4.50% 20491 | 242 | 254 |
| Freddie Mac Pool #ZT1953 4.50% 20491 | 24 | 25 |
| Freddie Mac, Series 3061, Class PN, 5.50% 20351 | 110 | 124 |
| Freddie Mac, Series 3318, Class JT, 5.50% 20371 | 282 | 309 |
| Freddie Mac, Series K716, Class A2, Multi Family, 3.13% 20211 | 6,575 | 6,643 |
| Freddie Mac, Series K020, Class A2, Multi Family, 2.373% 20221 | 4,300 | 4,335 |
| Freddie Mac, Series K718, Class A2, Multi Family, 2.791% 20221 | 9,240 | 9,360 |
| Freddie Mac, Series 3146, Class PO, principal only, 0% 20361 | 235 | 205 |
| Freddie Mac, Series 3156, Class PO, principal only, 0% 20361 | 223 | 199 |
| Freddie Mac Seasoned Credit Risk Transfer Trust, Series 2019-2, Class MA, 3.50% 20581 | 3,651 | 3,793 |
| Government National Mortgage Assn. 4.50% 20491 | 4,018 | 4,198 |
| Government National Mortgage Assn. 3.50% 20501,4 | 77,460 | 79,824 |
| Government National Mortgage Assn. 4.00% 20501,4 | 30,942 | 32,027 |
| Government National Mortgage Assn. 5.00% 20501,4 | 15,609 | 16,454 |
| Government National Mortgage Assn. Pool #MA5817 4.00% 20491 | 83,163 | 86,151 |
| Government National Mortgage Assn. Pool #MA5986 4.00% 20491 | 24,627 | 25,523 |
| Government National Mortgage Assn. Pool #MA5931 4.00% 20491 | 3,875 | 4,020 |
| Government National Mortgage Assn. Pool #MA6221 4.50% 20491 | 30,819 | 32,448 |
| Government National Mortgage Assn. Pool #MA5878 5.00% 20491 | 104,318 | 109,869 |
| Government National Mortgage Assn. Pool #MA5933 5.00% 20491 | 8,879 | 9,390 |
| Government National Mortgage Assn. Pool #MA5988 5.00% 20491 | 4,859 | 5,129 |
| Government National Mortgage Assn. Pool #MA6042 5.00% 20491 | 261 | 275 |
| Uniform Mortgage-Backed Security 3.00% 20351,4 | 275,708 | 282,323 |
American Funds Insurance Series — Bond Fund — Page 112 of 184
| Bonds, notes & other debt instruments (continued) Mortgage-backed obligations (continued) Federal agency mortgage-backed obligations (continued) | Principal amount (000) | Value (000) |
| Uniform Mortgage-Backed Security 3.00% 20351,4 | $2,784 | $2,852 |
| Uniform Mortgage-Backed Security 4.50% 20501,4 | 2,753 | 2,898 |
| 3,336,234 | ||
| Collateralized mortgage-backed obligations (privately originated) 0.26% | ||
| Bellemeade Re Ltd., Series 2019-3A, Class M1B, (1-month USD-LIBOR + 1.60%) 3.392% 20291,2,3 | 3,175 | 3,182 |
| Cascade Funding Mortgage Trust, Series 2019-HB1, Class M1, 2.572% 20291,2,3 | 1,950 | 1,965 |
| Cascade Funding Mortgage Trust, Series 2019-HB1, Class M2, 2.863% 20291,2,3 | 475 | 479 |
| Cascade Funding Mortgage Trust, Series 2019-HB1, Class M3, 3.257% 20291,2,3 | 243 | 244 |
| Finance of America HECM Buyout, Series 2019-AB1, Class A, 2.656% 20491,2,5 | 1,695 | 1,694 |
| Finance of America HECM Buyout, Series 2019-AB1, Class M1, 3.50% 20491,2,5 | 1,717 | 1,701 |
| Finance of America Structured Securities Trust, Series 2019-JR2, Class A1, 2.00% 20691,2 | 4,897 | 5,107 |
| Finance of America Structured Securities Trust, Series 2019-JR1, Class A, 2.00% 20691,2 | 4,111 | 4,266 |
| JPMorgan Mortgage Trust, Series 2019-INV3, Class A13, 3.50% 20501,2,3 | 2,074 | 2,119 |
| JPMorgan Mortgage Trust, Series 2019-INV3, Class A3, 3.50% 20501,2,3 | 1,979 | 2,022 |
| Legacy Mortgage Asset Trust, Series 2019-GS2, Class A1, 3.75% 20591,2,3 | 1,854 | 1,872 |
| Starwood Mortgage Residential Trust, Series 2019-IMC1, Class A1, 3.468% 20491,2,3 | 2,753 | 2,776 |
| 27,427 | ||
| Commercial mortgage-backed securities 0.00% | ||
| L.A. Arena Funding, LLC, Series 1, Class A, 7.656% 20261,2 | 292 | 308 |
| Total mortgage-backed obligations | 3,363,969 | |
| Corporate bonds & notes 29.59% Financials 6.30% | ||
| ACE INA Holdings Inc. 2.30% 2020 | 2,005 | 2,012 |
| ACE INA Holdings Inc. 2.875% 2022 | 3,625 | 3,719 |
| ACE INA Holdings Inc. 3.35% 2026 | 2,025 | 2,153 |
| ACE INA Holdings Inc. 4.35% 2045 | 2,220 | 2,686 |
| Ally Financial Inc. 8.00% 2031 | 15,530 | 21,318 |
| Ally Financial Inc. 8.00% 2031 | 3,070 | 4,267 |
| American Express Co. 2.20% 2020 | 14,400 | 14,431 |
| American International Group, Inc. 4.20% 2028 | 9,875 | 10,865 |
| Assicurazioni Generali SpA 7.75% 2042 (3-month EUR-EURIBOR + 7.113% on 12/12/2022)6 | €3,100 | 4,197 |
| Assicurazioni Generali SpA 10.125% 2042 (3-month EUR-EURIBOR + 9.181% on 7/10/2022)6 | 3,800 | 5,310 |
| AXA Equitable Holdings, Inc. 4.35% 2028 | $2,250 | 2,443 |
| AXA Equitable Holdings, Inc. 5.00% 2048 | 7,740 | 8,319 |
| Banco Do Brasil, SA 4.75% 20242 | 5,000 | 5,259 |
| Bank of America Corp. 3.419% 2028 (3-month USD-LIBOR + 1.04% on 12/20/2027)6 | 10,129 | 10,631 |
| Berkshire Hathaway Finance Corp. 4.20% 2048 | 8,720 | 10,305 |
| BNP Paribas 3.50% 20232 | 10,050 | 10,400 |
| BNP Paribas 3.80% 20242 | 24,000 | 25,208 |
| BNP Paribas 2.819% 20252,6 | 2,875 | 2,908 |
| BNP Paribas 3.375% 20252 | 2,375 | 2,466 |
| Capital One Financial Corp. 2.15% 2022 | 8,325 | 8,341 |
| Capital One Financial Corp. 4.25% 2025 | 3,335 | 3,630 |
| Credit Suisse Group AG 2.997% 2023 (3-month USD-LIBOR + 1.20% on 12/14/2022)2,6 | 12,000 | 12,223 |
| Credit Suisse Group AG 3.80% 2023 | 12,925 | 13,531 |
| Credit Suisse Group AG 4.207% 2024 (3-month USD-LIBOR + 1.24% on 6/12/2023)2,6 | 500 | 529 |
| Credit Suisse Group AG 2.593% 2025 (USD-SOFR + 1.56% on 9/11/2024)2,6 | 4,000 | 4,014 |
| Deutsche Bank AG 3.15% 2021 | 27,607 | 27,734 |
| Deutsche Bank AG 3.375% 2021 | 1,300 | 1,314 |
| Deutsche Bank AG 4.25% 2021 | 27,043 | 27,477 |
American Funds Insurance Series — Bond Fund — Page 113 of 184
| Bonds, notes & other debt instruments (continued) Corporate bonds & notes (continued) Financials (continued) | Principal amount (000) | Value (000) |
| Deutsche Bank AG 4.25% 2021 | $525 | $540 |
| Deutsche Bank AG 3.30% 2022 | 2,495 | 2,521 |
| Deutsche Bank AG 5.00% 2022 | 2,675 | 2,794 |
| Deutsche Bank AG 3.95% 2023 | 7,875 | 8,076 |
| Deutsche Bank AG 3.70% 2024 | 5,300 | 5,379 |
| Deutsche Bank AG 3.70% 2024 | 3,725 | 3,791 |
| Deutsche Bank AG 3.961% 2025 (USD-SOFR + 2.581% on 11/26/2024)6 | 10,175 | 10,399 |
| Deutsche Bank AG 4.10% 2026 | 7,050 | 7,151 |
| Ford Motor Credit Co. 3.81% 2024 | 1,200 | 1,218 |
| Ford Motor Credit Co. 4.063% 2024 | 5,000 | 5,105 |
| Goldman Sachs Group, Inc. 5.75% 2022 | 4,800 | 5,152 |
| Goldman Sachs Group, Inc. 3.814% 2029 (3-month USD-LIBOR + 1.158% on 4/23/2028)6 | 9,600 | 10,291 |
| Goldman Sachs Group, Inc. 4.223% 2029 (3-month USD-LIBOR + 1.301% on 5/1/2028)6 | 3,000 | 3,306 |
| Goldman Sachs Group, Inc., junior subordinated, 5.30% (3-month USD-LIBOR + 3.834% on 11/10/2026)6 | 1,750 | 1,883 |
| Groupe BPCE SA 2.75% 20232 | 6,875 | 6,987 |
| Groupe BPCE SA 5.70% 20232 | 28,166 | 31,188 |
| Groupe BPCE SA 5.15% 20242 | 4,711 | 5,170 |
| HSBC Holdings PLC 4.583% 2029 (3-month USD-LIBOR + 1.535% on 6/19/2028)6 | 12,000 | 13,412 |
| Intesa Sanpaolo SpA 3.375% 20232 | 9,055 | 9,208 |
| Intesa Sanpaolo SpA 5.017% 20242 | 67,843 | 71,278 |
| Intesa Sanpaolo SpA 5.71% 20262 | 15,700 | 16,992 |
| Intesa Sanpaolo SpA 3.875% 20272 | 6,250 | 6,256 |
| Intesa Sanpaolo SpA 3.875% 20282 | 2,395 | 2,405 |
| JPMorgan Chase & Co. 3.559% 2024 (3-month USD-LIBOR + 0.73% on 4/23/2023)6 | 8,125 | 8,467 |
| JPMorgan Chase & Co. 3.509% 2029 (3-month USD-LIBOR + 0.945% on 1/23/2028)6 | 9,600 | 10,199 |
| JPMorgan Chase & Co. 4.203% 2029 (3-month USD-LIBOR + 1.26% on 7/23/2028)6 | 11,980 | 13,366 |
| Lloyds Banking Group PLC 4.375% 2028 | 8,825 | 9,728 |
| MetLife Capital Trust IV, junior subordinated, 7.875% 2067 (3-month USD-LIBOR + 3.96% on 12/1/2037)2,6 | 1,405 | 1,878 |
| MetLife, Inc. 3.60% 2025 | 3,490 | 3,750 |
| Metropolitan Life Global Funding I 2.00% 20202 | 230 | 230 |
| Morgan Stanley 2.50% 2021 | 19,200 | 19,350 |
| Morgan Stanley 2.72% 2025 (USD-SOFR + 1.152% on 7/22/2024)6 | 2,300 | 2,329 |
| New York Life Global Funding 1.95% 20202 | 145 | 145 |
| Nordea Bank AB 2.50% 20202 | 7,125 | 7,158 |
| PNC Financial Services Group, Inc. 2.854% 20226 | 5,850 | 5,990 |
| PNC Funding Corp. 3.30% 2022 | 8,700 | 8,938 |
| Royal Bank of Scotland PLC 4.445% 2030 (3-month USD-LIBOR + 1.871% on 5/5/2029)6 | 5,000 | 5,522 |
| Santander Holdings USA, Inc. 3.50% 2024 | 8,325 | 8,563 |
| Synchrony Bank 3.65% 2021 | 8,024 | 8,193 |
| Synchrony Financial 2.85% 2022 | 5,400 | 5,466 |
| Synchrony Financial 4.375% 2024 | 3,640 | 3,883 |
| UniCredit SpA 3.75% 20222 | 1,175 | 1,204 |
| UniCredit SpA 6.572% 20222 | 9,735 | 10,455 |
| UniCredit SpA 4.625% 20272 | 625 | 662 |
| UniCredit SpA 5.861% 20322,6 | 11,975 | 12,513 |
| UniCredit SpA 7.296% 2034 (5-year USD-ICE Swap + 4.914% on 4/2/2029)2,6 | 11,500 | 13,230 |
| Wells Fargo & Co. 2.10% 2021 | 16,800 | 16,828 |
| Wells Fargo & Co. 2.406% 2025 (3-month USD-LIBOR + 0.82% on 10/30/2024)6 | 8,650 | 8,656 |
| 664,895 | ||
| Health care 5.18% | ||
| Abbott Laboratories 3.40% 2023 | 910 | 957 |
| Abbott Laboratories 3.75% 2026 | 2,244 | 2,452 |
| Abbott Laboratories 4.75% 2036 | 4,565 | 5,705 |
American Funds Insurance Series — Bond Fund — Page 114 of 184
| Bonds, notes & other debt instruments (continued) Corporate bonds & notes (continued) Health care (continued) | Principal amount (000) | Value (000) |
| AbbVie Inc. 2.50% 2020 | $16,315 | $16,340 |
| AbbVie Inc. 3.20% 2022 | 11,070 | 11,363 |
| AbbVie Inc. 2.85% 2023 | 6,133 | 6,255 |
| AbbVie Inc. 3.75% 2023 | 3,667 | 3,859 |
| AbbVie Inc. 3.20% 2026 | 500 | 518 |
| AbbVie Inc. 3.20% 20292 | 28,505 | 29,016 |
| AbbVie Inc. 4.05% 20392 | 10,000 | 10,604 |
| AbbVie Inc. 4.45% 2046 | 2,577 | 2,757 |
| AbbVie Inc. 4.25% 20492 | 9,033 | 9,547 |
| Allergan PLC 3.45% 2022 | 11,533 | 11,797 |
| Allergan PLC 3.80% 2025 | 250 | 263 |
| Allergan, Inc. 5.00% 20212 | 7,221 | 7,553 |
| Anthem, Inc. 2.375% 2025 | 1,534 | 1,536 |
| AstraZeneca PLC 4.00% 2029 | 5,920 | 6,574 |
| Baxalta Inc. 4.00% 2025 | 116 | 125 |
| Bayer US Finance II LLC 3.875% 20232 | 26,358 | 27,666 |
| Bayer US Finance II LLC 4.25% 20252 | 27,370 | 29,530 |
| Becton, Dickinson and Co. 3.734% 2024 | 903 | 957 |
| Becton, Dickinson and Co. 4.669% 2047 | 3,395 | 4,041 |
| Boston Scientific Corp. 3.375% 2022 | 700 | 723 |
| Boston Scientific Corp. 3.85% 2025 | 255 | 274 |
| Bristol-Myers Squibb Co. 4.25% 20492 | 14,242 | 16,878 |
| Centene Corp. 4.75% 2022 | 200 | 204 |
| Centene Corp. 6.125% 2024 | 375 | 390 |
| Centene Corp. 4.75% 20252 | 9,375 | 9,758 |
| Centene Corp. 4.75% 2025 | 325 | 338 |
| Cigna Corp. 3.75% 2023 | 4,989 | 5,233 |
| Cigna Corp. 4.375% 2028 | 7,090 | 7,859 |
| EMD Finance LLC 2.40% 20202 | 13,295 | 13,300 |
| EMD Finance LLC 2.95% 20222 | 2,100 | 2,128 |
| GlaxoSmithKline PLC 3.375% 2023 | 16,800 | 17,521 |
| Laboratory Corp. of America Holdings 4.70% 2045 | 4,160 | 4,678 |
| Shire PLC 2.40% 2021 | 26,279 | 26,428 |
| Shire PLC 2.875% 2023 | 11,084 | 11,294 |
| Shire PLC 3.20% 2026 | 15,100 | 15,558 |
| Takeda Pharmaceutical Co., Ltd. 4.00% 2021 | 500 | 517 |
| Takeda Pharmaceutical Co., Ltd. 4.40% 2023 | 2,665 | 2,862 |
| Teva Pharmaceutical Finance Co. BV 2.20% 2021 | 5,236 | 5,080 |
| Teva Pharmaceutical Finance Co. BV 2.80% 2023 | 86,064 | 80,004 |
| Teva Pharmaceutical Finance Co. BV 6.00% 2024 | 29,067 | 29,476 |
| Teva Pharmaceutical Finance Co. BV 3.15% 2026 | 41,528 | 34,677 |
| Teva Pharmaceutical Finance Co. BV 6.75% 2028 | 19,324 | 19,654 |
| Teva Pharmaceutical Finance Co. BV 4.10% 2046 | 46,666 | 33,721 |
| UnitedHealth Group Inc. 3.35% 2022 | 4,385 | 4,541 |
| UnitedHealth Group Inc. 3.75% 2025 | 5,410 | 5,843 |
| Zimmer Holdings, Inc. 3.15% 2022 | 7,845 | 8,009 |
| 546,363 | ||
| Energy 4.46% | ||
| Apache Corp. 4.25% 2030 | 2,465 | 2,556 |
| Ascent Resources Marcellus Holdings, Inc., Term Loan B, (3-month USD-LIBOR + 6.50%) 8.245% 20233,7 | 92 | 87 |
| Boardwalk Pipeline Partners, LP 3.375% 2023 | 1,900 | 1,939 |
| Cenovus Energy Inc. 3.80% 2023 | 1,120 | 1,159 |
| Cenovus Energy Inc. 4.25% 2027 | 10,985 | 11,635 |
American Funds Insurance Series — Bond Fund — Page 115 of 184
| Bonds, notes & other debt instruments (continued) Corporate bonds & notes (continued) Energy (continued) | Principal amount (000) | Value (000) |
| Cenovus Energy Inc. 5.25% 2037 | $193 | $214 |
| Cenovus Energy Inc. 5.40% 2047 | 17,547 | 20,476 |
| Cheniere Energy, Inc. 7.00% 2024 | 410 | 473 |
| Cheniere Energy, Inc. 3.70% 20292 | 23,369 | 23,860 |
| Chevron Corp. 2.355% 2022 | 4,800 | 4,867 |
| Columbia Pipeline Partners LP 5.80% 2045 | 1,410 | 1,785 |
| Concho Resources Inc. 4.30% 2028 | 6,095 | 6,643 |
| Concho Resources Inc. 4.85% 2048 | 5,000 | 5,829 |
| DCP Midstream Operating LP 4.95% 2022 | 500 | 520 |
| Diamondback Energy, Inc. 3.25% 2026 | 8,725 | 8,835 |
| Enbridge Energy Partners, LP 4.20% 2021 | 6,325 | 6,518 |
| Enbridge Energy Partners, LP 5.875% 2025 | 12,660 | 14,763 |
| Enbridge Energy Partners, LP 7.375% 2045 | 22,767 | 33,962 |
| Enbridge Inc. 4.00% 2023 | 1,500 | 1,585 |
| Energy Transfer Partners, LP 4.15% 2020 | 1,000 | 1,011 |
| Energy Transfer Partners, LP 4.20% 2023 | 2,860 | 3,003 |
| Energy Transfer Partners, LP 4.50% 2024 | 4,915 | 5,232 |
| Energy Transfer Partners, LP 4.75% 2026 | 1,506 | 1,630 |
| Energy Transfer Partners, LP 4.20% 2027 | 45 | 47 |
| Energy Transfer Partners, LP 4.95% 2028 | 4,559 | 4,994 |
| Energy Transfer Partners, LP 5.25% 2029 | 1,275 | 1,432 |
| Energy Transfer Partners, LP 6.125% 2045 | 11,780 | 13,647 |
| Energy Transfer Partners, LP 5.30% 2047 | 10,459 | 11,153 |
| Energy Transfer Partners, LP 5.40% 2047 | 6,190 | 6,723 |
| Energy Transfer Partners, LP 6.00% 2048 | 1,868 | 2,177 |
| Energy Transfer Partners, LP 6.25% 2049 | 1,775 | 2,139 |
| Energy Transfer Partners, LP, junior subordinated, 6.25% (3-month USD-LIBOR + 4.028% on 2/15/2023)6 | 7,850 | 7,391 |
| Energy Transfer Partners, LP, junior subordinated, 6.625% (3-month USD-LIBOR + 4.155% on 12/31/2049)6 | 500 | 473 |
| EQT Corp. 2.50% 2020 | 4,910 | 4,910 |
| EQT Corp. 3.00% 2022 | 1,700 | 1,670 |
| EQT Corp. 3.90% 2027 | 455 | 426 |
| Equinor ASA 3.625% 2028 | 7,900 | 8,670 |
| Equinor ASA 3.25% 2049 | 5,687 | 5,730 |
| Exxon Mobil Corp. 3.043% 2026 | 4,625 | 4,851 |
| Kinder Morgan Energy Partners, LP 6.50% 2037 | 900 | 1,124 |
| Kinder Morgan Energy Partners, LP 5.50% 2044 | 700 | 818 |
| Kinder Morgan, Inc. 5.30% 2034 | 760 | 895 |
| MPLX LP 4.00% 2028 | 4,665 | 4,830 |
| Noble Corp. PLC 7.95% 20256 | 1,595 | 826 |
| Noble Corp. PLC 8.95% 20456 | 845 | 368 |
| Noble Energy, Inc. 4.20% 2049 | 5,108 | 5,140 |
| Occidental Petroleum Corp. 2.70% 2022 | 3,500 | 3,537 |
| Occidental Petroleum Corp. 2.90% 2024 | 7,371 | 7,493 |
| Occidental Petroleum Corp. 3.20% 2026 | 920 | 932 |
| Occidental Petroleum Corp. 3.50% 2029 | 5,971 | 6,092 |
| Occidental Petroleum Corp. 6.60% 2046 | 1,690 | 2,175 |
| Odebrecht Drilling Norbe 7.35% 2026 (13.61% PIK)2,8 | 35 | 19 |
| Odebrecht Drilling Norbe 0%2 | 1,150 | 11 |
| Petróleos Mexicanos 6.875% 2026 | 43,810 | 48,230 |
| Petróleos Mexicanos 6.50% 2027 | 29,533 | 31,440 |
| QEP Resources, Inc. 5.25% 2023 | 3,420 | 3,394 |
| Ras Laffan Liquefied Natural Gas II 5.298% 2020 | 123 | 125 |
| Sabine Pass Liquefaction, LLC 5.625% 20216 | 1,100 | 1,131 |
| Sabine Pass Liquefaction, LLC 6.25% 2022 | 2,300 | 2,471 |
American Funds Insurance Series — Bond Fund — Page 116 of 184
| Bonds, notes & other debt instruments (continued) Corporate bonds & notes (continued) Energy (continued) | Principal amount (000) | Value (000) |
| Sabine Pass Liquefaction, LLC 5.625% 20236 | $1,000 | $1,088 |
| Sabine Pass Liquefaction, LLC 5.75% 2024 | 8,000 | 8,924 |
| Sabine Pass Liquefaction, LLC 5.625% 2025 | 10,000 | 11,259 |
| Sabine Pass Liquefaction, LLC 5.875% 2026 | 15,700 | 18,027 |
| Saudi Arabian Oil Co. 2.875% 20242 | 4,885 | 4,958 |
| Saudi Arabian Oil Co. 3.50% 20292 | 21,348 | 22,121 |
| Schlumberger BV 4.00% 20252 | 8,791 | 9,465 |
| Shell International Finance BV 3.875% 2028 | 9,410 | 10,433 |
| Southwestern Energy Co. 6.20% 20256 | 920 | 846 |
| Targa Resources Partners LP 5.125% 2025 | 175 | 182 |
| Targa Resources Partners LP 5.375% 2027 | 175 | 182 |
| TC PipeLines, LP 4.375% 2025 | 405 | 431 |
| Total Capital Canada Ltd. 2.75% 2023 | 2,140 | 2,195 |
| TransCanada PipeLines Ltd. 4.25% 2028 | 11,275 | 12,519 |
| Transocean Inc. 5.80% 20226 | 2,195 | 2,124 |
| Transocean Inc. 9.00% 20232 | 5,000 | 5,292 |
| Ultra Petroleum Corp. 11.00% 2024 (18.18% PIK)8 | 455 | 75 |
| Williams Partners LP 5.25% 2020 | 2,900 | 2,917 |
| Williams Partners LP 4.50% 2023 | 500 | 535 |
| Williams Partners LP 4.30% 2024 | 595 | 635 |
| 470,274 | ||
| Utilities 3.58% | ||
| Abu Dhabi National Energy Co. PJSC (TAQA) 4.375% 20252 | 10,500 | 11,339 |
| Abu Dhabi National Energy Co. PJSC (TAQA) 4.375% 20262 | 300 | 327 |
| AES Corp. 4.00% 2021 | 1,000 | 1,016 |
| Alliant Energy Finance LLC 4.25% 20282 | 500 | 538 |
| Ameren Corp. 4.50% 2049 | 2,875 | 3,542 |
| Avangrid, Inc. 3.80% 2029 | 8,325 | 8,830 |
| Berkshire Hathaway Energy Co. 4.50% 2045 | 5,895 | 6,938 |
| CMS Energy Corp. 5.05% 2022 | 2,569 | 2,711 |
| Consolidated Edison Co. of New York, Inc. 3.875% 2047 | 9,200 | 9,960 |
| Consumers Energy Co. 4.05% 2048 | 8,270 | 9,527 |
| Consumers Energy Co. 3.75% 2050 | 5,625 | 6,214 |
| Dominion Resources, Inc., junior subordinated, 2.715% 20216 | 2,375 | 2,393 |
| Dominion Resources, Inc., junior subordinated, 3.071% 20246 | 1,400 | 1,443 |
| DTE Energy Co. 3.70% 2023 | 250 | 261 |
| DTE Energy Co., Series C, 2.529% 20243 | 2,975 | 2,990 |
| Duke Energy Corp. 3.75% 2024 | 3,826 | 4,054 |
| Duke Energy Florida, LLC 3.40% 2046 | 6,445 | 6,556 |
| Duke Energy Progress, LLC 3.70% 2028 | 3,750 | 4,101 |
| Edison International 3.125% 2022 | 2,900 | 2,946 |
| Edison International 3.55% 2024 | 3,600 | 3,688 |
| Edison International 5.75% 2027 | 2,781 | 3,124 |
| Edison International 4.125% 2028 | 2,419 | 2,481 |
| EDP Finance BV 3.625% 20242 | 14,800 | 15,408 |
| Emera Inc. 6.75% 2076 (3-month USD-LIBOR + 5.44% on 6/15/2026)6 | 1,950 | 2,206 |
| Emera US Finance LP 3.55% 2026 | 495 | 514 |
| Enel Finance International SA 4.875% 20292 | 10,180 | 11,489 |
| Enel Società per Azioni 8.75% 20732,6 | 1,000 | 1,176 |
| Entergy Louisiana, LLC 4.20% 2048 | 6,325 | 7,308 |
| Eversource Energy 2.75% 2022 | 527 | 535 |
| Eversource Energy 3.80% 2023 | 5,000 | 5,266 |
| Exelon Corp. 3.40% 2026 | 1,570 | 1,640 |
American Funds Insurance Series — Bond Fund — Page 117 of 184
| Bonds, notes & other debt instruments (continued) Corporate bonds & notes (continued) Utilities (continued) | Principal amount (000) | Value (000) |
| FirstEnergy Corp. 2.85% 2022 | $4,281 | $4,350 |
| FirstEnergy Corp. 3.90% 2027 | 14,078 | 15,054 |
| FirstEnergy Corp. 3.50% 20282 | 2,400 | 2,499 |
| FirstEnergy Corp. 7.375% 2031 | 5,150 | 7,266 |
| IPALCO Enterprises, Inc. 3.70% 2024 | 200 | 207 |
| Jersey Central Power & Light Co. 4.30% 20262 | 310 | 338 |
| Metropolitan Edison Co. 4.30% 20292 | 1,000 | 1,114 |
| Mississippi Power Co. 4.25% 2042 | 11,247 | 12,083 |
| Niagara Mohawk Power Corp. 3.508% 20242 | 7,575 | 7,967 |
| Niagara Mohawk Power Corp. 4.278% 20342 | 1,000 | 1,134 |
| NiSource Finance Corp. 2.65% 2022 | 275 | 278 |
| NV Energy, Inc. 6.25% 2020 | 2,850 | 2,951 |
| Pacific Gas and Electric Co. 2.45% 20229 | 7,200 | 7,216 |
| Pacific Gas and Electric Co. 3.25% 20239 | 5,615 | 5,603 |
| Pacific Gas and Electric Co. 3.40% 20249 | 850 | 863 |
| Pacific Gas and Electric Co. 3.30% 20279 | 3,750 | 3,759 |
| Pacific Gas and Electric Co. 4.65% 20282,9 | 7,500 | 7,765 |
| Pacific Gas and Electric Co. 4.75% 20449 | 336 | 346 |
| Progress Energy, Inc. 7.75% 2031 | 1,820 | 2,561 |
| Public Service Electric and Gas Co. 3.20% 2029 | 6,000 | 6,327 |
| Puget Energy, Inc. 6.50% 2020 | 5,294 | 5,507 |
| Puget Energy, Inc. 6.00% 2021 | 8,186 | 8,694 |
| Puget Energy, Inc. 5.625% 2022 | 8,004 | 8,586 |
| Puget Energy, Inc. 3.65% 2025 | 3,000 | 3,107 |
| SCANA Corp. 4.75% 2021 | 2,798 | 2,861 |
| SCANA Corp. 4.125% 2022 | 427 | 439 |
| Southern California Edison Co. 2.90% 2021 | 10,072 | 10,179 |
| Southern California Edison Co. 3.40% 2023 | 1,800 | 1,867 |
| Southern California Edison Co. 3.50% 2023 | 11,525 | 12,013 |
| Southern California Edison Co. 3.70% 2025 | 1,425 | 1,510 |
| Southern California Edison Co. 3.65% 2028 | 1,100 | 1,179 |
| Southern California Edison Co. 2.85% 2029 | 3,525 | 3,524 |
| Southern California Edison Co. 4.20% 2029 | 13,050 | 14,450 |
| Southern California Edison Co. 6.00% 2034 | 650 | 800 |
| Southern California Edison Co. 5.35% 2035 | 500 | 586 |
| Southern California Edison Co. 5.75% 2035 | 4,475 | 5,457 |
| Southern California Edison Co. 5.625% 2036 | 2,300 | 2,802 |
| Southern California Edison Co. 5.55% 2037 | 1,050 | 1,268 |
| Southern California Edison Co. 5.95% 2038 | 8,000 | 10,140 |
| Southern California Edison Co. 6.05% 2039 | 2,478 | 3,231 |
| Southern California Edison Co. 4.50% 2040 | 3,475 | 3,815 |
| Southern California Edison Co. 4.05% 2042 | 1,667 | 1,726 |
| Southern California Edison Co. 4.00% 2047 | 12,447 | 13,086 |
| Southern California Edison Co. 4.125% 2048 | 5,858 | 6,250 |
| Southern California Edison Co., Series C, 3.60% 2045 | 1,901 | 1,879 |
| Tampa Electric Co. 2.60% 2022 | 4,350 | 4,414 |
| Virginia Electric and Power Co. 4.45% 2044 | 7,995 | 9,275 |
| Xcel Energy Inc. 3.30% 2025 | 5,650 | 5,899 |
| Xcel Energy Inc. 2.60% 2029 | 2,925 | 2,897 |
| 377,643 |
American Funds Insurance Series — Bond Fund — Page 118 of 184
| Bonds, notes & other debt instruments (continued) Corporate bonds & notes (continued) Consumer discretionary 3.54% | Principal amount (000) | Value (000) |
| DaimlerChrysler North America Holding Corp. 3.00% 20212 | $500 | $505 |
| DaimlerChrysler North America Holding Corp. 2.85% 20222 | 500 | 506 |
| DaimlerChrysler North America Holding Corp. 3.35% 20232 | 2,000 | 2,057 |
| Ford Motor Credit Co. 2.343% 2020 | 3,000 | 2,995 |
| Ford Motor Credit Co. 3.157% 2020 | 3,188 | 3,201 |
| Ford Motor Credit Co. 3.20% 2021 | 6,665 | 6,703 |
| Ford Motor Credit Co. 3.336% 2021 | 300 | 302 |
| Ford Motor Credit Co. 3.47% 2021 | 15,400 | 15,543 |
| Ford Motor Credit Co. 3.813% 2021 | 16,314 | 16,616 |
| Ford Motor Credit Co. 3.219% 2022 | 770 | 776 |
| Ford Motor Credit Co. 3.339% 2022 | 13,345 | 13,478 |
| Ford Motor Credit Co. 5.596% 2022 | 14,275 | 15,043 |
| Ford Motor Credit Co. 3.096% 2023 | 8,071 | 8,065 |
| Ford Motor Credit Co. 4.14% 2023 | 12,000 | 12,346 |
| General Motors Co. 4.35% 2025 | 11,255 | 12,061 |
| General Motors Co. 6.25% 2043 | 5,923 | 6,648 |
| General Motors Co. 6.75% 2046 | 1,228 | 1,443 |
| General Motors Co. 5.40% 2048 | 7,200 | 7,449 |
| General Motors Co. 5.95% 2049 | 4,489 | 4,971 |
| General Motors Financial Co. 3.70% 2020 | 15,295 | 15,478 |
| General Motors Financial Co. 4.20% 2021 | 12,073 | 12,518 |
| General Motors Financial Co. 3.15% 2022 | 11,000 | 11,211 |
| General Motors Financial Co. 3.55% 2022 | 3,703 | 3,812 |
| General Motors Financial Co. 3.25% 2023 | 964 | 986 |
| General Motors Financial Co. 3.70% 2023 | 10,000 | 10,312 |
| General Motors Financial Co. 3.50% 2024 | 9,945 | 10,247 |
| General Motors Financial Co. 3.95% 2024 | 6,269 | 6,554 |
| General Motors Financial Co. 5.10% 2024 | 1,081 | 1,174 |
| Home Depot, Inc. 4.40% 2021 | 7,200 | 7,394 |
| Home Depot, Inc. 2.95% 2029 | 6,081 | 6,326 |
| Home Depot, Inc. 4.50% 2048 | 1,915 | 2,361 |
| Hyundai Capital America 2.55% 20202 | 4,200 | 4,202 |
| Hyundai Capital America 2.60% 20202 | 325 | 325 |
| Hyundai Capital America 2.75% 20202 | 3,321 | 3,333 |
| Hyundai Capital America 3.75% 20212 | 8,500 | 8,670 |
| Hyundai Capital America 2.85% 20222 | 4,118 | 4,164 |
| Hyundai Capital America 3.00% 20222 | 4,500 | 4,550 |
| Hyundai Capital America 3.25% 20222 | 1,521 | 1,550 |
| Hyundai Capital America 3.95% 20222 | 8,000 | 8,226 |
| Hyundai Capital America 3.40% 20242 | 8,180 | 8,349 |
| Lowe’s Cos., Inc. 3.65% 2029 | 6,331 | 6,768 |
| Lowe’s Cos., Inc. 4.55% 2049 | 1,130 | 1,332 |
| McDonald’s Corp. 4.45% 2047 | 3,535 | 4,058 |
| MGM Resorts International 7.75% 2022 | 2,000 | 2,234 |
| Newell Rubbermaid Inc. 3.85% 2023 | 13,669 | 14,205 |
| Newell Rubbermaid Inc. 4.20% 2026 | 17,294 | 18,031 |
| Newell Rubbermaid Inc. 5.50% 2046 | 1,630 | 1,745 |
| NIKE, Inc. 3.875% 2045 | 6,845 | 7,768 |
| Nissan Motor Co., Ltd. 2.60% 20222 | 1,415 | 1,417 |
| Sally Holdings LLC and Sally Capital Inc. 5.625% 2025 | 300 | 315 |
| Starbucks Corp. 3.75% 2047 | 3,785 | 3,928 |
| Starbucks Corp. 4.50% 2048 | 7,680 | 8,933 |
| Volkswagen Group of America Finance, LLC 2.40% 20202 | 2,855 | 2,859 |
| Volkswagen Group of America Finance, LLC 4.00% 20212 | 5,426 | 5,612 |
American Funds Insurance Series — Bond Fund — Page 119 of 184
| Bonds, notes & other debt instruments (continued) Corporate bonds & notes (continued) Consumer discretionary (continued) | Principal amount (000) | Value (000) |
| Volkswagen Group of America Finance, LLC 2.70% 20222 | $6,573 | $6,649 |
| Volkswagen Group of America Finance, LLC 4.25% 20232 | 15,953 | 16,999 |
| Volkswagen Group of America Finance, LLC 2.85% 20242 | 2,996 | 3,044 |
| Volkswagen Group of America Finance, LLC 4.625% 20252 | 1,177 | 1,303 |
| Volkswagen International Finance NV 4.00% 20202 | 4,000 | 4,047 |
| 373,697 | ||
| Consumer staples 2.33% | ||
| Altria Group, Inc. 2.85% 2022 | 4,800 | 4,892 |
| Altria Group, Inc. 4.40% 2026 | 16,054 | 17,441 |
| Altria Group, Inc. 4.50% 2043 | 1,585 | 1,619 |
| Altria Group, Inc. 5.95% 2049 | 3,333 | 4,036 |
| Anheuser-Busch InBev NV 4.75% 2029 | 7,500 | 8,689 |
| Anheuser-Busch InBev NV 5.55% 2049 | 11,149 | 14,463 |
| British American Tobacco International Finance PLC 3.50% 20222 | 152 | 156 |
| British American Tobacco International Finance PLC 3.95% 20252 | 16,879 | 17,852 |
| British American Tobacco PLC 3.222% 2024 | 3,769 | 3,854 |
| British American Tobacco PLC 3.557% 2027 | 10,320 | 10,533 |
| British American Tobacco PLC 4.39% 2037 | 1,500 | 1,518 |
| British American Tobacco PLC 4.54% 2047 | 12,786 | 12,845 |
| British American Tobacco PLC 4.758% 2049 | 20,129 | 20,833 |
| Conagra Brands, Inc. 5.30% 2038 | 2,320 | 2,754 |
| Conagra Brands, Inc. 5.40% 2048 | 3,680 | 4,489 |
| Constellation Brands, Inc. 2.65% 2022 | 2,017 | 2,046 |
| Constellation Brands, Inc. 3.50% 2027 | 7,500 | 7,833 |
| General Mills, Inc. (3-month USD-LIBOR + 0.54%) 2.541% 20213 | 10,620 | 10,657 |
| General Mills, Inc. 3.20% 2021 | 2,170 | 2,209 |
| Imperial Tobacco Finance PLC 3.50% 20232 | 2,335 | 2,390 |
| Keurig Dr Pepper Inc. 4.057% 2023 | 6,190 | 6,528 |
| Keurig Dr Pepper Inc. 4.597% 2028 | 10,752 | 12,080 |
| Kroger Co. 2.60% 2021 | 8,000 | 8,050 |
| Molson Coors Brewing Co. 2.25% 2020 | 4,525 | 4,523 |
| Molson Coors Brewing Co. 2.10% 2021 | 2,415 | 2,417 |
| Molson Coors Brewing Co. 3.00% 2026 | 975 | 987 |
| Molson Coors Brewing Co. 4.20% 2046 | 4,530 | 4,516 |
| Philip Morris International Inc. 2.625% 2022 | 1,515 | 1,534 |
| Philip Morris International Inc. 4.25% 2044 | 9,550 | 10,545 |
| Reynolds American Inc. 3.25% 2022 | 1,477 | 1,507 |
| Reynolds American Inc. 4.45% 2025 | 14,570 | 15,686 |
| Reynolds American Inc. 5.85% 2045 | 125 | 143 |
| Wal-Mart Stores, Inc. 2.85% 2024 | 6,765 | 7,017 |
| Wal-Mart Stores, Inc. 3.05% 2026 | 7,720 | 8,140 |
| WM. Wrigley Jr. Co. 3.375% 20202 | 11,255 | 11,366 |
| 246,148 | ||
| Information technology 1.59% | ||
| Apple Inc. 1.55% 2021 | 11,630 | 11,586 |
| Broadcom Inc. 4.25% 20262 | 41,375 | 43,995 |
| Broadcom Inc. 4.75% 20292 | 61,009 | 66,768 |
| Broadcom Ltd. 3.00% 2022 | 12,000 | 12,177 |
| Broadcom Ltd. 3.625% 2024 | 1,962 | 2,033 |
| Broadcom Ltd. 3.875% 2027 | 12,860 | 13,356 |
| Financial & Risk US Holdings, Inc. 6.25% 20262 | 3,325 | 3,634 |
American Funds Insurance Series — Bond Fund — Page 120 of 184
| Bonds, notes & other debt instruments (continued) Corporate bonds & notes (continued) Information technology (continued) | Principal amount (000) | Value (000) |
| Microsoft Corp. 4.25% 2047 | $10,000 | $12,248 |
| Xerox Corp. 3.50% 2020 | 1,500 | 1,514 |
| 167,311 | ||
| Industrials 1.18% | ||
| Airbus Group SE 2.70% 20232 | 2,120 | 2,156 |
| ARAMARK Corp. 5.125% 2024 | 1,200 | 1,234 |
| Avolon Holdings Funding Ltd. 3.625% 20222 | 2,810 | 2,883 |
| Avolon Holdings Funding Ltd. 3.95% 20242 | 12,514 | 13,056 |
| BNSF Funding Trust I, junior subordinated, 6.613% 2055 (3-month USD-LIBOR + 2.35% on 1/15/2026)6 | 1,680 | 1,884 |
| Boeing Co. 2.95% 2030 | 10,000 | 10,234 |
| Bohai Financial Investment Holding Co., Ltd. 5.25% 20222 | 2,485 | 2,654 |
| Continental Airlines, Inc., Series 1999-2, Class B, 7.566% 2021 | —10 | —10 |
| Continental Airlines, Inc., Series 2001-1, Class A1, 6.703% 2022 | 50 | 53 |
| Continental Airlines, Inc., Series 2000-2, Class A1, 7.707% 2022 | 318 | 330 |
| Continental Airlines, Inc., Series 2000-1, Class A1, 8.048% 2022 | 187 | 191 |
| General Electric Capital Corp. 2.342% 2020 | 4,588 | 4,592 |
| General Electric Capital Corp. 3.10% 2023 | 1,750 | 1,788 |
| General Electric Capital Corp. 3.373% 2025 | 4,615 | 4,807 |
| General Electric Co. 2.70% 2022 | 4,800 | 4,865 |
| Harris Corp. 3.832% 2025 | 945 | 1,008 |
| IHS Markit Ltd. 4.25% 2029 | 5,000 | 5,394 |
| Lockheed Martin Corp. 2.50% 2020 | 3,055 | 3,071 |
| Lockheed Martin Corp. 3.10% 2023 | 1,155 | 1,192 |
| Lockheed Martin Corp. 3.55% 2026 | 2,445 | 2,623 |
| Lockheed Martin Corp. 4.50% 2036 | 1,895 | 2,246 |
| Lockheed Martin Corp. 4.70% 2046 | 4,995 | 6,368 |
| Mexico City Airport Trust 5.50% 2046 | 1,751 | 1,812 |
| Mexico City Airport Trust 5.50% 2047 | 3,034 | 3,139 |
| Mexico City Airport Trust 5.50% 20472 | 215 | 222 |
| Northrop Grumman Corp. 3.25% 2028 | 10,845 | 11,314 |
| NXP BV and NXP Funding LLC 4.125% 20212 | 2,000 | 2,051 |
| Republic Services, Inc. 5.00% 2020 | 4,800 | 4,822 |
| United Rentals, Inc. 5.50% 2027 | 5,000 | 5,369 |
| United Technologies Corp. 3.125% 2027 | 9,525 | 10,002 |
| Vinci SA 3.75% 20292 | 12,456 | 13,588 |
| 124,948 | ||
| Communication services 0.91% | ||
| AT&T Inc. 3.80% 2027 | 4,335 | 4,623 |
| CCO Holdings LLC and CCO Holdings Capital Corp. 3.579% 2020 | 6,505 | 6,547 |
| CCO Holdings LLC and CCO Holdings Capital Corp. 5.125% 20272 | 4,800 | 5,073 |
| CCO Holdings LLC and CCO Holdings Capital Corp. 5.75% 2048 | 5,000 | 5,832 |
| CenturyLink, Inc. 7.50% 2024 | 2,060 | 2,327 |
| CenturyLink, Inc. 5.125% 20262 | 2,025 | 2,066 |
| CenturyLink, Inc. 7.65% 2042 | 5,000 | 5,255 |
| Comcast Corp. 3.15% 2028 | 7,200 | 7,545 |
| Comcast Corp. 2.65% 2030 | 7,500 | 7,530 |
| Comcast Corp. 4.00% 2048 | 5,000 | 5,551 |
| France Télécom 9.00% 20316 | 1,480 | 2,291 |
| Level 3 Communications, Inc. 4.625% 20272 | 4,525 | 4,641 |
| NBCUniversal Enterprise, Inc., junior subordinated, 5.25%2 | 5,170 | 5,340 |
| SoftBank Group Corp. 3.36% 20232 | 5,075 | 5,127 |
| Tencent Holdings Ltd. 3.28% 20242 | 5,000 | 5,146 |
American Funds Insurance Series — Bond Fund — Page 121 of 184
| Bonds, notes & other debt instruments (continued) Corporate bonds & notes (continued) Communication services (continued) | Principal amount (000) | Value (000) |
| Verizon Communications Inc. 4.40% 2034 | $5,080 | $5,886 |
| Vodafone Group PLC 4.375% 2028 | 10,000 | 11,083 |
| Vodafone Group PLC 4.25% 2050 | 3,050 | 3,187 |
| Walt Disney Co. 4.00% 2023 | 1,100 | 1,179 |
| 96,229 | ||
| Real estate 0.43% | ||
| Alexandria Real Estate Equities, Inc. 3.95% 2028 | 1,425 | 1,531 |
| Alexandria Real Estate Equities, Inc. 4.50% 2029 | 150 | 169 |
| American Campus Communities, Inc. 3.35% 2020 | 2,810 | 2,834 |
| American Campus Communities, Inc. 3.75% 2023 | 2,900 | 3,022 |
| Corporate Office Properties LP 5.25% 2024 | 10 | 11 |
| Equinix, Inc. 2.90% 2026 | 3,287 | 3,299 |
| Equinix, Inc. 3.20% 2029 | 3,846 | 3,867 |
| Essex Portfolio LP 3.25% 2023 | 335 | 344 |
| Essex Portfolio LP 3.875% 2024 | 1,000 | 1,057 |
| Hospitality Properties Trust 4.25% 2021 | 4,250 | 4,311 |
| Hospitality Properties Trust 5.00% 2022 | 1,270 | 1,336 |
| Hospitality Properties Trust 4.50% 2025 | 855 | 879 |
| Hospitality Properties Trust 3.95% 2028 | 1,710 | 1,668 |
| Kimco Realty Corp. 3.40% 2022 | 1,045 | 1,080 |
| Omega Healthcare Investors, Inc. 4.375% 2023 | 900 | 955 |
| Piedmont Operating Partnership LP 4.45% 2024 | 1,000 | 1,066 |
| Scentre Group 2.375% 20212 | 175 | 175 |
| Scentre Group 3.50% 20252 | 4,565 | 4,737 |
| WEA Finance LLC 3.25% 20202 | 13,375 | 13,484 |
| 45,825 | ||
| Materials 0.09% | ||
| BHP Billiton Finance Ltd. 6.25% 2075 (USD Semi Annual 30/360 (vs. 3-month USD-LIBOR) 5-year + 4.971% on 10/19/2020)2,6 | 4,765 | 4,920 |
| Braskem SA 4.50% 20302 | 2,500 | 2,491 |
| Holcim Ltd. 5.15% 20232 | 1,560 | 1,676 |
| 9,087 | ||
| Total corporate bonds & notes | 3,122,420 | |
| U.S. Treasury bonds & notes 28.74% U.S. Treasury 24.36% | ||
| U.S. Treasury 8.75% 202011 | 38,500 | 40,174 |
| U.S. Treasury 1.625% 2021 | 6,740 | 6,749 |
| U.S. Treasury 1.625% 2022 | 70,000 | 70,022 |
| U.S. Treasury 1.625% 2022 | 521 | 521 |
| U.S. Treasury 2.375% 2023 | 48,100 | 49,179 |
| U.S. Treasury 2.50% 2023 | 57,200 | 58,775 |
| U.S. Treasury 2.625% 2023 | 70,000 | 72,625 |
| U.S. Treasury 2.75% 2023 | 173,600 | 179,831 |
| U.S. Treasury 1.50% 2024 | 75,423 | 74,802 |
| U.S. Treasury 1.75% 2024 | 48,282 | 48,440 |
| U.S. Treasury 2.125% 2024 | 72,100 | 73,554 |
| U.S. Treasury 2.125% 202411 | 72,100 | 73,520 |
| U.S. Treasury 2.125% 2024 | 50,000 | 50,938 |
| U.S. Treasury 2.25% 2024 | 65,000 | 66,521 |
| U.S. Treasury 2.75% 2025 | 132,000 | 138,843 |
American Funds Insurance Series — Bond Fund — Page 122 of 184
| Bonds, notes & other debt instruments (continued) U.S. Treasury bonds & notes (continued) U.S. Treasury (continued) | Principal amount (000) | Value (000) |
| U.S. Treasury 2.875% 202511 | $96,200 | $102,032 |
| U.S. Treasury 2.875% 2025 | 72,100 | 76,361 |
| U.S. Treasury 1.375% 2026 | 150,000 | 145,940 |
| U.S. Treasury 1.625% 2026 | 75,000 | 74,118 |
| U.S. Treasury 2.25% 2026 | 146,369 | 150,433 |
| U.S. Treasury 2.375% 2026 | 67,586 | 69,975 |
| U.S. Treasury 2.25% 202711 | 120,200 | 123,645 |
| U.S. Treasury 2.25% 202711 | 72,100 | 74,148 |
| U.S. Treasury 6.125% 202711 | 24,000 | 31,536 |
| U.S. Treasury 2.875% 2028 | 72,100 | 77,679 |
| U.S. Treasury 1.75% 2029 | 69,308 | 68,252 |
| U.S. Treasury 2.25% 204911 | 364,471 | 353,646 |
| U.S. Treasury 2.375% 2049 | 11,800 | 11,761 |
| U.S. Treasury 3.00% 204911 | 182,915 | 206,346 |
| 2,570,366 | ||
| U.S. Treasury inflation-protected securities 4.38% | ||
| U.S. Treasury Inflation-Protected Security 0.125% 202412 | 25,074 | 25,235 |
| U.S. Treasury Inflation-Protected Security 0.375% 202512 | 55,368 | 56,544 |
| U.S. Treasury Inflation-Protected Security 0.375% 202711,12 | 105,195 | 107,342 |
| U.S. Treasury Inflation-Protected Security 0.50% 202811,12 | 130,403 | 133,824 |
| U.S. Treasury Inflation-Protected Security 1.00% 204912 | 124,504 | 138,576 |
| 461,521 | ||
| Total U.S. Treasury bonds & notes | 3,031,887 | |
| Bonds & notes of governments & government agencies outside the U.S. 3.03% | ||
| Dominican Republic 5.95% 20272 | 8,100 | 8,963 |
| Italy (Republic of) 0.95% 2023 | €45,000 | 51,635 |
| Italy (Republic of) 1.50% 2025 | 33,327 | 38,897 |
| Japan, Series 20, 0.10% 202512 | ¥11,475,000 | 107,563 |
| Portuguese Republic 5.125% 2024 | $24,775 | 27,881 |
| Portuguese Republic 5.65% 2024 | €20,000 | 27,792 |
| PT Indonesia Asahan Aluminium Tbk 5.23% 20212 | $1,862 | 1,955 |
| PT Indonesia Asahan Aluminium Tbk 5.71% 20232 | 1,020 | 1,127 |
| Qatar (State of) 4.50% 20282 | 5,100 | 5,853 |
| Qatar (State of) 5.103% 20482 | 3,400 | 4,376 |
| Saudi Arabia (Kingdom of) 3.628% 20272 | 5,000 | 5,312 |
| Saudi Arabia (Kingdom of) 3.625% 20282 | 11,435 | 12,095 |
| United Mexican States, Series M, 5.75% 2026 | MXN527,500 | 26,459 |
| 319,908 | ||
| Asset-backed obligations 2.26% | ||
| AmeriCredit Automobile Receivables Trust, Series 2017-1, Class C, 2.71% 20221 | $5,970 | 6,007 |
| AmeriCredit Automobile Receivables Trust, Series 2016-1, Class C, 2.89% 20221 | 1,062 | 1,064 |
| CarMaxAuto Owner Trust, Series 2019-2, Class C, 3.16% 20251 | 400 | 409 |
| CenterPoint Energy Transition Bond Co. III, LLC, Series 2008, Class A2, 5.234% 20231 | 218 | 218 |
| CPS Auto Receivables Trust, Series 2017-B, Class C, 2.92% 20221,2 | 4,311 | 4,319 |
| CPS Auto Receivables Trust, Series 2019-B, Class C, 3.35% 20241,2 | 835 | 847 |
| CPS Auto Receivables Trust, Series 2019-C, Class C, 2.84% 20251,2 | 743 | 747 |
| CPS Auto Receivables Trust, Series 2019-C, Class D, 3.17% 20251,2 | 1,125 | 1,132 |
| CPS Auto Receivables Trust, Series 2019-B, Class D, 3.69% 20251,2 | 3,045 | 3,092 |
| Drive Auto Receivables Trust, Series 2017-1, Class C, 2.84% 20221 | 307 | 307 |
| Drive Auto Receivables Trust, Series 2017-AA, Class C, 2.98% 20221,2 | 522 | 522 |
American Funds Insurance Series — Bond Fund — Page 123 of 184
| Bonds, notes & other debt instruments (continued) Asset-backed obligations (continued) | Principal amount (000) | Value (000) |
| Drive Auto Receivables Trust, Series 2017-2, Class C, 2.75% 20231 | $227 | $227 |
| Drive Auto Receivables Trust, Series 2019-2, Class B, 3.17% 20231 | 2,480 | 2,506 |
| Drive Auto Receivables Trust, Series 2019-3, Class C, 2.90% 20251 | 4,910 | 4,964 |
| Drive Auto Receivables Trust, Series 2019-2, Class C, 3.42% 20251 | 4,665 | 4,744 |
| Drive Auto Receivables Trust, Series 2019-3, Class D, 3.18% 20261 | 4,020 | 4,079 |
| Drivetime Auto Owner Trust, Series 2017-4A, Class C, 2.86% 20231,2 | 306 | 306 |
| Drivetime Auto Owner Trust, Series 2017-3A, Class C, 3.01% 20231,2 | 1,437 | 1,438 |
| Drivetime Auto Owner Trust, Series 2019-3, Class C, 2.74% 20251,2 | 880 | 885 |
| Drivetime Auto Owner Trust, Series 2019-3, Class D, 2.96% 20251,2 | 1,915 | 1,917 |
| Drivetime Auto Owner Trust, Series 2019-2A Class C, 3.18% 20251,2 | 2,565 | 2,597 |
| Drivetime Auto Owner Trust, Series 2019-2A Class D, 3.48% 20251,2 | 4,250 | 4,311 |
| Enterprise Fleet Financing LLC, Series 2017-1, Class A2, 2.13% 20221,2 | 976 | 976 |
| Exeter Automobile Receivables Trust, Series 2015-3A, Class C, 4.83% 20211,2 | 87 | 87 |
| Exeter Automobile Receivables Trust, Series 2017-3A, Class B, 2.81% 20221,2 | 7,312 | 7,332 |
| Exeter Automobile Receivables Trust, Series 2019-2A, Class B, 3.06% 20231,2 | 3,140 | 3,166 |
| Exeter Automobile Receivables Trust, Series 2019-3A, Class C, 2.79% 20241,2 | 5,000 | 5,030 |
| Exeter Automobile Receivables Trust, Series 2019-2A, Class C, 3.30% 20241,2 | 2,500 | 2,537 |
| Exeter Automobile Receivables Trust, Series 2019-1A, Class C, 3.82% 20241,2 | 4,145 | 4,236 |
| Exeter Automobile Receivables Trust, Series 2019-3A, Class D, 3.11% 20251,2 | 5,000 | 5,039 |
| Exeter Automobile Receivables Trust, Series 2019-2A, Class D, 3.71% 20251,2 | 6,000 | 6,150 |
| Ford Credit Auto Owner Trust, Series 2016-2, Class A, 2.03% 20271,2 | 26,755 | 26,763 |
| Ford Credit Auto Owner Trust, Series 2018-2, Class A, 3.47% 20301,2 | 17,675 | 18,467 |
| Ford Credit Auto Owner Trust, Series 2018-1, Class A, 3.52% 20301,2 | 1,500 | 1,575 |
| Ford Credit Auto Owner Trust, Series 2018-1, Class A, 3.19% 20311,2 | 31,410 | 32,671 |
| Ford Credit Floorplan Master Owner Trust, Series 2019-3, Class A1, 2.23% 20241 | 2,625 | 2,632 |
| GM Financial Consumer Automobile Receivables Trust, Series 2018-1, Class B, 2.57% 20231 | 520 | 524 |
| GM Financial Consumer Automobile Receivables Trust, Series 2018-1, Class C, 2.77% 20231 | 360 | 361 |
| Hertz Vehicle Financing LLC, Rental Car Asset-backed Notes, Series 2016-4A, Class A, 2.65% 20221,2 | 4,015 | 4,037 |
| Hertz Vehicle Financing LLC, Rental Car Asset-Backed Notes, Series 2019-3A, Class A, 2.67% 20251,2 | 8,484 | 8,465 |
| Hertz Vehicle Financing LLC, Rental Car Asset-Backed Notes, Series 2019-2A, Class A, 3.42% 20251,2 | 4,500 | 4,640 |
| Home Equity Mortgage Trust, Series 2006-6, Class 2A1, (1-month USD-LIBOR + 0.10%) 1.992% 20371,3 | 1,333 | 68 |
| Prestige Auto Receivables Trust, Series 2019-1A, Class C, 2.70% 20241,2 | 2,190 | 2,203 |
| Prestige Auto Receivables Trust, Series 2019-1A, Class D, 3.01% 20251,2 | 1,355 | 1,365 |
| Santander Drive Auto Receivables Trust, Series 2016-3, Class C, 2.46% 20221 | 321 | 322 |
| Santander Drive Auto Receivables Trust, Series 2017-1, Class C, 2.58% 20221 | 5,268 | 5,272 |
| Santander Drive Auto Receivables Trust, Series 2017-3, Class C, 2.76% 20221 | 3,955 | 3,968 |
| Santander Drive Auto Receivables Trust, Series 2016-1, Class C, 3.09% 20221 | 335 | 335 |
| Santander Drive Auto Receivables Trust, Series 2019-2, Class D, 3.22% 20251 | 3,110 | 3,173 |
| Social Professional Loan Program LLC, Series 2015-C, Class A2, 2.51% 20331,2 | 1,146 | 1,146 |
| Toyota Auto Loan Extended Note Trust, Series 2019-1, Class A, 2.56% 20311,2 | 6,000 | 6,096 |
| Verizon Owner Trust, Series 2017-1A, Class A, 2.06% 20211,2 | 4,150 | 4,151 |
| Verizon Owner Trust, Series 2017-1A, Class B, 2.45% 20211,2 | 1,500 | 1,503 |
| Verizon Owner Trust, Series 2017-1A, Class C, 2.65% 20211,2 | 2,000 | 2,004 |
| Verizon Owner Trust, Series 2017-3A, Class A1A, 2.06% 20221,2 | 3,719 | 3,725 |
| Verizon Owner Trust, Series 2017-3A, Class B, 2.38% 20221,2 | 2,450 | 2,460 |
| Voya Ltd., CLO, Series 2014-3A, Class A1R, (3-month USD-LIBOR + 0.72%) 2.66% 20261,2,3 | 2,739 | 2,740 |
| Westlake Automobile Receivables Trust, Series 2017-1A, Class C, 2.70% 20221,2 | 493 | 493 |
| World Financial Network Credit Card Master Note Trust, Series 2019-C, Class A, 2.21% 20261 | 16,000 | 16,026 |
| 238,376 | ||
| Municipals 2.14% Illinois 1.91% | ||
| City of Chicago, Board of Education, Unlimited Tax G.O. Bonds (Dedicated Rev.), Series 2009-E, 6.138% 2039 | 29,010 | 31,576 |
| City of Chicago, Board of Education, Unlimited Tax G.O. Bonds (Dedicated Rev.), Series 2010-D, 6.519% 2040 | 8,590 | 9,808 |
| G.O. Bonds, Pension Funding, Series 2003, 4.95% 2023 | 27,639 | 28,850 |
American Funds Insurance Series — Bond Fund — Page 124 of 184
| Bonds, notes & other debt instruments (continued) Municipals (continued) Illinois (continued) | Principal amount (000) | Value (000) |
| G.O. Bonds, Pension Funding, Series 2003, 5.10% 2033 | $106,125 | $114,494 |
| G.O. Bonds, Series 2013-B, 3.65% 2020 | 1,825 | 1,831 |
| G.O. Bonds, Series 2013-B, 4.11% 2022 | 750 | 762 |
| G.O. Bonds, Series 2013-B, 4.31% 2023 | 2,125 | 2,167 |
| G.O. Bonds, Taxable Build America Bonds, Series 2010-2, 5.65% 2020 | 250 | 251 |
| G.O. Bonds, Taxable Build America Bonds, Series 2010-2, 5.85% 2022 | 2,370 | 2,504 |
| G.O. Bonds, Taxable Build America Bonds, Series 2010-2, 5.95% 2023 | 3,210 | 3,447 |
| G.O. Bonds, Taxable Build America Bonds, Series 2010-3, 5.727% 2020 | 2,400 | 2,419 |
| G.O. Bonds, Taxable Build America Bonds, Series 2010-5, 6.20% 2021 | 3,892 | 4,034 |
| 202,143 | ||
| Florida 0.14% | ||
| Hurricane Catastrophe Fund Fin. Corp., Rev. Bonds, Series 2013-A, 2.995% 2020 | 14,400 | 14,493 |
| California 0.07% | ||
| G.O. Bonds, Series 2009, 7.50% 2034 | 2,100 | 3,165 |
| High-Speed Passenger Train G.O. Rev. Ref. Bonds, Series 2017-A, 2.367% 2022 | 3,775 | 3,829 |
| 6,994 | ||
| New Jersey 0.02% | ||
| Econ. Dev. Auth., School Facs. Construction Rev. Ref. Bonds, Series 2015-YY, 4.447% 2020 | 2,500 | 2,527 |
| Total municipals | 226,157 | |
| Federal agency bonds & notes 0.12% | ||
| Fannie Mae 2.125% 2026 | 11,910 | 12,086 |
| Total bonds, notes & other debt instruments(cost: $9,994,467,000) | 10,314,803 | |
| Common stocks 0.00% Energy 0.00% | Shares | |
| Tribune Resources, Inc.5,13 | 83,079 | 135 |
| Information technology 0.00% | ||
| Corporate Risk Holdings I, Inc.5,13,14 | 70,193 | 8 |
| Communication services 0.00% | ||
| Adelphia Recovery Trust, Series ACC-15,13,14 | 2,409,545 | 1 |
| Total common stocks(cost: $605,000) | 144 | |
| Rights & warrants 0.00% Energy 0.00% | ||
| Tribune Resources, Inc., Class A, warrants, expire 20235,13,14 | 112,665 | 1 |
| Tribune Resources, Inc., Class B, warrants, expire 20235,13,14 | 87,629 | 1 |
| Tribune Resources, Inc., Class C, warrants, expire 20235,13,14 | 17,050 | —10 |
| Ultra Petroleum Corp., warrants, expire 202513 | 8,750 | 1 |
| Total rights & warrants(cost: $18,000) | 3 |
American Funds Insurance Series — Bond Fund — Page 125 of 184
| Short-term securities 5.71% Money market investments 5.71% | Shares | Value (000) |
| Capital Group Central Cash Fund 1.73%15 | 6,024,511 | $602,451 |
| Total short-term securities(cost: $602,341,000) | 602,451 | |
| Total investment securities 103.47%(cost: $10,597,431,000) | 10,917,401 | |
| Other assets less liabilities (3.47)% | (366,241) | |
| Net assets 100.00% | $10,551,160 |
Futures contracts
| Contracts | Type | Number of contracts | Expiration | Notional amount16 (000) | Value at 12/31/201917 (000) | Unrealized (depreciation) appreciation at 12/31/2019 (000) |
| 2 Year U.S. Treasury Note Futures | Long | 9,081 | April 2020 | $1,816,200 | $1,956,956 | $(375) |
| 5 Year Euro-Bobl Futures | Short | 1,633 | March 2020 | €(163,300) | (244,775) | 804 |
| 5 Year U.S. Treasury Note Futures | Long | 11,307 | April 2020 | $1,130,700 | 1,341,116 | (5,279) |
| 10 Year Euro-Bund Futures | Short | 532 | March 2020 | €(53,200) | (101,739) | 972 |
| 10 Year U.S. Treasury Note Futures | Short | 489 | March 2020 | $(48,900) | (62,798) | 663 |
| 10 Year Ultra U.S. Treasury Note Futures | Short | 3,335 | March 2020 | (333,500) | (469,245) | 5,934 |
| 30 Year Euro-Buxl Futures | Long | 272 | March 2020 | €27,200 | 60,526 | (1,684) |
| 30 Year Ultra U.S. Treasury Bond Futures | Long | 924 | March 2020 | $92,400 | 167,850 | (5,114) |
| $(4,079) |
Forward currency contracts
| Contract amount | Counterparty | Settlement date | Unrealized appreciation (depreciation) at 12/31/2019 (000) | |
| Purchases (000) | Sales (000) | |||
| EUR69,777 | USD77,714 | Citibank | 1/6/2020 | $584 |
| EUR3,926 | USD4,371 | Bank of New York Mellon | 1/6/2020 | 35 |
| USD81,563 | EUR73,700 | Morgan Stanley | 1/6/2020 | (1,137) |
| USD38,670 | MXN755,000 | Barclays Bank PLC | 1/7/2020 | (1,224) |
| KRW96,758,000 | USD82,788 | Citibank | 1/9/2020 | 899 |
| KRW96,758,000 | USD82,809 | JPMorgan Chase | 1/9/2020 | 878 |
| USD104 | MXN2,000 | Barclays Bank PLC | 1/13/2020 | (2) |
| USD121,292 | EUR109,250 | HSBC Bank | 1/13/2020 | (1,355) |
| USD99,139 | JPY10,730,000 | Citibank | 1/14/2020 | 306 |
| USD13,351 | JPY1,445,000 | Goldman Sachs | 1/15/2020 | 41 |
| USD51,458 | EUR46,000 | Morgan Stanley | 1/23/2020 | (216) |
| $(1,191) | ||||
American Funds Insurance Series — Bond Fund — Page 126 of 184
Swap contracts
Interest rate swaps
| Receive | Pay | Expiration date | Notional (000) | Value at 12/31/2019 (000) | Upfront payments/ receipts (000) | Unrealized (depreciation) appreciation at 12/31/2019 (000) |
| 1.355% | U.S. EFFR | 10/24/2021 | $95,600 | $(160) | $— | $(160) |
| 1.339% | U.S. EFFR | 10/24/2021 | 173,700 | (341) | — | (341) |
| 3-month USD-LIBOR | 2.18075% | 3/29/2024 | 31,600 | (621) | — | (621) |
| 3-month USD-LIBOR | 2.194% | 3/29/2024 | 31,900 | (644) | — | (644) |
| 3-month USD-LIBOR | 2.21875% | 3/29/2024 | 33,500 | (710) | — | (710) |
| 3-month USD-LIBOR | 2.3105% | 5/3/2024 | 275,590 | (7,009) | — | (7,009) |
| 6-month EURIBOR | 0.9852% | 10/17/2024 | €25,000 | (1,512) | — | (1,512) |
| 3-month USD-LIBOR | 1.556% | 11/27/2024 | $148,600 | 1,222 | — | 1,222 |
| 3-month USD-LIBOR | 1.561% | 11/27/2024 | 148,600 | 1,187 | — | 1,187 |
| 3-month USD-LIBOR | 1.554% | 11/27/2024 | 126,300 | 1,051 | — | 1,051 |
| 3-month USD-LIBOR | 1.5335% | 11/29/2024 | 148,500 | 1,373 | — | 1,373 |
| 6-month JPY-LIBOR | 0.0875% | 3/10/2026 | ¥11,100,000 | (228) | — | (228) |
| 6-month JPY-LIBOR | 0.58295% | 3/23/2046 | 2,000,000 | (760) | — | (760) |
| 0.64355% | 6-month JPY-LIBOR | 4/27/2046 | 2,000,000 | 1,046 | — | 1,046 |
| $— | $(6,106) |
| 1 | Principal payments may be made periodically. Therefore, the effective maturity date may be earlier than the stated maturity date. |
| 2 | Acquired in a transaction exempt from registration under Rule 144A of the Securities Act of 1933. May be resold in the U.S. in transactions exempt from registration, normally to qualified institutional buyers. The total value of all such securities was $1,120,890,000, which represented 10.62% of the net assets of the fund. |
| 3 | Coupon rate may change periodically. Reference rate and spread are as of the most recent information available. Some coupon rates are determined by the issuer or agent based on current market conditions; therefore, the reference rate and spread are not available. |
| 4 | Purchased on a TBA basis. |
| 5 | Valued under fair value procedures adopted by authority of the board of trustees. The total value of all such securities was $3,541,000, which represented .03% of the net assets of the fund. |
| 6 | Step bond; coupon rate may change at a later date. |
| 7 | Loan participations and assignments; may be subject to legal or contractual restrictions on resale. The total value of all such loans was $87,000, which represented less than .01% of the net assets of the fund. |
| 8 | Payment in kind; the issuer has the option of paying additional securities in lieu of cash. Most recent payment was 100% cash unless otherwise noted. |
| 9 | Scheduled interest and/or principal payment was not received. |
| 10 | Amount less than one thousand. |
| 11 | All or a portion of this security was pledged as collateral. The total value of pledged collateral was $40,365,000, which represented .38% of the net assets of the fund. |
| 12 | Index-linked bond whose principal amount moves with a government price index. |
| 13 | Security did not produce income during the last 12 months. |
| 14 | Value determined using significant unobservable inputs. |
| 15 | Rate represents the seven-day yield at 12/31/2019. |
| 16 | Notional amount is calculated based on the number of contracts and notional contract size. |
| 17 | Value is calculated based on the notional amount and current market price. |
| Key to abbreviations and symbols | |
| Auth. = Authority | ICE = Intercontinental Exchange, Inc. |
| CLO = Collateralized Loan Obligations | JPY/¥ = Japanese yen |
| Dev. = Development | KRW = South Korean won |
| Econ. = Economic | LIBOR = London Interbank Offered Rate |
| EFFR = Effective Federal Funds Rate | MXN = Mexican pesos |
| EUR/€ = Euros | Ref. = Refunding |
| EURIBOR = Euro Interbank Offered Rate | Rev. = Revenue |
| Facs. = Facilities | SOFR = Secured Overnight Financing Rate |
| Fin. = Finance | TBA = To-be-announced |
| G.O. = General Obligation | USD/$ = U.S. dollars |
American Funds Insurance Series — Bond Fund — Page 127 of 184
Global Bond Fund
Investment portfolio
December 31, 2019
| Bonds, notes & other debt instruments 93.61% Euros 17.85% | Principal amount (000) | Value (000) |
| Allianz SE 4.75% (3-month EUR-EURIBOR + 3.60% on 10/24/2023)1 | €4,200 | $5,452 |
| Altria Group, Inc. 1.00% 2023 | 1,020 | 1,165 |
| Altria Group, Inc. 1.70% 2025 | 1,600 | 1,866 |
| Altria Group, Inc. 2.20% 2027 | 2,900 | 3,447 |
| Banque Centrale de Tunisie 6.75% 2023 | 1,250 | 1,454 |
| Banque Centrale de Tunisie 6.375% 2026 | 3,800 | 4,240 |
| Barclays Bank PLC 6.00% 2021 | 1,000 | 1,191 |
| Barclays Bank PLC 6.625% 2022 | 1,070 | 1,372 |
| CaixaBank, SA 3.50% 2027 (5-year EUR Mid-Swap + 3.35% on 2/15/2022)1 | 1,500 | 1,779 |
| CaixaBank, SA 2.25% 2030 (EUR Annual (vs. 6-month EURIBOR) 5-year + 1.68% on 4/17/2025)1 | 2,400 | 2,789 |
| Canada 3.50% 2020 | 2,500 | 2,807 |
| China (People’s Republic of) 0.125% 2026 | 1,400 | 1,565 |
| Cote d’Ivoire (Republic of) 5.25% 2030 | 900 | 1,032 |
| Cote d’Ivoire (Republic of) 5.875% 2031 | 840 | 983 |
| Deutsche Telekom International Finance BV 7.50% 2033 | 200 | 395 |
| Egypt (Arab Republic of) 5.625% 2030 | 745 | 864 |
| European Financial Stability Facility 0.40% 2025 | 6,000 | 6,933 |
| French Republic O.A.T. 0% 2029 | 4,725 | 5,240 |
| French Republic O.A.T. 0.50% 2029 | 14,440 | 16,845 |
| French Republic O.A.T. 2.00% 2048 | 1,490 | 2,150 |
| Germany (Federal Republic of) 0.10% 20262 | 4,547 | 5,554 |
| Germany (Federal Republic of) 0% 2029 | 12,440 | 14,209 |
| Germany (Federal Republic of) 0.50% 20302 | 4,056 | 5,400 |
| Germany (Federal Republic of) 1.25% 2048 | 1,150 | 1,620 |
| Greece (Hellenic Republic of) 3.45% 2024 | 11,275 | 14,205 |
| Greece (Hellenic Republic of) 3.375% 2025 | 6,800 | 8,683 |
| Greece (Hellenic Republic of) 3.75% 2028 | 12,204 | 16,210 |
| Greece (Hellenic Republic of) 3.875% 2029 | 24,005 | 32,521 |
| Greece (Hellenic Republic of) 3.90% 2033 | 2,575 | 3,550 |
| Greece (Hellenic Republic of) 4.00% 2037 | 2,520 | 3,545 |
| Greece (Hellenic Republic of) 4.20% 2042 | 2,409 | 3,577 |
| Groupe BPCE SA 4.625% 2023 | 1,200 | 1,550 |
| Groupe BPCE SA 1.00% 2025 | 2,900 | 3,350 |
| Hungary 3.875% 2020 | 1,000 | 1,131 |
| Intesa Sanpaolo SpA 6.625% 2023 | 510 | 684 |
| Israel (State of) 1.50% 2027 | 775 | 944 |
| Israel (State of) 1.50% 2029 | 725 | 890 |
| Italy (Republic of) 1.35% 2022 | 2,665 | 3,076 |
| Italy (Republic of) 0.10% 20232 | 22,007 | 25,004 |
| Italy (Republic of) 1.85% 2024 | 5,200 | 6,178 |
| Italy (Republic of) 2.80% 2028 | 32,938 | 41,841 |
| Italy (Republic of) 3.00% 2029 | 7,440 | 9,620 |
| Italy (Republic of) 3.85% 2049 | 3,130 | 4,549 |
| Lloyds Banking Group PLC 6.50% 2020 | 1,090 | 1,240 |
| Lloyds Banking Group PLC 1.75% 20281 | 2,400 | 2,771 |
| Morocco (Kingdom of) 3.50% 2024 | 1,400 | 1,789 |
American Funds Insurance Series — Global Bond Fund — Page 128 of 184
| Bonds, notes & other debt instruments (continued) Euros (continued) | Principal amount (000) | Value (000) |
| Morocco (Kingdom of) 1.50% 2031 | €4,100 | $4,620 |
| Portuguese Republic 2.875% 2025 | 7,625 | 9,934 |
| Portuguese Republic 1.95% 2029 | 2,110 | 2,700 |
| Rabobank Nederland 2.50% 2026 (5-year EUR Mid-Swap + 1.40% on 5/26/2021)1 | 2,400 | 2,779 |
| Romania 2.875% 2029 | 1,640 | 2,081 |
| Romania 3.50% 2034 | 835 | 1,057 |
| Romania 3.875% 2035 | 2,810 | 3,670 |
| Romania 3.375% 2038 | 4,170 | 5,101 |
| Romania 4.125% 2039 | 1,550 | 2,022 |
| Romania 4.625% 2049 | 12,905 | 17,913 |
| Romania 4.625% 2049 | 80 | 111 |
| Russian Federation 2.875% 2025 | 2,700 | 3,451 |
| Russian Federation 2.875% 2025 | 1,500 | 1,917 |
| Serbia (Republic of) 1.50% 2029 | 9,729 | 11,127 |
| Spain (Kingdom of) 1.45% 2027 | 8,975 | 10,990 |
| Spain (Kingdom of) 1.45% 2029 | 6,910 | 8,475 |
| Spain (Kingdom of) 2.70% 2048 | 850 | 1,268 |
| State Grid Europe Development (2014) PLC 1.50% 2022 | 194 | 224 |
| State Grid Overseas Investment Ltd. 1.25% 2022 | 765 | 880 |
| State Grid Overseas Investment Ltd. 1.375% 2025 | 441 | 517 |
| State Grid Overseas Investment Ltd. 2.125% 2030 | 200 | 249 |
| Stryker Corp 0.25% 2024 | 480 | 538 |
| Stryker Corp. 0.75% 2029 | 980 | 1,102 |
| Stryker Corp. 1.00% 2031 | 450 | 502 |
| Takeda Pharmaceutical Co., Ltd. 2.25% 2026 | 2,275 | 2,853 |
| Ukraine Government 6.75% 2026 | 3,119 | 3,937 |
| Ukraine Government 6.75% 2026 | 1,225 | 1,546 |
| UniCredit SpA 5.75% 20251 | 900 | 1,052 |
| 379,876 | ||
| Japanese yen 13.35% | ||
| Export-Import Bank of India 0.59% 2022 | ¥400,000 | 3,667 |
| Goldman Sachs Group, Inc. 1.00% 20213 | 28,000 | 261 |
| Goldman Sachs Group, Inc. 2.80% 20223 | 100,000 | 970 |
| Indonesia (Republic of) 0.67% 2021 | 200,000 | 1,844 |
| Indonesia (Republic of) 0.54% 2022 | 100,000 | 920 |
| Japan, Series 19, 0.10% 20242 | 2,438,212 | 22,821 |
| Japan, Series 18, 0.10% 20242 | 1,966,375 | 18,378 |
| Japan, Series 20, 0.10% 20252 | 683,400 | 6,406 |
| Japan, Series 21, 0.10% 20262 | 993,223 | 9,342 |
| Japan, Series 344, 0.10% 2026 | 605,000 | 5,650 |
| Japan, Series 346, 0.10% 2027 | 3,125,000 | 29,185 |
| Japan, Series 23, 0.10% 20282 | 2,001,246 | 18,953 |
| Japan, Series 356, 0.10% 2029 | 6,560,000 | 61,085 |
| Japan, Series 24, 0.10% 20292 | 1,614,981 | 15,294 |
| Japan, Series 116, 2.20% 2030 | 1,735,000 | 19,571 |
| Japan, Series 145, 1.70% 2033 | 2,210,000 | 24,705 |
| Japan, Series 21, 2.30% 2035 | 720,000 | 8,842 |
| Japan, Series 161, 0.60% 2037 | 790,000 | 7,744 |
| Japan, Series 42, 1.70% 2044 | 911,900 | 11,047 |
| Japan, Series 57, 0.80% 2047 | 70,000 | 714 |
| Japan, Series 59, 0.70% 2048 | 382,500 | 3,806 |
| KT Corp. 0.30% 2020 | 600,000 | 5,522 |
| KT Corp. 0.31% 2020 | 100,000 | 921 |
American Funds Insurance Series — Global Bond Fund — Page 129 of 184
| Bonds, notes & other debt instruments (continued) Japanese yen (continued) | Principal amount (000) | Value (000) |
| United Mexican States 0.70% 2021 | ¥600,000 | $5,547 |
| United Mexican States 0.62% 2022 | 100,000 | 921 |
| 284,116 | ||
| Chinese yuan renminbi 3.25% | ||
| China (People’s Republic of), Series 1906, 3.29% 2029 | CNY49,600 | 7,199 |
| China (People’s Republic of), Series 1910, 3.86% 2049 | 172,240 | 25,394 |
| China Development Bank Corp., Series 1814, 4.15% 2025 | 20,900 | 3,113 |
| China Development Bank Corp., Series 1805, 4.04% 2028 | 33,000 | 4,853 |
| China Development Bank Corp., Series 1905, 3.48% 2029 | 203,200 | 28,709 |
| 69,268 | ||
| Malaysian ringgits 1.83% | ||
| Malaysia (Federation of), Series 0319, 3.478% 2024 | MYR61,900 | 15,312 |
| Malaysia (Federation of), Series 0217, 4.059% 2024 | 2,000 | 507 |
| Malaysia (Federation of), Series 0114, 4.181% 2024 | 2,000 | 510 |
| Malaysia (Federation of), Series 0310, 4.498% 2030 | 8,420 | 2,236 |
| Malaysia (Federation of), Series 0418, 4.893% 2038 | 61,226 | 17,060 |
| Malaysia (Federation of), Series 0219, 4.467% 2039 | 9,000 | 2,386 |
| Malaysia (Federation of), Series 0518, 4.921% 2048 | 3,000 | 833 |
| 38,844 | ||
| Indian rupees 1.66% | ||
| India (Republic of) 8.83% 2023 | INR469,900 | 7,119 |
| India (Republic of) 6.97% 2026 | 396,450 | 5,616 |
| India (Republic of) 7.59% 2026 | 277,600 | 4,051 |
| India (Republic of) 6.79% 2027 | 525,000 | 7,337 |
| India (Republic of) 8.24% 2027 | 180,600 | 2,725 |
| India (Republic of) 7.17% 2028 | 226,200 | 3,235 |
| India (Republic of) 7.59% 2029 | 95,800 | 1,406 |
| National Highways Authority of India 7.17% 2021 | 220,000 | 3,107 |
| National Highways Authority of India 7.27% 2022 | 50,000 | 700 |
| 35,296 | ||
| Brazilian reais 1.58% | ||
| Brazil (Federative Republic of) 0% 2020 | BRL91,700 | 22,329 |
| Brazil (Federative Republic of) 0% 2020 | 12,100 | 2,976 |
| Brazil (Federative Republic of) 0% 2021 | 13,000 | 3,011 |
| Brazil (Federative Republic of) 10.00% 2025 | 18,600 | 5,317 |
| 33,633 | ||
| South African rand 1.46% | ||
| South Africa (Republic of), Series R-214, 6.50% 2041 | ZAR168,450 | 8,383 |
| South Africa (Republic of), Series R-2044, 8.75% 2044 | 192,925 | 12,121 |
| South Africa (Republic of), Series R-2048, 8.75% 2048 | 167,350 | 10,554 |
| 31,058 | ||
| Danish kroner 1.45% | ||
| Nykredit Realkredit AS, Series 01E, 1.50% 20374 | DKr44,076 | 6,844 |
| Nykredit Realkredit AS, Series 01E, 2.00% 20374 | 14,470 | 2,267 |
| Nykredit Realkredit AS, Series 01E, 1.50% 20404 | 134,552 | 20,876 |
| Nykredit Realkredit AS, Series 01E, 2.50% 20474 | 6,054 | 958 |
| 30,945 |
American Funds Insurance Series — Global Bond Fund — Page 130 of 184
| Bonds, notes & other debt instruments (continued) British pounds 1.37% | Principal amount (000) | Value (000) |
| France Télécom 5.375% 2050 | £300 | $623 |
| Lloyds Banking Group PLC 7.625% 2025 | 655 | 1,108 |
| United Kingdom 2.25% 2023 | 1,550 | 2,179 |
| United Kingdom 2.75% 2024 | 1,210 | 1,761 |
| United Kingdom 4.25% 2027 | 2,800 | 4,730 |
| United Kingdom 3.25% 2044 | 4,440 | 8,182 |
| United Kingdom 3.50% 2045 | 890 | 1,719 |
| United Kingdom 1.50% 2047 | 6,490 | 8,911 |
| 29,213 | ||
| Canadian dollars 1.29% | ||
| Canada 1.00% 2022 | C$1,050 | 795 |
| Canada 2.25% 2025 | 29,450 | 23,346 |
| Canada 2.75% 2048 | 3,500 | 3,298 |
| 27,439 | ||
| Mexican pesos 1.26% | ||
| Petróleos Mexicanos 7.19% 2024 | MXN7,073 | 342 |
| Petróleos Mexicanos 7.47% 2026 | 91,927 | 4,277 |
| United Mexican States, Series M, 7.50% 2027 | 291,520 | 16,028 |
| United Mexican States, Series M20, 8.50% 2029 | 106,000 | 6,244 |
| 26,891 | ||
| Norwegian kroner 1.16% | ||
| Norway (Kingdom of) 3.75% 2021 | NKr111,851 | 13,170 |
| Norway (Kingdom of) 2.00% 2023 | 99,579 | 11,570 |
| 24,740 | ||
| Israeli shekels 1.11% | ||
| Israel (State of) 2.00% 2027 | ILS42,900 | 13,547 |
| Israel (State of) 5.50% 2042 | 20,200 | 10,041 |
| 23,588 | ||
| Polish zloty 0.82% | ||
| Poland (Republic of), Series 1021, 5.75% 2021 | PLN19,180 | 5,441 |
| Poland (Republic of), Series 0922, 5.75% 2022 | 36,700 | 10,733 |
| Poland (Republic of), Series 1029, 2.75% 2029 | 4,900 | 1,363 |
| 17,537 | ||
| Indonesian rupiah 0.51% | ||
| Indonesia (Republic of), Series 64, 6.125% 2028 | IDR9,247,000 | 629 |
| Indonesia (Republic of), Series 78, 8.25% 2029 | 105,022,000 | 8,172 |
| Indonesia (Republic of), Series 68, 8.375% 2034 | 27,353,000 | 2,113 |
| 10,914 | ||
| Russian rubles 0.49% | ||
| Russian Federation 7.00% 2023 | RUB120,000 | 2,012 |
| Russian Federation 6.90% 2029 | 248,750 | 4,226 |
| Russian Federation 8.50% 2031 | 82,440 | 1,571 |
| Russian Federation 7.70% 2033 | 22,840 | 411 |
| Russian Federation 7.25% 2034 | 121,920 | 2,119 |
| 10,339 | ||
| Thai baht 0.43% | ||
| Thailand (Kingdom of) 2.125% 2026 | THB257,750 | 9,046 |
American Funds Insurance Series — Global Bond Fund — Page 131 of 184
| Bonds, notes & other debt instruments (continued) South Korean won 0.37% | Principal amount (000) | Value (000) |
| South Korea (Republic of), Series 2712, 2.375% 2027 | KRW8,658,930 | $7,885 |
| Ukrainian hryvnia 0.36% | ||
| Ukraine Government 16.06% 2022 | UAH86,536 | 3,937 |
| Ukraine Government 17.00% 2022 | 60,180 | 2,756 |
| Ukraine Government 17.25% 2022 | 19,484 | 883 |
| 7,576 | ||
| Colombian pesos 0.26% | ||
| Colombia (Republic of), Series B, 10.00% 2024 | COP7,897,500 | 2,850 |
| Colombia (Republic of), Series B, 6.00% 2028 | 8,825,000 | 2,675 |
| 5,525 | ||
| Australian dollars 0.13% | ||
| Australia (Commonwealth of), Series 133, 5.50% 2023 | A$3,335 | 2,686 |
| Uruguayan pesos 0.10% | ||
| Uruguay (Oriental Republic of) 8.50% 2028 | UYU95,641 | 2,199 |
| Dominican pesos 0.08% | ||
| Dominican Republic 9.75% 2026 | DOP90,700 | 1,759 |
| Argentine pesos 0.06% | ||
| Argentine Republic 2.50% 20212 | ARS151,572 | 1,182 |
| Buenos Aires (City of) (Badlar Private Banks ARS Index + 3.75%) 60.528% 20285 | 13,568 | 146 |
| 1,328 | ||
| U.S. dollars 41.38% | ||
| Abbott Laboratories 3.40% 2023 | $137 | 144 |
| Abbott Laboratories 3.75% 2026 | 793 | 867 |
| AbbVie Inc. 2.50% 2020 | 3,155 | 3,160 |
| AbbVie Inc. 2.90% 2022 | 1,170 | 1,194 |
| AbbVie Inc. 3.20% 2022 | 200 | 205 |
| AbbVie Inc. 3.20% 2026 | 2,007 | 2,078 |
| AbbVie Inc. 4.50% 2035 | 410 | 465 |
| ACE INA Holdings Inc. 2.30% 2020 | 180 | 181 |
| ACE INA Holdings Inc. 2.875% 2022 | 195 | 200 |
| ACE INA Holdings Inc. 3.35% 2026 | 195 | 207 |
| ACE INA Holdings Inc. 4.35% 2045 | 425 | 514 |
| ADT Corp. 3.50% 2022 | 595 | 607 |
| AES Corp. 5.50% 2025 | 250 | 259 |
| Aetna Inc. 2.80% 2023 | 340 | 346 |
| AG Merger Sub II, Inc. 10.75% 20273 | 204 | 205 |
| AK Steel Holding Corp. 7.625% 2021 | 225 | 227 |
| Albertsons Cos. LLC 4.625% 20273 | 450 | 450 |
| Allergan PLC 3.00% 2020 | 2,820 | 2,822 |
| Allergan PLC 4.75% 2045 | 130 | 141 |
| Allison Transmission Holdings, Inc. 5.00% 20243 | 455 | 467 |
| Almonde Inc., Term Loan, (3-month USD-LIBOR + 7.25%) 9.446% 20255,6 | 650 | 637 |
| Altice NV 7.50% 20263 | 275 | 296 |
| Altice SA 7.625% 20253 | 450 | 469 |
American Funds Insurance Series — Global Bond Fund — Page 132 of 184
| Bonds, notes & other debt instruments (continued) U.S. dollars (continued) | Principal amount (000) | Value (000) |
| Altria Group, Inc. 4.50% 2043 | $191 | $195 |
| Altria Group, Inc. 5.95% 2049 | 131 | 159 |
| Amazon.com, Inc. 2.80% 2024 | 2,920 | 3,023 |
| Amazon.com, Inc. 3.15% 2027 | 980 | 1,037 |
| AMC Networks Inc. 5.00% 2024 | 50 | 51 |
| AMC Networks Inc. 4.75% 2025 | 225 | 226 |
| American Campus Communities, Inc. 3.75% 2023 | 1,810 | 1,886 |
| American Campus Communities, Inc. 4.125% 2024 | 1,195 | 1,274 |
| American Energy-Permian Basin, LLC/AEPB Finance Corp. 12.00% 20243 | 355 | 247 |
| Amgen Inc. 1.85% 2021 | 420 | 419 |
| Anheuser-Busch InBev NV 4.15% 2025 | 2,230 | 2,428 |
| Anheuser-Busch InBev NV 4.00% 2028 | 1,050 | 1,155 |
| Anheuser-Busch InBev NV 4.75% 2029 | 1,975 | 2,288 |
| Apple Inc. 2.50% 2022 | 1,200 | 1,218 |
| Apple Inc. 3.35% 2027 | 1,075 | 1,145 |
| Applied Systems, Inc., Term Loan, (3-month USD-LIBOR + 7.00%) 8.945% 20255,6 | 80 | 82 |
| Argentine Republic 6.875% 2021 | 3,575 | 1,941 |
| Argentine Republic 7.50% 2026 | 2,200 | 1,150 |
| Argentine Republic 6.875% 2048 | 1,695 | 817 |
| Ascent Resources Marcellus Holdings, Inc., Term Loan B, (3-month USD-LIBOR + 6.50%) 8.245% 20235,6 | 210 | 199 |
| Associated Materials, LLC 9.00% 20243 | 1,069 | 941 |
| AstraZeneca PLC 3.50% 2023 | 2,700 | 2,825 |
| AT&T Inc. 4.250% 2027 | 3,775 | 4,145 |
| Autoridad del Canal de Panama 4.95% 20353 | 1,000 | 1,168 |
| Avis Budget Group, Inc. 5.50% 2023 | 220 | 225 |
| Avis Budget Group, Inc. 5.25% 20253 | 125 | 129 |
| B&G Foods, Inc. 5.25% 2025 | 225 | 232 |
| Bank of America Corp. 2.625% 2020 | 1,550 | 1,559 |
| Bank of America Corp. 3.55% 2024 (3-month USD-LIBOR + 0.78% on 3/5/2023)1 | 1,400 | 1,454 |
| Bausch Health Cos. Inc. 5.00% 20283 | 115 | 118 |
| Bayer AG 3.375% 20243 | 840 | 866 |
| Bayer US Finance II LLC 3.875% 20233 | 900 | 945 |
| Bayer US Finance II LLC 4.25% 20253 | 203 | 219 |
| Bayerische Motoren Werke AG 2.95% 20223 | 3,675 | 3,745 |
| Becton, Dickinson and Co. 3.70% 2027 | 933 | 994 |
| Boyd Gaming Corp. 4.75% 20273 | 265 | 276 |
| Brandywine Operating Partnership, LP 3.95% 2023 | 190 | 197 |
| Braskem SA 4.50% 20303 | 745 | 742 |
| Bristol-Myers Squibb Co. 2.90% 20243 | 2,756 | 2,845 |
| British American Tobacco International Finance PLC 3.50% 20223 | 385 | 396 |
| British American Tobacco PLC 2.789% 2024 | 1,150 | 1,160 |
| British American Tobacco PLC 3.215% 2026 | 955 | 963 |
| British American Tobacco PLC 3.557% 2027 | 1,545 | 1,577 |
| British American Tobacco PLC 3.462% 2029 | 1,150 | 1,164 |
| British American Tobacco PLC 4.39% 2037 | 2,400 | 2,429 |
| British American Tobacco PLC 4.758% 2049 | 894 | 925 |
| Brookfield Property REIT Inc. 5.75% 20263 | 600 | 634 |
| Cablevision Systems Corp. 6.75% 2021 | 950 | 1,025 |
| Calpine Corp. 5.25% 20263 | 105 | 110 |
| Carrizo Oil & Gas Inc. 6.25% 2023 | 280 | 285 |
| CCO Holdings LLC and CCO Holdings Capital Corp. 5.125% 20233 | 450 | 460 |
| CCO Holdings LLC and CCO Holdings Capital Corp. 5.75% 20263 | 475 | 502 |
| CCO Holdings LLC and CCO Holdings Capital Corp. 3.75% 2028 | 2,650 | 2,748 |
| CCO Holdings LLC and CCO Holdings Capital Corp. 4.75% 20303 | 275 | 281 |
| Centene Corp. 4.75% 2022 | 540 | 552 |
American Funds Insurance Series — Global Bond Fund — Page 133 of 184
| Bonds, notes & other debt instruments (continued) U.S. dollars (continued) | Principal amount (000) | Value (000) |
| Centene Corp. 4.75% 2025 | $350 | $364 |
| Centene Corp. 4.625% 20293 | 505 | 533 |
| CenterPoint Energy Transition Bond Co. III, LLC, Series 2008, Class A2, 5.234% 20234 | 62 | 62 |
| CenturyLink, Inc. 6.75% 2023 | 800 | 895 |
| CenturyLink, Inc. 7.50% 2024 | 250 | 282 |
| CenturyLink, Inc. 5.125% 20263 | 225 | 230 |
| CenturyLink, Inc., Series T, 5.80% 2022 | 325 | 342 |
| Chemours Co. 6.625% 2023 | 780 | 785 |
| Chesapeake Energy Corp. 4.875% 2022 | 915 | 725 |
| Chesapeake Energy Corp. 5.75% 2023 | 460 | 313 |
| Chesapeake Energy Corp. 11.50% 20253 | 136 | 129 |
| Chesapeake Energy Corp., Term Loan, (3-month USD-LIBOR + 8.00%) 9.928% 20245,6 | 205 | 212 |
| Cigna Corp. 3.40% 2021 | 750 | 768 |
| Cigna Corp. 4.125% 2025 | 830 | 901 |
| Citigroup Inc. 2.35% 2021 | 1,500 | 1,509 |
| Cleveland-Cliffs Inc. 4.875% 20243 | 950 | 973 |
| Cleveland-Cliffs Inc. 5.75% 2025 | 672 | 665 |
| Cleveland-Cliffs Inc. 5.875% 20273 | 1,300 | 1,250 |
| CMS Energy Corp. 5.05% 2022 | 392 | 414 |
| CMS Energy Corp. 3.875% 2024 | 100 | 105 |
| CMS Energy Corp. 3.00% 2026 | 1,200 | 1,233 |
| Colombia (Republic of) 3.875% 2027 | 350 | 371 |
| Colombia (Republic of) 4.50% 2029 | 1,165 | 1,295 |
| Colombia (Republic of) 5.20% 2049 | 2,420 | 2,921 |
| Columbia Pipeline Partners LP 3.30% 2020 | 85 | 85 |
| Comcast Corp. 3.95% 2025 | 2,610 | 2,848 |
| CommScope Finance LLC 6.00% 20263 | 250 | 266 |
| Community Health Systems Inc. 5.125% 2021 | 150 | 150 |
| Compass Diversified Holdings 8.00% 20263 | 440 | 478 |
| Comstock Resources, Inc. 9.75% 2026 | 375 | 341 |
| Conagra Brands, Inc. 4.30% 2024 | 2,380 | 2,563 |
| CONSOL Energy Inc. 5.875% 2022 | 1,949 | 1,955 |
| Consolidated Energy Finance SA 6.50% 20263 | 185 | 174 |
| Constellation Oil Services Holding SA 10.00% 20243,7,8,9 | 2,499 | 1,187 |
| Consumers Energy Co. 3.375% 2023 | 345 | 361 |
| Continental Airlines, Inc., Series 2000-2, Class A1, 7.707% 2022 | 7 | 8 |
| Continental Airlines, Inc., Series 2000-1, Class A1, 8.048% 2022 | 23 | 24 |
| Convey Park Energy LLC 7.50% 20253 | 125 | 108 |
| Costa Rica (Republic of) 6.125% 20313 | 640 | 682 |
| Crédit Agricole SA 4.375% 20253 | 1,100 | 1,183 |
| CVR Partners, LP 9.25% 20233 | 200 | 209 |
| CVS Health Corp. 2.80% 2020 | 430 | 431 |
| CVS Health Corp. 3.35% 2021 | 277 | 282 |
| CVS Health Corp. 3.50% 2022 | 430 | 444 |
| CVS Health Corp. 3.70% 2023 | 710 | 740 |
| DaimlerChrysler North America Holding Corp. 2.00% 20213 | 2,100 | 2,096 |
| DaimlerChrysler North America Holding Corp. 2.875% 20213 | 2,275 | 2,295 |
| DaimlerChrysler North America Holding Corp. 3.00% 20213 | 6,425 | 6,489 |
| Danske Bank AS 2.70% 20223 | 1,400 | 1,410 |
| DaVita HealthCare Partners Inc. 5.00% 2025 | 230 | 237 |
| DCP Midstream Operating LP 4.95% 2022 | 365 | 380 |
| Deutsche Telekom International Finance BV 1.95% 20213 | 575 | 575 |
| Deutsche Telekom International Finance BV 2.82% 20223 | 1,675 | 1,700 |
| Deutsche Telekom International Finance BV 4.375% 20283 | 890 | 994 |
| Deutsche Telekom International Finance BV 9.25% 2032 | 930 | 1,478 |
American Funds Insurance Series — Global Bond Fund — Page 134 of 184
| Bonds, notes & other debt instruments (continued) U.S. dollars (continued) | Principal amount (000) | Value (000) |
| Diamond Offshore Drilling, Inc. 4.875% 2043 | $675 | $370 |
| Diebold Nixdorf AG, Term Loan B, (3-month USD-LIBOR + 2.75%) 4.50% 20235,6 | 114 | 111 |
| Diebold, Inc. 8.50% 2024 | 150 | 145 |
| Dominican Republic 7.50% 20213 | 1,333 | 1,387 |
| Dominican Republic 5.50% 20253 | 1,375 | 1,484 |
| Dominican Republic 8.625% 20273 | 225 | 274 |
| Dominican Republic 6.40% 20493 | 1,613 | 1,774 |
| DP World Crescent 4.848% 20283 | 550 | 604 |
| Duke Energy Corp. 3.75% 2024 | 550 | 583 |
| Duke Energy Corp. 2.65% 2026 | 2,695 | 2,707 |
| Duke Energy Progress, LLC 3.70% 2028 | 1,225 | 1,340 |
| Dun & Bradstreet Corp. 6.875% 20263 | 205 | 227 |
| Dun & Bradstreet Corp., Term Loan B, (3-month USD-LIBOR + 5.00%) 6.792% 20265,6 | 225 | 227 |
| Egypt (Arab Republic of) 5.75% 2020 | 1,800 | 1,822 |
| Egypt (Arab Republic of) 7.50% 20273 | 2,200 | 2,458 |
| Electricité de France SA 4.875% 20383 | 795 | 934 |
| Embarq Corp. 7.995% 2036 | 330 | 350 |
| EMD Finance LLC 2.40% 20203 | 1,485 | 1,486 |
| EMD Finance LLC 2.95% 20223 | 225 | 228 |
| EMD Finance LLC 3.25% 20253 | 2,950 | 3,037 |
| Empresas Publicas de Medellin E.S.P. 4.25% 20293 | 1,030 | 1,073 |
| Enbridge Inc. 4.00% 2023 | 600 | 634 |
| Enbridge Inc. 4.25% 2026 | 655 | 721 |
| Enbridge Inc. 3.70% 2027 | 754 | 798 |
| Encompass Health Corp. 4.50% 2028 | 86 | 89 |
| Endo International PLC 5.75% 20223 | 1,155 | 860 |
| Endo International PLC 6.00% 20251,3 | 1,075 | 728 |
| Enel Finance International SA 2.75% 20233 | 5,000 | 5,036 |
| Enel Finance International SA 3.625% 20273 | 2,375 | 2,460 |
| Enel Finance International SA 3.50% 20283 | 1,800 | 1,842 |
| Energy Transfer Partners, LP 4.00% 2027 | 1,490 | 1,541 |
| Energy Transfer Partners, LP 4.20% 2027 | 110 | 115 |
| Energy Transfer Partners, LP 6.00% 2048 | 70 | 82 |
| Energy Transfer Partners, LP 6.25% 2049 | 910 | 1,097 |
| Enersis Américas SA 4.00% 2026 | 650 | 675 |
| Essex Portfolio LP 3.50% 2025 | 2,835 | 2,976 |
| Essex Portfolio LP 3.375% 2026 | 885 | 920 |
| Euramax International, Inc. 12.00% 20203 | 650 | 645 |
| European Investment Bank 2.25% 2022 | 700 | 709 |
| Exelon Corp. 3.40% 2026 | 1,465 | 1,530 |
| Exelon Corp., junior subordinated, 3.497% 20221 | 525 | 539 |
| Extraction Oil & Gas, Inc. 5.625% 20263 | 425 | 256 |
| Exxon Mobil Corp. 2.222% 2021 | 570 | 574 |
| Fannie Mae Pool #MA2754 3.00% 20264 | 225 | 231 |
| Fannie Mae Pool #AB4281 3.00% 20274 | 33 | 34 |
| Fannie Mae Pool #MA3798 3.00% 20344 | 631 | 647 |
| Fannie Mae Pool #MA3657 3.00% 20344 | 61 | 63 |
| Fannie Mae Pool #AP7888 3.50% 20424 | 620 | 655 |
| Fannie Mae Pool #AO4151 3.50% 20424 | 295 | 311 |
| Fannie Mae Pool #AQ0770 3.50% 20424 | 209 | 223 |
| Fannie Mae Pool #MA3467 4.00% 20484 | 6,404 | 6,672 |
| Fannie Mae Pool #FM1437 4.00% 20484 | 3,737 | 3,896 |
| Fannie Mae Pool #MA3495 4.00% 20484 | 2,272 | 2,367 |
| Fannie Mae Pool #MA3521 4.00% 20484 | 1,014 | 1,055 |
| Fannie Mae Pool #MA3443 4.00% 20484 | 109 | 113 |
American Funds Insurance Series — Global Bond Fund — Page 135 of 184
| Bonds, notes & other debt instruments (continued) U.S. dollars (continued) | Principal amount (000) | Value (000) |
| Fannie Mae Pool #MA3692 3.50% 20494 | $21,336 | $21,926 |
| Fannie Mae Pool #MA3775 3.50% 20494 | 967 | 994 |
| Fannie Mae Pool #BN6683 3.50% 20494 | 821 | 844 |
| Fannie Mae Pool #MA3637 3.50% 20494 | 32 | 33 |
| Fannie Mae Pool #MA3776 4.00% 20494 | 9,182 | 9,583 |
| Fannie Mae Pool #MA3693 4.00% 20494 | 6,658 | 6,924 |
| Fannie Mae Pool #BO2188 4.00% 20494 | 1,750 | 1,825 |
| Fannie Mae Pool #FM1238 4.00% 20494 | 1,262 | 1,313 |
| Fannie Mae Pool #MA3804 4.00% 20494 | 1,225 | 1,280 |
| Fannie Mae, Series 2012-M17, Class A2, Multi Family, 2.184% 20224 | 1,495 | 1,501 |
| First Quantum Minerals Ltd. 7.25% 20233 | 875 | 908 |
| First Quantum Minerals Ltd. 7.50% 20253 | 1,875 | 1,921 |
| First Quantum Minerals Ltd. 6.875% 20263 | 325 | 330 |
| FirstEnergy Corp. 3.90% 2027 | 3,915 | 4,187 |
| FirstEnergy Corp. 3.50% 20283 | 645 | 672 |
| FirstEnergy Corp. 4.85% 2047 | 380 | 451 |
| France Télécom 9.00% 20311 | 2,434 | 3,767 |
| Freddie Mac 3.50% 20484 | 651 | 671 |
| Freddie Mac Pool #ZS8588 3.00% 20304 | 125 | 128 |
| Freddie Mac Pool #SB8002 3.00% 20344 | 753 | 772 |
| Freddie Mac Pool #QN0549 3.00% 20344 | 677 | 694 |
| Freddie Mac Pool #ZT2091 3.00% 20344 | 295 | 303 |
| Freddie Mac Pool #SB8027 3.00% 20354 | 443 | 455 |
| Freddie Mac Pool #ZT1545 4.00% 20484 | 21,875 | 22,779 |
| Freddie Mac Pool #SI2002 4.00% 20484 | 5,587 | 5,860 |
| Freddie Mac Pool #SD8005 3.50% 20494 | 4,435 | 4,557 |
| Freddie Mac Pool #SD8001 3.50% 20494 | 938 | 965 |
| Freddie Mac Pool #RA1173 3.50% 20494 | 892 | 918 |
| Freddie Mac Pool #ZT1709 3.50% 20494 | 596 | 613 |
| Freddie Mac Pool #ZT1951 3.50% 20494 | 72 | 74 |
| Freddie Mac Pool #ZT2086 3.50% 20494 | 54 | 56 |
| Freddie Mac Pool #ZA7047 3.50% 20494 | 36 | 37 |
| Freddie Mac Pool #2B7343 3.767% 20494,5 | 4,968 | 5,115 |
| Freddie Mac Pool #ZA6548 4.00% 20494 | 2,348 | 2,442 |
| Freddie Mac Pool #ZN4802 4.00% 20494 | 1,166 | 1,215 |
| Freddie Mac Pool #SD8003 4.00% 20494 | 75 | 78 |
| Freddie Mac, Series 3213, Class OG, principal only, 0% 20364 | 9 | 8 |
| Freddie Mac, Series 3292, Class BO, principal only, 0% 20374 | 41 | 37 |
| Freeport-McMoRan Inc. 3.55% 2022 | 1,287 | 1,305 |
| Frontier Communications Corp. 11.00% 2025 | 3,390 | 1,653 |
| Frontier Communications Corp. 8.00% 20273 | 225 | 236 |
| FS Energy and Power Fund 7.50% 20233 | 325 | 334 |
| FXI Holdings, Inc. 7.875% 20243 | 125 | 120 |
| FXI Holdings, Inc. 12.25% 20263 | 370 | 386 |
| General Mills, Inc. 3.20% 2021 | 455 | 463 |
| Genesis Energy, LP 6.75% 2022 | 698 | 706 |
| Genesis Energy, LP 6.50% 2025 | 150 | 146 |
| Genesys Telecommunications Laboratories, Inc. 10.00% 20243 | 100 | 108 |
| Gogo Inc. 9.875% 20243 | 2,090 | 2,212 |
| Goldman Sachs Group, Inc. 2.905% 2023 (3-month USD-LIBOR + 0.99% on 7/24/2022)1 | 1,200 | 1,222 |
| Goldman Sachs Group, Inc. 3.20% 2023 | 2,152 | 2,213 |
| Goldman Sachs Group, Inc. 3.50% 2025 | 5,190 | 5,445 |
| Goldman Sachs Group, Inc. 4.75% 2045 | 1,805 | 2,200 |
| Government National Mortgage Assn. 4.50% 20494 | 75 | 78 |
| Government National Mortgage Assn. 4.50% 20504,10 | 361 | 377 |
American Funds Insurance Series — Global Bond Fund — Page 136 of 184
| Bonds, notes & other debt instruments (continued) U.S. dollars (continued) | Principal amount (000) | Value (000) |
| Government National Mortgage Assn. Pool #MA5987 4.50% 20494 | $9,195 | $9,643 |
| Government National Mortgage Assn. Pool #MA6041 4.50% 20494 | 5,246 | 5,513 |
| Government National Mortgage Assn. Pool #MA5877 4.50% 20494 | 564 | 589 |
| Groupe BPCE SA 5.70% 20233 | 1,800 | 1,993 |
| H.I.G. Capital, LLC 6.75% 20243 | 143 | 133 |
| Halliburton Co. 3.80% 2025 | 870 | 929 |
| Hanesbrands Inc. 4.625% 20243 | 85 | 90 |
| Hanesbrands Inc. 4.875% 20263 | 350 | 371 |
| Hardwoods Acquisition Inc. 7.50% 20213 | 228 | 116 |
| HCA Inc. 5.875% 2023 | 250 | 277 |
| HealthSouth Corp. 5.75% 2025 | 745 | 783 |
| Hertz Global Holdings Inc. 7.625% 20223 | 321 | 335 |
| Hess Midstream Partners LP 5.125% 20283 | 140 | 142 |
| Hexion Inc. 7.875% 20273 | 80 | 83 |
| Holcim Ltd. 5.15% 20233 | 1,290 | 1,386 |
| Honduras (Republic of) 8.75% 2020 | 1,555 | 1,641 |
| HSBC Holdings PLC 3.033% 2023 (3-month USD-LIBOR + 0.923% on 11/12/2022)1 | 430 | 440 |
| HSBC Holdings PLC 2.633% 2025 (3-month USD-LIBOR + 1.14% on 11/7/2024)1 | 305 | 306 |
| HSBC Holdings PLC 4.292% 2026 (3-month USD-LIBOR + 1.348% on 9/12/2025)1 | 4,172 | 4,510 |
| Humana Inc. 3.85% 2024 | 1,000 | 1,063 |
| Hyundai Capital America 2.55% 20203 | 2,580 | 2,581 |
| Hyundai Capital America 3.25% 20223 | 250 | 255 |
| Hyundai Capital Services Inc. 2.625% 20203 | 500 | 501 |
| Hyundai Capital Services Inc. 3.75% 20233 | 2,450 | 2,528 |
| Icahn Enterprises Finance Corp. 6.25% 2022 | 575 | 587 |
| Icahn Enterprises Finance Corp. 4.75% 20243 | 225 | 231 |
| Icahn Enterprises Finance Corp. 5.25% 20273 | 225 | 231 |
| iHeartCommunications, Inc. 5.25% 20273 | 275 | 288 |
| Imperial Tobacco Finance PLC 3.50% 20233 | 2,000 | 2,047 |
| Indonesia (Republic of) 3.75% 2022 | 1,110 | 1,148 |
| Indonesia (Republic of) 4.75% 2026 | 3,500 | 3,894 |
| Inmarsat PLC 4.875% 20223 | 350 | 355 |
| Intelsat Jackson Holding Co. 8.50% 20243 | 1,625 | 1,483 |
| International Paper Co. 7.30% 2039 | 600 | 831 |
| Intesa Sanpaolo SpA 5.017% 20243 | 3,270 | 3,436 |
| Iraq (Republic of) 6.752% 20233 | 545 | 559 |
| Jaguar Holding Co. 6.375% 20233 | 375 | 388 |
| Jonah Energy LLC 7.25% 20253 | 200 | 60 |
| Jordan (Hashemite Kingdom of) 5.75% 20273 | 1,035 | 1,095 |
| JPMorgan Chase & Co. 2.55% 2021 | 6,039 | 6,086 |
| JPMorgan Chase & Co. 2.604% 2021 (3-month USD-LIBOR + 0.28% on 2/1/2020)1 | 1,700 | 1,701 |
| JPMorgan Chase & Co. 3.25% 2022 | 1,000 | 1,034 |
| Keurig Dr Pepper Inc. 4.597% 2028 | 2,740 | 3,078 |
| Keurig Dr Pepper Inc. 5.085% 2048 | 1,075 | 1,297 |
| Korea Housing Finance Corp. 2.50% 20203,4 | 2,250 | 2,263 |
| Korea Housing Finance Corp. 2.00% 20213,4 | 2,525 | 2,519 |
| Kraft Heinz Co. 4.375% 2046 | 825 | 812 |
| Kronos Inc., Term Loan B, (3-month USD-LIBOR + 8.25%) 10.159% 20245,6 | 650 | 668 |
| Kuwait (State of) 2.75% 20223 | 3,550 | 3,610 |
| Liberty Global PLC 5.50% 20283 | 250 | 254 |
| Ligado Networks, Term Loan, (3-month USD-LIBOR + 8.75%) 10.85% 2020 (100% PIK)5,6,9 | 574 | 367 |
| Lima Metro Line 2 Finance Ltd. 5.875% 20343 | 2,000 | 2,321 |
| Lima Metro Line 2 Finance Ltd. 5.875% 2034 | 754 | 874 |
| Lima Metro Line 2 Finance Ltd. 4.35% 20363 | 630 | 669 |
| Lockheed Martin Corp. 2.50% 2020 | 205 | 206 |
American Funds Insurance Series — Global Bond Fund — Page 137 of 184
| Bonds, notes & other debt instruments (continued) U.S. dollars (continued) | Principal amount (000) | Value (000) |
| LPL Financial Holdings Inc. 4.625% 20273 | $195 | $199 |
| LSB Industries, Inc. 9.625% 20233 | 520 | 536 |
| LSC Communications, Inc. 8.75% 20233 | 380 | 206 |
| Mallinckrodt PLC 4.875% 20203 | 2,110 | 1,631 |
| Mallinckrodt PLC 5.75% 20223 | 195 | 80 |
| Mattel, Inc. 6.75% 20253 | 350 | 377 |
| McAfee, LLC, Term Loan, (3-month USD-LIBOR + 3.75%) 5.555% 20245,6 | 388 | 390 |
| McDermott International, Inc. 10.625% 20243,11 | 395 | 35 |
| McDonald’s Corp. 3.35% 2023 | 1,420 | 1,479 |
| MDC Partners Inc. 6.50% 20243 | 320 | 290 |
| Medtronic, Inc. 3.50% 2025 | 1,558 | 1,670 |
| Mexico City Airport Trust 5.50% 2047 | 432 | 447 |
| MGM Resorts International 7.75% 2022 | 200 | 223 |
| Microsoft Corp. 2.40% 2026 | 2,688 | 2,723 |
| Molina Healthcare, Inc. 5.375% 2022 | 1,375 | 1,464 |
| Molina Healthcare, Inc. 4.875% 20253 | 482 | 497 |
| Morgan Stanley 4.431% 2030 (3-month USD-LIBOR + 1.628% on 1/23/2029)1 | 1,534 | 1,734 |
| Morocco (Kingdom of) 5.50% 2042 | 3,100 | 3,809 |
| Murphy Oil Corp. 5.875% 2027 | 56 | 59 |
| Navient Corp. 5.50% 2023 | 2,170 | 2,322 |
| Navient Corp. 6.125% 2024 | 175 | 190 |
| NGL Energy Partners LP 7.50% 2023 | 155 | 156 |
| NGL Energy Partners LP 6.125% 2025 | 670 | 633 |
| Niagara Mohawk Power Corp. 3.508% 20243 | 180 | 189 |
| Nielsen Finance LLC and Nielsen Finance Co. 5.00% 20253 | 225 | 232 |
| Noble Corp. PLC 7.95% 20251 | 150 | 78 |
| Noble Corp. PLC 8.95% 20451 | 325 | 141 |
| Noble Energy, Inc. 4.95% 2047 | 1,050 | 1,162 |
| Nova Chemicals Corp. 5.25% 20273 | 300 | 309 |
| Oasis Petroleum Inc. 6.875% 2022 | 455 | 439 |
| Occidental Petroleum Corp. 4.40% 2049 | 1,100 | 1,134 |
| Odebrecht Drilling Norbe 7.63% 2026 (86.90% PIK)3,9 | 13 | 3 |
| Oracle Corp. 2.65% 2026 | 2,327 | 2,380 |
| Oracle Corp. 3.25% 2027 | 1,880 | 1,993 |
| Owens & Minor, Inc. 3.875% 2021 | 800 | 772 |
| Owens & Minor, Inc. 4.375% 2024 | 100 | 76 |
| Owens & Minor, Inc., Term Loan B, (3-month USD-LIBOR + 4.50%) 6.191% 20255,6 | 356 | 319 |
| Owl Rock Capital Corp. 4.625% 20243 | 225 | 228 |
| Pacific Gas and Electric Co. 2.95% 202611 | 590 | 593 |
| Pacific Gas and Electric Co. 3.30% 202711 | 659 | 661 |
| Pacific Gas and Electric Co. 4.65% 20283,11 | 542 | 561 |
| Pacific Gas and Electric Co. 6.35% 203811 | 1,566 | 1,662 |
| Pacific Gas and Electric Co. 3.95% 204711 | 1,250 | 1,244 |
| Pakistan (Islamic Republic of) 5.50% 20213 | 3,535 | 3,621 |
| Pakistan (Islamic Republic of) 8.25% 2024 | 2,240 | 2,502 |
| Panama (Republic of) 3.75% 20263 | 1,440 | 1,519 |
| Panama (Republic of) 3.16% 2030 | 3,730 | 3,848 |
| Panama (Republic of) 4.50% 2050 | 1,230 | 1,460 |
| Par Pharmaceutical Cos. Inc. 7.50% 20273 | 570 | 569 |
| Paraguay (Republic of) 4.625% 2023 | 947 | 1,003 |
| Paraguay (Republic of) 5.00% 2026 | 235 | 260 |
| Paraguay (Republic of) 4.70% 20273 | 350 | 386 |
| Paraguay (Republic of) 5.60% 20483 | 2,340 | 2,746 |
| Peabody Energy Corp. 6.00% 20223 | 225 | 220 |
| Pernod Ricard SA 4.45% 20223 | 730 | 764 |
American Funds Insurance Series — Global Bond Fund — Page 138 of 184
| Bonds, notes & other debt instruments (continued) U.S. dollars (continued) | Principal amount (000) | Value (000) |
| Peru (Republic of) 5.625% 2050 | $280 | $410 |
| Petróleos Mexicanos 6.35% 2048 | 927 | 898 |
| PetSmart, Inc. 5.875% 20253 | 1,165 | 1,190 |
| PetSmart, Inc. 8.875% 20253 | 1,515 | 1,500 |
| PetSmart, Inc., Term Loan, (3-month USD-LIBOR + 3.00%) 4.74% 20225,6 | 714 | 699 |
| Pisces Parent LLC 8.00% 20263 | 505 | 528 |
| PNC Bank 2.30% 2020 | 865 | 866 |
| PNC Bank 2.60% 2020 | 275 | 276 |
| Poland (Republic of) 4.00% 2024 | 980 | 1,056 |
| Poland (Republic of) 3.25% 2026 | 4,590 | 4,876 |
| Progress Energy, Inc. 7.75% 2031 | 150 | 211 |
| Prologis, Inc. 4.25% 2023 | 2,075 | 2,222 |
| PT Indonesia Asahan Aluminium Tbk 5.23% 20213 | 555 | 583 |
| Puget Energy, Inc. 6.50% 2020 | 335 | 348 |
| Puget Energy, Inc. 6.00% 2021 | 1,023 | 1,086 |
| Puget Energy, Inc. 5.625% 2022 | 480 | 515 |
| Qatar (State of) 3.875% 20233 | 475 | 502 |
| Qatar (State of) 4.50% 20283 | 3,205 | 3,678 |
| Qatar (State of) 5.103% 20483 | 530 | 682 |
| R.R. Donnelley & Sons Co. 6.50% 2023 | 225 | 231 |
| Rabobank Nederland 4.625% 2023 | 2,180 | 2,366 |
| Rayonier Advanced Materials Inc. 5.50% 20243 | 550 | 415 |
| Realogy Corp. 5.25% 20213 | 175 | 177 |
| Realogy Corp. 4.875% 20233 | 605 | 596 |
| Realogy Corp. 9.375% 20273 | 275 | 288 |
| Reynolds American Inc. 3.25% 2020 | 640 | 643 |
| Reynolds American Inc. 4.00% 2022 | 455 | 474 |
| Reynolds American Inc. 4.45% 2025 | 2,115 | 2,277 |
| Ryerson Inc. 11.00% 20223 | 560 | 592 |
| Sally Holdings LLC and Sally Capital Inc. 5.625% 2025 | 725 | 761 |
| Santander Holdings USA, Inc. 3.244% 20263 | 3,750 | 3,793 |
| Saudi Arabia (Kingdom of) 2.894% 20223 | 1,900 | 1,933 |
| Saudi Arabia (Kingdom of) 3.628% 20273 | 1,900 | 2,018 |
| Saudi Arabia (Kingdom of) 3.625% 20283 | 3,840 | 4,062 |
| Scentre Group 3.50% 20253 | 210 | 218 |
| Scentre Group 3.75% 20273 | 110 | 115 |
| Schlumberger BV 4.00% 20253 | 935 | 1,007 |
| Scientific Games Corp. 8.25% 20263 | 420 | 464 |
| Scientific Games Corp. 7.00% 20283 | 60 | 64 |
| Scientific Games Corp. 7.25% 20293 | 80 | 87 |
| Shell International Finance BV 1.75% 2021 | 1,740 | 1,739 |
| Shell International Finance BV 3.50% 2023 | 3,808 | 4,010 |
| Shire PLC 2.40% 2021 | 3,930 | 3,952 |
| Shire PLC 2.875% 2023 | 818 | 833 |
| Shire PLC 3.20% 2026 | 405 | 417 |
| Sirius XM Radio Inc. 3.875% 20223 | 550 | 563 |
| Sirius XM Radio Inc. 4.625% 20243 | 360 | 379 |
| Skandinaviska Enskilda Banken AB 2.625% 2021 | 2,250 | 2,264 |
| Skandinaviska Enskilda Banken AB 2.80% 2022 | 2,100 | 2,132 |
| South Africa (Republic of) 5.50% 2020 | 1,900 | 1,913 |
| Springleaf Finance Corp. 6.125% 2024 | 650 | 713 |
| Sprint Corp. 7.625% 2026 | 300 | 331 |
| Sprint Corp. 6.875% 2028 | 975 | 1,052 |
| Sri Lanka (Democratic Socialist Republic of) 6.25% 2020 | 1,900 | 1,930 |
| Sri Lanka (Democratic Socialist Republic of) 6.25% 2021 | 1,700 | 1,731 |
American Funds Insurance Series — Global Bond Fund — Page 139 of 184
| Bonds, notes & other debt instruments (continued) U.S. dollars (continued) | Principal amount (000) | Value (000) |
| Sri Lanka (Democratic Socialist Republic of) 5.75% 2022 | $1,600 | $1,608 |
| Staples, Inc. 7.50% 20263 | 1,550 | 1,611 |
| Starwood Property Trust, Inc. 5.00% 2021 | 350 | 364 |
| State Grid Overseas Investment Ltd. 3.50% 20273 | 5,600 | 5,865 |
| Statoil ASA 3.70% 2024 | 1,950 | 2,078 |
| Statoil ASA 4.25% 2041 | 1,000 | 1,157 |
| Swiss Re Finance (Luxembourg) SA 5.00% 2049 (UST Yield Curve Rate T Note Constant Maturity 5-year + 3.582% on 4/2/2029)1,3 | 800 | 894 |
| Takeda Pharmaceutical Co., Ltd. 4.40% 2023 | 2,075 | 2,228 |
| Talen Energy Corp. 10.50% 20263 | 105 | 100 |
| Talen Energy Corp. 7.25% 20273 | 210 | 221 |
| Targa Resources Partners LP 5.875% 2026 | 175 | 186 |
| Targa Resources Partners LP 5.50% 20303 | 380 | 391 |
| Team Health Holdings, Inc. 6.375% 20253 | 1,185 | 794 |
| Team Health Holdings, Inc., Term Loan B, 4.549% 20245,6 | 20 | 16 |
| Teco Finance, Inc. 5.15% 2020 | 75 | 75 |
| Teekay Corp. 9.25% 20223 | 520 | 549 |
| Teekay Offshore Partners LP 8.50% 20233 | 550 | 546 |
| Tenet Healthcare Corp. 4.625% 2024 | 396 | 406 |
| Tenet Healthcare Corp. 4.875% 20263 | 1,850 | 1,940 |
| Teva Pharmaceutical Finance Co. BV 2.20% 2021 | 99 | 96 |
| Teva Pharmaceutical Finance Co. BV 2.80% 2023 | 2,026 | 1,883 |
| Teva Pharmaceutical Finance Co. BV 6.00% 2024 | 1,430 | 1,450 |
| Teva Pharmaceutical Finance Co. BV 7.125% 20253 | 210 | 216 |
| Teva Pharmaceutical Finance Co. BV 3.15% 2026 | 2,420 | 2,021 |
| TPC Group Inc. 10.50% 20243 | 45 | 45 |
| Transocean Inc. 9.00% 20233 | 269 | 285 |
| Trilogy International Partners, LLC 8.875% 20223 | 1,375 | 1,296 |
| Tronox Ltd. 6.50% 20263 | 575 | 594 |
| Turkey (Republic of) 6.25% 2022 | 1,880 | 1,968 |
| Turkey (Republic of) 5.75% 2024 | 2,500 | 2,562 |
| U.S. Treasury 2.50% 2020 | 7,900 | 7,928 |
| U.S. Treasury 1.50% 2021 | 5,500 | 5,492 |
| U.S. Treasury 2.625% 2023 | 6,900 | 7,111 |
| U.S. Treasury 2.75% 2023 | 2,270 | 2,351 |
| U.S. Treasury 1.50% 202412 | 38,920 | 38,608 |
| U.S. Treasury 1.875% 202412 | 4,515 | 4,555 |
| U.S. Treasury 2.75% 2025 | 10,140 | 10,683 |
| U.S. Treasury 2.875% 2025 | 5,400 | 5,738 |
| U.S. Treasury 2.25% 202712 | 9,000 | 9,258 |
| U.S. Treasury 2.75% 202812 | 7,600 | 8,095 |
| U.S. Treasury 2.875% 202812 | 19,850 | 21,358 |
| U.S. Treasury 1.625% 2029 | 12,500 | 12,176 |
| U.S. Treasury 2.75% 204712 | 1,625 | 1,744 |
| U.S. Treasury 3.00% 204812 | 8,325 | 9,378 |
| U.S. Treasury 3.00% 204912 | 3,340 | 3,768 |
| U.S. Treasury Inflation-Protected Security 0.375% 20252,12 | 5,968 | 6,095 |
| U.S. Treasury Inflation-Protected Security 0.25% 20292,12 | 13,782 | 13,935 |
| U.S. Treasury Inflation-Protected Security 0.875% 20292,12 | 78,843 | 83,772 |
| U.S. Treasury Inflation-Protected Security 0.75% 20422,12 | 712 | 741 |
| U.S. Treasury Inflation-Protected Security 0.625% 20432 | 1,343 | 1,362 |
| U.S. Treasury Inflation-Protected Security 1.375% 20442,12 | 5,852 | 6,915 |
| U.S. Treasury Inflation-Protected Security 1.00% 20492,12 | 29,605 | 32,951 |
| Ultra Petroleum Corp. 11.00% 2024 (18.18% PIK)9 | 520 | 86 |
| UniCredit SpA 3.75% 20223 | 1,750 | 1,793 |
American Funds Insurance Series — Global Bond Fund — Page 140 of 184
| Bonds, notes & other debt instruments (continued) U.S. dollars (continued) | Principal amount (000) | Value (000) |
| UniCredit SpA 4.625% 20273 | $2,890 | $3,062 |
| Uniform Mortgage-Backed Security 3.00% 20354,10 | 5,457 | 5,588 |
| Unisys Corp. 10.75% 20223 | 325 | 350 |
| United Technologies Corp. 4.125% 2028 | 1,900 | 2,140 |
| UnitedHealth Group Inc. 2.70% 2020 | 520 | 522 |
| Univision Communications Inc. 5.125% 20233 | 775 | 775 |
| Valaris PLC 7.75% 2026 | 525 | 298 |
| Valaris PLC 5.75% 2044 | 430 | 195 |
| Valeant Pharmaceuticals International, Inc. 6.125% 20253 | 1,350 | 1,398 |
| Valeant Pharmaceuticals International, Inc. 9.25% 20263 | 1,095 | 1,260 |
| Venator Materials Corp. 5.75% 20253 | 625 | 578 |
| Veritas Holdings Ltd. 7.50% 20233 | 600 | 600 |
| Veritas Holdings Ltd. 10.50% 20243 | 200 | 186 |
| Vine Oil & Gas LP 8.75% 20233 | 175 | 86 |
| Volkswagen Group of America Finance, LLC 3.875% 20203 | 1,900 | 1,931 |
| Volkswagen Group of America Finance, LLC 4.00% 20213 | 1,900 | 1,965 |
| Volkswagen Group of America Finance, LLC 4.25% 20233 | 1,700 | 1,811 |
| Volkswagen Group of America Finance, LLC 4.625% 20253 | 1,280 | 1,417 |
| Wal-Mart Stores, Inc. 2.85% 2024 | 1,655 | 1,717 |
| Warrior Met Coal, Inc. 8.00% 20243 | 329 | 334 |
| WEA Finance LLC 3.25% 20203 | 530 | 534 |
| WEA Finance LLC 3.75% 20243 | 535 | 563 |
| Weatherford International PLC 11.00% 20243 | 1,222 | 1,324 |
| Wesco Aircraft Holdings, Inc. 9.00% 20263 | 355 | 373 |
| Westfield Corp. Ltd. 3.15% 20223 | 245 | 250 |
| Williams Partners LP 4.125% 2020 | 375 | 380 |
| Williams Partners LP 4.30% 2024 | 820 | 875 |
| WM. Wrigley Jr. Co. 3.375% 20203 | 515 | 520 |
| Wynn Las Vegas, LLC and Wynn Capital Corp. 4.25% 20233 | 868 | 911 |
| Xerox Corp. 4.125% 2023 | 97 | 101 |
| Ziggo Bond Finance BV 5.50% 20273 | 625 | 665 |
| Zimmer Holdings, Inc. 3.15% 2022 | 790 | 807 |
| 880,866 | ||
| Total bonds, notes & other debt instruments(cost: $1,932,196,000) | 1,992,567 | |
| Convertible bonds 0.00% U.S. dollars 0.00% | ||
| Gogo Inc., convertible notes, 6.00% 2022 | 8 | 10 |
| Total convertible bonds(cost: $8,000) | 10 | |
| Convertible stocks 0.04% U.S. dollars 0.04% | Shares | |
| Associated Materials, LLC, convertible preferred, 14.00% 20207,8 | 850 | 847 |
| Total convertible stocks(cost: $816,000) | 847 |
American Funds Insurance Series — Global Bond Fund — Page 141 of 184
| Common stocks 0.05% U.S. dollars 0.05% | Shares | Value (000) |
| Weatherford International13 | 29,932 | $837 |
| Tribune Resources, Inc.7,13 | 158,988 | 258 |
| Advanz Pharma Corp.13,14 | 9,130 | 27 |
| Advanz Pharma Corp.13 | 6,028 | 17 |
| Corporate Risk Holdings I, Inc.7,8,13 | 25,840 | 3 |
| Total common stocks(cost: $2,504,000) | 1,142 | |
| Rights & warrants 0.01% U.S. dollars 0.01% | ||
| Sable Permian Resources, LLC, warrants, expire 20243,7,8,13 | 1,785 | 129 |
| Tribune Resources, Inc., Class A, warrants, expire 20237,8,13 | 53,128 | 1 |
| Tribune Resources, Inc., Class B, warrants, expire 20237,8,13 | 41,322 | —15 |
| Tribune Resources, Inc., Class C, warrants, expire 20237,8,13 | 39,060 | —15 |
| Associated Materials, LLC, warrants, expire 20237,8,13 | 12,075 | —15 |
| Total rights & warrants(cost: $427,000) | 130 | |
| Short-term securities 5.83% Money market investments 3.65% | ||
| Capital Group Central Cash Fund 1.73%16 | 777,446 | 77,745 |
| Other short-term securities 2.18% | Principal amount (000) | |
| Argentinian Treasury Bills (13.53%)–0.23% due 7/29/2020–7/31/2020 | ARS76,794 | 944 |
| Canadian Treasury Bills 1.67%–1.68% due 9/17/2020–10/15/2020 | C$24,270 | 18,446 |
| Egyptian Treasury Bill 14.11% due 4/7/2020 | EGP31,700 | 1,906 |
| Greek Treasury Bill (0.03%) due 6/5/2020 | €7,275 | 8,167 |
| Nigerian Treasury Bills 12.34%–12.92% due 1/9/2020–3/5/2020 | NGN3,125,000 | 8,516 |
| United Kingdom Treasury Bill 0.70% due 4/14/2020 | £6,410 | 8,473 |
| 46,452 | ||
| Total short-term securities(cost: $125,174,000) | 124,197 | |
| Total investment securities 99.54%(cost: $2,061,125,000) | 2,118,893 | |
| Other assets less liabilities 0.46% | 9,751 | |
| Net assets 100.00% | $2,128,644 |
Futures contracts
| Contracts | Type | Number of contracts | Expiration | Notional amount17 (000) | Value at 12/31/201918 (000) | Unrealized (depreciation) appreciation at 12/31/2019 (000) |
| 2 Year U.S. Treasury Note Futures | Long | 410 | April 2020 | $82,000 | $88,355 | $(46) |
| 5 Year U.S. Treasury Note Futures | Long | 922 | April 2020 | 92,200 | 109,358 | (407) |
| 10 Year Euro-Bund Futures | Short | 92 | March 2020 | €(9,200) | (17,594) | 76 |
| 10 Year U.S. Treasury Note Futures | Long | 165 | March 2020 | $16,500 | 21,189 | (197) |
| 20 Year U.S. Treasury Bond Futures | Long | 37 | March 2020 | 3,700 | 5,768 | (129) |
American Funds Insurance Series — Global Bond Fund — Page 142 of 184
Futures contracts (continued)
| Contracts | Type | Number of contracts | Expiration | Notional amount17 (000) | Value at 12/31/201918 (000) | Unrealized (depreciation) appreciation at 12/31/2019 (000) |
| 30 Year Euro-Buxl Futures | Long | 42 | March 2020 | €4,200 | $9,346 | $(260) |
| 30 Year Ultra U.S. Treasury Bond Futures | Short | 28 | March 2020 | $(2,800) | (5,086) | 158 |
| $(805) |
Forward currency contracts
| Contract amount | Counterparty | Settlement date | Unrealized appreciation (depreciation) at 12/31/2019 (000) | |
| Purchases (000) | Sales (000) | |||
| AUD10,600 | USD7,267 | Goldman Sachs | 1/6/2020 | $173 |
| EUR2,575 | USD2,859 | JPMorgan Chase | 1/6/2020 | 31 |
| EUR2,800 | USD3,113 | Standard Chartered Bank | 1/6/2020 | 29 |
| THB20 | USD1 | JPMorgan Chase | 1/6/2020 | —15 |
| USD11,342 | ILS39,170 | JPMorgan Chase | 1/6/2020 | (4) |
| USD3,598 | ZAR53,200 | Citibank | 1/6/2020 | (198) |
| USD10,597 | JPY1,149,000 | UBS AG | 1/7/2020 | 18 |
| USD592 | ZAR8,780 | Morgan Stanley | 1/7/2020 | (35) |
| JPY1,496,000 | USD13,823 | JPMorgan Chase | 1/7/2020 | (48) |
| USD2,740 | MXN54,000 | Goldman Sachs | 1/7/2020 | (113) |
| USD10,625 | EUR9,610 | HSBC Bank | 1/7/2020 | (159) |
| USD5,087 | ZAR74,900 | Bank of America | 1/7/2020 | (256) |
| USD5,533 | ZAR82,000 | JPMorgan Chase | 1/7/2020 | (317) |
| EUR6,400 | USD7,142 | Citibank | 1/8/2020 | 41 |
| CZK165,000 | EUR6,461 | Goldman Sachs | 1/8/2020 | 28 |
| USD11,470 | JPY1,244,630 | UBS AG | 1/8/2020 | 10 |
| USD1,516 | CNH10,700 | HSBC Bank | 1/8/2020 | (21) |
| USD7,105 | EUR6,400 | Goldman Sachs | 1/8/2020 | (77) |
| CLP12,189,000 | USD15,324 | Morgan Stanley | 1/9/2020 | 888 |
| AUD5,850 | USD3,994 | Citibank | 1/9/2020 | 112 |
| EUR6,815 | USD7,578 | Morgan Stanley | 1/9/2020 | 71 |
| GBP2,800 | USD3,683 | Bank of America | 1/9/2020 | 27 |
| USD7,142 | EUR6,400 | Citibank | 1/9/2020 | (41) |
| USD1,225 | CLP982,000 | Bank of America | 1/9/2020 | (82) |
| USD2,071 | CLP1,654,653 | Citibank | 1/9/2020 | (130) |
| USD7,386 | BRL31,080 | Goldman Sachs | 1/9/2020 | (338) |
| USD4,981 | CLP4,000,347 | Citibank | 1/9/2020 | (340) |
| USD6,794 | CLP5,552,000 | HSBC Bank | 1/9/2020 | (591) |
| USD1,522 | INR109,575 | JPMorgan Chase | 1/10/2020 | (12) |
| EUR7,100 | USD7,883 | HSBC Bank | 1/13/2020 | 88 |
| GBP7,659 | USD10,086 | Bank of America | 1/13/2020 | 63 |
| USD829 | EUR745 | Standard Chartered Bank | 1/13/2020 | (8) |
| USD4,717 | EUR4,249 | HSBC Bank | 1/13/2020 | (53) |
| EUR9,079 | USD10,137 | Bank of New York Mellon | 1/15/2020 | 56 |
| KRW10,058,500 | USD8,651 | Standard Chartered Bank | 1/15/2020 | 50 |
| GBP15,670 | EUR18,547 | Goldman Sachs | 1/15/2020 | (59) |
| CLP10,219,000 | USD13,139 | Goldman Sachs | 1/16/2020 | 454 |
| GBP18,640 | USD24,544 | HSBC Bank | 1/16/2020 | 159 |
| ILS12,500 | USD3,581 | Bank of America | 1/16/2020 | 42 |
American Funds Insurance Series — Global Bond Fund — Page 143 of 184
Forward currency contracts (continued)
| Contract amount | Counterparty | Settlement date | Unrealized appreciation (depreciation) at 12/31/2019 (000) | |
| Purchases (000) | Sales (000) | |||
| JPY1,900,496 | USD17,468 | Citibank | 1/16/2020 | $40 |
| CHF1,000 | USD1,019 | Citibank | 1/16/2020 | 15 |
| CAD880 | USD668 | JPMorgan Chase | 1/16/2020 | 10 |
| USD818 | INR58,300 | Standard Chartered Bank | 1/16/2020 | 2 |
| USD7,771 | CLP5,841,270 | Goldman Sachs | 1/16/2020 | 1 |
| USD9,358 | ILS32,500 | UBS AG | 1/16/2020 | (61) |
| USD7,864 | MXN150,700 | Citibank | 1/16/2020 | (87) |
| EUR21,331 | NOK216,090 | Bank of America | 1/16/2020 | (664) |
| JPY2,842,160 | USD26,002 | Barclays Bank PLC | 1/17/2020 | 181 |
| EUR7,460 | USD8,345 | Bank of America | 1/17/2020 | 32 |
| EUR6,190 | USD6,925 | Citibank | 1/17/2020 | 26 |
| EUR3,200 | USD3,582 | Standard Chartered Bank | 1/17/2020 | 11 |
| USD20,818 | EUR18,600 | Morgan Stanley | 1/17/2020 | (68) |
| AUD21,200 | USD14,619 | Citibank | 1/21/2020 | 266 |
| MXN172,760 | USD9,081 | Standard Chartered Bank | 1/21/2020 | 26 |
| JPY398,400 | USD3,649 | UBS AG | 1/21/2020 | 22 |
| USD9,099 | MXN172,760 | UBS AG | 1/21/2020 | (8) |
| USD4,856 | MYR20,120 | HSBC Bank | 1/21/2020 | (59) |
| GBP5,460 | USD7,302 | Standard Chartered Bank | 1/21/2020 | (65) |
| EUR23,977 | USD26,822 | Citibank | 1/23/2020 | 113 |
| JPY1,354,660 | USD12,395 | Goldman Sachs | 1/23/2020 | 89 |
| USD3,582 | INR254,800 | HSBC Bank | 1/23/2020 | 20 |
| USD3,158 | MXN59,979 | UBS AG | 1/23/2020 | (2) |
| USD3,400 | CNH23,800 | JPMorgan Chase | 1/23/2020 | (18) |
| USD4,756 | CNH33,330 | UBS AG | 1/23/2020 | (30) |
| USD33,503 | EUR29,950 | Morgan Stanley | 1/23/2020 | (141) |
| USD1,658 | COP5,509,000 | Citibank | 1/24/2020 | (16) |
| USD7,324 | AUD10,670 | Citibank | 1/24/2020 | (169) |
| EUR25,135 | USD28,021 | Standard Chartered Bank | 1/27/2020 | 221 |
| USD4,205 | INR299,650 | Standard Chartered Bank | 1/27/2020 | 19 |
| USD514 | BRL2,100 | JPMorgan Chase | 1/27/2020 | (7) |
| USD5,822 | EUR5,220 | JPMorgan Chase | 1/27/2020 | (44) |
| EUR5,010 | USD5,594 | Standard Chartered Bank | 1/30/2020 | 36 |
| CNH60,800 | USD8,591 | Standard Chartered Bank | 2/10/2020 | 135 |
| CNH18,800 | USD2,668 | Standard Chartered Bank | 2/10/2020 | 30 |
| USD3,927 | CNH27,700 | HSBC Bank | 2/10/2020 | (48) |
| USD19,976 | CNH142,790 | Standard Chartered Bank | 2/10/2020 | (517) |
| USD7,131 | MXN141,260 | JPMorgan Chase | 3/4/2020 | (269) |
| EUR27,760 | USD31,090 | HSBC Bank | 3/17/2020 | 200 |
| USD4,553 | EUR3,940 | Bank of America | 3/26/2020 | 109 |
| EUR2,580 | USD2,888 | HSBC Bank | 3/26/2020 | 22 |
| USD393 | EUR340 | JPMorgan Chase | 3/26/2020 | 10 |
| USD2,937 | BRL12,100 | JPMorgan Chase | 4/1/2020 | (59) |
| USD21,630 | BRL91,700 | Citibank | 7/1/2020 | (972) |
| $(2,210) | ||||
American Funds Insurance Series — Global Bond Fund — Page 144 of 184
Swap contracts
Interest rate swaps
| Receive | Pay | Expiration date | Notional (000) | Value at 12/31/2019 (000) | Upfront payments/ receipts (000) | Unrealized (depreciation) appreciation at 12/31/2019 (000) |
| (0.0955)% | 6-month EURIBOR | 7/22/2024 | €64,700 | $(156) | $— | $(156) |
| (0.356)% | 6-month EURIBOR | 8/9/2024 | 60,000 | (511) | — | (511) |
| 6-month HUF-BUBOR | 1.39% | 11/11/2029 | HUF2,335,000 | 106 | — | 106 |
| 6-month PLN-WIBOR | 1.90% | 11/12/2029 | PLN30,800 | (26) | — | (26) |
| 6-month PLN-WIBOR | 1.88% | 11/20/2029 | 30,710 | (11) | — | (11) |
| 3-month USD-LIBOR | 2.0105% | 12/18/2049 | $3,125 | 59 | — | 59 |
| $— | $(539) |
Credit default swaps
Centrally cleared credit default swaps on credit indices — sell protection
| Receive/ Payment frequency | Pay | Expiration date | Notional (000) | Value at 12/31/2019 (000) | Upfront receipts (000) | Unrealized appreciation at 12/31/2019 (000) |
| 1.00%/Quarterly | CDX.NA.IG.33 | 12/20/2024 | $130,250 | $3,377 | $2,646 | $731 |
| 1 | Step bond; coupon rate may change at a later date. |
| 2 | Index-linked bond whose principal amount moves with a government price index. |
| 3 | Acquired in a transaction exempt from registration under Rule 144A of the Securities Act of 1933. May be resold in the U.S. in transactions exempt from registration, normally to qualified institutional buyers. The total value of all such securities was $185,840,000, which represented 8.73% of the net assets of the fund. |
| 4 | Principal payments may be made periodically. Therefore, the effective maturity date may be earlier than the stated maturity date. |
| 5 | Coupon rate may change periodically. Reference rate and spread are as of the most recent information available. Some coupon rates are determined by the issuer or agent based on current market conditions; therefore, the reference rate and spread are not available. |
| 6 | Loan participations and assignments; may be subject to legal or contractual restrictions on resale. The total value of all such loans was $3,927,000, which represented .18% of the net assets of the fund. |
| 7 | Valued under fair value procedures adopted by authority of the board of trustees. The total value of all such securities was $2,425,000, which represented .11% of the net assets of the fund. |
| 8 | Value determined using significant unobservable inputs. |
| 9 | Payment in kind; the issuer has the option of paying additional securities in lieu of cash. Most recent payment was 100% cash unless otherwise noted. |
| 10 | Purchased on a TBA basis. |
| 11 | Scheduled interest and/or principal payment was not received. |
| 12 | All or a portion of this security was pledged as collateral. The total value of pledged collateral was $9,498,000, which represented .45% of the net assets of the fund. |
| 13 | Security did not produce income during the last 12 months. |
| 14 | Acquired through a private placement transaction exempt from registration under the Securities Act of 1933. May be subject to legal or contractual restrictions on resale. Further details on this holding appear below. |
| 15 | Amount less than one thousand. |
| 16 | Rate represents the seven-day yield at 12/31/2019. |
| 17 | Notional amount is calculated based on the number of contracts and notional contract size. |
| 18 | Value is calculated based on the notional amount and current market price. |
| Private placement security | Acquisition date | Cost (000) | Value (000) | Percent of net assets |
| Advanz Pharma Corp. | 8/31/2018 | $116 | $27 | .00% |
American Funds Insurance Series — Global Bond Fund — Page 145 of 184
| Key to abbreviations and symbols | |
| ARS = Argentine pesos | ILS = Israeli shekels |
| AUD/A$ = Australian dollars | INR = Indian rupees |
| BRL = Brazilian reais | JPY/¥ = Japanese yen |
| BUBOR = Budapest Interbank Offered Rate | KRW = South Korean won |
| CAD/C$ = Canadian dollars | LIBOR = London Interbank Offered Rate |
| CHF = Swiss francs | MXN = Mexican pesos |
| CLP = Chilean pesos | MYR = Malaysian ringgits |
| CNH/CNY = Chinese yuan renminbi | NGN = Nigerian naira |
| COP = Colombian pesos | NOK/NKr = Norwegian kroner |
| CZK = Czech korunas | PLN = Polish zloty |
| DKr = Danish kroner | RUB = Russian rubles |
| DOP = Dominican pesos | TBA = To-be-announced |
| EGP = Egyptian pounds | THB = Thai baht |
| EUR/€ = Euros | UAH = Ukrainian hryvnia |
| EURIBOR = Euro Interbank Offered Rate | USD/$ = U.S. dollars |
| GBP/£ = British pounds | UYU = Uruguayan pesos |
| HUF = Hungarian forints | WIBOR = Warsaw Interbank Offer Rate |
| IDR = Indonesian rupiah | ZAR = South African rand |
American Funds Insurance Series — Global Bond Fund — Page 146 of 184
High-Income Bond Fund
Investment portfolio
December 31, 2019
| Bonds, notes & other debt instruments 92.80% Corporate bonds & notes 92.80% Communication services 16.19% | Principal amount (000) | Value (000) |
| Altice Finco SA 8.125% 20241 | $505 | $522 |
| Altice NV 6.625% 20231 | 835 | 851 |
| Altice NV 7.50% 20261 | 1,150 | 1,238 |
| Altice SA 7.625% 20251 | 3,275 | 3,414 |
| AMC Networks Inc. 5.00% 2024 | 175 | 179 |
| AMC Networks Inc. 4.75% 2025 | 900 | 905 |
| Cablevision Systems Corp. 6.75% 2021 | 5,025 | 5,419 |
| Cablevision Systems Corp. 5.75% 20301 | 1,175 | 1,256 |
| CBS Corp. 7.25% 20241 | 350 | 369 |
| CCO Holdings LLC and CCO Holdings Capital Corp. 4.00% 20231 | 2,925 | 2,973 |
| CCO Holdings LLC and CCO Holdings Capital Corp. 5.125% 20231 | 1,050 | 1,074 |
| CCO Holdings LLC and CCO Holdings Capital Corp. 5.875% 20241 | 350 | 363 |
| CCO Holdings LLC and CCO Holdings Capital Corp. 5.375% 20251 | 225 | 233 |
| CCO Holdings LLC and CCO Holdings Capital Corp. 5.50% 20261 | 825 | 871 |
| CCO Holdings LLC and CCO Holdings Capital Corp. 5.75% 20261 | 6,450 | 6,817 |
| CCO Holdings LLC and CCO Holdings Capital Corp. 5.125% 20271 | 550 | 581 |
| CCO Holdings LLC and CCO Holdings Capital Corp. 5.00% 20281 | 300 | 315 |
| CCO Holdings LLC and CCO Holdings Capital Corp. 5.375% 20291 | 1,150 | 1,230 |
| CCO Holdings LLC and CCO Holdings Capital Corp. 4.75% 20301 | 2,790 | 2,851 |
| CenturyLink, Inc. 6.75% 2023 | 7,100 | 7,940 |
| CenturyLink, Inc. 7.50% 2024 | 700 | 791 |
| CenturyLink, Inc. 5.125% 20261 | 2,975 | 3,035 |
| CenturyLink, Inc., Series T, 5.80% 2022 | 200 | 211 |
| Cinemark USA, Inc. 4.875% 2023 | 550 | 560 |
| Clear Channel Worldwide Holdings, Inc. 9.25% 20241 | 2,314 | 2,568 |
| CSC Holdings, LLC 5.50% 20261 | 1,300 | 1,379 |
| Cumulus Media New Holdings Inc. 6.75% 20261 | 2,565 | 2,753 |
| Diamond Sports Group LLC 5.375% 20261 | 2,400 | 2,432 |
| Diamond Sports Group LLC 6.625% 20271 | 1,051 | 1,024 |
| DISH DBS Corp. 5.125% 2020 | 1,000 | 1,007 |
| DISH DBS Corp. 6.75% 2021 | 1,100 | 1,158 |
| Embarq Corp. 7.995% 2036 | 1,275 | 1,351 |
| Entercom Media Corp. 6.50% 20271 | 375 | 402 |
| Frontier Communications Corp. 8.50% 2020 | 825 | 494 |
| Frontier Communications Corp. 9.25% 2021 | 1,300 | 637 |
| Frontier Communications Corp. 10.50% 2022 | 5,080 | 2,491 |
| Frontier Communications Corp. 11.00% 2025 | 16,070 | 7,834 |
| Frontier Communications Corp. 8.50% 20261 | 1,775 | 1,800 |
| Frontier Communications Corp. 8.00% 20271 | 3,810 | 3,989 |
| Getty Images Inc. 9.75% 20271 | 675 | 672 |
| Gogo Inc. 9.875% 20241 | 14,750 | 15,610 |
| Gray Television, Inc. 7.00% 20271 | 1,225 | 1,364 |
| iHeartCommunications, Inc. 6.375% 2026 | 828 | 900 |
| iHeartCommunications, Inc. 5.25% 20271 | 3,993 | 4,185 |
| iHeartCommunications, Inc. 8.375% 2027 | 1,407 | 1,557 |
American Funds Insurance Series — High-Income Bond Fund — Page 147 of 184
| Bonds, notes & other debt instruments (continued) Corporate bonds & notes (continued) Communication services (continued) | Principal amount (000) | Value (000) |
| Inmarsat PLC 4.875% 20221 | $2,325 | $2,358 |
| Inmarsat PLC 6.75% 20261 | 3,375 | 3,599 |
| Intelsat Jackson Holding Co. 5.50% 2023 | 2,210 | 1,903 |
| Intelsat Jackson Holding Co. 8.00% 20241 | 250 | 257 |
| Intelsat Jackson Holding Co. 8.50% 20241 | 6,100 | 5,569 |
| Intelsat Jackson Holding Co., Term Loan, 6.625% 20242 | 2,900 | 2,943 |
| LCPR Senior Secured Financing Designated Activity Co. 6.75% 20271 | 1,075 | 1,141 |
| Level 3 Communications, Inc. 3.875% 20291 | 1,450 | 1,464 |
| Liberty Global PLC 5.50% 20281 | 775 | 787 |
| Ligado Networks, Term Loan, (3-month USD-LIBOR + 8.75%) 10.85% 2020 (100% PIK)2,3,4 | 2,676 | 1,707 |
| Live Nation Entertainment, Inc. 5.625% 20261 | 425 | 454 |
| Live Nation Entertainment, Inc. 4.75% 20271 | 649 | 673 |
| Loral Space & Communications Inc. 4.875% 20271 | 450 | 459 |
| Match Group, Inc. 5.00% 20271 | 175 | 183 |
| Match Group, Inc. 5.625% 20291 | 1,425 | 1,522 |
| MDC Partners Inc. 6.50% 20241 | 9,510 | 8,630 |
| Meredith Corp. 6.875% 2026 | 4,250 | 4,431 |
| Neptune Finco Corp. (Altice NV) 6.625% 20251 | 1,250 | 1,330 |
| Netflix, Inc. 5.375% 20291 | 1,425 | 1,520 |
| Netflix, Inc. 4.875% 20301 | 2,585 | 2,630 |
| Nexstar Broadcasting, Inc. 5.625% 20241 | 950 | 992 |
| Nexstar Escrow Corp. 5.625% 20271 | 2,090 | 2,206 |
| Numericable Group SA 7.375% 20261 | 2,400 | 2,581 |
| OUTFRONT Media Cap LLC 5.00% 20271 | 905 | 950 |
| Qwest Capital Funding, Inc. 6.875% 2028 | 1,100 | 1,087 |
| Sinclair Broadcast Group, Inc. 5.50% 20301 | 900 | 922 |
| Sirius XM Radio Inc. 3.875% 20221 | 2,650 | 2,713 |
| Sirius XM Radio Inc. 4.625% 20231 | 900 | 915 |
| Sirius XM Radio Inc. 4.625% 20241 | 1,495 | 1,573 |
| Sirius XM Radio Inc. 5.50% 20291 | 1,100 | 1,191 |
| Sprint Corp. 7.25% 2021 | 690 | 731 |
| Sprint Corp. 11.50% 2021 | 2,930 | 3,353 |
| Sprint Corp. 7.875% 2023 | 1,580 | 1,747 |
| Sprint Corp. 7.125% 2024 | 750 | 811 |
| Sprint Corp. 7.625% 2026 | 1,600 | 1,767 |
| Sprint Corp. 6.875% 2028 | 5,395 | 5,823 |
| Sprint Corp. 8.75% 2032 | 2,800 | 3,404 |
| TEGNA Inc. 5.00% 20291 | 850 | 866 |
| Terrier Media Buyer (3-month USD-LIBOR + 4.00%) 6.148% 20262,4 | 875 | 885 |
| Terrier Media Buyer, Inc. 8.875% 20271 | 875 | 928 |
| T-Mobile US, Inc. 6.375% 2025 | 875 | 906 |
| T-Mobile US, Inc. 6.50% 2026 | 900 | 967 |
| Trilogy International Partners, LLC 8.875% 20221 | 5,400 | 5,091 |
| Twitter, Inc. 3.875% 20271 | 1,240 | 1,242 |
| Univision Communications Inc. 5.125% 20231 | 6,200 | 6,200 |
| Univision Communications Inc. 5.125% 20251 | 3,650 | 3,618 |
| Warner Music Group 5.00% 20231 | 1,200 | 1,231 |
| Warner Music Group 4.875% 20241 | 1,000 | 1,038 |
| Warner Music Group 5.50% 20261 | 1,000 | 1,055 |
| Zayo Group Holdings, Inc. 6.00% 2023 | 900 | 922 |
| Zayo Group Holdings, Inc. 6.375% 2025 | 300 | 310 |
American Funds Insurance Series — High-Income Bond Fund — Page 148 of 184
| Bonds, notes & other debt instruments (continued) Corporate bonds & notes (continued) Communication services (continued) | Principal amount (000) | Value (000) |
| Zayo Group Holdings, Inc. 5.75% 20271 | $200 | $204 |
| Ziggo Bond Finance BV 5.50% 20271 | 3,400 | 3,619 |
| 205,013 | ||
| Health care 15.42% | ||
| Auris Luxembourg III SARL, Term Loan, (3-month USD-LIBOR + 3.75%) 5.549% 20262,4 | 854 | 859 |
| Bausch Health Cos. Inc. 5.00% 20281 | 2,655 | 2,732 |
| Bausch Health Cos. Inc. 7.00% 20281 | 1,510 | 1,664 |
| Bausch Health Cos. Inc. 5.25% 20301 | 2,790 | 2,900 |
| Centene Corp. 4.75% 2022 | 4,580 | 4,680 |
| Centene Corp. 6.125% 2024 | 1,500 | 1,558 |
| Centene Corp. 4.75% 2025 | 1,425 | 1,483 |
| Centene Corp. 5.375% 20261 | 3,475 | 3,694 |
| Centene Corp. 4.25% 20271 | 4,625 | 4,767 |
| Centene Corp. 4.625% 20291 | 6,985 | 7,374 |
| Charles River Laboratories International, Inc. 5.50% 20261 | 885 | 953 |
| Charles River Laboratories International, Inc. 4.25% 20281 | 2,190 | 2,235 |
| Community Health Systems Inc. 5.125% 2021 | 550 | 551 |
| Concordia International Corp. 8.00% 2024 | 34 | 32 |
| Concordia International Corp., Term Loan, (3-month USD-LIBOR + 5.50%) 7.447% 20242,4 | 92 | 86 |
| DaVita HealthCare Partners Inc. 5.125% 2024 | 1,000 | 1,027 |
| DaVita HealthCare Partners Inc. 5.00% 2025 | 965 | 995 |
| Eagle Holding Co. II, LLC 7.625% 20221,3 | 1,250 | 1,273 |
| Eagle Holding Co. II, LLC 7.75% 20221,3 | 2,410 | 2,451 |
| Encompass Health Corp. 4.50% 2028 | 903 | 937 |
| Encompass Health Corp. 4.75% 2030 | 740 | 769 |
| Endo International PLC 5.75% 20221 | 3,525 | 2,626 |
| Endo International PLC 6.00% 20231 | 4,754 | 3,447 |
| Endo International PLC 5.875% 20241 | 2,450 | 2,384 |
| Endo International PLC 6.00% 20251,5 | 5,030 | 3,406 |
| HCA Inc. 7.50% 2022 | 360 | 398 |
| HCA Inc. 5.875% 2023 | 1,925 | 2,131 |
| HCA Inc. 5.875% 2026 | 650 | 740 |
| HCA Inc. 4.50% 2027 | 350 | 378 |
| HCA Inc. 5.625% 2028 | 1,475 | 1,684 |
| HCA Inc. 5.50% 2047 | 756 | 868 |
| HCA Inc. 5.25% 2049 | 69 | 77 |
| HealthSouth Corp. 5.75% 2024 | 744 | 754 |
| HealthSouth Corp. 5.75% 2025 | 1,380 | 1,450 |
| Hill-Rom Holdings, Inc. 4.375% 20271 | 1,576 | 1,626 |
| IMS Health Holdings, Inc. 5.00% 20261 | 3,460 | 3,658 |
| Jaguar Holding Co. 6.375% 20231 | 2,425 | 2,509 |
| Kinetic Concepts, Inc. 12.50% 20211 | 6,573 | 6,781 |
| Mallinckrodt International Finance SA 5.50% 20251 | 1,300 | 465 |
| Mallinckrodt PLC 4.875% 20201 | 11,135 | 8,610 |
| Mallinckrodt PLC 5.75% 20221 | 1,175 | 485 |
| Molina Healthcare, Inc. 5.375% 2022 | 10,235 | 10,898 |
| Molina Healthcare, Inc. 4.875% 20251 | 1,744 | 1,797 |
| NVA Holdings Inc. 6.875% 20261 | 1,490 | 1,615 |
| Owens & Minor, Inc. 3.875% 2021 | 2,850 | 2,751 |
| Owens & Minor, Inc. 4.375% 2024 | 200 | 153 |
| Owens & Minor, Inc., Term Loan B, (3-month USD-LIBOR + 4.50%) 6.191% 20252,4 | 1,728 | 1,551 |
| Par Pharmaceutical Cos. Inc. 7.50% 20271 | 5,755 | 5,741 |
| PAREXEL International Corp. 6.375% 20251 | 2,305 | 2,305 |
American Funds Insurance Series — High-Income Bond Fund — Page 149 of 184
| Bonds, notes & other debt instruments (continued) Corporate bonds & notes (continued) Health care (continued) | Principal amount (000) | Value (000) |
| Prestige Brands International Inc. 6.375% 20241 | $810 | $844 |
| Rotech Healthcare Inc., Term Loan, (3-month USD-LIBOR + 11.00%) 13.31% 2023 (100% PIK)2,3,4,6,7 | 5,665 | 5,721 |
| Select Medical Holdings Corp. 6.25% 20261 | 1,394 | 1,512 |
| Surgery Center Holdings 10.00% 20271 | 1,055 | 1,161 |
| Team Health Holdings, Inc. 6.375% 20251 | 5,600 | 3,754 |
| Team Health Holdings, Inc., Term Loan B, 4.549% 20242,4 | 85 | 69 |
| Tenet Healthcare Corp. 8.125% 2022 | 4,600 | 5,097 |
| Tenet Healthcare Corp. 4.625% 2024 | 2,892 | 2,967 |
| Tenet Healthcare Corp. 4.875% 20261 | 9,600 | 10,067 |
| Tenet Healthcare Corp. 5.125% 20271 | 1,225 | 1,295 |
| Teva Pharmaceutical Finance Co. BV 2.20% 2021 | 406 | 394 |
| Teva Pharmaceutical Finance Co. BV 2.80% 2023 | 6,891 | 6,406 |
| Teva Pharmaceutical Finance Co. BV 6.00% 2024 | 8,192 | 8,307 |
| Teva Pharmaceutical Finance Co. BV 7.125% 20251 | 2,735 | 2,815 |
| Teva Pharmaceutical Finance Co. BV 3.15% 2026 | 3,335 | 2,785 |
| Teva Pharmaceutical Finance Co. BV 6.75% 2028 | 2,050 | 2,085 |
| Valeant Pharmaceuticals International, Inc. 5.875% 20231 | 3,570 | 3,603 |
| Valeant Pharmaceuticals International, Inc. 6.125% 20251 | 12,430 | 12,869 |
| Valeant Pharmaceuticals International, Inc. 9.00% 20251 | 1,815 | 2,069 |
| Valeant Pharmaceuticals International, Inc. 9.25% 20261 | 4,670 | 5,373 |
| Valeant Pharmaceuticals International, Inc. 8.50% 20271 | 850 | 970 |
| Vizient Inc. 6.25% 20271 | 240 | 257 |
| WellCare Health Plans, Inc. 5.375% 20261 | 500 | 533 |
| 195,261 | ||
| Materials 12.07% | ||
| AK Steel Holding Corp. 7.625% 2021 | 3,325 | 3,360 |
| AK Steel Holding Corp. 7.00% 2027 | 450 | 455 |
| Ardagh Group SA 6.50% 20271,3 | 1,185 | 1,227 |
| Ardagh Packaging Finance 6.00% 20251 | 3,310 | 3,480 |
| Axalta Coating Systems LLC 4.875% 20241 | 1,450 | 1,504 |
| Ball Corp. 4.375% 2020 | 450 | 460 |
| Ball Corp. 5.00% 2022 | 825 | 874 |
| Berry Plastics Corp. 5.50% 2022 | 585 | 593 |
| Blue Cube Spinco Inc. 10.00% 2025 | 1,000 | 1,108 |
| Braskem Idesa Sapi 7.45% 20291 | 860 | 918 |
| BWAY Parent Co., Inc. 5.50% 20241 | 2,840 | 2,933 |
| Carlyle Group LP 8.75% 20231,3 | 450 | 460 |
| Cascades Inc. 5.125% 20261 | 750 | 772 |
| Chemours Co. 6.625% 2023 | 3,940 | 3,963 |
| Cleveland-Cliffs Inc. 4.875% 20241 | 5,375 | 5,505 |
| Cleveland-Cliffs Inc. 5.75% 2025 | 6,831 | 6,758 |
| Cleveland-Cliffs Inc. 5.875% 20271 | 8,285 | 7,969 |
| Consolidated Energy Finance SA 6.50% 20261 | 2,395 | 2,252 |
| CVR Partners, LP 9.25% 20231 | 700 | 733 |
| Cydsa SAB de CV 6.25% 20271 | 455 | 469 |
| First Quantum Minerals Ltd. 7.00% 20211 | 380 | 382 |
| First Quantum Minerals Ltd. 7.25% 20221 | 2,425 | 2,441 |
| First Quantum Minerals Ltd. 7.25% 20231 | 8,150 | 8,455 |
| First Quantum Minerals Ltd. 6.50% 20241 | 2,860 | 2,873 |
| First Quantum Minerals Ltd. 7.50% 20251 | 11,100 | 11,373 |
| First Quantum Minerals Ltd. 6.875% 20261 | 5,075 | 5,148 |
| Freeport-McMoRan Inc. 3.55% 2022 | 4,786 | 4,854 |
American Funds Insurance Series — High-Income Bond Fund — Page 150 of 184
| Bonds, notes & other debt instruments (continued) Corporate bonds & notes (continued) Materials (continued) | Principal amount (000) | Value (000) |
| Freeport-McMoRan Inc. 3.875% 2023 | $400 | $408 |
| FXI Holdings, Inc. 7.875% 20241 | 5,105 | 4,914 |
| Greif, Inc. 6.50% 20271 | 725 | 784 |
| H.I.G. Capital, LLC 6.75% 20241 | 534 | 498 |
| Hexion Inc. 7.875% 20271 | 1,910 | 1,991 |
| INEOS Group Holdings SA 5.625% 20241 | 2,375 | 2,445 |
| LSB Industries, Inc. 9.625% 20231 | 5,010 | 5,159 |
| Mineral Resources Ltd. 8.125% 20271 | 2,230 | 2,453 |
| Neon Holdings, Inc. 10.125% 20261 | 3,045 | 3,037 |
| Nova Chemicals Corp. 4.875% 20241 | 750 | 776 |
| Nova Chemicals Corp. 5.25% 20271 | 3,300 | 3,397 |
| Novelis Corp. 6.25% 20241 | 860 | 904 |
| Novelis Corp. 5.875% 20261 | 950 | 1,013 |
| OCI NV 5.25% 20241 | 1,470 | 1,532 |
| Owens-Illinois, Inc. 5.00% 20221 | 560 | 582 |
| Owens-Illinois, Inc. 5.875% 20231 | 2,530 | 2,706 |
| Owens-Illinois, Inc. 6.375% 20251 | 705 | 772 |
| Plastipak Holdings, Inc. 6.25% 20251 | 200 | 173 |
| Platform Specialty Products Corp. 5.875% 20251 | 1,030 | 1,080 |
| Rayonier Advanced Materials Inc. 5.50% 20241 | 2,135 | 1,613 |
| Reynolds Group Inc. 5.75% 2020 | 315 | 316 |
| Ryerson Inc. 11.00% 20221 | 5,191 | 5,489 |
| S.P.C.M. SA 4.875% 20251 | 1,675 | 1,746 |
| Scotts Miracle-Gro Co. 4.50% 20291 | 1,180 | 1,209 |
| Sealed Air Corp. 4.875% 20221 | 1,000 | 1,062 |
| Sealed Air Corp. 5.25% 20231 | 405 | 432 |
| Sealed Air Corp. 4.00% 20271 | 988 | 1,003 |
| Silgan Holdings Inc. 4.125% 20281 | 1,177 | 1,180 |
| Standard Industries Inc. 6.00% 20251 | 550 | 580 |
| Starfruit US Holdco LLC 8.00% 20261 | 1,410 | 1,498 |
| Summit Materials, Inc. 6.125% 2023 | 1,720 | 1,750 |
| Summit Materials, Inc. 6.50% 20271 | 545 | 587 |
| TPC Group Inc. 10.50% 20241 | 2,913 | 2,941 |
| Trivium Packaging BV 5.50% 20261 | 1,504 | 1,588 |
| Trivium Packaging BV 8.50% 20271 | 509 | 567 |
| Tronox Ltd. 5.75% 20251 | 700 | 715 |
| Tronox Ltd. 6.50% 20261 | 3,300 | 3,408 |
| United States Steel Corp. 6.875% 2025 | 650 | 608 |
| Univar Solutions USA Inc. 5.125% 20271 | 900 | 941 |
| Venator Materials Corp. 5.75% 20251 | 6,535 | 6,045 |
| Warrior Met Coal, Inc. 8.00% 20241 | 1,260 | 1,280 |
| Zekelman Industries Inc. 9.875% 20231 | 328 | 345 |
| 152,846 | ||
| Energy 10.52% | ||
| American Energy-Permian Basin, LLC/AEPB Finance Corp. 12.00% 20241 | 1,934 | 1,344 |
| Antero Resources Corp. 5.375% 2024 | 1,050 | 976 |
| Ascent Resources - Utica LLC 10.00% 20221 | 685 | 683 |
| Ascent Resources - Utica LLC 7.00% 20261 | 1,550 | 1,241 |
| Ascent Resources Marcellus Holdings, Inc., Term Loan B, (3-month USD-LIBOR + 6.50%) 8.245% 20232,4 | 1,329 | 1,259 |
| Berry Petroleum Corp. 7.00% 20261 | 250 | 232 |
| Blue Racer Midstream LLC and Blue Racer Finance Corp. 6.125% 20221 | 1,300 | 1,276 |
| California Resources Corp. 8.00% 20221 | 865 | 374 |
| California Resources Corp., Term Loan B, (3-month USD-LIBOR + 4.75%) 6.555% 20222,4 | 950 | 849 |
American Funds Insurance Series — High-Income Bond Fund — Page 151 of 184
| Bonds, notes & other debt instruments (continued) Corporate bonds & notes (continued) Energy (continued) | Principal amount (000) | Value (000) |
| Carrizo Oil & Gas Inc. 6.25% 2023 | $1,865 | $1,897 |
| Centennial Resource Production, LLC 6.875% 20271 | 705 | 735 |
| Cheniere Energy Partners, LP 4.50% 20291 | 3,134 | 3,226 |
| Cheniere Energy, Inc. 7.00% 2024 | 1,575 | 1,818 |
| Cheniere Energy, Inc. 5.875% 2025 | 750 | 845 |
| Cheniere Energy, Inc. 3.70% 20291 | 334 | 341 |
| Chesapeake Energy Corp. 4.875% 2022 | 4,300 | 3,409 |
| Chesapeake Energy Corp. 11.50% 20251 | 2,824 | 2,676 |
| Chesapeake Energy Corp., Term Loan, (3-month USD-LIBOR + 8.00%) 9.928% 20242,4 | 1,245 | 1,286 |
| Citgo Holding, Inc. 9.25% 20241 | 909 | 977 |
| Comstock Resources, Inc. 9.75% 2026 | 3,400 | 3,094 |
| CONSOL Energy Inc. 5.875% 2022 | 7,366 | 7,390 |
| Constellation Oil Services Holding SA 10.00% 20241,3,6,7 | 7,096 | 3,371 |
| Convey Park Energy LLC 7.50% 20251 | 950 | 820 |
| DCP Midstream Operating LP 4.95% 2022 | 1,405 | 1,462 |
| Denbury Resources Inc. 9.00% 20211 | 1,656 | 1,606 |
| Denbury Resources Inc. 7.75% 20241 | 100 | 89 |
| Diamond Offshore Drilling, Inc. 7.875% 2025 | 1,175 | 1,025 |
| Diamond Offshore Drilling, Inc. 4.875% 2043 | 2,760 | 1,514 |
| Extraction Oil & Gas, Inc. 7.375% 20241 | 100 | 63 |
| Extraction Oil & Gas, Inc. 5.625% 20261 | 1,890 | 1,139 |
| Genesis Energy, LP 6.75% 2022 | 3,135 | 3,172 |
| Genesis Energy, LP 6.50% 2025 | 2,490 | 2,415 |
| Hess Midstream Partners LP 5.125% 20281 | 1,805 | 1,830 |
| Indigo Natural Resources LLC 6.875% 20261 | 370 | 349 |
| Jonah Energy LLC 7.25% 20251 | 2,200 | 655 |
| Laredo Petroleum, Inc. 5.625% 2022 | 650 | 632 |
| Matador Resources Co. 5.875% 2026 | 585 | 588 |
| McDermott International, Inc. 10.625% 20241,8 | 4,010 | 352 |
| McDermott International, Inc., Term Loan B, (3-month USD-LIBOR + 5.00%) 6.945% 20252,4,8 | 892 | 525 |
| McDermott International, Inc., Term Loan B, (3-month USD-LIBOR + 10.00%) 12.002% 20212,4 | 210 | 215 |
| Murphy Oil Corp. 6.875% 2024 | 1,000 | 1,057 |
| Murphy Oil Corp. 5.875% 2027 | 1,189 | 1,250 |
| Nabors Industries Inc. 5.75% 2025 | 700 | 632 |
| Neptune Energy Group Holdings Ltd. 6.625% 20251 | 825 | 827 |
| NGL Energy Partners LP 7.50% 2023 | 850 | 855 |
| NGL Energy Partners LP 6.125% 2025 | 3,815 | 3,607 |
| Noble Corp. PLC 8.95% 20455 | 2,075 | 903 |
| NuStar Logistics, LP 6.00% 2026 | 1,040 | 1,102 |
| Oasis Petroleum Inc. 6.875% 2022 | 2,500 | 2,412 |
| Oasis Petroleum Inc. 6.25% 20261 | 910 | 758 |
| PDC Energy Inc. 5.75% 2026 | 1,100 | 1,100 |
| Peabody Energy Corp. 6.00% 20221 | 2,350 | 2,297 |
| Peabody Energy Corp. 6.375% 20251 | 100 | 92 |
| Petrobras Global Finance Co. 5.299% 2025 | 511 | 558 |
| Petrobras Global Finance Co. 6.90% 2049 | 625 | 734 |
| Petróleos Mexicanos 6.49% 20271 | 200 | 213 |
| Petróleos Mexicanos 5.35% 2028 | 749 | 747 |
| Petróleos Mexicanos 7.69% 20501 | 418 | 458 |
| QEP Resources, Inc. 5.25% 2023 | 735 | 729 |
| QEP Resources, Inc. 5.625% 2026 | 1,080 | 1,056 |
| Range Resources Corp. 4.875% 2025 | 715 | 613 |
| Sanchez Energy Corp. 7.25% 20231,8 | 825 | 539 |
| Sanchez Energy Corp., Term Loan, (3-month USD-LIBOR + 8.00%) 10.176% 20202,4,6,7 | 95 | 95 |
American Funds Insurance Series — High-Income Bond Fund — Page 152 of 184
| Bonds, notes & other debt instruments (continued) Corporate bonds & notes (continued) Energy (continued) | Principal amount (000) | Value (000) |
| Seven Generations Energy Ltd. 5.375% 20251 | $750 | $756 |
| SM Energy Co. 6.125% 2022 | 245 | 248 |
| SM Energy Co. 5.00% 2024 | 250 | 239 |
| SM Energy Co. 5.625% 2025 | 1,555 | 1,480 |
| SM Energy Co. 6.625% 2027 | 850 | 837 |
| Southwestern Energy Co. 6.20% 20255 | 750 | 690 |
| Southwestern Energy Co. 7.50% 2026 | 1,645 | 1,526 |
| Southwestern Energy Co. 7.75% 2027 | 475 | 441 |
| Sunoco LP 4.875% 2023 | 3,040 | 3,117 |
| Sunoco LP 5.50% 2026 | 825 | 858 |
| Sunoco LP 6.00% 2027 | 500 | 535 |
| Tallgrass Energy Partners, LP 5.50% 20241 | 1,000 | 1,007 |
| Tapstone Energy Inc. 9.75% 20221,8 | 555 | 7 |
| Targa Resources Partners LP 6.75% 2024 | 375 | 390 |
| Targa Resources Partners LP 5.875% 2026 | 850 | 905 |
| Targa Resources Partners LP 6.50% 20271 | 1,105 | 1,212 |
| Targa Resources Partners LP 6.875% 20291 | 1,230 | 1,368 |
| Targa Resources Partners LP 5.50% 20301 | 2,795 | 2,875 |
| Teekay Corp. 9.25% 20221 | 4,070 | 4,295 |
| Teekay Offshore Partners LP 8.50% 20231 | 3,250 | 3,224 |
| Transocean Guardian Ltd. 5.875% 20241 | 983 | 1,008 |
| Transocean Inc. 8.375% 20215 | 1,900 | 1,953 |
| Transocean Inc. 9.00% 20231 | 1,041 | 1,102 |
| Transocean Inc. 6.125% 20251 | 3,195 | 3,283 |
| Transocean Poseidon Ltd. 6.875% 20271 | 655 | 696 |
| Transocean Sentry Ltd. 5.375% 20231 | 1,500 | 1,530 |
| Ultra Petroleum Corp. 11.00% 2024 (18.18% PIK)3 | 3,541 | 584 |
| USA Compression Partners, LP 6.875% 2026 | 825 | 868 |
| USA Compression Partners, LP 6.875% 2027 | 1,700 | 1,774 |
| Valaris PLC 7.75% 2026 | 2,225 | 1,263 |
| Valaris PLC 5.75% 2044 | 2,920 | 1,324 |
| Vine Oil & Gas LP 8.75% 20231 | 2,450 | 1,208 |
| Vine Oil & Gas LP 9.75% 20231 | 1,000 | 505 |
| Viper Energy Partners LP 5.375% 20271 | 1,000 | 1,042 |
| Weatherford International PLC 11.00% 20241 | 6,660 | 7,218 |
| Whiting Petroleum Corp. 5.75% 2021 | 335 | 318 |
| Whiting Petroleum Corp. 6.625% 2026 | 1,050 | 718 |
| WPX Energy Inc. 5.75% 2026 | 450 | 481 |
| 133,269 | ||
| Consumer discretionary 9.69% | ||
| Allied Universal Holdco LLC 6.625% 20261 | 1,625 | 1,749 |
| Allied Universal Holdco LLC 9.75% 20271 | 3,120 | 3,340 |
| Boyd Gaming Corp. 4.75% 20271 | 2,485 | 2,586 |
| Burger King Corp. 4.375% 20281 | 875 | 879 |
| Cedar Fair, LP 5.25% 20291 | 410 | 443 |
| Churchill Downs Inc. 4.75% 20281 | 1,850 | 1,918 |
| Cirsa Gaming Corp. SA 7.875% 20231 | 3,891 | 4,131 |
| Extended Stay America Inc. 4.625% 20271 | 1,249 | 1,267 |
| Fertitta Entertainment, Inc. 6.75% 20241 | 335 | 348 |
| Fertitta Entertainment, Inc. 8.75% 20251 | 1,325 | 1,420 |
| Golden Entertainment, Inc. 7.625% 20261 | 600 | 648 |
| Hanesbrands Inc. 4.625% 20241 | 2,905 | 3,070 |
| Hanesbrands Inc. 4.875% 20261 | 1,790 | 1,899 |
American Funds Insurance Series — High-Income Bond Fund — Page 153 of 184
| Bonds, notes & other debt instruments (continued) Corporate bonds & notes (continued) Consumer discretionary (continued) | Principal amount (000) | Value (000) |
| Hilton Worldwide Holdings Inc. 4.875% 2030 | $770 | $818 |
| Levi Strauss & Co. 5.00% 2025 | 555 | 573 |
| Limited Brands, Inc. 6.625% 2021 | 750 | 788 |
| Mattel, Inc. 6.75% 20251 | 1,325 | 1,427 |
| McGraw-Hill Global Education Holdings, LLC, Term Loan B, (3-month USD-LIBOR + 4.00%) 5.799% 20222,4 | 1,271 | 1,222 |
| Melco International Development Ltd. 5.375% 20291 | 1,275 | 1,311 |
| Merlin Entertainment 5.75% 20261 | 1,200 | 1,317 |
| MGM Growth Properties LLC 5.625% 2024 | 200 | 218 |
| MGM Resorts International 7.75% 2022 | 1,500 | 1,675 |
| MGM Resorts International 6.00% 2023 | 820 | 902 |
| MGM Resorts International 5.50% 2027 | 1,255 | 1,395 |
| Neiman Marcus Group Ltd. LLC 8.00% 20241 | 3,656 | 1,170 |
| Neiman Marcus Group Ltd. LLC 8.75% 20241 | 2,922 | 964 |
| Neiman Marcus Group Ltd. LLC 14.00% 2024 (42.86% PIK)1,3 | 4,809 | 2,501 |
| Neiman Marcus Group Ltd. LLC, Term Loan B, (3-month USD-LIBOR + 6.00%) 8.27% 2023 (12.09% PIK)2,3,4 | 2,475 | 2,038 |
| NMG Finco PLC 5.75% 20221 | 1,780 | 1,761 |
| Panther BF Aggregator 2, LP 6.25% 20261 | 985 | 1,063 |
| Panther BF Aggregator 2, LP 8.50% 20271 | 1,500 | 1,597 |
| Party City Holdings Inc. 6.625% 20261 | 500 | 354 |
| PetSmart, Inc., Term Loan B2, (3-month USD-LIBOR + 4.00%) 5.74% 20222,4 | 2,475 | 2,454 |
| PetSmart, Inc. 7.125% 20231 | 10,565 | 10,380 |
| PetSmart, Inc. 5.875% 20251 | 8,093 | 8,265 |
| PetSmart, Inc. 8.875% 20251 | 9,205 | 9,113 |
| PetSmart, Inc., Term Loan, (3-month USD-LIBOR + 3.00%) 4.74% 20222,4 | 3,025 | 2,961 |
| Sally Holdings LLC and Sally Capital Inc. 5.50% 2023 | 1,770 | 1,805 |
| Sally Holdings LLC and Sally Capital Inc. 5.625% 2025 | 4,355 | 4,569 |
| Scientific Games Corp. 6.625% 2021 | 175 | 178 |
| Scientific Games Corp. 5.00% 20251 | 1,465 | 1,538 |
| Scientific Games Corp. 8.25% 20261 | 5,130 | 5,665 |
| Scientific Games Corp. 7.00% 20281 | 2,100 | 2,251 |
| Scientific Games Corp. 7.25% 20291 | 1,465 | 1,596 |
| ServiceMaster Global Holdings, Inc. 5.125% 20241 | 1,300 | 1,351 |
| Six Flags Entertainment Corp. 4.875% 20241 | 3,450 | 3,582 |
| Sotheby’s 4.875% 20251 | 1,650 | 1,663 |
| Staples, Inc. 7.50% 20261 | 8,100 | 8,419 |
| Staples, Inc. 10.75% 20271 | 1,750 | 1,780 |
| Staples, Inc., Term Loan, (3 month USD-LIBOR + 4.50%) 6.191% 20242,4 | 1,241 | 1,225 |
| Stars Group Holdings BV 7.00% 20261 | 275 | 299 |
| William Carter Co. 5.625% 20271 | 445 | 479 |
| Wyndham Worldwide Corp. 5.375% 20261 | 1,000 | 1,057 |
| Wynn Las Vegas, LLC and Wynn Capital Corp. 4.25% 20231 | 2,823 | 2,964 |
| Wynn Las Vegas, LLC and Wynn Capital Corp. 5.25% 20271 | 975 | 1,037 |
| Wynn Resorts Ltd. 5.125% 20291 | 1,207 | 1,298 |
| 122,721 | ||
| Industrials 8.71% | ||
| ACCO Brands Corp. 5.25% 20241 | 445 | 465 |
| ADT Corp. 3.50% 2022 | 4,025 | 4,108 |
| Advanced Disposal Services, Inc. 5.625% 20241 | 1,550 | 1,617 |
| Allison Transmission Holdings, Inc. 5.00% 20241 | 4,190 | 4,300 |
| ARAMARK Corp. 5.125% 2024 | 3,020 | 3,105 |
| Ashtead Group PLC 4.00% 20281 | 200 | 202 |
| Ashtead Group PLC 4.25% 20291 | 740 | 758 |
American Funds Insurance Series — High-Income Bond Fund — Page 154 of 184
| Bonds, notes & other debt instruments (continued) Corporate bonds & notes (continued) Industrials (continued) | Principal amount (000) | Value (000) |
| Associated Materials, LLC 9.00% 20241 | $5,773 | $5,080 |
| Avis Budget Group, Inc. 5.50% 2023 | 1,274 | 1,300 |
| Avis Budget Group, Inc. 5.25% 20251 | 525 | 542 |
| Avolon Holdings Funding Ltd. 5.25% 20241 | 1,000 | 1,094 |
| Beacon Roofing Supply, Inc. 4.875% 20251 | 1,300 | 1,309 |
| Bohai Financial Investment Holding Co., Ltd. 5.25% 20221 | 1,600 | 1,709 |
| Bohai Financial Investment Holding Co., Ltd. 4.50% 20231 | 1,625 | 1,706 |
| Bohai Financial Investment Holding Co., Ltd. 5.125% 20231 | 1,000 | 1,081 |
| Bohai Financial Investment Holding Co., Ltd. 5.50% 20241 | 600 | 659 |
| Builders FirstSource, Inc. 5.625% 20241 | 5,958 | 6,209 |
| Clean Harbors, Inc. 4.875% 20271 | 1,160 | 1,223 |
| Clean Harbors, Inc. 5.125% 20291 | 915 | 984 |
| Continental Airlines, Inc., Series 2000-1, Class B, 8.388% 2022 | —9 | —9 |
| Covanta Holding Corp. 5.875% 2024 | 1,200 | 1,238 |
| Covanta Holding Corp. 5.875% 2025 | 1,300 | 1,375 |
| Dun & Bradstreet Corp. 6.875% 20261 | 3,490 | 3,859 |
| Dun & Bradstreet Corp. 10.25% 20271 | 5,303 | 6,108 |
| Dun & Bradstreet Corp., Term Loan B, (3-month USD-LIBOR + 5.00%) 6.792% 20262,4 | 1,370 | 1,382 |
| Euramax International, Inc. 12.00% 20201 | 1,850 | 1,837 |
| F-Brasile SpA 7.375% 20261 | 1,871 | 1,983 |
| FXI Holdings, Inc. 12.25% 20261 | 5,155 | 5,377 |
| GW B-CR Security Corp. 9.50% 20271 | 892 | 954 |
| Hardwoods Acquisition Inc. 7.50% 20211 | 1,160 | 592 |
| Harsco Corp. 5.75% 20271 | 985 | 1,053 |
| Hertz Global Holdings Inc. 7.625% 20221 | 1,756 | 1,831 |
| Icahn Enterprises Finance Corp. 4.75% 20241 | 885 | 910 |
| JELD-WEN Holding, Inc. 4.875% 20271 | 1,565 | 1,605 |
| Korn Ferry 4.625% 20271 | 875 | 882 |
| Kratos Defense & Security Solutions, Inc. 6.50% 20251 | 1,305 | 1,400 |
| LABL Escrow Issuer, LLC 10.50% 20271 | 1,045 | 1,071 |
| LSC Communications, Inc. 8.75% 20231 | 9,510 | 5,163 |
| LSC Communications, Inc., Term Loan B, (3-month USD-LIBOR + 5.50%) 7.124% 20222,4 | 334 | 218 |
| Moog Inc. 4.25% 20271 | 2,383 | 2,431 |
| Nielsen Finance LLC and Nielsen Finance Co. 5.00% 20251 | 900 | 929 |
| Pisces Parent LLC 8.00% 20261 | 3,915 | 4,091 |
| Pisces Parent LLC, Term Loan B, (3-month USD-LIBOR + 3.75%) 5.486% 20252,4 | 937 | 937 |
| Prime Security Services Borrower, LLC 9.25% 20231 | 1,000 | 1,051 |
| PrimeSource Building Products Inc. 9.00% 20231 | 650 | 647 |
| R.R. Donnelley & Sons Co. 7.875% 2021 | 742 | 770 |
| R.R. Donnelley & Sons Co. 6.50% 2023 | 1,375 | 1,410 |
| R.R. Donnelley & Sons Co., Term Loan B, (3-month USD-LIBOR + 5.00%) 6.799% 20242,4 | 1,337 | 1,349 |
| Rexnord Corp. 4.875% 20251 | 2,610 | 2,701 |
| Sensata Technologies Holding BV 4.875% 20231 | 125 | 133 |
| Stericycle, Inc. 5.375% 20241 | 2,000 | 2,104 |
| Swissport Financing SARL 5.25% 2024 | €777 | 929 |
| TransDigm Inc. 6.25% 20261 | $1,250 | 1,356 |
| TransDigm Inc. 5.50% 20271 | 1,025 | 1,038 |
| Uber Technologies, Inc. 7.50% 20231 | 600 | 628 |
| Uber Technologies, Inc. 8.00% 20261 | 1,125 | 1,175 |
| United Continental Holdings, Inc. 6.00% 2020 | 400 | 414 |
| United Rentals, Inc. 4.625% 2025 | 1,360 | 1,401 |
| United Rentals, Inc. 5.25% 2030 | 1,050 | 1,132 |
| Virgin Australia Holdings Ltd. 7.875% 20211 | 1,600 | 1,656 |
American Funds Insurance Series — High-Income Bond Fund — Page 155 of 184
| Bonds, notes & other debt instruments (continued) Corporate bonds & notes (continued) Industrials (continued) | Principal amount (000) | Value (000) |
| Wesco Aircraft Holdings, Inc. 8.50% 20241 | $1,470 | $1,525 |
| Wesco Aircraft Holdings, Inc. 9.00% 20261 | 3,965 | 4,161 |
| 110,257 | ||
| Information technology 6.29% | ||
| Alcatel-Lucent USA Inc. 6.45% 2029 | 1,800 | 1,908 |
| Almonde Inc., Term Loan, (3-month USD-LIBOR + 7.25%) 9.446% 20252,4 | 5,370 | 5,263 |
| Applied Systems, Inc., Term Loan, (3-month USD-LIBOR + 7.00%) 8.945% 20252,4 | 1,825 | 1,873 |
| Banff Merger Sub Inc. 9.75% 20261 | 1,150 | 1,167 |
| Camelot Finance SA 4.50% 20261 | 945 | 973 |
| CDW Corp. 5.00% 2025 | 1,150 | 1,204 |
| CommScope Finance LLC 6.00% 20261 | 1,000 | 1,066 |
| CommScope Technologies LLC 5.50% 20241 | 200 | 203 |
| CommScope Technologies LLC 6.00% 20251 | 1,000 | 1,004 |
| CommScope Technologies LLC 5.00% 20271 | 950 | 895 |
| Diebold Nixdorf AG, Term Loan A1, (3-month USD-LIBOR + 9.25%) 11.062% 20222,4 | 3,660 | 3,871 |
| Diebold Nixdorf AG, Term Loan B, (3-month USD-LIBOR + 2.75%) 4.50% 20232,4 | 793 | 772 |
| Diebold, Inc. 8.50% 2024 | 1,925 | 1,863 |
| Diebold, Inc., Term Loan A, (3-month USD-LIBOR + 4.75%) 6.50% 20222,4,6 | 772 | 749 |
| Ellucian, Inc. 9.00% 20231 | 450 | 464 |
| Fair Isaac Corp. 4.00% 20281 | 875 | 884 |
| Financial & Risk US Holdings, Inc. 6.25% 20261 | 2,161 | 2,362 |
| Financial & Risk US Holdings, Inc. 8.25% 20261 | 910 | 1,027 |
| Financial & Risk US Holdings, Inc., Term Loan B, (3-month USD-LIBOR + 3.25%) 4.952% 20252,4 | 743 | 750 |
| Genesys Telecommunications Laboratories, Inc. 10.00% 20241 | 7,370 | 7,984 |
| GoDaddy Operating Co. 5.25% 20271 | 2,435 | 2,567 |
| Infor (US), Inc. 6.50% 2022 | 5,400 | 5,491 |
| Informatica Corp. 7.125% 20231 | 1,425 | 1,450 |
| Internet Brands, Inc., Term Loan, (3-month USD-LIBOR + 7.50%) 9.299% 20252,4 | 700 | 703 |
| Kronos Inc., Term Loan B, (3-month USD-LIBOR + 8.25%) 10.159% 20242,4 | 8,645 | 8,883 |
| McAfee, LLC, Term Loan, (3-month USD-LIBOR + 3.75%) 5.555% 20242,4 | 1,359 | 1,366 |
| McAfee, LLC, Term Loan, (3-month USD-LIBOR + 8.50%) 10.305% 20252,4 | 766 | 772 |
| Mitchell International, Inc., Term Loan B, (3-month USD-LIBOR + 7.25%) 9.049% 20252,4 | 1,150 | 1,094 |
| MoneyGram International Inc., Term Loan B, (3-month USD-LIBOR + 6.00%) 7.799% 20232,4,6 | 1,229 | 1,115 |
| Solera Holdings, Inc. 10.50% 20241 | 1,100 | 1,169 |
| Tempo Acquisition LLC 6.75% 20251 | 1,625 | 1,682 |
| Unisys Corp. 10.75% 20221 | 6,600 | 7,113 |
| VeriSign, Inc. 4.625% 2023 | 650 | 662 |
| VeriSign, Inc. 5.25% 2025 | 200 | 221 |
| VeriSign, Inc. 4.75% 2027 | 830 | 877 |
| Veritas Holdings Ltd. 7.50% 20231 | 3,530 | 3,531 |
| Veritas Holdings Ltd. 10.50% 20241 | 525 | 487 |
| Veritas US Inc., Term Loan B, (3-month USD-LIBOR + 4.50%) 6.299% 20232,4 | 1,391 | 1,345 |
| Vertafore Inc., Term Loan, (3-month USD-LIBOR + 7.25%) 9.049% 20262,4 | 1,500 | 1,491 |
| ViaSat, Inc. 5.625% 20271 | 835 | 895 |
| Xerox Corp. 4.125% 2023 | 377 | 392 |
| 79,588 | ||
| Financials 5.68% | ||
| AG Merger Sub II, Inc. 10.75% 20271 | 4,734 | 4,747 |
| Alliant Holdings Intermediate, LLC 6.75% 20271 | 2,425 | 2,602 |
| Ally Financial Inc. 8.00% 2020 | 1,540 | 1,554 |
| Ally Financial Inc. 8.00% 2031 | 2,480 | 3,447 |
American Funds Insurance Series — High-Income Bond Fund — Page 156 of 184
| Bonds, notes & other debt instruments (continued) Corporate bonds & notes (continued) Financials (continued) | Principal amount (000) | Value (000) |
| Ally Financial Inc. 8.00% 2031 | $105 | $144 |
| AmWINS Group, Inc. 7.75% 20261 | 885 | 981 |
| AssuredPartners, Inc. 7.00% 20251 | 440 | 449 |
| AssuredPartners, Inc. 8.00% 20271 | 3,075 | 3,207 |
| CIT Group Inc. 4.125% 2021 | 950 | 970 |
| Compass Diversified Holdings 8.00% 20261 | 5,260 | 5,709 |
| Credit Acceptance Corp. 5.125% 20241 | 1,035 | 1,077 |
| Fairstone Financial Inc. 7.875% 20241 | 3,158 | 3,404 |
| FS Energy and Power Fund 7.50% 20231 | 7,115 | 7,308 |
| General Motors Acceptance Corp. 7.50% 2020 | 1,920 | 1,993 |
| goeasy Ltd. 5.375% 20241 | 1,725 | 1,760 |
| HUB International Ltd. 7.00% 20261 | 3,605 | 3,821 |
| Icahn Enterprises Finance Corp. 6.25% 2022 | 2,800 | 2,858 |
| Icahn Enterprises Finance Corp. 5.25% 20271 | 1,280 | 1,312 |
| LPL Financial Holdings Inc. 4.625% 20271 | 2,600 | 2,658 |
| MSCI Inc. 5.375% 20271 | 1,000 | 1,080 |
| MSCI Inc. 4.00% 20291 | 2,890 | 2,935 |
| Navient Corp. 6.50% 2022 | 4,240 | 4,606 |
| Navient Corp. 5.50% 2023 | 4,235 | 4,531 |
| Navient Corp. 6.125% 2024 | 500 | 544 |
| Owl Rock Capital Corp. 4.625% 20241 | 900 | 911 |
| Springleaf Finance Corp. 8.25% 2020 | 450 | 473 |
| Springleaf Finance Corp. 6.125% 2024 | 2,450 | 2,689 |
| Springleaf Finance Corp. 6.625% 2028 | 775 | 876 |
| Springleaf Finance Corp. 5.375% 2029 | 1,480 | 1,548 |
| Starwood Property Trust, Inc. 5.00% 2021 | 1,710 | 1,778 |
| 71,972 | ||
| Utilities 2.96% | ||
| AES Corp. 4.00% 2021 | 1,000 | 1,016 |
| AES Corp. 4.875% 2023 | 1,010 | 1,027 |
| AES Corp. 5.50% 2025 | 1,857 | 1,922 |
| AES Corp. 6.00% 2026 | 2,165 | 2,310 |
| AmeriGas Partners, LP 5.50% 2025 | 700 | 758 |
| AmeriGas Partners, LP 5.75% 2027 | 450 | 495 |
| Calpine Corp. 6.00% 20221 | 425 | 426 |
| Calpine Corp. 5.375% 2023 | 2,450 | 2,484 |
| Calpine Corp. 5.875% 20241 | 2,420 | 2,475 |
| Calpine Corp. 5.75% 2025 | 300 | 309 |
| Calpine Corp. 5.25% 20261 | 405 | 423 |
| Calpine Corp. 5.125% 20281 | 1,205 | 1,233 |
| Clearway Energy Operating LLC 5.00% 2026 | 440 | 456 |
| Clearway Energy Operating LLC 4.75% 20281 | 875 | 888 |
| DPL Inc. 4.35% 20291 | 575 | 555 |
| Edison International 4.125% 2028 | 575 | 590 |
| Emera Inc. 6.75% 2076 (3-month USD-LIBOR + 5.44% on 6/15/2026)5 | 1,650 | 1,867 |
| Enel Società per Azioni 8.75% 20731,5 | 1,750 | 2,059 |
| NGL Energy Partners LP 7.50% 20261 | 2,525 | 2,449 |
| NRG Energy, Inc. 7.25% 2026 | 500 | 547 |
| Pacific Gas and Electric Co. 2.45% 20228 | 675 | 676 |
| Pacific Gas and Electric Co. 3.25% 20238 | 450 | 449 |
| Pacific Gas and Electric Co. 6.05% 20348 | 1,575 | 1,653 |
| Talen Energy Corp. 6.50% 2025 | 575 | 492 |
American Funds Insurance Series — High-Income Bond Fund — Page 157 of 184
| Bonds, notes & other debt instruments (continued) Corporate bonds & notes (continued) Utilities (continued) | Principal amount (000) | Value (000) |
| Talen Energy Corp. 10.50% 20261 | $5,425 | $5,173 |
| Talen Energy Corp. 7.25% 20271 | 4,450 | 4,690 |
| 37,422 | ||
| Real estate 2.64% | ||
| Brookfield Property REIT Inc. 5.75% 20261 | 4,860 | 5,137 |
| Communications Sales & Leasing, Inc. 6.00% 20231 | 450 | 433 |
| Communications Sales & Leasing, Inc. 7.125% 20241 | 400 | 340 |
| Equinix, Inc. 5.875% 2026 | 575 | 611 |
| Five Point Holdings LLC 7.875% 20251 | 775 | 783 |
| Howard Hughes Corp. 5.375% 20251 | 6,070 | 6,343 |
| Iron Mountain Inc. 5.75% 2024 | 3,875 | 3,928 |
| Iron Mountain Inc. 4.875% 20271 | 1,350 | 1,397 |
| Iron Mountain Inc. 5.25% 20281 | 1,840 | 1,917 |
| Medical Properties Trust, Inc. 5.00% 2027 | 2,020 | 2,146 |
| Realogy Corp. 5.25% 20211 | 1,865 | 1,888 |
| Realogy Corp. 4.875% 20231 | 3,985 | 3,925 |
| Realogy Corp. 9.375% 20271 | 2,765 | 2,892 |
| SBA Communications Corp. 4.00% 2022 | 1,010 | 1,032 |
| SBA Communications Corp. 4.875% 2022 | 700 | 710 |
| 33,482 | ||
| Consumer staples 2.63% | ||
| Albertsons Cos. LLC 4.625% 20271 | 1,800 | 1,801 |
| B&G Foods, Inc. 5.25% 2025 | 4,333 | 4,465 |
| B&G Foods, Inc. 5.25% 2027 | 1,485 | 1,502 |
| Cott Beverages Inc. 5.50% 20251 | 1,980 | 2,073 |
| Darling Ingredients Inc. 5.25% 20271 | 380 | 405 |
| Energizer Holdings, Inc. 6.375% 20261 | 2,375 | 2,534 |
| Energizer Holdings, Inc. 7.75% 20271 | 930 | 1,041 |
| Energizer SpinCo, Inc. 5.50% 20251 | 625 | 650 |
| First Quality Enterprises, Inc. 5.00% 20251 | 1,995 | 2,081 |
| Lamb Weston Holdings, Inc. 4.625% 20241 | 850 | 904 |
| Nestle Skin Health SA, Term Loan B1, (3-month USD-LIBOR + 4.25%) 6.195% 20262,4 | 3,080 | 3,113 |
| Performance Food Group, Inc. 5.50% 20271 | 1,595 | 1,709 |
| Post Holdings, Inc. 8.00% 20251 | 1,550 | 1,664 |
| Post Holdings, Inc. 5.00% 20261 | 2,865 | 3,031 |
| Post Holdings, Inc. 5.625% 20281 | 1,955 | 2,110 |
| Post Holdings, Inc. 5.50% 20291 | 1,085 | 1,159 |
| Prestige Brands International Inc. 5.125% 20281 | 321 | 337 |
| Spectrum Brands Inc. 5.75% 2025 | 800 | 837 |
| TreeHouse Foods, Inc. 6.00% 20241 | 1,800 | 1,869 |
| 33,285 | ||
| Total corporate bonds & notes | 1,175,116 | |
| Municipals 0.00% Puerto Rico 0.00% | ||
| Aqueduct and Sewer Auth., Rev. Bonds, Series 2012-B, 5.35% 2027 | 5 | 5 |
| Total bonds, notes & other debt instruments(cost: $1,171,836,000) | 1,175,121 |
American Funds Insurance Series — High-Income Bond Fund — Page 158 of 184
| Convertible bonds 0.37% Communication services 0.22% | Principal amount (000) | Value (000) |
| DISH DBS Corp., convertible notes, 3.375% 2026 | $1,010 | $974 |
| Gogo Inc., convertible notes, 6.00% 2022 | 797 | 1,001 |
| Liberty Media Corp. 2.75% 20491 | 560 | 589 |
| Twitter, Inc. 1.00% 2021 | 227 | 221 |
| 2,785 | ||
| Health care 0.10% | ||
| Teva Pharmaceutical Finance Co. BV, Series C, convertible bonds, 0.25% 2026 | 1,375 | 1,310 |
| Materials 0.05% | ||
| Cleveland-Cliffs Inc., convertible notes, 1.50% 2025 | 500 | 599 |
| Total convertible bonds(cost: $4,531,000) | 4,694 | |
| Convertible stocks 0.63% Industrials 0.43% | Shares | |
| Associated Materials, LLC, convertible preferred, 14.00% 20206,7 | 4,850 | 4,834 |
| Stanley Black & Decker, Inc., convertible preferred, 5.25% 2022 | 6,000 | 654 |
| 5,488 | ||
| Utilities 0.16% | ||
| Dominion Energy, Inc., Series A units, convertible preferred, 7.25% 2022 | 8,600 | 920 |
| Southern Co., units, convertible preferred, 6.75% 2022 | 11,000 | 593 |
| DTE Energy Co., units, convertible preferred, 6.25% 2022 | 10,263 | 526 |
| 2,039 | ||
| Information technology 0.04% | ||
| Broadcom Inc., Series A, cumulative convertible preferred, 8.00% 2022 | 450 | 530 |
| Total convertible stocks(cost: $7,673,000) | 8,057 | |
| Preferred securities 0.17% Consumer discretionary 0.17% | ||
| Neiman Marcus Group, Inc., preferred shares1,10 | 2,470,906 | 2,187 |
| Total preferred securities(cost: $1,656,000) | 2,187 | |
| Common stocks 1.11% Energy 0.55% | ||
| Weatherford International10 | 156,872 | 4,385 |
| Tribune Resources, Inc.6,10 | 1,006,339 | 1,635 |
| Ascent Resources - Utica, LLC, Class A6,7,10,11 | 6,297,894 | 882 |
| McDermott International, Inc.10 | 3,370 | 2 |
| 6,904 | ||
| Health care 0.34% | ||
| Rotech Healthcare Inc.6,7,10,11 | 201,793 | 4,036 |
| Advanz Pharma Corp.10,11 | 80,350 | 234 |
| Advanz Pharma Corp.10 | 29,584 | 86 |
| 4,356 |
American Funds Insurance Series — High-Income Bond Fund — Page 159 of 184
| Common stocks (continued) Materials 0.07% | Shares | Value (000) |
| Hexion Holdings Corp., Class B10 | 74,701 | $900 |
| Utilities 0.07% | ||
| Aqua America, Inc. | 13,000 | 811 |
| Information technology 0.05% | ||
| Diebold Nixdorf, Inc.10 | 32,000 | 338 |
| MoneyGram International, Inc.10 | 145,000 | 304 |
| Corporate Risk Holdings I, Inc.6,7,10 | 218,504 | 26 |
| 668 | ||
| Communication services 0.03% | ||
| iHeartMedia, Inc., Class A10 | 22,639 | 382 |
| Frontier Communications Corp.10 | 13,333 | 12 |
| Adelphia Recovery Trust, Series Arahova6,7,10 | 388,601 | 2 |
| Adelphia Recovery Trust, Series ACC-16,7,10 | 449,306 | —9 |
| 396 | ||
| Total common stocks(cost: $19,328,000) | 14,035 | |
| Rights & warrants 0.06% Energy 0.06% | ||
| Sable Permian Resources, LLC, warrants, expire 20241,6,7,10 | 9,715 | 700 |
| Tribune Resources, Inc., Class A, warrants, expire 20236,7,10 | 336,564 | 5 |
| Tribune Resources, Inc., Class B, warrants, expire 20236,7,10 | 261,772 | 2 |
| Tribune Resources, Inc., Class C, warrants, expire 20236,7,10 | 247,225 | 1 |
| Ultra Petroleum Corp., warrants, expire 202510 | 80,710 | 3 |
| 711 | ||
| Industrials 0.00% | ||
| Associated Materials, LLC, warrants, expire 20236,7,10 | 68,899 | —9 |
| Total rights & warrants(cost: $2,287,000) | 711 | |
| Short-term securities 3.09% Money market investments 3.09% | ||
| Capital Group Central Cash Fund 1.73%12 | 391,124 | 39,112 |
| Total short-term securities(cost: $38,979,000) | 39,112 | |
| Total investment securities 98.23%(cost: $1,246,290,000) | 1,243,917 | |
| Other assets less liabilities 1.77% | 22,376 | |
| Net assets 100.00% | $1,266,293 |
American Funds Insurance Series — High-Income Bond Fund — Page 160 of 184
Futures contracts
| Contracts | Type | Number of contracts | Expiration | Notional amount13 (000) | Value at 12/31/201914 (000) | Unrealized (depreciation) appreciation at 12/31/2019 (000) |
| 2 Year U.S. Treasury Note Futures | Long | 295 | April 2020 | $59,000 | $63,572 | $(33) |
| 10 Year Ultra U.S. Treasury Note Futures | Short | 113 | March 2020 | (11,300) | (15,899) | 192 |
| $159 |
Swap contracts
Credit default swaps
Centrally cleared credit default swaps on credit indices — buy protection
| Receive | Pay/ Payment frequency | Expiration date | Notional (000) | Value at 12/31/2019 (000) | Upfront payments (000) | Unrealized depreciation at 12/31/2019 (000) |
| CDX.NA.IG.33 | 1.00%/Quarterly | 12/20/2024 | $41,200 | $(1,068) | $(970) | $(98) |
| CDX.NA.HY.33 | 5.00%/Quarterly | 12/20/2024 | 53,680 | (5,171) | (3,691) | (1,480) |
| $(4,661) | $(1,578) |
| 1 | Acquired in a transaction exempt from registration under Rule 144A of the Securities Act of 1933. May be resold in the U.S. in transactions exempt from registration, normally to qualified institutional buyers. The total value of all such securities was $792,983,000, which represented 62.62% of the net assets of the fund. |
| 2 | Loan participations and assignments; may be subject to legal or contractual restrictions on resale. The total value of all such loans was $64,996,000, which represented 5.13% of the net assets of the fund. |
| 3 | Payment in kind; the issuer has the option of paying additional securities in lieu of cash. Most recent payment was 100% cash unless otherwise noted. |
| 4 | Coupon rate may change periodically. Reference rate and spread are as of the most recent information available. Some coupon rates are determined by the issuer or agent based on current market conditions; therefore, the reference rate and spread are not available. |
| 5 | Step bond; coupon rate may change at a later date. |
| 6 | Valued under fair value procedures adopted by authority of the board of trustees. The total value of all such securities was $23,174,000, which represented 1.83% of the net assets of the fund. |
| 7 | Value determined using significant unobservable inputs. |
| 8 | Scheduled interest and/or principal payment was not received. |
| 9 | Amount less than one thousand. |
| 10 | Security did not produce income during the last 12 months. |
| 11 | Acquired through a private placement transaction exempt from registration under the Securities Act of 1933. May be subject to legal or contractual restrictions on resale. Further details on these holdings appear below. |
| 12 | Rate represents the seven-day yield at 12/31/2019. |
| 13 | Notional amount is calculated based on the number of contracts and notional contract size. |
| 14 | Value is calculated based on the notional amount and current market price. |
| Private placement securities | Acquisition date | Cost (000) | Value (000) | Percent of net assets |
| Rotech Healthcare Inc. | 9/26/2013 | $4,331 | $4,036 | .32% |
| Ascent Resources - Utica, LLC, Class A | 11/15/2016 | 302 | 882 | .07 |
| Advanz Pharma Corp. | 8/31/2018 | 1,017 | 234 | .02 |
| Total private placement securities | $5,650 | $5,152 | .41% |
| Key to abbreviations and symbols |
| Auth. = Authority |
| € = Euros |
| LIBOR = London Interbank Offered Rate |
| Rev. = Revenue |
| USD/$ = U.S. dollars |
American Funds Insurance Series — High-Income Bond Fund — Page 161 of 184
Mortgage Fund
Investment portfolio
December 31, 2019
| Bonds, notes & other debt instruments 81.04% Mortgage-backed obligations 63.38% Federal agency mortgage-backed obligations 59.31% | Principal amount (000) | Value (000) |
| Fannie Mae 5.00% 20361 | $37 | $38 |
| Fannie Mae Pool #AJ7716 3.00% 20261 | 832 | 856 |
| Fannie Mae Pool #AJ8325 3.00% 20261 | 171 | 176 |
| Fannie Mae Pool #AL5603 3.00% 20271 | 873 | 896 |
| Fannie Mae Pool #MA3159 3.00% 20271 | 48 | 49 |
| Fannie Mae Pool #MA3315 3.00% 20281 | 18 | 18 |
| Fannie Mae Pool #AL3803 3.00% 20281 | 13 | 13 |
| Fannie Mae Pool #BM4299 3.00% 20301 | 965 | 989 |
| Fannie Mae Pool #BJ9590 3.00% 20341 | 1,855 | 1,901 |
| Fannie Mae Pool #MA2856 4.00% 20361 | 404 | 429 |
| Fannie Mae Pool #BM4488 3.435% 20481,2 | 1,690 | 1,730 |
| Fannie Mae Pool #MA3692 3.50% 20491 | 3,160 | 3,247 |
| Fannie Mae Pool #CA4566 3.50% 20491 | 2,992 | 3,077 |
| Fannie Mae Pool #FM0020 3.50% 20491 | 1,296 | 1,336 |
| Fannie Mae Pool #FM1028 3.50% 20491 | 125 | 129 |
| Fannie Mae Pool #BN8901 3.50% 20491 | 70 | 72 |
| Fannie Mae Pool #BJ8402 3.549% 20491,2 | 297 | 306 |
| Freddie Mac 5.00% 20341 | 1,037 | 1,144 |
| Freddie Mac 4.00% 20361 | 4,219 | 4,497 |
| Freddie Mac Pool #ZK3775 3.00% 20261 | 790 | 811 |
| Freddie Mac Pool #ZS6520 3.00% 20271 | 188 | 194 |
| Freddie Mac Pool #ZS6765 3.00% 20281 | 172 | 177 |
| Freddie Mac Pool #ZS8574 3.00% 20301 | 191 | 196 |
| Freddie Mac Pool #SB8002 3.00% 20341 | 1,750 | 1,794 |
| Freddie Mac Pool #QN0549 3.00% 20341 | 48 | 49 |
| Freddie Mac Pool #SB8027 3.00% 20351 | 1,278 | 1,313 |
| Freddie Mac Pool #760012 3.01% 20451,2 | 133 | 134 |
| Freddie Mac Pool #760013 3.009% 20451,2 | 104 | 105 |
| Freddie Mac Pool #760014 3.486% 20451,2 | 1,595 | 1,627 |
| Freddie Mac Pool #760015 3.238% 20471,2 | 228 | 229 |
| Freddie Mac Pool #ZT1319 3.50% 20481 | 180 | 185 |
| Freddie Mac Pool #SD8005 3.50% 20491 | 4,462 | 4,585 |
| Freddie Mac Pool #SD8001 3.50% 20491 | 3,325 | 3,417 |
| Freddie Mac Pool #ZT1863 3.50% 20491 | 779 | 801 |
| Freddie Mac Pool #RA1824 3.50% 20491 | 776 | 799 |
| Freddie Mac Pool #ZT1951 3.50% 20491 | 394 | 405 |
| Freddie Mac, Series KJ02, Class A2, Multi Family, 2.597% 20201 | 194 | 194 |
| Freddie Mac, Series K031, Class A2, Multi Family, 3.30% 20231 | 4,722 | 4,908 |
| Freddie Mac, Series K032, Class A2, Multi Family, 3.31% 20231 | 1,250 | 1,301 |
| Freddie Mac Seasoned Credit Risk Transfer Trust, Series 2017-2, Class HA, 3.00% 20561,3 | 1,490 | 1,515 |
| Freddie Mac Seasoned Credit Risk Transfer Trust, Series 2017-2, Class MA, 3.00% 20561 | 1,437 | 1,464 |
| Freddie Mac Seasoned Credit Risk Transfer Trust, Series 2017-1, Class HA, 3.00% 20561,2 | 1,228 | 1,252 |
| Freddie Mac Seasoned Credit Risk Transfer Trust, Series 2017-4, Class HT, 3.25% 20571,3 | 10,713 | 11,041 |
| Freddie Mac Seasoned Credit Risk Transfer Trust, Series 2018-2, Class MT, 3.50% 20571 | 9,853 | 10,390 |
| Freddie Mac Seasoned Credit Risk Transfer Trust, Series 2017-4, Class MT, 3.50% 20571 | 6,803 | 7,063 |
American Funds Insurance Series — Mortgage Fund — Page 162 of 184
| Bonds, notes & other debt instruments (continued) Mortgage-backed obligations (continued) Federal agency mortgage-backed obligations (continued) | Principal amount (000) | Value (000) |
| Freddie Mac Seasoned Credit Risk Transfer Trust, Series 2019-4, Class MA, 3.00% 20591 | $3,737 | $3,808 |
| Freddie Mac Seasoned Loan Structured Transaction Trust, Series 2018-2, Class A1, 3.50% 20281 | 6,847 | 7,090 |
| Freddie Mac Seasoned Loan Structured Transaction Trust, Series 2018-1, Class A1, 3.50% 20281 | 1,873 | 1,934 |
| Freddie Mac Seasoned Loan Structured Transaction Trust, Series 2019-3, Class A1C, 2.75% 20291 | 9,962 | 10,100 |
| Government National Mortgage Assn. 3.75% 20341 | 1,137 | 1,181 |
| Government National Mortgage Assn. 3.75% 20381 | 761 | 793 |
| Government National Mortgage Assn. 3.75% 20391 | 787 | 820 |
| Government National Mortgage Assn. 4.00% 20391 | 322 | 324 |
| Government National Mortgage Assn. 6.00% 20391 | 177 | 200 |
| Government National Mortgage Assn. 4.00% 20401 | 371 | 373 |
| Government National Mortgage Assn. 5.50% 20401 | 1,469 | 1,640 |
| Government National Mortgage Assn. 4.50% 20411 | 30 | 31 |
| Government National Mortgage Assn. 5.00% 20411 | 869 | 948 |
| Government National Mortgage Assn. 5.00% 20411 | 650 | 690 |
| Government National Mortgage Assn. 6.50% 20411 | 149 | 159 |
| Government National Mortgage Assn. 3.50% 20421 | 215 | 221 |
| Government National Mortgage Assn. 3.50% 20421 | 216 | 217 |
| Government National Mortgage Assn. 3.50% 20431 | 1,887 | 1,973 |
| Government National Mortgage Assn. 3.50% 20431 | 1,535 | 1,605 |
| Government National Mortgage Assn. 3.50% 20431 | 1,214 | 1,275 |
| Government National Mortgage Assn. 3.50% 20431 | 880 | 919 |
| Government National Mortgage Assn. 3.50% 20431 | 707 | 733 |
| Government National Mortgage Assn. 3.50% 20431 | 207 | 214 |
| Government National Mortgage Assn. 3.75% 20441 | 610 | 637 |
| Government National Mortgage Assn. 4.25% 20441 | 1,574 | 1,682 |
| Government National Mortgage Assn. 4.00% 20461 | 705 | 727 |
| Government National Mortgage Assn. 4.50% 20491 | 16,600 | 17,345 |
| Government National Mortgage Assn. 4.00% 20501,4 | 4,760 | 4,927 |
| Government National Mortgage Assn. 4.50% 20501,4 | 2,639 | 2,759 |
| Government National Mortgage Assn. Pool #AA5326 3.50% 20421 | 361 | 365 |
| Government National Mortgage Assn. Pool #MA1411 3.50% 20431 | 244 | 244 |
| Government National Mortgage Assn. Pool #MA5986 4.00% 20491 | 1,030 | 1,068 |
| Government National Mortgage Assn. Pool #MA5931 4.00% 20491 | 162 | 168 |
| Government National Mortgage Assn. Pool #MA5877 4.50% 20491 | 1,727 | 1,804 |
| Government National Mortgage Assn. Pool #MA5987 4.50% 20491 | 1,172 | 1,229 |
| Government National Mortgage Assn. Pool #MA6156 4.50% 20491 | 1,002 | 1,053 |
| Government National Mortgage Assn. Pool #MA6092 4.50% 20491 | 616 | 649 |
| Government National Mortgage Assn. Pool #MA6041 4.50% 20491 | 559 | 587 |
| Government National Mortgage Assn. Pool #MA6042 5.00% 20491 | —5 | —5 |
| Government National Mortgage Assn. Pool #AO0409 4.531% 20651 | 333 | 349 |
| Government National Mortgage Assn. Pool #AO0461 4.542% 20651 | 182 | 190 |
| Government National Mortgage Assn. Pool #AN1825 4.558% 20651 | 575 | 602 |
| Government National Mortgage Assn. Pool #AO0385 4.514% 20661 | 972 | 1,035 |
| Government National Mortgage Assn. Pool #725897 5.20% 20661 | 6 | 7 |
| Uniform Mortgage-Backed Security 3.00% 20351,4 | 15,493 | 15,864 |
| Uniform Mortgage-Backed Security 3.00% 20351,4 | 17 | 17 |
| Uniform Mortgage-Backed Security 4.50% 20501,4 | 3,000 | 3,159 |
| Vendee Mortgage Trust, Series 2011-2, Class V, 3.75% 20281 | 3,774 | 3,806 |
| Vendee Mortgage Trust, Series 2010-1, Class DA, 4.25% 20351 | 292 | 298 |
| 174,671 |
American Funds Insurance Series — Mortgage Fund — Page 163 of 184
| Bonds, notes & other debt instruments (continued) Mortgage-backed obligations (continued) Collateralized mortgage-backed obligations (privately originated) 4.07% | Principal amount (000) | Value (000) |
| Arroyo Mortgage Trust, Series 2018-1, Class A1, 3.763% 20481,2,6 | $662 | $671 |
| Cascade Funding Mortgage Trust, Series 2019-HB1, Class A, 2.386% 20291,2,6 | 328 | 329 |
| Finance of America HECM Buyout, Series 2019-AB1, Class A, 2.656% 20491,6,7 | 1,271 | 1,270 |
| Finance of America Structured Securities Trust, Series 2018-HB1, Class A, 3.375% 20281,2,6 | 1,121 | 1,122 |
| Finance of America Structured Securities Trust, Series 2019-HB1, Class A, 3.279% 20291,2,6 | 817 | 823 |
| JPMorgan Mortgage Trust, Series 2019-INV3, Class A13, 3.50% 20501,2,6 | 830 | 848 |
| JPMorgan Mortgage Trust, Series 2019-INV3, Class A3, 3.50% 20501,2,6 | 791 | 808 |
| Mello Warehouse Securitization Trust, Series 2019-2, Class A, (1-month USD-LIBOR + 0.75%) 2.573% 20521,2,6 | 750 | 750 |
| Nationstar HECM Loan Trust, Series 2018-2, Class A, 3.188% 20281,2,6 | 268 | 268 |
| Nationstar HECM Loan Trust, Series 2018-3A, Class A, 3.555% 20281,2,6 | 329 | 332 |
| Nationstar HECM Loan Trust, Series 2019-2A, Class A, 2.575% 20291,2,6 | 692 | 694 |
| Nationstar HECM Loan Trust, Series 2019-1A, Class A, 2.651% 20291,2,6 | 729 | 730 |
| Reverse Mortgage Investment Trust, Series 2018-1, Class A, 3.436% 20281,2,6 | 154 | 154 |
| RMF Proprietary Issuance Trust, Series 2019-1, Class A, 2.75% 20631,2,6 | 1,246 | 1,235 |
| Station Place Securitization Trust, Series 2019-WL1, Class A, (1-month USD-LIBOR + 0.65%) 2.442% 20521,2,6 | 1,140 | 1,143 |
| Towd Point Mortgage Trust, Series 2017-5, Class A1, 2.392% 20571,2,6 | 46 | 46 |
| Towd Point Mortgage Trust, Series 2015-2, Class 2A11, 3.00% 20571,2,6 | 753 | 756 |
| 11,979 | ||
| Total mortgage-backed obligations | 186,650 | |
| U.S. Treasury bonds & notes 9.65% U.S. Treasury 4.86% | ||
| U.S. Treasury 2.00% 2022 | 2,400 | 2,425 |
| U.S. Treasury 2.125% 2022 | 1,000 | 1,015 |
| U.S. Treasury 1.75% 2023 | 3,500 | 3,513 |
| U.S. Treasury 2.75% 2023 | 224 | 232 |
| U.S. Treasury 2.875% 2023 | 4,350 | 4,547 |
| U.S. Treasury 2.50% 2024 | 2,500 | 2,588 |
| 14,320 | ||
| U.S. Treasury inflation-protected securities 4.79% | ||
| U.S. Treasury Inflation-Protected Security 0.625% 20238 | 6,216 | 6,315 |
| U.S. Treasury Inflation-Protected Security 2.125% 20418 | 129 | 170 |
| U.S. Treasury Inflation-Protected Security 0.75% 20428,9 | 7,328 | 7,629 |
| 14,114 | ||
| Total U.S. Treasury bonds & notes | 28,434 | |
| Federal agency bonds & notes 6.42% | ||
| Fannie Mae 2.00% 2022 | 5,800 | 5,849 |
| Federal Home Loan Bank 1.375% 2021 | 3,000 | 2,992 |
| Federal Home Loan Bank 1.875% 2021 | 10,000 | 10,055 |
| 18,896 | ||
| Asset-backed obligations 1.59% | ||
| AmeriCredit Automobile Receivables Trust, Series 2018-1, Class A2A, 2.71% 20211 | 5 | 5 |
| Angel Oak Capital Advisors LLC, CLO, Series 2013-9A, Class A1R, (3-month USD-LIBOR + 1.01%) 2.976% 20251,2,6 | 29 | 30 |
| CPS Auto Receivables Trust, Series 2018-B, Class A, 2.72% 20211,6 | 19 | 19 |
| Drive Auto Receivables Trust, Series 2017-3, Class C, 2.80% 20221 | 97 | 97 |
| Drivetime Auto Owner Trust, Series 2019-3, Class A, 2.55% 20221,6 | 222 | 223 |
| Ford Credit Floorplan Master Owner Trust, Series 2019-3, Class A1, 2.23% 20241 | 1,000 | 1,003 |
American Funds Insurance Series — Mortgage Fund — Page 164 of 184
| Bonds, notes & other debt instruments (continued) Asset-backed obligations (continued) | Principal amount (000) | Value (000) |
| Hertz Vehicle Financing LLC, Rental Car Asset-Backed Notes, Series 2015-1, Class A, 2.73% 20211,6 | $1,823 | $1,825 |
| Palmer Square Loan Funding, CLO, Series 2019-2, Class A1, (3-month USD-LIBOR + 0.97%) 2.936% 20271,2,6 | 784 | 784 |
| Symphony Ltd., CLO, Series 2013-12A, Class AR, (3-month USD-LIBOR + 1.03%) 3.031% 20251,2,6 | 210 | 210 |
| Toyota Auto Receivables Owner Trust, Series 2018-B, Class A2A, 2.64% 20211 | 273 | 273 |
| Westlake Automobile Receivables Trust, Series 2018-2A, Class A2A, 2.84% 20211,6 | 159 | 159 |
| Westlake Automobile Receivables Trust, Series 2017-1A, Class C, 2.70% 20221,6 | 53 | 53 |
| 4,681 | ||
| Total bonds, notes & other debt instruments(cost: $234,202,000) | 238,661 | |
| Short-term securities 13.90% Federal agency discount notes 13.05% | ||
| Fannie Mae 1.50%-1.55% due 1/22/2020-1/23/2020 | 12,500 | 12,489 |
| Federal Farm Credit Banks 1.57%due 1/30/2020 | 8,000 | 7,990 |
| Federal Home Loan Bank 1.55%-1.59% due 1/3/2020-2/18/2020 | 13,000 | 12,988 |
| Freddie Mac 1.64%due 3/18/2020 | 5,000 | 4,984 |
| 38,451 | ||
| Commercial paper 0.85% | ||
| Starbird Funding Corp. 1.58%due 1/2/20206 | 2,500 | 2,500 |
| Total short-term securities(cost: $40,948,000) | 40,951 | |
| Total investment securities 94.94%(cost: $275,150,000) | 279,612 | |
| Other assets less liabilities 5.06% | 14,898 | |
| Net assets 100.00% | $294,510 |
Futures contracts
| Contracts | Type | Number of contracts | Expiration | Notional amount10 (000) | Value at 12/31/201911 (000) | Unrealized depreciation at 12/31/2019 (000) |
| 2 Year U.S. Treasury Note Futures | Long | 425 | April 2020 | $85,000 | $91,588 | $(49) |
| 5 Year U.S. Treasury Note Futures | Long | 427 | April 2020 | 42,700 | 50,646 | (176) |
| 10 Year Ultra U.S. Treasury Note Futures | Long | 126 | March 2020 | 12,600 | 17,729 | (213) |
| 10 Year U.S. Treasury Note Futures | Long | 79 | March 2020 | 7,900 | 10,145 | (95) |
| 20 Year U.S. Treasury Bond Futures | Long | 56 | March 2020 | 5,600 | 8,731 | (186) |
| 30 Year Ultra U.S. Treasury Bond Futures | Long | 5 | March 2020 | 500 | 908 | (27) |
| $(746) |
Swap contracts
Interest rate swaps
| Receive | Pay | Expiration date | Notional (000) | Value at 12/31/2019 (000) | Upfront payments/ receipts (000) | Unrealized (depreciation) appreciation at 12/31/2019 (000) |
| 1.553% | U.S. EFFR | 1/29/2020 | $102,700 | $—5 | $— | $—5 |
| 1.5365% | U.S. EFFR | 1/29/2020 | 81,500 | (1) | — | (1) |
| 1.535% | U.S. EFFR | 1/29/2020 | 85,500 | (1) | — | (1) |
| 1.531% | U.S. EFFR | 3/18/2020 | 95,000 | (4) | — | (4) |
American Funds Insurance Series — Mortgage Fund — Page 165 of 184
Swap contracts (continued)
Interest rate swaps (continued)
| Receive | Pay | Expiration date | Notional (000) | Value at 12/31/2019 (000) | Upfront payments/ receipts (000) | Unrealized (depreciation) appreciation at 12/31/2019 (000) |
| 1.515% | U.S. EFFR | 3/18/2020 | $86,100 | $(6) | $— | $(6) |
| 1.5155% | U.S. EFFR | 3/18/2020 | 182,000 | (12) | — | (12) |
| 1.5135% | U.S. EFFR | 3/18/2020 | 181,900 | (13) | — | (13) |
| 3-month USD-LIBOR | 2.806% | 8/29/2020 | 300 | (2) | — | (2) |
| 1.4555% | U.S. EFFR | 12/10/2020 | 16,900 | (10) | — | (10) |
| 1.454% | U.S. EFFR | 12/10/2020 | 20,100 | (12) | — | (12) |
| 1.487% | U.S. EFFR | 12/16/2020 | 18,375 | (5) | — | (5) |
| 1.491% | U.S. EFFR | 12/16/2020 | 18,625 | (5) | — | (5) |
| 1.34% | U.S. EFFR | 10/18/2021 | 21,000 | (42) | — | (42) |
| 2.0135% | 3-month USD-LIBOR | 10/20/2021 | 30,000 | 171 | — | 171 |
| 1.3615% | U.S. EFFR | 11/1/2021 | 29,500 | (45) | — | (45) |
| 1.281% | U.S. EFFR | 11/4/2021 | 29,500 | (88) | — | (88) |
| U.S. EFFR | 1.335% | 11/26/2021 | 30,000 | 61 | — | 61 |
| 2.012% | 3-month USD-LIBOR | 10/4/2022 | 9,000 | 82 | — | 82 |
| 2.00% | 3-month USD-LIBOR | 10/5/2022 | 41,500 | 364 | — | 364 |
| 2.1045% | 3-month USD-LIBOR | 10/31/2022 | 4,000 | 48 | — | 48 |
| 3-month USD-LIBOR | 2.2835% | 1/5/2023 | 36,000 | (640) | — | (640) |
| 2.21875% | U.S. EFFR | 3/14/2024 | 9,000 | 271 | — | 271 |
| 3-month USD-LIBOR | 2.322% | 5/2/2024 | 10,100 | (262) | — | (262) |
| 3-month USD-LIBOR | 2.325% | 5/2/2024 | 23,300 | (606) | — | (606) |
| 3-month USD-LIBOR | 2.24% | 12/5/2026 | 10,500 | (313) | — | (313) |
| 3-month USD-LIBOR | 2.05% | 7/18/2029 | 6,000 | (92) | — | (92) |
| U.S. EFFR | 1.485% | 10/23/2029 | 2,100 | 32 | — | 32 |
| U.S. EFFR | 1.4869% | 10/23/2029 | 1,900 | 29 | — | 29 |
| U.S. EFFR | 1.453% | 10/24/2029 | 2,500 | 45 | — | 45 |
| U.S. EFFR | 1.4741% | 10/24/2029 | 2,500 | 41 | — | 41 |
| U.S. EFFR | 1.4495% | 10/24/2029 | 1,800 | 33 | — | 33 |
| U.S. EFFR | 1.446% | 10/24/2029 | 200 | 4 | — | 4 |
| 1.419% | U.S. EFFR | 11/26/2029 | 6,000 | (130) | — | (130) |
| 3-month USD-LIBOR | 3.206% | 7/31/2044 | 1,000 | (222) | — | (222) |
| 3-month USD-LIBOR | 3.238% | 8/8/2044 | 2,000 | (457) | — | (457) |
| 3-month USD-LIBOR | 3.2265% | 9/25/2044 | 3,000 | (682) | — | (682) |
| U.S. EFFR | 2.155% | 11/10/2047 | 1,280 | (86) | — | (86) |
| U.S. EFFR | 2.5635% | 2/12/2048 | 4,528 | (714) | — | (714) |
| 2.98% | 3-month USD-LIBOR | 3/15/2048 | 300 | 59 | — | 59 |
| 2.9625% | 3-month USD-LIBOR | 3/15/2048 | 300 | 57 | — | 57 |
| 2.917% | 3-month USD-LIBOR | 3/16/2048 | 600 | 109 | — | 109 |
| 3-month USD-LIBOR | 1.934% | 12/12/2049 | 2,200 | 80 | — | 80 |
| 3-month USD-LIBOR | 1.935% | 12/17/2049 | 2,480 | 90 | — | 90 |
| 3-month USD-LIBOR | 2.007% | 12/19/2049 | 900 | 18 | — | 18 |
| 3-month USD-LIBOR | 2.045% | 12/27/2049 | 2,200 | 24 | — | 24 |
| $— | $(2,832) |
American Funds Insurance Series — Mortgage Fund — Page 166 of 184
| 1 | Principal payments may be made periodically. Therefore, the effective maturity date may be earlier than the stated maturity date. |
| 2 | Coupon rate may change periodically. Reference rate and spread are as of the most recent information available. Some coupon rates are determined by the issuer or agent based on current market conditions; therefore, the reference rate and spread are not available. |
| 3 | Step bond; coupon rate may change at a later date. |
| 4 | Purchased on a TBA basis. |
| 5 | Amount less than one thousand. |
| 6 | Acquired in a transaction exempt from registration under Rule 144A or Section 4(2) of the Securities Act of 1933. May be resold in the U.S. in transactions exempt from registration, normally to qualified institutional buyers. The total value of all such securities was $17,782,000, which represented 6.04% of the net assets of the fund. |
| 7 | Valued under fair value procedures adopted by authority of the board of trustees. The total value of the security was $1,270,000, which represented .43% of the net assets of the fund. |
| 8 | Index-linked bond whose principal amount moves with a government price index. |
| 9 | All or a portion of this security was pledged as collateral. The total value of pledged collateral was $4,195,000, which represented 1.42% of the net assets of the fund. |
| 10 | Notional amount is calculated based on the number of contracts and notional contract size. |
| 11 | Value is calculated based on the notional amount and current market price. |
| Key to abbreviations and symbol |
| CLO = Collateralized Loan Obligations |
| EFFR = Effective Federal Funds Rate |
| LIBOR = London Interbank Offered Rate |
| TBA = To-be-announced |
| USD/$ = U.S. dollars |
American Funds Insurance Series — Mortgage Fund — Page 167 of 184
Ultra-Short Bond Fund
Investment portfolio
December 31, 2019
| Short-term securities 99.86% Commercial paper 71.65% | Principal amount (000) | Value (000) |
| Alberta (Province of) 1.78%due 1/8/20201 | $9,000 | $8,997 |
| American Honda Finance Corp. 1.84%due 1/6/2020 | 11,000 | 10,997 |
| BMW U.S. Capital LLC 1.61%due 1/8/20201 | 7,000 | 6,997 |
| Chariot Funding, LLC 2.00%due 1/7/20201 | 9,300 | 9,297 |
| CHARTA, LLC 1.78%due 1/16/20201 | 10,000 | 9,992 |
| Eli Lilly and Co. 1.66%due 1/6/20201 | 10,000 | 9,997 |
| ExxonMobil Corp. 1.65%due 2/18/2020 | 10,000 | 9,977 |
| Henkel of America, Inc. 1.75%due 2/4/20201 | 7,000 | 6,989 |
| LVMH Moët Hennessy Louis Vuitton Inc. 1.70%due 2/13/20201 | 10,000 | 9,980 |
| National Rural Utilities Cooperative Finance Corp. 1.72%due 1/13/2020 | 8,100 | 8,095 |
| Nederlandse Waterschapsbank N.V. 1.84%due 3/18/20201 | 10,000 | 9,961 |
| New York Life Capital Corp. 1.60%due 2/12/20201 | 10,000 | 9,980 |
| NRW.BANK 1.90%due 1/21/20201 | 9,000 | 8,991 |
| OMERS Finance Trust 1.87%due 1/22/20201 | 10,000 | 9,990 |
| Oversea-Chinese Banking Corp. Ltd. 1.87%due 1/24/20201 | 10,800 | 10,787 |
| Pfizer Inc. 2.04%due 1/23/20201 | 11,700 | 11,688 |
| Simon Property Group, LP 1.70%due 1/13/20201 | 8,100 | 8,095 |
| ST Engineering North America, Inc. 1.87%due 1/21/20201 | 2,000 | 1,998 |
| Starbird Funding Corp. 1.58%due 1/2/20201 | 6,000 | 6,000 |
| United Overseas Bank Ltd. 1.83%due 2/25/20201 | 10,000 | 9,974 |
| United Parcel Service Inc. 1.62%due 1/13/20201 | 10,200 | 10,195 |
| Victory Receivables Corp. 1.82%due 2/3/20201 | 10,000 | 9,983 |
| Walt Disney Co. 1.69%due 2/26/20201 | 5,000 | 4,986 |
| 203,946 | ||
| Federal agency discount notes 14.73% | ||
| Fannie Mae 1.53%due 1/10/2020 | 10,000 | 9,996 |
| Federal Farm Credit Banks 1.55%due 3/4/2020 | 7,000 | 6,981 |
| Federal Home Loan Bank 1.57%due 1/31/2020 | 15,000 | 14,982 |
| Freddie Mac 1.55%due 3/10/2020 | 10,000 | 9,971 |
| 41,930 | ||
| Bonds & notes of governments & government agencies outside the U.S. 9.97% | ||
| CPPIB Capital Inc. 1.82%due 1/24/2020 | 10,000 | 9,989 |
| Ontario (Province of) 1.74%due 2/3/2020 | 7,400 | 7,389 |
| Québec (Province of) 1.85%due 1/16/20201 | 11,000 | 10,992 |
| 28,370 | ||
| U.S. Treasury 3.51% | ||
| U.S. Treasury Bill 1.50%due 2/11/2020 | 10,000 | 9,983 |
| Total short-term securities(cost: $284,222,000) | 284,229 | |
| Total investment securities 99.86%(cost: $284,222,000) | 284,229 | |
| Other assets less liabilities 0.14% | 401 | |
| Net assets 100.00% | $284,630 |
American Funds Insurance Series — Ultra-Short Bond Fund — Page 168 of 184
| 1 | Acquired in a transaction exempt from registration under Rule 144A or Section 4(2) of the Securities Act of 1933. May be resold in the U.S. in transactions exempt from registration, normally to qualified institutional buyers. The total value of all such securities was $185,869,000, which represented 65.30% of the net assets of the fund. |
American Funds Insurance Series — Ultra-Short Bond Fund — Page 169 of 184
U.S. Government/AAA-Rated Securities Fund
Investment portfolio
December 31, 2019
| Bonds, notes & other debt instruments 96.81% U.S. Treasury bonds & notes 51.15% U.S. Treasury 43.49% | Principal amount (000) | Value (000) |
| U.S. Treasury 1.75% 20211 | $33,540 | $33,641 |
| U.S. Treasury (3-month U.S. Treasury Bill Yield + 0.30%) 1.826% 20212 | 51,589 | 51,671 |
| U.S. Treasury 2.00% 2021 | 46,300 | 46,669 |
| U.S. Treasury 2.00% 2021 | 5,350 | 5,386 |
| U.S. Treasury 2.125% 2021 | 23,450 | 23,661 |
| U.S. Treasury 2.25% 2021 | 23,580 | 23,820 |
| U.S. Treasury 1.625% 2022 | 100 | 100 |
| U.S. Treasury 1.75% 2022 | 174,300 | 174,930 |
| U.S. Treasury 1.75% 2022 | 11,700 | 11,739 |
| U.S. Treasury 1.875% 2022 | 63,000 | 63,391 |
| U.S. Treasury 1.875% 2022 | 25,000 | 25,170 |
| U.S. Treasury 1.875% 2022 | 23,000 | 23,167 |
| U.S. Treasury 2.00% 2022 | 69,500 | 70,238 |
| U.S. Treasury 2.00% 2022 | 16,010 | 16,185 |
| U.S. Treasury 1.625% 2023 | 11,900 | 11,897 |
| U.S. Treasury 1.625% 20231 | 10,000 | 9,997 |
| U.S. Treasury 2.125% 20231 | 57,739 | 58,782 |
| U.S. Treasury 2.625% 2023 | 17,255 | 17,783 |
| U.S. Treasury 2.875% 2023 | 43,000 | 44,952 |
| U.S. Treasury 2.875% 2023 | 22,500 | 23,538 |
| U.S. Treasury 1.50% 2024 | 47,000 | 46,623 |
| U.S. Treasury 1.50% 2024 | 16,170 | 16,037 |
| U.S. Treasury 2.00% 2024 | 30,050 | 30,469 |
| U.S. Treasury 2.125% 20241 | 31,975 | 32,620 |
| U.S. Treasury 2.25% 2024 | 6,500 | 6,652 |
| U.S. Treasury 2.50% 2024 | 44,000 | 45,540 |
| U.S. Treasury 2.75% 2025 | 38,000 | 39,970 |
| U.S. Treasury 2.875% 2025 | 13,000 | 13,773 |
| U.S. Treasury 1.625% 2026 | 77,000 | 76,037 |
| U.S. Treasury 1.625% 2026 | 15,000 | 14,824 |
| U.S. Treasury 1.75% 2026 | 12,900 | 12,828 |
| U.S. Treasury 1.875% 2026 | 86,000 | 86,393 |
| U.S. Treasury 2.00% 20261 | 8,000 | 8,093 |
| U.S. Treasury 1.75% 2029 | 35,000 | 34,467 |
| U.S. Treasury 2.25% 20491 | 25,700 | 24,937 |
| U.S. Treasury 2.375% 2049 | 5,000 | 4,984 |
| U.S. Treasury 2.875% 20491 | 26,000 | 28,663 |
| 1,259,627 | ||
| U.S. Treasury inflation-protected securities 7.66% | ||
| U.S. Treasury Inflation-Protected Security 0.125% 20223 | 11,710 | 11,709 |
| U.S. Treasury Inflation-Protected Security 0.625% 20233 | 36,777 | 37,362 |
| U.S. Treasury Inflation-Protected Security 0.125% 20243 | 72,013 | 72,476 |
| U.S. Treasury Inflation-Protected Security 0.25% 20253 | 24,054 | 24,283 |
| U.S. Treasury Inflation-Protected Security 0.375% 20273 | 13,360 | 13,632 |
American Funds Insurance Series — U.S. Government/AAA-Rated Securities Fund — Page 170 of 184
| Bonds, notes & other debt instruments (continued) U.S. Treasury bonds & notes (continued) U.S. Treasury inflation-protected securities (continued) | Principal amount (000) | Value (000) |
| U.S. Treasury Inflation-Protected Security 0.25% 20293 | $16,297 | $16,477 |
| U.S. Treasury Inflation-Protected Security 2.125% 20413 | 364 | 481 |
| U.S. Treasury Inflation-Protected Security 0.75% 20421,3 | 22,423 | 23,344 |
| U.S. Treasury Inflation-Protected Security 1.00% 20463 | 2,883 | 3,178 |
| U.S. Treasury Inflation-Protected Security 0.875% 20473 | 5,437 | 5,839 |
| U.S. Treasury Inflation-Protected Security 1.00% 20493 | 11,658 | 12,976 |
| 221,757 | ||
| Total U.S. Treasury bonds & notes | 1,481,384 | |
| Mortgage-backed obligations 27.67% Federal agency mortgage-backed obligations 27.67% | ||
| Fannie Mae 6.50% 20374 | 23 | 26 |
| Fannie Mae 7.00% 20374 | 4 | 5 |
| Fannie Mae 6.00% 20384 | 16 | 16 |
| Fannie Mae Pool #AJ7716 3.00% 20264 | 1,000 | 1,029 |
| Fannie Mae Pool #AO5427 3.00% 20274 | 944 | 969 |
| Fannie Mae Pool #AP7539 3.00% 20274 | 339 | 348 |
| Fannie Mae Pool #AR8558 3.00% 20274 | 290 | 299 |
| Fannie Mae Pool #AO7538 3.00% 20274 | 277 | 284 |
| Fannie Mae Pool #257104 6.50% 20284 | 131 | 145 |
| Fannie Mae Pool #BM4299 3.00% 20304 | 949 | 973 |
| Fannie Mae Pool #AL9668 3.00% 20304 | 22 | 22 |
| Fannie Mae Pool #BM3501 3.00% 20324 | 305 | 314 |
| Fannie Mae Pool #BO6920 3.00% 20344 | 435 | 446 |
| Fannie Mae Pool #BN7354 3.00% 20344 | 319 | 327 |
| Fannie Mae Pool #BK9093 3.00% 20344 | 297 | 305 |
| Fannie Mae Pool #MA3657 3.00% 20344 | 233 | 239 |
| Fannie Mae Pool #MA2746 4.00% 20364 | 6,682 | 7,119 |
| Fannie Mae Pool #AS6870 4.00% 20364 | 5,273 | 5,617 |
| Fannie Mae Pool #MA2588 4.00% 20364 | 1,676 | 1,785 |
| Fannie Mae Pool #888698 7.00% 20374 | 52 | 57 |
| Fannie Mae Pool #AH0351 4.50% 20414 | 839 | 900 |
| Fannie Mae Pool #AI1862 5.00% 20414 | 704 | 784 |
| Fannie Mae Pool #AI3510 5.00% 20414 | 449 | 501 |
| Fannie Mae Pool #AJ0704 5.00% 20414 | 372 | 415 |
| Fannie Mae Pool #AJ5391 5.00% 20414 | 248 | 277 |
| Fannie Mae Pool #CA0770 3.50% 20474 | 12,918 | 13,430 |
| Fannie Mae Pool #BH2597 4.00% 20474 | 25,092 | 26,390 |
| Fannie Mae Pool #BM4488 3.435% 20482,4 | 7,816 | 8,001 |
| Fannie Mae Pool #MA3467 4.00% 20484 | 4 | 4 |
| Fannie Mae Pool #CA3099 4.50% 20484 | 4,015 | 4,230 |
| Fannie Mae Pool #MA3775 3.50% 20494 | 44,907 | 46,182 |
| Fannie Mae Pool #MA3692 3.50% 20494 | 8,637 | 8,876 |
| Fannie Mae Pool #CA4026 3.50% 20494 | 3,000 | 3,092 |
| Fannie Mae Pool #MA3686 3.50% 20494 | 3,000 | 3,083 |
| Fannie Mae Pool #CA4358 3.50% 20494 | 3,000 | 3,082 |
| Fannie Mae Pool #FM0020 3.50% 20494 | 1,000 | 1,031 |
| Fannie Mae Pool #CA4813 3.50% 20494 | 414 | 427 |
| Fannie Mae Pool #BN4381 3.50% 20494 | 131 | 135 |
| Fannie Mae Pool #BM5446 3.50% 20494 | 78 | 81 |
| Fannie Mae Pool #BJ8402 3.549% 20492,4 | 1,375 | 1,415 |
| Fannie Mae Pool #MA3665 4.50% 20494 | 660 | 695 |
| Fannie Mae Pool #MA3639 4.50% 20494 | 392 | 412 |
American Funds Insurance Series — U.S. Government/AAA-Rated Securities Fund — Page 171 of 184
| Bonds, notes & other debt instruments (continued) Mortgage-backed obligations (continued) Federal agency mortgage-backed obligations (continued) | Principal amount (000) | Value (000) |
| Fannie Mae, Series 2001-4, Class NA, 9.013% 20252,4 | $—5 | $—5 |
| Fannie Mae, Series 2001-4, Class GA, 9.16% 20252,4 | —5 | —5 |
| Fannie Mae, Series 2001-T10, Class A1, 7.00% 20414 | 57 | 65 |
| Fannie Mae, Series 2012-M2, Class A2, Multi Family, 2.717% 20224 | 1,525 | 1,537 |
| Fannie Mae, Series 2012-M3, Class 1A2, Multi Family, 3.044% 20224 | 1,361 | 1,385 |
| Fannie Mae, Series 2014-M1, Class A2, Multi Family, 3.188% 20232,4 | 1,603 | 1,651 |
| Fannie Mae, Series 2014-M3, Class A2, Multi Family, 3.48% 20242,4 | 2,962 | 3,099 |
| Fannie Mae, Series 2006-56, Class OG, principal only, 0% 20364 | 108 | 97 |
| Freddie Mac 5.50% 20244 | 223 | 232 |
| Freddie Mac 3.50% 20334 | 17,735 | 18,410 |
| Freddie Mac 5.00% 20404 | 829 | 915 |
| Freddie Mac 5.00% 20414 | 1,506 | 1,680 |
| Freddie Mac 4.00% 20434 | 354 | 383 |
| Freddie Mac 3.50% 20474 | 14,885 | 15,482 |
| Freddie Mac 3.50% 20474 | 11,729 | 12,189 |
| Freddie Mac Pool #ZK3727 3.00% 20264 | 309 | 317 |
| Freddie Mac Pool #ZA2603 3.00% 20264 | 29 | 30 |
| Freddie Mac Pool #ZK7580 3.00% 20274 | 466 | 479 |
| Freddie Mac Pool #ZS7367 3.00% 20284 | 676 | 693 |
| Freddie Mac Pool #ZK7590 3.00% 20294 | 1,000 | 1,025 |
| Freddie Mac Pool #ZS8602 3.00% 20314 | 52 | 54 |
| Freddie Mac Pool #ZT1344 3.00% 20334 | 3,000 | 3,078 |
| Freddie Mac Pool #ZT0716 3.00% 20334 | 204 | 210 |
| Freddie Mac Pool #SB8002 3.00% 20344 | 1,000 | 1,025 |
| Freddie Mac Pool #ZT2091 3.00% 20344 | 475 | 487 |
| Freddie Mac Pool #QN0573 3.00% 20344 | 268 | 274 |
| Freddie Mac Pool #SB8027 3.00% 20354 | 2,082 | 2,138 |
| Freddie Mac Pool #1H1354 4.209% 20362,4 | 181 | 192 |
| Freddie Mac Pool #760012 3.01% 20452,4 | 615 | 619 |
| Freddie Mac Pool #760013 3.009% 20452,4 | 480 | 485 |
| Freddie Mac Pool #760014 3.486% 20452,4 | 1,276 | 1,302 |
| Freddie Mac Pool #760015 3.238% 20472,4 | 1,024 | 1,032 |
| Freddie Mac Pool #ZM4352 3.50% 20474 | 45 | 46 |
| Freddie Mac Pool #ZS4784 3.50% 20484 | 853 | 877 |
| Freddie Mac Pool #SD8001 3.50% 20494 | 90,895 | 93,422 |
| Freddie Mac Pool #SD8005 3.50% 20494 | 34,320 | 35,264 |
| Freddie Mac Pool #ZT1951 3.50% 20494 | 12,342 | 12,684 |
| Freddie Mac Pool #ZT2086 3.50% 20494 | 2,500 | 2,570 |
| Freddie Mac, Series 1567, Class A, (1-month USD-LIBOR + 0.40%) 2.14% 20232,4 | 20 | 20 |
| Freddie Mac, Series K013, Class A1, Multi Family, 2.902% 20204 | 133 | 133 |
| Freddie Mac, Series K031, Class A1, Multi Family, 2.778% 20224 | 597 | 603 |
| Freddie Mac, Series KS01, Class A2, Multi Family, 2.522% 20234 | 1,680 | 1,694 |
| Freddie Mac, Series K029, Class A2, Multi Family, 3.32% 20234 | 400 | 415 |
| Freddie Mac, Series K070, Class A2, Multi Family, 3.303% 20272,4 | 5,765 | 6,145 |
| Freddie Mac, Series 3213, Class OG, principal only, 0% 20364 | 181 | 169 |
| Freddie Mac Seasoned Credit Risk Transfer Trust, Series 2017-2, Class HA, 3.00% 20564,6 | 10,950 | 11,130 |
| Freddie Mac Seasoned Credit Risk Transfer Trust, Series 2017-2, Class MA, 3.00% 20564 | 10,562 | 10,759 |
| Freddie Mac Seasoned Credit Risk Transfer Trust, Series 2017-1, Class HA, 3.00% 20562,4 | 10,358 | 10,565 |
| Freddie Mac Seasoned Credit Risk Transfer Trust, Series 2017-4, Class HT, 3.25% 20574,6 | 2,040 | 2,103 |
| Freddie Mac Seasoned Credit Risk Transfer Trust, Series 2018-2, Class MT, 3.50% 20574 | 37,774 | 39,835 |
| Freddie Mac Seasoned Credit Risk Transfer Trust, Series 2017-4, Class MT, 3.50% 20574 | 1,634 | 1,697 |
| Freddie Mac Seasoned Credit Risk Transfer Trust, Series 2019-4, Class MA, 3.00% 20594 | 16,820 | 17,140 |
| Freddie Mac Seasoned Loan Structured Transaction Trust, Series 2018-2, Class A1, 3.50% 20284 | 39,374 | 40,773 |
| Freddie Mac Seasoned Loan Structured Transaction Trust, Series 2018-1, Class A1, 3.50% 20284 | 9,169 | 9,470 |
American Funds Insurance Series — U.S. Government/AAA-Rated Securities Fund — Page 172 of 184
| Bonds, notes & other debt instruments (continued) Mortgage-backed obligations (continued) Federal agency mortgage-backed obligations (continued) | Principal amount (000) | Value (000) |
| Freddie Mac Seasoned Loan Structured Transaction Trust, Series 2019-3, Class A1C, 2.75% 20294 | $10,959 | $11,110 |
| Government National Mortgage Assn. 3.75% 20344 | 1,097 | 1,138 |
| Government National Mortgage Assn. 5.50% 20384 | 291 | 327 |
| Government National Mortgage Assn. 5.50% 20384 | 123 | 132 |
| Government National Mortgage Assn. 5.50% 20384 | 48 | 54 |
| Government National Mortgage Assn. 6.00% 20384 | 191 | 219 |
| Government National Mortgage Assn. 6.50% 20384 | 332 | 376 |
| Government National Mortgage Assn. 5.00% 20394 | 498 | 555 |
| Government National Mortgage Assn. 6.00% 20394 | 177 | 200 |
| Government National Mortgage Assn. 4.50% 20404 | 380 | 411 |
| Government National Mortgage Assn. 5.50% 20404 | 5,393 | 6,024 |
| Government National Mortgage Assn. 4.50% 20414 | 1,106 | 1,168 |
| Government National Mortgage Assn. 5.00% 20414 | 1,954 | 2,130 |
| Government National Mortgage Assn. 3.00% 20424 | 44 | 46 |
| Government National Mortgage Assn. 3.50% 20434 | 1,507 | 1,587 |
| Government National Mortgage Assn. 4.50% 20494 | 1,081 | 1,130 |
| Government National Mortgage Assn. 3.50% 20504,7 | 40,000 | 41,221 |
| Government National Mortgage Assn. 4.00% 20504,7 | 30,870 | 31,952 |
| Government National Mortgage Assn. 4.50% 20504,7 | 11,946 | 12,492 |
| Government National Mortgage Assn. Pool #699537 5.50% 20384 | 131 | 145 |
| Government National Mortgage Assn. Pool #MA5986 4.00% 20494 | 6,680 | 6,923 |
| Government National Mortgage Assn. Pool #MA5931 4.00% 20494 | 1,051 | 1,090 |
| Government National Mortgage Assn. Pool #MA5987 4.50% 20494 | 17,450 | 18,300 |
| Government National Mortgage Assn. Pool #MA5877 4.50% 20494 | 9,981 | 10,429 |
| Government National Mortgage Assn. Pool #MA6041 4.50% 20494 | 8,326 | 8,750 |
| Government National Mortgage Assn. Pool #MA6156 4.50% 20494 | 2,294 | 2,412 |
| Government National Mortgage Assn. Pool #MA6092 4.50% 20494 | 1,411 | 1,485 |
| Government National Mortgage Assn. Pool #892950 2.815% 20602,4 | 959 | 977 |
| Government National Mortgage Assn. Pool #756692 4.14% 20614 | —5 | —5 |
| Government National Mortgage Assn. Pool #751409 4.406% 20614 | 25 | 26 |
| Government National Mortgage Assn. Pool #710077 4.70% 20614 | 46 | 48 |
| Government National Mortgage Assn. Pool #756695 4.70% 20614 | 12 | 13 |
| Government National Mortgage Assn. Pool #710079 4.70% 20614 | 12 | 12 |
| Government National Mortgage Assn. Pool #710074 4.72% 20614 | 4 | 5 |
| Government National Mortgage Assn. Pool #721640 4.81% 20614 | —5 | —5 |
| Government National Mortgage Assn. Pool #765151 4.921% 20614 | 30 | 31 |
| Government National Mortgage Assn. Pool #756694 5.147% 20614 | 163 | 163 |
| Government National Mortgage Assn. Pool #756715 4.424% 20624 | 28 | 30 |
| Government National Mortgage Assn. Pool #767610 4.522% 20624 | 3 | 4 |
| Government National Mortgage Assn. Pool #759735 4.903% 20624 | 4 | 4 |
| Government National Mortgage Assn. Pool #795471 5.09% 20624 | 5 | 5 |
| Government National Mortgage Assn. Pool #894475 4.045% 20632,4 | 2,957 | 3,090 |
| Government National Mortgage Assn. Pool #767641 4.395% 20634 | 11 | 11 |
| Government National Mortgage Assn. Pool #795533 5.012% 20634 | 4 | 4 |
| Government National Mortgage Assn. Pool #AG8149 2.258% 20642,4 | 351 | 353 |
| Government National Mortgage Assn. Pool #AG8156 2.728% 20642,4 | 431 | 437 |
| Government National Mortgage Assn. Pool #894482 4.041% 20642,4 | 3,902 | 4,074 |
| Government National Mortgage Assn. Pool #AG8194 4.386% 20644 | 88 | 90 |
| Government National Mortgage Assn. Pool #AG8068 4.934% 20644 | 17 | 17 |
| Government National Mortgage Assn. Pool #AG8150 4.956% 20644 | 31 | 31 |
| Government National Mortgage Assn. Pool #AG8155 5.069% 20644 | 29 | 29 |
| Government National Mortgage Assn. Pool #AG8189 5.116% 20644 | 28 | 29 |
| Government National Mortgage Assn. Pool #AG8171 5.337% 20644 | 2 | 2 |
| Government National Mortgage Assn. Pool #AA7554 6.64% 20644 | 360 | 373 |
American Funds Insurance Series — U.S. Government/AAA-Rated Securities Fund — Page 173 of 184
| Bonds, notes & other debt instruments (continued) Mortgage-backed obligations (continued) Federal agency mortgage-backed obligations (continued) | Principal amount (000) | Value (000) |
| Government National Mortgage Assn. Pool #AL7438 4.49% 20654 | $21 | $22 |
| Government National Mortgage Assn., Series 2010-H23, Class PT, 5.327% 20602,4 | 376 | 386 |
| Government National Mortgage Assn., Series 2012-H12, Class FT, (1-year CMT Weekly Rate + 0.70%) 2.27% 20622,4 | 1,683 | 1,688 |
| Government National Mortgage Assn., Series 2012-H20, Class PT, 2.634% 20622,4 | 2,153 | 2,163 |
| National Credit Union Administration, Series 2011-R2, Class 1A, (1-month USD-LIBOR + 0.40%) 2.092% 20202,4 | 61 | 61 |
| National Credit Union Administration, Series 2011-R3, Class 1A, (1-month USD-LIBOR + 0.40%) 2.118% 20202,4 | 179 | 179 |
| National Credit Union Administration, Series 2011-R1, Class 1A, (1-month USD-LIBOR + 0.45%) 2.144% 20202,4 | 97 | 97 |
| Uniform Mortgage-Backed Security 3.00% 20354,7 | 76,804 | 78,695 |
| Uniform Mortgage-Backed Security 3.00% 20354,7 | 28,225 | 28,903 |
| Uniform Mortgage-Backed Security 4.50% 20504,7 | 16 | 17 |
| Vendee Mortgage Trust, Series 2011-2, Class DA, 3.75% 20334 | 2,327 | 2,341 |
| Vendee Mortgage Trust, Series 2010-1, Class DA, 4.25% 20354 | 3,296 | 3,361 |
| Total mortgage-backed obligations | 801,424 | |
| Federal agency bonds & notes 17.99% | ||
| Export-Import Bank of the United States-Guaranteed, VCK Lease SA 2.591% 2026 | 802 | 818 |
| Export-Import Bank of the United States-Guaranteed, Ethiopian Leasing 2012 LLC 2.646% 2026 | 569 | 579 |
| Fannie Mae 1.25% 2021 | 2,900 | 2,883 |
| Fannie Mae 2.75% 2021 | 26,500 | 26,938 |
| Fannie Mae 2.875% 2023 | 36,000 | 37,533 |
| Fannie Mae 7.125% 2030 | 4,000 | 5,790 |
| Federal Home Loan Bank 3.375% 2023 | 16,715 | 17,700 |
| Federal Home Loan Bank 3.25% 2028 | 13,000 | 14,203 |
| Federal Home Loan Bank 5.50% 2036 | 600 | 844 |
| Freddie Mac 2.375% 2021 | 40,000 | 40,340 |
| Private Export Funding Corp. 2.25% 2020 | 5,000 | 5,005 |
| Private Export Funding Corp. 3.266% 20218 | 34,000 | 34,994 |
| Private Export Funding Corp. 3.55% 2024 | 6,340 | 6,763 |
| Small Business Administration, Series 2001-20K, 5.34% 2021 | 16 | 16 |
| Small Business Administration, Series 2001-20J, 5.76% 2021 | 6 | 7 |
| Small Business Administration, Series 2001-20F, 6.44% 2021 | 25 | 26 |
| Small Business Administration, Series 2003-20B, 4.84% 2023 | 101 | 104 |
| Tennessee Valley Authority 2.875% 2027 | 10,000 | 10,530 |
| Tennessee Valley Authority 4.65% 2035 | 2,330 | 2,896 |
| Tennessee Valley Authority 5.88% 2036 | 1,750 | 2,482 |
| Tennessee Valley Authority, Series A, 3.875% 2021 | 32,975 | 33,756 |
| Tennessee Valley Authority, Series A, 4.625% 2060 | 250 | 343 |
| TVA Southaven 3.846% 2033 | 1,218 | 1,307 |
| U.S. Agency for International Development, Iraq (State of) 2.149% 2022 | 6,670 | 6,749 |
| U.S. Agency for International Development, Jordan (Kingdom of) 2.503% 2020 | 88,000 | 88,693 |
| U.S. Agency for International Development, Jordan (Kingdom of) 2.578% 2022 | 43,000 | 43,884 |
| U.S. Agency for International Development, Jordan (Kingdom of) 3.00% 2025 | 43,250 | 45,794 |
| U.S. Agency for International Development, Morocco (Kingdom of) 7.55% 2026 | 3,010 | 3,549 |
| U.S. Agency for International Development, Tunisia (Kingdom of) 1.416% 2021 | 3,000 | 2,990 |
| U.S. Agency for International Development, Ukraine 1.471% 2021 | 4,410 | 4,397 |
| U.S. Department of Housing and Urban Development, Series 2015-A-6, 1.98% 2020 | 11,510 | 11,523 |
| U.S. Department of Housing and Urban Development, Series 2015-A-7, 2.35% 2021 | 5,000 | 5,057 |
| U.S. Department of Housing and Urban Development, Series 2015-A-8, 2.45% 2022 | 8,000 | 8,147 |
| U.S. Department of Housing and Urban Development, Series 2015-A-9, 2.80% 2023 | 2,000 | 2,077 |
| U.S. Department of Housing and Urban Development, Series 2015-A-10, 2.85% 2024 | 3,000 | 3,151 |
American Funds Insurance Series — U.S. Government/AAA-Rated Securities Fund — Page 174 of 184
| Bonds, notes & other debt instruments (continued) Federal agency bonds & notes (continued) | Principal amount (000) | Value (000) |
| U.S. Department of Housing and Urban Development, Series 2015-A-11, 2.95% 2025 | $3,515 | $3,713 |
| U.S. Department of Housing and Urban Development, Series 2015-A-12, 3.10% 2026 | 3,500 | 3,710 |
| U.S. Department of Housing and Urban Development, Series 2015-A-13, 3.15% 2027 | 15,332 | 16,231 |
| U.S. Department of Housing and Urban Development, Series 2015-A-14, 3.25% 2028 | 5,106 | 5,416 |
| U.S. Department of Housing and Urban Development, Series 2015-A-15, 3.35% 2029 | 3,500 | 3,720 |
| U.S. Department of Housing and Urban Development, Series 2015-A-16, 3.50% 2030 | 3,307 | 3,455 |
| U.S. Department of Housing and Urban Development, Series 2015-A-17, 3.55% 2031 | 3,300 | 3,454 |
| U.S. Department of Housing and Urban Development, Series 2015-A-18, 3.60% 2032 | 3,177 | 3,315 |
| U.S. Department of Housing and Urban Development, Series 2015-A-19, 3.65% 2033 | 2,734 | 2,916 |
| U.S. Department of Housing and Urban Development, Series 2015-A-20, 3.70% 2034 | 651 | 682 |
| U.S. Government-Guaranteed Certificates of Participation, Overseas Private Investment Corp., 3.49% 2029 | 769 | 820 |
| U.S. Government-Guaranteed Certificates of Participation, Overseas Private Investment Corp., 3.82% 2032 | 875 | 957 |
| U.S. Government-Guaranteed Certificates of Participation, Overseas Private Investment Corp., 3.938% 2032 | 716 | 788 |
| 521,045 | ||
| Total bonds, notes & other debt instruments(cost: $2,765,266,000) | 2,803,853 | |
| Short-term securities 8.05% Commercial paper 7.88% | ||
| Bank of New York Co., Inc. 1.60%due 1/2/2020 | 26,700 | 26,698 |
| Exxon Mobil Corp. 1.62%due 2/3/2020 | 50,000 | 49,923 |
| National Rural Utilities Cooperative Finance Corp. 1.70%due 1/14/2020 | 8,700 | 8,695 |
| Pfizer Inc. 1.67%due 1/16/20208 | 64,800 | 64,755 |
| Starbird Funding Corp. 1.58%due 1/2/20208 | 28,100 | 28,098 |
| Toronto-Dominion Bank 1.70%due 1/7/20208 | 50,000 | 49,983 |
| 228,152 | ||
| Federal agency discount notes 0.17% | ||
| Federal Farm Credit Banks 1.56%due 1/30/2020 | 5,000 | 4,994 |
| Total short-term securities(cost: $233,152,000) | 233,146 | |
| Total investment securities 104.86%(cost: $2,998,418,000) | 3,036,999 | |
| Other assets less liabilities (4.86)% | (140,665) | |
| Net assets 100.00% | $2,896,334 |
Futures contracts
| Contracts | Type | Number of contracts | Expiration | Notional amount9 (000) | Value at 12/31/201910 (000) | Unrealized (depreciation) appreciation at 12/31/2019 (000) |
| 30 Day Federal Funds Futures | Long | 451 | January 2020 | $187,932 | $185,014 | $(118) |
| 90 Day Euro Dollar Futures | Long | 565 | March 2020 | 141,250 | 138,799 | 543 |
| 2 Year U.S. Treasury Note Futures | Long | 4,270 | April 2020 | 854,000 | 920,185 | 90 |
| 5 Year U.S. Treasury Note Futures | Long | 6,935 | April 2020 | 693,500 | 822,556 | (3,396) |
| 10 Year U.S. Treasury Note Futures | Long | 1,481 | March 2020 | 148,100 | 190,193 | (1,498) |
| 10 Year Ultra U.S. Treasury Note Futures | Short | 32 | March 2020 | (3,200) | (4,502) | 54 |
| 20 Year U.S. Treasury Bond Futures | Long | 219 | March 2020 | 21,900 | 34,144 | (596) |
| 30 Year Ultra U.S. Treasury Bond Futures | Long | 569 | March 2020 | 56,900 | 103,362 | (3,027) |
| $(7,948) |
American Funds Insurance Series — U.S. Government/AAA-Rated Securities Fund — Page 175 of 184
Swap contracts
Interest rate swaps
| Receive | Pay | Expiration date | Notional (000) | Value at 12/31/2019 (000) | Upfront payments/ receipts (000) | Unrealized appreciation (depreciation) at 12/31/2019 (000) |
| 1.553% | U.S. EFFR | 1/29/2020 | $1,624,100 | $1 | $— | $1 |
| 1.5365% | U.S. EFFR | 1/29/2020 | 1,288,300 | (16) | — | (16) |
| 1.535% | U.S. EFFR | 1/29/2020 | 1,351,500 | (18) | — | (18) |
| 1.531% | U.S. EFFR | 3/18/2020 | 741,200 | (33) | — | (33) |
| 1.515% | U.S. EFFR | 3/18/2020 | 671,100 | (45) | — | (45) |
| 1.5155% | U.S. EFFR | 3/18/2020 | 1,419,000 | (93) | — | (93) |
| 1.5135% | U.S. EFFR | 3/18/2020 | 1,418,700 | (97) | — | (97) |
| 1.5435% | U.S. EFFR | 4/29/2020 | 770,000 | (9) | — | (9) |
| 1.535% | U.S. EFFR | 4/29/2020 | 1,187,700 | (25) | — | (25) |
| 3-month USD-LIBOR | 2.806% | 8/29/2020 | 34,300 | (223) | — | (223) |
| 1.4555% | U.S. EFFR | 12/10/2020 | 129,200 | (77) | — | (77) |
| 1.454% | U.S. EFFR | 12/10/2020 | 152,800 | (94) | — | (94) |
| 1.4995% | U.S. EFFR | 12/20/2020 | 283,000 | (43) | — | (43) |
| 2.197% | U.S. EFFR | 4/15/2021 | 174,000 | 1,418 | — | 1,418 |
| 1.605% | U.S. EFFR | 6/20/2021 | 116,816 | 124 | — | 124 |
| 1.6325% | U.S. EFFR | 7/18/2021 | 243,000 | 453 | — | 453 |
| 1.34% | U.S. EFFR | 10/18/2021 | 50,000 | (99) | — | (99) |
| 1.355% | U.S. EFFR | 10/24/2021 | 34,100 | (57) | — | (57) |
| 1.339% | U.S. EFFR | 10/24/2021 | 62,000 | (122) | — | (122) |
| 1.3065% | U.S. EFFR | 10/25/2021 | 83,800 | (213) | — | (213) |
| 1.39% | U.S. EFFR | 10/31/2021 | 116,000 | (116) | — | (116) |
| 1.3615% | U.S. EFFR | 11/1/2021 | 252,400 | (383) | — | (383) |
| 1.281% | U.S. EFFR | 11/4/2021 | 252,700 | (756) | — | (756) |
| 1.411% | U.S. EFFR | 11/7/2021 | 56,875 | (35) | — | (35) |
| 1.3925% | U.S. EFFR | 11/7/2021 | 56,875 | (54) | — | (54) |
| U.S. EFFR | 1.335% | 11/26/2021 | 222,000 | 451 | — | 451 |
| 1.433% | U.S. EFFR | 12/16/2021 | 137,600 | (21) | — | (21) |
| 3-month USD-LIBOR | 2.2175% | 3/17/2022 | 52,000 | (612) | — | (612) |
| 2.197% | U.S. EFFR | 4/18/2022 | 47,400 | 768 | — | 768 |
| 3-month USD-LIBOR | 1.75918% | 4/29/2022 | 58,000 | (111) | — | (111) |
| 1.8475% | 3-month USD-LIBOR | 7/11/2022 | 34,900 | 150 | — | 150 |
| 2.5775% | U.S. EFFR | 7/16/2022 | 181,639 | 2,107 | — | 2,107 |
| 3-month USD-LIBOR | 1.948% | 7/28/2022 | 20,000 | (139) | — | (139) |
| 2.80% | 3-month USD-LIBOR | 9/2/2022 | 280,000 | 6,379 | — | 6,379 |
| 2.75% | 3-month USD-LIBOR | 9/2/2022 | 280,000 | 6,107 | — | 6,107 |
| 2.009% | 3-month USD-LIBOR | 10/4/2022 | 50,000 | 450 | — | 450 |
| 3-month USD-LIBOR | 2.0815% | 2/10/2024 | 28,700 | (441) | — | (441) |
| 2.21875% | U.S. EFFR | 3/14/2024 | 54,000 | 1,627 | — | 1,627 |
| 3-month USD-LIBOR | 2.21079% | 3/27/2024 | 48,318 | (1,010) | — | (1,010) |
| 3-month USD-LIBOR | 2.33% | 5/2/2024 | 48,460 | (1,272) | — | (1,272) |
| 3-month USD-LIBOR | 2.588% | 1/26/2025 | 15,600 | (647) | — | (647) |
| 3-month USD-LIBOR | 1.867% | 7/11/2025 | 49,400 | (84) | — | (84) |
| 3-month USD-LIBOR | 2.27% | 12/5/2026 | 44,900 | (1,426) | — | (1,426) |
| 2.91% | 3-month USD-LIBOR | 2/1/2028 | 16,000 | 723 | — | 723 |
| 2.908% | 3-month USD-LIBOR | 2/1/2028 | 16,000 | 721 | — | 721 |
| 2.925% | 3-month USD-LIBOR | 2/1/2028 | 12,800 | 587 | — | 587 |
| 2.92% | 3-month USD-LIBOR | 2/2/2028 | 12,200 | 556 | — | 556 |
| U.S. EFFR | 2.5065% | 3/22/2028 | 8,700 | (610) | — | (610) |
| U.S. EFFR | 2.535% | 3/23/2028 | 6,700 | (484) | — | (484) |
| U.S. EFFR | 2.471% | 3/27/2028 | 8,100 | (546) | — | (546) |
American Funds Insurance Series — U.S. Government/AAA-Rated Securities Fund — Page 176 of 184
Swap contracts (continued)
Interest rate swaps (continued)
| Receive | Pay | Expiration date | Notional (000) | Value at 12/31/2019 (000) | Upfront payments/ receipts (000) | Unrealized appreciation (depreciation) at 12/31/2019 (000) |
| U.S. EFFR | 2.4575% | 3/29/2028 | $9,638 | $(639) | $— | $(639) |
| U.S. EFFR | 2.424% | 3/30/2028 | 8,160 | (520) | — | (520) |
| U.S. EFFR | 2.412% | 4/5/2028 | 3,702 | (233) | — | (233) |
| 3-month USD-LIBOR | 1.9675% | 6/21/2029 | 50,700 | (418) | — | (418) |
| 3-month USD-LIBOR | 2.05% | 7/18/2029 | 41,000 | (629) | — | (629) |
| 3-month USD-LIBOR | 1.995% | 7/19/2029 | 25,400 | (266) | — | (266) |
| U.S. EFFR | 1.485% | 10/23/2029 | 16,000 | 244 | — | 244 |
| U.S. EFFR | 1.4869% | 10/23/2029 | 14,600 | 220 | — | 220 |
| U.S. EFFR | 1.453% | 10/24/2029 | 18,500 | 336 | — | 336 |
| U.S. EFFR | 1.4741% | 10/24/2029 | 18,500 | 300 | — | 300 |
| U.S. EFFR | 1.4495% | 10/24/2029 | 13,600 | 251 | — | 251 |
| U.S. EFFR | 1.446% | 10/24/2029 | 1,800 | 34 | — | 34 |
| 1.419% | U.S. EFFR | 11/26/2029 | 47,000 | (1,021) | — | (1,021) |
| 3-month USD-LIBOR | 2.97125% | 9/2/2030 | 62,000 | (5,923) | — | (5,923) |
| 3-month USD-LIBOR | 3.005% | 9/2/2030 | 62,000 | (6,114) | — | (6,114) |
| 3-month USD-LIBOR | 2.986% | 2/1/2038 | 7,800 | (449) | — | (449) |
| 3-month USD-LIBOR | 2.9625% | 2/1/2038 | 9,800 | (545) | — | (545) |
| 3-month USD-LIBOR | 2.963% | 2/1/2038 | 9,800 | (546) | — | (546) |
| 3-month USD-LIBOR | 2.967% | 2/2/2038 | 7,600 | (426) | — | (426) |
| 3-month USD-LIBOR | 3.34% | 6/27/2044 | 10,000 | (2,481) | — | (2,481) |
| 3-month USD-LIBOR | 3.206% | 7/31/2044 | 16,000 | (3,559) | — | (3,559) |
| 3-month USD-LIBOR | 3.238% | 8/8/2044 | 16,000 | (3,659) | — | (3,659) |
| 3-month USD-LIBOR | 2.7045% | 1/2/2045 | 12,000 | (1,489) | — | (1,489) |
| 3-month USD-LIBOR | 2.4945% | 1/9/2045 | 2,000 | (164) | — | (164) |
| 3-month USD-LIBOR | 2.5055% | 1/9/2045 | 11,000 | (925) | — | (925) |
| 3-month USD-LIBOR | 2.52822% | 11/23/2045 | 4,390 | (398) | — | (398) |
| U.S. EFFR | 2.155% | 11/10/2047 | 8,640 | (580) | — | (580) |
| U.S. EFFR | 2.5635% | 2/12/2048 | 33,204 | (5,234) | — | (5,234) |
| 3-month USD-LIBOR | 1.934% | 12/12/2049 | 19,300 | 704 | — | 704 |
| 3-month USD-LIBOR | 1.935% | 12/17/2049 | 17,280 | 627 | — | 627 |
| 3-month USD-LIBOR | 2.007% | 12/19/2049 | 21,500 | 423 | — | 423 |
| 3-month USD-LIBOR | 2.045% | 12/27/2049 | 15,100 | 166 | — | 166 |
| $— | $(20,302) |
| 1 | All or a portion of this security was pledged as collateral. The total value of pledged collateral was $46,115,000, which represented 1.59% of the net assets of the fund. |
| 2 | Coupon rate may change periodically. Reference rate and spread are as of the most recent information available. Some coupon rates are determined by the issuer or agent based on current market conditions; therefore, the reference rate and spread are not available. |
| 3 | Index-linked bond whose principal amount moves with a government price index. |
| 4 | Principal payments may be made periodically. Therefore, the effective maturity date may be earlier than the stated maturity date. |
| 5 | Amount less than one thousand. |
| 6 | Step bond; coupon rate may change at a later date. |
| 7 | Purchased on a TBA basis. |
| 8 | Acquired in a transaction exempt from registration under Rule 144A or Section 4(2) of the Securities Act of 1933. May be resold in the U.S. in transactions exempt from registration, normally to qualified institutional buyers. The total value of all such securities was $177,830,000, which represented 6.14% of the net assets of the fund. |
| 9 | Notional amount is calculated based on the number of contracts and notional contract size. |
| 10 | Value is calculated based on the notional amount and current market price. |
American Funds Insurance Series — U.S. Government/AAA-Rated Securities Fund — Page 177 of 184
| Key to abbreviations and symbol |
| CMT = Constant Maturity Treasury |
| EFFR = Effective Federal Funds Rate |
| LIBOR = London Interbank Offered Rate |
| TBA = To-be-announced |
| USD/$ = U.S. dollars |
American Funds Insurance Series — U.S. Government/AAA-Rated Securities Fund — Page 178 of 184
Managed Risk Growth Fund
Investment portfolio
December 31, 2019
| Growth funds 81.52% | Shares | Value (000) |
| American Funds Insurance Series – Growth Fund, Class 1 | 4,413,020 | $358,426 |
| Total growth funds(cost: $314,327,000) | 358,426 | |
| Fixed income funds 15.17% | ||
| American Funds Insurance Series – Bond Fund, Class 1 | 5,970,036 | 66,685 |
| Total fixed income funds(cost: $64,788,000) | 66,685 | |
| Short-term securities 3.38% | ||
| Government Cash Management Fund 1.51%1 | 14,836,148 | 14,836 |
| Total short-term securities(cost: $14,836,000) | 14,836 | |
| Total investment securities 100.07%(cost: $393,951,000) | 439,947 | |
| Other assets less liabilities (0.07)% | (297) | |
| Net assets 100.00% | $439,650 |
Futures contracts
| Contracts | Type | Number of contracts | Expiration | Notional amount2 (000) | Value at 12/31/20193 (000) | Unrealized depreciation at 12/31/2019 (000) |
| 5 Year U.S. Treasury Note Futures | Long | 142 | March 2020 | $14,200 | $16,843 | $(61) |
| 1 | Rate represents the seven-day yield at 12/31/2019. |
| 2 | Notional amount is calculated based on the number of contracts and notional contract size. |
| 3 | Value is calculated based on the notional amount and current market price. |
American Funds Insurance Series — Managed Risk Growth Fund — Page 179 of 184
Managed Risk International Fund
Investment portfolio
December 31, 2019
| Growth funds 80.75% | Shares | Value (000) |
| American Funds Insurance Series – International Fund, Class 1 | 6,417,163 | $133,862 |
| Total growth funds(cost: $119,729,000) | 133,862 | |
| Fixed income funds 14.76% | ||
| American Funds Insurance Series – Bond Fund, Class 1 | 2,190,172 | 24,465 |
| Total fixed income funds(cost: $23,789,000) | 24,465 | |
| Short-term securities 4.55% | ||
| Government Cash Management Fund 1.51%1 | 7,541,294 | 7,541 |
| Total short-term securities(cost: $7,541,000) | 7,541 | |
| Total investment securities 100.06%(cost: $151,059,000) | 165,868 | |
| Other assets less liabilities (0.06)% | (99) | |
| Net assets 100.00% | $165,769 |
Futures contracts
| Contracts | Type | Number of contracts | Expiration | Notional amount2 (000) | Value at 12/31/20193 (000) | Unrealized depreciation at 12/31/2019 (000) |
| 5 Year U.S. Treasury Note Futures | Long | 72 | March 2020 | $7,200 | $8,540 | $(30) |
| 1 | Rate represents the seven-day yield at 12/31/2019. |
| 2 | Notional amount is calculated based on the number of contracts and notional contract size. |
| 3 | Value is calculated based on the notional amount and current market price. |
American Funds Insurance Series — Managed Risk International Fund — Page 180 of 184
Managed Risk Blue Chip
Income and Growth Fund
Investment portfolio
December 31, 2019
| Growth-and-income funds 81.97% | Shares | Value (000) |
| American Funds Insurance Series – Blue Chip Income and Growth Fund, Class 1 | 22,089,727 | $299,536 |
| Total growth-and-income funds(cost: $295,807,000) | 299,536 | |
| Fixed income funds 14.64% | ||
| American Funds Insurance Series – U.S. Government/AAA-Rated Securities Fund, Class 1 | 4,337,434 | 53,524 |
| Total fixed income funds(cost: $52,792,000) | 53,524 | |
| Short-term securities 3.45% | ||
| Government Cash Management Fund 1.51%1 | 12,608,727 | 12,609 |
| Total short-term securities(cost: $12,609,000) | 12,609 | |
| Total investment securities 100.06%(cost: $361,208,000) | 365,669 | |
| Other assets less liabilities (0.06)% | (234) | |
| Net assets 100.00% | $365,435 |
Futures contracts
| Contracts | Type | Number of contracts | Expiration | Notional amount2 (000) | Value at 12/31/20193 (000) | Unrealized depreciation at 12/31/2019 (000) |
| 5 Year U.S. Treasury Note Futures | Long | 121 | March 2020 | $12,100 | $14,352 | $(52) |
| 1 | Rate represents the seven-day yield at 12/31/2019. |
| 2 | Notional amount is calculated based on the number of contracts and notional contract size. |
| 3 | Value is calculated based on the notional amount and current market price. |
American Funds Insurance Series — Managed Risk Blue Chip Income and Growth Fund — Page 181 of 184
Managed Risk Growth-Income Fund
Investment portfolio
December 31, 2019
| Growth-and-income funds 81.15% | Shares | Value (000) |
| American Funds Insurance Series – Growth-Income Fund, Class 1 | 36,320,774 | $1,841,827 |
| Total growth-and-income funds(cost: $1,679,355,000) | 1,841,827 | |
| Fixed income funds 14.86% | ||
| American Funds Insurance Series – Bond Fund, Class 1 | 30,186,789 | 337,186 |
| Total fixed income funds(cost: $317,192,000) | 337,186 | |
| Short-term securities 3.81% | ||
| Government Cash Management Fund 1.51%1 | 86,525,815 | 86,526 |
| Total short-term securities(cost: $86,526,000) | 86,526 | |
| Options purchased 0.19% | ||
| Options purchased* | 4,322 | |
| Total options purchased (cost: $14,443,000) | 4,322 | |
| Total investment securities 100.01%(cost: $2,097,516,000) | 2,269,861 | |
| Other assets less liabilities (0.01)% | (137) | |
| Net assets 100.00% | $2,269,724 |
*Options purchased
Put
| Description | Number of contracts | Notional amount (000) | Exercise price | Expiration date | Value at 12/31/2019 (000) |
| S&P 500 Index | 110 | $355 | $2,050.00 | 3/20/2020 | $8 |
| S&P 500 Index | 2,720 | 8,788 | 2,100.00 | 3/20/2020 | 231 |
| S&P 500 Index | 1,200 | 3,877 | 2,150.00 | 3/20/2020 | 144 |
| S&P 500 Index | 50 | 162 | 2,175.00 | 3/20/2020 | 5 |
| S&P 500 Index | 715 | 2,310 | 2,200.00 | 3/20/2020 | 82 |
| S&P 500 Index | 135 | 436 | 2,225.00 | 3/20/2020 | 17 |
| S&P 500 Index | 170 | 549 | 2,250.00 | 3/20/2020 | 25 |
| S&P 500 Index | 95 | 307 | 2,225.00 | 6/19/2020 | 50 |
| S&P 500 Index | 250 | 808 | 2,250.00 | 6/19/2020 | 148 |
| S&P 500 Index | 130 | 420 | 2,275.00 | 6/19/2020 | 92 |
| S&P 500 Index | 3,520 | 11,372 | 2,325.00 | 6/19/2020 | 3,041 |
| S&P 500 Index | 160 | 517 | 2,350.00 | 6/19/2020 | 130 |
| S&P 500 Index | 180 | 582 | 2,375.00 | 6/19/2020 | 160 |
| S&P 500 Index | 70 | 226 | 2,400.00 | 6/19/2020 | 78 |
American Funds Insurance Series — Managed Risk Growth-Income Fund — Page 182 of 184
*Options purchased (continued)
Put (continued)
| Description | Number of contracts | Notional amount (000) | Exercise price | Expiration date | Value at 12/31/2019 (000) |
| S&P 500 Index | 65 | $210 | $2,450.00 | 6/19/2020 | $86 |
| S&P 500 Index | 15 | 48 | 2,325.00 | 9/18/2020 | 25 |
| $4,322 |
Futures contracts
| Contracts | Type | Number of contracts | Expiration | Notional amount2 (000) | Value at 12/31/20193 (000) | Unrealized (depreciation) appreciation at 12/31/2019 (000) |
| 5 Year U.S. Treasury Note Futures | Long | 876 | March 2020 | $87,600 | $103,902 | $(375) |
| S&P 500 E-mini Index Contracts | Long | 380 | March 2020 | 19 | 61,391 | 1,045 |
| $670 |
| 1 | Rate represents the seven-day yield at 12/31/2019. |
| 2 | Notional amount is calculated based on the number of contracts and notional contract size. |
| 3 | Value is calculated based on the notional amount and current market price. |
American Funds Insurance Series — Managed Risk Growth-Income Fund — Page 183 of 184
Managed Risk Asset Allocation Fund
Investment portfolio
December 31, 2019
| Asset allocation funds 95.49% | Shares | Value (000) |
| American Funds Insurance Series – Asset Allocation Fund, Class 1 | 112,462,863 | $2,704,731 |
| Total asset allocation funds(cost: $2,461,096,000) | 2,704,731 | |
| Short-term securities 4.57% | ||
| Government Cash Management Fund 1.51%1 | 129,388,605 | 129,389 |
| Total short-term securities(cost: $129,389,000) | 129,389 | |
| Total investment securities 100.06%(cost: $2,590,485,000) | 2,834,120 | |
| Other assets less liabilities (0.06)% | (1,616) | |
| Net assets 100.00% | $2,832,504 |
Futures contracts
| Contracts | Type | Number of contracts | Expiration | Notional amount2 (000) | Value at 12/31/20193 (000) | Unrealized depreciation at 12/31/2019 (000) |
| 5 Year U.S. Treasury Note Futures | Long | 1,222 | March 2020 | $122,200 | $144,941 | $(525) |
| 1 | Rate represents the seven-day yield at 12/31/2019. |
| 2 | Notional amount is calculated based on the number of contracts and notional contract size. |
| 3 | Value is calculated based on the notional amount and current market price. |
Additional financial disclosures are included in the fund’s current shareholder report and should be read in conjunction with this report.
Investments are not FDIC-insured, nor are they deposits of or guaranteed by a bank or any other entity, so they may lose value.
Investors should carefully consider investment objectives, risks, charges and expenses. This and other important information is contained in the series prospectus and summary prospectuses, which can be obtained from your financial professional and should be read carefully before investing. You may also call American Funds Service Company (AFS) at (800) 421-4225 or visit the American Funds website at capitalgroup.com. Fund shares offered through American Funds Distributors, Inc.
All Capital Group trademarks mentioned are owned by The Capital Group Companies, Inc., an affiliated company or fund. All other company and product names mentioned are the property of their respective companies.
American Funds Distributors, Inc., member FINRA.
© 2020 Capital Group. All rights reserved.
| INGEFPX-998-002209O-S73180 | American Funds Insurance Series — Managed Risk Asset Allocation Fund — Page 184 of 184 |
Report of Independent Registered Public Accounting Firm
To the Board of Trustees of American Funds Insurance Series and Shareholders of Global Growth Fund, Global Small Capitalization Fund, Growth Fund, International Fund, New World Fund®, Blue Chip Income and Growth Fund, Global Growth and Income Fund, Growth-Income Fund, International Growth and Income Fund, Capital Income Builder®, Asset Allocation Fund, Global Balanced Fund, Bond Fund, Global Bond Fund, High-Income Bond Fund, Mortgage Fund and U.S. Government/AAA-Rated Securities Fund
Opinions on the Financial Statements
We have audited the accompanying statements of assets and liabilities, including the summary investment portfolios, of Global Growth Fund, Global Small Capitalization Fund, Growth Fund, International Fund, New World Fund®, Blue Chip Income and Growth Fund, Global Growth and Income Fund, Growth-Income Fund, International Growth and Income Fund, Capital Income Builder®, Asset Allocation Fund, Global Balanced Fund, Bond Fund, Global Bond Fund, High-Income Bond Fund, Mortgage Fund and U.S. Government/AAA-Rated Securities Fund (seventeen of the funds constituting American Funds Insurance Series, hereafter collectively referred to as the “Funds”) as of December 31, 2019, the related statements of operations for the year ended December 31, 2019, the statements of changes in net assets for each of the two years in the period ended December 31, 2019, including the related notes, and the financial highlights for each of the periods indicated therein (included in Item 1 of this Form N-CSR) and the investment portfolios (included in Item 6 of this Form N-CSR) as of December 31, 2019 (collectively referred to as the “financial statements”). In our opinion, the financial statements present fairly, in all material respects, the financial position of each of the Funds as of December 31, 2019, the results of each of their operations for the year then ended, the changes in each of their net assets for each of the two years in the period ended December 31, 2019 and each of the financial highlights for each of the periods indicated therein in conformity with accounting principles generally accepted in the United States of America.
Basis for Opinions
These financial statements are the responsibility of the Funds’ management. Our responsibility is to express an opinion on the Funds’ financial statements based on our audits. We are a public accounting firm registered with the Public Company Accounting Oversight Board (United States) (PCAOB) and are required to be independent with respect to the Funds in accordance with the U.S. federal securities laws and the applicable rules and regulations of the Securities and Exchange Commission and the PCAOB.
We conducted our audits of these financial statements in accordance with the standards of the PCAOB. Those standards require that we plan and perform the audit to obtain reasonable assurance about whether the financial statements are free of material misstatement, whether due to error or fraud.
Our audits included performing procedures to assess the risks of material misstatement of the financial statements, whether due to error or fraud, and performing procedures that respond to those risks. Such procedures included examining, on a test basis, evidence regarding the amounts and disclosures in the financial statements. Our audits also included evaluating the accounting principles used and significant estimates made by management, as well as evaluating the overall presentation of the financial statements. Our procedures included confirmation of securities owned as of December 31, 2019 by correspondence with the custodians, transfer agent and brokers; when replies were not received from brokers, we performed other auditing procedures. We believe that our audits provide a reasonable basis for our opinions.
/s/ PricewaterhouseCoopers LLP
Los Angeles, California
February 11, 2020
We have served as the auditor of one or more investment companies in The Capital Group Companies Investment Company Complex since 1934.
ITEM 7 – Disclosure of Proxy Voting Policies and Procedures for Closed-End Management Investment Companies
Not applicable to this Registrant, insofar as the Registrant is not a closed-end management investment company.
ITEM 8 – Portfolio Managers of Closed-End Management Investment Companies
Not applicable to this Registrant, insofar as the Registrant is not a closed-end management investment company.
ITEM 9 – Purchases of Equity Securities by Closed-End Management Investment Company and Affiliated Purchasers
Not applicable to this Registrant, insofar as the Registrant is not a closed-end management investment company.
ITEM 10 – Submission of Matters to a Vote of Security Holders
There have been no material changes to the procedures by which shareholders may recommend nominees to the Registrant’s board of trustees since the Registrant last submitted a proxy statement to its shareholders. The procedures are as follows. The Registrant has a nominating and governance committee comprised solely of persons who are not considered ‘‘interested persons’’ of the Registrant within the meaning of the Investment Company Act of 1940, as amended. The committee periodically reviews such issues as the board’s composition, responsibilities, committees, compensation and other relevant issues, and recommends any appropriate changes to the full board of trustees. While the committee normally is able to identify from its own resources an ample number of qualified candidates, it will consider shareholder suggestions of persons to be considered as nominees to fill future vacancies on the board. Such suggestions must be sent in writing to the nominating and governance committee of the Registrant, c/o the Registrant’s Secretary, and must be accompanied by complete biographical and occupational data on the prospective nominee, along with a written consent of the prospective nominee for consideration of his or her name by the nominating and governance committee.
ITEM 11 – Controls and Procedures
| (a) | The Registrant’s Principal Executive Officer and Principal Financial Officer have concluded, based on their evaluation of the Registrant’s disclosure controls and procedures (as such term is defined in Rule 30a-3 under the Investment Company Act of 1940), that such controls and procedures are adequate and reasonably designed to achieve the purposes described in paragraph (c) of such rule. |
| (b) | There were no changes in the Registrant’s internal controls over financial reporting (as defined in Rule 30a-3(d) under the Investment Company Act of 1940) that occurred during the Registrant’s semi-annual period covered by this report that has materially affected, or is reasonably likely to materially affect, the Registrant’s internal control over financial reporting.
|
ITEM 12 – Exhibits
| (a)(1) | The Code of Ethics that is the subject of the disclosure required by Item 2 is attached as an exhibit hereto. |
| (a)(2) | The certifications required by Rule 30a-2 of the Investment Company Act of 1940 and Sections 302 and 906 of the Sarbanes-Oxley Act of 2002 are attached as exhibits hereto. |
SIGNATURES
Pursuant to the requirements of the Securities Exchange Act of 1934 and the Investment Company Act of 1940, the Registrant has duly caused this report to be signed on its behalf by the undersigned, thereunto duly authorized.
| AMERICAN FUNDS INSURANCE SERIES | |
| By __/s/ Maria Manotok________________ | |
Maria Manotok, Executive Vice President and Principal Executive Officer | |
| Date: February 28, 2020 |
Pursuant to the requirements of the Securities Exchange Act of 1934 and the Investment Company Act of 1940, this report has been signed below by the following persons on behalf of the Registrant and in the capacities and on the dates indicated.
| By _/s/ Maria Manotok_____________ |
Maria Manotok, Executive Vice President and Principal Executive Officer |
| Date: February 28, 2020 |
| By___/s/ Gregory F. Niland__________________ |
Gregory F. Niland, Treasurer and Principal Financial Officer |
| Date: February 28, 2020 |