
2017 First Quarter Earnings Webcast April 27, 2017 Beethoven Wind Farm near Tripp, South Dakota
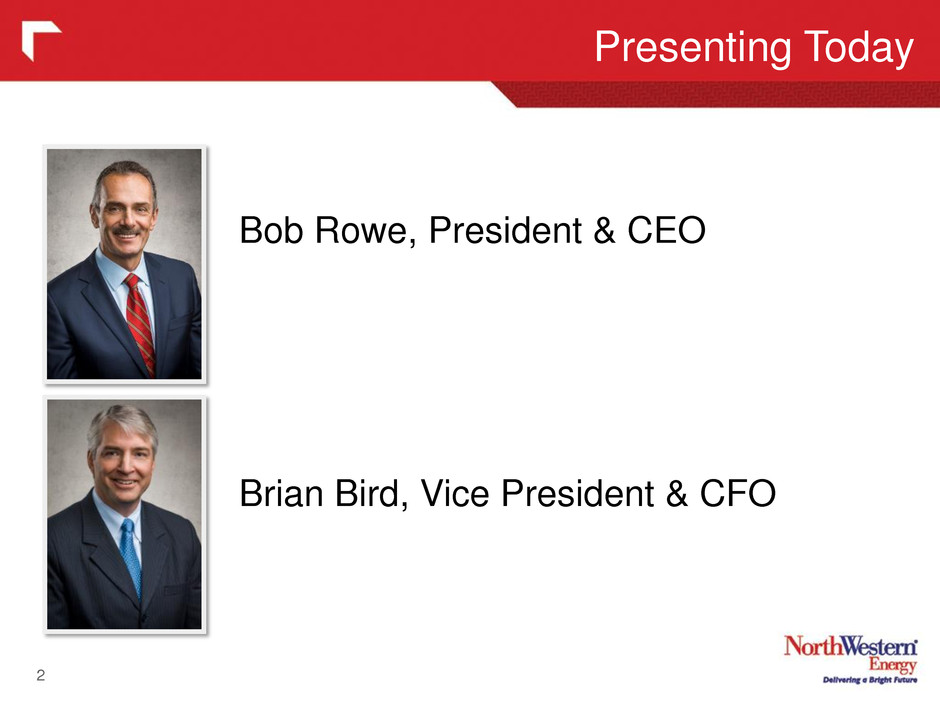
Presenting Today 2 Bob Rowe, President & CEO Brian Bird, Vice President & CFO
3 Forward Looking Statements During the course of this presentation, there will be forward-looking statements within the meaning of the “safe harbor” provisions of the Private Securities Litigation Reform Act of 1995. Forward-looking statements often address our expected future business and financial performance, and often contain words such as “expects,” “anticipates,” “intends,” “plans,” “believes,” “seeks,” or “will.” The information in this presentation is based upon our current expectations as of the date hereof unless otherwise noted. Our actual future business and financial performance may differ materially and adversely from our expectations expressed in any forward-looking statements. We undertake no obligation to revise or publicly update our forward-looking statements or this presentation for any reason. Although our expectations and beliefs are based on reasonable assumptions, actual results may differ materially. The factors that may affect our results are listed in certain of our press releases and disclosed in the Company’s 10-Q which we filed with the SEC on April 26, 2017 and our other public filings with the SEC.

• Net income for the quarter was $56.6 million, or $1.17 per diluted share, as compared with net income of $39.9 million, or $0.82 per diluted share, for the same period in 2016. • Non-GAAP adjusted diluted earnings per share was $1.13 as compared with $1.04 for the same period in 2016. • In March 2017, Moody’s Investor Service downgraded our senior secured First Mortgage Bonds rating to A2, from A1, and our unsecured rating to Baa1, from A3, while maintaining a negative outlook. Moody’s cited weak financial metrics and a heightened degree of regulatory uncertainty in Montana as reasons for the rating action. • The Board approved a quarterly stock dividend of $0.525 per share payable June 30, 2017. Recent Significant Activities 4
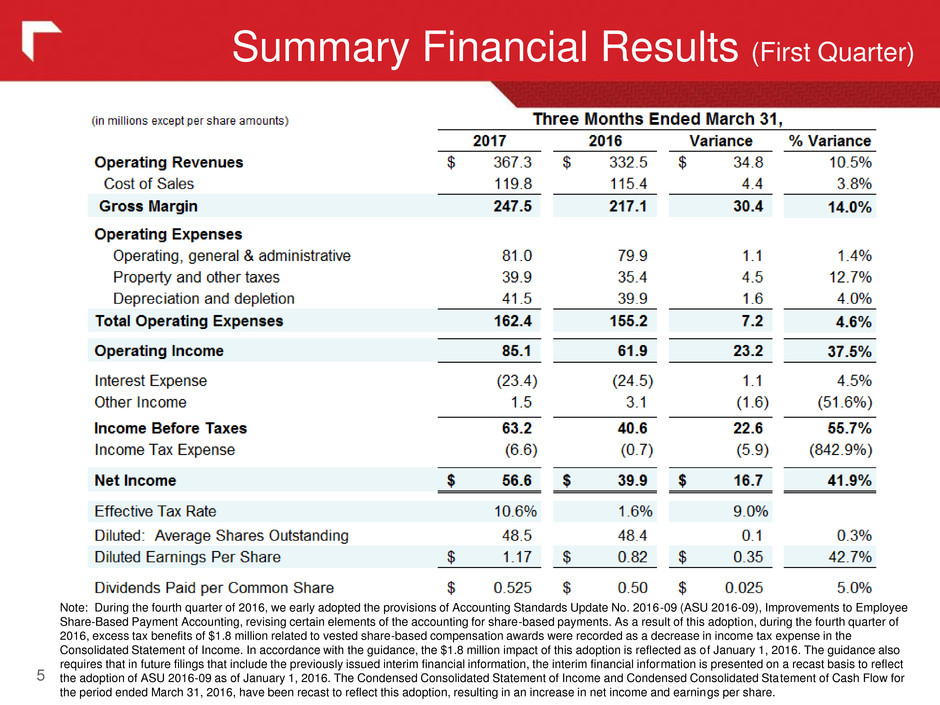
Summary Financial Results (First Quarter) 5 Note: During the fourth quarter of 2016, we early adopted the provisions of Accounting Standards Update No. 2016-09 (ASU 2016-09), Improvements to Employee Share-Based Payment Accounting, revising certain elements of the accounting for share-based payments. As a result of this adoption, during the fourth quarter of 2016, excess tax benefits of $1.8 million related to vested share-based compensation awards were recorded as a decrease in income tax expense in the Consolidated Statement of Income. In accordance with the guidance, the $1.8 million impact of this adoption is reflected as of January 1, 2016. The guidance also requires that in future filings that include the previously issued interim financial information, the interim financial information is presented on a recast basis to reflect the adoption of ASU 2016-09 as of January 1, 2016. The Condensed Consolidated Statement of Income and Condensed Consolidated Statement of Cash Flow for the period ended March 31, 2016, have been recast to reflect this adoption, resulting in an increase in net income and earnings per share.

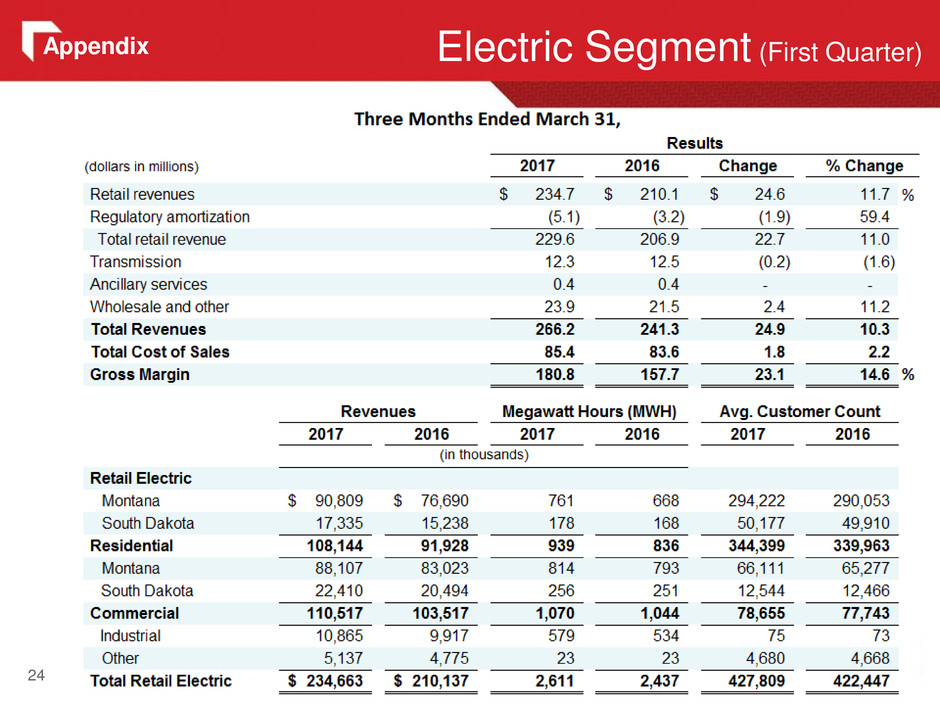
6 Gross Margin (First Quarter) (dollars in millions) Three Months Ended March 31, 2017 2016 Variance Electric $ 180.8 $ 157.7 $ 23.1 14.6% Natural Gas 66.7 59.4 7.3 12.3% Gross Margin $ 247.5 $ 217.1 $ 30.4 14.0% Increase in gross margin due to the following factors: $ 10.3 MPSC disallowance (2016) 8.6 Electric retail volumes 6.0 Natural gas retail volumes 1.2 South Dakota electric rate increase (0.6) Natural gas production 1.8 Other $ 27.3 Change in Gross Margin Impacting Net Income $ 3.1_ Property taxes recovered in trackers $ 3.1 Change in Gross Margin Offset Within Net Income $ 30.4 Increase in Consolidated Gross Margin
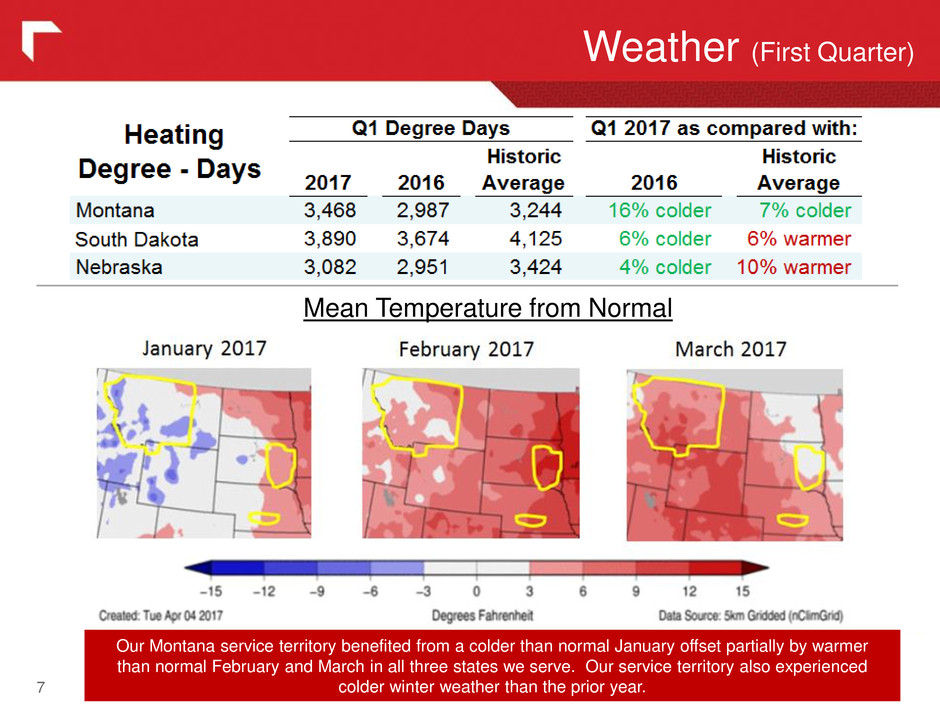
Weather (First Quarter) 7 Mean Temperature from Normal Our Montana service territory benefited from a colder than normal January offset partially by warmer than normal February and March in all three states we serve. Our service territory also experienced colder winter weather than the prior year.
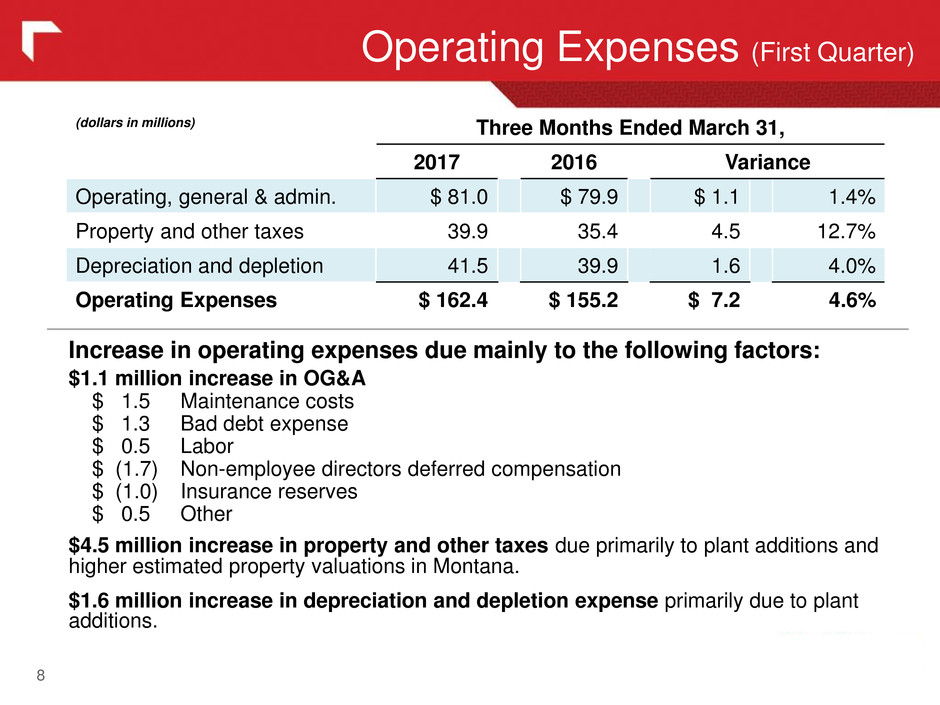
Operating Expenses (First Quarter) 8 Increase in operating expenses due mainly to the following factors: $1.1 million increase in OG&A $ 1.5 Maintenance costs $ 1.3 Bad debt expense $ 0.5 Labor $ (1.7) Non-employee directors deferred compensation $ (1.0) Insurance reserves $ 0.5 Other $4.5 million increase in property and other taxes due primarily to plant additions and higher estimated property valuations in Montana. $1.6 million increase in depreciation and depletion expense primarily due to plant additions. (dollars in millions) Three Months Ended March 31, 2017 2016 Variance Operating, general & admin. $ 81.0 $ 79.9 $ 1.1 1.4% Property and other taxes 39.9 35.4 4.5 12.7% Depreciation and depletion 41.5 39.9 1.6 4.0% Operating Expenses $ 162.4 $ 155.2 $ 7.2 4.6%

Operating to Net Income (First Quarter) 9 $1.1 million decrease in interest expenses was primarily due to debt refinancing at a lower interest rate of the Pollution Control Revenue Refunding Bonds during the third quarter of 2016. $1.6 million decrease in other income due primarily to a $1.7 million decrease in the value of deferred shares held in trust for non-employee directors deferred compensation (which had a corresponding increase to operating, general and administrative expenses). $5.9 million increase in income tax expense due primarily to higher pre-tax income, offset by lower flow-through repairs deductions. (dollars in millions) Three Months Ended March 31, 2017 2016 Variance Operating Income $ 85.1 $ 61.9 $ 23.2 37.5% Interest Expense (23.4) (24.5) 1.1 (4.5%) Other Income 1.5 3.1 (1.6) (51.6%) Income Before Taxes 63.2 40.6 22.6 55.7% Income Tax Expense (6.6) (0.7) (5.9) (842.9%) Net Income $ 56.6 $ 39.9 $ 16.7 41.9%
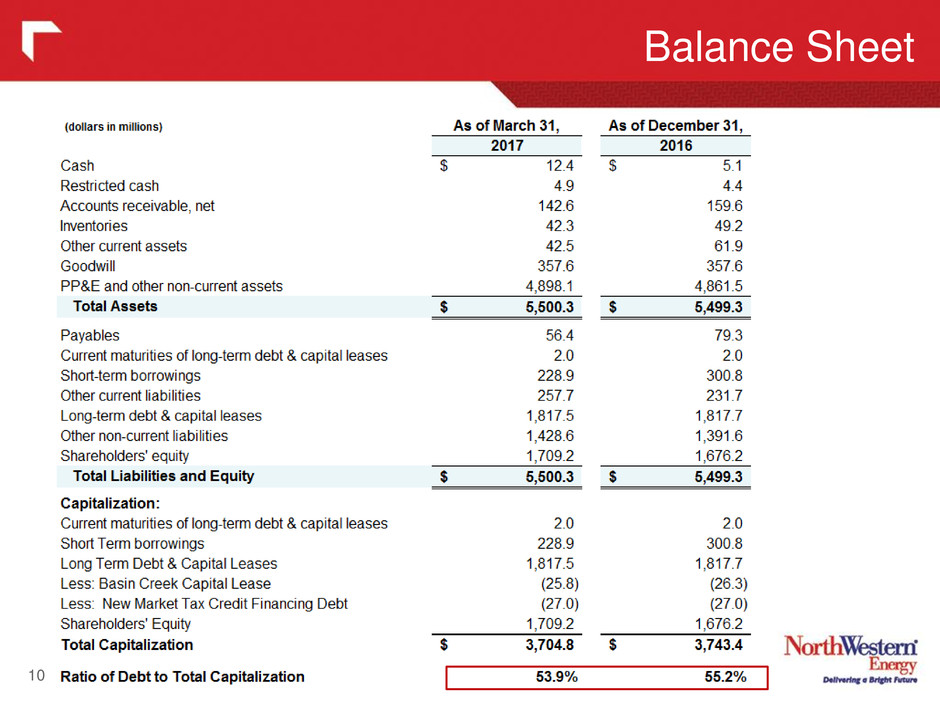
Balance Sheet 10
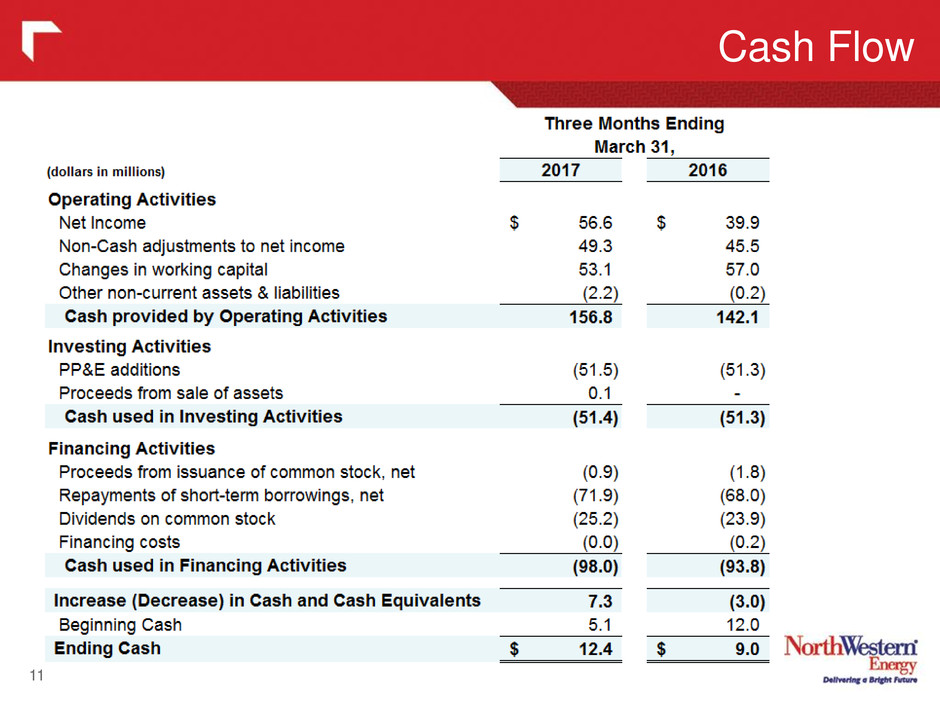
Cash Flow 11
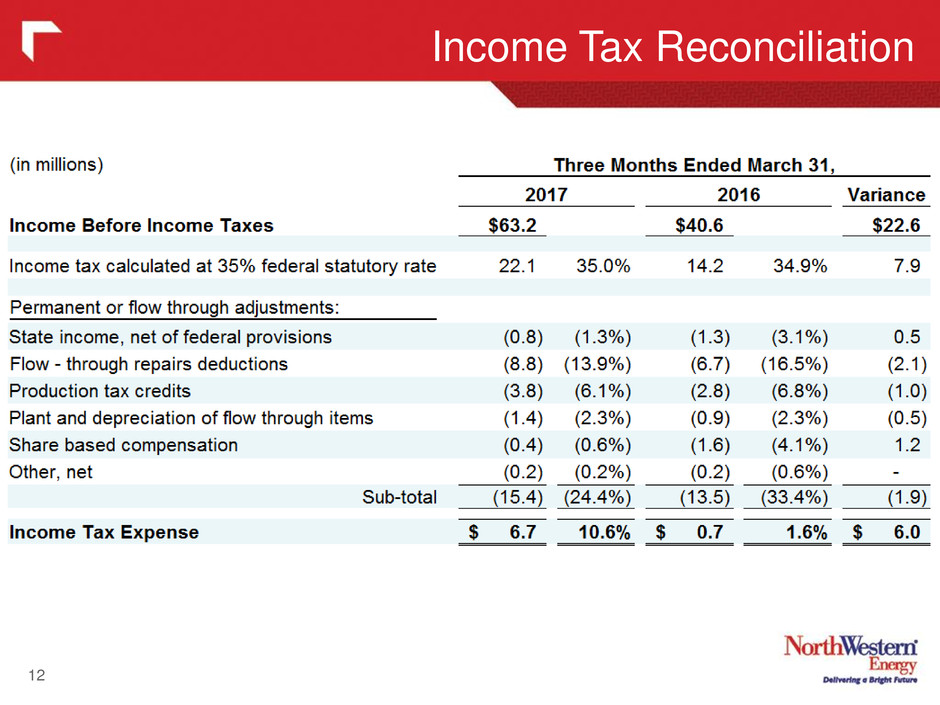
Income Tax Reconciliation 12

Adjusted Earnings (First Quarter ‘17 vs ’16) 13 The non-GAAP measures presented in the table above are being shown to reflect significant items that were not contemplated in our original guidance, however they should not be considered a substitute for financial results and measures determined or calculated in accordance with GAAP. (1) Note: First quarter net income and EPS last year (2016) was originally reported as $38.1M and $0.79, respectively. As a result of adopting Accounting Standards Update No. 2016-09 during the fourth quarter of 2016, excess tax benefits of $1.8 million related to vested share-based compensation awards were recorded as a decrease in income tax expense in the Consolidated Statement of Income. In accordance with the guidance, the $1.8 million impact of this adoption is reflected as of January 1, 2016.
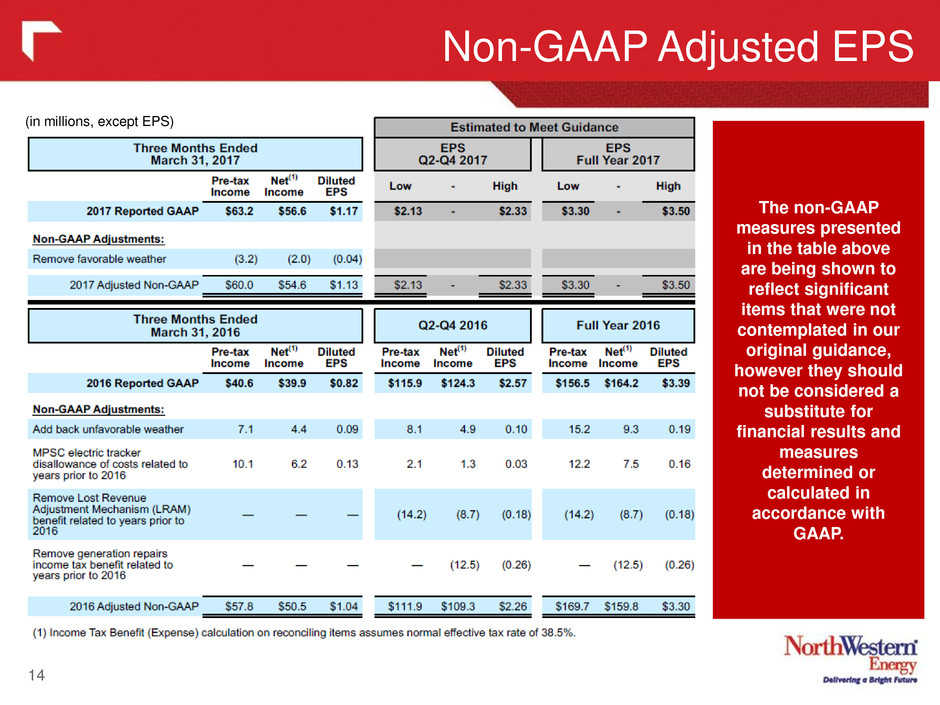
Non-GAAP Adjusted EPS 14 The non-GAAP measures presented in the table above are being shown to reflect significant items that were not contemplated in our original guidance, however they should not be considered a substitute for financial results and measures determined or calculated in accordance with GAAP. (in millions, except EPS)

2017 Earnings Guidance 15 NorthWestern reaffirms 2017 earnings guidance range of $3.30 - $3.50 per diluted share is based upon, but not limited to, the following major assumptions and expectations: • Normal weather in our electric and natural gas service territories; • A consolidated income tax rate of approximately 7% to 11% of pre-tax income; and • Diluted average shares outstanding of approximately 48.5 million. Continued investment in our system to serve our customers and communities is expected to provide a targeted 7-10% total return to our investors through a combination of earnings growth and dividend yield. However in light of recent regulatory headwinds and reduced & delayed generation spending, we anticipate in the near-term to be at the lower end of the 7-10% range. See “Non-GAAP Financial Measures” slide in appendix for “Non-GAAP “Adjusted EPS”. $2.60 - $2.75 $3.10 - $3.30 $3. 0-$3.40 $3.30-$3.50
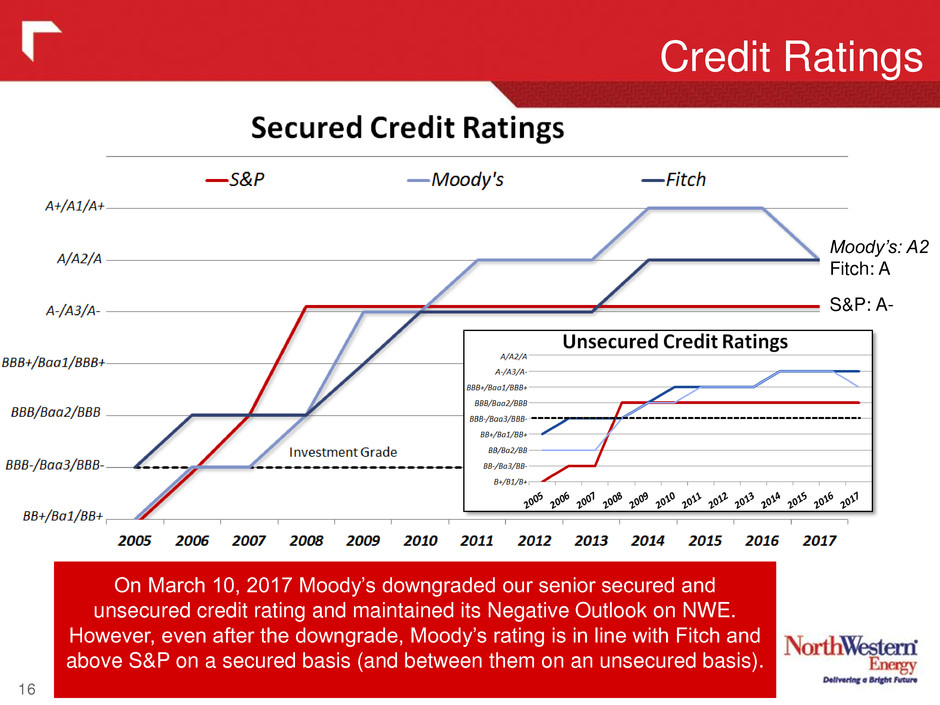
Credit Ratings 16 Moody’s: A2 Fitch: A S&P: A- On March 10, 2017 Moody’s downgraded our senior secured and unsecured credit rating and maintained its Negative Outlook on NWE. However, even after the downgrade, Moody’s rating is in line with Fitch and above S&P on a secured basis (and between them on an unsecured basis).
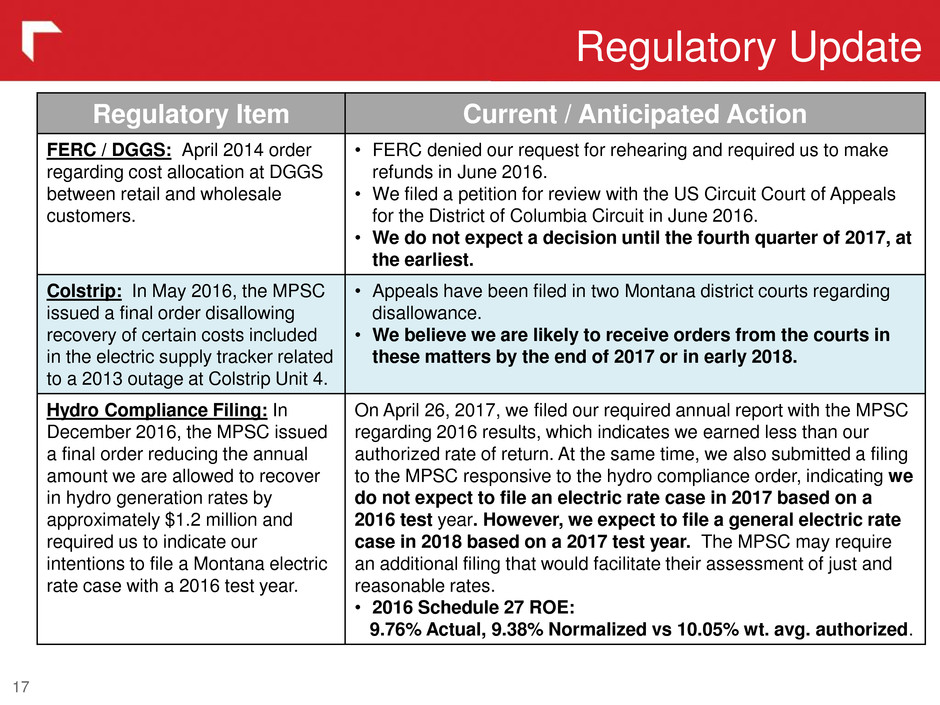
17 Regulatory Update Regulatory Item Current / Anticipated Action FERC / DGGS: April 2014 order regarding cost allocation at DGGS between retail and wholesale customers. • FERC denied our request for rehearing and required us to make refunds in June 2016. • We filed a petition for review with the US Circuit Court of Appeals for the District of Columbia Circuit in June 2016. • We do not expect a decision until the fourth quarter of 2017, at the earliest. Colstrip: In May 2016, the MPSC issued a final order disallowing recovery of certain costs included in the electric supply tracker related to a 2013 outage at Colstrip Unit 4. • Appeals have been filed in two Montana district courts regarding disallowance. • We believe we are likely to receive orders from the courts in these matters by the end of 2017 or in early 2018. Hydro Compliance Filing: In December 2016, the MPSC issued a final order reducing the annual amount we are allowed to recover in hydro generation rates by approximately $1.2 million and required us to indicate our intentions to file a Montana electric rate case with a 2016 test year. On April 26, 2017, we filed our required annual report with the MPSC regarding 2016 results, which indicates we earned less than our authorized rate of return. At the same time, we also submitted a filing to the MPSC responsive to the hydro compliance order, indicating we do not expect to file an electric rate case in 2017 based on a 2016 test year. However, we expect to file a general electric rate case in 2018 based on a 2017 test year. The MPSC may require an additional filing that would facilitate their assessment of just and reasonable rates. • 2016 Schedule 27 ROE: 9.76% Actual, 9.38% Normalized vs 10.05% wt. avg. authorized.
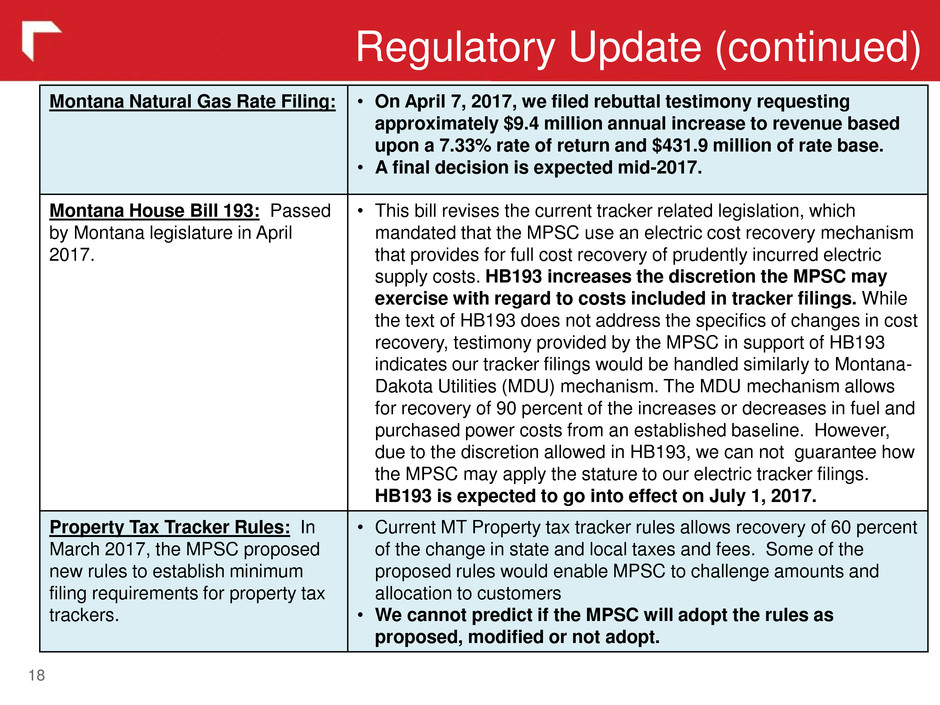
18 Montana Natural Gas Rate Filing: • On April 7, 2017, we filed rebuttal testimony requesting approximately $9.4 million annual increase to revenue based upon a 7.33% rate of return and $431.9 million of rate base. • A final decision is expected mid-2017. Montana House Bill 193: Passed by Montana legislature in April 2017. • This bill revises the current tracker related legislation, which mandated that the MPSC use an electric cost recovery mechanism that provides for full cost recovery of prudently incurred electric supply costs. HB193 increases the discretion the MPSC may exercise with regard to costs included in tracker filings. While the text of HB193 does not address the specifics of changes in cost recovery, testimony provided by the MPSC in support of HB193 indicates our tracker filings would be handled similarly to Montana- Dakota Utilities (MDU) mechanism. The MDU mechanism allows for recovery of 90 percent of the increases or decreases in fuel and purchased power costs from an established baseline. However, due to the discretion allowed in HB193, we can not guarantee how the MPSC may apply the stature to our electric tracker filings. HB193 is expected to go into effect on July 1, 2017. Property Tax Tracker Rules: In March 2017, the MPSC proposed new rules to establish minimum filing requirements for property tax trackers. • Current MT Property tax tracker rules allows recovery of 60 percent of the change in state and local taxes and fees. Some of the proposed rules would enable MPSC to challenge amounts and allocation to customers • We cannot predict if the MPSC will adopt the rules as proposed, modified or not adopt. Regulatory Update (continued)
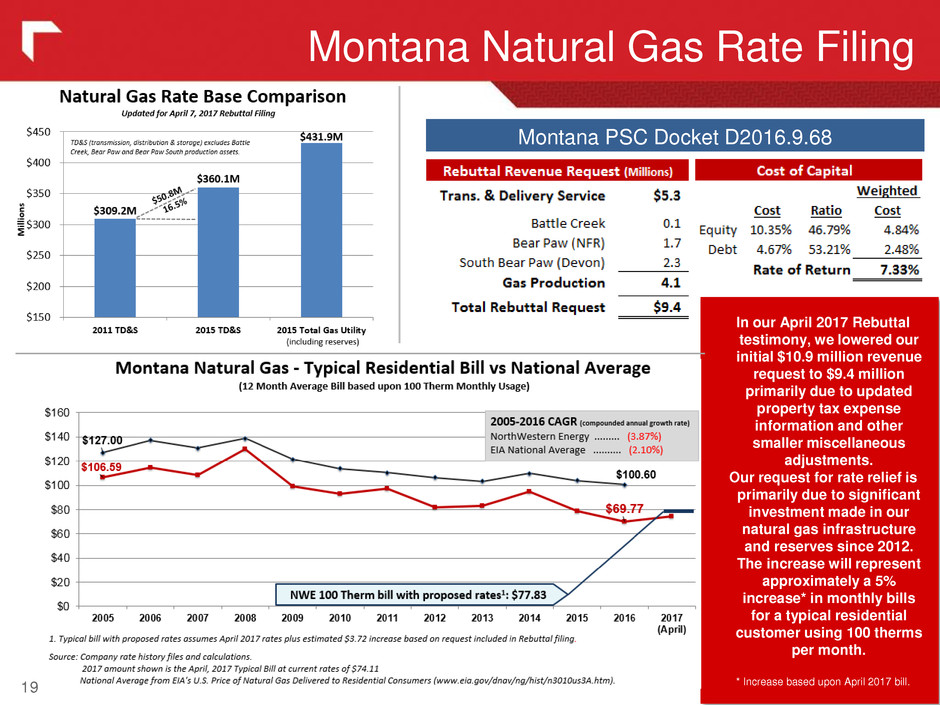
Montana Natural Gas Rate Filing 19 Montana PSC Docket D2016.9.68 In our April 2017 Rebuttal testimony, we lowered our initial $10.9 million revenue request to $9.4 million primarily due to updated property tax expense information and other smaller miscellaneous adjustments. Our request for rate relief is primarily due to significant investment made in our natural gas infrastructure and reserves since 2012. The increase will represent approximately a 5% increase* in monthly bills for a typical residential customer using 100 therms per month. * Increase based upon April 2017 bill.
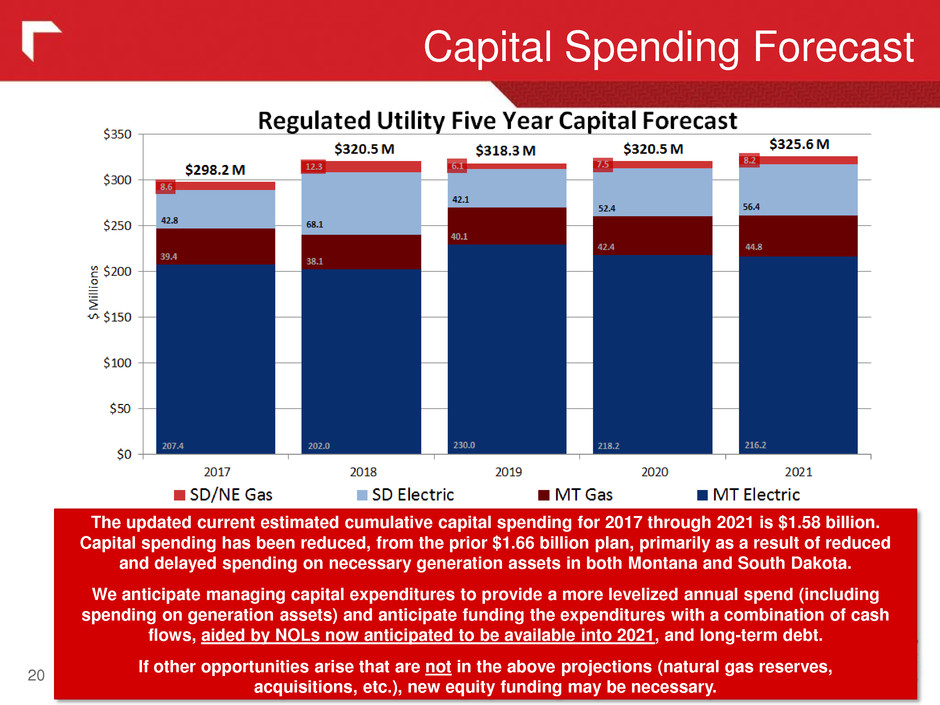
Capital Spending Forecast 20 The updated current estimated cumulative capital spending for 2017 through 2021 is $1.58 billion. Capital spending has been reduced, from the prior $1.66 billion plan, primarily as a result of reduced and delayed spending on necessary generation assets in both Montana and South Dakota. We anticipate managing capital expenditures to provide a more levelized annual spend (including spending on generation assets) and anticipate funding the expenditures with a combination of cash flows, aided by NOLs now anticipated to be available into 2021, and long-term debt. If other opportunities arise that are not in the above projections (natural gas reserves, acquisitions, etc.), new equity funding may be necessary. *

Conclusion 21 Pure Electric and Gas Utility Solid Utility Foundation Strong Earnings and Cash Flows Attractive Future Growth Prospects Best Practices Corporate Governance
22 Appendix
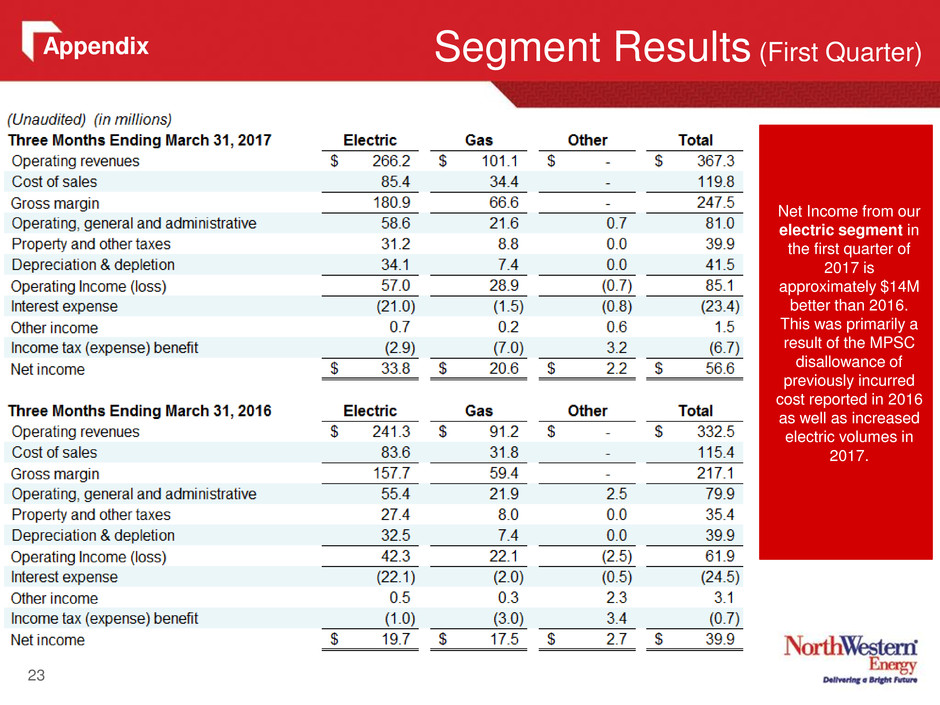
23 Segment Results (First Quarter) Net Income from our electric segment in the first quarter of 2017 is approximately $14M better than 2016. This was primarily a result of the MPSC disallowance of previously incurred cost reported in 2016 as well as increased electric volumes in 2017. Appendix
24 Electric Segment (First Quarter) Appendix

25 Natural Gas Segment (First Quarter) Appendix
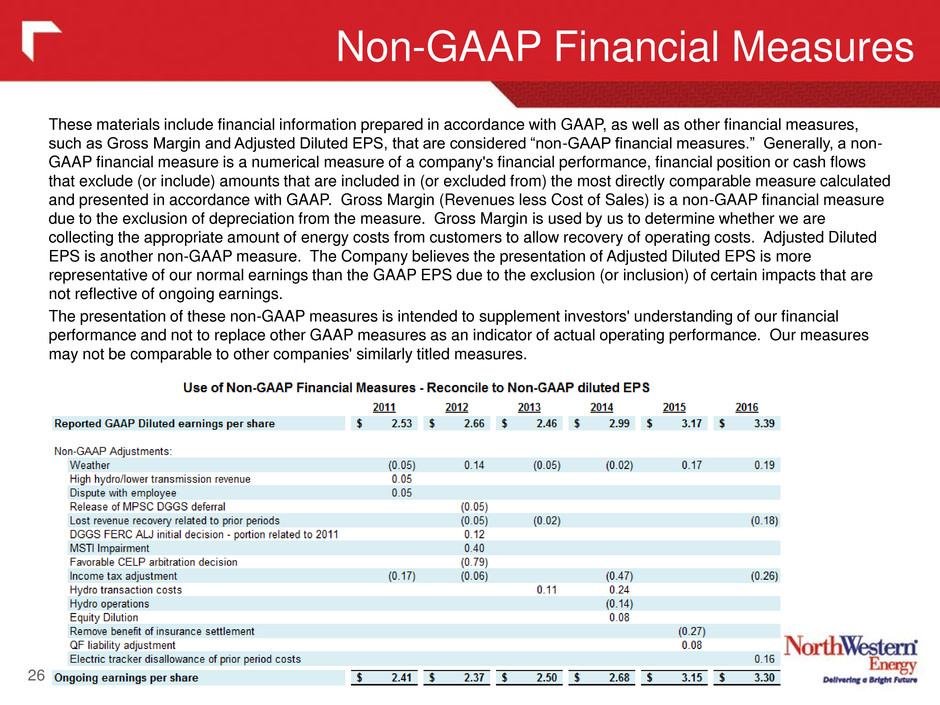
These materials include financial information prepared in accordance with GAAP, as well as other financial measures, such as Gross Margin and Adjusted Diluted EPS, that are considered “non-GAAP financial measures.” Generally, a non- GAAP financial measure is a numerical measure of a company's financial performance, financial position or cash flows that exclude (or include) amounts that are included in (or excluded from) the most directly comparable measure calculated and presented in accordance with GAAP. Gross Margin (Revenues less Cost of Sales) is a non-GAAP financial measure due to the exclusion of depreciation from the measure. Gross Margin is used by us to determine whether we are collecting the appropriate amount of energy costs from customers to allow recovery of operating costs. Adjusted Diluted EPS is another non-GAAP measure. The Company believes the presentation of Adjusted Diluted EPS is more representative of our normal earnings than the GAAP EPS due to the exclusion (or inclusion) of certain impacts that are not reflective of ongoing earnings. The presentation of these non-GAAP measures is intended to supplement investors' understanding of our financial performance and not to replace other GAAP measures as an indicator of actual operating performance. Our measures may not be comparable to other companies' similarly titled measures. Non-GAAP Financial Measures 26

27


