UNITED STATES
SECURITIES AND EXCHANGE COMMISSION
Washington, D.C. 20549
FORM N-CSR
CERTIFIED SHAREHOLDER REPORT OF REGISTERED
MANAGEMENT INVESTMENT COMPANIES
Investment Company Act file number | 811-03896 |
|
FPA U.S. VALUE FUND, INC. |
(Exact name of registrant as specified in charter) |
|
11601 WILSHIRE BLVD., STE. 1200 LOS ANGELES, CALIFORNIA | | 90025 |
(Address of principal executive offices) | | (Zip code) |
|
(Name and address of agent for service) | Copy to: |
| |
J. RICHARD ATWOOD, PRESIDENT FPA U.S. VALUE FUND, INC. 11601 WILSHIRE BLVD., STE. 1200 LOS ANGELES, CALIFORNIA 90025 | MARK D. PERLOW, ESQ. DECHERT LLP ONE BUSH STREET, STE. 1600 SAN FRANCISCO, CA 94104 |
|
Registrant’s telephone number, including area code: | (310) 473-0225 | |
|
Date of fiscal year end: | December 31 | |
|
Date of reporting period: | December 31, 2018 | |
| | | | | | | | | |
Item 1: Report to Shareholders.
FPA U.S. Value Fund, Inc.
Beginning on January 1, 2021, as permitted by regulations adopted by the Securities and Exchange Commission, we intend to no longer mail paper copies of the Fund's shareholder reports, unless you specifically request paper copies of the reports from the Fund or from your financial intermediary, such as a broker-dealer or bank. Instead, the reports will be made available on the FPA Funds website (fpa.com/funds), and you will be notified by mail each time a report is posted and provided with a website link to access the report. If you already elected to receive shareholder reports electronically, you will not be affected by this change and you need not take any action. If you prefer to receive shareholder reports and other communications electronically, you may update your mailing preferences with your financial intermediary, or enroll in e-delivery at fpa.com (for accounts held directly with the Fund).
You may elect to continue to receive paper copies of all future reports free of charge. If you invest through a financial intermediary, you may contact your financial intermediary to request that you continue to receive paper copies of your shareholder reports. If you invest directly with the Fund, you may inform the Fund that you wish to continue receiving paper copies of your shareholder reports by contacting us at (800) 638-3060. Your election to receive reports in paper will apply to all funds held with the FPA Funds or through your financial intermediary.

Distributor:
UMB DISTRIBUTION SERVICES, LLC
235 West Galena Street
Milwaukee, Wisconsin 53212
FPA U.S. VALUE FUND, INC.
LETTER TO SHAREHOLDERS
Introduction
In the fourth quarter, the FPA U.S. Value Fund, Inc.'s ("Fund") performance was -16.21%. It underperformed the total return of the S&P 500 Index ("Index") by 2.69%.1 For the year, the Fund's performance was -9.81% compared to -4.38% for the Index's total return. In 2018, the median stock price return in the Index experienced a loss greater than -8%1, which is similar to the Fund's 2018 gross performance.
In general, the larger-weighted companies in the Index performed better than the smaller ones2. This is a trend we have witnessed for some years now due to various large-cap companies continuing to enjoy some of the best revenue and earnings growth in the market. However, it was not all good news for the largest companies in the Index. While companies like Amazon and Microsoft enjoyed double-digit returns in 2018, others, like Facebook and Bank of America, experienced the opposite. What is interesting to note is that the 50 largest positive contributing stocks to the Index had a median return of approximately 20% and made up nearly 30% of the Index's weighting at the beginning of the year. It was a mirror image of that with the 50 greatest detractors to the index, which had a median return of approximately -20% and made up nearly 30% of the Index at the beginning of the year as well.2
Therefore, while on balance 2018 was a down year, depending on stock selection and position sizing, a fund's returns could have easily been much worse or much better than the index. Within this context it is not surprising that some of the best value investors over the past 20-plus years had one of their worst years ever in 2018 and a tough three-year stretch.3 We can empathize with these managers since we have also had a difficult time navigating the market over the past few years. However, we began making several important portfolio management changes toward the end of 2017 and have continued to tweak them throughout 2018. We believe those moves have positioned the Fund to achieve our goal of outperformance over full market cycles.
It is worth reiterating the changes we made to the portfolio construction process over the past five quarters.
First, we moved from a focused portfolio, which had an average of 27 disclosed investments over the first nine quarters, to a much more diversified portfolio averaging 65 disclosed positions over the last five quarters.4 We made the change because we have witnessed the pace of disruption to industries move ever more rapidly to the point where it has become increasingly difficult to have enough conviction to justify overwhelming concentration in any given sector. Businesses that appear to be unique and great today can quickly become a commodity and average tomorrow. Today, we believe very few companies have the ability to retain their greatness for extended periods.
Second, we completely changed the process by which we construct the portfolio. Over the first nine quarters, we built the portfolio from a purely bottom-up, fundamental perspective. If we found an attractive company, we added it to the portfolio and sized the investment based on our view of the quality of the business and estimated upside over the next few years. We did not mind being overly concentrated in an industry if we
1 Source: Morningstar. Comparison to the S&P 500 Index is being used as a representation of the "market" and is for illustrative purposes only. The Fund does not include outperformance of any index or benchmark in its investment objectives.
2 Source: Bloomberg.
3 Source: Morningstar.
4 On September 1, 2015, the Fund changed its name to FPA U.S. Value Fund, Inc., and the current portfolio manager assumed management of the Fund on that date. Contemporaneous with this change, the Fund transitioned to its current investment strategy. The transition took place during time period from September 1, 2015-September 30, 2015. The first nine quarters refers to the nine quarters starting with 4Q 2015 through 3Q 2017. The last five quarters refers to 4Q 2017 through 4Q 2018.
1
FPA U.S. VALUE FUND, INC.
LETTER TO SHAREHOLDERS
(Continued)
believed the risk/reward was highly attractive. However, more often than not, we were surprised to the downside on business fundamentals, even though they were usually historically very solid.
Over the past five quarters, the portfolio construction process has begun by determining what industries we want to avoid or be less exposed to due to lack of business quality and/or compelling valuation — with business quality being the most important factor. Among the industries we find attractive, we seek to invest in the highest quality companies we can find at compelling valuations. We base position sizing on a combination of valuation and the strength of our conviction that the business's attributes can be sustained and translated into above average revenue and earnings growth over the long term. Ultimately, the most difficult aspect of portfolio management is determining which industries and companies warrant overweighting — mostly because it's difficult to anticipate where the next disruption will occur that will impact business fundamentals.
While business quality is the most important factor for us, unattractive valuations have kept us from buying several high-quality5 companies. Those companies we continue to follow reside on our current "wish list", with the hope that one day their valuations become appealing so we get an opportunity to add them to the portfolio.
Third, we have changed our approach to technology-related companies. We believe the best secular growth within the global economy continues to be technology related. For the first three years, the portfolio was very under exposed to the sector due to above average valuation relative to the market. However, after expanding our research efforts within various technology related businesses, we added select companies to the portfolio and recently reached technology exposure that is more in line with the Index.
5 Although it is difficult to define a high quality business, the portfolio manager believes such businesses typically are able to earn higher than average operating margins and return on capital due to economies of scale, proprietary technology, brand value, pricing power or some other unique, sustainable competitive advantage. Additionally, these unique, sustainable advantages should result in above average earnings growth over time.
2
FPA U.S. VALUE FUND, INC.
LETTER TO SHAREHOLDERS
(Continued)
Portfolio Commentary
Compared to the broader market, we believe our portfolio is of higher quality and has greater potential for earnings growth.
| | FPA U.S. Value
Fund | | S&P 500 | |
Large Capitalization | | | 90.6 | % | | | 96.8 | % | |
Top 5 Holdings | | | 29.7 | % | | | 15.3 | % | |
Top 10 Holdings | | | 46.8 | % | | | 21.0 | % | |
Foreign Securities | | | 5.2 | % | | | 0.0 | % | |
| 12-Month Forward P/E6 | | | 16.5 | x | | | 15.1 | x | |
Price/Book7 | | | 3.7 | x | | | 3.0 | x | |
Return on Equity8 | | | 25.5 | % | | | 21.2 | % | |
EPS9 Growth Historical (2-year, $-weighted median) | | | 21.9 | % | | | 19.7 | % | |
EPS Growth Forecast (2-year, median) | | | 14.4 | % | | | 10.6 | % | |
Revenue Growth Historical (2-year, $-weighted median) | | | 15.6 | % | | | 11.5 | % | |
Revenue Growth Forecast (2-year, median) | | | 11.7 | % | | | 8.5 | % | |
Debt/Equity10 | | | 1.3 | x | | | 1.3 | x | |
Median Market Capitalization11 (billions) | | $ | 84.0 | | | $ | 18.5 | | |
Weighted Average Market Cap (billions) | | $ | 308.5 | | | $ | 201.1 | | |
Source: FPA, Mellon. Data as of December 31, 2018.
As of Dec. 31, 2018, the Fund was invested in 63 companies (56 of which are disclosed), including 55 that are in the Index. That leaves 445 other Index positions that are not in our portfolio. Moreover, the 55 positions in common made up approximately 38.5% of the Index's weighting. At the same time, a majority of those 55 positions were overweight in the Fund relative to the Index. The Fund's remaining eight investments were predominantly large-cap foreign companies and mid-cap U.S. companies. Combined, these eight companies made up 11.1% of the portfolio. Cash was 2.1%, which has come down as we put more money to work when stock prices declined at the end of the year. The Fund continues to have a relatively high active share compared to the Index.12
6 P/E (Price-to-Earnings Ratio) is a ratio used to value a company by measuring its current share price relative to its per-share earnings.
7 Price/Book ratio is the current closing price of the stock by the latest quarter's book value per share.
8 Return on Equity is the amount of profit computed by dividing net income before taxes less preferred dividends by the value of stockholders' equity.
9 EPS, or Earnings per Share, is the portion of a company's profit allocated to each share of common stock.
10 Debt/Equity (D/E) Ratio is calculated by dividing a company's total liabilities by its shareholder equity. These numbers are available on the balance sheet of a company's financial statements. The ratio is used to evaluate a company's financial leverage.
11 "Market Cap, short for market capitalization, refers to the total dollar market value of a company's outstanding shares."
12 Active share is a measure of the Fund's holdings that differ from the holdings in the Fund's benchmark index. The Fund's Active Share as of December 31, 2018 was 64.5%.
3
FPA U.S. VALUE FUND, INC.
LETTER TO SHAREHOLDERS
(Continued)
In terms of geography, 92.7% of the portfolio was in U.S. companies, while 5.2% was in foreign equities. By market capitalization, 90.6% of the disclosed portfolio was in large-cap companies, with approximately 47% of the portfolio invested in mega-caps — i.e., companies with market values above $200 billion. The portfolio's weighted average market cap was approximately $308 billion, while the Fund's median market cap was approximately $84 billion.
Regarding portfolio concentration, the Fund's top five positions made up 29.7% of the portfolio at year end compared to approximately 15.3% for the Index. The Fund's top 10 disclosed positions made up 46.8% of the portfolio versus 21.0% for the Index. Over time, our goal is to reduce the weighting of some of the Fund's largest positions and increase some of the Fund's smallest ones as our conviction grows.
From an industry exposure standpoint, the portfolio had disclosed investments in seven of the 11 sectors in the Index. Combined, those seven sectors made up approximately 81% of the Index and 93% of the Fund's disclosed portfolio. Relative to the S&P 500, at the end of 2018, the portfolio is overweight communication services, industrials, and consumer discretionary, slightly underweight materials and healthcare, and in-line with information technology and financials. At the end of the quarter, the Fund didn't have any disclosed investments in consumer staples, energy, utilities and real estate. Collectively, those four sectors made up about 19% of the Index.
| Sector | | FPA U.S. Value
Fund | | S&P 500 | |
Information Technology | | | 21.4 | % | | | 20.1 | % | |
Communication Services | | | 19.5 | % | | | 10.1 | % | |
Consumer Discretionary | | | 14.6 | % | | | 9.9 | % | |
Financials | | | 13.6 | % | | | 13.3 | % | |
Industrials | | | 13.2 | % | | | 9.2 | % | |
Health Care | | | 10.0 | % | | | 15.5 | % | |
Materials | | | 0.6 | % | | | 2.7 | % | |
Consumer Staples | | | 0.0 | % | | | 7.4 | % | |
Energy | | | 0.0 | % | | | 5.3 | % | |
Utilities | | | 0.0 | % | | | 3.3 | % | |
Real Estate | | | 0.0 | % | | | 3.0 | % | |
Total | | | 92.9 | % | | | 100.0 | % | |
Other | | | 5.0 | % | | | | | |
Cash and equivalents (net of liabilities) | | | 2.1 | % | | | | | |
Source: FPA, Mellon. Data as of December 31, 2018. Figures may not add up to 100% due to rounding. Sector classification scheme reflects GICS (Global Industry Classification Standard). Portfolio composition will change due to ongoing management of the Fund. Comparison to an index is for illustrative purposes only. The Fund does not include outperformance of any index or benchmark in its investment objectives. Please refer to the end of this commentary for important disclosures.
4
FPA U.S. VALUE FUND, INC.
LETTER TO SHAREHOLDERS
(Continued)
Q4 2018 Winners and Losers13
| Winners | | Performance
Contribution | | Losers | | Performance
Contribution | |
Twenty First Century Fox | | | 0.03 | % | | Apple | | | -1.68 | % | |
Dollar General | | | 0.01 | % | | Amazon.com | | | -1.27 | % | |
O'Reilly Automotive | | | 0.01 | % | | Facebook | | | -1.06 | % | |
PayPal Holdings | | | 0.00 | % | | Alphabet Inc. | | | -1.06 | % | |
HD Supply Holdings | | | -0.00 | % | | Airbus | | | -0.93 | % | |
2018 Winners and Losers13
| Winners | | Performance
Contribution | | Losers | | Performance
Contribution | |
Anthem | | | 0.28 | % | | Facebook | | | -1.33 | % | |
Madison Square Garden | | | 0.26 | % | | Citigroup | | | -0.55 | % | |
Twenty First Century Fox | | | 0.24 | % | | Apple | | | -0.50 | % | |
Microsoft | | | 0.20 | % | | Amazon.com | | | -0.48 | % | |
Medtronic | | | 0.19 | % | | Comcast | | | -0.45 | % | |
In looking at the top five detractors to performance in the fourth quarter and 2018, a majority of them are among the largest technology related companies in the world. With the exception of Amazon.com (NASDAQ: AMZN) and Microsoft (NASDAQ: MSFT), we were overweight Alphabet, Facebook and Apple throughout the year. Since the latter three companies were some of the largest detractors to the Index, it should be no surprise that being overweight to them in the portfolio hurt the Fund's return disproportionately more than it did the Index.14
Regarding AMZN, we began investing in the company in January 2018 and the Fund was meaningfully underweight compared to the Index for the first half of the year. While we have admired the company for a long time, we had struggled with its seemingly lofty valuation. As we continued to do more work on the company throughout the year, we became more comfortable with the long-term earnings power of its various businesses, particularly its AWS, 1P, 3P, Amazon Prime15 and nascent, but fast-growing digital advertising business. We also
13 Reflects top contributors and top detractors to the Fund's performance based on contribution-to-return basis. Contribution is presented gross of investment management fees, transactions costs, and Fund operating expenses, which if included, would reduce the returns presented. This is not a recommendation for a specific security and these securities may not be in the Fund at the time you receive this report. The information provided does not reflect all positions purchased, sold or recommended by FPA during the quarter. A copy of the methodology used and a list of every holding's contribution to the overall Fund's performance during the quarter is available by contacting FPA at crm@fpa.com. The portfolio holdings as of the most recent quarter-end may be obtained at www.fpa.com. Past performance is no guarantee, nor is it indicative, of future results. Please see Important Disclosures at the end of this commentary.
14 Source: Bloomberg.
15 Amazon Web Services (AWS) is a secure cloud services platform, offering computing power, database storage, content delivery and other functionality to help businesses scale and grow. 1P: Amazon sells sellers products on a wholesale relationship. Seller sends their inventory to Amazon, Amazon controls the pricing and the listing displays as "Ships from and sold by Amazon.com". 3P: Seller sells products on Amazon's marketplace and seller has Amazon fulfill orders from their fulfillment centers (Fulfillment by Amazon, FBA) and/or the seller can fulfill orders from their own warehouse or 3rd party warehouses (Fulfillment by Merchant, FBM). Amazon Prime: Amazon Prime is a paid service that gives Amazon shoppers a few distinct advantages. Members of Amazon Prime are eligible for free one- or two-day shipping on most items, among several other perks.
5
FPA U.S. VALUE FUND, INC.
LETTER TO SHAREHOLDERS
(Continued)
took note of several other relatively small but fast-growing ventures that Amazon is involved with that we believe may contribute meaningful earnings over time.
While our small initial investment in AMZN benefitted the Fund's performance for the year, the timing of our subsequent purchases throughout 2018 hurt our results. Had we known now what we knew a year ago, we would have begun 2018 with a full position. Unfortunately, we continued to build up our AMZN investment in the third and fourth quarters, which was followed by a double-digit correction in the stock market.
We felt that AMZN had run up too much, too quickly over the first nine months of the year, and as a result, we chose to write some covered calls against part of our investment in Q3'18. As the stock price declined in late 2018, we covered our call options and further increased our investment. As a result, our overall investment in AMZN was a detractor for the Fund in 2018, whereas the stock was a major benefit to the Index. Nevertheless, based on what we know today, we are happy to have a full position in AMZN at the current valuation and believe it will positively benefit the Fund's returns over the next full market cycle.
One of the Fund's largest contributors to performance in 2018 was MSFT. As we did with AMZN, we began 2018 with a small investment in MSFT (though larger than our initial AMZN position) and steadily increased our holding as the year progressed. Both were approximately 4% positions at the end of September. However, MSFT shares did not rise as much as AMZN in the first nine months of the year. When the market correction came, MSFT held up better than AMZN, which helps explain why MSFT contributed positively to the Fund's performance in 2018, but not nearly to the same degree it benefitted the Index.
Closing
We are optimistic that the portfolio will generate good absolute and relative returns compared to the Index going forward. To that end, we further increased our alignment with fellow shareholders by making opportunistic purchases of the Fund with our personal capital during the fourth quarter market sell-off — taking advantage of what we believe to be attractive prices for a reasonably diversified portfolio of high-quality companies.
We look forward to delivering value for our shareholders over the coming years. Thank you for your confidence and continued support.
Respectfully submitted,

Gregory R. Nathan
Portfolio Manager
January 2019
6
FPA U.S. VALUE FUND, INC.
LETTER TO SHAREHOLDERS
(Continued)
The discussions of Fund investments represent the views of the Fund's managers at the time of this report and are subject to change without notice. References to individual securities are for informational purposes only and should not be construed as recommendations to purchase or sell individual securities. While the Fund's managers believe that the Fund's holdings are value stocks, there can be no assurance that others will consider them as such. Further, investing in value stocks presents the risk that value stocks may fall out of favor with investors and underperform growth stocks during given periods.
FORWARD LOOKING STATEMENT DISCLOSURE
As mutual fund managers, one of our responsibilities is to communicate with shareholders in an open and direct manner. Insofar as some of our opinions and comments in our letters to shareholders are based on our current expectations, they are considered "forward-looking statements" which may or may not prove to be accurate over the long term. While we believe we have a reasonable basis for our comments and we have confidence in our opinions, actual results may differ materially from those we anticipate. You can identify forward-looking statements by words such as "believe," "expect," "may," "anticipate," and other similar expressions when discussing prospects for particular portfolio holdings and/or the markets, generally. We cannot, however, assure future results and disclaim any obligation to update or alter any forward-looking statements, whether as a result of new information, future events, or otherwise. Further, information provided in this report should not be construed as a recommendation to purchase or sell any particular security.
7
FPA U.S. VALUE FUND, INC.
HISTORICAL PERFORMANCE
(Unaudited)
Change in Value of a $10,000 Investment in FPA U.S. Value Fund, Inc. vs. Russell 2500 Index and S&P 500 for the Ten Years Ended December 31, 2018
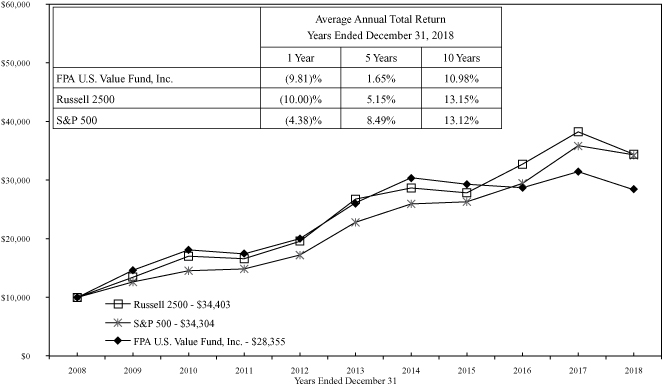
The Russell 2500 Index consists of the 2,500 smallest companies in the Russell 3000 total capitalization universe. This index is considered a measure of small to medium capitalization stock performance. The Standard & Poor's 500 Composite Index (S&P 500) is an unmanaged index that is generally representative of the U.S. stock market. The indexes do not reflect any commissions, fees or other expenses of investing which would be incurred by an investor purchasing the stocks it represents. The performance of the Fund and of the Indexes is computed on a total return basis which includes reinvestment of all distributions. It is not possible to invest directly in an index.
A new strategy for FPA U.S. Value Fund, Inc. was implemented beginning on September 1, 2015. The returns above include performance of the previous managers prior to that date. Past performance is no guarantee of future results and current performance may be higher or lower than the performance shown. This data represents past performance and investors should understand that investment returns and principal values fluctuate, so that when you redeem your investment may be worth more or less than its original cost. Current month-end performance data can be obtained by visiting the website at www.fpa.com or by calling toll-free, 1-800-982-4372. Information regarding the Fund's expense ratio and redemption fees can be found on page 13. The Prospectus details the Fund's objective and policies, sales charges, and other matters of interest to prospective investors. Please read the Prospectus carefully before investing. The Prospectus may be obtained by visiting the website at www.fpa.com, by email at crm@fpa.com, toll-free by calling 1-800-982-4372 or by contacting the Fund in writing.
8
FPA U.S. VALUE FUND, INC.
PORTFOLIO SUMMARY
December 31, 2018
Common Stocks | | | | | 97.0 | % | |
Internet Media | | | 13.8 | % | | | | | |
Consumer Finance | | | 8.7 | % | | | | | |
Managed Care | | | 6.6 | % | | | | | |
Communications Equipment | | | 6.4 | % | | | | | |
Diversified Banks | | | 6.0 | % | | | | | |
Aircraft & Parts | | | 5.6 | % | | | | | |
Infrastructure Software | | | 5.4 | % | | | | | |
E-Commerce Discretionary | | | 5.4 | % | | | | | |
Other Common Stocks | | | 5.0 | % | | | | | |
Private Equity | | | 3.1 | % | | | | | |
Defense Primes | | | 3.0 | % | | | | | |
Home Products Stores | | | 2.7 | % | | | | | |
P&C Insurance | | | 2.0 | % | | | | | |
Courier Services | | | 1.9 | % | | | | | |
Application Software | | | 1.8 | % | | | | | |
Entertainment Content | | | 1.7 | % | | | | | |
Entertainment Facilities | | | 1.7 | % | | | | | |
Internet Based Services | | | 1.6 | % | | | | | |
Cruise Lines | | | 1.6 | % | | | | | |
Cable & Satellite | | | 1.4 | % | | | | | |
Health Care Services | | | 1.4 | % | | | | | |
Rail Freight | | | 1.2 | % | | | | | |
Medical Devices | | | 1.1 | % | | | | | |
Institutional Brokerage | | | 1.1 | % | | | | | |
Homebuilders | | | 1.1 | % | | | | | |
Commercial & Residential Building
Equipment & Systems | | | 0.9 | % | | | | | |
Hotels, Restaurants & Leisure | | | 0.9 | % | | | | | |
Life Science Equipment | | | 0.8 | % | | | | | |
Electrical Components | | | 0.8 | % | | | | | |
Insurance Brokers | | | 0.6 | % | | | | | |
Industrial Distribution & Rental | | | 0.6 | % | | | | | |
Basic & Diversified Chemicals | | | 0.6 | % | | | | | |
Apparel, Footwear & Accessory Design | | | 0.5 | % | | | | | |
Closed End Fund | | | | | 0.9 | % | |
Short-term Investments | | | | | 2.6 | % | |
Other Assets And Liabilities, Net | | | | | (0.5 | )% | |
Net Assets | | | | | 100.0 | % | |
9
FPA U.S. VALUE FUND, INC.
PORTFOLIO OF INVESTMENTS
December 31, 2018
COMMON STOCKS | | Shares | | Fair Value | |
INTERNET MEDIA — 13.8% | |
Alphabet, Inc. (Class C) (a) | | | 5,050 | | | $ | 5,229,830 | | |
Facebook, Inc. (Class A) (a) | | | 25,155 | | | | 3,297,569 | | |
| | | $ | 8,527,399 | | |
CONSUMER FINANCE — 8.7% | |
American Express Co. | | | 5,700 | | | $ | 543,324 | | |
Mastercard, Inc. (Class A) | | | 7,950 | | | | 1,499,767 | | |
PayPal Holdings, Inc. (a) | | | 8,300 | | | | 697,947 | | |
Visa, Inc. (A Shares) | | | 19,900 | | | | 2,625,606 | | |
| | | $ | 5,366,644 | | |
MANAGED CARE — 6.6% | |
Anthem, Inc. | | | 7,350 | | | $ | 1,930,330 | | |
UnitedHealth Group, Inc. | | | 8,625 | | | | 2,148,660 | | |
| | | $ | 4,078,990 | | |
COMMUNICATIONS EQUIPMENT — 6.4% | |
Apple, Inc. | | | 19,817 | | | $ | 3,125,934 | | |
Cisco Systems, Inc. | | | 20,000 | | | | 866,600 | | |
| | | $ | 3,992,534 | | |
DIVERSIFIED BANKS — 6.0% | |
Bank of America Corporation | | | 54,050 | | | $ | 1,331,792 | | |
Citigroup, Inc. | | | 15,900 | | | | 827,754 | | |
JPMorgan Chase & Co. | | | 15,900 | | | | 1,552,158 | | |
| | | $ | 3,711,704 | | |
AIRCRAFT & PARTS — 5.6% | |
Airbus SE (France) | | | 24,250 | | | $ | 2,332,781 | | |
Boeing Co. (The) | | | 2,500 | | | | 806,250 | | |
United Technologies Corporation | | | 3,000 | | | | 319,440 | | |
| | | $ | 3,458,471 | | |
INFRASTRUCTURE SOFTWARE — 5.4% | |
Microsoft Corporation | | | 32,870 | | | $ | 3,338,606 | | |
E-COMMERCE DISCRETIONARY — 5.4% | |
Amazon.com, Inc. (a) | | | 2,217 | | | $ | 3,329,867 | | |
PRIVATE EQUITY — 3.1% | |
Blackstone Group LP (The) | | | 21,300 | | | $ | 634,953 | | |
KKR & Co., Inc. (Class A) | | | 65,250 | | | | 1,280,857 | | |
| | | $ | 1,915,810 | | |
10
FPA U.S. VALUE FUND, INC.
PORTFOLIO OF INVESTMENTS (Continued)
December 31, 2018
COMMON STOCKS — Continued | | Shares | | Fair Value | |
DEFENSE PRIMES — 3.0% | |
General Dynamics Corp. | | | 2,850 | | | $ | 448,048 | | |
Lockheed Martin Corp. | | | 1,875 | | | | 490,950 | | |
Northrop Grumman Corp. | | | 1,775 | | | | 434,698 | | |
Raytheon Co. | | | 3,160 | | | | 484,586 | | |
| | | $ | 1,858,282 | | |
HOME PRODUCTS STORES — 2.7% | |
Home Depot, Inc. (The) | | | 3,750 | | | $ | 644,325 | | |
Lowe's Cos., Inc. | | | 11,000 | | | | 1,015,960 | | |
| | | $ | 1,660,285 | | |
P&C INSURANCE — 2.0% | |
Berkshire Hathaway, Inc. (Class A) (a) | | | 4 | | | $ | 1,224,000 | | |
COURIER SERVICES — 1.9% | |
FedEx Corp. | | | 3,850 | | | $ | 621,120 | | |
United Parcel Service, Inc. (Class B) | | | 5,650 | | | | 551,045 | | |
| | | $ | 1,172,165 | | |
APPLICATION SOFTWARE — 1.8% | |
Activision Blizzard, Inc. | | | 9,925 | | | $ | 462,207 | | |
Adobe Systems, Inc. (a) | | | 2,800 | | | | 633,472 | | |
| | | $ | 1,095,679 | | |
ENTERTAINMENT CONTENT — 1.7% | |
CBS Corporation (Class B) | | | 8,200 | | | $ | 358,504 | | |
Twenty-First Century Fox, Inc. (Class A) | | | 15,000 | | | | 721,800 | | |
| | | $ | 1,080,304 | | |
ENTERTAINMENT FACILITIES — 1.7% | |
Madison Square Garden Co. (The) (Class A) (a) | | | 4,025 | | | $ | 1,077,492 | | |
INTERNET BASED SERVICES — 1.6% | |
Booking Holdings, Inc.(a) | | | 585 | | | $ | 1,007,616 | | |
CRUISE LINES — 1.6% | |
Carnival Corp. | | | 6,350 | | | $ | 313,055 | | |
Norwegian Cruise Line Holdings, Ltd. (a) | | | 8,100 | | | | 343,359 | | |
Royal Caribbean Cruises Ltd. | | | 3,150 | | | | 308,039 | | |
| | | $ | 964,453 | | |
CABLE & SATELLITE — 1.4% | |
Comcast Corp. (Class A) | | | 26,500 | | | $ | 902,325 | | |
11
FPA U.S. VALUE FUND, INC.
PORTFOLIO OF INVESTMENTS (Continued)
December 31, 2018
COMMON STOCKS — Continued | | Shares | | Fair Value | |
HEALTH CARE SERVICES — 1.4% | |
Cigna Corp. (a) | | | 2,700 | | | $ | 512,784 | | |
IQVIA Holdings, Inc. (a) | | | 2,825 | | | | 328,180 | | |
| | | $ | 840,964 | | |
RAIL FREIGHT — 1.2% | |
Union Pacific Corp. | | | 5,500 | | | $ | 760,265 | | |
MEDICAL DEVICES — 1.1% | |
Abbott Laboratories | | | 4,950 | | | $ | 358,034 | | |
Medtronic plc (Ireland) | | | 3,800 | | | | 345,648 | | |
| | | $ | 703,682 | | |
INSTITUTIONAL BROKERAGE — 1.1% | |
Morgan Stanley | | | 16,550 | | | $ | 656,208 | | |
HOMEBUILDERS — 1.1% | |
Lennar Corp. (B Shares) | | | 20,900 | | | $ | 654,797 | | |
COMMERCIAL & RESIDENTIAL BUILDING EQUIPMENT &
SYSTEMS — 0.9% | |
Honeywell International, Inc. | | | 2,100 | | | $ | 277,452 | | |
Ingersoll-Rand plc | | | 3,350 | | | | 305,621 | | |
| | | $ | 583,073 | | |
HOTELS, RESTAURANTS & LEISURE — 0.9% | |
Marriott International, Inc. (Class A) | | | 4,950 | | | $ | 537,372 | | |
LIFE SCIENCE EQUIPMENT — 0.8% | |
Thermo Fisher Scientific, Inc. | | | 2,350 | | | $ | 525,907 | | |
ELECTRICAL COMPONENTS — 0.8% | |
TE Connectivity, Ltd. (Switzerland) | | | 6,700 | | | $ | 506,721 | | |
INSURANCE BROKERS — 0.6% | |
Aon plc (Britain) | | | 2,700 | | | $ | 392,472 | | |
INDUSTRIAL DISTRIBUTION & RENTAL — 0.6% | |
HD Supply Holdings, Inc. (a) | | | 10,150 | | | $ | 380,828 | | |
12
FPA U.S. VALUE FUND, INC.
PORTFOLIO OF INVESTMENTS (Continued)
December 31, 2018
COMMON STOCKS — Continued | | Shares or
Principal
Amount | | Fair Value | |
BASIC & DIVERSIFIED CHEMICALS — 0.6% | |
DowDuPont, Inc. | | | 6,500 | | | $ | 347,620 | | |
APPAREL, FOOTWEAR & ACCESSORY DESIGN — 0.5% | |
LVMH Moet Hennessy Louis Vuitton SE (France) | | | 1,100 | | | $ | 325,416 | | |
| OTHER COMMON STOCKS — 5.0% (a)(b) | | $ | 3,091,831 | | |
| TOTAL COMMON STOCKS — 97.0% (Cost $57,018,415) | | $ | 60,069,782 | | |
CLOSED END FUND — 0.9% | |
Altaba, Inc. (a) (Cost $630,318) | | | 9,350 | | | $ | 541,739 | | |
| TOTAL INVESTMENT SECURITIES — 97.9% (Cost $57,648,733) | | $ | 60,611,521 | | |
SHORT-TERM INVESTMENTS — 2.6% | |
State Street Bank Repurchase Agreement — 0.50% 1/2/2019
(Dated 12/31/2018, repurchase price of $1,644,046, collateralized by
$1,635,000 principal amount U.S. Treasury Notes — 2.875% 2025,
fair value $1,677,677) (c) | | $ | 1,644,000 | | | $ | 1,644,000 | | |
| TOTAL SHORT-TERM INVESTMENTS (Cost $1,644,000) | | $ | 1,644,000 | | |
| TOTAL INVESTMENTS — 100.5% (Cost $59,292,733) | | $ | 62,255,521 | | |
Other Assets and Liabilities, net — (0.5)% | | | | | (327,910 | ) | |
NET ASSETS — 100.0% | | $ | 61,927,611 | | |
(a) Non-income producing security.
(b) As permitted by U.S. Securities and Exchange Commission regulations, "Other" Common Stocks include holdings in their first year of acquisition that have not previously been publicly disclosed.
(c) Security pledged as collateral (See Note 7 of the Notes to Financial Statements).
13
FPA U.S. VALUE FUND, INC.
PORTFOLIO OF INVESTMENTS (Continued)
December 31, 2018
Written Option Contracts
Description | | Exercise
Price | | Expiration
Date | | Counterparty | | Number of
Contracts | | Notional
Amount | | Premium | | Fair Value | |
Calls | | | | | | | | | | | | | | | |
Boeing Co. (the) | | $ | 390 | | | 01/18/2019 | | JPM | | | 6 | | | $ | 600 | | | $ | 11,961 | | | $ | (42 | ) | |
MasterCard, Inc. | | | 220 | | | 01/18/2019 | | JPM | | | 23 | | | | 2,300 | | | | 20,653 | | | | (207 | ) | |
Total Written Options | | | | | | | | | | | | $ | 32,614 | | | $ | (249 | ) | |
See accompanying Notes to Financial Statements.
14
FPA U.S. VALUE FUND, INC.
STATEMENT OF ASSETS AND LIABILITIES
December 31, 2018
ASSETS | |
Investment securities — at fair value (identified cost $57,648,733) | | $ | 60,611,521 | | |
Short-term investments — at amortized cost (maturities 60 days or less) | | | 1,644,000 | | |
Due from broker — OTC derivatives collateral | | | 121,438 | | |
Cash | | | 723 | | |
Receivable for: | |
Dividends and interest | | | 92,460 | | |
Capital Stock sold | | | 462 | | |
Total assets | | | 62,470,604 | | |
LIABILITIES | |
Written options, at value (premiums received $32,614) | | | 249 | | |
Payable for: | |
Capital Stock repurchased | | | 387,513 | | |
Advisory fees | | | 50,457 | | |
Accrued expenses and other liabilities | | | 104,774 | | |
Total liabilities | | | 542,993 | | |
NET ASSETS | | $ | 61,927,611 | | |
SUMMARY OF SHAREHOLDERS' EQUITY | |
Capital Stock — par value $0.01 per share; authorized 25,000,000 shares;
7,001,852 outstanding shares | | $ | 70,019 | | |
Additional Paid-in Capital | | | 59,064,705 | | |
Distributable earnings | | | 2,792,887 | | |
NET ASSETS | | $ | 61,927,611 | | |
NET ASSET VALUE | |
Offering and redemption price per share | | $ | 8.84 | | |
See accompanying Notes to Financial Statements.
15
FPA U.S. VALUE FUND, INC.
STATEMENT OF OPERATIONS
For the Year Ended December 31, 2018
INVESTMENT INCOME | |
Dividends (net of foreign taxes withheld of $45,522) | | $ | 873,219 | | |
Interest | | | 34,407 | | |
Total investment income | | | 907,626 | | |
EXPENSES | |
Advisory fees | | | 550,797 | | |
Legal fees | | | 122,983 | | |
Director fees and expenses | | | 99,033 | | |
Transfer agent fees and expenses | | | 80,077 | | |
Reports to shareholders | | | 69,556 | | |
Audit and tax services fees | | | 54,348 | | |
Filing fees | | | 34,181 | | |
Custodian fees | | | 27,090 | | |
Administrative services fees | | | 3,722 | | |
Other professional fees | | | 3,363 | | |
Other | | | 6,396 | | |
Total expenses | | | 1,051,546 | | |
Reimbursement from Adviser | | | (129,891 | ) | |
Net expenses | | | 921,655 | | |
Net investment loss | | | (14,029 | ) | |
NET REALIZED AND UNREALIZED GAIN (LOSS) | |
Net realized gain (loss) on: | |
Investments | | | 509,891 | | |
Written options | | | (227,053 | ) | |
Investments in foreign currency transactions | | | (3,773 | ) | |
Net change in unrealized appreciation (depreciation) of: | |
Investments | | | (6,652,278 | ) | |
Written options | | | 32,365 | | |
Translation of foreign currency denominated amounts | | | (2,347 | ) | |
Net realized and unrealized loss | | | (6,343,195 | ) | |
NET DECREASE IN NET ASSETS RESULTING FROM OPERATIONS | | $ | (6,357,224 | ) | |
See accompanying Notes to Financial Statements.
16
FPA U.S. VALUE FUND, INC.
STATEMENTS OF CHANGES IN NET ASSETS
| | | Year Ended
December 31, 2018 | | Year Ended
December 31, 2017 | |
INCREASE (DECREASE) IN NET ASSETS | |
Operations: | |
Net investment income (loss) | | $ | (14,029 | ) | | $ | 158,670 | | |
Net realized gain | | | 279,065 | | | | 3,161,566 | | |
Net change in unrealized appreciation (depreciation) | | | (6,622,260 | ) | | | 6,977,224 | | |
Net increase (decrease) in net assets resulting
from operations | | | (6,357,224 | ) | | | 10,297,460 | | |
Distributions to shareholders | | | (832,396 | ) | | | (549,989 | ) | |
Capital Stock transactions: | |
Proceeds from Capital Stock sold | | | 1,665,515 | | | | 17,183,002 | | |
Proceeds from shares issued to shareholders upon reinvestment of
dividends and distributions | | | 754,262 | | | | 385,339 | | |
Cost of Capital Stock repurchased | | | (19,514,559 | ) | | | (54,035,942 | )* | |
Net decrease from Capital Stock transactions | | | (17,094,782 | ) | | | (36,467,601 | ) | |
Total change in net assets | | | (24,284,402 | ) | | | (26,720,130 | ) | |
NET ASSETS | |
Beginning of Year | | | 86,212,013 | | | | 112,932,143 | | |
End of Year | | $ | 61,927,611 | | | $ | 86,212,013 | | |
CHANGE IN CAPITAL STOCK OUTSTANDING | |
Shares of Capital Stock sold | | | 168,266 | | | | 1,864,285 | | |
Shares issued to shareholders upon reinvestment of
dividends and distributions | | | 75,651 | | | | 39,440 | | |
Shares of Capital Stock repurchased | | | (1,937,852 | ) | | | (5,630,754 | ) | |
Change in Capital Stock outstanding | | | (1,693,935 | ) | | | (3,727,029 | ) | |
* Net of redemption fees of $15,497 for the year ended December 31, 2017.
See accompanying Notes to Financial Statements.
17
FPA U.S. VALUE FUND, INC.
FINANCIAL HIGHLIGHTS
Selected Data for Each Share of Capital Stock Outstanding Throughout Each Year
| | | Year Ended December 31, | |
| | | 2018 | | 2017 | | 2016 | | 2015 | | 2014 | |
Per share operating performance: | |
Net asset value at beginning of year | | $ | 9.91 | | | $ | 9.09 | | | $ | 9.36 | | | $ | 53.50 | | | $ | 49.53 | | |
Income from investment operations: | |
Net investment income (loss)* | | | — | ** | | $ | 0.01 | | | $ | 0.04 | | | $ | (0.01 | ) | | $ | (0.08 | ) | |
Net realized and unrealized gain (loss) on
investment securities | | $ | (0.95 | ) | | | 0.86 | | | | (0.23 | ) | | | (4.38 | ) | | | 8.08 | | |
Total from investment operations | | $ | (0.95 | ) | | $ | 0.87 | | | $ | (0.19 | ) | | $ | (4.39 | ) | | $ | 8.00 | | |
Less distributions: | |
Dividends from net investment income | | $ | (0.02 | ) | | $ | (0.05 | ) | | | — | | | | — | | | | — | | |
Distributions from net realized
capital gains | | | (0.10 | ) | | | — | | | $ | (0.08 | ) | | $ | (39.75 | ) | | $ | (4.03 | ) | |
Total distributions | | $ | (0.12 | ) | | $ | (0.05 | ) | | $ | (0.08 | ) | | $ | (39.75 | ) | | $ | (4.03 | ) | |
Redemption fees | | | — | | | | — | ** | | | — | ** | | | — | ** | | | — | ** | |
Net asset value at end of year | | $ | 8.84 | | | $ | 9.91 | | | $ | 9.09 | | | $ | 9.36 | | | $ | 53.50 | | |
Total investment return*** | | | (9.81 | )% | | | 9.52 | % | | | (2.00 | )% | | | (3.68 | )% | | | 16.38 | % | |
Ratios/supplemental data: | |
Net assets, end of year (in $000's) | | $ | 61,928 | | | $ | 86,212 | | | $ | 112,932 | | | $ | 166,636 | | | $ | 336,893 | | |
Ratio of expenses of average net assets: | |
Before reimbursement from Adviser | | | 1.37 | % | | | 1.22 | % | | | 1.20 | % | | | 0.97 | % | | | 0.94 | % | |
After reimbursement from Adviser | | | 1.20 | % | | | 1.13 | % | | | 1.11 | % | | | 0.97 | % | | | 0.94 | % | |
Ratio of net investment income to
average net assets: | |
Before reimbursement from Adviser | | | (0.19 | )% | | | 0.05 | % | | | 0.32 | % | | | (0.03 | )% | | | (0.16 | )% | |
After reimbursement from Adviser | | | (0.02 | )% | | | 0.14 | % | | | 0.40 | % | | | (0.03 | )% | | | (0.16 | )% | |
Portfolio turnover rate | | | 79 | % | | | 137 | % | | | 115 | % | | | 109 | % | | | 5 | % | |
* Per share amount is based on average shares outstanding.
** Rounds to less than $0.01 per share.
*** Return is based on net asset value per share, adjusted for reinvestment of distributions, and does not reflect deduction of the sales charge.
See accompanying Notes to Financial Statements.
18
FPA U.S. VALUE FUND, INC.
NOTES TO FINANCIAL STATEMENTS
December 31, 2018
NOTE 1 — Significant Accounting Policies
FPA U.S. Value Fund, Inc. (the "Fund") is registered under the Investment Company Act of 1940, as a diversified, open-end, management investment company. The Fund's primary investment objective is long-term growth of capital. Current income is a secondary consideration. The Fund qualifies as an investment company pursuant to Financial Accounting Standard Board (FASB) Accounting Standards Codification (ASC) No. 946, Financial Services — Investment Companies. The following is a summary of significant accounting policies consistently followed by the Fund in the preparation of its financial statements.
A. Security Valuation
The Fund's investments are reported at fair value as defined by accounting principles generally accepted in the United States of America, ("U.S. GAAP"). The Fund generally determines its net asset value as of approximately 4:00 p.m. New York time each day the New York Stock Exchange is open. Further discussion of valuation methods, inputs and classifications can be found under Disclosure of Fair Value Measurements.
B. Securities Transactions and Related Investment Income
Securities transactions are accounted for on the date the securities are purchased or sold. Dividend income and distributions to shareholders are recorded on the ex-dividend date. Interest income and expenses are recorded on an accrual basis. The books and records of the Fund are maintained in U.S. dollars as follows: (1) the foreign currency fair value of investment securities, and other assets and liabilities stated in foreign currencies, are translated using the daily spot rate; and (2) purchases, sales, income and expenses are translated at the rate of exchange prevailing on the respective dates of such transactions. The resultant exchange gains and losses are included in net realized or net unrealized gain (loss) in the statement of operations.
C. Use of Estimates
The preparation of the financial statements in accordance with U.S. GAAP requires management to make estimates and assumptions that affect the amounts reported. Actual results could differ from those estimates.
D. Recent Accounting Pronouncements
In August 2018, the Financial Accounting Standards Board (FASB) issued Accounting Standards Update (ASU) No. 2018-13, Fair Value Measurement (Topic 820) — Disclosure Framework — Changes to the Disclosure Requirements for Fair Value Measurement. The amendments eliminate certain disclosure requirements for fair value measurements for all entities, requires public entities to disclose certain new information and modifies some disclosure requirements. The new guidance is effective for all entities for fiscal years beginning after December 15, 2019 and for interim periods within those fiscal years. An entity is permitted to early adopt either the entire standard or only the provisions that eliminate or modify requirements. The Adviser is currently evaluating the impact of this new guidance on the Fund's financial statements.
NOTE 2 — Risk Considerations
Investing in the Fund may involve certain risks including, but not limited to, those described below.
Market Risk: Because the values of the Fund's investments will fluctuate with market conditions, so will the value of your investment in the Fund. You could lose money on your investment in the Fund or the Fund could underperform other investments.
19
FPA U.S. VALUE FUND, INC.
NOTES TO FINANCIAL STATEMENTS (Continued)
Common Stocks and Other Securities: The prices of common stocks and other securities held by the Fund may decline in response to certain events taking place around the world, including; those directly involving companies whose securities are owned by the Fund; conditions affecting the general economy; overall market changes; local, regional or global political, social or economic instability; and currency, interest rate and commodity price fluctuations. In addition, the Adviser's emphasis on a value-oriented investment approach generally results in the Fund's portfolio being invested primarily in medium or smaller sized companies. Smaller companies may be subject to a greater degree of change in earnings and business prospects than larger, more established companies, and smaller companies are often more reliant on key products or personnel than larger companies. The Fund's foreign investments are subject to additional risks such as, foreign markets could go down or prices of the Fund's foreign investments could go down because of unfavorable changes in foreign currency exchange rates, foreign government actions, social, economic or political instability or other factors that can adversely affect investments in foreign countries. These factors can also make foreign securities less liquid, more volatile and harder to value than U.S. securities. In light of these characteristics of smaller companies and their securities, the Fund may be subjected to greater risk than that assumed when investing in the equity securities of larger companies.
Repurchase Agreements: Repurchase agreements permit the Fund to maintain liquidity and earn income over periods of time as short as overnight. Repurchase agreements held by the Fund are fully collateralized by U.S. Government securities, or securities issued by U.S. Government agencies, or securities that are within the three highest credit categories assigned by established rating agencies (Aaa, Aa, or A by Moody's or AAA, AA or A by Standard & Poor's) or, if not rated by Moody's or Standard & Poor's, are of equivalent investment quality as determined by the Adviser. Such collateral is in the possession of the Fund's custodian. The collateral is evaluated daily to ensure its market value equals or exceeds the current market value of the repurchase agreements including accrued interest. In the event of default on the obligation to repurchase, the Fund has the right to liquidate the collateral and apply the proceeds in satisfaction of the obligation.
The Fund may enter into repurchase agreements, under the terms of a Master Repurchase Agreement ("MRA"). The MRA permits the Fund, under certain circumstances including an event of default (such as bankruptcy or insolvency), to offset payables and/or receivables under the MRA with collateral held and/or posted to the counterparty and create one single net payment due to or from the Fund. However, bankruptcy or insolvency laws of a particular jurisdiction may impose restrictions on or prohibitions against such a right of offset in the event of a MRA counterparty's bankruptcy or insolvency. Pursuant to the terms of the MRA, the Fund receives securities as collateral with a market value in excess of the repurchase price to be received by the Fund upon the maturity of the repurchase transaction. Upon a bankruptcy or insolvency of the MRA counterparty, the Fund recognizes a liability with respect to such excess collateral to reflect the Fund's obligation under bankruptcy law to return the excess to the counterparty. Repurchase agreements outstanding at the end of the period are listed in the Fund's Portfolio of Investments.
NOTE 3 — Purchases and Sales of Investment Securities
Cost of purchases of investment securities (excluding short-term investments) aggregated $57,571,003 for the year ended December 31, 2018. The proceeds and cost of securities sold resulting in net realized gains of $509,891 aggregated $73,812,279 and $73,302,388, respectively, for the year ended December 31, 2018. Realized gains or losses are based on the specific identification method.
20
FPA U.S. VALUE FUND, INC.
NOTES TO FINANCIAL STATEMENTS (Continued)
NOTE 4 — Federal Income Tax
No provision for federal income tax is required because the Fund has elected to be taxed as a "regulated investment company" under the Internal Revenue Code (the "Code") and intends to maintain this qualification and to distribute each year to its shareholders, in accordance with the minimum distribution requirements of the Code, its taxable net investment income and taxable net realized gains on investments.
Distributions paid to shareholders are based on net investment income and net realized gains determined on a tax reporting basis, which may differ from financial reporting. For federal income tax purposes, the Fund had the following components of distributable earnings at December 31, 2018:
Unrealized appreciation | | $ | 2,622,357 | | |
Accumulated net realized gains | | | 171,575 | | |
The tax status of distributions paid during the fiscal years ended December 31, 2018 and 2017 were as follows:
| | | 2018 | | 2017 | |
Dividends from ordinary income | | $ | 60,082 | | | $ | 549,989 | | |
Distributions from long-term capital gains | | | 772,314 | | | | — | | |
The Fund is designating as long-term capital gain dividends, pursuant to Section 852(b)(3) of the Code.
The cost of investment securities held at December 31, 2018, was $57,988,915 for federal income tax purposes. Gross unrealized appreciation and depreciation for all investments (excluding short-term investments) at December 31, 2018, for federal income tax purposes was $5,762,580 and $3,140,223, respectively resulting in net unrealized appreciation of $2,622,357. As of and during the year ended December 31, 2018, the Fund did not have any liability for unrecognized tax benefits. The Fund recognizes interest and penalties, if any, related to unrecognized tax benefits as income tax expense in the Statement of Operations. During the year, the Fund did not incur any interest or penalties. The statute of limitations remains open for the last 3 years, once a return is filed. No examinations are in progress at this time.
During the year ended December 31, 2018, the Fund reclassified $17,801 to Paid in Capital from Distributable Earnings to align financial reporting to tax reporting. These permanent differences were primarily due to net operating losses. Net assets were not affected by these reclassifications.
NOTE 5 — Advisory Fees and Other Affiliated Transactions
Pursuant to an Investment Advisory Agreement (the "Agreement"), advisory fees were paid by the Fund to First Pacific Advisors, LP (the "Adviser"). Under the terms of this Agreement, the Fund pays the Adviser a monthly fee calculated at the annual rate of 0.75% of the first $50 million of the Fund's average daily net assets and 0.65% of the average daily net assets in excess of $50 million. The Agreement obligates the Adviser to reduce its fee to the extent necessary to reimburse the Fund for any annual expenses (exclusive of interest, taxes, the cost of brokerage and research services, legal expenses related to portfolio securities, and extraordinary expenses such as litigation) in excess of 11/2% of the first $30 million and 1% of the remaining average net assets of the Fund for the year.
For the year ended December 31, 2018, the Fund paid aggregate fees and expenses of $99,033 to all Directors who are not affiliated persons of the Adviser.
21
FPA U.S. VALUE FUND, INC.
NOTES TO FINANCIAL STATEMENTS (Continued)
NOTE 6 — Disclosure of Fair Value Measurements
The Fund uses the following methods and inputs to establish the fair value of its assets and liabilities. Use of particular methods and inputs may vary over time based on availability and relevance as market and economic conditions evolve.
Equity securities are generally valued each day at the official closing price of, or the last reported sale price on, the exchange or market on which such securities principally are traded, as of the close of business on that day. If there have been no sales that day, equity securities are generally valued at the last available bid price. Securities that are unlisted and fixed-income and convertible securities listed on a national securities exchange for which the over-the-counter ("OTC") market more accurately reflects the securities' value in the judgment of the Fund's officers, are valued at the most recent bid price. Short-term corporate notes with maturities of 60 days or less at the time of purchase are valued at amortized cost.
Securities for which representative market quotations are not readily available or are considered unreliable by the Adviser are valued as determined in good faith under procedures adopted by the authority of the Fund's Board of Directors. Various inputs may be reviewed in order to make a good faith determination of a security's value. These inputs include, but are not limited to, the type and cost of the security; contractual or legal restrictions on resale of the security; relevant financial or business developments of the issuer; actively traded similar or related securities; conversion or exchange rights on the security; related corporate actions; significant events occurring after the close of trading in the security; and changes in overall market conditions. Fair valuations and valuations of investments that are not actively trading involve judgment and may differ materially from valuations of investments that would have been used had greater market activity occurred.
The Fund classifies its assets based on three valuation methodologies. Level 1 values are based on quoted market prices in active markets for identical assets. Level 2 values are based on significant observable market inputs, such as quoted prices for similar assets and quoted prices in inactive markets or other market observable inputs as noted above including spreads, cash flows, financial performance, prepayments, defaults, collateral, credit enhancements, and interest rate volatility. Level 3 values are based on significant unobservable inputs that reflect the Fund's determination of assumptions that market participants might reasonably use in valuing the assets. The valuation levels are not necessarily an indication of the risk associated with investing in those securities. The following table presents the valuation levels of the Fund's investments as of December 31, 2018:
Investments | | Level 1 | | Level 2 | | Level 3 | | Total | |
Common Stocks | |
Internet Media | | $ | 8,527,399 | | | | — | | | | — | | | $ | 8,527,399 | | |
Consumer Finance | | | 5,366,644 | | | | — | | | | — | | | | 5,366,644 | | |
Managed Care | | | 4,078,990 | | | | — | | | | — | | | | 4,078,990 | | |
Communications Equipment | | | 3,992,534 | | | | — | | | | — | | | | 3,992,534 | | |
Diversified Banks | | | 3,711,704 | | | | — | | | | — | | | | 3,711,704 | | |
Aircraft & Parts | | | 3,458,471 | | | | — | | | | — | | | | 3,458,471 | | |
Infrastructure Software | | | 3,338,606 | | | | — | | | | — | | | | 3,338,606 | | |
E-Commerce Discretionary | | | 3,329,867 | | | | — | | | | — | | | | 3,329,867 | | |
Private Equity | | | 1,915,810 | | | | — | | | | — | | | | 1,915,810 | | |
22
FPA U.S. VALUE FUND, INC.
NOTES TO FINANCIAL STATEMENTS (Continued)
Investments | | Level 1 | | Level 2 | | Level 3 | | Total | |
Defense Primes | | $ | 1,858,282 | | | | — | | | | — | | | $ | 1,858,282 | | |
Home Products Stores | | | 1,660,285 | | | | — | | | | — | | | | 1,660,285 | | |
P&C Insurance | | | 1,224,000 | | | | — | | | | — | | | | 1,224,000 | | |
Courier Services | | | 1,172,165 | | | | — | | | | — | | | | 1,172,165 | | |
Application Software | | | 1,095,679 | | | | — | | | | — | | | | 1,095,679 | | |
Entertainment Content | | | 1,080,304 | | | | — | | | | — | | | | 1,080,304 | | |
Entertainment Facilities | | | 1,077,492 | | | | — | | | | — | | | | 1,077,492 | | |
Internet Based Services | | | 1,007,616 | | | | — | | | | — | | | | 1,007,616 | | |
Cruise Lines | | | 964,453 | | | | — | | | | — | | | | 964,453 | | |
Cable & Satellite | | | 902,325 | | | | — | | | | — | | | | 902,325 | | |
Health Care Services | | | 840,964 | | | | — | | | | — | | | | 840,964 | | |
Rail Freight | | | 760,265 | | | | — | | | | — | | | | 760,265 | | |
Medical Devices | | | 703,682 | | | | — | | | | — | | | | 703,682 | | |
Institutional Brokerage | | | 656,208 | | | | — | | | | — | | | | 656,208 | | |
Homebuilders | | | 654,797 | | | | — | | | | — | | | | 654,797 | | |
Commercial & Residential
Building Equipment & Systems | | | 583,073 | | | | — | | | | — | | | | 583,073 | | |
Hotels, Restaurants & Leisure | | | 537,372 | | | | — | | | | — | | | | 537,372 | | |
Life Science Equipment | | | 525,907 | | | | — | | | | — | | | | 525,907 | | |
Electrical Components | | | 506,721 | | | | — | | | | — | | | | 506,721 | | |
Insurance Brokers | | | 392,472 | | | | — | | | | — | | | | 392,472 | | |
Industrial Distribution & Rental | | | 380,828 | | | | — | | | | — | | | | 380,828 | | |
Basic & Diversified Chemicals | | | 347,620 | | | | — | | | | — | | | | 347,620 | | |
Apparel, Footwear & Accessory Design | | | 325,416 | | | | — | | | | — | | | | 325,416 | | |
Other Common Stocks | | | 3,091,831 | | | | — | | | | — | | | | 3,091,831 | | |
Closed End Fund | | | 541,739 | | | | — | | | | — | | | | 541,739 | | |
Short-Term Investment | | | — | | | $ | 1,644,000 | | | | — | | | | 1,644,000 | | |
| | | $ | 60,611,521 | | | $ | 1,644,000 | | | | — | | | $ | 62,255,521 | | |
Equity Options (equity risk) | | $ | (249 | ) | | | — | | | | — | | | $ | (249 | ) | |
Transfers of investments between different levels of the fair value hierarchy are recorded at fair value as of the end of the reporting period. There were no transfers between Levels 1, 2, or 3 during the year ended December 31, 2018.
23
FPA U.S. VALUE FUND, INC.
NOTES TO FINANCIAL STATEMENTS (Continued)
When the Fund writes an option, the premium received by the Fund is recorded as a liability and is subsequently adjusted to the current fair value of the option written. Premiums received from written options which expire unexercised are recorded by the Fund on the expiration date as realized gains from options written. The difference between the premium received and the amount paid on effecting a closing purchase transaction, including brokerage commissions, is also treated as a realized gain, or if the premium received is less than the amount paid for the closing purchase transaction, as a realized loss. If a call option is exercised, the premium received is added to the proceeds from the sale of the underlying security or currency in determining whether the Fund has realized a gain or loss. If a put option is exercised, the premium received reduces the cost basis of the security or currency purchased by the Fund. In writing an option, the Fund bears the market risk of an unfavorable change in the price of the security or currency underlying the written option. Exercise of an option written by the Fund could result in the Fund selling or buying a security or currency at a price different from the current fair value.
During the year ended December 31, 2018, the Fund had entered into the following derivatives:
| | | Asset Derivatives | | Liability Derivatives | |
Derivative Type | | Statement of
Assets and
Liabilities Location | | Fair Value | | Statement of
Assets and
Liabilities Location | | Fair Value | |
Equity contracts | | | | | | | | | | Written options, at
fair value | | $ | (249 | ) | |
Total | | | | $ | (249 | ) | |
Derivative Type | | Location of Gain or (Loss)
on Derivatives Within
Statement of Operations | | Realized Gain or
(Loss) on
Derivatives | | Change in Unrealized
Appreciation or
(Depreciation) | |
Equity contracts | | Net realized gain on written
options/Net change in
unrealized appreciation
(depreciation) on written
options | | $ | (227,053 | ) | | $ | 32,365 | | |
Total | | | | $ | (227,053 | ) | | $ | 32,365 | | |
The following table represents the average monthly volume of the Fund's derivative transactions during the year ended December 31, 2018:
Written Options | |
Average notional amount | | $ | 14,140 | | |
24
FPA U.S. VALUE FUND, INC.
NOTES TO FINANCIAL STATEMENTS (Continued)
NOTE 7 — Collateral Requirements
FASB Accounting Standards Update No. 2011-11, Disclosures about Offsetting Assets and Liabilities, requires disclosures to make financial statements that are prepared under U.S. GAAP more comparable to those prepared under International Financial Reporting Standards. Under this guidance the Fund discloses both gross and net information about instruments and transactions eligible for offset such as instruments and transactions subject to an agreement similar to a master netting arrangement. In addition, the Fund discloses collateral received and posted in connection with master netting agreements or similar arrangements.
The following table presents the Fund's OTC derivative assets, liabilities and master repurchase agreements by counterparty net of amounts available for offset under an ISDA Master agreement or similar agreements and net of the related collateral received or pledged by the Fund as of December 31, 2018:
| | | | Gross Amounts Not Offset in the
Statement of Assets and Liabilities | | | |
| Counterparty | | Gross Assets
(Liabilities)
in the Statement of
Assets and Liabilities | | Collateral
Received
(Pledged) | | Assets (Liabilities)
Available for Offset | | Net Amount
of Assets and
(Liabilities)* | |
State Street Bank
and Trust Company:
Repurchase
Agreement | | $ | 1,644,000 | | | $ | (1,644,000 | )** | | | — | | | | — | | |
JPMorgan Chase & Co.:
Call Options Written | | $ | (249 | ) | | | — | | | | — | | | $ | (249 | ) | |
* Represents the net amount receivable (payable) from the counterparty in the event of default.
** Collateral with a value of $1,677,677 has been received in connection with a master repurchase agreement. Excess of collateral received from the individual master repurchase agreement is not shown for financial reporting purposes.
25
FPA U.S. VALUE FUND, INC.
REPORT OF INDEPENDENT REGISTERED
PUBLIC ACCOUNTING FIRM
TO THE SHAREHOLDERS AND
BOARD OF DIRECTORS OF FPA U.S. VALUE FUND, INC.
Opinion on the Financial Statements
We have audited the accompanying statement of assets and liabilities of FPA U.S. Value Fund, Inc. (the "Fund"), including the portfolio of investments, as of December 31, 2018, and the related statements of operations, changes in net assets and the financial highlights for the year then ended and the related notes (collectively referred to as the "financial statements"). The statement of changes in net assets for the year ended December 31, 2017 and the financial highlights for the years ended December 31, 2014, December 31, 2015, December 31, 2016 and December 31, 2017 were audited by another independent registered public accounting firm whose report, dated February 20, 2018, expressed an unqualified opinion on the statement of changes in net assets and those financial highlights. In our opinion, the financial statements present fairly, in all material respects, the financial position of the Fund at December 31, 2018, the results of its operations, the changes in its net assets, and its financial highlights for the year then ended, in conformity with U.S. generally accepted accounting principles.
Basis for Opinion
These financial statements are the responsibility of the Fund's management. Our responsibility is to express an opinion on the Fund's financial statements based on our audit. We are a public accounting firm registered with the Public Company Accounting Oversight Board (United States) ("PCAOB") and are required to be independent with respect to the Fund in accordance with the U.S. federal securities laws and the applicable rules and regulations of the Securities and Exchange Commission and the PCAOB.
We conducted our audit in accordance with the standards of the PCAOB. Those standards require that we plan and perform the audit to obtain reasonable assurance about whether the financial statements are free of material misstatement, whether due to error or fraud. The Fund is not required to have, nor were we engaged to perform, an audit of the Fund's internal control over financial reporting. As part of our audit, we are required to obtain an understanding of internal control over financial reporting, but not for the purpose of expressing an opinion on the effectiveness of the Fund's internal control over financial reporting. Accordingly, we express no such opinion.
Our audit included performing procedures to assess the risks of material misstatement of the financial statements, whether due to error or fraud, and performing procedures that respond to those risks. Such procedures included examining, on a test basis, evidence regarding the amounts and disclosures in the financial statements. Our procedures included confirmation of securities owned as of December 31, 2018, by correspondence with the custodian and brokers or by other appropriate auditing procedures where replies from brokers were not received. Our audit also included evaluating the accounting principles used and significant estimates made by management, as well as evaluating the overall presentation of the financial statements. We believe that our audit provides a reasonable basis for our opinion.

We have served as the auditor of the Fund since 2018.
Los Angeles, CA
February 22, 2019
26
FPA U.S. VALUE FUND, INC.
APPROVAL OF INVESTMENT ADVISORY AGREEMENT
(Unaudited)
Approval of the Advisory Agreement. At a meeting of the Board of Directors held on August 13, 2018, the Directors approved the continuation of the advisory agreement between the Fund and the Adviser (the "Advisory Agreement") for an additional one-year period through September 30, 2019, on the recommendation of the Independent Directors, who met in executive session on August 13, 2018 prior to the Board meeting to review and discuss the proposed continuation of the Advisory Agreement. The Board had also met on July 9, 2018, with the Independent Directors meeting separately prior to the Meeting in executive session with the management of the Adviser and then separately with independent counsel to evaluate the renewal of the Advisory Agreement. Prior to their July 9 meeting, the Independent Directors, through their independent counsel, had requested and received extensive materials prepared in connection with the review of the Advisory Agreement. The materials provided a broad range of information regarding the Fund, including a description of, among other matters, the terms of the Advisory Agreement; the services provided by the Adviser; the experience of the relevant investment personnel; the Fund's performance in absolute terms and as compared to the performance of peers and appropriate benchmark(s); the fees and expenses of the Fund in absolute terms and as compared to peers; and the profitability of the Adviser from serving as adviser to the Fund. Following their review at the July 9 meeting, the Independent Directors requested (through their independent counsel) and received supplemental information and responses to a number of questions relating to the materials provided by the Adviser.
In addition, the Board met regularly throughout the year and received information on a variety of topics that were relevant to its annual consideration of the renewal of the Advisory Agreement including, among other matters, Fund investment performance, compliance, risk management, liquidity, valuation, trade execution and other matters relating to Fund operations. The Independent Directors also had met with management of the Adviser (including key investment personnel) at their quarterly meetings as well as with management at other times between the quarterly meetings throughout the year. The materials specifically provided in connection with the annual review of the Advisory Agreement supplement the information received throughout the year.
At their regular Board meetings and executive sessions, the Independent Directors were also assisted by independent legal counsel. In addition to the materials provided by the Adviser, the Independent Directors received a legal memorandum from independent counsel that outlined, among other matters: the duties of the Independent Directors and relevant requirements under the 1940 Act; the general principles under state law relevant to considering the approval of advisory contracts; an adviser's fiduciary duty with respect to advisory agreements and compensation; the standards used by courts in determining whether investment advisers and investment company boards of directors have fulfilled their duties; and factors to be considered by the Independent Directors when voting on advisory agreements. During executive session, independent legal counsel reviewed with the Independent Directors these duties, standards and factors summarized in the legal memorandum described above. The following paragraphs summarize the material information and factors considered by the Board and the Independent Directors, as well as the Directors' conclusions relative to such factors.
Nature, Extent and Quality of Services. The Board and the Independent Directors considered information provided by the Adviser in response to their requests, as well as information provided throughout the year regarding: the Adviser and its staffing in connection with the Fund, including the Fund's portfolio managers and the senior analysts on their team; the scope of services supervised and provided by the Adviser; and the absence of any significant service problems reported to the Board. The Adviser also discussed the name change from FPA Perennial Fund, Inc. to FPA U.S. Value Fund, Inc. in 2015 and the related changes to the Fund's investment strategy. It was noted that as a result of the change in investment strategy the Fund added the S&P 500 as an index, in addition to the Russell 2500 Index, since it is generally representative of the U.S. stock market. The
27
FPA U.S. VALUE FUND, INC.
APPROVAL OF INVESTMENT ADVISORY AGREEMENT (Continued)
(Unaudited)
Board and the Independent Directors then acknowledged the length of service of the Fund's portfolio manager, Gregory Nathan, who originally joined the Adviser in 2003 and has managed the Fund since 2015. After discussion, the Board and the Independent Directors concluded that the nature, extent and quality of services provided by the Adviser have benefited and should continue to benefit the Fund and its shareholders.
Investment Performance. The Board and the Independent Directors reviewed the overall investment performance of the Fund. The Directors also received information from an independent consultant, Broadridge, regarding the Fund's performance relative to a peer group of midcap core funds selected by Broadridge (the "Peer Group"). The Board and the Independent Directors recognized that the new strategy is less than 3 years old and has not yet had time to develop a meaningful, long term track record. However, given the Fund's and the Adviser's long history, the Board and the Independent Directors noted the Adviser's experience and track record, as well as the Fund's long-term investment performance. The Board and the Independent Directors noted the Fund underperformed its Peer Group median for the one-, three-, five- and ten-year periods ending March 31, 2018. In addition, the Fund underperformed the Fund's benchmark, Russell 2500 Index for the one-, three-, five- and ten-year periods ending March 31, 2018 and underperformed the S&P 500 Index for the one-, three-, five- and ten-year periods ending March 31, 2018. The Board and the Independent Directors concluded that the Adviser's continued management of the Fund should benefit the Fund and its shareholders.
Advisory Fees and Fund Expenses; Comparison with Peer Group and Institutional Fees. The Board and the Independent Directors considered information provided by the Adviser regarding the Fund's advisory fees and total expense levels. The Board and the Independent Directors reviewed comparative information regarding fees and expenses for the Peer Group. The Board and the Independent Directors noted that the Fund's advisory fees were above the median of those for the Peer Group and that the overall expense ratio of the Fund was above the median of that of the Peer Group. In addition, the Directors noted that the fee rate charged to the Fund is currently lower than the fee rate charged by the Adviser on the institutional account managed in a similar style by the portfolio managers. The Board and the Independent Directors concluded that the continued payment of advisory fees and expenses by the Fund to the Adviser was fair and reasonable and should continue to benefit the Fund and its shareholders.
Adviser Profitability and Costs. The Board and the Independent Directors considered information provided by the Adviser regarding the Adviser's costs in providing services to the Fund, the profitability of the Adviser and the benefits to the Adviser from its relationship to the Fund. They reviewed and considered the Adviser's representations regarding its assumptions and methods of allocating certain costs, such as personnel costs, which constitute the Adviser's largest operating cost, over-head and trading costs with respect to the provision of investment advisory services. The Independent Directors discussed with the Adviser the general process through which individuals' compensation is determined and then reviewed by the management committee of the Adviser, as well as the Adviser's methods for determining that its compensation levels are set at appropriate levels to attract and retain the personnel necessary to provide high quality professional investment advice. In evaluating the Adviser's profitability, they excluded certain distribution and marketing-related expenses. The Board and the Independent Directors recognized that the Adviser is entitled under the law to earn a reasonable level of profits for the services that it provides to the Fund. The Board and the Independent Directors concluded that the Adviser's level of profitability from its relationship with the Fund did not indicate that the Adviser's compensation was unreasonable or excessive.
Economies of Scale and Sharing of Economies of Scale. The Board and the Independent Directors considered whether there have been economies of scale with respect to the management of the Fund, whether the
28
FPA U.S. VALUE FUND, INC.
APPROVAL OF INVESTMENT ADVISORY AGREEMENT (Continued)
(Unaudited)
Fund has appropriately benefited from any economies of scale, and whether the fee rate is reasonable in relation to the Fund's asset levels and any economies of scale that may exist. The Board and the Independent Directors considered the Adviser's representation that its internal costs of providing investment management services to the Fund have significantly increased in recent years as a result of a number of factors, including new or increased administrative expenses resulting from recent legislative and regulatory requirements. The Board and the Independent Directors considered both quantitative and qualitative information regarding the Adviser's representation that it has also made significant investments in: (1) the portfolio manager, traders and other investment personnel who assist with the management of the Fund; (2) new compliance, operations, and administrative personnel; (3) information technology, portfolio accounting and trading systems; and (4) office space, each of which enhances the quality of services provided to the Fund. The Board and the Independent Directors also considered that the Adviser had agreed to forgo the reimbursement for providing certain financial services that it had previously received from the Fund. The Board and the Independent Directors also considered the Adviser's willingness to close funds to new investors when it believed that a fund may have limited capacity to grow or that it otherwise would benefit fund shareholders. The Board and the Independent Directors also noted that asset levels of the Fund are currently lower than they were seven years ago.
The Independent Directors noted that the fee rate contained a breakpoint as the Fund's assets increased. They considered that many mutual funds have breakpoints in the advisory fee structure as a means by which to share in the benefits of potential economies of scale as a fund's assets grow. They also considered that not all funds have breakpoints in their fee structures and that breakpoints are not the exclusive means of sharing potential economies of scale. The Board and the Independent Directors considered the Adviser's statement that it believes that additional breakpoints would not be appropriate for the Fund at this time given the ongoing investments the Adviser is making in its business for the benefit of the Fund, uncertainties regarding the direction of the economy, rising inflation, increasing costs for personnel and systems, and growth or contraction in the Fund's assets, all of which could negatively impact the profitability of the Adviser. The Board and the Independent Directors also noted that the Investment Advisory Agreement contractually requires FPA to reimburse the Fund for Total Annual Fund Operating Expenses in excess of 1.50% of the first $30 million and 1.00% of the remaining average daily net assets of the Fund (exclusive of interest, taxes, the cost of brokerage and research services, legal expenses related to portfolio securities, and extraordinary expenses such as litigation, merger, reorganization or recapitalization) each year. The Board and the Independent Directors concluded that the Fund is benefitting from the ongoing investments made by the Adviser in its team of personnel serving the Fund and in the Adviser's service infrastructure, and that in light of these investments, additional breakpoints in the Fund's advisory fee structure were not warranted at current asset levels.
Ancillary Benefits. The Board and the Independent Directors considered other actual and potential benefits to the Adviser from managing the Fund, including the acquisition and use of research services with commissions generated by the Fund, in concluding that the contractual advisory and other fees are fair and reasonable for the Fund. They noted that the Adviser does not have any affiliates that benefit from the Adviser's relationship to the Fund.
Conclusions. The Board and the Independent Directors determined that the Fund continues benefitted from the services of the Adviser's highly experienced investment management team, which has produced competitive long-term returns, as well as their expectation that the new portfolio management team can also produce competitive long-term returns. In addition, the Board and the Independent Directors agreed that the Fund continues to receive high quality services from the Adviser. The Board and the Independent Directors concluded that the
29
FPA U.S. VALUE FUND, INC.
APPROVAL OF INVESTMENT ADVISORY AGREEMENT (Continued)
(Unaudited)
current advisory fee rate is reasonable and fair to the Fund and its shareholders in light of the nature and quality of the services provided by the Adviser and the Adviser's profitability and costs. The Board and the Independent Directors also noted their intention to continue monitoring the factors relevant to the Adviser's compensation, such as changes in the Fund's asset levels, changes in portfolio management personnel and the cost and quality of the services provided by the Adviser to the Fund. On the basis of the foregoing, and without assigning particular weight to any single factor, none of which was dispositive, the Board and the Independent Directors concluded that it would be in the best interests of the Fund to continue to be advised and managed by the Adviser and determined to approve the continuation of the current Advisory Agreement for another one-year period through September 30, 2019.
30
FPA U.S. VALUE FUND, INC.
SHAREHOLDER EXPENSE EXAMPLE
December 31, 2018 (Unaudited)
Fund Expenses
Mutual fund shareholders generally incur two types of costs: (1) transaction costs, and (2) ongoing costs, including advisory and administrative fees; shareholder service fees; and other Fund expenses. The Example is intended to help you understand your ongoing costs (in dollars) of investing in the Fund and to compare these costs with the ongoing costs of investing in other mutual funds. The Example is based on an investment of $1,000 invested at the beginning of the year and held for the entire year.
Actual Expenses
The information in the table under the heading "Actual Performance" provides information about actual account values and actual expenses. You may use the information in this column, together with the amount you invested, to estimate the expenses that you paid over the period. Simply divide your account value by $1,000 (for example, an $8,600 account value divided by $1,000 = 8.6), then multiply the result by the number in the first column in the row entitled "Expenses Paid During Period" to estimate the expenses you paid on your account during this period.
Hypothetical Example for Comparison Purposes
The information in the table under the heading "Hypothetical Performance (5% return before expenses)" provides information about hypothetical account values and hypothetical expenses based on the Fund's actual expense ratio and an assumed rate of return of 5% per year before expenses, which is not the Fund's actual return. The hypothetical account values and expenses may not be used to estimate the actual ending account balance or expenses you paid for the period. You may use this information to compare the ongoing costs of investing in the Fund
and other funds. To do so, compare this 5% hypothetical example with the 5% hypothetical examples that appear in the shareholder reports of other funds.
Please note that the expenses shown in the table are meant to highlight your ongoing costs only and do not reflect any transactional costs. Therefore, the information under the heading "Hypothetical Performance (5% return before expenses)" is useful in comparing ongoing costs only, and will not help you determine the relative total costs of owning different funds. In addition, if these transactional costs were included, your costs would have been higher. Even though the Fund does not charge transaction fees, if you purchase shares through a broker, the broker may charge you a fee. You should evaluate other mutual funds' transaction fees and any applicable broker fees to assess the total cost of ownership for comparison purposes.
| | | Actual
Performance | | Hypothetical
Performance
(5% return
before
expenses) | |
Beginning Account Value
June 30, 2018 | | $ | 1,000.00 | | | $ | 1,000.00 | | |
Ending Account Value
December 31, 2018 | | $ | 890.20 | | | $ | 1,019.12 | | |
Expenses Paid During
Period* | | $ | 5.75 | | | $ | 6.15 | | |
* Expenses are equal to the Fund's annualized expense ratio of 1.21%, multiplied by the average account value over the period and prorated for the six-months ended December 31, 2018 (184/365 days).
31
FPA U.S. VALUE FUND, INC.
PRIVACY POLICY
(Unaudited)
The Fund considers customer privacy to be an essential part of its investor relationships and is committed to maintaining the confidentiality, integrity and security of its current, prospective and former investors' non-public personal information. The Fund has developed policies that are designed to protect this confidentiality, while permitting investor needs to be served.
Obtaining Personal Information
While providing investors with products and services, the Fund and certain service providers, such as the Fund's Transfer Agent and/or Administrator, may obtain non-public personal information about investors, which may come from sources such as (i) account applications, subscription agreements and other forms, (ii) written, electronic or verbal correspondence, (iii) investor transactions, (iv) an investor's brokerage or financial advisory firm, financial advisor or consultant, and/or (v) from information captured on applicable websites. The nonpublic personal information that may be collected from investors may include the investor's name, address, tax identification number, birth date, investment selection, beneficiary information, and possibly the investor's personal bank account information and/or email address if the investor has provided that information, as well as the investor's transaction and account history with the Fund or other investment companies advised by First Pacific Advisors, LP.
Respecting Your Privacy
The Fund does not disclose any non-public personal information provided by investors or gathered by the Fund to third parties, except as required or permitted by law or as necessary for such third parties to perform their agreements with respect to the Fund. Non-affiliated companies may from time to time be used to provide certain services, such as maintaining investor accounts, preparing and mailing prospectuses, reports, account statements and other information, and gathering shareholder proxies. In many instances, the investors will be clients of a third party, but the Fund may also provide an investor's personal and account information to the investor's respective brokerage or financial advisory firm and/or financial advisor or consultant.
Sharing Information with Third Parties
The Fund reserves the right to report or disclose personal or account information to third parties in circumstances where the Fund believes in good faith that disclosure is required or permitted under law, to cooperate with regulators or law enforcement authorities, to protect its rights or property, or upon reasonable request by the Fund in which an investor has invested. In addition, the Fund may disclose information about an investor or an investor's accounts to a third party at the investor's request or with the consent of the investor.
Procedures to Safeguard Private Information
The Fund is committed to its obligation to safeguard investor non-public personal information. In addition to this policy, the Fund has implemented procedures that are designed to limit access to an investor's non-public personal information to internal personnel who require the information to complete tasks, such as processing transactions, maintaining client accounts or otherwise providing services the investor requested. Physical, electronic and procedural safeguards are in place to guard an investor's non-public personal information.
Information Collected from Websites
Websites maintained by the Fund or its service providers may use a variety of technologies to collect information that helps the Fund and its service providers understand how the website is used. Information collected from your web browser (including small files stored on your device that are commonly referred to as "cookies") allow the websites to recognize your web browser and help to personalize and improve your user experience and enhance navigation of the website. If you are a registered user of the Fund's and/or its service providers' website,
32
FPA U.S. VALUE FUND, INC.
PRIVACY POLICY (Continued)
(Unaudited)
the Fund, its service providers or third party firms engaged by the Fund or its service providers, may collect or share information submitted by you, which may include personally identifiable information. You can change your cookie preferences by changing the setting on your web browser to delete or reject cookies. If you delete or reject cookies, some website pages may not function properly. The Fund does not look for web browser "do not track" requests.
Changes to the Privacy Policy
From time to time, the Fund may update or revise this privacy policy. If there are changes to the terms of this privacy policy, documents containing the revised policy on the relevant website will be updated.
Revised: February, 2018
33
FPA U.S. VALUE FUND, INC.
DIRECTOR AND OFFICER INFORMATION
(Unaudited)
Sandra Brown, Mark L. Lipson, Alfred E. Osborne, Jr., A. Robert Pisano, Patrick B. Purcell and Allan M. Rudnick are all Directors of the Fund who are not "interested persons" of the Fund, as that term is defined in the 1940 Act (collectively, the "Independent Directors"). Directors serve until their resignation, removal or retirement. The Statement of Additional Information includes additional information about the Directors and is available, without charge, upon request by calling (800) 982-4372.
Name, Address(1)
and Year of Birth | | Position(s)
Held with
the Fund | | Year First
Elected as
Director of
the Fund | | Principal Occupation(s)
During the
Past Five Years | | Number of
FPA Funds
Overseen
by Director | | Other
Directorships
Held by Director
During the Past
Five Years | |
Independent Directors | |
Sandra Brown,
1955 | | Director | | | 2016 | | | Consultant. Formerly, CEO and President of Transamerica Financial Advisers, Inc. (1999-2009); President, Transamerica Securities Sales Corp. (1998-2009); Vice President, Bank of America Mutual Fund Administration (1990-1998). Director/Trustee of FPA Capital, Inc., FPA Funds Trust, FPA New Income, Inc., FPA Paramount Fund, Inc., FPA U.S. Value Fund, Inc. and Source Capital, Inc. (since October 2016). | | | 8 | | | None | |
Mark L. Lipson,
1949 | | Director | | | 2015 | | | Registered Investment Adviser, ML2 Wealth Advisors. Formerly Managing Director, Bessemer Trust (2007-2014) and US Trust (2003-2006); Chairman and CEO of the Northstar Mutual Funds (1993-2001); and President and CEO of the National Mutual Funds (1988-1993). Director/Trustee of FPA Capital, Inc., FPA Funds Trust, FPA New Income, Inc., FPA Paramount Fund, Inc., FPA U.S. Value Fund, Inc. and Source Capital, Inc. (since October 2015). | | | 8 | | | None | |
Alfred E. Osborne, Jr.,
1944 | | Director | | | 2013 | | | Interim Dean, Professor and Faculty Director, Price Center for Entrepreneurship and Innovation at the John E. Anderson School of Management at UCLA. Dr. Osborne has been at UCLA since 1972. Director/Trustee of FPA Capital Fund, Inc. and FPA New Income, Inc. (since 1999), of FPA Funds Trust (since 2002), of FPA Paramount Fund, Inc., FPA U.S. Value Fund, Inc. and Source Capital, Inc. (since 2013). | | | 8 | | | Kaiser Aluminum, and Wedbush, Inc. | |
34
FPA U.S. VALUE FUND, INC.
DIRECTOR AND OFFICER INFORMATION (Continued)
(Unaudited)
Name, Address(1)
and Year of Birth | | Position(s)
Held with
the Fund | | Year First
Elected as
Director of
the Fund | | Principal Occupation(s)
During the
Past Five Years | | Number of
FPA Funds
Overseen
by Director | | Other
Directorships
Held by Director
During the Past
Five Years | |
A. Robert Pisano,
1943 | | Director | | | 2012 | | | Consultant. Formerly, President and Chief Operating Officer of The Motion Picture Association of America, Inc. (October 2005-2011). Formerly, National Executive Director and Chief Executive Officer of The Screen Actors Guild (2001-April 2005). Director/Trustee of FPA Paramount Fund, Inc. and FPA U.S. Value Fund, Inc. (since 2012), and of FPA Capital, Inc., FPA Funds Trust, FPA New Income, Inc. and Source Capital, Inc. (since 2013). | | | 8 | | | Entertainment Partners and Resources Global Professionals | |
Patrick B. Purcell,
1943 | | Director | | | 2012 | | | Retired. Formerly, Executive Vice President, Chief Financial and Administrative Officer of Paramount Pictures (1983 to 1998). Director/Trustee of FPA Capital, Inc., FPA Funds Trust and FPA New Income, Inc. (since 2006), of Source Capital, Inc. (since 2010), of FPA U.S. Value Fund, Inc. and FPA Paramount Fund, Inc. (since 2012). | | | 8 | | | None | |
Allan M. Rudnick,
1940 | | Director & Chairman | | | 2012 | | | Private investor. Formerly, Co-founder and Chief Investment Officer of Kayne Anderson Rudnick Investment Management ("KAR") (1989-December 2007). Formerly, President (from 2001) and Chief Executive Officer and Chairman of the Board (from 2005) of KAR. Director/Trustee of FPA Capital, Inc. and of FPA Funds Trust and FPA New Income, Inc. (since 2010), of Source Capital, Inc. (since 2012), and of FPA Paramount Fund, Inc. and FPA U.S. Value Fund, Inc. (since 2012). | | | 8 | | | None | |
"Interested" Director(2) | |
J. Richard Atwood,
1960 | | Director | | | 2016 | | | Director and President of FPA GP, Inc., the General Partner of the Adviser (since October 2018). Director/Trustee of each FPA Fund (since 2016). President of each FPA Fund (since February 2015). Formerly, Managing Partner of FPA (2006-2018). Formerly, until February 2015, Treasurer of each FPA Fund for more than the past five years. | | | 8 | | | None | |
(1) The address of each Director is 11601 Wilshire Boulevard, Suite 1200, Los Angeles, California 90025.
(2) "Interested person" within the meaning of the 1940 Act by virtue of their affiliation with the Fund's Adviser.
35
FPA U.S. VALUE FUND, INC.
DIRECTOR AND OFFICER INFORMATION (Continued)
(Unaudited)
Officers of the Fund. Officers of the Fund are elected annually by the Board.
Name, Address(1)
and Year of Birth | | Position
with Fund | | Year First
Elected as
Officer of the
Fund | | Principal Occupation(s)
During the Past Five Years | |
J. Richard Atwood,
1960 | | President | | | 1997 | | | Director and President of FPA GP, Inc., the General Partner of FPA (since October 2018). Director/Trustee of each FPA Fund (since May 2016). President of each FPA Fund (since February 2015). Formerly, Managing Partner of FPA (2006-2018). Formerly, until February 2015, Treasurer of each FPA Fund for more than the past five years. | |
Gregory Nathan,
1980 | | Vice President and Portfolio Manager | | | 2015 | | | Managing Director of FPA (since May 2015); Vice President of FPA (January 2007-April 2015). | |
Karen E. Richards,
1969 | | Chief Compliance Officer | | | 2019 | | | Senior Vice President and Chief Compliance Officer of FPA (since August 2018). Formerly, Deputy Chief Compliance Officer of First Republic Investment Management, LLC (from February 2016 to March 2018), and Vice President, Senior Compliance Officer of Pacific Investment Management Company (from June 2010 to January 2016). | |
E. Lake Setzler III,
1967 | | Treasurer | | | 2006 | | | Senior Vice President (since January 2013) and Controller of FPA; and Treasurer of each FPA Fund (since February 2015). Formerly, until February 2015, Assistant Treasurer of each FPA Fund (February 2006 to February 2015). | |
Francine S. Hayes,
1967 | | Secretary | | | 2015 | | | Vice President and Senior Counsel, State Street Bank and Trust Company (various positions since 2005). | |
(1) The address for each Officer (except Ms. Hayes) is 11601 Wilshire Boulevard, Suite 1200, Los Angeles, California 90025. Ms. Hayes' address is State Street Bank and Trust Company, One Lincoln Street, Boston, Massachusetts 02111.
36
FPA U.S. VALUE FUND, INC.
(Unaudited)
INVESTMENT ADVISER
First Pacific Advisors, LP
11601 Wilshire Boulevard, Suite 1200
Los Angeles, CA 90025
TRANSFER & SHAREHOLDER SERVICE AGENT
UMB Fund Services, Inc.
P.O. Box 2175
Milwaukee, WI 53201-2175
or
235 West Galena Street
Milwaukee, WI 53212-3948
(800) 638-3060
CUSTODIAN AND ADMINISTRATOR
State Street Bank and Trust Company
One Lincoln Street
Boston, Massachusetts 02111
TICKER SYMBOL: FPPFX
CUSIP: 302548102
DISTRIBUTOR
UMB Distribution Services, LLC
235 West Galena Street
Milwaukee, Wisconsin 53212-3948
LEGAL COUNSEL
Dechert LLP
One Bush Street, Suite 1600
San Francisco, California 94104
INDEPENDENT REGISTERED PUBLIC ACCOUNTING FIRM
Ernst & Young LLP
725 South Figueroa Street,
Los Angeles, California 90017
This report has been prepared for the information of shareholders of FPA U.S. VALUE FUND, INC., and is not authorized for distribution to prospective investors unless preceded or accompanied by an effective prospectus.
A description of the policies and procedures that the Adviser uses to vote proxies related to the Fund's portfolio securities is set forth in the Fund's Statement of Additional Information which is available without charge, upon request, on the Fund's website at www.fpa.com or by calling (800) 982-4372 and on the Securities and Exchange Commission's (SEC) website at www.sec.gov.
The Fund's complete proxy voting record for the 12 months ended June 30, 2018 is available without charge, upon request by calling (800) 982-4372 and on the SEC's website at www.sec.gov.
The Fund's schedule of portfolio holdings, filed the first and third quarter of the Fund's fiscal year on Form N-Q with the SEC, is available on the SEC's website at www.sec.gov. To obtain Form N-Q from the Fund, shareholders can call (800) 982-4372.
Additional information about the Fund is available online at www.fpa.com. This information includes, among other things, holdings, top sectors, and performance, and is updated on or about the 15th business day after the end of each quarter.
Item 2. Code of Ethics.
(a) The registrant has adopted a code of ethics that applies to the registrant’s principal executive and financial officers.
(b) Not applicable.
(c) During the period covered by this report, there were no amendments to the provisions of the code of ethics adopted in 2(a) above.
(d) During the period covered by this report, there were not any implicit or explicit waivers to the provisions of the code of ethics adopted in 2(a).
(e) Not Applicable
(f) A copy of the registrant’s code of ethics is filed as an exhibit to this Form N-CSR.
Item 3. Audit Committee Financial Expert.
The registrant’s board of directors has determined that Patrick B. Purcell, who is a member of the registrant’s audit committee and board of directors, is an “audit committee financial expert” and is “independent,” as those terms are defined in this Item. This designation will not increase the designee’s duties, obligations or liability as compared to his duties, obligations or liability as a member of the audit committee and of the board of directors. This designation does not affect the duties, obligations or liability of any other member of the audit committee or the board of directors.
Item 4. Principal Accountant Fees and Services.
| | 2017 | | 2018 | |
(a) Audit Fees | | $ | 41,905 | | $ | 33,300 | |
(b) Audit Related Fees | | $ | -0- | | $ | -0- | |
(c) Tax Fees(1) | | $ | 9,230 | | $ | 6,300 | |
(d) All Other Fees | | $ | -0- | | $ | -0- | |
(1) Tax fees are for the preparation of the registrant’s tax return(s).
(e)(1) The audit committee shall pre-approve all audit and permissible non-audit services that the committee considers compatible with maintaining the independent auditors’ independence. The pre-approval requirement will extend to all non-audit services provided to the registrant, the adviser, and any entity controlling, controlled by, or under common control with the adviser that provides ongoing services to the registrant, if the engagement relates directly to the operations and financial reporting of the registrant; provided, however, that an engagement of the registrant’s independent auditors to perform attest services for the registrant, the adviser or its affiliates required by generally accepted auditing standards to complete the examination of the registrant’s financial statements (such as an examination conducted in accordance with Statement on Standards for Attestation Engagements Number 16, or a Successor Statement, issued by the American Institute of Certified Public Accountants), will be deem pre-approved if:
(i) the registrant’s independent auditors inform the audit committee of the engagement,
(ii) the registrant’s independent auditors advise the audit committee at least annually that the performance of this engagement will not impair the independent auditor’s independence with respect to the registrant, and
(iii) the audit committee receives a copy of the independent auditor’s report prepared in connection with such services. The committee may delegate to one or more committee members the authority to review and pre-approve audit and permissible non-audit services. Actions taken under any such delegation will be reported to the full committee at its next meeting.
(e)(2) 0% of the services provided to the registrant described in paragraphs b-d of this Item were approved by the Audit Committee pursuant to paragraph (c)(7)(i)(C) of Rule 2-01 of Regulation S-X. There were no services provided to the investment adviser or any entity controlling, controlled by or under common control with the adviser described in paragraphs (b) — (d) of this Item that were required to be pre-approved by the audit committee.
(f) All services performed on the engagement to audit the registrant’s financial statements for the most recent fiscal year end were performed by the principal accountant’s full-time, permanent employees.
(g) None.
(h) Not applicable.
Item 5. Audit Committee of Listed Registrants.
Not applicable.
Item 6. Investments.
(a) Schedule of Investments is included as a part of the report to shareholders filed under Item 1 of this Form N-CSR.
(b) Not applicable.
Item 7. Disclosure of Proxy Voting Policies and Procedures for Closed-End Management Investment Companies.
Not applicable.
Item 8. Portfolio Managers of Closed-End Management Investment Companies.
Not applicable.
Item 9. Purchases of Equity Securities by Closed-End Management Investment Company and Affiliated Purchasers.
Not applicable.
Item 10. Submission of Matters to a Vote of Security Holders.
There have been no material changes to the procedures by which the shareholders may recommend nominees to the registrant’s board of directors.
Item 11. Controls and Procedures.
(a) The principal executive officer and principal financial officer of the registrant have concluded that the registrant’s disclosure controls and procedures (as defined in Rule 30a-3(c) under the Investment Company Act of 1940) are effective based on their evaluation of the disclosure controls and procedures as of a date within 90 days of the filing date of this report.
(b) There have been no significant changes in the registrant’s internal controls over financial reporting (as defined in Rule 30a-3(d) under the Investment Company Act of 1940) that occurred during the registrant’s second fiscal quarter of the period covered by this report that have materially affected, or is reasonably likely to materially affect, the registrant’s internal controls over financial reporting.
Item 12. Disclosure of Securities Lending Activities for Closed-End Management Investment Companies
Not applicable.
Item 13. Exhibits.
(a)(1) Code of ethics as applies to the registrant’s principal executive and financial officers is attached hereto.
(a)(2) The certifications required by Rule 30a-2(a) under the Investment Company Act of 1940 are attached hereto.
(a)(3) Not applicable.
(a)(4) Not applicable.
(b) The certifications required by Rule 30a-2(b) under the Investment Company Act of 1940 and Section 906 of the Sarbanes-Oxley Act of 2002 are attached hereto.
SIGNATURES
Pursuant to the requirements of the Securities Exchange Act of 1934 and the Investment Company Act of 1940, the registrant has duly caused this report to be signed on its behalf by the undersigned, thereunto duly authorized.
FPA U.S. VALUE FUND, INC. | |
| |
By: | /s/ J. Richard Atwood | |
| J. Richard Atwood | |
| President (principal executive officer) | |
| |
Date: | March 8, 2019 | |
Pursuant to the requirements of the Securities Exchange Act of 1934 and the Investment Company Act of 1940, this report has been signed below by the following persons on behalf of the registrant and in the capacities and on the dates indicated.
By: | /s/ J. Richard Atwood | |
| J. Richard Atwood | |
| President (principal executive officer) | |
| |
Date: | March 8, 2019 | |
| | |
By: | /s/ E. Lake Setzler III | |
| E. Lake Setzler III | |
| Treasurer (principal financial officer) | |
| | |
Date: | March 8, 2019 | |