| | | |
| UNITED STATES |
| SECURITIES AND EXCHANGE COMMISSION |
| Washington, D.C. 20549 |
|
| FORM N-CSR |
|
| CERTIFIED SHAREHOLDER REPORT OF REGISTERED |
| MANAGEMENT INVESTMENT COMPANIES |
|
| Investment Company Act file number: (811-03897) |
| |
| Exact name of registrant as specified in charter: | Putnam U.S. Government Income Trust |
|
| Address of principal executive offices: One Post Office Square, Boston, Massachusetts 02109 |
|
| Name and address of agent for service: | | Beth S. Mazor, Vice President |
| | One Post Office Square |
| | Boston, Massachusetts 02109 |
| |
| Copy to: | | John W. Gerstmayr, Esq. |
| | Ropes & Gray LLP |
| | 800 Boylston Street |
| | Boston, Massachusetts 02199-3600 |
| |
| Registrant’s telephone number, including area code: | (617) 292-1000 |
| |
| Date of fiscal year end: September 30, 2010 | | |
| | |
| Date of reporting period: October 1, 2009 — September 30, 2010 |
Item 1. Report to Stockholders:
The following is a copy of the report transmitted to stockholders pursuant to Rule 30e-1 under the Investment Company Act of 1940:

Putnam
U.S. Government
Income Trust
Annual report
9 | 30 | 10
| | | |
| Message from the Trustees | 1 | | |
| | |
| About the fund | 2 | | |
| | |
| Performance snapshot | 4 | | |
| | |
| Interview with your fund’s portfolio manager | 5 | | |
| | |
| Your fund’s performance | 10 | | |
| | |
| Your fund’s expenses | 12 | | |
| | |
| Terms and definitions | 14 | | |
| | |
| Trustee approval of management contract | 15 | | |
| | |
| Other information for shareholders | 19 | | |
| | |
| Financial statements | 20 | | |
| | |
| Federal tax information | 56 | | |
| | |
| Shareholder meeting results | 57 | | |
| | |
| About the Trustees | 58 | | |
| | |
| Officers | 60 | | |
| | |
Message from the Trustees
Dear Fellow Shareholder:
Even in the midst of a challenging economic recovery, bright spots are emerging. U.S. corporate balance sheets are strong, with companies delivering healthy profits and holding record amounts of cash.
If there is a lesson to be gleaned from recent events, it is the easily overlooked risk of investors missing out on market surges, which can come swiftly. For example, U.S. stocks recorded their best September in 71 years. In today’s ever-changing investment environment, where markets can move quickly in either direction, we believe Putnam’s risk-focused, active-management approach is well suited for pursuing opportunities for our shareholders.
In developments affecting oversight of your fund, Barbara M. Baumann has been elected to the Board of Trustees of the Putnam Funds, effective July 1, 2010. Ms. Baumann is president and owner of Cross Creek Energy Corporation of Denver, Colorado, a strategic consultant to domestic energy firms and direct investor in energy assets. We also want to thank Elizabeth T. Kennan, who has retired from the Board of Trustees, for her many years of dedicated and thoughtful leadership.
Lastly, we would like to take this opportunity to welcome new shareholders to the fund and to thank all of our investors for your continued confidence in Putnam.

About the fund
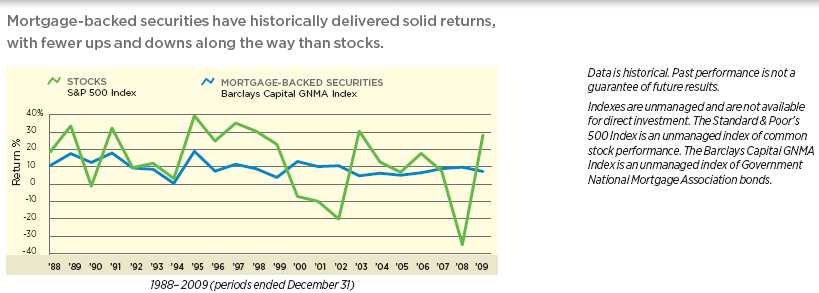
Seeking opportunities through mortgage-backed securities
Home ownership is the most common way to invest in the real estate market, but it is not the only way. It is also possible for individuals to invest in the mortgages used to finance homes and businesses through instruments called mortgage-backed securities (MBSs).
Since 1984, Putnam U.S. Government Income Trust has invested in some of the highest-quality MBSs with the goal of maximizing income. However, investing in MBSs carries certain risks. As a result, your fund’s team of experienced analysts uses proprietary models to seek out investment opportunities, while striving to maintain an appropriate amount of risk for the fund.
MBSs are essentially securities that represent a stake in the principal from, and interest paid on, a collection of mortgages. Most MBSs are created when government-sponsored entities, including Fannie Mae, Ginnie Mae, and Freddie Mac, buy mortgages from financial institutions, such as banks or credit unions, and package them together by the thousands. These pools of mortgages act as collateral for the MBSs that government-sponsored entities sell to different investors, including Putnam U.S. Government Income Trust.
As a consequence of the credit crisis that gripped financial markets in 2007 and 2008, Fannie Mae and Freddie Mac were placed under conservatorship by their regulator, the Federal Housing Finance Agency, and were given a line of credit with the U.S. Treasury. By seeking opportunities among MBSs, your fund’s managers seek higher returns than Treasuries can typically offer, but with less volatility than stocks.
Consider these risks before investing:
Funds that invest in government securities are not guaranteed. Mortgage-backed securities are subject to prepayment risk. The use of derivatives involves special risks and may result in losses. Funds that invest in bonds are subject to certain risks including interest-rate risk, credit risk, and inflation risk. As interest rates rise, the prices of bonds fall. Long-term bonds are more exposed to interest-rate risk than short-term bonds. Unlike bonds, bond funds have ongoing fees and expenses.

Understanding mortgage-related securities
MBSs (Mortgage-backed securities): MBSs are pools of mortgages used as collateral for issuing a security. These securities represent claims on the principal and interest payments made by the borrowers whose loans are in the pool.
Fannie Mae (Federal National Mortgage Association) and Freddie Mac (Federal Home Loan Mortgage Corporation): Formerly public companies, Fannie Mae and Freddie Mac were placed under conservatorship by the U.S. government in September 2008 and are now controlled by the Federal Housing Finance Agency. Both companies buy mortgages from primary lenders (savings and loans, commercial banks, credit unions, and housing finance agencies) and develop MBSs that may carry an explicit government guarantee on the payment of principal and interest.
Ginnie Mae (Government National Mortgage Association): Ginnie Mae is a government-owned corporation established in 1968 whose MBSs are backed by the full faith and credit of the U.S. government.
Collateralized mortgage obligations (CMOs): CMOs are structured mortgage-backed securities that use pools of MBSs, or mortgage loans themselves, as collateral and carve the cash flows into different classes to meet the needs of various investors.
Current performance may be lower or higher than the quoted past performance, which cannot guarantee future results. Share price, principal value, and return will fluctuate, and you may have a gain or a loss when you sell your shares. Performance of class A shares assumes reinvestment of distributions and does not account for taxes. Fund returns in the bar chart do not reflect a sales charge of 4.00%; had they, returns would have been lower. See pages 5 and 10–12 for additional performance information. For a portion of the periods, the fund had expense limitations, without which returns would have been lower. To obtain the most recent month-end performance, visit putnam.com.
4
Interview with your fund’s portfolio manager
Rob Bloemker
How did the fund perform for the year ended September 30, 2010?
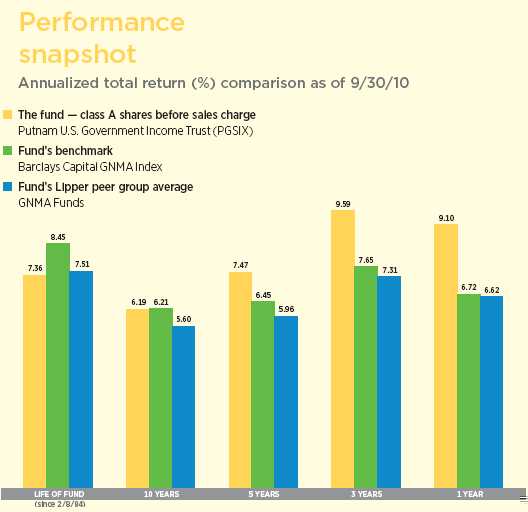
I’m pleased to report that Putnam U.S. Government Income Trust’s class A shares returned 9.10%, outperforming both its benchmark, the Barclays Capital GNMA Index, which advanced 6.72%, and the average return of its Lipper peer group, GNMA Funds, which finished at 6.62%.
How would you characterize the market environment for government securities during the period?
Against the backdrop of a slowly recovering U.S. economy, government-agency mortgage-backed securities [MBS] generally underperformed other types of bonds as U.S. mortgage rates fell to new lows. Declining mortgage rates sparked increased investor concerns about refinancing activity and early mortgage repayments. As a result, during the final months of the period, many MBS holders were forced to accept 100 cents on the dollar for securities that were previously trading at prices higher than this. However, despite record-low mortgage rates, refinancing activity was constrained by extremely tight bank-underwriting requirements, making it difficult for many borrowers to qualify for a new loan. Declining home prices also hampered borrowers’ attempts to refinance by putting loan-to-home-value ratios outside ranges considered acceptable by most lenders.
U.S. Treasuries outperformed MBS but still trailed riskier market segments, such as commercial mortgage-backed securities, emerging-market debt, and high-yield corporate bonds. Treasuries benefited from flight-to-quality demand amid worries about Europe’s sovereign debt crisis. More recently, a string of disappointing economic
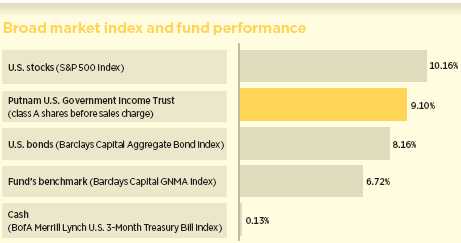
This comparison shows your fund’s performance in the context of broad market indexes for the 12 months ended 9/30/10. See pages 4 and 10–12 for additional fund performance information. Index descriptions can be found on page 14.
5
data releases fueled further gains, as did an indication from the Federal Reserve Board [the Fed] that it might restart its program of large-scale bond purchases.
The fund surpassed its market benchmark and Lipper peer group by significant margins. What accounted for this strong relative performance?
The returns generated by our holdings of interest-only collateralized mortgage obligations [CMO IOs] — which are not held in the benchmark — drove the fund’s outperformance. CMOs are structured mortgage-backed securities that use pools of mortgage pass-through bonds, or mortgage loans themselves, as collateral and carve the cash flows into different classes to meet the needs of various investors. IOs are securities derived from the interest portion of the underlying mortgages. CMO IOs are designed so that the longer homeowners take to pay down their mortgages, the more valuable the securities become. Essentially, the longer it takes to pay down principal, the more money a bondholder will make from interest payments on that loan.
In March, Fannie Mae and Freddie Mac announced that they would buy back delinquent mortgages. The MBS market viewed this announcement negatively because, for mortgage investors, a government-sponsored buyback program would have the same effect as mortgagees prepaying their loans. Consequently, most CMO IOs underperformed. We had anticipated this announcement and had begun to shift away from IOs derived from loans that could not be refinanced to those based on mortgages with lower interest rates or lower
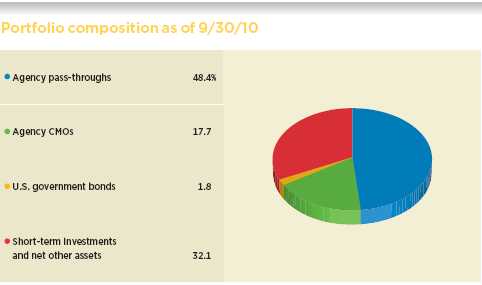
Allocations are represented as a percentage of portfolio value and include derivative instruments. These may differ from allocations shown later in this report. Holdings and allocations may vary over time.
Chart data reflect new calculation methodology in effect within the past six months.
6
balances, believing these types of loans would not be bought back. Prices of IOs in the former category remained depressed, while prices of IOs in the latter categories rose sharply.

In terms of risk-management strategies, we used interest-rate futures and swap contracts to manage the fund’s term-structure risk — that is, the risk related to changes in interest rates along the yield curve.
Is there added risk that accompanies the returns from CMO IOs?
The CMO IOs held by the fund carry minimal credit risk, or risk of default, because they are agency securities backed by the full faith and credit of the federal government. In the event that refinancing activity increases significantly, CMO IOs are subject to prepayment risk. However, we have attempted to mitigate this risk by holding IOs that are structured from loans that were issued at comparatively low rates, meaning they are less likely to be refinanced. We also used interest-rate swaps and options to manage prepayment risk. Lastly, given the relatively small size of the IO market, there is liquidity risk. We seek to manage liquidity risk by carefully analyzing the IOs we purchase and by continually monitoring the liquidity levels in the IO market.
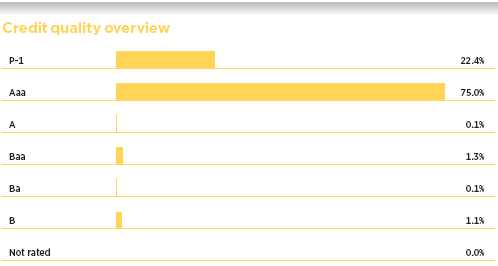
Credit qualities are shown as a percentage of net assets as of 9/30/10. A bond rated Baa or higher (Prime-3 or higher, for short-term debt) is considered investment grade. The chart reflects Moody’s ratings; percentages may include bonds or derivatives not rated by Moody’s but rated by Standard & Poor’s or, if unrated by S&P, by Fitch, and then included in the closest equivalent Moody’s rating. Ratings will vary over time.
Credit quality includes bonds and represents only the fixed-income portion of the portfolio. Derivative instruments, including currency forwards, are only included to the extent of any unrealized gain or loss on such instruments and are shown in the not-rated category. The fund itself has not been rated by an independent rating agency.
7
How did you reposition the fund’s portfolio during the period?
Following a period of very rewarding performance, we reduced the fund’s CMO IO holdings by about half. We still viewed IOs as offering solid value, but believed that increased future volatility was a distinct possibility and wanted to reduce the fund’s exposure to this risk.
What is your outlook for the coming months, and how are you positioning the fund?
We anticipate continued high unemployment and weak economic growth in the months ahead, and believe low interest rates may persist for some time. The final month of the period saw the short-term end of the yield curve anchored by a still-low federal funds rate, while yields on longer-term maturities began to rise as inflation expectations increased.
Given the sluggish economic backdrop, it appears likely that the Fed will launch a second round of quantitative easing. We anticipate that the central bank will purchase between $500 billion and $1 trillion in Treasury debt, with an eye toward lowering long-term rates and spurring more borrowing by consumers and businesses. Because of the economy’s weakness, inflation is currently running below the Fed’s informal target of 1.7% to 2.0% annually.
We believe the fund is well positioned should there be additional quantitative easing, even if the Fed’s actions trigger increasing expectations for higher inflation. The fund is receiving substantial amounts of income from its CMO IO holdings. What’s more, if inflation expectations were to rise, the prices of our CMO IO positions may be driven higher by strong demand for high-yielding securities
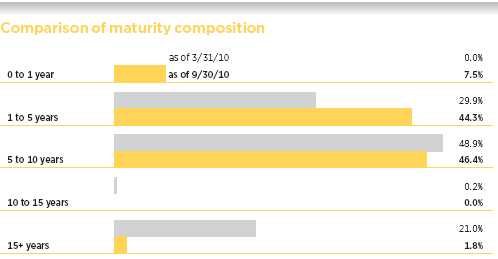
This chart illustrates the fund’s composition by maturity, showing the percentage of holdings in different maturity ranges and how the composition has changed over the past six months. Holdings and maturity ranges will vary over time.
8
derived from mortgages that are unlikely to be paid off early.
Thanks for bringing us up to date, Rob.
The views expressed in this report are exclusively those of Putnam Management. They are not meant as investment advice.
Please note that the holdings discussed in this report may not have been held by the fund for the entire period. Portfolio composition is subject to review in accordance with the fund’s investment strategy and may vary in the future. Current and future portfolio holdings are subject to risk.
Of special interest
We are pleased to report that your fund’s monthly dividend increased from $0.055 to $0.065 per share during the 12-month period.
The increases, which took effect in November 2009 and February 2010, were made possible due to increased interest income resulting from higher yields on interest-only (IO) securities and other mortgage-backed securities. IOs are securities whose cash flows come from the interest portion of underlying government-agency mortgages.

Portfolio Manager Rob Bloemker is Head of Fixed Income at Putnam. He has a B.S. and a B.A. from Washington University. Rob joined Putnam in 1999 and has been in the investment industry since 1988.
In addition to Rob, your fund’s portfolio managers are Daniel Choquette and Michael Salm.
IN THE NEWS
With the pace of recovery slowing, the Federal Open Market Committee (FOMC) said that additional monetary policy easing may be necessary “before long.” According to the FOMC’s minutes from its September 21 meeting, several members noted that unless the pace of economic recovery strengthened, they “would consider taking appropriate action soon.” Members of the rate-setting FOMC viewed recent growth and inflation trends as unsatisfactory. Fed officials focused their discussion on a second round of buying U.S. Treasuries, also known as quantitative easing. The purchases are seen as a way to keep the economy from heading into a period of declining inflation and slow growth.
9
Your fund’s performance
This section shows your fund’s performance, price, and distribution information for periods ended September 30, 2010, the end of its most recent fiscal year. In accordance with regulatory requirements for mutual funds, we also include expense information taken from the fund’s current prospectus. Performance should always be considered in light of a fund’s investment strategy. Data represents past performance. Past performance does not guarantee future results. More recent returns may be less or more than those shown. Investment return and principal value will fluctuate, and you may have a gain or a loss when you sell your shares. Performance information does not reflect any deduction for taxes a shareholder may owe on fund distributions or on the redemption of fund shares. For the most recent month-end performance, please visit the Individual Investors section at putnam.com or call Putnam at 1-800-225-1581. Class Y shares are generally o nly available to corporate and institutional clients and clients in other approved programs. See the Terms and Definitions section in this report for definitions of the share classes offered by your fund.
Fund performance Total return for periods ended 9/30/10
| | | | | | | | | | |
| | Class A | Class B | Class C | Class M | Class R | Class Y |
| (inception dates) | (2/8/84) | (4/27/92) | (7/26/99) | (2/6/95) | (1/21/03) | (4/11/94) |
|
| | NAV | POP | NAV | CDSC | NAV | CDSC | NAV | POP | NAV | NAV |
|
| Annual average | | | | | | | | | | |
| (life of fund) | 7.36% | 7.19% | 6.49% | 6.49% | 6.53% | 6.53% | 7.03% | 6.90% | 7.06% | 7.51% |
|
| 10 years | 82.34 | 75.08 | 69.48 | 69.48 | 68.50 | 68.50 | 78.46 | 72.65 | 76.72 | 86.41 |
| Annual average | 6.19 | 5.76 | 5.42 | 5.42 | 5.36 | 5.36 | 5.96 | 5.61 | 5.86 | 6.43 |
|
| 5 years | 43.34 | 37.57 | 38.31 | 36.31 | 37.43 | 37.43 | 42.02 | 37.41 | 40.65 | 44.72 |
| Annual average | 7.47 | 6.59 | 6.70 | 6.39 | 6.57 | 6.57 | 7.27 | 6.56 | 7.06 | 7.67 |
|
| 3 years | 31.62 | 26.34 | 28.93 | 25.93 | 28.15 | 28.15 | 31.04 | 26.79 | 29.80 | 32.24 |
| Annual average | 9.59 | 8.11 | 8.84 | 7.99 | 8.62 | 8.62 | 9.43 | 8.23 | 9.08 | 9.76 |
|
| 1 year | 9.10 | 4.76 | 8.27 | 3.27 | 8.06 | 7.06 | 9.13 | 5.56 | 8.77 | 9.28 |
|
Current performance may be lower or higher than the quoted past performance, which cannot guarantee future results. After-sales-charge returns (public offering price, or POP) for class A and M shares reflect a maximum 4.00% and 3.25% load, respectively. Class B share returns reflect the applicable contingent deferred sales charge (CDSC), which is 5% in the first year, declining to 1% in the sixth year, and is eliminated thereafter. Class C shares reflect a 1% CDSC for the first year that is eliminated thereafter. Class R and Y shares have no initial sales charge or CDSC.
Performance for class B, C, M, R, and Y shares before their inception is derived from the historical performance of class A shares, adjusted for the applicable sales charge (or CDSC) and the higher operating expenses for such shares, except for class Y shares, for which 12b-1 fees are not applicable.
For a portion of the periods, the fund had expense limitations, without which returns would have been lower.
Class B share performance does not reflect conversion to class A shares.
10
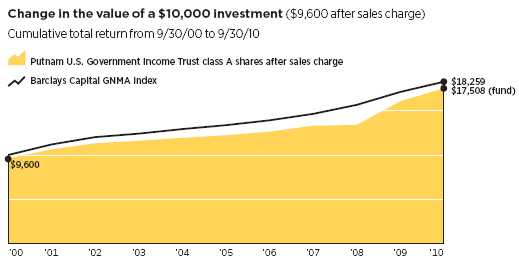
Past performance does not indicate future results. At the end of the same time period, a $10,000 investment in the fund’s class B and class C shares would have been valued at $16,948 and $16,850, respectively, and no contingent deferred sales charges would apply. A $10,000 investment in the fund’s class M shares ($9,675 after sales charge) would have been valued at $17,265 at public offering price. A $10,000 investment in the fund’s class R and class Y shares would have been valued at $17,672 and $18,641, respectively.
Comparative index returns For periods ended 9/30/10
| | |
| | Barclays Capital GNMA Index | Lipper GNMA Funds category average* |
|
| Annual average (life of fund) | 8.45% | 7.51% |
|
| 10 years | 82.59 | 72.68 |
| Annual average | 6.21 | 5.60 |
|
| 5 years | 36.66 | 33.63 |
| Annual average | 6.45 | 5.96 |
|
| 3 years | 24.76 | 23.59 |
| Annual average | 7.65 | 7.31 |
|
| 1 year | 6.72 | 6.62 |
|
Index and Lipper results should be compared to fund performance at net asset value.
* Over the 1-year, 3-year, 5-year, 10-year, and life-of-fund periods ended 9/30/10, there were 66, 61, 56, 42, and 7 funds, respectively, in this Lipper category.
11
Fund price and distribution information For the 12-month period ended 9/30/10
| | | | | | | | |
| Distributions | Class A | Class B | Class C | Class M | Class R | Class Y |
|
| Number | 12 | 12 | 12 | 12 | 12 | 12 |
|
| Income | $0.749 | $0.640 | $0.640 | $0.713 | $0.714 | $0.785 |
|
| Capital gains — Long-term | 0.050 | 0.050 | 0.050 | 0.050 | 0.050 | 0.050 |
|
| Capital gains — Short-term | — | — | — | — | — | — |
|
| Total | $0.799 | $0.690 | $0.690 | $0.763 | $0.764 | $0.835 |
|
| Share value | NAV | POP | NAV | NAV | NAV | POP | NAV | NAV |
|
| 9/30/09 | $14.50 | $15.10 | $14.44 | $14.44 | $14.49 | $14.98 | $14.40 | $14.42 |
|
| 9/30/10 | 15.00 | 15.63 | 14.93 | 14.90 | 15.03 | 15.53 | 14.88 | 14.90 |
|
| Current yield (end of period) | NAV | POP | NAV | NAV | NAV | POP | NAV | NAV |
|
| Current dividend rate 1 | 5.20% | 4.99% | 4.50% | 4.51% | 4.95% | 4.79% | 5.00% | 5.48% |
|
| Current 30-day SEC yield 2 | N/A | 3.32 | 2.73 | 2.71 | N/A | 3.11 | 3.21 | 3.71 |
|
The classification of distributions, if any, is an estimate. Final distribution information will appear on your year-end tax forms.
1 Most recent distribution, excluding capital gains, annualized and divided by NAV or POP at end of period.
2 Based only on investment income and calculated using the maximum offering price for each share class, in accordance with SEC guidelines.
Your fund’s expenses
As a mutual fund investor, you pay ongoing expenses, such as management fees, distribution fees (12b-1 fees), and other expenses. In the most recent six-month period, your fund’s expenses were limited; had expenses not been limited, they would have been higher. Using the following information, you can estimate how these expenses affect your investment and compare them with the expenses of other funds. You may also pay one-time transaction expenses, including sales charges (loads) and redemption fees, which are not shown in this section and would have resulted in higher total expenses. For more information, see your fund’s prospectus or talk to your financial representative.
Expense ratios
| | | | | | |
| | Class A | Class B | Class C | Class M | Class R | Class Y |
|
| Total annual operating expenses for the | | | | | | |
| fiscal year ended 9/30/09* | 0.94% | 1.65% | 1.69% | 1.18% | 1.19% | 0.69% |
|
| Annualized expense ratio for the six-month | | | | | | |
| period ended 9/30/10† | 0.86% | 1.57% | 1.61% | 1.10% | 1.11% | 0.61% |
|
Fiscal-year expense information in this table is taken from the most recent prospectus, is subject to change, and may differ from that shown for the annualized expense ratio and in the financial highlights of this report. Expenses are shown as a percentage of average net assets.
* Reflects projected expenses based on a new management contract effective 1/1/10. Excludes estimated interest expense accruing in connection with the termination of certain derivative contracts.
† For the fund’s most recent fiscal half year; may differ from expense ratios based on one-year data in the financial highlights. Excludes the impact of a reduction in expenses during the six months ended 9/30/10 related to the resolution of certain terminated derivatives contracts.
12
Expenses per $1,000
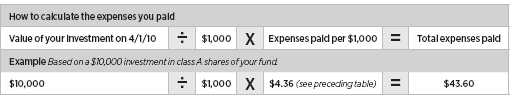
The following table shows the expenses you would have paid on a $1,000 investment in Putnam U.S. Government Income Trust from April 1, 2010, to September 30, 2010. It also shows how much a $1,000 investment would be worth at the close of the period, assuming actual returns and expenses.
| | | | | | |
| | Class A | Class B | Class C | Class M | Class R | Class Y |
|
| Expenses paid per $1,000*† | $4.36 | $7.94 | $8.14 | $5.58 | $5.62 | $3.09 |
|
| Ending value (after expenses) | $1,022.10 | $1,017.70 | $1,016.40 | $1,022.20 | $1,021.00 | $1,022.80 |
|
* Expenses for each share class are calculated using the fund’s annualized expense ratio for each class, which represents the ongoing expenses as a percentage of average net assets for the six months ended 9/30/10. The expense ratio may differ for each share class.
† Expenses are calculated by multiplying the expense ratio by the average account value for the period; then multiplying the result by the number of days in the period; and then dividing that result by the number of days in the year.
Estimate the expenses you paid
To estimate the ongoing expenses you paid for the six months ended September 30, 2010, use the following calculation method. To find the value of your investment on April 1, 2010, call Putnam at 1-800-225-1581.
Compare expenses using the SEC’s method
The Securities and Exchange Commission (SEC) has established guidelines to help investors assess fund expenses. Per these guidelines, the following table shows your fund’s expenses based on a $1,000 investment, assuming a hypothetical 5% annualized return. You can use this information to compare the ongoing expenses (but not transaction expenses or total costs) of investing in the fund with those of other funds. All mutual fund shareholder reports will provide this information to help you make this comparison. Please note that you cannot use this information to estimate your actual ending account balance and expenses paid during the period.
| | | | | | |
| | Class A | Class B | Class C | Class M | Class R | Class Y |
|
| Expenses paid per $1,000*† | $4.36 | $7.94 | $8.14 | $5.57 | $5.62 | $3.09 |
|
| Ending value (after expenses) | $1,020.76 | $1,017.20 | $1,017.00 | $1,019.55 | $1,019.50 | $1,022.01 |
|
* Expenses for each share class are calculated using the fund’s annualized expense ratio for each class, which represents the ongoing expenses as a percentage of average net assets for the six months ended 9/30/10. The expense ratio may differ for each share class.
† Expenses are calculated by multiplying the expense ratio by the average account value for the period; then multiplying the result by the number of days in the period; and then dividing that result by the number of days in the year.
13
Terms and definitions
Important terms
Total return shows how the value of the fund’s shares changed over time, assuming you held the shares through the entire period and reinvested all distributions in the fund.
Net asset value (NAV) is the price, or value, of one share of a mutual fund, without a sales charge. NAVs fluctuate with market conditions. NAV is calculated by dividing the net assets of each class of shares by the number of outstanding shares in the class.
Public offering price (POP) is the price of a mutual fund share plus the maximum sales charge levied at the time of purchase. POP performance figures shown here assume the 4.00% maximum sales charge for class A shares and 3.25% for class M shares.
Contingent deferred sales charge (CDSC) is generally a charge applied at the time of the redemption of class B or C shares and assumes redemption at the end of the period. Your fund’s class B CDSC declines from a 5% maximum during the first year to 1% during the sixth year. After the sixth year, the CDSC no longer applies. The CDSC for class C shares is 1% for one year after purchase.
Current yield is the annual rate of return earned from dividends or interest of an investment. Current yield is expressed as a percentage of the price of a security, fund share, or principal investment.
Share classes
Class A shares are generally subject to an initial sales charge and no CDSC (except on certain redemptions of shares bought without an initial sales charge).
Class B shares are not subject to an initial sales charge. They may be subject to a CDSC.
Class C shares are not subject to an initial sales charge and are subject to a CDSC only if the shares are redeemed during the first year.
Class M shares have a lower initial sales charge and a higher 12b-1 fee than class A shares and no CDSC (except on certain redemptions of shares bought without an initial sales charge).
Class R shares are not subject to an initial sales charge or CDSC and are available only to certain defined contribution plans.
Class Y shares are not subject to an initial sales charge or CDSC, and carry no 12b-1 fee. They are generally only available to corporate and institutional clients and clients in other approved programs.
Comparative indexes
Barclays Capital Aggregate Bond Index is an unmanaged index of U.S. investment-grade fixed-income securities.
Barclays Capital GNMA Index is an unmanaged index of Government National Mortgage Association bonds.
BofA (Bank of America) Merrill Lynch U.S. 3-Month Treasury Bill Index is an unmanaged index that seeks to measure the performance of U.S. Treasury bills available in the marketplace.
S&P 500 Index is an unmanaged index of common stock performance.
Indexes assume reinvestment of all distributions and do not account for fees. Securities and performance of a fund and an index will differ. You cannot invest directly in an index.
Lipper is a third-party industry-ranking entity that ranks mutual funds. Its rankings do not reflect sales charges. Lipper rankings are based on total return at net asset value relative to other funds that have similar current investment styles or objectives as determined by Lipper. Lipper may change a fund’s category assignment at its discretion. Lipper category averages reflect performance trends for funds within a category.
14
Trustee approval of management contract
General conclusions
The Board of Trustees of the Putnam funds oversees the management of each fund and, as required by law, determines annually whether to approve the continuance of your fund’s management contract with Putnam Investment Management (“Putnam Management”) and the sub-management contract with respect to your fund between Putnam Management and its affiliate, Putnam Investments Limited (“PIL”).
In this regard, the Board of Trustees, with the assistance of its Contract Committee consisting solely of Trustees who are not “interested persons” (as this term is defined in the Investment Company Act of 1940, as amended) of the Putnam funds (the “Independent Trustees”), requests and evaluates all information it deems reasonably necessary under the circumstances. Over the course of several months ending in June 2010, the Contract Committee met several times with representatives of Putnam Management and in executive session to consider the information provided by Putnam Management and other information developed with the assistance of the Board’s independent counsel and independent staff. The Contract Committee reviewed and discussed key aspects of this information with all of the Independent Trustees. At the Trustees’ June 11, 2010 meeting, the Contract Committee recommended, and the Independent Trustees approved, the co ntinuance of your fund’s management and sub-management contracts, effective July 1, 2010. (Because PIL is an affiliate of Putnam Management and Putnam Management remains fully responsible for all services provided by PIL, the Trustees have not evaluated PIL as a separate entity, and all subsequent references to Putnam Management below should be deemed to include reference to PIL as necessary or appropriate in the context.)
The Independent Trustees’ approval was based on the following conclusions:
• That the fee schedule in effect for your fund represented reasonable compensation in light of the nature and quality of the services being provided to the fund, the fees paid by competitive funds, and the costs incurred by Putnam Management in providing such services, and
• That the fee schedule represented an appropriate sharing between fund shareholders and Putnam Management of such economies of scale as may exist in the management of the fund at current asset levels.
These conclusions were based on a comprehensive consideration of all information provided to the Trustees and were not the result of any single factor. Some of the factors that figured particularly in the Trustees’ deliberations and how the Trustees considered these factors are described below, although individual Trustees may have evaluated the information presented differently, giving different weights to various factors. It is also important to recognize that the fee arrangements for your fund and the other Putnam funds are the result of many years of review and discussion between the Independent Trustees and Putnam Management, that certain aspects of the arrangements may receive greater scrutiny in some years than others, and that the Trustees’ conclusions may be based, in part, on their consideration of fee arrangements in prior years.
Consideration of implementation of strategic pricing initiative
The Trustees were mindful that new management contracts had been implemented for all but a few funds at the beginning of 2010 as part of Putnam Management’s strategic pricing initiative. These new management contracts reflected the implementation of more competitive fee levels for many funds, complex-wide breakpoints for the open-end funds and performance fees for certain funds. The
15
Trustees had approved these new management contracts on July 10, 2009 and submitted them to shareholder meetings of the affected funds in late 2009, where the contracts were in all cases approved by overwhelming majorities of the shares voted.
Because the management contracts had been implemented only recently, the Contract Committee had limited practical experience with the operation of the new fee structures. The financial data available to the Committee reflected actual operations under the prior contracts; information was also available on a pro forma basis, adjusted to reflect the fees payable under the new management contracts. In light of the limited information available regarding operations under the new management contracts, in recommending the continuation of the new management contracts in June 2010, the Contract Committee relied to a considerable extent on its review of the financial information and analysis that formed the basis of the Board’s approval of the new management contracts on July 10, 2009.
Management fee schedules and categories; total expenses
The Trustees reviewed the management fee schedules in effect for all Putnam funds, including fee levels and breakpoints. In reviewing management fees, the Trustees generally focus their attention on material changes in circumstances — for example, changes in assets under management or investment style, changes in Putnam Management’s operating costs, or changes in competitive practices in the mutual fund industry — that suggest that consideration of fee changes might be warranted. The Trustees concluded that the circumstances did not warrant changes to the management fee structure of your fund.
As in the past, the Trustees continued to focus on the competitiveness of the total expense ratio of each fund. In order to ensure that expenses of the Putnam funds continue to meet evolving competitive standards, the Trustees and Putnam Management agreed in 2009 to implement: (i) a contractual expense limitation applicable to all retail open-end funds of 37.5 basis points on investor servicing fees and expenses and (ii) a contractual expense limitation applicable to all open-end funds of 20 basis points on so-called “other expenses” (i.e., all expenses exclusive of management fees, investor servicing fees, distribution fees, taxes, brokerage commissions and extraordinary expenses). These expense limitations serve in particular to maintain competitive expense levels for funds with large numbers of small shareholder accounts and funds with relatively small net assets.
The Trustees reviewed comparative fee and expense information for competitive funds, which indicated that, in a custom peer group of competitive funds selected by Lipper Inc., your fund ranked in the 62nd percentile in effective management fees (determined for your fund and the other funds in the custom peer group based on fund asset size and the applicable contractual management fee schedule) and in the 69th percentile in total expenses (less any applicable 12b-1 fees) as of December 31, 2009 (the first percentile representing the least expensive funds and the 100th percentile the most expensive funds). The Trustees also considered that your fund ranked in the 23rd percentile in effective management fees, on a pro forma basis adjusted to reflect the impact of the strategic pricing initiative discussed above, as of December 31, 2009.
Your fund currently has the benefit of breakpoints in its management fee that provide shareholders with significant economies of scale in the form of reduced fee levels as assets under management in the Putnam family of funds increase. The Contract Committee observed that the complex-wide breakpoints of the open-end funds have only been in place for a short while, and the Trustees will examine
16
the operation of this new breakpoint structure in future years in light of actual experience.
In connection with their review of the management fees and total expenses of the Putnam funds, the Trustees also reviewed the costs of the services provided and profits realized by Putnam Management and its affiliates from their contractual relationships with the funds. This information included trends in revenues, expenses and profitability of Putnam Management and its affiliates relating to the investment management, investor servicing and distribution services provided to the funds. In this regard, the Trustees also reviewed an analysis of Putnam Management’s revenues, expenses and profitability, allocated on a fund-by-fund basis, with respect to the funds’ management, distribution, and investor servicing contracts. For each fund, the analysis presented information about revenues, expenses and profitability for each of the agreements separately and for the agreements taken together on a combined basis. The Trustees concluded that, at curre nt asset levels, the fee schedules currently in place represented an appropriate sharing of economies of scale at that time.
The information examined by the Trustees as part of their annual contract review for the Putnam funds has included for many years information regarding fees charged by Putnam Management and its affiliates to institutional clients such as defined benefit pension plans, college endowments, and the like. This information included comparisons of such fees with fees charged to the funds, as well as a detailed assessment of the differences in the services provided to these two types of clients. The Trustees observed, in this regard, that the differences in fee rates between institutional clients and mutual funds are by no means uniform when examined by individual asset sectors, suggesting that differences in the pricing of investment management services to these types of clients may reflect historical competitive forces operating in separate market places. The Trustees considered the fact that fee rates across different as set classes are typically higher on average for mutual funds than for institutional clients, as well as the differences between the services that Putnam Management provides to the Putnam funds and those that it provides to institutional clients of the firm, and did not rely on these comparisons to any significant extent in concluding that the management fees paid by your fund are reasonable.
Investment performance
The quality of the investment process provided by Putnam Management represented a major factor in the Trustees’ evaluation of the quality of services provided by Putnam Management under your fund’s management contract. The Trustees were assisted in their review of the Putnam funds’ investment process and performance by the work of the Investment Oversight Coordinating Committee of the Trustees and the Investment Oversight Committees of the Trustees, which met on a regular monthly basis with the funds’ portfolio teams throughout the year. The Trustees concluded that Putnam Management generally provides a high-quality investment process — as measured by the experience and skills of the individuals assigned to the management of fund portfolios, the resources made available to such personnel, and in general the ability of Putnam Management to attract and retain high-quality personnel — but also recognized that this does not gu arantee favorable investment results for every fund in every time period. The Trustees considered the investment performance of each fund over multiple time periods and considered information comparing each fund’s performance with various benchmarks and with the performance of competitive funds.
The Committee noted the substantial improvement in the performance of most Putnam funds during 2009. The Committee also noted the disappointing investment performance
17
of a number of the funds for periods ended December 31, 2009 and considered information provided by Putnam Management regarding the factors contributing to the underperformance and actions being taken to improve performance. The Trustees recognized that, in recent years, Putnam Management has taken steps to strengthen its investment personnel and processes to address areas of underperformance, including Putnam Management’s continuing efforts to strengthen the equity research function, recent changes in portfolio managers, increased accountability of individual managers rather than teams, recent changes in Putnam Management’s approach to incentive compensation, including emphasis on top quartile performance over a rolling three-year period, and the recent arrival of a new chief investment officer. The Trustees indicated their intention to continue to monitor performance trends to assess the effectiveness of these efforts and to evaluate whethe r additional changes to address areas of underperformance are warranted.
In the case of your fund, the Trustees considered that your fund’s class A share cumulative total return performance at net asset value was in the following percentiles of its Lipper Inc. peer group (Lipper GNMA Funds) for the one-year, three-year and five-year periods ended December 31, 2009 (the first percentile representing the best-performing funds and the 100th percentile the worst-performing funds):
| | | |
| One-year period | 4th | | |
| | |
| Three-year period | 4th | | |
| | |
| Five-year period | 4th | | |
| | |
Over the one-year, three-year and five-year periods ended December 31, 2009, there were 63, 56 and 55 funds, respectively, in your fund’s Lipper peer group. (When considering performance information, shareholders should be mindful that past performance is not a guarantee of future results.)
Brokerage and soft-dollar allocations; investor servicing; distribution
The Trustees considered various potential benefits that Putnam Management may receive in connection with the services it provides under the management contract with your fund. These include benefits related to brokerage and soft-dollar allocations, whereby a portion of the commissions paid by a fund for brokerage may be used to acquire research services that are expected to be useful to Putnam Management in managing the assets of the fund and of other clients. The Trustees considered a change made, at Putnam Management’s request, to the Putnam funds’ brokerage allocation policies commencing in 2010, which increased the permitted soft dollar allocation to third-party services over what had been authorized in previous years. The Trustees noted that a portion of available soft dollars continues to be allocated to the payment of fund expenses. The Trustees indicated their continued intent to monitor regulatory developments in this area with the a ssistance of their Brokerage Committee and also indicated their continued intent to monitor the potential benefits associated with fund brokerage and soft-dollar allocations and trends in industry practices to ensure that the principle of seeking best price and execution remains paramount in the portfolio trading process.
Putnam Management may also receive benefits from payments that the funds make to Putnam Management’s affiliates for investor or distribution services. In conjunction with the annual review of your fund’s management contract, the Trustees reviewed your fund’s investor servicing agreement with Putnam Investor Services, Inc. (“PSERV”) and its distributor’s contracts and distribution plans with Putnam Retail Management Limited Partnership (“PRM”), both of which are affiliates of Putnam Management. The Trustees concluded that the fees payable by the funds to PSERV and PRM, as applicable, for such services are reasonable in relation to the nature and quality of such services.
18
Other information for shareholders
Important notice regarding Putnam’s privacy policy
In order to conduct business with our shareholders, we must obtain certain personal information such as account holders’ names, addresses, Social Security numbers, and dates of birth. Using this information, we are able to maintain accurate records of accounts and transactions.
It is our policy to protect the confidentiality of our shareholder information, whether or not a shareholder currently owns shares of our funds. In particular, it is our policy not to sell information about you or your accounts to outside marketing firms. We have safeguards in place designed to prevent unauthorized access to our computer systems and procedures to protect personal information from unauthorized use.
Under certain circumstances, we must share account information with outside vendors who provide services to us, such as mailings and proxy solicitations. In these cases, the service providers enter into confidentiality agreements with us, and we provide only the information necessary to process transactions and perform other services related to your account. Finally, it is our policy to share account information with your financial representative, if you’ve listed one on your Putnam account.
Proxy voting
Putnam is committed to managing our mutual funds in the best interests of our shareholders. The Putnam funds’ proxy voting guidelines and procedures, as well as information regarding how your fund voted proxies relating to portfolio securities during the 12-month period ended June 30, 2010, are available in the Individual Investors section at putnam.com, and on the SEC’s Web site, www.sec.gov. If you have questions about finding forms on the SEC’s Web site, you may call the SEC at 1-800-SEC-0330. You may also obtain the Putnam funds’ proxy voting guidelines and procedures at no charge by calling Putnam’s Shareholder Services at 1-800-225-1581.
Fund portfolio holdings
The fund will file a complete schedule of its portfolio holdings with the SEC for the first and third quarters of each fiscal year on Form N-Q. Shareholders may obtain the fund’s Forms N-Q on the SEC’s Web site at www.sec.gov. In addition, the fund’s Forms N-Q may be reviewed and copied at the SEC’s Public Reference Room in Washington, D.C. You may call the SEC at 1-800-SEC-0330 for information about the SEC’s Web site or the operation of the Public Reference Room.
Trustee and employee fund ownership
Putnam employees and members of the Board of Trustees place their faith, confidence, and, most importantly, investment dollars in Putnam mutual funds. As of September 30, 2010, Putnam employees had approximately $319,000,000 and the Trustees had approximately $60,000,000 invested in Putnam mutual funds. These amounts include investments by the Trustees’ and employees’ immediate family members as well as investments through retirement and deferred compensation plans.
19
Financial statements
These sections of the report, as well as the accompanying Notes, preceded by the Report of Independent Registered Public Accounting Firm, constitute the fund’s financial statements.
The fund’s portfolio lists all the fund’s investments and their values as of the last day of the reporting period. Holdings are organized by asset type and industry sector, country, or state to show areas of concentration and diversification.
Statement of assets and liabilities shows how the fund’s net assets and share price are determined. All investment and non-investment assets are added together. Any unpaid expenses and other liabilities are subtracted from this total. The result is divided by the number of shares to determine the net asset value per share, which is calculated separately for each class of shares. (For funds with preferred shares, the amount subtracted from total assets includes the liquidation preference of preferred shares.)
Statement of operations shows the fund’s net investment gain or loss. This is done by first adding up all the fund’s earnings — from dividends and interest income — and subtracting its operating expenses to determine net investment income (or loss). Then, any net gain or loss the fund realized on the sales of its holdings — as well as any unrealized gains or losses over the period — is added to or subtracted from the net investment result to determine the fund’s net gain or loss for the fiscal year.
Statement of changes in net assets shows how the fund’s net assets were affected by the fund’s net investment gain or loss, by distributions to shareholders, and by changes in the number of the fund’s shares. It lists distributions and their sources (net investment income or realized capital gains) over the current reporting period and the most recent fiscal year-end. The distributions listed here may not match the sources listed in the Statement of operations because the distributions are determined on a tax basis and may be paid in a different period from the one in which they were earned.
Financial highlights provide an overview of the fund’s investment results, per-share distributions, expense ratios, net investment income ratios, and portfolio turnover in one summary table, reflecting the five most recent reporting periods. In a semiannual report, the highlights table also includes the current reporting period.
20
Report of Independent Registered Public Accounting Firm
The Shareholders and Board of Trustees
Putnam U.S. Government Income Trust:
We have audited the accompanying statement of assets and liabilities of Putnam U.S. Government Income Trust (the fund), including the fund’s portfolio as of September 30, 2010, and the related statement of operations for the year then ended, the statements of changes in net assets for each of the two years in the period then ended and the financial highlights for each of the five years in the period then ended. These financial statements and financial highlights are the responsibility of the fund’s management. Our responsibility is to express an opinion on these financial statements and financial highlights based on our audits.
We conducted our audits in accordance with the standards of the Public Company Accounting Oversight Board (United States). Those standards require that we plan and perform the audit to obtain reasonable assurance about whether the financial statements and financial highlights are free of material misstatement. An audit includes examining, on a test basis, evidence supporting the amounts and disclosures in the financial statements. Our procedures included confirmation of securities owned as of September 30, 2010, by correspondence with the custodian and brokers, or by other appropriate auditing procedures. An audit also includes assessing the accounting principles used and significant estimates made by management, as well as evaluating the overall financial statement presentation. We believe that our audits provide a reasonable basis for our opinion.
In our opinion, the financial statements and financial highlights referred to above present fairly, in all material respects, the financial position of Putnam U.S. Government Income Trust as of September 30, 2010, the results of its operations for the year then ended, the changes in its net assets for each of the two years in the period then ended, and the financial highlights for each of the five years in the period then ended, in conformity with U.S. generally accepted accounting principles.

Boston, Massachusetts
November 12, 2010
21
The fund’s portfolio 9/30/10
| | |
| U.S. GOVERNMENT AND AGENCY | | |
| MORTGAGE OBLIGATIONS (82.9%)* | Principal amount | Value |
|
| U.S. Government Guaranteed Mortgage Obligations (63.8%) | | |
| Government National Mortgage Association Adjustable Rate | | |
| Mortgages 4 5/8s, July 20, 2026 | $35,021 | $36,040 |
|
| Government National Mortgage Association | | |
| Graduated Payment Mortgages | | |
| 13 1/4s, December 20, 2014 | 10,856 | 12,711 |
| 12 3/4s, with due dates from December 15, 2013 to July 20, 2014 | 18,076 | 20,653 |
| 12 1/4s, with due dates from February 15, 2014 to March 15, 2014 | 27,884 | 31,665 |
| 11 1/4s, with due dates from September 15, 2015 to December 15, 2015 | 26,144 | 30,472 |
| 9 1/4s, with due dates from April 15, 2016 to May 15, 2016 | 18,442 | 20,839 |
|
| Government National Mortgage Association Pass-Through Certificates | | |
| 8 1/2s, December 15, 2019 | 8,861 | 10,045 |
| 7 1/2s, October 20, 2030 | 150,406 | 172,117 |
| 7s, with due dates from November 15, 2010 to August 15, 2012 | 67,587 | 68,608 |
| 6 1/2s, with due dates from September 15, 2025 to August 20, 2039 | 71,640,820 | 78,878,785 |
| 6 1/2s, with due dates from May 15, 2024 to June 15, 2024 | 119,197 | 132,000 |
| 6s, with due dates from April 15, 2026 to October 20, 2039 | 6,345,493 | 6,875,680 |
| 6s, with due dates from November 15, 2023 to January 15, 2024 | 566,780 | 622,166 |
| 5 1/2s, with due dates from March 15, 2033 to October 15, 2035 | 5,934,670 | 6,412,743 |
| 5 1/2s, TBA, October 1, 2040 | 225,000,000 | 241,892,573 |
| 5s, with due dates from March 20, 2040 to April 20, 2040 | 98,591,604 | 105,273,493 |
| 5s, TBA, October 1, 2040 | 7,000,000 | 7,469,218 |
| 4 1/2s, with due dates from February 20, 2040 to May 20, 2040 | 532,472,687 | 562,484,902 |
|
| | | 1,010,444,710 |
| U.S. Government Agency Mortgage Obligations (19.1%) | | |
| Federal Home Loan Mortgage Corporation Pass-Through | | |
| Certificates 4s, TBA, August 1, 2025 | 88,000,000 | 91,740,000 |
|
| Federal National Mortgage Association Pass-Through Certificates | | |
| 4 1/2s, TBA, October 1, 2040 | 61,000,000 | 63,535,313 |
| 4s, TBA, October 1, 2040 | 143,000,000 | 147,021,875 |
|
| | | 302,297,188 |
| Total U.S. government and agency mortgage obligations (cost $1,278,039,341) | $1,312,741,898 |
|
| |
| U.S. TREASURY OBLIGATIONS (1.8%)* | Principal amount | Value |
|
| U.S. Treasury Bonds 4 1/2s, August 15, 2039 ## | $24,581,000 | $28,152,927 |
|
| U.S. Treasury Bonds 2 3/8s, August 31, 2014 i | 246,000 | 260,096 |
|
| Total U.S. treasury obligations (cost $25,876,035) | | $28,413,023 |
|
| |
| MORTGAGE-BACKED SECURITIES (17.5%)* | Principal amount | Value |
|
| Countrywide Home Loans 144A | | |
| IFB Ser. 05-R2, Class 2A3, 8s, 2035 | $945,937 | $874,992 |
| IFB Ser. 05-R1, Class 1AS, IO, 5.646s, 2035 | 1,090,348 | 158,881 |
| Ser. 06-R1, Class AS, IO, 5.471s, 2036 | 2,968,808 | 328,424 |
| Ser. 05-R3, Class AS, IO, 5.523s, 2035 | 2,839,656 | 372,705 |
| Ser. 06-R2, Class AS, IO, 5.528s, 2036 | 5,114,408 | 613,729 |
| Ser. 05-R2, Class 1AS, IO, 5.295s, 2035 | 9,985,015 | 1,351,324 |
| FRB Ser. 05-R3, Class AF, 0.656s, 2035 | 46,717 | 39,710 |
| FRB Ser. 05-R1, Class 1AF1, 0.616s, 2035 | 1,073,179 | 890,739 |
|
22
| | |
| MORTGAGE-BACKED SECURITIES (17.5%)* cont. | Principal amount | Value |
|
| Federal National Mortgage Association | | |
| IFB Ser. 10-100, Class QS, IO, 6.394s, 2040 | $13,745,995 | $2,300,221 |
| IFB Ser. 10-110, Class SB, IO, 5.74s, 2040 | 15,606,000 | 2,242,114 |
| Ser. 10-98, Class DI, IO, 5s, 2040 | 1,610,121 | 261,500 |
| IFB Ser. 07-75, Class JS, 50.31s, 2037 | 416,921 | 797,344 |
| IFB Ser. 06-62, Class PS, 38.363s, 2036 | 2,344,191 | 3,973,412 |
| IFB Ser. 07-30, Class FS, 28.641s, 2037 | 860,795 | 1,434,808 |
| IFB Ser. 06-49, Class SE, 27.975s, 2036 | 1,070,539 | 1,698,827 |
| IFB Ser. 05-25, Class PS, 27.033s, 2035 | 99,220 | 156,094 |
| IFB Ser. 05-74, Class NK, 26.219s, 2035 | 2,690,142 | 4,296,265 |
| IFB Ser. 06-115, Class ES, 25.535s, 2036 | 622,742 | 946,175 |
| IFB Ser. 06-8, Class HP, 23.627s, 2036 | 1,552,640 | 2,400,149 |
| IFB Ser. 05-99, Class SA, 23.627s, 2035 | 1,032,223 | 1,519,164 |
| IFB Ser. 05-74, Class DM, 23.444s, 2035 | 10,689,362 | 15,854,404 |
| IFB Ser. 05-45, Class DC, 23.37s, 2035 F | 609,677 | 893,090 |
| IFB Ser. 08-24, Class SP, 22.344s, 2038 F | 7,875,692 | 11,829,713 |
| IFB Ser. 05-122, Class SC, 22.203s, 2035 | 2,382,986 | 3,401,579 |
| IFB Ser. 05-106, Class JC, 19.329s, 2035 | 1,943,972 | 2,793,779 |
| IFB Ser. 05-83, Class QP, 16.728s, 2034 | 757,234 | 983,175 |
| IFB Ser. 05-66, Class SL, 15.934s, 2035 | 2,275,470 | 2,927,211 |
| FRB Ser. 03-W6, Class PT1, 9.928s, 2042 | 992,857 | 1,214,078 |
| IFB Ser. 04-W2, Class 1A3S, IO, 6.894s, 2044 | 497,212 | 48,478 |
| IFB Ser. 04-24, Class CS, IO, 6.894s, 2034 | 5,671,885 | 985,470 |
| IFB Ser. 04-40, Class KS, IO, 6.794s, 2034 | 15,331,879 | 2,653,028 |
| IFB Ser. 05-48, Class SM, IO, 6.544s, 2034 | 1,728,512 | 247,886 |
| IFB Ser. 07-54, Class CI, IO, 6.504s, 2037 F | 3,716,487 | 548,751 |
| IFB Ser. 07-58, Class SP, IO, 6.494s, 2037 | 1,156,313 | 206,537 |
| IFB Ser. 07-28, Class SE, IO, 6.494s, 2037 F | 4,326,364 | 635,836 |
| IFB Ser. 07-24, Class SD, IO, 6.494s, 2037 | 1,510,374 | 227,070 |
| IFB Ser. 05-90, Class GS, IO, 6.494s, 2035 | 337,265 | 48,833 |
| IFB Ser. 05-90, Class SP, IO, 6.494s, 2035 | 2,827,325 | 387,102 |
| IFB Ser. 05-45, Class PL, IO, 6.494s, 2034 F | 4,371,354 | 601,836 |
| IFB Ser. 06-123, Class CI, IO, 6.484s, 2037 | 7,528,563 | 1,217,670 |
| IFB Ser. 06-43, Class JS, IO, 6.444s, 2036 | 14,614,801 | 2,286,632 |
| IFB Ser. 06-36, Class SP, IO, 6.444s, 2036 | 6,468,820 | 806,087 |
| IFB Ser. 06-16, Class SM, IO, 6.444s, 2036 F | 1,027,277 | 171,359 |
| IFB Ser. 06-3, Class SB, IO, 6.444s, 2035 | 8,197,721 | 1,452,226 |
| IFB Ser. 05-104, Class SI, IO, 6.444s, 2033 | 21,904,934 | 2,831,601 |
| IFB Ser. 06-128, Class GS, IO, 6.424s, 2037 F | 4,081,762 | 593,740 |
| IFB Ser. 06-116, Class LS, IO, 6.394s, 2036 | 4,351,605 | 700,956 |
| IFB Ser. 05-51, Class WS, IO, 6.374s, 2035 | 86,069 | 13,677 |
| IFB Ser. 06-109, Class SH, IO, 6.364s, 2036 F | 1,763,737 | 296,478 |
| IFB Ser. 06-103, Class SB, IO, 6.344s, 2036 F | 2,748,560 | 361,875 |
| IFB Ser. 06-36, Class PS, IO, 6.344s, 2036 | 117,875 | 19,234 |
| IFB Ser. 05-122, Class SG, IO, 6.344s, 2035 | 3,315,183 | 480,900 |
| IFB Ser. 05-122, Class SW, IO, 6.344s, 2035 | 1,555,641 | 216,810 |
| IFB Ser. 06-17, Class SI, IO, 6.324s, 2036 | 1,239,576 | 176,032 |
| IFB Ser. 06-86, Class SB, IO, 6.294s, 2036 | 3,142,534 | 485,899 |
| IFB Ser. 07-15, Class NI, IO, 6.244s, 2022 | 1,824,935 | 224,621 |
| IFB Ser. 07-30, Class LI, IO, 6.184s, 2037 | 2,296,182 | 346,609 |
| IFB Ser. 07-30, Class OI, IO, 6.184s, 2037 | 3,894,976 | 639,789 |
23
| | |
| MORTGAGE-BACKED SECURITIES (17.5%)* cont. | Principal amount | Value |
|
| Federal National Mortgage Association | | |
| IFB Ser. 07-89, Class SA, IO, 6.174s, 2037 F | $4,942,004 | $671,457 |
| IFB Ser. 06-115, Class JI, IO, 6.124s, 2036 | 4,156,236 | 640,185 |
| IFB Ser. 06-123, Class LI, IO, 6.064s, 2037 | 2,752,982 | 410,470 |
| IFB Ser. 10-2, Class SD, IO, 6.044s, 2040 | 257,489 | 26,914 |
| IFB Ser. 07-81, Class IS, IO, 6.044s, 2037 | 2,029,834 | 276,646 |
| IFB Ser. 08-11, Class SC, IO, 6.024s, 2038 | 400,446 | 57,400 |
| IFB Ser. 07-39, Class AI, IO, 5.864s, 2037 | 2,817,247 | 392,978 |
| IFB Ser. 07-32, Class SD, IO, 5.854s, 2037 | 5,649,156 | 760,760 |
| IFB Ser. 07-30, Class UI, IO, 5.844s, 2037 | 1,715,606 | 227,556 |
| IFB Ser. 07-32, Class SC, IO, 5.844s, 2037 F | 2,702,864 | 354,422 |
| IFB Ser. 07-1, Class CI, IO, 5.844s, 2037 F | 1,866,111 | 245,648 |
| IFB Ser. 09-12, Class DI, IO, 5.774s, 2037 | 597,648 | 90,687 |
| Ser. 06-W2, Class 1AS, IO, 5.764s, 2036 | 2,868,770 | 329,909 |
| Ser. 07-W1, Class 1AS, IO, 5.508s, 2046 | 9,486,201 | 1,349,274 |
| IFB Ser. 09-3, Class SE, IO, 5.244s, 2037 | 2,017,082 | 251,611 |
| FRB Ser. 03-W14, Class 2A, 4.504s, 2043 | 42,666 | 42,793 |
| FRB Ser. 04-W2, Class 4A, 4.362s, 2044 | 40,838 | 41,160 |
| FRB Ser. 03-W3, Class 1A4, 4.345s, 2042 | 66,955 | 67,295 |
| FRB Ser. 04-W7, Class A2, 3.647s, 2034 | 18,645 | 19,428 |
| FRB Ser. 03-W11, Class A1, 3.251s, 2033 | 3,808 | 3,887 |
| Ser. 03-W12, Class 1IO2, IO, 1.985s, 2043 | 14,229,287 | 1,003,689 |
| Ser. 98-W2, Class X, IO, 1.204s, 2028 | 6,886,988 | 325,448 |
| Ser. 06-26, Class NB, 1s, 2036 | 318,064 | 315,636 |
| Ser. 98-W5, Class X, IO, 0.964s, 2028 | 2,935,542 | 131,223 |
| FRB Ser. 07-80, Class F, 0.956s, 2037 | 584,396 | 584,396 |
| FRB Ser. 06-3, Class FY, 0.756s, 2036 | 164,489 | 164,658 |
| FRB Ser. 07-95, Class A3, 0.506s, 2036 | 13,676,000 | 12,590,536 |
| Ser. 03-W1, Class 2A, IO, zero %, 2042 | 10,389,395 | — |
| Ser. 08-53, Class DO, PO, zero %, 2038 | 746,685 | 614,507 |
| Ser. 07-64, Class LO, PO, zero %, 2037 | 430,956 | 404,500 |
| Ser. 07-44, Class CO, PO, zero %, 2037 | 657,452 | 602,134 |
| Ser. 07-14, Class KO, PO, zero %, 2037 | 70,083 | 62,623 |
| Ser. 06-125, Class OX, PO, zero %, 2037 | 44,102 | 40,643 |
| Ser. 06-84, Class OT, PO, zero %, 2036 | 34,454 | 31,924 |
| Ser. 06-46, Class OC, PO, zero %, 2036 | 46,426 | 41,567 |
| Ser. 06-48, Class LO, PO, zero %, 2036 | 1,087 | 1,076 |
| Ser. 06-62, Class KO, PO, zero %, 2036 | 34,610 | 30,830 |
| Ser. 08-36, Class OV, PO, zero %, 2036 | 154,244 | 120,759 |
| Ser. 05-108, PO, zero %, 2035 | 19,640 | 19,247 |
| Ser. 05-50, Class LO, PO, zero %, 2035 | 13,753 | 13,596 |
| Ser. 03-23, Class QO, PO, zero %, 2032 | 102,797 | 99,462 |
| Ser. 04-61, Class CO, PO, zero %, 2031 | 1,201,663 | 1,186,829 |
| Ser. 1988-12, Class B, zero %, 2018 | 17,904 | 16,114 |
| FRB Ser. 06-115, Class SN, zero %, 2036 F | 977,506 | 816,866 |
| FRB Ser. 06-104, Class EK, zero %, 2036 | 28,910 | 27,441 |
| FRB Ser. 05-117, Class GF, zero %, 2036 | 56,494 | 55,335 |
| FRB Ser. 05-45, Class FG, zero %, 2035 | 390,259 | 377,822 |
| FRB Ser. 05-36, Class QA, zero %, 2035 | 6,521 | 6,385 |
| FRB Ser. 06-9, Class FG, zero %, 2033 | 171,367 | 129,669 |
| FRB Ser. 06-1, Class HF, zero %, 2032 | 148,565 | 140,127 |
24
| | |
| MORTGAGE-BACKED SECURITIES (17.5%)* cont. | Principal amount | Value |
|
| Federal Home Loan Mortgage Corp. | | |
| IFB Ser. T-56, Class 2ASI, IO, 7.844s, 2043 | $951,280 | $193,133 |
| FRB Ser. T-57, Class 2A1, 4.24s, 2043 | 41,728 | 41,951 |
| FRB Ser. T-59, Class 2A1, 4.17s, 2043 | 20,215 | 20,248 |
| Ser. T-59, Class 1AX, IO, 0.271s, 2043 | 8,797,321 | 71,478 |
| Ser. T-48, Class A2, IO, 0.212s, 2033 | 11,973,521 | 91,041 |
| Ser. T-8, Class A9, IO, 0.018s, 2028 | 4,016,208 | 59,544 |
| FRB Ser. T-54, Class 2A, IO, zero %, 2043 | 5,041,845 | — |
| IFB Ser. 3408, Class EK, 24.758s, 2037 | 913,555 | 1,344,844 |
| IFB Ser. 2976, Class LC, 23.476s, 2035 | 4,719,420 | 7,318,384 |
| IFB Ser. 2976, Class KL, 23.44s, 2035 | 1,088,205 | 1,674,116 |
| IFB Ser. 2979, Class AS, 23.33s, 2034 | 793,894 | 1,136,285 |
| IFB Ser. 3065, Class DC, 19.088s, 2035 | 5,411,722 | 7,713,165 |
| IFB Ser. 3105, Class SI, IO, 18.955s, 2036 | 1,705,163 | 869,360 |
| IFB Ser. 3012, Class UP, 18.488s, 2035 | 41,987 | 50,466 |
| IFB Ser. 3031, Class BS, 16.082s, 2035 F | 1,958,944 | 2,527,386 |
| IFB Ser. 3184, Class SP, IO, 7.093s, 2033 F | 1,785,626 | 175,032 |
| IFB Ser. 3110, Class SP, IO, 7.043s, 2035 | 3,950,532 | 739,145 |
| IFB Ser. 3156, Class PS, IO, 6.993s, 2036 | 2,164,796 | 379,056 |
| IFB Ser. 3149, Class LS, IO, 6.943s, 2036 | 10,891,663 | 2,090,873 |
| IFB Ser. 2882, Class NS, IO, 6.943s, 2034 | 1,357,426 | 169,081 |
| IFB Ser. 3149, Class SE, IO, 6.893s, 2036 | 1,595,748 | 307,054 |
| IFB Ser. 3151, Class SI, IO, 6.893s, 2036 | 9,029,321 | 1,509,067 |
| IFB Ser. 3157, Class SA, IO, 6.893s, 2036 | 4,829,775 | 911,958 |
| IFB Ser. 2752, Class XS, IO, 6.893s, 2030 | 17,593,713 | 1,375,652 |
| IFB Ser. 3203, Class SH, IO, 6.883s, 2036 F | 3,391,878 | 540,211 |
| IFB Ser. 2835, Class AI, IO, 6.843s, 2034 | 1,102,528 | 186,085 |
| IFB Ser. 2828, Class TI, IO, 6.793s, 2030 | 2,645,006 | 331,125 |
| IFB Ser. 3410, Class SD, IO, 6.743s, 2038 F | 7,550,668 | 1,191,671 |
| IFB Ser. 3249, Class SI, IO, 6.493s, 2036 | 906,090 | 143,381 |
| IFB Ser. 3042, Class SP, IO, 6.493s, 2035 | 4,888,279 | 750,387 |
| IFB Ser. 3316, Class SA, IO, 6.473s, 2037 | 1,100,116 | 156,167 |
| IFB Ser. 3287, Class SE, IO, 6.443s, 2037 | 4,836,592 | 727,182 |
| IFB Ser. 3123, Class LI, IO, 6.443s, 2036 | 2,485,325 | 437,815 |
| IFB Ser. 2935, Class SX, IO, 6.443s, 2035 | 14,102,651 | 1,516,740 |
| IFB Ser. 3256, Class S, IO, 6.433s, 2036 | 1,928,654 | 290,633 |
| IFB Ser. 3031, Class BI, IO, 6.433s, 2035 | 1,347,172 | 242,269 |
| IFB Ser. 3249, Class SM, IO, 6.393s, 2036 | 944,614 | 155,181 |
| IFB Ser. 3240, Class SM, IO, 6.393s, 2036 | 3,151,974 | 460,377 |
| IFB Ser. 3147, Class SD, IO, 6.393s, 2036 | 5,353,002 | 741,896 |
| IFB Ser. 3398, Class SI, IO, 6.393s, 2036 | 5,730,968 | 754,883 |
| IFB Ser. 3067, Class SI, IO, 6.393s, 2035 | 7,061,323 | 1,180,865 |
| IFB Ser. 3128, Class JI, IO, 6.373s, 2036 | 4,067,215 | 615,758 |
| IFB Ser. 3240, Class S, IO, 6.363s, 2036 | 4,443,894 | 711,290 |
| IFB Ser. 3065, Class DI, IO, 6.363s, 2035 | 1,013,563 | 166,582 |
| IFB Ser. 3145, Class GI, IO, 6.343s, 2036 | 3,572,116 | 545,488 |
| IFB Ser. 3114, Class GI, IO, 6.343s, 2036 | 1,413,584 | 243,732 |
| IFB Ser. 3485, Class SI, IO, 6.293s, 2036 | 7,316,170 | 1,196,194 |
| IFB Ser. 3153, Class QI, IO, 6.293s, 2036 | 5,599,638 | 1,198,378 |
| IFB Ser. 3349, Class AS, IO, 6.243s, 2037 | 4,782,112 | 719,373 |
| IFB Ser. 3171, Class PS, IO, 6.228s, 2036 | 384,994 | 52,056 |
25
| | |
| MORTGAGE-BACKED SECURITIES (17.5%)* cont. | Principal amount | Value |
|
| Federal Home Loan Mortgage Corp. | | |
| IFB Ser. 3171, Class ST, IO, 6.228s, 2036 F | $4,130,017 | $648,244 |
| IFB Ser. 3510, Class CI, IO, 6.223s, 2037 | 14,610,602 | 2,276,186 |
| IFB Ser. 3152, Class SY, IO, 6.223s, 2036 | 2,632,031 | 464,422 |
| IFB Ser. 3181, Class PS, IO, 6.213s, 2036 | 1,355,406 | 203,785 |
| IFB Ser. 3199, Class S, IO, 6.193s, 2036 | 5,008,113 | 785,422 |
| IFB Ser. 3012, Class UI, IO, 6.163s, 2035 | 2,069,011 | 305,858 |
| IFB Ser. 3510, Class AS, IO, 6.153s, 2037 | 1,772,198 | 291,686 |
| IFB Ser. 3265, Class SC, IO, 6.153s, 2037 | 3,487,147 | 501,521 |
| IFB Ser. 3240, Class GS, IO, 6.123s, 2036 | 8,908,254 | 1,368,575 |
| IFB Ser. 3380, Class SI, IO, 6.113s, 2037 F | 28,268,780 | 4,010,155 |
| IFB Ser. 3257, Class SI, IO, 6.063s, 2036 | 1,241,957 | 170,721 |
| IFB Ser. 3225, Class EY, IO, 6.033s, 2036 | 8,057,478 | 1,109,434 |
| IFB Ser. 3225, Class JY, IO, 6.033s, 2036 | 5,204,481 | 782,442 |
| IFB Ser. 3502, Class DS, IO, 5.893s, 2039 | 3,099,437 | 371,705 |
| IFB Ser. 3339, Class TI, IO, 5.883s, 2037 | 2,242,149 | 326,121 |
| IFB Ser. 3510, Class IC, IO, 5.823s, 2037 | 3,797,328 | 557,106 |
| IFB Ser. 3012, Class IG, IO, 5.823s, 2035 F | 8,760,616 | 1,380,909 |
| IFB Ser. 3309, Class SG, IO, 5.813s, 2037 F | 4,690,689 | 601,962 |
| IFB Ser. 3510, Class BI, IO, 5.773s, 2037 | 3,573,233 | 544,525 |
| IFB Ser. 3725, Class CS, IO, 5.65s, 2040 | 17,176,000 | 2,620,027 |
| Ser. 3707, Class IK, IO, 5s, 2040 | 998,616 | 170,364 |
| Ser. 3707, Class HI, IO, 4s, 2023 | 2,693,852 | 235,739 |
| FRB Ser. 2634, Class LF, 1.559s, 2033 | 7,965 | 7,963 |
| FRB Ser. 3190, Class FL, 1.057s, 2032 | 186,996 | 187,245 |
| FRB Ser. 3035, Class NF, 0.959s, 2035 | 25,859 | 25,853 |
| FRB Ser. 3350, Class FK, 0.857s, 2037 | 197,429 | 197,544 |
| Ser. 3369, Class BO, PO, zero %, 2037 | 50,877 | 47,001 |
| Ser. 3327, Class IF, IO, zero %, 2037 | 192,410 | 2,048 |
| Ser. 3331, Class GO, PO, zero %, 2037 | 32,730 | 32,363 |
| Ser. 3439, Class AO, PO, zero %, 2037 | 389,156 | 355,650 |
| Ser. 3391, PO, zero %, 2037 | 158,997 | 135,465 |
| Ser. 3289, Class SI, IO, zero %, 2037 | 106,375 | 2,135 |
| Ser. 3300, PO, zero %, 2037 | 727,515 | 659,059 |
| Ser. 3245, Class OC, PO, zero %, 2036 | 38,704 | 37,494 |
| Ser. 3314, PO, zero %, 2036 | 315,676 | 288,244 |
| Ser. 3206, Class EO, PO, zero %, 2036 | 40,007 | 35,721 |
| Ser. 3175, Class MO, PO, zero %, 2036 | 392,769 | 345,562 |
| Ser. 3210, PO, zero %, 2036 | 44,880 | 40,289 |
| Ser. 3145, Class GK, PO, zero %, 2036 | 145,995 | 126,322 |
| Ser. 3124, Class DO, PO, zero %, 2036 | 154,498 | 143,130 |
| Ser. 3106, PO, zero %, 2036 | 5,607 | 5,615 |
| Ser. 3084, Class ON, PO, zero %, 2035 | 5,071 | 4,989 |
| Ser. 3089, Class QO, PO, zero %, 2035 | 65,107 | 64,971 |
| Ser. 3067, PO, zero %, 2035 | 46,161 | 44,685 |
| Ser. 3075, PO, zero %, 2035 | 146,944 | 135,472 |
| Ser. 3046, PO, zero %, 2035 | 302,819 | 293,582 |
| Ser. 3155, Class AO, PO, zero %, 2035 | 71,561 | 63,027 |
| Ser. 2984, Class BO, PO, zero %, 2035 | 29,524 | 29,221 |
| Ser. 2989, Class WO, PO, zero %, 2035 | 1,433 | 1,419 |
26
| | |
| MORTGAGE-BACKED SECURITIES (17.5%)* cont. | Principal amount | Value |
|
| Federal Home Loan Mortgage Corp. | | |
| Ser. 2975, Class QO, PO, zero %, 2035 | $264 | $262 |
| Ser. 2947, Class AO, PO, zero %, 2035 | 32,182 | 29,365 |
| Ser. 2951, Class JO, PO, zero %, 2035 | 7,534 | 6,345 |
| Ser. 2985, Class CO, PO, zero %, 2035 | 67,109 | 60,094 |
| Ser. 3055, Class CO, PO, zero %, 2035 | 7,479 | 7,358 |
| Ser. 3008, PO, zero %, 2034 | 59,594 | 59,139 |
| Ser. 2692, Class TO, PO, zero %, 2033 | 98,827 | 88,589 |
| Ser. 2684, PO, zero %, 2033 | 645,000 | 570,580 |
| Ser. 2777, Class OE, PO, zero %, 2032 | 225,000 | 210,175 |
| FRB Ser. 3349, Class DO, zero %, 2037 | 14,099 | 13,997 |
| FRB Ser. 3299, Class FD, zero %, 2037 | 51,747 | 51,302 |
| FRB Ser. 3304, Class UF, zero %, 2037 | 515,000 | 505,035 |
| FRB Ser. 3326, Class XF, zero %, 2037 F | 34,489 | 34,393 |
| FRB Ser. 3274, Class TX, zero %, 2037 | 349,047 | 317,308 |
| FRB Ser. 3326, Class YF, zero %, 2037 F | 211,739 | 205,966 |
| FRB Ser. 3261, Class KF, zero %, 2037 | 146,383 | 144,085 |
| FRB Ser. 3263, Class TA, zero %, 2037 | 89,833 | 89,380 |
| FRB Ser. 3238, Class LK, zero %, 2036 | 854,333 | 813,291 |
| FRB Ser. 3147, Class SF, zero %, 2036 | 67,498 | 58,290 |
| FRB Ser. 3129, Class TF, zero %, 2036 | 306,605 | 282,843 |
| FRB Ser. 3117, Class AF, zero %, 2036 | 72,316 | 58,780 |
| FRB Ser. 3072, Class TJ, zero %, 2035 | 35,370 | 32,029 |
| FRB Ser. 3092, Class FA, zero %, 2035 | 115,618 | 101,752 |
| FRB Ser. 3047, Class BD, zero %, 2035 | 107,985 | 105,899 |
| FRB Ser. 3052, Class TJ, zero %, 2035 | 14,344 | 13,994 |
| FRB Ser. 3326, Class WF, zero %, 2035 F | 767,452 | 730,557 |
| FRB Ser. 3030, Class CF, zero %, 2035 | 374,623 | 304,342 |
| FRB Ser. 3033, Class YF, zero %, 2035 | 116,161 | 110,580 |
| FRB Ser. 3036, Class AS, zero %, 2035 | 97,362 | 78,156 |
| FRB Ser. 3025, Class XA, zero %, 2035 | 190,988 | 167,179 |
| FRB Ser. 3251, Class TP, zero %, 2035 | 72,896 | 72,182 |
| FRB Ser. 3003, Class XF, zero %, 2035 F | 60,547 | 59,373 |
| FRB Ser. 2984, Class FL, zero %, 2035 | 88,136 | 73,712 |
| FRB Ser. 2958, Class TP, zero %, 2035 | 4,632 | 4,598 |
| FRB Ser. 2958, Class FB, zero %, 2035 | 4,955 | 4,953 |
| FRB Ser. 2947, Class GF, zero %, 2034 | 88,993 | 87,442 |
|
| Government National Mortgage Association | | |
| IFB Ser. 09-61, Class SA, IO, 6.443s, 2039 | 4,262,450 | 484,172 |
| IFB Ser. 10-98, Class CS, IO, 6.443s, 2038 | 1,995,543 | 338,324 |
| IFB Ser. 10-98, Class SA, IO, 6.443s, 2038 | 1,931,575 | 326,069 |
| IFB Ser. 10-32, Class SP, IO, 6.443s, 2036 | 2,671,114 | 321,228 |
| IFB Ser. 10-113, Class AS, IO, 6.4s, 2039 | 1,934,000 | 351,466 |
| IFB Ser. 10-85, Class SA, IO, 6.393s, 2040 | 836,892 | 134,581 |
| IFB Ser. 10-85, Class AS, IO, 6.393s, 2039 | 2,733,260 | 427,427 |
| IFB Ser. 10-85, Class SD, IO, 6.393s, 2038 | 1,827,188 | 280,473 |
| IFB Ser. 10-69, Class SP, IO, 6.393s, 2038 F | 24,148,332 | 3,875,169 |
| IFB Ser. 09-106, Class LP, IO, 6.353s, 2036 | 1,526,520 | 187,869 |
| IFB Ser. 10-98, Class QS, IO, 6.343s, 2040 | 2,588,019 | 404,896 |
27
| | |
| MORTGAGE-BACKED SECURITIES (17.5%)* cont. | Principal amount | Value |
|
| Government National Mortgage Association | | |
| IFB Ser. 10-98, Class YS, IO, 6.343s, 2039 | $2,676,724 | $414,598 |
| IFB Ser. 10-47, Class HS, IO, 6.343s, 2039 | 1,243,769 | 198,195 |
| IFB Ser. 06-34, Class PS, IO, 6.333s, 2036 | 8,122,777 | 1,098,606 |
| IFB Ser. 10-42, Class SM, IO, 6.293s, 2039 | 10,770,650 | 1,794,028 |
| IFB Ser. 10-53, Class SA, IO, 6.243s, 2039 F | 2,602,801 | 325,591 |
| IFB Ser. 10-2, Class SA, IO, 6.243s, 2037 | 2,923,989 | 375,908 |
| IFB Ser. 10-62, Class SD, IO, 6.233s, 2040 F | 16,078,056 | 2,147,231 |
| IFB Ser. 09-35, Class SP, IO, 6.143s, 2037 | 9,040,615 | 1,038,947 |
| IFB Ser. 10-20, Class SE, IO, 5.993s, 2040 | 30,475,268 | 3,893,520 |
| IFB Ser. 10-26, Class QS, IO, 5.993s, 2040 | 20,618,637 | 3,010,321 |
| IFB Ser. 10-20, Class SC, IO, 5.893s, 2040 | 24,226,047 | 3,658,867 |
| IFB Ser. 09-58, Class SG, IO, 5.843s, 2039 | 8,154,623 | 797,441 |
| IFB Ser. 10-113, Class BS, IO, 5.736s, 2040 | 24,453,000 | 3,273,279 |
| IFB Ser. 10-62, Class SE, IO, 5.493s, 2040 | 25,713,637 | 2,973,525 |
| Ser. 10-68, Class MI, IO, 5s, 2039 | 21,439,067 | 3,318,155 |
| Ser. 10-29, Class CI, IO, 5s, 2038 | 10,331,000 | 1,507,387 |
| IFB Ser. 10-14, Class SC, IO, 4.541s, 2035 | 26,924,880 | 3,823,333 |
| Ser. 10-84, Class NI, IO, 4 1/2s, 2036 | 27,489,381 | 3,221,412 |
| Ser. 06-36, Class OD, PO, zero %, 2036 | 72,773 | 68,515 |
| Ser. 06-64, PO, zero %, 2034 | 88,551 | 79,452 |
| FRB Ser. 07-73, Class KI, IO, zero %, 2037 F | 6,334,518 | 41,406 |
| FRB Ser. 07-73, Class KM, zero %, 2037 | 633,597 | 578,883 |
| FRB Ser. 07-35, Class UF, zero %, 2037 | 76,264 | 74,418 |
| FRB Ser. 07-16, Class WF, zero %, 2037 | 58,541 | 58,076 |
| FRB Ser. 07-16, Class YF, zero %, 2037 | 41,700 | 40,172 |
|
| GSMPS Mortgage Loan Trust | | |
| Ser. 05-RP3, Class 1A2, 7 1/2s, 2035 | 910,810 | 851,607 |
| FRB Ser. 05-RP2, Class 1AF, 0.606s, 2035 | 20,731,809 | 17,518,378 |
|
| GSMPS Mortgage Loan Trust 144A | | |
| Ser. 05-RP1, Class 1AS, IO, 5.677s, 2035 | 5,783,806 | 791,830 |
| Ser. 05-RP2, Class 1AS, IO, 5.484s, 2035 | 19,658,241 | 2,801,299 |
| Ser. 06-RP2, Class 1AS1, IO, 5.404s, 2036 | 16,031,582 | 2,404,737 |
| Ser. 98-2, IO, 0.867s, 2027 | 1,161,085 | 24,759 |
| FRB Ser. 06-RP2, Class 1AF1, 0.656s, 2036 | 16,031,582 | 13,546,687 |
| FRB Ser. 05-RP1, Class 1AF, 0.606s, 2035 | 3,427,359 | 2,921,824 |
| Ser. 98-3, IO, 0.516s, 2027 | 1,398,729 | 23,953 |
| Ser. 98-4, IO, 0.183s, 2026 | 1,485,782 | 38,909 |
| Ser. 99-2, IO, 0.01s, 2027 | 1,899,542 | 20,526 |
|
| MASTR Reperforming Loan Trust 144A | | |
| Ser. 05-1, Class 1A4, 7 1/2s, 2034 | 107,751 | 101,824 |
| FRB Ser. 05-2, Class 1A1F, 0.606s, 2035 | 1,994,202 | 1,645,217 |
|
| Nomura Asset Acceptance Corp. 144A | | |
| Ser. 04-R2, Class A2, 7s, 2034 | 967,627 | 933,760 |
| IFB Ser. 04-R3, Class AS, IO, 6.794s, 2035 | 704,893 | 127,432 |
|
| Structured Adjustable Rate Mortgage Loan Trust 144A | | |
| Ser. 04-NP2, Class A, 0.614s, 2034 | 74,801 | 60,963 |
|
| Structured Asset Securities Corp. Ser. 07-4, Class 1A4, IO, | | |
| 1s, 2037 | 33,620,821 | 1,085,762 |
|
| Total mortgage-backed securities (cost $225,870,967) | | $277,140,898 |
28
| | | |
| PURCHASED OPTIONS | Expiration date/ | Contract | |
| OUTSTANDING (3.1%)* | strike price | amount | Value |
|
| Option on an interest rate swap | | | |
| with JPMorgan Chase Bank, N.A. for the | | | |
| right to receive a fixed rate of 3.50% | | | |
| versus the three month USD-LIBOR-BBA | | | |
| maturing November 17, 2040. | Nov-10/3.5 | $91,388,200 | $4,236,757 |
|
| Option on an interest rate swap | | | |
| with Barclays Bank PLC for the right | | | |
| to receive a fixed rate of 3.74% versus | | | |
| the three month USD-LIBOR-BBA | | | |
| maturing November 10, 2020. | Nov-10/3.74 | 10,636,700 | 1,085,901 |
|
| Option on an interest rate swap | | | |
| with Barclays Bank PLC for the right | | | |
| to pay a fixed rate of 3.74% versus the | | | |
| three month USD-LIBOR-BBA | | | |
| maturing November 10, 2020. | Nov-10/3.74 | 10,636,700 | 213 |
|
| Option on an interest rate swap | | | |
| with JPMorgan Chase Bank, N.A. | | | |
| for the right to receive a fixed rate of 4.04% | | | |
| versus the three month USD-LIBOR-BBA | | | |
| maturing September 11, 2025. | Sep-15/4.04 | 49,594,500 | 3,603,040 |
|
| Option on an interest rate swap | | | |
| with JPMorgan Chase Bank, N.A. for the | | | |
| right to receive a fixed rate of 4.375% | | | |
| versus the three month USD-LIBOR-BBA | | | |
| maturing August 10, 2045. | Aug-15/4.375 | 4,017,700 | 718,204 |
|
| Option on an interest rate swap | | | |
| with JPMorgan Chase Bank, N.A. for the | | | |
| right to pay a fixed rate of 4.375% versus | | | |
| the three month USD-LIBOR-BBA | | | |
| maturing August 10, 2045. | Aug-15/4.375 | 4,017,700 | 401,099 |
|
| Option on an interest rate swap | | | |
| with JPMorgan Chase Bank, N.A. for the | | | |
| right to receive a fixed rate of 4.46% | | | |
| versus the three month USD-LIBOR-BBA | | | |
| maturing August 07, 2045. | Aug-15/4.46 | 4,017,700 | 748,884 |
|
| Option on an interest rate swap | | | |
| with JPMorgan Chase Bank, N.A. for the | | | |
| right to pay a fixed rate of 4.46% versus | | | |
| the three month USD-LIBOR-BBA | | | |
| maturing August 07, 2045. | Aug-15/4.46 | 4,017,700 | 380,343 |
|
| Option on an interest rate swap | | | |
| with JPMorgan Chase Bank, N.A. for the | | | |
| right to receive a fixed rate of 3.04% | | | |
| versus the three month USD-LIBOR-BBA | | | |
| maturing February 09, 2021. | Feb-11/3.04 | 69,507,600 | 2,900,552 |
|
| Option on an interest rate swap | | | |
| with JPMorgan Chase Bank, N.A. for the | | | |
| right to pay a fixed rate of 3.04 versus | | | |
| the three month USD-LIBOR-BBA | | | |
| maturing February 09, 2021. | Feb-11/3.04 | 69,507,600 | 809,764 |
|
29
| | | |
| PURCHASED OPTIONS | Expiration date/ | Contract | |
| OUTSTANDING (3.1%)* cont. | strike price | amount | Value |
|
| Option on an interest rate swap | | | |
| with JPMorgan Chase Bank, N.A. for the | | | |
| right to pay a fixed rate of 3.11% versus | | | |
| the three month USD-LIBOR-BBA | | | |
| maturing February 09, 2021. | Feb-11/3.11 | $69,507,600 | $696,466 |
|
| Option on an interest rate swap with | | | |
| JPMorgan Chase Bank, N.A. for the right to | | | |
| pay a fixed rate of 3.50% versus the three month | | | |
| USD-LIBOR-BBA maturing November 17, 2040. | Nov-10/3.5 | 91,388,200 | 1,623,968 |
|
| Option on an interest rate swap with | | | |
| JPMorgan Chase Bank, N.A. for the right to | | | |
| receive a fixed rate of 3.75% versus the three | | | |
| month USD-LIBOR-BBA maturing | | | |
| November 10, 2040. | Nov-10/3.75 | 17,251,400 | 1,421,170 |
|
| Option on an interest rate swap with | | | |
| JPMorgan Chase Bank, N.A. for the right to pay | | | |
| a fixed rate of 3.75% versus the three month | | | |
| USD-LIBOR-BBA maturing November 10, 2040. | Nov-10/3.75 | 17,251,400 | 79,529 |
|
| Option on an interest rate swap with | | | |
| JPMorgan Chase Bank, N.A. for the right to | | | |
| receive a fixed rate of 3.82% versus the three | | | |
| month USD-LIBOR-BBA maturing | | | |
| November 09, 2040. | Nov-10/3.82 | 17,251,400 | 1,623,357 |
|
| Option on an interest rate swap with | | | |
| JPMorgan Chase Bank, N.A. for the right to pay | | | |
| a fixed rate of 3.82% versus the three month | | | |
| USD-LIBOR-BBA maturing November 09, 2040. | Nov-10/3.82 | 17,251,400 | 45,889 |
|
| Option on an interest rate swap with | | | |
| JPMorgan Chase Bank, N.A. for the right to | | | |
| receive a fixed rate of 3.7575% versus the | | | |
| three month USD-LIBOR-BBA maturing | | | |
| October 20, 2040. | Oct-10/3.7575 | 47,907,500 | 3,923,145 |
|
| Option on an interest rate swap with | | | |
| JPMorgan Chase Bank, N.A. for the right to pay | | | |
| a fixed rate of 4.04% versus the three month | | | |
| USD-LIBOR-BBA maturing September 11, 2025. | Sep-15/4.04 | 49,594,500 | 3,318,368 |
|
| Option on an interest rate swap with Barclays | | | |
| Bank PLC for the right to receive a fixed rate of | | | |
| 3.7375% versus the three month USD-LIBOR-BBA | | | |
| maturing March 9, 2021. | Mar-11/3.7375 | 74,935,600 | 6,989,243 |
|
| Option on an interest rate swap with | | | |
| JPMorgan Chase Bank, N.A. for the right to | | | |
| receive a fixed rate of 3.665% versus the three | | | |
| month USD-LIBOR-BBA maturing March 8, 2021. | Mar-11/3.665 | 74,935,600 | 6,545,625 |
|
| Option on an interest rate swap with | | | |
| JPMorgan Chase Bank, N.A. for the right to | | | |
| receive a fixed rate of 3.11% versus the three | | | |
| month USD-LIBOR-BBA maturing February 09, 2021. | Feb-11/3.11 | 69,507,600 | 3,223,067 |
|
| Option on an interest rate swap with | | | |
| JPMorgan Chase Bank, N.A. for the right to | | | |
| receive a fixed rate of 1.885% versus the three | | | |
| month USD-LIBOR-BBA maturing | | | |
| December 13, 2015. | Dec-10/1.885 | 243,474,600 | 3,705,683 |
|
30
| | | |
| PURCHASED OPTIONS | Expiration date/ | Contract | |
| OUTSTANDING (3.1%)* cont. | strike price | amount | Value |
|
| Option on an interest rate swap with | | | |
| JPMorgan Chase Bank, N.A. for the right to pay | | | |
| a fixed rate of 1.885% versus the three month | | | |
| USD-LIBOR-BBA maturing December 13, 2015. | Dec-10/1.885 | $243,474,600 | $647,642 |
|
| Option on an interest rate swap with | | | |
| JPMorgan Chase Bank, N.A. for the right to pay | | | |
| a fixed rate of 3.7575% versus the three month | | | |
| USD-LIBOR-BBA maturing October 20, 2040. | Oct-10/3.7575 | 47,907,500 | 34,974 |
|
| Total purchased options outstanding (cost $35,493,820) | | $48,762,883 |
| | | |
| | |
| SHORT-TERM INVESTMENTS (47.0%)* | Principal amount/shares | Value |
|
| Putnam Money Market Liquidity Fund 0.15% e | 218,673,317 | $218,673,317 |
|
| Interest in $486,000,000 joint tri-party repurchase | | |
| agreement dated September 30, 2010 with JPMorgan | | |
| Securities, Inc. due October 1, 2010 — maturity value | | |
| of $72,000,800 for an effective yield of 0.40% | | |
| (collaterallized by various mortgage backed securities | | |
| with coupon rates ranging from 3.50% to 12.50% and due | | |
| dates ranging from March 1, 2011 to August 5, 2050, valued | | |
| at $495,721,493) | $72,000,000 | 72,000,000 |
|
| Interest in $425,000,000 joint tri-party repurchase | | |
| agreement dated September 30, 2010 with Citigroup Global | | |
| Markets, Inc. due October 1, 2010 — maturity value | | |
| of $15,279,127 for an effective yield of 0.30% | | |
| (collateralized by various mortgage backed securities | | |
| with coupon rates ranging from 2.683% to 6.50% and due | | |
| dates ranging from September 1, 2013 to June 1, 2040, | | |
| valued at $433,500,000) | 15,279,000 | 15,279,000 |
|
| Fannie Mae Discount Notes, for an effective yield of 0.25%, | | |
| October 1, 2010 | 36,500,000 | 36,500,000 |
|
| SSgA Prime Money Market Fund 0.18% i,P | 791,000 | 791,000 |
|
| U.S. Treasury Bills, for effective yields ranging from | | |
| 0.22% to 0.24%, July 28, 2011 # ## | 52,014,000 | 51,914,133 |
|
| U.S. Treasury Bills, for effective yields ranging from | | |
| 0.20% to 0.21%, June 2, 2011 # ## | 83,832,000 | 83,717,988 |
|
| U.S. Treasury Bills, for an effective yield of zero %, | | |
| June 2, 2011 i | 2,305,000 | 2,301,773 |
|
| U.S. Treasury Bills, for effective yields ranging from | | |
| 0.16% to 0.32%, March 10, 2011 # ## | 20,674,000 | 20,657,254 |
|
| U.S. Treasury Bills, for an effective yield of zero %, | | |
| February 10, 2011 i | 121,000 | 120,927 |
|
| U.S. Treasury Bills, for an effective yield of 0.16%, | | |
| December 23, 2010 ## | 30,000,000 | 29,990,400 |
|
| U.S. Treasury Bills, for an effective yield of zero %, | | |
| December 2, 2010 i | 6,961,000 | 6,959,608 |
|
| U.S. Treasury Bills, for an effective yield of 0.22%, | | |
| December 16, 2010 # | 635,000 | 634,829 |
|
| U.S. Treasury Bills, for an effective yield of zero %, | | |
| November 26, 2010 i | 4,080,000 | 4,079,184 |
|
| U.S. Treasury Bills, for an effective yield of 0.15%, | | |
| November 18, 2010 ## | 96,000,000 | 95,981,440 |
|
31
| | |
| SHORT-TERM INVESTMENTS (47.0%)* cont. | Principal amount/shares | Value |
|
| U.S. Treasury Bills, for an effective yield of zero %, | | |
| November 12, 2010 i | $1,260,000 | $1,259,748 |
|
| U.S. Treasury Bills, for an effective yield of 0.10%, | | |
| November 4, 2010 | 50,000,000 | 49,994,809 |
|
| U.S. Treasury Bills, for an effective yield of 0.11%, | | |
| October 21, 2010 | 54,000,000 | 53,996,790 |
|
| Total short-term investments (cost $744,847,335) | | $744,852,200 |
|
| |
| TOTAL INVESTMENTS | | |
|
| Total investments (cost $2,310,127,498) | | $2,411,910,902 |
Key to holding’s abbreviations
| | | |
| FRB | Floating Rate Bonds | | |
| IFB | Inverse Floating Rate Bonds | | |
| IO | Interest Only | | |
| PO | Principal Only | | |
| TBA | To Be Announced Commitments | | |
Notes to the fund’s portfolio
Unless noted otherwise, the notes to the fund’s portfolio are for the close of the fund’s reporting period, which ran from October 1, 2009 through September 30, 2010 (the reporting period).
* Percentages indicated are based on net assets of $1,583,290,880.
# These securities, in part or in entirety, were pledged and segregated with the broker to cover margin requirements for futures contracts at the close of the reporting period.
## These securities, in part or in entirety, were pledged and segregated with the custodian for collateral on certain derivatives contracts at the close of the reporting period.
e See Note 6 to the financial statements regarding investments in Putnam Money Market Liquidity Fund. The rate quoted in the security description is the annualized 7-day yield of the fund at the close of the reporting period.
F Is valued at fair value following procedures approved by the Trustees. Securities may be classified as Level 2 or Level 3 for Accounting Standards Codification ASC 820 Fair Value Measurements and Disclosures (ASC 820) based on the securities valuation inputs.
i Securities purchased with cash or securities received, that were pledged to the fund for collateral on certain derivatives contracts (Note 1).
P The rate quoted in the security description is the annualized 7-day yield of the fund at the close of the reporting period.
At the close of the reporting period, the fund maintained liquid assets totaling $923,174,669 to cover certain derivatives contracts.
Debt obligations are considered secured unless otherwise indicated.
144A after the name of an issuer represents securities exempt from registration under Rule 144A under the Securities Act of 1933, as amended. These securities may be resold in transactions exempt from registration, normally to qualified institutional buyers.
See Note 1 to the financial statements regarding TBA’s.
The rates shown on FRB are the current interest rates at the close of the reporting period.
The dates shown on debt obligations are the original maturity dates.
IFB are securities that pay interest rates that vary inversely to changes in the market interest rates. As interest rates rise, inverse floaters produce less current income. The interest rates shown are the current interest rates at the close of the reporting period.
32
FUTURES CONTRACTS OUTSTANDING at 9/30/10
| | | | | |
| | | | | | Unrealized |
| | Number of | | | Expiration | appreciation/ |
| | contracts | Value | | date | (depreciation) |
|
| U.S. Treasury Bond 20 yr (Long) | 562 | $75,149,938 | | Dec-10 | $621,315 |
|
| U.S. Treasury Bond 30 yr (Long) | 684 | 96,636,375 | | Dec-10 | (398,979) |
|
| U.S. Treasury Note 2 yr (Long) | 120 | 26,338,125 | | Dec-10 | 45,834 |
|
| U.S. Treasury Note 5 yr (Long) | 267 | 32,271,539 | | Dec-10 | 228,071 |
|
| U.S. Treasury Note 10 yr (Long) | 1,118 | 140,920,406 | | Dec-10 | 1,990,810 |
|
| Total | | | | | $2,487,051 |
| | | |
| | | | |
| WRITTEN OPTIONS OUTSTANDING at 9/30/10 (premiums received $109,215,884) | |
| | Contract | | Expiration date/ | |
| | amount | | strike price | Value |
|
| Option on an interest rate swap with Citibank, N.A. | | | | |
| for the obligation to pay a fixed rate of 4.49% versus the | | | | |
| three month USD-LIBOR-BBA maturing | | | | |
| August 17, 2021. | $101,580,000 | | Aug-11/4.49 | $14,716,910 |
|
| Option on an interest rate swap with JPMorgan Chase | | | | |
| Bank, N.A. for the obligation to pay a fixed rate of | | | | |
| 4.525% versus the three month USD-LIBOR-BBA | | | | |
| maturing July 26, 2021. | 20,208,000 | | Jul-11/4.525 | 3,024,733 |
|
| Option on an interest rate swap with Bank of America, | | | | |
| N.A. for the obligation to receive a fixed rate of 4.475% | | | | |
| versus the three month USD-LIBOR-BBA maturing | | | | |
| August 19, 2021. | 46,434,000 | | Aug-11/4.475 | 213,132 |
|
| Option on an interest rate swap with Bank of America, | | | | |
| N.A. for the obligation to pay a fixed rate of 4.475% | | | | |
| versus the three month USD-LIBOR-BBA maturing | | | | |
| August 19, 2021. | 46,434,000 | | Aug-11/4.475 | 6,663,743 |
|
| Option on an interest rate swap with Bank of America, | | | | |
| N.A. for the obligation to receive a fixed rate of 4.55% | | | | |
| versus the three month USD-LIBOR-BBA maturing | | | | |
| August 17, 2021. | 50,790,000 | | Aug-11/4.55 | 207,731 |
|
| Option on an interest rate swap with Citibank, N.A. | | | | |
| for the obligation to receive a fixed rate of 4.49% | | | | |
| versus the three month USD-LIBOR-BBA maturing | | | | |
| August 17, 2021. | 101,580,000 | | Aug-11/4.49 | 449,999 |
|
| Option on an interest rate swap with Bank of America, | | | | |
| N.A. for the obligation to pay a fixed rate of 4.55% | | | | |
| versus the three month USD-LIBOR-BBA maturing | | | | |
| August 17, 2021. | 50,790,000 | | Aug-11/4.55 | 7,609,866 |
|
| Option on an interest rate swap with Bank of America, | | | | |
| N.A. for the obligation to receive a fixed rate of 4.765% | | | | |
| versus the three month USD-LIBOR-BBA maturing | | | | |
| August 16, 2021. | 54,331,000 | | Aug-11/4.765 | 162,450 |
|
| Option on an interest rate swap with Bank of America, | | | | |
| N.A. for the obligation to pay a fixed rate of 4.765% | | | | |
| versus the three month USD-LIBOR-BBA maturing | | | | |
| August 16, 2021. | 54,331,000 | | Aug-11/4.765 | 9,118,915 |
|
| Option on an interest rate swap with Bank of America, | | | | |
| N.A. for the obligation to receive a fixed rate of 4.70% | | | | |
| versus the three month USD-LIBOR-BBA maturing | | | | |
| August 8, 2021. | 55,951,000 | | Aug-11/4.7 | 171,770 |
|
33
WRITTEN OPTIONS OUTSTANDING at 9/30/10 (premiums received $109,215,884) cont.
| | | | |
| | Contract | | Expiration date/ | |
| | amount | | strike price | Value |
|
| Option on an interest rate swap with Bank of America, | �� | | | |
| N.A. for the obligation to pay a fixed rate of 4.70% | | | | |
| versus the three month USD-LIBOR-BBA maturing | | | | |
| August 8, 2021. | $55,951,000 | | Aug-11/4.7 | $9,120,573 |
|
| Option on an interest rate swap with JPMorgan Chase | | | | |
| Bank, N.A. for the obligation to receive a fixed rate | | | | |
| of 4.745% versus the three month USD-LIBOR-BBA | | | | |
| maturing July 27, 2021. | 30,312,000 | | Jul-11/4.745 | 79,721 |
|
| Option on an interest rate swap with JPMorgan Chase | | | | |
| Bank, N.A. for the obligation to pay a fixed rate of | | | | |
| 4.745% versus the three month USD-LIBOR-BBA | | | | |
| maturing July 27, 2021. | 30,312,000 | | Jul-11/4.745 | 5,086,354 |
|
| Option on an interest rate swap with Citibank, N.A. | | | | |
| for the obligation to receive a fixed rate of 4.5475% | | | | |
| versus the three month USD-LIBOR-BBA maturing | | | | |
| July 26, 2021. | 9,476,000 | | Jul-11/4.5475 | 31,839 |
|
| Option on an interest rate swap with Citibank, N.A. for | | | | |
| the obligation to receive a fixed rate of 4.52% versus the | | | | |
| three month USD-LIBOR-BBA maturing July 26, 2021. | 18,952,000 | | Jul-11/4.52 | 66,142 |
|
| Option on an interest rate swap with JPMorgan Chase | | | | |
| Bank, N.A. for the obligation to receive a fixed rate | | | | |
| of 4.525% versus the three month USD-LIBOR-BBA | | | | |
| maturing July 26, 2021. | 20,208,000 | | Jul-11/4.525 | 70,122 |
|
| Option on an interest rate swap with JPMorgan Chase | | | | |
| Bank, N.A. for the obligation to receive a fixed rate | | | | |
| of 4.46% versus the three month USD-LIBOR-BBA | | | | |
| maturing July 26, 2021. | 20,208,000 | | Jul-11/4.46 | 76,992 |
|
| Option on an interest rate swap with Citibank, N.A. for | | | | |
| the obligation to pay a fixed rate of 4.5475% versus the | | | | |
| three month USD-LIBOR-BBA maturing July 26, 2021. | 9,476,000 | | Jul-11/4.5475 | 1,436,183 |
|
| Option on an interest rate swap with Citibank, N.A. for | | | | |
| the obligation to pay a fixed rate of 4.52% versus the | | | | |
| three month USD-LIBOR-BBA maturing July 26, 2021. | 18,952,000 | | Jul-11/4.52 | 2,828,776 |
|
| Option on an interest rate swap with JPMorgan Chase | | | | |
| Bank, N.A. for the obligation to pay a fixed rate of 4.46% | | | | |
| versus the three month USD-LIBOR-BBA maturing | | | | |
| July 26, 2021. | 20,208,000 | | Jul-11/4.46 | 2,908,072 |
|
| Option on an interest rate swap with Barclays Bank | | | | |
| PLC for the obligation to receive a fixed rate of 5.36% | | | | |
| versus the three month USD-LIBOR-BBA maturing | | | | |
| February 13, 2025. | 12,010,980 | | Feb-15/5.36 | 375,223 |
|
| Option on an interest rate swap with Barclays Bank | | | | |
| PLC for the obligation to pay a fixed rate of 5.36% | | | | |
| versus the three month USD-LIBOR-BBA maturing | | | | |
| February 13, 2025. | 12,010,980 | | Feb-15/5.36 | 1,757,206 |
|
| Option on an interest rate swap with JPMorgan Chase | | | | |
| Bank, N.A. for the obligation to receive a fixed rate | | | | |
| of 5.27% versus the three month USD-LIBOR-BBA | | | | |
| maturing February 12, 2025. | 31,703,820 | | Feb-15/5.27 | 1,030,336 |
|
| Option on an interest rate swap with JPMorgan Chase | | | | |
| Bank, N.A. for the obligation to pay a fixed rate of 5.27% | | | | |
| versus the three month USD-LIBOR-BBA maturing | | | | |
| February 12, 2025. | 31,703,820 | | Feb-15/5.27 | 4,468,019 |
|
34
WRITTEN OPTIONS OUTSTANDING at 9/30/10 (premiums received $109,215,884) cont.
| | | | |
| | Contract | | Expiration date/ | |
| | amount | | strike price | Value |
|
| Option on an interest rate swap with JPMorgan Chase | | | | |
| Bank, N.A. for the obligation to pay a fixed rate of 5.51% | | | | |
| versus the three month USD-LIBOR-BBA maturing | | | | |
| May 14, 2022. | $1,473,000 | | May-12/5.51 | $306,193 |
|
| Option on an interest rate swap with JPMorgan Chase | | | | |
| Bank, N.A. for the obligation to pay a fixed rate of 5.32% | | | | |
| versus the three month USD-LIBOR-BBA maturing | | | | |
| January 09, 2022. | 391,998,000 | | Jan-12/5.32 | 79,359,995 |
|
| Option on an interest rate swap with Barclays Bank | | | | |
| PLC for the obligation to receive a fixed rate of 4.7375% | | | | |
| versus the three month USD-LIBOR-BBA maturing | | | | |
| March 9, 2021. | 74,935,600 | | Mar-11/4.7375 | 28,476 |
|
| Option on an interest rate swap with JPMorgan Chase | | | | |
| Bank, N.A. for the obligation to receive a fixed rate | | | | |
| of 4.665% versus the three month USD-LIBOR-BBA | | | | |
| maturing March 8, 2021. | 74,935,600 | | Mar-11/4.665 | 31,473 |
|
| Option on an interest rate swap with JPMorgan Chase | | | | |
| Bank, N.A. for the obligation to receive a fixed rate | | | | |
| of 3.50% versus the three month USD-LIBOR-BBA | | | | |
| maturing November 17, 2040. | 114,557,800 | | Nov-10/3.5 | 2,035,692 |
|
| Option on an interest rate swap with JPMorgan Chase | | | | |
| Bank, N.A. for the obligation to pay a fixed rate of 3.50% | | | | |
| versus the three month USD-LIBOR-BBA maturing | | | | |
| November 17, 2040. | 114,557,800 | | Nov-10/3.5 | 5,310,900 |
|
| Option on an interest rate swap with JPMorgan Chase | | | | |
| Bank, N.A. for the obligation to receive a fixed rate | | | | |
| of 4.02% versus the three month USD-LIBOR-BBA | | | | |
| maturing October 14, 2020. | 69,212,000 | | Oct-10/4.02 | — |
|
| Option on an interest rate swap with JPMorgan Chase | | | | |
| Bank, N.A. for the obligation to pay a fixed rate of 4.02% | | | | |
| versus the three month USD-LIBOR-BBA maturing | | | | |
| October 14, 2020. | 69,212,000 | | Oct-10/4.02 | 9,008,634 |
|
| Option on an interest rate swap with JPMorgan Chase | | | | |
| Bank, N.A. for the obligation to receive a fixed rate | | | | |
| of 5.51% versus the three month USD-LIBOR-BBA | | | | |
| maturing May 14, 2022. | 1,473,000 | | May-12/5.51 | 8,387 |
|
| Option on an interest rate swap with JPMorgan Chase | | | | |
| Bank, N.A. for the obligation to receive a fixed rate | | | | |
| of 5.32% versus the three month USD-LIBOR-BBA | | | | |
| maturing January 9, 2022. | 391,998,000 | | Jan-12/5.32 | 1,500,250 |
|
| Total | | | $169,264,807 |
| | | | |
TBA SALE COMMITMENTS OUTSTANDING at 9/30/10 (proceeds receivable $154,686,094)
| | | | |
| | Principal | | Settlement | |
| Agency | amount | | date | Value |
|
| FHLMC, 4s, August 1, 2025 | $88,000,000 | | 8/17/10 | $91,740,000 |
|
| FNMA, 4 1/2s, October 1, 2040 | 61,000,000 | | 10/13/10 | 63,535,313 |
|
| Total | | | | $155,275,313 |
35
INTEREST RATE SWAP CONTRACTS OUTSTANDING at 9/30/10
| | | | | | | |
| | | Upfront | | | Payments | Payments | Unrealized |
| Swap counterparty / | | premium | Termination | | made by | received by | appreciation/ |
| Notional amount | | received (paid) | date | | fund per annum | fund per annum | (depreciation) |
|
| Bank of America, N.A. | |
| $155,766,000 | | $141,599 | 10/20/10 | | 3 month USD- | | |
| | | | | | LIBOR-BBA | 3.00% | $2,281,775 |
|
| 529,252,000 | | (484,736) | 7/23/20 | | 3 month USD- | | |
| | | | | | LIBOR-BBA | 2.96% | 21,636,270 |
|
| Barclays Bank PLC | |
| 38,636,200 | | (52,388) | 3/5/19 | | 3.53% | 3 month USD- | |
| | | | | | | LIBOR-BBA | (3,752,891) |
|
| 46,459,900 | E | — | 3/9/21 | | 4.2375% | 3 month USD- | |
| | | | | | | LIBOR-BBA | (6,250,250) |
|
| 41,640,800 | | (952,533) | 9/21/20 | | 3 month USD- | | |
| | | | | | LIBOR-BBA | 3.95% | 4,306,959 |
|
| 8,541,600 | | 224,217 | 9/28/20 | | 4.02% | 3 month USD- | |
| | | | | | | LIBOR-BBA | (902,684) |
|
| 246,524,600 | | 717,433 | 6/21/40 | | 3.938% | 3 month USD- | |
| | | | | | | LIBOR-BBA | (31,036,883) |
|
| 138,908,500 | | — | 8/9/15 | | 3 month USD- | | |
| | | | | | LIBOR-BBA | 1.77% | 2,261,581 |
|
| 29,510,000 | | — | 8/27/15 | | 3 month USD- | | |
| | | | | | LIBOR-BBA | 1.6275% | 245,871 |
|
| 25,400,000 | | — | 8/27/40 | | 3.21625% | 3 month USD- | |
| | | | | | | LIBOR-BBA | 498,291 |
|
| 86,900,000 | | — | 9/1/15 | | 1.72% | 3 month USD- | |
| | | | | | | LIBOR-BBA | (1,085,028) |
|
| 36,950,000 | | — | 9/1/40 | | 3 month USD- | | |
| | | | | | LIBOR-BBA | 3.35% | 228,509 |
|
| 99,485,100 | | — | 9/7/15 | | 3 month USD- | | |
| | | | | | LIBOR-BBA | 1.6525% | 869,148 |
|
| 12,700,000 | | — | 7/6/30 | | 3.5675% | 3 month USD- | |
| | | | | | | LIBOR-BBA | (802,305) |
|
| Citibank, N.A. | |
| 553,479,500 | | 106,031 | 7/9/20 | | 3 month USD- | | |
| | | | | | LIBOR-BBA | 3.01% | 26,479,177 |
|
| 71,890,300 | | (32,374) | 7/9/12 | | 3 month USD- | | |
| | | | | | LIBOR-BBA�� | 0.96% | 557,146 |
|
| 69,454,300 | | — | 8/9/20 | | 3 month USD- | | |
| | | | | | LIBOR-BBA | 2.89875% | 2,416,419 |
|
| 5,326,400 | | — | 9/24/12 | | 0.6175% | 3 month USD- | |
| | | | | | | LIBOR-BBA | (2,683) |
|
| 150,676,100 | | — | 9/24/20 | | 3 month USD- | | |
| | | | | | LIBOR-BBA | 2.5875% | 379,230 |
|
| Credit Suisse International | |
| 74,000,000 | | — | 9/27/12 | | 0.6125% | 3 month USD- | |
| | | | | | | LIBOR-BBA | (24,857) |
|
| 9,800,000 | | — | 9/27/20 | | 2.53875% | 3 month USD- | |
| | | | | | | LIBOR-BBA | 21,757 |
|
36
INTEREST RATE SWAP CONTRACTS OUTSTANDING at 9/30/10 cont.
| | | | | | | |
| | | Upfront | | | Payments | Payments | Unrealized |
| Swap counterparty / | | premium | Termination | | made by | received by | appreciation/ |
| Notional amount | | received (paid) | date | | fund per annum | fund per annum | (depreciation) |
|
| Deutsche Bank AG | |
| $277,817,500 | | $(404,813) | 7/27/14 | | 1.51% | 3 month USD- | |
| | | | | | | LIBOR-BBA | $(4,858,331) |
|
| 439,992,100 | | 1,030,724 | 7/27/20 | | 3 month USD- | | |
| | | | | | LIBOR-BBA | 2.94% | 18,468,753 |
|
| 281,150,000 | | — | 2/3/14 | | 2.44% | 3 month USD- | |
| | | | | | | LIBOR-BBA | (14,408,225) |
|
| 46,457,000 | | — | 10/5/21 | | 3 month USD- | | |
| | | | | | LIBOR-BBA | 3.52057% | 4,531,150 |
|
| Goldman Sachs International | |
| 347,392,900 | | 886,695 | 4/8/15 | | 2.94% | 3 month USD- | |
| | | | | | | LIBOR-BBA | (27,906,714) |
|
| 359,010,400 | | 1,238,597 | 4/8/16 | | 3.28% | 3 month USD- | |
| | | | | | | LIBOR-BBA | (34,819,749) |
|
| 70,210,300 | | — | 7/20/12 | | 3 month USD- | | |
| | | | | | LIBOR-BBA | 0.8375% | 392,810 |
|
| 4,191,400 | | — | 7/20/40 | | 3 month USD- | | |
| | | | | | LIBOR-BBA | 3.7275% | 349,288 |
|
| 49,146,900 | | — | 7/23/40 | | 3.7125% | 3 month USD- | |
| | | | | | | LIBOR-BBA | (3,938,540) |
|
| 139,615,900 | | (34,380) | 10/1/13 | | 0.84% | 3 month USD- | |
| | | | | | | LIBOR-BBA | 94,067 |
|
| 313,039,600 | | (189,473) | 10/1/14 | | 1.14% | 3 month USD- | |
| | | | | | | LIBOR-BBA | 377,129 |
|
| 93,639,700 | | — | 8/12/15 | | 3 month USD- | | |
| | | | | | LIBOR-BBA | 1.665% | 1,033,196 |
|
| 26,093,600 | | — | 8/12/40 | | 3.68% | 3 month USD- | |
| | | | | | | LIBOR-BBA | (1,884,124) |
|
| JPMorgan Chase Bank, N.A. | |
| 46,459,900 | E | — | 3/8/21 | | 4.165% | 3 month USD- | |
| | | | | | | LIBOR-BBA | (5,953,836) |
|
| 34,661,700 | | (811,084) | 9/20/20 | | 3 month USD- | | |
| | | | | | LIBOR-BBA | 3.995% | 3,711,632 |
|
| 23,107,800 | | (538,412) | 9/20/20 | | 3 month USD- | | |
| | | | | | LIBOR-BBA | 3.965% | 2,413,898 |
|
| 4,191,400 | | — | 7/20/40 | | 3 month USD- | | |
| | | | | | LIBOR-BBA | 3.7225% | 345,181 |
|
| 203,044,300 | | — | 7/22/12 | | 3 month USD- | | |
| | | | | | LIBOR-BBA | 0.8075% | 1,010,540 |
|
| 18,471,500 | | — | 7/22/40 | | 3.75% | 3 month USD- | |
| | | | | | | LIBOR-BBA | (1,617,858) |
|
| 145,500,200 | | — | 8/12/15 | | 1.7325% | 3 month USD- | |
| | | | | | | LIBOR-BBA | (2,084,379) |
|
| 59,620,500 | | — | 9/7/14 | | 3 month USD- | | |
| | | | | | LIBOR-BBA | 1.3375% | 437,403 |
|
| 24,000,000 | | — | 9/22/20 | | 3 month USD- | | |
| | | | | | LIBOR-BBA | 2.736% | 387,874 |
|
37
INTEREST RATE SWAP CONTRACTS OUTSTANDING at 9/30/10 cont.
| | | | | | | |
| | | Upfront | | | Payments | Payments | Unrealized |
| Swap counterparty / | | premium | Termination | | made by | received by | appreciation/ |
| Notional amount | | received (paid) | date | | fund per annum | fund per annum | (depreciation) |
|
| JPMorgan Chase Bank, N.A. cont. | |
| $283,719,800 | | 565,288 | 7/16/15 | | 2.14% | 3 month USD- | |
| | | | | | | LIBOR-BBA | $(9,610,058) |
|
| 146,901,700 | | 552,023 | 7/16/40 | | 3.88% | 3 month USD- | |
| | | | | | | LIBOR-BBA | (16,138,811) |
|
| 70,210,300 | | — | 7/20/12 | | 3 month USD- | | |
| | | | | | LIBOR-BBA | 0.84% | 396,664 |
|
| Total | $(70,946,488) |
E See Interest rate swap contracts note regarding extended effective dates.
TOTAL RETURN SWAP CONTRACTS OUTSTANDING at 9/30/10
| | | | | | |
| | Upfront | | | Fixed payments | Total return | Unrealized |
| Swap counterparty / | premium | Termination | | received (paid) by | received by | appreciation/ |
| Notional amount | received (paid) | date | | fund per annum | or paid by fund | (depreciation) |
|
| Barclays Bank PLC | |
| $389,926 | $— | 1/12/40 | | (4.00%)1 month | Synthetic TRS | $10,136 |
| | | | | USD-LIBOR | Index 4.00% 30 | |
| | | | | | year Fannie Mae | |
| | | | | | pools | |
|
| 758,373 | — | 1/12/40 | | 4.50% (1 month | Synthetic TRS | (18,455) |
| | | | | | Index 4.50% 30 | |
| | | | | | year Fannie Mae | |
| | | | | | pools | |
|
| 361,799 | — | 1/12/40 | | (5.00%)1 month | Synthetic TRS | 7,356 |
| | | | | USD-LIBOR | Index 5.00% 30 | |
| | | | | | year Fannie Mae | |
| | | | | | pools | |
|
| 10,211,652 | — | 1/12/39 | | 5.50% (1 month | Synthetic TRS | (163,618) |
| | | | | USD-LIBOR) | Index 5.50% 30 | |
| | | | | | year Fannie Mae | |
| | | | | | pools | |
|
| 51,920,923 | — | 1/12/38 | | (6.50%) 1 month | Synthetic TRS | (22,935) |
| | | | | USD-LIBOR | Index 6.50% 30 | |
| | | | | | year Fannie Mae | |
| | | | | | pools | |
|
| 34,321,503 | — | 1/12/38 | | (6.50%) 1 month | Synthetic TRS | (15,161) |
| | | | | USD-LIBOR | Index 6.50% 30 | |
| | | | | | year Fannie Mae | |
| | | | | | pools | |
|
| 12,751,591 | — | 1/12/39 | | 5.50% (1 month | Synthetic TRS | (204,314) |
| | | | | USD-LIBOR) | Index 5.50% 30 | |
| | | | | | year Fannie Mae | |
| | | | | | pools | |
|
| 1,999,296 | — | 1/12/38 | | (6.50%) 1 month | Synthetic TRS | (883) |
| | | | | USD-LIBOR | Index 6.50% 30 | |
| | | | | | year Fannie Mae | |
| | | | | | pools | |
|
| 5,898,654 | — | 1/12/38 | | 6.50% (1 month | Synthetic TRS | 2,606 |
| | | | | USD-LIBOR) | Index 6.50% 30 | |
| | | | | | year Fannie Mae | |
| | | | | | pools | |
|
38
TOTAL RETURN SWAP CONTRACTS OUTSTANDING at 9/30/10 cont.
| | | | | | |
| | Upfront | | | Fixed payments | Total return | Unrealized |
| Swap counterparty / | premium | Termination | | received (paid) by | received by | appreciation/ |
| Notional amount | received (paid) | date | | fund per annum | or paid by fund | (depreciation) |
|
| Barclays Bank PLC cont. | |
| $1,534,571 | $ — | 1/12/39 | | 5.50% (1 month | Synthetic TRS | $(24,588) |
| | | | | USD-LIBOR) | Index 5.50% 30 | |
| | | | | | year Fannie Mae | |
| | | | | | pools | |
|
| 5,405,561 | — | 1/12/38 | | (6.50%) 1 month | Synthetic TRS | (2,388) |
| | | | | USD-LIBOR | Index 6.50% 30 | |
| | | | | | year Fannie Mae | |
| | | | | | pools | |
|
| 6,972,573 | — | 1/12/39 | | 5.50% (1 month | Synthetic TRS | (111,719) |
| | | | | USD-LIBOR) | Index 5.50% 30 | |
| | | | | | year Fannie Mae | |
| | | | | | pools | |
|
| 7,027,537 | — | 1/12/38 | | (6.50%) 1 month | Synthetic TRS | (3,104) |
| | | | | USD-LIBOR | Index 6.50% 30 | |
| | | | | | year Fannie Mae | |
| | | | | | pools | |
|
| 37,353,525 | — | 1/12/38 | | (6.50%) 1 month | Synthetic TRS | (16,501) |
| | | | | USD-LIBOR | Index 6.50% 30 | |
| | | | | | year Fannie Mae | |
| | | | | | pools | |
|
| 36,767,535 | — | 1/12/39 | | 5.50% (1 month | Synthetic TRS | (589,114) |
| | | | | USD-LIBOR) | Index 5.50% 30 | |
| | | | | | year Fannie Mae | |
| | | | | | pools | |
|
| 36,767,535 | — | 1/12/39 | | 5.50% (1 month | Synthetic TRS | (589,114) |
| | | | | USD-LIBOR) | Index 5.50% 30 | |
| | | | | | year Fannie Mae | |
| | | | | | pools | |
|
| 37,353,525 | — | 1/12/38 | | (6.50%) 1 month | Synthetic TRS | (16,501) |
| | | | | USD-LIBOR | Index 6.50% 30 | |
| | | | | | year Fannie Mae | |
| | | | | | pools | |
|
| 15,967,289 | — | 1/12/39 | | 5.50% (1 month | Synthetic TRS | (255,838) |
| | | | | USD-LIBOR) | Index 5.50% 30 | |
| | | | | | year Fannie Mae | |
| | | | | | pools | |
|
| Deutsche Bank AG | |
| 389,926 | — | 1/12/40 | | 4.00% (1 month | Synthetic TRS | (10,136) |
| | | | | USD-LIBOR) | Index 4.00% 30 | |
| | | | | | year Fannie Mae | |
| | | | | | pools | |
|
| 758,373 | — | 1/12/40 | | (4.50%)1 month | Synthetic TRS | 18,455 |
| | | | | USD-LIBOR | Index 4.50% 30 | |
| | | | | | year Fannie Mae | |
| | | | | | pools | |
|
| 361,799 | — | 1/12/40 | | 5.00% (1 month | Synthetic TRS | (7,356) |
| | | | | USD-LIBOR) | Index 5.00% 30 | |
| | | | | | year Fannie Mae | |
| | | | | | pools | |
|
39
TOTAL RETURN STOCKS SWAP.CONTRACTS . OUTSTANDING at 9/30/10 cont.
| | | | | | |
| | Upfront | | | Fixed payments | Total return | Unrealized |
| Swap counterparty / | premium | Termination | | received (paid) by | received by | appreciation/ |
| Notional amount | received (paid) | date | | fund per annum | or paid by fund | (depreciation) |
|
| Goldman Sachs International | |
| $28,094,445 | $— | 1/12/39 | | 5.50% (1 month | Synthetic TRS | $(450,148) |
| | | | | USD-LIBOR) | Index 5.50% 30 | |
| | | | | | year Fannie Mae | |
| | | | | | pools | |
|
| 19,447,018 | — | 1/12/39 | | 5.50% (1 month | Synthetic TRS | (311,593) |
| | | | | USD-LIBOR) | Index 5.50% 30 | |
| | | | | | year Fannie Mae | |
| | | | | | pools | |
|
| 19,674,872 | — | 1/12/38 | | (6.50%) 1 month | Synthetic TRS | (8,691) |
| | | | | USD-LIBOR | Index 6.50% 30 | |
| | | | | | year Fannie Mae | |
| | | | | | pools | |
|
| 34,005,194 | 212,532 | 1/12/39 | | 5.50% (1 month | Synthetic TRS | (358,131) |
| | | | | USD-LIBOR) | Index 5.50% 30 | |
| | | | | | year Fannie Mae | |
| | | | | | pools | |
|
| Total | $(3,141,735) |
ASC 820 establishes a three-level hierarchy for disclosure of fair value measurements. The valuation hierarchy is based upon the transparency of inputs to the valuation of the fund’s investments. The three levels are defined as follows:
Level 1 — Valuations based on quoted prices for identical securities in active markets.
Level 2 — Valuations based on quoted prices in markets that are not active or for which all significant inputs are observable, either directly or indirectly.
Level 3 — Valuations based on inputs that are unobservable and significant to the fair value measurement.
The following is a summary of the inputs used to value the fund’s net assets as of the close of the reporting period:
| | | | |
| | | Valuation inputs | |
|
| Investments in securities: | Level 1 | Level 2 | Level 3 |
|
| Mortgage-backed securities | $— | $257,721,915 | $19,418,983 |
|
| Purchased options outstanding | — | 48,762,883 | — |
|
| U.S. Government and agency mortgage obligations | — | 1,312,741,898 | — |
|
| U.S. Treasury Obligations | — | 28,413,023 | — |
|
| Short-term investments | 219,464,317 | 525,387,883 | — |
|
| Totals by level | $219,464,317 | $2,173,027,602 | $19,418,983 |
| | |
| | | Valuation inputs | |
|
| Other financial instruments: | Level 1 | Level 2 | Level 3 |
|
| Futures contracts | $2,487,051 | $— | $— |
|
| Written options | — | (169,264,807) | — |
|
| TBA sale commitments | — | (155,275,313) | — |
|
| Interest rate swap contracts | — | (72,908,902) | — |
|
| Total return swap contracts | — | (3,354,267) | — |
|
| Totals by level | $2,487,051 | $(400,803,289) | $— |
At the start and/or close of the reporting period, Level 3 investments in securities and other financial instruments were not considered a significant portion of the fund’s portfolio.
The accompanying notes are an integral part of these financial statements.
40
Statement of assets and liabilities 9/30/10
| |
| ASSETS | |
|
| Investment in securities, at value (Note 1): | |
| Unaffiliated issuers (identified cost $2,091,454,181) | $2,193,237,585 |
| Affiliated issuers (identified cost $218,673,317) (Note 6) | 218,673,317 |
|
| Cash | 3,277,038 |
|
| Interest and other receivables | 6,195,717 |
|
| Receivable for shares of the fund sold | 10,689,955 |
|
| Receivable for investments sold | 22,304,129 |
|
| Receivable for sales of delayed delivery securities (Note 1) | 154,934,039 |
|
| Unrealized appreciation on swap contracts (Note 1) | 96,170,271 |
|
| Receivable for variation margin (Note 1) | 366 |
|
| Premium paid on swap contracts (Note 1) | 3,500,193 |
|
| Total assets | 2,708,982,610 |
| |
| LIABILITIES | |
|
| Payable for investments purchased | 53,664,942 |
|
| Payable for purchases of delayed delivery securities (Note 1) | 551,527,505 |
|
| Payable for shares of the fund repurchased | 1,963,985 |
|
| Payable for compensation of Manager (Note 2) | 520,504 |
|
| Payable for investor servicing fees (Note 2) | 179,668 |
|
| Payable for custodian fees (Note 2) | 42,690 |
|
| Payable for Trustee compensation and expenses (Note 2) | 354,998 |
|
| Payable for administrative services (Note 2) | 3,152 |
|
| Payable for distribution fees (Note 2) | 986,463 |
|
| Written options outstanding, at value (premiums received $109,215,884) (Notes 1 and 3) | 169,264,807 |
|
| Premium received on swap contracts (Note 1) | 5,675,139 |
|
| Unrealized depreciation on swap contracts (Note 1) | 170,258,494 |
|
| TBA sale commitments, at value (proceeds receivable $154,686,094) (Note 1) | 155,275,313 |
|
| Collateral on certain derivative contracts, at value (Note 1) | 15,772,336 |
|
| Other accrued expenses | 201,734 |
|
| Total liabilities | 1,125,691,730 |
| | |
| Net assets | $1,583,290,880 |
|
| |
| REPRESENTED BY | |
|
| Paid-in capital (Unlimited shares authorized) (Notes 1 and 4) | $1,469,427,910 |
|
| Undistributed net investment income (Note 1) | 61,222,543 |
|
| Accumulated net realized gain on investments (Note 1) | 83,096,337 |
|
| Net unrealized depreciation of investments | (30,455,910) |
|
| Total — Representing net assets applicable to capital shares outstanding | $1,583,290,880 |
| |
| COMPUTATION OF NET ASSET VALUE AND OFFERING PRICE | |
|
| Net asset value and redemption price per class A share | |
| ($1,305,667,911 divided by 87,038,860 shares) | $15.00 |
|
| Offering price per class A share (100/96.00 of $15.00)* | $15.63 |
|
| Net asset value and offering price per class B share ($50,675,512 divided by 3,393,180 shares)** | $14.93 |
|
| Net asset value and offering price per class C share ($134,364,846 divided by 9,018,768 shares)** | $14.90 |
|
| Net asset value and redemption price per class M share ($28,380,245 divided by 1,888,083 shares) | $15.03 |
|
| Offering price per class M share (100/96.75 of $15.03)*** | $15.53 |
|
| Net asset value, offering price and redemption price per class R share | |
| ($12,357,780 divided by 830,659 shares) | $14.88 |
|
| Net asset value, offering price and redemption price per class Y share | |
| ($51,844,586 divided by 3,479,575 shares) | $14.90 |
|
* On single retail sales of less than $100,000. On sales of $100,000 or more the offering price is reduced.
** Redemption price per share is equal to net asset value less any applicable contingent deferred sales charge.
*** On single retail sales of less than $50,000. On sales of $50,000 or more the offering price is reduced.
The accompanying notes are an integral part of these financial statements.
41
Statement of operations Year ended 9/30/10
| |
| INVESTMENT INCOME | |
|
| Interest (including interest income of $381,346 from investments in affiliated issuers) (Note 6) | $83,945,422 |
|
| Total investment income | 83,945,422 |
|
| |
| EXPENSES | |
|
| Compensation of Manager (Note 2) | 6,139,073 |
|
| Investor servicing fees (Note 2) | 2,168,270 |
|
| Custodian fees (Note 2) | 91,209 |
|
| Trustee compensation and expenses (Note 2) | 105,910 |
|
| Administrative services (Note 2) | 68,641 |
|
| Distribution fees — Class A (Note 2) | 3,050,900 |
|
| Distribution fees — Class B (Note 2) | 571,871 |
|
| Distribution fees — Class C (Note 2) | 894,638 |
|
| Distribution fees — Class M (Note 2) | 143,550 |
|
| Distribution fees — Class R (Note 2) | 41,846 |
|
| Other | 546,094 |
|
| Fees waived and reimbursed by Manager (Note 2) | (292,298) |
|
| Total expenses | 13,529,704 |
| | |
| Expense reduction (Note 2) | (9,510) |
|
| Interest expense (Note 2) | (825,354) |
|
| Net expenses | 12,694,840 |
| |
| Net investment income | 71,250,582 |
|
| |
| Net realized gain on investments (Notes 1 and 3) | 112,401,766 |
|
| Net realized loss on swap contracts (Note 1) | (52,889,581) |
|
| Net realized gain on futures contracts (Note 1) | 52,462,829 |
|
| Net realized gain on written options (Notes 1 and 3) | 6,398,291 |
|
| Net unrealized depreciation of investments, futures contracts, | |
| swap contracts, written options, TBA sale commitments and | |
| receivable purchase agreements during the year | (70,574,563) |
|
| Net gain on investments | 47,798,742 |
| |
| Net increase in net assets resulting from operations | $119,049,324 |
|
The accompanying notes are an integral part of these financial statements.
42
Statement of changes in net assets
| | |
| INCREASE IN NET ASSETS | Year ended 9/30/10 | Year ended 9/30/09 |
|
| Operations: | | |
| Net investment income | $71,250,582 | $55,518,786 |
|
| Net realized gain on investments | 118,373,305 | 126,892,470 |
|
| Net unrealized appreciation (depreciation) of investments | (70,574,563) | 33,429,591 |
|
| Net increase in net assets resulting from operations | 119,049,324 | 215,840,847 |
|
| Distributions to shareholders (Note 1): | | |
| From ordinary income | | |
| Net investment income | | |
|
| Class A | (60,798,692) | (49,318,989) |
|
| Class B | (2,497,618) | (2,962,252) |
|
| Class C | (3,849,728) | (1,496,861) |
|
| Class M | (1,391,674) | (1,199,136) |
|
| Class R | (404,230) | (135,824) |
|
| Class Y | (1,808,326) | (617,605) |
|
| From net realized long-term gain on investments | | |
|
| Class A | (3,947,936) | — |
|
| Class B | (217,226) | — |
|
| Class C | (229,005) | — |
|
| Class M | (97,770) | — |
|
| Class R | (20,345) | — |
|
| Class Y | (99,576) | — |
|
| Increase in capital from settlement payments | 89,729 | 32,952 |
|
| Redemption fees (Note 1) | 4,649 | 9,391 |
|
| Increase (decrease) from capital share transactions (Note 4) | 237,369,971 | (73,756,566) |
|
| Total increase in net assets | 281,151,547 | 86,395,957 |
|
| |
| NET ASSETS | | |
|
| Beginning of year | 1,302,139,333 | 1,215,743,376 |
|
| End of year (including undistributed net investment income of | | |
| $61,222,543 and $30,040,286, respectively) | $1,583,290,880 | $1,302,139,333 |
|
The accompanying notes are an integral part of these financial statements.
43
Financial highlights (For a common share outstanding throughout the period)
| | | | | | | | | | | | | | | | |
| INVESTMENT OPERATIONS: | | LESS DISTRIBUTIONS: | | RATIOS AND SUPPLEMENTAL DATA: |
|
| | | | | | | | | | | | | | | Ratio | | |
| | | | | | | | | | | | | | | of expenses | | |
| | | | | | | | | | | | | | | to average | Ratio | |
| | Net asset | Net | Net realized | | From | From | | | | | | | Ratio | net assets | of net investment | |
| | value, | investment | ��and unrealized | Total from | net | net realized | | | Non-recurring | | Total return | Net assets, | of expenses | excluding | income (loss) | Portfolio |
| | beginning | income | gain (loss) | investment | investment | gain | Total | Redemption | reimburse- | Net asset value, | at net asset | end of period | to average | interest expense | to average | turnover |
| Period ended | of period | (loss) a | on investments | operations | income | on investments | distributions | fees b | ments | end of period | value (%) c | (in thousands) | net assets (%) d | (%) d | net assets (%) | (%) e |
|
| Class A | | | | | | | | | | | | | | | | |
| September 30, 2010 | $14.50 | .76 | .54 | 1.30 | (.75) | (.05) | (.80) | — | — b,f | $15.00 | 9.10 | $1,305,668 | .86 g,h | .86 g | 5.03 g | 515.18 |
| September 30, 2009 | 12.68 | .62 | 1.82 | 2.44 | (.62) | — | (.62) | — | — b,j | 14.50 | 19.92 | 1,129,477 | 1.23 g,i | .98 g | 4.73 g | 604.28 |
| September 30, 2008 | 13.17 | .73 | (.63) k | .10 | (.59) | — | (.59) | — | — | 12.68 | .60 k | 1,057,520 | .96 g | .96 g | 5.47 g | 270.58 |
| September 30, 2007 | 13.03 | .57 | .12 | .69 | (.55) | — | (.55) | — | — | 13.17 | 5.41 | 968,106 | .99 g | .99 g | 4.37 g | 252.54 |
| September 30, 2006 | 13.15 | .52 | (.10) | .42 | (.54) | — | (.54) | — | — | 13.03 | 3.30 | 1,068,197 | .94 l | .94 l | 4.02 l | 579.42 |
|
| Class B | | | | | | | | | | | | | | | | |
| September 30, 2010 | $14.44 | .66 | .52 | 1.18 | (.64) | (.05) | (.69) | — | — b,f | $14.93 | 8.27 | $50,676 | 1.57 g,h | 1.57 g | 4.44 g | 515.18 |
| September 30, 2009 | 12.62 | .51 | 1.84 | 2.35 | (.53) | — | (.53) | — | — b,j | 14.44 | 19.15 | 68,377 | 1.94 g,i | 1.69 g | 3.97 g | 604.28 |
| September 30, 2008 | 13.10 | .63 | (.62) k | .01 | (.49) | — | (.49) | — | — | 12.62 | (.06) k | 85,571 | 1.67 g | 1.67 g | 4.78 g | 270.58 |
| September 30, 2007 | 12.96 | .47 | .12 | .59 | (.45) | — | (.45) | — | — | 13.10 | 4.63 | 84,146 | 1.74 g | 1.74 g | 3.62 g | 252.54 |
| September 30, 2006 | 13.08 | .42 | (.10) | .32 | (.44) | — | (.44) | — | — | 12.96 | 2.52 | 132,827 | 1.69 l | 1.69 l | 3.29 l | 579.42 |
|
| Class C | | | | | | | | | | | | | | | | |
| September 30, 2010 | $14.44 | .62 | .53 | 1.15 | (.64) | (.05) | (.69) | — | — b,f | $14.90 | 8.06 | $134,365 | 1.61 g,h | 1.61 g | 4.10 g | 515.18 |
| September 30, 2009 | 12.66 | .53 | 1.77 | 2.30 | (.52) | — | (.52) | — | — b,j | 14.44 | 18.75 | 56,171 | 1.98 g,i | 1.73 g | 4.05 g | 604.28 |
| September 30, 2008 | 13.15 | .63 | (.63) k | — b | (.49) | — | (.49) | — | — | 12.66 | (.13) k | 29,635 | 1.71 g | 1.71 g | 4.73 g | 270.58 |
| September 30, 2007 | 13.01 | .47 | .12 | .59 | (.45) | — | (.45) | — | — | 13.15 | 4.62 | 16,713 | 1.74 g | 1.74 g | 3.62 g | 252.54 |
| September 30, 2006 | 13.13 | .43 | (.11) | .32 | (.44) | — | (.44) | — | — | 13.01 | 2.50 | 15,985 | 1.69 l | 1.69 l | 3.28 l | 579.42 |
|
| Class M | | | | | | | | | | | | | | | | |
| September 30, 2010 | $14.49 | .73 | .57 | 1.30 | (.71) | (.05) | (.76) | — | — b,f | $15.03 | 9.13 | $28,380 | 1.10 g,h | 1.10 g | 4.83 g | 515.18 |
| September 30, 2009 | 12.68 | .58 | 1.82 | 2.40 | (.59) | — | (.59) | — | — b,j | 14.49 | 19.57 | 28,104 | 1.47 g,i | 1.22 g | 4.48 g | 604.28 |
| September 30, 2008 | 13.16 | .70 | (.63) k | .07 | (.55) | — | (.55) | — | — | 12.68 | .42 k | 27,627 | 1.20 g | 1.20 g | 5.23 g | 270.58 |
| September 30, 2007 | 13.02 | .54 | .11 | .65 | (.51) | — | (.51) | — | — | 13.16 | 5.12 | 27,563 | 1.24 g | 1.24 g | 4.12 g | 252.54 |
| September 30, 2006 | 13.13 | .49 | (.10) | .39 | (.50) | — | (.50) | — | — | 13.02 | 3.10 | 31,087 | 1.19 l | 1.19 l | 3.78 l | 579.42 |
|
| Class R | | | | | | | | | | | | | | | | |
| September 30, 2010 | $14.40 | .69 | .55 | 1.24 | (.71) | (.05) | (.76) | — | — b,f | $14.88 | 8.77 | $12,358 | 1.11 g,h | 1.11 g | 4.57 g | 515.18 |
| September 30, 2009 | 12.64 | .59 | 1.76 | 2.35 | (.59) | — | (.59) | — | — b,j | 14.40 | 19.20 | 3,895 | 1.48 g,i | 1.23 g | 4.54 g | 604.28 |
| September 30, 2008 | 13.16 | .70 | (.67) k | .03 | (.55) | — | (.55) | — | — | 12.64 | .12 k | 2,651 | 1.21 g | 1.21 g | 5.22 g | 270.58 |
| September 30, 2007 | 13.02 | .54 | .12 | .66 | (.52) | — | (.52) | — | — | 13.16 | 5.16 | 627 | 1.24 g | 1.24 g | 4.12 g | 252.54 |
| September 30, 2006 | 13.14 | .48 | (.09) | .39 | (.51) | — | (.51) | — | — | 13.02 | 3.04 | 396 | 1.19 l | 1.19 l | 3.73 l | 579.42 |
|
| Class Y | | | | | | | | | | | | | | | | |
| September 30, 2010 | $14.42 | .77 | .55 | 1.32 | (.79) | (.05) | (.84) | — | — b,f | $14.90 | 9.28 | $51,845 | .61 g,h | .61 g | 5.10 g | 515.18 |
| September 30, 2009 | 12.64 | .65 | 1.78 | 2.43 | (.65) | — | (.65) | — | — b,j | 14.42 | 19.97 | 16,116 | .98 g,i | .73 g | 4.99 g | 604.28 |
| September 30, 2008 | 13.13 | .77 | (.64) k | .13 | (.62) | — | (.62) | — | — | 12.64 | .87 k | 12,740 | .71 g | .71 g | 5.76 g | 270.58 |
| September 30, 2007 | 13.00 | .60 | .11 | .71 | (.58) | — | (.58) | — | — | 13.13 | 5.64 | 4,458 | .74 g | .74 g | 4.62 g | 252.54 |
| September 30, 2006 | 13.12 | .55 | (.09) | .46 | (.58) | — | (.58) | — | — | 13.00 | 3.60 | 4,542 | .69 l | .69 l | 4.23 l | 579.42 |
|
See notes to financial highlights at the end of this section.
The accompanying notes are an integral part of these financial statements.
Financial highlights (Continued)
a Per share net investment income (loss) has been determined on the basis of the weighted average number of shares outstanding during the period.
b Amount represents less than $0.01 per share.
c Total return assumes dividend reinvestment and does not reflect the effect of sales charges.
d Includes amounts paid through expense offset arrangements (Note 2).
e Portfolio turnover excludes dollar roll transactions.
f Reflects a non-recurring reimbursement pursuant to a settlement between the Securities and Exchange Commission (the SEC) and Prudential Securities, Inc., which amounted to less than $0.01 per share outstanding as of March 30, 2010.
g Reflects an involuntary contractual expense limitation in effect during the period. For periods prior to September 30, 2009, certain fund expenses were waived in connection with the fund’s investment in Putnam Prime Money Market Fund. As a result of such limitation and/or waivers, the expenses of each class reflect a reduction of the following amounts (Note 2):
| |
| | Percentage of |
| | average net assets |
|
| September 30, 2010 | 0.02% |
|
| September 30, 2009 | 0.05 |
|
| September 30, 2008 | 0.01 |
|
| September 30, 2007 | 0.01 |
|
h Excludes the impact of a current period reduction to interest expense related to the resolution of certain terminated derivatives contracts, which amounted to 0.06% of average net assets as of September 30, 2010 (Note 2).
i Includes interest accrued in connection with certain terminated derivatives contracts, which amounted to 0.25% of average net assets as of September 30, 2009 (Note 2).
j Reflects a non-recurring reimbursement pursuant to a settlement between the SEC and Bear, Stearns & Co., Inc. and Bear Stearns Securities Corp., which amounted to less than $0.01 per share outstanding as of May 21, 2009.
k Reflects a non-recurring reimbursement from Putnam Management relating to the misidentification, in 2006, of the characteristics of certain securities in the fund’s portfolio, which amounted to $0.02 per share.
l Reflects a non-recurring reimbursement from Putnam Investments relating to the calculation of certain amounts paid by the fund to Putnam in previous years for transfer agent services, which amounted to less than $0.01 per share and 0.02% of average net assets for the period ended September 30, 2006.
The accompanying notes are an integral part of these financial statements.
46
Notes to financial statements 9/30/10
Note 1: Significant accounting policies
Putnam U.S. Government Income Trust (the fund), is a diversified Massachusetts business trust, registered under the Investment Company Act of 1940, as amended, as an open-end management investment company. The investment objective of the fund is to seek as high a level of current income as is consistent with preservation of capital by investing mainly in securities which have short to long-term maturities and are backed by the full faith and credit of the United States or by the credit of the issuing U.S. government agency. The fund may invest a significant portion of its assets in securitized debt instruments, including mortgage-backed and asset-backed investments. The yields and values of these investments are sensitive to changes in interest rates, the rate of principal payments on the underlying assets and the market’s perception of the issuers. The market for these investments may be volatile and limited, which may make them difficult to buy or sell.
The fund offers class A, class B, class C, class M, class R and class Y shares. Class A and class M shares are sold with a maximum front-end sales charge of 4.00% and 3.25%, respectively, and generally do not pay a contingent deferred sales charge. Class B shares, which convert to class A shares after approximately eight years, do not pay a front-end sales charge and are subject to a contingent deferred sales charge, if those shares are redeemed within six years of purchase. Class C shares have a one-year 1.00% contingent deferred sales charge and do not convert to class A shares. Class R shares, which are offered to qualified employee-benefit plans, are sold at net asset value. The expenses for class A, class B, class C, class M and class R shares may differ based on the distribution fee of each class, which is identified in Note 2. Class Y shares, which are sold at net asset value, are generally subject to the same expenses as class A, class B, class C, class M and class R shares, but do not bear a distribution fee. Class Y shares are generally only available to corporate and institutional clients and clients in other approved programs.
A 1.00% redemption fee applied on certain shares that were redeemed (either by selling or exchanging into another fund) within 7 days of purchase. The redemption fee is accounted for as an addition to paid-in-capital. Effective August 2, 2010, a redemption fee will no longer apply to shares redeemed.
Investment income, realized and unrealized gains and losses and expenses of the fund are borne pro-rata based on the relative net assets of each class to the total net assets of the fund, except that each class bears expenses unique to that class (including the distribution fees applicable to such classes). Each class votes as a class only with respect to its own distribution plan or other matters on which a class vote is required by law or determined by the Trustees. If the fund were liquidated, shares of each class would receive their pro-rata share of the net assets of the fund. In addition, the Trustees declare separate dividends on each class of shares.
In the normal course of business, the fund enters into contracts that may include agreements to indemnify another party under given circumstances. The fund’s maximum exposure under these arrangements is unknown as this would involve future claims that may be, but have not yet been, made against the fund. However, the fund’s management team expects the risk of material loss to be remote.
The following is a summary of significant accounting policies consistently followed by the fund in the preparation of its financial statements. The preparation of financial statements is in conformity with accounting principles generally accepted in the United States of America and requires management to make estimates and assumptions that affect the reported amounts of assets and liabilities in the financial statements and the reported amounts of increases and decreases in net assets from operations. Actual results could differ from those estimates. Subsequent events after the Statement of assets and liabilities date through the date that the financial statements were issued have been evaluated in the preparation of the financial statements. Unless otherwise noted, the “reporting period” represents the period from October 1, 2009 through September 30, 2010.
A) Security valuation Investments, including mortgage backed securities, are valued on the basis of valuations provided by an independent pricing service approved by the Trustees or dealers selected by Putnam Investment Management, LLC (Putnam Management), the fund’s manager, an indirect wholly-owned subsidiary of Putnam Investments, LLC. Such service providers use information with respect to transactions in bonds, quotations from bond dealers, market transactions in comparable securities and various relationships between securities in determining value. These securities will generally be categorized as Level 2.
Certain investments, including certain restricted and illiquid securities and derivatives, are also valued at fair value following procedures approved by the Trustees. These valuations consider such factors as significant market or specific security events such as interest rate or credit quality changes, various relationships with other securities,
47
discount rates, U.S. Treasury, U.S. swap and credit yields, index levels, convexity exposures and recovery rates. These securities are classified as Level 2 or as Level 3 depending on the priority of the significant inputs.
Such valuations and procedures are reviewed periodically by the Trustees. Certain securities may be valued on the basis of a price provided by a single source. The fair value of securities is generally determined as the amount that the fund could reasonably expect to realize from an orderly disposition of such securities over a reasonable period of time. By its nature, a fair value price is a good faith estimate of the value of a security in a current sale and does not reflect an actual market price, which may be different by a material amount.
B) Joint trading account Pursuant to an exemptive order from the Securities and Exchange Commission (the SEC), the fund may transfer uninvested cash balances, including cash collateral received under security lending arrangements, into a joint trading account along with the cash of other registered investment companies and certain other accounts managed by Putnam Management. These balances may be invested in issues of short-term investments having maturities of up to 397 days for collateral received under security lending arrangements and up to 90 days for other cash investments.
C) Repurchase agreements The fund, or any joint trading account, through its custodian, receives delivery of the underlying securities, the market value of which at the time of purchase is required to be in an amount at least equal to the resale price, including accrued interest. Collateral for certain tri-party repurchase agreements is held at the counterparty’s custodian in a segregated account for the benefit of the fund and the counterparty. Putnam Management is responsible for determining that the value of these underlying securities is at all times at least equal to the resale price, including accrued interest. In the event of default or bankruptcy by the other party to the agreement, retention of the collateral may be subject to legal proceedings.
D) Security transactions and related investment income Security transactions are recorded on the trade date (the date the order to buy or sell is executed). Gains or losses on securities sold are determined on the identified cost basis. Interest income is recorded on the accrual basis. All premiums/discounts are amortized/accreted on a yield-to-maturity basis.
Securities purchased or sold on a forward commitment or delayed delivery basis may be settled a month or more after the trade date; interest income is accrued based on the terms of the securities. Losses may arise due to changes in the market value of the underlying securities or if the counterparty does not perform under the contract.
E) Stripped securities The fund may invest in stripped securities which represent a participation in securities that may be structured in classes with rights to receive different portions of the interest and principal. Interest-only securities receive all of the interest and principal-only securities receive all of the principal. If the interest-only securities experience greater than anticipated prepayments of principal, the fund may fail to recoup fully its initial investment in these securities. Conversely, principal-only securities increase in value if prepayments are greater than anticipated and decline if prepayments are slower than anticipated. The market value of these securities is highly sensitive to changes in interest rates.
F) Futures contracts The fund uses futures contracts to gain exposure to interest rates. The potential risk to the fund is that the change in value of futures contracts may not correspond to the change in value of the hedged instruments. In addition, losses may arise from changes in the value of the underlying instruments, if there is an illiquid secondary market for the contracts, if interest or exchange rates move unexpectedly or if the counterparty to the contract is unable to perform. With futures, there is minimal counterparty credit risk to the fund since futures are exchange traded and the exchange’s clearinghouse, as counterparty to all exchange traded futures, guarantees the futures against default. Risks may exceed amounts recognized on the Statement of assets and liabilities. When the contract is closed, the fund records a realized gain or loss equal to the difference between the value of the c ontract at the time it was opened and the value at the time it was closed.
Futures contracts are valued at the quoted daily settlement prices established by the exchange on which they trade. The fund and the broker agree to exchange an amount of cash equal to the daily fluctuation in the value of the futures contract. Such receipts or payments are known as “variation margin.” Futures contracts outstanding at period end, if any, are listed after the fund’s portfolio. The fund had an average contract amount of approximately 3,000 on futures contracts for the reporting period.
G) Options contracts The fund uses options contracts to hedge duration, convexity and prepayment risk and hedge against changes in values of securities it owns, owned or expected to own. The potential risk to the fund is that the change in value of options contracts may not correspond to the change in value of the hedged instruments. In addition, losses may arise from changes in the value of the underlying instruments, if there is an illiquid secondary market for the contracts, if interest or exchange rates move unexpectedly or if the counterparty to the contract is
48
unable to perform. Realized gains and losses on purchased options are included in realized gains and losses on investment securities. If a written call option is exercised, the premium originally received is recorded as an addition to sales proceeds. If a written put option is exercised, the premium originally received is recorded as a reduction to the cost of investments.
Exchange traded options are valued at the last sale price or, if no sales are reported, the last bid price for purchased options and the last ask price for written options. Options traded over-the-counter are valued using prices supplied by dealers. The fund had an average contract amount of approximately $747,000,000 on purchased options contracts for the reporting period. Written option contracts outstanding at period end, if any, are listed after the fund’s portfolio. See Note 3 for the volume of written options contracts activity for the reporting period.
H) Total return swap contracts The fund enters into total return swap contracts, which are arrangements to exchange a market linked return for a periodic payment, both based on a notional principal amount to hedge sector exposure and manage exposure to specific sectors or industries. To the extent that the total return of the security, index or other financial measure underlying the transaction exceeds or falls short of the offsetting interest rate obligation, the fund will receive a payment from or make a payment to the counterparty. Total return swap contracts are marked to market daily based upon quotations from market makers and the change, if any, is recorded as an unrealized gain or loss. Payments received or made are recorded as realized gains or losses. Certain total return swap contracts may include extended effective dates. Payments related to these swap contracts are accrued based on the terms of th e contract. The fund could be exposed to credit or market risk due to unfavorable changes in the fluctuation of interest rates or in the price of the underlying security or index, the possibility that there is no liquid market for these agreements or that the counterparty may default on its obligation to perform. The fund’s maximum risk of loss from counterparty risk is the fair value of the contract. This risk may be mitigated by having a master netting arrangement between the fund and the counterparty. Risk of loss may exceed amounts recognized on the Statement of assets and liabilities. Total return swap contracts outstanding at period end, if any, are listed after the fund’s portfolio. The fund had an average notional amount of approximately $136,500,000 on total return swap contracts for the reporting period.
I) Interest rate swap contracts The fund enters into interest rate swap contracts, which are arrangements between two parties to exchange cash flows based on a notional principal amount, to hedge interest rate risk and hedge prepayment risk. An interest rate swap can be purchased or sold with an upfront premium. An upfront payment received by the fund is recorded as a liability on the fund’s books. An upfront payment made by the fund is recorded as an asset on the fund’s books. Interest rate swap contracts are marked to market daily based upon quotations from an independent pricing service or market makers and the change, if any, is recorded as an unrealized gain or loss. Payments received or made are recorded as realized gains or losses. Certain interest rate swap contracts may include extended effective dates. Payments related to these swap contracts are accrued based on the terms of the contract. The fund could be exposed to credit or market risk due to unfavorable changes in the fluctuation of interest rates or if the counterparty defaults on its obligation to perform. The fund’s maximum risk of loss from counterparty risk is the fair value of the contract. This risk may be mitigated by having a master netting arrangement between the fund and the counterparty. Risk of loss may exceed amounts recognized on the Statement of assets and liabilities. Interest rate swap contracts outstanding at period end, if any, are listed after the fund’s portfolio. The fund had an average notional amount of approximately $9,270,700,000 on interest rate swap contracts for the reporting period.
J) Master agreements The fund is a party to ISDA (International Swap and Derivatives Association, Inc.) Master Agreements (Master Agreements) with certain counterparties that govern over-the-counter derivative and foreign exchange contracts entered into from time to time. The Master Agreements may contain provisions regarding, among other things, the parties’ general obligations, representations, agreements, collateral requirements, events of default and early termination. With respect to certain counterparties, in accordance with the terms of the Master Agreements, collateral posted to the fund is held in a segregated account by the fund’s custodian and with respect to those amounts which can be sold or repledged, are presented in the fund’s portfolio. Collateral pledged by the fund is segregated by the fund’s custodian and identified in the fund’s portfolio. Collateral can be in the form of cash or debt securities issued by the U.S. Government or related agencies or other securities as agreed to by the fund and the applicable counterparty. Collateral requirements are determined based on the fund’s net position with each counterparty. Termination events applicable to the fund may occur upon a decline in the fund’s net assets below a specified threshold over a certain period of time. Termination events applicable to counterparties may occur upon a decline in the counterparty’s long-term and short-term credit ratings below a specified level. In each case, upon occurrence, the other party may elect to terminate early and cause settlement of all derivative and foreign exchange contracts outstanding, including the payment of any losses and costs resulting from such early termination, as reasonably determined by the
49
terminating party. Any decision by one or more of the fund’s counterparties to elect early termination could impact the fund’s future derivative activity.
At the close of the reporting period, the fund had a net liability position of $210,099,275 on derivative contracts subject to the Master Agreements. Collateral posted by the fund totaled $219,350,784.
K) TBA purchase commitments The fund may enter into TBA (to be announced) commitments to purchase securities for a fixed unit price at a future date beyond customary settlement time. Although the unit price has been established, the principal value has not been finalized. However, it is anticipated that the amount of the commitments will not significantly differ from the principal amount. The fund holds, and maintains until settlement date, cash or high-grade debt obligations in an amount sufficient to meet the purchase price, or the fund may enter into offsetting contracts for the forward sale of other securities it owns. Income on the securities will not be earned until settlement date. TBA purchase commitments may be considered securities themselves, and involve a risk of loss if the value of the security to be purchased declines prior to the settlement date, which risk is in addition to the risk of decline in the value of the fund’s other assets. Unsettled TBA purchase commitments are valued at fair value of the underlying securities, according to the procedures described under “Security valuation” above. The contract is marked to market daily and the change in market value is recorded by the fund as an unrealized gain or loss.
Although the fund will generally enter into TBA purchase commitments with the intention of acquiring securities for its portfolio or for delivery pursuant to options contracts it has entered into, the fund may dispose of a commitment prior to settlement if Putnam Management deems it appropriate to do so.
L) TBA sale commitments The fund may enter into TBA sale commitments to hedge its portfolio positions or to sell mortgage-backed securities it owns under delayed delivery arrangements. Proceeds of TBA sale commitments are not received until the contractual settlement date. During the time a TBA sale commitment is outstanding, equivalent deliverable securities or an offsetting TBA purchase commitment deliverable on or before the sale commitment date, are held as “cover” for the transaction.
Unsettled TBA sale commitments are valued at the fair value of the underlying securities, generally according to the procedures described under “Security valuation” above. The contract is marked to market daily and the change in market value is recorded by the fund as an unrealized gain or loss. If the TBA sale commitment is closed through the acquisition of an offsetting TBA purchase commitment, the fund realizes a gain or loss. If the fund delivers securities under the commitment, the fund realizes a gain or a loss from the sale of the securities based upon the unit price established at the date the commitment was entered into. TBA sale commitments outstanding at period end, if any, are listed after the fund’s portfolio.
M) Dollar rolls To enhance returns, the fund may enter into dollar rolls (principally using TBAs) in which the fund sells securities for delivery in the current month and simultaneously contracts to purchase similar securities on a specified future date. During the period between the sale and subsequent purchase, the fund will not be entitled to receive income and principal payments on the securities sold. The fund will, however, retain the difference between the initial sales price and the forward price for the future purchase. The fund will also be able to earn interest on the cash proceeds that are received from the initial sale, on settlement date. The fund may be exposed to market or credit risk if the price of the security changes unfavorably or the counterparty fails to perform under the terms of the agreement.
N) Interfund lending Effective July 2010, the fund, along with other Putnam funds, may participate in an interfund lending program pursuant to an exemptive order issued by the SEC. This program allows the fund to borrow from or lend to other Putnam funds that permit such transactions. Interfund lending transactions are subject to each fund’s investment policies and borrowing and lending limits. Interest earned or paid on the interfund lending transaction will be based on the average of certain current market rates. During the reporting period, the fund did not utilize the program.
O) Line of credit Effective July 2010, the fund participates, along with other Putnam funds, in a $285 million unsecured committed line of credit and a $165 million unsecured uncommitted line of credit, both provided by State Street Bank and Trust Company (State Street). Borrowings may be made for temporary or emergency purposes, including the funding of shareholder redemption requests and trade settlements. Interest is charged to the fund based on the fund’s borrowing at a rate equal to the Federal Funds rate plus 1.25% for the committed line of credit and the Federal Funds rate plus 1.30% for the uncommitted line of credit. A closing fee equal to 0.03% of the committed line of credit and $100,000 for the uncommitted line of credit has been paid by the participating funds. In addition, a commitment fee of 0.15% per annum on any unutilized portion of the committed line of credit is allocated to the partic ipating funds based on their relative net assets and paid quarterly. During the reporting period, the fund had no borrowings against these arrangements.
50
P) Federal taxes It is the policy of the fund to distribute all of its taxable income within the prescribed time period and otherwise comply with the provisions of the Internal Revenue Code of 1986, as amended (the Code), applicable to regulated investment companies. It is also the intention of the fund to distribute an amount sufficient to avoid imposition of any excise tax under Section 4982 of the Code. The fund is subject to the provisions of Accounting Standards Codification ASC 740 Income Taxes (ASC 740). ASC 740 sets forth a minimum threshold for financial statement recognition of the benefit of a tax position taken or expected to be taken in a tax return. The fund did not have a liability to record for any unrecognized tax benefits in the accompanying financial statements. No provision has been made for federal taxes on inco me, capital gains or unrealized appreciation on securities held nor for excise tax on income and capital gains. Each of the fund’s federal tax returns for the prior three fiscal years remains subject to examination by the Internal Revenue Service.
Q) Distributions to shareholders Distributions to shareholders from net investment income are recorded by the fund on the ex-dividend date. Distributions from capital gains, if any, are recorded on the ex-dividend date and paid at least annually. The amount and character of income and gains to be distributed are determined in accordance with income tax regulations, which may differ from generally accepted accounting principles. These differences include temporary and/or permanent differences of unrealized gains and losses on certain futures contracts, income on swap contracts and interest only securities. Reclassifications are made to the fund’s capital accounts to reflect income and gains available for distribution (or available capital loss carryovers) under income tax regulations. For the reporting period ended, the fund reclassified $30,681,943 to increase undistributed net investment income and $67,5 25 to decrease paid-in-capital, with a decrease to accumulated net realized gains of $30,614,418.
The tax basis components of distributable earnings and the federal tax cost as of the close of the reporting period were as follows:
| |
| Unrealized appreciation | $115,719,705 |
| Unrealized depreciation | (14,812,673) |
|
| Net unrealized appreciation | 100,907,032 |
| Undistributed ordinary income | 52,774,630 |
| Undistributed short-term gain | 61,969,210 |
| Undistributed long-term gain | 24,464,444 |
| Cost for federal income tax purposes | $2,311,003,870 |
Note 2: Management fee, administration services and other transactions
Effective January 1, 2010, the fund pays Putnam Management a management fee (based on the fund’s average net assets and computed and paid monthly) at annual rates that may vary based on the average of the aggregate net assets of most open-end funds, as defined in the fund’s management contract, sponsored by Putnam Management. Such annual rates may vary as follows: 0.550% of the first $5 billion, 0.500% of the next $5 billion, 0.450% of the next $10 billion, 0.400% of the next $10 billion, 0.350% of the next $50 billion, 0.330% of the next $50 billion, 0.320% of the next $100 billion, and 0.315% thereafter.
Prior to January 1, 2010, the fund paid Putnam Management for management and investment advisory services quarterly based on the average net assets of the fund. Such fee was based on the following annual rates: 0.57% of the first $500 million of average net assets, 0.475% of the next $500 million, 0.4275% of the next $500 million and 0.38% thereafter.
Putnam Management has contractually agreed, through June 30, 2011, to waive fees or reimburse the fund’s expenses to the extent necessary to limit the cumulative expenses of the fund, exclusive of brokerage, interest, taxes, investment-related expenses, extraordinary expenses and payments under the fund’s investor servicing contract, investment management contract and distribution plans, on a fiscal year-to-date basis to an annual rate of 0.20% of the fund’s average net assets over such fiscal year-to-date period. During the reporting period, the fund’s expenses were not reduced as a result of this limit.
Putnam Management has also contractually agreed, through July 31, 2010, to limit the management fee for the fund to an annual rate of 0.412% of the fund’s average net assets. During the reporting period, the fund’s expenses were reduced by $292,298 as a result of this limit.
Effective January 30, 2010, Putnam Investments Limited (PIL), an affiliate of Putnam Management, is authorized by the Trustees to manage a separate portion of the assets of the fund as determined by Putnam Management from time to time. Putnam Management pays a quarterly sub-management fee to PIL for its services at an annual rate of 0.40% of the average net assets of the portion of the fund managed by PIL.
51
On September 15, 2008, the fund terminated its outstanding derivatives contracts with Lehman Brothers Special Financing, Inc. (LBSF) in connection with the bankruptcy filing of LBSF’s parent company, Lehman Brothers Holdings, Inc. On September 26, 2008, the fund entered into a receivable purchase agreement (Agreement) with another registered investment company (the Seller) managed by Putnam Management. Under the Agreement, the Seller sold to the fund the right to receive, in the aggregate, $2,002,118 in net payments from LBSF in connection with certain terminated derivatives transactions (the Receivable), in exchange for an initial payment plus (or minus) additional amounts based on the fund’s ultimate realized gain (or loss) with respect to the Receivable. The Receivable offset against the fund’s net payable to LBSF. The fund paid $622,318 (exclusive of the initial payment) to the Seller in accordance with the terms of the Agreement and the fund paid $81,549,489, including interest, to LBSF in complete satisfaction of the fund’s obligations under the terminated contracts
The fund reimburses Putnam Management an allocated amount for the compensation and related expenses of certain officers of the fund and their staff who provide administrative services to the fund. The aggregate amount of all such reimbursements is determined annually by the Trustees.
Custodial functions for the fund’s assets are provided by State Street. Custody fees are based on the fund’s asset level, the number of its security holdings and transaction volumes.
Putnam Investor Services, Inc., an affiliate of Putnam Management, provides investor servicing agent functions to the fund. Putnam Investor Services, Inc. received fees for investor servicing, based on the fund’s retail asset level, the number of shareholder accounts in the fund and the level of defined contribution plan assets in the fund. Investor servicing fees will not exceed an annual rate of 0.375% of the fund’s average net assets. The amounts incurred for investor servicing agent functions during the reporting period are included in Investor servicing fees in the Statement of operations.
The fund has entered into expense offset arrangements with Putnam Investor Services, Inc. and State Street whereby Putnam Investor Services, Inc.’s and State Street’s fees are reduced by credits allowed on cash balances. For the reporting period, the fund’s expenses were reduced by $9,510 under the expense offset arrangements.
Each independent Trustee of the fund receives an annual Trustee fee, of which $1,124, as a quarterly retainer, has been allocated to the fund, and an additional fee for each Trustees meeting attended. Trustees also are reimbursed for expenses they incur relating to their services as Trustees.
The fund has adopted a Trustee Fee Deferral Plan (the Deferral Plan) which allows the Trustees to defer the receipt of all or a portion of Trustees fees payable on or after July 1, 1995. The deferred fees remain invested in certain Putnam funds until distribution in accordance with the Deferral Plan.
The fund has adopted an unfunded noncontributory defined benefit pension plan (the Pension Plan) covering all Trustees of the fund who have served as a Trustee for at least five years and were first elected prior to 2004. Benefits under the Pension Plan are equal to 50% of the Trustee’s average annual attendance and retainer fees for the three years ended December 31, 2005. The retirement benefit is payable during a Trustee’s lifetime, beginning the year following retirement, for the number of years of service through December 31, 2006. Pension expense for the fund is included in Trustee compensation and expenses in the Statement of operations. Accrued pension liability is included in Payable for Trustee compensation and expenses in the Statement of assets and liabilities. The Trustees have terminated the Pension Plan with respect to any Trustee first elected after 2003.
The fund has adopted distribution plans (the Plans) with respect to its class A, class B, class C, class M and class R shares pursuant to Rule 12b-1 under the Investment Company Act of 1940. The purpose of the Plans is to compensate Putnam Retail Management Limited Partnership, a wholly-owned subsidiary of Putnam Investments, LLC and Putnam Retail Management GP, Inc., for services provided and expenses incurred in distributing shares of the fund. The Plans provide for payments by the fund to Putnam Retail Management Limited Partnership at an annual rate of up to 0.35%, 1.00%, 1.00%, 1.00% and 1.00% of the average net assets attributable to class A, class B, class C, class M and class R shares, respectively. The Trustees have approved payment by the fund at an annual rate of 0.25%, 1.00%, and 0.50% of the average net assets attributable to class A, class C and class R shares, respectively. For class B shares, the annual payment rate will equal the weighted average of (i) 0.85% on the assets of Putnam Limited Duration Government Income Fund attributable to class B shares existing on November 9, 2007; and (ii) 1.00% on all other class of Putnam U.S. Government Income Trust attributable to class B shares. For class M shares, the annual payment rate will equal the weighted average of (i) 0.40% on the net assets of Putnam Limited Duration Government Income Fund attributable to class M shares existing on November 9, 2007; and (ii) 0.50% on all other net assets of Putnam U.S. Government Income Trust attributable to class M shares.
52
For the reporting period, Putnam Retail Management Limited Partnership, acting as underwriter, received net commissions of $287,265 and $7,586 from the sale of class A and class M shares, respectively, and received $40,679 and $21,715 in contingent deferred sales charges from redemptions of class B and class C shares, respectively.
A deferred sales charge of up to 1.00% and 0.40% is assessed on certain redemptions of class A and class M shares, respectively. For the reporting period, Putnam Retail Management Limited Partnership, acting as underwriter, received $8,265 and no monies on class A and class M redemptions, respectively.
Note 3: Purchases and sales of securities
During the reporting period, cost of purchases and proceeds from sales of U.S. government securities and agency obligations other than short-term investments aggregated $5,389,768,186 and $5,159,170,772, respectively.
Written option transactions during the reporting period are summarized as follows:
| | |
| | Contract amounts | Premiums received |
|
| Written options outstanding at | | |
| beginning of the reporting period | $1,771,428,000 | $90,678,452 |
|
| Options opened | 621,923,600 | 25,159,939 |
| Options exercised | (8,541,600) | (224,217) |
| Options expired | (176,543,600) | (6,398,290) |
|
| Written options outstanding | | |
| at end of the reporting period | $2,208,266,400 | $109,215,884 |
|
Note 4: Capital shares
At the close of the reporting period, there was an unlimited number of shares of beneficial interest authorized.
Transactions in capital shares were as follows:
| | | | |
| | Year ended 9/30/10 | Year ended 9/30/09 |
|
| Class A | Shares | Amount | Shares | Amount |
|
| Shares sold | 20,493,719 | $308,354,238 | 12,016,952 | $155,636,783 |
|
| Shares issued in connection with | | | | |
| reinvestment of distributions | 3,621,424 | 54,280,158 | 3,165,171 | 41,148,936 |
|
| | 24,115,143 | 362,634,396 | 15,182,123 | 196,785,719 |
|
| Shares repurchased | (14,973,914) | (224,795,559) | (20,698,125) | (264,938,144) |
|
| Net increase (decrease) | 9,141,229 | $137,838,837 | (5,516,002) | $(68,152,425) |
|
| |
| | Year ended 9/30/10 | Year ended 9/30/09 |
|
| Class B | Shares | Amount | Shares | Amount |
|
| Shares sold | 1,074,346 | $16,089,203 | 1,158,174 | $14,725,960 |
|
| Shares issued in connection with | | | | |
| reinvestment of distributions | 160,771 | 2,397,891 | 204,001 | 2,625,365 |
|
| | 1,235,117 | 18,487,094 | 1,362,175 | 17,351,325 |
|
| Shares repurchased | (2,578,093) | (38,603,519) | (3,408,850) | (43,592,655) |
|
| Net decrease | (1,342,976) | $(20,116,425) | (2,046,675) | $(26,241,330) |
|
| |
| | Year ended 9/30/10 | Year ended 9/30/09 |
|
| Class C | Shares | Amount | Shares | Amount |
|
| Shares sold | 6,240,980 | $93,468,285 | 2,482,798 | $33,209,665 |
|
| Shares issued in connection with | | | | |
| reinvestment of distributions | 209,731 | 3,132,748 | 90,771 | 1,189,170 |
|
| | 6,450,711 | 96,601,033 | 2,573,569 | 34,398,835 |
|
| Shares repurchased | (1,322,521) | (19,780,128) | (1,024,447) | (13,367,776) |
|
| Net increase | 5,128,190 | $76,820,905 | 1,549,122 | $21,031,059 |
|
53
| | | | |
| | Year ended 9/30/10 | Year ended 9/30/09 |
|
| Class M | Shares | Amount | Shares | Amount |
|
| Shares sold | 328,038 | $4,942,890 | 201,378 | $2,617,999 |
|
| Shares issued in connection with | | | | |
| reinvestment of distributions | 29,669 | 445,164 | 25,245 | 327,718 |
|
| | 357,707 | 5,388,054 | 226,623 | 2,945,717 |
|
| Shares repurchased | (408,525) | (6,146,803) | (466,236) | (5,921,219) |
|
| Net decrease | (50,818) | $(758,749) | (239,613) | $(2,975,502) |
|
| |
| | Year ended 9/30/10 | Year ended 9/30/09 |
|
| Class R | Shares | Amount | Shares | Amount |
|
| Shares sold | 738,751 | $11,022,640 | 165,026 | $2,119,955 |
|
| Shares issued in connection with | | | | |
| reinvestment of distributions | 24,030 | 358,133 | 10,044 | 130,975 |
|
| | 762,781 | 11,380,773 | 175,070 | 2,250,930 |
|
| Shares repurchased | (202,700) | (3,027,224) | (114,190) | (1,444,590) |
|
| Net increase | 560,081 | $8,353,549 | 60,880 | $806,340 |
|
| |
| | Year ended 9/30/10 | Year ended 9/30/09 |
|
| Class Y | Shares | Amount | Shares | Amount |
|
| Shares sold | 3,971,450 | $59,247,111 | 539,213 | $7,435,807 |
|
| Shares issued in connection with | | | | |
| reinvestment of distributions | 76,261 | 1,137,404 | 45,658 | 590,260 |
|
| | 4,047,711 | 60,384,515 | 584,871 | 8,026,067 |
|
| Shares repurchased | (1,685,629) | (25,152,661) | (475,168) | (6,250,775) |
|
| Net increase | 2,362,082 | $35,231,854 | 109,703 | $1,775,292 |
|
Note 5: Summary of derivative activity
The following is a summary of the market values of derivative instruments as of the close of the reporting period:
Market values of derivative instruments as of the close of the reporting period
| | | | |
| | Asset derivatives | Liability derivatives |
|
| Derivatives not | | | | |
| accounted for as | Statement of | | Statement of | |
| hedging instruments | assets and | | assets and | |
| under ASC 815 | liabilities location | Market value | liabilities location | Market value |
|
| | Investments, | | | |
| | Receivables, Net assets — | | Payables, Net assets — | |
| Interest rate | Unrealized appreciation/ | | Unrealized appreciation/ | |
| contracts | (depreciation) | $149,583,822* | (depreciation) | $343,861,864* |
|
| Total | | $149,583,822 | | $343,861,864 |
|
* Includes cumulative appreciation/depreciation of futures contracts as reported in The fund’s portfolio. Only current day’s variation margin is reported within the Statement of assets and liabilities.
54
The following is a summary of realized and change in unrealized gains or losses of derivative instruments on the Statement of operations for the reporting period (see Note 1):
Amount of realized gain or (loss) on derivatives recognized in net gain or (loss) on investments
| | | | |
| Derivatives not | | | | |
| accounted for as | | | | |
| hedging instruments | | | | |
| under ASC 815 | Options | Futures | Swaps | Total |
|
| Interest rate contracts | $(12,799,884) | $52,462,829 | $(52,889,581) | $(13,226,636) |
|
| Total | $(12,799,884) | $52,462,829 | $(52,889,581) | $(13,226,636) |
|
Change in unrealized appreciation or (depreciation) on derivatives recognized in net gain or (loss) on investments
| | | | |
| Derivatives not | | | | |
| accounted for as | | | | |
| hedging instruments | | | | |
| under ASC 815 | Options | Futures | Swaps | Total |
|
| Interest rate contracts | $(55,068,729) | $(1,872,359) | $(881,650) | $(57,822,738) |
|
| Total | $(55,068,729) | $(1,872,359) | $(881,650) | $(57,822,738) |
|
Note 6: Investment in Putnam Money Market Liquidity Fund
The fund invested in Putnam Money Market Liquidity Fund, an open-end management investment company managed by Putnam Management. Investments in Putnam Money Market Liquidity Fund are valued at its closing net asset value each business day. Income distributions earned by the fund are recorded as interest income in the Statement of operations and totaled $381,346 for the reporting period. During the reporting period, cost of purchases and proceeds of sales of investments in Putnam Money Market Liquidity Fund aggregated $329,853,659 and $296,871,481, respectively. Management fees charged to Putnam Money Market Liquidity Fund have been waived by Putnam Management.
Note 7: Regulatory matters and litigation
In late 2003 and 2004, Putnam Management settled charges brought by the SEC and the Massachusetts Securities Division in connection with excessive short-term trading in Putnam funds. Distribution of payments from Putnam Management to certain open-end Putnam funds and their shareholders is expected to be completed in the next several months. These allegations and related matters have served as the general basis for certain lawsuits, including purported class action lawsuits against Putnam Management and, in a limited number of cases, some Putnam funds. Putnam Management believes that these lawsuits will have no material adverse effect on the funds or on Putnam Management’s ability to provide investment management services. In addition, Putnam Management has agreed to bear any costs incurred by the Putnam funds as a result of these matters.
Note 8: Market and credit risk
In the normal course of business, the fund trades financial instruments and enters into financial transactions where risk of potential loss exists due to changes in the market (market risk) or failure of the contracting party to the transaction to perform (credit risk). The fund may be exposed to additional credit risk that an institution or other entity with which the fund has unsettled or open transactions will default.
55
Federal tax information (Unaudited)
Pursuant to §852 of the Internal Revenue Code, as amended, the fund hereby designates $24,662,579 as a capital gain dividend with respect to the taxable year ended September 30, 2010, or, if subsequently determined to be different, the net capital gain of such year.
For the tax year ended September 30, 2010, pursuant to §871(k) of the Internal Revenue Code, the fund hereby designates $66,098,037 of distributions paid as qualifying to be taxed as interest-related dividends, and $— to be taxed as short-term capital gain dividends for nonresident alien shareholders.
The Form 1099 that will be mailed to you in January 2011 will show the tax status of all distributions paid to your account in calendar 2010.
56
Shareholder meeting results (Unaudited)
November 19, 2009 meeting
At the meeting, each of the nominees for Trustee was elected, with all funds of the Trust voting together as single class, as follows:
| | | |
| | | Votes for | Votes withheld |
|
| Ravi Akhoury | | 57,551,981 | 1,957,037 |
|
| Jameson A. Baxter | | 57,657,018 | 1,852,000 |
|
| Charles B. Curtis | | 57,645,219 | 1,863,799 |
|
| Robert J. Darretta | | 57,668,569 | 1,840,449 |
|
| Myra R. Drucker | | 57,660,789 | 1,848,229 |
|
| John A. Hill | | 57,636,797 | 1,872,221 |
|
| Paul L. Joskow | | 57,695,480 | 1,813,538 |
|
| Elizabeth T. Kennan* | | 57,652,732 | 1,856,286 |
|
| Kenneth R. Leibler | | 57,654,485 | 1,854,533 |
|
| Robert E. Patterson | | 57,650,614 | 1,858,404 |
|
| George Putnam, III | | 57,656,836 | 1,852,182 |
|
| Robert L. Reynolds | | 57,654,835 | 1,854,183 |
|
| W. Thomas Stephens | | 57,668,456 | 1,840,562 |
|
| Richard B. Worley | | 57,670,676 | 1,838,342 |
|
* Dr. Kennan retired from the Board of Trustees of the Putnam funds effective June 30, 2010.
A proposal to approve a new management contract between the fund and Putnam Management was approved as follows:
| | | |
| Votes | Votes | | Broker |
| for | against | Abstentions | non-votes |
|
| 41,130,685 | 1,246,617 | 1,223,008 | 15,908,708 |
|
All tabulations are rounded to the nearest whole number.
57
About the Trustees
Independent Trustees
| | |
| Name | | |
| Year of birth | | |
| Position held | Principal occupations during past five years | Other directorships |
|
| Ravi Akhoury | Advisor to New York Life Insurance Company. Trustee of | Jacob Ballas Capital |
| Born 1947 | American India Foundation and of the Rubin Museum. | India, a non-banking |
| Trustee since 2009 | From 1992 to 2007, was Chairman and CEO of MacKay | finance company |
| | Shields, a multi-product investment management firm | focused on private |
| | with over $40 billion in assets under management. | equity advisory services |
|
| Barbara M. Baumann | President and Owner of Cross Creek Energy Corporation, | SM Energy Company, |
| Born 1955 | a strategic consultant to domestic energy firms and direct | a publicly held energy |
| Trustee since 2010 | investor in energy assets. Trustee, and Co-Chair of the | company focused on |
| | Finance Committee, of Mount Holyoke College. Former | natural gas and crude |
| | Chair and current board member of Girls Incorporated of | oil in the United States; |
| | Metro Denver. Member of the Finance Committee, The | UniSource Energy |
| | Children’s Hospital of Denver. | Corporation, a publicly |
| | | held provider of natural |
| | | gas and electric service |
| | | across Arizona; Cody |
| | | Resources Management, |
| | | LLP, a privately held |
| | | energy, ranching, and |
| | | commercial real estate |
| | | company |
|
| Jameson A. Baxter | President of Baxter Associates, Inc., a private investment | ASHTA Chemicals, Inc. |
| Born 1943 | firm. Chairman of Mutual Fund Directors Forum. | |
| Trustee since 1994 and | Chairman Emeritus of the Board of Trustees of Mount | |
| Vice Chairman since 2005 | Holyoke College. | |
|
| Charles B. Curtis | President Emeritus of the Nuclear Threat Initiative, a | Edison International; |
| Born 1940 | private foundation dealing with national security issues. | Southern California |
| Trustee since 2001 | Senior Advisor to the United Nations Foundation. Senior | Edison |
| | Advisor to the Center for Strategic and International | |
| Studies. Member of the Council on Foreign Relations and | |
| | the National Petroleum Council. | |
|
| Robert J. Darretta | Health Care Industry Advisor to Permira, a global private | United-Health |
| Born 1946 | equity firm. Until April 2007, was Vice Chairman of the | Group, a diversified |
| Trustee since 2007 | Board of Directors of Johnson & Johnson. Served as | health-care company |
| Johnson & Johnson’s Chief Financial Officer for a decade. | |
|
| Myra R. Drucker | Vice Chair of the Board of Trustees of Sarah Lawrence | Grantham, Mayo, |
| Born 1948 | College, and a member of the Investment Committee of | Van Otterloo & Co., |
| Trustee since 2004 | the Kresge Foundation, a charitable trust. Advisor to the | LLC, an investment |
| | Employee Benefits Investment Committee of The Boeing | management company |
| Company. Retired in 2009 as Chair of the Board of Trustees | |
| of Commonfund, a not-for-profit firm that manages assets | |
| for educational endowments and foundations. Until July | |
| 2010, Advisor to RCM Capital Management and member of | |
| | the Board of Interactive Data Corporation. | |
|
| John A. Hill | Founder and Vice-Chairman of First Reserve | Devon Energy |
| Born 1942 | Corporation, the leading private equity buyout firm | Corporation, a leading |
| Trustee since 1985 and | focused on the worldwide energy industry. Serves as a | independent natural gas |
| Chairman since 2000 | Trustee and Chairman of the Board of Trustees of Sarah | and oil exploration and |
| | Lawrence College. Also a member of the Advisory Board | production company |
| | of the Millstein Center for Corporate Governance and | |
| | Performance at the Yale School of Management. | |
|
58
| | |
| Name | | |
| Year of birth | | |
| Position held | Principal occupations during past five years | Other directorships |
|
| Paul L. Joskow | Economist and President of the Alfred P. Sloan | TransCanada |
| Born 1947 | Foundation, a philanthropic institution focused primarily | Corporation, an energy |
| Trustee since 1997 | on research and education on issues related to science, | company focused on |
| | technology, and economic performance. Elizabeth and | natural gas transmission |
| | James Killian Professor of Economics and Management, | and power services; |
| | Emeritus at the Massachusetts Institute of Technology | Exelon Corporation, an |
| | (MIT). Prior to 2007, served as the Director of the Center | energy company focused |
| | for Energy and Environmental Policy Research at MIT. | on power services |
|
| Kenneth R. Leibler | Founder and former Chairman of Boston Options | Northeast Utilities, |
| Born 1949 | Exchange, an electronic marketplace for the trading | which operates New |
| Trustee since 2006 | of derivative securities. Vice Chairman of the Board of | England’s largest energy |
| | Trustees of Beth Israel Deaconess Hospital in Boston, | delivery system |
| Massachusetts. Until November 2010, director of Ruder | |
| Finn Group, a global communications and advertising firm. | |
|
| Robert E. Patterson | Senior Partner of Cabot Properties, LP and Co-Chairman | None |
| Born 1945 | of Cabot Properties, Inc., a private equity firm investing in | |
| Trustee since 1984 | commercial real estate. Past Chairman and Trustee of the | |
| | Joslin Diabetes Center. | |
|
| George Putnam, III | Chairman of New Generation Research, Inc., a publisher | None |
| Born 1951 | of financial advisory and other research services, and | |
| Trustee since 1984 | founder and President of New Generation Advisors, LLC, | |
| | a registered investment advisor to private funds. | |
| Director of The Boston Family Office, LLC, a registered | |
| | investment advisor. | |
|
| W. Thomas Stephens | Retired as Chairman and Chief Executive Officer of Boise | TransCanada |
| Born 1942 | Cascade, LLC, a paper, forest products, and timberland | Corporation, an energy |
| Trustee from 1997 to 2008 | assets company, in December 2008. | company focused on |
| and since 2009 | | natural gas transmission |
| | | and power services |
|
| Richard B. Worley | Managing Partner of Permit Capital LLC, an investment | Neuberger Berman, |
| Born 1945 | management firm. Serves as a Trustee of the University of | an investment |
| Trustee since 2004 | Pennsylvania Medical Center, the Robert Wood Johnson | management firm |
| | Foundation, a philanthropic organization devoted to | |
| health-care issues, and the National Constitution Center. | |
| | Also serves as a Director of the Colonial Williamsburg | |
| Foundation, a historical preservation organization, and as | |
| | Chairman of the Philadelphia Orchestra Association. | |
|
| Interested Trustee | | |
|
| Robert L. Reynolds* | President and Chief Executive Officer of Putnam | None |
| Born 1952 | Investments since 2008. Prior to joining Putnam | |
| Trustee since 2008 and | Investments, served as Vice Chairman and Chief | |
| President of the Putnam | Operating Officer of Fidelity Investments from | |
| Funds since July 2009 | 2000 to 2007. | |
|
The address of each Trustee is One Post Office Square, Boston, MA 02109.
As of September 30, 2010, there were 104 Putnam funds. All Trustees serve as Trustees of all Putnam funds.
Each Trustee serves for an indefinite term, until his or her resignation, retirement at age 72, removal, or death.
* Mr. Reynolds is an “interested person” (as defined in the Investment Company Act of 1940) of the fund, Putnam Management, and/or Putnam Retail Management. He is President and Chief Executive Officer of Putnam Investments, as well as the President of your fund and each of the other Putnam funds.
59
Officers
In addition to Robert L. Reynolds, the other officers of the fund are shown below:
| |
| Jonathan S. Horwitz (Born 1955) | Francis J. McNamara, III (Born 1955) |
| Executive Vice President, Principal Executive | Vice President and Chief Legal Officer |
| Officer, Treasurer and Compliance Liaison | Since 2004 |
| Since 2004 | Senior Managing Director, Putnam Investments |
| Senior Vice President and Treasurer, | and Putnam Management |
| The Putnam Funds | |
| | James P. Pappas (Born 1953) |
| Steven D. Krichmar (Born 1958) | Vice President |
| Vice President and Principal Financial Officer | Since 2004 |
| Since 2002 | Managing Director, Putnam Investments and |
| Senior Managing Director, Putnam Investments | Putnam Management |
| and Putnam Management | |
| | Judith Cohen (Born 1945) |
| Janet C. Smith (Born 1965) | Vice President, Clerk and Assistant Treasurer |
| Vice President, Assistant Treasurer and Principal | Since 1993 |
| Accounting Officer | Vice President, Clerk and Assistant Treasurer, |
| Since 2007 | The Putnam Funds |
| Managing Director, Putnam Investments and | |
| Putnam Management | Michael Higgins (Born 1976) |
| | Vice President, Senior Associate Treasurer and |
| Beth S. Mazor (Born 1958) | Assistant Clerk |
| Vice President | Since 2010 |
| Since 2002 | Manager of Finance, Dunkin’ Brands (2008– |
| Managing Director, Putnam Investments and | 2010); Senior Financial Analyst, Old Mutual Asset |
| Putnam Management | Management (2007–2008); Senior Financial |
| | Analyst, Putnam Investments (1999–2007) |
| Robert R. Leveille (Born 1969) | |
| Vice President and Chief Compliance Officer | Nancy E. Florek (Born 1957) |
| Since 2007 | Vice President, Assistant Clerk, |
| Managing Director, Putnam Investments, | Assistant Treasurer and Proxy Manager |
| Putnam Management and Putnam | Since 2000 |
| Retail Management | Vice President, Assistant Clerk, |
| | Assistant Treasurer and Proxy Manager, |
| Mark C. Trenchard (Born 1962) | The Putnam Funds |
| Vice President and BSA Compliance Officer | |
| Since 2002 | Susan G. Malloy (Born 1957) |
| Managing Director, Putnam Investments and | Vice President and Assistant Treasurer |
| Putnam Retail Management | Since 2007 |
| | Managing Director, Putnam Management |
The principal occupations of the officers for the past five years have been with the employers as shown above although in some cases, they have held different positions with such employers. The address of each Officer is One Post Office Square, Boston, MA 02109.
60
Fund information
Founded over 70 years ago, Putnam Investments was built around the concept that a balance between risk and reward is the hallmark of a well-rounded financial program. We manage over 100 funds across income, value, blend, growth, asset allocation, absolute return, and global sector categories.
| | |
| Investment Manager | Myra R. Drucker | Mark C. Trenchard |
| Putnam Investment | Paul L. Joskow | Vice President and BSA |
| Management, LLC | Kenneth R. Leibler | Compliance Officer |
| One Post Office Square | Robert E. Patterson | |
| Boston, MA 02109 | George Putnam, III | Francis J. McNamara, III |
| | Robert L. Reynolds | Vice President and |
| Investment Sub-Manager | W. Thomas Stephens | Chief Legal Officer |
| Putnam Investments Limited | Richard B. Worley | |
| 57–59 St James’s Street | | James P. Pappas |
| London, England SW1A 1LD | Officers | Vice President |
| | Robert L. Reynolds | |
| Marketing Services | President | Judith Cohen |
| Putnam Retail Management | | Vice President, Clerk |
| One Post Office Square | Jonathan S. Horwitz | and Assistant Treasurer |
| Boston, MA 02109 | Executive Vice President, | |
| | Principal Executive | Michael Higgins |
| Custodian | Officer, Treasurer and | Vice President, Senior Associate |
| State Street Bank | Compliance Liaison | Treasurer and Assistant Clerk |
| and Trust Company | | |
| | Steven D. Krichmar | Nancy E. Florek |
| Legal Counsel | Vice President and | Vice President, Assistant Clerk, |
| Ropes & Gray LLP | Principal Financial Officer | Assistant Treasurer and |
| | | Proxy Manager |
| Independent Registered | Janet C. Smith | |
| Public Accounting Firm | Vice President, Assistant | Susan G. Malloy |
| KPMG LLP | Treasurer and Principal | Vice President and |
| | Accounting Officer | Assistant Treasurer |
| Trustees | | |
| John A. Hill, Chairman | Beth S. Mazor | |
| Jameson A. Baxter, | Vice President | |
| Vice Chairman | | |
| Ravi Akhoury | Robert R. Leveille | |
| Barbara M. Baumann | Vice President and | |
| Charles B. Curtis | Chief Compliance Officer | |
| Robert J. Darretta | | |
This report is for the information of shareholders of Putnam U.S. Government Income Trust. It may also be used as sales literature when preceded or accompanied by the current prospectus, the most recent copy of Putnam’s Quarterly Performance Summary, and Putnam’s Quarterly Ranking Summary. For more recent performance, please visit putnam.com. Investors should carefully consider the investment objective, risks, charges, and expenses of a fund, which are described in its prospectus. For this and other information or to request a prospectus, or a summary prospectus if available, call 1-800-225-1581 toll free. Please read the prospectus carefully before investing. The fund’s Statement of Additional Information contains additional information about the fund’s Trustees and is available without charge upon request by calling 1-800-225-1581.
Item 2. Code of Ethics:
(a) The fund’s principal executive, financial and accounting officers are employees of Putnam Investment Management, LLC, the Fund's investment manager. As such they are subject to a comprehensive Code of Ethics adopted and administered by Putnam Investments which is designed to protect the interests of the firm and its clients. The Fund has adopted a Code of Ethics which incorporates the Code of Ethics of Putnam Investments with respect to all of its officers and Trustees who are employees of Putnam Investment Management, LLC. For this reason, the Fund has not adopted a separate code of ethics governing its principal executive, financial and accounting officers.
(c) In May 2008, the Code of Ethics of Putnam Investment Management, LLC was updated in its entirety to include the amendments adopted in August 2007 as well as a several additional technical, administrative and non-substantive changes. In May of 2009, the Code of Ethics of Putnam Investment Management, LLC was amended to reflect that all employees will now be subject to a 90-day blackout restriction on holding Putnam open-end funds, except for portfolio managers and their supervisors (and each of their immediate family members), who will be subject to a one-year blackout restriction on the funds that they manage or supervise. In June 2010, the Code of Ethics of Putnam Investments was updated in its entirety to include the amendments adopted in May of 2009 and to change certain rules and limits contained in the Code of Ethics. In addition, the updated Code of Ethics included numerous technical, administrative and non - -substantive changes, which were intended primarily to make the document easier to navigate and understand.
Item 3. Audit Committee Financial Expert:
The Funds' Audit and Compliance Committee is comprised solely of Trustees who are "independent" (as such term has been defined by the Securities and Exchange Commission ("SEC") in regulations implementing Section 407 of the Sarbanes-Oxley Act (the "Regulations")). The Trustees believe that each of the members of the Audit and Compliance Committee also possess a combination of knowledge and experience with respect to financial accounting matters, as well as other attributes, that qualify them for service on the Committee. In addition, the Trustees have determined that each of Mr. Patterson, Mr. Leibler, Mr. Hill, Mr. Darretta and Ms. Baumann qualifies as an "audit committee financial expert" (as such term has been defined by the Regulations) based on their review of his or her pertinent experience and education. The SEC has stated that the designation or identification of a person as an audit committee financial expert pursuant to this Item 3 of Form N- CSR does not impose on such person any duties, obligations or liability that are greater than the duties, obligations and liability imposed on such person as a member of the Audit and Compliance Committee and the Board of Trustees in the absence of such designation or identification.
Item 4. Principal Accountant Fees and Services:
The following table presents fees billed in each of the last two fiscal years for services rendered to the fund by the fund’s independent auditor:
| | | | |
| Fiscal | | Audit- | | |
| year | Audit | Related | Tax | All Other |
| ended | Fees | Fees | Fees | Fees |
| |
| September 30, 2010 | $86,002 | $-- | $4,300 | $-- |
| September 30, 2009 | $89,093 | $-- | $4,300 | $-- |
For the fiscal years ended September 30, 2010 and September 30, 2009, the fund’s independent auditor billed aggregate non-audit fees in the amounts of $ 4,300 and $4,300 respectively, to the fund, Putnam Management and any entity controlling, controlled by or under common control with Putnam Management that provides ongoing services to the fund.
Audit Fees represent fees billed for the fund's last two fiscal years relating to the audit and review of the financial statements included in annual reports and registration statements, and other services that are normally provided inconnection with statutory and regulatory filings or engagements.
Audit-Related Fees represent fees billed in the fund’s last two fiscal years for services traditionally performed by the fund’s auditor, including accounting consultation for proposed transactions or concerning financial accounting and reporting standards and other audit or attest services not required by statute or regulation.
Tax Fees represent fees billed in the fund’s last two fiscal years for tax compliance, tax planning and tax advice services. Tax planning and tax advice services include assistance with tax audits, employee benefit plans and requests for rulings or technical advice from taxing authorities.
Pre-Approval Policies of the Audit and Compliance Committee. The Audit and Compliance Committee of the Putnam funds has determined that, as a matter of policy, all work performed for the funds by the funds’ independent auditors will be pre-approved by the Committee itself and thus will generally not be subject to pre-approval procedures.
The Audit and Compliance Committee also has adopted a policy to pre-approve the engagement by Putnam Management and certain of its affiliates of the funds’ independent auditors, even in circumstances where pre-approval is not required by applicable law. Any such requests by Putnam Management or certain of its affiliates are typically submitted in writing to the Committee and explain, among other things, the nature of the proposed engagement, the estimated fees, and why this work should be performed by that particular audit firm as opposed to another one. In reviewing such requests, the Committee considers, among other things, whether the provision of such services by the audit firm are compatible with the independence of the audit firm.
The following table presents fees billed by the fund’s independent auditor for services required to be approved pursuant to paragraph (c)(7)(ii) of Rule 2-01 of Regulation S-X.
| | | | |
| Fiscal | Audit- | | All | Total |
| year | Related | Tax | Other | Non-Audit |
| ended | Fees | Fees | Fees | Fees |
| | | | |
| September 30, 2010 | $ - | $ - | $ - | $ - |
| September 30, 2009 | $ - | $ - | $ - | $ - |
Item 5. Audit Committee of Listed Registrants
Not applicable
Item 6. Schedule of Investments:
The registrant’s schedule of investments in unaffiliated issuers is included in the report to shareholders in Item 1 above.
Item 7. Disclosure of Proxy Voting Policies and Procedures For Closed- End Management Investment Companies:
Not applicable
Item 8. Portfolio Managers of Closed- End Investment Companies
Not Applicable
Item 9. Purchases of Equity Securities by Closed-End Management Investment Companies and Affiliated Purchasers:
Not applicable
Item 10. Submission of Matters to a Vote of Security Holders:
Not applicable
Item 11. Controls and Procedures:
(a) The registrant's principal executive officer and principal financial officer have concluded, based on their evaluation of the effectiveness of the design and operation of the registrant's disclosure controls and procedures as of a date within 90 days of the filing date of this report, that the design and operation of such procedures are generally effective to provide reasonable assurance that information required to be disclosed by the registrant in this report is recorded, processed, summarized and reported within the time periods specified in the Commission's rules and forms.
(b) Changes in internal control over financial reporting: Not applicable
Item 12. Exhibits:
(a)(1) The Code of Ethics of The Putnam Funds, which incorporates the Code of Ethics of Putnam Investments, is filed herewith.
(a)(2) Separate certifications for the principal executive officer and principal financial officer of the registrant as required by Rule 30a-2(a) under the Investment Company Act of 1940, as amended, are filed herewith.
(b) The certifications required by Rule 30a-2(b) under the Investment Company Act of 1940, as amended, are filed herewith.
SIGNATURES
Pursuant to the requirements of the Securities Exchange Act of 1934 and the Investment Company Act of 1940, the registrant has duly caused this report to be signed on its behalf by the undersigned, thereunto duly authorized.
Putnam U.S. Government Income Trust
By (Signature and Title):
/s/Janet C. Smith
Janet C. Smith
Principal Accounting Officer
Date: November 24, 2010
Pursuant to the requirements of the Securities Exchange Act of 1934 and the Investment Company Act of 1940, this report has been signed below by the following persons on behalf of the registrant and in the capacities and on the dates indicated.
By (Signature and Title):
/s/Jonathan S. Horwitz
Jonathan S. Horwitz
Principal Executive Officer
Date: November 24, 2010
By (Signature and Title):
/s/Steven D. Krichmar
Steven D. Krichmar
Principal Financial Officer
Date: November 24, 2010