| | |
| UNITED STATES
SECURITIES AND EXCHANGE COMMISSION |
| | |
| CERTIFIED SHAREHOLDER REPORT OF REGISTERED
MANAGEMENT INVESTMENT COMPANIES
|
| | |
| Investment Company Act file number: | (811-03897) |
| | |
| Exact name of registrant as specified in charter: | Putnam U.S. Government Income Trust |
| | |
| Address of principal executive offices: | One Post Office Square, Boston, Massachusetts 02109 |
| | |
| Name and address of agent for service: | Robert T. Burns, Vice President
One Post Office Square
Boston, Massachusetts 02109 |
| | |
| Copy to: | John W. Gerstmayr, Esq.
Ropes & Gray LLP
800 Boylston Street
Boston, Massachusetts 02199-3600 |
| | |
| Registrant’s telephone number, including area code: | (617) 292-1000 |
| | |
| Date of fiscal year end: | September 30, 2012 |
| | |
| Date of reporting period: | October 1, 2011 — September 30, 2012 |
| | |
|
Item 1. Report to Stockholders: | |
| | |
| The following is a copy of the report transmitted to stockholders pursuant to Rule 30e-1 under the Investment Company Act of 1940: | |

Putnam
U.S. Government
Income Trust
Annual report
9 | 30 | 12
| | |
| Message from the Trustees | 1 | |
| |
| About the fund | 2 | |
| |
| Performance snapshot | 4 | |
| |
| Interview with your fund’s portfolio managers | 5 | |
| |
| Your fund’s performance | 11 | |
| |
| Your fund’s expenses | 14 | |
| |
| Terms and definitions | 16 | |
| |
| Other information for shareholders | 17 | |
| |
| Trustee approval of management contract | 18 | |
| |
| Financial statements | 23 | |
| |
| Federal tax information | 65 | |
| |
| About the Trustees | 66 | |
| |
| Officers | 68 | |
| |
Consider these risks before investing: Funds that invest in government securities are not guaranteed. Mortgage-backed securities are subject to prepayment risk. The use of derivatives involves additional risks, such as the potential inability to terminate or sell derivatives positions and the potential failure of the other party to the instrument to meet its obligations. Bond investments are subject to interest-rate risk, which means the prices of the fund’s bond investments are likely to fall if interest rates rise. Bond investments also are subject to credit risk, which is the risk that the issuer of the bond may default on payment of interest or principal. Interest-rate risk is generally greater for longer-term bonds, and credit risk is generally greater for below-investment-grade bonds, which may be considered speculative. Unlike bonds, funds that invest in bonds have ongoing fees and expenses. The prices of bonds in the fund’s portfolio may fall or fail to rise over extended periods of time for a variety of reasons, including both general financial market conditions and factors related to a specific issuer or industry.
Message from the Trustees
Dear Fellow Shareholder:
Coordinated action by central banks on both sides of the Atlantic helped lift both equity and fixed-income markets this year. Global markets continue to show signs of vulnerability, however, with investors growing more concerned about economic slowdowns in the United States, Europe, and emerging markets, particularly China. The outcome of the U.S. presidential election and the impending “fiscal cliff” are additional sources of potential volatility.
Putnam’s veteran investment team relies on fundamental research and experienced judgment to seek opportunities and manage risk in this environment. In the same way, it is prudent for long-term investors to rely on the expertise of a trusted financial advisor, who can help you work toward your financial goals.
We would like to take this opportunity to announce the arrival of two new Trustees, Liaquat Ahamed and Katinka Domotorffy, CFA, to your fund’s Board of Trustees. Mr. Ahamed, who in 2010 won the Pulitzer Prize for History with his book, Lords of Finance: The Bankers Who Broke the World, also serves on the Board of Aspen Insurance and the Board of the Rohatyn Group, an emerging-market fund complex that manages money for institutional investors.
Ms. Domotorffy, who until year-end 2011 was a Partner, Chief Investment Officer, and Global Head of Quantitative Investment Strategies at Goldman Sachs Asset Management, currently serves as a member of the Anne Ray Charitable Trust’s Investment Committee, Margaret A. Cargill Philanthropies, and director for Reach Out and Read of Greater New York, an organization dedicated to promoting early childhood literacy.
We would also like to extend a welcome to new shareholders of the fund and to thank all of our investors for your continued confidence in Putnam.

About the fund
Seeking opportunities through mortgage-backed securities
Home ownership is the most common way to invest in the real estate market, but it is not the only way. It is also possible for individuals to invest in the mortgages used to finance homes and businesses through instruments called mortgage-backed securities (MBS).
Since 1984, Putnam U.S. Government Income Trust has invested in some of the highest-quality MBS with the goal of maximizing income. However, investing in MBS carries certain risks. As a result, your fund’s team of experienced analysts uses proprietary models to seek out investment opportunities, while striving to maintain an appropriate amount of risk for the fund.
MBS are essentially securities that represent a stake in the principal from, and interest paid on, a collection of mortgages. Most MBS are created when government agencies or government-sponsored entities, including Fannie Mae, Ginnie Mae, and Freddie Mac, buy mortgages from financial institutions, such as banks or credit unions, and package them together by the thousands. These pools of mortgages act as collateral for the MBS that government-sponsored entities sell to different investors, including Putnam U.S. Government Income Trust.
By seeking opportunities among MBS, your fund’s managers seek higher returns than Treasuries can typically offer, but with less volatility than stocks.
Understanding mortgage-related securities
MBS (Mortgage-backed securities): MBS are pools of mortgages used as collateral for issuing a security. These securities represent claims on the principal and interest payments made by the borrowers whose loans are in the pool.
Fannie Mae (Federal National Mortgage Association) and Freddie Mac (Federal Home Loan Mortgage Corporation): Formerly public companies, Fannie Mae and Freddie Mac were placed under conservatorship by the U.S. government in September 2008 and are now controlled by the Federal Housing Finance Agency. Both companies buy mortgages from primary lenders (savings and loans, commercial banks, credit unions, and housing finance agencies) and develop MBS that may carry an explicit government guarantee on the payment of principal and interest.
Ginnie Mae (Government National Mortgage Association): Ginnie Mae is a government-owned corporation established in 1968 whose MBS are backed by the full faith and credit of the U.S. government.
CMOs (Collateralized mortgage obligations): CMOs are structured mortgage-backed securities that use pools of MBS, or mortgage loans themselves, as collateral and carve the cash flows into different classes to meet the needs of various investors.
| | |
| 2 | U.S. Government Income Trust | U.S. Government Income Trust | 3 |

Current performance may be lower or higher than the quoted past performance, which cannot guarantee future results. Share price, principal value, and return will fluctuate, and you may have a gain or a loss when you sell your shares. Performance of class A shares assumes reinvestment of distributions and does not account for taxes. Fund returns in the bar chart do not reflect a sales charge of 4.00%; had they, returns would have been lower. See pages 5 and 11–13 for additional performance information. For a portion of the periods, the fund had expense limitations, without which returns would have been lower. To obtain the most recent month-end performance, visit putnam.com.
| |
| 4 | U.S. Government Income Trust |
Interview with your fund’s portfolio managers

What was the market environment like for government securities during the 12 months ended September 30, 2012?
Mike: Amid the crosscurrents of declining interest rates, the ebb and flow of concern about Europe’s sovereign debt crisis, mixed global economic data, and accommodative monetary policy, U.S. government securities posted moderate returns for the period. The continuation of the Federal Reserve’s low-interest-rate policy, the European Central Bank’s Long-Term Refinancing Operation, and plentiful liquidity in the marketplace helped foster an environment in which risk-taking was rewarded. As a result, bonds in sectors with greater credit or market risk that trade at a yield premium to U.S. Treasuries — so called “spread sectors” —outperformed government securities.
Treasuries and government agency securities were buffeted during periods when rising interest rates and improved global economic sentiment tempered demand for more rate-sensitive, higher-quality bonds. Agency mortgage-backed securities [agency pass-throughs] outperformed Treasuries, but were hampered by concern over revisions to the government’s Home Affordable Refinance Program [HARP] that were designed to spur more refinancing activity. Additionally, agency pass-throughs were held back by their relatively short duration — a measure of interest-rate sensitivity — which limited their price appreciation as yields declined.
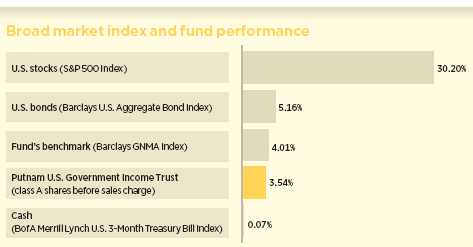
This comparison shows your fund’s performance in the context of broad market indexes for the 12 months ended 9/30/12. See pages 4 and 11–13 for additional fund performance information. Index descriptions can be found on pages 16–17.
| |
| U.S. Government Income Trust | 5 |
Agency pass-throughs received a boost during the period’s final months when investors began to snap them up in anticipation of increased Fed purchases under “QE3,” which was launched in mid September. Under the program, the Fed plans to buy $40 billion of agency pass-throughs every month until the job market improves. The central bank also affirmed that it would continue “Operation Twist” through December. Under Operation Twist, the Fed is helping to keep long-term Treasury yields low by selling short-term bonds and buying longer-term ones.
What strategies helped the fund’s relative performance during the period?
Dan: Our strategy of combining lower-coupon agency pass-throughs with interest-only collateralized mortgage obligations [IO CMOs] contributed the most versus the index. Lower-coupon pass-throughs are backed by mortgages carrying relatively low interest rates, which have a smaller probability of being refinanced, particularly if rates rise. By blending lower-coupon pass-throughs with IO CMOs, we were able to synthetically create higher-yielding positions that outperformed higher-coupon Ginnie Mae bonds.
In general, IO CMOs benefited from improved risk sentiment, as the European sovereign debt crisis remained contained. Additionally, refinancing activity on the mortgage pools underlying the IO CMOs that we held was low, as bank-lending standards remained relatively tight during the period, boosting the securities’ prices. All told, the fund benefited from the increased total return generated by this lower-coupon pass-through/IO CMO structure, while holding securities that were largely immune from losing value due to refinancing and resulting prepayment.
Another strategy that helped the fund was our overweight in higher-coupon Ginnie Maes coupled with an underweight in Ginnie Maes carrying coupons of 4%–4.5%. During the period, changes in the Federal Housing Administration’s [FHA] refinancing program

Allocations are represented as a percentage of net assets. Summary information may differ from the portfolio schedule included in the financial statements due to the inclusion of derivative securities and the exclusion of as-of trades, if any. Holdings and allocations may vary over time. Percentages may not total 100% of net assets because cash may be set aside as collateral for certain securities holdings, such as to-be-announced (TBA) commitments.
| |
| 6 | U.S. Government Income Trust |
accelerated the prepayment speeds of mortgage pools underlying Ginnie Maes, particularly those with 4%–4.5% coupons. So this was an area of the market that we largely avoided.

Lastly, security selection among agency pass-throughs issued after the HARP cut-off date, which tended to be less prepayment sensitive, also aided the fund’s relative performance. By way of background, HARP was launched in 2009 to help homeowners who owed more on their mortgages than their homes were worth. When HARP was established, the government stipulated that loans originating before June 2009 would be eligible for the streamlined refinancing process offered under HARP, while mortgages created after that date would not be eligible. As a result, mortgages originating after June 2009 would be more cumbersome to refinance, and the securities created from these mortgage pools would have relatively slow prepayment rates.
What risk does prepayment pose for investors in mortgage-backed securities [MBS]?
Dan: All MBS are subject to prepayment risk, because mortgage holders have the right to prepay their loans without penalty. A homeowner will prepay a mortgage by selling the property, refinancing the mortgage, or otherwise paying off the loan in part or entirely. Fast prepayments are generally unwelcome for holders of MBS priced above their $100 par value. That’s because prepayment would result in the loss of the security’s price premium on the prepaid balance. For example, if a security is priced at $105 and, hypothetically speaking, all the
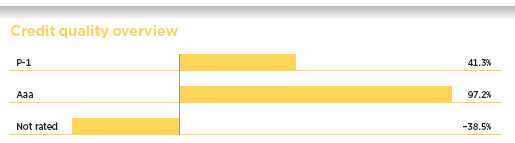
Credit qualities are shown as a percentage of the fund’s net assets as of 9/30/12. A bond rated Baa or higher (Prime-3 or higher, for short-term debt) is considered investment grade. The chart reflects Moody’s ratings; percentages may include bonds or derivatives not rated by Moody’s but rated by Standard & Poor’s (S&P) or, if unrated by S&P, by Fitch, and then included in the closest equivalent Moody’s rating. Ratings will vary over time.
Credit quality represents only the fixed-income portion of the portfolio. Convertible bonds are excluded from the calculation. Derivative instruments, including currency forwards, are only included to the extent of any unrealized gain or loss on such instruments and are shown in the not-rated category. Cash is also shown in the not-rated category. The fund itself has not been rated by an independent rating agency.
A negative percentage reflects the effect of fund strategies that are designed to enhance performance if certain securities decline in value.
| |
| U.S. Government Income Trust | 7 |
borrowers prepay, investors would get back $100 on bonds that had been valued at $105.
What factors hampered the fund’s return versus the benchmark?
Mike: Given the low level of Treasury yields and expectations for modestly improving U.S. economic growth, we took a cautious approach toward interest-rate risk by keeping the fund’s duration shorter than the benchmark. However, this positioning, which can be beneficial when rates are rising, dampened performance because interest rates, while volatile during the period, ended the period lower across the yield curve.
The fund holds both agency pass-throughs and to-be-announced commitments [TBAs] to purchase pass-throughs. How do these differ?
Mike: TBAs allow us to purchase pass-throughs for a fixed price at a future date. Frequently, TBAs are more liquid than regular pass-throughs, and may represent a better value in terms of their total return potential. We prefer to hold cash or high-grade debt in amounts sufficient to meet our TBA commitments. As a result, it may appear that the fund has allocated a substantial portion of the portfolio to cash, while in actuality we’re simply holding cash to collateralize our TBAs.
How did you use derivatives during the period?
Mike: We used bond futures and interest-rate swaps — which allow two parties to exchange one stream of future interest payments for another, based on a specified principal amount — to take tactical positions at various points along the yield curve. In addition, we employed interest-rate swaps and “swaptions” — which give us the option to enter into a swap contract — to hedge the interest-rate risk associated with our mortgage pass-through and IO CMO holdings.
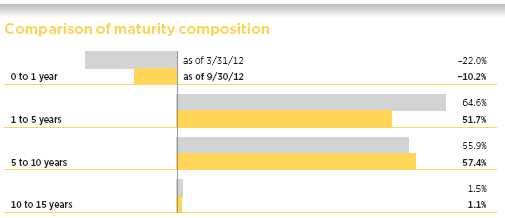
This chart illustrates the fund’s composition by maturity, showing the percentage of holdings in different maturity ranges and how the composition has changed over the past six months. Holdings and maturity ranges will vary over time.
A negative percentage reflects the effect of fund strategies that are designed to enhance performance if certain securities decline in value.
| |
| 8 | U.S. Government Income Trust |
The fund reduced its distribution rate during the period. What led to that decision?
Mike: The fund’s distribution rate per class A share was lowered to $0.038 from $0.065 in August, due to an overall decline in the amount of interest income earned by the fund — a result of generally lower yields in the marketplace. The distribution rates for other share classes were also reduced.
What is your outlook for the months ahead?
Dan: The Fed’s massive buying power has placed a valuation floor under agency pass-throughs that, in our view, may bolster their performance as long as the central bank remains active in the market. Additionally, given the Fed’s accommodative monetary policy, we believe agency pass-through yields may remain near current ranges over the near term.
We continue to have a positive outlook for prepayment rates among securities backed by mortgages where borrowers have little incentive to refinance. As a result, if prepayment rates stay in line with what the market is anticipating, we believe IO CMOs may continue to deliver solid risk-adjusted performance.
Thanks for your time and for bringing us up to date, gentlemen.
The views expressed in this report are exclusively those of Putnam Management and are subject to change. They are not meant as investment advice.
Please note that the holdings discussed in this report may not have been held by the fund for the entire period. Portfolio composition is subject to review in accordance with the fund’s investment strategy and may vary in the future. Current and future portfolio holdings are subject to risk.
A word about derivatives
Derivatives are an increasingly common type of investment instrument, the performance of which is derived from an underlying security, index, currency, or other area of the capital markets. Derivatives employed by the fund’s managers generally serve one of two main purposes: to implement a strategy that may be difficult or more expensive to invest in through traditional securities, or to hedge unwanted risk associated with a particular position.
For example, the fund’s managers might use forward currency contracts to capitalize on an anticipated change in exchange rates between two currencies. This approach would require a significantly smaller outlay of capital than purchasing traditional bonds denominated in the underlying currencies. In another example, the managers may identify a bond that they believe is undervalued relative to its risk of default, but may seek to reduce the interest-rate risk of that bond by using interest-rate swaps, a derivative through which two parties “swap” payments based on the movement of certain rates.
Like any other investment, derivatives may not appreciate in value and may lose money. Derivatives may amplify traditional fixed-income risks through the creation of leverage and may be less liquid than traditional securities. And because derivatives typically represent contractual agreements between two financial institutions, derivatives entail “counterparty risk,” which is the risk that the other party is unable or unwilling to pay. Putnam monitors the counterparty risks we assume. For some types of derivatives, Putnam also seeks to mitigate the level of ongoing counterparty credit risk by entering into collateral agreements with counterparties that require the counterparties to post collateral on a regular basis to cover their obligations to the fund.
| |
| U.S. Government Income Trust | 9 |
Portfolio Manager Michael V. Salm is Co-Head of Fixed Income at Putnam. He has a B.A. from Cornell University. Michael joined Putnam in 1997 and has been in the investment industry since 1989.
Portfolio Manager Daniel S. Choquette holds a B.A. from Yale University and a B.A. from the Royal Conservatory of Music. A CFA charterholder, he joined Putnam in 2002 and has been in the investment industry since 1997.
IN THE NEWS
Global economic growth is losing steam, according to the International Monetary Fund (IMF), with the majority of the world’s advanced economies expected to contract in 2012, or expand at anemic rates of less than 2%. Several issues are challenging economic growth, including Europe’s sovereign debt troubles, the impending “fiscal cliff” in the United States, and high unemployment in various economies. Unless leaders take meaningful steps to address these issues, the current global economic expansion may slow to the weakest level since 2009’s Great Recession. These issues are weighing increasingly on the global economy. In July, the IMF predicted that global growth would be 3.5% in 2012, rising to 3.9% in 2013, but now, in its recently released World Economic Outlook, the IMF has revised its growth forecasts downwards, to growth of just 3.3% this year, and 3.6% in 2013.
| |
| 10 | U.S. Government Income Trust |
Your fund’s performance
This section shows your fund’s performance, price, and distribution information for periods ended September 30, 2012, the end of its most recent fiscal year. In accordance with regulatory requirements for mutual funds, we also include expense information taken from the fund’s current prospectus. Performance should always be considered in light of a fund’s investment strategy. Data represent past performance. Past performance does not guarantee future results. More recent returns may be less or more than those shown. Investment return and principal value will fluctuate, and you may have a gain or a loss when you sell your shares. Performance information does not reflect any deduction for taxes a shareholder may owe on fund distributions or on the redemption of fund shares. For the most recent month-end performance, please visit the Individual Investors section at putnam.com or call Putnam at 1-800-225-1581. Class R and class Y shares are not available to all investors. See the Terms and Definitions section in this report for definitions of the share classes offered by your fund.
Fund performance Total return for periods ended 9/30/12
| | | | | | | | | | |
| | Class A | Class B | Class C | Class M | Class R | Class Y |
| (inception dates) | (2/8/84) | (4/27/92) | (7/26/99) | (2/6/95) | (1/21/03) | (4/11/94) |
|
| | Before | After | | | | | Before | After | Net | Net |
| | sales | sales | Before | After | Before | After | sales | sales | asset | asset |
| | charge | charge | CDSC | CDSC | CDSC | CDSC | charge | charge | value | value |
|
| Annual average | | | | | | | | | | |
| (life of fund) | 7.16% | 7.00% | 6.30% | 6.30% | 6.34% | 6.34% | 6.84% | 6.72% | 6.87% | 7.32% |
|
| 10 years | 69.19 | 62.43 | 57.33 | 57.33 | 56.11 | 56.11 | 65.64 | 60.29 | 63.90 | 72.88 |
| Annual average | 5.40 | 4.97 | 4.64 | 4.64 | 4.55 | 4.55 | 5.18 | 4.83 | 5.06 | 5.63 |
|
| 5 years | 43.92 | 38.15 | 38.99 | 36.99 | 37.96 | 37.96 | 42.72 | 38.10 | 41.15 | 45.33 |
| Annual average | 7.55 | 6.68 | 6.81 | 6.50 | 6.65 | 6.65 | 7.37 | 6.67 | 7.14 | 7.76 |
|
| 3 years | 19.29 | 14.55 | 16.72 | 13.89 | 16.33 | 16.33 | 18.86 | 14.97 | 18.28 | 20.10 |
| Annual average | 6.06 | 4.63 | 5.29 | 4.43 | 5.17 | 5.17 | 5.93 | 4.76 | 5.76 | 6.30 |
|
| 1 year | 3.54 | –0.57 | 2.83 | –1.98 | 2.81 | 1.85 | 3.34 | –0.02 | 3.32 | 3.85 |
|
Current performance may be lower or higher than the quoted past performance, which cannot guarantee future results. After-sales-charge returns for class A and M shares reflect the deduction of the maximum 4.00% and 3.25% sales charge, respectively, levied at the time of purchase. Class B share returns after contingent deferred sales charge (CDSC) reflect the applicable CDSC, which is 5% in the first year, declining over time to 1% in the sixth year, and is eliminated thereafter. Class C share returns after CDSC reflect a 1% CDSC for the first year that is eliminated thereafter. Class R and Y shares have no initial sales charge or CDSC. Performance for class B, C, M, R, and Y shares before their inception is derived from the historical performance of class A shares, adjusted for the applicable sales charge (or CDSC) and the higher operating expenses for such shares, except for class Y shares, for which 12b-1 fees are not applicable.
For a portion of the periods, the fund had expense limitations, without which returns would have been lower.
Class B share performance does not reflect conversion to class A shares.
| |
| U.S. Government Income Trust | 11 |
Comparative index returns For periods ended 9/30/12
| | |
| | | Lipper GNMA Funds |
| | Barclays GNMA Index | category average* |
|
| Annual average (life of fund) | 8.24% | 7.31% |
|
| 10 years | 68.94 | 58.37 |
| Annual average | 5.38 | 4.69 |
|
| 5 years | 38.72 | 35.69 |
| Annual average | 6.76 | 6.28 |
|
| 3 years | 18.65 | 17.07 |
| Annual average | 5.87 | 5.39 |
|
| 1 year | 4.01 | 3.77 |
|
Index and Lipper results should be compared with fund performance before sales charge, before CDSC, or at net asset value.
* Over the 1-year, 3-year, 5-year, 10-year, and life-of-fund periods ended 9/30/12, there were 69, 65, 60, 52 and 7 funds, respectively, in this Lipper category.
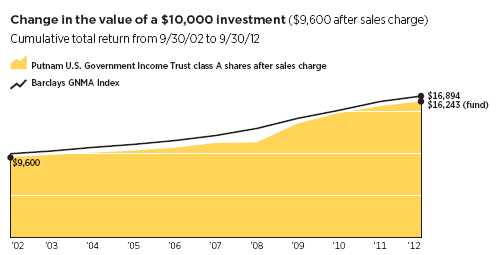
Past performance does not indicate future results. At the end of the same time period, a $10,000 investment in the fund’s class B and class C shares would have been valued at $15,733 and $15,611, respectively, and no contingent deferred sales charges would apply. A $10,000 investment in the fund’s class M shares ($9,675 after sales charge) would have been valued at $16,029. A $10,000 investment in the fund’s class R and class Y shares would have been valued at $16,390 and $17,288, respectively.
| |
| 12 | U.S. Government Income Trust |
Fund price and distribution information For the 12-month period ended 9/30/12
| | | | | | | | |
| Distributions | Class A | Class B | Class C | Class M | Class R | Class Y |
|
| Number | 12 | 12 | 12 | 12 | 12 | 12 |
|
| Income | $0.5377 | $0.4397 | $0.4367 | $0.5017 | $0.5027 | $0.5737 |
|
| Capital gains — Long-term | 0.2796 | 0.2796 | 0.2796 | 0.2796 | 0.2796 | 0.2796 |
|
| Capital gains — Short-term | 0.2187 | 0.2187 | 0.2187 | 0.2187 | 0.2187 | 0.2187 |
|
| Total | $1.0360 | $0.9380 | $0.9350 | $1.0000 | $1.0010 | $1.0720 |
|
| | Before | After | Net | Net | Before | After | Net | Net |
| | sales | sales | asset | asset | sales | sales | asset | asset |
| Share value | charge | charge | value | value | charge | charge | value | value |
|
| 9/30/11 | $14.25 | $14.84 | $14.18 | $14.13 | $14.29 | $14.77 | $14.11 | $14.14 |
|
| 9/30/12 | 13.69 | 14.26 | 13.62 | 13.57 | 13.74 | 14.20 | 13.55 | 13.58 |
|
| | Before | After | Net | Net | Before | After | Net | Net |
| Current yield | sales | sales | asset | asset | sales | sales | asset | asset |
| (end of period) | charge | charge | value | value | charge | charge | value | value |
|
| Current dividend rate 1 | 3.33% | 3.20% | 2.64% | 2.56% | 3.06% | 2.96% | 3.10% | 3.62% |
|
| Current 30-day SEC yield 2 | N/A | 1.01 | 0.33 | 0.31 | N/A | 0.79 | 0.80 | 1.30 |
|
The classification of distributions, if any, is an estimate. Before-sales-charge share value and current dividend rate for class A and M shares, if applicable, do not take into account any sales charge levied at the time of purchase. After-sales-charge share value, current dividend rate, and current 30-day SEC yield, if applicable, are calculated assuming that the maximum sales charge (4.00% for class A shares and 3.25% for class M shares) was levied at the time of purchase. Final distribution information will appear on your year-end tax forms.
1 Most recent distribution, excluding capital gains, annualized and divided by share price before or after sales charge at period-end.
2 Based only on investment income and calculated using the maximum offering price for each share class, in accordance with SEC guidelines.
| |
| U.S. Government Income Trust | 13 |
Your fund’s expenses
As a mutual fund investor, you pay ongoing expenses, such as management fees, distribution fees (12b-1 fees), and other expenses. Using the following information, you can estimate how these expenses affect your investment and compare them with the expenses of other funds. You may also pay one-time transaction expenses, including sales charges (loads) and redemption fees, which are not shown in this section and would have resulted in higher total expenses. For more information, see your fund’s prospectus or talk to your financial representative.
Expense ratios
| | | | | | |
| | Class A | Class B | Class C | Class M | Class R | Class Y |
|
| Total annual operating expenses | | | | | | |
| for the fiscal year ended 9/30/11 | 0.85% | 1.58% | 1.60% | 1.09% | 1.10% | 0.60% |
|
| Annualized expense ratio | | | | | | |
| for the six-month period | | | | | | |
| ended 9/30/12* | 0.86% | 1.59% | 1.61% | 1.10% | 1.11% | 0.61% |
|
Fiscal-year expense information in this table is taken from the most recent prospectus, is subject to change, and may differ from that shown for the annualized expense ratio and in the financial highlights of this report. Expenses are shown as a percentage of average net assets.
* For the fund’s most recent fiscal half year; may differ from expense ratios based on one-year data in the financial highlights.
Expenses per $1,000
The following table shows the expenses you would have paid on a $1,000 investment in the fund from April 1, 2012, to September 30, 2012. It also shows how much a $1,000 investment would be worth at the close of the period, assuming actual returns and expenses.
| | | | | | |
| | Class A | Class B | Class C | Class M | Class R | Class Y |
|
| Expenses paid per $1,000*† | $4.36 | $8.06 | $8.16 | $5.58 | $5.63 | $3.10 |
|
| Ending value (after expenses) | $1,030.10 | $1,026.70 | $1,026.60 | $1,029.40 | $1,029.10 | $1,031.70 |
|
* Expenses for each share class are calculated using the fund’s annualized expense ratio for each class, which represents the ongoing expenses as a percentage of average net assets for the six months ended 9/30/12. The expense ratio may differ for each share class.
† Expenses are calculated by multiplying the expense ratio by the average account value for the period; then multiplying the result by the number of days in the period; and then dividing that result by the number of days in the year.
| |
| 14 | U.S. Government Income Trust |
Estimate the expenses you paid
To estimate the ongoing expenses you paid for the six months ended September 30, 2012, use the following calculation method. To find the value of your investment on April 1, 2012, call Putnam at 1-800-225-1581.
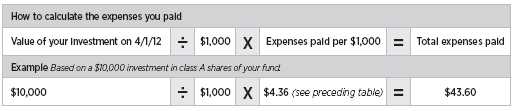
Compare expenses using the SEC’s method
The Securities and Exchange Commission (SEC) has established guidelines to help investors assess fund expenses. Per these guidelines, the following table shows your fund’s expenses based on a $1,000 investment, assuming a hypothetical 5% annualized return. You can use this information to compare the ongoing expenses (but not transaction expenses or total costs) of investing in the fund with those of other funds. All mutual fund shareholder reports will provide this information to help you make this comparison. Please note that you cannot use this information to estimate your actual ending account balance and expenses paid during the period.
| | | | | | |
| | Class A | Class B | Class C | Class M | Class R | Class Y |
|
| Expenses paid per $1,000*† | $4.34 | $8.02 | $8.12 | $5.55 | $5.60 | $3.08 |
|
| Ending value (after expenses) | $1,020.70 | $1,017.05 | $1,016.95 | $1,019.50 | $1,019.45 | $1,021.95 |
|
* Expenses for each share class are calculated using the fund’s annualized expense ratio for each class, which represents the ongoing expenses as a percentage of average net assets for the six months ended 9/30/12. The expense ratio may differ for each share class.
† Expenses are calculated by multiplying the expense ratio by the average account value for the period; then multiplying the result by the number of days in the period; and then dividing that result by the number of days in the year.
| |
| U.S. Government Income Trust | 15 |
Terms and definitions
Important terms
Total return shows how the value of the fund’s shares changed over time, assuming you held the shares through the entire period and reinvested all distributions in the fund.
Before sales charge, or net asset value, is the price, or value, of one share of a mutual fund, without a sales charge. Before-sales-charge figures fluctuate with market conditions, and are calculated by dividing the net assets of each class of shares by the number of outstanding shares in the class.
After sales charge is the price of a mutual fund share plus the maximum sales charge levied at the time of purchase. After-sales-charge performance figures shown here assume the 4.00% maximum sales charge for class A shares and 3.25% for class M shares.
Contingent deferred sales charge (CDSC) is generally a charge applied at the time of the redemption of class B or C shares and assumes redemption at the end of the period. Your fund’s class B CDSC declines over time from a 5% maximum during the first year to 1% during the sixth year. After the sixth year, the CDSC no longer applies. The CDSC for class C shares is 1% for one year after purchase.
Share classes
Class A shares are generally subject to an initial sales charge and no CDSC (except on certain redemptions of shares bought without an initial sales charge).
Class B shares are not subject to an initial sales charge. They may be subject to a CDSC.
Class C shares are not subject to an initial sales charge and are subject to a CDSC only if the shares are redeemed during the first year.
Class M shares have a lower initial sales charge and a higher 12b-1 fee than class A shares and no CDSC (except on certain redemptions of shares bought without an initial sales charge).
Class R shares are not subject to an initial sales charge or CDSC and are available only to certain defined contribution plans.
Class Y shares are not subject to an initial sales charge or CDSC, and carry no 12b-1 fee. They are generally only available to corporate and institutional clients and clients in other approved programs.
Fixed-income terms
Current yield is the annual rate of return earned from dividends or interest of an investment. Current yield is expressed as a percentage of the price of a security, fund share, or principal investment.
Mortgage-backed security (MBS), also known as a mortgage “pass-through”, is a type of asset-backed security that is secured by a mortgage or collection of mortgages. The following are types of MBSs:
• Agency “pass-through” has its principal and interest backed by a U.S. government agency, such as the Federal National Mortgage Association (Fannie Mae), Government National Mortgage Association (Ginnie Mae), and Federal Home Loan Mortgage Corporation (Freddie Mac).
• Collateralized mortgage obligation (CMO) represents claims to specific cash flows from pools of home mortgages. The streams of principal and interest payments on the mortgages are distributed to the different classes of CMO interests in “tranches”. Each tranche may have different principal balances, coupon rates, prepayment risks, and maturity dates. A CMO is highly sensitive to changes in interest rates and any resulting change in the rate at which homeowners sell their properties, refinance, or otherwise prepay loans. CMOs are subject to prepayment, market, and liquidity risks.
• Interest-only (IO) security is a type of CMO in which the underlying asset is the interest portion of mortgage, Treasury, or bond payments.
• Non-agency residential mortgage-backed security (RMBS) is an MBS not backed by Fannie Mae, Ginnie Mae, or Freddie Mac. One type of RMBS is an Alt-A mortgage-backed security.
• Commercial mortgage-backed security (CMBS) is secured by the loan on a commercial property.
Yield curve is a graph that plots the yields of bonds with equal credit quality against their differing maturity dates, ranging from shortest to longest. It is used as a benchmark for other debt, such as mortgage or bank lending rates.
Comparative indexes
Barclays GNMA Index is an unmanaged index of Government National Mortgage Association bonds.
Barclays U.S. Aggregate Bond Index is an unmanaged index of U.S. investment-grade fixed-income securities.
| |
| 16 | U.S. Government Income Trust |
BofA (Bank of America) Merrill Lynch U.S. 3-Month Treasury Bill Index is an unmanaged index that seeks to measure the performance of U.S. Treasury bills available in the marketplace.
S&P 500 Index is an unmanaged index of common stock performance.
Indexes assume reinvestment of all distributions and do not account for fees. Securities and performance of a fund and an index will differ. You cannot invest directly in an index.
Lipper is a third-party industry-ranking entity that ranks mutual funds. Its rankings do not reflect sales charges. Lipper rankings are based on total return at net asset value relative to other funds that have similar current investment styles or objectives as determined by Lipper. Lipper may change a fund’s category assignment at its discretion. Lipper category averages reflect performance trends for funds within a category.
Other information for shareholders
Important notice regarding Putnam’s privacy policy
In order to conduct business with our shareholders, we must obtain certain personal information such as account holders’ names, addresses, Social Security numbers, and dates of birth. Using this information, we are able to maintain accurate records of accounts and transactions.
It is our policy to protect the confidentiality of our shareholder information, whether or not a shareholder currently owns shares of our funds. In particular, it is our policy not to sell information about you or your accounts to outside marketing firms. We have safeguards in place designed to prevent unauthorized access to our computer systems and procedures to protect personal information from unauthorized use.
Under certain circumstances, we must share account information with outside vendors who provide services to us, such as mailings and proxy solicitations. In these cases, the service providers enter into confidentiality agreements with us, and we provide only the information necessary to process transactions and perform other services related to your account. Finally, it is our policy to share account information with your financial representative, if you’ve listed one on your Putnam account.
Proxy voting
Putnam is committed to managing our mutual funds in the best interests of our shareholders. The Putnam funds’ proxy voting guidelines and procedures, as well as information regarding how your fund voted proxies relating to portfolio securities during the 12-month period ended June 30, 2012, are available in the Individual Investors section at putnam.com, and on the Securities and Exchange Commission (SEC) website, www.sec.gov. If you have questions about finding forms on the SEC’s website, you may call the SEC at 1-800-SEC-0330. You may also obtain the Putnam funds’ proxy voting guidelines and procedures at no charge by calling Putnam’s Shareholder Services at 1-800-225-1581.
Fund portfolio holdings
The fund will file a complete schedule of its portfolio holdings with the SEC for the first and third quarters of each fiscal year on Form N-Q. Shareholders may obtain the fund’s Forms N-Q on the SEC’s website at www.sec.gov. In addition, the fund’s Forms N-Q may be reviewed and copied at the SEC’s Public Reference Room in Washington, D.C. You may call the SEC at 1-800-SEC-0330 for information about the SEC’s website or the operation of the Public Reference Room.
Trustee and employee fund ownership
Putnam employees and members of the Board of Trustees place their faith, confidence, and, most importantly, investment dollars in Putnam mutual funds. As of September 30, 2012, Putnam employees had approximately $342,000,000 and the Trustees had approximately $81,000,000 invested in Putnam mutual funds. These amounts include investments by the Trustees’ and employees’ immediate family members as well as investments through retirement and deferred compensation plans.
| |
| U.S. Government Income Trust | 17 |
Trustee approval of management contract
General conclusions
The Board of Trustees of the Putnam funds oversees the management of each fund and, as required by law, determines annually whether to approve the continuance of your fund’s management contract with Putnam Investment Management (“Putnam Management”) and the sub-management contract with respect to your fund between Putnam Management and its affiliate, Putnam Investments Limited (“PIL”).
The Board of Trustees, with the assistance of its Contract Committee, requests and evaluates all information it deems reasonably necessary under the circumstances in connection with its annual contract review. The Contract Committee consists solely of Trustees who are not “interested persons” (as this term is defined in the Investment Company Act of 1940, as amended (the “1940 Act”)) of the Putnam funds (“Independent Trustees”).
At the outset of the review process, members of the Board’s independent staff and independent legal counsel met with representatives of Putnam Management to review the annual contract review materials furnished to the Contract Committee during the course of the previous year’s review and to discuss possible changes in these materials that might be necessary or desirable for the coming year. Following these discussions and in consultation with the Contract Committee, the Independent Trustees’ independent legal counsel requested that Putnam Management furnish specified information, together with any additional information that Putnam Management considered relevant, to the Contract Committee. Over the course of several months ending in June 2012, the Contract Committee met on a number of occasions with representatives of Putnam Management, and separately in executive session, to consider the information that Putnam Management provided. Throughout this process, the Contract Committee was assisted by the members of the Board’s independent staff and by independent legal counsel for the Putnam funds and the Independent Trustees.
In May 2012, the Contract Committee met in executive session with the other Independent Trustees to discuss the Contract Committee’s preliminary recommendations with respect to the continuance of the contracts. At the Trustees’ June 22, 2012 meeting, the Contract Committee met in executive session with the other Independent Trustees to review a summary of the key financial data that the Contract Committee considered in the course of its review. The Contract Committee then presented its written report, which summarized the key factors that the Committee had considered and set forth its final recommendations. The Contract Committee then recommended, and the Independent Trustees approved, the continuance of your fund’s management and sub-management contracts, effective July 1, 2012. (Because PIL is an affiliate of Putnam Management and Putnam Management remains fully responsible for all services provided by PIL, the Trustees have not evaluated PIL as a separate entity, and all subsequent references to Putnam Management below should be deemed to include reference to PIL as necessary or appropriate in the context.)
The Independent Trustees’ approval was based on the following conclusions:
That the fee schedule in effect for your fund represented reasonable compensation in light of the nature and quality of the services being provided to the fund, the fees paid by competitive funds, and the costs incurred by Putnam Management in providing services, and
That the fee schedule represented an appropriate sharing between fund shareholders and Putnam Management of such economies of scale as may exist in the management of the fund at current asset levels.
| |
| 18 | U.S. Government Income Trust |
These conclusions were based on a comprehensive consideration of all information provided to the Trustees and were not the result of any single factor. Some of the factors that figured particularly in the Trustees’ deliberations and how the Trustees considered these factors are described below, although individual Trustees may have evaluated the information presented differently, giving different weights to various factors. It is also important to recognize that the management arrangements for your fund and the other Putnam funds are the result of many years of review and discussion between the Independent Trustees and Putnam Management, that some aspects of the arrangements may receive greater scrutiny in some years than others, and that the Trustees’ conclusions may be based, in part, on their consideration of fee arrangements in previous years.
Management fee schedules and total expenses
The Trustees reviewed the management fee schedules in effect for all Putnam funds, including fee levels and breakpoints. In reviewing management fees, the Trustees generally focus their attention on material changes in circumstances — for example, changes in assets under management, changes in a fund’s investment style, changes in Putnam Management’s operating costs, or changes in competitive practices in the mutual fund industry — that suggest that consideration of fee changes might be warranted. The Trustees concluded that the circumstances did not warrant changes to the management fee structure of your fund.
Most of the open-end Putnam funds, including your fund, have relatively new management contracts, which introduced fee schedules that reflect more competitive fee levels for many funds, complex-wide breakpoints for the open-end funds, and performance fees for some funds. These new management contracts have been in effect for two years — since January or, for a few funds, February 2010. The Trustees approved the new management contracts on July 10, 2009, and fund shareholders subsequently approved the contracts by overwhelming majorities of the shares voted.
Under its management contract, your fund has the benefit of breakpoints in its management fee that provide shareholders with significant economies of scale in the form of reduced fee levels as assets under management in the Putnam family of funds increase. The Contract Committee observed that the complex-wide breakpoints of the open-end funds had only been in place for two years, and the Trustees will continue to examine the operation of this new breakpoint structure in future years in light of further experience.
As in the past, the Trustees also focused on the competitiveness of each fund’s total expense ratio. In order to ensure that expenses of the Putnam funds continue to meet evolving competitive standards, the Trustees and Putnam Management agreed in 2009 to implement certain expense limitations. These expense limitations serve in particular to maintain competitive expense levels for funds with large numbers of small shareholder accounts and funds with relatively small net assets. Most funds, including your fund, had sufficiently low expenses that these expense limitations did not apply. The expense limitations were: (i) a contractual expense limitation applicable to all retail open-end funds of 37.5 basis points (effective March 1, 2012, this expense limitation was reduced to 32 basis points) on investor servicing fees and expenses and (ii) a contractual expense limitation applicable to all open-end funds of 20 basis points on so-called “other expenses” (i.e., all expenses exclusive of management fees, investor servicing fees, distribution fees, investment-related expenses, interest, taxes, brokerage commissions, extraordinary expenses and acquired fund fees and expenses). Putnam Management’s support for these expense limitations, including its agreement to reduce the expense limitation applicable to the open-end funds’ investor servicing fees and expenses as noted above,
| |
| U.S. Government Income Trust | 19 |
was an important factor in the Trustees’ decision to approve the continuance of your fund’s management and sub-management contracts.
The Trustees reviewed comparative fee and expense information for a custom group of competitive funds selected by Lipper Inc. This comparative information included your fund’s percentile ranking for effective management fees and total expenses (excluding any applicable 12b-1 fee), which provides a general indication of your fund’s relative standing. In the custom peer group, your fund ranked in the 2nd quintile in effective management fees (determined for your fund and the other funds in the custom peer group based on fund asset size and the applicable contractual management fee schedule) and in the 3rd quintile in total expenses (excluding any applicable 12b-1 fees) as of December 31, 2011 (the first quintile representing the least expensive funds and the fifth quintile the most expensive funds). The fee and expense data reported by Lipper as of December 31, 2011 reflected the most recent fiscal year-end data available in Lipper’s database at that time.
In connection with their review of the management fees and total expenses of the Putnam funds, the Trustees also reviewed the costs of the services provided and the profits realized by Putnam Management and its affiliates from their contractual relationships with the funds. This information included trends in revenues, expenses and profitability of Putnam Management and its affiliates relating to the investment management, investor servicing and distribution services provided to the funds. In this regard, the Trustees also reviewed an analysis of Putnam Management’s revenues, expenses and profitability, allocated on a fund-by-fund basis, with respect to the funds’ management, distribution, and investor servicing contracts. For each fund, the analysis presented information about revenues, expenses and profitability for each of the agreements separately and for the agreements taken together on a combined basis. The Trustees concluded that, at current asset levels, the fee schedules in place represented reasonable compensation for the services being provided and represented an appropriate sharing of such economies of scale as may exist in the management of the funds at that time.
The information examined by the Trustees as part of their annual contract review for the Putnam funds has included for many years information regarding fees charged by Putnam Management and its affiliates to institutional clients such as defined benefit pension plans, college endowments, and the like. This information included comparisons of those fees with fees charged to the funds, as well as an assessment of the differences in the services provided to these different types of clients. The Trustees observed that the differences in fee rates between institutional clients and mutual funds are by no means uniform when examined by individual asset sectors, suggesting that differences in the pricing of investment management services to these types of clients may reflect historical competitive forces operating in separate markets. The Trustees considered the fact that in many cases fee rates across different asset classes are higher on average for mutual funds than for institutional clients, as well as the differences between the services that Putnam Management provides to the Putnam funds and those that it provides to its institutional clients. The Trustees did not rely on these comparisons to any significant extent in concluding that the management fees paid by your fund are reasonable.
Investment performance
The quality of the investment process provided by Putnam Management represented a major factor in the Trustees’ evaluation of the quality of services provided by Putnam Management under your fund’s management contract. The Trustees were assisted in their review of the Putnam funds’ investment process and performance by the work of the investment oversight committees of the Trustees, which meet on a
|
| 20 U.S. Government Income Trust |
regular basis with the funds’ portfolio teams and with the Chief Investment Officer and other members of Putnam Management’s Investment Division throughout the year. The Trustees concluded that Putnam Management generally provides a high-quality investment process — based on the experience and skills of the individuals assigned to the management of fund portfolios, the resources made available to them, and in general Putnam Management’s ability to attract and retain high-quality personnel — but also recognized that this does not guarantee favorable investment results for every fund in every time period.
The Trustees considered the investment performance of each fund over multiple time periods and considered information comparing each fund’s performance with various benchmarks and, where applicable, with the performance of competitive funds or targeted annualized return. They noted that since 2009, when Putnam Management began implementing major changes to strengthen its investment personnel and processes, there has been a steady improvement in the number of Putnam funds showing above-median three-year performance results. They also noted the disappointing investment performance of some funds for periods ended December 31, 2011 and considered information provided by Putnam Management regarding the factors contributing to the underperformance and actions being taken to improve the performance of these particular funds. The Trustees indicated their intention to continue to monitor performance trends to assess the effectiveness of these efforts and to evaluate whether additional actions to address areas of underperformance are warranted.
In the case of your fund, the Trustees considered that its class A share cumulative total return performance at net asset value was in the following quartiles of its Lipper Inc. peer group (Lipper GNMA Funds) for the one-year, three-year and five-year periods ended December 31, 2011 (the first quartile representing the best-performing funds and the fourth quartile the worst-performing funds):
| | | |
| One-year period | 4th | | |
| | |
| Three-year period | 1st | | |
| | |
| Five-year period | 1st | | |
| | |
Over the one-year, three-year and five-year periods ended December 31, 2011, there were 69, 63 and 56 funds, respectively, in your fund’s Lipper peer group. (When considering performance information, shareholders should be mindful that past performance is not a guarantee of future results.)
The Trustees, while noting that your fund’s investment performance over the three- and five-year periods ended December 31, 2011 had been favorable, expressed concern about your fund’s fourth quartile performance over the one-year period ended December 31, 2011 and considered the circumstances that may have contributed to this disappointing performance. The Trustees considered Putnam Management’s view that the fund’s underperformance over the one-year period was due in significant part to the fund’s investments in interest-only collateralized mortgage obligations, which underperformed sharply in the second half of 2011 due in part to rapidly falling interest rates, heightened investor risk aversion and uncertainty surrounding potential further government intervention in the housing market. They also considered Putnam Management’s observation that the fund’s relative emphasis on shorter duration investments detracted from the fund’s performance in 2011 due to the persistent low interest rate environment.
The Trustees also observed that, although the fund had not performed well in 2011, the fund ranked in the first quartile for the three- and five-year periods ended December 31, 2011, and that Putnam Management remained confident in the fund’s portfolio managers and their investment process. The Trustees also considered a number of other changes that Putnam Management had made in recent years in efforts to support and improve fund
| |
| U.S. Government Income Trust | 21 |
performance generally. In particular, the Trustees recognized that Putnam Management has adjusted the compensation structure for portfolio managers and research analysts so that only those who achieve top-quartile returns over a rolling three-year basis are eligible for full bonuses.
As a general matter, the Trustees believe that cooperative efforts between the Trustees and Putnam Management represent the most effective way to address investment performance problems. The Trustees noted that investors in the Putnam funds have, in effect, placed their trust in the Putnam organization, under the oversight of the funds’ Trustees, to make appropriate decisions regarding the management of the funds. Based on the responsiveness of Putnam Management in the recent past to performance issues, the Trustees concluded that it is preferable to seek change within Putnam Management to address performance shortcomings. In the Trustees’ view, the alternative of engaging a new investment adviser for an underperforming fund would entail significant disruptions and would not provide any greater assurance of improved investment performance.
Brokerage and soft-dollar allocations; investor servicing
The Trustees considered various potential benefits that Putnam Management may receive in connection with the services it provides under the management contract with your fund. These include benefits related to brokerage allocation and the use of soft dollars, whereby a portion of the commissions paid by a fund for brokerage may be used to acquire research services that are expected to be useful to Putnam Management in managing the assets of the fund and of other clients. Subject to policies established by the Trustees, soft-dollar credits acquired through these means are used primarily to acquire research services that supplement Putnam Management’s internal research efforts. However, the Trustees noted that a portion of available soft-dollar credits continues to be allocated to the payment of fund expenses. The Trustees indicated their continued intent to monitor regulatory developments in this area with the assistance of their Brokerage Committee and also indicated their continued intent to monitor the potential benefits associated with fund brokerage and soft-dollar allocations and trends in industry practices to ensure that the principle of seeking best price and execution remains paramount in the portfolio trading process.
Putnam Management may also receive benefits from payments that the funds make to Putnam Management’s affiliates for investor or distribution services. In conjunction with the annual review of your fund’s management and sub-management contracts, the Trustees reviewed your fund’s investor servicing agreement with Putnam Investor Services, Inc. (“PSERV”) and its distributor’s contracts and distribution plans with Putnam Retail Management Limited Partnership (“PRM”), both of which are affiliates of Putnam Management. The Trustees concluded that the fees payable by the funds to PSERV and PRM, as applicable, for such services are reasonable in relation to the nature and quality of such services.
|
| 22 U.S. Government Income Trust |
Financial statements
These sections of the report, as well as the accompanying Notes, preceded by the Report of Independent Registered Public Accounting Firm, constitute the fund’s financial statements.
The fund’s portfolio lists all the fund’s investments and their values as of the last day of the reporting period. Holdings are organized by asset type and industry sector, country, or state to show areas of concentration and diversification.
Statement of assets and liabilities shows how the fund’s net assets and share price are determined. All investment and non-investment assets are added together. Any unpaid expenses and other liabilities are subtracted from this total. The result is divided by the number of shares to determine the net asset value per share, which is calculated separately for each class of shares. (For funds with preferred shares, the amount subtracted from total assets includes the liquidation preference of preferred shares.)
Statement of operations shows the fund’s net investment gain or loss. This is done by first adding up all the fund’s earnings — from dividends and interest income — and subtracting its operating expenses to determine net investment income (or loss). Then, any net gain or loss the fund realized on the sales of its holdings — as well as any unrealized gains or losses over the period — is added to or subtracted from the net investment result to determine the fund’s net gain or loss for the fiscal year.
Statement of changes in net assets shows how the fund’s net assets were affected by the fund’s net investment gain or loss, by distributions to shareholders, and by changes in the number of the fund’s shares. It lists distributions and their sources (net investment income or realized capital gains) over the current reporting period and the most recent fiscal year-end. The distributions listed here may not match the sources listed in the Statement of operations because the distributions are determined on a tax basis and may be paid in a different period from the one in which they were earned.
Financial highlights provide an overview of the fund’s investment results, per-share distributions, expense ratios, net investment income ratios, and portfolio turnover in one summary table, reflecting the five most recent reporting periods. In a semiannual report, the highlights table also includes the current reporting period.
| |
| U.S. Government Income Trust | 23 |
Report of Independent Registered Public Accounting Firm
The Board of Trustees and Shareholders
Putnam U.S. Government Income Trust:
We have audited the accompanying statement of assets and liabilities of Putnam U.S. Government Income Trust (the fund), including the fund’s portfolio, as of September 30, 2012, and the related statement of operations for the year then ended, the statements of changes in net assets for each of the years in the two-year period then ended, and the financial highlights for each of the years in the five-year period then ended. These financial statements and financial highlights are the responsibility of the fund’s management. Our responsibility is to express an opinion on these financial statements and financial highlights based on our audits.
We conducted our audits in accordance with the standards of the Public Company Accounting Oversight Board (United States). Those standards require that we plan and perform the audit to obtain reasonable assurance about whether the financial statements and financial highlights are free of material misstatement. An audit includes examining, on a test basis, evidence supporting the amounts and disclosures in the financial statements. Our procedures included confirmation of securities owned as of September 30, 2012, by correspondence with the custodian and brokers or by other appropriate auditing procedures. An audit also includes assessing the accounting principles used and significant estimates made by management, as well as evaluating the overall financial statement presentation. We believe that our audits provide a reasonable basis for our opinion.
In our opinion, the financial statements and financial highlights referred to above present fairly, in all material respects, the financial position of Putnam U.S. Government Income Trust as of September 30, 2012, the results of its operations for the year then ended, the changes in its net assets for each of the years in the two-year period then ended, and the financial highlights for each of the years in the five-year period then ended, in conformity with U.S. generally accepted accounting principles.

Boston, Massachusetts
November 14, 2012
|
| 24 U.S. Government Income Trust |
The fund’s portfolio 9/30/12
| | |
| U.S. GOVERNMENT AND AGENCY | | |
| MORTGAGE OBLIGATIONS (109.5%)* | Principal amount | Value |
|
| U.S. Government Guaranteed Mortgage Obligations (100.3%) | | |
| Government National Mortgage Association Adjustable Rate | | |
| Mortgages 1 5/8s, July 20, 2026 | $27,901 | $29,005 |
|
| Government National Mortgage Association | | |
| Graduated Payment Mortgages | | |
| 13 1/4s, December 20, 2014 | 6,173 | 6,677 |
| 12 3/4s, with due dates from December 15, 2013 to July 20, 2014 | 4,947 | 5,236 |
| 12 1/4s, with due dates from February 15, 2014 to March 15, 2014 | 11,883 | 12,431 |
| 11 1/4s, with due dates from September 15, 2015 to | | |
| December 15, 2015 | 16,511 | 18,017 |
| 9 1/4s, with due dates from April 15, 2016 to May 15, 2016 | 12,738 | 13,777 |
|
| Government National Mortgage Association | | |
| Pass-Through Certificates | | |
| 8 1/2s, December 15, 2019 | 7,126 | 7,861 |
| 7 1/2s, October 20, 2030 | 107,261 | 126,023 |
| 5 1/2s, August 15, 2035 | 940 | 1,057 |
| 5s, with due dates from May 20, 2033 to July 20, 2041 | 235,222,232 | 261,280,524 |
| 4 1/2s, with due dates from June 20, 2040 to July 15, 2041 | 215,726,972 | 239,661,134 |
| 4 1/2s, TBA, October 1, 2042 | 18,000,000 | 19,870,312 |
| 4 1/2s, TBA, October 1, 2042 | 50,000,000 | 54,898,440 |
| 4 1/2s, TBA, September 1, 2042 | 3,000,000 | 3,317,578 |
| 3s, TBA, November 1, 2042 | 260,000,000 | 277,803,916 |
| 3s, TBA, October 1, 2042 | 719,000,000 | 770,228,750 |
|
| | | 1,627,280,738 |
| U.S. Government Agency Mortgage Obligations (9.2%) | | |
| Federal National Mortgage Association | | |
| Pass-Through Certificates | | |
| 4 1/2s, TBA, October 1, 2042 | 85,000,000 | 92,025,777 |
| 4s, October 1, 2042 | 13,000,000 | 14,437,617 |
| 3s, TBA, November 1, 2042 | 7,000,000 | 7,370,234 |
| 3s, TBA, October 1, 2042 | 34,000,000 | 35,888,595 |
|
| | | 149,722,223 |
| | | |
| Total U.S. government and agency mortgage obligations (cost $1,745,648,443) | $1,777,002,961 |
|
| |
| MORTGAGE-BACKED SECURITIES (16.3%)* | Principal amount | Value |
|
| Federal Home Loan Mortgage Corp. | | |
| IFB Ser. 3182, Class SP, 27.717s, 2032 | $50,605 | $82,383 |
| IFB Ser. 3408, Class EK, 24.905s, 2037 | 672,332 | 1,084,687 |
| IFB Ser. 2976, Class LC, 23.611s, 2035 | 3,526,011 | 5,641,618 |
| IFB Ser. 2979, Class AS, 23.464s, 2034 | 421,895 | 565,781 |
| IFB Ser. 3072, Class SM, 22.987s, 2035 | 1,741,472 | 2,779,461 |
| IFB Ser. 3072, Class SB, 22.841s, 2035 | 1,039,973 | 1,653,400 |
| IFB Ser. 3249, Class PS, 21.547s, 2036 | 762,750 | 1,169,985 |
| IFB Ser. 3065, Class DC, 19.198s, 2035 | 4,374,847 | 6,814,131 |
| IFB Ser. 2990, Class LB, 16.381s, 2034 | 3,880,332 | 5,444,843 |
| IFB Ser. 4048, Class GS, IO, 6.429s, 2040 | 6,007,193 | 1,164,554 |
| IFB Ser. 3860, Class SP, IO, 6.379s, 2040 | 8,015,881 | 1,352,600 |
| IFB Ser. 3780, Class PS, IO, 6.229s, 2035 | 29,164,069 | 2,455,022 |
| IFB Ser. 3934, Class SA, IO, 6.179s, 2041 | 10,154,194 | 1,607,511 |
| |
| U.S. Government Income Trust | 25 |
| | |
| MORTGAGE-BACKED SECURITIES (16.3%)* cont. | Principal amount | Value |
|
| Federal Home Loan Mortgage Corp. | | |
| IFB Ser. 4105, Class LS, IO, 5.9s, 2041 | $4,140,000 | $868,572 |
| IFB Ser. 3922, Class CS, IO, 5.879s, 2041 | 24,325,578 | 3,708,215 |
| IFB Ser. 3751, Class SB, IO, 5.819s, 2039 | 22,357,047 | 3,465,342 |
| IFB Ser. 4052, Class LS, IO, 5.779s, 2042 | 12,535,831 | 2,005,733 |
| IFB Ser. 4012, Class SM, IO, 5.729s, 2042 | 9,859,648 | 1,491,469 |
| Ser. 4024, Class PI, IO, 4 1/2s, 2041 | 15,588,718 | 1,987,562 |
| Ser. 4018, Class DI, IO, 4 1/2s, 2041 | 8,747,040 | 995,063 |
| Ser. 3747, Class HI, IO, 4 1/2s, 2037 | 947,595 | 75,462 |
| Ser. 4090, Class BI, IO, 4s, 2042 | 12,683,882 | 1,549,844 |
| Ser. 4019, Class JI, IO, 4s, 2041 | 15,770,924 | 1,870,432 |
| Ser. 3756, Class IG, IO, 4s, 2037 | 42,670,580 | 2,318,719 |
| Ser. 3768, Class MI, IO, 4s, 2035 | 23,507,528 | 881,532 |
| Ser. 3738, Class MI, IO, 4s, 2034 | 34,154,042 | 1,280,777 |
| FRB Ser. T-57, Class 2A1, 3.374s, 2043 | 35,389 | 35,707 |
| Ser. 4077, Class AI, IO, 3s, 2027 | 17,164,464 | 1,728,633 |
| FRB Ser. T-59, Class 2A1, 2.887s, 2043 | 18,779 | 18,724 |
| Ser. T-56, Class A, IO, 0.524s, 2043 | 831,047 | 14,511 |
| Ser. T-56, Class 3, IO, 0.482s, 2043 | 716,288 | 9,401 |
| Ser. T-56, Class 1, IO, 0.299s, 2043 | 936,510 | 7,024 |
| Ser. T-59, Class 1AX, IO, 0.275s, 2043 | 7,139,178 | 71,113 |
| Ser. T-8, Class A9, IO, 0.263s, 2028 | 3,053,932 | 38,174 |
| Ser. T-48, Class A2, IO, 0.212s, 2033 | 10,264,455 | 76,983 |
| Ser. T-56, Class 2, IO, 0.131s, 2043 | 859,256 | 2,685 |
| Ser. 4077, Class TO, PO, zero %, 2041 | 4,846,270 | 4,142,398 |
| Ser. 3369, Class BO, PO, zero %, 2037 | 33,206 | 31,046 |
| Ser. 3391, PO, zero %, 2037 | 97,517 | 88,994 |
| Ser. 3300, PO, zero %, 2037 | 379,353 | 354,962 |
| Ser. 3314, PO, zero %, 2036 | 138,607 | 132,528 |
| Ser. 3206, Class EO, PO, zero %, 2036 | 22,872 | 21,468 |
| Ser. 3175, Class MO, PO, zero %, 2036 | 259,604 | 245,058 |
| Ser. 3210, PO, zero %, 2036 | 26,669 | 25,478 |
| Ser. 3145, Class GK, PO, zero %, 2036 | 34,439 | 33,815 |
| Ser. 3124, Class DO, PO, zero %, 2036 | 16,998 | 16,785 |
| Ser. 2777, Class OE, PO, zero %, 2032 | 85,437 | 84,712 |
| FRB Ser. T-54, Class 2A, IO, zero %, 2043 | 4,144,252 | 648 |
| FRB Ser. 3117, Class AF, zero %, 2036 | 34,771 | 28,761 |
| FRB Ser. 3092, Class FA, zero %, 2035 | 15,950 | 15,720 |
| FRB Ser. 3326, Class WF, zero %, 2035 | 212,701 | 191,431 |
| FRB Ser. 3036, Class AS, zero %, 2035 | 52,058 | 45,599 |
|
| Federal National Mortgage Association | | |
| IFB Ser. 06-62, Class PS, 38.601s, 2036 | 1,566,735 | 2,881,640 |
| IFB Ser. 05-74, Class NK, 26.418s, 2035 | 2,633,624 | 4,786,270 |
| IFB Ser. 06-8, Class HP, 23.773s, 2036 | 1,151,034 | 1,952,395 |
| IFB Ser. 07-53, Class SP, 23.406s, 2037 | 1,516,710 | 2,460,361 |
| IFB Ser. 08-24, Class SP, 22.489s, 2038 | 5,869,976 | 9,215,863 |
| IFB Ser. 05-122, Class SE, 22.342s, 2035 | 1,274,407 | 1,948,646 |
| IFB Ser. 05-75, Class GS, 19.601s, 2035 | 869,133 | 1,284,650 |
| IFB Ser. 05-106, Class JC, 19.453s, 2035 | 1,601,037 | 2,556,663 |
| IFB Ser. 05-83, Class QP, 16.831s, 2034 | 557,291 | 785,667 |
| IFB Ser. 11-4, Class CS, 12.467s, 2040 | 4,825,996 | 5,763,702 |
|
| 26 U.S. Government Income Trust |
| | |
| MORTGAGE-BACKED SECURITIES (16.3%)* cont. | Principal amount | Value |
|
| Federal National Mortgage Association | | |
| IFB Ser. 12-96, Class PS, IO, 6.484s, 2041 | $12,760,079 | $2,724,660 |
| IFB Ser. 12-3, Class SD, IO, 6.294s, 2042 | 10,394,583 | 1,801,173 |
| IFB Ser. 11-27, Class AS, IO, 6.264s, 2041 | 9,526,312 | 1,273,001 |
| IFB Ser. 12-113, Class SG, IO, 5.85s, 2042 | 7,541,000 | 1,396,819 |
| Ser. 12-30, Class PI, IO, 4s, 2042 | 31,609,907 | 4,267,337 |
| Ser. 409, Class C16, IO, 4s, 2040 | 19,962,254 | 2,100,293 |
| Ser. 12-31, Class LI, IO, 4s, 2040 | 18,213,993 | 2,549,959 |
| FRB Ser. 04-W7, Class A2, 3 3/4s, 2034 | 14,964 | 15,667 |
| FRB Ser. 03-W14, Class 2A, 3.471s, 2043 | 32,613 | 32,334 |
| FRB Ser. 03-W11, Class A1, 3.332s, 2033 | 2,567 | 2,632 |
| FRB Ser. 03-W3, Class 1A4, 3.314s, 2042 | 57,886 | 57,651 |
| FRB Ser. 04-W2, Class 4A, 2.987s, 2044 | 32,185 | 32,329 |
| Ser. 98-W2, Class X, IO, 1.003s, 2028 | 19,424,819 | 855,906 |
| Ser. 98-W5, Class X, IO, 0.945s, 2028 | 5,582,267 | 244,224 |
| FRB Ser. 07-95, Class A3, 0.467s, 2036 | 13,676,000 | 12,376,780 |
| Ser. 01-50, Class B1, IO, 0.406s, 2041 | 1,307,840 | 8,174 |
| Ser. 01-79, Class BI, IO, 0.311s, 2045 | 3,089,646 | 28,724 |
| Ser. 03-34, Class P1, PO, zero %, 2043 | 151,087 | 134,781 |
| Ser. 03-W1, Class 2A, IO, zero %, 2042 | 8,882,808 | 694 |
| Ser. 08-53, Class DO, PO, zero %, 2038 | 592,313 | 524,570 |
| Ser. 07-64, Class LO, PO, zero %, 2037 | 219,985 | 205,974 |
| Ser. 07-44, Class CO, PO, zero %, 2037 | 463,714 | 422,865 |
| Ser. 07-14, Class KO, PO, zero %, 2037 | 44,773 | 41,797 |
| Ser. 06-125, Class OX, PO, zero %, 2037 | 14,543 | 14,030 |
| Ser. 06-84, Class OT, PO, zero %, 2036 | 15,917 | 15,134 |
| Ser. 06-46, Class OC, PO, zero %, 2036 | 27,657 | 25,760 |
| Ser. 06-62, Class KO, PO, zero %, 2036 | 2,162 | 2,135 |
| Ser. 08-36, Class OV, PO, zero %, 2036 | 110,745 | 99,395 |
| Ser. 03-23, Class QO, PO, zero %, 2032 | 17,629 | 17,489 |
| Ser. 1988-12, Class B, zero %, 2018 | 10,455 | 9,828 |
|
| Government National Mortgage Association | | |
| IFB Ser. 11-56, Class SA, 23.582s, 2041 | 10,046,363 | 15,691,314 |
| IFB Ser. 10-158, Class SD, 14.345s, 2040 | 2,266,000 | 3,243,009 |
| IFB Ser. 11-70, Class WS, 9.263s, 2040 | 3,909,000 | 4,624,699 |
| IFB Ser. 11-72, Class SE, 7.111s, 2041 | 16,383,286 | 18,349,280 |
| IFB Ser. 11-56, Class MS, 6.855s, 2041 | 9,860,724 | 10,805,973 |
| IFB Ser. 11-81, Class SB, IO, 6.484s, 2036 | 19,141,329 | 3,439,314 |
| IFB Ser. 11-61, Class CS, IO, 6.462s, 2035 | 7,174,690 | 986,520 |
| IFB Ser. 10-20, Class SC, IO, 5.932s, 2040 | 22,510,073 | 3,421,306 |
| IFB Ser. 10-115, Class TS, IO, 5.882s, 2038 | 14,118,478 | 1,756,339 |
| IFB Ser. 10-14, Class SH, IO, 5.779s, 2040 | 20,232,256 | 3,589,000 |
| IFB Ser. 11-70, Class SN, IO, 5.679s, 2041 | 3,260,000 | 855,359 |
| Ser. 10-58, Class VI, IO, 5s, 2038 | 2,160,354 | 86,414 |
| Ser. 11-18, Class PI, IO, 4 1/2s, 2040 | 11,736,774 | 1,759,342 |
| Ser. 11-81, Class PI, IO, 4 1/2s, 2037 | 19,910,301 | 1,735,979 |
| Ser. 10-116, Class IB, IO, 4 1/2s, 2036 | 661,688 | 52,935 |
| Ser. 10-19, Class IH, IO, 4 1/2s, 2034 | 1,353,430 | 77,822 |
| Ser. 10-116, Class QI, IO, 4s, 2034 | 11,535,176 | 739,073 |
| Ser. 11-116, Class BI, IO, 4s, 2026 | 9,276,546 | 1,047,971 |
| Ser. 10-158, Class EI, IO, 4s, 2025 | 27,068,479 | 3,014,346 |
| |
| U.S. Government Income Trust | 27 |
| | |
| MORTGAGE-BACKED SECURITIES (16.3%)* cont. | Principal amount | Value |
|
| Government National Mortgage Association | | |
| Ser. 12-48, Class AI, IO, 3 1/2s, 2036 | $22,953,240 | $3,554,768 |
| Ser. 10-H03, Class DI, IO, 2.115s, 2060 | 13,252,193 | 1,391,480 |
| Ser. 11-H22, Class FI, IO, 1.623s, 2061 | 33,025,266 | 2,404,570 |
| Ser. 12-H15, Class BI, IO, 1.556s, 2062 | 38,541,079 | 3,252,867 |
| Ser. 11-70, PO, zero %, 2041 | 56,528,761 | 47,917,174 |
| Ser. 10-151, Class KO, PO, zero %, 2037 | 3,354,604 | 3,083,620 |
| Ser. 06-36, Class OD, PO, zero %, 2036 | 35,383 | 33,071 |
| Ser. 06-64, PO, zero %, 2034 | 85,706 | 84,283 |
| Ser. 99-31, Class MP, PO, zero %, 2029 | 22,042 | 20,860 |
| FRB Ser. 07-16, Class YF, zero %, 2037 | 2,415 | 2,184 |
|
| GSMPS Mortgage Loan Trust 144A | | |
| Ser. 99-2, IO, 0.542s, 2027 | 1,500,496 | 19,518 |
| Ser. 98-2, IO, 0.394s, 2027 | 831,676 | 13,515 |
| Ser. 98-3, IO, 0.29s, 2027 | 981,123 | 14,564 |
| Ser. 98-4, IO, zero %, 2026 | 1,192,616 | 32,797 |
|
| Total mortgage-backed securities (cost $246,860,523) | | $263,796,294 |
| | | |
| | | |
| PURCHASED OPTIONS | Expiration date/ | Contract | |
| OUTSTANDING (3.9%)* | strike price | amount | Value |
|
| |
| Option on an interest rate swap with Credit | | | |
| Suisse International for the right to receive a | | | |
| fixed rate of 4.28% versus the three month | | | |
| USD-LIBOR-BBA maturing August 2026.E | Aug-16/4.28 | $51,265,000 | $7,582,094 |
|
| Option on an interest with JPMorgan Chase | | | |
| Bank NA for the right to receive a fixed | | | |
| rate of 4.17% versus the three month | | | |
| USD-LIBOR-BBA maturing | | | |
| August 2021.E | Aug-16/4.17 | 31,631,000 | 3,043,693 |
|
| Option on an interest rate swap | | | |
| with Goldman Sachs International for the | | | |
| right to receive a fixed rate of 4.17% | | | |
| versus the three month USD-LIBOR-BBA | | | |
| maturing August 2021.E | Aug-16/4.17 | 31,631,000 | 3,043,693 |
|
| Option on an interest rate swap with Credit | | | |
| Suisse International for the right to pay | | | |
| a fixed rate of 4.28% versus the three | | | |
| month USD-LIBOR-BBA maturing | | | |
| August 2026.E | Aug-16/4.28 | 51,265,000 | 1,240,510 |
|
| Option on an interest rate swap | | | |
| with JPMorgan Chase Bank NA for the right | | | |
| to pay a fixed rate of 4.17% versus the | | | |
| three month USD-LIBOR-BBA | | | |
| maturing August 2021.E | Aug-16/4.17 | 31,631,000 | 353,097 |
|
| Option on an interest rate swap with | | | |
| Goldman Sachs International for the | | | |
| right to pay a fixed rate of 4.17% versus | | | |
| the three month USD-LIBOR-BBA | | | |
| maturing August 2021.E | Aug-16/4.17 | 31,631,000 | 353,097 |
|
| Option on an interest rate swap with Credit | | | |
| Suisse International for the right | | | |
| to receive a fixed rate of 4.67% versus | | | |
| the three month USD-LIBOR-BBA | | | |
| maturing July 2026.E | Jul-16/4.67 | 48,383,000 | 8,544,438 |
|
|
| 28 U.S. Government Income Trust |
| | | |
| PURCHASED OPTIONS | Expiration date/ | Contract | |
| OUTSTANDING (3.9%)* cont. | strike price | amount | Value |
|
| |
| Option on an interest rate swap with Credit | | | |
| Suisse International for the right to pay | | | |
| a fixed rate of 4.67% versus the three | | | |
| month USD-LIBOR-BBA maturing July 2026.E | Jul-16/4.67 | $48,383,000 | $929,534 |
|
| Option on an interest rate swap with | | | |
| Citibank, N.A. for the right to receive a fixed | | | |
| rate of 4.74% versus the three month | | | |
| USD-LIBOR-BBA maturing July 2026.E | Jul-16/4.74 | 48,289,493 | 8,770,434 |
|
| Option on an interest rate swap with | | | |
| Citibank, N.A. for the right to pay | | | |
| a fixed rate of 4.74% versus the three | | | |
| month USD-LIBOR-BBA maturing July 2026.E | Jul-16/4.74 | 48,289,493 | 880,511 |
|
| Option on an interest rate swap with | | | |
| JPMorgan Chase Bank NA for the right | | | |
| to pay a fixed rate of 5.11% versus the | | | |
| three month USD-LIBOR-BBA | | | |
| maturing May 2021.E | May-16/5.11 | 35,695,000 | 232,125 |
|
| Option on an interest rate swap with | | | |
| Goldman Sachs International for the | | | |
| right to receive a fixed rate of 4.72% | | | |
| versus the three month USD-LIBOR-BBA | | | |
| maturing May 2021.E | May-16/4.72 | 55,938,000 | 6,832,435 |
|
| Option on an interest rate swap with | | | |
| Goldman Sachs International for the | | | |
| right to pay a fixed rate of 4.72% versus | | | |
| the three month USD-LIBOR-BBA | | | |
| maturing May 2021.E | May-16/4.72 | 55,938,000 | 428,205 |
|
| Option on an interest rate swap | | | |
| with Deutsche Bank AG for the right | | | |
| to receive a fixed rate of 4.765% versus | | | |
| the three month USD-LIBOR-BBA | | | |
| maturing May 2021.E | May-16/4.765 | 27,127,294 | 3,368,043 |
|
| Option on an interest rate swap with | | | |
| Deutsche Bank AG for the right to pay | | | |
| a fixed rate of 4.765% versus the | | | |
| three month USD-LIBOR-BBA | | | |
| maturing May 2021.E | May-16/4.765 | 27,127,294 | 203,238 |
|
| Option on an interest rate swap with | | | |
| JPMorgan Chase Bank NA for the right | | | |
| to receive a fixed rate of 4.705% versus | | | |
| the three month USD-LIBOR-BBA | | | |
| maturing May 2021.E | May-16/4.705 | 52,592,000 | 6,406,652 |
|
| Option on an interest rate swap with | | | |
| Goldman Sachs International for the | | | |
| right to receive a fixed rate of 4.705% | | | |
| versus the three month USD-LIBOR-BBA | | | |
| maturing May 2021.E | May-16/4.705 | 52,592,000 | 6,406,652 |
|
| Option on an interest rate swap with | | | |
| JPMorgan Chase Bank NA for the right | | | |
| to pay a fixed rate of 4.705% versus the | | | |
| three month USD-LIBOR-BBA maturing | | | |
| May 2021.E | May-16/4.705 | 52,592,000 | 400,646 |
|
|
| U.S. Government Income Trust 29 |
| | | |
| PURCHASED OPTIONS | Expiration date/ | Contract | |
| OUTSTANDING (3.9%)* cont. | strike price | amount | Value |
|
| |
| Option on an interest rate swap with | | | |
| Goldman Sachs International for the | | | |
| right to pay a fixed rate of 4.705% versus | | | |
| the three month USD-LIBOR-BBA | | | |
| maturing May 2021.E | May-16/4.705 | $52,592,000 | $400,646 |
|
| Option on an interest rate swap with | | | |
| Deutsche Bank AG for the right | | | |
| to receive a fixed rate of 4.77% versus | | | |
| the three month USD-LIBOR-BBA | | | |
| maturing May 2021.E | May-16/4.77 | 2,309,000 | 287,902 |
|
| Option on an interest rate swap with | | | |
| Deutsche Bank AG for the right to pay | | | |
| a fixed rate of 4.77% versus the three | | | |
| month USD-LIBOR-BBA maturing May 2021.E | May-16/4.77 | 2,309,000 | 17,054 |
|
| Option on an interest rate swap with | | | |
| JPMorgan Chase Bank NA for the right | | | |
| to pay a fixed rate of 2.00% versus the | | | |
| three month USD-LIBOR-BBA | | | |
| maturing December 2022. | Dec-12/2.00 | 49,637,000 | 278,464 |
|
| Option on an interest rate swap with | | | |
| Barclay’s Bank, PLC for the right | | | |
| to receive a fixed rate of 1.50% versus | | | |
| the three month USD-LIBOR-BBA | | | |
| maturing December 2022. | Dec-12/1.50 | 46,477,000 | 152,909 |
|
| Option on an interest rate swap with | | | |
| Goldman Sachs International for the | | | |
| right to receive a fixed rate of 1.8625% | | | |
| versus the three month USD-LIBOR-BBA | | | |
| maturing January 2023. | Jan-13/1.8625 | 5,564,000 | 104,325 |
|
| Option on an interest rate swap with | | | |
| Goldman Sachs International for the | | | |
| right to receive a fixed rate of 1.855% | | | |
| versus the three month USD-LIBOR-BBA | | | |
| maturing December 2022. | Dec-12/1.855 | 5,564,000 | 99,874 |
|
| Option on an interest rate swap with | | | |
| Goldman Sachs International for the | | | |
| right to receive a fixed rate of 2.325% | | | |
| versus the three month USD-LIBOR-BBA | | | |
| maturing December 2022. | Dec-12/2.325 | 6,200,000 | 333,870 |
|
| Option on an interest rate swap with | | | |
| Goldman Sachs International for the | | | |
| right to pay a fixed rate of 2.325% versus | | | |
| the three month USD-LIBOR-BBA | | | |
| maturing December 2022. | Dec-12/2.325 | 6,200,000 | 9,548 |
|
| Option on an interest rate swap with | | | |
| Goldman Sachs International for the | | | |
| right to receive a fixed rate of 2.8825% | | | |
| versus the three month USD-LIBOR-BBA | | | |
| maturing December 2042. | Dec-12/2.8825 | 5,623,000 | 375,110 |
|
| Option on an interest rate swap with | | | |
| Goldman Sachs International for the | | | |
| right to pay a fixed rate of 2.8825% | | | |
| versus the three month USD-LIBOR-BBA | | | |
| maturing December 2042. | Dec-12/2.8825 | 5,623,000 | 71,412 |
|
|
| 30 U.S. Government Income Trust |
| | | |
| PURCHASED OPTIONS | Expiration date/ | Contract | |
| OUTSTANDING (3.9%)* cont. | strike price | amount | Value |
|
| Option on an interest rate swap with | | | |
| Goldman Sachs International for the | | | |
| right to receive a fixed rate of 1.845% | | | |
| versus the three month USD-LIBOR-BBA | | | |
| maturing December 2022. | Dec-12/1.845 | $5,564,000 | $92,696 |
|
| Option on an interest rate swap with | | | |
| Goldman Sachs International for the | | | |
| right to receive a fixed rate of 1.835% | | | |
| versus the three month USD-LIBOR-BBA | | | |
| maturing November 2022. | Nov-12/1.835 | 5,564,000 | 84,851 |
|
| Option on an interest rate swap with | | | |
| Goldman Sachs International for the | | | |
| right to receive a fixed rate of 2.305% | | | |
| versus the three month USD-LIBOR-BBA | | | |
| maturing November 2022. | Nov-12/2.305 | 6,200,000 | 329,716 |
|
| Option on an interest rate swap with | | | |
| Goldman Sachs International for the | | | |
| right to pay a fixed rate of 2.305% versus | | | |
| the three month USD-LIBOR-BBA | | | |
| maturing November 2022. | Nov-12/2.305 | 6,200,000 | 2,790 |
|
| Option on an interest rate swap with | | | |
| Goldman Sachs International for the | | | |
| right to receive a fixed rate of 1.82% | | | |
| versus the three month USD-LIBOR-BBA | | | |
| maturing November 2022. | Nov-12/1.82 | 5,564,000 | 76,338 |
|
| Option on an interest rate swap with | | | |
| Goldman Sachs International for the | | | |
| right to receive a fixed rate of 2.28% | | | |
| versus the three month USD-LIBOR-BBA | | | |
| maturing October 2022. | Oct-12/2.28 | 6,200,000 | 328,414 |
|
| Option on an interest rate swap with | | | |
| Goldman Sachs International for the | | | |
| right to pay a fixed rate of 2.28% versus | | | |
| the three month USD-LIBOR-BBA | | | |
| maturing October 2022. | Oct-12/2.28 | 6,200,000 | 62 |
|
| Option on an interest rate swap with | | | |
| Credit Suisse International for the right | | | |
| to receive a fixed rate of 2.193% versus | | | |
| the three month USD-LIBOR-BBA | | | |
| maturing October 2022. | Oct-12/2.193 | 14,466,000 | 654,443 |
|
| Total purchased options outstanding (cost $64,822,359) | | $62,719,521 |
| | | |
| | |
| SHORT-TERM INVESTMENTS (53.4%)* | Principal amount/shares | Value |
|
| |
| Federal Home Loan Bank discount notes with an effective | | |
| yield of 0.128%, November 14, 2012 | $25,000,000 | $24,996,028 |
|
| Federal Home Loan Bank discount notes with an effective | | |
| yield of 0.117%, October 23, 2012 | 25,000,000 | 24,998,167 |
|
| Federal Home Loan Bank discount notes with an effective | | |
| yield of 0.116%, October 12, 2012 | 27,390,000 | 27,388,996 |
|
| Federal Home Loan Mortgage Corp. discount notes with an | | |
| effective yield of 0.139%, November 26, 2012 | 64,900,000 | 64,885,866 |
|
| Federal Home Loan Mortgage Corp. discount notes with an | | |
| effective yield of 0.124%, December 17, 2012 | 25,000,000 | 24,997,850 |
|
| |
| U.S. Government Income Trust | 31 |
| | |
| SHORT-TERM INVESTMENTS (53.4%)* cont. | Principal amount/shares | Value |
|
| |
| Federal Home Loan Mortgage Corp. discount notes with an | | |
| effective yield of 0.119%, November 6, 2012 | $5,300,000 | $5,299,364 |
|
| Federal National Mortgage Association discount | | |
| notes with an effective yield of 0.159%, December 12, 2012 | 15,862,000 | 15,860,731 |
|
| Federal National Mortgage Association discount | | |
| notes with an effective yield of 0.129%, December 5, 2012 | 25,000,000 | 24,998,200 |
|
| Federal National Mortgage Association discount | | |
| notes with an effective yield of 0.129%, October 2, 2012 | 25,000,000 | 24,999,910 |
|
| Interest in $450,000,000 joint tri-party repurchase | | |
| agreement dated 9/28/12 with RBC Capital Markets, LLC due | | |
| 10/1/12 — maturity value of $60,606,263 for an effective | | |
| yield of 0.25% (collateralized by various mortgage backed | | |
| securities with a coupon rate of 3.50% and due dates | | |
| ranging from 6/1/42 to 8/1/42, valued at $459,009,563) | 60,605,000 | 60,605,000 |
|
| Interest in $283,475,000 joint tri-party repurchase | | |
| agreement dated 9/28/12 with Merrill Lynch & Co., Inc. due | | |
| 10/1/12 — maturity value of $60,604,909 for an effective | | |
| yield of 0.18% (collateralized by various mortgage backed | | |
| securities with coupon rates ranging from 3.00% to 4.50% | | |
| and due dates ranging from 8/1/27 to 9/1/42, valued | | |
| at $289,144,501) | 60,604,000 | 60,604,000 |
|
| Straight-A Funding, LLC discounted commercial paper with an | | |
| effective yield of 0.178%, November 7, 2012 | 7,000,000 | 6,998,705 |
|
| Straight-A Funding, LLC discounted commercial paper with an | | |
| effective yield of 0.178%, November 5, 2012 | 18,000,000 | 17,996,850 |
|
| Straight-A Funding, LLC discounted commercial paper with an | | |
| effective yield of 0.178%, October 22, 2012 | 22,200,000 | 22,197,669 |
|
| Straight-A Funding, LLC discounted commercial paper with an | | |
| effective yield of 0.178%, October 9, 2012 | 2,000,000 | 1,999,920 |
|
| U.S. Treasury Bills with an effective yield of 0.158%, | | |
| April 4, 2013 ## | 40,000,000 | 39,971,760 |
|
| U.S. Treasury Bills with an effective yield of 0.125%, | | |
| November 29, 2012 | 25,000,000 | 24,994,838 |
|
| U.S. Treasury Bills with effective yields ranging from | | |
| 0.077% to 0.119%, October 18, 2012 ## | 76,740,000 | 76,736,490 |
|
| U.S. Treasury Bills with effective yields ranging from | | |
| 0.104% to 0.105%, December 13, 2012 ## | 50,822,000 | 50,813,513 |
|
| U.S. Treasury Bills with effective yields ranging from | | |
| 0.088% to 0.105%, November 15, 2012 ## | 69,072,000 | 69,063,490 |
|
| Putnam Money Market Liquidity Fund 0.14% L | 181,365,197 | 181,365,197 |
|
| SSgA Prime Money Market Fund 0.14% P | 15,418,032 | 15,418,032 |
|
| Total short-term investments (cost $867,171,142) | | $867,190,576 |
|
| |
| TOTAL INVESTMENTS | | |
|
| Total investments (cost $2,924,502,467) | | $2,970,709,352 |
|
| 32 U.S. Government Income Trust |
Key to holding’s abbreviations
| |
| FRB | Floating Rate Bonds: the rate shown is the current interest rate at the close of the reporting period |
| IFB | Inverse Floating Rate Bonds, which are securities that pay interest rates that vary inversely to changes |
| | in the market interest rates. As interest rates rise, inverse floaters produce less current income. The rate |
| | shown is the current interest rate at the close of the reporting period. |
| IO | Interest Only |
| PO | Principal Only |
| TBA | To Be Announced Commitments |
Notes to the fund’s portfolio
Unless noted otherwise, the notes to the fund’s portfolio are for the close of the fund’s reporting period, which ran from October 1, 2011 through September 30, 2012 (the reporting period). Within the following notes to the portfolio, references to “ASC 820” represent Accounting Standards Codification ASC 820 Fair Value Measurements and Disclosures.
* Percentages indicated are based on net assets of $1,623,174,694.
## This security, in part or in entirety, was pledged and segregated with the custodian for collateral on certain derivative contracts at the close of the reporting period.
E Extended settlement date on premium.
L Affiliated company (Note 6). The rate quoted in the security description is the annualized 7-day yield of the fund at the close of the reporting period.
P Security was pledged, or purchased with cash that was pledged, to the fund for collateral on certain derivatives contracts. The rate quoted in the security description is the annualized 7-day yield of the fund at the close of the reporting period (Note 1).
At the close of the reporting period, the fund maintained liquid assets totaling $783,602,247 to cover certain derivatives contracts.
Debt obligations are considered secured unless otherwise indicated.
144A after the name of an issuer represents securities exempt from registration under Rule 144A under the Securities Act of 1933, as amended. These securities may be resold in transactions exempt from registration, normally to qualified institutional buyers.
See Note 1 to the financial statements regarding TBA’s.
The dates shown on debt obligations are the original maturity dates.
| | | | |
| TBA SALE COMMITMENTS OUTSTANDING at 9/30/12 (proceeds receivable $458,150,312) | |
| |
| | Principal | | Settlement | |
| Agency | amount | | date | Value |
|
| Federal National Mortgage Association, 3s, | | | | |
| November 1, 2042 | $1,000,000 | | 11/14/12 | $1,052,891 |
|
| Federal National Mortgage Association, 3s, | | | | |
| October 1, 2042 | 34,000,000 | | 10/11/12 | 35,888,595 |
|
| Federal National Mortgage Association, 4 1/2s, | | | | |
| October 1, 2042 | 85,000,000 | | 10/11/12 | 92,025,776 |
|
| Government National Mortgage Association, 3s, | | | | |
| October 1, 2042 | 260,000,000 | | 10/18/12 | 278,525,000 |
|
| Government National Mortgage Association, 4 1/2s, | | | | |
| October 1, 2042 | 50,000,000 | | 10/18/12 | 54,898,440 |
|
| Government National Mortgage Association, 4 1/2s, | | | | |
| September 1, 2042 | 3,000,000 | | 10/23/12 | 3,317,578 |
|
| Total | | | | $465,708,280 |
| |
| U.S. Government Income Trust | 33 |
| | | | |
| WRITTEN OPTIONS OUTSTANDING at 9/30/12 (premiums received $65,576,527) | | | |
|
| | Contract | | Expiration date/ | |
| | amount | | strike price | Value |
|
| Option on an interest rate swap with Citibank, N.A. for | | | | |
| the obligation to pay a fixed rate of 4.11% versus the | | | | |
| three month USD-LIBOR-BBA maturing May 2021.E | $15,112,294 | | May-16/4.11 | $1,455,435 |
|
| Option on an interest rate swap with Goldman Sachs | | | | |
| International for the obligation to receive a fixed rate | | | | |
| of 3.49% versus the three month USD-LIBOR-BBA | | | | |
| maturing September 2026.E | 2,511,871 | | Sep-16/3.49 | 101,881 |
|
| Option on an interest rate swap with Goldman Sachs | | | | |
| International for the obligation to pay a fixed rate | | | | |
| of 3.49% versus the three month USD-LIBOR-BBA | | | | |
| maturing September 2026.E | 2,511,871 | | Sep-16/3.49 | 237,766 |
|
| Option on an interest rate swap with Bank of America, | | | | |
| N.A. for the obligation to pay a fixed rate of 4.35% | | | | |
| versus the three month USD-LIBOR-BBA maturing | | | | |
| August 2026.E | 4,831,610 | | Aug-16/4.35 | 736,854 |
|
| Option on an interest rate swap with Barclay’s Bank, | | | | |
| PLC for the obligation to receive a fixed rate of 4.17% | | | | |
| versus the three month USD-LIBOR-BBA maturing | | | | |
| August 2021.E | 27,908,714 | | Aug-16/4.17 | 311,545 |
|
| Option on an interest rate swap with Bank of America, | | | | |
| N.A. for the obligation to receive a fixed rate of 4.28% | | | | |
| versus the three month USD-LIBOR-BBA maturing | | | | |
| August 2026.E | 48,891,842 | | Aug-16/4.28 | 1,183,085 |
|
| Option on an interest rate swap with Barclay’s Bank, | | | | |
| PLC for the obligation to pay a fixed rate of 4.17% | | | | |
| versus the three month USD-LIBOR-BBA maturing | | | | |
| August 2021.E | 27,908,714 | | Aug-16/4.17 | 2,764,944 |
|
| Option on an interest rate swap with Bank of America, | | | | |
| N.A. for the obligation to pay a fixed rate of 4.28% | | | | |
| versus the three month USD-LIBOR-BBA maturing | | | | |
| August 2026.E | 48,891,842 | | Aug-16/4.28 | 7,183,825 |
|
| Option on an interest rate swap with Barclay’s Bank, | | | | |
| PLC for the obligation to receive a fixed rate of 4.67% | | | | |
| versus the three month USD-LIBOR-BBA maturing | | | | |
| July 2026.E | 8,886,571 | | Jul-16/4.67 | 170,729 |
|
| Option on an interest rate swap with Barclay’s Bank, | | | | |
| PLC for the obligation to pay a fixed rate of 4.67% versus | | | | |
| the three month USD-LIBOR-BBA maturing July 2026.E | 8,886,571 | | Jul-16/4.67 | 1,631,965 |
|
| Option on an interest rate swap with Barclay’s Bank, | | | | |
| PLC for the obligation to receive a fixed rate of 4.80% | | | | |
| versus the three month USD-LIBOR-BBA maturing | | | | |
| July 2026.E | 6,554,629 | | Jul-16/4.80 | 116,312 |
|
| Option on an interest rate swap with Barclay’s Bank, | | | | |
| PLC for the obligation to pay a fixed rate of 4.80% versus | | | | |
| the three month USD-LIBOR-BBA maturing July 2026.E | 6,554,629 | | Jul-16/4.80 | 1,272,234 |
|
| Option on an interest rate swap with Citibank, N.A. for | | | | |
| the obligation to receive a fixed rate of 5.12% versus the | | | | |
| three month USD-LIBOR-BBA maturing June 2021.E | 19,848,328 | | Jun-16/5.12 | 129,768 |
|
| Option on an interest rate swap with Barclay’s Bank, | | | | |
| PLC for the obligation to receive a fixed rate of 4.89% | | | | |
| versus the three month USD-LIBOR-BBA maturing | | | | |
| June 2021.E | 19,531,262 | | Jun-16/4.89 | 141,484 |
|
|
| 34 U.S. Government Income Trust |
| | | | |
| WRITTEN OPTIONS OUTSTANDING at 9/30/12 (premiums received $65,576,527) cont. | | | |
| |
| | Contract | | Expiration date/ | |
| | amount | | strike price | Value |
|
| Option on an interest rate swap with JPMorgan Chase | | | | |
| Bank NA for the obligation to receive a fixed rate of | | | | |
| 4.575% versus the three month USD-LIBOR-BBA | | | | |
| maturing June 2021.E | $19,407,254 | | Jun-16/4.575 | $162,652 |
|
| Option on an interest rate swap with Barclay’s Bank, PLC | | | | |
| for the obligation to pay a fixed rate of 4.39% versus the | | | | |
| three month USD-LIBOR-BBA maturing June 2021.E | 19,531,262 | | Jun-16/4.39 | 2,167,482 |
|
| Option on an interest rate swap with JPMorgan Chase | | | | |
| Bank NA for the obligation to pay a fixed rate of 4.575% | | | | |
| versus the three month USD-LIBOR-BBA maturing | | | | |
| June 2021.E | 19,407,254 | | Jun-16/4.575 | 2,240,994 |
|
| Option on an interest rate swap with Citibank, N.A. for | | | | |
| the obligation to receive a fixed rate of 5.11% versus the | | | | |
| three month USD-LIBOR-BBA maturing May 2021.E | 15,112,294 | | May-16/5.11 | 98,275 |
|
| Option on an interest rate swap with Goldman Sachs | | | | |
| International for the obligation to receive a fixed rate | | | | |
| of 4.86% versus the three month USD-LIBOR-BBA | | | | |
| maturing May 2021.E | 16,957,889 | | May-16/4.86 | 123,335 |
|
| Option on an interest rate swap with Deutsche Bank AG | | | | |
| for the obligation to receive a fixed rate of 4.60% versus | | | | |
| the three month USD-LIBOR-BBA maturing May 2021.E | 16,873,491 | | May-16/4.60 | 138,447 |
|
| Option on an interest rate swap with Goldman Sachs | | | | |
| International for the obligation to pay a fixed rate | | | | |
| of 4.36% versus the three month USD-LIBOR-BBA | | | | |
| maturing May 2021.E | 16,957,889 | | May-16/4.36 | 1,808,152 |
|
| Option on an interest rate swap with Deutsche Bank AG | | | | |
| for the obligation to pay a fixed rate of 4.60% versus the | | | | |
| three month USD-LIBOR-BBA maturing May 2021.E | 16,873,491 | | May-16/4.60 | 1,969,103 |
|
| Option on an interest rate swap with Credit Suisse | | | | |
| International for the obligation to receive a fixed rate | | | | |
| of 4.7575% versus the three month USD-LIBOR-BBA | | | | |
| maturing May 2021.E | 21,439,163 | | May-16/4.7575 | 152,218 |
|
| Option on an interest rate swap with Barclay’s Bank, PLC | | | | |
| for the obligation to receive a fixed rate of 4.745% versus | | | | |
| the three month USD-LIBOR-BBA maturing May 2021.E | 32,739,828 | | May-16/4.745 | 244,632 |
|
| Option on an interest rate swap with Credit Suisse | | | | |
| International for the obligation to receive a fixed rate | | | | |
| of 4.77% versus the three month USD-LIBOR-BBA | | | | |
| maturing May 2021.E | 81,849,571 | | May-16/4.77 | 604,541 |
|
| Option on an interest rate swap with Credit Suisse | | | | |
| International for the obligation to pay a fixed rate of | | | | |
| 4.7575% versus the three month USD-LIBOR-BBA | | | | |
| maturing May 2021.E | 21,439,163 | | May-16/4.7575 | 2,656,312 |
|
| Option on an interest rate swap with Barclay’s Bank, | | | | |
| PLC for the obligation to pay a fixed rate of 4.745% | | | | |
| versus the three month USD-LIBOR-BBA maturing | | | | |
| May 2021.E | 32,739,828 | | May-16/4.745 | 4,173,968 |
|
| Option on an interest rate swap with Credit Suisse | | | | |
| International for the obligation to pay a fixed rate | | | | |
| of 4.77% versus the three month USD-LIBOR-BBA | | | | |
| maturing May 2021.E | 81,849,571 | | May-16/4.77 | 10,205,577 |
|
| |
| U.S. Government Income Trust | 35 |
| | | | |
| WRITTEN OPTIONS OUTSTANDING at 9/30/12 (premiums received $65,576,527) cont. | | | |
| |
| | Contract | | Expiration date/ |
| | amount | | strike price | Value |
|
| Option on an interest rate swap with Deutsche Bank AG | | | | |
| for the obligation to receive a fixed rate of 5.02% versus | | | | |
| the three month USD-LIBOR-BBA maturing April 2026.E | $78,676,775 | | Apr-16/5.02 | $1,104,622 |
|
| Option on an interest rate swap with Deutsche Bank AG | | | | |
| for the obligation to pay a fixed rate of 5.02% versus the | | | | |
| three month USD-LIBOR-BBA maturing April 2026.E | 78,676,775 | | Apr-16/5.02 | 16,282,001 |
|
| Option on an interest rate swap with Citibank, N.A. for | | | | |
| the obligation to pay a fixed rate of 4.12% versus the | | | | |
| three month USD-LIBOR-BBA maturing June 2021.E | 19,848,328 | | Jun-16/4.12 | 1,916,497 |
|
| Total | | | | $63,486,635 |
E Extended settlement date on premium.
| | | | | | |
| INTEREST RATE SWAP CONTRACTS OUTSTANDING at 9/30/12 | | |
| |
| | Upfront | | | Payments | Payments | Unrealized |
| Swap counterparty / | premium | Termination | | made by | received by | appreciation/ |
| Notional amount | received (paid) | date | | fund per annum | fund per annum | (depreciation) |
|
| Bank of America N.A. | | | | | | |
| $357,407,000 | $— | 5/14/14 | | 0.577% | 3 month USD- | |
| | | | | | LIBOR-BBA | $(1,852,490) |
|
| 6,429,000 | — | 5/14/22 | | 2.0215% | 3 month USD- | |
| | | | | | LIBOR-BBA | (264,619) |
|
| 2,615,000 | 69,409 | 6/20/22 | | 2.183% | 3 month USD- | |
| | | | | | LIBOR-BBA | (71,484) |
|
| Barclay’s Bank, PLC | | | | | | |
| 246,524,000 E | 202,895 | 12/19/14 | | 0.45% | 3 month USD- | |
| | | | | | LIBOR-BBA | (132,378) |
|
| 9,736,000 E | (8,178) | 12/19/14 | | 3 month USD- | | |
| | | | | LIBOR-BBA | 0.45% | 5,063 |
|
| 11,333,000 E | (691,440) | 12/19/42 | | 2.40% | 3 month USD- | |
| | | | | | LIBOR-BBA | (124,450) |
|
| 38,256,000 E | 346,665 | 12/19/22 | | 3 month USD- | | |
| | | | | LIBOR-BBA | 1.75% | 284,309 |
|
| 137,673,000 E | (1,022,416) | 12/19/22 | | 1.75% | 3 month USD- | |
| | | | | | LIBOR-BBA | (798,009) |
|
| 37,182,000 E | — | 12/19/22 | | 3 month USD- | | |
| | | | | LIBOR-BBA | 1.805% | 130,881 |
|
| 22,464,000 E | — | 12/19/22 | | 3 month USD- | | |
| | | | | LIBOR-BBA | 1.83% | 131,864 |
|
| 12,394,000 E | — | 12/19/22 | | 3 month USD- | | |
| | | | | LIBOR-BBA | 1.80% | 37,926 |
|
| 49,567,000 E | (10,268) | 12/19/17 | | 3 month USD- | | |
| | | | | LIBOR-BBA | 0.90% | 145,868 |
|
| Citibank, N.A. | | | | | | |
| 1,887,000 E | — | 10/7/21 | | 3 month USD- | | |
| | | | | LIBOR-BBA | 3.0625% | 58,271 |
|
| 20,449,000 E | 4,859 | 12/19/14 | | 0.45% | 3 month USD- | |
| | | | | | LIBOR-BBA | (22,952) |
|
| 11,646,000 E | 13,416 | 12/19/17 | | 3 month USD- | | |
| | | | | LIBOR-BBA | 0.90% | 50,101 |
|
| 33,269,000 E | (259,508) | 12/19/22 | | 1.75% | 3 month USD- | |
| | | | | | LIBOR-BBA | (205,280) |
|
|
| 36 U.S. Government Income Trust |
| | | | | | |
| INTEREST RATE SWAP CONTRACTS OUTSTANDING at 9/30/12 cont. | | |
| |
| | Upfront | | | Payments | Payments | Unrealized |
| Swap counterparty / | premium | Termination | | made by | received by | appreciation/ |
| Notional amount | received (paid) | date | | fund per annum | fund per annum | (depreciation) |
|
| Credit Suisse International | | | | | |
| $326,487,000 E | $(349,551) | 12/19/14 | | 3 month USD- | | |
| | | | | LIBOR-BBA | 0.45% | $94,473 |
|
| 25,282,000 E | 19,784 | 12/19/17 | | 3 month USD- | | |
| | | | | LIBOR-BBA | 0.90% | 99,422 |
|
| 21,958,000 E | 1,643,503 | 12/19/42 | | 3 month USD- | | |
| | | | | LIBOR-BBA | 2.40% | 544,944 |
|
| 63,767,000 E | 43,189 | 12/19/14 | | 0.45% | 3 month USD- | |
| | | | | | LIBOR-BBA | (43,536) |
|
| 72,766,000 E | 36,048 | 12/19/17 | | 0.90% | 3 month USD- | |
| | | | | | LIBOR-BBA | (193,165) |
|
| 26,384,000 E | (1,825,245) | 12/19/42 | | 2.40% | 3 month USD- | |
| | | | | | LIBOR-BBA | (505,254) |
|
| 253,356,000 E | 2,716,452 | 12/19/22 | | 3 month USD- | | |
| | | | | LIBOR-BBA | 1.75% | 2,303,481 |
|
| 377,981,000 E | (5,259,978) | 12/19/22 | | 1.75% | 3 month USD- | |
| | | | | | LIBOR-BBA | (4,643,867) |
|
| Deutsche Bank AG | | | | | | |
| 955,000 E | — | 10/7/21 | | 3 month USD- | | |
| | | | | LIBOR-BBA | 3.0475% | 28,831 |
|
| 18,637,000 | (5,781) | 12/19/17 | | 3 month USD- | | |
| | | | | LIBOR-BBA | 0.90% | 52,926 |
|
| 65,249,000 E | (613,872) | 12/19/22 | | 1.75% | 3 month USD- | |
| | | | | | LIBOR-BBA | (507,516) |
|
| Goldman Sachs International | | | | | |
| 23,817,000 E | (16,408) | 12/19/14 | | 3 month USD- | | |
| | | | | LIBOR-BBA | 0.45% | 15,983 |
|
| 56,733,000 E | (108,463) | 12/19/17 | | 0.90% | 3 month USD- | |
| | | | | | LIBOR-BBA | (287,171) |
|
| 5,340,000 E | (84,042) | 12/19/22 | | 1.75% | 3 month USD- | |
| | | | | | LIBOR-BBA | (75,338) |
|
| 10,276,000 | 730,329 | 12/19/42 | | 3 month USD- | | |
| | | | | LIBOR-BBA | 2.40% | 216,220 |
|
| JPMorgan Chase Bank NA | | | | | |
| 18,138,000 E | (33,080) | 12/19/17 | | 0.90% | 3 month USD- | |
| | | | | | LIBOR-BBA | (90,215) |
|
| 60,646,000 E | (346,332) | 12/19/22 | | 1.75% | 3 month USD- | |
| | | | | | LIBOR-BBA | (247,480) |
|
| 107,051,000 E | 1,844,406 | 12/19/22 | | 3 month USD- | | |
| | | | | LIBOR-BBA | 1.75% | 1,669,913 |
|
| 14,854,000 E | 1,499,889 | 12/19/42 | | 3 month USD- | | |
| | | | | LIBOR-BBA | 2.40% | 756,743 |
|
| 73,899,000 E | — | 12/19/22 | | 3 month USD- | | |
| | | | | LIBOR-BBA | 1.854% | 600,060 |
|
| Total | | | | | | $(2,837,925) |
E Extended effective date.
| |
| U.S. Government Income Trust | 37 |
| | | | | | |
| TOTAL RETURN SWAP CONTRACTS OUTSTANDING at 9/30/12 | | |
| |
| | Upfront | | | Fixed payments | Total return | Unrealized |
| Swap counterparty / | premium | Termination | | received (paid) by | received by | appreciation/ |
| Notional amount | received (paid) | date | | fund per annum | or paid by fund | (depreciation) |
|
| Bank of America N.A. | | | | | | |
| $11,255,470 | $— | 1/12/41 | | 4.00% (1 month | Synthetic TRS | $(307,082) |
| | | | | USD-LIBOR) | Index 4.00% | |
| | | | | | 30 year Fannie Mae | |
| | | | | | pools | |
|
| 2,292,634 | — | 1/12/41 | | 4.00% (1 month | Synthetic TRS | (62,550) |
| | | | | USD-LIBOR) | Index 4.00% | |
| | | | | | 30 year Fannie Mae | |
| | | | | | pools | |
|
| Barclay’s Bank, PLC | | | | | | |
| 9,258,541 | — | 1/12/38 | | (6.50%) 1 month | Synthetic MBX | (21,815) |
| | | | | USD-LIBOR | Index 6.50% | |
| | | | | | 30 year Fannie Mae | |
| | | | | | pools | |
|
| 3,043,887 | — | 1/12/40 | | 4.50% (1 month | Synthetic MBX | (5,055) |
| | | | | USD-LIBOR) | Index 4.50% | |
| | | | | | 30 year Fannie Mae | |
| | | | | | pools | |
|
| 20,953,352 | — | 1/12/38 | | (6.50%) 1 month | Synthetic MBX | (49,371) |
| | | | | USD-LIBOR | Index 6.50% | |
| | | | | | 30 year Fannie Mae | |
| | | | | | pools | |
|
| 13,967,023 | — | 1/12/40 | | 5.00% (1 month | Synthetic MBX | 50,277 |
| | | | | USD-LIBOR) | Index 5.00% | |
| | | | | | 30 year Fannie Mae | |
| | | | | | pools | |
|
| 11,403,134 | — | 1/12/41 | | 5.00% (1 month | Synthetic MBX | 41,034 |
| | | | | USD-LIBOR) | Index 5.00% | |
| | | | | | 30 year Fannie Mae | |
| | | | | | pools | |
|
| 11,726,589 | 415,928 | 1/12/41 | | 4.00% (1 month | Synthetic TRS | 79,206 |
| | | | | USD-LIBOR) | Index 4.00% | |
| | | | | | 30 year Fannie Mae | |
| | | | | | pools | |
|
| 9,705,337 | 357,884 | 1/12/41 | | 4.00% (1 month | Synthetic TRS | 78,133 |
| | | | | USD-LIBOR) | Index 4.00% | |
| | | | | | 30 year Fannie Mae | |
| | | | | | pools | |
|
| 9,530,049 | (302,281) | 1/12/40 | | (4.00%) 1 month | Synthetic TRS | (78,218) |
| | | | | USD-LIBOR | Index 4.00% | |
| | | | | | 30 year Fannie Mae | |
| | | | | | pools | |
|
| 54,754,743 | — | 1/12/38 | | (6.50%) 1 month | Synthetic MBX | (129,014) |
| | | | | USD-LIBOR | Index 6.50% | |
| | | | | | 30 year Fannie Mae | |
| | | | | | pools | |
|
| 29,718,923 | — | 1/12/41 | | 5.00% (1 month | Synthetic MBX | 106,942 |
| | | | | USD-LIBOR) | Index 5.00% | |
| | | | | | 30 year Fannie Mae | |
| | | | | | pools | |
|
|
| 38 U.S. Government Income Trust |
| | | | | | |
| TOTAL RETURN SWAP CONTRACTS OUTSTANDING at 9/30/12 cont. | | |
| |
| | Upfront | | | Fixed payments | Total return | Unrealized |
| Swap counterparty / | premium | Termination | | received (paid) by | received by | appreciation/ |
| Notional amount | received (paid) | date | | fund per annum | or paid by fund | (depreciation) |
|
| Barclay’s Bank, PLC cont. | | | | | |
| $310,355 | $— | 1/12/40 | | 5.00% (1 month | Synthetic TRS | $(3,504) |
| | | | | USD-LIBOR) | Index 5.00% | |
| | | | | | 30 year Fannie Mae | |
| | | | | | pools | |
|
| 8,104,065 | — | 1/12/40 | | 4.00% (1 month | Synthetic MBX | (1,654) |
| | | | | USD-LIBOR) | Index 4.00% | |
| | | | | | 30 year Fannie Mae | |
| | | | | | pools | |
|
| 1,963,325 | — | 1/12/41 | | 5.00% (1 month | Synthetic MBX | 7,065 |
| | | | | USD-LIBOR) | Index 5.00% | |
| | | | | | 30 year Fannie Mae | |
| | | | | | pools | |
|
| 121,398,131 | — | 1/12/40 | | 4.00% (1 month | Synthetic MBX | (24,780) |
| | | | | USD-LIBOR) | Index 4.00% | |
| | | | | | 30 year Fannie Mae | |
| | | | | | pools | |
|
| 46,879,908 | — | 1/12/38 | | (6.50%) 1 month | Synthetic MBX | (110,459) |
| | | | | USD-LIBOR | Index 6.50% | |
| | | | | | 30 year Fannie Mae | |
| | | | | | pools | |
|
| 37,534,680 | — | 1/12/41 | | 5.00% (1 month | Synthetic MBX | 135,067 |
| | | | | USD-LIBOR) | Index 5.00% | |
| | | | | | 30 year Fannie Mae | |
| | | | | | pools | |
|
| 13,434,332 | — | 1/12/40 | | 4.00% (1 month | Synthetic MBX | (2,742) |
| | | | | USD-LIBOR) | Index 4.00% | |
| | | | | | 30 year Fannie Mae | |
| | | | | | pools | |
|
| 453,196 | — | 1/12/38 | | 6.50% (1 month | Synthetic TRS | (2,137) |
| | | | | USD-LIBOR) | Index 6.50% | |
| | | | | | 30 year Fannie Mae | |
| | | | | | pools | |
|
| 2,485,344 | — | 1/12/38 | | (6.50%) 1 month | Synthetic MBX | (5,856) |
| | | | | USD-LIBOR | Index 6.50% | |
| | | | | | 30 year Fannie Mae | |
| | | | | | pools | |
|
| 278,461 | — | 1/12/39 | | (5.50%) 1 month | Synthetic TRS | 3,112 |
| | | | | USD-LIBOR | Index 5.50% | |
| | | | | | 30 year Fannie Mae | |
| | | | | | pools | |
|
| 278,461 | — | 1/12/39 | | (5.50%) 1 month | Synthetic TRS | 3,112 |
| | | | | USD-LIBOR | Index 5.50% | |
| | | | | | 30 year Fannie Mae | |
| | | | | | pools | |
|
| 6,168,787 | — | 1/12/41 | | 3.50% (1 month | Synthetic MBX | 12,543 |
| | | | | USD-LIBOR) | Index 3.50% | |
| | | | | | 30 year Fannie Mae | |
| | | | | | pools | |
|
|
| U.S. Government Income Trust 39 |
| | | | | | |
| TOTAL RETURN SWAP CONTRACTS OUTSTANDING at 9/30/12 cont. | | |
| |
| | Upfront | | | Fixed payments | Total return | Unrealized |
| Swap counterparty / | premium | Termination | | received (paid) by | received by | appreciation/ |
| Notional amount | received (paid) | date | | fund per annum | or paid by fund | (depreciation) |
|
| Barclay’s Bank, PLC cont. | | | | | |
| $1,262,413 | $— | 1/12/41 | | 3.50% (1 month | Synthetic MBX | $2,567 |
| | | | | USD-LIBOR) | Index 3.50% | |
| | | | | | 30 year Fannie Mae | |
| | | | | | pools | |
|
| 8,649,481 | — | 1/12/41 | | 4.00% (1 month | Synthetic TRS | (235,983) |
| | | | | USD-LIBOR) | Index 4.00% | |
| | | | | | 30 year Fannie Mae | |
| | | | | | pools | |
|
| 1,326,615 | — | 1/12/40 | | 4.00% (1 month | Synthetic TRS | (29,142) |
| | | | | USD-LIBOR) | Index 4.00% | |
| | | | | | 30 year Fannie Mae | |
| | | | | | pools | |
|
| 668,803 | — | 1/12/39 | | (5.50%) 1 month | Synthetic TRS | 7,474 |
| | | | | USD-LIBOR | Index 5.50% | |
| | | | | | 30 year Fannie Mae | |
| | | | | | pools | |
|
| 422,137 | — | 1/12/40 | | 4.50% (1 month | Synthetic TRS | (7,447) |
| | | | | USD-LIBOR) | Index 4.50% | |
| | | | | | 30 year Fannie Mae | |
| | | | | | pools | |
|
| 111,880 | — | 1/12/39 | | (5.50%) 1 month | Synthetic TRS | 1,250 |
| | | | | USD-LIBOR | Index 5.50% | |
| | | | | | 30 year Fannie Mae | |
| | | | | | pools | |
|
| 5,837,920 | — | 1/12/34 | | (5.50%) 1 month | Synthetic TRS | 41,539 |
| | | | | USD-LIBOR | Index 5.50% | |
| | | | | | 30 year Fannie Mae | |
| | | | | | pools | |
|
| 19,786,702 | — | 1/12/38 | | (6.50%) 1 month | Synthetic MBX | (46,622) |
| | | | | USD-LIBOR | Index 6.50% | |
| | | | | | 30 year Fannie Mae | |
| | | | | | pools | |
|
| 825,724 | — | 1/12/41 | | 4.00% (1 month | Synthetic TRS | (22,528) |
| | | | | USD-LIBOR) | Index 4.00% | |
| | | | | | 30 year Fannie Mae | |
| | | | | | pools | |
|
| 8,029,283 | — | 1/12/41 | | 4.00% (1 month | Synthetic TRS | (219,062) |
| | | | | USD-LIBOR) | Index 4.00% | |
| | | | | | 30 year Fannie Mae | |
| | | | | | pools | |
|
| 1,498,574 | — | 1/12/40 | | 5.00% (1 month | Synthetic MBX | 5,394 |
| | | | | USD-LIBOR) | Index 5.00% | |
| | | | | | 30 year Fannie Mae | |
| | | | | | pools | |
|
| 88,875,799 | — | 1/12/41 | | 5.00% (1 month | Synthetic MBX | 139,353 |
| | | | | USD-LIBOR) | Index 5.00% | |
| | | | | | 30 year Ginnie Mae II |
| | | | | | pools | |
|
|
| 40 U.S. Government Income Trust |
| | | | | | |
| TOTAL RETURN SWAP CONTRACTS OUTSTANDING at 9/30/12 cont. | | |
| |
| | Upfront | | | Fixed payments | Total return | Unrealized |
| Swap counterparty / | premium | Termination | | received (paid) by | received by | appreciation/ |
| Notional amount | received (paid) | date | | fund per annum | or paid by fund | (depreciation) |
|
| Barclay’s Bank, PLC cont. | | | | | |
| $8,836,778 | $— | 1/12/40 | | 4.50% (1 month | Synthetic MBX | $(14,676) |
| | | | | USD-LIBOR) | Index 4.50% | |
| | | | | | 30 year Fannie Mae | |
| | | | | | pools | |
|
| 24,914,201 | — | 1/12/41 | | 5.00% (1 month | Synthetic MBX | 89,653 |
| | | | | USD-LIBOR) | Index 5.00% | |
| | | | | | 30 year Fannie Mae | |
| | | | | | pools | |
|
| 402,429 | — | 1/12/40 | | 5.00% (1 month | Synthetic MBX | 1,449 |
| | | | | USD-LIBOR) | Index 5.00% | |
| | | | | | 30 year Fannie Mae | |
| | | | | | pools | |
|
| 1,304,734 | — | 1/12/40 | | 5.00% (1 month | Synthetic MBX | 4,697 |
| | | | | USD-LIBOR) | Index 5.00% | |
| | | | | | 30 year Fannie Mae | |
| | | | | | pools | |
|
| 946,024 | — | 1/12/40 | | 5.00% (1 month | Synthetic MBX | 3,405 |
| | | | | USD-LIBOR) | Index 5.00% | |
| | | | | | 30 year Fannie Mae | |
| | | | | | pools | |
|
| 20,366,776 | — | 1/12/38 | | (6.50%) 1 month | Synthetic TRS | 96,052 |
| | | | | USD-LIBOR | Index 6.50% | |
| | | | | | 30 year Fannie Mae | |
| | | | | | pools | |
|
| 15,958,935 | — | 1/12/39 | | 5.50% (1 month | Synthetic TRS | (178,343) |
| | | | | USD-LIBOR) | Index 5.50% | |
| | | | | | 30 year Fannie Mae | |
| | | | | | pools | |
|
| Citibank, N.A. | | | | | | |
| 271,036 | — | 1/12/39 | | (5.50%) 1 month | Synthetic TRS | 3,029 |
| | | | | USD-LIBOR | Index 5.50% | |
| | | | | | 30 year Fannie Mae | |
| | | | | | pools | |
|
| Credit Suisse International | | | | | |
| 1,390,457 | — | 1/12/41 | | 5.00% (1 month | Synthetic MBX | 5,003 |
| | | | | USD-LIBOR) | Index 5.00% | |
| | | | | | 30 year Fannie Mae | |
| | | | | | pools | |
|
| 3,292,042 | — | 1/12/41 | | 4.00% (1 month | Synthetic TRS | (89,816) |
| | | | | USD-LIBOR) | Index 4.00% | |
| | | | | | 30 year Fannie Mae | |
| | | | | | pools | |
|
| 21,254,623 | — | 1/12/41 | | 4.00% (1 month | Synthetic TRS | (579,887) |
| | | | | USD-LIBOR) | Index 4.00% | |
| | | | | | 30 year Fannie Mae | |
| | | | | | pools | |
|
| 9,988,426 | — | 1/12/36 | | 5.00% (1 month | Synthetic TRS | (112,721) |
| | | | | USD-LIBOR) | Index 5.00% | |
| | | | | | 30 year Fannie Mae | |
| | | | | | pools | |
|
| |
| U.S. Government Income Trust | 41 |
| | | | | | |
| TOTAL RETURN SWAP CONTRACTS OUTSTANDING at 9/30/12 cont. | | |
| |
| | Upfront | | | Fixed payments | Total return | Unrealized |
| Swap counterparty / | premium | Termination | | received (paid) by | received by | appreciation/ |
| Notional amount | received (paid) | date | | fund per annum | or paid by fund | (depreciation) |
|
| Credit Suisse International cont. | | | | | |
| $5,837,920 | $— | 1/12/34 | | 5.50% (1 month | Synthetic TRS | $(41,539) |
| | | | | USD-LIBOR) | Index 5.50% | |
| | | | | | 30 year Fannie Mae | |
| | | | | | pools | |
|
| 278,461 | — | 1/12/39 | | (5.50%) 1 month | Synthetic TRS | 3,112 |
| | | | | USD-LIBOR | Index 5.50% | |
| | | | | | 30 year Fannie Mae | |
| | | | | | pools | |
|
| 4,226,296 | — | 1/12/42 | | 4.00% (1 month | Synthetic TRS | (119,932) |
| | | | | USD-LIBOR) | Index 4.00% | |
| | | | | | 30 year Fannie Mae | |
| | | | | | pools | |
|
| 4,226,296 | — | 1/12/42 | | 4.00% (1 month | Synthetic MBX | 1,112 |
| | | | | USD-LIBOR) | Index 4.00% | |
| | | | | | 30 year Fannie Mae | |
| | | | | | pools | |
|
| 2,291,910 | — | 1/12/41 | | 4.00% (1 month | Synthetic TRS | (62,530) |
| | | | | USD-LIBOR) | Index 4.00% | |
| | | | | | 30 year Fannie Mae | |
| | | | | | pools | |
|
| 680,441 | — | 1/12/41 | | 5.00% (1 month | Synthetic MBX | 1,067 |
| | | | | USD-LIBOR) | Index 5.00% | |
| | | | | | 30 year Ginnie Mae II |
| | | | | | pools | |
|
| Deutsche Bank AG | | | | | | |
| 243,270 | — | 1/12/40 | | 4.00% (1 month | Synthetic TRS | (5,344) |
| | | | | USD-LIBOR) | Index 4.00% | |
| | | | | | 30 year Fannie Mae | |
| | | | | | pools | |
|
| 422,137 | — | 1/12/40 | | (4.50%)1 month | Synthetic TRS | 7,447 |
| | | | | USD-LIBOR | Index 4.50% | |
| | | | | | 30 year Fannie Mae | |
| | | | | | pools | |
|
| 216,385 | — | 1/12/40 | | 5.00% (1 month | Synthetic TRS | (2,443) |
| | | | | USD-LIBOR) | Index 5.00% | |
| | | | | | 30 year Fannie Mae | |
| | | | | | pools | |
|
| 756,722 | — | 1/12/41 | | 4.50% (1 month | Synthetic MBX | 3,116 |
| | | | | USD-LIBOR) | Index 4.50% | |
| | | | | | 30 year Ginnie Mae II |
| | | | | | pools | |
|
| 9,988,426 | — | 1/12/36 | | (5.00%) 1 month | Synthetic TRS | 112,721 |
| | | | | USD-LIBOR | Index 5.00% | |
| | | | | | 30 year Fannie Mae | |
| | | | | | pools | |
|
| Goldman Sachs International | | | | | |
| 8,843,428 | — | 1/12/41 | | 4.00% (1 month | Synthetic TRS | (241,274) |
| | | | | USD-LIBOR) | Index 4.00% | |
| | | | | | 30 year Fannie Mae | |
| | | | | | pools | |
|
|
| 42 U.S. Government Income Trust |
| | | | | | |
| TOTAL RETURN SWAP CONTRACTS OUTSTANDING at 9/30/12 cont. | | |
| |
| | Upfront | | | Fixed payments | Total return | Unrealized |
| Swap counterparty / | premium | Termination | | received (paid) by | received by | appreciation/ |
| Notional amount | received (paid) | date | | fund per annum | or paid by fund | (depreciation) |
|
| Goldman Sachs International cont. | | | | | |
| $8,937,508 | $— | 1/12/41 | | 4.00% (1 month | Synthetic TRS | $(243,841) |
| | | | | USD-LIBOR) | Index 4.00% | |
| | | | | | 30 year Fannie Mae | |
| | | | | | pools | |
|
| 3,533,714 | — | 1/12/38 | | 6.50% (1 month | Synthetic TRS | (16,665) |
| | | | | USD-LIBOR) | Index 6.50% | |
| | | | | | 30 year Fannie Mae | |
| | | | | | pools | |
|
| 12,384,777 | — | 1/12/38 | | 6.50% (1 month | Synthetic TRS | (58,408) |
| | | | | USD-LIBOR) | Index 6.50% | |
| | | | | | 30 year Fannie Mae | |
| | | | | | pools | |
|
| 9,554,031 | — | 1/12/38 | | 6.50% (1 month | Synthetic TRS | (45,058) |
| | | | | USD-LIBOR) | Index 6.50% | |
| | | | | | 30 year Fannie Mae | |
| | | | | | pools | |
|
| 11,390,799 | 418,256 | 1/12/41 | | 4.00% (1 month | Synthetic TRS | 91,176 |
| | | | | USD-LIBOR) | Index 4.00% | |
| | | | | | 30 year Fannie Mae | |
| | | | | | pools | |
|
| 3,618,424 | 133,429 | 1/12/41 | | 4.00% (1 month | Synthetic TRS | 29,130 |
| | | | | USD-LIBOR) | Index 4.00% | |
| | | | | | 30 year Fannie Mae | |
| | | | | | pools | |
|
| 3,553,116 | (110,757) | 1/12/40 | | (4.00%) 1 month | Synthetic TRS | (27,219) |
| | | | | USD-LIBOR | Index 4.00% | |
| | | | | | 30 year Fannie Mae | |
| | | | | | pools | |
|
| 10,722,568 | — | 1/12/38 | | 6.50% (1 month | Synthetic TRS | (50,569) |
| | | | | USD-LIBOR) | Index 6.50% | |
| | | | | | 30 year Fannie Mae | |
| | | | | | pools | |
|
| 3,322,437 | — | 1/12/41 | | 4.00% (1 month | Synthetic TRS | (90,646) |
| | | | | USD-LIBOR) | Index 4.00% | |
| | | | | | 30 year Fannie Mae | |
| | | | | | pools | |
|
| 194,671 | — | 1/12/41 | | 4.00% (1 month | Synthetic TRS | (5,311) |
| | | | | USD-LIBOR) | Index 4.00% | |
| | | | | | 30 year Fannie Mae | |
| | | | | | pools | |
|
| 11,752,641 | — | 1/12/41 | | 4.00% (1 month | Synthetic TRS | (320,646) |
| | | | | USD-LIBOR) | Index 4.00% | |
| | | | | | 30 year Fannie Mae | |
| | | | | | pools | |
|
| 9,272,574 | — | 1/12/41 | | 4.00% (1 month | Synthetic TRS | (252,983) |
| | | | | USD-LIBOR) | Index 4.00% | |
| | | | | | 30 year Fannie Mae | |
| | | | | | pools | |
|
|
| U.S. Government Income Trust 43 |
| | | | | | |
| TOTAL RETURN SWAP CONTRACTS OUTSTANDING at 9/30/12 cont. | | |
| |
| | Upfront | | | Fixed payments | Total return | Unrealized |
| Swap counterparty / | premium | Termination | | received (paid) by | received by | appreciation/ |
| Notional amount | received (paid) | date | | fund per annum | or paid by fund | (depreciation) |
|
| Goldman Sachs International cont. | | | | | |
| $16,318,629 | $— | 1/12/38 | | (6.50%) 1 month | Synthetic MBX | $(38,450) |
| | | | | USD-LIBOR | Index 6.50% | |
| | | | | | 30 year Fannie Mae | |
| | | | | | pools | |
|
| 6,130,417 | — | 1/12/38 | | (6.50%) 1 month | Synthetic MBX | (14,445) |
| | | | | USD-LIBOR | Index 6.50% | |
| | | | | | 30 year Fannie Mae | |
| | | | | | pools | |
|
| 12,041,392 | — | 1/12/41 | | 4.00% (1 month | Synthetic TRS | (328,524) |
| | | | | USD-LIBOR) | Index 4.00% | |
| | | | | | 30 year Fannie Mae | |
| | | | | | pools | |
|
| 13,312,614 | — | 1/12/39 | | (5.50%) 1 month | Synthetic TRS | 148,770 |
| | | | | USD-LIBOR | Index 5.50% | |
| | | | | | 30 year Fannie Mae | |
| | | | | | pools | |
|
| 202,296 | — | 1/12/39 | | (5.50%) 1 month | Synthetic TRS | 2,261 |
| | | | | USD-LIBOR | Index 5.50% | |
| | | | | | 30 year Fannie Mae | |
| | | | | | pools | |
|
| 680,109 | — | 1/12/38 | | 6.50% (1 month | Synthetic TRS | (3,207) |
| | | | | USD-LIBOR) | Index 6.50% | |
| | | | | | 30 year Fannie Mae | |
| | | | | | pools | |
|
| 9,227,503 | — | 1/12/38 | | 6.50% (1 month | Synthetic TRS | (43,518) |
| | | | | USD-LIBOR) | Index 6.50% | |
| | | | | | 30 year Fannie Mae | |
| | | | | | pools | |
|
| 14,389,025 | — | 1/12/41 | | 4.00% (1 month | Synthetic TRS | (392,574) |
| | | | | USD-LIBOR) | Index 4.00% | |
| | | | | | 30 year Fannie Mae | |
| | | | | | pools | |
|
| 8,277,576 | — | 1/12/40 | | (4.00%) 1 month | Synthetic TRS | 181,837 |
| | | | | USD-LIBOR | Index 4.00% | |
| | | | | | 30 year Fannie Mae | |
| | | | | | pools | |
|
| 9,404,284 | — | 1/12/41 | | 4.00% (1 month | Synthetic TRS | (256,576) |
| | | | | USD-LIBOR) | Index 4.00% | |
| | | | | | 30 year Fannie Mae | |
| | | | | | pools | |
|
| 5,675,136 | — | 1/12/41 | | 4.00% (1 month | Synthetic TRS | (154,834) |
| | | | | USD-LIBOR) | Index 4.00% | |
| | | | | | 30 year Fannie Mae | |
| | | | | | pools | |
|
| 12,469,921 | — | 1/12/38 | | 6.50% (1 month | Synthetic TRS | (58,810) |
| | | | | USD-LIBOR) | Index 6.50% | |
| | | | | | 30 year Fannie Mae | |
| | | | | | pools | |
|
|
| 44 U.S. Government Income Trust |
| | | | | | |
| TOTAL RETURN SWAP CONTRACTS OUTSTANDING at 9/30/12 cont. | | |
| |
| | Upfront | | | Fixed payments | Total return | Unrealized |
| Swap counterparty / | premium | Termination | | received (paid) by | received by | appreciation/ |
| Notional amount | received (paid) | date | | fund per annum | or paid by fund | (depreciation) |
|
| Goldman Sachs International cont. | | | | | |
| $22,355,932 | $— | 1/12/38 | | (6.50%) 1 month | Synthetic MBX | $(52,675) |
| | | | | USD-LIBOR | Index 6.50% | |
| | | | | | 30 year Fannie Mae | |
| | | | | | pools | |
|
| 1,591,535 | — | 1/12/38 | | 6.50% (1 month | Synthetic TRS | (7,506) |
| | | | | USD-LIBOR) | Index 6.50% | |
| | | | | | 30 year Fannie Mae | |
| | | | | | pools | |
|
| 2,952,801 | — | 1/12/38 | | 6.50% (1 month | Synthetic TRS | (13,926) |
| | | | | USD-LIBOR) | Index 6.50% | |
| | | | | | 30 year Fannie Mae | |
| | | | | | pools | |
|
| 828,798 | — | 1/12/38 | | (6.50%) 1 month | Synthetic MBX | (1,953) |
| | | | | USD-LIBOR | Index 6.50% | |
| | | | | | 30 year Fannie Mae | |
| | | | | | pools | |
|
| 2,210,197 | — | 1/12/38 | | (6.50%) 1 month | Synthetic MBX | (5,208) |
| | | | | USD-LIBOR | Index 6.50% | |
| | | | | | 30 year Fannie Mae | |
| | | | | | pools | |
|
| 1,966,926 | — | 1/12/38 | | (6.50%) 1 month | Synthetic MBX | (4,635) |
| | | | | USD-LIBOR | Index 6.50% | |
| | | | | | 30 year Fannie Mae | |
| | | | | | pools | |
|
| 2,865,769 | — | 1/12/38 | | 6.50% (1 month | Synthetic TRS | (13,515) |
| | | | | USD-LIBOR) | Index 6.50% | |
| | | | | | 30 year Fannie Mae | |
| | | | | | pools | |
|
| 5,731,747 | — | 1/12/38 | | 6.50% (1 month | Synthetic TRS | (27,032) |
| | | | | USD-LIBOR) | Index 6.50% | |
| | | | | | 30 year Fannie Mae | |
| | | | | | pools | |
|
| 3,882,472 | — | 1/12/38 | | 6.50% (1 month | Synthetic TRS | (18,310) |
| | | | | USD-LIBOR) | Index 6.50% | |
| | | | | | 30 year Fannie Mae | |
| | | | | | pools | |
|
| 840,353 | — | 1/12/41 | | (4.00%) 1 month | Synthetic MBX | (7,310) |
| | | | | USD-LIBOR | Index 4.00% | |
| | | | | | 30 year Ginnie Mae II |
| | | | | | pools | |
|
| 1,691,251 | 20,876 | 1/12/41 | | 4.00% (1 month | Synthetic TRS | (26,383) |
| | | | | USD-LIBOR) | Index 4.00% | |
| | | | | | 30 year Fannie Mae | |
| | | | | | pools | |
|
| 3,242,108 | 44,579 | 1/12/41 | | 4.00% (1 month | Synthetic TRS | (46,017) |
| | | | | USD-LIBOR) | Index 4.00% | |
| | | | | | 30 year Fannie Mae | |
| | | | | | pools | |
|
|
| U.S. Government Income Trust 45 |
| | | | | | |
| TOTAL RETURN SWAP CONTRACTS OUTSTANDING at 9/30/12 cont. | | |
| |
| | Upfront | | | Fixed payments | Total return | Unrealized |
| Swap counterparty / | premium | Termination | | received (paid) by | received by | appreciation/ |
| Notional amount | received (paid) | date | | fund per annum | or paid by fund | (depreciation) |
|
| Goldman Sachs International cont. | | | | | |
| $1,893,526 | $— | 1/12/38 | | 6.50% (1 month | Synthetic TRS | $(8,930) |
| | | | | USD-LIBOR) | Index 6.50% | |
| | | | | | 30 year Fannie Mae | |
| | | | | | pools | |
|
| 1,861,317 | — | 1/12/41 | | 4.00% (1 month | Synthetic TRS | (50,782) |
| | | | | USD-LIBOR) | Index 4.00% | |
| | | | | | 30 year Fannie Mae | |
| | | | | | pools | |
|
| 12,617,771 | — | 1/12/38 | | 6.50% (1 month | Synthetic TRS | (59,507) |
| | | | | USD-LIBOR) | Index 6.50% | |
| | | | | | 30 year Fannie Mae | |
| | | | | | pools | |
|
| 10,700,404 | — | 1/12/41 | | 4.00% (1 month | Synthetic TRS | (291,939) |
| | | | | USD-LIBOR) | Index 4.00% | |
| | | | | | 30 year Fannie Mae | |
| | | | | | pools | |
|
| Total | | | | | | $(4,352,333) |
ASC 820 establishes a three-level hierarchy for disclosure of fair value measurements. The valuation hierarchy is based upon the transparency of inputs to the valuation of the fund’s investments. The three levels are defined as follows:
Level 1: Valuations based on quoted prices for identical securities in active markets.
Level 2: Valuations based on quoted prices in markets that are not active or for which all significant inputs are observable, either directly or indirectly.
Level 3: Valuations based on inputs that are unobservable and significant to the fair value measurement.
The following is a summary of the inputs used to value the fund’s net assets as of the close of the reporting period:
| | | |
| | | Valuation inputs | |
|
| Investments in securities: | Level 1 | Level 2 | Level 3 |
|
| Mortgage-backed securities | $— | $263,796,294 | $— |
|
| Purchased options outstanding | — | 62,719,521 | — |
|
| U.S. Government and agency mortgage obligations | — | 1,777,002,961 | — |
|
| Short-term investments | 196,783,229 | 670,407,347 | — |
|
| Totals by level | $196,783,229 | $2,773,926,123 | $— |
| | | | |
| | | Valuation inputs | |
|
| Other financial instruments: | Level 1 | Level 2 | Level 3 |
|
| Written options | $— | $(63,486,635) | $— |
|
| TBA sale commitments | — | (465,708,280) | — |
|
| Interest rate swap contracts | — | (1,374,207) | — |
|
| Total return swap contracts | — | (5,330,247) | — |
|
| Totals by level | $— | $(535,899,369) | $— |
The accompanying notes are an integral part of these financial statements.
|
| 46 U.S. Government Income Trust |
Statement of assets and liabilities 9/30/12
| |
| ASSETS | |
|
| Investment in securities, at value (Note 1): | |
| Unaffiliated issuers (identified cost $2,743,137,270) | $2,789,344,155 |
| Affiliated issuers (identified cost $181,365,197) (Notes 1 and 6) | 181,365,197 |
|
| Cash | 802,448 |
|
| Interest and other receivables | 5,507,630 |
|
| Receivable for shares of the fund sold | 2,303,440 |
|
| Receivable for investments sold | 75,341,271 |
|
| Receivable for sales of delayed delivery securities (Note 1) | 500,735,028 |
|
| Unrealized appreciation on swap contracts (Note 1) | 8,726,384 |
|
| Premium paid on swap contracts (Note 1) | 11,047,600 |
|
| Total assets | 3,575,173,153 |
| |
| LIABILITIES | |
|
| Payable for investments purchased | 95,839,070 |
|
| Payable for purchases of delayed delivery securities (Note 1) | 1,279,660,860 |
|
| Payable for shares of the fund repurchased | 2,667,357 |
|
| Payable for compensation of Manager (Note 2) | 540,529 |
|
| Payable for investor servicing fees (Note 2) | 419,257 |
|
| Payable for custodian fees (Note 2) | 54,383 |
|
| Payable for Trustee compensation and expenses (Note 2) | 431,090 |
|
| Payable for administrative services (Note 2) | 7,378 |
|
| Payable for distribution fees (Note 2) | 1,026,610 |
|
| Written options outstanding, at value (premiums $65,576,527) (Notes 1 and 3) | 63,486,635 |
|
| Premium received on swap contracts (Note 1) | 10,561,796 |
|
| Unrealized depreciation on swap contracts (Note 1) | 15,916,642 |
|
| TBA sale commitments, at value (proceeds receivable $458,150,312) (Note 1) | 465,708,280 |
|
| Collateral on certain derivative contracts, at value (Note 1) | 15,418,032 |
|
| Other accrued expenses | 260,540 |
|
| Total liabilities | 1,951,998,459 |
| | |
| Net assets | $1,623,174,694 |
|
| |
| REPRESENTED BY | |
|
| Paid-in capital (Unlimited shares authorized) (Notes 1 and 4) | $1,653,180,500 |
|
| Undistributed net investment income (Note 1) | 17,146,805 |
|
| Accumulated net realized loss on investments (Note 1) | (80,701,162) |
|
| Net unrealized appreciation of investments | 33,548,551 |
|
| Total — Representing net assets applicable to capital shares outstanding | $1,623,174,694 |
(Continued on next page)
|
| U.S. Government Income Trust 47 |
Statement of assets and liabilities (Continued)
| |
| COMPUTATION OF NET ASSET VALUE AND OFFERING PRICE | |
|
| Net asset value and redemption price per class A share | |
| ($1,250,545,763 divided by 91,318,445 shares) | $13.69 |
|
| Offering price per class A share (100/96.00 of $13.69)* | $14.26 |
|
| Net asset value and offering price per class B share ($44,351,780 divided by 3,255,717 shares)** | $13.62 |
|
| Net asset value and offering price per class C share ($170,247,337 divided by 12,543,767 shares)** | $13.57 |
|
| Net asset value and redemption price per class M share ($22,554,970 divided by 1,641,996 shares) | $13.74 |
|
| Offering price per class M share (100/96.75 of $13.74)† | $14.20 |
|
| Net asset value, offering price and redemption price per class R share | |
| ($36,899,773 divided by 2,722,555 shares) | $13.55 |
|
| Net asset value, offering price and redemption price per class Y share | |
| ($98,575,071 divided by 7,257,093 shares) | $13.58 |
|
* On single retail sales of less than $100,000. On sales of $100,000 or more the offering price is reduced.
** Redemption price per share is equal to net assets less any applicable contingent deferred sales charge.
† On single retail sales of less than $50,000. On sales of $50,000 or more the offering price is reduced.
The accompanying notes are an integral part of these financial statements.
|
| 48 U.S. Government Income Trust |
Statement of operations Year ended 9/30/12
| |
| INVESTMENT INCOME | |
|
| Interest (including interest income of $113,487 from investments in affiliated issuers) (Note 6) | $36,600,068 |
|
| Total investment income | 36,600,068 |
| |
| EXPENSES | |
|
| Compensation of Manager (Note 2) | 6,537,443 |
|
| Investor servicing fees (Note 2) | 2,422,731 |
|
| Custodian fees (Note 2) | 118,751 |
|
| Trustee compensation and expenses (Note 2) | 142,214 |
|
| Administrative services (Note 2) | 49,535 |
|
| Distribution fees (Note 2) | 5,430,603 |
|
| Other | 527,756 |
|
| Total expenses | 15,229,033 |
| Expense reduction (Note 2) | (5,415) |
|
| Net expenses | 15,223,618 |
| | |
| Net investment income | 21,376,450 |
|
| |
| Net realized gain on investments (Notes 1 and 3) | 53,040,431 |
|
| Net realized loss on swap contracts (Note 1) | (118,746,009) |
|
| Net realized gain on futures contracts (Note 1) | 4,242,009 |
|
| Net realized loss on written options (Notes 1 and 3) | (10,175,255) |
|
| Net unrealized appreciation of investments, futures contracts, swap contracts, written options, | |
| and TBA sale commitments during the year | 105,851,674 |
|
| Net gain on investments | 34,212,850 |
| | |
| Net increase in net assets resulting from operations | $55,589,300 |
|
The accompanying notes are an integral part of these financial statements.
|
| U.S. Government Income Trust 49 |
| | |
| Statement of changes in net assets | | |
| |
| INCREASE IN NET ASSETS | Year ended 9/30/12 | Year ended 9/30/11 |
|
| Operations: | | |
| Net investment income | $21,376,450 | $48,586,385 |
|
| Net realized gain (loss) on investments | (71,638,824) | 75,512,942 |
|
| Net unrealized appreciation (depreciation) of investments | 105,851,674 | (41,847,213) |
|
| Net increase in net assets resulting from operations | 55,589,300 | 82,252,114 |
|
| Distributions to shareholders (Note 1): | | |
| From ordinary income | | |
| Net investment income | | |
|
| Class A | (49,858,671) | (46,925,878) |
|
| Class B | (1,274,740) | (1,213,360) |
|
| Class C | (5,204,885) | (3,995,074) |
|
| Class M | (883,885) | (901,060) |
|
| Class R | (1,141,644) | (554,046) |
|
| Class Y | (3,832,271) | (2,067,202) |
|
| Net realized short-term gain on investments | | |
|
| Class A | (19,995,473) | (67,624,464) |
|
| Class B | (581,818) | (2,337,671) |
|
| Class C | (2,338,756) | (7,467,350) |
|
| Class M | (397,410) | (1,439,596) |
|
| Class R | (395,868) | (839,473) |
|
| Class Y | (1,100,840) | (3,110,189) |
|
| From net realized long-term gain on investments | | |
| Class A | (25,625,596) | (20,135,281) |
|
| Class B | (747,094) | (735,037) |
|
| Class C | (3,047,221) | (2,261,868) |
|
| Class M | (513,934) | (435,171) |
|
| Class R | (510,095) | (224,309) |
|
| Class Y | (1,457,751) | (794,310) |
|
| Increase in capital from settlement payments (Note 8) | — | 259,229 |
|
| Increase from capital share transactions (Note 4) | 100,507,784 | 83,244,678 |
|
| Total increase in net assets | 37,189,132 | 2,694,682 |
| |
| NET ASSETS | | |
|
| Beginning of year | 1,585,985,562 | 1,583,290,880 |
|
| End of year (including undistributed net investment income | | |
| of $17,146,805 and $50,492,846, respectively) | $1,623,174,694 | $1,585,985,562 |
|
The accompanying notes are an integral part of these financial statements.
|
| 50 U.S. Government Income Trust |
|
| This page left blank intentionally. |
| |
| U.S. Government Income Trust | 51 |
Financial highlights (For a common share outstanding throughout the period)
| | | | | | | | | | | | | | | | |
| INVESTMENT OPERATIONS: | | | | LESS DISTRIBUTIONS: | | | | | | RATIOS AND SUPPLEMENTAL DATA: | | |
|
| | | | | | | | | | | | | | | Ratio | | |
| | | | | | | | | | | | | | | of expenses | | |
| | | | | | | | | | | | | | | to average | Ratio | |
| | Net asset | Net | Net realized | | From | From | | | | | | | Ratio | net assets | of net investment | |
| | value, | investment | and unrealized | Total from | net | net realized | | | Non-recurring | | Total return | Net assets, | of expenses | excluding | income (loss) | Portfolio |
| | beginning | income | gain (loss) | investment | investment | gain | Total | Redemption | reimburse- | Net asset value, | at net asset | end of period | to average | interest | to average | turnover |
| Period ended | of period | (loss) a | on investments | operations | income | on investments | distributions | fees | ments | end of period | value (%) c | (in thousands) | net assets (%) d | expense (%) d | net assets (%) | (%) e |
|
| Class A | | | | | | | | | | | | | | | | |
| September 30, 2012 | $14.25 | .20 | .28 | .48 | (.54) | (.50) | (1.04) | — | — | $13.69 | 3.54 | $1,250,546 | .86 | .86 | 1.43 | 512 |
| September 30, 2011 | 15.00 | .46 | .31 | .77 | (.52) | (1.00) | (1.52) | — | — b,l | 14.25 | 5.60 | 1,290,113 | .84 | .84 | 3.16 | 496 |
| September 30, 2010 | 14.50 | .76 | .54 | 1.30 | (.75) | (.05) | (.80) | — b | — b,f | 15.00 | 9.10 | 1,305,668 | .86 g,h | .86 g | 5.03 g | 515 |
| September 30, 2009 | 12.68 | .62 | 1.82 | 2.44 | (.62) | — | (.62) | — b | — b,j | 14.50 | 19.92 | 1,129,477 | 1.23 g,i | .98 g | 4.73 g | 604 |
| September 30, 2008 | 13.17 | .73 | (.63) k | .10 | (.59) | — | (.59) | — b | — | 12.68 | .60 k | 1,057,520 | .96 g | .96 g | 5.47 g | 271 |
|
| Class B | | | | | | | | | | | | | | | | |
| September 30, 2012 | $14.18 | .09 | .29 | .38 | (.44) | (.50) | (.94) | — | — | $13.62 | 2.83 | $44,352 | 1.59 | 1.59 | .65 | 512 |
| September 30, 2011 | 14.93 | .34 | .33 | .67 | (.42) | (1.00) | (1.42) | — | — b,l | 14.18 | 4.84 | 37,213 | 1.56 | 1.56 | 2.40 | 496 |
| September 30, 2010 | 14.44 | .66 | .52 | 1.18 | (.64) | (.05) | (.69) | — b | — b,f | 14.93 | 8.27 | 50,676 | 1.57 g,h | 1.57 g | 4.44 g | 515 |
| September 30, 2009 | 12.62 | .51 | 1.84 | 2.35 | (.53) | — | (.53) | — b | — b,j | 14.44 | 19.15 | 68,377 | 1.94 g,i | 1.69 g | 3.97 g | 604 |
| September 30, 2008 | 13.10 | .63 | (.62) k | .01 | (.49) | — | (.49) | — b | — | 12.62 | (.06) k | 85,571 | 1.67 g | 1.67 g | 4.78 g | 271 |
|
| Class C | | | | | | | | | | | | | | | | |
| September 30, 2012 | $14.13 | .09 | .29 | .38 | (.44) | (.50) | (.94) | — | — | $13.57 | 2.81 | $170,247 | 1.61 | 1.61 | .63 | 512 |
| September 30, 2011 | 14.90 | .34 | .30 | .64 | (.41) | (1.00) | (1.41) | — | — b,l | 14.13 | 4.71 | 143,059 | 1.59 | 1.59 | 2.40 | 496 |
| September 30, 2010 | 14.44 | .62 | .53 | 1.15 | (.64) | (.05) | (.69) | — b | — b,f | 14.90 | 8.06 | 134,365 | 1.61 g,h | 1.61 g | 4.10 g | 515 |
| September 30, 2009 | 12.66 | .53 | 1.77 | 2.30 | (.52) | — | (.52) | — b | — b,j | 14.44 | 18.75 | 56,171 | 1.98 g,i | 1.73 g | 4.05 g | 604 |
| September 30, 2008 | 13.15 | .63 | (.63) k | — b | (.49) | — | (.49) | — b | — | 12.66 | (.13) k | 29,635 | 1.71 g | 1.71 g | 4.73 g | 271 |
|
| Class M | | | | | | | | | | | | | | | | |
| September 30, 2012 | $14.29 | .17 | .28 | .45 | (.50) | (.50) | (1.00) | — | — | $13.74 | 3.34 | $22,555 | 1.10 | 1.10 | 1.21 | 512 |
| September 30, 2011 | 15.03 | .42 | .33 | .75 | (.49) | (1.00) | (1.49) | — | — b,l | 14.29 | 5.40 | 25,907 | 1.08 | 1.08 | 2.92 | 496 |
| September 30, 2010 | 14.49 | .73 | .57 | 1.30 | (.71) | (.05) | (.76) | — b | — b,f | 15.03 | 9.13 | 28,380 | 1.10 g,h | 1.10 g | 4.83 g | 515 |
| September 30, 2009 | 12.68 | .58 | 1.82 | 2.40 | (.59) | — | (.59) | — b | — b,j | 14.49 | 19.57 | 28,104 | 1.47 g,i | 1.22 g | 4.48 g | 604 |
| September 30, 2008 | 13.16 | .70 | (.63) k | .07 | (.55) | — | (.55) | — b | — | 12.68 | .42 k | 27,627 | 1.20 g | 1.20 g | 5.23 g | 271 |
|
| Class R | | | | | | | | | | | | | | | | |
| September 30, 2012 | $14.11 | .14 | .30 | .44 | (.50) | (.50) | (1.00) | — | — | $13.55 | 3.32 | $36,900 | 1.11 | 1.11 | 1.06 | 512 |
| September 30, 2011 | 14.88 | .42 | .30 | .72 | (.49) | (1.00) | (1.49) | — | — b,l | 14.11 | 5.25 | 24,466 | 1.09 | 1.09 | 2.95 | 496 |
| September 30, 2010 | 14.40 | .69 | .55 | 1.24 | (.71) | (.05) | (.76) | — b | — b,f | 14.88 | 8.77 | 12,358 | 1.11 g,h | 1.11 g | 4.57 g | 515 |
| September 30, 2009 | 12.64 | .59 | 1.76 | 2.35 | (.59) | — | (.59) | — b | — b,j | 14.40 | 19.20 | 3,895 | 1.48 g,i | 1.23 g | 4.54 g | 604 |
| September 30, 2008 | 13.16 | .70 | (.67) k | .03 | (.55) | — | (.55) | — b | — | 12.64 | .12 k | 2,651 | 1.21 g | 1.21 g | 5.22 g | 271 |
|
| Class Y | | | | | | | | | | | | | | | | |
| September 30, 2012 | $14.14 | .21 | .30 | .51 | (.57) | (.50) | (1.07) | — | — | $13.58 | 3.85 | $98,575 | .61 | .61 | 1.56 | 512 |
| September 30, 2011 | 14.90 | .50 | .30 | .80 | (.56) | (1.00) | (1.56) | — | — b,l | 14.14 | 5.83 | 65,227 | .59 | .59 | 3.47 | 496 |
| September 30, 2010 | 14.42 | .77 | .55 | 1.32 | (.79) | (.05) | (.84) | — b | — b,f | 14.90 | 9.28 | 51,845 | .61 g,h | .61 g | 5.10 g | 515 |
| September 30, 2009 | 12.64 | .65 | 1.78 | 2.43 | (.65) | — | (.65) | — b | — b,j | 14.42 | 19.97 | 16,116 | .98 g,i | .73 g | 4.99 g | 604 |
| September 30, 2008 | 13.13 | .77 | (.64) k | .13 | (.62) | — | (.62) | — b | — | 12.64 | .87 k | 12,740 | .71 g | .71 g | 5.76 g | 271 |
|
See notes to financial highlights at the end of this section.
The accompanying notes are an integral part of these financial statements.
| | |
| 52 U.S. Government Income Trust | U.S. Government Income Trust | 53 |
Financial highlights (Continued)
a Per share net investment income (loss) has been determined on the basis of the weighted average number of shares outstanding during the period.
b Amount represents less than $0.01 per share.
c Total return assumes dividend reinvestment and does not reflect the effect of sales charges.
d Includes amounts paid through expense offset arrangements (Note 2).
e Portfolio turnover excludes TBA roll transactions.
f Reflects a non-recurring reimbursement pursuant to a settlement between the Securities and Exchange Commission (the SEC) and Prudential Securities, Inc., which amounted to less than $0.01 per share outstanding as of March 30, 2010.
g Reflects an involuntary contractual expense limitation in effect during the period. For periods prior to September 30, 2009, certain fund expenses were waived in connection with the fund’s investment in Putnam Prime Money Market Fund. As a result of such limitation and/or waivers, the expenses of each class reflect a reduction of the following amounts:
| |
| | Percentage of |
| | average net assets |
|
| September 30, 2010 | 0.02% |
|
| September 30, 2009 | 0.05 |
|
| September 30, 2008 | 0.01 |
|
h Excludes the impact of a reduction to interest expense related to the resolution of certain terminated derivatives contracts, which amounted to 0.06% of average net assets as of September 30, 2010.
i Includes interest accrued in connection with certain terminated derivatives contracts, which amounted to 0.25% of average net assets as of September 30, 2009.
j Reflects a non-recurring reimbursement pursuant to a settlement between the SEC and Bear, Stearns & Co., Inc. and Bear Stearns Securities Corp., which amounted to less than $0.01 per share outstanding as of May 21, 2009.
k Reflects a non-recurring reimbursement from Putnam Management relating to the misidentification, in 2006, of the characteristics of certain securities in the fund’s portfolio, which amounted to $0.02 per share.
l Reflects a non-recurring reimbursement related to restitution amounts in connection with a distribution plan approved by the SEC which amounted to less than $0.01 per share outstanding on July 21, 2011. Also reflects a non-recurring reimbursement related to short-term trading related lawsuits, which amounted to less than $0.01 per share outstanding on May 11, 2011 (Note 8).
The accompanying notes are an integral part of these financial statements.
|
| 54 U.S. Government Income Trust |
Notes to financial statements 9/30/12
Within the following Notes to financial statements, references to “State Street” represent State Street Bank and Trust Company, references to “the SEC” represent the Securities and Exchange Commission and references to “Putnam Management” represent Putnam Investment Management, LLC, the fund’s manager, an indirect wholly-owned subsidiary of Putnam Investments, LLC. Unless otherwise noted, the “reporting period” represents the period from October 1, 2011 through September 30, 2012.
Putnam U.S. Government Income Trust (the fund) is a Massachusetts business trust, which is registered under the Investment Company Act of 1940, as amended, as a diversified open-end management investment company. The investment objective of the fund is to seek as high a level of current income as Putnam Management believes is consistent with preservation of capital. The fund invests mainly in bonds and securitized debt instruments (such as mortgage-backed investments) that are obligations of the U.S. government, its agencies and instrumentalities and accordingly are backed by the full faith and credit of the United States (e.g., U.S. Treasury bonds and Ginnie Mae mortgage-backed bonds), or by only the credit of a federal agency or government-sponsored entity (e.g., Fannie Mae and Freddie Mac mortgaged backed bonds) and that have short-to long-term maturities.
The fund offers class A, class B, class C, class M, class R and class Y shares. Class A and class M shares are sold with a maximum front-end sales charge of 4.00% and 3.25%, respectively, and generally do not pay a contingent deferred sales charge. Class B shares, which convert to class A shares after approximately eight years, do not pay a front-end sales charge and are subject to a contingent deferred sales charge if those shares are redeemed within six years of purchase. Class C shares have a one-year 1.00% contingent deferred sales charge and do not convert to class A shares. Class R shares, which are not available to all investors, are sold at net asset value. The expenses for class A, class B, class C, class M and class R shares may differ based on the distribution fee of each class, which is identified in Note 2. Class Y shares, which are sold at net asset value, are generally subject to the same expenses as class A, class B, class C, class M and class R shares, but do not bear a distribution fee. Class Y shares are not available to all investors.
In the normal course of business, the fund enters into contracts that may include agreements to indemnify another party under given circumstances. The fund’s maximum exposure under these arrangements is unknown as this would involve future claims that may be, but have not yet been, made against the fund. However, the fund’s management team expects the risk of material loss to be remote.
Note 1: Significant accounting policies
The following is a summary of significant accounting policies consistently followed by the fund in the preparation of its financial statements. The preparation of financial statements is in conformity with accounting principles generally accepted in the United States of America and requires management to make estimates and assumptions that affect the reported amounts of assets and liabilities in the financial statements and the reported amounts of increases and decreases in net assets from operations. Actual results could differ from those estimates. Subsequent events after the Statement of assets and liabilities date through the date that the financial statements were issued have been evaluated in the preparation of the financial statements.
Investment income, realized and unrealized gains and losses and expenses of the fund are borne pro-rata based on the relative net assets of each class to the total net assets of the fund, except that each class bears expenses unique to that class (including the distribution fees applicable to such classes). Each class votes as a class only with respect to its own distribution plan or other matters on which a class vote is required by law or determined by the Trustees. If the fund were liquidated, shares of each class would receive their pro-rata share of the net assets of the fund. In addition, the Trustees declare separate dividends on each class of shares.
Security valuation Investments are valued on the basis of valuations provided by an independent pricing service approved by the Trustees or dealers selected by Putnam Management. Such service providers use information with respect to transactions in bonds, quotations from bond dealers, market transactions in comparable securities and various relationships between securities in determining value. These securities will generally be categorized as Level 2.
Investments in other open-end investment companies (excluding exchange traded funds), which are classified as Level 1 securities, are based on their net asset value. The net asset value of an investment company equals the total value of its assets less its liabilities and divided by the number of its outstanding shares. Shares are only valued as of the close of regular trading on the New York Stock Exchange each day that the exchange is open.
|
| U.S. Government Income Trust 55 |
Certain investments, including certain restricted and illiquid securities and derivatives, are also valued at fair value following procedures approved by the Trustees. These valuations consider such factors as significant market or specific security events such as interest rate or credit quality changes, various relationships with other securities, discount rates, U.S. Treasury, U.S. swap and credit yields, index levels, convexity exposures and recovery rates. These securities are classified as Level 2 or as Level 3 depending on the priority of the significant inputs.
Such valuations and procedures are reviewed periodically by the Trustees. Certain securities may be valued on the basis of a price provided by a single source. The fair value of securities is generally determined as the amount that the fund could reasonably expect to realize from an orderly disposition of such securities over a reasonable period of time. By its nature, a fair value price is a good faith estimate of the value of a security in a current sale and does not reflect an actual market price, which may be different by a material amount.
Joint trading account Pursuant to an exemptive order from the SEC, the fund may transfer uninvested cash balances into a joint trading account along with the cash of other registered investment companies and certain other accounts managed by Putnam Management. These balances may be invested in issues of short-term investments having maturities of up to 90 days.
Repurchase agreements The fund, or any joint trading account, through its custodian, receives delivery of the underlying securities, the market value of which at the time of purchase is required to be in an amount at least equal to the resale price, including accrued interest. Collateral for certain tri-party repurchase agreements is held at the counterparty’s custodian in a segregated account for the benefit of the fund and the counterparty. Putnam Management is responsible for determining that the value of these underlying securities is at all times at least equal to the resale price, including accrued interest. In the event of default or bankruptcy by the other party to the agreement, retention of the collateral may be subject to legal proceedings.
Security transactions and related investment income Security transactions are recorded on the trade date (the date the order to buy or sell is executed). Gains or losses on securities sold are determined on the identified cost basis. Interest income is recorded on the accrual basis. All premiums/discounts are amortized/accreted on a yield-to-maturity basis.
Securities purchased or sold on a delayed delivery or forward commitment basis may be settled a month or more after the trade date; interest income is accrued based on the terms of the securities. Losses may arise due to changes in the market value of the underlying securities or if the counterparty does not perform under the contract.
Stripped securities The fund may invest in stripped securities which represent a participation in securities that may be structured in classes with rights to receive different portions of the interest and principal. Interest-only securities receive all of the interest and principal-only securities receive all of the principal. If the interest-only securities experience greater than anticipated prepayments of principal, the fund may fail to recoup fully its initial investment in these securities. Conversely, principal-only securities increase in value if prepayments are greater than anticipated and decline if prepayments are slower than anticipated. The market value of these securities is highly sensitive to changes in interest rates.
Options contracts The fund uses options contracts to hedge duration and convexity and to isolate prepayment risk.
The potential risk to the fund is that the change in value of options contracts may not correspond to the change in value of the hedged instruments. In addition, losses may arise from changes in the value of the underlying instruments if there is an illiquid secondary market for the contracts, if interest or exchange rates move unexpectedly or if the counterparty to the contract is unable to perform. Realized gains and losses on purchased options are included in realized gains and losses on investment securities. If a written call option is exercised, the premium originally received is recorded as an addition to sales proceeds. If a written put option is exercised, the premium originally received is recorded as a reduction to the cost of investments.
Exchange traded options are valued at the last sale price or, if no sales are reported, the last bid price for purchased options and the last ask price for written options. Options traded over-the-counter are valued using prices supplied by dealers. Certain options contracts include premiums that do not settle until the expiration date of the contract.
Written option contracts outstanding at period end, if any, are listed after the fund’s portfolio. See Note 3 for the volume of written options contracts activity for the reporting period. The fund had an average contract amount of approximately $2,614,000,000 on purchased options contracts for the reporting period.
Futures contracts The fund uses futures contracts to manage exposure to market risk, to hedge interest rate risk and to gain exposure to interest rates.
|
| 56 U.S. Government Income Trust |
The potential risk to the fund is that the change in value of futures contracts may not correspond to the change in value of the hedged instruments. In addition, losses may arise from changes in the value of the underlying instruments if there is an illiquid secondary market for the contracts, if interest or exchange rates move unexpectedly or if the counterparty to the contract is unable to perform. With futures, there is minimal counterparty credit risk to the fund since futures are exchange traded and the exchange’s clearinghouse, as counterparty to all exchange traded futures, guarantees the futures against default. Risks may exceed amounts recognized on the Statement of assets and liabilities. When the contract is closed, the fund records a realized gain or loss equal to the difference between the value of the contract at the time it was opened and the value at the time it was closed.
Futures contracts are valued at the quoted daily settlement prices established by the exchange on which they trade. The fund and the broker agree to exchange an amount of cash equal to the daily fluctuation in the value of the futures contract. Such receipts or payments are known as “variation margin.”
Futures contracts outstanding at period end, if any, are listed after the fund’s portfolio. The fund had an average of approximately 620 futures contracts outstanding for the reporting period.
Total return swap contracts The fund entered into total return swap contracts, which are arrangements to exchange a market linked return for a periodic payment, both based on a notional principal amount, to hedge sector exposure, to manage exposure to specific sectors or industries and to gain exposure to specific sectors or industries.
To the extent that the total return of the security, index or other financial measure underlying the transaction exceeds or falls short of the offsetting interest rate obligation, the fund will receive a payment from or make a payment to the counterparty. Total return swap contracts are marked to market daily based upon quotations from an independent pricing service or market makers and the change, if any, is recorded as an unrealized gain or loss. Payments received or made are recorded as realized gains or losses. Certain total return swap contracts may include extended effective dates. Payments related to these swap contracts are accrued based on the terms of the contract. The fund could be exposed to credit or market risk due to unfavorable changes in the fluctuation of interest rates or in the price of the underlying security or index, the possibility that there is no liquid market for these agreements or that the counterparty may default on its obligation to perform. The fund’s maximum risk of loss from counterparty risk is the fair value of the contract. This risk may be mitigated by having a master netting arrangement between the fund and the counterparty. Risk of loss may exceed amounts recognized on the Statement of assets and liabilities.
Total return swap contracts outstanding at period end, if any, are listed after the fund’s portfolio. The fund had an average notional amount of approximately $1,164,000,000 on total return swap contracts for the reporting period.
Interest rate swap contracts The fund entered into interest rate swap contracts, which are arrangements between two parties to exchange cash flows based on a notional principal amount, to hedge interest rate risk.
An interest rate swap can be purchased or sold with an upfront premium. An upfront payment received by the fund is recorded as a liability on the fund’s books. An upfront payment made by the fund is recorded as an asset on the fund’s books. Upfront payments are recorded as realized gains and losses at the closing of the contract. Interest rate swap contracts are marked to market daily based upon quotations from an independent pricing service or market makers and the change, if any, is recorded as an unrealized gain or loss. Payments received or made are recorded as realized gains or losses. Certain interest rate swap contracts may include extended effective dates. Payments related to these swap contracts are accrued based on the terms of the contract. The fund could be exposed to credit or market risk due to unfavorable changes in the fluctuation of interest rates or if the counterparty defaults on its obligation to perform. The fund’s maximum risk of loss from counterparty risk is the fair value of the contract. This risk may be mitigated by having a master netting arrangement between the fund and the counterparty. Risk of loss may exceed amounts recognized on the Statement of assets and liabilities.
Interest rate swap contracts outstanding at period end, if any, are listed after the fund’s portfolio. The fund had an average notional amount of approximately $7,125,800,000 on interest rate swap contracts for the reporting period.
Master agreements The fund is a party to ISDA (International Swaps and Derivatives Association, Inc.) Master Agreements (Master Agreements) with certain counterparties that govern over-the-counter derivative and foreign exchange contracts entered into from time to time. The Master Agreements may contain provisions regarding, among other things, the parties’ general obligations, representations, agreements, collateral requirements, events of default and early termination. With respect to certain counterparties, in accordance with the terms of the Master Agreements, collateral posted to the fund is held in a segregated account by the fund’s custodian and with respect
| |
| U.S. Government Income Trust | 57 |
to those amounts which can be sold or repledged, are presented in the fund’s portfolio. Collateral posted to the fund which cannot be sold or repledged totaled $13,752,692 at the close of the reporting period.
Collateral pledged by the fund is segregated by the fund’s custodian and identified in the fund’s portfolio. Collateral can be in the form of cash or debt securities issued by the U.S. Government or related agencies or other securities as agreed to by the fund and the applicable counterparty. Collateral requirements are determined based on the fund’s net position with each counterparty.
Termination events applicable to the fund may occur upon a decline in the fund’s net assets below a specified threshold over a certain period of time. Termination events applicable to counterparties may occur upon a decline in the counterparty’s long-term and short-term credit ratings below a specified level. In each case, upon occurrence, the other party may elect to terminate early and cause settlement of all derivative and foreign exchange contracts outstanding, including the payment of any losses and costs resulting from such early termination, as reasonably determined by the terminating party. Any decision by one or more of the fund’s counterparties to elect early termination could impact the fund’s future derivative activity.
At the close of the reporting period, the fund had a net liability position of $4,924,180 on open derivative contracts subject to the Master Agreements. Collateral posted by the fund totaled $44,245,415.
TBA purchase commitments The fund may enter into TBA (to be announced) commitments to purchase securities for a fixed unit price at a future date beyond customary settlement time. Although the unit price has been established, the principal value has not been finalized. However, it is anticipated that the amount of the commitments will not significantly differ from the principal amount. The fund holds, and maintains until settlement date, cash or high-grade debt obligations in an amount sufficient to meet the purchase price, or the fund may enter into offsetting contracts for the forward sale of other securities it owns. Income on the securities will not be earned until settlement date. TBA purchase commitments may be considered securities themselves, and involve a risk of loss if the value of the security to be purchased declines prior to the settlement date, which risk is in addition to the risk of decline in the value of the fund’s other assets. Unsettled TBA purchase commitments are valued at fair value of the underlying securities, according to the procedures described under “Security valuation” above. The contract is marked to market daily and the change in market value is recorded by the fund as an unrealized gain or loss.
Although the fund will generally enter into TBA purchase commitments with the intention of acquiring securities for its portfolio or for delivery pursuant to options contracts it has entered into, the fund may dispose of a commitment prior to settlement if Putnam Management deems it appropriate to do so.
TBA sale commitments The fund may enter into TBA sale commitments to hedge its portfolio positions or to sell mortgage-backed securities it owns under delayed delivery arrangements. Proceeds of TBA sale commitments are not received until the contractual settlement date. During the time a TBA sale commitment is outstanding, equivalent deliverable securities, or an offsetting TBA purchase commitment deliverable on or before the sale commitment date, are held as “cover” for the transaction.
Unsettled TBA sale commitments are valued at the fair value of the underlying securities, generally according to the procedures described under “Security valuation” above. The contract is marked to market daily and the change in market value is recorded by the fund as an unrealized gain or loss. If the TBA sale commitment is closed through the acquisition of an offsetting TBA purchase commitment, the fund realizes a gain or loss. If the fund delivers securities under the commitment, the fund realizes a gain or a loss from the sale of the securities based upon the unit price established at the date the commitment was entered into. TBA sale commitments outstanding at period end, if any, are listed after the fund’s portfolio.
Interfund lending The fund, along with other Putnam funds, may participate in an interfund lending program pursuant to an exemptive order issued by the SEC. This program allows the fund to borrow from or lend to other Putnam funds that permit such transactions. Interfund lending transactions are subject to each fund’s investment policies and borrowing and lending limits. Interest earned or paid on the interfund lending transaction will be based on the average of certain current market rates. During the reporting period, the fund did not utilize the program.
Line of credit The fund participates, along with other Putnam funds, in a $315 million unsecured committed line of credit and a $185 million unsecured uncommitted line of credit, both provided by State Street. Borrowings may be made for temporary or emergency purposes, including the funding of shareholder redemption requests and trade settlements. Interest is charged to the fund based on the fund’s borrowing at a rate equal to the Federal Funds rate plus 1.25% for the committed line of credit and the Federal Funds rate plus 1.30% for the uncommitted line of credit. A closing fee equal to 0.02% of the committed line of credit and $50,000 for the uncommitted line of credit has been paid by the participating funds. In addition, a commitment fee of 0.11% per annum on any unutilized portion
|
| 58 U.S. Government Income Trust |
of the committed line of credit is allocated to the participating funds based on their relative net assets and paid quarterly. During the reporting period, the fund had no borrowings against these arrangements.
Federal taxes It is the policy of the fund to distribute all of its taxable income within the prescribed time period and otherwise comply with the provisions of the Internal Revenue Code of 1986, as amended (the Code), applicable to regulated investment companies. It is also the intention of the fund to distribute an amount sufficient to avoid imposition of any excise tax under Section 4982 of the Code.
The fund is subject to the provisions of Accounting Standards Codification ASC 740 Income Taxes (ASC 740). ASC 740 sets forth a minimum threshold for financial statement recognition of the benefit of a tax position taken or expected to be taken in a tax return. The fund did not have a liability to record for any unrecognized tax benefits in the accompanying financial statements. No provision has been made for federal taxes on income, capital gains or unrealized appreciation on securities held nor for excise tax on income and capital gains. Each of the fund’s federal tax returns for the prior three fiscal years remains subject to examination by the Internal Revenue Service.
Pursuant to federal income tax regulations applicable to regulated investment companies, the fund has elected to defer $78,924,249 of certain losses recognized during the period from November 1, 2011 to September 30, 2012 to its fiscal year ending September 30, 2013.
Distributions to shareholders Distributions to shareholders from net investment income are recorded by the fund on the ex-dividend date. Distributions from capital gains, if any, are recorded on the ex-dividend date and paid at least annually. The amount and character of income and gains to be distributed are determined in accordance with income tax regulations, which may differ from generally accepted accounting principles. These differences include temporary and/or permanent differences of late year loss deferrals, income on swap contracts, interest only securities and redesignation of taxable income. Reclassifications are made to the fund’s capital accounts to reflect income and gains available for distribution (or available capital loss carryovers) under income tax regulations. For the reporting period ended, the fund reclassified $7,473,605 to increase undistributed net investment income, $100 to increase paid-in-capital and $7,473,705 to increase accumulated net realized loss.
The tax basis components of distributable earnings and the federal tax cost as of the close of the reporting period were as follows:
| |
| Unrealized appreciation | $61,621,401 |
| Unrealized depreciation | (17,205,776) |
|
| Net unrealized appreciation | 44,415,625 |
| Undistributed ordinary income | 12,156,501 |
| Post-October capital loss deferral | (78,924,249) |
| Cost for federal income tax purposes | $2,926,293,727 |
Note 2: Management fee, administrative services and other transactions
The fund pays Putnam Management a management fee (based on the fund’s average net assets and computed and paid monthly) at annual rates that may vary based on the average of the aggregate net assets of most open-end funds, as defined in the fund’s management contract, sponsored by Putnam Management. Such annual rates may vary as follows:
| |
| 0.550% | of the first $5 billion, |
| 0.500% | of the next $5 billion, |
| 0.450% | of the next $10 billion, |
| 0.400% | of the next $10 billion, |
| 0.350% | of the next $50 billion, |
| 0.330% | of the next $50 billion, |
| 0.320% | of the next $100 billion and |
| 0.315% | of any excess thereafter. |
Putnam Management has contractually agreed, through June 30, 2013, to waive fees or reimburse the fund’s expenses to the extent necessary to limit the cumulative expenses of the fund, exclusive of brokerage, interest, taxes, investment-related expenses, extraordinary expenses, acquired fund fees and expenses, and payments under the fund’s investor servicing contract, investment management contract and distribution plans, on a fiscal year-to-date basis to an annual rate of 0.20% of the fund’s average net assets over such fiscal year-to-date period. During the reporting period, the fund’s expenses were not reduced as a result of this limit.
|
| U.S. Government Income Trust 59 |
Putnam Investments Limited (PIL), an affiliate of Putnam Management, is authorized by the Trustees to manage a separate portion of the assets of the fund as determined by Putnam Management from time to time. Putnam Management pays a quarterly sub-management fee to PIL for its services at an annual rate of 0.40% of the average net assets of the portion of the fund managed by PIL.
The fund reimburses Putnam Management an allocated amount for the compensation and related expenses of certain officers of the fund and their staff who provide administrative services to the fund. The aggregate amount of all such reimbursements is determined annually by the Trustees.
Custodial functions for the fund’s assets are provided by State Street. Custody fees are based on the fund’s asset level, the number of its security holdings and transaction volumes.
Putnam Investor Services, Inc., an affiliate of Putnam Management, provides investor servicing agent functions to the fund. Putnam Investor Services, Inc. received fees for investor servicing based on the fund’s retail asset level, the number of shareholder accounts in the fund and the level of defined contribution plan assets in the fund. Investor servicing fees will not exceed an annual rate of 0.32% of the fund’s average net assets. Prior to March 1, 2012, investor servicing fees could not exceed an annual rate of 0.375% of the fund’s average net assets. During the reporting period, the class specific expenses related to investor servicing fees were as follows:
| | | |
| Class A | $1,913,481 | | |
| Class B | 59,030 | | |
| Class C | 238,912 | | |
| Class M | 36,701 | | |
| Class R | 44,804 | | |
| Class Y | 129,803 | | |
| Total | $2,422,731 | | |
The fund has entered into expense offset arrangements with Putnam Investor Services, Inc. and State Street whereby Putnam Investor Services, Inc.’s and State Street’s fees are reduced by credits allowed on cash balances. For the reporting period, the fund’s expenses were reduced by $5,415 under the expense offset arrangements.
Each independent Trustee of the fund receives an annual Trustee fee, of which $1,301 as a quarterly retainer, has been allocated to the fund, and an additional fee for each Trustees meeting attended. Trustees also are reimbursed for expenses they incur relating to their services as Trustees.
The fund has adopted a Trustee Fee Deferral Plan (the Deferral Plan) which allows the Trustees to defer the receipt of all or a portion of Trustees fees payable on or after July 1, 1995. The deferred fees remain invested in certain Putnam funds until distribution in accordance with the Deferral Plan.
The fund has adopted an unfunded noncontributory defined benefit pension plan (the Pension Plan) covering all Trustees of the fund who have served as a Trustee for at least five years and were first elected prior to 2004. Benefits under the Pension Plan are equal to 50% of the Trustee’s average annual attendance and retainer fees for the three years ended December 31, 2005. The retirement benefit is payable during a Trustee’s lifetime, beginning the year following retirement, for the number of years of service through December 31, 2006. Pension expense for the fund is included in Trustee compensation and expenses in the Statement of operations. Accrued pension liability is included in Payable for Trustee compensation and expenses in the Statement of assets and liabilities. The Trustees have terminated the Pension Plan with respect to any Trustee first elected after 2003.
The fund has adopted distribution plans (the Plans) with respect to its class A, class B, class C, class M and class R shares pursuant to Rule 12b–1 under the Investment Company Act of 1940. The purpose of the Plans is to compensate Putnam Retail Management Limited Partnership, an indirect wholly-owned subsidiary of Putnam Investments, LLC, for services provided and expenses incurred in distributing shares of the fund. The Plans provide for payments by the fund to Putnam Retail Management Limited Partnership at an annual rate of up to 0.35%, 1.00%, 1.00%, 1.00% and 1.00% of the average net assets attributable to class A, class B, class C, class M and class R shares, respectively. The Trustees have approved payment by the fund at an annual rate of 0.25%, 1.00%, and 0.50% of the average net assets attributable to class A, class C and class R shares, respectively. For class B shares, the annual payment rate will equal the weighted average of (i) 0.85% on the assets of Putnam Limited Duration Government Income Fund attributable to class B shares existing on November 9, 2007; and (ii) 1.00% on all other net assets of Putnam U.S. Government Income Trust attributable to class B shares. For class M shares, the annual payment rate will equal the weighted average of (i) 0.40% on the net assets of Putnam Limited Duration Government Income Fund attributable to class M shares existing on November 9, 2007; and (ii) 0.50% on all other net assets of Putnam U.S.
|
| 60 U.S. Government Income Trust |
Government Income Trust attributable to class M shares. During the reporting period, the class specific expenses related to distribution fees were as follows:
| | | |
| Class A | $3,184,426 | | |
| Class B | 385,545 | | |
| Class C | 1,591,023 | | |
| Class M | 120,188 | | |
| Class R | 149,421 | | |
| Total | $5,430,603 | | |
For the reporting period, Putnam Retail Management Limited Partnership, acting as underwriter, received net commissions of $252,256 and $2,960 from the sale of class A and class M shares, respectively, and received $35,375 and $11,904 in contingent deferred sales charges from redemptions of class B and class C shares, respectively.
A deferred sales charge of up to 1.00% and 0.40% is assessed on certain redemptions of class A and class M shares, respectively. For the reporting period, Putnam Retail Management Limited Partnership, acting as underwriter, received $8,325 and no monies on class A and class M redemptions, respectively.
Note 3: Purchases and sales of securities
During the reporting period, cost of purchases and proceeds from sales of investment securities other than short-term investments and TBA transactions aggregated $4,686,234,347 and $5,210,516,654, respectively. These figures include the cost of purchases and proceeds from sales of long-term U.S. government securities of $46,515,000 and $46,563,750, respectively.
Written option transactions during the reporting period are summarized as follows:
| | |
| | Written swap option | Written swap option |
| | contract amounts | premiums received |
|
| Written options outstanding at the | | |
| beginning of the reporting period | $3,217,241,848 | $147,445,186 |
|
| Options opened | 2,036,394,574 | 91,859,353 |
| Options exercised | (1,155,921,317) | (32,383,720) |
| Options expired | — | — |
| Options closed | (3,258,504,531) | (141,344,292) |
|
| Written options outstanding at the | | |
| end of the reporting period | $839,210,574 | $65,576,527 |
|
Note 4: Capital shares
At the close of the reporting period, there was an unlimited number of shares of beneficial interest authorized. Transactions in capital shares were as follows:
| | | | |
| | Year ended 9/30/12 | Year ended 9/30/11 |
|
| Class A | Shares | Amount | Shares | Amount |
|
| Shares sold | 20,355,086 | $280,361,194 | 17,979,021 | $259,024,121 |
|
| Shares issued in connection with | | | | |
| reinvestment of distributions | 5,943,322 | 81,681,328 | 8,007,346 | 113,493,052 |
|
| | 26,298,408 | 362,042,522 | 25,986,367 | 372,517,173 |
|
| Shares repurchased | (25,527,187) | (350,765,253) | (22,478,003) | (323,025,942) |
|
| Net increase | 771,221 | $11,277,269 | 3,508,364 | $49,491,231 |
|
| |
| U.S. Government Income Trust | 61 |
| | | | |
| | Year ended 9/30/12 | Year ended 9/30/11 |
|
| Class B | Shares | Amount | Shares | Amount |
|
| Shares sold | 1,249,825 | $17,103,641 | 780,783 | $11,271,764 |
|
| Shares issued in connection with | | | | |
| reinvestment of distributions | 169,770 | 2,321,466 | 266,442 | 3,755,581 |
|
| | 1,419,595 | 19,425,107 | 1,047,225 | 15,027,345 |
|
| Shares repurchased | (788,118) | (10,807,778) | (1,816,165) | (26,031,802) |
|
| Net increase (decrease) | 631,477 | $8,617,329 | (768,940) | $(11,004,457) |
|
| |
| | Year ended 9/30/12 | Year ended 9/30/11 |
|
| Class C | Shares | Amount | Shares | Amount |
|
| Shares sold | 5,145,834 | $70,381,576 | 4,188,883 | $60,443,258 |
|
| Shares issued in connection with | | | | |
| reinvestment of distributions | 630,669 | 8,590,960 | 769,497 | 10,808,850 |
|
| | 5,776,503 | 78,972,536 | 4,958,380 | 71,252,108 |
|
| Shares repurchased | (3,355,941) | (45,737,830) | (3,853,943) | (54,798,830) |
|
| Net increase | 2,420,562 | $33,234,706 | 1,104,437 | $16,453,278 |
|
| |
| | Year ended 9/30/12 | Year ended 9/30/11 |
|
| Class M | Shares | Amount | Shares | Amount |
|
| Shares sold | 148,439 | $2,063,393 | 134,280 | $1,963,370 |
|
| Shares issued in connection with | | | | |
| reinvestment of distributions | 51,876 | 715,083 | 74,256 | 1,054,429 |
|
| | 200,315 | 2,778,476 | 208,536 | 3,017,799 |
|
| Shares repurchased | (371,855) | (5,125,312) | (283,083) | (4,079,378) |
|
| Net decrease | (171,540) | $(2,346,836) | (74,547) | $(1,061,579) |
|
| |
| | Year ended 9/30/12 | Year ended 9/30/11 |
|
| Class R | Shares | Amount | Shares | Amount |
|
| Shares sold | 1,611,037 | $21,942,165 | 1,489,419 | $21,211,024 |
|
| Shares issued in connection with | | | | |
| reinvestment of distributions | 109,361 | 1,486,805 | 89,479 | 1,257,468 |
|
| | 1,720,398 | 23,428,970 | 1,578,898 | 22,468,492 |
|
| Shares repurchased | (731,578) | (9,991,773) | (675,822) | (9,593,944) |
|
| Net increase | 988,820 | $13,437,197 | 903,076 | $12,874,548 |
|
| |
| | Year ended 9/30/12 | Year ended 9/30/11 |
|
| Class Y | Shares | Amount | Shares | Amount |
|
| Shares sold | 6,310,088 | $86,241,644 | 6,253,519 | $89,382,169 |
|
| Shares issued in connection with | | | | |
| reinvestment of distributions | 312,609 | 4,256,526 | 245,727 | 3,460,719 |
|
| | 6,622,697 | 90,498,170 | 6,499,246 | 92,842,888 |
|
| Shares repurchased | (3,977,710) | (54,210,051) | (5,366,715) | (76,351,231) |
|
| Net increase | 2,644,987 | $36,288,119 | 1,132,531 | $16,491,657 |
|
|
| 62 U.S. Government Income Trust |
Note 5: Summary of derivative activity
The following is a summary of the market values of derivative instruments as of the close of the reporting period:
Market values of derivative instruments as of the close of the reporting period
| | | | |
| | Asset derivatives | Liability derivatives |
|
| Derivatives not | | | | |
| accounted for as | Statement of | | Statement of | |
| hedging instruments | assets and | | assets and | |
| under ASC 815 | liabilities location | Market value | liabilities location | Market value |
|
| Interest rate contracts | Investments, Receivables | $69,052,876 | Payables | $76,524,444 |
|
| Total | | $69,052,876 | | $76,524,444 |
|
The following is a summary of realized and change in unrealized gains or losses of derivative instruments on the Statement of operations for the reporting period (see Note 1):
Amount of realized gain or (loss) on derivatives recognized in net gain or (loss) on investments
| | | | |
| Derivatives not accounted for | | | | |
| as hedging instruments under | | | | |
| ASC 815 | Options | Futures | Swaps | Total |
|
| Interest rate contracts | $(49,300,672) | $4,242,009 | $(118,746,009) | $(163,804,672) |
|
| Total | $(49,300,672) | $4,242,009 | $(118,746,009) | $(163,804,672) |
|
Change in unrealized appreciation or (depreciation) on derivatives recognized in net gain or (loss) on investments
| | | | |
| Derivatives not accounted for | | | | |
| as hedging instruments under | | | | |
| ASC 815 | Options | Futures | Swaps | Total |
|
| Interest rate contracts | $82,748,757 | $(1,028,442) | $59,217,394 | $140,937,709 |
|
| Total | $82,748,757 | $(1,028,442) | $59,217,394 | $140,937,709 |
|
Note 6: Transactions with affiliated issuer
Transactions during the reporting period with Putnam Money Market Liquidity Fund, which is under common ownership and control, were as follows:
| | | | | |
| | Market | | | | |
| | value at | | | | Market |
| | beginning | | | | value at end |
| | of reporting | Purchase | Sale | Income | of reporting |
| Affiliate | period | cost | proceeds | distributions | period |
|
| Putnam Money | | | | | |
| Market Liquidity Fund* | $16,620,466 | $461,711,488 | $296,966,757 | $113,487 | $181,365,197 |
|
* Management fees charged to Putnam Money Market Liquidity Fund have been waived by Putnam Management.
Note 7: Market, credit and other risks
In the normal course of business, the fund trades financial instruments and enters into financial transactions where risk of potential loss exists due to changes in the market (market risk) or failure of the contracting party to the transaction to perform (credit risk). The fund may be exposed to additional credit risk that an institution or other entity with which the fund has unsettled or open transactions will default. The fund may invest a significant portion of its assets in securitized debt instruments, including mortgage-backed and asset-backed investments. The yields and values of these investments are sensitive to changes in interest rates, the rate of principal payments on the underlying assets and the market’s perception of the issuers. The market for these investments may be volatile and limited, which may make them difficult to buy or sell.
|
| U.S. Government Income Trust 63 |
Note 8: Regulatory matters and litigation
In late 2003 and 2004, Putnam Management settled charges brought by the SEC and the Massachusetts Securities Division in connection with excessive short-term trading in Putnam funds. In July 2011, the fund recorded a receivable of $254,079 related to restitution amounts in connection with a distribution plan approved by the SEC. This amount, which was received by the fund in December 2011, is reported as part of Increase in capital from settlement payments on the Statement of changes in net assets. These allegations and related matters have served as the general basis for certain lawsuits, including purported class action lawsuits against Putnam Management and, in a limited number of cases, some Putnam funds. In May 2011, the fund received a payment of $5,150 related to settlement of those lawsuits. This amount is reported as a part of Increase in capital from settlement payments on the Statement of changes in net assets. Putnam Management has agreed to bear any costs incurred by the Putnam funds as a result of these matters.
Note 9: New accounting pronouncements
In May 2011, the Financial Accounting Standards Board (FASB) issued Accounting Standards Update (ASU) 2011–04 “Fair Value Measurements and Disclosures (Topic 820) — Amendments to Achieve Common Fair Value Measurement and Disclosure Requirements in U.S. GAAP and IFRS”. ASU 2011–04 amends FASB Topic 820 “Fair Value Measurement” and seeks to develop common requirements for measuring fair value and for disclosing information about fair value measurements in accordance with GAAP. ASU 2011–04 is effective for fiscal years and interim periods beginning after December 15, 2011. The application of ASU 2011–04 did not have a material impact on the fund’s financial statements.
In December 2011, the FASB issued ASU No. 2011–11 “Disclosures about Offsetting Assets and Liabilities”. The update creates new disclosure requirements requiring entities to disclose both gross and net information for derivatives and other financial instruments that are either offset in the Statement of assets and liabilities or subject to an enforceable master netting arrangement or similar agreement. The disclosure requirements are effective for annual reporting periods beginning on or after January 1, 2013 and interim periods within those annual periods. Putnam Management is currently evaluating the application of ASU 2011–11 and its impact, if any, on the fund’s financial statements.
|
| 64 U.S. Government Income Trust |
Federal tax information (Unaudited)
For the reporting period ended, pursuant to §871(k) of the Internal Revenue Code, the fund hereby designates $26,164,539 of distributions paid as qualifying to be taxed as interest-related dividends, and $24,810,165 to be taxed as short-term capital gain dividends for nonresident alien shareholders.
The Form 1099 that will be mailed to you in January 2013 will show the tax status of all distributions paid to your account in calendar 2012.
|
| U.S. Government Income Trust 65 |
About the Trustees
Independent Trustees

|
| 66 U.S. Government Income Trust |

* Mr. Reynolds is an “interested person” (as defined in the Investment Company Act of 1940) of the fund, Putnam Management, and Putnam Retail Management. He is President and Chief Executive Officer of Putnam Investments, as well as the President of your fund and each of the other Putnam funds.
The address of each Trustee is One Post Office Square, Boston, MA 02109.
As of September 30, 2012, there were 109 Putnam funds. All Trustees serve as Trustees of all Putnam funds.
Each Trustee serves for an indefinite term, until his or her resignation, retirement at age 75, removal, or death.
| |
| U.S. Government Income Trust | 67 |
Officers
In addition to Robert L. Reynolds, the other officers of the fund are shown below:
| |
| Jonathan S. Horwitz (Born 1955) | Janet C. Smith (Born 1965) |
| Executive Vice President, Principal Executive | Vice President, Principal Accounting Officer, |
| Officer, and Compliance Liaison | and Assistant Treasurer |
| Since 2004 | Since 2007 |
| | Director of Fund Administration Services, |
| Steven D. Krichmar (Born 1958) | Putnam Investments and Putnam Management |
| Vice President and Principal Financial Officer | |
| Since 2002 | Susan G. Malloy (Born 1957) |
| Chief of Operations, Putnam Investments and | Vice President and Assistant Treasurer |
| Putnam Management | Since 2007 |
| | Director of Accounting & Control Services, |
| Robert T. Burns (Born 1961) | Putnam Management |
| Vice President and Chief Legal Officer | |
| Since 2011 | James P. Pappas (Born 1953) |
| General Counsel, Putnam Investments and | Vice President |
| Putnam Management | Since 2004 |
| | Director of Trustee Relations, |
| Robert R. Leveille (Born 1969) | Putnam Investments and Putnam Management |
| Vice President and Chief Compliance Officer | |
| Since 2007 | Mark C. Trenchard (Born 1962) |
| Chief Compliance Officer, Putnam Investments, | Vice President and BSA Compliance Officer |
| Putnam Management, and Putnam Retail | Since 2002 |
| Management | Director of Operational Compliance, |
| | Putnam Investments and Putnam |
| Michael J. Higgins (Born 1976) | Retail Management |
| Vice President and Treasurer | |
| Since 2010 | Judith Cohen (Born 1945) |
| Manager of Finance, Dunkin’ Brands (2008– | Vice President, Clerk, and Associate Treasurer |
| 2010); Senior Financial Analyst, Old Mutual Asset | Since 1993 |
| Management (2007–2008); Senior Financial | |
| Analyst, Putnam Investments (1999–2007) | Nancy E. Florek (Born 1957) |
| Vice President, Proxy Manager, Assistant Clerk, |
| | and Associate Treasurer |
| | Since 2000 |
The principal occupations of the officers for the past five years have been with the employers as shown above although in some cases, they have held different positions with such employers. The address of each Officer is One Post Office Square, Boston, MA 02109.
|
| 68 U.S. Government Income Trust |
Fund information
Founded 75 years ago, Putnam Investments was built around the concept that a balance between risk and reward is the hallmark of a well-rounded financial program. We manage over 100 funds across income, value, blend, growth, asset allocation, absolute return, and global sector categories.
| | |
| Investment Manager | Trustees | Robert R. Leveille |
| Putnam Investment | Jameson A. Baxter, Chair | Vice President and |
| Management, LLC | Liaquat Ahamed | Chief Compliance Officer |
| One Post Office Square | Ravi Akhoury | |
| Boston, MA 02109 | Barbara M. Baumann | Michael J. Higgins |
| | Charles B. Curtis | Vice President and Treasurer |
| Investment Sub-Manager | Robert J. Darretta | |
| Putnam Investments Limited | Katinka Domotorffy | Janet C. Smith |
| 57–59 St James’s Street | John A. Hill | Vice President, |
| London, England SW1A 1LD | Paul L. Joskow | Principal Accounting Officer, |
| | Elizabeth T. Kennan | and Assistant Treasurer |
| Marketing Services | Kenneth R. Leibler | |
| Putnam Retail Management | Robert E. Patterson | Susan G. Malloy |
| One Post Office Square | George Putnam, III | Vice President and |
| Boston, MA 02109 | Robert L. Reynolds | Assistant Treasurer |
| W. Thomas Stephens | |
| Custodian | | James P. Pappas |
| State Street Bank | Officers | Vice President |
| and Trust Company | Robert L. Reynolds | |
| President | Mark C. Trenchard |
| Legal Counsel | | Vice President and |
| Ropes & Gray LLP | Jonathan S. Horwitz | BSA Compliance Officer |
| | Executive Vice President, | |
| Independent Registered | Principal Executive Officer, and | Judith Cohen |
| Public Accounting Firm | Compliance Liaison | Vice President, Clerk, and |
| KPMG LLP | | Associate Treasurer |
| Steven D. Krichmar | |
| Vice President and | Nancy E. Florek |
| Principal Financial Officer | Vice President, Proxy |
| | | Manager, Assistant Clerk, and |
| | Robert T. Burns | Associate Treasurer |
| | Vice President and | |
| | Chief Legal Officer | |
| | | |
| | | |
| | | |
| | | |
This report is for the information of shareholders of Putnam U.S. Government Income Trust. It may also be used as sales literature when preceded or accompanied by the current prospectus, the most recent copy of Putnam’s Quarterly Performance Summary, and Putnam’s Quarterly Ranking Summary. For more recent performance, please visit putnam.com. Investors should carefully consider the investment objectives, risks, charges, and expenses of a fund, which are described in its prospectus. For this and other information or to request a prospectus or summary prospectus, call 1-800-225-1581 toll free. Please read the prospectus carefully before investing. The fund’s Statement of Additional Information contains additional information about the fund’s Trustees and is available without charge upon request by calling 1-800-225-1581.
| |
| (a) The fund’s principal executive, financial and accounting officers are employees of Putnam Investment Management, LLC, the Fund’s investment manager. As such they are subject to a comprehensive Code of Ethics adopted and administered by Putnam Investments which is designed to protect the interests of the firm and its clients. The Fund has adopted a Code of Ethics which incorporates the Code of Ethics of Putnam Investments with respect to all of its officers and Trustees who are employees of Putnam Investment Management, LLC. For this reason, the Fund has not adopted a separate code of ethics governing its principal executive, financial and accounting officers. |
| |
| (c) In May 2008, the Code of Ethics of Putnam Investment Management, LLC was updated in its entirety to include the amendments adopted in August 2007 as well as a several additional technical, administrative and non-substantive changes. In May of 2009, the Code of Ethics of Putnam Investment Management, LLC was amended to reflect that all employees will now be subject to a 90-day blackout restriction on holding Putnam open-end funds, except for portfolio managers and their supervisors (and each of their immediate family members), who will be subject to a one-year blackout restriction on the funds that they manage or supervise. In June 2010, the Code of Ethics of Putnam Investments was updated in its entirety to include the amendments adopted in May of 2009 and to change certain rules and limits contained in the Code of Ethics. In addition, the updated Code of Ethics included numerous technical, administrative and non-substantive changes, which were intended primarily to make the document easier to navigate and understand. In July 2011, the Code of Ethics of Putnam Investments was updated to reflect several technical, administrative and non-substantive changes resulting from changes in employee titles. |
| |
| Item 3. Audit Committee Financial Expert: |
| |
| The Funds’ Audit and Compliance Committee is comprised solely of Trustees who are “independent” (as such term has been defined by the Securities and Exchange Commission (“SEC”) in regulations implementing Section 407 of the Sarbanes-Oxley Act (the “Regulations”)). The Trustees believe that each of the members of the Audit and Compliance Committee also possess a combination of knowledge and experience with respect to financial accounting matters, as well as other attributes, that qualify them for service on the Committee. In addition, the Trustees have determined that each of Mr. Leibler, Mr. Hill, Mr. Darretta and Ms. Baumann qualifies as an “audit committee financial expert” (as such term has been defined by the Regulations) based on their review of his or her pertinent experience and education. The SEC has stated that the designation or identification of a person as an audit committee financial expert pursuant to this Item 3 of Form N-CSR does not impose on such person any duties, obligations or liability that are greater than the duties, obligations and liability imposed on such person as a member of the Audit and Compliance Committee and the Board of Trustees in the absence of such designation or identification. |
| |
| Item 4. Principal Accountant Fees and Services: |
| |
| The following table presents fees billed in each of the last two fiscal years for services rendered to the fund by the fund’s independent auditor: |
| | | | | |
| Fiscal year ended | Audit Fees | Audit-Related Fees | Tax Fees | All Other Fees |
|
|
| | | | | |
| September 30, 2012 | $122,150 | $-- | $4,650 | $ — |
| September 30, 2011 | $97,734 | $-- | $4,550 | $ — |
| |
| For the fiscal years ended September 30 2012 and September 30, 2011, the fund’s independent auditor billed aggregate non-audit fees in the amounts of $4,650 and $4,550 respectively, to the fund, Putnam Management and any entity controlling, controlled by or under common control with Putnam Management that provides ongoing services to the fund. |
| |
| Audit Fees represent fees billed for the fund’s last two fiscal years relating to the audit and review of the financial statements included in annual reports and registration statements, and other services that are normally provided in connection with statutory and regulatory filings or engagements. |
| |
| Audit-Related Fees represent fees billed in the fund’s last two fiscal years for services traditionally performed by the fund’s auditor, including accounting consultation for proposed transactions or concerning financial accounting and reporting standards and other audit or attest services not required by statute or regulation. |
| |
| Tax Fees represent fees billed in the fund’s last two fiscal years for tax compliance, tax planning and tax advice services. Tax planning and tax advice services include assistance with tax audits, employee benefit plans and requests for rulings or technical advice from taxing authorities. |
| |
| Pre-Approval Policies of the Audit and Compliance Committee. The Audit and Compliance Committee of the Putnam funds has determined that, as a matter of policy, all work performed for the funds by the funds’ independent auditors will be pre-approved by the Committee itself and thus will generally not be subject to pre-approval procedures. |
| |
| The Audit and Compliance Committee also has adopted a policy to pre-approve the engagement by Putnam Management and certain of its affiliates of the funds’ independent auditors, even in circumstances where pre-approval is not required by applicable law. Any such requests by Putnam Management or certain of its affiliates are typically submitted in writing to the Committee and explain, among other things, the nature of the proposed engagement, the estimated fees, and why this work should be performed by that particular audit firm as opposed to another one. In reviewing such requests, the Committee considers, among other things, whether the provision of such services by the audit firm are compatible with the independence of the audit firm. |
| |
| The following table presents fees billed by the fund’s independent auditor for services required to be approved pursuant to paragraph (c)(7)(ii) of Rule 2-01 of Regulation S-X. |
| | | | | |
| Fiscal year ended | Audit-Related Fees | Tax Fees | All Other Fees | Total Non-Audit Fees |
|
|
| | | | | |
| September 30, 2012 | $ — | $ — | $ — | $ — |
| | | | | |
| September 30, 2011 | $ — | $ — | $ — | $ — |
| |
| Item 5. Audit Committee of Listed Registrants |
| |
| Item 6. Schedule of Investments: |
| |
| The registrant’s schedule of investments in unaffiliated issuers is included in the report to shareholders in Item 1 above. |
| |
| Item 7. Disclosure of Proxy Voting Policies and Procedures For Closed-End Management Investment Companies: |
| |
| Item 8. Portfolio Managers of Closed-End Investment Companies |
| |
| Item 9. Purchases of Equity Securities by Closed-End Management Investment Companies and Affiliated Purchasers: |
| |
| Item 10. Submission of Matters to a Vote of Security Holders: |
| |
| Item 11. Controls and Procedures: |
| |
| (a) The registrant’s principal executive officer and principal financial officer have concluded, based on their evaluation of the effectiveness of the design and operation of the registrant’s disclosure controls and procedures as of a date within 90 days of the filing date of this report, that the design and operation of such procedures are generally effective to provide reasonable assurance that information required to be disclosed by the registrant in this report is recorded, processed, summarized and reported within the time periods specified in the Commission’s rules and forms. |
| |
| (b) Changes in internal control over financial reporting: Not applicable |
| |
| (a)(1) The Code of Ethics of The Putnam Funds, which incorporates the Code of Ethics of Putnam Investments, is filed herewith. |
| |
| (a)(2) Separate certifications for the principal executive officer and principal financial officer of the registrant as required by Rule 30a-2(a) under the Investment Company Act of 1940, as amended, are filed herewith. |
| |
| (b) The certifications required by Rule 30a-2(b) under the Investment Company Act of 1940, as amended, are filed herewith. |
| |
| Pursuant to the requirements of the Securities Exchange Act of 1934 and the Investment Company Act of 1940, the registrant has duly caused this report to be signed on its behalf by the undersigned, thereunto duly authorized. |
| |
| Putnam U.S. Government Income Trust |
| |
| By (Signature and Title): |
| |
| /s/Janet C. Smith
Janet C. Smith
Principal Accounting Officer
|
| |
| Pursuant to the requirements of the Securities Exchange Act of 1934 and the Investment Company Act of 1940, this report has been signed below by the following persons on behalf of the registrant and in the capacities and on the dates indicated. |
| |
| By (Signature and Title): |
| |
| /s/Jonathan S. Horwitz
Jonathan S. Horwitz
Principal Executive Officer
|
| |
| By (Signature and Title): |
| |
| /s/Steven D. Krichmar
Steven D. Krichmar
Principal Financial Officer
|