| | |
| UNITED STATES
SECURITIES AND EXCHANGE COMMISSION |
| | |
| CERTIFIED SHAREHOLDER REPORT OF REGISTERED
MANAGEMENT INVESTMENT COMPANIES
|
| | |
| Investment Company Act file number: | (811–03897) |
| | |
| Exact name of registrant as specified in charter: | Putnam Mortgage Securities Fund |
| | |
| Address of principal executive offices: | 100 Federal Street, Boston, Massachusetts 02110 |
| | |
| Name and address of agent for service: | Robert T. Burns, Vice President
100 Federal Street
Boston, Massachusetts 02110 |
| | |
| Copy to: | Bryan Chegwidden, Esq.
Ropes & Gray LLP
1211 Avenue of the Americas
New York, New York 10036 |
| | |
| Registrant's telephone number, including area code: | (617) 292–1000 |
| | |
| Date of fiscal year end: | September 30, 2019 |
| | |
| Date of reporting period: | October 1, 2018 — September 30, 2019 |
| | |
|
Item 1. Report to Stockholders: | |
| | |
| The following is a copy of the report transmitted to stockholders pursuant to Rule 30e-1 under the Investment Company Act of 1940: | |
Putnam
Mortgage Securities
Fund
Annual report
9|30|19
IMPORTANT NOTICE: Delivery of paper fund reports
In accordance with regulations adopted by the Securities and Exchange Commission, beginning on January 1, 2021, reports like this one will no longer be sent by mail unless you specifically request it. Instead, they will be on Putnam’s website, and you will be notified by mail whenever a new one is available, and provided with a website link to access the report.
If you wish to stop receiving paper reports sooner, or if you wish to continue to receive paper reports free of charge after January 1, 2021, please see the back cover or insert for instructions. If you invest through a bank or broker, your choice will apply to all funds held in your account. If you invest directly with Putnam, your choice will apply to all Putnam funds in your account.
If you already receive these reports electronically, no action is required.
Message from the Trustees
November 13, 2019
Dear Fellow Shareholder:
We believe your mutual fund investment offers a number of advantages, such as investment diversification and daily liquidity. Putnam funds also include a commitment to active investing. Putnam’s portfolio managers and analysts take a research-intensive approach that incorporates risk management strategies designed to serve you through changing conditions.
To support your overall investment program, we believe that the counsel of a financial advisor is prudent. For over 80 years, Putnam has recognized the importance of professional investment advice. Your financial advisor can help in many ways, including defining and planning for goals, determining your appropriate level of risk, and reviewing your investments on a regular basis.
As always, your fund’s Board of Trustees remains committed to protecting the interests of Putnam shareholders like you. We thank you for investing with Putnam.

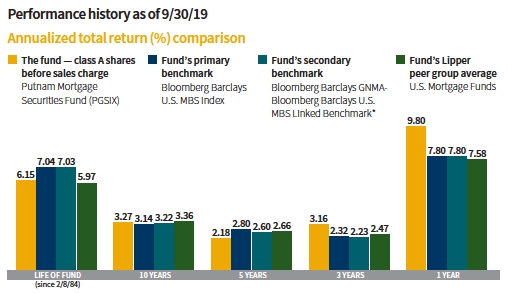
Current performance may be lower or higher than the quoted past performance, which cannot guarantee future results. Share price, principal value, and return will fluctuate, and you may have a gain or a loss when you sell your shares.Performance of class A shares assumes reinvestment of distributions and does not account for taxes. Fund returns in the bar chart do not reflect a sales charge of 4.00%; had they, returns would have been lower. See below and pages 8–10 for additional performance information. For a portion of the periods, the fund had expense limitations, without which returns would have been lower. To obtain the most recent month-end performance, visit putnam.com.
Before April 19, 2018, the fund was managed with a materially different investment strategy and may have achieved materially different performance results under its current investment strategy from that shown for periods before this date.
As of April 19, 2018, the Bloomberg Barclays U.S. MBS Index, an unmanaged index of agency mortgage backed pass-through securities (both fixed-rate and hybrid ARM) guaranteed by Ginnie Mae, Fannie Mae, and Freddie Mac, replaced the Bloomberg Barclays GNMA Index as the primary benchmark for this fund. In Putnam Investment Management, LLC’s opinion, the securities tracked by the Bloomberg Barclays U.S. MBS Index more accurately reflect the types of securities that generally will be held by the fund.
*The Bloomberg Barclays GNMA-Bloomberg Barclays U.S. MBS Linked Benchmark represents performance of the Bloomberg Barclays GNMA Index from inception date of the fund, February 8, 1984, through April 18, 2018, and performance of the Bloomberg Barclays U.S. MBS Index from April 19, 2018, and thereafter.
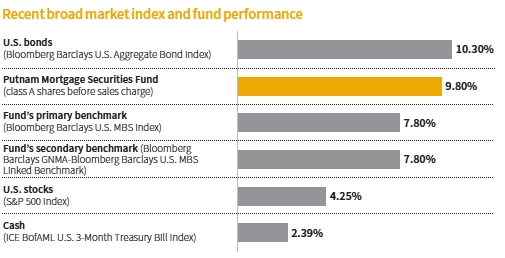
This comparison shows your fund’s performance in the context of broad market indexes for the 12 months ended 9/30/19. See above and pages 8–10 for additional fund performance information. Index descriptions can be found on page 15.
|
| 2 Mortgage Securities Fund |


Mike is a Co-Head of Fixed Income. He has a B.S. from Cornell University. Mike joined Putnam in 1997 and has been in the investment industry since 1989.
Brett S. Kozlowski, CFA, and Jatin Misra, Ph.D., CFA, are also Portfolio Managers of the fund.
Mike, what was the fund’s investment environment like during the reporting period?
U.S. mortgage credit securities performed well, supported by an increasingly dovish Federal Reserve. However, the market trajectory was not smooth. Trade talks between the United States and China contributed to bouts of heightened volatility, as investors digested news of progress and setbacks in negotiations. Signs of a slowing global economy also weighed on risk assets.
After raising its benchmark interest rate in December 2018, the Fed became less hawkish. Fed policymakers stated that they were not on a “pre-set” course and indicated a willingness to pause on future rate hikes. During the second quarter of 2019, recession fears grew. With investors expecting cuts from the Fed and other central banks, bonds rallied, and yields fell globally. The bellwether 10-year U.S. Treasury yield fell below 2% in June, and the yield curve remained flat to slightly inverted from three months to 10 years.
As widely expected, the Fed reduced its benchmark interest rate on July 31, 2019. Chair Jerome Powell described the cut as a
|
| Mortgage Securities Fund 3 |
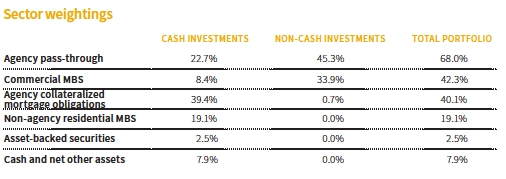
Allocations are shown as a percentage of the fund’s net assets as of 9/30/19. Cash and net other assets, if any, represent the market value weights of cash, derivatives, short-term securities, and other unclassified assets in the portfolio. Summary information may differ from the portfolio schedule included in the financial statements due to the inclusion of derivative securities, any interest accruals, the use of different classifications of securities for presentation purposes, and rounding. Allocations may not total 100% because the table includes the notional value (non-cash investments) of certain derivatives (the economic value for purposes of calculating periodic payment obligations), including to-be-announced (TBA) commitments, if any, in addition to the market value of securities. Holdings and allocations may vary over time.
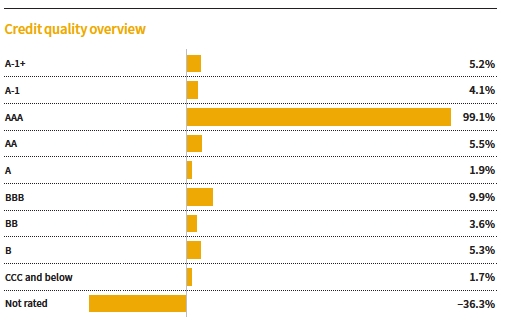
Credit qualities are shown as a percentage of the fund’s net assets as of 9/30/19. A bond rated BBB or higher (A-3 or higher, for short-term debt) is considered investment grade. This chart reflects the highest security rating provided by one or more of Standard & Poor’s, Moody’s, and Fitch. To-be-announced (TBA) mortgage commitments, if any, are included based on their issuer ratings. Ratings may vary over time.
Cash, derivative instruments, and net other assets are shown in the not-rated category. Payables and receivables for TBA mortgage commitments are included in the not-rated category and may result in negative weights. The fund itself has not been rated by an independent rating agency.
|
| 4 Mortgage Securities Fund |
“mid-cycle adjustment” to support economic growth. The Fed announced a second decrease in September amid ongoing U.S.–China trade tensions and the lack of clarity on how the United Kingdom would structure its departure from the European Union. Political risk in Hong Kong and Italy and an impeachment inquiry against President Trump contributed to further unease. Fed officials reiterated that they could act to prevent a recession and left open the possibility of another rate cut before year-end.
The yield on the benchmark 10-year U.S. Treasury fell sharply during the 12-month period from 3.06% to 1.67%. The 2-year to 10-year portion of the Treasury yield curve inverted in August 2019. Many investors interpret such an inversion as a sign that a recession is more likely to occur. Inversions preceded recession in each of the past five cycles, including the most recent recession between 2007 and 2009. While many economists don’t believe a recession is eminent, market conditions pushed many investors into a more risk-averse mindset that favored bonds over stocks.
The fund outperformed its primary and secondary benchmarks for the period. Which strategies and holdings contributed to this result?
Our allocation to mezzanine commercial mortgage-backed securities [CMBS] performed well and was the main contributor versus the benchmarks. Although the retail sector has struggled, it has performed better than expected by some market participants, who during the past year abandoned their efforts to short-sell the CMBS market. The fund’s exposure to CMBS via CMBX was especially beneficial. [CMBX is an index that references a basket of CMBS issued in a particular year.] Within CMBX, the fund’s exposure to the Series 6 [2012 issuance] mezzanine BBB-rated tranche rallied along with other risk assets during the period. This was reflected in spreads, which continued to tighten. [Yield spreads are the yieldadvantage credit-sensitive bonds offer over comparable-maturity U.S. Treasuries.]

The fund’s exposure to residential MBS, through agency credit-risk transfer securities [CRTs] securities, also produced positive returns.The market continues to be supported by robust investor demand, improved housing fundamentals, and upgrades from credit rating agencies.
What about relative detractors?
Prepayment strategies were the only notable detractor from the fund’s performance. Our allocation to agency interest-only collateralized mortgage obligations [IO CMOs] was a modest negative performer over the period due to the risk-off sentiment during the fourth quarter of 2018.
How did the fund’s interest-rate and yield-curve positioning fare during the period?
Our term-structure strategies added to performance results. For most of the period, the fund’s duration was modestly longer than that of the benchmarks. This meant that the fund had more interest-rate sensitivity than the broad market indexes as rates declined. Also, the fund benefited from our portfolio bias for the yield curve flattening when yields declined across the curve.
How did you use derivatives during the period?
We used credit default swaps for hedging credit and market risk. We used interest-rate swaps to hedge the risks inherent in the fund’s duration and yield-curve positioning. We also employed options to hedge duration and convexity, to isolate the prepayment risk associated with
|
| Mortgage Securities Fund 5 |
our CMO holdings, and to help manage overall downside risk. Lastly, we used total return swaps to hedge the fund’s sector exposures and to gain access to specific areas of the market.
What is your near-term outlook?
We believe the U.S. economy, particularly manufacturing, is showing signs of deceleration in response to the U.S.–China trade war. The trade uncertainty also appears to be weighing on business sentiment, although consumer spending remains solid and employment strong. Geopolitical issues aside, our main concern continues to be whether the trade conflict will deepen. This could create headwinds for other key parts of the U.S. economy that have so far been unaffected by the trade conflict.
With regard to Fed rate policy, there appears to be a divide between the hawks and doves about whether to pause or continue gradually cutting interest rates. We believe the Fed will continue easing and expect another 50 basis points, or half a percentage point, of short-term rate cuts between period-end and July 2020.
What areas of the market do you find to be most attractive?
We continue to have a generally favorable outlook for mortgage credit, which is expressed through the fund’s exposure to CMBS. We believe the sector remains supported by generally positive U.S. economic fundamentals. These include a robust labor market, low interest rates, and solid GDP growth. We also continue to find relative value in CMBX over cash bonds, as we believe the index incorrectly reflects negative retail sentiment.
Within the agency credit risk transfer (CRT) market, we are maintaining positions in mezzanine and subordinated tranches. These holdings are more seasoned loans versus newly issued CRTs and have low loan-to-value characteristics. We find their origination metrics are stronger, and their higher prepayments and low current loan-to-value ratios are leading to credit rating upgrades.
We continue to find opportunities in areas within agency IO CMOs. Security selection within the sector continues to be important. Meanwhile, we maintain a position, albeit modest, to capitalize on mortgage spreads widening versus Treasuries. This strategy seeks to benefit from the difference
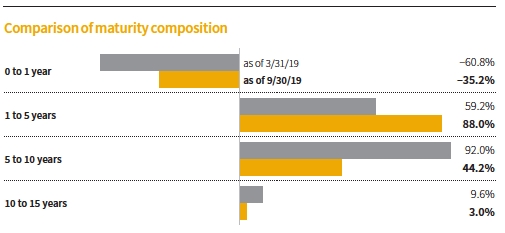
This chart illustrates the fund’s composition by maturity, showing the percentage of holdings in different maturity ranges and how the composition has changed over the past six months. Holdings and maturity ranges may vary over time. A negative number represents cash to be allocated to to-be-announced (TBA) agency pass-through mortgage-backed securities, which the fund has agreed to purchase.
|
| 6 Mortgage Securities Fund |
in the yield differential between current-coupon, 30-year agency pass-throughs and 30-year Treasuries.
Thank you, Mike, for your time and insights today.
The views expressed in this report are exclusively those of Putnam Management and are subject to change. They are not meant as investment advice.
Please note that the holdings discussed in this report may not have been held by the fund for the entire period. Portfolio composition is subject to review in accordance with the fund’s investment strategy and may vary in the future. Current and future portfolio holdings are subject to risk. Statements in the Q&A concerning the fund’s performance or portfolio composition relative to those of the fund’s Lipper peer group may reference information produced by Lipper Inc. or through a third party.
Of special interest
The fund’s monthly dividend rate increased from $0.046 to $0.049 in November 2018 per class A share due to an increase in income generated by the portfolio. Similar increases were made to other share classes.
ABOUT DERIVATIVES
Derivatives are an increasingly common type of investment instrument, the performance of which isderivedfrom an underlying security, index, currency, or other area of the capital markets. Derivatives employed by the fund’s managers generally serve one of two main purposes: to implement a strategy that may be difficult or more expensive to invest in through traditional securities, or to hedge unwanted risk associated with a particular position.
For example, the fund’s managers may identify a bond that they believe is undervalued relative to its risk of default, but may seek to reduce the interest-rate risk of that bond by using interest-rate swaps, a derivative through which two parties “swap” payments based on the movement of certain rates.
Like any other investment, derivatives may not appreciate in value and may lose money. Derivatives may amplify traditional investment risks through the creation of leverage and may be less liquid than traditional securities. And because derivatives typically represent contractual agreements between two financial institutions, derivatives entail “counterparty risk,” which is the risk that the other party is unable or unwilling to pay. Putnam monitors the counterparty risks we assume. For example, Putnam often enters into collateral agreements that require the counterparties to post collateral on a regular basis to cover their obligations to the fund. Counterparty risk for exchange-traded futures and centrally cleared swaps is mitigated by the daily exchange of margin and other safeguards against default through their respective clearinghouses.
|
| Mortgage Securities Fund 7 |
Your fund’s performance
This section shows your fund’s performance, price, and distribution information for periods ended September 30, 2019, the end of its most recent fiscal year. In accordance with regulatory requirements for mutual funds, we also include expense information taken from the fund’s current prospectus. Performance should always be considered in light of a fund’s investment strategy. Data represent past performance. Past performance does not guarantee future results. More recent returns may be less or more than those shown. Investment return and principal value will fluctuate, and you may have a gain or a loss when you sell your shares. Performance information does not reflect any deduction for taxes a shareholder may owe on fund distributions or on the redemption of fund shares. For the most recent month-end performance, please visit the Individual Investors section at putnam.com or call Putnam at 1-800-225-1581. Class R, R6, and Y shares are not available to all investors. Effective November 25, 2019 (December 9, 2019 for certain shareholders), class M shares will no longer be available for purchase and will convert automatically to class A shares. See the Terms and definitions section in this report for definitions of the share classes offered by your fund.
Fund performanceTotal return for periods ended 9/30/19
| | | | | | | | |
| | Annual | | | | | | | |
| | average | | Annual | | Annual | | Annual | |
| | (life of fund) | 10 years | average | 5 years | average | 3 years | average | 1 year |
| Class A(2/8/84) | | | | | | | | |
| Before sales charge | 6.15% | 37.98% | 3.27% | 11.36% | 2.18% | 9.79% | 3.16% | 9.80% |
| After sales charge | 6.02 | 32.46 | 2.85 | 6.91 | 1.35 | 5.40 | 1.77 | 5.41 |
| Class B(4/27/92) | | | | | | | | |
| Before CDSC | 5.92 | 30.21 | 2.68 | 7.31 | 1.42 | 7.29 | 2.37 | 8.91 |
| After CDSC | 5.92 | 30.21 | 2.68 | 5.42 | 1.06 | 4.35 | 1.43 | 3.91 |
| Class C(7/26/99) | | | | | | | | |
| Before CDSC | 5.92 | 27.72 | 2.48 | 7.29 | 1.42 | 7.37 | 2.40 | 9.04 |
| After CDSC | 5.92 | 27.72 | 2.48 | 7.29 | 1.42 | 7.37 | 2.40 | 8.04 |
| Class M(2/6/95) | | | | | | | | |
| Before sales charge | 5.84 | 35.11 | 3.05 | 10.03 | 1.93 | 8.99 | 2.91 | 9.57 |
| After sales charge | 5.75 | 30.72 | 2.71 | 6.46 | 1.26 | 5.45 | 1.78 | 6.01 |
| Class R(1/21/03) | | | | | | | | |
| Net asset value | 5.86 | 34.35 | 3.00 | 9.92 | 1.91 | 8.86 | 2.87 | 9.55 |
| Class R6(4/20/18) | | | | | | | | |
| Net asset value | 6.33 | 41.70 | 3.55 | 13.04 | 2.48 | 10.83 | 3.49 | 10.25 |
| Class Y(4/11/94) | | | | | | | | |
| Net asset value | 6.33 | 41.33 | 3.52 | 12.75 | 2.43 | 10.54 | 3.40 | 10.12 |
Current performance may be lower or higher than the quoted past performance, which cannot guarantee future results. After-sales-charge returns for class A and M shares reflect the deduction of the maximum 4.00% and 3.25% sales charge, respectively, levied at the time of purchase. Class B share returns after contingent deferred sales charge (CDSC) reflect the applicable CDSC, which is 5% in the first year, declining over time to 1% in the sixth year, and is eliminated thereafter. Class C share returns after CDSC reflect a 1% CDSC for the first year that is eliminated thereafter.Class R, R6, and Y shares have no initial sales charge or CDSC. Performance for class B, C, M, R, and Y shares before their inception is derived from the historical performance of class A shares, adjusted for the applicable sales charge (or CDSC) and the higher operating expenses for such shares, except for class Y shares, for which 12b-1 fees are not applicable. Performance for class R6 shares prior to their inception is derived from the historical performance of class Y shares and has not been adjusted for the lower investor servicing fees applicable to class R6 shares; had it, returns would have been higher.
For a portion of the periods, the fund had expense limitations, without which returns would have been lower.
|
| 8 Mortgage Securities Fund |
Before April 19, 2018, the fund was managed with a materially different investment strategy and may have achieved materially different performance results under its current investment strategy from that shown for periods before this date.
Class B share performance reflects conversion to class A shares after eight years.
Class C share performance reflects conversion to class A shares after 10 years.
Comparative index returnsFor periods ended 9/30/19
| | | | | | | | |
| | Annual | | | | | | | |
| | average | | Annual | | Annual | | Annual | |
| | (life of fund) | 10 years | average | 5 years | average | 3 years | average | 1 year |
| Bloomberg Barclays U.S. | | | | | | | | |
| MBS Index | 7.04% | 36.23% | 3.14% | 14.80% | 2.80% | 7.13% | 2.32% | 7.80% |
| Bloomberg Barclays | | | | | | | | |
| GNMA-Bloomberg | | | | | | | | |
| Barclays U.S. MBS Linked | 7.03 | 37.34 | 3.22 | 13.71 | 2.60 | 6.84 | 2.23 | 7.80 |
| Benchmark* | | | | | | | | |
| Lipper U.S. Mortgage | | | | | | | | |
| Funds category average† | 5.97 | 39.59 | 3.36 | 14.08 | 2.66 | 7.62 | 2.47 | 7.58 |
Index and Lipper results should be compared with fund performance before sales charge, before CDSC, or at net asset value.
As of April 19, 2018, the Bloomberg Barclays U.S. MBS Index, an unmanaged index of agency mortgage backed pass-through securities (both fixed-rate and hybrid ARM) guaranteed by Ginnie Mae, Fannie Mae, and Freddie Mac, replaced the Bloomberg Barclays GNMA Index as the primary benchmark for this fund. In Putnam Investment Management, LLC’s opinion, the securities tracked by the Bloomberg Barclays U.S. MBS Index more accurately reflect the types of securities that generally will be held by the fund.
*The Bloomberg Barclays GNMA-Bloomberg Barclays U.S. MBS Linked Benchmark represents performance of the Bloomberg Barclays GNMA Index from inception date of the fund, February 8, 1984, through April 18, 2018, and performance of the Bloomberg Barclays U.S. MBS Index from April 19, 2018, and thereafter.
†Over the 1-year, 3-year, 5-year, 10-year, and life-of-fund periods ended 9/30/19, there were 126, 111, 97, 71, and 3 funds, respectively, in this Lipper category.
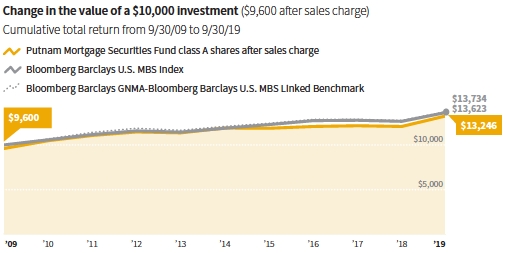
Past performance does not indicate future results. At the end of the same time period, a $10,000 investment in the fund’s class B and C shares would have been valued at $13,021 and $12,772, respectively, and no contingent deferred sales charges would apply. A $10,000 investment in the fund’s class M shares ($9,675 after sales charge) would have been valued at $13,072. A $10,000 investment in the fund’s class R, R6, and Y shares would have been valued at $13,435, $14,170, and $14,133, respectively.
|
| Mortgage Securities Fund 9 |
Fund price and distribution informationFor the 12-month period ended 9/30/19
| | | | | | | | | |
| Distributions | Class A | Class B | Class C | Class M | Class R | Class R6 | Class Y |
| Number | 12 | 12 | 12 | 12 | 12 | 12 | 12 |
| Income | $0.585 | $0.488 | $0.488 | $0.555 | $0.553 | $0.633 | $0.617 |
| Capital gains | — | — | — | — | — | — | — |
| Total | $0.585 | $0.488 | $0.488 | $0.555 | $0.553 | $0.633 | $0.617 |
| | Before | After | Net | Net | Before | After | Net | Net | Net |
| | sales | sales | asset | asset | sales | sales | asset | asset | asset |
| Share value | charge | charge | value | value | charge | charge | value | value | value |
| 9/30/18 | $12.37 | $12.89 | $12.31 | $12.25 | $12.43 | $12.85 | $12.23 | $12.24 | $12.23 |
| 9/30/19 | 12.96 | 13.50 | 12.89 | 12.84 | 13.03 | 13.47 | 12.81 | 12.82 | 12.81 |
| | Before | After | Net | Net | Before | After | Net | Net | Net |
| Current rate | sales | sales | asset | asset | sales | sales | asset | asset | asset |
| (end of period) | charge | charge | value | value | charge | charge | value | value | value |
| Current dividend | | | | | | | | | |
| rate1 | 4.54% | 4.36% | 3.72% | 3.74% | 4.24% | 4.10% | 4.31% | 4.96% | 4.87% |
| Current 30-day | | | | | | | | | |
| SEC yield | | | | | | | | | |
| (with expense | | | | | | | | | |
| limitation)2,3 | N/A | 4.03 | 3.45 | 3.44 | N/A | 3.83 | 3.94 | 4.57 | 4.44 |
| Current 30-day | | | | | | | | | |
| SEC yield | | | | | | | | | |
| (without expense | | | | | | | | | |
| limitation)3 | N/A | 3.88 | 3.29 | 3.29 | N/A | 3.68 | 3.79 | 4.41 | 4.29 |
The classification of distributions, if any, is an estimate. Before-sales-charge share value and current dividend rate for class A and M shares, if applicable, do not take into account any sales charge levied at the time of purchase. After-sales-charge share value, current dividend rate, and current 30-day SEC yield, if applicable, are calculated assuming that the maximum sales charge (4.00% for class A shares and 3.25% for class M shares) was levied at the time of purchase. Final distribution information will appear on your year-end tax forms.
1Most recent distribution, including any return of capital and excluding capital gains, annualized and divided by share price before or after sales charge at period-end.
2For a portion of the period, the fund had expense limitations, without which yields would have been lower.
3Based only on investment income and calculated using the maximum offering price for each share class, in accordance with SEC guidelines.
|
| 10 Mortgage Securities Fund |
Your fund’s expenses
As a mutual fund investor, you pay ongoing expenses, such as management fees, distribution fees (12b-1 fees), and other expenses. In the most recent six-month period, your fund’s expenses were limited; had expenses not been limited, they would have been higher. Using the following information, you can estimate how these expenses affect your investment and compare them with the expenses of other funds. You may also pay one-time transaction expenses, including sales charges (loads) and redemption fees, which are not shown in this section and would have resulted in higher total expenses. Effective November 25, 2019 (December 9, 2019 for certain shareholders), all outstanding class M shares were converted to class A shares, and class M shares are no longer available for purchase. For more information, see your fund’s prospectus or talk to your financial representative.
Expense ratios
| | | | | | | |
| | Class A | Class B | Class C | Class M | Class R | Class R6 | Class Y |
| Net expenses for the fiscal year | | | | | | | |
| ended 9/30/18* | 0.75%† | 1.50%† | 1.50%† | 0.99%† | 1.00%† | 0.37%‡ | 0.50%† |
| Total annual operating expenses for the | | | | | | | |
| fiscal year ended 9/30/18 | 0.94%† | 1.69%† | 1.69%† | 1.18%† | 1.19%† | 0.56%‡ | 0.69%† |
| Annualized expense ratio for the | | | | | | | |
| six-month period ended 9/30/19** | 0.75% | 1.50% | 1.50% | 0.99% | 1.00% | 0.37% | 0.50% |
Fiscal-year expense information in this table is taken from the most recent prospectus, is subject to change, and may differ from that shown for the annualized expense ratio and in the financial highlights of this report.
Expenses are shown as a percentage of average net assets.
*Reflects Putnam Management’s contractual obligation to limit certain fund expenses through 1/30/20.
†Restated to reflect current fees.
‡Other expenses are based on expenses of class A shares for the fund’s last fiscal year, restated to reflect current fees and adjustments to reflect lower investor servicing fees applicable to Class R6 shares.
**Expense ratios for each class are for the fund’s most recent fiscal half year. As a result of this, ratios may differ from expense ratios based on one-year data in the financial highlights.
Expenses per $1,000
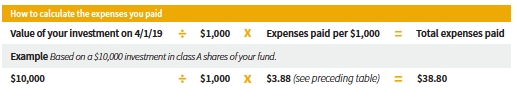
The following table shows the expenses you would have paid on a $1,000 investment in each class of the fund from 4/1/19 to 9/30/19. It also shows how much a $1,000 investment would be worth at the close of the period, assumingactual returnsand expenses.
| | | | | | | |
| | Class A | Class B | Class C | Class M | Class R | Class R6 | Class Y |
| Expenses paid per $1,000*† | $3.88 | $7.75 | $7.75 | $5.12 | $5.17 | $1.92 | $2.59 |
| Ending value (after expenses) | $1,064.50 | $1,059.70 | $1,060.80 | $1,062.80 | $1,062.10 | $1,066.40 | $1,065.10 |
*Expenses for each share class are calculated using the fund’s annualized expense ratio for each class, which represents the ongoing expenses as a percentage of average net assets for the six months ended 9/30/19. The expense ratio may differ for each share class.
†Expenses are calculated by multiplying the expense ratio by the average account value for the period; then multiplying the result by the number of days in the period; and then dividing that result by the number of days in the year.
|
| Mortgage Securities Fund 11 |
Estimate the expenses you paid
To estimate the ongoing expenses you paid for the six months ended 9/30/19, use the following calculation method. To find the value of your investment on 4/1/19, call Putnam at 1-800-225-1581.
Compare expenses using the SEC’s method
The Securities and Exchange Commission (SEC) has established guidelines to help investors assess fund expenses. Per these guidelines, the following table shows your fund’s expenses based on a $1,000 investment, assuming ahypothetical 5% annualized return. You can use this information to compare the ongoing expenses (but not transaction expenses or total costs) of investing in the fund with those of other funds. All mutual fund shareholder reports will provide this information to help you make this comparison. Please note that you cannot use this information to estimate your actual ending account balance and expenses paid during the period.
| | | | | | | |
| | Class A | Class B | Class C | Class M | Class R | Class R6 | Class Y |
| Expenses paid per $1,000*† | $3.80 | $7.59 | $7.59 | $5.01 | $5.06 | $1.88 | $2.54 |
| Ending value (after expenses) | $1,021.31 | $1,017.55 | $1,017.55 | $1,020.10 | $1,020.05 | $1,023.21 | $1,022.56 |
*Expenses for each share class are calculated using the fund’s annualized expense ratio for each class, which represents the ongoing expenses as a percentage of average net assets for the six months ended 9/30/19. The expense ratio may differ for each share class.
†Expenses are calculated by multiplying the expense ratio by the average account value for the six-month period; then multiplying the result by the number of days in the six-month period; and then dividing that result by the number of days in the year.
|
| 12 Mortgage Securities Fund |
Consider these risks before investing
Funds that invest in government securities are not guaranteed. Mortgage- and asset-backed securities are subject to prepayment risk, which means that they may increase in value less than other bonds when interest rates decline and decline in value more than other bonds when interest rates rise. The fund may have to invest the proceeds from prepaid investments, including mortgage- and asset-backed investments, in other investments with less attractive terms and yields. The fund’s investments in mortgage-backed securities and asset-backed securities, and in certain other securities and derivatives, may be or become illiquid. The fund’s exposure to privately issued mortgage-backed securities and mortgage-backed securities issued or guaranteed by the U.S. government or its agencies or instrumentalities may make the fund’s net asset value more susceptible to economic, market, political and other developments affecting the housing or real estate markets. Bond investments are subject to interest-rate risk (the risk of bond prices falling if interest rates rise) and credit risk (the risk of an issuer defaulting on interest or principal payments). Interest-rate risk is generally greater for longer-term bonds, and credit risk is generally greater for below-investment-grade bonds. Default risk is generally higher for non-qualified mortgages. Risks associated with derivatives include increased investment exposure (which may be considered leverage) and, in the case of over-the-counter instruments, the potential inability to terminate or sell derivatives positions and the potential failure of the other party to the instrument to meet its obligations. Unlike bonds, funds that invest in bonds have fees and expenses. The value of investments in the fund’s portfolio may fall or fail to rise over extended periods of time for a variety of reasons, including general economic, political, or financial market conditions; investor sentiment and market perceptions; government actions; geopolitical events or changes; and factors related to a specific issuer, geography (such as a region of the United States), industry, or sector, such as the housing or real estate markets. These and other factors may lead to increased volatility and reduced liquidity in the fund’s portfolio holdings or in relevant markets. You can lose money by investing in the fund.
|
| Mortgage Securities Fund 13 |
Terms and definitions
Important terms
Total returnshows how the value of the fund’s shares changed over time, assuming you held the shares through the entire period and reinvested all distributions in the fund.
Before sales charge, or net asset value, is the price, or value, of one share of a mutual fund, without a sales charge. Before-sales-charge figures fluctuate with market conditions, and are calculated by dividing the net assets of each class of shares by the number of outstanding shares in the class.
After sales chargeis the price of a mutual fund share plus the maximum sales charge levied at the time of purchase. After-sales-charge performance figures shown here assume the 4.00% maximum sales charge for class A shares and 3.25% for class M shares.
Contingent deferred sales charge (CDSC)is generally a charge applied at the time of the redemption of class B or C shares and assumes redemption at the end of the period. Your fund’s class B CDSC declines over time from a 5% maximum during the first year to 1% during the sixth year. After the sixth year, the CDSC no longer applies. The CDSC for class C shares is 1% for one year after purchase.
Share classes
Class A sharesare generally subject to an initial sales charge and no CDSC (except on certain redemptions of shares bought without an initial sales charge).
Class B sharesare closed to new investments and are only available by exchange from another Putnam fund or through dividend and/or capital gains reinvestment. They are not subject to an initial sales charge and may be subject to a CDSC.
Class C sharesare not subject to an initial sales charge and are subject to a CDSC only if the shares are redeemed during the first year.
Class M shareshave a lower initial sales charge and a higher 12b-1 fee than class A sharesand no CDSC. Effective November 25, 2019 (December 9, 2019 for certain shareholders), class M shares will no longer be available for purchase and will convert automatically to class A shares.
Class R sharesare not subject to an initial sales charge or CDSC and are only available to employer-sponsored retirement plans.
Class R6 sharesare not subject to an initial sales charge or CDSC and carry no 12b-1 fee. They are generally only available to employer-sponsored retirement plans, corporate and institutional clients, and clients in other approved programs.
Class Y sharesare not subject to an initial sales charge or CDSC and carry no 12b-1 fee. They are generally only available to corporate and institutional clients and clients in other approved programs.
Fixed-income terms
Current rateis the annual rate of return earned from dividends or interest of an investment. Current rate is expressed as a percentage of the price of a security, fund share, or principal investment.
Mortgage-backed security (MBS), also known as a mortgage “pass-through,” is a type of asset-backed security that is secured by a mortgage or collection of mortgages. The following are types of MBSs:
•Agency credit-risk transfer security (CRT)is backed by a reference pool of agency mortgages. Unlike a regular agency pass-through, the principal invested in a CRT is not backed by a U.S. government agency. To compensate investors for this risk, a CRT typically offers a higher yield than conventional pass-through securities. Similar to a CMBS, a CRT is structured into various tranches for investors, offering different levels of risk and yield based on the underlying reference pool.
|
| 14 Mortgage Securities Fund |
•Agency “pass-through”has its principal and interest backed by a U.S. government agency, such as the Federal National Mortgage Association (Fannie Mae), Government National Mortgage Association (Ginnie Mae), and Federal Home Loan Mortgage Corporation (Freddie Mac).
•Collateralized mortgage obligation (CMO)represents claims to specific cash flows from pools of home mortgages. The streams of principal and interest payments on the mortgages are distributed to the different classes of CMO interests in “tranches.” Each tranche may have different principal balances, coupon rates, prepayment risks, and maturity dates. A CMO is highly sensitive to changes in interest rates and any resulting change in the rate at which homeowners sell their properties, refinance, or otherwise prepay loans. CMOs are subject to prepayment, market, and liquidity risks.
◦ Interest-only (IO) securityis a type of CMO in which the underlying asset is the interest portion of mortgage, Treasury, or bond payments.
•Non-agency residential mortgage-backed security (RMBS)is an MBS not backed by Fannie Mae, Ginnie Mae, or Freddie Mac. One type of RMBS is an Alt-A mortgage-backed security.
•Commercial mortgage-backed security (CMBS)is secured by the loan on a commercial property.
•CMBS mezzanine tranchesare securities positioned between a senior tranche (mostly rated AAA) and a subordinated tranche (unrated, typically called an equity tranche). The mezzanine tranches are typically rated between AA and B because they are more exposed to credit risk than the senior tranches, and thus generally carry a higher yield.
Yield curveis a graph that plots the yields of bonds with equal credit quality against their differing maturity dates, ranging from shortestto longest. It is used as a benchmark for other debt, such as mortgage or bank lending rates.
Comparative indexes
Bloomberg Barclays GNMA Indexis an unmanaged index of Government National Mortgage Association bonds.
Bloomberg Barclays U.S. Aggregate Bond Indexis an unmanaged index of U.S. investment-grade fixed-income securities.
Bloomberg Barclays U.S. MBS Indexis an unmanaged index of agency mortgage-backed pass-through securities guaranteed by Ginnie Mae (GNMA), Fannie Mae (FNMA), and Freddie Mac (FHLMC).
CMBX Indextracks the performance of a basket of CMBS issued in a particular year.
ICE BofAML (Intercontinental Exchange Bank of America Merrill Lynch) U.S. 3-Month Treasury Bill Indexis an unmanaged index that seeks to measure the performance of U.S. Treasury bills available in the marketplace.
S&P 500 Indexis an unmanaged index of common stock performance.
Indexes assume reinvestment of all distributions and do not account for fees. Securities and performance of a fund and an index will differ. You cannot invest directly in an index.
ICE Data Indices, LLC (“ICE BofAML”), used with permission. ICE BofAML permits use of the ICE BofAML indices and related data on an “as is” basis; makes no warranties regarding same; does not guarantee the suitability, quality, accuracy, timeliness, and/or completeness of the ICE BofAML indices or any data included in, related to, or derived therefrom; assumes no liability in connection with the use of the foregoing; and does not sponsor, endorse, or recommend Putnam Investments, or any of its products or services.
Lipperis a third-party industry-ranking entity that ranks mutual funds. Its rankings do not reflect sales charges. Lipper rankings are based on total return at net asset value relative to other funds that have similar current investment styles or objectives as determined by Lipper. Lipper may change a fund’s category assignment at its discretion. Lipper category averages reflect performance trends for funds within a category.
|
| Mortgage Securities Fund 15 |
Other information for shareholders
Proxy voting
Putnam is committed to managing our mutual funds in the best interests of our shareholders. The Putnam funds’ proxy voting guidelines and procedures, as well as information regarding how your fund voted proxies relating to portfolio securities during the 12-month period ended June 30, 2019, are available in the Individual Investors section of putnam.com and on the Securities and Exchange Commission (SEC) website, www.sec.gov. If you have questions about finding forms on the SEC’s website, you may call the SEC at 1-800-SEC-0330. You may also obtain the Putnam funds’ proxy voting guidelines and procedures at no charge by calling Putnam’s Shareholder Services at 1-800-225-1581.
Fund portfolio holdings
The fund will file a complete schedule of its portfolio holdings with the SEC for the first and third quarters of each fiscal year onForm N-PORT within 60 days of the end of such fiscal quarter. Shareholders may obtain the fund’s Form N-PORT on the SEC’s website at www.sec.gov.
Prior to its use of Form N-PORT, the fund filed its complete schedule of its portfolio holdings with the SEC on Form N-Q, which is available online at www.sec.gov.
Trustee and employee fund ownership
Putnam employees and members of the Board of Trustees place their faith, confidence, and, most importantly, investment dollars in Putnam mutual funds. As of September 30, 2019, Putnam employees had approximately $473,000,000 and the Trustees had approximately $73,000,000 invested in Putnam mutual funds. These amounts include investments by the Trustees’ and employees’ immediate family members as well as investments through retirement and deferred compensation plans.
|
| 16 Mortgage Securities Fund |
Important notice regarding Putnam’s privacy policy
In order to conduct business with our shareholders, we must obtain certain personal information such as account holders’ names, addresses, Social Security numbers, and dates of birth. Using this information, we are able to maintain accurate records of accounts and transactions.
It is our policy to protect the confidentiality of our shareholder information, whether or not a shareholder currently owns shares of our funds. In particular, it is our policy not to sell information about you or your accounts to outside marketing firms. We have safeguards in place designed to prevent unauthorized accessto our computer systems and procedures to protect personal information from unauthorized use.
Under certain circumstances, we must share account information with outside vendors who provide services to us, such as mailings and proxy solicitations. In these cases, the service providers enter into confidentiality agreements with us, and we provide only the information necessary to process transactions and perform other services related to your account. Finally, it is our policy to share account information with your financial representative, if you’ve listed one on your Putnam account.
|
| Mortgage Securities Fund 17 |
Trustee approval of management contract
General conclusions
The Board of Trustees of The Putnam Funds oversees the management of each fund and, as required by law, determines annually whether to approve the continuance of your fund’s management contract with Putnam Investment Management, LLC (“Putnam Management”) and the sub-management contract with respect to your fund between Putnam Management and its affiliate, Putnam Investments Limited (“PIL”). The Board, with the assistance of its Contract Committee, requests and evaluates all information it deems reasonably necessary under the circumstances in connection with its annual contract review. The Contract Committee consists solely of Trustees who are not “interested persons” (as this term is defined in the Investment Company Act of 1940, as amended (the “1940 Act”)) of The Putnam Funds (“Independent Trustees”).
At the outset of the review process, members of the Board’s independent staff and independent legal counsel discussed with representatives of Putnam Management the annual contract review materials furnished to the Contract Committee during the course of the previous year’s review, identifying possible changes in these materials that might be necessary or desirable for the coming year. Following these discussions and in consultation with the Contract Committee, the Independent Trustees’ independent legal counsel requested that Putnam Management and its affiliates furnish specified information, together with any additional information that Putnam Management considered relevant, to the Contract Committee. Over the course of several months ending in June 2019, the Contract Committee met on a number of occasions with representatives of Putnam Management, and separately in executive session, to consider the information that Putnam Management provided. Throughout this process, the Contract Committee was assisted by the members of the Board’s independent staff and by independent legal counsel for The Putnam Funds and the Independent Trustees.
In May 2019, the Contract Committee met in executive session to discuss and consider its recommendations with respect to the continuance of the contracts. At the Trustees’ June 2019 meeting, the Contract Committee met in executive session with the other Independent Trustees to review a summary of the key financial,performance and other data that the Contract Committee considered in the course of its review. The Contract Committee then presented its written report, which summarized the key factors that the Committee had considered and set forth its recommendations. The Contract Committee recommended, and the Independent Trustees approved, the continuance of your fund’s management and sub-management contracts, effective July 1, 2019. (Because PIL is an affiliate of Putnam Management and Putnam Management remains fully responsible for all services provided by PIL, the Trustees have not attempted to evaluate PIL as a separate entity, and all subsequent references to Putnam Management below should be deemed to include reference to PIL as necessary or appropriate in the context.)
The Independent Trustees’ approval was based on the following conclusions:
• That the fee schedule in effect for your fund represented reasonable compensation in light of the nature and quality of the services being provided to the fund, the fees paid by competitive funds, the costs incurred by Putnam Management in providing services to the fund, and the application of certain reductions and waivers noted below; and
• That the fee schedule in effect for your fund represented an appropriate sharing between fund shareholders and Putnam Management of such economies of scale as may exist in the management of the fund at current asset levels.
These conclusions were based on a comprehensive consideration of all information provided to the Trustees and were not the result of any single factor. Some of the factors that figured particularly in the Trustees’ deliberations and how the Trustees considered these factors are described below, although individual Trustees may have evaluated the information presented differently, giving different weights to various factors. It is also important to recognize that the management arrangements for your fund and the other Putnam funds are the result of many years of review and discussion between the Independent Trustees and Putnam Management, that some aspects of the arrangements may receive greater scrutiny in some years than others, and that the Trustees’ conclusions may be based, in part, on their consideration of fee arrangements in previous
|
| 18 Mortgage Securities Fund |
years. For example, with some minor exceptions, the funds’ current fee arrangements under the management contracts were first implemented at the beginning of 2010 following extensive review by the Contract Committee and discussions with representatives of Putnam Management, as well as approval by shareholders.
Management fee schedules and total expenses
The Trustees reviewed the management fee schedules in effect for all Putnam funds, including fee levels and breakpoints. The Trustees also reviewed the total expenses of each Putnam fund, recognizing that in most cases management fees represented the major, but not the sole, determinant of total costs to fund shareholders. (Two funds have implemented so-called “all-in” management fees covering substantially all routine fund operating costs.)
In reviewing fees and expenses, the Trustees generally focus their attention on material changes in circumstances — for example, changes in assets under management, changes in a fund’s investment strategy, changes in Putnam Management’s operating costs or profitability, or changes in competitive practices in the mutual fund industry — that suggest that consideration of fee changes might be warranted. The Trustees concluded that the circumstances did not indicate that changes to the management fee structure for your fund would be appropriate at this time.
Under its management contract, your fund has the benefit of breakpoints in its management fee schedule that provide shareholders with economies of scale in the form of reduced fee rates as assets under management in the Putnam family of funds increase. The Trustees concluded that the fee schedule in effect for your fund represented an appropriate sharing of economies of scale between fund shareholders and Putnam Management.
As in the past, the Trustees also focused on the competitiveness of each fund’s total expense ratio. In order to support the effort to have fund expenses meet competitive standards, the Trustees and Putnam Management and the funds’ investor servicing agent, Putnam Investor Services, Inc. (“PSERV”), have implemented expense limitations that were in effect during your fund’s fiscal year ending in 2018. These expense limitations were: (i) a contractual expense limitation applicable to all open-end funds of25 basis points on investor servicing fees and expenses and (ii) a contractual expense limitation applicable to specified open-end funds, including your fund, of 20 basis points on so-called “other expenses” (i.e., all expenses exclusive of management fees, distribution fees, investor servicing fees, investment-related expenses, interest, taxes, brokerage commissions, acquired fund fees and expenses and extraordinary expenses). These expense limitations attempt to maintain competitive expense levels for the funds. Most funds had sufficiently low expenses that these expense limitations were not operative during their fiscal years ending in 2018. However, in the case of your fund, the first expense limitation applied during its fiscal year ending in 2018. Putnam Management and PSERV have agreed to maintain these expense limitations until at least January 30, 2021. In addition, Putnam Management contractually agreed to waive fees and/or reimburse expenses of your fund to the extent that expenses of the fund (excluding payments under the fund’s distribution plans, investor servicing fees, brokerage, interest, taxes, investment-related expenses, extraordinary expenses, and acquired fund fees and expenses) would exceed an annual rate of 0.32% of its average net assets through at least January 30, 2021. The support of Putnam Management and PSERV for these expense limitation arrangements was an important factor in the Trustees’ decision to approve the continuance of your fund’s management and sub-management contracts.
The Trustees reviewed comparative fee and expense information for a custom group of competitive funds selected by Broadridge Financial Solutions, Inc. (“Broadridge”). This comparative information included your fund’s percentile ranking for effective management fees and total expenses (excluding any applicable 12b-1 fees), which provides a general indication of your fund’s relative standing. In the custom peer group, your fund ranked in the second quintile in effective management fees (determined for your fund and the other funds in the custom peer group based on fund asset size and the applicable contractual management fee schedule) and in the second quintile in total expenses (excluding any applicable 12b-1 fees) as of December 31, 2018. The first quintile represents the least expensive funds and the fifth quintile the most expensive funds. The fee and expense data reported by Broadridge as of December 31, 2018 reflected
|
| Mortgage Securities Fund 19 |
the most recent fiscal year-end data available in Broadridge’s database at that time.
In connection with their review of fund management fees and total expenses, the Trustees also reviewed the costs of the services provided and the profits realized by Putnam Management and its affiliates from their contractual relationships with the funds. This information included trends in revenues, expenses and profitability of Putnam Management and its affiliates relating to the investment management, investor servicing and distribution services provided to the funds. In this regard, the Trustees also reviewed an analysis of Putnam Management’s revenues, expenses and profitability, allocated on a fund-by-fund basis, with respect to the funds’ management, distribution, and investor servicing contracts. For each fund, the analysis presented information about revenues, expenses and profitability for each of the agreements separately and for the agreements taken together on a combined basis. The Trustees concluded that, at current asset levels, the fee schedules in place represented reasonable compensation for the services being provided and represented an appropriate sharing between fund shareholders and Putnam Management of such economies of scale as may exist in the management of the Putnam funds at that time.
The information examined by the Trustees in connection with their annual contract review for the Putnam funds included information regarding fees charged by Putnam Management and its affiliates to institutional clients, including defined benefit pension and profit-sharing plans and sub-advised mutual funds. This information included, in cases where an institutional product’s investment strategy corresponds with a fund’s strategy, comparisons of those fees with fees charged to the Putnam funds, as well as an assessment of the differences in the services provided to these different types of clients as compared to the services provided to the Putnam funds. The Trustees observed that the differences in fee rates between these clients and the Putnam funds are by no means uniform when examined by individual asset sectors, suggesting that differences in the pricing of investment management services to these types of clients may reflect, among other things, historical competitive forces operating in separate markets. The Trustees considered the fact that in many cases fee rates across different asset classes are higher on average for mutual funds than for institutional clients, and the Trustees also considered the differences betweenthe services that Putnam Management provides to the Putnam funds and those that it provides to its other clients. The Trustees did not rely on these comparisons to any significant extent in concluding that the management fees paid by your fund are reasonable.
Investment performance
The quality of the investment process provided by Putnam Management represented a major factor in the Trustees’ evaluation of the quality of services provided by Putnam Management under your fund’s management contract. The Trustees were assisted in their review of the Putnam funds’ investment process and performance by the work of the investment oversight committees of the Trustees and the full Board of Trustees, which meet on a regular basis with the funds’ portfolio teams and with the Chief Investment Officers and other senior members of Putnam Management’s Investment Division throughout the year. The Trustees concluded that Putnam Management generally provides a high-quality investment process — based on the experience and skills of the individuals assigned to the management of fund portfolios, the resources made available to them, and in general Putnam Management’s ability to attract and retain high-quality personnel — but also recognized that this does not guarantee favorable investment results for every fund in every time period.
The Trustees considered that, after a strong start to the year, 2018 was a mixed year for The Putnam Funds, with the Putnam open-end Funds’ performance, on an asset-weighted basis, ranking in the 54th percentile of their Lipper Inc. (“Lipper”) peers (excluding those Putnam funds that are evaluated based on their total returns versus selected investment benchmarks). The Trustees also noted that The Putnam Funds were ranked by the Barron’s/Lipper Fund Families survey as the 41st-best performing mutual fund complex out of 57 complexes for the one-year period ended December 31, 2018 and the 29th-best performing mutual fund complex out of 55 complexes for the five-year period ended December 31, 2018. The Trustees observed that The Putnam Funds’ performance over the longer-term continued to be strong, ranking 6th out of 49 mutual fund complexes in the survey over the ten-year period ended 2018. In addition, the Trustees noted that 22 of the funds were four- or five-star rated by Morningstar Inc. at the end of 2018. They also noted, however, the disappointing investment
|
| 20 Mortgage Securities Fund |
performance of some funds for periods ended December 31, 2018 and considered information provided by Putnam Management regarding the factors contributing to the underperformance and actions being taken to improve the performance of these particular funds. The Trustees indicated their intention to continue to monitor closely the performance of those funds, including the effectiveness of any efforts Putnam Management has undertaken to address underperformance and whether additional actions to address areas of underperformance are warranted.
For purposes of the Trustees’ evaluation of the Putnam Funds’ investment performance, the Trustees generally focus on a competitive industry ranking of each fund’s total net return over a one-year, three-year and five-year period. For a number of Putnam funds with relatively unique investment mandates for which Putnam Management informed the Trustees that meaningful competitive performance rankings are not considered to be available, the Trustees evaluated performance based on their total gross and net returns and comparisons of those returns with the returns of selected investment benchmarks. In the case of your fund, the Trustees considered that its class A share cumulative total return performance at net asset value was in the following quartiles of its Lipper peer group (Lipper U.S. Mortgage Funds) for the one-year, three-year and five-year periods ended December 31, 2018 (the first quartile representing the best-performing funds and the fourth quartile the worst-performing funds):
| |
| One-year period | 4th |
| Three-year period | 4th |
| Five-year period | 4th |
Over the one-year, three-year and five-year periods ended December 31, 2018, there were 122, 111 and 95 funds, respectively, in your fund’s Lipper peer group. (When considering performance information, shareholders should be mindful that past performance is not a guarantee of future results.)
The Trustees expressed concern about your fund’s fourth quartile performance over the one-year, three-year and five-year periods ended December 31, 2018 and considered the circumstances that may have contributed to this disappointing performance. The Trustees noted that, until April 2018, the fund was named Putnam U.S. Government Income Fund and invested mainly in U.S. government bonds and securitized debt instruments, and that, in April 2018, the fundwas renamed as Putnam Mortgage Securities Fund and began investing mainly in mortgages, mortgage-related fixed income securities and related derivatives. They also noted that Putnam American Government Income Fund merged into the fund in April 2018. The Trustees considered that, in conjunction with the fund’s April 2018 repositioning, Lipper reclassified the fund from the Lipper GNMA Funds group to the Lipper U.S. Mortgage Funds group. The Trustees noted Putnam Management’s observation that the fourth quartile performance of the fund, which invested mainly in U.S. government securities before its repositioning, reflected its evaluation against mortgage-only funds in an environment in which mortgage-only funds generally outperformed funds investing in U.S. government securities.The Trustees also considered that commercial mortgage-backed securities had strong performance in early 2018, which was followed by weaker performance, and that the fund had begun investing in mortgages, mortgage-related fixed income securities and related derivatives during this period of weaker performance.
The Trustees considered that Putnam Management remained confident in the fund’s portfolio managers. The Trustees also considered Putnam Management’s continued efforts to support fund performance through initiatives including structuring compensation for portfolio managers and research analysts to enhance accountability for fund performance, emphasizing accountability in the portfolio management process, and affirming its commitment to a fundamental-driven approach to investing. The Trustees noted further that Putnam Management had made selective hires in 2018 to strengthen its investment team.
As a general matter, the Trustees believe that cooperative efforts between the Trustees and Putnam Management represent the most effective way to address investment performance concerns that may arise from time to time. The Trustees noted that investors in the Putnam funds have, in effect, placed their trust in the Putnam organization, under the oversight of the funds’ Trustees, to make appropriate decisions regarding the management of the funds. Based on Putnam Management’s willingness to take appropriate measures to address fund performance issues and Putnam Management’s responsiveness to Trustee concerns about investment performance, the Trustees concluded that it continues to be advisable to seek change within Putnam Management to address performance shortcomings. In the
|
| Mortgage Securities Fund 21 |
Trustees’ view, the alternative of engaging a new investment adviser for an underperforming fund, with all the attendant risks and disruptions, would not likely provide any greater assurance of improved investment performance.
Brokerage and soft-dollar allocations; investor servicing
The Trustees considered various potential benefits that Putnam Management may receive in connection with the services it provides under the management contract with your fund. These include benefits related to brokerage allocation and the use of soft dollars, whereby a portion of the commissions paid by a fund for brokerage may be used to acquire research services that are expected to be useful to Putnam Management in managing the assets of the fund and of other clients. Subject to policies established by the Trustees, soft dollars generated by these means are used predominantly to acquire brokerage and research services (including third-party research and market data) that enhance Putnam Management’s investment capabilities and supplement Putnam Management’s internal research efforts. However, the Trustees noted that a portion of available soft dollars continues to be used to pay fund expenses. The Trustees indicated their continued intent to monitor regulatory andindustry developments in this area with the assistance of their Brokerage Committee. The Trustees also indicated their continued intent to monitor the allocation of the Putnam funds’ brokerage in order to ensure that the principle of seeking best price and execution remains paramount in the portfolio trading process.
Putnam Management may also receive benefits from payments that the funds make to Putnam Management’s affiliates for investor or distribution services. In conjunction with the annual review of your fund’s management and sub-management contracts, the Trustees reviewed your fund’s investor servicing agreement with PSERV and its distributor’s contracts and distribution plans with Putnam Retail Management Limited Partnership (“PRM”), both of which are affiliates of Putnam Management. The Trustees concluded that the fees payable by the funds to PSERV and PRM, as applicable, for such services are fair and reasonable in relation to the nature and quality of such services, the fees paid by competitive funds, and the costs incurred by PSERV and PRM, as applicable, in providing such services. Furthermore, the Trustees were of the view that the services provided were required for the operation of the funds, and that they were of a quality at least equal to those provided by other providers.
|
| 22 Mortgage Securities Fund |
Audited financial statements
These sections of the report, as well as the accompanying Notes, preceded by the Report of Independent Registered Public Accounting Firm, constitute the fund’s audited financial statements.
The fund’s portfoliolists all the fund’s investments and their values as of the last day of the reporting period. Holdings are organized by asset type and industry sector, country, or state to show areas of concentration and diversification.
Statement of assets and liabilitiesshows how the fund’s net assets and share price are determined. All investment and non-investment assets are added together. Any unpaid expenses and other liabilities are subtracted from this total. The result is divided by the number of shares to determine the net asset value per share, which is calculated separately for each class of shares. (For funds with preferred shares, the amount subtracted from total assets includes the liquidation preference of preferred shares.)
Statement of operationsshows the fund’s net investment gain or loss. This is done by first adding up all the fund’s earnings — from dividends and interest income — and subtracting its operatingexpenses to determine net investment income (or loss). Then, any net gain or loss the fund realized on the sales of its holdings — as well as any unrealized gains or losses over the period — is added to or subtracted from the net investment result to determine the fund’s net gain or loss for the fiscal year.
Statement of changes in net assetsshows how the fund’s net assets were affected by the fund’s net investment gain or loss, by distributions to shareholders, and by changes in the number of the fund’s shares. It lists distributions and their sources (net investment income or realized capital gains) over the current reporting period and the most recent fiscal year-end. The distributions listed here may not match the sources listed in the Statement of operations because the distributions are determined on a tax basis and may be paid in a different period from the one in which they were earned.
Financial highlightsprovide an overview of the fund’s investment results, per-share distributions, expense ratios, net investment income ratios, and portfolio turnover in one summary table, reflecting the five most recent reporting periods. In a semiannual report, the highlights table also includes the current reporting period.
|
| Mortgage Securities Fund 23 |
Report of Independent Registered Public Accounting Firm
Shareholders and the Board of Trustees
Putnam Mortgage Securities Fund:
Opinion on the Financial Statements
We have audited the accompanying statement of assets and liabilities of Putnam Mortgage Securities Fund (the “fund”), including the fund’s portfolio, as of September 30, 2019, and the related statement of operations for the year then ended, the statements of changes in net assets for each of the years in the two-year period then ended, and the related notes (collectively, the “financial statements”) and the financial highlights for each of the years or periods in the five-year period then ended. In our opinion, the financial statements and financial highlights present fairly, in all material respects, the financial position of the fund as of September 30, 2019, and the results of its operations for the year then ended, the changes in its net assets for each of the years in the two-year period then ended, and the financial highlights for each of the years or periods in the five-year period then ended, in conformity with U.S. generally accepted accounting principles.
Basis for Opinion
These financial statements and financial highlights are the responsibility of the fund’s management. Our responsibility is to express an opinion on these financial statements and financial highlights based on our audits. We are a public accounting firm registered with the Public Company Accounting Oversight Board (United States) (“PCAOB”) and are required to be independent with respect to the fund in accordance with the U.S. federal securities laws and the applicable rules and regulations of the Securities and Exchange Commission and the PCAOB.
We conducted our audits in accordance with the standards of the PCAOB. Those standards require that we plan and perform the audit to obtain reasonable assurance about whether the financial statements and financial highlights are free of material misstatement, whether due to error or fraud. Our audits included performing procedures to assess the risks of material misstatement of the financial statements and financial highlights, whether due to error or fraud, and performing procedures that respond to those risks. Such procedures included examining, on a test basis, evidence regarding the amounts and disclosures in the financial statements and financial highlights. Such procedures also included confirmation of securities owned as of September 30, 2019, by correspondence with the custodians, transfer agent and brokers or by other appropriate auditing procedures. Our audits also included evaluating the accounting principles used and significant estimates made by management, as well as evaluating the overall presentation of the financial statements and financial highlights. We believe that our audits provide a reasonable basis for our opinion.

We have served as the auditor of one or more Putnam investment companies since 1999.
|
| Boston, Massachusetts |
| November 13, 2019 |
|
| 24 Mortgage Securities Fund |
The fund’s portfolio9/30/19
| | |
| U.S. GOVERNMENT AND AGENCY | Principal | |
| MORTGAGE OBLIGATIONS (67.4%)* | amount | Value |
| U.S. Government Guaranteed Mortgage Obligations (43.5%) | | |
| Government National Mortgage Association Adjustable Rate Mortgages | | |
| (1 Yr Monthly Treasury Average CMT Index + 1.50%), 3.75%, 7/20/26 | $8,830 | $8,971 |
| Government National Mortgage Association Pass-Through Certificates | | |
| 7.50%, 10/20/30 | 39,693 | 45,639 |
| 6.00%, 1/15/29 | 1 | 2 |
| 5.50%, with due dates from 8/15/35 to 5/20/49 | 253,105 | 280,797 |
| 5.00%, TBA, 10/1/49 | 56,500,000 | 59,558,944 |
| 5.00%, with due dates from 4/20/49 to 8/20/49 | 5,026,333 | 5,516,377 |
| 4.70%, with due dates from 5/20/67 to 8/20/67 | 659,895 | 741,146 |
| 4.666%, 9/20/65 | 150,386 | 162,700 |
| 4.626%, 6/20/67 | 710,407 | 793,880 |
| 4.509%, 3/20/67 | 596,433 | 662,041 |
| 4.50%, TBA, 10/1/49 | 76,000,000 | 79,414,064 |
| 4.50%, with due dates from 2/20/34 to 4/20/46 | 11,356,073 | 12,195,237 |
| 4.323%, 5/20/67 | 213,937 | 238,005 |
| 4.00%, TBA, 10/1/49 | 66,000,000 | 68,629,691 |
| 4.00%, with due dates from 7/20/44 to 5/20/46 | 38,659,613 | 41,268,168 |
| 3.50%, TBA, 10/1/49 | 71,000,000 | 73,557,108 |
| 3.50%, with due dates from 10/15/42 to 5/20/46 | 51,485,880 | 54,546,599 |
| 3.00%, TBA, 10/1/49 | 4,000,000 | 4,104,062 |
| 3.00%, with due dates from 3/20/43 to 10/20/44 | 2,034,013 | 2,097,753 |
| | | 403,821,184 |
| U.S. Government Agency Mortgage Obligations (23.9%) | | |
| Federal Home Loan Mortgage Corporation Pass-Through Certificates | | |
| 7.50%, 10/1/29 | 171,710 | 195,098 |
| 6.00%, 9/1/21 | 739 | 757 |
| 5.00%, 4/1/49 | 87,547 | 96,434 |
| 4.50%, with due dates from 1/1/37 to 6/1/37 | 139,503 | 150,814 |
| 3.00%, 4/1/27 i | 2,954,434 | 3,032,989 |
| Federal National Mortgage Association Pass-Through Certificates | | |
| 6.00%, with due dates from 4/1/21 to 8/1/22 | 103,438 | 106,076 |
| 5.50%, with due dates from 12/1/19 to 1/1/21 | 13,345 | 13,507 |
| 5.00%, with due dates from 3/1/21 to 8/1/49 | 464,601 | 511,898 |
| 4.50%, with due dates from 3/1/39 to 5/1/49 | 1,253,138 | 1,337,463 |
| 4.00%, with due dates from 9/1/20 to 9/1/46 | 12,385,585 | 13,348,252 |
| 3.50%, with due dates from 10/1/44 to 6/1/56 | 22,199,604 | 23,402,550 |
| 2.50%, 3/1/43 | 52,277,576 | 52,372,951 |
| Uniform Mortgage-Backed Securities | | |
| 6.00%, TBA, 10/1/49 | 11,400,000 | 12,619,265 |
| 5.50%, TBA, 10/1/49 | 52,000,000 | 56,318,439 |
| 4.50%, TBA, 10/1/49 | 35,000,000 | 36,851,171 |
| 3.00%, TBA, 10/1/49 | 21,000,000 | 21,315,000 |
| | | 221,672,664 |
| Total U.S. government and agency mortgage obligations (cost $619,831,737) | $625,493,848 |
|
| Mortgage Securities Fund 25 |
| | |
| | Principal | |
| U.S. TREASURY OBLIGATIONS (0.4%)* | amount | Value |
| U.S. Treasury Notes | | |
| 2.25%, 1/31/24 i | $3,421,000 | $3,531,019 |
| 1.25%, 3/31/21 i | 153,000 | 151,900 |
| Total U.S. treasury obligations (cost $3,682,919) | | $3,682,919 |
| |
| | Principal | |
| MORTGAGE-BACKED SECURITIES (66.2%)* | amount | Value |
| Agency collateralized mortgage obligations (38.8%) | | |
| Federal Home Loan Mortgage Corporation | | |
| REMICs IFB Ser. 3408, Class EK, ((-4.024 x 1 Month US LIBOR) | | |
| + 25.79%), 17.635%, 4/15/37 | $297,727 | $490,148 |
| REMICs IFB Ser. 2976, Class LC, ((-3.667 x 1 Month US LIBOR) | | |
| + 24.42%), 16.986%, 5/15/35 | 1,118,513 | 1,673,966 |
| REMICs IFB Ser. 3072, Class SM, ((-3.667 x 1 Month US LIBOR) | | |
| + 23.80%), 16.362%, 11/15/35 | 613,806 | 981,599 |
| REMICs IFB Ser. 3249, Class PS, ((-3.3 x 1 Month US LIBOR) | | |
| + 22.28%), 15.584%, 12/15/36 | 204,189 | 296,706 |
| REMICs IFB Ser. 3065, Class DC, ((-3 x 1 Month US LIBOR) | | |
| + 19.86%), 13.778%, 3/15/35 | 2,630,087 | 3,487,496 |
| REMICs IFB Ser. 2990, Class LB, ((-2.556 x 1 Month US LIBOR) | | |
| + 16.95%), 11.764%, 6/15/34 | 982,890 | 1,148,802 |
| REMICs Ser. 4122, Class TI, IO, 4.50%, 10/15/42 | 4,619,264 | 750,205 |
| REMICs Ser. 4024, Class PI, IO, 4.50%, 12/15/41 | 2,463,131 | 333,817 |
| REMICs Ser. 4018, Class DI, IO, 4.50%, 7/15/41 | 3,148,918 | 329,448 |
| REMICs IFB Ser. 4136, Class ES, IO, ((-1 x 1 Month US LIBOR) | | |
| + 6.25%), 4.223%, 11/15/42 | 5,575,127 | 477,768 |
| Structured Pass-Through Certificates FRB Ser. 57, Class 2A1, | | |
| 4.163%, 7/25/43 W | 15,686 | 16,983 |
| REMICs IFB Ser. 4436, Class SC, IO, ((-1 x 1 Month US LIBOR) | | |
| + 6.15%), 4.123%, 2/15/45 | 9,562,524 | 1,676,033 |
| Structured Pass-Through Certificates FRB Ser. 59, Class 2A1, | | |
| 4.032%, 10/25/43 W | 9,490 | 10,084 |
| REMICs Ser. 4546, Class PI, IO, 4.00%, 12/15/45 | 12,963,483 | 1,669,476 |
| REMICs Ser. 4601, Class IC, IO, 4.00%, 12/15/45 | 8,987,842 | 1,007,321 |
| REMICs Ser. 4530, Class HI, IO, 4.00%, 11/15/45 | 7,122,707 | 874,056 |
| REMICs Ser. 4500, Class GI, IO, 4.00%, 8/15/45 | 5,858,720 | 876,054 |
| REMICs Ser. 4425, IO, 4.00%, 1/15/45 | 7,765,519 | 1,083,833 |
| REMICs Ser. 4425, Class EI, IO, 4.00%, 1/15/45 | 9,320,891 | 1,266,336 |
| REMICs Ser. 4452, Class QI, IO, 4.00%, 11/15/44 | 6,984,491 | 1,340,003 |
| REMICs Ser. 4213, Class GI, IO, 4.00%, 11/15/41 | 13,481,515 | 1,255,048 |
| REMICs Ser. 4019, Class JI, IO, 4.00%, 5/15/41 | 6,556,853 | 578,033 |
| REMICs Ser. 3996, Class IK, IO, 4.00%, 3/15/39 | 4,988,107 | 164,175 |
| REMICs Ser. 4015, Class GI, IO, 4.00%, 3/15/27 | 2,880,425 | 273,378 |
| REMICs Ser. 4621, Class QI, IO, 3.50%, 10/15/46 | 21,805,345 | 2,875,689 |
| REMICs Ser. 4165, Class AI, IO, 3.50%, 2/15/43 | 4,819,545 | 652,598 |
| REMICs Ser. 4136, Class IQ, IO, 3.50%, 11/15/42 | 8,241,675 | 892,465 |
| REMICs Ser. 4199, Class CI, IO, 3.50%, 12/15/37 | 4,235,652 | 157,812 |
| Strips Ser. 304, Class C37, IO, 3.50%, 12/15/27 | 1,589,126 | 120,456 |
| REMICs Ser. 4150, Class DI, IO, 3.00%, 1/15/43 | 8,932,874 | 904,454 |
| REMICs Ser. 4141, Class PI, IO, 3.00%, 12/15/42 | 7,777,087 | 708,605 |
| REMICs Ser. 4158, Class TI, IO, 3.00%, 12/15/42 | 13,188,304 | 1,078,276 |
|
| 26 Mortgage Securities Fund |
| | |
| | Principal | |
| MORTGAGE-BACKED SECURITIES (66.2%)*cont. | amount | Value |
| Agency collateralized mortgage obligationscont. | | |
| Federal Home Loan Mortgage Corporation | | |
| REMICs Ser. 4165, Class TI, IO, 3.00%, 12/15/42 | $15,031,578 | $1,182,143 |
| REMICs Ser. 4171, Class NI, IO, 3.00%, 6/15/42 | 9,673,639 | 744,649 |
| REMICs Ser. 4183, Class MI, IO, 3.00%, 2/15/42 | 6,051,896 | 418,186 |
| REMICs Ser. 4201, Class JI, IO, 3.00%, 12/15/41 | 7,794,964 | 444,304 |
| Structured Pass-Through Certificates FRB Ser. 8, Class A9, IO, | | |
| 0.427%, 11/15/28 W | 915,351 | 12,632 |
| Structured Pass-Through Certificates FRB Ser. 59, Class 1AX, IO, | | |
| 0.28%, 10/25/43 W | 3,031,133 | 29,705 |
| Structured Pass-Through Certificates Ser. 48, Class A2, IO, | | |
| 0.212%, 7/25/33 W | 4,756,044 | 34,244 |
| REMICs Ser. 3835, Class FO, PO, zero %, 4/15/41 | 2,809,804 | 2,545,836 |
| REMICs Ser. 3369, Class BO, PO, zero %, 9/15/37 | 4,194 | 3,677 |
| REMICs Ser. 3391, PO, zero %, 4/15/37 | 55,634 | 49,537 |
| REMICs Ser. 3300, PO, zero %, 2/15/37 | 63,340 | 56,544 |
| REMICs Ser. 3314, PO, zero %, 11/15/36 | 4,446 | 4,403 |
| REMICs Ser. 3206, Class EO, PO, zero %, 8/15/36 | 2,695 | 2,453 |
| REMICs Ser. 3175, Class MO, PO, zero %, 6/15/36 | 35,558 | 31,639 |
| REMICs Ser. 3210, PO, zero %, 5/15/36 | 7,667 | 7,232 |
| REMICs Ser. 3326, Class WF, zero %, 10/15/35 W | 30,876 | 25,586 |
| REMICs FRB Ser. 3117, Class AF, (1 Month US LIBOR + 0.00%), | | |
| zero %, 2/15/36 | 21,043 | 17,272 |
| Strips Ser. 315, PO, zero %, 9/15/43 | 15,185,833 | 13,224,789 |
| Federal National Mortgage Association | | |
| REMICs IFB Ser. 06-62, Class PS, ((-6 x 1 Month US LIBOR) | | |
| + 39.90%), 27.79%, 7/25/36 | 345,542 | 616,344 |
| REMICs IFB Ser. 05-74, Class NK, ((-5 x 1 Month US LIBOR) | | |
| + 27.50%), 17.408%, 5/25/35 | 749,097 | 1,051,223 |
| REMICs IFB Ser. 06-8, Class HP, ((-3.667 x 1 Month US LIBOR) | | |
| + 24.57%), 17.166%, 3/25/36 | 451,809 | 748,467 |
| REMICs IFB Ser. 07-53, Class SP, ((-3.667 x 1 Month US LIBOR) | | |
| + 24.20%), 16.799%, 6/25/37 | 554,787 | 873,734 |
| REMICs IFB Ser. 05-122, Class SE, ((-3.5 x 1 Month US LIBOR) | | |
| + 23.10%), 16.036%, 11/25/35 | 373,793 | 505,032 |
| REMICs IFB Ser. 08-24, Class SP, ((-3.667 x 1 Month US LIBOR) | | |
| + 23.28%), 15.883%, 2/25/38 | 2,004,161 | 2,638,766 |
| REMICs IFB Ser. 05-75, Class GS, ((-3 x 1 Month US LIBOR) | | |
| + 20.25%), 14.195%, 8/25/35 | 248,725 | 333,316 |
| REMICs IFB Ser. 05-106, Class JC, ((-3.101 x 1 Month US LIBOR) | | |
| + 20.12%), 13.865%, 12/25/35 | 676,689 | 918,808 |
| REMICs IFB Ser. 05-83, Class QP, ((-2.6 x 1 Month US LIBOR) | | |
| + 17.39%), 12.146%, 11/25/34 | 162,118 | 189,419 |
| REMICs IFB Ser. 11-4, Class CS, ((-2 x 1 Month US LIBOR) + 12.90%), | | |
| 8.863%, 5/25/40 | 1,265,744 | 1,509,020 |
| REMICs Ser. 15-58, Class KI, IO, 6.00%, 3/25/37 | 10,454,783 | 2,309,639 |
| REMICs Ser. 16-3, Class MI, IO, 5.50%, 2/25/46 | 7,774,262 | 1,510,539 |
| REMICs Ser. 15-86, Class MI, IO, 5.50%, 11/25/45 | 9,230,986 | 1,885,521 |
| REMICs Ser. 10-109, Class IM, IO, 5.50%, 9/25/40 | 19,607,795 | 3,363,745 |
| REMICs Ser. 18-51, Class BI, IO, 5.50%, 7/25/38 | 13,355,957 | 2,044,200 |
| REMICs FRB Ser. 03-W11, Class A1, 5.334%, 6/25/33 W | 363 | 379 |
|
| Mortgage Securities Fund 27 |
| | |
| | Principal | |
| MORTGAGE-BACKED SECURITIES (66.2%)*cont. | amount | Value |
| Agency collateralized mortgage obligationscont. | | |
| Federal National Mortgage Association | | |
| REMICs Trust FRB Ser. 04-W7, Class A2, 5.213%, 3/25/34 W | $4,619 | $5,093 |
| REMICs Ser. 17-19, Class IH, IO, 5.00%, 3/25/47 | 11,028,881 | 2,151,073 |
| REMICs Ser. 12-151, Class IM, IO, 5.00%, 4/25/42 | 13,484,422 | 2,035,413 |
| REMICs FRB Ser. 03-W14, Class 2A, 4.627%, 1/25/43 W | 13,808 | 14,438 |
| REMICs IFB Ser. 11-123, Class KS, IO, ((-1 x 1 Month US LIBOR) | | |
| + 6.60%), 4.582%, 10/25/41 | 1,461,412 | 198,781 |
| REMICs Ser. 17-66, IO, 4.50%, 9/25/47 | 11,480,305 | 1,962,559 |
| REMICs Ser. 17-32, Class IP, IO, 4.50%, 5/25/47 | 12,326,074 | 2,415,064 |
| Trust FRB Ser. 04-W2, Class 4A, 4.424%, 2/25/44 W | 9,248 | 9,541 |
| REMICs IFB Ser. 18-47, Class SA, IO, ((-1 x 1 Month US LIBOR) | | |
| + 6.25%), 4.232%, 7/25/48 | 8,786,005 | 1,559,779 |
| REMICs IFB Ser. 18-36, Class SD, IO, ((-1 x 1 Month US LIBOR) | | |
| + 6.25%), 4.232%, 6/25/48 | 27,862,633 | 4,905,258 |
| REMICs IFB Ser. 18-20, Class SB, IO, ((-1 x 1 Month US LIBOR) | | |
| + 6.25%), 4.232%, 3/25/48 | 12,841,625 | 2,379,553 |
| Trust FRB Ser. 03-W3, Class 1A4, 4.202%, 8/25/42 W | 27,493 | 28,944 |
| REMICs IFB Ser. 17-104, Class SL, IO, ((-1 x 1 Month US LIBOR) | | |
| + 6.15%), 4.132%, 1/25/48 | 22,152,931 | 3,485,205 |
| REMICs IFB Ser. 16-81, Class SA, IO, ((-1 x 1 Month US LIBOR) | | |
| + 6.15%), 4.132%, 11/25/46 | 25,818,748 | 4,789,636 |
| REMICs IFB Ser. 16-83, Class BS, IO, ((-1 x 1 Month US LIBOR) | | |
| + 6.10%), 4.082%, 11/25/46 | 29,906,117 | 5,589,800 |
| REMICs IFB Ser. 16-85, Class SL, IO, ((-1 x 1 Month US LIBOR) | | |
| + 6.10%), 4.082%, 11/25/46 | 44,197,563 | 7,190,944 |
| REMICs IFB Ser. 16-50, Class SM, IO, ((-1 x 1 Month US LIBOR) | | |
| + 6.10%), 4.082%, 8/25/46 | 20,216,227 | 3,474,688 |
| REMICs IFB Ser. 19-45, Class SD, IO, ((-1 x 1 Month US LIBOR) | | |
| + 6.05%), 4.032%, 8/25/49 | 12,755,581 | 2,248,171 |
| REMICs IFB Ser. 16-8, Class SA, IO, ((-1 x 1 Month US LIBOR) | | |
| + 6.05%), 4.032%, 3/25/46 | 22,948,967 | 3,908,946 |
| REMICs Ser. 15-83, IO, 4.00%, 10/25/43 | 5,528,278 | 732,497 |
| REMICs Ser. 12-118, Class PI, IO, 4.00%, 6/25/42 | 6,067,472 | 802,105 |
| REMICs Ser. 12-62, Class MI, IO, 4.00%, 3/25/41 | 3,973,804 | 368,372 |
| REMICs Ser. 12-104, Class HI, IO, 4.00%, 9/25/27 | 7,213,222 | 644,962 |
| REMICs IFB Ser. 19-58, Class SA, IO, ((-1 x 1 Month US LIBOR) | | |
| + 0.00%), 3.968%, 10/25/49 | 16,420,000 | 2,874,758 |
| REMICs Ser. 16-70, Class QI, IO, 3.50%, 10/25/46 | 24,057,980 | 3,260,056 |
| REMICs Ser. 15-10, Class AI, IO, 3.50%, 8/25/43 | 9,837,875 | 1,059,627 |
| REMICs Ser. 12-124, Class JI, IO, 3.50%, 11/25/42 | 2,994,268 | 262,597 |
| REMICs Ser. 13-22, Class PI, IO, 3.50%, 10/25/42 | 8,608,959 | 1,242,981 |
| REMICs Ser. 12-114, Class NI, IO, 3.50%, 10/25/41 | 11,949,763 | 1,401,284 |
| REMICs Ser. 13-55, Class IK, IO, 3.00%, 4/25/43�� | 5,980,991 | 522,069 |
| REMICs Ser. 13-6, Class JI, IO, 3.00%, 2/25/43 | 11,617,629 | 1,016,543 |
| REMICs Ser. 12-151, Class PI, IO, 3.00%, 1/25/43 | 6,066,427 | 538,347 |
| REMICs Ser. 12-145, Class TI, IO, 3.00%, 11/25/42 | 4,113,093 | 186,208 |
| REMICs Ser. 13-35, Class IP, IO, 3.00%, 6/25/42 | 3,916,592 | 210,219 |
| REMICs Ser. 13-55, Class PI, IO, 3.00%, 5/25/42 | 8,426,735 | 430,193 |
| REMICs Ser. 13-53, Class JI, IO, 3.00%, 12/25/41 | 7,323,102 | 536,549 |
| REMICs Ser. 13-23, Class PI, IO, 3.00%, 10/25/41 | 4,967,961 | 161,741 |
|
| 28 Mortgage Securities Fund |
| | |
| | Principal | |
| MORTGAGE-BACKED SECURITIES (66.2%)*cont. | amount | Value |
| Agency collateralized mortgage obligationscont. | | |
| Federal National Mortgage Association | | |
| REMICs Ser. 13-30, Class IP, IO, 3.00%, 10/25/41 | $6,845,973 | $224,201 |
| REMICs Ser. 13-23, Class LI, IO, 3.00%, 6/25/41 | 4,866,025 | 164,949 |
| REMICs Ser. 14-28, Class AI, IO, 3.00%, 3/25/40 | 7,658,057 | 551,005 |
| REMICs FRB Ser. 07-95, Class A3, (1 Month US LIBOR + 0.25%), | | |
| 2.395%, 8/27/36 | 25,120,382 | 24,176,677 |
| REMICs Trust Ser. 98-W5, Class X, IO, 1.45%, 7/25/28 W | 1,720,089 | 49,539 |
| REMICs Trust Ser. 98-W2, Class X, IO, 0.918%, 6/25/28 W | 6,123,075 | 199,000 |
| REMICs FRB Ser. 01-50, Class B1, IO, 0.376%, 10/25/41 W | 3,317,957 | 14,267 |
| REMICs Ser. 01-79, Class BI, IO, 0.276%, 3/25/45 W | 1,881,509 | 15,993 |
| REMICs Ser. 03-34, Class P1, PO, zero %, 4/25/43 | 75,515 | 62,677 |
| REMICs Ser. 08-53, Class DO, PO, zero %, 7/25/38 | 212,129 | 199,244 |
| REMICs Ser. 07-64, Class LO, PO, zero %, 7/25/37 | 28,016 | 26,466 |
| REMICs Ser. 07-44, Class CO, PO, zero %, 5/25/37 | 110,591 | 95,661 |
| REMICs Ser. 07-14, Class KO, PO, zero %, 3/25/37 | 6,987 | 6,152 |
| REMICs Ser. 06-125, Class OX, PO, zero %, 1/25/37 | 1,215 | 1,086 |
| REMICs Ser. 06-84, Class OT, PO, zero %, 9/25/36 | 2,227 | 2,016 |
| REMICs Ser. 06-46, Class OC, PO, zero %, 6/25/36 | 3,361 | 2,965 |
| REMICs Ser. 08-36, Class OV, PO, zero %, 1/25/36 | 34,022 | 30,554 |
| Government National Mortgage Association | | |
| Ser. 16-75, Class LI, IO, 6.00%, 1/20/40 | 6,969,899 | 1,515,953 |
| Ser. 14-137, Class ID, IO, 5.50%, 9/16/44 | 6,976,334 | 1,471,635 |
| Ser. 18-127, Class ID, IO, 5.00%, 7/20/45 | 247,994 | 31,061 |
| Ser. 15-89, Class LI, IO, 5.00%, 12/20/44 | 9,308,928 | 1,898,184 |
| Ser. 14-133, Class IP, IO, 5.00%, 9/16/44 | 6,047,431 | 1,159,413 |
| Ser. 14-76, IO, 5.00%, 5/20/44 | 5,552,652 | 1,121,863 |
| Ser. 13-51, Class QI, IO, 5.00%, 2/20/43 | 6,865,680 | 1,106,984 |
| Ser. 13-3, Class IT, IO, 5.00%, 1/20/43 | 3,129,334 | 630,248 |
| Ser. 13-6, Class OI, IO, 5.00%, 1/20/43 | 15,804,954 | 3,128,275 |
| Ser. 10-35, Class UI, IO, 5.00%, 3/20/40 | 2,745,316 | 552,889 |
| Ser. 10-9, Class UI, IO, 5.00%, 1/20/40 | 13,044,125 | 2,659,697 |
| Ser. 09-121, Class UI, IO, 5.00%, 12/20/39 | 7,765,906 | 1,565,296 |
| IFB Ser. 11-81, Class SB, IO, ((-1 x 1 Month US LIBOR) + 6.71%), | | |
| 4.678%, 11/16/36 | 1,822,331 | 46,633 |
| IFB Ser. 13-182, Class SP, IO, ((-1 x 1 Month US LIBOR) + 6.70%), | | |
| 4.656%, 12/20/43 | 7,467,370 | 1,535,441 |
| IFB Ser. 11-156, Class SK, IO, ((-1 x 1 Month US LIBOR) + 6.60%), | | |
| 4.556%, 4/20/38 | 9,152,816 | 2,013,620 |
| Ser. 18-1, IO, 4.50%, 1/20/48 | 12,542,342 | 1,713,905 |
| Ser. 18-127, Class IB, IO, 4.50%, 6/20/45 | 2,855,304 | 281,704 |
| Ser. 13-34, Class HI, IO, 4.50%, 3/20/43 | 9,827,583 | 1,796,417 |
| Ser. 12-129, IO, 4.50%, 11/16/42 | 5,097,659 | 1,038,444 |
| Ser. 12-91, Class IN, IO, 4.50%, 5/20/42 | 2,490,483 | 482,451 |
| Ser. 10-35, Class AI, IO, 4.50%, 3/20/40 | 9,111,444 | 1,150,692 |
| Ser. 10-35, Class DI, IO, 4.50%, 3/20/40 | 12,936,054 | 2,351,775 |
| Ser. 10-35, Class QI, IO, 4.50%, 3/20/40 | 3,630,892 | 645,487 |
| Ser. 10-9, Class QI, IO, 4.50%, 1/20/40 | 2,137,518 | 400,357 |
| Ser. 09-121, Class CI, IO, 4.50%, 12/16/39 | 8,199,349 | 1,674,433 |
| IFB Ser. 18-89, Class LS, IO, ((-1 x 1 Month US LIBOR) + 6.20%), | | |
| 4.156%, 6/20/48 | 12,375,119 | 1,732,517 |
|
| Mortgage Securities Fund 29 |
| | |
| | Principal | |
| MORTGAGE-BACKED SECURITIES (66.2%)*cont. | amount | Value |
| Agency collateralized mortgage obligationscont. | | |
| Government National Mortgage Association | | |
| IFB Ser. 13-87, Class SA, IO, ((-1 x 1 Month US LIBOR) + 6.20%), | | |
| 4.156%, 6/20/43 | $18,813,038 | $3,433,754 |
| IFB Ser. 19-35, Class SE, IO, ((-1 x 1 Month US LIBOR) + 6.15%), | | |
| 4.123%, 1/16/44 | 11,444,763 | 1,964,820 |
| IFB Ser. 10-20, Class SC, IO, ((-1 x 1 Month US LIBOR) + 6.15%), | | |
| 4.106%, 2/20/40 | 1,238,058 | 220,523 |
| IFB Ser. 19-100, Class JS, IO, ((-1 x 1 Month US LIBOR) + 6.10%), | | |
| 4.056%, 8/20/49 | 13,456,163 | 1,902,702 |
| IFB Ser. 19-83, Class SL, IO, ((-1 x 1 Month US LIBOR) + 6.10%), | | |
| 4.056%, 7/20/49 | 21,069,862 | 2,559,567 |
| IFB Ser. 19-99, Class KS, IO, ((-1 x 1 Month US LIBOR) + 6.05%), | | |
| 4.006%, 8/20/49 | 1,203,672 | 187,955 |
| IFB Ser. 19-78, Class SJ, IO, ((-1 x 1 Month US LIBOR) + 6.05%), | | |
| 4.006%, 6/20/49 | 1,055,074 | 154,305 |
| Ser. 16-69, IO, 4.00%, 5/20/46 | 3,793,443 | 550,656 |
| Ser. 16-27, Class IB, IO, 4.00%, 11/20/45 | 8,032,862 | 1,225,248 |
| Ser. 15-94, IO, 4.00%, 7/20/45 | 18,423,336 | 3,629,397 |
| Ser. 15-53, Class MI, IO, 4.00%, 4/16/45 | 6,903,285 | 1,344,070 |
| Ser. 14-2, Class IL, IO, 4.00%, 1/16/44 | 1,490,975 | 265,123 |
| Ser. 14-100, Class NI, IO, 4.00%, 6/20/43 | 12,573,676 | 1,305,854 |
| Ser. 13-67, Class IP, IO, 4.00%, 4/16/43 | 9,045,967 | 1,785,131 |
| Ser. 13-165, Class IL, IO, 4.00%, 3/20/43 | 3,304,550 | 518,859 |
| Ser. 12-56, Class IB, IO, 4.00%, 4/20/42 | 8,141,795 | 1,404,080 |
| Ser. 12-38, Class MI, IO, 4.00%, 3/20/42 | 14,098,713 | 2,598,957 |
| Ser. 12-47, Class CI, IO, 4.00%, 3/20/42 | 3,757,196 | 620,861 |
| Ser. 14-104, IO, 4.00%, 3/20/42 | 9,645,033 | 1,447,720 |
| Ser. 14-4, Class IK, IO, 4.00%, 7/20/39 | 3,461,785 | 190,551 |
| Ser. 11-71, Class IK, IO, 4.00%, 4/16/39 | 1,521,443 | 79,826 |
| Ser. 10-114, Class MI, IO, 4.00%, 3/20/39 | 3,177,539 | 116,043 |
| Ser. 14-182, Class BI, IO, 4.00%, 1/20/39 | 11,354,157 | 1,587,753 |
| IFB Ser. 14-119, Class SA, IO, ((-1 x 1 Month US LIBOR) + 5.60%), | | |
| 3.556%, 8/20/44 | 9,299,408 | 1,453,032 |
| Ser. 16-156, Class PI, IO, 3.50%, 11/20/46 | 13,397,259 | 656,466 |
| Ser. 18-127, Class IE, IO, 3.50%, 1/20/46 | 8,602,942 | 903,481 |
| Ser. 13-79, Class PI, IO, 3.50%, 4/20/43 | 10,255,856 | 1,111,325 |
| Ser. 15-168, Class IG, IO, 3.50%, 3/20/43 | 10,070,923 | 1,200,285 |
| Ser. 13-37, Class JI, IO, 3.50%, 1/20/43 | 4,657,864 | 575,852 |
| Ser. 13-27, Class PI, IO, 3.50%, 12/20/42 | 4,060,231 | 488,649 |
| Ser. 12-136, IO, 3.50%, 11/20/42 | 9,608,941 | 1,653,015 |
| Ser. 18-127, Class IA, IO, 3.50%, 4/20/42 | 21,953,180 | 1,680,296 |
| Ser. 14-102, Class IG, IO, 3.50%, 3/16/41 | 3,467,715 | 266,010 |
| Ser. 15-52, Class KI, IO, 3.50%, 11/20/40 | 7,528,915 | 734,069 |
| Ser. 15-99, Class TI, IO, 3.50%, 4/20/39 | 7,938,457 | 371,188 |
| Ser. 15-24, Class AI, IO, 3.50%, 12/20/37 | 10,043,837 | 671,312 |
| Ser. 15-24, Class IC, IO, 3.50%, 11/20/37 | 3,191,679 | 222,141 |
| Ser. 12-48, Class AI, IO, 3.50%, 2/20/36 | 5,644,491 | 318,121 |
| Ser. 14-160, Class IB, IO, 3.00%, 11/20/40 | 10,386,082 | 425,871 |
| Ser. 14-141, Class CI, IO, 3.00%, 3/20/40 | 4,346,662 | 237,762 |
| Ser. 14-174, Class AI, IO, 3.00%, 11/16/29 | 4,758,875 | 419,257 |
|
| 30 Mortgage Securities Fund |
| | |
| | Principal | |
| MORTGAGE-BACKED SECURITIES (66.2%)*cont. | amount | Value |
| Agency collateralized mortgage obligationscont. | | |
| Government National Mortgage Association | | |
| Ser. 16-H18, Class QI, IO, 2.869%, 6/20/66 W | $23,811,436 | $2,807,702 |
| Ser. 17-H03, Class KI, IO, 2.663%, 1/20/67 W | 27,492,149 | 3,524,603 |
| Ser. 16-H13, Class IK, IO, 2.618%, 6/20/66 W | 22,882,634 | 2,860,329 |
| Ser. 16-H17, Class DI, IO, 2.615%, 7/20/66 W | 24,291,537 | 2,377,583 |
| Ser. 15-H22, Class GI, IO, 2.577%, 9/20/65 W | 20,659,168 | 2,388,200 |
| Ser. 17-H04, Class BI, IO, 2.538%, 2/20/67 W | 18,359,981 | 2,386,798 |
| Ser. 17-H08, Class GI, IO, 2.442%, 2/20/67 W | 18,180,865 | 2,681,678 |
| Ser. 17-H08, Class EI, IO, 2.419%, 2/20/67 W | 20,067,017 | 2,458,210 |
| Ser. 16-H04, Class HI, IO, 2.38%, 7/20/65 W | 17,728,100 | 1,467,887 |
| Ser. 16-H24, Class KI, IO, 2.361%, 11/20/66 W | 12,079,828 | 1,540,178 |
| Ser. 18-H02, Class IM, IO, 2.346%, 2/20/68 W | 13,981,293 | 2,009,811 |
| Ser. 16-H27, Class GI, IO, 2.32%, 12/20/66 W | 27,822,362 | 3,561,847 |
| Ser. 18-H02, IO, 2.312%, 1/20/68 W | 10,817,611 | 1,369,077 |
| Ser. 17-H06, Class MI, IO, 2.306%, 2/20/67 W | 30,600,172 | 3,402,005 |
| Ser. 17-H14, Class LI, IO, 2.295%, 6/20/67 W | 11,503,940 | 1,366,093 |
| Ser. 16-H07, Class PI, IO, 2.275%, 3/20/66 W | 36,421,191 | 4,142,911 |
| Ser. 18-H05, Class ID, IO, 2.258%, 3/20/68 W | 10,096,006 | 1,312,481 |
| Ser. 16-H23, Class NI, IO, 2.258%, 10/20/66 W | 39,735,442 | 4,490,105 |
| Ser. 18-H01, Class XI, IO, 2.254%, 1/20/68 W | 19,519,806 | 2,903,571 |
| Ser. 16-H03, Class AI, IO, 2.229%, 1/20/66 W | 19,284,748 | 1,759,733 |
| Ser. 18-H04, Class JI, IO, 2.227%, 3/20/68 W | 22,233,305 | 2,763,600 |
| Ser. 17-H08, Class NI, IO, 2.226%, 3/20/67 W | 17,961,796 | 1,995,556 |
| Ser. 17-H25, Class CI, IO, 2.214%, 12/20/67 W | 24,181,389 | 3,445,848 |
| Ser. 17-H14, Class JI, IO, 2.191%, 6/20/67 W | 8,758,851 | 1,226,239 |
| Ser. 17-H25, Class AI, IO, 2.176%, 12/20/67 W | 9,596,394 | 1,127,576 |
| Ser. 17-H03, Class CI, IO, 2.173%, 12/20/66 W | 14,710,886 | 1,746,918 |
| Ser. 15-H10, Class HI, IO, 2.167%, 4/20/65 W | 27,805,441 | 2,396,829 |
| Ser. 16-H14, Class AI, IO, 2.165%, 6/20/66 W | 17,823,415 | 1,827,417 |
| Ser. 16-H24, Class JI, IO, 2.159%, 11/20/66 W | 6,421,009 | 778,547 |
| Ser. 16-H24, IO, 2.117%, 9/20/66 W | 19,265,160 | 2,119,168 |
| Ser. 16-H06, Class AI, IO, 2.107%, 2/20/66 | 14,213,889 | 1,271,830 |
| Ser. 16-H11, Class HI, IO, 2.097%, 1/20/66 W | 57,958,384 | 4,854,015 |
| Ser. 16-H06, Class HI, IO, 2.082%, 2/20/66 | 18,805,468 | 1,583,383 |
| Ser. 16-H01, Class HI, IO, 2.072%, 10/20/65 W | 11,741,440 | 863,853 |
| FRB Ser. 15-H16, Class XI, IO, 2.052%, 7/20/65 W | 13,551,113 | 1,439,128 |
| Ser. 15-H24, Class HI, IO, 2.034%, 9/20/65 W | 23,228,512 | 1,442,072 |
| Ser. 15-H13, Class AI, IO, 2.034%, 6/20/65 W | 22,776,351 | 2,049,872 |
| Ser. 17-H20, Class AI, IO, 1.997%, 10/20/67 W | 35,348,046 | 4,628,385 |
| Ser. 17-H16, Class HI, IO, 1.978%, 8/20/67 W | 13,433,000 | 1,276,135 |
| Ser. 15-H04, Class AI, IO, 1.963%, 12/20/64 W | 24,219,931 | 1,937,594 |
| Ser. 15-H23, Class TI, IO, 1.932%, 9/20/65 W | 21,022,663 | 2,053,914 |
| Ser. 17-H23, Class BI, IO, 1.911%, 11/20/67 W | 13,662,494 | 1,429,097 |
| Ser. 16-H04, Class KI, IO, 1.891%, 2/20/66 W | 21,757,911 | 1,604,646 |
| Ser. 15-H23, Class DI, IO, 1.88%, 9/20/65 W | 6,481,381 | 584,783 |
| Ser. 16-H10, Class AI, IO, 1.873%, 4/20/66 W | 30,898,516 | 2,091,088 |
| Ser. 17-H09, IO, 1.861%, 4/20/67 W | 16,560,676 | 1,580,220 |
| Ser. 17-H10, Class MI, IO, 1.853%, 4/20/67 W | 19,972,543 | 1,869,430 |
| Ser. 15-H25, Class BI, IO, 1.85%, 10/20/65 W | 15,999,480 | 1,491,152 |
|
| Mortgage Securities Fund 31 |
| | |
| | Principal | |
| MORTGAGE-BACKED SECURITIES (66.2%)*cont. | amount | Value |
| Agency collateralized mortgage obligationscont. | | |
| Government National Mortgage Association | | |
| Ser. 16-H06, Class DI, IO, 1.782%, 7/20/65 | $23,026,772 | $1,771,334 |
| Ser. 15-H22, Class AI, IO, 1.776%, 9/20/65 W | 32,988,693 | 3,193,305 |
| Ser. 15-H20, Class CI, IO, 1.746%, 8/20/65 W | 29,859,062 | 3,078,469 |
| Ser. 17-H25, IO, 1.728%, 11/20/67 W | 15,430,914 | 1,779,377 |
| Ser. 14-H25, Class BI, IO, 1.706%, 12/20/64 W | 19,732,049 | 1,450,661 |
| Ser. 14-H21, Class AI, IO, 1.631%, 10/20/64 W | 24,320,759 | 2,031,464 |
| Ser. 14-H18, Class CI, IO, 1.617%, 9/20/64 W | 15,591,445 | 1,297,115 |
| Ser. 17-H06, Class EI, IO, 1.60%, 2/20/67 W | 14,166,107 | 969,684 |
| Ser. 16-H08, Class GI, IO, 1.446%, 4/20/66 W | 16,208,751 | 844,298 |
| FRB Ser. 11-H07, Class FI, IO, 1.259%, 2/20/61 W | 62,059,172 | 1,768,686 |
| Ser. 12-H11, Class FI, IO, 1.232%, 2/20/62 W | 36,171,190 | 1,115,954 |
| Ser. 11-H16, Class FI, IO, 1.055%, 7/20/61 W | 26,896,801 | 918,284 |
| Ser. 10-151, Class KO, PO, zero %, 6/16/37 | 673,522 | 592,383 |
| Ser. 06-36, Class OD, PO, zero %, 7/16/36 | 7,609 | 6,594 |
| GSMPS Mortgage Loan Trust 144A | | |
| FRB Ser. 98-2, IO, 1.004%, 5/19/27 W | 170,029 | — |
| FRB Ser. 99-2, IO, 0.84%, 9/19/27 W | 503,147 | 4,428 |
| FRB Ser. 98-3, IO, zero %, 9/19/27 W | 224,539 | — |
| FRB Ser. 98-4, IO, zero %, 12/19/26 W | 392,345 | — |
| | | 360,508,946 |
| Commercial mortgage-backed securities (8.3%) | | |
| Bear Stearns Commercial Mortgage Securities Trust FRB | | |
| Ser. 07-T26, Class AJ, 5.566%, 1/12/45 W | 1,321,000 | 1,175,690 |
| COMM Mortgage Trust 144A | | |
| FRB Ser. 14-CR17, Class D, 5.012%, 5/10/47 W | 2,371,000 | 2,408,772 |
| FRB Ser. 14-CR19, Class D, 4.906%, 8/10/47 W | 3,620,000 | 3,617,131 |
| Ser. 12-CR4, Class B, 3.703%, 10/15/45 | 1,179,000 | 1,140,847 |
| DBUBS Mortgage Trust 144A FRB Ser. 11-LC3A, Class D, | | |
| 5.512%, 8/10/44 W | 6,001,000 | 6,243,032 |
| GS Mortgage Securities Trust | | |
| FRB Ser. 14-GC18, Class C, 5.157%, 1/10/47 W | 3,437,000 | 3,532,549 |
| FRB Ser. 14-GC22, Class C, 4.847%, 6/10/47 W | 1,596,000 | 1,686,817 |
| GS Mortgage Securities Trust 144A FRB Ser. 14-GC24, Class D, | | |
| 4.667%, 9/10/47 W | 5,349,000 | 4,502,290 |
| JPMBB Commercial Mortgage Securities Trust 144A FRB Ser. C14, | | |
| Class D, 4.859%, 8/15/46 W | 4,088,000 | 4,027,093 |
| JPMorgan Chase Commercial Mortgage Securities Trust | | |
| Ser. 06-LDP9, Class AMS, 5.337%, 5/15/47 | 2,796,652 | 2,575,160 |
| FRB Ser. 13-LC11, Class D, 4.307%, 4/15/46 W | 2,891,000 | 2,600,913 |
| JPMorgan Chase Commercial Mortgage Securities Trust 144A | | |
| FRB Ser. 11-C3, Class D, 5.853%, 2/15/46 W | 1,980,000 | 1,972,735 |
| FRB Ser. 11-C3, Class E, 5.853%, 2/15/46 W | 1,629,000 | 1,574,764 |
| FRB Ser. 10-C2, Class D, 5.786%, 11/15/43 W | 1,946,000 | 1,972,665 |
| ML-CFC Commercial Mortgage Trust FRB Ser. 06-4, Class C, | | |
| 5.324%, 12/12/49 W | 2,299,413 | 1,833,405 |
| Morgan Stanley Bank of America Merrill Lynch Trust 144A | | |
| FRB Ser. 13-C12, Class E, 4.924%, 10/15/46 W | 2,993,584 | 2,710,949 |
| FRB Ser. 13-C10, Class F, 4.218%, 7/15/46 W | 2,316,000 | 1,959,569 |
|
| 32 Mortgage Securities Fund |
| | |
| | Principal | |
| MORTGAGE-BACKED SECURITIES (66.2%)*cont. | amount | Value |
| Commercial mortgage-backed securitiescont. | | |
| Morgan Stanley Capital I Trust 144A | | |
| FRB Ser. 12-C4, Class E, 5.60%, 3/15/45 W | $2,436,000 | $2,046,240 |
| FRB Ser. 11-C3, Class E, 5.292%, 7/15/49 W | 8,047,130 | 8,001,192 |
| UBS Commercial Mortgage Trust 144A | | |
| FRB Ser. 12-C1, Class D, 5.728%, 5/10/45 W | 4,527,000 | 4,532,116 |
| FRB Ser. 12-C1, Class E, 5.00%, 5/10/45 W | 2,266,000 | 2,118,933 |
| UBS-Barclays Commercial Mortgage Trust 144A FRB Ser. 12-C4, | | |
| Class D, 4.63%, 12/10/45 W | 1,594,000 | 1,594,815 |
| UBS-Citigroup Commercial Mortgage Trust 144A FRB Ser. 11-C1, | | |
| Class D, 6.252%, 1/10/45 W | 3,176,000 | 3,300,063 |
| Wells Fargo Commercial Mortgage Trust 144A Ser. 10-C1, Class E, | | |
| 4.00%, 11/15/43 | 1,201,000 | 1,166,126 |
| WF-RBS Commercial Mortgage Trust 144A | | |
| Ser. 11-C4, Class E, 5.397%, 6/15/44 W | 1,659,568 | 1,659,300 |
| FRB Ser. 12-C9, Class D, 4.971%, 11/15/45 W | 5,183,466 | 5,235,638 |
| FRB Ser. 12-C9, Class E, 4.971%, 11/15/45 W | 2,012,000 | 1,831,280 |
| | | 77,020,084 |
| Residential mortgage-backed securities (non-agency) (19.1%) | | |
| Arroyo Mortgage Trust 144A Ser. 19-3, Class M1, 4.204%, 10/25/48 W | 750,000 | 751,635 |
| Bayview Financial Mortgage Pass-Through Trust Ser. 06-C, | | |
| Class 1A3, 6.028%, 11/28/36 | 8,140,000 | 8,184,058 |
| Bear Stearns Alt-A Trust FRB Ser. 05-8, Class 21A1, | | |
| 4.183%, 10/25/35 W | 879,697 | 818,510 |
| Bellemeade Re, Ltd. 144A | | |
| FRB Ser. 17-1, Class M2, (1 Month US LIBOR + 3.35%), 5.368%, | | |
| 10/25/27 (Bermuda) | 3,760,000 | 3,868,100 |
| FRB Ser. 18-2A, Class M1C, (1 Month US LIBOR + 1.60%), 3.618%, | | |
| 8/25/28 (Bermuda) | 2,230,000 | 2,227,491 |
| Carrington Mortgage Loan Trust FRB Ser. 06-NC2, Class A4, | | |
| (1 Month US LIBOR + 0.24%), 2.258%, 6/25/36 | 8,710,000 | 8,267,516 |
| Countrywide Alternative Loan Trust FRB Ser. 06-OA19, Class A1, | | |
| (1 Month US LIBOR + 0.18%), 2.224%, 2/20/47 | 3,549,321 | 2,802,814 |
| Countrywide Asset-Backed Certificates FRB Ser. 07-10, Class 1A1, | | |
| (1 Month US LIBOR + 0.18%), 2.198%, 6/25/47 | 7,118,444 | 6,740,276 |
| Federal Home Loan Mortgage Corporation | | |
| Structured Agency Credit Risk Debt Notes FRB Ser. 15-HQA1, | | |
| Class B, (1 Month US LIBOR + 8.80%), 10.818%, 3/25/28 | 2,726,594 | 3,376,987 |
| Structured Agency Credit Risk Debt FRN Ser. 16-HQA1, Class M3, | | |
| (1 Month US LIBOR + 6.35%), 8.368%, 9/25/28 | 916,040 | 1,012,764 |
| Structured Agency Credit Risk Trust FRN Ser. 16-DNA3, Class M3, | | |
| (1 Month US LIBOR + 5.00%), 7.018%, 12/25/28 | 6,538,000 | 7,077,940 |
| Structured Agency Credit Risk Debt FRN Ser. 17-HQA2, Class B1, | | |
| (1 Month US LIBOR + 4.75%), 6.768%, 12/25/29 | 250,000 | 280,604 |
| Structured Agency Credit Risk Debt FRN Ser. 14-HQ3, Class M3, | | |
| (1 Month US LIBOR + 4.75%), 6.768%, 10/25/24 | 877,310 | 931,314 |
| Structured Agency Credit Risk Debt Notes FRB Ser. 14-DN4, | | |
| Class M3, (1 Month US LIBOR + 4.55%), 6.568%, 10/25/24 | 2,153,056 | 2,308,076 |
| Structured Agency Credit Risk Debt FRN Ser. 17-DNA2, Class M2, | | |
| (1 Month US LIBOR + 3.45%), 5.468%, 10/25/29 | 2,375,000 | 2,507,307 |
| Structured Agency Credit Risk Debt FRN Ser. 17-DNA1, Class M2, | | |
| (1 Month US LIBOR + 3.25%), 5.268%, 7/25/29 | 480,000 | 502,251 |
|
| Mortgage Securities Fund 33 |
| | |
| | Principal | |
| MORTGAGE-BACKED SECURITIES (66.2%)*cont. | amount | Value |
| Residential mortgage-backed securities (non-agency)cont. | | |
| Federal Home Loan Mortgage Corporation | | |
| Structured Agency Credit Risk Debt FRN Ser. 15-HQ1, Class M3, | | |
| (1 Month US LIBOR + 3.80%), 5.818%, 3/25/25 | $715,707 | $738,520 |
| Structured Agency Credit Risk Debt FRN Ser. 18-DNA1, Class B1, | | |
| (1 Month US LIBOR + 3.15%), 5.168%, 7/25/30 | 7,525,000 | 7,587,705 |
| Structured Agency Credit Risk Debt FRN Ser. 17-HQA2, Class M2, | | |
| (1 Month US LIBOR + 2.65%), 4.668%, 12/25/29 | 4,740,000 | 4,862,694 |
| Structured Agency Credit Risk Debt FRN Ser. 17-DNA3, Class M2, | | |
| (1 Month US LIBOR + 2.50%), 4.518%, 3/25/30 | 1,190,000 | 1,216,368 |
| Structured Agency Credit Risk Debt FRN Ser. 18-HQA1, Class M2, | | |
| (1 Month US LIBOR + 2.30%), 4.318%, 9/25/30 | 5,285,000 | 5,341,240 |
| Federal Home Loan Mortgage Corporation 144A | | |
| Structured Agency Credit Risk Debt FRN Ser. 18-DNA2, Class B1, | | |
| (1 Month US LIBOR + 3.70%), 5.718%, 12/25/30 | 6,390,000 | 6,733,034 |
| Seasoned Credit Risk Transfer Trust Ser. 19-2, Class M, | | |
| 4.75%, 8/25/58 W | 1,129,000 | 1,143,738 |
| Structured Agency Credit Risk Trust FRN Ser. 19-DNA1, Class M2, | | |
| (1 Month US LIBOR + 2.65%), 4.668%, 1/25/49 | 997,000 | 1,011,503 |
| Structured Agency Credit Risk Debt FRN Ser. 19-DNA2, Class M2, | | |
| (1 Month US LIBOR + 2.45%), 4.468%, 3/25/49 | 582,000 | 587,872 |
| Structured Agency Credit Risk Trust FRN Ser. 18-DNA2, Class M2, | | |
| (1 Month US LIBOR + 2.15%), 4.168%, 12/25/30 | 1,453,000 | 1,462,984 |
| Federal National Mortgage Association | | |
| Connecticut Avenue Securities FRB Ser. 16-C03, Class 2B, | | |
| (1 Month US LIBOR + 12.75%), 14.768%, 10/25/28 | 467,757 | 665,055 |
| Connecticut Avenue Securities FRB Ser. 16-C03, Class 1B, | | |
| (1 Month US LIBOR + 11.75%), 13.768%, 10/25/28 | 2,838,447 | 4,049,365 |
| Connecticut Avenue Securities FRB Ser. 15-C04, Class 1M2, | | |
| (1 Month US LIBOR + 5.70%), 7.718%, 4/25/28 | 708,735 | 773,634 |
| Connecticut Avenue Securities FRB Ser. 17-C02, Class 2B1, | | |
| (1 Month US LIBOR + 5.50%), 7.518%, 9/25/29 | 748,000 | 872,107 |
| Connecticut Avenue Securities FRB Ser. 16-C03, Class 1M2, | | |
| (1 Month US LIBOR + 5.30%), 7.318%, 10/25/28 | 2,683,000 | 2,882,366 |
| Connecticut Avenue Securities FRB Ser. 17-C06, Class 2B1, | | |
| (1 Month US LIBOR + 4.45%), 6.468%, 2/25/30 | 3,913,000 | 4,282,465 |
| Connecticut Avenue Securities FRB Ser. 16-C05, Class 2M2, | | |
| (1 Month US LIBOR + 4.45%), 6.468%, 1/25/29 | 3,148,209 | 3,309,028 |
| Connecticut Avenue Securities Trust FRB Ser. 17-C07, Class 2B1, | | |
| (1 Month US LIBOR + 4.45%), 6.468%, 5/25/30 | 594,000 | 654,966 |
| Connecticut Avenue Securities FRB Ser. 16-C07, Class 2M2, | | |
| (1 Month US LIBOR + 4.35%), 6.368%, 5/25/29 | 260,065 | 273,869 |
| Connecticut Avenue Securities FRB Ser. 16-C06, Class 1M2, | | |
| (1 Month US LIBOR + 4.25%), 6.268%, 4/25/29 | 3,743,000 | 3,995,800 |
| Connecticut Avenue Securities FRB Ser. 17-C06, Class 1B1, | | |
| (1 Month US LIBOR + 4.15%), 6.168%, 2/25/30 | 3,742,000 | 4,018,975 |
| Connecticut Avenue Securities FRB Ser. 17-C07, Class 1B1, | | |
| (1 Month US LIBOR + 4.00%), 6.018%, 5/25/30 | 3,800,000 | 4,097,389 |
|
| 34 Mortgage Securities Fund |
| | |
| | Principal | |
| MORTGAGE-BACKED SECURITIES (66.2%)*cont. | amount | Value |
| Residential mortgage-backed securities (non-agency)cont. | | |
| Federal National Mortgage Association | | |
| Connecticut Avenue Securities FRB Ser. 18-C06, Class 1B1, | | |
| (1 Month US LIBOR + 3.75%), 5.768%, 3/25/31 | $2,687,000 | $2,833,263 |
| Connecticut Avenue Securities FRB Ser. 18-C03, Class 1B1, | | |
| (1 Month US LIBOR + 3.75%), 5.768%, 10/25/30 | 260,000 | 271,926 |
| Connecticut Avenue Securities FRB Ser. 17-C02, Class 2M2, | | |
| (1 Month US LIBOR + 3.65%), 5.668%, 9/25/29 | 200,879 | 210,810 |
| Connecticut Avenue Securities FRB Ser. 17-C05, Class 1B1, | | |
| (1 Month US LIBOR + 3.60%), 5.618%, 1/25/30 | 7,417,000 | 7,795,012 |
| Connecticut Avenue Securities FRB Ser. 18-C01, Class 1B1, | | |
| (1 Month US LIBOR + 3.55%), 5.568%, 7/25/30 | 5,849,000 | 6,084,305 |
| Connecticut Avenue Securities FRB Ser. 17-C01, Class 1M2, | | |
| (1 Month US LIBOR + 3.55%), 5.568%, 7/25/29 | 4,928,000 | 5,175,106 |
| Connecticut Avenue Securities FRB Ser. 17-C06, Class 1M2, | | |
| (1 Month US LIBOR + 2.65%), 4.668%, 2/25/30 | 4,203,000 | 4,293,331 |
| Connecticut Avenue Securities FRB Ser. 18-C04, Class 2M2, | | |
| (1 Month US LIBOR + 2.55%), 4.568%, 12/25/30 | 5,300,000 | 5,396,323 |
| Connecticut Avenue Securities FRB Ser. 18-C05, Class 1M2, | | |
| (1 Month US LIBOR + 2.35%), 4.368%, 1/25/31 | 2,476,000 | 2,501,988 |
| Connecticut Avenue Securities FRB Ser. 18-C01, Class 1M2, | | |
| (1 Month US LIBOR + 2.25%), 4.268%, 7/25/30 | 442,000 | 446,903 |
| Connecticut Avenue Securities FRB Ser. 18-C02, Class 2M2, | | |
| (1 Month US LIBOR + 2.20%), 4.218%, 8/25/30 | 5,335,000 | 5,375,991 |
| Connecticut Avenue Securities FRB Ser. 18-C03, Class 1M2, | | |
| (1 Month US LIBOR + 2.15%), 4.168%, 10/25/30 | 2,725,000 | 2,748,255 |
| Federal National Mortgage Association 144A Connecticut Avenue | | |
| Securities Trust FRB Ser. 19-R02, Class 1M2, (1 Month US LIBOR | | |
| + 2.30%), 4.318%, 8/25/31 | 755,000 | 759,888 |
| HarborView Mortgage Loan Trust FRB Ser. 05-2, Class 1A, (1 Month | | |
| US LIBOR + 0.52%), 2.577%, 5/19/35 | 1,316,048 | 832,484 |
| JPMorgan Alternative Loan Trust FRB Ser. 06-A6, Class 1A1, | | |
| (1 Month US LIBOR + 0.16%), 2.178%, 11/25/36 | 2,365,279 | 2,290,153 |
| Legacy Mortgage Asset Trust 144A FRB Ser. 19-GS2, Class A2, | | |
| 4.25%, 1/25/59 | 1,220,000 | 1,216,340 |
| Morgan Stanley ABS Capital I, Inc. Trust FRB Ser. 04-HE9, Class M2, | | |
| (1 Month US LIBOR + 0.93%), 2.948%, 11/25/34 | 1,091,620 | 1,088,675 |
| Oaktown Re II, Ltd. 144A FRB Ser. 18-1A, Class M2, (1 Month | | |
| US LIBOR + 2.85%), 4.868%, 7/25/28 (Bermuda) | 2,980,000 | 2,988,381 |
| Oaktown Re III, Ltd. 144A | | |
| FRB Ser. 19-1A, Class B1B, (1 Month US LIBOR + 4.35%), 6.368%, | | |
| 7/25/29 (Bermuda) | 695,000 | 697,538 |
| FRB Ser. 19-1A, Class B1A, (1 Month US LIBOR + 3.50%), 5.518%, | | |
| 7/25/29 (Bermuda) | 574,000 | 575,835 |
| Oaktown Re, Ltd. 144A FRB Ser. 17-1A, Class M2, (1 Month US LIBOR | | |
| + 4.00%), 6.018%, 4/25/27 (Bermuda) | 1,668,060 | 1,703,715 |
| Starwood Mortgage Residential Trust 144A Ser. 19-1, Class M1, | | |
| 3.764%, 6/25/49 W | 980,000 | 983,675 |
| Structured Asset Mortgage Investments II Trust FRB Ser. 06-AR7, | | |
| Class A1BG, (1 Month US LIBOR + 0.12%), 2.138%, 8/25/36 | 553,439 | 506,060 |
|
| Mortgage Securities Fund 35 |
| | |
| | Principal | |
| MORTGAGE-BACKED SECURITIES (66.2%)*cont. | amount | Value |
| Residential mortgage-backed securities (non-agency)cont. | | |
| WaMu Mortgage Pass-Through Certificates Trust | | |
| FRB Ser. 05-AR14, Class 1A2, 4.166%, 12/25/35 W | $5,360,510 | $5,379,056 |
| FRB Ser. 05-AR8, Class 2AC2, (1 Month US LIBOR + 0.92%), | | |
| 2.938%, 7/25/45 | 985,794 | 977,649 |
| Wells Fargo Home Equity Asset-Backed Securities Trust FRB | | |
| Ser. 07-2, Class A3, (1 Month US LIBOR + 0.23%), 2.248%, 4/25/37 | 1,544,547 | 1,503,193 |
| | | 176,854,175 |
| Total mortgage-backed securities (cost $616,504,875) | | $614,383,205 |
| | | |
| PURCHASED SWAP OPTIONS OUTSTANDING (7.2%)* | | | |
| Counterparty | | Notional/ | |
| Fixed right % to receive or (pay)/ | Expiration | contract | |
| Floating rate index/Maturity date | date/strike | amount | Value |
| Bank of America N.A. | | | |
| 3.312/3 month USD-LIBOR-BBA/Nov-38 | Nov-28/3.312 | $73,288,200 | $10,375,410 |
| 2.785/3 month USD-LIBOR-BBA/Jan-47 | Jan-27/2.785 | 22,487,600 | 4,391,603 |
| 2.3075/3 month USD-LIBOR-BBA/Jun-52 | Jun-22/2.3075 | 9,706,600 | 1,732,240 |
| (3.312)/3 month USD-LIBOR-BBA/Nov-38 | Nov-28/3.312 | 73,288,200 | 1,560,306 |
| (2.785)/3 month USD-LIBOR-BBA/Jan-47 | Jan-27/2.785 | 22,487,600 | 962,020 |
| (2.3075)/3 month USD-LIBOR-BBA/Jun-52 | Jun-22/2.3075 | 9,706,600 | 427,479 |
| Citibank, N.A. | | | |
| (1.30)/3 month USD-LIBOR-BBA/Dec-24 | Dec-19/1.30 | 151,689,700 | 1,773,253 |
| Goldman Sachs International | | | |
| 2.7475/3 month USD-LIBOR-BBA/Feb-30 | Feb-20/2.7475 | 72,086,800 | 7,978,567 |
| (2.983)/3 month USD-LIBOR-BBA/May-52 | May-22/2.983 | 21,113,200 | 311,631 |
| (2.7475)/3 month USD-LIBOR-BBA/Feb-30 | Feb-20/2.7475 | 72,086,800 | 7,930 |
| JPMorgan Chase Bank N.A. | | | |
| 3.162/3 month USD-LIBOR-BBA/Nov-33 | Nov-20/3.162 | 35,660,900 | 6,447,491 |
| 3.096/3 month USD-LIBOR-BBA/Nov-29 | Nov-19/3.096 | 28,528,700 | 4,073,328 |
| (3.162)/3 month USD-LIBOR-BBA/Nov-33 | Nov-20/3.162 | 35,660,900 | 34,234 |
| (3.095)/3 month USD-LIBOR-BBA/Nov-21 | Nov-19/3.095 | 71,321,800 | 71 |
| (3.096)/3 month USD-LIBOR-BBA/Nov-29 | Nov-19/3.096 | 28,528,700 | 29 |
| Morgan Stanley & Co. International PLC | | | |
| 2.7725/3 month USD-LIBOR-BBA/Feb-31 | Feb-21/2.7725 | 67,069,200 | 7,529,188 |
| 2.764/3 month USD-LIBOR-BBA/Feb-31 | Feb-21/2.764 | 67,069,200 | 7,481,569 |
| 2.8025/3 month USD-LIBOR-BBA/Apr-56 | Apr-26/2.8025 | 24,028,900 | 6,689,405 |
| (2.8025)/3 month USD-LIBOR-BBA/Apr-56 | Apr-26/2.8025 | 24,028,900 | 1,196,880 |
| (1.613)/3 month USD-LIBOR-BBA/Aug-34 | Aug-24/1.613 | 17,746,600 | 998,246 |
| 1.613/3 month USD-LIBOR-BBA/Aug-34 | Aug-24/1.613 | 17,746,600 | 824,152 |
| (2.7725)/3 month USD-LIBOR-BBA/Feb-31 | Feb-21/2.7725 | 67,069,200 | 181,087 |
| (2.764)/3 month USD-LIBOR-BBA/Feb-31 | Feb-21/2.764 | 67,069,200 | 175,721 |
| (2.904)/3 month USD-LIBOR-BBA/May-51 | May-21/2.904 | 9,048,500 | 75,284 |
| (2.265)/3 month USD-LIBOR-BBA/Oct-29 | Oct-19/2.265 | 88,821,200 | 89 |
| (3.0975)/3 month USD-LIBOR-BBA/Nov-21 | Nov-19/3.0975 | 71,321,800 | 71 |
| UBS AG | | | |
| (1.6125)/3 month USD-LIBOR-BBA/Aug-34 | Aug-24/1.6125 | 17,746,600 | 998,601 |
| 1.6125/3 month USD-LIBOR-BBA/Aug-34 | Aug-24/1.6125 | 17,746,600 | 823,797 |
| Total purchased swap options outstanding (cost $41,947,929) | | $67,049,682 |
|
| 36 Mortgage Securities Fund |
| | | | |
| PURCHASED OPTIONS | Expiration | | | |
| OUTSTANDING (—%)* | date/strike | Notional | Contract | |
| Counterparty | price | amount | amount | Value |
| JPMorgan Chase Bank N.A. | | | | |
| Government National Mortgage | | | | |
| Association 30 yr 3.00% TBA | | | | |
| commitments (Call) | Oct-19/$103.25 | $84,000,000 | $84,000,000 | $4,368 |
| Uniform Mortgage-Backed | | | | |
| Securities 30 yr 3.00% TBA | | | | |
| commitments (Call) | Oct-19/101.72 | 331,000,000 | 331,000,000 | 214,819 |
| Uniform Mortgage-Backed | | | | |
| Securities 30 yr 3.00% TBA | | | | |
| commitments (Call) | Oct-19/102.16 | 27,000,000 | 27,000,000 | 1,458 |
| Uniform Mortgage-Backed | | | | |
| Securities 30 yr 3.00% TBA | | | | |
| commitments (Put) | Nov-19/101.24 | 50,000,000 | 50,000,000 | 165,000 |
| Uniform Mortgage-Backed | | | | |
| Securities 30 yr 3.00% TBA | | | | |
| commitments (Put) | Nov-19/99.74 | 50,000,000 | 50,000,000 | 27,950 |
| Uniform Mortgage-Backed | | | | |
| Securities 30 yr 3.00% TBA | | | | |
| commitments (Put) | Oct-19/100.49 | 34,000,000 | 34,000,000 | 374 |
| Uniform Mortgage-Backed | | | | |
| Securities 30 yr 3.00% TBA | | | | |
| commitments (Put) | Oct-19/100.30 | 34,000,000 | 34,000,000 | 102 |
| Uniform Mortgage-Backed | | | | |
| Securities 30 yr 3.00% TBA | | | | |
| commitments (Put) | Oct-19/100.12 | 34,000,000 | 34,000,000 | 34 |
| Uniform Mortgage-Backed | | | | |
| Securities 30 yr 3.50% TBA | | | | |
| commitments (Call) | Oct-19/102.94 | 342,000,000 | 342,000,000 | 27,018 |
| Uniform Mortgage-Backed | | | | |
| Securities 30 yr 4.00% TBA | | | | |
| commitments (Call) | Oct-19/103.98 | 119,000,000 | 119,000,000 | 13,447 |
| Total purchased options outstanding (cost $3,433,283) | | | $454,570 |
| | |
| | Principal | |
| ASSET-BACKED SECURITIES (2.5%)* | amount | Value |
| Finance of America Structured Securities Trust 144A Ser. 19-HB1, | | |
| Class M5, 6.00%, 4/25/29 W | $1,700,000 | $1,623,330 |
| Mello Warehouse Securitization Trust 144A | | |
| FRB Ser. 18-W1, Class A, (1 Month US LIBOR + 0.85%), | | |
| 2.868%, 11/25/51 | 5,470,000 | 5,470,000 |
| FRB Ser. 19-1, Class A, (1 Month US LIBOR + 0.80%), | | |
| 2.818%, 6/25/52 | 2,841,000 | 2,841,000 |
| Station Place Securitization Trust 144A | | |
| FRB Ser. 19-11, Class A, (1 Month US LIBOR + 0.75%), | | |
| 2.787%, 10/24/20 | 2,177,000 | 2,177,000 |
| FRB Ser. 19-7, Class A, (1 Month US LIBOR + 0.70%), | | |
| 2.737%, 9/24/20 | 4,463,000 | 4,463,000 |
| FRB Ser. 19-3, Class A, (1 Month US LIBOR + 0.70%), | | |
| 2.737%, 6/24/20 | 4,590,000 | 4,590,000 |
| FRB Ser. 18-8, Class A, (1 Month US LIBOR + 0.70%), | | |
| 2.737%, 2/24/20 | 2,389,000 | 2,389,000 |
| Total asset-backed securities (cost $23,532,061) | | $23,553,330 |
|
| Mortgage Securities Fund 37 |
| | | |
| | Principal amount/ | |
| SHORT-TERM INVESTMENTS (9.8%)* | | shares | Value |
| Interest in $384,750,000 joint tri-party repurchase agreement | | | |
| dated 9/30/19 with HSBC Bank USA, National Association due | | | |
| 10/1/19 — maturity value of $37,754,485 for an effective yield | | | |
| of 2.370% (collateralized by various mortgage backed securities | | | |
| with coupon rates ranging from 3.000% to 5.500% and due dates | | | |
| ranging from 4/1/25 to 9/1/49, valued at $392,470,836) | | $37,752,000 | $37,752,000 |
| Putnam Government Money Market Fund 1.58% L | Shares | 10,000 | 10,000 |
| State Street Institutional U.S. Government Money Market Fund, | | | |
| Premier Class 1.88% P | Shares | 5,333,000 | 5,333,000 |
| U.S. Treasury Bills 2.046%, 12/5/19 #∆ § | | $2,982,000 | 2,972,388 |
| U.S. Treasury Bills 2.018%, 10/10/19 ∆ | | 2,530,000 | 2,528,882 |
| U.S. Treasury Bills 1.946%, 11/14/19 #∆ § | | 4,275,000 | 4,265,698 |
| U.S. Treasury Bills 1.866%, 11/7/19 #∆ § | | 11,828,000 | 11,807,091 |
| U.S. Treasury Bills 2.029%, 11/21/19 #∆ § | | 5,965,000 | 5,949,840 |
| U.S. Treasury Bills 2.039%, 12/12/19 #∆ § | | 13,349,000 | 13,301,567 |
| U.S. Treasury Bills 1.908%, 1/2/20 § | | 601,000 | 598,189 |
| U.S. Treasury Bills 1.907%, 3/12/20 Ƥ | | 6,623,000 | 6,569,247 |
| Total short-term investments (cost $91,075,193) | | | $91,087,902 |
| |
| TOTAL INVESTMENTS | | | |
| Total investments (cost $1,400,007,997) | | | $1,425,705,456 |
Key to holding’s abbreviations
| |
| bp | Basis Points |
| FRB | Floating Rate Bonds: the rate shown is the current interest rate at the close of the reporting period. Rates may |
| | be subject to a cap or floor. For certain securities, the rate may represent a fixed rate currently in place at the |
| | close of the reporting period. |
| FRN | Floating Rate Notes: the rate shown is the current interest rate or yield at the close of the reporting period. |
| | Rates may be subject to a cap or floor. For certain securities, the rate may represent a fixed rate currently in |
| | place at the close of the reporting period. |
| IFB | Inverse Floating Rate Bonds, which are securities that pay interest rates that vary inversely to changes in the |
| | market interest rates. As interest rates rise, inverse floaters produce less current income. The rate shown is |
| | the current interest rate at the close of the reporting period. Rates may be subject to a cap or floor. |
| IO | Interest Only |
| OTC | Over-the-counter |
| PO | Principal Only |
| TBA | To Be Announced Commitments |
Notes to the fund’s portfolio
Unless noted otherwise, the notes to the fund’s portfolio are for the close of the fund’s reporting period, which ran from October 1, 2018 through September 30, 2019 (the reporting period). Within the following notes to the portfolio, references to “Putnam Management” represent Putnam Investment Management, LLC, the fund’s manager, an indirect wholly-owned subsidiary of Putnam Investments, LLC and references to “ASC 820” represent Accounting Standards Codification 820Fair Value Measurements and Disclosures.
*Percentages indicated are based on net assets of $927,660,319.
#This security, in part or in entirety, was pledged and segregated with the broker to cover margin requirements for futures contracts at the close of the reporting period. Collateral at period end totaled $461,646 and is included in Investments in securities on the Statement of assets and liabilities (Notes 1 and 9).
∆This security, in part or in entirety, was pledged and segregated with the custodian for collateral on certain derivative contracts at the close of the reporting period. Collateral at period end totaled $22,705,829 and is included in Investments in securities on the Statement of assets and liabilities (Notes 1 and 9).
|
| 38 Mortgage Securities Fund |
§This security, in part or in entirety, was pledged and segregated with the custodian for collateral on the initial margin on certain centrally cleared derivative contracts at the close of the reporting period. Collateral at period end totaled $22,260,459 and is included in Investments in securities on the Statement of assets and liabilities (Notes 1 and 9).
iThis security was pledged, or purchased with cash that was pledged, to the fund for collateral on certain derivative contracts (Note 1).
LAffiliated company (Note 5). The rate quoted in the security description is the annualized 7-day yield of the fund at the close of the reporting period.
PThis security was pledged, or purchased with cash that was pledged, to the fund for collateral on certain derivative contracts and TBA commitments. The rate quoted in the security description is the annualized 7-day yield of the fund at the close of the reporting period.
WThe rate shown represents the weighted average coupon associated with the underlying mortgage pools. Rates may be subject to a cap or floor.
At the close of the reporting period, the fund maintained liquid assets totaling $850,050,270 to cover certain derivative contracts and delayed delivery securities.
Unless otherwise noted, the rates quoted in Short-term investments security descriptions represent the weighted average yield to maturity.
144A after the name of an issuer represents securities exempt from registration under Rule 144A of the Securities Act of 1933, as amended. These securities may be resold in transactions exempt from registration, normally to qualified institutional buyers.
See Note 1 to the financial statements regarding TBA commitments.
The dates shown on debt obligations are the original maturity dates.
| | | | | |
| FUTURES CONTRACTS OUTSTANDING at 9/30/19 | | | |
| | | | | | Unrealized |
| | Number of | Notional | | Expiration | appreciation/ |
| | contracts | amount | Value | date | (depreciation) |
| Euro-Dollar 90 day (Long) | 705 | $705,000,000 | $173,306,625 | Mar-20 | $(202,269) |
| Euro-Dollar 90 day (Short) | 705 | 705,000,000 | 173,791,313 | Mar-21 | (488,602) |
| U.S. Treasury Bond Ultra 30 yr (Long) | 25 | 4,797,656 | 4,797,656 | Dec-19 | (99,939) |
| U.S. Treasury Note 2 yr (Long) | 141 | 30,385,500 | 30,385,500 | Dec-19 | (74,489) |
| U.S. Treasury Note 5 yr (Short) | 271 | 32,289,227 | 32,289,227 | Dec-19 | 187,820 |
| Unrealized appreciation | | | | | 187,820 |
| Unrealized (depreciation) | | | | | (865,299) |
| Total | | | | | $(677,479) |
| | | |
| WRITTEN SWAP OPTIONS OUTSTANDING at 9/30/19 (premiums $33,819,378) | |
| Counterparty | | Notional/ | |
| Fixed Obligation % to receive or (pay)/ | Expiration | contract | |
| Floating rate index/Maturity date | date/strike | amount | Value |
| Bank of America N.A. | | | |
| 3.195/3 month USD-LIBOR-BBA/Nov-55 | Nov-25/3.195 | $34,601,700 | $1,083,725 |
| (3.195)/3 month USD-LIBOR-BBA/Nov-55 | Nov-25/3.195 | 34,601,700 | 12,048,658 |
| Citibank, N.A. | | | |
| 1.475/3 month USD-LIBOR-BBA/Dec-24 | Dec-19/1.475 | 303,379,400 | 1,923,425 |
| Goldman Sachs International | | | |
| 2.823/3 month USD-LIBOR-BBA/May-27 | May-22/2.823 | 84,452,600 | 268,559 |
| 2.9425/3 month USD-LIBOR-BBA/Feb-34 | Feb-24/2.9425 | 36,043,400 | 481,540 |
| (2.9425)/3 month USD-LIBOR-BBA/Feb-34 | Feb-24/2.9425 | 36,043,400 | 4,398,016 |
|
| Mortgage Securities Fund 39 |
| | | |
| WRITTEN SWAP OPTIONS OUTSTANDING at 9/30/19 (premiums $33,819,378)cont. | |
| Counterparty | | Notional/ | |
| Fixed Obligation % to receive or (pay)/ | Expiration | contract | |
| Floating rate index/Maturity date | date/strike | amount | Value |
| JPMorgan Chase Bank N.A. | | | |
| 3.415/3 month USD-LIBOR-BBA/Nov-21 | Nov-19/3.415 | $142,643,700 | $143 |
| 2.975/3 month USD-LIBOR-BBA/Nov-23 | Nov-20/2.975 | 35,660,900 | 4,636 |
| 3.229/3 month USD-LIBOR-BBA/Nov-33 | Nov-23/3.229 | 35,660,900 | 322,731 |
| (2.975)/3 month USD-LIBOR-BBA/Nov-23 | Nov-20/2.975 | 35,660,900 | 1,625,067 |
| (3.229)/3 month USD-LIBOR-BBA/Nov-33 | Nov-23/3.229 | 35,660,900 | 5,136,596 |
| Morgan Stanley & Co. International PLC | | | |
| 3.3975/3 month USD-LIBOR-BBA/Nov-21 | Nov-19/3.3975 | 142,643,700 | 143 |
| 2.7225/3 month USD-LIBOR-BBA/Feb-30 | Feb-20/2.7225 | 48,777,600 | 6,341 |
| 2.715/3 month USD-LIBOR-BBA/Feb-30 | Feb-20/2.715 | 48,777,600 | 7,804 |
| 2.664/3 month USD-LIBOR-BBA/May-26 | May-21/2.664 | 36,194,000 | 61,530 |
| 3.01/3 month USD-LIBOR-BBA/Feb-36 | Feb-26/3.01 | 18,291,600 | 355,589 |
| 2.97/3 month USD-LIBOR-BBA/Feb-36 | Feb-26/2.97 | 18,291,600 | 366,564 |
| (1.512)/3 month USD-LIBOR-BBA/Aug-32 | Aug-22/1.512 | 17,746,600 | 636,216 |
| 1.512/3 month USD-LIBOR-BBA/Aug-32 | Aug-22/1.512 | 17,746,600 | 845,093 |
| 2.7875/3 month USD-LIBOR-BBA/Apr-59 | Apr-29/2.7875 | 21,626,000 | 1,409,366 |
| (2.97)/3 month USD-LIBOR-BBA/Feb-36 | Feb-26/2.97 | 18,291,600 | 2,225,356 |
| (3.01)/3 month USD-LIBOR-BBA/Feb-36 | Feb-26/3.01 | 18,291,600 | 2,272,914 |
| (2.715)/3 month USD-LIBOR-BBA/Feb-30 | Feb-20/2.715 | 48,777,600 | 5,256,274 |
| (2.7225)/3 month USD-LIBOR-BBA/Feb-30 | Feb-20/2.7225 | 48,777,600 | 5,285,541 |
| (2.7875)/3 month USD-LIBOR-BBA/Apr-59 | Apr-29/2.7875 | 21,626,000 | 6,090,963 |
| UBS AG | | | |
| (1.30)/3 month USD-LIBOR-BBA/Aug-26 | Aug-21/1.30 | 37,711,500 | 545,308 |
| 1.30/3 month USD-LIBOR-BBA/Aug-26 | Aug-21/1.30 | 37,711,500 | 834,933 |
| Total | | | $53,493,031 |
| | | | |
| WRITTEN OPTIONS OUTSTANDING at 9/30/19 (premiums $3,449,219) | | |
| | Expiration | Notional | Contract | |
| Counterparty | date/strike price | amount | amount | Value |
| JPMorgan Chase Bank N.A. | | | | |
| Government National Mortgage | | | | |
| Association 30 yr 3.00% TBA | | | | |
| commitments (Put) | Oct-19/$103.25 | $84,000,000 | $84,000,000 | $535,920 |
| Uniform Mortgage-Backed | | | | |
| Securities 30 yr 3.00% TBA | | | | |
| commitments (Put) | Oct-19/101.72 | 331,000,000 | 331,000,000 | 887,080 |
| Uniform Mortgage-Backed | | | | |
| Securities 30 yr 3.00% TBA | | | | |
| commitments (Put) | Oct-19/102.16 | 27,000,000 | 27,000,000 | 174,420 |
| Uniform Mortgage-Backed | | | | |
| Securities 30 yr 3.00% TBA | | | | |
| commitments (Put) | Nov-19/100.74 | 50,000,000 | 50,000,000 | 91,600 |
| Uniform Mortgage-Backed | | | | |
| Securities 30 yr 3.00% TBA | | | | |
| commitments (Put) | Nov-19/100.24 | 50,000,000 | 50,000,000 | 50,850 |
|
| 40 Mortgage Securities Fund |
| | | | |
| WRITTEN OPTIONS OUTSTANDING at 9/30/19 (premiums $3,449,219)cont. | | |
| | Expiration | Notional | Contract | |
| Counterparty | date/strike price | amount | amount | Value |
| JPMorgan Chase Bank N.A.cont. | | | | |
| Uniform Mortgage-Backed | | | | |
| Securities 30 yr 3.00% TBA | | | | |
| commitments (Put) | Oct-19/$99.05 | $34,000,000 | $34,000,000 | $34 |
| Uniform Mortgage-Backed | | | | |
| Securities 30 yr 3.00% TBA | | | | |
| commitments (Put) | Oct-19/99.24 | 34,000,000 | 34,000,000 | 34 |
| Uniform Mortgage-Backed | | | | |
| Securities 30 yr 3.00% TBA | | | | |
| commitments (Put) | Oct-19/99.43 | 34,000,000 | 34,000,000 | 34 |
| Uniform Mortgage-Backed | | | | |
| Securities 30 yr 3.00% TBA | | | | |
| commitments (Put) | Oct-19/99.96 | 34,000,000 | 34,000,000 | 34 |
| Uniform Mortgage-Backed | | | | |
| Securities 30 yr 3.00% TBA | | | | |
| commitments (Put) | Oct-19/99.59 | 34,000,000 | 34,000,000 | 34 |
| Uniform Mortgage-Backed | | | | |
| Securities 30 yr 3.00% TBA | | | | |
| commitments (Put) | Oct-19/99.77 | 34,000,000 | 34,000,000 | 34 |
| Uniform Mortgage-Backed | | | | |
| Securities 30 yr 3.50% TBA | | | | |
| commitments (Put) | Oct-19/102.94 | 342,000,000 | 342,000,000 | 1,202,814 |
| Uniform Mortgage-Backed | | | | |
| Securities 30 yr 4.00% TBA | | | | |
| commitments (Call) | Nov-19/104.00 | 33,000,000 | 33,000,000 | 42,702 |
| Uniform Mortgage-Backed | | | | |
| Securities 30 yr 4.00% TBA | | | | |
| commitments (Call) | Nov-19/104.19 | 33,000,000 | 33,000,000 | 21,252 |
| Uniform Mortgage-Backed | | | | |
| Securities 30 yr 4.00% TBA | | | | |
| commitments (Call) | Nov-19/104.09 | 34,000,000 | 34,000,000 | 17,238 |
| Uniform Mortgage-Backed | | | | |
| Securities 30 yr 4.00% TBA | | | | |
| commitments (Put) | Oct-19/103.98 | 119,000,000 | 119,000,000 | 245,973 |
| Total | | | | $3,270,053 |
| | | | |
| FORWARD PREMIUM SWAP OPTION CONTRACTS OUTSTANDING at 9/30/19 | | |
| Counterparty | | | | |
| Fixed right or obligation % to receive | | Notional/ | Premium | Unrealized |
| or (pay)/Floating rate index/ | Expiration | contract | receivable/ | appreciation/ |
| Maturity date | date/strike | amount | (payable) | (depreciation) |
| Bank of America N.A. | | | | |
| 2.2275/3 month USD-LIBOR-BBA/ | | | | |
| May-24 (Purchased) | May-22/2.2275 | $97,081,400 | $(895,576) | $902,857 |
| (2.2275)/3 month USD-LIBOR-BBA/ | | | | |
| May-24 (Purchased) | May-22/2.2275 | 97,081,400 | (895,576) | (596,080) |
| Citibank, N.A. | | | | |
| 1.765/3 month USD-LIBOR-BBA/ | | | | |
| Jun-25 (Purchased) | Jun-20/1.765 | 91,013,800 | (1,219,585) | 671,682 |
| 2.689/3 month USD-LIBOR-BBA/ | | | | |
| Nov-49 (Purchased) | Nov-24/2.689 | 4,579,000 | (589,546) | 449,612 |
|
| Mortgage Securities Fund 41 |
| | | | |
| FORWARD PREMIUM SWAP OPTION CONTRACTS OUTSTANDING at 9/30/19cont. | | |
| Counterparty | | | | |
| Fixed right or obligation % to receive | | Notional/ | Premium | Unrealized |
| or (pay)/Floating rate index/ | Expiration | contract | receivable/ | appreciation/ |
| Maturity date | date/strike | amount | (payable) | (depreciation) |
| Citibank, N.A.cont. | | | | |
| (2.689)/3 month USD-LIBOR-BBA/ | | | | |
| Nov-49 (Purchased) | Nov-24/2.689 | $4,579,000 | $(589,546) | $(365,404) |
| (1.765)/3 month USD-LIBOR-BBA/ | | | | |
| Jun-25 (Purchased) | Jun-20/1.765 | 91,013,800 | (1,219,585) | (730,841) |
| (1.245)/3 month USD-LIBOR-BBA/ | | | | |
| Aug-24 (Written) | Aug-22/1.245 | 67,957,000 | 621,807 | 114,847 |
| 1.245/3 month USD-LIBOR-BBA/ | | | | |
| Aug-24 (Written) | Aug-22/1.245 | 67,957,000 | 621,807 | (120,963) |
| Goldman Sachs International | | | | |
| 1.755/3 month USD-LIBOR-BBA/ | | | | |
| Jun-25 (Purchased) | Jun-20/1.755 | 91,013,800 | (1,224,136) | 639,827 |
| 2.8175/3 month USD-LIBOR-BBA/ | | | | |
| Mar-47 (Purchased) | Mar-27/2.8175 | 4,497,500 | (567,809) | 379,769 |
| (2.8175)/3 month USD-LIBOR-BBA/ | | | | |
| Mar-47 (Purchased) | Mar-27/2.8175 | 4,497,500 | (567,809) | (326,069) |
| (1.755)/3 month USD-LIBOR-BBA/ | | | | |
| Jun-25 (Purchased) | Jun-20/1.755 | 91,013,800 | (1,224,136) | (719,919) |
| JPMorgan Chase Bank N.A. | | | | |
| 2.8325/3 month USD-LIBOR-BBA/ | | | | |
| Feb-52 (Purchased) | Feb-22/2.8325 | 22,487,600 | (3,139,831) | 3,146,690 |
| 2.902/3 month USD-LIBOR-BBA/ | | | | |
| Nov-49 (Purchased) | Nov-24/2.902 | 4,579,000 | (707,913) | 487,114 |
| 2.50/3 month USD-LIBOR-BBA/ | | | | |
| Nov-39 (Purchased) | Nov-29/2.50 | 7,631,600 | (441,106) | 330,372 |
| (2.902)/3 month USD-LIBOR-BBA/ | | | | |
| Nov-49 (Purchased) | Nov-24/2.902 | 4,579,000 | (491,327) | (313,799) |
| (2.50)/3 month USD-LIBOR-BBA/ | | | | |
| Nov-39 (Purchased) | Nov-29/2.50 | 7,631,600 | (793,686) | (379,672) |
| (2.8325)/3 month USD-LIBOR-BBA/ | | | | |
| Feb-52 (Purchased) | Feb-22/2.8325 | 22,487,600 | (3,139,831) | (2,674,675) |
| Morgan Stanley & Co. International PLC | | | | |
| 2.505/3 month USD-LIBOR-BBA/ | | | | |
| Nov-49 (Purchased) | Nov-24/2.505 | 4,579,000 | (492,700) | 419,986 |
| 1.5775/3 month USD-LIBOR-BBA/ | | | | |
| Sep-22 (Purchased) | Sep-20/1.5775 | 70,063,200 | (386,048) | 100,190 |
| 3.27/3 month USD-LIBOR-BBA/ | | | | |
| Oct-53 (Purchased) | Oct-23/3.27 | 219,200 | (25,011) | 56,293 |
| (3.27)/3 month USD-LIBOR-BBA/ | | | | |
| Oct-53 (Purchased) | Oct-23/3.27 | 219,200 | (25,011) | (19,930) |
| (1.5775)/3 month USD-LIBOR-BBA/ | | | | |
| Sep-22 (Purchased) | Sep-20/1.5775 | 70,063,200 | (386,048) | (124,012) |
| (2.505)/3 month USD-LIBOR-BBA/ | | | | |
| Nov-49 (Purchased) | Nov-24/2.505 | 4,579,000 | (701,503) | (427,495) |
| Unrealized appreciation | | | | 7,699,239 |
| Unrealized (depreciation) | | | | (6,798,859) |
| Total | | | | $900,380 |
|
| 42 Mortgage Securities Fund |
| | | |
| TBA SALE COMMITMENTS OUTSTANDING at 9/30/19 (proceeds receivable $27,582,188) | |
| | Principal | Settlement | |
| Agency | amount | date | Value |
| Uniform Mortgage-Backed Securities, 3.00%, 10/1/49 | $27,000,000 | 10/10/19 | $27,405,000 |
| Total | | | $27,405,000 |
| | | | | | |
| CENTRALLY CLEARED INTEREST RATE SWAP CONTRACTS OUTSTANDING at 9/30/19 | |
| | | Upfront | | | | |
| | | premium | | | | Unrealized |
| | | received | Termination | Payments | Payments | appreciation/ |
| Notional amount | Value | (paid) | date | made by fund | received by fund | (depreciation) |
| $9,777,000 | $3,687,396 | $(333) | 11/8/48 | 3 month USD- | 3.312% — | $3,783,615 |
| | | | | LIBOR-BBA — | Semiannually | |
| | | | | Quarterly | | |
| 35,660,900 | 4,676,820 | (505) | 1/3/29 | 3.065% — | 3 month USD- | (4,736,611) |
| | | | | Semiannually | LIBOR-BBA — | |
| | | | | | Quarterly | |
| 19,684,800 | 2,634,397 | (279) | 3/4/29 | 3 month USD- | 3.073% — | 2,648,000 |
| | | | | LIBOR-BBA — | Semiannually | |
| | | | | Quarterly | | |
| 106,982,700 | 231,725 | (53,750) | 1/22/20 | 3 month USD- | 2.86% — | 283,852 |
| | | | | LIBOR-BBA — | Semiannually | |
| | | | | Quarterly | | |
| 3,938,800 | 87,398E | (22) | 2/2/24 | 3 month USD- | 2.5725% — | 87,376 |
| | | | | LIBOR-BBA — | Semiannually | |
| | | | | Quarterly | | |
| 10,194,500 | 217,540E | (57) | 2/2/24 | 2.528% — | 3 month USD- | (217,597) |
| | | | | Semiannually | LIBOR-BBA — | |
| | | | | | Quarterly | |
| 5,135,200 | 504,919 | (68) | 2/13/29 | 2.6785% — | 3 month USD- | (508,119) |
| | | | | Semiannually | LIBOR-BBA — | |
| | | | | | Quarterly | |
| 21,340,200 | 694,666E | (4,319) | 12/2/23 | 3 month USD- | 2.536% — | 690,347 |
| | | | | LIBOR-BBA — | Semiannually | |
| | | | | Quarterly | | |
| 7,377,600 | 163,347E | (1,261) | 2/2/24 | 3 month USD- | 2.57% — | 162,087 |
| | | | | LIBOR-BBA — | Semiannually | |
| | | | | Quarterly | | |
| 5,556,700 | 644,722E | (79) | 3/5/30 | 3 month USD- | 2.806% — | 644,643 |
| | | | | LIBOR-BBA — | Semiannually | |
| | | | | Quarterly | | |
| 15,259,700 | 1,545,594E | (216) | 3/16/30 | 2.647% — | 3 month USD- | (1,545,810) |
| | | | | Semiannually | LIBOR-BBA — | |
| | | | | | Quarterly | |
| 5,093,700 | 1,116,702E | (174) | 3/28/52 | 2.67% — | 3 month USD- | (1,116,876) |
| | | | | Semiannually | LIBOR-BBA — | |
| | | | | | Quarterly | |
| 14,417,400 | 1,182,299E | (7,413) | 3/26/30 | 2.44% — | 3 month USD- | (1,189,712) |
| | | | | Semiannually | LIBOR-BBA — | |
| | | | | | Quarterly | |
| 13,291,900 | 227,650E | (74) | 2/2/24 | 3 month USD- | 2.3075% — | 227,576 |
| | | | | LIBOR-BBA — | Semiannually | |
| | | | | Quarterly | | |
|
| Mortgage Securities Fund 43 |
| | | | | | |
| CENTRALLY CLEARED INTEREST RATE SWAP CONTRACTS OUTSTANDING at 9/30/19cont. | |
| | | Upfront | | | | |
| | | premium | | | | Unrealized |
| | | received | Termination | Payments | Payments | appreciation/ |
| Notional amount | Value | (paid) | date | made by fund | received by fund | (depreciation) |
| $19,511,000 | $338,594E | $(109) | 2/9/24 | 3 month USD- | 2.32% — | $338,485 |
| | | | | LIBOR-BBA — | Semiannually | |
| | | | | Quarterly | | |
| 19,463,500 | 977,574E | (276) | 3/4/30 | 2.098% — | 3 month USD- | (977,849) |
| | | | | Semiannually | LIBOR-BBA — | |
| | | | | | Quarterly | |
| 4,426,300 | 249,072E | (99) | 11/20/39 | 3 month USD- | 2.55% — | 248,974 |
| | | | | LIBOR-BBA — | Semiannually | |
| | | | | Quarterly | | |
| 12,365,300 | 698,874E | (175) | 12/7/30 | 2.184% — | 3 month USD- | (699,049) |
| | | | | Semiannually | LIBOR-BBA — | |
| | | | | | Quarterly | |
| 23,311,500 | 1,336,378E | — | 12/14/30 | 2.1935% — | 3 month USD- | (1,336,378) |
| | | | | Semiannually | LIBOR-BBA — | |
| | | | | | Quarterly | |
| 9,825,500 | 1,546,868E | — | 6/14/52 | 2.4105% — | 3 month USD- | (1,546,868) |
| | | | | Semiannually | LIBOR-BBA — | |
| | | | | | Quarterly | |
| 12,694,400 | 347,522E | (143) | 6/5/29 | 3 month USD- | 2.2225% — | 347,379 |
| | | | | LIBOR-BBA — | Semiannually | |
| | | | | Quarterly | | |
| 1,061,700 | 141,592E | (36) | 6/22/52 | 2.3075% — | 3 month USD- | (141,628) |
| | | | | Semiannually | LIBOR-BBA — | |
| | | | | | Quarterly | |
| 1,515,100 | 70,629E | (21) | 6/22/30 | 2.0625% — | 3 month USD- | (70,651) |
| | | | | Semiannually | LIBOR-BBA — | |
| | | | | | Quarterly | |
| 3,540,200 | 133,274E | (50) | 7/6/30 | 1.9665% — | 3 month USD- | (133,325) |
| | | | | Semiannually | LIBOR-BBA — | |
| | | | | | Quarterly | |
| 158,900 | 19,033E | (5) | 7/5/52 | 2.25% — | 3 month USD- | (19,038) |
| | | | | Semiannually | LIBOR-BBA — | |
| | | | | | Quarterly | |
| 33,028,200 | 202,958E | (184) | 2/7/24 | 1.733% — | 3 month USD- | (203,142) |
| | | | | Semiannually | LIBOR-BBA — | |
| | | | | | Quarterly | |
| 899,900 | 38,155E | (13) | 1/22/31 | 2.035% — | 3 month USD- | (38,168) |
| | | | | Semiannually | LIBOR-BBA — | |
| | | | | | Quarterly | |
| 6,307,100 | 781,235E | (215) | 7/22/52 | 2.2685% — | 3 month USD- | (781,450) |
| | | | | Semiannually | LIBOR-BBA — | |
| | | | | | Quarterly | |
| 8,769,700 | 371,169E | (299) | 8/8/52 | 1.9185% — | 3 month USD- | (371,468) |
| | | | | Semiannually | LIBOR-BBA — | |
| | | | | | Quarterly | |
| 2,648,000 | 12,734E | (38) | 8/28/30 | 1.5095% — | 3 month USD- | 12,697 |
| | | | | Semiannually | LIBOR-BBA — | |
| | | | | | Quarterly | |
|
| 44 Mortgage Securities Fund |
| | | | | | |
| CENTRALLY CLEARED INTEREST RATE SWAP CONTRACTS OUTSTANDING at 9/30/19cont. | |
| | | Upfront | | | | |
| | | premium | | | | Unrealized |
| | | received | Termination | Payments | Payments | appreciation/ |
| Notional amount | Value | (paid) | date | made by fund | received by fund | (depreciation) |
| $21,843,300 | $191,544E | $(206) | 12/9/24 | 1.30% — | 3 month USD- | $191,338 |
| | | | | Semiannually | LIBOR-BBA — | |
| | | | | | Quarterly | |
| 6,091,800 | 157,382E | (208) | 9/12/52 | 1.626% — | 3 month USD- | 157,174 |
| | | | | Semiannually | LIBOR-BBA — | |
| | | | | | Quarterly | |
| 31,207,000 | 239,389 | (414) | 9/24/29 | 1.655% — | 3 month USD- | (236,892) |
| | | | | Semiannually | LIBOR-BBA — | |
| | | | | | Quarterly | |
| 15,604,000 | 55,784 | (207) | 9/26/29 | 1.534% — | 3 month USD- | 56,832 |
| | | | | Semiannually | LIBOR-BBA — | |
| | | | | | Quarterly | |
| 700,387,700 | 358,599E | 426,376 | 12/18/21 | 1.58 % — | 3 month USD- | 67,777 |
| | | | | Semiannually | LIBOR-BBA — | |
| | | | | | Quarterly | |
| 705,969,500 | 983,416E | (862,418) | 12/18/24 | 1.45 % — | 3 month USD- | 120,997 |
| | | | | Semiannually | LIBOR-BBA — | |
| | | | | | Quarterly | |
| 7,064,900 | 112,763E | 100,536 | 12/18/49 | 3 month USD- | 1.65 % — | (12,227) |
| | | | | LIBOR-BBA — | Semiannually | |
| | | | | Quarterly | | |
| 405,509,600 | 1,466,323E | 1,195,627 | 12/18/29 | 3 month USD- | 1.525% — | (270,697) |
| | | | | LIBOR-BBA — | Semiannually | |
| | | | | Quarterly | | |
| 91,013,800 | 36,132 | (736) | 9/30/24 | 1.50% — | 3 month USD- | 36,924 |
| | | | | Semiannually | LIBOR-BBA — | |
| | | | | | Quarterly | |
| 23,397,000 | 28,030 | (310) | 9/30/29 | 1.5594% — | 3 month USD- | 28,074 |
| | | | | Semiannually | LIBOR-BBA — | |
| | | | | | Quarterly | |
| 91,013,800 | 97,840 | (736) | 10/1/24 | 1.53% — | 3 month USD- | (98,576) |
| | | | | Semiannually | LIBOR-BBA — | |
| | | | | | Quarterly | |
| Total | | $787,091 | | | | $(6,117,984) |
EExtended effective date.
| | | | | | |
| OTC TOTAL RETURN SWAP CONTRACTS OUTSTANDING at 9/30/19 | | |
| | | Upfront | | | | |
| | | premium | Termina- | Payments | Total return | Unrealized |
| Swap counterparty/ | | received | tion | received (paid) | received by | appreciation/ |
| Notional amount | Value | (paid) | date | by fund | or paid by fund | (depreciation) |
| Bank of America N.A. | | | | | | |
| $190,178 | $186,340 | $— | 1/12/41 | 4.00% (1 month | Synthetic TRS | $(1,686) |
| | | | | USD-LIBOR) — | Index 4.00% 30 year | |
| | | | | Monthly | Fannie Mae pools — | |
| | | | | | Monthly | |
| 93,714 | 91,822 | — | 1/12/41 | 4.00% (1 month | Synthetic TRS | (831) |
| | | | | USD-LIBOR) — | Index 4.00% 30 year | |
| | | | | Monthly | Fannie Mae pools — | |
| | | | | | Monthly | |
|
| Mortgage Securities Fund 45 |
| | | | | | |
| OTC TOTAL RETURN SWAP CONTRACTS OUTSTANDING at 9/30/19cont. | | |
| | | Upfront | | | | |
| | | premium | Termina- | Payments | Total return | Unrealized |
| Swap counterparty/ | | received | tion | received (paid) | received by | appreciation/ |
| Notional amount | Value | (paid) | date | by fund | or paid by fund | (depreciation) |
| Barclays Bank PLC | | | | | | |
| $18,680,946 | $18,694,790 | $— | 1/12/40 | 4.00% (1 month | Synthetic MBX | $31,154 |
| | | | | USD-LIBOR) — | Index 4.00% 30 year | |
| | | | | Monthly | Fannie Mae pools — | |
| | | | | | Monthly | |
| 3,692,315 | 3,695,051 | — | 1/12/40 | 4.00% (1 month | Synthetic MBX | 6,158 |
| | | | | USD-LIBOR) — | Index 4.00% 30 year | |
| | | | | Monthly | Fannie Mae pools — | |
| | | | | | Monthly | |
| 1,751,244 | 1,752,542 | — | 1/12/40 | 4.00% (1 month | Synthetic MBX | 2,921 |
| | | | | USD-LIBOR) — | Index 4.00% 30 year | |
| | | | | Monthly | Fannie Mae pools — | |
| | | | | | Monthly | |
| 1,275,514 | 1,277,564 | — | 1/12/40 | 4.50% (1 month | Synthetic MBX | 3,511 |
| | | | | USD-LIBOR) — | Index 4.50% 30 year | |
| | | | | Monthly | Fannie Mae pools — | |
| | | | | | Monthly | |
| 707,791 | 708,929 | — | 1/12/40 | 4.50% (1 month | Synthetic MBX | 1,948 |
| | | | | USD-LIBOR) — | Index 4.50% 30 year | |
| | | | | Monthly | Fannie Mae pools — | |
| | | | | | Monthly | |
| 39,946,605 | 40,032,315 | — | 1/12/41 | 5.00% (1 month | Synthetic MBX | 139,233 |
| | | | | USD-LIBOR) — | Index 5.00% 30 year | |
| | | | | Monthly | Fannie Mae pools — | |
| | | | | | Monthly | |
| 9,919,552 | 9,940,835 | — | 1/12/41 | 5.00% (1 month | Synthetic MBX | 34,574 |
| | | | | USD-LIBOR) — | Index 5.00% 30 year | |
| | | | | Monthly | Fannie Mae pools — | |
| | | | | | Monthly | |
| 3,677,003 | 3,682,238 | — | 1/12/40 | 5.00% (1 month | Synthetic MBX | 10,120 |
| | | | | USD-LIBOR) — | Index 5.00% 30 year | |
| | | | | Monthly | Fannie Mae pools — | |
| | | | | | Monthly | |
| 16,926,930 | 16,978,800 | — | 1/12/41 | 5.00% (1 month | Synthetic MBX Index | 75,373 |
| | | | | USD-LIBOR) — | 5.00% 30 year Ginnie | |
| | | | | Monthly | Mae II pools — | |
| | | | | | Monthly | |
| 275,387 | 276,231 | — | 1/12/41 | 5.00% (1 month | Synthetic MBX Index | 1,226 |
| | | | | USD-LIBOR) — | 5.00% 30 year Ginnie | |
| | | | | Monthly | Mae II pools — | |
| | | | | | Monthly | |
| 3,120,597 | 3,124,887 | — | 1/12/39 | (6.00%) 1 month | Synthetic MBX | (9,625) |
| | | | | USD-LIBOR — | Index 6.00% 30 year | |
| | | | | Monthly | Fannie Mae pools — | |
| | | | | | Monthly | |
| 50,380,228 | 50,433,640 | — | 1/12/38 | (6.50%) 1 month | Synthetic MBX | (145,788) |
| | | | | USD-LIBOR — | Index 6.50% 30 year | |
| | | | | Monthly | Fannie Mae pools — | |
| | | | | | Monthly | |
|
| 46 Mortgage Securities Fund |
| | | | | | |
| OTC TOTAL RETURN SWAP CONTRACTS OUTSTANDING at 9/30/19cont. | | |
| | | Upfront | | | | |
| | | premium | Termina- | Payments | Total return | Unrealized |
| Swap counterparty/ | | received | tion | received (paid) | received by | appreciation/ |
| Notional amount | Value | (paid) | date | by fund | or paid by fund | (depreciation) |
| Barclays Bank PLCcont. | | | | | |
| $153,508 | $151,819 | $— | 1/12/43 | 3.50% (1 month | Synthetic TRS | $(190) |
| | | | | USD-LIBOR) — | Index 3.50% 30 year | |
| | | | | Monthly | Fannie Mae pools — | |
| | | | | | Monthly | |
| 332,657 | 329,222 | — | 1/12/42 | 4.00% (1 month | Synthetic TRS | 75 |
| | | | | USD-LIBOR) — | Index 4.00% 30 year | |
| | | | | Monthly | Fannie Mae pools — | |
| | | | | | Monthly | |
| 113,356 | 111,068 | — | 1/12/41 | 4.00% (1 month | Synthetic TRS | (1,005) |
| | | | | USD-LIBOR) — | Index 4.00% 30 year | |
| | | | | Monthly | Fannie Mae pools — | |
| | | | | | Monthly | |
| 113,237 | 110,952 | — | 1/12/41 | 4.00% (1 month | Synthetic TRS | (1,004) |
| | | | | USD-LIBOR) — | Index 4.00% 30 year | |
| | | | | Monthly | Fannie Mae pools — | |
| | | | | | Monthly | |
| 43,100 | 42,230 | — | 1/12/41 | 4.00% (1 month | Synthetic TRS | (382) |
| | | | | USD-LIBOR) — | Index 4.00% 30 year | |
| | | | | Monthly | Fannie Mae pools — | |
| | | | | | Monthly | |
| 12,395 | 12,144 | — | 1/12/41 | 4.00% (1 month | Synthetic TRS | (110) |
| | | | | USD-LIBOR) — | Index 4.00% 30 year | |
| | | | | Monthly | Fannie Mae pools — | |
| | | | | | Monthly | |
| 12,301 | 12,344 | — | 1/12/40 | 4.50% (1 month | Synthetic TRS | 191 |
| | | | | USD-LIBOR) — | Index 4.50% 30 year | |
| | | | | Monthly | Fannie Mae pools — | |
| | | | | | Monthly | |
| 10,695 | 10,577 | — | 1/12/40 | 5.00% (1 month | Synthetic TRS | 13 |
| | | | | USD-LIBOR) — | Index 5.00% 30 year | |
| | | | | Monthly | Fannie Mae pools — | |
| | | | | | Monthly | |
| 556,994 | 550,705 | — | 1/12/41 | (5.00%) 1 month | Synthetic TRS | (698) |
| | | | | USD-LIBOR — | Index 5.00% 30 year | |
| | | | | Monthly | Fannie Mae pools — | |
| | | | | | Monthly | |
| 345,919 | 344,005 | — | 1/12/39 | 5.50% (1 month | Synthetic TRS | 2,158 |
| | | | | USD-LIBOR) — | Index 5.50% 30 year | |
| | | | | Monthly | Fannie Mae pools — | |
| | | | | | Monthly | |
| 2,425 | 2,412 | — | 1/12/39 | (5.50%) 1 month | Synthetic TRS | (15) |
| | | | | USD-LIBOR — | Index 5.50% 30 year | |
| | | | | Monthly | Fannie Mae pools — | |
| | | | | | Monthly | |
| 6,036 | 6,002 | — | 1/12/39 | (5.50%) 1 month | Synthetic TRS | (38) |
| | | | | USD-LIBOR — | Index 5.50% 30 year | |
| | | | | Monthly | Fannie Mae pools — | |
| | | | | | Monthly | |
|
| Mortgage Securities Fund 47 |
| | | | | | |
| OTC TOTAL RETURN SWAP CONTRACTS OUTSTANDING at 9/30/19cont. | | |
| | | Upfront | | | | |
| | | premium | Termina- | Payments | Total return | Unrealized |
| Swap counterparty/ | | received | tion | received (paid) | received by | appreciation/ |
| Notional amount | Value | (paid) | date | by fund | or paid by fund | (depreciation) |
| Barclays Bank PLCcont. | | | | | | |
| $6,036 | $6,002 | $— | 1/12/39 | (5.50%) 1 month | Synthetic TRS | $(38) |
| | | | | USD-LIBOR — | Index 5.50% 30 year | |
| | | | | Monthly | Fannie Mae pools — | |
| | | | | | Monthly | |
| 14,497 | 14,416 | — | 1/12/39 | (5.50%) 1 month | Synthetic TRS | (90) |
| | | | | USD-LIBOR — | Index 5.50% 30 year | |
| | | | | Monthly | Fannie Mae pools — | |
| | | | | | Monthly | |
| 183,316 | 182,492 | — | 1/12/39 | 6.00% (1 month | Synthetic TRS | 1,363 |
| | | | | USD-LIBOR) — | Index 6.00% 30 year | |
| | | | | Monthly | Fannie Mae pools — | |
| | | | | | Monthly | |
| 371,784 | 368,749 | — | 1/12/38 | 6.50% (1 month | Synthetic TRS | 1,325 |
| | | | | USD-LIBOR) — | Index 6.50% 30 year | |
| | | | | Monthly | Fannie Mae pools — | |
| | | | | | Monthly | |
| 21,836 | 21,658 | — | 1/12/38 | 6.50% (1 month | Synthetic TRS | 78 |
| | | | | USD-LIBOR) — | Index 6.50% 30 year | |
| | | | | Monthly | Fannie Mae pools — | |
| | | | | | Monthly | |
| 656,142 | 650,786 | — | 1/12/38 | (6.50%) 1 month | Synthetic TRS | (2,338) |
| | | | | USD-LIBOR — | Index 6.50% 30 year | |
| | | | | Monthly | Fannie Mae pools — | |
| | | | | | Monthly | |
| Citibank, N.A. | | | | | | |
| 548,362 | 549,538 | — | 1/12/41 | 5.00% (1 month | Synthetic MBX | 1,911 |
| | | | | USD-LIBOR) — | Index 5.00% 30 year | |
| | | | | Monthly | Fannie Mae pools — | |
| | | | | | Monthly | |
| 59,627 | 59,755 | — | 1/12/41 | 5.00% (1 month | Synthetic MBX | 208 |
| | | | | USD-LIBOR) — | Index 5.00% 30 year | |
| | | | | Monthly | Fannie Mae pools — | |
| | | | | | Monthly | |
| 5,875 | 5,842 | — | 1/12/39 | (5.50%) 1 month | Synthetic TRS | (37) |
| | | | | USD-LIBOR — | Index 5.50% 30 year | |
| | | | | Monthly | Fannie Mae pools — | |
| | | | | | Monthly | |
| Credit Suisse International | | | | | |
| 450,585 | 451,552 | — | 1/12/41 | 5.00% (1 month | Synthetic MBX | 1,571 |
| | | | | USD-LIBOR) — | Index 5.00% 30 year | |
| | | | | Monthly | Fannie Mae pools — | |
| | | | | | Monthly | |
| 129,594 | 129,991 | — | 1/12/41 | 5.00% (1 month | Synthetic MBX Index | 577 |
| | | | | USD-LIBOR) — | 5.00% 30 year Ginnie | |
| | | | | Monthly | Mae II pools — | |
| | | | | | Monthly | |
| 143,994 | 142,278 | — | 1/12/45 | 3.50% (1 month | Synthetic TRS | (180) |
| | | | | USD-LIBOR) — | Index 3.50% 30 year | |
| | | | | Monthly | Fannie Mae pools — | |
| | | | | | Monthly | |
|
| 48 Mortgage Securities Fund |
| | | | | | |
| OTC TOTAL RETURN SWAP CONTRACTS OUTSTANDING at 9/30/19cont. | | |
| | | Upfront | | | | |
| | | premium | Termina- | Payments | Total return | Unrealized |
| Swap counterparty/ | | received | tion | received (paid) | received by | appreciation/ |
| Notional amount | Value | (paid) | date | by fund | or paid by fund | (depreciation) |
| Credit Suisse Internationalcont. | | | | | |
| $137,007 | $135,500 | $— | 1/12/44 | 3.50% (1 month | Synthetic TRS | $(170) |
| | | | | USD-LIBOR) — | Index 3.50% 30 year | |
| | | | | Monthly | Fannie Mae pools — | |
| | | | | | Monthly | |
| 15,586 | 15,415 | — | 1/12/43 | 3.50% (1 month | Synthetic TRS | (19) |
| | | | | USD-LIBOR) — | Index 3.50% 30 year | |
| | | | | Monthly | Fannie Mae pools — | |
| | | | | | Monthly | |
| 4,262 | 4,215 | — | 1/12/43 | 3.50% (1 month | Synthetic TRS | (5) |
| | | | | USD-LIBOR) — | Index 3.50% 30 year | |
| | | | | Monthly | Fannie Mae pools — | |
| | | | | | Monthly | |
| 1,241,249 | 1,217,148 | — | 1/12/45 | 4.00% (1 month | Synthetic TRS | (10,635) |
| | | | | USD-LIBOR) — | Index 4.00% 30 year | |
| | | | | Monthly | Fannie Mae pools — | |
| | | | | | Monthly | |
| 1,044,279 | 1,029,913 | — | 1/12/44 | 4.00% (1 month | Synthetic TRS | (3,358) |
| | | | | USD-LIBOR) — | Index 4.00% 30 year | |
| | | | | Monthly | Fannie Mae pools — | |
| | | | | | Monthly | |
| 296,199 | 292,124 | — | 1/12/44 | 4.00% (1 month | Synthetic TRS | (953) |
| | | | | USD-LIBOR) — | Index 4.00% 30 year | |
| | | | | Monthly | Fannie Mae pools — | |
| | | | | | Monthly | |
| 199,435 | 197,375 | — | 1/12/42 | 4.00% (1 month | Synthetic TRS | 45 |
| | | | | USD-LIBOR) — | Index 4.00% 30 year | |
| | | | | Monthly | Fannie Mae pools — | |
| | | | | | Monthly | |
| 151,210 | 148,274 | — | 1/12/45 | 4.00% (1 month | Synthetic TRS | (1,295) |
| | | | | USD-LIBOR) — | Index 4.00% 30 year | |
| | | | | Monthly | Fannie Mae pools — | |
| | | | | | Monthly | |
| 675,105 | 661,479 | — | 1/12/41 | (4.00%) 1 month | Synthetic TRS | 5,984 |
| | | | | USD-LIBOR — | Index 4.00% 30 year | |
| | | | | Monthly | Fannie Mae pools — | |
| | | | | | Monthly | |
| 557,500 | 551,205 | — | 1/12/41 | (5.00%) 1 month | Synthetic TRS | (699) |
| | | | | USD-LIBOR — | Index 5.00% 30 year | |
| | | | | Monthly | Fannie Mae pools — | |
| | | | | | Monthly | |
| 6,036 | 6,002 | — | 1/12/39 | (5.50%) 1 month | Synthetic TRS | (38) |
| | | | | USD-LIBOR — | Index 5.50% 30 year | |
| | | | | Monthly | Fannie Mae pools — | |
| | | | | | Monthly | |
| Deutsche Bank AG | | | | | | |
| 152,224 | 152,578 | — | 1/12/41 | 4.50% (1 month | Synthetic MBX Index | 527 |
| | | | | USD-LIBOR) — | 4.50% 30 year Ginnie | |
| | | | | Monthly | Mae II pools — | |
| | | | | | Monthly | |
|
| Mortgage Securities Fund 49 |
| | | | | | |
| OTC TOTAL RETURN SWAP CONTRACTS OUTSTANDING at 9/30/19cont. | | |
| | | Upfront | | | | |
| | | premium | Termina- | Payments | Total return | Unrealized |
| Swap counterparty/ | | received | tion | received (paid) | received by | appreciation/ |
| Notional amount | Value | (paid) | date | by fund | or paid by fund | (depreciation) |
| Deutsche Bank AGcont. | | | | | |
| $7,748 | $7,663 | $— | 1/12/40 | 4.00% (1 month | Synthetic TRS | $2 |
| | | | | USD-LIBOR) — | Index 4.00% 30 year | |
| | | | | Monthly | Fannie Mae pools — | |
| | | | | | Monthly | |
| 12,301 | 12,344 | — | 1/12/40 | (4.50%) 1 month | Synthetic TRS | (191) |
| | | | | USD-LIBOR — | Index 4.50% 30 year | |
| | | | | Monthly | Fannie Mae pools — | |
| | | | | | Monthly | |
| 7,457 | 7,374 | — | 1/12/40 | 5.00% (1 month | Synthetic TRS | 9 |
| | | | | USD-LIBOR) — | Index 5.00% 30 year | |
| | | | | Monthly | Fannie Mae pools — | |
| | | | | | Monthly | |
| Goldman Sachs International | | | | | |
| 2,300,987 | 2,305,924 | — | 1/12/41 | 5.00% (1 month | Synthetic MBX | 8,020 |
| | | | | USD-LIBOR) — | Index 5.00% 30 year | |
| | | | | Monthly | Fannie Mae pools — | |
| | | | | | Monthly | |
| 176,582 | 176,769 | — | 1/12/38 | (6.50%) 1 month | Synthetic MBX | (511) |
| | | | | USD-LIBOR — | Index 6.50% 30 year | |
| | | | | Monthly | Fannie Mae pools — | |
| | | | | | Monthly | |
| 278,815 | 279,111 | — | 1/12/38 | (6.50%) 1 month | Synthetic MBX | (807) |
| | | | | USD-LIBOR — | Index 6.50% 30 year | |
| | | | | Monthly | Fannie Mae pools — | |
| | | | | | Monthly | |
| 470,855 | 471,355 | — | 1/12/38 | (6.50%) 1 month | Synthetic MBX | (1,363) |
| | | | | USD-LIBOR — | Index 6.50% 30 year | |
| | | | | Monthly | Fannie Mae pools — | |
| | | | | | Monthly | |
| 619,642 | 620,299 | — | 1/12/38 | (6.50%) 1 month | Synthetic MBX | (1,793) |
| | | | | USD-LIBOR — | Index 6.50% 30 year | |
| | | | | Monthly | Fannie Mae pools — | |
| | | | | | Monthly | |
| 743,577 | 744,365 | — | 1/12/38 | (6.50%) 1 month | Synthetic MBX | (2,152) |
| | | | | USD-LIBOR — | Index 6.50% 30 year | |
| | | | | Monthly | Fannie Mae pools — | |
| | | | | | Monthly | |
| 1,306,023 | 1,307,407 | — | 1/12/38 | (6.50%) 1 month | Synthetic MBX | (3,780) |
| | | | | USD-LIBOR — | Index 6.50% 30 year | |
| | | | | Monthly | Fannie Mae pools — | |
| | | | | | Monthly | |
| 3,476,494 | 3,480,180 | — | 1/12/38 | (6.50%) 1 month | Synthetic MBX | (10,060) |
| | | | | USD-LIBOR — | Index 6.50% 30 year | |
| | | | | Monthly | Fannie Mae pools — | |
| | | | | | Monthly | |
| 4,762,600 | 4,767,649 | — | 1/12/38 | (6.50%) 1 month | Synthetic MBX | (13,782) |
| | | | | USD-LIBOR — | Index 6.50% 30 year | |
| | | | | Monthly | Fannie Mae pools — | |
| | | | | | Monthly | |
|
| 50 Mortgage Securities Fund |
| | | | | | |
| OTC TOTAL RETURN SWAP CONTRACTS OUTSTANDING at 9/30/19cont. | | |
| | | Upfront | | | | |
| | | premium | Termina- | Payments | Total return | Unrealized |
| Swap counterparty/ | | received | tion | received (paid) | received by | appreciation/ |
| Notional amount | Value | (paid) | date | by fund | or paid by fund | (depreciation) |
| Goldman Sachs Internationalcont. | | | | |
| $825,542 | $816,742 | $— | 1/12/44 | (3.00%) 1 month | Synthetic TRS | $1,582 |
| | | | | USD-LIBOR — | Index 3.00% 30 year | |
| | | | | Monthly | Fannie Mae pools — | |
| | | | | | Monthly | |
| 112,411 | 111,175 | — | 1/12/43 | (3.50%) 1 month | Synthetic TRS | 139 |
| | | | | USD-LIBOR — | Index 3.50% 30 year | |
| | | | | Monthly | Fannie Mae pools — | |
| | | | | | Monthly | |
| 825,500 | 816,975 | — | 1/12/42 | 4.00% (1 month | Synthetic TRS | 185 |
| | | | | USD-LIBOR) — | Index 4.00% 30 year | |
| | | | | Monthly | Fannie Mae pools — | |
| | | | | | Monthly | |
| 825,500 | 816,975 | — | 1/12/42 | 4.00% (1 month | Synthetic TRS | 185 |
| | | | | USD-LIBOR) — | Index 4.00% 30 year | |
| | | | | Monthly | Fannie Mae pools — | |
| | | | | | Monthly | |
| 760,245 | 752,394 | — | 1/12/42 | 4.00% (1 month | Synthetic TRS | 171 |
| | | | | USD-LIBOR) — | Index 4.00% 30 year | |
| | | | | Monthly | Fannie Mae pools — | |
| | | | | | Monthly | |
| 607,558 | 601,284 | — | 1/12/42 | 4.00% (1 month | Synthetic TRS | 136 |
| | | | | USD-LIBOR) — | Index 4.00% 30 year | |
| | | | | Monthly | Fannie Mae pools — | |
| | | | | | Monthly | |
| 313,870 | 310,629 | — | 1/12/42 | 4.00% (1 month | Synthetic TRS | 70 |
| | | | | USD-LIBOR) — | Index 4.00% 30 year | |
| | | | | Monthly | Fannie Mae pools — | |
| | | | | | Monthly | |
| 92,349 | 90,556 | — | 1/12/45 | 4.00% (1 month | Synthetic TRS | (791) |
| | | | | USD-LIBOR) — | Index 4.00% 30 year | |
| | | | | Monthly | Fannie Mae pools — | |
| | | | | | Monthly | |
| 76,100 | 75,266 | — | 1/12/40 | 4.00% (1 month | Synthetic TRS | 23 |
| | | | | USD-LIBOR) — | Index 4.00% 30 year | |
| | | | | Monthly | Fannie Mae pools — | |
| | | | | | Monthly | |
| 599,911 | 593,138 | — | 1/12/41 | (5.00%) 1 month | Synthetic TRS | (752) |
| | | | | USD-LIBOR — | Index 5.00% 30 year | |
| | | | | Monthly | Fannie Mae pools — | |
| | | | | | Monthly | |
| 4,385 | 4,361 | — | 1/12/39 | (5.50%) 1 month | Synthetic TRS | (27) |
| | | | | USD-LIBOR — | Index 5.50% 30 year | |
| | | | | Monthly | Fannie Mae pools — | |
| | | | | | Monthly | |
| 288,558 | 286,962 | — | 1/12/39 | (5.50%) 1 month | Synthetic TRS | (1,800) |
| | | | | USD-LIBOR — | Index 5.50% 30 year | |
| | | | | Monthly | Fannie Mae pools — | |
| | | | | | Monthly | |
|
| Mortgage Securities Fund 51 |
| | | | | | |
| OTC TOTAL RETURN SWAP CONTRACTS OUTSTANDING at 9/30/19cont. | | |
| | | Upfront | | | | |
| | | premium | Termina- | Payments | Total return | Unrealized |
| Swap counterparty/ | | received | tion | received (paid) | received by | appreciation/ |
| Notional amount | Value | (paid) | date | by fund | or paid by fund | (depreciation) |
| Goldman Sachs Internationalcont. | | | | |
| $1,242,669 | $1,237,086 | $— | 1/12/39 | 6.00% (1 month | Synthetic TRS | $9,244 |
| | | | | USD-LIBOR) — | Index 6.00% 30 year | |
| | | | | Monthly | Fannie Mae pools — | |
| | | | | | Monthly | |
| 886,498 | 882,515 | — | 1/12/39 | 6.00% (1 month | Synthetic TRS | 6,595 |
| | | | | USD-LIBOR) — | Index 6.00% 30 year | |
| | | | | Monthly | Fannie Mae pools — | |
| | | | | | Monthly | |
| 498,037 | 495,800 | — | 1/12/39 | 6.00% (1 month | Synthetic TRS | 3,705 |
| | | | | USD-LIBOR) — | Index 6.00% 30 year | |
| | | | | Monthly | Fannie Mae pools — | |
| | | | | | Monthly | |
| 27,531 | 27,408 | — | 1/12/39 | 6.00% (1 month | Synthetic TRS | 205 |
| | | | | USD-LIBOR) — | Index 6.00% 30 year | |
| | | | | Monthly | Fannie Mae pools — | |
| | | | | | Monthly | |
| 608,923 | 603,952 | — | 1/12/38 | 6.50% (1 month | Synthetic TRS | 2,169 |
| | | | | USD-LIBOR) — | Index 6.50% 30 year | |
| | | | | Monthly | Fannie Mae pools — | |
| | | | | | Monthly | |
| 583,701 | 578,937 | — | 1/12/38 | 6.50% (1 month | Synthetic TRS | 2,080 |
| | | | | USD-LIBOR) — | Index 6.50% 30 year | |
| | | | | Monthly | Fannie Mae pools — | |
| | | | | | Monthly | |
| 524,415 | 520,134 | — | 1/12/38 | 6.50% (1 month | Synthetic TRS | 1,869 |
| | | | | USD-LIBOR) — | Index 6.50% 30 year | |
| | | | | Monthly | Fannie Mae pools — | |
| | | | | | Monthly | |
| 450,285 | 446,610 | — | 1/12/38 | 6.50% (1 month | Synthetic TRS | 1,605 |
| | | | | USD-LIBOR) — | Index 6.50% 30 year | |
| | | | | Monthly | Fannie Mae pools — | |
| | | | | | Monthly | |
| 401,735 | 398,455 | — | 1/12/38 | 6.50% (1 month | Synthetic TRS | 1,431 |
| | | | | USD-LIBOR) — | Index 6.50% 30 year | |
| | | | | Monthly | Fannie Mae pools — | |
| | | | | | Monthly | |
| 297,276 | 294,849 | — | 1/12/38 | 6.50% (1 month | Synthetic TRS | 1,059 |
| | | | | USD-LIBOR) — | Index 6.50% 30 year | |
| | | | | Monthly | Fannie Mae pools — | |
| | | | | | Monthly | |
| 158,941 | 157,644 | — | 1/12/38 | 6.50% (1 month | Synthetic TRS | 566 |
| | | | | USD-LIBOR) — | Index 6.50% 30 year | |
| | | | | Monthly | Fannie Mae pools — | |
| | | | | | Monthly | |
| JPMorgan Chase Bank N.A. | | | | | |
| 90,223 | 88,402 | — | 1/12/41 | 4.00% (1 month | Synthetic TRS | (800) |
| | | | | USD-LIBOR) — | Index 4.00% 30 year | |
| | | | | Monthly | Fannie Mae pools — | |
| | | | | | Monthly | |
|
| 52 Mortgage Securities Fund |
| | | | | | |
| OTC TOTAL RETURN SWAP CONTRACTS OUTSTANDING at 9/30/19cont. | | |
| | | Upfront | | | | |
| | | premium | Termina- | Payments | Total return | Unrealized |
| Swap counterparty/ | | received | tion | received (paid) | received by | appreciation/ |
| Notional amount | Value | (paid) | date | by fund | or paid by fund | (depreciation) |
| JPMorgan Chase Bank N.A.cont. | | | | | |
| $18,902 | $18,521 | $— | 1/12/41 | 4.00% (1 month | Synthetic TRS | $(168) |
| | | | | USD-LIBOR) — | Index 4.00% 30 year | |
| | | | | Monthly | Fannie Mae pools — | |
| | | | | | Monthly | |
| 599,911 | 593,138 | — | 1/12/41 | (5.00%) 1 month | Synthetic TRS | (752) |
| | | | | USD-LIBOR — | Index 5.00% 30 year | |
| | | | | Monthly | Fannie Mae pools — | |
| | | | | | Monthly | |
| JPMorgan Securities LLC | | | | | |
| 37,470 | 37,058 | — | 1/12/43 | (3.50%) 1 month | Synthetic TRS | 46 |
| | | | | USD-LIBOR — | Index 3.50% 30 year | |
| | | | | Monthly | Fannie Mae pools — | |
| | | | | | Monthly | |
| 137,007 | 135,500 | — | 1/12/44 | (3.50%) 1 month | Synthetic TRS | 170 |
| | | | | USD-LIBOR — | Index 3.50% 30 year | |
| | | | | Monthly | Fannie Mae pools — | |
| | | | | | Monthly | |
| 672,787 | 663,531 | — | 1/12/44 | 4.00% (1 month | Synthetic TRS | (2,164) |
| | | | | USD-LIBOR) — | Index 4.00% 30 year | |
| | | | | Monthly | Fannie Mae pools — | |
| | | | | | Monthly | |
| 3,665,331 | 3,627,479 | — | 1/12/42 | (4.00%) 1 month | Synthetic TRS | (823) |
| | | | | USD-LIBOR — | Index 4.00% 30 year | |
| | | | | Monthly | Fannie Mae pools — | |
| | | | | | Monthly | |
| Upfront premium received | — | | Unrealized appreciation | 363,510 |
| Upfront premium (paid) | — | | Unrealized (depreciation) | (223,743) |
| Total | | $— | | Total | | $139,767 |
| | | | | | | |
| OTC CREDIT DEFAULT CONTRACTS OUTSTANDING — PROTECTION SOLD at 9/30/19 | |
| | | Upfront | | | | | |
| | | premium | | | Termi- | Payments | Unrealized |
| Swap counterparty/ | | received | Notional | | nation | received | appreciation/ |
| Referenced debt* | Rating*** | (paid)** | amount | Value | date | by fund | (depreciation) |
| Citigroup Global Markets, Inc. | | | | | | |
| CMBX NA A.6 | A/P | $(5,107) | $11,562,000 | $25,436 | 5/11/63 | 200 bp — | $24,183 |
| Index | | | | | | Monthly | |
| CMBX NA A.7 | A-/P | (3,558) | 2,445,000 | 42,299 | 1/17/47 | 200 bp — | 39,556 |
| Index | | | | | | Monthly | |
| CMBX NA BB.7 | BB/P | 24,160 | 174,000 | 12,424 | 1/17/47 | 500 bp — | 11,882 |
| Index | | | | | | Monthly | |
| CMBX NA BB.7 | BB/P | 34,061 | 265,000 | 18,921 | 1/17/47 | 500 bp — | 15,361 |
| Index | | | | | | Monthly | |
| CMBX NA BBB–.6 | BBB–/P | 50,006 | 585,000 | 49,491 | 5/11/63 | 300 bp — | 710 |
| Index | | | | | | Monthly | |
| CMBX NA BBB–.6 | BBB–/P | 167,740 | 1,724,000 | 145,850 | 5/11/63 | 300 bp — | 22,752 |
| Index | | | | | | Monthly | |
|
| Mortgage Securities Fund 53 |
| | | | | | | |
| OTC CREDIT DEFAULT CONTRACTS OUTSTANDING — PROTECTION SOLD at 9/30/19cont. | |
| | | Upfront | | | | | |
| | | premium | | | Termi- | Payments | Unrealized |
| Swap counterparty/ | | received | Notional | | nation | received | appreciation/ |
| Referenced debt* | Rating*** | (paid)** | amount | Value | date | by fund | (depreciation) |
| Citigroup Global Markets, Inc.cont. | | | | | |
| CMBX NA BBB–.6 | BBB–/P | $168,211 | $1,986,000 | $168,016 | 5/11/63 | 300 bp — | $1,189 |
| Index | | | | | | Monthly | |
| CMBX NA BBB–.6 | BBB–/P | 342,385 | 3,429,000 | 290,093 | 5/11/63 | 300 bp — | 54,006 |
| Index | | | | | | Monthly | |
| CMBX NA BBB–.6 | BBB–/P | 555,198 | 6,555,000 | 554,553 | 5/11/63 | 300 bp — | 3,923 |
| Index | | | | | | Monthly | |
| CMBX NA BBB–.6 | BBB–/P | 698,630 | 6,976,000 | 590,170 | 5/11/63 | 300 bp — | 111,948 |
| Index | | | | | | Monthly | |
| CMBX NA BBB–.6 | BBB–/P | 4,413,184 | 46,610,000 | 3,943,206 | 5/11/63 | 300 bp — | 493,283 |
| Index | | | | | | Monthly | |
| Credit Suisse International | | | | | | |
| CMBX NA A.6 | A/P | (10,004) | 9,059,000 | 19,930 | 5/11/63 | 200 bp — | 12,946 |
| Index | | | | | | Monthly | |
| CMBX NA BB.7 | BB/P | 36,784 | 275,000 | 19,635 | 1/17/47 | 500 bp — | 17,378 |
| Index | | | | | | Monthly | |
| CMBX NA BBB–.6 | BBB–/P | 5,367,041 | 57,119,000 | 4,832,267 | 5/11/63 | 300 bp — | 563,333 |
| Index | | | | | | Monthly | |
| Deutsche Bank AG | | | | | | | |
| CMBX NA BBB–.6 | BBB–/P | 935,424 | 8,774,000 | 742,280 | 5/11/63 | 300 bp — | 197,530 |
| Index | | | | | | Monthly | |
| Goldman Sachs International | | | | | | |
| CMBX NA A.6 | A/P | 3,914 | 520,000 | 1,144 | 5/11/63 | 200 bp — | 5,232 |
| Index | | | | | | Monthly | |
| CMBX NA A.7 | A-/P | (3,836) | 2,631,000 | 45,516 | 1/17/47 | 200 bp — | 42,557 |
| Index | | | | | | Monthly | |
| CMBX NA BBB–.6 | BBB–/P | 54,735 | 495,000 | 41,877 | 5/11/63 | 300 bp — | 13,106 |
| Index | | | | | | Monthly | |
| CMBX NA BBB–.6 | BBB–/P | 108,807 | 1,034,000 | 87,476 | 5/11/63 | 300 bp — | 21,847 |
| Index | | | | | | Monthly | |
| CMBX NA BBB–.6 | BBB–/P | 133,183 | 1,146,000 | 96,952 | 5/11/63 | 300 bp — | 36,805 |
| Index | | | | | | Monthly | |
| CMBX NA BBB–.6 | BBB–/P | 416,605 | 3,605,000 | 304,983 | 5/11/63 | 300 bp — | 113,424 |
| Index | | | | | | Monthly | |
| CMBX NA BBB–.6 | BBB–/P | 805,784 | 7,549,000 | 638,645 | 5/11/63 | 300 bp — | 170,914 |
| Index | | | | | | Monthly | |
| JPMorgan Securities LLC | | | | | | |
| CMBX NA A.6 | A/P | 64,690 | 2,812,000 | 6,186 | 5/11/63 | 200 bp — | 71,813 |
| Index | | | | | | Monthly | |
| CMBX NA BB.10 | BB–/P | 28,886 | 360,000 | 31,392 | 5/11/63 | 500 bp — | (2,206) |
| Index | | | | | | Monthly | |
| CMBX NA BBB–.6 | BBB–/P | 1,198 | 12,000 | 1,015 | 5/11/63 | 300 bp — | 188 |
| Index | | | | | | Monthly | |
| CMBX NA BBB–.6 | BBB–/P | 69,984 | 529,000 | 44,753 | 5/11/63 | 300 bp — | 25,495 |
| Index | | | | | | Monthly | |
| CMBX NA BBB–.6 | BBB–/P | 110,850 | 1,102,000 | 93,229 | 5/11/63 | 300 bp — | 18,171 |
| Index | | | | | | Monthly | |
|
| 54 Mortgage Securities Fund |
| | | | | | | |
| OTC CREDIT DEFAULT CONTRACTS OUTSTANDING — PROTECTION SOLD at 9/30/19cont. | |
| | | Upfront | | | | | |
| | | premium | | | Termi- | Payments | Unrealized |
| Swap counterparty/ | | received | Notional | | nation | received | appreciation/ |
| Referenced debt* | Rating*** | (paid)** | amount | Value | date | by fund | (depreciation) |
| JPMorgan Securities LLCcont. | | | | | | |
| CMBX NA BBB–.6 | BBB–/P | $173,710 | $1,806,000 | $152,788 | 5/11/63 | 300 bp — | $21,826 |
| Index | | | | | | Monthly | |
| CMBX NA BBB–.6 | BBB–/P | 210,923 | 2,137,000 | 180,790 | 5/11/63 | 300 bp — | 31,201 |
| Index | | | | | | Monthly | |
| Merrill Lynch International | | | | | | |
| CMBX NA BB.6 | BB/P | 786,921 | 3,865,000 | 602,167 | 5/11/63 | 500 bp — | 187,975 |
| Index | | | | | | Monthly | |
| CMBX NA BB.7 | BB/P | 20,331 | 168,000 | 11,995 | 1/17/47 | 500 bp — | 8,476 |
| Index | | | | | | Monthly | |
| CMBX NA BBB–.6 | BBB–/P | 35,583 | 370,000 | 31,302 | 5/11/63 | 300 bp — | 4,466 |
| Index | | | | | | Monthly | |
| CMBX NA BBB–.6 | BBB–/P | 94,252 | 937,000 | 79,270 | 5/11/63 | 300 bp — | 15,451 |
| Index | | | | | | Monthly | |
| CMBX NA BBB–.6 | BBB–/P | 134,241 | 1,341,000 | 113,449 | 5/11/63 | 300 bp — | 21,463 |
| Index | | | | | | Monthly | |
| CMBX NA BBB–.6 | BBB–/P | 1,683,541 | 17,063,000 | 1,443,530 | 5/11/63 | 300 bp — | 248,543 |
| Index | | | | | | Monthly | |
| Morgan Stanley & Co. International PLC | | | | | |
| CMBX NA A.6 | A/P | 42,933 | 15,903,000 | 34,987 | 5/11/63 | 200 bp — | 83,220 |
| Index | | | | | | Monthly | |
| CMBX NA A.6 | A/P | 42,911 | 15,787,000 | 34,731 | 5/11/63 | 200 bp — | 82,905 |
| Index | | | | | | Monthly | |
| CMBX NA A.6 | A/P | 5 | 7,941,000 | 17,470 | 5/11/63 | 200 bp — | 20,123 |
| Index | | | | | | Monthly | |
| CMBX NA A.6 | A/P | 62,164 | 5,675,000 | 12,485 | 5/11/63 | 200 bp — | 76,541 |
| Index | | | | | | Monthly | |
| CMBX NA A.6 | A/P | 50,952 | 4,523,000 | 9,951 | 5/11/63 | 200 bp — | 62,410 |
| Index | | | | | | Monthly | |
| CMBX NA A.6 | A/P | 33,647 | 3,314,000 | 7,291 | 5/11/63 | 200 bp — | 42,043 |
| Index | | | | | | Monthly | |
| CMBX NA A.6 | A/P | 22,920 | 2,801,000 | 6,162 | 5/11/63 | 200 bp — | 30,016 |
| Index | | | | | | Monthly | |
| CMBX NA A.6 | A/P | 31,263 | 2,261,000 | 4,974 | 5/11/63 | 200 bp — | 36,991 |
| Index | | | | | | Monthly | |
| CMBX NA A.6 | A/P | 12,740 | 1,140,000 | 2,508 | 5/11/63 | 200 bp — | 15,628 |
| Index | | | | | | Monthly | |
| CMBX NA A.6 | A/P | 6,470 | 689,000 | 1,516 | 5/11/63 | 200 bp — | 8,215 |
| Index | | | | | | Monthly | |
| CMBX NA A.7 | A-/P | (4,035) | 4,170,000 | 72,141 | 1/17/47 | 200 bp — | 69,496 |
| Index | | | | | | Monthly | |
| CMBX NA A.7 | A-/P | (292) | 602,000 | 10,415 | 1/17/47 | 200 bp — | 10,323 |
| Index | | | | | | Monthly | |
| CMBX NA BB.6 | BB/P | 316,495 | 1,751,000 | 272,806 | 5/11/63 | 500 bp — | 45,148 |
| Index | | | | | | Monthly | |
| CMBX NA BB.6 | BB/P | 409,100 | 1,951,000 | 303,966 | 5/11/63 | 500 bp — | 106,760 |
| Index | | | | | | Monthly | |
|
| Mortgage Securities Fund 55 |
| | | | | | | |
| OTC CREDIT DEFAULT CONTRACTS OUTSTANDING — PROTECTION SOLD at 9/30/19cont. | |
| | | Upfront | | | | | |
| | | premium | | | Termi- | Payments | Unrealized |
| Swap counterparty/ | | received | Notional | | nation | received | appreciation/ |
| Referenced debt* | Rating*** | (paid)** | amount | Value | date | by fund | (depreciation) |
| Morgan Stanley & Co. International PLCcont. | | | | | |
| CMBX NA BBB–.6 | BBB–/P | $11,228 | $133,000 | $11,252 | 5/11/63 | 300 bp — | $43 |
| Index | | | | | | Monthly | |
| CMBX NA BBB–.6 | BBB–/P | 20,420 | 174,000 | 14,720 | 5/11/63 | 300 bp — | 5,786 |
| Index | | | | | | Monthly | |
| CMBX NA BBB–.6 | BBB–/P | 23,773 | 183,000 | 15,482 | 5/11/63 | 300 bp — | 8,383 |
| Index | | | | | | Monthly | |
| CMBX NA BBB–.6 | BBB–/P | 16,377 | 194,000 | 16,412 | 5/11/63 | 300 bp — | 62 |
| Index | | | | | | Monthly | |
| CMBX NA BBB–.6 | BBB–/P | 48,923 | 413,000 | 34,940 | 5/11/63 | 300 bp — | 14,190 |
| Index | | | | | | Monthly | |
| CMBX NA BBB–.6 | BBB–/P | 57,214 | 486,000 | 41,116 | 5/11/63 | 300 bp — | 16,341 |
| Index | | | | | | Monthly | |
| CMBX NA BBB–.6 | BBB–/P | 66,076 | 580,000 | 49,068 | 5/11/63 | 300 bp — | 17,298 |
| Index | | | | | | Monthly | |
| CMBX NA BBB–.6 | BBB–/P | 57,993 | 607,000 | 51,352 | 5/11/63 | 300 bp — | 6,944 |
| Index | | | | | | Monthly | |
| CMBX NA BBB–.6 | BBB–/P | 85,801 | 646,000 | 54,652 | 5/11/63 | 300 bp — | 31,472 |
| Index | | | | | | Monthly | |
| CMBX NA BBB–.6 | BBB–/P | 97,568 | 649,000 | 54,905 | 5/11/63 | 300 bp — | 42,988 |
| Index | | | | | | Monthly | |
| CMBX NA BBB–.6 | BBB–/P | 75,478 | 667,000 | 56,428 | 5/11/63 | 300 bp — | 19,383 |
| Index | | | | | | Monthly | |
| CMBX NA BBB–.6 | BBB–/P | 102,952 | 805,000 | 68,103 | 5/11/63 | 300 bp — | 35,251 |
| Index | | | | | | Monthly | |
| CMBX NA BBB–.6 | BBB–/P | 96,777 | 844,000 | 71,402 | 5/11/63 | 300 bp — | 25,797 |
| Index | | | | | | Monthly | |
| CMBX NA BBB–.6 | BBB–/P | 129,490 | 1,057,000 | 89,422 | 5/11/63 | 300 bp — | 40,596 |
| Index | | | | | | Monthly | |
| CMBX NA BBB–.6 | BBB–/P | 125,364 | 1,284,000 | 108,626 | 5/11/63 | 300 bp — | 17,380 |
| Index | | | | | | Monthly | |
| CMBX NA BBB–.6 | BBB–/P | 121,194 | 1,299,000 | 109,895 | 5/11/63 | 300 bp — | 11,948 |
| Index | | | | | | Monthly | |
| CMBX NA BBB–.6 | BBB–/P | 173,889 | 1,620,000 | 137,052 | 5/11/63 | 300 bp — | 37,647 |
| Index | | | | | | Monthly | |
| CMBX NA BBB–.6 | BBB–/P | 224,456 | 1,753,000 | 148,304 | 5/11/63 | 300 bp — | 77,029 |
| Index | | | | | | Monthly | |
| CMBX NA BBB–.6 | BBB–/P | 150,012 | 1,777,000 | 150,334 | 5/11/63 | 300 bp — | 566 |
| Index | | | | | | Monthly | |
| CMBX NA BBB–.6 | BBB–/P | 210,077 | 2,246,000 | 190,012 | 5/11/63 | 300 bp — | 21,188 |
| Index | | | | | | Monthly | |
| CMBX NA BBB–.6 | BBB–/P | 254,272 | 2,772,000 | 234,511 | 5/11/63 | 300 bp — | 21,147 |
| Index | | | | | | Monthly | |
| CMBX NA BBB–.6 | BBB–/P | 436,717 | 3,115,000 | 263,529 | 5/11/63 | 300 bp — | 174,745 |
| Index | | | | | | Monthly | |
| CMBX NA BBB–.6 | BBB–/P | 394,590 | 3,660,000 | 309,636 | 5/11/63 | 300 bp — | 86,784 |
| Index | | | | | | Monthly | |
|
| 56 Mortgage Securities Fund |
| | | | | | | |
| OTC CREDIT DEFAULT CONTRACTS OUTSTANDING — PROTECTION SOLD at 9/30/19cont. | |
| | | Upfront | | | | | |
| | | premium | | | Termi- | Payments | Unrealized |
| Swap counterparty/ | | received | Notional | | nation | received | appreciation/ |
| Referenced debt* | Rating*** | (paid)** | amount | Value | date | by fund | (depreciation) |
| Morgan Stanley & Co. International PLCcont. | | | | | |
| CMBX NA BBB–.6 | BBB–/P | $412,380 | $3,859,000 | $326,471 | 5/11/63 | 300 bp — | $87,838 |
| Index | | | | | | Monthly | |
| CMBX NA BBB–.6 | BBB–/P | 701,922 | 5,698,000 | 482,051 | 5/11/63 | 300 bp — | 222,720 |
| Index | | | | | | Monthly | |
| CMBX NA BBB–.6 | BBB–/P | 716,649 | 6,771,000 | 572,827 | 5/11/63 | 300 bp — | 147,208 |
| Index | | | | | | Monthly | |
| CMBX NA BBB–.6 | BBB–/P | 837,740 | 7,301,000 | 617,665 | 5/11/63 | 300 bp — | 223,726 |
| Index | | | | | | Monthly | |
| CMBX NA BBB–.6 | BBB–/P | 855,706 | 8,129,000 | 687,713 | 5/11/63 | 300 bp — | 172,057 |
| Index | | | | | | Monthly | |
| CMBX NA BBB–.6 | BBB–/P | 868,433 | 8,162,000 | 690,505 | 5/11/63 | 300 bp — | 182,009 |
| Index | | | | | | Monthly | |
| CMBX NA BBB–.6 | BBB–/P | 1,127,850 | 10,606,000 | 897,268 | 5/11/63 | 300 bp — | 235,885 |
| Index | | | | | | Monthly | |
| CMBX NA BBB–.6 | BBB–/P | 3,918,344 | 32,336,000 | 2,735,626 | 5/11/63 | 300 bp — | 1,198,887 |
| Index | | | | | | Monthly | |
| CMBX NA BBB–.6 | BBB–/P | 5,419,593 | 44,725,000 | 3,783,735 | 5/11/63 | 300 bp — | 1,658,234 |
| Index | | | | | | Monthly | |
| CMBX NA BBB–.7 | BBB–/P | 55,762 | 913,000 | 14,243 | 1/17/47 | 300 bp — | 41,975 |
| Index | | | | | | Monthly | |
| CMBX NA BBB–.7 | BBB–/P | 670,955 | 9,859,000 | 153,800 | 1/17/47 | 300 bp — | 522,084 |
| Index | | | | | | Monthly | |
| Upfront premium received | 37,328,537 | | Unrealized appreciation | | 8,724,343 |
| Upfront premium (paid) | (26,832) | | Unrealized (depreciation) | | (2,206) |
| Total | | $37,301,705 | | Total | | $8,722,137 |
*Payments related to the referenced debt are made upon a credit default event.
**Upfront premium is based on the difference between the original spread on issue and the market spread on day of execution.
***Ratings for an underlying index represent the average of the ratings of all the securities included in that index. The Moody’s, Standard & Poor’s or Fitch ratings are believed to be the most recent ratings available at September 30, 2019.Securities rated by Fitch are indicated by “/F.” Securities rated by Putnam are indicated by “/P.” The Putnam rating categories are comparable to the Standard & Poor’s classifications.
| | | | | | |
| OTC CREDIT DEFAULT CONTRACTS OUTSTANDING — PROTECTION PURCHASED at 9/30/19 | |
| | Upfront | | | | | |
| | premium | | | Termi- | Payments | Unrealized |
| Swap counterparty/ | received | Notional | | nation | (paid) | appreciation/ |
| Referenced debt* | (paid)** | amount | Value | date | by fund | (depreciation) |
| Citigroup Global Markets, Inc. | | | | | | |
| CMBX NA A.7 Index | $(59,719) | $8,055,000 | $139,352 | 1/17/47 | (200 bp) — | $(201,756) |
| | | | | | Monthly | |
| CMBX NA BB.10 Index | (17,533) | 168,000 | 14,650 | 11/17/59 | (500 bp) — | (3,023) |
| | | | | | Monthly | |
| CMBX NA BB.10 Index | (15,241) | 139,000 | 12,121 | 11/17/59 | (500 bp) — | (3,257) |
| | | | | | Monthly | |
| CMBX NA BB.11 Index | (65,428) | 505,000 | 37,219 | 11/18/54 | (500 bp) — | (28,630) |
| | | | | | Monthly | |
|
| Mortgage Securities Fund 57 |
| | | | | | |
| OTC CREDIT DEFAULT CONTRACTS OUTSTANDING — PROTECTION PURCHASED at 9/30/19cont. |
| | Upfront | | | | | |
| | premium | | | Termi- | Payments | Unrealized |
| Swap counterparty/ | received | Notional | | nation | (paid) | appreciation/ |
| Referenced debt* | (paid)** | amount | Value | date | by fund | (depreciation) |
| Citigroup Global Markets, Inc.cont. | | | | | |
| CMBX NA BB.11 Index | $(16,307) | $173,000 | $12,750 | 11/18/54 | (500 bp) — | $(3,701) |
| | | | | | Monthly | |
| CMBX NA BB.7 Index | (470,830) | 3,695,000 | 263,823 | 1/17/47 | (500 bp) — | (210,086) |
| | | | | | Monthly | |
| CMBX NA BB.9 Index | (148,843) | 1,442,000 | 85,366 | 9/17/58 | (500 bp) — | (64,678) |
| | | | | | Monthly | |
| CMBX NA BB.9 Index | (23,292) | 361,000 | 21,371 | 9/17/58 | (500 bp) — | (2,221) |
| | | | | | Monthly | |
| CMBX NA BBB–.6 Index | (21,789) | 197,000 | 16,666 | 5/11/63 | (300 bp) — | (5,221) |
| | | | | | Monthly | |
| CMBX NA BBB–.7 Index | (56,283) | 1,356,000 | 21,154 | 1/17/47 | (300 bp) — | (35,807) |
| | | | | | Monthly | |
| Credit Suisse International | | | | | | |
| CMBX NA BB.10 Index | (46,565) | 349,000 | 30,433 | 11/17/59 | (500 bp) — | (16,423) |
| | | | | | Monthly | |
| CMBX NA BB.10 Index | (41,383) | 348,000 | 30,346 | 11/17/59 | (500 bp) — | (11,328) |
| | | | | | Monthly | |
| CMBX NA BB.10 Index | (22,747) | 183,000 | 15,958 | 11/17/59 | (500 bp) — | (6,942) |
| | | | | | Monthly | |
| CMBX NA BB.9 Index | (792,652) | 7,907,000 | 468,094 | 9/17/58 | (500 bp) — | (331,147) |
| | | | | | Monthly | |
| Goldman Sachs International | | | | | | |
| CMBX NA BB.9 Index | (608,603) | 3,823,000 | 226,322 | 9/17/58 | (500 bp) — | (385,468) |
| | | | | | Monthly | |
| CMBX NA BB.9 Index | (445,272) | 2,779,000 | 164,517 | 9/17/58 | (500 bp) — | (283,071) |
| | | | | | Monthly | |
| CMBX NA BB.9 Index | (442,738) | 2,779,000 | 164,517 | 9/17/58 | (500 bp) — | (280,537) |
| | | | | | Monthly | |
| CMBX NA BB.9 Index | (312,340) | 1,977,000 | 117,038 | 9/17/58 | (500 bp) — | (196,949) |
| | | | | | Monthly | |
| CMBX NA BB.9 Index | (297,097) | 1,860,000 | 110,112 | 9/17/58 | (500 bp) — | (188,535) |
| | | | | | Monthly | |
| JPMorgan Securities LLC | | | | | | |
| CMBX NA BB.12 Index | (32,828) | 360,000 | 28,404 | 8/17/61 | (500 bp) — | (4,724) |
| | | | | | Monthly | |
| CMBX NA BB.7 Index | (84,282) | 666,000 | 47,552 | 1/17/47 | (500 bp) — | (37,284) |
| | | | | | Monthly | |
| CMBX NA BB.9 Index | (830,999) | 5,265,000 | 311,688 | 9/17/58 | (500 bp) — | (523,698) |
| | | | | | Monthly | |
| CMBX NA BB.9 Index | (482,919) | 3,412,000 | 201,990 | 9/17/58 | (500 bp) — | (283,772) |
| | | | | | Monthly | |
| CMBX NA BB.9 Index | (410,777) | 2,633,000 | 155,874 | 9/17/58 | (500 bp) — | (257,097) |
| | | | | | Monthly | |
| CMBX NA BB.9 Index | (319,744) | 2,264,000 | 134,029 | 9/17/58 | (500 bp) — | (187,602) |
| | | | | | Monthly | |
| CMBX NA BB.9 Index | (77,888) | 508,000 | 30,074 | 9/17/58 | (500 bp) — | (48,237) |
| | | | | | Monthly | |
|
| 58 Mortgage Securities Fund |
| | | | | | |
| OTC CREDIT DEFAULT CONTRACTS OUTSTANDING — PROTECTION PURCHASED at 9/30/19cont. |
| | Upfront | | | | | |
| | premium | | | Termi- | Payments | Unrealized |
| Swap counterparty/ | received | Notional | | nation | (paid) | appreciation/ |
| Referenced debt* | (paid)** | amount | Value | date | by fund | (depreciation) |
| JPMorgan Securities LLCcont. | | | | | |
| CMBX NA BBB–.7 Index | $(172,113) | $4,536,000 | $70,762 | 1/17/47 | (300 bp) — | $(103,619) |
| | | | | | Monthly | |
| CMBX NA BBB–.7 Index | (45,957) | 1,266,000 | 19,750 | 1/17/47 | (300 bp) — | (26,841) |
| | | | | | Monthly | |
| CMBX NA BBB–.7 Index | (46,594) | 985,000 | 15,366 | 1/17/47 | (300 bp) — | (31,721) |
| | | | | | Monthly | |
| Merrill Lynch International | | | | | | |
| CMBX NA BB.10 Index | (19,970) | 168,000 | 14,650 | 11/17/59 | (500 bp) — | (5,461) |
| | | | | | Monthly | |
| CMBX NA BB.10 Index | (17,706) | 168,000 | 14,650 | 11/17/59 | (500 bp) — | (3,196) |
| | | | | | Monthly | |
| CMBX NA BB.9 Index | (1,637,486) | 15,999,000 | 947,141 | 9/17/58 | (500 bp) — | (703,678) |
| | | | | | Monthly | |
| Morgan Stanley & Co. International PLC | | | | | |
| CMBX NA BB.10 Index | (17,619) | 168,000 | 14,650 | 11/17/59 | (500 bp) — | (3,110) |
| | | | | | Monthly | |
| CMBX NA BB.9 Index | (595,749) | 3,828,000 | 226,618 | 9/17/58 | (500 bp) — | (372,322) |
| | | | | | Monthly | |
| CMBX NA BB.9 Index | (432,245) | 3,182,000 | 188,374 | 9/17/58 | (500 bp) — | (246,522) |
| | | | | | Monthly | |
| CMBX NA BB.9 Index | (421,822) | 3,169,000 | 187,605 | 9/17/58 | (500 bp) — | (236,858) |
| | | | | | Monthly | |
| CMBX NA BB.9 Index | (475,843) | 3,164,000 | 187,309 | 9/17/58 | (500 bp) — | (291,171) |
| | | | | | Monthly | |
| CMBX NA BB.9 Index | (408,392) | 2,987,000 | 176,830 | 9/17/58 | (500 bp) — | (234,050) |
| | | | | | Monthly | |
| CMBX NA BB.9 Index | (423,229) | 2,805,000 | 166,056 | 9/17/58 | (500 bp) — | (259,510) |
| | | | | | Monthly | |
| CMBX NA BB.9 Index | (357,854) | 2,484,000 | 147,053 | 9/17/58 | (500 bp) — | (212,871) |
| | | | | | Monthly | |
| CMBX NA BB.9 Index | (217,055) | 1,434,000 | 84,893 | 9/17/58 | (500 bp) — | (133,357) |
| | | | | | Monthly | |
| CMBX NA BB.9 Index | (217,055) | 1,434,000 | 84,893 | 9/17/58 | (500 bp) — | (133,357) |
| | | | | | Monthly | |
| CMBX NA BBB–.7 Index | (89,903) | 1,416,000 | 22,090 | 1/17/47 | (300 bp) — | (68,521) |
| | | | | | Monthly | |
| Upfront premium received | — | | Unrealized appreciation | | — |
| Upfront premium (paid) | (11,740,691) | | Unrealized (depreciation) | | (6,667,359) |
| Total | $(11,740,691) | | Total | | $(6,667,359) |
*Payments related to the referenced debt are made upon a credit default event.
**Upfront premium is based on the difference between the original spread on issue and the market spread on day of execution.
|
| Mortgage Securities Fund 59 |
ASC 820 establishes a three-level hierarchy for disclosure of fair value measurements. The valuation hierarchy is based upon the transparency of inputs to the valuation of the fund’s investments. The three levels are defined as follows:
Level 1: Valuations based on quoted prices for identical securities in active markets.
Level 2: Valuations based on quoted prices in markets that are not active or for which all significant inputs are observable, either directly or indirectly.
Level 3: Valuations based on inputs that are unobservable and significant to the fair value measurement.
The following is a summary of the inputs used to value the fund’s net assets as of the close of the reporting period:
| | | |
| | | | Valuation inputs | |
| Investments in securities: | Level 1 | Level 2 | Level 3 |
| Asset-backed securities | $— | $23,553,330 | $— |
| Mortgage-backed securities | — | 614,383,205 | — |
| Purchased options outstanding | — | 454,570 | — |
| Purchased swap options outstanding | — | 67,049,682 | — |
| U.S. government and agency mortgage obligations | — | 625,493,848 | — |
| U.S. treasury obligations | — | 3,682,919 | — |
| Short-term investments | 5,343,000 | 85,744,902 | — |
| Totals by level | $5,343,000 | $1,420,362,456 | $— |
| | | |
| | | | Valuation inputs | |
| Other financial instruments: | Level 1 | Level 2 | Level 3 |
| Futures contracts | $(677,479) | $— | $— |
| Written options outstanding | — | (3,270,053) | — |
| Written swap options outstanding | — | (53,493,031) | — |
| Forward premium swap option contracts | — | 900,380 | — |
| TBA sale commitments | — | (27,405,000) | — |
| Interest rate swap contracts | — | (6,905,075) | — |
| Total return swap contracts | — | 139,767 | — |
| Credit default contracts | — | (23,506,236) | — |
| Totals by level | $(677,479) | $(113,539,248) | $— |
The accompanying notes are an integral part of these financial statements.
|
| 60 Mortgage Securities Fund |
Statement of assets and liabilities9/30/19
| |
| ASSETS | |
| Investment in securities, at value (Notes 1 and 9): | |
| Unaffiliated issuers (identified cost $1,399,997,997) | $1,425,695,456 |
| Affiliated issuers (identified cost $10,000) (Notes 1 and 5) | 10,000 |
| Cash | 4,293,390 |
| Interest and other receivables | 8,002,816 |
| Receivable for shares of the fund sold | 1,008,855 |
| Receivable for investments sold | 2,265,552 |
| Receivable for sales of delayed delivery securities (Note 1) | 1,483,896 |
| Receivable for sales of TBA securities (Note 1) | 27,602,438 |
| Receivable from Manager (Note 2) | 16,811 |
| Receivable for variation margin on futures contracts (Note 1) | 40,703 |
| Receivable for variation margin on centrally cleared swap contracts (Note 1) | 443,639 |
| Unrealized appreciation on forward premium swap option contracts (Note 1) | 7,699,239 |
| Unrealized appreciation on OTC swap contracts (Note 1) | 9,087,853 |
| Premium paid on OTC swap contracts (Note 1) | 11,767,523 |
| Prepaid assets | 38,371 |
| Total assets | 1,499,456,542 |
| |
| LIABILITIES | |
| Payable for investments purchased | 5,995,468 |
| Payable for purchases of delayed delivery securities (Note 1) | 2,531,632 |
| Payable for purchases of TBA securities (Note 1) | 412,624,918 |
| Payable for shares of the fund repurchased | 1,280,658 |
| Payable for custodian fees (Note 2) | 142,604 |
| Payable for investor servicing fees (Note 2) | 264,111 |
| Payable for Trustee compensation and expenses (Note 2) | 695,169 |
| Payable for administrative services (Note 2) | 3,587 |
| Payable for distribution fees (Note 2) | 534,024 |
| Payable for variation margin on futures contracts (Note 1) | 13,219 |
| Payable for variation margin on centrally cleared swap contracts (Note 1) | 218,678 |
| Unrealized depreciation on OTC swap contracts (Note 1) | 6,893,308 |
| Premium received on OTC swap contracts (Note 1) | 37,328,537 |
| Unrealized depreciation on forward premium swap option contracts (Note 1) | 6,798,859 |
| Written options outstanding, at value (premiums $37,268,597) (Note 1) | 56,763,084 |
| TBA sale commitments, at value (proceeds receivable $27,582,188) (Note 1) | 27,405,000 |
| Collateral on certain derivative contracts and TBA commitments, at value (Notes 1 and 9) | 12,048,908 |
| Other accrued expenses | 254,459 |
| Total liabilities | 571,796,223 |
| | |
| Net assets | $927,660,319 |
(Continued on next page)
|
| Mortgage Securities Fund 61 |
Statement of assets and liabilitiescont.
| |
| REPRESENTED BY | |
| Paid-in capital (Unlimited shares authorized) (Notes 1, 4 and 7) | $1,089,324,201 |
| Total distributable earnings (Note 1) | (161,663,882) |
| Total — Representing net assets applicable to capital shares outstanding | $927,660,319 |
| |
| COMPUTATION OF NET ASSET VALUE AND OFFERING PRICE | |
| Net asset value and redemption price per class A share | |
| ($780,516,785 divided by 60,209,299 shares) | $12.96 |
| Offering price per class A share(100/96.00 of $12.96)* | $13.50 |
| Net asset value and offering price per class B share($5,214,298 divided by 404,369 shares)** | $12.89 |
| Net asset value and offering price per class C share($23,971,791 divided by 1,867,629 shares)** | $12.84 |
| Net asset value and redemption price per class M share($10,224,540 divided by 784,463 shares) | $13.03 |
| Offering price per class M share(100/96.75 of $13.03)† | $13.47 |
| Net asset value, offering price and redemption price per class R share | |
| ($11,126,464 divided by 868,582 shares) | $12.81 |
| Net asset value, offering price and redemption price per class R6 share | |
| ($7,454,417 divided by 581,684 shares) | $12.82 |
| Net asset value, offering price and redemption price per class Y share | |
| ($89,152,024 divided by 6,959,032 shares) | $12.81 |
*On single retail sales of less than $100,000. On sales of $100,000 or more the offering price is reduced.
**Redemption price per share is equal to net asset value less any applicable contingent deferred sales charge.
†On single retail sales of less than $50,000. On sales of $50,000 or more the offering price is reduced.
The accompanying notes are an integral part of these financial statements.
|
| 62 Mortgage Securities Fund |
Statement of operationsYear ended 9/30/19
| |
| INVESTMENT INCOME | |
| Interest (including interest income of $201 from investments in affiliated issuers) (Note 5) | $40,298,602 |
| Total investment income | 40,298,602 |
| |
| EXPENSES | |
| Compensation of Manager (Note 2) | 3,656,720 |
| Investor servicing fees (Note 2) | 1,701,816 |
| Custodian fees (Note 2) | 183,094 |
| Trustee compensation and expenses (Note 2) | 38,710 |
| Distribution fees (Note 2) | 2,417,553 |
| Administrative services (Note 2) | 28,119 |
| Other | 544,755 |
| Fees waived and reimbursed by Manager (Note 2) | (1,449,595) |
| Total expenses | 7,121,172 |
| Expense reduction (Note 2) | (37,078) |
| Net expenses | 7,084,094 |
| | |
| Net investment income | 33,214,508 |
| |
| REALIZED AND UNREALIZED GAIN (LOSS) | |
| Net realized gain (loss) on: | |
| Securities from unaffiliated issuers (Notes 1 and 3) | 3,248,516 |
| Futures contracts (Note 1) | 473,876 |
| Swap contracts (Note 1) | (7,939,791) |
| Written options (Note 1) | 17,625,105 |
| Total net realized gain | 13,407,706 |
| Change in net unrealized appreciation (depreciation) on: | |
| Securities from unaffiliated issuers and TBA sale commitments | 56,511,116 |
| Futures contracts | (677,479) |
| Swap contracts | 194,310 |
| Written options | (16,427,330) |
| Total change in net unrealized appreciation | 39,600,617 |
| | |
| Net gain on investments | 53,008,323 |
| |
| Net increase in net assets resulting from operations | $86,222,831 |
The accompanying notes are an integral part of these financial statements.
|
| Mortgage Securities Fund 63 |
Statement of changes in net assets
| | |
| INCREASE (DECREASE) IN NET ASSETS | Year ended 9/30/19 | Year ended 9/30/18 |
| Operations | | |
| Net investment income | $33,214,508 | $32,160,607 |
| Net realized gain on investments | 13,407,706 | 2,404,047 |
| Change in net unrealized appreciation (depreciation) | | |
| of investments | 39,600,617 | (39,157,285) |
| Net increase (decrease) in net assets resulting | | |
| from operations | 86,222,831 | (4,592,631) |
| Distributions to shareholders (Note 1): | | |
| From ordinary income | | |
| Net investment income | | |
| Class A | (36,787,545) | (25,224,198) |
| Class B | (261,319) | (253,272) |
| Class C | (1,072,303) | (969,640) |
| Class M | (451,658) | (339,768) |
| Class R | (558,494) | (515,028) |
| Class R6 | (372,252) | (136,434) |
| Class Y | (4,226,478) | (3,862,971) |
| Increase (decrease) from capital share transactions | | |
| (Notes 4 and 7) | (118,523,927) | 209,689,014 |
| Total increase (decrease) in net assets | (76,031,145) | 173,795,072 |
| |
| NET ASSETS | | |
| Beginning of year | 1,003,691,464 | 829,896,392 |
| End of year | $927,660,319 | $1,003,691,464 |
The accompanying notes are an integral part of these financial statements.
|
| 64 Mortgage Securities Fund |
|
| This page left blank intentionally. |
|
| Mortgage Securities Fund 65 |
Financial highlights(For a common share outstanding throughout the period)
| | | | | | | | | | | | |
| | INVESTMENT OPERATIONS | LESS DISTRIBUTIONS | RATIOS AND SUPPLEMENTAL DATA |
| | | | | | | | | | | | Ratio | |
| | | | Net realized | | | | | | | | of net investment | |
| | Net asset value, | | and unrealized | Total from | From net | | | Total return | Net assets, | Ratio of expenses | income (loss) | Portfolio |
| | beginning | Net investment | gain (loss) | investment | investment | Total | Net asset value, | at net asset value | end of period | to average | to average | turnover |
| Period ended | of period | income (loss)a | on investments | operations | income | distributions | end of period | (%)b | (in thousands) | net assets (%)c | net assets (%) | (%)d |
| Class A | | | | | | | | | | | | |
| September 30, 2019 | $12.37 | .44 | .74 | 1.18 | (.59) | (.59) | $12.96 | 9.80 | $780,517 | .75f,h | 3.55f,h | 1,089 |
| September 30, 2018 | 12.89 | .45 | (.53) | (.08) | (.44) | (.44) | 12.37 | (.67) | 826,165 | .84f,g,h | 3.57f,h | 1,403 |
| September 30, 2017 | 13.20 | .33 | (.24) | .09 | (.40) | (.40) | 12.89 | .67 | 645,996 | .89f | 2.53f | 1,452 |
| September 30, 2016 | 13.35 | .31 | (.09) | .22 | (.37) | (.37) | 13.20 | 1.70 | 746,534 | .88e | 2.31e | 1,272 |
| September 30, 2015 | 13.70 | .30 | (.33) | (.03) | (.32) | (.32) | 13.35 | (.27) | 857,238 | .85 | 2.20 | 1,388 |
| Class B | | | | | | | | | | | | |
| September 30, 2019 | $12.31 | .35 | .72 | 1.07 | (.49) | (.49) | $12.89 | 8.91 | $5,214 | 1.49f,h | 2.85f,h | 1,089 |
| September 30, 2018 | 12.83 | .34 | (.52) | (.18) | (.34) | (.34) | 12.31 | (1.42) | 8,280 | 1.57f,g,h | 2.73f,h | 1,403 |
| September 30, 2017 | 13.14 | .23 | (.24) | (.01) | (.30) | (.30) | 12.83 | (.07) | 10,736 | 1.62f | 1.79f | 1,452 |
| September 30, 2016 | 13.28 | .21 | (.07) | .14 | (.28) | (.28) | 13.14 | 1.04 | 14,957 | 1.61e | 1.58e | 1,272 |
| September 30, 2015 | 13.63 | .20 | (.33) | (.13) | (.22) | (.22) | 13.28 | (1.01) | 17,272 | 1.58 | 1.46 | 1,388 |
| Class C | | | | | | | | | | | | |
| September 30, 2019 | $12.25 | .35 | .73 | 1.08 | (.49) | (.49) | $12.84 | 9.04 | $23,972 | 1.50f,h | 2.83f,h | 1,089 |
| September 30, 2018 | 12.77 | .33 | (.51) | (.18) | (.34) | (.34) | 12.25 | (1.45) | 31,674 | 1.59f,g,h | 2.68f,h | 1,403 |
| September 30, 2017 | 13.08 | .23 | (.24) | (.01) | (.30) | (.30) | 12.77 | (.09) | 41,652 | 1.64f | 1.77f | 1,452 |
| September 30, 2016 | 13.23 | .20 | (.07) | .13 | (.28) | (.28) | 13.08 | .97 | 56,947 | 1.63e | 1.56e | 1,272 |
| September 30, 2015 | 13.58 | .20 | (.34) | (.14) | (.21) | (.21) | 13.23 | (1.02) | 68,042 | 1.60 | 1.45 | 1,388 |
| Class M | | | | | | | | | | | | |
| September 30, 2019 | $12.43 | .41 | .75 | 1.16 | (.56) | (.56) | $13.03 | 9.57 | $10,225 | .99f,h | 3.30f,h | 1,089 |
| September 30, 2018 | 12.95 | .41 | (.53) | (.12) | (.40) | (.40) | 12.43 | (.94) | 10,342 | 1.08f,g,h | 3.22f,h | 1,403 |
| September 30, 2017 | 13.26 | .30 | (.25) | .05 | (.36) | (.36) | 12.95 | .41 | 11,452 | 1.13f | 2.29f | 1,452 |
| September 30, 2016 | 13.40 | .27 | (.07) | .20 | (.34) | (.34) | 13.26 | 1.49 | 13,059 | 1.12e | 2.07e | 1,272 |
| September 30, 2015 | 13.75 | .27 | (.34) | (.07) | (.28) | (.28) | 13.40 | (.53) | 14,451 | 1.09 | 1.95 | 1,388 |
| Class R | | | | | | | | | | | | |
| September 30, 2019 | $12.23 | .41 | .72 | 1.13 | (.55) | (.55) | $12.81 | 9.55 | $11,126 | 1.00f,h | 3.32f,h | 1,089 |
| September 30, 2018 | 12.76 | .40 | (.53) | (.13) | (.40) | (.40) | 12.23 | (1.03) | 14,329 | 1.09f,g,h | 3.20f,h | 1,403 |
| September 30, 2017 | 13.07 | .29 | (.24) | .05 | (.36) | (.36) | 12.76 | .41 | 17,599 | 1.14f | 2.28f | 1,452 |
| September 30, 2016 | 13.21 | .27 | (.07) | .20 | (.34) | (.34) | 13.07 | 1.52 | 22,317 | 1.13e | 2.06e | 1,272 |
| September 30, 2015 | 13.56 | .26 | (.33) | (.07) | (.28) | (.28) | 13.21 | (.53) | 23,513 | 1.10 | 1.94 | 1,388 |
| Class R6 | | | | | | | | | | | | |
| September 30, 2019 | $12.24 | .49 | .72 | 1.21 | (.63) | (.63) | $12.82 | 10.25 | $7,454 | .37f,h | 3.96f,h | 1,089 |
| September 30, 2018† | 12.41 | .26 | (.21) | .05 | (.22) | (.22) | 12.24 | .42* | 7,530 | .16*f,g,h | 2.11*f,h | 1,403 |
| Class Y | | | | | | | | | | | | |
| September 30, 2019 | $12.23 | .48 | .72 | 1.20 | (.62) | (.62) | $12.81 | 10.12 | $89,152 | .50f,h | 3.89f,h | 1,089 |
| September 30, 2018 | 12.76 | .47 | (.53) | (.06) | (.47) | (.47) | 12.23 | (.49) | 105,371 | .59f,g,h | 3.75f,h | 1,403 |
| September 30, 2017 | 13.08 | .36 | (.25) | .11 | (.43) | (.43) | 12.76 | .89 | 102,461 | .64f | 2.79f | 1,452 |
| September 30, 2016 | 13.22 | .34 | (.07) | .27 | (.41) | (.41) | 13.08 | 2.07 | 100,836 | .63e | 2.56e | 1,272 |
| September 30, 2015 | 13.58 | .33 | (.34) | (.01) | (.35) | (.35) | 13.22 | (.08) | 100,614 | .60 | 2.48 | 1,388 |
See notes to financial highlights at the end of this section.
The accompanying notes are an integral part of these financial statements.
| |
| 66 Mortgage Securities Fund | Mortgage Securities Fund 67 |
Financial highlightscont.
*Not annualized.
†For the period April 20, 2018 (commencement of operations) to September 30, 2018.
aPer share net investment income (loss) has been determined on the basis of the weighted average number of shares outstanding during the period.
bTotal return assumes dividend reinvestment and does not reflect the effect of sales charges.
cIncludes amounts paid through expense offset and/or brokerage service arrangements, if any (Note 2). Also excludes acquired fund fees and expenses, if any.
dPortfolio turnover includes TBA purchase and sale commitments.
eReflects a voluntary waiver of certain fund expenses in effect during the period. As a result of such waiver, the expenses of each class reflect a reduction of less than 0.01% as a percentage of average net assets.
fReflects an involuntary contractual expense limitation and/or waivers of certain fund expenses in connection with investments in Putnam Government Money Market Fund in effect during the period. As a result of such limitations and/or waivers, the expenses of each class reflect a reduction of less than 0.01% as a percentage of average net assets.
gIncludes one-time merger costs of 0.02%.
hReflects an involuntary contractual expense limitation in effect during the period. As a result of such limitation, the expenses of each class reflect a reduction of the following amounts as a percentage of average net assets (Note 2):
| | |
| | 9/30/19 | 9/30/18 |
| Class A | 0.15% | 0.12% |
| Class B | 0.15 | 0.12 |
| Class C | 0.15 | 0.12 |
| Class M | 0.15 | 0.12 |
| Class R | 0.15 | 0.12 |
| Class R6 | 0.15 | 0.10 |
| Class Y | 0.15 | 0.12 |
The accompanying notes are an integral part of these financial statements.
|
| 68 Mortgage Securities Fund |
Notes to financial statements9/30/19
Within the following Notes to financial statements, references to “State Street” represent State Street Bank and Trust Company, references to “the SEC” represent the Securities and Exchange Commission, references to “Putnam Management” represent Putnam Investment Management, LLC, the fund’s manager, an indirect wholly-owned subsidiary of Putnam Investments, LLC and references to “OTC”, if any, represent over-the-counter. Unless otherwise noted, the “reporting period” represents the period from October 1, 2018 through September 30, 2019.
Putnam Mortgage Securities Fund (the fund) is a Massachusetts business trust, which is registered under the Investment Company Act of 1940, as amended, as a diversified, open-end management investment company. The goal of the fund is to seek as high a level of current income as Putnam Management believes is consistent with preservation of capital. The fund invests mainly in mortgages, mortgage-related fixed income securities and related derivatives that are either investment-grade or below-investment-grade in quality (sometimes referred to as “junk bonds”). Under normal circumstances, the fund invests at least 80% of its net assets (plus any borrowings for investment purposes) in mortgages, mortgage-related fixed income securities and related derivatives (i.e., derivatives used to acquire exposure to, or whose underlying securities are, mortgages or mortgage-related securities). The fund generally uses the net unrealized gain or loss, or market value, of mortgage-related derivatives for purposes of this policy but may use the notional value of a derivative if that is determined to be a more appropriate measure of the fund’s investment exposure. This policy may be changed only after 60 days’ notice to shareholders.
The fund expects to invest in mortgage-backed investments that are obligations of U.S. government agencies and instrumentalities and accordingly are backed by the full faith and credit of the United States (e.g., Ginnie Mae mortgage-backed bonds) as well as in mortgage-backed investments that are backed by only the credit of a federal agency or government-sponsored entity (e.g., Fannie Mae and Freddie Mac mortgage-backed bonds), and that have short- to long-term maturities.
The fund also expects to invest in lower-rated, higher-yielding mortgage-backed securities, including non-agency residential mortgage-backed securities (which may be backed by non-qualified or “sub-prime” mortgages), commercial mortgage-backed securities, and collateralized mortgage obligations (including interest only, principal only, and other prepayment derivatives). Non-agency (i.e., privately issued) securities typically are lower rated and higher yielding than securities issued or backed by agencies such as Ginnie Mae, Fannie Mae or Freddie Mac. While the fund’s emphasis will be on mortgage-backed securities, it may also invest to a lesser extent in other types of asset-backed securities.
Putnam Management may consider, among other factors, credit, interest rate, prepayment and liquidity risks, as well as general market conditions, when deciding whether to buy or sell investments.
The fund typically uses to a significant extent derivatives, including interest rate swaps, swaptions, forward delivery contracts, total return swaps, and options on mortgage-backed securities and indices, for both hedging and non-hedging purposes, including to obtain or adjust exposure to mortgage-backed investments.
The fund offers class A, class B, class C, class M, class R, class R6 and class Y shares. Effective November 25, 2019 (December 9, 2019 for certain shareholders), class M shares will no longer be available for purchase and will convert automatically to class A shares. Purchases of class B shares are closed to new and existing investors except by exchange from class B shares of another Putnam fund or through dividend and/or capital gains reinvestment. Class A and class M shares are sold with a maximum front-end sales charge of 4.00% and 3.25%, respectively. Class A shares generally are not subject to a contingent deferred sales charge, and class M, class R, class R6 and class Y shares are not subject to a contingent deferred sales charge. Class B shares, which convert to class A shares after approximately eight years, are not subject to a front-end sales charge and are subject to a contingent deferred sales charge if those shares are redeemed within six years of purchase. Class C shares are subject to a one-year 1.00% contingent deferred sales charge and generally convert to class A shares after approximately ten years. Class R shares, which are not available to all investors, are sold at net asset value. The expenses for class A, class B, class C, class M and class R shares may differ based on the distribution fee of each class, which is identified in Note 2. Class R6 and class Y shares, which are sold at net asset value, are generally subject to the same expenses as class A, class B, class C, class M and class R shares, but do not bear a distribution fee, and in the case of class R6 shares, bear a lower investor servicing fee, which is identified in Note 2. Class R6 and class Y shares are not available to all investors.
In the normal course of business, the fund enters into contracts that may include agreements to indemnify another party under given circumstances. The fund’s maximum exposure under these arrangements is unknown
|
| Mortgage Securities Fund 69 |
as this would involve future claims that may be, but have not yet been, made against the fund. However, the fund’s management team expects the risk of material loss to be remote.
The fund has entered into contractual arrangements with an investment adviser, administrator, distributor, shareholder servicing agent and custodian, who each provide services to the fund. Unless expressly stated otherwise, shareholders are not parties to, or intended beneficiaries of these contractual arrangements, and these contractual arrangements are not intended to create any shareholder right to enforce them against the service providers or to seek any remedy under them against the service providers, either directly or on behalf of the fund.
Under the fund’s Amended and Restated Agreement and Declaration of Trust, any claims asserted against or on behalf of the Putnam Funds, including claims against Trustees and Officers, must be brought in state and federal courts located within the Commonwealth of Massachusetts.
Note 1: Significant accounting policies
The following is a summary of significant accounting policies consistently followed by the fund in the preparation of its financial statements. The preparation of financial statements is in conformity with accounting principles generally accepted in the United States of America and requires management to make estimates and assumptions that affect the reported amounts of assets and liabilities in the financial statements and the reported amounts of increases and decreases in net assets from operations. Actual results could differ from those estimates. Subsequent events after the Statement of assets and liabilities date through the date that the financial statements were issued have been evaluated in the preparation of the financial statements.
Investment income, realized and unrealized gains and losses and expenses of the fund are borne pro-rata based on the relative net assets of each class to the total net assets of the fund, except that each class bears expenses unique to that class (including the distribution fees applicable to such classes). Each class votes as a class only with respect to its own distribution plan or other matters on which a class vote is required by law or determined by the Trustees. If the fund were liquidated, shares of each class would receive their pro-rata share of the net assets of the fund. In addition, the Trustees declare separate dividends on each class of shares.
Security valuationPortfolio securities and other investments are valued using policies and procedures adopted by the Board of Trustees. The Trustees have formed a Pricing Committee to oversee the implementation of these procedures and have delegated responsibility for valuing the fund’s assets in accordance with these procedures to Putnam Management. Putnam Management has established an internal Valuation Committee that is responsible for making fair value determinations, evaluating the effectiveness of the pricing policies of the fund and reporting to the Pricing Committee.
Investments, including mortgage backed securities and short-term investments with remaining maturities of 60 days or less, are valued on the basis of valuations provided by an independent pricing service approved by the Trustees or dealers selected by Putnam Management. Such service providers use information with respect to transactions in bonds, quotations from bond dealers, market transactions in comparable securities and various relationships between securities in determining value. These securities will generally be categorized as Level 2.
Investments in open-end investment companies (excluding exchange-traded funds), if any, which can be classified as Level 1 or Level 2 securities, are valued based on their net asset value. The net asset value of such investment companies equals the total value of their assets less their liabilities and divided by the number of their outstanding shares.
Certain investments, including certain restricted and illiquid securities and derivatives, are also valued at fair value following procedures approved by the Trustees. These valuations consider such factors as significant market or specific security events such as interest rate or credit quality changes, various relationships with other securities, discount rates, U.S. Treasury, U.S. swap and credit yields, index levels, convexity exposures, recovery rates, sales and other multiples and resale restrictions. These securities are classified as Level 2 or as Level 3 depending on the priority of the significant inputs.
To assess the continuing appropriateness of fair valuations, the Valuation Committee reviews and affirms the reasonableness of such valuations on a regular basis after considering all relevant information that is reasonably available. Such valuations and procedures are reviewed periodically by the Trustees. Certain securities may be valued on the basis of a price provided by a single source. The fair value of securities is generally determined as the amount that the fund could reasonably expect to realize from an orderly disposition of such securities over a reasonable period of time. By its nature, a fair value price is a good faith estimate of the value of a security in a current sale and does not reflect an actual market price, which may be different by a material amount.
|
| 70 Mortgage Securities Fund |
Joint trading accountPursuant to an exemptive order from the SEC, the fund may transfer uninvested cash balances into a joint trading account along with the cash of other registered investment companies and certain other accounts managed by Putnam Management. These balances may be invested in issues of short-term investments having maturities of up to 90 days.
Repurchase agreementsThe fund, or any joint trading account, through its custodian, receives delivery of the underlying securities, the fair value of which at the time of purchase is required to be in an amount at least equal to the resale price, including accrued interest. Collateral for certain tri-party repurchase agreements, which totaled $38,509,575 at the end of the reporting period, is held at the counterparty’s custodian in a segregated account for the benefit of the fund and the counterparty. Putnam Management is responsible for determining that the value of these underlying securities is at all times at least equal to the resale price, including accrued interest. In the event of default or bankruptcy by the other party to the agreement, retention of the collateral may be subject to legal proceedings.
Security transactions and related investment incomeSecurity transactions are recorded on the trade date (the date the order to buy or sell is executed). Gains or losses on securities sold are determined on the identified cost basis.
Interest income, net of any applicable withholding taxes and including amortization and accretion of premiums and discounts on debt securities, is recorded on the accrual basis.
Securities purchased or sold on a delayed delivery basis may be settled at a future date beyond customary settlement time; interest income is accrued based on the terms of the securities. Losses may arise due to changes in the fair value of the underlying securities or if the counterparty does not perform under the contract.
Stripped securitiesThe fund may invest in stripped securities which represent a participation in securities that may be structured in classes with rights to receive different portions of the interest and principal. Interest-only securities receive all of the interest and principal-only securities receive all of the principal. If the interest-only securities experience greater than anticipated prepayments of principal, the fund may fail to recoup fully its initial investment in these securities. Conversely, principal-only securities increase in value if prepayments are greater than anticipated and decline if prepayments are slower than anticipated. The fair value of these securities is highly sensitive to changes in interest rates.
Options contractsThe fund uses options contracts to hedge duration and convexity, to isolate prepayment risk and to manage downside risks.
The potential risk to the fund is that the change in value of options contracts may not correspond to the change in value of the hedged instruments. In addition, losses may arise from changes in the value of the underlying instruments if there is an illiquid secondary market for the contracts, if interest or exchange rates move unexpectedly or if the counterparty to the contract is unable to perform. Realized gains and losses on purchased options are included in realized gains and losses on investment securities. If a written call option is exercised, the premium originally received is recorded as an addition to sales proceeds. If a written put option is exercised, the premium originally received is recorded as a reduction to the cost of investments.
Exchange-traded options are valued at the last sale price or, if no sales are reported, the last bid price for purchased options and the last ask price for written options. OTC traded options are valued using prices supplied by dealers.
Options on swaps are similar to options on securities except that the premium paid or received is to buy or grant the right to enter into a previously agreed upon interest rate or credit default contract. Forward premium swap option contracts include premiums that have extended settlement dates. The delayed settlement of the premiums is factored into the daily valuation of the option contracts. In the case of interest rate cap and floor contracts, in return for a premium, ongoing payments between two parties are based on interest rates exceeding a specified rate, in the case of a cap contract, or falling below a specified rate in the case of a floor contract.
Written option contracts outstanding at period end, if any, are listed after the fund’s portfolio.
Futures contractsThe fund uses futures contracts to hedge treasury term structure risk and for yield curve positioning.
The potential risk to the fund is that the change in value of futures contracts may not correspond to the change in value of the hedged instruments. In addition, losses may arise from changes in the value of the underlying instruments, if there is an illiquid secondary market for the contracts, if interest or exchange rates move unexpectedly or if the counterparty to the contract is unable to perform. With futures, there is minimal counterparty credit risk
|
| Mortgage Securities Fund 71 |
to the fund since futures are exchange traded and the exchange’s clearinghouse, as counterparty to all exchange traded futures, guarantees the futures against default. Risks may exceed amounts recognized on the Statement of assets and liabilities. When the contract is closed, the fund records a realized gain or loss equal to the difference between the value of the contract at the time it was opened and the value at the time it was closed.
Futures contracts are valued at the quoted daily settlement prices established by the exchange on which they trade. The fund and the broker agree to exchange an amount of cash equal to the daily fluctuation in the value of the futures contract. Such receipts or payments are known as “variation margin.”
Futures contracts outstanding at period end, if any, are listed after the fund’s portfolio.
Interest rate swap contractsThe fund entered into OTC and/or centrally cleared interest rate swap contracts, which are arrangements between two parties to exchange cash flows based on a notional principal amount, to hedge term structure risk and for yield curve positioning.
An OTC and centrally cleared interest rate swap can be purchased or sold with an upfront premium. For OTC interest rate swap contracts, an upfront payment received by the fund is recorded as a liability on the fund’s books. An upfront payment made by the fund is recorded as an asset on the fund’s books. OTC and centrally cleared interest rate swap contracts are marked to market daily based upon quotations from an independent pricing service or market makers. Any change is recorded as an unrealized gain or loss on OTC interest rate swaps. Daily fluctuations in the value of centrally cleared interest rate swaps are settled through a central clearing agent and are recorded in variation margin on the Statement of assets and liabilities and recorded as unrealized gain or loss. Payments, including upfront premiums, received or made are recorded as realized gains or losses at the reset date or the closing of the contract. Certain OTC and centrally cleared interest rate swap contracts may include extended effective dates. Payments related to these swap contracts are accrued based on the terms of the contract.
The fund could be exposed to credit or market risk due to unfavorable changes in the fluctuation of interest rates or if the counterparty defaults, in the case of OTC interest rate contracts, or the central clearing agency or a clearing member defaults, in the case of centrally cleared interest rate swap contracts, on its respective obligation to perform under the contract. The fund’s maximum risk of loss from counterparty risk or central clearing risk is the fair value of the contract. This risk may be mitigated for OTC interest rate swap contracts by having a master netting arrangement between the fund and the counterparty and for centrally cleared interest rate swap contracts through the daily exchange of variation margin. There is minimal counterparty risk with respect to centrally cleared interest rate swap contracts due to the clearinghouse guarantee fund and other resources that are available in the event of a clearing member default. Risk of loss may exceed amounts recognized on the Statement of assets and liabilities.
OTC and centrally cleared interest rate swap contracts outstanding, including their respective notional amounts at period end, if any, are listed after the fund’s portfolio.
Total return swap contractsThe fund entered into OTC and/or centrally cleared total return swap contracts, which are arrangements to exchange a market-linked return for a periodic payment, both based on a notional principal amount, to hedge sector exposure and to gain exposure to specific sectors.
To the extent that the total return of the security, index or other financial measure underlying the transaction exceeds or falls short of the offsetting interest rate obligation, the fund will receive a payment from or make a payment to the counterparty. OTC and/or centrally cleared total return swap contracts are marked to market daily based upon quotations from an independent pricing service or market maker. Any change is recorded as an unrealized gain or loss on OTC total return swaps. Daily fluctuations in the value of centrally cleared total return swaps are settled through a central clearing agent and are recorded in variation margin on the Statement of assets and liabilities and recorded as unrealized gain or loss. Payments received or made are recorded as realized gains or losses. Certain OTC and/or centrally cleared total return swap contracts may include extended effective dates. Payments related to these swap contracts are accrued based on the terms of the contract. The fund could be exposed to credit or market risk due to unfavorable changes in the fluctuation of interest rates or in the price of the underlying security or index, the possibility that there is no liquid market for these agreements or that the counterparty may default on its obligation to perform. The fund’s maximum risk of loss from counterparty risk or central clearing risk is the fair value of the contract. This risk may be mitigated for OTC total return swap contracts by having a master netting arrangement between the fund and the counterparty and for centrally cleared total return swap contracts through the daily exchange of variation margin. There is minimal counterparty risk with respect to centrally cleared total return swap contracts due to the clearinghouse guarantee fund and
|
| 72 Mortgage Securities Fund |
other resources that are available in the event of a clearing member default. Risk of loss may exceed amounts recognized on the Statement of assets and liabilities.
OTC and/or centrally cleared total return swap contracts outstanding, including their respective notional amounts at period end, if any, are listed after the fund’s portfolio.
Credit default contractsThe fund entered into OTC and/or centrally cleared credit default contracts to hedge credit risk, to hedge market risk and for gaining exposure to specific sectors.
In OTC and centrally cleared credit default contracts, the protection buyer typically makes a periodic stream of payments to a counterparty, the protection seller, in exchange for the right to receive a contingent payment upon the occurrence of a credit event on the reference obligation or all other equally ranked obligations of the reference entity. Credit events are contract specific but may include bankruptcy, failure to pay, restructuring and obligation acceleration. For OTC credit default contracts, an upfront payment received by the fund is recorded as a liability on the fund’s books. An upfront payment made by the fund is recorded as an asset on the fund’s books. Centrally cleared credit default contracts provide the same rights to the protection buyer and seller except the payments between parties, including upfront premiums, are settled through a central clearing agent through variation margin payments. Upfront and periodic payments received or paid by the fund for OTC and centrally cleared credit default contracts are recorded as realized gains or losses at the reset date or close of the contract. The OTC and centrally cleared credit default contracts are marked to market daily based upon quotations from an independent pricing service or market makers. Any change in value of OTC credit default contracts is recorded as an unrealized gain or loss. Daily fluctuations in the value of centrally cleared credit default contracts are recorded in variation margin on the Statement of assets and liabilities and recorded as unrealized gain or loss. Upon the occurrence of a credit event, the difference between the par value and fair value of the reference obligation, net of any proportional amount of the upfront payment, is recorded as a realized gain or loss.
In addition to bearing the risk that the credit event will occur, the fund could be exposed to market risk due to unfavorable changes in interest rates or in the price of the underlying security or index or the possibility that the fund may be unable to close out its position at the same time or at the same price as if it had purchased the underlying reference obligations. In certain circumstances, the fund may enter into offsetting OTC and centrally cleared credit default contracts which would mitigate its risk of loss. Risks of loss may exceed amounts recognized on the Statement of assets and liabilities. The fund’s maximum risk of loss from counterparty risk, either as the protection seller or as the protection buyer, is the fair value of the contract. This risk may be mitigated for OTC credit default contracts by having a master netting arrangement between the fund and the counterparty and for centrally cleared credit default contracts through the daily exchange of variation margin. Counterparty risk is further mitigated with respect to centrally cleared credit default swap contracts due to the clearinghouse guarantee fund and other resources that are available in the event of a clearing member default. Where the fund is a seller of protection, the maximum potential amount of future payments the fund may be required to make is equal to the notional amount.
OTC and centrally cleared credit default contracts outstanding, including their respective notional amounts at period end, if any, are listed after the fund’s portfolio.
TBA commitmentsThe fund may enter into TBA (to be announced) commitments to purchase securities for a fixed unit price at a future date beyond customary settlement time. Although the unit price and par amount have been established, the actual securities have not been specified. However, it is anticipated that the amount of the commitments will not significantly differ from the principal amount. The fund holds, and maintains until settlement date, cash or high-grade debt obligations in an amount sufficient to meet the purchase price, or the fund may enter into offsetting contracts for the forward sale of other securities it owns. Income on the securities will not be earned until settlement date.
The fund may also enter into TBA sale commitments to hedge its portfolio positions, to sell mortgage-backed securities it owns under delayed delivery arrangements or to take a short position in mortgage-backed securities. Proceeds of TBA sale commitments are not received until the contractual settlement date. During the time a TBA sale commitment is outstanding, either equivalent deliverable securities or an offsetting TBA purchase commitment deliverable on or before the sale commitment date are held as “cover” for the transaction, or other liquid assets in an amount equal to the notional value of the TBA sale commitment are segregated. If the TBA sale commitment is closed through the acquisition of an offsetting TBA purchase commitment, the fund realizes a gain or loss. If the fund delivers securities under the commitment, the fund realizes a gain or a loss from the sale of the securities based upon the unit price established at the date the commitment was entered into.
|
| Mortgage Securities Fund 73 |
TBA commitments, which are accounted for as purchase and sale transactions, may be considered securities themselves, and involve a risk of loss due to changes in the value of the security prior to the settlement date as well as the risk that the counterparty to the transaction will not perform its obligations. Counterparty risk is mitigated by having a master agreement between the fund and the counterparty.
Unsettled TBA commitments are valued at their fair value according to the procedures described under “Security valuation” above. The contract is marked to market daily and the change in fair value is recorded by the fund as an unrealized gain or loss. Based on market circumstances, Putnam Management will determine whether to take delivery of the underlying securities or to dispose of the TBA commitments prior to settlement.
TBA purchase commitments outstanding at period end, if any, are listed within the fund’s portfolio and TBA sale commitments outstanding at period end, if any, are listed after the fund’s portfolio.
Master agreementsThe fund is a party to ISDA (International Swaps and Derivatives Association, Inc.) Master Agreements that govern OTC derivative and foreign exchange contracts and Master Securities Forward Transaction Agreements that govern transactions involving mortgage-backed and other asset-backed securities that may result in delayed delivery (Master Agreements) with certain counterparties entered into from time to time. The Master Agreements may contain provisions regarding, among other things, the parties’ general obligations, representations, agreements, collateral requirements, events of default and early termination. With respect to certain counterparties, in accordance with the terms of the Master Agreements, collateral posted to the fund is held in a segregated account by the fund’s custodian and, with respect to those amounts which can be sold or repledged, are presented in the fund’s portfolio.
Collateral pledged by the fund is segregated by the fund’s custodian and identified in the fund’s portfolio. Collateral can be in the form of cash or debt securities issued by the U.S. Government or related agencies or other securities as agreed to by the fund and the applicable counterparty. Collateral requirements are determined based on the fund’s net position with each counterparty.
With respect to ISDA Master Agreements, termination events applicable to the fund may occur upon a decline in the fund’s net assets below a specified threshold over a certain period of time. Termination events applicable to counterparties may occur upon a decline in the counterparty’s long-term or short-term credit ratings below a specified level. In each case, upon occurrence, the other party may elect to terminate early and cause settlement of all derivative and foreign exchange contracts outstanding, including the payment of any losses and costs resulting from such early termination, as reasonably determined by the terminating party. Any decision by one or more of the fund’s counterparties to elect early termination could impact the fund’s future derivative activity.
At the close of the reporting period, the fund had a net liability position of $23,469,127 on open derivative contracts subject to the Master Agreements. Collateral posted by the fund at period end for these agreements totaled $22,705,829 and may include amounts related to unsettled agreements.
Interfund lendingThe fund, along with other Putnam funds, may participate in an interfund lending program pursuant to an exemptive order issued by the SEC. This program allows the fund to borrow from or lend to other Putnam funds that permit such transactions. Interfund lending transactions are subject to each fund’s investment policies and borrowing and lending limits. Interest earned or paid on the interfund lending transaction will be based on the average of certain current market rates. During the reporting period, the fund did not utilize the program.
Lines of creditThe fund participates, along with other Putnam funds, in a $317.5 million unsecured committed line of credit and a $235.5 million unsecured uncommitted line of credit, both provided by State Street. Borrowings may be made for temporary or emergency purposes, including the funding of shareholder redemption requests and trade settlements. Interest is charged to the fund based on the fund’s borrowing at a rate equal to 1.25% plus the higher of (1) the Federal Funds rate and (2) the overnight LIBOR for the committed line of credit and the Federal Funds rate plus 1.30% for the uncommitted line of credit. A closing fee equal to 0.04% of the committed line of credit and 0.04% of the uncommitted line of credit has been paid by the participating funds. In addition, a commitment fee of 0.21% per annum on any unutilized portion of the committed line of credit is allocated to the participating funds based on their relative net assets and paid quarterly. During the reporting period, the fund had no borrowings against these arrangements.
Federal taxesIt is the policy of the fund to distribute all of its taxable income within the prescribed time period and otherwise comply with the provisions of the Internal Revenue Code of 1986, as amended (the Code), applicable to regulated investment companies. It is also the intention of the fund to distribute an amount sufficient to avoid imposition of any excise tax under Section 4982 of the Code.
|
| 74 Mortgage Securities Fund |
The fund is subject to the provisions of Accounting Standards Codification 740Income Taxes(ASC 740). ASC 740 sets forth a minimum threshold for financial statement recognition of the benefit of a tax position taken or expected to be taken in a tax return. The fund did not have a liability to record for any unrecognized tax benefits in the accompanying financial statements. No provision has been made for federal taxes on income, capital gains or unrealized appreciation on securities held nor for excise tax on income and capital gains. Each of the fund’s federal tax returns for the prior three fiscal years remains subject to examination by the Internal Revenue Service.
Under the Regulated Investment Company Modernization Act of 2010, the fund will be permitted to carry forward capital losses incurred for an unlimited period and the carry forwards will retain their character as either short-term or long-term capital losses. At September 30, 2019, the fund had the following capital loss carryovers available, to the extent allowed by the Code, to offset future net capital gain, if any:
| | |
| | Loss carryover | |
| Short-term | Long-term | Total |
| $107,030,197 | $44,579,824 | $151,610,021 |
Distributions to shareholdersDistributions to shareholders from net investment income are recorded by the fund on the ex-dividend date. Distributions from capital gains, if any, are recorded on the ex-dividend date and paid at least annually. The amount and character of income and gains to be distributed are determined in accordance with income tax regulations, which may differ from generally accepted accounting principles. These differences include temporary and/or permanent differences from unrealized gains and losses on certain futures contracts, income on swap contracts and interest-only securities. Reclassifications are made to the fund’s capital accounts to reflect income and gains available for distribution (or available capital loss carryovers) under income tax regulations. At the close of the reporting period, the fund reclassified $8,757,460 to increase undistributed net investment income and $8,757,460 to increase accumulated net realized loss.
Tax cost of investments includes adjustments to net unrealized appreciation (depreciation) which may not necessarily be final tax cost basis adjustments, but closely approximate the tax basis unrealized gains and losses that may be realized and distributed to shareholders. The tax basis components of distributable earnings and the federal tax cost as of the close of the reporting period were as follows:
| |
| Unrealized appreciation | $84,598,235 |
| Unrealized depreciation | (115,211,555) |
| Net unrealized depreciation | (30,613,320) |
| Undistributed ordinary income | 20,559,460 |
| Capital loss carryforward | (151,610,021) |
| Cost for federal income tax purposes | $1,342,102,049 |
Note 2: Management fee, administrative services and other transactions
The fund pays Putnam Management a management fee (based on the fund’s average net assets and computed and paid monthly) at annual rates that may vary based on the average of the aggregate net assets of all open-end mutual funds sponsored by Putnam Management (excluding net assets of funds that are invested in, or that are invested in by, other Putnam funds to the extent necessary to avoid “double counting” of those assets). Such annual rates may vary as follows:
| | | | |
| 0.550% | of the first $5 billion, | | 0.350% | of the next $50 billion, |
| 0.500% | of the next $5 billion, | | 0.330% | of the next $50 billion, |
| 0.450% | of the next $10 billion, | | 0.320% | of the next $100 billion and |
| 0.400% | of the next $10 billion, | | 0.315% | of any excess thereafter. |
For the reporting period, the management fee represented an effective rate (excluding the impact from any expense waivers in effect) of 0.391% of the fund’s average net assets.
Putnam Management has contractually agreed to waive fees (and, to the extent necessary, bear other expenses) of the fund through January 30, 2021, to the extent that total expenses of the fund (excluding brokerage, interest, taxes, investment-related expenses, payments under distribution plans, extraordinary expenses, payments under the fund’s investor servicing contract and acquired fund fees and expenses, but including payments under the
|
| Mortgage Securities Fund 75 |
fund’s investment management contract) would exceed an annual rate of 0.32% of the fund’s average net assets. During the reporting period, the fund’s expenses were reduced by $1,449,556 as a result of this limit.
Putnam Management has also contractually agreed, through January 30, 2021, to waive fees and/or reimburse the fund’s expenses to the extent necessary to limit the cumulative expenses of the fund, exclusive of brokerage, interest, taxes, investment-related expenses, extraordinary expenses, acquired fund fees and expenses and payments under the fund’s investor servicing contract, investment management contract and distribution plans, on a fiscal year-to-date basis to an annual rate of 0.20% of the fund’s average net assets over such fiscal year-to-date period. During the reporting period, the fund’s expenses were not reduced as a result of this limit.
The fund invests in Putnam Government Money Market Fund, an open-end management investment company managed by Putnam Management. Management fees paid by the fund are reduced by an amount equal to the management fees paid by Putnam Government Money Market Fund with respect to assets invested by the fund in Putnam Government Money Market Fund. For the reporting period, management fees paid were reduced by $39 relating to the fund’s investment in Putnam Government Money Market Fund.
Putnam Investments Limited (PIL), an affiliate of Putnam Management, is authorized by the Trustees to manage a separate portion of the assets of the fund as determined by Putnam Management from time to time. PIL did not manage any portion of the assets of the fund during the reporting period. If Putnam Management were to engage the services of PIL, Putnam Management would pay a quarterly sub-management fee to PIL for its services at an annual rate of 0.25% of the average net assets of the portion of the fund managed by PIL.
The fund reimburses Putnam Management an allocated amount for the compensation and related expenses of certain officers of the fund and their staff who provide administrative services to the fund. The aggregate amount of all such reimbursements is determined annually by the Trustees.
Custodial functions for the fund’s assets are provided by State Street. Custody fees are based on the fund’s asset level, the number of its security holdings and transaction volumes.
Putnam Investor Services, Inc., an affiliate of Putnam Management, provides investor servicing agent functions to the fund. Putnam Investor Services, Inc. received fees for investor servicing for class A, class B, class C, class M, class R and class Y shares that included (1) a per account fee for each direct and underlying non-defined contribution account (retail account) of the fund; (2) a specified rate of the fund’s assets attributable to defined contribution plan accounts; and (3) a specified rate based on the average net assets in retail accounts. Putnam Investor Services, Inc. has agreed that the aggregate investor servicing fees for each fund’s retail and defined contribution accounts for these share classes will not exceed an annual rate of 0.25% of the fund’s average assets attributable to such accounts.
Class R6 shares paid a monthly fee based on the average net assets of class R6 shares at an annual rate of 0.05%.
During the reporting period, the expenses for each class of shares related to investor servicing fees were as follows:
| | | | |
| Class A | $1,438,193 | | Class R | 22,956 |
| Class B | 12,265 | | Class R6 | 3,648 |
| Class C | 49,961 | | Class Y | 156,120 |
| Class M | 18,673 | | Total | $1,701,816 |
The fund has entered into expense offset arrangements with Putnam Investor Services, Inc. and State Street whereby Putnam Investor Services, Inc.’s and State Street’s fees are reduced by credits allowed on cash balances. For the reporting period, the fund’s expenses were reduced by $37,078 under the expense offset arrangements.
Each Independent Trustee of the fund receives an annual Trustee fee, of which $643, as a quarterly retainer, has been allocated to the fund, and an additional fee for each Trustees meeting attended. Trustees also are reimbursed for expenses they incur relating to their services as Trustees.
The fund has adopted a Trustee Fee Deferral Plan (the Deferral Plan) which allows the Trustees to defer the receipt of all or a portion of Trustees fees payable on or after July 1, 1995. The deferred fees remain invested in certain Putnam funds until distribution in accordance with the Deferral Plan.
The fund has adopted an unfunded noncontributory defined benefit pension plan (the Pension Plan) covering all Trustees of the fund who have served as a Trustee for at least five years and were first elected prior to 2004. Benefits under the Pension Plan are equal to 50% of the Trustee’s average annual attendance and retainer fees for
|
| 76 Mortgage Securities Fund |
the three years ended December 31, 2005. The retirement benefit is payable during a Trustee’s lifetime, beginning the year following retirement, for the number of years of service through December 31, 2006. Pension expense for the fund is included in Trustee compensation and expenses in the Statement of operations. Accrued pension liability is included in Payable for Trustee compensation and expenses in the Statement of assets and liabilities. The Trustees have terminated the Pension Plan with respect to any Trustee first elected after 2003.
The fund has adopted distribution plans (the Plans) with respect to the following share classes pursuant to Rule 12b–1 under the Investment Company Act of 1940. The purpose of the Plans is to compensate Putnam Retail Management Limited Partnership, an indirect wholly-owned subsidiary of Putnam Investments, LLC, for services provided and expenses incurred in distributing shares of the fund. The Plans provide payments by the fund to Putnam Retail Management Limited Partnership at an annual rate of up to the following amounts (Maximum %) of the average net assets attributable to each class. The Trustees have approved payment by the fund at the following annual rate (Approved %) of the average net assets attributable to each class. During the reporting period, the class-specific expenses related to distribution fees were as follows:
| | | |
| | Maximum % | Approved % | Amount |
| Class A | 0.35% | 0.25% | $1,966,105 |
| Class B | 1.00% | 1.00%* | 66,183 |
| Class C | 1.00% | 1.00% | 272,659 |
| Class M | 1.00% | † | 49,883 |
| Class R | 1.00% | 0.50% | 62,723 |
| Total | | | $2,417,553 |
*Effective January 31, 2019. Prior to January 31, 2019, the fee equaled the weighted average of (i) 0.85% of the net assets of Putnam Limited Duration Government Income Fund attributable to class B shares existing on November 9, 2007; and (ii) 1.00% of all other net assets of Putnam U.S. Government Income Trust attributable to class B shares.
†Equals the weighted average of (i) 0.40% of the net assets of Putnam Limited Duration Government Income Fund attributable to class M shares existing on November 9, 2007; and (ii) 0.50% of all other net assets of Putnam Mortgage Securities Fund attributable to class M shares.
For the reporting period, Putnam Retail Management Limited Partnership, acting as underwriter, received net commissions of $15,493 and $333 from the sale of class A and class M shares, respectively, and received $1,456 and $1,329 in contingent deferred sales charges from redemptions of class B and class C shares, respectively.
A deferred sales charge of up to 1.00% is assessed on certain redemptions of class A shares. For the reporting period, Putnam Retail Management Limited Partnership, acting as underwriter, received $75 on class A redemptions.
Note 3: Purchases and sales of securities
During the reporting period, the cost of purchases and the proceeds from sales, excluding short-term investments, were as follows:
| | |
| | Cost of purchases | Proceeds from sales |
| Investments in securities, including TBA commitments (Long-term) | $16,125,571,903 | $16,366,991,882 |
| U.S. government securities (Long-term) | — | — |
| Total | $16,125,571,903 | $16,366,991,882 |
The fund may purchase or sell investments from or to other Putnam funds in the ordinary course of business, which can reduce the fund’s transaction costs, at prices determined in accordance with SEC requirements and policies approved by the Trustees. During the reporting period, purchases or sales of long-term securities from or to other Putnam funds, if any, did not represent more than 5% of the fund’s total cost of purchases and/or total proceeds from sales.
|
| Mortgage Securities Fund 77 |
Note 4: Capital shares
At the close of the reporting period, there were an unlimited number of shares of beneficial interest authorized. Transactions, including, if applicable, direct exchanges pursuant to share conversions, in capital shares were as follows:
| | | | |
| | YEAR ENDED 9/30/19 | YEAR ENDED 9/30/18 |
| Class A | Shares | Amount | Shares | Amount |
| Shares sold | 3,327,754 | $41,729,471 | 3,841,891 | $48,524,050 |
| Shares issued in connection with | | | | |
| reinvestment of distributions | 2,527,713 | 31,458,314 | 1,697,195 | 21,396,761 |
| Shares issued in connection with the | | | | |
| merger of Putnam American | | | | |
| Government Income Fund | — | — | 24,503,476 | 307,067,755 |
| | 5,855,467 | 73,187,785 | 30,042,562 | 376,988,566 |
| Shares repurchased | (12,444,204) | (155,120,227) | (13,344,675) | (168,238,106) |
| Net increase (decrease) | (6,588,737) | $(81,932,442) | 16,697,887 | $208,750,460 |
| |
| | YEAR ENDED 9/30/19 | YEAR ENDED 9/30/18 |
| Class B | Shares | Amount | Shares | Amount |
| Shares sold | 4,245 | $52,372 | 6,229 | $79,399 |
| Shares issued in connection with | | | | |
| reinvestment of distributions | 19,982 | 246,858 | 18,820 | 236,468 |
| Shares issued in connection with the | | | | |
| merger of Putnam American | | | | |
| Government Income Fund | — | — | 214,052 | 2,669,148 |
| | 24,227 | 299,230 | 239,101 | 2,985,015 |
| Shares repurchased | (292,691) | (3,641,357) | (403,152) | (5,069,172) |
| Net decrease | (268,464) | $(3,342,127) | (164,051) | $(2,084,157) |
| |
| | YEAR ENDED 9/30/19 | YEAR ENDED 9/30/18 |
| Class C | Shares | Amount | Shares | Amount |
| Shares sold | 170,613 | $2,103,798 | 148,452 | $1,868,335 |
| Shares issued in connection with | | | | |
| reinvestment of distributions | 75,022 | 923,701 | 66,999 | 838,185 |
| Shares issued in connection with the | | | | |
| merger of Putnam American | | | | |
| Government Income Fund | — | — | 704,769 | 8,749,079 |
| | 245,635 | 3,027,499 | 920,220 | 11,455,599 |
| Shares repurchased | (963,822) | (11,896,148) | (1,595,720) | (19,954,244) |
| Net decrease | (718,187) | $(8,868,649) | (675,500) | $(8,498,645) |
|
| 78 Mortgage Securities Fund |
| | | | |
| | YEAR ENDED 9/30/19 | YEAR ENDED 9/30/18 |
| Class M | Shares | Amount | Shares | Amount |
| Shares sold | 29,756 | $377,306 | 6,663 | $84,365 |
| Shares issued in connection with | | | | |
| reinvestment of distributions | 14,627 | 183,028 | 10,663 | 135,279 |
| Shares issued in connection with the | | | | |
| merger of Putnam American | | | | |
| Government Income Fund | — | — | 52,516 | 661,414 |
| | 44,383 | 560,334 | 69,842 | 881,058 |
| Shares repurchased | (91,817) | (1,160,265) | (121,964) | (1,547,185) |
| Net decrease | (47,434) | $(599,931) | (52,122) | $(666,127) |
| |
| | YEAR ENDED 9/30/19 | YEAR ENDED 9/30/18 |
| Class R | Shares | Amount | Shares | Amount |
| Shares sold | 262,076 | $3,254,125 | 296,894 | $3,721,780 |
| Shares issued in connection with | | | | |
| reinvestment of distributions | 35,327 | 434,436 | 29,907 | 373,692 |
| Shares issued in connection with the | | | | |
| merger of Putnam American | | | | |
| Government Income Fund | — | — | 173,909 | 2,156,873 |
| | 297,403 | 3,688,561 | 500,710 | 6,252,345 |
| Shares repurchased | (600,061) | (7,424,320) | (708,630) | (8,852,976) |
| Net decrease | (302,658) | $(3,735,759) | (207,920) | $(2,600,631) |
| |
| | | | FOR THE PERIOD 4/20/18 |
| | | | (COMMENCEMENT OF OPERATIONS) |
| | YEAR ENDED 9/30/19 | TO 9/30/18 |
| Class R6 | Shares | Amount | Shares | Amount |
| Shares sold | 110,481 | $1,368,846 | 361,543 | $4,473,349 |
| Shares issued in connection with | | | | |
| reinvestment of distributions | 30,263 | 372,252 | 11,020 | 136,434 |
| Shares issued in connection with the | | | | |
| merger of Putnam American | | | | |
| Government Income Fund | — | — | 371,454 | 4,607,628 |
| | 140,744 | 1,741,098 | 744,017 | 9,217,411 |
| Shares repurchased | (174,486) | (2,149,812) | (128,591) | (1,596,578) |
| Net increase (decrease) | (33,742) | $(408,714) | 615,426 | $7,620,833 |
| |
| | YEAR ENDED 9/30/19 | YEAR ENDED 9/30/18 |
| Class Y | Shares | Amount | Shares | Amount |
| Shares sold | 3,573,206 | $44,499,748 | 2,764,287 | $34,502,099 |
| Shares issued in connection with | | | | |
| reinvestment of distributions | 282,194 | 3,466,629 | 243,829 | 3,043,851 |
| Shares issued in connection with the | | | | |
| merger of Putnam American | | | | |
| Government Income Fund | — | — | 1,488,979 | 18,458,721 |
| | 3,855,400 | 47,966,377 | 4,497,095 | 56,004,671 |
| Shares repurchased | (5,509,926) | (67,602,682) | (3,912,406) | (48,837,390) |
| Net increase (decrease) | (1,654,526) | $(19,636,305) | 584,689 | $7,167,281 |
|
| Mortgage Securities Fund 79 |
Note 5: Affiliated transactions
Transactions during the reporting period with any company which is under common ownership or control were as follows:
| | | | | |
| | | | | | Shares |
| | | | | | outstanding |
| | | | | | and fair |
| | Fair value as | Purchase | Sale | Investment | value as |
| Name of affiliate | of 9/30/18 | cost | proceeds | income | of 9/30/19 |
| Short-term investments | | | | | |
| Putnam Government | | | | | |
| Money Market Fund* | $10,000 | $— | $— | $201 | $10,000 |
| Total Short-term | | | | | |
| investments | $10,000 | $— | $— | $201 | $10,000 |
*Management fees incurred through investment in Putnam Government Money Market Fund have been waived by the fund (Note 2). There were no realized or unrealized gains or losses during the period.
Note 6: Market, credit and other risks
In the normal course of business, the fund trades financial instruments and enters into financial transactions where risk of potential loss exists due to changes in the market (market risk) or failure of the contracting party to the transaction to perform (credit risk). The fund may be exposed to additional credit risk that an institution or other entity with which the fund has unsettled or open transactions will default. The fund may invest in higher-yielding, lower-rated bonds that may have a higher rate of default. The fund may invest a significant portion of its assets in securitized debt instruments, including mortgage-backed and asset-backed investments. The yields and values of these investments are sensitive to changes in interest rates, the rate of principal payments on the underlying assets and the market’s perception of the issuers. The market for these investments may be volatile and limited, which may make them difficult to buy or sell.
Note 7: Acquisition of Putnam American Government Income Fund
On April 20, 2018, the fund issued 24,503,476, 214,052, 704,769, 52,516, 173,909, 371,454 and 1,488,979 class A, class B, class C, class M, class R, class R6 and class Y shares, respectively, for 37,100,088, 325,386, 1,061,540, 79,115, 259,832, 558,643 and 2,237,368 class A, class B, class C, class M, class R, class R6 and class Y shares of Putnam American Government Income Fund to acquire that fund’s net assets in a tax-free exchange. The purpose of the transaction was to combine two Putnam funds with substantially similar investment objectives and investment strategies into a single Putnam fund with a larger asset base and therefore potentially lower expenses for fund shareholders. The investment portfolio of Putnam American Government Income Fund, with a fair value of $424,225,389 and an identified cost of $427,284,905 at April 20, 2018, was the principal asset acquired by the fund. The net assets of the fund and Putnam American Government Income Fund on April 20, 2018 were $753,329,168 and $344,370,618, respectively. On April 20, 2018, Putnam American Government Income Fund had distributions in excess of investment income of $621,621, accumulated net realized loss of $62,569,629 and unrealized depreciation of $1,560,134. The aggregate net assets of the fund immediately following the acquisition were $1,097,699,786.
Assuming the acquisition had been completed on October 1, 2017, the fund’s pro forma results of operations for the prior fiscal year would have been as follows (unaudited):
| |
| Net investment Income | $39,034,797 |
| Net loss on investments | $(46,746,517) |
| Net decrease in net assets resulting from operations | $(7,711,720) |
|
| 80 Mortgage Securities Fund |
Note 8: Summary of derivative activity
The volume of activity for the reporting period for any derivative type that was held during the period is listed below and was based on an average of the holdings at the end of each fiscal quarter:
| |
| Purchased TBA commitment option contracts (contract amount) | $717,200,000 |
| Purchased swap option contracts (contract amount) | $2,567,600,000 |
| Written TBA commitment option contracts (contract amount) | $821,100,000 |
| Written swap option contracts (contract amount) | $2,072,300,000 |
| Futures contracts (number of contracts) | 1,000 |
| Centrally cleared interest rate swap contracts (notional) | $2,288,100,000 |
| OTC total return swap contracts (notional) | $203,300,000 |
| Centrally cleared total return swap contracts (notional) | $21,500,000 |
| OTC credit default contracts (notional) | $564,500,000 |
The following is a summary of the fair value of derivative instruments as of the close of the reporting period:
| | | | |
| Fair value of derivative instruments as of the close of the reporting period | |
| | ASSET DERIVATIVES | LIABILITY DERIVATIVES |
| Derivatives not | | | | |
| accounted for as | Statement of | | Statement of | |
| hedging instruments | assets and | | assets and | |
| under ASC 815 | liabilities location | Fair value | liabilities location | Fair value |
| Credit contracts | Receivables | $5,601,790 | Payables | $29,108,026 |
| | Investments, | | | |
| | Receivables, Net | | | |
| | assets — Unrealized | | Payables, Net assets — | |
| Interest rate contracts | appreciation | 86,745,782* | Unrealized depreciation | 82,547,021* |
| Total | | $92,347,572 | | $111,655,047 |
*Includes cumulative appreciation/depreciation of futures contracts and/or centrally cleared swaps as reported in the fund’s portfolio. Only current day’s variation margin is reported within the Statement of assets and liabilities.
The following is a summary of realized and change in unrealized gains or losses of derivative instruments in the Statement of operations for the reporting period (Note 1):
| | | | |
| Amount of realized gain or (loss) on derivatives recognized in net gain or (loss) on investments | |
| Derivatives not | | | | |
| accounted for as | | | | |
| hedging instruments | | | | |
| under ASC 815 | Options | Futures | Swaps | Total |
| Credit contracts | $— | $— | $9,341,627 | $9,341,627 |
| Interest rate contracts | 15,984,623 | 473,876 | (17,281,418) | (822,919) |
| Total | $15,984,623 | $473,876 | $(7,939,791) | $8,518,708 |
| |
| Change in unrealized appreciation or (depreciation) on derivatives recognized in net gain or (loss) |
| on investments | | | | |
| Derivatives not | | | | |
| accounted for as | | | | |
| hedging instruments | | | | |
| under ASC 815 | Options | Futures | Swaps | Total |
| Credit contracts | $— | $— | $5,385,372 | $5,385,372 |
| Interest rate contracts | 11,942,251 | (677,479) | (5,191,062) | 6,073,710 |
| Total | $11,942,251 | $(677,479) | $194,310 | $11,459,082 |
|
| Mortgage Securities Fund 81 |
Note 9: Offsetting of financial and derivative assets and liabilities
The following table summarizes any derivatives, repurchase agreements and reverse repurchase agreements, at the end of the reporting period, that are subject to an enforceable master netting agreement or similar agreement. For securities lending transactions or borrowing transactions associated with securities sold short, if any, see Note 1. For financial reporting purposes, the fund does not offset financial assets and financial liabilities that are subject to the master netting agreements in the Statement of assets and liabilities.
| | | | | | | | | | | | | | | | |
| | Bank of
America N.A. | Barclays Bank PLC | Barclays
Capital, Inc. (clearing
broker) | BofA
Securities,
Inc. | Citibank, N.A. | Citigroup
Global
Markets, Inc. | Credit Suisse International | Deutsche
Bank AG | Goldman
Sachs
International | HSBC Bank
USA, National Association | JPMorgan
Chase Bank
N.A. | JPMorgan
Securities LLC | Merrill Lynch International | Morgan
Stanley & Co. International
PLC | UBS AG | Total |
| Assets: | | | | | | | | | | | | | | | | |
| Centrally cleared interest rate | | | | | | | | | | | | | | | | |
| swap contracts§ | $— | $— | $443,639 | $— | $— | $— | $— | $— | $— | $— | $— | $— | $— | $— | $— | $443,639 |
| OTC Total return swap contracts*# | — | 311,421 | — | — | 2,119 | — | 8,177 | 538 | 41,039 | — | — | 216 | — | — | — | 363,510 |
| OTC Credit default contracts — | | | | | | | | | | | | | | | | |
| protection sold*# | — | — | — | — | — | 72,404 | 22,950 | — | 47,711 | — | — | 7,123 | — | 236,233 | — | 386,421 |
| OTC Credit default contracts — | | | | | | | | | | | | | | | | |
| protection purchased*# | — | — | — | — | — | 478,922 | 537,507 | — | 771,490 | — | — | 999,506 | 962,827 | 1,465,117 | — | 5,215,369 |
| Futures contracts§ | — | — | — | 40,703 | — | — | — | — | — | — | — | — | — | — | — | 40,703 |
| Forward premium swap | | | | | | | | | | | | | | | | |
| option contracts# | 902,857 | — | — | — | 1,236,141 | — | — | — | 1,019,596 | — | 3,964,176 | — | — | 576,469 | — | 7,699,239 |
| Purchased swap options**# | 19,449,058 | — | — | — | 1,773,253 | — | — | — | 8,298,128 | — | 10,555,153 | — | — | 25,151,692 | 1,822,398 | 67,049,682 |
| Purchased options**# | — | — | — | — | — | — | — | — | — | — | 454,570 | — | — | — | — | 454,570 |
| Repurchase agreements** | — | — | — | — | — | — | — | — | — | 37,752,000 | — | — | — | — | — | 37,752,000 |
| Total Assets | $20,351,915 | $311,421 | $443,639 | $40,703 | $3,011,513 | $551,326 | $568,634 | $538 | $10,177,964 | $37,752,000 | $14,973,899 | $1,006,845 | $962,827 | $27,429,511 | $1,822,398 | $119,405,133 |
| Liabilities: | | | | | | | | | | | | | | | | |
| Centrally cleared interest rate | | | | | | | | | | | | | | | | |
| swap contracts§ | — | — | 218,678 | — | — | — | — | — | — | — | — | — | — | — | — | 218,678 |
| OTC Total return swap contracts*# | 2,517 | 161,321 | — | — | 37 | — | 17,352 | 191 | 37,618 | — | 1,720 | 2,987 | — | — | — | 223,743 |
| OTC Credit default contracts — | | | | | | | | | | | | | | | | |
| protection sold*# | — | — | — | — | — | 5,738,521 | 4,823,114 | 737,894 | 1,163,018 | — | — | 500,876 | 2,268,495 | 13,734,071 | — | 28,965,989 |
| OTC Credit default contracts — | | | | | | | | | | | | | | | | |
| protection purchased*# | — | — | — | — | — | 142,037 | — | — | — | — | — | — | — | — | — | 142,037 |
| Futures contracts§ | — | — | — | 13,219 | — | — | — | — | — | — | — | — | — | — | — | 13,219 |
| Forward premium swap | | | | | | | | | | | | | | | | |
| option contracts# | 596,080 | — | — | — | 1,217,208 | — | — | — | 1,045,988 | — | 3,368,146 | — | — | 571,437 | — | 6,798,859 |
| Written swap options# | 13,132,383 | — | — | — | 1,923,425 | — | — | — | 5,148,115 | — | 7,089,173 | — | — | 24,819,694 | 1,380,241 | 53,493,031 |
| Written options# | — | — | — | — | — | — | — | — | — | — | 3,270,053 | — | — | — | — | 3,270,053 |
| Reverse repurchase agreements | — | — | — | — | — | — | — | — | — | — | — | — | — | — | — | — |
| Total Liabilities | $13,730,980 | $161,321 | $218,678 | $13,219 | $3,140,670 | $5,880,558 | $4,840,466 | $738,085 | $7,394,739 | $— | $13,729,092 | $503,863 | $2,268,495 | $39,125,202 | $1,380,241 | $93,125,609 |
| Total Financial and Derivative | | | | | | | | | | | | | | | | |
| Net Assets | $6,620,935 | $150,100 | $224,961 | $27,484 | $(129,157) | $(5,329,232) | $(4,271,832) | $(737,547) | $2,783,225 | $37,752,000 | $1,244,807 | $502,982 | $(1,305,668) | $(11,695,691) | $442,157 | $26,279,524 |
| Total collateral received (pledged)†## | $6,620,935 | $150,100 | $— | $— | $140,000 | $(4,601,771) | $(4,248,906) | $(737,547) | $2,783,225 | $37,752,000 | $318,000 | $502,982 | $(1,216,629) | $(11,695,691) | $430,000 | |
| Net amount | $— | $— | $224,961 | $27,484 | $(269,157) | $(727,461) | $(22,926) | $— | $— | $— | $926,807 | $— | $(89,039) | $— | $12,157 | |
| |
| 82 Mortgage Securities Fund | Mortgage Securities Fund 83 |
| | | | | | | | | | | | | | | | |
| | Bank of
America N.A. | Barclays
Bank
PLC | Barclays
Capital, Inc. (clearing
broker) | BofA
Securities,
Inc. | Citibank, N.A. | Citigroup
Globa
lMarkets, Inc. | Credit Suisse International | Deutsche
Bank AG | Goldman
Sachs
International | HSBC Bank
USA, National Association | JPMorgan
Chase Bank
N.A. | JPMorgan
Securities LLC | Merrill Lynch International | Morgan
Stanley & Co. International
PLC | UBS AG | Total |
| Controlled collateral received | | | | | | | | | | | | | | | | |
| (including TBA commitments)** | $6,715,908 | $160,000 | $— | $— | $140,000 | $— | $— | $— | $3,260,000 | $— | $318,000 | $1,025,000 | $— | $— | $430,000 | $12,048,908 |
| Uncontrolled collateral received | $— | $— | $— | $— | $— | $— | $— | $— | $— | $38,509,575 | $— | $— | $— | $— | $— | $38,509,575 |
| Collateral (pledged) (including | | | | | | | | | | | | | | | | |
| TBA commitments)** | $— | $— | $— | $— | $— | $(4,601,771) | $(4,248,906) | $(772,661) | $— | $— | $— | $— | $(1,216,629) | $(11,865,862) | $— | $(22,705,829) |
*Excludes premiums, if any. Included in unrealized appreciation and depreciation on OTC swap contracts on the Statement of assets and liabilities.
**Included with Investments in securities on the Statement of assets and liabilities.
†Additional collateral may be required from certain brokers based on individual agreements.
#Covered by master netting agreement (Note 1).
##Any over-collateralization of total financial and derivative net assets is not shown. Collateral may include amounts related to unsettled agreements.
§Includes current day’s variation margin only as reported on the Statement of assets and liabilities, which is not collateralized. Cumulative appreciation/(depreciation) for futures contracts and centrally cleared swap contracts is represented in the tables listed after the fund’s portfolio. Collateral pledged for initial margin on futures contracts and centrally cleared swap contracts, which is not included in the table above, amounted to $461,646 and $22,260,459, respectively.
Note 10: New accounting pronouncements
In March 2017, the Financial Accounting Standards Board issued Accounting Standards Update (ASU) No. 2017–08,Receivables — Nonrefundable Fees and Other Costs(Subtopic 310–20):Premium Amortization on Purchased Callable Debt Securities. The amendments in the ASU shorten the amortization period for certain callable debt securities held at a premium, to be amortized to the earliest call date. The ASU is effective for fiscal years and interim periods within those fiscal years beginning after December 15, 2018. Management is currently evaluating the impact, if any, of applying this provision.
| |
| 84 Mortgage Securities Fund | Mortgage Securities Fund 85 |
Federal tax information (Unaudited)
For the reporting period, pursuant to §871(k) of the Internal Revenue Code, the fund hereby designates $36,885,772 of distributions paid as qualifying to be taxed as interest-related dividends, and no amount to be taxed as short-term capital gain dividends for nonresident alien shareholders.
The Form 1099 that will be mailed to you in January 2020 will show the tax status of all distributions paid to your account in calendar 2019.
|
| 86 Mortgage Securities Fund |

|
| Mortgage Securities Fund 87 |

*Mr. Reynolds is an “interested person” (as defined in the Investment Company Act of 1940) of the fund and Putnam Investments. He is President and Chief Executive Officer of Putnam Investments, as well as the President of your fund and each of the other Putnam funds.
The address of each Trustee is 100 Federal Street, Boston, MA 02110.
As of September 30, 2019, there were 91 Putnam funds. All Trustees serve as Trustees of all Putnam funds.
Each Trustee serves for an indefinite term, until his or her resignation, retirement at age 75, removal, or death.
|
| 88 Mortgage Securities Fund |
Officers
In addition to Robert L. Reynolds, the other officers of the fund are shown below:
| |
| Robert T. Burns(Born 1961) | Richard T. Kircher(Born 1962) |
| Vice President and Chief Legal Officer | Vice President and BSA Compliance Officer |
| Since 2011 | Since 2019 |
| General Counsel, Putnam Investments, | Assistant Director, Operational Compliance, Putnam |
| Putnam Management, and Putnam Retail Management | Investments and Putnam Retail Management |
| |
| James F. Clark(Born 1974) | Susan G. Malloy(Born 1957) |
| Vice President and Chief Compliance Officer | Vice President and Assistant Treasurer |
| Since 2016 | Since 2007 |
| Chief Compliance Officer and Chief Risk Officer, | Head of Accounting and Middle Office Services, |
| Putnam Investments and Chief Compliance Officer, | Putnam Investments and Putnam Management |
| Putnam Management | |
| Denere P. Poulack(Born 1968) |
| Nancy E. Florek(Born 1957) | Assistant Vice President, Assistant Clerk, |
| Vice President, Director of Proxy Voting and Corporate | and Assistant Treasurer |
| Governance, Assistant Clerk, and Assistant Treasurer | Since 2004 |
| Since 2000 | |
| Janet C. Smith(Born 1965) |
| Michael J. Higgins(Born 1976) | Vice President, Principal Financial Officer, Principal |
| Vice President, Treasurer, and Clerk | Accounting Officer, and Assistant Treasurer |
| Since 2010 | Since 2007 |
| | Head of Fund Administration Services, |
| Jonathan S. Horwitz(Born 1955) | Putnam Investments and Putnam Management |
| Executive Vice President, Principal Executive Officer, | |
| and Compliance Liaison | Mark C. Trenchard(Born 1962) |
| Since 2004 | Vice President |
| | Since 2002 |
| | Director of Operational Compliance, Putnam |
| | Investments and Putnam Retail Management |
The principal occupations of the officers for the past five years have been with the employers as shown above, although in some cases they have held different positions with such employers. The address of each officer is 100 Federal Street, Boston, MA 02110.
|
| Mortgage Securities Fund 89 |
Putnam family of funds
The following is a list of Putnam’s open-end mutual funds offered to the public.Investors should carefully consider the investment objective, risks, charges, and expenses of a fund before investing. For a prospectus, or a summary prospectus if available, containing this and other information for any Putnam fund or product, contact your financial advisor or call Putnam Investor Services at 1-800-225-1581. Please read the prospectus carefully before investing.
| |
| Blend | Income |
| Capital Spectrum Fund | Diversified Income Trust |
| Emerging Markets Equity Fund | Floating Rate Income Fund |
| Equity Spectrum Fund | Global Income Trust |
| Focused Equity Fund | Government Money Market Fund* |
| Global Equity Fund | High Yield Fund |
| International Capital Opportunities Fund | Income Fund |
| International Equity Fund | Money Market Fund† |
| Multi-Cap Core Fund | Mortgage Opportunities Fund |
| Research Fund | Mortgage Securities Fund |
| Short Duration Bond Fund |
| Global Sector | Ultra Short Duration Income Fund |
| Global Health Care Fund | |
| Global Technology Fund | Tax-free Income |
| AMT-Free Municipal Fund |
| Growth | Intermediate-Term Municipal Income Fund |
| Growth Opportunities Fund | Short-Term Municipal Income Fund |
| International Growth Fund | Tax Exempt Income Fund |
| Small Cap Growth Fund | Tax-Free High Yield Fund |
| Sustainable Future Fund | |
| Sustainable Leaders Fund | State tax-free income funds‡: |
| California, Massachusetts, Minnesota, |
| Value | New Jersey, New York, Ohio, and Pennsylvania. |
| Convertible Securities Fund | |
| Equity Income Fund | |
| International Value Fund | |
| Small Cap Value Fund | |
|
| 90 Mortgage Securities Fund |
| |
| Absolute Return | Asset Allocation |
| Fixed Income Absolute Return Fund | Dynamic Risk Allocation Fund |
| Multi-Asset Absolute Return Fund | George Putnam Balanced Fund |
| | |
| Putnam PanAgora** | Dynamic Asset Allocation Balanced Fund |
| Putnam PanAgora Managed Futures Strategy | Dynamic Asset Allocation Conservative Fund |
| Putnam PanAgora Market Neutral Fund | Dynamic Asset Allocation Growth Fund |
| Putnam PanAgora Risk Parity Fund | |
| Retirement Income Fund Lifestyle 1 |
| |
| | RetirementReady® 2060 Fund |
| | RetirementReady® 2055 Fund |
| | RetirementReady® 2050 Fund |
| | RetirementReady® 2045 Fund |
| | RetirementReady® 2040 Fund |
| | RetirementReady® 2035 Fund |
| | RetirementReady® 2030 Fund |
| | RetirementReady® 2025 Fund |
| | RetirementReady® 2020 Fund |
*You could lose money by investing in the fund. Although the fund seeks to preserve the value of your investment at $1.00 per share, it cannot guarantee it will do so. An investment in the fund is not insured or guaranteed by the Federal Deposit Insurance Corporation or any other government agency. The fund’s sponsor has no legal obligation to provide financial support to the fund, and you should not expect that the sponsor will provide financial support to the fund at any time.
†You could lose money by investing in the fund. Although the fund seeks to preserve the value of your investment at $1.00 per share, it cannot guarantee it will do so. The fund may impose a fee upon sale of your shares or may temporarily suspend your ability to sell shares if the fund’s liquidity falls below required minimums because of market conditions or other factors.An investment in the fund is not insured or guaranteed by the Federal Deposit Insurance Corporation or any other government agency. The fund’s sponsor has no legal obligation to provide financial support to the fund, and you should not expect that the sponsor will provide financial support to the fund at any time.
‡Not available in all states.
**Sub-advised by PanAgora Asset Management.
Check your account balances and the most recent month-end performance in the Individual Investors section at putnam.com.
|
| Mortgage Securities Fund 91 |
Services for shareholders
Investor services
Systematic investment planTell us how much you wish to invest regularly — weekly, semimonthly, or monthly — and the amount you choose will be transferred automatically from your checking or savings account. There’s no additional fee for this service, and you can suspend it at any time. This plan may be a great way to save for college expenses or to plan for your retirement.
Please note that regular investing does not guarantee a profit or protect against loss in a declining market. Before arranging a systematic investment plan, consider your financial ability to continue making purchases in periods when prices are low.
Systematic exchangeYou can make regular transfers from one Putnam fund to another Putnam fund. There are no additional fees for this service, and you can cancel or change your options at any time.
Dividends PLUSYou can choose to have the dividend distributions from one of your Putnam funds automatically reinvested in another Putnam fund at no additional charge.
Free exchange privilegeYou can exchange money between Putnam funds free of charge, as long as they are the same class of shares. A signature guarantee is required if you are exchanging more than $500,000. The fund reserves the right to revise or terminate the exchange privilege.
Reinstatement privilegeIf you’ve sold Putnam shares or received a check for a dividend or capital gain, you may reinvest the proceeds with Putnam within 90 days of thetransaction and they will be reinvested at the fund’s current net asset value — with no sales charge. However, reinstatement of class B shares may have special tax consequences. Ask your financial or tax representative for details.
Check-writing serviceYou have ready access to many Putnam accounts. It’s as simple as writing a check, and there are no special fees or service charges. For more information about the check-writing service, call Putnam or visit our website.
Dollar cost averagingWhen you’re investing for long-term goals, it’s time, not timing, that counts. Investing on a systematic basis is a better strategy than trying to figure out when the markets will go up or down. This means investing the same amount of money regularly over a long period. This method of investing is called dollar cost averaging. When a fund’s share price declines, your investment dollars buy more shares at lower prices. When it increases, they buy fewer shares. Over time, you will pay a lower average price per share.
For more information
Visit the Individual Investors section at putnam.comA secure section of our website contains complete information on your account, including balances and transactions, updated daily. You may also conduct transactions, such as exchanges, additional investments, and address changes. Log on today to get your password.
Call us toll free at 1-800-225-1581Ask a helpful Putnam representative or your financial advisor for details about any of these or other services, or see your prospectus.
|
| 92 Mortgage Securities Fund |
Fund information
Founded over 80 years ago, Putnam Investments was built around the concept that a balance between risk and reward is the hallmark of a well-rounded financial program. We manage funds across income, value, blend, growth, sustainable, asset allocation, absolute return, and global sector categories.
| | |
| Investment Manager | Trustees | Michael J. Higgins |
| Putnam Investment | Kenneth R. Leibler,Chair | Vice President, Treasurer, |
| Management, LLC | Liaquat Ahamed | and Clerk |
| 100 Federal Street | Ravi Akhoury | |
| Boston, MA 02110 | Barbara M. Baumann | Jonathan S. Horwitz |
| | Katinka Domotorffy | Executive Vice President, |
| Investment Sub-Advisor | Catharine Bond Hill | Principal Executive Officer, |
| Putnam Investments Limited | Paul L. Joskow | and Compliance Liaison |
| 16 St James’s Street | Robert E. Patterson | |
| London, England SW1A 1ER | George Putnam, III | Richard T. Kircher |
| | Robert L. Reynolds | Vice President and BSA |
| Marketing Services | Manoj P. Singh | Compliance Officer |
| Putnam Retail Management | | |
| 100 Federal Street | Officers | Susan G. Malloy |
| Boston, MA 02110 | Robert L. Reynolds | Vice President and |
| President | Assistant Treasurer |
| Custodian | | |
| State Street Bank | Robert T. Burns | Denere P. Poulack |
| and Trust Company | Vice President and | Assistant Vice President, Assistant |
| Chief Legal Officer | Clerk, and Assistant Treasurer |
| Legal Counsel | | |
| Ropes & Gray LLP | James F. Clark | Janet C. Smith |
| Vice President, Chief Compliance | Vice President, |
| Independent Registered Public | Officer, and Chief Risk Officer | Principal Financial Officer, |
| Accounting Firm | | Principal Accounting Officer, |
| KPMG LLP | Nancy E. Florek | and Assistant Treasurer |
| | Vice President, Director of | |
| | Proxy Voting and Corporate | Mark C. Trenchard |
| | Governance, Assistant Clerk, | Vice President |
| | and Assistant Treasurer | |
This report is for the information of shareholders of Putnam Mortgage Securities Fund. It may also be used as sales literature when preceded or accompanied by the current prospectus, the most recent copy of Putnam’s Quarterly Performance Summary, and Putnam’s Quarterly Ranking Summary. For more recent performance, please visit putnam.com. Investors should carefully consider the investment objectives, risks, charges, and expenses of a fund, which are described in its prospectus. For this and other information or to request a prospectus or summary prospectus, call 1-800-225-1581 toll free. Please read the prospectus carefully before investing. The fund’s Statement of Additional Information contains additional information about the fund’s Trustees and is available without charge upon request by calling 1-800-225-1581.

| |
| (a) The fund's principal executive, financial and accounting officers are employees of Putnam Investment Management, LLC, the Fund's investment manager. As such they are subject to a comprehensive Code of Ethics adopted and administered by Putnam Investments which is designed to protect the interests of the firm and its clients. The Fund has adopted a Code of Ethics which incorporates the Code of Ethics of Putnam Investments with respect to all of its officers and Trustees who are employees of Putnam Investment Management, LLC. For this reason, the Fund has not adopted a separate code of ethics governing its principal executive, financial and accounting officers. |
| |
| Item 3. Audit Committee Financial Expert: |
| |
| The Funds' Audit, Compliance and Distributions Committee is comprised solely of Trustees who are “independent” (as such term has been defined by the Securities and Exchange Commission (“SEC”) in regulations implementing Section 407 of the Sarbanes-Oxley Act (the “Regulations”)). The Trustees believe that each of the members of the Audit, Compliance and Distributions Committee also possess a combination of knowledge and experience with respect to financial accounting matters, as well as other attributes, that qualify them for service on the Committee. In addition, the Trustees have determined that each of Mr. Patterson, Ms. Baumann and Mr. Singh qualifies as an “audit committee financial expert” (as such term has been defined by the Regulations) based on their review of his or her pertinent experience and education. The SEC has stated, and the funds' amended and restated agreement and Declaration of Trust provides, that the designation or identification of a person as an audit committee financial expert pursuant to this Item 3 of Form N-CSR does not impose on such person any duties, obligations or liability that are greater than the duties, obligations and liability imposed on such person as a member of the Audit, Compliance and Distribution Committee and the Board of Trustees in the absence of such designation or identification. |
| |
| Item 4. Principal Accountant Fees and Services: |
| |
| The following table presents fees billed in each of the last two fiscal years for services rendered to the fund by the fund's independent auditor: |
| | | | | |
| Fiscal year ended | Audit Fees | Audit-Related Fees | Tax Fees | All Other Fees |
|
|
| | | | | |
| September 30, 2019 | $147,425 | $ — | $5,555 | $ — |
| September 30, 2018 | $162,679 | $12,924* | $5,445 | $ — |
| * | Fees billed to the fund for services relating to a fund merger ($11,750) and for services relating to a review of certain trading activity that was the subject of a settlement between Putnam Investment Management, LLC and the Securities and Exchange Commission ($1,174). |
| |
| For the fiscal years ended September 30, 2019 and September 30, 2018, the fund's independent auditor billed aggregate non-audit fees in the amounts of $5,555 and $5,445 respectively, to the fund, Putnam Management and any entity controlling, controlled by or under common control with Putnam Management that provides ongoing services to the fund. |
| |
| Audit Fees represent fees billed for the fund's last two fiscal years relating to the audit and review of the financial statements included in annual reports and registration statements, and other services that are normally provided in connection with statutory and regulatory filings or engagements. |
| |
| Audit-Related Fees represent fees billed in the fund's last two fiscal years for services traditionally performed by the fund's auditor, including accounting consultation for proposed transactions or concerning financial accounting and reporting standards and other audit or attest services not required by statute or regulation. |
| |
| Tax Fees represent fees billed in the fund's last two fiscal years for tax compliance, tax planning and tax advice services. Tax planning and tax advice services include assistance with tax audits, employee benefit plans and requests for rulings or technical advice from taxing authorities. |
| |
| Pre-Approval Policies of the Audit, Compliance and Distributions Committee. The Audit, Compliance and Distributions Committee of the Putnam funds has determined that, as a matter of policy, all work performed for the funds by the funds' independent auditors will be pre-approved by the Committee itself and thus will generally not be subject to pre-approval procedures. |
| |
| The Audit, Compliance and Distributions Committee also has adopted a policy to pre-approve the engagement by Putnam Management and certain of its affiliates of the funds' independent auditors, even in circumstances where pre-approval is not required by applicable law. Any such requests by Putnam Management or certain of its affiliates are typically submitted in writing to the Committee and explain, among other things, the nature of the proposed engagement, the estimated fees, and why this work should be performed by that particular audit firm as opposed to another one. In reviewing such requests, the Committee considers, among other things, whether the provision of such services by the audit firm are compatible with the independence of the audit firm. |
| |
| The following table presents fees billed by the fund's independent auditor for services required to be approved pursuant to paragraph (c)(7)(ii) of Rule 2–01 of Regulation S-X. |
| | | | | |
| Fiscal year ended | Audit-Related Fees | Tax Fees | All Other Fees | Total Non-Audit Fees |
|
|
| September 30, 2019 | $ — | $ — | $ — | $ — |
| September 30, 2018 | $ — | $ — | $ — | $ — |
| |
| Item 5. Audit Committee of Listed Registrants |
| |
|
Item 6. Schedule of Investments: |
| |
| The registrant's schedule of investments in unaffiliated issuers is included in the report to shareholders in Item 1 above. |
| |
| Item 7. Disclosure of Proxy Voting Policies and Procedures For Closed-End Management Investment Companies: |
| |
|
Item 8. Portfolio Managers of Closed-End Investment Companies |
| |
|
Item 9. Purchases of Equity Securities by Closed-End Management Investment Companies and Affiliated Purchasers: |
| |
|
Item 10. Submission of Matters to a Vote of Security Holders: |
| |
|
Item 11. Controls and Procedures: |
| |
| (a) The registrant's principal executive officer and principal financial officer have concluded, based on their evaluation of the effectiveness of the design and operation of the registrant's disclosure controls and procedures as of a date within 180 days of the filing date of this report, that the design and operation of such procedures are generally effective to provide reasonable assurance that information required to be disclosed by the registrant in this report is recorded, processed, summarized and reported within the time periods specified in the Commission's rules and forms. |
| |
| (b) Changes in internal control over financial reporting: Not applicable |
| |
|
Item 12. Disclosures of Securities Lending Activities for Closed-End Management Investment Companies: |
| |
| (a)(1) The Code of Ethics of The Putnam Funds, which incorporates the Code of Ethics of Putnam Investments, is filed herewith. |
| |
| (a)(2) Separate certifications for the principal executive officer and principal financial officer of the registrant as required by Rule 30a-2(a) under the Investment Company Act of 1940, as amended, are filed herewith. |
| |
| (b) The certifications required by Rule 30a-2(b) under the Investment Company Act of 1940, as amended, are filed herewith. |
| |
| Pursuant to the requirements of the Securities Exchange Act of 1934 and the Investment Company Act of 1940, the registrant has duly caused this report to be signed on its behalf by the undersigned, thereunto duly authorized. |
| |
| Putnam Mortgage Securities Fund |
| |
| By (Signature and Title): |
| |
| /s/ Janet C. Smith
Janet C. Smith
Principal Accounting Officer
|
| |
| Pursuant to the requirements of the Securities Exchange Act of 1934 and the Investment Company Act of 1940, this report has been signed below by the following persons on behalf of the registrant and in the capacities and on the dates indicated. |
| |
| By (Signature and Title): |
| |
| /s/ Jonathan S. Horwitz
Jonathan S. Horwitz
Principal Executive Officer
|
| |
| By (Signature and Title): |
| |
| /s/ Janet C. Smith
Janet C. Smith
Principal Financial Officer
|