Exhibit (c)(2)(J) Project Alpha Discussion Materials Prepared for the Special Committee of the Board of Directors October 16, 2022

These materials have been prepared by Evercore Group L.L.C. (“Evercore”) for the Special Committee of the Board of Directors of Alpha (the “Company”) to whom such materials are directly addressed and delivered and may not be used or relied upon for any purpose other than as specifically contemplated. These materials are based on information provided by or on behalf of the Company and/or other potential transaction participants, from public sources or otherwise reviewed by Evercore. Evercore assumes no responsibility for independent investigation or verification of such information and has relied on such information being complete and accurate in all material respects. To the extent such information includes estimates and forecasts of future financial performance prepared by or reviewed with the Management of the Company and/or other potential transaction participants or obtained from public sources, Evercore has assumed that such estimates and forecasts have been reasonably prepared on bases reflecting the best currently available estimates and judgments of such Management (or, with respect to estimates and forecasts obtained from public sources, represent reasonable estimates). No representation or warranty, express or implied, is made as to the accuracy or completeness of such information and nothing contained herein is, or shall be relied upon as, a representation, whether as to the past, the present or the future. These materials were designed for use by specific persons familiar with the business and affairs of the Company. These materials are not intended to provide the sole basis for evaluating, and should not be considered a recommendation with respect to, any transaction or other matter. These materials have been developed by and are proprietary to Evercore and were prepared exclusively for the benefit and internal use of the Special Committee of the Board of Directors of the Company. These materials supplement the “Project Alpha Discussion Materials Prepared for the Special Committee of the Board of Directors dated July 25, 2022” presented by Evercore to the Special Committee on that date in connection with the proposed transaction described in those materials and the supplements to those materials presented to the Special Committee on July 28, 2022, September 2, 2022, September 13, 2022, September 18, 2022 and October 5, 2022 (collectively sometimes referred to as the “Prior Presentations”). These materials do not restate all of the assumptions and qualifications set forth in the Prior Presentations and must be read in conjunction with those presentations. These materials were compiled on a confidential basis for use by the Special Committee of the Board of Directors of the Company in evaluating the potential transaction described in the Prior Presentations and not with a view to public disclosure or filing thereof under state or federal securities laws, and may not be reproduced, disseminated, quoted or referred to, in whole or in part, without the prior written consent of Evercore. These materials do not constitute an offer or solicitation to sell or purchase any securities and are not a commitment by Evercore (or any affiliate) to provide or arrange any financing for any transaction or to purchase any security in connection therewith. Evercore assumes no obligation to update or otherwise revise these materials. These materials may not reflect information known to other professionals in other business areas of Evercore and its affiliates. Evercore and its affiliates do not provide legal, accounting or tax advice. Accordingly, any statements contained herein as to tax matters were neither written nor intended by Evercore or its affiliates to be used and cannot be used by any taxpayer for the purpose of avoiding tax penalties that may be imposed on such taxpayer. Each person should seek legal, accounting and tax advice based on his, her or its particular circumstances from independent advisors regarding the impact of the transactions or matters described herein.

Table of Contents Section Executive Summary I Alpha Situation Analysis II Alpha Financial Projections III Preliminary Valuation Analysis IV Appendix A. Weighted Average Cost of Capital B. Additional Analysis C. WaterCo Valuation Detail D. The Mineral Resources Company Supplemental Information

I. Executive Summary

Executive Summary Introduction ◼ Evercore Group L.L.C. (“Evercore”) is pleased to provide the following materials to the Special Committee (the “Special Committee”) of the Board of Alpha (“Alpha”) regarding the proposed acquisition by the Harold G. Hamm Trust and certain trusts established for the benefit of Hamm family members (collectively, the “Founder Family Rollover Shareholders”), of all of the outstanding shares of common stock of Alpha (the “Company Common Stock”), to the Unaffiliated Shareholders, which we define as the holders of Company Common Stock, other than shares of Company Common Stock owned by the Founder Family Rollover Shareholders (as defined in the Merger Agreement) and shares of Company Common Stock underlying unvested Company Restricted Stock Awards (collectively, with the Founder Family Rollover Shares (as defined in the Merger Agreement), the “Rollover Shares”) „ The Founder Family Rollover Shareholders own, in the aggregate, approximately 299.7 million shares of Company Common Stock, representing approximately 83% Company Common Stock outstanding „ The June 13, 2022 offer letter (the “Initial Proposal”) stated that the Hamm Family proposed to acquire each outstanding share of Company Common Stock (other than Rollover Shares) for $70.00 in cash „ Pursuant to the Offer and the merger contemplated by the agreement and plan of merger (the “Merger Agreement”), Omega Acquisition, Inc., an Oklahoma corporation (“Merger Sub”), of which 100% of the capital stock is owned by Harold G. Hamm, and Alpha, would acquire for cash all of the Company Common Stock, other than the Rollover Shares, at a price of $74.28 per share (the “Offer Price”) in cash (the “Proposed Merger”) ● The Offer Price represents an approximate 15% premium to the closing price and 18% premium to the 30-day VWAP of the Common Stock as of June 13, 2022 ● The transactions contemplated by the Merger Agreement are to be structured as a tender offer for any and all shares of Company Common Stock (other than Rollover Shares) followed by a merger without a vote of the Alpha shareholders in accordance with Section 1081.H of the Oklahoma General Corporation Act ◼ The following materials include: „ In the Executive Summary, an overview of the Proposed Merger and Evercore’s evaluation process to-date „ An overview of Alpha’s current market situation including an overview of its assets by business segment, including Alpha’s produced water and source water business (“WaterCo”), Alpha’s underlying mineral interest business (“The Mineral Resources Company” or “TMRC”), Alpha’s investment in a carbon capture business (“Summit Carbon Solutions”, “Summit” or “SCS”), and certain other investments „ A review of the financial projections for Alpha as provided by the management of Alpha (“Alpha Management”) and a review of the assumptions utilized by Alpha Management in deriving such financial projections „ A preliminary implied valuation of Alpha „ In the Appendix, Alpha’s weighted average cost of capital, Alpha’s last twelve months EBITDA multiple over time and detail with respect to the preliminary valuation of WaterCo and additional information, including valuation detail, regarding TMRC 1

Executive Summary Project Alpha Organizational Structure Founder Family Rollover Unaffiliated Shareholders Shareholders Alpha (363,000,544 shares outstanding) 83% of Alpha total 17% of Alpha total outstanding shares outstanding shares (299,732,253 shares) (63,268,291) 100% ownership 100% ownership 100% ownership 100% ownership 100% ownership 100% ownership 100% ownership 100% ownership interest interest interest interest interest interest interest interest 20 Broadway Banner Alpha The Mineral Alpha Alpha Asset Jagged Peak SCSI Holdings Associates Pipeline Innovations Resources Innovation Holdings, LLC Energy LLC LLC LLC LLC Company LLC Company, LLC 57.4% ownership 50.1% ownership 100% ownership interest interest interest The Mineral Parsley SoDe SFPG, LLC Resources Water LLC Company II LLC Source: Public filings; Alpha Management 2
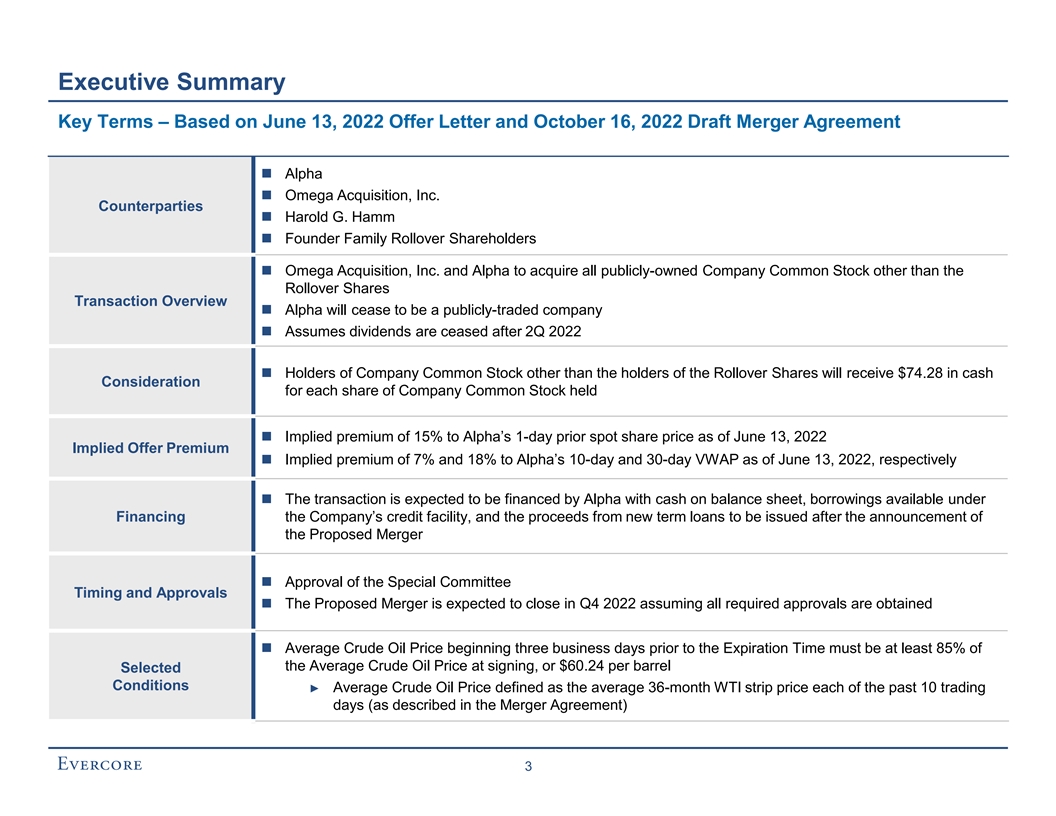
Executive Summary Key Terms – Based on June 13, 2022 Offer Letter and October 16, 2022 Draft Merger Agreement ◼ Alpha ◼ Omega Acquisition, Inc. Counterparties ◼ Harold G. Hamm ◼ Founder Family Rollover Shareholders ◼ Omega Acquisition, Inc. and Alpha to acquire all publicly-owned Company Common Stock other than the Rollover Shares Transaction Overview ◼ Alpha will cease to be a publicly-traded company ◼ Assumes dividends are ceased after 2Q 2022 ◼ Holders of Company Common Stock other than the holders of the Rollover Shares will receive $74.28 in cash Consideration for each share of Company Common Stock held ◼ Implied premium of 15% to Alpha’s 1-day prior spot share price as of June 13, 2022 Implied Offer Premium ◼ Implied premium of 7% and 18% to Alpha’s 10-day and 30-day VWAP as of June 13, 2022, respectively ◼ The transaction is expected to be financed by Alpha with cash on balance sheet, borrowings available under Financing the Company’s credit facility, and the proceeds from new term loans to be issued after the announcement of the Proposed Merger ◼ Approval of the Special Committee Timing and Approvals ◼ The Proposed Merger is expected to close in Q4 2022 assuming all required approvals are obtained ◼ Average Crude Oil Price beginning three business days prior to the Expiration Time must be at least 85% of the Average Crude Oil Price at signing, or $60.24 per barrel Selected Conditions ► Average Crude Oil Price defined as the average 36-month WTI strip price each of the past 10 trading days (as described in the Merger Agreement) 3
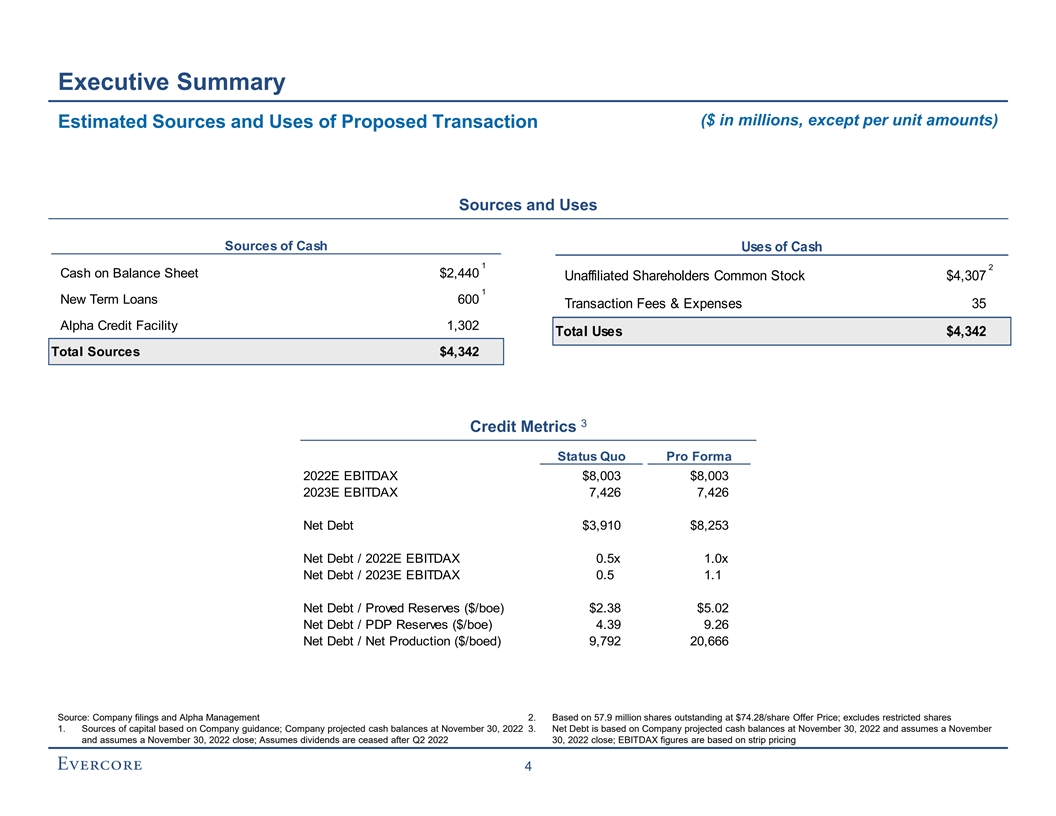
Executive Summary ($ in millions, except per unit amounts) Estimated Sources and Uses of Proposed Transaction Sources and Uses Sources of Cash Uses of Cash 1 2 Cash on Balance Sheet $2,440 Unaffiliated Shareholders Common Stock $4,307 1 New Term Loans 600 Transaction Fees & Expenses 35 Alpha Credit Facility 1,302 Total Uses $4,342 Total Sources $4,342 3 Credit Metrics Status Quo Pro Forma 2022E EBITDAX $8,003 $8,003 2023E EBITDAX 7,426 7,426 Net Debt $3,910 $8,253 Net Debt / 2022E EBITDAX 0.5x 1.0x Net Debt / 2023E EBITDAX 0.5 1.1 Net Debt / Proved Reserves ($/boe) $2.38 $5.02 Net Debt / PDP Reserves ($/boe) 4.39 9.26 Net Debt / Net Production ($/boed) 9,792 20,666 Source: Company filings and Alpha Management 2. Based on 57.9 million shares outstanding at $74.28/share Offer Price; excludes restricted shares 1. Sources of capital based on Company guidance; Company projected cash balances at November 30, 2022 3. Net Debt is based on Company projected cash balances at November 30, 2022 and assumes a November and assumes a November 30, 2022 close; Assumes dividends are ceased after Q2 2022 30, 2022 close; EBITDAX figures are based on strip pricing 4
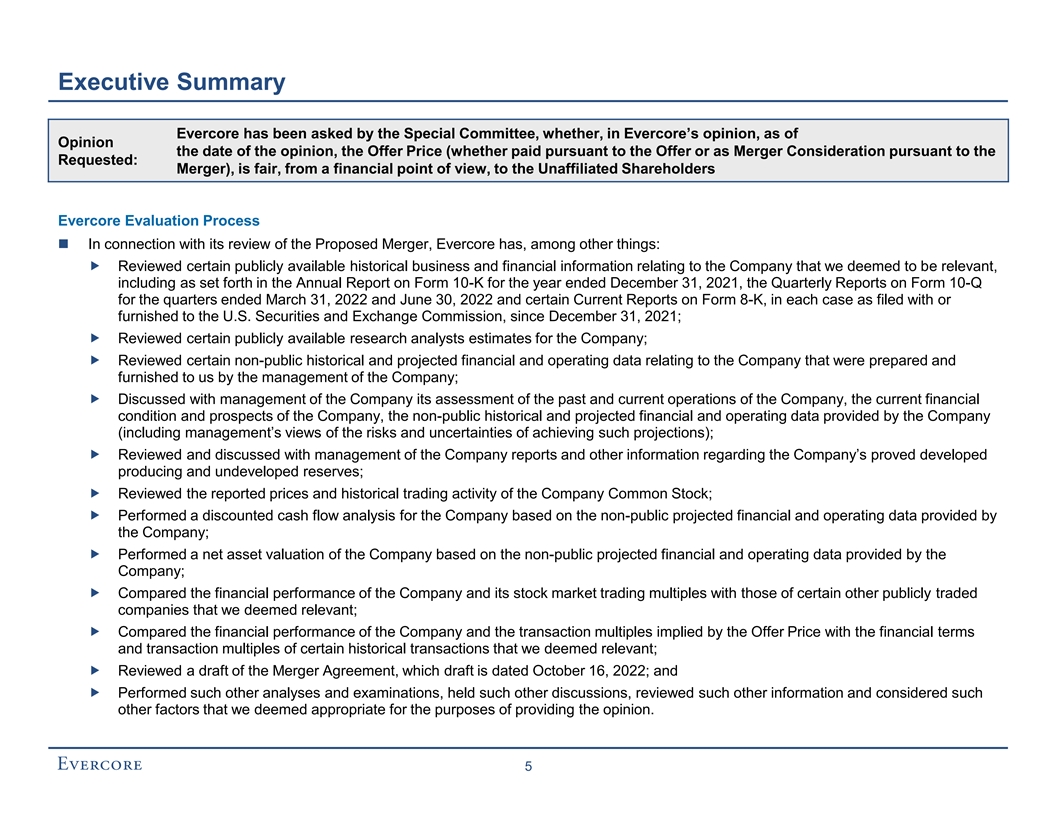
Executive Summary Evercore has been asked by the Special Committee, whether, in Evercore’s opinion, as of Opinion the date of the opinion, the Offer Price (whether paid pursuant to the Offer or as Merger Consideration pursuant to the Requested: Merger), is fair, from a financial point of view, to the Unaffiliated Shareholders Evercore Evaluation Process ◼ In connection with its review of the Proposed Merger, Evercore has, among other things: „ Reviewed certain publicly available historical business and financial information relating to the Company that we deemed to be relevant, including as set forth in the Annual Report on Form 10-K for the year ended December 31, 2021, the Quarterly Reports on Form 10-Q for the quarters ended March 31, 2022 and June 30, 2022 and certain Current Reports on Form 8-K, in each case as filed with or furnished to the U.S. Securities and Exchange Commission, since December 31, 2021; „ Reviewed certain publicly available research analysts estimates for the Company; „ Reviewed certain non-public historical and projected financial and operating data relating to the Company that were prepared and furnished to us by the management of the Company; „ Discussed with management of the Company its assessment of the past and current operations of the Company, the current financial condition and prospects of the Company, the non-public historical and projected financial and operating data provided by the Company (including management’s views of the risks and uncertainties of achieving such projections); „ Reviewed and discussed with management of the Company reports and other information regarding the Company’s proved developed producing and undeveloped reserves; „ Reviewed the reported prices and historical trading activity of the Company Common Stock; „ Performed a discounted cash flow analysis for the Company based on the non-public projected financial and operating data provided by the Company; „ Performed a net asset valuation of the Company based on the non-public projected financial and operating data provided by the Company; „ Compared the financial performance of the Company and its stock market trading multiples with those of certain other publicly traded companies that we deemed relevant; „ Compared the financial performance of the Company and the transaction multiples implied by the Offer Price with the financial terms and transaction multiples of certain historical transactions that we deemed relevant; „ Reviewed a draft of the Merger Agreement, which draft is dated October 16, 2022; and „ Performed such other analyses and examinations, held such other discussions, reviewed such other information and considered such other factors that we deemed appropriate for the purposes of providing the opinion. 5
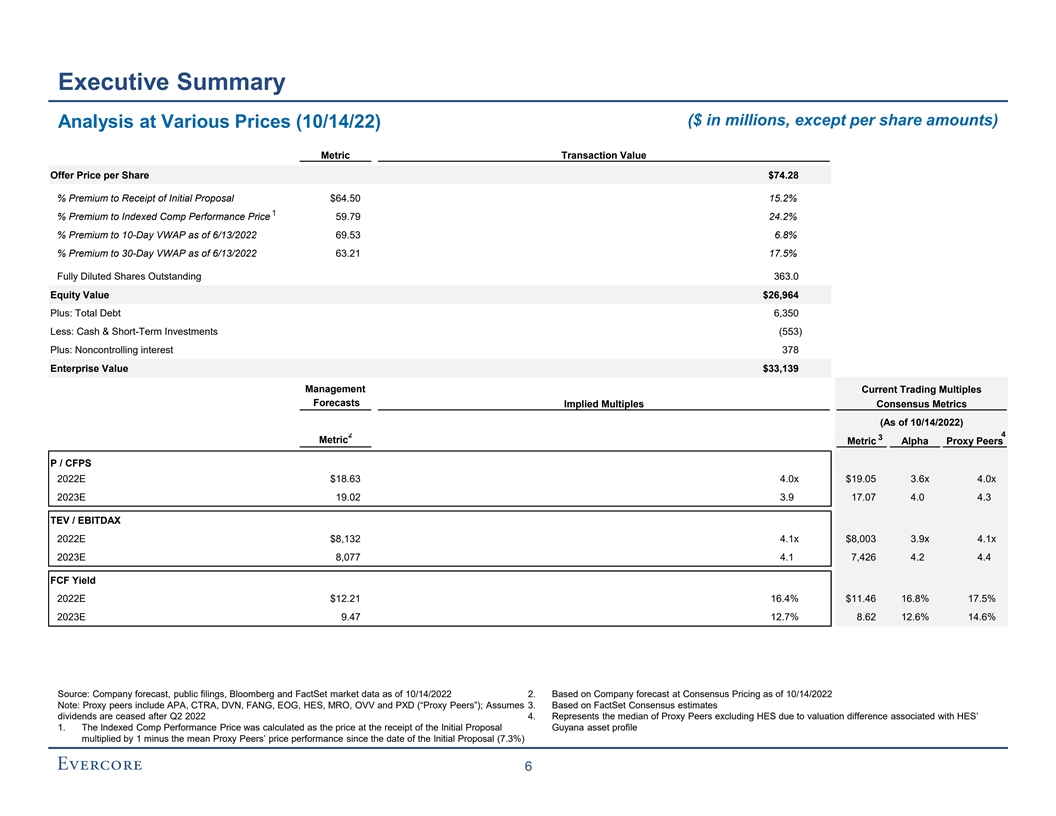
Executive Summary ($ in millions, except per share amounts) Analysis at Various Prices (10/14/22) Metric Transaction Value Offer Price per Share $74.28 % Premium to Receipt of Initial Proposal $64.50 15.2% 1 % Premium to Indexed Comp Performance Price 59.79 24.2% % Premium to 10-Day VWAP as of 6/13/2022 69.53 6.8% % Premium to 30-Day VWAP as of 6/13/2022 63.21 17.5% Fully Diluted Shares Outstanding 363.0 Equity Value $26,964 Plus: Total Debt 6,350 Less: Cash & Short-Term Investments (553) Plus: Noncontrolling interest 378 Enterprise Value $33,139 Management Current Trading Multiples Forecasts Implied Multiples Consensus Metrics (As of 10/14/2022) 2 4 3 Metric Metric Alpha Proxy Peers P / CFPS 2022E $18.63 4.0x $19.05 3.6x 4.0x 2023E 19.02 3.9 17.07 4.0 4.3 TEV / EBITDAX 2022E $8,132 4.1x $8,003 3.9x 4.1x 2023E 8,077 4.1 7,426 4.2 4.4 FCF Yield 2022E $12.21 16.4% $11.46 16.8% 17.5% 2023E 9.47 12.7% 8.62 12.6% 14.6% Source: Company forecast, public filings, Bloomberg and FactSet market data as of 10/14/2022 2. Based on Company forecast at Consensus Pricing as of 10/14/2022 Note: Proxy peers include APA, CTRA, DVN, FANG, EOG, HES, MRO, OVV and PXD (“Proxy Peers”); Assumes 3. Based on FactSet Consensus estimates dividends are ceased after Q2 2022 4. Represents the median of Proxy Peers excluding HES due to valuation difference associated with HES’ 1. The Indexed Comp Performance Price was calculated as the price at the receipt of the Initial Proposal Guyana asset profile multiplied by 1 minus the mean Proxy Peers’ price performance since the date of the Initial Proposal (7.3%) 6

Executive Summary Summary Trading Performance Share Performance $80.00 $74.28 $70.00 $70.00 $68.22 $60.00 Initial Proposal $50.00 $40.00 $30.00 $20.00 10/14/21 12/13/21 2/12/22 4/14/22 6/14/22 8/14/22 10/14/22 Alpha Initial Proposal Offer Price Historical Share Performance vs. Market Groups Period Alpha Proxy Peers WTI HHUB S&P 500 YTD 52.4% 47.5% 18.3% 76.5% (24.8%) Initial Proposal Since Initial Proposal 5.8% (7.3%) (26.3%) (25.1%) (4.4%) 1 Month (5.1%) (5.0%) 0.3% (22.5%) (9.2%) 100% 3 Months 47.7% 42.7% 17.3% 80.2% (25.3%) 6 Months 37.2% 51.4% 14.7% 16.2% (16.7%) 1 Year 30.4% 41.9% 9.4% 13.9% (19.3%) 75% 3 Years 141.5% 103.4% 68.7% 194.4% 19.6% 5 Years 49.7% 40.4% 77.3% 115.4% 51.9% 50% 41.9% 30.4% 25% 13.9% 9.4% --% (19.3%) (25%) (50%) 10/14/21 12/13/21 2/12/22 4/14/22 6/14/22 8/14/22 10/14/22 Alpha Proxy Peers WTI HHUB S&P 500 Source: FactSet market data as of 10/14/2022 7

Executive Summary Alpha Valuation Multiples Over Time TEV / NTM EBITDAX Simple Average 2021 2022 3 Years 5 Years 20.0x Alpha 5.1x 4.2x 5.1x 5.7x Proxy Peers 5.3 4.6 5.5 6.0 15.0x 10.0x 5.0x 4.1x 0.0x 2017 2018 2019 2020 2021 2022 Alpha Proxy Peers Range Price / NTM CFPS 16.0x Simple Average 2021 2022 3 Years 5 Years Alpha 3.8x 3.7x 3.6x 4.4x Proxy Peers 4.4 4.4 4.4 5.0 12.0x 8.0x 4.0x 3.9x 0.0x 1/1/20 4/1/20 7/1/20 10/1/20 1/1/21 4/1/21 7/1/21 10/1/21 1/1/22 4/1/22 7/1/22 10/1/22 Alpha Proxy Peers Range Source: FactSet market data and estimates as of 10/14/2022 Note: Averages calculated on weekly basis 8

II. Alpha Situation Analysis
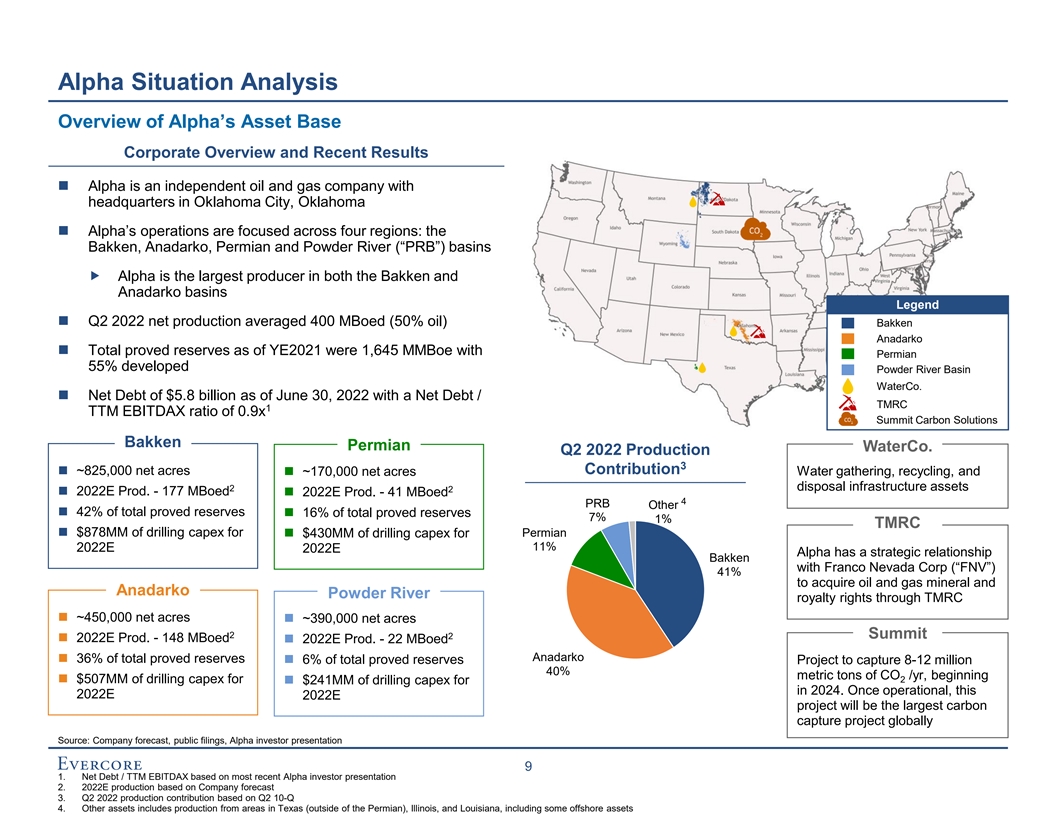
Alpha Situation Analysis Overview of Alpha’s Asset Base Corporate Overview and Recent Results ◼ Alpha is an independent oil and gas company with headquarters in Oklahoma City, Oklahoma ◼ Alpha’s operations are focused across four regions: the Bakken, Anadarko, Permian and Powder River (“PRB”) basins „ Alpha is the largest producer in both the Bakken and Anadarko basins Legend ◼ Q2 2022 net production averaged 400 MBoed (50% oil) Bakken Anadarko ◼ Total proved reserves as of YE2021 were 1,645 MMBoe with Permian 55% developed Powder River Basin WaterCo. ◼ Net Debt of $5.8 billion as of June 30, 2022 with a Net Debt / TMRC 1 TTM EBITDAX ratio of 0.9x Summit Carbon Solutions Bakken Permian WaterCo. Q2 2022 Production 3 ◼ ~825,000 net acres Contribution ◼ ~170,000 net acres Water gathering, recycling, and disposal infrastructure assets 2 2 ◼ 2022E Prod. - 177 MBoed◼ 2022E Prod. - 41 MBoed 4 PRB Other ◼ 42% of total proved reserves ◼ 16% of total proved reserves 7% 1% TMRC ◼ $878MM of drilling capex for ◼ $430MM of drilling capex for Permian 11% 2022E 2022E Alpha has a strategic relationship Bakken with Franco Nevada Corp (“FNV”) 41% to acquire oil and gas mineral and Anadarko Powder River royalty rights through TMRC ◼ ~450,000 net acres ◼ ~390,000 net acres 2 Summit 2 ◼ 2022E Prod. - 148 MBoed ◼ 2022E Prod. - 22 MBoed Anadarko ◼ 36% of total proved reserves ◼ 6% of total proved reserves Project to capture 8-12 million 40% metric tons of CO /yr, beginning 2 ◼ $507MM of drilling capex for ◼ $241MM of drilling capex for in 2024. Once operational, this 2022E 2022E project will be the largest carbon capture project globally Source: Company forecast, public filings, Alpha investor presentation 9 1. Net Debt / TTM EBITDAX based on most recent Alpha investor presentation 2. 2022E production based on Company forecast 3. Q2 2022 production contribution based on Q2 10-Q 4. Other assets includes production from areas in Texas (outside of the Permian), Illinois, and Louisiana, including some offshore assets

Alpha Situation Analysis A Bakken Asset Overview Asset Map Legend ◼ Alpha is the largest leaseholder and the largest producer Alpha Acreage in the Bakken field of North Dakota and Montana with 825,000 net acres ◼ The Bakken properties contain 764 MMBoe of proved reserves, 42% of total proved reserves and 163 MBoed, or 41% of Alpha’s total average daily Boe production for the second quarter of 2022 ◼ Alpha plans to average 7 operated rigs in the Bakken and expects to have first production on 319 gross (121 net) operated and non-operated wells during 2022 2-Stream Reserves by Category Reserves by Commodity 2-Stream Production History 100,000 CONT POSS Gas 4% 1% 33% PDP 75,000 32% 22,171 PROB 30% 22,982 19,664 50,000 PNP 56,721 1% 25,000 43,934 43,431 Oil 67% PUD 32% -- 2019 2020 2021 Crude Oil (MBbls) Natural Gas (MBoe) Source: Alpha Management, public filings, investor presentation 10
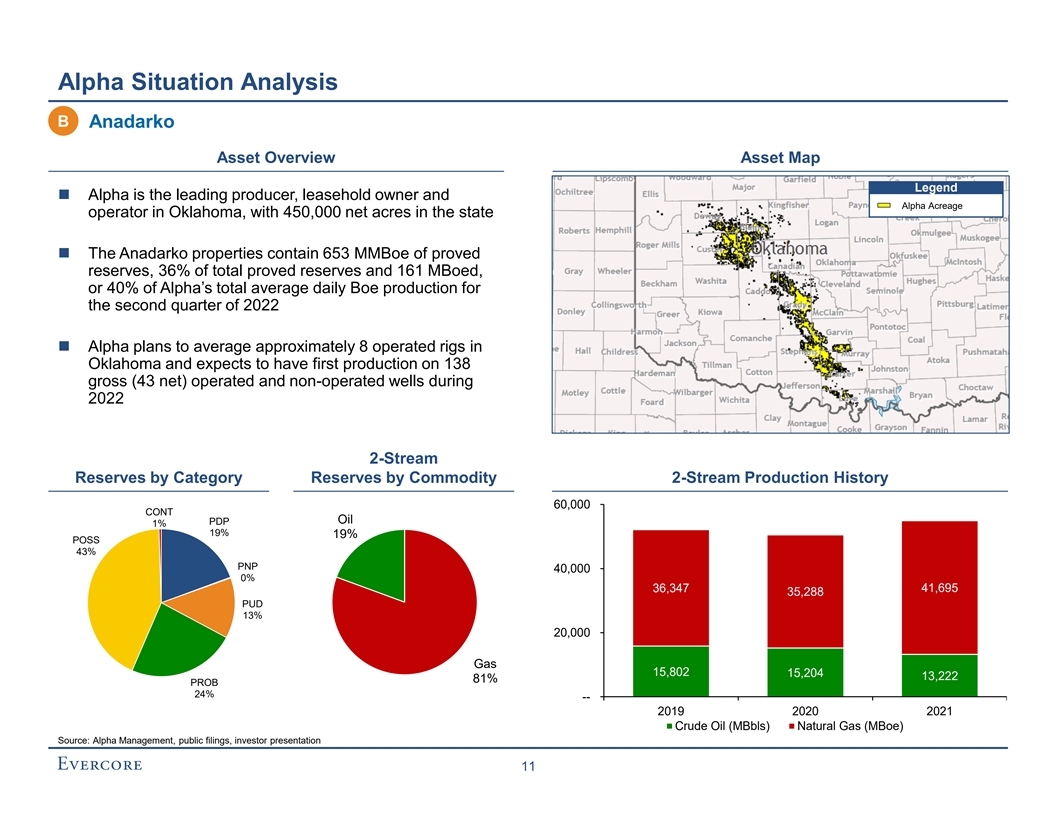
Alpha Situation Analysis B Anadarko Asset Overview Asset Map Legend ◼ Alpha is the leading producer, leasehold owner and Alpha Acreage operator in Oklahoma, with 450,000 net acres in the state ◼ The Anadarko properties contain 653 MMBoe of proved reserves, 36% of total proved reserves and 161 MBoed, or 40% of Alpha’s total average daily Boe production for the second quarter of 2022 ◼ Alpha plans to average approximately 8 operated rigs in Oklahoma and expects to have first production on 138 gross (43 net) operated and non-operated wells during 2022 2-Stream Reserves by Category Reserves by Commodity 2-Stream Production History 60,000 CONT Oil PDP 1% 19% 19% POSS 43% PNP 40,000 0% 36,347 41,695 35,288 PUD 13% 20,000 Gas 15,802 15,204 13,222 81% PROB 24% -- 2019 2020 2021 Crude Oil (MBbls) Natural Gas (MBoe) Source: Alpha Management, public filings, investor presentation 11

Alpha Situation Analysis C Permian Asset Overview Asset Map Legend ◼ Alpha entered the Permian via the acquisition of 92,000 Alpha Acreage net acres from Pioneer and currently holds ~170,000 net acres ◼ The Permian properties contain 284 MMBoe of proved reserves, 12% of total proved reserves and 44 MBoed, or 11% of Alpha’s total average daily Boe production for the second quarter of 2022 ◼ Alpha plans to average approximately 3 operated rigs in the play and expects to have first production on 41 gross (36 net) operated and non-operated wells during the year 2-Stream Reserves by Category Reserves by Commodity 2-Stream Production History 25,000 CONT POSS Gas PDP 6% 0% 19% 27% 20,000 4,531 4,123 PNP 1% 15,000 3,621 10,000 PUD 16,920 PROB 21% 15,595 53% Oil 12,907 5,000 73% -- 2019 2020 2021 Crude Oil (MBbls) Natural Gas (MBoe) Source: Alpha Management, public filings, investor presentation 12

Alpha Situation Analysis D Powder River Asset Overview Asset Map Legend ◼ Alpha has made significant acquisitions in the basin, Alpha Acreage acquiring 130,000 net acres from Samson Resources in 2021 and another 172,000 net acres from Chesapeake in 2022, bringing the total acreage in the basin to ~ 390,000 net acres ◼ The PRB properties contain 111 MMBoe of proved reserves, or 6% of total proved reserves and 27 MBoed, or 7% of Alpha’s total average daily Boe production for the second quarter of 2022 ◼ Alpha plans to average approximately 2 operated rigs in the play and expects to have first production on 40 gross (23 net) operated and non-operated wells during 2022 2-Stream Reserves by Category Reserves by Commodity 2-Stream Production History 20,000 PDP PUD Gas 5% 4% POSS 41% 45% 15,000 6,607 10,000 4,639 4,279 PROB 46% 5,000 Oil 8,057 6,515 59% 5,033 -- 2019 2020 2021 Crude Oil (MBbls) Natural Gas (MBoe) Source: Alpha Management, public filings, investor presentation 13
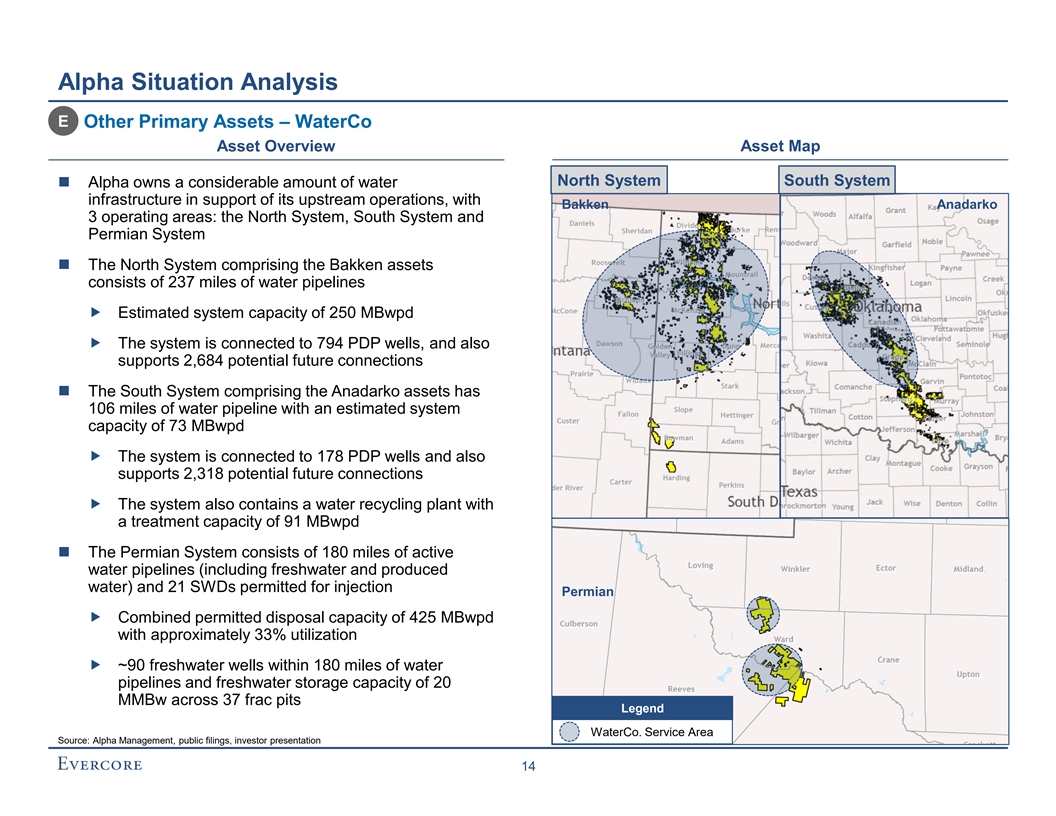
Alpha Situation Analysis E Other Primary Assets – WaterCo Asset Overview Asset Map North System South System ◼ Alpha owns a considerable amount of water infrastructure in support of its upstream operations, with Bakken Anadarko 3 operating areas: the North System, South System and Permian System ◼ The North System comprising the Bakken assets consists of 237 miles of water pipelines „ Estimated system capacity of 250 MBwpd „ The system is connected to 794 PDP wells, and also supports 2,684 potential future connections ◼ The South System comprising the Anadarko assets has 106 miles of water pipeline with an estimated system capacity of 73 MBwpd „ The system is connected to 178 PDP wells and also supports 2,318 potential future connections „ The system also contains a water recycling plant with a treatment capacity of 91 MBwpd ◼ The Permian System consists of 180 miles of active water pipelines (including freshwater and produced water) and 21 SWDs permitted for injection Permian „ Combined permitted disposal capacity of 425 MBwpd with approximately 33% utilization „ ~90 freshwater wells within 180 miles of water pipelines and freshwater storage capacity of 20 MMBw across 37 frac pits Legend WaterCo. Service Area Source: Alpha Management, public filings, investor presentation 14
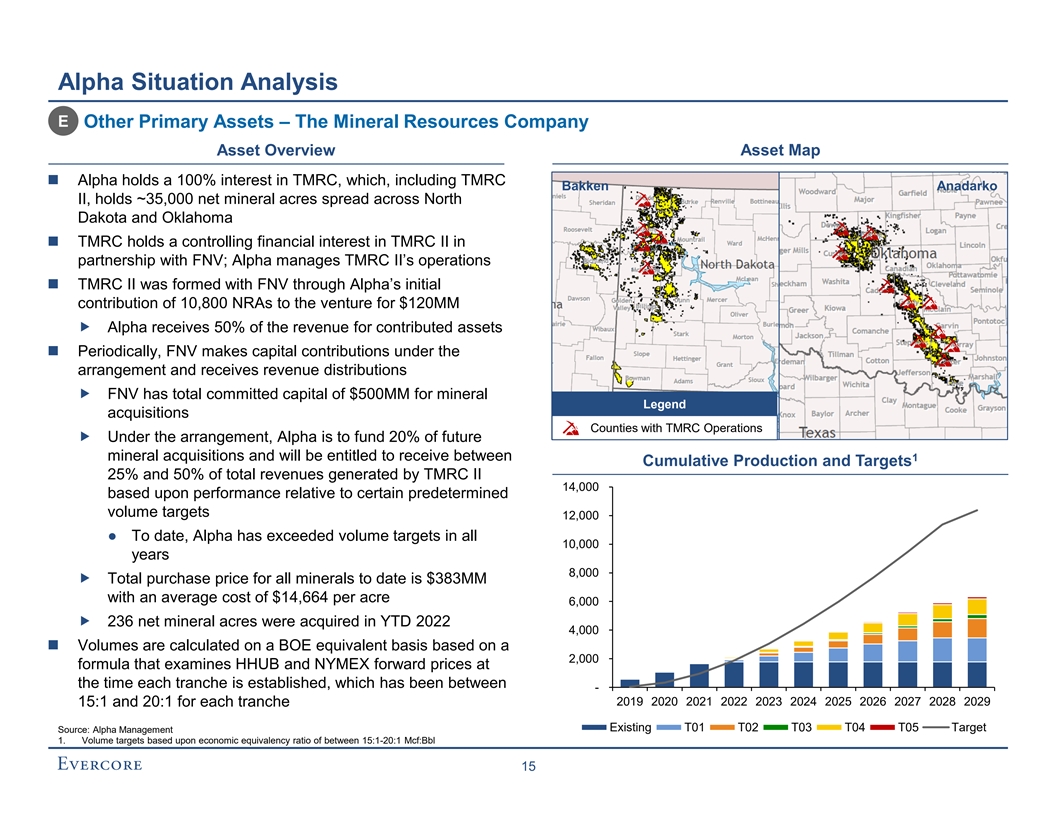
Alpha Situation Analysis E Other Primary Assets – The Mineral Resources Company Asset Overview Asset Map ◼ Alpha holds a 100% interest in TMRC, which, including TMRC Bakken Anadarko II, holds ~35,000 net mineral acres spread across North Dakota and Oklahoma ◼ TMRC holds a controlling financial interest in TMRC II in partnership with FNV; Alpha manages TMRC II’s operations ◼ TMRC II was formed with FNV through Alpha’s initial contribution of 10,800 NRAs to the venture for $120MM „ Alpha receives 50% of the revenue for contributed assets ◼ Periodically, FNV makes capital contributions under the arrangement and receives revenue distributions „ FNV has total committed capital of $500MM for mineral Legend acquisitions Counties with TMRC Operations „ Under the arrangement, Alpha is to fund 20% of future mineral acquisitions and will be entitled to receive between 1 Cumulative Production and Targets 25% and 50% of total revenues generated by TMRC II 14,000 based upon performance relative to certain predetermined volume targets 12,000 ● To date, Alpha has exceeded volume targets in all 10,000 years 8,000 „ Total purchase price for all minerals to date is $383MM with an average cost of $14,664 per acre 6,000 „ 236 net mineral acres were acquired in YTD 2022 4,000 ◼ Volumes are calculated on a BOE equivalent basis based on a 2,000 formula that examines HHUB and NYMEX forward prices at the time each tranche is established, which has been between - 2019 2020 2021 2022 2023 2024 2025 2026 2027 2028 2029 15:1 and 20:1 for each tranche Existing T01 T02 T03 T04 T05 Target Source: Alpha Management 1. Volume targets based upon economic equivalency ratio of between 15:1-20:1 Mcf:Bbl 15

Alpha Situation Analysis E Other Primary Assets – The Mineral Resources Company (cont’d) Acquisition Capital ◼ Total committed capital of $500 MM „ FNV to fund 80% of future acquisitions over 5 years ($400MM) Alpha 20% „ Alpha funds 20% of acquisitions for 25 - 50% revenues ($100 MM) FNV 80% „ FNV will receive 50% of monthly revenues „ Alpha will receive 25% of monthly revenues „ Remaining 25% of monthly revenues escrowed, and released only if production volumes are met Revenue Distribution ● Distribution of the escrowed amount is based upon volumes produced Escrow Alpha 25% − Alpha to receive 100% of escrowed revenues if volumes 25% exceeded targets − FNV to receive 100% of escrowed revenues if volumes < 62.5% of targets − Escrowed revenues to be shared when 62.5 –100% of FNV targets achieved based on a predetermined formula 50% ◼ While Alpha has exceeded all volume production targets to date, it Escrow Allocation is expected to fall below targets for the first time in 2023, falling Percent of Vol. FNV Alpha further behind as time moves forward based on the current drilling Target program 100.0% 0.0% 100.0% 90.0% 27.0% 73.0% ◼ Over $100 million of committed capital remains in the program, 80.0% 53.0% 47.0% though no acquisitions are included in the projections 70.0% 80.0% 20.0% 62.5% 100.0% 0.0% Cumulative Annual Tranche Volume Targets (MBoe) – Per $100 million Capital Spent Tranche Year 1 2 3 4 5 6 7 8 9 10 11 Volume Target (MBoe) - 20 160 390 690 1,040 1,430 1,860 2,310 2,800 3,310 Source: Alpha Management 16

Alpha Situation Analysis E Other Primary Assets – Summit Carbon Solutions Asset Overview Asset Map ◼ Alpha holds a 23.6% interest in Summit Carbon Solutions, which owns an infrastructure project that aims to be the world’s largest carbon capture and sequestration (“CCS”) project when operational „ 9.0 MMtpa of CO sequestered when operational, 2 committed from 38 ethanol plants „ Ability to scale to 16.0 – 17.0 MMtpa with incremental compression ◼ $250MM investment expected to yield 32.7% IRR at Company’s estimate of 45Q tax credit for carbon sequestration 1 „ $100 million invested as of June 30, 2022 ◼ Customers include ethanol plants across five states connected by pipeline infrastructure providing high purity CO byproduct 2 „ 38 ethanol plants representing 3.3-4.2 billion gallons of ethanol production partnered with Summit to inject CO with 76 identified potential sources 2 Legend „ ~20 MMtpa of US CO geologic storage 2 Summit pipeline system CO storage deep saline 2 ◼ Broom Creek injection site in contiguous sand with >25% Summit Carbon Solutions partner porosity located in Oliver County, North Dakota Storage site ethanol plant Ethanol plants unaffiliated with carbon capture projects Source: Alpha Management, public filings, investor presentation 1. Includes Alpha’s $2.4 MM invested capital in Ekona Power 17
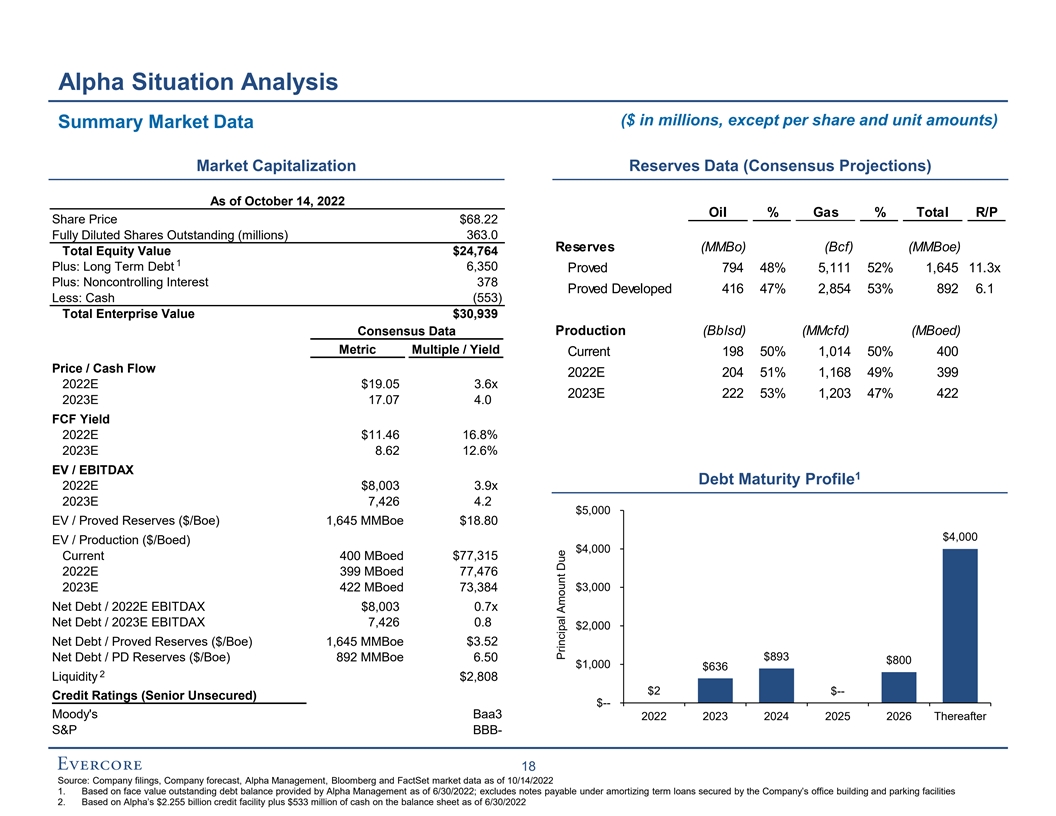
Alpha Situation Analysis ($ in millions, except per share and unit amounts) Summary Market Data Market Capitalization Reserves Data (Consensus Projections) As of October 14, 2022 Oil % Gas % Total R/P Share Price $68.22 Fully Diluted Shares Outstanding (millions) 363.0 Reserves (MMBo) (Bcf) (MMBoe) Total Equity Value $24,764 1 Plus: Long Term Debt 6,350 Proved 794 48% 5,111 52% 1,645 11.3x Plus: Noncontrolling Interest 378 Proved Developed 416 47% 2,854 53% 892 6.1 Less: Cash (553) Total Enterprise Value $30,939 Production (Bblsd) (MMcfd) (MBoed) Consensus Data Metric Multiple / Yield Current 198 50% 1,014 50% 400 Price / Cash Flow 2022E 204 51% 1,168 49% 399 2022E $19.05 3.6x 2023E 222 53% 1,203 47% 422 2023E 17.07 4.0 FCF Yield 2022E $11.46 16.8% 2023E 8.62 12.6% EV / EBITDAX 1 Debt Maturity Profile 2022E $8,003 3.9x 2023E 7,426 4.2 $5,000 EV / Proved Reserves ($/Boe) 1,645 MMBoe $18.80 $4,000 EV / Production ($/Boed) $4,000 Current 400 MBoed $77,315 2022E 399 MBoed 77,476 2023E 422 MBoed 73,384 $3,000 Net Debt / 2022E EBITDAX $8,003 0.7x Net Debt / 2023E EBITDAX 7,426 0.8 $2,000 $3.52 Net Debt / Proved Reserves ($/Boe) 1,645 MMBoe Net Debt / PD Reserves ($/Boe) 892 MMBoe 6.50 $893 $800 $1,000 $636 2 Liquidity $2,808 $2 $-- Credit Ratings (Senior Unsecured) $-- Moody's Baa3 2022 2023 2024 2025 2026 Thereafter S&P BBB- 18 Source: Company filings, Company forecast, Alpha Management, Bloomberg and FactSet market data as of 10/14/2022 1. Based on face value outstanding debt balance provided by Alpha Management as of 6/30/2022; excludes notes payable under amortizing term loans secured by the Company’s office building and parking facilities 2. Based on Alpha’s $2.255 billion credit facility plus $533 million of cash on the balance sheet as of 6/30/2022 Principal Amount Due

Share Price Alpha Situation Analysis Wall Street Research Price Targets Summary of Alpha Broker Coverage Alpha Broker Target Prices Firm Analyst Date Target Price RBC Capital Markets Scott Hanold 11 Oct '22 $80.00 100% $80 5% 5% 5% 6% SMBC Nikko Securities America David S. Havens 30 Sep '22 70.00 10% 10% 10% 11% 12% Tudor Pickering Holt Matthew Portillo 30 Sep '22 57.00 $73.00 TD Securities Menno Hulshof 28 Sept '22 70.00 $68.22 Siebert Williams Shank Gabriele Sorbara 23 Sep '22 75.00 80% $60 BMO Capital Markets Phillip Jungwirth 19 Sep '22 70.00 J.P. Morgan Arun Jayaram 15 Sep '22 78.00 58% Boston Energy Research LLC Paul S. Kuklinski 09 Sep '22 75.00 67% 57% 67% 60% 71% Stifel Nicolaus Derrick Whitfield 09 Sep '22 70.00 65% 70% Piper Sandler Mark A. Lear 15 Aug '22 70.00 72% $40 76% Susquehanna Biju Perincheril 7 Aug '22 70.00 Scotiabank GBM Paul Y. Cheng 1 Aug '22 80.00 40% Cowen & Company David Deckelbaum 29 Jul '22 70.00 Mizuho Securities USA Vincent Lovaglio 29 Jul '22 72.00 Raymond James John C. Freeman 29 Jul '22 75.00 $20 5 4 7 7 9 8 9 5 9 Truist Securities Neal Dingmann 29 Jul '22 85.00 20% 37% 33% Barclays Jeanine Wai 28 Jul '22 73.00 29% 28% 25% 24% 20% Morgan Stanley Devin McDermott 28 Jul '22 67.00 17% 12% Wells Fargo Securities Nitin Kumar 08 Jul '22 82.00 --% $ -- Citi Scott Gruber 15 Jun '22 74.00 Credit Suisse William Janela 14 Jun '22 78.00 Oct-20Jan-21Apr-21 Jul-21 Oct-21Jan-22Apr-22 Jul-22 Oct-22 Median: $73.00 Buy Hold Sell Target Price Share Price Mean: 73.38 75% Percentile: $78.00 25% Percentile: 70.00 Proxy Peers Target 7% 35% 29% 19% 24% 23% 15% 18% 41% 18% Upside 100% 6% 6% 7% 6% 12% 14% 13% 13% 26% 22% 80% 38% 29% 41% 38% 53% 60% 76% 86% 87% 40% 74% 72% 65% 62% 53% 50% 20% 40% 12% 0% Alpha APA CTRA DVN FANG EOG HES MRO OVV PXD Buy Hold Sell Source: FactSet market data as of 10/14/2022, Wall Street research; Alpha Management 19 Broker Ratings

Alpha Situation Analysis Ratings Agency Commentary Current Ratings Corporate Rating BBB- Senior Unsecured Baa3 Outlook Stable Outlook Stable Analyst Paul J O'Donnell Analyst Elena Nadtotchi Recent Comments S&P’s Credit Opinion: May 3, 2022 Moody’s Credit Opinion: November 4, 2021 ◼ Expect repayment of the $650 million, 2023 senior ◼ Reflects consistently robust operating performance and unsecured notes and $911 million, 2024 senior high durability of cash flows delivered amid wide-ranging unsecured notes within the next 12 months if commodity commodity price volatility prices remain supportive ◼ Commitment to a strong balance sheet, demonstrated by ◼ Anticipate free funds flow to debt well over 100% and significant repayment of debt. Rating also reflects leading debt to EBITDA below 0.75x in 2022 and 2023 margins, high capital efficiency and conservative financial ◼ Stable outlook based on strong stable credit measures policy and expectation that supportive commodity prices and What could prompt an Upgrade: moderate capital spending will lead to material cash flow „ Debt/production declining to $10,000/boe and What could prompt an Upgrade: revolver/debt maintained in excess of 50%. Would „ Increased scale of operations more in line with also require a sustained leveraged full-cycle ratio higher-rated peers or maintain a prudent financial above 2x policy and strong financial measures, including free What could prompt a Downgrade: funds flow to debt above 60% on a sustained basis „ A downgrade would be probable should revolver/debt What could prompt a Downgrade: fall below 30% or the leveraged full-cycle ratio „ If expected free funds flow to debt was to approach decline below 2x 30% on a sustained basis with no clear path to recovery Source: S&P Global Ratings and Moody’s 20

Alpha Situation Analysis Top 20 Institutional Shareholders and Hedge Funds of Note Top 250 Institutional Holders Summary Price $68.22 (10/14/22): Other Position (% Outstanding) 6% Estimated Prem. / (Disc.) 2 1 GARP Rank Investor Style to Basis Current 3/31/22 Cost Basis 9% Index 1 Smead Capital Mgmt. Core Value $27.95 144.1 % 2.0 % 2.0 % 30% 2 The Vanguard Group Index 42.65 60.0 1.5 1.1 Core Growth 3 Fidelity Mgmt. & Research GARP 63.20 7.9 0.8 0.1 10% 4 State Street Global Advisors Index 24.92 173.8 0.6 0.8 5 Dimensional Fund Advisors Quasi-Index 25.90 163.4 0.5 0.5 6 BlackRock Institutional Trust Index 24.72 176.0 0.5 0.7 Quasi-Index 7 First Trust Advisors Index 45.09 51.3 0.4 0.4 4% 8 D. E. Shaw & Co. Hedge Fund 38.76 76.0 0.3 0.4 Core Value 19% 9 Northern Trust Global Investments Core Growth 22.90 197.9 0.3 0.3 Hedge Funds & Broker-Dealers 10 Goldman Sachs Asset Mgmt. Core Growth 27.23 150.6 0.3 0.3 22% 11 Pentwater Capital Mgmt. Hedge Fund 64.68 5.5 0.2 0.0 3 12 Mellon Investments Corp. Index 41.04 66.2 0.2 0.2 Investor Type 13 Parametric Portfolio Associates Aggres. Gr. 18.55 267.7 0.2 0.2 Institutional 14 Citadel Advisors Hedge Fund 53.51 27.5 0.2 0.2 12% 15 BofA Global Research Broker-Dealer 41.85 63.0 0.2 0.4 Retail 16 Laurion Capital Mgmt. Hedge Fund 64.68 5.5 0.2 0.0 5% 17 Geode Capital Mgmt. Index 39.94 70.8 0.2 0.2 18 MFS Invst. Mgmt. Core Growth 64.23 6.2 0.2 0.0 19 EARNEST Partners Core Value 14.05 385.4 0.2 0.3 20 Encompass Capital Advisors Hedge Fund 64.68 5.5 0.1 0.0 Top 20 Total $40.53 68.3 % 8.9 % 8.1 % Hamm Family Source: Thomson Reuters, Company filings 83% 1. Estimated cost basis is a per share item calculated as the summed product of the volume-weighted average price over the periods when shares were purchased and the increase in shares over these periods divided by the total number of shares purchased during the most recent period of continuous ownership since 6/30/07 2. Data based on 6/30/22 13F filings and any subsequent 13Ds and 13Gs 3. Retail percent ownership based on disclosed broker non-votes from the 2022 annual meeting 21
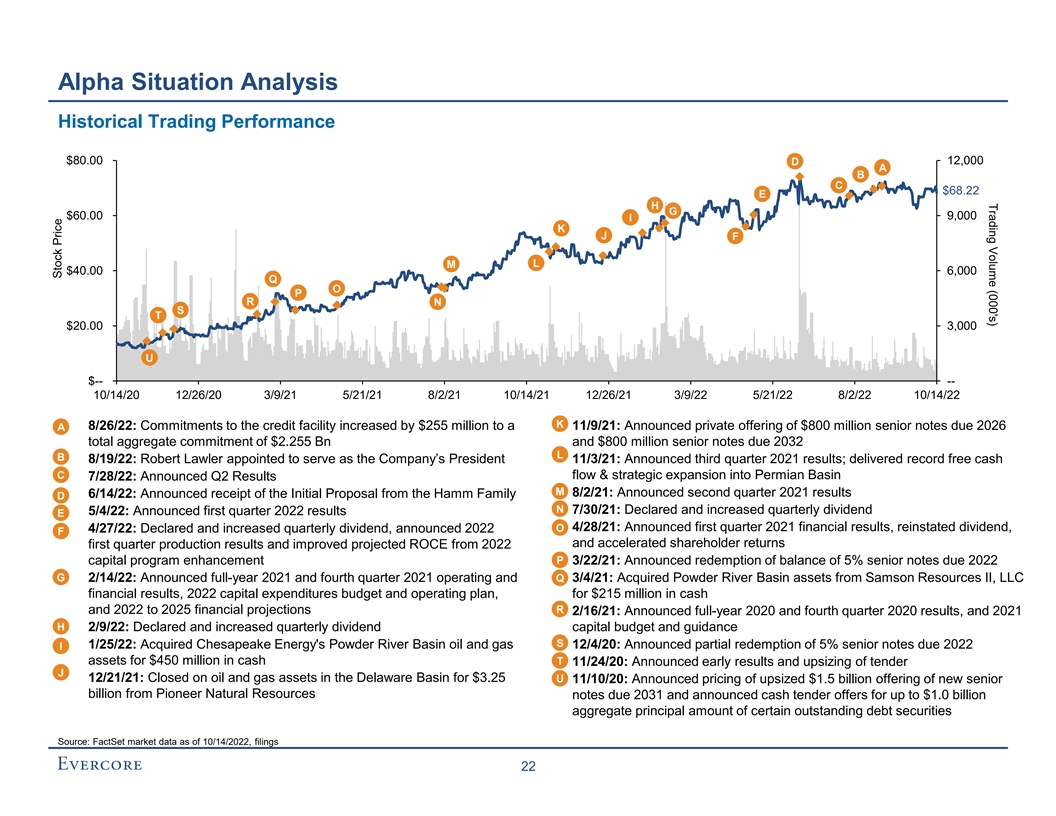
Trading Volume (000's) Alpha Situation Analysis Historical Trading Performance $80.00 12,000 D A B C $68.22 E H G $60.00 9,000 I K J F L M $40.00 6,000 Q O P R N S T $20.00 3,000 U $-- -- 10/14/20 12/26/20 3/9/21 5/21/21 8/2/21 10/14/21 12/26/21 3/9/22 5/21/22 8/2/22 10/14/22 K A • 8/26/22: Commitments to the credit facility increased by $255 million to a 11/9/21: Announced private offering of $800 million senior notes due 2026 total aggregate commitment of $2.255 Bn and $800 million senior notes due 2032 L B • 8/19/22: Robert Lawler appointed to serve as the Company’s President 11/3/21: Announced third quarter 2021 results; delivered record free cash C flow & strategic expansion into Permian Basin • 7/28/22: Announced Q2 Results M 8/2/21: Announced second quarter 2021 results • 6/14/22: Announced receipt of the Initial Proposal from the Hamm Family D N 7/30/21: Declared and increased quarterly dividend • 5/4/22: Announced first quarter 2022 results E O 4/28/21: Announced first quarter 2021 financial results, reinstated dividend, • 4/27/22: Declared and increased quarterly dividend, announced 2022 F and accelerated shareholder returns first quarter production results and improved projected ROCE from 2022 P capital program enhancement 3/22/21: Announced redemption of balance of 5% senior notes due 2022 G • 2/14/22: Announced full-year 2021 and fourth quarter 2021 operating and Q 3/4/21: Acquired Powder River Basin assets from Samson Resources II, LLC financial results, 2022 capital expenditures budget and operating plan, for $215 million in cash R and 2022 to 2025 financial projections 2/16/21: Announced full-year 2020 and fourth quarter 2020 results, and 2021 H • 2/9/22: Declared and increased quarterly dividend capital budget and guidance S • 1/25/22: Acquired Chesapeake Energy's Powder River Basin oil and gas 12/4/20: Announced partial redemption of 5% senior notes due 2022 I assets for $450 million in cash T 11/24/20: Announced early results and upsizing of tender J • 12/21/21: Closed on oil and gas assets in the Delaware Basin for $3.25 U 11/10/20: Announced pricing of upsized $1.5 billion offering of new senior billion from Pioneer Natural Resources notes due 2031 and announced cash tender offers for up to $1.0 billion aggregate principal amount of certain outstanding debt securities Source: FactSet market data as of 10/14/2022, filings 22 Stock Price

III. Alpha Financial Projections
Alpha Financial Projections Alpha Financial Projections – Assumptions ◼ The Company forecast incorporates the following assumptions provided by Alpha Management: „ Revenue / Expenses: ● 2022E – 2026E revenue and expenses per 2022 budget and Alpha’s five-year forecast „ Financing Assumptions: ● Revolving credit facility maturing October 2026 is extended at the same terms ● Assumes the 4.500% Senior Notes due 2023 are repaid in Q2 2023 ● Assumes the 3.800% Senior Notes due 2024 are repaid in Q2 2024 „ Distribution policy: ● Other than the repurchase of stock-based compensation, the forecast does not include any share repurchases beyond Q1 2022 ● The forecast assumes ~$101 million in dividends in Q2 and Q3 2022, with negligible dividend amounts in Q4 2022 and beyond Source: Alpha Management 23

Alpha Financial Projections Commodity Price Assumptions WTI ($ / Bbl) $120.00 $100.00 $80.00 $73.88 $62.30 $60.00 $40.00 7/1/22 7/1/23 7/1/24 7/1/25 7/1/26 2H 2022E 2023E 2024E 2025E 2026E Strip Pricing as of October 14, 2022 $89.02 $78.32 $71.12 $66.63 $63.43 Consensus Pricing as of October 14, 2022 95.79 90.56 81.85 78.64 73.88 Henry Hub ($ / MMBtu) $10.00 $8.00 $6.00 $4.92 $4.00 $3.81 $2.00 $ -- 7/1/22 7/1/23 7/1/24 7/1/25 7/1/26 2H 2022E 2023E 2024E 2025E 2026E Strip Pricing as of October 14, 2022 $7.23 $5.63 $4.78 $4.55 $4.47 Consensus Pricing as of October 14, 2022 7.68 5.42 4.56 4.36 3.81 Strip Pricing as of October 14, 2022 Consensus Pricing as of October 14, 2022 Source: Bloomberg market data as of 10/14/2022 Note: Commodity prices subject to final daily settlement prices 24
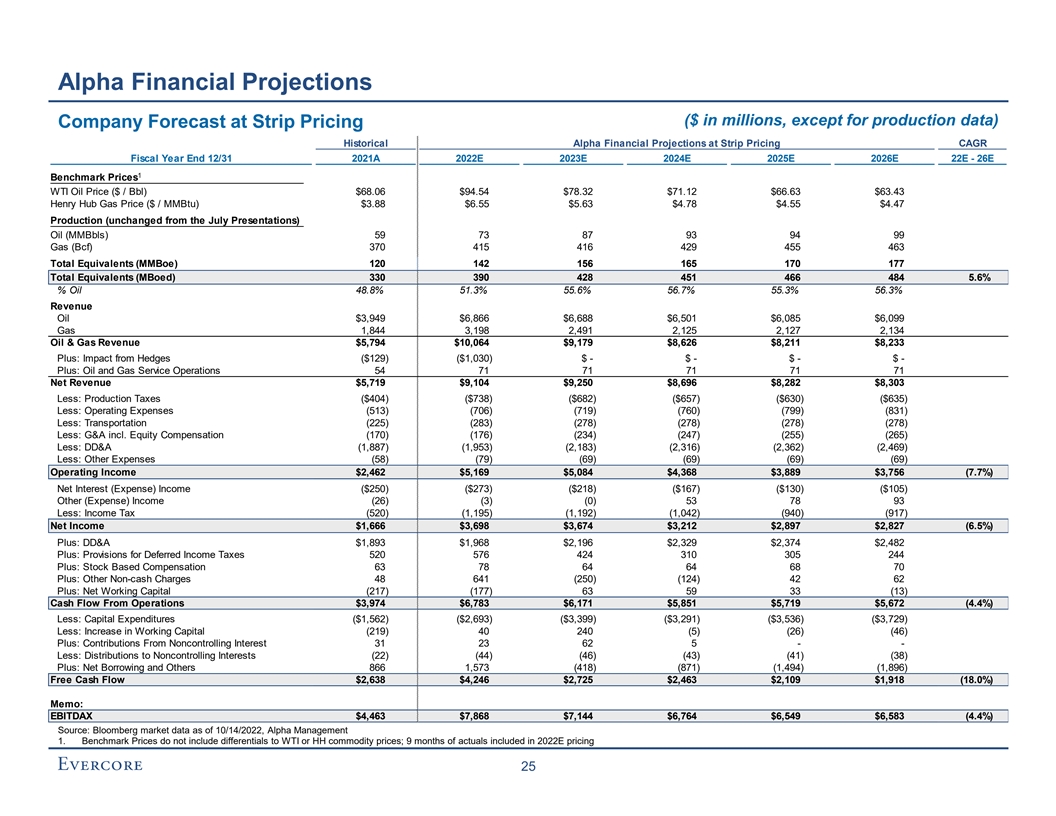
Alpha Financial Projections ($ in millions, except for production data) Company Forecast at Strip Pricing Historical Alpha Financial Projections at Strip Pricing CAGR Fiscal Year End 12/31 2021A 2022E 2023E 2024E 2025E 2026E 22E - 26E 1 Benchmark Prices WTI Oil Price ($ / Bbl) $68.06 $94.54 $78.32 $71.12 $66.63 $63.43 Henry Hub Gas Price ($ / MMBtu) $3.88 $6.55 $5.63 $4.78 $4.55 $4.47 Production (unchanged from the July Presentations) Oil (MMBbls) 59 73 87 93 94 99 Gas (Bcf) 370 415 416 429 455 463 Total Equivalents (MMBoe) 120 142 156 165 170 177 Total Equivalents (MBoed) 330 390 428 451 466 484 5.6% % Oil 48.8% 51.3% 55.6% 56.7% 55.3% 56.3% Revenue Oil $3,949 $6,866 $6,688 $6,501 $6,085 $6,099 Gas 1,844 3,198 2,491 2,125 2,127 2,134 Oil & Gas Revenue $5,794 $10,064 $9,179 $8,626 $8,211 $8,233 Plus: Impact from Hedges ($129) ($1,030) $ - $ - $ - $ - Plus: Oil and Gas Service Operations 54 71 71 71 71 71 Net Revenue $5,719 $9,104 $9,250 $8,696 $8,282 $8,303 Less: Production Taxes ($404) ($738) ($682) ($657) ($630) ($635) Less: Operating Expenses (513) (706) (719) (760) (799) (831) Less: Transportation (225) (283) (278) (278) (278) (278) Less: G&A incl. Equity Compensation (170) (176) (234) (247) (255) (265) Less: DD&A (1,887) (1,953) (2,183) (2,316) (2,362) (2,469) Less: Other Expenses (58) (79) (69) (69) (69) (69) Operating Income $2,462 $5,169 $5,084 $4,368 $3,889 $3,756 (7.7%) Net Interest (Expense) Income ($250) ($273) ($218) ($167) ($130) ($105) Other (Expense) Income (26) (3) (0) 53 78 93 Less: Income Tax (520) (1,195) (1,192) (1,042) (940) (917) Net Income $1,666 $3,698 $3,674 $3,212 $2,897 $2,827 (6.5%) Plus: DD&A $1,893 $1,968 $2,196 $2,329 $2,374 $2,482 Plus: Provisions for Deferred Income Taxes 520 576 424 310 305 244 Plus: Stock Based Compensation 63 78 64 64 68 70 Plus: Other Non-cash Charges 48 641 (250) (124) 42 62 Plus: Net Working Capital (217) (177) 63 59 33 (13) Cash Flow From Operations $3,974 $6,783 $6,171 $5,851 $5,719 $5,672 (4.4%) Less: Capital Expenditures ($1,562) ($2,693) ($3,399) ($3,291) ($3,536) ($3,729) Less: Increase in Working Capital (219) 40 240 (5) (26) (46) Plus: Contributions From Noncontrolling Interest 31 23 62 5 - - Less: Distributions to Noncontrolling Interests (22) (44) (46) (43) (41) (38) Plus: Net Borrowing and Others 866 1,573 (418) (871) (1,494) (1,896) Free Cash Flow $2,638 $4,246 $2,725 $2,463 $2,109 $1,918 (18.0%) Memo: EBITDAX $4,463 $7,868 $7,144 $6,764 $6,549 $6,583 (4.4%) Source: Bloomberg market data as of 10/14/2022, Alpha Management 1. Benchmark Prices do not include differentials to WTI or HH commodity prices; 9 months of actuals included in 2022E pricing 25
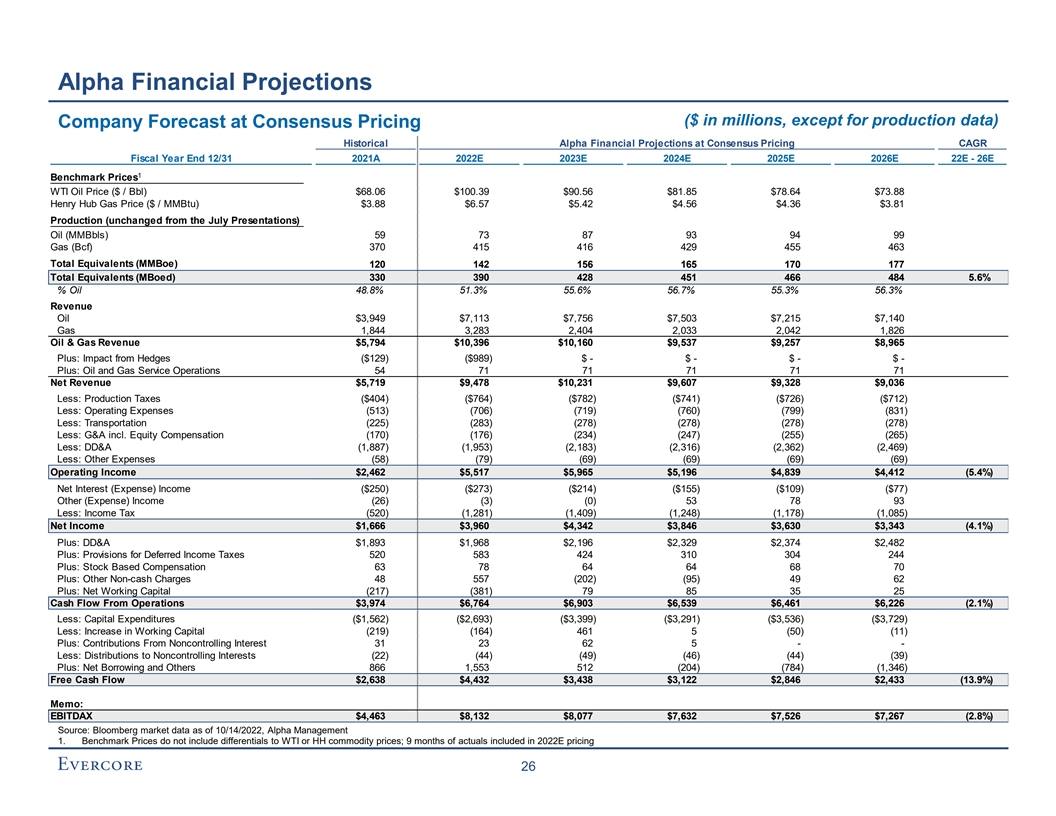
Alpha Financial Projections ($ in millions, except for production data) Company Forecast at Consensus Pricing Historical Alpha Financial Projections at Consensus Pricing CAGR Fiscal Year End 12/31 2021A 2022E 2023E 2024E 2025E 2026E 22E - 26E 1 Benchmark Prices WTI Oil Price ($ / Bbl) $68.06 $100.39 $90.56 $81.85 $78.64 $73.88 Henry Hub Gas Price ($ / MMBtu) $3.88 $6.57 $5.42 $4.56 $4.36 $3.81 Production (unchanged from the July Presentations) Oil (MMBbls) 59 73 87 93 94 99 Gas (Bcf) 370 415 416 429 455 463 Total Equivalents (MMBoe) 120 142 156 165 170 177 Total Equivalents (MBoed) 330 390 428 451 466 484 5.6% % Oil 48.8% 51.3% 55.6% 56.7% 55.3% 56.3% Revenue Oil $3,949 $7,113 $7,756 $7,503 $7,215 $7,140 Gas 1,844 3,283 2,404 2,033 2,042 1,826 Oil & Gas Revenue $5,794 $10,396 $10,160 $9,537 $9,257 $8,965 Plus: Impact from Hedges ($129) ($989) $ - $ - $ - $ - Plus: Oil and Gas Service Operations 54 71 71 71 71 71 Net Revenue $5,719 $9,478 $10,231 $9,607 $9,328 $9,036 Less: Production Taxes ($404) ($764) ($782) ($741) ($726) ($712) Less: Operating Expenses (513) (706) (719) (760) (799) (831) Less: Transportation (225) (283) (278) (278) (278) (278) Less: G&A incl. Equity Compensation (170) (176) (234) (247) (255) (265) Less: DD&A (1,887) (1,953) (2,183) (2,316) (2,362) (2,469) Less: Other Expenses (58) (79) (69) (69) (69) (69) Operating Income $2,462 $5,517 $5,965 $5,196 $4,839 $4,412 (5.4%) Net Interest (Expense) Income ($250) ($273) ($214) ($155) ($109) ($77) Other (Expense) Income (26) (3) (0) 53 78 93 Less: Income Tax (520) (1,281) (1,409) (1,248) (1,178) (1,085) Net Income $1,666 $3,960 $4,342 $3,846 $3,630 $3,343 (4.1%) Plus: DD&A $1,893 $1,968 $2,196 $2,329 $2,374 $2,482 Plus: Provisions for Deferred Income Taxes 520 583 424 310 304 244 Plus: Stock Based Compensation 63 78 64 64 68 70 Plus: Other Non-cash Charges 48 557 (202) (95) 49 62 Plus: Net Working Capital (217) (381) 79 85 35 25 Cash Flow From Operations $3,974 $6,764 $6,903 $6,539 $6,461 $6,226 (2.1%) Less: Capital Expenditures ($1,562) ($2,693) ($3,399) ($3,291) ($3,536) ($3,729) Less: Increase in Working Capital (219) (164) 461 5 (50) (11) Plus: Contributions From Noncontrolling Interest 31 23 62 5 - - Less: Distributions to Noncontrolling Interests (22) (44) (49) (46) (44) (39) Plus: Net Borrowing and Others 866 1,553 512 (204) (784) (1,346) Free Cash Flow $2,638 $4,432 $3,438 $3,122 $2,846 $2,433 (13.9%) Memo: EBITDAX $4,463 $8,132 $8,077 $7,632 $7,526 $7,267 (2.8%) Source: Bloomberg market data as of 10/14/2022, Alpha Management 1. Benchmark Prices do not include differentials to WTI or HH commodity prices; 9 months of actuals included in 2022E pricing 26

Alpha Financial Projections ($ in millions) Total Production (MBoed) Corporate EBITDAX 2021A 2022E 2023E 2024E 2025E 2026E 2021A 2022E 2023E 2024E 2025E 2026E Capital Expenditures Free Cash Flow 2021A 2022E 2023E 2024E 2025E 2026E 2021A 2022E 2023E 2024E 2025E 2026E 2 1 Company Forecast (Strip Pricing) Company Forecast (Consensus Pricing) Wall Street Consensus Estimate Source: Alpha Management and Bloomberg market data as of 10/14/2022 1. Applied Wall Street Consensus regarding WTI and Henry Hub pricing to the same production, remaining drilling locations, drilling cadence and financial assumptions used in the Company forecast based on Strip Pricing 2. Wall Street Consensus estimates regarding Alpha’s individual metric shown in each graph (i.e., total production, corporate EBITDAX, capital expenditures and free cash flow) 27 330 $1,562 330 $1,562 330 $1,562 390 $2,693 390 $2,693 399 $2,754 428 $3,399 428 $3,399 422 $3,066 451 $3,291 451 $3,291 436 $3,199 466 $3,536 466 $3,536 458 $3,314 484 $3,729 484 $3,729 502 $3,385 $4,463 $2,638 $4,463 $2,638 $4,463 $2,412 $7,868 $4,246 $8,132 $4,432 $8,003 $4,161 $7,144 $2,725 $8,077 $3,438 $7,426 $3,130 $6,764 $2,463 $7,632 $3,122 $6,660 $2,679 $6,549 $2,109 $7,526 $2,846 $6,046 $2,001 $6,583 $1,918 $7,267 $2,433 $5,882 $1,700

IV. Preliminary Valuation Analysis
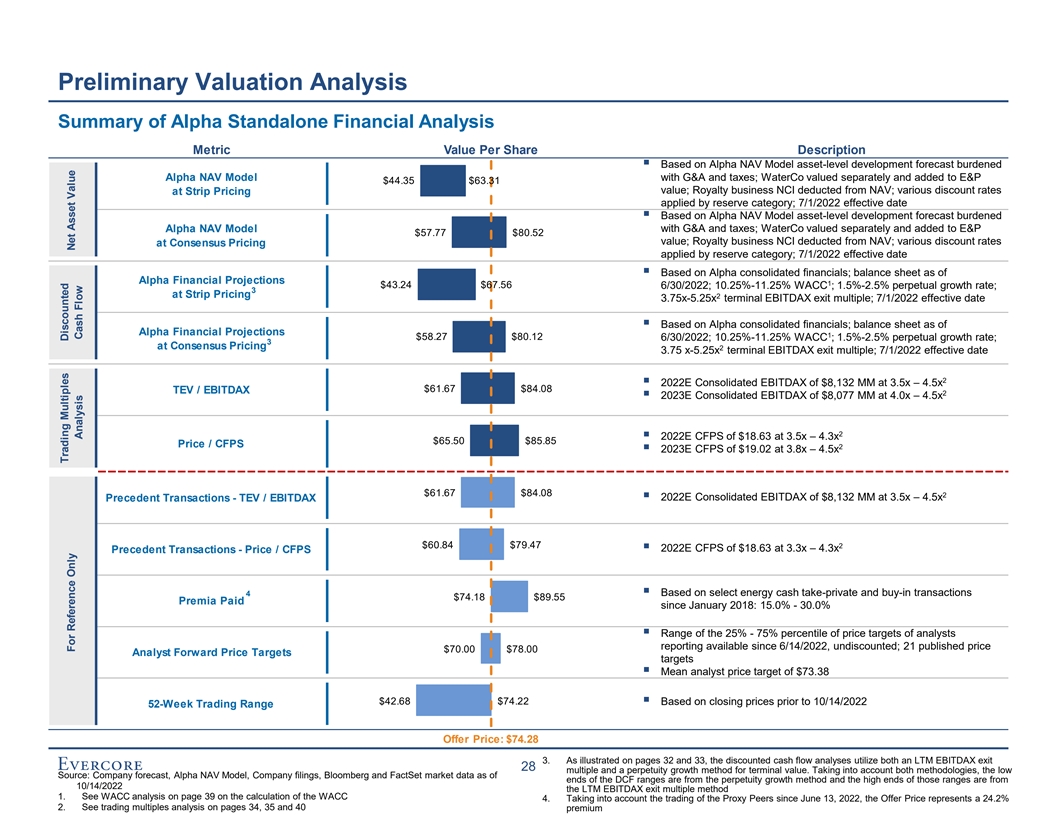
Preliminary Valuation Analysis Summary of Alpha Standalone Financial Analysis Metric Value Per Share Description ▪ Based on Alpha NAV Model asset-level development forecast burdened Alpha NAV Model with G&A and taxes; WaterCo valued separately and added to E&P $44.35 $63.31 value; Royalty business NCI deducted from NAV; various discount rates at Strip Pricing applied by reserve category; 7/1/2022 effective date ▪ Based on Alpha NAV Model asset-level development forecast burdened Alpha NAV Model with G&A and taxes; WaterCo valued separately and added to E&P $57.77 $80.52 value; Royalty business NCI deducted from NAV; various discount rates at Consensus Pricing applied by reserve category; 7/1/2022 effective date ▪ Based on Alpha consolidated financials; balance sheet as of Alpha Financial Projections 1 $43.24 $67.56 6/30/2022; 10.25%-11.25% WACC ; 1.5%-2.5% perpetual growth rate; 3 at Strip Pricing 2 3.75x-5.25x terminal EBITDAX exit multiple; 7/1/2022 effective date ▪ Based on Alpha consolidated financials; balance sheet as of Alpha Financial Projections 1 $58.27 $80.12 6/30/2022; 10.25%-11.25% WACC ; 1.5%-2.5% perpetual growth rate; 3 at Consensus Pricing 2 3.75 x-5.25x terminal EBITDAX exit multiple; 7/1/2022 effective date 2 ▪ 2022E Consolidated EBITDAX of $8,132 MM at 3.5x – 4.5x $61.67 $84.08 TEV / EBITDAX 2 ▪ 2023E Consolidated EBITDAX of $8,077 MM at 4.0x – 4.5x 2 ▪ 2022E CFPS of $18.63 at 3.5x – 4.3x $65.50 $85.85 Price / CFPS 2 ▪ 2023E CFPS of $19.02 at 3.8x – 4.5x $61.67 $84.08 2 Precedent Transactions - TEV / EBITDAX▪ 2022E Consolidated EBITDAX of $8,132 MM at 3.5x – 4.5x $60.84 $79.47 2 ▪ 2022E CFPS of $18.63 at 3.3x – 4.3x Precedent Transactions - Price / CFPS 4▪ Based on select energy cash take-private and buy-in transactions $74.18 $89.55 Premia Paid since January 2018: 15.0% - 30.0% ▪ Range of the 25% - 75% percentile of price targets of analysts reporting available since 6/14/2022, undiscounted; 21 published price $70.00 $78.00 Analyst Forward Price Targets targets ▪ Mean analyst price target of $73.38 $42.68 $74.22 ▪ Based on closing prices prior to 10/14/2022 52-Week Trading Range Offer Price: $74.28 3. As illustrated on pages 32 and 33, the discounted cash flow analyses utilize both an LTM EBITDAX exit 28 multiple and a perpetuity growth method for terminal value. Taking into account both methodologies, the low Source: Company forecast, Alpha NAV Model, Company filings, Bloomberg and FactSet market data as of ends of the DCF ranges are from the perpetuity growth method and the high ends of those ranges are from 10/14/2022 the LTM EBITDAX exit multiple method 1. See WACC analysis on page 39 on the calculation of the WACC 4. Taking into account the trading of the Proxy Peers since June 13, 2022, the Offer Price represents a 24.2% 2. See trading multiples analysis on pages 34, 35 and 40 premium Trading Multiples Discounted For Reference Only Net Asset Value Analysis Cash Flow

Preliminary Valuation Analysis Overview of Alpha NAV Assumptions (unchanged from the July Presentations, except for the two pricing cases) ◼ Valuation assumes a 7/1/2022 effective date (i.e. starting point for NAV cash flows) ◼ Projected production and cash flows are based on the Alpha NAV Model provided by Alpha on 6/28/2022 and rolled forward to a 7/1/2022 effective date „ Alpha provided updates to PDP, remaining locations and drilling cadence as a part of this roll forward „ Selected discount rates by reserve category based on Evercore review of type curve areas provided in the Alpha NAV Model ◼ The model applies two pricing cases as shown below: 2H 2022E 2023E 2024E 2025E 2026E Thereafter WTI ($ / Bbl) $89.02 $78.32 $71.12 $66.63 $63.43 $63.43 Strip Pricing as of October 14, 2022 HHUB ($ / MMBtu) 7.23 5.63 4.78 4.55 4.47 4.47 WTI ($ / Bbl) $95.79 $90.56 $81.85 $78.64 $73.88 $73.88 Consensus Pricing as of October 14, 2022 HHUB ($ / MMBtu) 7.68 5.42 4.56 4.36 3.81 3.81 ◼ Hedges based on Company-provided hedge portfolio as of 5/24/2022; Company confirmed no additional hedges have been added as of 10/14/22 ◼ G&A assumptions are based on Company-provided projections in the Alpha NAV Model „ Per Alpha Management, G&A assumed to be $1.50 / Boe, with a maximum of $350 million per year, and decreasing 50% upon completion of full rig utilization in the Anadarko Basin in 2045 ◼ Cash taxes assume a year end 2021 net capitalized cost of $16.7 billion and 2021 year end Federal and Oklahoma NOL balances of $1.2 billion and $3.1 billion, respectively, each rolled forward to 7/1/2022 „ Cash taxes discount rate based on weighted average of discount rates applied to undiscounted cash flows by reserve category ◼ Net debt based on Alpha provided balances as of 6/30/2022 ◼ Fully diluted shares outstanding based on Alpha provided share count as of 5/24/2022 ◼ WaterCo valued as a standalone entity, including all capital expenditures ◼ Fully consolidated TMRC, with a deduct for the non-controlling interests associated with FNV’s economic interest in the venture ◼ Summit valued at invested capital as of 6/30/2022 (including capital invested in Ekona Power) Note: Commodity prices subject to final daily settlement prices 29

Preliminary Valuation Analysis ($ in millions, except per share amounts) Alpha NAV Summary at Various Discount Rates – Strip Pricing Asset Reserves Discount Rate Selected Range Area (MBoe) 0% 5% 8% 10% 12% 15% 20% 25% 30% 35% Low High Discount Rates PDP North 528,478 $11,493 $8,862 $7,896 $7,394 $6,972 $6,452 $5,792 $5,298 $4,912 $4,601 $7,394 $7,896 South 467,975 10,400 7,243 6,234 5,741 5,342 4,867 4,289 3,874 3,559 3,309 5,741 6,234 PRB 71,344 1,794 1,367 1,212 1,132 1,066 983 879 802 741 693 1,132 1,212 Permian 145,917 5,151 3,584 3,074 2,822 2,618 2,375 2,078 1,865 1,704 1,576 2,822 3,074 TMRC 16,371 483 323 274 251 232 211 185 166 152 141 251 274 Total PDP 1,230,085 $29,321 $21,379 $18,691 $17,340 $16,230 $14,888 $13,223 $12,005 $11,068 $10,320 $17,340 $18,691 Technical PUD North 607,743 $9,712 $6,291 $5,081 $4,469 $3,966 $3,363 $2,632 $2,119 $1,743 $1,458 $3,363 $3,966 South 406,336 7,915 4,125 3,078 2,603 2,239 1,833 1,380 1,087 884 735 1,833 2,239 PRB 437,466 7,821 3,040 1,876 1,399 1,064 730 418 257 167 113 730 1,064 Permian 476,130 12,065 6,159 4,439 3,652 3,049 2,381 1,657 1,208 912 708 2,381 3,049 Technical PUD Reserves 1,927,675 $37,512 $19,615 $14,474 $12,122 $10,318 $8,306 $6,086 $4,670 $3,705 $3,014 $8,306 $10,318 PROB North 343,976 $4,455 $2,255 $1,587 $1,278 $1,042 $781 $502 $335 $229 $159 $502 $781 South 582,826 9,251 3,831 2,562 2,040 1,667 1,279 887 656 505 401 887 1,279 PRB 231,160 3,840 1,879 1,321 1,069 878 670 447 312 225 165 447 670 Permian 124,011 2,749 1,276 880 706 577 438 292 204 146 106 292 438 PROB Reserves 1,281,974 $20,295 $9,241 $6,350 $5,093 $4,164 $3,168 $2,129 $1,506 $1,105 $831 $2,129 $3,168 POSS North 159,781 $1,956 $615 $301 $178 $96 $21 $-- $-- $-- $-- $-- $-- South 556,192 8,881 3,272 1,999 1,492 1,141 793 469 299 201 141 299 469 PRB 805,764 12,176 3,916 2,169 1,508 1,068 655 303 138 54 8 138 303 Permian 345,542 6,617 2,139 1,241 911 697 500 334 254 207 177 254 334 POSS Reserves 1,867,279 $29,630 $9,942 $5,710 $4,089 $3,002 $1,970 $1,106 $691 $462 $326 $691 $1,106 Total Reserves 6,307,012 $116,759 $60,178 $45,225 $38,644 $33,715 $28,332 $22,544 $18,873 $16,341 $14,490 $28,466 $33,283 Total E&P Asset-Level Value $116,759 $60,178 $45,225 $38,644 $33,715 $28,332 $22,544 $18,873 $16,341 $14,490 $28,466 $33,283 1 Less: Hedges (761) (743) Plus: Value of WaterCo 1,419 2,211 Plus: Invested Capital from Energy Innovations 100 100 2 Less: G&A (2,366) (1,935) 3 Less: Cash Taxes (4,614) (3,842) Less: Minerals Non-Controlling Interest⁴ (271) (236) Less: Asset Retirement Obligation (77) (63) Enterprise Value $21,895 $28,775 Less: Net Debt (5,797) Implied Equity Value $16,098 $22,978 / Fully Diluted Shares (millions) 363.0 Implied Equity Value per Share $44.35 $63.31 Source: Alpha NAV Model; Bloomberg and FactSet market data as of 10/14/2022 1. Assumes hedges held to expiration and discounted at 5-8% 2. G&A discount rates based on the weighted average discount rates of reserve categories by total reserves (14.2%-18.0%) 3. Cash tax discount rates based on the weighted average discount rates of reserve categories by PV-0 of cash flows (13.5%-17.2%) 4. TMRC consolidated in NAV; NCI represents FNV’s share of future value associated with TMRC cash flows 30

Preliminary Valuation Analysis ($ in millions, except per share amounts) Alpha NAV Summary at Various Discount Rates – Consensus Pricing Asset Reserves Discount Rate Selected Range Area (MBoe) 0% 5% 8% 10% 12% 15% 20% 25% 30% 35% Low High Discount Rates PDP North 528,478 $13,800 $10,485 $9,288 $8,671 $8,155 $7,522 $6,723 $6,129 $5,666 $5,293 $8,671 $9,288 South 467,975 10,867 7,621 6,582 6,072 5,659 5,166 4,565 4,132 3,801 3,538 6,072 6,582 PRB 71,344 2,080 1,571 1,388 1,294 1,216 1,120 999 909 839 783 1,294 1,388 Permian 145,917 6,142 4,219 3,601 3,299 3,054 2,763 2,409 2,156 1,964 1,813 3,299 3,601 TMRC 16,371 505 339 289 265 246 223 196 177 162 150 265 289 Total PDP 1,230,085 $33,394 $24,235 $21,148 $19,600 $18,329 $16,794 $14,892 $13,501 $12,431 $11,577 $19,600 $21,148 Technical PUD North 607,743 $12,597 $8,296 $6,776 $6,005 $5,370 $4,605 $3,671 $3,010 $2,520 $2,145 $4,605 $5,370 South 406,336 8,534 4,532 3,418 2,911 2,521 2,082 1,591 1,270 1,046 882 2,082 2,521 PRB 437,466 9,953 4,070 2,600 1,988 1,552 1,108 681 451 317 232 1,108 1,552 Permian 476,130 15,285 7,972 5,827 4,838 4,077 3,230 2,301 1,718 1,330 1,059 3,230 4,077 Technical PUD Reserves 1,927,675 $46,369 $24,870 $18,621 $15,741 $13,520 $11,025 $8,245 $6,449 $5,212 $4,318 $11,025 $13,520 PROB North 343,976 $6,360 $3,388 $2,472 $2,043 $1,710 $1,336 $925 $669 $500 $384 $925 $1,336 South 582,826 9,574 4,176 2,880 2,337 1,944 1,528 1,096 834 660 537 1,096 1,528 PRB 231,160 4,794 2,445 1,767 1,458 1,223 963 680 505 388 307 680 963 Permian 124,011 3,605 1,723 1,211 986 817 635 441 323 245 190 441 635 PROB Reserves 1,281,974 $24,333 $11,732 $8,331 $6,824 $5,693 $4,461 $3,143 $2,331 $1,794 $1,419 $3,143 $4,461 POSS North 159,781 $2,952 $1,101 $641 $451 $319 $189 $74 $22 $-- $-- $22 $74 South 556,192 9,203 3,472 2,158 1,630 1,263 896 549 362 253 184 362 549 PRB 805,764 15,668 5,408 3,164 2,294 1,704 1,134 623 368 228 144 368 623 Permian 345,542 8,441 2,783 1,630 1,203 924 665 446 339 279 240 339 446 POSS Reserves 1,867,279 $36,264 $12,764 $7,593 $5,579 $4,210 $2,884 $1,692 $1,092 $760 $568 $1,092 $1,692 Total Reserves 6,307,012 $140,360 $73,601 $55,694 $47,745 $41,752 $35,164 $27,972 $23,374 $20,197 $17,881 $34,861 $40,821 Total E&P Asset-Level Value $140,360 $73,601 $55,694 $47,745 $41,752 $35,164 $27,972 $23,374 $20,197 $17,881 $34,861 $40,821 1 Less: Hedges (719) (702) Plus: Value of WaterCo 1,419 2,211 Plus: Invested Capital from Energy Innovations 100 100 2 Less: G&A (2,366) (1,935) 3 Less: Cash Taxes (6,164) (5,159) Less: Minerals Non-Controlling Interest⁴ (289) (252) Less: Asset Retirement Obligation (77) (63) Enterprise Value $26,766 $35,022 Less: Net Debt (5,797) Implied Equity Value $20,969 $29,225 / Fully Diluted Shares (millions) 363.0 Implied Equity Value per Share $57.77 $80.52 Source: Alpha NAV Model; Bloomberg and FactSet market data as of 10/14/2022 1. Assumes hedges held to expiration and discounted at 5-8% 2. G&A discount rates based on the weighted average discount rates of reserve categories by total reserves (14.2%-18.0%) 3. Cash tax discount rates based on the weighted average discount rates of reserve categories by PV-0 of cash flows (13.6%-17.3%) 4. TMRC consolidated in NAV; NCI represents FNV’s share of future value associated with TMRC cash flows 31

Preliminary Valuation Analysis ($ in millions, except per share values) Alpha Discounted Cash Flow Analysis – Strip Pricing For Years Ending December 31, Perpetuity LTM EBITDAX 2H 2022E 2023E 2024E 2025E 2026E Multiple Growth EBITDAX $3,893 $7,144 $6,764 $6,549 $6,583 $6,583 $6,583 Less: Tax Depreciation and Amortization (1,588) (2,864) (2,232) (1,964) (1,696) (3,729) EBIT $2,306 $4,280 $4,532 $4,585 $4,887 $2,854 1 Less: Taxes (576) (1,070) (1,133) (1,146) (1,222) (714) Plus: Federal and State NOL Tax Shield 156 29 23 25 2 EBIAT $1,885 $3,240 $3,422 $3,463 $3,668 $2,141 Plus: Tax Depreciation and Amortization 1,588 2,864 2,232 1,964 1,696 3,729 Less: Change in Working Capital (406) 103 5 26 46 -- Less: Capital Expenditures (1,588) (3,493) (3,291) (3,536) (3,729) (3,729) Unlevered Free Cash Flow $1,479 $2,714 $2,368 $1,917 $1,681 $2,141 EBITDAX Multiple / Perpetuity Growth Rate 4.5x 2.0% Implied Terminal Value $29,626 $24,465 18,712 15,452 PV of Terminal Value @ 10.8% Discount Rate Plus: PV of Unlevered Free Cash Flow @ 10.8% Discount Rate 8,351 8,351 Implied Enterprise Value $27,063 $23,803 Less: Net Debt as of 6/30/22 (5,797) (5,797) Less: Non-Controlling Interest (378) (378) Implied Equity Value $20,888 $17,628 Fully Diluted Shares Outstanding (mm) 363.0 363.0 Implied Equity Value per Share $57.54 $48.56 Exit Multiple Sensitivity Perpetuity Growth Rate Sensitivity WACC Terminal Exit Multiple WACC Perpetuity Growth Rate 3.0x 3.8x 4.5x 5.3x 6.0x 1.0% 1.5% 2.0% 2.5% 3.0% 9.75% $42.18 $51.13 $60.08 $69.03 $77.98 9.75% $50.72 $53.41 $56.45 $59.90 $63.86 10.25% 41.26 50.03 58.80 67.56 76.33 10.25% 47.28 49.63 52.26 55.24 58.62 10.75% 40.36 48.95 57.54 66.13 74.72 10.75% 44.20 46.26 48.56 51.14 54.05 11.25% 39.48 47.90 56.32 64.74 73.16 11.25% 41.41 43.24 45.26 47.52 50.05 11.75% 38.62 46.87 55.12 63.37 71.62 11.75% 38.89 40.52 42.31 44.29 46.50 Implied Perpetuity Growth Rate Sensitivity Implied Exit Multiple Sensitivity WACC Terminal Exit Multiple WACC Perpetuity Growth Rate 3.0x 3.8x 4.5x 5.3x 6.0x 1.0% 1.5% 2.0% 2.5% 3.0% 9.75% (1.1%) 1.1% 2.5% 3.6% 4.3% 9.75% 3.7x 3.9x 4.2x 4.5x 4.8x 10.25% (0.6%) 1.6% 3.0% 4.1% 4.8% 10.25% 3.5 3.7 3.9 4.2 4.5 10.75% (0.1%) 2.1% 3.5% 4.6% 5.3% 10.75% 3.3 3.5 3.7 3.9 4.2 11.25% 0.4% 2.6% 4.0% 5.1% 5.8% 11.25% 3.2 3.3 3.5 3.7 3.9 11.75% 0.9% 3.1% 4.5% 5.6% 6.3% 11.75% 3.0 3.2 3.3 3.5 3.7 32 Source: Company forecast 1. 25% tax rate based upon long term effective rate in NAV model; NOL balances and projected annual utilizations as provided by the Company; Analysis assumes half of 2022E NOL utilization remains as of 6/30/22 and total remaining NOL balances assumed of $585mm for Federal, $229mm for North Dakota, $2,526mm for Oklahoma and $47mm for Montana
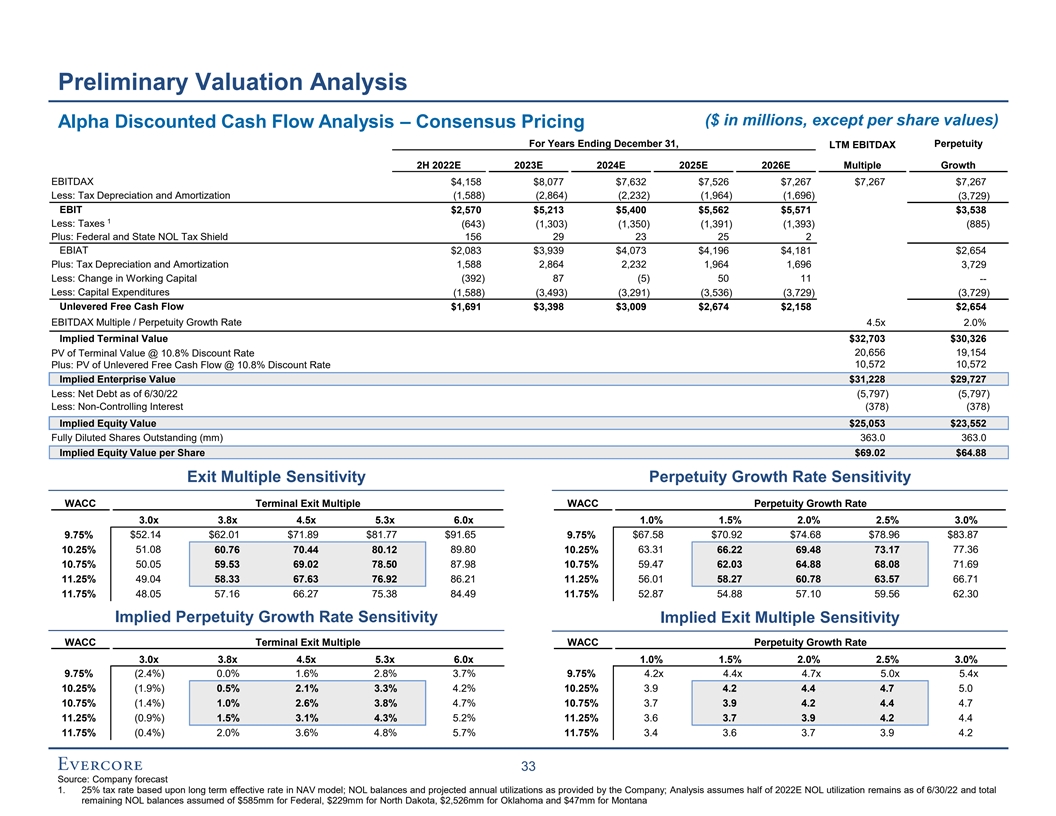
Preliminary Valuation Analysis ($ in millions, except per share values) Alpha Discounted Cash Flow Analysis – Consensus Pricing For Years Ending December 31, Perpetuity LTM EBITDAX 2H 2022E 2023E 2024E 2025E 2026E Multiple Growth EBITDAX $4,158 $8,077 $7,632 $7,526 $7,267 $7,267 $7,267 Less: Tax Depreciation and Amortization (1,588) (2,864) (2,232) (1,964) (1,696) (3,729) EBIT $2,570 $5,213 $5,400 $5,562 $5,571 $3,538 1 Less: Taxes (643) (1,303) (1,350) (1,391) (1,393) (885) Plus: Federal and State NOL Tax Shield 156 29 23 25 2 EBIAT $2,083 $3,939 $4,073 $4,196 $4,181 $2,654 Plus: Tax Depreciation and Amortization 1,588 2,864 2,232 1,964 1,696 3,729 Less: Change in Working Capital (392) 87 (5) 50 11 -- Less: Capital Expenditures (1,588) (3,493) (3,291) (3,536) (3,729) (3,729) Unlevered Free Cash Flow $1,691 $3,398 $3,009 $2,674 $2,158 $2,654 EBITDAX Multiple / Perpetuity Growth Rate 4.5x 2.0% Implied Terminal Value $32,703 $30,326 20,656 19,154 PV of Terminal Value @ 10.8% Discount Rate Plus: PV of Unlevered Free Cash Flow @ 10.8% Discount Rate 10,572 10,572 Implied Enterprise Value $31,228 $29,727 Less: Net Debt as of 6/30/22 (5,797) (5,797) Less: Non-Controlling Interest (378) (378) Implied Equity Value $25,053 $23,552 Fully Diluted Shares Outstanding (mm) 363.0 363.0 Implied Equity Value per Share $69.02 $64.88 Exit Multiple Sensitivity Perpetuity Growth Rate Sensitivity WACC Terminal Exit Multiple WACC Perpetuity Growth Rate 3.0x 3.8x 4.5x 5.3x 6.0x 1.0% 1.5% 2.0% 2.5% 3.0% 9.75% $52.14 $62.01 $71.89 $81.77 $91.65 9.75% $67.58 $70.92 $74.68 $78.96 $83.87 10.25% 51.08 60.76 70.44 80.12 89.80 10.25% 63.31 66.22 69.48 73.17 77.36 10.75% 50.05 59.53 69.02 78.50 87.98 10.75% 59.47 62.03 64.88 68.08 71.69 11.25% 49.04 58.33 67.63 76.92 86.21 11.25% 56.01 58.27 60.78 63.57 66.71 11.75% 48.05 57.16 66.27 75.38 84.49 11.75% 52.87 54.88 57.10 59.56 62.30 Implied Perpetuity Growth Rate Sensitivity Implied Exit Multiple Sensitivity WACC Terminal Exit Multiple WACC Perpetuity Growth Rate 3.0x 3.8x 4.5x 5.3x 6.0x 1.0% 1.5% 2.0% 2.5% 3.0% 9.75% (2.4%) 0.0% 1.6% 2.8% 3.7% 9.75% 4.2x 4.4x 4.7x 5.0x 5.4x 10.25% (1.9%) 0.5% 2.1% 3.3% 4.2% 10.25% 3.9 4.2 4.4 4.7 5.0 10.75% (1.4%) 1.0% 2.6% 3.8% 4.7% 10.75% 3.7 3.9 4.2 4.4 4.7 11.25% (0.9%) 1.5% 3.1% 4.3% 5.2% 11.25% 3.6 3.7 3.9 4.2 4.4 11.75% (0.4%) 2.0% 3.6% 4.8% 5.7% 11.75% 3.4 3.6 3.7 3.9 4.2 33 Source: Company forecast 1. 25% tax rate based upon long term effective rate in NAV model; NOL balances and projected annual utilizations as provided by the Company; Analysis assumes half of 2022E NOL utilization remains as of 6/30/22 and total remaining NOL balances assumed of $585mm for Federal, $229mm for North Dakota, $2,526mm for Oklahoma and $47mm for Montana
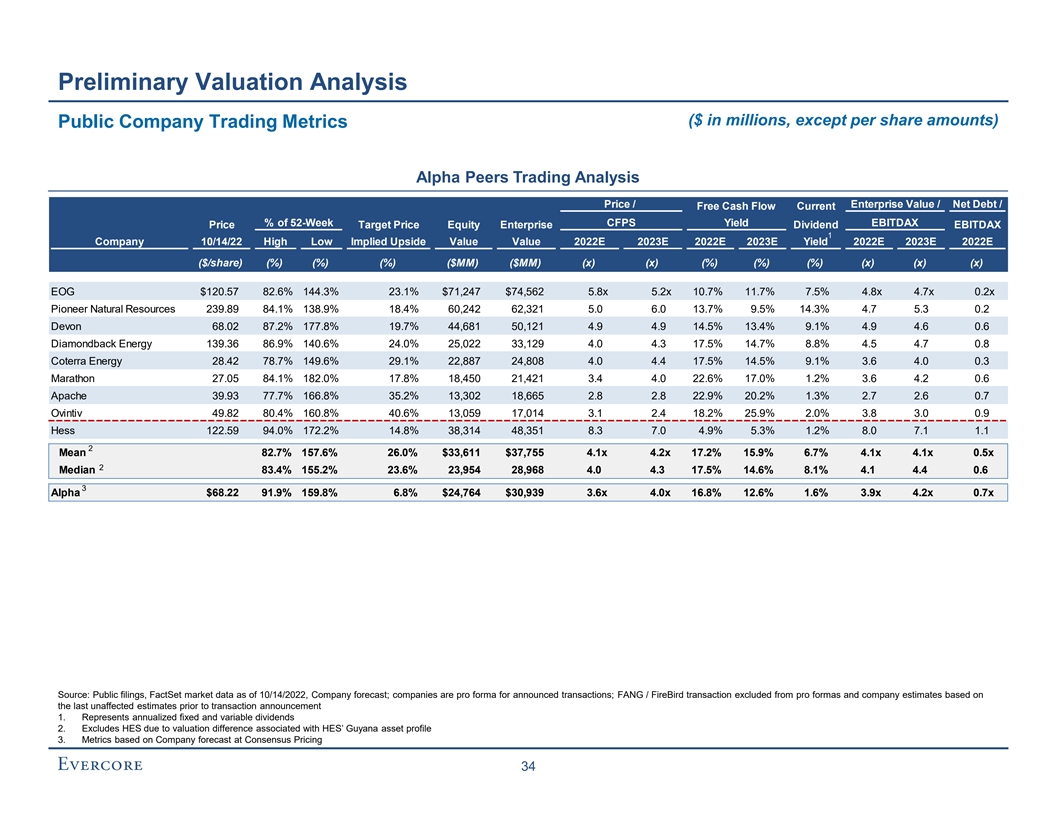
Preliminary Valuation Analysis ($ in millions, except per share amounts) Public Company Trading Metrics Alpha Peers Trading Analysis Price / Enterprise Value / Net Debt / Free Cash Flow Current % of 52-Week CFPS Yield EBITDAX Price Target Price Equity Enterprise Dividend EBITDAX 1 Company 10/14/22 High Low Implied Upside Value Value 2022E 2023E 2022E 2023E Yield 2022E 2023E 2022E ($/share) (%) (%) (%) ($MM) ($MM) (x) (x) (%) (%) (%) (x) (x) (x) EOG $120.57 82.6% 144.3% 23.1% $71,247 $74,562 5.8x 5.2x 10.7% 11.7% 7.5% 4.8x 4.7x 0.2x Pioneer Natural Resources 239.89 84.1% 138.9% 18.4% 60,242 62,321 5.0 6.0 13.7% 9.5% 14.3% 4.7 5.3 0.2 Devon 68.02 87.2% 177.8% 19.7% 44,681 50,121 4.9 4.9 14.5% 13.4% 9.1% 4.9 4.6 0.6 Diamondback Energy 139.36 86.9% 140.6% 24.0% 25,022 33,129 4.0 4.3 17.5% 14.7% 8.8% 4.5 4.7 0.8 Coterra Energy 28.42 78.7% 149.6% 29.1% 22,887 24,808 4.0 4.4 17.5% 14.5% 9.1% 3.6 4.0 0.3 Marathon 27.05 84.1% 182.0% 17.8% 18,450 21,421 3.4 4.0 22.6% 17.0% 1.2% 3.6 4.2 0.6 Apache 39.93 77.7% 166.8% 35.2% 13,302 18,665 2.8 2.8 22.9% 20.2% 1.3% 2.7 2.6 0.7 Ovintiv 49.82 80.4% 160.8% 40.6% 13,059 17,014 3.1 2.4 18.2% 25.9% 2.0% 3.8 3.0 0.9 Hess 122.59 94.0% 172.2% 14.8% 38,314 48,351 8.3 7.0 4.9% 5.3% 1.2% 8.0 7.1 1.1 2 Mean 82.7% 157.6% 26.0% $33,611 $37,755 4.1x 4.2x 17.2% 15.9% 6.7% 4.1x 4.1x 0.5x 2 Median 83.4% 155.2% 23.6% 23,954 28,968 4.0 4.3 17.5% 14.6% 8.1% 4.1 4.4 0.6 3 Alpha $68.22 91.9% 159.8% 6.8% $24,764 $30,939 3.6x 4.0x 16.8% 12.6% 1.6% 3.9x 4.2x 0.7x Source: Public filings, FactSet market data as of 10/14/2022, Company forecast; companies are pro forma for announced transactions; FANG / FireBird transaction excluded from pro formas and company estimates based on the last unaffected estimates prior to transaction announcement 1. Represents annualized fixed and variable dividends 2. Excludes HES due to valuation difference associated with HES’ Guyana asset profile 3. Metrics based on Company forecast at Consensus Pricing 34

Preliminary Valuation Analysis ($ in millions, except per share amounts) Public Company Trading Metrics (cont’d) 2022E Trading Analysis 1 Public Company Trading Analysis - EBITDAX 2022E EBITDAX $8,132 EBITDAX Multiple 3.5x 4.5x – Implied Enterprise Value of Based on 2022 EBITDAX (Excluding Invested Capital from Energy Innovations) $28,462 – $36,595 Plus: Invested Capital from Energy Innovations $100 Less: Net Debt as of 6/30/22 (5,797) Less: Non-Controlling Interest (378) Implied Equity Value $22,387 – $30,519 Fully Diluted Shares Outstanding (mm) 363.0 Implied Equity Value per Share $61.67 – $84.08 Public Company Trading Analysis - CFPS 2022E CFPS $18.63 Relevant CFPS Multiple 3.5x – 4.3x Implied Share Price Based on 2022 CFPS (Before Energy Innovations) $65.22 – $79.20 Plus: Invested Capital from Energy Innovations (Per Share) $0.28 Implied Share Price Based on 2022 CFPS $65.50 – $79.47 2023E Trading Analysis Public Company Trading Analysis - EBITDAX 2023E EBITDAX $8,077 EBITDAX Multiple 4.0x 4.5x – Implied Enterprise Value of Based on 2023 EBITDAX (Excluding Invested Capital from Energy Innovations) $32,309 – $36,348 Plus: Invested Capital from Energy Innovations $100 Less: Net Debt as of 6/30/22 (5,797) Less: Non-Controlling Interest (378) Implied Equity Value $26,234 – $30,273 Fully Diluted Shares Outstanding (mm) 363.0 Implied Equity Value per Share $72.27 – $83.40 Public Company Trading Analysis - CFPS 2023E CFPS $19.02 Relevant CFPS Multiple 3.8x – 4.5x Implied Share Price Based on 2023 CFPS (Before Energy Innovations) $71.31 – $85.57 Plus: Invested Capital from Energy Innovations (Per Share) $0.28 Implied Share Price Based on 2023 CFPS $71.59 – $85.85 Source: Public filings, Bloomberg market data as of 10/14/2022, Company forecast at Consensus Pricing 35

Preliminary Valuation Analysis ($ in millions, except per share amounts and as noted) Select Corporate E&P Transactions Greater than $5 Billion Summary of Select Transactions Implied Spot Price 1 Consideration Premium Ownership Deal Value / Equity Value / (Announcement) Cash Flow Cash Flow Deal Value EBITDAX EBITDAX WTI HHUB 2 2 Announced Buyer Seller Region ($B) % Stock 1-Day Prior A / T (FY1) (FY2) (FY1) (FY2) ($ / Bbl) ($ / MMBtu) 5/24/21 Cabot Oil & Gas Cimarex Energy Co. Multi $9.3 100% 0% 51 / 49% 5.6x 4.9x 4.7x 4.1x $66.13 $2.89 10/20/20 Pioneer Natural Resources Parsley Energy Permian 7.6 100% 8% 76% / 24% 5.9 5.7 4.0 3.8 41.37 2.91 10/19/20 ConocoPhillips Concho Resources Permian 13.3 100% 15% 79% / 21% 4.9 5.6 3.8 4.7 40.69 2.80 9/28/20 Devon Energy WPX Energy Multi 5.7 100% 3% 57% / 43% 3.7 4.4 2.1 2.4 40.47 2.10 7/20/20 Chevron Noble Energy Multi 13.0 100% 8% 97% / 3% 6.9 6.4 3.4 3.0 40.83 1.64 Median $9.3 100% 8% 76% / 24% 5.6x 5.6x 3.8x 3.8x $40.83 $2.80 Mean 9.8 100% 7% 72% / 28% 5.4 5.4 3.6 3.6 45.90 2.47 5/9/19 Occidental Petroleum Anadarko Petroleum Multi $57.0 22% 62% 84% / 16% 7.1x 6.4x 6.0x 5.3x $61.58 $2.60 11/1/18 Encana Newfield Exploration Multi 7.7 100% 35% 64% / 36% 5.0 4.1 3.8 3.1 63.67 3.24 8/14/18 Diamondback Energy Energen Permian 9.2 100% 19% 62% / 38% 8.9 6.8 8.3 6.1 67.04 2.96 3/28/18 Concho Resources RSP Permian Permian 9.5 100% 29% 75% / 25% 10.0 7.8 9.4 6.8 64.30 2.70 Median $9.4 100% 32% 70% / 31% 8.0x 6.6x 7.2x 5.7x $63.99 $2.83 Mean 20.9 81% 36% 71% / 29% 7.7 6.3 6.9 5.3 64.15 2.87 Precedent Transactions Analysis - EBITDAX 2022E EBITDAX (FY1) $8,132 3 EBITDAX Multiple 3.5x 4.5x – Implied Enterprise Value of Based on 2022 EBITDAX (Excluding Invested Capital from Energy Innovations) $28,462 – $36,595 Plus: Invested Capital from Energy Innovations $100 Less: Net Debt as of 6/30/22 ($5,797) Less: Non-Controlling Interest ($378) Implied Equity Value $22,387 – $30,519 Fully Diluted Shares Outstanding (mm) 363 Implied Equity Value per Share $61.67 – $84.08 Precedent Transactions Analysis - CFPS 2022E CFPS (FY1) $18.63 3 Relevant CFPS Multiple 3.3x – 4.3x Implied Share Price Based on 2022 CFPS (Before Energy Innovations) $60.56 – $79.20 Plus: Invested Capital from Energy Innovations (Per Share) $0.28 Implied Share Price Based on 2022 CFPS $60.84 – $79.47 Source: Company filings and press releases, Enverus, Company forecast at Consensus Pricing 1. Premiums based on last unaffected trading day prior to announcement 2. Based on mean analyst Consensus forecasts; FY1 refers to current unreported year or year in which the deal is announced and FY2 refers to subsequent year 3. Multiple ranges selected in light of the steep backwardation of the commodity curves compared to transactions from prior time periods 36

Preliminary Valuation Analysis Steep Backwardation for Crude and Gas Pricing WTI Current Strip Pricing vs. Historical The 4-year average of the 1-year forward historical strip price traded $90.00 5 Year Contango at a 23% discount to the current 1-year forward strip price $80.00 (Backwardation) $70.00 10/14/22 (29%) $60.00 $50.00 10/14/21 (22%) $40.00 10/14/20 8% $30.00 $20.00 10/14/19 2% $10.00 10/14/18 (3%) $ - Year 0 Year 1 Year 2 Year 3 Year 4 Year 5 10/14/22 NYMEX Strip Price 10/14/21 NYMEX Strip Price 10/14/20 NYMEX Strip Price 10/14/19 NYMEX Strip Price 10/14/18 NYMEX Strip Price Henry Hub Current Strip Pricing vs. Historical $8.00 The 4-year average of the 1-year forward historical strip price traded 5 Year Contango at a 44% discount to the current 1-year forward strip price $6.00 (Backwardation) 10/14/22 (34%) $4.00 10/14/21 (27%) $2.00 10/14/20 (6%) 10/14/19 12% $ - Year 0 Year 1 Year 2 Year 3 Year 4 Year 5 10/14/18 12% 10/14/22 HHub Strip Price 10/14/21 HHub Strip Price 10/14/20 HHub Strip Price 10/14/19 HHub Strip Price 10/14/18 HHub Strip Price Source: Factset as of 10/14/2022 37
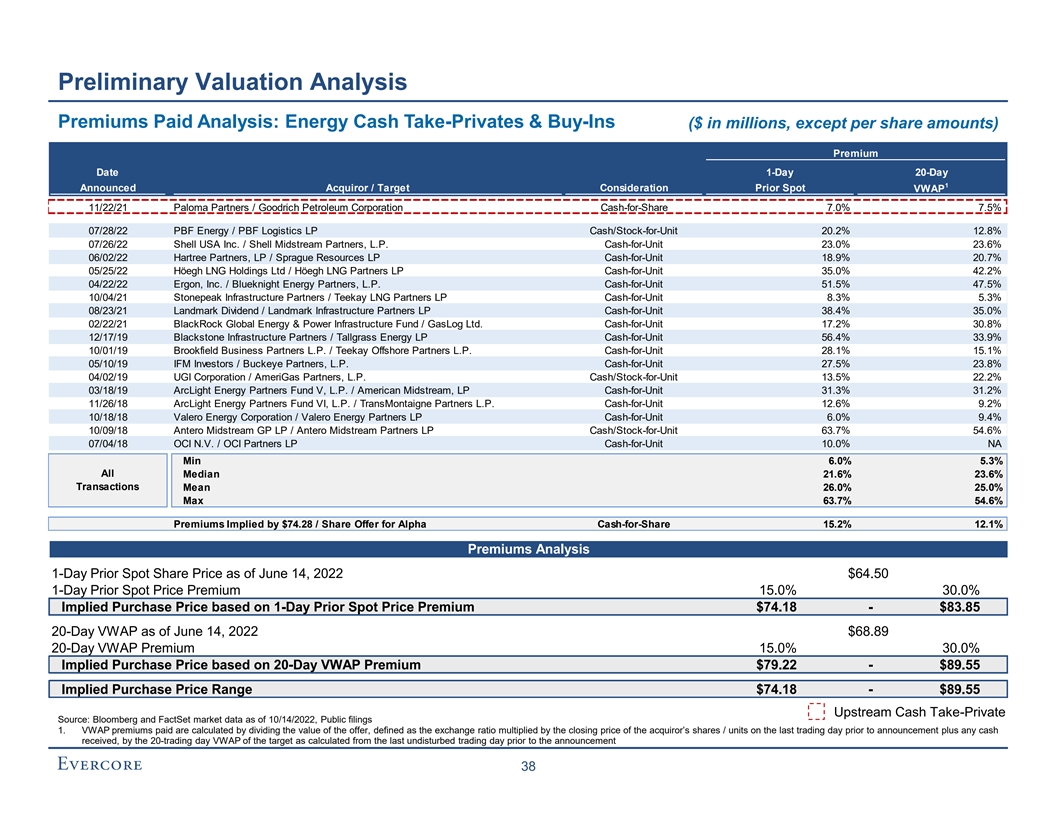
Preliminary Valuation Analysis Premiums Paid Analysis: Energy Cash Take-Privates & Buy-Ins ($ in millions, except per share amounts) Premium Date 1-Day 20-Day 1 Announced Acquiror / Target Consideration Prior Spot VWAP 11/22/21 Paloma Partners / Goodrich Petroleum Corporation Cash-for-Share 7.0% 7.5% 07/28/22 PBF Energy / PBF Logistics LP Cash/Stock-for-Unit 20.2% 12.8% 07/26/22 Shell USA Inc. / Shell Midstream Partners, L.P. Cash-for-Unit 23.0% 23.6% 06/02/22 Hartree Partners, LP / Sprague Resources LP Cash-for-Unit 18.9% 20.7% 05/25/22 Höegh LNG Holdings Ltd / Höegh LNG Partners LP Cash-for-Unit 35.0% 42.2% 04/22/22 Ergon, Inc. / Blueknight Energy Partners, L.P. Cash-for-Unit 51.5% 47.5% 10/04/21 Stonepeak Infrastructure Partners / Teekay LNG Partners LP Cash-for-Unit 8.3% 5.3% 08/23/21 Landmark Dividend / Landmark Infrastructure Partners LP Cash-for-Unit 38.4% 35.0% 02/22/21 BlackRock Global Energy & Power Infrastructure Fund / GasLog Ltd. Cash-for-Unit 17.2% 30.8% 12/17/19 Blackstone Infrastructure Partners / Tallgrass Energy LP Cash-for-Unit 56.4% 33.9% 10/01/19 Brookfield Business Partners L.P. / Teekay Offshore Partners L.P. Cash-for-Unit 28.1% 15.1% 05/10/19 IFM Investors / Buckeye Partners, L.P. Cash-for-Unit 27.5% 23.8% 04/02/19 UGI Corporation / AmeriGas Partners, L.P. Cash/Stock-for-Unit 13.5% 22.2% 03/18/19 ArcLight Energy Partners Fund V, L.P. / American Midstream, LP Cash-for-Unit 31.3% 31.2% 11/26/18 ArcLight Energy Partners Fund VI, L.P. / TransMontaigne Partners L.P. Cash-for-Unit 12.6% 9.2% 10/18/18 Valero Energy Corporation / Valero Energy Partners LP Cash-for-Unit 6.0% 9.4% 10/09/18 Antero Midstream GP LP / Antero Midstream Partners LP Cash/Stock-for-Unit 63.7% 54.6% 07/04/18 OCI N.V. / OCI Partners LP Cash-for-Unit 10.0% NA Min 6.0% 5.3% All Median 21.6% 23.6% Transactions Mean 26.0% 25.0% Max 63.7% 54.6% Premiums Implied by $74.28 / Share Offer for Alpha Cash-for-Share 15.2% 12.1% Premiums Analysis 1-Day Prior Spot Share Price as of June 14, 2022 $64.50 1-Day Prior Spot Price Premium 15.0% 30.0% Implied Purchase Price based on 1-Day Prior Spot Price Premium $74.18 - $83.85 20-Day VWAP as of June 14, 2022 $68.89 20-Day VWAP Premium 15.0% 30.0% Implied Purchase Price based on 20-Day VWAP Premium $79.22 - $89.55 Implied Purchase Price Range $74.18 - $89.55 Upstream Cash Take-Private Source: Bloomberg and FactSet market data as of 10/14/2022, Public filings 1. VWAP premiums paid are calculated by dividing the value of the offer, defined as the exchange ratio multiplied by the closing price of the acquiror’s shares / units on the last trading day prior to announcement plus any cash received, by the 20-trading day VWAP of the target as calculated from the last undisturbed trading day prior to the announcement 38

Appendix
A. Weighted Average Cost of Capital Analysis
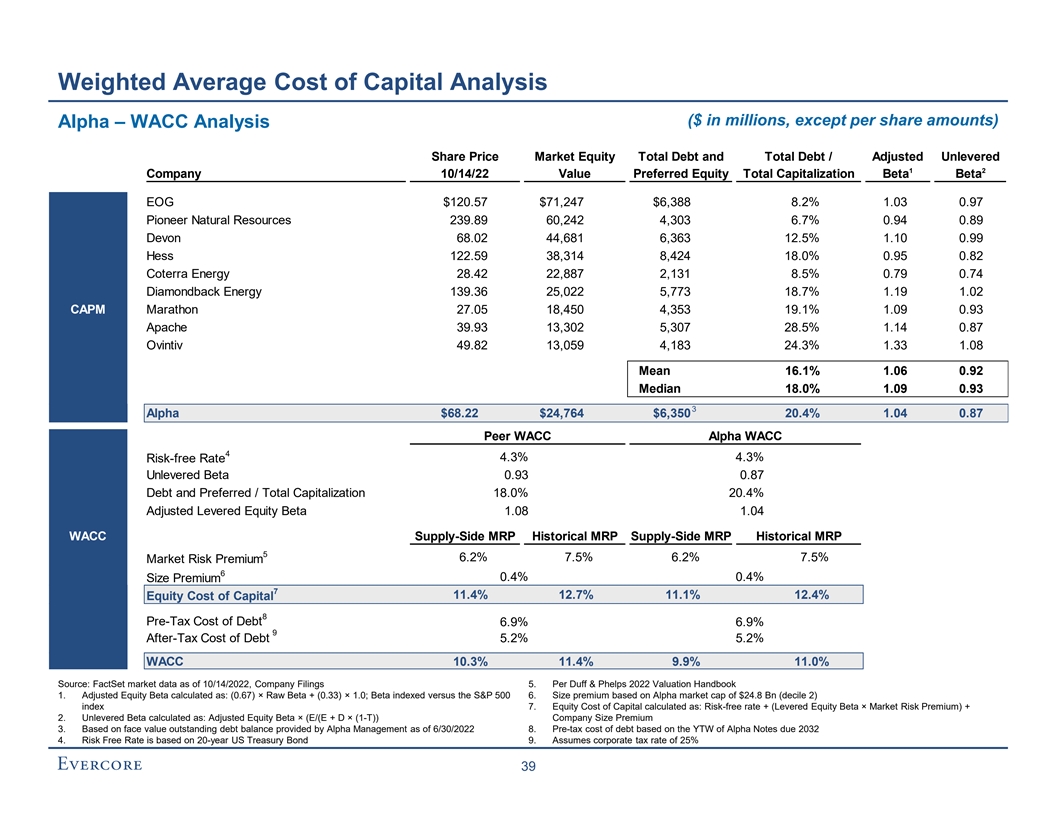
Weighted Average Cost of Capital Analysis ($ in millions, except per share amounts) Alpha – WACC Analysis Share Price Market Equity Total Debt and Total Debt / Adjusted Unlevered 1 2 Company 10/14/22 Value Preferred Equity Total Capitalization Beta Beta EOG $120.57 $71,247 $6,388 8.2% 1.03 0.97 Pioneer Natural Resources 239.89 60,242 4,303 6.7% 0.94 0.89 Devon 68.02 44,681 6,363 12.5% 1.10 0.99 Hess 122.59 38,314 8,424 18.0% 0.95 0.82 Coterra Energy 28.42 22,887 2,131 8.5% 0.79 0.74 Risk Free Rate and Cost Diamondback Energy 139.36 25,022 5,773 18.7% 1.19 1.02 CAPM Marathon 27.05 18,450 4,353 19.1% 1.09 0.93 Apache 39.93 13,302 5,307 28.5% 1.14 0.87 Ovintiv 49.82 13,059 4,183 24.3% 1.33 1.08 Mean 16.1% 1.06 0.92 Median 18.0% 1.09 0.93 3 Alpha $68.22 $24,764 $6,350 20.4% 1.04 0.87 Peer WACC Alpha WACC 4 4.3% 4.3% Risk-free Rate Unlevered Beta 0.93 0.87 Debt and Preferred / Total Capitalization 18.0% 20.4% Adjusted Levered Equity Beta 1.08 1.04 WACC Supply-Side MRP Historical MRP Supply-Side MRP Historical MRP 5 6.2% 7.5% 6.2% 7.5% Market Risk Premium 6 0.4% 0.4% Size Premium 7 11.4% 12.7% 11.1% 12.4% Equity Cost of Capital 8 Pre-Tax Cost of Debt 6.9% 6.9% 9 After-Tax Cost of Debt 5.2% 5.2% WACC 10.3% 11.4% 9.9% 11.0% Source: FactSet market data as of 10/14/2022, Company Filings 5. Per Duff & Phelps 2022 Valuation Handbook 1. Adjusted Equity Beta calculated as: (0.67) × Raw Beta + (0.33) × 1.0; Beta indexed versus the S&P 500 6. Size premium based on Alpha market cap of $24.8 Bn (decile 2) index 7. Equity Cost of Capital calculated as: Risk-free rate + (Levered Equity Beta × Market Risk Premium) + 2. Unlevered Beta calculated as: Adjusted Equity Beta × (E/(E + D × (1-T)) Company Size Premium 3. Based on face value outstanding debt balance provided by Alpha Management as of 6/30/2022 8. Pre-tax cost of debt based on the YTW of Alpha Notes due 2032 4. Risk Free Rate is based on 20-year US Treasury Bond 9. Assumes corporate tax rate of 25% 39
B. Additional Analysis
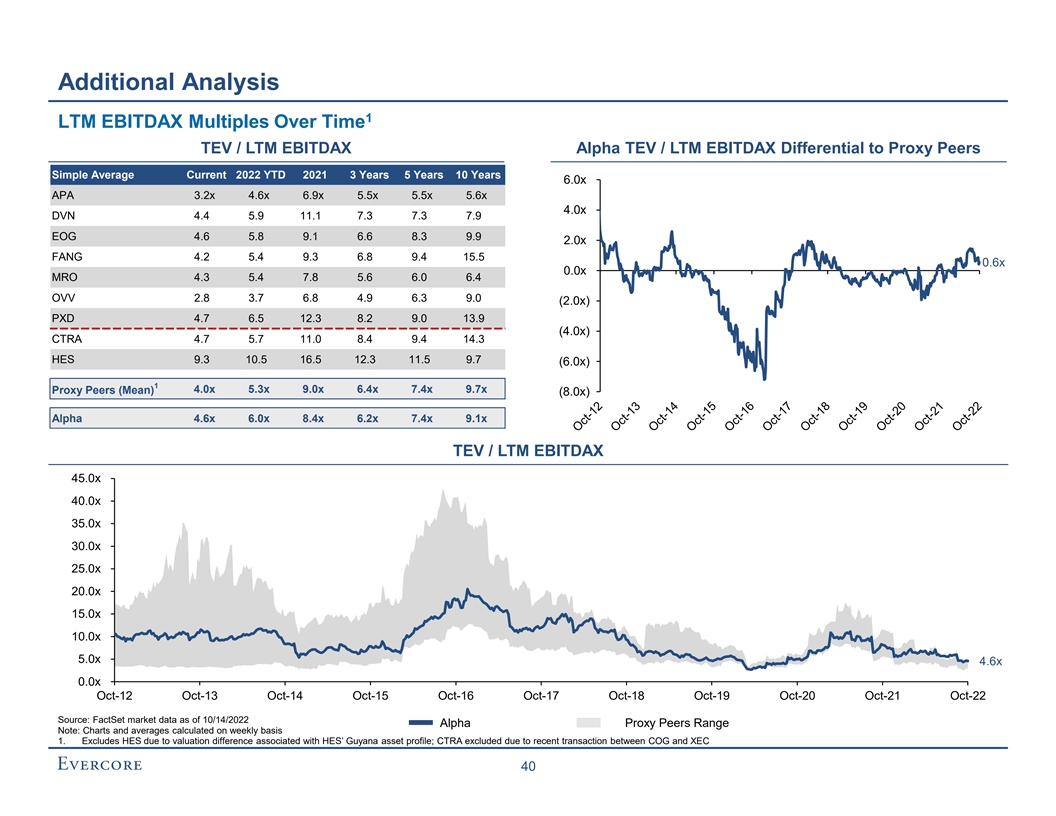
Additional Analysis 1 LTM EBITDAX Multiples Over Time TEV / LTM EBITDAX Alpha TEV / LTM EBITDAX Differential to Proxy Peers Simple Average Current 2022 YTD 2021 3 Years 5 Years 10 Years 6.0x APA 3.2x 4.6x 6.9x 5.5x 5.5x 5.6x 4.0x DVN 4.4 5.9 11.1 7.3 7.3 7.9 EOG 4.6 5.8 9.1 6.6 8.3 9.9 2.0x FANG 4.2 5.4 9.3 6.8 9.4 15.5 0.6x 0.0x MRO 4.3 5.4 7.8 5.6 6.0 6.4 OVV 2.8 3.7 6.8 4.9 6.3 9.0 (2.0x) PXD 4.7 6.5 12.3 8.2 9.0 13.9 (4.0x) CTRA 4.7 5.7 11.0 8.4 9.4 14.3 HES 9.3 10.5 16.5 12.3 11.5 9.7 (6.0x) 1 4.0x 5.3x 9.0x 6.4x 7.4x 9.7x Proxy Peers (Mean) (8.0x) Alpha 4.6x 6.0x 8.4x 6.2x 7.4x 9.1x TEV / LTM EBITDAX 45.0x 40.0x 35.0x 30.0x 25.0x 20.0x 15.0x 10.0x 5.0x 4.6x 0.0x Oct-12 Oct-13 Oct-14 Oct-15 Oct-16 Oct-17 Oct-18 Oct-19 Oct-20 Oct-21 Oct-22 Source: FactSet market data as of 10/14/2022 Alpha Proxy Peers Range Note: Charts and averages calculated on weekly basis 1. Excludes HES due to valuation difference associated with HES’ Guyana asset profile; CTRA excluded due to recent transaction between COG and XEC 40

C. WaterCo Valuation Detail

WaterCo Valuation Detail Valuation Methodologies ◼ The following sets forth the methodologies utilized by Evercore in its preliminary valuation of WaterCo’s total enterprise value assuming a 7/1/2022 valuation date Methodology Description Metrics / Assumptions ◼ Values WaterCo based on the sum of the valuation Sum of the Parts of Source Water and Produced Water Gathering ◼ Enterprise value / EBITDA multiples applied to Peer Group and Disposal business units (“SOTP”) implied by 2023E EBITDA Trading Analysis the current market enterprise value multiples of relevant EBITDA for companies with similar assets Sum of the Parts◼ Values WaterCo based on the sum of the valuation Precedent of each Source Water and Produced Water ◼ Enterprise value / EBITDA multiples applied to Gathering and Disposal business units implied by 2023E EBITDA Transaction historical transactions involving similar assets Analysis 41

WaterCo Valuation Detail ($ in millions, except per share or unit amounts) Peer Group Trading Analysis Source Water Peers Price % of 52-Week Equity Enterprise Dividend Net Debt / Enterprise Value / EBITDA Company 10/14/22 High Value Value 2022E 2023E Yield 2022E EBITDA \ Select Energy Services, Inc. $7.69 73.7% $879 $854 4.9x 3.7x NA NM TETRA Technologies, Inc. 3.75 64.5% 494 610 7.8 6.0 NA 1.2x Mean 6.3x 4.9x NA 1.2x Median 6.3 4.9 NA 1.2 Produced Water Gathering & Disposal Peers Dividend / Price % of 52-Week Equity Enterprise Enterprise Value / EBITDA Distribution Net Debt / Company / Partnership 10/14/22 High Value Value 2022E 2023E Yield 2022E EBITDA Aris Water Solutions, Inc. $13.83 58.7% $815 $1,166 7.5x 5.5x 2.6% 2.3x 1 Crestwood Equity Partners LP 29.10 88.3% 3,598 7,740 9.4 8.1 9.0% 3.8 NGL Energy Partners LP 1.25 43.3% 166 3,917 6.6 6.3 --% 5.7 Mean 7.8x 6.6x 3.9% 3.9x Median 7.5 6.3 2.6% 3.8 Source: Public filings, FactSet market data as of 10/14/2022 1. Pro forma for the Sendero acquisition, Barnett sale and Appalachia sale 42
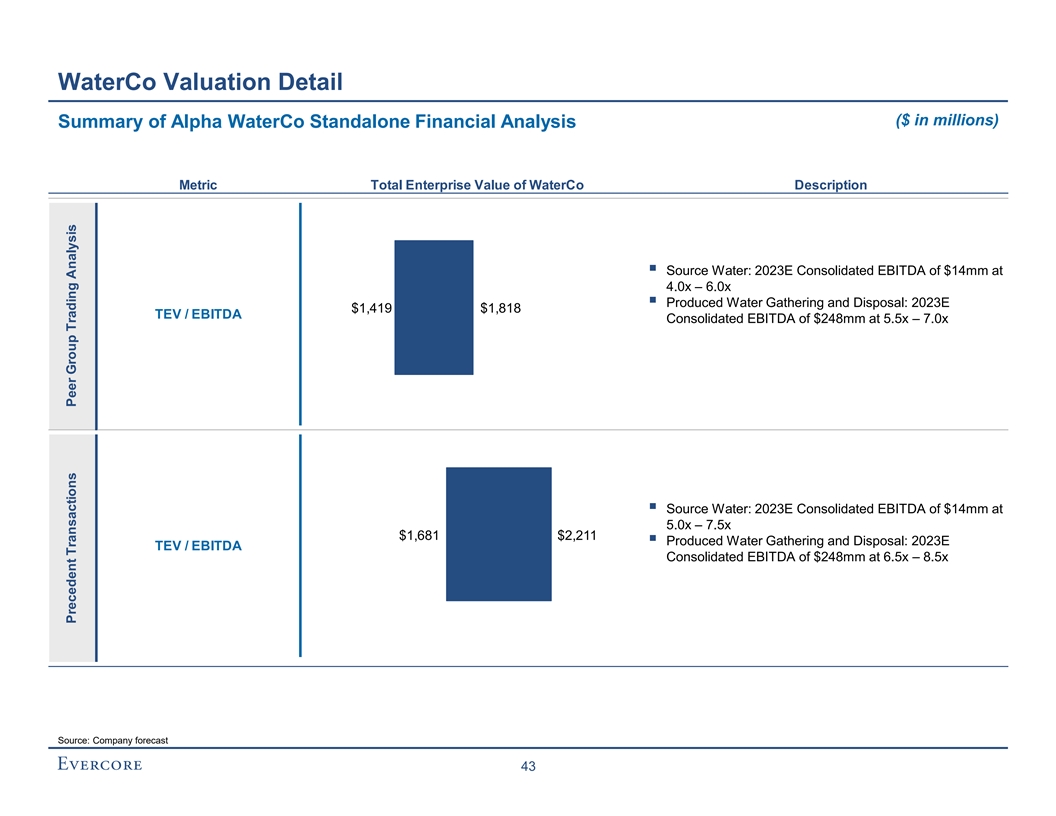
WaterCo Valuation Detail ($ in millions) Summary of Alpha WaterCo Standalone Financial Analysis Metric Total Enterprise Value of WaterCo Description ▪ Source Water: 2023E Consolidated EBITDA of $14mm at 4.0x – 6.0x ▪ Produced Water Gathering and Disposal: 2023E $1,419 $1,818 TEV / EBITDA Consolidated EBITDA of $248mm at 5.5x – 7.0x ▪ Source Water: 2023E Consolidated EBITDA of $14mm at 5.0x – 7.5x $1,681 $2,211 ▪ Produced Water Gathering and Disposal: 2023E TEV / EBITDA Consolidated EBITDA of $248mm at 6.5x – 8.5x Source: Company forecast 43 Precedent Transactions Peer Group Trading Analysis

WaterCo Valuation Detail Sum of the Parts Analysis ($ in millions) Peer Group Trading Analysis 2023E 2023E EBITDA Resulting Enterprise Value Range EBITDA Multiple Range Low High Source Water $14 4.0x – 6.0x $55 $83 Produced Water Gathering & Disposal 248 5.5 – 7.0 1,364 1,735 Total Enterprise Value $1,419 $1,818 Precedent Transactions Analysis 2023E 2023E EBITDA Resulting Enterprise Value Range EBITDA Multiple Range Low High Source Water $14 5.0x – 7.5x $69 $104 Produced Water Gathering & Disposal 248 6.5 – 8.5 1,611 2,107 Total Enterprise Value $1,681 $2,211 Source: Company forecast 44
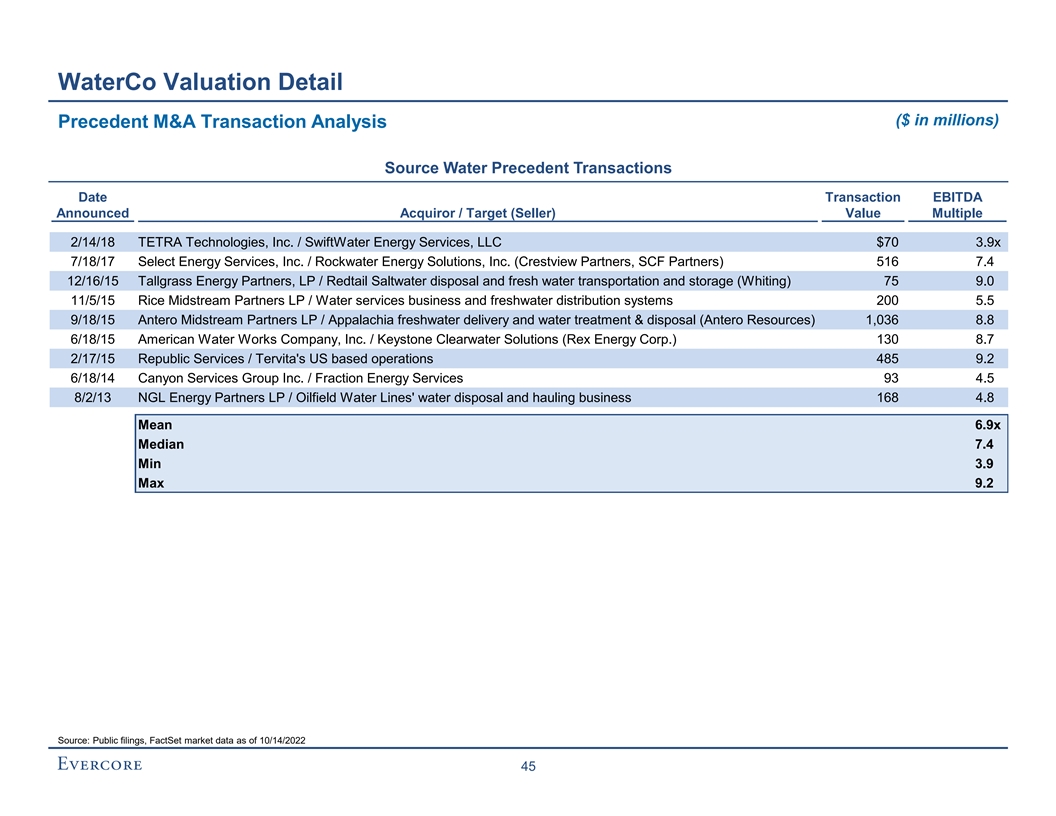
WaterCo Valuation Detail ($ in millions) Precedent M&A Transaction Analysis Source Water Precedent Transactions Date Transaction EBITDA Announced Acquiror / Target (Seller) Value Multiple 2/14/18 TETRA Technologies, Inc. / SwiftWater Energy Services, LLC $70 3.9x 7/18/17 Select Energy Services, Inc. / Rockwater Energy Solutions, Inc. (Crestview Partners, SCF Partners) 516 7.4 12/16/15 Tallgrass Energy Partners, LP / Redtail Saltwater disposal and fresh water transportation and storage (Whiting) 75 9.0 11/5/15 Rice Midstream Partners LP / Water services business and freshwater distribution systems 200 5.5 9/18/15 Antero Midstream Partners LP / Appalachia freshwater delivery and water treatment & disposal (Antero Resources) 1,036 8.8 6/18/15 American Water Works Company, Inc. / Keystone Clearwater Solutions (Rex Energy Corp.) 130 8.7 2/17/15 Republic Services / Tervita's US based operations 485 9.2 6/18/14 Canyon Services Group Inc. / Fraction Energy Services 93 4.5 8/2/13 NGL Energy Partners LP / Oilfield Water Lines' water disposal and hauling business 168 4.8 Mean 6.9x Median 7.4 Min 3.9 Max 9.2 Source: Public filings, FactSet market data as of 10/14/2022 45
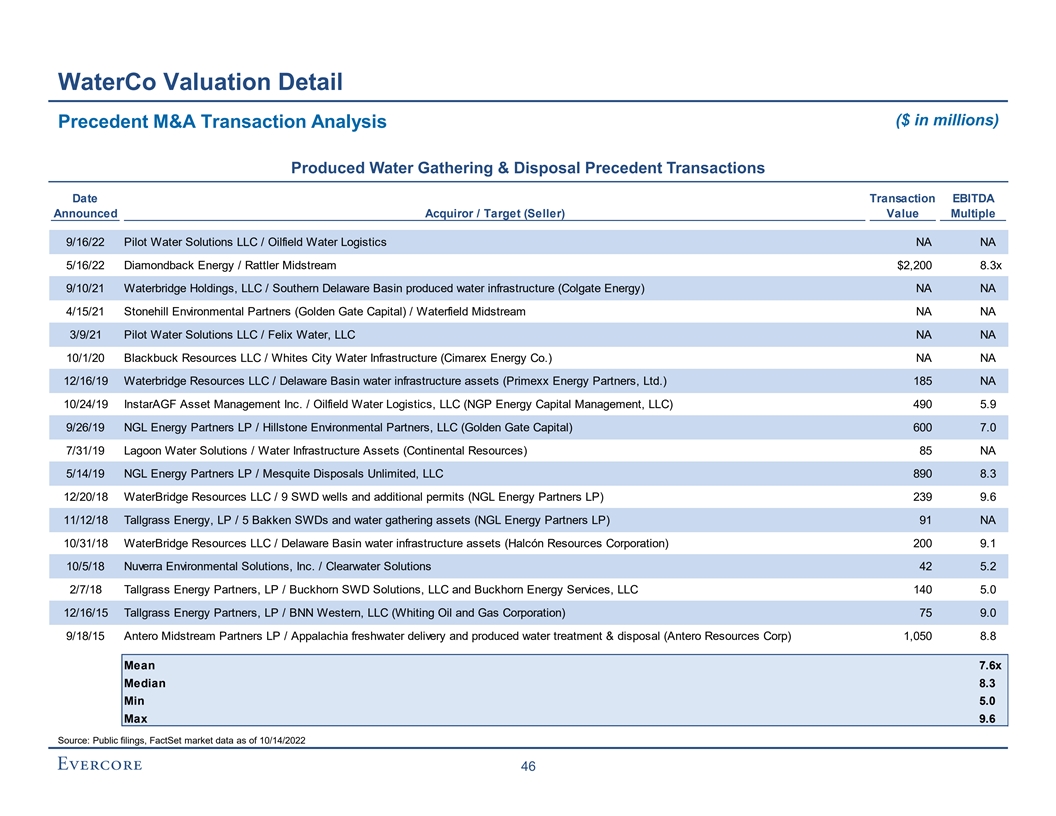
WaterCo Valuation Detail ($ in millions) Precedent M&A Transaction Analysis Produced Water Gathering & Disposal Precedent Transactions Date Transaction EBITDA Announced Acquiror / Target (Seller) Value Multiple 9/16/22 Pilot Water Solutions LLC / Oilfield Water Logistics NA NA 5/16/22 Diamondback Energy / Rattler Midstream $2,200 8.3x 9/10/21 Waterbridge Holdings, LLC / Southern Delaware Basin produced water infrastructure (Colgate Energy) NA NA 4/15/21 Stonehill Environmental Partners (Golden Gate Capital) / Waterfield Midstream NA NA 3/9/21 Pilot Water Solutions LLC / Felix Water, LLC NA NA 10/1/20 Blackbuck Resources LLC / Whites City Water Infrastructure (Cimarex Energy Co.) NA NA 12/16/19 Waterbridge Resources LLC / Delaware Basin water infrastructure assets (Primexx Energy Partners, Ltd.) 185 NA 10/24/19 InstarAGF Asset Management Inc. / Oilfield Water Logistics, LLC (NGP Energy Capital Management, LLC) 490 5.9 9/26/19 NGL Energy Partners LP / Hillstone Environmental Partners, LLC (Golden Gate Capital) 600 7.0 7/31/19 Lagoon Water Solutions / Water Infrastructure Assets (Continental Resources) 85 NA 5/14/19 NGL Energy Partners LP / Mesquite Disposals Unlimited, LLC 890 8.3 12/20/18 WaterBridge Resources LLC / 9 SWD wells and additional permits (NGL Energy Partners LP) 239 9.6 11/12/18 Tallgrass Energy, LP / 5 Bakken SWDs and water gathering assets (NGL Energy Partners LP) 91 NA 10/31/18 WaterBridge Resources LLC / Delaware Basin water infrastructure assets (Halcón Resources Corporation) 200 9.1 10/5/18 Nuverra Environmental Solutions, Inc. / Clearwater Solutions 42 5.2 2/7/18 Tallgrass Energy Partners, LP / Buckhorn SWD Solutions, LLC and Buckhorn Energy Services, LLC 140 5.0 12/16/15 Tallgrass Energy Partners, LP / BNN Western, LLC (Whiting Oil and Gas Corporation) 75 9.0 9/18/15 Antero Midstream Partners LP / Appalachia freshwater delivery and produced water treatment & disposal (Antero Resources Corp) 1,050 8.8 Mean 7.6x Median 8.3 Min 5.0 Max 9.6 Source: Public filings, FactSet market data as of 10/14/2022 46
D. The Mineral Resources Company Supplemental Information

The Mineral Resources Company Supplemental Information ths ($ in millions) TMRC Operating Statistics By Reserve Category – 8/8 Production and Cash Average Daily Production (MBoed) 5.3 5.2 5.1 4.8 4.5 4.3 4.0 3.8 3.6 3.6 2H 2022 2023 2024 2025 2026 2027 2028 2029 2030 2031 1 1 Asset-Level EBITDAX – Strip Pricing Asset-Level EBITDAX – Consensus Pricing $85 $78 $68 $63 $60 $55 $54 $51 $51 $50 $49 $47 $46 $44 $43 $41 $41 $40 $39 $38 2H 2023 2024 2025 2026 2027 2028 2029 2030 2031 2H 2023 2024 2025 2026 2027 2028 2029 2030 2031 2022 2022 Source: Alpha NAV Model 1. Pricing as of 10/14/2022 strip 47
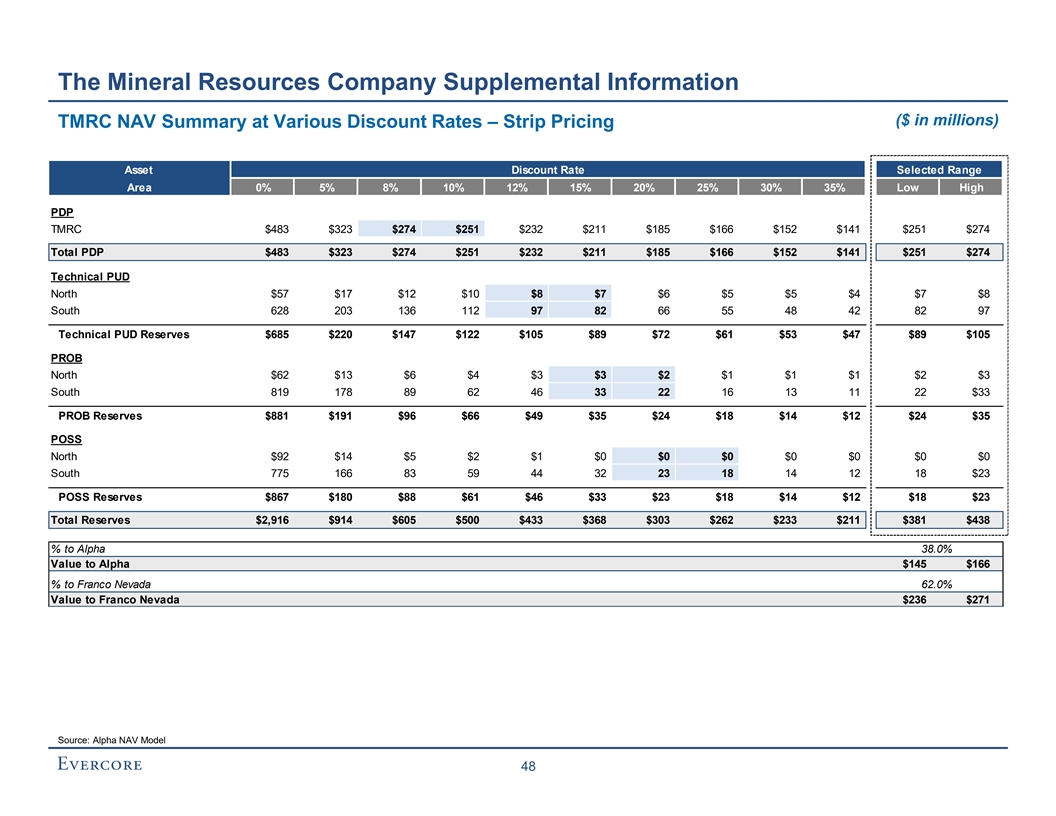
The Mineral Resources Company Supplemental Information ($ in millions) TMRC NAV Summary at Various Discount Rates – Strip Pricing Asset Discount Rate Selected Range Area 0% 5% 8% 10% 12% 15% 20% 25% 30% 35% Low High Discount Rates PDP TMRC $483 $323 $274 $251 $232 $211 $185 $166 $152 $141 $251 $274 Total PDP $483 $323 $274 $251 $232 $211 $185 $166 $152 $141 $251 $274 Technical PUD North $57 $17 $12 $10 $8 $7 $6 $5 $5 $4 $7 $8 South 628 203 136 112 97 82 66 55 48 42 82 97 Technical PUD Reserves $685 $220 $147 $122 $105 $89 $72 $61 $53 $47 $89 $105 PROB North $62 $13 $6 $4 $3 $3 $2 $1 $1 $1 $2 $3 South 819 178 89 62 46 33 22 16 13 11 22 $33 PROB Reserves $881 $191 $96 $66 $49 $35 $24 $18 $14 $12 $24 $35 POSS North $92 $14 $5 $2 $1 $0 $0 $0 $0 $0 $0 $0 South 775 166 83 59 44 32 23 18 14 12 18 $23 POSS Reserves $867 $180 $88 $61 $46 $33 $23 $18 $14 $12 $18 $23 Total Reserves $2,916 $914 $605 $500 $433 $368 $303 $262 $233 $211 $381 $438 % to Alpha 38.0% Value to Alpha $145 $166 % to Franco Nevada 62.0% Value to Franco Nevada $236 $271 Source: Alpha NAV Model 48
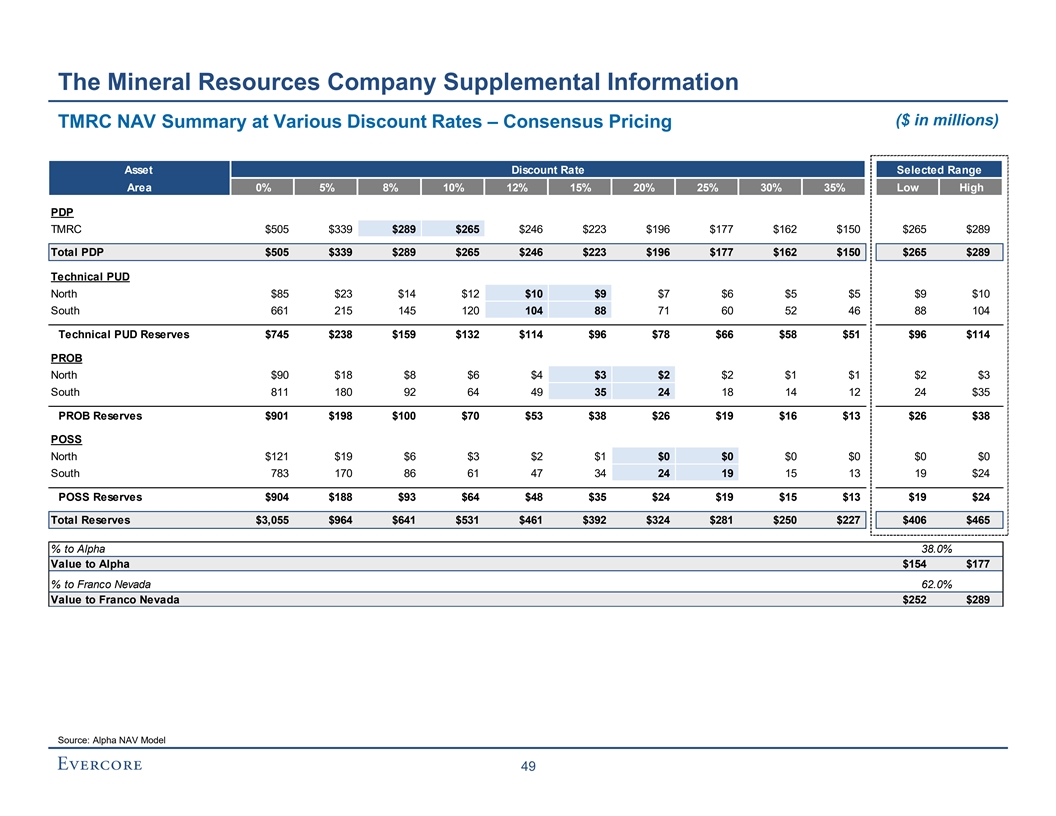
The Mineral Resources Company Supplemental Information ($ in millions) TMRC NAV Summary at Various Discount Rates – Consensus Pricing Asset Discount Rate Selected Range Area 0% 5% 8% 10% 12% 15% 20% 25% 30% 35% Low High Discount Rates PDP TMRC $505 $339 $289 $265 $246 $223 $196 $177 $162 $150 $265 $289 Total PDP $505 $339 $289 $265 $246 $223 $196 $177 $162 $150 $265 $289 Technical PUD North $85 $23 $14 $12 $10 $9 $7 $6 $5 $5 $9 $10 South 661 215 145 120 104 88 71 60 52 46 88 104 Technical PUD Reserves $745 $238 $159 $132 $114 $96 $78 $66 $58 $51 $96 $114 PROB North $90 $18 $8 $6 $4 $3 $2 $2 $1 $1 $2 $3 South 811 180 92 64 49 35 24 18 14 12 24 $35 PROB Reserves $901 $198 $100 $70 $53 $38 $26 $19 $16 $13 $26 $38 POSS North $121 $19 $6 $3 $2 $1 $0 $0 $0 $0 $0 $0 South 783 170 86 61 47 34 24 19 15 13 19 $24 POSS Reserves $904 $188 $93 $64 $48 $35 $24 $19 $15 $13 $19 $24 Total Reserves $3,055 $964 $641 $531 $461 $392 $324 $281 $250 $227 $406 $465 % to Alpha 38.0% Value to Alpha $154 $177 % to Franco Nevada 62.0% Value to Franco Nevada $252 $289 Source: Alpha NAV Model 49

The Mineral Resources Company Supplemental Information ($ in millions) Production Targets and Allocation Projections 1 Production Vs Targets ◼ Alpha has historically met all volume targets on an annual 14,000 basis, but is projected to fall below targets beginning in 2023 12,000 ◼ The Company projects falling behind targets on a go forward 10,000 basis, and does not project getting any portion of the escrowed amounts beginning in 2026 8,000 2022 2023 2024 2025 2026 2027 6,000 Alpha Escrow 100.0% 69.3% 29.3% 8.0% 0.0% 0.0% 4,000 % 2,000 ◼ TMRC development pace differs from the development pace in the NAV - 2019 2020 2021 2022 2023 2024 2025 2026 2027 2028 2029 „ Evercore is utilizing the TMRC forecast only for value Existing T01 T02 T03 T04 T05 Target allocation between Alpha and FNV 2 3 Total Production by Tranche Cash Flow Distributions 7.00 $100.0 5.8 6.00 $80.0 $73.0 5.00 4.7 4.7 4.6 4.3 4.3 4.1 $56.2 $55.3 3.9 $60.0 $52.2 3.7 4.00 3.7 $48.6 $46.8 $45.0 $42.2 $39.2 $38.2 3.00 $40.0 2.00 $20.0 1.00 $- - 2H 2023 2024 2025 2026 2027 2028 2029 2030 2031 2H 2023 2024 2025 2026 2027 2028 2029 2030 2031 2022 2022 EA T01 T02 T03 T04 T05 Non-TMRC Alpha FNV Source: Alpha Management 1. Volume targets based upon economic equivalency ratio of between 15:1-20:1 Mcf:Bbl 2. Production forecasts based upon 6:1 Mcf:Bbl ratio 3. Pricing as of 10/14/2022 strip 50
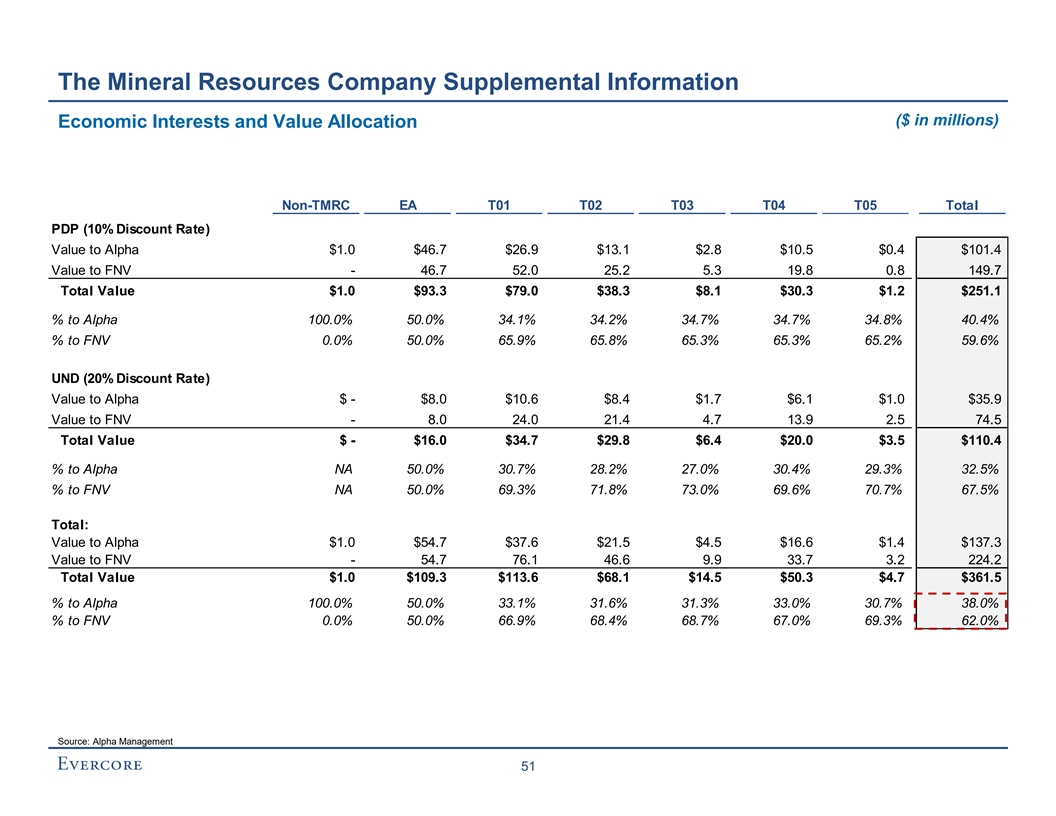
The Mineral Resources Company Supplemental Information ($ in millions) Economic Interests and Value Allocation Non-TMRC EA T01 T02 T03 T04 T05 Total PDP (10% Discount Rate) Value to Alpha $1.0 $46.7 $26.9 $13.1 $2.8 $10.5 $0.4 $101.4 Value to FNV - 46.7 52.0 25.2 5.3 19.8 0.8 149.7 Total Value $1.0 $93.3 $79.0 $38.3 $8.1 $30.3 $1.2 $251.1 % to Alpha 100.0% 50.0% 34.1% 34.2% 34.7% 34.7% 34.8% 40.4% % to FNV 0.0% 50.0% 65.9% 65.8% 65.3% 65.3% 65.2% 59.6% UND (20% Discount Rate) Value to Alpha $ - $8.0 $10.6 $8.4 $1.7 $6.1 $1.0 $35.9 Value to FNV - 8.0 24.0 21.4 4.7 13.9 2.5 74.5 Total Value $ - $16.0 $34.7 $29.8 $6.4 $20.0 $3.5 $110.4 % to Alpha NA 50.0% 30.7% 28.2% 27.0% 30.4% 29.3% 32.5% % to FNV NA 50.0% 69.3% 71.8% 73.0% 69.6% 70.7% 67.5% Total: Value to Alpha $1.0 $54.7 $37.6 $21.5 $4.5 $16.6 $1.4 $137.3 Value to FNV - 54.7 76.1 46.6 9.9 33.7 3.2 224.2 Total Value $1.0 $109.3 $113.6 $68.1 $14.5 $50.3 $4.7 $361.5 % to Alpha 100.0% 50.0% 33.1% 31.6% 31.3% 33.0% 30.7% 38.0% % to FNV 0.0% 50.0% 66.9% 68.4% 68.7% 67.0% 69.3% 62.0% Source: Alpha Management 51