
Exhibit (c)(3)(B) DISCUSSION MATERIALS September 13, 2022

Talking Points – General ▪ There is no “change of control” premium given the Hamm Family’s existing 83% ownership − The Hamm Family already has control − “Take Private” by the Hamm Family specifically carved out by CoC definition in all debt documents ▪ Not an “opportunistic” proposal; not trying to take advantage of market conditions − Price performance since COVID trough (3/9/20): Alpha +889%; Peers +571%; XOP +333% − The Hamm Family did not pursue a transaction when stock was at single digits during COVID lows ▪ The Hamm Family is not a seller and is not interested in any alternative transaction ▪ Analysis of precedent transactions shows that premiums are generally lower when the target’s stock price is at or near a 52- week high − Further, premiums in energy transactions have generally been lower when compared to other industries − 52-week high prior to the offer was $72.65 (closing price), with intra-day tick at $73.54; trading post-offer materially impacted by offer price o Trading activity on June 14, when Alpha traded above $75/sh. intraday, was heavily influenced by short interest covering and the corresponding positive share price movement was exacerbated due to Alpha’s lack of trading liquidity and public float ▪ Public cost basis data indicates that virtually all shareholders are “in the money” at $71.50/sh. ▪ Median pre-offer research price target was $73/sh.; currently $72/sh. ▪ To get above $70/sh., the NAV analysis requires unrealistic assumptions with respect to reserve category discount rates or with hydrocarbon pricing − Using management’s model, “market” discount rates, and spot prices yields an implied share price in the low-$50’s 1 Note: Market data as of September 13, 2022. Peers include APA, CTRA, DVN, EOG, FANG, HES, MRO, OVV and PXD. Source: FactSet, public disclosure.

Talking Points – Market ▪ Since the offer, Alpha has traded up +8.1% while its peers and commodity prices have traded down amidst heightened volatility − If Alpha had traded in-line with WTI (down -28%), the equivalent share price would be ~$47 today and the $71.50 offer would imply a 53% premium o For the 24 months prior to the offer, the linear correlation between the price of WTI and Alpha’s share price was 0.97, demonstrating an extremely strong positive correlation; therefore, we believe this is highly relevant when attempting to evaluate Alpha’s share price in the absence of the offer. − If Alpha had traded in-line with the XOP (down -7%), the equivalent share price would be ~$60 today and the $71.50 offer would imply a 20% premium ▪ Oil prices are at their lowest levels since the initial proposal; remainder of 2022 and 2023 – 2026 are down -24%, -17%, -13%, -10%, and -8% respectively − Back end of the curve has eroded from mid-$80s and mid-$70s to low-$70s and mid-$60s ▪ The $71.50 offer implies a flat $86/Bbl oil price throughout the life of the NAV, which is higher than any single month at current strip; Committee’s proposal of $75.75/sh. implies close to $90/Bbl through 2040 − Note: utilizes Alpha Management’s NAV model and assumes (a) PV10, PUD-PV15, PROB-PV20, POSS-PV25 and (b) gas strip as of August 30 ▪ We believe the current offer provides an attractive risk-adjusted alternative to Alpha shareholders and insulates them from future commodity price and execution uncertainties 2 Note: Market data as of September 13, 2022. Peers include APA, CTRA, DVN, EOG, FANG, HES, MRO, OVV and PXD. Source: FactSet, public disclosure.

Volume ('000s) Price Performance Prior to Offer Price Performance Since June 13, 2020 (Peers Indexed to Alpha) $75 15,000 Alpha Price VWAP Current Price (6/13/22): $64.50 Perf. Min Max $/sh. Current vs. $70 10-Day (5.2%) $64.50 $72.65 $69.53 (7.2%) 30-Day 16.5% $55.02 $72.65 $63.21 2.0% 90-Day 16.7% $51.42 $72.65 $59.41 8.6% $65 Alpha: $64.50; +288% Since Dividend Increase (4/27/22) 15.0% $55.02 $72.65 $62.60 3.0% Since CHK Transaction (1/24/22) 30.8% $49.33 $72.65 $58.91 9.5% Since PXD Transaction (11/2/21) 29.8% $42.68 $72.65 $54.76 17.8% $60 12,000 Correlation to WTI Peers: +253% Time Period Correlation (r) Historically, Alpha stock price WTI Spot: $120.92; $55 90-Day 0.727 +234% has been highly correlated to 180-Day 0.928 WTI oil price $50 12-Months 0.923 24-Months 0.971 $45 9,000 XOP: +163% $40 $35 $30 6,000 $25 $20 $16.61 $36.24 $15 3,000 $10 $5 $-- -- Jun-20 Nov-20 Apr-21 Aug-21 Jan-22 Jun-22 (1) Volume Alpha Peers XOP WTI Oil Note: Market data as of June 13, 2022. 3 (1) Reflects average of peer index. Peers includes APA, CTRA, DVN, EOG, FANG, HES, MRO, OVV, and PXD. Source: FactSet, company disclosure. Share Price ($) | Indexed to Alpha

Volume ('000s) Price Performance Since Offer Price Performance Since June 13, 2022 (Peers Indexed to Alpha) $75 15,000 $70 Alpha: $69.73; +8% $65 $64.50 $120.92 $60 12,000 XOP: (7%) Peers: (7%) $55 $50 WTI Spot: $87.55; (28%) $45 Alpha Price VWAP 9,000 Current Price (9/13/22): $69.73 Perf. Min Max $/sh. Current vs. $40 10-Day (0.4%) $68.35 $70.88 $69.41 0.5% 30-Day 2.8% $65.09 $72.31 $68.98 1.1% Post Announcement 8.1% $62.96 $74.22 $67.81 2.8% $35 Correlation to WTI Time Period Correlation (r) Alpha has de-coupled from WTI price $30 6,000 since the offer; offer is substantially 10-Day 0.477 30-Day 0.085 supporting the stock price $25 (0.221) Since Annoncement $20 $15 3,000 $10 $5 $-- -- Jun-22 Jul-22 Jul-22 Aug-22 Aug-22 Sep-22 (1) Volume Alpha Peers XOP WTI Oil Note: Market data as of September 13, 2022. 4 (1) Reflects average of peer index. Peers includes APA, CTRA, DVN, EOG, FANG, HES, MRO, OVV, and PXD. Source: FactSet, company disclosure. Share Price ($) | Indexed to Alpha
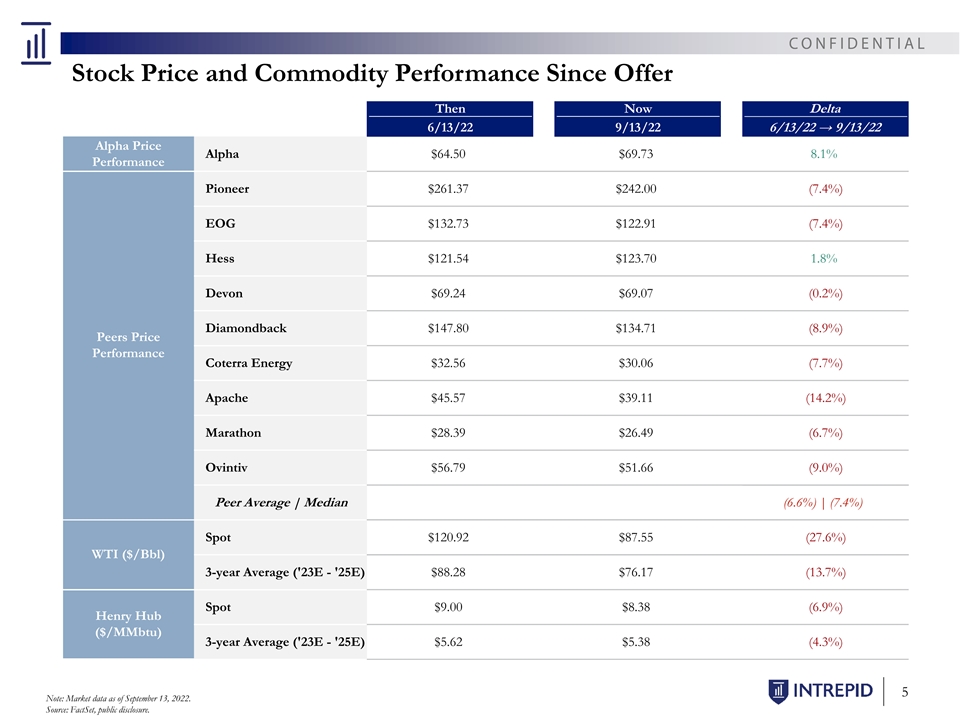
Stock Price and Commodity Performance Since Offer Then Now Delta 6/13/22 9/13/22 6/13/22 → 9/13/22 Alpha Price Alpha $64.50 $69.73 8.1% Performance Pioneer $261.37 $242.00 (7.4%) EOG $132.73 $122.91 (7.4%) Hess $121.54 $123.70 1.8% Devon $69.24 $69.07 (0.2%) Diamondback $147.80 $134.71 (8.9%) Peers Price Performance Coterra Energy $32.56 $30.06 (7.7%) Apache $45.57 $39.11 (14.2%) Marathon $28.39 $26.49 (6.7%) Ovintiv $56.79 $51.66 (9.0%) Peer Average | Median (6.6%) | (7.4%) Spot $120.92 $87.55 (27.6%) WTI ($/Bbl) 3-year Average ('23E - '25E) $88.28 $76.17 (13.7%) Spot $9.00 $8.38 (6.9%) Henry Hub ($/MMbtu) 3-year Average ('23E - '25E) $5.62 $5.38 (4.3%) 5 Note: Market data as of September 13, 2022. Source: FactSet, public disclosure.
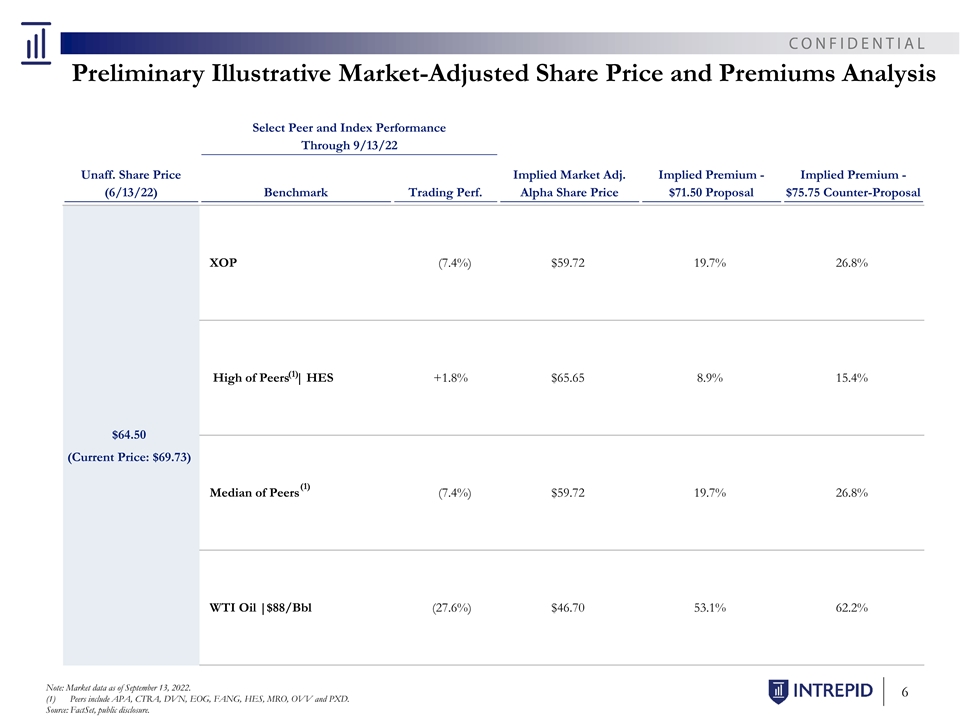
Preliminary Illustrative Market-Adjusted Share Price and Premiums Analysis Select Peer and Index Performance Through 9/13/22 Unaff. Share Price Implied Market Adj. Implied Premium - Implied Premium - (6/13/22) Benchmark Trading Perf. Alpha Share Price $71.50 Proposal $75.75 Counter-Proposal XOP (7.4%) $59.72 19.7% 26.8% (1) High of Peers | HES +1.8% $65.65 8.9% 15.4% $64.50 (Current Price: $69.73) (1) Median of Peers (7.4%) $59.72 19.7% 26.8% WTI Oil |$88/Bbl (27.6%) $46.70 53.1% 62.2% Note: Market data as of September 13, 2022. 6 (1) Peers include APA, CTRA, DVN, EOG, FANG, HES, MRO, OVV and PXD. Source: FactSet, public disclosure.
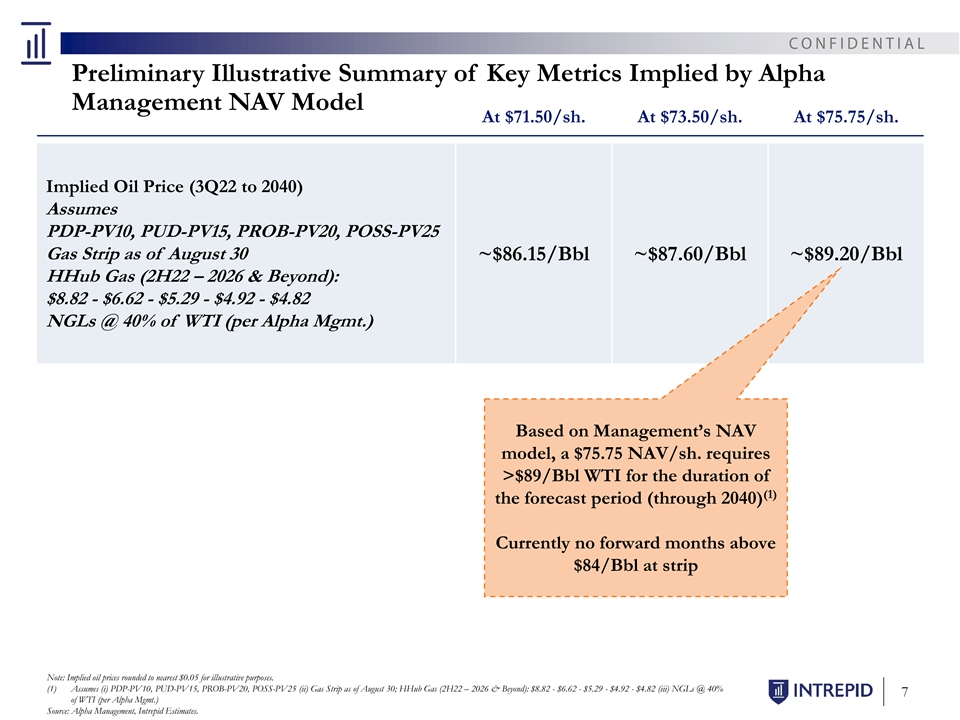
Preliminary Illustrative Summary of Key Metrics Implied by Alpha Management NAV Model At $71.50/sh. At $73.50/sh. At $75.75/sh. Implied Oil Price (3Q22 to 2040) Assumes PDP-PV10, PUD-PV15, PROB-PV20, POSS-PV25 Gas Strip as of August 30 ~$86.15/Bbl ~$87.60/Bbl ~$89.20/Bbl HHub Gas (2H22 – 2026 & Beyond): $8.82 - $6.62 - $5.29 - $4.92 - $4.82 NGLs @ 40% of WTI (per Alpha Mgmt.) Based on Management’s NAV model, a $75.75 NAV/sh. requires >$89/Bbl WTI for the duration of (1) the forecast period (through 2040) Currently no forward months above $84/Bbl at strip Note: Implied oil prices rounded to nearest $0.05 for illustrative purposes. (1) Assumes (i) PDP-PV10, PUD-PV15, PROB-PV20, POSS-PV25 (ii) Gas Strip as of August 30; HHub Gas (2H22 – 2026 & Beyond): $8.82 - $6.62 - $5.29 - $4.92 - $4.82 (iii) NGLs @ 40% 7 of WTI (per Alpha Mgmt.) Source: Alpha Management, Intrepid Estimates.

Disclaimer This document has been prepared by Intrepid Partners, L.L.C. (“Intrepid”), member FINRA and SIPC, for informational purposes only. You should not rely upon or use it to form the definitive basis for any decision or action whatsoever, with respect to any proposed transaction or otherwise. This document and any oral information provided in connection with this document, as well as any information derived by you from the information contained herein, is confidential and is for the intended recipient and cannot be redistributed, reproduced, disclosed or transmitted without prior written permission from Intrepid. If you are not the intended recipient of this document, please delete and destroy all copies immediately. Prices shown in this document are indicative only and Intrepid is not offering to buy or sell, or soliciting offers to buy or sell any financial instrument. This document is “as is”. Unless otherwise specified, the source for all graphs, charts, and other information is Intrepid. Intrepid’s databases are derived from various internal and external sources. Intrepid’s use of any information from external sources does not imply that it has independently verified or necessarily agrees with any of such information, and Intrepid has assumed and relied upon the accuracy and completeness of such information for purposes of this document. Neither Intrepid nor any of its affiliates or agents represents or warrants, expressly or impliedly, that the information provided herein, or any oral information provided in connection herewith, or any data it generates, is accurate or complete, and it should not be relied upon as such. Intrepid and its affiliates and agents expressly disclaim any and all liability (whether direct or indirect, in contract, tort or otherwise) in relation to any of such information or any errors or omissions therein. Any data on past performance, modeling or back-testing or any other information contained herein is no indication as to future performance. No representation is made as to the reasonableness of the assumptions made within or the accuracy or completeness of any modeling or back-testing or any other information contained herein. All levels, prices and spreads are historical and do not represent current market levels, prices or spreads, some or all of which may have changed since the issuance of this document. All opinions, terms and estimates contained herein are preliminary and are based on financial, economic, market and other conditions prevailing as of the date hereof and are subject to change. Intrepid assumes no obligation or responsibility to update any of the information contained in this document to reflect any such changes. The value of any investment may fluctuate as a result of market changes. The information herein is not intended to predict actual results and no assurances are given with respect thereto. Nothing herein shall be deemed to constitute investment, legal, tax, financial, accounting or other advice. Intrepid and/or its affiliated companies may make a market or deal as principal in the securities mentioned in this document or in options or other derivatives based thereon. Intrepid may be on the opposite side of any orders executed for securities or financial instruments that are related to or the subject of this material. In addition, Intrepid, its affiliated companies, shareholders, directors, officers, and/or employees, including persons involved in preparation or issuance of this material, may from time to time have long or short positions in such securities or financial instruments, or in options, futures, or other derivative instruments based thereon. Intrepid and its affiliates and their respective officers, directors, partners and employees, including persons involved in the preparation or issuance of this document, may from time to time act as manager, co-manager, arranger or underwriter of an offering or otherwise, in the capacity of principal or agent, transact in, hold or act as market-maker or advisor, broker or commercial and/or investment banker in relation to the securities, instruments or related derivatives which are the subject of this document. This document does not constitute nor does it form part of an offer to sell or purchase, or the solicitation of an offer to sell or purchase, any securities or instruments or an offer or recommendation to enter into any transaction described herein nor does this document constitute an offer or commitment to provide, syndicate, arrange or underwrite any financing, underwrite or purchase or act as an agent or advisor or in any other capacity with respect to any transaction, or commit capital, or to participate in any trading strategies, and does not constitute legal, regulatory, accounting or tax advice to the recipient. This document does not constitute and should not be considered as any form of financial opinion or recommendation by Intrepid or any of its affiliates. This document is not a research report nor should it be construed as such. IRS Circular 230 Disclosure: Intrepid and its affiliates do not provide tax advice. Please note that (i) any discussion of U.S. tax matters contained in this communication (including any attachments) cannot be used by you for the purpose of avoiding tax penalties; (ii) this communication was written to support the promotion or marketing of the matters addressed herein; and (iii) you should seek advice based on your particular circumstances from an independent tax advisor. No action has been made or will be taken that would permit a public offering of the securities described herein in any jurisdiction in which action for that purpose is required. No offers, sales, resales, or delivery of the securities described herein or distribution of any offering material relating to such securities may be made in or from any jurisdiction except in circumstances which will result in compliance with any applicable laws and regulations and which will not impose any obligation on Intrepid or any of its affiliates. This document does not disclose all the risks and other significant issues related to an investment in the securities described herein. Prior to transacting, potential investors should ensure that they fully understand the terms of the relevant securities and any applicable risks. The information contained herein is not intended to be distributed to any prospective or actual investors and, accordingly, may not be shown or given to any person other than the recipient, and is not to be forwarded to any other person (including any retail investor or customer), copied or otherwise reproduced or distributed to any such person in any manner whatsoever. Failure to comply with this directive can result in a violation of the Securities Act of 1933, as amended.