Exhibit (c)(2)(G) Preliminary Draft Subject to Review and Significant Revision Project Alpha Supplemental Discussion Materials Prepared for the Special Committee of the Board of Directors September 18, 2022

Preliminary Draft Subject to Review and Significant Revision These materials have been prepared by Evercore Group L.L.C. (“Evercore”) for the Special Committee of the Board of Directors of Alpha (the “Company”) to whom such materials are directly addressed and delivered and may not be used or relied upon for any purpose other than as specifically contemplated. These materials are based on information provided by or on behalf of the Company and/or other potential transaction participants, from public sources or otherwise reviewed by Evercore. Evercore assumes no responsibility for independent investigation or verification of such information and has relied on such information being complete and accurate in all material respects. To the extent such information includes estimates and forecasts of future financial performance prepared by or reviewed with the Management of the Company and/or other potential transaction participants or obtained from public sources, Evercore has assumed that such estimates and forecasts have been reasonably prepared on bases reflecting the best currently available estimates and judgments of such Management (or, with respect to estimates and forecasts obtained from public sources, represent reasonable estimates). No representation or warranty, express or implied, is made as to the accuracy or completeness of such information and nothing contained herein is, or shall be relied upon as, a representation, whether as to the past, the present or the future. These materials were designed for use by specific persons familiar with the business and affairs of the Company. These materials are not intended to provide the sole basis for evaluating, and should not be considered a recommendation with respect to, any transaction or other matter. These materials have been developed by and are proprietary to Evercore and were prepared exclusively for the benefit and internal use of the Special Committee of the Board of Directors of the Company. These materials supplement the “Project Alpha Discussion Materials Prepared for the Special Committee of the Board of Directors dated July 25, 2022 presented by Evercore to the Special Committee on that date in connection with the proposed transaction described in those materials and the supplements to those materials presented to the Special Committee on July 28, 2022, September 2, 2022 and September 13, 2022 (collectively sometimes referred to as the “Prior Presentations ). These materials do not restate all of the assumptions and qualifications set forth in the July Presentations and must be read in conjunction with those presentations. These materials were compiled on a confidential basis for use by the Special Committee of the Board of Directors of the Company in evaluating the potential transaction described in the Prior Presentations and not with a view to public disclosure or filing thereof under state or federal securities laws, and may not be reproduced, disseminated, quoted or referred to, in whole or in part, without the prior written consent of Evercore. These materials do not constitute an offer or solicitation to sell or purchase any securities and are not a commitment by Evercore (or any affiliate) to provide or arrange any financing for any transaction or to purchase any security in connection therewith. Evercore assumes no obligation to update or otherwise revise these materials. These materials may not reflect information known to other professionals in other business areas of Evercore and its affiliates. Evercore and its affiliates do not provide legal, accounting or tax advice. Accordingly, any statements contained herein as to tax matters were neither written nor intended by Evercore or its affiliates to be used and cannot be used by any taxpayer for the purpose of avoiding tax penalties that may be imposed on such taxpayer. Each person should seek legal, accounting and tax advice based on his, her or its particular circumstances from independent advisors regarding the impact of the transactions or matters described herein.
Preliminary Draft Subject to Review and Significant Revision Table of Contents Section Market Trading and Financial Update I Alpha Financial Projections as of September 16, 2022 II Preliminary Valuation Analysis III Appendix

Preliminary Draft Subject to Review and Significant Revision I. Market Trading and Financial Update
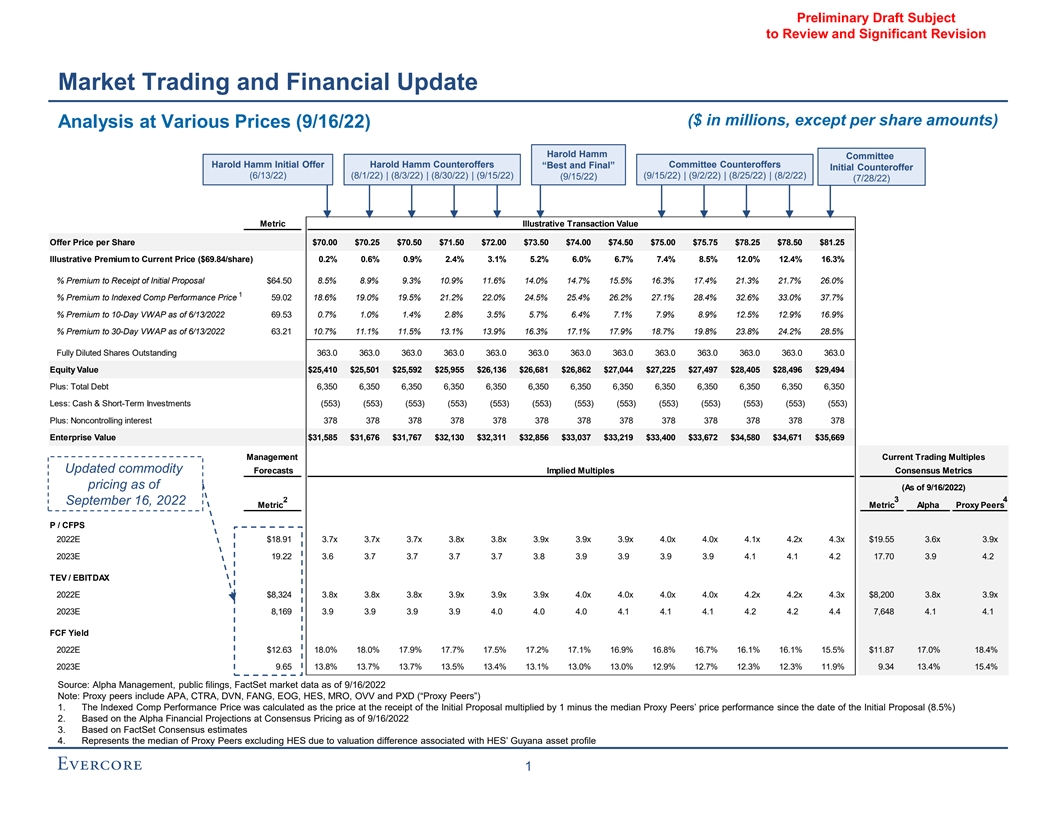
Preliminary Draft Subject to Review and Significant Revision Market Trading and Financial Update ($ in millions, except per share amounts) Analysis at Various Prices (9/16/22) Harold Hamm Committee Harold Hamm Initial Offer Harold Hamm Counteroffers “Best and Final” Committee Counteroffers Initial Counteroffer (6/13/22) (8/1/22) | (8/3/22) | (8/30/22) | (9/15/22) (9/15/22) | (9/2/22) | (8/25/22) | (8/2/22) (9/15/22) (7/28/22) Metric Illustrative Transaction Value Offer Price per Share $70.00 $70.25 $70.50 $71.50 $72.00 $73.50 $74.00 $74.50 $75.00 $75.75 $78.25 $78.50 $81.25 Illustrative Premium to Current Price ($69.84/share) 0.2% 0.6% 0.9% 2.4% 3.1% 5.2% 6.0% 6.7% 7.4% 8.5% 12.0% 12.4% 16.3% % Premium to Receipt of Initial Proposal $64.50 8.5% 8.9% 9.3% 10.9% 11.6% 14.0% 14.7% 15.5% 16.3% 17.4% 21.3% 21.7% 26.0% 1 % Premium to Indexed Comp Performance Price 59.02 18.6% 19.0% 19.5% 21.2% 22.0% 24.5% 25.4% 26.2% 27.1% 28.4% 32.6% 33.0% 37.7% % Premium to 10-Day VWAP as of 6/13/2022 69.53 0.7% 1.0% 1.4% 2.8% 3.5% 5.7% 6.4% 7.1% 7.9% 8.9% 12.5% 12.9% 16.9% % Premium to 30-Day VWAP as of 6/13/2022 63.21 10.7% 11.1% 11.5% 13.1% 13.9% 16.3% 17.1% 17.9% 18.7% 19.8% 23.8% 24.2% 28.5% Fully Diluted Shares Outstanding 363.0 363.0 363.0 363.0 363.0 363.0 363.0 363.0 363.0 363.0 363.0 363.0 363.0 Equity Value $25,410 $25,501 $25,592 $25,955 $26,136 $26,681 $26,862 $27,044 $27,225 $27,497 $28,405 $28,496 $29,494 Plus: Total Debt 6,350 6,350 6,350 6,350 6,350 6,350 6,350 6,350 6,350 6,350 6,350 6,350 6,350 Less: Cash & Short-Term Investments (553) (553) (553) (553) (553) (553) (553) (553) (553) (553) (553) (553) (553) Plus: Noncontrolling interest 378 378 378 378 378 378 378 378 378 378 378 378 378 Enterprise Value $31,585 $31,676 $31,767 $32,130 $32,311 $32,856 $33,037 $33,219 $33,400 $33,672 $34,580 $34,671 $35,669 Management Current Trading Multiples Updated commodity Forecasts Implied Multiples Consensus Metrics pricing as of (As of 9/16/2022) 2 3 4 September 16, 2022 Metric Metric Alpha Proxy Peers P / CFPS 2022E $18.91 3.7x 3.7x 3.7x 3.8x 3.8x 3.9x 3.9x 3.9x 4.0x 4.0x 4.1x 4.2x 4.3x $19.55 3.6x 3.9x 2023E 19.22 3.6 3.7 3.7 3.7 3.7 3.8 3.9 3.9 3.9 3.9 4.1 4.1 4.2 17.70 3.9 4.2 TEV / EBITDAX 2022E $8,324 3.8x 3.8x 3.8x 3.9x 3.9x 3.9x 4.0x 4.0x 4.0x 4.0x 4.2x 4.2x 4.3x $8,200 3.8x 3.9x 2023E 8,169 3.9 3.9 3.9 3.9 4.0 4.0 4.0 4.1 4.1 4.1 4.2 4.2 4.4 7,648 4.1 4.1 FCF Yield 2022E $12.63 18.0% 18.0% 17.9% 17.7% 17.5% 17.2% 17.1% 16.9% 16.8% 16.7% 16.1% 16.1% 15.5% $11.87 17.0% 18.4% 2023E 9.65 13.8% 13.7% 13.7% 13.5% 13.4% 13.1% 13.0% 13.0% 12.9% 12.7% 12.3% 12.3% 11.9% 9.34 13.4% 15.4% Source: Alpha Management, public filings, FactSet market data as of 9/16/2022 Note: Proxy peers include APA, CTRA, DVN, FANG, EOG, HES, MRO, OVV and PXD (“Proxy Peers”) 1. The Indexed Comp Performance Price was calculated as the price at the receipt of the Initial Proposal multiplied by 1 minus the median Proxy Peers’ price performance since the date of the Initial Proposal (8.5%) 2. Based on the Alpha Financial Projections at Consensus Pricing as of 9/16/2022 3. Based on FactSet Consensus estimates 4. Represents the median of Proxy Peers excluding HES due to valuation difference associated with HES’ Guyana asset profile 1

Preliminary Draft Subject to Review and Significant Revision Market Trading and Financial Update Valuation Multiples Since Initial Proposal 1 Relative Price Performance Since June 13, 2022 25% 8.3% --% (7.5%) (8.2%) (25%) (29.6%) (50%) 6/13/22 6/28/22 7/14/22 7/30/22 8/15/22 8/31/22 9/16/22 Alpha Proxy Peers HHUB WTI Change in Share Price and Valuation Multiples Share Price EV / 2023E EBITDAX² 6/13/22 7/20/22 8/30/22 9/16/22 Δ 6/13 - 7/20 Δ 6/13 - 8/30 Δ 6/13 - 9/16 6/13/22 7/20/22 8/30/22 9/16/22 Δ 6/13 - 7/20 Δ 6/13 - 8/30 Δ 6/13 - 9/16 Alpha $64.50 $66.51 $70.03 $69.84 3.1% 8.6% 8.3% 4.2x 4.1x 4.2x 4.1x (1.8%) (0.9%) (1.6%) Peers: APA $45.57 $35.00 $39.32 $40.46 (23.2%) (13.7%) (11.2%) 3.3x 2.6x 2.6x 2.6x (21.0%) (20.5%) (21.1%) CTRA 32.56 28.91 30.40 28.74 (11.2%) (6.6%) (11.7%) 5.0 4.2 4.2 4.0 (16.6%) (16.6%) (21.2%) DVN 69.24 57.68 71.08 66.82 (16.7%) 2.7% (3.5%) 4.9 4.1 4.5 4.3 (16.8%) (8.0%) (11.7%) EOG 132.73 105.57 121.86 121.45 (20.5%) (8.2%) (8.5%) 5.4 4.0 4.7 4.6 (24.6%) (12.5%) (13.3%) FANG 147.80 118.77 134.07 132.62 (19.6%) (9.3%) (10.3%) 5.0 4.2 4.6 4.5 (16.3%) (9.4%) (10.0%) HES 121.54 104.92 122.12 121.64 (13.7%) 0.5% 0.1% 6.9 6.0 6.7 6.7 (13.8%) (3.8%) (3.3%) MRO 28.39 22.92 25.58 26.22 (19.3%) (9.9%) (7.6%) 4.6 3.7 3.9 4.0 (20.9%) (16.0%) (14.3%) OVV 56.79 46.58 52.83 49.55 (18.0%) (7.0%) (12.7%) 3.4 2.7 3.0 2.9 (18.8%) (10.0%) (14.5%) PXD 261.37 216.81 254.71 239.50 (17.0%) (2.5%) (8.4%) 5.8 4.6 5.4 5.1 (20.5%) (7.3%) (12.4%) Median of Peers (18.0%) (7.0%) (8.5%) 5.0x 4.1x 4.5x 4.3x (18.8%) (10.0%) (13.3%) Source: FactSet market data as of 9/16/2022 1. Proxy Peers relative price performance calculated as an average of Proxy Peers indexed price performance 2. EV / 2023E EBITDAX based on Consensus trading multiples 2
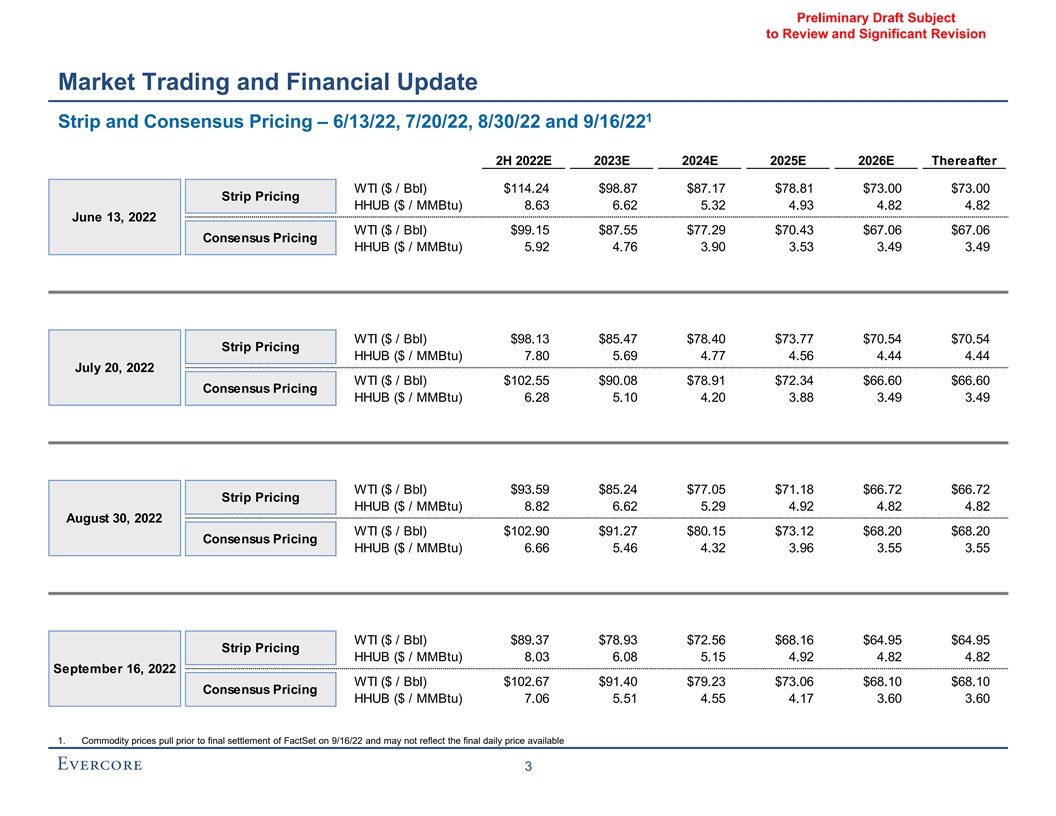
Preliminary Draft Subject to Review and Significant Revision Market Trading and Financial Update 1 Strip and Consensus Pricing – 6/13/22, 7/20/22, 8/30/22 and 9/16/22 2H 2022E 2023E 2024E 2025E 2026E Thereafter WTI ($ / Bbl) $114.24 $98.87 $87.17 $78.81 $73.00 $73.00 Strip Pricing HHUB ($ / MMBtu) 8.63 6.62 5.32 4.93 4.82 4.82 June 13, 2022 WTI ($ / Bbl) $99.15 $87.55 $77.29 $70.43 $67.06 $67.06 Consensus Pricing HHUB ($ / MMBtu) 5.92 4.76 3.90 3.53 3.49 3.49 WTI ($ / Bbl) $98.13 $85.47 $78.40 $73.77 $70.54 $70.54 Strip Pricing HHUB ($ / MMBtu) 7.80 5.69 4.77 4.56 4.44 4.44 July 20, 2022 WTI ($ / Bbl) $102.55 $90.08 $78.91 $72.34 $66.60 $66.60 Consensus Pricing HHUB ($ / MMBtu) 6.28 5.10 4.20 3.88 3.49 3.49 WTI ($ / Bbl) $93.59 $85.24 $77.05 $71.18 $66.72 $66.72 Strip Pricing HHUB ($ / MMBtu) 8.82 6.62 5.29 4.92 4.82 4.82 August 30, 2022 WTI ($ / Bbl) $102.90 $91.27 $80.15 $73.12 $68.20 $68.20 Consensus Pricing HHUB ($ / MMBtu) 6.66 5.46 4.32 3.96 3.55 3.55 WTI ($ / Bbl) $89.37 $78.93 $72.56 $68.16 $64.95 $64.95 Strip Pricing HHUB ($ / MMBtu) 8.03 6.08 5.15 4.92 4.82 4.82 September 16, 2022 WTI ($ / Bbl) $102.67 $91.40 $79.23 $73.06 $68.10 $68.10 Consensus Pricing HHUB ($ / MMBtu) 7.06 5.51 4.55 4.17 3.60 3.60 1. Commodity prices pull prior to final settlement of FactSet on 9/16/22 and may not reflect the final daily price available 3
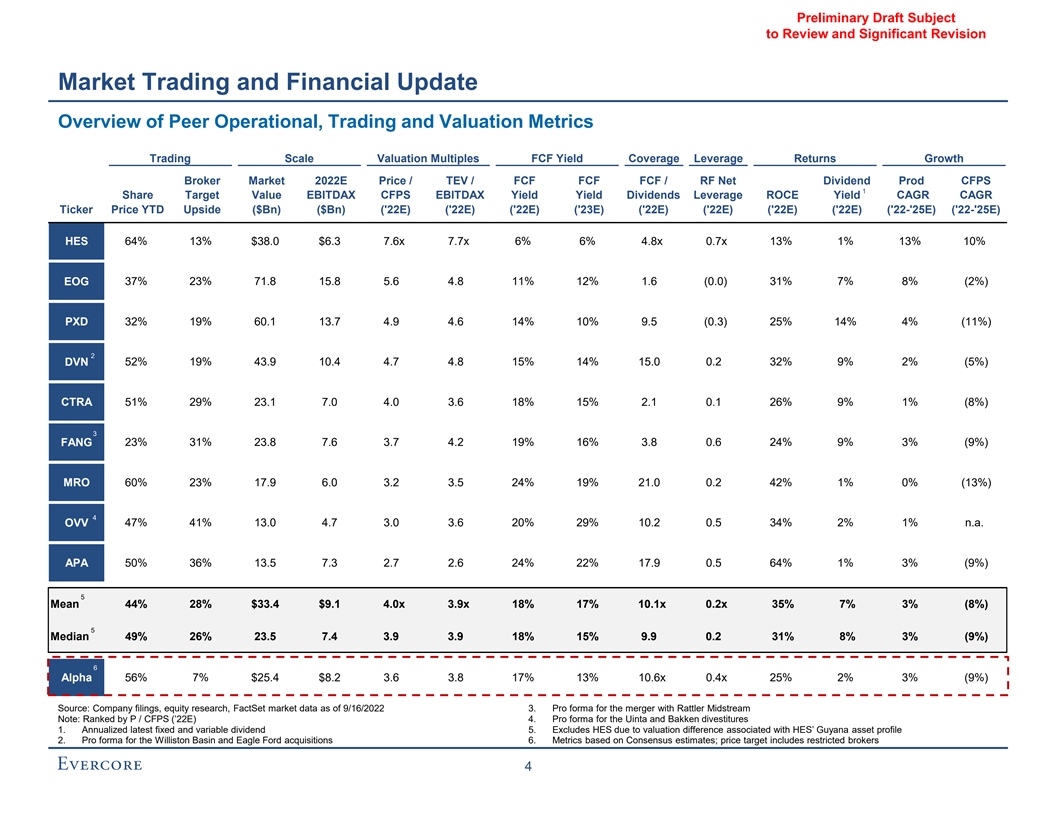
Preliminary Draft Subject to Review and Significant Revision Market Trading and Financial Update Overview of Peer Operational, Trading and Valuation Metrics Trading Scale Valuation Multiples FCF Yield Coverage Leverage Returns Growth Broker Market 2022E Price / TEV / FCF FCF FCF / RF Net Dividend Prod CFPS 1 Share Target Value EBITDAX CFPS EBITDAX Yield Yield Dividends Leverage ROCE Yield CAGR CAGR Ticker Price YTD Upside ($Bn) ($Bn) ('22E) ('22E) ('22E) ('23E) ('22E) ('22E) ('22E) ('22E) ('22-'25E) ('22-'25E) HES 64% 13% $38.0 $6.3 7.6x 7.7x 6% 6% 4.8x 0.7x 13% 1% 13% 10% EOG 37% 23% 71.8 15.8 5.6 4.8 11% 12% 1.6 (0.0) 31% 7% 8% (2%) PXD 32% 19% 60.1 13.7 4.9 4.6 14% 10% 9.5 (0.3) 25% 14% 4% (11%) 2 DVN 52% 19% 43.9 10.4 4.7 4.8 15% 14% 15.0 0.2 32% 9% 2% (5%) CTRA 51% 29% 23.1 7.0 4.0 3.6 18% 15% 2.1 0.1 26% 9% 1% (8%) 3 FANG 23% 31% 23.8 7.6 3.7 4.2 19% 16% 3.8 0.6 24% 9% 3% (9%) MRO 60% 23% 17.9 6.0 3.2 3.5 24% 19% 21.0 0.2 42% 1% 0% (13%) 4 OVV 47% 41% 13.0 4.7 3.0 3.6 20% 29% 10.2 0.5 34% 2% 1% n.a. APA 50% 36% 13.5 7.3 2.7 2.6 24% 22% 17.9 0.5 64% 1% 3% (9%) 5 Mean 44% 28% $33.4 $9.1 4.0x 3.9x 18% 17% 10.1x 0.2x 35% 7% 3% (8%) 5 Median 49% 26% 23.5 7.4 3.9 3.9 18% 15% 9.9 0.2 31% 8% 3% (9%) 6 Alpha 56% 7% $25.4 $8.2 3.6 3.8 17% 13% 10.6x 0.4x 25% 2% 3% (9%) Source: Company filings, equity research, FactSet market data as of 9/16/2022 3. Pro forma for the merger with Rattler Midstream Note: Ranked by P / CFPS (’22E) 4. Pro forma for the Uinta and Bakken divestitures 1. Annualized latest fixed and variable dividend 5. Excludes HES due to valuation difference associated with HES’ Guyana asset profile 2. Pro forma for the Williston Basin and Eagle Ford acquisitions 6. Metrics based on Consensus estimates; price target includes restricted brokers 4
Preliminary Draft Subject to Review and Significant Revision II. Alpha Financial Projections as of September 16, 2022
Preliminary Draft Subject to Review and Significant Revision Alpha Financial Projections as of September 16, 2022 Alpha Financial Projections – Assumptions ◼ The Alpha Financial Projections incorporate the following assumptions provided by Alpha Management: „ Revenue / Expenses: ● 2022E – 2026E revenue and expenses per 2022 budget and Alpha’s five-year forecast „ Financing Assumptions: ● Revolving credit facility maturing October 2026 is extended at the same terms ● Assumes the 4.500% Senior Notes due 2023 are repaid in Q2 2023 ● Assumes the 3.800% Senior Notes due 2024 are repaid in Q2 2024 „ Distribution policy: ● Other than the repurchase of stock-based compensation, the forecast does not include any share repurchases beyond Q1 2022 ● The forecast assumes ~$101 million in dividends in Q2 and Q3 2022, with negligible dividend amounts in Q4 2022 and beyond Source: Alpha Management 5
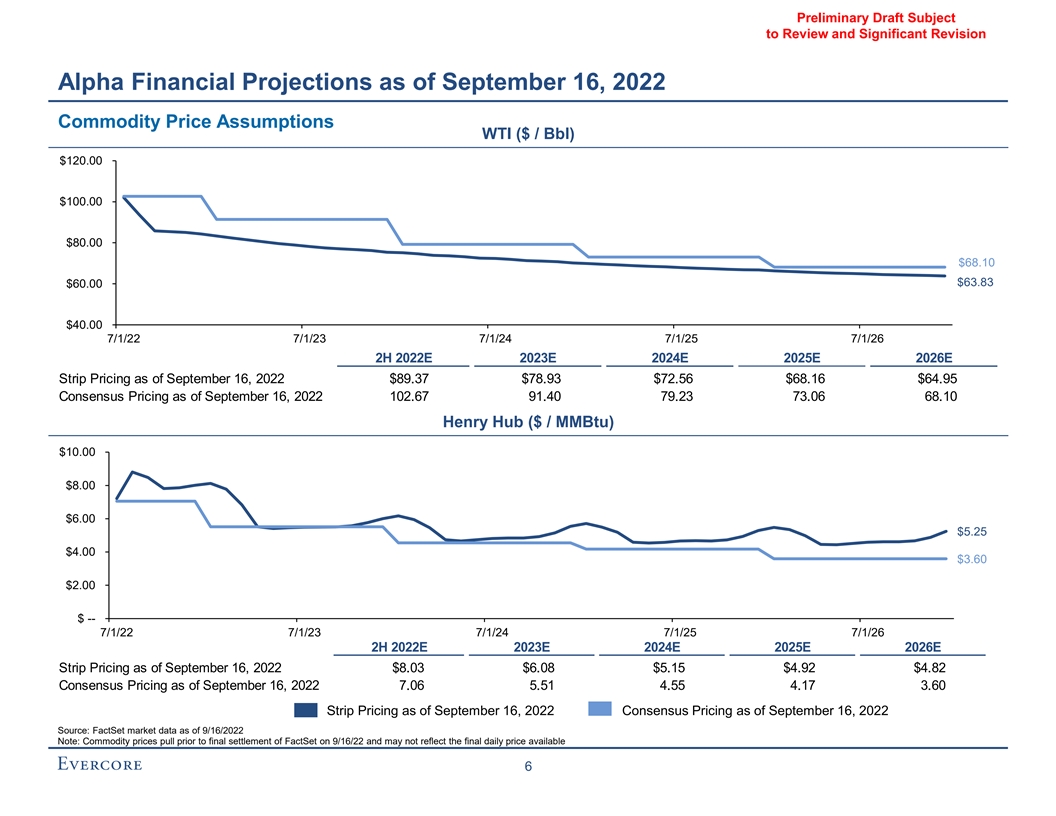
Preliminary Draft Subject to Review and Significant Revision Alpha Financial Projections as of September 16, 2022 Commodity Price Assumptions WTI ($ / Bbl) $120.00 $100.00 $80.00 $68.10 $63.83 $60.00 $40.00 7/1/22 7/1/23 7/1/24 7/1/25 7/1/26 2H 2022E 2023E 2024E 2025E 2026E Strip Pricing as of September 16, 2022 $89.37 $78.93 $72.56 $68.16 $64.95 Consensus Pricing as of September 16, 2022 102.67 91.40 79.23 73.06 68.10 Henry Hub ($ / MMBtu) $10.00 $8.00 $6.00 $5.25 $4.00 $3.60 $2.00 $ -- 7/1/22 7/1/23 7/1/24 7/1/25 7/1/26 2H 2022E 2023E 2024E 2025E 2026E Strip Pricing as of September 16, 2022 $8.03 $6.08 $5.15 $4.92 $4.82 Consensus Pricing as of September 16, 2022 7.06 5.51 4.55 4.17 3.60 Strip Pricing as of September 16, 2022 Consensus Pricing as of September 16, 2022 Source: FactSet market data as of 9/16/2022 Note: Commodity prices pull prior to final settlement of FactSet on 9/16/22 and may not reflect the final daily price available 6
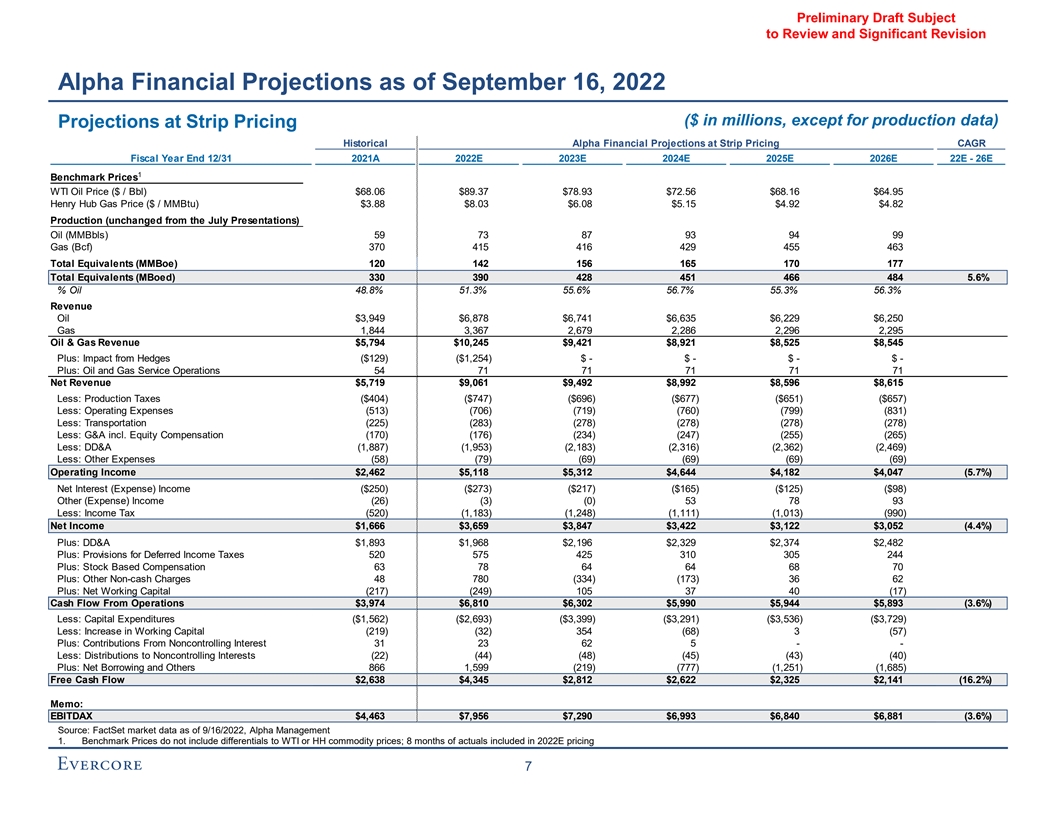
Preliminary Draft Subject to Review and Significant Revision Alpha Financial Projections as of September 16, 2022 ($ in millions, except for production data) Projections at Strip Pricing Historical Alpha Financial Projections at Strip Pricing CAGR Fiscal Year End 12/31 2021A 2022E 2023E 2024E 2025E 2026E 22E - 26E 1 Benchmark Prices WTI Oil Price ($ / Bbl) $68.06 $89.37 $78.93 $72.56 $68.16 $64.95 Henry Hub Gas Price ($ / MMBtu) $3.88 $8.03 $6.08 $5.15 $4.92 $4.82 Production (unchanged from the July Presentations) Oil (MMBbls) 59 73 87 93 94 99 Gas (Bcf) 370 415 416 429 455 463 Total Equivalents (MMBoe) 120 142 156 165 170 177 Total Equivalents (MBoed) 330 390 428 451 466 484 5.6% % Oil 48.8% 51.3% 55.6% 56.7% 55.3% 56.3% Revenue Oil $3,949 $6,878 $6,741 $6,635 $6,229 $6,250 Gas 1,844 3,367 2,679 2,286 2,296 2,295 Oil & Gas Revenue $5,794 $10,245 $9,421 $8,921 $8,525 $8,545 Plus: Impact from Hedges ($129) ($1,254) $ - $ - $ - $ - Plus: Oil and Gas Service Operations 54 71 71 71 71 71 Net Revenue $5,719 $9,061 $9,492 $8,992 $8,596 $8,615 Less: Production Taxes ($404) ($747) ($696) ($677) ($651) ($657) Less: Operating Expenses (513) (706) (719) (760) (799) (831) Less: Transportation (225) (283) (278) (278) (278) (278) Less: G&A incl. Equity Compensation (170) (176) (234) (247) (255) (265) Less: DD&A (1,887) (1,953) (2,183) (2,316) (2,362) (2,469) Less: Other Expenses (58) (79) (69) (69) (69) (69) Operating Income $2,462 $5,118 $5,312 $4,644 $4,182 $4,047 (5.7%) Net Interest (Expense) Income ($250) ($273) ($217) ($165) ($125) ($98) Other (Expense) Income (26) (3) (0) 53 78 93 Less: Income Tax (520) (1,183) (1,248) (1,111) (1,013) (990) Net Income $1,666 $3,659 $3,847 $3,422 $3,122 $3,052 (4.4%) Plus: DD&A $1,893 $1,968 $2,196 $2,329 $2,374 $2,482 Plus: Provisions for Deferred Income Taxes 520 575 425 310 305 244 Plus: Stock Based Compensation 63 78 64 64 68 70 Plus: Other Non-cash Charges 48 780 (334) (173) 36 62 Plus: Net Working Capital (217) (249) 105 37 40 (17) Cash Flow From Operations $3,974 $6,810 $6,302 $5,990 $5,944 $5,893 (3.6%) Less: Capital Expenditures ($1,562) ($2,693) ($3,399) ($3,291) ($3,536) ($3,729) Less: Increase in Working Capital (219) (32) 354 (68) 3 (57) Plus: Contributions From Noncontrolling Interest 31 23 62 5 - - Less: Distributions to Noncontrolling Interests (22) (44) (48) (45) (43) (40) Plus: Net Borrowing and Others 866 1,599 (219) (777) (1,251) (1,685) Free Cash Flow $2,638 $4,345 $2,812 $2,622 $2,325 $2,141 (16.2%) Memo: EBITDAX $4,463 $7,956 $7,290 $6,993 $6,840 $6,881 (3.6%) Source: FactSet market data as of 9/16/2022, Alpha Management 1. Benchmark Prices do not include differentials to WTI or HH commodity prices; 8 months of actuals included in 2022E pricing 7
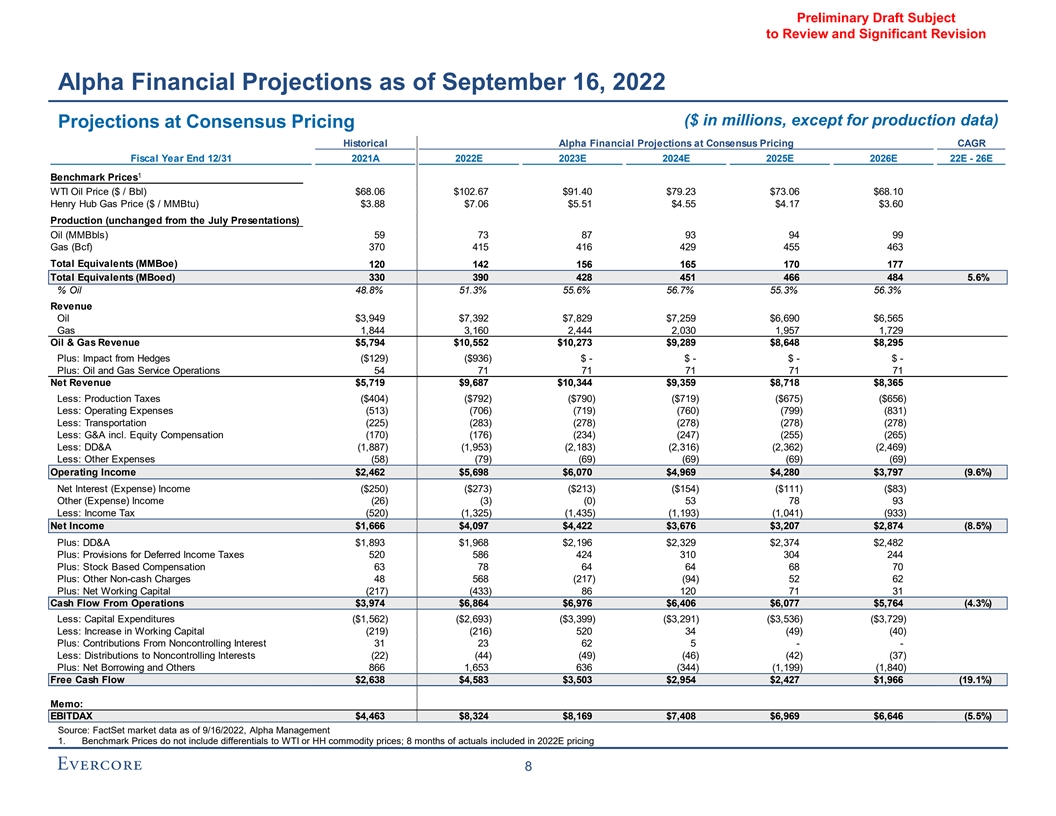
Preliminary Draft Subject to Review and Significant Revision Alpha Financial Projections as of September 16, 2022 ($ in millions, except for production data) Projections at Consensus Pricing Historical Alpha Financial Projections at Consensus Pricing CAGR Fiscal Year End 12/31 2021A 2022E 2023E 2024E 2025E 2026E 22E - 26E 1 Benchmark Prices WTI Oil Price ($ / Bbl) $68.06 $102.67 $91.40 $79.23 $73.06 $68.10 Henry Hub Gas Price ($ / MMBtu) $3.88 $7.06 $5.51 $4.55 $4.17 $3.60 Production (unchanged from the July Presentations) Oil (MMBbls) 59 73 87 93 94 99 Gas (Bcf) 370 415 416 429 455 463 Total Equivalents (MMBoe) 120 142 156 165 170 177 Total Equivalents (MBoed) 330 390 428 451 466 484 5.6% % Oil 48.8% 51.3% 55.6% 56.7% 55.3% 56.3% Revenue Oil $3,949 $7,392 $7,829 $7,259 $6,690 $6,565 Gas 1,844 3,160 2,444 2,030 1,957 1,729 Oil & Gas Revenue $5,794 $10,552 $10,273 $9,289 $8,648 $8,295 Plus: Impact from Hedges ($129) ($936) $ - $ - $ - $ - Plus: Oil and Gas Service Operations 54 71 71 71 71 71 Net Revenue $5,719 $9,687 $10,344 $9,359 $8,718 $8,365 Less: Production Taxes ($404) ($792) ($790) ($719) ($675) ($656) Less: Operating Expenses (513) (706) (719) (760) (799) (831) Less: Transportation (225) (283) (278) (278) (278) (278) Less: G&A incl. Equity Compensation (170) (176) (234) (247) (255) (265) Less: DD&A (1,887) (1,953) (2,183) (2,316) (2,362) (2,469) Less: Other Expenses (58) (79) (69) (69) (69) (69) Operating Income $2,462 $5,698 $6,070 $4,969 $4,280 $3,797 (9.6%) Net Interest (Expense) Income ($250) ($273) ($213) ($154) ($111) ($83) Other (Expense) Income (26) (3) (0) 53 78 93 Less: Income Tax (520) (1,325) (1,435) (1,193) (1,041) (933) Net Income $1,666 $4,097 $4,422 $3,676 $3,207 $2,874 (8.5%) Plus: DD&A $1,893 $1,968 $2,196 $2,329 $2,374 $2,482 Plus: Provisions for Deferred Income Taxes 520 586 424 310 304 244 Plus: Stock Based Compensation 63 78 64 64 68 70 Plus: Other Non-cash Charges 48 568 (217) (94) 52 62 Plus: Net Working Capital (217) (433) 86 120 71 31 Cash Flow From Operations $3,974 $6,864 $6,976 $6,406 $6,077 $5,764 (4.3%) Less: Capital Expenditures ($1,562) ($2,693) ($3,399) ($3,291) ($3,536) ($3,729) Less: Increase in Working Capital (219) (216) 520 34 (49) (40) Plus: Contributions From Noncontrolling Interest 31 23 62 5 - - Less: Distributions to Noncontrolling Interests (22) (44) (49) (46) (42) (37) Plus: Net Borrowing and Others 866 1,653 636 (344) (1,199) (1,840) Free Cash Flow $2,638 $4,583 $3,503 $2,954 $2,427 $1,966 (19.1%) Memo: EBITDAX $4,463 $8,324 $8,169 $7,408 $6,969 $6,646 (5.5%) Source: FactSet market data as of 9/16/2022, Alpha Management 1. Benchmark Prices do not include differentials to WTI or HH commodity prices; 8 months of actuals included in 2022E pricing 8
Preliminary Draft Subject to Review and Significant Revision III. Preliminary Valuation Analysis
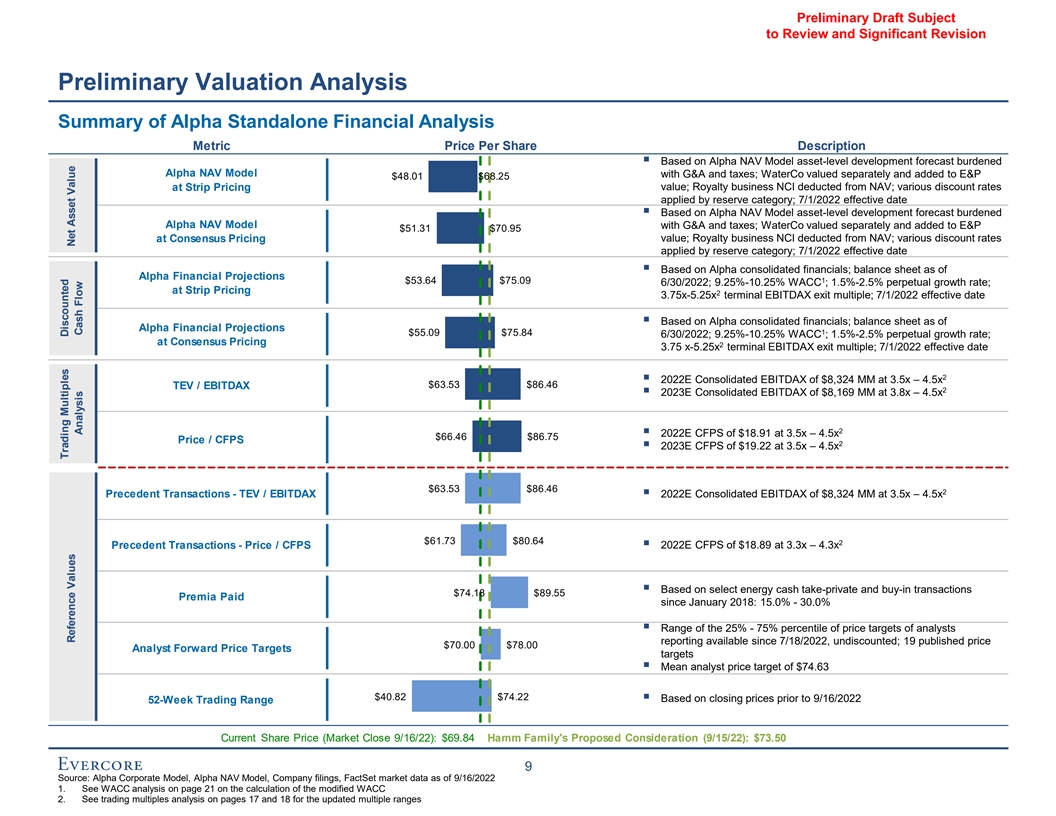
Preliminary Draft Subject to Review and Significant Revision Preliminary Valuation Analysis Summary of Alpha Standalone Financial Analysis Metric Price Per Share Description ▪ Based on Alpha NAV Model asset-level development forecast burdened Alpha NAV Model with G&A and taxes; WaterCo valued separately and added to E&P $48.01 $68.25 at Strip Pricing value; Royalty business NCI deducted from NAV; various discount rates applied by reserve category; 7/1/2022 effective date ▪ Based on Alpha NAV Model asset-level development forecast burdened Alpha NAV Model with G&A and taxes; WaterCo valued separately and added to E&P $51.31 $70.95 at Consensus Pricing value; Royalty business NCI deducted from NAV; various discount rates applied by reserve category; 7/1/2022 effective date ▪ Based on Alpha consolidated financials; balance sheet as of Alpha Financial Projections 1 $53.64 $75.09 6/30/2022; 9.25%-10.25% WACC ; 1.5%-2.5% perpetual growth rate; at Strip Pricing 2 3.75x-5.25x terminal EBITDAX exit multiple; 7/1/2022 effective date ▪ Based on Alpha consolidated financials; balance sheet as of Alpha Financial Projections 1 $55.09 $75.84 6/30/2022; 9.25%-10.25% WACC ; 1.5%-2.5% perpetual growth rate; at Consensus Pricing 2 3.75 x-5.25x terminal EBITDAX exit multiple; 7/1/2022 effective date 2 ▪ 2022E Consolidated EBITDAX of $8,324 MM at 3.5x – 4.5x $63.53 $86.46 TEV / EBITDAX 2 ▪ 2023E Consolidated EBITDAX of $8,169 MM at 3.8x – 4.5x 2 ▪ 2022E CFPS of $18.91 at 3.5x – 4.5x $66.46 $86.75 Price / CFPS 2 ▪ 2023E CFPS of $19.22 at 3.5x – 4.5x $63.53 $86.46 2 Precedent Transactions - TEV / EBITDAX▪ 2022E Consolidated EBITDAX of $8,324 MM at 3.5x – 4.5x $61.73 $80.64 2 Precedent Transactions - Price / CFPS▪ 2022E CFPS of $18.89 at 3.3x – 4.3x ▪ Based on select energy cash take-private and buy-in transactions $74.18 $89.55 Premia Paid since January 2018: 15.0% - 30.0% ▪ Range of the 25% - 75% percentile of price targets of analysts reporting available since 7/18/2022, undiscounted; 19 published price $70.00 $78.00 Analyst Forward Price Targets targets ▪ Mean analyst price target of $74.63 $40.82 $74.22 ▪ Based on closing prices prior to 9/16/2022 52-Week Trading Range Current Share Price (Market Close 9/16/22): $69.84 Hamm Family's Proposed Consideration (9/15/22): $73.50 9 Source: Alpha Corporate Model, Alpha NAV Model, Company filings, FactSet market data as of 9/16/2022 1. See WACC analysis on page 21 on the calculation of the modified WACC 2. See trading multiples analysis on pages 17 and 18 for the updated multiple ranges Trading Multiples Discounted Reference Values Net Asset Value Analysis Cash Flow
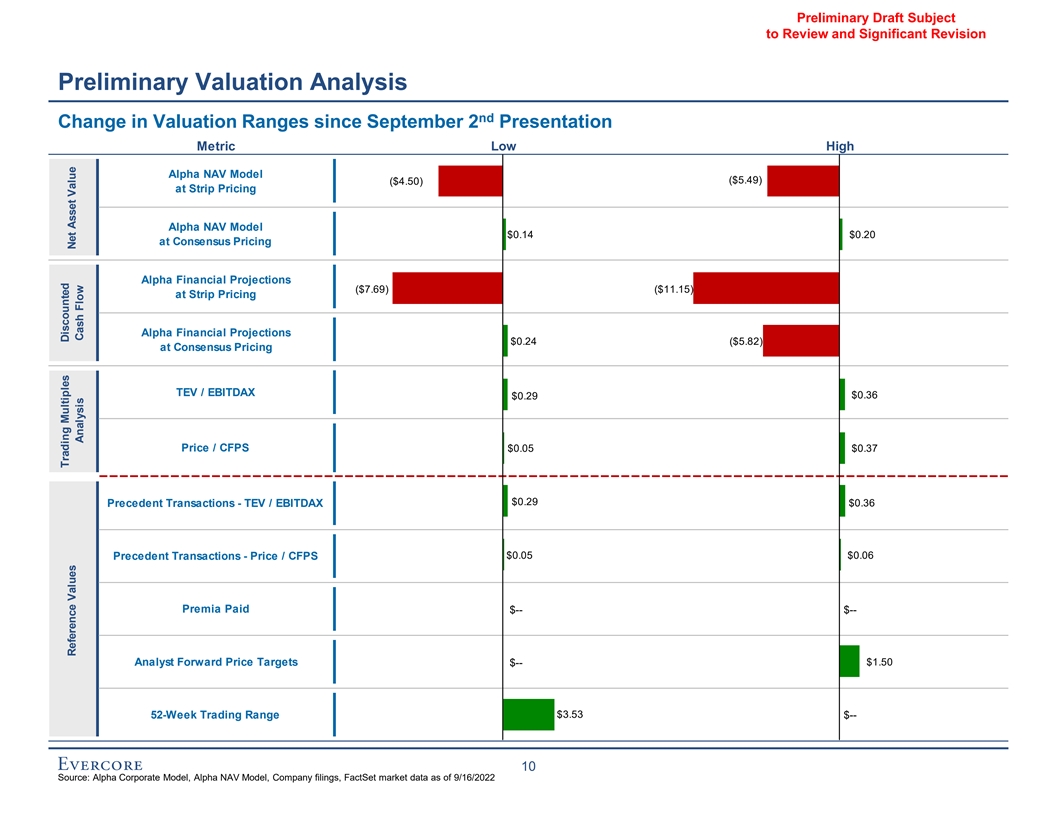
Preliminary Draft Subject to Review and Significant Revision Preliminary Valuation Analysis nd Change in Valuation Ranges since September 2 Presentation Metric Low High Alpha NAV Model ($5.49) ($4.50) at Strip Pricing Alpha NAV Model $0.14 $0.20 at Consensus Pricing Alpha Financial Projections ($7.69) ($11.15) at Strip Pricing Alpha Financial Projections $0.24 ($5.82) at Consensus Pricing TEV / EBITDAX $0.36 $0.29 Price / CFPS $0.05 $0.37 $0.29 Precedent Transactions - TEV / EBITDAX $0.36 $0.05 $0.06 Precedent Transactions - Price / CFPS Premia Paid $-- $-- Analyst Forward Price Targets $1.50 $-- 52-Week Trading Range $3.53 $-- 10 Source: Alpha Corporate Model, Alpha NAV Model, Company filings, FactSet market data as of 9/16/2022 Trading Multiples Discounted Reference Values Net Asset Value Analysis Cash Flow
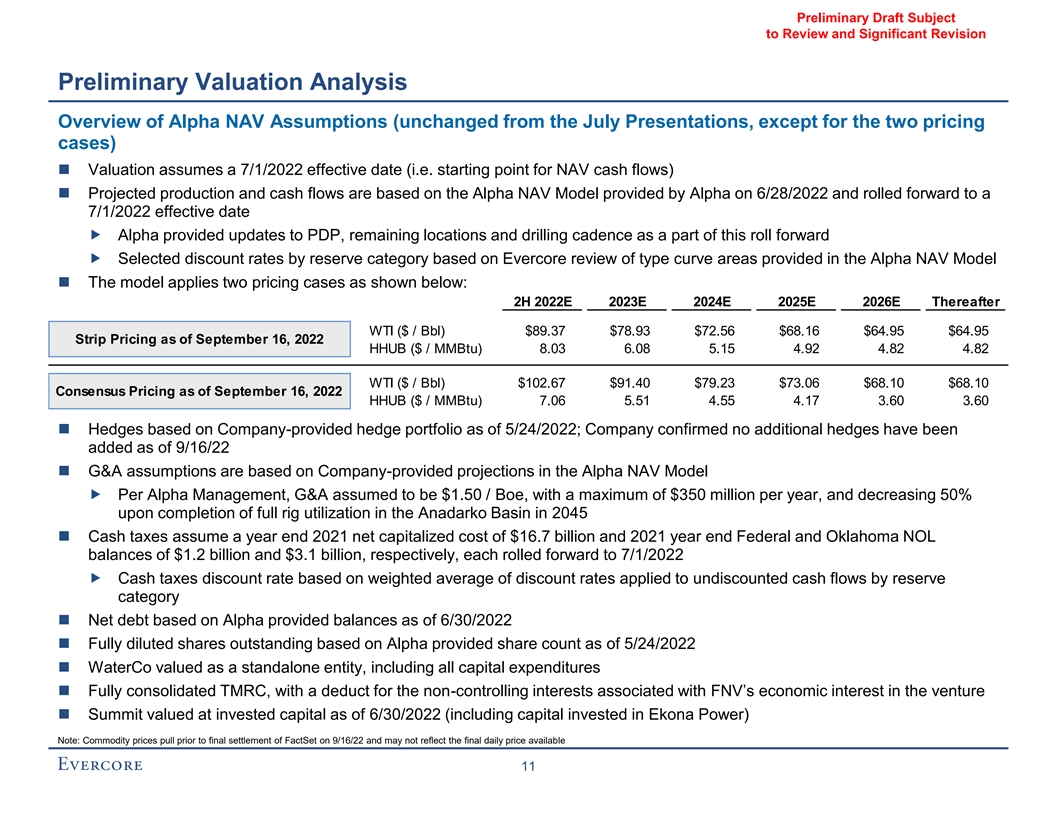
Preliminary Draft Subject to Review and Significant Revision Preliminary Valuation Analysis Overview of Alpha NAV Assumptions (unchanged from the July Presentations, except for the two pricing cases) ◼ Valuation assumes a 7/1/2022 effective date (i.e. starting point for NAV cash flows) ◼ Projected production and cash flows are based on the Alpha NAV Model provided by Alpha on 6/28/2022 and rolled forward to a 7/1/2022 effective date „ Alpha provided updates to PDP, remaining locations and drilling cadence as a part of this roll forward „ Selected discount rates by reserve category based on Evercore review of type curve areas provided in the Alpha NAV Model ◼ The model applies two pricing cases as shown below: 2H 2022E 2023E 2024E 2025E 2026E Thereafter WTI ($ / Bbl) $89.37 $78.93 $72.56 $68.16 $64.95 $64.95 Strip Pricing as of September 16, 2022 HHUB ($ / MMBtu) 8.03 6.08 5.15 4.92 4.82 4.82 WTI ($ / Bbl) $102.67 $91.40 $79.23 $73.06 $68.10 $68.10 Consensus Pricing as of September 16, 2022 HHUB ($ / MMBtu) 7.06 5.51 4.55 4.17 3.60 3.60 ◼ Hedges based on Company-provided hedge portfolio as of 5/24/2022; Company confirmed no additional hedges have been added as of 9/16/22 ◼ G&A assumptions are based on Company-provided projections in the Alpha NAV Model „ Per Alpha Management, G&A assumed to be $1.50 / Boe, with a maximum of $350 million per year, and decreasing 50% upon completion of full rig utilization in the Anadarko Basin in 2045 ◼ Cash taxes assume a year end 2021 net capitalized cost of $16.7 billion and 2021 year end Federal and Oklahoma NOL balances of $1.2 billion and $3.1 billion, respectively, each rolled forward to 7/1/2022 „ Cash taxes discount rate based on weighted average of discount rates applied to undiscounted cash flows by reserve category ◼ Net debt based on Alpha provided balances as of 6/30/2022 ◼ Fully diluted shares outstanding based on Alpha provided share count as of 5/24/2022 ◼ WaterCo valued as a standalone entity, including all capital expenditures ◼ Fully consolidated TMRC, with a deduct for the non-controlling interests associated with FNV’s economic interest in the venture ◼ Summit valued at invested capital as of 6/30/2022 (including capital invested in Ekona Power) Note: Commodity prices pull prior to final settlement of FactSet on 9/16/22 and may not reflect the final daily price available 11
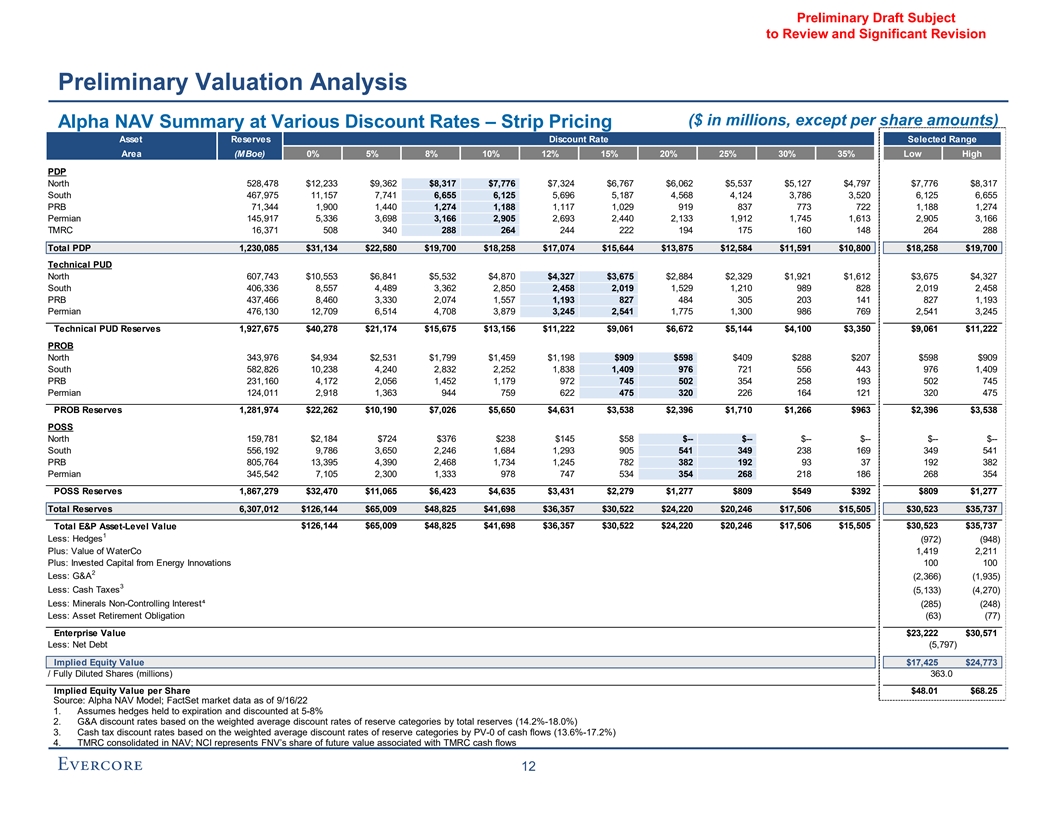
Preliminary Draft Subject to Review and Significant Revision Preliminary Valuation Analysis ($ in millions, except per share amounts) Alpha NAV Summary at Various Discount Rates – Strip Pricing Asset Reserves Discount Rate Selected Range Area (MBoe) 0% 5% 8% 10% 12% 15% 20% 25% 30% 35% Low High Discount Rates PDP North 528,478 $12,233 $9,362 $8,317 $7,776 $7,324 $6,767 $6,062 $5,537 $5,127 $4,797 $7,776 $8,317 South 467,975 11,157 7,741 6,655 6,125 5,696 5,187 4,568 4,124 3,786 3,520 6,125 6,655 PRB 71,344 1,900 1,440 1,274 1,188 1,117 1,029 919 837 773 722 1,188 1,274 Permian 145,917 5,336 3,698 3,166 2,905 2,693 2,440 2,133 1,912 1,745 1,613 2,905 3,166 TMRC 16,371 508 340 288 264 244 222 194 175 160 148 264 288 Total PDP 1,230,085 $31,134 $22,580 $19,700 $18,258 $17,074 $15,644 $13,875 $12,584 $11,591 $10,800 $18,258 $19,700 Technical PUD North 607,743 $10,553 $6,841 $5,532 $4,870 $4,327 $3,675 $2,884 $2,329 $1,921 $1,612 $3,675 $4,327 South 406,336 8,557 4,489 3,362 2,850 2,458 2,019 1,529 1,210 989 828 2,019 2,458 PRB 437,466 8,460 3,330 2,074 1,557 1,193 827 484 305 203 141 827 1,193 Permian 476,130 12,709 6,514 4,708 3,879 3,245 2,541 1,775 1,300 986 769 2,541 3,245 Technical PUD Reserves 1,927,675 $40,278 $21,174 $15,675 $13,156 $11,222 $9,061 $6,672 $5,144 $4,100 $3,350 $9,061 $11,222 PROB North 343,976 $4,934 $2,531 $1,799 $1,459 $1,198 $909 $598 $409 $288 $207 $598 $909 South 582,826 10,238 4,240 2,832 2,252 1,838 1,409 976 721 556 443 976 1,409 PRB 231,160 4,172 2,056 1,452 1,179 972 745 502 354 258 193 502 745 Permian 124,011 2,918 1,363 944 759 622 475 320 226 164 121 320 475 PROB Reserves 1,281,974 $22,262 $10,190 $7,026 $5,650 $4,631 $3,538 $2,396 $1,710 $1,266 $963 $2,396 $3,538 POSS North 159,781 $2,184 $724 $376 $238 $145 $58 $-- $-- $-- $-- $-- $-- South 556,192 9,786 3,650 2,246 1,684 1,293 905 541 349 238 169 349 541 PRB 805,764 13,395 4,390 2,468 1,734 1,245 782 382 192 93 37 192 382 Permian 345,542 7,105 2,300 1,333 978 747 534 354 268 218 186 268 354 POSS Reserves 1,867,279 $32,470 $11,065 $6,423 $4,635 $3,431 $2,279 $1,277 $809 $549 $392 $809 $1,277 Total Reserves 6,307,012 $126,144 $65,009 $48,825 $41,698 $36,357 $30,522 $24,220 $20,246 $17,506 $15,505 $30,523 $35,737 Total E&P Asset-Level Value $126,144 $65,009 $48,825 $41,698 $36,357 $30,522 $24,220 $20,246 $17,506 $15,505 $30,523 $35,737 1 Less: Hedges (972) (948) Plus: Value of WaterCo 1,419 2,211 Plus: Invested Capital from Energy Innovations 100 100 2 Less: G&A (2,366) (1,935) 3 Less: Cash Taxes (5,133) (4,270) Less: Minerals Non-Controlling Interest⁴ (285) (248) Less: Asset Retirement Obligation (63) (77) Enterprise Value $23,222 $30,571 Less: Net Debt (5,797) Implied Equity Value $17,425 $24,773 / Fully Diluted Shares (millions) 363.0 Implied Equity Value per Share $48.01 $68.25 Source: Alpha NAV Model; FactSet market data as of 9/16/22 1. Assumes hedges held to expiration and discounted at 5-8% 2. G&A discount rates based on the weighted average discount rates of reserve categories by total reserves (14.2%-18.0%) 3. Cash tax discount rates based on the weighted average discount rates of reserve categories by PV-0 of cash flows (13.6%-17.2%) 4. TMRC consolidated in NAV; NCI represents FNV’s share of future value associated with TMRC cash flows 12
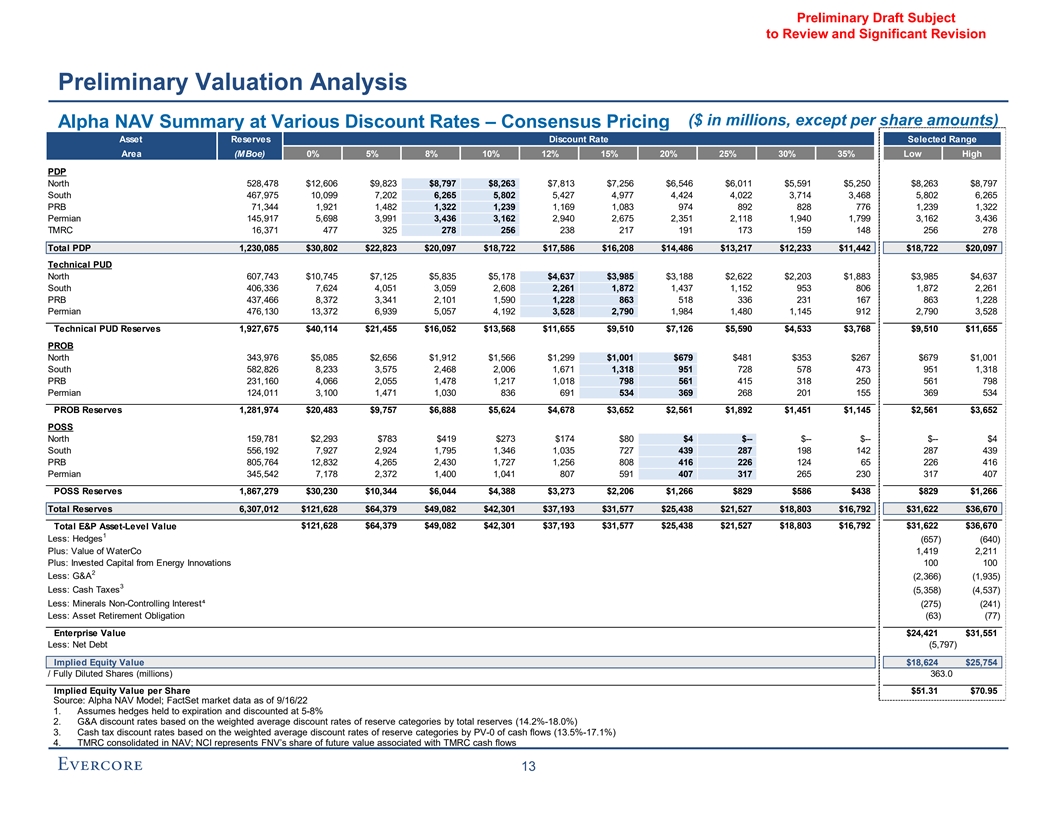
Preliminary Draft Subject to Review and Significant Revision Preliminary Valuation Analysis ($ in millions, except per share amounts) Alpha NAV Summary at Various Discount Rates – Consensus Pricing Asset Reserves Discount Rate Selected Range Area (MBoe) 0% 5% 8% 10% 12% 15% 20% 25% 30% 35% Low High Discount Rates PDP North 528,478 $12,606 $9,823 $8,797 $8,263 $7,813 $7,256 $6,546 $6,011 $5,591 $5,250 $8,263 $8,797 South 467,975 10,099 7,202 6,265 5,802 5,427 4,977 4,424 4,022 3,714 3,468 5,802 6,265 PRB 71,344 1,921 1,482 1,322 1,239 1,169 1,083 974 892 828 776 1,239 1,322 Permian 145,917 5,698 3,991 3,436 3,162 2,940 2,675 2,351 2,118 1,940 1,799 3,162 3,436 TMRC 16,371 477 325 278 256 238 217 191 173 159 148 256 278 Total PDP 1,230,085 $30,802 $22,823 $20,097 $18,722 $17,586 $16,208 $14,486 $13,217 $12,233 $11,442 $18,722 $20,097 Technical PUD North 607,743 $10,745 $7,125 $5,835 $5,178 $4,637 $3,985 $3,188 $2,622 $2,203 $1,883 $3,985 $4,637 South 406,336 7,624 4,051 3,059 2,608 2,261 1,872 1,437 1,152 953 806 1,872 2,261 PRB 437,466 8,372 3,341 2,101 1,590 1,228 863 518 336 231 167 863 1,228 Permian 476,130 13,372 6,939 5,057 4,192 3,528 2,790 1,984 1,480 1,145 912 2,790 3,528 Technical PUD Reserves 1,927,675 $40,114 $21,455 $16,052 $13,568 $11,655 $9,510 $7,126 $5,590 $4,533 $3,768 $9,510 $11,655 PROB North 343,976 $5,085 $2,656 $1,912 $1,566 $1,299 $1,001 $679 $481 $353 $267 $679 $1,001 South 582,826 8,233 3,575 2,468 2,006 1,671 1,318 951 728 578 473 951 1,318 PRB 231,160 4,066 2,055 1,478 1,217 1,018 798 561 415 318 250 561 798 Permian 124,011 3,100 1,471 1,030 836 691 534 369 268 201 155 369 534 PROB Reserves 1,281,974 $20,483 $9,757 $6,888 $5,624 $4,678 $3,652 $2,561 $1,892 $1,451 $1,145 $2,561 $3,652 POSS North 159,781 $2,293 $783 $419 $273 $174 $80 $4 $-- $-- $-- $-- $4 South 556,192 7,927 2,924 1,795 1,346 1,035 727 439 287 198 142 287 439 PRB 805,764 12,832 4,265 2,430 1,727 1,256 808 416 226 124 65 226 416 Permian 345,542 7,178 2,372 1,400 1,041 807 591 407 317 265 230 317 407 POSS Reserves 1,867,279 $30,230 $10,344 $6,044 $4,388 $3,273 $2,206 $1,266 $829 $586 $438 $829 $1,266 Total Reserves 6,307,012 $121,628 $64,379 $49,082 $42,301 $37,193 $31,577 $25,438 $21,527 $18,803 $16,792 $31,622 $36,670 Total E&P Asset-Level Value $121,628 $64,379 $49,082 $42,301 $37,193 $31,577 $25,438 $21,527 $18,803 $16,792 $31,622 $36,670 1 Less: Hedges (657) (640) Plus: Value of WaterCo 1,419 2,211 Plus: Invested Capital from Energy Innovations 100 100 2 Less: G&A (2,366) (1,935) 3 Less: Cash Taxes (5,358) (4,537) Less: Minerals Non-Controlling Interest⁴ (275) (241) Less: Asset Retirement Obligation (63) (77) Enterprise Value $24,421 $31,551 Less: Net Debt (5,797) Implied Equity Value $18,624 $25,754 / Fully Diluted Shares (millions) 363.0 Implied Equity Value per Share $51.31 $70.95 Source: Alpha NAV Model; FactSet market data as of 9/16/22 1. Assumes hedges held to expiration and discounted at 5-8% 2. G&A discount rates based on the weighted average discount rates of reserve categories by total reserves (14.2%-18.0%) 3. Cash tax discount rates based on the weighted average discount rates of reserve categories by PV-0 of cash flows (13.5%-17.1%) 4. TMRC consolidated in NAV; NCI represents FNV’s share of future value associated with TMRC cash flows 13
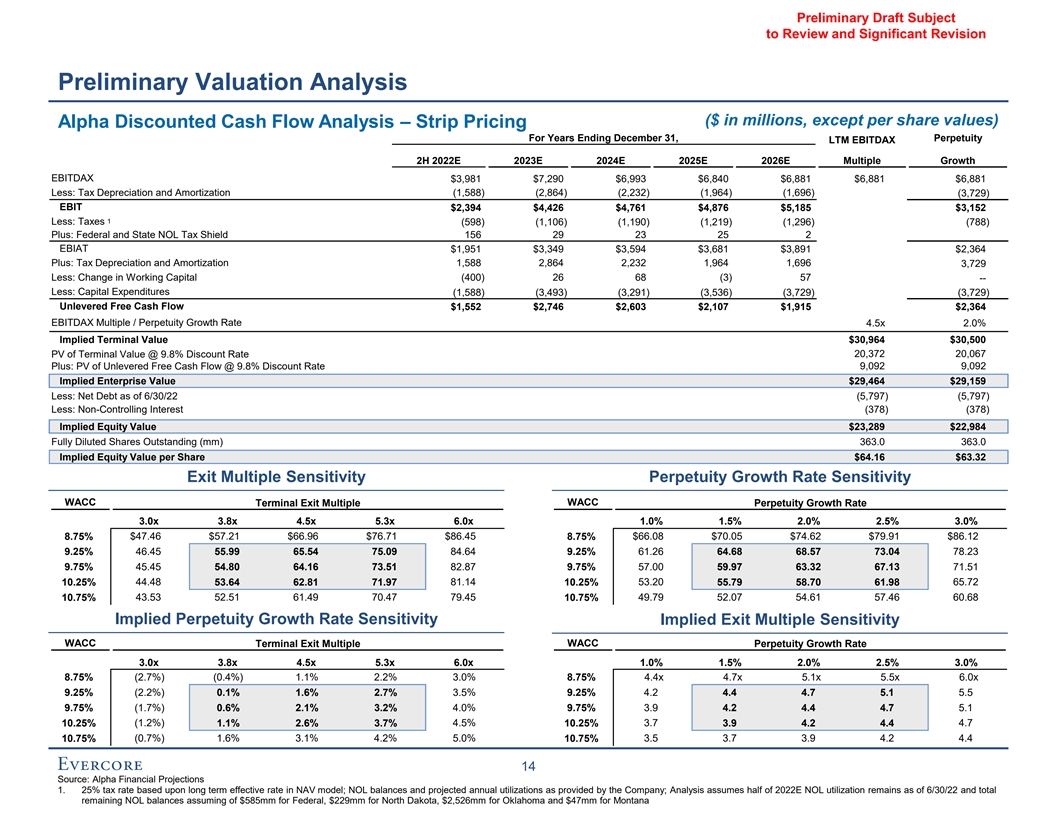
Preliminary Draft Subject to Review and Significant Revision Preliminary Valuation Analysis ($ in millions, except per share values) Alpha Discounted Cash Flow Analysis – Strip Pricing For Years Ending December 31, Perpetuity LTM EBITDAX 2H 2022E 2023E 2024E 2025E 2026E Multiple Growth EBITDAX $3,981 $7,290 $6,993 $6,840 $6,881 $6,881 $6,881 Less: Tax Depreciation and Amortization (1,588) (2,864) (2,232) (1,964) (1,696) (3,729) EBIT $2,394 $4,426 $4,761 $4,876 $5,185 $3,152 1 Less: Taxes (598) (1,106) (1,190) (1,219) (1,296) (788) Plus: Federal and State NOL Tax Shield 156 29 23 25 2 EBIAT $1,951 $3,349 $3,594 $3,681 $3,891 $2,364 Plus: Tax Depreciation and Amortization 1,588 2,864 2,232 1,964 1,696 3,729 Less: Change in Working Capital (400) 26 68 (3) 57 -- Less: Capital Expenditures (1,588) (3,493) (3,291) (3,536) (3,729) (3,729) Unlevered Free Cash Flow $1,552 $2,746 $2,603 $2,107 $1,915 $2,364 EBITDAX Multiple / Perpetuity Growth Rate 4.5x 2.0% Implied Terminal Value $30,964 $30,500 PV of Terminal Value @ 9.8% Discount Rate 20,372 20,067 Plus: PV of Unlevered Free Cash Flow @ 9.8% Discount Rate 9,092 9,092 Implied Enterprise Value $29,464 $29,159 Less: Net Debt as of 6/30/22 (5,797) (5,797) Less: Non-Controlling Interest (378) (378) Implied Equity Value $23,289 $22,984 Fully Diluted Shares Outstanding (mm) 363.0 363.0 Implied Equity Value per Share $64.16 $63.32 Exit Multiple Sensitivity Perpetuity Growth Rate Sensitivity WACC WACC Terminal Exit Multiple Perpetuity Growth Rate 3.0x 3.8x 4.5x 5.3x 6.0x 1.0% 1.5% 2.0% 2.5% 3.0% 8.75% $47.46 $57.21 $66.96 $76.71 $86.45 8.75% $66.08 $70.05 $74.62 $79.91 $86.12 46.45 84.64 61.26 78.23 9.25% 55.99 65.54 75.09 9.25% 64.68 68.57 73.04 9.75% 45.45 54.80 64.16 73.51 82.87 9.75% 57.00 59.97 63.32 67.13 71.51 10.25% 44.48 53.64 62.81 71.97 81.14 10.25% 53.20 55.79 58.70 61.98 65.72 10.75% 43.53 52.51 61.49 70.47 79.45 10.75% 49.79 52.07 54.61 57.46 60.68 Implied Perpetuity Growth Rate Sensitivity Implied Exit Multiple Sensitivity WACC WACC Terminal Exit Multiple Perpetuity Growth Rate 3.0x 3.8x 4.5x 5.3x 6.0x 1.0% 1.5% 2.0% 2.5% 3.0% 8.75% (2.7%) (0.4%) 1.1% 2.2% 3.0% 8.75% 4.4x 4.7x 5.1x 5.5x 6.0x 9.25% (2.2%) 0.1% 1.6% 2.7% 3.5% 9.25% 4.2 4.4 4.7 5.1 5.5 9.75% (1.7%) 0.6% 2.1% 3.2% 4.0% 9.75% 3.9 4.2 4.4 4.7 5.1 10.25% (1.2%) 1.1% 2.6% 3.7% 4.5% 10.25% 3.7 3.9 4.2 4.4 4.7 (0.7%) 1.6% 3.1% 4.2% 5.0% 3.5 3.7 3.9 4.2 4.4 10.75% 10.75% 14 Source: Alpha Financial Projections 1. 25% tax rate based upon long term effective rate in NAV model; NOL balances and projected annual utilizations as provided by the Company; Analysis assumes half of 2022E NOL utilization remains as of 6/30/22 and total remaining NOL balances assuming of $585mm for Federal, $229mm for North Dakota, $2,526mm for Oklahoma and $47mm for Montana
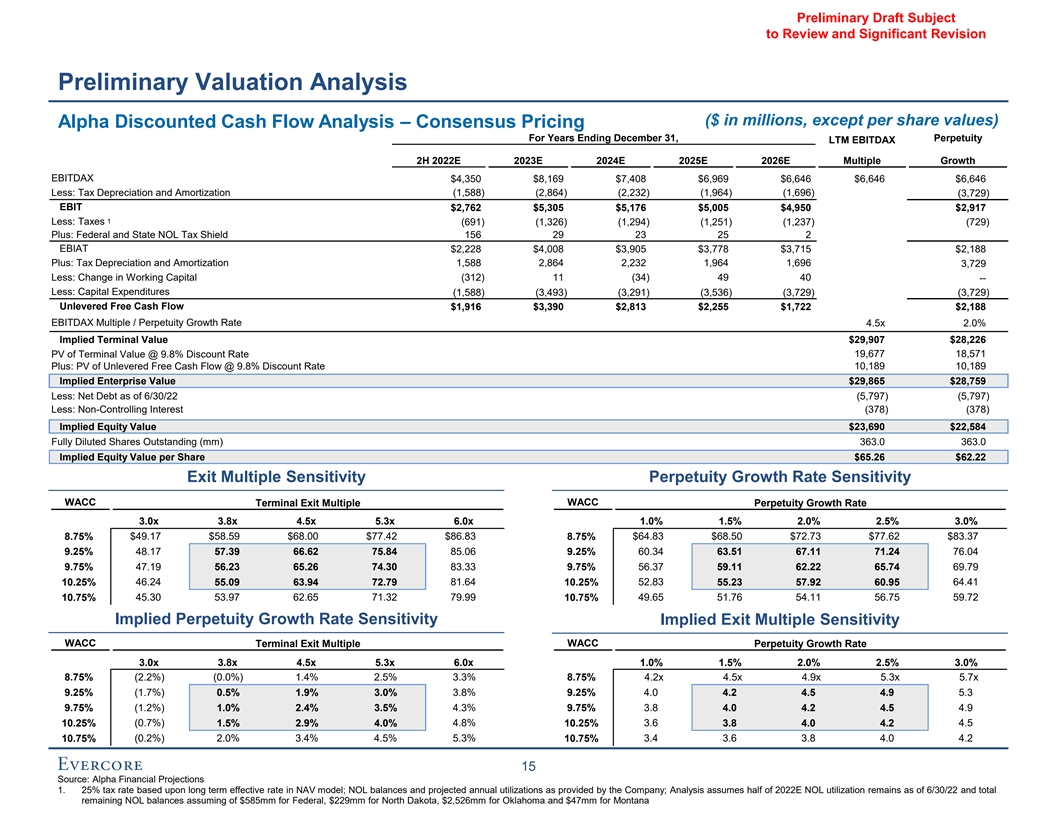
Preliminary Draft Subject to Review and Significant Revision Preliminary Valuation Analysis ($ in millions, except per share values) Alpha Discounted Cash Flow Analysis – Consensus Pricing For Years Ending December 31, Perpetuity LTM EBITDAX 2H 2022E 2023E 2024E 2025E 2026E Multiple Growth EBITDAX $4,350 $8,169 $7,408 $6,969 $6,646 $6,646 $6,646 Less: Tax Depreciation and Amortization (1,588) (2,864) (2,232) (1,964) (1,696) (3,729) EBIT $2,762 $5,305 $5,176 $5,005 $4,950 $2,917 1 Less: Taxes (691) (1,326) (1,294) (1,251) (1,237) (729) Plus: Federal and State NOL Tax Shield 156 29 23 25 2 EBIAT $2,228 $4,008 $3,905 $3,778 $3,715 $2,188 Plus: Tax Depreciation and Amortization 1,588 2,864 2,232 1,964 1,696 3,729 Less: Change in Working Capital (312) 11 (34) 49 40 -- Less: Capital Expenditures (1,588) (3,493) (3,291) (3,536) (3,729) (3,729) Unlevered Free Cash Flow $1,916 $3,390 $2,813 $2,255 $1,722 $2,188 EBITDAX Multiple / Perpetuity Growth Rate 4.5x 2.0% Implied Terminal Value $29,907 $28,226 PV of Terminal Value @ 9.8% Discount Rate 19,677 18,571 Plus: PV of Unlevered Free Cash Flow @ 9.8% Discount Rate 10,189 10,189 Implied Enterprise Value $29,865 $28,759 Less: Net Debt as of 6/30/22 (5,797) (5,797) Less: Non-Controlling Interest (378) (378) Implied Equity Value $23,690 $22,584 Fully Diluted Shares Outstanding (mm) 363.0 363.0 Implied Equity Value per Share $65.26 $62.22 Exit Multiple Sensitivity Perpetuity Growth Rate Sensitivity WACC WACC Terminal Exit Multiple Perpetuity Growth Rate 3.0x 3.8x 4.5x 5.3x 6.0x 1.0% 1.5% 2.0% 2.5% 3.0% 8.75% $49.17 $58.59 $68.00 $77.42 $86.83 8.75% $64.83 $68.50 $72.73 $77.62 $83.37 48.17 85.06 60.34 76.04 9.25% 57.39 66.62 75.84 9.25% 63.51 67.11 71.24 9.75% 47.19 56.23 65.26 74.30 83.33 9.75% 56.37 59.11 62.22 65.74 69.79 10.25% 46.24 55.09 63.94 72.79 81.64 10.25% 52.83 55.23 57.92 60.95 64.41 10.75% 45.30 53.97 62.65 71.32 79.99 10.75% 49.65 51.76 54.11 56.75 59.72 Implied Perpetuity Growth Rate Sensitivity Implied Exit Multiple Sensitivity WACC WACC Terminal Exit Multiple Perpetuity Growth Rate 3.0x 3.8x 4.5x 5.3x 6.0x 1.0% 1.5% 2.0% 2.5% 3.0% 8.75% (2.2%) (0.0%) 1.4% 2.5% 3.3% 8.75% 4.2x 4.5x 4.9x 5.3x 5.7x 9.25% (1.7%) 0.5% 1.9% 3.0% 3.8% 9.25% 4.0 4.2 4.5 4.9 5.3 9.75% (1.2%) 1.0% 2.4% 3.5% 4.3% 9.75% 3.8 4.0 4.2 4.5 4.9 10.25% (0.7%) 1.5% 2.9% 4.0% 4.8% 10.25% 3.6 3.8 4.0 4.2 4.5 (0.2%) 2.0% 3.4% 4.5% 5.3% 3.4 3.6 3.8 4.0 4.2 10.75% 10.75% 15 Source: Alpha Financial Projections 1. 25% tax rate based upon long term effective rate in NAV model; NOL balances and projected annual utilizations as provided by the Company; Analysis assumes half of 2022E NOL utilization remains as of 6/30/22 and total remaining NOL balances assuming of $585mm for Federal, $229mm for North Dakota, $2,526mm for Oklahoma and $47mm for Montana

Preliminary Draft Subject to Review and Significant Revision Preliminary Valuation Analysis DCF Value Bridge Strip Consensus Low High Low High September 2, 2022 $61.33 $86.24 $54.85 $81.66 Implied Share Price Range Share Price Change due to Methodology Change $2.63 $5.86 (Perpetuity Growth to LTM EBITDA Multiple) Share Price Change due to FCF from $2.90 $2.95 $0.18 $0.18 2H’ 2022E – 2026E Share Price Change due to Terminal Year $0.10 $0.14 $1.31 $1.84 EBITDA Share Price Change due Exit EBITDA Multiple $6.11 $6.37 $5.90 $6.15 Decrease September 18, 2022 Implied Share $53.64 $75.09 $55.09 $75.84 Price Range 16

Preliminary Draft Subject to Review and Significant Revision Preliminary Valuation Analysis ($ in millions, except per share amounts) Public Company Trading Metrics Alpha Peers Trading Analysis Price / Enterprise Value / Net Debt / Free Cash Flow Current % of 52-Week CFPS Yield EBITDAX Price Target Price Equity Enterprise Dividend EBITDAX 1 Company 9/16/22 High Low Implied Upside Value Value 2022E 2023E 2022E 2023E Yield 2022E 2023E 2022E ($/share) (%) (%) (%) ($MM) ($MM) (x) (x) (%) (%) (%) (x) (x) (x) EOG $121.45 83.2% 169.8% 22.7% $71,768 $75,083 5.6x 5.2x 11.1% 11.8% 7.4% 4.8x 4.6x 0.2x Pioneer Natural Resources 239.50 84.0% 161.9% 19.4% 60,144 62,223 4.9 5.8 14.3% 10.3% 14.3% 4.6 5.1 0.2 Devon 66.82 85.6% 237.1% 22.6% 43,892 49,332 4.7 4.7 15.3% 14.0% 9.3% 4.8 4.3 0.6 Diamondback Energy 132.62 82.7% 167.6% 30.9% 23,812 31,934 3.7 4.1 18.9% 15.5% 9.2% 4.2 4.5 0.8 Coterra Energy 28.74 79.6% 151.4% 28.6% 23,145 25,066 4.0 4.3 18.0% 15.3% 9.0% 3.6 4.0 0.3 Marathon 26.22 81.5% 229.8% 22.9% 17,884 20,855 3.2 3.7 24.0% 18.9% 1.2% 3.5 4.0 0.6 Apache 40.46 78.7% 215.6% 36.1% 13,479 18,842 2.7 2.7 24.1% 22.1% 1.2% 2.6 2.6 0.7 Ovintiv 49.55 80.0% 176.6% 41.1% 12,988 16,943 3.0 2.3 19.6% 29.2% 2.0% 3.6 2.9 0.8 Hess 121.64 93.8% 180.7% 12.6% 38,017 48,253 7.6 6.7 5.8% 6.0% 1.2% 7.7 6.7 1.0 2 Mean 81.9% 188.7% 28.0% $33,389 $37,535 4.0x 4.1x 18.2% 17.1% 6.7% 3.9x 4.0x 0.5x 2 Median 82.1% 173.2% 25.7% 23,478 28,500 3.9 4.2 18.4% 15.4% 8.2% 3.9 4.1 0.6 3 Alpha $69.84 94.1% 171.1% 6.7% $25,352 $31,527 3.6x 3.9x 17.0% 13.4% 1.6% 3.8x 4.1x 0.7x Source: Public filings, FactSet market data as of 9/16/2022, Alpha Financial Projections 1. Represents annualized fixed and variable dividends 2. Excludes HES due to valuation difference associated with HES’ Guyana asset profile 3. Metrics based on Alpha Financial Projections at Consensus Pricing 17

Preliminary Draft Subject to Review and Significant Revision Preliminary Valuation Analysis ($ in millions, except per share amounts) Public Company Trading Metrics (cont’d) 2022E Trading Analysis 1 Public Company Trading Analysis - EBITDAX 2022E EBITDAX $8,324 EBITDAX Multiple 3.5x 4.5x – Implied Enterprise Value of Based on 2022 EBITDAX (Excluding Invested Capital from Energy Innovations) $29,136 – $37,460 Plus: Invested Capital from Energy Innovations $100 Less: Net Debt as of 6/30/22 (5,797) Less: Non-Controlling Interest (378) Implied Equity Value $23,061 – $31,385 Fully Diluted Shares Outstanding (mm) 363.0 Implied Equity Value per Share $63.53 – $86.46 Public Company Trading Analysis - CFPS 2022E CFPS $18.91 Relevant CFPS Multiple 3.5x – 4.5x Implied Share Price Based on 2022 CFPS (Before Energy Innovations) $66.18 – $85.09 Plus: Invested Capital from Energy Innovations (Per Share) $0.28 Implied Share Price Based on 2022 CFPS $66.46 – $85.36 2023E Trading Analysis Public Company Trading Analysis - EBITDAX 2023E EBITDAX $8,169 EBITDAX Multiple 3.8x 4.5x – Implied Enterprise Value of Based on 2023 EBITDAX (Excluding Invested Capital from Energy Innovations) $30,634 – $36,761 Plus: Invested Capital from Energy Innovations $100 Less: Net Debt as of 6/30/22 (5,797) Less: Non-Controlling Interest (378) Implied Equity Value $24,559 – $30,686 Fully Diluted Shares Outstanding (mm) 363.0 Implied Equity Value per Share $67.66 – $84.53 Public Company Trading Analysis - CFPS 2023E CFPS $19.22 Relevant CFPS Multiple 3.5x – 4.5x Implied Share Price Based on 2023 CFPS (Before Energy Innovations) $67.26 – $86.47 Plus: Invested Capital from Energy Innovations (Per Share) $0.28 Implied Share Price Based on 2023 CFPS $67.53 – $86.75 Source: Public filings, FactSet market data as of 9/16/2022, Alpha Financial Projections at Consensus Pricing 18
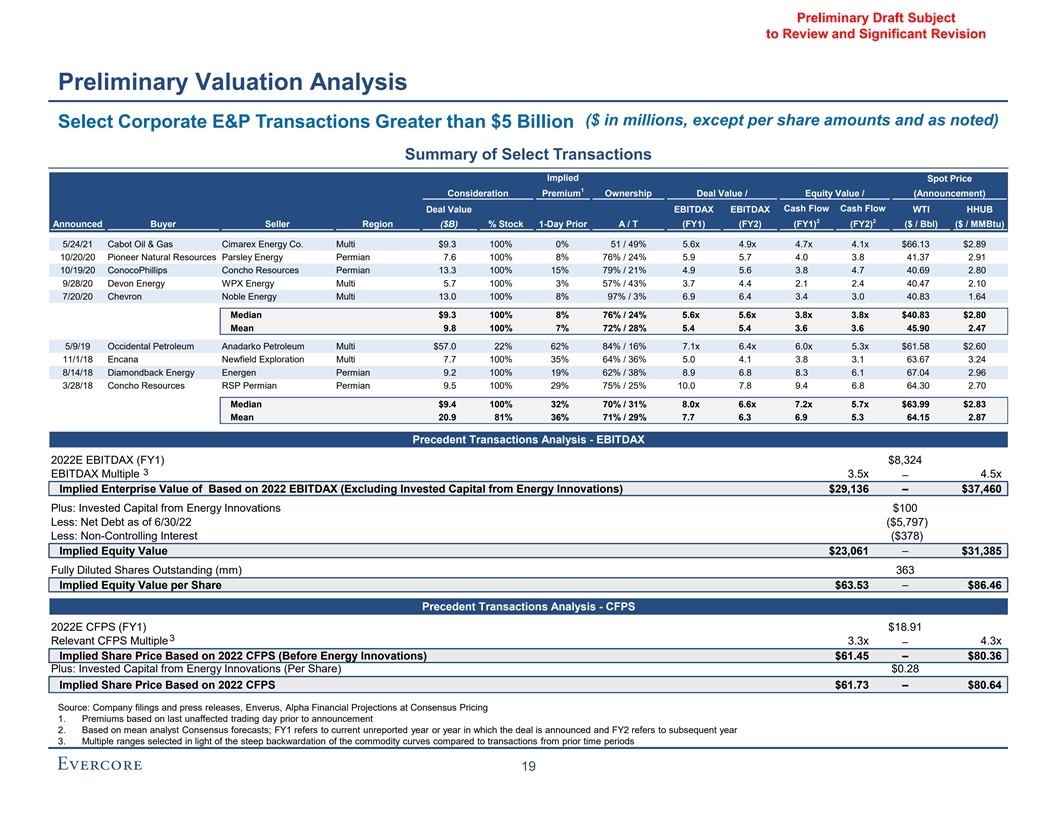
Preliminary Draft Subject to Review and Significant Revision Preliminary Valuation Analysis ($ in millions, except per share amounts and as noted) Select Corporate E&P Transactions Greater than $5 Billion Summary of Select Transactions Implied Spot Price 1 Consideration Premium Ownership Deal Value / Equity Value / (Announcement) Cash Flow Cash Flow Deal Value EBITDAX EBITDAX WTI HHUB 2 2 Announced Buyer Seller Region ($B) % Stock 1-Day Prior A / T (FY1) (FY2) (FY1) (FY2) ($ / Bbl) ($ / MMBtu) 5/24/21 Cabot Oil & Gas Cimarex Energy Co. Multi $9.3 100% 0% 51 / 49% 5.6x 4.9x 4.7x 4.1x $66.13 $2.89 10/20/20 Pioneer Natural Resources Parsley Energy Permian 7.6 100% 8% 76% / 24% 5.9 5.7 4.0 3.8 41.37 2.91 10/19/20 ConocoPhillips Concho Resources Permian 13.3 100% 15% 79% / 21% 4.9 5.6 3.8 4.7 40.69 2.80 9/28/20 Devon Energy WPX Energy Multi 5.7 100% 3% 57% / 43% 3.7 4.4 2.1 2.4 40.47 2.10 7/20/20 Chevron Noble Energy Multi 13.0 100% 8% 97% / 3% 6.9 6.4 3.4 3.0 40.83 1.64 Median $9.3 100% 8% 76% / 24% 5.6x 5.6x 3.8x 3.8x $40.83 $2.80 Mean 9.8 100% 7% 72% / 28% 5.4 5.4 3.6 3.6 45.90 2.47 5/9/19 Occidental Petroleum Anadarko Petroleum Multi $57.0 22% 62% 84% / 16% 7.1x 6.4x 6.0x 5.3x $61.58 $2.60 11/1/18 Encana Newfield Exploration Multi 7.7 100% 35% 64% / 36% 5.0 4.1 3.8 3.1 63.67 3.24 8/14/18 Diamondback Energy Energen Permian 9.2 100% 19% 62% / 38% 8.9 6.8 8.3 6.1 67.04 2.96 3/28/18 Concho Resources RSP Permian Permian 9.5 100% 29% 75% / 25% 10.0 7.8 9.4 6.8 64.30 2.70 Median $9.4 100% 32% 70% / 31% 8.0x 6.6x 7.2x 5.7x $63.99 $2.83 Mean 20.9 81% 36% 71% / 29% 7.7 6.3 6.9 5.3 64.15 2.87 Precedent Transactions Analysis - EBITDAX 2022E EBITDAX (FY1) $8,324 3 EBITDAX Multiple 3.5x 4.5x – Implied Enterprise Value of Based on 2022 EBITDAX (Excluding Invested Capital from Energy Innovations) $29,136 – $37,460 Plus: Invested Capital from Energy Innovations $100 Less: Net Debt as of 6/30/22 ($5,797) Less: Non-Controlling Interest ($378) Implied Equity Value $23,061 – $31,385 Fully Diluted Shares Outstanding (mm) 363 Implied Equity Value per Share $63.53 – $86.46 Precedent Transactions Analysis - CFPS 2022E CFPS (FY1) $18.91 3 Relevant CFPS Multiple 3.3x – 4.3x Implied Share Price Based on 2022 CFPS (Before Energy Innovations) $61.45 – $80.36 Plus: Invested Capital from Energy Innovations (Per Share) $0.28 Implied Share Price Based on 2022 CFPS $61.73 – $80.64 Source: Company filings and press releases, Enverus, Alpha Financial Projections at Consensus Pricing 1. Premiums based on last unaffected trading day prior to announcement 2. Based on mean analyst Consensus forecasts; FY1 refers to current unreported year or year in which the deal is announced and FY2 refers to subsequent year 3. Multiple ranges selected in light of the steep backwardation of the commodity curves compared to transactions from prior time periods 19
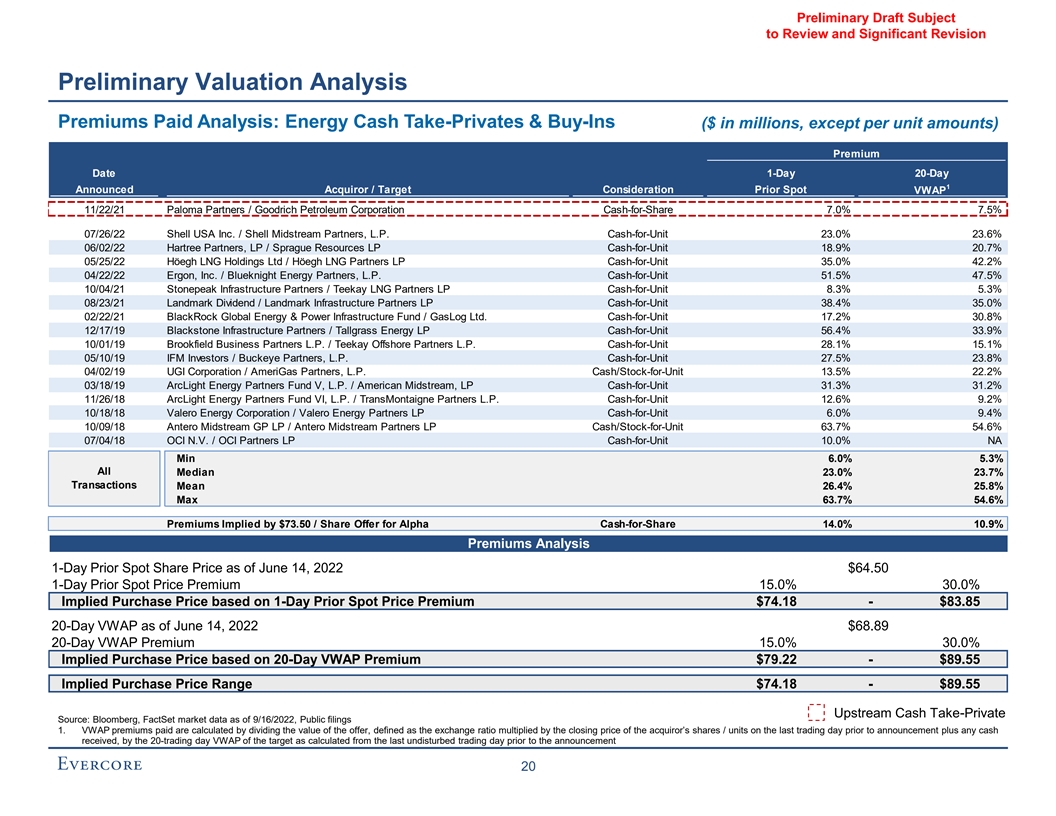
Preliminary Draft Subject to Review and Significant Revision Preliminary Valuation Analysis Premiums Paid Analysis: Energy Cash Take-Privates & Buy-Ins ($ in millions, except per unit amounts) Premium Date 1-Day 20-Day 1 Announced Acquiror / Target Consideration Prior Spot VWAP 11/22/21 Paloma Partners / Goodrich Petroleum Corporation Cash-for-Share 7.0% 7.5% 07/26/22 Shell USA Inc. / Shell Midstream Partners, L.P. Cash-for-Unit 23.0% 23.6% 06/02/22 Hartree Partners, LP / Sprague Resources LP Cash-for-Unit 18.9% 20.7% 05/25/22 Höegh LNG Holdings Ltd / Höegh LNG Partners LP Cash-for-Unit 35.0% 42.2% 04/22/22 Ergon, Inc. / Blueknight Energy Partners, L.P. Cash-for-Unit 51.5% 47.5% 10/04/21 Stonepeak Infrastructure Partners / Teekay LNG Partners LP Cash-for-Unit 8.3% 5.3% 08/23/21 Landmark Dividend / Landmark Infrastructure Partners LP Cash-for-Unit 38.4% 35.0% 02/22/21 BlackRock Global Energy & Power Infrastructure Fund / GasLog Ltd. Cash-for-Unit 17.2% 30.8% 12/17/19 Blackstone Infrastructure Partners / Tallgrass Energy LP Cash-for-Unit 56.4% 33.9% 10/01/19 Brookfield Business Partners L.P. / Teekay Offshore Partners L.P. Cash-for-Unit 28.1% 15.1% 05/10/19 IFM Investors / Buckeye Partners, L.P. Cash-for-Unit 27.5% 23.8% 04/02/19 UGI Corporation / AmeriGas Partners, L.P. Cash/Stock-for-Unit 13.5% 22.2% 03/18/19 ArcLight Energy Partners Fund V, L.P. / American Midstream, LP Cash-for-Unit 31.3% 31.2% 11/26/18 ArcLight Energy Partners Fund VI, L.P. / TransMontaigne Partners L.P. Cash-for-Unit 12.6% 9.2% 10/18/18 Valero Energy Corporation / Valero Energy Partners LP Cash-for-Unit 6.0% 9.4% 10/09/18 Antero Midstream GP LP / Antero Midstream Partners LP Cash/Stock-for-Unit 63.7% 54.6% 07/04/18 OCI N.V. / OCI Partners LP Cash-for-Unit 10.0% NA Min 6.0% 5.3% All Median 23.0% 23.7% Transactions Mean 26.4% 25.8% Max 63.7% 54.6% Premiums Implied by $73.50 / Share Offer for Alpha Cash-for-Share 14.0% 10.9% Premiums Analysis 1-Day Prior Spot Share Price as of June 14, 2022 $64.50 1-Day Prior Spot Price Premium 15.0% 30.0% Implied Purchase Price based on 1-Day Prior Spot Price Premium $74.18 - $83.85 20-Day VWAP as of June 14, 2022 $68.89 20-Day VWAP Premium 15.0% 30.0% Implied Purchase Price based on 20-Day VWAP Premium $79.22 - $89.55 Implied Purchase Price Range $74.18 - $89.55 Upstream Cash Take-Private Source: Bloomberg, FactSet market data as of 9/16/2022, Public filings 1. VWAP premiums paid are calculated by dividing the value of the offer, defined as the exchange ratio multiplied by the closing price of the acquiror’s shares / units on the last trading day prior to announcement plus any cash received, by the 20-trading day VWAP of the target as calculated from the last undisturbed trading day prior to the announcement 20
Preliminary Draft Subject to Review and Significant Revision Appendix

Preliminary Draft Subject to Review and Significant Revision Weighted Average Cost of Capital Analysis ($ in millions, except per share amounts) Alpha – WACC Analysis Share Price Market Equity Total Debt and Total Debt / Adjusted Unlevered 1 2 Beta Beta Company 9/16/22 Value Preferred Equity Total Capitalization EOG $121.45 $71,768 $6,388 8.2% 0.99 0.93 Pioneer Natural Resources 239.50 60,144 4,303 6.7% 0.87 0.83 Devon 66.82 43,892 6,363 12.7% 1.04 0.94 Hess 121.64 38,017 8,424 18.1% 0.87 0.75 Coterra Energy 28.74 23,145 2,836 10.9% 0.77 0.70 Diamondback Energy 132.62 23,812 5,573 19.0% 1.13 0.96 Marathon 26.22 17,884 4,353 19.6% 1.00 0.85 CAPM Apache 40.46 13,479 5,307 28.3% 1.03 0.80 Ovintiv 49.55 12,988 4,183 24.4% 1.33 1.07 Mean 16.4% 1.00 0.87 Median 18.1% 1.00 0.85 3 Alpha $69.84 $25,352 $6,350 20.0% 1.04 0.87 Risk-free Rate⁴ 3.8% Unlevered Beta 0.85 Debt and Preferred / Total Capitalization 18.1% Adjusted Levered Equity Beta 0.99 WACC Supply-Side MRP Historical MRP 6.2% 7.5% Market Risk Premium⁵ Size Premium⁶ 0.4% Equity Cost of Capital⁷ 10.4% 11.6% Pre-Tax Cost of Debt⁸ 6.3% After-Tax Cost of Debt 4.7% WACC 9.3% 10.3% Source: FactSet market data as of 9/16/2022, Company Filings 5. Per Duff & Phelps 2022 Valuation Handbook 1. Adjusted Equity Beta calculated as: (0.67) × Raw Beta + (0.33) × 1.0; Beta indexed versus the S&P 500 6. Size premium based on Alpha market cap of $25.4 Bn (decile 2) index 7. Equity Cost of Capital calculated as: Risk-free rate + (Levered Equity Beta × Market Risk Premium) + 2. Unlevered Beta calculated as: Adjusted Equity Beta × (E/(E + D × (1-T)) Company Size Premium 3. Based on face value outstanding debt balance provided by Alpha Management as of 6/30/2022 8. Pre-tax cost of debt based on the YTW of Alpha Notes due 2032 4. Risk Free Rate is based on 20-year US Treasury Bond 21

Preliminary Draft Subject to Review and Significant Revision Additional Analysis 1 LTM EBITDAX Multiples Over Time TEV / LTM EBITDAX Alpha TEV / LTM EBITDAX Differential to Proxy Peers Simple Average Current 2022 YTD 2021 3 Years 5 Years 10 Years 6.0x APA 3.2x 4.7x 6.9x 5.5x 5.6x 5.6x 4.0x DVN 4.4 6.1 11.1 7.3 7.4 7.9 EOG 4.6 5.9 9.1 6.6 8.5 9.9 2.0x FANG 4.1 5.5 9.3 7.0 9.6 15.6 0.7x 0.0x MRO 4.2 5.6 7.8 5.6 6.0 6.4 OVV 2.8 3.8 6.8 5.0 6.5 9.1 (2.0x) PXD 4.7 6.7 12.3 8.2 9.2 13.9 (4.0x) CTRA 4.7 5.8 11.0 8.4 9.6 14.5 HES 9.2 10.7 16.5 12.3 11.6 9.6 (6.0x) 1 4.0x 5.5x 9.0x 6.4x 7.5x 9.8x Proxy Peers (Mean) (8.0x) Alpha 4.7x 6.1x 8.4x 6.2x 7.5x 9.2x TEV / LTM EBITDAX 45.0x 40.0x 35.0x 30.0x 25.0x 20.0x 15.0x 10.0x 5.0x 4.7x 0.0x Sep-12 Sep-13 Sep-14 Sep-15 Sep-16 Sep-17 Sep-18 Sep-19 Sep-20 Sep-21 Sep-22 Source: FactSet market data as of 9/16/2022 Alpha Proxy Peers Range Note: Charts and averages calculated on weekly basis 1. Excludes HES due to valuation difference associated with HES’ Guyana asset profile; CTRA excluded due to recent transaction between COG and XEC 22

Preliminary Draft Subject to Review and Significant Revision WaterCo Supplemental Information ($ in millions) Summary of Alpha WaterCo Standalone Financial Analysis Metric Total Enterprise Value of WaterCo Description ▪ Source Water: 2023E Consolidated EBITDA of $14mm at 4.0x – 6.0x ▪ Produced Water Gathering and Disposal: 2023E $1,419 $1,818 TEV / EBITDA Consolidated EBITDA of $248mm at 5.5x – 7.0x ▪ Source Water: 2023E Consolidated EBITDA of $14mm at 5.0x – 7.5x $1,681 $2,211 ▪ Produced Water Gathering and Disposal: 2023E TEV / EBITDA Consolidated EBITDA of $248mm at 6.5x – 8.5x Source: Alpha Financial Projections 23 Precedent Transactions Peer Group Trading Analysis
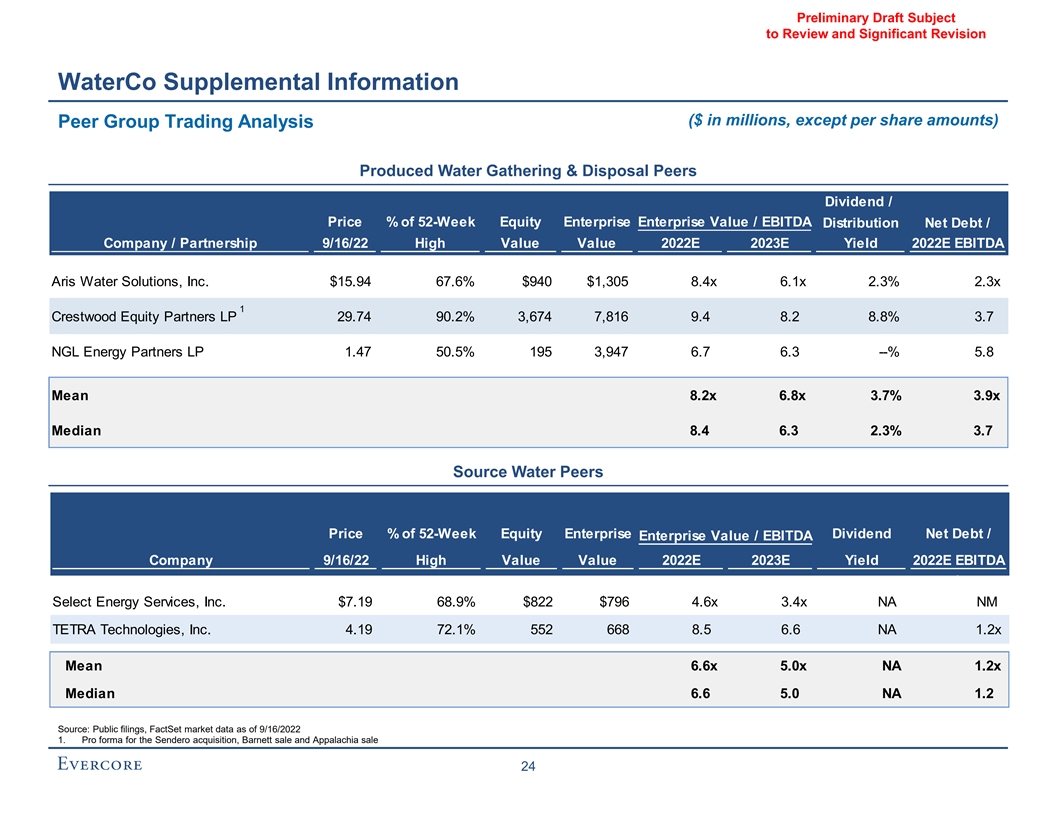
Preliminary Draft Subject to Review and Significant Revision WaterCo Supplemental Information ($ in millions, except per share amounts) Peer Group Trading Analysis Produced Water Gathering & Disposal Peers Dividend / Price % of 52-Week Equity Enterprise Enterprise Value / EBITDA Distribution Net Debt / Company / Partnership 9/16/22 High Value Value 2022E 2023E Yield 2022E EBITDA Aris Water Solutions, Inc. $15.94 67.6% $940 $1,305 8.4x 6.1x 2.3% 2.3x 1 Crestwood Equity Partners LP 29.74 90.2% 3,674 7,816 9.4 8.2 8.8% 3.7 NGL Energy Partners LP 1.47 50.5% 195 3,947 6.7 6.3 --% 5.8 Mean 8.2x 6.8x 3.7% 3.9x Median 8.4 6.3 2.3% 3.7 Source Water Peers Price % of 52-Week Equity Enterprise Dividend Net Debt / Enterprise Value / EBITDA Company 9/16/22 High Value Value 2022E 2023E Yield 2022E EBITDA \ Select Energy Services, Inc. $7.19 68.9% $822 $796 4.6x 3.4x NA NM TETRA Technologies, Inc. 4.19 72.1% 552 668 8.5 6.6 NA 1.2x Mean 6.6x 5.0x NA 1.2x Median 6.6 5.0 NA 1.2 Source: Public filings, FactSet market data as of 9/16/2022 1. Pro forma for the Sendero acquisition, Barnett sale and Appalachia sale 24

Preliminary Draft Subject to Review and Significant Revision WaterCo Supplemental Information Sum of the Parts Analysis ($ in millions) Peer Group Trading Analysis 2023E 2023E EBITDA Resulting Enterprise Value Range EBITDA Multiple Range Low High Source Water $14 4.0x – 6.0x $55 $83 Produced Water Gathering & Disposal 248 5.5 – 7.0 1,364 1,735 Total Enterprise Value $1,419 $1,818 Precedent Transactions Analysis 2023E 2023E EBITDA Resulting Enterprise Value Range EBITDA Multiple Range Low High Source Water $14 5.0x – 7.5x $69 $104 Produced Water Gathering & Disposal 248 6.5 – 8.5 1,611 2,107 Total Enterprise Value $1,681 $2,211 Source: Alpha Financial Projections 25
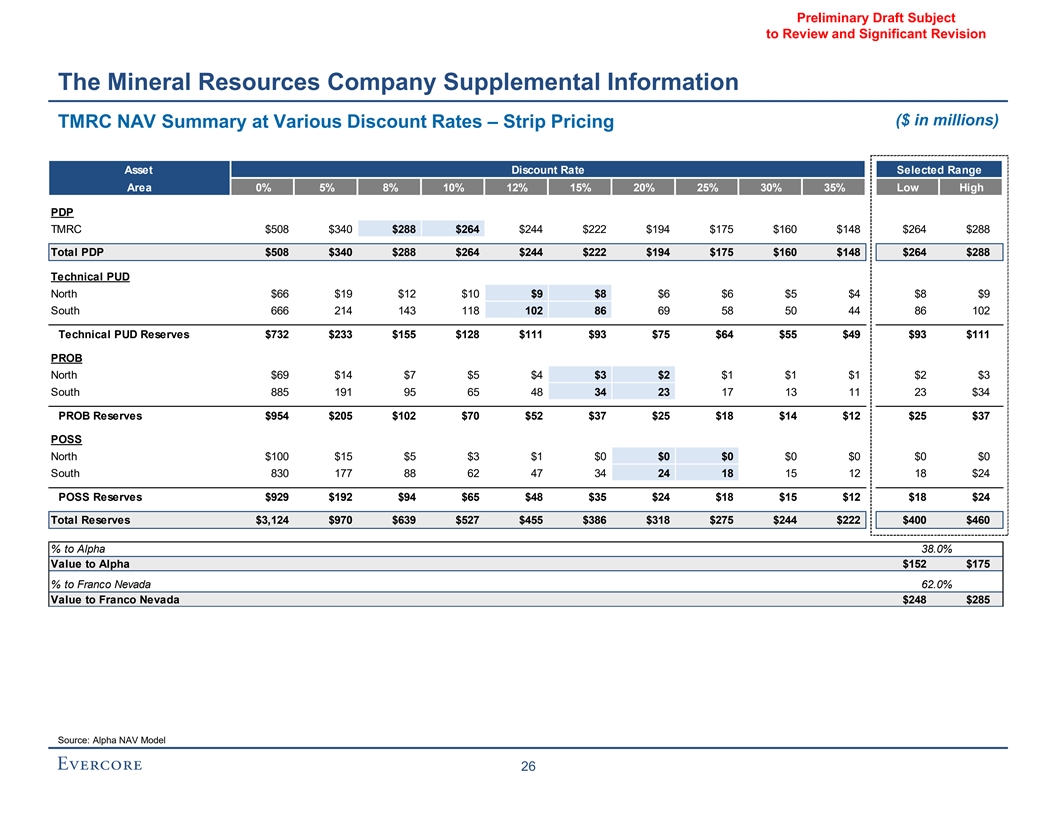
Preliminary Draft Subject to Review and Significant Revision The Mineral Resources Company Supplemental Information ($ in millions) TMRC NAV Summary at Various Discount Rates – Strip Pricing Asset Discount Rate Selected Range Area 0% 5% 8% 10% 12% 15% 20% 25% 30% 35% Low High Discount Rates PDP TMRC $508 $340 $288 $264 $244 $222 $194 $175 $160 $148 $264 $288 Total PDP $508 $340 $288 $264 $244 $222 $194 $175 $160 $148 $264 $288 Technical PUD North $66 $19 $12 $10 $9 $8 $6 $6 $5 $4 $8 $9 South 666 214 143 118 102 86 69 58 50 44 86 102 Technical PUD Reserves $732 $233 $155 $128 $111 $93 $75 $64 $55 $49 $93 $111 PROB North $69 $14 $7 $5 $4 $3 $2 $1 $1 $1 $2 $3 South 885 191 95 65 48 34 23 17 13 11 23 $34 PROB Reserves $954 $205 $102 $70 $52 $37 $25 $18 $14 $12 $25 $37 POSS North $100 $15 $5 $3 $1 $0 $0 $0 $0 $0 $0 $0 South 830 177 88 62 47 34 24 18 15 12 18 $24 POSS Reserves $929 $192 $94 $65 $48 $35 $24 $18 $15 $12 $18 $24 Total Reserves $3,124 $970 $639 $527 $455 $386 $318 $275 $244 $222 $400 $460 % to Alpha 38.0% Value to Alpha $152 $175 % to Franco Nevada 62.0% Value to Franco Nevada $248 $285 Source: Alpha NAV Model 26

Preliminary Draft Subject to Review and Significant Revision The Mineral Resources Company Supplemental Information ($ in millions) TMRC NAV Summary at Various Discount Rates – Consensus Pricing Asset Discount Rate Selected Range Area 0% 5% 8% 10% 12% 15% 20% 25% 30% 35% Low High Discount Rates PDP TMRC $477 $325 $278 $256 $238 $217 $191 $173 $159 $148 $256 $278 Total PDP $477 $325 $278 $256 $238 $217 $191 $173 $159 $148 $256 $278 Technical PUD North $62 $19 $12 $10 $9 $8 $7 $6 $5 $5 $8 $9 South 603 200 135 113 98 83 68 57 50 44 83 98 Technical PUD Reserves $665 $218 $148 $123 $107 $91 $74 $63 $55 $49 $91 $107 PROB North $69 $14 $7 $5 $4 $3 $2 $2 $1 $1 $2 $3 South 729 164 84 59 45 32 22 17 13 11 22 $32 PROB Reserves $798 $178 $91 $64 $49 $35 $24 $18 $15 $12 $24 $35 POSS North $101 $15 $5 $3 $1 $0 $0 $0 $0 $0 $0 $0 South 709 155 79 56 43 32 23 18 14 12 18 $23 POSS Reserves $810 $170 $84 $59 $44 $32 $23 $18 $14 $12 $18 $23 Total Reserves $2,751 $891 $601 $502 $438 $375 $312 $272 $243 $222 $389 $443 % to Alpha 38.0% Value to Alpha $148 $168 % to Franco Nevada 62.0% Value to Franco Nevada $241 $275 Source: Alpha NAV Model 27