Item 1. Reports to Stockholders
Fixed income mutual funds
Delaware Tax-Free Minnesota Fund
Delaware Tax-Free Minnesota Intermediate Fund
Delaware Minnesota High-Yield Municipal Bond Fund
August 31, 2017
Carefully consider the Funds’ investment objectives, risk factors, charges, and expenses before investing. This and other information can be found in the Funds’ prospectus and their summary prospectuses, which may be obtained by visiting delawarefunds.com/literature or calling 800 523-1918. Investors should read the prospectus and the summary prospectus carefully before investing.
You can obtain shareholder reports and prospectuses online instead of in the mail.
Visit delawarefunds.com/edelivery.

Experience Delaware FundsSM by Macquarie
Macquarie Investment Management (MIM) is a global asset manager with offices throughout the United States, Europe, Asia, and Australia. We are active managers who prioritize autonomy and accountability at the investment team level in pursuit of opportunities that matter for our clients. Delaware Funds is one of the longest-standing mutual fund families, with more than 75 years in existence.
If you are interested in learning more about creating an investment plan, contact your financial advisor.
You can learn more about Delaware Funds or obtain a prospectus for Delaware Tax-Free Minnesota Fund, Delaware Tax-Free Minnesota Intermediate Fund, and Delaware Minnesota High-Yield Municipal Bond Fund at delawarefunds.com/literature.
Manage your account online
| ● | | Check your account balance and transactions |
| ● | | View statements and tax forms |
| ● | | Make purchases and redemptions |
Visit delawarefunds.com/account-access.
MIM is the marketing name for the registered investment advisers including Macquarie Investment Management Business Trust (MIMBT) (formerly, Delaware Management Business Trust), Macquarie Funds Management Hong Kong Limited, Macquarie Investment Management Austria Kapitalanlage AG, Macquarie Investment Management Global Limited, Macquarie Bank International Limited, Macquarie Investment Management Europe Limited, Macquarie Investment Management Limited, and Macquarie Capital Investment Management, Inc.
The Funds are distributed by Delaware Distributors, L.P., an affiliate of MIMBT and Macquarie Group Limited. MIM, a member of Macquarie Group, refers to the companies comprising the asset management division of Macquarie Group Limited and its subsidiaries and affiliates worldwide.
Other than Macquarie Bank Limited (MBL), none of the entities noted are authorized deposit-taking institutions for the purposes of the Banking Act 1959 (Commonwealth of Australia). The obligations of these entities do not represent deposits or other liabilities of MBL. MBL does not guarantee or otherwise provide assurance in respect of the obligations of these entities, unless noted otherwise. The Funds are governed by US laws and regulations.
Unless otherwise noted, views expressed herein are current as of Aug. 31, 2017, and subject to change for events occurring after such date.
The Funds are not FDIC insured and are not guaranteed. It is possible to lose the principal amount invested.
Advisory services provided by Delaware Management Company, a series of MIMBT, a US registered investment advisor.
All third-party marks cited are the property of their respective owners.
© 2017 Macquarie Management Holdings, Inc. (formerly, Delaware Management Holdings, Inc.)
| | |
| Portfolio management review |
| Delaware Minnesota Municipal Bond Funds | | September 12, 2017 |
| | | | | | | | |
Performance preview (for the year ended August 31, 2017) | | | | | | | | |
| Delaware Tax-Free Minnesota Fund (Institutional Class shares) | | | 1-year return | | | | +0.75% | |
| Delaware Tax-Free Minnesota Fund (Class A shares) | | | 1-year return | | | | +0.49% | |
| Bloomberg Barclays Municipal Bond Index (benchmark) | | | 1-year return | | | | +0.88% | |
| Lipper Minnesota Municipal Debt Funds Average | | | 1-year return | | | | +0.24% | |
Past performance does not guarantee future results.
For complete, annualized performance for Delaware Tax-Free Minnesota Fund, please see the table on page 6.
Institutional Class shares are available without sales or asset-based distribution charges only to certain eligible accounts. The performance of Class A shares excludes the applicable sales charge. Both Institutional Class shares and Class A shares reflect the reinvestment of all distributions.
The Lipper Minnesota Municipal Debt Funds Average compares funds that limit assets to those securities that are exempt from taxation in Minnesota (double tax-exempt) or a city in Minnesota (triple tax-exempt).
Please see page 9 for a description of the index. Index performance returns do not reflect any management fees, transaction costs, or expenses. Indices are unmanaged and one cannot invest directly in an index.
| | | | | | | | |
Delaware Tax-Free Minnesota Intermediate Fund (Institutional Class shares) | | | 1-year return | | | | +0.61% | |
Delaware Tax-Free Minnesota Intermediate Fund (Class A shares) | | | 1-year return | | | | +0.55% | |
Bloomberg Barclays 3–15 Year Blend Municipal Bond Index (benchmark) | | | 1-year return | | | | +1.09% | |
Lipper Other States Intermediate Municipal Debt Funds Average | | | 1-year return | | | | +0.10% | |
Past performance does not guarantee future results.
For complete, annualized performance for Delaware Tax-Free Minnesota Intermediate Fund, please see the table on page 10.
Institutional Class shares are available without sales or asset-based distribution charges only to certain eligible accounts. The performance of Class A shares excludes the applicable sales charge. Both Institutional Class shares and Class A shares reflect the reinvestment of all distributions.
The Lipper Other States Intermediate Municipal Debt Funds Average compares funds that invest in municipal debt issues with dollar-weighted average maturities of 5 to 10 years and are exempt from taxation on a specified city or state basis.
Please see page 13 for a description of the index. Index performance returns do not reflect any management fees, transaction costs, or expenses. Indices are unmanaged and one cannot invest directly in an index.
| | | | | | | | |
Delaware Minnesota High-Yield Municipal Bond Fund (Institutional Class shares) | | | 1-year return | | | | +1.09% | |
Delaware Minnesota High-Yield Municipal Bond Fund (Class A shares) | | | 1-year return | | | | +0.84% | |
Bloomberg Barclays Municipal Bond Index (benchmark) | | | 1-year return | | | | +0.88% | |
Lipper Minnesota Municipal Debt Funds Average | | | 1-year return | | | | +0.24% | |
Past performance does not guarantee future results.
For complete, annualized performance for Delaware Minnesota High-Yield Municipal Bond Fund, please see the table on page 14.
Institutional Class shares are available without sales or asset-based distribution charges only to certain eligible accounts. The performance of Class A shares excludes the applicable sales charge. Both Institutional Class shares and Class A shares reflect the reinvestment of all distributions.
The Lipper Minnesota Municipal Debt Funds Average compares funds that limit assets to those securities that are exempt from taxation in Minnesota (double tax-exempt) or a city in Minnesota (triple tax-exempt).
Please see page 17 for a description of the index. Index performance returns do not reflect any management fees, transaction costs, or expenses. Indices are unmanaged and one cannot invest directly in an index.
1
Portfolio management review
Delaware Minnesota Municipal Bond Funds
Economic backdrop
The US economy continued its slow but steady expansion throughout the Funds’ fiscal year ended Aug. 31, 2017. The country’s gross domestic product (GDP) – a measure of national economic output – grew by an annualized 2.8% in the third quarter of 2016 and 1.8% in the fourth quarter. In the first two quarters of 2017, US GDP increased by 1.2% and 3.0%, respectively. Meanwhile, the employment picture continued to improve, with the national unemployment rate falling to 4.4% at the end of the fiscal year, down a half percentage point from September 2016. (Source: US Commerce Department.)
This combination of consistent economic growth, an improving employment picture and manageable inflation led the US Federal Reserve to raise its benchmark short-term interest rate by 0.25 percentage points on three separate occasions – in December, March, and June – bringing the federal funds rate to a range of 1.00%–1.25%, up from 0.25%–0.50% to start the fiscal year.
Municipal bond market conditions
In the first half of the Funds’ fiscal year, conditions were generally challenging for municipal bond investors. Initially, an increase in supply relative to demand for municipal securities tended to push down the prices of bonds and lift their yields (a bond’s price and yield move in opposite directions). In the fourth quarter of 2016, conditions dramatically worsened, especially following the US elections in November 2016. With the presidential victory of Donald Trump, expectations grew that Republicans would be able to swiftly execute their priority of cutting taxes, thus making tax-exempt bonds less compelling for residents of high-tax states.
Market conditions began to stabilize several weeks after the election, however. This stabilization continued throughout the rest of the Funds’ fiscal year, as the likelihood of a rapid,
transformative change in tax policy appeared to diminish. Coupled with tighter supply, the tax-exempt bond market generally strengthened through August 2017.
Against this backdrop, the municipal bond yield curve steepened, meaning that yields on long-term municipal bonds rose more quickly than those on short-dated municipal bonds, while longer-dated bonds tended to underperform shorter-dated issues.
The following table shows municipal bond returns by maturity for the 12 months ended Aug. 31, 2017:
Returns by maturity
| | | | |
5 years | | | 1.44 | % |
10 years | | | 1.06 | % |
22+ years | | | 0.42 | % |
Source: Bloomberg
Meanwhile, in continuation of a trend now in place for several years, lower-rated bonds generally outperformed their higher-quality counterparts. This trend is evident in the following table, which indicates municipal bond performance by credit quality rating for the Funds’ fiscal year:
Returns by credit rating
| | | | |
AAA | | | 0.58 | % |
AA | | | 0.75 | % |
A | | | 1.06 | % |
BBB | | | 1.91 | % |
BB and below | | | 2.25 | % |
Source: Bloomberg
Among the market’s strong-performing sectors, tobacco bonds led the way, as their credit spreads continued to narrow, and investors seemed increasingly comfortable assuming the credit risk inherent in these often lower-rated securities. Meanwhile, bonds issued by Puerto Rico, which, like tobacco bonds, tended to be found in the high yield municipal bond universe, struggled during the fiscal year as concerns mounted about the US territory’s credit quality.
2
Focused on credit research
For the three Funds profiled in this report, we maintained a consistent management strategy. We do this regardless of underlying market conditions. We have a bottom-up investment approach, meaning we evaluate potential bond holdings one at a time. Working closely with our team’s municipal analysts, we conduct thorough research to find securities offering what we see as a desirable trade-off between income and credit risk.
Following this approach, to the extent possible in the Minnesota municipal bond marketplace, we are often led to bonds rated lower investment grade or below investment grade, where we look to find value for shareholders. During the fiscal year ended Aug. 31, 2017, roughly 24% of the net assets of Delaware Tax-Free Minnesota Fund were invested in bonds rated A and BBB, the two lowest rating tiers of the investment grade bond universe. Approximately 28% of the net assets of Delaware Tax-Free Minnesota Intermediate Fund were invested in these credit tiers during the same time period.
In addition, both Funds had allocations to high yield municipal bonds, specifically those with credit ratings below BBB. By prospectus, both Funds are able to invest in these credit tiers, and we pay close attention to credit risk when selecting securities, focusing on those providing what we see as sufficiently high yields for the risk.
Meanwhile, the mandate of Delaware Minnesota High-Yield Municipal Bond Fund allows us to focus on high yield securities to a greater degree. Accordingly, as of Aug. 31, 2017, more than 30% of the Fund’s net assets were invested in bonds rated below investment grade.
Portfolio positioning
Throughout the fiscal year, we maintained a roughly neutral duration – or sensitivity to changes in interest rates – relative to the Funds’
respective benchmarks, seeking to add value through bond selection rather than by managing interest rate exposure.
When the municipal bond market sold off in the fourth quarter of 2016, we believed that the decline in bond prices was significantly greater than justified. Accordingly, we took advantage of opportunities to invest in bonds at prices we saw as undeservedly low relative to their credit risk. As the fiscal period progressed and the market became less concerned about the near-term likelihood of federal tax reform, many of these securities regained a portion of their lost value, adding to the Funds’ results.
Since the market recovered, we found it somewhat more challenging to find similarly attractively priced bonds. Accordingly, we became increasingly selective in our purchases, as we searched for bonds that offered yields sufficiently high to compensate us for their credit risk.
Particularly in calendar year 2017, we positioned the Funds’ portfolios for a flattening yield curve, because we anticipated that longer-duration bonds would outperform shorter-dated bonds. This view reflected our expectation for continued solid economic growth and subdued inflation – factors that we believed could put a ceiling on long-term interest rates and support the Funds’ positioning.
Proceeds for our purchases primarily came from a combination of new shareholder investments and bond calls. In addition, because of a significant amount of bond refinancing activity within the Minnesota marketplace, we saw a number of older, higher yielding bonds in the Funds get refunded, leaving the Funds with more cash than usual. A primary focus during the fiscal year was to reinvest these assets.
Because the Minnesota municipal bond market is relatively small and tends to be higher quality, we sometimes found it challenging to replace these credits with similarly high yielding bonds, given
3
Portfolio management review
Delaware Minnesota Municipal Bond Funds
historically low interest rates. We responded to this situation by investing in a variety of Minnesota issues, often of higher quality, that would allow the Funds to remain fully invested as we continued to search for compelling lower-rated bonds with higher income streams.
Notable performance factors
During the fiscal year, many of the Funds’ strongest individual contributors were bonds refunded by their issuers during the period, leading to significant price appreciation. For example, all three Funds benefited from an investment in nonrated bonds for The Homestead at Anoka, a senior living facility. Similarly, both Delaware Tax-Free Minnesota Fund and Delaware Tax-Free Minnesota Intermediate Fund benefited from owning lower-investment-grade bonds for HealthEast Care System, a network of healthcare facilities in and around St. Paul. In Delaware Minnesota High-Yield Municipal Bond Fund, bonds for Nova Classical Academy, a St. Paul charter school, added value, as these issues, refunded during the fiscal period, returned more than 10%.
On the negative side, Guam Waterworks Authority bonds hampered all three Funds. As concern mounted about the credit quality of Puerto Rico and the US Virgin Islands, bonds issued by another US territory, Guam, declined in sympathy. We had more confidence in Guam’s underlying credit quality, however, and liked that the Guam Waterworks bonds were backed by a strong covenant.
In Delaware Tax-Free Minnesota Fund and Delaware Minnesota High-Yield Municipal Bond Fund, the largest individual detractors were bonds for Stride Academy Charter School in St. Cloud, Minn. These securities struggled as the school experienced management challenges and its certifying organization put it on probation. This caused the bonds’ credit spreads to widen. Late in
the Funds’ fiscal year, the school, under new management, received a one-year reprieve as it sought to work out its difficulties, causing the bonds’ performance to stabilize. As of fiscal year end, we were closely monitoring the situation.
Meanwhile, an investment in bonds for Cologne Academy, a charter school in Cologne, Minn., also hampered Delaware Tax-Free Minnesota Intermediate Fund as the price of these securities declined during the fiscal year. Despite its negative return, at period end we continued to see this credit as fundamentally sound.
Minnesota economic backdrop
Minnesota has a fundamentally sound economy and is not dependent on any one sector. Employment is diverse, with a mix of manufacturing, services, and trade similar to the United States. Other relevant notes:
| ● | | August 2017 non-farm employment of 2.95 million was up 1.5% from a year earlier. |
| ● | | The state’s unemployment rate of 3.8% in August 2017 was well below the national average of 4.4%. |
| ● | | Over the past five years, per capita personal income levels for Minnesota have consistently been above the national average ranging between 105%-108%, with the most recent measurement period continuing this trend at 106% of the national average. |
| ● | | Minnesota operates on a biennial basis. Fiscal year 2017 General Fund revenues are estimated to total $20.95 billion, 0.5% below projections but 0.3% greater than fiscal 2016 revenues. |
| ● | | Weak income taxes that were 2.3% less than budget more than offset sales and corporate taxes which exceeded estimates by 0.2% and 5.2%, respectively. |
4
| ● | | The state approved a biennial budget for fiscal 2018 and 2019 totaling $45.56 billion, an 8.9% increase over the prior biennial budget. Although the General Fund budgetary balance is expected to decline to $163 million, the state still maintains a $1.6 billion reserve. |
Data: bls.gov, bea.gov, ncsl.org, Minnesota Management and Budget.
5
| | |
| Performance summaries | | |
| Delaware Tax-Free Minnesota Fund | | August 31, 2017 |
The performance quoted represents past performance and does not guarantee future results. Investment return and principal value of an investment will fluctuate so that shares, when redeemed, may be worth more or less than their original cost. Current performance may be lower or higher than the performance quoted. Performance data current to the most recent month end may be obtained by calling 800 523-1918 or visiting delawarefunds.com/performance.
| | | | | | | | | | | | | | | | |
| Fund and benchmark performance1, 2 | | Average annual total returns through August 31, 2017 | |
| | | | |
| | | 1 year | | | 5 years | | | 10 years | | | Lifetime | |
Class A (Est. Feb. 27, 1984) | | | | | | | | | | | | | | | | |
Excluding sales charge | | | +0.49% | | | | +2.85% | | | | +4.34% | | | | +6.33% | |
Including sales charge | | | -4.05% | | | | +1.92% | | | | +3.86% | | | | +6.19% | |
Class C (Est. May 4, 1994) | | | | | | | | | | | | | | | | |
Excluding sales charge | | | -0.25% | | | | +2.09% | | | | +3.56% | | | | +4.15% | |
Including sales charge | | | -1.22% | | | | +2.09% | | | | +3.56% | | | | +4.15% | |
Institutional Class (Est. Dec. 31, 2013) | | | | | | | | | | | | | | | | |
Excluding sales charge | | | +0.75% | | | | n/a | | | | n/a | | | | +4.78% | |
Including sales charge | | | +0.75% | | | | n/a | | | | n/a | | | | +4.78% | |
Bloomberg Barclays Municipal Bond Index | | | +0.88% | | | | +3.23% | | | | +4.73% | | | | +4.81%* | |
*The benchmark lifetime return is for Institutional Class share comparison only and is calculated using the last business day in the month of the Fund’s Institutional Class inception date.
1 Returns reflect the reinvestment of all distributions and are presented both with and without the applicable sales charges described below. Returns do not reflect the deduction of taxes the shareholder would pay on Fund distributions or redemptions of Fund shares.
Expense limitations were in effect for certain classes during some or all of the periods shown in the “Fund and benchmark performance” table. Expenses for each class are listed on the “Fund expense ratios” table on page 7. Performance would have been lower had expense limitations not been in effect.
Institutional Class shares are available without sales or asset-based distribution charges only to certain eligible accounts.
Class A shares are sold with a maximum front-end sales charge of 4.50%, and have an annual distribution and service fee of 0.25% of average daily net assets. Performance for Class A shares,
excluding sales charges, assumes that no front-end sales charge applied.
Class C shares are sold with a contingent deferred sales charge of 1.00% if redeemed during the first 12 months. They are also subject to an annual distribution and service fee of 1.00% of average daily net assets. Performance for Class C shares, excluding sales charges, assumes either that contingent deferred sales charges did not apply or that the investment was not redeemed.
Fixed income securities and bond funds can lose value, and investors can lose principal, as interest rates rise. They also may be affected by economic conditions that hinder an issuer’s ability to make interest and principal payments on its debt.
The Fund may also be subject to prepayment risk, the risk that the principal of a bond that is held by a portfolio will be prepaid prior to maturity, at the time when interest rates are lower than what the bond was paying. A portfolio may then have to reinvest that money at a lower interest rate.
6
Funds that invest primarily in one state may be more susceptible to the economic, regulatory, regional, and other factors of that state than geographically diversified funds.
Substantially all dividend income derived from tax-free funds is exempt from federal income tax. Some income may be subject to state or local and/or the federal alternative minimum tax (AMT) that applies to certain investors. Capital gains, if any, are taxable.
Duration number will change as market conditions change. Therefore, duration should not be solely relied upon to indicate a municipal bond fund’s potential volatility.
This document may mention bond ratings published by nationally recognized statistical rating organizations (NRSROs) Standard & Poor’s,
Moody’s Investors Service, and Fitch, Inc. For securities rated by an NRSRO other than S&P, the rating is converted to the equivalent S&P credit rating. Bonds rated AAA are rated as having the highest quality and are generally considered to have the lowest degree of investment risk. Bonds rated AA are considered to be of high quality, but with a slightly higher degree of risk than bonds rated AAA. Bonds rated A are considered to have many favorable investment qualities, though they are somewhat more susceptible to adverse economic conditions. Bonds rated BBB are believed to be of medium-grade quality and generally riskier over the long term. Bonds rated BB, B, and CCC are regarded as having significant speculative characteristics, with BB indicating the least degree of speculation of the three.
2 The Fund’s expense ratios, as described in the most recent prospectus, are disclosed in the following “Fund expense ratios” table. Delaware Management Company has agreed to reimburse certain expenses and/or waive certain fees in order to prevent total annual fund operating expenses (excluding any 12b-1 fees, acquired fund fees and expenses, taxes, interest, short sale and dividend interest expenses, brokerage fees, certain insurance costs, and nonroutine expenses or costs, including, but not limited to, those relating to reorganizations, litigation, conducting shareholder meetings, and liquidations (collectively, nonroutine expenses)) from exceeding 0.60% of the Fund’s average daily net assets during the period from Sept. 1, 2016 through Aug. 31, 2017.* Please see the most recent prospectus and any applicable supplement(s) for additional information on these fee waivers and/or reimbursements. Please see the “Financial highlights” section in this report for the most recent expense ratios.
| | | | | | | | | | |
| Fund expense ratios | | Class A | | | | Class C | | | | Institutional Class |
Total annual operating expenses | | 0.95% | | | | 1.70% | | | | 0.70% |
(without fee waivers) | | | | | | | | | | |
Net expenses | | 0.85% | | | | 1.60% | | | | 0.60% |
(including fee waivers, if any) | | | | | | | | | | |
Type of waiver | | Contractual | | | | Contractual | | | | Contractual |
*The aggregate contractual waiver period covering this report is from Dec. 29, 2015 through Dec. 29, 2017.
7
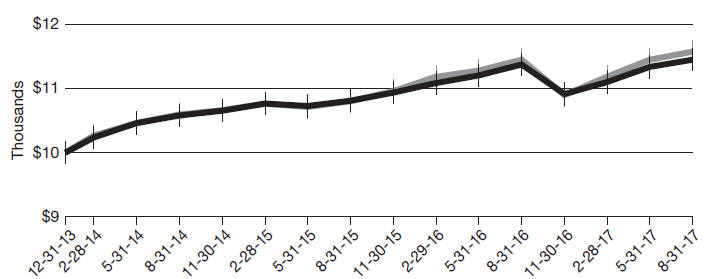
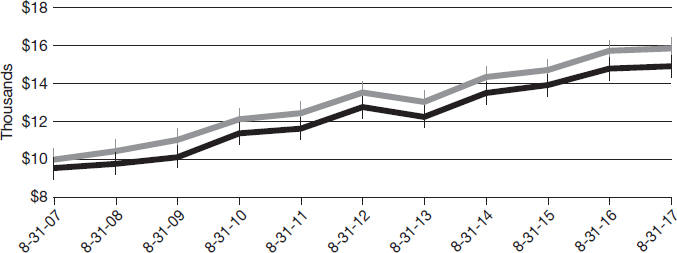
Performance summaries
Delaware Tax-Free Minnesota Fund
Performance of a $10,000 investment1
Class A shares
Average annual total returns from Aug. 31, 2007, through Aug. 31, 2017
| | | | | | | | |
| For period beginning Aug. 31, 2007, through Aug. 31, 2017 | | Starting value | | | Ending value | |
 Bloomberg Barclays Municipal Bond Index Bloomberg Barclays Municipal Bond Index
| | | $10,000 | | | | $15,870 | |
 Delaware Tax-Free Minnesota Fund — Class A shares Delaware Tax-Free Minnesota Fund — Class A shares
| | | $9,550 | | | | $14,603 | |
Institutional Class shares
Average annual total returns from Dec. 31, 2013 (inception date) through Aug. 31, 2017
| | | | | | | | |
| For period beginning Dec. 31, 2013, through Aug. 31, 2017 | | Starting value | | | Ending value | |
Bloomberg Barclays Municipal Bond Index | | | $10,000 | | | | $11,882 | |
Delaware Tax-Free Minnesota Fund — Institutional Class shares | | | $10,000 | | | | $11,868 | |
8
1 The “Performance of a $10,000 investment” graph for Class A shares assumes $10,000 invested in Class A shares of the Fund on Aug. 31, 2007, and includes the effect of a 4.50% front-end sales charge and the reinvestment of all distributions. The graph also assumes $10,000 invested in the Bloomberg Barclays Municipal Bond Index as of Aug. 31, 2007.
The “Performance of a $10,000 investment” graph for Institutional Class shares assumes $10,000 invested in Institutional Class shares of the Fund on Dec. 31, 2013, and includes the reinvestment of all distributions. The graph also assumes $10,000 invested in the Bloomberg Barclays Municipal Bond Index as of Dec. 31, 2013.
The graphs do not reflect the deduction of taxes the shareholders would pay on Fund distributions or redemptions of Fund shares. Expense
limitations were in effect for some or all of the periods shown. Performance would have been lower had expense limitations not been in effect. Expenses are listed in the “Fund expense ratios” table on page 7. Please note additional details on pages 6 through 9.
The Bloomberg Barclays Municipal Bond Index measures the total return performance of the long-term, investment grade tax-exempt bond market.
Index performance returns do not reflect any management fees, transaction costs, or expenses. Indices are unmanaged and one cannot invest directly in an index. Past performance is not a guarantee of future results.
Performance of other Fund classes will vary due to different charges and expenses.
| | | | | | |
| | | Nasdaq symbols | | CUSIPs | | |
Class A | | DEFFX | | 928918101 | | |
Class C | | DMOCX | | 928918408 | | |
Institutional Class | | DMNIX | | 928918705 | | |
|
|
9
| | |
| Performance summaries | | |
| Delaware Tax-Free Minnesota Intermediate Fund | | August 31, 2017 |
The performance quoted represents past performance and does not guarantee future results. Investment return and principal value of an investment will fluctuate so that shares, when redeemed, may be worth more or less than their original cost. Current performance may be lower or higher than the performance quoted. Performance data current to the most recent month end may be obtained by calling 800 523-1918 or visiting delawarefunds.com/performance.
| | | | | | | | | | | | | | | | |
| Fund and benchmark performance1, 2 | | Average annual total returns through August 31, 2017 | |
| | | | |
| | | 1 year | | | 5 years | | | 10 years | | | Lifetime | |
Class A (Est. Oct. 27, 1985) | | | | | | | | | | | | | | | | |
Excluding sales charge | | | +0.55% | | | | +2.40% | | | | +3.83% | | | | +4.81% | |
Including sales charge | | | -2.19% | | | | +1.82% | | | | +3.54% | | | | +4.72% | |
Class C (Est. May 4, 1994) | | | | | | | | | | | | | | | | |
Excluding sales charge | | | -0.39% | | | | +1.52% | | | | +2.95% | | | | +3.37% | |
Including sales charge | | | -1.36% | | | | +1.52% | | | | +2.95% | | | | +3.37% | |
Institutional Class (Est. Dec. 31, 2013) | | | | | | | | | | | | | | | | |
Excluding sales charge | | | +0.61% | | | | n/a | | | | n/a | | | | +3.76% | |
Including sales charge | | | +0.61% | | | | n/a | | | | n/a | | | | +3.76% | |
| Bloomberg Barclays 3–15 Year Blend Municipal Bond Index | | | +1.09% | | | | +2.93% | | | | +4.60% | | | | +4.07* | |
*The benchmark lifetime return is for Institutional Class share comparison only and is calculated using the last business day in the month of the Fund’s Institutional Class inception date.
1 Returns reflect the reinvestment of all distributions and are presented both with and without the applicable sales charges described below. Returns do not reflect the deduction of taxes the shareholder would pay on Fund distributions or redemptions of Fund shares.
Expense limitations were in effect for certain classes during some or all of the periods shown in the “Fund and benchmark performance” table. Expenses for each class are listed on the “Fund expense ratios” table on page 11. Performance would have been lower had expense limitations not been in effect.
Institutional Class shares are available without sales or asset-based distribution charges only to certain eligible accounts.
Class A shares are sold with a maximum front-end sales charge of 2.75%, and have an annual distribution and service fee of 0.25% of average daily net assets. This fee has been contractually limited to 0.15% of average daily net assets from Sept. 1, 2016, through Aug. 31, 2017.** Performance for Class A shares, excluding sales charges, assumes that no front-end sales charge applied.
Class C shares are sold with a contingent deferred sales charge of 1.00% if redeemed during the first 12 months. They are also subject to an annual distribution and service fee of 1.00% of average daily net assets. Performance for Class C shares, excluding sales charges, assumes either that contingent deferred sales charges did not apply or that the investment was not redeemed.
| ** | The aggregate contractual waiver period covering this report is from Dec. 29, 2015 through Dec. 29, 2017. |
10
Fixed income securities and bond funds can lose value, and investors can lose principal, as interest rates rise. They also may be affected by economic conditions that hinder an issuer’s ability to make interest and principal payments on its debt.
The Fund may also be subject to prepayment risk, the risk that the principal of a bond that is held by a portfolio will be prepaid prior to maturity, at the time when interest rates are lower than what the bond was paying. A portfolio may then have to reinvest that money at a lower interest rate.
Funds that invest primarily in one state may be more susceptible to the economic, regulatory, regional, and other factors of that state than geographically diversified funds.
Substantially all dividend income derived from tax-free funds is exempt from federal income tax. Some income may be subject to state or local and/or the federal alternative minimum tax (AMT) that applies to certain investors. Capital gains, if any, are taxable.
Duration number will change as market conditions
change. Therefore, duration should not be solely relied upon to indicate a municipal bond fund’s potential volatility.
This document may mention bond ratings published by nationally recognized statistical rating organizations (NRSROs) Standard & Poor’s, Moody’s Investors Service, and Fitch, Inc. For securities rated by an NRSRO other than S&P, the rating is converted to the equivalent S&P credit rating. Bonds rated AAA are rated as having the highest quality and are generally considered to have the lowest degree of investment risk. Bonds rated AA are considered to be of high quality, but with a slightly higher degree of risk than bonds rated AAA. Bonds rated A are considered to have many favorable investment qualities, though they are somewhat more susceptible to adverse economic conditions. Bonds rated BBB are believed to be of medium-grade quality and generally riskier over the long term. Bonds rated BB, B, and CCC are regarded as having significant speculative characteristics, with BB indicating the least degree of speculation of the three.
2 The Fund’s expense ratios, as described in the most recent prospectus, are disclosed in the following “Fund expense ratios” table. Delaware Management Company has agreed to reimburse certain expenses and/or waive certain fees in order to prevent total annual fund operating expenses (excluding any 12b-1 fees, acquired fund fees and expenses, taxes, interest, short sale and dividend interest expenses, brokerage fees, certain insurance costs, and nonroutine expenses or costs, including, but not limited to, those relating to reorganizations, litigation, conducting shareholder meetings, and liquidations (collectively, nonroutine expenses)) from exceeding 0.69% of the Fund’s average daily net assets during the period from Sept. 1, 2016 through Aug. 31, 2017.* Please see the most recent prospectus and any applicable supplement(s) for additional information on these fee waivers and/or reimbursements. Please see the “Financial highlights” section in this report for the most recent expense ratios.
| | | | | | | | | | |
| Fund expense ratios | | Class A | | | | Class C | | | | Institutional Class |
Total annual operating expenses (without fee waivers) | | 0.97% | | | | 1.72% | | | | 0.72% |
Net expenses (including fee waivers, if any) | | 0.84% | | | | 1.69% | | | | 0.69% |
Type of waiver | | Contractual | | | | Contractual | | | | Contractual |
*The aggregate contractual waiver period covering this report is from Dec. 29, 2015 through Dec. 29, 2017.
11
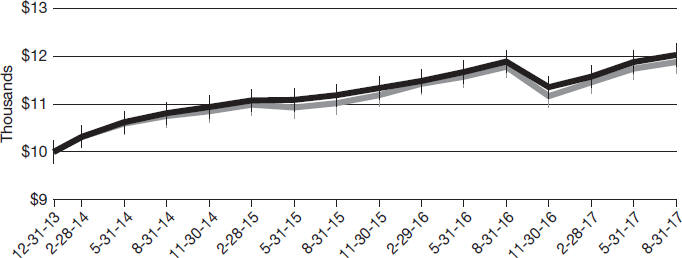
Performance summaries
Delaware Tax-Free Minnesota Intermediate Fund
Performance of a $10,000 investment1
Class A shares
Average annual total returns from Aug. 31, 2007, through Aug. 31, 2017
| | | | | | | | |
| For period beginning Aug. 31, 2007, through Aug. 31, 2017 | | Starting value | | | Ending value | |
| Bloomberg Barclays 3–15 Year Blend Municipal Bond Index | | | $10,000 | | | | $15,674 | |
| Delaware Tax-Free Minnesota Intermediate Fund — Class A shares | | | $9,725 | | | | $14,162 | |
Institutional Class shares
Average annual total returns from Dec. 31, 2013 (inception date) through Aug. 31, 2017
| | | | | | | | |
| For period beginning Dec. 31, 2013, through Aug. 31, 2017 | | Starting value | | | Ending value | |
| Bloomberg Barclays 3–15 Year Blend Municipal Bond Index | | | $10,000 | | | | $11,576 | |
| Delaware Tax-Free Minnesota Intermediate Fund — Institutional Class shares | | | $10,000 | | | | $11,449 | |
12
1 The “Performance of a $10,000 investment” graph for Class A shares assumes $10,000 invested in Class A shares of the Fund on Aug. 31, 2007, and includes the effect of a 2.75% front-end sales charge and the reinvestment of all distributions. The graph also assumes $10,000 invested in the Bloomberg Barclays 3–15 Year Blend Municipal Bond Index as of Aug. 31, 2007.
The “Performance of a $10,000 investment” graph for Institutional Class shares assumes $10,000 invested in Institutional Class shares of the Fund on Dec. 31, 2013, and includes the reinvestment of all distributions. The graph also assumes $10,000 invested in the Bloomberg Barclays 3–15 Year Blend Municipal Bond Index as of Dec. 31, 2013.
The graphs do not reflect the deduction of taxes the shareholders would pay on Fund distributions or redemptions of Fund shares. Expense
limitations were in effect for some or all of the periods shown. Performance would have been lower had expense limitations not been in effect. Expenses are listed in the “Fund expense ratios” table on page 11. Please note additional details on pages 10 through 13.
The Bloomberg Barclays 3–15 Year Blend Municipal Bond Index measures the total return performance of investment grade, US tax-exempt bonds with maturities from 2 to 17 years.
Index performance returns do not reflect any management fees, transaction costs, or expenses. Indices are unmanaged and one cannot invest directly in an index. Past performance is not a guarantee of future results.
Performance of other Fund classes will vary due to different charges and expenses.
| | | | | | |
| | | Nasdaq symbols | | CUSIPs | | |
Class A | | DXCCX | | 928930106 | | |
Class C | | DVSCX | | 928930205 | | |
Institutional Class | | DMIIX | | 92910U109 | | |
13
| | |
| Performance summaries | | |
| Delaware Minnesota High-Yield Municipal Bond Fund | | August 31, 2017 |
The performance quoted represents past performance and does not guarantee future results. Investment return and principal value of an investment will fluctuate so that shares, when redeemed, may be worth more or less than their original cost. Current performance may be lower or higher than the performance quoted. Performance data current to the most recent month end may be obtained by calling 800 523-1918 or visiting delawarefunds.com/performance.
| | | | | | | | | | | | | | | | |
| Fund and benchmark performance1, 2 | | Average annual total returns through August 31, 2017 | |
| | | | |
| | | 1 year | | | 5 years | | | 10 years | | | Lifetime | |
Class A (Est. June 4, 1996) | | | | | | | | | | | | | | | | |
Excluding sales charge | | | +0.84% | | | | +3.16% | | | | +4.57% | | | | +5.15% | |
Including sales charge | | | -3.66% | | | | +2.21% | | | | +4.09% | | | | +4.92% | |
Class C (Est. June 7, 1996) | | | | | | | | | | | | | | | | |
Excluding sales charge | | | +0.09% | | | | +2.39% | | | | +3.78% | | | | +4.37% | |
Including sales charge | | | -0.89% | | | | +2.39% | | | | +3.78% | | | | +4.37% | |
Institutional Class (Est. Dec. 31, 2013) | | | | | | | | | | | | | | | | |
Excluding sales charge | | | +1.09% | | | | n/a | | | | n/a | | | | +5.17% | |
Including sales charge | | | +1.09% | | | | n/a | | | | n/a | | | | +5.17% | |
Bloomberg Barclays Municipal Bond Index | | | +0.88% | | | | +3.23% | | | | +4.73% | | | | +4.81%* | |
*The benchmark lifetime return is for Institutional Class share comparison only and is calculated using the last business day in the month of the Fund’s Institutional Class inception date.
1 Returns reflect the reinvestment of all distributions and are presented both with and without the applicable sales charges described below. Returns do not reflect the deduction of taxes the shareholder would pay on Fund distributions or redemptions of Fund shares.
Expense limitations were in effect for certain classes during some or all of the periods shown in the “Fund and benchmark performance” table. Expenses for each class are listed on the “Fund expense ratios” table on page 15. Performance would have been lower had expense limitations not been in effect.
Institutional Class shares are available without sales or asset-based distribution charges only to certain eligible accounts.
Class A shares are sold with a maximum front-end sales charge of 4.50%, and have an annual distribution and service fee of 0.25% of average daily net assets. Performance for Class A shares,
excluding sales charges, assumes that no front-end sales charge applied.
Class C shares are sold with a contingent deferred sales charge of 1.00% if redeemed during the first 12 months. They are also subject to an annual distribution and service fee of 1.00% of average daily net assets. Performance for Class C shares, excluding sales charges, assumes either that contingent deferred sales charges did not apply or that the investment was not redeemed.
Fixed income securities and bond funds can lose value, and investors can lose principal, as interest rates rise. They also may be affected by economic conditions that hinder an issuer’s ability to make interest and principal payments on its debt.
The Fund may also be subject to prepayment risk, the risk that the principal of a bond that is held by a portfolio will be prepaid prior to maturity at the time when interest rates are lower than what the bond was paying. A portfolio may then have to reinvest that money at a lower interest rate.
14
High yielding, non-investment-grade bonds (junk bonds) involve higher risk than investment grade
bonds. The high yield secondary market is particularly susceptible to liquidity problems when institutional investors, such as mutual funds and certain other financial institutions, temporarily stop buying bonds for regulatory, financial, or other reasons. In addition, a less liquid secondary market makes it more difficult for the Fund to obtain precise valuations of the high yield securities in its portfolio.
Funds that invest primarily in one state may be more susceptible to the economic, regulatory, regional, and other factors of that state than geographically diversified funds.
Substantially all dividend income derived from tax-free funds is exempt from federal income tax. Some income may be subject to state or local and/or the federal alternative minimum tax (AMT) that applies to certain investors. Capital gains, if any, are taxable.
Duration number will change as market conditions
change. Therefore, duration should not be solely relied upon to indicate a municipal bond fund’s potential volatility.
This document may mention bond ratings published by nationally recognized statistical rating organizations (NRSROs) Standard & Poor’s, Moody’s Investors Service, and Fitch, Inc. For securities rated by an NRSRO other than S&P, the rating is converted to the equivalent S&P credit rating. Bonds rated AAA are rated as having the highest quality and are generally considered to have the lowest degree of investment risk. Bonds rated AA are considered to be of high quality, but with a slightly higher degree of risk than bonds rated AAA. Bonds rated A are considered to have many favorable investment qualities, though they are somewhat more susceptible to adverse economic conditions. Bonds rated BBB are believed to be of medium-grade quality and generally riskier over the long term. Bonds rated BB, B, and CCC are regarded as having significant speculative characteristics, with BB indicating the least degree of speculation of the three.
2 The Fund’s expense ratios, as described in the most recent prospectus, are disclosed in the following “Fund expense ratios” table. Delaware Management Company has agreed to reimburse certain expenses and/or waive certain fees in order to prevent total annual fund operating expenses (excluding any 12b-1 fees, acquired fund fees and expenses, taxes, interest, short sale and dividend interest expenses, brokerage fees, certain insurance costs, and nonroutine expenses or costs, including, but not limited to, those relating to reorganizations, litigation, conducting shareholder meetings, and liquidations (collectively, nonroutine expenses)) from exceeding 0.64% of the Fund’s average daily net assets during the period from Sept. 1, 2016 through Aug. 31, 2017.* Please see the most recent prospectus and any applicable supplement(s) for additional information on these fee waivers and/or reimbursements. Please see the “Financial highlights” section in this report for the most recent expense ratios.
| | | | | | | | | | |
| Fund expense ratios | | Class A | | | | Class C | | | | Institutional Class |
Total annual operating expenses (without fee waivers) | | 0.98% | | | | 1.73% | | | | 0.73% |
Net expenses (including fee waivers, if any) | | 0.89% | | | | 1.64% | | | | 0.64% |
Type of waiver | | Contractual | | | | Contractual | | | | Contractual |
*The aggregate contractual waiver period covering this report is from Dec. 29, 2015 through Dec. 29, 2017.
15
Performance summaries
Delaware Minnesota High-Yield Municipal Bond Fund
Performance of a $10,000 investment1
Class A shares
Average annual total returns from Aug. 31, 2007, through Aug. 31, 2017
| | | | | | | | |
| For period beginning Aug. 31, 2007, through Aug. 31, 2017 | | Starting value | | | Ending value | |
Bloomberg Barclays Municipal Bond Index | | | $10,000 | | | | $15,870 | |
Delaware Minnesota High-Yield Municipal Bond Fund — Class A shares | | | $9,550 | | | | $14,926 | |
Institutional Class shares
Average annual total returns from Dec. 31, 2013 (inception date) through Aug. 31, 2017
| | | | | | | | |
| For period beginning Dec. 31, 2013, through Aug. 31, 2017 | | Starting value | | | Ending value | |
Delaware Minnesota High-Yield Municipal Bond Fund — Institutional Class shares | | | $10,000 | | | | $12,027 | |
Bloomberg Barclays Municipal Bond Index | | | $10,000 | | | | $11,882 | |
16
1 The “Performance of a $10,000 investment” graph for Class A shares assumes $10,000 invested in Class A shares of the Fund on Aug. 31, 2007, and includes the effect of a 4.50% front-end sales charge and the reinvestment of all distributions. The graph also assumes $10,000 invested in the Bloomberg Barclays Municipal Bond Index as of Aug. 31, 2007.
The “Performance of a $10,000 investment” graph for Institutional Class shares assumes $10,000 invested in Institutional Class shares of the Fund on Dec. 31, 2013, and includes the reinvestment of all distributions. The graph also assumes $10,000 invested in the Bloomberg Barclays Municipal Bond Index as of Dec. 31, 2013.
The graphs do not reflect the deduction of taxes the shareholders would pay on Fund distributions or redemptions of Fund shares. Expense
limitations were in effect for some or all of the periods shown. Performance would have been lower had expense limitations not been in effect. Expenses are listed in the “Fund expense ratios” table on page 15. Please note additional details on pages 14 through 17.
The Bloomberg Barclays Municipal Bond Index measures the total return performance of the long-term, investment grade tax-exempt bond market.
Index performance returns do not reflect any management fees, transaction costs, or expenses. Indices are unmanaged and one cannot invest directly in an index. Past performance is not a guarantee of future results.
Performance of other Fund classes will vary due to different charges and expenses.
| | | | | | |
| | | Nasdaq symbols | | CUSIPs | | |
Class A | | DVMHX | | 928928316 | | |
Class C | | DVMMX | | 928928282 | | |
Institutional Class | | DMHIX | | 928928175 | | |
17
Disclosure of Fund expenses
For the six-month period from March 1, 2017 to August 31, 2017 (Unaudited)
As a shareholder of a Fund, you incur two types of costs: (1) transaction costs, including sales charges (loads) on purchase payments, reinvested dividends, or other distributions; redemption fees; and exchange fees; and (2) ongoing costs, including management fees; distribution and/or service (12b-1) fees; and other Fund expenses. These following examples are intended to help you understand your ongoing costs (in dollars) of investing in a Fund and to compare these costs with the ongoing costs of investing in other mutual funds.
The examples are based on an investment of $1,000 invested at the beginning of the period and held for the entire six-month period from March 1, 2017 to Aug. 31, 2017.
Actual expenses
The first section of the tables shown, “Actual Fund return,” provides information about actual account values and actual expenses. You may use the information in this section of the table, together with the amount you invested, to estimate the expenses that you paid over the period. Simply divide your account value by $1,000 (for example, an $8,600 account value divided by $1,000 = 8.6), then multiply the result by the number in the first section under the heading entitled “Expenses Paid During Period” to estimate the expenses you paid on your account during this period.
Hypothetical example for comparison purposes
The second section of the tables shown, “Hypothetical 5% return,” provides information about hypothetical account values and hypothetical expenses based on the Funds’ actual expense ratios and an assumed rate of return of 5% per year before expenses, which is not the Funds’ actual return. The hypothetical account values and expenses may not be used to estimate the actual ending account balance or expenses you paid for the period. You may use this information to compare the ongoing costs of investing in the Funds and other funds. To do so, compare this 5% hypothetical example with the 5% hypothetical examples that appear in the shareholder reports of the other funds.
Please note that the expenses shown in the tables are meant to highlight your ongoing costs only and do not reflect any transactional costs, such as sales charges (loads), redemption fees, or exchange fees. Therefore, the second section of each table is useful in comparing ongoing costs only, and will not help you determine the relative total costs of owning different funds. In addition, if these transactional costs were included, your costs would have been higher. The Funds’ expenses shown in the tables reflect fee waivers in effect. The expenses shown in each table assume reinvestment of all dividends and distributions.
18
Delaware Tax-Free Minnesota Fund
Expense analysis of an investment of $1,000
| | | | | | | | | | |
| | | Beginning
Account Value
3/1/17 | | Ending
Account Value
8/31/17 | | Annualized
Expense Ratio | | Expenses
Paid During Period
3/1/17 to 8/31/17* | |
| |
Actual Fund return† | | | | |
Class A | | $1,000.00 | | $1,031.90 | | 0.85% | | | $4.35 | |
Class C | | 1,000.00 | | 1,027.90 | | 1.60% | | | 8.18 | |
Institutional Class | | 1,000.00 | | 1,033.20 | | 0.60% | | | 3.07 | |
| |
Hypothetical 5% return (5% return before expenses) | | | | |
Class A | | $1,000.00 | | $1,020.92 | | 0.85% | | | $4.33 | |
Class C | | 1,000.00 | | 1,017.14 | | 1.60% | | | 8.13 | |
Institutional Class | | 1,000.00 | | 1,022.18 | | 0.60% | | | 3.06 | |
Delaware Tax-Free Minnesota Intermediate Fund
Expense analysis of an investment of $1,000
| | | | | | | | | | |
| | | Beginning
Account Value
3/1/17 | | Ending
Account Value
8/31/17 | | Annualized
Expense Ratio | | Expenses
Paid During Period
3/1/17 to 8/31/17* | |
| |
Actual Fund return† | | | | |
Class A | | $1,000.00 | | $1,031.40 | | 0.84% | | | $4.30 | |
Class C | | 1,000.00 | | 1,026.10 | | 1.69% | | | 8.63 | |
Institutional Class | | 1,000.00 | | 1,031.20 | | 0.69% | | | 3.53 | |
| |
Hypothetical 5% return (5% return before expenses) | | | | |
Class A | | $1,000.00 | | $1,020.97 | | 0.84% | | | $4.28 | |
Class C | | 1,000.00 | | 1,016.69 | | 1.69% | | | 8.59 | |
Institutional Class | | 1,000.00 | | 1,021.73 | | 0.69% | | | 3.52 | |
19
Disclosure of Fund expenses
For the six-month period from March 1, 2017 to August 31, 2017 (Unaudited)
Delaware Minnesota High-Yield Municipal Bond Fund
Expense analysis of an investment of $1,000
| | | | | | | | | | |
| | | Beginning
Account Value
3/1/17 | | Ending
Account Value
8/31/17 | | Annualized
Expense Ratio | | Expenses
Paid During Period
3/1/17 to 8/31/17* | |
| |
Actual Fund return† | | | | |
Class A | | $1,000.00 | | $1,038.70 | | 0.89% | | | $4.57 | |
Class C | | 1,000.00 | | 1,033.80 | | 1.64% | | | 8.41 | |
Institutional Class | | 1,000.00 | | 1,039.00 | | 0.64% | | | 3.29 | |
| |
Hypothetical 5% return (5% return before expenses) | | | | |
Class A | | $1,000.00 | | $1,020.72 | | 0.89% | | | $4.53 | |
Class C | | 1,000.00 | | 1,016.94 | | 1.64% | | | 8.34 | |
Institutional Class | | 1,000.00 | | 1,021.98 | | 0.64% | | | 3.26 | |
| * | “Expenses Paid During Period” are equal to the relevant Fund’s annualized expense ratio, multiplied by the average account value over the period, multiplied by 184/365 (to reflect the one-half year period). |
| † | Because actual returns reflect only the most recent six-month period, the returns shown may differ significantly from fiscal year returns. |
20
| | |
| Security type / sector / territory allocations |
| Delaware Tax-Free Minnesota Fund | | As of August 31, 2017 (Unaudited) |
Sector designations may be different than the sector designations presented in other fund materials.
| | | | | | | |
| Security type / sector | | Percentage of net assets | | |
Municipal Bonds* | | | | 98.48 | % | | |
Corporate-Backed Revenue Bonds | | | | 1.70 | % | | |
Education Revenue Bonds | | | | 14.63 | % | | |
Electric Revenue Bonds | | | | 6.56 | % | | |
Healthcare Revenue Bonds | | | | 25.09 | % | | |
Housing Revenue Bonds | | | | 0.50 | % | | |
Lease Revenue Bonds | | | | 2.97 | % | | |
Local General Obligation Bonds | | | | 10.90 | % | | |
Pre-Refunded/Escrowed to Maturity Bonds | | | | 17.16 | % | | |
Special Tax Revenue Bonds | | | | 1.68 | % | | |
State General Obligation Bonds | | | | 10.78 | % | | |
Transportation Revenue Bonds | | | | 4.35 | % | | |
Water & Sewer Revenue Bonds | | | | 2.16 | % | | |
Short-Term Investments | | | | 1.43 | % | | |
Total Value of Securities | | | | 99.91 | % | | |
Receivables and Other Assets Net of Liabilities | | | | 0.09 | % | | |
Total Net Assets | | | | 100.00 | % | | |
* As of the date of this report, Delaware Tax-Free Minnesota Fund held bonds issued by or on behalf of territories and the states of the US as follows:
| | | | | | | |
| State / territory | | Percentage of net assets | | |
Guam | | | | 0.32 | % | | |
Minnesota | | | | 99.21 | % | | |
US Virgin Islands | | | | 0.38 | % | | |
Total Value of Securities | | | | 99.91 | % | | |
21
| | |
| Security type / sector / territory allocations |
| Delaware Tax-Free Minnesota Intermediate Fund | | As of August 31, 2017 (Unaudited) |
Sector designations may be different than the sector designations presented in other fund materials.
| | | | | | | |
| Security type / sector | | Percentage of net assets | | |
Municipal Bonds* | | | | 98.59 | % | | |
Corporate-Backed Revenue Bond | | | | 0.75 | % | | |
Education Revenue Bonds | | | | 16.32 | % | | |
Electric Revenue Bonds | | | | 8.68 | % | | |
Healthcare Revenue Bonds | | | | 24.47 | % | | |
Housing Revenue Bonds | | | | 0.31 | % | | |
Lease Revenue Bonds | | | | 6.41 | % | | |
Local General Obligation Bonds | | | | 7.08 | % | | |
Pre-Refunded/Escrowed to Maturity Bonds | | | | 14.82 | % | | |
Special Tax Revenue Bonds | | | | 0.58 | % | | |
State General Obligation Bonds | | | | 13.84 | % | | |
Transportation Revenue Bonds | | | | 3.81 | % | | |
Water & Sewer Revenue Bonds | | | | 1.52 | % | | |
Short-Term Investment | | | | 0.75 | % | | |
Total Value of Securities | | | | 99.34 | % | | |
Receivables and Other Assets Net of Liabilities | | | | 0.66 | % | | |
Total Net Assets | | | | 100.00 | % | | |
* As of the date of this report, Delaware Tax-Free Minnesota Intermediate Fund held bonds issued by or on behalf of territories and the states of the US as follows:
| | | | | | | |
| State / territory | | Percentage of net assets | | |
Guam | | | | 0.33 | % | | |
Minnesota | | | | 99.01 | % | | |
Total Value of Securities | | | | 99.34 | % | | |
22
| | |
| Security type / sector / territory allocations |
| Delaware Minnesota High-Yield Municipal Bond Fund | | As of August 31, 2017 (Unaudited) |
Sector designations may be different than the sector designations presented in other fund materials.
| | | | | | | |
| Security type / sector | | Percentage of net assets | | |
Municipal Bonds* | | | | 98.99 | % | | |
Corporate-Backed Revenue Bonds | | | | 3.02 | % | | |
Education Revenue Bonds | | | | 20.82 | % | | |
Electric Revenue Bonds | | | | 8.28 | % | | |
Healthcare Revenue Bonds | | | | 27.24 | % | | |
Housing Revenue Bonds | | | | 1.56 | % | | |
Lease Revenue Bonds | | | | 2.88 | % | | |
Local General Obligation Bonds | | | | 11.88 | % | | |
Pre-Refunded Bonds | | | | 9.64 | % | | |
Special Tax Revenue Bonds | | | | 3.03 | % | | |
State General Obligation Bonds | | | | 5.96 | % | | |
Transportation Revenue Bonds | | | | 3.35 | % | | |
Water & Sewer Revenue Bonds | | | | 1.33 | % | | |
Short-Term Investments | | | | 0.29 | % | | |
Total Value of Securities | | | | 99.28 | % | | |
Receivables and Other Assets Net of Liabilities | | | | 0.72 | % | | |
Total Net Assets | | | | 100.00 | % | | |
* As of the date of this report, Delaware Minnesota High-Yield Municipal Bond Fund held bonds issued by or on behalf of territories and the states of the US as follows:
| | | | | | | |
| State / territory | | Percentage of net assets | | |
Guam | | | | 0.32 | % | | |
Minnesota | | | | 98.96 | % | | |
Total Value of Securities | | | | 99.28 | % | | |
23
| | |
| Schedules of investments |
| Delaware Tax-Free Minnesota Fund | | August 31, 2017 |
| | | | | | | | |
| | | Principal amount° | | | Value (US $) | |
| |
Municipal Bonds – 98.48% | | | | | | | | |
| |
Corporate-Backed Revenue Bonds – 1.70% | | | | | | | | |
Laurentian Energy Authority I Cogeneration Revenue | | | | | | | | |
Series A 5.00% 12/1/21 | | | 8,000,000 | | | $ | 7,987,280 | |
St. Paul Port Authority Solid Waste Disposal Revenue | | | | | | | | |
(Gerdau St. Paul Steel Mill Project) | | | | | | | | |
Series 7 144A 4.50% 10/1/37 (AMT)# | | | 1,790,000 | | | | 1,608,512 | |
| | | | | | | | |
| | | | | | | 9,595,792 | |
| | | | | | | | |
Education Revenue Bonds – 14.63% | | | | | | | | |
Brooklyn Park Charter School Lease Revenue | | | | | | | | |
(Prairie Seeds Academy Project) | | | | | | | | |
Series A 5.00% 3/1/34 | | | 2,260,000 | | | | 2,360,502 | |
Series A 5.00% 3/1/39 | | | 385,000 | | | | 398,625 | |
Cologne Charter School Lease Revenue | | | | | | | | |
(Cologne Academy Project) | | | | | | | | |
Series A 5.00% 7/1/34 | | | 250,000 | | | | 259,503 | |
Series A 5.00% 7/1/45 | | | 1,390,000 | | | | 1,427,113 | |
Deephaven Charter School Lease Revenue | | | | | | | | |
(Eagle Ridge Academy Project) Series A 5.50% 7/1/50 | | | 2,000,000 | | | | 2,132,040 | |
Duluth Housing & Redevelopment Authority Revenue | | | | | | | | |
(Public Schools Academy) Series A 5.875% 11/1/40 | | | 3,500,000 | | | | 3,617,250 | |
Forest Lake Charter School Lease Revenue Fund | | | | | | | | |
(Lakes International Language Academy Project) | | | | | | | | |
Series A 5.50% 8/1/36 | | | 580,000 | | | | 624,498 | |
Series A 5.75% 8/1/44 | | | 1,190,000 | | | | 1,288,306 | |
Ham Lake Charter School Lease Revenue | | | | | | | | |
(Davinci Academy Project) | | | | | | | | |
Series A 5.00% 7/1/36 | | | 765,000 | | | | 779,726 | |
Series A 5.00% 7/1/47 | | | 2,290,000 | | | | 2,311,022 | |
Hugo Charter School Lease Revenue | | | | | | | | |
(Noble Academy Project) | | | | | | | | |
Series A 5.00% 7/1/34 | | | 580,000 | | | | 596,861 | |
Series A 5.00% 7/1/44 | | | 1,770,000 | | | | 1,800,621 | |
Minneapolis Charter School Lease Revenue | | | | | | | | |
(Hiawatha Academies Project) | | | | | | | | |
Series A 5.00% 7/1/31 | | | 885,000 | | | | 926,108 | |
Series A 5.00% 7/1/47 | | | 2,300,000 | | | | 2,337,214 | |
Minneapolis Student Housing Revenue | | | | | | | | |
(Riverton Community Housing Project) | | | | | | | | |
5.25% 8/1/39 | | | 470,000 | | | | 484,255 | |
5.50% 8/1/49 | | | 2,260,000 | | | | 2,340,953 | |
Minnesota Colleges & Universities Revenue Fund | | | | | | | | |
Series A 5.00% 10/1/26 | | | 4,990,000 | | | | 6,237,101 | |
24
| | | | | | | | |
| | | Principal amount° | | | Value (US $) | |
| |
Municipal Bonds (continued) | | | | | | | | |
| |
Education Revenue Bonds (continued) | | | | | | | | |
Minnesota Higher Education Facilities Authority Revenue | | | | | | | | |
(Bethel University) | | | | | | | | |
5.00% 5/1/32 | | | 1,375,000 | | | $ | 1,570,731 | |
5.00% 5/1/37 | | | 1,250,000 | | | | 1,406,963 | |
5.00% 5/1/47 | | | 250,000 | | | | 278,133 | |
(Carleton College) | | | | | | | | |
4.00% 3/1/35 | | | 1,000,000 | | | | 1,089,900 | |
4.00% 3/1/36 | | | 415,000 | | | | 450,516 | |
5.00% 3/1/34 | | | 225,000 | | | | 271,669 | |
5.00% 3/1/44 | | | 2,085,000 | | | | 2,461,488 | |
(College of St. Benedict) Series 8-K 4.00% 3/1/43 | | | 1,000,000 | | | | 1,032,770 | |
(Gustavus Adolphus College) 5.00% 10/1/47 | | | 4,850,000 | | | | 5,593,796 | |
(St. Catherine University) | | | | | | | | |
Series 7-Q 5.00% 10/1/23 | | | 350,000 | | | | 402,469 | |
Series 7-Q 5.00% 10/1/24 | | | 475,000 | | | | 544,777 | |
Series 7-Q 5.00% 10/1/27 | | | 200,000 | | | | 224,614 | |
(St. John’s University) | | | | | | | | |
Series 8-I 5.00% 10/1/32 | | | 500,000 | | | | 583,000 | |
Series 8-I 5.00% 10/1/33 | | | 250,000 | | | | 290,123 | |
(St. Olaf College) | | | | | | | | |
Series 8-G 5.00% 12/1/31 | | | 670,000 | | | | 785,421 | |
Series 8-G 5.00% 12/1/32 | | | 670,000 | | | | 783,257 | |
Series 8-N 4.00% 10/1/35 | | | 500,000 | | | | 543,635 | |
(St. Scholastica College) Series 7-J 6.30% 12/1/40 | | | 1,800,000 | | | | 1,937,178 | |
(University of St. Thomas) | | | | | | | | |
Series 7-A 5.00% 10/1/39 | | | 2,000,000 | | | | 2,142,700 | |
Series 7-U 5.00% 4/1/23 | | | 550,000 | | | | 652,333 | |
Series 8-L 5.00% 4/1/35 | | | 750,000 | | | | 870,135 | |
Otsego Charter School Lease Revenue | | | | | | | | |
(Kaleidoscope Charter School) | | | | | | | | |
Series A 5.00% 9/1/34 | | | 520,000 | | | | 541,804 | |
Series A 5.00% 9/1/44 | | | 1,165,000 | | | | 1,199,647 | |
Rice County Educational Facilities Revenue | | | | | | | | |
(Shattuck-St. Mary’s School) Series A 144A 5.00% 8/1/22 # | | | 2,855,000 | | | | 3,034,865 | |
St. Cloud Charter School Lease Revenue | | | | | | | | |
(Stride Academy Project) Series A 5.00% 4/1/46 | | | 875,000 | | | | 621,180 | |
St. Paul Housing & Redevelopment Authority Charter School Lease Revenue | | | | | | | | |
(Academia Cesar Chavez School Project) Series A 5.25% 7/1/50 | | | 1,945,000 | | | | 1,989,988 | |
25
Schedules of investments
Delaware Tax-Free Minnesota Fund
| | | | | | | | |
| | | Principal amount° | | | Value (US $) | |
| |
Municipal Bonds (continued) | | | | | | | | |
| |
Education Revenue Bonds (continued) | | | | | | | | |
St. Paul Housing & Redevelopment Authority Charter | | | | | | | | |
School Lease Revenue | | | | | | | | |
(Great River School Project) | | | | | | | | |
Series A 144A 4.75% 7/1/29 # | | | 150,000 | | | $ | 152,706 | |
Series A 144A 5.50% 7/1/52 # | | | 735,000 | | | | 739,373 | |
(Nova Classical Academy Project) Series A 4.125% 9/1/47 | | | 1,750,000 | | | | 1,750,647 | |
(Twin Cities Academy Project) Series A 5.30% 7/1/45 | | | 1,440,000 | | | | 1,486,642 | |
University of Minnesota | | | | | | | | |
Series A 5.00% 4/1/34 | | | 925,000 | | | | 1,108,159 | |
Series A 5.00% 4/1/35 | | | 3,175,000 | | | | 3,790,093 | |
Series A 5.00% 4/1/36 | | | 2,650,000 | | | | 3,156,627 | |
Series A 5.25% 12/1/28 | | | 1,000,000 | | | | 1,134,640 | |
Series A 5.25% 12/1/29 | | | 1,850,000 | | | | 2,099,084 | |
Series D 5.00% 12/1/27 | | | 1,000,000 | | | | 1,155,090 | |
(State Supported Stadium Debt) Series A 5.00% 8/1/26 | | | 3,760,000 | | | | 4,631,568 | |
| | | | | | | | |
| | | | | | | 82,429,419 | |
| | | | | | | | |
Electric Revenue Bonds – 6.56% | | | | | | | | |
Chaska Electric Revenue | | | | | | | | |
(Generating Facilities) Series A 5.00% 10/1/30 | | | 1,150,000 | | | | 1,349,341 | |
Minnesota Municipal Power Agency Electric Revenue | | | | | | | | |
4.00% 10/1/41 | | | 1,000,000 | | | | 1,069,120 | |
5.00% 10/1/29 | | | 395,000 | | | | 467,099 | |
5.00% 10/1/30 | | | 500,000 | | | | 587,855 | |
5.00% 10/1/33 | | | 1,205,000 | | | | 1,404,524 | |
Series A 5.00% 10/1/30 | | | 1,060,000 | | | | 1,246,253 | |
Series A 5.00% 10/1/34 | | | 750,000 | | | | 871,013 | |
Series A 5.00% 10/1/35 | | | 1,525,000 | | | | 1,767,841 | |
Northern Municipal Power Agency Electric System Revenue | | | | | | | | |
5.00% 1/1/27 | | | 540,000 | | | | 652,709 | |
5.00% 1/1/30 | | | 520,000 | | | | 614,229 | |
Series A 5.00% 1/1/25 | | | 125,000 | | | | 146,153 | |
Series A 5.00% 1/1/26 | | | 425,000 | | | | 493,153 | |
Series A 5.00% 1/1/31 | | | 520,000 | | | | 585,900 | |
Rochester Electric Utility Revenue | | | | | | | | |
Series A 5.00% 12/1/42 | | | 1,395,000 | | | | 1,642,278 | |
Series A 5.00% 12/1/47 | | | 2,265,000 | | | | 2,654,399 | |
Series B 5.00% 12/1/27 | | | 295,000 | | | | 352,549 | |
Series B 5.00% 12/1/28 | | | 275,000 | | | | 327,717 | |
Series B 5.00% 12/1/31 | | | 1,365,000 | | | | 1,607,929 | |
Series B 5.00% 12/1/33 | | | 300,000 | | | | 350,892 | |
26
| | | | | | | | |
| | | Principal amount° | | | Value (US $) | |
| |
Municipal Bonds (continued) | | | | | | | | |
| |
Electric Revenue Bonds (continued) | | | | | | | | |
Southern Minnesota Municipal Power Agency Revenue | | | | | | | | |
Series A 5.00% 1/1/41 | | | 1,310,000 | | | $ | 1,498,745 | |
Series A 5.00% 1/1/46 | | | 2,000,000 | | | | 2,277,100 | |
Capital Appreciation Series A | | | | | | | | |
6.70% 1/1/25 (NATL)^ | | | 5,000,000 | | | | 4,317,900 | |
Western Minnesota Municipal Power Agency Revenue | | | | | | | | |
Series A 5.00% 1/1/33 | | | 1,000,000 | | | | 1,165,300 | |
Series A 5.00% 1/1/34 | | | 4,000,000 | | | | 4,648,360 | |
Series A 5.00% 1/1/40 | | | 1,250,000 | | | | 1,439,063 | |
Series A 5.00% 1/1/46 | | | 3,000,000 | | | | 3,436,680 | |
| | | | | | | | |
| | | | | | | 36,974,102 | |
| | | | | | | | |
Healthcare Revenue Bonds – 25.09% | | | | | | | | |
Alexandria Senior Housing Revenue | | | | | | | | |
(Knute Nelson Senior Living Campus) | | | | | | | | |
6.00% 7/1/35 | | | 1,500,000 | | | | 1,517,520 | |
6.20% 7/1/45 | | | 2,000,000 | | | | 2,023,720 | |
Anoka Healthcare & Housing Facilities Revenue | | | | | | | | |
(The Homestead at Anoka Project) | | | | | | | | |
5.125% 11/1/49 | | | 1,100,000 | | | | 1,119,162 | |
5.375% 11/1/34 | | | 320,000 | | | | 335,274 | |
Apple Valley Senior Living Revenue | | | | | | | | |
(Senior Living LLC Project) | | | | | | | | |
2nd Tier Series B 5.00% 1/1/47 | | | 1,725,000 | | | | 1,768,746 | |
4th Tier Series D 7.00% 1/1/37 | | | 1,665,000 | | | | 1,646,901 | |
4th Tier Series D 7.25% 1/1/52 | | | 2,500,000 | | | | 2,480,875 | |
Breckenridge Catholic Health Initiatives | | | | | | | | |
Series A 5.00% 5/1/30 | | | 2,250,000 | | | | 2,257,290 | |
Center City Health Care Facilities Revenue | | | | | | | | |
(Hazelden Betty Ford Foundation Project) | | | | | | | | |
5.00% 11/1/26 | | | 500,000 | | | | 584,745 | |
Dakota County Community Development Agency Senior | | | | | | | | |
Housing Revenue | | | | | | | | |
(Walker Highview Hills Project) | | | | | | | | |
Series A 144A 5.00% 8/1/36 # | | | 280,000 | | | | 287,221 | |
Series A 144A 5.00% 8/1/46 # | | | 2,380,000 | | | | 2,425,577 | |
Deephaven Housing & Healthcare Revenue | | | | | | | | |
(St. Therese Senior Living Project) | | | | | | | | |
Series A 5.00% 4/1/38 | | | 730,000 | | | | 744,563 | |
Series A 5.00% 4/1/40 | | | 705,000 | | | | 717,676 | |
Series A 5.00% 4/1/48 | | | 315,000 | | | | 317,696 | |
27
Schedules of investments
Delaware Tax-Free Minnesota Fund
| | | | | | | | |
| | | Principal amount° | | | Value (US $) | |
| |
Municipal Bonds (continued) | | | | | | | | |
| |
Healthcare Revenue Bonds (continued) | | | | | | | | |
Duluth Economic Development Authority | | | | | | | | |
(St. Luke’s Hospital Authority Obligation Group) | | | | | | | | |
5.75% 6/15/32 | | | 1,850,000 | | | $ | 2,014,077 | |
6.00% 6/15/39 | | | 3,570,000 | | | | 3,909,043 | |
Fergus Falls Health Care Facilities Revenue | | | | | | | | |
(Lake Region Health Care) | | | | | | | | |
5.15% 8/1/35 | | | 1,250,000 | | | | 1,251,275 | |
5.40% 8/1/40 | | | 1,000,000 | | | | 1,001,250 | |
Glencoe Health Care Facilities Revenue | | | | | | | | |
(Glencoe Regional Health Services Project) | | | | | | | | |
4.00% 4/1/24 | | | 500,000 | | | | 536,655 | |
4.00% 4/1/25 | | | 660,000 | | | | 708,101 | |
4.00% 4/1/31 | | | 60,000 | | | | 62,996 | |
Hayward Health Care Facilities Revenue | | | | | | | | |
(American Baptist Homes Midwest Obligated Group) | | | | | | | | |
5.375% 8/1/34 | | | 660,000 | | | | 681,694 | |
5.75% 2/1/44 | | | 500,000 | | | | 519,900 | |
(St. John’s Lutheran Home of Albert Lea) | | | | | | | | |
5.375% 10/1/44 | | | 1,570,000 | | | | 1,592,059 | |
Maple Grove Health Care Facilities Revenue | | | | | | | | |
(Maple Grove Hospital Corporation) | | | | | | | | |
4.00% 5/1/37 | | | 2,000,000 | | | | 2,084,680 | |
5.00% 5/1/27 | | | 1,400,000 | | | | 1,699,796 | |
5.00% 5/1/29 | | | 1,000,000 | | | | 1,184,860 | |
5.00% 5/1/30 | | | 850,000 | | | | 1,001,351 | |
5.00% 5/1/31 | | | 500,000 | | | | 585,185 | |
5.00% 5/1/32 | | | 500,000 | | | | 582,895 | |
(North Memorial Health Care) | | | | | | | | |
5.00% 9/1/31 | | | 1,000,000 | | | | 1,140,550 | |
5.00% 9/1/32 | | | 1,000,000 | | | | 1,134,470 | |
Minneapolis Health Care System Revenue | | | | | | | | |
(Fairview Health Services) | | | | | | | | |
Series A 5.00% 11/15/33 | | | 500,000 | | | | 581,320 | |
Series A 5.00% 11/15/34 | | | 500,000 | | | | 579,725 | |
Series A 5.00% 11/15/44 | | | 1,000,000 | | | | 1,136,680 | |
Series B Unrefunded Balance 6.50% 11/15/38 (AGC) | | | 1,730,000 | | | | 1,835,253 | |
Minneapolis Senior Housing & Healthcare Revenue | | | | | | | | |
(Ecumen-Abiitan Mill City Project) | | | | | | | | |
5.00% 11/1/35 | | | 500,000 | | | | 517,660 | |
5.25% 11/1/45 | | | 1,950,000 | | | | 2,017,392 | |
5.375% 11/1/50 | | | 455,000 | | | | 470,666 | |
28
| | | | | | | | |
| | | Principal amount° | | | Value (US $) | |
| |
Municipal Bonds (continued) | | | | | | | | |
| |
Healthcare Revenue Bonds (continued) | | | | | | | | |
Minneapolis – St. Paul Housing & Redevelopment Authority Health Care Facilities Revenue | | | | | | | | |
(Allina Health System) Series A 5.00% 11/15/28 | | | 1,550,000 | | | $ | 1,899,851 | |
(Children’s Health Care) Series A 5.25% 8/15/35 | | | 2,085,000 | | | | 2,281,657 | |
Minnesota Agricultural & Economic Development Board Revenue | | | | | | | | |
(Essenthia Remarketing) | | | | | | | | |
Series C-1 5.00% 2/15/30 (AGC) | | | 5,725,000 | | | | 6,120,827 | |
Series C-1 5.25% 2/15/23 (AGC) | | | 5,000,000 | | | | 5,490,450 | |
Series C-1 5.50% 2/15/25 (AGC) | | | 5,120,000 | | | | 5,609,626 | |
Red Wing Senior Housing | | | | | | | | |
(Deer Crest Project) | | | | | | | | |
Series A 5.00% 11/1/27 | | | 430,000 | | | | 451,487 | |
Series A 5.00% 11/1/32 | | | 330,000 | | | | 343,217 | |
Series A 5.00% 11/1/42 | | | 1,250,000 | | | | 1,291,375 | |
Rochester Health Care & Housing Revenue | | | | | | | | |
(The Homestead at Rochester Project) Series A | | | | | | | | |
6.875% 12/1/48 | | | 2,980,000 | | | | 3,325,233 | |
Rochester Health Care Facilities Revenue | | | | | | | | |
(Mayo Clinic) | | | | | | | | |
4.00% 11/15/41 | | | 4,515,000 | | | | 4,681,468 | |
Series D Remarketing 5.00% 11/15/38 | | | 6,405,000 | | | | 6,934,886 | |
(Olmsted Medical Center Project) | | | | | | | | |
5.00% 7/1/24 | | | 295,000 | | | | 348,303 | |
5.00% 7/1/33 | | | 650,000 | | | | 730,912 | |
5.875% 7/1/30 | | | 1,850,000 | | | | 2,046,193 | |
Sartell Health Care Facilities Revenue | | | | | | | | |
(Country Manor Campus Project) | | | | | | | | |
Series A 5.25% 9/1/27 | | | 1,280,000 | | | | 1,353,933 | |
Series A 5.30% 9/1/37 | | | 1,200,000 | | | | 1,257,180 | |
Series A 6.375% 9/1/42 | | | 2,435,000 | | | | 2,439,286 | |
Sauk Rapids Health Care Housing Facilities Revenue | | | | | | | | |
(Good Shepherd Lutheran Home) 5.125% 1/1/39 | | | 1,350,000 | | | | 1,362,811 | |
Shakopee Health Care Facilities Revenue | | | | | | | | |
(St. Francis Regional Medical Center) | | | | | | | | |
4.00% 9/1/31 | | | 915,000 | | | | 982,554 | |
5.00% 9/1/24 | | | 575,000 | | | | 691,587 | |
5.00% 9/1/25 | | | 750,000 | | | | 893,407 | |
5.00% 9/1/26 | | | 575,000 | | | | 679,328 | |
5.00% 9/1/27 | | | 405,000 | | | | 473,425 | |
5.00% 9/1/28 | | | 425,000 | | | | 492,345 | |
5.00% 9/1/29 | | | 425,000 | | | | 488,231 | |
29
Schedules of investments
Delaware Tax-Free Minnesota Fund
| | | | | | | | |
| | | Principal amount° | | | Value (US $) | |
| |
Municipal Bonds (continued) | | | | | | | | |
| |
Healthcare Revenue Bonds (continued) | | | | | | | | |
Shakopee Health Care Facilities Revenue | | | | | | | | |
(St. Francis Regional Medical Center) | | | | | | | | |
5.00% 9/1/34 | | | 730,000 | | | $ | 825,009 | |
St. Cloud Health Care Revenue | | | | | | | | |
(Centracare Health System Project) | | | | | | | | |
Series A 4.00% 5/1/37 | | | 965,000 | | | | 1,032,801 | |
Series A 5.00% 5/1/46 | | | 7,715,000 | | | | 8,808,678 | |
Unrefunded Balance 5.125% 5/1/30 | | | 740,000 | | | | 804,040 | |
St. Paul Housing & Redevelopment Authority Health Care Facilities Revenue | | | | | | | | |
(Allina Health System) Series A-1 Unrefunded Balance | | | | | | | | |
5.25% 11/15/29 | | | 2,825,000 | | | | 3,086,793 | |
(Fairview Health Services) | | | | | | | | |
Series A 4.00% 11/15/43 | | | 2,080,000 | | | | 2,186,766 | |
Series A 5.00% 11/15/47 | | | 1,560,000 | | | | 1,814,576 | |
(Health Partners Obligation Group Project) | | | | | | | | |
Series A 5.00% 7/1/29 | | | 2,200,000 | | | | 2,586,474 | |
Series A 5.00% 7/1/32 | | | 2,500,000 | | | | 2,891,975 | |
Series A 5.00% 7/1/33 | | | 1,260,000 | | | | 1,452,755 | |
St. Paul Housing & Redevelopment Authority Housing & Health Care Facilities Revenue | | | | | | | | |
(Senior Episcopal Homes Project) 5.125% 5/1/48 | | | 3,100,000 | | | | 3,138,781 | |
St. Paul Housing & Redevelopment Authority Multifamily Housing Revenue | | | | | | | | |
(Marian Center Project) | | | | | | | | |
Series A 5.30% 11/1/30 | | | 500,000 | | | | 500,390 | |
Series A 5.375% 5/1/43 | | | 500,000 | | | | 500,290 | |
Wayzata Senior Housing Revenue | | | | | | | | |
(Folkestone Senior Living Community) | | | | | | | | |
Series A 5.50% 11/1/32 | | | 1,050,000 | | | | 1,117,998 | |
Series A 5.75% 11/1/39 | | | 2,365,000 | | | | 2,519,671 | |
Series A 6.00% 5/1/47 | | | 3,685,000 | | | | 3,918,997 | |
Winona Health Care Facilities Revenue | | | | | | | | |
(Winona Health Obligation Group) | | | | | | | | |
4.50% 7/1/25 | | | 850,000 | | | | 909,185 | |
4.65% 7/1/26 | | | 540,000 | | | | 577,784 | |
Woodbury Housing & Redevelopment Authority Revenue | | | | | | | | |
(St. Therese of Woodbury) | | | | | | | | |
5.00% 12/1/34 | | | 500,000 | | | | 515,285 | |
5.125% 12/1/44 | | | 1,605,000 | | | | 1,651,850 | |
5.25% 12/1/49 | | | 750,000 | | | | 771,367 | |
| | | | | | | | |
| | | | | | | 141,337,536 | |
| | | | | | | | |
30
| | | | | | | | |
| | | Principal amount° | | | Value (US $) | |
| |
Municipal Bonds (continued) | | | | | | | | |
| |
Housing Revenue Bonds – 0.50% | | | | | | | | |
Minnesota Housing Finance Agency Homeownership | | | | | | | | |
Finance (Mortgage-Backed Securities Program)
Series D 4.70% 1/1/31 (GNMA) (FNMA) (FHLMC) | | | 1,375,000 | | | $ | 1,463,385 | |
Northwest Multi-County Housing & Redevelopment Authority | | | | | | | | |
(Pooled Housing Program) 5.50% 7/1/45 | | | 1,330,000 | | | | 1,346,412 | |
| | | | | | | | |
| | | | | | | 2,809,797 | |
| | | | | | | | |
Lease Revenue Bonds – 2.97% | | | | | | | | |
Minnesota General Fund Revenue Appropriations | | | | | | | | |
Series A 5.00% 6/1/38 | | | 1,250,000 | | | | 1,435,113 | |
Series A 5.00% 6/1/43 | | | 3,835,000 | | | | 4,376,272 | |
Series B 5.00% 3/1/28 | | | 2,500,000 | | | | 2,892,425 | |
Minnesota Housing Finance Agency | | | | | | | | |
(State Appropriation – Housing Infrastructure) | | | | | | | | |
Series C 5.00% 8/1/34 | | | 1,565,000 | | | | 1,791,737 | |
Series C 5.00% 8/1/35 | | | 1,645,000 | | | | 1,904,499 | |
University of Minnesota Special Purpose Revenue | | | | | | | | |
(State Supported Biomed Science Research Facilities Funding Project) | | | | | | | | |
Series A 5.00% 8/1/35 | | | 3,960,000 | | | | 4,349,466 | |
| | | | | | | | |
| | | | | | | 16,749,512 | |
| | | | | | | | |
Local General Obligation Bonds – 10.90% | | | | | | | | |
Anoka County Capital Improvement | | | | | | | | |
Series A 5.00% 2/1/22 | | | 500,000 | | | | 528,880 | |
Brainerd Independent School District No. 181 | | | | | | | | |
(School Building) Series A 4.00% 2/1/23 | | | 5,990,000 | | | | 6,245,773 | |
Burnsville-Eagan-Savage Independent School District No. 191 | | | | | | | | |
(Alternative Facilities) | | | | | | | | |
Series A 4.00% 2/1/28 | | | 920,000 | | | | 1,039,729 | |
Series A 4.00% 2/1/29 | | | 1,800,000 | | | | 2,015,874 | |
Chaska Independent School District No. 112 | | | | | | | | |
(School Building) Series A 5.00% 2/1/27 | | | 1,905,000 | | | | 2,357,685 | |
Duluth | | | | | | | | |
(DECC Improvement) | | | | | | | | |
Series A 5.00% 2/1/32 | | | 1,000,000 | | | | 1,191,180 | |
Series A 5.00% 2/1/33 | | | 3,585,000 | | | | 4,252,419 | |
Duluth Independent School District No. 709 | | | | | | | | |
Series A 4.00% 2/1/27 | | | 160,000 | | | | 181,651 | |
Series A 4.00% 2/1/28 | | | 1,250,000 | | | | 1,401,987 | |
Edina Independent School District No. 273 | | | | | | | | |
Series A 5.00% 2/1/27 | | | 5,660,000 | | | | 6,917,595 | |
31
Schedules of investments
Delaware Tax-Free Minnesota Fund
| | | | | | | | |
| | | Principal amount° | | | Value (US $) | |
| |
Municipal Bonds (continued) | | | | | | | | |
| |
Local General Obligation Bonds (continued) | | | | | | | | |
Farmington Independent School District No. 192 | | | | | | | | |
Series A 5.00% 2/1/25 | | | 3,775,000 | | | $ | 4,539,135 | |
Hennepin County | | | | | | | | |
Series A 5.00% 12/1/26 | | | 1,885,000 | | | | 2,404,317 | |
Series A 5.00% 12/1/36 | | | 3,065,000 | | | | 3,697,003 | |
Series B 5.00% 12/1/30 | | | 1,000,000 | | | | 1,237,320 | |
Series C 5.00% 12/1/28 | | | 1,500,000 | | | | 1,954,050 | |
Series C 5.00% 12/1/30 | | | 2,745,000 | | | | 3,396,443 | |
Metropolitan Council General Obligation Wastewater | | | | | | | | |
Revenue (Minneapolis-St.Paul Metropolitan Area) | | | | | | | | |
Series C 4.00% 3/1/31 | | | 3,120,000 | | | | 3,556,020 | |
Series C 4.00% 3/1/32 | | | 3,225,000 | | | | 3,643,476 | |
South Washington County Independent School District No. 833 | | | | | | | | |
(School Building) | | | | | | | | |
Series A 4.75% 2/1/25 | | | 2,500,000 | | | | 2,539,575 | |
Series A 4.75% 2/1/26 | | | 3,600,000 | | | | 3,656,988 | |
Series A 4.75% 2/1/27 | | | 2,300,000 | | | | 2,336,409 | |
St Michael-Albertville Independent School District No. 885 | | | | | | | | |
(School Building) Series A 5.00% 2/1/27 | | | 1,865,000 | | | | 2,301,652 | |
| | | | | | | | |
| | | | | | | 61,395,161 | |
| | | | | | | | |
Pre-Refunded/Escrowed to Maturity Bonds – 17.16% | | | | | | | | |
Anoka Health Care Facilities Revenue | | | | | | | | |
(The Homestead at Anoka Project) | | | | | | | | |
Series A 7.00% 11/1/40-19§ | | | 1,000,000 | | | | 1,136,100 | |
Series A 7.00% 11/1/46-19§ | | | 1,220,000 | | | | 1,386,042 | |
Anoka Housing Facilities Revenue | | | | | | | | |
(Senior Homestead Anoka Project) | | | | | | | | |
Series B 6.875% 11/1/34-19§ | | | 2,015,000 | | | | 2,291,619 | |
Dakota & Washington Counties Housing & Redevelopment | | | | | | | | |
Authority Single Family Residential Mortgage Revenue | | | | | | | | |
(City of Anoka) 8.45% 9/1/19 (GNMA) (AMT) | | | 9,000,000 | | | | 10,207,440 | |
(City of Bloomington) | | | | | | | | |
Series B 8.375% 9/1/21 (GNMA) (AMT) | | | 14,115,000 | | | | 17,879,188 | |
Minneapolis Health Care System Revenue | | | | | | | | |
(Fairview Health Services) | | | | | | | | |
Series A 6.625% 11/15/28-18§ | | | 3,000,000 | | | | 3,208,170 | |
Series B 6.50% 11/15/38-18 (AGC)§ | | | 175,000 | | | | 186,891 | |
Minneapolis Revenue | | | | | | | | |
(National Marrow Donor Program Project) | | | | | | | | |
4.875% 8/1/25-18§ | | | 6,430,000 | | | | 6,667,267 | |
Minnesota Colleges & Universities Revenue Fund | | | | | | | | |
Series A 5.00% 10/1/28-18§ | | | 6,000,000 | | | | 6,276,600 | |
32
| | | | | | | | |
| | | Principal amount° | | | Value (US $) | |
| |
Municipal Bonds (continued) | | | | | | | | |
| |
Pre-Refunded/Escrowed to Maturity Bonds (continued) | | | | | | | | |
Rochester Healthcare & Housing Revenue | | | | | | | | |
(Samaritan Bethany Project) Series A | | | | | | | | |
7.375% 12/1/41-19§ | | | 5,220,000 | | | $ | 5,587,488 | |
St. Cloud Health Care Revenue | | | | | | | | |
(Centracare Health System Project) | | | | | | | | |
5.375% 5/1/31-19 (AGC)§ | | | 1,000,000 | | | | 1,074,430 | |
5.50% 5/1/39-19 (AGC)§ | | | 6,000,000 | | | | 6,458,940 | |
St. Louis Park Health Care Facilities Revenue | | | | | | | | |
(Park Nicollet Health Services) | | | | | | | | |
5.75% 7/1/39-19§ | | | 12,025,000 | | | | 13,089,814 | |
Series C 5.75% 7/1/30-18§ | | | 2,035,000 | | | | 2,119,859 | |
St. Paul Housing & Redevelopment Authority Health Care Facilities Revenue | | | | | | | | |
(Allina Health System) Series A-1 5.25% 11/15/29-19§ | | | 2,780,000 | | | | 3,042,349 | |
St. Paul Housing & Redevelopment Authority Hospital Facility Revenue | | | | | | | | |
(Healtheast Care System Project) | | | | | | | | |
Series A 5.00% 11/15/29-25§ | | | 910,000 | | | | 1,140,758 | |
Series A 5.00% 11/15/30-25§ | | | 670,000 | | | | 839,899 | |
University of Minnesota | | | | | | | | |
Series A 5.50% 7/1/21 | | | 12,500,000 | | | | 14,071,500 | |
| | | | | | | | |
| | | | | | | 96,664,354 | |
| | | | | | | | |
Special Tax Revenue Bonds – 1.68% | | | | | | | | |
Hennepin County Sales Tax Revenue | | | | | | | | |
(Second Lien-Ballpark Project) Series B 5.00% 12/15/24 | | | 1,150,000 | | | | 1,164,214 | |
Minneapolis Development Revenue | | | | | | | | |
(Limited Tax Supported Common Bond Fund) | | | | | | | | |
Series 2-A 6.00% 12/1/40 | | | 3,000,000 | | | | 3,408,990 | |
Minneapolis Revenue | | | | | | | | |
(YMCA Greater Twin Cities Project) 4.00% 6/1/30 | | | 250,000 | | | | 270,007 | |
St. Paul Sales Tax Revenue | | | | | | | | |
Series G 5.00% 11/1/30 | | | 655,000 | | | | 759,865 | |
Series G 5.00% 11/1/31 | | | 1,500,000 | | | | 1,735,020 | |
Virgin Islands Public Finance Authority | | | | | | | | |
(Matching Fund Senior Lien) 5.00% 10/1/29 (AGM) | | | 2,000,000 | | | | 2,124,200 | |
| | | | | | | | |
| | | | | | | 9,462,296 | |
| | | | | | | | |
State General Obligation Bonds – 10.78% | | | | | | | | |
Minnesota | | | | | | | | |
Series A 5.00% 8/1/27 | | | 7,590,000 | | | | 9,354,068 | |
Series A 5.00% 8/1/29 | | | 1,500,000 | | | | 1,824,165 | |
Series A Unrefunded Balance 5.00% 10/1/24 | | | 4,555,000 | | | | 5,280,156 | |
33
Schedules of investments
Delaware Tax-Free Minnesota Fund
| | | | | | | | |
| | | Principal amount° | | | Value (US $) | |
| |
Municipal Bonds (continued) | | | | | | | | |
| |
State General Obligation Bonds (continued) | | | | | | | | |
Minnesota | | | | | | | | |
Series A Unrefunded Balance 5.00% 10/1/27 | | | 5,200,000 | | | $ | 6,021,080 | |
Series D 5.00% 8/1/24 | | | 4,500,000 | | | | 5,557,095 | |
Series D 5.00% 8/1/26 | | | 6,000,000 | | | | 7,611,420 | |
Series D 5.00% 8/1/27 | | | 2,500,000 | | | | 3,141,650 | |
(State Trunk Highway) Series B 5.00% 10/1/29 | | | 5,000,000 | | | | 5,780,800 | |
(Various Purposes) | | | | | | | | |
Series A 5.00% 8/1/25 | | | 5,545,000 | | | | 6,774,105 | |
Series A 5.00% 8/1/30 | | | 4,200,000 | | | | 5,049,408 | |
Series A 5.00% 8/1/32 | | | 2,755,000 | | | | 3,290,297 | |
Series A Unrefunded Balance 4.00% 8/1/27 | | | 955,000 | | | | 1,058,054 | |
| | | | | | | | |
| | | | | | | 60,742,298 | |
| | | | | | | | |
Transportation Revenue Bonds – 4.35% | | | | | | | | |
Minneapolis – St. Paul Metropolitan Airports Commission Revenue | | | | | | | | |
Senior | | | | | | | | |
Series A 5.00% 1/1/28 | | | 1,250,000 | | | | 1,363,800 | |
Series C 5.00% 1/1/29 | | | 350,000 | | | | 433,269 | |
Series C 5.00% 1/1/33 | | | 850,000 | | | | 1,025,109 | |
Series C 5.00% 1/1/36 | | | 600,000 | | | | 715,890 | |
Series C 5.00% 1/1/41 | | | 600,000 | | | | 706,116 | |
Series C 5.00% 1/1/46 | | | 1,595,000 | | | | 1,867,107 | |
Subordinate | | | | | | | | |
Series A 5.00% 1/1/35 | | | 1,000,000 | | | | 1,150,620 | |
Series B 5.00% 1/1/26 | | | 575,000 | | | | 660,945 | |
Series B 5.00% 1/1/27 | | | 1,160,000 | | | | 1,332,330 | |
Series B 5.00% 1/1/28 | | | 2,750,000 | | | | 3,156,037 | |
Series B 5.00% 1/1/29 | | | 120,000 | | | | 137,609 | |
Series B 5.00% 1/1/30 | | | 1,675,000 | | | | 1,881,795 | |
Series B 5.00% 1/1/31 | | | 1,750,000 | | | | 1,961,417 | |
St. Paul Housing & Redevelopment Authority Revenue | | | | | | | | |
(Parking Facilities Project) | | | | | | | | |
Series A 5.00% 8/1/30 | | | 1,870,000 | | | | 1,973,467 | |
Series A 5.00% 8/1/35 | | | 1,145,000 | | | | 1,148,584 | |
(Smith Avenue Project) Series B 5.00% 8/1/35 | | | 1,500,000 | | | | 1,581,165 | |
St. Paul Port Authority Revenue | | | | | | | | |
(Amherst H. Wilder Foundation) Series 3 5.00% 12/1/36 | | | 3,200,000 | | | | 3,378,336 | |
| | | | | | | | |
| | | | | | | 24,473,596 | |
| | | | | | | | |
Water & Sewer Revenue Bonds – 2.16% | | | | | | | | |
Guam Government Waterworks Authority | | | | | | | | |
5.00% 1/1/46 | | | 1,670,000 | | | | 1,802,181 | |
34
| | | | | | | | |
| | | Principal amount° | | | Value (US $) | |
| |
Municipal Bonds (continued) | | | | | | | | |
| |
Water & Sewer Revenue Bonds (continued) | | | | | | | | |
Metropolitan Council Waste Water Treatment Revenue | | | | | | | | |
Series B 4.00% 9/1/27 | | | 2,400,000 | | | $ | 2,662,296 | |
Series B 5.00% 9/1/25 | | | 2,000,000 | | | | 2,371,660 | |
Series E 5.00% 9/1/23 | | | 2,000,000 | | | | 2,361,700 | |
Minnesota Public Facilities Authority | | | | | | | | |
Series B 4.00% 3/1/26 | | | 2,500,000 | | | | 2,957,400 | |
| | | | | | | | |
| | | | | | | 12,155,237 | |
| | | | | | | | |
Total Municipal Bonds (cost $527,951,022) | | | | | | | 554,789,100 | |
| | | | | | | | |
| | | | | | | | |
| |
Short-Term Investments – 1.43% | | | | | | | | |
| |
Variable Rate Demand Notes – 1.43%¤ | | | | | | | | |
Minneapolis – St. Paul Housing & Redevelopment Authority Health Care Revenue | | | | | | | | |
(Allina Health System) | | | | | | | | |
Series B-1 0.79% 11/15/35 | | | | | | | | |
(LOC – JPMorgan Chase Bank N.A.) | | | 1,000,000 | | | | 1,000,000 | |
Series B-2 0.79% 11/15/35 | | | | | | | | |
(LOC – JPMorgan Chase Bank N.A.) | | | 1,350,000 | | | | 1,350,000 | |
(Children’s Hospitals & Clinics) | | | | | | | | |
Series A-II 0.75% 8/15/37 (AGM) (SPA – US Bank N.A.) | | | 775,000 | | | | 775,000 | |
Series B 0.75% 8/15/25 (AGM) (SPA – US Bank N.A.) | | | 4,950,000 | | | | 4,950,000 | |
| | | | | | | | |
Total Short-Term Investments (cost $8,075,000) | | | | | | | 8,075,000 | |
| | | | | | | | |
| | |
Total Value of Securities – 99.91%
(cost $536,026,022) | | | | | | $ | 562,864,100 | |
| | | | | | | | |
| # | Security exempt from registration under Rule 144A of the Securities Act of 1933, as amended. At Aug. 31, 2017, the aggregate value of Rule 144A securities was $8,248,254, which represents 1.46% of the Fund’s net assets. See Note 8 in “Notes to financial statements.” |
| ¤ | Tax-exempt obligations that contain a floating or variable interest rate adjustment formula and an unconditional right of demand to receive payment of the unpaid principal balance plus accrued interest upon a short notice period (generally up to 30 days) prior to specified dates either from the issuer or by drawing on a bank letter of credit, a guarantee, or insurance issued with respect to such instrument. Each rate shown is as of Aug. 31, 2017. |
| § | Pre-refunded bonds. Municipal bonds that are generally backed or secured by US Treasury bonds. For pre-refunded bonds, the stated maturity is followed by the year in which the bond is pre-refunded. See Note 8 in “Notes to financial statements.” |
| ° | Principal amount shown is stated in US dollars unless noted that the security is denominated in another currency. |
| ^ | Zero coupon security. The rate shown is the yield at the time of purchase. |
35
Schedules of investments
Delaware Tax-Free Minnesota Fund
Summary of abbreviations:
AGC – Insured by Assured Guaranty Corporation
AGM – Insured by Assured Guaranty Municipal Corporation
AMT – Subject to Alternative Minimum Tax
FHLMC – Federal Home Loan Mortgage Corporation collateral
FNMA – Federal National Mortgage Association collateral
GNMA – Government National Mortgage Association collateral
LOC – Letter of Credit
N.A. – National Association
NATL – Insured by National Public Finance Guarantee Corporation
SPA – Stand-by Purchase Agreement
See accompanying notes, which are an integral part of the financial statements.
36
| | |
| Schedules of investments |
| Delaware Tax-Free Minnesota Intermediate Fund | | August 31, 2017 |
| | | | | | | | |
| | | Principal amount° | | | Value (US $) | |
| |
Municipal Bonds – 98.59% | | | | | | | | |
| |
Corporate-Backed Revenue Bond – 0.75% | | | | | | | | |
Laurentian Energy Authority I Cogeneration Revenue | | | | | | | | |
Series A 5.00% 12/1/21 | | | 750,000 | | | $ | 748,807 | |
| | | | | | | | |
| | | | | | | 748,807 | |
| | | | | | | | |
Education Revenue Bonds – 16.32% | | | | | | | | |
Brooklyn Park Charter School Lease Revenue | | | | | | | | |
(Prairie Seeds Academy Project) Series A 5.00% 3/1/34 | | | 485,000 | | | | 506,568 | |
Cologne Charter School Lease Revenue | | | | | | | | |
(Cologne Academy Project) Series A 5.00% 7/1/29 | | | 305,000 | | | | 321,943 | |
Forest Lake Charter School Lease Revenue Fund | | | | | | | | |
(Lakes International Language Academy Project) | | | | | | | | |
Series A 5.50% 8/1/36 | | | 420,000 | | | | 452,222 | |
Hugo Charter School Lease Revenue | | | | | | | | |
(Noble Academy Project) Series A 5.00% 7/1/29 | | | 530,000 | | | | 555,573 | |
Independence Charter School Lease Revenue | | | | | | | | |
(Beacon Academy Project) Series A 5.00% 7/1/46 | | | 320,000 | | | | 313,869 | |
Minneapolis Charter School Lease Revenue | | | | | | | | |
(Hiawatha Academies Project) Series A 5.00% 7/1/31 | | | 500,000 | | | | 523,225 | |
Minneapolis Student Housing Revenue | | | | | | | | |
(Riverton Community Housing Project) 5.25% 8/1/39 | | | 525,000 | | | | 540,923 | |
Minnesota Higher Education Facilities Authority Revenue | | | | | | | | |
(Bethel University) 5.00% 5/1/32 | | | 525,000 | | | | 599,734 | |
(Carleton College) 5.00% 3/1/34 | | | 275,000 | | | | 332,041 | |
(Gustavus Adolphus College) | | | | | | | | |
5.00% 10/1/34 | | | 435,000 | | | | 513,831 | |
5.00% 10/1/35 | | | 555,000 | | | | 652,930 | |
(St. Catherine University) Series 7-Q 5.00% 10/1/22 | | | 425,000 | | | | 491,725 | |
(St. Johns University) | | | | | | | | |
Series 6-U 4.40% 10/1/21 | | | 325,000 | | | | 336,889 | |
Series 6-U 4.50% 10/1/23 | | | 265,000 | | | | 274,967 | |
Series 8-I 5.00% 10/1/31 | | | 130,000 | | | | 151,992 | |
(St. Olaf College) | | | | | | | | |
Series 8-G 5.00% 12/1/31 | | | 125,000 | | | | 146,534 | |
Series 8-G 5.00% 12/1/32 | | | 125,000 | | | | 146,130 | |
(St. Scholastica College) Series H 5.125% 12/1/30 | | | 1,000,000 | | | | 1,045,930 | |
(University of St. Thomas) Series 7-U 4.00% 4/1/26 | | | 1,400,000 | | | | 1,546,258 | |
Rice County Educational Facilities Revenue | | | | | | | | |
(Shattuck-St. Mary’s School) Series A 144A | | | | | | | | |
5.00% 8/1/22 # | | | 325,000 | | | | 345,475 | |
St. Paul Housing & Redevelopment Authority Charter School Lease Revenue | | | | | | | | |
(Academia Cesar Chavez School Project) Series A | | | | | | | | |
5.25% 7/1/50 | | | 340,000 | | | | 347,864 | |
37
Schedules of investments
Delaware Tax-Free Minnesota Intermediate Fund
| | | | | | | | |
| | | Principal amount° | | | Value (US $) | |
| |
Municipal Bonds (continued) | | | | | | | | |
| |
Education Revenue Bonds (continued) | | | | | | | | |
St. Paul Housing & Redevelopment Authority Charter School Lease Revenue | | | | | | | | |
(Great River School Project) Series A 144A | | | | | | | | |
5.25% 7/1/33 # | | | 140,000 | | | $ | 142,432 | |
(Twin Cities Academy Project) Series A 5.30% 7/1/45 | | | 260,000 | | | | 268,421 | |
University of Minnesota | | | | | | | | |
Series A 5.00% 12/1/23 | | | 1,000,000 | | | | 1,128,720 | |
Series A 5.00% 4/1/37 | | | 1,125,000 | | | | 1,337,209 | |
Series A 5.25% 12/1/28 | | | 750,000 | | | | 850,980 | |
Series D 5.00% 12/1/26 | | | 1,000,000 | | | | 1,156,440 | |
(State Supported Stadium Debt) Series A 5.00% 8/1/26 | | | 1,000,000 | | | | 1,231,800 | |
| | | | | | | | |
| | | | | | | 16,262,625 | |
| | | | | | | | |
Electric Revenue Bonds – 8.68% | | | | | | | | |
Central Minnesota Municipal Power Agency | | | | | | | | |
(Brookings Twin Cities Transmission Project) | | | | | | | | |
Series E 5.00% 1/1/21 | | | 1,095,000 | | | | 1,219,129 | |
Series E 5.00% 1/1/23 | | | 1,000,000 | | | | 1,132,800 | |
Chaska Electric Revenue | | | | | | | | |
Series A 5.00% 10/1/28 | | | 250,000 | | | | 296,840 | |
Minnesota Municipal Power Agency Electric Revenue | | | | | | | | |
Series A 5.00% 10/1/29 | | | 500,000 | | | | 591,265 | |
Series A 5.00% 10/1/30 | | | 240,000 | | | | 282,170 | |
Northern Municipal Power Agency Electric System Revenue | | | | | | | | |
5.00% 1/1/29 | | | 150,000 | | | | 178,296 | |
5.00% 1/1/31 | | | 350,000 | | | | 410,841 | |
Series A 5.00% 1/1/25 | | | 200,000 | | | | 233,844 | |
Rochester Electric Utility Revenue | | | | | | | | |
Series A 5.00% 12/1/28 | | | 300,000 | | | | 369,264 | |
Series A 5.00% 12/1/29 | | | 500,000 | | | | 611,225 | |
Series A 5.00% 12/1/31 | | | 575,000 | | | | 696,210 | |
Western Minnesota Municipal Power Agency Revenue | | | | | | | | |
Series A 5.00% 1/1/33 | | | 2,250,000 | | | | 2,621,925 | |
| | | | | | | | |
| | | | | | | 8,643,809 | |
| | | | | | | | |
Healthcare Revenue Bonds – 24.47% | | | | | | | | |
Anoka Healthcare & Housing Facilities Revenue | | | | | | | | |
(The Homestead at Anoka Project) 5.375% 11/1/34 | | | 270,000 | | | | 282,887 | |
Apple Valley Senior Living Revenue | | | | | | | | |
(Senior Living LLC Project) | | | | | | | | |
3rd Tier Series C 4.25% 1/1/27 | | | 500,000 | | | | 504,905 | |
3rd Tier Series C 5.00% 1/1/32 | | | 420,000 | | | | 422,570 | |
38
| | | | | | | | |
| | | Principal amount° | | | Value (US $) | |
| |
Municipal Bonds (continued) | | | | | | | | |
| |
Healthcare Revenue Bonds (continued) | | | | | | | | |
Center City Health Care Facilities Revenue | | | | | | | | |
(Hazelden Betty Ford Foundation Project) | | | | | | | | |
5.00% 11/1/24 | | | 600,000 | | | $ | 717,972 | |
Dakota County Community Development Agency Senior Housing Revenue | | | | | | | | |
(Walker Highview Hills Project) Series A 144A | | | | | | | | |
5.00% 8/1/36 # | | | 480,000 | | | | 492,379 | |
Duluth Economic Development Authority | | | | | | | | |
(St. Luke’s Hospital Authority Obligation Group) | | | | | | | | |
5.75% 6/15/32 | | | 750,000 | | | | 816,517 | |
Fergus Falls Health Care Facilities Revenue | | | | | | | | |
(Lake Region Health Care) 4.75% 8/1/25 | | | 500,000 | | | | 500,660 | |
Glencoe Health Care Facilities Revenue | | | | | | | | |
(Glencoe Regional Health Services Project) | | | | | | | | |
4.00% 4/1/26 | | | 270,000 | | | | 287,917 | |
Hayward Health Care Facilities Revenue | | | | | | | | |
(American Baptist Homes Midwest Obligated Group) | | | | | | | | |
4.25% 8/1/24 | | | 725,000 | | | | 730,126 | |
(St. John’s Lutheran Home of Albert Lea) | | | | | | | | |
5.375% 10/1/44 | | | 300,000 | | | | 304,215 | |
Maple Grove Health Care Facilities Revenue | | | | | | | | |
(Maple Grove Hospital Corporation) | | | | | | | | |
4.00% 5/1/37 | | | 500,000 | | | | 521,170 | |
5.00% 5/1/28 | | | 1,000,000 | | | | 1,202,690 | |
(North Memorial Health Care) 5.00% 9/1/31 | | | 320,000 | | | | 364,976 | |
Minneapolis Health Care System Revenue | | | | | | | | |
(Fairview Health Services) | | | | | | | | |
Series A 5.00% 11/15/33 | | | 500,000 | | | | 581,320 | |
Series A 5.00% 11/15/34 | | | 500,000 | | | | 579,725 | |
Series B Unrefunded Balance 6.50% 11/15/38 (AGC) | | | 700,000 | | | | 742,588 | |
Minneapolis Senior Housing & Healthcare Revenue | | | | | | | | |
(Ecumen-Abiitan Mill City Project) 5.00% 11/1/35 | | | 530,000 | | | | 548,720 | |
Minneapolis – St. Paul Housing & Redevelopment Authority | | | | | | | | |
Health Care Facilities Revenue | | | | | | | | |
(Allina Health System) Series A 5.00% 11/15/27 | | | 1,205,000 | | | | 1,489,055 | |
(Children’s Health Care) Series A 5.25% 8/15/25 | | | 1,000,000 | | | | 1,105,350 | |
Minnesota Agricultural & Economic Development Board Revenue | | | | | | | | |
(Essenthia Remarketing) Series C-1 | | | | | | | | |
5.50% 2/15/25 (AGC) | | | 2,500,000 | | | | 2,739,075 | |
Rochester Health Care Facilities Revenue | | | | | | | | |
(Mayo Clinic) Series C 4.50% 11/15/38 ● | | | 925,000 | | | | 1,051,549 | |
(Olmsted Medical Center Project) 5.125% 7/1/20 | | | 630,000 | | | | 679,493 | |
39
Schedules of investments
Delaware Tax-Free Minnesota Intermediate Fund
| | | | | | | | |
| | | Principal amount° | | | Value (US $) | |
| |
Municipal Bonds (continued) | | | | | | | | |
| |
Healthcare Revenue Bonds (continued) | | | | | | | | |
Sartell Health Care Facilities Revenue | | | | | | | | |
(Country Manor Campus Project) | | | | | | | | |
Series A 5.00% 9/1/21 | | | 1,050,000 | | | $ | 1,132,435 | |
Series A 6.125% 9/1/30 | | | 845,000 | | | | 846,318 | |
Sauk Rapids Health Care Housing Facilities Revenue | | | | | | | | |
(Good Shepherd Lutheran Home) 5.125% 1/1/39 | | | 575,000 | | | | 580,457 | |
St. Cloud Health Care Revenue | | | | | | | | |
(Centracare Health System Project) Unrefunded Balance | | | | | | | | |
5.125% 5/1/30 | | | 360,000 | | | | 391,154 | |
St. Paul Housing & Redevelopment Authority Health Care Facilities Revenue | | | | | | | | |
(Allina Health System) Series A-2 5.25% 11/15/28 | | | 975,000 | | | | 1,065,353 | |
(Fairview Health Services) | | | | | | | | |
Series A 4.00% 11/15/43 | | | 370,000 | | | | 388,992 | |
Series A 5.00% 11/15/47 | | | 275,000 | | | | 319,877 | |
(Health Partners Obligation Group Project) | | | | | | | | |
5.00% 7/1/32 | | | 1,500,000 | | | | 1,735,185 | |
5.00% 7/1/33 | | | 200,000 | | | | 230,596 | |
St. Paul Housing & Redevelopment Authority Housing & Health Care Facilities Revenue | | | | | | | | |
(Senior Episcopal Homes Project) 5.00% 5/1/33 | | | 500,000 | | | | 509,345 | |
Woodbury Housing & Redevelopment Authority Revenue | | | | | | | | |
(St. Therese of Woodbury) 5.00% 12/1/34 | | | 500,000 | | | | 515,285 | |
| | | | | | | | |
| | | | | | | 24,380,856 | |
| | | | | | | | |
Housing Revenue Bonds – 0.31% | | | | | | | | |
Minnesota Housing Finance Agency | | | | | | | | |
(Residential Housing) Series I 5.10% 7/1/20 (AMT) | | | 20,000 | | | | 20,052 | |
Northwest Multi-County Housing & Redevelopment Authority | | | | | | | | |
(Pooled Housing Program) 5.50% 7/1/45 | | | 285,000 | | | | 288,517 | |
| | | | | | | | |
| | | | | | | 308,569 | |
| | | | | | | | |
Lease Revenue Bonds – 6.41% | | | | | | | | |
Minnesota General Fund Revenue Appropriations | | | | | | | | |
Series A 5.00% 6/1/38 | | | 1,100,000 | | | | 1,262,899 | |
Series A 5.00% 6/1/43 | | | 715,000 | | | | 815,915 | |
Series B 5.00% 3/1/27 | | | 1,000,000 | | | | 1,158,870 | |
Minnesota Housing Finance Agency | | | | | | | | |
(Housing Infrastructure) Series C 5.00% 8/1/36 | | | 1,000,000 | | | | 1,157,750 | |
St. Paul Housing & Redevelopment Authority | | | | | | | | |
(Minnesota Public Radio) 5.00% 12/1/25 | | | 1,000,000 | | | | 1,104,970 | |
40
| | | | | | | | |
| | | Principal amount° | | | Value (US $) | |
| |
Municipal Bonds (continued) | | | | | | | | |
| |
Lease Revenue Bonds (continued) | | | | | | | | |
Virginia Housing & Redevelopment Authority Health Care Facility Lease Revenue | | | | | | | | |
5.25% 10/1/25 | | | 880,000 | | | $ | 882,235 | |
| | | | | | | | |
| | | | | | | 6,382,639 | |
| | | | | | | | |
Local General Obligation Bonds – 7.08% | | | | | | | | |
Burnsville-Eagan-Savage Independent School District No. 191 | | | | | | | | |
(Alternative Facilities) Series A 4.00% 2/1/27 | | | 445,000 | | | | 507,122 | |
Duluth Independent School District No. 709 | | | | | | | | |
Series A 4.00% 2/1/28 | | | 250,000 | | | | 280,397 | |
Hennepin County | | | | | | | | |
Series A 5.00% 12/1/26 | | | 1,000,000 | | | | 1,275,500 | |
Metropolitan Council General Obligation Wastewater Revenue | | | | | | | | |
(Minneapolis – St. Paul Metropolitan Area) | | | | | | | | |
Series C 4.00% 3/1/31 | | | 565,000 | | | | 643,959 | |
Series C 4.00% 3/1/32 | | | 585,000 | | | | 660,909 | |
Robbinsdale Independent School District No. 281 | | | | | | | | |
(School Building) Series A 5.00% 2/1/20 | | | 1,850,000 | | | | 2,036,591 | |
St. Michael-Albertville Independent School District No. 885 | | | | | | | | |
(School Building) Series A 5.00% 2/1/27 | | | 500,000 | | | | 617,065 | |
White Bear Lake Independent School District No. 624 | | | | | | | | |
(Alternative Facilities) Series B 4.75% 2/1/22 | | | 1,000,000 | | | | 1,035,560 | |
| | | | | | | | |
| | | | | | | 7,057,103 | |
| | | | | | | | |
Pre-Refunded/Escrowed to Maturity Bonds – 14.82% | | | | | | | | |
Anoka County Capital Improvement | | | | | | | | |
Series C 5.00% 2/1/27-18§ | | | 500,000 | | | | 507,985 | |
Anoka Housing Facilities Revenue | | | | | | | | |
(Senior Homestead Anoka Project) Series B | | | | | | | | |
6.875% 11/1/34-19§ | | | 750,000 | | | | 852,960 | |
Duluth Independent School District No. 709 | | | | | | | | |
Series A 4.25% 2/1/20-18 (AGM)§ | | | 500,000 | | | | 507,130 | |
Mankato Independent School District No. 77 | | | | | | | | |
(School Building) Series A 4.125% 2/1/22-19§ | | | 1,000,000 | | | | 1,044,030 | |
Minneapolis Health Care System Revenue | | | | | | | | |
(Fairview Health Services) Series A | | | | | | | | |
6.625% 11/15/28-18§ | | | 1,500,000 | | | | 1,604,085 | |
Minnesota | | | | | | | | |
(Various Purposes) Series A 5.00% 12/1/21-19§ | | | 500,000 | | | | 545,650 | |
Minnesota 911 Services Revenue | | | | | | | | |
(Public Safety Radio Communication System Project) | | | | | | | | |
4.25% 6/1/18 (AGC) | | | 1,170,000 | | | | 1,200,046 | |
41
Schedules of investments
Delaware Tax-Free Minnesota Intermediate Fund
| | | | | | | | |
| | | Principal amount° | | | Value (US $) | |
| |
Municipal Bonds (continued) | | | | | | | | |
| |
Pre-Refunded/Escrowed to Maturity Bonds (continued) | | | | | | | | |
Minnesota 911 Services Revenue | | | | | | | | |
(Public Safety Radio Communication System Project) | | | | | | | | |
4.50% 6/1/25-19 (AGC)§ | | | 1,000,000 | | | $ | 1,063,920 | |
Minnesota Colleges & Universities Revenue Fund | | | | | | | | |
Series A 5.00% 10/1/28-18§ | | | 1,000,000 | | | | 1,046,100 | |
Minnesota Higher Education Facilities Authority Revenue | | | | | | | | |
(Carleton College) Series 6-T 4.75% 1/1/23-18§ | | | 1,000,000 | | | | 1,013,280 | |
Rochester Healthcare & Housing Revenue | | | | | | | | |
(Samaritan Bethany Project) Series A | | | | | | | | |
6.875% 12/1/29-19§ | | | 950,000 | | | | 1,014,087 | |
South Washington County Independent School District No. 833 (School Building) | | | | | | | | |
Series A 4.00% 2/1/22-18§ | | | 750,000 | | | | 759,533 | |
St. Louis Park Health Care Facilities Revenue | | | | | | | | |
(Park Nicollet Health Services) 5.50% 7/1/29-19§ | | | 1,000,000 | | | | 1,084,020 | |
St. Paul Housing & Redevelopment Authority Health Care Facilities Revenue | | | | | | | | |
(Allina Health System) Series A-2 5.25% 11/15/28-19§ | | | 1,025,000 | | | | 1,121,729 | |
(Gillette Children’s Specialty Project) 5.00% 2/1/27-19§ | | | 1,000,000 | | | | 1,042,220 | |
St. Paul Housing & Redevelopment Authority Hospital Revenue | | | | | | | | |
(Healtheast Care System Project) | | | | | | | | |
Series A 5.00% 11/15/29-25§ | | | 165,000 | | | | 206,841 | |
Series A 5.00% 11/15/30-25§ | | | 120,000 | | | | 150,430 | |
| | | | | | | | |
| | | | | | | 14,764,046 | |
| | | | | | | | |
Special Tax Revenue Bonds – 0.58% | | | | | | | | |
Minneapolis Revenue | | | | | | | | |
(YMCA Greater Twin Cities Project) 4.00% 6/1/27 | | | 100,000 | | | | 109,810 | |
St. Paul Sales Tax Revenue | | | | | | | | |
Series G 5.00% 11/1/28 | | | 400,000 | | | | 468,420 | |
| | | | | | | | |
| | | | | | | 578,230 | |
| | | | | | | | |
State General Obligation Bonds – 13.84% | | | | | | | | |
Minnesota | | | | | | | | |
Series A 5.00% 8/1/27 | | | 1,610,000 | | | | 1,984,196 | |
Series A 5.00% 8/1/29 | | | 1,000,000 | | | | 1,216,110 | |
Series D 5.00% 8/1/26 | | | 4,500,000 | | | | 5,708,565 | |
Series D 5.00% 8/1/27 | | | 1,500,000 | | | | 1,884,990 | |
(State Trunk Highway) Series B 5.00% 10/1/22 | | | 400,000 | | | | 463,856 | |
(Various Purposes) | | | | | | | | |
Series A 5.00% 8/1/32 | | | 1,120,000 | | | | 1,337,616 | |
Series F 5.00% 10/1/22 | | | 1,000,000 | | | | 1,189,290 | |
| | | | | | | | |
| | | | | | | 13,784,623 | |
| | | | | | | | |
42
| | | | | | | | |
| | | Principal amount° | | | Value (US $) | |
| |
Municipal Bonds (continued) | | | | | | | | |
| |
Transportation Revenue Bonds – 3.81% | | | | | | | | |
Minneapolis – St. Paul Metropolitan Airports Commission Revenue | | | | | | | | |
Senior Series B 5.00% 1/1/22 (AMT) | | | 1,000,000 | | | $ | 1,054,210 | |
Subordinate | | | | | | | | |
Series B 5.00% 1/1/26 | | | 710,000 | | | | 816,124 | |
Series B 5.00% 1/1/31 | | | 750,000 | | | | 840,607 | |
Series D 5.00% 1/1/22 (AMT) | | | 1,000,000 | | | | 1,080,180 | |
| | | | | | | | |
| | | | | | | 3,791,121 | |
| | | | | | | | |
Water & Sewer Revenue Bonds – 1.52% | | | | | | | | |
Guam Government Waterworks Authority | | | | | | | | |
5.00% 1/1/46 | | | 305,000 | | | | 329,141 | |
Minnesota Public Facilities Authority | | | | | | | | |
Series B 4.00% 3/1/26 | | | 1,000,000 | | | | 1,182,960 | |
| | | | | | | | |
| | | | | | | 1,512,101 | |
| | | | | | | | |
Total Municipal Bonds (cost $93,955,449) | | | | | | | 98,214,529 | |
| | | | | | | | |
| | | | | | | | |
| |
Short-Term Investment – 0.75% | | | | | | | | |
| |
Variable Rate Demand Note - 0.75%¤ | | | | | | | | |
Minneapolis – St. Paul Housing & Redevelopment Authority Health Care Revenue | | | | | | | | |
(Allina Health System) Series B-2 | | | | | | | | |
0.79% 11/15/35 (LOC- JPMorgan Chase Bank N.A.) | | | 750,000 | | | | 750,000 | |
| | | | | | | | |
Total Short-Term Investment (cost $750,000) | | | | | | | 750,000 | |
| | | | | | | | |
| | |
Total Value of Securities – 99.34%
(cost $94,705,449) | | | | | | $ | 98,964,529 | |
| | | | | | | | |
| # | Security exempt from registration under Rule 144A of the Securities Act of 1933, as amended. At Aug. 31, 2017, the aggregate value of Rule 144A securities was $980,286, which represents 0.98% of the Fund’s net assets. See Note 8 in “Notes to financial statements.” |
| ¤ | Tax-exempt obligations that contain a floating or variable interest rate adjustment formula and an unconditional right of demand to receive payment of the unpaid principal balance plus accrued interest upon a short notice period (generally up to 30 days) prior to specified dates either from the issuer or by drawing on a bank letter of credit, a guarantee, or insurance issued with respect to such instrument. Each rate shown is as of Aug. 31, 2017. |
| § | Pre-refunded bonds. Municipal bonds that are generally backed or secured by US Treasury bonds. For pre-refunded bonds, the stated maturity is followed by the year in which the bond is pre-refunded. See Note 8 in “Notes to financial statements.” |
| ° | Principal amount shown is stated in US dollars unless noted that the security is denominated in another currency. |
43
Schedules of investments
Delaware Tax-Free Minnesota Intermediate Fund
| ● | Variable rate investment. Interest rates reset periodically. Interest rate shown reflects the rate in effect at Aug. 31, 2017. For securities based on a published reference rate and spread, the reference rate and spread are indicated in their description above. Certain variable rate securities are not based on a published reference rate and spread but are determined by the issuer or agent and are based on current market conditions. These securities do not indicate a reference rate and spread in their description above. |
Summary of abbreviations:
AGC – Insured by Assured Guaranty Corporation
AGM – Insured by Assured Guaranty Municipal Corporation
AMT – Subject to Alternative Minimum Tax
LOC – Letter of Credit
N.A. – National Association
See accompanying notes, which are an integral part of the financial statements.
44
| | |
| Schedules of investments |
| Delaware Minnesota High-Yield Municipal Bond Fund | | August 31, 2017 |
| | | | | | | | |
| | | Principal amount° | | | Value (US $) | |
| |
Municipal Bonds – 98.99% | | | | | | | | |
| |
Corporate-Backed Revenue Bonds – 3.02% | | | | | | | | |
Laurentian Energy Authority I Cogeneration Revenue | | | | | | | | |
Series A 5.00% 12/1/21 | | | 1,750,000 | | | $ | 1,747,217 | |
St. Paul Port Authority Solid Waste Disposal Revenue | | | | | | | | |
(Gerdau St. Paul Steel Mill Project) | | | | | | | | |
Series 7 144A 4.50% 10/1/37 (AMT)# | | | 3,950,000 | | | | 3,549,509 | |
| | | | | | | | |
| | | | | | | 5,296,726 | |
| | | | | | | | |
Education Revenue Bonds – 20.82% | | | | | | | | |
Brooklyn Park Charter School Lease Revenue | | | | | | | | |
(Prairie Seeds Academy Project) Series A 5.00% 3/1/39 | | | 1,270,000 | | | | 1,314,945 | |
Cologne Charter School Lease Revenue | | | | | | | | |
(Cologne Academy Project) | | | | | | | | |
Series A 5.00% 7/1/34 | | | 250,000 | | | | 259,503 | |
Series A 5.00% 7/1/45 | | | 230,000 | | | | 236,141 | |
Deephaven Charter School Lease Revenue | | | | | | | | |
(Eagle Ridge Academy Project) Series A 5.50% 7/1/50 | | | 1,000,000 | | | | 1,066,020 | |
Duluth Housing & Redevelopment Authority Revenue | | | | | | | | |
(Public Schools Academy) Series A 5.875% 11/1/40 | | | 1,000,000 | | | | 1,033,500 | |
Forest Lake Charter School Lease Revenue Fund | | | | | | | | |
(Lakes International Language Academy) | | | | | | | | |
Series A 5.75% 8/1/44 | | | 585,000 | | | | 633,327 | |
Ham Lake Charter School Lease Revenue | | | | | | | | |
(Davinci Academy Project) | | | | | | | | |
Series A 5.00% 7/1/36 | | | 235,000 | | | | 239,524 | |
Series A 5.00% 7/1/47 | | | 710,000 | | | | 716,518 | |
(Parnassus Preparatory School Project) Series A | | | | | | | | |
5.00% 11/1/47 | | | 650,000 | | | | 660,913 | |
Hugo Charter School Lease Revenue | | | | | | | | |
(Noble Academy Project) | | | | | | | | |
Series A 5.00% 7/1/34 | | | 165,000 | | | | 169,797 | |
Series A 5.00% 7/1/44 | | | 495,000 | | | | 503,563 | |
Independence Charter School Lease Revenue | | | | | | | | |
(Beacon Academy Project) Series A 5.00% 7/1/46 | | | 625,000 | | | | 613,025 | |
Minneapolis Charter School Lease Revenue | | | | | | | | |
(Hiawatha Academies Project) | | | | | | | | |
Series A 5.00% 7/1/36 | | | 1,000,000 | | | | 1,030,170 | |
Series A 5.00% 7/1/47 | | | 800,000 | | | | 812,944 | |
Minneapolis Student Housing Revenue | | | | | | | | |
(Riverton Community Housing Project) 5.25% 8/1/39 | | | 800,000 | | | | 824,264 | |
Minnesota Higher Education Facilities Authority Revenue | | | | | | | | |
(Bethel University) 5.00% 5/1/47 | | | 1,500,000 | | | | 1,668,795 | |
(Carleton College) 4.00% 3/1/37 | | | 635,000 | | | | 687,699 | |
(Gustavus Adolphus College) 5.00% 10/1/47 | | | 750,000 | | | | 865,020 | |
45
| | |
| Schedules of investments |
| Delaware Minnesota High-Yield Municipal Bond Fund | | |
| | | | | | | | |
| | | Principal amount° | | | Value (US $) | |
| |
Municipal Bonds (continued) | | | | | | | | |
| |
Education Revenue Bonds (continued) | | | | | | | | |
Minnesota Higher Education Facilities Authority Revenue | | | | | | | | |
(Minneapolis College of Art & Design) | | | | | | | | |
4.00% 5/1/24 | | | 250,000 | | | $ | 272,687 | |
4.00% 5/1/25 | | | 200,000 | | | | 215,614 | |
4.00% 5/1/26 | | | 100,000 | | | | 106,787 | |
(St. Catherine University) | | | | | | | | |
Series 7-Q 5.00% 10/1/25 | | | 325,000 | | | | 368,618 | |
Series 7-Q 5.00% 10/1/26 | | | 280,000 | | | | 316,103 | |
(St. John’s University) | | | | | | | | |
Series 6-U 4.75% 10/1/33 | | | 825,000 | | | | 854,395 | |
Series 8-I 5.00% 10/1/34 | | | 215,000 | | | | 248,495 | |
(St. Olaf College) | | | | | | | | |
Series 8-G 5.00% 12/1/31 | | | 205,000 | | | | 240,315 | |
Series 8-G 5.00% 12/1/32 | | | 205,000 | | | | 239,653 | |
Series 8-N 4.00% 10/1/34 | | | 800,000 | | | | 873,824 | |
Series 8-N 4.00% 10/1/35 | | | 590,000 | | | | 641,489 | |
(St. Scholastica College) Series H 5.125% 12/1/40 | | | 750,000 | | | | 783,727 | |
(University of St. Thomas) Series 7-A 5.00% 10/1/39 | | | 1,000,000 | | | | 1,071,350 | |
Otsego Charter School Lease Revenue | | | | | | | | |
(Kaleidoscope Charter School) Series A 5.00% 9/1/44 | | | 1,435,000 | | | | 1,477,677 | |
Rice County Educational Facilities Revenue | | | | | | | | |
(Shattuck-St. Mary’s School) Series A 144A | | | | | | | | |
5.00% 8/1/22 # | | | 870,000 | | | | 924,810 | |
St. Cloud Charter School Lease Revenue | | | | | | | | |
(Stride Academy Project) Series A 5.00% 4/1/46 | | | 750,000 | | | | 532,440 | |
St. Paul Housing & Redevelopment Authority Charter School Lease Revenue | | | | | | | | |
(Academia Cesar Chavez School Project) Series A | | | | | | | | |
5.25% 7/1/50 | | | 1,750,000 | | | | 1,790,478 | |
(Great River School Project) Series A 144A | | | | | | | | |
5.50% 7/1/52 # | | | 265,000 | | | | 266,577 | |
(Hmong College Preparatory Academy Project) | | | | | | | | |
Series A 5.75% 9/1/46 | | | 500,000 | | | | 523,590 | |
Series A 6.00% 9/1/51 | | | 500,000 | | | | 528,830 | |
(Nova Classical Academy Project) | | | | | | | | |
Series A 4.00% 9/1/36 | | | 1,270,000 | | | | 1,274,775 | |
Series A 4.125% 9/1/47 | | | 500,000 | | | | 500,185 | |
(St. Paul Conservatory for Performing Artists) Series A | | | | | | | | |
4.625% 3/1/43 | | | 445,000 | | | | 451,582 | |
(Twin Cities Academy Project) Series A 5.375% 7/1/50 | | | 1,500,000 | | | | 1,551,705 | |
University of Minnesota | | | | | | | | |
Series A 5.00% 4/1/34 | | | 2,115,000 | | | | 2,533,791 | |
Series A 5.125% 4/1/34 | | | 1,000,000 | | | | 1,064,590 | |
46
| | | | | | | | |
| | | Principal amount° | | | Value (US $) | |
| |
Municipal Bonds (continued) | | | | | | | | |
| |
Education Revenue Bonds (continued) | | | | | | | | |
University of Minnesota | | | | | | | | |
Series A 5.25% 12/1/28 | | | 1,500,000 | | | $ | 1,701,960 | |
(State Supported Stadium Debt) Series A 5.00% 8/1/26 | | | 1,500,000 | | | | 1,847,700 | |
| | | | | | | | |
| | | | | | | 36,539,415 | |
| | | | | | | | |
Electric Revenue Bonds – 8.28% | | | | | | | | |
Central Minnesota Municipal Power Agency | | | | | | | | |
(Brookings Twin Cities Transmission Project) | | | | | | | | |
5.00% 1/1/42 | | | 1,500,000 | | | | 1,646,580 | |
Chaska Electric Revenue | | | | | | | | |
Series A 5.00% 10/1/28 | | | 350,000 | | | | 415,576 | |
Hutchinson Utilities Commission Revenue | | | | | | | | |
Series A 5.00% 12/1/22 | | | 490,000 | | | | 575,696 | |
Series A 5.00% 12/1/26 | | | 360,000 | | | | 415,696 | |
Minnesota Municipal Power Agency Electric Revenue | | | | | | | | |
5.00% 10/1/27 | | | 165,000 | | | | 197,147 | |
5.00% 10/1/47 | | | 745,000 | | | | 860,117 | |
Series A 5.00% 10/1/28 | | | 500,000 | | | | 594,510 | |
Northern Municipal Power Agency Electric System Revenue | | | | | | | | |
5.00% 1/1/26 | | | 500,000 | | | | 618,925 | |
5.00% 1/1/28 | | | 500,000 | | | | 598,475 | |
5.00% 1/1/29 | | | 470,000 | | | | 558,661 | |
Series A 5.00% 1/1/24 | | | 335,000 | | | | 394,499 | |
Rochester Electric Utility Revenue | | | | | | | | |
Series A 5.00% 12/1/34 | | | 450,000 | | | | 537,453 | |
Series A 5.00% 12/1/35 | | | 500,000 | | | | 595,360 | |
Series A 5.00% 12/1/36 | | | 520,000 | | | | 617,765 | |
Southern Minnesota Municipal Power Agency Revenue | | | | | | | | |
Series A 5.00% 1/1/41 | | | 400,000 | | | | 457,632 | |
Western Minnesota Municipal Power Agency Revenue | | | | | | | | |
Series A 5.00% 1/1/30 | | | 500,000 | | | | 588,475 | |
Series A 5.00% 1/1/33 | | | 1,750,000 | | | | 2,039,275 | |
Series A 5.00% 1/1/34 | | | 450,000 | | | | 522,941 | |
Series A 5.00% 1/1/40 | | | 2,000,000 | | | | 2,302,500 | |
| | | | | | | | |
| | | | | | | 14,537,283 | |
| | | | | | | | |
Healthcare Revenue Bonds – 27.24% | | | | | | | | |
Anoka Healthcare & Housing Facilities Revenue | | | | | | | | |
(The Homestead at Anoka Project) 5.125% 11/1/49 | | | 400,000 | | | | 406,968 | |
Anoka Housing & Redevelopment Authority Revenue | | | | | | | | |
(Fridley Medical Center Project) Series A 6.875% 5/1/40 | | | 1,000,000 | | | | 1,045,310 | |
47
Schedules of investments
Delaware Minnesota High-Yield Municipal Bond Fund
| | | | | | | | |
| | | Principal amount° | | | Value (US $) | |
| |
Municipal Bonds (continued) | | | | | | | | |
| |
Healthcare Revenue Bonds (continued) | | | | | | | | |
Apple Valley Senior Living Revenue | | | | | | | | |
(Senior Living LLC Project) | | | | | | | | |
2nd Tier Series B 5.00% 1/1/47 | | | 525,000 | | | $ | 538,314 | |
4th Tier Series D 7.00% 1/1/37 | | | 515,000 | | | | 509,402 | |
4th Tier Series D 7.25% 1/1/52 | | | 1,500,000 | | | | 1,488,525 | |
Breckenridge Catholic Health Initiatives | | | | | | | | |
Series A 5.00% 5/1/30 | | | 1,775,000 | | | | 1,780,751 | |
Brooklyn Center Multifamily Housing Revenue | | | | | | | | |
(Sanctuary at Brooklyn Center Project) Series A | | | | | | | | |
5.50% 11/1/35 | | | 750,000 | | | | 755,827 | |
Cloquet Housing Facilities | | | | | | | | |
(HADC Cloquet Project) Series A 5.00% 8/1/48 | | | 850,000 | | | | 862,461 | |
Dakota County Community Development Agency Senior Housing Revenue | | | | | | | | |
(Walker Highview Hills Project) Series A 144A | | | | | | | | |
5.00% 8/1/51 # | | | 870,000 | | | | 883,589 | |
Deephaven Housing & Healthcare Revenue | | | | | | | | |
(St. Therese Senior Living Project) | | | | | | | | |
Series A 5.00% 4/1/38 | | | 335,000 | | | | 341,683 | |
Series A 5.00% 4/1/40 | | | 315,000 | | | | 320,664 | |
Series A 5.00% 4/1/48 | | | 185,000 | | | | 186,584 | |
Duluth Economic Development Authority | | | | | | | | |
(St. Luke’s Hospital Authority Obligation Group) | | | | | | | | |
5.75% 6/15/32 | | | 750,000 | | | | 816,517 | |
6.00% 6/15/39 | | | 1,000,000 | | | | 1,094,970 | |
Glencoe Health Care Facilities Revenue | | | | | | | | |
(Glencoe Regional Health Services Project) | | | | | | | | |
4.00% 4/1/31 | | | 185,000 | | | | 194,239 | |
Hayward Health Care Facilities Revenue | | | | | | | | |
(American Baptist Homes Midwest Obligated Group) | | | | | | | | |
5.375% 8/1/34 | | | 750,000 | | | | 774,653 | |
(St. John’s Lutheran Home of Albert Lea) | | | | | | | | |
5.375% 10/1/44 | | | 450,000 | | | | 456,323 | |
Maple Grove Health Care Facilities Revenue | | | | | | | | |
(Maple Grove Hospital Corporation) | | | | | | | | |
4.00% 5/1/37 | | | 1,155,000 | | | | 1,203,903 | |
5.00% 5/1/26 | | | 1,300,000 | | | | 1,568,710 | |
5.00% 5/1/29 | | | 500,000 | | | | 592,430 | |
(North Memorial Health Care) 5.00% 9/1/30 | | | 610,000 | | | | 701,189 | |
Minneapolis Health Care System Revenue | | | | | | | | |
(Fairview Health Services) | | | | | | | | |
Series A 5.00% 11/15/33 | | | 500,000 | | | | 581,320 | |
Series A 5.00% 11/15/34 | | | 500,000 | | | | 579,725 | |
48
| | | | | | | | |
| | | Principal amount° | | | Value (US $) | |
| |
Municipal Bonds (continued) | | | | | | | | |
| |
Healthcare Revenue Bonds (continued) | | | | | | | | |
Minneapolis Health Care System Revenue | | | | | | | | |
(Fairview Health Services) | | | | | | | | |
Series A 5.00% 11/15/44 | | | 1,000,000 | | | $ | 1,136,680 | |
Series B Unrefunded Balance 6.50% 11/15/38 (AGC) | | | 210,000 | | | | 222,776 | |
Minneapolis Senior Housing & Healthcare Revenue | | | | | | | | |
(Ecumen-Abiitan Mill City Project) 5.375% 11/1/50 | | | 1,700,000 | | | | 1,758,531 | |
Minneapolis – St. Paul Housing & Redevelopment Authority Health Care Facilities Revenue | | | | | | | | |
(Allina Health System) Series A 5.00% 11/15/29 | | | 415,000 | | | | 505,458 | |
Oak Park Heights Housing Revenue | | | | | | | | |
(Oakgreen Commons Project) 7.00% 8/1/45 | | | 1,500,000 | | | | 1,593,345 | |
Oakdale Senior Housing | | | | | | | | |
(Oak Meadows Project) 5.00% 4/1/34 | | | 500,000 | | | | 514,000 | |
Rochester Health Care & Housing Revenue | | | | | | | | |
(The Homestead at Rochester Project) | | | | | | | | |
Series A 5.25% 12/1/23 | | | 175,000 | | | | 192,789 | |
Series A 6.875% 12/1/48 | | | 800,000 | | | | 892,680 | |
Rochester Health Care Facilities Revenue | | | | | | | | |
(Mayo Clinic) 4.00% 11/15/41 | | | 1,790,000 | | | | 1,855,997 | |
(Olmsted Medical Center Project) | | | | | | | | |
5.00% 7/1/22 | | | 350,000 | | | | 407,351 | |
5.00% 7/1/27 | | | 245,000 | | | | 283,521 | |
5.00% 7/1/28 | | | 225,000 | | | | 258,975 | |
Sartell Health Care Facilities Revenue | | | | | | | | |
(Country Manor Campus Project) | | | | | | | | |
Series A 5.25% 9/1/22 | | | 1,080,000 | | | | 1,188,367 | |
Series A 6.25% 9/1/36 | | | 925,000 | | | | 926,647 | |
Sauk Rapids Health Care Housing Facilities Revenue | | | | | | | | |
(Good Shepherd Lutheran Home) 5.125% 1/1/39 | | | 825,000 | | | | 832,829 | |
Shakopee Health Care Facilities Revenue | | | | | | | | |
(St. Francis Regional Medical Center) | | | | | | | | |
4.00% 9/1/31 | | | 130,000 | | | | 139,598 | |
5.00% 9/1/34 | | | 105,000 | | | | 118,666 | |
St. Cloud Health Care Revenue | | | | | | | | |
(Centracare Health System Project) | | | | | | | | |
Series A 4.00% 5/1/37 | | | 1,440,000 | | | | 1,541,174 | |
Unrefunded Balance 5.125% 5/1/30 | | | 15,000 | | | | 16,298 | |
St. Paul Housing & Redevelopment Authority Health Care Facilities Revenue | | | | | | | | |
(Fairview Health Services) | | | | | | | | |
Series A 4.00% 11/15/43 | | | 645,000 | | | | 678,108 | |
Series A 5.00% 11/15/47 | | | 485,000 | | | | 564,147 | |
49
Schedules of investments
Delaware Minnesota High-Yield Municipal Bond Fund
| | | | | | | | |
| | | Principal amount° | | | Value (US $) | |
| |
Municipal Bonds (continued) | | | | | | | | |
| |
Healthcare Revenue Bonds (continued) | | | | | | | | |
St. Paul Housing & Redevelopment Authority Health Care Facilities Revenue | | | | | | | | |
(Health Partners Obligation Group Project) | | | | | | | | |
Series A 4.00% 7/1/33 | | | 1,320,000 | | | $ | 1,404,850 | |
Series A 5.00% 7/1/32 | | | 900,000 | | | | 1,041,111 | |
Series A 5.00% 7/1/33 | | | 1,540,000 | | | | 1,775,589 | |
St. Paul Housing & Redevelopment Authority Housing & Health Care Facilities Revenue | | | | | | | | |
(Senior Episcopal Homes Project) | | | | | | | | |
5.125% 5/1/48 | | | 1,700,000 | | | | 1,721,267 | |
Series A 5.15% 11/1/42 | | | 775,000 | | | | 782,510 | |
St. Paul Housing & Redevelopment Authority Multifamily Housing Revenue | | | | | | | | |
(Marian Center Project) Series A 5.375% 5/1/43 | | | 1,000,000 | | | | 1,000,580 | |
Twin Valley Congregate Housing Revenue | | | | | | | | |
(Living Options Project) 5.95% 11/1/28 | | | 1,825,000 | | | | 1,825,894 | |
Victoria Health Care Facilities Revenue | | | | | | | | |
(Augustana Emerald Care Project) 5.00% 8/1/39 | | | 1,500,000 | | | | 1,545,060 | |
Wayzata Senior Housing Revenue | | | | | | | | |
(Folkestone Senior Living Community) | | | | | | | | |
Series A 5.50% 11/1/32 | | | 260,000 | | | | 276,838 | |
Series A 5.75% 11/1/39 | | | 590,000 | | | | 628,586 | |
Series A 6.00% 5/1/47 | | | 920,000 | | | | 978,420 | |
Winona Health Care Facilities Revenue | | | | | | | | |
(Winona Health Obligation Group) 5.15% 7/1/31 | | | 230,000 | | | | 230,736 | |
Woodbury Housing & Redevelopment Authority Revenue | | | | | | | | |
(St. Therese of Woodbury) 5.25% 12/1/49 | | | 1,250,000 | | | | 1,285,613 | |
| | | | | | | | |
| | | | | | | 47,809,048 | |
| | | | | | | | |
Housing Revenue Bonds – 1.56% | | | | | | | | |
Minneapolis Multifamily Housing Revenue | | | | | | | | |
(Olson Townhomes Project) 6.00% 12/1/19 (AMT) | | | 565,000 | | | | 565,350 | |
Minneapolis – St. Paul Housing Finance Board Single Family Mortgage-Backed Securities Program | | | | | | | | |
(City Living Project) Series A-2 | | | | | | | | |
5.00% 12/1/38 (GNMA) (FNMA) (FHLMC) (AMT) | | | 13,197 | | | | 13,216 | |
Minnesota Housing Finance Agency State Appropriation | | | | | | | | |
(Housing Infrastructure) Series C 5.00% 8/1/33 | | | 100,000 | | | | 114,624 | |
Northwest Multi-County Housing & Redevelopment Authority | | | | | | | | |
(Pooled Housing Program) 5.50% 7/1/45 | | | 1,275,000 | | | | 1,290,733 | |
50
| | | | | | | | |
| | | Principal amount° | | | Value (US $) | |
| |
Municipal Bonds (continued) | | | | | | | | |
| |
Housing Revenue Bonds (continued) | | | | | | | | |
Stillwater Multifamily Housing Revenue | | | | | | | | |
(Orleans Homes Project) 5.50% 2/1/42 (AMT) | | | 750,000 | | | $ | 750,225 | |
| | | | | | | | |
| | | | | | | 2,734,148 | |
| | | | | | | | |
Lease Revenue Bonds – 2.88% | | | | | | | | |
Minnesota General Fund Revenue Appropriations | | | | | | | | |
Series A 5.00% 6/1/38 | | | 1,750,000 | | | | 2,009,157 | |
Series A 5.00% 6/1/43 | | | 1,000,000 | | | | 1,141,140 | |
Series B 5.00% 3/1/21 | | | 250,000 | | | | 284,375 | |
Minnesota Housing Finance Agency State Appropriation | | | | | | | | |
(Housing Infrastructure) Series C 5.00% 8/1/32 | | | 1,415,000 | | | | 1,625,793 | |
| | | | | | | | |
| | | | | | | 5,060,465 | |
| | | | | | | | |
Local General Obligation Bonds – 11.88% | | | | | | | | |
Chaska Independent School District No. 112 | | | | | | | | |
(School Building) Series A 5.00% 2/1/28 | | | 2,240,000 | | | | 2,747,248 | |
Duluth | | | | | | | | |
(DECC Improvement) Series A 5.00% 2/1/34 | | | 1,000,000 | | | | 1,181,190 | |
Duluth Independent School District No. 709 | | | | | | | | |
Series A 4.00% 2/1/27 | | | 440,000 | | | | 499,541 | |
Edina Independent School District No. 273 | | | | | | | | |
Series A 5.00% 2/1/27 | | | 1,355,000 | | | | 1,656,067 | |
Foley Independent School District No. 51 | | | | | | | | |
(School Building) Series A 5.00% 2/1/21 | | | 1,105,000 | | | | 1,108,867 | |
Hennepin County | | | | | | | | |
Series A 5.00% 12/1/26 | | | 750,000 | | | | 956,625 | |
Series A 5.00% 12/1/36 | | | 1,500,000 | | | | 1,809,300 | |
Series C 5.00% 12/1/37 | | | 2,500,000 | | | | 3,008,625 | |
Mahtomedi Independent School District No. 832 | | | | | | | | |
(School Building) | | | | | | | | |
Series A 5.00% 2/1/28 | | | 1,000,000 | | | | 1,201,540 | |
Series A 5.00% 2/1/29 | | | 1,000,000 | | | | 1,192,440 | |
Series A 5.00% 2/1/30 | | | 445,000 | | | | 527,040 | |
Series A 5.00% 2/1/31 | | | 1,000,000 | | | | 1,176,410 | |
Metropolitan Council General Obligation Wastewater Revenue | | | | | | | | |
(Minneapolis – St. Paul Metropolitan Area) | | | | | | | | |
Series C 4.00% 3/1/31 | | | 965,000 | | | | 1,099,859 | |
Series C 4.00% 3/1/32 | | | 1,000,000 | | | | 1,129,760 | |
White Bear Lake Independent School District No. 624 | | | | | | | | |
(Alternative Facilities) Series B 4.75% 2/1/22 | | | 1,500,000 | | | | 1,553,340 | |
| | | | | | | | |
| | | | | | | 20,847,852 | |
| | | | | | | | |
51
Schedules of investments
Delaware Minnesota High-Yield Municipal Bond Fund
| | | | | | | | |
| | | Principal amount° | | | Value (US $) | |
| |
Municipal Bonds (continued) | | | | | | | | |
| |
Pre-Refunded Bonds – 9.64% | | | | | | | | |
Anoka Health Care Facilities Revenue | | | | | | | | |
(The Homestead at Anoka Project) Series A | | | | | | | | |
7.00% 11/1/46-19§ | | | 1,650,000 | | | $ | 1,874,565 | |
Deephaven Charter School Lease Revenue | | | | | | | | |
(Eagle Ridge Academy Project) Series A | | | | | | | | |
5.50% 7/1/43-23§ | | | 500,000 | | | | 606,945 | |
Hennepin County Sales Tax Revenue | | | | | | | | |
(First Lien-Ballpark Project) Series A | | | | | | | | |
5.00% 12/15/24-17§ | | | 1,000,000 | | | | 1,012,540 | |
Minneapolis Health Care System Revenue | | | | | | | | |
(Fairview Health Services) | | | | | | | | |
Series A 6.625% 11/15/28-18§ | | | 1,900,000 | | | | 2,031,841 | |
Series B 6.50% 11/15/38-18 (AGC)§ | | | 40,000 | | | | 42,718 | |
Minnesota 911 Services Revenue | | | | | | | | |
(Public Safety Radio Communication System Project) | | | | | | | | |
5.00% 6/1/24-18 (AGC)§ | | | 1,000,000 | | | | 1,031,740 | |
Minnesota Higher Education Facilities Authority Revenue | | | | | | | | |
(Carleton College) Series 7-D 5.00% 3/1/40-19§ | | | 1,055,000 | | | | 1,120,231 | |
Rochester Healthcare & Housing Revenue | | | | | | | | |
(Samaritan Bethany Project) | | | | | | | | |
Series A 6.875% 12/1/29-19§ | | | 1,000,000 | | | | 1,067,460 | |
Series A 7.375% 12/1/41-19§ | | | 375,000 | | | | 401,400 | |
South Washington County Independent School District No. 833 | | | | | | | | |
(School Building) Series A 4.75% 2/1/27-18§ | | | 1,500,000 | | | | 1,523,745 | |
St. Cloud Health Care Revenue | | | | | | | | |
(Centracare Health System Project) | | | | | | | | |
5.50% 5/1/39-19 (AGC)§ | | | 1,500,000 | | | | 1,614,735 | |
St. Louis Park Health Care Facilities Revenue | | | | | | | | |
(Park Nicollet Health Services) 5.75% 7/1/39-19§ | | | 2,005,000 | | | | 2,182,543 | |
St. Paul Housing & Redevelopment Authority Charter School Lease Revenue | | | | | | | | |
(Nova Classical Academy Project) Series A | | | | | | | | |
6.625% 9/1/42-21§ | | | 1,500,000 | | | | 1,816,320 | |
St. Paul Housing & Redevelopment Authority Hospital Facility Revenue | | | | | | | | |
(Healtheast Care System Project) | | | | | | | | |
Series A 5.00% 11/15/29-25§ | | | 275,000 | | | | 344,735 | |
Series A 5.00% 11/15/30-25§ | | | 205,000 | | | | 256,984 | |
| | | | | | | | |
| | | | | | | 16,928,502 | |
| | | | | | | | |
52
| | | | | | | | |
| | | Principal amount° | | | Value (US $) | |
| |
Municipal Bonds (continued) | | | | | | | | |
| |
Special Tax Revenue Bonds – 3.03% | | | | | | | | |
Hennepin County Sales Tax Revenue | | | | | | | | |
(Second Lien-Ballpark Project) | | | | | | | | |
Series B 5.00% 12/15/20 | | | 1,500,000 | | | $ | 1,518,900 | |
Series B 5.00% 12/15/24 | | | 1,000,000 | | | | 1,012,360 | |
Minneapolis Revenue | | | | | | | | |
(YMCA Greater Twin Cities Project) 4.00% 6/1/31 | | | 250,000 | | | | 268,110 | |
Minneapolis Tax Increment Revenue | | | | | | | | |
(Giant Park Project) | | | | | | | | |
4.00% 3/1/27 | | | 200,000 | | | | 204,420 | |
4.00% 3/1/30 | | | 260,000 | | | | 260,562 | |
(Village of St. Anthony Falls Project) | | | | | | | | |
4.00% 3/1/24 | | | 700,000 | | | | 705,677 | |
4.00% 3/1/27 | | | 650,000 | | | | 650,130 | |
St. Paul Sales Tax Revenue | | | | | | | | |
Series G 5.00% 11/1/28 | | | 600,000 | | | | 702,630 | |
| | | | | | | | |
| | | | | | | 5,322,789 | |
| | | | | | | | |
State General Obligation Bonds – 5.96% | | | | | | | | |
Minnesota | | | | | | | | |
Series A 5.00% 8/1/24 | | | 500,000 | | | | 617,455 | |
Series A 5.00% 8/1/27 | | | 2,175,000 | | | | 2,680,513 | |
Series A 5.00% 8/1/29 | | | 1,000,000 | | | | 1,216,110 | |
Series A Unrefunded Balance 5.00% 10/1/24 | | | 985,000 | | | | 1,141,812 | |
Series D 5.00% 8/1/26 | | | 1,000,000 | | | | 1,268,570 | |
Series D 5.00% 8/1/27 | | | 1,000,000 | | | | 1,256,660 | |
(Various Purposes) Series A 5.00% 8/1/32 | | | 1,915,000 | | | | 2,287,085 | |
| | | | | | | | |
| | | | | | | 10,468,205 | |
| | | | | | | | |
Transportation Revenue Bonds – 3.35% | | | | | | | | |
Minneapolis – St. Paul Metropolitan Airports Commission Revenue | | | | | | | | |
Senior | | | | | | | | |
Series A 5.00% 1/1/32 | | | 1,245,000 | | | | 1,508,392 | |
Series C 5.00% 1/1/46 | | | 185,000 | | | | 216,561 | |
Subordinate | | | | | | | | |
Series A 5.00% 1/1/22 | | | 1,000,000 | | | | 1,125,190 | |
Series A 5.00% 1/1/32 | | | 500,000 | | | | 580,725 | |
Series B 5.00% 1/1/29 | | | 2,130,000 | | | | 2,442,556 | |
| | | | | | | | |
| | | | | | | 5,873,424 | |
| | | | | | | | |
Water & Sewer Revenue Bonds – 1.33% | | | | | | | | |
Guam Government Waterworks Authority | | | | | | | | |
5.00% 1/1/46 | | | 515,000 | | | | 555,762 | |
53
Schedules of investments
Delaware Minnesota High-Yield Municipal Bond Fund
| | | | | | | | |
| | | Principal amount° | | | Value (US $) | |
| |
Municipal Bonds (continued) | | | | | | | | |
| |
Water & Sewer Revenue Bonds (continued) | | | | | | | | |
Minnesota Public Facilities Authority | | | | | | | | |
Series B 4.00% 3/1/26 | | | 1,500,000 | | | $ | 1,774,440 | |
| | | | | | | | |
| | | | | | | 2,330,202 | |
| | | | | | | | |
Total Municipal Bonds (cost $168,147,707) | | | | | | | 173,748,059 | |
| | | | | | | | |
| | | | | | | | |
| |
Short-Term Investments – 0.29% | | | | | | | | |
| |
Variable Rate Demand Notes - 0.29%¤ | | | | | | | | |
Minneapolis – St. Paul Housing & Redevelopment Authority | | | | | | | | |
Health Care Revenue | | | | | | | | |
(Children’s Hospitals & Clinics) | | | | | | | | |
Series A-II | | | | | | | | |
0.75% 8/15/37 (AGM) (SPA - US Bank N.A.) | | | 400,000 | | | | 400,000 | |
Series B | | | | | | | | |
0.75% 8/15/25 (AGM) (SPA - US Bank N.A.) | | | 100,000 | | | | 100,000 | |
| | | | | | | | |
Total Short-Term Investments (cost $500,000) | | | | | | | 500,000 | |
| | | | | | | | |
| | |
Total Value of Securities – 99.28%
(cost $168,647,707) | | | | | | $ | 174,248,059 | |
| | | | | | | | |
| # | Security exempt from registration under Rule 144A of the Securities Act of 1933, as amended. At Aug. 31, 2017, the aggregate value of Rule 144A securities was $5,624,485, which represents 3.20% of the Fund’s net assets. See Note 8 in “Notes to financial statements.” |
| ¤ | Tax-exempt obligations that contain a floating or variable interest rate adjustment formula and an unconditional right of demand to receive payment of the unpaid principal balance plus accrued interest upon a short notice period (generally up to 30 days) prior to specified dates either from the issuer or by drawing on a bank letter of credit, a guarantee, or insurance issued with respect to such instrument. Each rate shown is as of Aug. 31, 2017. |
| § | Pre-refunded bonds. Municipal bonds that are generally backed or secured by US Treasury bonds. For pre-refunded bonds, the stated maturity is followed by the year in which the bond is pre-refunded. See Note 8 in “Notes to financial statements.” |
| ° | Principal amount shown is stated in US dollars unless noted that the security is denominated in another currency. |
Summary of abbreviations:
AGC – Insured by Assured Guaranty Corporation
AGM – Insured by Assured Guaranty Municipal Corporation
AMT – Subject to Alternative Minimum Tax
FHLMC – Federal Home Loan Mortgage Corporation collateral
FNMA – Federal National Mortgage Association collateral
GNMA – Government National Mortgage Association collateral
N.A. – National Association
54
Summary of abbreviations (continued):
SPA – Stand-by Purchase Agreement
See accompanying notes, which are an integral part of the financial statements.
55
| | |
| Statements of assets and liabilities |
| | August 31, 2017 |
| | | | | | | | | | | | |
| |
| | | Delaware Tax-Free
Minnesota Fund | | | Delaware Tax-Free Minnesota
Intermediate Fund | | | Delaware
Minnesota High-Yield Municipal Bond Fund | |
| | | |
Assets: | | | | | | | | | | | | |
Investments, at value1 | | $ | 554,789,100 | | | $ | 98,214,529 | | | $ | 173,748,059 | |
Short-term investments, at value2 | | | 8,075,000 | | | | 750,000 | | | | 500,000 | |
Cash | | | 3,901,492 | | | | 919,192 | | | | 597,957 | |
Interest receivable | | | 6,492,890 | | | | 954,108 | | | | 1,985,131 | |
Receivable for securities sold | | | 3,991,456 | | | | 700,877 | | | | 1,237,486 | |
Receivable for fund shares sold | | | 821,715 | | | | 223,725 | | | | 78,058 | |
| | | | | | | | | | | | |
Total assets | | | 578,071,653 | | | | 101,762,431 | | | | 178,146,691 | |
| | | | | | | | | | | | |
Liabilities: | | | | | | | | | | | | |
Payable for securities purchased | | | 12,928,121 | | | | 1,857,748 | | | | 2,093,418 | |
Payable for fund shares redeemed | | | 893,528 | | | | 132,256 | | | | 266,325 | |
Distribution payable | | | 398,885 | | | | 62,336 | | | | 99,222 | |
Investment management fees payable to affiliates | | | 214,998 | | | | 37,864 | | | | 68,444 | |
Distribution fees payable to affiliates | | | 133,439 | | | | 18,885 | | | | 48,392 | |
Other accrued expenses | | | 113,825 | | | | 26,906 | | | | 41,931 | |
Dividend disbursing and transfer agent fees and expenses payable to affiliates | | | 9,448 | | | | 1,670 | | | | 2,939 | |
Audit and tax fees payable | | | 4,584 | | | | 4,584 | | | | 4,584 | |
Trustees’ fees and expenses payable to affiliates | | | 3,192 | | | | 565 | | | | 992 | |
Accounting and administration expenses payable to affiliates | | | 2,199 | | | | 389 | | | | 684 | |
Reports and statements to shareholders expenses payable to affiliates | | | 1,077 | | | | 79 | | | | 140 | |
Legal fees payable to affiliates | | | 450 | | | | 191 | | | | 333 | |
| | | | | | | | | | | | |
Total liabilities | | | 14,703,746 | | | | 2,143,473 | | | | 2,627,404 | |
| | | | | | | | | | | | |
Total Net Assets | | $ | 563,367,907 | | | $ | 99,618,958 | | | $ | 175,519,287 | |
| | | | | | | | | | | | |
| | | |
Net Assets Consist of: | | | | | | | | | | | | |
Paid-in capital | | $ | 534,694,948 | | | $ | 95,167,497 | | | $ | 173,691,574 | |
Distributions in excess of net investment income | | | (215,430 | ) | | | (786 | ) | | | — | |
Accumulated net realized gain (loss) on investments | | | 2,050,311 | | | | 193,167 | | | | (3,772,639 | ) |
Net unrealized appreciation of investments | | | 26,838,078 | | | | 4,259,080 | | | | 5,600,352 | |
| | | | | | | | | | | | |
Total Net Assets | | $ | 563,367,907 | | | $ | 99,618,958 | | | $ | 175,519,287 | |
| | | | | | | | | | | | |
56
| | | | | | | | | | | | |
| | | Delaware Tax-Free
Minnesota Fund | | | Delaware Tax-Free Minnesota Intermediate
Fund | | | Delaware
Minnesota High-Yield Municipal Bond Fund | |
| | | |
Net Asset Value | | | | | | | | | | | | |
Class A: | | | | | | | | | | | | |
Net assets | | $ | 423,496,606 | | | $ | 68,933,845 | | | $ | 98,491,104 | |
Shares of beneficial interest outstanding, unlimited authorization, no par | | | 33,759,895 | | | | 6,172,145 | | | | 9,054,603 | |
Net asset value per share | | $ | 12.54 | | | $ | 11.17 | | | $ | 10.88 | |
Sales charge | | | 4.50 | % | | | 2.75 | % | | | 4.50 | % |
Offering price per share, equal to net asset value per share/(1 – sales charge) | | $ | 13.13 | | | $ | 11.49 | | | $ | 11.39 | |
| | | |
Class C: | | | | | | | | | | | | |
Net assets | | $ | 51,044,989 | | | $ | 11,884,864 | | | $ | 32,223,376 | |
Shares of beneficial interest outstanding, unlimited authorization, no par | | | 4,056,194 | | | | 1,061,925 | | | | 2,956,573 | |
Net asset value per share | | $ | 12.58 | | | $ | 11.19 | | | $ | 10.90 | |
| | | |
Institutional Class: | | | | | | | | | | | | |
Net assets | | $ | 88,826,312 | | | $ | 18,800,249 | | | $ | 44,804,807 | |
Shares of beneficial interest outstanding, unlimited authorization, no par | | | 7,082,312 | | | | 1,682,684 | | | | 4,120,300 | |
Net asset value per share | | $ | 12.54 | | | $ | 11.17 | | | $ | 10.87 | |
| | | |
1 Investments, at cost | | $ | 527,951,022 | | | $ | 93,955,449 | | | $ | 168,147,707 | |
| | | |
2 Short-term investments, at cost | | | 8,075,000 | | | | 750,000 | | | | 500,000 | |
See accompanying notes, which are an integral part of the financial statements.
57
| | |
| Statements of operations |
| | Year ended August 31, 2017 |
| | | | | | | | | | | | |
| | | Delaware Tax-Free
Minnesota Fund | | | Delaware Tax-Free
Minnesota
Intermediate
Fund | | | Delaware
Minnesota
High-Yield
Municipal
Bond Fund | |
| | | |
Investment Income: | | | | | | | | | | | | |
Interest | | $ | 22,074,512 | | | $ | 3,651,039 | | | $ | 7,008,870 | |
| | | | | | | | | | | | |
Expenses: | | | | | | | | | | | | |
Management fees | | | 3,060,654 | | | | 502,946 | | | | 970,954 | |
Distribution expenses — Class A | | | 1,109,574 | | | | 179,533 | | | | 272,165 | |
Distribution expenses — Class C | | | 519,400 | | | | 124,205 | | | | 336,287 | |
Dividend disbursing and transfer agent fees and expenses | | | 391,534 | | | | 79,256 | | | | 140,976 | |
Accounting and administration expenses | | | 166,993 | | | | 33,399 | | | | 55,414 | |
Registration fees | | | 65,292 | | | | 24,586 | | | | 16,102 | |
Legal fees | | | 57,238 | | | | 11,130 | | | | 18,262 | |
Reports and statements to shareholders | | | 48,394 | | | | 17,402 | | | | 17,621 | |
Audit and tax fees | | | 43,096 | | | | 43,826 | | | | 43,860 | |
Trustees’ fees and expenses | | | 27,255 | | | | 4,887 | | | | 8,568 | |
Custodian fees | | | 22,786 | | | | 4,470 | | | | 8,567 | |
Other | | | 42,566 | | | | 18,928 | | | | 25,701 | |
| | | | | | | | | | | | |
| | | 5,554,782 | | | | 1,044,568 | | | | 1,914,477 | |
Less expenses waived | | | (549,537 | ) | | | (46,069 | ) | | | (173,787 | ) |
Less waived distribution expenses — Class A | | | — | | | | (71,813 | ) | | | — | |
Less expenses paid indirectly | | | (2,074 | ) | | | (330 | ) | | | (1,752 | ) |
| | | | | | | | | | | | |
Total operating expenses | | | 5,003,171 | | | | 926,356 | | | | 1,738,938 | |
| | | | | | | | | | | | |
Net Investment Income | | | 17,071,341 | | | | 2,724,683 | | | | 5,269,932 | |
| | | | | | | | | | | | |
| | | |
Net Realized and Unrealized Gain (Loss): | | | | | | | | | | | | |
Net realized gain on investments | | | 3,679,670 | | | | 272,027 | | | | 809,652 | |
Net change in unrealized appreciation (depreciation) of investments | | | (18,824,613 | ) | | | (2,617,465 | ) | | | (5,379,286 | ) |
| | | | | | | | | | | | |
Net Realized and Unrealized Loss | | | (15,144,943 | ) | | | (2,345,438 | ) | | | (4,569,634 | ) |
| | | | | | | | | | | | |
Net Increase in Net Assets Resulting from Operations | | $ | 1,926,398 | | | $ | 379,245 | | | $ | 700,298 | |
| | | | | | | | | | | | |
See accompanying notes, which are an integral part of the financial statements.
58
This page intentionally left blank.
Statements of changes in net assets
Delaware Tax-Free Minnesota Fund
| | | | | | | | |
| | | Year ended | |
| | |
| | | 8/31/17 | | | 8/31/16 | |
| | |
Increase (Decrease) in Net Assets from Operations: | | | | | | | | |
Net investment income | | $ | 17,071,341 | | | $ | 18,283,681 | |
Net realized gain | | | 3,679,670 | | | | 1,245,728 | |
Net change in unrealized appreciation (depreciation) | | | (18,824,613 | ) | | | 11,243,374 | |
| | | | | | | | |
Net increase in net assets resulting from operations | | | 1,926,398 | | | | 30,772,783 | |
| | | | | | | | |
| | |
Dividends and Distributions to Shareholders from: | | | | | | | | |
Net investment income: | | | | | | | | |
Class A | | | (13,728,190 | ) | | | (15,753,186 | ) |
Class C | | | (1,216,526 | ) | | | (1,219,395 | ) |
Institutional Class | | | (2,215,895 | ) | | | (1,374,763 | ) |
| | | | | | | | |
| | | (17,160,611 | ) | | | (18,347,344 | ) |
| | | | | | | | |
| | |
Capital Share Transactions: | | | | | | | | |
Proceeds from shares sold: | | | | | | | | |
Class A | | | 34,147,763 | | | | 37,364,611 | |
Class C | | | 6,466,911 | | | | 10,427,741 | |
Institutional Class | | | 59,311,879 | | | | 24,205,727 | |
| | |
Net asset value of shares issued upon reinvestment of dividends and distributions: | | | | | | | | |
Class A | | | 11,416,767 | | | | 13,061,531 | |
Class C | | | 1,104,881 | | | | 1,099,622 | |
Institutional Class | | | 1,976,859 | | | | 1,261,298 | |
| | | | | | | | |
| | | 114,425,060 | | | | 87,420,530 | |
| | | | | | | | |
60
| | | | | | | | |
| | | Year ended | |
| | | 8/31/17 | | | 8/31/16 | |
| | |
Capital Share Transactions (continued): | | | | | | | | |
Cost of shares redeemed: | | | | | | | | |
Class A | | $ | (90,242,074 | ) | | $ | (59,159,857 | ) |
Class C | | | (8,627,762 | ) | | | (4,470,992 | ) |
Institutional Class | | | (24,653,789 | ) | | | (5,266,453 | ) |
| | | | | | | | |
| | | (123,523,625 | ) | | | (68,897,302 | ) |
| | | | | | | | |
Increase (decrease) in net assets derived from capital share transactions | | | (9,098,565 | ) | | | 18,523,228 | |
| | | | | | | | |
Net Increase (Decrease) in Net Assets | | | (24,332,778 | ) | | | 30,948,667 | |
| | |
Net Assets: | | | | | | | | |
Beginning of year | | | 587,700,685 | | | | 556,752,018 | |
| | | | | | | | |
End of year | | $ | 563,367,907 | | | $ | 587,700,685 | |
| | | | | | | | |
Distributions in excess of net investment income | | $ | (215,430 | ) | | $ | (215,430 | ) |
| | | | | | | | |
See accompanying notes, which are an integral part of the financial statements.
61
Statements of changes in net assets
Delaware Tax-Free Minnesota Intermediate Fund
| | | | | | | | |
| | | Year ended | |
| | | 8/31/17 | | | 8/31/16 | |
| | |
Increase (Decrease) in Net Assets from Operations: | | | | | | | | |
Net investment income | | $ | 2,724,683 | | | $ | 2,922,746 | |
Net realized gain | | | 272,027 | | | | 210,669 | |
Net change in unrealized appreciation (depreciation) | | | (2,617,465 | ) | | | 1,840,780 | |
| | | | | | | | |
Net increase in net assets resulting from operations | | | 379,245 | | | | 4,974,195 | |
| | | | | | | | |
| | |
Dividends and Distributions to Shareholders from: | | | | | | | | |
Net investment income: | | | | | | | | |
Class A | | | (2,003,337 | ) | | | (2,419,983 | ) |
Class C | | | (241,177 | ) | | | (259,127 | ) |
Institutional Class | | | (480,415 | ) | | | (243,028 | ) |
Net realized gain: | | | | | | | | |
Class A | | | (106,466 | ) | | | — | |
Class C | | | (18,615 | ) | | | — | |
Institutional Class | | | (18,418 | ) | | | — | |
| | | | | | | | |
| | | (2,868,428 | ) | | | (2,922,138 | ) |
| | | | | | | | |
| | |
Capital Share Transactions: | | | | | | | | |
Proceeds from shares sold: | | | | | | | | |
Class A | | | 2,977,155 | | | | 6,598,977 | |
Class C | | | 1,326,646 | | | | 2,151,769 | |
Institutional Class | | | 11,040,900 | | | | 9,193,108 | |
| | |
Net asset value of shares issued upon reinvestment of dividends and distributions: | | | | | | | | |
Class A | | | 1,808,316 | | | | 2,121,972 | |
Class C | | | 247,603 | | | | 245,356 | |
Institutional Class | | | 468,456 | | | | 229,586 | |
| | | | | | | | |
| | | 17,869,076 | | | | 20,540,768 | |
| | | | | | | | |
62
| | | | | | | | |
| | | Year ended | |
| | | 8/31/17 | | | 8/31/16 | |
| | |
Capital Share Transactions (continued): | | | | | | | | |
Cost of shares redeemed: | | | | | | | | |
Class A | | $ | (13,609,683 | ) | | $ | (15,293,224 | ) |
Class C | | | (2,669,175 | ) | | | (1,070,105 | ) |
Institutional Class | | | (5,221,186 | ) | | | (1,295,683 | ) |
| | | | | | | | |
| | | (21,500,044 | ) | | | (17,659,012 | ) |
| | | | | | | | |
Increase (decrease) in net assets derived from capital share transactions | | | (3,630,968 | ) | | | 2,881,756 | |
| | | | | | | | |
Net Increase (Decrease) in Net Assets | | | (6,120,151 | ) | | | 4,933,813 | |
| | |
Net Assets: | | | | | | | | |
Beginning of year | | | 105,739,109 | | | | 100,805,296 | |
| | | | | | | | |
End of year | | $ | 99,618,958 | | | $ | 105,739,109 | |
| | | | | | | | |
Distributions in excess of net investment income | | $ | (786 | ) | | $ | (785 | ) |
| | | | | | | | |
See accompanying notes, which are an integral part of the financial statements.
63
Statements of changes in net assets
Delaware Minnesota High-Yield Municipal Bond Fund
| | | | | | | | |
| | | Year ended | |
| | | 8/31/17 | | | 8/31/16 | |
| | |
Increase (Decrease) in Net Assets from Operations: | | | | | | | | |
Net investment income | | $ | 5,269,932 | | | $ | 5,487,957 | |
Net realized gain | | | 809,652 | | | | 293,830 | |
Net change in unrealized appreciation (depreciation) | | | (5,379,286 | ) | | | 4,356,386 | |
| | | | | | | | |
Net increase in net assets resulting from operations | | | 700,298 | | | | 10,138,173 | |
| | | | | | | | |
| | |
Dividends and Distributions to Shareholders from: | | | | | | | | |
Net investment income: | | | | | | | | |
Class A | | | (3,365,896 | ) | | | (3,958,434 | ) |
Class C | | | (788,348 | ) | | | (853,841 | ) |
Institutional Class | | | (1,142,511 | ) | | | (786,400 | ) |
| | | | | | | | |
| | | (5,296,755 | ) | | | (5,598,675 | ) |
| | | | | | | | |
| | |
Capital Share Transactions: | | | | | | | | |
Proceeds from shares sold: | | | | | | | | |
Class A | | | 11,398,520 | | | | 15,179,207 | |
Class C | | | 2,597,707 | | | | 4,655,746 | |
Institutional Class | | | 32,544,758 | | | | 17,825,598 | |
| | |
Net asset value of shares issued upon reinvestment of dividends and distributions: | | | | | | | | |
Class A | | | 2,697,626 | | | | 3,147,387 | |
Class C | | | 681,425 | | | | 726,911 | |
Institutional Class | | | 1,029,137 | | | | 725,923 | |
| | | | | | | | |
| | | 50,949,173 | | | | 42,260,772 | |
| | | | | | | | |
64
| | | | | | | | |
| | | Year ended | |
| | | 8/31/17 | | | 8/31/16 | |
| | |
Capital Share Transactions (continued): | | | | | | | | |
Cost of shares redeemed: | | | | | | | | |
Class A | | $ | (33,747,538 | ) | | $ | (22,859,653 | ) |
Class C | | | (5,963,054 | ) | | | (2,667,925 | ) |
Institutional Class | | | (19,247,512 | ) | | | (2,781,029 | ) |
| | | | | | | | |
| | | (58,958,104 | ) | | | (28,308,607 | ) |
| | | | | | | | |
Increase (decrease) in net assets derived from capital share transactions | | | (8,008,931 | ) | | | 13,952,165 | |
| | | | | | | | |
Net Increase (Decrease) in Net Assets | | | (12,605,388 | ) | | | 18,491,663 | |
| | |
Net Assets: | | | | | | | | |
Beginning of year | | | 188,124,675 | | | | 169,633,012 | |
| | | | | | | | |
End of year (there was no undistributed net investment income at either year end) | | $ | 175,519,287 | | | $ | 188,124,675 | |
| | | | | | | | |
See accompanying notes, which are an integral part of the financial statements.
65
Financial highlights
Delaware Tax-Free Minnesota Fund Class A
Selected data for each share of the Fund outstanding throughout each period were as follows:
|
| |
|
| |
|
Net asset value, beginning of period |
|
Income (loss) from investment operations: |
Net investment income1 |
Net realized and unrealized gain (loss) |
|
Total from investment operations |
|
|
Less dividends and distributions from: |
Net investment income |
Net realized gain |
|
Total dividends and distributions |
|
|
Net asset value, end of period |
|
|
Total return2 |
|
Ratios and supplemental data: |
Net assets, end of period (000 omitted) |
Ratio of expenses to average net assets |
Ratio of expenses to average net assets prior to fees waived3 |
Ratio of net investment income to average net assets |
Ratio of net investment income to average net assets prior to fees waived3 |
Portfolio turnover |
|
|
| 1 | The average shares outstanding have been applied for per share information. |
| 2 | Total investment return is based on the change in net asset value of a share during the period and assumes reinvestment of dividends and distributions at net asset value and does not reflect the impact of a sales charge. Total investment return during all of the periods shown reflects a waiver by the manager. Performance would have been lower had the waiver not been in effect. |
| 3 | Expenses paid indirectly were not material, as reflected in the “Statements of operations”, and had no impact on the ratios disclosed. |
See accompanying notes, which are an integral part of the financial statements.
66
| | | | | | | | | | | | | | | | | | | | | | | | | | | | |
| | | Year ended | |
| | | | |
| | | 8/31/17 | | | | | 8/31/16 | | | | | 8/31/15 | | | | | 8/31/14 | | | | | 8/31/13 | |
| |
| | $ | 12.87 | | | | | $ | 12.60 | | | | | $ | 12.67 | | | | | $ | 11.97 | | | | | $ | 13.03 | |
| | | | | | | | | |
| | | | | | | | | | | | | | | | | | | | | | | | | | | | |
| | | 0.38 | | | | | | 0.41 | | | | | | 0.44 | | | | | | 0.45 | | | | | | 0.44 | |
| | | (0.32 | ) | | | | | 0.28 | | | | | | (0.06 | ) | | | | | 0.73 | | | | | | (0.97 | ) |
| | | | | | | | | | | | | | | | | | | | | | | | | | | | |
| | | 0.06 | | | | | | 0.69 | | | | | | 0.38 | | | | | | 1.18 | | | | | | (0.53 | ) |
| | | | | | | | | | | | | | | | | | | | | | | | | | | | |
| | | | | | | | | |
| | | | | | | | | | | | | | | | | | | | | | | | | | | | |
| | | (0.39 | ) | | | | | (0.42 | ) | | | | | (0.45 | ) | | | | | (0.44 | ) | | | | | (0.44 | ) |
| | | — | | | | | | — | | | | | | — | | | | | | (0.04 | ) | | | | | (0.09 | ) |
| | | | | | | | | | | | | | | | | | | | | | | | | | | | |
| | | (0.39 | ) | | | | | (0.42 | ) | | | | | (0.45 | ) | | | | | (0.48 | ) | | | | | (0.53 | ) |
| | | | | | | | | | | | | | | | | | | | | | | | | | | | |
| | | | | | | | | |
| | $ | 12.54 | | | | | $ | 12.87 | | | | | $ | 12.60 | | | | | $ | 12.67 | | | | | $ | 11.97 | |
| | | | | | | | | | | | | | | | | | | | | | | | | | | | |
| | | | | | | | | |
| | | 0.49% | | | | | | 5.52% | | | | | | 3.02% | | | | | | 10.03% | | | | | | (4.24% | ) |
| | | | | | | | | |
| | | | | | | | | | | | | | | | | | | | | | | | | | | | |
| | $ | 423,497 | | | | | $ | 481,066 | | | | | $ | 479,275 | | | | | $ | 503,072 | | | | | $ | 540,533 | |
| | | 0.85% | | | | | | 0.85% | | | | | | 0.87% | | | | | | 0.90% | | | | | | 0.90% | |
| | | 0.95% | | | | | | 0.95% | | | | | | 0.96% | | | | | | 0.95% | | | | | | 0.95% | |
| | | 3.08% | | | | | | 3.25% | | | | | | 3.51% | | | | | | 3.61% | | | | | | 3.47% | |
| | | 2.98% | | | | | | 3.15% | | | | | | 3.42% | | | | | | 3.56% | | | | | | 3.42% | |
| | | 17% | | | | | | 15% | | | | | | 11% | | | | | | 10% | | | | | | 16% | |
| | | | | | | | | | | | | | | | | | | | | | | | | | | | |
| |
67
Financial highlights
Delaware Tax-Free Minnesota Fund Class C
Selected data for each share of the Fund outstanding throughout each period were as follows:
|
| |
|
| |
|
Net asset value, beginning of period |
|
Income (loss) from investment operations: |
Net investment income1 |
Net realized and unrealized gain (loss) |
| |
Total from investment operations |
| |
|
Less dividends and distributions from: |
Net investment income |
Net realized gain |
| |
Total dividends and distributions |
| |
|
Net asset value, end of period |
| |
|
Total return2 |
|
Ratios and supplemental data: |
Net assets, end of period (000 omitted) |
Ratio of expenses to average net assets |
Ratio of expenses to average net assets prior to fees waived3 |
Ratio of net investment income to average net assets |
Ratio of net investment income to average net assets prior to fees waived3 |
Portfolio turnover |
|
|
| 1 | The average shares outstanding have been applied for per share information. |
| 2 | Total investment return is based on the change in net asset value of a share during the period and assumes reinvestment of dividends and distributions at net asset value and does not reflect the impact of a sales charge. Total investment return during all of the periods shown reflects a waiver by the manager. Performance would have been lower had the waiver not been in effect. |
| 3 | Expenses paid indirectly were not material, as reflected in the “Statements of operations”, and had no impact on the ratios disclosed. |
See accompanying notes, which are an integral part of the financial statements.
68
| | | | | | | | | | | | | | | | | | | | | | | | | | | | |
| | | Year ended | |
| | | | |
| | | 8/31/17 | | | | | 8/31/16 | | | | | 8/31/15 | | | | | 8/31/14 | | | | | 8/31/13 | |
| |
| | $ | 12.91 | | | | | $ | 12.64 | | | | | $ | 12.71 | | | | | $ | 12.01 | | | | | $ | 13.07 | |
| | | | | | | | | |
| | | | | | | | | | | | | | | | | | | | | | | | | | | | |
| | | 0.29 | | | | | | 0.32 | | | | | | 0.35 | | | | | | 0.35 | | | | | | 0.35 | |
| | | (0.33 | ) | | | | | 0.27 | | | | | | (0.07 | ) | | | | | 0.74 | | | | | | (0.97 | ) |
| | | | | | | | | | | | | | | | | | | | | | | | | | | | |
| | | (0.04 | ) | | | | | 0.59 | | | | | | 0.28 | | | | | | 1.09 | | | | | | (0.62 | ) |
| | | | | | | | | | | | | | | | | | | | | | | | | | | | |
| | | | | | | | | |
| | | | | | | | | | | | | | | | | | | | | | | | | | | | |
| | | (0.29 | ) | | | | | (0.32 | ) | | | | | (0.35 | ) | | | | | (0.35 | ) | | | | | (0.35 | ) |
| | | — | | | | | | — | | | | | | — | | | | | | (0.04 | ) | | | | | (0.09 | ) |
| | | | | | | | | | | | | | | | | | | | | | | | | | | | |
| | | (0.29 | ) | | | | | (0.32 | ) | | | | | (0.35 | ) | | | | | (0.39 | ) | | | | | (0.44 | ) |
| | | | | | | | | | | | | | | | | | | | | | | | | | | | |
| | | | | | | | | |
| | $ | 12.58 | | | | | $ | 12.91 | | | | | $ | 12.64 | | | | | $ | 12.71 | | | | | $ | 12.01 | |
| | | | | | | | | | | | | | | | | | | | | | | | | | | | |
| | | | | | | | | |
| | | (0.25% | ) | | | | | 4.73% | | | | | | 2.25% | | | | | | 9.19% | | | | | | (4.93% | ) |
| | | | | | | | | |
| | | | | | | | | | | | | | | | | | | | | | | | | | | | |
| | $ | 51,045 | | | | | $ | 53,502 | | | | | $ | 45,393 | | | | | $ | 41,612 | | | | | $ | 42,985 | |
| | | 1.60% | | | | | | 1.60% | | | | | | 1.62% | | | | | | 1.65% | | | | | | 1.65% | |
| | | 1.70% | | | | | | 1.70% | | | | | | 1.71% | | | | | | 1.70% | | | | | | 1.70% | |
| | | 2.33% | | | | | | 2.50% | | | | | | 2.76% | | | | | | 2.86% | | | | | | 2.72% | |
| | | 2.23% | | | | | | 2.40% | | | | | | 2.67% | | | | | | 2.81% | | | | | | 2.67% | |
| | | 17% | | | | | | 15% | | | | | | 11% | | | | | | 10% | | | | | | 16% | |
| | | | | | | | | | | | | | | | | | | | | | | | | | | | |
| |
69
Financial highlights
Delaware Tax-Free Minnesota Fund Institutional Class
Selected data for each share of the Fund outstanding throughout each period were as follows:
|
| |
|
| |
|
Net asset value, beginning of period |
|
Income (loss) from investment operations: |
Net investment income2 |
Net realized and unrealized gain (loss) |
| |
Total from investment operations |
| |
|
Less dividends and distributions from: |
Net investment income |
| |
Total dividends and distributions |
| |
|
Net asset value, end of period |
| |
|
Total return3 |
|
Ratios and supplemental data: |
Net assets, end of period (000 omitted) |
Ratio of expenses to average net assets |
Ratio of expenses to average net assets prior to fees waived4 |
Ratio of net investment income to average net assets |
Ratio of net investment income to average net assets prior to fees waived4 |
Portfolio turnover |
|
|
| 1 | Date of commencement of operations; ratios have been annualized and total return has not been annualized. |
| 2 | The average shares outstanding have been applied for per share information. |
| 3 | Total investment return is based on the change in net asset value of a share during the period and assumes reinvestment of dividends and distributions at net asset value. Total investment return during all of the periods shown reflects a waiver by the manager. Performance would have been lower had the waiver not been in effect. |
| 4 | Expenses paid indirectly were not material, as reflected in the “Statements of operations”, and had no impact on the ratios disclosed. |
| 5 | Portfolio turnover is representative of the Fund for the entire year. |
See accompanying notes, which are an integral part of the financial statements.
70
| | | | | | | | | | | | | | | | | | | | | | |
| | | Year ended | |
| 12/31/131
to
8/31/14 |
|
| | | | |
| | | 8/31/17 | | | | | | 8/31/16 | | | | | | 8/31/15 | | | | |
| |
| | $ | 12.87 | | | | | $ | 12.59 | | | | | $ | 12.66 | | | | | $ | 12.07 | |
| | | | | | | |
| | | | | | | | | | | | | | | | | | | | | | |
| | | 0.41 | | | | | | 0.45 | | | | | | 0.48 | | | | | | 0.34 | |
| | | (0.32 | ) | | | | | 0.28 | | | | | | (0.07 | ) | | | | | 0.59 | |
| | | | | | | | | | | | | | | | | | | | | | |
| | | 0.09 | | | | | | 0.73 | | | | | | 0.41 | | | | | | 0.93 | |
| | | | | | | | | | | | | | | | | | | | | | |
| | | | | | | |
| | | | | | | | | | | | | | | | | | | | | | |
| | | (0.42 | ) | | | | | (0.45 | ) | | | | | (0.48 | ) | | | | | (0.34 | ) |
| | | | | | | | | | | | | | | | | | | | | | |
| | | (0.42 | ) | | | | | (0.45 | ) | | | | | (0.48 | ) | | | | | (0.34 | ) |
| | | | | | | | | | | | | | | | | | | | | | |
| | | | | | | |
| | $ | 12.54 | | | | | $ | 12.87 | | | | | $ | 12.59 | | | | | $ | 12.66 | |
| | | | | | | | | | | | | | | | | | | | | | |
| | | | | | | |
| | | 0.75% | | | | | | 5.87% | | | | | | 3.27% | | | | | | 7.74% | |
| | | | | | | |
| | | | | | | | | | | | | | | | | | | | | | |
| | $ | 88,826 | | | | | $ | 53,133 | | | | | $ | 32,084 | | | | | $ | 17,533 | |
| | | 0.60% | | | | | | 0.60% | | | | | | 0.62% | | | | | | 0.65% | |
| | | 0.70% | | | | | | 0.70% | | | | | | 0.71% | | | | | | 0.70% | |
| | | 3.33% | | | | | | 3.50% | | | | | | 3.76% | | | | | | 3.84% | |
| | | 3.23% | | | | | | 3.40% | | | | | | 3.67% | | | | | | 3.79% | |
| | | 17% | | | | | | 15% | | | | | | 11% | | | | | | 10% | 5 |
| | | | | | | | | | | | | | | | | | | | | | |
| |
71
Financial highlights
Delaware Tax-Free Minnesota Intermediate Fund Class A
Selected data for each share of the Fund outstanding throughout each period were as follows:
|
| |
|
| |
|
Net asset value, beginning of period |
|
Income (loss) from investment operations: |
Net investment income1 |
Net realized and unrealized gain (loss) |
| |
Total from investment operations |
| |
|
Less dividends and distributions from: |
Net investment income |
Net realized gain |
| |
Total dividends and distributions |
| |
|
Net asset value, end of period |
| |
|
Total return2 |
|
Ratios and supplemental data: |
Net assets, end of period (000 omitted) |
Ratio of expenses to average net assets |
Ratio of expenses to average net assets prior to fees waived3 |
Ratio of net investment income to average net assets |
Ratio of net investment income to average net assets prior to fees waived3 |
Portfolio turnover |
|
|
| 1 | The average shares outstanding have been applied for per share information. |
| 2 | Total investment return is based on the change in net asset value of a share during the period and assumes reinvestment of dividends and distributions at net asset value and does not reflect the impact of a sales charge. Total investment return during all of the periods shown reflects waivers by the manager and/or distributor. Performance would have been lower had the waivers not been in effect. |
| 3 | Expenses paid indirectly were not material, as reflected in the “Statements of operations”, and had no impact on the ratios disclosed. |
See accompanying notes, which are an integral part of the financial statements.
72
| | | | | | | | | | | | | | | | | | | | | | | | | | | | |
| | | Year ended | |
| | | | |
| | | 8/31/17 | | | | | 8/31/16 | | | | | 8/31/15 | | | | | 8/31/14 | | | | | 8/31/13 | |
| |
| | $ | 11.44 | | | | | $ | 11.22 | | | | | $ | 11.32 | | | | | $ | 10.84 | | | | | $ | 11.53 | |
| | | | | | | | | |
| | | | | | | | | | | | | | | | | | | | | | | | | | | | |
| | | 0.31 | | | | | | 0.33 | | | | | | 0.34 | | | | | | 0.34 | | | | | | 0.33 | |
| | | (0.25 | ) | | | | | 0.22 | | | | | | (0.10 | ) | | | | | 0.49 | | | | | | (0.67 | ) |
| | | | | | | | | | | | | | | | | | | | | | | | | | | | |
| | | 0.06 | | | | | | 0.55 | | | | | | 0.24 | | | | | | 0.83 | | | | | | (0.34 | ) |
| | | | | | | | | | | | | | | | | | | | | | | | | | | | |
| | | | | | | | | |
| | | | | | | | | | | | | | | | | | | | | | | | | | | | |
| | | (0.31 | ) | | | | | (0.33 | ) | | | | | (0.34 | ) | | | | | (0.34 | ) | | | | | (0.33 | ) |
| | | (0.02 | ) | | | | | — | | | | | | — | | | | | | (0.01 | ) | | | | | (0.02 | ) |
| | | | | | | | | | | | | | | | | | | | | | | | | | | | |
| | | (0.33 | ) | | | | | (0.33 | ) | | | | | (0.34 | ) | | | | | (0.35 | ) | | | | | (0.35 | ) |
| | | | | | | | | | | | | | | | | | | | | | | | | | | | |
| | | | | | | | | |
| | $ | 11.17 | | | | | $ | 11.44 | | | | | $ | 11.22 | | | | | $ | 11.32 | | | | | $ | 10.84 | |
| | | | | | | | | | | | | | | | | | | | | | | | | | | | |
| | | | | | | | | |
| | | 0.55% | | | | | | 4.98% | | | | | | 2.12% | | | | | | 7.79% | | | | | | (3.09% | ) |
| | | | | | | | | |
| | | | | | | | | | | | | | | | | | | | | | | | | | | | |
| | $ | 68,934 | | | | | $ | 79,730 | | | | | $ | 84,663 | | | | | $ | 90,571 | | | | | $ | 90,110 | |
| | | 0.84% | | | | | | 0.84% | | | | | | 0.85% | | | | | | 0.84% | | | | | | 0.84% | |
| | | 0.99% | | | | | | 0.97% | | | | | | 0.98% | | | | | | 0.98% | | | | | | 0.97% | |
| | | 2.79% | | | | | | 2.92% | | | | | | 2.98% | | | | | | 3.08% | | | | | | 2.89% | |
| | | 2.64% | | | | | | 2.79% | | | | | | 2.85% | | | | | | 2.94% | | | | | | 2.76% | |
| | | 22% | | | | | | 14% | | | | | | 14% | | | | | | 14% | | | | | | 17% | |
| | | | | | | | | | | | | | | | | | | | | | | | | | | | |
| |
73
Financial highlights
Delaware Tax-Free Minnesota Intermediate Fund Class C
Selected data for each share of the Fund outstanding throughout each period were as follows:
|
| |
|
| |
|
Net asset value, beginning of period |
|
Income (loss) from investment operations: |
Net investment income1 |
Net realized and unrealized gain (loss) |
| |
Total from investment operations |
| |
|
Less dividends and distributions from: |
Net investment income |
Net realized gain |
| |
Total dividends and distributions |
| |
|
Net asset value, end of period |
| |
|
Total return2 |
|
Ratios and supplemental data: |
Net assets, end of period (000 omitted) |
Ratio of expenses to average net assets |
Ratio of expenses to average net assets prior to fees waived3 |
Ratio of net investment income to average net assets |
Ratio of net investment income to average net assets prior to fees waived3 |
Portfolio turnover |
|
|
| 1 | The average shares outstanding have been applied for per share information. |
| 2 | Total investment return is based on the change in net asset value of a share during the period and assumes reinvestment of dividends and distributions at net asset value and does not reflect the impact of a sales charge. Total investment return during all of the periods shown reflects a waiver by the manager. Performance would have been lower had the waiver not been in effect. |
| 3 | Expenses paid indirectly were not material, as reflected in the “Statements of operations”, and had no impact on the ratios disclosed. |
See accompanying notes, which are an integral part of the financial statements.
74
| | | | | | | | | | | | | | | | | | | | | | | | | | | | |
| | | Year ended | |
| | | | |
| | | 8/31/17 | | | | | 8/31/16 | | | | | 8/31/15 | | | | | 8/31/14 | | | | | 8/31/13 | |
| |
| | $ | 11.47 | | | | | $ | 11.24 | | | | | $ | 11.35 | | | | | $ | 10.86 | | | | | $ | 11.56 | |
| | | | | | | | | |
| | | | | | | | | | | | | | | | | | | | | | | | | | | | | |
| | | 0.22 | | | | | | 0.24 | | | | | | 0.24 | | | | | | 0.25 | | | | | | 0.23 | |
| | | (0.26 | ) | | | | | 0.23 | | | | | | (0.11 | ) | | | | | 0.50 | | | | | | (0.68 | ) |
| | | | | | | | | | | | | | | | | | | | | | | | | | | | |
| | | (0.04 | ) | | | | | 0.47 | | | | | | 0.13 | | | | | | 0.75 | | | | | | (0.45 | ) |
| | | | | | | | | | | | | | | | | | | | | | | | | | | | |
| | | | | | | | | |
| | | | | | | | | | | | | | | | | | | | | | | | | | | | |
| | | (0.22 | ) | | | | | (0.24 | ) | | | | | (0.24 | ) | | | | | (0.25 | ) | | | | | (0.23 | ) |
| | | (0.02 | ) | | | | | — | | | | | | — | | | | | | (0.01 | ) | | | | | (0.02 | ) |
| | | | | | | | | | | | | | | | | | | | | | | | | | | | |
| | | (0.24 | ) | | | | | (0.24 | ) | | | | | (0.24 | ) | | | | | (0.26 | ) | | | | | (0.25 | ) |
| | | | | | | | | | | | | | | | | | | | | | | | | | | | |
| | | | | | | | | |
| | $ | 11.19 | | | | | $ | 11.47 | | | | | $ | 11.24 | | | | | $ | 11.35 | | | | | $ | 10.86 | |
| | | | | | | | | | | | | | | | | | | | | | | | | | | | |
| | | | | | | | | |
| | | (0.39% | ) | | | | | 4.17% | | | | | | 1.16% | | | | | | 6.96% | | | | | | (3.99% | ) |
| | | | | | | | | |
| | | | | | | | | | | | | | | | | | | | | | | | | | | | |
| | $ | 11,885 | | | | | $ | 13,315 | | | | | $ | 11,740 | | | | | $ | 12,651 | | | | | $ | 14,538 | |
| | | 1.69% | | | | | | 1.69% | | | | | | 1.70% | | | | | | 1.69% | | | | | | 1.69% | |
| | | 1.74% | | | | | | 1.72% | | | | | | 1.73% | | | | | | 1.73% | | | | | | 1.72% | |
| | | 1.94% | | | | | | 2.07% | | | | | | 2.13% | | | | | | 2.23% | | | | | | 2.04% | |
| | | 1.89% | | | | | | 2.04% | | | | | | 2.10% | | | | | | 2.19% | | | | | | 2.01% | |
| | | 22% | | | | | | 14% | | | | | | 14% | | | | | | 14% | | | | | | 17% | |
| | | | | | | | | | | | | | | | | | | | | | | | | | | | |
| |
75
Financial highlights
Delaware Tax-Free Minnesota Intermediate Fund Institutional Class
Selected data for each share of the Fund outstanding throughout each period were as follows:
|
|
| |
|
| |
|
Net asset value, beginning of period |
|
Income (loss) from investment operations: |
Net investment income2 |
Net realized and unrealized gain (loss) |
| |
Total from investment operations |
| |
|
Less dividends and distributions from: |
Net investment income |
Net realized gain |
| |
Total dividends and distributions |
| |
|
Net asset value, end of period |
| |
|
Total return3 |
|
Ratios and supplemental data: |
Net assets, end of period (000 omitted) |
Ratio of expenses to average net assets |
Ratio of expenses to average net assets prior to fees waived4 |
Ratio of net investment income to average net assets |
Ratio of net investment income to average net assets prior to fees waived4 |
Portfolio turnover |
|
|
| 1 | Date of commencement of operations; ratios have been annualized and total return has not been annualized. |
| 2 | The average shares outstanding have been applied for per share information. |
| 3 | Total investment return is based on the change in net asset value of a share during the period and assumes reinvestment of dividends and distributions at net asset value. Total investment return during all of the periods shown reflects a waiver by the manager. Performance would have been lower had the waiver not been in effect. |
| 4 | Expenses paid indirectly were not material, as reflected in the “Statements of operations”, and had no impact on the ratios disclosed. |
| 5 | Portfolio turnover is representative of the Fund for the entire year. |
See accompanying notes, which are an integral part of the financial statements.
76
| | | | | | | | | | | | | | | | | | | | | | |
| | | Year ended | | | | |
| 12/31/131
to 8/31/14 |
|
| | | | | | | |
| | | 8/31/17 | | | | | | 8/31/16 | | | | | | 8/31/15 | | | | |
| |
| | $ | 11.45 | | | | | $ | 11.22 | | | | | $ | 11.33 | | | | | $ | 10.95 | |
| | | | | | | |
| | | | | | | | | | | | | | | | | | | | | | | |
| | | 0.33 | | | | | | 0.35 | | | | | | 0.35 | | | | | | 0.26 | |
| | | (0.26 | ) | | | | | 0.23 | | | | | | (0.11 | ) | | | | | 0.38 | |
| | | | | | | | | | | | | | | | | | | | | | |
| | | 0.07 | | | | | | 0.58 | | | | | | 0.24 | | | | | | 0.64 | |
| | | | | | | | | | | | | | | | | | | | | | |
| | | | | | | |
| | | | | | | | | | | | | | | | | | | | | | | |
| | | (0.33 | ) | | | | | (0.35 | ) | | | | | (0.35 | ) | | | | | (0.26 | ) |
| | | (0.02 | ) | | | | | — | | | | | | — | | | | | | — | |
| | | | | | | | | | | | | | | | | | | | | | |
| | | (0.35 | ) | | | | | (0.35 | ) | | | | | (0.35 | ) | | | | | (0.26 | ) |
| | | | | | | | | | | | | | | | | | | | | | |
| | | | | | | |
| | $ | 11.17 | | | | | $ | 11.45 | | | | | $ | 11.22 | | | | | $ | 11.33 | |
| | | | | | | | | | | | | | | | | | | | | | |
| | | | | | | |
| | | 0.61% | | | | | | 5.22% | | | | | | 2.18% | | | | | | 5.85% | |
| | | | | | | |
| | | | | | | | | | | | | | | | | | | | | | | |
| | $ | 18,800 | | | | | $ | 12,694 | | | | | $ | 4,402 | | | | | $ | 2,376 | |
| | | 0.69% | | | | | | 0.69% | | | | | | 0.70% | | | | | | 0.69% | |
| | | 0.74% | | | | | | 0.72% | | | | | | 0.73% | | | | | | 0.73% | |
| | | 2.94% | | | | | | 3.07% | | | | | | 3.13% | | | | | | 3.21% | |
| | | 2.89% | | | | | | 3.04% | | | | | | 3.10% | | | | | | 3.17% | |
| | | 22% | | | | | | 14% | | | | | | 14% | | | | | | 14% | 5 |
| | | | | | | | | | | | | | | | | | | | | | | |
| |
77
Financial highlights
Delaware Minnesota High-Yield Municipal Bond Fund Class A
Selected data for each share of the Fund outstanding throughout each period were as follows:
|
| |
|
| |
|
Net asset value, beginning of period |
|
Income (loss) from investment operations: |
Net investment income1 |
Net realized and unrealized gain (loss) |
|
Total from investment operations |
|
|
Less dividends and distributions from: |
Net investment income |
|
Total dividends and distributions |
|
|
Net asset value, end of period |
|
|
Total return2 |
|
|
Ratios and supplemental data: |
Net assets, end of period (000 omitted) |
|
Ratio of expenses to average net assets |
|
Ratio of expenses to average net assets prior to fees waived3 |
|
Ratio of net investment income to average net assets |
|
Ratio of net investment income to average net assets prior to fees waived3 |
|
Portfolio turnover |
|
|
| 1 | The average shares outstanding have been applied for per share information. |
| 2 | Total investment return is based on the change in net asset value of a share during the period and assumes reinvestment of dividends and distributions at net asset value and does not reflect the impact of a sales charge. Total investment return during all of the periods shown reflects a waiver by the manager. Performance would have been lower had the waiver not been in effect. |
| 3 | Expenses paid indirectly were not material, as reflected in the “Statements of operations”, and had no impact on the ratios disclosed. |
See accompanying notes, which are an integral part of the financial statements.
78
| | | | | | | | | | | | | | | | | | | | | | | | | | | | |
| | | Year ended | |
| | | 8/31/17 | | | | | 8/31/16 | | | | | 8/31/15 | | | | | 8/31/14 | | | | | 8/31/13 | |
| |
| | $ | 11.13 | | | | | $ | 10.84 | | | | | $ | 10.88 | | | | | $ | 10.25 | | | | | $ | 11.08 | |
| | | | | | | | | |
| | | | | | | | | | | | | | | | | | | | | | | | | | | | |
| | | 0.33 | | | | | | 0.36 | | | | | | 0.38 | | | | | | 0.40 | | | | | | 0.40 | |
| | | (0.25 | ) | | | | | 0.29 | | | | | | (0.04 | ) | | | | | 0.63 | | | | | | (0.83 | ) |
| | | | | | | | | | | | | | | | | | | | | | | | | | | | |
| | | 0.08 | | | | | | 0.65 | | | | | | 0.34 | | | | | | 1.03 | | | | | | (0.43 | ) |
| | | | | | | | | | | | | | | | | | | | | | | | | | | | |
| | | | | | | | | |
| | | | | | | | | | | | | | | | | | | | | | | | | | | | |
| | | (0.33 | ) | | | | | (0.36 | ) | | | | | (0.38 | ) | | | | | (0.40 | ) | | | | | (0.40 | ) |
| | | | | | | | | | | | | | | | | | | | | | | | | | | | |
| | | (0.33 | ) | | | | | (0.36 | ) | | | | | (0.38 | ) | | | | | (0.40 | ) | | | | | (0.40 | ) |
| | | | | | | | | | | | | | | | | | | | | | | | | | | | |
| | | | | | | | | |
| | $ | 10.88 | | | | | $ | 11.13 | | | | | $ | 10.84 | | | | | $ | 10.88 | | | | | $ | 10.25 | |
| | | | | | | | | | | | | | | | | | | | | | | | | | | | |
| | | | | | | | | |
| | | 0.84% | | | | | | 6.12% | | | | | | 3.20% | | | | | | 10.25% | | | | | | (4.06% | ) |
| | | | | | | | | |
| | $ | 98,491 | | | | | $ | 121,168 | | | | | $ | 122,618 | | | | | $ | 119,044 | | | | | $ | 121,232 | |
| | | 0.89% | | | | | | 0.89% | | | | | | 0.91% | | | | | | 0.89% | | | | | | 0.89% | |
| | | 0.99% | | | | | | 0.98% | | | | | | 1.01% | | | | | | 0.99% | | | | | | 0.99% | |
| | | 3.08% | | | | | | 3.23% | | | | | | 3.52% | | | | | | 3.82% | | | | | | 3.64% | |
| | | 2.98% | | | | | | 3.14% | | | | | | 3.42% | | | | | | 3.72% | | | | | | 3.54% | |
| | | 19% | | | | | | 15% | | | | | | 16% | | | | | | 15% | | | | | | 14% | |
| | | | | | | | | | | | | | | | | | | | | | | | | | | | |
| |
79
Financial highlights
Delaware Minnesota High-Yield Municipal Bond Fund Class C
Selected data for each share of the Fund outstanding throughout each period were as follows:
|
| |
|
| |
|
Net asset value, beginning of period |
|
Income (loss) from investment operations: |
Net investment income1 |
Net realized and unrealized gain (loss) |
|
Total from investment operations |
|
|
Less dividends and distributions from: |
Net investment income |
|
Total dividends and distributions |
|
|
Net asset value, end of period |
|
|
Total return2 |
|
Ratios and supplemental data: |
Net assets, end of period (000 omitted) |
Ratio of expenses to average net assets |
Ratio of expenses to average net assets prior to fees waived3 |
Ratio of net investment income to average net assets |
Ratio of net investment income to average net assets prior to fees waived3 |
Portfolio turnover |
|
|
| 1 | The average shares outstanding have been applied for per share information. |
| 2 | Total investment return is based on the change in net asset value of a share during the period and assumes reinvestment of dividends and distributions at net asset value and does not reflect the impact of a sales charge. Total investment return during all of the periods shown reflects a waiver by the manager. Performance would have been lower had the waiver not been in effect. |
| 3 | Expenses paid indirectly were not material, as reflected in the “Statements of operations”, and had no impact on the ratios disclosed. |
See accompanying notes, which are an integral part of the financial statements.
80
| | | | | | | | | | | | | | | | | | | | | | | | | | | | |
| | | Year ended | |
| | | 8/31/17 | | | | | 8/31/16 | | | | | 8/31/15 | | | | | 8/31/14 | | | | | 8/31/13 | |
| |
| | $ | 11.15 | | | | | $ | 10.87 | | | | | $ | 10.90 | | | | | $ | 10.27 | | | | | $ | 11.10 | |
| | | | | | | | | |
| | | | | | | | | | | | | | | | | | | | | | | | | | | | |
| | | 0.25 | | | | | | 0.27 | | | | | | 0.30 | | | | | | 0.33 | | | | | | 0.32 | |
| | | (0.25 | ) | | | | | 0.29 | | | | | | (0.03 | ) | | | | | 0.62 | | | | | | (0.83 | ) |
| | | | | | | | | | | | | | | | | | | | | | | | | | | | |
| | | — | | | | | | 0.56 | | | | | | 0.27 | | | | | | 0.95 | | | | | | (0.51 | ) |
| | | | | | | | | | | | | | | | | | | | | | | | | | | | |
| | | | | | | | | |
| | | | | | | | | | | | | | | | | | | | | | | | | | | | |
| | | (0.25 | ) | | | | | (0.28 | ) | | | | | (0.30 | ) | | | | | (0.32 | ) | | | | | (0.32 | ) |
| | | | | | | | | | | | | | | | | | | | | | | | | | | | |
| | | (0.25 | ) | | | | | (0.28 | ) | | | | | (0.30 | ) | | | | | (0.32 | ) | | | | | (0.32 | ) |
| | | | | | | | | | | | | | | | | | | | | | | | | | | | |
| | | | | | | | | |
| | $ | 10.90 | | | | | $ | 11.15 | | | | | $ | 10.87 | | | | | $ | 10.90 | | | | | $ | 10.27 | |
| | | | | | | | | | | | | | | | | | | | | | | | | | | | |
| | | 0.09% | | | | | | 5.22% | | | | | | 2.53% | | | | | | 9.41% | | | | | | (4.77% | ) |
| | | | | | | | | |
| | | | | | | | | | | | | | | | | | | | | | | | | | | | |
| | $ | 32,223 | | | | | $ | 35,751 | | | | | $ | 32,174 | | | | | $ | 32,279 | | | | | $ | 33,140 | |
| | | 1.64% | | | | | | 1.64% | | | | | | 1.66% | | | | | | 1.64% | | | | | | 1.64% | |
| | | | | | | | | |
| | | 1.74% | | | | | | 1.73% | | | | | | 1.76% | | | | | | 1.74% | | | | | | 1.74% | |
| | | 2.33% | | | | | | 2.48% | | | | | | 2.77% | | | | | | 3.07% | | | | | | 2.89% | |
| | | | | | | | | |
| | | 2.23% | | | | | | 2.39% | | | | | | 2.67% | | | | | | 2.97% | | | | | | 2.79% | |
| | | 19% | | | | | | 15% | | | | | | 16% | | | | | | 15% | | | | | | 14% | |
| | | | | | | | | | | | | | | | | | | | | | | | | | | | |
| |
81
Financial highlights
Delaware Minnesota High-Yield Municipal Bond Fund Institutional Class
Selected data for each share of the Fund outstanding throughout each period were as follows:
|
| |
|
| |
|
Net asset value, beginning of period |
|
Income (loss) from investment operations: |
Net investment income2 |
Net realized and unrealized gain (loss) |
|
Total from investment operations |
|
|
Less dividends and distributions from: |
Net investment income |
|
Total dividends and distributions |
|
|
Net asset value, end of period |
|
|
Total return3 |
|
Ratios and supplemental data: |
Net assets, end of period (000 omitted) |
Ratio of expenses to average net assets |
Ratio of expenses to average net assets prior to fees waived4 |
Ratio of net investment income to average net assets |
Ratio of net investment income to average net assets prior to fees waived4 |
Portfolio turnover |
|
|
| 1 | Date of commencement of operations; ratios have been annualized and total return has not been annualized. |
| 2 | The average shares outstanding have been applied for per share information. |
| 3 | Total investment return is based on the change in net asset value of a share during the period and assumes reinvestment of dividends and distributions at net asset value. Total investment return during all of the periods shown reflects a waiver by the manager. Performance would have been lower had the waiver not been in effect. |
| 4 | Expenses paid indirectly were not material, as reflected in the “Statements of operations”, and had no impact on the ratios disclosed. |
| 5 | Portfolio turnover is representative of the Fund for the entire year. |
See accompanying notes, which are an integral part of the financial statements.
82
| | | | | | | | | | | | | | | | | | | | | | |
| | | Year ended | | | | | 12/31/131
to | |
| | | 8/31/17 | | | | | 8/31/16 | | | | | 8/31/15 | | | | | 8/31/14 | |
| |
| | $ | 11.12 | | | | | $ | 10.84 | | | | | $ | 10.88 | | | | | $ | 10.35 | |
| | | | | | | |
| | | | | | | | | | | | | | | | | | | | | | |
| | | 0.36 | | | | | | 0.38 | | | | | | 0.41 | | | | | | 0.31 | |
| | | (0.25 | ) | | | | | 0.29 | | | | | | (0.04 | ) | | | | | 0.53 | |
| | | | | | | | | | | | | | | | | | | | | | |
| | | 0.11 | | | | | | 0.67 | | | | | | 0.37 | | | | | | 0.84 | |
| | | | | | | | | | | | | | | | | | | | | | |
| | | | | | | |
| | | | | | | | | | | | | | | | | | | | | | |
| | | (0.36 | ) | | | | | (0.39 | ) | | | | | (0.41 | ) | | | | | (0.31 | ) |
| | | | | | | | | | | | | | | | | | | | | | |
| | | (0.36 | ) | | | | | (0.39 | ) | | | | | (0.41 | ) | | | | | (0.31 | ) |
| | | | | | | | | | | | | | | | | | | | | | |
| | | | | | | |
| | $ | 10.87 | | | | | $ | 11.12 | | | | | $ | 10.84 | | | | | $ | 10.88 | |
| | | | | | | | | | | | | | | | | | | | | | |
| | | 1.09% | | | | | | 6.28% | | | | | | 3.46% | | | | | | 8.21% | |
| | | | | | | |
| | | | | | | | | | | | | | | | | | | | | | |
| | $ | 44,805 | | | | | $ | 31,206 | | | | | $ | 14,841 | | | | | $ | 6,470 | |
| | | 0.64% | | | | | | 0.64% | | | | | | 0.66% | | | | | | 0.64% | |
| | | | | | | |
| | | 0.74% | | | | | | 0.73% | | | | | | 0.76% | | | | | | 0.74% | |
| | | 3.33% | | | | | | 3.48% | | | | | | 3.77% | | | | | | 4.04% | |
| | | | | | | |
| | | 3.23% | | | | | | 3.39% | | | | | | 3.67% | | | | | | 3.94% | |
| | | 19% | | | | | | 15% | | | | | | 16% | | | | | | 15% | 5 |
| | | | | | | | | | | | | | | | | | | | | | |
| |
83
| | |
| Notes to financial statements |
| Delaware Minnesota Municipal Bond Funds | | August 31, 2017 |
Voyageur Mutual Funds is organized as a Delaware statutory trust and offers five series: Delaware Minnesota High-Yield Municipal Bond Fund, Delaware National High-Yield Municipal Bond Fund, Delaware Tax-Free California Fund, Delaware Tax-Free Idaho Fund, and Delaware Tax-Free New York Fund. Voyageur Tax-Free Funds is organized as a Delaware statutory trust and offers Delaware Tax-Free Minnesota Fund. Voyageur Intermediate Tax-Free Funds is organized as a Delaware statutory trust and offers Delaware Tax-Free Minnesota Intermediate Fund. Voyageur Mutual Funds, Voyageur Tax-Free Funds, and Voyageur Intermediate Tax-Free Funds are each referred to as a Trust, or collectively, as the Trusts. These financial statements and the related notes pertain to Delaware Tax-Free Minnesota Fund, Delaware Tax-Free Minnesota Intermediate Fund, and Delaware Minnesota High-Yield Municipal Bond Fund (each referred to as a Fund, or collectively, as the Funds). The above Trusts are open-end investment companies. The Funds are considered diversified under the Investment Company Act of 1940, as amended (1940 Act), and offer Class A, Class C, and Institutional Class shares. Class A shares are sold with a maximum front-end sales charge of 4.50% for Delaware Tax-Free Minnesota Fund and Delaware Minnesota High-Yield Municipal Bond Fund, and 2.75% for Delaware Tax-Free Minnesota Intermediate Fund. Class A share purchases of $1,000,000 or more will incur a contingent deferred sales charge (CDSC) instead of a front-end sales charge of 1.00% if redeemed during the first year, and 0.50% during the second year for Delaware Tax-Free Minnesota Fund and Delaware Minnesota High-Yield Municipal Bond Fund, and 0.75% for Delaware Tax-Free Minnesota Intermediate Fund, if redeemed within the first year, provided that Delaware Distributors, L.P. (DDLP) paid a financial advisor a commission on the purchase of those shares. Class C shares are sold with a CDSC of 1.00%, if redeemed during the first 12 months. Institutional Class shares are not subject to a sales charge and are offered for sale exclusively to certain eligible investors.
The investment objective of Delaware Tax-Free Minnesota Fund is to seek as high a level of current income exempt from federal income tax and from Minnesota state personal income taxes as is consistent with preservation of capital.
The investment objective of Delaware Tax-Free Minnesota Intermediate Fund is to seek to provide investors with preservation of capital and, secondarily, current income exempt from federal income tax and Minnesota state personal income taxes, by maintaining a dollar-weighted average effective portfolio maturity of 10 years or less.
The investment objective of Delaware Minnesota High-Yield Municipal Bond Fund is to seek a high level of current income exempt from federal income tax and from Minnesota state personal income taxes, primarily through investment in medium- and lower-grade municipal obligations.
1. Significant Accounting Policies
The following accounting policies are in accordance with US generally accepted accounting principles (US GAAP) and are consistently followed by the Funds.
Security Valuation – Debt securities are valued based upon valuations provided by an independent pricing service or broker and reviewed by management. To the extent current market prices are not available, the pricing service may take into account developments related to the specific security, as well as transactions in comparable securities. Valuations for fixed income securities utilize matrix systems, which reflect such factors as security prices, yields, maturities, and ratings, and are supplemented by
84
dealer and exchange quotations. Generally, other securities and assets for which market quotations are not readily available are valued at fair value as determined in good faith under the direction of each Trust’s Board of Trustees (each, a Board, or collectively, the Boards). In determining whether market quotations are readily available or fair valuation will be used, various factors will be taken into consideration, such as market closures or suspension of trading in a security. The foregoing valuation policies apply to restricted and unrestricted securities.
Federal Income Taxes – No provision for federal income taxes has been made as each Fund intends to continue to qualify for federal income tax purposes as a regulated investment company under Subchapter M of the Internal Revenue Code of 1986, as amended, and make the requisite distributions to shareholders. Each Fund evaluates tax positions taken or expected to be taken in the course of preparing each Fund’s tax returns to determine whether the tax positions are “more-likely-than-not” of being sustained by the applicable tax authority. Tax positions not deemed to meet the “more-likely-than-not” threshold are recorded as a tax benefit or expense in the current year. Management has analyzed each Fund’s tax positions taken or to be taken on the Fund’s federal income tax returns through the year ended Aug. 31, 2017 and for all open tax years (years ended Aug. 31, 2014–Aug. 31, 2016), and has concluded that no provision for federal income tax is required in each Fund’s financial statements. If applicable, each Fund recognizes interest accrued on unrecognized tax benefits in interest expense and penalties in other expenses on the “Statements of operations.” During the year ended Aug. 31, 2017, the Funds did not incur any interest or tax penalties.
Class Accounting – Investment income and common expenses are allocated to the various classes of each Fund on the basis of “settled shares” of each class in relation to the net assets of each Fund. Realized and unrealized gain (loss) on investments are allocated to the various classes of each Fund on the basis of daily net assets of each class. Distribution expenses relating to a specific class are charged directly to that class.
Use of Estimates – Each Fund is an investment company, whose financial statements are prepared in conformity with US GAAP. Therefore, each Fund follows the accounting and reporting guidelines for investment companies. The preparation of financial statements in conformity with US GAAP requires management to make estimates and assumptions that affect the fair value of investments, the reported amounts of assets and liabilities and disclosure of contingent assets and liabilities at the date of the financial statements, and the reported amounts of revenues and expenses during the reporting period. Actual results could differ from those estimates and the differences could be material.
Other – Expenses directly attributable to a Fund are charged directly to that Fund. Other expenses common to various funds within the Delaware FundsSM by Macquarie (Delaware Funds) are generally allocated among such funds on the basis of average net assets. Management fees and certain other expenses are paid monthly. Security transactions are recorded on the date the securities are purchased or sold (trade date) for financial reporting purposes. Costs used in calculating realized gains and losses on the sale of investment securities are those of the specific securities sold. Interest income is recorded on the accrual basis. Discounts and premiums on debt securities are accreted or amortized to interest income, respectively, over the lives of the respective securities using the effective interest method. Each Fund declares dividends daily from net investment income and pays the dividends monthly and declares and pays distributions from net realized gain on investments, if any, annually. Each Fund may distribute
85
| | |
| Notes to financial statements |
| Delaware Minnesota Municipal Bond Funds | | |
1. Significant Accounting Policies (continued)
more frequently, if necessary for tax purposes. Dividends and distributions, if any, are recorded on the ex-dividend date.
Each Fund may receive earnings credits from its custodian when positive cash balances are maintained, which may be used to offset custody fees. The expense paid under this arrangement is included on the “Statements of operations” under “Custodian fees” with the corresponding expense offset shown under “Less expenses paid indirectly.” For the year ended Aug. 31, 2017, each Fund earned the following amounts under this agreement:
| | | | | | |
| | | Delaware Tax-Free Minnesota Fund | | Delaware Tax-Free Minnesota Intermediate Fund | | Delaware Minnesota
High-Yield Municipal Bond Fund |
| | | |
| | $1,632 | | $254 | | $1,613 |
Each Fund receives earnings credits from its transfer agent when positive cash balances are maintained, which may be used to offset transfer agent fees. If the amount earned is greater than $1, the expense paid under this arrangement is included on the “Statements of operations” under “Dividend disbursing and transfer agent fees and expenses” with the corresponding expense offset shown under “Less expenses paid indirectly.” For the year ended Aug. 31, 2017, each Fund earned the following amounts under this agreement:
| | | | | | |
| | | Delaware Tax-Free Minnesota Fund | | Delaware Tax-Free Minnesota Intermediate Fund | | Delaware Minnesota High-Yield Municipal Bond Fund |
| | | |
| | $442 | | $76 | | $139 |
2. Investment Management, Administration Agreements, and Other Transactions with Affiliates
In accordance with the terms of its respective investment management agreement, each Fund pays Delaware Management Company (DMC), a series of Macquarie Investment Management Business Trust (formerly, Delaware Management Business Trust) and the investment manager, an annual fee which is calculated daily and paid monthly based on each Fund’s average daily net assets as follows:
| | | | | | |
| | | Delaware Tax-Free Minnesota Fund | | Delaware Tax-Free Minnesota Intermediate Fund | | Delaware Minnesota
High-Yield Municipal Bond Fund |
On the first $500 million | | 0.550% | | 0.500% | | 0.550% |
On the next $500 million | | 0.500% | | 0.475% | | 0.500% |
On the next $1.5 billion | | 0.450% | | 0.450% | | 0.450% |
In excess of $2.5 billion | | 0.425% | | 0.425% | | 0.425% |
DMC has contractually agreed to waive that portion, if any, of its investment advisory fees and/or pay/reimburse each Fund to the extent necessary to ensure that total annual operating expenses (excluding any distribution and service (12b-1) fees, taxes, interest, acquired fund fees and expenses, inverse floater program expenses, short sale and dividend interest expenses, brokerage fees, certain insurance costs, and nonroutine expenses or costs, including, but not limited to, those relating to reorganizations, litigation, conducting shareholder meetings, and liquidations (collectively, nonroutine
86
expenses)), do not exceed the following percentage of each Fund’s average daily net assets from Sept. 1, 2016 through Aug. 31, 2017.* For purposes of these waivers and reimbursements, nonroutine expenses may also include such additional costs and expenses, as may be agreed upon from time to time by each Board and DMC. These waivers and reimbursements apply only to expenses paid directly by each Fund and may only be terminated by agreement of DMC and each Fund.
| | | | | | |
| | | Delaware Tax-Free Minnesota Fund | | Delaware Tax-Free Minnesota Intermediate Fund | | Delaware Minnesota High-Yield Municipal Bond Fund |
| | | |
Operating expense limitation as a percentage of average daily net assets (per annum) | | 0.60% | | 0.69% | | 0.64% |
Delaware Investments Fund Services Company (DIFSC), an affiliate of DMC, provides fund accounting and financial administration oversight services to each Fund. For these services, DIFSC’s fees are calculated daily and paid monthly based on the aggregate daily net asset of the Delaware Funds at the following annual rate: 0.0050% of the first $30 billion; 0.0045% of the next $10 billion; 0.0040% of the next $10 billion; and 0.0025% of aggregate average daily net assets in excess of $50 billion. The fees payable to DIFSC under the service agreement described above are allocated among all funds in the Delaware Funds on a relative net asset value (NAV) basis. These amounts are included on the “Statements of operations” under “Accounting and administration expenses.” For the year ended Aug. 31, 2017, each Fund was charged for these services as follows:
| | | | | | |
| | | Delaware Tax-Free Minnesota Fund | | Delaware Tax-Free Minnesota Intermediate Fund | | Delaware Minnesota High-Yield Municipal Bond Fund |
| | | |
| | $26,158 | | $4,681 | | $8,216 |
DIFSC is also the transfer agent and dividend disbursing agent of the Funds. For these services, DIFSC’s fees are calculated daily and paid monthly based on the aggregate daily net assets of the retail funds within the Delaware Funds at the following annual rate: 0.025% of the first $20 billion; 0.020% of the next $5 billion; 0.015% of the next $5 billion; and 0.013% of average daily net assets in excess of $30 billion. The fees payable to DIFSC under the service agreement described above are allocated among all retail funds in the Delaware Funds on a relative NAV basis. These amounts are included on the “Statements of operations” under “Dividend disbursing and transfer agent fees and expenses.” For the year ended Aug. 31, 2017, each Fund was charged for these services as follows:
| | | | | | |
| | | Delaware Tax-Free Minnesota Fund | | Delaware Tax-Free Minnesota Intermediate Fund | | Delaware Minnesota High-Yield Municipal Bond Fund |
| | | |
| | $112,336 | | $20,102 | | $35,283 |
Pursuant to a sub-transfer agency agreement between DIFSC and BNY Mellon Investment Servicing (US) Inc. (BNYMIS), BNYMIS provides certain sub-transfer agency services to each Fund. Sub-transfer agency fees are paid by each Fund and are also included on the “Statements of operations” under “Dividend disbursing and transfer agent fees and expenses.”
87
| | |
| Notes to financial statements |
| Delaware Minnesota Municipal Bond Funds | | |
2. Investment Management, Administration Agreements, and Other Transactions with Affiliates (continued)
Pursuant to a distribution agreement and distribution plan, each Fund pays DDLP, the distributor and an affiliate of DMC, an annual 12b-1 fee of 0.25% of the average daily net assets of the Class A shares. DDLP has contracted to waive Delaware Tax-Free Minnesota Intermediate Fund’s Class A shares 12b-1 fee to 0.15% of average daily net assets from Sept. 1, 2016 through Aug. 31, 2017.* Each Fund pays 1.00% of the average daily net assets of the Class C shares. The fees are calculated daily and paid monthly. Institutional Class shares pay no 12b-1 fees.
As provided in the investment management agreement, each Fund bears a portion of the cost of certain resources shared with DMC, including the cost of internal personnel of DMC and/or its affiliates that provide legal, tax, and regulatory reporting services to each Fund. These amounts are included on the “Statements of operations” under “Legal fees.” For the year ended Aug. 31, 2017, each Fund was charged for internal legal, tax, and regulatory reporting services provided by DMC and/or its affiliates’ employees as follows:
| | | | | | |
| | | Delaware Tax-Free Minnesota Fund | | Delaware Tax-Free Minnesota Intermediate Fund | | Delaware Minnesota High-Yield Municipal Bond Fund |
| | | |
| | $11,121 | | $2,103 | | $3,516 |
For the year ended Aug. 31, 2017, DDLP earned commissions on sales of each Fund’s Class A shares as follows:
| | | | | | |
| | | Delaware Tax-Free Minnesota Fund | | Delaware Tax-Free Minnesota Intermediate Fund | | Delaware Minnesota High-Yield Municipal Bond Fund |
| | | |
| | $32,258 | | $4,019 | | $12,487 |
For the year ended Aug. 31, 2017, DDLP received gross CDSC commissions on redemption of each Fund’s Class A and Class C shares, respectively, and these commissions were entirely used to offset upfront commissions previously paid by DDLP to broker/dealers on sales of those shares. The amounts received were as follows:
| | | | | | |
| | | Delaware Tax-Free Minnesota Fund | | Delaware Tax-Free Minnesota Intermediate Fund | | Delaware Minnesota High-Yield Municipal Bond Fund |
| | | |
| Class A | | $10,279 | | $ — | | $ — |
| Class C | | 4,830 | | 911 | | 1,594 |
Trustees’ fees include expenses accrued by each Fund for each Trustee’s retainer and meeting fees. Certain officers of DMC, DIFSC, and DDLP are officers and/or Trustees of the Trusts. These officers and Trustees are paid no compensation by the Funds.
Cross trades for the year ended Aug. 31, 2017, were executed by each Fund pursuant to procedures adopted by the Boards designed to ensure compliance with Rule 17a-7 under the 1940 Act. Cross trading is the buying or selling of portfolio securities between funds of investment companies, or between a fund of an investment company and another entity, that are or could be considered affiliates by virtue of having a common investment advisor (or affiliated investment advisors), common
88
directors/trustees and/or common officers. At their regularly scheduled meetings, the Boards review such transactions for compliance with the procedures adopted by the Boards. Pursuant to these procedures, for the year ended Aug. 31, 2017, each Fund engaged in securities purchases and securities sales, which resulted in net realized gains (losses) as follows:
| | | | | | | | | | | | | | | |
| | | Delaware Tax-Free Minnesota Fund | | Delaware Tax-Free Minnesota Intermediate Fund | | Delaware Minnesota High-Yield Municipal Bond Fund |
| | | |
| Purchases | | | $ | 33,188,637 | | | | $ | 9,777,504 | | | | $ | 13,589,828 | |
| Sales | | | | 38,545,978 | | | | | 14,477,526 | | | | | 16,623,868 | |
| Net realized losses | | | | (202,720 | ) | | | | (190,477 | ) | | | | — | |
* The aggregate contractual waiver period covering this report is from Dec. 29, 2015 through Dec. 29, 2017.
3. Investments
For the year ended Aug. 31, 2017, each Fund made purchases and sales of investment securities other than short-term investments as follows:
| | | | | | |
| | | Delaware Tax-Free Minnesota Fund | | Delaware Tax-Free Minnesota Intermediate Fund | | Delaware Minnesota High-Yield Municipal Bond Fund |
| | | |
| Purchases | | $ 93,205,462 | | $21,742,640 | | $32,499,685 |
| Sales | | 103,407,159 | | 25,571,517 | | 38,672,124 |
At Aug. 31, 2017, the cost and unrealized appreciation (depreciation) of investments for federal income tax purposes for each Fund were as follows:
| | | | | | | | | | | | |
| | | Delaware Tax-Free Minnesota Fund | | | Delaware Tax-Free Minnesota Intermediate Fund | | | Delaware Minnesota High-Yield Municipal Bond Fund | |
| | | |
| Cost of investments | | $ | 536,298,212 | | | | $94,705,711 | | | | $168,611,583 | |
| | | | | | | | | | | | |
| Aggregate unrealized appreciation of investments | | $ | 27,535,360 | | | | $ 4,288,412 | | | | $ 6,266,642 | |
| Aggregate unrealized depreciation of investments | | | (969,472) | | | | (29,594) | | | | (630,166) | |
| | | | | | | | | | | | |
| Net unrealized appreciation of investments | | $ | 26,565,888 | | | | $ 4,258,818 | | | | $ 5,636,476 | |
| | | | | | | | | | | | |
89
| | |
| Notes to financial statements |
| Delaware Minnesota Municipal Bond Funds | | |
3. Investments (continued)
US GAAP defines fair value as the price that each Fund would receive to sell an asset or pay to transfer a liability in an orderly transaction between market participants at the measurement date under current market conditions. A three-level hierarchy for fair value measurements has been established based upon the transparency of inputs to the valuation of an asset or liability. Inputs may be observable or unobservable and refer broadly to the assumptions that market participants would use in pricing the asset or liability. Observable inputs reflect the assumptions market participants would use in pricing the asset or liability based on market data obtained from sources independent of the reporting entity. Unobservable inputs reflect the reporting entity’s own assumptions about the assumptions that market participants would use in pricing the asset or liability based on the best information available under the circumstances. Each Fund’s investment in its entirety is assigned a level based upon the observability of the inputs which are significant to the overall valuation. The three-level hierarchy of inputs is summarized below and on the next page.
| | |
| Level 1 – | | Inputs are quoted prices in active markets for identical investments. (Examples: equity securities, open-end investment companies, futures contracts, exchange-traded options contracts) |
| |
| Level 2 – | | Other observable inputs, including, but not limited to: quoted prices for similar assets or liabilities in markets that are active, quoted prices for identical or similar assets or liabilities in markets that are not active, inputs other than quoted prices that are observable for the assets or liabilities (such as interest rates, yield curves, volatilities, prepayment speeds, loss severities, credit risks and default rates), or other market-corroborated inputs. (Examples: debt securities, government securities, swap contracts, foreign currency exchange contracts, foreign securities utilizing international fair value pricing, broker-quoted securities, fair valued securities) |
| |
| Level 3 – | | Significant unobservable inputs, including each Fund’s own assumptions used to determine the fair value of investments. (Examples: broker-quoted securities, fair valued securities) |
Level 3 investments are valued using significant unobservable inputs. Each Fund may also use an income-based valuation approach in which the anticipated future cash flows of the investment are discounted to calculate fair value. Discounts may also be applied due to the nature or duration of any restrictions on the disposition of the investments. Valuations may also be based upon current market prices of securities that are comparable in coupon, rating, maturity, and industry. The derived value of a Level 3 investment may not represent the value which is received upon disposition and this could impact the results of operations.
90
The following tables summarize the valuation of each Fund’s investments by fair value hierarchy levels as of Aug. 31, 2017:
| | | | | |
| | | Delaware Tax-Free Minnesota Fund |
| |
Securities | | Level 2 |
| |
Assets: | | | | | |
Municipal Bonds | | | $ | 554,789,100 | |
Short-Term Investments | | | | 8,075,000 | |
| | | | | |
Total Value of Securities | | | $ | 562,864,100 | |
| | | | | |
| |
| | | Delaware Tax-Free Minnesota Intermediate Fund |
| |
Securities | | Level 2 |
| |
Assets: | | | | | |
Municipal Bonds | | | $ | 98,214,529 | |
Short-Term Investment | | | | 750,000 | |
| | | | | |
Total Value of Securities | | | $ | 98,964,529 | |
| | | | | |
| |
| | | Delaware Minnesota High-Yield Municipal Bond Fund |
| |
Securities | | Level 2 |
| |
Assets: | | | | | |
Municipal Bonds | | | $ | 173,748,059 | |
Short-Term Investments | | | | 500,000 | |
| | | | | |
Total Value of Securities | | | $ | 174,248,059 | |
| | | | | |
During the year ended Aug. 31, 2017, there were no transfers between Level 1 investments, Level 2 investments, or Level 3 investments that had a significant impact to each Fund. Each Fund’s policy is to recognize transfers between levels based on fair value at the beginning of the reporting period.
A reconciliation of Level 3 investments is presented when each Fund has a significant amount of Level 3 investments at the beginning, interim, or end of the period in relation to net assets. During the year ended Aug. 31, 2017, there were no Level 3 investments.
91
| | |
| Notes to financial statements |
| Delaware Minnesota Municipal Bond Funds | | |
4. Dividend and Distribution Information
Income and long-term capital gain distributions are determined in accordance with federal income tax regulations, which may differ from US GAAP. Additionally, distributions from net short-term gains on sales of investment securities are treated as ordinary income for federal income tax purposes. The tax character of dividends and distributions paid during the years ended Aug. 31, 2017 and 2016 was as follows:
| | | | | | | | | | | | | | | |
| | | Delaware
Tax-Free
Minnesota Fund | | Delaware Tax-Free
Minnesota
Intermediate Fund | | Delaware Minnesota
High-Yield Municipal
Bond Fund |
Year ended 8/31/17 | | | | | | | | | | | | | | | |
Ordinary income | | | $ | 86,993 | | | | $ | — | | | | $ | 29,439 | |
Tax-exempt income | | | | 17,073,618 | | | | | 2,724,929 | | | | | 5,267,316 | |
Long-term capital gains | | | | — | | | | | 143,499 | | | | | — | |
| | | | | | | | | | | | | | | |
Total | | | $ | 17,160,611 | | | | $ | 2,868,428 | | | | $ | 5,296,755 | |
| | | | | | | | | | | | | | | |
| | | |
Year ended 8/31/16 | | | | | | | | | | | | | | | |
Ordinary income | | | $ | 62,813 | | | | $ | — | | | | $ | 56,800 | |
Tax-exempt income | | | | 18,284,531 | | | | | 2,922,138 | | | | | 5,541,875 | |
| | | | | | | | | | | | | | | |
Total | | | $ | 18,347,344 | | | | $ | 2,922,138 | | | | $ | 5,598,675 | |
| | | | | | | | | | | | | | | |
5. Components of Net Assets on a Tax Basis
As of Aug. 31, 2017, the components of net assets on a tax basis were as follows:
| | | | | | | | | | | | | | | |
| | | Delaware
Tax-Free
Minnesota Fund | | Delaware Tax-Free
Minnesota
Intermediate Fund | | Delaware Minnesota
High-Yield Municipal
Bond Fund |
Shares of beneficial interest | | | $ | 534,694,948 | | | | $ | 95,167,497 | | | | $ | 173,691,574 | |
Undistributed tax-exempt income | | | | 183,455 | | | | | 61,550 | | | | | 99,222 | |
Undistributed long-term capital gain | | | | 2,322,501 | | | | | 193,429 | | | | | — | |
Capital loss carryforwards | | | | — | | | | | — | | | | | (3,808,763 | ) |
Distributions payable | | | | (398,885 | ) | | | | (62,336 | ) | | | | (99,222 | ) |
Unrealized appreciation of investments | | | | 26,565,888 | | | | | 4,258,818 | | | | | 5,636,476 | |
| | | | | | | | | | | | | | | |
Net assets | | | $ | 563,367,907 | | | | $ | 99,618,958 | | | | $ | 175,519,287 | |
| | | | | | | | | | | | | | | |
The differences between book basis and tax basis components of net assets are primarily attributable to tax treatment of market discount and premium on debt instruments and tax deferral of losses due to wash sales, if applicable.
For financial reporting purposes, capital accounts are adjusted to reflect the tax character of permanent book/tax differences. Reclassifications are primarily due to tax treatment of market discount and
92
premium on certain debt instruments and expiration of capital loss carryforwards. Results of operations and net assets were not affected by these reclassifications.
For the year ended Aug. 31, 2017, each Fund recorded the following reclassifications:
| | | | | | | | | | | | | | | |
| | | Delaware
Tax-Free
Minnesota Fund | | Delaware Tax-Free
Minnesota
Intermediate Fund | | Delaware Minnesota
High-Yield Municipal
Bond Fund |
Distributions in excess of net investment income | | | $ | 89,270 | | | | $ | 245 | | | | $ | 26,823 | |
Accumulated net realized gain (loss) | | | | (89,270 | ) | | | | (245 | ) | | | | 57,138 | |
Paid-in capital | | | | — | | | | | — | | | | | (83,961 | ) |
For federal income tax purposes, capital loss carryforwards may be carried forward and applied against future capital gains. At Aug. 31, 2017, $83,961 of capital loss carryforwards expired for Delaware Minnesota High-Yield Municipal Bond Fund. At Aug. 31, 2017, Delaware Tax-Free Minnesota Fund and Delaware Minnesota High-Yield Municipal Bond Fund utilized capital loss carryforwards as follows:
| | | | | | | | | | |
| | | Delaware
Tax-Free
Minnesota Fund | | Delaware Minnesota
High-Yield Municipal
Bond Fund |
Capital loss carryforwards utilized | | | $ | 1,535,859 | | | | $ | 752,519 | |
Under the Regulated Investment Company Modernization Act of 2010 (Act), net capital losses recognized for tax years beginning after Dec. 22, 2010 may be carried forward indefinitely, and their character is retained as short-term and/or long-term losses. Previously, net capital losses were carried forward for eight years and treated as short-term losses. As a transition rule, the Act requires that post-enactment net capital losses be used before pre-enactment net capital losses. At Aug. 31, 2017, Delaware Tax-Free Minnesota Fund and Delaware Tax-Free Minnesota Intermediate Fund did not have any capital loss carryforwards.
At Aug. 31, 2017, capital loss carryforwards available to offset future realized capital gains for Delaware Minnesota High-Yield Municipal Bond Fund were as follows:
| | | | | | | | | | | | |
| | | | | | Pre-enactment capital loss Expiration date | | No expiration Post-enactment capital loss character | | |
| | | | | |
| | | | | | 2018 | | Short-term | | Long-term | | Total |
Delaware Minnesota High-Yield Municipal Bond Fund | | | | | | $2,974,512 | | $834,251 | | $— | | $3,808,763 |
93
| | |
| Notes to financial statements |
| Delaware Minnesota Municipal Bond Funds | | |
6. Capital Shares
Transactions in capital shares were as follows:
| | | | | | | | | | | | | | | | | | | | | | | | |
| | | Delaware Tax-Free
Minnesota Fund | | | Delaware Tax-Free
Minnesota
Intermediate Fund | | | Delaware Minnesota
High-Yield Municipal
Bond Fund | |
| | | |
| | | Year ended | | | Year ended | | | Year ended | |
| | | | | | |
| | | 8/31/17 | | | 8/31/16 | | | 8/31/17 | | | 8/31/16 | | | 8/31/17 | | | 8/31/16 | |
Shares sold: | | | | | | | | | | | | | | | | | | | | | | | | |
Class A | | | 2,747,811 | | | | 2,932,737 | | | | 269,504 | | | | 581,319 | | | | 1,060,326 | | | | 1,381,534 | |
Class C | | | 517,770 | | | | 814,808 | | | | 119,496 | | | | 189,236 | | | | 241,813 | | | | 422,381 | |
Institutional Class | | | 4,787,117 | | | | 1,894,217 | | | | 1,004,436 | | | | 809,883 | | | | 3,027,526 | | | | 1,623,503 | |
| | |
Shares issued upon reinvestment of dividends and distributions: | | | | | | | | | |
Class A | | | 917,146 | | | | 1,025,969 | | | | 163,261 | | | | 187,219 | | | | 250,746 | | | | 286,859 | |
Class C | | | 88,474 | | | | 86,077 | | | | 22,320 | | | | 21,589 | | | | 63,226 | | | | 66,112 | |
Institutional Class | | | 158,787 | | | | 98,996 | | | | 42,296 | | | | 20,187 | | | | 95,656 | | | | 66,056 | |
| | | | | | | | | | | | | | | | | | | | | | | | |
| | | 9,217,105 | | | | 6,852,804 | | | | 1,621,313 | | | | 1,809,433 | | | | 4,739,293 | | | | 3,846,445 | |
| | | | | | | | | | | | | | | | | | | | | | | | |
Shares redeemed: | | | | | | | | | | | | | | | | | | | | | | | | |
Class A | | | (7,273,577 | ) | | | (4,636,674 | ) | | | (1,227,248 | ) | | | (1,347,933 | ) | | | (3,146,683 | ) | | | (2,085,479 | ) |
Class C | | | (692,757 | ) | | | (350,128 | ) | | | (240,858 | ) | | | (94,024 | ) | | | (555,354 | ) | | | (242,730 | ) |
Institutional Class | | | (1,991,890 | ) | | | (412,513 | ) | | | (472,778 | ) | | | (113,588 | ) | | | (1,808,540 | ) | | | (252,972 | ) |
| | | | | | | | | | | | | | | | | | | | | | | | |
| | | (9,958,224 | ) | | | (5,399,315 | ) | | | (1,940,884 | ) | | | (1,555,545 | ) | | | (5,510,577 | ) | | | (2,581,181 | ) |
| | | | | | | | | | | | | | | | | | | | | | | | |
| | | | | | |
Net increase (decrease) | | | (741,119 | ) | | | 1,453,489 | | | | (319,571 | ) | | | 253,888 | | | | (771,284 | ) | | | 1,265,264 | |
| | | | | | | | | | | | | | | | | | | | | | | | |
94
Certain shareholders may exchange shares of one class for shares of another class in the same Fund. These exchange transactions are included as subscriptions and redemptions in the tables above and the “Statements of changes in net assets.” For the years ended Aug. 31, 2017 and 2016, the Funds had the following exchange transactions:
| | | | | | | | | | | | | | | | | | | | | | | | | | | | | | |
| | | | | | | Year ended | | | | | | |
| | | | | | | 8/31/17 | | | | | | |
| | | |
| | | Exchange Redemptions | | Exchange Subscriptions | | |
| | | | | | |
| | | Class A
Shares | | Class C
Shares | | Institutional
Class
Shares | | Class A
Shares | | Institutional
Class
Shares | | Value |
Delaware Tax-Free Minnesota Fund | | | | 1,100,450 | | | | | 32,124 | | | | | 3,022 | | | | | 6,248 | | | | | 1,131,525 | | | | $ | 14,020,023 | |
Delaware Tax-Free Minnesota Intermediate Fund | | | | 181,773 | | | | | 2,496 | | | | | — | | | | | — | | | | | 184,436 | | | | | 2,027,196 | |
Delaware Minnesota High-Yield Municipal Bond Fund | | | | 723,695 | | | | | 16,753 | | | | | — | | | | | — | | | | | 742,303 | | | | | 7,897,713 | |
| | | | | | | | | | | | | | | | | |
| | | | | Year ended 8/31/16 | | | | |
| | | | |
| | | Exchange
Redemptions Class A
Shares | | Exchange
Subscriptions
Institutional
Class
Shares | | Value | | |
Delaware Tax-Free Minnesota Fund | | | | 40,302 | | | | | 40,367 | | | | $ | 518,917 | | | |
Delaware Tax-Free Minnesota Intermediate Fund | | | | 7,520 | | | | | 7,529 | | | | | 86,357 | | | |
Delaware Minnesota High-Yield Municipal Bond Fund | | | | 96,773 | | | | | 96,971 | | | | | 1,076,549 | | | |
7. Line of Credit
Each Fund, along with certain other funds in the Delaware Funds (Participants), was a participant in a $155,000,000 revolving line of credit intended to be used for temporary or emergency purposes as an additional source of liquidity to fund redemptions of investor shares. Under the agreement, the Participants were charged an annual commitment fee of 0.10%, which was allocated across the Participants on the basis of relative net assets of each Participant’s allocation of the entire facility. The Participants were permitted to borrow up to a maximum of one-third of their net assets under the agreement. Each Participant was individually, and not jointly, liable for its particular advances, if any, under the line of credit. The line of credit available under the agreement expired on Nov. 7, 2016.
95
| | |
| Notes to financial statements |
| Delaware Minnesota Municipal Bond Funds | | |
7. Line of Credit (continued)
On Nov. 7, 2016, each Fund, along with the other Participants, entered into an amendment to the agreement for a $155,000,000 revolving line of credit. The line of credit is to be used as described above and operates in substantially the same manner as the original agreement, with the exception of the annual commitment fee. Under the amendment to the agreement, the Participants are charged an annual commitment fee of 0.15%, which is allocated across the Participants on the basis of relative net assets of each Participant’s allocation of the entire facility. The line of credit available under the agreement expires on Nov. 6, 2017.
The Funds had no amounts outstanding as of Aug. 31, 2017, or at any time during the year then ended.
8. Geographic, Credit, and Market Risks
The Funds concentrate their investments in securities issued by municipalities, mainly in Minnesota, and may be subject to geographic concentration risk. In addition, the Funds have the flexibility to invest in issuers in US territories and possessions such as the Commonwealth of Puerto Rico, the US Virgin Islands, and Guam whose bonds are also free of federal and individual state income taxes.
The value of the Funds’ investments may be adversely affected by new legislation within the state or US territories, regional or local economic conditions, and differing levels of supply and demand for municipal bonds. Many municipalities insure repayment for their obligations. Although bond insurance reduces the risk of loss due to default by an issuer, such bonds remain subject to the risk that value may fluctuate for other reasons, and there is no certainty that the insurance company will meet its obligations. A real or perceived decline in creditworthiness of a bond insurer can have an adverse impact on the value of insured bonds held in each Fund. At Aug. 31, 2017, the percentages of each Fund’s net assets insured by bond insurers are listed below, and these securities have been identified in the “Schedules of investments.”
| | | | | | | | | | | | | | | |
| | | Delaware
Tax-Free
Minnesota Fund | | Delaware Tax-Free
Minnesota
Intermediate Fund | | Delaware Minnesota
High-Yield Municipal
Bond Fund |
Assured Guaranty Corporation | | | | 4.75% | | | | | 5.77% | | | | | 1.66% | |
Assured Guaranty Municipal Corporation | | | | 1.39% | | | | | 0.51% | | | | | 0.28% | |
National Public Finance Guarantee Corporation | | | | 0.77% | | | | | — | | | | | — | |
| | | | | | | | | | | | | | | |
| | | | 6.91% | | | | | 6.28% | | | | | 1.94% | |
| | | | | | | | | | | | | | | |
Each Fund invests a portion of its assets in high yield fixed income securities, which are securities rated lower than BBB- by Standard & Poor’s Financial Services LLC (S&P), lower than Baa3 by Moody’s Investors Service Inc. (Moody’s), or similarly rated by another nationally recognized statistical rating organization. Investments in these higher yielding securities are generally accompanied by a greater degree of credit risk than higher-rated securities. Additionally, lower-rated securities may be more susceptible to adverse economic and competitive industry conditions than investment grade securities.
96
Each Fund invests in certain obligations that may have liquidity protection designed to ensure that the receipt of payments due on the underlying security is timely. Such protection may be provided through guarantees, insurance policies, or letters of credit obtained by the issuer or sponsor through third parties, through various means of structuring the transaction or through a combination of such approaches. Each Fund will not pay any additional fees for such credit support, although the existence of credit support may increase the price of a security.
Each Fund may invest in advance refunded bonds, escrow secured bonds, or defeased bonds. Under current federal tax laws and regulations, state and local government borrowers are permitted to refinance outstanding bonds by issuing new bonds. The issuer refinances the outstanding debt to either reduce interest costs or to remove or alter restrictive covenants imposed by the bonds being refinanced. A refunding transaction where the municipal securities are being refunded within 90 days from the issuance of the refunding issue is known as a “current refunding.” Advance refunded bonds are bonds in which the refunded bond issue remains outstanding for more than 90 days following the issuance of the refunding issue. In an advance refunding, the issuer will use the proceeds of a new bond issue to purchase high grade interest bearing debt securities, which are then deposited in an irrevocable escrow account held by an escrow agent to secure all future payments of principal and interest and bond premium of the advance refunded bond. Bonds are “escrowed to maturity” when the proceeds of the refunding issue are deposited in an escrow account for investment sufficient to pay all of the principal and interest on the original interest payment and maturity dates.
Bonds are considered “pre-refunded” when the refunding issue’s proceeds are escrowed only until a permitted call date or dates on the refunded issue with the refunded issue being redeemed at the time, including any required premium. Bonds become “defeased” when the rights and interests of the bondholders and of their lien on the pledged revenues or other security under the terms of the bond contract are substituted with an alternative source of revenues (the escrow securities) sufficient to meet payments of principal and interest to maturity or to the first call dates. Escrowed secured bonds will often receive a rating of AAA from Moody’s, S&P, and/or Fitch Ratings due to the strong credit quality of the escrow securities and the irrevocable nature of the escrow deposit agreement.
Each Fund may invest up to 15% of its net assets in illiquid securities, which may include securities with contractual restrictions on resale, securities exempt from registration under Rule 144A, promulgated under the Securities Act of 1933, as amended, and other securities which may not be readily marketable. The relative illiquidity of these securities may impair each Fund from disposing of them in a timely manner and at a fair price when it is necessary or desirable to do so. While maintaining oversight, the Boards have delegated to DMC, the day-to-day functions of determining whether individual securities are liquid for purposes of each Fund’s limitation on investments in illiquid securities. Securities eligible for resale pursuant to Rule 144A, which are determined to be liquid, are not subject to each Fund’s 15% limit on investments in illiquid securities. Rule 144A securities have been identified on the “Schedules of investments.”
9. Contractual Obligations
Each Fund enters into contracts in the normal course of business that contain a variety of indemnifications. Each Fund’s maximum exposure under these arrangements is unknown. However,
97
| | |
| Notes to financial statements |
| Delaware Minnesota Municipal Bond Funds | | |
9. Contractual Obligations (continued)
each Fund has not had prior claims or losses pursuant to these contracts. Management has reviewed each Fund’s existing contracts and expects the risk of loss to be remote.
10. Recent Accounting Pronouncements
In October 2016, the Securities and Exchange Commission released its Final Rule on Investment Company Reporting Modernization (the “Rule”). The Rule contains amendments to Regulation S-X which impact financial statement presentation, particularly the presentation of derivative investments. The financial statements presented are in compliance with the most recent Regulations S-X amendments.
11. Subsequent Events
Effective Sept. 1, 2017, the Funds entered into an amendment to the DIFSC agreement. Under the amendment to the DIFSC agreement, DIFSC’s fees are calculated daily and paid monthly based on the aggregate daily net assets of the Delaware Funds at the following annual rate: 0.00475% of the first $35 billion; 0.0040% of the next $10 billion; and 0.0025% of aggregate average daily net assets in excess of $45 billion (Total Fee). Each Fund in the Delaware Funds pays a minimum of $4,000, which, in aggregate, is subtracted from the Total Fee. Each Fund in the Delaware Funds then pays its relative portion of the remainder of the Total Fee on a relative NAV basis.
Management has determined that no other material events or transactions occurred subsequent to Aug. 31, 2017, that would require recognition or disclosure in the Fund’s financial statements.
98
Report of independent registered
public accounting firm
To the Board of Trustees of Voyageur Tax-Free Funds, Voyageur Intermediate Tax-Free Funds and Voyageur Mutual Funds and the Shareholders of the Funds, as defined
In our opinion, the accompanying statements of assets and liabilities, including the schedules of investments, and the related statements of operations and of changes in net assets and the financial highlights present fairly, in all material respects, the financial position of Delaware Tax-Free Minnesota Fund (constituting Voyageur Tax-Free Funds), Delaware Tax-Free Minnesota Intermediate Fund (constituting Voyageur Intermediate Tax-Free Funds) and Delaware Minnesota High-Yield Municipal Bond Fund (one of the series constituting Voyageur Mutual Funds) (hereafter collectively referred to as the “Funds”) as of August 31, 2017, the results of each of their operations for the year then ended, the changes in each of their net assets for each of the two years in the period then ended and the financial highlights for each of the periods indicated, in conformity with accounting principles generally accepted in the United States of America. These financial statements and financial highlights (hereafter referred to as “financial statements”) are the responsibility of the Funds’ management. Our responsibility is to express an opinion on these financial statements based on our audits. We conducted our audits of these financial statements in accordance with the standards of the Public Company Accounting Oversight Board (United States). Those standards require that we plan and perform the audit to obtain reasonable assurance about whether the financial statements are free of material misstatement. An audit includes examining, on a test basis, evidence supporting the amounts and disclosures in the financial statements, assessing the accounting principles used and significant estimates made by management, and evaluating the overall financial statement presentation. We believe that our audits, which included confirmation of securities as of August 31, 2017 by correspondence with the custodian and brokers, provide a reasonable basis for our opinion.
PricewaterhouseCoopers LLP
Philadelphia, Pennsylvania
October 16, 2017
99
| | |
| Other Fund information (Unaudited) |
| Delaware Minnesota Municipal Bond Funds | | |
Tax Information
The information set forth below is for each Fund’s fiscal year as required by federal income tax laws. Shareholders, however, must report distributions on a calendar year basis for income tax purposes, which may include distributions for portions of two fiscal years of the Funds. Accordingly, the information needed by shareholders for income tax purposes will be sent to them in January of each year. Please consult your tax advisor for proper treatment of this information.
All disclosures are based on financial information available as of the date of this annual report and, accordingly are subject to change. For any and all items requiring reporting, it is the intention of the Funds to report the maximum amount permitted under the Internal Revenue Code and the regulations thereunder.
For the fiscal year ended Aug. 31, 2017, each Fund reports distributions paid during the year as follows:
| | | | | | | | | | | | | | | | | | | | |
| | | (A)
Ordinary
Income
Distributions
(Tax Basis) | | (B)
Tax-Exempt
Income
Distributions
(Tax Basis) | | (C)
Long-Term
Capital Gain
Distributions
(Tax Basis) | | Total
Distributions
(Tax Basis) |
Delaware Tax-Free Minnesota Fund | | | | 0.51 | % | | | | 99.49 | % | | | | — | | | | | 100.00 | % |
Delaware Tax-Free Minnesota Intermediate Fund | | | | — | | | | | 95.00 | % | | | | 5.00 | % | | | | 100.00 | % |
Delaware Minnesota High-Yield Municipal Bond Fund | | | | 0.56 | % | | | | 99.44 | % | | | | — | | | | | 100.00 | % |
(A), (B) and (C) are based on a percentage of each Fund’s total distributions.
Board consideration of Delaware Minnesota High-Yield Municipal Bond Fund, Delaware Tax-Free Minnesota Fund, and Delaware Tax-Free Minnesota Intermediate Fund Investment Management Agreements
At a meeting held on Aug. 16–17, 2017 (the “Annual Meeting”), the Board of Trustees (the “Board”), including a majority of disinterested or independent Trustees, approved the renewal of the Investment Advisory Agreements for Delaware Tax-Free Minnesota Fund, Delaware Tax-Free Minnesota Intermediate Fund, and Delaware Minnesota High-Yield Municipal Bond Fund (each, a “Fund” and together, the “Funds”). In making its decision, the Board considered information furnished at regular quarterly Board meetings, including reports detailing Fund performance, investment strategies and expenses, as well as information prepared specifically in connection with the renewal of the investment advisory and sub-advisory contracts. Information furnished specifically in connection with the renewal of the Investment Management Agreements with Delaware Management Company (“DMC”), a series of Macquarie Investment Management Business Trust (formerly, Delaware Management Business Trust), included materials provided by DMC and its affiliates concerning, among other things, the nature, extent, and quality of services provided to the Funds; the costs of such services to the Funds;
100
economies of scale; and the investment manager’s financial condition and profitability. In addition, in connection with the Annual Meeting, reports were provided to the Trustees in May 2017 and included reports provided by Broadridge Financial Solutions (formerly Lipper) (“Broadridge” or “Lipper”). The Broadridge reports compared each Fund’s investment performance and expenses with those of other comparable mutual funds. The Independent Trustees reviewed and discussed the Broadridge reports with independent legal counsel to the Independent Trustees. In addition to the information noted above, the Board also requested and received information regarding DMC’s policy with respect to advisory fee levels and its breakpoint philosophy; the structure of portfolio manager compensation; comparative client fee information; and any constraints or limitations on the availability of securities for certain investment styles, which had in the past year inhibited, or which were likely in the future to inhibit, the investment manager’s ability to invest fully in accordance with Fund policies.
In considering information relating to the approval of each Fund’s advisory agreement, the Independent Trustees received assistance and advice from and met separately with independent legal counsel to the Independent Trustees. Although the Board gave attention to all information furnished, the following discussion identifies, under separate headings, the primary factors taken into account by the Board during its contract renewal considerations.
Nature, extent, and quality of service. The Board considered the services provided by DMC to the Funds and their shareholders. In reviewing the nature, extent, and quality of services, the Board considered reports furnished to it throughout the year, which covered matters such as the relative performance of the Funds; compliance of portfolio managers with the investment policies, strategies, and restrictions for the Funds; compliance by DMC and Delaware Distributors, L.P. (together, “Management”) personnel with the Code of Ethics adopted throughout the Delaware FundsSM by Macquarie (“Delaware Funds”); and adherence to fair value pricing procedures as established by the Board. The Board was pleased with the current staffing of the Funds’ investment advisor and the emphasis placed on research in the investment process. The Board recognized DMC’s receipt of several industry distinctions during the past several years. The Board gave favorable consideration to DMC’s efforts to control expenditures while maintaining service levels committed to Fund matters. The Board also noted the benefits provided to Fund shareholders through each shareholder’s ability to exchange an investment in one Delaware Fund for the same class of shares in another Delaware Fund without a sales charge, to reinvest Fund dividends into additional shares of the Fund or into additional shares of other Delaware Funds, and the privilege to combine holdings in other Delaware Funds to obtain a reduced sales charge. The Board was satisfied with the nature, extent, and quality of the overall services provided by DMC.
Investment performance. The Board placed significant emphasis on the investment performance of the Funds in view of the importance of investment performance to shareholders. Although the Board considered performance reports and discussions with portfolio managers at Investment Committee meetings throughout the year, the Board gave particular weight to the Broadridge reports furnished for the Annual Meeting. The Broadridge reports prepared for each Fund showed the investment performance of its Class A shares in comparison to a group of similar funds as selected by Broadridge (the “Performance Universe”). A fund with the best performance ranked first, and a fund with the poorest performance ranked last. The highest/best performing 25% of funds in the Performance Universe make up the first quartile; the next 25%, the second quartile; the next 25%, the third quartile; and the
101
| | |
| Other Fund information (Unaudited) |
| Delaware Minnesota Municipal Bond Funds | | |
Board consideration of Delaware Minnesota High-Yield Municipal Bond Fund, Delaware Tax-Free Minnesota Fund, and Delaware Tax-Free Minnesota Intermediate Fund Investment Management Agreements (continued)
poorest/worst performing 25% of funds in the Performance Universe make up the fourth quartile. Comparative annualized performance for each Fund was shown for the past 1-, 3-, 5-, and 10-year periods, to the extent applicable, ended Jan. 31, 2017. The Board’s objective is that each Fund’s performance for the 1-, 3-, and 5-year periods be at or above the median of its Performance Universe.
Delaware Minnesota High-Yield Municipal Bond Fund – Lipper currently classifies the Fund as a Minnesota municipal debt fund. However, Management believes that it would be more appropriate to include the Fund in the high yield municipal debt funds category, which would provide a comparison to a representative peer group based on credit quality instead of a peer group based on state of issuance. Accordingly, the Broadridge report prepared for the Fund compares the Fund’s performance to two separate Performance Universes – one consisting of the Fund and all retail and institutional Minnesota municipal debt funds and the other consisting of the Fund and all retail and institutional high yield municipal debt funds. When compared to other Minnesota municipal debt funds, the Broadridge report comparison showed that the Fund’s total return for the 1- and 3-year periods was in the second quartile of its Performance Universe and its total return for the 5-year period was in the first quartile of its Performance Universe. When compared to other high yield municipal debt funds, the Broadridge report comparison showed that the Fund’s total return for the 1-, 3-, and 5-year periods was in the fourth quartile of its Performance Universe. The Board observed that, when compared to other Minnesota municipal debt funds, the Fund’s performance was in line with the Board’s objective; however, when compared to other high yield municipal debt funds, the Fund’s performance results were not in line with the Board’s objective. In evaluating the Fund’s performance, the Board considered the numerous investment and performance reports and other information delivered by Management personnel to the Board’s Investments Committee. The Board was satisfied that Management was taking action to improve Fund performance and to meet the Board’s performance objective.
Delaware Tax-Free Minnesota Fund – The Performance Universe for the Fund consisted of the Fund and all retail and institutional Minnesota municipal debt funds as selected by Broadridge. The Broadridge report comparison showed that the Fund’s total return for the 1-, 3-, and 5-year periods was in the second quartile of its Performance Universe. The Board was satisfied with performance.
Delaware Tax-Free Minnesota Intermediate Fund – The Performance Universe for the Fund consisted of the Fund and all retail and institutional “other states” intermediate municipal debt funds as selected by Broadridge. The Broadridge report comparison showed that the Fund’s total return for the 1-, 3-, and 5-year periods was in the first quartile of its Performance Universe. The Board was satisfied with performance.
Comparative expenses. The Board considered expense comparison data for the Delaware Funds. Management provided the Board with information on pricing levels and fee structures for each Fund as of its most recently completed fiscal year. The Board also focused on the comparative analysis of effective management fees and total expense ratios of each Fund versus effective management fees and expense ratios of a group of similar funds as selected by Broadridge (the “Expense Group”). In reviewing comparative costs, each Fund’s contractual management fee and the actual management fee incurred
102
by the Fund were compared with the contractual management fees (assuming all funds in the Expense Group were similar in size to the Fund) and actual management fees (as reported by each fund) within the Expense Group, taking into account any applicable breakpoints and fee waivers. Each Fund’s total expenses were also compared with those of its Expense Group. The Broadridge total expenses, for comparative consistency, were shown by Broadridge for Class A shares and comparative total expenses including 12b-1 and non-12b-1 service fees. The Board’s objective is to limit each Fund’s total expense ratio to be competitive with that of the Expense Group.
Delaware Minnesota High-Yield Municipal Bond Fund – When compared to other Minnesota municipal debt funds, the expense comparisons for the Fund showed that its actual management fee was in the quartile with the second highest expenses in its Expense Group and its total expenses were in the quartile with the highest expenses of the Expense Group. When compared to other high yield municipal debt funds, the expense comparisons for the Fund showed that its actual management fee was in the quartile with the lowest expenses of its Expense Group and its total expenses were in the quartile with the second lowest expenses of the Expense. The Board noted that, when compared to other Minnesota municipal debt funds, the Fund’s total expenses were not in line with the Board’s objective. In evaluating the total expenses, the Board considered fee waivers in place through Dec. 29, 2017 and various initiatives implemented by Management, such as the negotiation of lower fees for fund accounting, fund accounting oversight services, and custody, which had created an opportunity for a further reduction in expenses. The Board was satisfied with Management’s efforts to improve the Fund’s total expense ratio and to bring it in line with the Board’s objective.
Delaware Tax-Free Minnesota Fund – The expense comparisons for the Fund showed that its actual management fee was in the quartile with the second lowest expenses of its Expense Group and its total expenses were in the quartile with the second highest expenses of its Expense Group. The Board gave favorable consideration to the Fund’s management fee, but noted that the Fund’s total expenses were not in line with the Board’s objective. In evaluating the total expenses, the Board considered waivers in place through Dec. 29, 2017 and various initiatives implemented by Management, such as the negotiation of lower fees for fund accounting, fund accounting oversight services, and custody, which had created an opportunity for a further reduction in expenses. The Board was satisfied with Management’s efforts to improve the Fund’s total expense ratio and to bring it in line with the Board’s objective.
Delaware Tax-Free Minnesota Intermediate Fund – The expense comparisons for the Fund showed that its actual management fee and total expenses were in the quartile with the second highest expenses of its Expense Group. The Board noted that the Fund’s management fee and total expenses were not in line with the Board’s objective. In evaluating the total expenses, the Board considered waivers in place through Dec. 29, 2017 and various initiatives implemented by Management, such as the negotiation of lower fees for fund accounting, fund accounting oversight services, and custody, which had created an opportunity for a further reduction in expenses. The Board was satisfied with Management’s efforts to improve the Fund’s total expense ratio and to bring it in line with the Board’s objective.
Management profitability. The Board considered the level of profits realized by DMC in connection with the operation of the Funds. In this respect, the Board reviewed the Investment Management Profitability Analysis that addressed the overall profitability of DMC’s business in providing management and other
103
| | |
| Other Fund information (Unaudited) |
| Delaware Minnesota Municipal Bond Funds | | |
Board consideration of Delaware Minnesota High-Yield Municipal Bond Fund, Delaware Tax-Free Minnesota Fund, and Delaware Tax-Free Minnesota Intermediate Fund Investment Management Agreements (continued)
services to each of the individual funds and the Delaware Funds as a whole. Specific attention was given to the methodology followed in allocating costs for the purpose of determining profitability. Management stated that the level of profits of DMC, to a certain extent, reflects recent operational cost savings and efficiencies initiated by DMC. The Board considered DMC’s efforts to improve services provided to fund shareholders and to meet additional regulatory and compliance requirements resulting from recent industry-wide Securities and Exchange Commission initiatives. The Board also considered the extent to which DMC might derive ancillary benefits from fund operations, including the potential for procuring additional business as a result of the prestige and visibility associated with its role as service provider to the Delaware Funds and the benefits from allocation of fund brokerage to improve trading efficiencies. The Board found that the management fees were reasonable in light of the services rendered and the level of profitability of DMC.
Economies of scale. The Trustees considered whether economies of scale are realized by DMC as each Fund’s assets increase and the extent to which any economies of scale are reflected in the level of management fees charged. The Trustees reviewed the standardized advisory fee pricing and structure, approved by the Board and shareholders, which includes breakpoints, and which applies to most funds in the Delaware Funds complex. Breakpoints in the advisory fee occur when the advisory fee rate is reduced on assets in excess of specified levels. Breakpoints result in a lower advisory fee than would otherwise be the case in the absence of breakpoints, when the asset levels specified in the breakpoints are exceeded. The Board noted that the fee under the Fund’s management contract fell within the standardized fee pricing structure. The Board also noted that, as of Feb. 28, 2017, the assets of Delaware Tax-Free Minnesota Fund exceeded the first breakpoint level. The Board believed that, given the extent to which economies of scale might be realized by the advisor and its affiliates, the schedule of fees under the Investment Management Agreement provides a sharing of benefits with the Fund and its shareholders. Although, as of Feb. 28, 2017, Delaware Tax-Free Minnesota Intermediate Fund and Delaware Minnesota High-Yield Municipal Bond Fund had not reached a size at which they can take advantage of any breakpoints in the applicable fee schedule, the Board recognized that the fee was structured so that if the Funds grow, economies of scale may be shared.
104
This page intentionally left blank.
| | |
| Board of trustees / directors and officers addendum |
| Delaware FundsSM by Macquarie | | |
A mutual fund is governed by a Board of Trustees/Directors (“Trustees”), which has oversight responsibility for the management of a fund’s business affairs. Trustees establish procedures and oversee and review the performance of the investment manager, the distributor, and others who perform services for the fund. The independent fund trustees, in particular, are advocates
| | | | | | |
Name, Address, and Birth Date | | Position(s) Held with Fund(s) | | Length of Time Served | | |
Interested Trustee | | | | |
Shawn K. Lytle1, 2 | | President, | | Trustee since | | |
2005 Market Street | | Chief Executive Officer, | | September 2015 | | |
Philadelphia, PA 19103 | | and Trustee | | | | |
February 1970 | | | | President and | | |
| | | | Chief Executive Officer | | |
| | | | since August 2015 | | |
| | | | | | |
| | | | | | |
| | | | | | |
Independent Trustees | | | | |
Thomas L. Bennett | | Chairman and Trustee | | Trustee since | | |
2005 Market Street | | | | March 2005 | | |
Philadelphia, PA 19103 | | | | | | |
October 1947 | | | | Chairman since | | |
| | | | | March 2015 | | |
Ann D. Borowiec | | Trustee | | Since March 2015 | | |
2005 Market Street | | | | | | |
Philadelphia, PA 19103 | | | | | | |
November 1958 | | | | | | |
| | | | | | |
| | | | | | |
| | | | | | | |
Joseph W. Chow | | Trustee | | Since January 2013 | | |
2005 Market Street | | | | | | |
Philadelphia, PA 19103 | | | | | | |
January 1953 | | | | | | |
| | | | | | |
| | | | | | | |
| 1 | Shawn K. Lytle is considered to be an “Interested Trustee” because he is an executive officer of the Fund’s(s’) investment advisor. |
| 2 | Shawn K. Lytle, David F. Connor, Daniel V. Geatens, and Richard Salus serve in similar capacities for the six portfolios of the Optimum Fund Trust, which have the same investment advisor, principal underwriter, and transfer agent as registrant. |
106
for shareholder interests. Each trustee has served in that capacity since he or she was elected to or appointed to the Board of Trustees, and will continue to serve until his or her retirement or the election of a new trustee in his or her place. The following is a list of the Trustees and Officers with certain background and related information.
| | | | |
Principal Occupation(s) During the Past Five Years | | Number of Portfolios in Fund Complex Overseen by Trustee or Officer | | Other Directorships Held by Trustee or Officer |
| | | | |
Shawn K. Lytle has served as | | 62 | | Trustee — UBS |
President of | | | | Relationship Funds, |
Macquarie Investment | | | | SMA Relationship |
Management3 | | | | Trust, and UBS Funds |
since June 2015 and was the | | | | (May 2010–April 2015) |
Regional Head of Americas for | | | | |
UBS Global Asset | | | | |
Management from | | | | |
2010 through 2015. | | | | |
| | | | |
Private Investor | | 62 | | None |
(March 2004–Present) | | | | |
| | | | |
| | | | |
| | | | | |
Chief Executive Officer, | | 62 | | Director — |
Private Wealth Management | | | | Banco Santander International |
(2011–2013) and | | | | |
Market Manager, | | | | Director — |
New Jersey Private | | | | Santander Bank, N.A. |
| Bank (2005–2011) — | | | | |
J.P. Morgan Chase & Co. | | | | |
Executive Vice President | | 62 | | Director and Audit Committee |
(Emerging Economies | | | | Member — Hercules |
Strategies, Risks, and | | | | Technology Growth |
Corporate Administration) | | | | Capital, Inc. |
State Street Corporation | | | | (2004–2014) |
(July 2004–March 2011) | | | | |
| 3 | Macquarie Investment Management (formerly known as Delaware Investments) is the marketing name for Macquarie Management Holdings, Inc. (formerly known as Delaware Management Holdings, Inc.) and its subsidiaries, including the Fund’s(s’) investment advisor, principal underwriter, and its transfer agent. |
107
Board of trustees / directors and officers addendum
Delaware FundsSM by Macquarie
| | | | | | |
Name, Address, and Birth Date | | Position(s) Held with Fund(s) | | Length of Time Served | | |
Independent Trustees (continued) | | | | |
John A. Fry | | Trustee | | Since January 2001 | | |
2005 Market Street | | | | | | |
Philadelphia, PA 19103 | | | | | | |
May 1960 | | | | | | |
| | | | | | |
| | | | | | |
| | | | | | |
| | | | | | |
| | | | | | |
| | | | | | |
| | | | | | |
| | | | | | |
| | | | | | |
| | | | | | | |
Lucinda S. Landreth | | Trustee | | Since March 2005 | | |
2005 Market Street | | | | | | |
Philadelphia, PA 19103 | | | | | | |
June 1947 | | | | | | |
Frances A. Sevilla-Sacasa | | Trustee | | Since September 2011 | | |
2005 Market Street | | | | | | |
Philadelphia, PA 19103 | | | | | | |
January 1956 | | | | | | |
| | | | | | |
| | | | | | |
| | | | | | |
| | | | | | |
| | | | | | |
| | | | | | |
| | | | | | |
| | | | | | |
| | | | | | |
| | | | | | |
| | | | | | |
| | | | | | |
| | | | | | |
| | | | | | | |
108
| | | | |
Principal Occupation(s)
During the Past Five Years | | Number of Portfolios in Fund Complex Overseen by Trustee or Officer | | Other Directorships
Held by Trustee or Officer |
| | | | |
President — | | 62 | | Director, Audit Committee, |
Drexel University | | | | and Governance Committee |
(August 2010–Present) | | | | Member — Community |
| | | | Health Systems |
President — | | | | |
Franklin & Marshall College | | | | Director — Drexel |
(July 2002–July 2010) | | | | Morgan & Co. |
| | | | |
| | | | Director, Audit Committee |
| | | | Member — vTv |
| | | | Therapeutics LLC |
| | | | |
| | | | Director — FS Credit Real |
| | | | | Estate Income Trust, Inc. |
| Private Investor | | 62 | | None |
| (2004–Present) | | | | |
| | | | |
| | | | | |
Chief Executive Officer — | | 62 | | Trust Manager and |
Banco Itaú | | | | Audit Committee |
International | | | | Member — Camden |
(April 2012–December 2016) | | | | Property Trust |
| | |
Executive Advisor to Dean | | | | |
(August 2011–March 2012) and Interim Dean | | | | |
(January 2011–July 2011) — | | | | |
University of Miami School of | | | | |
Business Administration | | | | |
| | |
President — U.S. Trust, | | | | |
Bank of America Private | | | | |
Wealth Management | | | | |
(Private Banking) | | | | |
(July 2007–December 2008) | | | | |
109
Board of trustees / directors and officers addendum
Delaware FundsSM by Macquarie
| | | | | | | | |
Name, Address,
and Birth Date | | Position(s) Held with Fund(s) | | Length of
Time Served | | | |
Independent Trustees (continued) | | | | | | |
Thomas K. Whitford | | Trustee | | Since January 2013 | | | | |
2005 Market Street | | | | | | | | |
Philadelphia, PA 19103 | | | | | | | | |
March 1956 | | | | | | | | |
| | | | | | | | |
| | | | | | | | | |
| Janet L. Yeomans | | Trustee | | Since April 1999 | | | | |
| 2005 Market Street | | | | | | | | |
| Philadelphia, PA 19103 | | | | | | | | |
| July 1948 | | | | | | | | |
| | | | | | | | |
| | | | | | | | |
| | | | | | | | |
| | | | | | | | |
| | | | | | | | |
| | | | | | | | |
Officers | | | | | | |
David F. Connor | | Senior Vice President, | | Senior Vice President | | | | |
2005 Market Street | | General Counsel, | | since May 2013; | | | | |
Philadelphia, PA 19103 | | and Secretary | | General Counsel | | | | |
December 1963 | | | | since May 2015; | | | | |
| | | | Secretary since | | | | |
| | | | | October 2005 | | | | |
Daniel V. Geatens | | Vice President | | Treasurer since October 2007 | | | | |
2005 Market Street | | and Treasurer | | | | | | |
Philadelphia, PA 19103 | | | | | | | | |
October 1972 | | | | | | | | |
| | | | | | | | |
| | | | | | | | | |
Richard Salus | | Senior Vice President | | Chief Financial Officer | | | | |
2005 Market Street | | and Chief Financial Officer | | since November 2006 | | | | |
Philadelphia, PA 19103 | | | | | | | | |
October 1963 | | | | | | | | |
| | | | | | | | |
| | | | | | | | | |
The Statement of Additional Information for the Fund(s) includes additional information about the Trustees and Officers and is available, without charge, upon request by calling 800 523-1918.
110
| | | | |
Principal Occupation(s)
During the Past Five Years | | Number of Portfolios in Fund Complex Overseen by Trustee or Officer | | Other Directorships
Held by Trustee or Officer |
| | | | |
Vice Chairman | | 62 | | Director — HSBC Finance |
(2010–April 2013) — | | | | Corporation and HSBC |
PNC Financial | | | | North America Holdings Inc. |
Services Group | | | | |
| | | | Director — |
| | | | HSBC USA Inc. |
| | | | | |
| Vice President and Treasurer | | 62 | | Director, Personnel and |
| (January 2006–July 2012), | | | | Compensation Committee |
| Vice President — | | | | Chair, and Member of |
| Mergers & Acquisitions | | | | Nominating, Investments, and |
| (January 2003–January 2006), | | | | Audit Committees — |
| and Vice President | | | | Okabena Company |
| and Treasurer | | | | (2009–2014) |
(July 1995–January 2003) —
3M Company | | | | |
| | | | |
| | | | |
| David F. Connor has served | | 62 | | None2 |
in various capacities at
different times at | | | | |
| Macquarie Investment | | | | |
| Management. | | | | |
| | | | |
| | | | | |
| Daniel V. Geatens has served | | 62 | | None2 |
in various capacities at
different times at | | | | |
| Macquarie Investment | | | | |
| Management. | | | | |
| | | | | |
| Richard Salus has served | | 62 | | None2 |
in various executive capacities
at different times at | | | | |
| Macquarie Investment | | | | |
| Management. | | | | |
| | | | | |
111
About the organization
| | | | | | |
Board of trustees | | | | | | |
Shawn K. Lytle President and Chief Executive Officer Delaware FundsSM by Macquarie Philadelphia, PA Thomas L. Bennett Chairman of the Board Delaware Funds by Macquarie Private Investor Rosemont, PA | | Ann D. Borowiec Former Chief Executive Officer Private Wealth Management J.P. Morgan Chase & Co. New York, NY Joseph W. Chow Former Executive Vice President State Street Corporation Boston, MA | | John A. Fry President Drexel University Philadelphia, PA Lucinda S. Landreth Former Chief Investment Officer Assurant, Inc. New York, NY | | Frances A. Sevilla-Sacasa Former Chief Executive Officer Banco Itaú International Miami, FL Thomas K. Whitford Former Vice Chairman PNC Financial Services Group Pittsburgh, PA Janet L. Yeomans Former Vice President and Treasurer 3M Company St. Paul, MN |
| | | |
Affiliated officers | | | | | | |
David F. Connor Senior Vice President, General Counsel, and Secretary Delaware Funds by Macquarie Philadelphia, PA | | Daniel V. Geatens Vice President and Treasurer Delaware Funds by Macquarie Philadelphia, PA | | Richard Salus Senior Vice President and Chief Financial Officer Delaware Funds by Macquarie Philadelphia, PA | | |
This annual report is for the information of Delaware Tax-Free Minnesota Fund, Delaware Tax-Free Minnesota Intermediate Fund, and Delaware Minnesota High-Yield Municipal Bond Fund shareholders, but it may be used with prospective investors when preceded or accompanied by the Delaware Fund fact sheet for the most recently completed calendar quarter. These documents are available at delawarefunds.com/literature.
Each Fund files its complete schedule of portfolio holdings with the Securities and Exchange Commission (SEC) for the first and third quarters of each fiscal year on Form N-Q. Each Fund’s Forms N-Q, as well as a description of the policies and procedures that each Fund uses to determine how to vote proxies (if any) relating to portfolio securities are available without charge (i) upon request, by calling 800 523-1918; and (ii) on the SEC’s website at sec.gov. In addition, a description of the policies and procedures that the Funds use to determine how to vote proxies (if any) relating to portfolio securities and the Schedules of Investments included in the Funds’ most recent Forms N-Q are available without charge on the Funds’ website at delawarefunds.com/literature. Each Fund’s Forms N-Q may be reviewed and copied at the SEC’s Public Reference Room in Washington, D.C.; information on the operation of the Public Reference Room may be obtained by calling 800 SEC-0330.
Information (if any) regarding how the Funds voted proxies relating to portfolio securities during the most recently disclosed 12-month period ended June 30 is available without charge (i) through the Funds’ website at delawarefunds.com/proxy; and (ii) on the SEC’s website at sec.gov.
112
Item 2. Code of Ethics
Item 3. Audit Committee Financial Expert
The registrant’s Board of Trustees/Directors has determined that certain members of the registrant’s Audit Committee are audit committee financial experts, as defined below. For purposes of this item, an “audit committee financial expert” is a person who has the following attributes:
a. An understanding of generally accepted accounting principles and financial statements;
b. The ability to assess the general application of such principles in connection with the accounting for estimates, accruals, and reserves;
c. Experience preparing, auditing, analyzing, or evaluating financial statements that present a breadth and level of complexity of accounting issues that are generally comparable to the breadth and complexity of issues that can reasonably be expected to be raised by the registrant’s financial statements, or experience actively supervising one or more persons engaged in such activities;
d. An understanding of internal controls and procedures for financial reporting; and
e. An understanding of audit committee functions.
An “audit committee financial expert” shall have acquired such attributes through:
a. Education and experience as a principal financial officer, principal accounting officer, controller, public accountant, or auditor or experience in one or more positions that involve the performance of similar functions;
b. Experience actively supervising a principal financial officer, principal accounting officer, controller, public accountant, auditor, or person performing similar functions;
c. Experience overseeing or assessing the performance of companies or public accountants with respect to the preparation, auditing, or evaluation of financial statements; or
d. Other relevant experience.
The registrant’s Board of Trustees/Directors has also determined that each member of the registrant’s Audit Committee is independent. In order to be “independent” for purposes of this item, the Audit Committee member may not: (i) other than in his or her capacity as a member of the Board of Trustees/Directors or any committee thereof, accept directly or indirectly any consulting, advisory or other compensatory fee from the issuer; or (ii) be an “interested person” of the registrant as defined in Section 2(a)(19) of the Investment Company Act of 1940.
The names of the audit committee financial experts on the registrant’s Audit Committee are set forth below:
Joseph W. Chow
John A. Fry
Lucinda S. Landreth
Thomas K. Whitford
Item 4. Principal Accountant Fees and Services
The aggregate fees billed for services provided to the registrant by its independent auditors for the audit of the registrant’s annual financial statements and for services normally provided by the independent auditors in connection with statutory and regulatory filings or engagements were $38,500 for the fiscal year ended August 31, 2017.
The aggregate fees billed for services provided to the registrant by its independent auditors for the audit of the registrant’s annual financial statements and for services normally provided by the independent auditors in connection with statutory and regulatory filings or engagements were $38,500 for the fiscal year ended August 31, 2016.
The aggregate fees billed by the registrant’s independent auditors for services relating to the performance of the audit of the registrant’s financial statements and not reported under paragraph (a) of this Item were $0 for the fiscal year ended August 31, 2017.
The aggregate fees billed by the registrant’s independent auditors for services relating to the performance of the audit of the registrant’s financial statements and not reported under paragraph (a) of this Item were $0 for the fiscal year ended August 31, 2016.
The aggregate fees billed by the registrant’s independent auditors for tax-related services provided to the registrant’s investment adviser and other service providers under common control with the adviser and that relate directly to the operations or financial reporting of the registrant were $0 for the registrant’s fiscal year ended August 31, 2016. The percentage of these fees relating to services approved by the registrant’s Audit Committee pursuant to the de minimis exception from the pre-approval requirement in Rule 2-01(c)(7)(i)(C) of Regulation S-X was 0%.
The aggregate fees billed for all services provided by the independent auditors to the registrant other than those set forth in paragraphs (a), (b) and (c) of this Item were $0 for the fiscal year ended August 31, 2017.
The aggregate fees billed for all services provided by the independent auditors to the registrant other than those set forth in paragraphs (a), (b) and (c) of this Item were $0 for the fiscal year ended August 31, 2016.
The aggregate fees billed for all services other than those set forth in paragraphs (b) and (c) of this Item provided by the registrant’s independent auditors to the registrant’s adviser and other service providers under common control with the adviser and that relate directly to the operations or financial reporting of the registrant were $0 for the registrant’s fiscal year ended August 31, 2016. The percentage of these fees relating to services approved by the registrant’s Audit Committee pursuant to the de minimis exception from the pre-approval requirement in Rule 2-01(c)(7)(i)(C) of Regulation S-X was 0%.
Under the Pre-Approval Policy, the Audit Committee has also pre-approved the services set forth in the table below with respect to the registrant’s investment adviser and other entities controlling, controlled by or under common control with the investment adviser that provide ongoing services to the registrant (the “Control Affiliates”) up to the specified fee limit. This fee limit is based on aggregate fees to the investment adviser and its Control Affiliates.
The Pre-Approval Policy requires the registrant’s independent auditors to report to the Audit Committee at each of its regular meetings regarding all services initiated since the last such report was rendered, including those services authorized by the Pre-Approval Policy.
(f) Not applicable.
(g) The aggregate non-audit fees billed by the registrant’s independent auditors for services rendered to the registrant and to its investment adviser and other service providers under common control with the adviser were $11,180,000 and $10,036,000 for the registrant’s fiscal years ended August 31, 2017 and August 31, 2016, respectively.
(h) In connection with its selection of the independent auditors, the registrant’s Audit Committee has considered the independent auditors’ provision of non-audit services to the registrant’s investment adviser and other service providers under common control with the adviser that were not required to be pre-approved pursuant to Rule 2-01(c)(7)(ii) of Regulation S-X. The Audit Committee has determined that the independent auditors’ provision of these services is compatible with maintaining the auditors’ independence.
Item 5. Audit Committee of Listed Registrants
Not applicable.
Item 6. Investments
(a) Included as part of report to shareholders filed under Item 1 of this Form N-CSR.
(b) Divestment of securities in accordance with Section 13(c) of the Investment Company Act of 1940.
Not applicable.
Item 7. Disclosure of Proxy Voting Policies and Procedures for Closed-End Management Investment Companies
Not applicable.
Item 8. Portfolio Managers of Closed-End Management Investment Companies
Not applicable.
Item 9. Purchases of Equity Securities by Closed-End Management Investment Company and Affiliated Purchasers
Not applicable.
Item 10. Submission of Matters to a Vote of Security Holders
Not applicable.
Item 11. Controls and Procedures
The registrant’s principal executive officer and principal financial officer have evaluated the registrant’s disclosure controls and procedures within 90 days of the filing of this report and have concluded that they are effective in providing reasonable assurance that the information required to be disclosed by the registrant in its reports or statements filed under the Securities Exchange Act of 1934 is recorded, processed, summarized and reported within the time periods specified in the rules and forms of the Securities and Exchange Commission.
There were no significant changes in the registrant’s internal control over financial reporting that occurred during the second fiscal quarter of the period covered by the report to stockholders included herein (i.e., the registrant’s fourth fiscal quarter) that have materially affected, or are reasonably likely to materially affect, the registrant’s internal control over financial reporting.
Item 12. Exhibits
Not applicable.
(2) Certifications of Principal Executive Officer and Principal Financial Officer pursuant to Rule 30a-2 under the Investment Company Act of 1940 are attached hereto as Exhibit 99.CERT.
(3) Written solicitations to purchase securities pursuant to Rule 23c-1 under the Securities Exchange Act of 1934.
Not applicable.
(b) Certifications pursuant to Section 906 of the Sarbanes-Oxley Act of 2002 are furnished herewith as Exhibit 99.906CERT.
Pursuant to the requirements of the Securities Exchange Act of 1934 and the Investment Company Act of 1940, the registrant has duly caused this report to be signed on its behalf, by the undersigned, thereunto duly authorized.
Pursuant to the requirements of the Securities Exchange Act of 1934 and the Investment Company Act of 1940, this report has been signed below by the following persons on behalf of the registrant and in the capacities and on the dates indicated.