Item 1. Reports to Stockholders
| | |
 |  |
| | |
| | |
| | |
| | |
| | |
| | |
| | |
| | |
| | |
| | |
| | Annual report |
| | |
Fixed income mutual funds
Delaware Tax-Free Minnesota Fund
Delaware Tax-Free Minnesota Intermediate Fund
Delaware Minnesota High-Yield Municipal Bond Fund
August 31, 2021
Carefully consider the Funds’ investment objectives, risk factors, charges, and expenses before investing. This and other information can be found in the Funds’ prospectus and their summary prospectuses, which may be obtained by visiting delawarefunds.com/literature or calling 800 523-1918. Investors should read the prospectus and the summary prospectus carefully before investing.
You can obtain shareholder reports and prospectuses online instead of in the mail.
Visit delawarefunds.com/edelivery.
Table of Contents
Experience Delaware Funds by Macquarie®
Macquarie Investment Management (MIM) is a global asset manager with offices in the United States, Europe, Asia, and Australia. As active managers, we prioritize autonomy and accountability at the investment team level in pursuit of opportunities that matter for clients. Delaware Funds is one of the longest-standing mutual fund families, with more than 80 years in existence.
If you are interested in learning more about creating an investment plan, contact your financial advisor.
You can learn more about Delaware Funds or obtain a prospectus for Delaware Tax-Free Minnesota Fund, Delaware Tax-Free Minnesota Intermediate Fund, and Delaware Minnesota High-Yield Municipal Bond Fund at delawarefunds.com/literature.
Manage your account online
| ● | Check your account balance and transactions |
| ● | View statements and tax forms |
| ● | Make purchases and redemptions |
Visit delawarefunds.com/account-access.
Macquarie Asset Management (MAM) offers a diverse range of products including securities investment management, infrastructure and real asset management, and fund and equity-based structured products. MIM is the marketing name for certain companies comprising the asset management division of Macquarie Group. This includes the following investment advisers: Macquarie Investment Management Business Trust (MIMBT), Macquarie Funds Management Hong Kong Limited, Macquarie Investment Management Austria Kapitalanlage AG, Macquarie Investment Management Global Limited, Macquarie Investment Management Europe Limited, and Macquarie Investment Management Europe S.A.
The Funds are distributed by Delaware Distributors, L.P. (DDLP), an affiliate of MIMBT and Macquarie Group Limited.
Other than Macquarie Bank Limited (MBL), none of the entities noted are authorized deposit-taking institutions for the purposes of the Banking Act 1959 (Commonwealth of Australia). The obligations of these entities do not represent deposits or other liabilities of MBL. MBL does not guarantee or otherwise provide assurance in respect of the obligations of these entities, unless noted otherwise.
The Funds are governed by US laws and regulations.
Table of contents
Unless otherwise noted, views expressed herein are current as of August 31, 2021, and subject to change for events occurring after such date.
The Funds are not FDIC insured and are not guaranteed. It is possible to lose the principal amount invested.
Advisory services provided by Delaware Management Company, a series of MIMBT, a US registered investment advisor.
All third-party marks cited are the property of their respective owners.
© 2021 Macquarie Management Holdings, Inc.
Table of Contents
| Portfolio management review | |
| Delaware Funds by Macquarie® Minnesota municipal bond funds | September 7, 2021 (Unaudited) |
| Performance preview (for the year ended August 31, 2021) | | | | | |
| Delaware Tax-Free Minnesota Fund (Institutional Class shares) | | 1-year return | | +4.31 | % |
| Delaware Tax-Free Minnesota Fund (Class A shares) | | 1-year return | | +4.05 | % |
| Bloomberg Municipal Bond Index (benchmark) | | 1-year return | | +3.40 | % |
| Lipper Minnesota Municipal Debt Funds Average | | 1-year return | | +3.03 | % |
Past performance does not guarantee future results.
For complete, annualized performance for Delaware Tax-Free Minnesota Fund, please see the table on page 6.
Institutional Class shares are not subject to a sales charge and are offered for sale exclusively to certain eligible investors. In addition, Institutional Class shares pay no distribution and service fee.
The performance of Class A shares excludes the applicable sales charge. The performance of both Institutional Class shares and Class A shares reflects the reinvestment of all distributions.
The Lipper Minnesota Municipal Debt Funds Average compares funds that invest primarily in municipal debt issues that are exempt from taxation in Minnesota.
Please see page 10 for a description of the index. Index performance returns do not reflect any management fees, transaction costs, or expenses. Indices are unmanaged and one cannot invest directly in an index.
| Delaware Tax-Free Minnesota Intermediate Fund | | 1-year return | | +3.29% |
| (Institutional Class shares) | | |
| Delaware Tax-Free Minnesota Intermediate Fund (Class A shares) | | 1-year return | | +3.13 | % |
| Bloomberg 3–15 Year Blend Municipal Bond Index (benchmark) | | 1-year return | | +2.75 | % |
| Lipper Other States Intermediate Municipal Debt Funds Average | | 1-year return | | +1.85 | % |
Past performance does not guarantee future results.
For complete, annualized performance for Delaware Tax-Free Minnesota Intermediate Fund, please see the table on page 11.
Institutional Class shares are not subject to a sales charge and are offered for sale exclusively to certain eligible investors. In addition, Institutional Class shares pay no distribution and service fee.
The performance of Class A shares excludes the applicable sales charge. The performance of both Institutional Class shares and Class A shares reflects the reinvestment of all distributions.
The Lipper Other States Intermediate Municipal Debt Funds Average compares funds that invest in municipal debt issues with dollar-weighted average maturities of 5 to 10 years and are exempt from taxation on a specified state or city basis.
Please see page 14 for a description of the index. Index performance returns do not reflect any management fees, transaction costs, or expenses. Indices are unmanaged and one cannot invest directly in an index.
| Delaware Minnesota High-Yield Municipal Bond Fund | | 1-year return | | +5.89% |
| (Institutional Class shares) | | |
| Delaware Minnesota High-Yield Municipal Bond Fund (Class A shares) | | 1-year return | | +5.71 | % |
| Bloomberg Municipal Bond Index (benchmark) | | 1-year return | | +3.40 | % |
| Lipper Minnesota Municipal Debt Funds Average | | 1-year return | | +3.03 | % |
Past performance does not guarantee future results.
For complete, annualized performance for Delaware Minnesota High-Yield Municipal Bond Fund, please see the table on page 16.
Institutional Class shares are not subject to a sales charge and are offered for sale exclusively to certain eligible investors. In addition, Institutional Class shares pay no distribution and service fee.
The performance of Class A shares excludes the applicable sales charge. The performance of both Institutional Class shares and Class A shares reflects the reinvestment of all distributions.
The Lipper Minnesota Municipal Debt Funds Average compares funds that invest primarily in municipal debt issues that are exempt from taxation in Minnesota.
1
Table of Contents
Portfolio management review
Delaware Funds by Macquarie® Minnesota municipal bond funds
Please see page 19 for a description of the index. Index performance returns do not reflect any management fees, transaction costs, or expenses. Indices are unmanaged and one cannot invest directly in an index.
Investment objectives
Delaware Tax-Free Minnesota Fund seeks as high a level of current income exempt from federal income tax and from Minnesota state personal income taxes as is consistent with preservation of capital.
Delaware Tax-Free Minnesota Intermediate Fund seeks to provide investors with preservation of capital and, secondarily, current income exempt from federal income tax and Minnesota state personal income taxes, by maintaining a dollar-weighted average effective portfolio maturity of 10 years or less.
Delaware Minnesota High-Yield Municipal Bond Fund seeks a high level of current income that is exempt from federal income tax and from Minnesota state personal income taxes, primarily through investment in medium- and lower-grade municipal obligations.
Economic backdrop
During the fiscal year ended August 31, 2021, the US economy expanded at a rapid pace, as states and municipalities opened up their economies and ended or scaled back pandemic-related restrictions. A $1.9 trillion federal economic stimulus program – the American Rescue Plan Act, passed in March 2021 – and continued aggressive monetary policy further supported the economy’s recovery after a difficult 2020.
Investors’ optimism began to grow in late 2020, along with the introduction of vaccines for COVID-19, which helped lead to a dramatic decline in virus cases and hospitalization rates. Uncertainty returned in the final months of the fiscal year, however, as the Delta variant of COVID-19 aggressively spread and new concerns emerged about the future path of the economic recovery.
Against this backdrop, the US economy enjoyed robust growth throughout the fiscal year. In the third quarter of 2020, for example, US gross domestic product (GDP) – a measure of national economic output – expanded by an annualized 33.4%. This was the fastest such increase in the country’s history, following an equally unprecedented 31.4% decline in the prior three-month period. US GDP grew by 4.5% in the fourth quarter of 2020, followed by increases of 6.3% in the first quarter of 2021 and an estimated 6.6% in the second quarter of 2021.
Employment trends similarly reflected the favorable economic backdrop. After the US jobless rate peaked in April 2020 at 14.7% – the highest level seen since the Great Depression – the employment picture quickly improved as state and local economies reopened. At the beginning of the Funds’ fiscal year in September 2020, US unemployment stood at a still historically high 8.4%. A year later, the country’s jobless rate had fallen to 5.2%.
Early in the pandemic, the US Federal Reserve cut its benchmark short-term interest rate, the federal funds rate, to essentially zero, where the rate remained throughout the fiscal year ended August 31, 2021. As signs mounted that inflation was accelerating, the Fed suggested it would consider increasing interest rates as early as 2023, moving up its previous timeline by a year.
Sources: US Bureau of Economic Analysis, US Bureau of Labor Statistics, and Bloomberg.
2
Table of Contents
Municipal bond market conditions
Overall, the municipal bond market, as measured by the Bloomberg Municipal Bond Index, gained 3.40% for the fiscal year ended August 31, 2021.
Municipal bonds benefited from a favorable technical backdrop, with robust demand for tax-exempt bonds accompanied by relatively limited supply. As the pandemic progressed, investors’ appetite for municipal debt remained strong, reflecting increased confidence in issuers’ underlying credit quality and expectations for higher tax rates in the future.
In this environment, longer-maturity bonds generally outperformed their intermediate- and shorter-dated counterparts, while lower-rated bonds outpaced higher-quality issues. High yield municipal debt – bonds with credit ratings below BBB – enjoyed particularly strong results.
The following tables show municipal bond returns by maturity length and by credit quality for the fiscal year ended August 31, 2021.
| Returns by maturity | | |
| 1 year | | 0.62% |
| 3 years | | 1.17% |
| 5 years | | 1.70% |
| 10 years | | 3.10% |
| 22+ years | | 5.54% |
| | | |
| Returns by credit rating | | |
| AAA | | 1.70% |
| AA | | 2.50% |
| A | | 4.72% |
| BBB | | 8.52% |
| Source: Bloomberg. | | |
A consistent management approach
For all three Funds discussed in this report, we continued to follow the same management strategy we use regardless of the market environment. We emphasize a bottom-up investment approach, meaning we rely on our team’s thorough credit research to choose bonds on an issuer-by-issuer basis. We regularly seek tax-exempt bonds that offer the Funds’ shareholders what we view as an attractive trade-off between return opportunity and risk.
In following this strategy, we generally position the Funds with relatively less exposure to highly rated, lower yielding bonds. Instead, we prefer to overweight bonds with lower-investment-grade or below-investment-grade credit ratings backed by what we believe is solid underlying credit quality, due to these securities’ tendency to offer better income characteristics.
In the three Funds covered by this report, however, we regularly balance this approach with the recognition that lower-rated, higher yielding bonds tend to be scarce in Minnesota relative to other state marketplaces. In Minnesota, municipal bond issuance tends to feature highly rated, lower-coupon state and local general obligation bonds. Accordingly, our focus with these Funds involves investing in bonds offering what we view as the most attractive risk-reward trade-offs available, while we regularly remain on the lookout for suitable lower-rated issues to support our portfolio management objectives.
As of August 31, 2021, roughly 29% of the net assets of Delaware Tax-Free Minnesota Fund was invested in bonds with lower-investment-grade credit ratings, while about 33% of the net assets of Delaware Tax-Free Minnesota Intermediate Fund was invested in these credit tiers. Both Funds also maintained allocations to high yield municipal bonds. By prospectus, both Funds may hold up to 20% of their net assets in high yield debt.
Consistent with its mandate, Delaware Minnesota High-Yield Municipal Bond Fund maintained the largest high yield exposure of the three Funds. As of August 31, 2021, about 40% of the Fund’s portfolio was held in bonds with credit ratings below BBB, including nonrated bonds.
3
Table of Contents
Portfolio management review
Delaware Funds by Macquarie® Minnesota municipal bond funds
Consistently seeking value
At the start of the fiscal year, the US was only a few months into the coronavirus pandemic, and municipal bond valuations remained depressed in several sectors. This was especially true of market areas uniquely vulnerable to the spread of COVID-19, such as continuing care retirement communities and charter schools.
When possible, we prioritized opportunities to buy suitable higher yielding bonds in these and other sectors that we believed would allow us to enhance the Funds’ income-generating capability while also potentially providing total return opportunity.
Especially in Delaware Minnesota High-Yield Municipal Bond Fund, and to a far more limited extent in Delaware Tax-Free Minnesota Fund and Delaware Tax-Free Minnesota Intermediate Fund, we bought higher yielding bonds early in the fiscal year at depressed valuations. These included select opportunities among bonds in the healthcare and education sectors. Over time, bonds in these sectors experienced narrowing credit spreads and provided lower yields, gradually making them less attractive areas for new investment, in our view.
To varying extents in each Fund, we also bought tax-exempt bonds affiliated with the US territory of Puerto Rico, where we continued to find value amid that commonwealth’s ongoing financial restructuring.
Over time, as credit spreads narrowed, we became especially selective with new investments, focusing on purchasing bonds that we believed offered the Funds’ shareholders a favorable risk-reward trade-off. As attractive value opportunities became harder to find, we continued to prioritize our research efforts to try to find higher yielding Minnesota bonds that we believed represented long-term value, and we were willing to remain patient while pursuing this goal.
Individual performance effects
As we mentioned, longer-duration bonds – those with more sensitivity to interest rates – generally outperformed shorter-duration bonds, and lower-rated bonds outpaced higher-quality bonds. Often during this fiscal year, the Funds’ leading individual contributors and detractors reflected these performance trends.
In all three Funds, for example, the strongest-performing securities were bonds affiliated with Puerto Rico. (Bonds issued by Puerto Rico and other US territories are generally fully tax-exempt for US residents.) In Delaware Tax-Free Minnesota Fund and Delaware Minnesota High-Yield Municipal Bond Fund, Puerto Rico Electric Power Authority bonds were the leading individual performers. These bonds, yielding 5.25% and maturing in 2024, returned nearly 45% for the Funds, benefiting from investors’ increased optimism about the issuer’s debt restructuring efforts and the bonds’ relatively low valuation to begin the fiscal year. Meanwhile, Delaware Tax-Free Minnesota Intermediate Fund similarly benefited from a position in Puerto Rico general obligation debt, which gained 30%.
In addition, all three Funds benefited from exposure to senior-housing bonds that came into the fiscal year at depressed valuations but enjoyed strong results as investors eased their concerns about issuers’ credit quality. For example, nonrated bonds of Chosen Valley Care Center, a skilled-nursing facility in Chatwood, gained more than 25%, lifting the performance of Delaware Tax-Free Minnesota Intermediate Fund and Delaware Minnesota High-Yield Municipal Bond Fund, while bonds for the senior living facility project in Apple Valley and the Deephaven Woods project gained more than 25% and close to 20%, respectively, boosting results for Delaware Tax-Free Minnesota Fund.
Further adding value for Delaware Minnesota High-Yield Municipal Bond Fund were bonds for
4
Table of Contents
Stride Academy, a St. Cloud charter school. As the issuer’s underlying credit quality strengthened during the fiscal year, these bonds continued to gain in value, rising more than 40%.
In contrast, most of the Funds’ weakest-performing bonds – many of which still managed a small positive return – featured relatively high credit quality or short durations. In both Delaware Tax-Free Minnesota Fund and Delaware Tax-Free Minnesota Intermediate Fund, for instance, holdings in pre-refunded state general obligation bonds produced a relatively flat return, lagging the overall market by several percentage points. Pre-refunded bonds, with their high degree of credit quality and short durations, were relative laggards in a market environment that rewarded bonds of lower quality and longer durations.
Meanwhile, AAA-rated Metropolitan Council (St. Paul) water-and-sewer debt gained only modestly for Delaware Tax-Free Minnesota Fund, while similarly high-rated debt for Hennepin County did the same for Delaware Tax-Free Minnesota Intermediate Fund.
For Delaware Minnesota High-Yield Municipal Bond Fund, University of Minnesota bonds’ modest return reflected their addition to the Fund’s portfolio at a relative high point for the market, leading to a lower return for the Fund’s fiscal year. A holding in pre-refunded bonds for the HealthEast Care System also lagged the benchmark.
Minnesota economic backdrop
Minnesota finished its 2021 fiscal year with $26.6 billion in its General Fund, outpacing earlier projections by more than 11% and representing a $2.9 billion swing from the budget deficit that had been projected in mid-2020. The state’s corporate tax revenues ended the fiscal year 38.4% above projections, while personal income taxes finished 12.4% higher. The state’s new biennial budget (which begins on July 1 of every odd-numbered year) is $52 billion, representing a 7.7% increase over the previous biennial budget. Of the new budget, about 41% represents spending on K-12 education and 36% on Human Services. The budget also includes $1 billion in tax relief related to COVID-19. In April 2021, Minnesota received $2.8 billion from the American Rescue Plan Act, and in 2020 the state received $1.9 billion in Coronavirus Aid, Relief, and Economic Security (CARES) Act funding. As of July 2021, the state’s unemployment rate was down to 3.9%, higher than the July 2019 rate of 3.1% but below the pandemic high of 11.3% in May 2020.
5
Table of Contents
| Performance summaries | |
| Delaware Tax-Free Minnesota Fund | August 31, 2021 (Unaudited) |
The performance quoted represents past performance and does not guarantee future results. Investment return and principal value of an investment will fluctuate so that shares, when redeemed, may be worth more or less than their original cost. Current performance may be lower or higher than the performance quoted. Performance data current to the most recent month end may be obtained by calling 800 523-1918 or visiting delawarefunds.com/performance.
| Fund and benchmark performance1,2 | | Average annual total returns through August 31, 2021 |
| | 1 year | | 5 year | | 10 year | | Lifetime |
| Class A (Est. February 27, 1984) | | | | | | | | | | | | |
| Excluding sales charge | | +4.05 | % | | +2.69 | % | | +3.65 | % | | +6.00 | % |
| Including sales charge | | -0.65 | % | | +1.74 | % | | +3.17 | % | | +5.87 | % |
| Class C (Est. May 4, 1994) | | | | | | | | | | | | |
| Excluding sales charge | | +3.35 | % | | +1.94 | % | | +2.88 | % | | +3.91 | % |
| Including sales charge | | +2.35 | % | | +1.94 | % | | +2.88 | % | | +3.91 | % |
| Institutional Class (Est. December 31, 2013) | | | | | | | | | | | | |
| Excluding sales charge | | +4.31 | % | | +2.95 | % | | — | | | +4.11 | % |
| Including sales charge | | +4.31 | % | | +2.95 | % | | — | | | +4.11 | % |
| Bloomberg Municipal Bond Index | | +3.40 | % | | +3.30 | % | | +4.05 | % | | +4.34 | %* |
| * | The benchmark lifetime return is for Institutional Class share comparison only and is calculated using the last business day in the month of the Fund’s Institutional Class inception date. |
| | |
| 1 | Returns reflect the reinvestment of all distributions and are presented both with and without the applicable sales charges described below. Returns do not reflect the deduction of taxes the shareholder would pay on Fund distributions or redemptions of Fund shares. |
Expense limitations were in effect for certain classes during some or all of the periods shown in the “Fund and benchmark performance” table. Expenses for each class are listed in the “Fund expense ratios” table on page 8. Performance would have been lower had expense limitations not been in effect.
Institutional Class shares are not subject to a sales charge and are offered for sale exclusively to certain eligible investors. In addition, Institutional Class shares pay no distribution and service (12b-1) fee.
Class A shares are sold with a maximum front-end sales charge of 4.50%, and have an annual 12b-1 fee of 0.25% of average daily net assets. Performance for Class A shares, excluding sales charges, assumes that no front-end sales charge applied.
Class C shares are sold with a contingent deferred sales charge (CDSC) of 1.00% if redeemed during the first 12 months. They are also subject to an annual 12b-1 fee of 1.00% of average daily net assets. Performance for Class C shares, excluding sales charges, assumes either that CDSCs did not apply or that the investment was not redeemed.
Fixed income securities and bond funds can lose value, and investors can lose principal, as interest rates rise. They also may be affected by economic conditions that hinder an issuer’s ability to make interest and principal payments on its debt.
The Fund may also be subject to prepayment risk, the risk that the principal of a bond that is held by a portfolio will be prepaid prior to maturity, at the time when interest rates are lower than what the
6
Table of Contents
bond was paying. A portfolio may then have to reinvest that money at a lower interest rate.
Funds that invest primarily in one state may be more susceptible to the economic, regulatory, regional, and other factors of that state than geographically diversified funds.
Substantially all dividend income derived from tax-free funds is exempt from federal income tax. Some income may be subject to state or local and/or the federal alternative minimum tax (AMT) that applies to certain investors. Capital gains, if any, are taxable.
Duration number will change as market conditions change. Therefore, duration should not be solely relied upon to indicate a municipal bond fund’s potential volatility.
IBOR risk is the risk that changes related to the use of the London interbank offered rate (LIBOR) or similar rates (such as EONIA) could have adverse impacts on financial instruments that reference these rates. The abandonment of these rates and transition to alternative rates could affect the value and liquidity of instruments that reference them and could affect investment strategy performance.
The disruptions caused by natural disasters, pandemics, or similar events could prevent the Fund from executing advantageous investment decisions in a timely manner and could negatively impact the Fund’s ability to achieve its investment objective and the value of the Fund’s investments.
This document may mention bond ratings published by nationally recognized statistical rating organizations (NRSROs) Standard & Poor’s, Moody’s Investors Service, and Fitch, Inc. For securities rated by an NRSRO other than S&P, the rating is converted to the equivalent S&P credit rating. Bonds rated AAA are rated as having the highest quality and are generally considered to have the lowest degree of investment risk. Bonds rated AA are considered to be of high quality, but with a slightly higher degree of risk than bonds rated AAA. Bonds rated A are considered to have many favorable investment qualities, though they are somewhat more susceptible to adverse economic conditions. Bonds rated BBB are believed to be of medium-grade quality and generally riskier over the long term. Bonds rated BB, B, and CCC are regarded as having significant speculative characteristics, with BB indicating the least degree of speculation of the three.
7
Table of Contents
Performance summaries
Delaware Tax-Free Minnesota Fund
2 | The Fund’s expense ratios, as described in the most recent prospectus, are disclosed in the following “Fund expense ratios” table. Delaware Management Company has agreed to reimburse certain expenses and/or waive certain fees in order to prevent total annual fund operating expenses (excluding any 12b-1 fees, acquired fund fees and expenses, taxes, interest, short sale dividend and interest expenses, brokerage fees, certain insurance costs, and nonroutine expenses or costs, including, but not limited to, those relating to reorganizations, litigation, conducting shareholder meetings, and liquidations) from exceeding 0.60% of the Fund’s average daily net assets from September 1, 2020 to August 31, 2021.* Please see the most recent prospectus and any applicable supplement(s) for additional information on these fee waivers and/or reimbursements. Please see the “Financial highlights” section in this report for the most recent expense ratios. |
| Fund expense ratios | | Class A | | Class C | | Institutional Class |
| Total annual operating expenses | | | | | | |
| (without fee waivers) | | 0.93% | | 1.68% | | 0.68% |
| Net expenses (including fee | | | | | | |
| waivers, if any) | | 0.85% | | 1.60% | | 0.60% |
| Type of waiver | | Contractual | | Contractual | | Contractual |
* | The aggregate contractual waiver period covering this report is from December 27, 2019 through December 29, 2021. |
8
Table of Contents
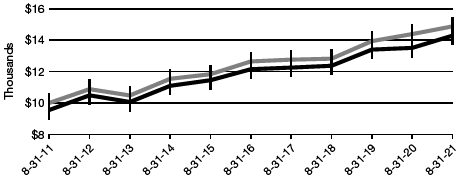
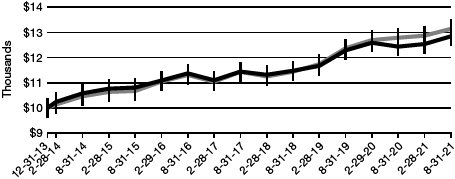
Performance of a $10,000 investment1
Class A shares
Average annual total returns from August 31, 2011 through August 31, 2021
| For period beginning August 31, 2011 through August 31, 2021 | | Starting value | | Ending value |
 | Bloomberg Municipal Bond Index | | $10,000 | | $14,874 |
 | Delaware Tax-Free Minnesota Fund – Class A shares | | $9,550 | | $13,664 |
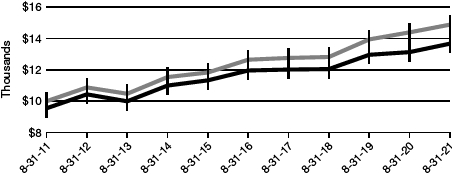
Institutional Class shares
Average annual total returns from December 31, 2013 (inception date) through August 31, 2021
| For period beginning December 31, 2013 through August 31, 2021 | | Starting value | | Ending value |
 | Delaware Tax-Free Minnesota Fund – Institutional Class shares | | $10,000 | | $13,621 |
 | Bloomberg Municipal Bond Index | | $10,000 | | $13,550 |
9
Table of Contents
Performance summaries
Delaware Tax-Free Minnesota Fund
1 | The “Performance of a $10,000 investment” graph for Class A shares assumes $10,000 invested in Class A shares of the Fund on August 31, 2011, and includes the effect of a 4.50% front-end sales charge and the reinvestment of all distributions. The graph also assumes $10,000 invested in the Bloomberg Municipal Bond Index as of August 31, 2011. |
The “Performance of a $10,000 investment” graph for Institutional Class shares assumes $10,000 invested in Institutional Class shares of the Fund on December 31, 2013, and includes the reinvestment of all distributions. The graph also assumes $10,000 invested in the Bloomberg Municipal Bond Index as of December 31, 2013.
The graphs do not reflect the deduction of taxes the shareholders would pay on Fund distributions or redemptions of Fund shares. Expense limitations were in effect for some or all of the periods shown. Performance would have been lower had expense limitations not been in effect. Expenses are listed in the “Fund expense ratios” table on page 8. Please note additional details on pages 6 through 10.
The Bloomberg Municipal Bond Index measures the total return performance of the long-term, investment grade tax-exempt bond market.
Gross domestic product, mentioned on page 2, is a measure of all goods and services produced by a nation in a year.
Index performance returns do not reflect any management fees, transaction costs, or expenses. Indices are unmanaged and one cannot invest directly in an index. Past performance is not a guarantee of future results.
Performance of other Fund classes will vary due to different charges and expenses.
| | Nasdaq symbols | | CUSIPs |
| Class A | | DEFFX | | 928918101 |
| Class C | | DMOCX | | 928918408 |
| Institutional Class | | DMNIX | | 928918705 |
10
Table of Contents
| Performance summaries | | |
| Delaware Tax-Free Minnesota Intermediate Fund | | August 31, 2021 (Unaudited) |
The performance quoted represents past performance and does not guarantee future results. Investment return and principal value of an investment will fluctuate so that shares, when redeemed, may be worth more or less than their original cost. Current performance may be lower or higher than the performance quoted. Performance data current to the most recent month end may be obtained by calling 800 523-1918 or visiting delawarefunds.com/performance.
| Fund and benchmark performance1,2 | | Average annual total returns through August 31, 2021 |
| | 1 year | | 5 year | | 10 year | | Lifetime |
| Class A (Est. October 27, 1985) | | | | | | | | |
| Excluding sales charge | | +3.13% | | +2.32% | | +2.98% | | +4.58% |
| Including sales charge | | +0.33% | | +1.75% | | +2.70% | | +4.50% |
| Class C (Est. May 4, 1994) | | | | | | | | |
| Excluding sales charge | | +2.26% | | +1.43% | | +2.10% | | +3.15% |
| Including sales charge | | +1.26% | | +1.43% | | +2.10% | | +3.15% |
| Institutional Class (Est. December 31, 2013) | | | | | | | | |
| Excluding sales charge | | +3.29% | | +2.45% | | – | | +3.32% |
| Including sales charge | | +3.29% | | +2.45% | | – | | +3.32% |
| Bloomberg 3–15 Year Blend Municipal Bond | | | | | | | | |
| Index | | +2.75% | | +3.05% | | +3.57% | | +3.80%* |
* | The benchmark lifetime return is for Institutional Class share comparison only and is calculated using the last business day in the month of the Fund’s Institutional Class inception date. |
1 | Returns reflect the reinvestment of all distributions and are presented both with and without the applicable sales charges described below. Returns do not reflect the deduction of taxes the shareholder would pay on Fund distributions or redemptions of Fund shares. |
Expense limitations were in effect for certain classes during some or all of the periods shown in the “Fund and benchmark performance” table. Expenses for each class are listed in the “Fund expense ratios” table on page 13. Performance would have been lower had expense limitations not been in effect.
Institutional Class shares are not subject to a sales charge and are offered for sale exclusively to certain eligible investors. In addition, Institutional Class shares pay no distribution and service (12b-1) fee.
Class A shares are sold with a maximum front-end sales charge of 2.75%, and have an annual 12b-1 fee of 0.25% of average daily net assets. This fee was contractually limited to 0.15% of average daily net assets from September 1, 2020 through August 31, 2021.* Performance for Class A shares, excluding sales charges, assumes that no front-end sales charge applied.
Class C shares are sold with a contingent deferred sales charge (CDSC) of 1.00% if redeemed during the first 12 months. They are also subject to an annual 12b-1 fee of 1.00% of average daily net assets. Performance for Class C shares, excluding sales charges, assumes either that CDSCs did not apply or that the investment was not redeemed.
Fixed income securities and bond funds can lose value, and investors can lose principal, as interest rates rise. They also may be affected by economic
11
Table of Contents
Performance summaries
Delaware Tax-Free Minnesota Intermediate Fund
conditions that hinder an issuer’s ability to make interest and principal payments on its debt.
The Fund may also be subject to prepayment risk, the risk that the principal of a bond that is held by a portfolio will be prepaid prior to maturity, at the time when interest rates are lower than what the bond was paying. A portfolio may then have to reinvest that money at a lower interest rate.
Funds that invest primarily in one state may be more susceptible to the economic, regulatory, regional, and other factors of that state than geographically diversified funds.
Substantially all dividend income derived from tax-free funds is exempt from federal income tax. Some income may be subject to state or local and/or the federal alternative minimum tax (AMT) that applies to certain investors. Capital gains, if any, are taxable.
Duration number will change as market conditions change. Therefore, duration should not be solely relied upon to indicate a municipal bond fund’s potential volatility.
IBOR risk is the risk that changes related to the use of the London interbank offered rate (LIBOR) or similar rates (such as EONIA) could have adverse impacts on financial instruments that reference these rates. The abandonment of these rates and transition to alternative rates could affect the value and liquidity of instruments that reference them and could affect investment strategy performance.
The disruptions caused by natural disasters, pandemics, or similar events could prevent the Fund from executing advantageous investment decisions in a timely manner and could negatively impact the Fund’s ability to achieve its investment objective and the value of the Fund’s investments.
This document may mention bond ratings published by nationally recognized statistical rating organizations (NRSROs) Standard & Poor’s, Moody’s Investors Service, and Fitch, Inc. For securities rated by an NRSRO other than S&P, the rating is converted to the equivalent S&P credit rating. Bonds rated AAA are rated as having the highest quality and are generally considered to have the lowest degree of investment risk. Bonds rated AA are considered to be of high quality, but with a slightly higher degree of risk than bonds rated AAA. Bonds rated A are considered to have many favorable investment qualities, though they are somewhat more susceptible to adverse economic conditions. Bonds rated BBB are believed to be of medium-grade quality and generally riskier over the long term. Bonds rated BB, B, and CCC are regarded as having significant speculative characteristics, with BB indicating the least degree of speculation of the three.
12
Table of Contents
| 2 | The Fund’s expense ratios, as described in the most recent prospectus, are disclosed in the following “Fund expense ratios” table. Delaware Management Company has agreed to reimburse certain expenses and/or waive certain fees in order to prevent total annual fund operating expenses (excluding any 12b-1 fees, acquired fund fees and expenses, taxes, interest, short sale dividend and interest expenses, brokerage fees, certain insurance costs, and nonroutine expenses or costs, including, but not limited to, those relating to reorganizations, litigation, conducting shareholder meetings, and liquidations) from exceeding 0.56% of the Fund’s average daily net assets from September 1, 2020 to August 31, 2021.* Please see the most recent prospectus and any applicable supplement(s) for additional information on these fee waivers and/or reimbursements. Please see the “Financial highlights” section in this report for the most recent expense ratios. |
| Fund expense ratios | | Class A | | Class C | | Institutional Class |
Total annual operating expenses
(without fee waivers) | | 1.02% | | 1.77% | | 0.77% |
Net expenses (including fee
waivers, if any) | | 0.71% | | 1.56% | | 0.56% |
| Type of waiver | | Contractual | | Contractual | | Contractual |
| * | The aggregate contractual waiver period covering this report is from December 27, 2019 through December 29, 2021. |
Performance of a $10,000 investment1
Class A shares
Average annual total returns from August 31, 2011 through August 31, 2021
| For period beginning August 31, 2011 through August 31, 2021 | | Starting value | | Ending value |
 | Bloomberg 3–15 Year Blend Municipal Bond Index | | $10,000 | | $14,195 |
 | Delaware Tax-Free Minnesota Intermediate Fund — Class A shares | | $9,725 | | $13,054 |
13
Table of Contents
Performance summaries
Delaware Tax-Free Minnesota Intermediate Fund
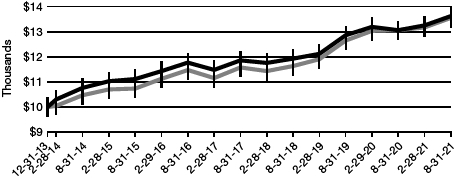
Institutional Class shares
Average annual total returns from December 31, 2013 (inception date) through August 31, 2021
| For period beginning December 31, 2013 through August 31, 2021 | | Starting value | | Ending value |
 | Bloomberg 3–15 Year Blend Municipal Bond Index | | $10,000 | | $13,141 |
 | Delaware Tax-Free Minnesota Intermediate Fund — Institutional Class shares | | $10,000 | | $12,845 |
| 1 | The “Performance of a $10,000 investment” graph for Class A shares assumes $10,000 invested in Class A shares of the Fund on August 31, 2011, and includes the effect of a 2.75% front-end sales charge and the reinvestment of all distributions. The graph also assumes $10,000 invested in the Bloomberg 3-15 Year Blend Municipal Bond Index as of August 31, 2011. |
The “Performance of a $10,000 investment” graph for Institutional Class shares assumes $10,000 invested in Institutional Class shares of the Fund on December 31, 2013, and includes the reinvestment of all distributions. The graph also assumes $10,000 invested in the Bloomberg 3-15 Year Blend Municipal Bond Index as of December 31, 2013.
The graphs do not reflect the deduction of taxes the shareholders would pay on Fund distributions or redemptions of Fund shares. Expense limitations were in effect for some or all of the periods shown. Performance would have been lower had expense limitations not been in effect. Expenses are listed in the “Fund expense ratios” table on page 13. Please note additional details on pages 11 through 15.
The Bloomberg 3-15 Year Blend Municipal Bond Index measures the total return performance of investment grade, US tax-exempt bonds with maturities from 2 to 17 years.
Gross domestic product, mentioned on page 2, is a measure of all goods and services produced by a nation in a year.
Index performance returns do not reflect any management fees, transaction costs, or expenses. Indices are unmanaged and one cannot invest directly in an index. Past performance is not a guarantee of future results.
Performance of other Fund classes will vary due to different charges and expenses.
14
Table of Contents
| | Nasdaq symbols | | CUSIPs |
| Class A | | DXCCX | | 928930106 |
| Class C | | DVSCX | | 928930205 |
| Institutional Class | | DMIIX | | 92910U109 |
15
Table of Contents
| Performance summaries | |
| Delaware Minnesota High-Yield Municipal Bond Fund | August 31, 2021 (Unaudited) |
The performance quoted represents past performance and does not guarantee future results. Investment return and principal value of an investment will fluctuate so that shares, when redeemed, may be worth more or less than their original cost. Current performance may be lower or higher than the performance quoted. Performance data current to the most recent month end may be obtained by calling 800 523-1918 or visiting delawarefunds.com/performance.
| Fund and benchmark performance1,2 | | Average annual total returns through August 31, 2021 |
| | 1 year | | 5 year | | 10 year | | Lifetime |
| Class A (Est. June 4, 1996) | | | | | | | | |
| Excluding sales charge | | +5.71% | | +3.28% | | +4.10% | | +4.95% |
| Including sales charge | | +0.94% | | +2.34% | | +3.63% | | +4.76% |
| Class C (Est. June 7, 1996) | | | | | | | | |
| Excluding sales charge | | +4.92% | | +2.51% | | +3.33% | | +4.17% |
| Including sales charge | | +3.92% | | +2.51% | | +3.33% | | +4.17% |
| Institutional Class (Est. December 31, 2013) | | | | | | | | |
| Excluding sales charge | | +5.89% | | +3.54% | | — | | +4.64% |
| Including sales charge | | +5.89% | | +3.54% | | — | | +4.64% |
| Bloomberg Municipal Bond Index | | +3.40% | | +3.30% | | +4.05% | | +4.34%* |
| * | The benchmark lifetime return is for Institutional Class share comparison only and is calculated using the last business day in the month of the Fund’s Institutional Class inception date. |
| 1 | Returns reflect the reinvestment of all distributions and are presented both with and without the applicable sales charges described below. Returns do not reflect the deduction of taxes the shareholder would pay on Fund distributions or redemptions of Fund shares. |
Expense limitations were in effect for certain classes during some or all of the periods shown in the “Fund and benchmark performance” table. Expenses for each class are listed in the “Fund expense ratios” table on page 18. Performance would have been lower had expense limitations not been in effect.
Institutional Class shares are not subject to a sales charge and are offered for sale exclusively to certain eligible investors. In addition, Institutional Class shares pay no distribution and service (12b-1) fee.
Class A shares are sold with a maximum front-end sales charge of 4.50%, and have an annual 12b-1 fee of 0.25% of average daily net assets. Performance for Class A shares, excluding sales charges, assumes that no front-end sales charge applied.
Class C shares are sold with a contingent deferred sales charge (CDSC) of 1.00% if redeemed during the first 12 months. They are also subject to an annual 12b-1 fee of 1.00% of average daily net assets. Performance for Class C shares, excluding sales charges, assumes either that CDSCs did not apply or that the investment was not redeemed.
Fixed income securities and bond funds can lose value, and investors can lose principal, as interest rates rise. They also may be affected by economic conditions that hinder an issuer’s ability to make interest and principal payments on its debt.
The Fund may also be subject to prepayment risk, the risk that the principal of a bond that is held by a portfolio will be prepaid prior to maturity, at the time when interest rates are lower than what the
16
Table of Contents
bond was paying. A portfolio may then have to reinvest that money at a lower interest rate.
Funds that invest primarily in one state may be more susceptible to the economic, regulatory, regional, and other factors of that state than geographically diversified funds.
Substantially all dividend income derived from tax-free funds is exempt from federal income tax. Some income may be subject to state or local and/or the federal alternative minimum tax (AMT) that applies to certain investors. Capital gains, if any, are taxable.
Duration number will change as market conditions change. Therefore, duration should not be solely relied upon to indicate a municipal bond fund’s potential volatility.
IBOR risk is the risk that changes related to the use of the London interbank offered rate (LIBOR) or similar rates (such as EONIA) could have adverse impacts on financial instruments that reference these rates. The abandonment of these rates and transition to alternative rates could affect the value and liquidity of instruments that reference them and could affect investment strategy performance.
The disruptions caused by natural disasters, pandemics, or similar events could prevent the Fund from executing advantageous investment decisions in a timely manner and could negatively impact the Fund’s ability to achieve its investment objective and the value of the Fund’s investments.
This document may mention bond ratings published by nationally recognized statistical rating organizations (NRSROs) Standard & Poor’s, Moody’s Investors Service, and Fitch, Inc. For securities rated by an NRSRO other than S&P, the rating is converted to the equivalent S&P credit rating. Bonds rated AAA are rated as having the highest quality and are generally considered to have the lowest degree of investment risk. Bonds rated AA are considered to be of high quality, but with a slightly higher degree of risk than bonds rated AAA. Bonds rated A are considered to have many favorable investment qualities, though they are somewhat more susceptible to adverse economic conditions. Bonds rated BBB are believed to be of medium-grade quality and generally riskier over the long term. Bonds rated BB, B, and CCC are regarded as having significant speculative characteristics, with BB indicating the least degree of speculation of the three.
17
Table of Contents
Performance summaries
Delaware Minnesota High-Yield Municipal Bond Fund
| 2 | The Fund’s expense ratios, as described in the most recent prospectus, are disclosed in the following “Fund expense ratios” table. Delaware Management Company has agreed to reimburse certain expenses and/or waive certain fees in order to prevent total annual fund operating expenses (excluding any 12b-1 fees, acquired fund fees and expenses, taxes, interest, short sale dividend and interest expenses, brokerage fees, certain insurance costs, and nonroutine expenses or costs, including, but not limited to, those relating to reorganizations, litigation, conducting shareholder meetings, and liquidations) from exceeding 0.64% of the Fund’s average daily net assets from September 1, 2020 to August 31, 2021.* Please see the most recent prospectus and any applicable supplement(s) for additional information on these fee waivers and/or reimbursements. Please see the “Financial highlights” section in this report for the most recent expense ratios. |
| Fund expense ratios | | Class A | | Class C | | Institutional Class |
| Total annual operating expenses | | | | | | |
| (without fee waivers) | | 0.97% | | 1.72% | | 0.72% |
| Net expenses (including fee | | | | | | |
| waivers, if any) | | 0.89% | | 1.64% | | 0.64% |
| Type of waiver | | Contractual | | Contractual | | Contractual |
| * | The aggregate contractual waiver period covering this report is from December 27, 2019 through December 29, 2021. |
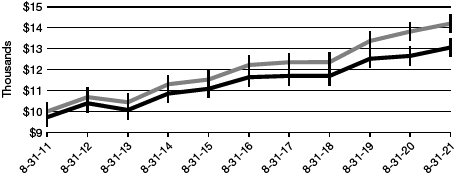
Performance of a $10,000 investment1
Class A shares
Average annual total returns from August 31, 2011 through August 31, 2021
| For period beginning August 31, 2011 through August 31, 2021 | | Starting value | | Ending value |
 | Bloomberg Municipal Bond Index | | | $10,000 | | | | $14,874 | |
 | Delaware Minnesota High-Yield Municipal Bond Fund — Class A | | | | | | | | |
| shares | | | $9,550 | | | | $14,285 | |
18
Table of Contents
Institutional Class shares
Average annual total returns from December 31, 2013 (inception date) through August 31, 2021
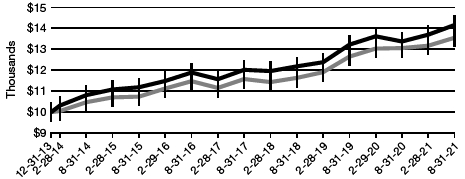
| For period beginning December 31, 2013 through August 31, 2021 | | Starting value | | Ending value |
| Delaware Minnesota High-Yield Municipal Bond Fund — | | | | | | | | |
| Institutional Class shares | | | $10,000 | | | | $14,158 | |
| Bloomberg Municipal Bond Index | | | $10,000 | | | | $13,550 | |
| 1 | The “Performance of a $10,000 investment” graph for Class A shares assumes $10,000 invested in Class A shares of the Fund on August 31, 2011, and includes the effect of a 4.50% front-end sales charge and the reinvestment of all distributions. The graph also assumes $10,000 invested in the Bloomberg Municipal Bond Index as of August 31, 2011. |
The “Performance of a $10,000 investment” graph for Institutional Class shares assumes $10,000 invested in Institutional Class shares of the Fund on December 31, 2013, and includes the reinvestment of all distributions. The graph also assumes $10,000 invested in the Bloomberg Municipal Bond Index as of December 31, 2013.
The graphs do not reflect the deduction of taxes the shareholders would pay on Fund distributions or redemptions of Fund shares. Expense limitations were in effect for some or all of the periods shown. Performance would have been lower had expense limitations not been in effect. Expenses are listed in the “Fund expense ratios” table on page 18. Please note additional details on pages 16 through 20.
The Bloomberg Municipal Bond Index measures the total return performance of the long-term, investment grade tax-exempt bond market.
Gross domestic product, mentioned on page 2, is a measure of all goods and services produced by a nation in a year.
Index performance returns do not reflect any management fees, transaction costs, or expenses. Indices are unmanaged and one cannot invest directly in an index. Past performance is not a guarantee of future results.
Performance of other Fund classes will vary due to different charges and expenses.
19
Table of Contents
Performance summaries
Delaware Minnesota High-Yield Municipal Bond Fund
| | Nasdaq symbols | | CUSIPs |
| Class A | | DVMHX | | 928928316 |
| Class C | | DVMMX | | 928928282 |
| Institutional Class | | DMHIX | | 928928175 |
20
Table of Contents
Disclosure of Fund expenses
For the six-month period from March 1, 2021 to August 31, 2021 (Unaudited)
As a shareholder of a Fund, you incur two types of costs: (1) transaction costs, including sales charges (loads) on purchase payments, reinvested dividends, or other distributions; redemption fees; and exchange fees; and (2) ongoing costs, including management fees; distribution and service (12b-1) fees; and other Fund expenses. The following examples are intended to help you understand your ongoing costs (in dollars) of investing in a Fund and to compare these costs with the ongoing costs of investing in other mutual funds.
The examples are based on an investment of $1,000 invested at the beginning of the period and held for the entire six-month period from March 1, 2021 to August 31, 2021.
Actual expenses
The first section of the tables shown, “Actual Fund return,” provides information about actual account values and actual expenses. You may use the information in this section of the table, together with the amount you invested, to estimate the expenses that you paid over the period. Simply divide your account value by $1,000 (for example, an $8,600 account value divided by $1,000 = 8.6), then multiply the result by the number in the first section under the heading entitled “Expenses Paid During Period” to estimate the expenses you paid on your account during this period.
Hypothetical example for comparison purposes
The second section of the tables shown, “Hypothetical 5% return,” provides information about hypothetical account values and hypothetical expenses based on the Funds’ actual expense ratios and an assumed rate of return of 5% per year before expenses, which is not the Funds’ actual return. The hypothetical account values and expenses may not be used to estimate the actual ending account balance or expenses you paid for the period. You may use this information to compare the ongoing costs of investing in each Fund and other funds. To do so, compare this 5% hypothetical example with the 5% hypothetical examples that appear in the shareholder reports of the other funds.
Please note that the expenses shown in the tables are meant to highlight your ongoing costs only and do not reflect any transactional costs, such as sales charges (loads), redemption fees, or exchange fees. Therefore, the second section of each table is useful in comparing ongoing costs only, and will not help you determine the relative total costs of owning different funds. In addition, if these transactional costs were included, your costs would have been higher. The Funds’ expenses shown in the tables reflect fee waivers in effect and assume reinvestment of all dividends and distributions.
21
Table of Contents
Disclosure of Fund expenses
For the six-month period from March 1, 2021 to August 31, 2021 (Unaudited)
Delaware Tax-Free Minnesota Fund
Expense analysis of an investment of $1,000
| Beginning | | Ending | | | | Expenses |
| Account Value | | Account Value | | Annualized | | Paid During Period |
| 3/1/21 | | 8/31/21 | | Expense Ratio | | 3/1/21 to 8/31/21* |
| Actual Fund return† | | | | | | | | | | | | | | | | |
| Class A | | $ | 1,000.00 | | | | $ | 1,025.80 | | | 0.85% | | | $ | 4.34 | |
| Class C | | | 1,000.00 | | | | | 1,022.70 | | | 1.60% | | | | 8.16 | |
| Institutional Class | | | 1,000.00 | | | | | 1,027.90 | | | 0.60% | | | | 3.07 | |
| Hypothetical 5% return (5% return before expenses) | | | | | | | | |
| Class A | | $ | 1,000.00 | | | | $ | 1,020.92 | | | 0.85% | | | $ | 4.33 | |
| Class C | | | 1,000.00 | | | | | 1,017.14 | | | 1.60% | | | | 8.13 | |
| Institutional Class | | | 1,000.00 | | | | | 1,022.18 | | | 0.60% | | | | 3.06 | |
Delaware Tax-Free Minnesota Intermediate Fund
Expense analysis of an investment of $1,000
| Beginning | | Ending | | | | Expenses |
| Account Value | | Account Value | | Annualized | | Paid During Period |
| 3/1/21 | | 8/31/21 | | Expense Ratio | | 3/1/21 to 8/31/21* |
| Actual Fund return† | | | | | | | | | | | | | | | | |
| Class A | | $ | 1,000.00 | | | | $ | 1,023.80 | | | 0.71% | | | $ | 3.62 | |
| Class C | | | 1,000.00 | | | | | 1,019.40 | | | 1.56% | | | | 7.94 | |
| Institutional Class | | | 1,000.00 | | | | | 1,024.50 | | | 0.56% | | | | 2.86 | |
| Hypothetical 5% return (5% return before expenses) | | | | | | | | |
| Class A | | $ | 1,000.00 | | | | $ | 1,021.63 | | | 0.71% | | | $ | 3.62 | |
| Class C | | | 1,000.00 | | | | | 1,017.34 | | | 1.56% | | | | 7.93 | |
| Institutional Class | | | 1,000.00 | | | | | 1,022.38 | | | 0.56% | | | | 2.85 | |
22
Table of Contents
Delaware Minnesota High-Yield Municipal Bond Fund Expense analysis of an investment of $1,000
| Beginning | | Ending | | | | Expenses |
| Account Value | | Account Value | | Annualized | | Paid During Period |
| 3/1/21 | | 8/31/21 | | Expense Ratio | | 3/1/21 to 8/31/21* |
| Actual Fund return† | | | | | | | | | | | | | | | | |
| Class A | | $ | 1,000.00 | | | | $ | 1,032.30 | | | 0.89% | | �� | $ | 4.56 | |
| Class C | | | 1,000.00 | | | | | 1,028.40 | | | 1.64% | | | | 8.38 | |
| Institutional Class | | | 1,000.00 | | | | | 1,033.60 | | | 0.64% | | | | 3.28 | |
| Hypothetical 5% return (5% return before expenses) | | | | | | | | |
| Class A | | $ | 1,000.00 | | | | $ | 1,020.72 | | | 0.89% | | | $ | 4.53 | |
| Class C | | | 1,000.00 | | | | | 1,016.94 | | | 1.64% | | | | 8.34 | |
| Institutional Class | | | 1,000.00 | | | | | 1,021.98 | | | 0.64% | | | | 3.26 | |
| * | “Expenses Paid During Period” are equal to the relevant Fund’s annualized expense ratio, multiplied by the average account value over the period, multiplied by 184/365 (to reflect the one-half year period). |
| † | Because actual returns reflect only the most recent six-month period, the returns shown may differ significantly from fiscal year returns. |
23
Table of Contents
| Security type / sector / state / territory allocations |
| Delaware Tax-Free Minnesota Fund | As of August 31, 2021 (Unaudited) |
Sector designations may be different from the sector designations presented in other Fund materials.
| Security type / sector | Percentage of net assets |
| Municipal Bonds* | | 98.50 | % | |
| Corporate Revenue Bonds | | 1.38 | % | |
| Education Revenue Bonds | | 18.07 | % | |
| Electric Revenue Bonds | | 7.57 | % | |
| Healthcare Revenue Bonds | | 22.84 | % | |
| Housing Revenue Bonds | | 0.54 | % | |
| Lease Revenue Bonds | | 2.72 | % | |
| Local General Obligation Bonds | | 13.16 | % | |
| Pre-Refunded/Escrowed to Maturity Bonds | | 7.13 | % | |
| Special Tax Revenue Bonds | | 3.19 | % | |
| State General Obligation Bonds | | 12.88 | % | |
| Transportation Revenue Bonds | | 6.16 | % | |
| Water & Sewer Revenue Bonds | | 2.86 | % | |
| Short-Term Investments | | 1.08 | % | |
| Total Value of Securities | | 99.58 | % | |
| Receivables and Other Assets Net of Liabilities | | 0.42 | % | |
| Total Net Assets | | 100.00 | % | |
| * | As of the date of this report, Delaware Tax-Free Minnesota Fund held bonds issued by or on behalf of territories and the states of the US as follows: |
| State / territory | Percentage of net assets |
| Guam | | 0.37 | % | |
| Minnesota | | 95.28 | % | |
| Puerto Rico | | 3.59 | % | |
| US Virgin Islands | | 0.34 | % | |
| Total Value of Securities | | 99.58 | % | |
24
Table of Contents
| Security type / sector / state / territory allocations |
| Delaware Tax-Free Minnesota Intermediate Fund | As of August 31, 2021 (Unaudited) |
Sector designations may be different from the sector designations presented in other Fund materials.
| Security type / sector | Percentage of net assets |
| Municipal Bonds* | | 98.70 | % | |
| Corporate Revenue Bond | | 1.00 | % | |
| Education Revenue Bonds | | 15.00 | % | |
| Electric Revenue Bonds | | 5.98 | % | |
| Healthcare Revenue Bonds | | 23.12 | % | |
| Housing Revenue Bonds | | 0.66 | % | |
| Lease Revenue Bonds | | 4.16 | % | |
| Local General Obligation Bonds | | 17.24 | % | |
| Pre-Refunded/Escrowed to Maturity Bonds | | 5.01 | % | |
| Special Tax Revenue Bonds | | 3.09 | % | |
| State General Obligation Bonds | | 15.78 | % | |
| Transportation Revenue Bonds | | 5.44 | % | |
| Water & Sewer Revenue Bonds | | 2.22 | % | |
| Short-Term Investments | | 0.88 | % | |
| Total Value of Securities | | 99.58 | % | |
| Receivables and Other Assets Net of Liabilities | | 0.42 | % | |
| Total Net Assets | | 100.00 | % | |
| * | As of the date of this report, Delaware Tax-Free Minnesota Intermediate Fund held bonds issued by or on behalf of territories and the states of the US as follows: |
| State / territory | Percentage of net assets |
| Guam | | 0.74 | % | |
| Minnesota | | 96.13 | % | |
| Puerto Rico | | 2.71 | % | |
| Total Value of Securities | | 99.58 | % | |
25
Table of Contents
| Security type / sector / state / territory allocations |
| Delaware Minnesota High-Yield Municipal Bond Fund | As of August 31, 2021 (Unaudited) |
Sector designations may be different from the sector designations presented in other Fund materials.
| Security type / sector | Percentage of net assets |
| Municipal Bonds* | | 96.00 | % | |
| Corporate Revenue Bonds | | 1.86 | % | |
| Education Revenue Bonds | | 22.79 | % | |
| Electric Revenue Bonds | | 5.34 | % | |
| Healthcare Revenue Bonds | | 30.98 | % | |
| Housing Revenue Bonds | | 1.70 | % | |
| Lease Revenue Bonds | | 1.99 | % | |
| Local General Obligation Bonds | | 7.74 | % | |
| Pre-Refunded/Escrowed to Maturity Bonds | | 4.71 | % | |
| Special Tax Revenue Bonds | | 4.42 | % | |
| State General Obligation Bonds | | 8.41 | % | |
| Transportation Revenue Bonds | | 5.06 | % | |
| Water & Sewer Revenue Bonds | | 1.00 | % | |
| Short-Term Investments | | 3.42 | % | |
| Total Value of Securities | | 99.42 | % | |
| Receivables and Other Assets Net of Liabilities | | 0.58 | % | |
| Total Net Assets | | 100.00 | % | |
| * | As of the date of this report, Delaware Minnesota High-Yield Municipal Bond Fund held bonds issued by or on behalf of territories and the states of the US as follows: |
| State / territory | Percentage of net assets |
| Minnesota | | 94.80 | % | |
| Puerto Rico | | 4.62 | % | |
| Total Value of Securities | | 99.42 | % | |
26
Table of Contents
| Schedules of investments | |
| Delaware Tax-Free Minnesota Fund | August 31, 2021 |
| | | | | Principal
amount° | | Value (US $) |
| Municipal Bonds – 98.50% | | | | | |
| Corporate Revenue Bonds – 1.38% | | | | | |
| Cottonwood Revenue | | | | | |
| | (Extreme Holdings LLC Project) | | | | | |
| | Series A 144A 5.00% 12/1/50 (AMT) # | | 1,000,000 | | $ | 1,029,200 |
| St. Paul Port Authority Solid Waste Disposal Revenue | | | | | |
| | (Gerdau St. Paul Steel Mill Project) | | | | | |
| | Series 7 144A 4.50% 10/1/37 (AMT) # | | 7,250,000 | | | 7,393,260 |
| | | | | | | 8,422,460 |
| Education Revenue Bonds – 18.07% | | | | | |
| Bethel Charter School Lease Revenue | | | | | |
| | (Spectrum High School Project) | | | | | |
| | Series A 4.00% 7/1/32 | | 840,000 | | | 915,239 |
| | Series A 4.25% 7/1/47 | | 1,550,000 | | | 1,674,852 |
| | Series A 4.375% 7/1/52 | | 400,000 | | | 433,264 |
| Brooklyn Park Charter School Lease Revenue | | | | | |
| | (Prairie Seeds Academy Project) | | | | | |
| | Series A 5.00% 3/1/34 | | 2,260,000 | | | 2,406,674 |
| | Series A 5.00% 3/1/39 | | 385,000 | | | 407,103 |
| Cologne Charter School Lease Revenue | | | | | |
| | (Cologne Academy Project) | | | | | |
| | Series A 5.00% 7/1/34 | | 250,000 | | | 268,528 |
| | Series A 5.00% 7/1/45 | | 1,390,000 | | | 1,477,278 |
| Deephaven Charter School Lease Revenue | | | | | |
| | (Eagle Ridge Academy Project) | | | | | |
| | Series A 5.50% 7/1/50 | | 2,000,000 | | | 2,242,680 |
| Duluth Housing & Redevelopment Authority Revenue | | | | | |
| | (Duluth Public Schools Academy Project) | | | | | |
| | Series A 5.00% 11/1/38 | | 700,000 | | | 786,744 |
| | Series A 5.00% 11/1/48 | | 2,800,000 | | | 3,103,968 |
| Duluth Independent School District No. 709 Certificates of | | | | | |
| | Participation | | | | | |
| | Series B 5.00% 2/1/28 | | 350,000 | | | 432,870 |
| Forest Lake Charter School Lease Revenue Fund | | | | | |
| | (Lakes International Language Academy Project) | | | | | |
| | Series A 5.25% 8/1/43 | | 400,000 | | | 461,032 |
| | Series A 5.375% 8/1/50 | | 1,690,000 | | | 1,952,271 |
| | Series A 5.50% 8/1/36 | | 580,000 | | | 608,472 |
| | Series A 5.75% 8/1/44 | | 1,190,000 | | | 1,250,524 |
| Ham Lake Charter School Lease Revenue | | | | | |
| | (Davinci Academy Project) | | | | | |
| | Series A 5.00% 7/1/36 | | 765,000 | | | 835,602 |
| | Series A 5.00% 7/1/47 | | 2,290,000 | | | 2,476,933 |
27
Table of Contents
Schedules of investments
Delaware Tax-Free Minnesota Fund
| | | | | Principal | | | |
| | | | amount° | | Value (US $) |
| Municipal Bonds (continued) | | | | | |
| Education Revenue Bonds (continued) | | | | | |
| Hugo Charter School Lease Revenue | | | | | |
| | (Noble Academy Project) | | | | | |
| | Series A 5.00% 7/1/34 | | 580,000 | | $ | 617,891 |
| | Series A 5.00% 7/1/44 | | 1,770,000 | | | 1,865,297 |
| Minneapolis Charter School Lease Revenue | | | | | |
| | (Hiawatha Academies Project) | | | | | |
| | Series A 5.00% 7/1/31 | | 885,000 | | | 967,447 |
| | Series A 5.00% 7/1/47 | | 2,300,000 | | | 2,470,039 |
| Minneapolis Student Housing Revenue | | | | | |
| | (Riverton Community Housing Project) | | | | | |
| | 5.25% 8/1/39 | | 470,000 | | | 504,173 |
| | 5.50% 8/1/49 | | 2,260,000 | | | 2,424,935 |
| Minnesota Colleges & Universities Revenue Fund | | | | | |
| | Series A 5.00% 10/1/26 | | 4,990,000 | | | 6,126,073 |
| Minnesota Higher Education Facilities Authority Revenue | | | | | |
| | (Bethel University) | | | | | |
| | 5.00% 5/1/37 | | 1,250,000 | | | 1,415,600 |
| | 5.00% 5/1/47 | | 250,000 | | | 279,583 |
| | (Carleton College) | | | | | |
| | 4.00% 3/1/35 | | 1,000,000 | | | 1,135,530 |
| | 4.00% 3/1/36 | | 415,000 | | | 471,008 |
| | 5.00% 3/1/44 | | 2,110,000 | | | 2,530,903 |
| | (College of St. Benedict) | | | | | |
| | Series 8-K 4.00% 3/1/43 | | 1,000,000 | | | 1,078,650 |
| | (College of St. Scholastica) | | | | | |
| | 4.00% 12/1/29 | | 280,000 | | | 336,568 |
| | 4.00% 12/1/30 | | 290,000 | | | 345,947 |
| | 4.00% 12/1/33 | | 500,000 | | | 588,495 |
| | 4.00% 12/1/34 | | 500,000 | | | 586,805 |
| | 4.00% 12/1/40 | | 1,200,000 | | | 1,387,056 |
| | (Gustavus Adolphus College) | | | | | |
| | 5.00% 10/1/47 | | 5,600,000 | | | 6,681,864 |
| | (St. Catherine University) | | | | | |
| | Series A 4.00% 10/1/36 | | 925,000 | | | 1,045,398 |
| | Series A 5.00% 10/1/35 | | 875,000 | | | 1,060,815 |
| | Series A 5.00% 10/1/45 | | 2,120,000 | | | 2,519,578 |
| | (St. John’s University) | | | | | |
| | Series 8-I 5.00% 10/1/32 | | 500,000 | | | 580,470 |
| | Series 8-I 5.00% 10/1/33 | | 250,000 | | | 290,060 |
| | (St. Olaf College) | | | | | |
| | 3.00% 10/1/41 | | 1,585,000 | | | 1,743,579 |
28
Table of Contents
| | | | | Principal | | | |
| | | | amount° | | Value (US $) |
| Municipal Bonds (continued) | | | | | |
| Education Revenue Bonds (continued) | | | | | |
| Minnesota Higher Education Facilities Authority Revenue | | | | | |
| | (St. Olaf College) | | | | | |
| | 4.00% 10/1/46 | | 750,000 | | $ | 890,040 |
| | 4.00% 10/1/50 | | 565,000 | | | 668,050 |
| | Series 8-G 5.00% 12/1/31 | | 745,000 | | | 871,948 |
| | Series 8-G 5.00% 12/1/32 | | 670,000 | | | 783,431 |
| | Series 8-N 4.00% 10/1/35 | | 500,000 | | | 568,725 |
| | (Trustees of The Hamline University) | | | | | |
| | Series B 5.00% 10/1/37 | | 955,000 | | | 1,064,453 |
| | Series B 5.00% 10/1/38 | | 1,000,000 | | | 1,113,450 |
| | Series B 5.00% 10/1/39 | | 170,000 | | | 188,821 |
| | Series B 5.00% 10/1/40 | | 625,000 | | | 693,594 |
| | Series B 5.00% 10/1/47 | | 1,060,000 | | | 1,165,597 |
| | (University of St. Thomas) | | | | | |
| | 4.00% 10/1/36 | | 1,450,000 | | | 1,709,434 |
| | 4.00% 10/1/37 | | 750,000 | | | 881,685 |
| | 4.00% 10/1/44 | | 1,255,000 | | | 1,451,997 |
| | 5.00% 10/1/40 | | 500,000 | | | 627,735 |
| | Series 8-L 5.00% 4/1/35 | | 1,250,000 | | | 1,455,637 |
| | Series A 4.00% 10/1/34 | | 400,000 | | | 461,480 |
| | Series A 4.00% 10/1/36 | | 500,000 | | | 574,955 |
| Minnesota Office of Higher Education Revenue | | | | | |
| | (Senior Supplemental Student Loan Program) | | | | | |
| | 2.65% 11/1/38 (AMT) | | 1,000,000 | | | 1,032,280 |
| Otsego Charter School Lease Revenue | | | | | |
| | (Kaleidoscope Charter School) | | | | | |
| | Series A 5.00% 9/1/34 | | 520,000 | | | 551,434 |
| | Series A 5.00% 9/1/44 | | 1,165,000 | | | 1,221,747 |
| St. Cloud Charter School Lease Revenue | | | | | |
| | (Stride Academy Project) | | | | | |
| | Series A 5.00% 4/1/46 | | 875,000 | | | 798,796 |
| St. Paul Housing & Redevelopment Authority Charter School Lease | | | | | |
| | Revenue | | | | | |
| | (Academia Cesar Chavez School Project) | | | | | |
| | Series A 5.25% 7/1/50 | | 1,945,000 | | | 2,094,843 |
| | (Great River School Project) | | | | | |
| | Series A 144A 4.75% 7/1/29 # | | 300,000 | | | 331,077 |
| | Series A 144A 5.50% 7/1/52 # | | 735,000 | | | 831,741 |
| | (Hmong College Preparatory Academy Project) | | | | | |
| | Series A 5.00% 9/1/43 | | 750,000 | | | 904,927 |
| | Series A 5.75% 9/1/46 | | 1,000,000 | | | 1,166,090 |
29
Table of Contents
Schedules of investments
Delaware Tax-Free Minnesota Fund
| | | | | Principal | | | |
| | | | amount° | | Value (US $) |
| Municipal Bonds (continued) | | | | | |
| Education Revenue Bonds (continued) | | | | | |
| St. Paul Housing & Redevelopment Authority Charter School Lease | | | | | |
| | Revenue | | | | | |
| | (Nova Classical Academy Project) | | | | | |
| | Series A 4.00% 9/1/36 | | 500,000 | | $ | 531,260 |
| | Series A 4.125% 9/1/47 | | 1,750,000 | | | 1,849,977 |
| | (Twin Cities Academy Project) | | | | | |
| | Series A 5.30% 7/1/45 | | 1,440,000 | | | 1,594,685 |
| University of Minnesota | | | | | |
| | Series A 5.00% 11/1/32 | | 985,000 | | | 1,322,894 |
| | Series A 5.00% 4/1/34 | | 925,000 | | | 1,097,022 |
| | Series A 5.00% 9/1/34 | | 2,625,000 | | | 3,228,566 |
| | Series A 5.00% 4/1/35 | | 3,175,000 | | | 3,765,455 |
| | Series A 5.00% 4/1/36 | | 2,650,000 | | | 3,142,821 |
| | Series A 5.00% 4/1/37 | | 1,125,000 | | | 1,334,216 |
| | Series A 5.00% 9/1/40 | | 1,560,000 | | | 1,898,520 |
| | Series A 5.00% 9/1/41 | | 1,750,000 | | | 2,129,103 |
| | Series A 5.00% 4/1/44 | | 3,000,000 | | | 3,762,990 |
| | | | | | | 110,549,274 |
| Electric Revenue Bonds – 7.57% | | | | | |
| Chaska Electric Revenue | | | | | |
| | (Generating Facilities) | | | | | |
| | Series A 5.00% 10/1/28 | | 350,000 | | | 413,182 |
| | Series A 5.00% 10/1/30 | | 1,150,000 | | | 1,357,598 |
| Minnesota Municipal Power Agency Electric Revenue | | | | | |
| | 4.00% 10/1/41 | | 1,000,000 | | | 1,127,030 |
| | 5.00% 10/1/29 | | 395,000 | | | 449,893 |
| | 5.00% 10/1/30 | | 500,000 | | | 569,485 |
| | 5.00% 10/1/33 | | 1,205,000 | | | 1,370,471 |
| | 5.00% 10/1/47 | | 2,000,000 | | | 2,371,200 |
| | Series A 5.00% 10/1/30 | | 1,060,000 | | | 1,207,308 |
| | Series A 5.00% 10/1/34 | | 750,000 | | | 852,248 |
| | Series A 5.00% 10/1/35 | | 1,525,000 | | | 1,730,905 |
| Northern Municipal Power Agency Electric System Revenue | | | | | |
| | 5.00% 1/1/27 | | 540,000 | | | 639,322 |
| | 5.00% 1/1/28 | | 560,000 | | | 667,874 |
| | 5.00% 1/1/29 | | 805,000 | | | 954,783 |
| | 5.00% 1/1/30 | | 520,000 | | | 611,505 |
| | 5.00% 1/1/31 | | 200,000 | | | 240,976 |
| | 5.00% 1/1/32 | | 210,000 | | | 252,710 |
| | 5.00% 1/1/35 | | 160,000 | | | 191,725 |
| | 5.00% 1/1/36 | | 180,000 | | | 214,927 |
30
Table of Contents
| | | | | Principal | | | |
| | | | amount° | | Value (US $) |
| Municipal Bonds (continued) | | | | | |
| Electric Revenue Bonds (continued) | | | | | |
| Northern Municipal Power Agency Electric System Revenue | | | | | |
| | 5.00% 1/1/41 | | 400,000 | | $ | 475,280 |
| | Series A 5.00% 1/1/25 | | 125,000 | | | 132,621 |
| | Series A 5.00% 1/1/26 | | 425,000 | | | 450,560 |
| | Series A 5.00% 1/1/31 | | 520,000 | | | 551,132 |
| Puerto Rico Electric Power Authority Revenue | | | | | |
| | Series A 5.05% 7/1/42 ‡ | | 430,000 | | | 421,400 |
| | Series AAA 5.25% 7/1/25 ‡ | | 250,000 | | | 245,938 |
| | Series CCC 5.25% 7/1/27 ‡ | | 1,875,000 | | | 1,844,531 |
| | Series WW 5.00% 7/1/28 ‡ | | 1,775,000 | | | 1,739,500 |
| | Series WW 5.25% 7/1/33 ‡ | | 1,250,000 | | | 1,229,687 |
| | Series XX 4.75% 7/1/26 ‡ | | 260,000 | | | 253,825 |
| | Series XX 5.25% 7/1/40 ‡ | | 750,000 | | | 737,812 |
| | Series XX 5.75% 7/1/36 ‡ | | 925,000 | | | 915,750 |
| | Series ZZ 4.75% 7/1/27 ‡ | | 210,000 | | | 205,013 |
| | Series ZZ 5.25% 7/1/24 ‡ | | 350,000 | | | 344,313 |
| Rochester Electric Utility Revenue | | | | | |
| | Series A 5.00% 12/1/42 | | 1,395,000 | | | 1,669,076 |
| | Series A 5.00% 12/1/47 | | 2,265,000 | | | 2,688,396 |
| Southern Minnesota Municipal Power Agency Revenue | | | | | |
| | Series A 5.00% 1/1/41 | | 1,310,000 | | | 1,530,172 |
| | Series A 5.00% 1/1/42 | | 1,500,000 | | | 1,817,130 |
| | Series A 5.00% 1/1/46 | | 2,000,000 | | | 2,321,380 |
| | Series A 5.00% 1/1/47 | | 3,130,000 | | | 3,766,579 |
| Southern Minnesota Municipal Power Agency Revenue Capital | | | | | |
| | Appreciation | | | | | |
| | Series A 4.965% 1/1/25 ^ | | 5,000,000 | | | 4,888,300 |
| St. Paul Housing & Redevelopment Energy Revenue | | | | | |
| | Series A 4.00% 10/1/30 | | 1,235,000 | | | 1,418,163 |
| | Series A 4.00% 10/1/31 | | 885,000 | | | 1,011,785 |
| | Series A 4.00% 10/1/33 | | 365,000 | | | 414,341 |
| | | | | | | 46,295,826 |
| Healthcare Revenue Bonds – 22.84% | | | | | |
| Anoka Healthcare & Housing Facilities Revenue | | | | | |
| | (The Homestead at Anoka Project) | | | | | |
| | 5.125% 11/1/49 | | 1,100,000 | | | 1,162,843 |
| | 5.375% 11/1/34 | | 320,000 | | | 344,566 |
| Apple Valley Senior Housing Revenue | | | | | |
| | (PHS Apple Valley Senior Housing, Inc. - Orchard Path Project) | | | | | |
| | 5.00% 9/1/43 | | 465,000 | | | 491,100 |
| | 5.00% 9/1/58 | | 3,220,000 | | | 3,381,419 |
31
Table of Contents
Schedules of investments
Delaware Tax-Free Minnesota Fund
| | Principal | | | |
| | amount° | | Value (US $) |
| Municipal Bonds (continued) | | | | | |
| Healthcare Revenue Bonds (continued) | | | | | |
| Apple Valley Senior Living Revenue | | | | | |
| (Senior Living LLC Project) | | | | | |
| 2nd Tier Series B 5.00% 1/1/47 | | 1,640,000 | | $ | 1,285,514 |
| 2nd Tier Series B 5.25% 1/1/37 | | 480,000 | | | 422,266 |
| 4th Tier Series D 7.00% 1/1/37 | | 1,585,000 | | | 1,293,328 |
| 4th Tier Series D 7.25% 1/1/52 | | 2,580,000 | | | 2,000,945 |
| Bethel Housing & Health Care Facilities Revenue | | | | | |
| (Benedictine Health System – St. Peter Communities Project) | | | | | |
| Series A 5.50% 12/1/48 | | 2,350,000 | | | 2,501,246 |
| Bethel Senior Housing Revenue | | | | | |
| (The Lodge at The Lakes at Stillwater Project) | | | | | |
| 5.00% 6/1/38 | | 450,000 | | | 470,259 |
| 5.00% 6/1/48 | | 1,000,000 | | | 1,039,630 |
| 5.00% 6/1/53 | | 2,450,000 | | | 2,544,962 |
| Center City Health Care Facilities Revenue | | | | | |
| (Hazelden Betty Ford Foundation Project) | | | | | |
| 4.00% 11/1/34 | | 500,000 | | | 582,695 |
| 4.00% 11/1/41 | | 800,000 | | | 918,776 |
| 5.00% 11/1/26 | | 500,000 | | | 565,165 |
| Chatfield Healthcare and Housing Facilities Revenue | | | | | |
| (Chosen Valley Care Center Project) | | | | | |
| 5.00% 9/1/44 | | 500,000 | | | 530,250 |
| Crookston Health Care Facilities Revenue | | | | | |
| (Riverview Health Project) | | | | | |
| 5.00% 5/1/38 | | 100,000 | | | 105,225 |
| 5.00% 5/1/44 | | 1,500,000 | | | 1,568,835 |
| 5.00% 5/1/51 | | 1,585,000 | | | 1,647,243 |
| Dakota County Community Development Agency Senior Housing | | | | | |
| Revenue | | | | | |
| (Walker Highview Hills Project) | | | | | |
| Series A 144A 5.00% 8/1/36 # | | 280,000 | | | 286,869 |
| Series A 144A 5.00% 8/1/46 # | | 2,380,000 | | | 2,432,931 |
| Deephaven Housing & Healthcare Revenue | | | | | |
| (St. Therese Senior Living Project) | | | | | |
| Series A 5.00% 4/1/38 | | 730,000 | | | 743,403 |
| Series A 5.00% 4/1/40 | | 705,000 | | | 717,076 |
| Series A 5.00% 4/1/48 | | 315,000 | | | 319,429 |
| Duluth Economic Development Authority | | | | | |
| (Essentia Health Obligated Group) | | | | | |
| Series A 4.25% 2/15/43 | | 2,000,000 | | | 2,300,460 |
| Series A 5.00% 2/15/48 | | 1,850,000 | | | 2,224,347 |
32
Table of Contents
| | Principal | | | |
| | amount° | | Value (US $) |
| Municipal Bonds (continued) | | | | | |
| Healthcare Revenue Bonds (continued) | | | | | |
| Duluth Economic Development Authority | | | | | |
| (St. Luke’s Hospital of Duluth Obligated Group) | | | | | |
| 5.75% 6/15/32 | | 3,750,000 | | $ | 3,883,462 |
| 6.00% 6/15/39 | | 3,570,000 | | | 3,693,094 |
| Series A 3.00% 6/15/44 | | 850,000 | | | 877,251 |
| Series A 4.00% 6/15/34 | | 215,000 | | | 254,306 |
| Series A 4.00% 6/15/36 | | 990,000 | | | 1,154,217 |
| Series A 4.00% 6/15/37 | | 380,000 | | | 437,597 |
| Series A 4.00% 6/15/38 | | 150,000 | | | 175,460 |
| Series A 4.00% 6/15/39 | | 150,000 | | | 174,818 |
| Glencoe Health Care Facilities Revenue | | | | | |
| (Glencoe Regional Health Services Project) | | | | | |
| 4.00% 4/1/24 | | 500,000 | | | 509,425 |
| 4.00% 4/1/25 | | 660,000 | | | 671,708 |
| 4.00% 4/1/31 | | 60,000 | | | 60,701 |
| Hayward Health Care Facilities Revenue | | | | | |
| (American Baptist Homes Midwest Obligated Group) | | | | | |
| 5.375% 8/1/34 | | 660,000 | | | 670,712 |
| 5.75% 2/1/44 | | 500,000 | | | 510,025 |
| (St. John’s Lutheran Home of Albert Lea Project) | | | | | |
| 5.375% 10/1/44 | | 575,000 | | | 580,244 |
| Maple Grove Health Care Facilities Revenue | | | | | |
| (Maple Grove Hospital Corporation) | | | | | |
| 4.00% 5/1/37 | | 2,000,000 | | | 2,253,320 |
| 5.00% 5/1/27 | | 1,400,000 | | | 1,719,200 |
| 5.00% 5/1/29 | | 1,000,000 | | | 1,216,430 |
| 5.00% 5/1/30 | | 850,000 | | | 1,028,288 |
| 5.00% 5/1/31 | | 500,000 | | | 602,525 |
| 5.00% 5/1/32 | | 500,000 | | | 601,015 |
| (North Memorial Health Care) | | | | | |
| 5.00% 9/1/31 | | 1,000,000 | | | 1,146,590 |
| 5.00% 9/1/32 | | 1,000,000 | | | 1,144,760 |
| Maple Plain Senior Housing & Health Care Revenue | | | | | |
| (Haven Homes Project) | | | | | |
| 5.00% 7/1/54 | | 3,500,000 | | | 3,732,155 |
| Minneapolis Health Care System Revenue | | | | | |
| (Fairview Health Services) | | | | | |
| Series A 4.00% 11/15/48 | | 5,600,000 | | | 6,376,664 |
| Series A 5.00% 11/15/33 | | 825,000 | | | 993,298 |
| Series A 5.00% 11/15/34 | | 500,000 | | | 582,385 |
| Series A 5.00% 11/15/35 | | 1,000,000 | | | 1,256,920 |
33
Table of Contents
Schedules of investments
Delaware Tax-Free Minnesota Fund
| | Principal | | | |
| | amount° | | Value (US $) |
| Municipal Bonds (continued) | | | | | |
| Healthcare Revenue Bonds (continued) | | | | | |
| Minneapolis Health Care System Revenue | | | | | |
| (Fairview Health Services) | | | | | |
| Series A 5.00% 11/15/44 | | 1,000,000 | | $ | 1,160,290 |
| Series A 5.00% 11/15/49 | | 3,475,000 | | | 4,251,454 |
| Minneapolis Senior Housing & Healthcare Revenue | | | | | |
| (Ecumen-Abiitan Mill City Project) | | | | | |
| 5.00% 11/1/35 | | 500,000 | | | 508,670 |
| 5.25% 11/1/45 | | 1,950,000 | | | 1,981,200 |
| 5.375% 11/1/50 | | 455,000 | | | 462,817 |
| Minneapolis – St. Paul Housing & Redevelopment Authority Health | | | | | |
| Care Facilities Revenue | | | | | |
| (Allina Health System) | | | | | |
| Series A 5.00% 11/15/28 | | 1,550,000 | | | 1,914,932 |
| Red Wing Senior Housing | | | | | |
| (Deer Crest Project) | | | | | |
| Series A 5.00% 11/1/27 | | 430,000 | | | 435,044 |
| Series A 5.00% 11/1/32 | | 330,000 | | | 333,871 |
| Series A 5.00% 11/1/42 | | 1,250,000 | | | 1,264,662 |
| Rochester Health Care & Housing Revenue | | | | | |
| (The Homestead at Rochester Project) | | | | | |
| Series A 6.875% 12/1/48 | | 2,980,000 | | | 3,204,692 |
| Rochester Health Care Facilities Revenue | | | | | |
| (Mayo Clinic) | | | | | |
| 4.00% 11/15/41 | | 4,515,000 | | | 4,622,728 |
| Sartell Health Care Facilities Revenue | | | | | |
| (Country Manor Campus Project) | | | | | |
| Series A 5.25% 9/1/27 | | 1,280,000 | | | 1,306,944 |
| Series A 5.30% 9/1/37 | | 1,200,000 | | | 1,236,864 |
| Sauk Rapids Health Care Housing Facilities Revenue | | | | | |
| (Good Shepherd Lutheran Home) | | | | | |
| 5.125% 1/1/39 | | 1,350,000 | | | 1,363,824 |
| Shakopee Health Care Facilities Revenue | | | | | |
| (St. Francis Regional Medical Center) | | | | | |
| 4.00% 9/1/31 | | 915,000 | | | 968,244 |
| 5.00% 9/1/24 | | 575,000 | | | 647,059 |
| 5.00% 9/1/25 | | 750,000 | | | 838,995 |
| 5.00% 9/1/26 | | 575,000 | | | 641,113 |
| 5.00% 9/1/27 | | 405,000 | | | 450,060 |
| 5.00% 9/1/28 | | 425,000 | | | 469,379 |
| 5.00% 9/1/29 | | 425,000 | | | 467,900 |
| 5.00% 9/1/34 | | 730,000 | | | 790,831 |
34
Table of Contents
| | Principal | | | |
| | amount° | | Value (US $) |
| Municipal Bonds (continued) | | | | | |
| Healthcare Revenue Bonds (continued) | | | | | |
| St. Cloud Health Care Revenue | | | | | |
| (Centracare Health System Project) | | | | | |
| 4.00% 5/1/49 | | 5,315,000 | | $ | 6,090,458 |
| 5.00% 5/1/48 | | 5,090,000 | | | 6,272,305 |
| Series A 4.00% 5/1/37 | | 965,000 | | | 1,085,403 |
| Series A 5.00% 5/1/46 | | 3,715,000 | | | 4,384,629 |
| St. Paul Housing & Redevelopment Authority Health Care Facilities | | | | | |
| Revenue | | | | | |
| (Fairview Health Services) | | | | | |
| Series A 4.00% 11/15/43 | | 2,450,000 | | | 2,810,566 |
| Series A 5.00% 11/15/47 | | 1,560,000 | | | 1,893,778 |
| (HealthPartners Obligated Group Project) | | | | | |
| Series A 5.00% 7/1/29 | | 2,200,000 | | | 2,580,204 |
| Series A 5.00% 7/1/32 | | 3,000,000 | | | 3,510,960 |
| Series A 5.00% 7/1/33 | | 1,260,000 | | | 1,473,028 |
| St. Paul Housing & Redevelopment Authority Housing & Health Care | | | | | |
| Facilities Revenue | | | | | |
| (Episcopal Homes Project) | | | | | |
| 5.125% 5/1/48 | | 3,100,000 | | | 3,123,095 |
| St. Paul Housing & Redevelopment Authority Multifamily Housing | | | | | |
| Revenue | | | | | |
| (Marian Center Project) | | | | | |
| Series A 5.30% 11/1/30 | | 500,000 | | | 500,670 |
| Series A 5.375% 5/1/43 | | 500,000 | | | 500,435 |
| Wayzata Senior Housing Revenue | | | | | |
| (Folkestone Senior Living Community) | | | | | |
| 3.75% 8/1/36 | | 500,000 | | | 527,040 |
| 4.00% 8/1/44 | | 800,000 | | | 841,880 |
| 5.00% 8/1/49 | | 1,000,000 | | | 1,079,560 |
| 5.00% 8/1/54 | | 875,000 | | | 942,051 |
| West St. Paul Housing and Health Care Facilities Revenue | | | | | |
| (Walker Westwood Ridge Campus Project) | | | | | |
| 4.50% 11/1/40 | | 250,000 | | | 255,218 |
| 4.75% 11/1/52 | | 750,000 | | | 765,277 |
| Winona Health Care Facilities Revenue | | | | | |
| (Winona Health Obligation Group) | | | | | |
| 4.50% 7/1/25 | | 850,000 | | | 852,227 |
| 4.65% 7/1/26 | | 540,000 | | | 541,431 |
| Woodbury Housing & Redevelopment Authority Revenue | | | | | |
| (St. Therese of Woodbury) | | | | | |
| 5.00% 12/1/34 | | 500,000 | | | 529,265 |
35
Table of Contents
Schedules of investments
Delaware Tax-Free Minnesota Fund
| | Principal | | | |
| | amount° | | Value (US $) |
| Municipal Bonds (continued) | | | | | |
| Healthcare Revenue Bonds (continued) | | | | | |
| Woodbury Housing & Redevelopment Authority Revenue | | | | | |
| (St. Therese of Woodbury) | | | | | |
| 5.125% 12/1/44 | | 1,605,000 | | $ | 1,688,845 |
| | | | | | 139,757,250 |
| Housing Revenue Bonds – 0.54% | | | | | |
| Minnesota Housing Finance Agency | | | | | |
| Series I 2.00% 7/1/40 | | 690,000 | | | 688,399 |
| Series I 2.20% 1/1/51 | | 1,290,000 | | | 1,276,068 |
| Northwest Multi-County Housing & Redevelopment Authority | | | | | |
| (Pooled Housing Program) | | | | | |
| 5.50% 7/1/45 | | 1,330,000 | | | 1,373,664 |
| | | | | | 3,338,131 |
| Lease Revenue Bonds – 2.72% | | | | | |
| Minnesota General Fund Revenue Appropriations | | | | | |
| Series A 5.00% 6/1/38 | | 1,250,000 | | | 1,346,475 |
| Series A 5.00% 6/1/43 | | 3,835,000 | | | 4,118,445 |
| Series B 5.00% 3/1/28 | | 2,500,000 | | | 2,559,400 |
| Series B 5.00% 3/1/29 | | 1,000,000 | | | 1,023,710 |
| Minnesota Housing Finance Agency | | | | | |
| (State Appropriation – Housing Infrastructure) | | | | | |
| Series C 5.00% 8/1/34 | | 1,565,000 | | | 1,769,545 |
| Series C 5.00% 8/1/35 | | 1,645,000 | | | 1,857,452 |
| University of Minnesota Special Purpose Revenue | | | | | |
| (State Supported Biomed Science Research Facilities Funding | | | | | |
| Project) | | | | | |
| Series A 5.00% 8/1/35 | | 3,960,000 | | | 3,975,801 |
| | | | | | 16,650,828 |
| Local General Obligation Bonds – 13.16% | | | | | |
| Anoka-Hennepin Independent School District No. 11 | | | | | |
| (Minnesota School District Credit Enhancement Program) | | | | | |
| Series A 3.00% 2/1/43 | | 750,000 | | | 812,543 |
| Brainerd Independent School District No. 181 | | | | | |
| (School Building) | | | | | |
| Series A 4.00% 2/1/38 | | 1,500,000 | | | 1,706,730 |
| Series A 4.00% 2/1/43 | | 3,500,000 | | | 3,950,310 |
| Burnsville-Eagan-Savage Independent School District No. 191 | | | | | |
| (Alternative Facilities) | | | | | |
| Series A 4.00% 2/1/28 | | 920,000 | | | 1,026,242 |
| Series A 4.00% 2/1/29 | | 1,800,000 | | | 2,003,562 |
36
Table of Contents
| | | | Principal | | | |
| | | | | amount° | | Value (US $) |
| Municipal Bonds (continued) | | | | | |
| Local General Obligation Bonds (continued) | | | | | |
| Chaska Independent School District No. 112 | | | | | |
| | (School Building) | | | | | |
| | Series A 5.00% 2/1/27 | | 1,905,000 | | $ | 2,282,285 |
| Duluth | | | | | |
| | (DECC Improvement) | | | | | |
| | Series A 5.00% 2/1/30 | | 630,000 | | | 749,599 |
| | Series A 5.00% 2/1/32 | | 1,000,000 | | | 1,188,390 |
| | Series A 5.00% 2/1/33 | | 3,585,000 | | | 4,255,216 |
| Duluth Independent School District No. 709 | | | | | |
| | Series A 4.00% 2/1/27 | | 160,000 | | | 183,630 |
| | Series A 4.00% 2/1/28 | | 1,250,000 | | | 1,430,213 |
| Hennepin County | | | | | |
| | Series A 5.00% 12/1/26 | | 2,635,000 | | | 3,254,093 |
| | Series A 5.00% 12/1/33 | | 2,000,000 | | | 2,687,860 |
| | Series A 5.00% 12/1/36 | | 940,000 | | | 1,149,921 |
| | Series A 5.00% 12/1/37 | | 5,495,000 | | | 6,770,095 |
| | Series A 5.00% 12/1/38 | | 3,310,000 | | | 4,102,778 |
| | Series B 5.00% 12/1/30 | | 1,000,000 | | | 1,230,280 |
| | Series C 5.00% 12/1/28 | | 1,500,000 | | | 1,952,970 |
| | Series C 5.00% 12/1/30 | | 1,245,000 | | | 1,531,699 |
| | Series C 5.00% 12/1/37 | | 3,000,000 | | | 3,664,740 |
| Lakeville Independent School District No. 194 | | | | | |
| | Series B 4.00% 2/1/28 | | 1,975,000 | | | 2,379,124 |
| Mahtomedi Independent School District No. 832 | | | | | |
| | (School Building) | | | | | |
| | Series A 5.00% 2/1/30 | | 445,000 | | | 514,687 |
| Marshall | | | | | |
| | Series B 4.00% 4/1/28 | | 275,000 | | | 332,307 |
| | Series B 4.00% 4/1/29 | | 285,000 | | | 350,445 |
| Minneapolis Special School District No. 1 | | | | | |
| | Series A 4.00% 2/1/36 | | 450,000 | | | 536,382 |
| | Series A 4.00% 2/1/37 | | 600,000 | | | 713,292 |
| | Series A 4.00% 2/1/38 | | 625,000 | | | 741,406 |
| | Series A 5.00% 2/1/33 | | 1,420,000 | | | 2,006,347 |
| | Series B 4.00% 2/1/36 | | 945,000 | | | 1,126,402 |
| | Series B 4.00% 2/1/37 | | 1,255,000 | | | 1,491,969 |
| | Series B 4.00% 2/1/38 | | 1,305,000 | | | 1,548,056 |
| | (School Building) | | | | | |
| | Series B 4.00% 2/1/37 | | 1,000,000 | | | 1,210,250 |
37
Table of Contents
Schedules of investments
Delaware Tax-Free Minnesota Fund
| | | | Principal | | | |
| | | | | amount° | | Value (US $) |
| Municipal Bonds (continued) | | | | | |
| Local General Obligation Bonds (continued) | | | | | |
| Mounds View Independent School District No. 621 | | | | | |
| | (Minnesota School District Credit Enhancement Program) | | | | | |
| | Series A 4.00% 2/1/43 | | 3,000,000 | | $ | 3,394,320 |
| Mountain Iron-Buhl Independent School District No. 712 | | | | | |
| | (School Building) | | | | | |
| | Series A 4.00% 2/1/26 | | 1,315,000 | | | 1,515,551 |
| St. Michael-Albertville Independent School District No. 885 | | | | | |
| | (School Building) | | | | | |
| | Series A 5.00% 2/1/27 | | 1,865,000 | | | 2,243,427 |
| Virginia, Minnesota Sales Tax Revenue | | | | | |
| | (General Obligation Sales Tax) | | | | | |
| | Series A 4.00% 2/1/35 (AGM) | | 500,000 | | | 575,310 |
| Wayzata Independent School District No. 284 | | | | | |
| | Series A 5.00% 2/1/28 | | 1,950,000 | | | 2,403,004 |
| White Bear Lake Independent School District No. 624 | | | | | |
| | Series A 3.00% 2/1/43 | | 10,645,000 | | | 11,505,648 |
| | | | | | | 80,521,083 |
| Pre-Refunded/Escrowed to Maturity Bonds – 7.13% | | | | | |
| Dakota & Washington Counties Housing & Redevelopment Authority | | | | | |
| | Single Family Residential Mortgage Revenue | | | | | |
| | (City of Bloomington) | | | | | |
| | Series B 8.375% 9/1/21 | | 14,115,000 | | | 14,115,000 |
| Minnesota | | | | | |
| | Series A Unrefunded Balance 5.00% 10/1/24-21 § | | 2,555,000 | | | 2,565,092 |
| | Series A Unrefunded Balance 5.00% 10/1/27-21 § | | 5,200,000 | | | 5,220,540 |
| | (State Trunk Highway) | | | | | |
| | Series B 5.00% 10/1/29-21 § | | 5,000,000 | | | 5,019,750 |
| Minnesota Higher Education Facilities Authority Revenue | | | | | |
| | (St. Catherine University) | | | | | |
| | Series 7-Q 5.00% 10/1/23-22 § | | 350,000 | | | 368,281 |
| | Series 7-Q 5.00% 10/1/24-22 § | | 475,000 | | | 499,809 |
| | Series 7-Q 5.00% 10/1/27-22 § | | 200,000 | | | 210,446 |
| Rice County Educational Facilities Revenue | | | | | |
| | (Shattuck-St. Mary’s School) | | | | | |
| | Series A 144A 5.00% 8/1/22 # | | 2,355,000 | | | 2,458,149 |
| Rochester Electric Utility Revenue | | | | | |
| | Series B 5.00% 12/1/27-23 § | | 295,000 | | | 327,084 |
| | Series B 5.00% 12/1/28-23 § | | 275,000 | | | 304,909 |
| | Series B 5.00% 12/1/31-23 § | | 1,365,000 | | | 1,513,457 |
| | Series B 5.00% 12/1/33-23 § | | 300,000 | | | 332,628 |
38
Table of Contents
| | | | Principal | | | |
| | | | | amount° | | Value (US $) |
| Municipal Bonds (continued) | | | | | |
| Pre-Refunded/Escrowed to Maturity Bonds (continued) | | | | | |
| Rochester Health Care Facilities Revenue | | | | | |
| | (Olmsted Medical Center Project) | | | | | |
| | 5.00% 7/1/24-23 § | | 295,000 | | $ | 320,630 |
| | 5.00% 7/1/33-23 § | | 650,000 | | | 706,472 |
| St. Paul Housing & Redevelopment Authority Hospital Facility | | | | | |
| | Revenue | | | | | |
| | (Healtheast Care System Project) | | | | | |
| | Series A 5.00% 11/15/29-25 § | | 910,000 | | | 1,083,855 |
| | Series A 5.00% 11/15/30-25 § | | 670,000 | | | 798,004 |
| Western Minnesota Municipal Power Agency Revenue | | | | | |
| | Series A 5.00% 1/1/34-24 § | | 4,000,000 | | | 4,451,160 |
| | Series A 5.00% 1/1/46-24 § | | 3,000,000 | | | 3,338,370 |
| | | | | | | 43,633,636 |
| Special Tax Revenue Bonds – 3.19% | | | | | |
| Minneapolis Development Revenue | | | | | |
| | (Limited Tax Supported Common Bond Fund) | | | | | |
| | Series 2-A 6.00% 12/1/40 | | 3,000,000 | | | 3,042,570 |
| Minneapolis Revenue | | | | | |
| | (YMCA Greater Twin Cities Project) | | | | | |
| | 4.00% 6/1/30 | | 250,000 | | | 270,860 |
| Puerto Rico Sales Tax Financing Revenue | | | | | |
| | (Restructured) | | | | | |
| | Series A-1 4.75% 7/1/53 | | 10,200,000 | | | 11,672,880 |
| St. Paul Sales Tax Revenue | | | | | |
| | Series G 5.00% 11/1/30 | | 655,000 | | | 748,488 |
| | Series G 5.00% 11/1/31 | | 1,500,000 | | | 1,713,585 |
| Virgin Islands Public Finance Authority | | | | | |
| | (Matching Fund Senior Lien) | | | | | |
| | 5.00% 10/1/29 (AGM) | | 2,000,000 | | | 2,065,400 |
| | | | | | | 19,513,783 |
| State General Obligation Bonds – 12.88% | | | | | |
| Commonwealth of Puerto Rico | | | | | |
| | (Public Improvement) | | | | | |
| | Series B 5.75% 7/1/38 ‡ | | 2,530,000 | | | 2,337,087 |
| Minnesota | | | | | |
| | (State Trunk Highway) | | | | | |
| | Series E 5.00% 10/1/26 | | 3,395,000 | | | 4,181,384 |
| | (Various Purposes) | | | | | |
| | Series A 5.00% 8/1/27 | | 7,590,000 | | | 8,969,179 |
| | Series A 5.00% 8/1/29 | | 3,200,000 | | | 3,780,096 |
| | Series A 5.00% 8/1/30 | | 14,480,000 | | | 18,209,921 |
39
Table of Contents
Schedules of investments
Delaware Tax-Free Minnesota Fund
| | | | Principal | | | |
| | | | | amount° | | Value (US $) |
| Municipal Bonds (continued) | | | | | |
| State General Obligation Bonds (continued) | | | | | |
| Minnesota | | | | | |
| | (Various Purposes) | | | | | |
| | Series A 5.00% 8/1/32 | | 3,875,000 | | $ | 4,397,195 |
| | Series A 5.00% 8/1/33 | | 3,750,000 | | | 4,894,606 |
| | Series A 5.00% 10/1/33 | | 3,000,000 | | | 3,743,550 |
| | Series A 5.00% 8/1/35 | | 5,975,000 | | | 7,706,044 |
| | Series A 5.00% 8/1/38 | | 5,335,000 | | | 6,863,632 |
| | Series A 5.00% 8/1/40 | | 1,750,000 | | | 2,292,465 |
| | Series A Unrefunded Balance 4.00% 8/1/27 | | 955,000 | | | 987,947 |
| | Series D 5.00% 8/1/26 | | 6,000,000 | | | 7,351,320 |
| | Series D 5.00% 8/1/27 | | 2,525,000 | | | 3,081,283 |
| | | | | | | 78,795,709 |
| Transportation Revenue Bonds – 6.16% | | | | | |
| Minneapolis – St. Paul Metropolitan Airports Commission Revenue | | | | | |
| | (Senior) | | | | | |
| | Series A 5.00% 1/1/32 | | 1,245,000 | | | 1,506,836 |
| | Series C 5.00% 1/1/29 | | 410,000 | | | 501,221 |
| | Series C 5.00% 1/1/33 | | 850,000 | | | 1,028,551 |
| | Series C 5.00% 1/1/36 | | 600,000 | | | 723,306 |
| | Series C 5.00% 1/1/41 | | 600,000 | | | 721,482 |
| | Series C 5.00% 1/1/46 | | 1,595,000 | | | 1,918,434 |
| | (Subordinate) | | | | | |
| | Series A 5.00% 1/1/35 | | 1,000,000 | | | 1,104,550 |
| | Series A 5.00% 1/1/44 | | 3,000,000 | | | 3,733,980 |
| | Series A 5.00% 1/1/49 | | 5,000,000 | | | 6,204,200 |
| | Series B 5.00% 1/1/26 | | 575,000 | | | 584,108 |
| | Series B 5.00% 1/1/27 | | 1,160,000 | | | 1,178,374 |
| | Series B 5.00% 1/1/28 | | 2,750,000 | | | 2,793,092 |
| | Series B 5.00% 1/1/29 | | 120,000 | | | 121,864 |
| | Series B 5.00% 1/1/30 | | 1,675,000 | | | 1,700,845 |
| | Series B 5.00% 1/1/31 | | 1,750,000 | | | 1,777,003 |
| | Series B 5.00% 1/1/44 (AMT) | | 3,595,000 | | | 4,465,601 |
| | Series B 5.00% 1/1/49 (AMT) | | 6,150,000 | | | 7,595,619 |
| | | | | | | 37,659,066 |
| Water & Sewer Revenue Bonds – 2.86% | | | | | |
| Guam Government Waterworks Authority | | | | | |
| | 5.00% 7/1/40 | | 1,930,000 | | | 2,240,769 |
| Metropolitan Council General Obligation Wastewater Revenue | | | | | |
| | (Minneapolis-St. Paul Metropolitan Area) | | | | | |
| | Series B 4.00% 9/1/27 | | 2,400,000 | | | 2,490,096 |
40
Table of Contents
| | | | Principal | | | |
| | | | | amount° | | Value (US $) |
| Municipal Bonds (continued) | | | | | |
| Water & Sewer Revenue Bonds (continued) | | | | | |
| Metropolitan Council General Obligation Wastewater Revenue | | | | | |
| | (Minneapolis-St. Paul Metropolitan Area) | | | | | |
| | Series B 5.00% 9/1/25 | | 2,000,000 | | $ | 2,095,000 |
| | Series C 4.00% 3/1/31 | | 3,120,000 | | | 3,643,224 |
| | Series C 4.00% 3/1/32 | | 3,225,000 | | | 3,755,867 |
| | Series E 5.00% 9/1/23 | | 2,000,000 | | | 2,095,000 |
| Minnesota Public Facilities Authority | | | | | |
| | Series B 4.00% 3/1/26 | | 1,000,000 | | | 1,162,640 |
| | | | | | | 17,482,596 |
| Total Municipal Bonds (cost $566,515,166) | | | | | 602,619,642 |
| | | | | | | | |
| Short-Term Investments – 1.08% | | | | | |
| Variable Rate Demand Notes – 1.08%¤ | | | | | |
| Minneapolis Health Care System Revenue | | | | | |
| | (Fairview Health Services) Series C 0.02% 11/15/48 (LOC – Wells | | | | | |
| | Fargo Bank N.A.) | | 3,950,000 | | | 3,950,000 |
| Minneapolis – St. Paul Housing & Redevelopment Authority Health | | | | | |
| | Care Revenue | | | | | |
| | (Allina Health System) | | | | | |
| | Series B-1 0.01% 11/15/35 | | | | | |
| | (LOC – JPMorgan Chase Bank N.A.) | | 2,630,000 | | | 2,630,000 |
| Total Short-Term Investments (cost $6,580,000) | | | | | 6,580,000 |
| Total Value of Securities–99.58% | | | | | |
| (cost $573,095,166) | | | | $ | 609,199,642 |
| ° | Principal amount shown is stated in USD unless noted that the security is denominated in another currency. |
| # | Security exempt from registration under Rule 144A of the Securities Act of 1933, as amended. At August 31, 2021, the aggregate value of Rule 144A securities was $14,763,227, which represents 2.41% of the Fund’s net assets. See Note 8 in “Notes to financial statements.” |
| ‡ | Non-income producing security. Security is currently in default. |
| ^ | Zero-coupon security. The rate shown is the effective yield at the time of purchase. |
| § | Pre-refunded bonds. Municipal bonds that are generally backed or secured by US Treasury bonds. For pre-refunded bonds, the stated maturity is followed by the year in which the bond will be pre-refunded. See Note 8 in “Notes to financial statements.” |
41
Table of Contents
Schedules of investments
Delaware Tax-Free Minnesota Fund
| ¤ | Tax-exempt obligations that contain a floating or variable interest rate adjustment formula and an unconditional right of demand to receive payment of the unpaid principal balance plus accrued interest upon a short notice period (generally up to 30 days) prior to specified dates either from the issuer or by drawing on a bank letter of credit, a guarantee, or insurance issued with respect to such instrument. Each rate shown is as of August 31, 2021. |
Summary of abbreviations:
AGM – Insured by Assured Guaranty Municipal Corporation
AMT – Subject to Alternative Minimum Tax
LLC – Limited Liability Corporation
LOC – Letter of Credit
N.A. – National Association
USD – US Dollar
See accompanying notes, which are an integral part of the financial statements.
42
Table of Contents
| Schedules of investments | | |
| Delaware Tax-Free Minnesota Intermediate Fund | | August 31, 2021 |
| | | | Principal | | | |
| | | | amount° | | Value (US $) |
| Municipal Bonds – 98.70% | | | | | |
| Corporate Revenue Bond – 1.00% | | | | | |
| | St. Paul Port Authority Solid Waste Disposal Revenue | | | | | |
| | (Gerdau St. Paul Steel Mill Project) | | | | | |
| | Series 7 144A 4.50% 10/1/37 (AMT) # | | 885,000 | | $ | 902,488 |
| | | | | | | 902,488 |
| Education Revenue Bonds – 15.00% | | | | | |
| Bethel Charter School Lease Revenue | | | | | |
| | (Spectrum High School Project) | | | | | |
| | Series A 4.00% 7/1/32 | | 425,000 | | | 463,067 |
| Brooklyn Park Charter School Lease Revenue | | | | | |
| | (Prairie Seeds Academy Project) | | | | | |
| | Series A 5.00% 3/1/34 | | 485,000 | | | 516,477 |
| Cologne Charter School Lease Revenue | | | | | |
| | (Cologne Academy Project) | | | | | |
| | Series A 5.00% 7/1/29 | | 305,000 | | | 331,013 |
| Duluth Housing & Redevelopment Authority Revenue | | | | | |
| | (Duluth Public Schools Academy Project) | | | | | |
| | Series A 5.00% 11/1/38 | | 400,000 | | | 449,568 |
| Forest Lake Charter School Lease Revenue Fund | | | | | |
| | (Lakes International Language Academy Project) | | | | | |
| | Series A 5.50% 8/1/36 | | 420,000 | | | 440,618 |
| Hugo Charter School Lease Revenue | | | | | |
| | (Noble Academy Project) | | | | | |
| | Series A 5.00% 7/1/29 | | 530,000 | | | 569,432 |
| Minneapolis Charter School Lease Revenue | | | | | |
| | (Hiawatha Academies Project) | | | | | |
| | Series A 5.00% 7/1/31 | | 500,000 | | | 546,580 |
| Minneapolis Student Housing Revenue | | | | | |
| | (Riverton Community Housing Project) | | | | | |
| | 5.25% 8/1/39 | | 525,000 | | | 563,173 |
| Minnesota Higher Education Facilities Authority Revenue | | | | | |
| | (Bethel University) | | | | | |
| | 5.00% 5/1/32 | | 750,000 | | | 858,420 |
| | (Gustavus Adolphus College) | | | | | |
| | 5.00% 10/1/34 | | 435,000 | | | 530,000 |
| | 5.00% 10/1/35 | | 555,000 | | | 675,302 |
| | (St. Catherine University) | | | | | |
| | Series A 5.00% 10/1/35 | | 565,000 | | | 684,983 |
| | (St. John’s University) | | | | | |
| | Series 8-I 5.00% 10/1/31 | | 130,000 | | | 151,226 |
| | (St. Olaf College) | | | | | |
| | 3.00% 10/1/41 | | 415,000 | | | 456,521 |
| | Series 8-G 5.00% 12/1/31 | | 125,000 | | | 146,300 |
43
Table of Contents
Schedules of investments
Delaware Tax-Free Minnesota Intermediate Fund
| | | | Principal | | | |
| | | | amount° | | Value (US $) |
| Municipal Bonds (continued) | | | | | |
| Education Revenue Bonds (continued) | | | | | |
| | Minnesota Higher Education Facilities Authority Revenue | | | | | |
| | (St. Olaf College) | | | | | |
| | Series 8-G 5.00% 12/1/32 | | 125,000 | | $ | 146,163 |
| | (University of St. Thomas) | | | | | |
| | 4.00% 10/1/36 | | 300,000 | | | 353,676 |
| | 5.00% 10/1/34 | | 350,000 | | | 445,403 |
| | 5.00% 10/1/35 | | 750,000 | | | 952,792 |
| | Series 7-U 4.00% 4/1/26 | | 1,400,000 | | | 1,476,776 |
| | Series A 5.00% 10/1/29 | | 630,000 | | | 778,730 |
| St. Paul Housing & Redevelopment Authority Charter School Lease | | | | | |
| | Revenue | | | | | |
| | (Academia Cesar Chavez School Project) | | | | | |
| | Series A 5.25% 7/1/50 | | 340,000 | | | 366,194 |
| | (Great River School Project) | | | | | |
| | Series A 144A 5.25% 7/1/33 # | | 140,000 | | | 160,681 |
| | (Hmong College Prep Academy Project) | | | | | |
| | Series A 5.00% 9/1/40 | | 1,000,000 | | | 1,215,580 |
| | (Twin Cities Academy Project) | | | | | |
| | Series A 5.30% 7/1/45 | | 260,000 | | | 287,929 |
| | | | | | | 13,566,604 |
| Electric Revenue Bonds – 5.98% | | | | | |
| Central Minnesota Municipal Power Agency | | | | | |
| | (Brookings Twin Cities Transmission Project) | | | | | |
| | Series E 5.00% 1/1/23 | | 1,000,000 | | | 1,015,680 |
| Chaska Electric Revenue | | | | | |
| | Series A 5.00% 10/1/28 | | 250,000 | | | 295,130 |
| Minnesota Municipal Power Agency Electric Revenue | | | | | |
| | Series A 5.00% 10/1/29 | | 500,000 | | | 569,485 |
| | Series A 5.00% 10/1/30 | | 240,000 | | | 273,353 |
| Northern Municipal Power Agency Electric System Revenue | | | | | |
| | 5.00% 1/1/29 | | 150,000 | | | 176,676 |
| | 5.00% 1/1/30 | | 235,000 | | | 283,584 |
| | 5.00% 1/1/31 | | 350,000 | | | 411,425 |
| | Series A 5.00% 1/1/25 | | 200,000 | | | 212,194 |
| Rochester Electric Utility Revenue | | | | | |
| | Series A 5.00% 12/1/28 | | 300,000 | | | 368,562 |
| | Series A 5.00% 12/1/29 | | 500,000 | | | 612,525 |
| | Series A 5.00% 12/1/31 | | 575,000 | | | 702,408 |
| St. Paul Housing & Redevelopment Energy Revenue | | | | | |
| | Series A 4.00% 10/1/30 | | 425,000 | | | 488,032 |
| | | | | | | 5,409,054 |
44
Table of Contents
| | | | Principal | | | |
| | | | amount° | | Value (US $) |
| Municipal Bonds (continued) | | | | | |
| Healthcare Revenue Bonds – 23.12% | | | | | |
| | Anoka Healthcare & Housing Facilities Revenue | | | | | |
| | (The Homestead at Anoka Project) | | | | | |
| | 5.375% 11/1/34 | | 270,000 | | $ | 290,728 |
| Apple Valley Senior Living Revenue | | | | | |
| | (Senior Living LLC Project) | | | | | |
| | 3rd Tier Series C 4.25% 1/1/27 | | 475,000 | | | 394,863 |
| | 3rd Tier Series C 5.00% 1/1/32 | | 400,000 | | | 305,404 |
| Bethel Housing & Health Care Facilities Revenue | | | | | |
| | (Benedictine Health System - St. Peter Communities Project) | | | | | |
| | Series A 5.50% 12/1/48 | | 250,000 | | | 266,090 |
| Bethel Senior Housing Revenue | | | | | |
| | (The Lodge at the Lakes at Stillwater Project) | | | | | |
| | 5.00% 6/1/38 | | 250,000 | | | 261,255 |
| Center City Health Care Facilities Revenue | | | | | |
| | (Hazelden Betty Ford Foundation Project) | | | | | |
| | 5.00% 11/1/24 | | 600,000 | | | 681,552 |
| Chatfield Healthcare and Housing Facilities Revenue | | | | | |
| | (Chosen Valley Care Center Project) | | | | | |
| | 4.00% 9/1/34 | | 100,000 | | | 102,766 |
| | 4.00% 9/1/39 | | 100,000 | | | 100,912 |
| Crookston Health Care Facilities Revenue | | | | | |
| | (RiverView Health Project) | | | | | |
| | 5.00% 5/1/38 | | 400,000 | | | 420,900 |
| Dakota County Community Development Agency Senior Housing | | | | | |
| | Revenue | | | | | |
| | (Walker Highview Hills Project) | | | | | |
| | Series A 144A 5.00% 8/1/36 # | | 480,000 | | | 491,774 |
| Duluth Economic Development Authority | | | | | |
| | (Essentia Health Obligated Group) | | | | | |
| | Series A 5.00% 2/15/37 | | 750,000 | | | 910,440 |
| | Series A 5.00% 2/15/48 | | 390,000 | | | 468,917 |
| | (St. Luke’s Hospital of Duluth Obligated Group) | | | | | |
| | 5.75% 6/15/32 | | 750,000 | | | 776,692 |
| | Series A 4.00% 6/15/33 | | 380,000 | | | 452,299 |
| Glencoe Health Care Facilities Revenue | | | | | |
| | (Glencoe Regional Health Services Project) | | | | | |
| | 4.00% 4/1/26 | | 270,000 | | | 274,609 |
| Hayward Health Care Facilities Revenue | | | | | |
| | (American Baptist Homes Midwest Obligated Group) | | | | | |
| | 4.25% 8/1/24 | | 348,334 | | | 349,107 |
45
Table of Contents
Schedules of investments
Delaware Tax-Free Minnesota Intermediate Fund
| | | | Principal | | | |
| | | | amount° | | Value (US $) |
| Municipal Bonds (continued) | | | | | |
| Healthcare Revenue Bonds (continued) | | | | | |
| | Maple Grove Health Care Facilities Revenue | | | | | |
| | (Maple Grove Hospital Corporation) | | | | | |
| | 4.00% 5/1/37 | | 500,000 | | $ | 563,330 |
| | 5.00% 5/1/28 | | 1,000,000 | | | 1,223,500 |
| | (North Memorial Health Care) | | | | | |
| | 5.00% 9/1/31 | | 320,000 | | | 366,909 |
| Minneapolis Health Care System Revenue | | | | | |
| | (Fairview Health Services) | | | | | |
| | Series A 5.00% 11/15/33 | | 500,000 | | | 583,060 |
| | Series A 5.00% 11/15/34 | | 500,000 | | | 582,385 |
| | Series A 5.00% 11/15/35 | | 500,000 | | | 628,460 |
| | Series A 5.00% 11/15/49 | | 1,000,000 | | | 1,223,440 |
| Minneapolis Senior Housing & Healthcare Revenue | | | | | |
| | (Ecumen-Abiitan Mill City Project) | | | | | |
| | 5.00% 11/1/35 | | 530,000 | | | 539,190 |
| Minneapolis – St. Paul Housing & Redevelopment Authority Health | | | | | |
| | Care Facilities Revenue | | | | | |
| | (Allina Health System) | | | | | |
| | Series A 5.00% 11/15/27 | | 1,205,000 | | | 1,491,585 |
| Rochester Health Care Facilities Revenue | | | | | |
| | (Mayo Clinic) | | | | | |
| | Series C 4.50% 11/15/38 • | | 925,000 | | | 933,112 |
| Sartell Health Care Facilities Revenue | | | | | |
| | (Country Manor Campus Project) | | | | | |
| | Series A 5.00% 9/1/21 | | 1,050,000 | | | 1,050,000 |
| Sauk Rapids Health Care Housing Facilities Revenue | | | | | |
| | (Good Shepherd Lutheran Home) | | | | | |
| | 5.125% 1/1/39 | | 575,000 | | | 580,888 |
| St. Cloud Health Care Revenue | | | | | |
| | (Centracare Health System Project) | | | | | |
| | 5.00% 5/1/48 | | 810,000 | | | 998,147 |
| St. Paul Housing & Redevelopment Authority Health Care Facilities | | | | | |
| | Revenue | | | | | |
| | (Fairview Health Services) | | | | | |
| | Series A 5.00% 11/15/47 | | 275,000 | | | 333,839 |
| | (HealthPartners Obligated Group Project) | | | | | |
| | Series A 5.00% 7/1/32 | | 1,000,000 | | | 1,170,320 |
| | Series A 5.00% 7/1/33 | | 200,000 | | | 233,814 |
| St. Paul Housing & Redevelopment Authority Housing & Health Care | | | | | |
| | Facilities Revenue | | | | | |
| | (Episcopal Homes Project) | | | | | |
| | 5.00% 5/1/33 | | 500,000 | | | 507,215 |
46
Table of Contents
| | | | | Principal | | | |
| | | | amount° | | | Value (US $) |
| Municipal Bonds (continued) | | | | | |
| Healthcare Revenue Bonds (continued) | | | | | |
| Wayzata Senior Housing Revenue | | | | | |
| | (Folkestone Senior Living Community) | | | | | |
| | 5.00% 8/1/34 | | 125,000 | | $ | 136,386 |
| | 5.00% 8/1/35 | | 150,000 | | | 163,529 |
| West St. Paul, Housing and Health Care Facilities Revenue | | | | | |
| | (Walker Westwood Ridge Campus Project) | | | | | |
| | 5.00% 11/1/37 | | 500,000 | | | 522,485 |
| Woodbury Housing & Redevelopment Authority Revenue | | | | | |
| | (St. Therese of Woodbury) | | | | | |
| | 5.00% 12/1/34 | | 500,000 | | | 529,265 |
| | | | | | | | 20,909,167 |
| Housing Revenue Bonds – 0.66% | | | | | |
| Minnesota Housing Finance Agency Residential Housing Finance | | | | | |
| | Series I 2.00% 7/1/40 | | 300,000 | | | 299,304 |
| Northwest Multi-County Housing & Redevelopment Authority | | | | | |
| | (Pooled Housing Program) | | | | | |
| | 5.50% 7/1/45 | | 285,000 | | | 294,357 |
| | | | | | | | 593,661 |
| Lease Revenue Bonds – 4.16% | | | | | |
| Minnesota General Fund Revenue Appropriations | | | | | |
| | Series A 5.00% 6/1/38 | | 1,100,000 | | | 1,184,898 |
| | Series A 5.00% 6/1/43 | | 715,000 | | | 767,846 |
| | Series B 5.00% 3/1/27 | | 1,000,000 | | | 1,023,760 |
| Minnesota Housing Finance Agency State Appropriation | | | | | |
| | (Housing Infrastructure) | | | | | |
| | Series A 4.00% 8/1/33 | | 655,000 | | | 785,070 |
| | | | | | | | 3,761,574 |
| Local General Obligation Bonds – 17.24% | | | | | |
| Chaska Independent School District No. 112 | | | | | |
| | (School Building) | | | | | |
| | Series A 5.00% 2/1/28 | | 1,000,000 | | | 1,195,140 |
| Duluth Independent School District No. 709 | | | | | |
| | Series A 4.00% 2/1/28 | | 250,000 | | | 286,042 |
| Hennepin County | | | | | |
| | Series A 5.00% 12/1/36 | | 1,500,000 | | | 1,834,980 |
| | Series A 5.00% 12/1/38 | | 1,055,000 | | | 1,307,683 |
| | Series C 5.00% 12/1/30 | | 1,500,000 | | | 1,845,420 |
| Hennepin County Regional Railroad Authority | | | | | |
| | Series D 5.00% 12/1/30 | | 2,365,000 | | | 3,217,535 |
47
Table of Contents
Schedules of investments
Delaware Tax-Free Minnesota Intermediate Fund
| | | | | Principal | | | |
| | | | amount° | | | Value (US $) |
| Municipal Bonds (continued) | | | | | |
| Local General Obligation Bonds (continued) | | | | | |
| Minneapolis Special School District No. 1 | | | | | |
| | Series A 4.00% 2/1/36 | | 220,000 | | $ | 262,231 |
| | Series B 4.00% 2/1/36 | | 465,000 | | | 554,262 |
| | Series B 4.00% 2/1/37 | | 600,000 | | | 726,150 |
| St. Michael-Albertville Independent School District No. 885 | | | | | |
| | (School Building) | | | | | |
| | Series A 5.00% 2/1/27 | | 500,000 | | | 601,455 |
| Virginia, Minnesota | | | | | |
| | (General Obligation Sales Tax Revenue) | | | | | |
| | Series A 4.00% 2/1/38 (AGM) | | 1,000,000 | | | 1,142,380 |
| White Bear Lake Independent School District No. 624 | | | | | |
| | Series A 3.00% 2/1/43 | | 2,420,000 | | | 2,615,657 |
| | | | | | | | 15,588,935 |
| Pre-Refunded/Escrowed to Maturity Bonds – 5.01% | | | | | |
| Minnesota | | | | | |
| | Series A Unrefunded Balance 5.00% 10/1/24-21 § | | 1,000,000 | | | 1,003,950 |
| Minnesota Higher Education Facilities Authority Revenue | | | | | |
| | (St. Catherine University) | | | | | |
| | Series 7-Q 5.00% 10/1/22 | | 425,000 | | | 447,198 |
| Rice County Educational Facilities Revenue | | | | | |
| | (Shattuck-St. Mary’s School) | | | | | |
| | Series A 144A 5.00% 8/1/22 # | | 325,000 | | | 339,235 |
| St. Paul Housing & Redevelopment Authority Hospital Revenue | | | | | |
| | (Healtheast Care System Project) | | | | | |
| | Series A 5.00% 11/15/29-25 § | | 165,000 | | | 196,523 |
| | Series A 5.00% 11/15/30-25 § | | 120,000 | | | 142,926 |
| University of Minnesota | | | | | |
| | Series D 5.00% 12/1/26-21 § | | 1,000,000 | | | 1,012,130 |
| Western Minnesota Municipal Power Agency Revenue | | | | | |
| | Series A 5.00% 1/1/33-24 § | | 1,250,000 | | | 1,390,987 |
| | | | | | | | 4,532,949 |
| Special Tax Revenue Bonds – 3.09% | | | | | |
| Minneapolis Revenue | | | | | |
| | (YMCA Greater Twin Cities Project) | | | | | |
| | 4.00% 6/1/27 | | 150,000 | | | 166,051 |
| Puerto Rico Sales Tax Financing Revenue | | | | | |
| | (Restructured) | | | | | |
| | Series A-1 4.55% 7/1/40 | | 830,000 | | | 955,097 |
| | Series A-1 4.75% 7/1/53 | | 655,000 | | | 749,582 |
| | Series A-2 4.536% 7/1/53 | | 378,000 | | | 427,522 |
48
Table of Contents
| | | | | Principal | | | |
| | | | amount° | | | Value (US $) |
| Municipal Bonds (continued) | | | | | |
| Special Tax Revenue Bonds (continued) | | | | | |
| St. Paul Sales Tax Revenue | | | | | |
| | Series G 5.00% 11/1/28 | | 435,000 | | $ | 497,088 |
| | | | | | | 2,795,340 |
| State General Obligation Bonds – 15.78% | | | | | |
| Commonwealth of Puerto Rico | | | | | |
| | (Public Improvement) | | | | | |
| | Series B 5.75% 7/1/38 ‡ | | 345,000 | | | 318,694 |
| Minnesota | | | | | |
| | Series A 5.00% 8/1/30 | | 450,000 | | | 578,295 |
| | Series A 5.00% 8/1/30 | | 2,000,000 | | | 2,635,860 |
| | Series A 5.00% 8/1/33 | | 285,000 | | | 365,219 |
| | Series A 5.00% 8/1/34 | | 1,000,000 | | | 1,279,470 |
| | Series A 5.00% 8/1/35 | | 2,000,000 | | | 2,600,600 |
| | Series A 5.00% 8/1/40 | | 750,000 | | | 982,485 |
| | Series D 5.00% 8/1/26 | | 2,500,000 | | | 3,063,050 |
| | Series D 5.00% 8/1/27 | | 1,500,000 | | | 1,830,465 |
| | Series E 5.00% 10/1/26 | | 500,000 | | | 615,815 |
| | | | | | | | 14,269,953 |
| Transportation Revenue Bonds – 5.44% | | | | | |
| Minneapolis – St. Paul Metropolitan Airports Commission Revenue | | | | | |
| | (Subordinate) | | | | | |
| | Series B 5.00% 1/1/26 | | 710,000 | | | 721,246 |
| | Series B 5.00% 1/1/31 | | 750,000 | | | 761,573 |
| | Series B 5.00% 1/1/44 (AMT) | | 1,600,000 | | | 1,987,472 |
| St. Paul Housing & Redevelopment Authority | | | | | |
| | (Parking Enterprise) | | | | | |
| | Series A 4.00% 8/1/26 | | 450,000 | | | 485,644 |
| | Series A 4.00% 8/1/27 | | 545,000 | | | 585,439 |
| | Series A 4.00% 8/1/28 | | 350,000 | | | 374,332 |
| | | | | | | 4,915,706 |
| Water & Sewer Revenue Bonds – 2.22% | | | | | |
| Guam Government Waterworks Authority Water & Wastewater | | | | | |
| | System Revenue | | | | | |
| | 5.00% 7/1/37 | | 575,000 | | | 670,226 |
| Metropolitan Council General Obligation Wastewater Revenue | | | | | |
| | (Minneapolis – St. Paul Metropolitan Area) | | | | | |
| | Series C 4.00% 3/1/31 | | 565,000 | | | 659,750 |
49
Table of Contents
Schedules of investments
Delaware Tax-Free Minnesota Intermediate Fund
| | | | | Principal | | | |
| | | | amount° | | | Value (US $) |
| Municipal Bonds (continued) | | | | | |
| Water & Sewer Revenue Bonds (continued) | | | | | |
| Metropolitan Council General Obligation Wastewater Revenue | | | | | |
| | (Minneapolis – St. Paul Metropolitan Area) | | | | | |
| | Series C 4.00% 3/1/32 | | 585,000 | | $ | 681,297 |
| | | | | | | 2,011,273 |
| Total Municipal Bonds (cost $84,654,906) | | | | | 89,256,704 |
| | | |
| Short-Term Investments – 0.88% | | | | | |
| Variable Rate Demand Note – 0.88%¤ | | | | | |
| Minneapolis – St. Paul Housing & Redevelopment Authority Health | | | | | |
| | Care Facilities Revenue | | | | | |
| | (Allina Health System) Series B-1 0.01% 11/15/35 | | | | | |
| | (LOC – JPMorgan Chase Bank N.A.) | | 800,000 | | | 800,000 |
| Total Short-Term Investments (cost $800,000) | | | | | 800,000 |
| Total Value of Securities–99.58% | | | | | |
| (cost $85,454,906) | | | | $ | 90,056,704 |
| ° | Principal amount shown is stated in USD unless noted that the security is denominated in another currency. |
| # | Security exempt from registration under Rule 144A of the Securities Act of 1933, as amended. At August 31, 2021, the aggregate value of Rule 144A securities was $1,894,178, which represents 2.09% of the Fund’s net assets. See Note 8 in “Notes to financial statements.” |
| • | Variable rate investment. Rates reset periodically. Rate shown reflects the rate in effect at August 31, 2021. For securities based on a published reference rate and spread, the reference rate and spread are indicated in their descriptions. The reference rate descriptions (i.e. LIBOR03M, LIBOR06M, etc.) used in this report are identical for different securities, but the underlying reference rates may differ due to the timing of the reset period. Certain variable rate securities are not based on a published reference rate and spread but are determined by the issuer or agent and are based on current market conditions, or for mortgage-backed securities, are impacted by the individual mortgages which are paying off over time. These securities do not indicate a reference rate and spread in their descriptions. |
| § | Pre-refunded bonds. Municipal bonds that are generally backed or secured by US Treasury bonds. For pre-refunded bonds, the stated maturity is followed by the year in which the bond will be pre-refunded. See Note 8 in “Notes to financial statements.” |
| ‡ | Non-income producing security. Security is currently in default. |
50
Table of Contents
| ¤ | Tax-exempt obligations that contain a floating or variable interest rate adjustment formula and an unconditional right of demand to receive payment of the unpaid principal balance plus accrued interest upon a short notice period (generally up to 30 days) prior to specified dates either from the issuer or by drawing on a bank letter of credit, a guarantee, or insurance issued with respect to such instrument. Each rate shown is as of August 31, 2021. |
| Summary of abbreviations: |
| AGM – Insured by Assured Guaranty Municipal Corporation |
| AMT – Subject to Alternative Minimum Tax |
| ICE – Intercontinental Exchange, Inc. |
| LIBOR – London interbank offered rate |
| LIBOR03M – ICE LIBOR USD 3 Month |
| LIBOR06M – ICE LIBOR USD 6 Month |
| LLC – Limited Liability Corporation |
| LOC – Letter of Credit |
| N.A. – National Association |
| USD – US Dollar |
See accompanying notes, which are an integral part of the financial statements.
51
Table of Contents
| Schedules of investments | |
| Delaware Minnesota High-Yield Municipal Bond Fund | August 31, 2021 |
| | | | Principal | | | |
| | | | | amount° | | Value (US $) |
| Municipal Bonds – 96.00% | | | | | |
| Corporate Revenue Bonds – 1.86% | | | | | |
| Cottonwood | | | | | |
| | (Extreme Holdings LLC Project) | | | | | |
| | Series A 144A 5.00% 12/1/50 (AMT) # | | 1,210,000 | | $ | 1,245,332 |
| St. Paul Port Authority Solid Waste Disposal Revenue | | | | | |
| | (Gerdau St. Paul Steel Mill Project) | | | | | |
| | Series 7 144A 4.50% 10/1/37 (AMT) # | | 2,975,000 | | | 3,033,786 |
| | | | | | | 4,279,118 |
| Education Revenue Bonds – 22.79% | | | | | |
| Bethel Charter School Lease Revenue | | | | | |
| | (Spectrum High School Project) | | | | | |
| | Series A 4.00% 7/1/37 | | 850,000 | | | 919,878 |
| | Series A 4.25% 7/1/47 | | 750,000 | | | 810,413 |
| Brooklyn Park Charter School Lease Revenue | | | | | |
| | (Prairie Seeds Academy Project) | | | | | |
| | Series A 5.00% 3/1/39 | | 1,270,000 | | | 1,342,911 |
| Cologne Charter School Lease Revenue | | | | | |
| | (Cologne Academy Project) | | | | | |
| | Series A 5.00% 7/1/34 | | 250,000 | | | 268,527 |
| | Series A 5.00% 7/1/45 | | 230,000 | | | 244,442 |
| Deephaven Charter School Lease Revenue | | | | | |
| | (Eagle Ridge Academy Project) | | | | | |
| | Series A 5.50% 7/1/50 | | 1,000,000 | | | 1,121,340 |
| Duluth Housing & Redevelopment Authority Revenue | | | | | |
| | (Duluth Public Schools Academy Project) | | | | | |
| | Series A 5.00% 11/1/48 | | 1,000,000 | | | 1,108,560 |
| Forest Lake Charter School Lease Revenue Fund | | | | | |
| | (Lakes International Language Academy) | | | | | |
| | Series A 5.375% 8/1/50 | | 660,000 | | | 762,425 |
| | Series A 5.75% 8/1/44 | | 585,000 | | | 614,753 |
| Ham Lake Charter School Lease Revenue | | | | | |
| | (Davinci Academy Project) | | | | | |
| | Series A 5.00% 7/1/36 | | 235,000 | | | 256,688 |
| | Series A 5.00% 7/1/47 | | 710,000 | | | 767,957 |
| | (Parnassus Preparatory School Project) | | | | | |
| | Series A 5.00% 11/1/47 | | 650,000 | | | 721,253 |
| Hugo Charter School Lease Revenue | | | | | |
| | (Noble Academy Project) | | | | | |
| | Series A 5.00% 7/1/34 | | 165,000 | | | 175,779 |
| | Series A 5.00% 7/1/44 | | 495,000 | | | 521,651 |
52
Table of Contents
| | | | Principal | | | |
| | | | | amount° | | | Value (US $) |
| Municipal Bonds (continued) | | | | | |
| Education Revenue Bonds (continued) | | | | | |
| Minneapolis Charter School Lease Revenue | | | | | |
| | (Hiawatha Academies Project) | | | | | |
| | Series A 5.00% 7/1/36 | | 1,000,000 | | $ | 1,080,770 |
| | Series A 5.00% 7/1/47 | | 800,000 | | | 859,144 |
| Minneapolis Student Housing Revenue | | | | | |
| | (Riverton Community Housing Project) | | | | | |
| | 144A 4.75% 8/1/43 # | | 750,000 | | | 796,830 |
| | 144A 5.00% 8/1/53 # | | 570,000 | | | 608,538 |
| | 5.25% 8/1/39 | | 800,000 | | | 858,168 |
| Minnesota Higher Education Facilities Authority Revenue | | | | | |
| | (Bethel University) | | | | | |
| | 5.00% 5/1/32 | | 1,150,000 | | | 1,316,244 |
| | 5.00% 5/1/47 | | 1,500,000 | | | 1,677,495 |
| | (Carleton College) | | | | | |
| | 4.00% 3/1/37 | | 635,000 | | | 718,890 |
| | (Gustavus Adolphus College) | | | | | |
| | 5.00% 10/1/47 | | 1,000,000 | | | 1,193,190 |
| | (Macalester College) | | | | | |
| | 3.00% 3/1/40 | | 365,000 | | | 402,580 |
| | 3.00% 3/1/43 | | 325,000 | | | 354,880 |
| | 4.00% 3/1/31 | | 125,000 | | | 156,591 |
| | 4.00% 3/1/32 | | 155,000 | | | 192,557 |
| | 4.00% 3/1/33 | | 150,000 | | | 185,517 |
| | 4.00% 3/1/34 | | 150,000 | | | 184,976 |
| | 4.00% 3/1/35 | | 125,000 | | | 153,339 |
| | 4.00% 3/1/36 | | 125,000 | | | 152,716 |
| | 4.00% 3/1/37 | | 100,000 | | | 121,873 |
| | (Minneapolis College of Art & Design) | | | | | |
| | 4.00% 5/1/24 | | 250,000 | | | 260,932 |
| | 4.00% 5/1/25 | | 200,000 | | | 208,396 |
| | 4.00% 5/1/26 | | 100,000 | | | 104,039 |
| | (St. Catherine University) | | | | | |
| | Series A 4.00% 10/1/37 | | 580,000 | | | 653,846 |
| | Series A 5.00% 10/1/32 | | 715,000 | | | 874,023 |
| | Series A 5.00% 10/1/45 | | 670,000 | | | 796,282 |
| | (St. John’s University) | | | | | |
| | Series 8-I 5.00% 10/1/34 | | 215,000 | | | 249,041 |
| | (St. Olaf College) | | | | | |
| | 3.00% 10/1/41 | | 530,000 | | | 583,026 |
| | 4.00% 10/1/50 | | 935,000 | | | 1,105,535 |
| | Series 8-G 5.00% 12/1/31 | | 205,000 | | | 239,932 |
53
Table of Contents
Schedules of investments
Delaware Minnesota High-Yield Municipal Bond Fund
| | | | Principal | | | |
| | | | | amount° | | Value (US $) |
| Municipal Bonds (continued) | | | | | |
| Education Revenue Bonds (continued) | | | | | |
| Minnesota Higher Education Facilities Authority Revenue | | | | | |
| | (St. Olaf College) | | | | | |
| | Series 8-G 5.00% 12/1/32 | | 205,000 | | $ | 239,707 |
| | Series 8-N 4.00% 10/1/34 | | 800,000 | | | 911,016 |
| | Series 8-N 4.00% 10/1/35 | | 590,000 | | | 671,095 |
| | (Trustees of the Hamline University of Minnesota) | | | | | |
| | Series B 5.00% 10/1/37 | | 300,000 | | | 334,383 |
| | Series B 5.00% 10/1/39 | | 770,000 | | | 855,247 |
| | (University of St. Thomas) | | | | | |
| | 4.00% 10/1/37 | | 500,000 | | | 587,790 |
| | 4.00% 10/1/41 | | 1,000,000 | | | 1,164,700 |
| | 4.00% 10/1/44 | | 950,000 | | | 1,099,121 |
| | Series A 4.00% 10/1/35 | | 400,000 | | | 460,848 |
| Otsego Charter School Lease Revenue | | | | | |
| | (Kaleidoscope Charter School) | | | | | |
| | Series A 5.00% 9/1/44 | | 1,435,000 | | | 1,504,899 |
| St. Cloud Charter School Lease Revenue | | | | | |
| | (Stride Academy Project) | | | | | |
| | Series A 5.00% 4/1/46 | | 750,000 | | | 684,683 |
| St. Paul Housing & Redevelopment Authority Charter School Lease | | | | | |
| | Revenue | | | | | |
| | (Academia Cesar Chavez School Project) | | | | | |
| | Series A 5.25% 7/1/50 | | 1,750,000 | | | 1,884,820 |
| | (Great River School Project) | | | | | |
| | Series A 144A 5.50% 7/1/52 # | | 265,000 | | | 299,879 |
| | (Hmong College Preparatory Academy Project) | | | | | |
| | Series A 5.00% 9/1/43 | | 250,000 | | | 301,643 |
| | Series A 5.00% 9/1/55 | | 1,000,000 | | | 1,192,990 |
| | Series A 5.75% 9/1/46 | | 500,000 | | | 583,045 |
| | Series A 6.00% 9/1/51 | | 3,500,000 | | | 4,113,445 |
| | (Nova Classical Academy Project) | | | | | |
| | Series A 4.00% 9/1/36 | | 1,270,000 | | | 1,349,400 |
| | Series A 4.125% 9/1/47 | | 500,000 | | | 528,565 |
| | (Twin Cities Academy Project) | | | | | |
| | Series A 5.375% 7/1/50 | | 1,500,000 | | | 1,662,330 |
| University of Minnesota | | | | | |
| | Series A 5.00% 4/1/34 | | 2,115,000 | | | 2,508,326 |
| | Series A 5.00% 9/1/40 | | 900,000 | | | 1,095,300 |
| | Series A 5.00% 9/1/41 | | 620,000 | | | 754,311 |
| Woodbury Charter School Lease Revenue | | | | | |
| | (MSA Building Company) | | | | | |
| | Series A 4.00% 12/1/50 | | 450,000 | | | 490,743 |
54
Table of Contents
| | | | Principal | | | |
| | | | | amount° | | Value (US $) |
| Municipal Bonds (continued) | | | | | |
| Education Revenue Bonds (continued) | | | | | |
| Woodbury Charter School Lease Revenue | | | | | |
| | (Woodbury Leadership Academy Project) | | | | | |
| | Series A 4.00% 7/1/51 | | 660,000 | | $ | 724,409 |
| | Series A 4.00% 7/1/56 | | 575,000 | | | 629,223 |
| | | | | | | 52,357,845 |
| Electric Revenue Bonds – 5.34% | | | | | |
| Central Minnesota Municipal Power Agency | | | | | |
| | (Brookings Twin Cities Transmission Project) | | | | | |
| | 5.00% 1/1/42 | | 1,500,000 | | | 1,521,825 |
| Hutchinson Utilities Commission Revenue | | | | | |
| | Series A 5.00% 12/1/22 | | 490,000 | | | 519,425 |
| | Series A 5.00% 12/1/26 | | 360,000 | | | 381,103 |
| Minnesota Municipal Power Agency Electric Revenue | | | | | |
| | 5.00% 10/1/27 | | 165,000 | | | 188,039 |
| | 5.00% 10/1/28 | | 500,000 | | | 569,485 |
| | 5.00% 10/1/47 | | 745,000 | | | 883,272 |
| Northern Municipal Power Agency Electric System Revenue | | | | | |
| | 5.00% 1/1/26 | | 500,000 | | | 593,380 |
| | 5.00% 1/1/28 | | 500,000 | | | 590,560 |
| | 5.00% 1/1/29 | | 470,000 | | | 553,585 |
| | 5.00% 1/1/33 | | 225,000 | | | 270,187 |
| | 5.00% 1/1/34 | | 200,000 | | | 239,982 |
| | Series A 5.00% 1/1/24 | | 335,000 | | | 355,612 |
| Puerto Rico Electric Power Authority Revenue | | | | | |
| | Series A 5.05% 7/1/42 ‡ | | 165,000 | | | 161,700 |
| | Series AAA 5.25% 7/1/25 ‡ | | 95,000 | | | 93,456 |
| | Series CCC 5.25% 7/1/27 ‡ | | 650,000 | | | 639,438 |
| | Series WW 5.00% 7/1/28 ‡ | | 585,000 | | | 573,300 |
| | Series XX 4.75% 7/1/26 ‡ | | 105,000 | | | 102,506 |
| | Series XX 5.25% 7/1/40 ‡ | | 295,000 | | | 290,206 |
| | Series XX 5.75% 7/1/36 ‡ | | 370,000 | | | 366,300 |
| | Series ZZ 4.75% 7/1/27 ‡ | | 85,000 | | | 82,981 |
| | Series ZZ 5.25% 7/1/24 ‡ | | 130,000 | | | 127,888 |
| Rochester Electric Utility Revenue | | | | | |
| | Series A 5.00% 12/1/34 | | 450,000 | | | 547,897 |
| | Series A 5.00% 12/1/35 | | 500,000 | | | 607,625 |
| | Series A 5.00% 12/1/36 | | 520,000 | | | 630,734 |
| Southern Minnesota Municipal Power Agency Revenue | | | | | |
| | Series A 5.00% 1/1/41 | | 400,000 | | | 467,228 |
55
Table of Contents
Schedules of investments
Delaware Minnesota High-Yield Municipal Bond Fund
| | | | Principal | | | |
| | | | | amount° | | Value (US $) |
| Municipal Bonds (continued) | | | | | |
| Electric Revenue Bonds (continued) | | | | | |
| St. Paul Housing & Redevelopment Energy Revenue | | | | | |
| | Series A 4.00% 10/1/32 | | 800,000 | | $ | 911,432 |
| | | | | | | 12,269,146 |
| Healthcare Revenue Bonds – 30.98% | | | | | |
| Anoka Healthcare & Housing Facilities Revenue | | | | | |
| | (The Homestead at Anoka Project) | | | | | |
| | 5.125% 11/1/49 | | 400,000 | | | 422,852 |
| Apple Valley Senior Housing Revenue | | | | | |
| | (PHS Senior Housing, Inc. Orchard Path Project) | | | | | |
| | 4.50% 9/1/53 | | 840,000 | | | 874,062 |
| | 5.00% 9/1/43 | | 535,000 | | | 565,029 |
| | 5.00% 9/1/58 | | 1,175,000 | | | 1,233,903 |
| Apple Valley Senior Living Revenue | | | | | |
| | (Senior Living LLC Project) | | | | | |
| | 2nd Tier Series B 5.00% 1/1/47 | | 535,000 | | | 419,360 |
| | 4th Tier Series D 7.00% 1/1/37 | | 490,000 | | | 399,830 |
| | 4th Tier Series D 7.25% 1/1/52 | | 1,495,000 | | | 1,159,462 |
| Bethel Housing & Health Care Facilities Revenue | | | | | |
| | (Benedictine Health System - St. Peter Communities Project) | | | | | |
| | Series A 5.50% 12/1/48 | | 1,280,000 | | | 1,362,381 |
| Bethel Senior Housing Revenue | | | | | |
| | (The Lodge at the Lakes at Stillwater Project) | | | | | |
| | 5.25% 6/1/58 | | 1,475,000 | | | 1,537,068 |
| Brooklyn Center Multifamily Housing Revenue | | | | | |
| | (Sanctuary at Brooklyn Center Project) | | | | | |
| | Series A 5.50% 11/1/35 | | 645,000 | | | 640,685 |
| Chatfield Healthcare and Housing Facilities Revenue | | | | | |
| | (Chosen Valley Care Center Project) | | | | | |
| | 4.00% 9/1/39 | | 250,000 | | | 252,280 |
| | 5.00% 9/1/52 | | 1,500,000 | | | 1,576,740 |
| City of West St. Paul Minnesota | | | | | |
| | (Walker Westwood Ridge Campus Project) | | | | | |
| | 5.00% 11/1/49 | | 1,500,000 | | | 1,546,470 |
| Crookston Health Care Facilities Revenue | | | | | |
| | (Riverview Health Project) | | | | | |
| | 5.00% 5/1/51 | | 1,025,000 | | | 1,065,252 |
| Dakota County Community Development Agency Senior Housing | | | | | |
| | Revenue | | | | | |
| | (Walker Highview Hills Project) | | | | | |
| | Series A 144A 5.00% 8/1/51 # | | 870,000 | | | 888,949 |
56
Table of Contents
| | | | | Principal | | | |
| | | | amount° | | Value (US $) |
| Municipal Bonds (continued) | | | | | |
| Healthcare Revenue Bonds (continued) | | | | | |
| Deephaven Housing & Healthcare Revenue | | | | | |
| | (St. Therese Senior Living Project) | | | | | |
| | Series A 5.00% 4/1/38 | | 335,000 | | $ | 341,151 |
| | Series A 5.00% 4/1/40 | | 315,000 | | | 320,396 |
| | Series A 5.00% 4/1/48 | | 185,000 | | | 187,601 |
| Duluth Economic Development Authority | | | | | |
| | (Benedictine Health System) | | | | | |
| | Series A 4.00% 7/1/41 | | 930,000 | | | 1,020,517 |
| | (Essentia Health Obligated Group) | | | | | |
| | Series A 4.25% 2/15/43 | | 2,500,000 | | | 2,875,575 |
| | Series A 5.00% 2/15/48 | | 1,590,000 | | | 1,911,736 |
| | (St. Luke’s Hospital of Duluth Obligated Group) | | | | | |
| | 5.75% 6/15/32 | | 2,000,000 | | | 2,071,180 |
| | 6.00% 6/15/39 | | 1,000,000 | | | 1,034,480 |
| | Series A 4.00% 6/15/38 | | 400,000 | | | 458,936 |
| | Series A 4.00% 6/15/39 | | 250,000 | | | 285,748 |
| Glencoe Health Care Facilities Revenue | | | | | |
| | (Glencoe Regional Health Services Project) | | | | | |
| | 4.00% 4/1/31 | | 185,000 | | | 187,161 |
| Hayward Health Care Facilities Revenue | | | | | |
| | (American Baptist Homes Midwest Obligated Group) | | | | | |
| | 5.375% 8/1/34 | | 750,000 | | | 762,172 |
| | (St. John’s Lutheran Home of Albert Lea Project) | | | | | |
| | 5.375% 10/1/44 | | 165,000 | | | 166,505 |
| Maple Grove Health Care Facilities Revenue | | | | | |
| | (Maple Grove Hospital Corporation) | | | | | |
| | 4.00% 5/1/37 | | 1,155,000 | | | 1,301,292 |
| | 5.00% 5/1/26 | | 1,300,000 | | | 1,554,644 |
| | 5.00% 5/1/29 | | 500,000 | | | 608,215 |
| | (North Memorial Health Care) | | | | | |
| | 5.00% 9/1/30 | | 610,000 | | | 701,024 |
| Maple Plain Senior Housing & Health Care Revenue | | | | | |
| | (Haven Homes Incorporate Project) | | | | | |
| | 5.00% 7/1/49 | | 1,000,000 | | | 1,068,190 |
| Minneapolis Health Care System Revenue | | | | | |
| | (Fairview Health Services) | | | | | |
| | Series A 4.00% 11/15/48 | | 1,000,000 | | | 1,138,690 |
| | Series A 5.00% 11/15/33 | | 1,200,000 | | | 1,399,344 |
| | Series A 5.00% 11/15/34 | | 500,000 | | | 582,385 |
| | Series A 5.00% 11/15/44 | | 1,000,000 | | | 1,160,290 |
| | Series A 5.00% 11/15/49 | | 1,450,000 | | | 1,773,988 |
57
Table of Contents
Schedules of investments
Delaware Minnesota High-Yield Municipal Bond Fund
| | | | | Principal | | | |
| | | | amount° | | Value (US $) |
| Municipal Bonds (continued) | | | | | |
| Healthcare Revenue Bonds (continued) | | | | | |
| Minneapolis Senior Housing & Healthcare Revenue | | | | | |
| | (Ecumen-Abiitan Mill City Project) | | | | | |
| | 5.375% 11/1/50 | | 1,700,000 | | $ | 1,729,206 |
| Minneapolis – St. Paul Housing & Redevelopment Authority Health | | | | | |
| | Care Facilities Revenue | | | | | |
| | (Allina Health System) | | | | | |
| | Series A 5.00% 11/15/29 | | 415,000 | | | 512,152 |
| Morris Health Care Facilities Revenue | | | | | |
| | (Farmington Health Services) | | | | | |
| | 4.10% 8/1/44 | | 500,000 | | | 503,220 |
| | 4.20% 8/1/49 | | 1,500,000 | | | 1,508,550 |
| Rochester Health Care & Housing Revenue | | | | | |
| | (The Homestead at Rochester Project) | | | | | |
| | Series A 5.25% 12/1/23 | | 175,000 | | | 185,484 |
| Rochester Health Care Facilities Revenue | | | | | |
| | (Mayo Clinic) | | | | | |
| | 4.00% 11/15/41 | | 1,790,000 | | | 1,832,709 |
| Rochester, Minnesota | | | | | |
| | (The Homestead at Rochester Project) | | | | | |
| | Series A 6.875% 12/1/48 | | 950,000 | | | 1,021,630 |
| Sartell Health Care Facilities Revenue | | | | | |
| | (Country Manor Campus Project) | | | | | |
| | Series A 5.25% 9/1/22 | | 1,080,000 | | | 1,108,415 |
| Sauk Rapids Health Care Housing Facilities Revenue | | | | | |
| | (Good Shepherd Lutheran Home) | | | | | |
| | 5.125% 1/1/39 | | 825,000 | | | 833,448 |
| Shakopee Health Care Facilities Revenue | | | | | |
| | (St. Francis Regional Medical Center) | | | | | |
| | 4.00% 9/1/31 | | 130,000 | | | 137,565 |
| | 5.00% 9/1/34 | | 105,000 | | | 113,749 |
| St. Cloud Health Care Revenue | | | | | |
| | (Centracare Health System Project) | | | | | |
| | 4.00% 5/1/49 | | 250,000 | | | 286,475 |
| | 5.00% 5/1/48 | | 3,900,000 | | | 4,805,892 |
| | Series A 4.00% 5/1/37 | | 1,440,000 | | | 1,619,669 |
| | Series A 5.00% 5/1/46 | | 2,000,000 | | | 2,360,500 |
| St. Joseph Senior Housing & Healthcare Revenue | | | | | |
| | (Woodcrest Country Manor Project) | | | | | |
| | 5.00% 7/1/55 | | 1,000,000 | | | 1,027,100 |
58
Table of Contents
| | | | | Principal | | | |
| | | | amount° | | Value (US $) |
| Municipal Bonds (continued) | | | | | |
| Healthcare Revenue Bonds (continued) | | | | | |
| St. Paul Housing & Redevelopment Authority Health Care Facilities | | | | | |
| | Revenue | | | | | |
| | (Fairview Health Services) | | | | | |
| | Series A 4.00% 11/15/43 | | 645,000 | | $ | 739,925 |
| | Series A 5.00% 11/15/47 | | 485,000 | | | 588,770 |
| | (HealthPartners Obligated Group Project) | | | | | |
| | Series A 4.00% 7/1/33 | | 1,320,000 | | | 1,462,019 |
| | Series A 5.00% 7/1/29 | | 1,000,000 | | | 1,172,820 |
| | Series A 5.00% 7/1/32 | | 900,000 | | | 1,053,288 |
| | Series A 5.00% 7/1/33 | | 1,540,000 | | | 1,800,368 |
| St. Paul Housing & Redevelopment Authority Housing & Health Care | | | | | |
| | Facilities Revenue | | | | | |
| | (Episcopal Homes Project) | | | | | |
| | 5.125% 5/1/48 | | 1,700,000 | | | 1,712,665 |
| | Series A 5.15% 11/1/42 | | 775,000 | | | 775,744 |
| St. Paul Housing & Redevelopment Authority Multifamily Housing | | | | | |
| | Revenue | | | | | |
| | (Marian Center Project) | | | | | |
| | Series A 5.375% 5/1/43 | | 1,000,000 | | | 1,000,870 |
| St. Paul Housing & Redevelopment Authority Revenue | | | | | |
| | (Amherst H. Wilder Foundation Project) | | | | | |
| | Series A 5.00% 12/1/36 | | 1,000,000 | | | 1,219,060 |
| Victoria Health Care Facilities Revenue | | | | | |
| | (Augustana Emerald Care Project) | | | | | |
| | 5.00% 8/1/39 | | 1,500,000 | | | 1,501,080 |
| Wayzata Senior Housing Revenue | | | | | |
| | (Folkestone Senior Living Community) | | | | | |
| | 4.00% 8/1/38 | | 500,000 | | | 529,365 |
| | 4.00% 8/1/39 | | 400,000 | | | 423,028 |
| | 4.00% 8/1/44 | | 350,000 | | | 368,323 |
| | 5.00% 8/1/54 | | 350,000 | | | 376,820 |
| | | | | | | 71,165,452 |
| Housing Revenue Bonds – 1.70% | | | | | |
| Bethel Senior Housing Revenue | | | | | |
| | (Birchwood Landing at the Lakes at Stillwater Project) | | | | | |
| | 5.00% 5/1/54 | | 1,000,000 | | | 1,059,320 |
| Minneapolis – St. Paul Housing Finance Board Single Family | | | | | |
| | Mortgage-Backed Securities Program | | | | | |
| | (City Living Project) | | | | | |
| | Series A-2 5.00% 12/1/38 (GNMA) (FNMA) (FHLMC) (AMT) | | 296 | | | 297 |
| Minnesota Housing Finance Agency | | | | | |
| | Series I 2.20% 1/1/51 | | 680,000 | | | 672,656 |
59
Table of Contents
Schedules of investments
Delaware Minnesota High-Yield Municipal Bond Fund
| | | | | Principal | | | |
| | | | amount° | | Value (US $) |
| Municipal Bonds (continued) | | | | | |
| Housing Revenue Bonds (continued) | | | | | |
| Minnesota Housing Finance Agency State Appropriation | | | | | |
| | (Housing Infrastructure) | | | | | |
| | Series C 5.00% 8/1/33 | | 100,000 | | $ | 113,195 |
| Northwest Multi-County Housing & Redevelopment Authority | | | | | |
| | (Pooled Housing Program) | | | | | |
| | 5.50% 7/1/45 | | 1,275,000 | | | 1,316,858 |
| Stillwater Multifamily Housing Revenue | | | | | |
| | (Orleans Homes Project) | | | | | |
| | 5.50% 2/1/42 (AMT) | | 750,000 | | | 750,795 |
| | | | | | | 3,913,121 |
| Lease Revenue Bonds – 1.99% | | | | | |
| Minnesota General Fund Revenue Appropriations | | | | | |
| | Series A 5.00% 6/1/38 | | 1,750,000 | | | 1,885,065 |
| | Series A 5.00% 6/1/43 | | 1,000,000 | | | 1,073,910 |
| Minnesota Housing Finance Agency State Appropriation | | | | | |
| | (Housing Infrastructure) | | | | | |
| | Series C 5.00% 8/1/32 | | 1,415,000 | | | 1,602,586 |
| | | | | | | 4,561,561 |
| Local General Obligation Bonds – 7.74% | | | | | |
| Anoka-Hennepin Independent School District No. 11 | | | | | |
| | Series A 3.00% 2/1/43 | | 500,000 | | | 541,695 |
| Duluth General Obligation Entertainment Convention Center | | | | | |
| | Improvement | | | | | |
| | Series A 5.00% 2/1/34 | | 1,000,000 | | | 1,185,040 |
| Duluth Independent School District No. 709 | | | | | |
| | Series A 4.00% 2/1/27 | | 440,000 | | | 504,984 |
| | Series A 4.20% 3/1/34 | | 750,000 | | | 805,522 |
| Hennepin County | | | | | |
| | Series A 5.00% 12/1/33 | | 1,560,000 | | | 2,096,531 |
| | Series A 5.00% 12/1/37 | | 910,000 | | | 1,130,001 |
| | Series C 5.00% 12/1/37 | | 2,500,000 | | | 3,053,950 |
| Lakeville Independent School District No. 194 | | | | | |
| | Series B 4.00% 2/1/29 | | 1,625,000 | | | 1,992,656 |
| Mahtomedi Independent School District No. 832 | | | | | |
| | (School Building) | | | | | |
| | Series A 5.00% 2/1/28 | | 1,000,000 | | | 1,158,080 |
| | Series A 5.00% 2/1/29 | | 1,000,000 | | | 1,156,600 |
| | Series A 5.00% 2/1/31 | | 1,000,000 | | | 1,156,230 |
| Minneapolis Special School District No. 1 | | | | | |
| | Series A 4.00% 2/1/36 | | 160,000 | | | 190,714 |
| | Series A 4.00% 2/1/37 | | 215,000 | | | 255,596 |
60
Table of Contents
| | | | | Principal | | | |
| | | | amount° | | Value (US $) |
| Municipal Bonds (continued) | | | | | |
| Local General Obligation Bonds (continued) | | | | | |
| Minneapolis Special School District No. 1 | | | | | |
| | Series A 4.00% 2/1/38 | | 220,000 | | $ | 260,975 |
| | Series B 4.00% 2/1/36 | | 335,000 | | | 399,307 |
| | Series B 4.00% 2/1/37 | | 445,000 | | | 529,025 |
| | Series B 4.00% 2/1/38 | | 465,000 | | | 551,606 |
| Wayzata Independent School District No. 284 | | | | | |
| | (School Building) | | | | | |
| | Series A 5.00% 2/1/28 | | 650,000 | | | 801,002 |
| | | | | | | 17,769,514 |
| Pre-Refunded/Escrowed to Maturity Bonds – 4.71% | | | | | |
| Deephaven Charter School Lease Revenue | | | | | |
| | (Eagle Ridge Academy Project) | | | | | |
| | Series A 5.50% 7/1/43-23 § | | 500,000 | | | 547,035 |
| Minnesota | | | | | |
| | Series A Unrefunded Balance 5.00% 10/1/24-21 § | | 985,000 | | | 988,891 |
| Minnesota Higher Education Facilities Authority Revenue | | | | | |
| | (St. Catherine University) | | | | | |
| | Series 7-Q 5.00% 10/1/25-22 § | | 325,000 | | | 341,975 |
| | Series 7-Q 5.00% 10/1/26-22 § | | 280,000 | | | 294,624 |
| Rice County Educational Facilities Revenue | | | | | |
| | (Shattuck-St. Mary’s School) | | | | | |
| | Series A 144A 5.00% 8/1/22 # | | 1,520,000 | | | 1,586,576 |
| Rochester Health Care Facilities Revenue | | | | | |
| | (Olmsted Medical Center Project) | | | | | |
| | 5.00% 7/1/22 | | 350,000 | | | 363,933 |
| | 5.00% 7/1/27-23 § | | 245,000 | | | 266,286 |
| | 5.00% 7/1/28-23 § | | 225,000 | | | 244,548 |
| St. Paul Housing & Redevelopment Authority Charter School Lease | | | | | |
| | Revenue | | | | | |
| | (Nova Classical Academy Project) | | | | | |
| | Series A 6.625% 9/1/42-21 § | | 1,500,000 | | | 1,500,000 |
| St. Paul Housing & Redevelopment Authority Hospital Facility | | | | | |
| | Revenue | | | | | |
| | (Healtheast Care System Project) | | | | | |
| | Series A 5.00% 11/15/29-25 § | | 275,000 | | | 327,539 |
| | Series A 5.00% 11/15/30-25 § | | 205,000 | | | 244,165 |
| Western Minnesota Municipal Power Agency Revenue | | | | | |
| | Series A 5.00% 1/1/30-24 § | | 500,000 | | | 556,395 |
| | Series A 5.00% 1/1/33-24 § | | 750,000 | | | 834,592 |
| | Series A 5.00% 1/1/34-24 § | | 450,000 | | | 500,756 |
61
Table of Contents
Schedules of investments
Delaware Minnesota High-Yield Municipal Bond Fund
| | | Principal | | | |
| | | amount° | | | Value (US $) |
| Municipal Bonds (continued) | | | | | |
| Pre-Refunded/Escrowed to Maturity Bonds (continued) | | | | | |
| | Western Minnesota Municipal Power Agency Revenue | | | | | |
| Series A 5.00% 1/1/40-24 § | | 2,000,000 | | $ | 2,225,580 |
| | | | | | 10,822,895 |
| Special Tax Revenue Bonds – 4.42% | | | | | |
| Minneapolis Revenue | | | | | |
| (YMCA Greater Twin Cities Project) | | | | | |
| 4.00% 6/1/31 | | 250,000 | | | 269,413 |
| Minneapolis Tax Increment Revenue | | | | | |
| (Grant Park Project) | | | | | |
| 4.00% 3/1/27 | | 200,000 | | | 205,722 |
| 4.00% 3/1/30 | | 260,000 | | | 266,276 |
| (Village of St. Anthony Falls Project) | | | | | |
| 4.00% 3/1/24 | | 700,000 | | | 722,330 |
| 4.00% 3/1/27 | | 650,000 | | | 668,304 |
| Puerto Rico Sales Tax Financing Revenue | | | | | |
| (Restructured) | | | | | |
| Series A-1 4.75% 7/1/53 | | 3,155,000 | | | 3,610,582 |
| Series A-1 5.00% 7/1/58 | | 275,000 | | | 318,409 |
| Series A-2 4.536% 7/1/53 | | 3,000,000 | | | 3,393,030 |
| St. Paul Sales Tax Revenue | | | | | |
| Series G 5.00% 11/1/28 | | 600,000 | | | 685,638 |
| | | | | | 10,139,704 |
| State General Obligation Bonds – 8.41% | | | | | |
| Commonwealth of Puerto Rico | | | | | |
| (Public Improvement) | | | | | |
| Series B 5.75% 7/1/38 ‡ | | 920,000 | | | 849,850 |
| Minnesota | | | | | |
| Series A 5.00% 8/1/27 | | 750,000 | | | 886,283 |
| Series A 5.00% 8/1/29 | | 1,000,000 | | | 1,181,280 |
| Series A 5.00% 8/1/30 | | 1,250,000 | | | 1,606,375 |
| Series A 5.00% 8/1/33 | | 660,000 | | | 845,770 |
| Series A 5.00% 8/1/34 | | 2,185,000 | | | 2,795,642 |
| Series A 5.00% 8/1/35 | | 1,000,000 | | | 1,300,300 |
| Series D 5.00% 8/1/26 | | 1,000,000 | | | 1,225,220 |
| Series D 5.00% 8/1/27 | | 1,000,000 | | | 1,220,310 |
| Series E 5.00% 10/1/26 | | 1,085,000 | | | 1,336,319 |
| (Various Purposes) | | | | | |
| Series A 5.00% 8/1/32 | | 1,915,000 | | | 2,173,065 |
| Series A 5.00% 8/1/38 | | 1,000,000 | | | 1,270,290 |
62
Table of Contents
| | Principal | | | |
| | amount° | | Value (US $) |
| Municipal Bonds (continued) | | | | |
| State General Obligation Bonds (continued) | | | | |
| | Minnesota | | | | |
| (Various Purposes) | | | | |
| Series A 5.00% 8/1/38 | 2,000,000 | | $ | 2,632,500 |
| | | | | 19,323,204 |
| Transportation Revenue Bonds – 5.06% | | | | |
| Minneapolis – St. Paul Metropolitan Airports Commission Revenue | | | | |
| (Senior) | | | | |
| Series C 5.00% 1/1/46 | 185,000 | | | 222,514 |
| (Subordinate) | | | | |
| Series A 5.00% 1/1/32 | 500,000 | | | 552,890 |
| Series A 5.00% 1/1/49 | 1,500,000 | | | 1,861,260 |
| Series B 5.00% 1/1/29 | 2,130,000 | | | 2,163,079 |
| Series B 5.00% 1/1/44 (AMT) | 4,000,000 | | | 4,968,680 |
| Series B 5.00% 1/1/49 (AMT) | 1,500,000 | | | 1,852,590 |
| | | | | 11,621,013 |
| Water & Sewer Revenue Bonds – 1.00% | | | | |
| Metropolitan Council General Obligation Wastewater Revenue | | | | |
| (Minneapolis – St. Paul Metropolitan Area) | | | | |
| Series C 4.00% 3/1/31 | 965,000 | | | 1,126,830 |
| Series C 4.00% 3/1/32 | 1,000,000 | | | 1,164,610 |
| | | | | 2,291,440 |
| Total Municipal Bonds (cost $207,844,606) | | | | 220,514,013 |
| | | | | |
| Short-Term Investments – 3.42% | | | | |
| Variable Rate Demand Notes – 3.42%¤ | | | | |
| Minneapolis Health Care System Revenue | | | | |
| (Fairview Health Services) Series C 0.02% 11/15/48 (LOC – Wells | | | | |
| Fargo Bank N.A.) | 3,200,000 | | | 3,200,000 |
| Minneapolis – St. Paul Housing & Redevelopment Authority Health | | | | |
| Care Revenue | | | | |
| (Allina Health System) | | | | |
| Series B-1A 0.01% 11/15/35 | | | | |
| (LOC – JPMorgan Chase Bank N.A.) | 3,650,000 | | | 3,650,000 |
63
Table of Contents
Schedules of investments
Delaware Minnesota High-Yield Municipal Bond Fund
| | | Principal | | | |
| | | amount° | | Value (US $) |
| Short-Term Investments (continued) | | | | | |
| Variable Rate Demand Notes (continued) | | | | | |
| | Minneapolis – St. Paul Housing & Redevelopment Authority Health | | | | | |
| Care Revenue | | | | | |
| (Allina Health System) | | | | | |
| Series B-2 0.01% 11/15/35 | | | | | |
| (LOC – JPMorgan Chase Bank N.A.) | | 1,005,000 | | $ | 1,005,000 |
| Total Short-Term Investments (cost $7,855,000) | | | | | 7,855,000 |
| Total Value of Securities–99.42% | | | | | |
| (cost $215,699,606) | | | | $ | 228,369,013 |
| ° | Principal amount shown is stated in USD unless noted that the security is denominated in another currency. |
| # | Security exempt from registration under Rule 144A of the Securities Act of 1933, as amended. At August 31, 2021, the aggregate value of Rule 144A securities was $8,459,890, which represents 3.68% of the Fund’s net assets. See Note 8 in “Notes to financial statements.” |
| ‡ | Non-income producing security. Security is currently in default. |
| § | Pre-refunded bonds. Municipal bonds that are generally backed or secured by US Treasury bonds. For pre-refunded bonds, the stated maturity is followed by the year in which the bond will be pre-refunded. See Note 8 in “Notes to financial statements.” |
| ¤ | Tax-exempt obligations that contain a floating or variable interest rate adjustment formula and an unconditional right of demand to receive payment of the unpaid principal balance plus accrued interest upon a short notice period (generally up to 30 days) prior to specified dates either from the issuer or by drawing on a bank letter of credit, a guarantee, or insurance issued with respect to such instrument. Each rate shown is as of August 31, 2021. |
Summary of abbreviations:
AMT – Subject to Alternative Minimum Tax
FHLMC – Federal Home Loan Mortgage Corporation
FNMA – Federal National Mortgage Association
GNMA – Government National Mortgage Association
LLC – Limited Liability Corporation
LOC – Letter of Credit
N.A. – National Association
USD – US Dollar
See accompanying notes, which are an integral part of the financial statements.
64
Table of Contents
| Statements of assets and liabilities | August 31, 2021 |
| | | | | | | | | Delaware |
| | | | | | | | | Minnesota |
| | | | | | Delaware Tax-Free | | High-Yield |
| | | Delaware Tax-Free | | Minnesota | | Municipal Bond |
| | | | Minnesota Fund | | Intermediate Fund | | Fund |
| Assets: | | | | | | | | | |
| Investments, at value* | | $ | 609,199,642 | | $ | 90,056,704 | | $ | 228,369,013 |
| Cash | | | 146,559 | | | 125,894 | | | 287,364 |
| Interest receivable | | | 6,723,592 | | | 866,878 | | | 2,431,944 |
| Receivable for fund shares sold | | | 445,016 | | | 1,385 | | | 176,586 |
| Total Assets | | | 616,514,809 | | | 91,050,861 | | | 231,264,907 |
| Liabilities: | | | | | | | | | |
| Payable for securities purchased | | | 3,073,990 | | | 452,310 | | | 744,865 |
| Payable for fund shares redeemed | | | 956,208 | | | 56,442 | | | 576,799 |
| Investment management fees payable to | | | | | | | | | |
| affiliates | | | 248,103 | | | 31,585 | | | 92,337 |
| Distribution payable | | | 194,007 | | | 14,830 | | | 17,324 |
| Distribution fees payable to affiliates | | | 94,603 | | | 10,654 | | | 36,079 |
| Dividend disbursing and transfer agent | | | | | | | | | |
| fees and expenses payable to | | | | | | | | | |
| non-affiliates | | | 60,877 | | | 10,528 | | | 25,885 |
| Other accrued expenses | | | 58,040 | | | 16,473 | | | 32,394 |
| Accounting and administration expenses | | | | | | | | | |
| payable to non-affiliates | | | 32,764 | | | 15,894 | | | 20,294 |
| Audit and tax fees payable | | | 4,950 | | | 4,950 | | | 4,950 |
| Dividend disbursing and transfer agent | | | | | | | | | |
| fees and expenses payable to affiliates | | | 4,437 | | | 657 | | | 1,662 |
| Accounting and administration expenses | | | | | | | | | |
| payable to affiliates | | | 2,190 | | | 614 | | | 1,033 |
| Trustees’ fees and expenses payable to | | | | | | | | | |
| affiliates | | | 1,798 | | | 266 | | | 670 |
| Legal fees payable to affiliates | | | 1,537 | | | 228 | | | 573 |
| Reports and statements to shareholders | | | | | | | | | |
| expenses payable to affiliates | | | 745 | | | 110 | | | 280 |
| Total Liabilities | | | 4,734,249 | | | 615,541 | | | 1,555,145 |
| Total Net Assets | | $ | 611,780,560 | | $ | 90,435,320 | | $ | 229,709,762 |
| | | | | | | | | | |
| Net Assets Consist of: | | | | | | | | | |
| Paid-in capital | | $ | 576,138,172 | | $ | 85,993,759 | | $ | 217,735,288 |
| Total distributable earnings (loss) | | | 35,642,388 | | | 4,441,561 | | | 11,974,474 |
| Total Net Assets | | $ | 611,780,560 | | $ | 90,435,320 | | $ | 229,709,762 |
65
Table of Contents
Statements of assets and liabilities
| | | | | | | | | | Delaware |
| | | | | | | | | | Minnesota |
| | | | | | Delaware Tax-Free | | High-Yield |
| | Delaware Tax-Free | | Minnesota | | Municipal Bond |
| | Minnesota Fund | | Intermediate Fund | | Fund |
| Net Asset Value | | | | | | | | | | | | |
| | | | | | | | | | | | | |
| Class A: | | | | | | | | | | | | |
| Net assets | | $ | 375,799,001 | | | $ | 63,499,498 | | | $ | 112,606,029 | |
| Shares of beneficial interest outstanding, | | | | | | | | | | | | |
| unlimited authorization, no par | | | 29,579,246 | | | | 5,659,465 | | | | 9,933,434 | |
| Net asset value per share | | $ | 12.70 | | | $ | 11.22 | | | $ | 11.34 | |
| Sales charge | | | 4.50 | % | | | 2.75 | % | | | 4.50 | % |
| Offering price per share, equal to net asset | | | | | | | | | | | | |
| value per share / (1 - sales charge) | | $ | 13.30 | | | $ | 11.54 | | | $ | 11.87 | |
| Class C: | | | | | | | | | | | | |
| Net assets | | $ | 17,095,736 | | | $ | 2,989,658 | | | $ | 14,316,383 | |
| Shares of beneficial interest outstanding, | | | | | | | | | | | | |
| unlimited authorization, no par | | | 1,341,176 | | | | 265,910 | | | | 1,260,454 | |
| Net asset value per share | | $ | 12.75 | | | $ | 11.24 | | | $ | 11.36 | |
| Institutional Class: | | | | | | | | | | | | |
| Net assets | | $ | 218,885,823 | | | $ | 23,946,164 | | | $ | 102,787,350 | |
| Shares of beneficial interest outstanding, | | | | | | | | | | | | |
| unlimited authorization, no par | | | 17,232,229 | | | | 2,133,456 | | | | 9,069,993 | |
| Net asset value per share | | $ | 12.70 | | | $ | 11.22 | | | $ | 11.33 | |
| ____________________ | | | | | | | | | | | | |
| *Investments, at cost | | $ | 573,095,166 | | | $ | 85,454,906 | | | $ | 215,699,606 | |
See accompanying notes, which are an integral part of the financial statements.
66
Table of Contents
Statements of operations
Year ended August 31, 2021
| | | | | | | | | | | Delaware Minnesota | |
| | | | | | | Delaware Tax-Free | | | High-Yield | |
| | | Delaware Tax-Free | | | Minnesota | | | Municipal Bond | |
| | | | Minnesota Fund | | | Intermediate Fund | | | Fund | |
| Investment Income: | | | | | | | | | | | | |
| Interest | | $ | 18,735,878 | | | $ | 2,436,939 | | | $ | 7,166,291 | |
| Expenses: | | | | | | | | | | | | |
| Management fees | | | 3,225,990 | | | | 447,955 | | | | 1,156,633 | |
| Distribution expenses — Class A | | | 934,860 | | | | 152,566 | | | | 267,816 | |
| Distribution expenses — Class C | | | 203,386 | | | | 38,835 | | | | 162,333 | |
| Dividend disbursing and transfer agent
fees and expenses | | | 382,930 | | | | 61,585 | | | | 154,759 | |
| Accounting and administration expenses | | | 133,963 | | | | 53,269 | | | | 72,551 | |
| Registration fees | | | 54,792 | | | | 15,654 | | | | 18,691 | |
| Reports and statements to shareholders
expenses | | | 49,083 | | | | 14,392 | | | | 19,561 | |
| Audit and tax fees | | | 41,723 | | | | 40,626 | | | | 41,006 | |
| Legal fees | | | 34,957 | | | | 5,325 | | | | 12,056 | |
| Trustees’ fees and expenses | | | 25,516 | | | | 3,854 | | | | 8,908 | |
| Custodian fees | | | 17,599 | | | | 2,856 | | | | 6,538 | |
| Other | | | 58,272 | | | | 22,241 | | | | 33,478 | |
| | | | 5,163,071 | | | | 859,158 | | | | 1,954,330 | |
| Less expenses waived | | | (453,391 | ) | | | (165,941 | ) | | | (178,624 | ) |
| Less waived distribution
expenses — Class A | | | — | | | | (61,027 | ) | | | — | |
| Less expenses paid indirectly | | | (206 | ) | | | (34 | ) | | | (86 | ) |
| Total operating expenses | | | 4,709,474 | | | | 632,156 | | | | 1,775,620 | |
| Net Investment Income | | | 14,026,404 | | | | 1,804,783 | | | | 5,390,671 | |
| Net Realized and Unrealized Gain: | | | | | | | | | | | | |
| Net realized gain on investments | | | 363,044 | | | | 8,561 | | | | 131,524 | |
| Net change in unrealized appreciation
(depreciation) of investments | | | 9,593,632 | | | | 950,052 | | | | 6,128,862 | |
| Net Realized and Unrealized Gain | | | 9,956,676 | | | | 958,613 | | | | 6,260,386 | |
Net Increase in Net Assets Resulting
from Operations | | $ | 23,983,080 | | | $ | 2,763,396 | | | $ | 11,651,057 | |
See accompanying notes, which are an integral part of the financial statements.
67
Table of Contents
Statements of changes in net assets
Delaware Tax-Free Minnesota Fund
| | | | Year ended | |
| | | 8/31/21 | | | 8/31/20 | |
| Increase (Decrease) in Net Assets from Operations: | | | | | | | | |
| Net investment income | | $ | 14,026,404 | | | $ | 14,887,472 | |
| Net realized gain | | | 363,044 | | | | 932,823 | |
| Net change in unrealized appreciation (depreciation) | | | 9,593,632 | | | | (8,816,749 | ) |
| Net increase in net assets resulting from operations | | | 23,983,080 | | | | 7,003,546 | |
| | | | | | | | | |
| Dividends and Distributions to Shareholders from: | | | | | | | | |
| Distributable earnings: | | | | | | | | |
| Class A | | | (8,602,767 | ) | | | (10,479,934 | ) |
| Class C | | | (317,142 | ) | | | (567,741 | ) |
| Institutional Class | | | (5,112,180 | ) | | | (5,376,871 | ) |
| | | | (14,032,089 | ) | | | (16,424,546 | ) |
| | | | | | | | | | |
| Capital Share Transactions: | | | | | | | | |
| Proceeds from shares sold: | | | | | | | | |
| Class A | | | 32,776,523 | | | | 30,564,638 | |
| Class C | | | 2,912,226 | | | | 2,044,174 | |
| Institutional Class | | | 50,547,588 | | | | 49,162,276 | |
| Net asset value of shares issued upon reinvestment of
dividends and distributions: | | | | | | | | |
| Class A | | | 7,926,134 | | | | 9,360,817 | |
| Class C | | | 317,438 | | | | 554,458 | |
| Institutional Class | | | 3,667,541 | | | | 3,892,433 | |
| | | | 98,147,450 | | | | 95,578,796 | |
68
Table of Contents
| | Year ended | |
| | 8/31/21 | | | 8/31/20 | |
| Capital Share Transactions (continued): | | | | | | | | |
| Cost of shares redeemed: | | | | | | | | |
| Class A | | $ | (44,859,294 | ) | | $ | (47,198,375 | ) |
| Class C | | | (11,729,082 | ) | | | (6,825,961 | ) |
| Institutional Class | | | (19,881,471 | ) | | | (37,945,871 | ) |
| | | (76,469,847 | ) | | | (91,970,207 | ) |
| Increase in net assets derived from capital share transactions | | | 21,677,603 | | | | 3,608,589 | |
| Net Increase (Decrease) in Net Assets | | | 31,628,594 | | | | (5,812,411 | ) |
| | | | | | | | | |
| Net Assets: | | | | | | | | |
| Beginning of year | | | 580,151,966 | | | | 585,964,377 | |
| End of year | | $ | 611,780,560 | | | $ | 580,151,966 | |
See accompanying notes, which are an integral part of the financial statements.
69
Table of Contents
Statements of changes in net assets
Delaware Tax-Free Minnesota Intermediate Fund
| | | Year ended | |
| | | | 8/31/21 | | | 8/31/20 | |
| Increase (Decrease) in Net Assets from Operations: | | | | | | | | |
| Net investment income | | $ | 1,804,783 | | | $ | 1,942,599 | |
| Net realized gain (loss) | | | 8,561 | | | | (68,890 | ) |
| Net change in unrealized appreciation (depreciation) | | | 950,052 | | | | (916,519 | ) |
| Net increase in net assets resulting from operations | | | 2,763,396 | | | | 957,190 | |
| | | | | | | | | |
| Dividends and Distributions to Shareholders from: | | | | | | | | |
| Distributable earnings: | | | | | | | | |
| Class A | | | (1,225,791 | ) | | | (1,346,270 | ) |
| Class C | | | (45,202 | ) | | | (98,584 | ) |
| Institutional Class | | | (533,028 | ) | | | (497,364 | ) |
| | | | (1,804,021 | ) | | | (1,942,218 | ) |
| | | | | | | | | |
| Capital Share Transactions: | | | | | | | | |
| Proceeds from shares sold: | | | | | | | | |
| Class A | | | 8,198,066 | | | | 8,419,718 | |
| Class C | | | 203,775 | | | | 635,657 | |
| Institutional Class | | | 2,572,951 | | | | 11,917,665 | |
| Net asset value of shares issued upon reinvestment of
dividends and distributions: | | | | | | | | |
| Class A | | | 1,062,594 | | | | 1,146,384 | |
| Class C | | | 45,232 | | | | 94,088 | |
| Institutional Class | | | 517,558 | | | | 463,348 | |
| | | | 12,600,176 | | | | 22,676,860 | |
70
Table of Contents
| | | Year ended |
| | | | 8/31/21 | | 8/31/20 |
| Capital Share Transactions (continued): | | | | | | | | |
| Cost of shares redeemed: | | | | | | | | |
| Class A | | $ | (4,194,808 | ) | | $ | (6,850,828 | ) |
| Class C | | | (2,455,208 | ) | | | (2,655,009 | ) |
| Institutional Class | | | (4,259,309 | ) | | | (5,203,976 | ) |
| | | | (10,909,325 | ) | | | (14,709,813 | ) |
| Increase in net assets derived from capital share transactions | | | 1,690,851 | | | | 7,967,047 | |
| Net Increase in Net Assets | | | 2,650,226 | | | | 6,982,019 | |
| | | | | | | | | |
| Net Assets: | | | | | | | | |
| Beginning of year | | | 87,785,094 | | | | 80,803,075 | |
| End of year | | $ | 90,435,320 | | | $ | 87,785,094 | |
See accompanying notes, which are an integral part of the financial statements.
71
Table of Contents
Statements of changes in net assets
Delaware Minnesota High-Yield Municipal Bond Fund
| | Year ended |
| | 8/31/21 | | 8/31/20 |
| Increase (Decrease) in Net Assets from Operations: | | | | | | | | |
| Net investment income | | $ | 5,390,671 | | | $ | 5,533,266 | |
| Net realized gain | | | 131,524 | | | | 180,719 | |
| Net change in unrealized appreciation (depreciation) | | | 6,128,862 | | | | (4,939,126 | ) |
| Net increase in net assets resulting from operations | | | 11,651,057 | | | | 774,859 | |
| | | | | | | | | |
| Dividends and Distributions to Shareholders from: | | | | | | | | |
| Distributable earnings: | | | | | | | | |
| Class A | | | (2,693,124 | ) | | | (2,770,295 | ) |
| Class C | | | (287,866 | ) | | | (393,155 | ) |
| Institutional Class | | | (2,391,905 | ) | | | (2,354,836 | ) |
| | | (5,372,895 | ) | | | (5,518,286 | ) |
| | | | | | | | | |
| Capital Share Transactions: | | | | | | | | |
| Proceeds from shares sold: | | | | | | | | |
| Class A | | | 14,985,779 | | | | 12,533,954 | |
| Class C | | | 1,946,841 | | | | 3,689,377 | |
| Institutional Class | | | 37,821,169 | | | | 28,268,095 | |
| | | | | | | | | |
| Net asset value of shares issued upon reinvestment of | | | | | | | | |
| dividends and distributions: | | | | | | | | |
| Class A | | | 2,555,804 | | | | 2,475,879 | |
| Class C | | | 286,098 | | | | 369,511 | |
| Institutional Class | | | 2,344,543 | | | | 2,262,483 | |
| | | 59,940,234 | | | | 49,599,299 | |
72
Table of Contents
| | Year ended |
| | 8/31/21 | | 8/31/20 |
| Capital Share Transactions (continued): | | | | | | | | |
| Cost of shares redeemed: | | | | | | | | |
| Class A | | $ | (12,024,584 | ) | | $ | (12,513,039 | ) |
| Class C | | | (7,801,987 | ) | | | (5,297,308 | ) |
| Institutional Class | | | (15,296,157 | ) | | | (28,132,087 | ) |
| | | (35,122,728 | ) | | | (45,942,434 | ) |
| Increase in net assets derived from capital share transactions | | | 24,817,506 | | | | 3,656,865 | |
| Net Increase (Decrease) in Net Assets | | | 31,095,668 | | | | (1,086,562 | ) |
| | | | | | | | | |
| Net Assets: | | | | | | | | |
| Beginning of year | | | 198,614,094 | | | | 199,700,656 | |
| End of year | | $ | 229,709,762 | | | $ | 198,614,094 | |
See accompanying notes, which are an integral part of the financial statements.
73
Table of Contents
Financial highlights
Delaware Tax-Free Minnesota Fund Class A
Selected data for each share of the Fund outstanding throughout each period were as follows:
| Net asset value, beginning of period |
| |
| Income (loss) from investment operations: |
| Net investment income1 |
| Net realized and unrealized gain (loss) |
| Total from investment operations |
| |
| Less dividends and distributions from: |
| Net investment income |
| Net realized gain |
| Total dividends and distributions |
| |
| Net asset value, end of period |
| |
| Total return2 |
| |
| Ratios and supplemental data: |
| Net assets, end of period (000 omitted) |
| Ratio of expenses to average net assets |
| Ratio of expenses to average net assets prior to fees waived |
| Ratio of net investment income to average net assets |
| Ratio of net investment income to average net assets prior to fees waived |
| Portfolio turnover |
| 1 | Calculated using average shares outstanding. |
| 2 | Total return is based on the change in net asset value of a share during the period and assumes reinvestment of dividends and distributions at net asset value and does not reflect the impact of a sales charge. Total return during all of the periods shown reflects a waiver by the manager. Performance would have been lower had the waiver not been in effect. |
See accompanying notes, which are an integral part of the financial statements.
74
Table of Contents
| Year ended |
| | 8/31/21 | | 8/31/20 | | 8/31/19 | | 8/31/18 | | 8/31/17 | |
| $ | 12.49 | | | $ | 12.68 | | | $ | 12.14 | | | $ | 12.54 | | | $ | 12.87 | | |
| | | |
| | | |
| | 0.29 | | | | 0.31 | | | | 0.36 | | | | 0.37 | | | | 0.38 | | |
| | 0.21 | | | | (0.16 | ) | | | 0.54 | | | | (0.34 | ) | | | (0.32 | ) | |
| | 0.50 | | | | 0.15 | | | | 0.90 | | | | 0.03 | | | | 0.06 | | |
| | | |
| | | |
| | (0.29 | ) | | | (0.31 | ) | | | (0.36 | ) | | | (0.37 | ) | | | (0.39 | ) | |
| | — | | | | (0.03 | ) | | | — | | | | (0.06 | ) | | | — | | |
| | (0.29 | ) | | | (0.34 | ) | | | (0.36 | ) | | | (0.43 | ) | | | (0.39 | ) | |
| | | |
| $ | 12.70 | | | $ | 12.49 | | | $ | 12.68 | | | $ | 12.14 | | | $ | 12.54 | | |
| | | |
| | 4.05% | | | | 1.30% | | | | 7.54% | | | | 0.26% | | | | 0.49% | | |
| | | |
| | | |
| $ | 375,799 | | | $ | 373,691 | | | $ | 386,790 | | | $ | 390,477 | | | $ | 423,497 | | |
| | 0.85% | | | | 0.85% | | | | 0.85% | | | | 0.85% | | | | 0.85% | | |
| | 0.93% | | | | 0.93% | | | | 0.93% | | | | 0.94% | | | | 0.95% | | |
| | 2.30% | | | | 2.53% | | | | 2.92% | | | | 2.99% | | | | 3.08% | | |
| | 2.22% | | | | 2.45% | | | | 2.84% | | | | 2.90% | | | | 2.98% | | |
| | 3% | | | | 15% | | | | 13% | | | | 16% | | | | 17% | | |
75
Table of Contents
Financial highlights
Delaware Tax-Free Minnesota Fund Class C
Selected data for each share of the Fund outstanding throughout each period were as follows:
| Net asset value, beginning of period |
| |
| Income (loss) from investment operations: |
| Net investment income1 |
| Net realized and unrealized gain (loss) |
| Total from investment operations |
| |
| Less dividends and distributions from: |
| Net investment income |
| Net realized gain |
| Total dividends and distributions |
| |
| Net asset value, end of period |
| |
| Total return2 |
| |
| Ratios and supplemental data: |
| Net assets, end of period (000 omitted) |
| Ratio of expenses to average net assets |
| Ratio of expenses to average net assets prior to fees waived |
| Ratio of net investment income to average net assets |
| Ratio of net investment income to average net assets prior to fees waived |
| Portfolio turnover |
| 1 | Calculated using average shares outstanding. |
| 2 | Total return is based on the change in net asset value of a share during the period and assumes reinvestment of dividends and distributions at net asset value and does not reflect the impact of a sales charge. Total return during all of the periods shown reflects a waiver by the manager. Performance would have been lower had the waiver not been in effect. |
See accompanying notes, which are an integral part of the financial statements.
76
Table of Contents
| | Year ended | |
| | 8/31/21 | | 8/31/20 | | 8/31/19 | | 8/31/18 | | 8/31/17 | |
| | $ | 12.53 | | | $ | 12.72 | | | $ | 12.18 | | | $ | 12.58 | | | $ | 12.91 | | |
| | | |
| | | |
| | | 0.20 | | | | 0.22 | | | | 0.27 | | | | 0.28 | | | | 0.29 | | |
| | | 0.22 | | | | (0.16 | ) | | | 0.54 | | | | (0.34 | ) | | | (0.33 | ) | |
| | | 0.42 | | | | 0.06 | | | | 0.81 | | | | (0.06 | ) | | | (0.04 | ) | |
| | | |
| | | |
| | | (0.20 | ) | | | (0.22 | ) | | | (0.27 | ) | | | (0.28 | ) | | | (0.29 | ) | |
| | | — | | | | (0.03 | ) | | | — | | | | (0.06 | ) | | | — | | |
| | | (0.20 | ) | | | (0.25 | ) | | | (0.27 | ) | | | (0.34 | ) | | | (0.29 | ) | |
| | | |
| | $ | 12.75 | | | $ | 12.53 | | | $ | 12.72 | | | $ | 12.18 | | | $ | 12.58 | | |
| | | |
| | | 3.35% | | | | 0.54% | | | | 6.73% | | | | (0.49% | ) | | | (0.25% | ) | |
| | | |
| | | |
| | $ | 17,096 | | | $ | 25,219 | | | $ | 29,933 | | | $ | 35,642 | | | $ | 51,045 | | |
| | | 1.60% | | | | 1.60% | | | | 1.60% | | | | 1.60% | | | | 1.60% | | |
| | | 1.68% | | | | 1.68% | | | | 1.68% | | | | 1.69% | | | | 1.70% | | |
| | | 1.55% | | | | 1.78% | | | | 2.17% | | | | 2.24% | | | | 2.33% | | |
| | | 1.47% | | | | 1.70% | | | | 2.09% | | | | 2.15% | | | | 2.23% | | |
| | | 3% | | | | 15% | | | | 13% | | | | 16% | | | | 17% | | |
77
Table of Contents
Financial highlights
Delaware Tax-Free Minnesota Fund Institutional Class
Selected data for each share of the Fund outstanding throughout each period were as follows:
| Net asset value, beginning of period |
| |
| Income (loss) from investment operations: |
| Net investment income1 |
| Net realized and unrealized gain (loss) |
| Total from investment operations |
| |
| Less dividends and distributions from: |
| Net investment income |
| Net realized gain |
| Total dividends and distributions |
| |
| Net asset value, end of period |
| |
| Total return2 |
| |
| Ratios and supplemental data: |
| Net assets, end of period (000 omitted) |
| Ratio of expenses to average net assets |
| Ratio of expenses to average net assets prior to fees waived |
| Ratio of net investment income to average net assets |
| Ratio of net investment income to average net assets prior to fees waived |
| Portfolio turnover |
| 1 | Calculated using average shares outstanding. |
| 2 | Total return is based on the change in net asset value of a share during the period and assumes reinvestment of dividends and distributions at net asset value. Total return during all of the periods shown reflects a waiver by the manager. Performance would have been lower had the waiver not been in effect. |
See accompanying notes, which are an integral part of the financial statements.
78
Table of Contents
| | Year ended | |
| | 8/31/21 | | 8/31/20 | | 8/31/19 | | 8/31/18 | | 8/31/17 | |
| | $ | 12.49 | | | $ | 12.68 | | | $ | 12.14 | | | $ | 12.54 | | | $ | 12.87 | | |
| | | |
| | | |
| | | 0.32 | | | | 0.34 | | | | 0.39 | | | | 0.40 | | | | 0.41 | | |
| | | 0.21 | | | | (0.16 | ) | | | 0.54 | | | | (0.34 | ) | | | (0.32 | ) | |
| | | 0.53 | | | | 0.18 | | | | 0.93 | | | | 0.06 | | | | 0.09 | | |
| | | |
| | | |
| | | (0.32 | ) | | | (0.34 | ) | | | (0.39 | ) | | | (0.40 | ) | | | (0.42 | ) | |
| | | — | | | | (0.03 | ) | | | — | | | | (0.06 | ) | | | — | | |
| | | (0.32 | ) | | | (0.37 | ) | | | (0.39 | ) | | | (0.46 | ) | | | (0.42 | ) | |
| | | |
| | $ | 12.70 | | | $ | 12.49 | | | $ | 12.68 | | | $ | 12.14 | | | $ | 12.54 | | |
| | | |
| | | 4.31% | | | | 1.55% | | | | 7.81% | | | | 0.51% | | | | 0.75% | | |
| | | |
| | | |
| | $ | 218,886 | | | $ | 181,242 | | | $ | 169,241 | | | $ | 119,894 | | | $ | 88,826 | | |
| | | 0.60% | | | | 0.60% | | | | 0.60% | | | | 0.60% | | | | 0.60% | | |
| | | 0.68% | | | | 0.68% | | | | 0.68% | | | | 0.69% | | | | 0.70% | | |
| | | 2.55% | | | | 2.78% | | | | 3.17% | | | | 3.24% | | | | 3.33% | | |
| | | 2.47% | | | | 2.70% | | | | 3.09% | | | | 3.15% | | | | 3.23% | | |
| | | 3% | | | | 15% | | | | 13% | | | | 16% | | | | 17% | | |
79
Table of Contents
Financial highlights
Delaware Tax-Free Minnesota Intermediate Fund Class A
Selected data for each share of the Fund outstanding throughout each period were as follows:
| Net asset value, beginning of period |
| |
| Income (loss) from investment operations: |
| Net investment income1 |
| Net realized and unrealized gain (loss) |
| Total from investment operations |
| |
| Less dividends and distributions from: |
| Net investment income |
| Net realized gain |
| Total dividends and distributions |
| |
| Net asset value, end of period |
| |
| Total return2 |
| |
| Ratios and supplemental data: |
| Net assets, end of period (000 omitted) |
| Ratio of expenses to average net assets |
| Ratio of expenses to average net assets prior to fees waived |
| Ratio of net investment income to average net assets |
| Ratio of net investment income to average net assets prior to fees waived |
| Portfolio turnover |
| 1 | Calculated using average shares outstanding. |
| 2 | Total return is based on the change in net asset value of a share during the period and assumes reinvestment of dividends and distributions at net asset value and does not reflect the impact of a sales charge. Total return during all of the periods shown reflects waivers by the manager and/or distributor. Performance would have been lower had the waivers not been in effect. |
See accompanying notes, which are an integral part of the financial statements.
80
Table of Contents
| | Year ended | |
| | 8/31/21 | | 8/31/20 | | 8/31/19 | | 8/31/18 | | 8/31/17 | |
| | $ | 11.10 | | | $ | 11.25 | | | $ | 10.82 | | | $ | 11.17 | | | $ | 11.44 | | |
| | | |
| | | |
| | | 0.23 | | | | 0.27 | | | | 0.31 | | | | 0.30 | | | | 0.31 | | |
| | | 0.11 | | | | (0.15 | ) | | | 0.43 | | | | (0.31 | ) | | | (0.25 | ) | |
| | | 0.34 | | | | 0.12 | | | | 0.74 | | | | (0.01 | ) | | | 0.06 | | |
| | | |
| | | |
| | | (0.22 | ) | | | (0.27 | ) | | | (0.31 | ) | | | (0.30 | ) | | | (0.31 | ) | |
| | | — | | | | — | | | | — | | | | (0.04 | ) | | | (0.02 | ) | |
| | | (0.22 | ) | | | (0.27 | ) | | | (0.31 | ) | | | (0.34 | ) | | | (0.33 | ) | |
| | | |
| | $ | 11.22 | | | $ | 11.10 | | | $ | 11.25 | | | $ | 10.82 | | | $ | 11.17 | | |
| | | |
| | | 3.13% | | | | 1.08% | | | | 7.00% | | | | (0.01% | ) | | | 0.55% | | |
| | | |
| | | |
| | $ | 63,499 | | | $ | 57,788 | | | $ | 55,918 | | | $ | 59,284 | | | $ | 68,934 | | |
| | | 0.71% | | | | 0.71% | | | | 0.71% | | | | 0.79% | | | | 0.84% | | |
| | | 1.00% | | | | 1.02% | | | | 1.04% | | | | 1.00% | | | | 0.99% | | |
| | | 2.01% | | | | 2.39% | | | | 2.87% | | | | 2.77% | | | | 2.79% | | |
| | | 1.72% | | | | 2.08% | | | | 2.54% | | | | 2.56% | | | | 2.64% | | |
| | | 7% | | | | 20% | | | | 19% | | | | 17% | | | | 22% | | |
81
Table of Contents
Financial highlights
Delaware Tax-Free Minnesota Intermediate Fund Class C
Selected data for each share of the Fund outstanding throughout each period were as follows:
| Net asset value, beginning of period |
| |
| Income (loss) from investment operations: |
| Net investment income1 |
| Net realized and unrealized gain (loss) |
| Total from investment operations |
| |
| Less dividends and distributions from: |
| Net investment income |
| Net realized gain |
| Total dividends and distributions |
| |
| Net asset value, end of period |
| |
| Total return2 |
| |
| Ratios and supplemental data: |
| Net assets, end of period (000 omitted) |
| Ratio of expenses to average net assets |
| Ratio of expenses to average net assets prior to fees waived |
| Ratio of net investment income to average net assets |
| Ratio of net investment income to average net assets prior to fees waived |
| Portfolio turnover |
| 1 | Calculated using average shares outstanding. |
| 2 | Total return is based on the change in net asset value of a share during the period and assumes reinvestment of dividends and distributions at net asset value and does not reflect the impact of a sales charge. Total return during all of the periods shown reflects a waiver by the manager. Performance would have been lower had the waiver not been in effect. |
See accompanying notes, which are an integral part of the financial statements.
82
Table of Contents
| Year ended | | |
| | 8/31/21 | | | 8/31/20 | | | 8/31/19 | | | 8/31/18 | | | 8/31/17 | | |
| $ | 11.12 | | | $ | 11.27 | | | $ | 10.84 | | | $ | 11.19 | | | $ | 11.47 | | |
| | |
| | |
| | 0.13 | | | | 0.17 | | | | 0.22 | | | | 0.21 | | | | 0.22 | | |
| | 0.12 | | | | (0.15 | ) | | | 0.43 | | | | (0.31 | ) | | | (0.26 | ) | |
| | 0.25 | | | | 0.02 | | | | 0.65 | | | | (0.10 | ) | | | (0.04 | ) | |
| | |
| | |
| | (0.13 | ) | | | (0.17 | ) | | | (0.22 | ) | | | (0.21 | ) | | | (0.22 | ) | |
| | — | | | | — | | | | — | | | | (0.04 | ) | | | (0.02 | ) | |
| | (0.13 | ) | | | (0.17 | ) | | | (0.22 | ) | | | (0.25 | ) | | | (0.24 | ) | |
| | |
| $ | 11.24 | | | $ | 11.12 | | | $ | 11.27 | | | $ | 10.84 | | | $ | 11.19 | | |
| | |
| | 2.26% | | | | 0.22% | | | | 6.09% | | | | (0.86% | ) | | | (0.39% | ) | |
| | |
| | |
| $ | 2,990 | | | $ | 5,149 | | | $ | 7,167 | | | $ | 8,558 | | | $ | 11,885 | | |
| | 1.56% | | | | 1.56% | | | | 1.56% | | | | 1.64% | | | | 1.69% | | |
| | 1.75% | | | | 1.77% | | | | 1.79% | | | | 1.75% | | | | 1.74% | | |
| | 1.16% | | | | 1.54% | | | | 2.02% | | | | 1.92% | | | | 1.94% | | |
| | 0.97% | | | | 1.33% | | | | 1.79% | | | | 1.81% | | | | 1.89% | | |
| | 7% | | | | 20% | | | | 19% | | | | 17% | | | | 22% | | |
83
Table of Contents
Financial highlights
Delaware Tax-Free Minnesota Intermediate Fund Institutional Class
Selected data for each share of the Fund outstanding throughout each period were as follows:
| Net asset value, beginning of period |
| |
| Income (loss) from investment operations: |
| Net investment income1 |
| Net realized and unrealized gain (loss) |
| Total from investment operations |
| |
| Less dividends and distributions from: |
| Net investment income |
| Net realized gain |
| Total dividends and distributions |
| |
| Net asset value, end of period |
| |
| Total return2 |
| |
| Ratios and supplemental data: |
| Net assets, end of period (000 omitted) |
| Ratio of expenses to average net assets |
| Ratio of expenses to average net assets prior to fees waived |
| Ratio of net investment income to average net assets |
| Ratio of net investment income to average net assets prior to fees waived |
| Portfolio turnover |
| 1 | Calculated using average shares outstanding. |
| 2 | Total return is based on the change in net asset value of a share during the period and assumes reinvestment of dividends and distributions at net asset value. Total return during all of the periods shown reflects a waiver by the manager. Performance would have been lower had the waiver not been in effect. |
See accompanying notes, which are an integral part of the financial statements.
84
Table of Contents
| Year ended | |
| | 8/31/21 | | | 8/31/20 | | | 8/31/19 | | | 8/31/18 | | | 8/31/17 | | |
| $ | 11.10 | | | $ | 11.25 | | | $ | 10.83 | | | $ | 11.17 | | | $ | 11.45 | | |
| | |
| | |
| | 0.24 | | | | 0.28 | | | | 0.33 | | | | 0.32 | | | | 0.33 | | |
| | 0.12 | | | | (0.15 | ) | | | 0.42 | | | | (0.30 | ) | | | (0.26 | ) | |
| | 0.36 | | | | 0.13 | | | | 0.75 | | | | 0.02 | | | | 0.07 | | |
| | |
| | |
| | (0.24 | ) | | | (0.28 | ) | | | (0.33 | ) | | | (0.32 | ) | | | (0.33 | ) | |
| | — | | | | — | | | | — | | | | (0.04 | ) | | | (0.02 | ) | |
| | (0.24 | ) | | | (0.28 | ) | | | (0.33 | ) | | | (0.36 | ) | | | (0.35 | ) | |
| | |
| $ | 11.22 | | | $ | 11.10 | | | $ | 11.25 | | | $ | 10.83 | | | $ | 11.17 | | |
| | |
| | 3.29% | | | | 1.23% | | | | 7.06% | | | | 0.23% | | | | 0.61% | | |
| | |
| | |
| $ | 23,946 | | | $ | 24,848 | | | $ | 17,718 | | | $ | 11,470 | | | $ | 18,800 | | |
| | 0.56% | | | | 0.56% | | | | 0.56% | | | | 0.64% | | | | 0.69% | | |
| | 0.75% | | | | 0.77% | | | | 0.79% | | | | 0.75% | | | | 0.74% | | |
| | 2.16% | | | | 2.54% | | | | 3.02% | | | | 2.92% | | | | 2.94% | | |
| | 1.97% | | | | 2.33% | | | | 2.79% | | | | 2.81% | | | | 2.89% | | |
| | 7% | | | | 20% | | | | 19% | | | | 17% | | | | 22% | | |
85
Table of Contents
Financial highlights
Delaware Minnesota High-Yield Municipal Bond Fund Class A
Selected data for each share of the Fund outstanding throughout each period were as follows:
| Net asset value, beginning of period |
| |
| Income (loss) from investment operations: |
| Net investment income1 |
| Net realized and unrealized gain (loss) |
| Total from investment operations |
| |
| Less dividends and distributions from: |
| Net investment income |
| Total dividends and distributions |
| |
| Net asset value, end of period |
| |
| Total return2 |
| |
| Ratios and supplemental data: |
| Net assets, end of period (000 omitted) |
| Ratio of expenses to average net assets |
| Ratio of expenses to average net assets prior to fees waived |
| Ratio of net investment income to average net assets |
| Ratio of net investment income to average net assets prior to fees waived |
| Portfolio turnover |
| 1 | Calculated using average shares outstanding. |
| 2 | Total return is based on the change in net asset value of a share during the period and assumes reinvestment of dividends and distributions at net asset value and does not reflect the impact of a sales charge. Total return during all of the periods shown reflects a waiver by the manager. Performance would have been lower had the waiver not been in effect. |
See accompanying notes, which are an integral part of the financial statements.
86
Table of Contents
| Year ended |
| | 8/31/21 | | 8/31/20 | | 8/31/19 | | 8/31/18 | | 8/31/17 | |
| $ | 11.00 | | | $ | 11.21 | | | $ | 10.66 | | | $ | 10.88 | | | $ | 11.13 | | |
| | | | | | | | | | | | | | | | | | | | | |
| | | | | | | | | | | | | | | | | | | | | |
| | 0.28 | | | | 0.29 | | | | 0.32 | | | | 0.32 | | | | 0.33 | | |
| | 0.34 | | | | (0.21 | ) | | | 0.55 | | | | (0.22 | ) | | | (0.25 | ) | |
| | 0.62 | | | | 0.08 | | | | 0.87 | | | | 0.10 | | | | 0.08 | | |
| | | | | | | | | | | | | | | | | | | | | |
| | | | | | | | | | | | | | | | | | | | | |
| | (0.28 | ) | | | (0.29 | ) | | | (0.32 | ) | | | (0.32 | ) | | | (0.33 | ) | |
| | (0.28 | ) | | | (0.29 | ) | | | (0.32 | ) | | | (0.32 | ) | | | (0.33 | ) | |
| | | | | | | | | | | | | | | | | | | | | |
| $ | 11.34 | | | $ | 11.00 | | | $ | 11.21 | | | $ | 10.66 | | | $ | 10.88 | | |
| | | | | | | | | | | | | | | | | | | | | |
| | 5.71% | | | | 0.81% | | | | 8.33% | | | | 0.95% | | | | 0.84% | | |
| | | | | | | | | | | | | | | | | | | | | |
| | | | | | | | | | | | | | | | | | | | | |
| $ | 112,606 | | | $ | 103,913 | | | $ | 103,487 | | | $ | 98,980 | | | $ | 98,491 | | |
| | 0.89% | | | | 0.89% | | | | 0.89% | | | | 0.89% | | | | 0.89% | | |
| | 0.97% | | | | 0.97% | | | | 0.99% | | | | 0.99% | | | | 0.99% | | |
| | 2.52% | | | | 2.69% | | | | 2.97% | | | | 2.98% | | | | 3.08% | | |
| | 2.44% | | | | 2.61% | | | | 2.87% | | | | 2.88% | | | | 2.98% | | |
| | 3% | | | | 18% | | | | 12% | | | | 14% | | | | 19% | | |
87
Table of Contents
Financial highlights
Delaware Minnesota High-Yield Municipal Bond Fund Class C
Selected data for each share of the Fund outstanding throughout each period were as follows:
| Net asset value, beginning of period |
| |
| Income (loss) from investment operations: |
| Net investment income1 |
| Net realized and unrealized gain (loss) |
| Total from investment operations |
| |
| Less dividends and distributions from: |
| Net investment income |
| Total dividends and distributions |
| |
| Net asset value, end of period |
| |
| Total return3 |
| |
| Ratios and supplemental data: |
| Net assets, end of period (000 omitted) |
| Ratio of expenses to average net assets |
| Ratio of expenses to average net assets prior to fees waived |
| Ratio of net investment income to average net assets |
| Ratio of net investment income to average net assets prior to fees waived |
| Portfolio turnover |
| 1 | Calculated using average shares outstanding. |
| 2 | Amount is less than $0.005 per share. |
| 3 | Total return is based on the change in net asset value of a share during the period and assumes reinvestment of dividends and distributions at net asset value and does not reflect the impact of a sales charge. Total return during all of the periods shown reflects a waiver by the manager. Performance would have been lower had the waiver not been in effect. |
See accompanying notes, which are an integral part of the financial statements.
88
Table of Contents
| Year ended |
| 8/31/21 | | 8/31/20 | | 8/31/19 | | 8/31/18 | | 8/31/17 | |
| $ | 11.02 | | | $ | 11.23 | | | $ | 10.68 | | | $ | 10.90 | | | $ | 11.15 | | |
| | | | | | | | | | | | | | | | | | | | | |
| | | | | | | | | | | | | | | | | | | | | |
| | 0.20 | | | | 0.21 | | | | 0.24 | | | | 0.24 | | | | 0.25 | | |
| | 0.34 | | | | (0.21 | ) | | | 0.55 | | | | (0.22 | ) | | | (0.25 | ) | |
| | 0.54 | | | | — | 2 | | | 0.79 | | | | 0.02 | | | | — | 2 | |
| | | | | | | | | | | | | | | | | | | | | |
| | | | | | | | | | | | | | | | | | | | | |
| | (0.20 | ) | | | (0.21 | ) | | | (0.24 | ) | | | (0.24 | ) | | | (0.25 | ) | |
| | (0.20 | ) | | | (0.21 | ) | | | (0.24 | ) | | | (0.24 | ) | | | (0.25 | ) | |
| | | | | | | | | | | | | | | | | | | | | |
| $ | 11.36 | | | $ | 11.02 | | | $ | 11.23 | | | $ | 10.68 | | | $ | 10.90 | | |
| | | | | | | | | | | | | | | | | | | | | |
| | 4.92% | | | | 0.05% | | | | 7.51% | | | | 0.19% | | | | 0.09% | | |
| | | | | | | | | | | | | | | | | | | | | |
| | | | | | | | | | | | | | | | | | | | | |
| $ | 14,317 | | | $ | 19,376 | | | $ | 21,059 | | | $ | 21,651 | | | $ | 32,223 | | |
| | 1.64% | | | | 1.64% | | | | 1.64% | | | | 1.64% | | | | 1.64% | | |
| | 1.72% | | | | 1.72% | | | | 1.74% | | | | 1.74% | | | | 1.74% | | |
| | 1.77% | | | | 1.94% | | | | 2.22% | | | | 2.23% | | | | 2.33% | | |
| | 1.69% | | | | 1.86% | | | | 2.12% | | | | 2.13% | | | | 2.23% | | |
| | 3% | | | | 18% | | | | 12% | | | | 14% | | | | 19% | | |
89
Table of Contents
Financial highlights
Delaware Minnesota High-Yield Municipal Bond Fund Institutional Class
Selected data for each share of the Fund outstanding throughout each period were as follows:
| Net asset value, beginning of period |
| |
| Income (loss) from investment operations: |
| Net investment income1 |
| Net realized and unrealized gain (loss) |
| Total from investment operations |
| |
| Less dividends and distributions from: |
| Net investment income |
| Total dividends and distributions |
| |
| Net asset value, end of period |
| |
| Total return2 |
| |
| Ratios and supplemental data: |
| Net assets, end of period (000 omitted) |
| Ratio of expenses to average net assets |
| Ratio of expenses to average net assets prior to fees waived |
| Ratio of net investment income to average net assets |
| Ratio of net investment income to average net assets prior to fees waived |
| Portfolio turnover |
| 1 | Calculated using average shares outstanding. |
| 2 | Total return is based on the change in net asset value of a share during the period and assumes reinvestment of dividends and distributions at net asset value. Total return during all of the periods shown reflects a waiver by the manager. Performance would have been lower had the waiver not been in effect. |
See accompanying notes, which are an integral part of the financial statements.
90
Table of Contents
| Year ended |
| 8/31/21 | | 8/31/20 | | 8/31/19 | | 8/31/18 | | 8/31/17 | |
| $ | 11.00 | | | $ | 11.20 | | | $ | 10.66 | | | $ | 10.87 | | | $ | 11.12 | | |
| | | | | | | | | | | | | | | | | | | | | |
| | | | | | | | | | | | | | | | | | | | | |
| | 0.31 | | | | 0.32 | | | | 0.35 | | | | 0.35 | | | | 0.36 | | |
| | 0.33 | | | | (0.20 | ) | | | 0.54 | | | | (0.21 | ) | | | (0.25 | ) | |
| | 0.64 | | | | 0.12 | | | | 0.89 | | | | 0.14 | | | | 0.11 | | |
| | | | | | | | | | | | | | | | | | | | | |
| | | | | | | | | | | | | | | | | | | | | |
| | (0.31 | ) | | | (0.32 | ) | | | (0.35 | ) | | | (0.35 | ) | | | (0.36 | ) | |
| | (0.31 | ) | | | (0.32 | ) | | | (0.35 | ) | | | (0.35 | ) | | | (0.36 | ) | |
| | | | | | | | | | | | | | | | | | | | | |
| $ | 11.33 | | | $ | 11.00 | | | $ | 11.20 | | | $ | 10.66 | | | $ | 10.87 | | |
| | | | | | | | | | | | | | | | | | | | | |
| | 5.89% | | | | 1.15% | | | | 8.50% | | | | 1.30% | | | | 1.09% | | |
| | | | | | | | | | | | | | | | | | | | | |
| | | | | | | | | | | | | | | | | | | | | |
| $ | 102,787 | | | $ | 75,325 | | | $ | 75,155 | | | $ | 53,501 | | | $ | 44,805 | | |
| | 0.64% | | | | 0.64% | | | | 0.64% | | | | 0.64% | | | | 0.64% | | |
| | 0.72% | | | | 0.72% | | | | 0.74% | | | | 0.74% | | | | 0.74% | | |
| | 2.77% | | | | 2.94% | | | | 3.22% | | | | 3.23% | | | | 3.33% | | |
| | 2.69% | | | | 2.86% | | | | 3.12% | | | | 3.13% | | | | 3.23% | | |
| | 3% | | | | 18% | | | | 12% | | | | 14% | | | | 19% | | |
91
Table of Contents
| Notes to financial statements | |
| Delaware Funds by Macquarie® Minnesota municipal bond funds | August 31, 2021 |
Voyageur Mutual Funds is organized as a Delaware statutory trust and offers five series: Delaware Minnesota High-Yield Municipal Bond Fund, Delaware National High-Yield Municipal Bond Fund, Delaware Tax-Free California Fund, Delaware Tax-Free Idaho Fund, and Delaware Tax-Free New York Fund. Voyageur Tax-Free Funds is organized as a Delaware statutory trust and offers Delaware Tax-Free Minnesota Fund. Voyageur Intermediate Tax-Free Funds is organized as a Delaware statutory trust and offers Delaware Tax-Free Minnesota Intermediate Fund. Voyageur Mutual Funds, Voyageur Tax-Free Funds, and Voyageur Intermediate Tax-Free Funds are each referred to as a Trust, or collectively, as the Trusts. These financial statements and the related notes pertain to Delaware Tax-Free Minnesota Fund, Delaware Tax-Free Minnesota Intermediate Fund, and Delaware Minnesota High-Yield Municipal Bond Fund (each a Fund, or together, the Funds). Each Trust is an open-end investment company. The Funds are considered diversified under the Investment Company Act of 1940, as amended (1940 Act), and offer Class A, Class C, and Institutional Class shares. Class A shares are sold with a maximum front-end sales charge of 4.50% for Delaware Tax-Free Minnesota Fund and Delaware Minnesota High-Yield Municipal Bond Fund, and 2.75% for Delaware Tax-Free Minnesota Intermediate Fund. There is no front-end sales charge when you purchase $250,000 or more of Class A shares. However, if Delaware Distributors, L.P. (DDLP) paid your financial intermediary a commission on your purchase of $1,000,000 or more of Class A shares, for shares of Delaware Tax-Free Minnesota Fund or Delaware Tax-Free Minnesota High-Yield Fund prior to December 2, 2019, you will have to pay a limited contingent deferred sales charge (Limited CDSC) of 1.00% if you redeem these shares within the first year after your purchase and 0.50% if you redeem shares within the second year; and for shares of Delaware Tax-Free Minnesota Intermediate Fund, you will have to pay a Limited CDSC of 0.75% if you redeem these shares within the first year after your purchase, unless a specific waiver of the Limited CDSC applies. If DDLP paid your financial intermediary a commission on your purchase of $250,000 or more of Class A shares, for shares of Delaware Tax-Free Minnesota Fund or Delaware Minnesota High-Yield Municipal Bond Fund on or after December 2, 2019, you will have to pay a Limited CDSC of 1.00% if you redeem these shares within the first 18 months after your purchase, unless a specific waiver of the Limited CDSC applies. Class C shares are sold with a CDSC of 1.00%, which will be incurred if redeemed during the first 12 months. Institutional Class shares are not subject to a sales charge and are offered for sale exclusively to certain eligible investors.
1. Significant Accounting Policies
Each Fund follows accounting and reporting guidance under Financial Accounting Standards Board (FASB) Accounting Standards Codification Topic 946, Financial Services — Investment Companies. The following accounting policies are in accordance with US generally accepted accounting principles (US GAAP) and are consistently followed by the Funds.
Security Valuation — Debt securities are valued based upon valuations provided by an independent pricing service or broker and reviewed by management. To the extent current market prices are not available, the pricing service may take into account developments related to the specific security, as well as transactions in comparable securities. Valuations for fixed income securities utilize matrix systems, which reflect such factors as security prices, yields, maturities, and ratings, and are supplemented by dealer and exchange quotations. Generally, other securities and assets for which market quotations are
92
Table of Contents
not readily available are valued at fair value as determined in good faith under the direction of each Trust’s Board of Trustees (each, a Board, or collectively, the Boards). In determining whether market quotations are readily available or fair valuation will be used, various factors will be taken into consideration, such as market closures or suspension of trading in a security. Restricted securities are valued at fair value using methods approved by the Boards.
Federal Income Taxes — No provision for federal income taxes has been made as each Fund intends to continue to qualify for federal income tax purposes as a regulated investment company under Subchapter M of the Internal Revenue Code of 1986, as amended, and make the requisite distributions to shareholders. Each Fund evaluates tax positions taken or expected to be taken in the course of preparing each Fund’s tax returns to determine whether the tax positions are “more-likely-than-not” of being sustained by the applicable tax authority. Tax positions not deemed to meet the “more-likely-than-not” threshold are recorded as a tax benefit or expense in the current year. Management has analyzed each Fund’s tax positions taken or expected to be taken on each Fund’s federal income tax returns through the year ended August 31, 2021, and for all open tax years (years ended August 31, 2018–August 31, 2020), and has concluded that no provision for federal income tax is required in each Fund’s financial statements. If applicable, each Fund recognizes interest accrued on unrecognized tax benefits in interest expense and penalties in “Other” on the “Statements of operations.” During the year ended August 31, 2021, the Funds did not incur any interest or tax penalties.
Class Accounting — Investment income and common expenses are allocated to the various classes of each Fund on the basis of “settled shares” of each class in relation to the net assets of each Fund. Realized and unrealized gain (loss) on investments are allocated to the various classes of each Fund on the basis of daily net assets of each class. Distribution expenses relating to a specific class are charged directly to that class.
Use of Estimates — The preparation of financial statements in conformity with US GAAP requires management to make estimates and assumptions that affect the fair value of investments, the reported amounts of assets and liabilities and disclosure of contingent assets and liabilities at the date of the financial statements, and the reported amounts of revenues and expenses during the reporting period. Actual results could differ from those estimates and the differences could be material.
Other — Expenses directly attributable to a Fund are charged directly to that Fund. Other expenses common to various funds within the Delaware Funds by Macquarie® (Delaware Funds) are generally allocated among such funds on the basis of average net assets. Management fees and certain other expenses are paid monthly. Security transactions are recorded on the date the securities are purchased or sold (trade date) for financial reporting purposes. Costs used in calculating realized gains and losses on the sale of investment securities are those of the specific securities sold. Interest income is recorded on the accrual basis. Discounts and premiums on debt securities are accreted or amortized to interest income, respectively, over the lives of the respective securities using the effective interest method. Premiums on callable debt securities are amortized to interest income to the earliest call date using the effective interest method. Each Fund declares dividends daily from net investment income and pays the dividends monthly and declares and pays distributions from net realized gain on investments, if any,
93
Table of Contents
Notes to financial statements
Delaware Funds by Macquarie® Minnesota municipal bond funds
1. Significant Accounting Policies (continued)
annually. Each Fund may distribute more frequently, if necessary for tax purposes. Dividends and distributions, if any, are recorded on the ex-dividend date.
Each Fund receives earnings credits from its custodian when positive cash balances are maintained, which may be used to offset custody fees. The expenses paid under this arrangement are included on the “Statements of operations” under “Custodian fees” with the corresponding expenses offset included under “Less expenses paid indirectly.” There were no such earnings credits for the year ended August 31, 2021.
Each Fund receives earnings credits from its transfer agent when positive cash balances are maintained, which may be used to offset transfer agent fees. If the amount earned is greater than $1, the expenses paid under this arrangement are included on the “Statements of operations” under “Dividend disbursing and transfer agent fees and expenses” with the corresponding expenses offset included under “Less expenses paid indirectly.” For the year ended August 31, 2021, each Fund earned the following amounts under this arrangement:
| Fund | | Earnings Credits |
| Delaware Tax-Free Minnesota Fund | | | $ | 206 | |
| Delaware Tax-Free Minnesota Intermediate Fund | | | | 34 | |
| Delaware Minnesota High-Yield Municipal Bond Fund | | | | 86 | |
2. Investment Management, Administration Agreements, and Other Transactions with Affiliates
In accordance with the terms of its respective investment management agreement, each Fund pays Delaware Management Company (DMC), a series of Macquarie Investment Management Business Trust and the investment manager, an annual fee which is calculated daily and paid monthly, based on each Fund’s average daily net assets as follows:
| | | | | | Delaware Tax-Free | | Delaware Minnesota |
| | Delaware Tax-Free | | Minnesota | | High-Yield Municipal |
| | Minnesota Fund | | Intermediate Fund | | Bond Fund |
| On the first $500 million | | | 0.5500% | | | | 0.5000% | | | | 0.5500% | |
| On the next $500 million | | | 0.5000% | | | | 0.4750% | | | | 0.5000% | |
| On the next $1.5 billion | | | 0.4500% | | | | 0.4500% | | | | 0.4500% | |
| In excess of $2.5 billion | | | 0.4250% | | | | 0.4250% | | | | 0.4250% | |
DMC has contractually agreed to waive all or a portion of its management fee and/or pay/reimburse expenses (excluding any distribution and service (12b-1) fees, taxes, interest, inverse floater program expenses, short sale dividend and interest expenses, brokerage fees, certain insurance costs, and nonroutine expenses or costs, including, but not limited to, those relating to reorganizations, litigation, conducting shareholder meetings, and liquidations), in order to prevent total annual fund operating expenses from exceeding the following percentage of each Fund’s average daily net assets from September 1, 2020 through August 31, 2021.* These waivers and reimbursements may only be
94
Table of Contents
terminated by agreement of DMC and each Fund. The waivers and reimbursements are accrued daily and received monthly.
| | Operating expense |
| | limitation as |
| | a percentage |
| | of average |
| Fund | | daily net assets |
| Delaware Tax-Free Minnesota Fund | | | 0.60% | |
| Delaware Tax-Free Minnesota Intermediate Fund | | | 0.56% | |
| Delaware Minnesota High-Yield Municipal Bond Fund | | | 0.64% | |
Delaware Investments Fund Services Company (DIFSC), an affiliate of DMC, provides fund accounting and financial administrative oversight services to each Fund. For these services, DIFSC’s fees are calculated daily and paid monthly, based on the aggregate daily net assets of all funds within the Delaware Funds at the following annual rates: 0.00475% of the first $35 billion; 0.0040% of the next $10 billion; and 0.0025% of aggregate average daily net assets in excess of $45 billion (Total Fee). Each fund in the Delaware Funds pays a minimum of $4,000, which, in aggregate, is subtracted from the Total Fee. Each fund then pays its portion of the remainder of the Total Fee on a relative net asset value (NAV) basis. These amounts are included on the “Statements of operations” under “Accounting and administration expenses.” For the year ended August 31, 2021, each Fund was charged for these services as follows:
| Fund | | Fees |
| Delaware Tax-Free Minnesota Fund | | $ | 24,322 |
| Delaware Tax-Free Minnesota Intermediate Fund | | | 7,055 |
| Delaware Minnesota High-Yield Municipal Bond Fund | | | 11,183 |
DIFSC is also the transfer agent and dividend disbursing agent of each Fund. For these services, DIFSC’s fees are calculated daily and paid monthly, based on the aggregate daily net assets of the retail funds within the Delaware Funds at the following annual rates: 0.014% of the first $20 billion; 0.011% of the next $5 billion; 0.007% of the next $5 billion; 0.005% of the next $20 billion; and 0.0025% of average daily net assets in excess of $50 billion. The fees payable to DIFSC under the shareholder services agreement described above are allocated among all retail funds in the Delaware Funds on a relative NAV basis. These amounts are included on the “Statements of operations” under “Dividend disbursing and transfer agent fees and expenses.” For the year ended August 31, 2021, each Fund was charged for these services as follows:
| Fund | | Fees |
| Delaware Tax-Free Minnesota Fund | | $ | 51,258 |
| Delaware Tax-Free Minnesota Intermediate Fund | | | 7,717 |
| Delaware Minnesota High-Yield Municipal Bond Fund | | | 18,101 |
Pursuant to a sub-transfer agency agreement between DIFSC and BNY Mellon Investment Servicing (US) Inc. (BNYMIS), BNYMIS provides certain sub-transfer agency services to each Fund. Sub-transfer agency fees are paid by each Fund and are also included on the “Statements of operations” under
95
Table of Contents
Notes to financial statements
Delaware Funds by Macquarie® Minnesota municipal bond funds
2. Investment Management, Administration Agreements, and Other Transactions with Affiliates (continued)
“Dividend disbursing and transfer agent fees and expenses.” The fees that are calculated daily and paid as invoices are received on a monthly or quarterly basis.
Pursuant to a distribution agreement and distribution plan, each Fund pays DDLP, the distributor and an affiliate of DMC, an annual 12b-1 fee of 0.25% of the average daily net assets of the Class A shares and 1.00% of the average daily net assets of the Class C shares. DDLP has contracted to waive Delaware Tax-Free Minnesota Intermediate Fund’s Class A shares 12b-1 fee to 0.15% of average daily net assets from September 1, 2020 through August 31, 2021.* The fees are calculated daily and paid monthly. Institutional Class shares do not pay 12b-1 fees.
As provided in the investment management agreement, each Fund bears a portion of the cost of certain resources shared with DMC, including the cost of internal personnel of DMC and/or its affiliates that provide legal, tax, and regulatory reporting services to each Fund. These amounts are included on the “Statements of operations” under “Legal fees.” For the year ended August 31, 2021, each Fund was charged for internal legal, tax, and regulatory reporting services provided by DMC and/or its affiliates’ employees as follows:
| Fund | | Fees |
| Delaware Tax-Free Minnesota Fund | | $ | 18,829 |
| Delaware Tax-Free Minnesota Intermediate Fund | | | 2,832 |
| Delaware Minnesota High-Yield Municipal Bond Fund | | | 6,637 |
For the year ended August 31, 2021, DDLP earned commissions on sales of Class A shares for each Fund as follows:
| Fund | | Commissions |
| Delaware Tax-Free Minnesota Fund | | | $ | 13,588 | |
| Delaware Tax-Free Minnesota Intermediate Fund | | | | 4,108 | |
| Delaware Minnesota High-Yield Municipal Bond Fund | | | | 6,439 | |
For the year ended August 31, 2021, DDLP received gross CDSC commissions on redemptions of each Fund’s Class A and Class C shares, respectively, and these commissions were entirely used to offset upfront commissions previously paid by DDLP to broker/dealers on sales of those shares. The amounts received were as follows:
| Fund | | Class A | | Class C |
| Delaware Tax-Free Minnesota Fund | | $ | — | | $ | 631 |
| Delaware Tax-Free Minnesota Intermediate Fund | | | 150 | | | 101 |
| Delaware Minnesota High-Yield Municipal Bond Fund | | | 4,624 | | | 590 |
Trustees’ fees include expenses accrued by each Fund for each Trustee’s retainer and meeting fees. Certain officers of DMC, DIFSC, and DDLP are officers and/or Trustees of the Trust. These officers and Trustees are paid no compensation by the Funds.
96
Table of Contents
Cross trades for the year ended August 31, 2021, were executed by the Funds pursuant to procedures adopted by the Boards designed to ensure compliance with Rule 17a-7 under the 1940 Act. Cross trading is the buying or selling of portfolio securities between funds of investment companies, or between a fund of an investment company and another entity, that are or could be considered affiliates by virtue of having a common investment advisor (or affiliated investment advisors), common directors/ trustees and/or common officers. At their regularly scheduled meetings, the Boards review a report related to the Funds’ compliance with the procedures adopted by the Boards. Pursuant to these procedures, for the year ended August 31, 2021, the Funds engaged in Rule 17a-7 securities purchases and securities sales, which resulted in net realized gains or losses as follows:
| | Purchases | | Sales | | Net realized gain (loss) |
| Delaware Tax-Free Minnesota Fund | | $ | 16,807,978 | | | | $ | 10,587,914 | | | $ | 70,219 | |
| Delaware Tax-Free Minnesota | | | | | | | | | | | | | |
| Intermediate Fund | | | 3,291,428 | | | | | 3,180,040 | | | | — | |
| Delaware Minnesota High-Yield | | | | | | | | | | | | | |
| Municipal Bond Fund | | | 10,236,740 | | | | | 8,977,566 | | | | 85,207 | |
____________________
Delaware Tax-Free Minnesota Intermediate Fund did not have any realized gains (losses) during the year ended August 31, 2021.
| * | The aggregate contractual waiver period covering this report is from December 27, 2019 through December 29, 2021. |
3. Investments
For the year ended August 31, 2021, each Fund made purchases and sales of investment securities other than short-term investments as follows:
| Fund | | Purchases | | Sales |
| Delaware Tax-Free Minnesota Fund | | $ | 50,815,590 | | $ | 19,757,824 |
| Delaware Tax-Free Minnesota Intermediate Fund | | | 9,900,899 | | | 6,007,467 |
| Delaware Minnesota High-Yield Municipal Bond Fund | | | 27,236,355 | | | 5,650,987 |
97
Table of Contents
Notes to financial statements
Delaware Funds by Macquarie® Minnesota municipal bond funds
3. Investments (continued)
The tax cost of investments includes adjustments to net unrealized appreciation (depreciation) which may not necessarily be the final tax cost basis adjustments, but approximates the tax basis unrealized gains and losses that may be realized and distributed to shareholders. At August 31, 2021, the cost and unrealized appreciation (depreciation) of investments for federal income tax purposes for each Fund were as follows:
| | | | | | Aggregate | | Aggregate | | | |
| | | | | | unrealized | | unrealized | | Net unrealized |
| | Cost of | | | appreciation | | depreciation | | appreciation |
| Fund | | investments | | | of investments | | of investments | | of investments |
| Delaware Tax-Free | | | | | | | | | | | | | |
| Minnesota Fund | | $ | 573,273,076 | | $ | 37,487,425 | | $ | (1,560,859 | ) | | $ | 35,926,566 |
| Delaware Tax-Free | | | | | | | | | | | | | |
| Minnesota | | | | | | | | | | | | | |
| Intermediate Fund | | | 85,452,125 | | | 4,807,876 | | | (203,297 | ) | | | 4,604,579 |
| Delaware Minnesota | | | | | | | | | | | | | |
| High-Yield Municipal | | | | | | | | | | | | | |
| Bond Fund | | | 215,736,037 | | | 13,308,430 | | | (675,454 | ) | | | 12,632,976 |
US GAAP defines fair value as the price that each Fund would receive to sell an asset or pay to transfer a liability in an orderly transaction between market participants at the measurement date under current market conditions. A three-level hierarchy for fair value measurements has been established based upon the transparency of inputs to the valuation of an asset or liability. Inputs may be observable or unobservable and refer broadly to the assumptions that market participants would use in pricing the asset or liability. Observable inputs reflect the assumptions market participants would use in pricing the asset or liability based on market data obtained from sources independent of the reporting entity. Unobservable inputs reflect the reporting entity’s own assumptions about the assumptions that market participants would use in pricing the asset or liability based on the best information available under the circumstances. Each Fund’s investment in its entirety is assigned a level based upon the observability of the inputs which are significant to the overall valuation. The three-level hierarchy of inputs is summarized as follows:
| Level 1 – | Inputs are quoted prices in active markets for identical investments. (Examples: equity securities, open-end investment companies, futures contracts, and exchange-traded options contracts) |
| | |
| Level 2 – | Other observable inputs, including, but not limited to: quoted prices for similar assets or liabilities in markets that are active, quoted prices for identical or similar assets or liabilities in markets that are not active, inputs other than quoted prices that are observable for the assets or liabilities (such as interest rates, yield curves, volatilities, prepayment speeds, loss severities, credit risks, and default rates) or other market-corroborated inputs. (Examples: debt securities, government securities, swap contracts, foreign currency exchange contracts, foreign securities utilizing international fair value pricing, broker-quoted securities, and fair valued securities) |
98
Table of Contents
| Level 3 – | Significant unobservable inputs, including each Fund’s own assumptions used to determine the fair value of investments. (Examples: broker-quoted securities and fair valued securities) |
Level 3 investments are valued using significant unobservable inputs. Each Fund may also use an income-based valuation approach in which the anticipated future cash flows of the investment are discounted to calculate fair value. Discounts may also be applied due to the nature or duration of any restrictions on the disposition of the investments. Valuations may also be based upon current market prices of securities that are comparable in coupon, rating, maturity, and industry. The derived value of a Level 3 investment may not represent the value which is received upon disposition and this could impact the results of operations.
The following tables summarize the valuation of each Fund’s investments by fair value hierarchy levels as of August 31, 2021:
| | Delaware Tax-Free Minnesota Fund |
| | Level 2 |
| Securities | | | | | |
| Assets: | | | | | |
| Municipal Bonds | | | $ | 602,619,642 | |
| Short-Term Investments | | | | 6,580,000 | |
| Total Value of Securities | | | $ | 609,199,642 | |
| | Delaware Tax-Free Minnesota Intermediate Fund |
| | Level 2 |
| Securities | | | | | |
| Assets: | | | | | |
| Municipal Bonds | | | $ | 89,256,704 | |
| Short-Term Investments | | | | 800,000 | |
| Total Value of Securities | | | $ | 90,056,704 | |
| | Delaware Minnesota High-Yield Municipal Bond Fund |
| | Level 2 |
| Securities | | | | | |
| Assets: | | | | | |
| Municipal Bonds | | | $ | 220,514,013 | |
| Short-Term Investments | | | | 7,855,000 | |
| Total Value of Securities | | | $ | 228,369,013 | |
During the year ended August 31, 2021, there were no transfers into or out of Level 3 investments. Each Fund’s policy is to recognize transfers into or out of Level 3 investments based on fair value at the beginning of the reporting period.
99
Table of Contents
Notes to financial statements
Delaware Funds by Macquarie® Minnesota municipal bond funds
3. Investments (continued)
A reconciliation of Level 3 investments is presented when each Fund has a significant amount of Level 3 investments at the beginning, interim, or end of the period in relation to each Fund’s net assets. During the year ended August 31, 2021, there were no Level 3 investments.
4. Dividend and Distribution Information
Income and long-term capital gain distributions are determined in accordance with federal income tax regulations, which may differ from US GAAP. Additionally, distributions from net short-term gains on sales of investment securities are treated as ordinary income for federal income tax purposes. The tax character of dividends and distributions paid during the years ended August 31, 2021 and 2020 were as follows:
| | | | | | | | Long-term | | | |
| | Tax-exempt | | Ordinary | | capital | | | |
| | income | | income | | gains | | Total |
| Year ended August 31, 2021: | | | | | | | | | | | | |
| Delaware Tax-Free Minnesota Fund | | $ | 13,865,208 | | $ | 52,559 | | $ | 114,322 | | $ | 14,032,089 |
| Delaware Tax-Free Minnesota Intermediate Fund | | | 1,804,021 | | | — | | | — | | | 1,804,021 |
| Delaware Minnesota High-Yield Municipal | | | | | | | | | | | | |
| Bond Fund | | | 5,372,873 | | | 22 | | | — | | | 5,372,895 |
| | | | | | | | | | | | | |
| Year ended August 31, 2020: | | | | | | | | | | | | |
| Delaware Tax-Free Minnesota Fund | | | 14,903,273 | | | 843,521 | | | 677,752 | | | 16,424,546 |
| Delaware Tax-Free Minnesota Intermediate Fund | | | 1,942,218 | | | — | | | — | | | 1,942,218 |
| Delaware Minnesota High-Yield Municipal | | | | | | | | | | | | |
| Bond Fund | | | 5,518,266 | | | 20 | | | — | | | 5,518,286 |
5. Components of Net Assets on a Tax Basis
As of August 31, 2021, the components of net assets on a tax basis were as follows:
| | | | | | Delaware Tax-Free | | Delaware Minnesota |
| | Delaware Tax-Free | | Minnesota | | High-Yield Municipal |
| | Minnesota Fund | | Intermediate Fund | | Bond Fund |
| Shares of beneficial interest | | $ | 576,138,172 | | | | $ | 85,993,759 | | | | | $ | 217,735,288 | | |
| Undistributed tax-exempt | | | | | | | | | | | | | | | | |
| income | | | — | | | | | 10,640 | | | | | | 17,324 | | |
| Qualified late year loss | | | | | | | | | | | | | | | | |
| deferrals | | | (90,171 | ) | | | | — | | | | | | — | | |
| Distributions payable | | | (194,007 | ) | | | | (14,830 | ) | | | | | (17,324 | ) | |
| Capital loss carryforwards | | | — | | | | | (158,828 | ) | | | | | (658,502 | ) | |
| Unrealized appreciation of | | | | | | | | | | | | | | | | |
| investments | | | 35,926,566 | | | | | 4,604,579 | | | | | | 12,632,976 | | |
| Net assets | | $ | 611,780,560 | | | | $ | 90,435,320 | | | | | $ | 229,709,762 | | |
100
Table of Contents
The differences between book basis and tax basis components of net assets are primarily attributable to tax treatment of market discount and premium on debt instruments and tax deferral of losses due to wash sales, as applicable.
Qualified late year ordinary and capital losses (including currency and specified gain (loss) items) represent losses realized from January 1, 2021 through August 31, 2021 and November 1, 2020 through August 31, 2021, respectively, that, in accordance with federal income tax regulations, the Funds have elected to defer and treat as having arisen in the following fiscal year.
For financial reporting purposes, capital accounts are adjusted to reflect the tax character of permanent book/tax differences. Results of operations and net assets were not affected by these reclassifications. For the year ended August 31, 2021, the Funds had no reclassifications.
For federal income tax purposes, capital loss carryforwards may be carried forward and applied against future capital gains. At August 31, 2021, the Funds utilized capital loss carryforwards as follows:
| Delaware Tax-Free Minnesota Fund | | $ | — |
| Delaware Tax-Free Minnesota Intermediate Fund | | | 8,561 |
| Delaware Minnesota High-Yield Municipal Bond Fund | | | 131,523 |
At August 31, 2021, capital loss carryforwards available to offset future realized capital gains were as follows:
| | Loss carryforward character | | | |
| | Short-term | | Long-term | | Total |
| Delaware Tax-Free | | | | | | | | | | | |
| Minnesota | | | | | | | | | | | |
| Intermediate Fund | | $ | 158,828 | | | $ | — | | | $ | 158,828 |
| Delaware Minnesota | | | | | | | | | | | |
| High-Yield Municipal | | | | | | | | | | | |
| Bond Fund | | | 658,502 | | | | — | | | | 658,502 |
At August 31, 2021, Delaware Tax-Free Minnesota Fund did not have any capital loss carryforwards.
101
Table of Contents
Notes to financial statements
Delaware Funds by Macquarie® Minnesota municipal bond funds
6. Capital Shares
Transactions in capital shares were as follows:
| | | | | | | | Delaware Tax-Free | | Delaware Minnesota |
| | Delaware Tax-Free | | Minnesota | | High-Yield Municipal |
| | Minnesota Fund | | Intermediate Fund | | Bond Fund |
| | Year ended | | Year ended | | Year ended |
| | 8/31/21 | | | 8/31/20 | | 8/31/21 | | 8/31/20 | | 8/31/21 | | 8/31/20 |
| Shares sold: | | | | | | | | | | | | | | | | | | |
| Class A | | 2,598,178 | | | 2,470,484 | | | 733,303 | | | 760,322 | | | 1,335,478 | | | 1,132,737 | |
| Class C | | 229,665 | | | 162,787 | | | 18,231 | | | 58,542 | | | 173,126 | | | 332,654 | |
| Institutional Class | | 4,005,429 | | | 3,968,576 | | | 230,335 | | | 1,097,848 | | | 3,378,165 | | | 2,563,763 | |
| | | | | | | | | | | | | | | | | | | |
| Shares issued upon reinvestment of dividends and distributions: | | | | | | | | | | |
| Class A | | 628,677 | | | 756,678 | | | 95,192 | | | 104,225 | | | 228,413 | | | 227,598 | |
| Class C | | 25,115 | | | 44,653 | | | 4,046 | | | 8,531 | | | 25,557 | | | 33,910 | |
| Institutional Class | | 290,920 | | | 314,844 | | | 46,357 | | | 42,075 | | | 209,471 | | | 208,101 | |
| | 7,777,984 | | | 7,718,022 | | | 1,127,464 | | | 2,071,543 | | | 5,350,210 | | | 4,498,763 | |
| |
| Shares redeemed: | | | | | | | | | | | | | | | | | | |
| Class A | | (3,561,554 | ) | | (3,813,207 | ) | | (375,043 | ) | | (629,289 | ) | | (1,077,601 | ) | | (1,146,037 | ) |
| Class C | | (925,806 | ) | | (547,958 | ) | | (219,279 | ) | | (240,006 | ) | | (696,408 | ) | | (483,508 | ) |
| Institutional Class | | (1,575,505 | ) | | (3,120,080 | ) | | (380,986 | ) | | (476,666 | ) | | (1,367,958 | ) | | (2,628,916 | ) |
| | (6,062,865 | ) | | (7,481,245 | ) | | (975,308 | ) | | (1,345,961 | ) | | (3,141,967 | ) | | (4,258,461 | ) |
| Net increase | | 1,715,119 | | | 236,777 | | | 152,156 | | | 725,582 | | | 2,208,243 | | | 240,302 | |
Certain shareholders may exchange shares of one class for shares of another class in the same Fund. These exchange transactions are included as subscriptions and redemptions in the tables above and on the “Statements of changes in net assets.” For the years ended August 31, 2021 and 2020, each Fund had the following exchange transactions:
| | | Exchange Redemptions | | Exchange Subscriptions | | | |
| | | | | | | | Institutional | | | |
| | Class A | | Class C | | Class A | | Class | | | |
| | Shares | | Shares | | Shares | | Shares | | Value |
| Delaware Tax-Free Minnesota Fund | | | | | | | | | | | |
| Year ended | | | | | | | | | | | |
| 8/31/21 | | 98,743 | | 222,179 | | 218,722 | | 103,060 | | $ | 4,062,123 |
| 8/31/20 | | 73,750 | | 57,333 | | 55,209 | | 76,105 | | | 1,625,460 |
Delaware Tax-Free Minnesota Intermediate Fund | | | | | | | | | | | |
| Year ended | | | | | | | | | | | |
| 8/31/21 | | — | | 37,029 | | 37,119 | | — | | | 415,214 |
| 8/31/20 | | — | | 20,392 | | 20,195 | | 252 | | | 225,863 |
102
Table of Contents
| | | | | | Exchange | | | |
| | Exchange Redemptions | | Subscriptions | | | |
| | | | | | | | Institutional | | | |
| | Class A | | Class C | | Class A | | Class | | | |
| | Shares | | Shares | | Shares | | Shares | | Value |
| Delaware Minnesota High-Yield Municipal Bond Fund | | | | | | | | | | | |
| Year ended | | | | | | | | | | | |
| 8/31/21 | | 629 | | 56,466 | | 56,330 | | 936 | | $ | 636,964 |
| 8/31/20 | | 4,022 | | 46,853 | | 45,608 | | 5,405 | | | 559,234 |
7. Line of Credit
Each Fund, along with certain other funds in the Delaware Funds (Participants), was a participant in a $275,000,000 revolving line of credit (Agreement) intended to be used for temporary or emergency purposes as an additional source of liquidity to fund redemptions of investor shares. Under the Agreement, the Participants were charged an annual commitment fee of 0.15%, which was allocated across the Participants based on a weighted average of the respective net assets of each Participant. The Participants were permitted to borrow up to a maximum of one-third of their net assets under the Agreement. Each Participant was individually, and not jointly, liable for its particular advances, if any, under the line of credit. The line of credit available under the Agreement expired on November 2, 2020.
On November 2, 2020, each Fund, along with the other Participants entered into an amendment to the Agreement for an amount of $225,000,000 to be used as described above. It operates in substantially the same manner as the original Agreement with the addition of an upfront fee of 0.05%, which was allocated across the Participants. The line of credit available under the Agreement expires on November 1, 2021.
The Funds had no amounts outstanding as of August 31, 2021, or at any time during the year then ended.
8. Geographic, Credit, and Market Risks
Beginning in January 2020, global financial markets have experienced and may continue to experience significant volatility resulting from the spread of a novel coronavirus known as COVID-19. The outbreak of COVID-19 has resulted in travel and border restrictions, quarantines, supply chain disruptions, lower consumer demand and general market uncertainty. The effects of COVID-19 have and may continue to adversely affect the global economy, the economies of certain nations, and individual issuers, all of which may negatively impact the Funds’ performance.
When interest rates rise, fixed income securities (i.e. debt obligations) generally will decline in value. These declines in value are greater for fixed income securities with longer maturities or durations.
IBOR is the risk that changes related to the use of the London interbank offered rate (LIBOR) and other interbank offered rate (collectively, IBORs) could have adverse impacts on financial instruments that reference LIBOR (or the corresponding IBOR). The abandonment of LIBOR could affect the value and liquidity of instruments that reference LIBOR. The use of alternative reference rate products may impact
103
Table of Contents
Notes to financial statements
Delaware Funds by Macquarie® Minnesota municipal bond funds
8. Geographic, Credit, and Market Risks (continued)
investment strategy performance. These risks may also apply with respect to changes in connection with other IBORs, such as the euro overnight index average (EONIA), which are also the subject of recent reform.
The Funds concentrate their investments in securities issued by municipalities, mainly in Minnesota, and may be subject to geographic concentration risk. In addition, the Funds have the flexibility to invest in issuers in US territories and possessions such as the Commonwealth of Puerto Rico, the US Virgin Islands, and Guam, whose bonds are also free of federal and individual state income taxes.
Each Fund invests a portion of its assets in high yield fixed income securities, which are securities rated lower than BBB- by Standard & Poor’s Financial Services LLC (S&P), lower than Baa3 by Moody’s Investors Service Inc. (Moody’s), or similarly rated by another nationally recognized statistical rating organization. Investments in these higher yielding securities are generally accompanied by a greater degree of credit risk than higher rated securities. Additionally, lower rated securities may be more susceptible to adverse economic and competitive industry conditions than investment grade securities.
Each Fund invests in certain obligations that may have liquidity protection designed to ensure that the receipt of payments due on the underlying security is timely. Such protection may be provided through guarantees, insurance policies, or letters of credit obtained by the issuer or sponsor through third parties, through various means of structuring the transaction or through a combination of such approaches. Each Fund will not pay any additional fees for such credit support, although the existence of credit support may increase the price of a security.
Each Fund may invest in advance refunded bonds, escrow secured bonds, or defeased bonds. Under current federal tax laws and regulations, state and local government borrowers are permitted to refinance outstanding bonds by issuing new bonds. The issuer refinances the outstanding debt to either reduce interest costs or to remove or alter restrictive covenants imposed by the bonds being refinanced. A refunding transaction where the municipal securities are being refunded within 90 days from the issuance of the refunding issue is known as a “current refunding.” Advance refunded bonds are bonds in which the refunded bond issue remains outstanding for more than 90 days following the issuance of the refunding issue. In an advance refunding, the issuer will use the proceeds of a new bond issue to purchase high grade interest-bearing debt securities, which are then deposited in an irrevocable escrow account held by an escrow agent to secure all future payments of principal and interest and bond premium of the advance refunded bond. Bonds are “escrowed to maturity” when the proceeds of the refunding issue are deposited in an escrow account for investment sufficient to pay all of the principal and interest on the original interest payment and maturity dates.
Bonds are considered “pre-refunded” when the refunding issue’s proceeds are escrowed only until a permitted call date or dates on the refunded issue with the refunded issue being redeemed at the time, including any required premium. Bonds become “defeased” when the rights and interests of the bondholders and of their lien on the pledged revenues or other security under the terms of the bond contract are substituted with an alternative source of revenues (the escrow securities) sufficient to meet payments of principal and interest to maturity or to the first call dates. Escrowed secured bonds will
104
Table of Contents
often receive a rating of AAA from Moody’s, S&P, and/or Fitch Ratings due to the strong credit quality of the escrow securities and the irrevocable nature of the escrow deposit agreement.
Each Fund may invest up to 15% of its net assets in illiquid securities, which may include securities with contractual restrictions on resale, securities exempt from registration under Rule 144A, promulgated under the Securities Act of 1933, as amended, and other securities which may not be readily marketable. The relative illiquidity of these securities may impair each Fund from disposing of them in a timely manner and at a fair price when it is necessary or desirable to do so. While maintaining oversight, each Board has delegated to DMC, the day-to-day functions of determining whether individual securities are liquid for purposes of each Fund’s limitation on investments in illiquid securities. Securities eligible for resale pursuant to Rule 144A, which are determined to be liquid, are not subject to each Fund’s 15% limit on investments in illiquid securities. Rule 144A securities have been identified on the “Schedules of investments.”
9. Contractual Obligations
Each Fund enters into contracts in the normal course of business that contain a variety of indemnifications. Each Fund’s maximum exposure under these arrangements is unknown. However, each Fund has not had prior claims or losses pursuant to these contracts. Management has reviewed each Fund’s existing contracts and expects the risk of loss to be remote.
10. Recent Accounting Pronouncements
In March 2020, FASB issued an Accounting Standards Update (ASU), ASU 2020-04, Reference Rate Reform (Topic 848) – Facilitation of the Effects of Reference Rate Reform on Financial Reporting. The amendments in ASU 2020-04 provide optional temporary financial reporting relief from the effect of certain types of contract modifications due to the planned discontinuation of LIBOR and other interbank-offered based reference rates as of the end of 2021. ASU 2020-04 is effective for certain reference rate-related contract modifications that occur during the period March 12, 2020 through December 31, 2022. As of the financial reporting period, Management is evaluating the impact of applying this ASU.
11. Subsequent Events
Management has determined that no material events or transactions occurred subsequent to August 31, 2021, that would require recognition or disclosure in the Funds’ financial statements.
105
Table of Contents
Report of independent registered public accounting firm
To the Board of Trustees of Voyageur Tax-Free Funds, Voyageur Intermediate Tax-Free Funds and Voyageur Mutual Funds and Shareholders of Delaware Tax-Free Minnesota Fund, Delaware Tax-Free Minnesota Intermediate Fund and Delaware Minnesota High-Yield Municipal Bond Fund
Opinions on the Financial Statements
We have audited the accompanying statements of assets and liabilities, including the schedules of investments, of Delaware Tax-Free Minnesota Fund (constituting Voyageur Tax-Free Funds), Delaware Tax-Free Minnesota Intermediate Fund (constituting Voyageur Intermediate Tax-Free Funds) and Delaware Minnesota High-Yield Municipal Bond Fund (one of the funds constituting Voyageur Mutual Funds) (hereafter collectively referred to as the “Funds”) as of August 31, 2021, the related statements of operations for the year ended August 31, 2021, the statements of changes in net assets for each of the two years in the period ended August 31, 2021, including the related notes, and the financial highlights for each of the five years in the period ended August 31, 2021 (collectively referred to as the “financial statements”). In our opinion, the financial statements present fairly, in all material respects, the financial position of the Funds as of August 31, 2021, the results of each of their operations for the year then ended, the changes in each of their net assets for each of the two years in the period ended August 31, 2021 and each of the financial highlights for each of the five years in the period ended August 31, 2021 in conformity with accounting principles generally accepted in the United States of America.
Basis for Opinions
These financial statements are the responsibility of the Funds’ management. Our responsibility is to express an opinion on the Funds’ financial statements based on our audits. We are a public accounting firm registered with the Public Company Accounting Oversight Board (United States) (PCAOB) and are required to be independent with respect to the Funds in accordance with the U.S. federal securities laws and the applicable rules and regulations of the Securities and Exchange Commission and the PCAOB.
We conducted our audits of these financial statements in accordance with the standards of the PCAOB. Those standards require that we plan and perform the audit to obtain reasonable assurance about whether the financial statements are free of material misstatement, whether due to error or fraud.
Our audits included performing procedures to assess the risks of material misstatement of the financial statements, whether due to error or fraud, and performing procedures that respond to those risks. Such procedures included examining, on a test basis, evidence regarding the amounts and disclosures in the financial statements. Our audits also included evaluating the accounting principles used and significant estimates made by management, as well as evaluating the overall presentation of the financial statements. Our procedures included confirmation of securities owned as of August 31, 2021 by correspondence with the custodian and brokers. We believe that our audits provide a reasonable basis for our opinions.
/s/PricewaterhouseCoopers LLP
Philadelphia, Pennsylvania
October 18, 2021
We have served as the auditor of one or more investment companies in Delaware Funds by Macquarie® since 2010.
106
Table of Contents
Other Fund information (Unaudited)
Delaware Funds by Macquarie® Minnesota municipal bond funds
Liquidity Risk Management Program
The Securities and Exchange Commission (the “SEC”) has adopted Rule 22e-4 under the Investment Company Act of 1940 (the “Liquidity Rule”), which requires all open-end funds (other than money market funds) to adopt and implement a program reasonably designed to assess and manage the fund’s “liquidity risk,” defined as the risk that the fund could not meet requests to redeem shares issued by the fund without significant dilution of remaining investors’ interests in the fund.
The Funds have adopted and implemented a liquidity risk management program in accordance with the Liquidity Rule (the “Program”). The Board has designated the Division Director of the US Operational Risk Group of Macquarie Asset Management as the Program Administrator for each Fund in the Trust.
As required by the Liquidity Rule, the Program includes policies and procedures that provide for: (1) assessment, management, and review (no less frequently than annually) of each Fund’s liquidity risk; (2) classification of each of the Fund’s portfolio holdings into one of four liquidity categories (Highly Liquid, Moderately Liquid, Less Liquid, and Illiquid); (3) funds that do not primarily hold assets that are Highly Liquid, establishing and maintaining a minimum percentage of each Fund’s net assets in Highly Liquid investments (called a “Highly Liquid Investment Minimum” or “HLIM”); and (4) prohibiting each Fund’s acquisition of Illiquid investments if, immediately after the acquisition, each Fund would hold more than 15% of its net assets in Illiquid assets. The Program also requires reporting to the SEC (on a non-public basis) and to the Board if each Fund’s holdings of Illiquid assets exceed 15% of the Fund’s net assets. Funds with HLIMs must have procedures for addressing HLIM shortfalls, including reporting to the Board and, with respect to HLIM shortfalls lasting more than seven consecutive calendar days, reporting to the SEC (on a non-public basis).
In assessing and managing each Fund’s liquidity risk, the Program Administrator considers, as relevant, a variety of factors, including: (1) each Fund’s investment strategy and liquidity of portfolio investments during both normal and reasonably foreseeable stressed conditions; (2) short-term and long-term cash flow projections for the Funds during both normal and reasonably foreseeable stressed conditions; and (3) each Fund’s holdings of cash and cash equivalents and any borrowing arrangements. Classification of each Fund’s portfolio holdings in the four liquidity categories is based on the number of days it is reasonably expected to take to convert the investment to cash (for Highly Liquid and Moderately Liquid holdings) or to sell or dispose of the investment (for Less Liquid and Illiquid investments), in current market conditions without significantly changing the investment’s market value. Each Fund primarily holds assets that are classified as Highly Liquid, and therefore is not required to establish an HLIM.
At a meeting of the Board held on May 25-27, 2021, the Program Administrator provided a written report to the Board addressing the Program’s operation and assessing the adequacy and effectiveness of its implementation for the period from April 1, 2020 through March 31, 2021. The report concluded that the Program is appropriately designed and effectively implemented and that it meets the requirements of Rule 22e-4 and each Fund’s liquidity needs. Each Fund’s HLIM is set at an appropriate level and the Funds complied with their HLIM at all times during the reporting period.
107
Table of Contents
Other Fund information (Unaudited)
Delaware Funds by Macquarie® Minnesota municipal bond funds
Tax Information
The information set forth below is for each Fund’s fiscal year as required by federal income tax laws. Shareholders, however, must report distributions on a calendar year basis for income tax purposes, which may include distributions for portions of two fiscal years of a Fund. Accordingly, the information needed by shareholders for income tax purposes will be sent to them in January of each year. Please consult your tax advisor for proper treatment of this information.
All disclosures are based on financial information available as of the date of this annual report and, accordingly are subject to change. For any and all items requiring reporting, it is the intention of each Fund to report the maximum amount permitted under the Internal Revenue Code and the regulations thereunder.
For the fiscal year ended August 31, 2021, each Fund reports distributions paid during the year as follows:
| | (A) | | | | | | | | | | | | | | | |
| | Long-Term | | (B) | | (C) | | | | | |
| | Capital Gains | | Ordinary Income | | Tax-Exempt | | Total |
| | Distributions | | Distributions | | Distributions | | Distributions |
| | (Tax Basis) | | (Tax Basis) | | (Tax Basis) | | (Tax Basis) |
| Delaware Tax-Free | | | | | | | | | | | | | | | | | | | | |
| Minnesota Fund | | | 0.82 | % | | | | 0.37 | % | | | | 98.81 | % | | | | 100.00 | % | |
| Delaware Tax-Free | | | | | | | | | | | | | | | | | | | | |
| Minnesota Intermediate | | | | | | | | | | | | | | | | | | | | |
| Fund | | | – | | | | | – | | | | | 100.00 | % | | | | 100.00 | % | |
| Delaware Minnesota | | | | | | | | | | | | | | | | | | | | |
| High-Yield Municipal | | | | | | | | | | | | | | | | | | | | |
| Bond Fund | | | – | | | | | – | | | | | 100.00 | % | | | | 100.00 | % | |
____________________
| (A), (B) and (C) are based on a percentage of each Fund’s total distributions. |
| |
| The percentage of the ordinary dividends reported by Delaware Minnesota High-Yield Municipal Bond Fund that is treated as a Section 163(j) interest dividend and thus is eligible to be treated as interest income for purposes of Section 163(j) and the regulations thereunder is 100.00%. |
Board consideration of Investment Advisory Agreements for Delaware Tax-Free Minnesota Fund, Delaware Tax-Free Minnesota Intermediate Fund, and Delaware Minnesota High-Yield Municipal Bond Fund at a meeting held August 10-12, 2021
At a meeting held on August 10-12, 2021 (the “Annual Meeting”), the Board of Trustees (the “Board”), including a majority of disinterested or independent Trustees, approved the renewal of the Investment Advisory Agreements for Delaware Tax-Free Minnesota Fund, Delaware Tax-Free Minnesota Intermediate Fund, and Delaware Minnesota High-Yield Municipal Bond Fund (each, a “Fund” and together, the “Funds”). In making its decision, the Board considered information furnished at regular quarterly Board meetings, including reports detailing Fund performance, investment strategies, and expenses, as well as information prepared specifically in connection with the renewal of the investment
108
Table of Contents
advisory and sub-advisory contracts. Information furnished specifically in connection with the renewal of the Investment Management Agreement with Delaware Management Company (“DMC”), a series of Macquarie Investment Management Business Trust (“MIMBT”), included materials provided by DMC and its affiliates (collectively, “Macquarie Asset Management”) concerning, among other things, the nature, extent, and quality of services provided to the Funds; the costs of such services to the Funds; economies of scale; and the investment manager’s financial condition and profitability. In addition, in connection with the Annual Meeting, materials were provided to the Trustees in May 2021, including reports provided by Broadridge Financial Solutions (“Broadridge”). The Broadridge reports compared each Fund’s investment performance and expenses with those of other comparable mutual funds. The Independent Trustees reviewed and discussed the Broadridge reports with independent legal counsel to the Independent Trustees. In addition to the information noted above, the Board also requested and received information regarding DMC’s policy with respect to advisory fee levels and its breakpoint philosophy; the structure of portfolio manager compensation; comparative client fee information; and any constraints or limitations on the availability of securities for certain investment styles, which had in the past year inhibited, or which were likely in the future to inhibit, the investment manager’s ability to invest fully in accordance with Fund policies.
In considering information relating to the approval of each Fund’s advisory agreement, the Independent Trustees received assistance and advice from and met separately with independent legal counsel to the Independent Trustees and also received assistance and advice from an experienced and knowledgeable independent fund consultant, JDL Consultants, LLC (“JDL”). Although the Board gave attention to all information furnished, the following discussion identifies, under separate headings, the primary factors taken into account by the Board during its contract renewal considerations.
Nature, extent, and quality of services. The Board considered the services provided by DMC to the Funds and their shareholders. In reviewing the nature, extent, and quality of services, the Board considered reports furnished to it throughout the year, which covered matters such as the relative performance of the Funds; compliance of portfolio managers with the investment policies, strategies, and restrictions for the Funds; compliance by DMC and Delaware Distributors, L.P. (together, “Management”) personnel with the Code of Ethics adopted throughout the Delaware Funds by Macquarie® (“Delaware Funds”); and adherence to fair value pricing procedures as established by the Board. The Board was pleased with the current staffing of DMC and the emphasis placed on research in the investment process. The Board recognized DMC’s receipt of certain favorable industry distinctions during the past several years. The Board gave favorable consideration to DMC’s efforts to control expenses while maintaining service levels committed to Fund matters. The Board also noted the benefits provided to Fund shareholders through (a) each shareholder’s ability to: (i) exchange an investment in one Delaware Fund for the same class of shares in another Delaware Fund without a sales charge, or (ii) reinvest Fund dividends into additional shares of the Fund or into additional shares of other Delaware Funds, and (b) the privilege to combine holdings in other Delaware Funds to obtain a reduced sales charge. The Board was satisfied with the nature, extent, and quality of the overall services provided by DMC.
Investment performance. The Board placed significant emphasis on the investment performance of the Funds in view of the importance of investment performance to shareholders. Although the Board considered performance reports and discussions with portfolio managers at Investment
109
Table of Contents
Other Fund information (Unaudited)
Delaware Funds by Macquarie® Minnesota municipal bond funds
Board consideration of Investment Advisory Agreements for Delaware Tax-Free Minnesota Fund, Delaware Tax-Free Minnesota Intermediate Fund, and Delaware Minnesota High-Yield Municipal Bond Fund at a meeting held August 10-12, 2021 (continued)
Committee meetings throughout the year, the Board gave particular weight to the Broadridge reports furnished for the Annual Meeting. The Broadridge reports prepared for each Fund showed the Fund’s investment performance in comparison to a group of similar funds (the “Performance Universe”). A fund with the best performance ranked first, and a fund with the poorest performance ranked last. The highest/best performing 25% of funds in the Performance Universe make up the first quartile; the next 25%, the second quartile; the next 25%, the third quartile; and the poorest/worst performing 25% of funds in the Performance Universe make up the fourth quartile. Comparative annualized performance for each Fund was shown for the past 1-, 3-, 5-, and 10-year periods, to the extent applicable, ended December 31, 2020. The Board’s objective is that each Fund’s performance for the 1-, 3-, and 5-year periods be at or above the median of its Performance Universe.
Delaware Tax-Free Minnesota Fund – The Performance Universe for the Fund consisted of the Fund and all retail and institutional Minnesota municipal debt funds as selected by Broadridge. The Broadridge report comparison showed that the Fund’s total return for the 1-year period was in the third quartile of its Performance Universe. The report further showed that the Fund’s total return for the 3-year, 5-year, and since inception periods was in the second quartile of its Performance Universe. The Board was satisfied with performance.
Delaware Tax-Free Minnesota Intermediate Fund – The Performance Universe for the Fund consisted of the Fund and all retail and institutional “other states” intermediate municipal debt funds as selected by Broadridge. The Broadridge report comparison showed that the Fund’s total return for the 1-year period was in the fourth quartile of its Performance Universe. The report further showed that the Fund’s total return for the 3-year period was in the third quartile of its Performance Universe and the Fund’s total return for the 5-year and since inception periods was in the first quartile of its Performance Universe. The Board observed that the Fund’s performance results were not in line with the Board’s objective. In evaluating the Fund’s performance, the Board considered the performance attribution included in the Meeting materials, as well as the numerous investment and performance reports delivered by Management personnel to the Board’s Investments Committee. The Board was satisfied that Management was taking action to improve Fund performance and to meet the Board’s performance objective.
Delaware Minnesota High-Yield Municipal Bond Fund – The Performance Universe for the Fund consisted of the Fund and all retail and institutional high yield municipal debt funds category. The Broadridge report comparison showed that the Fund’s total return for the 1-year period was in the second quartile of its Performance Universe. The report further showed that the Fund’s total return for the 3-year period was in the third quartile of its Performance Universe and the Fund’s total return for the five-year and since inception periods was in the fourth quartile of its Performance Universe. The Board observed that the Fund’s performance results were not in line with the Board’s objective. In evaluating the Fund’s performance, the Board considered the performance attribution included in the Meeting materials, as well as the numerous investment and performance reports and other information delivered
110
Table of Contents
by Management personnel to the Board’s Investments Committee. The Board was satisfied that Management was taking action to improve comparative Fund performance and to meet the Board’s performance objective.
Comparative expenses. The Board considered expense data for the Delaware Funds. Management provided the Board with information on pricing levels and fee structures for each Fund as of its most recently completed fiscal year. The Board also focused on the comparative analysis of effective management fees and total expense ratios of each Fund versus effective management fees and total expense ratios of a group of similar funds as selected by Broadridge (the “Expense Group”). In reviewing comparative costs, each Fund’s contractual management fee and the actual management fee incurred by the Fund were compared with the contractual management fees (assuming all funds in the Expense Group were similar in size to the Fund) and actual management fees (as reported by each fund) within the Expense Group, taking into account any applicable breakpoints and fee waivers. Each Fund’s total expenses were also compared with those of its Expense Group and, for comparative consistency, included 12b-1 and non-12b-1 service fees. The Board’s objective is for each Fund’s total expense ratio to be competitive with those of the peer funds within its Expense Group.
Delaware Tax-Free Minnesota Fund – The expense comparisons for the Fund showed that its actual management fee was in the quartile with the second highest expenses of its Expense Group and its total expenses were in the quartile with the highest expenses of its Expense Group. The Board noted that the Fund’s total expenses were not in line with the Board’s objective. In evaluating the total expenses, the Board considered waivers in place through December 2021 and various initiatives implemented by Management, such as the negotiation of lower fees for fund accounting and fund accounting oversight services, which had created an opportunity for a further reduction in expenses. The Board was satisfied with Management’s efforts to improve the Fund’s total expense ratio and to bring it in line with the Board’s objective.
Delaware Tax-Free Minnesota Intermediate Fund – The expense comparisons for the Fund showed that its actual management fee was in the quartile with the lowest expenses of its Expense Group and its total expenses were in the quartile with the highest expenses of its Expense Group. The Board gave favorable consideration to the Fund’s management fee but noted that the Fund’s total expenses were not in line with the Board’s objective. In evaluating the total expenses, the Board considered waivers in place through December 2021 and various initiatives implemented by Management, such as the negotiation of lower fees for fund accounting and fund accounting oversight services, which had created an opportunity for a further reduction in expenses. The Board was satisfied with Management’s efforts to improve the Fund’s total expense ratio and to bring it in line with the Board’s objective.
Delaware Minnesota High-Yield Municipal Bond Fund – The expense comparisons for the Fund showed that its actual management fee was in the quartile with the second lowest expenses of its Expense Group and its total expenses were in the quartile with the highest expenses of its Expense Group. The Board gave favorable consideration to the Fund’s management fee but noted that the Fund’s total expenses were not in line with the Board’s objective. In evaluating the total expenses, the Board considered fee waivers in place through December 2021 and various initiatives implemented by Management, such as the negotiation of lower fees for fund accounting, fund accounting oversight, and
111
Table of Contents
Other Fund information (Unaudited)
Delaware Funds by Macquarie® Minnesota municipal bond funds
Board consideration of Investment Advisory Agreements for Delaware Tax-Free Minnesota Fund, Delaware Tax-Free Minnesota Intermediate Fund, and Delaware Minnesota High-Yield Municipal Bond Fund at a meeting held August 10-12, 2021 (continued)
custody services, which had created an opportunity for a further reduction in expenses. The Board was satisfied with Management’s efforts to improve the Fund’s total expense ratio and to bring it in line with the Board’s objective.
Management profitability. The Board considered the level of profits realized by DMC in connection with the operation of the Funds. In this respect, the Board reviewed the Investment Management Profitability Analysis that addressed the overall profitability of DMC’s business in providing management and other services to each of the individual funds and the Delaware Funds as a whole. Specific attention was given to the methodology used by DMC in allocating costs for the purpose of determining profitability. Management stated that the level of profits of DMC, to a certain extent, reflects recent operational cost savings and efficiencies initiated by DMC. The Board considered DMC’s efforts to improve services provided to Fund shareholders and to meet additional regulatory and compliance requirements resulting from recent industry-wide Securities and Exchange Commission initiatives. The Board also considered the extent to which DMC might derive ancillary benefits from fund operations, including the potential for procuring additional business as a result of the prestige and visibility associated with its role as service provider to the Delaware Funds and the benefits from allocation of fund brokerage to improve trading efficiencies. As part of its work, the Board also reviewed a report prepared by JDL regarding MIMBT profitability as compared to certain peer fund complexes and the Independent Trustees discussed with JDL personnel regarding DMC’s profitability in such context. The Board found that the management fees were reasonable in light of the services rendered and the level of profitability of DMC.
Economies of scale. The Trustees considered whether economies of scale are realized by DMC as each Fund’s assets increase and the extent to which any economies of scale are reflected in the level of management fees charged. The Trustees reviewed each Fund’s advisory fee pricing and structure, approved by the Board and shareholders, which includes breakpoints, and which applies to most funds in the Delaware Funds complex. Breakpoints in the advisory fee occur when the advisory fee rate is reduced on assets in excess of specified levels. Breakpoints result in a lower advisory fee than would otherwise be the case in the absence of breakpoints, when the asset levels specified in the breakpoints are exceeded. The Board noted that, as of March 31, 2021, Delaware Tax-Free Minnesota Fund’s net assets exceeded the first breakpoint level. The Board believed that, given the extent to which economies of scale might be realized by DMC and its affiliates, the schedule of fees under the Investment Management Agreement provides a sharing of benefits with the Fund and its shareholders. Although, as of March 31, 2021, Delaware Tax-Free Minnesota Intermediate Fund and Delaware Minnesota High-Yield Municipal Bond Fund had each not reached a size at which it could take advantage of any breakpoints in the applicable fee schedule, the Board recognized that the fee was structured so that, if the Fund increases sufficiently in size, then economies of scale may be shared.
112
Table of Contents
Board of trustees / directors and officers addendum
Delaware Funds by Macquarie®
A mutual fund is governed by a Board of Trustees/Directors (“Trustees”), which has oversight responsibility for the management of a fund’s business affairs. Trustees establish procedures and oversee and review the performance of the investment manager, the distributor, and others who perform services for the fund. The independent fund trustees, in particular, are advocates for shareholder interests. Each trustee has served in that capacity since he or she was elected to or appointed to the Board of Trustees, and will continue to serve until his or her retirement or the election of a new trustee in his or her place. The following is a list of the Trustees and Officers with certain background and related information.
| | | | | | | | Number of | | Other |
| | | | | | Principal | | Portfolios in Fund | | Directorships |
| Name, | | Position(s) | | | | Occupation(s) | | Complex Overseen | | Held by |
| Address, | | Held with | | Length of Time | | During the | | by Trustee | | Trustee |
| and Birth Date | | Fund(s) | | Served | | Past Five Years | | or Officer | | or Officer |
| Interested Trustee | | | | | | | | |
| | | | | | | | | | | |
| Shawn K. Lytle1 | | President, | | President and | | Global Head of Macquarie | | 150 | | Trustee — UBS Relationship |
| 610 Market Street | | Chief Executive | | Chief Executive | | Investment Management2 | | | | Funds, SMA Relationship Trust, |
| Philadelphia, PA | | Officer, | | Officer | | (January 2019–Present) | | | | and UBS Funds |
| 19106-2354 | | and Trustee | | since August 2015 | | Head of Americas of | | | | (May 2010–April 2015) |
| February 1970 | | | | Trustee since | | Macquarie Group | | | | |
| | | | September 2015 | | (December 2017–Present) | | | | |
| | | | | | Deputy Global Head of | | | | |
| | | | | | Macquarie Investment | | | | |
| | | | | | Management | | | | |
| | | | | | (2017–2019) | | | | |
| | | | | | Head of Macquarie Investment | | | | |
| | | | | | Management Americas | | | | |
| | | | | | (2015–2017) | | | | |
113
Table of Contents
Board of trustees / directors and officers addendum
Delaware Funds by Macquarie®
| | | | | | | | Number of | | Other |
| | | | | | Principal | | Portfolios in Fund | | Directorships |
| Name, | | Position(s) | | | | Occupation(s) | | Complex Overseen | | Held by |
| Address, | | Held with | | Length of Time | | During the | | by Trustee | | Trustee |
| and Birth Date | | Fund(s) | | Served | | Past Five Years | | or Officer | | or Officer |
| Independent Trustees | | | | | | | | |
| | | | | | | | | | | |
| Jerome D. | | Trustee | | Since January 2019 | | Managing Member, Stonebrook | | 150 | | None |
| Abernathy | | | | | | Capital Management, LLC | | | | |
| 610 Market Street | | | | | | (financial technology: macro | | | | |
| Philadelphia, PA | | | | | | factors and databases) | | | | |
| 19106-2354 | | | | | | (January 1993-Present) | | | | |
| July 1959 | | | | | | | | | | |
| | | | | | | | | | | |
| Thomas L. Bennett | | Chair and Trustee | | Trustee since March | | Private Investor | | 150 | | None |
| 610 Market Street | | | | 2005 | | (March 2004–Present) | | | | |
| Philadelphia, PA | | | | Chair since March | | | | | | |
| 19106-2354 | | | | 2015 | | | | | | |
| October 1947 | | | | | | | | | | |
| | | | | | | | | | | |
| Ann D. Borowiec | | Trustee | | Since March 2015 | | Chief Executive Officer, Private | | 150 | | Director — Banco Santander |
| 610 Market Street | | | | | | Wealth Management | | | | International |
| Philadelphia, PA | | | | | | (2011–2013) and Market | | | | (October 2016–December 2019) |
| 19106-2354 | | | | | | Manager, New Jersey Private | | | | Director — Santander Bank, N.A. |
| November 1958 | | | | | | Bank (2005–2011) — J.P. | | | | (December 2016–December |
| | | | | | Morgan Chase & Co. | | | | 2019) |
114
Table of Contents
| | | | | | | | Number of | | Other |
| | | | | | Principal | | Portfolios in Fund | | Directorships |
| Name, | | Position(s) | | | | Occupation(s) | | Complex Overseen | | Held by |
| Address, | | Held with | | Length of Time | | During the | | by Trustee | | Trustee |
| and Birth Date | | Fund(s) | | Served | | Past Five Years | | or Officer | | or Officer |
| | | | | | | | | | | |
| Joseph W. Chow | | Trustee | | Since January 2013 | | Private Investor | | 150 | | Director and Audit Committee |
| 610 Market Street | | | | | | (April 2011–Present) | | | | Member — Hercules Technology |
| Philadelphia, PA | | | | | | | | | | Growth Capital, Inc. |
| 19106-2354 | | | | | | | | | | (July 2004–July 2014) |
| January 1953 | | | | | | | | | | |
| | | | | | | | | | | |
| John A. Fry | | Trustee | | Since January 2001 | | President — Drexel University | | 150 | | Director; Compensation |
| 610 Market Street | | | | | | (August 2010–Present) | | | | Committee and Governance |
| Philadelphia, PA | | | | | | President — Franklin & Marshall | | | | Committee Member — |
| 19106-2354 | | | | | | College | | | | Community Health Systems |
| May 1960 | | | | | | (July 2002–June 2010) | | | | (May 2004–Present) |
| | | | | | | | | | Director — Drexel Morgan & Co. |
| | | | | | | | | | (2015–2019) |
| | | | | | | | | | Director, Audit and |
| | | | | | | | | | Compensation Committee |
| | | | | | | | | | Member — vTv Therapeutics Inc. |
| | | | | | | | | | (2017–Present) |
| | | | | | | | | | Director and Audit Committee |
| | | | | | | | | | Member — FS Credit Real Estate |
| | | | | | | | | | Income Trust, Inc. |
| | | | | | | | | | (2018–Present) |
| | | | | | | | | | Director — Federal Reserve |
| | | | | | | | | | Bank of Philadelphia |
| | | | | | | | | | (January 2020–Present) |
115
Table of Contents
Board of trustees / directors and officers addendum
Delaware Funds by Macquarie®
| | | | | | | | Number of | | Other |
| | | | | | Principal | | Portfolios in Fund | | Directorships |
| Name, | | Position(s) | | | | Occupation(s) | | Complex Overseen | | Held by |
| Address, | | Held with | | Length of Time | | During the | | by Trustee | | Trustee |
| and Birth Date | | Fund(s) | | Served | | Past Five Years | | or Officer | | or Officer |
| | | | | | | | | | | |
| Frances A. | | Trustee | | Since September | | Private Investor | | 150 | | Trust Manager and Audit |
| Sevilla-Sacasa | | | | 2011 | | (January 2017–Present) | | | | Committee Chair — Camden |
| 610 Market Street | | | | | | Chief Executive Officer — Banco | | | | Property Trust |
| Philadelphia, PA | | | | | | Itaú International | | | | (August 2011–Present) |
| 19106-2354 | | | | | | (April 2012–December 2016) | | | | Director; Audit |
| January 1956 | | | | | | Executive Advisor to Dean | | | | and Compensation |
| | | | | | (August 2011–March 2012) and | | | | Committee Member — |
| | | | | | Interim Dean | | | | Callon Petroleum Company |
| | | | | | (January 2011–July 2011) — | | | | (December 2019–Present) |
| | | | | | University of Miami School of | | | | Director — New Senior |
| | | | | | Business Administration | | | | Investment Group Inc. |
| | | | | | President — U.S. Trust, Bank of | | | | (January 2021–Present) |
| | | | | | America Private Wealth | | | | Director; Audit Committee |
| | | | | | Management (Private Banking) | | | | Member — Carrizo Oil & Gas, |
| | | | | | (July 2007-December 2008) | | | | Inc. (March 2018–December |
| | | | | | | | | | 2019) |
116
Table of Contents
| | | | | | | | Number of | | Other |
| | | | | | Principal | | Portfolios in Fund | | Directorships |
| Name, | | Position(s) | | | | Occupation(s) | | Complex Overseen | | Held by |
| Address, | | Held with | | Length of Time | | During the | | by Trustee | | Trustee |
| and Birth Date | | Fund(s) | | Served | | Past Five Years | | or Officer | | or Officer |
| | | | | | | | | | | |
| Thomas K. Whitford | | Trustee | | Since January 2013 | | Vice Chairman — PNC Financial | | 150 | | Director — HSBC North America |
| 610 Market Street | | | | | | Services Group | | | | Holdings Inc. |
| Philadelphia, PA | | | | | | (2010–April 2013) | | | | (December 2013–Present) |
| 19106-2354 | | | | | | | | | | Director — HSBC USA Inc. |
| March 1956 | | | | | | | | | | (July 2014–Present) |
| | | | | | | | | | Director — HSBC Bank USA, |
| | | | | | | | | | National Association |
| | | | | | | | | | (July 2014–March 2017) |
| | | | | | | | | | Director — HSBC Finance |
| | | | | | | | | | Corporation |
| | | | | | | | | | (December 2013–April 2018) |
117
Table of Contents
Board of trustees / directors and officers addendum
Delaware Funds by Macquarie®
| | | | | | | | Number of | | Other |
| | | | | | Principal | | Portfolios in Fund | | Directorships |
| Name, | | Position(s) | | | | Occupation(s) | | Complex Overseen | | Held by |
| Address, | | Held with | | Length of Time | | During the | | by Trustee | | Trustee |
| and Birth Date | | Fund(s) | | Served | | Past Five Years | | or Officer | | or Officer |
| | | | | | | | | | | |
| Christianna Wood | | Trustee | | Since January 2019 | | Chief Executive Officer and | | 150 | | Director; Finance Committee and |
| 610 Market Street | | | | | | President — Gore Creek Capital, | | | | Audit Committee Member — |
| Philadelphia, PA | | | | | | Ltd. (August 2009–Present) | | | | H&R Block Corporation |
| 19106-2354 | | | | | | | | | | (July 2008–Present) |
| August 1959 | | | | | | | | | | Director; Investments |
| | | | | | | | | | Committee, Capital and Finance |
| | | | | | | | | | Committee, and Audit |
| | | | | | | | | | Committee Member — Grange |
| | | | | | | | | | Insurance (2013–Present) |
| | | | | | | | | | Trustee; Chair of Nominating and |
| | | | | | | | | | Governance Committee and |
| | | | | | | | | | Audit Committee Member — |
| | | | | | | | | | The Merger Fund |
| | | | | | | | | | (2013–October 2021), |
| | | | | | | | | | The Merger Fund VL |
| | | | | | | | | | (2013–October 2021); WCM |
| | | | | | | | | | Alternatives: Event-Driven Fund |
| | | | | | | | | | (2013–October 2021), and WCM |
| | | | | | | | | | Alternatives: Credit Event Fund |
| | | | | | | | | | (December 2017–October 2021) |
| | | | | | | | | | Director; Chair of Governance |
| | | | | | | | | | Committee and Audit Committee |
| | | | | | | | | | Member — International |
| | | | | | | | | | Securities Exchange (2010–2016) |
118
Table of Contents
| | | | | | | | Number of | | Other |
| | | | | | Principal | | Portfolios in Fund | | Directorships |
| Name, | | Position(s) | | | | Occupation(s) | | Complex Overseen | | Held by |
| Address, | | Held with | | Length of Time | | During the | | by Trustee | | Trustee |
| and Birth Date | | Fund(s) | | Served | | Past Five Years | | or Officer | | or Officer |
| | | | | | | | | | | |
| Janet L. Yeomans | | Trustee | | Since April 1999 | | Vice President and Treasurer | | 150 | | Director; Personnel and |
| 610 Market Street | | | | | | (January 2006–July 2012), Vice | | | | Compensation Committee Chair; |
| Philadelphia, PA | | | | | | President — Mergers & | | | | Member of Nominating, |
| 19106-2354 | | | | | | Acquisitions | | | | Investments, and Audit |
| July 1948 | | | | | | (January 2003–January 2006), | | | | Committees for various periods |
| | | | | | and Vice President and Treasurer | | | | throughout directorship — |
| | | | | | (July 1995–January 2003) — 3M | | | | Okabena Company (2009–2017) |
| | | | | | Company | | | | |
| Officers | | | | | | | | | |
| | | | | | | | | | | |
| David F. Connor | | Senior Vice President, | | Senior Vice President, | | David F. Connor has served in | | 150 | | None3 |
| 610 Market Street | | General Counsel, and | | since May 2013; | | various capacities at different | | | | |
| Philadelphia, PA | | Secretary | | General Counsel | | times at Macquarie Investment | | | | |
| 19106-2354 | | | | since May 2015; | | Management. | | | | |
| December 1963 | | | | Secretary since | | | | | | |
| | | | October 2005 | | | | | | |
| | | | | | | | | | | |
| Daniel V. Geatens | | Senior Vice President | | Senior Vice President | | Daniel V. Geatens has served in | | 150 | | None3 |
| 610 Market Street | | and Treasurer | | and Treasurer since | | various capacities at different | | | | |
| Philadelphia, PA | | | | October 2007 | | times at Macquarie Investment | | | | |
| 19106-2354 | | | | | | Management. | | | | |
| October 1972 | | | | | | | | | | |
119
Table of Contents
Board of trustees / directors and officers addendum
Delaware Funds by Macquarie®
| | | | | | | | Number of | | Other |
| | | | | | Principal | | Portfolios in Fund | | Directorships |
| Name, | | Position(s) | | | | Occupation(s) | | Complex Overseen | | Held by |
| Address, | | Held with | | Length of Time | | During the | | by Trustee | | Trustee |
| and Birth Date | | Fund(s) | | Served | | Past Five Years | | or Officer | | or Officer |
| | | | | | | | | | | |
| Richard Salus | | Senior Vice President | | Senior Vice President | | Richard Salus has served in | | 150 | | None |
| 610 Market Street | | and Chief Financial | | and Chief Financial | | various capacities at different | | | | |
| Philadelphia, PA | | Officer | | Officer since | | times at Macquarie Investment | | | | |
| 19106-2354 | | | | November 2006 | | Management. | | | | |
| October 1963 | | | | | | | | | | |
| 1 | Shawn K. Lytle is considered to be an “Interested Trustee” because he is an executive officer of the Fund’s(s’) investment advisor. |
| 2 | Macquarie Investment Management is the marketing name for Macquarie Management Holdings, Inc. and its subsidiaries, including the Fund’s(s’) investment advisor, principal underwriter, and its transfer agent. |
| 3 | David F. Connor and Daniel V. Geatens serve in similar capacities for the six portfolios of the Optimum Fund Trust, which have the same investment advisor, principal underwriter, and transfer agent as the registrant. Mr. Geatens also serves as the Chief Financial Officer of the Optimum Fund Trust and he is the Chief Financial Officer and Treasurer for Macquarie Global Infrastructure Total Return Fund Inc. |
The Statement of Additional Information for the Fund(s) includes additional information about the Trustees and Officers and is available, without charge, upon request by calling 800 523-1918.
120
Table of Contents
About the organization
| Board of trustees |
| | | | | | | |
Shawn K. Lytle
President and
Chief Executive Officer
Delaware Funds
by Macquarie®
Philadelphia, PA | | Ann D. Borowiec
Former Chief Executive
Officer
Private Wealth Management
J.P. Morgan Chase & Co.
New York, NY | | Frances A.
Sevilla-Sacasa
Former Chief Executive
Officer
Banco Itaú International
Miami, FL | | Christianna Wood
Chief Executive Officer
and President
Gore Creek Capital, Ltd.
Golden, CO |
| | | | | | | |
Jerome D. Abernathy
Managing Member,
Stonebrook Capital
Management, LLC
Jersey City, NJ | | Joseph W. Chow
Former Executive Vice
President
State Street Corporation
Boston, MA | | Thomas K. Whitford
Former Vice Chairman
PNC Financial Services
Group
Pittsburgh, PA | | Janet L. Yeomans
Former Vice President and
Treasurer
3M Company
St. Paul, MN |
| | | | | | | |
Thomas L. Bennett
Chairman of the Board
Delaware Funds
by Macquarie
Private Investor
Rosemont, PA | | John A. Fry
President
Drexel University
Philadelphia, PA | | | | |
| | | | | | | |
| Affiliated officers |
| | | | | | | |
David F. Connor
Senior Vice President,
General Counsel,
and Secretary
Delaware Funds
by Macquarie
Philadelphia, PA | | Daniel V. Geatens
Senior Vice President and
Treasurer
Delaware Funds
by Macquarie
Philadelphia, PA | | Richard Salus
Senior Vice President and
Chief Financial Officer
Delaware Funds
by Macquarie
Philadelphia, PA | | |
| | | | | | | |
| This annual report is for the information of Delaware Tax-Free Minnesota Fund, Delaware Tax-Free Minnesota Intermediate Fund, and Delaware Minnesota High-Yield Municipal Bond Fund shareholders, but it may be used with prospective investors when preceded or accompanied by the Delaware Fund fact sheet for the most recently completed calendar quarter. These documents are available at delawarefunds.com/literature. |
Each Fund files its complete schedule of portfolio holdings with the Securities and Exchange Commission (SEC) for the first and third quarters of each fiscal year on Form N-PORT. Each Fund’s Forms N-PORT, as well as a description of the policies and procedures that the Funds use to determine how to vote proxies (if any) relating to portfolio securities, are available without charge (i) upon request, by calling 800 523-1918; and (ii) on the SEC’s website at sec.gov. In addition, a description of the policies and procedures that the Funds use to determine how to vote proxies (if any) relating to portfolio securities and the Schedules of Investments included in the Funds’ most recent Form N-PORT are available without charge on the Funds’ website at delawarefunds.com/literature. Each Fund’s Forms N-PORT may be reviewed and copied at the SEC’s Public Reference Room in Washington, D.C.; information on the operation of the Public Reference Room may be obtained by calling 800 SEC-0330.
Information (if any) regarding how the Funds voted proxies relating to portfolio securities during the most recently disclosed 12-month period ended June 30 is available without charge (i) through the Funds’ website at delawarefunds.com/proxy; and (ii) on the SEC’s website at sec.gov.
121