| | |
| | |
| | |
| | |
| Annual Report | January 31, 2021 | |
| | |
| | |
| Vanguard Dividend Appreciation Index Fund |
| | |
| | |
| | |
| | |
| | |
| | |
| | |
| | |
| | |
| |
| |
| |
| |
| | |
| | |
| | |
| | |
| | |
| | |
| | |
| | |
| | |
| | |
| | |
| | |
| | |
| | |
| | |
| | |
| | |
| | |
| | |
| | |
| | |
| | |
| | |
| | |
| | |
| | |
| | |
| | |
| | |
| | |
|
| | |
| | |
Contents
| Your Fund’s Performance at a Glance | 1 |
| | |
| About Your Fund’s Expenses | 2 |
| | |
| Performance Summary | 4 |
| | |
| Financial Statements | 7 |
Please note: The opinions expressed in this report are just that—informed opinions. They should not be considered promises or advice. Also, please keep in mind that the information and opinions cover the period through the date on the front of this report. Of course, the risks of investing in your fund are spelled out in the prospectus.
Your Fund’s Performance at a Glance
• For the 12 months ended January 31, 2021, Vanguard Dividend Appreciation Index Fund returned 11.44% for both ETF Shares (based on net asset value) and Admiral Shares. Those results were in line with the 11.59% return of its benchmark index after taking into account the cost of running the fund.
• The emergence of COVID-19 in early 2020 turned into a global health crisis, and aggressive attempts to contain it resulted in a sharp downturn in economic activity. Unemployment spiked, and sectors where social distancing isn’t possible were hit hard. Stocks initially plummeted as infections surged, but they finished the 12 months significantly higher, thanks in part to rapid and robust monetary and fiscal action by policymakers and the rollout of COVID-19 vaccines.
• Dividend-paying stocks underperformed the broad U.S. stock market for the fiscal year as the outlook for global growth turned around.
• Small- and mid-capitalization stocks outperformed large-caps, and growth stocks returned significantly more than their value counterparts.
• Eight of the fund’s industry sectors recorded positive results. Technology stood out, followed by consumer discretionary and basic materials. Financials was the sole sector to post a negative return.
Market Barometer
| | Average Annual Total Returns
Periods Ended January 31, 2021 |
| | One Year | Three Years | Five Years |
| Stocks | | | |
| Russell 1000 Index (Large-caps) | 19.84% | 12.48% | 16.69% |
| Russell 2000 Index (Small-caps) | 30.17 | 11.11 | 16.50 |
| Russell 3000 Index (Broad U.S. market) | 20.48 | 12.38 | 16.68 |
| FTSE All-World ex US Index (International) | 14.59 | 3.40 | 10.76 |
| | | | |
| Bonds | | | |
| Bloomberg Barclays U.S. Aggregate Bond Index | | | |
| (Broad taxable market) | 4.72% | 5.49% | 4.00% |
| Bloomberg Barclays Municipal Bond Index | | | |
| (Broad tax-exempt market) | 4.01 | 5.28 | 3.79 |
| FTSE Three-Month U.S. Treasury Bill Index | 0.45 | 1.53 | 1.16 |
| | | | |
| CPI | | | |
| Consumer Price Index | 1.40% | 1.81% | 2.00% |
About Your Fund’s Expenses
As a shareholder of the fund, you incur ongoing costs, which include costs for portfolio management, administrative services, and shareholder reports (like this one), among others. Operating expenses, which are deducted from a fund’s gross income, directly reduce the investment return of the fund.
A fund’s expenses are expressed as a percentage of its average net assets. This figure is known as the expense ratio. The following examples are intended to help you understand the ongoing costs (in dollars) of investing in your fund and to compare these costs with those of other mutual funds. The examples are based on an investment of $1,000 made at the beginning of the period shown and held for the entire period.
The accompanying table illustrates your fund’s costs in two ways:
• Based on actual fund return. This section helps you to estimate the actual expenses that you paid over the period. The ”Ending Account Value“ shown is derived from the fund‘s actual return, and the third column shows the dollar amount that would have been paid by an investor who started with $1,000 in the fund. You may use the information here, together with the amount you invested, to estimate the expenses that you paid over the period.
To do so, simply divide your account value by $1,000 (for example, an $8,600 account value divided by $1,000 = 8.6), then multiply the result by the number given for your fund under the heading ”Expenses Paid During Period.“
• Based on hypothetical 5% yearly return. This section is intended to help you compare your fund‘s costs with those of other mutual funds. It assumes that the fund had a yearly return of 5% before expenses, but that the expense ratio is unchanged. In this case—because the return used is not the fund’s actual return—the results do not apply to your investment. The example is useful in making comparisons because the Securities and Exchange Commission requires all mutual funds to calculate expenses based on a 5% return. You can assess your fund’s costs by comparing this hypothetical example with the hypothetical examples that appear in shareholder reports of other funds.
Note that the expenses shown in the table are meant to highlight and help you compare ongoing costs only and do not reflect transaction costs incurred by the fund for buying and selling securities. Further, the expenses do not include any purchase, redemption, or account service fees described in the fund prospectus. If such fees were applied to your account, your costs would be higher. Your fund does not carry a “sales load.”
The calculations assume no shares were bought or sold during the period. Your actual costs may have been higher or lower, depending on the amount of your investment and the timing of any purchases or redemptions.
You can find more information about the fund’s expenses, including annual expense ratios, in the Financial Statements section of this report. For additional information on operating expenses and other shareholder costs, please refer to your fund’s current prospectus.
Six Months Ended January 31, 2021
| | Beginning | Ending | Expenses |
| | Account Value | Account Value | Paid During |
| Dividend Appreciation Index Fund | 7/31/2020 | 1/31/2021 | Period |
| Based on Actual Fund Return | | | |
| ETF Shares | $1,000.00 | $1,141.07 | $0.32 |
| Admiral™ Shares | 1,000.00 | 1,140.86 | 0.43 |
| Based on Hypothetical 5% Yearly Return | | | |
| ETF Shares | $1,000.00 | $1,024.83 | $0.31 |
| Admiral Shares | 1,000.00 | 1,024.73 | 0.41 |
The calculations are based on expenses incurred in the most recent six-month period. The fund’s annualized six-month expense ratios for that period are 0.06% for ETF Shares and 0.08% for Admiral Shares. The dollar amounts shown as “Expenses Paid” are equal to the annualized expense ratio multiplied by the average account value over the period, multiplied by the number of days in the most recent six-month period, then divided by the number of days in the most recent 12-month period (184/366).
Dividend Appreciation Index Fund
Performance Summary
All of the returns in this report represent past performance, which is not a guarantee of future results that may be achieved by the fund. (Current performance may be lower or higher than the performance data cited. For performance data current to the most recent month-end, visit our website at vanguard.com/performance.) Note, too, that both investment returns and principal value can fluctuate widely, so an investor’s shares, when sold, could be worth more or less than their original cost. The returns shown do not reflect taxes that a shareholder would pay on fund distributions or on the sale of fund shares.
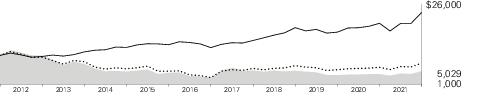
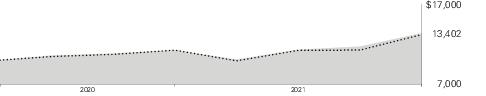
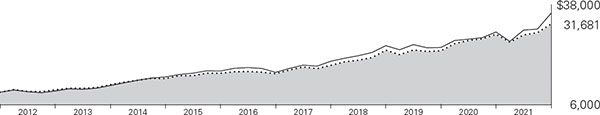
Cumulative Performance: January 31, 2011, Through January 31, 2021
Initial Investment of $10,000
| | | Average Annual Total Returns | |
| | | Periods Ended January 31, 2021 | |
| | | | | | Final Value |
| | | One | Five | Ten | of a $10,000 |
| | | Year | Years | Years | Investment |
 | Dividend Appreciation Index Fund ETF Shares Net Asset Value | 11.44% | 14.78% | 12.22% | $31,681 |
| | Dividend Appreciation Index Fund ETF Shares Market Price | 11.38 | 14.78 | 12.21 | 37,091 |
 | NASDAQ US Dividend Achievers Select Index | 11.59 | 14.86 | 12.30 | 31,909 |
 | Dow Jones U.S. Total Stock Market Float Adjusted Index | 20.55 | 16.64 | 13.46 | 35,343 |
| | | | Since | Final Value |
| | One | Five | Inception | of a $10,000 |
| | Year | Years | (12/19/2013) | Investment |
| Dividend Appreciation Index Fund Admiral Shares | 11.44% | 14.77% | 11.31% | $21,446 |
| NASDAQ US Dividend Achievers Select Index | 11.59 | 14.86 | 11.40 | 21,558 |
| Dow Jones U.S. Total Stock Market Float Adjusted Index | 20.55 | 16.64 | 12.79 | 23,558 |
"Since Inception" performance is calculated from the Admiral Shares’ inception date for both the fund and its comparative standard(s).
See Financial Highlights for dividend and capital gains information.
Dividend Appreciation Index Fund
Cumulative Returns of ETF Shares: January 31, 2011, Through January 31, 2021
| | One | Five | Ten |
| | Year | Years | Years |
| Dividend Appreciation Index Fund ETF Shares Market Price | 11.38% | 99.25% | 216.35% |
| Dividend Appreciation Index Fund ETF Shares Net Asset Value | 11.44 | 99.24 | 216.81 |
| NASDAQ US Dividend Achievers Select Index | 11.59 | 99.95 | 219.09 |
For the ETF Shares, the market price is determined by the midpoint of the bid-offer spread as of the closing time of the New York Stock Exchange (generally 4 p.m., Eastern time). The net asset value is also determined as of the NYSE closing time. For more information about how the ETF Shares' market prices have compared with their net asset value, visit vanguard.com, select your ETF, and then select the Price and Performance tab. The ETF premium/discount analysis there shows the percentages of days on which the ETF Shares' market price was above or below the NAV.
Dividend Appreciation Index Fund
Fund Allocation
As of January 31, 2021
| Basic Materials | 2.8% |
| Consumer Discretionary | 22.8 |
| Consumer Staples | 9.5 |
| Financials | 8.0 |
| Health Care | 15.4 |
| Industrials | 20.1 |
| Technology | 13.0 |
| Telecommunications | 3.0 |
| Utilities | 5.4 |
| The table reflects the fund’s investments, except for short-term investments and derivatives. Sector categories are based on the Industry Classification Benchmark ("ICB"), except for the "Other" category (if applicable), which includes securities that have not been provided an ICB classification as of the effective reporting period. |
| |
| The fund may invest in derivatives (such as futures and swap contracts) for various reasons, including, but not limited to, attempting to remain fully invested and tracking its target index as closely as possible. |
The Industry Classification Benchmark ("ICB") is owned by FTSE. FTSE does not accept any liability to any person for any loss or damage arising out of any error or omission in the ICB.
Dividend Appreciation Index Fund
Financial Statements
Schedule of Investments
As of January 31, 2021
The fund files its complete schedule of portfolio holdings with the Securities and Exchange Commission (SEC) for the first and third quarters of each fiscal year as an exhibit to its reports on Form N-PORT. The fund’s Form N-PORT reports are available on the SEC’s website at www.sec.gov.
| | | | Market |
| | | | Value• |
| | | Shares | ($000) |
| Common Stocks (99.6%) | | |
| Basic Materials (2.8%) | | |
| | Ecolab Inc. | 2,025,601 | 414,256 |
| | Air Products & Chemicals Inc. | 1,551,698 | 413,931 |
| | Fastenal Co. | 4,040,296 | 184,197 |
| | Albemarle Corp. | 746,765 | 121,469 |
| | Nucor Corp. | 2,115,600 | 103,093 |
| | Celanese Corp. Class A | 840,283 | 102,641 |
| | Scotts Miracle-Gro Co. | 391,095 | 86,592 |
| ^ | International Flavors & Fragrances Inc. | 751,455 | 84,448 |
| | Westlake Chemical Corp. | 903,190 | 69,058 |
| | Royal Gold Inc. | 461,806 | 49,358 |
| | Ashland Global Holdings Inc. | 423,456 | 33,872 |
| | Quaker Chemical Corp. | 124,817 | 32,718 |
| | Balchem Corp. | 227,066 | 24,303 |
| | Sensient Technologies Corp. | 298,633 | 21,063 |
| | Stepan Co. | 157,772 | 17,778 |
| | Hawkins Inc. | 74,476 | 4,091 |
| | | | 1,762,868 |
| Consumer Discretionary (22.7%) | |
| | Walmart Inc. | 18,877,839 | 2,652,148 |
| | Walt Disney Co. | 12,693,800 | 2,134,716 |
| | Home Depot Inc. | 7,669,355 | 2,077,015 |
| | NIKE Inc. Class B | 8,734,453 | 1,166,836 |
| | Costco Wholesale Corp. | 3,105,916 | 1,094,618 |
| | McDonald’s Corp. | 5,240,953 | 1,089,280 |
| | Lowe’s Cos. Inc. | 5,388,835 | 899,127 |
| | Target Corp. | 3,563,071 | 645,522 |
| | TJX Cos. Inc. | 8,459,536 | 541,749 |
| | Estee Lauder Cos. Inc. Class A | 1,562,861 | 369,851 |
| | Ross Stores Inc. | 2,523,434 | 280,833 |
| | Marriott International Inc. Class A | 2,279,783 | 265,161 |
| | VF Corp. | 2,776,032 | 213,394 |
| | Best Buy Co. Inc. | 1,819,050 | 197,949 |
| | Rollins Inc. | 3,453,499 | 124,395 |
| | Genuine Parts Co. | 1,022,105 | 95,955 |
| | Hasbro Inc. | 961,391 | 90,198 |
| | Williams-Sonoma Inc. | 545,129 | 70,278 |
| | Polaris Inc. | 432,598 | 50,471 |
| | Columbia Sportswear Co. | 473,651 | 41,425 |
| | Wendy’s Co. | 1,568,128 | 31,990 |
| | PROG Holdings Inc. | 470,575 | 22,202 |
| | John Wiley & Sons Inc. Class A | 329,171 | 15,013 |
| | Monro Inc. | 233,047 | 13,626 |
| | Matthews International Corp. Class A | 218,967 | 6,685 |
| | | | 14,190,437 |
| Consumer Staples (9.5%) | | |
| | Procter & Gamble Co. | 17,361,657 | 2,225,938 |
| | PepsiCo Inc. | 9,769,633 | 1,334,239 |
| | Colgate-Palmolive Co. | 6,011,749 | 468,916 |
| | Sysco Corp. | 3,574,415 | 255,606 |
| | McKesson Corp. | 1,244,892 | 217,196 |
| | Clorox Co. | 879,190 | 184,155 |
| | Hormel Foods Corp. | 3,758,739 | 176,135 |
| | Kroger Co. | 4,626,676 | 159,620 |
| | McCormick & Co. Inc. | 1,738,752 | 155,688 |
| | Brown-Forman Corp. Class B | 2,171,763 | 155,650 |
| | Hershey Co. | 1,042,076 | 151,560 |
| | AmerisourceBergen Corp. Class A | 1,447,240 | 150,802 |
| | Church & Dwight Co. Inc. | 1,726,383 | 145,759 |
| | Casey’s General Stores Inc. | 259,101 | 48,576 |
| | Lancaster Colony Corp. | 193,684 | 33,813 |
| | WD-40 Co. | 96,387 | 29,341 |
| | J&J Snack Foods Corp. | 133,260 | 20,344 |
| ^ | Tootsie Roll Industries Inc. | 279,409 | 11,059 |
| | Andersons Inc. | 229,761 | 5,285 |
| | | | 5,929,682 |
Dividend Appreciation Index Fund
| | | | Market |
| | | | Value• |
| | | Shares | ($000) |
| Financials (7.9%) | | |
| | BlackRock Inc. | 1,088,566 | 763,368 |
| | S&P Global Inc. | 1,714,342 | 543,446 |
| | Chubb Ltd. | 3,177,840 | 462,916 |
| | Marsh & McLennan Cos. Inc. | 3,542,459 | 389,352 |
| | Moody’s Corp. | 1,317,203 | 350,718 |
| | T. Rowe Price Group Inc. | 1,659,800 | 259,726 |
| | Travelers Cos. Inc. | 1,793,677 | 244,478 |
| | Aflac Inc. | 5,078,842 | 229,462 |
| | Ameriprise Financial Inc. | 866,319 | 171,419 |
| | MarketAxess Holdings Inc. | 266,777 | 144,262 |
| | Broadridge Financial Solutions Inc. | 807,708 | 114,137 |
| | Raymond James Financial Inc. | 978,389 | 97,770 |
| | Cincinnati Financial Corp. | 1,144,200 | 96,216 |
| | Brown & Brown Inc. | 1,979,280 | 85,287 |
| | FactSet Research Systems Inc. | 266,402 | 80,544 |
| | W R Berkley Corp. | 1,288,242 | 80,051 |
| | Erie Indemnity Co. Class A | 324,708 | 78,937 |
| | Globe Life Inc. | 757,190 | 68,442 |
| | American Financial Group Inc. | 633,983 | 59,683 |
| | Assurant Inc. | 421,030 | 57,037 |
| | SEI Investments Co. | 1,055,212 | 55,768 |
| | Commerce Bancshares Inc. | 826,977 | 55,283 |
| | RenaissanceRe Holdings Ltd. | 357,355 | 53,761 |
| | Reinsurance Group of America Inc. | 440,685 | 46,294 |
| | Prosperity Bancshares Inc. | 665,321 | 44,869 |
| | Cullen/Frost Bankers Inc. | 440,020 | 40,587 |
| | BOK Financial Corp. | 497,201 | 36,723 |
| | RLI Corp. | 315,698 | 30,553 |
| | Hanover Insurance Group Inc. | 270,496 | 30,423 |
| | Axis Capital Holdings Ltd. | 590,972 | 27,126 |
| | UMB Financial Corp. | 345,591 | 24,527 |
| | Community Bank System Inc. | 365,047 | 23,673 |
| | Cohen & Steers Inc. | 336,293 | 22,027 |
| | American Equity Investment Life Holding Co. | 638,849 | 18,648 |
| | International Bancshares Corp. | 460,871 | 17,426 |
| | BancFirst Corp. | 229,056 | 13,201 |
| | Horace Mann Educators Corp. | 288,492 | 11,300 |
| | Westamerica BanCorp | 189,448 | 10,575 |
| | Stock Yards Bancorp Inc. | 158,555 | 7,167 |
| | 1st Source Corp. | 178,743 | 7,034 |
| | Tompkins Financial Corp. | 104,699 | 7,001 |
| | First Financial Corp. | 95,801 | 3,678 |
| | Bank of Marin Bancorp | 94,976 | 3,527 |
| | First of Long Island Corp. | 169,115 | 2,829 |
| | | | 4,971,251 |
| Health Care (15.4%) | | |
| | Johnson & Johnson | 15,115,663 | 2,465,818 |
| | UnitedHealth Group Inc. | 6,669,185 | 2,224,707 |
| | Abbott Laboratories | 12,397,875 | 1,532,253 |
| | Medtronic plc | 9,422,490 | 1,049,006 |
| | Bristol-Myers Squibb Co. | 15,872,508 | 975,048 |
| | Stryker Corp. | 2,633,735 | 582,082 |
| | Becton Dickinson and Co. | 1,906,641 | 499,140 |
| | West Pharmaceutical Services Inc. | 519,105 | 155,467 |
| | Chemed Corp. | 112,926 | 58,484 |
| | Perrigo Co. plc | 956,111 | 40,826 |
| | Ensign Group Inc. | 377,182 | 29,526 |
| | Atrion Corp. | 13,157 | 8,571 |
| | National HealthCare Corp. | 107,365 | 6,877 |
| | | | 9,627,805 |
| Industrials (20.0%) | | |
| | Visa Inc. Class A | 10,738,627 | 2,075,240 |
| | Accenture plc Class A | 4,464,784 | 1,080,121 |
| | Union Pacific Corp. | 4,853,142 | 958,350 |
| | Raytheon Technologies Corp. | 10,943,297 | 730,246 |
| | Caterpillar Inc. | 3,867,551 | 707,143 |
| | Lockheed Martin Corp. | 1,982,313 | 637,948 |
| | Automatic Data Processing Inc. | 3,035,720 | 501,258 |
| | CSX Corp. | 5,439,942 | 466,502 |
| | Sherwin-Williams Co. | 648,455 | 448,601 |
| | Illinois Tool Works Inc. | 2,242,283 | 435,474 |
| | FedEx Corp. | 1,835,842 | 432,047 |
| | Emerson Electric Co. | 4,300,737 | 341,264 |
| | Northrop Grumman Corp. | 1,178,682 | 337,822 |
| | General Dynamics Corp. | 2,036,732 | 298,748 |
| | Cummins Inc. | 1,056,656 | 247,701 |
| | Cintas Corp. | 729,642 | 232,114 |
| | PPG Industries Inc. | 1,657,853 | 223,329 |
| | Rockwell Automation Inc. | 817,231 | 203,106 |
| | Stanley Black & Decker Inc. | 1,083,430 | 187,964 |
| | WW Grainger Inc. | 377,212 | 137,452 |
Dividend Appreciation Index Fund
| | | | Market |
| | | | Value• |
| | | Shares | ($000) |
| | Dover Corp. | 1,015,428 | 118,287 |
| | Expeditors International of Washington Inc. | 1,193,627 | 106,854 |
| | JB Hunt Transport Services Inc. | 749,281 | 100,898 |
| | IDEX Corp. | 535,789 | 99,759 |
| | Graco Inc. | 1,179,859 | 81,339 |
| | CH Robinson Worldwide Inc. | 949,370 | 81,228 |
| | Jack Henry & Associates Inc. | 539,013 | 78,044 |
| | RPM International Inc. | 911,969 | 75,210 |
| | Lennox International Inc. | 271,256 | 74,728 |
| | Nordson Corp. | 406,436 | 72,748 |
| | Toro Co. | 756,249 | 71,276 |
| | Snap-on Inc. | 384,401 | 69,188 |
| | AptarGroup Inc. | 450,989 | 59,968 |
| | Hubbell Inc. Class B | 382,065 | 59,449 |
| | Carlisle Cos. Inc. | 392,526 | 56,889 |
| | Robert Half International Inc. | 808,003 | 54,540 |
| | Donaldson Co. Inc. | 888,426 | 52,808 |
| | A O Smith Corp. | 957,413 | 51,988 |
| | Lincoln Electric Holdings Inc. | 423,743 | 48,519 |
| | HEICO Corp. | 380,121 | 44,755 |
| | MSA Safety Inc. | 273,044 | 42,628 |
| | Sonoco Products Co. | 703,271 | 40,726 |
| | MDU Resources Group Inc. | 1,408,892 | 37,040 |
| | Regal Beloit Corp. | 285,911 | 35,876 |
| | Silgan Holdings Inc. | 780,177 | 28,422 |
| | Franklin Electric Co. Inc. | 327,397 | 22,728 |
| | Hillenbrand Inc. | 527,484 | 21,680 |
| | Applied Industrial Technologies Inc. | 273,004 | 19,217 |
| | Badger Meter Inc. | 205,620 | 18,857 |
| | HB Fuller Co. | 359,791 | 18,310 |
| | ABM Industries Inc. | 467,353 | 17,171 |
| | Brady Corp. Class A | 352,752 | 16,195 |
| | McGrath RentCorp | 169,850 | 11,854 |
| | Lindsay Corp. | 75,591 | 10,570 |
| | Tennant Co. | 128,389 | 8,698 |
| | Gorman-Rupp Co. | 182,868 | 5,760 |
| | Cass Information Systems Inc. | 102,067 | 4,144 |
| | | | 12,500,781 |
| Technology (12.9%) | | |
| | Microsoft Corp. | 12,546,889 | 2,910,376 |
| | Oracle Corp. | 22,551,741 | 1,362,802 |
| | QUALCOMM Inc. | 8,036,217 | 1,255,900 |
| | Texas Instruments Inc. | 6,566,443 | 1,087,994 |
| | Analog Devices Inc. | 2,588,719 | 381,396 |
| | KLA Corp. | 1,102,114 | 308,669 |
| | Roper Technologies Inc. | 745,835 | 293,046 |
| | Microchip Technology Inc. | 1,684,350 | 229,257 |
| | Xilinx Inc. | 1,749,946 | 228,490 |
| | ITT Inc. | 616,458 | 46,056 |
| | | | 8,103,986 |
| Telecommunications (3.0%) | |
| | Comcast Corp. Class A | 31,946,004 | 1,583,563 |
| | L3Harris Technologies Inc. | 1,554,317 | 266,581 |
| | Telephone and Data Systems Inc. | 753,109 | 14,121 |
| | | | 1,864,265 |
| Utilities (5.4%) | | |
| | NextEra Energy Inc. | 13,750,403 | 1,111,995 |
| | Waste Management Inc. | 2,985,245 | 332,317 |
| | American Electric Power | | |
| | Co. Inc. | 3,474,881 | 281,153 |
| | Xcel Energy Inc. | 3,687,838 | 235,985 |
| | Republic Services Inc. Class A | 2,244,734 | 203,193 |
| | Eversource Energy | 2,320,547 | 203,048 |
| | American Water Works Co. Inc. | 1,271,815 | 202,244 |
| | WEC Energy Group Inc. | 2,218,378 | 197,214 |
| | CMS Energy Corp. | 1,996,400 | 113,555 |
| | Alliant Energy Corp. | 1,724,446 | 83,894 |
| | Atmos Energy Corp. | 861,249 | 76,651 |
| | Essential Utilities Inc. | 1,566,203 | 72,515 |
| | UGI Corp. | 1,463,665 | 52,677 |
| | Portland General Electric Co. | 629,820 | 26,635 |
| | Black Hills Corp. | 441,564 | 26,105 |
| | New Jersey Resources Corp. | 673,197 | 23,569 |
| | Southwest Gas Holdings Inc. | 384,649 | 23,064 |
| | American States Water Co. | 260,054 | 20,092 |
| | California Water Service Group | 343,215 | 18,753 |
| | MGE Energy Inc. | 244,718 | 15,584 |
| | SJW Group | 199,184 | 13,180 |
| | Chesapeake Utilities Corp. | 114,656 | 11,630 |
| | Northwest Natural Holding Co. | 213,165 | 9,957 |
| | Middlesex Water Co. | 122,186 | 9,726 |
| | York Water Co. | 90,883 | 3,948 |
| | | | 3,368,684 |
| Total Common Stocks | | |
| (Cost $42,087,442) | | 62,319,759 |
Dividend Appreciation Index Fund
| | | | Market |
| | | | Value• |
| | | Shares | ($000) |
| Temporary Cash Investments (0.4%) | |
| Money Market Fund (0.4%) | | |
| 1,2 | Vanguard Market Liquidity Fund, 0.107% | 2,294,944 | 229,494 |
| | | | |
| | | Face | |
| | | Amount | |
| | | ($000) | |
| U.S. Government and Agency Obligations (0.0%) |
| 3 | United States Treasury Bill, 0.115%, 2/16/21 | 4,000 | 4,000 |
| Total Temporary Cash Investments | |
| (Cost $233,456) | | 233,494 |
| Total Investments (100.0%) | | |
| (Cost $42,320,898) | | 62,553,253 |
| Other Assets and Liabilities—Net (0.0%) | | (26,581) |
| Net Assets (100%) | | 62,526,672 |
Cost is in $000.
| • | See Note A in Notes to Financial Statements. |
| ^ | Includes partial security positions on loan to broker-dealers. The total value of securities on loan is $87,859,000. |
| 1 | Affiliated money market fund available only to Vanguard funds and certain trusts and accounts managed by Vanguard. Rate shown is the 7-day yield. |
| 2 | Collateral of $91,861,000 was received for securities on loan. |
| 3 | Securities with a value of $4,000,000 have been segregated as initial margin for open futures contracts. |
Dividend Appreciation Index Fund
Derivative Financial Instruments Outstanding as of Period End
Futures Contracts
| | | | | | | ($000) |
| | | | | | | Value and |
| | | | Number of | | Unrealized |
| | | | Long (Short) | Notional | Appreciation |
| | | Expiration | Contracts | Amount | (Depreciation) |
| Long Futures Contracts | | | | | | |
| E-mini S&P 500 Index | | March 2021 | 455 | 84,293 | (847) |
Over-the-Counter Total Return Swaps
| | | | | Floating | | |
| | | | | Interest | | |
| | | | | Rate | Value and | Value and |
| | | | Notional | Received | Unrealized | Unrealized |
| | Termination | | Amount | (Paid)1 | Appreciation | (Depreciation) |
| Reference Entity | Date | Counterparty | ($000) | (%) | ($000) | ($000) |
| Kroger Co. | 2/2/21 | GSI | 33,700 | (1.131) | 799 | — |
| Kroger Co. | 2/2/22 | GSI | 34,500 | (1.131) | — | — |
| Visa Inc. Class A | 9/2/21 | BOANA | 97,335 | (0.044) | — | (11,342) |
| | | | | | 799 | (11,342) |
| 1 | Based on 1M USD London Interbank Offered Rate (LIBOR) as of the most recent payment date. Floating interest payment received/ paid monthly. |
1M—1-month.
BOANA—Bank of America, N.A.
GSI—Goldman Sachs International.
At January 31, 2021, a counterparty had deposited in a segregated account securities with a value of $1,746,000 in connection with open over-the-counter swap contracts.
See accompanying Notes, which are an integral part of the Financial Statements.
Dividend Appreciation Index Fund
Statement of Assets and Liabilities
As of January 31, 2021
| ($000s, except shares and per-share amounts) | Amount |
| Assets | |
| Investments in Securities, at Value | |
| Unaffiliated Issuers (Cost $42,091,442) | 62,323,759 |
| Affiliated Issuers (Cost $229,456) | 229,494 |
| Total Investments in Securities | 62,553,253 |
| Investment in Vanguard | 2,457 |
| Cash | 9 |
| Cash Collateral Pledged—Futures Contracts | 1,060 |
| Cash Collateral Pledged—Over-the-Counter Swap Contracts | 9,140 |
| Receivables for Accrued Income | 58,474 |
| Receivables for Capital Shares Issued | 35,379 |
| Unrealized Appreciation—Over-the-Counter Swap Contracts | 799 |
| Total Assets | 62,660,571 |
| Liabilities | |
| Payables for Investment Securities Purchased | 20,591 |
| Collateral for Securities on Loan | 91,861 |
| Payables for Capital Shares Redeemed | 7,198 |
| Payables to Vanguard | 1,221 |
| Variation Margin Payable—Futures Contracts | 1,686 |
| Unrealized Depreciation—Over-the-Counter Swap Contracts | 11,342 |
| Total Liabilities | 133,899 |
| Net Assets | 62,526,672 |
Dividend Appreciation Index Fund
Statement of Assets and Liabilities (continued)
| At January 31, 2021, net assets consisted of: | |
| | |
| ($000s, except shares and per-share amounts) | Amount |
| Paid-in Capital | 44,278,138 |
| Total Distributable Earnings (Loss) | 18,248,534 |
| Net Assets | 62,526,672 |
| | |
| ETF Shares—Net Assets | |
| Applicable to 378,101,747 outstanding $.001 par value shares of beneficial interest (unlimited authorization) | 51,841,561 |
| Net Asset Value Per Share—ETF Shares | $137.11 |
| | |
| Admiral Shares—Net Assets | |
| Applicable to 287,166,461 outstanding $.001 par value shares of beneficial interest (unlimited authorization) | 10,685,111 |
| Net Asset Value Per Share—Admiral Shares | $37.21 |
See accompanying Notes, which are an integral part of the Financial Statements.
Dividend Appreciation Index Fund
Statement of Operations
| | Year Ended |
| | January 31, 2021 |
| | ($000) |
| Investment Income | |
| Income | |
| Dividends | 1,043,971 |
| Interest1 | 670 |
| Securities Lending—Net | 1,940 |
| Total Income | 1,046,581 |
| Expenses | |
| The Vanguard Group—Note B | |
| Investment Advisory Services | 2,683 |
| Management and Administrative—ETF Shares | 22,532 |
| Management and Administrative—Admiral Shares | 6,608 |
| Marketing and Distribution—ETF Shares | 1,805 |
| Marketing and Distribution—Admiral Shares | 538 |
| Custodian Fees | 146 |
| Auditing Fees | 34 |
| Shareholders’ Reports—ETF Shares | 567 |
| Shareholders’ Reports—Admiral Shares | 88 |
| Trustees’ Fees and Expenses | 27 |
| Total Expenses | 35,028 |
| Net Investment Income | 1,011,553 |
| Realized Net Gain (Loss) | |
| Investment Securities Sold1,2 | 17,331 |
| Futures Contracts | 16,276 |
| Swap Contracts | 19,549 |
| Realized Net Gain (Loss) | 53,156 |
| Change in Unrealized Appreciation (Depreciation) | |
| Investment Securities1 | 5,440,620 |
| Futures Contracts | (2,276) |
| Swap Contracts | (13,520) |
| Change in Unrealized Appreciation (Depreciation) | 5,424,824 |
| Net Increase (Decrease) in Net Assets Resulting from Operations | 6,489,533 |
| 1 | Interest income, realized net gain (loss), and change in unrealized appreciation (depreciation) from an affiliated company of the fund were $630,000, $7,000, and $24,000, respectively. Purchases and sales are for temporary cash investment purposes. |
| 2 | Includes $1,336,039 of net gain (loss) resulting from in-kind redemptions. |
See accompanying Notes, which are an integral part of the Financial Statements.
Dividend Appreciation Index Fund
Statement of Changes in Net Assets
| | Year Ended January 31, |
| | 2021 | 2020 |
| | ($000) | ($000) |
| Increase (Decrease) in Net Assets | | |
| Operations | | |
| Net Investment Income | 1,011,553 | 865,655 |
| Realized Net Gain (Loss) | 53,156 | 1,514,420 |
| Change in Unrealized Appreciation (Depreciation) | 5,424,824 | 6,739,343 |
| Net Increase (Decrease) in Net Assets Resulting from Operations | 6,489,533 | 9,119,418 |
| Distributions1 | | |
| Investor Shares | — | (8,596) |
| ETF Shares | (843,074) | (677,362) |
| Admiral Shares | (175,014) | (151,843) |
| Total Distributions | (1,018,088) | (837,801) |
| Capital Share Transactions | | |
| Investor Shares | — | (1,174,095) |
| ETF Shares | 4,985,503 | 4,581,785 |
| Admiral Shares | (101,929) | 1,720,389 |
| Net Increase (Decrease) from Capital Share Transactions | 4,883,574 | 5,128,079 |
| Total Increase (Decrease) | 10,355,019 | 13,409,696 |
| Net Assets | | |
| Beginning of Period | 52,171,653 | 38,761,957 |
| End of Period | 62,526,672 | 52,171,653 |
| 1 | Certain prior-period numbers have been reclassified to conform with the current-period presentation. |
See accompanying Notes, which are an integral part of the Financial Statements.
Dividend Appreciation Index Fund
Financial Highlights
ETF Shares
| For a Share Outstanding | | | | Year Ended January 31, |
| Throughout Each Period | | 2021 | 2020 | 2019 | 2018 | 2017 |
| Net Asset Value, Beginning of Period | $125.38 | $104.09 | $107.10 | $86.66 | $75.98 |
| Investment Operations | | | | | | |
| Net Investment Income | 2.2991 | 2.2141 | 2.0841 | 1.9511 | 1.810 |
| Net Realized and Unrealized Gain (Loss) | | | | | | |
| on Investments | 11.728 | 21.210 | (3.056) | 20.408 | 10.696 |
| Total from Investment Operations | 14.027 | 23.424 | (.972) | 22.359 | 12.506 |
| Distributions | | | | | | |
| Dividends from Net Investment Income | (2.297) | (2.134) | (2.038) | (1.919) | (1.826) |
| Distributions from Realized Capital Gains | | — | — | — | — | — |
| Total Distributions | (2.297) | (2.134) | (2.038) | (1.919) | (1.826) |
| Net Asset Value, End of Period | $137.11 | $125.38 | $104.09 | $107.10 | $86.66 |
| | | | | | |
| Total Return | 11.44% | 22.68% | -0.87% | 26.10% | 16.59% |
| | | | | | | |
| Ratios/Supplemental Data | | | | | | |
| Net Assets, End of Period (Millions) | $51,842 | $42,217 | $30,969 | $28,717 | $22,698 |
| Ratio of Total Expenses to Average Net Assets | 0.06% | 0.06% | 0.06% | 0.08% | 0.08% |
| Ratio of Net Investment Income to Average Net Assets | 1.84% | 1.90% | 2.01% | 2.06% | 2.20% |
| Portfolio Turnover Rate2 | 25% | 14% | 16% | 14% | 19% |
| 1 | Calculated based on average shares outstanding. |
| 2 | Excludes the value of portfolio securities received or delivered as a result of in-kind purchases or redemptions of the fund’s capital shares, including ETF Creation Units. |
See accompanying Notes, which are an integral part of the Financial Statements.
Dividend Appreciation Index Fund
Financial Highlights
Admiral Shares
| For a Share Outstanding | | | Year Ended January 31, |
| Throughout Each Period | 2021 | 2020 | 2019 | 2018 | 2017 |
| Net Asset Value, Beginning of Period | $34.03 | $28.25 | $29.07 | $23.52 | $20.62 |
Investment Operations | | | | | |
| Net Investment Income | .6171 | .5941 | .5601 | .5281 | .492 |
| Net Realized and Unrealized Gain (Loss) on Investments | 3.179 | 5.757 | (.830) | 5.542 | 2.903 |
| Total from Investment Operations | 3.796 | 6.351 | (.270) | 6.070 | 3.395 |
| Distributions | | | | | |
| Dividends from Net Investment Income | (.616) | (.571) | (.550) | (.520) | (.495) |
| Distributions from Realized Capital Gains | — | — | — | — | — |
| Total Distributions | (.616) | (.571) | (.550) | (.520) | (.495) |
| Net Asset Value, End of Period | $37.21 | $34.03 | $28.25 | $29.07 | $23.52 |
| | | | | | |
| Total Return2 | 11.44% | 22.65% | -0.89% | 26.11% | 16.58% |
| | | | | | |
| Ratios/Supplemental Data | | | | | |
| Net Assets, End of Period (Millions) | $10,685 | $9,955 | $6,755 | $6,014 | $4,294 |
| Ratio of Total Expenses to Average Net Assets | 0.08% | 0.08% | 0.08% | 0.08% | 0.08% |
| Ratio of Net Investment Income to Average Net Assets | 1.82% | 1.87% | 1.99% | 2.06% | 2.20% |
| Portfolio Turnover Rate3 | 25% | 14% | 16% | 14% | 19% |
| 1 | Calculated based on average shares outstanding. |
| 2 | Total returns do not include account service fees that may have applied in the periods shown. Fund prospectuses provide information about any applicable account service fees. |
| 3 | Excludes the value of portfolio securities received or delivered as a result of in-kind purchases or redemptions of the fund’s capital shares, including ETF Creation Units. |
See accompanying Notes, which are an integral part of the Financial Statements.
Dividend Appreciation Index Fund
Notes to Financial Statements
Vanguard Dividend Appreciation Index Fund is registered under the Investment Company Act of 1940 as an open-end investment company, or mutual fund. The fund offers two classes of shares: ETF Shares and Admiral Shares. Each of the share classes has different eligibility and minimum purchase requirements, and is designed for different types of investors. ETF Shares are listed for trading on NYSE Arca; they can be purchased and sold through a broker.
Market disruptions associated with the COVID-19 pandemic have had a global impact, and uncertainty exists as to the long-term implications. Such disruptions can adversely affect assets of the fund and thus fund performance.
A. The following significant accounting policies conform to generally accepted accounting principles for U.S. investment companies. The fund consistently follows such policies in preparing its financial statements.
1. Security Valuation: Securities are valued as of the close of trading on the New York Stock Exchange (generally 4 p.m., Eastern time) on the valuation date. Equity securities are valued at the latest quoted sales prices or official closing prices taken from the primary market in which each security trades; such securities not traded on the valuation date are valued at the mean of the latest quoted bid and asked prices. Securities for which market quotations are not readily available, or whose values have been materially affected by events occurring before the fund’s pricing time but after the close of the securities’ primary markets, are valued by methods deemed by the board of trustees to represent fair value. Investments in Vanguard Market Liquidity Fund are valued at that fund’s net asset value. Temporary cash investments are valued using the latest bid prices or using valuations based on a matrix system (which considers such factors as security prices, yields, maturities, and ratings), both as furnished by independent pricing services.
2. Futures Contracts: The fund uses index futures contracts to a limited extent, with the objectives of maintaining full exposure to the stock market, maintaining liquidity, and minimizing transaction costs. The fund may purchase futures contracts to immediately invest incoming cash in the market, or sell futures in response to cash outflows, thereby simulating a fully invested position in the underlying index while maintaining a cash balance for liquidity. The primary risks associated with the use of futures contracts are imperfect correlation between changes in market values of stocks held by the fund and the prices of futures contracts, and the possibility of an illiquid market. Counterparty risk involving futures is mitigated because a regulated clearinghouse is the counterparty instead of the clearing broker. To further mitigate counterparty risk, the fund trades futures contracts on an exchange, monitors the financial strength of its clearing brokers and clearinghouse, and has entered into clearing agreements with its clearing brokers. The clearinghouse imposes initial margin requirements to secure the fund’s performance and requires daily settlement of variation margin representing changes in the market value of each contract. Any securities pledged as initial margin for open contracts are noted in the Schedule of Investments.
Futures contracts are valued at their quoted daily settlement prices. The notional amounts of the contracts are not recorded in the Statement of Assets and Liabilities. Fluctuations in the value of the contracts are recorded in the Statement of Assets and Liabilities as an asset (liability) and in the Statement of Operations as unrealized appreciation (depreciation) until the contracts are closed, when they are recorded as realized gains (losses) on futures contracts.
Dividend Appreciation Index Fund
During the year ended January 31, 2021, the fund’s average investments in long and short futures contracts represented less than 1% and 0% of net assets, respectively, based on the average of the notional amounts at each quarter-end during the period.
3. Swap Contracts: The fund has entered into equity swap contracts to earn the total return on selected reference stocks in the fund’s target index. Under the terms of the swaps, the fund receives the total return on the referenced stock (i.e., receiving the increase or paying the decrease in value of the selected reference stock and receiving the equivalent of any dividends in respect of the selected referenced stock) over a specified period of time, applied to a notional amount that represents the value of a designated number of shares of the selected reference stock at the beginning of the equity swap contract. The fund also pays a floating rate that is based on short-term interest rates, applied to the notional amount. At the same time, the fund generally invests an amount approximating the notional amount of the swap in high-quality temporary cash investments.
A risk associated with all types of swaps is the possibility that a counterparty may default on its obligation to pay net amounts due to the fund. The fund’s maximum amount subject to counterparty risk is the unrealized appreciation on the swap contract. The fund mitigates its counterparty risk by entering into swaps only with a diverse group of prequalified counterparties, monitoring their financial strength, entering into master netting arrangements with its counterparties, and requiring its counterparties to transfer collateral as security for their performance. In the absence of a default, the collateral pledged or received by the fund cannot be repledged, resold, or rehypothecated. In the event of a counterparty’s default (including bankruptcy), the fund may terminate any swap contracts with that counterparty, determine the net amount owed by either party in accordance with its master netting arrangements, and sell or retain any collateral held up to the net amount owed to the fund under the master netting arrangements. The swap contracts contain provisions whereby a counterparty may terminate open contracts if the fund’s net assets decline below a certain level, triggering a payment by the fund if the fund is in a net liability position at the time of the termination. The payment amount would be reduced by any collateral the fund has pledged. Any securities pledged as collateral for open contracts are noted in the Schedule of Investments. The value of collateral received or pledged is compared daily to the value of the swap contracts exposure with each counterparty, and any difference, if in excess of a specified minimum transfer amount, is adjusted and settled within two business days.
The notional amounts of swap contracts are not recorded in the Statement of Assets and Liabilities. Swaps are valued daily based on market quotations received from independent pricing services or recognized dealers and the change in value is recorded in the Statement of Assets and Liabilities as an asset (liability) and in the Statement of Operations as unrealized appreciation (depreciation) until periodic payments are made or the termination of the swap, at which time realized gain (loss) is recorded.
During the year ended January 31, 2021, the fund’s average amounts of investments in total return swaps represented less than 1% of net assets, based on the average of notional amounts at each quarter-end during the period.
Dividend Appreciation Index Fund
4. Federal Income Taxes: The fund intends to continue to qualify as a regulated investment company and distribute all of its taxable income. The fund’s tax returns are open to examination by the relevant tax authorities until expiration of the applicable statute of limitations, which is generally three years after the filing of the tax return. Management has analyzed the fund’s tax positions taken for all open federal and state income tax years, and has concluded that no provision for income tax is required in the fund’s financial statements.
5. Distributions: Distributions to shareholders are recorded on the ex-dividend date. Distributions are determined on a tax basis at the fiscal year-end and may differ from net investment income and realized capital gains for financial reporting purposes.
6. Securities Lending: To earn additional income, the fund lends its securities to qualified institutional borrowers. Security loans are subject to termination by the fund at any time, and are required to be secured at all times by collateral in an amount at least equal to the market value of securities loaned. Daily market fluctuations could cause the value of loaned securities to be more or less than the value of the collateral received. When this occurs, the collateral is adjusted and settled before the opening of the market on the next business day. The fund further mitigates its counterparty risk by entering into securities lending transactions only with a diverse group of prequalified counterparties, monitoring their financial strength, and entering into master securities lending agreements with its counterparties. The master securities lending agreements provide that, in the event of a counterparty’s default (including bankruptcy), the fund may terminate any loans with that borrower, determine the net amount owed, and sell or retain the collateral up to the net amount owed to the fund; however, such actions may be subject to legal proceedings. While collateral mitigates counterparty risk, in the event of a default, the fund may experience delays and costs in recovering the securities loaned. The fund invests cash collateral received in Vanguard Market Liquidity Fund, and records a liability in the Statement of Assets and Liabilities for the return of the collateral, during the period the securities are on loan. Collateral investments in Vanguard Market Liquidity Fund are subject to market appreciation or depreciation. Securities lending income represents fees charged to borrowers plus income earned on invested cash collateral, less expenses associated with the loan. During the term of the loan, the fund is entitled to all distributions made on or in respect of the loaned securities.
7. Credit Facilities and Interfund Lending Program: The fund and certain other funds managed by The Vanguard Group (“Vanguard”) participate in a $4.3 billion committed credit facility provided by a syndicate of lenders pursuant to a credit agreement and an uncommitted credit facility provided by Vanguard. Both facilities may be renewed annually. Each fund is individually liable for its borrowings, if any, under the credit facilities. Borrowings may be utilized for temporary or emergency purposes, subject to the fund’s regulatory and contractual borrowing restrictions. With respect to the committed credit facility, the participating funds are charged administrative fees and an annual commitment fee of 0.10% of the undrawn committed amount of the facility; these fees are allocated to the funds based on a method approved by the fund’s board of trustees and included in Management and Administrative expenses on the fund’s Statement of Operations. Any borrowings under either facility bear interest at a rate based upon the higher of the one-month London Interbank Offered
Dividend Appreciation Index Fund
Rate (or an acceptable alternate rate, if necessary), federal funds effective rate, or overnight bank funding rate plus an agreed-upon spread, except that borrowings under the uncommitted credit facility may bear interest based upon an alternative rate agreed to by the fund and Vanguard.
In accordance with an exemptive order (the “Order”) from the SEC, the fund may participate in a joint lending and borrowing program that allows registered open-end Vanguard funds to borrow money from and lend money to each other for temporary or emergency purposes (the “Interfund Lending Program”), subject to compliance with the terms and conditions of the Order, and to the extent permitted by the fund’s investment objective and investment policies. Interfund loans and borrowings normally extend overnight, but can have a maximum duration of seven days. Loans may be called on one business day’s notice. The interest rate to be charged is governed by the conditions of the Order and internal procedures adopted by the board of trustees. The board of trustees is responsible for overseeing the Interfund Lending Program.
For the year ended January 31, 2021, the fund did not utilize the credit facilities or the Interfund Lending Program.
8. Other: Dividend income is recorded on the ex-dividend date. Non-cash dividends included in dividend income, if any, are recorded at the fair value of the securities received. Interest income includes income distributions received from Vanguard Market Liquidity Fund and is accrued daily. Premiums and discounts on debt securities are amortized and accreted, respectively, to interest income over the lives of the respective securities, except for premiums on certain callable debt securities that are amortized to the earliest call date. Security transactions are accounted for on the date securities are bought or sold. Costs used to determine realized gains (losses) on the sale of investment securities are those of the specific securities sold.
Each class of shares has equal rights as to assets and earnings, except that each class separately bears certain class-specific expenses related to maintenance of shareholder accounts (included in Management and Administrative expenses) and shareholder reporting. Marketing and distribution expenses are allocated to each class of shares based on a method approved by the board of trustees. Income, other non-class-specific expenses, and gains and losses on investments are allocated to each class of shares based on its relative net assets.
B. In accordance with the terms of a Funds’ Service Agreement (the “FSA”) between Vanguard and the fund, Vanguard furnishes to the fund investment advisory, corporate management, administrative, marketing, and distribution services at Vanguard’s cost of operations (as defined by the FSA). These costs of operations are allocated to the fund based on methods and guidelines approved by the board of trustees and are generally settled twice a month.
Upon the request of Vanguard, the fund may invest up to 0.40% of its net assets as capital in Vanguard. At January 31, 2021, the fund had contributed to Vanguard capital in the amount of $2,457,000, representing less than 0.01% of the fund’s net assets and 0.98% of Vanguard’s capital received pursuant to the FSA. The fund’s trustees and officers are also directors and employees, respectively, of Vanguard.
Dividend Appreciation Index Fund
C. Various inputs may be used to determine the value of the fund’s investments and derivatives. These inputs are summarized in three broad levels for financial statement purposes. The inputs or methodologies used to value securities are not necessarily an indication of the risk associated with investing in those securities.
Level 1—Quoted prices in active markets for identical securities.
Level 2—Other significant observable inputs (including quoted prices for similar securities, interest rates, prepayment speeds, credit risk, etc.).
Level 3—Significant unobservable inputs (including the fund’s own assumptions used to determine the fair value of investments). Any investments and derivatives valued with significant unobservable inputs are noted on the Schedule of Investments.
The following table summarizes the market value of the fund’s investments and derivatives as of January 31, 2021, based on the inputs used to value them:
| | Level 1 | Level 2 | Level 3 | Total |
| | ($000) | ($000) | ($000) | ($000) |
| Investments | | | | |
| Assets | | | | |
| Common Stocks | 62,319,759 | — | — | 62,319,759 |
| Temporary Cash Investments | 229,494 | 4,000 | — | 233,494 |
| Total | 62,549,253 | 4,000 | — | 62,553,253 |
| Derivative Financial Instruments | | | | |
| Assets | | | | |
| Swap Contracts | — | 799 | — | 799 |
| Liabilities | | | | |
| Futures Contracts1 | 1,686 | — | — | 1,686 |
| Swap Contracts | — | 11,342 | — | 11,342 |
| Total | 1,686 | 11,342 | — | 13,028 |
1 Represents variation margin on the last day of the reporting period.
D. Permanent differences between book-basis and tax-basis components of net assets are reclassified among capital accounts in the financial statements to reflect their tax character. These reclassifications have no effect on net assets or net asset value per share. As of period end, permanent differences primarily attributable to the accounting for in-kind redemptions and swap agreements were reclassified between the following accounts:
| | Amount |
| | ($000) |
| Paid-in Capital | 1,336,038 |
| Total Distributable Earnings (Loss) | (1,336,038) |
Dividend Appreciation Index Fund
Temporary differences between book-basis and tax-basis components of total distributable earnings (loss) arise when certain items of income, gain, or loss are recognized in different periods for financial statement and tax purposes; these differences will reverse at some time in the future. The differences are primarily related to the deferral of losses from wash sales and the recognition of unrealized gains or losses from certain derivative contracts. As of period end, the tax-basis components of total distributable earnings (loss) are detailed in the table as follows:
| | Amount |
| | ($000) |
| Undistributed Ordinary Income | 69,505 |
| Undistributed Long-Term Gains | — |
| Capital Loss Carryforwards | (2,053,327) |
| Qualified Late-Year Losses | — |
| Net Unrealized Gains (Losses) | 20,232,356 |
The tax character of distributions paid was as follows:
| | Year Ended January 31, |
| | 2021 | 2020 |
| | Amount | Amount |
| | ($000) | ($000) |
| Ordinary Income* | 1,018,088 | 837,801 |
| Long-Term Capital Gains | — | — |
| Total | 1,018,088 | 837,801 |
* Includes short-term capital gains, if any.
As of January 31, 2021, gross unrealized appreciation and depreciation for investments and derivatives based on cost for U.S. federal income tax purposes were as follows:
| | Amount |
| | ($000) |
| Tax Cost | 42,320,898 |
| Gross Unrealized Appreciation | 20,530,686 |
| Gross Unrealized Depreciation | (298,330) |
| Net Unrealized Appreciation (Depreciation) | 20,232,356 |
E. During the year ended January 31, 2021, the fund purchased $21,689,899,000 of investment securities and sold $16,799,696,000 of investment securities, other than temporary cash investments. Purchases and sales include $7,562,280,000 and $3,085,839,000, respectively, in connection with in-kind purchases and redemptions of the fund’s capital shares.
Dividend Appreciation Index Fund
F. Capital share transactions for each class of shares were:
| | | | | Year Ended January 31, |
| | | 2021 | | | 2020 |
| | Amount | Shares | | Amount | Shares |
| | ($000) | (000) | | ($000) | (000) |
| Investor Shares | | | | | |
| Issued | — | — | | 254,211 | 5,369 |
| Issued in Lieu of Cash Distributions | — | — | | 7,936 | 179 |
| Redeemed1 | — | — | | (1,436,242) | (30,460) |
| Net Increase (Decrease)—Investor Shares | — | — | | (1,174,095) | (24,912) |
| ETF Shares | | | | | |
| Issued | 8,074,533 | 67,477 | | 9,814,909 | 85,404 |
| Issued in Lieu of Cash Distributions | — | — | | — | — |
| Redeemed | (3,089,030) | (26,075) | | (5,233,124) | (46,225) |
| Net Increase (Decrease)—ETF Shares | 4,985,503 | 41,402 | | 4,581,785 | 39,179 |
| Admiral Shares | | | | | |
| Issued1 | 2,460,287 | 73,984 | | 3,452,025 | 108,647 |
| Issued in Lieu of Cash Distributions | 150,122 | 4,627 | | 130,515 | 4,114 |
| Redeemed | (2,712,338) | (84,013) | | (1,862,151) | (59,339) |
| Net Increase (Decrease)—Admiral Shares | (101,929) | (5,402) | | 1,720,389 | 53,422 |
| 1 | In November 2018, the fund announced changes to the availability and minimum investment criteria of the Investor and Admiral Share classes. As a result, all of the outstanding Investor Shares automatically converted to Admiral Shares beginning in April 2019. Investor Shares—Redeemed and Admiral Shares—Issued include 26,826,000 and 39,551,000 shares, respectively, in the amount of $1,130,304,000 from the conversion during the year ended January 31, 2020. |
G. Management has determined that no events or transactions occurred subsequent to January 31, 2021, that would require recognition or disclosure in these financial statements.
Report of Independent Registered Public Accounting Firm
To the Board of Trustees of Vanguard Specialized Funds and Shareholders of Vanguard Dividend Appreciation Index Fund
Opinion on the Financial Statements
We have audited the accompanying statement of assets and liabilities, including the schedule of investments, of Vanguard Dividend Appreciation Index Fund (one of the funds constituting Vanguard Specialized Funds, referred to hereafter as the “Fund”) as of January 31, 2021, the related statement of operations for the year ended January 31, 2021, the statement of changes in net assets for each of the two years in the period ended January 31, 2021, including the related notes, and the financial highlights for each of the five years in the period ended January 31, 2021 (collectively referred to as the “financial statements”). In our opinion, the financial statements present fairly, in all material respects, the financial position of the Fund as of January 31, 2021, the results of its operations for the year then ended, the changes in its net assets for each of the two years in the period ended January 31, 2021 and the financial highlights for each of the five years in the period ended January 31, 2021 in conformity with accounting principles generally accepted in the United States of America.
Basis for Opinion
These financial statements are the responsibility of the Fund’s management. Our responsibility is to express an opinion on the Fund’s financial statements based on our audits. We are a public accounting firm registered with the Public Company Accounting Oversight Board (United States) (PCAOB) and are required to be independent with respect to the Fund in accordance with the U.S. federal securities laws and the applicable rules and regulations of the Securities and Exchange Commission and the PCAOB.
We conducted our audits of these financial statements in accordance with the standards of the PCAOB. Those standards require that we plan and perform the audit to obtain reasonable assurance about whether the financial statements are free of material misstatement, whether due to error or fraud.
Our audits included performing procedures to assess the risks of material misstatement of the financial statements, whether due to error or fraud, and performing procedures that respond to those risks. Such procedures included examining, on a test basis, evidence regarding the amounts and disclosures in the financial statements. Our audits also included evaluating the accounting principles used and significant estimates made by management, as well as evaluating the overall presentation of the financial statements. Our procedures included confirmation of securities owned as of January 31, 2021 by correspondence with the custodian and brokers and by agreement to the underlying ownership records of the transfer agent; when replies were not received from brokers, we performed other auditing procedures. We believe that our audits provide a reasonable basis for our opinion.
/s/PricewaterhouseCoopers LLP
Philadelphia, Pennsylvania
March 17, 2021
We have served as the auditor of one or more investment companies in The Vanguard Group of Funds since 1975.
Special 2020 tax information (unaudited) for Vanguard Dividend Appreciation Index Fund
This information for the fiscal year ended January 31, 2021, is included pursuant to provisions of the Internal Revenue Code.
The fund distributed $1,018,088 of qualified dividend income to shareholders during the fiscal year.
For corporate shareholders, 97.9% of investment income (dividend income plus short-term gains, if any) qualifies for the dividends-received deduction.
The People Who Govern Your Fund
The trustees of your mutual fund are there to see that the fund is operated and managed in your best interests since, as a shareholder, you are a part owner of the fund. Your fund’s trustees also serve on the board of directors of The Vanguard Group, Inc., which is owned by the Vanguard funds and provides services to them.
A majority of Vanguard’s board members are independent, meaning that they have no affiliation with Vanguard or the funds they oversee, apart from the sizable personal investments they have made as private individuals. The independent board members have distinguished backgrounds in business, academia, and public service. Each of the trustees and executive officers oversees 211 Vanguard funds.
Information for each trustee and executive officer of the fund appears below. That information, as well as the Vanguard fund count, is as of the date on the cover of this fund report. The mailing address of the trustees and officers is P.O. Box 876, Valley Forge, PA 19482. More information about the trustees is in the Statement of Additional Information, which can be obtained, without charge, by contacting Vanguard at 800-662-7447, or online at vanguard.com.
Interested Trustee1
Mortimer J. Buckley
Born in 1969. Trustee since January 2018. Principal occupation(s) during the past five years and other experience: chairman of the board (2019–present) of Vanguard and of each of the investment companies served by Vanguard; chief executive officer (2018– present) of Vanguard; chief executive officer, president, and trustee (2018–present) of each of the investment companies served by Vanguard; president and director (2017–present) of Vanguard; and president (2018–present) of Vanguard Marketing Corporation. Chief investment officer (2013–2017), managing director (2002–2017), head of the Retail Investor Group (2006–2012), and chief information officer (2001–2006) of Vanguard. Chairman of the board (2011–2017) and trustee (2009–2017) of the Children’s Hospital of Philadelphia; and trustee (2018–present) and vice chair (2019–present) of The Shipley School.
Independent Trustees
Emerson U. Fullwood
Born in 1948. Trustee since January 2008. Principal occupation(s) during the past five years and other experience: executive chief staff and marketing officer for North America and corporate vice president (retired 2008) of Xerox Corporation (document management products and services). Former president of the Worldwide Channels Group, Latin America, and Worldwide Customer Service and executive chief staff officer of Developing Markets of Xerox. Executive in residence and 2009–2010 Distinguished Minett Professor at the Rochester Institute of Technology. Director of SPX FLOW, Inc. (multi-industry manufacturing). Director of the University of Rochester Medical Center, the Monroe Community College Foundation, the United Way of Rochester, North Carolina A&T University, and Roberts Wesleyan College. Trustee of the University of Rochester.
Amy Gutmann
Born in 1949. Trustee since June 2006. Principal occupation(s) during the past five years and other experience: president (2004–present) of the University of Pennsylvania. Christopher H. Browne Distinguished Professor of Political Science, School of Arts and Sciences, and professor of communication, Annenberg School for Communication, with secondary faculty appointments in the Department of Philosophy, School of Arts and Sciences, and at the Graduate School of Education, University of Pennsylvania.
F. Joseph Loughrey
Born in 1949. Trustee since October 2009. Principal occupation(s) during the past five years and other experience: president and chief operating officer (retired 2009) and vice chairman of the board (2008–2009) of Cummins Inc. (industrial machinery). Chairman of the board of Hillenbrand, Inc. (specialized
| 1 | Mr. Buckley is considered an “interested person,” as defined in the Investment Company Act of 1940, because he is an officer of the Vanguard funds. |
consumer services). Director of the V Foundation. Member of the advisory council for the College of Arts and Letters and chair of the advisory board to the Kellogg Institute for International Studies, both at the University of Notre Dame. Chairman of the board of Saint Anselm College.
Mark Loughridge
Born in 1953. Trustee since March 2012. Principal occupation(s) during the past five years and other experience: senior vice president and chief financial officer (retired 2013) of IBM (information technology services). Fiduciary member of IBM’s Retirement Plan Committee (2004–2013), senior vice president and general manager (2002–2004) of IBM Global Financing, vice president and controller (1998–2002) of IBM, and a variety of other prior management roles at IBM. Member of the Council on Chicago Booth.
Scott C. Malpass
Born in 1962. Trustee since March 2012. Principal occupation(s) during the past five years and other experience: chief investment officer (retired June 2020) and vice president (retired June 2020) of the University of Notre Dame. Assistant professor (retired June 2020) of finance at the Mendoza College of Business, University of Notre Dame, and member of the Notre Dame 403(b) Investment Committee. Member of the board of Catholic Investment Services, Inc. (investment advisors) and the board of superintendence of the Institute for the Works of Religion.
Deanna Mulligan
Born in 1963. Trustee since January 2018. Principal occupation(s) during the past five years and other experience: board chair (2020), chief executive officer (2011–2020), and president (2010–2019) of The Guardian Life Insurance Company of America. Chief operating officer (2010–2011) and executive vice president (2008–2010) of Individual Life and Disability of the Guardian Life Insurance Company of America. Member of the board of the Economic Club of New York. Trustee of the Partnership for New York City (business leadership), Chief Executives for Corporate Purpose, NewYork-Presbyterian Hospital, and the Bruce Museum (arts and science). Member of the Advisory Council for the Stanford Graduate School of Business.
André F. Perold
Born in 1952. Trustee since December 2004. Principal occupation(s) during the past five years and other experience: George Gund Professor of Finance and Banking, Emeritus at the Harvard Business School (retired 2011). Chief investment officer and co-managing partner of HighVista Strategies (private investment firm). Member of the board (2018–present) of RIT Capital Partners (investment firm). Member of the investment committee of Partners Health Care System.
Sarah Bloom Raskin
Born in 1961. Trustee since January 2018. Principal occupation(s) during the past five years and other experience: deputy secretary (2014–2017) of the United States Department of the Treasury. Governor (2010–2014) of the Federal Reserve Board. Commissioner (2007–2010) of financial regulation for the State of Maryland. Director (2017–present) of i(x) Investments, LLC. Rubenstein Fellow (2017–2020) of Duke University. Trustee (2017–present) of Amherst College and member (2019–present) of Amherst College Investment Committee.
Peter F. Volanakis
Born in 1955. Trustee since July 2009. Principal occupation(s) during the past five years and other experience: president and chief operating officer (retired 2010) of Corning Incorporated (communications equipment) and director of Corning Incorporated (2000–2010) and Dow Corning (2001–2010). Director (2012) of SPX Corporation (multi-industry manufacturing). Overseer of the Amos Tuck School of Business Administration, Dartmouth College (2001–2013). Chairman of the board of trustees of Colby-Sawyer College. Member of the BMW Group Mobility Council.
Executive Officers
John Bendl
Born in 1970. Principal occupation(s) during the past five years and other experience: principal of Vanguard. Chief financial officer (2019–present) of each of the investment companies served by Vanguard. Chief accounting officer, treasurer, and controller of Vanguard (2017–present). Partner (2003–2016) at KPMG (audit, tax, and advisory services).
Christine M. Buchanan
Born in 1970. Principal occupation(s) during the past five years and other experience: principal of Vanguard. Treasurer (2017–present) of each of the investment companies served by Vanguard. Partner (2005–2017) at KPMG (audit, tax, and advisory services).
David Cermak
Born in 1960. Principal occupation(s) during the past five years and other experience: principal of Vanguard. Finance director (2019–present) of each of the investment companies served by Vanguard. Managing director and head (2017–present) of Vanguard Investments Singapore. Managing director and head (2017–2019) of Vanguard Investments Hong Kong. Representative director and head (2014–2017) of Vanguard Investments Japan.
John Galloway
Born in 1973. Principal occupation(s) during the past five years and other experience: principal of Vanguard. Investment stewardship officer (September 2020–present) of each of the investment companies served by Vanguard. Head of Investor Advocacy (February 2020–present) and head of Marketing Strategy and Planning (2017–2020) at Vanguard. Deputy assistant to the President of the United States (2015).
Peter Mahoney
Born in 1974. Principal occupation(s) during the past five years and other experience: principal of Vanguard. Controller (2015–present) of each of the investment companies served by Vanguard. Head of International Fund Services (2008–2014) at Vanguard.
Anne E. Robinson
Born in 1970. Principal occupation(s) during the past five years and other experience: general counsel (2016–present) of Vanguard. Secretary (2016–present) of Vanguard and of each of the investment companies served by Vanguard. Managing director (2016–present) of Vanguard. Managing director and general counsel of Global Cards and Consumer Services (2014–2016) at Citigroup. Counsel (2003–2014) at American Express.
Michael Rollings
Born in 1963. Principal occupation(s) during the past five years and other experience: finance director (2017–present) and treasurer (2017) of each of the investment companies served by Vanguard. Managing director (2016–present) of Vanguard. Chief financial officer (2016–present) of Vanguard. Director (2016–present) of Vanguard Marketing Corporation. Executive vice president and chief financial officer (2006–2016) of MassMutual Financial Group.
John E. Schadl
Born in 1972. Principal occupation(s) during the past five years and other experience: principal of Vanguard. Chief compliance officer (2019–present) of Vanguard and of each of the investment companies served by Vanguard. Assistant vice president (2019–present) of Vanguard Marketing Corporation.
Vanguard Senior Management Team
| Joseph Brennan | James M. Norris |
| Mortimer J. Buckley | Thomas M. Rampulla |
| Gregory Davis | Karin A. Risi |
| John James | Anne E. Robinson |
| John T. Marcante | Michael Rollings |
| Chris D. McIsaac | Lauren Valente |
Connect with Vanguard® > vanguard.com
Fund Information > 800-662-7447
Direct Investor Account Services > 800-662-2739
Institutional Investor Services > 800-523-1036
Text Telephone for People
Who Are Deaf or Hard of Hearing > 800-749-7273
This material may be used in conjunction with the offering of shares of any Vanguard fund only if preceded or accompanied by the fund’s current prospectus.
All comparative mutual fund data are from Morningstar, Inc., unless otherwise noted.
You can obtain a free copy of Vanguard’s proxy voting guidelines by visiting vanguard.com/proxyreporting or by calling Vanguard at 800-662-2739. The guidelines are also available from the SEC’s website, www.sec.gov. In addition, you may obtain a free report on how your fund voted the proxies for securities it owned during the 12 months ended June 30. To get the report, visit either vanguard.com/proxyreporting or www.sec.gov.
You can review information about your fund on the SEC’s website, and you can receive copies of this information, for a fee, by sending a request via email addressed to publicinfo@sec.gov.
Source for Bloomberg Barclays indexes: Bloomberg Index Services Limited. Copyright 2021, Bloomberg. All rights reserved.
“Dividend Achievers” is a trademark of The NASDAQ OMX Group, Inc. (collectively, with its affiliates “NASDAQ OMX”), and has been licensed for use by The Vanguard Group, Inc. Vanguard mutual funds are not sponsored, endorsed, sold, or promoted by NASDAQ OMX and NASDAQ OMX makes no representation regarding the advisability of investing in the funds. NASDAQ OMX MAKES NO WARRANTIES AND BEARS NO LIABILITY WITH RESPECT TO THE VANGUARD MUTUAL FUNDS.
| | © 2021 The Vanguard Group, Inc. |
| | All rights reserved. |
| | U.S. Patent Nos. 6,879,964; 7,337,138; |
| | 7,720,749; 7,925,573; 8,090,646; 8,417,623; and 8,626,636. |
| | Vanguard Marketing Corporation, Distributor. |
| | |
| | Q6020 032021 |
Item 2: Code of Ethics. The Registrant has adopted a code of ethics that applies to the Registrant’s principal executive officer, principal financial officer, principal accounting officer or controller or persons performing similar functions. The Code of Ethics was amended during the reporting period covered by this report to make certain technical, non-material changes.
Item 3: Audit Committee Financial Expert. All members of the Audit Committee have been determined by the Registrant’s Board of Trustees to be Audit Committee Financial Experts and to be independent: F. Joseph Loughrey, Mark Loughridge, Sarah Bloom Raskin, and Peter F. Volanakis.
Item 4: Principal Accountant Fees and Services.
(a) Audit Fees.
Audit Fees of the Registrant.
Fiscal Year Ended January 31, 2021: $244,000
Fiscal Year Ended January 31, 2020: $219,000
Aggregate Audit Fees of Registered Investment Companies in the Vanguard Group.
Fiscal Year Ended January 31, 2021: $10,761,407
Fiscal Year Ended January 31, 2020: $9,568,215
Includes fees billed in connection with audits of the Registrant, other registered investment companies in the Vanguard complex, The Vanguard Group, Inc., and Vanguard Marketing Corporation.
(b) Audit-Related Fees.
Fiscal Year Ended January 31, 2021: $2,915,863
Fiscal Year Ended January 31, 2020: $3,012,031
Includes fees billed in connection with assurance and related services provided to the Registrant, other registered investment companies in the Vanguard complex, The Vanguard Group, Inc., and Vanguard Marketing Corporation.
(c) Tax Fees.
Fiscal Year Ended January 31, 2021: $247,168
Fiscal Year Ended January 31, 2020: $357,238
Includes fees billed in connection with tax compliance, planning, and advice services provided to the Registrant, other registered investment companies in the Vanguard complex, The Vanguard Group, Inc., and Vanguard Marketing Corporation.
(d) All Other Fees.
Fiscal Year Ended January 31, 2021: $115,000
Fiscal Year Ended January 31, 2020: $0
Includes fees billed for services related to tax reported information provided to the Registrant, other registered investment companies in the Vanguard complex, The Vanguard Group, Inc., and Vanguard Marketing Corporation.
(e) (1) Pre-Approval Policies. The policy of the Registrant’s Audit Committee is to consider, and, if appropriate, approve before the principal accountant is engaged for such services, all specific audit and non-audit services provided to: the Registrant, other registered investment companies in the Vanguard complex, The Vanguard Group, Inc., and entities controlled by The Vanguard Group, Inc. that provide ongoing services to the Registrant. In making a determination, the Audit Committee considers whether the services are consistent with maintaining the principal accountant’s independence.
In the event of a contingency situation in which the principal accountant is needed to provide services in between scheduled Audit Committee meetings, the Chairman of the Audit Committee would be called on to consider and, if appropriate, pre-approve audit or permitted non-audit services in an amount sufficient to complete services through the next Audit Committee meeting, and to determine if such services would be consistent with maintaining the accountant’s independence. At the next scheduled Audit Committee meeting, services and fees would be presented to the Audit Committee for formal consideration, and, if appropriate, approval by the entire Audit Committee. The Audit Committee would again consider whether such services and fees are consistent with maintaining the principal accountant’s independence.
The Registrant’s Audit Committee is informed at least annually of all audit and non-audit services provided by the principal accountant to the Vanguard complex, whether such services are provided to: the Registrant, other registered investment companies in the Vanguard complex, The Vanguard Group, Inc., or other entities controlled by The Vanguard Group, Inc. that provide ongoing services to the Registrant.
(2) No percentage of the principal accountant’s fees or services were approved pursuant to the waiver provision of paragraph (c)(7)(i)(C) of Rule 2-01 of Regulation S-X.
(f) For the most recent fiscal year, over 50% of the hours worked under the principal accountant’s engagement were not performed by persons other than full-time, permanent employees of the principal accountant.
(g) Aggregate Non-Audit Fees.
Fiscal Year Ended January 31, 2021: $362,168
Fiscal Year Ended January 31, 2020: $357,238
Includes fees billed for non-audit services provided to the Registrant, other registered investment companies in the Vanguard complex, The Vanguard Group, Inc., and Vanguard Marketing Corporation.
(h) For the most recent fiscal year, the Audit Committee has determined that the provision of all non-audit services was consistent with maintaining the principal accountant’s independence.
Item 5: Audit Committee of Listed Registrants.
The Registrant is a listed issuer as defined in rule 10A-3 under the Securities Exchange Act of 1934 (“Exchange Act”). The Registrant has a separately-designated standing audit committee established in accordance with Section 3(a)(58)(A) of the Exchange Act. The Registrant’s audit committee members are: F. Joseph Loughrey, Mark Loughridge, Sarah Bloom Raskin, and Peter F. Volanakis.
Item 6: Investments.
Not applicable.
Item 7: Disclosure of Proxy Voting Policies and Procedures for Closed-End Management Investment Companies.
Not applicable.
Item 8: Portfolio Managers of Closed-End Management Investment Companies.
Not applicable.
Item 9: Purchase of Equity Securities by Closed-End Management Investment Company and Affiliated Purchasers.
Not applicable.
Item 10: Submission of Matters to a Vote of Security Holders.
Not applicable.
Item 11: Controls and Procedures.
(a) Disclosure Controls and Procedures. The Principal Executive and Financial Officers concluded that the Registrant’s Disclosure Controls and Procedures are effective based on their evaluation of the Disclosure Controls and Procedures as of a date within 90 days of the filing date of this report.
(b) Internal Control Over Financial Reporting. In 2020, a third-party service provider began performing certain administrative and accounting services for Vanguard Real Estate Index Fund, Vanguard Global Capital Cycles Fund, Vanguard Global ESG Select Stock Fund, Vanguard Dividend Growth Fund, Vanguard Energy Fund and Vanguard Health Care Fund. There were no other significant changes in the Registrant’s Internal Control Over Financial Reporting or in other factors that could significantly affect this control subsequent to the date of the evaluation, including any corrective actions with regard to significant deficiencies and material weaknesses.
Item 12: Disclosure of Securities Lending Activities for Closed-End Management Investment Companies.
Not applicable.
Item 13: Exhibits.
Pursuant to the requirements of the Securities Exchange Act of 1934 and the Investment Company Act of 1940, the registrant has duly caused this report to be signed on its behalf by the undersigned, thereunto duly authorized.
VANGUARD SPECIALIZED FUNDS
BY: /s/ MORTIMER J. BUCKLEY*
___________________________
MORTIMER J. BUCKLEY
CHIEF EXECUTIVE OFFICER
Date: March 22, 2021
Pursuant to the requirements of the Securities Exchange Act of 1934 and the Investment Company Act of 1940, this report has been signed below by the following persons on behalf of the registrant and in the capacities and on the dates indicated.
VANGUARD SPECIALIZED FUNDS
BY: /s/ MORTIMER J. BUCKLEY*
___________________________
MORTIMER J. BUCKLEY
CHIEF EXECUTIVE OFFICER
Date: March 22, 2021
VANGUARD SPECIALIZED FUNDS
BY: /s/ JOHN BENDL*
___________________________
JOHN BENDL
CHIEF FINANCIAL OFFICER
Date: March 22, 2021
* By: /s/ Anne E. Robinson
Anne E. Robinson, pursuant to a Power of Attorney filed on December 18, 2020 (see File Number 33-64845), Incorporated by Reference