UNITED STATES
SECURITIES AND EXCHANGE COMMISSION
Washington, DC 20549
FORM N-CSR
CERTIFIED SHAREHOLDER REPORT OF REGISTERED MANANGEMENT INVESTMENT COMPANY
Investment Company Act file number 811-03931
CLIPPER FUND, INC.
(Exact name of registrant as specified in charter)
2949 East Elvira Road, Suite 101
Tucson, AZ 85756
(Address of principal executive offices)
Thomas D. Tays
Davis Selected Advisers, L.P.
2949 East Elvira Road, Suite 101
Tucson, AZ 85756
(Name and address of agent for service)
Registrant’s telephone number, including area code: 520-806-7600
Date of fiscal year end: December 31, 2008
Date of reporting period: December 31, 2008
____________________
ITEM 1. REPORT TO STOCKHOLDERS
Cautionary Statement
Davis Advisors is committed to communicating with our investment partners as candidly as possible because we believe our investors benefit from understanding our investment philosophy and approach. Our views and opinions regarding the investment prospects of our portfolio holdings include “forward looking statements” which may or may not be accurate over the long term. While we believe we have a reasonable basis for our appraisals and we have confidence in our opinions, actual results may differ materially from those we anticipate. These opinions are current as of the date of this report but are subject to change. The information provided in this report should not be considered a recommendation to buy, sell, or hold any particular security.
You can identify forward looking statements by words like “believe,” “expect,” “anticipate,” or similar expressions when discussing prospects for particular portfolio holdings and/or of the Fund. We cannot assure future results and achievements. You should not place undue reliance on forward looking statements, which speak only as of the date of this report. We disclaim any obligation to update or alter any forward looking statements, whether as a result of new information, future events, or otherwise. This material must be preceded or accompanied by a Prospectus. Please read the Prospectus carefully for a discussion of investment objectives, risks, fees, and expenses. Current performance may be lower or higher than the performance quoted herein. You may obtain a current copy of the prospectus or more current performance information by calling investor services at 1-800-432-2504, or on Clipper Fund’s website (www.clipperfund.com).
Clipper Fund Shareholders Meeting
Davis Advisors cordially invites you to the 2009 Clipper Fund Shareholders Meeting with Portfolio Managers Christopher Davis and Kenneth Feinberg to be held on Wednesday, March 25th.
The Fund managers will discuss the investment approach and portfolio. A question-and-answer session will follow.
Location: | The Peninsula Hotel Beverly Hills |
9882 South Santa Monica Boulevard
Beverly Hills, CA 90212
Verandah Room
Time: | 9:30 A.M. – 11:00 A.M. (PDT) |
Attendees: | Clipper Fund shareholders, consultants and other interested parties. |
For more information, please call 800-432-2504.
CLIPPER FUNDSM | Table of Contents |
Shareholder Letter | 2 |
| |
Management’s Discussion and Analysis | 12 |
| |
Fund Overview | 14 |
| |
Portfolio Activity | 15 |
| |
Fund Performance | 16 |
| |
Schedule of Investments | 18 |
| |
Statement of Assets and Liabilities | 21 |
| |
Statement of Operations | 22 |
| |
Statements of Changes in Net Assets | 23 |
| |
Notes to Financial Statements | 24 |
| |
Financial Highlights | 28 |
| |
Report of Independent Registered Public Accounting Firm | 29 |
| |
Fund Information | 30 |
| |
Directors and Officers | 31 |
CLIPPER FUNDSM | Shareholder Letter |
The table below summarizes the results of Clipper Fund compared with the S&P 500® Index against which my co-manager Ken Charles Feinberg, our colleagues and I judge ourselves. We will not mince words. These results are terrible on an absolute basis for all periods and poor on a relative basis for all but the 10 year period. We assumed management of the Fund on January 1, 2006 and thus bear full responsibility for the three year results, partial responsibility for the five year results and can take no credit for the relatively better ten year results.
Annualized Total Returns as of December 31, 2008 |
| 1 Year | 3 Years | 5 Years | 10 Years |
Clipper Fund | (49.57)% | (16.53)% | (9.28)% | 0.28% |
S&P 500® Index | (37.00)% | (8.34)% | (2.19)% | (1.38)% |
The performance presented represents past performance and is not a guarantee of future results. Total return assumes reinvestment of dividends and capital gain distributions. Investment return and principal value will vary so that, when redeemed, an investor’s shares may be worth more or less than their original cost. The total annual operating expense ratio for Clipper Fund shares as of the most recent prospectus was 0.69%. The total annual operating expense ratio may vary in future years.Current performance may be higher or lower than the performance data quoted. For most recent month-end returns, visit clipperfund.com or call 800-432-2504. Clipper Fund was managed from inception, February 29, 1984, until January 1, 2006 by another Adviser. Davis Selected Advisers, L.P. took over management of the Fund on January 1, 2006.
In the pages that follow, we will provide more perspective to put these results in context but we will not try to excuse them. You have a right to expect more from us. Given that our families, colleagues and the two of us have substantial holdings in Clipper Fund, you can be sure that we are committed to living up to those expectations.
The first part of this report will provide more detail about Fund results. The second part will be a review of the past year, covering the market and economy in general and our Portfolio in particular. As always, this review will include an accounting of our biggest mistakes. The final part will be forward-looking and explain why an environment characterized by fear and uncertainty creates enormous opportunity for long-term investors. By outlining this opportunity, we are not trying to predict the direction of the market over the next year, but to provide data that might help investors stay the course at a time when many feel like giving up. The fact that Clipper’s poor relative results have come during a time of terrible market returns has been especially hard. In the general market, investors have suffered through the second worst decade for stocks on record—a record that includes the Crash of 1929 as well as the Great Depression. In fact, even if the market produces satisfactory returns for 2009 (and it is certainly not off to a good start), it is highly likely that the 10 year period ending this coming December will prove to be the worst decade ever, as it will no longer include the 21% return of 1999. Given that the market has lost 3.6% per year for the last nine years versus the 1.7% annual loss suffered between 1928-1938, currently the worst decade on record, this is not a bold prediction.
So why should such data give investors confidence? The answer is that low prices may increase future returns. 1 Because investors are buyers, they should welcome the opportunity to buy the same businesses at lower prices, as doing so raises their returns. Consider a business that generates $100,000 of income. In good times, such a business might be priced at more than $2 million, leaving the buyer with only a 5% return on investment. But if the price falls by half, the return doubles to 10%. This same math applies at the level of the stock market, which is after all simply a collection of businesses, the majority of which will be earning more money 10 years from now than they do today. The data shows that it has always been profitable to invest in the stock market after a decade of poor returns.1 Specifically, there previously have been ten rolling 10 year periods since 1928 when the S&P 500® Index (and before that the Dow Jones Industrial Average) returned less than 5% per year.In every case, the 10 years that followed produced satisfactory returns averaging approximately 13% per year and ranging from a low of 7% per year to a high of 18% per year.1 While we cannot know for sure what the next decade holds, it is highly likely to be far better than what we have suffered through in the last 10 years as we are starting at much more attractive valuations. Beyond the general market returns, we are committed to the goal that Clipper’s returns should exceed those of the market over the long term. Given our poor first three years of management, we have ground to make up and we are hopeful that our shareholders who have endured these hard times will be there with us for the rebound.
_________________________
1 There is no guarantee that low priced securities will appreciate. Equity markets are volatile and an investor may lose money. Past performance is not a guarantee of future results.
Not a part of Annual Report to Fund shareholders
CLIPPER FUNDSM Shareholder Letter – (Continued)
Results
Because our objective is to outperform the S&P 500® Index over the long term, which we define as rolling five and rolling ten year periods, enough time has not yet passed for us to label our results a failure. We are, however, off to an awful start—one that has been bad enough to shake shareholders’ confidence. While our firm is well known for managing several other large diversified equity funds, including Selected American Shares, which have produced satisfactory results over the long term, these funds are more diversified and larger than Clipper and thus their results may not be relevant. However, it remains our strong view that Clipper’s relatively small size and ability to concentrate its investments should be long-term advantages. 2 This view is supported by the fact that the one concentrated account that we have managed for more than a decade and that should be more analogous to Clipper Fund generated a positive returnafter fees that exceeded that of our more diversified funds over the last decade compared with the negative return for the S&P 500® Index. 3 Although we cannot be certain that Clipper would have earned the same results had it been under our management for this period, these results give us some confidence in our ability to manage a concentrated portfolio. A concentrated approach, however, does increase a fund’s volatility, meaning that over time the increased opportunity to outperform carries with it the possibility of experiencing worse periods of underperformance as we have regretfully but clearly done in the last three years.
It is important to note that if Clipper’s results improve in the years ahead as we believe they will, the Fund should be incredibly tax efficient as unrealized losses currently amount to almost 70% of the Fund’s net asset value.
Annualized Total Returns as of December 31, 2008 for Clipper Fund | 1 Year | 5 Years | 10 Years |
Return Before Taxes | (49.57)% | (9.28)% | 0.28% |
Return After Taxes on Distributions | (49.73)% | (10.08)% | (1.14)% |
Returns after Taxes on Distributions and Sale Of Fund Shares | (32.01)% | (7.15)% | 0.13% |
The performance presented represents past performance and is not a guarantee of future results. Total return assumes reinvestment of dividends and capital gain distributions. Investment return and principal value will vary so that, when redeemed, an investor’s shares may be worth more or less than their original cost. See endnotes for additional disclosure.
The Year 20084
While capital market downturns are nothing new, the dislocation and panic that swept through the markets in 2008 were unique in scale, severity and pace. The vast majority of major financial institutions collapsed, were taken over, raised dilutive capital and/or required some sort of government intervention. The combined market capitalization of the top 25 financial institutions in the United States (excluding Berkshire Hathaway, which we do not consider a pure financial institution) fell 75% during the last two years from $2 trillion to less than $500 billion (as of January 22, 2009). The loss to shareholders has been even greater than these numbers indicate as most of these companies now have meaningfully more shares outstanding, including warrants held by the U.S. government.
The amount of direct investments, pledges and guarantees announced by the federal government now approaches $5 trillion. To put this sum in perspective, previously the most expensive financial debacle in U.S. history, the savings and loan (S&L) crisis, cost the government about $185 billion in today’s dollars, about 1/27th as much. The long-term consequences of the government’s ownership interest in private businesses are unlikely to be positive and the extension of such vast amounts of credit must almost certainly lead to higher inflation.
Turning to the economy, as is often the case, the capital markets have been leading indicators. What began as a financial crisis tied to falling real estate prices is swiftly becoming a broad-based economic crisis. Consumer and corporate spending
_________________________
2 Concentrating a fund’s portfolio in a select limited number of securities can increase the volatility of the portfolio.
3 Discussion of other concentrated accounts should not be considered as a substitute or proxy for Clipper Fund. Holdings and performance will vary.
4 Individual securities are discussed in this piece. While we believe we have a reasonable basis for our appraisals and we have confidence in our opinions, actual results may differ materially from those we anticipate. The return of a security to a portfolio will vary based on weighting and timing of purchase. This is not a recommendation to buy or sell any specific security. Past performance is not a guarantee of future results.
Not a part of Annual Report to Fund shareholders
CLIPPER FUNDSM Shareholder Letter – (Continued)
are in a free fall. Auto sales for example fell a staggering 35% in the fourth quarter alone. Unemployment is increasing sharply as are virtually all other negative indicators. As these metrics deteriorate, however, it is worth remembering that the front side of a recession is always the scariest. To understand why, consider this simple example. Suppose a distributor who normally sells 10 widgets per month, sells only eight in a given month. When it is time to reorder, the distributor needs to order only six widgets as there are two left in inventory from the previous month. Thus, a 20% decline in sales leads to a 40% decline in orders. This inventory effect is a painful magnifier that things are slowing but is not permanent and will reverse when sales stabilize.
Another unsettling aspect of 2008 was that many fundamental tenets of sound investing did not help. For example, it is generally (and rightly) believed that diversification among different asset classes should reduce the volatility of an investor’s returns, as often one type of investment goes up while others are going down. However, this did not hold true in 2008. As one exasperated institutional investor put it, “All correlations have gone to one.” In other words, virtually every asset class except government bonds performed badly: domestic stocks, foreign stocks, commodities, hedge funds, private equity, corporate bonds, real estate, and so on. Only 6% of the stocks in the S&P 500® Index were up last year, the lowest percentage on record. 5
In addition, many so-called value investors (a category in which we are generally included) have fared poorly at a time when they would have been expected to do far better than the average. The reason for this expectation is that value investors tend to focus their investments in companies whose businesses are not considered highly speculative in nature and whose valuations relative to current earnings and shareholders’ equity are comparatively low. As a result, their prices tend to hold up better in times of trouble compared to more speculative companies whose prospects are less secure. For example, in the bear market that began in March 2000 and continued through 2002, when the stock market fell almost 50%, many value investors outperformed dramatically as speculative tech and telecom companies collapsed while companies in mundane sectors such as raw materials, utilities, retail, and banking held up relatively well.
In the last couple of years, though, many of these well-regarded managers, including us, have underperformed. Some portion of this underperformance can be attributed to the managers’ mistaken appraisals and declines in the value of the underlying businesses they owned. We had our share of such mistakes, which we will discuss later in this report. However, another portion of this underperformance is simply attributable to the unpredictability and vagaries of short-term results. It is the nature of markets that value and price can diverge for long periods of time. In euphoric times, such as during the Internet bubble, the stock prices of many companies exceed their value. In times of panic and dislocation, the value of many companies exceeds their prices. In such periods, poor reported results may indicate deferred returns rather than permanent losses. For example, a company purchased at $10 per share that has an intrinsic value of $20 is a good investment even if its price falls to $5 for some period of time. One simple example in the Portfolio illustrates the manner in which price and value can diverge. At the time of this writing, our investment in holding company RHJ International trades for just 3.76 euros per share, even though the company has no outstanding debt or other large liabilities and holds more than 5 euros of cash per share and almost 1 euro per share worth of other public investments. Thus, an investor buying the shares today gets almost 60% more cash and liquid investments than the share price. On top of these liquid assets, the company has illiquid investments that are currently carried at 6.48 euros per share. While these investments are likely worth substantially less than their carrying value, they are certainly worth more than zero. Finally, RHJ’s chairman has a demonstrated record as a successful investor and also happens to be the largest shareholder. In cases such as this, it seems clear that price and value are not the same.
While this divergence between price and value is easy to understand at the level of an individual company, it is also true for whole portfolios. For example, the vast majority of top-performing managers over a long period of time will still experience multiyear stretches of poor performance. Specifically, as the accompanying chart shows, 97% of all of the managers whose results over the last 10 years placed them in the top performance quartile still underperformed for at least a three year stretch during that decade of excellent relative results. More important, in almost half of these cases (44% to be precise), the three year stretches were bad enough to place them in the bottom decile relative to their peers.
_________________________
5 Source: Davis Advisors. Percentage is from 1/1/08–12/31/08.
Not a part of Annual Report to Fund shareholders
CLIPPER FUNDSM Shareholder Letter – (Continued)
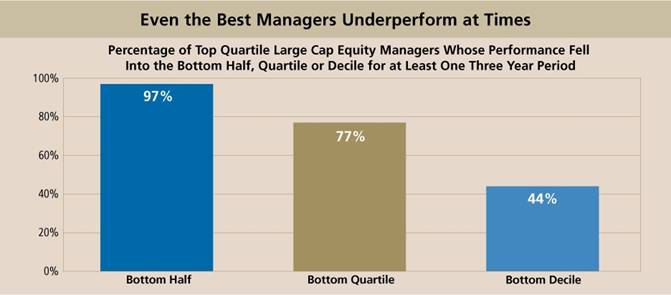
Source: Davis Advisors. 163 managers from eVestment Alliance’s large cap universe whose 10 year average annualized performance ranked in the top quartile from January 1, 1999-December 31, 2008. Past performance is no guarantee of future results.
We are certainly in such a trough at the moment and while we are unhappy with these results and not making excuses, it is reassuring that the data confirms that such periods are not inconsistent with producing strong long-term returns.
Such periods of underperformance can be doubly costly for clients. After all, as portfolio managers, we can focus on the value of the underlying businesses and in doing so maintain our conviction; but clients can only see the prices. As a result, clients often lose confidence and get out after they have already suffered through the period of bad performance but before benefiting from the recovery. Such has been the case in Clipper Fund, which continues to have redemptions. In the years ahead, we hope to prove that these poor results do not reflect a flawed investment discipline but rather the fact that prices and values can irrationally diverge for relatively long periods of time.
Before turning to the reasons that such divergences can create real opportunities, we must also recognize the cases in which falling stock prices reflect substantial declines in the value of the underlying businesses. In these cases, we were mistaken in our business appraisals.
Mistakes
By far our largest mistake over the last three years was our investment in American International Group (AIG), which cumulatively detracted roughly 12% from our returns, more than twice as much as any other mistake. In essence, this mistake resulted from our incorrectly assessing three factors: the financial sophistication of management, the leverage of derivatives, and the danger of collateral requirements tied to mark-to-market accounting.
Starting with management, the chief executive officer of a complex financial institution also serves as the de facto chief risk officer. He or she must understand the nature and extent of the risks being taken and must have the courage to forgo profits if the risks, however remote, could prove catastrophic. At AIG, the need for a highly capable CEO was accentuated by the diverse business models and risk profiles of its semiautonomous divisions. Unfortunately, the abrupt ouster of its long-time CEO and the promotion of a far less able successor came at the worst possible time. Although this successor had deep experience in the field of property and casualty insurance, the company’s financial operations and risks went far beyond this sector into areas in which new management had virtually no expertise.
The second factor that we—and this new management team—grossly underestimated lay in a relatively small division of AIG called AIG Financial Products. This unit contributed about 5% of total profits, only a small portion of which came from selling a type of highly complex and highly leveraged derivative known as a Credit Default Swap or CDS. At its heart, a CDS
Not a part of Annual Report to Fund shareholders
CLIPPER FUNDSM Shareholder Letter – (Continued)
is a type of financial insurance in which a buyer would pay AIG a tiny premium in exchange for insurance against a highly unlikely financial event, such as the default of a triple-A security. In some cases, the premium could be as low as $1 for $1000 worth of coverage. Unfortunately, many of the triple-A securities that AIG insured were tied to mortgages and presumed that residential real estate prices would never go down substantially. To make matters worse, unlike normal insurance contracts, credit default swaps are marked-to-market, meaning that they are priced not for what the actual losses are today but for what the market estimates the losses will be in the future. This mark-to-market accounting brings us to the third aspect of our mistake.
As the estimated losses on the contracts went up, AIG was required to post cash collateral for the buyers of the swaps. Worse still, the amount of cash collateral was also tied to AIG’s own credit rating. As is now apparent, all the factors were in place for a spiral. Because these contracts assumed virtually no losses, small increases in loss estimates led to huge losses. As these losses mounted, rating agencies became concerned and downgraded the company. Thus, AIG was required to post more collateral for both higher estimated losses and its lower credit rating. Adding to these liquidity demands, the company engaged in a massive securities lending program in which it lent out many of its investments. These loans were themselves collateralized with cash. Unfortunately, rather than simply hold this cash in short-term liquid instruments, the company invested much of it in illiquid, often mortgage related, securities. As nervous customers returned borrowed securities and immediately demanded their cash back, AIG was forced to try to sell these illiquid securities at a time when there were no buyers. In just a matter of months, these liquidity demands exceeded AIG’s available resources. Facing default, AIG asked for government intervention. In exchange for providing the necessary liquidity and guaranteeing or assuming responsibility for a number of assets and liabilities, the government took equity warrants for approximately 80% of the company.
All of the above analysis begs the question: “Why did we continue to hold the shares even as the situation got worse and worse?” The answer is twofold. First, we remained focused on the fact that the company had close to $100 billion of tangible equity, more than $1 trillion in investments and more than $20 billion of pretax earnings from global insurance, leasing and asset management operations. Furthermore, in contrast to a bank, it is difficult to have a run on an insurance company as policyholders, unlike depositors, generally cannot suddenly take back their premiums. Thus, we thought the company’s powerful, diversified earnings, tangible equity and assets would more than cover the losses over time. This thinking ignored three important facts. First, because of the collateral requirements discussed above, the company did not have the luxury of time but needed to come up with the cash immediately. Second, because there had been inadequate disclosure about the massive securities lending operation, the scale and the immediacy of the cash requirements were far greater than anyone imagined. Finally, although the company’s financial statements showed a huge amount of liquid assets, most were held in the company’s insurance subsidiaries. As regulated entities, these subsidiaries were not permitted to release the assets to the parent company in order for AIG to meet these collateral calls. As a result, even if these mark-to-market losses proved temporary rather than permanent (as they still could), even if the company’s net worth remained substantial, or even if the company could have earned enough in the next five years to pay the losses as they came due, it still faced bankruptcy as a result of defaulting on the collateral calls.
We will end this discussion with an example of the dangers of this sort of collateral posting requirement. Imagine a homeowner has a $400,000 home with a $300,000 mortgage. Now imagine he earns $100,000 per year of which he uses $50,000 for living expenses, leaving $50,000 to service the mortgage. If we add to this example, as a given that this person will never move and will never lose his job, it would seem that the mortgage is virtually risk free. But if we change one feature that on its face seems minor, we completely alter the risk profile. Specifically, imagine that the mortgage requires that if the estimated price at which the house could be sold on any given day falls below $300,000, the homeowner must put the shortfall in an escrow account or face eviction. Now, even if the homeowner could service this mortgage forever and even pay it down completely over time with no risk to the bank, he could still be bankrupted by having to mark his house to market and post collateral. It was this type of liquidity risk that, in a matter of months, brought down what had been the most profitable and highly valued insurance company in the world.
The next two largest detractors from our results were American Express and Harley-Davidson, which even combined were far less costly than AIG. In both cases, we made two mistakes, the first of which was less important than the second. First, by underestimating the severity of the economic downturn, we did not anticipate how quickly results in their core businesses could collapse. Because of the normal leverage of fixed costs, a sharp slowdown in revenue led to an even more precipitous decline in profitability. Second, and more important, we did not appreciate the danger that these companies faced if their cost of funding rose substantially or worse if they lost access to the capital markets altogether. While both companies will be able to maintain some access to capital, they are facing far higher funding costs that will change important aspects of their
Not a part of Annual Report to Fund shareholders
CLIPPER FUNDSM Shareholder Letter – (Continued)
business model and profitability. In the case of American Express, this means that even after the company gets through the inevitable period of higher credit losses, its return on equity is unlikely to be as high as it once was. At Harley-Davidson, a higher cost of funding in all likelihood will permanently eliminate the company’s ability to provide financing to motorcycle buyers. To the extent that providing this financing has been both a source of incremental sales and a source of profitability in itself, earnings are unlikely to reach previous peaks for many, many years. We still hold both companies because we believe that their share prices have overshot on the downside and that both trade at less than they are worth. An important part of our assessment is based on the fact that, unlike AIG, these companies have durable business models and strong brand positions that would be almost impossible to duplicate. Because of this brand strength, both companies retain enormous earnings power that should return as the economy stabilizes, although not to the peak levels seen in recent years.
As always, the only value of mistakes lies in the lessons learned. Looking back at the crisis of 2008, the lessons can be reduced to a single word: liquidity. In a nutshell, we learned that while the answer to the question, How much long-term debt is appropriate for a given company? varies by industry and business, the answer to, How much short-term debt is appropriate for a given company? should almost always be zero. In 2008, even companies with plenty of earnings and equity relative to their debt found themselves shut out of the credit markets. In the best cases, they were required to fund themselves at very high rates. In the worst, they were forced to sell valuable assets at pawn shop prices, auction off the entire company or face bankruptcy. Companies like Countrywide, Lehman, Bear Stearns, and even Fannie Mae and Freddie Mac (none of which we owned) all were financed with short-term funds or required constant access to new capital. In virtually all these cases, managements put companies at risk by trying to save a few percentage points of interest costs. Such a strategy has accurately been likened to picking up pennies in front of a fast-moving steam roller.
Looking Ahead
This long dissertation on economic turmoil and uncertainty as well as the recounting of our biggest mistakes, raises the question: Why are we almost fully invested and confident that today’s prices should be viewed as an enormous long-term opportunity? Before answering, we should provide one caveat. In making the case for equities today, we are not predicting that the market has reached bottom. Although stocks could be substantially higher six months from now, they could also be 30% lower. We simply do not know—and no one else does either. With this caveat out of the way, we will now turn to the subject of opportunity.
When I first started investing, my grandfather gave me a card on which was written, “You make most of your money in a bear market, you just don’t realize it at the time.” Although at first blush this saying sounds counterintuitive—after all, in a bear market prices are going down—it makes sense when you recognize that as investors we are buyers and thus should welcome lower prices for the simple reason that lower prices increase future returns. In bear markets, prices are driven down by fear and forced selling. Sellers are not asking what a business is worth but taking whatever they can get. Such irrational selling allows investors with patience to buy great businesses at distressed prices. These low prices increase future returns. Over the years, my father and grandfather used to tell me about the opportunities they had to buy great growth companies at 10-12 times earnings with 3% dividend yields or leading financial companies at five times earnings with 5% dividends and so on. Great records developed from the depths of these bear markets as steady-handed investors purchased stalwart companies with decent dividends at low price-earnings multiples and simply held on, letting compounding and gradually improving confidence take care of the rest.
Imagine, for example, a high-quality company that can grow its earnings on average at 10% per year over a decade. In a bull market, such a company might sell at 20 times earnings and have a negligible dividend yield. As a result, buyers of that company would be lucky to have returns even in line with the earnings growth rate. In fact, should the multiple contract to the long-term market average of 15 times earnings over a decade, the company’s 10% growth rate would shrink to a 6.9% return for investors.
However, in a bear market, this math is reversed. Imagine the same company now trading at 10 times earnings and carrying a 3% dividend yield. The buyer of this company now can reasonably expect to make returns in line with the earnings growth rate of 10% plus dividends of 3% for a total return of 13%. While this in itself is a satisfactory return, it can even be enhanced should confidence return and the multiple rise to the long-term average of 15 times earnings. If this happens over a decade, the company’s 10% growth rate would expand to an 18% return for investors.
Not a part of Annual Report to Fund shareholders
CLIPPER FUNDSM Shareholder Letter – (Continued)
Because a bear market presents the opportunity to benefit from earnings growth, dividend yield and multiple expansion, I had always been a bit jealous of the opportunities that my father and grandfather were given in the terrible bear markets of the last 60 years. Now that our generation has finally been given the same opportunity, I recognize the wisdom of the saying, “Be careful what you wish for.” In a time of fear and panic, investments will never seem as straightforward as the example given above. More important, even if investors can recognize such opportunities with their heads, their stomachs often have other ideas. As legendary manager Peter Lynch observed, “The key organ (for investment success) is your stomach. Everyone has the brainpower, but not everyone has the stomach for it.” In today’s bear market, investors are racing for the exits. Cash is pouring into “riskless” securities like short-term U.S. Treasuries with virtually no yield. Although such a choice feels good, it is, given the near certainty of inflation, likely to prove very costly. Meanwhile, investments in high grade common stocks, which feel like a terrible choice, are likely to prove very profitable and are almost certain to outperform cash over the next decade. 6
Before turning to the Portfolio itself, we would remind you of the old saying that investing is the art of the specific and warn that general discussions tend to oversimplify the rationale behind our investment decisions. Nevertheless, in today’s environment, we are looking for opportunities that roughly fall into five categories. The first most closely resembles the hypothetical high-quality company discussed above and would include companies such as Procter & Gamble, Costco and Hewlett-Packard. These companies are characterized by healthy balance sheets, strong competitive positions and durable business models. They are generally (but not always) global leaders with relatively strong pricing power and the ability to pass through cost increases. Because such businesses produce excess cash, they are self-funding and have no need to regularly replenish capital. This self-sufficiency has led some wags to refer to such companies as “camels.”
A second much smaller category is made up of companies whose business model and management mind-set put them in a position to take advantage of the chaos in the capital markets. Such opportunistic companies may use distressed prices to make investments or acquisitions or even to buy in their own shares. Although many companies have the balance sheet strength to fall into this category, few have the temperament. Instead, most companies that were only too happy to buy in shares and do deals when prices were high, have reduced or eliminated such activities in response to the current uncertain environment, forgetting that the environment is never certain. Our holdings in Oaktree Capital, which specializes in distressed debt investing; Redwood Trust, which has just started buying tranches of mortgage-backed securities from desperate sellers; RHJ International whose cash hoard is overseen by one of the leading private equity investors; Brookfield Asset Management, which has a strong record of contrarian investing in real assets; and even disciplined share repurchasers such as Microsoft fall into this category. But by far the best example is Berkshire Hathaway, which having spent much of the last decade building up cash and warning about the dangers of derivatives, is now making enormous investments at a time when others seem paralyzed.
The third category comprises investments made where the headlines are the worst7—specifically in selected financial companies. While we recognize there are many fundamental uncertainties, we believe that some positives are being overlooked in the midst of the turmoil. First, although aspects of the insurance, asset management, and retail, commercial and investment banking businesses are changing, their underlying business models are unlikely to become obsolete. Furthermore, those companies that get through this storm will face far less competition. In retail and commercial banking, for example, there is an astounding flight to quality. Incredibly, in the fourth quarter alone, Wells Fargo’s deposits, which pay extremely low interest, grew at a staggering 31% annualized rate. JPMorgan Chase was also seen as a safe haven, with its wholesale and commercial deposits growing almost 15%. In businesses such as securities processing, master trust and custody, firms like Bank of New York Mellon and other parts of JPMorgan generate recurring fee streams that require relatively little capital to be put at risk. For investment banks, although leveraged proprietary trading will never be the same (which is a positive), services like mergers and acquisitions advice and equity and debt underwriting will always be in demand for leaders like Goldman Sachs. To be clear, we know that there are still many risks in this sector, including the fact that nonperforming assets will continue to rise. While we are selectively adding, we are not “swinging for the fences.”
The fourth category focuses on what we consider to be the inexorable growth of the middle class in massive economies such as China’s. We continue to expect that the Chinese economy will grow faster than average for decades to come, putting strain
_________________________
6 Equity markets are volatile and an investor may lose money.
7 While we research companies subject to such contingencies, we cannot be correct every time, and a company’s stock may never recover.
Not a part of Annual Report to Fund shareholders
CLIPPER FUNDSM Shareholder Letter – (Continued)
on China’s infrastructure and increasing demand for most natural resources. A number of Portfolio companies are positioned to benefit from these trends including our investments in energy and commodity companies like ConocoPhillips and Canadian Natural Resources.
The final category is a catchall that includes the diverse range of remaining investments. Although no one theme describes businesses as varied as UnitedHealth and Nipponkoa, they share the important characteristic of trading well below our assessment of their intrinsic values.
Concluding Thoughts
In mid-October Warren Buffett wrote an unusual and important editorial for The New York Times. Just as we were coming through one of the worst years and worst decades ever for stock investors, he noted, “The financial world is a mess, both in the United States and abroad. Its problems, moreover, have been leaking into the general economy, and the leaks are now turning into a gusher. In the near term, unemployment will rise, business activity will falter and headlines will be scary. So . . . I’ve been buying American stocks.” He continues, “Over the long term, the stock market news will be good. In the 20th century, the United States endured two world wars and other traumatic and expensive military conflicts; the Depression; a dozen or so recessions and financial panics; oil shocks; a flu epidemic; and the resignation of a disgraced president. Yet the Dow rose from 66 to11,497.” 8
Although such a powerful statistic makes it hard to believe that stock investors could have lost money during a century marked by such an extraordinary gain, Mr. Buffett goes on to caution that “some investors did. The hapless ones bought stocks only when they felt comfort in doing so and then proceeded to sell when the headlines made them queasy.” While the poor returns we have generated during our first three years managing Clipper understandably have made it even harder for shareholders to have confidence and while the dire headlines we read day after day make “queasy” an understatement, the result of both the market declines and our poor relative performance has been far lower prices, which over time should increase future returns. While we cannot predict the direction of the market over the next month or the next year, we do know that it will move higher long before the economy or the headlines are more reassuring. 9 If investors wait until things seem better, they will pay much higher prices. Finally, if we are successful in achieving our long-term goal of outperforming, then Clipper’s returns should be additive to the market’s returns in the years ahead. Although we cannot say so with certainty, our confidence is enhanced by the fact that, in our experience, the prices of our Portfolio companies reflect some of the most attractive valuations we have seen in decades.
While bear markets and periods of relative underperformance are both inevitable, the fact that both occurred at the same time for Clipper has been doubly hard for our shareholders. In this commentary, we have tried to provide you with not just a report of the past but with facts and data that might give you confidence in the future. Even if shareholders reach the conclusion that they no longer want to hold shares in Clipper, we hope that this data will at least convince them to remain invested in equities. For those who have chosen to remain in Clipper Fund during this difficult time, we are grateful for your patience and never forget the trust you have placed in our firm. We wholeheartedly look forward to the years ahead when we should be able to report that today’s low prices became tomorrow’s high returns.9 Thank you.
Sincerely,


Christopher C. Davis | Kenneth Charles Feinberg |
President & Portfolio Manager | Portfolio Manager |
January 30, 2009
_________________________
8 Buffett, Warren, “Buy American. I Am.” The New York Times, October 17, 2008.
9 There is no guarantee that low priced securities will appreciate. Equity markets are volatile and an investor may lose money.
Not a part of Annual Report to Fund shareholders
CLIPPER FUNDSM Shareholder Letter – (Continued)
This material is authorized for use by existing shareholders. A current Clipper Fund prospectus must accompany or precede this piece if it is distributed to prospective shareholders. You should carefully consider the Fund’s investment objectives, risks, fees and expenses before investing. Read the prospectus carefully before you invest or send money.
This is not an advertisement to invest in Selected American Shares or any other Fund, which would be sold under a separate prospectus.
This report includes candid statements and observations regarding investment strategies, individual securities, economic and market conditions; however, there is no guarantee that these statements, opinions or forecasts will prove to be correct. These comments may also include the expression of opinions that are speculative in nature and should not be relied on as statements of fact.
Clipper Fund’s investment objective is long-term capital growth and capital preservation. There can be no assurance that the Fund will achieve its objective. Clipper Fund invests primarily in equity securities issued by large companies with market capitalizations of at least $10 billion. Some important risks of an investment in the Fund are: market risk: the market value of shares of common stock can change rapidly and unpredictably; company risk: the market value of a common stock varies with the success or failure of the company issuing the stock; focused portfolio risk: concentrating a fund’s portfolio in a select limited number of securities can increase the volatility of the portfolio; financial services risk: investing a significant portion of assets in the financial services sector may cause a fund to be more volatile as securities within the financial services sector are more prone to regulatory action in the financial services industry, more sensitive to interest rate fluctuations, and are the target of increased competition; and foreign country risk: companies operating, incorporated, or principally traded in foreign countries may have more fluctuation as foreign economies may not be as strong or diversified, foreign political systems may not be as stable, and foreign financial reporting standards may not be as rigorous as they are in the United States. As of December 31, 2008, Clipper Fund had approximately 12.9% of assets invested in foreign companies. See the prospectus for a complete listing of the principal risks.
Davis Advisors is committed to communicating with our investment partners as candidly as possible because we believe our investors benefit from understanding our investment philosophy and approach. Our views and opinions regarding the investment prospects of our portfolio holdings include “forward looking statements” which may or may not be accurate over the long term. While we believe we have a reasonable basis for our appraisals and we have confidence in our opinions, actual results may differ materially from those we anticipate. These opinions are current as of the date of this piece but are subject to change. Market values will vary so that an investor may experience a gain or a loss. The information provided in this report should not be considered a recommendation to buy, sell, or hold any particular security.
Not a part of Annual Report to Fund shareholders
CLIPPER FUNDSM Shareholder Letter – (Continued)
As of December 31, 2008, Clipper Fund had invested the following percentages of its assets in the companies listed:
American International Group | 0.55% | | Hewlett-Packard | 1.88% |
American Express | 6.57% | | JPMorgan Chase | 5.57% |
Bank of New York Mellon | 9.33% | | Microsoft | 2.66% |
Berkshire Hathaway | 10.09% | | NIPPONKOA | 4.49% |
Brookfield Asset Management | 1.26% | | Oaktree Capital | 3.91% |
Canadian Natural Resources | 4.77% | | Procter & Gamble | 8.71% |
ConocoPhillips | 6.49% | | Redwood Trust | 1.95% |
Costco Wholesale | 11.49% | | RHJ International | 2.40% |
Goldman Sachs | 0.61% | | UnitedHealth | 4.79% |
Harley-Davidson | 3.71% | | Wells Fargo | 0.29% |
Clipper Fund has adopted a Portfolio Holdings Disclosure policy that governs the release of non-public portfolio holding information. This policy is described in detail in the prospectus. Visit clipperfund.com or call 800-432-2504 for the most current public portfolio holdings information.
Over the last five years, the high and low turnover ratio for Clipper Fund was 63% and 7%, respectively.
After-tax returns show the fund’s annualized after-tax total return for the time period specified. After-tax returns with shares sold show the fund’s annualized after-tax total return for the time period specified plus the tax effect of selling your shares at the end of the period. To determine these figures, distributions are treated as taxed at the maximum tax rate in effect at the time they were paid with the balance reinvested. The maximum rates are currently 35% for non-qualified dividend income and short-term capital gains distributions. Long-term capital gains and qualified dividends currently are taxed at a maximum 15% rate. The tax rate is applied to distributions prior to reinvestment and the after-tax portion is reinvested in the fund. State and local taxes are ignored.
Broker-dealers and other financial intermediaries may charge Davis Advisors substantial fees for selling its products and providing continuing support to clients and shareholders. For example, broker-dealers and other financial intermediaries may charge: sales commissions; distribution and service fees; and record-keeping fees. In addition, payments or reimbursements may be requested for: marketing support concerning Davis Advisors’ products; placement on a list of offered products; access to sales meetings, sales representatives and management representatives; and participation in conferences or seminars, sales or training programs for invited registered representatives and other employees, client and investor events and other dealer-sponsored events. Financial advisors should not consider Davis Advisors’ payment(s) to a financial intermediary as a basis for recommending Davis Advisors.
The S&P 500® Index is an unmanaged index of 500 selected common stocks, most of which are listed on the New York Stock Exchange. The Index is adjusted for dividends, weighted towards stocks with large market capitalizations and represents approximately two-thirds of the total market value of all domestic common stocks. The Dow Jones Industrial Average is a price-weighted average of 30 actively traded blue chip stocks. The Dow Jones is calculated by adding the closing prices of the component stocks and using a divisor that is adjusted for splits and stock dividends equal to 10% or more of the market value of an issue as well as substitutions and mergers. The average is quoted in points, not in dollars. Investments cannot be made directly in an index.
After April 30, 2009, this material must be accompanied by a supplement containing performance data for the most recent quarter end.
Shares of the Clipper Fund are not deposits or obligations of any bank, are not guaranteed by any bank, are not insured by the FDIC or any other agency, and involve investment risks, including possible loss of the principal amount invested.
The information provided in this commentary, unless otherwise indicated, is as of the date that this commentary was written (January 2009).
12/08 Davis Distributors, LLC, 2949 East Elvira Road, Suite 101, Tucson, AZ 85756, 800-432-2504, clipperfund.com.
Not a part of Annual Report to Fund shareholders
CLIPPER FUNDSM | Management’s Discussion and Analysis |
Clipper Fund delivered a negative return on net asset value of 49.57% for the year ended December 31, 20081. Over the same time period, the Standard & Poor’s 500® Index2 (“Index”) decreased by 37.00%. The decline was widespread as every sector3 within the Index posted substantial declines. The sectors within the Index that turned in the weakest performance over the year were financials, materials, and information technology. The sectors that turned in the strongest (but still negative) performance over the year were consumer staples and health care.
Factors Impacting the Fund’s Performance
Two sectors, financials and consumer discretionary, accounted for almost three-quarters of the Fund’s negative return.
The Fund had more invested in financial companies than in any other sector and they were the most important detractors4 from the Fund’s performance. The Fund’s financial companies under-performed the corresponding sector within the Index (down 57% versus down 55% for the Index) and had a higher relative average weighting (53% versus 16% for the Index). Tokio Marine Holdings5 and Wells Fargo were the most important contributors to the Fund’s performance. American International Group, American Express, Bank of New York Mellon, RHJ International, Merrill Lynch, and Berkshire Hathaway were among the most important detractors from performance. The Fund no longer owns Tokio Marine Holdings or Merrill Lynch.
The second largest detractor from performance was consumer discretionary companies. The Fund’s consumer discretionary companies under-performed the corresponding sector within the Index (down 60% versus down 33% for the Index) and had approximately the same relative average weighting as the Index (both approximately 8%). Harley-Davidson was among the most important detractors from performance.
The Fund’s relative performance was also harmed both by having a lower relative average weighting in health care companies (4% versus 13% for the Index) and because the Fund’s health care companies under-performed the corresponding sector within the Index (down 53% versus down 23% for the Index). UnitedHealth Group was among the most important detractors.
The Fund held approximately 13% of assets in foreign companies at December 31, 2008. As a whole these companies out-performed the domestic companies held by the Fund while under-performing the Index.
______________________________________________________________
This Annual Report is authorized for use by existing shareholders. Prospective shareholders must receive a current Clipper Fund prospectus, which contains more information about investment strategies, risks, fees, and expenses. Please read the prospectus carefully before investing or sending money.
Clipper Fund’s investment objective is to seek long-term capital growth and capital preservation. There can be no assurance that the Fund will achieve its objective. The primary risks of an investment in Clipper Fund are: (1) market risk, (2) company risk, (3) focused portfolio risk, (4) financial services risk, (5) foreign country risk, (6) headline risk, and (7) selection risk. See the prospectus for a full description of each risk.
1 Total return assumes reinvestment of dividends and capital gain distributions. Past performance is not a guarantee of future results. Investment return and principal value will vary so that, when redeemed, an investor’s shares may be worth more or less than when purchased. The total annual operating expense ratio for the year ended December 31, 2008 was 0.76%. The following table lists the average annual total returns for the periods ended December 31, 2008:
| | | | Fund |
| 1-Year | 5-Year | 10-Year | Inception |
| | | | (02/29/84) |
Clipper Fund | (49.57)% | (9.28)% | 0.28% | 10.41% |
Standard & Poor’s 500® Index | (37.00)% | (2.19)% | (1.38)% | 10.02% |
Fund performance changes over time and current performance may be higher or lower than stated. The operating expense ratio may vary in future years. For more current information please call Clipper Fund Investor Services at 1-800-432-2504.
CLIPPER FUNDSM | Management’s Discussion and Analysis – (Continued) |
Davis Selected Advisers, L.P. began serving as investment adviser to Clipper Fund on January 1, 2006. A different investment adviser managed the Fund from inception through December 31, 2005.
2 The Standard & Poor’s 500® Index is an unmanaged index of 500 selected common stocks, most of which are listed on the New York Stock Exchange. The Index is adjusted for dividends, weighted towards stocks with large market capitalization, and represents approximately two-thirds of the total market value of all domestic common stocks. Investments cannot be made directly in the Index.
3 The companies included in the Standard & Poor’s 500® Index are divided into ten sectors. One or more industry groups make up a sector.
4 A company’s or sector’s contribution to or detraction from the Fund’s performance is a product both of its appreciation or depreciation and its weighting within the Fund. For example, a 5% holding that rises 20% has twice as much impact as a 1% holding that rises 50%.
5 This Management Discussion and Analysis discusses a number of individual companies. The information provided in this report does not provide information reasonably sufficient upon which to base an investment decision and should not be considered a recommendation to purchase or sell any particular security. The Schedule of Investments lists the Fund’s holdings of each company discussed.
Shares of the Clipper Fund are not deposits or obligations of any bank, are not guaranteed by any bank, are not insured by the FDIC or any other agency, and involve risks, including possible loss of the principal amount invested.
CLIPPER FUNDSM Fund Overview
At December 31, 2008
Portfolio Composition | | Industry Weightings |
(% of Fund’s Net Assets) | | (% of Stock Holdings) |
| | | | | |
| | | | Fund | S&P 500® |
Common Stock (U.S.) | 83.91% | | Diversified Financials | 32.10% | 6.28% |
Common Stock (Foreign) | 12.93% | | Insurance | 15.63% | 2.67% |
Short Term Investments | 3.57% | | Food & Staples Retailing | 11.87% | 3.30% |
Other Assets & Liabilities | (0.41)% | | Energy | 11.62% | 13.31% |
| 100.00% | | Household & Personal Products | 8.99% | 3.34% |
| | | Information Technology | 5.70% | 15.30% |
| | | Health Care | 4.95% | 14.76% |
| | | Automobiles & Components | 3.84% | 0.30% |
| | | Real Estate | 2.01% | 0.98% |
| | | Media | 1.67% | 2.57% |
| | | Retailing | 1.32% | 2.79% |
| | | Banks | 0.30% | 3.36% |
| | | Capital Goods | – | 8.12% |
| | | Other | – | 22.92% |
| | | | 100.00% | 100.00% |
Top 10 Holdings
(% of Fund’s Net Assets)
| | |
Costco Wholesale Corp. | Food & Staples Retailing | 11.49% |
Berkshire Hathaway Inc., Class A | Property & Casualty Insurance | 10.09% |
Bank of New York Mellon Corp. | Capital Markets | 9.33% |
Procter & Gamble Co. | Household & Personal Products | 8.71% |
American Express Co. | Consumer Finance | 6.57% |
ConocoPhillips | Energy | 6.49% |
JPMorgan Chase & Co. | Diversified Financial Services | 5.57% |
UnitedHealth Group Inc. | Health Care Equipment & Services | 4.79% |
Canadian Natural Resources Ltd. | Energy | 4.77% |
NIPPONKOA Insurance Co., Ltd. | Property & Casualty Insurance | 4.49% |
CLIPPER FUNDSM Portfolio Activity
January 1, 2008 through December 31, 2008
New Positions Added (01/01/08-12/31/08) |
(Highlighted positions are those greater than 1.00% of 12/31/08 total net assets)
Security | Industry | Date of 1st Purchase | % of 12/31/08 Fund Net Assets |
Brookfield Asset Management Inc., Class A | Capital Markets | 05/15/08 | 1.26% |
Goldman Sachs Group, Inc. | Capital Markets | 09/24/08 | 0.61% |
Hewlett-Packard Co. | Technology Hardware & Equipment | 06/06/08 | 1.88% |
Texas Instruments Inc. | Semiconductors & Semiconductor Equipment | 10/21/08 | 0.98% |
Wells Fargo & Co. | Commercial Banks | 12/04/08 | 0.29% |
Positions Closed (01/01/08-12/31/08) |
(Gains and losses greater than $30,000,000 are highlighted)
| | Date of | Realized |
Security | Industry | Final Sale | Gain (Loss) |
Agilent Technologies, Inc. | Technology Hardware & Equipment | 10/21/08 | $ | (2,075,037) |
Ambac Financial Group, Inc. | Property & Casualty Insurance | 07/03/08 | | (33,597,115) |
Covidien Ltd. | Health Care Equipment & Services | 03/10/08 | | 30,300,079 |
Merrill Lynch & Co., Inc. | Capital Markets | 10/01/08 | | (57,300,785) |
Tokio Marine Holdings, Inc. | Property & Casualty Insurance | 07/31/08 | | (2,156,580) |
Tyco Electronics Ltd. | Technology Hardware & Equipment | 03/18/08 | | 26,069,171 |
Tyco International Ltd. | Capital Goods | 02/25/08 | | 24,943,032 |
CLIPPER FUNDSM Fund Performance
Average Annual Total Return for the periods ended December 31, 2008 | Expense Example | Beginning Account Value (07/01/08) | Ending Account Value (12/31/08) | Expenses Paid During Period* (07/01/08-12/31/08) |
One-Year | (49.57)% | Actual | $1,000.00 | $642.80 | $3.22 |
Five-Year | (9.28)% | Hypothetical (5% return before expenses) | $1,000.00 | $1,021.22 | $3.96 |
Ten-Year | 0.28% |
*Expenses are equal to the Fund’s annualized expense ratio (0.78%), multiplied by the average account valueover the period, multiplied by 184/366 (to reflect the one-half year period). The expense ratio reflects the impact, if any, of the reduction of expenses paid indirectly and of certain reimbursements from the Adviser. See Notes to Performance on page 17 for a description of the “Expense Example”.
$10,000 invested over ten years. Let’s say you invested $10,000 in Clipper Fund on December 31, 1998. As the chart below shows, by December 31, 2008 the value of your investment would have grown to $10,284 – a 2.84% increase on your initial investment. For comparison, the Standard & Poor’s 500® Index is also presented on the chart below.
The Standard & Poor’s 500® Index is an unmanaged index of 500 selected common stocks, most of which are listed on the New York Stock Exchange. The Index is adjusted for dividends, weighted towards stocks with large market capitalizations, and represents approximately two-thirds of the total market value of all domestic common stocks.
The performance data for Clipper Fund contained in this report represents past performance and assumes that all distributions were reinvested, and should not be considered as an indication of future performance from an investment in the Fund today. The investment return and principal value will fluctuate so that shares may be worth more or less than their original cost when redeemed. Returns shown do not reflect the deduction of taxes that a shareholder would pay on fund distributions or the redemption of fund shares.
Davis Selected Advisers, L.P. began serving as investment adviser to Clipper Fund on January 1, 2006. A different investment adviser managed the Fund through December 31, 2005.
CLIPPER FUNDSM Notes to Performance
Example
As a shareholder of the Fund, you incur ongoing costs only, including advisory and administrative fees and other Fund expenses. The Expense Example is intended to help you understand your ongoing costs (in dollars) of investing in the Fund and to compare these costs with the ongoing costs of investing in other mutual funds. The Expense Example is based on an investment of $1,000 invested at the beginning of the period and held for the entire period indicated, which is from 07/01/08 to 12/31/08.
Actual Expenses
The information represented in the row entitled “Actual” provides information about actual account values and actual expenses. You may use the information in this row, together with the amount you invested, to estimate the expenses that you paid over the period. Simply divide your account value by $1,000 (for example, an $8,600 account value divided by $1,000 = 8.6), then multiply the result by the number under the heading “Expenses Paid During Period” to estimate the expenses you paid on your account during this period. An annual maintenance fee of $10, charged on retirement plan accounts per Social Security Number, is not included in the Expense Example. If this fee was included, the estimate of expenses you paid during the period would be higher, and your ending account value lower, by this amount.
Hypothetical Example for Comparison Purposes
The information represented in the row entitled “Hypothetical” provides information about hypothetical account values and hypothetical expenses based on the Fund’s actual expense ratio and an assumed rate of return of 5% per year before expenses, which is not the Fund’s actual return. The hypothetical account values and expenses may not be used to estimate the actual ending account balance or expenses you paid for the period. You may use this information to compare the ongoing costs of investing in the Fund and other funds. To do so, compare this 5% hypothetical example with the 5% hypothetical examples that appear in the shareholder reports of the other funds. An annual maintenance fee of $10, charged on retirement plan accounts per Social Security Number, is not included in the Expense Example. If this fee was included, the estimate of expenses you paid during the period would be higher, and your ending account value lower, by this amount.
Please note that the expenses shown in the table are meant to highlight your ongoing costs only. Therefore, the information in the row entitled “Hypothetical” is useful in comparing ongoing costs only, and will not help you determine the relative total costs of owning different funds.
CLIPPER FUNDSM | Schedule of Investments |
Shares | | Security | | Value
(Note 1) | |
COMMON STOCK - (96.84%) | |
| CONSUMER DISCRETIONARY - (6.61%) | |
| Automobiles & Components – (3.71%) | |
| 2,374,560 | Harley-Davidson, Inc. | | $ | 40,296,283 | |
|
| Media – (1.62%) | |
| 1,934,622 | News Corp., Class A | | | 17,547,022 | |
|
| Retailing – (1.28%) | |
| 1,758,123 | CarMax, Inc. * | | | 13,854,009 | |
|
| TOTAL CONSUMER DISCRETIONARY | | | 71,697,314 | |
|
| CONSUMER STAPLES - (20.20%) | |
| Food & Staples Retailing – (11.49%) | |
| 2,375,591 | Costco Wholesale Corp. | | | 124,575,992 | |
|
| Household & Personal Products – (8.71%) | |
| 1,526,025 | Procter & Gamble Co. | | | 94,338,865 | |
|
| TOTAL CONSUMER STAPLES | | | 218,914,857 | |
|
| ENERGY - (11.26%) | |
| 1,291,987 | Canadian Natural Resources Ltd. (Canada) | | | 51,653,640 | |
| 1,358,041 | ConocoPhillips | | | 70,346,524 | |
|
| TOTAL ENERGY | | | 122,000,164 | |
|
| FINANCIALS - (48.46%) | |
| Banks – (0.29%) | |
| Commercial Banks – (0.29%) | |
| 106,700 | Wells Fargo & Co. | | | 3,145,516 | |
|
| Diversified Financials – (31.09%) | |
| Capital Markets – (12.64%) | |
| 666,629 | Ameriprise Financial, Inc. | | | 15,572,454 | |
| 3,568,789 | Bank of New York Mellon Corp. | | | 101,103,792 | |
| 896,000 | Brookfield Asset Management Inc., Class A (Canada) | | | 13,681,920 | |
| 78,600 | Goldman Sachs Group, Inc. | | | 6,633,054 | |
|
| 136,991,220 | |
|
| Consumer Finance – (6.57%) | |
| 3,837,410 | American Express Co. | | | 71,183,956 | |
|
| Diversified Financial Services – (11.88%) | |
| 1,914,036 | JPMorgan Chase & Co. | | | 60,349,555 | |
| 2,232,700 | Oaktree Capital Group LLC, Class A (a) | | | 42,421,300 | |
| 5,384,194 | RHJ International (Belgium)*(b) | | | 26,044,948 | |
|
| 128,815,803 | |
|
| | 336,990,979 | |
|
| Insurance – (15.13%) | |
| Multi-line Insurance – (0.55%) | |
| 3,796,647 | American International Group, Inc. | | | 5,960,736 | |
|
| Property & Casualty Insurance – (14.58%) | |
| 1,132 | Berkshire Hathaway Inc., Class A * | | | 109,351,200 | |
| 6,265,300 | NIPPONKOA Insurance Co., Ltd. (Japan) | | | 48,742,790 | |
|
| 158,093,990 | |
|
| | 164,054,726 | |
|
| Real Estate – (1.95%) | |
| 1,416,021 | Redwood Trust, Inc. | | | 21,112,873 | |
|
| TOTAL FINANCIALS | | | 525,304,094 | |
|
| | | | | | | | | | | | | | | |
CLIPPER FUNDSM | Schedule of Investments – (Continued) |
Shares/Principal | | Security | | Value
(Note 1) | |
COMMON STOCK – (CONTINUED) | |
| HEALTH CARE - (4.79%) | |
| Health Care Equipment & Services – (4.79%) | |
| 1,951,655 | UnitedHealth Group Inc. | | $ | 51,914,023 | |
|
| TOTAL HEALTH CARE | | | 51,914,023 | |
|
| INFORMATION TECHNOLOGY - (5.52%) | |
| Semiconductors & Semiconductor Equipment – (0.98%) | |
| 686,000 | Texas Instruments Inc. | | | 10,646,720 | |
|
| Software & Services – (2.66%) | |
| 1,482,329 | Microsoft Corp. | | | 28,816,476 | |
|
| Technology Hardware & Equipment – (1.88%) | |
| 561,000 | Hewlett-Packard Co. | | | 20,358,690 | |
|
| TOTAL INFORMATION TECHNOLOGY | | | 59,821,886 | |
|
| TOTAL COMMON STOCK – (Identified cost $1,778,621,669) | | | 1,049,652,338 | |
|
| |
SHORT TERM INVESTMENTS - (3.57%) | |
| COMMERCIAL PAPER - (1.83%) | |
$ | 4,903,000 | NATC California LLC, 0.23%, 01/02/09 | | | 4,902,969 | |
| 15,000,000 | Sanpaolo IMI U.S. Financial Co., 0.47%, 01/02/09 | | | 14,999,804 | |
|
| TOTAL COMMERCIAL PAPER | | | 19,902,773 | |
|
| REPURCHASE AGREEMENTS - (1.74%) | |
| 9,412,000 | Banc of America Securities LLC Joint Repurchase Agreement, | |
| 0.06%, 01/02/09, dated 12/31/08, repurchase value of $9,412,031 | |
| (collateralized by: U.S. Government agency mortgage in a pooled cash account, 6.00%, 10/20/38, total market value $9,600,240) | | | 9,412,000 | |
| 3,922,000 | Goldman, Sachs & Co. Joint Repurchase Agreement, | |
| 0.04%, 01/02/09, dated 12/31/08, repurchase value of $3,922,009 | |
| (collateralized by: US Government agency mortgages in a pooled cash account, 5.00%-5.50%, 05/01/35-05/01/38, total market value $4,000,440) | | | 3,922,000 | |
| 5,491,000 | UBS Securities LLC Joint Repurchase Agreement, | |
| 0.05%, 01/02/09, dated 12/31/08, repurchase value of $5,491,015 | |
| (collateralized by: U.S. Government agency mortgages in a pooled cash account, 5.00%-6.50%, 06/01/17-02/01/38, total market value $5,600,820) | | | 5,491,000 | |
|
| TOTAL REPURCHASE AGREEMENTS | | | 18,825,000 | |
|
| TOTAL SHORT TERM INVESTMENTS – (Identified cost $38,727,773) | | | 38,727,773 | |
|
| | | | | |
| Total Investments – (100.41%) – (Identified cost $1,817,349,442) – (c) | | | 1,088,380,111 | |
| Liabilities Less Other Assets – (0.41%) | | | (4,406,630) | |
|
| Net Assets – (100.00%) | | $ | 1,083,973,481 | |
|
|
| | | | | |
| * | | Non-Income producing security. | | |
| (a) | | Illiquid Security – See Note 6 of the Notes to Financial Statements. | | |
| | | | | | | | | | | | | | | | | | |
CLIPPER FUNDSM Schedule of Investments – (Continued)
| (b) | | Affiliated Company. Represents ownership of at least 5% of the voting securities of the issuer and is an affiliate, as defined in the Investment Company Act of 1940, at or during the year ended December 31, 2008. The aggregate fair value of the securities of affiliated companies held by the Fund as of December 31, 2008, amounts to $26,044,948. Transactions during the period in which the issuers were affiliates are as follows: | |
| Security | Shares December 31, 2007 | Gross Additions | Gross Reductions | Shares December 31, 2008 | | Dividend Income |
| Redwood Trust, Inc. (1)(2) | 1,928,564 | | 195,358 | | 707,901 | 1,416,021 | $ | 4,016,014 |
| RHJ International | | 4,448,941 | | 935,253 | | – | 5,384,194 | | – |
| | | | | |
| | (1) | | Gross additions due to dividend reinvestment program. | | |
| | (2) | | Not an affiliate as of December 31, 2008. | | |
| | | | | |
| (c) | | Aggregate cost for federal income tax purposes is $1,817,434,581. At December 31, 2008 unrealized appreciation (depreciation) of securities for federal income tax purposes is as follows: | | |
| Unrealized appreciation | | $ | 26,042,166 | |
| Unrealized depreciation | | | (755,096,636) | |
|
| Net unrealized depreciation | | $ | (729,054,470) | |
|
|
| | | | | | | | | | | | | | | | | | | | | | | | | | | | | | |
See Notes to Financial Statements |
CLIPPER FUNDSM Statement of Assets and Liabilities
ASSETS: | |
Investments in securities at value* (see accompanying Schedule of Investments): | |
| Unaffiliated companies | | $ | 1,062,335,163 |
| Affiliated companies | | | 26,044,948 |
Cash | | | 166,999 |
Cash - foreign currencies** | | | 283,077 |
Receivables: | |
| Capital stock sold | | | 3,385,094 |
| Dividends and interest | | | 1,195,802 |
Prepaid expenses | | | 81,860 |
| Total assets | | | 1,093,492,943 |
LIABILITIES: | |
Payables: | |
| Investment securities purchased | | | 679,250 |
| Capital stock redeemed | | | 7,686,520 |
Accrued management fee | | | 622,128 |
Other accrued expenses | | | 531,564 |
| Total liabilities | | | 9,519,462 |
NET ASSETS | | $ | 1,083,973,481 |
SHARES OUTSTANDING | | | 27,110,793 |
NET ASSET VALUE, offering, and redemption price per share (Net Assets ÷ Shares Outstanding) | | $ | 39.98 |
NET ASSETS CONSIST OF: | |
Paid in capital | | $ | 1,849,012,219 |
Accumulated net realized losses from investments and foreign currency transactions | | | (36,070,603) |
Net unrealized depreciation on investments and foreign currency transactions | | | (728,968,135) |
| Net Assets | | $ | 1,083,973,481 |
| |
*Including: | |
| Cost of unaffiliated companies | | $ | 1,729,130,119 |
| Cost of affiliated companies | | | 88,219,323 |
**Cost of cash - foreign currencies | | | 284,492 |
| |
See Notes to Financial Statements | |
| | | | | | | |
CLIPPER FUNDSM Statement of Operations
| For the year ended December 31, 2008 |
INVESTMENT INCOME: | |
Income: | |
| Dividends: | |
| Unaffiliated companies* | | $ | 31,948,294 |
| Affiliated companies | | | 4,016,014 |
| Interest | | | 318,368 |
| Total income | | | 36,282,676 |
| |
Expenses: | |
| Management fees (Note 2) | | $ | 10,889,178 | |
| Custodian fees | | | 188,181 | |
| Transfer agent fees | | | 2,226,356 | |
| Audit fees | | | 54,000 | |
| Legal fees | | | 44,876 | |
| Reports to shareholders | | | 274,990 | |
| Directors’ fees and expenses | | | 90,822 | |
| Registration and filing fees | | | 75,016 | |
| Miscellaneous | | | 159,414 | |
| Total expenses | | | 14,002,833 |
| Expenses paid indirectly (Note 5) | | | (24,618) |
| Net expenses | | | 13,978,215 |
| Net investment income | | | 22,304,461 |
| |
REALIZED & UNREALIZED GAIN (LOSS) ON INVESTMENTS AND FOREIGN | |
CURRENCY TRANSACTIONS: |
Net realized gain (loss) from: | |
| Investment transactions: | | | |
| Unaffiliated companies | | | 714,607 |
| Affiliated companies | | | (10,594,202) |
| Foreign currency transactions | | | (105,199) |
Net change in unrealized appreciation (depreciation) | | | (1,184,652,027) |
Net realized and unrealized loss on investments and foreign currency | | | (1,194,636,821) |
| Net decrease in net assets resulting from operations | | $ | (1,172,332,360) |
| | | |
*Net of foreign taxes withheld as follows | | $ | 166,400 |
| |
See Notes to Financial Statements | |
| | | | | | | | | | |
CLIPPER FUNDSM Statements of Changes in Net Assets
| | | | Year ended December 31, | | | Year ended December 31, |
| | | | 2008 | | | 2007 |
OPERATIONS: | |
| Net investment income | | $ | 22,304,461 | | $ | 27,440,347 | |
| Net realized gain (loss) from investments and foreign currency transactions | | | (9,984,794) | | | 319,575,287 | |
| Net change in unrealized appreciation (depreciation) on investments and foreign currency transactions | | | (1,184,652,027) | | | (341,076,615) | |
| Net increase (decrease) in net assets resulting from operations | | | (1,172,332,360) | | | 5,939,019 | |
| |
DIVIDENDS AND DISTRIBUTIONS TO SHAREHOLDERS FROM: | |
| Net investment income | | | (22,188,466) | | | (27,209,131) | |
| Realized gains from investment transactions | | | (460,436) | | | (317,456,555) | |
| Return of capital | | | (184,450) | | | – | |
| |
CAPITAL SHARE TRANSACTIONS: | |
| Net decrease in net assets resulting from capital share | | | (502,166,852) | | | (308,368,312) | |
| transactions (Note 4) |
| | | | | | | |
Total decrease in net assets | | | (1,697,332,564) | | | (647,094,979) | |
| |
NET ASSETS: | |
| Beginning of year | | | 2,781,306,045 | | | 3,428,401,024 | |
| |
| End of year* | | $ | 1,083,973,481 | | $ | 2,781,306,045 | |
| |
*Including undistributed net investment income of | | $ | – | | | 62,685 | |
| |
See Notes to Financial Statements | |
| | | | | | | | | | |
CLIPPER FUNDSM Notes to Financial Statements
NOTE 1 — SUMMARY OF SIGNIFICANT ACCOUNTING POLICIES
Clipper Fund, Inc. (“Fund”, a California corporation) is registered under the Investment Company Act of 1940, as amended, as a non-diversified open-end management investment company. The Fund’s investment objective is long-term capital growth and capital preservation. Effective January 1, 2006, Davis Selected Advisers, L.P. (“Davis Advisors” or “Adviser”) assumed management of the Fund. The Adviser seeks to invest the Fund’s assets primarily in common stocks of large companies (generally, companies with market capitalizations of $10 billion or more at the time of initial purchase) that are trading at prices below the Adviser’s estimate of their intrinsic values. The following is a summary of significant accounting policies consistently followed by the Fund in the preparation of its financial statements.
A. VALUATION OF SECURITIES - The Fund calculates the net asset value of its shares as of the close of the New York Stock Exchange (“Exchange”), normally 4:00 P.M. Eastern time, on each day the Exchange is open for business. Securities listed on the Exchange (and other national exchanges) are valued at the last reported sales price on the day of valuation. Securities traded in the over-the-counter market (e.g. NASDAQ) and listed securities for which no sale was reported on that date are stated at the closing bid price. Securities traded on foreign exchanges are valued based upon the last sales price on the principal exchange on which the security is traded prior to the time when Fund’s assets are valued. Securities (including restricted securities) for which market quotations are not readily available are valued at their fair value. Securities whose values have been materially affected by what the Adviser identifies as a significant event occurring before the Fund’s assets are valued but after the close of their respective exchanges will be fair valued. Fair value is determined in good faith using consistently applied procedures under the supervision of the Board of Directors. Short-term securities purchased within 60 days to maturity are valued at amortized cost, which approximates market value. These valuation procedures are reviewed and subject to approval by the Board of Directors.
Fair Value Measurements – The Fund adopted Financial Accounting Standards Board Statement of Financial Accounting Standards No. 157, Fair Value Measurements (“FAS 157”), effective January 1, 2008. In accordance with FAS 157, fair value is defined as the price that the Fund would receive upon selling an investment in an orderly transaction to an independent buyer in the principal or most advantageous market of the investment. FAS 157 established a three-tier hierarchy for measuring fair value of assets and liabilities. The three-tier hierarchy of inputs is summarized in the three broad levels listed below.
| § | Level 1 – quoted prices in active markets for identical securities |
| § | Level 2 – other significant observable inputs (including quoted prices for similar investments, interest rates, prepayment speeds, credit risk, etc.) |
| § | Level 3 – significant unobservable inputs (including Fund’s own assumptions in determining the fair value of investments) |
The inputs or methodology used for valuing securities are not necessarily an indication of the risk associated with investing in those securities.
The following is a summary of the inputs used as of December 31, 2008 in valuing the Fund’s investments carried at value:
| Investments in |
Valuation inputs | Securities at Value |
Level 1 – Quoted prices | $ | 932,443,300 | |
Level 2 – Other Significant Observable Inputs | | 155,936,811 | * |
Level 3 – Significant Unobservable Inputs | | – | |
Total | $ | 1,088,380,111 | |
* Includes certain securities trading primarily outside the U.S. whose values the Fund adjusted as a result of significant market movements following the close of local trading.
CLIPPER FUNDSM Notes to Financial Statements – (Continued)
NOTE 1 — SUMMARY OF SIGNIFICANT ACCOUNTING POLICIES - (Continued)
B. MASTER REPURCHASE AGREEMENTS - The Fund, along with other affiliated funds, may transfer uninvested cash balances into one or more master repurchase agreement accounts. These balances are invested in one or more repurchase agreements, secured by U.S. Government securities. A custodian bank holds securities pledged as collateral for repurchase agreements until the agreements mature. Each agreement requires that the market value of the collateral be sufficient to cover payments of interest and principal; however, in the event of default by the other party to the agreement, retention of the collateral may be subject to legal proceedings.
C. CURRENCY TRANSLATION - The market values of all assets and liabilities denominated in foreign currencies are recorded in the financial statements after translation to the U.S. Dollar based upon the mean between the bid and offered quotations of the currencies against U.S. Dollars on the date of valuation. The cost basis of such assets and liabilities is determined based upon historical exchange rates. Income and expenses are translated at average exchange rates in effect as accrued or incurred.
D. FOREIGN CURRENCY - The Fund may enter into forward purchases or sales of foreign currencies to hedge certain foreign currency denominated assets and liabilities against declines in market value relative to the U.S. Dollar. Forward currency contracts are marked-to-market daily and the change in market value is recorded by the Fund as an unrealized gain or loss. When the forward currency contract is closed, the Fund records a realized gain or loss equal to the difference between the value of the forward currency contract at the time it was opened and value at the time it was closed. Investments in forward currency contracts may expose the Fund to risks resulting from unanticipated movements in foreign currency exchange rates or failure of the counter-party to the agreement to perform in accordance with the terms of the contract.
Reported net realized foreign exchange gains or losses arise from the sales of foreign currencies, currency gains or losses realized between the trade and settlement dates on securities transactions, the difference between the amounts of dividends, interest and foreign withholding taxes recorded on the Fund’s books, and the U.S. Dollar equivalent of the amounts actually received or paid. Net unrealized foreign exchange gains and losses arise from changes in the value of assets and liabilities other than investments in securities at fiscal year end, resulting from changes in the exchange rate. The Fund includes foreign currency gains and losses realized on the sale of investments together with market gains and losses on such investments in the statement of operations.
E. FEDERAL INCOME TAXES - It is the Fund’s policy to comply with the requirements of the Internal Revenue Code applicable to regulated investment companies, and to distribute substantially all of its taxable income, including any net realized gains on investments not offset by loss carryovers, to shareholders. Therefore, no provision for Federal Income or Excise Tax is required. The Adviser has analyzed the Fund’s tax positions taken on federal income tax returns for all open tax years and has concluded that as of December 31, 2008, no provision for income tax would be required in the Fund’s financial statements. The Fund’s federal and state (Arizona and California) income and federal excise tax returns for tax years for which the applicable statutes of limitations have not expired are subject to examination by the Internal Revenue Service and state departments of revenue. The earliest tax year that remains subject to examination by these jurisdictions is 2005. At December 31, 2008, the Fund had available for federal income tax purposes unused capital loss carryovers of $35,985,000 which expire in 2016.
F. SECURITIES TRANSACTIONS AND RELATED INVESTMENT INCOME - Securities transactions are accounted for on the trade date (date the order to buy or sell is executed) with realized gain or loss on the sale of securities being determined based upon identified cost. Dividend income is recorded on the ex-dividend date. Dividend income from REIT securities may include return of capital. Upon notification from the issuer, the amount of the return of capital is reclassified to adjust dividend income, reduce the cost basis, and/or adjust realized gain/loss. Interest income, which includes accretion of discount and amortization of premium, is accrued as earned.
G. DIVIDENDS AND DISTRIBUTIONS TO SHAREHOLDERS - Dividends and distributions to shareholders are recorded on the ex-dividend date. Net investment income (loss), net realized gains (losses), and net unrealized appreciation (depreciation) on investments may differ for financial statement and tax purposes primarily due to differing treatments of wash sales, foreign currency transactions and partnership income. The character of dividends and distributions made during the fiscal year from net investment income and net realized securities gains may differ from their ultimate characterization for Federal Income Tax purposes. Also, due to the timing of dividends and distributions, the fiscal year in which amounts are distributed may differ from the fiscal year in which income or realized gain was recorded by the Fund. The Fund adjusts the classification of distributions to shareholders to reflect the differences between financial statement amounts and distributions determined in accordance with income tax regulations.
CLIPPER FUNDSM Notes to Financial Statements – (Continued)
NOTE 1 — SUMMARY OF SIGNIFICANT ACCOUNTING POLICIES - (Continued)
G. | DIVIDENDS AND DISTRIBUTIONS TO SHAREHOLDERS - (Continued) |
Accordingly, during the year ended December 31, 2008, amounts have been reclassified to reflect a decrease in undistributed net investment income of $178,680, an increase to accumulated net realized losses of $25,947,749, and an increase to additional paid in capital of $26,126,429. Net assets have not been affected by this reclassification.
The tax character of distributions paid during the years ended December 31, 2008 and 2007 was as follows:
| Ordinary Income | | Long-Term Capital Gain | | Return of Capital | | Total | |
2008 | $ | 22,199,262 | | $ | 449,640 | | $ | 184,450 | | $ | 22,833,352 | |
2007 | | 27,209,131 | | | 317,456,555 | | | – | | | 344,665,686 | |
As of December 31, 2008 the components of accumulated losses on a tax basis were as follows:
| Total | |
Accumulated net realized losses from | | | |
investments and foreign currency transactions | $ | (35,985,463) | |
Net unrealized depreciation on investments | | (729,053,275) | |
Total | $ | (765,038,738) | |
H. INDEMNIFICATION - Under the Fund’s organizational documents, its officers and directors are indemnified against certain liabilities arising out of the performance of their duties to the Fund. In addition, some of the Fund’s contracts with its service providers contain general indemnification clauses. The Fund’s maximum exposure under these arrangements is unknown since the amount of any future claims that may be made against the Fund cannot be determined and the Fund has no historical basis for predicting the likelihood of any such claims.
I. USE OF ESTIMATES IN FINANCIAL STATEMENTS - In preparing financial statements in conformity with accounting principles generally accepted in the United States of America, management makes estimates and assumptions that affect the reported amounts of assets and liabilities and disclosure of contingent assets and liabilities at the date of the financial statements,as well as the reported amounts of income and expenses during the reporting period. Actual results may differ from these estimates.
NOTE 2 — INVESTMENT ADVISORY FEES
Advisory fees are paid monthly to the Adviser. The annual rate is 0.65% of the average net assets for the first $500 million, 0.60% on the next $500 million, 0.55% on the next $2 billion, 0.54% on the next $1 billion, 0.53% on the next $1 billion, 0.52% on the next $1 billion, 0.51% on the next $1 billion, 0.50% on the next $3 billion, and 0.485% of the average net assets greater than $10 billion. Advisory fees paid during the year ended December 31, 2008 approximated 0.59% of average net assets.
Boston Financial Data Services, Inc. (“BFDS”) is the Fund’s primary transfer agent. The Adviser is also paid for certain transfer agent services. The fee for these services for the year ended December 31, 2008 amounted to $61,082. State Street Bank & Trust Co. (“State Street Bank”) is the Fund’s primary accounting provider. Fees for such services are included in the custodian fee as State Street Bank also serves as the Fund’s custodian. Certain officers of the Fund are also officers of the general partner of the Adviser.
Davis Selected Advisers-NY, Inc. (“DSA-NY”), a wholly-owned subsidiary of the Adviser, acts as sub-adviser to the Fund. DSA-NY performs research and portfolio management services for the Fund under a Sub-Advisory Agreement with the Adviser. The Fund pays no fees directly to DSA-NY.
CLIPPER FUNDSM Notes to Financial Statements – (Continued)
NOTE 3 — PURCHASES AND SALES OF SECURITIES
Purchases and sales of investment securities (excluding short-term securities) for the year ended December 31, 2008 were $123,455,679 and $670,032,448, respectively.
NOTE 4 — CAPITAL STOCK
At December 31, 2008, there were 200,000,000 shares of capital stock (no par value) authorized. Transactions in capital stock were as follows:
| Year ended December 31, | | Year ended December 31, | |
| 2008 | | 2007 | |
Shares sold | | 7,794,982 | | | 3,219,826 | |
Shares issued in reinvestment of distributions | | 551,426 | | | 4,089,235 | |
| | 8,346,408 | | | 7,309,061 | |
Shares redeemed* | | (15,573,901) | | | (10,242,878) | |
Net decrease | | (7,227,493) | | | (2,933,817) | |
| | | | | | |
Proceeds from shares sold | $ | 423,869,961 | | $ | 295,654,804 | |
Proceeds from shares issued in reinvestment of distributions | | 21,620,757 | | | 330,982,605 | |
| | 445,490,718 | | | 626,637,409 | |
Cost of shares redeemed* | | (947,657,570) | | | (935,005,721) | |
Net decrease | $ | (502,166,852) | | $ | (308,368,312) | |
* Amounts for the year ended December 31, 2008 include a redemption as a result of an in-kind transfer of securities (see Note 7 of the Notes to Financial Statements).
NOTE 5 — EXPENSES PAID INDIRECTLY
Under an agreement with State Street Bank, custodian fees are reduced for earnings on cash balances maintained at the custodian by the Fund. Such reductions amounted to $24,618 during the year ended December 31, 2008.
NOTE 6 — ILLIQUID SECURITIES
Securities may be considered illiquid if they lack a readily available market or if valuation has not changed for a certain period of time. The aggregate value of illiquid securities amounted to $42,421,300 or 3.91% of the Fund’s net assets as of December 31, 2008.
Security | | Acquisition Date | | Shares | | Cost per Share | | Valuation per Share as of December 31, 2008 |
| | | | | | | | | | |
Oaktree Capital Group LLC, Class A | | 09/20/07 | | 2,232,700 | | $ | 36.90 | | $ | 19.00 |
| | | | | | | | | | | | |
NOTE 7 — IN-KIND REDEMPTION
During the year ended December 31, 2008, shareholders redeemed 1,433,782 shares in exchange for Fund portfolio securities valued at $114,286,748. The Fund realized a gain of $26,126,429. This gain is not taxable to the Fund for federal income tax purposes.
CLIPPER FUNDSM Financial Highlights
Financial Highlights for a share of capital stock outstanding throughout each period:
| | |
| | |
| Year ended December 31, | |
| 2008 | | 2007 | | 20064 | | 2005 | | 2004 | |
| | | | | | | | | | | | | | | |
Net Asset Value, Beginning of Period | $ | 81.00 | | $ | 91.98 | | $ | 88.18 | | $ | 89.68 | | $ | 87.97 | |
| | | | | | | | | | | | | | | |
Income (Loss) from Investment Operations: | | | | | | | | | | | | | | | |
Net Investment Income | | 0.83 | | | 0.88 | | | 1.07 | | | 1.31 | | | 0.58 | |
Net Realized and Unrealized | | | | | | | | | | | | | | | |
Gains (Losses) | | (40.99) | | | (0.84) | | | 11.84 | | | (1.52) | | | 4.51 | |
Total from Investment Operations | | (40.16) | | | 0.04 | | | 12.91 | | | (0.21) | | | 5.09 | |
| | | | | | | | | | | | | | | |
Dividends and Distributions: | | | | | | | | | | | | | | | |
Dividends from Net Investment Income | | (0.83) | | | (0.87) | | | (1.10) | | | (1.29) | | | (0.57) | |
Distributions from Realized Gains | | (0.02) | | | (10.15) | | | (8.01) | | | – | | | (2.81) | |
Return of Capital | | (0.01) | | | – | | | – | | | – | | | – | |
Total Dividends and Distributions | | (0.86) | | | (11.02) | | | (9.11) | | | (1.29) | | | (3.38) | |
| | | | | | | | | | | | | | | |
Net Asset Value, End of Period | $ | 39.98 | | $ | 81.00 | | $ | 91.98 | | $ | 88.18 | | $ | 89.68 | |
| | | | | | | | | | | | | | | |
Total Return1 | | (49.57)% | | | 0.05% | | | 15.27% | | | (0.24)% | | | 5.87% | |
| | | | | | | | | | | | | | | |
Ratios/Supplemental Data: | | | | | | | | | | | | | | | |
Net Assets, End of Period | | | | | | | | | | | | | | | |
(000,000 omitted) | $ | 1,084 | | $ | 2,781 | | $ | 3,428 | | $ | 4,006 | | $ | 7,208 | |
Ratio of Expenses to Average Net Assets: | | | | | | | | | | | | | | | |
Gross | | 0.76% | | | 0.69% | | | 0.70% | | | 1.12% | | | 1.12% | |
Net3 | | 0.76% | | | 0.69% | | | 0.62% | | | 1.11% | | | 1.12% | |
Ratio of Net Investment Income to | | | | | | | | | | | | | | | |
Average Net Assets | | 1.21% | | | 0.85% | | | 1.11% | | | 0.97% | | | 0.65% | |
Portfolio Turnover Rate2 | | 7% | | | 25% | | | 63% | | | 13% | | | 16% | |
1 Assumes hypothetical initial investment on the business day before the first day of the fiscal period, with all dividends and distributions reinvested in additional shares on the reinvestment date, and redemption at the net asset value calculated on the last business day of the fiscal period.
2 The lesser of purchases or sales of portfolio securities for a period, divided by the monthly average of the market value of portfolio securities owned during the period. Securities with a maturity or expiration date at the time of acquisition of one year or less are excluded from the calculation.
3 The Net ratio of expenses to average net assets reflects the impact, if any, of the reduction of expenses paid indirectly and of certain reimbursements or waivers from the Adviser.
4 Effective January 1, 2006, Davis Selected Advisers, L.P., assumed management of the Fund. A different investment adviser managed the Fund from inception through December 31, 2005.
|
See Notes to Financial Statements |
CLIPPER FUNDSM Report of Independent Registered Public Accounting Firm
To the Shareholders and Board of Directors
of Clipper Fund, Inc.:
We have audited the accompanying statement of assets and liabilities of Clipper Fund, Inc., including the schedule of investments, as of December 31, 2008, the related statement of operations for the year then ended, the statements of changes in net assets for each of the years in the two-year period then ended, and the financial highlights for each of the years in the three-year period then ended. These financial statements and financial highlights are the responsibility of the Fund’s management. Our responsibility is to express an opinion on these financial statements and financial highlights based on our audits. The financial highlights for each of the years in the two-year period ended December 31, 2005 were audited by other auditors, whose report dated February 22, 2006, expressed an unqualified opinion of this information.
We conducted our audits in accordance with the standards of the Public Company Accounting Oversight Board (United States). Those standards require that we plan and perform the audit to obtain reasonable assurance about whether the financial statements and financial highlights are free of material misstatement. An audit includes examining, on a test basis, evidence supporting the amounts and disclosures in the financial statements. Our procedures included confirmation of securities owned as of December 31, 2008, by correspondence with the custodian and brokers or by other appropriate auditing procedures where replies from brokers were not received. An audit also includes assessing the accounting principles used and significant estimates made by management, as well as evaluating the overall financial statement presentation. We believe that our audits provide a reasonable basis for our opinion.
In our opinion, the financial statements and financial highlights referred to above present fairly, in all material respects, the financial position of Clipper Fund, Inc. as of December 31, 2008, the results of its operations for the year then ended, the changes in its net assets for each of the years in the two-year period then ended, and the financial highlights for each of the years in the three-year period then ended, in conformity with U.S. generally accepted accounting principles.
KPMG LLP
Denver, Colorado
February 20, 2009
CLIPPER FUNDSM Fund Information
Federal Income Tax Information (Unaudited)
In early 2009, shareholders will receive information regarding all dividends and distributions paid to them by the Fund during calendar year 2008. Regulations of the U.S. Treasury Department require the Fund to report this information to the Internal Revenue Service.
The information and distributions reported herein may differ from the information reported as distributions taxable to certain shareholders for the calendar year 2008 with their 2008 Form 1099-DIV.
During the calendar year 2008, the Fund declared and paid long-term capital gain distributions in the amount of $449,640.
During the calendar year 2008, $22,199,262 of dividends paid by the Fund constituted income dividends for federal income tax purposes. The Fund designates $22,199,262 or 100% as income qualifying for the corporate dividends-received deduction.
For the calendar year 2008, certain dividends paid by the Fund constitute qualified dividend income for federal income tax purposes. The Fund designates $22,199,262 or 100% as qualified dividend income.
The foregoing information is presented to assist shareholders in reporting dividends and distributions received from the Fund to the Internal Revenue Service. Because of the complexity of the federal regulations, which may affect your individual tax return and the many variations in state and local tax regulations, we recommend that you consult your tax adviser for specific guidance.
Portfolio Proxy Voting Policies and Procedures
The Fund has adopted Portfolio Proxy Voting Policies and Procedures under which the Fund votes proxies relating to securities held by the Fund. A description of the Fund’s Portfolio Proxy Voting Policies and Procedures is available (i) without charge, upon request, by calling the Fund toll-free at 1-800-432-2504, (ii) on the Fund’s website at www.clipperfund.com, and (iii) on the SEC’s website at www.sec.gov.
In addition, the Fund is required to file Form N-PX, with its complete proxy voting record for the 12 months ended June 30th, no later than August 31st of each year. The Fund’s Form N-PX filing is available (i) without charge, upon request, by calling the Fund toll-free at 1-800-432-2504, (ii) on the Fund’s website at www.clipperfund.com, and (iii) on the SEC’s website at www.sec.gov.
Form N–Q
The Fund files its complete schedule of portfolio holdings with the SEC for the first and third quarters of each fiscal year on Form N-Q. The Fund’s Form N-Q is available without charge, upon request, by calling 1-800-432-2504 or on the Fund’s website at www.clipperfund.com, or on the SEC’s website at www.sec.gov. The Fund’s Form N-Q may be reviewed and copied at the SEC’s Public Reference Room in Washington, DC, and that information on the operation of the Public Reference Room may be obtained by calling 1-800-SEC-0330.
CLIPPER FUNDSM Directors and Officers
For the purpose of their service as directors to the Clipper Fund, the business address for each of the directors is 2949 E. Elvira Road, Suite 101, Tucson, AZ 85756. All directors qualify as independent under the Investment Company Act of 1940.
Name
(birthdate) | Position(s)
Held with
Fund | Term of Office
and Length of
Time Served | Principal
Occupation(s)
During Past
5 Years | Number of
Portfolios
Overseen in
Fund Complex | Other
Directorships
Held |
| | | | | |
Independent Directors | | | | | |
| | | | | | |
| Lawrence E. Harris (09/16/1956) | Director | Indefinite and since April 2006 | Fred V. Keenan Chair in Finance of the Marshall School of Business, University of Southern California, Los Angeles, CA | 1 | Interactive Brokers Group, Inc. |
| | | | | | |
| Steven N. Kearsley (09/29/1941) | Director | Indefinite and since April 2006 | Private Investor, Real Estate Development | 1 | None |
| | | | | | |
| Lawrence P. McNamee
(09/12/1934) | Director | Indefinite and since inception | Retired Educator | 1 | None |
| | | | | | |
Norman B. Williamson
(05/18/1932) | Director/ Chairman | Indefinite and since inception | Private Investor | 1 | None |
| | | | | | |
Officers
Christopher C. Davis (born 7/13/65, Clipper Fund officer since 12/19/05). President of Clipper Fund. Chairman, Davis Selected Advisers, L.P., and also serves as an executive officer in certain companies affiliated with the Adviser, including sole member of the Adviser’s general partner, Davis Investments, LLC; Chief Executive Officer, President or Vice President of each of the Davis Funds (consisting of 13 portfolios), and Selected Funds (consisting of three portfolios); Employee of Shelby Cullom Davis & Co. (registered broker/dealer); Director of Davis New York Venture Fund, Inc. (consisting of four portfolios), Davis Variable Account Fund, Inc. (consisting of three portfolios), and the Selected Funds (consisting of three portfolios); Director of Washington Post Co. (newspaper publisher).
Kenneth C. Eich (born 8/14/53, Clipper Fund officer since 12/19/05). Executive Vice President and Principal Executive Officer of Clipper Fund, each of the Davis Funds (consisting of 13 portfolios), and Selected Funds (consisting of three portfolios); Chief Operating Officer, Davis Selected Advisers, L.P.; and also serves as an executive officer in certain companies affiliated with the Adviser.
Douglas A. Haines (born 3/4/71, Clipper Fund officer since 12/19/05). Vice President, Treasurer, Chief Financial Officer, Principal Financial Officer, and Principal Accounting Officer of Clipper Fund, each of the Davis Funds (consisting of 13 portfolios), and Selected Funds (consisting of three portfolios); Vice President and Director of Fund Accounting, Davis Selected Advisers, L.P.
Sharra L. Haynes (born 9/25/66, Clipper Fund officer since 12/19/05). Vice President, Chief Compliance Officer of Clipper Fund, each of the Davis Funds (consisting of 13 portfolios), and Selected Funds (consisting of three portfolios); Vice President and Chief Compliance Officer, Davis Selected Advisers, L.P.; and also serves as an executive officer in certain companies affiliated with the Adviser.
Thomas D. Tays (born 3/7/57, Clipper Fund officer since 12/19/05). Vice President and Secretary of Clipper Fund; each of the Davis Funds (consisting of 13 portfolios), and Selected Funds (consisting of three portfolios); Vice President, Chief Legal Officer and Secretary, Davis Selected Advisers, L.P.; and also serves as an executive officer in certain companies affiliated with the Adviser.
CLIPPER FUNDSM
Investment Adviser | |
Davis Selected Advisers, L.P. (Doing business as “Davis Advisors”) | |
2949 East Elvira Road, Suite 101 | |
Tucson, Arizona 85756 | |
(800) 432-2504 | |
| |
Distributor | |
Davis Distributors, LLC | |
2949 East Elvira Road, Suite 101 | |
Tucson, Arizona 85756 | |
| |
Transfer Agent | |
Boston Financial Data Services, Inc. | |
P.O. Box 55468 | |
Boston, Massachusetts 02205-5468 | |
| |
Custodian | |
State Street Bank and Trust Co. | |
One Lincoln Street | |
Boston, Massachusetts 02111 | |
| |
Counsel | |
Paul, Hastings, Janofsky & Walker, LLP | |
515 South Flower Street, 25th Floor | |
Los Angeles, CA 90071 | |
| |
Independent Registered Public Accounting Firm | |
KPMG LLP | |
707 Seventeenth Street, Suite 2700 | |
Denver, Colorado 80202 | |
For more information about Clipper Fund including management fee, charges, and expenses, see the current prospectus, which must precede or accompany this report. The Fund’s Statement of Additional Information contains additional information about the Fund’s Directors and is available upon request, free of charge, by contacting the Fund at 800-432-2504 or on the Fund’s website at www.clipperfund.com.
ITEM 2. CODE OF ETHICS
The registrant has adopted a code of ethics that applies to the registrant’s principal executive officer, principal financial officer, principal accounting officer or controller, or persons performing similar functions.
A copy of the code of ethics is filed as an exhibit to this form N-CSR.
No waivers were granted to this code of ethics during the period covered by this report.
ITEM 3. AUDIT COMMITTEE FINANCIAL EXPERT
The Fund’s Board of Directors has determined that independent trustee Steven N. Kearsley qualifies as the “audit committee financial expert”, as defined in Item 3 of form N-CSR.
ITEM 4. PRINCIPAL ACCOUNTANT FEES AND SERVICES
| (a) | Audit Fees. The aggregate Audit Fees billed by KPMP LLP (“KPMG”) for professional services rendered for the audits of the audits of the financial statements, or services that are normally provided in connection with statutory and regulatory filings or engagements for the fiscal year ends December 31, 2008 and December 31, 2007 were $54,000 and $52,800, respectively. |
| (b) | Audit-Related Fees. The aggregate Audit-Related Fees billed by KPMG for services rendered for assurance and related services that are not reasonably related to the performance of the audit or review of the fund financial statements, but not reported as Audit Fees fore fiscal year ends December 31, 2008 and December 31, 2007 were $0 and $0, respectively. |
| (c) | Tax Fees. The aggregate Tax Fees billed by KPMG for professional services rendered for tax compliance, tax advice and tax planning for the fiscal year ends December 31, 2008 and December 31, 2007 were $8,040 and $8,280, respectively. |
Fees included in the Tax Fee category comprise all services performed by professional staff in the independent accountant’s tax division except those services related to the audit. These services include preparation of tax returns, tax advice related to mergers and a review of the fund income and capital gain distributions.
| (d) | All Other Fees. The aggregate Other Fees billed by KPMG for all other non-audit services rendered to the fund for the fiscal year ends December 31, 2008 and December 31, 2007 were $0 and $0, respectively. |
(e)(1) Audit Committee Pre-Approval Policies and Procedures.
The fund Audit Committee must pre-approve all audit and non-audit services provided by the independent accountant relating to the operations or financial reporting of the funds. Prior to the commencement of any audit or non-audit services to a fund, the Audit Committee reviews the services to determine whether they are appropriate and permissible under applicable law.
The fund Audit Committee has adopted a policy whereby audit and non-audit services performed by the fund independent accountant require pre-approval in advance at regularly scheduled Audit Committee meetings. If such a service is required between regularly scheduled Audit Committee meetings, pre-approval may be authorized by the Audit Committee Chairperson with ratification at the next scheduled audit committee meeting.
| (2) | No services included in (b) – (d) above were approved pursuant to paragraph (c)(7)(i)(C) of |
Rule 2-01 of Regulation S-X.
| (g) | The Funds’ independent accountant did not provide any services to the investment advisor or any affiliate for the fiscal years ended December 31, 2008 and December 31, 2007. The fund has not paid any fees for non-audit not previously disclosed in items 4 (b) – (d). |
| (h) | The registrant’s audit committee of the board of trustees has considered whether the provision of non-audit services that were rendered to the registrant’s investment adviser, and any entity controlling, controlled by, or under common control with the investment adviser that provides ongoing services to the registrant that not pre-approved pursuant to paragraph (c)(7)(ii) of Rule 2-01 of Regulation S-X is compatible with maintaining the principal accountant’s independence. No such services were rendered. |
ITEM 5. AUDIT COMMITTEE OF LISTED REGISTRANTS
Not Applicable
ITEM 6. SCHEDULE OF INVESTMENTS
Not Applicable. The complete Schedule of Investments is included in Item 1 of this for N-CSR
ITEM 7. DISCLOSURE OF PROXY VOTING POLICIES AND PROCEDURES FOR CLOSED-END MANAGEMENT INVESTMENT COMPANIES
Not Applicable
ITEM 8. PORTFOLIO MANAGERS OF CLOSED-END MANAGEMENT INVESTMENT COMPANIES
Not Applicable
ITEM 9. PURCHASES OF EQUITY SECURITIES BY CLOSED-END MANAGEMENT INVESTMENT COMPANIES AND AFFILIATED PURCHASERS
Not Applicable
ITEM 10. SUBMISSION OF MATTERS TO A VOTE OF SECURITY HOLDERS
There have been no changes to the procedure by which shareholders may recommend nominees to the registrant’s Board of Trustees.
ITEM 11. CONTROLS AND PROCUDURES
| (a) | The registrant’s principal executive officer and principal financial officer have concluded that the registrant’s disclosure controls and procedures (as defined in Rule 30a-3 (c) under the Investment Company Act of 1940, as amended) are effective as of a date within 90 days of the filing date of this report. |
| (b) | There have been no significant changes in the registrant’s internal controls or in other factors that could significantly affect these controls. |
ITEM 12. EXHIBITS
(a)(1) The registrant’s code of ethics pursuant to Item 2 of Form N-CSR is filed as an exhibit to this form N-CSR.
(a)(2) Certifications pursuant to Section 302 of the Sarbanes-Oxley Act of 2002 are attached.
(a)(3) Not applicable
(b) Certifications pursuant to Section 906 of the Sarbanes-Oxley Act of 2002 are attached.
SIGNATURES
Pursuant to the requirements of the Securities Exchange Act of 1934 and the Investment Company Act of 1940, the registrant has duly caused this report to be signed on its behalf by the undersigned, thereunto duly authorized.
CLIPPER FUND, INC.
| Principal Executive Officer |
Date: March 6, 2009
Pursuant to the requirements of the Securities Exchange Act of 1934 and the Investment Company Act of 1940, this report has been signed below by the following persons on behalf of the registrant and in the capacities and on the dates indicated.
| Principal Executive Officer |
Date: March 6, 2009
| Principal Financial Officer |
Date: March 6, 2009