UNITED STATES
SECURITIES AND EXCHANGE COMMISSION
Washington, DC 20549
FORM N-CSR
CERTIFIED SHAREHOLDER REPORT OF REGISTERED MANAGEMENT INVESTMENT COMPANY
Investment Company Act file number 811-03931
CLIPPER FUND, INC.
(Exact name of registrant as specified in charter)
2949 East Elvira Road, Suite 101
Tucson, AZ 85756
(Address of principal executive offices)
Thomas D. Tays
Davis Selected Advisers, L.P.
2949 East Elvira Road, Suite 101
Tucson, AZ 85756
(Name and address of agent for service)
Registrant’s telephone number, including area code: 520-806-7600
Date of fiscal year end: December 31, 2009
Date of reporting period: December 31, 2009
____________________
ITEM 1. REPORT TO STOCKHOLDERS
CLIPPER FUNDSM
Cautionary Statement
Davis Advisors is committed to communicating with our investment partners as candidly as possible because we believe our investors benefit from understanding our investment philosophy and approach. Our views and opinions regarding the investment prospects of our portfolio holdings include “forward looking statements” which may or may not be accurate over the long term. While we believe we have a reasonable basis for our appraisals and we have confidence in our opinions, actual results may differ materially from those we anticipate. These opinions are current as of the date of this report but are subject to change. The information provided in this report should not be considered a recommendation to buy, sell, or hold any particular security.
You can identify forward looking statements by words like “believe,” “expect,” “anticipate,” or similar expressions when discussing prospects for particular portfolio holdings and/or of the Fund. We cannot assure future results and achievements. You should not place undue reliance on forward looking statements, which speak only as of the date of this report. We disclaim any obligation to update or alter any forward looking statements, whether as a result of new information, future events, or otherwise. This material must be preceded or accompanied by a Prospectus. Please read the Prospectus carefully for a discussion of investment objectives, risks, fees, and expenses. Current performance may be lower or higher than the performance quoted herein. You may obtain a current copy of the prospectus or more current performance information by calling investor services at 1-800-432-2504, or on Clipper Fund’s website (www.clipperfund.com).
Clipper Fund Shareholders Meeting
Davis Advisors cordially invites you to the 2010 Clipper Fund Shareholders Meeting with Portfolio Managers Christopher Davis and Kenneth Feinberg to be held on Wednesday, March 31st.
The Fund managers will discuss the investment approach and portfolio. A question-and-answer session will follow.
Location: The Peninsula Hotel Beverly Hills
9882 South Santa Monica Boulevard
Beverly Hills, CA 90212
Verandah Room
Time: 9:30 A.M. – 11:00 A.M. (PDT)
Attendees: Clipper Fund shareholders, consultants, and other interested parties.
For more information, please call 800-432-2504.
(Not a part of Annual Report to Fund shareholders)
CLIPPER FUNDSM | Table of Contents |
| Shareholder Letter | 2 |
| | |
| Management’s Discussion of Fund Performance | 11 |
| | |
| Fund Overview | 13 |
| | |
| Expense Example | 15 |
| | |
| Schedule of Investments | 16 |
| | |
| Statement of Assets and Liabilities | 18 |
| | |
| Statement of Operations | 19 |
| | |
| Statements of Changes in Net Assets | 20 |
| | |
| Notes to Financial Statements | 21 |
| | |
| Financial Highlights | 26 |
| | |
| Report of Independent Registered Public Accounting Firm | 27 |
| | |
| Fund Information | 28 |
| | |
| Privacy Notice and Householding | 29 |
| | |
| Directors and Officers | 30 |
This Annual Report is authorized for use by existing shareholders. Prospective shareholders must receive a current Clipper Fund prospectus, which contains more information about investment strategies, risks, fees, and expenses. Please read the prospectus carefully before investing or sending money.
Shares of the Clipper Fund are not deposits or obligations of any bank, are not guaranteed by any bank, are not insured by the FDIC or any other agency, and involve investment risks, including possible loss of the principal amount invested.
CLIPPER FUNDSM | Shareholder Letter |
The chart below summarizes results through December 31, 2009 for Clipper Fund compared with the S&P 500® Index against which my co-manager Ken Charles Feinberg, our colleagues and I judge ourselves. Our goal is to outperform this Index after fees over the long term.
| Annualized Total Returns as of December 31, 2009 |
| | 1 Year | 5 Years | 10 Years | Since Inception (2/29/84) |
| Clipper Fund | 37.60% | (4.40)% | 3.74% | 11.36% |
S&P 500® Index | 26.46% | 0.42% | (0.95)% | 10.62% |
The performance presented represents past performance and is not a guarantee of future results. Total return assumes reinvestment of dividends and capital gain distributions. Investment return and principal value will vary so that, when redeemed, an investor’s shares may be worth more or less than their original cost. The total annual operating expense ratio as of the most recent prospectus was 0.76%. The total annual operating expense ratio may vary in future years. Current performance may be higher or lower than the performance data quoted. For most recent month-end returns, visit clipperfund.com or call 800-432-2504. The Fund received favorable class action settlements from companies that it no longer owns. These settlements had a material impact on the investment performance of the Fund in 2009. This was a one-time event that is unlikely to be repeated. Clipper Fund was managed from inception, February 29, 1984, until January 1, 2006 by another Adviser. Davis Selected Advisers, L.P. took over management of the Fund on January 1, 2006.
While this chart is bookended by satisfactory short-term and long-term results, these figures must be discounted, albeit for different reasons. Starting with the very short term, it might seem that Clipper Fund’s 2009 gain of 37.60% versus the 26.46% gain of the S&P 500® Index would be something to brag about.1 However, when these gains are put in the context of how far the Fund had fallen in the previous year, they become a grim reminder of the ground we still have to make up. Specifically, having declined almost 50% in 2008, the Fund would have to be up 100% to be back where it started. Looked at this way, last year’s 37.60% increase can only be described as a first step on a long journey. Furthermore, as highlighted in our last report, one year results were materially helped by the proceeds of two legal settlements. These settlements were awarded to Clipper Fund as compensation for losses in our holdings in Tyco and El Paso and amounted to $1.43 per share or roughly 5%.
At the other end of the table, Clipper Fund’s long-term results were achieved under the able stewardship of our predecessor. As a result, our firm deserves no credit for the Fund’s strong results over the last decade or since inception.
While we are embarrassed and disappointed by our results since being entrusted with the responsibility of managing Clipper Fund in January of 2006, we remain committed to the goal of generating satisfactory returns on both an absolute and relative basis and determined to continue to make up the ground we lost. This commitment is more than just words as we, our colleagues at Davis Advisors and our families now have more than $60 million invested in Clipper Fund. In addition to believing the stocks that make up Clipper are very attractively valued, we would also note that the combination of realized and unrealized losses in the Fund now amounts to almost 40% of net asset value. Thus, if we are successful in generating returns, Clipper Fund should be especially tax efficient.
| Annualized Total Returns as of December 31, 2009 for Clipper Fund | 1 Year | 5 Years | 10 Years |
| Return Before Taxes | 37.60% | (4.40%) | 3.74% |
| Return After Taxes on Distributions | 37.43% | (5.15%) | 2.60% |
| Returns after Taxes on Distributions and Sale Of Fund Shares | 24.67% | (3.49%) | 3.04% |
The performance presented represents past performance and is not a guarantee of future results. Total return assumes reinvestment of dividends and capital gain distributions. Investment return and principal value will vary so that, when redeemed, an investor’s shares may be worth more or less than their original cost. See endnotes for additional disclosure.
1 Past performance is not a guarantee of future results.
Not a part of Annual Report to Fund shareholders
CLIPPER FUNDSM | Shareholder Letter – (Continued) |
We should note that in 2009, the Fund’s management fees were reduced by about 6% from 0.62% to 0.58% per year (Clipper’s management fees going forward will not be higher than 0.55%). This reduction combined with market appreciation has lowered our overall expense ratio about 7%, from the 0.86% reported in our semiannual report in June to 0.80% as of year-end.
In the pages ahead, we will try to put the above results in context as well as share our perspective on the investment environment and our Portfolio companies. As with our semi-annual report, we have structured this report as a series of responses to the questions most frequently asked by our shareholders, including questions that we received at our 2009 shareholders’ gathering. (Please note that this year’s shareholder gathering will be held on March 31 at 9:30 a.m. at the Peninsula Hotel in Los Angeles.) The questions addressed in this report are organized from the general to the specific and, as always, will include a review of our mistakes as well as our successes.
Is this recovery for real?
Less than a year ago, many investors were concerned about a new Great Depression. Prices of all asset classes, except Treasuries, were collapsing. Unemployment was surging and liquidity was evaporating. The combined market capitalization of our nation’s financial institutions fell 80% on average and most of the largest were taken over, forced to raise capital or filed for bankruptcy. To make matters worse, the combination of overextended consumers, undercapitalized financial institutions, excess manufacturing capacity, and an underemployed workforce made it difficult to see what engine could pull the economy out of its nosedive. From the highs reached in 2007 through the trough in March 2009, the stock market fell more than 55% and Clipper Fund almost 66%.
In response to this free fall, the U.S. government and Federal Reserve pulled out all the stops, pouring liquidity into the system through near zero interest rates, huge increases in government spending, unprecedented capital investments in financial and industrial institutions, the direct purchase or guarantees of less liquid loans and securities, a ballooning of the Federal Reserve’s balance sheet, and expanded access to its discount window. While some of these individual actions may be questioned and the long-term consequences of soaring government deficits have yet to be faced, there is no doubt that drastic action was required.
As time passed, these actions took hold and though the economic news has not gotten much better, it has stopped getting worse. Although such important indicators as home prices and unemployment are still significantly worse than they were a year ago, they seem to have stabilized, albeit at depressed levels. Because we were in the midst of a financial panic, stabilization or a decline in the rate of decline was viewed with enormous relief, setting off an explosive rally in global stocks. As strange as this might sound, the news that we are in the midst of one of the worst downturns in more than 50 years was welcomed simply because it was better than Armageddon. As a result, despite a shrinking economy, high unemployment and soaring deficits, the S&P 500® Index surged a staggering 68% and Clipper Fund jumped more than 92% from their March lows through the end of the year.2
While such huge increases in so short a time are almost unprecedented, they are as much a consequence of how far markets had fallen as they are a reflection of new optimism. As suggested at the beginning of this report, an occasionally forgotten piece of math is that a 50% decline requires a 100% increase just to break even. Thus, having fallen more than 55% before recovering 68%, the S&P 500® Index still trades almost 30% below its starting point. The math is worse for Clipper, which after falling almost 66% and rising more than 92%, is still about 35% behind its starting point.
From a longer term perspective, even after this recent rally the S&P 500® Index is still well below where it was 10 years ago. Although the market has fallen during this decade, the companies that make up the S&P 500® Index are earning more and are thus more valuable. Specifically, at the end of 1999, the S&P 500® Index traded for 1,469 and earned about $48, implying an earnings yield of about 3%. Today, the S&P 500® Index trades for 1,115 and should earn $55-$75 this year, implying an
Not a part of Annual Report to Fund shareholders
CLIPPER FUNDSM | Shareholder Letter – (Continued) |
earnings yield of 5%-7% on fairly depressed earnings.3 More important, when we look at the individual companies that we hold in Clipper Fund, many now have earnings yields of 7%-10% and intrinsic values significantly above today’s prices.
Although valuations still seem reasonable, many investors are anxious that the market’s steep recovery means that it must be ahead of itself and that they would do better to wait for a correction. However, there is an old saying that “the market doesn’t know where it’s been.” In other words, the returns investors earn have nothing to do with where a specific stock or the market in general was trading a year before they invested. It is also not uncommon or a sign of overvaluation when the market bounces from depressed levels. For example, after falling more than 40% in less than two years and bottoming in October of 1974, the market soared 55% in the next nine months making 1975 one of the strongest years for the S&P 500® Index in the last 40 years. Given that the market was up more than 50% and the economy was still weak, with inflation and unemployment rising and the energy crisis looming, investors who missed 1975’s strong advance might have felt it would be prudent to wait for a better time to invest. If they waited, in one sense they were correct as many economic indicators continued to worsen, only reaching their nadir in the 1980-1981 recession with double-digit inflation, interest rates and unemployment. However, as is generally the case, the market recovered long before the economy, advancing another 24% the following year. In fact, in the five years following 1975’s 37% gain, the market almost doubled. Clearly, those who waited until investing “felt” better paid a big price. As Warren Buffett wrote in a prescient article that almost rang the bell at the end of the bear market in August 1979:
[The] argument is made that there are just too many question marks about the near future; wouldn't it be better to wait until things clear up a bit? You know the prose: Maintain buying reserves until current uncertainties are resolved, etc. Before reaching for that crutch, face up to two unpleasant facts: The future is never clear; you pay a very high price in the stock market for a cheery consensus. Uncertainty actually is the friend of the buyer of long-term values.4
We do not use this example of the 1970s market recovery as a forecast. We simply do not know what the market will do in the next year or two. Rather we use it to point out that stock market returns in any one year do not help predict what returns might be the following year. If investors have learned anything over the last several years, it should be the futility of short-term market forecasts.
How do concerns about the economy factor into investment decisions?
In selecting investments for Clipper Fund, we try to determine the intrinsic value of individual businesses, an approach often referred to as bottom-up or fundamental investing. Because of our long holding period, it is likely that we will own any business we buy through many different economic environments, including at least one recession. Thus, rather than try to predict the timing of economic downturns, we try to incorporate their inevitability into our business appraisals. Specifically, we ask ourselves, “Are the businesses that we own at today’s prices likely to produce satisfactory long-term returns for patient investors even if we go through periods of recession?” In our assessment, the companies that make up the Portfolio pass this threshold test.
However, it is also apparent that dramatic imbalances in the broader economic environment, such as the combined forces that created the real estate bubble, can threaten even well-capitalized companies in unexpected ways. One lesson learned from the losses incurred when that bubble burst is that we should always be looking for large but unsustainable trends in the macroeconomic environment that could have substantial effects on corporate earnings.
Today, the most glaring example of such an imbalance is the high and growing level of government debt. The monetary and fiscal implications of this trend will likely lower the value of many businesses. As a result, this top-down economic issue warrants the consideration of bottom-up investors like us.
3 Source: Standard & Poor’s Index Services and S&P Analytic Services, via standardandpoors.com. Actual results may differ materially from those we anticipate. The S&P 500® Index traded for 1,115 on 12/31/09.
4 Source: You pay a very high price in the stock market for a cheery consensus by Warren E. Buffett – Forbes, August 6, 1979.
Not a part of Annual Report to Fund shareholders
CLIPPER FUNDSM | Shareholder Letter – (Continued) |
While we often read about the high costs of last year’s stimulus and financial stabilization programs, these pale in comparison with the estimated costs of fulfilling the health care and Social Security promises that our elected officials continue to make year after year. In making these promises, our government is behaving in much the same manner as previous managements of General Motors (GM). Over the decades, it was far easier for executives to make concessions and promises to workers than to deal with the unpleasant reality that such promises were impairing the long-term prospects of the company. After all, these CEOs were likely to be long into a rich retirement before the consequences of their shortsightedness took hold. Similarly, most of today’s politicians will be long gone before the bill for today’s promises comes due. But just as with GM, the cost of these unrealistic and unsustainable promises must eventually be faced.
It is rightly said that terrible things can happen when the policy cycle is longer than the election cycle. A chilling example of these dangers appeared last year when the U.S. Department of Treasury issued its “2008 Financial Report of the United States Government.” Because we feel this report should be read by all concerned citizens, we have posted a copy of it in the “Fund Literature” section of clipperfund.com. It is written in plain English and in the spirit of Thomas Jefferson who said, “We might hope to see the finances of the Union as clear and intelligible as a merchant’s books, so that every member of Congress and every man of any mind in the Union should be able to comprehend them, to investigate abuses, and consequently to control them.” There in black and white, the report accounts for the Social Security and health care promises being made today in accordance with generally accepted accounting principles (GAAP) rather than the shameful pay as you go method of government accounting. What is so frightening is that this report shows that the present value of future expenditures on social insurance programs alone already exceeds anticipated future revenue by a staggering $43 trillion, three times the size of our total economy! The report goes on to warn, “The projected growth in entitlement spending under current law…will ultimately affect every citizen in the nation.… The Government must act to bring social insurance expenses and resources in balance.”
While the only responsible reaction to such data is to reduce the health care and retirement promises being made on the grounds that we simply cannot afford them, such a position would be deeply unpopular. Given that popularity is a requirement to be elected, we can assume that such reductions are unlikely until we are faced with another crisis.
A failure by our elected representatives to address these concerns has a number of important investment implications that factor into every one of our business appraisals. First of all, we assume that U.S. tax rates both on individuals and corporations will increase, perhaps substantially, in the years ahead. Because our business evaluations are based in part on after-tax free cash flow, this assumption has a direct influence on a number of factors in our appraisals. For example, higher taxes will tend to lower the value of companies with large U.S. earnings streams and/or overseas cash that must be repatriated. Conversely, higher taxes could raise the value of tax loss carryforwards and/or earnings that are not subject to U.S. taxation (for examples see the discussion of portfolio holdings on the next page).
More troubling and difficult to quantify is the fact that the government has the incentive to deflate the cost of its debts by inflating the amount of money it prints, making it likely that our country is entering a period of higher monetary inflation. Such inflation can wreak havoc on businesses that are unable to increase prices as well as cause substantial losses for investors in long-dated Treasuries and other fixed rate debt instruments. While such an outcome is not certain, investors who have been drawn to the “safety” of long-term government bonds are taking a far greater risk than they realize. In fact, we would suggest that long-dated government bonds are currently selling at bubble prices and that even though such bubbles can last a long time, they always burst in the end.
In sum, while we do not invest based on predictions about the macroeconomic environment, we do consider these troubling developments as risk factors to incorporate in our securities analysis. Just because we cannot predict the future does not mean we cannot prepare.
Not a part of Annual Report to Fund shareholders
CLIPPER FUNDSM | Shareholder Letter – (Continued) |
How is the Portfolio constructed today?5
Clipper Fund has investments in 24 companies, each of which was selected and evaluated based on its own merits. Nevertheless, as implied in the discussion above, we often incorporate larger themes or trends into our evaluations. For example, given our economic concerns, our growing investments in global leaders such as Merck, Procter & Gamble, Coca-Cola, and Diageo (the world’s largest spirits company) represent relatively safe havens. These businesses are characterized by balance sheet strength, competitive advantages, decent returns on capital, reasonable pricing power, low obsolescence risk, and geographic diversity. Furthermore, these companies on average trade at a discount to the market and have dividend yields that exceed the yield on Treasury bonds. Specifically, on average, these companies are generating an earnings yield of about 8% while paying a dividend yield of more than 3%. Such valuations seem particularly attractive when compared to the 5%-7% earnings yield and 2% dividend yield of the average company in the S&P 500® Index.
A second category of investments would include our holdings in the energy sector, which combine several top-down themes with bottom-up stock selection. From a top-down perspective, we have long believed that the combination of powerful growth in the emerging markets, steep depletion rates for some of the world’s largest oil fields, and the high cost of alternative energy sources would cause energy prices to rise over the long term. Further, the fact that oil is a global commodity means that it will hold its value even in times of monetary inflation, as discussed above. From a bottom-up point of view, when evaluating individual energy companies, our primary focus is not just on earnings durability (as measured by factors such as reserve life and growth in reserves per share) or on price (as measured by factors such as enterprise value per barrel of oil equivalent) but particularly on the reinvestment rate. After all, very few energy companies voluntarily liquidate. As a result, most of the money they make selling energy is reinvested in replacing the oil or gas that they just sold. Unfortunately, for most companies in the energy sector, the long-term returns on this reinvested capital have been poor due to a lack of discipline. Our largest holding in this sector, Canadian Natural Resources, as well as the energy operations of Loews Corp. have been welcome exceptions as both companies have generated satisfactory returns on reinvested capital over the very long term. We think the managements of these companies are among the best in the sector.
However, ConocoPhillips, which was once one of our largest holdings, has failed this test. Over the last five years, the company reinvested huge amounts in low-returning projects. As if this were not bad enough, the company also went on an acquisition binge, issuing its relatively undervalued shares in exchange for overpriced acquisitions. As a result of this lack of capital discipline, ConocoPhillips’ share price has trailed the majority of other energy companies in which we could have invested. While the company has still been a contributor to our returns because of strength in the sector, it has been a laggard compared to its industry. We continue to hold some shares, however, based on valuation and management’s commitment to greater capital discipline in the future.
A third category is made up of our holdings in financial companies. Excluding our investments in Berkshire Hathaway and Loews (which each have significant insurance operations but are really diversified holding companies) Clipper Fund has about 33% of assets invested in financials. Although the unprecedented events of the last year have left us shaken, the fact remains that financial service is one of the world’s oldest professions and unlikely to ever become obsolete. Companies like American Express, Wells Fargo & Company, and JPMorgan Chase have been in businesses for more than a century. But even these are relative newcomers compared with The Bank of New York Mellon, which was founded by Alexander Hamilton more than 200 years ago. It is not a coincidence that these four companies make up the lion’s share of our holdings in the financial sector.
Turning to price, financial services firms generally trade at below-average valuations in terms of both earnings and dividends. For example, the four companies mentioned above trade at average P/E multiples of 12-15 times our estimated range of their 2010 earnings compared with the market multiple of 15-20 times. This discount may be even wider as these companies benefit from industry consolidation, the collapse of the shadow banking sector and reductions in bad credit costs. In fact, over the next three to five years, earnings at these companies could increase 50%-100%. We should note, however, that some of these positives are likely to be offset by a more hostile political, regulatory and fiscal environment. Finally, we view it as
5 Individual securities are discussed in this piece. While we believe we have a reasonable basis for our appraisals and we have confidence in our opinions, actual results may differ materially from those we anticipate. The return of a security to the Portfolio will vary based on weighting and timing of purchase. This is not a recommendation to buy or sell any specific security. Past performance is not a guarantee of future results.
Not a part of Annual Report to Fund shareholders
CLIPPER FUNDSM | Shareholder Letter – (Continued) |
positive that all four of these companies are run by the same managements that prepared and guided their companies through the financial crisis.
Beyond the investment rationale and examples given on the previous page, we must make two further observations about the financial sector. First, we have made several investments in the sector that proved to be significant mistakes. We will discuss these in detail in the answer to the next question. Second, the financial category is a broad one that includes many companies with diverse business models. Yet the financial media tend to paint all financial companies with the same brush. For example, anyone who follows the financial media might reasonably think that the entire sector has done terribly over the last five years. However, over the last five years, companies such as Wells Fargo, Berkshire Hathaway, JPMorgan Chase, and Goldman Sachs, all of which we own, have not only outperformed the financial sector but have actually beaten the market too. Our other main holdings in the financial sector are Oaktree Capital, Ameriprise and Julius Baer Group. As these companies are essentially well-capitalized financial advisory firms, last year’s turmoil should have little lasting effect on their businesses.
Clipper Fund also holds three global technology companies, Microsoft, Hewlett-Packard and Texas Instruments. While these companies do have a higher exposure to obsolescence risk, all three enjoy very entrenched leadership positions in global businesses. Furthermore, each one generates large amounts of cash relative to its capitalization.
The final large category of Portfolio investments might be called companies that do not fit into a category. Some like Berkshire Hathaway, Loews and RHJ International are quasi-holding companies with investments in a range of industries. Others, like Costco and Harley-Davidson, uniquely dominate narrow subcategories of their respective industries. Meanwhile, a company like CVS Caremark is neither a pure retail company nor drug company but rather a type of distribution channel that should benefit from the aging of America and growth in generic drugs. As a result, while we often describe the Portfolio in terms of categories, the fact that so many holdings defy easy categorization is a reminder that, in the words of John Train, “Investing is the art of the specific.”
What were your biggest mistakes and the lessons learned?
As always, we must begin a discussion of mistakes with some definitions. Most important, we do not label an investment a mistake simply because it trades below our purchase price. In fact, it is probable that every company we buy will trade below our purchase price at some point, simply as a result of the unpredictability and vagaries of short-term results. Furthermore, it is the nature of markets that value and price often diverge for long periods of time. In euphoric times, such as during the Internet bubble, the stock prices of many companies exceed their value. In times of panic and dislocation, the value of many companies exceeds their prices. In such periods, the poor performance of an individual stock or even the Portfolio as a whole may indicate deferred returns rather than permanent losses. For example, a company purchased at $10 per share that has an intrinsic value of $20 is a good investment even if its price falls to $5 for some period of time. However, in other cases falling stock prices reflect substantial declines in the value of the underlying business. In these cases, we were mistaken in our business appraisals.
In our last several reports, we described our two largest mistakes in great detail—AIG and Merrill Lynch. These investments subtracted more than 4% per year from our results and account for the vast majority of our underperformance since assuming management for the Fund in January 2006. Because these companies remain the largest detractors from our results, we have left our last two reports on our website and commend them to your attention. (Please visit the “Fund Literature” section of the Clipper Fund website, clipperfund.com, to read these reports.) Both positions were subsequently eliminated and, although it is of little consolation, we would note that both AIG and Merrill Lynch (which was subsequently converted into Bank of America) currently trade at prices that are below the average price at which we sold them in 2008 and 2009. The lessons learned from these mistakes were valuable and deserve reexamining.
First, the chief executive officer of any large financial institution must have the skills, experience and discipline to also serve as the chief risk officer. Both AIG and Merrill Lynch were run for a number of years by executives who clearly failed this important test although in our opinion these executives were not the ones pilloried in the press. We consider it both striking and unfair that executives like John Thain and Ed Liddy were disproportionately blamed for the gross mismanagement of their predecessors. Their predecessors sowed the seeds of collapse but left just before the bitter harvest. The fact that they walked away with obscene severance packages only adds insult to injury.
Not a part of Annual Report to Fund shareholders
| CLIPPER FUNDSM | Shareholder Letter – (Continued) |
Second, both investments were grim reminders that, because of leverage, stupidity in even a relatively small part of a financial firm can bring down the entire enterprise. AIG’s global insurance operations and Merrill Lynch’s outstanding network of financial advisors were both the largest and most profitable parts of their respective firms. However, the steady profits of these huge and well-run operations were swamped by the losses at what were essentially small proprietary trading desks. In others words, the idiocy of a tiny minority overwhelmed the competence of the vast majority.
Finally, both mistakes reinforced the lesson of liquidity. Net worth and earnings power may be valuable, but in times of crisis only cash matters. Both companies faced calls on cash that was simply not available. Worse, their attempts to raise the cash by selling assets during a time of panic simply added gasoline to the fire by driving down asset prices further and reinforced a downward spiral. As Warren Buffett has rightly said, it is dangerous “to count on the kindness of strangers in order to meet tomorrow’s obligations.”
Before ending this section, we must note that it is likely that the largest mistakes we made in 2009 will never show up in our financial statements. This is not because we are glossing over them, but rather because they were mistakes of omission. In other words, our costliest mistakes during this financial crisis may well be the investments we failed to make when others were panicking. Wells Fargo, for example, traded roughly as low as $8 per share and American Express as low as $10. Had we increased our position by approximately 3% in each of these companies, we would have more than made up the losses we suffered in AIG and Merrill Lynch. Such mistakes of omission are rarely discussed and yet, as the example above shows, they can be just as costly to long-term returns.
Concluding Thoughts
We will end this report as we began: with the clear statement that we are embarrassed and disappointed by Clipper Fund’s results over the last four years. While we cannot promise satisfactory returns, we can promise our commitment. As large shareholders in Clipper Fund, we are determined to ensure that the turnaround that began in 2009 continues in the years ahead. We are grateful to those shareholders who have stayed the course with us.
Sincerely,

 Christopher C. Davis Kenneth Charles Feinberg
President & Portfolio Manager Portfolio Manager
January 29, 2010
Not a part of Annual Report to Fund shareholders
CLIPPER FUNDSM | Shareholder Letter – (Continued) |
This material is authorized for use by existing shareholders. A current Clipper Fund prospectus must accompany or precede this material if it is distributed to prospective shareholders. You should carefully consider the Fund’s investment objectives, risks, fees, and expenses before investing. Read the prospectus carefully before you invest or send money.
This report includes candid statements and observations regarding investment strategies, individual securities, economic and market conditions; however, there is no guarantee that these statements, opinions or forecasts will prove to be correct. Equity markets are volatile and an investor may lose money. Past performance is not a guarantee of future results.
Clipper Fund’s investment objective is long-term capital growth and capital preservation. There can be no assurance that the Fund will achieve its objective. The Fund invests primarily in equity securities issued by large companies with market capitalizations of at least $10 billion. Some important risks of an investment in the Fund are: market risk: the market value of shares of common stock can change rapidly and unpredictably; company risk: the market value of a common stock varies with the success or failure of the company issuing the stock; focused portfolio risk: concentrating a fund’s portfolio in a select limited number of securities can increase the volatility of the portfolio; financial services risk: investing a significant portion of assets in the financial services sector may cause a fund to be more volatile as securities within the financial services sector are more prone to regulatory action in the financial services industry, more sensitive to interest rate fluctuations, and are the target of increased competition; and foreign country risk: companies operating, incorporated, or principally traded in foreign countries may have more fluctuation as foreign economies may not be as strong or diversified, foreign political systems may not be as stable, and foreign financial reporting standards may not be as rigorous as they are in the United States. As of December 31, 2009, Clipper Fund had approximately 13.3% of assets invested in foreign companies. See the prospectus for a complete listing of the principal risks.
Davis Advisors is committed to communicating with our investment partners as candidly as possible because we believe our investors benefit from understanding our investment philosophy and approach. Our views and opinions regarding the investment prospects of our portfolio holdings include “forward looking statements” which may or may not be accurate over the long term. While we believe we have a reasonable basis for our appraisals and we have confidence in our opinions, actual results may differ materially from those we anticipate. These opinions are current as of the date of this piece but are subject to change. Market values will vary so that an investor may experience a gain or a loss. The information provided in this material should not be considered a recommendation to buy, sell, or hold any particular security. As of December 31, 2009, Clipper Fund had invested the following percentages of its net assets in the companies listed:
| American Express | 8.68% | | Hewlett-Packard | 3.02% |
| Ameriprise Financial | 1.33% | | JPMorgan Chase | 2.02% |
| Bank of New York Mellon | 6.03% | | Julius Baer Group | 0.96% |
| Berkshire Hathaway | 9.49% | | Loews Corp. | 5.57% |
| Canadian Natural Resources | 8.00% | | Merck | 3.54% |
| Coca-Cola | 1.49% | | Microsoft | 3.04% |
| ConocoPhillips | 2.48% | | Oaktree Capital | 6.43% |
| Costco Wholesale | 11.36% | | Procter & Gamble | 6.59% |
| CVS Caremark | 2.92% | | RHJ International | 3.72% |
| Diageo | 0.61% | | Texas Instruments | 1.35% |
| Goldman Sachs | 1.06% | | Wells Fargo & Company | 1.10% |
| Harley-Davidson | 6.12% | | | |
Clipper Fund has adopted a Portfolio Holdings Disclosure policy that governs the release of non-public portfolio holding information. This policy is described in detail in the prospectus. Visit clipperfund.com or call 800-432-2504 for the most current public portfolio holdings information.
We gather our index data from a combination of reputable sources, including, but not limited to, Thomson Financial, Lipper, and index websites.
Not a part of Annual Report to Fund shareholders
CLIPPER FUNDSM | Shareholder Letter – (Continued) |
The net expense ratio for Clipper Fund for the fiscal period ended December 31, 2009 was 0.80%.
Effective July 1, 2009, Davis Advisors voluntarily and permanently reduced any management fee breakpoints ABOVE 0.55% to 0.55%.
Over the last five years, the high and low turnover ratio for Clipper Fund was 63% and 7%, respectively.
After-tax returns show the fund’s annualized after-tax total return for the time period specified. After-tax returns with shares sold show the fund’s annualized after-tax total return for the time period specified plus the tax effect of selling your shares at the end of the period. To determine these figures, distributions are treated as taxed at the maximum tax rate in effect at the time they were paid with the balance reinvested. The maximum rates are currently 35% for non-qualified dividend income and short-term capital gain distributions. Long term capital gains and qualified dividends currently are taxed at a maximum 15% rate. The tax rate is applied to distributions prior to reinvestment and the after-tax portion is reinvested in the fund. State and local taxes are ignored.
Broker-dealers and other financial intermediaries may charge Davis Advisors substantial fees for selling its products and providing continuing support to clients and shareholders. For example, broker-dealers and other financial intermediaries may charge: sales commissions; distribution and service fees; and record-keeping fees. In addition, payments or reimbursements may be requested for: marketing support concerning Davis Advisors’ products; placement on a list of offered products; access to sales meetings, sales representatives and management representatives; and participation in conferences or seminars, sales or training programs for invited registered representatives and other employees, client and investor events, and other dealer-sponsored events. Financial advisors should not consider Davis Advisors’ payment(s) to a financial intermediary as a basis for recommending Davis Advisors.
The S&P 500® Index is an unmanaged index of 500 selected common stocks, most of which are listed on the New York Stock Exchange. The Index is adjusted for dividends, weighted towards stocks with large market capitalizations and represents approximately two-thirds of the total market value of all domestic common stocks. Investments cannot be made directly in an index.
After April 30, 2010, this material must be accompanied by a supplement containing performance data for the most recent quarter end.
Shares of the Clipper Fund are not deposits or obligations of any bank, are not guaranteed by any bank, are not insured by the FDIC or any other agency, and involve investment risks, including possible loss of the principal amount invested.
12/09 Davis Distributors, LLC, 2949 East Elvira Road, Suite 101, Tucson, AZ 85756, 800-432-2504, clipperfund.com.
Not a part of Annual Report to Fund shareholders
CLIPPER FUNDSM | Management’s Discussion of Fund Performance |
Performance Overview
Clipper Fund delivered a total return on net asset value of 37.60% for the year ended December 31, 2009. Over the same time period, the Standard & Poor’s 500® Index (“Index”) returned 26.46%. The sectors1 within the Index that turned in the strongest performance over the year were information technology, materials, and consumer discretionary. The sectors that turned in the weakest (but still positive) performance over the year were telecommunication services, utilities, and energy.
Factors Impacting the Fund’s Performance
The Fund had more invested in financial companies than in any other sector and these companies were the most important contributor2 to performance. The Fund’s financial companies gained 38% while the financial companies within the Index gained 17%. This strong stock selection made the financial companies the leading contributor to the Fund out-performing the Index. American Express3, Oaktree, Loews, and RHJ International were among the most important contributors to performance. NIPPONKOA, Bank of New York Mellon, American International Group, Redwood Trust, and JPMorgan Chase were among the most important detractors from performance. The Fund no longer owns NIPPONKOA, American International Group, or Redwood Trust.
Energy companies were the second largest contributor to the Fund’s performance. The Fund’s energy companies out-performed the corresponding sector within the Index (up 39% versus up 14% for the Index). Canadian Natural Resources was one of the most important contributors to the Fund’s performance. ConocoPhillips was among the most important detractors from the Fund’s performance.
Information technology companies were the most important contributor to the Index’s performance. The Fund’s information technology companies under-performed the corresponding sector within the Index (up 56% versus up 62% for the Index). A lower relative average weighting in this strongly performing sector (7% versus 18% for the Index) detracted from the Fund’s performance relative to the Index. Microsoft and Hewlett-Packard were among the most important contributors to the Fund’s performance.
The Fund’s consumer staple companies under-performed the corresponding sector within the Index (up 10% versus up 15% for the Index). A higher relative average weighting (20% versus 12% for the Index) in this relatively weakly performing sector also detracted from the Fund’s performance relative to the Index. Costco Wholesale was among the most important contributors to the Fund’s performance while Procter & Gamble was among the most important detractors.
In 2009, the Fund received class action settlements for two former holdings, Tyco International and El Paso, that contributed roughly 5% to the Fund’s total return.
The Fund held approximately 13% of its net assets in foreign companies at December 31, 2009. As a whole these companies out-performed the domestic companies held by the Fund.
Clipper Fund’s investment objective is to seek long-term capital growth and capital preservation. There can be no assurance that the Fund will achieve its objective. The primary risks of an investment in Clipper Fund are: (1) market risk, (2) company risk, (3) focused portfolio risk, (4) financial services risk, (5) foreign country risk, (6) headline risk, and (7) selection risk. See the prospectus for a full description of each risk.
1 The companies included in the Standard & Poor’s 500® Index are divided into ten sectors. One or more industry groups make up a sector.
2 A company’s or sector’s contribution to or detraction from the Fund’s performance is a product both of its appreciation or depreciation and its weighting within the Fund. For example, a 5% holding that rises 20% has twice as much impact as a 1% holding that rises 50%.
3 This Management Discussion of Fund Performance discusses a number of individual companies. The information provided in this report does not provide information reasonably sufficient upon which to base an investment decision and should not be considered a recommendation to purchase or sell any particular security. The Schedule of Investments lists the Fund’s holdings of each company discussed.
CLIPPER FUNDSM | Management’s Discussion of Fund Performance – (Continued) |
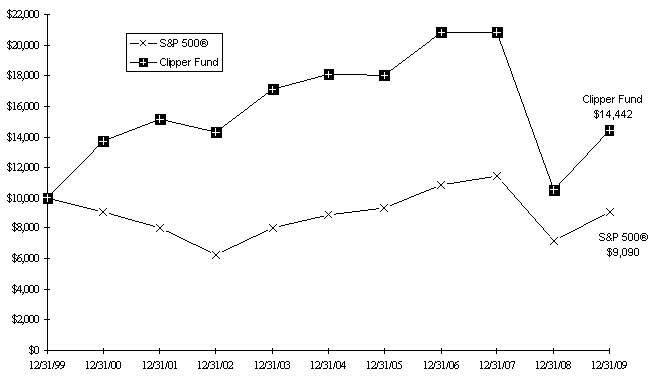
Comparison of a $10,000 investment in Clipper Fund versus the Standard & Poor’s 500® Index over 10 years for an investment made on December 31, 1999
Average Annual Total Return for periods ended December 31, 2009
Fund & Benchmark Index | 1-Year | 5-Year | 10-Year | Since fund’s Inception (02/29/84) | Gross Expense Ratio | Net Expense Ratio |
| Clipper Fund* | 37.60% | (4.40)% | 3.74% | 11.36% | 0.80% | 0.80% |
Standard & Poor’s 500® Index | 26.46% | 0.42% | (0.95)% | 10.62% | | |
*The Fund received favorable class action settlements from companies which it no longer owns. These settlements had a material impact on the investment performance of the Fund, adding approximately 5% to the Fund’s total return in 2009. This was a one time event that is unlikely to be repeated.
The Standard & Poor’s 500® Index is an unmanaged index of 500 selected common stocks, most of which are listed on the New York Stock Exchange. The Index is adjusted for dividends, weighted towards stocks with large market capitalizations, and represents approximately two-thirds of the total market value of all domestic common stocks. Investments cannot be made directly into the Index.
The performance data for Clipper Fund contained in this report represents past performance and assumes that all distributions were reinvested, and should not be considered as an indication of future performance from an investment in the Fund today. The investment return and principal value will fluctuate so that the shares may be worth more or less than their original cost when redeemed. Fund Performance changes over time and current performance may be higher or lower than stated. Returns shown do not reflect the deduction of taxes that a shareholder would pay on fund distributions or the redemption of fund shares. The operating expense ratio may vary in future years. For more current information please call Clipper Fund Investor Services at 1-800-432-2504.
Davis Selected Advisers, L.P. began serving as investment adviser to Clipper Fund on January 1, 2006. A different investment adviser managed the Fund through December 31, 2005.
CLIPPER FUNDSM | Fund Overview |
| | December 31, 2009 |
| Portfolio Composition | | Industry Weightings |
| (% of Fund’s Net Assets) | | (% of Stock Holdings) |
| | | | | | |
| | | | | Fund | S&P 500® |
| Common Stock (U.S.) | 84.94% | | Diversified Financials | 30.77% | 7.87% |
| Common Stock (Foreign) | 13.29% | | Insurance | 16.68% | 2.41% |
| Short Term Investments | 0.92% | | Food & Staples Retailing | 14.54% | 2.69% |
| Other Assets & Liabilities | 0.85% | | Energy | 10.67% | 11.48% |
| | 100.00% | | Information Technology | 7.54% | 19.85% |
| | | | Household & Personal Products | 6.71% | 2.83% |
| | | | Automobiles & Components | 6.23% | 0.61% |
| | | | Health Care | 3.60% | 12.63% |
| | | | Food, Beverage & Tobacco | 2.14% | 5.84% |
| | | | Banks | 1.12% | 2.86% |
| | | | Capital Goods | – | 7.49% |
| | | | Utilities | – | 3.71% |
| | | | Materials | – | 3.60% |
| | | | Other | – | 16.13% |
| | | | | 100.00% | 100.00% |
Top 10 Holdings
(% of Fund’s Net Assets)
| | | |
| Costco Wholesale Corp. | Food & Staples Retailing | 11.36% |
| Berkshire Hathaway Inc., Class A | Property & Casualty Insurance | 9.49% |
| American Express Co. | Consumer Finance | 8.68% |
| Canadian Natural Resources Ltd. | Energy | 8.00% |
| Procter & Gamble Co. | Household & Personal Products | 6.59% |
| Oaktree Capital Group LLC, Class A | Diversified Financial Services | 6.43% |
| Harley-Davidson, Inc. | Automobiles & Components | 6.12% |
| Bank of New York Mellon Corp. | Capital Markets | 6.03% |
| Loews Corp. | Multi-line Insurance | 5.57% |
| RHJ International | Diversified Financial Services | 3.72% |
CLIPPER FUNDSM | Fund Overview – (Continued) |
| | December 31, 2009 |
New Positions Added (01/01/09-12/31/09)
(Highlighted positions are those greater than 3.00% of 12/31/09 total net assets)
| Security | Industry | Date of 1st Purchase | | % of 12/31/09 Fund Net Assets |
| Coca-Cola Co. | Food, Beverage & Tobacco | 06/26/09 | | 1.49% |
| CVS Caremark Corp. | Food & Staples Retailing | 11/13/09 | | 2.92% |
| Diageo PLC | Food, Beverage & Tobacco | 04/01/09 | | 0.61% |
| GAM Holding Ltd. | Capital Markets | 03/16/09 | | – |
| Loews Corp. | Multi-line Insurance | 02/27/09 | | 5.57% |
| Merck & Co., Inc. | Pharmaceuticals, Biotechnology | | | |
| | & Life Sciences | 06/24/09 | | 3.54% |
| Transatlantic Holdings, Inc. | Reinsurance | 03/18/09 | | 1.32% |
| | | | | |
Positions Closed (01/01/09-12/31/09)
(Gains and losses greater than $50,000,000 are highlighted)
| Security | Industry | Date of Final Sale | | Realized Gain (Loss) |
| American International Group, Inc. | Multi-line Insurance | 03/12/09 | $ | (257,065,767) |
| Brookfield Asset Management Inc., Class A | Capital Markets | 02/05/09 | | (18,284,752) |
| CarMax, Inc. | Retailing | 07/15/09 | | (13,366,531) |
| GAM Holding Ltd. | Capital Markets | 12/18/09 | | 1,435,447 |
| News Corp., Class A | Media | 03/12/09 | | (22,014,243) |
| NIPPONKOA Insurance Co., Ltd. | Property & Casualty Insurance | 10/23/09 | | (18,684,596) |
| Redwood Trust, Inc. | Real Estate | 03/10/09 | | (20,614,492) |
| UnitedHealth Group Inc. | Heath Care Equipment & Services | 12/07/09 | | (50,337,568) |
| | | | | |
CLIPPER FUNDSM | Expense Example |
Example
As a shareholder of the Fund, you incur ongoing costs only, including advisory and administrative fees and other Fund expenses. The Expense Example is intended to help you understand your ongoing costs (in dollars) of investing in the Fund and to compare these costs with the ongoing costs of investing in other mutual funds. The Expense Example is based on an investment of $1,000 invested at the beginning of the period and held for the entire period indicated, which is for the six-month period ended December 31, 2009.
Actual Expenses
The information represented in the row entitled “Actual” provides information about actual account values and actual expenses. You may use the information in this row, together with the amount you invested, to estimate the expenses that you paid over the period. Simply divide your account value by $1,000 (for example, an $8,600 account value divided by $1,000 = 8.6), then multiply the result by the number under the heading “Expenses Paid During Period” to estimate the expenses you paid on your account during this period. An annual maintenance fee of $10, charged on retirement plan accounts per Social Security Number, is not included in the Expense Example. If this fee was included, the estimate of expenses you paid during the period would be higher, and your ending account value lower, by this amount.
Hypothetical Example for Comparison Purposes
The information represented in the row entitled “Hypothetical” provides information about hypothetical account values and hypothetical expenses based on the Fund’s actual expense ratio and an assumed rate of return of 5% per year before expenses, which is not the Fund’s actual return. The hypothetical account values and expenses may not be used to estimate the actual ending account balance or expenses you paid for the period. You may use this information to compare the ongoing costs of investing in the Fund and other funds. To do so, compare this 5% hypothetical example with the 5% hypothetical examples that appear in the shareholder reports of the other funds. An annual maintenance fee of $10, charged on retirement plan accounts per Social Security Number, is not included in the Expense Example. If this fee was included, the estimate of expenses you paid during the period would be higher, and your ending account value lower, by this amount.
Please note that the expenses shown in the table are meant to highlight your ongoing costs only. Therefore, the information in the row entitled “Hypothetical” is useful in comparing ongoing costs only, and will not help you determine the relative total costs of owning different funds.
| | Beginning | Ending | Expenses Paid |
| | Account Value | Account Value | During Period* |
| | (07/01/09) | (12/31/09) | (07/01/09-12/31/09) |
| | | | |
Actual | $1,000.00 | $1,283.20 | $4.26 |
Hypothetical | $1,000.00 | $1,021.48 | $3.77 |
Hypothetical assumes 5% annual return before expenses.
* Expenses are equal to the Fund’s annualized operating expense ratio (0.74%)**, multiplied by the average account value over the period, multiplied by 184/365 (to reflect the one-half year period).
** The expense ratio reflects the impact, if any, of the reduction of expenses paid indirectly and of certain reimbursements from the Adviser.
CLIPPER FUNDSM | Schedule of Investments |
| | December 31, 2009 |
| Shares | | Security | | Value (Note 1) | |
| |
| | CONSUMER DISCRETIONARY – (6.12%) | |
| | Automobiles & Components – (6.12%) | |
| | 2,823,060 | Harley-Davidson, Inc. | | $ | 71,141,112 | |
| |
| | Total Consumer Discretionary | | | 71,141,112 | |
| |
| | CONSUMER STAPLES – (22.97%) | |
| | Food & Staples Retailing – (14.28%) | |
| | 2,233,291 | Costco Wholesale Corp. | | | 132,009,831 | |
| | 1,054,000 | CVS Caremark Corp. | | | 33,949,340 | |
| |
| | | 165,959,171 | |
| |
| | Food, Beverage & Tobacco – (2.10%) | |
| | 303,000 | Coca-Cola Co. | | | 17,271,000 | |
| | 409,025 | Diageo PLC (United Kingdom) | | | 7,135,911 | |
| |
| | | 24,406,911 | |
| |
| | Household & Personal Products – (6.59%) | |
| | 1,263,025 | Procter & Gamble Co. | | | 76,577,206 | |
| |
| | Total Consumer Staples | | | 266,943,288 | |
| |
| | ENERGY – (10.48%) | |
| | 1,291,987 | Canadian Natural Resources Ltd. (Canada) | | | 92,958,464 | |
| | 566,341 | ConocoPhillips | | | 28,923,035 | |
| |
| | Total Energy | | | 121,881,499 | |
| |
| | FINANCIALS – (47.71%) | |
| | Banks – (1.10%) | |
| | Commercial Banks – (1.10%) | |
| | 473,300 | Wells Fargo & Co. | | | 12,774,367 | |
| |
| | Diversified Financials – (30.23%) | |
| | Capital Markets – (9.38%) | |
| | 398,629 | Ameriprise Financial, Inc. | | | 15,474,778 | |
| | 2,504,289 | Bank of New York Mellon Corp. | | | 70,044,963 | |
| | 73,100 | Goldman Sachs Group, Inc. | | | 12,342,204 | |
| | 316,400 | Julius Baer Group Ltd. (Switzerland) | | | 11,127,297 | |
| |
| | 108,989,242 | |
| |
| | Consumer Finance – (8.68%) | |
| | 2,490,633 | American Express Co. | | | 100,920,449 | |
| |
| | Diversified Financial Services – (12.17%) | |
| | 562,436 | JPMorgan Chase & Co. | | | 23,436,708 | |
| | 2,232,700 | Oaktree Capital Group LLC, Class A (a) | | | 74,795,450 | |
| | 5,686,297 | RHJ International (Belgium) * (b) | | | 43,183,957 | |
| |
| | 141,416,115 | |
| |
| | | 351,325,806 | |
| |
| | Insurance – (16.38%) | |
| | Multi-line Insurance – (5.57%) | |
| | 1,781,000 | Loews Corp. | | | 64,739,350 | |
| |
| | Property & Casualty Insurance – (9.49%) | |
| | 1,112 | Berkshire Hathaway Inc., Class A * | | | 110,310,400 | |
| |
| | Reinsurance – (1.32%) | |
| | 295,100 | Transatlantic Holdings, Inc. | | | 15,377,661 | |
| |
| | | 190,427,411 | |
| |
| | Total Financials | | | 554,527,584 | |
| |
| |
CLIPPER FUNDSM | Schedule of Investments - (Continued) |
| | December 31, 2009 |
| Shares/Principal | | Security | | Value (Note 1) | |
COMMON STOCK – (CONTINUED) | |
| | HEALTH CARE – (3.54%) | |
| | Pharmaceuticals, Biotechnology & Life Sciences – (3.54%) | |
| | 1,126,000 | Merck & Co., Inc. | | $ | 41,144,040 | |
| |
| | Total Health Care | | | 41,144,040 | |
| |
| | INFORMATION TECHNOLOGY – (7.41%) | |
| | Semiconductors & Semiconductor Equipment – (1.35%) | |
| | 601,800 | Texas Instruments Inc. | | | 15,682,908 | |
| |
| | Software & Services – (3.04%) | |
| | 1,157,229 | Microsoft Corp. | | | 35,272,340 | |
| |
| | Technology Hardware & Equipment – (3.02%) | |
| | 682,000 | Hewlett-Packard Co. | | | 35,129,820 | |
| |
| | Total Information Technology | | | 86,085,068 | |
| |
| | TOTAL COMMON STOCK – (Identified cost $1,132,769,469) | | | 1,141,722,591 | |
| |
SHORT TERM INVESTMENTS – (0.92%) | |
| $ | 10,739,000 | Three Pillars Funding, Commercial Paper, 0.30%, 01/04/10 | | | 10,738,732 | |
| |
| | TOTAL SHORT TERM INVESTMENTS – (Identified cost $10,738,732) | | | 10,738,732 | |
| |
| | Total Investments – (99.15%) – (Identified cost $1,143,508,201) – (c) | | | 1,152,461,323 | |
| | Other Assets Less Liabilities – (0.85%) | | | 9,862,024 | |
| |
| | Net Assets – (100.00%) | | $ | 1,162,323,347 | |
| |
| | * | | Non-Income producing security. |
| | (a) | | Illiquid Security – See Note 6 of the Notes to Financial Statements. |
| | (b) | | Affiliated Company. Represents ownership of at least 5% of the voting securities of the issuer and is an affiliate, as defined in the Investment Company Act of 1940, at or during the year ended December 31, 2009. The aggregate fair value of the securities of affiliated companies held by the Fund as of December 31, 2009, amounts to $43,183,957. Transactions during the period in which the issuers were affiliates are as follows: | |
| Security | Shares December 31, 2008 | Gross Additions | Gross Reductions | Shares December 31, 2009 | Dividend Income |
| RHJ International | 5,384,194 | 378,103 | 76,000 | 5,686,297 | − |
| | | | | |
| | (c) | | Aggregate cost for federal income tax purposes is $1,144,328,033. At December 31, 2009 unrealized appreciation (depreciation) of securities for federal income tax purposes is as follows: | |
| | Unrealized appreciation | | $ | 165,195,723 | |
| | Unrealized depreciation | | | (157,062,433) | |
| | Net unrealized appreciation | | $ | 8,133,290 | |
| |
| |
| See Notes to Financial Statements |
CLIPPER FUNDSM | Statement of Assets and Liabilities |
| | At December 31, 2009 |
| ASSETS: | | | | |
| Investments in securities at value* (see accompanying Schedule of Investments): | | | |
| | Unaffiliated companies | | $ | 1,109,277,366 |
| | Affiliated companies | | | 43,183,957 |
Cash | | | 145,324 |
| Receivables: | | | | |
| | Capital stock sold | | | 668,035 |
| | Dividends and interest | | | 624,035 |
| | Investment securities sold | | | 10,527,529 |
Prepaid expenses | | | 64,163 |
| | Total assets | | | 1,164,490,409 |
| LIABILITIES: | | | | |
| Payables: | | | | |
| | Capital stock redeemed | | | 1,116,236 |
Accrued transfer agent fees | | | 326,436 |
Accrued management fee | | | 562,209 |
Other accrued expenses | | | 162,181 |
| | Total liabilities | | | 2,167,062 |
NET ASSETS | | $ | 1,162,323,347 |
SHARES OUTSTANDING | | | 21,304,586 |
NET ASSET VALUE, offering, and redemption price per share (Net assets ÷ Shares outstanding) | | $ | 54.56 |
| NET ASSETS CONSIST OF: | | | | |
Paid in capital | | | 1,616,177,654 |
Undistributed net investment income | | | 92,161 |
Accumulated net realized losses from investments | | | (462,904,280) |
Net unrealized appreciation on investments and foreign currency transactions | | | 8,957,812 |
| | Net Assets | | $ | 1,162,323,347 |
| | | | | | |
| *Including: | | | | |
Cost of unaffiliated companies | | $ | 1,054,991,371 |
Cost of affiliated companies | | | 88,516,830 |
| | | | | | |
| | | | | | |
| See Notes to Financial Statements | |
| | | | | | |
CLIPPER FUNDSM | Statement of Operations |
| | For the year ended December 31, 2009 |
| INVESTMENT INCOME: | | | | |
| Income: | | | | |
| | Dividends* | | $ | 18,046,579 |
| | Interest | | | 48,021 |
| | Total income | | | 18,094,600 |
| | | | | | | | | |
| Expenses: | | | | |
| | Management fees (Note 3) | | $ | 6,015,400 | | | | |
| | Custodian fees | | | 115,872 | | | | |
| | Transfer agent fees | | | 1,454,419 | | | | |
| | Audit fees | | | 45,600 | | | | |
| | Legal fees | | | 37,628 | | | | |
| | Reports to shareholders | | | 209,845 | | | | |
| | Directors’ fees and expenses | | | 92,900 | | | | |
| | Registration and filing fees | | | 57,383 | | | | |
| | Miscellaneous | | | 158,684 | | | | |
| | Total expenses | | | 8,187,731 |
| | Expenses paid indirectly (Note 4) | | | (5) |
| | Net expenses | | | 8,187,726 |
| | Net investment income | | | 9,906,874 |
| | | | | | | | | |
| REALIZED & UNREALIZED GAIN (LOSS) ON INVESTMENTS AND FOREIGN CURRENCY TRANSACTIONS: | | | | |
| Net realized loss from: | | | | |
| | Investment transactions: | | | |
| | Unaffiliated companies | | | (426,049,271) |
| | Affiliated companies | | | (972,680) |
| | Foreign currency transactions | | | (61,016) |
Net change in unrealized appreciation (depreciation) | | | 737,925,947 |
| | Net realized and unrealized gain on investments and foreign currency transactions | | | 310,842,980 |
| | Net increase in net assets resulting from operations | | $ | 320,749,854 |
| | | | | | | | | |
*Net of foreign taxes withheld as follows | | $ | 137,072 |
| | | | | | | | | |
| See Notes to Financial Statements | |
CLIPPER FUNDSM | Statements of Changes in Net Assets |
| | | Year ended December 31, |
| | | 2009 | | 2008 |
| OPERATIONS: | | | | | | | |
| | Net investment income | | $ | 9,906,874 | | $ | 22,304,461 |
| | Net realized loss from investments and foreign currency transactions | | | (427,082,967) | | | (9,984,794) |
| | Net change in unrealized appreciation (depreciation) on investments and foreign currency transactions | | | 737,925,947 | | | (1,184,652,027) |
| | Net increase (decrease) in net assets resulting from operations | | | 320,749,854 | | | (1,172,332,360) |
| | | | | | | | | |
| DIVIDENDS AND DISTRIBUTIONS TO SHAREHOLDERS FROM: | | | | | | | |
| | Net investment income | | | (9,753,697) | | | (22,188,466) |
| | Realized gains from investment transactions | | | – | | | (460,436) |
| | Return of capital | | | – | | | (184,450) |
| | | | | | | | | |
| CAPITAL SHARE TRANSACTIONS: | | | | | | | |
| | Net decrease in net assets resulting from capital share transactions (Note 5) | | | (232,646,291) | | | (502,166,852) |
Total increase (decrease) in net assets | | | 78,349,866 | | | (1,697,332,564) |
| | | | | | | | | |
| NET ASSETS: | | | | | | | |
| | Beginning of year | | | 1,083,973,481 | | | 2,781,306,045 |
| | End of year* | | $ | 1,162,323,347 | | $ | 1,083,973,481 |
| | | | | | | | | |
*Including undistributed net investment income of | | $ | 92,161 | | $ | – |
| | | | | | | | | |
| See Notes to Financial Statements | |
CLIPPER FUNDSM | Notes to Financial Statements |
| | December 31, 2009 |
NOTE 1 - SUMMARY OF SIGNIFICANT ACCOUNTING POLICIES
Clipper Fund, Inc. (“Fund”, a California corporation) is registered under the Investment Company Act of 1940, as amended, as a non-diversified open-end management investment company. The Fund’s investment objective is long-term capital growth and capital preservation. Effective January 1, 2006, Davis Selected Advisers, L.P. (“Davis Advisors” or “Adviser”) assumed management of the Fund. The Adviser seeks to invest the Fund’s assets primarily in common stocks of large companies (generally, companies with market capitalizations of $10 billion or more at the time of initial purchase) that are trading at prices below the Adviser’s estimate of their intrinsic values. The following is a summary of significant accounting policies consistently followed by the Fund in the preparation of its financial statements.
Security Valuation - The Fund calculates the net asset value of its shares as of the close of the New York Stock Exchange (“Exchange”), normally 4:00 P.M. Eastern time, on each day the Exchange is open for business. Securities listed on the Exchange (and other national exchanges) are valued at the last reported sales price on the day of valuation. Securities traded in the over-the-counter market (e.g. NASDAQ) and listed securities for which no sale was reported on that date are stated at the closing bid price. Securities traded on foreign exchanges are valued based upon the last sales price on the principal exchange on which the security is traded prior to the time when the Fund’s assets are valued. Securities (including restricted securities) for which market quotations are not readily available are valued at their fair value. Securities whose values have been materially affected by what the Adviser identifies as a significant event occurring before the Fund’s assets are valued but after the close of their respective exchanges will be fair valued. Fair value is determined in good faith using consistently applied procedures under the supervision of the Board of Directors. Short-term securities purchased within 60 days to maturity are valued at amortized cost, which approximates market value. These valuation procedures are reviewed and subject to approval by the Board of Directors.
Value Measurements - Fair value is defined as the price that the Fund would receive upon selling an investment in an orderly transaction to an independent buyer in the principal or most advantageous market for the investment. Various inputs are used to determine the fair value of the Fund’s investments. These inputs are summarized in the three broad levels listed below.
Level 1 – quoted prices in active markets for identical securities
Level 2 – other significant observable inputs (including quoted prices for similar investments, interest rates, prepayment
speeds, credit risk, etc.)
| Level 3 – significant unobservable inputs (including Fund’s own assumptions in determining the fair value of investments) |
The inputs or methodology used for valuing securities are not necessarily an indication of the risk associated with investing in those securities.
The following is a summary of the inputs used as of December 31, 2009 in valuing the Fund’s investments carried at value:
| | Investments in Securities at Value |
| | Valuation Inputs |
| | | | Level 2: | | Level 3: | | |
| | | | Other Significant | | Significant | | |
| | Level 1: | | Observable | | Unobservable | | |
| | Quoted Prices | | Inputs* | | Inputs | | Total |
Equity securities: | | | | | | | | | | | |
| Consumer discretionary | $ | 71,141,112 | | $ | – | | $ | – | | $ | 71,141,112 |
| Consumer staples | | 259,807,377 | | | 7,135,911 | | | – | | | 266,943,288 |
| Energy | | 121,881,499 | | | – | | | – | | | 121,881,499 |
| Financials | | 436,548,177 | | | 117,979,407 | | | – | | | 554,527,584 |
| Health care | | 41,144,040 | | | – | | | – | | | 41,144,040 |
| Information technology | | 86,085,068 | | | – | | | – | | | 86,085,068 |
| Short-term securities | | – | | | 10,738,732 | | | – | | | 10,738,732 |
| Total | $ | 1,016,607,273 | | $ | 135,854,050 | | $ | – | | $ | 1,152,461,323 |
*Includes certain securities trading primarily outside the U.S. whose value the Fund adjusted as a result of significant market movements following the close of local trading.
CLIPPER FUNDSM | Notes to Financial Statements – (Continued) |
| | December 31, 2009 |
NOTE 1 - SUMMARY OF SIGNIFICANT ACCOUNTING POLICIES – (CONTINUED)
Master Repurchase Agreements - The Fund, along with other affiliated funds, may transfer uninvested cash balances into one or more master repurchase agreement accounts. These balances are invested in one or more repurchase agreements, secured by U.S. Government securities. A custodian bank holds securities pledged as collateral for repurchase agreements until the agreements mature. Each agreement requires that the market value of the collateral be sufficient to cover payments of interest and principal; however, in the event of default by the other party to the agreement, retention of the collateral may be subject to legal proceedings.
Currency Translation - The market values of all assets and liabilities denominated in foreign currencies are recorded in the financial statements after translation to the U.S. Dollar based upon the mean between the bid and offered quotations of the currencies against U.S. Dollars on the date of valuation. The cost basis of such assets and liabilities is determined based upon historical exchange rates. Income and expenses are translated at average exchange rates in effect as accrued or incurred.
Foreign Currency - The Fund may enter into forward purchases or sales of foreign currencies to hedge certain foreign currency denominated assets and liabilities against declines in market value relative to the U.S. Dollar. Forward currency contracts are marked-to-market daily and the change in market value is recorded by the Fund as an unrealized gain or loss. When the forward currency contract is closed, the Fund records a realized gain or loss equal to the difference between the value of the forward currency contract at the time it was opened and value at the time it was closed. Investments in forward currency contracts may expose the Fund to risks resulting from unanticipated movements in foreign currency exchange rates or failure of the counter-party to the agreement to perform in accordance with the terms of the contract.
Reported net realized foreign exchange gains or losses arise from the sales of foreign currencies, currency gains or losses realized between the trade and settlement dates on securities transactions, the difference between the amounts of dividends, interest, and foreign withholding taxes recorded on the Fund’s books, and the U.S. Dollar equivalent of the amounts actually received or paid. Net unrealized foreign exchange gains and losses arise from changes in the value of assets and liabilities other than investments in securities at fiscal year end, resulting from changes in the exchange rate. The Fund includes foreign currency gains and losses realized on the sale of investments together with market gains and losses on such investments in the Statement of Operations.
Federal Income Taxes - It is the Fund’s policy to comply with the requirements of the Internal Revenue Code applicable to regulated investment companies, and to distribute substantially all of its taxable income, including any net realized gains on investments not offset by loss carryovers, to shareholders. Therefore, no provision for federal income or excise tax is required. The Adviser has analyzed the Fund’s tax positions taken on federal income tax returns for all open tax years and has concluded that as of December 31, 2009, no provision for income tax would be required in the Fund’s financial statements. The Fund’s federal and state (Arizona and California) income and federal excise tax returns for tax years for which the applicable statutes of limitations have not expired are subject to examination by the Internal Revenue Service and state departments of revenue. The earliest tax year that remains subject to examination by these jurisdictions is 2006. At December 31, 2009, the Fund had available for federal income tax purposes unused capital loss carryforwards and post October 2009 capital losses as follows:
| | Capital Loss Carryforwards | | Post October 2009 Capital Losses |
| Expiring | | | | | |
| 12/31/2016 | $ | 35,042,000 | | $ | – |
| 12/31/2017 | | 419,518,000 | | | – |
| 12/31/2018 | | – | | | 7,525,000 |
| | $ | 454,560,000 | | $ | 7,525,000 |
Securities Transactions and Related Investment Income - Securities transactions are accounted for on the trade date (date the order to buy or sell is executed) with realized gain or loss on the sale of securities being determined based upon identified cost. Dividend income is recorded on the ex-dividend date. Dividend income from REIT securities may include return of capital. Upon notification from the issuer, the amount of the return of capital is reclassified to adjust dividend income, reduce the cost basis, and/or adjust realized gain/loss. Interest income, which includes accretion of discount and amortization of premium, is accrued as earned.
CLIPPER FUNDSM | Notes to Financial Statements – (Continued) |
| | December 31, 2009 |
NOTE 1 - SUMMARY OF SIGNIFICANT ACCOUNTING POLICIES – (CONTINUED)
Dividends and Distributions to Shareholders - Dividends and distributions to shareholders are recorded on the ex-dividend date. Net investment income (loss), net realized gains (losses), and net unrealized appreciation (depreciation) on investments may differ for financial statement and tax purposes primarily due to differing treatments of wash sales, foreign currency transactions, partnership income, and net operating losses. The character of dividends and distributions made during the fiscal year from net investment income and net realized securities gains may differ from their ultimate characterization for federal income tax purposes. Also, due to the timing of dividends and distributions, the fiscal year in which amounts are distributed may differ from the fiscal year in which income or realized gain was recorded by the Fund. The Fund adjusts the classification of distributions to shareholders to reflect the differences between financial statement amounts and distributions determined in accordance with income tax rules. Accordingly, during the year ended December 31, 2009, amounts have been reclassified to reflect a decrease in undistributed net investment income of $61,016, a decrease in paid in capital of $188,274, and a decrease to accumulated net realized losses from investments and foreign currency transactions of $249,290. Net assets have not been affected by this reclassification.
The tax character of distributions paid during the years ended December 31, 2009 and 2008 was as follows:
| | 2009 | | 2008 |
| Ordinary income | $ | 9,753,697 | | $ | 22,010,988 |
| Long-term capital gain | | – | | | 449,640 |
| Return of capital | | – | | | 372,724 |
| Total | $ | 9,753,697 | | $ | 22,833,352 |
| | | | | | |
As of December 31, 2009, the components of distributable earnings (accumulated losses) on a tax basis were as follows:
| Undistributed net investment income | $ | 92,161 | |
| Accumulated net realized losses from investments and | | | |
| foreign currency transactions | | (462,084,448) | |
| Net unrealized appreciation on investments | | 8,137,980 | |
| Total | $ | (453,854,307) | |
| | | | |
Indemnification - - Under the Fund’s organizational documents, its officers and directors are indemnified against certain liabilities arising out of the performance of their duties to the Fund. In addition, some of the Fund’s contracts with its service providers contain general indemnification clauses. The Fund’s maximum exposure under these arrangements is unknown since the amount of any future claims that may be made against the Fund cannot be determined and the Fund has no historical basis for predicting the likelihood of any such claims.
Use of Estimates in Financial Statements - In preparing financial statements in conformity with accounting principles generally accepted in the United States of America, management makes estimates and assumptions that affect the reported amounts of assets and liabilities and disclosure of contingent assets and liabilities at the date of the financial statements, as well as the reported amounts of income and expenses during the reporting period. Actual results may differ from these estimates.
NOTE 2 - PURCHASES AND SALES OF SECURITIES
Purchases and sales of investment securities (excluding short-term securities) during the year ended December 31, 2009 were $152,931,120 and $338,639,313, respectively.
CLIPPER FUNDSM | Notes to Financial Statements – (Continued) |
| | December 31, 2009 |
NOTE 3 - INVESTMENT ADVISORY FEES AND OTHER TRANSACTIONS WITH AFFILIATES
Advisory fees are paid monthly to the Adviser. Prior to July 1, 2009, the annual rate was 0.65% of the average net assets for the first $500 million, 0.60% on the next $500 million, 0.55% on the next $2 billion, 0.54% on the next $1 billion, 0.53% on the next $1 billion, 0.52% on the next $1 billion, 0.51% on the next $1 billion, 0.50% on the next $3 billion, and 0.485% of the average net assets greater than $10 billion. Effective July 1, 2009, the Adviser reduced the advisory fee breakpoints above 0.55% for the Fund. As a result, the new annual rate is 0.55% of the average net assets for the first $3 billion, 0.54% on the next $1 billion, 0.53% on the next $1 billion, 0.52% on the next $1 billion, 0.51% on the next $1 billion, 0.50% on the next $3 billion, and 0.485% of the average net assets greater than $10 billion. Advisory fees paid during the year ended December 31, 2009 approximated 0.58% of average net assets.
Boston Financial Data Services, Inc. (“BFDS”) is the Fund’s primary transfer agent. The Adviser is also paid for certain transfer agent services. The fee paid to the Adviser for these services for the year ended December 31, 2009 amounted to $60,169. State Street Bank and Trust Company (“State Street Bank”) is the Fund’s primary accounting provider. Fees for such services are included in the custodian fee as State Street Bank also serves as the Fund’s custodian. Certain officers of the Fund are also officers of the general partner of the Adviser.
Davis Selected Advisers-NY, Inc. (“DSA-NY”), a wholly-owned subsidiary of the Adviser, acts as sub-adviser to the Fund. DSA-NY performs research and portfolio management services for the Fund under a Sub-Advisory Agreement with the Adviser. The Fund pays no fees directly to DSA-NY.
NOTE 4 - EXPENSES PAID INDIRECTLY
Under an agreement with State Street Bank, custodian fees are reduced for earnings on cash balances maintained at the custodian by the Fund. Such reductions amounted to $5 during the year ended December 31, 2009.
NOTE 5 - CAPITAL STOCK
At December 31, 2009, there were 200 million shares of capital stock (no par value) authorized. Transactions in capital stock were as follows:
| | Year ended | | | Year ended | |
| | December 31, 2009 | | | December 31, 2008 | |
| | Shares | | | Amount | | | Shares | | | Amount | |
| Shares sold | 2,355,169 | | $ | 101,536,414 | | | 7,794,982 | | $ | 423,869,961 | |
| Shares issued in reinvestment | | | | | | | | | | | |
| of distributions | 167,179 | | | 9,204,841 | | | 551,426 | | | 21,620,757 | |
| | 2,522,348 | | | 110,741,255 | | | 8,346,408 | | | 445,490,718 | |
| Shares redeemed* | (8,328,555) | | | (343,387,546) | | | (15,573,901) | | | (947,657,570) | |
| Net decrease | (5,806,207) | | $ | (232,646,291) | | | (7,227,493) | | $ | (502,166,852) | |
| | | | | | | | | | | | |
| | | | | | | | | | | | |
* Amounts for the year ended December 31, 2008 include a redemption as a result of an in-kind transfer of securities (see Note 7 of the Notes to Financial Statements).
CLIPPER FUNDSM | Notes to Financial Statements – (Continued) |
| | December 31, 2009 |
NOTE 6 - ILLIQUID SECURITIES
Securities may be considered illiquid if they lack a readily available market or if valuation has not changed for a certain period of time. The aggregate value of illiquid securities in the Fund amounted to $74,795,450 or 6.43% of the Fund’s net assets as of December 31, 2009. Information regarding illiquid securities is as follows:
| Security | Acquisition Date | Shares | Cost per Share | Valuation per Share as of December 31, 2009 |
Oaktree Capital Group LLC, Class A | 09/20/07 | 2,232,700 | $ | 36.90 | $ | 33.50 |
NOTE 7 - IN-KIND REDEMPTION
During the year ended December 31, 2008, shareholders redeemed 1,433,782 shares in exchange for Fund portfolio securities valued at $114,286,748. The Fund realized a gain of $26,126,429. This gain was not taxable to the Fund for federal income tax purposes.
NOTE 8 - SUBSEQUENT EVENTS
Fund management has determined that no material events or transactions occurred subsequent to December 31, 2009 and through February 19, 2010, the date the Fund’s financial statements were issued, which require adjustments and/or additional disclosure in the Fund’s financial statements.
CLIPPER FUNDSM | Financial Highlights |
| | | | | | | | | | | | | | | | | | | | | | | | | | | | | | |
| The following financial information represents selected data for each share of capital stock outstanding throughout each period: |
| | | | | | | | | | | | | | | | | | | | | | | | | | | | | | |
| | Year ended December 31, | | |
| | | | 2009 | | 2008 | | 2007 | | 2006a | | 2005 | | |
| Net Asset Value, Beginning of Period | | $ | 39.98 | | $ | 81.00 | | $ | 91.98 | | $ | 88.18 | | $ | 89.68 | | |
| | | | | | | | | | | | | | | | | | | | | | | | | | | | | | |
| | | | | | | | | | | | | | | | | | | | | | | | | | | | |
| Income (Loss) from Investment Operations: | | | | | | | | | | | | | | | | | | | | | | | | | | | |
| | Net Investment Income | | 0.46 | | 0.83 | | 0.88 | | 1.07 | | 1.31 | | |
| | Net Realized and Unrealized Gains (Losses) | | 14.58 | | (40.99) | | (0.84) | | 11.84 | | (1.52) | | |
| | Total from Investment Operations | | 15.04 | | (40.16) | | 0.04 | | 12.91 | | (0.21) | | |
| | | | | | | | | | | | | | | | | | | | | | | | | | | | | | |
| Dividends and Distributions: | | | | | | | | | | | | | | | | | | | | | | | | | | | |
| | Dividends from Net Investment Income | | (0.46) | | (0.83) | | (0.87) | | (1.10) | | (1.29) | | |
| | Distributions from Realized Gains | | – | | (0.02) | | (10.15) | | (8.01) | | – | | |
| | Return of Capital | | – | | (0.01) | | – | | – | | – | | |
| | Total Dividends and Distributions | | (0.46) | | (0.86) | | (11.02) | | (9.11) | | (1.29) | | |
Net Asset Value, End of Period | | $ | 54.56 | | $ | 39.98 | | $ | 81.00 | | $ | 91.98 | | $ | 88.18 | | |
| | | | | | | | | | | | | | | | | | | | | | | | | | | | | | |
Total Returnb | | 37.60 | %c | | (49.57) | % | | 0.05 | % | | 15.27 | % | | (0.24) | % | | |
| | | | | | | | | | | | | | | | | | | | | | | | | | | | | | |
| Ratios/Supplemental Data: | | | | | | | | | | | | | | | | | | | | | | | | | | | |
| | Net Assets, End of Period (in millions) | | $ | 1,162 | | | $ | 1,084 | | | $ | 2,781 | | | $ | 3,428 | | | $ | 4,006 | | | |
| | Ratio of Expenses to Average Net Assets: | | | | | | | | | | | | | | | | | | | | | | | | | | | |
| | Gross | | 0.80 | % | | 0.76 | % | | 0.69 | % | | 0.70 | % | | 1.12 | % | | |
| | Netd | | 0.80 | % | | 0.76 | % | | 0.69 | % | | 0.62 | % | | 1.11 | % | | |
| Ratio of Net Investment Income to Average Net Assets | | 0.96 | % | | 1.21 | % | | 0.85 | % | | 1.11 | % | | 0.97 | % | | |
Portfolio Turnover Ratee | | 15 | % | | 7 | % | | 25 | % | | 63 | % | | 13 | % | | |
| a | Effective January 1, 2006, Davis Selected Advisers, L.P., assumed management of the Fund. A different investment adviser managed the Fund from inception through December 31, 2005. | |
| b | Assumes hypothetical initial investment on the business day before the first day of the fiscal period, with all dividends and distributions reinvested in additional shares on the reinvestment date, and redemption at the net asset value calculated on the last business day of the fiscal period. | |
| c | Clipper Fund received favorable class action settlements from companies that it no longer owns. These settlements contributed roughly 5% to the Fund’s total return in 2009. This was a one-time event that is unlikely to be repeated. | |
| d | The Net Ratio of Expenses to Average Net Assets reflects the impact, if any, of the reduction of expenses paid indirectly and of certain reimbursements from the Adviser. | |
| e | The lesser of purchases or sales of portfolio securities for a period, divided by the monthly average of the market value of portfolio securities owned during the period. Securities with a maturity or expiration date at the time of acquisition of one year or less are excluded from the calculation. | |
See Notes to Financial Statements |
CLIPPER FUNDSM | Report of Independent Registered Public Accounting Firm |
To the Shareholders and Board of Directors
of Clipper Fund, Inc.:
We have audited the accompanying statement of assets and liabilities of Clipper Fund, Inc., including the schedule of investments, as of December 31, 2009, the related statement of operations for the year then ended, the statements of changes in net assets for each of the years in the two-year period then ended, and the financial highlights for each of the years in the four-year period then ended. These financial statements and financial highlights are the responsibility of the Fund’s management. Our responsibility is to express an opinion on these financial statements and financial highlights based on our audits. The financial highlights for the year ended December 31, 2005 were audited by other auditors, whose report dated February 22, 2006, expressed an unqualified opinion of this information.
We conducted our audits in accordance with the standards of the Public Company Accounting Oversight Board (United States). Those standards require that we plan and perform the audit to obtain reasonable assurance about whether the financial statements and financial highlights are free of material misstatement. An audit includes examining, on a test basis, evidence supporting the amounts and disclosures in the financial statements. Our procedures included confirmation of securities owned as of December 31, 2009, by correspondence with the custodian. An audit also includes assessing the accounting principles used and significant estimates made by management, as well as evaluating the overall financial statement presentation. We believe that our audits provide a reasonable basis for our opinion.
In our opinion, the financial statements and financial highlights referred to above present fairly, in all material respects, the financial position of Clipper Fund, Inc. as of December 31, 2009, the results of its operations for the year then ended, the changes in its net assets for each of the years in the two-year period then ended, and the financial highlights for each of the years in the four-year period then ended, in conformity with U.S. generally accepted accounting principles.
KPMG LLP
Denver, Colorado
February 19, 2010
CLIPPER FUNDSM | Fund Information |
Federal Income Tax Information (Unaudited)
In early 2010, shareholders will receive information regarding all dividends and distributions paid to them by the Fund during calendar year 2009. Regulations of the U.S. Treasury Department require the Fund to report this information to the Internal Revenue Service.
The information and distributions reported herein may differ from the information reported as distributions taxable to certain shareholders for the calendar year 2009 with their 2009 Form 1099-DIV.
During the calendar year 2009, $9,753,697 of dividends paid by the Fund constituted income dividends for federal income tax purposes. The Fund designates $9,753,697 or 100% as income qualifying for the corporate dividends-received deduction.
For the calendar year 2009, certain dividends paid by the Fund constitute qualified dividend income for federal income tax purposes. The Fund designates $9,753,697 or 100% as qualified dividend income.
The foregoing information is presented to assist shareholders in reporting dividends and distributions received from the Fund to the Internal Revenue Service. Because of the complexity of the federal regulations, which may affect your individual tax return and the many variations in state and local tax regulations, we recommend that you consult your tax adviser for specific guidance.
Portfolio Proxy Voting Policies and Procedures
The Fund has adopted Portfolio Proxy Voting Policies and Procedures under which the Fund votes proxies relating to securities held by the Fund. A description of the Fund’s Portfolio Proxy Voting Policies and Procedures is available (i) without charge, upon request, by calling the Fund toll-free at 1-800-432-2504, (ii) on the Fund’s website at www.clipperfund.com, and (iii) on the SEC’s website at www.sec.gov.
In addition, the Fund is required to file Form N-PX, with its complete proxy voting record for the 12 months ended June 30th, no later than August 31st of each year. The Fund’s Form N-PX filing is available (i) without charge, upon request, by calling the Fund toll-free at 1-800-432-2504, (ii) on the Fund’s website at www.clipperfund.com, and (iii) on the SEC’s website at www.sec.gov.
Form N-Q
The Fund files its complete schedule of portfolio holdings with the SEC for the first and third quarters of each fiscal year on Form N-Q. The Fund’s Form N-Q is available without charge, upon request, by calling 1-800-432-2504 or on the Fund’s website at www.clipperfund.com, or on the SEC’s website at www.sec.gov. The Fund’s Form N-Q may be reviewed and copied at the SEC’s Public Reference Room in Washington, DC, and that information on the operation of the Public Reference Room may be obtained by calling 1-800-SEC-0330.
CLIPPER FUNDSM | Privacy Notice and Householding |
Privacy Notice
While you generally will be dealing with a broker-dealer or other financial adviser, we may collect information about you from your account application and other forms that you may deliver to us. We use this information to process your requests and transactions; for example, to provide you with additional information about the Fund, to open an account for you, or to process a transaction. In order to service your account and execute your transactions, we may provide your personal information to firms that assist us in servicing your account, such as our transfer agent. We may also provide your name and address to one of our agents for the purpose of mailing your account statement and other information about our products and services to you. We require these outside firms and agents to protect the confidentiality of your information and to use the information only for the purpose for which the disclosure is made. We do not provide customer names and addresses to outside firms, organizations or individuals except in furtherance of our business relationship with you or as otherwise allowed by law.
We restrict access to nonpublic personal information about you to those employees who need to know that information to provide products or services to you. We maintain physical, electronic and procedural safeguards that comply with federal standards to guard your personal information.
Householding
To avoid sending duplicate copies of materials to households, the Fund will mail only one copy of each prospectus, Annual and Semi-Annual Report to shareholders having the same last name and address on the Fund’s records. The consolidation of these mailings, called householding, benefits the Fund through reduced mailing expense. If you do not want the mailing of these documents to be combined with those to other members of your household, please contact the Clipper Fund by phone at 1-800-432-2504. Individual copies of current prospectuses and reports will be sent to you within 30 days after the Fund receives your request to stop householding.
CLIPPER FUNDSM | Directors and Officers |
For the purpose of their service as directors to the Clipper Fund, the business address for each of the directors is 2949 E. Elvira Road, Suite 101, Tucson, AZ 85756. All directors qualify as independent under the Investment Company Act of 1940.
Name (birthdate) | Position(s) Held with Fund | Term of Office and Length of Time Served | Principal Occupation(s) During Past 5 Years | Number of Portfolios Overseen in Fund Complex | Other Directorships Held |
| | | | | | |
| Independent Directors | | | | | |
| | | | | | |
Lawrence E. Harris (09/16/1956) | Director | Indefinite and since April 2006 | Fred V. Keenan Chair in Finance of the Marshall School of Business, University of Southern California, Los Angeles, CA | 1 | Interactive Brokers Group, Inc. |
| | | | | | |
Steven N. Kearsley (09/29/1941) | Director | Indefinite and since April 2006 | Private Investor, Real Estate Development | 1 | None |
| | | | | | |
Lawrence P. McNamee (09/12/1934) | Director | Indefinite and since inception | Retired Educator | 1 | None |
| | | | | | |
Norman B. Williamson (05/18/1932) | Director/ Chairman | Indefinite and since inception | Private Investor | 1 | None |
Officers
Christopher C. Davis (born 7/13/65, Clipper Fund officer since 12/19/05). President of Clipper Fund; Chairman, Davis Selected Advisers, L.P., and also serves as an executive officer in certain companies affiliated with the Adviser, including sole member of the Adviser’s general partner, Davis Investments, LLC; Chief Executive Officer, President or Vice President of each of the Davis Funds (consisting of 13 portfolios), and Selected Funds (consisting of three portfolios); Employee of Shelby Cullom Davis & Co. (registered broker/dealer); Director of Davis New York Venture Fund, Inc. (consisting of four portfolios), Davis Variable Account Fund, Inc. (consisting of three portfolios), and the Selected Funds (consisting of three portfolios); Director of Washington Post Co. (newspaper publisher).
Kenneth C. Eich (born 8/14/53, Clipper Fund officer since 12/19/05). Executive Vice President and Principal Executive Officer of Clipper Fund, each of the Davis Funds (consisting of 13 portfolios), and Selected Funds (consisting of three portfolios); Chief Operating Officer, Davis Selected Advisers, L.P.; and also serves as an executive officer in certain companies affiliated with the Adviser.
Douglas A. Haines (born 3/4/71, Clipper Fund officer since 12/19/05). Vice President, Treasurer, Chief Financial Officer, Principal Financial Officer, and Principal Accounting Officer of Clipper Fund, each of the Davis Funds (consisting of 13 portfolios), and Selected Funds (consisting of three portfolios); Vice President and Director of Fund Accounting, Davis Selected Advisers, L.P.
Sharra L. Haynes (born 9/25/66, Clipper Fund officer since 12/19/05). Vice President, Chief Compliance Officer of Clipper Fund, each of the Davis Funds (consisting of 13 portfolios), and Selected Funds (consisting of three portfolios); Vice President and Chief Compliance Officer, Davis Selected Advisers, L.P.; and also serves as an executive officer in certain companies affiliated with the Adviser.
Thomas D. Tays (born 3/7/57, Clipper Fund officer since 12/19/05). Vice President and Secretary of Clipper Fund; each of the Davis Funds (consisting of 13 portfolios), and Selected Funds (consisting of three portfolios); Vice President, Chief Legal Officer and Secretary, Davis Selected Advisers, L.P.; and also serves as an executive officer in certain companies affiliated with the Adviser.
| Investment Adviser | |
| Davis Selected Advisers, L.P. (Doing business as “Davis Advisors”) | |
| 2949 East Elvira Road, Suite 101 | |
| Tucson, Arizona 85756 | |
| (800) 432-2504 | |
| | |
| Distributor | |
| Davis Distributors, LLC | |
| 2949 East Elvira Road, Suite 101 | |
| Tucson, Arizona 85756 | |
| | |
| Transfer Agent | |
| Boston Financial Data Services, Inc. | |
| P.O. Box 55468 | |
| Boston, Massachusetts 02205-5468 | |
| | |
| Custodian | |
| State Street Bank and Trust Co. | |
| One Lincoln Street | |
| Boston, Massachusetts 02111 | |
| | |
| Counsel | |
| Bingham McCutchen LLP | |
| 355 South Grand Avenue, Suite 4400 | |
| Los Angeles, CA 90071-3106 | |
| | |
| Independent Registered Public Accounting Firm | |
| KPMG LLP | |
| 707 Seventeenth Street, Suite 2700 | |
| Denver, Colorado 80202 | |
For more information about Clipper Fund including management fee, charges, and expenses, see the current prospectus, which must precede or accompany this report. The Fund’s Statement of Additional Information contains additional information about the Fund’s Directors and is available upon request, free of charge, by contacting the Fund at 800-432-2504 or on the Fund’s website at www.clipperfund.com.
ITEM 2. CODE OF ETHICS
The registrant has adopted a code of ethics that applies to the registrant’s principal executive officer, principal financial officer, principal accounting officer or controller, or persons performing similar functions.
A copy of the code of ethics is filed as an exhibit to this form N-CSR.
No waivers were granted to this code of ethics during the period covered by this report.
ITEM 3. AUDIT COMMITTEE FINANCIAL EXPERT
The Fund’s Board of Directors has determined that independent trustee Steven N. Kearsley qualifies as the “audit committee financial expert”, as defined in Item 3 of form N-CSR.
ITEM 4. PRINCIPAL ACCOUNTANT FEES AND SERVICES
| (a) | Audit Fees. The aggregate Audit Fees billed by KPMP LLP (“KPMG”) for professional services rendered for the audits of the audits of the financial statements, or services that are normally provided in connection with statutory and regulatory filings or engagements for the fiscal year ends December 31, 2009 and December 31, 2008 were $45,600 and $54,000, respectively. |
| (b) | Audit-Related Fees. The aggregate Audit-Related Fees billed by KPMG for services rendered for assurance and related services that are not reasonably related to the performance of the audit or review of the fund financial statements, but not reported as Audit Fees fore fiscal year ends December 31, 2009 and December 31, 2008 were $0 and $0, respectively. |
| (c) | Tax Fees. The aggregate Tax Fees billed by KPMG for professional services rendered for tax compliance, tax advice and tax planning for the fiscal year ends December 31, 2009 and December 31, 2008 were $15,540 and $8,040, respectively. |
Fees included in the Tax Fee category comprise all services performed by professional staff in the independent accountant’s tax division except those services related to the audit. These services include preparation of tax returns and private letter rulings, tax advice related to mergers and a review of the fund income and capital gain distributions.
| (d) | All Other Fees. The aggregate Other Fees billed by KPMG for all other non-audit services rendered to the fund for the fiscal year ends December 31, 2009 and December 31, 2008 were $0 and $0, respectively. |
(e)(1) Audit Committee Pre-Approval Policies and Procedures.
The fund Audit Committee must pre-approve all audit and non-audit services provided by the independent accountant relating to the operations or financial reporting of the funds. Prior to the commencement of any audit or non-audit services to a fund, the Audit Committee reviews the services to determine whether they are appropriate and permissible under applicable law.
The fund Audit Committee has adopted a policy whereby audit and non-audit services performed by the fund independent accountant require pre-approval in advance at regularly scheduled Audit Committee meetings. If such a service is required between regularly scheduled Audit Committee meetings, pre-approval may be authorized by the Audit Committee Chairperson with ratification at the next scheduled audit committee meeting.
| (2) | No services included in (b) – (d) above were approved pursuant to paragraph (c)(7)(i)(C) of |
Rule 2-01 of Regulation S-X.
(f) Not applicable
| (g) | The Funds’ independent accountant did not provide any services to the investment advisor or any affiliate for the fiscal years ended December 31, 2009 and December 31, 2008. The fund has not paid any fees for non-audit not previously disclosed in items 4 (b) – (d). |
| (h) | The registrant’s audit committee of the board of trustees has considered whether the provision of non-audit services that were rendered to the registrant’s investment adviser, and any entity controlling, controlled by, or under common control with the investment adviser that provides ongoing services to the registrant that not pre-approved pursuant to paragraph (c)(7)(ii) of Rule 2-01 of Regulation S-X is compatible with maintaining the principal accountant’s independence. No such services were rendered. |
ITEM 5. AUDIT COMMITTEE OF LISTED REGISTRANTS
Not Applicable
ITEM 6. SCHEDULE OF INVESTMENTS
Not Applicable. The complete Schedule of Investments is included in Item 1 of this for N-CSR
ITEM 7. DISCLOSURE OF PROXY VOTING POLICIES AND PROCEDURES FOR CLOSED-END MANAGEMENT INVESTMENT COMPANIES
Not Applicable
ITEM 8. PORTFOLIO MANAGERS OF CLOSED-END MANAGEMENT INVESTMENT COMPANIES
Not Applicable
ITEM 9. PURCHASES OF EQUITY SECURITIES BY CLOSED-END MANAGEMENT INVESTMENT COMPANIES AND AFFILIATED PURCHASERS
Not Applicable
ITEM 10. SUBMISSION OF MATTERS TO A VOTE OF SECURITY HOLDERS
There have been no changes to the procedure by which shareholders may recommend nominees to the registrant’s Board of Trustees.
ITEM 11. CONTROLS AND PROCUDURES
| (a) | The registrant’s principal executive officer and principal financial officer have concluded that the registrant’s disclosure controls and procedures (as defined in Rule 30a-3 (c) under the Investment Company Act of 1940, as amended) are effective as of a date within 90 days of the filing date of this report. |
| (b) | There have been no significant changes in the registrant’s internal controls or in other factors that could significantly affect these controls. |
ITEM 12. EXHIBITS
| | (a)(1) The registrant’s code of ethics pursuant to Item 2 of Form N-CSR is filed as an exhibit to this form N-CSR. |
| | (a)(2) Certifications pursuant to Section 302 of the Sarbanes-Oxley Act of 2002 are attached. |
| | (b) Certifications pursuant to Section 906 of the Sarbanes-Oxley Act of 2002 are attached. |
Pursuant to the requirements of the Securities Exchange Act of 1934 and the Investment Company Act of 1940, the registrant has duly caused this report to be signed on its behalf by the undersigned, thereunto duly authorized.
CLIPPER FUND, INC.
By /s/ Kenneth C. Eich
Kenneth C. Eich
Principal Executive Officer
Date: March 5, 2010
Pursuant to the requirements of the Securities Exchange Act of 1934 and the Investment Company Act of 1940, this report has been signed below by the following persons on behalf of the registrant and in the capacities and on the dates indicated.
By /s/ Kenneth C. Eich
Kenneth C. Eich
Principal Executive Officer
Date: March 5, 2010
By /s/ Douglas A. Haines
Douglas A. Haines
Principal Financial Officer
Date: March 5, 2010