SECURITIES AND EXCHANGE COMMISSION
Washington, DC 20549
FORM N-CSR
CERTIFIED SHAREHOLDER REPORT OF REGISTERED MANAGEMENT INVESTMENT COMPANY
Investment Company Act file number 811-03931
CLIPPER FUND, INC.
(Exact name of registrant as specified in charter)
2949 East Elvira Road, Suite 101
Tucson, AZ 85756
(Address of principal executive offices)
Thomas D. Tays
Davis Selected Advisers, L.P.
2949 East Elvira Road, Suite 101
Tucson, AZ 85756
(Name and address of agent for service)
Registrant’s telephone number, including area code: 520-806-7600
Date of fiscal year end: December 31, 2011
Date of reporting period: December 31, 2011
____________________
ITEM 1. REPORT TO STOCKHOLDERS
Cautionary Statement
Davis Advisors is committed to communicating with our investment partners as candidly as possible because we believe our investors benefit from understanding our investment philosophy and approach. Our views and opinions regarding the investment prospects of our portfolio holdings include “forward looking statements” which may or may not be accurate over the long term. While we believe we have a reasonable basis for our appraisals and we have confidence in our opinions, actual results may differ materially from those we anticipate. These opinions are current as of the date of this report but are subject to change. The information provided in this report should not be considered a recommendation to buy, sell, or hold any particular security.
You can identify forward looking statements by words like “believe,” “expect,” “anticipate,” or similar expressions when discussing prospects for particular portfolio holdings and/or of the Fund. We cannot assure future results and achievements. You should not place undue reliance on forward looking statements, which speak only as of the date of this report. We disclaim any obligation to update or alter any forward looking statements, whether as a result of new information, future events, or otherwise. This material must be preceded or accompanied by a prospectus. Please read the prospectus carefully for a discussion of investment objectives, risks, fees, and expenses. Current performance may be lower or higher than the performance quoted herein. You may obtain a current copy of the Fund’s Prospectus or more current performance information by calling Investor Services at 1-800-432-2504 or on Clipper Fund’s website (www.clipperfund.com).
Clipper Fund Shareholders Meeting
Davis Advisors cordially invites you to the 2012 Clipper Fund Shareholder Meeting with Portfolio Managers Christopher C. Davis and Kenneth Charles Feinberg to be held on Thursday, March 29th.
The Fund managers will discuss the investment approach and Portfolio. A question-and-answer session will follow.
Location: The Peninsula Hotel Beverly Hills
9882 South Santa Monica Boulevard
Beverly Hills, CA 90212
Verandah Room
Time: 9:30 A.M. – 11:00 A.M. (PDT)
Attendees: Clipper Fund shareholders, consultants, and other interested parties.
For more information, please call 800-432-2504.
| Shareholder Letter | 2 |
| | |
| Management’s Discussion of Fund Performance | 10 |
| | |
| Fund Overview | 12 |
| | |
| Expense Example | 13 |
| | |
| Schedule of Investments | 14 |
| | |
| Statement of Assets and Liabilities | 17 |
| | |
| Statement of Operations | 18 |
| | |
| Statements of Changes in Net Assets | 19 |
| | |
| Notes to Financial Statements | 20 |
| | |
| Financial Highlights | 25 |
| | |
| Report of Independent Registered Public Accounting Firm | 26 |
| | |
| Fund Information | 27 |
| | |
| Privacy Notice and Householding | 28 |
| | |
| Directors and Officers | 29 |
This Annual Report is authorized for use by existing shareholders. Prospective shareholders must receive a current Clipper Fund Prospectus, which contains more information about investment strategies, risks, fees, and expenses. Please read the prospectus carefully before investing or sending money.
Shares of Clipper Fund are not deposits or obligations of any bank, are not guaranteed by any bank, are not insured by the FDIC or any other agency, and involve investment risks, including possible loss of the principal amount invested.
The chart below summarizes results through December 31, 2011 for the Clipper Fund. The credit for the Fund’s satisfactory results since inception belongs to our predecessor. The responsibility for the poor five year results rests entirely with us as we assumed management on January 1, 2006. On both a relative and absolute basis, these results are among the worst my partner Ken Charles Feinberg and I have had to report in our careers.
With more than $70 million of our own money invested in Clipper Fund alongside shareholders, we, our colleagues and our families share the cost of these unsatisfactory results and have every incentive to fix them.1 To this end, while longer term results signify more, it is heartening that results have improved in more recent periods and that the Fund’s one and three year returns now exceed the market. In fact, since its low point in March of 2009, the Fund is up about 119% versus 97% for the market’s.2 But we still have a long way to go. Nothing we say in the pages ahead is meant to excuse or minimize the poor results under our stewardship. We are committed to Clipper Fund and believe over a long period of time the fact that it is concentrated and, as a relatively small fund, opportunistic should be advantages.3
| Average Annual Total Returns as of December 31, 2011 |
| | 1 Year | 3 Year | 5 Years | 10 Years | Since Inception (2/29/84) |
| Clipper Fund | 2.29% | 17.33% | (4.01)% | 1.13% | 11.15% |
S&P 500® Index | 2.11% | 14.11% | (0.25)% | 2.92% | 10.46% |
The performance presented represents past performance and is not a guarantee of future results. Total return assumes reinvestment of dividends and capital gain distributions. Investment return and principal value will vary so that, when redeemed, an investor’s shares may be worth more or less than their original cost. The total annual operating expense ratio as of the most recent prospectus was 0.76%. The total annual operating expense ratio may vary in future years. Current performance may be higher or lower than the performance quoted. For most recent month-end performance, visit clipperfund.com or call 800-432-2504. The Fund received favorable class action settlements from companies which it no longer owns. These settlements had a material impact on the investment performance of the Fund in 2009. This was a one-time event that is unlikely to be repeated. Clipper Fund was managed from inception, February 29, 1984, until December 31, 2005 by another Adviser. Davis Selected Advisers, L.P. took over management of the Fund on January 1, 2006.
Results
During a period of such disappointing relative results, any attempt to put these results in context risks sounding evasive or defensive. Our goal is not to avoid taking responsibility for the fact that Clipper Fund’s results fall short of our standards and expectations. Instead, we want to provide our fellow shareholders with the reasons why we remain committed to our investment discipline and confident results in the years ahead should be much better.
Because we have only managed Clipper Fund since 2006, the only way we can provide a longer term context for our results is by referencing the investment records of the other more diversified mutual funds managed by our firm. However, before looking at these, we should point out that the other funds are more diversified and thus their records may not be directly comparable to Clipper Fund’s. Nevertheless, these results will at the least help demonstrate that periods such as this are unprecedented in our own history. For example, the Davis New York Venture Fund, a diversified mutual fund that our firm has managed since 1969 and that Ken and I have overseen for about 14 years and 16 years, respectively, has returned 11.47%
1 As of December 31, 2011.
2 Past performance is not a guarantee of future results. Cumulative return shown is for the period from 3/9/2009-12/31/2011. The market is represented by the S&P 500® Index.
3 Clipper Fund is non-diversified and therefore is allowed to focus its investments in fewer companies than a fund that is required to diversify its portfolio. The Fund may be subject to greater volatility and risk and the Fund’s investment performance, both good and bad, is expected to reflect the economic performance of the few companies on which the Fund focuses.
Not a part of Annual Report to Fund shareholders
| | Shareholder Letter – (Continued) |
per year after expenses since its inception versus 9.39% for the S&P 500® Index, a result we consider satisfactory on both a relative and absolute basis.4 Over this time, the Fund outperformed the market in 100% of all rolling 10 year periods.5
Average Annual Total Returns as of December 31, 2011 |
| | 1 Year | 5 Years | 10 Years |
| Davis New York Venture Fund Class A | | | |
| with a maximum 4.75% sales charge | (9.30)% | (3.30)% | 2.87% |
The performance presented represents past performance and is not a guarantee of future results. Total return assumes reinvestment of dividends and capital gain distributions. Investment return and principal value will vary so that, when redeemed, an investor’s shares may be worth more or less than their original cost. The total annual operating expense ratio for Class A shares as of the most recent prospectus was 0.89%. The total annual operating expense ratio may vary in future years. Returns and expenses for other classes of shares will vary. Current performance may be higher or lower than the performance quoted. For most recent month-end performance, visit davisfunds.com or call 800-279-0279.
In addition, the Fund outperformed in 76% of all rolling five year periods and, while this is a strong percentage, it also means the Fund underperformed in 24% of all five year periods.5 Bearing in mind that the Davis New York Venture Fund is a diversified fund and thus not directly comparable to Clipper Fund, we would note that five years of lagging results, while disappointing, are not unprecedented or inconsistent with our long-term history. Also, although we do not know if it would have been true for Clipper Fund, in every case in which Davis New York Venture Fund trailed the market for a five year period, it exceeded the market in the following five years.5
If we extend this analysis of our own history to the record of other managers that have generated good long-term results, a similar pattern emerges. For example, almost 60% of the top-performing funds over the past decade underperformed for at least a five year stretch during that decade of outperformance.6 To use an example closer to home, our predecessors in managing Clipper Fund built an outstanding long-term record from the time they started the Fund in 1984 until they stepped down in 2005, outperforming the market by almost 2% per year for more than 20 years. However, even under their excellent management, the Fund still underperformed in roughly half of all five year periods since its inception.7
From these statistics it would seem that while this has been a very difficult and disappointing period, such a stretch of underperformance is not unprecedented for us as managers, unexpected in comparison with other managers we admire, or unusual in Clipper Fund’s own history. While this historical data is somewhat reassuring, it does not make this period less disappointing.
4 Davis New York Venture Fund is sold under a separate prospectus. Past performance is not a guarantee of future results. There are material differences between Clipper Fund and Davis New York Venture Fund and this discussion is not meant to be a proxy for Clipper Fund. This discussion is provided to serve as a factual basis for the proposition that equity markets are volatile and over the long term it is very likely that an investor may experience shorter periods of underperformance.
5 Class A shares without a sales charge. Past performance is not a guarantee of future results. See endnotes for a description of the S&P 500® Index and rolling returns. There is no guarantee that periods of underperformance will be followed by outperformance.
6 Source: Davis Advisors. 193 managers from eVestment Alliance’s large cap universe whose 10 year average annualized performance ranked in the top quartile from January 1, 2001-December 31, 2010. Past performance is not a guarantee of future results.
7 Past performance is not a guarantee of future results.
Not a part of Annual Report to Fund shareholders
| | Shareholder Letter – (Continued) |
Finally, while it is no solace to Clipper shareholders and while Clipper as a more concentrated fund would have been run differently, our management team did outperform the market in 10 of the last 12 rolling five year periods with Davis New York Venture Fund.8 It is difficult to put into words how frustrating it is to us that none of those periods of outperformance were enjoyed by Clipper shareholders.
Looking ahead, our disappointment about our results over the last five years does not diminish our optimism about the future. Moreover, this optimism is not based on the longer term historical data presented on the prior page but rather on our Portfolio as it stands today. In other words, while history presents a positive statistical picture, the most important basis for our optimism is the strong fundamentals and attractive valuations of the individual companies that make up Clipper Fund now.
Portfolio Review
As equity investors, we never forget that stocks represent ownership interests in real businesses like Wells Fargo, Costco, American Express, CVS Caremark, Microsoft and Merck.9 Over the long term, the growing value of these businesses will determine our success, not the fluctuating prices of their stocks. As a result, while we recognize that the prices of the stocks we own have been disappointing over the last five years, the value of the underlying businesses has generally increased and continues to make progress. This is the most important reason we believe that patient investors who have stayed the course are doing better now and should continue to do so in the years ahead.
This critical point may be most easily understood by analogy. If instead of stocks, the Portfolio were made up of a broadly diversified array of rental apartment buildings, one useful metric we might report to clients would be the cash flow generated by collecting the rent on these properties relative to the price we paid for them. If, for example, one year ago we paid $100 million for a group of properties and since then these properties generated $7 million of cash flow after expenses, we would think of the Portfolio as earning a 7% return on our investment. If next year, the cash flow grows to $8 million, we would report that the return on the Portfolio had increased to 8%. In this example, the discussion of results would be based on the reality of cash flow, not estimates of what the Portfolio could be sold for on any given day.
Similarly, although our Portfolio is not made up of real estate, it is made up of ownership interests in businesses that like apartment buildings generate real cash flow and earnings every day. Today, we estimate the individually selected companies that make up the Clipper Fund are generating an owner earnings yield of 7%-8%. (Owner earnings is a measure of earnings that differs somewhat from generally accepted accounting principles in ways that we believe make it a more accurate measure of economic versus accounting reality. For example, in determining owner earnings, we normalize tax rates and credit costs as well as including the costs of adequately funding pension liabilities, adding back depreciation, deducting maintenance capital spending, and so on.) More important, based on our analysis and projections, we estimate the companies held in Clipper Fund on average should generate an earnings yield of 8.5%-10.5% by 2013. In a world where corporate bonds of such companies yield between 3%-6% we find the gap between the price and value of the companies that make up Clipper Fund especially compelling. This above all else strengthens our belief that Clipper Fund’s relative results over the next five years should be more than satisfactory.10
Holdings and Mistakes
While the information above speaks to our view of the overall Portfolio, we always remember that the Portfolio is made up of specific, individual investments. With each investment, we determine a reasonable estimate of fair value based on our own, independent research and analysis. We shared our investment rationale for some of our larger holdings, including Costco, Wells Fargo, CVS Caremark, Canadian Natural Resources, and Microsoft, in our midyear 2011 report. Because we have not
8 Class A shares without a sales charge. Past performance is not a guarantee of future results.
9 Individual securities are discussed in this piece. While we believe we have a reasonable basis for our appraisals and we have confidence in our opinions, actual results may differ materially from those we anticipate. The return of a security to the Fund will vary based on weighting and timing of purchase. This is not a recommendation to buy, sell or hold any specific security. Past performance is not a guarantee of future results.
10 While we believe we have a reasonable basis for our appraisals and we have confidence in our opinions, actual results may differ materially from those we anticipate.
Not a part of Annual Report to Fund shareholders
| | Shareholder Letter – (Continued) |
meaningfully changed our investment theses for these companies in the intervening months, we commend our midyear report to those looking for additional details about these individual holdings. (Please see the Commentary section of clipperfund.com to read this report.)
However, to paraphrase Tolstoy, while each of these “happy” investments is alike in that they all tend to be durable, well-run and well-regarded companies, each of our investment mistakes is unique and requires further explanation. As stewards of our clients’ savings, we firmly believe in the discipline of providing a review of our most significant mistakes and it is to these that we now turn.
Although the vast majority of our Portfolio companies made progress last year, developments at one of our largest holdings led us to reduce meaningfully our estimate of its intrinsic value. The reduction in our estimate of a company’s value is what makes us label an investment a mistake, not the fact that its stock price has declined. Unless investors make every purchase at the lowest price, their portfolios will likely show an unrealized loss on every position at some point. Mistakes occur in those cases where the lower stock price reflects a lower business value. In the worst cases, usually caused by some combination of leverage (e.g., Lehman Brothers, Fannie Mae, Freddie Mac), low-cost competition (e.g., General Motors), obsolescence (e.g., Kodak), or fraud (e.g., WorldCom, Enron), the company is unable to ever return to profitability and equity investors are essentially wiped out. While we avoided all the examples mentioned above, we like all investors, have our scars.
One of the largest detractors from last year’s results was our holding in Bank of New York Mellon, which we count as a mistake because we have meaningfully lowered our appraisal of the company’s fair value. However, unlike some of the examples mentioned above, we have no doubt about the bank’s durability or the fact that it will remain profitable. After all, this 233-year-old institution has endured despite panics, depressions, civil war, world wars, and more. More important, we believe that the stock price has declined more than the business value and thus we expect to earn back some of this loss in the years ahead.
The immediate cause of the stock’s decline was earnings’ shortfalls, which in turn were caused by a combination of factors. Some of the factors are likely to be permanent. For example, for many years the company made a considerable profit executing foreign exchange trades on behalf of custody clients in a manner that does not appear to have been clearly disclosed to clients. In addition to harming the bank’s reputation, this practice is now the subject of significant litigation led by several state attorneys general. Beyond the cost of litigation and settlements, it is likely that the foreign exchange profit pool has been significantly and permanently reduced. Other factors, such as today’s record low interest rates and clients’ preference for bonds over stocks, should eventually reverse and add to profits. But some, such as a competitive pricing environment in which steep discounting is the norm, may or may not reverse. This last factor is unexpected as the industry is an oligopoly with the top three institutions accounting for about 50% of a very slow growing market, which typically makes discounting unnecessary. Profits lost by price cuts are unlikely to be regained even by meaningful changes in market share.
In our estimation, this combination of short-term and long-term factors has reduced earnings by some 20%-25%. Because we expect at least a portion of these factors to eventually reverse, we have reduced our estimate of Bank of New York Mellon’s value somewhat less. Bank of New York Mellon’s stock price, however, fell more than 30% indicating a widespread belief that all of these factors represent permanent changes. While we think this pessimism is understandable given the bank’s poor record of execution in recent years, considerable evidence also indicates that the bank’s core businesses remain quite strong. For example, in 2011 the bank increased its assets under custody by 3%, its assets under management 8%, its deposits 37%, its loans 18%, and its capital 10%.
At today’s price, the company’s shares are valued at less than 10 times depressed profits that incorporate all the negative factors described above. We find this a particularly low valuation given that the company’s business model entails relatively little credit risk, obsolescence risk or balance sheet risk and that it can grow with relatively little incremental capital required. If some of the negative factors such as current interest rate spreads or today’s competitive environment improve, the stock could benefit not just from growing profitability but also from an upward revision of the company’s multiple to better reflect the durability and profitability of the underlying business. Although we recognize our mistake and have lowered our assessment of fair value, the fact that the shares now trade at a low multiple on depressed earnings leaves us optimistic that Bank of New York Mellon will add to our future returns and that we will earn back some of this loss in the years ahead.
Not a part of Annual Report to Fund shareholders
| | Shareholder Letter – (Continued) |
Conclusion
One of the most important reasons that we spend time reviewing and trying to learn from our mistakes is to help us recognize and adapt to changing economics whether at the level of a specific company or the global economy. As Charles Darwin stated, “In the struggle for survival, the fittest win out…because they succeed in adapting themselves best to their environment” [emphasis added].
However, the requirement that successful investors adapt to a changing world does not mean that there are not unchanging investment principles. In fact, in 1934, Ben Graham and David Dodd compiled these core principles in a textbook called Security Analysis. This seminal work is now in its sixth edition and is still considered to be among the most important investment books ever written. One of its central concepts is the essential distinction between price and value, a distinction that is still overlooked by the public, the press, the pundits, and even the professionals. The proof of this lies in the fact that after more than a decade of falling stock prices, investors are more pessimistic than ever and continue to shift out of stocks. However, during this same decade, rising revenue, earnings, cash flow, and dividends have increased the value of the vast majority of companies. While investors remain glum, the combination of lower prices and higher value should lead to improved stock returns in the years ahead. It is no wonder that John Templeton famously observed, “Bull markets are born on pessimism, grow on skepticism, mature on optimism and die on euphoria.” While it may not be clear whether we are in a time of skepticism or pessimism, it is certain we are far from optimism or euphoria.
In addition to the prospect of higher market returns, the quality, valuation and growth prospects of the specific companies we own give us confidence that our relative returns should continue to improve in the years ahead. If our confidence proves justified, then returns in the decade ahead should be more than satisfactory. While we cannot promise this outcome, we can promise that we will do all in our power to achieve it.
As a final note, Security Analysis begins with a quote from the Roman poet Horace who wrote more than 2000 years ago, “Many shall be restored that now are fallen, and many shall fall that now are in honor.” At a time when our results have been below our standards and expectations, this simple epigram reminds us that such periods are inevitable and that by sticking to our investment discipline, learning from mistakes and adapting to changing times, we can look forward to better days ahead.
As we said at the beginning of this report, we are deeply disappointed in the unsatisfactory results of Clipper Fund in its first five years under our management. We know we have ground to make up and, for the reasons outlined in this report, we have confidence we are moving in the right direction. We are mindful of the trust you have placed in our firm and committed to continuing to improve returns in the years ahead. Thank you.
Sincerely,
Christopher C. Davis Kenneth Charles Feinberg
President & Portfolio Manager Portfolio Manager
February 3, 2012
Not a part of Annual Report to Fund shareholders
| | Shareholder Letter – (Continued) |
Before investing in Davis New York Venture Fund, you should carefully consider the Fund’s investment objective, risks, charges, and expenses. The prospectus contains this and other information about the Fund. You can obtain a current Davis New York Venture Fund prospectus by visiting davisfunds.com or calling 800-279-0279. Please read the prospectus carefully before investing or sending money.
This report is authorized for use by existing Clipper Fund shareholders. A current Clipper Fund prospectus must accompany or precede this material if it is distributed to prospective shareholders. You should carefully consider the Fund’s investment objective, risks, fees, and expenses before investing. Read the prospectus carefully before you invest or send money.
This report includes candid statements and observations regarding investment strategies, individual securities, and economic and market conditions; however, there is no guarantee that these statements, opinions or forecasts will prove to be correct. These comments may also include the expression of opinions that are speculative in nature and should not be relied on as statements of fact.
Objective and Risks. Clipper Fund’s investment objective is long-term capital growth and capital preservation. There can be no assurance that the Fund will achieve its objective. The Fund invests primarily in equity securities issued by large companies with market capitalizations of at least $10 billion. Some important risks of an investment in the Fund are: stock market risk: stock markets have periods of rising prices and periods of falling prices, including sharp declines; manager risk: poor security selection may cause the Fund to underperform relevant benchmarks; common stock risk: an adverse event may have a negative impact on a company and could result in a decline in the price of its common stock; focused portfolio risk: investing in a limited number of companies causes changes in the value of a single security to have a more significant effect on the value of the Fund’s total portfolio; financial services risk: investing a significant portion of assets in the financial services sector may cause the Fund to be more sensitive to problem affecting financial companies; under $10 billion market capitalization risk: small- and mid-size companies typically involve more risk than larger, more mature companies; headline risk: the Fund may invest in a company when the company becomes the center of controversy. The company’s stock may never recover or may become worthless; fees and expenses risk: the Fund may not earn enough through income and capital appreciation to offset the operating expenses of the Fund; and foreign country risk: foreign companies may be subject to greater risk as foreign economies may not be as strong or diversified. As of December 31, 2011, the Fund had approximately 15.0% of assets invested in foreign companies. See the prospectus for a complete description of the principal risks.
Davis New York Venture Fund’s investment objective is long-term growth of capital. There can be no assurance that the Fund will achieve its objective. The Fund invests primarily in equity securities issued by large companies with market capitalizations of at least $10 billion. Some important risks of an investment in the Fund are: stock market risk: stock markets have periods of rising prices and periods of falling prices, including sharp declines; manager risk: poor security selection may cause the Fund to underperform relevant benchmarks; common stock risk: an adverse event may have a negative impact on a company and could result in a decline in the price of its common stock; financial services risk: investing a significant portion of assets in the financial services sector may cause the Fund to be more sensitive to problem affecting financial companies; headline risk: the Fund may invest in a company when the company becomes the center of controversy. The company’s stock may never recover or may become worthless; fees and expenses risk: the Fund may not earn enough through income and capital appreciation to offset the operating expenses of the Fund; foreign country risk: foreign companies may be subject to greater risk as foreign economies may not be as strong or diversified; emerging market risk: securities of issuers in emerging and developing markets may present risks not found in more mature markets; foreign currency risk: the change in value of a foreign currency against the U.S. dollar will result in a change in the U.S. dollar value of securities denominated in that foreign currency; trading markets and depositary receipts risk: depositary receipts involve higher expenses and may trade at a discount (or premium) to the underlying security. As of December 31, 2011, the Fund had approximately 17.5% of assets invested in foreign companies. See the prospectus for a complete description of the principal risks.
Davis Advisors is committed to communicating with our investment partners as candidly as possible because we believe our investors benefit from understanding our investment philosophy and approach. Our views and opinions include “forward-looking statements” which may or may not be accurate over the long term. Forward-looking statements can be identified by words like “believe,” “expect,” “anticipate,” or similar expressions. You should not place undue reliance on forward-looking statements, which are current as of the date of this report. We disclaim any obligation to update or alter any forward-looking statements, whether as a result of new information, future events, or otherwise. While we believe we have a reasonable basis for our appraisals and we have confidence in our opinions, actual results may differ materially from those we anticipate.
Not a part of Annual Report to Fund shareholders
| | Shareholder Letter – (Continued) |
The information provided in this material should not be considered a recommendation to buy, sell, or hold any particular security. As of December 31, 2011, Clipper Fund had invested the following percentages of its assets in the companies listed:
| American Express | 10.47% |
| Bank of New York Mellon | 4.98% |
| Canadian Natural Resources | 8.75% |
| Costco | 10.43% |
| CVS Caremark | 6.77% |
| Merck | 2.66% |
| Microsoft | 1.52% |
| Wells Fargo | 2.16% |
The information provided in this material should not be considered a recommendation to buy, sell, or hold any particular security. As of December 31, 2011, Davis New York Venture Fund had invested the following percentages of its assets in the companies listed:
| American Express | 5.13% |
| Bank of New York Mellon | 4.42% |
| Canadian Natural Resources | 3.05% |
| Costco | 4.55% |
| CVS Caremark | 5.34% |
| Merck | 2.14% |
| Microsoft | 1.20% |
| Wells Fargo | 5.71% |
The Funds have adopted Portfolio Holdings Disclosure policies that govern the release of non-public portfolio holding information. These policies are described in the prospectuses. For Clipper Fund, visit clipperfund.com or call 800-432-2504 for the most current public portfolio holdings information. For Davis Funds, visit davisfunds.com or call 800-279-0279 for the most current public portfolio holdings information.
Clipper Fund was managed from inception, February 29, 1984, until December 31, 2005 by another Adviser. Davis Selected Advisers, L.P. took over management of the Fund on January 1, 2006.
We gather our index data from a combination of reputable sources, including, but not limited to, Thomson Financial, Lipper and index websites.
Rolling Returns. Davis New York Venture Fund’s average annual total returns for Class A shares were compared against the returns of the S&P 500® Index as of December 31 of each year for all time periods shown from 1969 through 2011. The Fund’s returns assume an investment in Class A shares on January 1 of each year with all dividends and capital gain distributions reinvested for the time period. The returns are not adjusted for any sales charge that may be imposed. If a sales charge were imposed, the reported figures would be lower. The figures are based on past results; past performance is not a guarantee of future results. There can be no guarantee that the Fund will continue to deliver consistent investment performance. The performance presented includes periods of bear markets when performance was negative. Equity markets are volatile and an investor may lose money. Returns for other share classes will vary.
Broker-dealers and other financial intermediaries may charge Davis Advisors substantial fees for selling its funds and providing continuing support to clients and shareholders. For example, broker-dealers and other financial intermediaries may charge: sales commissions; distribution and service fees; and record-keeping fees. In addition, payments or reimbursements may be requested for: marketing support concerning Davis Advisors’ products; placement on a list of offered products; access to sales meetings, sales representatives and management representatives; and participation in conferences or seminars, sales or training programs for invited registered representatives and other employees, client and investor events, and other
Not a part of Annual Report to Fund shareholders
| | Shareholder Letter – (Continued) |
dealer-sponsored events. Financial advisors should not consider Davis Advisors’ payment(s) to a financial intermediary as a basis for recommending Davis Advisors.
The S&P 500® Index is an unmanaged index of 500 selected common stocks, most of which are listed on the New York Stock Exchange. The Index is adjusted for dividends, weighted towards stocks with large market capitalizations and represents approximately two-thirds of the total market value of all domestic common stocks. Investments cannot be made directly in an index.
After April 30, 2012, this material must be accompanied by a supplement containing performance data for the most recent quarter end.
Shares of the Clipper Fund and the Davis New York Venture Fund are not deposits or obligations of any bank, are not guaranteed by any bank, are not insured by the FDIC or any other agency, and involve investment risks, including possible loss of the principal amount invested.
12/11 Davis Distributors, LLC, 2949 East Elvira Road, Suite 101, Tucson, AZ 85756, 800-432-2504, clipperfund.com.
Not a part of Annual Report to Fund shareholders
| | Management’s Discussion of Fund Performance |
Performance Overview
Clipper Fund delivered a total return on net asset value of 2.29% for the year ended December 31, 2011. Over the same time period, the Standard & Poor’s 500® Index (“Index”) returned 2.11%. While the Index increased little over the year, individual sectors1 within the Index increased by as much as 20% (utilities) or decreased by as much as 16% (financials). The sectors within the Index that turned in the strongest performance over the year were utilities, consumer staples, and health care. The sectors that turned in the weakest performance over the year were financials, materials, and industrials.
Factors Impacting the Fund’s Performance
Consumer staple companies were the most important contributor2 to performance on an absolute basis. The Fund’s consumer staple companies out-performed the corresponding sector within the Index (up 16% versus up 14% for the Index) and had a higher relative average weighting (19% versus 11% for the Index) in this stronger performing sector. Costco Wholesale3, CVS Caremark, and Diageo were among the most important contributors to performance.
Consumer discretionary companies were the second most important contributor to performance on an absolute basis. The Fund’s consumer discretionary companies out-performed the corresponding sector within the Index (up 19% versus up 6% for the Index), but had a lower relative average weighting (6% versus 11% for the Index). Harley-Davidson and Bed Bath & Beyond were among the most important contributors to performance.
Energy companies were the most important detractor from performance, both on an absolute basis and relative to the Index. The Fund’s energy companies under-performed the corresponding sector within the Index (down 13% versus up 5% for the Index) and had a lower relative average weighting (9% versus 13% for the Index). Canadian Natural Resources was among the most important detractors from performance.
Information technology companies were the second most important detractor from performance, both on an absolute basis and relative to the Index. The Fund’s information technology companies under-performed the corresponding sector within the Index (down 20% versus up 2% for the Index) and had a lower relative average weighting (5% versus 18% for the Index). Hewlett-Packard and Texas Instruments were among the most important detractors from performance.
The Fund continued to have more invested in financial companies than in any other sector. While financial companies slightly detracted from absolute performance, they were an important contributor to performance relative to the Index. The Fund’s financial companies out-performed the corresponding sector within the Index (down 1% versus down 16% for the Index), but had a higher relative average weighting (50% versus 15% for the Index) in this weaker performing sector. Oaktree, American Express, and Transatlantic Holdings were among the most important contributors to performance. Bank of New York Mellon, RHJ International, Goldman Sachs, Berkshire Hathaway, Ameriprise Financial, Julius Baer Group, and Loews were among the most important detractors from performance.
The Fund had approximately 15% of its net assets invested in foreign companies at December 31, 2011. As a whole, those companies under-performed the domestic companies held by the Fund.
Clipper Fund’s investment objective is to seek long-term capital growth and capital preservation. There can be no assurance that the Fund will achieve its objective. Clipper Fund’s principal risks are: stock market risk, manager risk, common stock risk, focused portfolio risk, financial services risk, foreign country risk, under $10 billion market capitalization risk, headline risk, and fees and expenses risk. See the prospectus for a full description of each risk.
Clipper Fund focuses its investments in fewer companies, and it may be subject to greater risks than a more diversified fund that is not allowed to focus its investments in a few companies. The Fund’s investment performance, both good and bad, is expected to reflect the economic performance of its more focused portfolio.
1 The companies included in the Standard & Poor’s 500® Index are divided into ten sectors. One or more industry groups make up a sector.
2 A company’s or sector’s contribution to or detraction from the Fund’s performance is a product both of its appreciation or depreciation and its weighting within the Fund. For example, a 5% holding that rises 20% has twice as much impact as a 1% holding that rises 50%.
3 This Management Discussion of Fund Performance discusses a number of individual companies. The information provided in this report does not provide information reasonably sufficient upon which to base an investment decision and should not be considered a recommendation to purchase or sell any particular security. The Schedule of Investments lists the Fund’s holdings of each company discussed.
| | Management’s Discussion of Fund Performance – (Continued) |
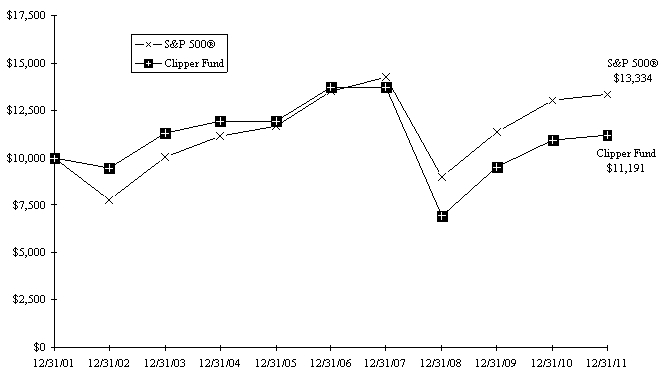
Comparison of a $10,000 investment in Clipper Fund versus the Standard & Poor’s 500® Index over 10 years for an investment made on December 31, 2001
Average Annual Total Return for periods ended December 31, 2011
Fund & Benchmark Index | 1-Year | 5-Year | 10-Year | Since Fund’s Inception (02/29/84) | Gross Expense Ratio | Net Expense Ratio |
| Clipper Fund | 2.29% | (4.01)% | 1.13% | 11.15% | 0.75% | 0.75% |
Standard & Poor’s 500® Index | 2.11% | (0.25)% | 2.92% | 10.46% | | |
In 2009, the Fund received favorable class action settlements from companies which it no longer owns. These settlements had a material impact on the investment performance of the Fund, adding approximately 5% to the Fund’s total return in 2009. This was a one-time event that is unlikely to be repeated.
The Standard & Poor’s 500® Index is an unmanaged index of 500 selected common stocks, most of which are listed on the New York Stock Exchange. The Index is adjusted for dividends, weighted towards stocks with large market capitalizations, and represents approximately two-thirds of the total market value of all domestic common stocks. Investments cannot be made directly in the Index.
The performance data for Clipper Fund contained in this report represents past performance and assumes that all distributions were reinvested, and should not be considered as an indication of future performance from an investment in the Fund today. The investment return and principal value will fluctuate so that shares may be worth more or less than their original cost when redeemed. Fund performance changes over time and current performance may be higher or lower than stated. Returns shown do not reflect the deduction of taxes that a shareholder would pay on fund distributions or the redemption of fund shares. The operating expense ratio may vary in future years. For more current information please call Clipper Fund Investor Services at 1-800-432-2504.
Davis Selected Advisers, L.P. began serving as investment adviser to Clipper Fund on January 1, 2006. A different investment adviser managed the Fund through December 31, 2005.
| | Fund Overview December 31, 2011 |
| Portfolio Composition | | Industry Weightings |
| (% of Fund’s 12/31/11 Net Assets) | | (% of 12/31/11 Stock Holdings) |
| | | | | | |
| | | | | Fund | S&P 500® |
| Common Stock (U.S.) | 85.41% | | Diversified Financials | 30.98% | 5.25% |
| Common Stock (Foreign) | 14.97% | | Insurance | 20.37% | 3.58% |
| Short-Term Investments | 0.55% | | Food & Staples Retailing | 17.85% | 2.41% |
| Other Assets & Liabilities | (0.93)% | | Energy | 8.71% | 12.30% |
| | 100.00% | | Information Technology | 5.14% | 19.00% |
| | | | Commercial & Professional Services | 4.95% | 0.54% |
| | | | Health Care | 3.73% | 11.85% |
| | | | Automobiles & Components | 3.07% | 0.72% |
| | | | Banks | 2.82% | 2.73% |
| | | | Retailing | 1.47% | 3.73% |
| | | | Food, Beverage & Tobacco | 0.91% | 6.61% |
| | | | Capital Goods | − | 8.18% |
| | | | Utilities | − | 3.86% |
| | | | Other | − | 19.24% |
| | | | | 100.00% | 100.00% |
Top 10 Long-Term Holdings
(% of Fund’s 12/31/11 Net Assets)
| | | |
| American Express Co. | Consumer Finance | 10.47% |
| Costco Wholesale Corp. | Food & Staples Retailing | 10.43% |
| Oaktree Capital Group LLC, Class A | Diversified Financial Services | 9.72% |
| Canadian Natural Resources Ltd. | Energy | 8.75% |
| Berkshire Hathaway Inc., Class A | Property & Casualty Insurance | 7.87% |
| CVS Caremark Corp. | Food & Staples Retailing | 6.77% |
| Loews Corp. | Multi-line Insurance | 6.40% |
| Bank of New York Mellon Corp. | Capital Markets | 4.98% |
| Iron Mountain Inc. | Commercial & Professional Services | 4.97% |
| Transatlantic Holdings, Inc. | Reinsurance | 4.93% |
New Positions Added (01/01/11 - 12/31/11)
(Highlighted positions are those greater than 4.00% of the Fund’s 12/31/11 net assets)
Security | Industry | | % of Fund’s 12/31/11 Net Assets |
| | | |
| Property & Casualty Insurance | | | |
| | | 03/17/11 | |
| | | 06/24/11 | |
| Iron Mountain Inc. | Commercial & Professional Services | | 02/04/11 | 4.97% |
Positions Closed (01/01/11 - 12/31/11)
Security | Industry | Date of Final Sale | Realized Gain |
| | | |
| Coca-Cola Co. | Food, Beverage & Tobacco | | 03/14/11 | $ | 5,057,601 |
| ConocoPhillips | Energy | | 05/12/11 | | 3,110,644 |
| Procter & Gamble Co. | Household & Personal Products | | 10/12/11 | | 5,923,602 |
CLIPPER FUNDSM | Expense Example |
Example
As a shareholder of the Fund, you incur ongoing costs only, including advisory and administrative fees and other Fund expenses. The Expense Example is intended to help you understand your ongoing costs (in dollars) of investing in the Fund and to compare these costs with the ongoing costs of investing in other mutual funds. The Expense Example is based on an investment of $1,000 invested at the beginning of the period and held for the entire period indicated, which is for the six-month period ended December 31, 2011.
Actual Expenses
The information represented in the row entitled “Actual” provides information about actual account values and actual expenses. You may use the information in this row, together with the amount you invested, to estimate the expenses that you paid over the period. Simply divide your account value by $1,000 (for example, an $8,600 account value divided by $1,000 = 8.6), then multiply the result by the number under the heading “Expenses Paid During Period” to estimate the expenses you paid on your account during this period. An annual maintenance fee of $10, charged on retirement plan accounts per Social Security Number, is not included in the Expense Example. If this fee was included, the estimate of expenses you paid during the period would be higher, and your ending account value would be lower, by this amount.
Hypothetical Example for Comparison Purposes
The information represented in the row entitled “Hypothetical” provides information about hypothetical account values and hypothetical expenses based on the Fund’s actual expense ratio and an assumed rate of return of 5% per year before expenses, which is not the Fund’s actual return. The hypothetical account values and expenses may not be used to estimate the actual ending account balance or expenses you paid for the period. You may use this information to compare the ongoing costs of investing in the Fund and other funds. To do so, compare this 5% hypothetical example with the 5% hypothetical examples that appear in the shareholder reports of the other funds. An annual maintenance fee of $10, charged on retirement plan accounts per Social Security Number, is not included in the Expense Example. If this fee was included, the estimate of expenses you paid during the period would be higher, and your ending account value would be lower, by this amount.
Please note that the expenses shown in the table are meant to highlight your ongoing costs only. Therefore, the information in the row entitled “Hypothetical” is useful in comparing ongoing costs only, and will not help you determine the relative total costs of owning different funds.
| | Beginning | | Ending | | Expenses Paid |
| | Account Value | | Account Value | | During Period* |
| | (07/01/11) | | (12/31/11) | | (07/01/11-12/31/11) |
| | | | | | |
| Actual | $1,000.00 | | $946.50 | | $3.63 |
| Hypothetical | $1,000.00 | | $1,021.48 | | $3.77 |
Hypothetical assumes 5% annual return before expenses.
* Expenses are equal to the Fund’s annualized operating expense ratio (0.74%)**, multiplied by the average account value over the period, multiplied by 184/365 (to reflect the one-half year period).
** The expense ratio reflects the impact, if any, of certain reimbursements from the Adviser.
| | Schedule of Investments December 31, 2011 |
| | Shares/Units | | | |
| |
| | CONSUMER DISCRETIONARY – (4.56%) | |
| | Automobiles & Components – (3.09%) | |
| | | | | | | | | |
| | Retailing – (1.47%) | |
| | | | | | | | | |
| | Total Consumer Discretionary | | | | |
| | CONSUMER STAPLES – (18.82%) | |
| | Food & Staples Retailing – (17.91%) | |
| | Brazil Pharma S.A., 144A (Brazil)*(a) | | | | | | | |
| | | | | | | | | |
| | | | | | | | | |
| | | 185,142,519 | |
| |
| | Food, Beverage & Tobacco – (0.91%) | |
| | Diageo PLC (United Kingdom) | | | | | | | |
| | | | | | |
| | ENERGY – (8.75%) | |
| | Canadian Natural Resources Ltd. (Canada) | | | | | | | |
| | | | | | |
| | FINANCIALS – (54.37%) | |
| | Banks – (2.83%) | |
| | Commercial Banks – (2.83%) | |
| | | | | | | | | |
| | | | | | | | | |
| | | 29,234,401 | |
| |
| | Diversified Financials – (31.10%) | |
| | Capital Markets – (8.58%) | |
| | Ameriprise Financial, Inc. | | | | | | | |
| | Bank of New York Mellon Corp. | | | | | | | |
| | Goldman Sachs Group, Inc. | | | | | | | |
| | Julius Baer Group Ltd. (Switzerland) | | | | | | | |
| | 88,712,388 | |
| |
| | Consumer Finance – (10.47%) | |
| | | | | | | | | |
| | Diversified Financial Services – (12.05%) | |
| | | | | | | | | |
| | Oaktree Capital Group LLC, Class A (b) | | | | | | | |
| | RHJ International (Belgium)* | | | | | | | |
| | 124,494,360 | |
| | | 321,378,549 | |
| |
| | Insurance – (20.44%) | |
Multi-line Insurance – (6.40%) | |
| | | | | | | | | |
Property & Casualty Insurance – (9.11%) | |
| | | | | | | | | |
| | Berkshire Hathaway Inc., Class A * | | | | | | | |
| | 94,199,345 | |
| |
Reinsurance – (4.93%) | |
| | Transatlantic Holdings, Inc. | | | | | | | |
| | | 211,312,914 | |
| | | | | | |
| | Schedule of Investments - (Continued) December 31, 2011 |
| | Shares/Principal | | Value (Note 1) | |
COMMON STOCK – (CONTINUED) | |
| | HEALTH CARE – (3.75%) | |
| | Pharmaceuticals, Biotechnology & Life Sciences – (3.75%) | |
| | | | | | | | | |
| | Roche Holding AG - Genusschein (Switzerland) | | | | | | | |
| | | 38,714,743 | |
| | | | | | |
| | INDUSTRIALS – (4.97%) | |
| | Commercial & Professional Services – (4.97%) | |
| | | | | | | | | |
| | | | | | |
| | INFORMATION TECHNOLOGY – (5.16%) | |
| | Semiconductors & Semiconductor Equipment – (1.37%) | |
| | | | | | | | | |
| | Software & Services – (1.52%) | |
| | | | | | | | | |
| | Technology Hardware & Equipment – (2.27%) | |
| | | | | | | | | |
| | Total Information Technology | | | | |
| | TOTAL COMMON STOCK – (Identified cost $912,819,830) | | | | |
SHORT-TERM INVESTMENTS – (0.55%) | |
| | Banc of America Securities LLC Joint Repurchase Agreement, 0.04%, 01/03/12, dated 12/30/11, repurchase value of $1,420,006 (collateralized by: U.S. Government agency mortgages in a pooled cash account, 3.00%-5.50%, 01/01/27-12/01/41, total market value $1,448,400) | | | | | | | |
| | Mizuho Securities USA Inc. Joint Repurchase Agreement, 0.05%, 01/03/12, dated 12/30/11, repurchase value of $4,291,024 (collateralized by: U.S. Government agency mortgages and obligations in a pooled cash account, 0.665%-7.00%, 06/30/13-08/01/41, total market value $4,376,820) | | | | | | | |
| | TOTAL SHORT-TERM INVESTMENTS – (Identified cost $5,711,000) | | | | |
| | Total Investments – (100.93%) – (Identified cost $918,530,830) – (d) | | | 1,043,031,376 | |
| | Liabilities Less Other Assets – (0.93%) | | | (9,600,897) | |
| | Net Assets – (100.00%) | | $ | 1,033,430,479 | |
| |
| |
| | * | | Non-Income producing security. | |
| | | | | |
| | (a) | | This security is subject to Rule 144A. The Board of Directors of the Fund has determined that there is sufficient liquidity in this security to realize current valuations. This security amounted to $7,382,389 or 0.71% of the Fund's net assets as of December 31, 2011. | |
| | | | | |
| | (b) | | Restricted Security – See Note 6 of the Notes to Financial Statements. | |
| | | | | |
| | (c) | | A portion of these securities is pledged to cover unfunded capital commitments at December 31, 2011. | |
| | Schedule of Investments - (Continued) December 31, 2011 |
| | (d) | | Aggregate cost for federal income tax purposes is $930,953,340. At December 31, 2011 unrealized appreciation (depreciation) of securities for federal income tax purposes is as follows: | |
| | Unrealized appreciation | | $ | 227,232,308 | |
| | Unrealized depreciation | | | (115,154,272) | |
| |
| | Net unrealized appreciation | | $ | 112,078,036 | |
| |
| |
| | | | Affiliated Company. Represents ownership of at least 5% of the voting securities of the issuer and is an affiliate, as defined in the Investment Company Act of 1940, at or during the year ended December 31, 2011. The Fund did not hold any affiliated companies as of December 31, 2011. Transactions during the period in which the issuers were affiliates are as follows: | |
| | | | Security | Shares December 31, 2010 | Gross Additions | Gross Reductions | | Shares December 31, 2011 | | Dividend Income | |
| | | | RHJ International (1) | | 4,844,297 | | − | | 693,702 | | 4,150,595 | | $ − | |
| | | | | (1) Not an affiliate as of December 31, 2011. | | | | | |
See Notes to Financial Statements | |
| | Statement of Assets and Liabilities December 31, 2011 |
| ASSETS: | | | | |
| Investments in securities at value* (see accompanying Schedule of Investments) | | $ | 1,043,031,376 | |
| Cash | | | 1,919 | |
| Receivables: | | | | |
| | Capital stock sold | | | 744,154 | |
| | Dividends and interest | | | 1,167,956 | |
| Prepaid expenses | | | 63,020 | |
| | | Total assets | | | 1,045,008,425 | |
| LIABILITIES: | | | | |
| Payables: | | | | |
| | Capital stock redeemed | | | 10,713,376 | |
| Accrued management fee | | | 502,175 | |
| Other accrued expenses | | | 362,395 | |
| | Total liabilities | | | 11,577,946 | |
| NET ASSETS | | $ | 1,033,430,479 | |
| SHARES OUTSTANDING | | | 16,534,265 | |
NET ASSET VALUE, offering, and redemption price per share (Net assets ÷ Shares outstanding) | | $ | 62.50 | |
| | | | | |
| NET ASSETS CONSIST OF: | | | | |
| Paid in capital | | $ | 1,332,802,562 | |
| Undistributed net investment income | | | 330,864 | |
| Accumulated net realized losses from investments | | | (424,215,778) | |
| Net unrealized appreciation on investments and foreign currency transactions | | | 124,512,831 | |
| | Net Assets | | $ | 1,033,430,479 | |
| | | | | | |
| *Including: | | | | |
| | Cost of Investments | | $ | 918,530,830 | |
| | | | | | |
| | | | | | |
| See Notes to Financial Statements |
| | Statement of Operations For the year ended December 31, 2011 |
| INVESTMENT INCOME: | | | | | | | |
| Income: | | | | |
| Dividends* | | $ | 20,256,862 | |
| Interest | | | 15,468 | |
| | | Total income | | | | 20,272,330 | |
| | | | | | | | | | |
| Expenses: | | | | |
| Management fees (Note 3) | | $ | 6,230,602 | | | | |
| Custodian fees | | | 155,415 | | | | |
| Transfer agent fees | | | 1,498,464 | | | | |
| Audit fees | | | 45,600 | | | | |
| Legal fees | | | 56,699 | | | | |
| Reports to shareholders | | | 173,219 | | | | |
| Directors’ fees and expenses | | | 96,073 | | | | |
| Registration and filing fees | | | 54,929 | | | | |
| Excise tax expense (Note 1) | | | 111,263 | | | | |
| Miscellaneous | | | 115,743 | | | | |
| Total expenses | | | 8,538,007 | |
| Expenses paid indirectly (Note 4) | | | (86) | |
| | Net expenses | | | | 8,537,921 | |
| Net investment income | | | 11,734,409 | |
| | | | | | | | | | |
| REALIZED & UNREALIZED GAIN (LOSS) ON INVESTMENTS AND FOREIGN CURRENCY TRANSACTIONS: | | | | | | | |
| Net realized gain (loss) from: | | | | |
| | Investment transactions: | | | | |
| | Unaffiliated companies | | | | 48,960,091 | |
| | Affiliated companies | | | | (2,786,086) | |
| | Foreign currency transactions | | | (338,015) | |
| Net realized gain | | | 45,835,990 | |
| Net decrease in unrealized appreciation | | | (33,694,815) | |
| Net realized and unrealized gain on investments and foreign currency transactions | | | 12,141,175 | |
| Net increase in net assets resulting from operations | | $ | 23,875,584 | |
| | | | | | | | | | |
| *Net of foreign taxes withheld as follows | | $ | 202,827 | |
| | | | | | | | | | |
| See Notes to Financial Statements |
| | Statements of Changes in Net Assets |
| | | Year ended December 31, |
| | | 2011 | | 2010 |
| | | | | | | | |
| OPERATIONS: | | | | | | |
| Net investment income | | $ | 11,734,409 | | $ | 11,115,524 |
| Net realized gain (loss) from investments and foreign currency transactions | | | 45,835,990 | | | (3,473,951) |
| Net increase (decrease) in unrealized appreciation on investments and foreign currency transactions | | | (33,694,815) | | | 149,249,834 |
| | Net increase in net assets resulting from operations | | | 23,875,584 | | | 156,891,407 |
| | | | | | | | |
| DIVIDENDS AND DISTRIBUTIONS TO SHAREHOLDERS FROM: | | | | | | |
| Net investment income | | | (14,384,000) | | | (12,114,629) |
| | | | | | | | |
| CAPITAL SHARE TRANSACTIONS: | | | | | | |
| Net decrease in net assets resulting from capital share transactions (Note 5) | | | (129,157,598) | | | (154,003,632) |
| | Total decrease in net assets | | | (119,666,014) | | | (9,226,854) |
| | | | | | | | |
| NET ASSETS: | | | | | | |
| Beginning of year | | | 1,153,096,493 | | | 1,162,323,347 |
End of year* | | $ | 1,033,430,479 | | $ | 1,153,096,493 |
| | | | | | | | |
| *Including undistributed net investment income of | | $ | 330,864 | | $ | 3,260,418 |
| | | | | | | | |
| See Notes to Financial Statements |
| | Notes to Financial Statements December 31, 2011 |
NOTE 1 - SUMMARY OF SIGNIFICANT ACCOUNTING POLICIES
Clipper Fund, Inc. (“Fund”) (a California corporation) is registered under the Investment Company Act of 1940, as amended, as a non-diversified, open-end management investment company. The Fund’s investment objective is long-term capital growth and capital preservation. The Adviser seeks to invest the Fund’s assets primarily in common stocks of large companies (generally, companies with market capitalizations of $10 billion or more at the time of initial purchase) that are trading at prices below the Adviser’s estimate of their intrinsic values. The following is a summary of significant accounting policies consistently followed by the Fund in the preparation of its financial statements.
Security Valuation - The Fund calculates the net asset value of its shares as of the close of the New York Stock Exchange (“Exchange”), normally 4:00 P.M. Eastern time, on each day the Exchange is open for business. Securities listed on the Exchange (and other national exchanges) are valued at the last reported sales price on the day of valuation. Securities traded in the over-the-counter market (e.g. NASDAQ) and listed securities for which no sale was reported on that date are stated at the closing bid price. Securities traded on foreign exchanges are valued based upon the last sales price on the principal exchange on which the security is traded prior to the time when the Fund’s assets are valued. Securities (including restricted securities) for which market quotations are not readily available are valued at their fair value. Securities whose values have been materially affected by what the Adviser identifies as a significant event occurring before the Fund’s assets are valued but after the close of their respective exchanges will be fair valued. Fair value is determined in good faith using consistently applied procedures under the supervision of the Board of Directors. These procedures include certain standardized methodologies to fair value securities. Such methodologies include, but are not limited to, pricing securities by adjusting the value based on changes in an appropriate securities index and applying liquidity discounts. Short-term securities purchased within 60 days to maturity are valued at amortized cost, which approximates market value. These valuation procedures are reviewed and subject to approval by the Board of Directors. There have been no significant changes to the fair valuation procedures during the period.
Value Measurements - Fair value is defined as the price that the Fund would receive upon selling an investment in an orderly transaction to an independent buyer in the principal or most advantageous market for the investment. Various inputs are used to determine the fair value of the Fund’s investments. These inputs are summarized in the three broad levels listed below.
Level 1 – quoted prices in active markets for identical securities
Level 2 – other significant observable inputs (including quoted prices for similar investments, interest rates, prepayment speeds, credit risk, etc.)
| Level 3 – significant unobservable inputs (including the Fund’s own assumptions in determining the fair value of investments) |
The inputs or methodology used for valuing securities are not necessarily an indication of the risk associated with investing in those securities.
| | Notes to Financial Statements - (Continued) December 31, 2011 |
NOTE 1 - SUMMARY OF SIGNIFICANT ACCOUNTING POLICIES – (CONTINUED)
Value Measurements – (Continued)
The following is a summary of the inputs used as of December 31, 2011 in valuing the Fund’s investments carried at value:
| | Investments in Securities at Value |
| | Valuation Inputs |
| | | | Level 2: | | Level 3: | | |
| | | | Other Significant | | Significant | | |
| | Level 1: | | Observable | | Unobservable | | |
| | Quoted Prices | | Inputs | | Inputs | | Total |
Equity securities: | | | | | | | | | | | |
| Consumer discretionary | $ | 47,116,179 | | $ | – | | $ | – | | $ | 47,116,179 |
| Consumer staples | | 194,543,307 | | | – | | | – | | | 194,543,307 |
| Energy | | 90,385,847 | | | – | | | – | | | 90,385,847 |
| Financials | | 454,579,391 | | | 100,471,500 | | | 6,874,973 | | | 561,925,864 |
| Health care | | 38,714,743 | | | – | | | – | | | 38,714,743 |
| Industrials | | 51,346,680 | | | – | | | – | | | 51,346,680 |
| Information technology | | 53,287,756 | | | – | | | – | | | 53,287,756 |
| Short-term securities | | – | | | 5,711,000 | | | – | | | 5,711,000 |
Total Investments | $ | 929,973,903 | | $ | 106,182,500 | | $ | 6,874,973 | | $ | 1,043,031,376 |
The following table reconciles the valuation of assets in which significant unobservable inputs (Level 3) were used in determining fair value during the year ended December 31, 2011:
| Investment Securities: | | | |
| Beginning balance | | $ | 3,519,890 |
| Decrease in unrealized depreciation | | | 83,387 |
| Cost of purchases | | | 3,271,696 |
Ending balance | | $ | 6,874,973 |
| | | | |
| | | | |
| Decrease in unrealized depreciation during the period on Level 3 securities still held at December 31, 2011 and included in the change in net assets for the year | | $ | 83,387 |
| | | | |
The cost of purchases and the proceeds from sales may include securities received or delivered through corporate actions or exchanges. Realized and unrealized gains (losses) are included in the related amounts on investments in the Statement of Operations.
Master Repurchase Agreements - The Fund, along with other affiliated funds, may transfer uninvested cash balances into one or more master repurchase agreement accounts. These balances are invested in one or more repurchase agreements, secured by U.S. Government securities. A custodian bank holds securities pledged as collateral for repurchase agreements until the agreements mature. Each agreement requires that the market value of the collateral be sufficient to cover payments of interest and principal; however, in the event of default by the other party to the agreement, retention of the collateral may be subject to legal proceedings.
Currency Translation - The market values of all assets and liabilities denominated in foreign currencies are recorded in the financial statements after translation to the U.S. Dollar based upon the mean between the bid and offered quotations of the currencies against U.S. Dollars on the date of valuation. The cost basis of such assets and liabilities is determined based upon historical exchange rates. Income and expenses are translated at average exchange rates in effect as accrued or incurred.
| | Notes to Financial Statements - (Continued) December 31, 2011 |
NOTE 1 - SUMMARY OF SIGNIFICANT ACCOUNTING POLICIES – (CONTINUED)
Foreign Currency - The Fund may enter into forward purchases or sales of foreign currencies to hedge certain foreign currency denominated assets and liabilities against declines in market value relative to the U.S. Dollar. Forward currency contracts are marked-to-market daily and the change in market value is recorded by the Fund as an unrealized gain or loss. When the forward currency contract is closed, the Fund records a realized gain or loss equal to the difference between the value of the forward currency contract at the time it was opened and value at the time it was closed. Investments in forward currency contracts may expose the Fund to risks resulting from unanticipated movements in foreign currency exchange rates or failure of the counter-party to the agreement to perform in accordance with the terms of the contract.
Reported net realized foreign exchange gains or losses arise from the sales of foreign currencies, currency gains or losses realized between the trade and settlement dates on securities transactions, the difference between the amounts of dividends, interest, and foreign withholding taxes recorded on the Fund’s books, and the U.S. Dollar equivalent of the amounts actually received or paid. Net unrealized foreign exchange gains and losses arise from changes in the value of assets and liabilities other than investments in securities at fiscal year end, resulting from changes in the exchange rate. The Fund includes foreign currency gains and losses realized on the sale of investments together with market gains and losses on such investments in the Statement of Operations.
Federal Income Taxes - It is the Fund’s policy to comply with the requirements of the Internal Revenue Code applicable to regulated investment companies, and to distribute substantially all of its taxable income, including any net realized gains on investments not offset by loss carryovers, to shareholders. Therefore, no provision for federal income tax is required. The Fund incurred a 2010 federal excise tax liability of $111,263 during the year ended December 31, 2011. The Adviser has analyzed the Fund’s tax positions taken on federal and state income tax returns for all open tax years and has concluded that as of December 31, 2011, no provision for income tax would be required in the Fund’s financial statements related to those tax positions. The Fund’s federal and state (Arizona and California) income and federal excise tax returns for tax years for which the applicable statutes of limitations have not expired are subject to examination by the Internal Revenue Service and state departments of revenue. The earliest tax year that remains subject to examination by these jurisdictions is 2008.
The Regulated Investment Company Modernization Act of 2010 (“Act”) was enacted on December 22, 2010. The Act makes changes to several tax rules impacting the Fund. Although the Act provides several benefits, including the unlimited carryforward of future capital losses, there may be a greater likelihood that all or a portion of the Fund’s pre-enactment capital loss carryforwards may expire without being utilized due to the fact that post-enactment capital losses are required to be utilized before pre-enactment capital loss carryforwards. At December 31, 2011, the Fund had available for federal income tax purposes unused capital loss carryforwards as follows:
| | Capital Loss Carryforwards |
Pre-Enactment Expiring | | | |
| 12/31/2017 | $ | 406,309,000 | |
| 12/31/2018 | | 5,484,000 | |
| Total | $ | 411,793,000 | |
Utilized in 2011 | $ | 48,250,000 | |
Securities Transactions and Related Investment Income - Securities transactions are accounted for on the trade date (date the order to buy or sell is executed) with realized gain or loss on the sale of securities being determined based upon identified cost. Dividend income is recorded on the ex-dividend date. Interest income, which includes accretion of discount and amortization of premium, is accrued as earned.
| | Notes to Financial Statements - (Continued) December 31, 2011 |
NOTE 1 - SUMMARY OF SIGNIFICANT ACCOUNTING POLICIES – (CONTINUED)
Dividends and Distributions to Shareholders - Dividends and distributions to shareholders are recorded on the ex-dividend date. Net investment income (loss), net realized gains (losses), and net unrealized appreciation (depreciation) on investments may differ for financial statement and tax purposes primarily due to differing treatments of wash sales, foreign currency transactions, partnership income, and net operating losses. The character of dividends and distributions made during the fiscal year from net investment income and net realized securities gains may differ from their ultimate characterization for federal income tax purposes. Also, due to the timing of dividends and distributions, the fiscal year in which amounts are distributed may differ from the fiscal year in which income or realized gain was recorded by the Fund. The Fund adjusts certain components of capital to reflect permanent differences between financial statement amounts and net income and realized gains/losses determined in accordance with income tax rules. Accordingly, during the year ended December 31, 2011, amounts have been reclassified to reflect a decrease in undistributed net investment income of $279,963, a decrease in accumulated net realized losses from investments and foreign currency transactions of $391,226, and a decrease in paid in capital of $111,263. Net assets have not been affected by this reclassification.
The tax character of distributions paid during the years ended December 31, 2011 and 2010 was as follows:
| | 2011 | | 2010 |
| Ordinary income | $ | 14,384,000 | | $ | 12,114,629 |
| Long-term capital gain | | − | | | − |
| Return of capital | | − | | | − |
| Total | $ | 14,384,000 | | $ | 12,114,629 |
| | | | | | |
As of December 31, 2011, the components of distributable earnings (accumulated losses) on a tax basis were as follows:
| Undistributed net investment income | $ | 330,864 |
| Accumulated net realized losses from investments and | | |
| foreign currency transactions | | (411,793,268) |
| Net unrealized appreciation on investments | | 112,090,321 |
| Total | $ | (299,372,083) |
| | | | | | |
| | | | | | |
Indemnification - Under the Fund’s organizational documents, its officers and directors are indemnified against certain liabilities arising out of the performance of their duties to the Fund. In addition, some of the Fund’s contracts with its service providers contain general indemnification clauses. The Fund’s maximum exposure under these arrangements is unknown since the amount of any future claims that may be made against the Fund cannot be determined and the Fund has no historical basis for predicting the likelihood of any such claims.
Use of Estimates in Financial Statements - In preparing financial statements in conformity with accounting principles generally accepted in the United States of America, management makes estimates and assumptions that affect the reported amounts of assets and liabilities and disclosure of contingent assets and liabilities at the date of the financial statements, as well as the reported amounts of income and expenses during the reporting period. Actual results may differ from these estimates.
Unfunded Capital Commitments - Unfunded capital commitments represent agreements which obligate the Fund to meet capital calls in the future. Payment would be made when a capital call is requested. Capital calls can only be made if and when certain requirements have been fulfilled; thus, the timing and the amount of such capital calls cannot readily be determined. Unfunded capital commitments are recorded when capital calls are requested. As of December 31, 2011, unfunded capital commitments amounted to $8,213,084.
NOTE 2 - PURCHASES AND SALES OF SECURITIES
The cost of purchases and proceeds from sales of investment securities (excluding short-term securities) during the year ended December 31, 2011 were $174,734,577 and $294,473,591, respectively.
| | Notes to Financial Statements - (Continued) December 31, 2011 |
NOTE 3 - INVESTMENT ADVISORY FEES AND OTHER TRANSACTIONS WITH AFFILIATES
Advisory fees are paid monthly to the Adviser. The annual rate is 0.55% of the average net assets for the first $3 billion, 0.54% on the next $1 billion, 0.53% on the next $1 billion, 0.52% on the next $1 billion, 0.51% on the next $1 billion, 0.50% on the next $3 billion, and 0.485% of the average net assets greater than $10 billion. Advisory fees paid during the year ended December 31, 2011 approximated 0.55% of average net assets.
Boston Financial Data Services, Inc. (“BFDS”) is the Fund’s primary transfer agent. The Adviser is also paid for certain transfer agent services. The fee paid to the Adviser for these services during the year ended December 31, 2011 amounted to $62,230. State Street Bank and Trust Company (“State Street Bank”) is the Fund’s primary accounting provider. Fees for such services are included in the custodian fees as State Street Bank also serves as the Fund’s custodian. Certain officers of the Fund are also officers of the general partner of the Adviser.
Davis Selected Advisers-NY, Inc. (“DSA-NY”), a wholly-owned subsidiary of the Adviser, acts as sub-adviser to the Fund. DSA-NY performs research and portfolio management services for the Fund under a Sub-Advisory Agreement with the Adviser. The Fund pays no fees directly to DSA-NY.
NOTE 4 - EXPENSES PAID INDIRECTLY
Under an agreement with State Street Bank, custodian fees are reduced for earnings on cash balances maintained at the custodian by the Fund. Such reductions amounted to $86 during the year ended December 31, 2011.
NOTE 5 - CAPITAL STOCK
At December 31, 2011, there were 200 million shares of capital stock (no par value) authorized. Transactions in capital stock were as follows:
| | Year ended | | | Year ended | |
| | December 31, 2011 | | | December 31, 2010 | |
| | Shares | | | Amount | | | Shares | | | Amount | |
| Shares sold | 1,915,332 | | $ | 121,988,211 | | | 2,336,980 | | $ | 133,871,293 | |
| Shares issued in reinvestment | | | | | | | | | | | |
| of distributions | 219,046 | | | 13,574,387 | | | 193,300 | | | 11,480,097 | |
| | 2,134,378 | | | 135,562,598 | | | 2,530,280 | | | 145,351,390 | |
| Shares redeemed | (4,209,710) | | | (264,720,196) | | | (5,225,269) | | | (299,355,022) | |
| Net decrease | (2,075,332) | | $ | (129,157,598) | | | (2,694,989) | | $ | (154,003,632) | |
| | | | | | | | | | | | |
| | | | | | | | | | | | |
NOTE 6 - RESTRICTED SECURITIES
Restricted securities are not registered under the Securities Act of 1933 and may have contractual restrictions on resale. They are valued under methods approved by the Board of Directors as reflecting fair value. The aggregate value of restricted securities amounted to $107,346,473 or 10.39% of the Fund’s net assets as of December 31, 2011. Information regarding restricted securities is as follows:
| Security | | Acquisition Date | | Units | | Cost per Unit | | Valuation per Unit as of December 31, 2011 |
| | | | | | | | | | | |
| Oaktree Capital Group LLC, | | | | | | | | | | |
| Class A | | 09/20/07 | | 2,232,700 | | $ | 36.90 | | $ | 45.00 |
| | | | | | | | | | | |
| SKBHC Holdings LLC | | 11/08/10 | | 1,737 | | $ | 5,000.00 | | $ | 3,957.09 |
| | | | | | | | | | | |
| The following financial information represents selected data for each share of capital stock outstanding throughout each period: |
| | | | | | | | | | | | | | | | | | | | | | | | | | | | | |
| | Year ended December 31, | |
| | | | 2011 | | 2010 | | 2009 | | 2008 | | 2007 | |
Net Asset Value, Beginning of Period | | $ | 61.96 | | $ | 54.56 | | $ | 39.98 | | $ | 81.00 | | $ | 91.98 | |
| | | | | | | | | | | | | | | | | | | | | | | | | | | | | |
| | | | | | | | | | | | | | | | | | | | | | | | | | | |
| Income (Loss) from Investment Operations: | | | | | | | | | | | | | | | | | | | | | | | | | | |
| Net Investment Income | | 0.66 | | 0.55 | | 0.46 | | 0.83 | | 0.88 | |
| Net Realized and Unrealized Gains (Losses) | | 0.75 | | 7.48 | | 14.58 | | (40.99) | | (0.84) | |
| | Total from Investment Operations | | 1.41 | | 8.03 | | 15.04 | | (40.16) | | 0.04 | |
| | | | | | | | | | | | | | | | | | | | | | | | | | | | | |
| Dividends and Distributions: | | | | | | | | | | | | | | | | | | | | | | | | | | |
| Dividends from Net Investment Income | | (0.87) | | (0.63) | | (0.46) | | (0.83) | | (0.87) | |
| Distributions from Realized Gains | | – | | – | | – | | (0.02) | | (10.15) | |
| Return of Capital | | – | | – | | – | | (0.01) | | – | |
| | Total Dividends and Distributions | | (0.87) | | (0.63) | | (0.46) | | (0.86) | | (11.02) | |
Net Asset Value, End of Period | | $ | 62.50 | | $ | 61.96 | | $ | 54.56 | | $ | 39.98 | | $ | 81.00 | |
| | | | | | | | | | | | | | | | | | | | | | | | | | | | | |
Total Returnb | | 2.29% | | 14.77% | | 37.60%c | (49.57)% | | 0.05% | |
| | | | | | | | | | | | | | | | | | | | | | | | | | | | | |
| Ratios/Supplemental Data: | | | | | | | | | | | | | | | | | | | | | | | | | | |
| Net Assets, End of Period (in millions) | | $ | 1,033 | | $ | 1,153 | | $ | 1,162 | | $ | 1,084 | | $ | 2,781 | |
| Ratio of Expenses to Average Net Assets: | | | | | | | | | | | | | | | | | | | | | | | | | | |
| | Gross | | 0.75% | | 0.76% | | 0.80% | | 0.76% | | 0.69% | |
| | Netd | | 0.75% | | 0.76% | | 0.80% | | 0.76% | | 0.69% | |
| Ratio of Net Investment Income to Average Net Assets | | 1.04% | | 0.96% | | 0.96% | | 1.21% | | 0.85% | |
Portfolio Turnover Ratee | | 15% | | 3% | | 15% | | 7% | | 25% | |
| | | | | | | | | | | | | | | | | | | | | | | | | | | | | |
| a | Per share calculations were based on average shares outstanding for the period. |
| b | Assumes hypothetical initial investment on the business day before the first day of the fiscal period, with all dividends and distributions reinvested in additional shares on the reinvestment date, and redemption at the net asset value calculated on the last business day of the fiscal period. |
| c | Clipper Fund received favorable class action settlements from companies that it no longer owns. These settlements contributed roughly 5% to the Fund's total return in 2009. This was a one-time event that is unlikely to be repeated. |
| d | The Net Ratio of Expenses to Average Net Assets reflects the impact, if any, of the reduction of expenses paid indirectly and of certain reimbursements from the Adviser. |
| e | The lesser of purchases or sales of portfolio securities for a period, divided by the monthly average of the market value of portfolio securities owned during the period. Securities with a maturity or expiration date at the time of acquisition of one year or less are excluded from the calculation. |
| See Notes to Financial Statements |
| | Report of Independent Registered Public Accounting Firm |
The Shareholders and Board of Directors
Clipper Fund, Inc.:
We have audited the accompanying statement of assets and liabilities of Clipper Fund, Inc., including the schedule of investments, as of December 31, 2011, the related statement of operations for the year then ended, the statements of changes in net assets for each of the years in the two-year period then ended, and the financial highlights for each of the years in the five-year period then ended. These financial statements and financial highlights are the responsibility of the Fund’s management. Our responsibility is to express an opinion on these financial statements and financial highlights based on our audits.
We conducted our audits in accordance with the standards of the Public Company Accounting Oversight Board (United States). Those standards require that we plan and perform the audit to obtain reasonable assurance about whether the financial statements and financial highlights are free of material misstatement. An audit includes examining, on a test basis, evidence supporting the amounts and disclosures in the financial statements. Our procedures included confirmation of securities owned as of December 31, 2011, by correspondence with the custodian. An audit also includes assessing the accounting principles used and significant estimates made by management, as well as evaluating the overall financial statement presentation. We believe that our audits provide a reasonable basis for our opinion.
In our opinion, the financial statements and financial highlights referred to above present fairly, in all material respects, the financial position of Clipper Fund, Inc. as of December 31, 2011, the results of its operations for the year then ended, the changes in its net assets for each of the years in the two-year period then ended, and the financial highlights for each of the years in the five-year period then ended, in conformity with U.S. generally accepted accounting principles.
KPMG LLP
Denver, Colorado
February 21, 2012
Federal Income Tax Information (Unaudited)
In early 2012, shareholders will receive information regarding all dividends and distributions paid to them by the Fund during the calendar year 2011. Regulations of the U.S. Treasury Department require the Fund to report this information to the Internal Revenue Service.
The information and distributions reported herein may differ from the information reported as distributions taxable to certain shareholders for the calendar year 2011 with their 2011 Form 1099-DIV.
During the calendar year 2011, $14,384,000 of dividends paid by the Fund constituted income dividends for federal income tax purposes. The Fund designates $14,384,000 or 100% as income qualifying for the corporate dividends-received deduction.
For the calendar year 2011, certain dividends paid by the Fund constitute qualified dividend income for federal income tax purposes. The Fund designates $14,384,000 or 100% as qualified dividend income.
The foregoing information is presented to assist shareholders in reporting dividends and distributions received from the Fund to the Internal Revenue Service. Because of the complexity of the federal regulations, which may affect your individual tax return and the many variations in state and local tax regulations, we recommend that you consult your tax adviser for specific guidance.
Portfolio Proxy Voting Policies and Procedures
The Fund has adopted Portfolio Proxy Voting Policies and Procedures under which the Fund votes proxies relating to securities held by the Fund. A description of the Fund’s Portfolio Proxy Voting Policies and Procedures is available (i) without charge, upon request, by calling the Fund toll-free at 1-800-432-2504, (ii) on the Fund’s website at www.clipperfund.com, and (iii) on the SEC’s website at www.sec.gov.
In addition, the Fund is required to file Form N-PX, with its complete proxy voting record for the 12 months ended June 30th, no later than August 31st of each year. The Fund’s Form N-PX filing is available (i) without charge, upon request, by calling the Fund toll-free at 1-800-432-2504, (ii) on the Fund’s website at www.clipperfund.com, and (iii) on the SEC’s website at www.sec.gov.
Form N-Q
The Fund files its complete schedule of portfolio holdings with the SEC for the first and third quarters of each fiscal year on Form N-Q. The Fund’s Form N-Q is available without charge, upon request, by calling 1-800-432-2504 or on the Fund’s website at www.clipperfund.com, or on the SEC’s website at www.sec.gov. The Fund’s Form N-Q may be reviewed and copied at the SEC’s Public Reference Room in Washington, DC, and information on the operation of the Public Reference Room may be obtained by calling 1-800-SEC-0330.
| | Privacy Notice and Householding |
Privacy Notice
While you generally will be dealing with a broker-dealer or other financial adviser, we may collect information about you from your account application and other forms that you may deliver to us. We use this information to process your requests and transactions; for example, to provide you with additional information about the Fund, to open an account for you, or to process a transaction. In order to service your account and execute your transactions, we may provide your personal information to firms that assist us in servicing your account, such as our transfer agent. We may also provide your name and address to one of our agents for the purpose of mailing to you your account statement and other information about our products and services. We require these outside firms and agents to protect the confidentiality of your information and to use the information only for the purpose for which the disclosure is made. We do not provide customer names and addresses to outside firms, organizations, or individuals except in furtherance of our business relationship with you or as otherwise allowed by law.
We restrict access to nonpublic personal information about you to those employees who need to know that information to provide products or services to you. We maintain physical, electronic, and procedural safeguards that comply with federal standards to guard your personal information.
Householding
To avoid sending duplicate copies of materials to households, the Fund will mail only one copy of each prospectus, Annual and Semi-Annual Report to shareholders having the same last name and address on the Fund’s records. The consolidation of these mailings, called householding, benefits the Fund through reduced mailing expense. If you do not want the mailing of these documents to be combined with those to other members of your household, please contact the Clipper Fund by phone at 1-800-432-2504. Individual copies of current prospectuses and reports will be sent to you within 30 days after the Fund receives your request to stop householding.
For the purpose of their service as directors to the Clipper Fund, the business address for each of the directors is 2949 E. Elvira Road, Suite 101, Tucson, AZ 85756. All directors qualify as independent under the Investment Company Act of 1940.
Name (birthdate) | Position(s) Held with Fund | Term of Office and Length of Time Served | Principal Occupation(s) During Past 5 Years | Number of Portfolios Overseen in Fund Complex | Other Directorships Held |
| | | | | | |
| Independent Directors | | | | | |
| | | | | | |
Lawrence E. Harris (09/16/56) | Director | Indefinite and since April 2006 | Fred V. Keenan Chair in Finance of the Marshall School of Business, University of Southern California, Los Angeles, CA | 1 | Interactive Brokers Group, Inc. |
| | | | | | |
Steven N. Kearsley (09/29/41) | Director | Indefinite and since April 2006 | Private Investor, Real Estate Development | 1 | None |
| | | | | | |
Lawrence P. McNamee (09/12/34) | Director | Indefinite and since inception | Retired Educator | 1 | None |
| | | | | | |
| Norman B. Williamson (05/18/32) | Director/ Chairman | Indefinite and since inception | Private Investor | 1 | None |
Officers
Christopher C. Davis (born 07/13/65, Clipper Fund officer since 12/19/05). President of Clipper Fund; Chairman, Davis Selected Advisers, L.P., and also serves as an executive officer in certain companies affiliated with the Adviser, including sole member of the Adviser’s general partner, Davis Investments, LLC; Chief Executive Officer, President, or Vice President of each of the Davis Funds (consisting of 13 portfolios) and Selected Funds (consisting of three portfolios); Employee of Shelby Cullom Davis & Co. (registered broker/dealer); Director of each of the Davis Funds (consisting of 13 portfolios) and the Selected Funds (consisting of three portfolios); Director of Washington Post Co. (publishing company).
Kenneth C. Eich (born 08/14/53, Clipper Fund officer since 12/19/05). Executive Vice President and Principal Executive Officer of Clipper Fund, each of the Davis Funds (consisting of 13 portfolios), and Selected Funds (consisting of three portfolios); Chief Operating Officer, Davis Selected Advisers, L.P., and also serves as an executive officer in certain companies affiliated with the Adviser.
Douglas A. Haines (born 03/04/71, Clipper Fund officer since 12/19/05). Vice President, Treasurer, Chief Financial Officer, Principal Financial Officer, and Principal Accounting Officer of Clipper Fund, each of the Davis Funds (consisting of 13 portfolios), and Selected Funds (consisting of three portfolios); Vice President and Director of Fund Accounting, Davis Selected Advisers, L.P.
Sharra L. Haynes (born 09/25/66, Clipper Fund officer since 12/19/05). Vice President, Chief Compliance Officer of Clipper Fund, each of the Davis Funds (consisting of 13 portfolios), and Selected Funds (consisting of three portfolios); Vice President and Chief Compliance Officer, Davis Selected Advisers, L.P., and also serves as an executive officer in certain companies affiliated with the Adviser.
Thomas D. Tays (born 03/07/57, Clipper Fund officer since 12/19/05). Vice President and Secretary of Clipper Fund, each of the Davis Funds (consisting of 13 portfolios), and Selected Funds (consisting of three portfolios); Vice President, Chief Legal Officer and Secretary, Davis Selected Advisers, L.P., and also serves as an executive officer in certain companies affiliated with the Adviser.
| Investment Adviser | |
| Davis Selected Advisers, L.P. (Doing business as “Davis Advisors”) | |
| 2949 East Elvira Road, Suite 101 | |
| Tucson, Arizona 85756 | |
| (800) 432-2504 | |
| | |
| Distributor | |
| Davis Distributors, LLC | |
| 2949 East Elvira Road, Suite 101 | |
| Tucson, Arizona 85756 | |
| | |
| Transfer Agent | |
| Boston Financial Data Services, Inc. | |
| P.O. Box 55468 | |
| Boston, Massachusetts 02205-5468 | |
| | |
| Custodian | |
| State Street Bank and Trust Co. | |
| One Lincoln Street | |
| Boston, Massachusetts 02111 | |
| | |
| Counsel | |
| Bingham McCutchen LLP | |
| 355 South Grand Avenue, Suite 4400 | |
| Los Angeles, CA 90071-3106 | |
| | |
| Independent Registered Public Accounting Firm | |
| KPMG LLP | |
| 707 Seventeenth Street, Suite 2700 | |
| Denver, Colorado 80202 | |
For more information about Clipper Fund including management fee, charges, and expenses, see the current prospectus, which must precede or accompany this report. The Fund’s Statement of Additional Information contains additional information about the Fund’s Directors and is available upon request, free of charge, by contacting the Fund at 1-800-432-2504 or on the Fund’s website at www.clipperfund.com. Quarterly Fact sheets are available on the Fund’s website at www.clipperfund.com.
ITEM 2. CODE OF ETHICS
The registrant has adopted a code of ethics that applies to the registrant’s principal executive officer, principal financial officer, principal accounting officer or controller, or persons performing similar functions.
A copy of the code of ethics is filed as an exhibit to this form N-CSR.
No waivers were granted to this code of ethics during the period covered by this report.
ITEM 3. AUDIT COMMITTEE FINANCIAL EXPERT
The Fund’s Board of Directors has determined that independent trustee Steven N. Kearsley qualifies as the “audit committee financial expert”, as defined in Item 3 of form N-CSR.
ITEM 4. PRINCIPAL ACCOUNTANT FEES AND SERVICES
| (a) | Audit Fees. The aggregate Audit Fees billed by KPMP LLP (“KPMG”) for professional services rendered for the audits of the audits of the financial statements, or services that are normally provided in connection with statutory and regulatory filings or engagements for the fiscal year ends December 31, 2011 and December 31, 2010 were $45,600 and $45,600, respectively. |
| (b) | Audit-Related Fees. The aggregate Audit-Related Fees billed by KPMG for services rendered for assurance and related services that are not reasonably related to the performance of the audit or review of the fund financial statements, but not reported as Audit Fees fore fiscal year ends December 31, 2011 and December 31, 2010 were $0 and $0, respectively. |
| (c) | Tax Fees. The aggregate Tax Fees billed by KPMG for professional services rendered for tax compliance, tax advice and tax planning for the fiscal year ends December 31, 2011 and December 31, 2010 were $7,370 and $7,370, respectively. |
Fees included in the Tax Fee category comprise all services performed by professional staff in the independent accountant’s tax division except those services related to the audit. These services include preparation of tax returns, tax advice related to mergers and a review of the fund income and capital gain distributions.
| (d) | All Other Fees. The aggregate Other Fees billed by KPMG for all other non-audit services rendered to the fund for the fiscal year ends December 31, 2011 and December 31, 2010 were $0 and $0, respectively. |
(e)(1) Audit Committee Pre-Approval Policies and Procedures.
The fund Audit Committee must pre-approve all audit and non-audit services provided by the independent accountant relating to the operations or financial reporting of the funds. Prior to the commencement of any audit or non-audit services to a fund, the Audit Committee reviews the services to determine whether they are appropriate and permissible under applicable law.
The fund Audit Committee has adopted a policy whereby audit and non-audit services performed by the fund independent accountant require pre-approval in advance at regularly scheduled Audit Committee meetings. If such a service is required between regularly scheduled Audit Committee meetings, pre-approval may be authorized by the Audit Committee Chairperson with ratification at the next scheduled audit committee meeting.
| (2) | No services included in (b) – (d) above were approved pursuant to paragraph (c)(7)(i)(C) of |
Rule 2-01 of Regulation S-X.
(f) Not applicable
| (g) | The Funds’ independent accountant did not provide any services to the investment advisor or any affiliate for the fiscal years ended December 31, 2011 and December 31, 2010. The fund has not paid any fees for non-audit not previously disclosed in items 4 (b) – (d). |
| (h) | The registrant’s audit committee of the board of trustees has considered whether the provision of non-audit services that were rendered to the registrant’s investment adviser, and any entity controlling, controlled by, or under common control with the investment adviser that provides ongoing services to the registrant that not pre-approved pursuant to paragraph (c)(7)(ii) of Rule 2-01 of Regulation S-X is compatible with maintaining the principal accountant’s independence. No such services were rendered. |
ITEM 5. AUDIT COMMITTEE OF LISTED REGISTRANTS
Not Applicable
ITEM 6. SCHEDULE OF INVESTMENTS
Not Applicable. The complete Schedule of Investments is included in Item 1 of this for N-CSR
ITEM 7. DISCLOSURE OF PROXY VOTING POLICIES AND PROCEDURES FOR CLOSED-END MANAGEMENT INVESTMENT COMPANIES
Not Applicable
ITEM 8. PORTFOLIO MANAGERS OF CLOSED-END MANAGEMENT INVESTMENT COMPANIES
Not Applicable
ITEM 9. PURCHASES OF EQUITY SECURITIES BY CLOSED-END MANAGEMENT INVESTMENT COMPANIES AND AFFILIATED PURCHASERS
Not Applicable
ITEM 10. SUBMISSION OF MATTERS TO A VOTE OF SECURITY HOLDERS
There have been no changes to the procedure by which shareholders may recommend nominees to the registrant’s Board of Trustees.
ITEM 11. CONTROLS AND PROCUDURES
| (a) | The registrant’s principal executive officer and principal financial officer have concluded that the registrant’s disclosure controls and procedures (as defined in Rule 30a-3 (c) under the Investment Company Act of 1940, as amended) are effective as of a date within 90 days of the filing date of this report. |
| (b) | There have been no significant changes in the registrant’s internal controls or in other factors that could significantly affect these controls. |
ITEM 12. EXHIBITS
| | (a)(1) The registrant’s code of ethics pursuant to Item 2 of Form N-CSR is filed as an exhibit to this form N-CSR. |
| | (a)(2) Certifications pursuant to Section 302 of the Sarbanes-Oxley Act of 2002 are attached. |
| | (b) Certifications pursuant to Section 906 of the Sarbanes-Oxley Act of 2002 are attached. |
Pursuant to the requirements of the Securities Exchange Act of 1934 and the Investment Company Act of 1940, the registrant has duly caused this report to be signed on its behalf by the undersigned, thereunto duly authorized.
CLIPPER FUND, INC.
By /s/ Kenneth C. Eich
Kenneth C. Eich
Principal Executive Officer
Date: March 8, 2012
Pursuant to the requirements of the Securities Exchange Act of 1934 and the Investment Company Act of 1940, this report has been signed below by the following persons on behalf of the registrant and in the capacities and on the dates indicated.
By /s/ Kenneth C. Eich
Kenneth C. Eich
Principal Executive Officer
Date: March 8, 2012
By /s/ Douglas A. Haines
Douglas A. Haines
Principal Financial Officer
Date: March 8, 2012