Exhibit 99.3

Annual Shareholders Meeting April 27, 2010 Large enough to serve, small enough to care. LNB Bancorp, Inc.

Forward Looking StatementsThis presentation contains forward-looking statements relating to the financial condition, results of operations and business of LNB Bancorp, Inc. Actual results could differ materially from those indicated. Among the important factors that could cause actual results to differ materially are interest rates, changes in the mix of the Company’s business, competitive pressures, general economic conditions and the risk factors detailed in the Company’s periodic reports and registration statements filed with the Securities and Exchange Commission. LNB Bancorp, Inc. undertakes no obligation to release revisions to these forward-looking statements or reflect events or circumstances after the date of this presentation.

Today’s Discussion Economic Conditions 2009 Performance 2010 Priorities & Expectations First Quarter Results

4 Local Economy Ohio unemployment rate reaches 11% in March Unemployment US 9.7% Ohio 11.0% Lorain County 10.5% (City of Lorain 11.7% ) Cuyahoga Co. 9.8% Erie Co. 12.9% Huron Co. 16.8% Summit Co. 11.5%

Local Economy Other Placeholder: 5 Home Sales in Northeast Ohio March SalesCounty 2009 2010 Change Avg. Sales PriceLorain 178 154 -13.5% $130,924 +18.3%Summit 432 356 -17.6% $126,670 +35.4%Cuyahoga 845 821 - 2.8% $124,370 +36.8%Medina 77 146 +19.4% $185,825 +10.9%

Other Placeholder: 6 Good News! Lorain County foreclosure filings in the First Quarter of 2010 were down 9.7% from 2009. (622 in 2010 compared to 689 in 2009) Foreclosure FilingsCounty 2008 2009 % ChangeLorain 2,442 2,696 +10.4%Summit 4,113 4,633 +12.6%Erie 562 539 - 4.1%Cuyahoga 13,858 14,171 + 2.3%

Local EconomyOther Placeholder: 7 Personal Bankruptcies continue to increase 2009Lorain Co. 1,970 up 29%Cuyahoga Co. 8,364 up 14%

8 Banking Industry Turmoil- 2009 140 Bank Failures 702 “Problem” Institutions (Highest level since June 1993) 1,143 Formal Enforcement Actions Issued (New record)

Today’s Discussion Other Placeholder: 9 Economic Conditions 2009 Performance 2010 Priorities & Expectations First Quarter Results

10 LNB Financial Performance(2009 vs. 2008) Net Loans - 0.95% Total Deposits + 5.45% Net Interest Income +17.37% Non Interest Income - 4.04%($000s) 2008 2009Provision for Loan Loss $6,809 $19,017Net Income (loss) $3,396 ($2,001)

Proud to Lead Lorain County in Deposits #1 Lorain National Bank Member FDIC

12 Deposit Market Share(2009) Lorain County #1 with 23.6% share City of Lorain #1 with 41.8% share Amherst #1 with 29.4% share Oberlin #1 with 52.3% share Vermilion #2 with 29.4% share Hudson #1 with 22.1% shareSource: FDIC, June 30, 2009

Interest Income to Assets (2009) 4.93% 4.93% 4 00% 5.00% 6.00% 7.00% 0 00% 1.00% 2.00% 3.00% 4.00% 0.00% LNBB Peer Group* 13 *Peer Group includes all bank holding companies with assets between $1 billion and $3 billion. (BHCP Report)

Interest Expense to Assets (2009) 1.69% 1.70% 2.00% 2.50% 3.00% 0.50% 1.00% 1.50% 0.00% LNBB Peer Group 14

Net Interest Income to Assets (2009) 3.24% 3.22% 2 50% 3.00% 3.50% 4.00% 0 50% 1.00% 1.50% 2.00% 2.50% 0.00% 0.50% LNBB Peer Group 15

Non Income to Interest Assets (2009) 0.95% 0.93% 0 75% 1.00% 0.25% 0.50% 0.75% 0.00% LNB Peer Group 16

Non Interest Expenses to Assets (2009) 2.99% 3.16% 2.50% 3.00% 3.50% 0 50% 1.00% 1.50% 2.00% 0.00% 0.50% LNB Peer Group 17

Net Income to Assets (2009) 0.20% ‐0.10% 0.00% 0.10% LNBB Peer Group ‐0.17% ‐0.23% ‐0.40% ‐0.30% ‐0.20% Peer Group ‐0.50% 18

PPE= Pre Tax Pre Loan Loss Tax, Provision Earnings “PPE has emerged as the de facto barometer of normal earnings.” -American Banker, March 16, 2010 “ looking PPE “…at PPE, you’re looking at a bank’s ability to grow its earnings.” -Janice Cox, managing partner, Harris Financial Group “It shows the earning power…It’s all about looking forward.” -David Dietze, Chief Investment Strategist, 19 Point View Financial Services

Pre Provision Core Earnings* To Assets (2009) 1.26% 1.13% 1.50% 2.00% 0.50% 1.00% 0.00% LNBB Peer Group 20 *Pre Provision Core Earnings= Income before tax expense, adjusted to exclude the impact of the provision for loan losses.

Pre Provision Core Earnings* Milli Millions $ 2009 2008 $40.0 $50.0 $30.0 $14.3 $14.7 $10.3 $14.5 $10.0 $20.0 $4.1 $2.2 $3.6 $2.1 $‐ LNB Middlefield First Citizens Parkview 21 *Pre Provision Core Earnings= Income before tax expense, adjusted to exclude the impact of the provision for loan losses.

Credit Quality

Net Avg Loan Loss to Avg. Total Loans/Leases (2009) 1.47% 1.50% 1.32% 1.25% 1.00% LNBB Peer Group 23

30 non accrual to days delinquent + Total Loans (2009) 5.56% 4.78% 4 50% 6.00% 1.50% 3.00% 4.50% 0.00% LNBB Peer Group 24

Allowance for Loan Losses to Total Loans 2009 2.34% 1.45% 0 00 0 01 0 02 0 03 2008 0.00 0.01 0.02 0.03 25

Capital 26

Tier 1 Leverage Capital (2009) 10.00% 7.70% 8.60% 7.00% 8.50% 4.00% 5.50% “well capitalized” at 5% LNBB Peer Group

Total Capital (2009) 13 77% 15.00% 13.77% 13.16% 11 00% 12.00% 13.00% 14.00% 8.00% 9.00% 10.00% 11.00% “well capitalized” at 10% LNBB Peer Group 28

Liquidity 29

Non Core Funding Dependency (2009) 40.00% 19.96% 28.11% 20.00% 30.00% 0.00% 10.00% LNBB Peer Group 30

Today’s Discussion Today s Economic Conditions 2009 Performance 2010 Priorities & Expectations First Quarter Results 31
2010 Expectations Economic challenges persist Continued elevated reserves charge‐offs versus “normal” period Continue to lend 32
2010 Priorities Capital Liquidity Credit quality Core earnings (PPE) Enterprise risk management 33
Our Activities in the Community Lorain County Erie County Summit County 34

Our Activities in the Community Lorain County Second Harvest Food Drive Special Olympics Housing Fair at St Joseph’s St. Joseph s Elyria Festival of Lights Children Summer Food Program Girl Scouts of NEO Team Lorain County Easter Seals 90th Anniversary Walk 35

Our Activities in the Community Erie County Second Harvest Food Drive Festival of the Fish Vermilion Schools Vermilion Easter Egg Hunt Wooly Bear Festival Concerts the Park in Vermilion YMCA

Our Activities in the Community Hudson Hudson Parent Teacher Org. Hudson Community Foundation Seaton Catholic School Hudson High School Hudson Rotary Hudson Little League Baseball 37
Today’s Discussion Today s Economic Conditions 2009 Performance 2010 Priorities & Expectations First Quarter Results 38
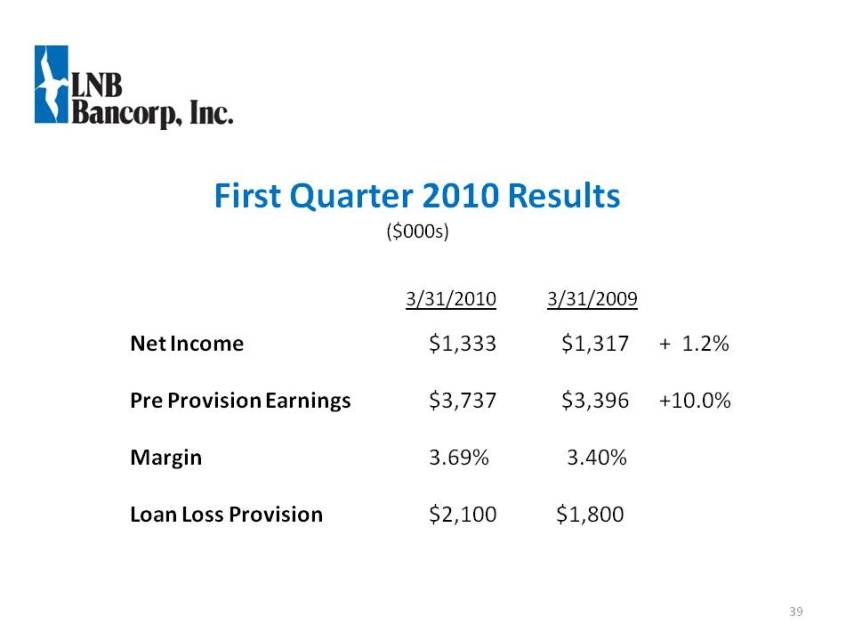
2010R l First Quarter 2010 Results ($000s) 3/31/2010 3/31/2009 Net Income $1,333 $1,317 + 1.2% Pre Provision Earnings $3,737 $3,396 +10.0% Margin 3 69% 3 40% 3.69% 3.40% Loan Loss Provision $2,100 $1,800 39
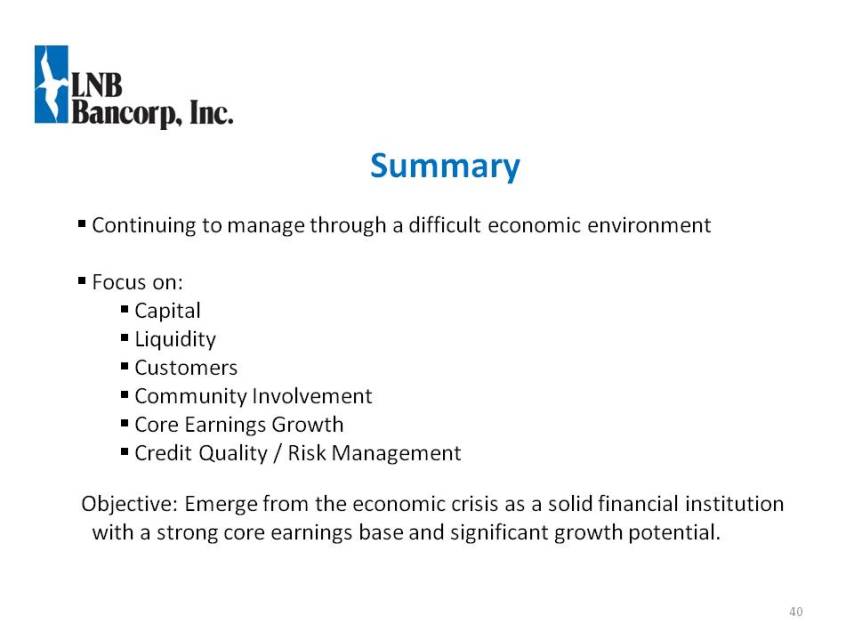
Summary Continuing to manage through a difficult economic environment Focus on: Capital Liquidity Customers Community Involvement Core Earnings Growth Credit Quality / Risk Management Objective: Emerge from the economic crisis as a solid financial institution with a strong core earnings base and significant growth potential. 40
LNB Bancorp, Inc. Lorain National Bank Member FDIC MorganBank Simply More Questions?


