| UNITED STATES |
| SECURITIES AND EXCHANGE COMMISSION |
| Washington, D.C. 20549 |
| |
| |
| FORM N-CSR |
| |
| CERTIFIED SHAREHOLDER REPORT OF REGISTERED MANAGEMENT |
| INVESTMENT COMPANIES |
| |
| Investment Company Act file number 811-3940 |
| |
| Strategic Funds, Inc. |
| (Exact name of Registrant as specified in charter) |
| |
| |
| c/o The Dreyfus Corporation |
| 200 Park Avenue |
| New York, New York 10166 |
| (Address of principal executive offices) (Zip code) |
| |
| Michael A. Rosenberg, Esq. |
| 200 Park Avenue |
| New York, New York 10166 |
| (Name and address of agent for service) |
| |
| Registrant's telephone number, including area code: (212) 922-6000 |
| Date of fiscal year end: | | 10/31 |
| Date of reporting period: | | 10/31/07 |
The following N-CSR relates only to the Registrant’s series listed below and does not affect the other series of the Registrant, which have different fiscal year ends and, therefore, different N-CSR reporting requirements. Separate N-CSR Forms will be filed for these series, as appropriate.
Systematic International Equity Fund
FORM N-CSR
Item 1. Reports to Stockholders.
Save time. Save paper. View your next shareholder report online as soon as it’s available. Log into www.dreyfus.com and sign up for Dreyfus eCommunications. It’s simple and only takes a few minutes.
The views expressed in this report reflect those of the portfolio manager only through the end of the period covered and do not necessarily represent the views of Dreyfus or any other person in the Dreyfus organization. Any such views are subject to change at any time based upon market or other conditions and Dreyfus disclaims any responsibility to update such views.These views may not be relied on as investment advice and, because investment decisions for a Dreyfus fund are based on numerous factors, may not be relied on as an indication of trading intent on behalf of any Dreyfus fund.
Not FDIC-Insured • Not Bank-Guaranteed • May Lose Value
| Contents |
| |
| | | THE FUND |
| |
|
| 2 | | A Letter from the CEO |
| 3 | | Discussion of Fund Performance |
| 6 | | Fund Performance |
| 8 | | Understanding Your Fund’s Expenses |
| 8 | | Comparing Your Fund’s Expenses |
| With Those of Other Funds |
| 9 | | Statement of Investments |
| 17 | | Statement of Financial Futures |
| 18 | | Statement of Assets and Liabilities |
| 19 | | Statement of Operations |
| 20 | | Statement of Changes in Net Assets |
| 21 | | Financial Highlights |
| 22 | | Notes to Financial Statements |
| 30 | | Report of Independent Registered |
| | | Public Accounting Firm |
| 31 | | Important Tax Information |
| 32 | | Board Members Information |
| 35 | | Officers of the Fund |
| |
| FOR MORE INFORMATION |
|
| | | Back Cover |
The Fund
| Systematic |
| International Equity Fund |

A LETTER FROM THE CEO
Dear Shareholder:
We are pleased to present this annual report for Systematic International Equity Fund covering the period from the fund’s inception on November 30, 2006, through October 31, 2007.
After an extended period of steady gains, turmoil in U.S. credit markets over the summer of 2007 has led to heightened volatility in many international equity markets. Nonetheless, fundamentals in the global economy have remained relatively robust, particularly in the “Greater China” region, and recent rate cuts in the United States helped to sustain market rebounds in many regions of the world.
While we expect the global expansion to continue, it probably will do so at a slower rate as U.S. consumer spending moderates and as some high-flying emerging markets, notably China, take steps to reduce unsustainably high growth rates by tightening their respective monetary policies. However, the U.S. dollar has declined against most major currencies throughout most of the reporting period, making investments denominated in foreign currencies more valuable for U.S. residents. Lastly, a stubborn U.S. trade deficit and stronger economic growth in overseas markets continue to attract global capital away from U.S. markets and toward those with higher potential returns.As always, we encourage you to discuss these developments with your financial advisor, who can help you make any adjustments that may be right for your portfolio.
For information about how the fund performed during the reporting period, as well as market perspectives, we have provided a Discussion of Fund Performance given by the fund’s Portfolio Managers.
Thank you for your continued confidence and support.
| Thomas F. Eggers |
| Chief Executive Officer |
| The Dreyfus Corporation |
| November 15, 2007 |
2

DISCUSSION OF FUND PERFORMANCE
For the period from the fund’s inception on November 30, 2006, through October 31, 2007, as provided by Robert A. Wilk and Donald E. Perks, Portfolio Managers
Fund and Market Performance Overview
International equity markets continued to fare well during the reporting period in an environment of robust global economic growth and strong industrial demand from emerging markets, especially in Asia. The fund participated in the market’s gains, with particularly strong results from materials stocks in the Asia/Pacific region and information technology shares in Europe.
For the period between the fund’s inception on November 30, 2006, and the end of its annual reporting period on October 31, 2007, Systematic International Equity Fund’s Class A shares achieved a 24.80% total return, Class C shares achieved a 24.00% total return, Class I shares achieved a 25.12% total return and Class T shares achieved a 24.56% total return.1 The fund’s benchmark, the Morgan Stanley Capital International Europe, Australasia, Far East Index (“MSCI EAFE Index”), produced a total return of 21.29% for the same period.2 Please note that effective June 1, 2007, the fund’s Class R shares were renamed Class I shares.
What is the fund’s investment approach?
The fund seeks long-term capital growth by normally investing at least 80% of its assets in equity securities.The fund normally invests primarily in equity securities of foreign companies.The fund invests in at least 10 different countries and may invest up to 25% of its assets in emerging market countries, but no more than 10% of its assets may be invested in any one emerging market country.
When selecting securities, we use a quantitative model to identify and rank stocks within geographic regions and economic sectors based on six factor classifications: value, stewardship, growth, accruals, market sentiment and analysts’ expectations.We generally select higher ranked securities as identified by the quantitative model, but we may also assess qualitative factors.We attempt to manage risk through diversifi-
The Fund 3
DISCUSSION OF FUND PERFORMANCE (continued)
cation across regions, countries, sectors and industries in proportions that are similar to those of the MSCI EAFE Index.The fund’s currency exposure typically is unhedged to the U.S. dollar.
Strong International Growth Drove Stock Prices Higher
In the emerging markets of Asia and Latin America, strong demand for the natural resources used in industrial construction helped support economic expansion and the growth of a larger middle class of consumers. In Europe, corporate restructuring and mergers-and-acquisitions activity helped bolster corporate earnings and stock prices. Japan was one of the few major markets to post disappointing results,primarily due to its longstanding struggle to reform its banking system.
During the summer of 2007, international markets encountered heightened volatility stemming from a U.S. credit and liquidity crisis.Although only a handful of international banks had direct exposure to the sub-prime mortgages that triggered the crisis, selling pressure from highly leveraged hedge funds and institutional investors caused market turbulence around the world. However, investors soon recognized that fundamental conditions had not deteriorated for most international companies, and global markets rebounded by the reporting period’s end.
Materials in Asia, Technology in Europe Fueled Fund Performance
Our disciplined, “bottom-up” investment approach proved successful in this environment. For example, our stock scoring system identified a number of basic materials producers in Asia that appeared to be attractively valued and poised to benefit from strong demand for construction materials from China and India.We invested primarily in materials companies listed on securities exchanges in developed markets, such as Taiwan and Hong Kong, to guard against risks that less regulated emerging markets typically entail.The fund achieved particularly strong results in this area from Nisshin Steel and Mitsubishi Corp.
In Europe, the fund received strong contributions to performance from information technology companies, such as cellular telephone handset maker Nokia, that helped deliver technological advances to eager consumers. German automaker Volkswagen boosted its penetration of the
4
U.S. market and forged a closer alliance with partner Porsche, boosting the valuations of both companies’ stocks. An underweight position among pharmaceutical developers helped the fund avoid weakness in several companies that continued to contend with product development issues and competitive pressures from generic drug manufacturers. Finally, the fund benefited from relatively light exposure to lackluster Japanese banks.
The Fund Remains Positioned for Robust Global Growth
Despite the slowdown of the U.S. economy, the recent results of our quantitative models have suggested that there are few signs of impending weakness in international markets. Our models have continued to assign higher rankings to information technology firms in Europe and industrial and materials companies in Asia outside of Japan. Our stock selection system also recently has found more attractively valued opportunities among health care companies, causing us to increase the fund’s exposure to the industry group. In our judgment, these tilts position the fund well over the foreseeable future. Of course, conditions can change rapidly and our models may or may not drive similar portfolio construction in such circumstances.
November 15, 2007
| | | Investing in foreign companies involves special risks, including changes in currency rates, |
| | | political, economic and social instability, a lack of comprehensive company information, |
| | | differing auditing and legal standards and less market liquidity. |
| 1 | | Total return includes reinvestment of dividends and any capital gains paid, and does not take into |
| | | consideration the maximum initial sales charges in the case of Class A and Class T shares, or the |
| | | applicable contingent deferred sales charges imposed on redemptions in the case of Class C shares. |
| | | Had these charges been reflected, returns would have been lower. Past performance is no guarantee |
| | | of future results. Share price and investment return fluctuate such that upon redemption, fund |
| | | shares may be worth more or less than their original cost. Return figures provided reflect the |
| | | absorption of certain fund expenses by The Dreyfus Corporation pursuant to an agreement in |
| | | effect through October 31, 2008, at which time it may be extended, terminated or modified. Had |
| | | these expenses not been absorbed, the fund’s returns would have been lower. |
| 2 | | SOURCE: LIPPER INC. — Reflects reinvestment of net dividends and, where applicable, |
| | | capital gain distributions.The Morgan Stanley Capital International Europe, Australasia, Far |
| | | East (MSCI EAFE) Free Index is an unmanaged index composed of a sample of companies |
| | | representative of the market structure of European and Pacific Basin countries.The index reflects |
| | | actual investable opportunities for global investors for stocks that are free of foreign ownership |
| | | limits or legal restrictions at the country level. |
The Fund 5
FUND PERFORMANCE
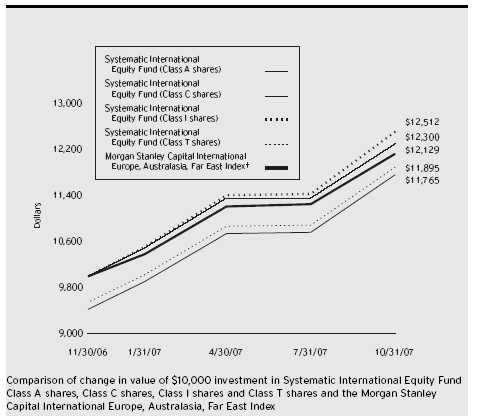
| † Source: Lipper Inc. |
| Past performance is not predictive of future performance. |
| The above graph compares a $10,000 investment made in Class A, Class C, Class I and Class T shares of Systematic |
| International Equity Fund on 11/30/06 (inception date) to a $10,000 investment made in the Morgan Stanley |
| Capital International Europe, Australasia, Far East Index (the “Index”) on that date. All dividends and capital gain |
| distributions are reinvested. |
| The fund’s performance shown in the line graph takes into account the maximum initial sales charges on Class A and |
| Class T shares, the applicable contingent deferred sales charge on Class C shares and all other applicable fees and |
| expenses on all classes.The Index is an unmanaged index composed of a sample of companies representative of the |
| market structure of European and Pacific Basin countries.The Index does not take into account charges, fees and other |
| expenses which can contribute to the Index potentially outperforming or underperforming the fund. Further information |
| relating to fund performance, including expense reimbursements, if applicable, is contained in the Financial Highlights |
| section of the prospectus and elsewhere in this report. |
6
| Actual Aggregate Total Returns as of 10/31/07 | | |
| |
| | | Inception | | From |
| | | Date | | Inception |
| |
| |
|
| Class A shares | | | | |
| with maximum sales charge (5.75%) | | 11/30/06 | | 17.65% |
| without sales charge | | 11/30/06 | | 24.80% |
| Class C shares | | | | |
| with applicable redemption charge † | | 11/30/06 | | 23.00% |
| without redemption | | 11/30/06 | | 24.00% |
| Class I shares | | 11/30/06 | | 25.12% |
| Class T shares | | | | |
| with applicable sales charge (4.5%) | | 11/30/06 | | 18.95% |
| without sales charge | | 11/30/06 | | 24.56% |
Past performance is not predictive of future performance.The fund’s performance shown in the graph and table does not reflect the deduction of taxes that a shareholder would pay on fund distributions or the redemption of fund shares.
| † The maximum contingent deferred sales charge for Class C shares is 1% for shares redeemed within one year of the |
| date of purchase. |
The Fund 7
UNDERSTANDING YOUR FUND’S EXPENSES (Unaudited)
As a mutual fund investor, you pay ongoing expenses, such as management fees and other expenses. Using the information below, you can estimate how these expenses affect your investment and compare them with the expenses of other funds.You also may pay one-time transaction expenses, including sales charges (loads) and redemption fees, which are not shown in this section and would have resulted in higher total expenses. For more information, see your fund’s prospectus or talk to your financial adviser.
Review your fund’s expenses
The table below shows the expenses you would have paid on a $1,000 investment in Systematic International Equity Fund from May 1, 2007 to October 31, 2007. It also shows how much a $1,000 investment would be worth at the close of the period, assuming actual returns and expenses.
| Expenses and Value of a $1,000 Investment | | | | | | |
| assuming actual returns for the six months ended October 31, 2007 | | | | |
| | | Class A | | Class C | | Class I | | Class T |
| |
| |
| |
| |
|
| Expenses paid per $1,000 † | | $ 7.39 | | $ 11.33 | | $ 6.08 | | $ 8.71 |
| Ending value (after expenses) | | $1,095.50 | | $1,091.60 | | $1,096.80 | | $1,094.20 |
| COMPARING YOUR FUND’S EXPENSES |
| WITH THOSE OF OTHER FUNDS (Unaudited) |
Using the SEC’s method to compare expenses
The Securities and Exchange Commission (SEC) has established guidelines to help investors assess fund expenses. Per these guidelines, the table below shows your fund’s expenses based on a $1,000 investment, assuming a hypothetical 5% annualized return. You can use this information to compare the ongoing expenses (but not transaction expenses or total cost) of investing in the fund with those of other funds.All mutual fund shareholder reports will provide this information to help you make this comparison. Please note that you cannot use this information to estimate your actual ending account balance and expenses paid during the period.
| Expenses and Value of a $1,000 Investment | | | | | | |
| assuming a hypothetical 5% annualized return for the six months ended October 31, 2007 |
| | | Class A | | Class C | | Class I | | Class T |
| |
| |
| |
| |
|
| Expenses paid per $1,000 † | | $ 7.12 | | $ 10.92 | | $ 5.85 | | $ 8.39 |
| Ending value (after expenses) | | $1,018.15 | | $1,014.37 | | $1,019.41 | | $1,016.89 |
| † Expenses are equal to the fund’s annualized expense ratio of 1.40% for Class A, 2.15% for Class C, 1.15% for |
| Class I and 1.65% for Class T, multiplied by the average account value over the period, multiplied by 184/365 (to |
| reflect the one-half year period). |
8
| STATEMENT OF INVESTMENTS |
| October 31, 2007 |
| Common Stocks—98.9% | | Shares | | Value ($) |
| |
| |
|
| Australia—6.7% | | | | |
| APA Group | | 1,264 | | 4,658 |
| BHP Billiton | | 2,900 | | 126,294 |
| BlueScope Steel | | 5,967 | | 59,458 |
| Coca-Cola Amatil | | 4,900 | | 46,919 |
| Computershare | | 5,489 | | 44,379 |
| CSL | | 1,350 | | 45,919 |
| DB RREEF Trust | | 30,662 | | 60,116 |
| GPT Group | | 11,033 | | 47,977 |
| Lion Nathan | | 6,506 | | 56,543 |
| Origin Energy | | 7,465 | | 64,112 |
| Pacific Brands | | 19,778 | | 64,557 |
| Qantas Airways | | 10,928 | | 60,511 |
| Rio Tinto | | 520 | | 54,037 |
| Santos | | 4,025 | | 53,348 |
| Telstra | | 14,000 | | 61,400 |
| | | | | 850,228 |
| Austria—1.4% | | | | |
| Flughafen Wien | | 439 | | 52,009 |
| OMV | | 850 | | 63,535 |
| Voestalpine | | 683 | | 61,399 |
| | | | | 176,943 |
| Belgium—2.1% | | | | |
| Belgacom | | 1,060 | | 50,646 |
| Dexia | | 1,884 | | 60,411 |
| Groupe Bruxelles Lambert | | 400 | | 51,073 |
| InBev | | 730 | | 68,891 |
| Omega Pharma | | 589 | | 39,411 |
| | | | | 270,432 |
| Denmark—2.3% | | | | |
| AP Moller—Maersk, Cl. B | | 5 | | 68,984 |
| Carlsberg, Cl. B | | 450 | | 60,599 |
| Novo Nordisk, Cl. B | | 650 | | 80,585 |
| Sydbank | | 850 | | 39,105 |
| Topdanmark | | 275 a | | 46,919 |
| | | | | 296,192 |
The Fund 9
STATEMENT OF INVESTMENTS (continued)
| Common Stocks (continued) | | Shares | | Value ($) |
| |
| |
|
| Finland—2.5% | | | | |
| Elisa | | 1,635 | | 48,472 |
| Konecranes | | 1,635 | | 73,170 |
| Nokia | | 4,883 | | 193,421 |
| | | | | 315,063 |
| France—7.2% | | | | |
| Air France-KLM | | 1,135 | | 43,134 |
| AXA | | 2,400 | | 107,267 |
| BNP Paribas | | 290 | | 31,958 |
| Business Objects | | 1,105 a | | 66,383 |
| Cie de Saint-Gobain | | 700 | | 75,012 |
| CNP Assurances | | 409 | | 52,121 |
| Compagnie Generale des Etablissements Michelin, Cl. B | | 568 | | 76,036 |
| France Telecom | | 2,975 | | 109,699 |
| Peugeot | | 400 | | 37,065 |
| Sanofi-Aventis | | 1,320 | | 115,738 |
| Scor | | 619 | | 16,854 |
| Total | | 1,212 | | 97,685 |
| Vivendi | | 1,900 | | 85,525 |
| | | | | 914,477 |
| Germany—10.2% | | | | |
| Allianz | | 547 | | 122,968 |
| BASF | | 820 | | 113,416 |
| Bayer | | 900 | | 75,002 |
| Daimler | | 1,300 | | 142,998 |
| Deutsche Boerse | | 618 | | 97,471 |
| Deutsche Lufthansa | | 1,785 | | 52,713 |
| Deutsche Telekom | | 525 | | 10,759 |
| E.ON | | 188 | | 36,731 |
| Fresenius Medical Care & Co. | | 1,050 | | 55,445 |
| MAN | | 519 | | 92,605 |
| Merck | | 400 | | 50,024 |
| Muenchener Rueckversicherungs | | 425 | | 81,508 |
| RWE | | 400 | | 54,595 |
| Salzgitter | | 280 | | 55,034 |
| Siemens | | 268 | | 36,377 |
| Suedzucker | | 1,737 | | 39,471 |
10
| Common Stocks (continued) | | Shares | | Value ($) |
| |
| |
|
| Germany (continued) | | | | |
| ThyssenKrupp | | 1,100 | | 73,284 |
| Volkswagen | | 390 | | 111,781 |
| | | | | 1,302,182 |
| Greece—.5% | | | | |
| Coca-Cola Hellenic Bottling | | 1,100 | | 68,250 |
| Hong Kong—5.1% | | | | |
| BOC Hong Kong Holdings | | 18,500 | | 53,005 |
| Cathay Pacific Airways | | 16,000 | | 48,094 |
| CLP Holdings | | 4,500 | | 30,376 |
| Esprit Holdings | | 4,000 | | 68,015 |
| Hang Lung Properties | | 12,000 | | 58,975 |
| Hang Seng Bank | | 4,200 | | 87,058 |
| Henderson Land Development | | 8,000 | | 71,717 |
| New World Development | | 15,000 | | 53,801 |
| Swire Pacific, Cl. A | | 4,500 | | 64,437 |
| Wharf Holdings | | 13,000 | | 78,697 |
| Yue Yuen Industrial Holdings | | 12,000 | | 37,309 |
| | | | | 651,484 |
| Ireland—1.5% | | | | |
| Allied Irish Banks | | 2,300 | | 57,428 |
| Bank of Ireland | | 2,600 | | 47,973 |
| Independent News & Media | | 11,400 | | 41,854 |
| Irish Life & Permanent | | 1,800 | | 40,788 |
| | | | | 188,043 |
| Italy—2.0% | | | | |
| Assicurazioni Generali | | 2,100 | | 99,668 |
| ENI | | 872 | | 31,826 |
| Fiat | | 2,200 | | 71,085 |
| Intesa Sanpaolo | | 800 | | 6,332 |
| Snam Rete Gas | | 8,000 | | 51,733 |
| | | | | 260,644 |
| Japan—16.7% | | | | |
| Aisin Seiki | | 1,300 | | 53,224 |
| Bank of Kyoto | | 4,000 | | 51,009 |
| Canon | | 330 | | 16,684 |
| Central Glass | | 7,000 | | 33,319 |
The Fund 11
STATEMENT OF INVESTMENTS (continued)
| Common Stocks (continued) | | Shares | | Value ($) |
| |
| |
|
| Japan (continued) | | | | |
| Central Japan Railway | | 5 | | 51,722 |
| eAccess | | 62 | | 39,223 |
| Electric Power Development | | 1,100 | | 43,633 |
| Hitachi High-Technologies | | 600 | | 13,485 |
| Honda Motor | | 1,300 | | 48,745 |
| Ibiden | | 700 | | 59,521 |
| Itochu | | 6,000 | | 76,435 |
| JFE Holdings | | 1,100 | | 64,297 |
| Joyo Bank | | 7,000 | | 43,298 |
| Kawasaki Kisen Kaisha | | 6,000 | | 83,201 |
| Kyocera | | 600 | | 50,840 |
| Kyowa Hakko Kogyo | | 5,000 | | 54,638 |
| Marubeni | | 6,000 | | 51,389 |
| Mitsubishi | | 1,700 | | 52,883 |
| Mitsubishi Chemical Holdings | | 7,000 | | 57,774 |
| Mitsubishi UFJ Financial Group | | 3,000 | | 29,903 |
| Mitsui & Co. | | 4,000 | | 104,051 |
| Mitsui OSK Lines | | 5,000 | | 82,592 |
| NEC | | 11,000 | | 54,708 |
| Nippon Mining Holdings | | 1,000 | | 9,426 |
| Nippon Oil | | 4,000 | | 35,516 |
| Nippon Sheet Glass | | 8,000 | | 48,569 |
| Nippon Steel | | 5,000 | | 33,169 |
| Nippon Yusen | | 7,000 | | 72,268 |
| Nisshin Steel | | 10,000 | | 38,442 |
| Nomura Research Institute | | 500 | | 17,599 |
| Resona Holdings | | 34 | | 60,328 |
| Ricoh | | 2,000 | | 39,453 |
| Shimachu | | 1,500 | | 42,979 |
| Sumitomo | | 3,700 | | 64,504 |
| Taiyo Yuden | | 2,000 | | 33,169 |
| TDK | | 600 | | 49,317 |
| Tokai Rika | | 1,700 | | 50,051 |
| Tokyo Tatemono | | 3,000 | | 38,499 |
| Tosoh | | 9,000 | | 57,406 |
| Toyota Industries | | 1,100 | | 47,015 |
12
| Common Stocks (continued) | | Shares | | Value ($) |
| |
| |
|
| Japan (continued) | | | | |
| Toyota Motor | | 3,000 | | 171,486 |
| Yamaha | | 400 | | 9,317 |
| | | | | 2,135,087 |
| Netherlands—1.8% | | | | |
| Aegon | | 3,300 | | 68,154 |
| Heineken | | 900 | | 62,958 |
| ING Groep | | 1,625 | | 73,052 |
| STMicroelectronics | | 1,500 | | 25,657 |
| | | | | 229,821 |
| New Zealand—.3% | | | | |
| Vector | | 20,600 | | 38,120 |
| Norway—1.8% | | | | |
| Frontline | | 1,000 | | 45,070 |
| Prosafe Se | | 1,100 | | 19,503 |
| Tandberg | | 3,200 | | 81,350 |
| Yara International | | 2,100 | | 81,252 |
| | | | | 227,175 |
| Singapore—3.8% | | | | |
| CapitaLand | | 10,000 | | 56,317 |
| ComfortDelgro | | 21,000 | | 28,293 |
| DBS Group Holdings | | 4,000 | | 62,519 |
| Haw Par | | 9,000 | | 49,514 |
| Jardine Cycle & Carriage | | 2,000 | | 29,371 |
| Keppel Corp | | 8,000 | | 82,590 |
| Oversea-Chinese Banking | | 5,000 | | 32,152 |
| Singapore Land | | 4,000 | | 27,084 |
| United Overseas Bank | | 4,000 | | 60,021 |
| UOL Group | | 14,000 | | 51,245 |
| | | | | 479,106 |
| Spain—3.8% | | | | |
| Acerinox | | 1,645 | | 48,507 |
| ACS-Actividades de Construccion y Servicios | | 1,000 | | 61,857 |
| Banco Bilbao Vizcaya Argentaria | | 1,074 | | 27,019 |
| Banco Santander | | 2,400 | | 52,139 |
| Iberia Lineas Aereas de Espana | | 11,712 | | 59,369 |
| Mapfre | | 9,129 | | 42,838 |
The Fund 13
STATEMENT OF INVESTMENTS (continued)
| Common Stocks (continued) | | Shares | | Value ($) |
| |
| |
|
| Spain (continued) | | | | |
| Sacyr Vallehermoso | | 200 | | 9,397 |
| Telefonica | | 5,618 | | 185,432 |
| | | | | 486,558 |
| Sweden—1.8% | | | | |
| Kungsleden | | 3,200 | | 45,569 |
| Scania, Cl. B | | 2,400 | | 65,521 |
| Ssab Svenskt Stal, Ser. B | | 1,400 | | 41,195 |
| Svenska Handelsbanken, Cl. A | | 1,500 | | 49,684 |
| Volvo, Cl. B | | 1,300 | | 25,314 |
| | | | | 227,283 |
| Switzerland—4.8% | | | | |
| Holcim | | 640 | | 72,966 |
| Nestle | | 200 | | 92,330 |
| Novartis | | 1,200 | | 63,845 |
| Roche Holding | | 300 | | 51,200 |
| Swatch Group | | 200 | | 63,914 |
| Swiss Life Holding | | 210 a | | 58,041 |
| Swiss Reinsurance | | 700 | | 65,719 |
| UBS | | 1,000 | | 53,506 |
| Zurich Financial Services | | 300 | | 90,365 |
| | | | | 611,886 |
| United Kingdom—22.1% | | | | |
| 3i Group | | 2,079 | | 46,914 |
| Aggreko | | 4,000 | | 51,628 |
| Anglo American | | 1,799 | | 121,943 |
| Barclays | | 8,133 | | 97,502 |
| Berkeley Group Holdings | | 1,311 a | | 46,586 |
| BHP Billiton | | 3,300 | | 125,312 |
| BP | | 12,431 | | 160,900 |
| British American Tobacco | | 2,000 | | 73,687 |
| British Land | | 2,125 | | 45,610 |
| Carnival | | 916 | | 42,817 |
| Daily Mail & General Trust, Cl. A | | 3,100 | | 39,225 |
| Enterprise Inns | | 3,850 | | 50,258 |
| GlaxoSmithKline | | 3,139 | | 79,909 |
| Home Retail Group | | 7,400 | | 66,802 |
14
| Common Stocks (continued) | | Shares | | Value ($) |
| |
| |
|
| United Kingdom (continued) | | | | |
| HSBC Holdings | | 9,767 | | 193,075 |
| Imperial Tobacco Group | | 1,550 | | 78,112 |
| International Power | | 6,800 | | 68,405 |
| Kelda Group | | 1,923 | | 37,594 |
| Liberty International | | 1,100 | | 27,103 |
| Next | | 1,301 | | 58,894 |
| Old Mutual | | 16,600 | | 62,673 |
| Prudential | | 4,950 | | 79,507 |
| Punch Taverns | | 2,625 | | 54,955 |
| Royal Bank of Scotland Group | | 10,896 | | 116,704 |
| Royal Dutch Shell, Cl. A | | 1,965 | | 85,734 |
| Royal Dutch Shell, Cl. B | | 3,291 | | 142,237 |
| SABMiller | | 2,600 | | 77,761 |
| Schroders | | 1,900 | | 60,776 |
| Scottish & Newcastle | | 3,200 | | 51,931 |
| Severn Trent | | 1,600 | | 48,227 |
| Smith & Nephew | | 4,700 | | 62,121 |
| Unilever | | 1,050 | | 35,736 |
| United Business Media | | 1,600 | | 23,823 |
| Vodafone Group | | 57,053 | | 223,660 |
| Whitbread | | 1,316 | | 48,072 |
| WPP Group | | 3,000 | | 40,958 |
| Xstrata | | 1,310 | | 93,499 |
| | | | | 2,820,650 |
| United States—.5% | | | | |
| iShares MSCI EAFE Index Fund | | 704 | | 60,614 |
| Total Common Stocks | | | | |
| (cost $10,632,918) | | | | 12,610,238 |
| |
| |
|
| |
| Preferred Stocks—.8% | | | | |
| |
| |
|
| Australia—.0% | | | | |
| BBI EPS | | 319 | | 268 |
| Germany—.8% | | | | |
| Porsche | | 41 | | 109,202 |
| Total Preferred Stocks | | | | |
| (cost $47,849) | | | | 109,470 |
The Fund 15
STATEMENT OF INVESTMENTS (continued)
| | | Principal | | |
| Short-Term Investments—.2% | | Amount ($) | | Value ($) |
| |
| |
|
| U.S. Treasury Bills; | | | | |
| 3.50%, 12/27/07 | | | | |
| (cost $19,891) | | 20,000 b | | 19,879 |
| |
| |
|
| Total Investments (cost $10,700,658) | | 99.9% | | 12,739,587 |
| Cash and Receivables (Net) | | .1% | | 7,957 |
| Net Assets | | 100.0% | | 12,747,544 |
| a | | Non-income producing security. |
| b | | All or partially held by a broker as collateral for open financial futures positions. |
| Portfolio Summary (Unaudited) † | | | | |
| |
| | | Value (%) | | | | Value (%) |
| |
| |
| |
|
| Financial | | 17.8 | | Telecommunication Services | | 5.8 |
| Consumer Discretionary | | 14.3 | | Health Care | | 5.5 |
| Industrial | | 13.3 | | Utilities | | 2.8 |
| Materials | | 11.4 | | Transportation | | .9 |
| Insurance | | 8.4 | | Index | | .5 |
| Energy | | 6.5 | | Short Term Investment | | .2 |
| Consumer Staples | | 6.4 | | | | |
| Information Technology | | 6.1 | | | | 99.9 |
| † Based on net assets. |
| See notes to financial statements. |
16
| STATEMENT OF FINANCIAL FUTURES |
| October 31, 2007 |
| | | | | | | | | Unrealized |
| | | | | Market Value | | | | Appreciation |
| | | | | Covered by | | | | (Depreciation) |
| | | Contracts | | Contracts ($) | | Expiration | | at 10/31/2007 ($) |
| |
| |
| |
| |
|
| Financial Futures Long | | | | | | | | |
| Euro FX | | 1 | | 181,375 | | December 2007 | | 7,059 |
| Japanese Yen | | 4 | | 435,800 | | December 2007 | | (6,166) |
| Franc FX | | 2 | | 216,775 | | December 2007 | | 4,142 |
| | | | | | | | | 5,035 |
See notes to financial statements.
The Fund 17
| STATEMENT OF ASSETS AND LIABILITIES |
| October 31, 2007 |
| | | Cost | | Value |
| |
| |
|
| Assets ($): | | | | |
| Investments in securities-See Statement of Investments | | 10,700,658 | | 12,739,587 |
| Cash | | | | 24,280 |
| Cash denominated in foreign currencies | | 10,364 | | 8,730 |
| Dividends and interest receivable | | | | 24,506 |
| Prepaid expenses | | | | 20,357 |
| | | | | 12,817,460 |
| |
| |
|
| Liabilities ($): | | | | |
| Due to The Dreyfus Corporation and affiliates—Note 3(c) | | | | 33,845 |
| Payable for futures variation margin—Note 4 | | | | 688 |
| Accrued expenses | | | | 35,383 |
| | | | | 69,916 |
| |
| |
|
| Net Assets ($) | | | | 12,747,544 |
| |
| |
|
| Composition of Net Assets ($): | | | | |
| Paid-in capital | | | | 10,244,928 |
| Accumulated undistributed investment income—net | | | | 122,228 |
| Accumulated net realized gain (loss) on investments | | | | 337,640 |
| Accumulated net unrealized appreciation (depreciation) on | | |
| investments and foreign currency transactions (including | | |
| $5,035 net unrealized appreciation on financial futures) | | 2,042,748 |
| |
|
| Net Assets ($) | | | | 12,747,544 |
See notes to financial statements.
| Net Asset Value Per Share | | | | | | | | |
| | | Class A | | Class C | | Class I | | ClassT |
| |
| |
| |
| |
|
| Net Assets ($) | | 8,973,935 | | 1,271,207 | | 1,256,661 | | 1,245,741 |
| Shares Outstanding | | 574,968 | | 82,011 | | 80,331 | | 80,000 |
| |
| |
| |
| |
|
| Net Asset Value Per Share ($) | | 15.61 | | 15.50 | | 15.64 | | 15.57 |
18
| STATEMENT OF OPERATIONS |
| From November 30, 2006 (commencement of operations) to October 31, 2007 |
| Investment Income ($): | | |
| Income: | | |
| Cash dividends (net of $25,792 foreign taxes withheld at source): | | |
| Unaffiliated issuers | | 276,673 |
| Affiliated issuers | | 1,714 |
| Interest | | 1,320 |
| Total Income | | 279,707 |
| Expenses: | | |
| Management fee—Note 3(a) | | 83,024 |
| Custodian fees—Note 3(c) | | 59,260 |
| Auditing fees | | 33,107 |
| Shareholder servicing costs—Note 3(c) | | 23,867 |
| Distribution fees—Note 3(b) | | 10,367 |
| Registration fees | | 8,435 |
| Prospectus and shareholders’ reports | | 7,334 |
| Legal fees | | 1,089 |
| Directors’ fees and expenses—Note 3(d) | | 1,088 |
| Miscellaneous | | 49,700 |
| Total Expenses | | 277,271 |
| Less—expense reimbursement by The Dreyfus Corporation | | |
| due to undertaking—Note 3(a) | | (124,186) |
| Less—reduction in custody fees due to earnings credits—Note 1(c) | | (5,805) |
| Net Expenses | | 147,280 |
| Investment Income-Net | | 132,427 |
| |
|
| Realized and Unrealized Gain (Loss) on Investments—Note 4 ($): |
| Net realized gain (loss) on investments and foreign currency transactions | | 265,462 |
| Net realized gain (loss) on financial futures | | 26,902 |
| Net realized gain (loss) on forward currency exchange contracts | | 35,055 |
| Net Realized Gain (Loss) | | 327,419 |
| Net unrealized appreciation (depreciation) on investments | | |
| and foreign currency transactions (including $5,035 | | |
| net unrealized appreciation on financial futures) | | 2,042,748 |
| Net Realized and Unrealized Gain (Loss) on Investments | | 2,370,167 |
| Net Increase in Net Assets Resulting from Operations | | 2,502,594 |
| |
| See notes to financial statements. | | |
The Fund 19
| STATEMENT OF CHANGES IN NET ASSETS |
| From November 30, 2006 (commencement of operations) to October 31, 2007a |
| Operations ($): | | |
| Investment income—net | | 132,427 |
| Net realized gain (loss) on investments | | 327,419 |
| Net unrealized appreciation (depreciation) on investments | | 2,042,748 |
| Net Increase (Decrease) in Net Assets | | |
| Resulting from Operations | | 2,502,594 |
| |
|
| Capital Stock Transactions ($): | | |
| Net proceeds from shares sold: | | |
| Class A shares | | 7,217,159 |
| Class C shares | | 1,033,587 |
| Class I shares | | 1,005,000 |
| Class T shares | | 1,000,000 |
| Cost of shares redeemed: | | |
| Class A shares | | (4,720) |
| Class C shares | | (6,076) |
| Increase (Decrease) in Net Assets | | |
| from Capital Stock Transactions | | 10,244,950 |
| Total Increase (Decrease) in Net Assets | | 12,747,544 |
| |
|
| Net Assets ($): | | |
| Beginning of Period | | — |
| End of Period | | 12,747,544 |
| Undistributed investment income—net | | 122,228 |
| |
|
| Capital Share Transactions (Shares): | | |
| Class A | | |
| Shares sold | | 575,335 |
| Shares redeemed | | (367) |
| Net Increase (Decrease) in Shares Outstanding | | 574,968 |
| |
|
| Class C | | |
| Shares sold | | 82,431 |
| Shares redeemed | | (420) |
| Net Increase (Decrease) in Shares Outstanding | | 82,011 |
| |
|
| Class I | | |
| Shares sold | | 80,331 |
| |
|
| Class T | | |
| Shares sold | | 80,000 |
| a Effective June 1, 2007, the fund redesignated Class R shares to Class I shares. |
| See notes to financial statements. |
20
FINANCIAL HIGHLIGHTS
The following table describes the performance for each share class for the period from November 30, 2006 (commencement of operations) to October 31, 2007. All information (except portfolio turnover rate) reflects financial results for a single fund share. Total return shows how much your investment in the fund would have increased (or decreased) during each period, assuming you had reinvested all dividends and distributions.These figures have been derived from the fund’s financial statements.
| | | Class A | | Class C | | Class Ia | | Class T |
| | | Shares | | Shares | | Shares | | Shares |
| |
| |
| |
| |
|
| Per Share Data ($): | | | | | | | | |
| Net asset value, beginning of period | | 12.50 | | 12.50 | | 12.50 | | 12.50 |
| Investment Operations: | | | | | | | | |
| Investment income—net b | | .17 | | .08 | | .21 | | .14 |
| Net realized and unrealized | | | | | | | | |
| gain (loss) on investments | | 2.94 | | 2.92 | | 2.93 | | 2.93 |
| Total from Investment Operations | | 3.11 | | 3.00 | | 3.14 | | 3.07 |
| Net asset value, end of period | | 15.61 | | 15.50 | | 15.64 | | 15.57 |
| |
| |
| |
| |
|
| Total Return (%) c | | 24.80d | | 24.00d | | 25.12 | | 24.56d |
| |
| |
| |
| |
|
| Ratios/Supplemental Data (%): | | | | | | | | |
| Ratio of total expenses | | | | | | | | |
| to average net assets e | | 2.60 | | 3.35 | | 2.35 | | 2.85 |
| Ratio of net expenses | | | | | | | | |
| to average net assets e | | 1.34 | | 2.09 | | 1.09 | | 1.59 |
| Ratio of net investment income | | | | | | | | |
| to average net assets e | | 1.35 | | .61 | | 1.60 | | 1.10 |
| Portfolio Turnover Rate c | | 85.40 | | 85.40 | | 85.40 | | 85.40 |
| |
| |
| |
| |
|
| Net Assets, end of period ($ x 1,000) | | 8,974 | | 1,271 | | 1,257 | | 1,246 |
| a | | Effective June 1, 2007, the fund redesignated Class R shares to Class I shares. |
| b | | Based on average shares outstanding at each month end. |
| c | | Not annualized. |
| d | | Exclusive of sales charge. |
| e | | Annualized. |
| See notes to financial statements. |
The Fund 21
NOTES TO FINANCIAL STATEMENTS
NOTE 1—Significant Accounting Policies:
Systematic International Equity Fund (the “fund”) is a separate diversified series of Strategic Funds, Inc. (the “Company”) which is registered under the Investment Company Act of 1940, as amended (the “Act”), as a diversified open-end management investment company and operates as a series company currently offering five series, including the fund, which commenced operations on November 30, 2006. The fund’s investment objective is to pursue long-term capital growth.The Dreyfus Corporation (the “Manager” or “Dreyfus”) serves as the fund’s investment adviser. Mellon Equity Associates, LLP (“Mellon Equity”) serves as the fund’s sub-investment adviser and is an affiliate of BNY Mellon.
On July 1,2007,Mellon Financial Corporation (“Mellon Financial”) and The Bank of New York Company, Inc. merged, forming The Bank of New York Mellon Corporation (“BNY Mellon”). As part of this transaction, Dreyfus became a wholly-owned subsidiary of BNY Mellon.
The fund’s Board of Trustees approved the redesignation of the fund’s Class R shares as Class I shares, effective June 1, 2007.The description of the eligibility requirements for Class I shares remains the same as it was for Class R shares.
MBSC Securities Corporation (the “Distributor”), a wholly-owned subsidiary of Dreyfus, is the distributor of the fund’s shares.The fund is authorized to issue 100 million shares of $.001 par value Common Stock in each of the following classes of shares: Class A, Class C, Class I and Class T. Class A and Class T shares are subject to a sales charge imposed at the time of purchase. Class C shares are subject to a contingent deferred sales charge (“CDSC”) on Class C shares redeemed within one year of purchase. Class I shares are sold at net asset value per share only to institutional investors. Other differences between the classes include the services offered to and the expenses borne by each class and certain voting rights. Income, expenses (other than expenses attributable to a specific class), and realized and unrealized gains or losses on investments are allocated to each class of shares based on its relative net assets.
22
As of October 31, 2007, MBC Investments Corp., an indirect subsidiary of BNY Mellon, held 560,000 of the outstanding Class A shares and 80,000 each of the outstanding Class C, Class I and Class T shares of the fund.
The Company accounts separately for the assets, liabilities and operations of each series. Expenses directly attributable to each series are charged to that series’ operations; expenses which are applicable to all series are allocated among them on a pro rata basis.
The fund’s financial statements are prepared in accordance with U.S. generally accepted accounting principles, which may require the use of management estimates and assumptions. Actual results could differ from those estimates.
The fund enters into contracts that contain a variety of indemnifications. The fund’s maximum exposure under these arrangements is unknown.The fund does not anticipate recognizing any loss related to these arrangements.
(a) Portfolio valuation: Investments in securities are valued at the last sales price on the securities exchange or national securities market on which such securities are primarily traded. Securities listed on the National Market System for which market quotations are available are valued at the official closing price or, if there is no official closing price that day, at the last sales price. Securities not listed on an exchange or the national securities market, or securities for which there were no transactions, are valued at the average of the most recent bid and asked prices, except for open short positions, where the asked price is used for valuation purposes. Bid price is used when no asked price is available. Registered open-end investment companies that are not traded on an exchange are valued at their net asset value.When market quotations or official closing prices are not readily available, or are determined not to reflect accurately fair value, such as when the value of a security has been significantly affected by events after the close of the exchange or market on which the security is principally traded (for example, a foreign exchange or market), but before the fund calculates its net asset value, the fund may value these investments at fair value as determined
The Fund 23
NOTES TO FINANCIAL STATEMENTS (continued)
in accordance with the procedures approved by the Board of Directors. Fair valuing of securities may be determined with the assistance of a pricing service using calculations based on indices of domestic securities and other appropriate indicators, such as prices of relevant ADR’s and futures contracts. For other securities that are fair valued by the Board of Directors, certain factors may be considered such as: fundamental analytical data, the nature and duration of restrictions on disposition, an evaluation of the forces that influence the market in which the securities are purchased and sold and public trading in similar securities of the issuer or comparable issuers. Financial futures are valued at the last sales price. Investments denominated in foreign currencies are translated to U.S. dollars at the prevailing rates of exchange. Forward currency exchange contracts are valued at the forward rate.
The Financial Accounting Standards Board (“FASB”) released Statement of Financial Accounting Standards No. 157 “Fair Value Measurements” (“FAS 157”). FAS 157 establishes an authoritative definition of fair value, sets out a framework for measuring fair value, and requires additional disclosures about fair-value measurements. The application of FAS 157 is required for fiscal years beginning after November 15, 2007 and interim periods within those fiscal years. Management does not believe that the application of this standard will have a material impact on the financial statements of the fund.
(b) Foreign currency transactions: The fund does not isolate that portion of the results of operations resulting from changes in foreign exchange rates on investments from the fluctuations arising from changes in market prices of securities held. Such fluctuations are included with the net realized and unrealized gain or loss on investments.
Net realized foreign exchange gains or losses arise from sales and maturities of short-term securities, sales of foreign currencies, currency gains or losses realized on securities transactions and the difference between the amounts of dividends, interest and foreign withholding taxes recorded on the fund’s books and the U.S. dollar equivalent of the amounts actually received or paid. Net unrealized foreign exchange
24
gains or losses arise from changes in the value of assets and liabilities other than investments in securities, resulting from changes in exchange rates. Such gains and losses are included with net realized and unrealized gain or loss on investments.
(c) Securities transactions and investment income: Securities transactions are recorded on a trade date basis. Realized gain and loss from securities transactions are recorded on the identified cost basis. Dividend income is recognized on the ex-dividend date and interest income, including, where applicable, accretion of discount and amortization of premium on investments, is recognized on the accrual basis.
The fund has an arrangement with the custodian bank whereby the fund receives earnings credits from the custodian when positive cash balances are maintained, which are used to offset custody fees. For financial reporting purposes, the fund includes net earnings credits as an expense offset in the Statement of Operations.
(d) Affiliated issuers: Investments in other investment companies advised by Dreyfus are defined as “affiliated” in the Act.
(e) Dividends to shareholders: Dividends are recorded on the ex-dividend date. Dividends from investment income-net and dividends from net realized capital gain, if any, are normally declared and paid annually, but the fund may make distributions on a more frequent basis to comply with the distribution requirements of the Internal Revenue Code of 1986, as amended (the “Code”).To the extent that net realized capital gain can be offset by capital loss carryovers, if any, it is the policy of the fund not to distribute such gain. Income and capital gain distributions are determined in accordance with income tax regulations, which may differ from U.S. generally accepted accounting principles.
(f) Federal income taxes: It is the policy of the fund to continue to qualify as a regulated investment company, if such qualification is in the best interests of its shareholders, by complying with the applicable provisions of the Code, and to make distributions of taxable income sufficient to relieve it from substantially all federal income and excise taxes.
The Fund 25
NOTES TO FINANCIAL STATEMENTS (continued)
The FASB released FASB Interpretation No. 48 “Accounting for Uncertainty in Income Taxes” (FIN 48). FIN 48 provides guidance for how uncertain tax positions should be recognized, measured, presented and disclosed in the financial statements. FIN 48 requires the evaluation of tax positions taken or expected to be taken in the course of preparing the fund’s tax returns to determine whether the tax positions are “morelikely-than-not” of being sustained by the applicable tax authority.Tax positions not deemed to meet the more-likely-than-not threshold would be recorded as a tax benefit or expense in the current year.Adoption of FIN 48 is required for fiscal years beginning after December 15, 2006 and is to be applied to all open tax years as of the effective date. Management does not believe that the application of this standard will have a material impact on the financial statements of the fund.
At October 31, 2007, the components of accumulated earnings on a tax basis were as follows: undistributed ordinary income $512,905, undistributed capital gains $19,162 and unrealized appreciation $1,970,549.
During the period ended October 31, 2007, as a result of permanent book to tax differences, primarily due to the tax treatment for foreign currency gains and losses and passive foreign investment companies, the fund decreased accumulated undistributed investment income-net by $10,199, increased accumulated net realized gain (loss) on investments by $10,221 and decreased paid-in capital by $22. Net assets and net asset value per share were not affected by this reclassification.
NOTE 2—Bank Line of Credit:
The fund participates with other Dreyfus-managed funds in a $350 million redemption credit facility (the “Facility”) to be utilized for temporary or emergency purposes, including the financing of redemptions. In connection therewith, the fund has agreed to pay commitment fees on its pro rata portion of the Facility. Interest is charged to the fund based on prevailing market rates in effect at the time of borrowings. During the period ended October 31, 2007, the fund did not borrow under the Facility.
26
NOTE 3—Management Fee, Sub-Investment Advisory Fee and Other Transactions With Affiliates:
(a) Pursuant to a management agreement (“Agreement”) with Dreyfus, the management fee is computed at the annual rate of .80% of the value of the fund’s average daily net assets and is payable monthly. Dreyfus has contractually agreed to waive receipt of its fees and/or assume the expenses of the fund, until October 31, 2008, so that annual fund operating expenses (excluding Rule 12b-1 fees, shareholder services fees, taxes, interest, brokerage commissions, commitment fees on borrowings and extraordinary expenses) do not exceed 1.15% of the fund’s average daily net assets.The expense reimbursement, pursuant to the undertaking, amounted to $124,186 during the period ended October 31, 2007.
Pursuant to a Sub-Investment Advisory Agreement between Dreyfus and Mellon Equity, Dreyfus pays Mellon Equity an annual fee of .45% of the value of the fund’s average daily net assets, payable monthly.
(b) Under the Distribution Plan (the “Plan”) adopted pursuant to Rule 12b-1 under the Act, Class C and Class T shares pay the Distributor for distributing their shares at an annual rate of .75% of the value of the average daily net assets of Class C shares and .25% of the value of the average daily net assets of Class T shares. During the period ended October 31, 2007, Class C and Class T shares were charged $7,800 and $2,567, respectively, pursuant to the Plan.
(c) Under the Shareholder Services Plan, Class A, Class C and Class T shares pay the Distributor at an annual rate of .25% of the value of their average daily net assets for the provision of certain services.The services provided may include personal services relating to shareholder accounts, such as answering shareholder inquiries regarding Class A, Class C and Class T shares and providing reports and other information, and services related to the maintenance of shareholder accounts. The Distributor may make payments to Service Agents (a securities dealer, financial institution or other industry professional) in respect of these services.The Distributor determines the amounts to be paid to
The Fund 27
NOTES TO FINANCIAL STATEMENTS (continued)
Service Agents. During the period ended October 31, 2007, Class A, Class C and Class T shares were charged $18,204, $2,600 and $2,567, respectively, pursuant to the Shareholder Services Plan.
The fund compensates Dreyfus Transfer, Inc., a wholly-owned subsidiary of Dreyfus, under a transfer agency agreement for providing personnel and facilities to perform transfer agency services for the fund. During the period ended October 31, 2007, the fund was charged $293 pursuant to the transfer agency agreement.
Effective July 1, 2007, the fund’s custodian, The Bank of New York, became an affiliate of the Manager. Under the fund’s pre-existing custody agreement with The Bank of New York, for providing custodial services for the fund for the four months ended October 31, 2007, the fund was charged $8,219. Prior to becoming an affiliate,The Bank of New York was paid $51,041 for the custody services to the fund for the seven months ended June 30, 2007.
During the period ended October 31, 2007, the fund was charged $4,660 for services performed by the Chief Compliance Officer.
The components of “Due to The Dreyfus Corporation and affiliates” in the Statement of Assets and Liabilities consist of: management fees $8,408, Rule 12b-1 distribution plan fees $1,044, shareholder services plan fees $2,369, custodian fees $31,366 and chief compliance officer fees $2,000, which are offset against an expense reimbursement currently in effect in the amount of $11,342.
(d) Each Board member also serves as a Board member of other funds within the Dreyfus complex. Annual retainer fees and attendance fees are allocated to each fund based on net assets.
NOTE 4—Securities Transactions:
The aggregate amount of purchases and sales of investment securities, excluding short-term securities, financial futures and forward currency exchange contracts, during the period ended October 31, 2007, amounted to $20,065,010 and $9,661,530, respectively.
The fund may invest in financial futures contracts in order to gain exposure to or protect against changes in the market.The fund is exposed to
28
market risk as a result of changes in the value of the underlying financial instruments. Investments in financial futures require the fund to “mark to market” on a daily basis, which reflects the change in market value of the contracts at the close of each day’s trading.Accordingly, variation margin payments are received or made to reflect daily unrealized gains or losses.When the contracts are closed, the fund recognizes a realized gain or loss.These investments require initial margin deposits with a broker, which consist of cash or cash equivalents.The amount of these deposits is determined by the exchange or Board of Trade on which the contract is traded and is subject to change. Contracts open at October 31, 2007, are set forth in the Statement of Financial Futures.
The fund enters into forward currency exchange contracts in order to hedge its exposure to changes in foreign currency exchange rates on its foreign portfolio holdings and to settle foreign currency transactions. When executing forward currency exchange contracts, the fund is obligated to buy or sell a foreign currency at a specified rate on a certain date in the future.With respect to sales of forward currency exchange contracts, the fund would incur a loss if the value of the contract increases between the date the forward contract is opened and the date the forward contract is closed.The fund realizes a gain if the value of the contract decreases between those dates.With respect to purchases of forward currency exchange contracts, the fund would incur a loss if the value of the contract decreases between the date the forward contract is opened and the date the forward contract is closed.The fund realizes a gain if the value of the contract increases between those dates. The fund is also exposed to credit risk associated with counterparty nonperformance on these forward currency exchange contracts which is typically limited to the unrealized gain on each open contract. At October 31, 2007, there were no forward currency exchange contracts outstanding.
At October 31, 2007, the cost of investments for federal income tax purposes was $10,767,822; accordingly, accumulated net unrealized appreciation on investments was $1,971,765, consisting of $2,262,722 gross unrealized appreciation and $290,957 gross unrealized depreciation.
The Fund 29
| REPORT OF INDEPENDENT REGISTERED |
| PUBLIC ACCOUNTING FIRM |
| Shareholders and Board of Directors |
| Systematic International Equity Fund |
We have audited the accompanying statement of assets and liabilities, including the statement of investments and financial futures, of Systematic International Equity Fund (one of the funds comprising Strategic Funds, Inc.) as of October 31, 2007, and the related statement of operations, the statement of changes in net assets and financial highlights for the period from November 30, 2006 (commencement of operations) to October 31, 2007.These financial statements and financial highlights are the responsibility of the Fund’s management. Our responsibility is to express an opinion on these financial statements and financial highlights based on our audit.
We conducted our audit in accordance with the standards of the Public Company Accounting Oversight Board (United States). Those standards require that we plan and perform the audit to obtain reasonable assurance about whether the financial statements and financial highlights are free of material misstatement.We were not engaged to perform an audit of the Fund’s internal control over financial reporting. Our audit included consideration of internal control over financial reporting as a basis for designing audit procedures that are appropriate in the circumstances, but not for the purpose of expressing an opinion on the effectiveness of the Fund’s internal control over financial reporting. Accordingly, we express no such opinion. An audit also includes examining, on a test basis, evidence supporting the amounts and disclosures in the financial statements and financial highlights, assessing the accounting principles used and significant estimates made by management, and evaluating the overall financial statement presentation. Our procedures included confirmation of securities owned as of October 31, 2007 by correspondence with the custodian and others.We believe that our audit provides a reasonable basis for our opinion.
In our opinion, the financial statements and financial highlights referred to above present fairly, in all material respects, the financial position of Systematic International Equity Fund at October 31, 2007, and the results of its operations, the changes in its net assets and financial highlights for the period from November 30, 2006 to October 31, 2007, in conformity with U. S. generally accepted accounting principles.

| New York, New York |
| December 21, 2007 |
30
IMPORTANT TAX INFORMATION ( U n a u d i t e d )
In accordance with federal tax law, the fund elects to provide each shareholder with their portion of the fund’s foreign taxes paid and the income sourced from foreign countries.Accordingly, the fund hereby makes the following designations regarding its fiscal year ended October 31, 2007:
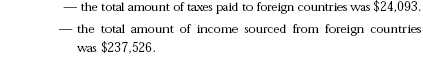
As required by federal tax law rules, shareholders will receive notification of their proportionate share of foreign taxes paid and foreign sourced income for the 2007 calendar year with Form 1099-DIV which will be mailed by January 31, 2008.
The Fund 31
BOARD MEMBERS INFORMATION ( U n a u d i t e d )
| Joseph S. DiMartino (64) |
| Chairman of the Board (1995) |
| Principal Occupation During Past 5 Years: |
| • Corporate Director and Trustee |
| Other Board Memberships and Affiliations: |
| • The Muscular Dystrophy Association, Director |
| • Century Business Services, Inc., a provider of outsourcing functions for small and medium size |
| companies, Director |
| • The Newark Group, a provider of a national market of paper recovery facilities, paperboard |
| mills and paperboard converting plants, Director |
| • Sunair Services Corporation, a provider of certain outdoor-related services to homes and |
| businesses, Director |
No. of Portfolios for which Board Member Serves: 165 ———————
| David W. Burke (71) |
| Board Member (1994) |
| Principal Occupation During Past 5 Years: |
| • Corporate Director and Trustee. |
| Other Board Memberships and Affiliations: |
| • John F. Kennedy Library Foundation, Director |
No. of Portfolios for which Board Member Serves: 88 ———————
| William Hodding Carter III (72) |
| Board Member (1988) |
| Principal Occupation During Past 5 Years: |
| • Professor of Leadership & Public Policy, University of North Carolina, Chapel Hill |
| (January 1, 2006-present) |
| • President and Chief Executive Officer of the John S. and James L. Knight Foundation |
| (February 1, 1998-February 1, 2006) |
Other Board Memberships and Affiliations:
- The Century Foundation, Emeritus Director
- The Enterprise Corporation of the Delta, Director
No. of Portfolios for which Board Member Serves: 27 ———————
| Gordon J. Davis (66) |
| Board Member (2006) |
| Principal Occupation During Past 5 Years: |
| • Partner in the law firm of Dewey & LeBoeuf, LLP |
| • President, Lincoln Center for the Performing Arts, Inc. (2001) |
Other Board Memberships and Affiliations:
- Consolidated Edison, Inc., a utility company, Director
- Phoenix Companies, Inc., a life insurance company, Director
- Board Member/Trustee for several not-for-profit groups
No. of Portfolios for which Board Member Serves: 36
32
| Joni Evans (65) |
| Board Member (2006) |
| Principal Occupation During Past 5 Years: |
| • Principal, Joni Evans Ltd. |
| • Senior Vice President of the William Morris Agency (2005) |
No. of Portfolios for which Board Member Serves: 27
———————
| Ehud Houminer (67) |
| Board Member (1994) |
| Principal Occupation During Past 5 Years: |
| • Executive-in-Residence at the Columbia Business School, Columbia University |
| Other Board Memberships and Affiliations: |
| • Avnet Inc., an electronics distributor, Director |
| • International Advisory Board to the MBA Program School of |
| Management, Ben Gurion University, Chairman |
No. of Portfolios for which Board Member Serves: 67
———————
| Richard C. Leone (67) |
| Board Member (1984) |
| Principal Occupation During Past 5 Years: |
| • President of The Century Foundation (formerly,The Twentieth Century Fund, Inc.), a tax exempt |
| research foundation engaged in the study of economic, foreign policy and domestic issues |
Other Board Memberships and Affiliations:
- The American Prospect, Director
- Center for American Progress, Director
No. of Portfolios for which Board Member Serves: 27
———————
| Hans C. Mautner (69) |
| Board Member (1984) |
| Principal Occupation During Past 5 Years: |
| • President—International Division and an Advisory Director of Simon Property Group, a |
| real estate investment company (1998-present) |
| • Director and Vice Chairman of Simon Property Group (1998-2003) |
| • Chairman and Chief Executive Officer of Simon Global Limited (1999-present) |
Other Board Memberships and Affiliations:
- Capital and Regional PLC, a British co-investing real estate asset manager, Director
- Member - Board of Managers of: Mezzacappa Long/Short Fund LLC
Mezzacappa Partners LLC
No. of Portfolios for which Board Member Serves: 27
The Fund 33
BOARD MEMBERS INFORMATION ( U n a u d i t e d ) (continued)
| Robin A. Melvin (44) |
| Board Member (1995) |
| Principal Occupation During Past 5 Years: |
| • Director, Boisi Family Foundation, a private family foundation that supports youth-serving orga- |
| nizations that promote the self sufficiency of youth from disadvantaged circumstances |
No. of Portfolios for which Board Member Serves: 27
———————
| Burton N. Wallack (56) |
| Board Member (2006) |
| Principal Occupation During Past 5 Years: |
| • President and co-owner of Wallack Management Company, a real estate management company |
No. of Portfolios for which Board Member Serves: 27
———————
| John E. Zuccotti (70) |
| Board Member (1984) |
| Principal Occupation During Past 5 Years: |
| • Chairman of Brookfield Financial Properties, Inc. |
| • Senior Counsel of Weil, Gotshal & Manges, LLP |
| • Chairman of the Real Estate Board of New York |
Other Board Memberships and Affiliations:
- Emigrant Savings Bank, Director
- Wellpoint, Inc., Director
- Visiting Nurse Service of New York, Director
- Columbia University,Trustee
- Doris Duke Charitable Foundation,Trustee
No. of Portfolios for which Board Member Serves: 27
———————
Once elected all Board Members serve for an indefinite term, but achieve Emeritus status upon reaching age 80.The address of the Board Members and Officers is in c/o The Dreyfus Corporation, 200 Park Avenue, New York, New York 10166. Additional information about the Board Members is available in the fund’s Statement of Additional Information which can be obtained from Dreyfus free of charge by calling this toll free number: 1-800-554-4611.
Arnold S. Hiatt, Emeritus Board Member
34
OFFICERS OF THE FUND ( U n a u d i t e d )
| J. DAVID OFFICER, President since |
| December 2006. |
Chief Operating Officer,Vice Chairman and a Director of the Manager, and an officer of 82 investment companies (comprised of 165 portfolios) managed by the Manager. He is 59 years old and has been an employee of the Manager since April 1998.
| PHILLIP N. MAISANO, Executive Vice |
| President since July 2007. |
Chief Investment Officer,Vice Chair and a director of the Manager, and an officer of 82 investment companies (comprised of 165 portfolios) managed by the Manager. Mr. Maisano also is an officer and/or Board member of certain other investment management subsidiaries of The Bank of New York Mellon Corporation, each of which is an affiliate of the Manager. He is 60 years old and has been an employee of the Manager since November 2006. Prior to joining the Manager, Mr. Maisano served as Chairman and Chief Executive Officer of EACM Advisors, an affiliate of the Manager, since August 2004, and served as Chief Executive Officer of Evaluation Associates, a leading institutional investment consulting firm, from 1988 until 2004.
| MICHAEL A. ROSENBERG, Vice President |
| and Secretary since August 2005. |
Associate General Counsel of the Manager, and an officer of 83 investment companies (comprised of 182 portfolios) managed by the Manager. He is 47 years old and has been an employee of the Manager since October 1991.
| JAMES BITETTO, Vice President and |
| Assistant Secretary since August 2005. |
Associate General Counsel and Secretary of the Manager, and an officer of 83 investment companies (comprised of 182 portfolios) managed by the Manager. He is 41 years old and has been an employee of the Manager since December 1996.
| JONI LACKS CHARATAN, Vice President |
| and Assistant Secretary since |
| August 2005. |
Associate General Counsel of the Manager, and an officer of 83 investment companies (comprised of 182 portfolios) managed by the Manager. She is 51 years old and has been an employee of the Manager since October 1988.
| JOSEPH M. CHIOFFI, Vice President and |
| Assistant Secretary since August 2005. |
Associate General Counsel of the Manager, and an officer of 83 investment companies (comprised of 182 portfolios) managed by the Manager. He is 45 years old and has been an employee of the Manager since June 2000.
| JANETTE E. FARRAGHER, Vice President |
| and Assistant Secretary since |
| August 2005. |
Associate General Counsel of the Manager, and an officer of 83 investment companies (comprised of 182 portfolios) managed by the Manager. She is 44 years old and has been an employee of the Manager since February 1984.
| JOHN B. HAMMALIAN, Vice President and |
| Assistant Secretary since August 2005. |
Associate General Counsel of the Manager, and an officer of 83 investment companies (comprised of 182 portfolios) managed by the Manager. He is 44 years old and has been an employee of the Manager since February 1991.
| ROBERT R. MULLERY, Vice President and |
| Assistant Secretary since August 2005. |
Associate General Counsel of the Manager, and an officer of 83 investment companies (comprised of 182 portfolios) managed by the Manager. He is 55 years old and has been an employee of the Manager since May 1986.
The Fund 35
OFFICERS OF THE FUND (Unaudited) (continued)
| JEFF PRUSNOFSKY, Vice President and |
| Assistant Secretary since August 2005. |
Associate General Counsel of the Manager, and an officer of 83 investment companies (comprised of 182 portfolios) managed by the Manager. He is 42 years old and has been an employee of the Manager since October 1990.
| JAMES WINDELS, Treasurer since |
| November 2001. |
Director – Mutual Fund Accounting of the Manager, and an officer of 83 investment companies (comprised of 182 portfolios) managed by the Manager. He is 49 years old and has been an employee of the Manager since April 1985.
| ROBERT ROBOL, Assistant Treasurer |
| since August 2005. |
Senior Accounting Manager – Money Market and Municipal Bond Funds of the Manager, and an officer of 83 investment companies (comprised of 182 portfolios) managed by the Manager. He is 43 years old and has been an employee of the Manager since October 1988.
ROBERT SALVIOLO, Assistant Treasurer since May 2007.
Senior Accounting Manager – Equity Funds of the Manager, and an officer of 83 investment companies (comprised of 182 portfolios) managed by the Manager. He is 40 years old and has been an employee of the Manager since June 1989.
| ROBERT SVAGNA, Assistant Treasurer |
| since December 2002. |
Senior Accounting Manager – Equity Funds of the Manager, and an officer of 83 investment companies (comprised of 182 portfolios) managed by the Manager. He is 40 years old and has been an employee of the Manager since November 1990.
| GAVIN C. REILLY, Assistant Treasurer |
| since December 2005. |
Tax Manager of the Investment Accounting and Support Department of the Manager, and an officer of 83 investment companies (comprised of 182 portfolios) managed by the Manager. He is 39 years old and has been an employee of the Manager since April 1991.
| JOSEPH W. CONNOLLY, Chief Compliance |
| Officer since October 2004. |
Chief Compliance Officer of the Manager and The Dreyfus Family of Funds (83 investment companies, comprised of 182 portfolios). From November 2001 through March 2004, Mr. Connolly was first Vice-President, Mutual Fund Servicing for Mellon Global Securities Services. In that capacity, Mr. Connolly was responsible for managing Mellon’s Custody, Fund Accounting and Fund Administration services to third-party mutual fund clients. He is 50 years old and has served in various capacities with the Manager since 1980, including manager of the firm’s Fund Accounting Department from 1997 through October 2001.
| WILLIAM GERMENIS, Anti-Money |
| Laundering Compliance Officer since |
| September 2002. |
Vice President and Anti-Money Laundering Compliance Officer of the Distributor, and the Anti-Money Laundering Compliance Officer of 79 investment companies (comprised of 178 portfolios) managed by the Manager. He is 37 years old and has been an employee of the Distributor since October 1998.
36
For More Information
Telephone Call your financial representative or 1-800-554-4611
| Mail | | The Dreyfus Premier Family of Funds |
| | | 144 Glenn Curtiss Boulevard, Uniondale, NY 11556-0144 |
The fund files its complete schedule of portfolio holdings with the Securities and Exchange Commission (“SEC”) for the first and third quarters of each fiscal year on Form N-Q. The fund’s Forms N-Q are available on the SEC’s website at http://www.sec.gov and may be reviewed and copied at the SEC’s Public Reference Room in Washington, DC. Information on the operation of the Public Reference Room may be obtained by calling 1-202-551-8090.
A description of the policies and procedures that the fund uses to determine how to vote proxies relating to portfolio securities, and information regarding how the fund voted these proxies for the 12-month period ended June 30, 2007, is available at http://www.dreyfus.com and on the SEC’s website at http://www.sec.gov. The description of the policies and procedures is also available without charge, upon request, by calling 1-800-645-6561.

© 2007 MBSC Securities Corporation
Item 2. Code of Ethics.
The Registrant has adopted a code of ethics that applies to the Registrant's principal executive officer, principal financial officer, principal accounting officer or controller, or persons performing similar functions. There have been no amendments to, or waivers in connection with, the Code of Ethics during the period covered by this Report.
Item 3. Audit Committee Financial Expert.
The Registrant's Board has determined that Joseph S. DiMartino, a member of the Audit Committee of the Board, is an audit committee financial expert as defined by the Securities and Exchange Commission (the "SEC"). Joseph S. DiMartino is "independent" as defined by the SEC for purposes of audit committee financial expert determinations.
Item 4. Principal Accountant Fees and Services
(a) Audit Fees. The aggregate fees billed for each of the last two fiscal years (the "Reporting Periods") for professional services rendered by the Registrant's principal accountant (the "Auditor") for the audit of the Registrant's annual financial statements, or services that are normally provided by the Auditor in connection with the statutory and regulatory filings or engagements for the Reporting Periods, were $0 in 2006 and $39,462 in 2007.
(b) Audit-Related Fees. The aggregate fees billed in the Reporting Periods for assurance and related services by the Auditor that are reasonably related to the performance of the audit of the Registrant's financial statements and are not reported under paragraph (a) of this Item 4 were $0 in 2006 and $0 in 2007.
The aggregate fees billed in the Reporting Periods for non-audit assurance and related services by the Auditor to the Registrant's investment adviser (not including any sub-investment adviser whose role is primarily portfolio management and is subcontracted with or overseen by another investment adviser), and any entity controlling, controlled by or under common control with the investment adviser that provides ongoing services to the Registrant ("Service Affiliates"), that were reasonably related to the performance of the annual audit of the Service Affiliate, which required pre-approval by the Audit Committee were $0 in 2006 and $0 in 2007.
Note: For the second paragraph in each of (b) through (d) of this Item 4, certain of such services were not pre-approved prior to May 6, 2003, when such services were required to be pre-approved. On and after May 6, 2003, 100% of all services provided by the Auditor were pre-approved as required. For comparative purposes, the fees shown assume that all such services were pre-approved, including services that were not pre-approved prior to the compliance date of the pre-approval requirement.
(c) Tax Fees. The aggregate fees billed in the Reporting Periods for professional services rendered by the Auditor for tax compliance, tax advice and tax planning ("Tax Services") were $0 in 2006 and $2,983 in 2007. These services consisted of (i) review or preparation of U.S. federal, state, local and excise tax returns; (ii) U.S. federal, state and local tax planning, advice and assistance regarding statutory, regulatory or administrative developments, (iii) tax advice regarding tax qualification matters and/or treatment of various
financial instruments held or proposed to be acquired or held, and (iv) determination of Passive Foreign Investment Companies.
The aggregate fees billed in the Reporting Periods for Tax Services by the Auditor to Service Affiliates which required pre-approval by the Audit Committee were $0 in 2006 and $0 in 2007.
(d) All Other Fees. The aggregate fees billed in the Reporting Periods for products and services provided by the Auditor, other than the services reported in paragraphs (a) through (c) of this Item, were $0 in 2006 and $0 in 2007.
The aggregate fees billed in the Reporting Periods for Non-Audit Services by the Auditor to Service Affiliates, other than the services reported in paragraphs (b) through (c) of this Item, which required pre-approval by the Audit Committee were $0 in 2006 and $0 in 2006.
Audit Committee Pre-Approval Policies and Procedures. The Registrant's Audit Committee has established policies and procedures (the "Policy") for pre-approval (within specified fee limits) of the Auditor's engagements for non-audit services to the Registrant and Service Affiliates without specific case-by-case consideration. Pre-approval considerations include whether the proposed services are compatible with maintaining the Auditor's independence. Pre-approvals pursuant to the Policy are considered annually.
Non-Audit Fees. The aggregate non-audit fees billed by the Auditor for services rendered to the Registrant, and rendered to Service Affiliates, for the Reporting Periods were $0 in 2006 and $1,627,514 in 2007.
Auditor Independence. The Registrant's Audit Committee has considered whether the provision of non-audit services that were rendered to Service Affiliates which were not pre-approved (not requiring pre-approval) is compatible with maintaining the Auditor's independence.
| Item 5. | | Audit Committee of Listed Registrants. |
| | | Not applicable. |
| Item 6. | | Schedule of Investments. |
| | | Not applicable. |
| Item 7. | | Disclosure of Proxy Voting Policies and Procedures for Closed-End Management |
| | | Investment Companies. |
| | | Not applicable. |
| Item 8. | | Portfolio Managers of Closed-End Management Investment Companies. |
| | | Not applicable. |
| Item 9. | | Purchases of Equity Securities by Closed-End Management Investment Companies and |
| | | Affiliated Purchasers. |
| | | Not applicable. |
Item 10. Submission of Matters to a Vote of Security Holders.
The Registrant has a Nominating Committee (the "Committee"), which is responsible for selecting and nominating persons for election or appointment by the Registrant's Board as Board members. The Committee has adopted a Nominating Committee Charter (the "Charter"). Pursuant to the Charter, the Committee will consider recommendations for nominees from shareholders submitted to the Secretary of the Registrant, c/o The Dreyfus Corporation Legal Department, 200 Park Avenue, 8th Floor East, New York, New York 10166. A nomination submission must include information regarding the recommended nominee as specified in the Charter. This information includes all information relating to a recommended nominee that is required to be disclosed in solicitations or proxy statements for the election of Board members, as well as information sufficient to evaluate the factors to be considered by the Committee, including character and integrity, business and professional experience, and whether the person has the ability to apply sound and independent business judgment and would act in the interests of the Registrant and its shareholders.
Nomination submissions are required to be accompanied by a written consent of the individual to stand for election if nominated by the Board and to serve if elected by the shareholders, and such additional information must be provided regarding the recommended nominee as reasonably requested by the Committee.
Item 11. Controls and Procedures.
(a) The Registrant's principal executive and principal financial officers have concluded, based on their evaluation of the Registrant's disclosure controls and procedures as of a date within 90 days of the filing date of this report, that the Registrant's disclosure controls and procedures are reasonably designed to ensure that information required to be disclosed by the Registrant on Form N-CSR is recorded, processed, summarized and reported within the required time periods and that information required to be disclosed by the Registrant in the reports that it files or submits on Form N-CSR is accumulated and communicated to the Registrant's management, including its principal executive and principal financial officers, as appropriate to allow timely decisions regarding required disclosure.
(b) There were no changes to the Registrant's internal control over financial reporting that occurred during the second fiscal quarter of the period covered by this report that have materially affected, or are reasonably likely to materially affect, the Registrant's internal control over financial reporting.
Item 12. Exhibits.
| (a)(1) | | Code of ethics referred to in Item 2. |
| (a)(2) | | Certifications of principal executive and principal financial officers as required by Rule 30a-2(a) |
| under the Investment Company Act of 1940. |
| (a)(3) | | Not applicable. |
| (b) | | Certification of principal executive and principal financial officers as required by Rule 30a-2(b) |
| under the Investment Company Act of 1940. |
SIGNATURES
Pursuant to the requirements of the Securities Exchange Act of 1934 and the Investment Company Act of 1940, the Registrant has duly caused this Report to be signed on its behalf by the undersigned, thereunto duly authorized.
| Strategic Funds, Inc. |
| |
| By: | | /s/ J. David Officer |
| | | J. David Officer |
| | | President |
| |
| Date: | | December 18, 2007 |
Pursuant to the requirements of the Securities Exchange Act of 1934 and the Investment Company Act of 1940, this Report has been signed below by the following persons on behalf of the Registrant and in the capacities and on the dates indicated.
| By: | | /s/ J. David Officer |
| | | J. David Officer |
| | | President |
| |
| Date: | | December 18, 2007 |
| |
| By: | | /s/ James Windels |
| | | James Windels |
| | | Treasurer |
| |
| Date: | | December 18, 2007 |
EXHIBIT INDEX
| (a)(1) | | Code of ethics referred to in Item 2. |
| |
| (a)(2) | | Certifications of principal executive and principal financial officers as required by Rule 30a- |
| 2(a) under the Investment Company Act of 1940. (EX-99.CERT) |
| |
| (b) | | Certification of principal executive and principal financial officers as required by Rule 30a- |
| 2(b) under the Investment Company Act of 1940. (EX-99.906CERT) |