| UNITED STATES |
| SECURITIES AND EXCHANGE COMMISSION |
| Washington, D.C. 20549 |
FORM N-CSR
| CERTIFIED SHAREHOLDER REPORT OF REGISTERED MANAGEMENT |
| INVESTMENT COMPANIES |
| Investment Company Act file number | | 811- 3940 |
| Strategic Funds, Inc. |
| (Exact name of Registrant as specified in charter) |
| c/o The Dreyfus Corporation |
| 200 Park Avenue |
| New York, New York 10166 |
| (Address of principal executive offices) | | (Zip code) |
| Michael A. Rosenberg, Esq. |
| 200 Park Avenue |
| New York, New York 10166 |
| (Name and address of agent for service) |
| Registrant's telephone number, including area code: | | (212) 922-6000 |
| Date of fiscal year end: | | 11/30 |
| Date of reporting period: | | 11/30/07 |
The following N-CSR relates only to the Registrant’s series listed below and does not affect the other series of the Registrant, which have different fiscal year ends and, therefore, different N-CSR reporting requirements. Separate N-CSR Forms will be filed for these series, as appropriate.
| Global Stock Fund |
| International Stock Fund |
FORM N-CSR
| Item 1. | | Reports to Stockholders. |
Global Stock Fund
ANNUAL REPORT November 30, 2007

Save time. Save paper. View your next shareholder report online as soon as it’s available. Log into www.dreyfus.com and sign up for Dreyfus eCommunications. It’s simple and only takes a few minutes.
The views expressed in this report reflect those of the portfolio manager only through the end of the period covered and do not necessarily represent the views of Dreyfus or any other person in the Dreyfus organization. Any such views are subject to change at any time based upon market or other conditions and Dreyfus disclaims any responsibility to update such views.These views may not be relied on as investment advice and, because investment decisions for a Dreyfus fund are based on numerous factors, may not be relied on as an indication of trading intent on behalf of any Dreyfus fund.
Not FDIC-Insured • Not Bank-Guaranteed • May Lose Value
| Contents |
| |
| | | THE FUND |
| |
|
| 2 | | A Letter from the CEO |
| 3 | | Discussion of Fund Performance |
| 6 | | Fund Performance |
| 8 | | Understanding Your Fund’s Expenses |
| 8 | | Comparing Your Fund’s Expenses |
| With Those of Other Funds |
| 9 | | Statement of Investments |
| 12 | | Statement of Assets and Liabilities |
| 13 | | Statement of Operations |
| 14 | | Statement of Changes in Net Assets |
| 16 | | Financial Highlights |
| 17 | | Notes to Financial Statements |
| 25 | | Report of Independent Registered |
| | | Public Accounting Firm |
| 26 | | Important Tax Information |
| 27 | | Board Members Information |
| 30 | | Officers of the Fund |
| FOR MORE INFORMATION |
|
| | | Back Cover |
The Fund

We are pleased to present this report for Global Stock Fund, covering the period from the fund’s inception on December 29, 2006, through the end of the annual reporting period on November 30, 2007.
After an extended period of steady gains, turmoil in U.S. credit markets over the summer of 2007 led to bouts of heightened volatility in many international equity markets. Nonetheless, fundamentals in the global economy have remained relatively robust, and recent shifts in monetary policy from several major central banks helped spark market rebounds in many regions of the world.
While we expect the global expansion to continue, it seems reasonable to expect to see some moderation as U.S. consumer spending wanes and some high-flying emerging markets, notably China, continue to take steps to reduce unsustainably high growth rates.With regard to the currency markets, we have seen weakness in the U.S. dollar for most of the reporting period, making investments denominated in foreign currencies more valuable for U.S. residents. Lastly, a stubborn U.S. trade deficit and stronger economic growth in overseas markets continue to attract global capital away from U.S. markets and toward those with higher potential returns.As always, we encourage you to discuss these trends and opportunities with your financial advisor, who can help you consider if any portfolio adjustments might be right for your investment needs.
For information about how the fund performed during the reporting period, as well as market perspectives, we have provided a Discussion of Fund Performance given by the fund’s Portfolio Managers.
Thank you for your continued confidence and support.
Thomas F. Eggers
Chief Executive Officer
The Dreyfus Corporation
December 17, 2007
|

DISCUSSION OF FUND PERFORMANCE
For the period between the fund’s inception on December 29, 2006, and November 30, 2007, as provided by Walter Scott & Partners Limited (WSPL), Sub-adviser
Fund and Market Performance Overview
Stocks throughout the world fared relatively well over the reporting period, as robust global economic growth generally offset the adverse effects of credit concerns stemming from turmoil in the sub-prime mortgage sector of the U.S. bond market.The fund produced slightly lower returns than its benchmark, primarily due to less-than-full participation in a market rally just after the fund’s inception, when it was putting new investment capital to work.
For the period between the fund’s inception on December 29, 2006, and the end of its annual reporting period on November 30, 2007, Global Stock Fund produced returns of 9.92% for its Class A shares, 9.12% for Class C shares, 10.08% for Class I shares and 9.68% for Class T shares.1 In comparison, the fund’s benchmark index, the Morgan Stanley Capital International World Index (the “MSCI World Index”), produced a 10.46% return over the same period.2
The Fund’s Investment Approach
|
The fund seeks long-term total return by normally investing at least 80% of its assets in stocks of companies with any market capitalization that are located in the world’s developed markets. When selecting stocks, WSPL seeks companies with fundamental strengths that indicate the potential for sustainable growth. The firm focuses on individual stock selection through extensive fundamental research. WSPL first selects candidates for investment that meet certain broad absolute and trend criteria. Financial statements are restated in an effort to identify the nature of their operating margins and to understand the variables that add value to their businesses. Companies meeting the financial criteria are subjected to a detailed investigation of their products, costs and pricing, competition, industry position and outlook. Stocks are then selected whose expected growth rate is available at a reasonable valuation.
The Fund 3
DISCUSSION OF FUND PERFORMANCE (continued)
|
Global Equities Advanced Despite Bouts of Volatility
Global stock markets posted generally strong returns during the first half of the reporting period,with gains fueled by corporate restructurings and robust mergers-and-acquisitions activity throughout much of Europe, as well as robust global demand for energy and industrial commodities, particularly from emerging markets such as China and India. U.S. stocks also advanced, but at a slower pace due to a slowing domestic economy and a faltering housing market. Japan proved to be the laggard early in the reporting period, as the country continued to struggle with economic issues despite efforts to reform its financial systems.
Market conditions changed for the worse over the reporting period’s second half, largely due to difficulties in the U.S. subprime mortgage sector and the subsequent repricing of risk in other financial markets.As credit concerns spread throughout the world’s equity and fixed-income markets, a number of highly leveraged institutional investors were compelled to sell their more liquid and creditworthy holdings to meet redemption requests and margin calls.As a result, even asset classes with no exposure to troubled sub-prime lending experienced downward pressure.
The U.S. Federal Reserve Board intervened in mid-August by implementing the first in a series of interest-rate reductions, which were designed to calm the markets and promote greater liquidity. Other central banks also adopted measures to inject liquidity into their financial systems. Consequently, global investors soon regained their footing, and stocks in most markets began to rebound.The financials sector proved to be a notable exception to the market recovery. Several large, global banks and brokerage firms announced substantial write-downs of sub-prime related assets, leading to sharp declines in their stock prices.
Relatively Light Financial Holdings Bolstered the Fund’s Performance
The fund’s performance was influenced primarily by macroeconomic and market developments during the reporting period. Indeed, after lagging in the midst of a market rally early in 2007 as we put cash to
work, the fund’s returns over the remainder of the reporting period generally remained in line with its benchmark.
In addition, the fund benefited from its relatively light exposure to financials stocks, many of which did not meet our investment criteria. Conversely, an overweighted position in Hong Kong, where a number of holdings benefited from rapid growth in mainland China, contributed positively to the fund’s relative performance. The fund’s energy holdings advanced on the strength of rising commodity prices.
Positioning the Fund for a Changing Market Environment
Although we have remained optimistic regarding the long-term prospects of global equity markets, we recently have adopted a more cautious investment posture due to signs of deteriorating economic conditions in the United States and Europe.Accordingly, we have intensified our focus on companies that, in our judgment, may be able to maintain their valuations in the event of a more severe downturn. Employing our bottom-up security selection process, we have favored cash-rich companies with sound balance sheets and a track record of relatively modest price volatility over full market cycles.We believe that this is a prudent strategy until the outlook for the global economy becomes clearer.
| 1 | | Total return includes reinvestment of dividends and any capital gains paid, and does not take into |
| | | consideration the maximum initial sales charges in the case of Class A and Class T shares, or the |
| | | applicable contingent deferred sales charge imposed on redemptions in the case of Class C shares. |
| | | Had these charges been reflected, returns would have been lower. Past performance is no guarantee |
| | | of future results. Share price and investment return fluctuate such that upon redemption, fund |
| | | shares may be worth more or less than their original cost. Return figures provided reflect the |
| | | absorption of certain fund expenses by The Dreyfus Corporation in effect through May 31, 2008, |
| | | at which time it may be extended, terminated or modified. Had these expenses not been absorbed, |
| | | the fund’s returns would have been lower. |
| 2 | | SOURCE: Morgan Stanley Capital International — Reflects reinvestment of net dividends |
| | | and, where applicable, capital gain distributions.The Morgan Stanley Capital International |
| | | (MSCI) World Index is an unmanaged index of global stock market performance, including the |
| | | United States, Canada, Europe,Australia, New Zealand and the Far East. |

† Source: Lipper Inc.
Past performance is not predictive of future performance.
The above graph compares a $10,000 investment made in Class A, Class C, Class I and Class T shares of Global Stock Fund on 12/29/06 (inception date) to a $10,000 investment made in the Morgan Stanley Capital International World Index (the “Index”) on that date. For comparative purposes, the value of the Index on 12/31/06 is used as the beginning value on 12/29/06.All dividends and capital gain distributions are reinvested.
The fund’s performance shown in the line graph takes into account the maximum initial sales charge on Class A shares and Class T shares, the applicable contingent deferred sales charge on Class C shares and all other applicable fees and expenses on all classes.The Index is an unmanaged index of global stock market performance, including the United States, Canada,Australia, New Zealand and the Far East and includes net dividends reinvested. Unlike a mutual fund, the Index is not subject to charges, fees and other expenses. Investors cannot invest directly in any index. Further information relating to fund performance, including expense reimbursements, if applicable, is contained in the Financial Highlights section of the prospectus and elsewhere in this report.
| Actual Aggregate Total Returns as of 11/30/07 | | |
| |
| | | Inception | | From |
| | | Date | | Inception |
| |
| |
|
| Class A shares | | | | |
| with maximum sales charge (5.75%) | | 12/29/06 | | 3.62% |
| without sales charge | | 12/29/06 | | 9.92% |
| Class C shares | | | | |
| with applicable redemption charge † | | 12/29/06 | | 8.12% |
| without redemption | | 12/29/06 | | 9.12% |
| Class I shares | | 12/29/06 | | 10.08% |
| Class T shares | | | | |
| with applicable sales charge (4.5%) | | 12/29/06 | | 4.74% |
| without sales charge | | 12/29/06 | | 9.68% |
Past performance is not predictive of future performance.The fund’s performance shown in the graph and table does not reflect the deduction of taxes that a shareholder would pay on fund distributions or the redemption of fund shares.
† The maximum contingent deferred sales charge for Class C shares is 1% for shares redeemed within one year of the date of purchase.
The Fund 7
UNDERSTANDING YOUR FUND’S EXPENSES (Unaudited)
As a mutual fund investor, you pay ongoing expenses, such as management fees and other expenses. Using the information below, you can estimate how these expenses affect your investment and compare them with the expenses of other funds.You also may pay one-time transaction expenses, including sales charges (loads) and redemption fees, which are not shown in this section and would have resulted in higher total expenses. For more information, see your fund’s prospectus or talk to your financial adviser.
Review your fund’s expenses
The table below shows the expenses you would have paid on a $1,000 investment in Global Stock Fund from June 1, 2007 to November 30, 2007. It also shows how much a $1,000 investment would be worth at the close of the period, assuming actual returns and expenses.
| Expenses and Value of a $1,000 Investment | | | | | | |
| assuming actual returns for the six months ended November 30, 2007 | | |
| | | Class A | | Class C | | Class I | | Class T |
| |
| |
| |
| |
|
| Expenses paid per $1,000 † | | $ 7.68 | | $ 11.50 | | $ 6.41 | | $ 8.96 |
| Ending value (after expenses) | | $1,043.30 | | $1,039.60 | | $1,044.00 | | $1,042.60 |
| | COMPARING YOUR FUND’S EXPENSES
WITH THOSE OF OTHER FUNDS (Unaudited)
|
Using the SEC’s method to compare expenses
The Securities and Exchange Commission (SEC) has established guidelines to help investors assess fund expenses. Per these guidelines, the table below shows your fund’s expenses based on a $1,000 investment, assuming a hypothetical 5% annualized return. You can use this information to compare the ongoing expenses (but not transaction expenses or total cost) of investing in the fund with those of other funds.All mutual fund shareholder reports will provide this information to help you make this comparison. Please note that you cannot use this information to estimate your actual ending account balance and expenses paid during the period.
Expenses and Value of a $1,000 Investment assuming a hypothetical 5% annualized return for the six months ended November 30, 2007
| | | Class A | | Class C | | Class I | | Class T |
| |
| |
| |
| |
|
| Expenses paid per $1,000 † | | $ 7.59 | | $ 11.36 | | $ 6.33 | | $ 8.85 |
| Ending value (after expenses) | | $1,017.55 | | $1,013.79 | | $1,018.80 | | $1,016.29 |
† Expenses are equal to the fund’s annualized expense ratio of 1.50% for Class A, 2.25% for Class C, 1.25% for Class I and 1.75% for Class T, multiplied by the average account value over the period, multiplied by 183/365 (to reflect the one-half year period).
STATEMENT OF INVESTMENTS
November 30, 2007
|
| Common Stocks—98.8% | | Shares | | Value ($) |
| |
| |
|
| Australia—2.2% | | | | |
| Woodside Petroleum | | 12,431 | | 531,410 |
| Bermuda—1.3% | | | | |
| Nabors Industries | | 11,600 a | | 312,040 |
| Canada—2.0% | | | | |
| Suncor Energy | | 5,200 | | 496,824 |
| France—5.6% | | | | |
| Cie Generale d’Optique | | | | |
| Essilor International | | 5,500 | | 344,796 |
| L’Oreal | | 3,900 | | 541,901 |
| LVMH Moet Hennessy Louis Vuitton | | 4,100 | | 497,737 |
| | | | | 1,384,434 |
| Hong Kong—9.7% | | | | |
| China Mobile | | 18,000 | | 324,566 |
| CLP Holdings | | 53,000 | | 359,056 |
| CNOOC | | 345,000 | | 636,263 |
| Hong Kong & China Gas | | 178,500 | | 527,266 |
| Hutchison Whampoa | | 46,000 | | 544,693 |
| | | | | 2,391,844 |
| Japan—33.4% | | | | |
| Advantest | | 9,000 | | 255,440 |
| AEON Mall | | 18,500 | | 488,399 |
| Astellas Pharma | | 9,800 | | 436,203 |
| Canon | | 9,000 | | 471,145 |
| Daikin Industries | | 9,600 | | 492,175 |
| Daito Trust Construction | | 6,400 | | 306,780 |
| Denso | | 9,600 | | 391,837 |
| Eisai | | 9,700 | | 428,256 |
| Fanuc | | 4,600 | | 478,713 |
| Honda Motor | | 10,100 | | 342,172 |
| HOYA | | 12,800 | | 445,177 |
| Keyence | | 1,900 | | 440,997 |
| Millea Holdings | | 12,000 | | 420,597 |
| Mitsubishi Estate | | 14,000 | | 374,645 |
| Mitsubishi UFJ Financial Group | | 38,000 | | 372,861 |
| Murata Manufacturing | | 5,600 | | 326,459 |
| Nitto Denko | | 5,800 | | 299,969 |
The Fund 9
| | STATEMENT OF INVESTMENTS (continued)
|
| Common Stocks (continued) | | Shares | | Value ($) |
| |
| |
|
| Japan (continued) | | | | |
| Secom | | 9,300 | | 516,178 |
| Shimamura | | 1,700 | | 173,699 |
| Shin-Etsu Chemical | | 5,600 | | 331,504 |
| Takeda Pharmaceutical | | 6,000 | | 383,836 |
| | | | | 8,177,042 |
| Singapore—2.0% | | | | |
| DBS Group Holdings | | 35,000 | | 485,642 |
| Spain—1.1% | | | | |
| Inditex | | 4,000 | | 278,806 |
| Sweden—2.1% | | | | |
| Hennes & Mauritz, Cl. B | | 3,453 | | 215,725 |
| Telefonaktiebolaget LM Ericsson, Cl. B | | 119,000 | | 290,671 |
| | | | | 506,396 |
| Switzerland—2.0% | | | | |
| Nestle | | 1,020 | | 489,535 |
| United Kingdom—10.5% | | | | |
| BG Group | | 29,500 | | 617,161 |
| GlaxoSmithKline | | 19,500 | | 515,621 |
| Kingfisher | | 55,000 | | 172,313 |
| Reckitt Benckiser Group | | 6,300 | | 375,929 |
| Rio Tinto | | 4,500 | | 524,049 |
| William Morrison Supermarkets | | 60,000 | | 378,686 |
| | | | | 2,583,759 |
| United States—26.9% | | | | |
| Abbott Laboratories | | 8,800 | | 506,088 |
| Anadarko Petroleum | | 6,400 | | 362,240 |
| Automatic Data Processing | | 7,600 | | 342,456 |
| C.R. Bard | | 2,500 | | 211,325 |
| Cisco Systems | | 10,500 a | | 294,210 |
| EOG Resources | | 4,600 | | 380,788 |
| Genentech | | 6,300 a | | 480,375 |
| Home Depot | | 8,000 | | 228,480 |
| Intel | | 14,000 | | 365,120 |
| Johnson & Johnson | | 5,600 | | 379,344 |
| Linear Technology | | 9,400 | | 286,324 |
| Medtronic | | 7,800 | | 396,630 |
10
| Common Stocks (continued) | | Shares | | Value ($) |
| |
| |
|
| United States (continued) | | | | |
| Microsoft | | | | 12,200 | | 409,920 |
| Patterson Cos. | | | | 6,800 a | | 218,824 |
| Schlumberger | | | | 4,600 | | 429,870 |
| SYSCO | | | | 10,000 | | 325,100 |
| Wal-Mart Stores | | | | 10,500 | | 502,950 |
| Walgreen | | | | 13,000 | | 475,670 |
| | | | | | | | | 6,595,714 |
| Total Common Stocks | | | | | | |
| (cost $22,668,492) | | | | | | 24,233,446 |
| |
| |
| |
|
| |
| Other Investment—6.2% | | | | |
| |
| |
|
| Registered Investment Company; | | | | |
| Dreyfus Institutional Preferred Plus Money Market Fund | | |
| (cost $1,525,000) | | | | 1,525,000 b | | 1,525,000 |
| |
| |
| |
|
| |
| Total Investments (cost $24,193,492) | | 105.0% | | 25,758,446 |
| Liabilities, Less Cash and Receivables | | (5.0%) | | (1,215,405) |
| Net Assets | | | | 100.0% | | 24,543,041 |
| |
| a | | Non-income producing security. | | | | |
| b | | Investment in affiliated money market mutual fund. | | | | |
| |
| |
| |
|
| |
| |
| |
| Portfolio Summary | | (Unaudited) † | | | | |
| | | | | Value (%) | | | | Value (%) |
| |
| |
| |
| |
|
| Health Care | | 17.6 | | Energy | | 12.3 |
| Consumer Services | | 15.4 | | Financial Services | | 6.7 |
| Consumer Goods | | 13.9 | | Energy Services | | 6.6 |
| Technology | | 13.6 | | Money Market Investment | | 6.2 |
| Industrials | | 12.7 | | | | 105.0 |
| |
| † | | Based on net assets. | | | | | | |
| See notes to financial statements. | | | | |
The Fund 11
STATEMENT OF ASSETS AND LIABILITIES
November 30, 2007
| | | | | | | Cost | | Value |
| |
| |
| |
| |
|
| Assets ($): | | | | | | | | |
| Investments in securities—See Statement of Investments: | | | | |
| Unaffiliated issuers | | | | | | 22,668,492 | | 24,233,446 |
| Affiliated issuers | | | | | | 1,525,000 | | 1,525,000 |
| Cash | | | | | | | | 45,198 |
| Cash denominated in foreign currencies | | | | 13,605 | | 13,484 |
| Dividends and interest receivable | | | | | | | | 43,704 |
| Receivable for shares of Common Stock subscribed | | | | 4,277 |
| Prepaid expenses | | | | | | | | 20,135 |
| | | | | | | | | 25,885,244 |
| |
| |
| |
| |
|
| Liabilities ($): | | | | | | | | |
| Due to The Dreyfus Corporation and affiliates—Note 3(c) | | | | 34,570 |
| Payable for shares of Common Stock redeemed | | | | | | 1,264,718 |
| Accrued expenses | | | | | | | | 42,915 |
| | | | | | | | | 1,342,203 |
| |
| |
| |
| |
|
| Net Assets ($) | | | | | | | | 24,543,041 |
| |
| |
| |
| |
|
| Composition of Net Assets ($): | | | | | | | | |
| Paid-in capital | | | | | | | | 22,762,682 |
| Accumulated undistributed investment income—net | | | | 59,654 |
| Accumulated net realized gain (loss) on investments | | | | 155,151 |
| Accumulated net unrealized appreciation (depreciation) | | | | |
| on investments and foreign currency transactions | | | | 1,565,554 |
| |
| |
|
| Net Assets ($) | | | | | | | | 24,543,041 |
| |
| |
| |
| |
|
| |
| |
| Net Asset Value Per Share | | | | | | | | |
| | | Class A | | Class C | | Class I | | Class T |
| |
| |
| |
| |
|
| Net Assets ($) | | 5,131,918 | | 925,178 | | 18,311,641 | | 174,304 |
| Shares Outstanding | | 373,648 | | 67,829 | | 1,330,391 | | 12,720 |
| |
| |
| |
| |
|
| Net Asset Value Per Share ($) | | 13.73 | | 13.64 | | 13.76 | | 13.70 |
See notes to financial statements.
|
STATEMENT OF OPERATIONS
From December 29, 2006
(commencement of operations) to November 30, 2007
|
| Investment Income ($): | | |
| Income: | | |
| Cash dividends (net of $12,590 foreign taxes withheld at source): | | |
| Unaffiliated issuers | | 238,677 |
| Affiliated issuers | | 26,578 |
| Total Income | | 265,255 |
| Expenses: | | |
| Management fee—Note 3(a) | | 128,473 |
| Registration fees | | 63,387 |
| Custodian fees—Note 3(c) | | 38,305 |
| Auditing fees | | 33,533 |
| Legal fees | | 32,380 |
| Shareholder servicing costs—Note 3(c) | | 18,013 |
| Distribution fees—Note 3(b) | | 6,732 |
| Prospectus and shareholders’ reports | | 5,224 |
| Directors’ fees and expenses—Note 3(d) | | 2,017 |
| Loan commitment fees—Note 2 | | 64 |
| Miscellaneous | | 10,695 |
| Total Expenses | | 338,823 |
| Less—reduction in management fee | | |
| due to undertaking—Note 3(a) | | (127,534) |
| Less—reduction in custody fees | | |
| due to earnings credits—Note 1(c) | | (9,241) |
| Net Expenses | | 202,048 |
| Investment Income—Net | | 63,207 |
| |
|
| Realized and Unrealized Gain (Loss) on Investments—Note 4 ($): |
| Net realized gain (loss) on investments and foreign currency transactions | | 147,037 |
| Net realized gain (loss) on forward currency exchange contracts | | 4,561 |
| Net Realized Gain (Loss) | | 151,598 |
| Net unrealized appreciation (depreciation) on investments | | |
| and foreign currency transactions | | 1,565,554 |
| Net Realized and Unrealized Gain (Loss) on Investments | | 1,717,152 |
| Net Increase in Net Assets Resulting from Operations | | 1,780,359 |
See notes to financial statements.
|
The Fund 13
| STATEMENT OF CHANGES IN NET ASSETS |
| From December 29, 2006 |
| (commencement of operations) to November 30, 2007 a |
| Operations ($): | | |
| Investment income—net | | 63,207 |
| Net realized gain (loss) on investments | | 151,598 |
| Net unrealized appreciation | | |
| (depreciation) on investments | | 1,565,554 |
| Net Increase (Decrease) in Net Assets | | |
| Resulting from Operations | | 1,780,359 |
| |
|
| Capital Stock Transactions ($): | | |
| Net proceeds from shares sold: | | |
| Class A shares | | 8,477,307 |
| Class C shares | | 1,229,372 |
| Class I shares | | 18,244,830 |
| Class T shares | | 500,000 |
| Cost of shares redeemed: | | |
| Class A shares | | (3,914,581) |
| Class C shares | | (388,773) |
| Class I shares | | (1,010,473) |
| Class T shares | | (375,000) |
| Increase (Decrease) in Net Assets | | |
| from Capital Stock Transactions | | 22,762,682 |
| Total Increase (Decrease) in Net Assets | | 24,543,041 |
| |
|
| Net Assets ($): | | |
| Beginning of Period | | — |
| End of Period | | 24,543,041 |
| Undistributed investment income—net | | 59,654 |
| Capital Share Transactions: | | |
| Class A | | |
| Shares sold | | 661,091 |
| Shares redeemed | | (287,443) |
| Net Increase (Decrease) in Shares Outstanding | | 373,648 |
| |
|
| Class C | | |
| Shares sold | | 96,321 |
| Shares redeemed | | (28,492) |
| Net Increase (Decrease) in Shares Outstanding | | 67,829 |
| |
|
| Class I | | |
| Shares sold | | 1,406,401 |
| Shares redeemed | | (76,010) |
| Net Increase (Decrease) in Shares Outstanding | | 1,330,391 |
| |
|
| Class T | | |
| Shares sold | | 40,000 |
| Shares redeemed | | (27,280) |
| Net Increase (Decrease) in Shares Outstanding | | 12,720 |
| |
| a Effective June 1, 2007, Class R shares were redesignated as Class I shares. |
| See notes to financial statements. | | |
The Fund 15
The following table describes the performance for each share class for the period from December 29, 2006 (commencement of operations) to November 30, 2007.All information (except portfolio turnover rate) reflects financial results for a single fund share. Total return shows how much your investment in the fund would have increased (or decreased) during the period, assuming you had reinvested all dividends and distributions.These figures have been derived from the fund’s financial statements.
| | | | | Class A | | Class C | | Class I a | | Class T |
| | | | | Shares | | Shares | | Shares | | Shares |
| |
| |
| |
| |
| |
|
| Per Share Data ($): | | | | | | | | |
| Net asset value, beginning of period | | 12.50 | | 12.50 | | 12.50 | | 12.50 |
| Investment Operations: | | | | | | | | |
| Investment income (loss)—net b | | .04 | | (.06) | | .07 | | .01 |
| Net realized and unrealized | | | | | | | | |
| gain (loss) on investments | | 1.19 | | 1.20 | | 1.19 | | 1.19 |
| Total from Investment Operations | | 1.23 | | 1.14 | | 1.26 | | 1.20 |
| Net asset value, end of period | | 13.73 | | 13.64 | | 13.76 | | 13.70 |
| |
| |
| |
| |
|
| Total Return (%) c | | 9.92d | | 9.12d | | 10.08 | | 9.68d |
| |
| |
| |
| |
|
| Ratios/Supplemental Data (%): | | | | | | | | |
| Ratio of total expenses | | | | | | | | |
| to average net assets e | | 2.40 | | 3.16 | | 2.05 | | 2.76 |
| Ratio of net expenses | | | | | | | | |
| to average net assets e | | 1.46 | | 2.20 | | 1.18 | | 1.73 |
| Ratio of net investment income | | | | | | | | |
| (loss) to average net assets e | | .29 | | (.46) | | .58 | | .09 |
| Portfolio Turnover Rate c | | 14.53 | | 14.53 | | 14.53 | | 14.53 |
| |
| |
| |
| |
|
| Net Assets, end of period ($ x 1,000) | | 5,132 | | 925 | | 18,312 | | 174 |
| |
| a | | Effective June 1, 2007, Class R shares were redesignated as Class I shares. | | | | |
| b | | Based on average shares outstanding at each month end. | | | | | | |
| c | | Not annualized. | | | | | | | | |
| d | | Exclusive of sales charge. | | | | | | | | |
| e | | Annualized. | | | | | | | | |
| See notes to financial statements. | | | | | | | | |
NOTES TO FINANCIAL STATEMENTS
NOTE 1—Significant Accounting Policies:
Global Stock Fund (the “fund”) is a separate diversified series of Strategic Funds, Inc. (the “Company”) which is registered under the Investment Company Act of 1940, as amended (the “Act”), as a diversified open-end management investment company and operates as a series company currently offering five series, including the fund, which commenced operations on December 29, 2006. The fund’s investment objective seeks long-term total return. The Dreyfus Corporation (the “Manager” or “Dreyfus”) serves as the fund’s investment adviser.Walter Scott & Partners Limited (“WSPL”) serves as the fund’s sub-investment adviser.
On July 1,2007,Mellon Financial Corporation (“Mellon Financial”) and The Bank of New York Company, Inc. merged, forming The Bank of New York Mellon Corporation (“BNY Mellon”). As part of this transaction, Dreyfus became a wholly-owned subsidiary of BNY Mellon.
The fund’s Board of Directors approved the redesignation of the fund’s Class R shares as Class I shares, effective June 1, 2007.The eligibility requirements for Class I shares remained the same as for Class R shares.
MBSC Securities Corporation (the “Distributor”), a wholly-owned subsidiary of Dreyfus, is the distributor of the fund’s shares.The fund is authorized to issue 100 million shares of $.001 par value Common Stock in each of the following classes of shares: Class A, Class C, Class I and Class T. Class A and Class T shares are subject to a sales charge imposed at the time of purchase. Class C shares are subject to a contingent deferred sales charge (“CDSC”) on Class C shares redeemed within one year of purchase. Class I shares are sold at net asset value per share only to institutional investors. Other differences between the classes include the services offered to and the expenses borne by each class, the allocation of certain transfer agency cost and certain voting rights. Income, expenses (other than expenses attributable to a specific class), and realized and unrealized gains or losses on investments are allocated to each class of shares based on its relative net assets.
The Fund 17
NOTES TO FINANCIAL STATEMENTS (continued)
|
As of November 30, 2007, MBC Investments Corp., an indirect subsidiary of BNY Mellon, held 89,457, 12,608 and 12,720 of the outstanding Class A, Class C and Class T shares of the fund, respectively.
The Company accounts separately for the assets, liabilities and operations of each series. Expenses directly attributable to each series are charged to that series’ operations; expenses which are applicable to all series are allocated among them on a pro rata basis.
The fund’s financial statements are prepared in accordance with U.S. generally accepted accounting principles, which may require the use of management estimates and assumptions. Actual results could differ from those estimates.
The fund enters into contracts that contain a variety of indemnifications. The fund’s maximum exposure under these arrangements is unknown.The fund does not anticipate recognizing any loss related to these arrangements.
(a) Portfolio valuation: Investments in securities are valued at the last sales price on the securities exchange or national securities market on which such securities are primarily traded. Securities listed on the National Market System for which market quotations are available are valued at the official closing price or, if there is no official closing price that day, at the last sales price. Securities not listed on an exchange or the national securities market, or securities for which there were no transactions, are valued at the average of the most recent bid and asked prices, except for open short positions, where the asked price is used for valuation purposes. Bid price is used when no asked price is available. Registered open-end investment companies that are not traded on an exchange are valued at their net asset value.When market quotations or official closing prices are not readily available, or are determined not to reflect accurately fair value, such as when the value of a security has been significantly affected by events after the close of the exchange or market on which the security is principally traded (for example, a foreign exchange or market), but before the fund calculates its net asset value, the fund may value these investments at fair value as determined in
accordance with the procedures approved by the Board of Directors. Fair valuing of securities may be determined with the assistance of a pricing service using calculations based on indices of domestic securities and other appropriate indicators, such as prices of relevant ADR’s and futures contracts. For other securities that are fair valued by the Board of Directors, certain factors may be considered such as: fundamental analytical data, the nature and duration of restrictions on disposition, an evaluation of the forces that influence the market in which the securities are purchased and sold and public trading in similar securities of the issuer or comparable issuers. Financial futures are valued at the last sales price. Investments denominated in foreign currencies are translated to U.S. dollars at the prevailing rates of exchange. Forward currency exchange contracts are valued at the forward rate.
The Financial Accounting Standards Board (“FASB”) released Statement of Financial Accounting Standards No. 157 “Fair Value Measurements” (“FAS 157”). FAS 157 establishes an authoritative definition of fair value, sets out a framework for measuring fair value, and requires additional disclosures about fair-value measurements. The application of FAS 157 is required for fiscal years beginning after November 15, 2007 and interim periods within those fiscal years. Management does not believe that the application of this standard will have a material impact on the financial statements of the fund.
(b) Foreign currency transactions: The fund does not isolate that portion of the results of operations resulting from changes in foreign exchange rates on investments from the fluctuations arising from changes in market prices of securities held. Such fluctuations are included with the net realized and unrealized gains or losses on investments.
Net realized foreign exchange gains or losses arise from sales and maturities of short-term securities, sales of foreign currencies, currency gains or losses realized on securities transactions and the difference between the amounts of dividends, interest and foreign withholding taxes recorded on the fund’s books and the U.S. dollar equivalent of the amounts actually received or paid. Net unrealized foreign exchange
The Fund 19
NOTES TO FINANCIAL STATEMENTS (continued)
|
gains or losses arise from changes in the value of assets and liabilities other than investments in securities, resulting from changes in exchange rates. Such gains and losses are included with net realized and unrealized gains or losses on investments.
(c) Securities transactions and investment income: Securities transactions are recorded on a trade date basis. Realized gains and losses from securities transactions are recorded on the identified cost basis. Dividend income is recognized on the ex-dividend date and interest income, including, where applicable, accretion of discount and amortization of premium on investments, is recognized on the accrual basis.
The fund has an arrangement with the custodian bank whereby the fund receives earnings credits from the custodian when positive cash balances are maintained, which are used to offset custody fees. For financial reporting purposes, the fund includes net earnings credits as an expense offset in the Statement of Operations.
(d) Affiliated issuers: Investments in other investment companies advised by Dreyfus are defined as “affiliated” in the Act.
(e) Dividends to shareholders: Dividends are recorded on the ex-dividend date. Dividends from investment income-net and dividends from net realized capital gains, if any, are normally declared and paid annually, but the fund may make distributions on a more frequent basis to comply with the distribution requirements of the Internal Revenue Code of 1986, as amended (the “Code”).To the extent that net realized capital gains can be offset by capital loss carryovers, if any, it is the policy of the fund not to distribute such gains. Income and capital gains distributions are determined in accordance with income tax regulations, which may differ from U.S. generally accepted accounting principles.
(f) Federal income taxes: It is the policy of the fund to continue to qualify as a regulated investment company, if such qualification is in the best interests of its shareholders, by complying with the applicable provisions of the Code, and to make distributions of taxable income sufficient to relieve it from substantially all federal income and excise taxes.
The FASB released FASB Interpretation No. 48 “Accounting for Uncertainty in Income Taxes” (FIN 48). FIN 48 provides guidance for how uncertain tax positions should be recognized, measured, presented and disclosed in the financial statements. FIN 48 requires the evaluation of tax positions taken or expected to be taken in the course of preparing the fund’s tax returns to determine whether the tax positions are “more-likely-than-not” of being sustained by the applicable tax authority. Tax positions not deemed to meet the more likely-than-not threshold would be recorded as a tax benefit or expense in the current year.Adoption of FIN 48 is required for fiscal years beginning after December 15, 2006. Management believes that the application of this standard does not have a material impact on the financial statements of the fund.
At November 30, 2007, the components of accumulated earnings on a tax basis were as follows: undistributed ordinary income $239,295 and unrealized appreciation $1,541,064.
During the period ended November 30, 2007, as a result of permanent book to tax differences, primarily due to the tax treatment for foreign currency gains and losses, the fund decreased accumulated undistributed investment income-net by $3,553 and increased accumulated net realized gain (loss) on investments by the same amount. Net assets and net asset value per share were not affected by this reclassification.
NOTE 2—Bank Line of Credit:
|
The fund participates with other Dreyfus-managed funds in a $350 million redemption credit facility (the “Facility”) to be utilized for temporary or emergency purposes, including the financing of redemptions. In connection therewith, the fund has agreed to pay commitment fees on its pro rata portion of the Facility. Interest is charged to the fund based on prevailing market rates in effect at the time of borrowings. During the period ended November 30, 2007, the fund did not borrow under the Facility.
The Fund 21
NOTES TO FINANCIAL STATEMENTS (continued)
|
NOTE 3—Management Fee, Sub-Investment Advisory Fee and Other Transactions With Affiliates:
(a) Pursuant to a management agreement (“Agreement”) with Dreyfus, the management fee is computed at the annual rate of .85% of the value of the fund’s average daily net assets and is payable monthly. Dreyfus has contractually agreed to waive receipt of its fees and/or assume the expenses of the fund, until May 31, 2008, so that annual fund operating expenses (excluding Rule 12b-1 fees, shareholder services fees, taxes, interest, brokerage commissions, commitment fees on borrowings and extraordinary expenses) do not exceed 1.25% of the fund’s average daily net assets. The reduction in management fee, pursuant to the undertaking, amounted to $127,534 during the period ended November 30, 2007.
During the period ended November 30, 2007, the Distributor retained $4,287 from commissions earned on sales of the fund’s Class A shares.
Pursuant to a Sub-Investment Advisory Agreement between Dreyfus and WSPL, Dreyfus pays WSPL a monthly fee at an annual percentage of the fund’s average daily net assets.
(b) Under the Distribution Plan (the “Plan”) adopted pursuant to Rule 12b-1 under the Act, Class C and Class T shares pay the Distributor for distributing their shares at an annual rate of .75% of the value of the average daily net assets of Class C shares and .25% of the value of the average daily net assets of Class T shares. During the period ended November 30, 2007, Class C and Class T shares were charged $5,616 and $1,116, respectively, pursuant to the Plan.
(c) Under the Shareholder Services Plan, Class A, Class C and Class T shares pay the Distributor at an annual rate of .25% of the value of their average daily net assets for the provision of certain services.The services provided may include personal services relating to shareholder accounts, such as answering shareholder inquiries regarding Class A, Class C and Class T shares and providing reports and other informa-
tion, and services related to the maintenance of shareholder accounts. The Distributor may make payments to Service Agents (a securities dealer, financial institution or other industry professional) in respect of these services.The Distributor determines the amounts to be paid to Service Agents. During the period ended November 30, 2007, Class A, Class C and Class T shares were charged $12,573, $1,872 and $1,116, respectively, pursuant to the Shareholder Services Plan.
The fund compensates Dreyfus Transfer, Inc., a wholly-owned subsidiary of Dreyfus, under a transfer agency agreement for providing personnel and facilities to perform transfer agency services for the fund. During the period ended November 30, 2007, the fund was charged $1,471 pursuant to the transfer agency agreement.
Effective July 1, 2007, the fund’s custodian, The Bank of New York, became an affiliate of the Manager. Under the fund’s pre-existing custody agreement with The Bank of New York, for providing custodial services for the fund for the five months ended November 30, 2007, the fund was charged $15,755. Prior to becoming an affiliate,The Bank of New York was paid $22,550 for the custody services to the fund for the six months ended June 30, 2007.
During the period ended November 30, 2007, the fund was charged $4,740 for services performed by the Chief Compliance Officer.
The components of “Due to The Dreyfus Corporation and affiliates” in the Statement of Assets and Liabilities consist of: management fees $17,630, Rule 12b-1 distribution plan fees $687, shareholder services plan fees $1,460, custodian fees $22,227, chief compliance officer fees $3,214 and transfer agency per account fees $446,which are offset against an expense reimbursement currently in effect in the amount of $11,094.
(d) Each Board member also serves as a Board member of other funds within the Dreyfus complex. Annual retainer fees and attendance fees are allocated to each fund based on net assets.
The Fund 23
NOTES TO FINANCIAL STATEMENTS (continued)
|
NOTE 4—Securities Transactions:
|
The aggregate amount of purchases and sales of investment securities, excluding short-term securities and forward currency exchange contracts, during the period ended November 30, 2007, amounted to $24,728,425 and $2,215,084, respectively.
The fund enters into forward currency exchange contracts in order to hedge its exposure to changes in foreign currency exchange rates on its foreign portfolio holdings and to settle foreign currency transactions. When executing forward currency exchange contracts, the fund is obligated to buy or sell a foreign currency at a specified rate on a certain date in the future.With respect to sales of forward currency exchange contracts, the fund would incur a loss if the value of the contract increases between the date the forward contract is opened and the date the forward contract is closed.The fund realizes a gain if the value of the contract decreases between those dates.With respect to purchases of forward currency exchange contracts, the fund would incur a loss if the value of the contract decreases between the date the forward contract is opened and the date the forward contract is closed. The fund realizes a gain if the value of the contract increases between those dates. The fund is also exposed to credit risk associated with counterparty nonperformance on these forward currency exchange contracts which is typically limited to the unrealized gain on each open contract.At November 30, 2007, there were no forward currency exchange contracts outstanding.
At November 30, 2007, the cost of investments for federal income tax purposes was $24,217,983;accordingly,accumulated net unrealized appreciation on investments was $1,540,463, consisting of $2,629,130 gross unrealized appreciation and $1,088,667 gross unrealized depreciation.
REPORT OF INDEPENDENT REGISTERED PUBLIC ACCOUNTING FIRM
| | Shareholders and Board of Directors
Global Stock Fund
|
We have audited the accompanying statement of assets and liabilities, including the statement of investments, of Global Stock Fund (one of the funds comprising Strategic Funds, Inc.) as of November 30, 2007, and the related statement of operations, the statement of changes in net assets and financial highlights for the period from December 29, 2006 (commencement of operations) to November 30, 2007.These financial statements and financial highlights are the responsibility of the Fund’s management. Our responsibility is to express an opinion on these financial statements and financial highlights based on our audit.
We conducted our audit in accordance with the standards of the Public Company Accounting Oversight Board (United States).Those standards require that we plan and perform the audit to obtain reasonable assurance about whether the financial statements and financial highlights are free of material misstatement. We were not engaged to perform an audit of the Fund’s internal control over financial reporting. Our audit included consideration of internal control over financial reporting as a basis for designing audit procedures that are appropriate in the circumstances, but not for the purpose of expressing an opinion on the effectiveness of the Fund’s internal control over financial reporting. Accordingly, we express no such opinion.An audit also includes examining, on a test basis, evidence supporting the amounts and disclosures in the financial statements and financial highlights, assessing the accounting principles used and significant estimates made by management, and evaluating the overall financial statement presentation. Our procedures included confirmation of securities owned as of November 30, 2007 by correspondence with the custodian.We believe that our audit provides a reasonable basis for our opinion.
In our opinion, the financial statements and financial highlights referred to above present fairly, in all material respects, the financial position of Global Stock Fund at November 30, 2007, and the results of its operations, the changes in its net assets and the financial highlights for the period from December 29, 2006 to November 30, 2007, in conformity with U. S. generally accepted accounting principles.
| | New York, New York
January 18, 2008
|
The Fund 25
IMPORTANT TAX INFORMATION (Unaudited)
In accordance with federal tax law, the fund elects to provide each shareholder with their portion of the fund’s foreign taxes paid and the income sourced from foreign countries.Accordingly, the fund hereby makes the following designations regarding its fiscal year ended November 30,2007:
—the total amount of taxes paid to foreign countries was $10,180.
—the total amount of income sourced from foreign countries was $113,005.
As required by federal tax law rules, shareholders will receive notification of their proportionate share of foreign taxes paid and foreign sourced income for the 2007 calendar year with Form 1099-DIV which will be mailed by January 31, 2008.
BOARD MEMBERS INFORMATION (Unaudited)
Joseph S. DiMartino (64) Chairman of the Board (1995)
Principal Occupation During Past 5 Years:
• Corporate Director and Trustee
Other Board Memberships and Affiliations:
- The Muscular Dystrophy Association, Director
- Century Business Services, Inc., a provider of outsourcing functions for small and medium size companies, Director
- The Newark Group, a provider of a national market of paper recovery facilities, paperboard mills and paperboard converting plants, Director
- Sunair Services Corporation, a provider of certain outdoor-related services to homes and businesses, Director
No. of Portfolios for which Board Member Serves: 164 ———————
David W. Burke (71) Board Member (1994)
Principal Occupation During Past 5 Years:
• Corporate Director and Trustee.
Other Board Memberships and Affiliations:
• John F. Kennedy Library Foundation, Director
No. of Portfolios for which Board Member Serves: 86 ———————
William Hodding Carter III (72) Board Member (1988)
Principal Occupation During Past 5 Years:
- Professor of Leadership & Public Policy, University of North Carolina, Chapel Hill (January 1, 2006-present)
- President and Chief Executive Officer of the John S. and James L. Knight Foundation (February 1, 1998-February 1, 2006)
Other Board Memberships and Affiliations:
- The Century Foundation, Emeritus Director
- The Enterprise Corporation of the Delta, Director
No. of Portfolios for which Board Member Serves: 27 ———————
Gordon J. Davis (66) Board Member (2006)
Principal Occupation During Past 5 Years:
- Partner in the law firm of Dewey and LeBoeuf, LLP
- President, Lincoln Center for the Performing Arts, Inc. (2001)
Other Board Memberships and Affiliations:
- Consolidated Edison, Inc., a utility company, Director
- Phoenix Companies, Inc., a life insurance company, Director
- Board Member/Trustee for several not-for-profit groups
No. of Portfolios for which Board Member Serves: 37
The Fund 27
BOARD MEMBERS INFORMATION (Unaudited) (continued)
| | Joni Evans (65)
Board Member (2006)
|
| | Principal Occupation During Past 5 Years:
|
- Principal, Joni Evans Ltd.
- Senior Vice President of the William Morris Agency (2005)
| | No. of Portfolios for which Board Member Serves: 27
|
———————
Ehud Houminer (67) Board Member (1994)
Principal Occupation During Past 5 Years:
• Executive-in-Residence at the Columbia Business School, Columbia University
| | Other Board Memberships and Affiliations:
|
- Avnet Inc., an electronics distributor, Director
- International Advisory Board to the MBA Program School of Management, Ben Gurion University, Chairman
No. of Portfolios for which Board Member Serves: 67 ———————
Richard C. Leone (67) Board Member (1984)
| | Principal Occupation During Past 5 Years:
|
- President of The Century Foundation (formerly,The Twentieth Century Fund, Inc.), a tax exempt research foundation engaged in the study of economic, foreign policy and domestic issues
| | Other Board Memberships and Affiliations:
|
- The American Prospect, Director
- Center for American Progress, Director
No. of Portfolios for which Board Member Serves: 27 ———————
Hans C. Mautner (70) Board Member (1984)
| | Principal Occupation During Past 5 Years:
|
- President—International Division and an Advisory Director of Simon Property Group, a real estate investment company (1998-present)
- Director and Vice Chairman of Simon Property Group (1998-2003)
- Chairman and Chief Executive Officer of Simon Global Limited (1999-present)
| | Other Board Memberships and Affiliations:
|
- Capital and Regional PLC, a British co-investing real estate asset manager, Director
- Member — Board of Managers of: Mezzacappa Long/Short Fund LLC
Mezzacappa Partners LLC
No. of Portfolios for which Board Member Serves: 27
28
Robin A. Melvin (44)
Board Member (1995)
|
Principal Occupation During Past 5 Years:
|
- Director, Boisi Family Foundation, a private family foundation that supports youth-serving organizations that promote the self sufficiency of youth from disadvantaged circumstances
No. of Portfolios for which Board Member Serves: 27 ———————
Burton N. Wallack (57) Board Member (2006)
Principal Occupation During Past 5 Years:
• President and co-owner of Wallack Management Company, a real estate management company
No. of Portfolios for which Board Member Serves: 27 ———————
John E. Zuccotti (70) Board Member (1984)
Principal Occupation During Past 5 Years:
|
- Chairman of Brookfield Financial Properties, Inc.
- Senior Counsel of Weil, Gotshal & Manges, LLP
- Chairman of the Real Estate Board of New York
Other Board Memberships and Affiliations:
|
- Emigrant Savings Bank, Director
- Wellpoint, Inc., Director
- Visiting Nurse Service of New York, Director
- Columbia University,Trustee
- Doris Duke Charitable Foundation,Trustee
No. of Portfolios for which Board Member Serves: 27 ———————
Once elected all Board Members serve for an indefinite term, but achieve Emeritus status upon reaching age 80.The address of the Board Members and Officers is in c/o The Dreyfus Corporation, 200 Park Avenue, New York, New York 10166.Additional information about the Board Members is available in the fund’s Statement of Additional Information which can be obtained from Dreyfus free of charge by calling this toll free number: 1-800-554-4611.
Arnold S. Hiatt, Emeritus Board Member
The Fund 29
OFFICERS OF THE FUND (Unaudited)
| J. DAVID OFFICER, President since | | JONI LACKS CHARATAN, Vice President |
| December 2006. | | and Assistant Secretary since |
| Chief Operating Officer,Vice Chairman and a | | August 2005. |
| Director of the Manager, and an officer of 81 | | Associate General Counsel of the Manager, |
| investment companies (comprised of 163 | | and an officer of 82 investment companies |
| portfolios) managed by the Manager. He is 59 | | (comprised of 180 portfolios) managed by the |
| years old and has been an employee of the | | Manager. She is 52 years old and has been an |
| Manager since April 1998. | | employee of the Manager since October 1988. |
| |
| PHILLIP N. MAISANO, Executive Vice | | JOSEPH M. CHIOFFI, Vice President and |
| President since July 2007. | | Assistant Secretary since August 2005. |
| Chief Investment Officer,Vice Chair and a | | Associate General Counsel of the Manager, |
| director of the Manager, and an officer of 81 | | and an officer of 82 investment companies |
| investment companies (comprised of 163 | | (comprised of 180 portfolios) managed by the |
| portfolios) managed by the Manager. Mr. | | Manager. He is 46 years old and has been an |
| Maisano also is an officer and/or Board | | employee of the Manager since June 2000. |
| |
| member of certain other investment | | JANETTE E. FARRAGHER, Vice President |
| management subsidiaries of The Bank of New | | and Assistant Secretary since |
| York Mellon Corporation, each of which is an | | August 2005. |
| affiliate of the Manager. He is 60 years old and | | |
| has been an employee of the Manager since | | Associate General Counsel of the Manager, |
| November 2006. Prior to joining the Manager, | | and an officer of 82 investment companies |
| Mr. Maisano served as Chairman and Chief | | (comprised of 180 portfolios) managed by the |
| Executive Officer of EACM Advisors, an | | Manager. She is 44 years old and has been an |
| affiliate of the Manager, since August 2004, and | | employee of the Manager since February 1984. |
| served as Chief Executive Officer of Evaluation | | JOHN B. HAMMALIAN, Vice President and |
| Associates, a leading institutional investment | | Assistant Secretary since August 2005. |
| consulting firm, from 1988 until 2004. | | |
| | | Associate General Counsel of the Manager, |
| MICHAEL A. ROSENBERG, Vice President | | and an officer of 82 investment companies |
| and Secretary since August 2005. | | (comprised of 180 portfolios) managed by the |
| Associate General Counsel of the Manager, | | Manager. He is 44 years old and has been an |
| and an officer of 82 investment companies | | employee of the Manager since February 1991. |
| (comprised of 180 portfolios) managed by the | | ROBERT R. MULLERY, Vice President and |
| Manager. He is 47 years old and has been an | | Assistant Secretary since August 2005. |
| employee of the Manager since October 1991. | | |
| | | Associate General Counsel of the Manager, |
| JAMES BITETTO, Vice President and | | and an officer of 82 investment companies |
| Assistant Secretary since August 2005. | | (comprised of 180 portfolios) managed by the |
| Associate General Counsel and Secretary of | | Manager. He is 55 years old and has been an |
| the Manager, and an officer of 82 investment | | employee of the Manager since May 1986. |
| companies (comprised of 180 portfolios) | | |
| managed by the Manager. He is 41 years old | | |
| and has been an employee of the Manager | | |
| since December 1996. | | |
| JEFF PRUSNOFSKY, Vice President and | | GAVIN C. REILLY, Assistant Treasurer |
| Assistant Secretary since August 2005. | | since December 2005. |
| Associate General Counsel of the Manager, | | Tax Manager of the Investment Accounting |
| and an officer of 82 investment companies | | and Support Department of the Manager, and |
| (comprised of 180 portfolios) managed by the | | an officer of 82 investment companies |
| Manager. He is 42 years old and has been an | | (comprised of 180 portfolios) managed by the |
| employee of the Manager since October 1990. | | Manager. He is 39 years old and has been an |
| |
| JAMES WINDELS, Treasurer since | | employee of the Manager since April 1991. |
| November 2001. | | JOSEPH W. CONNOLLY, Chief Compliance |
| Director – Mutual Fund Accounting of the | | Officer since October 2004. |
| Manager, and an officer of 82 investment | | Chief Compliance Officer of the Manager and |
| companies (comprised of 180 portfolios) | | The Dreyfus Family of Funds (82 investment |
| managed by the Manager. He is 49 years old | | companies, comprised of 180 portfolios). From |
| and has been an employee of the Manager | | November 2001 through March 2004, Mr. |
| since April 1985. | | Connolly was first Vice-President, Mutual |
| |
| ROBERT ROBOL, Assistant Treasurer | | Fund Servicing for Mellon Global Securities |
| since August 2005. | | Services. In that capacity, Mr. Connolly was |
| | | responsible for managing Mellon’s Custody, |
| Senior Accounting Manager – Money Market | | Fund Accounting and Fund Administration |
| and Municipal Bond Funds of the Manager, | | services to third-party mutual fund clients. He |
| and an officer of 82 investment companies | | is 50 years old and has served in various |
| (comprised of 180 portfolios) managed by the | | capacities with the Manager since 1980, |
| Manager. He is 43 years old and has been an | | including manager of the firm’s Fund |
| employee of the Manager since October 1988. | | Accounting Department from 1997 through |
| ROBERT SALVIOLO, Assistant Treasurer | | October 2001. |
| since May 2007. | | WILLIAM GERMENIS, Anti-Money |
| Senior Accounting Manager – Equity Funds of | | Laundering Compliance Officer since |
| the Manager, and an officer of 82 investment | | September 2002. |
| companies (comprised of 180 portfolios) | | Vice President and Anti-Money Laundering |
| managed by the Manager. He is 40 years old | | Compliance Officer of the Distributor, and the |
| and has been an employee of the Manager | | Anti-Money Laundering Compliance Officer |
| since June 1989. | | of 78 investment companies (comprised of 176 |
| ROBERT SVAGNA, Assistant Treasurer | | portfolios) managed by the Manager. He is 37 |
| since December 2002. | | years old and has been an employee of the |
| | | Distributor since October 1998. |
| Senior Accounting Manager – Equity Funds of | | |
| the Manager, and an officer of 82 investment | | |
| companies (comprised of 180 portfolios) | | |
| managed by the Manager. He is 40 years old | | |
| and has been an employee of the Manager | | |
| since November 1990. | | |
The Fund 31
NOTES
For More Information

The fund files its complete schedule of portfolio holdings with the Securities and Exchange Commission (“SEC”) for the first and third quarters of each fiscal year on Form N-Q. The fund’s Forms N-Q are available on the SEC’s website at http://www.sec.gov and may be reviewed and copied at the SEC’s Public Reference Room in Washington, DC. Information on the operation of the Public Reference Room may be obtained by calling 1-202-551-8090.
A description of the policies and procedures that the fund uses to determine how to vote proxies relating to portfolio securities, and information regarding how the fund voted these proxies for the 12-month period ended June 30, 2007, is available at http://www.dreyfus.com and on the SEC’s website at http://www.sec.gov. The description of the policies and procedures is also available without charge, upon request, by calling 1-800-645-6561.
© 2008 MBSC Securities Corporation

ANNUAL REPORT November 30, 2007

Save time. Save paper. View your next shareholder report online as soon as it’s available. Log into www.dreyfus.com and sign up for Dreyfus eCommunications. It’s simple and only takes a few minutes.
The views expressed in this report reflect those of the portfolio manager only through the end of the period covered and do not necessarily represent the views of Dreyfus or any other person in the Dreyfus organization. Any such views are subject to change at any time based upon market or other conditions and Dreyfus disclaims any responsibility to update such views.These views may not be relied on as investment advice and, because investment decisions for a Dreyfus fund are based on numerous factors, may not be relied on as an indication of trading intent on behalf of any Dreyfus fund.
Not FDIC-Insured • Not Bank-Guaranteed • May Lose Value
| Contents |
| |
| | | THE FUND |
| |
|
| 2 | | A Letter from the CEO |
| 3 | | Discussion of Fund Performance |
| 6 | | Fund Performance |
| 8 | | Understanding Your Fund’s Expenses |
| 8 | | Comparing Your Fund’s Expenses |
| With Those of Other Funds |
| 9 | | Statement of Investments |
| 12 | | Statement of Assets and Liabilities |
| 13 | | Statement of Operations |
| 14 | | Statement of Changes in Net Assets |
| 15 | | Financial Highlights |
| 16 | | Notes to Financial Statements |
| 24 | | Report of Independent Registered |
| | | Public Accounting Firm |
| 25 | | Important Tax Information |
| 26 | | Board Members Information |
| 29 | | Officers of the Fund |
| FOR MORE INFORMATION |
|
| | | Back Cover |
The Fund

We are pleased to present this report for International Stock Fund, covering the period from the fund’s inception on December 29, 2006, through the end of the annual reporting period on November 30, 2007.
After an extended period of steady gains, turmoil in U.S. credit markets over the summer of 2007 led to bouts of heightened volatility in many international equity markets. Nonetheless, fundamentals in the global economy have remained relatively robust, and recent shifts in monetary policy from several major central banks helped spark market rebounds in many regions of the world.
While we expect the global expansion to continue, it seems reasonable to expect to see some moderation as U.S. consumer spending wanes and some high-flying emerging markets, notably China, continue to take steps to reduce unsustainably high growth rates.With regard to the currency markets, we have seen weakness in the U.S. dollar for most of the reporting period, making investments denominated in foreign currencies more valuable for U.S. residents. Lastly, a stubborn U.S. trade deficit and stronger economic growth in overseas markets continue to attract global capital away from U.S. markets and toward those with higher potential returns.As always, we encourage you to discuss these trends and opportunities with your financial advisor, who can help you consider if any portfolio adjustments might be right for your investment needs.
For information about how the fund performed during the reporting period, as well as market perspectives, we have provided a Discussion of Fund Performance given by the fund’s Portfolio Managers.
Thank you for your continued confidence and support.
Thomas F. Eggers
Chief Executive Officer
The Dreyfus Corporation
December 17, 2007
|

DISCUSSION OF FUND PERFORMANCE
For the period between the fund’s inception on December 29, 2006, and November 30, 2007, as provided by Walter Scott & Partners Limited (WSPL), Sub-adviser
Fund and Market Performance Overview
International stocks fared relatively well over the reporting period, as robust global economic growth generally offset the adverse effects of credit concerns stemming from turmoil in the sub-prime mortgage sector of the U.S. bond market, which caused heightened market volatility during the summer and fall.The fund produced lower returns than its benchmark, primarily due to less-than-full participation in a market rally just after the fund’s inception, when it was putting new investment capital to work.
For the period between the fund’s inception on December 29, 2006, and the end of its annual reporting period on November 30, 2007, International Stock Fund produced returns of 9.76% for its Class A shares, 9.04% for Class C shares, 10.08% for Class I shares and 9.36% for Class T shares.1 In comparison, the fund’s benchmark index, the Morgan Stanley Capital International Europe, Australasia, Far East Index (the “MSCI EAFE Index”),produced a 13.73% return over the same period.2
The Fund’s Investment Approach
|
The fund seeks long-term total return by normally investing at least 80% of its assets in stocks of companies with any market capitalization that are located in the world’s developed markets outside of the United States.When selecting stocks,WSPL seeks companies with fundamental strengths that indicate the potential for sustainable growth.The firm focuses on individual stock selection through extensive fundamental research.WSPL first selects candidates for investment that meet certain broad absolute and trend criteria. Financial statements are restated in an effort to identify the nature of their operating margins and to understand the variables that add value to their businesses. Companies meeting the financial criteria are subjected to a detailed investigation of their products, costs and pricing, competition, industry position and
The Fund 3
DISCUSSION OF FUND PERFORMANCE (continued)
|
outlook. Stocks are then selected whose expected growth rate is available at a reasonable valuation.
International Equities Advanced Despite Bouts of Volatility
International stock markets posted generally strong returns during the first half of the reporting period, with gains fueled by corporate restructurings and robust mergers-and-acquisitions activity throughout much of Europe as well as robust global demand for energy and industrial commodities, particularly from emerging markets such as China and India. High levels of business confidence, positive earnings reports and favorable economic growth forecasts in most countries also supported stock prices. Japan proved to be the laggard early in the reporting period, as the country continued to struggle with economic issues despite efforts to reform its financial systems.
Market conditions changed for the worse over the reporting period’s second half, largely due to difficulties in the U.S. subprime mortgage sector and the subsequent repricing of risk in other financial markets.As credit concerns spread throughout the world’s equity and fixed-income markets, a number of highly leveraged institutional investors were compelled to sell their more liquid and creditworthy holdings to meet redemption requests and margin calls.As a result, even asset classes with no exposure to troubled sub-prime lending experienced downward pressure.
The U.S. Federal Reserve Board intervened in mid-August by implementing the first in a series of interest-rate reductions, which were designed to calm the markets and promote greater liquidity. Other central banks also adopted measures to inject liquidity into their financial systems. Consequently, international equity investors soon regained their footing, and stocks in most markets began to rebound. The financials sector proved to be a notable exception to the market recovery. Several large, global banks and brokerage firms announced substantial write-downs of sub-prime related assets, leading to sharp declines in their stock prices.
Relatively Light Financial Holdings Bolstered the Fund’s Performance
The fund’s performance was influenced primarily by macroeconomic and market developments during the reporting period. Indeed, after
lagging in the midst of a market rally early in 2007 as we put cash to work, the fund’s returns over the remainder of the reporting period generally remained in line with its benchmark.
In addition, the fund benefited from its relatively light exposure to financials stocks, many of which did not meet our investment criteria. Conversely, an overweighted position in Hong Kong, where a number of holdings benefited from rapid growth in mainland China, contributed positively to the fund’s relative performance.
Positioning the Fund for a Changing Market Environment
Although we have remained optimistic regarding the long-term prospects of international equity markets, we recently have adopted a more cautious investment posture due to signs of deteriorating economic conditions in the United States and Europe.Accordingly, we have intensified our focus on companies that, in our judgment, may be able to maintain their valuations in the event of a more severe downturn. Employing our bottom-up security selection process, we have favored cash-rich companies with sound balance sheets and a track record of relatively modest price volatility over full market cycles.We believe that this is a prudent strategy until the outlook for the global economy and equity markets becomes clearer.
| 1 | | Total return includes reinvestment of dividends and any capital gains paid, and does not take into |
| | | consideration the maximum initial sales charges in the case of Class A and Class T shares, or the |
| | | applicable contingent deferred sales charge imposed on redemptions in the case of Class C shares. |
| | | Had these charges been reflected, returns would have been lower. Past performance is no guarantee |
| | | of future results. Share price and investment return fluctuate such that upon redemption, fund |
| | | shares may be worth more or less than their original cost. Return figures provided reflect the |
| | | absorption of certain fund expenses by The Dreyfus Corporation in effect through May 31, 2008, |
| | | at which time it may be extended, terminated or modified. Had these expenses not been absorbed, |
| | | the fund’s returns would have been lower. |
| 2 | | SOURCE: Morgan Stanley Capital International – Reflects reinvestment of net dividends and, |
| | | where applicable, capital gain distributions.The Morgan Stanley Capital International Europe, |
| | | Australasia, Far East (MSCI EAFE) Index is an unmanaged index composed of a sample of |
| | | companies representative of the market structure of European and Pacific Basin countries. Returns |
| | | are calculated on a month-end basis. |
The Fund 5
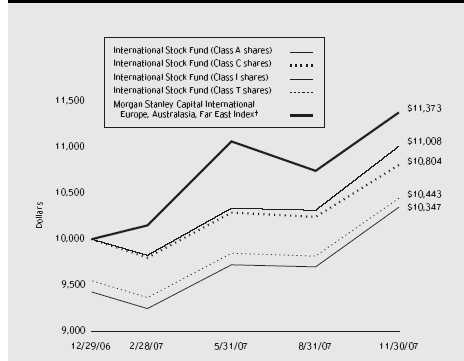
Comparison of change in value of $10,000 investment in International Stock Fund Class A shares, Class C shares, Class I shares and Class T shares and the Morgan Stanley Capital International Europe, Australasia, Far East Index
† Source: Lipper Inc.
Past performance is not predictive of future performance.
The above graph compares a $10,000 investment made in Class A, Class C, Class I and Class T shares of International Stock Fund on 12/29/06 (inception date) to a $10,000 investment made in the Morgan Stanley Capital International Europe, Australasia, Far East Index (the “Index”) on that date. For comparative purposes, the value of the Index on 12/31/06 is used as the beginning value on 12/29/06. All dividends and capital gain distributions are reinvested.
The fund’s performance shown in the line graph takes into account the maximum initial sales charge on Class A shares and Class T shares, the applicable contingent deferred sales charge on Class C shares and all other applicable fees and expenses on all classes.The Index is an unmanaged, market capitalization weighted index that is designed to measure the performance of publicly traded stocks issued by companies in developed markets excluding the U.S. and Canada. Unlike a mutual fund, the Index is not subject to charges, fees and other expenses. Investors cannot invest directly in any index. Further information relating to fund performance, including expense reimbursements, if applicable, is contained in the Financial Highlights section of the prospectus and elsewhere in this report.
| Actual Aggregate Total Returns as of 11/30/07 | | |
| |
| | | Inception | | From |
| | | Date | | Inception |
| |
| |
|
| Class A shares | | | | |
| with maximum sales charge (5.75%) | | 12/29/06 | | 3.47% |
| without sales charge | | 12/29/06 | | 9.76% |
| Class C shares | | | | |
| with applicable redemption charge † | | 12/29/06 | | 8.04% |
| without redemption | | 12/29/06 | | 9.04% |
| Class I shares | | 12/29/06 | | 10.08% |
| Class T shares | | | | |
| with applicable sales charge (4.5%) | | 12/29/06 | | 4.43% |
| without sales charge | | 12/29/06 | | 9.36% |
Past performance is not predictive of future performance.The fund’s performance shown in the graph and table does not reflect the deduction of taxes that a shareholder would pay on fund distributions or the redemption of fund shares.
† The maximum contingent deferred sales charge for Class C shares is 1% for shares redeemed within one year of the date of purchase.
The Fund 7
UNDERSTANDING YOUR FUND’S EXPENSES (Unaudited)
As a mutual fund investor, you pay ongoing expenses, such as management fees and other expenses. Using the information below, you can estimate how these expenses affect your investment and compare them with the expenses of other funds.You also may pay one-time transaction expenses, including sales charges (loads) and redemption fees, which are not shown in this section and would have resulted in higher total expenses. For more information, see your fund’s prospectus or talk to your financial adviser.
Review your fund’s expenses
The table below shows the expenses you would have paid on a $1,000 investment in International Stock Fund from June 1, 2007 to November 30, 2007. It also shows how much a $1,000 investment would be worth at the close of the period, assuming actual returns and expenses.
| Expenses and Value of a $1,000 Investment | | | | | | |
| assuming actual returns for the six months ended November 30, 2007 † | | |
| | | Class A | | Class C | | Class I | | Class T |
| |
| |
| |
| |
|
| Expenses paid per $1,000 † | | $ 7.76 | | $ 11.62 | | $ 6.47 | | $ 9.04 |
| Ending value (after expenses) | | $1,064.40 | | $1,059.90 | | $1,065.00 | | $1,060.50 |
COMPARING YOUR FUND’S EXPENSES
WITH THOSE OF OTHER FUNDS (Unaudited)
|
Using the SEC’s method to compare expenses
The Securities and Exchange Commission (SEC) has established guidelines to help investors assess fund expenses. Per these guidelines, the table below shows your fund’s expenses based on a $1,000 investment, assuming a hypothetical 5% annualized return. You can use this information to compare the ongoing expenses (but not transaction expenses or total cost) of investing in the fund with those of other funds.All mutual fund shareholder reports will provide this information to help you make this comparison. Please note that you cannot use this information to estimate your actual ending account balance and expenses paid during the period.
Expenses and Value of a $1,000 Investment assuming a hypothetical 5% annualized return for the six months ended November 30, 2007†
| | | Class A | | Class C | | Class I | | Class T |
| |
| |
| |
| |
|
| Expenses paid per $1,000 † | | $ 7.59 | | $ 11.36 | | $ 6.33 | | $ 8.85 |
| Ending value (after expenses) | | $1,017.55 | | $1,013.79 | | $1,018.80 | | $1,016.29 |
† Expenses are equal to the fund’s annualized expense ratio of 1.50% for Class A, 2.25% for Class C, 1.25% for Class I and 1.75% for Class T, multiplied by the average account value over the period, multiplied by 183/365 (to reflect the one-half year period).
STATEMENT OF INVESTMENTS
November 30, 2007
|
| Common Stocks—97.6% | | Shares | | Value ($) |
| |
| |
|
| Australia—3.2% | | | | |
| Woodside Petroleum | | 53,957 | | 2,306,596 |
| Canada—2.4% | | | | |
| Suncor Energy | | 17,800 | | 1,700,667 |
| France—7.2% | | | | |
| Cie Generale d’Optique Essilor International | | 25,100 | | 1,573,526 |
| L’Oreal | | 12,600 | | 1,750,758 |
| LVMH Moet Hennessy Louis Vuitton | | 14,700 | | 1,784,569 |
| | | | | 5,108,853 |
| Hong Kong—12.2% | | | | |
| China Mobile | | 65,000 | | 1,172,043 |
| CLP Holdings | | 233,000 | | 1,578,489 |
| CNOOC | | 1,400,000 | | 2,581,938 |
| Hong Kong & China Gas | | 593,500 | | 1,753,121 |
| Hutchison Whampoa | | 134,000 | | 1,586,715 |
| | | | | 8,672,306 |
| Japan—42.6% | | | | |
| Advantest | | 26,000 | | 737,938 |
| AEON Mall | | 56,000 | | 1,478,398 |
| Astellas Pharma | | 33,000 | | 1,468,847 |
| Canon | | 28,800 | | 1,507,663 |
| Daikin Industries | | 29,800 | | 1,527,792 |
| Daito Trust Construction | | 26,400 | | 1,265,468 |
| Denso | | 27,000 | | 1,102,041 |
| Eisai | | 34,000 | | 1,501,104 |
| Fanuc | | 15,400 | | 1,602,649 |
| Hirose Electric | | 8,200 | | 920,593 |
| Honda Motor | | 32,000 | | 1,084,110 |
| HOYA | | 39,000 | | 1,356,400 |
| Keyence | | 6,000 | | 1,392,621 |
| Millea Holdings | | 36,000 | | 1,261,792 |
| Mitsubishi Estate | | 50,000 | | 1,338,019 |
| Mitsubishi UFJ Financial Group | | 155,000 | | 1,520,881 |
| Murata Manufacturing | | 19,600 | | 1,142,605 |
The Fund 9
STATEMENT OF INVESTMENTS (continued)
|
| Common Stocks (continued) | | Shares | | Value ($) |
| |
| |
|
| Japan (continued) | | | | |
| Nitto Denko | | 22,500 | | 1,163,671 |
| Rohm | | 11,800 | | 1,080,218 |
| Secom | | 29,500 | | 1,637,338 |
| Shimamura | | 11,600 | | 1,185,241 |
| Shin-Etsu Chemical | | 23,300 | | 1,379,295 |
| Takeda Pharmaceutical | | 24,000 | | 1,535,343 |
| | | | | 30,190,027 |
| Singapore—2.2% | | | | |
| DBS Group Holdings | | 114,000 | | 1,581,803 |
| Spain—1.5% | | | | |
| Inditex | | 15,500 | | 1,080,372 |
| Sweden—2.8% | | | | |
| Hennes & Mauritz, Cl. B | | 17,200 | | 1,074,562 |
| Telefonaktiebolaget LM Ericsson, Cl. B | | 380,000 | | 928,193 |
| | | | | 2,002,755 |
| Switzerland—4.6% | | | | |
| Nestle | | 3,400 | | 1,631,784 |
| Novartis | | 28,700 | | 1,632,354 |
| | | | | 3,264,138 |
| United Kingdom—18.9% | | | | |
| BG Group | | 92,000 | | 1,924,705 |
| BP | | 118,000 | | 1,438,445 |
| Centrica | | 238,000 | | 1,779,353 |
| GlaxoSmithKline | | 63,000 | | 1,665,853 |
| Kingfisher | | 202,000 | | 632,858 |
| Reckitt Benckiser Group | | 22,000 | | 1,312,769 |
| Rio Tinto | | 13,800 | | 1,607,083 |
| Common Stocks (continued) | | Shares | | Value ($) |
| |
| |
|
| United Kingdom (continued) | | | | |
| Tesco | | 155,000 | | 1,527,294 |
| William Morrison Supermarkets | | 245,000 | | 1,546,303 |
| | | | | 13,434,663 |
| Total Common Stocks | | | | |
| (cost $64,094,607) | | | | 69,342,180 |
| |
| |
|
| |
| Other Investment—1.7% | | | | |
| |
| |
|
| Registered Investment Company; | | | | |
| Dreyfus Institutional Preferred Plus Money Market Fund | | |
| (cost $1,200,000) | | 1,200,000 a | | 1,200,000 |
| |
| |
|
| Total Investments (cost $65,294,607) | | 99.3% | | 70,542,180 |
| Cash and Receivables (Net) | | .7% | | 513,733 |
| Net Assets | | 100.0% | | 71,055,913 |
a Investment in affiliated money market mutual fund.
|
| Portfolio Summary (Unaudited) † | | | | |
| |
| | | Value (%) | | | | Value (%) |
| |
| |
| |
|
| Consumer Goods | | 16.2 | | Technology | | 10.3 |
| Industrials | | 14.4 | | Financial Services | | 8.0 |
| Consumer Services | | 14.3 | | Energy Services | | 7.2 |
| Energy | | 14.0 | | Money Market Investment | | 1.7 |
| Health Care | | 13.2 | | | | 99.3 |
| |
| † Based on net assets. | | | | | | |
| See notes to financial statements. | | | | |
The Fund 11
STATEMENT OF ASSETS AND LIABILITIES
November 30, 2007
| | | | | | | Cost | | Value |
| |
| |
| |
| |
|
| Assets ($): | | | | | | | | |
| Investments in securities—See Statement of Investments: | | | | |
| Unaffiliated issuers | | | | | | 64,094,607 | | 69,342,180 |
| Affiliated issuers | | | | | | 1,200,000 | | 1,200,000 |
| Cash | | | | | | | | 384,602 |
| Cash denominated in foreign currencies | | | | 47,046 | | 46,251 |
| Dividends and interest receivable | | | | | | | | 160,830 |
| Receivable for shares of Common Stock subscribed | | | | | | 25,000 |
| Prepaid expenses | | | | | | | | 15,321 |
| | | | | | | | | 71,174,184 |
| |
| |
| |
| |
|
| Liabilities ($): | | | | | | | | |
| Due to The Dreyfus Corporation and affiliates—Note 3(c) | | | | 76,451 |
| Accrued expenses | | | | | | | | 41,820 |
| | | | | | | | | 118,271 |
| |
| |
| |
| |
|
| Net Assets ($) | | | | | | | | 71,055,913 |
| |
| |
| |
| |
|
| Composition of Net Assets ($): | | | | | | | | |
| Paid-in capital | | | | | | | | 65,090,336 |
| Accumulated undistributed investment income—net | | | | | | 292,749 |
| Accumulated net realized gain (loss) on investments | | | | | | 423,020 |
| Accumulated net unrealized appreciation (depreciation) | | | | |
| on investments and foreign currency transactions | | | | | | 5,249,808 |
| |
| |
| |
|
| Net Assets ($) | | | | | | | | 71,055,913 |
| |
| |
| |
| |
|
| |
| |
| Net Asset Value Per Share | | | | | | | | |
| | | Class A | | Class C | | Class I | | Class T |
| |
| |
| |
| |
|
| Net Assets ($) | | 1,395,505 | | 445,438 | | 69,201,258 | | 13,712 |
| Shares Outstanding | | 101,704 | | 32,666 | | 5,028,074 | | 1,000 |
| |
| |
| |
| |
|
| Net Asset Value Per Share ($) | | 13.72 | | 13.64 | | 13.76 | | 13.71 |
See notes to financial statements.
|
STATEMENT OF OPERATIONS
Fr o m D e c e m b e r 2 9 , 2 0 0 6 ( c o m m e n c e m e n t o f o p e r a t i o n s ) t o N o v e m b e r 3 0 , 2 0 0 7
| Investment Income ($): | | |
| Income: | | |
| Cash dividends (net of $48,061 foreign taxes withheld at source): | | |
| Unaffiliated issuers | | 766,262 |
| Affiliated issuers | | 68,259 |
| Interest | | 7,304 |
| Total Income | | 841,825 |
| Expenses: | | |
| Management fee—Note 3(a) | | 363,996 |
| Custodian fees—Note 3(c) | | 77,045 |
| Registration fees | | 70,001 |
| Auditing fees | | 33,822 |
| Legal fees | | 31,863 |
| Shareholder servicing costs—Note 3(c) | | 11,106 |
| Prospectus and shareholders’ reports | | 6,515 |
| Distribution fees—Note 3(b) | | 4,851 |
| Directors’ fees and expenses—Note 3(d) | | 3,306 |
| Loan commitment fees—Note 2 | | 283 |
| Miscellaneous | | 7,559 |
| Total Expenses | | 610,347 |
| Less—reduction in management fee due to undertaking—Note 3(a) | | (60,394) |
| Less—reduction in custody fees due to earnings credits—Note 1(c) | | (38,053) |
| Net Expenses | | 511,900 |
| Investment Income-Net | | 329,925 |
| |
|
| Realized and Unrealized Gain (Loss) on Investments—Note 4 ($): |
| Net realized gain (loss) on investments and foreign currency transactions | | 277,538 |
| Net realized gain (loss) on forward currency exchange contracts | | 108,306 |
| Net Realized Gain (Loss) | | 385,844 |
| Net unrealized appreciation (depreciation) on | | |
| investments and foreign currency transactions | | 5,249,808 |
| Net Realized and Unrealized Gain (Loss) on Investments | | 5,635,652 |
| Net Increase in Net Assets Resulting from Operations | | 5,965,577 |
See notes to financial statements.
|
The Fund 13
STATEMENT OF CHANGES IN NET ASSETS
Fr o m D e c e m b e r 2 9, 2 0 0 6 (c o m m e n c e m e n t o f o p e r a t i o n s ) t o N o v e m b e r 3 0 , 2 0 0 7 a
| Operations ($): | | |
| Investment income—net | | 329,925 |
| Net realized gain (loss) on investments | | 385,844 |
| Net unrealized appreciation (depreciation) on investments | | 5,249,808 |
| Net Increase (Decrease) in Net Assets | | |
| Resulting from Operations | | 5,965,577 |
| |
|
| Capital Stock Transactions ($): | | |
| Net proceeds from shares sold: | | |
| Class A shares | | 4,979,283 |
| Class C shares | | 939,715 |
| Class I shares | | 66,029,114 |
| Class T shares | | 500,000 |
| Cost of shares redeemed: | | |
| Class A shares | | (3,800,027) |
| Class C shares | | (538,351) |
| Class I shares | | (2,514,003) |
| Class T shares | | (505,395) |
| Increase (Decrease) in Net Assets | | |
| from Capital Stock Transactions | | 65,090,336 |
| Total Increase (Decrease) in Net Assets | | 71,055,913 |
| |
|
| Net Assets ($): | | |
| Beginning of Period | | — |
| End of Period | | 71,055,913 |
| Undistributed investment income—net | | 292,749 |
| |
|
| Capital Share Transactions (Shares): | | |
| Class A | | |
| Shares sold | | 394,733 |
| Shares redeemed | | (293,029) |
| Net Increase (Decrease) in Shares Outstanding | | 101,704 |
| |
|
| Class C | | |
| Shares sold | | 74,250 |
| Shares redeemed | | (41,584) |
| Net Increase (Decrease) in Shares Outstanding | | 32,666 |
| |
|
| Class I | | |
| Shares sold | | 5,222,437 |
| Shares redeemed | | (194,363) |
| Net Increase (Decrease) in Shares Outstanding | | 5,028,074 |
| |
|
| Class T | | |
| Shares sold | | 40,000 |
| Shares redeemed | | (39,000) |
| Net Increase (Decrease) in Shares Outstanding | | 1,000 |
a Effective June 1, 2007, Class R shares were redesignated as Class I shares. See notes to financial statements.
14
The following table describes the performance for each share class for the period from December 29, 2006 (commencement of operations) to November 30, 2007.All information (except portfolio turnover rate) reflects financial results for a single fund share.Total return shows how much your investment in the fund would have increased (or decreased) during the period, assuming you had reinvested all dividends and dis-tributions.These figures have been derived from the fund’s financial statements.
| | | Class A | | Class C | | Class Ia | | Class T |
| | | Shares | | Shares | | Shares | | Shares |
| |
| |
| |
| |
|
| Per Share Data ($): | | | | | | | | |
| Net asset value, beginning of period | | 12.50 | | 12.50 | | 12.50 | | 12.50 |
| Investment Operations: | | | | | | | | |
| Investment income (loss)—net b | | .07 | | (.04) | | .11 | | .04 |
| Net realized and unrealized | | | | | | | | |
| gain (loss) on investments | | 1.15 | | 1.18 | | 1.15 | | 1.17 |
| Total from Investment Operations | | 1.22 | | 1.14 | | 1.26 | | 1.21 |
| Net asset value, end of period | | 13.72 | | 13.64 | | 13.76 | | 13.71 |
| |
| |
| |
| |
|
| Total Return (%) c | | 9.76d | | 9.04d | | 10.08 | | 9.36d |
| |
| |
| |
| |
|
| Ratios/Supplemental Data (%): | | | | | | | | |
| Ratio of total expenses | | | | | | | | |
| to average net assets e | | 1.75 | | 2.50 | | 1.38 | | 2.03 |
| Ratio of net expenses | | | | | | | | |
| to average net assets e | | 1.47 | | 2.21 | | 1.16 | | 1.74 |
| Ratio of net investment income | | | | | | | | |
| (loss) to average net assets e | | .50 | | (.31) | | .81 | | .32 |
| Portfolio Turnover Rate c | | 13.34 | | 13.34 | | 13.34 | | 13.34 |
| |
| |
| |
| |
|
| Net Assets, end of period ($ x 1,000) | | 1,396 | | 445 | | 69,201 | | 14 |
| |
| a Effective June 1, 2007, Class R shares were redesignated as Class I shares. | | | | |
| b Based on average shares outstanding at each month end. | | | | | | |
| c Not annualized. | | | | | | | | |
| d Exclusive of sales charge. | | | | | | | | |
| e Annualized. | | | | | | | | |
| See notes to financial statements. | | | | | | | | |
The Fund 15
NOTES TO FINANCIAL STATEMENTS
NOTE 1—Significant Accounting Policies:
International Stock Fund (the “fund”) is a separate diversified series of Strategic Funds, Inc. (the “Company”) which is registered under the Investment Company Act of 1940, as amended (the “Act”), as a diversified open-end management investment company and operates as a series company currently offering five series, including the fund, which commenced operations on December 29, 2006. The fund’s investment objective seeks long-term total return. The Dreyfus Corporation (the “Manager” or “Dreyfus”) serves as the fund’s investment adviser.Walter Scott & Partners Limited (“WSPL”) serves as the fund’s sub-investment adviser.
On July 1,2007,Mellon Financial Corporation (“Mellon Financial”) and The Bank of New York Company, Inc. merged, forming The Bank of New York Mellon Corporation (“BNY Mellon”). As part of this transaction, Dreyfus became a wholly-owned subsidiary of BNY Mellon.
The fund’s Board of Directors approved the redesignation of the fund’s Class R shares as Class I shares, effective June 1, 2007.The eligibility requirements for Class I shares remained the same as for Class R shares.
MBSC Securities Corporation (the “Distributor”), a wholly-owned subsidiary of Dreyfus, is the distributor of the fund’s shares.The fund is authorized to issue 100 million shares of $.001 par value Common Stock in each of the following classes of shares: Class A, Class C, Class I and Class T. Class A and Class T shares are subject to a sales charge imposed at the time of purchase. Class C shares are subject to a contingent deferred sales charge (“CDSC”) on Class C shares redeemed within one year of purchase. Class I shares are sold at net asset value per share only to institutional investors. Other differences between the classes include the services offered to and the expenses borne by each class, the allocation of certain transfer agency cost and certain voting rights. Income, expenses (other than expenses attributable to a specific class), and realized and unrealized gains or losses on investments are allocated to each class of shares based on its relative net assets.
As of November 30, 2007, MBC Investments Corp., an indirect subsidiary of BNY Mellon, held all of the outstanding Class T shares.
The Company accounts separately for the assets, liabilities and operations of each series. Expenses directly attributable to each series are charged to that series’ operations; expenses which are applicable to all series are allocated among them on a pro rata basis.
The fund’s financial statements are prepared in accordance with U.S. generally accepted accounting principles, which may require the use of management estimates and assumptions. Actual results could differ from those estimates.
The fund enters into contracts that contain a variety of indemnifications. The fund’s maximum exposure under these arrangements is unknown.The fund does not anticipate recognizing any loss related to these arrangements.
(a) Portfolio valuation: Investments in securities are valued at the last sales price on the securities exchange or national securities market on which such securities are primarily traded. Securities listed on the National Market System for which market quotations are available are valued at the official closing price or, if there is no official closing price that day, at the last sales price. Securities not listed on an exchange or the national securities market, or securities for which there were no transactions, are valued at the average of the most recent bid and asked prices, except for open short positions, where the asked price is used for valuation purposes. Bid price is used when no asked price is available. Registered open-end investment companies that are not traded on an exchange are valued at their net asset value.When market quotations or official closing prices are not readily available, or are determined not to reflect accurately fair value, such as when the value of a security has been significantly affected by events after the close of the exchange or market on which the security is principally traded (for example, a foreign exchange or market), but before the fund calculates its net asset value, the fund may value these investments at fair value as determined
The Fund 17
NOTES TO FINANCIAL STATEMENTS (continued)
|
in accordance with the procedures approved by the Board of Directors. Fair valuing of securities may be determined with the assistance of a pricing service using calculations based on indices of domestic securities and other appropriate indicators, such as prices of relevant ADR’s and futures contracts. For other securities that are fair valued by the Board of Directors, certain factors may be considered such as: fundamental analytical data, the nature and duration of restrictions on disposition, an evaluation of the forces that influence the market in which the securities are purchased and sold and public trading in similar securities of the issuer or comparable issuers. Financial futures are valued at the last sales price. Investments denominated in foreign currencies are translated to U.S. dollars at the prevailing rates of exchange. Forward currency exchange contracts are valued at the forward rate.
The Financial Accounting Standards Board (“FASB”) released Statement of Financial Accounting Standards No. 157 “Fair Value Measurements” (“FAS 157”). FAS 157 establishes an authoritative definition of fair value, sets out a framework for measuring fair value, and requires additional disclosures about fair-value measurements. The application of FAS 157 is required for fiscal years beginning after November 15, 2007 and interim periods within those fiscal years. Management does not believe that the application of this standard will have a material impact on the financial statements of the fund.
(b) Foreign currency transactions: The fund does not isolate that portion of the results of operations resulting from changes in foreign exchange rates on investments from the fluctuations arising from changes in market prices of securities held. Such fluctuations are included with the net realized and unrealized gains or losses on investments.
Net realized foreign exchange gains or losses arise from sales and maturities of short-term securities, sales of foreign currencies, currency gains or losses realized on securities transactions and the difference between the amounts of dividends, interest and foreign withholding taxes recorded on the fund’s books and the U.S. dollar equivalent of the amounts actually received or paid. Net unrealized foreign exchange
gains or losses arise from changes in the value of assets and liabilities other than investments in securities, resulting from changes in exchange rates. Such gains and losses are included with net realized and unrealized gains or losses on investments.
(c) Securities transactions and investment income: Securities transactions are recorded on a trade date basis. Realized gains and losses from securities transactions are recorded on the identified cost basis. Dividend income is recognized on the ex-dividend date and interest income, including, where applicable, accretion of discount and amortization of premium on investments, is recognized on the accrual basis.
The fund has an arrangement with the custodian bank whereby the fund receives earnings credits from the custodian when positive cash balances are maintained, which are used to offset custody fees. For financial reporting purposes, the fund includes net earnings credits as an expense offset in the Statement of Operations.
(d) Affiliated issuers: Investments in other investment companies advised by Dreyfus are defined as “affiliated” in the Act.
(e) Dividends to shareholders: Dividends are recorded on the ex-dividend date. Dividends from investment income-net and dividends from net realized capital gains, if any, are normally declared and paid annually, but the fund may make distributions on a more frequent basis to comply with the distribution requirements of the Internal Revenue Code of 1986, as amended (the “Code”).To the extent that net realized capital gains can be offset by capital loss carryovers, if any, it is the policy of the fund not to distribute such gains. Income and capital gains distributions are determined in accordance with income tax regulations, which may differ from U.S. generally accepted accounting principles.
(f) Federal income taxes: It is the policy of the fund to continue to qualify as a regulated investment company, if such qualification is in the best interests of its shareholders, by complying with the applicable provisions of the Code, and to make distributions of taxable income sufficient to relieve it from substantially all federal income and excise taxes.
The Fund 19
NOTES TO FINANCIAL STATEMENTS (continued)
|
The FASB released FASB Interpretation No. 48 “Accounting for Uncertainty in Income Taxes” (FIN 48). FIN 48 provides guidance for how uncertain tax positions should be recognized, measured, presented and disclosed in the financial statements. FIN 48 requires the evaluation of tax positions taken or expected to be taken in the course of preparing the fund’s tax returns to determine whether the tax positions are “more-likely-than-not” of being sustained by the applicable tax authority. Tax positions not deemed to meet the more-likely-than-not threshold would be recorded as a tax benefit or expense in the current year.Adoption of FIN 48 is required for fiscal years beginning after December 15, 2006. Management believes that the application of this standard does not have a material impact on the financial statements of the fund.
At November 30, 2007, the components of accumulated earnings on a tax basis were as follows: undistributed ordinary income $722,699 and unrealized appreciation $5,242,953. In addition, the fund had $75 of capital losses realized after October 31, 2007 which were deferred for tax purposes to the first day of the following fiscal year.
During the period ended November 30, 2007, as a result of permanent book to tax differences, primarily due to the tax treatment for foreign currency gains and losses, the fund decreased accumulated undistributed investment income-net by $37,176 and increased accumulated net realized gain (loss) on investments by the same amount. Net assets and net asset value per share were not affected by this reclassification.
NOTE 2—Bank Line of Credit:
|
The fund participates with other Dreyfus-managed funds in a $350 million redemption credit facility (the “Facility”) to be utilized for temporary or emergency purposes, including the financing of redemptions. In connection therewith, the fund has agreed to pay commitment fees on its pro rata portion of the Facility. Interest is charged to the fund based on prevailing market rates in effect at the time of borrowings. During the period ended November 30, 2007, the fund did not borrow under the Facility.
NOTE 3—Management Fee, Sub-Investment Advisory Fee and Other Transactions With Affiliates:
(a) Pursuant to a management agreement (“Agreement”) with Dreyfus, the management fee is computed at the annual rate of .85% of the value of the fund’s average daily net assets and is payable monthly. Dreyfus has contractually agreed to waive receipt of its fees and/or assume the expenses of the fund, until May 31, 2008, so that annual fund operating expenses (excluding Rule 12b-1 fees, shareholder services fees, taxes, interest, brokerage commissions, commitment fees on borrowings and extraordinary expenses) do not exceed 1.25% of the fund’s average daily net assets.The reduction in management fee, pursuant to the undertak-ing,amounted to $60,394 during the period ended November 30,2007.
During the period ended November 30, 2007, the Distributor retained $1,880 from commissions earned on sales of the fund’s Class A shares.
Pursuant to a Sub-Investment Advisory Agreement between Dreyfus and WSPL, Dreyfus pays WSPL a monthly fee at an annual percentage of the fund’s average daily net assets.
(b) Under the Distribution Plan (the “Plan”) adopted pursuant to Rule 12b-1 under the Act, Class C and Class T shares pay the Distributor for distributing their shares at an annual rate of .75% of the value of the average daily net assets of Class C shares and .25% of the value of the average daily net assets of Class T shares. During the period ended November 30, 2007, Class C and Class T shares were charged $4,015 and $836, respectively, pursuant to the Plan.
(c) Under the Shareholder Services Plan, Class A, Class C and Class T shares pay the Distributor at an annual rate of .25% of the value of their average daily net assets for the provision of certain services.The services provided may include personal services relating to shareholder accounts, such as answering shareholder inquiries regarding Class A, Class C and Class T shares and providing reports and other information, and services related to the maintenance of shareholder accounts.
The Fund 21
NOTES TO FINANCIAL STATEMENTS (continued)
|
The Distributor may make payments to Service Agents (a securities dealer, financial institution or other industry professional) in respect of these services.The Distributor determines the amounts to be paid to Service Agents. During the period ended November 30, 2007, Class A, Class C and Class T shares were charged $7,386, $1,338 and $836, respectively, pursuant to the Shareholder Services Plan.
The fund compensates Dreyfus Transfer, Inc., a wholly-owned subsidiary of Dreyfus, under a transfer agency agreement for providing personnel and facilities to perform transfer agency services for the fund. During the period ended November 30, 2007, the fund was charged $927 pursuant to the transfer agency agreement.
Effective July 1, 2007, the fund’s custodian, The Bank of New York, became an affiliate of the Manager. Under the fund’s pre-existing custody agreement with The Bank of New York, the fund was charged $36,926 for providing custodial services for the fund for the five months ended November 30, 2007. Prior to becoming an affiliate,The Bank of New York was paid $40,119 for the custody services to the fund for the six months ended June 30, 2007.
During the period ended November 30, 2007, the fund was charged $4,740 for services performed by the Chief Compliance Officer.
The components of “Due to The Dreyfus Corporation and affiliates” in the Statement of Assets and Liabilities consist of: management fees $48,138, Rule 12b-1 distribution plan fees $273, shareholder services plan fees $366, custodian fees $28,777, chief compliance officer fees $3,214 and transfer agency per account fees $178,which are offset against an expense reimbursement currently in effect in the amount of $4,495.
(d) Each Board member also serves as a Board member of other funds within the Dreyfus complex. Annual retainer fees and attendance fees are allocated to each fund based on net assets.
NOTE 4—Securities Transactions:
|
The aggregate amount of purchases and sales of investment securities, excluding short-term securities and forward currency exchange con-
tracts, during the period ended November 30, 2007, amounted to $69,485,783 and $5,814,195, respectively.
The fund enters into forward currency exchange contracts in order to hedge its exposure to changes in foreign currency exchange rates on its foreign portfolio holdings and to settle foreign currency transactions. When executing forward currency exchange contracts, the fund is obligated to buy or sell a foreign currency at a specified rate on a certain date in the future.With respect to sales of forward currency exchange contracts, the fund would incur a loss if the value of the contract increases between the date the forward contract is opened and the date the forward contract is closed.The fund realizes a gain if the value of the contract decreases between those dates.With respect to purchases of forward currency exchange contracts, the fund would incur a loss if the value of the contract decreases between the date the forward contract is opened and the date the forward contract is closed.The fund realizes a gain if the value of the contract increases between those dates. The fund is also exposed to credit risk associated with counterparty nonperformance on these forward currency exchange contracts which is typically limited to the unrealized gain on each open contract.At November 30, 2007, there were no forward currency exchange contracts outstanding.
At November 30, 2007, the cost of investments for federal income tax purposes was $65,301,462; accordingly, accumulated net unrealized appreciation on investments was $5,240,718, consisting of $7,881,791 gross unrealized appreciation and $2,641,073 gross unrealized depreciation.
A redemption fee of 2% will be assessed on redemptions (including exchanges) of fund shares purchased on or after December 1, 2007, and held for less than sixty days.
The Fund 23
REPORT OF INDEPENDENT REGISTERED
PUBLIC ACCOUNTING FIRM
|
Shareholders and Board of Directors
International Stock Fund
|
We have audited the accompanying statement of assets and liabilities, including the statement of investments, of International Stock Fund (one of the funds comprising Strategic Funds, Inc.) as of November 30, 2007, and the related statement of operations, the statement of changes in net assets and financial highlights for the period from December 29, 2006 (commencement of operations) to November 30, 2007.These financial statements and financial highlights are the responsibility of the Fund’s management. Our responsibility is to express an opinion on these financial statements and financial highlights based on our audit.
We conducted our audit in accordance with the standards of the Public Company Accounting Oversight Board (United States). Those standards require that we plan and perform the audit to obtain reasonable assurance about whether the financial statements and financial highlights are free of material misstatement.We were not engaged to perform an audit of the Fund’s internal control over financial reporting. Our audit included consideration of internal control over financial reporting as a basis for designing audit procedures that are appropriate in the circumstances, but not for the purpose of expressing an opinion on the effectiveness of the Fund’s internal control over financial reporting. Accordingly, we express no such opinion. An audit also includes examining, on a test basis, evidence supporting the amounts and disclosures in the financial statements and financial highlights, assessing the accounting principles used and significant estimates made by management, and evaluating the overall financial statement presentation. Our procedures included confirmation of securities owned as of November 30, 2007 by correspondence with the custodian and others.We believe that our audit provides a reasonable basis for our opinion.
In our opinion, the financial statements and financial highlights referred to above present fairly, in all material respects, the financial position of International Stock Fund at November 30, 2007, and the results of its operations, the changes in its net assets and the financial highlights for the period from December 29, 2006 to November 30, 2007, in conformity with U. S. generally accepted accounting principles.

New York, New York
January 18, 2008
|
IMPORTANT TAX INFORMATION ( U n a u d i t e d )
In accordance with federal tax law, the fund elects to provide each shareholder with their portion of the fund’s foreign taxes paid and the income sourced from foreign countries.Accordingly, the fund hereby makes the following designations regarding its fiscal year ended November 30,2007:
- the total amount of taxes paid to foreign countries was $40,242.
- the total amount of income sourced from foreign countries was $489,858.
As required by federal tax law rules, shareholders will receive notification of their proportionate share of foreign taxes paid and foreign sourced income for the 2007 calendar year with Form 1099-DIV which will be mailed by January 31, 2008.
The Fund 25
BOARD MEMBERS INFORMATION ( U n a u d i t e d )
Joseph S. DiMartino (64)
Chairman of the Board (1995)
|
Principal Occupation During Past 5 Years:
• Corporate Director and Trustee
|
Other Board Memberships and Affiliations:
|
- The Muscular Dystrophy Association, Director
- Century Business Services, Inc., a provider of outsourcing functions for small and medium size companies, Director
- The Newark Group, a provider of a national market of paper recovery facilities, paperboard mills and paperboard converting plants, Director
- Sunair Services Corporation, a provider of certain outdoor-related services to homes and businesses, Director
No. of Portfolios for which Board Member Serves: 164 ———————
David W. Burke (71) Board Member (1994)
Principal Occupation During Past 5 Years:
• Corporate Director and Trustee.
|
Other Board Memberships and Affiliations:
• John F. Kennedy Library Foundation, Director
|
No. of Portfolios for which Board Member Serves: 86 ———————
William Hodding Carter III (72) Board Member (1988)
Principal Occupation During Past 5 Years:
|
- Professor of Leadership & Public Policy, University of North Carolina, Chapel Hill (January 1, 2006-present)
- President and Chief Executive Officer of the John S. and James L. Knight Foundation (February 1, 1998-February 1, 2006)
Other Board Memberships and Affiliations:
|
- The Century Foundation, Emeritus Director
- The Enterprise Corporation of the Delta, Director
No. of Portfolios for which Board Member Serves: 27 ———————
Gordon J. Davis (66) Board Member (2006)
Principal Occupation During Past 5 Years:
|
- Partner in the law firm of Dewey and LeBoeuf, LLP
- President, Lincoln Center for the Performing Arts, Inc. (2001)
Other Board Memberships and Affiliations:
|
- Consolidated Edison, Inc., a utility company, Director
- Phoenix Companies, Inc., a life insurance company, Director
- Board Member/Trustee for several not-for-profit groups
No. of Portfolios for which Board Member Serves: 37
26
|
Joni Evans (65)
Board Member (2006)
|
Principal Occupation During Past 5 Years:
|
- Principal, Joni Evans Ltd.
- Senior Vice President of the William Morris Agency (2005)
No. of Portfolios for which Board Member Serves: 27 ———————
Ehud Houminer (67) Board Member (1994)
Principal Occupation During Past 5 Years:
• Executive-in-Residence at the Columbia Business School, Columbia University
Other Board Memberships and Affiliations:
|
- Avnet Inc., an electronics distributor, Director
- International Advisory Board to the MBA Program School of Management, Ben Gurion University, Chairman
No. of Portfolios for which Board Member Serves: 67 ———————
Richard C. Leone (67) Board Member (1984)
Principal Occupation During Past 5 Years:
|
- President of The Century Foundation (formerly,The Twentieth Century Fund, Inc.), a tax exempt research foundation engaged in the study of economic, foreign policy and domestic issues
Other Board Memberships and Affiliations:
|
- The American Prospect, Director
- Center for American Progress, Director
No. of Portfolios for which Board Member Serves: 27 ———————
Hans C. Mautner (70) Board Member (1984)
Principal Occupation During Past 5 Years:
|
- President—International Division and an Advisory Director of Simon Property Group, a real estate investment company (1998-present)
- Director and Vice Chairman of Simon Property Group (1998-2003)
- Chairman and Chief Executive Officer of Simon Global Limited (1999-present)
Other Board Memberships and Affiliations:
|
- Capital and Regional PLC, a British co-investing real estate asset manager, Director
- Member - Board of Managers of: Mezzacappa Long/Short Fund LLC
Mezzacappa Partners LLC
No. of Portfolios for which Board Member Serves: 27
|
The Fund 27
BOARD MEMBERS INFORMATION ( U n a u d i t e d ) (continued)
Robin A. Melvin (44)
Board Member (1995)
|
Principal Occupation During Past 5 Years:
|
- Director, Boisi Family Foundation, a private family foundation that supports youth-serving organizations that promote the self sufficiency of youth from disadvantaged circumstances
No. of Portfolios for which Board Member Serves: 27
|
———————
Burton N. Wallack (57) Board Member (2006)
Principal Occupation During Past 5 Years:
• President and co-owner of Wallack Management Company, a real estate management company
No. of Portfolios for which Board Member Serves: 27
|
John E. Zuccotti (70)
Board Member (1984)
|
Principal Occupation During Past 5 Years:
|
- Chairman of Brookfield Financial Properties, Inc.
- Senior Counsel of Weil, Gotshal & Manges, LLP
- Chairman of the Real Estate Board of New York
Other Board Memberships and Affiliations:
|
- Emigrant Savings Bank, Director
- Wellpoint, Inc., Director
- Visiting Nurse Service of New York, Director
- Columbia University,Trustee
- Doris Duke Charitable Foundation,Trustee
No. of Portfolios for which Board Member Serves: 27
|
Once elected all Board Members serve for an indefinite term, but achieve Emeritus status upon reaching age 80.The address of the Board Members and Officers is in c/o The Dreyfus Corporation, 200 Park Avenue, New York, New York 10166. Additional information about the Board Members is available in the fund’s Statement of Additional Information which can be obtained from Dreyfus free of charge by calling this toll free number: 1-800-554-4611.
Arnold S. Hiatt, Emeritus Board Member
|
OFFICERS OF THE FUND ( U n a u d i t e d )
| J. DAVID OFFICER, President since | | JONI LACKS CHARATAN, Vice President |
| December 2006. | | and Assistant Secretary since |
| Chief Operating Officer,Vice Chairman and a | | August 2005. |
| Director of the Manager, and an officer of 81 | | Associate General Counsel of the Manager, |
| investment companies (comprised of 163 | | and an officer of 82 investment companies |
| portfolios) managed by the Manager. He is 59 | | (comprised of 180 portfolios) managed by the |
| years old and has been an employee of the | | Manager. She is 52 years old and has been an |
| Manager since April 1998. | | employee of the Manager since October 1988. |
| |
| PHILLIP N. MAISANO, Executive Vice | | JOSEPH M. CHIOFFI, Vice President and |
| President since July 2007. | | Assistant Secretary since August 2005. |
| Chief Investment Officer,Vice Chair and a | | Associate General Counsel of the Manager, |
| director of the Manager, and an officer of 81 | | and an officer of 82 investment companies |
| investment companies (comprised of 163 | | (comprised of 180 portfolios) managed by the |
| portfolios) managed by the Manager. Mr. | | Manager. He is 46 years old and has been an |
| Maisano also is an officer and/or Board | | employee of the Manager since June 2000. |
| member of certain other investment | | |
| management subsidiaries of The Bank of New | | JANETTE E. FARRAGHER, Vice President |
| York Mellon Corporation, each of which is an | | and Assistant Secretary since |
| affiliate of the Manager. He is 60 years old and | | August 2005. |
| has been an employee of the Manager since | | Associate General Counsel of the Manager, |
| November 2006. Prior to joining the Manager, | | and an officer of 82 investment companies |
| Mr. Maisano served as Chairman and Chief | | (comprised of 180 portfolios) managed by the |
| Executive Officer of EACM Advisors, an | | Manager. She is 44 years old and has been an |
| affiliate of the Manager, since August 2004, and | | employee of the Manager since February 1984. |
| served as Chief Executive Officer of Evaluation | | JOHN B. HAMMALIAN, Vice President and |
| Associates, a leading institutional investment | | Assistant Secretary since August 2005. |
| consulting firm, from 1988 until 2004. | | |
| | | Associate General Counsel of the Manager, |
| MICHAEL A. ROSENBERG, Vice President | | and an officer of 82 investment companies |
| and Secretary since August 2005. | | (comprised of 180 portfolios) managed by the |
| Associate General Counsel of the Manager, | | Manager. He is 44 years old and has been an |
| and an officer of 82 investment companies | | employee of the Manager since February 1991. |
| (comprised of 180 portfolios) managed by the | | ROBERT R. MULLERY, Vice President and |
| Manager. He is 47 years old and has been an | | Assistant Secretary since August 2005. |
| employee of the Manager since October 1991. | | |
| | | Associate General Counsel of the Manager, |
| JAMES BITETTO, Vice President and | | and an officer of 82 investment companies |
| Assistant Secretary since August 2005. | | (comprised of 180 portfolios) managed by the |
| Associate General Counsel and Secretary of | | Manager. He is 55 years old and has been an |
| the Manager, and an officer of 82 investment | | employee of the Manager since May 1986. |
| companies (comprised of 180 portfolios) | | |
| managed by the Manager. He is 41 years old | | |
| and has been an employee of the Manager | | |
| since December 1996. | | |
The Fund 29
OFFICERS OF THE FUND (Unaudited) (continued)
| JEFF PRUSNOFSKY, Vice President and | | GAVIN C. REILLY, Assistant Treasurer |
| Assistant Secretary since August 2005. | | since December 2005. |
| Associate General Counsel of the Manager, | | Tax Manager of the Investment Accounting |
| and an officer of 82 investment companies | | and Support Department of the Manager, and |
| (comprised of 180 portfolios) managed by the | | an officer of 82 investment companies |
| Manager. He is 42 years old and has been an | | (comprised of 180 portfolios) managed by the |
| employee of the Manager since October 1990. | | Manager. He is 39 years old and has been an |
| |
| JAMES WINDELS, Treasurer since | | employee of the Manager since April 1991. |
| November 2001. | | JOSEPH W. CONNOLLY, Chief Compliance |
| Director – Mutual Fund Accounting of the | | Officer since October 2004. |
| Manager, and an officer of 82 investment | | Chief Compliance Officer of the Manager and |
| companies (comprised of 180 portfolios) | | The Dreyfus Family of Funds (82 investment |
| managed by the Manager. He is 49 years old | | companies, comprised of 180 portfolios). From |
| and has been an employee of the Manager | | November 2001 through March 2004, Mr. |
| since April 1985. | | Connolly was first Vice-President, Mutual |
| |
| ROBERT ROBOL, Assistant Treasurer | | Fund Servicing for Mellon Global Securities |
| since August 2005. | | Services. In that capacity, Mr. Connolly was |
| | | responsible for managing Mellon’s Custody, |
| Senior Accounting Manager – Money Market | | Fund Accounting and Fund Administration |
| and Municipal Bond Funds of the Manager, | | services to third-party mutual fund clients. He |
| and an officer of 82 investment companies | | is 50 years old and has served in various |
| (comprised of 180 portfolios) managed by the | | capacities with the Manager since 1980, |
| Manager. He is 43 years old and has been an | | including manager of the firm’s Fund |
| employee of the Manager since October 1988. | | Accounting Department from 1997 through |
| ROBERT SALVIOLO, Assistant Treasurer | | October 2001. |
| since May 2007. | | WILLIAM GERMENIS, Anti-Money |
| Senior Accounting Manager – Equity Funds of | | Laundering Compliance Officer since |
| the Manager, and an officer of 82 investment | | September 2002. |
| companies (comprised of 180 portfolios) | | Vice President and Anti-Money Laundering |
| managed by the Manager. He is 40 years old | | Compliance Officer of the Distributor, and the |
| and has been an employee of the Manager | | Anti-Money Laundering Compliance Officer |
| since June 1989. | | of 78 investment companies (comprised of 176 |
| ROBERT SVAGNA, Assistant Treasurer | | portfolios) managed by the Manager. He is 37 |
| since December 2002. | | years old and has been an employee of the |
| | | Distributor since October 1998. |
| Senior Accounting Manager – Equity Funds of | | |
| the Manager, and an officer of 82 investment | | |
| companies (comprised of 180 portfolios) | | |
| managed by the Manager. He is 40 years old | | |
| and has been an employee of the Manager | | |
| since November 1990. | | |
NOTES
For More Information

The fund files its complete schedule of portfolio holdings with the Securities and Exchange Commission (“SEC”) for the first and third quarters of each fiscal year on Form N-Q. The fund’s Forms N-Q are available on the SEC’s website at http://www.sec.gov and may be reviewed and copied at the SEC’s Public Reference Room in Washington, DC. Information on the operation of the Public Reference Room may be obtained by calling 1-202-551-8090.
A description of the policies and procedures that the fund uses to determine how to vote proxies relating to portfolio securities, and information regarding how the fund voted these proxies for the 12-month period ended June 30, 2007, is available at http://www.dreyfus.com and on the SEC’s website at http://www.sec.gov. The description of the policies and procedures is also available without charge, upon request, by calling 1-800-645-6561.
© 2008 MBSC Securities Corporation

The Registrant has adopted a code of ethics that applies to the Registrant's principal executive officer, principal financial officer, principal accounting officer or controller, or persons performing similar functions. There have been no amendments to, or waivers in connection with, the Code of Ethics during the period covered by this Report.
| Item 3. | | Audit Committee Financial Expert. |
The Registrant's Board has determined that Joseph S. DiMartino, a member of the Audit Committee of the Board, is an audit committee financial expert as defined by the Securities and Exchange Commission (the "SEC"). Joseph S. DiMartino is "independent" as defined by the SEC for purposes of audit committee financial expert determinations.
| Item 4. | | Principal Accountant Fees and Services |
(a) Audit Fees. The aggregate fees billed for each of the last two fiscal years (the "Reporting Periods") for professional services rendered by the Registrant's principal accountant (the "Auditor") for the audit of the Registrant's annual financial statements, or services that are normally provided by the Auditor in connection with the statutory and regulatory filings or engagements for the Reporting Periods, were $0 in 2006 and $63,968 in 2007.
(b) Audit-Related Fees. The aggregate fees billed in the Reporting Periods for assurance and related services by the Auditor that are reasonably related to the performance of the audit of the Registrant's financial statements and are not reported under paragraph (a) of this Item 4 were $0 in 2006 and $0 in 2007.
The aggregate fees billed in the Reporting Periods for non-audit assurance and related services by the Auditor to the Registrant's investment adviser (not including any sub-investment adviser whose role is primarily portfolio management and is subcontracted with or overseen by another investment adviser), and any entity controlling, controlled by or under common control with the investment adviser that provides ongoing services to the Registrant ("Service Affiliates"), that were reasonably related to the performance of the annual audit of the Service Affiliate, which required pre-approval by the Audit Committee were $0 in 2006 and $0 in 2007.
Note: For the second paragraph in each of (b) through (d) of this Item 4, certain of such services were not pre-approved prior to May 6, 2003, when such services were required to be pre-approved. On and after May 6, 2003, 100% of all services provided by the Auditor were pre-approved as required. For comparative purposes, the fees shown assume that all such services were pre-approved, including services that were not pre-approved prior to the compliance date of the pre-approval requirement.
(c) Tax Fees. The aggregate fees billed in the Reporting Periods for professional services rendered by the Auditor for tax compliance, tax advice and tax planning ("Tax Services") were $0 in 2006 and $1,323 in 2007. These services consisted of (i) review or preparation of U.S. federal, state, local and excise tax returns; (ii) U.S. federal, state and local tax planning, advice and assistance regarding statutory, regulatory or administrative developments, (iii) tax advice regarding tax qualification matters and/or treatment of various
-2-
financial instruments held or proposed to be acquired or held, and (iv) determination of Passive Foreign Investment Companies.
The aggregate fees billed in the Reporting Periods for Tax Services by the Auditor to Service Affiliates which required pre-approval by the Audit Committee were $0 in 2006 and $0 in 2007.
(d) All Other Fees. The aggregate fees billed in the Reporting Periods for products and services provided by the Auditor, other than the services reported in paragraphs (a) through (c) of this Item, were $0 in 2006 and $0 in 2007.
The aggregate fees billed in the Reporting Periods for Non-Audit Services by the Auditor to Service Affiliates, other than the services reported in paragraphs (b) through (c) of this Item, which required pre-approval by the Audit Committee were $0 in 2006 and $0 in 2007.
Audit Committee Pre-Approval Policies and Procedures. The Registrant's Audit Committee has established policies and procedures (the "Policy") for pre-approval (within specified fee limits) of the Auditor's engagements for non-audit services to the Registrant and Service Affiliates without specific case-by-case consideration. Pre-approval considerations include whether the proposed services are compatible with maintaining the Auditor's independence. Pre-approvals pursuant to the Policy are considered annually.
Non-Audit Fees. The aggregate non-audit fees billed by the Auditor for services rendered to the Registrant, and rendered to Service Affiliates, for the Reporting Periods were $375,571 in 2006 and $1,890,737 in 2007.
Auditor Independence. The Registrant's Audit Committee has considered whether the provision of non-audit services that were rendered to Service Affiliates which were not pre-approved (not requiring pre-approval) is compatible with maintaining the Auditor's independence.
| Item 5. | | Audit Committee of Listed Registrants. |
| | | Not applicable. |
| Item 6. | | Schedule of Investments. |
| | | Not applicable. |
| Item 7. | | Disclosure of Proxy Voting Policies and Procedures for Closed-End Management |
| | | Investment Companies. |
| | | Not applicable. |
| Item 8. | | Portfolio Managers of Closed-End Management Investment Companies. |
| | | Not applicable. |
| Item 9. | | Purchases of Equity Securities by Closed-End Management Investment Companies and |
| | | Affiliated Purchasers. |
| | | Not applicable. |
| Item 10. | | Submission of Matters to a Vote of Security Holders. |
-3-
The Registrant has a Nominating Committee (the "Committee"), which is responsible for selecting and nominating persons for election or appointment by the Registrant's Board as Board members. The Committee has adopted a Nominating Committee Charter (the "Charter"). Pursuant to the Charter, the Committee will consider recommendations for nominees from shareholders submitted to the Secretary of the Registrant, c/o The Dreyfus Corporation Legal Department, 200 Park Avenue, 8th Floor East, New York, New York 10166. A nomination submission must include information regarding the recommended nominee as specified in the Charter. This information includes all information relating to a recommended nominee that is required to be disclosed in solicitations or proxy statements for the election of Board members, as well as information sufficient to evaluate the factors to be considered by the Committee, including character and integrity, business and professional experience, and whether the person has the ability to apply sound and independent business judgment and would act in the interests of the Registrant and its shareholders.
Nomination submissions are required to be accompanied by a written consent of the individual to stand for election if nominated by the Board and to serve if elected by the shareholders, and such additional information must be provided regarding the recommended nominee as reasonably requested by the Committee.
| Item 11. | | Controls and Procedures. |
(a) The Registrant's principal executive and principal financial officers have concluded, based on their evaluation of the Registrant's disclosure controls and procedures as of a date within 90 days of the filing date of this report, that the Registrant's disclosure controls and procedures are reasonably designed to ensure that information required to be disclosed by the Registrant on Form N-CSR is recorded, processed, summarized and reported within the required time periods and that information required to be disclosed by the Registrant in the reports that it files or submits on Form N-CSR is accumulated and communicated to the Registrant's management, including its principal executive and principal financial officers, as appropriate to allow timely decisions regarding required disclosure.
(b) There were no changes to the Registrant's internal control over financial reporting that occurred during the second fiscal quarter of the period covered by this report that have materially affected, or are reasonably likely to materially affect, the Registrant's internal control over financial reporting.
(a)(1) Code of ethics referred to in Item 2.
(a)(2) Certifications of principal executive and principal financial officers as required by Rule 30a-2(a) under the Investment Company Act of 1940.
(a)(3) Not applicable.
(b) Certification of principal executive and principal financial officers as required by Rule 30a-2(b) under the Investment Company Act of 1940.
-4-
SIGNATURES
Pursuant to the requirements of the Securities Exchange Act of 1934 and the Investment Company Act of 1940, the Registrant has duly caused this Report to be signed on its behalf by the undersigned, thereunto duly authorized.
STRATEGIC FUNDS, INC
| By: | | /s/ J. David Officer |
| | | J. David Officer |
| | | President |
| |
| Date: | | January 24, 2008 |
Pursuant to the requirements of the Securities Exchange Act of 1934 and the Investment Company Act of 1940, this Report has been signed below by the following persons on behalf of the Registrant and in the capacities and on the dates indicated.
| By: | | /s/ J. David Officer |
| | | J. David Officer |
| | | President |
| |
| Date: | | January 24, 2008 |
| By: | | /s/ James Windels |
| | | James Windels |
| | | Treasurer |
| |
| Date: | | January 24, 2008 |
EXHIBIT INDEX
(a)(1) Code of ethics referred to in Item 2.
(a)(2) Certifications of principal executive and principal financial officers as required by Rule 30a-2(a) under the Investment Company Act of 1940. (EX-99.CERT)
(b) Certification of principal executive and principal financial officers as required by Rule 30a-2(b) under the Investment Company Act of 1940. (EX-99.906CERT)
-5-