| UNITED STATES |
| SECURITIES AND EXCHANGE COMMISSION |
| Washington, D.C. 20549 |
| FORM N-CSR |
| CERTIFIED SHAREHOLDER REPORT OF REGISTERED MANAGEMENT |
| INVESTMENT COMPANIES |
| Investment Company Act file number 811-3940 |
| Strategic Funds, Inc. |
| (Exact name of Registrant as specified in charter) |
| c/o The Dreyfus Corporation |
| 200 Park Avenue |
| New York, New York 10166 |
| (Address of principal executive offices) (Zip code) |
| |
| Michael A. Rosenberg, Esq. |
| 200 Park Avenue |
| New York, New York 10166 |
| (Name and address of agent for service) |
| |
| Registrant's telephone number, including area code: (212) 922-6000 |
| Date of fiscal year end: | | 5/31 |
| Date of reporting period: | | 5/31/08 |
The following N-CSR relates only to the Registrant’s series listed below and does not affect the other series of the Registrant, which have different fiscal year ends and, therefore, different N-CSR reporting requirements. Separate N-CSR Forms will be filed for these series, as appropriate.
Emerging Markets Opportunity Fund
|
FORM N-CSR
Item 1. Reports to Stockholders.

Save time. Save paper. View your next shareholder report online as soon as it’s available. Log into www.dreyfus.com and sign up for Dreyfus eCommunications. It’s simple and only takes a few minutes.
The views expressed in this report reflect those of the portfolio manager only through the end of the period covered and do not necessarily represent the views of Dreyfus or any other person in the Dreyfus organization. Any such views are subject to change at any time based upon market or other conditions and Dreyfus disclaims any responsibility to update such views.These views may not be relied on as investment advice and, because investment decisions for a Dreyfus fund are based on numerous factors, may not be relied on as an indication of trading intent on behalf of any Dreyfus fund.
Not FDIC-Insured • Not Bank-Guaranteed • May Lose Value
| Contents |
| |
| | | THE FUND |
| |
|
| 2 | | A Letter from the CEO |
| 3 | | Discussion of Fund Performance |
| 6 | | Fund Performance |
| 8 | | Understanding Your Fund’s Expenses |
| 8 | | Comparing Your Fund’s Expenses |
| | | With Those of Other Funds |
| 9 | | Statement of Investments |
| 14 | | Statement of Assets and Liabilities |
| 15 | | Statement of Operations |
| 16 | | Statement of Changes in Net Assets |
| 18 | | Financial Highlights |
| 22 | | Notes to Financial Statements |
| 31 | | Report of Independent Registered |
| | | Public Accounting Firm |
| 32 | | Important Tax Information |
| 33 | | Board Members Information |
| 36 | | Officers of the Fund |
| FOR MORE INFORMATION |
|
| | | Back Cover |
| Emerging Markets |
| Opportunity Fund |

A LETTER FROM THE CEO
Dear Shareholder:
We are pleased to present this annual report for Emerging Markets Opportunity Fund, covering the 12-month period from June 1, 2007, through May 31, 2008.
Although the international equity markets generally have declined this year due to concerns that the downturn in the U.S. economy might dampen global economic growth, we recently have seen signs of potential improvement.The Federal Reserve Board and other central banks have reduced short-term interest rates and injected liquidity into their banking systems, helping to reassure investors.
At Dreyfus, we believe that the current period of economic uncertainty is likely to be relatively brief by historical standards, but the ensuing recovery may be gradual as financial deleveraging and housing price deflation continue to weigh on economic activity in the United States and other nations that depend on exports to U.S. businesses and con-sumers.The implications of our economic outlook for the international stock markets generally are positive, especially since some of the world’s largest multinational companies are now selling at attractive valuations compared to historical norms.Your financial advisor can help you assess current risks and take advantage of these longer-term opportunities within the context of your overall investment portfolio.
For information about how the fund performed during the reporting period, as well as market perspectives, we have provided a Discussion of Fund Performance given by the fund’s Portfolio Managers.
Thank you for your continued confidence and support.

2

DISCUSSION OF FUND PERFORMANCE
For the period of June 1, 2007, through May 31, 2008, as provided by Hugh Hunter,Tony Hann, Richard Fairgrieve and Bill Rudman, Portfolio Managers, WestLB Mellon Asset Management (USA) LLC, Sub-Investment Adviser
Fund and Market Performance Overview
For the 12-month period ended May 31, 2008, Emerging Markets Opportunity Fund’s Class A shares achieved a total return of 29.25%, Class C shares returned 28.17%, Class I shares returned 29.52% and Class T shares returned 28.79% .1 In comparison, the fund’s benchmark, the Morgan Stanley Capital International Emerging Markets Index (the “Index”), produced a 22.00% total return for the same period.2
The emerging equity markets represented one of the few bright spots in the global financial landscape during the reporting period, as moderate regional economic growth stood in stark contrast to slowing U.S. and European economies. The fund produced higher returns than its benchmark, which we attribute to the success of our country allocation and stock selection strategies.
The Fund’s Investment Approach
The fund seeks long-term capital appreciation by investing at least 80% of its assets in the stocks of companies organized, or with a majority of their assets and operations, in emerging market countries. Normally, the fund will invest in at least ten emerging market countries. The fund may invest in companies of any size.We allocate the fund’s assets among emerging market countries using a top-down, quantitative model that incorporates valuation, currency, momentum, growth, interest-rate and risk factors to determine each country’s weighting relative to the Index. We also consider qualitative factors, such as political and economic developments, and market factors, such as liquidity.To select individual stocks, our bottom-up process focuses on fundamental analysis, including assessments of each company’s management, product lines and competitive positions.
Emerging Markets Held Up Well in Downturn
The emerging equity markets encountered heightened turbulence during the reporting period as the effects of a credit crisis originating
The Fund 3
D I S C U S S I O N O F F U N D P E R F O R M A N C E (continued)
in the U.S. sub-prime mortgage market spread to asset classes throughout the world. Stocks in many of the emerging markets fell sharply early in the reporting period when the credit crisis intensified, but some of these staged a strong recovery later in 2007 as assets continued to flow into investments in developing economies. The first several months of 2008 saw another sharp correction and subsequent recovery as countries with high exposure to commodities, like Brazil,Argentina and Russia, continued to outperform.
It is important to note that while market volatility increased during the reporting period, the emerging markets have not suffered nearly as much as they have in prior downturns. After reforming their fiscal and economic policies, many emerging market governments in the recent past have taken advantage of high commodity prices and low interest rates to pay down debt and build up reserves, making these countries more resilient during global slowdowns and under tighter credit conditions.
Country Allocations and Stock Selections Supported Returns
In this volatile environment, we took advantage of several trading opportunities, tactically increasing and decreasing allocations to certain countries as stock prices fluctuated. This strategy proved particularly successful in Mexico, China, South Africa and Egypt. For example, in China, an overweighted position through the end of 2007 enabled the fund to participate more fully in rallies, and underweighted exposure in 2008 protected the fund from the brunt of price declines. An underweighted position in India helped the fund avoid relative weakness in the sub-continent. On the other hand, the fund received more disappointing results from its relatively light exposure to stocks in Israel and overweighted positions in Hungary and Malaysia.
From a security selection perspective, the fund received strong contributions to relative performance from companies based in a variety of countries. China National Materials represented the fund’s top individual performer for the reporting period, as the supplier of cement, engineering services and non-metal commodities benefited from an ongoing Chinese construction boom. In South Korea, securities and insurance firm Mirae Asset Securities gained substantial value as domestic demand increased for financial services. Taiwan
4
Fertilizer prospered when rising global food prices boosted demand from farmers for agricultural supplies. Both Mirae Asset Securities and Taiwan Fertilizer were sold during the reporting period. In South Africa, steel producer ArcelorMittal South Africa saw earnings rise along with commodity prices. Conversely, financial companies in Russia generally detracted from the fund’s relative performance.
Long-Term Trends Remain Positive Despite Risks
Stocks in the emerging markets ended the reporting period with valuations that were roughly in line with developed markets, but with considerably higher earnings growth. We have found a number of value-oriented opportunities in Russia, South Korea and Poland, but relatively few in China, India and Brazil.
Of course, risks remain, including the possibility that an acceleration of inflation could derail consumer spending if food and energy costs escalate further. Central banks have raised interest rates to forestall inflationary pressures, which could have an adverse impact on economic growth over the short- to intermediate-term. Still, we believe that economic activity is likely to remain positive, and the longer-term prospects of the emerging markets remain bright as these countries mature and increase their share of the global economy.
June 16, 2008
| 1 | | Total return includes reinvestment of dividends and any capital gains paid, and does not take into |
| | | consideration the maximum initial sales charges in the case of Class A and Class T shares, or the |
| | | applicable contingent deferred sales charges imposed on redemptions in the case of Class C shares. |
| | | Had these charges been reflected, returns would have been lower. Past performance is no guarantee |
| | | of future results. Share price and investment return fluctuate such that upon redemption, fund |
| | | shares may be worth more or less than their original cost. Return figures provided reflect the |
| | | absorption of certain fund expenses by The Dreyfus Corporation in effect through September 30, |
| | | 2008, at which time it may be extended, terminated or modified. Had these expenses not been |
| | | absorbed, the fund’s returns would have been lower. |
| | | Part of the fund’s recent performance is attributable to positive returns from its initial public |
| | | offering (IPO) investments. There can be no guarantee that IPOs will have or continue to |
| | | have a positive effect on fund performance. Currently, the fund is relatively small in asset |
| | | size. IPOs tend to have a reduced effect on performance as a fund’s asset base grows. |
| 2 | | SOURCE: LIPPER INC. — Reflects reinvestment of net dividends and, where applicable, |
| | | capital gain distributions.The Morgan Stanley Capital International Emerging Markets (MSCI |
| | | EM) Index is a market capitalization-weighted index composed of companies representative of the |
| | | market structure of 26 emerging market countries in Europe, Latin America and the Pacific Basin. |
The Fund 5
FUND PERFORMANCE
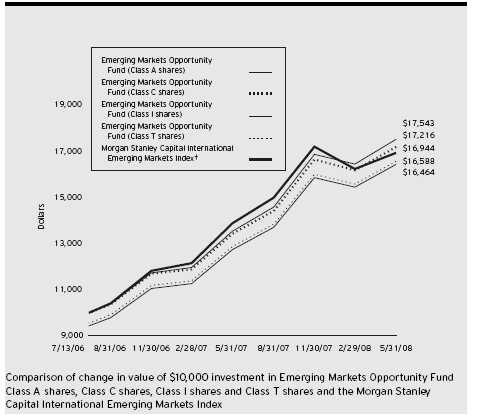
| † Source: Lipper Inc. |
| Past performance is not predictive of future performance. |
| Part of the fund’s recent performance is attributable to positive returns from its initial public offering (IPO) investments. |
| There can be no guarantee that IPOs will have or continue to have a positive effect on fund performance. Currently, the |
| fund is relatively small in asset size. IPOs tend to have a reduced effect on performance as a fund’s asset base grows. |
| The above graph compares a $10,000 investment made in Class A, Class C, Class I and Class T shares of Emerging |
| Markets Opportunity Fund on 7/13/06 (inception date) to a $10,000 investment made in the Morgan Stanley Capital |
| International Emerging Markets Index (the “Index”) on that date. For comparative purposes, the value of the Index on |
| 6/30/06 is used as the beginning value on 7/13/06.All dividends and capital gain distributions are reinvested. |
| The fund’s performance shown in the line graph above takes into account the maximum initial sales charge on Class A |
| shares and all other applicable fees and expenses on all classes.The Index is a market capitalization-weighted index |
| composed of companies representative of the market structure of 26 emerging market countries in Europe, Latin America |
| and the Pacific Basin.The Index excludes closed markets and those shares in otherwise free markets that are not |
| purchasable by foreigners.The Index includes gross dividends reinvested.These factors can contribute to the Index |
| potentially outperforming the fund. Unlike a mutual fund, the Index is not subject to charges, fees and other expenses. |
| Investors cannot invest directly in any index. Further information relating to fund performance, including expense |
| reimbursements, if applicable, is contained in the Financial Highlights section of the prospectus and elsewhere in this report. |
6
| Average Annual Total Returns | | as of | | 5/31/08 | | | | |
| |
| | | | | Inception | | | | From |
| | | | | Date | | 1 Year | | Inception |
| |
| |
| |
| |
|
| Class A shares | | | | | | | | |
| with maximum sales charge (5.75%) | | | | 7/13/06 | | 21.79% | | 30.37% |
| without sales charge | | | | 7/13/06 | | 29.25% | | 34.53% |
| Class C shares | | | | | | | | |
| with applicable redemption charge † | | | | 7/13/06 | | 27.17% | | 33.51% |
| without redemption | | | | 7/13/06 | | 28.17% | | 33.51% |
| Class I shares | | | | 7/13/06 | | 29.52% | | 34.85% |
| Class T shares | | | | | | | | |
| with applicable sales charge (4.5%) | | | | 7/13/06 | | 23.00% | | 30.89% |
| without sales charge | | | | 7/13/06 | | 28.79% | | 34.15% |
| Past performance is not predictive of future performance.The fund’s performance shown in the graph and table does not |
| reflect the deduction of taxes that a shareholder would pay on fund distributions or the redemption of fund shares. |
| † The maximum contingent deferred sales charge for Class C shares is 1% for shares redeemed within one year of the |
| date of purchase. |
The Fund 7
UNDERSTANDING YOUR FUND’S EXPENSES (Unaudited)
As a mutual fund investor, you pay ongoing expenses, such as management fees and other expenses. Using the information below, you can estimate how these expenses affect your investment and compare them with the expenses of other funds.You also may pay one-time transaction expenses, including sales charges (loads) and redemption fees, which are not shown in this section and would have resulted in higher total expenses. For more information, see your fund’s prospectus or talk to your financial adviser.
Review your fund’s expenses
The table below shows the expenses you would have paid on a $1,000 investment in Emerging Markets Opportunity Fund from December 1, 2007 to May 31, 2008. It also shows how much a $1,000 investment would be worth at the close of the period, assuming actual returns and expenses.
| Expenses and Value of a $1,000 Investment | | | | | | |
| assuming actual returns for the six months ended May 31, 2008 | | | | |
| | | Class A | | Class C | | Class I | | Class T |
| |
| |
| |
| |
|
| Expenses paid per $1,000 † | | $ 10.19 | | $ 13.98 | | $ 8.92 | | $ 11.45 |
| Ending value (after expenses) | | $1,037.60 | | $1,033.70 | | $1,039.20 | | $1,036.00 |
| COMPARING YOUR FUND’S EXPENSES |
| WITH THOSE OF OTHER FUNDS (Unaudited) |
Using the SEC’s method to compare expenses
The Securities and Exchange Commission (SEC) has established guidelines to help investors assess fund expenses. Per these guidelines, the table below shows your fund’s expenses based on a $1,000 investment, assuming a hypothetical 5% annualized return. You can use this information to compare the ongoing expenses (but not transaction expenses or total cost) of investing in the fund with those of other funds.All mutual fund shareholder reports will provide this information to help you make this comparison. Please note that you cannot use this information to estimate your actual ending account balance and expenses paid during the period.
| Expenses and Value of a $1,000 Investment | | | | | | |
| assuming a hypothetical 5% annualized return for the six months ended May 31, 2008 |
| | | Class A | | Class C | | Class I | | Class T |
| |
| |
| |
| |
|
| Expenses paid per $1,000 † | | $ 10.08 | | $ 13.83 | | $ 8.82 | | $ 11.33 |
| Ending value (after expenses) | | $1,015.00 | | $1,011.25 | | $1,016.25 | | $1,013.75 |
| † Expenses are equal to the fund’s annualized expense ratio of 2.00% for Class A, 2.75% for Class C, 1.75% for |
| Class I and 2.25% for Class T, multiplied by the average account value over the period, multiplied by 183/366 |
| (to reflect the one-half year period). |
8
| STATEMENT OF INVESTMENTS |
| M a y 3 1 , 2 0 0 8 |
| Common Stocks—96.5% | | Shares | | Value ($) |
| |
| |
|
| Brazil—10.1% | | | | |
| Banco Bradesco, ADR | | 8,450 | | 202,885 |
| Cia Brasileira de Distribuicao | | | | |
| Grupo Pao de Acucar, ADR | | 2,200 | | 103,796 |
| Cia Vale do Rio Doce (Preferred), Cl. A, ADR | | 14,000 | | 461,020 |
| Cia Vale do Rio Doce, ADR | | 5,400 | | 214,812 |
| Dufry South America | | 8,300 a | | 197,741 |
| Investimentos Itau (Rights) | | 353 a | | 553 |
| MRV Engenharia e Participacoes | | 10,000 | | 242,853 |
| Petroleo Brasileiro, ADR | | 15,800 | | 954,952 |
| Satipel Industrial | | 39,800 | | 282,625 |
| Unibanco—Uniao de Bancos Brasileiros, GDR | | 1,100 | | 172,557 |
| | | | | 2,833,794 |
| China—5.5% | | | | |
| Aluminum Corp. of China, Cl. H | | 114,000 | | 197,793 |
| Angang Steel, Cl. H | | 120,000 | | 322,915 |
| China COSCO Holdings, Cl. H | | 88,226 | | 256,632 |
| China Merchants Bank, Cl. H | | 68,500 | | 245,336 |
| China National Materials, Cl. H | | 292,000 | | 304,576 |
| Industrial & Commercial Bank of China, Cl. H | | 302,233 | | 225,787 |
| | | | | 1,553,039 |
| Egypt—.3% | | | | |
| Commercial International Bank, GDR | | 5,151 | | 81,386 |
| Hong Kong—2.9% | | | | |
| Beijing Enterprises Holdings | | 64,830 | | 239,253 |
| China Mobile | | 27,000 | | 396,840 |
| CNOOC | | 107,000 | | 186,471 |
| | | | | 822,564 |
| Hungary—4.4% | | | | |
| MOL Hungarian Oil and Gas, ADR | | 10,100 | | 767,600 |
| OTP Bank, GDR | | 5,100 | | 461,550 |
| | | | | 1,229,150 |
| India—1.5% | | | | |
| Reliance Industries | | 1,504 | | 85,066 |
| Reliance Industries, GDR | | 2,900 b | | 329,757 |
| | | | | 414,823 |
The Fund 9
S TAT E M E N T O F I N V E S T M E N T S (continued)
| Common Stocks (continued) | | Shares | | Value ($) |
| |
| |
|
| Indonesia—4.8% | | | | |
| Bank Rakyat Indonesia | | 287,500 | | 179,012 |
| Bumi Resources | | 744,000 | | 642,963 |
| Telekomunikasi Indonesia | | 211,000 | | 183,478 |
| United Tractors | | 232,500 | | 360,668 |
| | | | | 1,366,121 |
| Luxembourg—.6% | | | | |
| Tenaris, ADR | | 2,700 | | 165,510 |
| Malaysia—5.4% | | | | |
| Digi.Com | | 36,800 | | 300,988 |
| Gamuda | | 292,600 | | 221,256 |
| IOI | | 164,400 | | 378,019 |
| KNM Group | | 133,720 | | 286,838 |
| KNM Group (Rights) | | 33,430 a | | 24,247 |
| Public Bank | | 83,063 | | 305,077 |
| | | | | 1,516,425 |
| Mexico—8.2% | | | | |
| America Movil, ADR, Ser. L | | 11,400 | | 681,378 |
| Fomento Economico Mexicano, ADR | | 7,300 | | 343,465 |
| Grupo Financiero Banorte, Cl. O | | 95,000 | | 461,205 |
| Grupo Televisa, ADR | | 17,300 | | 453,260 |
| Telefonos de Mexico, ADR, Ser. L | | 8,700 | | 358,614 |
| | | | | 2,297,922 |
| Peru—.1% | | | | |
| Credicorp | | 400 | | 33,384 |
| Philippines—1.7% | | | | |
| Ayala | | 28,409 | | 228,817 |
| Philippine Long Distance Telephone, ADR | | 4,100 | | 247,599 |
| | | | | 476,416 |
| Poland—5.0% | | | | |
| KGHM Polska Miedz | | 6,943 | | 330,215 |
| PBG | | 1,965 a | | 288,257 |
| Powszechna Kasa Oszczednosci Bank Polski | | 25,238 | | 586,199 |
| Telekomunikacja Polska | | 21,562 | | 204,007 |
| | | | | 1,408,678 |
10
| Common Stocks (continued) | | Shares | | | | Value ($) |
| |
| |
| |
|
| Russia—13.6% | | | | | | |
| Evraz Group, GDR | | 1,400 | | | | 166,250 |
| Gazprom, ADR | | 28,330 | | | | 1,711,132 |
| LSR Group, GDR | | 11,100 | | | | 176,601 |
| LUKOIL, ADR | | 5,200 | | | | 576,502 |
| MMC Norilsk Nickel, ADR | | 15,500 | | | | 453,375 |
| Mobile Telesystems, ADR | | 2,300 | | | | 201,480 |
| Sberbank, GDR | | 670 | | | | 285,603 |
| Severstal, GDR | | 9,850 | | | | 259,055 |
| | | | | | | 3,829,998 |
| South Africa—1.7% | | | | | | |
| ArcelorMittal South Africa | | 3,718 | | | | 121,553 |
| MTN Group | | 2,967 | | | | 58,511 |
| Remgro | | 4,945 | | | | 137,174 |
| Sasol | | 2,691 | | | | 168,598 |
| | | | | | | 485,836 |
| South Korea—16.0% | | | | | | |
| CJ Cheiljedang | | 1,039a | | | | 268,816 |
| Daelim Industrial | | 1,518 | | | | 182,004 |
| Dongbu Insurance | | 4,030 | | | | 164,909 |
| GS Engineering & Construction | | 1,750 | | | | 220,014 |
| GS Holdings | | 5,360 | | | | 249,774 |
| Hyundai Heavy Industries | | 496 | | | | 180,574 |
| Hyundai Motor | | 2 | | | | 163 |
| Infopia | | 1,352 | | | | 54,734 |
| Kookmin Bank, ADR | | 5,400 | | | | 337,230 |
| Korea Exchange Bank | | 10,800 | | | | 160,944 |
| KT & G | | 1,758 | | | | 152,580 |
| LG | | 3,000 | | | | 234,455 |
| LG Display, ADR | | 15,500 | | | | 341,620 |
| LG Electronics | | 2,015 | | | | 279,739 |
| POSCO, ADR | | 3,000 | | | | 409,950 |
| Samsung Card | | 2,714 | | | | 139,119 |
| Samsung Electronics | | 433 | | | | 311,493 |
| Samsung Electronics, GDR (Common) | | 706b | | | | 250,136 |
The Fund 11
STATEMENT OF INVESTMENTS (continued)
| Common Stocks (continued) | | Shares | | | | Value ($) |
| |
| |
| |
|
| South Korea (continued) | | | | | | |
| Samsung Electronics, GDR (Preferred) | | 698b | | | | 175,085 |
| Samsung Fire & Marine Insurance | | 861 | | | | 186,820 |
| Shinsegae | | 349 | | | | 202,613 |
| | | | | | | 4,502,772 |
| Taiwan—5.8% | | | | | | |
| Cathay Financial Holding | | 91,889 | | | | 234,846 |
| China Steel | | 111,000 | | | | 189,856 |
| Far Eastern Textile | | 125,000 | | | | 194,477 |
| Farglory Land Development | | 27,000 | | | | 97,691 |
| High Tech Computer | | 7,000 | | | | 186,271 |
| HON HAI Precision Industry | | 13,080 | | | | 74,000 |
| Richtek Technology | | 22,633 | | | | 212,170 |
| Taiwan Cement | | 89,000 | | | | 149,299 |
| Taiwan Semiconductor Manufacturing, ADR | | 25,609 | | | | 293,223 |
| | | | | | | 1,631,833 |
| Thailand—4.3% | | | | | | |
| Banpu | | 1,200 | | | | 17,726 |
| Banpu, NVDR | | 11,029 | | | | 162,915 |
| Banpu-FOR REG | | 12,271 | | | | 181,261 |
| Kasikornbank | | 74,800 | | | | 194,510 |
| PTT | | 28,300 | | | | 292,623 |
| PTT Exploration & Production | | 27,300 | | | | 157,104 |
| Siam Commercial Bank | | 70,100 | | | | 194,153 |
| | | | | | | 1,200,292 |
| Turkey—4.6% | | | | | | |
| KOC Holding | | 116,077a | | | | 327,621 |
| Tupras Turkiye Petrol Rafine | | 12,843 | | | | 321,391 |
| Turk Hava Yollari | | 65,353a | | | | 353,897 |
| Turkcell Iletisim Hizmet | | 39,240 | | | | 309,078 |
| | | | | | | 1,311,987 |
| Total Common Stocks | | | | | | |
| (cost $23,186,853) | | | | | | 27,161,930 |
12
| Preferred Stocks—1.3% | | Shares | | Value ($) |
| |
| |
|
| Brazil | | | | |
| Bradespar | | 3,600 | | 108,011 |
| Investimentos Itau | | 34,824 | | 251,571 |
| Total Preferred Stocks | | | | |
| (cost $217,970) | | | | 359,582 |
| |
| |
|
| Total Investments (cost $23,404,823) | | 97.8% | | 27,521,512 |
| Cash and Receivables (Net) | | 2.2% | | 626,351 |
| Net Assets | | 100.0% | | 28,147,863 |
| ADR—American Depository Receipts |
| GDR—Global Depository Receipts |
| NVDR—Non Voting Depository Receipts |
| a Non-income producing security. |
| b Securities exempt from registration under Rule 144A of the Securities Act of 1933.These securities may be resold in |
| transactions exempt from registration, normally to qualified institutional buyers. At May 31, 2008, these securities |
| amounted to $754,978 or 2.7% of net assets. |
| Portfolio Summary (Unaudited) † | | | | |
| |
| | | Value (%) | | | | Value (%) |
| |
| |
| |
|
| Energy | | 24.1 | | Consumer Staples | | 6.3 |
| Financial | | 21.3 | | Information Technology | | 5.1 |
| Industrial | | 14.4 | | Consumer Discretionary | | 4.2 |
| Basic Materials | | 11.2 | | Health Care | | .2 |
| Telecommunications | | 11.0 | | | | 97.8 |
| † Based on net assets. |
| See notes to financial statements. |
The Fund 13
| STATEMENT OF ASSETS AND LIABILITIES |
| M a y 3 1 , 2 0 0 8 |
| | | Cost | | Value |
| |
| |
|
| Assets ($): | | | | |
| Investments in securities—See Statement of Investments | | 23,404,823 | | 27,521,512 |
| Cash | | | | 561,940 |
| Receivable for shares of Common Stock subscribed | | | | 288,110 |
| Receivable for investment securities sold | | | | 66,989 |
| Dividends and interest receivable | | | | 53,250 |
| Prepaid expenses | | | | 32,540 |
| | | | | 28,524,341 |
| |
| |
|
| Liabilities ($): | | | | |
| Due to The Dreyfus Corporation and affiliates—Note 3(c) | | | | 62,828 |
| Payable for investment securities purchased | | | | 230,006 |
| Payable for shares of Common Stock redeemed | | | | 35,043 |
| Interest payable—Note 2 | | | | 2,378 |
| Accrued expenses | | | | 46,223 |
| | | | | 376,478 |
| |
| |
|
| Net Assets ($) | | | | 28,147,863 |
| |
| |
|
| Composition of Net Assets ($): | | | | |
| Paid-in capital | | | | 21,176,529 |
| Accumulated undistributed investment income—net | | | | 62,881 |
| Accumulated net realized gain (loss) on investments | | | | 2,785,921 |
| Accumulated net unrealized appreciation (depreciation) | | | | |
| on investments and foreign currency transactions | | | | 4,122,532a |
| |
| |
|
| Net Assets ($) | | | | 28,147,863 |
| Net Asset Value Per Share | | | | | | | | |
| | | Class A | | Class C | | Class I | | Class T |
| |
| |
| |
| |
|
| Net Assets ($) | | 24,062,086 | | 3,413,971 | | 523,340 | | 148,466 |
| Shares Outstanding | | 1,225,157 | | 175,619 | | 26,772 | | 7,655 |
| |
| |
| |
| |
|
| Net Asset Value Per Share ($) | | 19.64 | | 19.44 | | 19.55 | | 19.39 |
| a Net of $14 deferred capital gain country tax. |
| See notes to financial statements. |
14
| STATEMENT OF OPERATIONS |
| Ye a r E n d e d M a y 3 1 , 2 0 0 8 |
| Investment Income ($): | | |
| Income: | | |
| Cash dividends (net of $54,796 foreign taxes withheld at source): | | |
| Unaffiliated issuers | | 503,146 |
| Affiliated issuers | | 29,892 |
| Total Income | | 533,038 |
| Expenses: | | |
| Management fee—Note 3(a) | | 296,793 |
| Custodian fees—Note 3(c) | | 140,077 |
| Shareholder servicing costs—Note 3(c) | | 61,311 |
| Registration fees | | 60,232 |
| Auditing fees | | 55,730 |
| Distribution fees—Note 3(b) | | 17,508 |
| Prospectus and shareholders’ reports | | 10,529 |
| Directors’ fees and expenses—Note 3(d) | | 2,389 |
| Interest expense—Note 2 | | 2,378 |
| Loan commitment fees—Note 2 | | 126 |
| Miscellaneous | | 11,015 |
| Total Expenses | | 658,088 |
| Less—reduction in management fee due to undertaking—Note 3(a) | | (163,822) |
| Less—reduction in fees due to earnings credits—Note 1(c) | | (6,775) |
| Net Expenses | | 487,491 |
| Investment Income—Net | | 45,547 |
| |
|
| Realized and Unrealized Gain (Loss) on Investments—Note 4 ($): |
| Net realized gain (loss) on investments and foreign currency transactions | | 4,413,006a |
| Net realized gain (loss) on forward currency exchange contracts | | (67,416) |
| Net Realized Gain (Loss) | | 4,345,590 |
| Net unrealized appreciation (depreciation) on | | |
| investments and foreign currency transactions | | 1,249,080 |
| Net Realized and Unrealized Gain (Loss) on Investments | | 5,594,670 |
| Net Increase in Net Assets Resulting from Operations | | 5,640,217 |
a Net of capital gain country tax of $3,667. See notes to financial statements.
The Fund 15
STATEMENT OF CHANGES IN NET ASSETS
| | | | | Year Ended May 31, |
| |
| |
|
| | | 2008 a | | 2007 b |
| |
| |
|
| Operations ($): | | | | |
| Investment income—net | | 45,547 | | 16,393 |
| Net realized gain (loss) on investments | | 4,345,590 | | 834,514 |
| Net unrealized appreciation | | | | |
| (depreciation) on investments | | 1,249,080 | | 2,873,452 |
| Net Increase (Decrease) in Net Assets | | | | |
| Resulting from Operations | | 5,640,217 | | 3,724,359 |
| |
| |
|
| Dividends to Shareholders from ($): | | | | |
| Investment income—net: | | | | |
| Class A Shares | | (100,028) | | — |
| Class I Shares | | (5,181) | | — |
| Class T Shares | | (3,522) | | — |
| Net realized gain on investments: | | | | |
| Class A Shares | | (1,921,126) | | (60,722) |
| Class C Shares | | (235,008) | | (3,052) |
| Class I Shares | | (35,613) | | (1,651) |
| Class T Shares | | (28,994) | | (1,448) |
| Total Dividends | | (2,329,472) | | (66,873) |
| |
| |
|
| Capital Stock Transactions ($): | | | | |
| Net proceeds from shares sold: | | | | |
| Class A Shares | | 19,805,299 | | 12,979,345 |
| Class C Shares | | 3,438,031 | | 808,849 |
| Class I Shares | | 1,271,153 | | 413,053 |
| Class T Shares | | 145,935 | | 265,107 |
| Dividends reinvested: | | | | |
| Class A Shares | | 980,767 | | 27,531 |
| Class C Shares | | 97,709 | | 1,539 |
| Class I Shares | | 40,794 | | 1,651 |
| Class T Shares | | 32,516 | | 1,448 |
| Cost of shares redeemed: | | | | |
| Class A Shares | | (15,390,085) | | (607,338) |
| Class C Shares | | (1,291,535) | | (95) |
| Class I Shares | | (1,335,579) | | (75,000) |
| Class T Shares | | (431,463) | | — |
| Increase (Decrease) in Net Assets | | | | |
| from Capital Stock Transactions | | 7,363,542 | | 13,816,090 |
| Total Increase (Decrease) in Net Assets | | 10,674,287 | | 17,473,576 |
| |
| |
|
| Net Assets ($): | | | | |
| Beginning of Period | | 17,473,576 | | — |
| End of Period | | 28,147,863 | | 17,473,576 |
| Undistributed investment income—net | | 62,881 | | 45,213 |
16
| | | | | Year Ended May 31, |
| |
| |
|
| | | 2008 a | | 2007 b |
| |
| |
|
| Capital Share Transactions: | | | | |
| Class A | | | | |
| Shares sold | | 1,043,492 | | 971,989 |
| Shares issued for dividends reinvested | | 50,581 | | 1,815 |
| Shares redeemed | | (802,268) | | (40,452) |
| Net Increase (Decrease) in Shares Outstanding | | 291,805 | | 933,352 |
| |
| |
|
| Class C | | | | |
| Shares sold | | 179,416 | | 58,918 |
| Shares issued for dividends reinvested | | 5,073 | | 102 |
| Shares redeemed | | (67,883) | | (7) |
| Net Increase (Decrease) in Shares Outstanding | | 116,606 | | 59,013 |
| |
| |
|
| Class I | | | | |
| Shares sold | | 64,979 | | 30,464 |
| Shares issued for dividends reinvested | | 2,115 | | 109 |
| Shares redeemed | | (66,441) | | (4,454) |
| Net Increase (Decrease) in Shares Outstanding | | 653 | | 26,119 |
| |
| |
|
| Class T | | | | |
| Shares sold | | 7,069 | | 20,990 |
| Shares issued for dividends reinvested | | 1,695 | | 96 |
| Shares redeemed | | (22,195) | | — |
| Net Increase (Decrease) in Shares Outstanding | | (13,431) | | 21,086 |
| a | | Effective June 1, 2007, Class R shares were redesignated as Class I shares. |
| b | | From July 13, 2006 (commencement of operations) to May 31, 2007. |
| See notes to financial statements. |
The Fund 17
FINANCIAL HIGHLIGHTS
The following tables describe the performance for each share class for the fiscal periods indicated. All information (except portfolio turnover rate) reflects financial results for a single fund share.Total return shows how much your investment in the fund would have increased (or decreased) during each period, assuming you had reinvested all dividends and distributions.These figures have been derived from the fund’s financial statements.
| | | Year Ended May 31, |
| |
|
| Class A Shares | | 2008 | | 2007 a |
| |
| |
|
| Per Share Data ($): | | | | |
| Net asset value, beginning of period | | 16.81 | | 12.50 |
| Investment Operations: | | | | |
| Investment income—net b | | .05 | | .02 |
| Net realized and unrealized gain (loss) on investments | | 4.84 | | 4.36 |
| Total from Investment Operations | | 4.89 | | 4.38 |
| Distributions: | | | | |
| Dividends from investment income—net | | (.10) | | — |
| Dividends from net realized gain on investments | | (1.96) | | (.07) |
| Total Distributions | | (2.06) | | (.07) |
| Net asset value, end of period | | 19.64 | | 16.81 |
| |
| |
|
| Total Return (%) c | | 29.25 | | 35.12d |
| |
| |
|
| Ratios/Supplemental Data (%): | | | | |
| Ratio of total expenses to average net assets | | 2.69 | | 3.46d |
| Ratio of net expenses to average net assets | | 1.98 | | 1.73d |
| Ratio of net investment income to average net assets | | .26 | | .17d |
| Portfolio Turnover Rate | | 259.49 | | 140.52d |
| |
| |
|
| Net Assets, end of period ($ x 1,000) | | 24,062 | | 15,694 |
| a | | From July 13, 2006 (commencement of operations) to May 31, 2007. |
| b | | Based on average shares outstanding at each monh end. |
| c | | Exclusive of sales charge. |
| d | | Not annualized. |
| See notes to financial statements. |
18
| | | Year Ended May 31, |
| |
|
| Class C Shares | | 2008 | | 2007 a |
| |
| |
|
| Per Share Data ($): | | | | |
| Net asset value, beginning of period | | 16.70 | | 12.50 |
| Investment Operations: | | | | |
| Investment (loss)—net b | | (.07) | | (.07) |
| Net realized and unrealized gain (loss) on investments | | 4.77 | | 4.34 |
| Total from Investment Operations | | 4.70 | | 4.27 |
| Distributions: | | | | |
| Dividends from net realized gain on investments | | (1.96) | | (.07) |
| Net asset value, end of period | | 19.44 | | 16.70 |
| |
| |
|
| Total Return (%) c | | 28.17 | | 34.32d |
| |
| |
|
| Ratios/Supplemental Data (%): | | | | |
| Ratio of total expenses to average net assets | | 3.54 | | 4.17d |
| Ratio of net expenses to average net assets | | 2.73 | | 2.38d |
| Ratio of net investment (loss) to average net assets | | (.40) | | (.46)d |
| Portfolio Turnover Rate | | 259.49 | | 140.52d |
| |
| |
|
| Net Assets, end of period ($ x 1,000) | | 3,414 | | 986 |
a From July 13, 2006 (commencement of operations) to May 31, 2007. b Based on average shares outstanding at each monh end. c Exclusive of sales charge. d Not annualized.
See notes to financial statements.
The Fund 19
F I N A N C I A L H I G H L I G H T S (continued)
| | | Year Ended May 31, |
| |
|
| Class I Shares | | 2008 a | | 2007 b |
| |
| |
|
| Per Share Data ($): | | | | |
| Net asset value, beginning of period | | 16.85 | | 12.50 |
| Investment Operations: | | | | |
| Investment income—net c | | .07 | | .05 |
| Net realized and unrealized gain (loss) on investments | | 4.88 | | 4.37 |
| Total from Investment Operations | | 4.95 | | 4.42 |
| Distributions: | | | | |
| Dividends from investment income—net | | (.29) | | — |
| Dividends from net realized gain on investments | | (1.96) | | (.07) |
| Total Distributions | | (2.25) | | (.07) |
| Net asset value, end of period | | 19.55 | | 16.85 |
| |
| |
|
| Total Return (%) | | 29.52 | | 35.44d |
| |
| |
|
| Ratios/Supplemental Data (%): | | | | |
| Ratio of total expenses to average net assets | | 2.47 | | 3.43d |
| Ratio of net expenses to average net assets | | 1.74 | | 1.51d |
| Ratio of net investment income to average net assets | | .40 | | .36d |
| Portfolio Turnover Rate | | 259.49 | | 140.52d |
| |
| |
|
| Net Assets, end of period ($ x 1,000) | | 523 | | 440 |
| a | | Effective June 1, 2007, Class R shares were redesignated as Class I shares. |
| b | | From July 13, 2006 (commencement of operations) to May 31, 2007. |
| c | | Based on average shares outstanding at each monh end. |
| d | | Not annualized. |
| See notes to financial statements. |
20
| | | Year Ended May 31, |
| |
|
| Class T Shares | | 2008 | | 2007 a |
| |
| |
|
| Per Share Data ($): | | | | |
| Net asset value, beginning of period | | 16.78 | | 12.50 |
| Investment Operations: | | | | |
| Investment (loss)—net b | | (.05) | | (.01) |
| Net realized and unrealized gain (loss) on investments | | 4.86 | | 4.36 |
| Total from Investment Operations | | 4.81 | | 4.35 |
| Distributions: | | | | |
| Dividends from investment income—net | | (.24) | | — |
| Dividends from net realized gain on investments | | (1.96) | | (.07) |
| Total Distributions | | (2.20) | | (.07) |
| Net asset value, end of period | | 19.39 | | 16.78 |
| |
| |
|
| Total Return (%) c | | 28.79 | | 34.88d |
| |
| |
|
| Ratios/Supplemental Data (%): | | | | |
| Ratio of total expenses to average net assets | | 2.96 | | 3.92d |
| Ratio of net expenses to average net assets | | 2.25 | | 1.96d |
| Ratio of net investment (loss) to average net assets | | (.26) | | (.10)d |
| Portfolio Turnover Rate | | 259.49 | | 140.52d |
| |
| |
|
| Net Assets, end of period ($ x 1,000) | | 148 | | 354 |
a From July 13, 2006 (commencement of operations) to May 31, 2007. b Based on average shares outstanding at each monh end. c Exclusive of sales charge. d Not annualized.
See notes to financial statements.
The Fund 21
NOTES TO FINANCIAL STATEMENTS
NOTE 1—Significant Accounting Policies:
Emerging Markets Opportunity Fund (the “fund”) is a separate non-diversified series of Strategic Funds, Inc. (the “Company”) which is registered under the Investment Company Act of 1940, as amended (the “Act”), as a diversified open-end management investment company and operates as a series company currently offering six series, including the fund. The fund’s investment objective is to pursue long-term capital appreciation by investing in stocks of companies located in emerging market countries.The Dreyfus Corporation (the “Manager” or “Dreyfus”), a wholly-owned subsidiary of The Bank of New York Mellon Corporation (“BNY Mellon”), serves as the fund’s investment adviser. WestLB Mellon Asset Management (USA) LLC (“WMAM US”) serves as the fund’s sub-investment adviser.
MBSC Securities Corporation (the “Distributor”), a wholly-owned subsidiary of Dreyfus, is the distributor of the fund’s shares.The fund is authorized to issue 100 million shares of $.001 par value Common Stock in each of the following classes of shares: Class A, Class C, Class I and Class T. Class A and Class T shares are subject to a sales charge imposed at the time of purchase. Class C shares are subject to a contingent deferred sales charge (“CDSC”) on Class C shares redeemed within one year of purchase. Class I shares are sold at net asset value per share only to institutional investors. Other differences between the classes include the services offered to and the expenses borne by each class, the allocation of certain transfer agency costs and certain voting rights. Income, expenses (other than expenses attributable to a specific class), and realized and unrealized gains or losses on investments are allocated to each class of shares based on its relative net assets.
The Company accounts separately for the assets, liabilities and operations of each series. Expenses directly attributable to each series are charged to that series’ operations; expenses which are applicable to all series are allocated among them on a pro rata basis.
The fund’s financial statements are prepared in accordance with U.S. generally accepted accounting principles, which may require the use of management estimates and assumptions. Actual results could differ from those estimates.
The fund enters into contracts that contain a variety of indemnifications. The fund’s maximum exposure under these arrangements is unknown.The fund does not anticipate recognizing any loss related to these arrangements.
(a) Portfolio valuation: Investments in securities are valued at the last sales price on the securities exchange or national securities market on which such securities are primarily traded. Securities listed on the National Market System for which market quotations are available are valued at the official closing price or, if there is no official closing price that day, at the last sales price. Securities not listed on an exchange or the national securities market, or securities for which there were no transactions, are valued at the average of the most recent bid and asked prices, except for open short positions, where the asked price is used for valuation purposes. Bid price is used when no asked price is available. Registered open-end investment companies that are not traded on an exchange are valued at their net asset value.When market quotations or official closing prices are not readily available, or are determined not to reflect accurately fair value, such as when the value of a security has been significantly affected by events after the close of the exchange or market on which the security is principally traded (for example, a foreign exchange or market), but before the fund calculates its net asset value, the fund may value these investments at fair value as determined in accordance with the procedures approved by the Board of Directors. Fair valuing of securities may be determined with the assistance of a pricing service using calculations based on indices of domestic securities and other appropriate indicators, such as prices of relevant ADRs and futures contracts. For other securities that are fair valued by the Board
The Fund 23
N O T E S T O F I N A N C I A L S TAT E M E N T S (continued)
of Directors, certain factors may be considered such as: fundamental analytical data, the nature and duration of restrictions on disposition, an evaluation of the forces that influence the market in which the securities are purchased and sold and public trading in similar securities of the issuer or comparable issuers. Financial futures are valued at the last sales price. Investments denominated in foreign currencies are translated to U.S. dollars at the prevailing rates of exchange. Forward currency exchange contracts are valued at the forward rate.
The Financial Accounting Standards Board (“FASB”) released Statement of Financial Accounting Standards No. 157 “Fair Value Measurements” (“FAS 157”). FAS 157 establishes an authoritative definition of fair value, sets out a framework for measuring fair value, and requires additional disclosures about fair-value measurements.The application of FAS 157 is required for fiscal years beginning after November 15, 2007 and interim periods within those fiscal years. Management does not believe that the application of this standard will have a material impact on the financial statements of the fund.
(b) Foreign currency transactions: The fund does not isolate that portion of the results of operations resulting from changes in foreign exchange rates on investments from the fluctuations arising from changes in market prices of securities held. Such fluctuations are included with the net realized and unrealized gain or loss on investments.
Net realized foreign exchange gains or losses arise from sales and maturities of short-term securities, sales of foreign currencies, currency gains or losses realized on securities transactions and the difference between the amounts of dividends, interest and foreign withholding taxes recorded on the fund’s books and the U.S. dollar equivalent of the amounts actually received or paid. Net unrealized foreign exchange gains or losses arise from changes in the value of assets and liabilities other than investments in securities, resulting from changes in exchange rates. Such gains and losses are included with net realized and unrealized gain or loss on investments.
(c) Securities transactions and investment income: Securities transactions are recorded on a trade date basis. Realized gains and losses
24
from securities transactions are recorded on the identified cost basis. Dividend income is recognized on the ex-dividend date and interest income, including, where applicable, accretion of discount and amortization of premium on investments, is recognized on the accrual basis.
The fund has arrangements with the custodian and cash management banks whereby the fund may receive earnings credits when positive cash balances are maintained, which are used to offset custody and cash management fees. For financial reporting purposes, the fund includes net earnings credits as an expense offset in the Statement of Operations.
Investing in foreign markets may involve special risks and considerations not typically associated with investing in the U.S. These risks include revaluation of currencies, high rates of inflation, repatriation restrictions on income and capital,and adverse political and economic developments. Moreover, securities issued in these markets may be less liquid, subject to government ownership controls,delayed settlements,and their prices may be more volatile than those of comparable securities in the U.S.
(d) Affiliated issuers: Investments in other investment companies advised by Dreyfus are defined as “affiliated” in the Act.
(e) Dividends to shareholders: Dividends are recorded on the ex-dividend date. Dividends from investment income-net and dividends from net realized capital gains, if any, are normally declared and paid annually, but the fund may make distributions on a more frequent basis to comply with the distribution requirements of the Internal Revenue Code of 1986, as amended (the “Code”).To the extent that net realized capital gains can be offset by capital loss carryovers, it is the policy of the fund not to distribute such gains. Income and capital gain distributions are determined in accordance with income tax regulations, which may differ from U.S. generally accepted accounting principles.
(f) Federal income taxes: It is the policy of the fund to continue to qualify as a regulated investment company, if such qualification is in the best interests of its shareholders, by complying with the applicable provisions of the Code, and to make distributions of taxable income sufficient to relieve it from substantially all federal income and excise taxes.
The Fund 25
N O T E S T O F I N A N C I A L S TAT E M E N T S (continued)
During the current year, the fund adopted FASB Interpretation No. 48 “Accounting for Uncertainty in Income Taxes” (“FIN 48”). FIN 48 provides guidance for how uncertain tax positions should be recognized, measured, presented and disclosed in the financial statements. FIN 48 requires the evaluation of tax positions taken or expected to be taken in the course of preparing the fund’s tax returns to determine whether the tax positions are “more-likely-than-not” of being sustained by the applicable tax authority. Tax positions not deemed to meet the more-likely-than-not threshold would be recorded as a tax expense in the current year. The adoption of FIN 48 had no impact on the operations of the fund for the period ended May 31, 2008.
As of and during the period ended May 31, 2008, the fund did not have any liabilities for any unrecognized tax benefits.The fund recognizes interest and penalties, if any, related to unrecognized tax benefits as income tax expense in the Statement of Operations. During the period, the fund did not incur any interest or penalties.
Each of the tax years in the two-year period ended May 31, 2008, remains subject to examination by the Internal Revenue Service and state taxing authorities.
At May 31,2008, the components of accumulated earnings on a tax basis were as follows:undistributed ordinary income $1,885,602,undistributed capital gains $1,480,199 and unrealized appreciation $3,605,533.
The tax character of distributions paid to shareholders during the fiscal periods ended May 31, 2008 and May 31, 2007 were as follows: ordinary income $2,194,573 and $66,873 and long-term capital gains $134,899 and $0, respectively.
During the period ended May 31, 2008, as a result of permanent book to tax differences, primarily due to the tax treatment for foreign currency transactions and passive foreign investment companies, the fund increased accumulated undistributed investment income-net by $80,852, and decreased accumulated net realized gain (loss) on investments by the same amount. Net assets and net asset value per share were not affected by this reclassification.
26
NOTE 2—Bank Line of Credit:
The fund participates with other Dreyfus-managed funds in a $350 million redemption credit facility (the “Facility”) to be utilized for temporary or emergency purposes, including the financing of redemptions. In connection therewith, the fund has agreed to pay commitment fees on its pro rata portion of the Facility. Interest is charged to the fund based on prevailing market rates in effect at the time of borrowing.
The average daily amount of borrowings outstanding under the Facility during the period ended May 31, 2008 was approximately $47,500, with a related weighted average annualized interest rate of 5.00% .
NOTE 3—Management Fee, Sub-Investment Advisory Fee and Other Transactions With Affiliates:
(a) Pursuant to a management agreement (“Agreement”) with Dreyfus, the management fee is computed at the annual rate of 1.25% of the value of the fund’s average daily net assets and is payable monthly. Dreyfus has contractually agreed to waive receipt of its fees and/or assume the expenses of the fund, until September 30, 2008, so that annual fund operating expenses (excluding Rule 12b-1 fees, shareholder services fees, taxes, interest, brokerage commissions, commitment fees on borrowings and extraordinary expenses) do not exceed 1.75% of the fund’s average daily net assets. The reduction in management fee, pursuant to the undertaking, amounted to $163,822 during the period ended May 31, 2008.
Pursuant to a Sub-Investment Advisory Agreement between Dreyfus and WMAM US, Dreyfus pays WMAM US a monthly fee at an annual percentage of the fund’s average daily net assets.
During the period ended May 31, 2008, the Distributor retained $13,564 and $19 from commissions earned on sales of the fund’s Class A and Class T shares, respectively, and $234 from CDSCs on redemptions of the fund’s Class C shares.
(b) Under the Distribution Plan (the “Plan”) adopted pursuant to Rule 12b-1 under the Act, Class C and Class T shares pay the Distributor for
The Fund 27
N O T E S T O F I N A N C I A L S TAT E M E N T S (continued)
distributing their shares at an annual rate of .75% of the value of the average daily net assets of Class C shares and .25% of the value of the average daily net assets of Class T shares. During the period ended May 31, 2008, Class C and Class T shares were charged $16,683 and $825, respectively, pursuant to the Plan.
(c) Under the Shareholder Services Plan, Class A, Class C and Class T shares pay the Distributor at an annual rate of .25% of the value of their average daily net assets for the provision of certain services.The services provided may include personal services relating to shareholder accounts, such as answering shareholder inquiries regarding Class A, Class C and Class T shares and providing reports and other information, and services related to the maintenance of shareholder accounts. The Distributor may make payments to Service Agents (a securities dealer, financial institution or other industry professional) in respect of these services.The Distributor determines the amounts to be paid to Service Agents. During the period ended May 31, 2008, Class A, Class C and Class T shares were charged $51,739, $5,561 and $825, respectively, pursuant to the Shareholder Services Plan.
The fund compensates Dreyfus Transfer, Inc., a wholly-owned subsidiary of Dreyfus, under a transfer agency agreement for providing personnel and facilities to perform transfer agency services for the fund. During the period ended May 31, 2008, the fund was charged $6,629 pursuant to the transfer agency agreement.
The fund compensates The Bank of New York, a subsidiary of BNY Mellon and a Dreyfus affiliate, under a cash management agreement for performing cash management services related to fund subscriptions and redemptions. During the period ended May 31, 2008, the fund was charged $589 pursuant to the cash management agreement.
Effective July 1, 2007, the fund’s custodian, The Bank of New York, became an affiliate of Dreyfus. Under the fund’s pre-existing custody agreement with The Bank of New York, the fund was charged $129,509 for providing custodial services for the fund for the eleven months ended May 31, 2008. Prior to becoming an affiliate,The Bank of New
28
York was paid $10,568 for custodial services to the fund for the one month ended June 30, 2007.
During the period ended May 31, 2008, the fund was charged $5,607 for services performed by the Chief Compliance Officer.
The components of “Due to The Dreyfus Corporation and affiliates” in the Statement of Assets and Liabilities consist of: management fees $27,800, Rule 12b-1 distribution plan fees $1,968, shareholder services plan fees $5,458, custodian fees $42,107, chief compliance officer fees $2,350 and transfer agency per account fees $1,170, which are offset against an expense reimbursement currently in effect in the amount of $18,025.
(d) Each Board member also serves as a Board member of other funds within the Dreyfus complex. Annual retainer fees and attendance fees are allocated to each fund based on net assets.
NOTE 4—Securities Transactions:
The aggregate amount of purchases and sales of investment securities, excluding short-term securities and forward currency exchange contracts, during the period ended May 31, 2008, amounted to $64,336,366 and $59,484,861, respectively.
The fund enters into forward currency exchange contracts in order to hedge its exposure to changes in foreign currency exchange rates on its foreign portfolio holdings and to settle foreign currency transac-tions.When executing forward currency exchange contracts, the fund is obligated to buy or sell a foreign currency at a specified rate on a certain date in the future. With respect to sales of forward currency exchange contracts, the fund would incur a loss if the value of the contract increases between the date the forward contract is opened and the date the forward contract is closed.The fund realizes a gain if the value of the contract decreases between those dates. With respect to purchases of forward currency exchange contracts, the fund would incur a loss if the value of the contract decreases between the date the for-
The Fund 29
N O T E S T O F I N A N C I A L S TAT E M E N T S (continued)
ward contract is opened and the date the forward contract is closed. The fund realizes a gain if the value of the contract increases between those dates. The fund is also exposed to credit risk associated with counterparty nonperformance on these forward currency exchange contracts which is typically limited to the unrealized gain on each open contract.At May 31, 2008, there were no open forward currency exchange contracts outstanding.
At May 31, 2008, the cost of investments for federal income tax purposes was $23,921,822; accordingly, accumulated net unrealized appreciation on investments was $3,599,690, consisting of $4,570,970 gross unrealized appreciation and $971,280 gross unrealized depreciation.
In March 2008, the FASB released Statement of Financial Accounting Standards No. 161, Disclosures about Derivative Instruments and Hedging Activities (“FAS 161”). FAS 161 requires qualitative disclosures about objectives and strategies for using derivatives, quantitative disclosures about fair value amounts of gains and losses on derivative instruments and disclosures about credit-risk-related contingent features in derivative agreements.The application of FAS 161 is required for fiscal years beginning after November 15, 2008 and interim periods within those fiscal years.At this time, management is evaluating the implications of FAS 161 and its impact on the financial statements and the accompanying notes has not yet been determined.
NOTE 5—Subsequent Event:
Effective July 1, 2008, BNY Mellon has reorganized and consolidated a number of its banking and trust company subsidiaries. As a result of the reorganization, any services previously provided to the fund by Mellon Bank, N.A. or Mellon Trust of New England, N.A. are now provided by The Bank of New York, which has changed its name to The Bank of New York Mellon.
30
| REPORT OF INDEPENDENT REGISTERED |
| PUBLIC ACCOUNTING FIRM |
| Shareholders and Board of Directors |
| Emerging Markets Opportunity Fund |
We have audited the accompanying statement of assets and liabilities, including the statement of investments, of Emerging Markets Opportunity Fund (one of the series comprising Strategic Funds, Inc.) as of May 31, 2008 and the related statement of operations for the year then ended, and the statement of changes in net assets and financial highlights for each of the periods indicated therein. These financial statements and financial highlights are the responsibility of the Fund’s management. Our responsibility is to express an opinion on these financial statements and financial highlights based on our audits.
We conducted our audits in accordance with the standards of the Public Company Accounting Oversight Board (United States).Those standards require that we plan and perform the audit to obtain reasonable assurance about whether the financial statements and financial highlights are free of material misstatement. We were not engaged to perform an audit of the Fund’s internal control over financial reporting. Our audits included consideration of internal control over financial reporting as a basis for designing audit procedures that are appropriate in the circumstances, but not for the purpose of expressing an opinion on the effectiveness of the Fund’s internal control over financial reporting. Accordingly, we express no such opinion.An audit also includes examining, on a test basis, evidence supporting the amounts and disclosures in the financial statements and financial highlights, assessing the accounting principles used and significant estimates made by management, and evaluating the overall financial statement presentation. Our procedures included confirmation of securities owned as of May 31, 2008 by correspondence with the custodian and others.We believe that our audits provide a reasonable basis for our opinion.
In our opinion, the financial statements and financial highlights referred to above present fairly, in all material respects, the financial position of Emerging Markets Opportunity Fund at May 31, 2008, the results of its operations for the year then ended, and the changes in its net assets and the financial highlights for each of the indicated periods, in conformity with U.S. generally accepted accounting principles.

| New York, New York |
| July 18, 2008 |
The Fund 31
IMPORTANT TAX INFORMATION ( U n a u d i t e d )
In accordance with federal tax law, the fund elects to provide each shareholder with their portion of the fund’s foreign taxes paid and the income sourced from foreign countries.Accordingly, the fund hereby makes the following designations regarding its fiscal year ended May 31, 2008:
—the total amount of taxes paid to foreign countries was $49,288.
—the total amount of income sourced from foreign countries was $481,335.
As required by federal tax law rules, shareholders will receive notification of their proportionate share of foreign taxes paid and foreign sourced income for the 2008 calendar year with Form 1099-DIV which will be mailed by January 31, 2009.Also, certain dividends paid by the fund may be subject to a maximum tax rate of 15%, as provided for by the Jobs and Growth Tax Relief Reconciliation Act of 2003. Of the distributions paid during the fiscal year, $651,830 represents the maximum amount that may be considered qualified dividend income. Also, the fund designates $.1190 per share as a long-term capital gain distribution and $1.8400 per share as a short-term capital gain distribution paid on December 26, 2007.
32
BOARD MEMBERS INFORMATION ( U n a u d i t e d )
| Joseph S. DiMartino (64) |
| Chairman of the Board (1995) |
| Principal Occupation During Past 5 Years: |
| • Corporate Director and Trustee |
| Other Board Memberships and Affiliations: |
| • The Muscular Dystrophy Association, Director |
| • Century Business Services, Inc., a provider of outsourcing functions for small and medium size |
| companies, Director |
| • The Newark Group, a provider of a national market of paper recovery facilities, paperboard |
| mills and paperboard converting plants, Director |
| • Sunair Services Corporation, a provider of certain outdoor-related services to homes and |
| businesses, Director |
| No. of Portfolios for which Board Member Serves: 160 |
| David W. Burke (72) |
| Board Member (1980) |
| Principal Occupation During Past 5 Years: |
| • Corporate Director and Trustee. |
| Other Board Memberships and Affiliations: |
| • John F. Kennedy Library Foundation, Director |
| No. of Portfolios for which Board Member Serves: 85 |
| William Hodding Carter III (73) |
| Board Member (1988) |
| Principal Occupation During Past 5 Years: |
| • Professor of Leadership & Public Policy, University of North Carolina, Chapel Hill |
| (January 1, 2006-present) |
| • President and Chief Executive Officer of the John S. and James L. Knight Foundation |
| (February 1, 1998-February 1, 2006) |
| Other Board Memberships and Affiliations: |
| • The Century Foundation, a tax-exempt research foundation, Emeritus Director |
| • The Enterprise Corporation of the Delta, a non-profit economic development organization, Director |
| No. of Portfolios for which Board Member Serves: 27 |
| Gordon J. Davis (66) |
| Board Member (2006) |
| Principal Occupation During Past 5 Years: |
| • Partner in the law firm of Dewey & LeBoeuf LLP |
| • President, Lincoln Center for the Performing Arts, Inc. (2001) |
| Other Board Memberships and Affiliations: |
| • Consolidated Edison, Inc., a utility company, Director |
| • Phoenix Companies, Inc., a life insurance company, Director |
| • Board Member/Trustee for several not-for-profit groups |
| No. of Portfolios for which Board Member Serves: 36 |
The Fund 33
B O A R D M E M B E R S I N F O R M AT I O N ( U n a u d i t e d ) (continued)
| Joni Evans (66) |
| Board Member (2006) |
| Principal Occupation During Past 5 Years: |
| • Chief Executive Officer, www.wowowow.com, an online community dedicated to women’s |
| conversations and publications |
| • Principal, Joni Evans Ltd. |
| • Senior Vice President of the William Morris Agency (2005) |
| |
| No. of Portfolios for which Board Member Serves: 27 |
| ——————— |
| Ehud Houminer (67) |
| Board Member (1994) |
| Principal Occupation During Past 5 Years: |
| • Executive-in-Residence at the Columbia Business School, Columbia University |
| Other Board Memberships and Affiliations: |
| • Avnet Inc., an electronics distributor, Director |
| • International Advisory Board to the MBA Program School of Management, Ben Gurion |
| University, Chairman |
| No. of Portfolios for which Board Member Serves: 66 |
| Richard C. Leone (68) |
| Board Member (1980) |
| Principal Occupation During Past 5 Years: |
| • President of The Century Foundation (formerly,The Twentieth Century Fund, Inc.), a tax |
| exempt research foundation engaged in the study of economic, foreign policy and domestic issues |
| |
| Other Board Memberships and Affiliations: |
| • The American Prospect, Director |
| • Center for American Progress, Director |
| |
| No. of Portfolios for which Board Member Serves: 27 |
| Hans C. Mautner (70) |
| Board Member (1980) |
| Principal Occupation During Past 5 Years: |
| • President—International Division and an Advisory Director of Simon Property Group, a real |
| estate investment company (1998-present) |
| • Director and Vice Chairman of Simon Property Group (1998-2003) |
| • Chairman and Chief Executive Officer of Simon Global Limited (1999-present) |
| |
| Other Board Memberships and Affiliations: |
| • Capital and Regional PLC, a British co-investing real estate asset manager, Director |
| • Member, Advisory Board, Lehman Brothers European Real Estate Private Equity Fund |
| |
| No. of Portfolios for which Board Member Serves: 27 |
34
| Robin A. Melvin (44) |
| Board Member (1995) |
| Principal Occupation During Past 5 Years: |
| • Director, Boisi Family Foundation, a private family foundation that supports youth-serving |
| organizations that promote the self sufficiency of youth from disadvantaged circumstances |
| • Senior Vice President, Mentor, a national non-profit youth mentoring organization (2005) |
| No. of Portfolios for which Board Member Serves: 27 |
| Burton N. Wallack (57) |
| Board Member (2006) |
| Principal Occupation During Past 5 Years: |
| • President and co-owner of Wallack Management Company, a real estate management company |
| No. of Portfolios for which Board Member Serves: 27 |
| John E. Zuccotti (70) |
| Board Member (1980) |
| Principal Occupation During Past 5 Years: |
| • Chairman of Brookfield Financial Properties, Inc. |
| • Senior Counsel of Weil, Gotshal & Manges, LLP |
| • Emeritus Chairman of the Real Estate Board of New York |
| Other Board Memberships and Affiliations: |
| • Emigrant Savings Bank, Director |
| • Wellpoint, Inc., Director |
| • Columbia University,Trustee |
| • Doris Duke Charitable Foundation,Trustee |
| No. of Portfolios for which Board Member Serves: 27 |
Once elected all Board Members serve for an indefinite term, but achieve Emeritus status upon reaching age 80.The address of the Board Members and Officers is in c/o The Dreyfus Corporation, 200 Park Avenue, New York, New York 10166.Additional information about the Board Members is available in the fund’s Statement of Additional Information which can be obtained from Dreyfus free of charge by calling this toll free number: 1-800-554-4611.
Arnold S. Hiatt, Emeritus Board Member
The Fund 35
OFFICERS OF THE FUND ( U n a u d i t e d )
J. DAVID OFFICER, President since December 2006.
Chief Operating Officer,Vice Chairman and a Director of the Manager, and an officer of 76 investment companies (comprised of 160 portfolios) managed by the Manager. He is 59 years old and has been an employee of the Manager since April 1998.
PHILLIP N. MAISANO, Executive Vice President since July 2007.
Chief Investment Officer,Vice Chair and a director of the Manager, and an officer of 76 investment companies (comprised of 160 portfolios) managed by the Manager. Mr. Maisano also is an officer and/or Board member of certain other investment management subsidiaries of The Bank of New York Mellon Corporation, each of which is an affiliate of the Manager. He is 61 years old and has been an employee of the Manager since November 2006. Prior to joining the Manager, Mr. Maisano served as Chairman and Chief Executive Officer of EACM Advisors, an affiliate of the Manager, since August 2004, and served as Chief Executive Officer of Evaluation Associates, a leading institutional investment consulting firm, from 1988 until 2004.
MICHAEL A. ROSENBERG, Vice President and Secretary since August 2005.
Associate General Counsel of the Manager, and an officer of 77 investment companies (comprised of 177 portfolios) managed by the Manager. He is 48 years old and has been an employee of the Manager since October 1991.
JAMES BITETTO, Vice President and Assistant Secretary since August 2005.
Associate General Counsel and Secretary of the Manager, and an officer of 77 investment companies (comprised of 177 portfolios) managed by the Manager. He is 41 years old and has been an employee of the Manager since December 1996.
JONI LACKS CHARATAN, Vice President and Assistant Secretary since August 2005.
Associate General Counsel of the Manager, and an officer of 77 investment companies (comprised of 177 portfolios) managed by the Manager. She is 52 years old and has been an employee of the Manager since October 1988.
JOSEPH M. CHIOFFI, Vice President and Assistant Secretary since August 2005.
Associate General Counsel of the Manager, and an officer of 77 investment companies (comprised of 177 portfolios) managed by the Manager. He is 46 years old and has been an employee of the Manager since June 2000.
JANETTE E. FARRAGHER, Vice President and Assistant Secretary since August 2005.
Associate General Counsel of the Manager, and an officer of 77 investment companies (comprised of 177 portfolios) managed by the Manager. She is 45 years old and has been an employee of the Manager since February 1984.
JOHN B. HAMMALIAN, Vice President and Assistant Secretary since August 2005.
Associate General Counsel of the Manager, and an officer of 77 investment companies (comprised of 177 portfolios) managed by the Manager. He is 44 years old and has been an employee of the Manager since February 1991.
ROBERT R. MULLERY, Vice President and Assistant Secretary since August 2005.
Associate General Counsel of the Manager, and an officer of 77 investment companies (comprised of 177 portfolios) managed by the Manager. He is 56 years old and has been an employee of the Manager since May 1986.
36
JEFF PRUSNOFSKY, Vice President and Assistant Secretary since August 2005.
Associate General Counsel of the Manager, and an officer of 77 investment companies (comprised of 177 portfolios) managed by the Manager. He is 43 years old and has been an employee of the Manager since October 1990.
JAMES WINDELS, Treasurer since November 2001.
Director – Mutual Fund Accounting of the Manager, and an officer of 77 investment companies (comprised of 177 portfolios) managed by the Manager. He is 49 years old and has been an employee of the Manager since April 1985.
RICHARD CASSARO, Assistant Treasurer since September 2007.
Senior Accounting Manager – Money Market and Municipal Bond Funds of the Manager, and an officer of 77 investment companies (comprised of 177 portfolios) managed by the Manager. He is 49 years old and has been an employee of the Manager since September 1982.
GAVIN C. REILLY, Assistant Treasurer since December 2005.
Tax Manager of the Investment Accounting and Support Department of the Manager, and an officer of 77 investment companies (comprised of 177 portfolios) managed by the Manager. He is 39 years old and has been an employee of the Manager since April 1991.
ROBERT ROBOL, Assistant Treasurer since August 2005.
Senior Accounting Manager – Fixed Income Funds of the Manager, and an officer of 77 investment companies (comprised of 177 portfolios) managed by the Manager. He is 44 years old and has been an employee of the Manager since October 1988.
ROBERT SALVIOLO, Assistant Treasurer since May 2007.
Senior Accounting Manager – Equity Funds of the Manager, and an officer of 77 investment companies (comprised of 177 portfolios) managed by the Manager. He is 41 years old and has been an employee of the Manager since June 1989.
ROBERT SVAGNA, Assistant Treasurer since August 2002.
Senior Accounting Manager – Equity Funds of the Manager, and an officer of 77 investment companies (comprised of 177 portfolios) managed by the Manager. He is 41 years old and has been an employee of the Manager since November 1990.
JOSEPH W. CONNOLLY, Chief Compliance Officer since October 2004.
Chief Compliance Officer of the Manager and The Dreyfus Family of Funds (77 investment companies, comprised of 177 portfolios). From November 2001 through March 2004, Mr. Connolly was first Vice-President, Mutual Fund Servicing for Mellon Global Securities Services. In that capacity, Mr. Connolly was responsible for managing Mellon’s Custody, Fund Accounting and Fund Administration services to third-party mutual fund clients. He is 51 years old and has served in various capacities with the Manager since 1980, including manager of the firm’s Fund Accounting Department from 1997 through October 2001.
WILLIAM GERMENIS, Anti-Money Laundering Compliance Officer since October 2002.
Vice President and Anti-Money Laundering Compliance Officer of the Distributor, and the Anti-Money Laundering Compliance Officer of 73 investment companies (comprised of 173 portfolios) managed by the Manager. He is 37 years old and has been an employee of the Distributor since October 1998.
The Fund 37

Item 2. Code of Ethics.
The Registrant has adopted a code of ethics that applies to the Registrant's principal executive officer, principal financial officer, principal accounting officer or controller, or persons performing similar functions. There have been no amendments to, or waivers in connection with, the Code of Ethics during the period covered by this Report.
Item 3. Audit Committee Financial Expert.
The Registrant's Board has determined that Joseph S. DiMartino, a member of the Audit Committee of the Board, is an audit committee financial expert as defined by the Securities and Exchange Commission (the "SEC"). Joseph S. DiMartino is "independent" as defined by the SEC for purposes of audit committee financial expert determinations.
Item 4. Principal Accountant Fees and Services
(a) Audit Fees. The aggregate fees billed for each of the last two fiscal years (the "Reporting Periods") for professional services rendered by the Registrant's principal accountant (the "Auditor") for the audit of the Registrant's annual financial statements, or services that are normally provided by the Auditor in connection with the statutory and regulatory filings or engagements for the Reporting Periods, were $39,466 in 2007 and $40,649 in 2008.
(b) Audit-Related Fees. The aggregate fees billed in the Reporting Periods for assurance and related services by the Auditor that are reasonably related to the performance of the audit of the Registrant's financial statements and are not reported under paragraph (a) of this Item 4 were $0 in 2007 and $0 in 2008.
The aggregate fees billed in the Reporting Periods for non-audit assurance and related services by the Auditor to the Registrant's investment adviser (not including any sub-investment adviser whose role is primarily portfolio management and is subcontracted with or overseen by another investment adviser), and any entity controlling, controlled by or under common control with the investment adviser that provides ongoing services to the Registrant ("Service Affiliates"), that were reasonably related to the performance of the annual audit of the Service Affiliate, which required pre-approval by the Audit Committee were $0 in 2007 and $0 in 2008.
Note: For the second paragraph in each of (b) through (d) of this Item 4, certain of such services were not pre-approved prior to May 6, 2003, when such services were required to be pre-approved. On and after May 6, 2003, 100% of all services provided by the Auditor were pre-approved as required. For comparative purposes, the fees shown assume that all such services were pre-approved, including services that were not pre-approved prior to the compliance date of the pre-approval requirement.
(c) Tax Fees. The aggregate fees billed in the Reporting Periods for professional services rendered by the Auditor for tax compliance, tax advice and tax planning ("Tax Services") were $3,485 in 2007 and $5,913 in 2008. These services consisted of (i) review or preparation of U.S. federal, state, local and excise tax returns; (ii) U.S. federal, state and local tax planning, advice and assistance regarding statutory, regulatory or administrative developments, (iii) tax advice regarding tax qualification matters and/or treatment of various
financial instruments held or proposed to be acquired or held, and (iv) determination of Passive Foreign Investment Companies (as applicable).
The aggregate fees billed in the Reporting Periods for Tax Services by the Auditor to Service Affiliates which required pre-approval by the Audit Committee were $0 in 2007 and $0 in 2008.
(d) All Other Fees. The aggregate fees billed in the Reporting Periods for products and services provided by the Auditor, other than the services reported in paragraphs (a) through (c) of this Item, were $0 in 2007 and $11 in 2008.
The aggregate fees billed in the Reporting Periods for Non-Audit Services by the Auditor to Service Affiliates, other than the services reported in paragraphs (b) through (c) of this Item, which required pre-approval by the Audit Committee were $0 in 2007 and $0 in 2008.
Audit Committee Pre-Approval Policies and Procedures. The Registrant's Audit Committee has established policies and procedures (the "Policy") for pre-approval (within specified fee limits) of the Auditor's engagements for non-audit services to the Registrant and Service Affiliates without specific case-by-case consideration. Pre-approval considerations include whether the proposed services are compatible with maintaining the Auditor's independence. Pre-approvals pursuant to the Policy are considered annually.
Non-Audit Fees. The aggregate non-audit fees billed by the Auditor for services rendered to the Registrant, and rendered to Service Affiliates, for the Reporting Periods were $1,302,603 in 2007 and $2,596,025 in 2008.
Auditor Independence. The Registrant's Audit Committee has considered whether the provision of non-audit services that were rendered to Service Affiliates which were not pre-approved (not requiring pre-approval) is compatible with maintaining the Auditor's independence.
| Item 5. | | Audit Committee of Listed Registrants. |
| | | Not applicable. |
| Item 6. | | Schedule of Investments. |
| (a) | | Not applicable. |
| Item 7. | | Disclosure of Proxy Voting Policies and Procedures for Closed-End Management |
| | | Investment Companies. |
| | | Not applicable. |
| Item 8. | | Portfolio Managers of Closed-End Management Investment Companies. |
| | | Not applicable. |
| Item 9. | | Purchases of Equity Securities by Closed-End Management Investment Companies and |
| | | Affiliated Purchasers. |
| | | Not applicable. |
| Item 10. | | Submission of Matters to a Vote of Security Holders. |
The Registrant has a Nominating Committee (the "Committee"), which is responsible for selecting and nominating persons for election or appointment by the Registrant's Board as Board members. The Committee has adopted a Nominating Committee Charter (the "Charter"). Pursuant to the Charter, the Committee will consider recommendations for nominees from shareholders submitted to the Secretary of the Registrant, c/o The Dreyfus Corporation Legal Department, 200 Park Avenue, 8th Floor East, New York, New York 10166. A nomination submission must include information regarding the recommended nominee as specified in the Charter. This information includes all information relating to a recommended nominee that is required to be disclosed in solicitations or proxy statements for the election of Board members, as well as information sufficient to evaluate the factors to be considered by the Committee, including character and integrity, business and professional experience, and whether the person has the ability to apply sound and independent business judgment and would act in the interests of the Registrant and its shareholders.
Nomination submissions are required to be accompanied by a written consent of the individual to stand for election if nominated by the Board and to serve if elected by the shareholders, and such additional information must be provided regarding the recommended nominee as reasonably requested by the Committee.
Item 11. Controls and Procedures.
(a) The Registrant's principal executive and principal financial officers have concluded, based on their evaluation of the Registrant's disclosure controls and procedures as of a date within 90 days of the filing date of this report, that the Registrant's disclosure controls and procedures are reasonably designed to ensure that information required to be disclosed by the Registrant on Form N-CSR is recorded, processed, summarized and reported within the required time periods and that information required to be disclosed by the Registrant in the reports that it files or submits on Form N-CSR is accumulated and communicated to the Registrant's management, including its principal executive and principal financial officers, as appropriate to allow timely decisions regarding required disclosure.
(b) There were no changes to the Registrant's internal control over financial reporting that occurred during the second fiscal quarter of the period covered by this report that have materially affected, or are reasonably likely to materially affect, the Registrant's internal control over financial reporting.
Item 12. Exhibits.
| (a)(1) | | Code of ethics referred to in Item 2. |
| (a)(2) | | Certifications of principal executive and principal financial officers as required by Rule 30a-2(a) |
| under the Investment Company Act of 1940. |
| (a)(3) | | Not applicable. |
| (b) | | Certification of principal executive and principal financial officers as required by Rule 30a-2(b) |
| under the Investment Company Act of 1940. |
Pursuant to the requirements of the Securities Exchange Act of 1934 and the Investment Company Act of 1940, the Registrant has duly caused this Report to be signed on its behalf by the undersigned, thereunto duly authorized.
Strategic Funds, Inc.
| By: | | /s/ J. David Officer |
| | | J. David Officer |
| | | President |
| |
| Date: | | July 23, 2008 |
| |
| Pursuant to the requirements of the Securities Exchange Act of 1934 and the Investment Company Act of |
| 1940, this Report has been signed below by the following persons on behalf of the Registrant and in the |
| capacities and on the dates indicated. |
| |
| By: | | /s/ J. David Officer |
| | | J. David Officer |
| | | President |
| |
| Date: | | July 23, 2008 |
| |
| By: | | /s/ James Windels |
| | | James Windels |
| | | Treasurer |
| |
| Date: | | July 23, 2008 |
| |
| EXHIBIT INDEX |
| |
| | | (a)(1) | | Code of ethics referred to in Item 2. |
| |
| | | (a)(2) | | Certifications of principal executive and principal financial officers as required by Rule 30a- |
| | | 2(a) under the Investment Company Act of 1940. (EX-99.CERT) |
| |
| | | (b) | | Certification of principal executive and principal financial officers as required by Rule 30a- |
| | | 2(b) under the Investment Company Act of 1940. (EX-99.906CERT) |