| UNITED STATES SECURITIES AND EXCHANGE COMMISSION Washington, D.C. 20549 |
| FORM N-CSR |
| CERTIFIED SHAREHOLDER REPORT OF REGISTERED MANAGEMENT INVESTMENT COMPANIES |
Investment Company Act file number 811-3940
| Strategic Funds, Inc. (Exact name of Registrant as specified in charter) |
| c/o The Dreyfus Corporation 200 Park Avenue New York, New York 10166 (Address of principal executive offices) (Zip code) |
| Michael A. Rosenberg, Esq. 200 Park Avenue New York, New York 10166 (Name and address of agent for service) |
| Registrant's telephone number, including area code: | (212) 922-6000 | |||
| Date of fiscal year end: | 10/31 | |||
| Date of reporting period: | 10/31/08 | |||
The following N-CSR relates only to the Registrant’s series listed below and does not affect the other series of the Registrant, which have different fiscal year ends and, therefore, different N-CSR reporting requirements. Separate N-CSR Forms will be filed for these series, as appropriate.
| Systematic International Equity Fund |
| FORM N-CSR |
Item 1. Reports to Stockholders.
Save time. Save paper. View your next shareholder report online as soon as it’s available. Log into www.dreyfus.com and sign up for Dreyfus eCommunications. It’s simple and only takes a few minutes.
The views expressed in this report reflect those of the portfolio manager only through the end of the period covered and do not necessarily represent the views of Dreyfus or any other person in the Dreyfus organization. Any such views are subject to change at any time based upon market or other conditions and Dreyfus disclaims any responsibility to update such views.These views may not be relied on as investment advice and, because investment decisions for a Dreyfus fund are based on numerous factors, may not be relied on as an indication of trading intent on behalf of any Dreyfus fund.
Not FDIC-Insured Not Bank-Guaranteed May Lose Value
| Contents | |
| THE FUND | |
| 2 | A Letter from the CEO |
| 3 | Discussion of Fund Performance |
| 6 | Fund Performance |
| 8 | Understanding Your Fund’s Expenses |
| 8 | Comparing Your Fund’s Expenses With Those of Other Funds |
| 9 | Statement of Investments |
| 17 | Statement of Financial Futures |
| 18 | Statement of Assets and Liabilities |
| 19 | Statement of Operations |
| 20 | Statement of Changes in Net Assets |
| 22 | Financial Highlights |
| 26 | Notes to Financial Statements |
| 36 | Report of Independent Registered Public Accounting Firm |
| 37 | Important Tax Information |
| 38 | Board Members Information |
| 41 | Officers of the Fund |
| FOR MORE INFORMATION | |
| Back Cover | |
| The Fund |
| Systematic International Equity Fund |

| A LETTER FROM THE CEO Dear Shareholder: |
We present to you this annual report for Systematic International Equity Fund, covering the 12-month period from November 1, 2007, through October 31, 2008.
These are difficult times for international investors. A credit crunch that began in the United States in 2007 has developed into a full-blown global financial crisis, recently resulting in the failure of several major financial institutions. Meanwhile, the global economic slowdown has gathered momentum, depressing investor sentiment, consumer confidence and business investment around the world.These factors undermined equity returns in most regions,including formerly high-flying emerging markets.
The depth and duration of the economic downturn will depend on how quickly the global financial system can be stabilized.We believe that government efforts in the United States and Europe meet several critical requirements for addressing today’s financial stresses, and we expect them to contribute to a more orderly deleveraging process. However, recuperation from the financial crisis is likely to take time. In the mean-time,we encourage you to keep in touch with your financial advisor and maintain a long-term and disciplined perspective to investing. Indeed, we already are seeing some positive signs, including a likely peak in global inflationary pressures, attractive valuations among fundamentally sound companies and a large pool of worldwide financial liquidity that could be deployed gradually as the economic cycle turns.
For information about how the fund performed during the reporting period, as well as market perspectives, we have provided a Discussion of Fund Performance given by the fund’s Portfolio Managers.
Thank you for your continued confidence and support.
| Jonathan R. Baum Chief Executive Officer The Dreyfus Corporation November 17, 2008 |
2

DISCUSSION OF FUND PERFORMANCE
For the period of November 1, 2007, through October 31, 2008, as provided by Peter Goslin, Jocelin Reed, Robert Wilk and Skender Cilka, Portfolio Managers
Fund and Market Performance Overview
For the 12-month period ended October 31, 2008, Systematic International Equity Fund’s Class A shares achieved a –51.12% total return, Class C shares achieved a –51.54% total return, Class I shares achieved a –51.00% total return and Class T shares achieved a –51.27% total return.1 The fund’s benchmark, the Morgan Stanley Capital International Europe, Australasia, Far East Index (“MSCI EAFE Index”), produced a total return of –46.62% for the same period.2
Stock markets throughout the world posted sharp declines due to a slowing global economy and a severe financial crisis.The fund’s returns lagged its benchmark, primarily due to shortfalls in the energy, consumer durables and non-energy minerals sectors.
The Fund’s Investment Approach
The fund seeks long-term capital growth by normally investing at least 80% of its assets in equity securities.The fund normally invests primarily in equity securities of foreign companies. The fund invests in at least 10 different countries and may invest up to 25% of its assets in emerging market countries, but no more than 10% of its assets may be invested in any one emerging market country.
When selecting securities, we use a quantitative model to identify and rank stocks within geographic regions and economic sectors based on six factor classifications: value, stewardship, growth, accruals, market sentiment and analysts’ expectations. We generally select higher ranked securities as identified by the quantitative model.We attempt to manage risk through diversification across regions, countries, sectors and industries in proportions that are similar to those of the MSCI EAFE Index. The fund’s currency exposure typically is unhedged to the U.S. dollar.
The Fund 3
| DISCUSSION OF FUND PERFORMANCE (continued) |
Global Financial Crisis Sparked Broad Declines
Following a downward trend established by the United States, most regions of the world suffered from slowing economic growth, fueling fears of a potentially deep and prolonged global recession. Commodity prices that had soared over the reporting period’s first half plummeted over the second half as worldwide demand eased.
Meanwhile,a global credit crunch that began in the U.S.sub-prime mortgage market in 2007 developed into a full-blown global financial crisis later in the reporting period, and poor liquidity conditions in the credit markets nearly led to the collapse of the global banking system in September 2008. Government and regulatory authorities intervened, pumping billions of dollars into the system to restore a degree of investor confidence.These efforts included capital infusions by the United States, United Kingdom and other governments, as well as unprecedented, coordinated reductions of short-term interest rates by major central banks.
As market conditions deteriorated, many highly leveraged institutional investors were forced to de-lever their portfolios, selling their more liquid investments to raise cash for margin calls and redemptions. Selling pressure led to broadly lower prices even among fundamentally sound markets and stocks.The financials sector was particularly hard-hit.
Models Challenged by Structural Volatility
Historically the quantitative model underlying the fund’s investment approach has been more successful during periods when strong stocks are rewarded and poor ones are punished.This is known as high cross sectional volatility.The quantitative model tends to underperform when “structural volatility” sparks broad-based declines regardless of a company’s individual strengths and weaknesses. The latter condition prevailed during the reporting period’s global economic downturn and financial crisis.
The effects of generally indiscriminate selling pressure and falling commodity prices were particularly severe among the fund’s holdings of steel producers within the non-energy minerals area, including Australian iron ore producer Mount Gibson Iron, which saw orders canceled or delayed. The fund’s investments in consumer products companies also suffered as the global economy softened, hurting holdings such as Australia’s Pacific Brands, which sells its products through retailers and reduced earnings guidance to analysts. Among consumer
4
durables stocks, the fund’s relatively light exposure to Volkswagen detracted from its relative performance when the German automaker gained due to technical factors related to short-sellers covering their positions.The fund realized relatively weak results from stock selection in the electric utilities and real estate development industries.
On the other hand, the fund achieved relatively strong performance in the troubled financials sector, where broad diversification and an emphasis on insurance companies helped the fund avoid the full brunt of weakness affecting commercial and investment banks. In addition, the fund benefited from investments in Japanese companies with unique products, such as Tokyo-based Oriental Land Co., owner of a Disney theme park and retail stores, and Rakuten, an Internet retailer selling quality goods at low prices.
Maintaining a Cautious Posture
Although we were encouraged by the aggressive responses of governments and central banks to the financial crisis, we expect the global economic downturn and portfolio deleveraging to persist. Therefore, we have adopted a cautious investment posture, maintaining a broadly diversified portfolio and a generally sector-neutral allocation strategy. However, we have found a number of attractively valued stocks, and we may begin to establish or increase positions in such companies.
| November 15, 2008 | ||
| Investing in foreign companies involves special risks, including changes in currency rates, | ||
| political, economic and social instability, a lack of comprehensive company information, | ||
| differing auditing and legal standards and less market liquidity. | ||
| 1 | Total return includes reinvestment of dividends and any capital gains paid, and does not take into | |
| consideration the maximum initial sales charges in the case of Class A and Class T shares, or the | ||
| applicable contingent deferred sales charges imposed on redemptions in the case of Class C shares. | ||
| Had these charges been reflected, returns would have been lower. Past performance is no guarantee | ||
| of future results. Share price and investment return fluctuate such that upon redemption, fund | ||
| shares may be worth more or less than their original cost. Return figures provided reflect the | ||
| absorption of certain fund expenses by The Dreyfus Corporation pursuant to an agreement in | ||
| effect through March 1, 2010, at which time it may be extended, terminated or modified. Had | ||
| these expenses not been absorbed, the fund’s returns would have been lower. | ||
| 2 | SOURCE: LIPPER INC. — Reflects reinvestment of net dividends and, where applicable, | |
| capital gain distributions.The Morgan Stanley Capital International Europe, Australasia, Far | ||
| East (MSCI EAFE) Free Index is an unmanaged index composed of a sample of companies | ||
| representative of the market structure of European and Pacific Basin countries.The index reflects | ||
| actual investable opportunities for global investors for stocks that are free of foreign ownership | ||
| limits or legal restrictions at the country level. | ||
The Fund 5
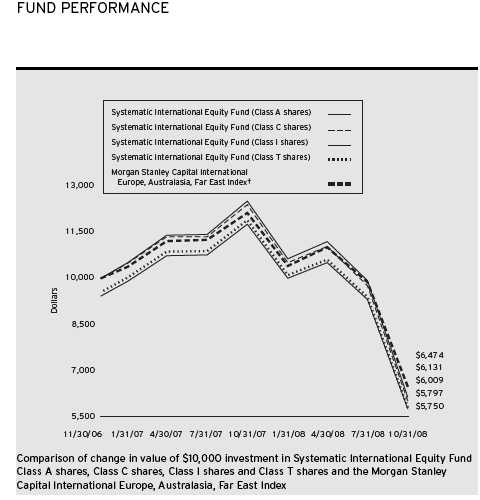
| † Source: Lipper Inc. |
| Past performance is not predictive of future performance. |
| The above graph compares a $10,000 investment made in Class A, Class C, Class I and Class T shares of the |
| Systematic International Equity Fund on 11/30/06 (inception date) to a $10,000 investment made in the Morgan |
| Stanley Capital International Europe, Australasia, Far East Index (the “Index”) on that date. All dividends and capital |
| gain distributions are reinvested. |
| The fund’s performance shown in the line graph takes into account the maximum initial sales charge on Class A shares |
| and Class T shares and all other applicable fees and expenses on all classes.The Index is an unmanaged index composed |
| of a sample of companies representative of the market structure of European and Pacific Basin countries. Unlike a mutual |
| fund, the Index is not subject to charges, fees and other expenses. Investors cannot invest directly in any index. Further |
| information relating to fund performance, including expense reimbursements, if applicable, is contained in the Financial |
| Highlights section of the prospectus and elsewhere in this report. |
6
| Average Annual Total Returns as of 10/31/08 | ||||||
| Inception | From | |||||
| Date | 1 Year | Inception | ||||
| Class A shares | ||||||
| with maximum sales charge (5.75%) | 11/30/06 | (53.93)% | (25.04)% | |||
| without sales charge | 11/30/06 | (51.12)% | (22.70)% | |||
| Class C shares | ||||||
| with applicable redemption charge † | 11/30/06 | (52.00)% | (23.30)% | |||
| without redemption | 11/30/06 | (51.54)% | (23.30)% | |||
| Class I shares | 11/30/06 | (51.00)% | (22.49)% | |||
| Class T shares | ||||||
| with applicable sales charge (4.5%) | 11/30/06 | (53.45)% | (24.72)% | |||
| without sales charge | 11/30/06 | (51.27)% | (22.89)% | |||
| Past performance is not predictive of future performance.The fund’s performance shown in the graph and table does not |
| reflect the deduction of taxes that a shareholder would pay on fund distributions or the redemption of fund shares. |
| † The maximum contingent deferred sales charge for Class C shares is 1% for shares redeemed within one year of the |
| date of purchase. |
The Fund 7
UNDERSTANDING YOUR FUND’S EXPENSES (Unaudited)
As a mutual fund investor, you pay ongoing expenses, such as management fees and other expenses. Using the information below, you can estimate how these expenses affect your investment and compare them with the expenses of other funds.You also may pay one-time transaction expenses, including sales charges (loads) and redemption fees, which are not shown in this section and would have resulted in higher total expenses. For more information, see your fund’s prospectus or talk to your financial adviser.
Review your fund’s expenses
The table below shows the expenses you would have paid on a $1,000 investment in Systematic International Equity Fund from May 1, 2008 to October 31, 2008. It also shows how much a $1,000 investment would be worth at the close of the period, assuming actual returns and expenses.
Expenses and Value of a $1,000 Investment assuming actual returns for the six months ended October 31, 2008
| Class A | Class C | Class I | Class T | |||||
| Expenses paid per $1,000† | $ 5.44 | $ 8.35 | $ 4.47 | $ 6.41 | ||||
| Ending value (after expenses) | $546.70 | $544.20 | $547.40 | $546.00 |
COMPARING YOUR FUND’S EXPENSES WITH THOSE OF OTHER FUNDS (Unaudited)
Using the SEC’s method to compare expenses
The Securities and Exchange Commission (SEC) has established guidelines to help investors assess fund expenses. Per these guidelines, the table below shows your fund’s expenses based on a $1,000 investment, assuming a hypothetical 5% annualized return. You can use this information to compare the ongoing expenses (but not transaction expenses or total cost) of investing in the fund with those of other funds.All mutual fund shareholder reports will provide this information to help you make this comparison. Please note that you cannot use this information to estimate your actual ending account balance and expenses paid during the period.
Expenses and Value of a $1,000 Investment assuming a hypothetical 5% annualized return for the six months ended October 31, 2008
| Class A | Class C | Class I | Class T | |||||
| Expenses paid per $1,000† | $ 7.10 | $ 10.89 | $ 5.84 | $ 8.36 | ||||
| Ending value (after expenses) | $1,018.10 | $1,014.33 | $1,019.36 | $1,016.84 |
| † Expenses are equal to the fund’s annualized expense ratio of 1.40% for Class A, 2.15% for Class C, 1.15% for |
| Class I and 1.65% for Class T, multiplied by the average account value over the period, multiplied by 184/366 (to |
| reflect the one-half year period). |
8
| STATEMENT OF INVESTMENTS October 31, 2008 |
| Common Stocks—98.5% | Shares | Value ($) | ||
| Australia—6.1% | ||||
| AXA Asia Pacific Holdings | 7,350 | 21,649 | ||
| BHP Billiton | 400 | 7,685 | ||
| BlueScope Steel | 5,967 | 17,531 | ||
| Boart Longyear Group | 20,672 | 5,996 | ||
| Brambles | 5,880 | 31,140 | ||
| Computershare | 5,489 | 30,773 | ||
| Dexus Property Group | 30,662 | 15,313 | ||
| Fortescue Metals Group | 5,713 a | 11,352 | ||
| Incitec Pivot | 9,175 | 24,930 | ||
| ING Industrial Fund | 19,800 | 4,445 | ||
| James Hardie Industries | 6,990 | 19,831 | ||
| Lion Nathan | 6,506 | 38,135 | ||
| Mount Gibson Iron | 15,786 a | 4,249 | ||
| Pacific Brands | 19,778 | 13,197 | ||
| Rio Tinto | 441 | 22,819 | ||
| Santos | 3,650 | 33,234 | ||
| SP Ausnet | 37,300 | 27,336 | ||
| Westfield Group | 3,980 | 44,242 | ||
| 373,857 | ||||
| Austria—.9% | ||||
| Flughafen Wien | 439 | 17,899 | ||
| IMMOEAST | 5,024 a | 6,019 | ||
| IMMOFINANZ | 2,000 a | 2,218 | ||
| Verbund-Oesterreichische | ||||
| Elektrizitaetswirtschafts, Cl. A | 600 | 28,295 | ||
| 54,431 | ||||
| Belgium—2.2% | ||||
| Ackermans & Van Haaren | 370 | 21,179 | ||
| Bekaert | 250 | 24,484 | ||
| Colruyt | 150 | 33,648 | ||
| Mobistar | 550 | 36,417 | ||
| Umicore | 1,050 | 18,682 | ||
| 134,410 | ||||
| China—.5% | ||||
| Tencent Holdings | 4,400 | 31,775 |
The Fund 9
| STATEMENT OF INVESTMENTS (continued) |
| Common Stocks (continued) | Shares | Value ($) | ||
| Denmark—.2% | ||||
| Novo Nordisk, Cl. B | 275 | 14,686 | ||
| Finland—2.6% | ||||
| Fortum | 1,330 | 32,564 | ||
| Konecranes | 1,635 | 27,716 | ||
| Nokia | 1,735 | 26,934 | ||
| Nokian Renkaat | 1,135 | 14,784 | ||
| Sampo, Cl. A | 1,900 | 37,705 | ||
| Tietoenator | 1,540 | 17,076 | ||
| 156,779 | ||||
| France—8.0% | ||||
| Air Liquide | 528 | 45,294 | ||
| AXA | 2,400 | 45,425 | ||
| BNP Paribas | 275 | 19,628 | ||
| CNP Assurances | 409 | 32,831 | ||
| Fonciere des Regions | 317 | 20,888 | ||
| France Telecom | 565 | 14,186 | ||
| Hermes International | 370 | 47,630 | ||
| Maurel et Prom | 1,706 | 20,113 | ||
| Neopost | 320 | 26,674 | ||
| Nexans | 340 | 19,249 | ||
| Sanofi-Aventis | 284 | 17,892 | ||
| Societe Des Autoroutes Paris-Rhin-Rhone | 300 | 19,401 | ||
| Total | 1,200 | 65,484 | ||
| Ubisoft Entertainment | 450 a | 23,613 | ||
| Vallourec | 260 | 28,830 | ||
| Wendel | 340 | 16,051 | ||
| Zodiac | 760 | 29,534 | ||
| 492,723 | ||||
| Germany—8.9% | ||||
| AMB Generali Holding | 170 | 17,607 | ||
| BASF | 1,624 | 53,962 | ||
| Bayer | 953 | 52,424 | ||
| Daimler | 680 | 23,236 | ||
| Deutsche Boerse | 510 | 40,295 | ||
| E.ON | 2,211 | 83,583 | ||
| Fresenius Medical Care & Co. | 1,050 | 47,188 | ||
| Hannover Rueckversicherung | 970 | 24,306 |
10
| Common Stocks (continued) | Shares | Value ($) | ||
| Germany (continued) | ||||
| K+S | 444 | 17,362 | ||
| Muenchener Rueckversicherungs | 425 | 55,739 | ||
| RWE | 87 | 7,184 | ||
| Salzgitter | 280 | 18,258 | ||
| Siemens | 381 | 22,561 | ||
| Solarworld | 630 | 15,690 | ||
| ThyssenKrupp | 720 | 13,774 | ||
| United Internet | 536 | 4,782 | ||
| Volkswagen | 77 | 49,021 | ||
| 546,972 | ||||
| Greece—.5% | ||||
| OPAP | 1,400 | 30,441 | ||
| Hong Kong—3.7% | ||||
| Cheung Kong Holdings | 4,000 | 38,951 | ||
| CLP Holdings | 7,000 | 47,534 | ||
| Hang Lung Group | 9,000 | 29,246 | ||
| Hutchison Whampoa | 5,000 | 27,369 | ||
| Link REIT | 16,500 | 28,746 | ||
| Pacific Basin Shipping | 22,000 | 11,513 | ||
| Wheelock & Co. | 15,000 | 22,595 | ||
| Yue Yuen Industrial Holdings | 11,500 | 22,773 | ||
| 228,727 | ||||
| Ireland—.2% | ||||
| Independent News & Media | 11,400 | 9,299 | ||
| Italy—2.2% | ||||
| Atlantia | 1,400 | 25,499 | ||
| ENI | 872 | 20,594 | ||
| Fondiaria-SAI | 1,070 | 19,938 | ||
| Intesa Sanpaolo | 800 | 2,897 | ||
| Lottomatica | 1,270 | 29,534 | ||
| Terna | 10,500 | 33,792 | ||
| 132,254 | ||||
| Japan—20.8% | ||||
| Acom | 800 | 30,227 | ||
| Asahi Glass | 4,000 | 25,625 | ||
| Bank of Kyoto | 4,000 | 41,884 | ||
| Central Japan Railway | 5 | 40,908 |
The Fund 11
| STATEMENT OF INVESTMENTS (continued) |
| Common Stocks (continued) | Shares | Value ($) | ||
| Japan (continued) | ||||
| eAccess | 62 | 28,836 | ||
| Electric Power Development | 1,400 | 41,521 | ||
| Gunma Bank | 6,000 | 31,033 | ||
| Hankyu Hashin Holdings | 8,000 | 37,781 | ||
| Hiroshima Bank | 5,000 | 18,505 | ||
| Hitachi Metals | 3,000 | 22,519 | ||
| Hokuhoku Financial Group | 17,000 | 33,423 | ||
| Itochu | 3,000 | 16,199 | ||
| Japan Steel Works | 2,000 | 14,090 | ||
| JGC | 1,000 | 10,615 | ||
| KDDI | 8 | 47,795 | ||
| KK daVinci Holdings | 45 a | 3,629 | ||
| Mitsubishi | 2,800 | 46,474 | ||
| Mitsubishi Estate | 2,000 | 35,205 | ||
| Mitsubishi UFJ Financial Group | 3,800 | 23,400 | ||
| Mitsui & Co. | 4,000 | 38,451 | ||
| Mitsui OSK Lines | 5,000 | 26,476 | ||
| Mitsui Sumitomo Insurance Group Holdings | 1,000 | 28,498 | ||
| Nippon Mining Holdings | 1,000 | 3,097 | ||
| Nippon Sheet Glass | 2,000 | 6,501 | ||
| Nippon Yusen | 7,000 | 33,557 | ||
| Nishi-Nippon City Bank | 14,000 | 30,282 | ||
| Nisshinbo Industries | 3,000 | 17,698 | ||
| NSK | 5,000 | 20,870 | ||
| Oriental Land | 600 | 42,563 | ||
| ORIX | 310 | 32,901 | ||
| Panasonic | 4,000 | 62,198 | ||
| Rakuten | 76 | 37,614 | ||
| Seven & I Holdings | 2,000 | 56,015 | ||
| Shimachu | 1,500 | 34,915 | ||
| Sompo Japan Insurance | 5,000 | 35,603 | ||
| Sony Financial Holdings | 9 | 29,657 | ||
| Sumitomo | 4,000 | 35,871 | ||
| Sumitomo Metal Industries | 10,000 | 26,579 | ||
| Tokio Marine Holdings | 1,700 | 53,027 |
12
| Common Stocks (continued) | Shares | Value ($) | ||
| Japan (continued) | ||||
| Tosoh | 9,000 | 18,234 | ||
| Toyota Motor | 1,310 | 51,643 | ||
| Yamaha | 400 | 3,848 | ||
| 1,275,767 | ||||
| Luxembourg—1.0% | ||||
| ArcelorMittal | 1,577 | 40,310 | ||
| Oriflame Cosmetics | 650 | 20,019 | ||
| 60,329 | ||||
| Netherlands—2.9% | ||||
| Corio | 530 | 28,223 | ||
| Gemalto | 900 a | 25,018 | ||
| ING Groep | 2,916 | 26,890 | ||
| Koninklijke Ahold | 3,700 | 39,457 | ||
| Koninklijke DSM | 915 | 25,319 | ||
| Wolters Kluwer | 1,705 | 30,032 | ||
| 174,939 | ||||
| Norway—1.8% | ||||
| Fred Olsen Energy | 500 | 16,369 | ||
| Norsk Hydro | 3,500 | 14,550 | ||
| Prosafe | 8,500 | 31,235 | ||
| SeaDrill | 3,100 | 29,457 | ||
| Tandberg | 1,700 | 20,899 | ||
| 112,510 | ||||
| Singapore—1.1% | ||||
| Ascendas Real Estate Investment Trust | 26,000 | 28,046 | ||
| CapitaLand | 11,000 | 21,726 | ||
| Haw Par | 3,000 | 6,959 | ||
| Singapore Petroleum | 9,000 | 12,691 | ||
| 69,422 | ||||
| Spain—3.4% | ||||
| Banco Santander | 3,057 | 32,612 | ||
| Enagas | 1,600 | 31,058 | ||
| Grifols | 1,400 | 27,658 | ||
| Iberdrola Renovables | 6,568 | 19,840 | ||
| Red Electrica | 750 | 32,711 |
The Fund 13
| STATEMENT OF INVESTMENTS (continued) |
| Common Stocks (continued) | Shares | Value ($) | ||
| Spain (continued) | ||||
| Telefonica | 2,063 | 37,916 | ||
| Zardoya Otis | 1,450 | 27,352 | ||
| 209,147 | ||||
| Sweden—1.0% | ||||
| Kungsleden | 3,200 | 15,052 | ||
| Scania, Cl. B | 2,300 | 18,524 | ||
| Swedish Match | 2,200 | 29,981 | ||
| 63,557 | ||||
| Switzerland—5.6% | ||||
| Baloise Holding | 397 | 21,105 | ||
| Helvetia Holding | 35 | 5,955 | ||
| Logitech International | 900 a | 13,410 | ||
| Nestle | 2,000 | 77,606 | ||
| Novartis | 1,200 | 60,429 | ||
| Roche Holding | 300 | 45,736 | ||
| Schindler Holding | 600 | 25,869 | ||
| Synthes | 255 | 32,829 | ||
| Zurich Financial Services | 300 | 60,274 | ||
| 343,213 | ||||
| United Kingdom—24.9% | ||||
| Admiral Group | 1,740 | 25,552 | ||
| Aggreko | 4,000 | 27,890 | ||
| Amlin | 8,365 | 42,641 | ||
| Ashmore Group | 7,750 | 20,205 | ||
| AstraZeneca | 415 | 17,565 | ||
| Aviva | 5,700 | 33,758 | ||
| BG Group | 4,630 | 68,030 | ||
| BHP Billiton | 3,300 | 55,923 | ||
| BP | 12,308 | 100,475 | ||
| British American Tobacco | 2,400 | 65,661 | ||
| British Land | 3,435 | 34,053 | ||
| Cadbury | 4,200 | 38,393 |
14
| Common Stocks (continued) | Shares | Value ($) | ||
| United Kingdom (continued) | ||||
| Compass Group | 7,600 | 35,195 | ||
| Drax Group | 2,739 | 25,368 | ||
| Enterprise Inns | 5,950 | 9,288 | ||
| GlaxoSmithKline | 6,199 | 119,417 | ||
| Greene King | 4,777 | 24,582 | ||
| HSBC Holdings | 7,421 | 91,005 | ||
| Inmarsat | 3,897 | 26,404 | ||
| Intercontinental Hotels Group | 3,339 | 28,292 | ||
| Intertek Group | 2,150 | 25,328 | ||
| Legal & General Group | 23,000 | 26,392 | ||
| Man Group | 5,000 | 28,646 | ||
| Next | 1,301 | 22,068 | ||
| Northumbrian Water Group | 6,000 | 30,103 | ||
| Premier Oil | 1,330 a | 15,839 | ||
| Prudential | 4,950 | 25,094 | ||
| Royal Dutch Shell, Cl. A | 1,965 | 53,665 | ||
| Royal Dutch Shell, Cl. B | 2,659 | 70,993 | ||
| RSA Insurance Group | 19,700 | 43,593 | ||
| Segro | 4,850 | 21,894 | ||
| Standard Life | 9,700 | 37,270 | ||
| Thomas Cook Group | 3,050 | 8,246 | ||
| Unilever | 1,350 | 30,330 | ||
| United Business Media | 4,218 | 27,272 | ||
| Vedanta Resources | 1,100 | 15,047 | ||
| Venture Production | 2,400 | 15,614 | ||
| Vodafone Group | 31,000 | 59,419 | ||
| VT Group | 3,350 | 26,889 | ||
| Whitbread | 2,068 | 29,737 | ||
| WPP Group | 2,500 | 15,088 | ||
| 1,518,224 | ||||
| Total Common Stocks | ||||
| (cost $9,369,445) | 6,033,462 |
The Fund 15
| STATEMENT OF INVESTMENTS (continued) |
| Principal | ||||
| Short-Term Investments—.3% | Amount ($) | Value ($) | ||
| U.S. Treasury Bills; | ||||
| 1.59%, 12/26/08 | ||||
| (cost $16,959) | 17,000 b | 16,993 | ||
| Total Investments (cost $9,386,404) | 98.8% | 6,050,455 | ||
| Cash and Receivables (Net) | 1.2% | 72,441 | ||
| Net Assets | 100.0% | 6,122,896 |
| a | Non-income producing security. | |
| b | Held by a broker as collateral for open financial futures positions. |
| Portfolio Summary (Unaudited)† | ||||||
| Value (%) | Value (%) | |||||
| Finance | 24.7 | Non-Energy Minerals | 4.3 | |||
| Energy Minerals | 7.7 | Communications | 4.1 | |||
| Utilities | 6.7 | Process Industries | 3.7 | |||
| Health Care Technology | 6.5 | Transportation | 3.5 | |||
| Consumer Non-Durables | 6.3 | U.S. Treasury Bills | .3 | |||
| Producer Manufacturing | 6.3 | Other | 19.1 | |||
| Consumer Services | 5.6 | 98.8 | ||||
| † Based on net assets. | ||||||
| See notes to financial statements. | ||||||
16
STATEMENT OF FINANCIAL FUTURES
October 31, 2008
| Unrealized | ||||||||
| Market Value | Appreciation | |||||||
| Covered by | (Depreciation) | |||||||
| Contracts | Contracts ($) | Expiration | at 10/31/2008 ($) | |||||
| Financial Futures Long | ||||||||
| Japanese Yen | 1 | 126,750 | December 2008 | 10,190 | ||||
| Swiss Franc | 2 | 216,600 | December 2008 | (4,533) | ||||
| Financial Futures Short | ||||||||
| Australian Dollar | 1 | (66,560) | December 2008 | 86 | ||||
| British Pound | 2 | (201,325) | December 2008 | 21,329 | ||||
| 27,072 | ||||||||
| See notes to financial statements. | ||||||||
The Fund 17
STATEMENT OF ASSETS AND LIABILITIES
October 31, 2008
| Cost | Value | |||||||
| Assets ($): | ||||||||
| Investments in securities—See Statement of Investments | 9,386,404 | 6,050,455 | ||||||
| Cash | 40,612 | |||||||
| Cash denominated in foreign currencies | 107 | 108 | ||||||
| Dividends and interest receivable | 30,050 | |||||||
| Receivable for investment securities sold | 6,742 | |||||||
| Receivable for futures variation margin—Note 4 | 1,175 | |||||||
| Prepaid expenses | 39,001 | |||||||
| 6,168,143 | ||||||||
| Liabilities ($): | ||||||||
| Due to The Dreyfus Corporation and affiliates—Note 3(c) | 8,386 | |||||||
| Accrued expenses | 36,861 | |||||||
| 45,247 | ||||||||
| Net Assets ($) | 6,122,896 | |||||||
| Composition of Net Assets ($): | ||||||||
| Paid-in capital | 10,622,799 | |||||||
| Accumulated undistributed investment income—net | 131,506 | |||||||
| Accumulated net realized gain (loss) on investments | (1,321,890) | |||||||
| Accumulated net unrealized appreciation (depreciation) on | ||||||||
| investments and foreign currency transactions (including | ||||||||
| $27,072 net unrealized appreciation on financial futures) | (3,309,519) | |||||||
| Net Assets ($) | 6,122,896 | |||||||
| Net Asset Value Per Share | ||||||||
| Class A | Class C | Class I | Class T | |||||
| Net Assets ($) | 4,309,183 | 613,603 | 602,879 | 597,231 | ||||
| Shares Outstanding | 593,590 | 85,181 | 82,840 | 82,494 | ||||
| Net Asset Value Per Share ($) | 7.26 | 7.20 | 7.28 | 7.24 | ||||
| See notes to financial statements. | ||||||||
18
| STATEMENT OF OPERATIONS | ||
| Year Ended October 31, 2008 | ||
| Investment Income ($): | ||
| Income: | ||
| Cash dividends (net of $31,420 foreign taxes withheld at source): | 361,238 | |
| Interest | 2,871 | |
| Total Income | 364,109 | |
| Expenses: | ||
| Management fee—Note 3(a) | 82,135 | |
| Registration fees | 87,405 | |
| Auditing fees | 46,707 | |
| Shareholder servicing costs—Note 3(c) | 24,526 | |
| Custodian fees—Note 3(c) | 15,783 | |
| Distribution fees—Note 3(b) | 10,349 | |
| Prospectus and shareholders’ reports | 9,534 | |
| Directors’ fees and expenses—Note 3(d) | 1,545 | |
| Loan commitment fees—Note 2 | 69 | |
| Miscellaneous | 15,884 | |
| Total Expenses | 293,937 | |
| Less—expense reimbursement from | ||
| The Dreyfus Corporation due to undertaking—Note 3(a) | (141,843) | |
| Less—reduction in fees due to earnings credits—Note 1(c) | (1,237) | |
| Net Expenses | 150,857 | |
| Investment Income—Net | 213,252 | |
| Realized and Unrealized Gain (Loss) on Investments—Note 4 ($): | ||
| Net realized gain (loss) on investments and foreign currency transactions | (1,334,939) | |
| Net realized gain (loss) on financial futures | 27,263 | |
| Net realized gain (loss) on forward currency exchange contracts | (3,218) | |
| Net Realized Gain (Loss) | (1,310,894) | |
| Net unrealized appreciation (depreciation) on investments and | ||
| foreign currency transactions (including $22,037 net | ||
| unrealized appreciation on financial futures) | (5,352,267) | |
| Net Realized and Unrealized Gain (Loss) on Investments | (6,663,161) | |
| Net (Decrease) in Net Assets Resulting from Operations | (6,449,909) | |
| See notes to financial statements. | ||
The Fund 19
STATEMENT OF CHANGES IN NET ASSETS
| Year Ended October 31, | ||||
| 2008 | 2007a,b | |||
| Operations ($): | ||||
| Investment income—net | 213,252 | 132,427 | ||
| Net realized gain (loss) on investments | (1,310,894) | 327,419 | ||
| Net unrealized appreciation | ||||
| (depreciation) on investments | (5,352,267) | 2,042,748 | ||
| Net Increase (Decrease) in Net Assets | ||||
| Resulting from Operations | (6,449,909) | 2,502,594 | ||
| Dividends to Shareholders from ($): | ||||
| Investment income—net: | ||||
| Class A Shares | (149,503) | — | ||
| Class C Shares | (13,752) | — | ||
| Class I Shares | (23,617) | — | ||
| Class T Shares | (18,400) | — | ||
| Net realized gain on investments: | ||||
| Class A Shares | (243,805) | — | ||
| Class C Shares | (35,553) | — | ||
| Class I Shares | (34,060) | — | ||
| Class T Shares | (33,920) | — | ||
| Total Dividends | (552,610) | — | ||
| Capital Stock Transactions ($): | ||||
| Net proceeds from shares sold: | ||||
| Class A Shares | 38,435 | 7,217,159 | ||
| Class C Shares | 46,248 | 1,033,587 | ||
| Class I Shares | — | 1,005,000 | ||
| Class T Shares | — | 1,000,000 | ||
| Dividends reinvested: | ||||
| Class A Shares | 247,661 | — | ||
| Class C Shares | 36,035 | — | ||
| Class I Shares | 34,158 | — | ||
| Class T Shares | 33,920 | — | ||
| Cost of shares redeemed: | ||||
| Class A Shares | (25,462) | (4,720) | ||
| Class C Shares | (33,124) | (6,076) | ||
| Increase (Decrease) in Net Assets | ||||
| from Capital Stock Transactions | 377,871 | 10,244,950 | ||
| Total Increase (Decrease) in Net Assets | (6,624,648) | 12,747,544 | ||
| Net Assets ($): | ||||
| Beginning of Period | 12,747,544 | — | ||
| End of Period | 6,122,896 | 12,747,544 | ||
| Undistributed investment income—net | 131,506 | 122,228 | ||
20
| Year Ended October 31, | ||||
| 2008 | 2007a,b | |||
| Capital Share Transactions: | ||||
| Class A | ||||
| Shares sold | 2,955 | 575,335 | ||
| Shares issued for dividends reinvested | 18,197 | — | ||
| Shares redeemed | (2,530) | (367) | ||
| Net Increase (Decrease) in Shares Outstanding | 18,622 | 574,968 | ||
| Class C | ||||
| Shares sold | 3,344 | 82,431 | ||
| Shares issued for dividends reinvested | 2,651 | — | ||
| Shares redeemed | (2,825) | (420) | ||
| Net Increase (Decrease) in Shares Outstanding | 3,170 | 82,011 | ||
| Class I | ||||
| Shares sold | — | 80,331 | ||
| Shares issued for dividends reinvested | 2,509 | — | ||
| Net Increase (Decrease) in Shares Outstanding | 2,509 | 80,331 | ||
| Class T | ||||
| Shares sold | — | 80,000 | ||
| Shares issued for dividends reinvested | 2,494 | — | ||
| Net Increase (Decrease) in Shares Outstanding | 2,494 | 80,000 | ||
| a | From November 30, 2006 (commencement of operations) to October 31, 2007. | |
| b | Effective June 1, 2007, Class R shares were redesignated as Class I shares. | |
| See notes to financial statements. | ||
The Fund 21
FINANCIAL HIGHLIGHTS
The following tables describe the performance for each share class for the fiscal periods indicated. All information (except portfolio turnover rate) reflects financial results for a single fund share.Total return shows how much your investment in the fund would have increased (or decreased) during each period, assuming you had reinvested all dividends and distributions.These figures have been derived from the fund’s financial statements.
| Year Ended October 31, | ||||
| Class A Shares | 2008 | 2007a | ||
| Per Share Data ($): | ||||
| Net asset value, beginning of period | 15.61 | 12.50 | ||
| Investment Operations: | ||||
| Investment income—netb | .26 | .17 | ||
| Net realized and unrealized | ||||
| gain (loss) on investments | (7.93) | 2.94 | ||
| Total from Investment Operations | (7.67) | 3.11 | ||
| Distributions: | ||||
| Dividends from investment income—net | (.26) | — | ||
| Dividends from net realized gain on investments | (.42) | — | ||
| Total Distributions | (.68) | — | ||
| Net asset value, end of period | 7.26 | 15.61 | ||
| Total Return (%)c | (51.12) | 24.80d | ||
| Ratios/Supplemental Data (%): | ||||
| Ratio of total expenses to average net assets | 2.78 | 2.60e | ||
| Ratio of net expenses to average net assets | 1.39 | 1.34e | ||
| Ratio of net investment income | ||||
| to average net assets | 2.15 | 1.35e | ||
| Portfolio Turnover Rate | 110.40 | 85.40d | ||
| Net Assets, end of period ($ x 1,000) | �� | 4,309 | 8,974 | |
| a | From November 30, 2006 (commencement of operations) to October 31, 2007. | |
| b | Based on average shares outstanding at each month end. | |
| c | Exclusive of sales charge. | |
| d | Not annualized. | |
| e | Annualized. | |
| See notes to financial statements. | ||
22
| Year Ended October 31, | ||||
| Class C Shares | 2008 | 2007a | ||
| Per Share Data ($): | ||||
| Net asset value, beginning of period | 15.50 | 12.50 | ||
| Investment Operations: | ||||
| Investment income—netb | .17 | .08 | ||
| Net realized and unrealized | ||||
| gain (loss) on investments | (7.89) | 2.92 | ||
| Total from Investment Operations | (7.72) | 3.00 | ||
| Distributions: | ||||
| Dividends from investment income—net | (.16) | — | ||
| Dividends from net realized gain on investments | (.42) | — | ||
| Total Distributions | (.58) | — | ||
| Net asset value, end of period | 7.20 | 15.50 | ||
| Total Return (%)c | (51.54) | 24.00d | ||
| Ratios/Supplemental Data (%): | ||||
| Ratio of total expenses to average net assets | 3.55 | 3.35e | ||
| Ratio of net expenses to average net assets | 2.15 | 2.09e | ||
| Ratio of net investment income | ||||
| to average net assets | 1.41 | .61e | ||
| Portfolio Turnover Rate | 110.40 | 85.40d | ||
| Net Assets, end of period ($ x 1,000) | 614 | 1,271 | ||
| a | From November 30, 2006 (commencement of operations) to October 31, 2007. | |
| b | Based on average shares outstanding at each month end. | |
| c | Exclusive of sales charge. | |
| d | Not annualized. | |
| e | Annualized. | |
| See notes to financial statements. | ||
The Fund 23
| FINANCIAL HIGHLIGHTS (continued) |
| Year Ended October 31, | ||||
| Class I Shares | 2008 | 2007a,b | ||
| Per Share Data ($): | ||||
| Net asset value, beginning of period | 15.64 | 12.50 | ||
| Investment Operations: | ||||
| Investment income—netc | .29 | .21 | ||
| Net realized and unrealized | ||||
| gain (loss) on investments | (7.94) | 2.93 | ||
| Total from Investment Operations | (7.65) | 3.14 | ||
| Distributions: | ||||
| Dividends from investment income—net | (.29) | — | ||
| Dividends from net realized gain on investments | (.42) | — | ||
| Total Distributions | (.71) | — | ||
| Net asset value, end of period | 7.28 | 15.64 | ||
| Total Return (%) | (51.00) | 25.12d | ||
| Ratios/Supplemental Data (%): | ||||
| Ratio of total expenses to average net assets | 2.55 | 2.35e | ||
| Ratio of net expenses to average net assets | 1.14 | 1.09e | ||
| Ratio of net investment income | ||||
| to average net assets | 2.40 | 1.60e | ||
| Portfolio Turnover Rate | 110.40 | 85.40d | ||
| Net Assets, end of period ($ x 1,000) | 603 | 1,257 | ||
| a | From November 30, 2006 (commencement of operations) to October 31, 2007. | |
| b | Effective June 1, 2007, Class R shares were redesignated as Class I shares. | |
| c | Based on average shares outstanding at each month end. | |
| d | Not annualized. | |
| e | Annualized. | |
| See notes to financial statements. | ||
24
| Year Ended October 31, | ||||
| Class T Shares | 2008 | 2007a | ||
| Per Share Data ($): | ||||
| Net asset value, beginning of period | 15.57 | 12.50 | ||
| Investment Operations: | ||||
| Investment income—netb | .23 | .14 | ||
| Net realized and unrealized | ||||
| gain (loss) on investments | (7.91) | 2.93 | ||
| Total from Investment Operations | (7.68) | 3.07 | ||
| Distributions: | ||||
| Dividends from investment income—net | (.23) | — | ||
| Dividends from net realized gain on investments | (.42) | — | ||
| Total Distributions | (.65) | — | ||
| Net asset value, end of period | 7.24 | 15.57 | ||
| Total Return (%)c | (51.27) | 24.56d | ||
| Ratios/Supplemental Data (%): | ||||
| Ratio of total expenses to average net assets | 3.04 | 2.85e | ||
| Ratio of net expenses to average net assets | 1.64 | 1.59e | ||
| Ratio of net investment income | ||||
| to average net assets | 1.90 | 1.10e | ||
| Portfolio Turnover Rate | 110.40 | 85.40d | ||
| Net Assets, end of period ($ x 1,000) | 597 | 1,246 | ||
| a | From November 30, 2006 (commencement of operations) to October 31, 2007. | |
| b | Based on average shares outstanding at each month end. | |
| c | Exclusive of sales charge. | |
| d | Not annualized. | |
| e | Annualized. | |
| See notes to financial statements. | ||
The Fund 25
NOTES TO FINANCIAL STATEMENTS
NOTE 1—Significant Accounting Policies:
Systematic International Equity Fund (the “fund”) is a separate non-diversified series of Strategic Funds, Inc. (the “Company”) which is registered under the Investment Company Act of 1940, as amended (the “Act”), as an open-end management investment company and operates as a series company currently offering five series, including the fund. The fund’s investment objective is to pursue long-term capital growth. The Dreyfus Corporation (the “Manager” or “Dreyfus”), a wholly-owned subsidiary of The Bank of New York Mellon Corporation (“BNY Mellon”), serves as the fund’s investment adviser. Mellon Capital Management Corporation (“Mellon Capital”), a subsidiary of BNY Mellon, serves as the fund’s sub-investment adviser.
Effective July 1, 2008, BNY Mellon has reorganized and consolidated a number of its banking and trust company subsidiaries. As a result of the reorganization, any services previously provided to the fund by Mellon Bank, N.A. or Mellon Trust of New England, N.A. are now provided by The Bank of New York, which has changed its name to The Bank of New York Mellon.
On December 31, 2007, Mellon Equity Associates (“MEA”), the sub-investment adviser prior to December 31, 2007, merged into Mellon Capital, which, as MEA was, is a subsidiary of BNY Mellon and an affiliate of Dreyfus. MEA then ceased operations and Mellon Capital began serving as sub-investment adviser.
MBSC Securities Corporation (the “Distributor”), a wholly-owned subsidiary of Dreyfus, is the distributor of the fund’s shares.The fund is authorized to issue 100 million shares of $.001 par value Common Stock in each of the following classes of shares: Class A, Class C, Class I and Class T. Class A and Class T shares are subject to a sales charge imposed at the time of purchase. Class C shares are subject to a contingent deferred sales charge (“CDSC”) on Class C shares redeemed within one year of purchase. Class I shares are sold at net asset value per share only to institutional investors. Other differences between the classes include the services offered to and the expenses borne by each
26
class, the allocation of certain transfer agency costs and certain voting rights. Income, expenses (other than expenses attributable to a specific class), and realized and unrealized gains or losses on investments are allocated to each class of shares based on its relative net assets.
As of October 31, 2008, MBC Investments Corp., an indirect subsidiary of BNY Mellon, held 577,446 Class A, 82,496 Class C, 82,492 Class I and 82,494 Class T shares of the fund.
The Company accounts separately for the assets, liabilities and operations of each series. Expenses directly attributable to each series are charged to that series’ operations; expenses which are applicable to all series are allocated among them on a pro rata basis.
The fund’s financial statements are prepared in accordance with U.S. generally accepted accounting principles, which may require the use of management estimates and assumptions. Actual results could differ from those estimates.
The fund enters into contracts that contain a variety of indemnifications. The fund’s maximum exposure under these arrangements is unknown.The fund does not anticipate recognizing any loss related to these arrangements.
(a) Portfolio valuation: Investments in securities are valued at the last sales price on the securities exchange or national securities market on which such securities are primarily traded. Securities listed on the National Market System for which market quotations are available are valued at the official closing price or, if there is no official closing price that day, at the last sales price. Securities not listed on an exchange or the national securities market, or securities for which there were no transactions, are valued at the average of the most recent bid and asked prices, except for open short positions, where the asked price is used for valuation purposes. Bid price is used when no asked price is available. Registered investment companies that are not traded on an exchange are valued at their net asset value.When market quotations or official closing prices are not readily available, or are determined not to
The Fund 27
| NOTES TO FINANCIAL STATEMENTS (continued) |
reflect accurately fair value, such as when the value of a security has been significantly affected by events after the close of the exchange or market on which the security is principally traded (for example, a foreign exchange or market), but before the fund calculates its net asset value, the fund may value these investments at fair value as determined in accordance with the procedures approved by the Board of Directors. Fair valuing of securities may be determined with the assistance of a pricing service using calculations based on indices of domestic securities and other appropriate indicators, such as prices of relevant ADRs and futures contracts. For other securities that are fair valued by the Board of Directors, certain factors may be considered such as: fundamental analytical data, the nature and duration of restrictions on disposition, an evaluation of the forces that influence the market in which the securities are purchased and sold and public trading in similar securities of the issuer or comparable issuers. Financial futures are valued at the last sales price. Investments denominated in foreign currencies are translated to U.S. dollars at the prevailing rates of exchange. Forward currency exchange contracts are valued at the forward rate.
The Financial Accounting Standards Board (“FASB”) released Statement of Financial Accounting Standards No. 157 “Fair Value Measurements” (“FAS 157”). FAS 157 establishes an authoritative definition of fair value, sets out a framework for measuring fair value, and requires additional disclosures about fair-value measurements. The application of FAS 157 is required for fiscal years beginning after November 15, 2007 and interim periods within those fiscal years. Management does not believe that the application of this standard will have a material impact on the financial statements of the fund.
(b) Foreign currency transactions: The fund does not isolate that portion of the results of operations resulting from changes in foreign exchange rates on investments from the fluctuations arising from changes in market prices of securities held. Such fluctuations are included with the net realized and unrealized gain or loss on investments.
28
Net realized foreign exchange gains or losses arise from sales and maturities of short-term securities, sales of foreign currencies, currency gains or losses realized on securities transactions and the difference between the amounts of dividends, interest and foreign withholding taxes recorded on the fund’s books and the U.S. dollar equivalent of the amounts actually received or paid. Net unrealized foreign exchange gains or losses arise from changes in the value of assets and liabilities other than investments in securities, resulting from changes in exchange rates. Such gains and losses are included with net realized and unrealized gain or loss on investments.
(c) Securities transactions and investment income: Securities transactions are recorded on a trade date basis. Realized gains and losses from securities transactions are recorded on the identified cost basis. Dividend income is recognized on the ex-dividend date and interest income, including, where applicable, accretion of discount and amortization of premium on investments, is recognized on the accrual basis.
The fund has arrangements with the custodian and cash management banks whereby the fund may receive earnings credits when positive cash balances are maintained, which are used to offset custody and cash management fees. For financial reporting purposes, the fund includes net earnings credits as an expense offset in the Statement of Operations.
Investing in foreign markets may involve special risks and considerations not typically associated with investing in the U.S. These risks include revaluation of currencies, high rates of inflation, repatriation restrictions on income and capital, and adverse political and economic developments. Moreover, securities issued in these markets may be less liquid, subject to government ownership controls and delayed settlements, and their prices may be more volatile than those of comparable securities in the U.S.
(d) Affiliated issuers: Investments in other investment companies advised by Dreyfus are defined as “affiliated” in the Act.
The Fund 29
| NOTES TO FINANCIAL STATEMENTS (continued) |
(e) Dividends to shareholders: Dividends are recorded on the ex-dividend date. Dividends from investment income-net and dividends from net realized capital gains, if any, are normally declared and paid annually, but the fund may make distributions on a more frequent basis to comply with the distribution requirements of the Internal Revenue Code of 1986, as amended (the “Code”).To the extent that net realized capital gains can be offset by capital loss carryovers, it is the policy of the fund not to distribute such gains. Income and capital gain distributions are determined in accordance with income tax regulations, which may differ from U.S. generally accepted accounting principles.
(f) Federal income taxes: It is the policy of the fund to continue to qualify as a regulated investment company, if such qualification is in the best interests of its shareholders, by complying with the applicable provisions of the Code, and to make distributions of taxable income sufficient to relieve it from substantially all federal income and excise taxes.
The fund adopted FASB Interpretation No. 48 “Accounting for Uncertainty in Income Taxes” (“FIN 48”). FIN 48 provides guidance for how uncertain tax positions should be recognized, measured, presented and disclosed in the financial statements. FIN 48 requires the evaluation of tax positions taken or expected to be taken in the course of preparing the fund’s tax returns to determine whether the tax positions are “more-likely-than not” of being sustained by the applicable tax authority. Liability for tax positions not deemed to meet the more likely-than-not threshold would be recorded as a tax expense in the current year.The adoption of FIN 48 had no impact on the operations of the fund for the period ended October 31, 2008.
As of and during the period ended October 31, 2008, the fund did not have any liabilities for any unrecognized tax positions. The fund recognizes interest and penalties, if any, related to unrecognized tax positions as income tax expense in the Statement of Operations. During the period, the fund did not incur any interest or penalties.
Each of the tax years in the two-year period ended October 31, 2008 remains subject to examination by the Internal Revenue Service and state taxing authorities.
30
At October 31, 2008, the components of accumulated earnings on a tax basis were as follows: undistributed ordinary income $134,866, accumulated capital losses $1,294,818 and unrealized depreciation $3,339,951.
The accumulated capital loss carryover is available for federal income tax purposes to be applied against future net securities profits, if any, realized subsequent to October 31, 2008. If not applied, the carryover expires in fiscal 2016.
The tax character of distributions paid to shareholders during the fiscal period ended October 31, 2008 was as follows: ordinary income $533,448 and long-term capital gains $19,162.
During the period ended October 31, 2008, as a result of permanent book to tax differences, primarily due to the tax treatment for foreign currency gains and losses and passive foreign investment companies, the fund increased accumulated undistributed investment income-net by $1,298 and decreased accumulated net realized gain (loss) on investments by the same amount. Net assets and net asset value per share were not affected by this reclassification.
NOTE 2—Bank Lines of Credit:
Prior to October 15, 2008, the fund participated with other Dreyfus-managed funds in a $350 million redemption credit facility. Effective October 15, 2008, the fund participates with other Dreyfus-managed funds in a $145 million redemption credit facility (the “Facility”) to be utilized for temporary or emergency purposes, including the financing of redemptions. In connection therewith, the fund has agreed to pay commitment fees on its pro rata portion of the Facility. Interest is charged to the fund based on prevailing market rates in effect at the time of borrowing. During the period ended October 31, 2008, the fund did not borrow under either Facility.
NOTE 3—Management Fee, Sub-Investment Advisory Fee, and Other Transactions With Affiliates:
(a) Pursuant to a Management Agreement (“Agreement”) with Dreyfus, the management fee is computed at the annual rate of .80% of the value
The Fund 31
| NOTES TO FINANCIAL STATEMENTS (continued) |
of the fund’s average daily net assets and is payable monthly. Dreyfus has contractually agreed to waive receipt of its fees and/or assume the expenses of the fund, until March 1, 2010, so that annual fund operating expenses (excluding Rule 12b-1 fees, shareholder services fees, taxes, interest, brokerage commissions, commitment fees on borrowings and extraordinary expenses) do not exceed 1.15% of the value of the fund’s average daily net assets.The expense reimbursement, pursuant to the undertaking, amounted to $141,843 during the period ended October 31, 2008.
Pursuant to a Sub-Investment Advisory Agreement between Dreyfus and Mellon Capital, Dreyfus pays Mellon Capital an annual fee at the rate of .45% of the value of the fund’s average daily net assets.
(b) Under the Distribution Plan (the “Plan”) adopted pursuant to Rule 12b-1 under the Act, Class C and Class T shares pay the Distributor for distributing their shares at an annual rate of .75% of the value of the average daily net assets of Class C shares and .25% of the value of the average daily net assets of Class T shares. During the period ended October 31, 2008, Class C and Class T shares were charged $7,850 and $2,499, respectively, pursuant to the Plan.
(c) Under the Shareholder Services Plan, Class A, Class C and Class T shares pay the Distributor at an annual rate of ..25% of the value of their average daily net assets for the provision of certain services.The services provided may include personal services relating to shareholder accounts, such as answering shareholder inquiries regarding Class A, Class C and Class T shares and providing reports and other information, and services related to the maintenance of shareholder accounts. The Distributor may make payments to Service Agents (a securities dealer, financial institution or other industry professional) in respect of these services.The Distributor determines the amounts to be paid to Service Agents. During the period ended October 31, 2008, Class A, Class C and Class T shares were charged $18,034, $2,616 and $2,499, respectively, pursuant to the Shareholder Services Plan.
32
The fund compensates Dreyfus Transfer, Inc., a wholly-owned subsidiary of Dreyfus, under a transfer agency agreement for providing personnel and facilities to perform transfer agency services for the fund. During the period ended October 31, 2008, the fund was charged $1,091 pursuant to the transfer agency agreement.
The fund compensates The Bank of New York Mellon, a subsidiary of BNY Mellon and an affiliate of Dreyfus, under a cash management agreement for performing cash management services related to fund subscriptions and redemptions. During the period ended October 31, 2008, the fund was charged $42 pursuant to the cash management agreement.
The fund compensates The Bank of New York Mellon under a custody agreement for providing custodial services for the fund. During the period ended October 31, 2008, the fund was charged $15,783 pursuant to the custody agreement.
During the period ended October 31, 2008, the fund was charged $6,203 for services performed by the Chief Compliance Officer.
The components of “Due to The Dreyfus Corporation and affiliates” in the Statement of Assets and Liabilities consist of: management fees $4,315,Rule 12b-1 distribution plan fees $537,shareholder services plan fees $1,216, custodian fees $8,921, chief compliance officer fees $1,973 and transfer agency per account fees $126, which are offset against an expense reimbursement currently in effect in the amount of $8,702.
(d) Each Board member also serves as a Board member of other funds within the Dreyfus complex. Annual retainer fees and attendance fees are allocated to each fund based on net assets.
NOTE 4—Securities Transactions:
The aggregate amount of purchases and sales of investment securities, excluding short-term securities, financial futures and forward currency exchange contracts, during the period ended October 31, 2008, amounted to $11,365,345 and $11,348,435, respectively.
The Fund 33
| NOTES TO FINANCIAL STATEMENTS (continued) |
The fund may invest in financial futures contracts in order to gain exposure to or protect against changes in the market. The fund is exposed to market risk as a result of changes in the value of the underlying financial instruments. Investments in financial futures require the fund to “mark to market” on a daily basis, which reflects the change in market value of the contracts at the close of each day’s trading.Accordingly, variation margin payments are received or made to reflect daily unrealized gains or losses. When the contracts are closed, the fund recognizes a realized gain or loss.These investments require initial margin deposits with a broker, which consist of cash or cash equivalents. The amount of these deposits is determined by the exchange or Board of Trade on which the contract is traded and is subject to change. Contracts open at October 31, 2008, are set forth in the Statement of Financial Futures.
The fund enters into forward currency exchange contracts in order to hedge its exposure to changes in foreign currency exchange rates on its foreign portfolio holdings and to settle foreign currency transactions. When executing forward currency exchange contracts, the fund is obligated to buy or sell a foreign currency at a specified rate on a certain date in the future.With respect to sales of forward currency exchange contracts, the fund would incur a loss if the value of the contract increases between the date the forward contract is opened and the date the forward contract is closed.The fund realizes a gain if the value of the contract decreases between those dates.With respect to purchases of forward currency exchange contracts, the fund would incur a loss if the value of the contract decreases between the date the forward contract is opened and the date the forward contract is closed.The fund realizes a gain if the value of the contract increases between those dates.The fund is also exposed to credit risk associated with counterparty nonperformance on these forward currency exchange contracts which is typically limited to the unrealized gain on each open contract. At October 31, 2008, there were no forward currency exchange contracts outstanding.
34
At October 31, 2008, the cost of investments for federal income tax purposes was $9,389,764; accordingly, accumulated net unrealized depreciation on investments was $3,339,309, consisting of $84,734 gross unrealized appreciation and $3,424,043, gross unrealized depreciation.
In March 2008, the FASB released Statement of Financial Accounting Standards No. 161 “Disclosures about Derivative Instruments and Hedging Activities” (“FAS 161”). FAS 161 requires qualitative disclosures about objectives and strategies for using derivatives, quantitative disclosures about fair value amounts of gains and losses on derivative instruments and disclosures about credit-risk-related contingent features in derivative agreements.The application of FAS 161 is required for fiscal years and interim periods beginning after November 15, 2008. At this time, management is evaluating the implications of FAS 161 and its impact on the financial statements and the accompanying notes has not yet been determined.
NOTE 5—Subsequent Event:
Effective on or about February 4, 2009 (the “Effective Date”), the fund will issue to each holder of its Class T shares, in exchange for said shares, Class A shares of the fund having an aggregate net asset value equal to the aggregate net asset value of the shareholder’s Class T shares.Thereafter, the fund will no longer offer Class T shares.
Effective on or about December 3, 2008, no investments for new accounts were permitted in Class T of the fund, except that participants in certain group retirement plans were able to open a new account in Class T of the fund, provided that the fund was established as an investment option under the plans before December 3, 2008. After the Effective Date, subsequent investments in the fund’s Class A shares made by holders of the fund’s ClassT shares who received Class A shares of the fund in exchange for their ClassT shares will be subject to the front-end sales load schedule currently in effect for Class T shares. Otherwise, all other Class A share attributes will be in effect.
The Fund 35
REPORT OF INDEPENDENT REGISTERED PUBLIC ACCOUNTING FIRM
| Shareholders and Board of Directors Systematic International Equity Fund |
We have audited the accompanying statement of assets and liabilities, including the statements of investments and financial futures, of Systematic International Equity Fund (one of the series comprising Strategic Funds, Inc.) as of October 31, 2008, and the related statement of operations for the year ended and the statement of changes in net assets and financial highlights for the periods indicated therein.These financial statements and financial highlights are the responsibility of the Fund’s management. Our responsibility is to express an opinion on these financial statements and financial highlights based on our audits.
We conducted our audits in accordance with the standards of the Public Company Accounting Oversight Board (United States).Those standards require that we plan and perform the audit to obtain reasonable assurance about whether the financial statements and financial highlights are free of material misstatement.We were not engaged to perform an audit of the Fund’s internal control over financial reporting. Our audits included consideration of internal control over financial reporting as a basis for designing audit procedures that are appropriate in the circumstances, but not for the purpose of expressing an opinion on the effectiveness of the Fund’s internal control over financial reporting. Accordingly, we express no such opinion. An audit also includes examining, on a test basis, evidence supporting the amounts and disclosures in the financial statements and financial highlights, assessing the accounting principles used and significant estimates made by management, and evaluating the overall financial statement presentation. Our procedures included confirmation of securities owned as of October 31, 2008 by correspondence with the custodian and others. We believe that our audits provide a reasonable basis for our opinion.
In our opinion, the financial statements and financial highlights referred to above present fairly, in all material respects, the financial position of Systematic International Equity Fund at October 31, 2008, the results of its operations for the year then ended and the changes in its net assets and the financial highlights for each of the indicated periods, in conformity with U. S. generally accepted accounting principles.

36
IMPORTANT TAX INFORMATION (Unaudited)
In accordance with federal tax law, the fund elects to provide each shareholder with their portion of the fund’s foreign taxes paid and the income sourced from foreign countries. Accordingly, the fund hereby makes the following designations regarding its fiscal year ended October 31, 2008:
—the total amount of taxes paid to foreign countries was $30,348.
—the total amount of income sourced from foreign countries was $186,829.
As required by federal tax law rules, shareholders will receive notification of their proportionate share of foreign taxes paid and foreign sourced income for the 2008 calendar year with Form 1099-DIV which will be mailed by January 31, 2009. For the fiscal year ended October 31, 2008, certain dividends paid by the fund may be subject to a maximum tax rate of 15%, as provided for by the Jobs and Growth Tax Relief Reconciliation Act of 2003. Of the distributions paid during the fiscal year, $305,929 represents the maximum amount that may be considered qualified dividend income. Also, the fund hereby designates $.0240 per share as a long-term capital gain distribution and $.4000 per share as a short-term capital gain distribution paid on December 26, 2007.
The Fund 37
BOARD MEMBERS INFORMATION (Unaudited)
| Joseph S. DiMartino (65) Chairman of the Board (1995) Principal Occupation During Past 5Years: Corporate Director and Trustee Other Board Memberships and Affiliations: |
- The Muscular Dystrophy Association, Director
- Century Business Services, Inc., a provider of outsourcing functions for small and medium size companies, Director
- The Newark Group, a provider of a national market of paper recovery facilities, paperboard mills and paperboard converting plants, Director
- Sunair Services Corporation, a provider of certain outdoor-related services to homes and businesses, Director
No. of Portfolios for which Board Member Serves: 167
| ——————— |
| David W. Burke (72) Board Member (1994) Principal Occupation During Past 5Years: Corporate Director and Trustee Other Board Memberships and Affiliations: John F. Kennedy Library Foundation, Director No. of Portfolios for which Board Member Serves: 90 |
———————
William Hodding Carter III (73) Board Member (1988)
Principal Occupation During Past 5Years:
- Professor of Leadership & Public Policy, University of North Carolina, Chapel Hill (January 1, 2006-present)
- President and Chief Executive Officer of the John S. and James L. Knight Foundation (February 1, 1998-February 1, 2006)
| Other Board Memberships and Affiliations: |
- The Century Foundation, a tax-exempt research foundation, Emeritus Director
- The Enterprise Corporation of the Delta, a non-profit economic development organization, Director
| No. of Portfolios for which Board Member Serves: 27 |
| ——————— |
| Gordon J. Davis (67) Board Member (2006) Principal Occupation During Past 5Years: |
- Partner in the law firm of Dewey & LeBoeuf LLP
- President, Lincoln Center for the Performing Arts, Inc. (2001)
| Other Board Memberships and Affiliations: |
- Consolidated Edison, Inc., a utility company, Director
- Phoenix Companies, Inc., a life insurance company, Director
- Board Member/Trustee for several not-for-profit groups
| No. of Portfolios for which Board Member Serves: 41 |
38
| Joni Evans (66) Board Member (2006) Principal Occupation During Past 5Years: |
- Chief Executive Officer, www.wowOwow.com an online community dedicated to women’s conversations and publications
- Principal, Joni Evans Ltd.
- Senior Vice President of the William Morris Agency (2005)
| No. of Portfolios for which Board Member Serves: 27 |
| ——————— |
| Ehud Houminer (68) Board Member (1994) |
Principal Occupation During Past 5Years:
Executive-in-Residence at the Columbia Business School, Columbia University
Other Board Memberships and Affiliations:
- Avnet Inc., an electronics distributor, Director
- International Advisory Board to the MBA Program School of Management, Ben Gurion University, Chairman
| No. of Portfolios for which Board Member Serves: 63 |
| ——————— |
| Richard C. Leone (68) Board Member (1984) Principal Occupation During Past 5Years: |
- President of The Century Foundation (formerly,The Twentieth Century Fund, Inc.), a tax exempt research foundation engaged in the study of economic, foreign policy and domestic issues
| Other Board Memberships and Affiliations: |
- The American Prospect, Director
- Center for American Progress, Director
| No. of Portfolios for which Board Member Serves: 27 |
| ——————— |
| Hans C. Mautner (70) Board Member (1984) Principal Occupation During Past 5Years: |
- President—International Division and an Advisory Director of Simon Property Group, a real estate investment company (1998-present)
- Director and Vice Chairman of Simon Property Group (1998-2003)
- Chairman and Chief Executive Officer of Simon Global Limited (1999-present)
| Other Board Memberships and Affiliations: |
- Capital and Regional PLC, a British co-investing real estate asset manager, Director
- Member, Advisory Board, Lehman Brothers European Real Estate Private Equity Fund
| No. of Portfolios for which Board Member Serves: 27 |
The Fund 39
BOARD MEMBERS INFORMATION (Unaudited) (continued)
| Robin A. Melvin (45) Board Member (1995) Principal Occupation During Past 5Years: |
- Director, Boisi Family Foundation, a private family foundation that supports youth-serving organizations that promote the self sufficiency of youth from disadvantaged circumstances
- Senior Vice President, Mentor, a National non-profit youth mentoring organization (2005)
| No. of Portfolios for which Board Member Serves: 27 |
| ——————— |
| Burton N. Wallack (57) Board Member (2006) |
Principal Occupation During Past 5Years:
President and co-owner of Wallack Management Company, a real estate management company
No. of Portfolios for which Board Member Serves: 27
| ——————— |
| John E. Zuccotti (71) Board Member (1984) Principal Occupation During Past 5Years: |
- Chairman of Brookfield Financial Properties, Inc.
- Senior Counsel of Weil, Gotshal & Manges, LLP
- Emeritus Chairman of the Real Estate Board of New York
| Other Board Memberships and Affiliations: |
- Emigrant Savings Bank, Director
- Wellpoint, Inc., Director
- Columbia University,Trustee
- Doris Duke Charitable Foundation,Trustee
| No. of Portfolios for which Board Member Serves: 27 |
| ——————— |
Once elected all Board Members serve for an indefinite term, but achieve Emeritus status upon reaching age 80.The address of the Board Members and Officers is in c/o The Dreyfus Corporation, 200 Park Avenue, NewYork, NewYork 10166. Additional information about the Board Members is available in the fund’s Statement of Additional Information which can be obtained from Dreyfus free of charge by calling this toll free number: 1-800-554-4611.
Arnold S. Hiatt, Emeritus Board Member
40
OFFICERS OF THE FUND (Unaudited)
| J. DAVID OFFICER, President since | JONI LACKS CHARATAN, Vice President | |
| December 2006. | and Assistant Secretary since | |
| Chief Operating Officer,Vice Chairman and a | August 2005. | |
| Director of the Manager, and an officer of 77 | Senior Counsel of BNY Mellon, and an officer | |
| investment companies (comprised of 167 | of 78 investment companies (comprised of 188 | |
| portfolios) managed by the Manager. He is 60 | portfolios) managed by the Manager. She is 53 | |
| years old and has been an employee of the | years old and has been an employee of the | |
| Manager since April 1998. | Manager since October 1988. | |
| PHILLIP N. MAISANO, Executive Vice | JOSEPH M. CHIOFFI, Vice President and | |
| President since July 2007. | Assistant Secretary since August 2005. | |
| Chief Investment Officer,Vice Chair and a | Senior Counsel of BNY Mellon, and an officer | |
| director of the Manager, and an officer of 77 | of 78 investment companies (comprised of 188 | |
| investment companies (comprised of 167 | portfolios) managed by the Manager. He is 47 | |
| portfolios) managed by the Manager. Mr. | years old and has been an employee of the | |
| Maisano also is an officer and/or Board | Manager since June 2000. | |
| member of certain other investment | ||
| JANETTE E. FARRAGHER, Vice President | ||
| management subsidiaries of The Bank of New | ||
| and Assistant Secretary since | ||
| York Mellon Corporation, each of which is an | ||
| August 2005. | ||
| affiliate of the Manager. He is 61 years old and | ||
| has been an employee of the Manager since | Assistant General Counsel of BNY Mellon, | |
| November 2006. Prior to joining the Manager, | and an officer of 78 investment companies | |
| Mr. Maisano served as Chairman and Chief | (comprised of 188 portfolios) managed by the | |
| Executive Officer of EACM Advisors, an | Manager. She is 45 years old and has been an | |
| affiliate of the Manager, since August 2004, and | employee of the Manager since February 1984. | |
| served as Chief Executive Officer of Evaluation | JOHN B. HAMMALIAN, Vice President and | |
| Associates, a leading institutional investment | Assistant Secretary since August 2005. | |
| consulting firm, from 1988 until 2004. | ||
| Managing Counsel of BNY Mellon, and an | ||
| MICHAEL A. ROSENBERG, Vice President | officer of 78 investment companies (comprised | |
| and Secretary since August 2005. | of 188 portfolios) managed by the Manager. | |
| Assistant General Counsel of BNY Mellon, | He is 45 years old and has been an employee | |
| and an officer of 78 investment companies | of the Manager since February 1991. | |
| (comprised of 188 portfolios) managed by the | ROBERT R. MULLERY, Vice President and | |
| Manager. He is 48 years old and has been an | Assistant Secretary since August 2005. | |
| employee of the Manager since October 1991. | ||
| Managing Counsel of BNY Mellon, and an | ||
| JAMES BITETTO, Vice President and | officer of 78 investment companies (comprised | |
| Assistant Secretary since August 2005. | of 188 portfolios) managed by the Manager. | |
| Senior Counsel of BNY Mellon and Secretary | He is 56 years old and has been an employee | |
| of the Manager, and an officer of 78 | of the Manager since May 1986. | |
| investment companies (comprised of 188 | ||
| portfolios) managed by the Manager. He is 42 | ||
| years old and has been an employee of the | ||
| Manager since December 1996. | ||
The Fund 41
OFFICERS OF THE FUND (Unaudited) (continued)
| JEFF PRUSNOFSKY, Vice President and | ROBERT SALVIOLO, Assistant Treasurer | |
| Assistant Secretary since August 2005. | since May 2007. | |
| Managing Counsel of BNY Mellon, and an | Senior Accounting Manager – Equity Funds of | |
| officer of 78 investment companies (comprised | the Manager, and an officer of 78 investment | |
| of 188 portfolios) managed by the Manager. | companies (comprised of 188 portfolios) | |
| He is 43 years old and has been an employee | managed by the Manager. He is 41 years old | |
| of the Manager since October 1990. | and has been an employee of the Manager | |
| since June 1989. | ||
| JAMES WINDELS, Treasurer since | ||
| November 2001. | ROBERT SVAGNA, Assistant Treasurer | |
| Director – Mutual Fund Accounting of the | since December 2002. | |
| Manager, and an officer of 78 investment | Senior Accounting Manager – Equity Funds of | |
| companies (comprised of 188 portfolios) | the Manager, and an officer of 78 investment | |
| managed by the Manager. He is 49 years old | companies (comprised of 188 portfolios) | |
| and has been an employee of the Manager | managed by the Manager. He is 41 years old | |
| since April 1985. | and has been an employee of the Manager | |
| since November 1990. | ||
| RICHARD CASSARO, Assistant Treasurer | ||
| since September 2007. | JOSEPH W. CONNOLLY, Chief Compliance | |
| Senior Accounting Manager – Money Market | Officer since October 2004. | |
| and Municipal Bond Funds of the Manager, | Chief Compliance Officer of the Manager and | |
| and an officer of 78 investment companies | The Dreyfus Family of Funds (78 investment | |
| (comprised of 188 portfolios) managed by | companies, comprised of 188 portfolios). From | |
| the Manager. He is 49 years old and has | November 2001 through March 2004, Mr. | |
| been an employee of the Manager since | Connolly was first Vice-President, Mutual | |
| September 1982. | Fund Servicing for Mellon Global Securities | |
| Services. In that capacity, Mr. Connolly was | ||
| GAVIN C. REILLY, Assistant Treasurer | ||
| responsible for managing Mellon’s Custody, | ||
| since December 2005. | ||
| Fund Accounting and Fund Administration | ||
| Tax Manager of the Investment Accounting | services to third-party mutual fund clients. He | |
| and Support Department of the Manager, and | is 51 years old and has served in various | |
| an officer of 78 investment companies | capacities with the Manager since 1980, | |
| (comprised of 188 portfolios) managed by the | including manager of the firm’s Fund | |
| Manager. He is 40 years old and has been an | Accounting Department from 1997 through | |
| employee of the Manager since April 1991. | October 2001. | |
| ROBERT ROBOL, Assistant Treasurer | WILLIAM GERMENIS, Anti-Money | |
| since August 2005. | Laundering Compliance Officer since | |
| Senior Accounting Manager – Fixed Income | September 2002. | |
| Funds of the Manager, and an officer of 78 | Vice President and Anti-Money Laundering | |
| investment companies (comprised of 188 | Compliance Officer of the Distributor, and the | |
| portfolios) managed by the Manager. He is 44 | Anti-Money Laundering Compliance Officer | |
| years old and has been an employee of the | of 74 investment companies (comprised of 184 | |
| Manager since October 1988. | portfolios) managed by the Manager. He is 38 | |
| years old and has been an employee of the | ||
| Distributor since October 1998. | ||
42
NOTES
Item 2. Code of Ethics.
The Registrant has adopted a code of ethics that applies to the Registrant's principal executive officer, principal financial officer, principal accounting officer or controller, or persons performing similar functions. There have been no amendments to, or waivers in connection with, the Code of Ethics during the period covered by this Report.
Item 3. Audit Committee Financial Expert.
The Registrant's Board has determined that Joseph S. DiMartino, a member of the Audit Committee of the Board, is an audit committee financial expert as defined by the Securities and Exchange Commission (the "SEC"). Joseph S. DiMartino is "independent" as defined by the SEC for purposes of audit committee financial expert determinations.
Item 4. Principal Accountant Fees and Services
(a) Audit Fees. The aggregate fees billed for each of the last two fiscal years (the "Reporting Periods") for professional services rendered by the Registrant's principal accountant (the "Auditor") for the audit of the Registrant's annual financial statements, or services that are normally provided by the Auditor in connection with the statutory and regulatory filings or engagements for the Reporting Periods, were $39,462 in 2007 and $27,667 in 2008.
(b) Audit-Related Fees. The aggregate fees billed in the Reporting Periods for assurance and related services by the Auditor that are reasonably related to the performance of the audit of the Registrant's financial statements and are not reported under paragraph (a) of this Item 4 were $0 in 2007 and $10,398 in 2008. These service consisted of (i) security counts required by Rule 17f-2 under the Investment Company act of 1940, as amended.
The aggregate fees billed in the Reporting Periods for non-audit assurance and related services by the Auditor to the Registrant's investment adviser (not including any sub-investment adviser whose role is primarily portfolio management and is subcontracted with or overseen by another investment adviser), and any entity controlling, controlled by or under common control with the investment adviser that provides ongoing services to the Registrant ("Service Affiliates"), that were reasonably related to the performance of the annual audit of the Service Affiliate, which required pre-approval by the Audit Committee were $0 in 2007 and $0 in 2008.
Note: For the second paragraph in each of (b) through (d) of this Item 4, certain of such services were not pre-approved prior to May 6, 2003, when such services were required to be pre-approved. On and after May 6, 2003, 100% of all services provided by the Auditor were pre-approved as required. For comparative purposes, the fees shown assume that all such services were pre-approved, including services that were not pre-approved prior to the compliance date of the pre-approval requirement.
(c) Tax Fees. The aggregate fees billed in the Reporting Periods for professional services rendered by the Auditor for tax compliance, tax advice and tax planning ("Tax Services") were $2,983 in 2007 and $6,305 in 2008. These services consisted of (i) review or preparation of U.S. federal, state, local and excise tax returns; (ii) U.S. federal, state and local tax planning, advice and assistance regarding statutory, regulatory or administrative developments, (iii) tax advice regarding tax qualification matters and/or treatment of various financial instruments held or proposed to be acquired or held, and (iv) determination of Passive Foreign Investment Companies.
The aggregate fees billed in the Reporting Periods for Tax Services by the Auditor to Service Affiliates which required pre-approval by the Audit Committee were $0 in 2007 and $0 in 2008.
(d) All Other Fees. The aggregate fees billed in the Reporting Periods for products and services provided by the Auditor, other than the services reported in paragraphs (a) through (c) of this Item, were $0 in 2007 and $5 in 2008.
The aggregate fees billed in the Reporting Periods for Non-Audit Services by the Auditor to Service Affiliates, other than the services reported in paragraphs (b) through (c) of this Item, which required pre-approval by the Audit Committee were $0 in 2007 and $0 in 2008.
Audit Committee Pre-Approval Policies and Procedures. The Registrant's Audit Committee has established policies and procedures (the "Policy") for pre-approval (within specified fee limits) of the Auditor's engagements for non-audit services to the Registrant and Service Affiliates without specific case-by-case consideration. Pre-approval considerations include whether the proposed services are compatible with maintaining the Auditor's independence. Pre-approvals pursuant to the Policy are considered annually.
Non-Audit Fees. The aggregate non-audit fees billed by the Auditor for services rendered to the Registrant, and rendered to Service Affiliates, for the Reporting Periods were $1,627,514 in 2007 and $7,879,835 in 2008.
Auditor Independence. The Registrant's Audit Committee has considered whether the provision of non-audit services that were rendered to Service Affiliates which were not pre-approved (not requiring pre-approval) is compatible with maintaining the Auditor's independence.
| Item 5. | Audit Committee of Listed Registrants. | |
| Not applicable. | ||
| Item 6. | Schedule of Investments. | |
| (a) | Not applicable. | |
| Item 7. | Disclosure of Proxy Voting Policies and Procedures for Closed-End Management | |
| Investment Companies. | ||
| Not applicable. | ||
| Item 8. | Portfolio Managers of Closed-End Management Investment Companies. | |
| Not applicable. | ||
| Item 9. | Purchases of Equity Securities by Closed-End Management Investment Companies and | |
| Affiliated Purchasers. | ||
| Not applicable. | ||
| Item 10. | Submission of Matters to a Vote of Security Holders. |
The Registrant has a Nominating Committee (the "Committee"), which is responsible for selecting and nominating persons for election or appointment by the Registrant's Board as Board members. The Committee has adopted a Nominating Committee Charter (the "Charter"). Pursuant to the Charter, the
Committee will consider recommendations for nominees from shareholders submitted to the Secretary of the Registrant, c/o The Dreyfus Corporation Legal Department, 200 Park Avenue, 8th Floor East, New York, New York 10166. A nomination submission must include information regarding the recommended nominee as specified in the Charter. This information includes all information relating to a recommended nominee that is required to be disclosed in solicitations or proxy statements for the election of Board members, as well as information sufficient to evaluate the factors to be considered by the Committee, including character and integrity, business and professional experience, and whether the person has the ability to apply sound and independent business judgment and would act in the interests of the Registrant and its shareholders. Nomination submissions are required to be accompanied by a written consent of the individual to stand for election if nominated by the Board and to serve if elected by the shareholders, and such additional information must be provided regarding the recommended nominee as reasonably requested by the Committee.
Item 11. Controls and Procedures.
(a) The Registrant's principal executive and principal financial officers have concluded, based on their evaluation of the Registrant's disclosure controls and procedures as of a date within 90 days of the filing date of this report, that the Registrant's disclosure controls and procedures are reasonably designed to ensure that information required to be disclosed by the Registrant on Form N-CSR is recorded, processed, summarized and reported within the required time periods and that information required to be disclosed by the Registrant in the reports that it files or submits on Form N-CSR is accumulated and communicated to the Registrant's management, including its principal executive and principal financial officers, as appropriate to allow timely decisions regarding required disclosure.
(b) There were no changes to the Registrant's internal control over financial reporting that occurred during the second fiscal quarter of the period covered by this report that have materially affected, or are reasonably likely to materially affect, the Registrant's internal control over financial reporting.
Item 12. Exhibits.
| (a)(1) | Code of ethics referred to in Item 2. | |
| (a)(2) | Certifications of principal executive and principal financial officers as required by Rule 30a-2(a) | |
| under the Investment Company Act of 1940. | ||
| (a)(3) | Not applicable. | |
| (b) | Certification of principal executive and principal financial officers as required by Rule 30a-2(b) | |
| under the Investment Company Act of 1940. | ||
| SIGNATURES |
Pursuant to the requirements of the Securities Exchange Act of 1934 and the Investment Company Act of 1940, the Registrant has duly caused this Report to be signed on its behalf by the undersigned, thereunto duly authorized.
| Strategic Funds, Inc. | ||
| By: | /s/ J. David Officer | |
| J. David Officer | ||
| President | ||
| Date: | December 18, 2008 | |
Pursuant to the requirements of the Securities Exchange Act of 1934 and the Investment Company Act of 1940, this Report has been signed below by the following persons on behalf of the Registrant and in the capacities and on the dates indicated.
| By: | /s/ J. David Officer | |
| J. David Officer | ||
| President | ||
| Date: | December 18, 2008 | |
| By: | /s/ James Windels | |
| James Windels | ||
| Treasurer | ||
| Date: | December 18, 2008 | |
EXHIBIT INDEX
| (a)(1) | Code of ethics referred to in Item 2. | |
| (a)(2) | Certifications of principal executive and principal financial officers as required by Rule 30a- | |
| 2(a) under the Investment Company Act of 1940. (EX-99.CERT) | ||
| (b) | Certification of principal executive and principal financial officers as required by Rule 30a- | |
| 2(b) under the Investment Company Act of 1940. (EX-99.906CERT) | ||