UNITED STATES
SECURITIES AND EXCHANGE COMMISSION
Washington, D.C. 20549 |
FORM N-CSR
CERTIFIED SHAREHOLDER REPORT OF REGISTERED MANAGEMENT
INVESTMENT COMPANIES |
| Investment Company Act file number | | 811-3940 |
STRATEGIC FUNDS, INC.
(formerly, Dreyfus Premier New Leaders Fund, Inc.)
(Exact name of Registrant as specified in charter) |
c/o The Dreyfus Corporation
200 Park Avenue
New York, New York 10166
(Address of principal executive offices) (Zip code) |
Michael A. Rosenberg, Esq.
200 Park Avenue
New York, New York 10166
(Name and address of agent for service) |
| Registrant's telephone number, including area code: | | (212) 922-6000 |
| Date of fiscal year end: | | 12/31 | | |
| Date of reporting period: | | 12/31/08 | | |
The following N-CSR relates only to the Registrant’s series listed below and does not affect the other series of the Registrant, which have different fiscal year ends and, therefore, different N-CSR reporting requirements. Separate N-CSR Forms will be filed for these series, as appropriate.
Dreyfus New Leaders Fund
FORM N-CSR
| Item 1. | | Reports to Stockholders. |
Save time. Save paper. View your next shareholder report online as soon as it’s available. Log into www.dreyfus.com and sign up for Dreyfus eCommunications. It’s simple and only takes a few minutes.
The views expressed in this report reflect those of the portfolio manager only through the end of the period covered and do not necessarily represent the views of Dreyfus or any other person in the Dreyfus organization. Any such views are subject to change at any time based upon market or other conditions and Dreyfus disclaims any responsibility to update such views.These views may not be relied on as investment advice and, because investment decisions for a Dreyfus fund are based on numerous factors, may not be relied on as an indication of trading intent on behalf of any Dreyfus fund.
Not FDIC-Insured Not Bank-Guaranteed May Lose Value
| | Contents |
| |
| | THE FUND |
| |
| 2 | A Letter from the CEO |
| |
| 3 | Discussion of Fund Performance |
| |
| 6 | Fund Performance |
| |
| 8 | Understanding Your Fund’s Expenses |
| |
| 8 | Comparing Your Fund’s Expenses With Those of Other Funds |
| |
| 9 | Statement of Investments |
| |
| 16 | Statement of Assets and Liabilities |
| |
| 17 | Statement of Operations |
| |
| 18 | Statement of Changes in Net Assets |
| |
| 21 | Financial Highlights |
| |
| 26 | Notes to Financial Statements |
| |
| 36 | Report of Independent Registered Public Accounting Firm |
| |
| 37 | Important Tax Information |
| |
| 38 | Information About the Review and Approval of the Fund’s Management Agreement |
| |
| 43 | Board Members Information |
| |
| 46 | Officers of the Fund |
| |
| | FOR MORE INFORMATION |
| |
| | Back Cover |
| |

A LETTER FROM THE CEO
Dear Shareholder: |
We present to you this annual report for Dreyfus New Leaders Fund, covering the 12-month period from January 1, 2008, through December 31, 2008.
2008 was the most difficult year in decades for the economy and stock market.A credit crunch that originated in 2007 in the U.S. sub-prime mortgage market exploded in mid-2008 into a global financial crisis, resulting in the failures of major financial institutions, a deep and prolonged recession and lower investment values across a broad range of asset classes. Governments and regulators throughout the world moved aggressively to curtail the damage, implementing unprecedented reductions of short-term interest rates, massive injections of liquidity into the banking system, government bailouts of struggling companies and plans for massive economic stimulus programs.
Although we expect the U.S. and global economies to remain weak until longstanding imbalances have worked their way out of the system, the financial markets currently appear to have priced in investors’ generally low expectations. In previous recessions, however, the markets have tended to anticipate economic improvement before it occurs, potentially leading to major rallies when few expected them. That’s why it makes sense to remain disciplined, maintain a long-term perspective and adopt a consistent asset allocation strategy that reflects one’s future goals and attitudes toward risk.As always, we urge you to consult with your financial advisor, who can recommend the course of action that is right for you.
For information about how the fund performed during the reporting period, as well as market perspectives, we have provided a Discussion of Fund Performance.
Thank you for your continued confidence and support.
Jonathan R. Baum
Chief Executive Officer
The Dreyfus Corporation
January 15, 2009 |
2

DISCUSSION OF FUND PERFORMANCE
For the period of January 1, 2008, through December 31, 2008
Market and Fund Performance Overview
For the 12-month period ended December 31, 2008, Dreyfus New Leaders Fund’s Class A shares produced a total return of –44.73%, Class B shares returned –45.21%, Class C shares returned –45.16%, Class I shares returned –45.03% and Class T shares returned –44.88% .1 In comparison, the Russell Midcap Index (the “Index”), the fund’s benchmark, produced a total return of –41.46% for the same period.2
Slowing economic growth and an intensifying financial crisis drove stock prices sharply lower in 2008, particularly over the second half of the year.All market capitalization ranges were negatively affected, with midcap stocks losing considerable ground along with their small- and large-cap counterparts. The momentum and value factors considered by the quantitative models underlying the fund’s investment process in 2008 proved ineffective during the downturn in determining stock price behavior, undermining the fund’s performance and causing it to underperform the benchmark on a total return basis.
Effective February 4, 2009,Warren Chiang, Prabhu Palani and C.Wesley Boggs became the fund’s primary portfolio managers.
The Fund’s Investment Approach
The fund seeks capital appreciation by investing in the stocks of small and midsize companies. In 2008, the fund employed a proprietary quantitative model that considered more than 40 factors and ranks stocks based on fundamental momentum, relative value, future value, long-term growth and other factors. It focused on “bottom-up” stock selection to construct a portfolio with exposure to industries and market capitalizations that are similar to the benchmark’s composition.
The fund’s new portfolio managers will also use quantitative models, but which value and weight factors differently.These models are designed to identify equity securities with attractive long-term relative valuations, sustainable earnings, and behavioral factors, such as stock buybacks and analysts’ earnings revisions, that may indicate potential misvaluations.
The Fund 3
| DISCUSSION OF FUND PERFORMANCE (continued) |
Generally, the fund’s sector concentrations will be proportional to those of the Russell Midcap Index. We will periodically reapply our models and adjust the fund’s holdings. Stocks no longer favored by the models will be sold, and highly rated stocks will be purchased. The fund’s models will be enhanced from time to time as suggested by our ongoing research efforts.
Markets Shifted Unpredictably Amid Heightened Volatility
After rising and falling according to changes in investor sentiment over the first half of 2008, midcap stocks tumbled during the second half. The bear market was triggered by the intensification of a credit crisis that began in 2007 and escalated in 2008 with the failures of several major financial institutions.These developments exacerbated an ongoing economic slowdown, as lenders grew reluctant to extend credit even to some of their more creditworthy customers, causing consumer spending and business investment to decline sharply and sparking a steep reversal in commodity prices from previous record highs. In late November, the National Bureau of Economic Research confirmed that the U.S. economy was mired in its first recession since 2001.
While the fund’s value-related analytical factors correlated poorly with performance during the first half of the year, momentum-related metrics worked reasonably well, enabling the fund to keep pace with its benchmark. However, as the financial crisis intensified, investors increasingly reacted to short-term events with little regard for long-term company fundamentals. Consequently, momentum and value metrics both detracted from the fund’s performance in the third quarter of 2008, causing its returns to lag the benchmark for the year overall.
Disappointments in the Market’s Weakest Sectors
The fund’s most notable disappointments occurred in the hard-hit basic materials and financials sectors. Commodity producers that scored well on our momentum metrics and outperformed during the first half of the year—such as agricultural chemical maker The Mosaic Company and steel fabricator AK Steel Holding—dropped precipitously from September through November. Leveraged real estate investment trusts, such as ProLogis and Hospitality Properties Trust, both of which were sold during the reporting period, experienced similar declines as credit availability tightened. Disappointments from independent power
4
producers, such as Reliant Energy, and certain consumer staples holdings, such as beverage distributor Central European Distribution, also detracted from relative performance.
On the other hand, the fund held a number of investments that provided positive attribution to the fund. In the consumer services area, the fund’s performance benefited from our focus on value-oriented restaurant chains, such as Darden Restaurants and Panera Bread, and from underweighted exposure to media and hotel stocks. In the energy sector, the fund emphasized exploration-and-production stocks, such as Chesapeake Energy, which was sold during the reporting period, and Southwestern Energy, which held up better than oil services providers. In the consumer discretionary sector, discount retailers Dollar Tree and Family Dollar Stores benefited from the increasingly cost-conscious behavior of shoppers. Finally, in the health care sector Millennium Pharmaceuticals was acquired at a premium price by a competitor.The fund sold its holdings in Millennium Pharmaceuticals shortly after the announcement of the acquisition.
Finding Ways to Reduce Risks
In light of continued global economic weakness and ongoing uncertainties associated with the financial crisis, we have worked to limit the fund’s exposure to highly leveraged companies that may be vulnerable to potential debt financing problems. As a result, as 2009 begins the fund holds lower leverage, on average, than the benchmark. We also have closely monitored the weightings of individual holdings in an attempt to reduce the fund’s overall sensitivity to unexpected dips in individual stocks. We have continued to maintain the fund’s industry-neutral discipline, which seeks to add value through our quantitatively driven stock selection process.
January 15, 2009
| 1 | Total return includes reinvestment of dividends and any capital gains paid, and does not take into consideration the maximum initial sales charges in the case of Class A and Class T shares or the applicable contingent deferred sales charges imposed on redemptions in the case of Class B and Class C shares. Had these charges been reflected, returns would have been lower. Past performance is no guarantee of future results. Share price and investment return fluctuate such that upon redemption, fund shares may be worth more or less than their original cost. |
| |
| 2 | SOURCE: LIPPER INC. — Reflects reinvestment of dividends and, where applicable, capital gain distributions.The Russell Midcap Index is a widely accepted, unmanaged index of medium- cap stock market performance. |
| |
The Fund 5
| Average Annual Total Returns as of 12/31/08 | | | | | | |
| |
| | | Inception | | | | | | |
| | | Date | | 1 Year | | 5 Years | | 10 Years |
| |
| |
| |
| |
|
| Class A shares | | | | | | | | |
| with maximum sales charge (5.75%) | | | | (47.90)% | | (5.76)% | | 1.57% |
| without sales charge | | | | (44.73)% | | (4.64)% | | 2.17% |
| Class B shares | | | | | | | | |
| with applicable redemption charge † | | 11/27/02 | | (47.40)% | | (5.62)% | | 2.02%†††,†††† |
| without redemption | | 11/27/02 | | (45.21)% | | (5.38)% | | 2.02%†††,†††† |
| Class C shares | | | | | | | | |
| with applicable redemption charge †† | | 11/27/02 | | (45.71)% | | (5.36)% | | 1.71%††† |
| without redemption | | 11/27/02 | | (45.16)% | | (5.36)% | | 1.71%††† |
| Class I shares | | 11/27/02 | | (45.03)% | | (4.65)% | | 2.19%††† |
| Class T shares | | | | | | | | |
| with applicable sales charge (4.5%) | | 11/27/02 | | (47.36)% | | (5.72)% | | 1.56%††† |
| without sales charge | | 11/27/02 | | (44.88)% | | (4.85)% | | 2.02%††† |
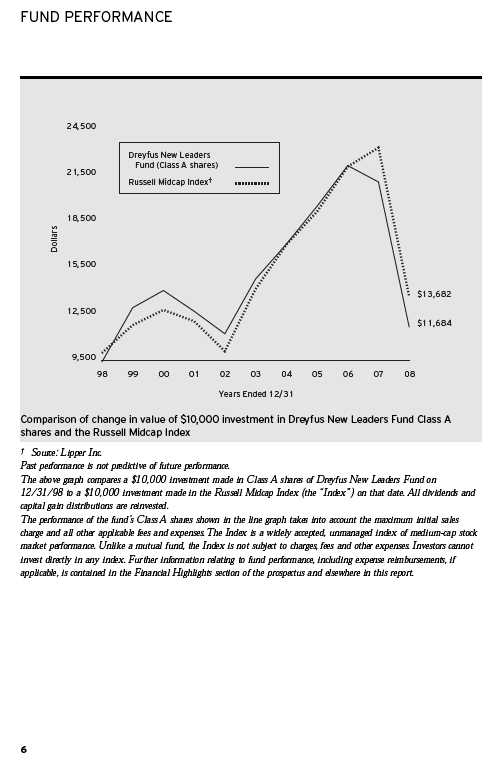
Past performance is not predictive of future performance.The fund’s performance shown in the graph and table does not reflect the deduction of taxes that a shareholder would pay on fund distributions or the redemption of fund shares.
| † | | The maximum contingent deferred sales charge for Class B shares is 4%. After six years Class B shares convert to |
| | | Class A shares. |
| †† | | The maximum contingent deferred sales charge for Class C shares is 1% for shares redeemed within one year of |
| | | the date of purchase. |
| ††† | | The total return performance figures presented for Class B, C, I and T shares of the fund reflect the performance of |
| | | the fund’s Class A shares for periods prior to 11/27/02 (the inception date for Class B, C, I and T shares), |
| | | adjusted to reflect the applicable sales load for that class and the applicable distribution/servicing fees thereafter. |
| †††† | | Assumes the conversion of Class B shares to Class A shares at the end of the sixth year following the date |
| | | of purchase. |
The Fund 7
UNDERSTANDING YOUR FUND’S EXPENSES (Unaudited)
As a mutual fund investor, you pay ongoing expenses, such as management fees and other expenses. Using the information below, you can estimate how these expenses affect your investment and compare them with the expenses of other funds.You also may pay one-time transaction expenses, including sales charges (loads) and redemption fees, which are not shown in this section and would have resulted in higher total expenses. For more information, see your fund’s prospectus or talk to your financial adviser.
Review your fund’s expenses
The table below shows the expenses you would have paid on a $1,000 investment in Dreyfus New Leaders Fund from July 1, 2008 to December 31, 2008. It also shows how much a $1,000 investment would be worth at the close of the period, assuming actual returns and expenses.
Expenses and Value of a $1,000 Investment assuming actual returns for the six months ended December 31, 2008
| | | Class A | | Class B | | Class C | | Class I | | Class T |
| |
| |
| |
| |
| |
|
| Expenses paid per $1,000† | | $ 5.01 | | $ 8.41 | | $ 8.17 | | $ 7.61 | | $ 5.89 |
| Ending value (after expenses) | | $595.40 | | $592.60 | | $593.10 | | $593.10 | | $594.70 |
COMPARING YOUR FUND’S EXPENSES WITH THOSE OF OTHER FUNDS (Unaudited)
Using the SEC’s method to compare expenses
The Securities and Exchange Commission (SEC) has established guidelines to help investors assess fund expenses. Per these guidelines, the table below shows your fund’s expenses based on a $1,000 investment, assuming a hypothetical 5% annualized return. You can use this information to compare the ongoing expenses (but not transaction expenses or total cost) of investing in the fund with those of other funds.All mutual fund shareholder reports will provide this information to help you make this comparison. Please note that you cannot use this information to estimate your actual ending account balance and expenses paid during the period.
Expenses and Value of a $1,000 Investment assuming a hypothetical 5% annualized return for the six months ended December 31, 2008
| | | Class A | | Class B | | Class C | | Class I | | Class T |
| |
| |
| |
| |
| |
|
| Expenses paid per $1,000† | | $ 6.34 | | $ 10.63 | | $ 10.33 | | $ 9.63 | | $ 7.46 |
| Ending value (after expenses) | | $1,018.85 | | $1,014.58 | | $1,014.88 | | $1,015.58 | | $1,017.75 |
† Expenses are equal to the fund’s annualized expense ratio of 1.25% for Class A, 2.10% for Class B, 2.04% for Class C, 1.90% for Class I and 1.47% for Class T, multiplied by the average account value over the period, multiplied by 184/366 (to reflect the one-half year period).
8
STATEMENT OF INVESTMENTS
December 31, 2008 |
| Common Stocks—99.8% | | Shares | | Value ($) |
| |
| |
|
| Commercial & Professional Services—4.1% | | | | |
| AmerisourceBergen | | 120,100 | | 4,282,766 |
| Avnet | | 197,000 a | | 3,587,370 |
| Brink’s | | 62,100 | | 1,669,248 |
| Dun & Bradstreet | | 22,800 | | 1,760,160 |
| Manpower | | 93,200 | | 3,167,868 |
| Patterson Cos. | | 188,200 a | | 3,528,750 |
| | | | | 17,996,162 |
| Communications—2.3% | | | | |
| CenturyTel | | 92,500 | | 2,528,025 |
| Embarq | | 57,500 | | 2,067,700 |
| NII Holdings | | 124,900 a | | 2,270,682 |
| Telephone & Data Systems | | 46,300 | | 1,470,025 |
| US Cellular | | 20,900 a | | 903,716 |
| Windstream | | 116,200 | | 1,069,040 |
| | | | | 10,309,188 |
| Consumer Durables—1.5% | | | | |
| Hasbro | | 77,300 b | | 2,254,841 |
| Marriott International, Cl. A | | 49,400 | | 960,830 |
| Pulte Homes | | 145,500 | | 1,590,315 |
| RadioShack | | 71,000 | | 847,740 |
| Scientific Games, Cl. A | | 53,700 a,b | | 941,898 |
| | | | | 6,595,624 |
| Consumer Non-Durables—6.0% | | | | |
| Avon Products | | 276,800 | | 6,651,504 |
| Brown-Forman, Cl. B | | 22,900 | | 1,179,121 |
| Central European Distribution | | 77,900 a,b | | 1,534,630 |
| Corn Products International | | 41,800 | | 1,205,930 |
| Estee Lauder, Cl. A | | 76,600 | | 2,371,536 |
| Hanesbrands | | 48,000 a | | 612,000 |
| Hormel Foods | | 55,500 | | 1,724,940 |
| J.M. Smucker | | 45,300 | | 1,964,208 |
| Jones Apparel Group | | 120,600 | | 706,716 |
| Lorillard | | 9,400 | | 529,690 |
| McCormick & Co. | | 35,300 | | 1,124,658 |
| Molson Coors Brewing, Cl. B | | 27,600 | | 1,350,192 |
| Pepsi Bottling Group | | 239,300 | | 5,386,643 |
| | | | | 26,341,768 |
The Fund 9
| STATEMENT OF INVESTMENTS (continued) |
| Common Stocks (continued) | | Shares | | Value ($) |
| |
| |
|
| Consumer Services—5.8% | | | | |
| Brink’s Home Security Holding | | 37,800 a | | 828,576 |
| Brinker International | | 251,000 | | 2,645,540 |
| Darden Restaurants | | 83,700 | | 2,358,666 |
| DISH Network, Cl. A | | 44,800 a,b | | 496,832 |
| H & R Block | | 95,000 | | 2,158,400 |
| International Speedway, Cl. A | | 23,200 | | 666,536 |
| John Wiley & Sons, Cl. A | | 29,500 | | 1,049,610 |
| Liberty Media-Entertainment, Ser. A | | 271,200 a | | 4,740,576 |
| Meredith | | 84,400 b | | 1,444,928 |
| Panera Bread, Cl. A | | 130,400 a,b | | 6,812,096 |
| Strayer Education | | 5,000 | | 1,072,050 |
| Tim Hortons | | 47,000 b | | 1,355,480 |
| | | | | 25,629,290 |
| Electronic Technology—9.8% | | | | |
| Amphenol, Cl. A | | 30,600 | | 733,788 |
| Analog Devices | | 39,100 | | 743,682 |
| Broadcom, Cl. A | | 53,300 a | | 904,501 |
| Goodrich | | 135,100 | | 5,001,402 |
| Harris | | 49,200 | | 1,872,060 |
| Intersil, Cl. A | | 380,900 | | 3,500,471 |
| Jabil Circuit | | 104,600 | | 706,050 |
| Juniper Networks | | 255,200 a | | 4,468,552 |
| Linear Technology | | 112,900 b | | 2,497,348 |
| NCR | | 255,300 a | | 3,609,942 |
| Precision Castparts | | 82,900 | | 4,930,892 |
| QLogic | | 117,500 a | | 1,579,200 |
| Synopsys | | 177,500 a | | 3,287,300 |
| Western Digital | | 192,300 a | | 2,201,835 |
| Xerox | | 221,000 | | 1,761,370 |
| Xilinx | | 289,100 b | | 5,151,762 |
| | | | | 42,950,155 |
| Energy Minerals—3.5% | | | | |
| Cimarex Energy | | 38,500 | | 1,031,030 |
| Encore Acquisition | | 36,300 a | | 926,376 |
| Massey Energy | | 60,500 | | 834,295 |
| Murphy Oil | | 49,000 | | 2,173,150 |
10
| Common Stocks (continued) | | Shares | | Value ($) |
| |
| |
|
| Energy Minerals (continued) | | | | |
| Plains Exploration & Production | | 29,900 a | | 694,876 |
| Southwestern Energy | | 220,700 a | | 6,393,679 |
| W & T Offshore | | 171,800 b | | 2,460,176 |
| Walter Industries | | 36,200 | | 633,862 |
| | | | | 15,147,444 |
| Finance—18.0% | | | | |
| Ameriprise Financial | | 144,700 | | 3,380,192 |
| Annaly Capital Management | | 168,100 | | 2,667,747 |
| Apartment Investment & Management, Cl. A | | 332,340 b | | 3,838,527 |
| Assurant | | 195,900 | | 5,877,000 |
| Axis Capital Holdings | | 159,900 | | 4,656,288 |
| BancorpSouth | | 69,000 b | | 1,611,840 |
| Brandywine Realty Trust | | 92,900 | | 716,259 |
| Cincinnati Financial | | 130,700 | | 3,799,449 |
| Comerica | | 47,400 b | | 940,890 |
| Equity Residential | | 26,900 | | 802,158 |
| First American | | 143,100 b | | 4,134,159 |
| HCC Insurance Holdings | | 72,500 | | 1,939,375 |
| Health Care REIT | | 23,700 b | | 1,000,140 |
| Host Hotels & Resorts | | 105,310 b | | 797,197 |
| Hudson City Bancorp | | 432,100 | | 6,896,316 |
| Janus Capital Group | | 180,900 | | 1,452,627 |
| Marshall & Ilsley | | 241,298 b | | 3,291,305 |
| Nasdaq OMX Group | | 242,000 a,b | | 5,979,820 |
| Northern Trust | | 35,300 | | 1,840,542 |
| Progressive | | 157,100 | | 2,326,651 |
| Protective Life | | 125,700 | | 1,803,795 |
| Public Storage | | 59,100 | | 4,698,450 |
| Reinsurance Group of America | | 25,000 b | | 1,070,500 |
| SL Green Realty | | 52,000 b | | 1,346,800 |
| StanCorp Financial Group | | 99,600 | | 4,160,292 |
| Taubman Centers | | 28,400 b | | 723,064 |
| TD Ameritrade Holding | | 112,200 a | | 1,598,850 |
| Torchmark | | 47,900 | | 2,141,130 |
| Transatlantic Holdings | | 20,500 | | 821,230 |
| UDR | | 55,900 b | | 770,861 |
The Fund 11
| STATEMENT OF INVESTMENTS (continued) |
| Common Stocks (continued) | | Shares | | Value ($) |
| |
| |
|
| Finance (continued) | | | | |
| Unum Group | | 63,200 | | 1,175,520 |
| Weingarten Realty Investors | | 32,700 b | | 676,563 |
| | | | | 78,935,537 |
| Health Care Technology—5.6% | | | | |
| Forest Laboratories | | 99,500 a | | 2,534,265 |
| Gen-Probe | | 41,400 a | | 1,773,576 |
| Life Technologies | | 303,600 a | | 7,076,916 |
| St. Jude Medical | | 90,500 a | | 2,982,880 |
| Varian Medical Systems | | 144,000 a | | 5,045,760 |
| Watson Pharmaceuticals | | 199,900 a | | 5,311,343 |
| | | | | 24,724,740 |
| Industrial Services—6.6% | | | | |
| Cameron International | | 114,200 a,b | | 2,341,100 |
| Flowserve | | 16,400 | | 844,600 |
| Fluor | | 117,700 | | 5,281,199 |
| FMC Technologies | | 148,100 a | | 3,529,223 |
| Foster Wheeler | | 59,500 a | | 1,391,110 |
| Jacobs Engineering Group | | 77,700 a | | 3,737,370 |
| National Oilwell Varco | | 82,622 a | | 2,019,281 |
| Noble | | 22,800 | | 503,652 |
| Republic Services | | 175,410 | | 4,348,414 |
| Williams | | 339,500 | | 4,915,960 |
| | | | | 28,911,909 |
| Non-Energy Minerals—.4% | | | | |
| AK Steel Holding | | 134,800 b | | 1,256,336 |
| Reliance Steel & Aluminum | | 27,000 | | 538,380 |
| | | | | 1,794,716 |
| Process Industries—5.1% | | | | |
| Ashland | | 153,400 | | 1,612,234 |
| Crown Holdings | | 207,300 a | | 3,980,160 |
| FMC | | 98,600 | | 4,410,378 |
| Lubrizol | | 22,500 | | 818,775 |
| Mosaic | | 101,000 | | 3,494,600 |
| Owens-Illinois | | 243,700 a | | 6,660,321 |
| Sealed Air | | 108,000 | | 1,613,520 |
| | | | | 22,589,988 |
12
| Common Stocks (continued) | | Shares | | Value ($) |
| |
| |
|
| Producer Manufacturing—5.5% | | | | |
| AGCO | | 62,200 a,b | | 1,467,298 |
| Autoliv | | 94,200 | | 2,021,532 |
| Avery Dennison | | 47,800 | | 1,564,494 |
| Cummins | | 138,400 | | 3,699,432 |
| Dover | | 71,600 | | 2,357,072 |
| Hubbell, Cl. B | | 61,900 b | | 2,022,892 |
| Ingersoll-Rand, Cl. A | | 208,000 | | 3,608,800 |
| Joy Global | | 32,700 | | 748,503 |
| Mettler-Toledo International | | 69,500 a | | 4,684,300 |
| Toro | | 57,400 b | | 1,894,200 |
| | | | | 24,068,523 |
| Retail Trade—7.8% | | | | |
| Advance Auto Parts | | 36,500 | | 1,228,225 |
| Dollar Tree | | 106,800 a | | 4,464,240 |
| Family Dollar Stores | | 201,900 | | 5,263,533 |
| GameStop, Cl. A | | 84,400 a,b | | 1,828,104 |
| Gap | | 345,600 | | 4,627,584 |
| Kohl’s | | 35,100 a | | 1,270,620 |
| Macy’s | | 74,300 | | 769,005 |
| Ross Stores | | 29,700 | | 882,981 |
| Safeway | | 279,900 | | 6,653,223 |
| Tiffany & Co. | | 152,700 b | | 3,608,301 |
| Urban Outfitters | | 257,800 a | | 3,861,844 |
| | | | | 34,457,660 |
| Technology Services—7.1% | | | | |
| Alliance Data Systems | | 18,400 a,b | | 856,152 |
| ANSYS | | 48,600 a | | 1,355,454 |
| Autodesk | | 34,000 a | | 668,100 |
| CA | | 116,700 | | 2,162,451 |
| CIGNA | | 154,000 | | 2,594,900 |
| Community Health Systems | | 154,300 a | | 2,249,694 |
| Computer Sciences | | 119,100 a | | 4,185,174 |
| Diebold | | 24,800 | | 696,632 |
| Express Scripts | | 76,900 a | | 4,227,962 |
| Global Payments | | 25,400 | | 832,866 |
| Hewitt Associates, Cl. A | | 77,500 a | | 2,199,450 |
The Fund 13
| STATEMENT OF INVESTMENTS (continued) |
| Common Stocks (continued) | | Shares | | Value ($) |
| |
| |
|
| Technology Services (continued) | | | | |
| Omnicare | | 68,600 | | 1,904,336 |
| Sohu.com | | 60,600 a,b | | 2,868,804 |
| Teradata | | 295,800 a | | 4,386,714 |
| | | | | 31,188,689 |
| Transportation—2.3% | | | | |
| CSX | | 119,800 | | 3,889,906 |
| Expeditors International Washington | | 139,700 | | 4,647,819 |
| Southwest Airlines | | 161,200 | | 1,389,544 |
| | | | | 9,927,269 |
| Utilities—8.4% | | | | |
| Alliant Energy | | 172,500 | | 5,033,550 |
| American Electric Power | | 196,200 | | 6,529,536 |
| CenterPoint Energy | | 271,600 | | 3,427,592 |
| CMS Energy | | 236,200 b | | 2,387,982 |
| DPL | | 203,600 | | 4,650,224 |
| Energen | | 23,900 | | 700,987 |
| Hawaiian Electric Industries | | 137,300 b | | 3,039,822 |
| Integrys Energy | | 96,300 | | 4,138,974 |
| NV Energy | | 264,400 | | 2,614,916 |
| Pepco Holdings | | 148,500 | | 2,637,360 |
| Reliant Energy | | 135,726 a | | 784,496 |
| Sempra Energy | | 26,000 | | 1,108,380 |
| | | | | 37,053,819 |
| Total Common Stocks | | | | |
| (cost $636,928,249) | | | | 438,622,481 |
| |
| |
|
| |
| Other Investment—.7% | | | | |
| |
| |
|
| Registered Investment Company; | | | | |
| Dreyfus Institutional Preferred | | | | |
| Plus Money Market Fund | | | | |
| (cost $3,172,000) | | 3,172,000 c | | 3,172,000 |
14
| Investment of Cash Collateral | | | | |
| for Securities Loaned—10.7% | | Shares | | Value ($) |
| |
| |
|
| Registered Investment Company; | | | | |
| Dreyfus Institutional Cash Advantage Fund | | | | |
| (cost $46,992,970) | | 46,992,970 c | | 46,992,970 |
| |
| |
|
| Total Investments (cost $687,093,219) | | 111.2% | | 488,787,451 |
| Liabilities, Less Cash and Receivables | | (11.2%) | | (49,185,545) |
| Net Assets | | 100.0% | | 439,601,906 |
| a | Non-income producing security. |
| |
| b | All or a portion of these securities are on loan. At December 31, 2008, the total market value of the fund’s securities on loan is $46,176,200 and the total market value of the collateral held by the fund is $46,992,970. |
| |
| c | Investment in affiliated money market mutual fund. |
| |
| Portfolio Summary (Unaudited)† | | | | |
| |
| | | Value (%) | | | | Value (%) |
| |
| |
| |
|
| Finance | | 18.0 | | Producer Manufacturing | | 5.5 |
| Money Market Investments | | 11.4 | | Process Industries | | 5.1 |
| Electronic Technology | | 9.8 | | Commercial & Professional Services | | 4.1 |
| Utilities | | 8.4 | | Energy Minerals | | 3.5 |
| Retail Trade | | 7.8 | | Communications | | 2.3 |
| Technology Services | | 7.1 | | Transportation | | 2.3 |
| Industrial Services | | 6.6 | | Consumer Durables | | 1.5 |
| Consumer Non-Durables | | 6.0 | | Non-Energy Minerals | | .4 |
| Consumer Services | | 5.8 | | | | |
| Health Care Technology | | 5.6 | | | | 111.2 |
| |
| † Based on net assets. | | | | | | |
| See notes to financial statements. | | | | | | |
The Fund 15
STATEMENT OF ASSETS AND LIABILITIES
December 31, 2008
| | | | | | | | | Cost | | Value |
| |
| |
| |
| |
| |
|
| Assets ($): | | | | | | | | | | |
| Investments in securities—See Statement of Investments (including | | | | |
| securities on loan, valued at $46,176,200)—Note 1(b): | | | | | | |
| Unaffiliated issuers | | | | | | 636,928,249 | | 438,622,481 |
| Affiliated issuers | | | | | | 50,164,970 | | 50,164,970 |
| Dividends and interest receivable | | | | | | | | 1,477,150 |
| Receivable for investment securities sold | | | | | | | | 1,079,718 |
| Receivable for shares of Common Stock subscribed | | | | | | 298,921 |
| Prepaid expenses | | | | | | | | | | 20,165 |
| | | | | | | | | | | 491,663,405 |
| |
| |
| |
| |
| |
|
| Liabilities ($): | | | | | | | | | | |
| Due to The Dreyfus Corporation and affiliates—Note 3(c) | | | | | | 415,191 |
| Cash overdraft due to Custodian | | | | | | | | 979,546 |
| Liability for securities on loan—Note 1(b) | | | | | | | | 46,992,970 |
| Payable for shares of Common Stock redeemed | | | | | | 3,398,133 |
| Interest payable—Note 2 | | | | | | | | | | 3,516 |
| Accrued expenses | | | | | | | | | | 272,143 |
| | | | | | | | | | | 52,061,499 |
| |
| |
| |
| |
| |
|
| Net Assets ($) | | | | | | | | | | 439,601,906 |
| |
| |
| |
| |
| |
|
| Composition of Net Assets ($): | | | | | | | | |
| Paid-in capital | | | | | | | | | | 782,329,349 |
| Accumulated net realized gain (loss) on investments | | | | (144,421,675) |
| Accumulated net unrealized appreciation | | | | | | | | |
| (depreciation) on investments | | | | | | (198,305,768) |
| |
| |
| |
|
| Net Assets ($) | | | | | | | | | | 439,601,906 |
| |
| |
| |
| |
| |
|
| |
| |
| Net Asset Value Per Share | | | | | | | | |
| | | Class A | | Class B | | Class C | | Class I | | Class T |
| |
| |
| |
| |
| |
|
| Net Assets ($) | | 414,175,881 | | 6,751,732 | | 8,004,669 | | 4,524,132 | | 6,145,492 |
| Shares Outstanding | | 19,847,330 | | 337,051 | | 398,926 | | 214,402 | | 297,472 |
| |
| |
| |
| |
| |
|
| Net Asset Value | | | | | | | | | | |
| Per Share ($) | | 20.87 | | 20.03 | | 20.07 | | 21.10 | | 20.66 |
| |
| See notes to financial statements. | | | | | | | | | | |
16
| STATEMENT OF OPERATIONS | | |
| Year Ended December 31, 2008 | | |
| |
|
| |
| |
| |
| |
| Investment Income ($): | | |
| Income: | | |
| Cash dividends: | | |
| Unaffiliated issuers | | 11,529,650 |
| Affiliated issuers | | 73,274 |
| Income from securities lending | | 945,588 |
| Total Income | | 12,548,512 |
| Expenses: | | |
| Management fee—Note 3(a) | | 5,845,744 |
| Shareholder servicing costs—Note 3(c) | | 3,293,785 |
| Distribution fees—Note 3(b) | | 228,501 |
| Prospectus and shareholders’ reports | | 82,907 |
| Professional fees | | 78,471 |
| Registration fees | | 66,280 |
| Custodian fees—Note 3(c) | | 62,881 |
| Directors’ fees and expenses—Note 3(d) | | 61,168 |
| Interest expense—Note 2 | | 26,518 |
| Loan commitment fees—Note 2 | | 10,261 |
| Miscellaneous | | 37,033 |
| Total Expenses | | 9,793,549 |
| Less—reduction in management fee due to undertaking—Note 3(a) | | (35,707) |
| Less—reduction in fees due to earnings credits—Note 1(b) | | (53,068) |
| Net Expenses | | 9,704,774 |
| Investment Income—Net | | 2,843,738 |
| |
|
| Realized and Unrealized Gain (Loss) on Investments—Note 4 ($): | | |
| Net realized gain (loss) on investments | | (141,346,971) |
| Net unrealized appreciation (depreciation) on investments | | (267,983,699) |
| Net Realized and Unrealized Gain (Loss) on Investments | | (409,330,670) |
| Net (Decrease) in Net Assets Resulting from Operations | | (406,486,932) |
| |
| See notes to financial statements. | | |
The Fund 17
STATEMENT OF CHANGES IN NET ASSETS
| | | Year Ended December 31, |
| | |
|
| | | 2008 | | 2007a |
| |
| |
|
| Operations ($): | | | | |
| Investment income—net | | 2,843,738 | | 5,914,917 |
| Net realized gain (loss) on investments | | (141,346,971) | | 163,878,189 |
| Net unrealized appreciation | | | | |
| (depreciation) on investments | | (267,983,699) | | (227,707,476) |
| Net Increase (Decrease) in Net Assets | | | | |
| Resulting from Operations | | (406,486,932) | | (57,914,370) |
| |
| |
|
| Dividends to Shareholders from ($): | | | | |
| Investment income—net: | | | | |
| Class A Shares | | (5,759,123) | | (4,143,705) |
| Class I Shares | | (22,032) | | (124,743) |
| Class T Shares | | (42,276) | | — |
| Net realized gain on investments: | | | | |
| Class A Shares | | (98,608) | | (168,390,973) |
| Class B Shares | | (1,716) | | (3,010,455) |
| Class C Shares | | (2,096) | | (3,814,717) |
| Class I Shares | | (1,293) | | (3,344,553) |
| Class T Shares | | (1,376) | | (2,401,221) |
| Total Dividends | | (5,928,520) | | (185,230,367) |
| |
| |
|
| Capital Stock Transactions ($): | | | | |
| Net proceeds from shares sold: | | | | |
| Class A Shares | | 65,218,954 | | 256,180,801 |
| Class B Shares | | 44,431 | | 1,289,016 |
| Class C Shares | | 637,378 | | 5,668,619 |
| Class I Shares | | 2,220,742 | | 13,852,607 |
| Class T Shares | | 2,860,126 | | 8,436,363 |
18
| | | Year Ended December 31, |
| | |
|
| | | 2008 | | 2007a |
| |
| |
|
| Capital Stock Transactions ($) (continued): | | | | |
| Dividends reinvested: | | | | |
| Class A Shares | | 5,518,761 | | 163,345,666 |
| Class B Shares | | 1,633 | | 2,844,224 |
| Class C Shares | | 1,827 | | 3,288,601 |
| Class I Shares | | 22,561 | | 3,335,591 |
| Class T Shares | | 42,109 | | 2,321,370 |
| Cost of shares redeemed: | | | | |
| Class A Shares | | (290,523,851) | | (304,055,790) |
| Class B Shares | | (4,254,111) | | (5,102,370) |
| Class C Shares | | (5,995,307) | | (9,002,300) |
| Class I Shares | | (13,682,098) | | (6,664,940) |
| Class T Shares | | (5,498,755) | | (13,777,849) |
| Increase (Decrease) in Net Assets | | | | |
| from Capital Stock Transactions | | (243,385,600) | | 121,959,609 |
| Total Increase (Decrease) in Net Assets | | (655,801,052) | | (121,185,128) |
| |
| |
|
| Net Assets ($): | | | | |
| Beginning of Period | | 1,095,402,958 | | 1,216,588,086 |
| End of Period | | 439,601,906 | | 1,095,402,958 |
| Undistributed investment income—net | | — | | 2,109,397 |
The Fund 19
STATEMENT OF CHANGES IN NET ASSETS (continued)
| | | Year Ended December 31, |
| | |
|
| | | 2008 | | 2007a |
| |
| |
|
| Capital Share Transactions: | | | | |
| Class Ab | | | | |
| Shares sold | | 2,076,245 | | 5,256,530 |
| Shares issued for dividends reinvested | | 246,262 | | 4,204,247 |
| Shares redeemed | | (9,198,036) | | (6,359,043) |
| Net Increase (Decrease) in Shares Outstanding | | (6,875,529) | | 3,101,734 |
| |
| |
|
| Class Bb | | | | |
| Shares sold | | 1,732 | | 26,887 |
| Shares issued for dividends reinvested | | 50 | | 76,355 |
| Shares redeemed | | (141,555) | | (109,610) |
| Net Increase (Decrease) in Shares Outstanding | | (139,773) | | (6,368) |
| |
| |
|
| Class C | | | | |
| Shares sold | | 23,004 | | 121,099 |
| Shares issued for dividends reinvested | | 56 | | 88,239 |
| Shares redeemed | | (204,131) | | (198,926) |
| Net Increase (Decrease) in Shares Outstanding | | (181,071) | | 10,412 |
| |
| |
|
| Class I | | | | |
| Shares sold | | 68,438 | | 275,089 |
| Shares issued for dividends reinvested | | 746 | | 85,975 |
| Shares redeemed | | (392,405) | | (141,116) |
| Net Increase (Decrease) in Shares Outstanding | | (323,221) | | 219,948 |
| |
| |
|
| Class T | | | | |
| Shares sold | | 94,924 | | 174,456 |
| Shares issued for dividends reinvested | | 2,115 | | 60,125 |
| Shares redeemed | | (173,576) | | (293,848) |
| Net Increase (Decrease) in Shares Outstanding | | (76,537) | | (59,267) |
| a | Effective June 1, 2007, Class R shares were redesignated as Class I shares. |
| |
| b | During the period ended December 31, 2008, 18,908 Class B shares representing $596,144 were automatically converted to 18,040 Class A shares and during the period ended December 31,2007, 21,550 Class B shares representing $1,007,667 were automatically converted to 20,752 Class A shares. |
| |
| See notes to financial statements. |
20
FINANCIAL HIGHLIGHTS
The following tables describe the performance for each share class for the fiscal periods indicated.All information (except portfolio turnover rate) reflects financial results for a single fund share.Total return shows how much your investment in the fund would have increased (or decreased) during each period, assuming you had reinvested all dividends and distributions.These figures have been derived from the fund’s financial statements.
| | | | | Year Ended December 31, | | |
| | |
| |
| |
|
| Class A Shares | | 2008 | | 2007 | | 2006 | | 2005 | | 2004 |
| |
| |
| |
| |
| |
|
| Per Share Data ($): | | | | | | | | | | |
| Net asset value, | | | | | | | | | | |
| beginning of period | | 38.24 | | 47.92 | | 47.02 | | 44.42 | | 41.91 |
| Investment Operations: | | | | | | | | | | |
| Investment income (loss)—neta | | .13 | | .24 | | .14 | | .13 | | (.05) |
| Net realized and unrealized | | | | | | | | | | |
| gain (loss) on investments | | (17.22) | | (2.51) | | 6.16 | | 6.03 | | 6.34 |
| Total from Investment Operations | | (17.09) | | (2.27) | | 6.30 | | 6.16 | | 6.29 |
| Distributions: | | | | | | | | | | |
| Dividends from | | | | | | | | | | |
| investment income—net | | (.28) | | (.18) | | (.08) | | (.09) | | — |
| Dividends from net realized | | | | | | | | | | |
| gain on investments | | (.00)b | | (7.23) | | (5.32) | | (3.47) | | (3.78) |
| Total Distributions | | (.28) | | (7.41) | | (5.40) | | (3.56) | | (3.78) |
| Net asset value, end of period | | 20.87 | | 38.24 | | 47.92 | | 47.02 | | 44.42 |
| |
| |
| |
| |
| |
|
| Total Return (%)c | | (44.73) | | (4.76) | | 13.56 | | 14.40 | | 15.33 |
| |
| |
| |
| |
| |
|
| Ratios/Supplemental Data (%): | | | | | | | | | | |
| Ratio of total expenses | | | | | | | | | | |
| to average net assets | | 1.22 | | 1.19 | | 1.20 | | 1.16 | | 1.22 |
| Ratio of net expenses | | | | | | | | | | |
| to average net assets | | 1.21 | | 1.19d | | 1.20d | | 1.16 | | 1.22d |
| Ratio of net investment income | | | | | | | | | | |
| (loss) to average net assets | | .40 | | .50 | | .29 | | .29 | | (.12) |
| Portfolio Turnover Rate | | 91.38 | | 88.97 | | 40.30 | | 37.93 | | 99.93 |
| |
| |
| |
| |
| |
|
| Net Assets, end of period | | | | | | | | | | |
| ($ x 1,000) | | 414,176 | | 1,021,924 | | 1,131,962 | | 1,041,238 | | 874,359 |
| a | Based on average shares outstanding at each month end. |
| |
| b | Amount represents less than $.01 per share. |
| |
| c | Exclusive of sales charge. |
| |
| d | Expense waivers and/or reimbursements amounted to less than .01%. |
| |
| See notes to financial statements. |
The Fund 21
| FINANCIAL HIGHLIGHTS (continued) |
| | | | | Year Ended December 31, | | |
| | |
| |
| |
|
| Class B Shares | | 2008 | | 2007 | | 2006 | | 2005 | | 2004 |
| |
| |
| |
| |
| |
|
| Per Share Data ($): | | | | | | | | | | |
| Net asset value, beginning of period | | 36.56 | | 46.33 | | 45.86 | | 43.67 | | 41.57 |
| Investment Operations: | | | | | | | | | | |
| Investment (loss)—neta | | (.14) | | (.14) | | (.23) | | (.24) | | (.38) |
| Net realized and unrealized | | | | | | | | | | |
| gain (loss) on investments | | (16.39) | | (2.40) | | 6.02 | | 5.90 | | 6.26 |
| Total from Investment Operations | | (16.53) | | (2.54) | | 5.79 | | 5.66 | | 5.88 |
| Distributions: | | | | | | | | | | |
| Dividends from net realized | | | | | | | | | | |
| gain on investments | | (.00)b | | (7.23) | | (5.32) | | (3.47) | | (3.78) |
| Net asset value, end of period | | 20.03 | | 36.56 | | 46.33 | | 45.86 | | 43.67 |
| |
| |
| |
| |
| |
|
| Total Return (%)c | | (45.21) | | (5.51) | | 12.78 | | 13.48 | | 14.46 |
| |
| |
| |
| |
| |
|
| Ratios/Supplemental Data (%): | | | | | | | | | | |
| Ratio of total expenses | | | | | | | | | | |
| to average net assets | | 2.07 | | 1.97 | | 1.97 | | 1.99 | | 2.00 |
| Ratio of net expenses | | | | | | | | | | |
| to average net assets | | 2.06 | | 1.97d | | 1.97d | | 1.99 | | 2.00d |
| Ratio of net investment (loss) | | | | | | | | | | |
| to average net assets | | (.45) | | (.30) | | (.49) | | (.54) | | (.88) |
| Portfolio Turnover Rate | | 91.38 | | 88.97 | | 40.30 | | 37.93 | | 99.93 |
| |
| |
| |
| |
| |
|
| Net Assets, end of period ($ x 1,000) | | 6,752 | | 17,435 | | 22,388 | | 20,938 | | 15,285 |
| a | Based on average shares outstanding at each month end. |
| |
| b | Amount represents less than $.01 per share. |
| |
| c | Exclusive of sales charge. |
| |
| d | Expense waivers and/or reimbursements amounted to less than .01%. |
| |
| See notes to financial statements. |
22
| | | | | Year Ended December 31, | | |
| | |
| |
| |
|
| Class C Shares | | 2008 | | 2007 | | 2006 | | 2005 | | 2004 |
| |
| |
| |
| |
| |
|
| Per Share Data ($): | | | | | | | | | | |
| Net asset value, beginning of period | | 36.60 | | 46.36 | | 45.90 | | 43.70 | | 41.58 |
| Investment Operations: | | | | | | | | | | |
| Investment (loss)—neta | | (.12) | | (.12) | | (.20) | | (.21) | | (.35) |
| Net realized and unrealized | | | | | | | | | | |
| gain (loss) on investments | | (16.41) | | (2.41) | | 5.98 | | 5.88 | | 6.25 |
| Total from Investment Operations | | (16.53) | | (2.53) | | 5.78 | | 5.67 | | 5.90 |
| Distributions: | | | | | | | | | | |
| Dividends from net realized | | | | | | | | | | |
| gain on investments | | (.00)b | | (7.23) | | (5.32) | | (3.47) | | (3.78) |
| Net asset value, end of period | | 20.07 | | 36.60 | | 46.36 | | 45.90 | | 43.70 |
| |
| |
| |
| |
| |
|
| Total Return (%)c | | (45.16) | | (5.48) | | 12.75 | | 13.49 | | 14.49 |
| |
| |
| |
| |
| |
|
| Ratios/Supplemental Data (%): | | | | | | | | | | |
| Ratio of total expenses | | | | | | | | | | |
| to average net assets | | 2.02 | | 1.94 | | 1.93 | | 1.93 | | 1.97 |
| Ratio of net expenses | | | | | | | | | | |
| to average net assets | | 2.01 | | 1.94d | | 1.93d | | 1.93 | | 1.97d |
| Ratio of net investment (loss) | | | | | | | | | | |
| to average net assets | | (.41) | | (.26) | | (.43) | | (.49) | | (.82) |
| Portfolio Turnover Rate | | 91.38 | | 88.97 | | 40.30 | | 37.93 | | 99.93 |
| |
| |
| |
| |
| |
|
| Net Assets, end of period ($ x 1,000) | | 8,005 | | 21,231 | | 26,406 | | 18,166 | | 10,193 |
| a | Based on average shares outstanding at each month end. |
| |
| b | Amount represents less than $.01 per share. |
| |
| c | Exclusive of sales charge. |
| |
| d | Expense waivers and/or reimbursements amounted to less than .01%. |
| |
| See notes to financial statements. |
The Fund 23
| FINANCIAL HIGHLIGHTS (continued) |
| | | | | Year Ended December 31, | | |
| | |
| |
| |
|
| Class I Shares | | 2008 | | 2007a | | 2006 | | 2005 | | 2004 |
| |
| |
| |
| |
| |
|
| Per Share Data ($): | | | | | | | | | | |
| Net asset value, beginning of period | | 38.49 | | 48.25 | | 47.37 | | 44.72 | | 42.04 |
| Investment Operations: | | | | | | | | | | |
| Investment income (loss)—netb | | (.04) | | .29 | | .16 | | .12 | | .15 |
| Net realized and unrealized | | | | | | | | | | |
| gain (loss) on investments | | (17.27) | | (2.54) | | 6.19 | | 6.12 | | 6.31 |
| Total from Investment Operations | | (17.31) | | (2.25) | | 6.35 | | 6.24 | | 6.46 |
| Distributions: | | | | | | | | | | |
| Dividends from investment income—net | | (.08) | | (.28) | | (.15) | | (.12) | | — |
| Dividends from net realized | | | | | | | | | | |
| gain on investments | | (.00)c | | (7.23) | | (5.32) | | (3.47) | | (3.78) |
| Total Distributions | | (.08) | | (7.51) | | (5.47) | | (3.59) | | (3.78) |
| Net asset value, end of period | | 21.10 | | 38.49 | | 48.25 | | 47.37 | | 44.72 |
| |
| |
| |
| |
| |
|
| Total Return (%) | | (45.03) | | (4.67) | | 13.56 | | 14.48 | | 15.69 |
| |
| |
| |
| |
| |
|
| Ratios/Supplemental Data (%): | | | | | | | | | | |
| Ratio of total expenses | | | | | | | | | | |
| to average net assets | | 1.68 | | 1.09 | | 1.18 | | 1.11 | | .92 |
| Ratio of net expenses | | | | | | | | | | |
| to average net assets | | 1.66 | | 1.09d | | 1.18d | | 1.11 | | .92d |
| Ratio of net investment income | | | | | | | | | | |
| (loss) to average net assets | | (.13) | | .60 | | .32 | | .27 | | .38 |
| Portfolio Turnover Rate | | 91.38 | | 88.97 | | 40.30 | | 37.93 | | 99.93 |
| |
| |
| |
| |
| |
|
| Net Assets, end of period ($ x 1,000) | | 4,524 | | 20,696 | | 15,328 | | 10,312 | | 3,583 |
| a | Effective June 1, 2007, Class R shares were redesignated as Class I shares. |
| |
| b | Based on average shares outstanding at each month end. |
| |
| c | Amount represents less than $.01 per share. |
| |
| d | Expense waivers and/or reimbursements amounted to less than .01%. |
| |
| See notes to financial statements. |
24
| | | | | Year Ended December 31, | | |
| | |
| |
| |
|
| Class T Shares | | 2008 | | 2007 | | 2006 | | 2005 | | 2004 |
| |
| |
| |
| |
| |
|
| Per Share Data ($): | | | | | | | | | | |
| Net asset value, beginning of period | | 37.75 | | 47.32 | | 46.54 | | 44.13 | | 41.76 |
| Investment Operations: | | | | | | | | | | |
| Investment income (loss)—neta | | .05 | | .13 | | .08 | | (.02) | | (.10) |
| Net realized and unrealized | | | | | | | | | | |
| gain (loss) on investments | | (17.00) | | (2.47) | | 6.09 | | 6.01 | | 6.25 |
| Total from Investment Operations | | (16.95) | | (2.34) | | 6.17 | | 5.99 | | 6.15 |
| Distributions: | | | | | | | | | | |
| Dividends from investment income—net | | (.14) | | — | | (.07) | | (.11) | | — |
| Dividends from net realized | | | | | | | | | | |
| gain on investments | | (.00)b | | (7.23) | | (5.32) | | (3.47) | | (3.78) |
| Total Distributions | | (.14) | | (7.23) | | (5.39) | | (3.58) | | (3.78) |
| Net asset value, end of period | | 20.66 | | 37.75 | | 47.32 | | 46.54 | | 44.13 |
| |
| |
| |
| |
| |
|
| Total Return (%)c | | (44.88) | | (4.97) | | 13.39 | | 14.12 | | 15.04 |
| |
| |
| |
| |
| |
|
| Ratios/Supplemental Data (%): | | | | | | | | | | |
| Ratio of total expenses | | | | | | | | | | |
| to average net assets | | 1.47 | | 1.41 | | 1.33 | | 1.38 | | 1.46 |
| Ratio of net expenses | | | | | | | | | | |
| to average net assets | | 1.46 | | 1.41d | | 1.33d | | 1.38 | | 1.46d |
| Ratio of net investment income | | | | | | | | | | |
| (loss) to average net assets | | .17 | | .27 | | .17 | | (.05) | | (.24) |
| Portfolio Turnover Rate | | 91.38 | | 88.97 | | 40.30 | | 37.93 | | 99.93 |
| |
| |
| |
| |
| |
|
| Net Assets, end of period ($ x 1,000) | | 6,145 | | 14,117 | | 20,504 | | 15,651 | | 1,302 |
| a | Based on average shares outstanding at each month end. |
| |
| b | Amount represents less than $.01 per share. |
| |
| c | Exclusive of sales charge. |
| |
| d | Expense waivers and/or reimbursements amounted to less than .01%. |
| |
| See notes to financial statements. |
The Fund 25
NOTES TO FINANCIAL STATEMENTS
NOTE 1—Significant Accounting Policies:
Dreyfus New Leaders Fund (the “fund”) is a separate diversified series of Strategic Funds, Inc. (the “Company”) which is registered under the Investment Company Act of 1940, as amended (the “Act”), as a diversified open-end management investment company and operates as a series company currently offering seven series, including the fund.The fund’s investment objective is to maximize capital appreciation. The Dreyfus Corporation (the “Manager” or “Dreyfus”), a wholly-owned subsidiary of The Bank of New York Mellon Corporation (“BNY Mellon”), serves as the fund’s investment adviser.
At a meeting of the fund’s Board of Directors held on July 25, 2008, the Board approved, effective December 1, 2008, a proposal to change the name of the fund from “Dreyfus Premier New Leaders Fund” to “Dreyfus New Leaders Fund”.
Effective July 1, 2008, BNY Mellon reorganized and consolidated a number of its banking and trust company subsidiaries.As a result of the reorganization, any services previously provided to the fund by Mellon Bank, N.A. or Mellon Trust of New England, N.A. are now provided by The Bank of NewYork Mellon (formerly,The Bank of NewYork).
MBSC Securities Corporation (the “Distributor”), a wholly-owned subsidiary of the Manager, is the distributor of the fund’s shares. The fund is authorized to issue 100 million shares of $.001 par value Common Stock.The fund currently offers five classes of shares: Class A (35 million shares authorized), Class B (30 million shares authorized), Class C (15 million shares authorized), Class I (15 million shares authorized) and Class T (5 million shares authorized). Class A and Class T shares are subject to a sales charge imposed at the time of purchase. Class B shares are subject to a contingent deferred sales charge (“CDSC”) imposed on Class B share redemptions made within six years of purchase and automatically convert to Class A shares after six years.The fund does not offer Class B shares, except in connection with dividend reinvestment and permitted exchanges of Class B shares. Class C shares are subject to a CDSC on Class C shares redeemed within one
26
year of purchase. Class I shares are sold at net asset value per share only to institutional investors. Effective December 3, 2008, investments for new accounts were no longer permitted in Class T of the fund, except that participants in certain group retirement plans were able to open a new account in Class T of the fund, provided that the fund was established as an investment option under the plans before December 3, 2008. Other differences between the classes include the services offered to and the expenses borne by each class, the allocation of certain transfer agency costs, and certain voting rights. Income, expenses (other than expenses attributable to a specific class), and realized and unrealized gains or losses on investments are allocated to each class of shares based on its relative net assets.
The Company accounts separately for the assets, liabilities and operations of each series. Expenses directly attributable to each series are charged to that series’ operations; expenses which are applicable to all series are allocated among them on a pro rata basis.
The fund’s financial statements are prepared in accordance with U.S. generally accepted accounting principles, which may require the use of management estimates and assumptions. Actual results could differ from those estimates.
The fund enters into contracts that contain a variety of indemnifications. The fund’s maximum exposure under these arrangements is unknown.The fund does not anticipate recognizing any loss related to these arrangements.
(a) Portfolio valuation: Investments in securities are valued at the last sales price on the securities exchange or national securities market on which such securities are primarily traded. Securities listed on the National Market System for which market quotations are available are valued at the official closing price or, if there is no official closing price that day, at the last sales price. Securities not listed on an exchange or the national securities market, or securities for which there were no transactions, are valued at the average of the most recent bid and asked
The Fund 27
| NOTES TO FINANCIAL STATEMENTS (continued) |
prices, except for open short positions, where the asked price is used for valuation purposes. Bid price is used when no asked price is available. Registered investment companies that are not traded on an exchange are valued at their net asset value.When market quotations or official closing prices are not readily available, or are determined not to reflect accurately fair value, such as when the value of a security has been significantly affected by events after the close of the exchange or market on which the security is principally traded (for example, a foreign exchange or market), but before the fund calculates its net asset value, the fund may value these investments at fair value as determined in accordance with the procedures approved by the Board of Directors. Fair valuing of securities may be determined with the assistance of a pricing service using calculations based on indices of domestic securities and other appropriate indicators, such as prices of relevant ADRs and futures contracts. For other securities that are fair valued by the Board of Directors, certain factors may be considered such as: fundamental analytical data, the nature and duration of restrictions on disposition, an evaluation of the forces that influence the market in which the securities are purchased and sold and public trading in similar securities of the issuer or comparable issuers. Financial futures are valued at the last sales price.
The fund adopted Statement of Financial Accounting Standards No. 157 “FairValue Measurements” (“FAS 157”). FAS 157 establishes an authoritative definition of fair value, sets out a framework for measuring fair value, and requires additional disclosures about fair value measurements.
Various inputs are used in determining the value of the fund’s investments relating to FAS 157.These inputs are summarized in the three broad levels listed below.
Level 1—quoted prices in active markets for identical securities. Level 2—other significant observable inputs (including quoted prices for similar securities, interest rates, prepayment speeds, credit risk, etc.).
Level 3—significant unobservable inputs (including the fund’s own assumptions in determining the fair value of investments).
28
The inputs or methodology used for valuing securities are not necessarily an indication of the risk associated with investing in those securities.
The following is a summary of the inputs used as of December 31, 2008 in valuing the fund’s investments carried at fair value:
| | | Investments in | | Other Financial |
| Valuation Inputs | | Securities ($) | | Instruments ($)† |
| |
| |
|
| Level 1—Quoted Prices | | 488,787,451 | | 0 |
| Level 2—Other Significant | | | | |
| Observable Inputs | | 0 | | 0 |
| Level 3—Significant | | | | |
| Unobservable Inputs | | 0 | | 0 |
| Total | | 488,787,451 | | 0 |
† Other financial instruments include derivative instruments such as futures, forward currency exchange contracts and swap contracts, which are valued at the unrealized appreciation (depreciation) on the instrument and written options contracts which are shown at value.
(b) Securities transactions and investment income: Securities transactions are recorded on a trade date basis. Realized gains and losses from securities transactions are recorded on the identified cost basis. Dividend income is recognized on the ex-dividend date and interest income, including, where applicable, accretion of discount and amortization of premium on investments, is recognized on the accrual basis.
The fund has arrangements with the custodian and cash management banks whereby the fund may receive earnings credits when positive cash balances are maintained, which are used to offset custody and cash management fees. For financial reporting purposes, the fund includes net earnings credits as an expense offset in the Statement of Operations.
Pursuant to a securities lending agreement with The Bank of New York Mellon, a subsidiary of BNY Mellon and an affiliate of Dreyfus, the fund may lend securities to qualified institutions. It is the fund’s policy that, at origination, all loans are secured by collateral of at least 102% of the value of U.S. securities loaned and 105% of the value of foreign securities loaned. Collateral equivalent to at least 100% of the market value of securities on loan is maintained at all times. Collateral
The Fund 29
| NOTES TO FINANCIAL STATEMENTS (continued) |
is either in the form of cash, which can be invested in certain money market mutual funds managed by the Manager, U.S. Government and Agency securities or letters of credit.The fund is entitled to receive all income on securities loaned, in addition to income earned as a result of the lending transaction. Although each security loaned is fully collateralized, the fund bears the risk of delay in recovery of, or loss of rights in, the securities loaned should a borrower fail to return the securities in a timely manner. During the period ended December 31, 2008,The Bank of New York Mellon earned $405,252 from lending fund portfolio securities, pursuant to the securities lending agreement.
(c) Affiliated issuers: Investments in other investment companies advised by the Manager are defined as “affiliated” in the Act.
(d) Dividends to shareholders: Dividends are recorded on the ex-dividend date. Dividends from investment income-net and dividends from net realized capital gains, are normally declared and paid annually, but the fund may make distributions on a more frequent basis to comply with the distribution requirements of the Internal Revenue Code of 1986, as amended (the “Code”).To the extent that net realized capital gains can be offset by capital loss carryovers, it is the policy of the fund not to distribute such gains. Income and capital gain distributions are determined in accordance with income tax regulations, which may differ from U.S. generally accepted accounting principles.
(e) Federal income taxes: It is the policy of the fund to continue to qualify as a regulated investment company, if such qualification is in the best interests of its shareholders, by complying with the applicable provisions of the Code, and to make distributions of taxable income sufficient to relieve it from substantially all federal income and excise taxes.
As of and during the period ended December 31, 2008, the fund did not have any liabilities for any unrecognized tax positions. The fund recognizes interest and penalties, if any, related to unrecognized tax positions as income tax expense in the Statement of Operations. During the period, the fund did not incur any interest or penalties.
30
Each of the tax years in the four-year period ended December 31, 2008 remains subject to examination by the Internal Revenue Service and state taxing authorities.
At December 31, 2008, the components of accumulated earnings on a tax basis were as follows: accumulated capital losses $66,154,840 and unrealized depreciation $200,401,844. In addition, the fund had $76,170,759 of capital losses realized after October 31, 2008 which were deferred for tax purposes to the first day of the following fiscal year.
The accumulated capital loss carryover is available for federal income tax purposes to be applied against future net securities profits, if any, realized subsequent to December 31, 2008. If not applied, $3,059,524 of the carryover expires in fiscal 2010 and $63,095,316 expires in fiscal 2016. Also, as a result of the fund’s mergers with Dreyfus Premier Aggressive Growth Fund and Dreyfus Aggressive Growth Fund, capital losses of $6,119,048 are available to offset future gains, if any. Based on certain provisions in the Code, the amount of acquired capital losses which can be utilized in subsequent years is subject to an annual limitation and is expected to expire in fiscal 2010.
The tax character of distributions paid to shareholders during the fiscal periods ended December 31, 2008 and December 31, 2007 were as follows: ordinary income $5,823,431 and $4,695,037 and long-term capital gains $105,089 and $180,535,330, respectively.
During the period ended December 31, 2008, as a result of permanent book to tax differences, primarily due to the tax treatment for real estate investment trusts, the fund increased accumulated undistributed investment income-net by $870,296, decreased accumulated net realized gain (loss) on investment by $3,050,628 and increased paid-in capital by $2,180,332. Net assets and net asset value per share were not affected by this reclassification.
The Fund 31
| NOTES TO FINANCIAL STATEMENTS (continued) |
NOTE 2—Bank Lines of Credit:
Prior to October 15, 2008, the fund participated with other Dreyfus-managed funds in a $350 million redemption credit facility. Effective October 15, 2008, the fund participates with other Dreyfus-Managed funds in a $145 million redemption credit facility (the “Facility”) to be utilized for temporary or emergency purposes, including the financing of redemptions. In connection therewith, the fund has agreed to pay commitment fees on its pro rata portion of the Facility. Interest is charged to the fund based on prevailing market rates in effect at the time of borrowing.
The average daily amount of borrowings outstanding under the Facilities during the period ended December 31, 2008 was approximately $697,200, with a related weighted average annualized interest rate of 3.80% .
NOTE 3—Management Fee and Other Transactions With Affiliates:
(a) Pursuant to a management agreement (“Agreement”) with the Manager, the management fee is computed at the annual rate of .75% of the value of the fund’s average daily net assets and is payable monthly. The Manager has agreed from December 1, 2008 through May 31, 2009 to waive receipt of a portion of the fund’s management fee in the amount of ..10% of the value of the fund’s average daily net assets.The reduction in management fee, pursuant to the undertaking, amounted to $35,707 during the period ended December 31, 2008.
During the period ended December 31, 2008, the Distributor retained $17,939 and $33 from commissions earned on sales of the fund’s Class A and ClassT shares, respectively, and $28,486 and $3,223 from CDSCs on redemptions of the fund’s Class B and Class C shares, respectively.
(b) Under the Distribution Plan (the “Plan”) adopted pursuant to Rule 12b-1 under the Act, Class B, Class C and Class T shares pay the Distributor for distributing their shares at an annual rate of .75% of the value of the average daily net assets of Class B and Class C shares and
32
.25% of the value of the average daily net assets of Class T shares. During the period ended December 31, 2008, Class B, Class C and Class T shares were charged $91,410, $111,407 and $25,684, respectively, pursuant to the Plan.
(c) Under the Shareholder Services Plan, Class A, Class B, Class C and Class T shares pay the Distributor at an annual rate of .25% of the value of their average daily net assets for the provision of certain ser-vices.The services provided may include personal services relating to shareholder accounts, such as answering shareholder inquiries regarding Class A, Class B, Class C and Class T shares and providing reports and other information, and services related to the maintenance of shareholder accounts.The Distributor may make payments to Service Agents (a securities dealer, financial institution or other industry professional) in respect of these services.The Distributor determines the amounts to be paid to Service Agents. During the period ended December 31, 2008, Class A, Class B, Class C and Class T shares were charged $1,832,787, $30,470, $37,136 and $25,684, respectively, pursuant to the Shareholder Services Plan.
The fund compensates Dreyfus Transfer, Inc., a wholly-owned subsidiary of the Manager, under a transfer agency agreement for providing personnel and facilities to perform transfer agency services for the fund. During the period ended December 31, 2008, the fund was charged $432,925 pursuant to the transfer agency agreement.
The fund compensates The Bank of New York Mellon under a cash management agreement for performing cash management services related to fund subscriptions and redemptions. During the period ended December 31, 2008, the fund was charged $53,068 pursuant to the cash management agreement.
The fund compensates The Bank of New York Mellon under a custody agreement for providing custodial services for the fund. During the period ended December 31, 2008, the fund was charged $62,881 pursuant to the custody agreement.
The Fund 33
| NOTES TO FINANCIAL STATEMENTS (continued) |
During the period ended December 31, 2008, the fund was charged $5,403 for services performed by the Chief Compliance Officer.
The components of “Due to The Dreyfus Corporation and affiliates” in the Statement of Assets and Liabilities consist of: management fees $268,105, Rule 12b-1 distribution plan fees $10,237, shareholder services plan fees $88,471, custodian fees $13,548, chief compliance officer fees $1,197 and transfer agency per account fees $69,340, which are offset against an expense reimbursement currently in effect in the amount of $35,707.
(d) Each Board member also serves as a Board member of other funds within the Dreyfus complex. Annual retainer fees and attendance fees are allocated to each fund based on net assets.
NOTE 4—Securities Transactions:
The aggregate amount of purchases and sales of investment securities, excluding short-term securities, during the period ended December 31, 2008, amounted to $718,516,069 and $972,124,505, respectively.
At December 31, 2008, the cost of investments for federal income tax purposes was $689,189,295; accordingly, accumulated net unrealized depreciation on investments was $200,401,844, consisting of $8,988,949 gross unrealized appreciation and $209,390,793 gross unrealized depreciation.
In March 2008, the Financial Accounting Standards Board released Statement of Financial Accounting Standards No. 161, “Disclosures about Derivative Instruments and Hedging Activities” (“FAS 161”). FAS 161 requires qualitative disclosures about objectives and strategies for using derivatives, quantitative disclosures about fair value amounts of gains and losses on derivative instruments, and disclosures about
34
credit-risk-related contingent features in derivative agreements. The application of FAS 161 is required for fiscal years and interim periods beginning after November 15, 2008.At this time, management is evaluating the implications of FAS 161 and its impact on the financial statements and the accompanying notes has not yet been determined.
NOTE 5—Subsequent Event:
On February 4, 2009, the fund issued to each holder of its Class T shares, in exchange for said shares, Class A shares of the fund having an aggregate net asset value equal to the aggregate net asset value of the shareholder’s Class T shares. Subsequent investments in the fund’s Class A shares made by prior holders of the fund’s Class T shares who received Class A shares of the fund in exchange for their Class T shares are subject to the front-end sales load schedule that was in effect for Class T shares at the time of the exchange. Otherwise, all other Class A share attributes will be in effect.
The Fund 35
REPORT OF INDEPENDENT REGISTERED PUBLIC ACCOUNTING FIRM
| | Shareholders and Board of Directors
Dreyfus New Leaders Fund |
We have audited the accompanying statement of assets and liabilities, including the statement of investments, of Dreyfus New Leaders Fund, (formerly, Dreyfus Premier New Leaders Fund) (one of the series comprising Strategic Funds, Inc.) as of December 31, 2008, and the related statement of operations for the year then ended, the statement of changes in net assets for each of the two years in the period then ended, and financial highlights for each of the periods indicated therein.These financial statements and financial highlights are the responsibility of the Fund’s management. Our responsibility is to express an opinion on these financial statements and financial highlights based on our audits. We conducted our audits in accordance with the standards of the Public Company Accounting Oversight Board (United States).Those standards require that we plan and perform the audit to obtain reasonable assurance about whether the financial statements and financial highlights are free of material misstatement.We were not engaged to perform an audit of the Fund’s internal control over financial reporting. Our audits included consideration of internal control over financial reporting as a basis for designing audit procedures that are appropriate in the circumstances, but not for the purpose of expressing an opinion on the effectiveness of the Fund’s internal control over financial reporting. Accordingly, we express no such opinion.An audit also includes examining, on a test basis, evidence supporting the amounts and disclosures in the financial statements and financial highlights, assessing the accounting principles used and significant estimates made by management, and evaluating the overall financial statement presentation. Our procedures included confirmation of securities owned as of December 31, 2008 by correspondence with the custodian and others. We believe that our audits provide a reasonable basis for our opinion.
In our opinion, the financial statements and financial highlights referred to above present fairly, in all material respects, the financial position of Dreyfus New Leaders Fund at December 31, 2008, the results of its operations for the year then ended, the changes in its net assets for each of the two years in the period then ended, and the financial highlights for each of the indicated periods, in conformity with U. S. generally accepted accounting principles.

36
IMPORTANT TAX INFORMATION (Unaudited)
For federal tax purposes, the fund also hereby designates 95.87% of the ordinary dividends paid during the fiscal year ended December 31, 2008 as qualifying for the corporate dividends received deduction. For the fiscal year ended December 31, 2008, certain dividends paid by the fund may be subject to a maximum tax rate of 15%, as provided for by the Jobs and Growth Tax Relief Reconciliation Act of 2003. Of the distributions paid during the fiscal year, $5,823,431 represents the maximum amount that may be considered qualified dividend income. Shareholders will receive notification in January 2009 of the percentage applicable to the preparation of their 2008 income tax returns. Also the fund hereby designates $.0040 per share as a long-term capital gain distribution paid on March 27, 2008.
The Fund 37
INFORMATION ABOUT THE REVIEW AND APPROVAL OF THE FUND’S MANAGEMENT AGREEMENT (Unaudited)
At a Meeting of the fund’s Board of Directors held on November 10-11, 2008, the Board considered the re-approval for an annual period of the fund’s Management Agreement,pursuant to which the Manager provides the fund with investment advisory and administrative services.The Board members, none of whom are “interested persons” (as defined in the Investment Company Act of 1940, as amended) of the fund, were assisted in their review by independent legal counsel and met with counsel in executive session separate from representatives of the Manager.
Analysis of Nature, Extent, and Quality of Services Provided to the Fund. The Board members considered information previously provided to them in a presentation from representatives of the Manager regarding services provided to the fund and other funds in the Dreyfus complex, and representatives of the Manager confirmed that there had been no material changes in the information. The Board also discussed the nature, extent, and quality of the services provided to the fund pursuant to the fund’s Management Agreement. The Manager’s representatives reviewed the fund’s distribution of accounts and the relationships that the Manager has with various intermediaries and the different needs of each.The Manager’s representatives noted the diversity of distribution of the fund as well as among the funds in the Dreyfus fund complex, and the Manager’s corresponding need for broad, deep, and diverse resources to be able to provide ongoing shareholder services to each of the fund’s distribution channels. The Board also reviewed the number of shareholder accounts in the fund, as well as the fund’s asset size.
The Board members also considered the Manager’s research and portfolio management capabilities and that the Manager also provides oversight of day-to-day fund operations, including fund accounting and administration and assistance in meeting legal and regulatory requirements. The Board members also considered the Manager’s extensive administrative, accounting, and compliance infrastructure.
Comparative Analysis of the Fund’s Management Fee and Expense Ratio and Performance. The Board members reviewed reports prepared by Lipper, Inc., an independent provider of investment company data, which included information comparing the fund’s management
38
fee and expense ratio with a group of comparable funds (the “Expense Group”) and with a broader group of funds (the “Expense Universe”) that were selected by Lipper. Included in the fund’s reports were comparisons of contractual and actual management fee rates and total operating expenses.
The Board members also reviewed the reports prepared by Lipper that presented the fund’s performance as well as comparisons of total return performance for the fund to the same group of funds as the Expense Group (the “Performance Group”) and to a group of funds that was broader than the Expense Universe (the “Performance Universe”) that also were selected by Lipper, all for various periods ended August 31, 2008. The Manager previously had furnished the Board with a description of the methodology Lipper used to select the fund’s Expense Group and Expense Universe, and Performance Group and Performance Universe. The Manager also provided a comparison of the fund’s total returns to the returns of the fund’s benchmark index for the past 10 calendar years.
The Board reviewed the results of the Expense Group and Expense Universe comparisons that were prepared based on financial statements currently available to Lipper as of August 31, 2008.The Board reviewed the range of management fees and expense ratios of the funds in the Expense Group and Expense Universe, and noted that the fund’s contractual management fee was lower than the Expense Group median, and that the fund’s actual management fee was lower than the Expense Group median and at the Expense Universe median. The Board also noted that the fund’s total expense ratio was lower than the Expense Group and Expense Universe medians.
With respect to the fund’s performance, the Board noted that the fund achieved fourth quartile total return rankings (the first quartile being the highest performance ranking group) in the Performance Group for each reported time period up to 10 years, as well as fourth quartile total return rankings in the Performance Universe for each reported time period up to 5 years (third quartile for the 10-year period).The
The Fund 39
INFORMATION ABOUT THE REVIEW AND APPROVAL OF THE FUND’S MANAGEMENT AGREEMENT (Unaudited) (continued)
Board received a presentation from the fund’s primary portfolio management team regarding the fund’s performance over the prior two years, as well as the team’s implementation of the proprietary investment model used to select portfolio investments, and considered the team’s discussion of the main factors that contributed to the fund’s underperformance. Representatives of the Manager, and the Board, expressed concern over the team’s performance record, and the Board communicated to the Manager’s representatives its’ expectation that the Manager would take affirmative steps to improve fund performance, to which the Manager agreed to recommend a new portfolio management team by February 2009.
Representatives of the Manager reviewed with the Board members the fees paid to the Manager or its affiliates by mutual funds managed by the Manager or its affiliates that were reported in the same Lipper category as the fund (the “Similar Funds”), and explained the nature of the Similar Funds and the differences, from the Manager’s perspective, in providing services to the Similar Funds as compared to the fund.The Manager’s representatives also reviewed the costs associated with distribution through intermediaries. The Board analyzed differences in fees paid to the Manager and discussed the relationship of the management fees paid in light of the services provided. The Board members considered the relevance of the fee information provided for the Similar Funds to evaluate the appropriateness and reasonableness of the fund’s management fee. The Manager’s representatives noted that there were no similarly managed institutional separate accounts or wrap fee accounts managed by the Manager or its affiliates with similar investment objectives, policies, and strategies as the fund.
Analysis of Profitability and Economies of Scale. The Manager’s representatives reviewed the dollar amount of expenses allocated and profit received by the Manager for the fund and the method used to determine such expenses and profit.The Board considered information, previously provided and discussed, prepared by an independent consulting firm regarding the Manager’s approach to allocating costs to, and determining the profitability of, individual funds and the
40
entire Dreyfus mutual fund complex. The Board also had been informed that the methodology had also been reviewed by an independent registered public accounting firm which, like the consultant, found the methodology to be reasonable. The consulting firm also analyzed where any economies of scale might emerge in connection with the management of the fund.The Board members evaluated the profitability analysis in light of the relevant circumstances for the fund, including the change in the fund’s asset size from the prior year, and the extent to which economies of scale would be realized if the fund grows and whether fee levels reflect these economies of scale for the benefit of fund shareholders.The Board members also considered potential benefits to the Manager from acting as investment adviser to the fund and noted the soft dollar arrangements in effect with respect to trading the fund’s portfolio.
It was noted that the Board members should consider the Manager’s profitability with respect to the fund as part of their evaluation of whether the fees under the Management Agreement bear a reasonable relationship to the mix of services provided by the Manager, including the nature, extent, and quality of such services and that a discussion of economies of scale is predicated on increasing assets and that, if a fund’s assets had been decreasing, the possibility that the Manager may have realized any economies of scale would be less. It was noted that the profitability percentage for managing the fund was within the range determined by appropriate court cases to be reasonable given the services rendered and that the profitability percentage for managing the fund was reasonable given the generally superior service levels provided.
At the conclusion of these discussions, the Board agreed that it had been furnished with sufficient information to make an informed business decision with respect to continuation of the fund’s Management Agreement. Based on the discussions and considerations as described above, the Board reached the following conclusions and determinations.
- The Board concluded that the nature, extent, and quality of the ser- vices provided by the Manager are adequate and appropriate.
The Fund 41
INFORMATION ABOUT THE REVIEW AND APPROVAL OF THE FUND’S MANAGEMENT AGREEMENT (Unaudited) (continued)
- While the Board was not satisfied with the performance of the fund’s portfolio management team, the Board noted the Manager’s commitment to recommend a new portfolio management team to the Board for approval by February 2009.
- The Board concluded that the fee paid to the Manager by the fund was reasonable in light of the services provided, comparative perfor- mance and expense and management fee information, costs of the services provided and profits to be realized and benefits derived or to be derived by the Manager from its relationship with the fund.
- The Board determined that the economies of scale which may accrue to the Manager and its affiliates in connection with the man- agement of the fund had been adequately considered by the Manager in connection with the management fee rate charged to the fund, and that, to the extent in the future it were to be deter- mined that material economies of scale had not been shared with the fund, the Board would seek to have those economies of scale shared with the fund.
The Board members considered these conclusions and determinations, along with the information received on a routine and regular basis throughout the year, and, without any one factor being dispositive, the Board re-approved the fund’s Management Agreement for a shorter six-month period, through May 31, 2009, noting that the six-month re-approval period offered the Board time for the Manager to prepare a recommendation for the Board for a new portfolio management team for the fund.
42
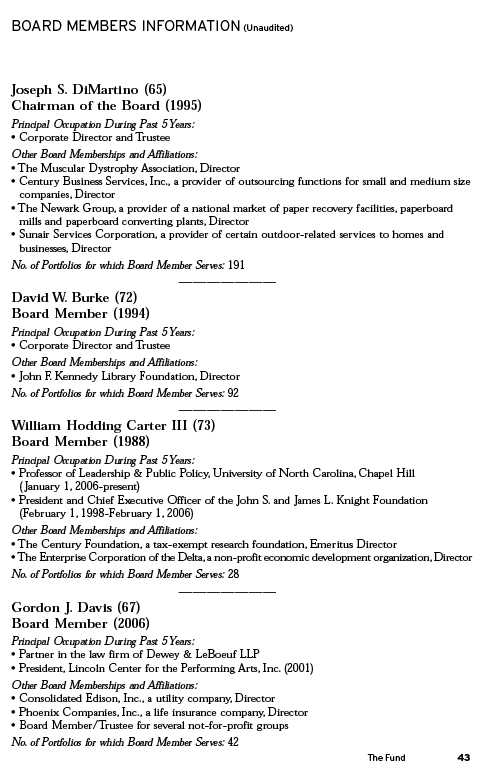
NOTES
The Registrant has adopted a code of ethics that applies to the Registrant's principal executive officer, principal financial officer, principal accounting officer or controller, or persons performing similar functions. There have been no amendments to, or waivers in connection with, the Code of Ethics during the period covered by this Report.
| Item 3. | | Audit Committee Financial Expert. |
The Registrant's Board has determined that Joseph S. DiMartino, a member of the Audit Committee of the Board, is an audit committee financial expert as defined by the Securities and Exchange Commission (the "SEC"). Joseph S. DiMartino is "independent" as defined by the SEC for purposes of audit committee financial expert determinations.
| Item 4. | | Principal Accountant Fees and Services |
(a) Audit Fees. The aggregate fees billed for each of the last two fiscal years (the "Reporting Periods") for professional services rendered by the Registrant's principal accountant (the "Auditor") for the audit of the Registrant's annual financial statements, or services that are normally provided by the Auditor in connection with the statutory and regulatory filings or engagements for the Reporting Periods, were $30,404 in 2007 and $31,316 in 2008.
(b) Audit-Related Fees. The aggregate fees billed in the Reporting Periods for assurance and related services by the Auditor that are reasonably related to the performance of the audit of the Registrant's financial statements and are not reported under paragraph (a) of this Item 4 were $5,122 in 2007 and $10,398 in 2008. These services consisted of (i) security counts required by Rule 17f-2 under the Investment Company Act of 1940, as amended.
The aggregate fees billed in the Reporting Periods for non-audit assurance and related services by the Auditor to the Registrant's investment adviser (not including any sub-investment adviser whose role is primarily portfolio management and is subcontracted with or overseen by another investment adviser), and any entity controlling, controlled by or under common control with the investment adviser that provides ongoing services to the Registrant ("Service Affiliates"), that were reasonably related to the performance of the annual audit of the Service Affiliate, which required pre-approval by the Audit Committee were $0 in 2007 and $0 in 2008.
Note: For the second paragraph in each of (b) through (d) of this Item 4, certain of such services were not pre-approved prior to May 6, 2003, when such services were required to be pre-approved. On and after May 6, 2003, 100% of all services provided by the Auditor were pre-approved as required. For comparative purposes, the fees shown assume that all such services were pre-approved, including services that were not pre-approved prior to the compliance date of the pre-approval requirement.
(c) Tax Fees. The aggregate fees billed in the Reporting Periods for professional services rendered by the Auditor for tax compliance, tax advice and tax planning ("Tax Services") were $3,311 in 2007 and $3,090 in 2008. These services consisted of (i) review or preparation of U.S. federal, state, local and excise tax returns; (ii) U.S. federal, state and local tax planning, advice and assistance regarding statutory, regulatory or administrative developments, (iii) tax advice regarding tax qualification matters and/or treatment of various financial instruments held or proposed to be acquired or held, and (iv) determination of Passive Foreign Investment Companies.
The aggregate fees billed in the Reporting Periods for Tax Services by the Auditor to Service Affiliates which required pre-approval by the Audit Committee were $0 in 2007 and $0 in 2008.
-3-
(d) All Other Fees. The aggregate fees billed in the Reporting Periods for products and services provided by the Auditor, other than the services reported in paragraphs (a) through (c) of this Item, were $0 in 2007 and $435 in 2008. These services consisted of a review of the Registrant's anti-money laundering program.
The aggregate fees billed in the Reporting Periods for Non-Audit Services by the Auditor to Service Affiliates, other than the services reported in paragraphs (b) through (c) of this Item, which required pre-approval by the Audit Committee were $0 in 2007 and $0 in 2008.
Audit Committee Pre-Approval Policies and Procedures. The Registrant's Audit Committee has established policies and procedures (the "Policy") for pre-approval (within specified fee limits) of the Auditor's engagements for non-audit services to the Registrant and Service Affiliates without specific case-by-case consideration. Pre-approval considerations include whether the proposed services are compatible with maintaining the Auditor's independence. Pre-approvals pursuant to the Policy are considered annually.
Non-Audit Fees. The aggregate non-audit fees billed by the Auditor for services rendered to the Registrant, and rendered to Service Affiliates, for the Reporting Periods were $1,889,332 in 2007 and $12,561,320 in 2008.
Auditor Independence. The Registrant's Audit Committee has considered whether the provision of non-audit services that were rendered to Service Affiliates which were not pre-approved (not requiring pre-approval) is compatible with maintaining the Auditor's independence.
| Item 5. | | Audit Committee of Listed Registrants. |
| | | Not applicable. [CLOSED-END FUNDS ONLY] |
| Item 6. | | Schedule of Investments. |
| (a) | | Not applicable. |
| Item 7. | | Disclosure of Proxy Voting Policies and Procedures for Closed-End Management |
| | | Investment Companies. |
| | | Not applicable. [CLOSED-END FUNDS ONLY] |
| Item 8. | | Portfolio Managers of Closed-End Management Investment Companies. |
| | | Not applicable. [CLOSED-END FUNDS ONLY, beginning with reports for periods ended |
| | | on and after December 31, 2005] |
| Item 9. | | Purchases of Equity Securities by Closed-End Management Investment Companies and |
| | | Affiliated Purchasers. |
| | | Not applicable. [CLOSED-END FUNDS ONLY] |
| Item 10. | | Submission of Matters to a Vote of Security Holders. |
The Registrant has a Nominating Committee (the "Committee"), which is responsible for selecting and nominating persons for election or appointment by the Registrant's Board as Board members. The Committee has adopted a Nominating Committee Charter (the "Charter"). Pursuant to the Charter, the Committee will consider recommendations for nominees from shareholders submitted to the Secretary of the
-4-
Registrant, c/o The Dreyfus Corporation Legal Department, 200 Park Avenue, 8th Floor East, New York, New York 10166. A nomination submission must include information regarding the recommended nominee as specified in the Charter. This information includes all information relating to a recommended nominee that is required to be disclosed in solicitations or proxy statements for the election of Board members, as well as information sufficient to evaluate the factors to be considered by the Committee, including character and integrity, business and professional experience, and whether the person has the ability to apply sound and independent business judgment and would act in the interests of the Registrant and its shareholders. Nomination submissions are required to be accompanied by a written consent of the individual to stand for election if nominated by the Board and to serve if elected by the shareholders, and such additional information must be provided regarding the recommended nominee as reasonably requested by the Committee.
| Item 11. | | Controls and Procedures. |
(a) The Registrant's principal executive and principal financial officers have concluded, based on their evaluation of the Registrant's disclosure controls and procedures as of a date within 90 days of the filing date of this report, that the Registrant's disclosure controls and procedures are reasonably designed to ensure that information required to be disclosed by the Registrant on Form N-CSR is recorded, processed, summarized and reported within the required time periods and that information required to be disclosed by the Registrant in the reports that it files or submits on Form N-CSR is accumulated and communicated to the Registrant's management, including its principal executive and principal financial officers, as appropriate to allow timely decisions regarding required disclosure.
(b) There were no changes to the Registrant's internal control over financial reporting that occurred during the second fiscal quarter of the period covered by this report that have materially affected, or are reasonably likely to materially affect, the Registrant's internal control over financial reporting.
(a)(1) Code of ethics referred to in Item 2.
(a)(2) Certifications of principal executive and principal financial officers as required by Rule 30a-2(a) under the Investment Company Act of 1940.
(a)(3) Not applicable.
(b) Certification of principal executive and principal financial officers as required by Rule 30a-2(b) under the Investment Company Act of 1940.
-5-
SIGNATURES
Pursuant to the requirements of the Securities Exchange Act of 1934 and the Investment Company Act of 1940, the Registrant has duly caused this Report to be signed on its behalf by the undersigned, thereunto duly authorized.
STRATEGIC FUNDS, INC.
| By: | | /s/ J. David Officer |
| | | J. David Officer |
| | | President |
| |
| Date: | | February 23, 2009 |
Pursuant to the requirements of the Securities Exchange Act of 1934 and the Investment Company Act of 1940, this Report has been signed below by the following persons on behalf of the Registrant and in the capacities and on the dates indicated.
| By: | | /s/ J. David Officer |
| | | J. David Officer |
| | | President |
| |
| Date: | | February 23, 2009 |
| By: | | /s/ James Windels |
| | | James Windels |
| | | Treasurer |
|
| |
| Date: | | February 23, 2009 |
EXHIBIT INDEX
| (a)(1) | | Code of ethics referred to in Item 2. |
| |
| (a)(2) | | Certifications of principal executive and principal financial officers as required by Rule 30a- |
| 2(a) under the Investment Company Act of 1940. (EX-99.CERT) |
| |
| (b) | | Certification of principal executive and principal financial officers as required by Rule 30a- |
| 2(b) under the Investment Company Act of 1940. (EX-99.906CERT) |
-6-