UNITED STATES
SECURITIES AND EXCHANGE COMMISSION
Washington, D.C. 20549 |
CERTIFIED SHAREHOLDER REPORT OF REGISTERED MANAGEMENT
INVESTMENT COMPANIES |
| Investment Company Act file number | | 811-3940 |
Strategic Funds, Inc.
(Exact name of Registrant as specified in charter) |
c/o The Dreyfus Corporation
200 Park Avenue
New York, New York 10166
(Address of principal executive offices) (Zip code) |
Michael A. Rosenberg, Esq.
200 Park Avenue
New York, New York 10166
(Name and address of agent for service) |
| Registrant's telephone number, including area code: | | (212) 922-6000 |
| Date of fiscal year end: | | 5/31 |
| Date of reporting period: | | 5/31/09 |
The following N-CSR relates only to the Registrant’s series listed below and does not affect the other series of the Registrant, which have different fiscal year ends and, therefore, different N-CSR reporting requirements. Separate N-CSR Forms will be filed for these series, as appropriate.
| Emerging Markets Opportunity Fund |
| Item 1. | | Reports to Stockholders. |

Save time. Save paper. View your next shareholder report online as soon as it’s available. Log into www.dreyfus.com and sign up for Dreyfus eCommunications. It’s simple and only takes a few minutes.
The views expressed in this report reflect those of the portfolio manager only through the end of the period covered and do not necessarily represent the views of Dreyfus or any other person in the Dreyfus organization. Any such views are subject to change at any time based upon market or other conditions and Dreyfus disclaims any responsibility to update such views.These views may not be relied on as investment advice and, because investment decisions for a Dreyfus fund are based on numerous factors, may not be relied on as an indication of trading intent on behalf of any Dreyfus fund.

| | Contents |
| |
| | THE FUND |
| |
| 2 | A Letter from the CEO |
| |
| 3 | Discussion of Fund Performance |
| |
| 6 | Fund Performance |
| |
| 8 | Understanding Your Fund’s Expenses |
| |
| 8 | Comparing Your Fund’s Expenses With Those of Other Funds |
| |
| 9 | Statement of Investments |
| |
| 14 | Statement of Assets and Liabilities |
| |
| 15 | Statement of Operations |
| |
| 16 | Statement of Changes in Net Assets |
| |
| 18 | Financial Highlights |
| |
| 21 | Notes to Financial Statements |
| |
| 32 | Report of Independent Registered Public Accounting Firm |
| |
| 33 | Important Tax Information |
| |
| 34 | Board Members Information |
| |
| 37 | Officers of the Fund |
| |
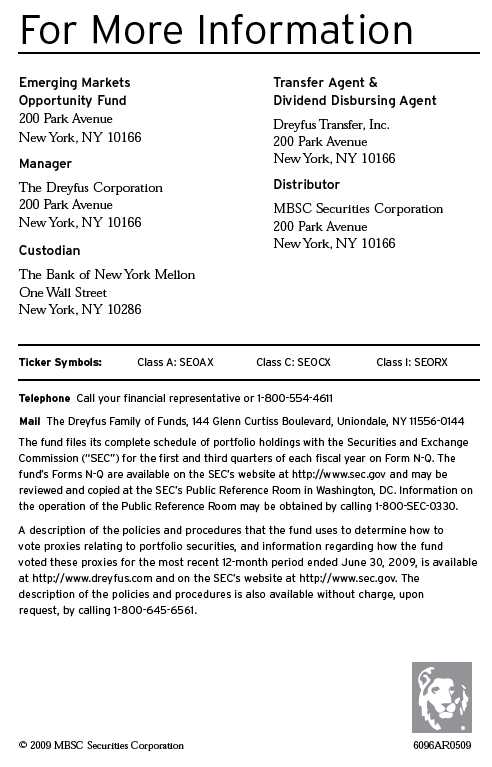
| | FOR MORE INFORMATION |
| |
| | Back Cover |
| |
Emerging Markets
Opportunity Fund |

LETTER FROM THE CEO
Dear Shareholder: |
We present to you this annual report for Emerging Markets Opportunity Fund, covering the 12-month period from June 1, 2008, through May 31, 2009.
The international equities markets went on a wild ride over the reporting period, with stocks in most markets plummeting during the fall of 2008 and rebounding strongly in the spring of 2009. In supporting the recent rally, investors apparently shrugged off more bad economic news, including rising unemployment and economic contraction in many regions of the world. Yet, the market rebound proved to be robust, particularly in the emerging markets, which posted double-digit returns over the final three months of the reporting period.
These enormous swings leave investors to wonder if the market is forecasting sustainable economic improvement, or could this be a bear market rally where stocks reach such depressed levels that even the slightest hint of good news lifts prices. We generally have remained cautious in the absence of real economic progress, but the market’s gyrations illustrate an important feature of many market rallies—when they snap back, the rebounds are often quick and sharp, potentially leaving investors on the sidelines. That’s why we encourage you to speak regularly with your financial consultant, who can discuss with you the potential benefits of adhering to a long-term investment strategy tailored to your current investment needs and future goals. For information about how the fund performed during the reporting period, as well as market perspectives, we have provided a Discussion of Fund Performance given by the fund’s Portfolio Managers.
Thank you for your continued confidence and support.
Jonathan R. Baum
Chairman and Chief Executive Officer
The Dreyfus Corporation
June 15, 2009 |
2

DISCUSSION OF FUND PERFORMANCE
For the reporting period of June 1, 2008, through May 31, 2009, as provided by Richard Fairgrieve,Tony Hann, Hugh Hunter and Bill Rudman, Portfolio Managers
Fund and Market Performance Overview
For the 12-month period ended May 31, 2009, Emerging Markets Opportunity Fund’s Class A shares produced a total return of –41.48%, Class C shares returned –41.83% and Class I shares returned –40.93%.1 In comparison, the fund’s benchmark, the Morgan Stanley Capital International Emerging Markets Index (the “Index”), produced a –34.13% total return for the same period.2
A deep global economic recession and a severe banking crisis produced a “flight to quality” among emerging market investors in the fall of 2008, sending stock prices sharply lower. The fund produced lower returns than its benchmark, primarily due to weakness in our country allocation and security selection strategies under unusually volatile market conditions.
The Fund’s Investment Approach
The fund seeks long-term capital appreciation by investing at least 80% of its assets in the stocks of companies organized, or with a majority of their assets and operations, in emerging market countries. Normally, the fund will invest in at least ten emerging market countries. The fund may invest in companies of any size.We allocate the fund’s assets among emerging market countries using a top-down, quantitative model that incorporates valuation, currency, momentum, growth, interest-rate and risk factors to determine each country’s weighting relative to the Index. We also consider qualitative factors, such as political and economic developments, and market factors, such as liquidity.To select individual stocks, our bottom-up process focuses on fundamental analysis, including assessments of each company’s management, product lines and competitive positions.
Economic and Credit Woes Weighed on World Markets
A severe economic downturn and a persistent banking crisis caused international stock markets to hemorrhage value during the final
The Fund 3
| DISCUSSION OF FUND PERFORMANCE (continued) |
months of 2008 as investors fled riskier markets and industries for traditional safe havens. The threat of a collapse of global credit markets was exacerbated by slumping housing markets, rising unemployment and plummeting consumer confidence throughout the world.
The “flight to quality” was particularly damaging to emerging stock markets, where stocks were punished during the downturn seemingly regardless of their underlying fundamentals. However, in 2009, many government and monetary authorities staged massive interventions to stimulate their economies and re-energize the world’s credit markets. These measures bolstered investor confidence late in the first quarter of the year, when signs of potential economic stabilization and some positive corporate earnings reports produced optimism that the economic and financial crises may have bottomed. However, the resulting rally was not enough to fully offset earlier weakness.
Mixed Results from Country Allocations and Stock Selections
As always, our quantitative approach relied on objective economic and market data to determine the proportions to which we allocated assets across the world’s emerging markets. However, the performance of international equity markets over much of the reporting period was driven not by regional strengths and weaknesses, but by a seemingly emotional reaction to macroeconomic developments, rendering our country allocation methodology relatively ineffective. More specifically, overweighted exposure to Poland undermined the fund’s results during the “flight to quality,” while an underweighted position in China prevented the fund from participating more fully in that market’s relative strength. These adverse influences were offset to a degree by better results stemming from overweighted positions in Brazil, Indonesia and Malaysia.
Our stock selection strategy, which is based on bottom-up, fundamental analysis, also seemed to be overwhelmed at times by investor sentiment. For example, investors fled stocks of companies tied to volatile commodity prices, punishing fund holdings such as Russian energy producers Gazprom and LUKOIL as well as Indonesian coal miner Bumi Resources. Despite continued construction activity in Asia, Indonesian heavy equipment manufacturer United Tractors declined due to economic concerns. In South Africa, gold producers lost value in U.S. dollar terms as the rand appreciated relative to most major currencies,
4
and infrastructure developer Murray & Roberts Holdings fell due to geopolitical concerns surrounding its projects in the Middle East.
Conversely, the fund achieved better results in Mexico, which is generally considered a defensive market. Overweighted exposure to national telephone services provider Telefonos de Mexico fared well, as did the lack of exposure to construction materials supplier Cemex. Other telecommunications holdings also held up relatively well, including China Mobile. The fund’s holdings of banks in Turkey contributed positively to its relative performance during the springtime rally.
Finding Growth Opportunities
Although we had shifted to a more defensive stance as the downturn gained momentum, recent evidence of economic and market stabilization prompted us to return to a more aggressive investment posture. In our view, the emerging markets continue to represent some of the greatest growth opportunities in the world as Latin America, Asia and other developing regions play a more prominent role in global trade. In addition, the fiscal conditions of many emerging markets appear more secure to us than some developed nations, suggesting to us that valuations of emerging markets equities could expand over the longer term.
June 15, 2009
| | | Please note, the position in any security highlighted with italicized typeface was sold during the |
| | | reporting period. |
| 1 | | Total return includes reinvestment of dividends and any capital gains paid, and does not take into |
| | | consideration the maximum initial sales charge in the case of Class A shares, or the applicable |
| | | contingent deferred sales charges imposed on redemptions in the case of Class C shares. Had these |
| | | charges been reflected, returns would have been lower. Past performance is no guarantee of future |
| | | results. Share price and investment return fluctuate such that upon redemption, fund shares may be |
| | | worth more or less than their original cost. Return figures provided reflect the absorption of certain |
| | | fund expenses by The Dreyfus Corporation pursuant to an undertaking in effect through |
| | | September 30, 2009, at which time it may be extended, terminated or modified. Had these |
| | | expenses not been absorbed, the fund’s returns would have been lower. |
| | | Part of the fund’s recent performance is attributable to positive returns from its initial public |
| | | offering (IPO) investments. There can be no guarantee that IPOs will have or continue to |
| | | have a positive effect on fund performance. Currently, the fund is relatively small in asset |
| | | size. IPOs tend to have a reduced effect on performance as a fund’s asset base grows. |
| 2 | | SOURCE: LIPPER INC. — Reflects reinvestment of net dividends and, where applicable, |
| | | capital gain distributions.The Morgan Stanley Capital International Emerging Markets (MSCI |
| | | EM) Index is a market capitalization-weighted index composed of companies representative of the |
| | | market structure of 26 emerging market countries in Europe, Latin America and the Pacific Basin. |
The Fund 5
FUND PERFORMANCE
| † Source: Lipper Inc. |
| Past performance is not predictive of future performance. |
| Part of the fund’s recent performance is attributable to positive returns from its initial public offering (IPO) investments. |
| There can be no guarantee that IPOs will have or continue to have a positive effect on fund performance. Currently, the |
| fund is relatively small in asset size. IPOs tend to have a reduced effect on performance as a fund’s asset base grows. |
| The above graph compares a $10,000 investment made in Class A, Class C and Class I shares of Emerging Markets |
| Opportunity Fund on 7/13/06 (inception date) to a $10,000 investment made in the Morgan Stanley Capital |
| International Emerging Markets Index (the “Index”) on that date. For comparative purposes, the value of the Index on |
| 6/30/06 is used as the beginning value on 7/13/06. All dividends and capital gain distributions are reinvested. |
| The fund’s performance shown in the line graph above takes into account the maximum initial sales charge on Class A |
| shares and all other applicable fees and expenses on all classes.The Index is a market capitalization-weighted index |
| composed of companies representative of the market structure of 26 emerging market countries in Europe, Latin America |
| and the Pacific Basin.The Index excludes closed markets and those shares in otherwise free markets that are not |
| purchasable by foreigners.The Index includes gross dividends reinvested.These factors can contribute to the Index |
| potentially outperforming the fund. Unlike a mutual fund, the Index is not subject to charges, fees and other expenses. |
| Investors cannot invest directly in any index. Further information relating to fund performance, including expense |
| reimbursements, if applicable, is contained in the Financial Highlights section of the prospectus and elsewhere in this report. |
6
| Average Annual Total Returns as of 5/31/09 | | | | |
| |
| | | Inception | | | | From |
| | | Date | | 1 Year | | Inception |
| |
| |
| |
|
| Class A shares | | | | | | |
| with maximum sales charge (5.75%) | | 7/13/06 | | –44.85% | | –1.29% |
| without sales charge | | 7/13/06 | | –41.48% | | 0.76% |
| Class C shares | | | | | | |
| with applicable redemption charge † | | 7/13/06 | | –42.27% | | 0.05% |
| without redemption | | 7/13/06 | | –41.83% | | 0.05% |
| Class I shares | | 7/13/06 | | –40.93% | | 1.25% |
| Past performance is not predictive of future performance.The fund’s performance shown in the graph and table does not |
| reflect the deduction of taxes that a shareholder would pay on fund distributions or the redemption of fund shares. |
| † The maximum contingent deferred sales charge for Class C shares is 1% for shares redeemed within one year of the |
| date of purchase. |
The Fund 7
UNDERSTANDING YOUR FUND’S EXPENSES (Unaudited)
As a mutual fund investor, you pay ongoing expenses, such as management fees and other expenses. Using the information below, you can estimate how these expenses affect your investment and compare them with the expenses of other funds.You also may pay one-time transaction expenses, including sales charges (loads) and redemption fees, which are not shown in this section and would have resulted in higher total expenses. For more information, see your fund’s prospectus or talk to your financial adviser.
Review your fund’s expenses
The table below shows the expenses you would have paid on a $1,000 investment in Emerging Markets Opportunity Fund from December 1, 2008 to May 31, 2009. It also shows how much a $1,000 investment would be worth at the close of the period, assuming actual returns and expenses.
| | Expenses and Value of a $1,000 Investment
assuming actual returns for the six months ended May 31, 2009 |
| | | Class A | | Class C | | Class I |
| |
| |
| |
|
| Expenses paid per $1,000† | | $ 12.01 | | $ 16.47 | | $ 10.55 |
| Ending value (after expenses) | | $1,408.50 | | $1,402.90 | | $1,417.00 |
| | COMPARING YOUR FUND’S EXPENSES
WITH THOSE OF OTHER FUNDS (Unaudited) |
Using the SEC’s method to compare expenses
The Securities and Exchange Commission (SEC) has established guidelines to help investors assess fund expenses. Per these guidelines, the table below shows your fund’s expenses based on a $1,000 investment, assuming a hypothetical 5% annualized return. You can use this information to compare the ongoing expenses (but not transaction expenses or total cost) of investing in the fund with those of other funds.All mutual fund shareholder reports will provide this information to help you make this comparison. Please note that you cannot use this information to estimate your actual ending account balance and expenses paid during the period.
| | Expenses and Value of a $1,000 Investment
assuming a hypothetical 5% annualized return for the six months ended May 31, 2009 |
| | | Class A | | Class C | | Class I |
| |
| |
| |
|
| Expenses paid per $1,000† | | $ 10.05 | | $ 13.79 | | $ 8.80 |
| Ending value (after expenses) | | $1,014.96 | | $1,011.22 | | $1,016.21 |
| † Expenses are equal to the fund’s annualized expense ratio of 2.00% for Class A, 2.75% for Class C and 1.75% |
| for Class I, multiplied by the average account value over the period, multiplied by 182/365 (to reflect the one-half |
| year period). |
8
STATEMENT OF INVESTMENTS
May 31, 2009 |
| Common Stocks—98.5% | | Shares | | Value ($) |
| |
| |
|
| Brazil—15.4% | | | | |
| Banco Bradesco, ADR | | 7,850 | | 119,869 |
| Cia Brasileira de Distribuicao Grupo Pao de Acucar, ADR | | 2,200 | | 82,368 |
| Cia de Bebidas das Americas, ADR (Preferred) | | 1,400 | | 91,700 |
| Cia Energetica de Minas Gerais, ADR | | 6,250 | | 82,687 |
| Investimentos Itau (Rights) | | 617 a | | 934 |
| Itau Unibanco Holding, ADR | | 5,550 | | 89,077 |
| Localiza Rent a Car | | 10,900 | | 68,194 |
| MRV Engenharia e Participacoes | | 7,000 | | 96,412 |
| Petroleo Brasileiro (Preferred), ADR | | 17,700 | | 618,969 |
| Vale (Preferred), ADR | | 13,600 | | 220,728 |
| Vale, ADR | | 5,400 | | 103,410 |
| Vivo Participacoes, ADR | | 4,000 | | 80,680 |
| | | | | 1,655,028 |
| China—12.6% | | | | |
| Angang Steel, Cl. H | | 147,000 | | 219,045 |
| Bank of Communications, Cl. H | | 238,000 | | 220,142 |
| China Construction Bank, Cl. H | | 536,000 | | 349,784 |
| China Life Insurance, Cl. H | | 68,000 | | 248,771 |
| China Petroleum & Chemical, Cl. H | | 147,000 | | 119,864 |
| Dongfeng Motor Group, Cl. H | | 206,000 | | 198,408 |
| | | | | 1,356,014 |
| Czech Republic—1.9% | | | | |
| CEZ | | 3,500 | | 158,124 |
| Telefonica O2 Czech Republic | | 2,350 | | 50,625 |
| | | | | 208,749 |
| Egypt—2.0% | | | | |
| Egyptian Financial Group-Hermes Holding | | 22,581 | | 92,519 |
| Orascom Construction, GDR | | 3,600 | | 126,528 |
| | | | | 219,047 |
| Hong Kong—7.7% | | | | |
| Belle International Holdings | | 227,000 | | 177,783 |
| China Mobile | | 31,500 | | 308,634 |
| China Overseas Land & Investment | | 70,000 | | 148,035 |
| CNOOC | | 148,000 | | 195,655 |
| | | | | 830,107 |
The Fund 9
| STATEMENT OF INVESTMENTS (continued) |
| Common Stocks (continued) | | Shares | | Value ($) |
| |
| |
|
| Hungary—1.5% | | | | |
| MOL Hungarian Oil and Gas | | 1,100 | | 68,112 |
| OTP Bank | | 5,230 a | | 93,161 |
| | | | | 161,273 |
| India—5.0% | | | | |
| Bharti Airtel | | 6,100 a | | 105,045 |
| Housing Development Finance | | 2,500 | | 108,485 |
| Larsen & Toubro | | 6,000 | | 170,774 |
| Reliance Industries | | 3,281 | | 147,655 |
| | | | | 531,959 |
| Ireland—.7% | | | | |
| Dragon Oil | | 15,700 a | | 79,083 |
| Luxembourg—2.0% | | | | |
| MSCI Daily TR New Emerging Markets | | | | |
| India (Warrants 11/11/09) | | 566 a | | 209,997 |
| Mexico—2.3% | | | | |
| America Movil, ADR, Ser. L | | 3,268 | | 125,262 |
| Fomento Economico Mexicano, ADR | | 1,200 | | 39,228 |
| Grupo Televisa, ADR | | 2,073 | | 36,858 |
| Wal-Mart de Mexico, Ser. V | | 15,800 | | 46,505 |
| | | | | 247,853 |
| Philippines—1.7% | | | | |
| Ayala | | 9,340 | | 57,139 |
| Philippine Long Distance Telephone, ADR | | 2,600 | | 123,240 |
| | | | | 180,379 |
| Poland—2.4% | | | | |
| Netia | | 37,480 | | 39,913 |
| PBG | | 1,337 a | | 87,890 |
| Powszechna Kasa | | | | |
| Oszczednosci Bank Polski | | 15,950 | | 126,263 |
| | | | | 254,066 |
| Russia—8.3% | | | | |
| Gazprom, ADR | | 16,870 | | 389,191 |
10
| Common Stocks (continued) | | Shares | | Value ($) |
| |
| |
|
| Russia (continued) | | | | |
| LUKOIL, ADR | | 2,765 | | 146,545 |
| Magnit, GDR | | 8,290 | | 75,435 |
| Mobile Telesystems, ADR | | 3,100 | | 128,619 |
| TMK, GDR | | 7,960 | | 64,655 |
| Uralkali, GDR | | 4,330 | | 82,392 |
| | | | | 886,837 |
| South Africa—10.3% | | | | |
| ABSA Group | | 3,611 | | 46,385 |
| Anglo Platinum | | 2,300 | | 160,997 |
| Aspen Pharmacare Holdings | | 13,929 a | | 84,168 |
| Exxaro Resources | | 12,500 | | 126,367 |
| FirstRand | | 93,200 | | 161,324 |
| Gold Fields | | 10,400 | | 142,417 |
| MTN Group | | 10,680 | | 155,742 |
| Sasol | | 3,438 | | 130,007 |
| Truworths International | | 22,040 | | 101,129 |
| | | | | 1,108,536 |
| South Korea—7.7% | | | | |
| Dongbu Insurance | | 4,390 | | 86,422 |
| Hyundai Mobis | | 1,185 | | 112,193 |
| KB Financial Group, ADR | | 1,700 a | | 54,332 |
| KT & G | | 1,277 | | 69,500 |
| LG | | 2,320 | | 119,793 |
| LG Household & Health Care | | 490 | | 75,608 |
| Samsung Card | | 4 | | 152 |
| Samsung Electronics | | 218 | | 97,746 |
| Samsung Electronics, | | | | |
| GDR (Common) | | 256 b | | 57,279 |
| Samsung Electronics, | | | | |
| GDR (Preferred) | | 648 | | 94,747 |
| Samsung Fire & Marine Insurance | | 357 | | 52,328 |
| | | | | 820,100 |
The Fund 11
| STATEMENT OF INVESTMENTS (continued) |
| Common Stocks (continued) | | Shares | | Value ($) |
| |
| |
|
| Taiwan—6.8% | | | | |
| Cathay Financial Holding | | 55,000 | | 89,973 |
| Chunghwa Telecom, ADR | | 2,901 | | 55,148 |
| Far Eastern Textile | | 99,220 | | 113,050 |
| HON HAI Precision Industry | | 15,042 | | 57,270 |
| HTC | | 6,500 | | 105,346 |
| MediaTek | | 8,000 | | 99,421 |
| Taiwan Mobile | | 28,670 | | 50,983 |
| Taiwan Semiconductor Manufacturing | | 56,000 | | 105,113 |
| Taiwan Semiconductor Manufacturing, ADR | | 4,515 | | 49,394 |
| | | | | 725,698 |
| Thailand—3.6% | | | | |
| Bangkok Bank, NVDR | | 28,100 | | 72,202 |
| Banpu, NVDR | | 5,100 | | 47,356 |
| Kasikornbank, NVDR | | 63,400 | | 104,574 |
| PTT | | 8,900 | | 57,153 |
| PTT Exploration & Production | | 27,000 | | 102,865 |
| | | | | 384,150 |
| Turkey—3.9% | | | | |
| KOC Holding | | 31,590 | | 73,164 |
| Turk Hava Yollari | | 11,408 | | 66,398 |
| Turk Telekomunikasyon | | 26,350 | | 73,691 |
| Turkiye Garanti Bankasi | | 49,830 a | | 126,160 |
| Turkiye Halk Bankasi | | 19,400 | | 75,443 |
| | | | | 414,856 |
| United States—2.7% | | | | |
| Central European Distribution | | 3,600 a | | 90,612 |
| iShares MSCI Emerging Markets Index Fund | | 6,000 | | 199,440 |
| | | | | 290,052 |
| Total Common Stocks | | | | |
| (cost $9,006,567) | | | | 10,563,784 |
12
| Preferred Stocks—2.1% | | Shares | | Value ($) |
| |
| |
|
| Brazil | | | | |
| Bradespar | | 4,700 | | 68,962 |
| Investimentos Itau | | 33,988 | | 154,945 |
| Total Preferred Stocks | | | | |
| (cost $174,641) | | | | 223,907 |
| |
| Total Investments (cost $9,181,208) | | 100.6% | | 10,787,691 |
| Liabilities, Less Cash and Receivables | | (.6%) | | (62,991) |
| Net Assets | | 100.0% | | 10,724,700 |
| ADR—American Depository Receipts |
| GDR—Global Depository Receipts |
| NVDR—Non-Voting Depository Receipts |
| a Non-income producing security. |
| b Security exempt from registration under Rule 144A of the Securities Act of 1933.This security may be resold in |
| transactions exempt from registration, normally to qualified institutional buyers. At May 31, 2009, this security |
| amounted to $57,279 or 0.5% of net assets. |
| Portfolio Summary (Unaudited)† | | | | |
| |
| | | Value (%) | | | | Value (%) |
| |
| |
| |
|
| Financial | | 21.3 | | Consumer Staples | | 5.3 |
| Energy | | 20.3 | | Insurance | | 4.5 |
| Telecommunications | | 12.1 | | Exchange Traded Funds | | 3.8 |
| Materials | | 9.7 | | Utilities | | 2.2 |
| Industrial | | 7.7 | | Health Care | | .8 |
| Consumer Discretionary | | 6.7 | | | | |
| Information Technology | | 6.2 | | | | 100.6 |
| |
| † Based on net assets. | | | | | | |
| See notes to financial statements. | | | | | | |
The Fund 13
STATEMENT OF ASSETS AND LIABILITIES
May 31, 2009 |
| | | | | Cost | | Value |
| |
| |
| |
|
| Assets ($): | | | | | | |
| Investments in securities—See Statement of Investments | | 9,181,208 | | 10,787,691 |
| Cash | | | | | | 359,444 |
| Cash denominated in foreign currencies | | | | 34,968 | | 35,474 |
| Receivable for investment securities sold | | | | | | 51,162 |
| Receivable for shares of Common Stock subscribed | | | | | | 49,357 |
| Dividends receivable | | | | | | 47,224 |
| Prepaid expenses | | | | | | 21,955 |
| | | | | | | 11,352,307 |
| Liabilities ($): | | | | | | |
| Due to The Dreyfus Corporation and affiliates—Note 3(c) | | | | 59,435 |
| Payable for investment securities purchased | | | | | | 399,920 |
| Payable for shares of Common Stock redeemed | | | | | | 119,008 |
| Interest payable—Note 2 | | | | | | 41 |
| Unrealized depreciation on forward | | | | | | |
| currency exchange contracts—Note 4 | | | | | | 15 |
| Accrued expenses | | | | | | 49,188 |
| | | | | | | 627,607 |
| Net Assets ($) | | | | | | 10,724,700 |
| Composition of Net Assets ($): | | | | | | |
| Paid-in capital | | | | | | 19,300,665 |
| Accumulated undistributed investment income—net | | | | | | 108,353 |
| Accumulated net realized gain (loss) on investments | | | | | | (10,291,495) |
| Accumulated net unrealized appreciation (depreciation) | | | | |
| on investments and foreign currency transactions | | | | | | 1,607,177a |
| Net Assets ($) | | | | | | 10,724,700 |
| |
| |
| |
|
| |
| |
| Net Asset Value Per Share | | | | | | |
| | | Class A | | Class C | | Class I |
| |
| |
| |
|
| Net Assets ($) | | 8,693,597 | | 1,876,241 | | 154,862 |
| Shares Outstanding | | 1,018,330 | | 220,755 | | 18,339 |
| Net Asset Value Per Share ($) | | 8.54 | | 8.50 | | 8.44 |
| |
| a Net of $28,435 deferred capital gain country tax. | | | | | | |
| See notes to financial statements. | | | | | | |
14
STATEMENT OF OPERATIONS
Year Ended May 31, 2009 |
| Investment Income ($): | | |
| Income: | | |
| Cash dividends (net of $46,878 foreign taxes withheld at source): | | |
| Unaffiliated issuers | | 369,085 |
| Affiliated issuers | | 2,950 |
| Total Income | | 372,035 |
| Expenses: | | |
| Management fee—Note 3(a) | | 167,183 |
| Custodian fees—Note 3(c) | | 123,177 |
| Shareholder servicing costs—Note 3(c) | | 62,691 |
| Auditing fees | | 56,589 |
| Registration fees | | 45,566 |
| Prospectus and shareholders’ reports | | 15,628 |
| Distribution fees—Note 3(b) | | 15,071 |
| Directors’ fees and expenses—Note 3(d) | | 1,820 |
| Legal fees | | 1,117 |
| Loan commitment fees—Note 2 | | 342 |
| Interest expense—Note 2 | | 130 |
| Miscellaneous | | 18,160 |
| Total Expenses | | 507,474 |
| Less—expense reimbursement from The Dreyfus | | |
| Corporation due to undertaking—Note 3(a) | | (224,381) |
| Less—reduction in fees due to earnings credits—Note 1(c) | | (1,099) |
| Net Expenses | | 281,994 |
| Investment Income—Net | | 90,041 |
| Realized and Unrealized Gain (Loss) on Investments—Note 4 ($): | | |
| Net realized gain (loss) on investments and foreign currency transactions | | (9,714,661) |
| Net realized gain (loss) on forward currency exchange contracts | | (34,160) |
| Net Realized Gain (Loss) | | (9,748,821) |
| Net unrealized appreciation (depreciation) on | | |
| investments and foreign currency transactions | | (2,515,355) |
| Net Realized and Unrealized Gain (Loss) on Investments | | (12,264,176) |
| Net (Decrease) in Net Assets Resulting from Operations | | (12,174,135) |
| |
| See notes to financial statements. | | |
The Fund 15
STATEMENT OF CHANGES IN NET ASSETS
| | | | | Year Ended May 31, |
| | |
| |
|
| | | 2009a | | 2008b |
| |
| |
|
| Operations ($): | | | | |
| Investment income—net | | 90,041 | | 45,547 |
| Net realized gain (loss) on investments | | (9,748,821) | | 4,345,590 |
| Net unrealized appreciation | | | | |
| (depreciation) on investments | | (2,515,355) | | 1,249,080 |
| Net Increase (Decrease) in Net Assets | | | | |
| Resulting from Operations | | (12,174,135) | | 5,640,217 |
| Dividends to Shareholders from ($): | | | | |
| Investment income—net: | | | | |
| Class A Shares | | (88,825) | | (100,028) |
| Class I Shares | | (3,128) | | (5,181) |
| Class T Shares | | (461) | | (3,522) |
| Net realized gain on investments: | | | | |
| Class A Shares | | (1,835,162) | | (1,921,126) |
| Class C Shares | | (355,993) | | (235,008) |
| Class I Shares | | (34,081) | | (35,613) |
| Class T Shares | | (9,610) | | (28,994) |
| Total Dividends | | (2,327,260) | | (2,329,472) |
| Capital Stock Transactions ($): | | | | |
| Net proceeds from shares sold: | | | | |
| Class A Shares | | 4,570,773 | | 19,805,299 |
| Class C Shares | | 1,731,897 | | 3,438,031 |
| Class I Shares | | 161,024 | | 1,271,153 |
| Class T Shares | | 1,864 | | 145,935 |
| Dividends reinvested: | | | | |
| Class A Shares | | 995,277 | | 980,767 |
| Class C Shares | | 158,588 | | 97,709 |
| Class I Shares | | 32,781 | | 40,794 |
| Class T Shares | | 10,071 | | 32,516 |
| Cost of shares redeemed: | | | | |
| Class A Shares | | (8,827,680) | | (15,390,085) |
| Class C Shares | | (1,392,437) | | (1,291,535) |
| Class I Shares | | (295,079) | | (1,335,579) |
| Class T Shares | | (68,847) | | (431,463) |
| Increase (Decrease) in Net Assets | | | | |
| from Capital Stock Transactions | | (2,921,768) | | 7,363,542 |
| Total Increase (Decrease) in Net Assets | | (17,423,163) | | 10,674,287 |
| Net Assets ($): | | | | |
| Beginning of Period | | 28,147,863 | | 17,473,576 |
| End of Period | | 10,724,700 | | 28,147,863 |
| Undistributed investment income—net | | 108,353 | | 62,881 |
16
| | | | | Year Ended May 31, |
| | |
| |
|
| | | 2009a | | 2008b |
| |
| |
|
| Capital Share Transactions: | | | | |
| Class Ac | | | | |
| Shares sold | | 442,165 | | 1,043,492 |
| Shares issued for dividends reinvested | | 149,890 | | 50,581 |
| Shares redeemed | | (798,882) | | (802,268) |
| Net Increase (Decrease) in Shares Outstanding | | (206,827) | | 291,805 |
| Class C | | | | |
| Shares sold | | 157,734 | | 179,416 |
| Shares issued for dividends reinvested | | 23,920 | | 5,073 |
| Shares redeemed | | (136,518) | | (67,883) |
| Net Increase (Decrease) in Shares Outstanding | | 45,136 | | 116,606 |
| Class I | | | | |
| Shares sold | | 11,714 | | 64,979 |
| Shares issued for dividends reinvested | | 5,028 | | 2,115 |
| Shares redeemed | | (25,175) | | (66,441) |
| Net Increase (Decrease) in Shares Outstanding | | (8,433) | | 653 |
| Class Tc | | | | |
| Shares sold | | 110 | | 7,069 |
| Shares issued for dividends reinvested | | 1,547 | | 1,695 |
| Shares redeemed | | (9,312) | | (22,195) |
| Net Increase (Decrease) in Shares Outstanding | | (7,655) | | (13,431) |
| a Effective close of business on February 4, 2009, the fund no longer offers Class T shares. |
| b Effective June 1, 2007, Class R shares were redesignated as Class I shares. |
| c On the close of business on February 4, 2009, 5,935 Class T shares representing $35,136 were automatically |
| converted to 5,817 Class A shares. |
| See notes to financial statements. |
The Fund 17
FINANCIAL HIGHLIGHTS
The following tables describe the performance for each share class for the fiscal periods indicated.All information (except portfolio turnover rate) reflects financial results for a single fund share.Total return shows how much your investment in the fund would have increased (or decreased) during each period, assuming you had reinvested all dividends and distributions.These figures have been derived from the fund’s financial statements.
| | | | | Year Ended May 31, |
| | |
| |
|
| Class A Shares | | 2009 | | 2008 | | 2007a |
| |
| |
| |
|
| Per Share Data ($): | | | | | | |
| Net asset value, beginning of period | | 19.64 | | 16.81 | | 12.50 |
| Investment Operations: | | | | | | |
| Investment income—netb | | .08 | | .05 | | .02 |
| Net realized and unrealized | | | | | | |
| gain (loss) on investments | | (8.88) | | 4.84 | | 4.36 |
| Total from Investment Operations | | (8.80) | | 4.89 | | 4.38 |
| Distributions: | | | | | | |
| Dividends from investment income—net | | (.11) | | (.10) | | — |
| Dividends from net realized gain on investments | | (2.19) | | (1.96) | | (.07) |
| Total Distributions | | (2.30) | | (2.06) | | (.07) |
| Net asset value, end of period | | 8.54 | | 19.64 | | 16.81 |
| Total Return (%)c | | (41.48) | | 29.25 | | 35.12d |
| Ratios/Supplemental Data (%): | | | | | | |
| Ratio of total expenses to average net assets | | 3.66 | | 2.69 | | 3.46d |
| Ratio of net expenses to average net assets | | 2.00 | | 1.98 | | 1.73d |
| Ratio of net investment income | | | | | | |
| to average net assets | | .78 | | .26 | | .17d |
| Portfolio Turnover Rate | | 188.35 | | 259.49 | | 140.52d |
| Net Assets, end of period ($ x 1,000) | | 8,694 | | 24,062 | | 15,694 |
| a | | From July 13, 2006 (commencement of operations) to May 31, 2007. |
| b | | Based on average shares outstanding at each month end. |
| c | | Exclusive of sales charge. |
| d | | Not annualized. |
| See notes to financial statements. |
18
| | | | | Year Ended May 31, |
| | |
| |
|
| Class C Shares | | 2009 | | 2008 | | 2007a |
| |
| |
| |
|
| Per Share Data ($): | | | | | | |
| Net asset value, beginning of period | | 19.44 | | 16.70 | | 12.50 |
| Investment Operations: | | | | | | |
| Investment income (loss)—netb | | .01 | | (.07) | | (.07) |
| Net realized and unrealized | | | | | | |
| gain (loss) on investments | | (8.78) | | 4.77 | | 4.34 |
| Total from Investment Operations | | (8.77) | | 4.70 | | 4.27 |
| Distributions: | | | | | | |
| Dividends from net realized gain on investments | | (2.19) | | (1.96) | | (.07) |
| Proceeds from redemption fees | | .02 | | — | | — |
| Net asset value, end of period | | 8.50 | | 19.44 | | 16.70 |
| Total Return (%)c | | (41.83) | | 28.17 | | 34.32d |
| Ratios/Supplemental Data (%): | | | | | | |
| Ratio of total expenses to average net assets | | 4.60 | | 3.54 | | 4.17d |
| Ratio of net expenses to average net assets | | 2.75 | | 2.73 | | 2.38d |
| Ratio of net investment income | | | | | | |
| (loss) to average net assets | | .06 | | (.40) | | (.46)d |
| Portfolio Turnover Rate | | 188.35 | | 259.49 | | 140.52d |
| Net Assets, end of period ($ x 1,000) | | 1,876 | | 3,414 | | 986 |
| a | | From July 13, 2006 (commencement of operations) to May 31, 2007. |
| b | | Based on average shares outstanding at each month end. |
| c | | Exclusive of sales charge. |
| d | | Not annualized. |
| See notes to financial statements. |
The Fund 19
| FINANCIAL HIGHLIGHTS (continued) |
| | | | | Year Ended May 31, |
| | |
| |
|
| Class I Shares | | 2009 | | 2008a | | 2007b |
| |
| |
| |
|
| Per Share Data ($): | | | | | | |
| Net asset value, beginning of period | | 19.55 | | 16.85 | | 12.50 |
| Investment Operations: | | | | | | |
| Investment income—netc | | .12 | �� | .07 | | .05 |
| Net realized and unrealized | | | | | | |
| gain (loss) on investments | | (8.89) | | 4.88 | | 4.37 |
| Total from Investment Operations | | (8.77) | | 4.95 | | 4.42 |
| Distributions: | | | | | | |
| Dividends from investment income—net | | (.20) | | (.29) | | — |
| Dividends from net realized gain on investments | | (2.19) | | (1.96) | | (.07) |
| Total Distributions | | (2.39) | | (2.25) | | (.07) |
| Proceeds from redemption fees | | .05 | | — | | — |
| Net asset value, end of period | | 8.44 | | 19.55 | | 16.85 |
| Total Return (%) | | (40.93) | | 29.52 | | 35.44d |
| Ratios/Supplemental Data (%): | | | | | | |
| Ratio of total expenses to average net assets | | 3.37 | | 2.47 | | 3.43d |
| Ratio of net expenses to average net assets | | 1.75 | | 1.74 | | 1.51d |
| Ratio of net investment income | | | | | | |
| to average net assets | | 1.04 | | .40 | | .36d |
| Portfolio Turnover Rate | | 188.35 | | 259.49 | | 140.52d |
| Net Assets, end of period ($ x 1,000) | | 155 | | 523 | | 440 |
| a | | Effective June 1, 2007, Class R shares were redesignated as Class I shares. |
| b | | From July 13, 2006 (commencement of operations) to May 31, 2007. |
| c | | Based on average shares outstanding at each month end. |
| d | | Not annualized. |
| See notes to financial statements. |
20
NOTES TO FINANCIAL STATEMENTS
NOTE 1—Significant Accounting Policies:
Emerging Markets Opportunity Fund (the “fund”) is a separate non-diversified series of Strategic Funds, Inc. (the “Company”), which is registered under the Investment Company Act of 1940, as amended (the “Act”), as an open-end management investment company and operates as a series company currently offering seven series, including the fund.The fund’s investment objective is to pursue long-term capital appreciation by investing in stocks of companies located in emerging market countries.The Dreyfus Corporation (the “Manager” or “Dreyfus”), a wholly-owned subsidiary of The Bank of New York Mellon Corporation (“BNY Mellon”), serves as the fund’s investment adviser. WestLB Mellon Asset Management (USA) LLC (“WMAM US”) served as the fund’s sub-investment adviser until December 31, 2008, when the agreement was terminated.
Effective July 1, 2008, BNY Mellon reorganized and consolidated a number of its banking and trust company subsidiaries.As a result of the reorganization, any services previously provided to the fund by Mellon Bank, N.A. or Mellon Trust of New England, N.A. are now provided by The Bank of NewYork Mellon (formerly,The Bank of NewYork).
MBSC Securities Corporation (the “Distributor”), a wholly-owned subsidiary of Dreyfus, is the distributor of the fund’s shares.The fund is authorized to issue 100 million shares of $.001 par value Common Stock in each of the following classes of shares: Class A, Class C and Class I. Class A shares are subject to a sales charge imposed at the time of purchase. Class C shares are subject to a contingent deferred sales charge (“CDSC”) imposed on Class C shares redeemed within one year of purchase. Class I shares are sold at net asset value per share only to institutional investors. Other differences between the classes include the services offered to and the expenses borne by each class, the allocation of certain transfer agency costs and certain voting rights. Income, expenses (other than expenses attributable to a specific class), and realized and unrealized gains or losses on investments are allocated to each class of shares based on its relative net assets.
The Fund 21
| NOTES TO FINANCIAL STATEMENTS (continued) |
Effective December 3, 2008, investments for new accounts were no longer permitted in Class T shares of the fund, except that participants in certain group retirement plans were able to open a new account in Class T shares of the fund, provided that the fund was established as an investment option under the plans before December 3, 2008. On February 4, 2009, the fund issued to each holder of its Class T shares, in exchange for said shares, Class A shares of the fund having an aggregate net asset value equal to the aggregate net asset value of the shareholder’s Class T shares. Subsequent investments in the fund’s Class A shares made by prior holders of the fund’s Class T shares who received Class A shares of the fund in exchange for their Class T shares are subject to the front-end sales load schedule that was in effect for Class T shares at the time of the exchange. Otherwise, all other Class A share attributes will be in effect. Effective close of business on February 4, 2009, the fund no longer offers Class T shares.
The Company accounts separately for the assets, liabilities and operations of each series. Expenses directly attributable to each series are charged to that series’ operations; expenses which are applicable to all series are allocated among them on a pro rata basis.
The fund’s financial statements are prepared in accordance with U.S. generally accepted accounting principles, which may require the use of management estimates and assumptions. Actual results could differ from those estimates.
The fund enters into contracts that contain a variety of indemnifications. The fund’s maximum exposure under these arrangements is unknown.The fund does not anticipate recognizing any loss related to these arrangements.
(a) Portfolio valuation: Investments in securities are valued at the last sales price on the securities exchange or national securities market on which such securities are primarily traded. Securities listed on the National Market System for which market quotations are available are
22
valued at the official closing price or, if there is no official closing price that day, at the last sales price. Securities not listed on an exchange or the national securities market, or securities for which there were no transactions, are valued at the average of the most recent bid and asked prices, except for open short positions, where the asked price is used for valuation purposes. Bid price is used when no asked price is available. Registered investment companies that are not traded on an exchange are valued at their net asset value.When market quotations or official closing prices are not readily available, or are determined not to reflect accurately fair value, such as when the value of a security has been significantly affected by events after the close of the exchange or market on which the security is principally traded (for example, a foreign exchange or market), but before the fund calculates its net asset value, the fund may value these investments at fair value as determined in accordance with the procedures approved by the Board of Directors. Fair valuing of securities may be determined with the assistance of a pricing service using calculations based on indices of domestic securities and other appropriate indicators, such as prices of relevant ADRs and futures contracts. For other securities that are fair valued by the Board of Directors, certain factors may be considered such as: fundamental analytical data, the nature and duration of restrictions on disposition, an evaluation of the forces that influence the market in which the securities are purchased and sold and public trading in similar securities of the issuer or comparable issuers. Financial futures are valued at the last sales price. Investments denominated in foreign currencies are translated to U.S. dollars at the prevailing rates of exchange. Forward currency exchange contracts are valued at the forward rate.
The fund adopted Statement of Financial Accounting Standards No. 157 “FairValue Measurements” (“FAS 157”). FAS 157 establishes an authoritative definition of fair value, sets out a framework for measuring fair value, and requires additional disclosures about fair value measurements.
The Fund 23
| NOTES TO FINANCIAL STATEMENTS (continued) |
Various inputs are used in determining the value of the fund’s investments relating to FAS 157.These inputs are summarized in the three broad levels listed below.
| | Level 1—quoted prices in active markets for identical investments.
Level 2—other significant observable inputs (including quoted
prices for similar securities, interest rates, prepayment speeds,
credit risk, etc.).
Level 3—significant unobservable inputs (including the fund’s own
assumptions in determining the fair value of investments). |
The inputs or methodology used for valuing securities are not necessarily an indication of the risk associated with investing in those securities.
The following is a summary of the inputs used as of May 31, 2009 in valuing the fund’s investments:
| | | | | Level 2—Other | | Level 3— | | |
| | | Level 1— | | Significant | | Significant | | |
| | | Quoted | | Observable Unobservable | | |
| | | Prices | | Inputs | | Inputs | | Total |
| |
| |
| |
| |
|
| Assets ($) | | | | | | | | |
| Investments in | | | | | | | | |
| Securities | | 3,243,635 | | 7,544,056 | | — | | 10,787,691 |
| Other Financial | | | | | | | | |
| Instruments† | | — | | — | | — | | — |
| Liabilities ($) | | | | | | | | |
| Other Financial | | | | | | | | |
| Instruments† | | — | | (15) | | — | | (15) |
| † | | Other financial instruments include derivative instruments, such as futures, forward currency |
| | | exchange contracts, swap contracts and options contracts. Amounts shown represent unrealized |
| | | appreciation (depreciation), or in the case of options, market value at period end. |
In April 2009, the Financial Accounting Standards Board (“FASB”) issued FASB Staff Position No. 157-4,“Determining Fair Value When the Volume and Level of Activity for the Asset or Liability Have Significantly Decreased and Identifying Transactions That Are Not Orderly” (“FSP 157-4”). FSP 157-4 provides additional guidance for estimating fair value in accordance with FAS 157, when the volume
24
and level of activity for the asset or liability have significantly decreased as well as guidance on identifying circumstances that indicate a transaction is not orderly. FSP 157-4 is effective for fiscal years and interim periods ending after June 15, 2009. Management is currently evaluating the impact the adoption of FSP 157-4 will have on the fund’s financial statement disclosures.
(b) Foreign currency transactions: The fund does not isolate that portion of the results of operations resulting from changes in foreign exchange rates on investments from the fluctuations arising from changes in market prices of securities held. Such fluctuations are included with the net realized and unrealized gain or loss on investments.
Net realized foreign exchange gains or losses arise from sales of foreign currencies, currency gains or losses realized on securities transactions and the difference between the amounts of dividends, interest and foreign withholding taxes recorded on the fund’s books and the U.S. dollar equivalent of the amounts actually received or paid. Net unrealized foreign exchange gains and losses arise from changes in the value of assets and liabilities other than investments resulting from changes in exchange rates. Foreign currency gains and losses on investments are included with net realized and unrealized gain or loss on investments.
(c) Securities transactions and investment income: Securities transactions are recorded on a trade date basis. Realized gains and losses from securities transactions are recorded on the identified cost basis. Dividend income is recognized on the ex-dividend date and interest income, including, where applicable, accretion of discount and amortization of premium on investments, is recognized on the accrual basis.
The fund has arrangements with the custodian and cash management bank whereby the fund may receive earnings credits when positive cash balances are maintained, which are used to offset custody and cash management fees. For financial reporting purposes, the fund includes net earnings credits as an expense offset in the Statement of Operations.
The Fund 25
| NOTES TO FINANCIAL STATEMENTS (continued) |
Investing in foreign markets may involve special risks and considerations not typically associated with investing in the U.S. These risks include revaluation of currencies, high rates of inflation, repatriation restrictions on income and capital, and adverse political and economic developments. Moreover, securities issued in these markets may be less liquid, subject to government ownership controls and delayed settlements, and their prices may be more volatile than those of comparable securities in the U.S.
(d) Affiliated issuers: Investments in other investment companies advised by Dreyfus are defined as “affiliated” in the Act.
(e) Dividends to shareholders: Dividends are recorded on the ex-dividend date. Dividends from investment income-net and dividends from net realized capital gains, if any, are normally declared and paid annually, but the fund may make distributions on a more frequent basis to comply with the distribution requirements of the Internal Revenue Code of 1986, as amended (the “Code”).To the extent that net realized capital gains can be offset by capital loss carryovers, it is the policy of the fund not to distribute such gains. Income and capital gain distributions are determined in accordance with income tax regulations, which may differ from U.S. generally accepted accounting principles.
(f) Federal income taxes: It is the policy of the fund to continue to qualify as a regulated investment company, if such qualification is in the best interests of its shareholders, by complying with the applicable provisions of the Code, and to make distributions of taxable income sufficient to relieve it from substantially all federal income and excise taxes.
As of and during the period ended May 31, 2009, the fund did not have any liabilities for any uncertain tax positions.The fund recognizes interest and penalties, if any, related to uncertain tax positions as income tax expense in the Statement of Operations. During the period, the fund did not incur any interest or penalties.
Each of the tax years in the three-year period ended May 31, 2009 remains subject to examination by the Internal Revenue Service and state taxing authorities.
26
At May 31, 2009, the components of accumulated earnings on a tax basis were as follows: undistributed ordinary income $175,834, accumulated capital losses $4,440,867 and unrealized appreciation $995,942. In addition, the fund had $5,306,874 of capital losses realized after October 31, 2008, which were deferred for tax purposes to the first day of the following fiscal year.
The accumulated capital loss carryover is available for federal income tax purposes to be applied against future net securities profits, if any, realized subsequent to May 31, 2009. If not applied, the carryover expires in fiscal 2017.
The tax character of distributions paid to shareholders during the fiscal periods ended May 31, 2009 and May 31, 2008 were as follows: ordinary income $1,892,967 and $2,194,573 and long-term capital gains $434,293 and $134,899, respectively.
During the period ended May 31, 2009, as a result of permanent book to tax differences, primarily due to the tax treatment for foreign currency gains and losses, passive foreign investment companies, dividend reclassification and treating a portion of the proceeds from redemptions as a distribution for tax purposes, the fund increased accumulated undistributed investment income-net by $47,845, decreased accumulated net realized gain (loss) on investments by $1,093,749 and increased paid-in capital by $1,045,904. Net assets and net asset value per share were not affected by this reclassification.
NOTE 2—Bank Lines of Credit:
Prior to October 15, 2008, the fund participated with other Dreyfus-managed funds in a $350 million redemption credit facility. Effective October 15, 2008, the fund participates with other Dreyfus-managed funds in a $145 million unsecured credit facility led by Citibank, N.A. and a $300 million unsecured credit facility provided by The Bank of NewYork Mellon (each, a “Facility”), each to be utilized primarily for temporary or emergency purposes, including the financing of redemptions. In connection therewith, the fund has agreed to pay its pro rata
The Fund 27
| NOTES TO FINANCIAL STATEMENTS (continued) |
portion of Facility fees for each Facility. Interest is charged to the fund based on rates determined pursuant to the terms of the respective Facility at the time of the borrowing.
The average amount of borrowings outstanding under the Facilities during the period ended May 31, 2009 was approximately $8,100, with a related weighted average annualized interest rate of 1.60%.
NOTE 3—Management Fee, Sub-Investment Advisory Fee and Other Transactions With Affiliates:
(a) Pursuant to a management agreement (“Agreement”) with Dreyfus, the management fee is computed at the annual rate of 1.25% of the value of the fund’s average daily net assets and is payable monthly. Dreyfus has contractually agreed, until October 1, 2010, to waive receipt of its fees and/or assume the expenses of the fund so that annual fund operating expenses (excluding Rule 12b-1 fees, shareholder services fees, taxes, interest on borrowings, brokerage commissions, commitment fees on borrowings and extraordinary expenses) do not exceed 1.75% of the value of the fund’s average daily net assets.The expense reimbursement, pursuant to the undertaking, amounted to $224,381 during the period ended May 31, 2009.
Pursuant to a Sub-Investment Advisory Agreement between Dreyfus andWMAM US, Dreyfus paidWMAM US a monthly fee at an annual percentage of the fund’s average daily net assets until December 31, 2008, when the agreement was terminated.
During the period ended May 31, 2009, the Distributor retained $4,957 and $9 from commissions earned on sales of the fund’s Class A and Class T shares, respectively, and $8,427 from CDSCs on redemptions of the fund’s Class C shares.
(b) Under the Distribution Plan (the “Plan”) adopted pursuant to Rule 12b-1 under the Act, Class C shares pay and Class T shares paid the Distributor for distributing their shares at an annual rate of .75% of the value of the average daily net assets of Class C shares and .25% of the value of the average daily net assets of Class T shares. During the
28
period ended May 31, 2009, Class C and Class T shares were charged $14,933 and $138, respectively, pursuant to the Plan.
(c) Under the Shareholder Services Plan, Class A and Class C shares pay and Class T shares paid the Distributor at an annual rate of .25% of the value of their average daily net assets for the provision of certain services. The services provided may include personal services relating to shareholder accounts, such as answering shareholder inquiries regarding Class A, Class C and Class T shares and providing reports and other information, and services related to the maintenance of shareholder accounts. The Distributor may make payments to Service Agents (a securities dealer, financial institution or other industry professional) in respect of these services. The Distributor determines the amounts to be paid to Service Agents. During the period ended May 31, 2009, Class A, Class C and Class T shares were charged $27,731, $4,978 and $138, respectively, pursuant to the Shareholder Services Plan.
The fund compensates Dreyfus Transfer, Inc., a wholly-owned subsidiary of Dreyfus, under a transfer agency agreement for providing personnel and facilities to perform transfer agency services for the fund. During the period ended May 31, 2009, the fund was charged $10,150 pursuant to the transfer agency agreement.
The fund compensates The Bank of NewYork Mellon, a subsidiary of BNY Mellon and an affiliate of Dreyfus, under a cash management agreement for performing cash management services related to fund subscriptions and redemptions. During the period ended May 31, 2009, the fund was charged $1,099 pursuant to the cash management agreement.These fees were offset by earnings credits pursuant to the cash management agreement.
The fund also compensates The Bank of New York Mellon under a custody agreement for providing custodial services for the fund. During the period ended May 31, 2009, the fund was charged $123,177 pursuant to the custody agreement.
The Fund 29
| NOTES TO FINANCIAL STATEMENTS (continued) |
During the period ended May 31, 2009, the fund was charged $5,814 for services performed by the Chief Compliance Officer.
The components of “Due to The Dreyfus Corporation and affiliates” in the Statement of Assets and Liabilities consist of: management fees $10,624, Rule 12b-1 distribution plan fees $1,084, shareholder services plan fees $2,098, custodian fees $50,195, chief compliance officer fees $1,150 and transfer agency per account fees $1,400, which are offset against an expense reimbursement currently in effect in the amount of $7,116.
(d) Each Board member also serves as a Board member of other funds within the Dreyfus complex. Annual retainer fees and attendance fees are allocated to each fund based on net assets.
(e) A 2% redemption fee is charged and retained by the fund on certain shares redeemed within sixty days, following the date of issuance, including redemptions made through the use of the fund’s exchange privilege. During the period ended May 31, 2009, redemption fees charged and retained by the fund amounted to $6,678.
NOTE 4—Securities Transactions:
The aggregate amount of purchases and sales of investment securities, excluding short-term securities and forward currency exchange contracts, during the period ended May 31, 2009, amounted to $26,146,598 and $30,581,897, respectively.
The fund adopted FASB Statement of Financial Accounting Standards No. 161 “Disclosures about Derivative Instruments and Hedging Activities” (“FAS 161”). FAS 161 requires qualitative disclosures about objectives and strategies for using derivatives, quantitative disclosures about fair value amounts of gains and losses on derivative instruments and disclosures about credit-risk-related contingent features in derivative agreements. All changes to accounting policies and disclosures have been made in accordance with FAS 161 and are incorporated for the current period as part of the disclosures within this Note.
30
During the period ended May 31, 2009, the average notional value of foreign exchange contracts was $45,560, which represented .34% of average net assets.
Forward Foreign Currency Exchange Contracts:The fund may enter into forward currency exchange contracts in order to hedge its exposure to changes in foreign currency exchange rates on its foreign portfolio holdings, to settle foreign currency transactions or as a part of an investment strategy. When executing forward currency exchange contracts, the fund is obligated to buy or sell a foreign currency at a specified rate on a certain date in the future. With respect to sales of forward currency exchange contracts, the fund would incur a loss if the value of the contract increases between the date the forward contract is opened and the date the forward contract is closed.The fund realizes a gain if the value of the contract decreases between those dates. With respect to purchases of forward currency exchange contracts, the fund would incur a loss if the value of the contract decreases between the date the forward contract is opened and the date the forward contract is closed.The fund realizes a gain if the value of the contract increases between those dates.The fund is also exposed to credit risk associated with counterparty nonperformance on these forward currency exchange contracts, which is typically limited to the unrealized gain on each open contract.The following summarizes open forward currency exchange contracts at May 31, 2009:
| | | Foreign | | | | | | |
| Forward Currency | | Currency | | | | | | Unrealized |
| Exchange Contracts | | Amounts | | Cost ($) | | Value ($) (Depreciation) ($) |
| |
| |
| |
|
| Purchases: | | | | | | | | |
| Hong Kong Dollar, | | | | | | | | |
| expiring 6/02/2009 | | 650,301 | | 83,900 | | 83,885 | | (15) |
At May 31, 2009, the cost of investments for federal income tax purposes was $9,792,443; accordingly, accumulated net unrealized appreciation on investments was $995,248, consisting of $2,050,212 gross unrealized appreciation and $1,054,964 gross unrealized depreciation.
The Fund 31
REPORT OF INDEPENDENT REGISTERED
PUBLIC ACCOUNTING FIRM |
| | Shareholders and Board of Directors
Emerging Markets Opportunity Fund |
We have audited the accompanying statement of assets and liabilities, including the statement of investments, of Emerging Markets Opportunity Fund (one of the series comprising Strategic Funds, Inc.) as of May 31, 2009 and the related statement of operations for the year then ended, the statement of changes in net assets for each of the two years in the period then ended and financial highlights for each of the periods indicated therein.These financial statements and financial highlights are the responsibility of the Fund’s management. Our responsibility is to express an opinion on these financial statements and financial highlights based on our audits.
We conducted our audits in accordance with the standards of the Public Company Accounting Oversight Board (United States).Those standards require that we plan and perform the audit to obtain reasonable assurance about whether the financial statements and financial highlights are free of material misstatement.We were not engaged to perform an audit of the Fund’s internal control over financial reporting. Our audits included consideration of internal control over financial reporting as a basis for designing audit procedures that are appropriate in the circumstances, but not for the purpose of expressing an opinion on the effectiveness of the Fund’s internal control over financial reporting. Accordingly, we express no such opinion. An audit also includes examining, on a test basis, evidence supporting the amounts and disclosures in the financial statements and financial highlights, assessing the accounting principles used and significant estimates made by management, and evaluating the overall financial statement presentation. Our procedures included confirmation of securities owned as of May 31, 2009 by correspondence with the custodian and others.We believe that our audits provide a reasonable basis for our opinion.
In our opinion, the financial statements and financial highlights referred to above present fairly, in all material respects, the financial position of Emerging Markets Opportunity Fund at May 31, 2009, the results of its operations for the year then ended, the changes in its net assets for each of the two years in the period then ended and the financial highlights for each of the indicated years, in conformity with U.S. generally accepted accounting principles.

| | New York, New York
July 22, 2009 |
32
IMPORTANT TAX INFORMATION (Unaudited)
In accordance with federal tax law, the fund elects to provide each shareholder with their portion of the fund’s foreign taxes paid and the income sourced from foreign countries. Accordingly, the fund hereby makes the following designations regarding its fiscal year ended May 31, 2009:
—the total amount of taxes paid to foreign countries was $43,104.
—the total amount of income sourced from foreign countries was $184,732.
As required by federal tax law rules, shareholders will receive notification of their proportionate share of foreign taxes paid and foreign sourced income for the 2009 calendar year with Form 1099-DIV which will be mailed by early 2010. Also, certain dividends paid by the fund may be subject to a maximum tax rate of 15%, as provided for by the Jobs and Growth Tax Relief Reconciliation Act of 2003. Of the distributions paid during the fiscal year, $7,364 represents the maximum amount that may be considered qualified dividend income. Also, the fund designates $.4260 per share as a long-term capital gain distribution and $1.7640 per share as a short-term capital gain distribution paid on December 16, 2008.
The Fund 33
BOARD MEMBERS INFORMATION (Unaudited)
34
The Fund 35
BOARD MEMBERS INFORMATION (Unaudited) (continued)
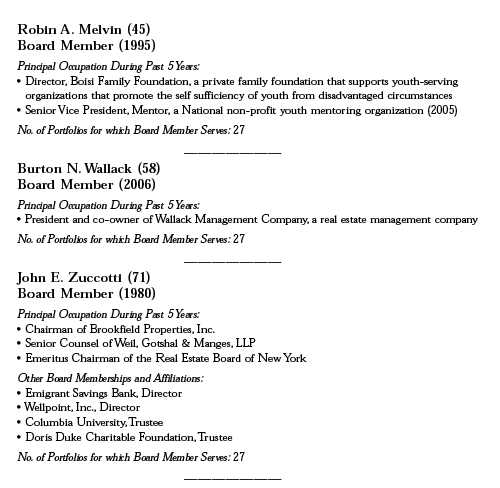
Once elected all Board Members serve for an indefinite term, but achieve Emeritus status upon reaching age 80.The address of the Board Members and Officers is in c/o The Dreyfus Corporation, 200 Park Avenue, NewYork, NewYork 10166. Additional information about the Board Members is available in the fund’s Statement of Additional Information which can be obtained from Dreyfus free of charge by calling this toll free number: 1-800-554-4611.
Arnold S. Hiatt, Emeritus Board Member
36
OFFICERS OF THE FUND (Unaudited)
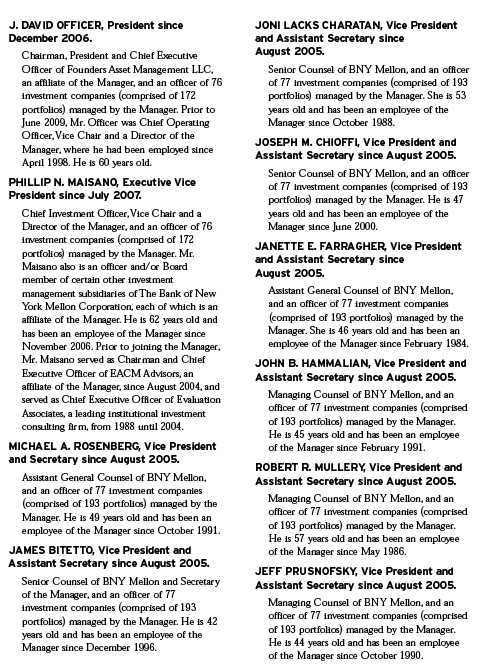
The Fund 37
OFFICERS OF THE FUND (Unaudited) (continued)

38
NOTES
Item 2. Code of Ethics.
The Registrant has adopted a code of ethics that applies to the Registrant's principal executive officer, principal financial officer, principal accounting officer or controller, or persons performing similar functions. There have been no amendments to, or waivers in connection with, the Code of Ethics during the period covered by this Report.
Item 3. Audit Committee Financial Expert.
The Registrant's Board has determined that Ehud Houminer, a member of the Audit Committee of the Board, is an audit committee financial expert as defined by the Securities and Exchange Commission (the "SEC"). Ehud Houminer is "independent" as defined by the SEC for purposes of audit committee financial expert determinations.
Item 4. Principal Accountant Fees and Services
(a) Audit Fees. The aggregate fees billed for each of the last two fiscal years (the "Reporting Periods") for professional services rendered by the Registrant's principal accountant (the "Auditor") for the audit of the Registrant's annual financial statements, or services that are normally provided by the Auditor in connection with the statutory and regulatory filings or engagements for the Reporting Periods, were $40,649 in 2008 and $41,463 in 2009.
(b) Audit-Related Fees. The aggregate fees billed in the Reporting Periods for assurance and related services by the Auditor that are reasonably related to the performance of the audit of the Registrant's financial statements and are not reported under paragraph (a) of this Item 4 were $0 in 2008 and $5,276 in 2009.
The aggregate fees billed in the Reporting Periods for non-audit assurance and related services by the Auditor to the Registrant's investment adviser (not including any sub-investment adviser whose role is primarily portfolio management and is subcontracted with or overseen by another investment adviser), and any entity controlling, controlled by or under common control with the investment adviser that provides ongoing services to the Registrant ("Service Affiliates"), that were reasonably related to the performance of the annual audit of the Service Affiliate, which required pre-approval by the Audit Committee were $0 in 2008 and $0 in 2009.
(c) Tax Fees. The aggregate fees billed in the Reporting Periods for professional services rendered by the Auditor for tax compliance, tax advice and tax planning ("Tax Services") were $5,913 in 2008 and $5,496 in 2009. These services consisted of (i) review or preparation of U.S. federal, state, local and excise tax returns; (ii) U.S. federal, state and local tax planning, advice and assistance regarding statutory, regulatory or administrative developments, (iii) tax advice regarding tax qualification matters and/or treatment of various financial instruments held or proposed to be acquired or held, and (iv) determination of Passive Foreign Investment Companies (as applicable).
The aggregate fees billed in the Reporting Periods for Tax Services by the Auditor to Service Affiliates which required pre-approval by the Audit Committee were $0 in 2008 and $0 in 2009.
(d) All Other Fees. The aggregate fees billed in the Reporting Periods for products and services provided by the Auditor, other than the services reported in paragraphs (a) through (c) of this Item, were $11 in 2008 and $3 in 2009.
The aggregate fees billed in the Reporting Periods for Non-Audit Services by the Auditor to Service Affiliates, other than the services reported in paragraphs (b) through (c) of this Item, which required pre-approval by the Audit Committee were $0 in 2008 and $0 in 2009.
Note: In each of (b) through (d) of this Item 4, 100% of all services provided by the Auditor were pre-approved as required.
Audit Committee Pre-Approval Policies and Procedures. The Registrant's Audit Committee has established policies and procedures (the "Policy") for pre-approval (within specified fee limits) of the Auditor's engagements for non-audit services to the Registrant and Service Affiliates without specific case-by-case consideration. Pre-approval considerations include whether the proposed services are compatible with maintaining the Auditor's independence. Pre-approvals pursuant to the Policy are considered annually.
Non-Audit Fees. The aggregate non-audit fees billed by the Auditor for services rendered to the Registrant, and rendered to Service Affiliates, for the Reporting Periods were $2,596,025 in 2008 and $20,898,574.
Auditor Independence. The Registrant's Audit Committee has considered whether the provision of non-audit services that were rendered to Service Affiliates which were not pre-approved (not requiring pre-approval) is compatible with maintaining the Auditor's independence.
| Item 5. | | Audit Committee of Listed Registrants. |
| | | Not applicable. |
| Item 6. | | Schedule of Investments. |
| (a) | | Not applicable. |
| Item 7. | | Disclosure of Proxy Voting Policies and Procedures for Closed-End Management |
| | | Investment Companies. |
| | | Not applicable. |
| Item 8. | | Portfolio Managers of Closed-End Management Investment Companies. |
| | | Not applicable. |
| Item 9. | | Purchases of Equity Securities by Closed-End Management Investment Companies and |
| | | Affiliated Purchasers. |
| | | Not applicable. |
| Item 10. | | Submission of Matters to a Vote of Security Holders. |
| There have been no material changes to the procedures applicable to Item 10. |
| Item 11. | | Controls and Procedures. |
(a) The Registrant's principal executive and principal financial officers have concluded, based on their evaluation of the Registrant's disclosure controls and procedures as of a date within 90 days of the filing date of this report, that the Registrant's disclosure controls and procedures are reasonably designed to ensure that information required to be disclosed by the Registrant on Form N-CSR is recorded, processed, summarized and reported within the required time periods and that information required to be disclosed by the Registrant in the reports that it files or submits on Form N-CSR is accumulated and communicated to the Registrant's management, including its principal executive and principal financial officers, as appropriate to allow timely decisions regarding required disclosure.
(b) There were no changes to the Registrant's internal control over financial reporting that occurred during the second fiscal quarter of the period covered by this report that have materially affected, or are reasonably likely to materially affect, the Registrant's internal control over financial reporting.
Item 12. Exhibits.
| (a)(1) | | Code of ethics referred to in Item 2. |
| (a)(2) | | Certifications of principal executive and principal financial officers as required by Rule 30a-2(a) |
| under the Investment Company Act of 1940. |
| (a)(3) | | Not applicable. |
| (b) | | Certification of principal executive and principal financial officers as required by Rule 30a-2(b) |
| under the Investment Company Act of 1940. |
Pursuant to the requirements of the Securities Exchange Act of 1934 and the Investment Company Act of 1940, the Registrant has duly caused this Report to be signed on its behalf by the undersigned, thereunto duly authorized.
| Strategic Funds, Inc. |
| |
| By: | | /s/ J. David Officer |
| | |
|
| | | J. David Officer |
| | President |
| |
| Date: | | July 23, 2009 |
Pursuant to the requirements of the Securities Exchange Act of 1934 and the Investment Company Act of 1940, this Report has been signed below by the following persons on behalf of the Registrant and in the capacities and on the dates indicated.
| By: | | /s/ J. David Officer |
| | |
|
| | | J. David Officer |
| | President |
| |
| Date: | | July 23, 2009 |
| |
| By: | | /s/ James Windels |
| | |
|
| | | James Windels |
| | Treasurer |
| |
| Date: | | July 23, 2009 |
EXHIBIT INDEX
| (a)(1) | | Code of ethics referred to in Item 2. |
| |
| (a)(2) | | Certifications of principal executive and principal financial officers as required by Rule 30a- |
| 2(a) under the Investment Company Act of 1940. (EX-99.CERT) |
| |
| (b) | | Certification of principal executive and principal financial officers as required by Rule 30a- |
| 2(b) under the Investment Company Act of 1940. (EX-99.906CERT) |