| UNITED STATES |
| SECURITIES AND EXCHANGE COMMISSION |
| Washington, D.C. 20549 |
| FORM N-CSR |
| CERTIFIED SHAREHOLDER REPORT OF REGISTERED MANAGEMENT |
| INVESTMENT COMPANIES |
Investment Company Act file number 811- 3940
| Strategic Funds, Inc. |
| (Exact name of Registrant as specified in charter) |
| c/o The Dreyfus Corporation | ||
| 200 Park Avenue | ||
| New York, New York 10166 | ||
| (Address of principal executive offices) | (Zip code) | |
| Michael A. Rosenberg, Esq. |
| 200 Park Avenue |
| New York, New York 10166 |
| (Name and address of agent for service) |
| Registrant's telephone number, including area code: | (212) 922-6000 | |||
| Date of fiscal year end: | 11/30 | |||
| Date of reporting period: | 11/30/08 | |||
The following N-CSR relates only to the Registrant’s series listed below and does not affect the other series of the Registrant, which have different fiscal year ends and, therefore, different N-CSR reporting requirements. Separate N-CSR Forms will be filed for these series, as appropriate.
| Global Stock Fund |
| International Stock Fund |
| Dreyfus U.S. Equity Fund |
| FORM N-CSR |
Item 1. Reports to Stockholders.
Global Stock Fund
ANNUAL REPORT November 30, 2008
Save time. Save paper. View your next shareholder report online as soon as it’s available. Log into www.dreyfus.com and sign up for Dreyfus eCommunications. It’s simple and only takes a few minutes.
The views expressed in this report reflect those of the portfolio manager only through the end of the period covered and do not necessarily represent the views of Dreyfus or any other person in the Dreyfus organization. Any such views are subject to change at any time based upon market or other conditions and Dreyfus disclaims any responsibility to update such views.These views may not be relied on as investment advice and, because investment decisions for a Dreyfus fund are based on numerous factors, may not be relied on as an indication of trading intent on behalf of any Dreyfus fund.

| Contents | |
| THE FUND | |
| 2 | A Letter from the CEO |
| 3 | Discussion of Fund Performance |
| 6 | Fund Performance |
| 8 | Understanding Your Fund’s Expenses |
| 8 | Comparing Your Fund’s Expenses With Those of Other Funds |
| 9 | Statement of Investments |
| 12 | Statement of Assets and Liabilities |
| 13 | Statement of Operations |
| 14 | Statement of Changes in Net Assets |
| 16 | Financial Highlights |
| 20 | Notes to Financial Statements |
| 31 | Report of Independent Registered Public Accounting Firm |
| 32 | Important Tax Information |
| 33 | Information About the Review and Approval of the Fund’s Management Agreement |
| 38 | Board Members Information |
| 41 | Officers of the Fund |
| FOR MORE INFORMATION | |
| Back Cover | |
| The Fund |
| Global Stock Fund |

| A LETTER FROM THE CEO Dear Shareholder: |
We present to you this annual report for Global Stock Fund,covering the 12-month period from December 1, 2007, through November 30, 2008.
The global economy suffered during the reporting period amid a financial crisis that sparked sharp declines in virtually all sectors, regions and capitalization ranges of the international stock markets.According to our Chief Economist, the combination of export-dependent growth in overseas markets and a rising U.S. debt burden proved to be unsustainable. Other contributors to the downturn included sharp declines in many countries’ home prices; excessive leverage among financial institutions, especially investment banks; and regulatory policies and behaviors that exacerbated financial stresses.Various governments and central banks have responded with massive interventions, including nationalizing some troubled financial institutions, providing loans to others and guaranteeing certain financial instruments. However, the global financial system remains fragile, and economic weakness is likely to persist.
In our view, today’s investment environment is rife with near-term challenges and long-term opportunities. Now more than ever, it is important to ensure that your investments are aligned with your current needs, future goals and attitudes toward risk.We urge you to speak regularly with your financial advisor, who can recommend the course of action that is right for you.
For information about how the fund performed during the reporting period, as well as market perspectives, we have provided a Discussion of Fund Performance given by the fund’s Portfolio Manager.
Thank you for your continued confidence and support.

| Jonathan R. Baum Chief Executive Officer The Dreyfus Corporation December 15, 2008 |
| 2 |

DISCUSSION OF FUND PERFORMANCE
For the period of December 1, 2007, through November 30, 2008, as provided by Walter Scott & Partners Limited (Walter Scott), Sub-adviser
Fund and Market Performance Overview
For the 12-month period ended November 30, 2008, Global Stock Fund’s Class A shares produced a return of –34.32%, Class C shares returned –34.82%, Class I shares returned –34.12% and Class T shares returned –34.86% .1 In comparison, the fund’s benchmark index, the Morgan Stanley Capital International World Index (the “MSCI World Index”), produced a –43.30% return over the same period.2
Stock markets throughout the world declined sharply over the second half of the reporting period when a global economic slowdown and financial crisis intensified.Although the fund also declined, it produced higher returns than its benchmark, primarily due to strong individual stock selections across a variety of market sectors.
The Fund’s Investment Approach
The fund seeks long-term total return by investing in stocks of companies with any market capitalization that are located in the world’s developed markets.When selecting stocks,Walter Scott seeks companies with fundamental strengths that indicate the potential for sustainable growth.The firm focuses on individual stock selection through extensive fundamental research. Walter Scott first selects candidates for investment that meet certain broad absolute and trend criteria. Financial statements are restated in an effort to identify the nature of their operating margins and to understand the variables that add value to their businesses. Companies meeting the financial criteria are subjected to a detailed investigation of their products, costs and pricing, competition, industry position and outlook. Stocks are then selected whose expected growth rate is available at a reasonable valuation.
Financial Crisis and Economic Slowdown Intensified
A credit crisis that began in 2007 mushroomed over the summer of 2008, nearly leading to the collapse of the global banking system. Major finan-
| T h e F u n d 3 |
| DISCUSSION OF FUND PERFORMANCE (continued) |
cial institutions that had been hit hard by losses in credit markets teetered on the edge of insolvency, causing some to be nationalized and others to receive massive capital infusions from their governments.As the situation worsened, banks and other lenders became increasingly risk-averse, refraining from lending to even their most trusted customers. Investors also grew more cautious,flocking to the traditional safe havens of the sovereign debt of industrialized nations.Conversely,investors fled asset classes they considered risky, including global equities, and stock prices fell precipitously over the reporting period’s final months.
Meanwhile, the global economy slowed, led by declining housing prices and rising unemployment in the United States and Europe. Other markets that depend heavily on exports to U.S. and European consumers were adversely affected, reducing the earnings outlook for local businesses. In addition, previously soaring commodity prices, including energy, fell sharply as demand waned. Finally, Walter Scott began to see an acceleration of a longstanding shift in economic leadership from the United States and Europe to emerging markets in the Pacific Rim, most notably China.These concurrent developments produced the most extreme market volatility in decades.
Bottom-Up Process Fared Relatively Well
In this highly challenging environment, the bottom-up security selection process led the firm to a number of conservative growth companies that, in Walter Scott’s analysis, are well positioned to weather the current storm and prosper during an eventual recovery. Some of these opportunities were found among global companies based in the United States and Japan, which produced some of the fund’s better results over the reporting period.
For example, U.S. retail giant Wal-Mart Stores gained value as cash-strapped consumers increasingly sought low-priced goods. Despite sharp declines along with crude oil prices, U.S. oil driller Nabors Industries benefited from strength early in the reporting period when commodity prices soared to record highs. Early strength on Hong Kong utility CLP Holdings also contributed positively to the fund’s performance. And, in the traditionally defensive health care sector, dental, veterinary and rehabilitation products distributor Patterson
4
Companies, Inc. held up relatively well. Nabors Industries and Patterson Companies were both sold during the reporting period.
As is to be expected in such a difficult market climate, the fund also suffered disappointments. China National Offshore Oil Corporation (CNOOC) fell sharply when oil prices retreated from more than $145 per barrel to less than $50 per barrel. Hong Kong-based industrial conglomerate Hutchison Whampoa was hurt by the effects of the global economic downturn. French luxury goods purveyor LVMH Moët Hennessy Louis Vuitton encountered a sharp reduction in consumer spending on its premium brands. Commercial bank DBS Group Holdings, based in Singapore, suffered the effects of the financial crisis on its quarterly earnings and was sold during the reporting period. Japanese optical glass manufacturer HOYA also fared poorly in the slumping economy.
Finding Opportunities in Turbulent Markets
Although the financial crisis has persisted and the global economic slowdown has intensified, the bottom-up security selection process has continued to identify what the firm believes to be fundamentally sound companies selling at historically attractive valuations. As global equities sold off indiscriminately, great businesses with strong long-term prospects for growth have become more inexpensive, signaling potential opportunities for investors with the patience and discipline to wait for an eventual economic and market recovery.
December 15, 2008
| 1 | Total return includes reinvestment of dividends and any capital gains paid, and does not take into | |
| consideration the maximum initial sales charges in the case of Class A and Class T shares, or the | ||
| applicable contingent deferred sales charge imposed on redemptions in the case of Class C shares. | ||
| Had these charges been reflected, returns would have been lower. Past performance is no guarantee | ||
| of future results. Share price and investment return fluctuate such that upon redemption, fund | ||
| shares may be worth more or less than their original cost. Return figures provided reflect the | ||
| absorption of certain fund expenses by The Dreyfus Corporation pursuant to an undertaking in | ||
| effect through April 1, 2010, at which time it may be extended, terminated or modified. Had | ||
| these expenses not been absorbed, the fund’s returns would have been lower. | ||
| 2 | SOURCE: LIPPER INC. — Reflects reinvestment of net dividends and, where applicable, | |
| capital gain distributions.The Morgan Stanley Capital International (MSCI) World Index is an | ||
| unmanaged index of global stock market performance, including the United States, Canada, | ||
| Europe,Australia, New Zealand and the Far East. |
| T h e F u n d 5 |
FUND PERFORMANCE
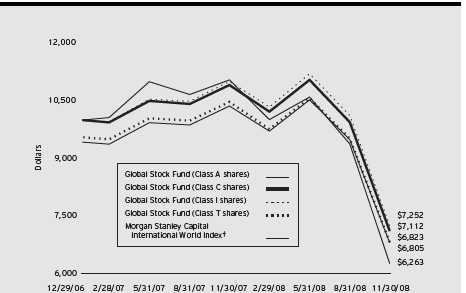
Comparison of change in value of $10,000 investment in Global Stock Fund Class A shares, Class C shares, Class I shares and Class T shares and the Morgan Stanley Capital International World Index
| † Source: Lipper Inc. |
| Past performance is not predictive of future performance. |
| The above graph compares a $10,000 investment made in Class A, Class C, Class I and Class T shares of Global |
| Stock Fund on 12/29/06 (inception date) to a $10,000 investment made in the Morgan Stanley Capital |
| International World Index (the “Index”) on that date. For comparative purposes, the value of the Index on 12/31/06 |
| used as the beginning value on 12/29/06.All dividends and capital gain distributions are reinvested. |
| The fund’s performance shown in the line graph takes into account the maximum initial sales charges on Class A shares |
| and Class T shares and all other applicable fees and expenses on all classes.The Index is an unmanaged index of global |
| stock market performance, including the United States, Canada,Australia, New Zealand and the Far East and includes |
| net dividends reinvested. Unlike a mutual fund, the Index is not subject to charges, fees and other expenses. Investors |
| cannot invest directly in any index. Further information relating to fund performance, including expense reimbursements, |
| if applicable, is contained in the Financial Highlights section of the prospectus and elsewhere in this report. |
6
| Average Annual Total Returns as of 11/30/08 | ||||||
| Inception | From | |||||
| Date | 1 Year | Inception | ||||
| Class A shares | ||||||
| with maximum sales charge (5.75%) | 12/29/06 | (38.11)% | (18.16)% | |||
| without sales charge | 12/29/06 | (34.32)% | (15.61)% | |||
| Class C shares | ||||||
| with applicable redemption charge † | 12/29/06 | (35.47)% | (16.26)% | |||
| without redemption | 12/29/06 | (34.82)% | (16.26)% | |||
| Class I shares | 12/29/06 | (34.12)% | (15.41)% | |||
| Class T shares | ||||||
| with applicable sales charge (4.5%) | 12/29/06 | (37.80)% | (18.06)% | |||
| without sales charge | 12/29/06 | (34.86)% | (16.06)% | |||
| Past performance is not predictive of future performance.The fund’s performance shown in the graph and table does not |
| reflect the deduction of taxes that a shareholder would pay on fund distributions or the redemption of fund shares. |
| † The maximum contingent deferred sales charge for Class C shares is 1% for shares redeemed within one year of the |
| date of purchase. |
| T h e F u n d 7 |
UNDERSTANDING YOUR FUND’S EXPENSES (Unaudited)
As a mutual fund investor, you pay ongoing expenses, such as management fees and other expenses. Using the information below, you can estimate how these expenses affect your investment and compare them with the expenses of other funds.You also may pay one-time transaction expenses, including sales charges (loads) and redemption fees, which are not shown in this section and would have resulted in higher total expenses. For more information, see your fund’s prospectus or talk to your financial adviser.
Review your fund’s expenses
The table below shows the expenses you would have paid on a $1,000 investment in Global Stock Fund from June 1, 2008 to November 30, 2008. It also shows how much a $1,000 investment would be worth at the close of the period, assuming actual returns and expenses.
| Expenses and Value of a $1,000 Investment assuming actual returns for the six months ended November 30, 2008 |
| Class A | Class C | Class I | Class T | |||||
| Expenses paid per $1,000† | $ 6.17 | $ 9.25 | $ 5.15 | $ 7.20 | ||||
| Ending value (after expenses) | $646.60 | $644.00 | $647.20 | $645.50 |
| COMPARING YOUR FUND’S EXPENSES WITH THOSE OF OTHER FUNDS (Unaudited) |
Using the SEC’s method to compare expenses
The Securities and Exchange Commission (SEC) has established guidelines to help investors assess fund expenses. Per these guidelines, the table below shows your fund’s expenses based on a $1,000 investment, assuming a hypothetical 5% annualized return. You can use this information to compare the ongoing expenses (but not transaction expenses or total cost) of investing in the fund with those of other funds.All mutual fund shareholder reports will provide this information to help you make this comparison. Please note that you cannot use this information to estimate your actual ending account balance and expenses paid during the period.
| Expenses and Value of a $1,000 Investment assuming a hypothetical 5% annualized return for the six months ended November 30, 2008 |
| Class A | Class C | Class I | Class T | |||||
| Expenses paid per $1,000† | $ 7.57 | $ 11.33 | $ 6.31 | $ 8.82 | ||||
| Ending value (after expenses) | $1,017.50 | $1,013.75 | $1,018.75 | $1,016.25 |
| † Expenses are equal to the fund’s annualized expense ratio of 1.50% for Class A, 2.25% for Class C, 1.25% for |
| Class I and 1.75% for Class T, multiplied by the average account value over the period, multiplied by 183/366 (to |
| reflect the one-half year period). |
8
| STATEMENT OF INVESTMENTS November 30, 2008 |
| Common Stocks—98.4% | Shares | Value ($) | ||
| Australia—2.0% | ||||
| Woodside Petroleum | 63,500 | 1,501,236 | ||
| Canada—2.0% | ||||
| Suncor Energy | 69,000 | 1,511,635 | ||
| France—6.2% | ||||
| Cie Generale d’Optique Essilor International | 39,500 | 1,578,063 | ||
| L’Oreal | 23,500 | 1,900,685 | ||
| LVMH Moet Hennessy Louis Vuitton | 22,000 | 1,246,058 | ||
| 4,724,806 | ||||
| Germany—2.1% | ||||
| Adidas | 51,500 | 1,600,440 | ||
| Hong Kong—10.5% | ||||
| China Mobile | 179,000 | 1,642,159 | ||
| CLP Holdings | 215,000 | 1,525,787 | ||
| CNOOC | 1,980,000 | 1,596,754 | ||
| Hong Kong & China Gas | 930,050 | 1,656,068 | ||
| Hutchison Whampoa | 320,000 | 1,606,173 | ||
| 8,026,941 | ||||
| Japan—22.6% | ||||
| Astellas Pharma | 32,500 | 1,322,852 | ||
| Canon | 50,500 | 1,492,754 | ||
| Chugai Pharmaceutical | 59,000 | 1,016,156 | ||
| Daikin Industries | 70,000 | 1,827,456 | ||
| Denso | 87,000 | 1,436,497 | ||
| Fanuc | 29,000 | 1,787,276 | ||
| Honda Motor | 74,000 | 1,614,419 | ||
| HOYA | 89,000 | 1,277,681 | ||
| Keyence | 8,900 | 1,477,901 | ||
| Mitsubishi Estate | 89,000 | 1,322,382 | ||
| Shin-Etsu Chemical | 38,000 | 1,447,316 | ||
| Takeda Pharmaceutical | 28,000 | 1,350,633 | ||
| 17,373,323 |
| T h e F u n d 9 |
| STATEMENT OF INVESTMENTS (continued) |
| Common Stocks (continued) | Shares | Value ($) | ||
| Spain—1.5% | ||||
| Inditex | 33,500 | 1,119,376 | ||
| Sweden—1.6% | ||||
| Hennes & Mauritz, Cl. B | 34,000 | 1,246,632 | ||
| Switzerland—6.9% | ||||
| Alcon | 19,700 | 1,571,863 | ||
| Nestle | 41,500 | 1,502,068 | ||
| Nobel Biocare Holding | 45,000 | 682,784 | ||
| SGS | 1,800 | 1,527,183 | ||
| 5,283,898 | ||||
| United Kingdom—9.6% | ||||
| BG Group | 122,000 | 1,726,185 | ||
| GlaxoSmithKline | 44,500 | 766,510 | ||
| Reckitt Benckiser Group | 39,000 | 1,656,039 | ||
| Rio Tinto | 22,500 | 556,427 | ||
| Tesco | 330,000 | 1,498,708 | ||
| WM Morrison Supermarkets | 303,000 | 1,130,040 | ||
| 7,333,909 | ||||
| United States—33.4% | ||||
| Abbott Laboratories | 31,500 | 1,650,285 | ||
| Anadarko Petroleum | 49,000 | 2,011,450 | ||
| Automatic Data Processing | 36,500 | 1,498,690 | ||
| C.R. Bard | 10,000 | 820,300 | ||
| Cisco Systems | 93,000 a | 1,538,220 | ||
| EOG Resources | 20,500 | 1,742,910 | ||
| Fastenal | 48,500 | 1,867,735 | ||
| Genentech | 21,500 a | 1,646,900 | ||
| Intel | 108,000 | 1,490,400 | ||
| Johnson & Johnson | 27,000 | 1,581,660 | ||
| Medtronic | 39,500 | 1,205,540 |
10
| Common Stocks (continued) | Shares | Value ($) | ||
| United States (continued) | ||||
| Microsoft | 71,000 | 1,435,620 | ||
| Oracle | 70,000 a | 1,126,300 | ||
| Schlumberger | 25,800 | 1,309,092 | ||
| SYSCO | 66,000 | 1,547,700 | ||
| Wal-Mart Stores | 31,000 | 1,732,280 | ||
| Walgreen | 61,000 | 1,509,140 | ||
| 25,714,222 | ||||
| Total Investments (cost $102,816,940) | 98.4% | 75,436,418 | ||
| Cash and Receivables (Net) | 1.6% | 1,261,905 | ||
| Net Assets | 100.0% | 76,698,323 | ||
| a Non-income producing security. | ||||
| Portfolio Summary (Unaudited)† | ||||||
| Value (%) | Value (%) | |||||
| Health Care | 19.8 | Consumer Services | 12.8 | |||
| Consumer Goods | 16.2 | Energy Services | 5.9 | |||
| Industrials | 15.8 | Financial Services | 1.7 | |||
| Energy | 13.2 | |||||
| Technology | 13.0 | 98.4 | ||||
| † Based on net assets. | ||||||
| See notes to financial statements. | ||||||
| T h e F u n d 11 |
| STATEMENT OF ASSETS AND LIABILITIES November 30, 2008 |
| Cost | Value | |||
| Assets ($): | ||||
| Investments in securities—See Statement of Investments | 102,816,940 | 75,436,418 | ||
| Cash | 1,251,107 | |||
| Cash denominated in foreign currencies | 56,723 | 56,740 | ||
| Dividends and interest receivable | 174,762 | |||
| Receivable for shares of Common Stock subscribed | 129,687 | |||
| Prepaid expenses | 23,317 | |||
| 77,072,031 | ||||
| Liabilities ($): | ||||
| Due to The Dreyfus Corporation and affiliates—Note 3(c) | 83,573 | |||
| Payable for shares of Common Stock redeemed | 240,895 | |||
| Accrued expenses | 49,240 | |||
| 373,708 | ||||
| Net Assets ($) | 76,698,323 | |||
| Composition of Net Assets ($): | ||||
| Paid-in capital | 106,743,087 | |||
| Accumulated undistributed investment income—net | 385,820 | |||
| Accumulated net realized gain (loss) on investments | (3,055,320) | |||
| Accumulated net unrealized appreciation (depreciation) on | ||||
| investments and foreign currency transactions | (27,375,264) | |||
| Net Assets ($) | 76,698,323 |
| Net Asset Value Per Share | ||||||||
| Class A | Class C | Class I | Class T | |||||
| Net Assets ($) | 3,329,324 | 694,880 | 72,656,067 | 18,052 | ||||
| Shares Outstanding | 373,817 | 78,694 | 8,079,509 | 2,220 | ||||
| Net Asset Value Per Share ($) | 8.91 | 8.83 | 8.99 | 8.13 | ||||
| See notes to financial statements. | ||||||||
12
| STATEMENT OF OPERATIONS Year Ended November 30, 2008 |
| Investment Income ($): | ||
| Income: | ||
| Cash dividends (net of $45,873 foreign taxes withheld at source): | ||
| Unaffiliated issuers | 953,325 | |
| Affiliated issuers | 62,234 | |
| Total Income | 1,015,559 | |
| Expenses: | ||
| Management fee—Note 3(a) | 436,993 | |
| Registration fees | 49,452 | |
| Auditing fees | 46,716 | |
| Custodian fees—Note 3(c) | 44,258 | |
| Shareholder servicing costs—Note 3(c) | 19,130 | |
| Prospectus and shareholders’ reports | 12,261 | |
| Distribution fees—Note 3(b) | 6,883 | |
| Directors’ fees and expenses—Note 3(d) | 3,929 | |
| Legal fees | 830 | |
| Loan commitment fees—Note 2 | 191 | |
| Miscellaneous | 10,435 | |
| Total Expenses | 631,078 | |
| Less—reduction in management fee due to undertaking—Note 3(a) | (18,395) | |
| Less—reduction in fees due to earnings credits—Note 1(c) | (308) | |
| Net Expenses | 612,375 | |
| Investment Income—Net | 403,184 | |
| Realized and Unrealized Gain (Loss) on Investments—Note 4 ($): | ||
| Net realized gain (loss) on investments and foreign currency transactions | (3,034,050) | |
| Net realized gain (loss) on forward currency exchange contracts | (10,977) | |
| Net Realized Gain (Loss) | (3,045,027) | |
| Net unrealized appreciation (depreciation) | ||
| on investments and foreign currency transactions | (28,940,818) | |
| Net Realized and Unrealized Gain (Loss) on Investments | (31,985,845) | |
| Net (Decrease) in Net Assets Resulting from Operations | (31,582,661) | |
| See notes to financial statements. | ||
| T h e F u n d 13 |
STATEMENT OF CHANGES IN NET ASSETS
| Year Ended November 30, | ||||
| 2008 | 2007a,b | |||
| Operations ($): | ||||
| Investment income—net | 403,184 | 63,207 | ||
| Net realized gain (loss) on investments | (3,045,027) | 151,598 | ||
| Net unrealized appreciation | ||||
| (depreciation) on investments | (28,940,818) | 1,565,554 | ||
| Net Increase (Decrease) in Net Assets | ||||
| Resulting from Operations | (31,582,661) | 1,780,359 | ||
| Dividends to Shareholders from ($): | ||||
| Investment income—net: | ||||
| Class A Shares | (27,511) | — | ||
| Class I Shares | (28,974) | — | ||
| Class T Shares | (3,780) | — | ||
| Net realized gain on investments: | ||||
| Class A Shares | (32,829) | — | ||
| Class C Shares | (6,537) | — | ||
| Class I Shares | (141,854) | — | ||
| Class T Shares | (977) | — | ||
| Total Dividends | (242,462) | — | ||
| Capital Stock Transactions ($): | ||||
| Net proceeds from shares sold: | ||||
| Class A Shares | 2,942,601 | 8,477,307 | ||
| Class C Shares | 710,293 | 1,229,372 | ||
| Class I Shares | 99,572,506 | 18,244,830 | ||
| Class T Shares | 14,577 | 500,000 | ||
| Dividends reinvested: | ||||
| Class A Shares | 31,182 | — | ||
| Class C Shares | 2,391 | — | ||
| Class I Shares | 55,509 | — | ||
| Class T Shares | 1,091 | — | ||
| Cost of shares redeemed: | ||||
| Class A Shares | (3,134,493) | (3,914,581) | ||
| Class C Shares | (551,272) | (388,773) | ||
| Class I Shares | (15,506,813) | (1,010,473) | ||
| Class T Shares | (157,167) | (375,000) | ||
| Increase (Decrease) in Net Assets | ||||
| from Capital Stock Transactions | 83,980,405 | 22,762,682 | ||
| Total Increase (Decrease) in Net Assets | 52,155,282 | 24,543,041 | ||
| Net Assets ($): | ||||
| Beginning of Period | 24,543,041 | — | ||
| End of Period | 76,698,323 | 24,543,041 | ||
| Undistributed investment income—net | 385,820 | 59,654 | ||
14
| Year Ended November 30, | ||||
| 2008 | 2007a,b | |||
| Capital Share Transactions: | ||||
| Class A | ||||
| Shares sold | 247,015 | 661,091 | ||
| Shares issued for dividends reinvested | 2,337 | — | ||
| Shares redeemed | (249,183) | (287,443) | ||
| Net Increase (Decrease) in Shares Outstanding | 169 | 373,648 | ||
| Class C | ||||
| Shares sold | 57,651 | 96,321 | ||
| Shares issued for dividends reinvested | 180 | — | ||
| Shares redeemed | (46,966) | (28,492) | ||
| Net Increase (Decrease) in Shares Outstanding | 10,865 | 67,829 | ||
| Class I | ||||
| Shares sold | 8,380,761 | 1,406,401 | ||
| Shares issued for dividends reinvested | 4,168 | — | ||
| Shares redeemed | (1,635,811) | (76,010) | ||
| Net Increase (Decrease) in Shares Outstanding | 6,749,118 | 1,330,391 | ||
| Class T | ||||
| Shares sold | 1,126 | 40,000 | ||
| Shares issued for dividends reinvested | 94 | — | ||
| Shares redeemed | (11,720) | (27,280) | ||
| Net Increase (Decrease) in Shares Outstanding | (10,500) | 12,720 | ||
| a From December 29, 2006 (commencement of operations) to November 30, 2007. |
| b Effective June 1, 2007, Class R shares were redesignated as Class I shares. |
| See notes to financial statements. |
| T h e F u n d 15 |
FINANCIAL HIGHLIGHTS
The following tables describe the performance for each share class for the fiscal periods indicated. All information (except portfolio turnover rate) reflects financial results for a single fund share.Total return shows how much your investment in the fund would have increased (or decreased) during each period, assuming you had reinvested all dividends and distributions.These figures have been derived from the fund’s financial statements.
| Year Ended November 30, | ||||
| Class A Shares | 2008 | 2007a | ||
| Per Share Data ($): | ||||
| Net asset value, beginning of period | 13.73 | 12.50 | ||
| Investment Operations: | ||||
| Investment income—netb | .05 | .04 | ||
| Net realized and unrealized | ||||
| gain (loss) on investments | (4.70) | 1.19 | ||
| Total from Investment Operations | (4.65) | 1.23 | ||
| Distributions: | ||||
| Dividends from investment income—net | (.08) | — | ||
| Dividends from net realized gain on investments | (.09) | — | ||
| Total Distributions | (.17) | — | ||
| Net asset value, end of period | 8.91 | 13.73 | ||
| Total Return (%)c | (34.32) | 9.92d | ||
| Ratios/Supplemental Data (%): | ||||
| Ratio of total expenses to average net assets | 1.59 | 2.40e | ||
| Ratio of net expenses to average net assets | 1.47 | 1.46e | ||
| Ratio of net investment income | ||||
| to average net assets | .44 | .29e | ||
| Portfolio Turnover Rate | 15.54 | 14.53d | ||
| Net Assets, end of period ($ x 1,000) | 3,329 | 5,132 | ||
| a | From December 29, 2006 (commencement of operations) to November 30, 2007. | |
| b | Based on average shares outstanding at each month end. | |
| c | Exclusive of sales charge. | |
| d | Not annualized. | |
| e | Annualized. |
| See notes to financial statements. |
16
| Year Ended November 30, | ||||
| Class C Shares | 2008 | 2007a | ||
| Per Share Data ($): | ||||
| Net asset value, beginning of period | 13.64 | 12.50 | ||
| Investment Operations: | ||||
| Investment (loss)—netb | (.04) | (.06) | ||
| Net realized and unrealized | ||||
| gain (loss) on investments | (4.68) | 1.20 | ||
| Total from Investment Operations | (4.72) | 1.14 | ||
| Distributions: | ||||
| Dividends from net realized gain on investments | (.09) | — | ||
| Net asset value, end of period | 8.83 | 13.64 | ||
| Total Return (%)c | (34.82) | 9.12d | ||
| Ratios/Supplemental Data (%): | ||||
| Ratio of total expenses to average net assets | 2.36 | 3.16e | ||
| Ratio of net expenses to average net assets | 2.22 | 2.20e | ||
| Ratio of net investment (loss) | ||||
| to average net assets | (.29) | (.46)e | ||
| Portfolio Turnover Rate | 15.54 | 14.53d | ||
| Net Assets, end of period ($ x 1,000) | 695 | 925 | ||
| a | From December 29, 2006 (commencement of operations) to November 30, 2007. | |
| b | Based on average shares outstanding at each month end. | |
| c | Exclusive of sales charge. | |
| d | Not annualized. | |
| e | Annualized. |
| See notes to financial statements. |
T h e F u n d 17
| FINANCIAL HIGHLIGHTS (continued) |
| Year Ended November 30, | ||||
| Class I Shares | 2008 | 2007a,b | ||
| Per Share Data ($): | ||||
| Net asset value, beginning of period | 13.76 | 12.50 | ||
| Investment Operations: | ||||
| Investment income—netc | .10 | .07 | ||
| Net realized and unrealized | ||||
| gain (loss) on investments | (4.76) | 1.19 | ||
| Total from Investment Operations | (4.66) | 1.26 | ||
| Distributions: | ||||
| Dividends from investment income—net | (.02) | — | ||
| Dividends from net realized gain on investments | (.09) | — | ||
| Total Distributions | (.11) | — | ||
| Net asset value, end of period | 8.99 | 13.76 | ||
| Total Return (%) | (34.12) | 10.08d | ||
| Ratios/Supplemental Data (%): | ||||
| Ratio of total expenses to average net assets | 1.17 | 2.05e | ||
| Ratio of net expenses to average net assets | 1.15 | 1.18e | ||
| Ratio of net investment income | ||||
| to average net assets | .83 | .58e | ||
| Portfolio Turnover Rate | 15.54 | 14.53d | ||
| Net Assets, end of period ($ x 1,000) | 72,656 | 18,312 | ||
| a | From December 29, 2006 (commencement of operations) to November 30, 2007. | |
| b | Effective June 1, 2007, Class R shares were redesignated as Class I shares. | |
| c | Based on average shares outstanding at each month end. | |
| d | Not annualized. | |
| e | Annualized. |
| See notes to financial statements. |
18
| Year Ended November 30, | ||||
| Class T Shares | 2008 | 2007a | ||
| Per Share Data ($): | ||||
| Net asset value, beginning of period | 13.70 | 12.50 | ||
| Investment Operations: | ||||
| Investment income (loss)—netb | (.01) | .01 | ||
| Net realized and unrealized | ||||
| gain (loss) on investments | (4.38) | 1.19 | ||
| Total from Investment Operations | (4.39) | 1.20 | ||
| Distributions: | ||||
| Dividends from investment income—net | (1.09) | — | ||
| Dividends from net realized gain on investments | (.09) | — | ||
| Total Distributions | (1.18) | — | ||
| Net asset value, end of period | 8.13 | 13.70 | ||
| Total Return (%)c | (34.86) | 9.68d | ||
| Ratios/Supplemental Data (%): | ||||
| Ratio of total expenses to average net assets | 2.11 | 2.76e | ||
| Ratio of net expenses to average net assets | 1.63 | 1.73e | ||
| Ratio of net investment income | ||||
| (loss) to average net assets | (.05) | .09e | ||
| Portfolio Turnover Rate | 15.54 | 14.53d | ||
| Net Assets, end of period ($ x 1,000) | 18 | 174 | ||
| a | From December 29, 2006 (commencement of operations) to November 30, 2007. | |
| b | Based on average shares outstanding at each month end. | |
| c | Exclusive of sales charge. | |
| d | Not annualized. | |
| e | Annualized. |
| See notes to financial statements. |
T h e F u n d 19
NOTES TO FINANCIAL STATEMENTS
NOTE 1—Significant Accounting Policies:
Global Stock Fund (the “fund”) is a separate diversified series of Strategic Funds, Inc. (the “Company”) which is registered under the Investment Company Act of 1940, as amended (the “Act”), as an open-end management investment company and operates as a series company currently offering seven series, including the fund.The fund’s investment objective is to pursue long-term total return.The Dreyfus Corporation (the “Manager” or “Dreyfus”), a wholly-owned subsidiary of The Bank of New York Mellon Corporation (“BNY Mellon”), serves as the fund’s investment adviser. Walter Scott & Partners Limited (“Walter Scott”), a subsidiary of BNY Mellon and an affiliate of Dreyfus, serves as the fund’s sub-investment adviser.
Effective July 1, 2008, BNY Mellon has reorganized and consolidated a number of its banking and trust company subsidiaries. As a result of the reorganization, any services previously provided to the fund by Mellon Bank, N.A. or Mellon Trust of New England, N.A. are now provided by The Bank of New York, which has changed its name to The Bank of New York Mellon.
MBSC Securities Corporation (the “Distributor”), a wholly-owned subsidiary of Dreyfus, is the distributor of the fund’s shares.The fund is authorized to issue 100 million shares of $.001 par value Common Stock in each of the following classes of shares: Class A, Class C, Class I and Class T. Class A and Class T shares are subject to a sales charge imposed at the time of purchase. Class C shares are subject to a contingent deferred sales charge (“CDSC”) on Class C shares redeemed within one year of purchase. Class I shares are sold at net asset value per share only to institutional investors. Other differences between the classes include the services offered to and the expenses borne by each class, the allocation of certain transfer agency costs and certain voting rights. Income, expenses (other than expenses attributable to a specific class), and realized and unrealized gains or losses on investments are allocated to each class of shares based on its relative net assets.
20
As of November 30, 2008, MBC Investments Corp., an indirect subsidiary of BNY Mellon, held 1,000 Class T shares of the fund.
The Company accounts separately for the assets, liabilities and operations of each series. Expenses directly attributable to each series are charged to that series’ operations; expenses which are applicable to all series are allocated among them on a pro rata basis.
The fund’s financial statements are prepared in accordance with U.S. generally accepted accounting principles, which may require the use of management estimates and assumptions. Actual results could differ from those estimates.
The fund enters into contracts that contain a variety of indemnifications. The fund’s maximum exposure under these arrangements is unknown.The fund does not anticipate recognizing any loss related to these arrangements.
(a) Portfolio valuation: Investments in securities are valued at the last sales price on the securities exchange or national securities market on which such securities are primarily traded. Securities listed on the National Market System for which market quotations are available are valued at the official closing price or, if there is no official closing price that day, at the last sales price. Securities not listed on an exchange or the national securities market, or securities for which there were no transactions, are valued at the average of the most recent bid and asked prices, except for open short positions, where the asked price is used for valuation purposes. Bid price is used when no asked price is available. Registered investment companies that are not traded on an exchange are valued at their net asset value. When market quotations or official closing prices are not readily available, or are determined not to reflect accurately fair value, such as when the value of a security has been significantly affected by events after the close of the exchange or market on which the security is principally traded (for example, a foreign exchange
T h e F u n d 21
| NOTES TO FINANCIAL STATEMENTS (continued) |
or market),but before the fund calculates its net asset value,the fund may value these investments at fair value as determined in accordance with the procedures approved by the Board of Directors. Fair valuing of securities may be determined with the assistance of a pricing service using calculations based on indices of domestic securities and other appropriate indicators, such as prices of relevant ADRs and futures contracts. For other securities that are fair valued by the Board of Directors, certain factors may be considered such as: fundamental analytical data, the nature and duration of restrictions on disposition, an evaluation of the forces that influence the market in which the securities are purchased and sold and public trading in similar securities of the issuer or comparable issuers. Financial futures are valued at the last sales price. Investments denominated in foreign currencies are translated to U.S. dollars at the prevailing rates of exchange. Forward currency exchange contracts are valued at the forward rate.
The fund adopted Statement of Financial Accounting Standards No. 157 “FairValue Measurements” (“FAS 157”). FAS 157 establishes an authoritative definition of fair value, sets out a framework for measuring fair value, and requires additional disclosures about fair-value measurements.
Various inputs are used in determining the value of the fund’s investments relating to FAS 157.These inputs are summarized in the three broad levels listed below.
| Level 1—quoted prices in active markets for identical securities. |
| Level 2—other significant observable inputs (including quoted |
| prices for similar securities, interest rates, prepayment speeds, credit |
| risk, etc.) |
| Level 3—significant unobservable inputs (including the fund’s own |
| assumptions in determining the fair value of investments). |
The inputs or methodology used for valuing securities are not necessarily an indication of the risk associated with investing in those securities.
22
The following is a summary of the inputs used as of November 30, 2008 in valuing the fund’s investments carried at fair value:
| Investments in | Other Financial | |||
| Valuation Inputs | Securities ($) | Instruments ($)† | ||
| Level 1—Quoted Prices | 75,436,418 | 0 | ||
| Level 2—Other Significant | ||||
| Observable Inputs | 0 | 0 | ||
| Level 3—Significant | ||||
| Unobservable Inputs | 0 | 0 | ||
| Total | 75,436,418 | 0 |
| † | Other financial instruments include derivative instruments, such as futures, forward currency | |
| exchange contracts and swap contracts, which are valued at the unrealized appreciation | ||
| (depreciation) on the instrument. |
(b) Foreign currency transactions: The fund does not isolate that portion of the results of operations resulting from changes in foreign exchange rates on investments from the fluctuations arising from changes in market prices of securities held. Such fluctuations are included with the net realized and unrealized gains or losses on investments.
Net realized foreign exchange gains or losses arise from sales and maturities of short-term securities, sales of foreign currencies, currency gains or losses realized on securities transactions and the difference between the amounts of dividends, interest and foreign withholding taxes recorded on the fund’s books and the U.S. dollar equivalent of the amounts actually received or paid. Net unrealized foreign exchange gains or losses arise from changes in the value of assets and liabilities other than investments in securities, resulting from changes in exchange rates. Such gains and losses are included with net realized and unrealized gains or losses on investments.
(c) Securities transactions and investment income: Securities transactions are recorded on a trade date basis. Realized gains and losses from securities transactions are recorded on the identified cost basis.
| T h e F u n d 23 |
| NOTES TO FINANCIAL STATEMENTS (continued) |
Dividend income is recognized on the ex-dividend date and interest income, including, where applicable, accretion of discount and amortization of premium on investments, is recognized on the accrual basis.
The fund has arrangements with the custodian and cash management banks whereby the fund may receive earnings credits when positive cash balances are maintained, which are used to offset custody and cash management fees. For financial reporting purposes, the fund includes net earnings credits as an expense offset in the Statement of Operations.
Investing in foreign markets may involve special risks and considerations not typically associated with investing in the U.S. These risks include revaluation of currencies, high rates of inflation, repatriation restrictions on income and capital, and adverse political and economic developments. Moreover, securities issued in these markets may be less liquid, subject to government ownership controls, delayed settlements, and their prices may be more volatile than those of comparable securities in the U.S.
(d) Affiliated issuers: Investments in other investment companies advised by Dreyfus are defined as “affiliated” in the Act.
(e) Dividends to shareholders: Dividends are recorded on the ex-dividend date. Dividends from investment income-net and dividends from net realized capital gains, if any, are normally declared and paid annually, but the fund may make distributions on a more frequent basis to comply with the distribution requirements of the Internal Revenue Code of 1986, as amended (the “Code”).To the extent that net realized capital gains can be offset by capital loss carryovers, if any, it is the policy of the fund not to distribute such gains. Income and capital gains distributions are determined in accordance with income tax regulations, which may differ from U.S. generally accepted accounting principles.
(f) Federal income taxes: It is the policy of the fund to continue to qualify as a regulated investment company, if such qualification is in the best interests of its shareholders, by complying with the applicable provisions of the Code, and to make distributions of taxable income sufficient to relieve it from substantially all federal income and excise taxes.
24
The fund adopted Financial Accounting Standards Board (“FASB”) Interpretation No. 48 “Accounting for Uncertainty in Income Taxes” (“FIN 48”). FIN 48 provides guidance for how uncertain tax positions should be recognized, measured, presented and disclosed in the financial statements. FIN 48 requires the evaluation of tax positions taken or expected to be taken in the course of preparing the fund’s tax returns to determine whether the tax positions are “more-likely-than not” of being sustained by the applicable tax authority. Liability for tax positions not deemed to meet the more likely-than-not threshold would be recorded as a tax expense in the current year.The adoption of FIN 48 had no impact on the operations of the fund for the period ended November 30, 2008.
As of and during the period ended November 30, 2008, the fund did not have any liabilities for any unrecognized tax positions. The fund recognizes interest and penalties, if any, related to unrecognized tax positions as income tax expense in the Statement of Operations. During the period, the fund did not incur any interest or penalties.
Each of the tax years for the two-year period ended November 30, 2008 remains subject to examination by the Internal Revenue Service and state taxing authorities.
At November 30, 2008, the components of accumulated earnings on a tax basis were as follows: undistributed ordinary income $385,820, accumulated capital losses $955,153 and unrealized depreciation $27,453,386. In addition, the fund had $2,022,045 of capital losses realized after October 31, 2008, which were deferred for tax purposes to the first day of the following fiscal year.
The accumulated capital loss carryover is available for federal income tax purposes to be applied against future net securities profits, if any, realized subsequent to November 30, 2008. If not applied, the carryover expires in fiscal 2016.
The tax character of distributions paid to shareholders during the fiscal period ended November 30, 2008 was as follows: ordinary income $242,462.
T h e F u n d 25
| NOTES TO FINANCIAL STATEMENTS (continued) |
During the period ended November 30, 2008, as a result of permanent book to tax differences, primarily due to the tax treatment for foreign currency gains and losses and dividend reclassification, the fund decreased accumulated undistributed investment income-net by $16,753 and increased accumulated net realized gain (loss) on investments by the same amount. Net assets and net asset value per share were not affected by this reclassification.
NOTE 2—Bank Lines of Credit:
Prior to October 15, 2008, the fund participated with other Dreyfus managed funds in a $350 million redemption credit facility. Effective October 15, 2008, the fund participates with other Dreyfus-managed funds in a $145 million redemption credit facility (the “Facility”) to be utilized for temporary or emergency purposes, including the financing of redemptions. In connection therewith, the fund has agreed to pay commitment fees on its pro rata portion of the Facility. Interest is charged to the fund based on prevailing market rates in effect at the time of borrowing. During the period ended November 30, 2008, the fund did not borrow under either Facility.
NOTE 3—Management Fee, Sub-Investment Advisory Fees and Other Transactions With Affiliates:
(a) Pursuant to a management agreement (“Agreement”) with Dreyfus, the management fee is computed at the annual rate of .85% of the value of the fund’s average daily net assets and is payable monthly. Dreyfus has contractually agreed, until April 1, 2010, to waive receipt of its fees and/or assume the expenses of the fund so that annual fund operating expenses (excluding Rule 12b-1 fees, shareholder services fees, taxes, interest, brokerage commissions, commitment fees on borrowings and extraordinary expenses) do not exceed 1.25% of the value of the fund’s average daily net assets.The reduction in management fee, pursuant to the undertaking, amounted to $18,395 during the period ended November 30, 2008.
26
During the period ended November 30, 2008, the Distributor retained $946 from commissions earned on sales of the fund’s Class A shares.
Pursuant to a Sub-Investment Advisory Agreement between Dreyfus and Walter Scott, Dreyfus pays Walter Scott a monthly fee at an annual percentage of the fund’s average daily net assets.
(b) Under the Distribution Plan (the “Plan”) adopted pursuant to Rule 12b-1 under the Act, Class C and Class T shares pay the Distributor for distributing their shares at an annual rate of .75% of the value of the average daily net assets of Class C shares and .25% of the value of the average daily net assets of Class T shares. During the period ended November 30, 2008, Class C and Class T shares were charged $6,788 and $95, respectively, pursuant to the Plan.
(c) Under the Shareholder Services Plan, Class A, Class C and Class T shares pay the Distributor at an annual rate of .25% of the value of their average daily net assets for the provision of certain services.The services provided may include personal services relating to shareholder accounts, such as answering shareholder inquiries regarding Class A, Class C and Class T shares and providing reports and other information, and services related to the maintenance of shareholder accounts. The Distributor may make payments to Service Agents (a securities dealer, financial institution or other industry professional) in respect of these services.The Distributor determines the amounts to be paid to Service Agents. During the period ended November 30, 2008, Class A, Class C and Class T shares were charged $9,795, $2,263 and $95, respectively, pursuant to the Shareholder Services Plan.
The fund compensates Dreyfus Transfer, Inc., a wholly-owned subsidiary of Dreyfus, under a transfer agency agreement for providing personnel and facilities to perform transfer agency services for the fund. During the period ended November 30, 2008, the fund was charged $2,305 pursuant to the transfer agency agreement.
| T h e F u n d 27 |
| NOTES TO FINANCIAL STATEMENTS (continued) |
The fund compensates The Bank of New York Mellon, a subsidiary of BNY Mellon and an affiliate of Dreyfus, under a cash management agreement for performing cash management services related to fund subscriptions and redemptions. During the period ended November 30, 2008, the fund was charged $209 pursuant to the cash management agreement.
The fund compensates The Bank of New York Mellon under a custody agreement for providing custodial services for the fund. During the period ended November 30, 2008, the fund was charged $44,258 pursuant to the custody agreement.
During the period ended November 30, 2008, the fund was charged $6,086 for services performed by the Chief Compliance Officer.
The components of “Due to The Dreyfus Corporation and affiliates” in the Statement of Assets and Liabilities consist of: management fees $55,022, Rule 12b-1 distribution plan fees $432, shareholder services plan fees $841, custodian fees $24,494, chief compliance officer fees $2,466 and transfer agency per account fees $318.
(d) Each Board member also serves as a Board member of other funds within the Dreyfus complex. Annual retainer fees and attendance fees are allocated to each fund based on net assets.
NOTE 4—Securities Transactions:
The aggregate amount of purchases and sales of investment securities, excluding short-term securities and forward currency exchange contracts, during the period ended November 30, 2008, amounted to $90,896,535 and $7,717,258, respectively.
The fund enters into forward currency exchange contracts in order to hedge its exposure to changes in foreign currency exchange rates on its foreign portfolio holdings and to settle foreign currency transactions. When executing forward currency exchange contracts, the
28
fund is obligated to buy or sell a foreign currency at a specified rate on a certain date in the future.With respect to sales of forward currency exchange contracts, the fund would incur a loss if the value of the contract increases between the date the forward contract is opened and the date the forward contract is closed.The fund realizes a gain if the value of the contract decreases between those dates.With respect to purchases of forward currency exchange contracts, the fund would incur a loss if the value of the contract decreases between the date the forward contract is opened and the date the forward contract is closed.The fund realizes a gain if the value of the contract increases between those dates.The fund is also exposed to credit risk associated with counterparty nonperformance on these forward currency exchange contracts which is typically limited to the unrealized gain on each open contract.At November 30, 2008, there were no forward currency exchange contracts outstanding.
At November 30, 2008, the cost of investments for federal income tax purposes was $102,895,062; accordingly, accumulated net unrealized depreciation on investments was $27,458,644, consisting of $225,898 gross unrealized appreciation and $27,684,542 gross unrealized depreciation.
In March 2008, the FASB released Statement of Financial Accounting Standards No. 161 “Disclosures about Derivative Instruments and Hedging Activities” (“FAS 161”). FAS 161 requires qualitative disclosures about objectives and strategies for using derivatives, quantitative disclosures about fair value amounts of gains and losses on derivative instruments and disclosures about credit-risk-related contingent features in derivative agreements.The application of FAS 161 is required for fiscal years and interim periods beginning after November 15, 2008. At this time, management is evaluating the implications of FAS 161 and its impact on the financial statements and the accompanying notes has not yet been determined.
| T h e F u n d 29 |
| NOTES TO FINANCIAL STATEMENTS (continued) |
NOTE 5—Subsequent Event:
Effective on or about February 4, 2009 (the “Effective Date”), the fund will issue to each holder of its Class T shares, in exchange for said shares, Class A shares of the fund having an aggregate net asset value equal to the aggregate net asset value of the shareholder’s Class T shares.Thereafter, the fund will no longer offer Class T shares.
Effective on or about December 3, 2008, no investments for new accounts were permitted in Class T of the fund, except that participants in certain group retirement plans were able to open a new account in Class T of the fund, provided that the fund was established as an investment option under the plans before December 3, 2008. After the Effective Date, subsequent investments in the fund’s Class A shares made by holders of the fund’s Class T shares who received Class A shares of the fund in exchange for their Class T shares will be subject to the front-end sales load schedule currently in effect for Class T shares. Otherwise, all other Class A share attributes will be in effect.
30
REPORT OF INDEPENDENT REGISTERED PUBLIC ACCOUNTING FIRM
| Shareholders and Board of Directors Global Stock Fund |
We have audited the accompanying statement of assets and liabilities, including the statement of investments, of Global Stock Fund (one of the series comprising Strategic Funds, Inc.) as of November 30, 2008, and the related statement of operations for the year then ended and the statement of changes in net assets and financial highlights for each of the periods indicated therein.These financial statements and financial highlights are the responsibility of the Fund’s management. Our responsibility is to express an opinion on these financial statements and financial highlights based on our audits.
We conducted our audits in accordance with the standards of the Public Company Accounting Oversight Board (United States).Those standards require that we plan and perform the audit to obtain reasonable assurance about whether the financial statements and financial highlights are free of material misstatement.We were not engaged to perform an audit of the Fund’s internal control over financial reporting.Our audits included consideration of internal control over financial reporting as a basis for designing audit procedures that are appropriate in the circumstances,but not for the purpose of expressing an opinion on the effectiveness of the Fund’s internal control over financial reporting.Accordingly, we express no such opinion.An audit also includes examining, on a test basis, evidence supporting the amounts and disclosures in the financial statements and financial highlights, assessing the accounting principles used and significant estimates made by management, and evaluating the overall financial statement presentation. Our procedures included confirmation of securities owned as of November 30, 2008 by correspondence with the custodian. We believe that our audits provide a reasonable basis for our opinion.
In our opinion, the financial statements and financial highlights referred to above present fairly, in all material respects, the financial position of Global Stock Fund at November 30, 2008, the results of its operations for the year then ended and the changes in its net assets and the financial highlights for each of the indicated periods, in conformity with U. S. generally accepted accounting principles.

| New York, New York January 22, 2009 |
T h e F u n d 31
IMPORTANT TAX INFORMATION (Unaudited)
In accordance with federal tax law, the fund elects to provide each shareholder with their portion of the fund’s foreign taxes paid and the income sourced from foreign countries. Accordingly, the fund hereby makes the following designations regarding its fiscal year ended November 30, 2008:
—the total amount of taxes paid to foreign countries was $45,873
—the total amount of income sourced from foreign countries was $322,831.
As required by federal tax law rules, shareholders will receive notification of their proportionate share of foreign taxes paid and foreign sourced income for the 2008 calendar year with Form 1099-DIV which will be mailed by January 31, 2009.
For the fiscal year ended November 30, 2008, certain dividends paid by the fund may be subject to a maximum tax rate of 15%, as provided for by the Jobs and Growth Tax Relief Reconciliation Act of 2003. Of the distributions paid during the fiscal year, $197,232 represents the maximum amount that may be considered qualified dividend income. Also, the fund hereby designates $.0740 per share as a short-term capital gain distribution paid on December 28, 2007 and also designates $.0170 per share as a short-term capital gain distribution paid on March 28, 2008.
32
| INFORMATION ABOUT THE REVIEW AND APPROVAL OF THE FUND’S MANAGEMENT AGREEMENT (Unaudited) |
At a meeting of the fund’s Board of Directors held on November 10-11, 2008, the Board considered the re-approval for an annual period of the fund’s Management Agreement, pursuant to which the Manager provides the fund with investment advisory and administrative services, and of the Manager’s Sub-Investment Advisory Agreement with Walter Scott & Partners Limited (“Walter Scott”), pursuant to which Walter Scott serves as sub-investment adviser and provides day-to-day management of the fund’s portfolio. The Board members, none of whom are “interested persons” (as defined in the Investment Company Act of 1940, as amended) of the fund, were assisted in their review by independent legal counsel and met with counsel in executive session separate from representatives of the Manager.
Analysis of Nature, Extent, and Quality of Services Provided to the Fund.The Board members considered information previously provided to them in a presentation from representatives of the Manager regarding services provided to the fund and other funds in the Dreyfus complex, and representatives of the Manager confirmed that there had been no material changes in the information. The Board also discussed the nature, extent, and quality of the services provided to the fund pursuant to the fund’s Management Agreement, and by Walter Scott pursuant to the Sub-Investment Advisory Agreement. The Manager’s representatives reviewed the fund’s distribution of accounts and the relationships the Manager has with various intermediaries and the different needs of each.The Manager’s representatives noted the diversity of distribution of the fund as well as among the funds in the Dreyfus fund complex, and the Manager’s corresponding need for broad, deep, and diverse resources to be able to provide ongoing shareholder services to each of the fund’s distribution channels.The Board also reviewed the number of shareholder accounts in the fund, as well as the fund’s asset size.
The Board members also considered the Manager’s and Walter Scott’s research and portfolio management capabilities and that the Manager also provides oversight of day-to-day fund operations, including fund accounting and administration and assistance in meeting legal and regulatory requirements.The Board members also considered the Manager’s
T h e F u n d 33
| INFORMATION ABOUT THE REVIEW AND APPROVAL OF THE FUND’S MANAGEMENT AGREEMENT (Unaudited) (continued) |
extensive administrative, accounting, and compliance infrastructure, as well as the Manager’s supervisory activities over Walter Scott.
Comparative Analysis of the Fund’s Management Fee and Expense Ratio and Performance. The Board members reviewed reports prepared by Lipper, Inc., an independent provider of investment company data, which included information comparing the fund’s management fee and expense ratio with a group of comparable funds (the “Expense Group”) and with a broader group of funds (the “Expense Universe”) that were selected by Lipper. Included in these reports were comparisons of contractual and actual management fee rates and total operating expenses.
The Board members also reviewed the reports prepared by Lipper that presented the fund’s performance for various periods ended August 31, 2008, and comparisons of total return performance for the fund to the same group of funds as the Expense Group (the “Performance Group”) and to a group of funds that was broader than the Expense Universe (the “Performance Universe”) that also were selected by Lipper. The Manager previously had furnished the Board with a description of the methodology Lipper used to select the fund’s Expense Group and Expense Universe, and Performance Group and Performance Universe.
The Board reviewed the results of the Expense Group and Expense Universe comparisons that were prepared based on financial statements currently available to Lipper as of August 31, 2008.The Board reviewed the range of management fees and expense ratios of the funds in the Expense Group and Expense Universe, and noted that the fund’s contractual management fee was lower than the Expense Group median, and that the fund’s actual management fee was lower that the Expense Group and Expense Universe medians.The Board also noted that the fund’s total expense ratio was lower than the Expense Group median and higher than the Expense Universe median.
With respect to the fund’s performance, the Board noted that the fund was the top ranked fund for total return in the Performance Group, and ranked in the top decile for total return in the Performance
34
Universe, for the reported 1-year period. The Board noted that the fund commenced operations in December 2006.
Representatives of the Manager reviewed with the Board members the fee paid to the Manager or its affiliates by the one mutual fund managed by the Manager or its affiliates that was reported in the same Lipper category as the fund (the “Similar Fund”), and explained the nature of the Similar Fund and any differences, from the Manager’s perspective, in providing services to the Similar Fund as compared to the fund. The Manager’s representatives also reviewed the costs associated with distribution through intermediaries. The Board analyzed differences in fees paid to the Manager and discussed the relationship of the management fees paid in light of the services provided.The Board members considered the relevance of the fee information provided for the Similar Fund, to evaluate the appropriateness and reasonableness of the fund’s management fee. Representatives of the Manager noted that there were no similarly managed institutional separate accounts or wrap fee accounts managed by the Manager or Walter Scott, or any other Dreyfus affiliate with similar investment objectives, policies, and strategies as the fund.
Analysis of Profitability and Economies of Scale. The Manager’s representatives reviewed the dollar amount of expenses allocated and profit received by the Manager and the method used to determine such expenses and profit. The Board considered information, previously provided and discussed, prepared by an independent consulting firm regarding the Manager’s approach to allocating costs to, and determining the profitability of, individual funds and the entire Dreyfus mutual fund complex. The Board members also considered that the methodology had also been reviewed by an independent registered public accounting firm which, like the consultant, found the methodology to be reasonable. The consulting firm also analyzed where any economies of scale might emerge in connection with the management of the fund.The Board members evaluated the profitability analysis in light of the relevant circumstances for the fund, includ-
| T h e F u n d 35 |
| INFORMATION ABOUT THE REVIEW AND APPROVAL OF THE FUND’S MANAGEMENT AGREEMENT (Unaudited) (continued) |
ing the change in the fund’s asset size from the prior year, and the extent to which economies of scale would be realized if the fund grows and whether fee levels reflect these economies of scale for the benefit of fund shareholders. The Board members also considered potential benefits to the Manager and Walter Scott from acting as investment adviser and sub-investment adviser to the fund, respectively, and noted the soft dollar arrangements in effect with respect to trading the fund’s portfolio.
It was noted that the Board members should consider the Manager’s profitability with respect to the fund as part of their evaluation of whether the fees under the Management Agreement bear a reasonable relationship to the mix of services provided by the Manager, including the nature, extent, and quality of such services and that a discussion of economies of scale is predicated on increasing assets and that, if a fund’s assets had been decreasing, the possibility that the Manager may have realized any economies of scale would be less. Since the Manager, and not the fund, pays Walter Scott the sub-advisory fee, the Board did not consider Walter Scott’s profitability to be relevant to its deliberations. It was noted that the profitability percentage for managing the fund was within the range determined by appropriate court cases to be reasonable given the services rendered and that the profitability percentage for managing the fund was reasonable given the generally superior service levels provided.
At the conclusion of these discussions, the Board agreed that it had been furnished with sufficient information to make an informed business decision with respect to continuation of the fund’s Management Agreement. Based on the discussions and considerations as described above, the Board reached the following conclusions and determinations.
- The Board concluded that the nature, extent, and quality of the ser- vices provided by the Manager and Walter Scott are adequate and appropriate.
- The Board was satisfied with the fund’s performance.
36
- The Board concluded that the fee paid to the Manager by the fund was reasonable in light of the services provided, comparative perfor- mance and expense and management fee information, costs of the services provided, and profits to be realized and benefits derived or to be derived by the Manager or Walter Scott from its relationship with the fund.
- The Board determined that the economies of scale which may accrue to the Manager and its affiliates in connection with the management of the fund had been adequately considered by the Manager in con- nection with the management fee rate charged to the fund, and that, to the extent in the future it were to be determined that material economies of scale had not been shared with the fund, the Board would seek to have those economies of scale shared with the fund.
The Board members considered these conclusions and determinations, along with the information received on a routine and regular basis throughout the year, and, without any one factor being dispositive, the Board determined that re-approval of the fund’s Management Agreement, and Sub-Investment Advisory Agreement with Walter Scott, was in the best interests of the fund and its shareholders.
| T h e F u n d 37 |
38
| T h e F u n d 39 |
Once elected all Board Members serve for an indefinite term, but achieve Emeritus status upon reaching age 80.The address of the Board Members and Officers is in c/o The Dreyfus Corporation, 200 Park Avenue, NewYork, NewYork 10166.Additional information about the Board Members is available in the fund’s Statement of Additional Information which can be obtained from Dreyfus free of charge by calling this toll free number: 1-800-554-4611.
Arnold S. Hiatt, Emeritus Board Member
40
OFFICERS OF THE FUND (Unaudited)
J. DAVID OFFICER, President since December 2006.
Chief Operating Officer,Vice Chairman and a Director of the Manager, and an officer of 77 investment companies (comprised of 180 portfolios) managed by the Manager. He is 60 years old and has been an employee of the Manager since April 1998.
PHILLIP N. MAISANO, Executive Vice President since July 2007.
Chief Investment Officer,Vice Chair and a director of the Manager, and an officer of 77 investment companies (comprised of 180 portfolios) managed by the Manager. Mr. Maisano also is an officer and/or Board member of certain other investment management subsidiaries of The Bank of New York Mellon Corporation, each of which is an affiliate of the Manager. He is 61 years old and has been an employee of the Manager since November 2006. Prior to joining the Manager, Mr. Maisano served as Chairman and Chief Executive Officer of EACM Advisors, an affiliate of the Manager, since August 2004, and served as Chief Executive Officer of Evaluation Associates, a leading institutional investment consulting firm, from 1988 until 2004.
MICHAEL A. ROSENBERG, Vice President and Secretary since August 2005.
Assistant General Counsel of BNY Mellon, and an officer of 78 investment companies (comprised of 201 portfolios) managed by the Manager. He is 48 years old and has been an employee of the Manager since October 1991.
JAMES BITETTO, Vice President and Assistant Secretary since August 2005.
Senior Counsel of BNY Mellon and Secretary of the Manager, and an officer of 78 investment companies (comprised of 201 portfolios) managed by the Manager. He is 42 years old and has been an employee of the Manager since December 1996.
JONI LACKS CHARATAN, Vice President and Assistant Secretary since August 2005.
Senior Counsel of BNY Mellon, and an officer of 78 investment companies (comprised of 201 portfolios) managed by the Manager. She is 53 years old and has been an employee of the Manager since October 1988.
JOSEPH M. CHIOFFI, Vice President and Assistant Secretary since August 2005.
Senior Counsel of BNY Mellon, and an officer of 78 investment companies (comprised of 201 portfolios) managed by the Manager. He is 47 years old and has been an employee of the Manager since June 2000.
JANETTE E. FARRAGHER, Vice President and Assistant Secretary since August 2005.
Assistant General Counsel of BNY Mellon, and an officer of 78 investment companies (comprised of 201 portfolios) managed by the Manager. She is 46 years old and has been an employee of the Manager since February 1984.
JOHN B. HAMMALIAN, Vice President and Assistant Secretary since August 2005.
Managing Counsel of BNY Mellon, and an officer of 78 investment companies (comprised of 201 portfolios) managed by the Manager. He is 45 years old and has been an employee of the Manager since February 1991.
ROBERT R. MULLERY, Vice President and Assistant Secretary since August 2005.
Managing Counsel of BNY Mellon, and an officer of 78 investment companies (comprised of 201 portfolios) managed by the Manager. He is 56 years old and has been an employee of the Manager since May 1986.
| T h e F u n d 41 |
OFFICERS OF THE FUND (Unaudited) (continued)
JEFF PRUSNOFSKY, Vice President and Assistant Secretary since August 2005.
Managing Counsel of BNY Mellon, and an officer of 78 investment companies (comprised of 201 portfolios) managed by the Manager. He is 43 years old and has been an employee of the Manager since October 1990.
JAMES WINDELS, Treasurer since November 2001.
Director – Mutual Fund Accounting of the Manager, and an officer of 78 investment companies (comprised of 201 portfolios) managed by the Manager. He is 49 years old and has been an employee of the Manager since April 1985.
RICHARD CASSARO, Assistant Treasurer since January 2008.
Senior Accounting Manager – Money Market and Municipal Bond Funds of the Manager, and an officer of 78 investment companies (comprised of 201 portfolios) managed by the Manager. He is 49 years old and has been an employee of the Manager since September 1982.
GAVIN C. REILLY, Assistant Treasurer since December 2005.
Tax Manager of the Investment Accounting and Support Department of the Manager, and an officer of 78 investment companies (comprised of 201 portfolios) managed by the Manager. He is 40 years old and has been an employee of the Manager since April 1991.
ROBERT ROBOL, Assistant Treasurer since August 2005.
Senior Accounting Manager – Fixed Income Funds of the Manager, and an officer of 78 investment companies (comprised of 201 portfolios) managed by the Manager. He is 44 years old and has been an employee of the Manager since October 1988.
ROBERT SALVIOLO, Assistant Treasurer since July 2007.
Senior Accounting Manager – Equity Funds of the Manager, and an officer of 78 investment companies (comprised of 201 portfolios) managed by the Manager. He is 41 years old and has been an employee of the Manager since June 1989.
ROBERT SVAGNA, Assistant Treasurer since December 2002.
Senior Accounting Manager – Equity Funds of the Manager, and an officer of 78 investment companies (comprised of 201 portfolios) managed by the Manager. He is 41 years old and has been an employee of the Manager since November 1990.
JOSEPH W. CONNOLLY, Chief Compliance Officer since October 2004.
Chief Compliance Officer of the Manager and The Dreyfus Family of Funds (78 investment companies, comprised of 201 portfolios). From November 2001 through March 2004, Mr. Connolly was first Vice-President, Mutual Fund Servicing for Mellon Global Securities Services. In that capacity, Mr. Connolly was responsible for managing Mellon’s Custody, Fund Accounting and Fund Administration services to third-party mutual fund clients. He is 51 years old and has served in various capacities with the Manager since 1980, including manager of the firm’s Fund Accounting Department from 1997 through October 2001.
WILLIAM GERMENIS, Anti-Money Laundering Compliance Officer since September 2002.
Vice President and Anti-Money Laundering Compliance Officer of the Distributor, and the Anti-Money Laundering Compliance Officer of 74 investment companies (comprised of 197 portfolios) managed by the Manager. He is 38 years old and has been an employee of the Distributor since October 1998.
42
NOTES
For More Information
Telephone Call your financial representative or 1-800-554-4611
Mail The Dreyfus Family of Funds, 144 Glenn Curtiss Boulevard, Uniondale, NY 11556-0144
The fund files its complete schedule of portfolio holdings with the Securities and Exchange Commission (“SEC”) for the first and third quarters of each fiscal year on Form N-Q. The fund’s Forms N-Q are available on the SEC’s website at http://www.sec.gov and may be reviewed and copied at the SEC’s Public Reference Room in Washington, DC. Information on the operation of the Public Reference Room may be obtained by calling 1-800-SEC-0330.
A description of the policies and procedures that the fund uses to determine how to vote proxies relating to portfolio securities, and information regarding how the fund voted these proxies for the 12-month period ended June 30, 2008, is available at http://www.dreyfus.com and on the SEC’s website at http://www.sec.gov. The description of the policies and procedures is also available without charge, upon request, by calling 1-800-645-6561.

Save time. Save paper. View your next shareholder report online as soon as it’s available. Log into www.dreyfus.com and sign up for Dreyfus eCommunications. It’s simple and only takes a few minutes.
The views expressed in this report reflect those of the portfolio manager only through the end of the period covered and do not necessarily represent the views of Dreyfus or any other person in the Dreyfus organization. Any such views are subject to change at any time based upon market or other conditions and Dreyfus disclaims any responsibility to update such views.These views may not be relied on as investment advice and, because investment decisions for a Dreyfus fund are based on numerous factors, may not be relied on as an indication of trading intent on behalf of any Dreyfus fund.

| Contents | |
| THE FUND | |
| 2 | A Letter from the CEO |
| 3 | Discussion of Fund Performance |
| 6 | Fund Performance |
| 8 | Understanding Your Fund’s Expenses |
| 8 | Comparing Your Fund’s Expenses With Those of Other Funds |
| 9 | Statement of Investments |
| 12 | Statement of Assets and Liabilities |
| 13 | Statement of Operations |
| 14 | Statement of Changes in Net Assets |
| 16 | Financial Highlights |
| 20 | Notes to Financial Statements |
| 31 | Report of Independent Registered Public Accounting Firm |
| 32 | Important Tax Information |
| 33 | Information About the Review and Approval of the Fund’s Management Agreement |
| 37 | Board Members Information |
| 40 | Officers of the Fund |
| FOR MORE INFORMATION | |
| Back Cover | |
The Fund
| International Stock Fund |

| A LETTER FROM THE CEO Dear Shareholder: |
We present to you this annual report for International Stock Fund, covering the 12-month period from December 1, 2007, through November 30, 2008.
The global economy suffered during the reporting period amid a financial crisis that sparked sharp declines in virtually all sectors, regions and capitalization ranges of the international stock markets.According to our Chief Economist, the combination of export-dependent growth in overseas markets and a rising U.S. debt burden proved to be unsustainable. Other contributors to the downturn included sharp declines in many countries’ home prices; excessive leverage among financial institutions, especially investment banks; and regulatory policies and behaviors that exacerbated financial stresses.Various governments and central banks have responded with massive interventions, including nationalizing some troubled financial institutions, providing loans to others and guaranteeing certain financial instruments. However, the global financial system remains fragile, and economic weakness is likely to persist.
In our view, today’s investment environment is rife with near-term challenges and long-term opportunities. Now more than ever, it is important to ensure that your investments are aligned with your current needs, future goals and attitudes toward risk.We urge you to speak regularly with your financial advisor, who can recommend the course of action that is right for you.
For information about how the fund performed during the reporting period, as well as market perspectives, we have provided a Discussion of Fund Performance given by the fund’s Portfolio Manager.
Thank you for your continued confidence and support.
| Jonathan R. Baum Chief Executive Officer The Dreyfus Corporation |
| December 15, 2008 |
| 2 |

DISCUSSION OF FUND PERFORMANCE
For the period of December 1, 2007, through November 30, 2008, as provided by Walter Scott & Partners Limited (Walter Scott), Sub-adviser
Fund and Market Performance Overview
For the 12-month period ended November 30, 2008, International Stock Fund’s Class A shares produced a return of –38.07%, Class C shares returned –38.58%, Class I shares returned –37.82% and Class T shares returned –38.25% .1 In comparison, the fund’s benchmark index, the Morgan Stanley Capital International Europe, Australasia, Far East Index (the “MSCI EAFE Index”), produced a –47.79% return over the same period.2
Stock markets throughout the world declined sharply over the second half of the reporting period when a global economic slowdown and financial crisis intensified.Although the fund also declined, it produced higher returns than its benchmark, primarily due to strong individual stock selections across a variety of market sectors.
The Fund’s Investment Approach
The fund seeks long-term total return by investing in stocks of companies with any market capitalization that are located in the world’s developed markets outside of the United States.When selecting stocks,Walter Scott seeks companies with fundamental strengths that indicate the potential for sustainable growth. The firm focuses on individual stock selection through extensive fundamental research. Walter Scott first selects candidates for investment that meet certain broad absolute and trend criteria. Financial statements are restated in an effort to identify the nature of their operating margins and to understand the variables that add value to their businesses. Companies meeting the financial criteria are subjected to a detailed investigation of their products, costs and pricing, competition, industry position and outlook. Stocks are then selected whose expected growth rate is available at a reasonable valuation.
| The Fund 3 |
| DISCUSSION OF FUND PERFORMANCE (continued) |
Financial Crisis and Economic Slowdown Intensified
A credit crisis that began in 2007 mushroomed over the summer of 2008, nearly leading to the collapse of the global banking system. Major financial institutions that had been hit hard by losses in credit markets teetered on the edge of insolvency, causing some to be nationalized and others to receive massive capital infusions from their governments.As the situation worsened, banks and other lenders became increasingly risk-averse, refraining from lending to even their most trusted customers. Investors also grew more cautious,flocking to the traditional safe havens of the sovereign debt of industrialized nations.Conversely,investors fled asset classes they considered risky, including global equities, and stock prices fell precipitously over the reporting period’s final months.
Meanwhile, the global economy slowed, led by declining housing prices and rising unemployment in the United States and Europe. International markets that depend heavily on exports to U.S. and European consumers were adversely affected, reducing the earnings outlook for businesses in most regions. In addition, previously soaring commodity prices, including energy, fell sharply as demand waned. Finally,Walter Scott began to see an acceleration of a longstanding shift in economic leadership from the United States and Europe to emerging markets in the Pacific Rim, most notably China.These concurrent developments produced the most extreme market volatility in decades.
Bottom-Up Process Fared Relatively Well
In this highly challenging environment, the bottom-up security selection process led the firm to a number of conservative growth companies that, in Walter Scott’s analysis, are well positioned to weather the current storm and prosper during an eventual recovery. Some of these opportunities were found among global companies based in Japan and Hong Kong, which produced some of the fund’s better individual performers over the reporting period.
For example, Hong Kong utility CLP Holdings benefited from strength early in the reporting period when commodity prices soared to record highs.Investments in Japanese health care company Eisai and information technology firm Advantest benefited from fortunate timing in the sale of
4
the fund’s positions in November.Also in Japan,DaitoTrust Construction held up relatively well despite the global economic slump, and drug developer Astellas Pharma declined less than market averages on the strength of a favorable U.S. regulatory response to a new product.
As is to be expected in such a difficult market climate, the fund also suffered disappointments. China National Offshore Oil Corporation (CNOOC), Australia’s Woodside Petroleum and Canada’s Suncor Energy fell sharply when oil prices retreated from more than $145 per barrel to less than $50 per barrel. Hong Kong-based industrial conglomerate Hutchison Whampoa was hurt by the effects of the global economic downturn. French luxury goods purveyor LVMH Moët Hennessy Louis Vuitton encountered concerns regarding a sharp reduction in consumer spending on its premium brands.
Finding Opportunities in Turbulent Markets
Although the financial crisis has persisted and the global economic slowdown has intensified, the bottom-up security selection process has continued to identify what the firm believes to be fundamentally sound companies selling at historically attractive valuations. As international equities sold off indiscriminately, great businesses with strong long-term prospects for growth have become more inexpensive, signaling potential opportunities for investors with the patience and discipline to wait for an eventual economic and market recovery.
December 15, 2008
| 1 | Total return includes reinvestment of dividends and any capital gains paid, and does not take into | |
| consideration the maximum initial sales charges in the case of Class A and Class T shares, or the | ||
| applicable contingent deferred sales charge imposed on redemptions in the case of Class C shares. | ||
| Had these charges been reflected, returns would have been lower. Past performance is no guarantee | ||
| of future results. Share price and investment return fluctuate such that upon redemption, fund | ||
| shares may be worth more or less than their original cost. Return figures provided reflect the | ||
| absorption of certain fund expenses by The Dreyfus Corporation pursuant to an undertaking in | ||
| effect through April 1, 2010, at which time it may be extended, terminated or modified. Had | ||
| these expenses not been absorbed, the fund’s returns would have been lower. | ||
| 2 | SOURCE: LIPPER INC. – Reflects reinvestment of net dividends and, where applicable, | |
| capital gain distributions.The Morgan Stanley Capital International Europe, Australasia, Far | ||
| East (MSCI EAFE) Index is an unmanaged index composed of a sample of companies | ||
| representative of the market structure of European and Pacific Basin countries. Returns are | ||
| calculated on a month-end basis. |
| The Fund 5 |
FUND PERFORMANCE
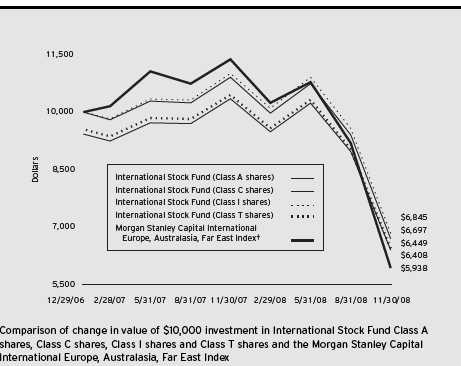
| † Source: Lipper Inc. |
| Past performance is not predictive of future performance. |
| The above graph compares a $10,000 investment made in Class A, Class C, Class I and Class T shares of |
| International Stock Fund on 12/29/06 (inception date) to a $10,000 investment made in the Morgan Stanley |
| Capital International Europe, Australasia, Far East Index (the “Index”) on that date. For comparative purposes, the |
| value of the Index on 12/31/06 is used as the beginning value on 12/29/06. All dividends and capital gain |
| distributions are reinvested. |
| The fund’s performance shown in the line graph takes into account the maximum initial sales charges on Class A |
| shares and Class T shares and all other applicable fees and expenses on all classes.The Index is an unmanaged, market |
| capitalization weighted index that is designed to measure the performance of publicly traded stocks issued by companies |
| in developed markets excluding the U.S. and Canada. Unlike a mutual fund, the Index is not subject to charges, fees |
| and other expenses. Investors cannot invest directly in any index. Further information relating to fund performance, |
| including expense reimbursements, if applicable, is contained in the Financial Highlights section of the prospectus and |
| elsewhere in this report. |
6
| Average Annual Total Returns as of 11/30/08 | ||||||
| Inception | From | |||||
| Date | 1 Year | Inception | ||||
| Class A shares | ||||||
| with maximum sales charge (5.75%) | 12/29/06 | (41.64)% | (20.69)% | |||
| without sales charge | 12/29/06 | (38.07)% | (18.21)% | |||
| Class C shares | ||||||
| with applicable redemption charge † | 12/29/06 | (39.19)% | (18.85)% | |||
| without redemption | 12/29/06 | (38.58)% | (18.85)% | |||
| Class I shares | 12/29/06 | (37.82)% | (17.92)% | |||
| Class T shares | ||||||
| with applicable sales charge (4.5%) | 12/29/06 | (41.01)% | (20.43)% | |||
| without sales charge | 12/29/06 | (38.25)% | (18.49)% | |||
| Past performance is not predictive of future performance.The fund’s performance shown in the graph and table does not |
| reflect the deduction of taxes that a shareholder would pay on fund distributions or the redemption of fund shares. |
| † The maximum contingent deferred sales charge for Class C shares is 1% for shares redeemed within one year of the |
| date of purchase. |
The Fund 7
UNDERSTANDING YOUR FUND’S EXPENSES (Unaudited)
As a mutual fund investor, you pay ongoing expenses, such as management fees and other expenses. Using the information below, you can estimate how these expenses affect your investment and compare them with the expenses of other funds.You also may pay one-time transaction expenses, including sales charges (loads) and redemption fees, which are not shown in this section and would have resulted in higher total expenses. For more information, see your fund’s prospectus or talk to your financial adviser.
Review your fund’s expenses
The table below shows the expenses you would have paid on a $1,000 investment in International Stock Fund from June 1, 2008 to November 30, 2008. It also shows how much a $1,000 investment would be worth at the close of the period, assuming actual returns and expenses.
| Expenses and Value of a $1,000 Investment assuming actual returns for the six months ended November 30, 2008 |
| Class A | Class C | Class I | Class T | |||||
| Expenses paid per $1,000† | $ 5.73 | $ 9.01 | $ 4.15 | $ 7.11 | ||||
| Ending value (after expenses) | $626.30 | $623.70 | $627.90 | $625.20 |
| COMPARING YOUR FUND’S EXPENSES WITH THOSE OF OTHER FUNDS (Unaudited) |
Using the SEC’s method to compare expenses
The Securities and Exchange Commission (SEC) has established guidelines to help investors assess fund expenses. Per these guidelines, the table below shows your fund’s expenses based on a $1,000 investment, assuming a hypothetical 5% annualized return. You can use this information to compare the ongoing expenses (but not transaction expenses or total cost) of investing in the fund with those of other funds.All mutual fund shareholder reports will provide this information to help you make this comparison. Please note that you cannot use this information to estimate your actual ending account balance and expenses paid during the period.
| Expenses and Value of a $1,000 Investment assuming a hypothetical 5% annualized return for the six months ended November 30, 2008 |
| Class A | Class C | Class I | Class T | |||||
| Expenses paid per $1,000† | $ 7.11 | $ 11.18 | $ 5.15 | $ 8.82 | ||||
| Ending value (after expenses) | $1,017.95 | $1,013.90 | $1,019.90 | $1,016.25 |
| † Expenses are equal to the fund’s annualized expense ratio of 1.41% for Class A, 2.22% for Class C, 1.02% for |
| Class I and 1.75% for Class T, multiplied by the average account value over the period, multiplied by 183/366 (to |
| reflect the one-half year period). |
8
| STATEMENT OF INVESTMENTS November 30, 2008 |
| Common Stocks—99.4% | Shares | Value ($) | ||
| Australia—1.8% | ||||
| Woodside Petroleum | 91,181 | 2,155,657 | ||
| Belgium—2.1% | ||||
| Colruyt | 12,000 | 2,584,279 | ||
| Canada—1.6% | ||||
| Suncor Energy | 86,000 | 1,884,067 | ||
| France—8.9% | ||||
| Cie Generale d’Optique Essilor International | 60,000 | 2,397,058 | ||
| Groupe Danone | 55,000 | 3,163,711 | ||
| L’Oreal | 36,000 | 2,911,687 | ||
| LVMH Moet Hennessy Louis Vuitton | 40,000 | 2,265,560 | ||
| 10,738,016 | ||||
| Germany—3.9% | ||||
| Adidas | 73,000 | 2,268,584 | ||
| SAP | 73,000 | 2,489,321 | ||
| 4,757,905 | ||||
| Hong Kong—10.6% | ||||
| China Mobile | 320,000 | 2,935,704 | ||
| CLP Holdings | 345,000 | 2,448,356 | ||
| CNOOC | 3,200,000 | 2,580,612 | ||
| Hong Kong & China Gas | 1,470,550 | 2,618,494 | ||
| Hutchison Whampoa | 440,000 | 2,208,488 | ||
| 12,791,654 | ||||
| Japan—38.4% | ||||
| AEON Mall | 139,000 | 2,923,407 | ||
| Astellas Pharma | 87,000 | 3,541,174 | ||
| Canon | 97,000 | 2,867,270 | ||
| Chugai Pharmaceutical | 135,000 | 2,325,102 | ||
| Daikin Industries | 115,000 | 3,002,250 | ||
| Daito Trust Construction | 26,400 | 1,121,523 | ||
| Denso | 157,000 | 2,592,299 | ||
| Fanuc | 53,000 | 3,266,402 | ||
| Hirose Electric | 23,000 | 2,079,314 |
| The Fund 9 |
| STATEMENT OF INVESTMENTS (continued) |
| Common Stocks (continued) | Shares | Value ($) | ||
| Japan (continued) | ||||
| Honda Motor | 120,000 | 2,617,976 | ||
| HOYA | 190,000 | 2,727,634 | ||
| Keyence | 18,000 | 2,989,013 | ||
| Mitsubishi Estate | 172,000 | 2,555,614 | ||
| Secom | 63,000 | 2,920,268 | ||
| Shimamura | 13,600 | 1,037,397 | ||
| Shin-Etsu Chemical | 80,000 | 3,046,981 | ||
| Takeda Pharmaceutical | 76,000 | 3,666,004 | ||
| Tokio Marine Holdings | 51,000 | 1,235,377 | ||
| 46,515,005 | ||||
| Singapore—.7% | ||||
| DBS Group Holdings | 145,000 | 901,574 | ||
| Spain—2.7% | ||||
| Inditex | 96,000 | 3,207,765 | ||
| Sweden—3.5% | ||||
| Hennes & Mauritz, Cl. B | 61,000 | 2,236,604 | ||
| Telefonaktiebolaget LM Ericsson, Cl. B | 286,000 | 2,026,896 | ||
| 4,263,500 | ||||
| Switzerland—10.5% | ||||
| Nestle | 86,000 | 3,112,718 | ||
| Nobel Biocare Holding | 110,000 | 1,669,028 | ||
| Novartis | 72,000 | 3,350,906 | ||
| Roche Holding | 12,900 | 1,828,740 | ||
| SGS | 3,200 | 2,714,992 | ||
| 12,676,384 | ||||
| United Kingdom—14.7% | ||||
| BG Group | 195,000 | 2,759,066 | ||
| Burberry Group | 480,000 | 1,517,025 | ||
| Centrica | 680,000 | 2,473,317 |
10
| Common Stocks (continued) | Shares | Value ($) | ||
| United Kingdom (continued) | ||||
| Centrica (Rights) | 255,000 a | 290,209 | ||
| GlaxoSmithKline | 95,000 | 1,636,369 | ||
| Reckitt Benckiser Group | 76,000 | 3,227,154 | ||
| Tesco | 580,000 | 2,634,093 | ||
| WM Morrison Supermarkets | 860,000 | 3,207,376 | ||
| 17,744,609 | ||||
| Total Investments (cost $178,714,733) | 99.4% | 120,220,415 | ||
| Cash and Receivables (Net) | .6% | 772,180 | ||
| Net Assets | 100.0% | 120,992,595 | ||
| a Non-income producing security. | ||||
| Portfolio Summary (Unaudited)† | ||||||
| Value (%) | Value (%) | |||||
| Consumer Goods | 22.8 | Energy | 7.8 | |||
| Consumer Services | 17.2 | Energy Services | 6.5 | |||
| Health Care | 16.9 | Financial Services | 3.9 | |||
| Industrials | 14.2 | |||||
| Technology | 10.1 | 99.4 | ||||
| † Based on net assets. | ||||||
| See notes to financial statements. | ||||||
| The Fund 11 |
| STATEMENT OF ASSETS AND LIABILITIES November 30, 2008 |
| Cost | Value | |||
| Assets ($): | ||||
| Investments in securities—See Statement of Investments | 178,714,733 | 120,220,415 | ||
| Cash | 826,097 | |||
| Cash denominated in foreign currencies | 157,021 | 157,054 | ||
| Receivable for investment securities sold | 1,196,054 | |||
| Dividends receivable | 373,890 | |||
| Unrealized appreciation on forward | ||||
| currency exchange contracts—Note 4 | 5,785 | |||
| Receivable for shares of Common Stock subscribed | 400 | |||
| Prepaid expenses | 22,424 | |||
| 122,802,119 | ||||
| Liabilities ($): | ||||
| Due to The Dreyfus Corporation and affiliates—Note 3(c) | 120,434 | |||
| Bank loan payable—Note 2 | 1,400,000 | |||
| Payable for shares of Common Stock redeemed | 238,959 | |||
| Interest payable—Note 2 | 1,089 | |||
| Accrued expenses | 49,042 | |||
| 1,809,524 | ||||
| Net Assets ($) | 120,992,595 | |||
| Composition of Net Assets ($): | ||||
| Paid-in capital | 184,577,941 | |||
| Accumulated undistributed investment income—net | 1,430,902 | |||
| Accumulated net realized gain (loss) on investments | (6,537,943) | |||
| Accumulated net unrealized appreciation (depreciation) | ||||
| on investments and foreign currency transactions | (58,478,305) | |||
| Net Assets ($) | 120,992,595 |
| Net Asset Value Per Share | ||||||||
| Class A | Class C | Class I | Class T | |||||
| Net Assets ($) | 1,125,831 | 196,934 | 119,650,058 | 19,772 | ||||
| Shares Outstanding | 133,600 | 23,667 | 14,132,828 | 2,350 | ||||
| Net Asset Value Per Share ($) | 8.43 | 8.32 | 8.47 | 8.41 | ||||
| See notes to financial statements. | ||||||||
12
| STATEMENT OF OPERATIONS Year Ended November 30, 2008 |
| Investment Income ($): | ||
| Income: | ||
| Cash dividends (net of $173,895 foreign taxes withheld at source): | ||
| Unaffiliated issuers | 2,519,968 | |
| Affiliated issuers | 124,289 | |
| Total Income | 2,644,257 | |
| Expenses: | ||
| Management fee—Note 3(a) | 1,016,432 | |
| Custodian fees—Note 3(c) | 85,283 | |
| Professional fees | 49,287 | |
| Registration fees | 45,337 | |
| Directors’ fees and expenses—Note 3(d) | 10,526 | |
| Shareholder servicing costs—Note 3(c) | 7,556 | |
| Prospectus and shareholders’ reports | 7,444 | |
| Distribution fees—Note 3(b) | 2,837 | |
| Interest expense—Note 2 | 1,089 | |
| Loan commitment fees—Note 2 | 485 | |
| Miscellaneous | 15,215 | |
| Total Expenses | 1,241,491 | |
| Less—reduction in management fee due to undertaking—Note 3(a) | (425) | |
| Less—reduction in fees due to earnings credits—Note 1(c) | (6,238) | |
| Net Expenses | 1,234,828 | |
| Investment Income—Net | 1,409,429 | |
| Realized and Unrealized Gain (Loss) on Investments—Note 4 ($): | ||
| Net realized gain (loss) on investments and foreign currency transactions | (6,646,262) | |
| Net realized gain (loss) on forward currency exchange contracts | 148,179 | |
| Net Realized Gain (Loss) | (6,498,083) | |
| Net unrealized appreciation (depreciation) on | ||
| investments and foreign currency transactions | (63,728,113) | |
| Net Realized and Unrealized Gain (Loss) on Investments | (70,226,196) | |
| Net (Decrease) in Net Assets Resulting from Operations | (68,816,767) | |
| See notes to financial statements. | ||
| The Fund 13 |
STATEMENT OF CHANGES IN NET ASSETS
| Year Ended November 30, | ||||
| 2008 | 2007a,b | |||
| Operations ($): | ||||
| Investment income—net | 1,409,429 | 329,925 | ||
| Net realized gain (loss) on investments | (6,498,083) | 385,844 | ||
| Net unrealized appreciation | ||||
| (depreciation) on investments | (63,728,113) | 5,249,808 | ||
| Net Increase (Decrease) in Net Assets | ||||
| Resulting from Operations | (68,816,767) | 5,965,577 | ||
| Dividends to Shareholders from ($): | ||||
| Investment income—net: | ||||
| Class A Shares | (2,703) | — | ||
| Class I Shares | (297,622) | — | ||
| Net realized gain on investments: | ||||
| Class A Shares | (9,236) | — | ||
| Class C Shares | (2,680) | — | ||
| Class I Shares | (421,833) | — | ||
| Class T Shares | (82) | — | ||
| Total Dividends | (734,156) | — | ||
| Capital Stock Transactions ($): | ||||
| Net proceeds from shares sold: | ||||
| Class A Shares | 1,019,761 | 4,979,283 | ||
| Class C Shares | 140,622 | 939,715 | ||
| Class I Shares | 154,993,986 | 66,029,114 | ||
| Class T Shares | 69,887 | 500,000 | ||
| Dividends reinvested: | ||||
| Class A Shares | 11,178 | — | ||
| Class C Shares | 993 | — | ||
| Class I Shares | 383,949 | — | ||
| Cost of shares redeemed: | ||||
| Class A Shares | (661,814) | (3,800,027) | ||
| Class C Shares | (234,101) | (538,351) | ||
| Class I Shares | (36,181,696) | (2,514,003) | ||
| Class T Shares | (55,160) | (505,395) | ||
| Increase (Decrease) in Net Assets | ||||
| from Capital Stock Transactions | 119,487,605 | 65,090,336 | ||
| Total Increase (Decrease) in Net Assets | 49,936,682 | 71,055,913 | ||
| Net Assets ($): | ||||
| Beginning of Period | 71,055,913 | — | ||
| End of Period | 120,992,595 | 71,055,913 | ||
| Undistributed investment income—net | 1,430,902 | 292,749 | ||
14
| Year Ended November 30, | ||||
| 2008 | 2007a,b | |||
| Capital Share Transactions: | ||||
| Class A | ||||
| Shares sold | 91,782 | 394,733 | ||
| Shares issued for dividends reinvested | 837 | — | ||
| Shares redeemed | (60,723) | (293,029) | ||
| Net Increase (Decrease) in Shares Outstanding | 31,896 | 101,704 | ||
| Class C | ||||
| Shares sold | 13,120 | 74,250 | ||
| Shares issued for dividends reinvested | 75 | — | ||
| Shares redeemed | (22,194) | (41,584) | ||
| Net Increase (Decrease) in Shares Outstanding | (8,999) | 32,666 | ||
| Class I | ||||
| Shares sold | 12,943,558 | 5,222,437 | ||
| Shares issued for dividends reinvested | 28,804 | — | ||
| Shares redeemed | (3,867,608) | (194,363) | ||
| Net Increase (Decrease) in Shares Outstanding | 9,104,754 | 5,028,074 | ||
| Class T | ||||
| Shares sold | 5,875 | 40,000 | ||
| Shares redeemed | (4,525) | (39,000) | ||
| Net Increase (Decrease) in Shares Outstanding | 1,350 | 1,000 | ||
| a From December 29, 2006 (commencement of operations) to November 30, 2007. |
| b Effective June 1, 2007, Class R shares were redesignated as Class I shares. |
| See notes to financial statements. |
| The Fund 15 |
FINANCIAL HIGHLIGHTS
The following tables describe the performance for each share class for the fiscal periods indicated.All information (except portfolio turnover rate) reflects financial results for a single fund share.Total return shows how much your investment in the fund would have increased (or decreased) during each period, assuming you had reinvested all dividends and distributions.These figures have been derived from the fund’s financial statements.
| Year Ended November 30, | ||||
| Class A Shares | 2008 | 2007a | ||
| Per Share Data ($): | ||||
| Net asset value, beginning of period | 13.72 | 12.50 | ||
| Investment Operations: | ||||
| Investment income—netb | .09 | .07 | ||
| Net realized and unrealized | ||||
| gain (loss) on investments | (5.28) | 1.15 | ||
| Total from Investment Operations | (5.19) | 1.22 | ||
| Distributions: | ||||
| Dividends from investment income—net | (.02) | — | ||
| Dividends from net realized gain on investments | (.08) | — | ||
| Total Distributions | (.10) | — | ||
| Net asset value, end of period | 8.43 | 13.72 | ||
| Total Return (%)c | (38.07) | 9.76d | ||
| Ratios/Supplemental Data (%): | ||||
| Ratio of total expenses to average net assets | 1.43 | 1.75e | ||
| Ratio of net expenses to average net assets | 1.41 | 1.47e | ||
| Ratio of net investment income | ||||
| to average net assets | .79 | .50e | ||
| Portfolio Turnover Rate | 13.18 | 13.34d | ||
| Net Assets, end of period ($ x 1,000) | 1,126 | 1,396 | ||
| a | From December 29, 2006 (commencement of operations) to November 30, 2007. | |
| b | Based on average shares outstanding at each month end. | |
| c | Exclusive of sales charge. | |
| d | Not annualized. | |
| e | Annualized. |
| See notes to financial statements. |
16
| Year Ended November 30, | ||||
| Class C Shares | 2008 | 2007a | ||
| Per Share Data ($): | ||||
| Net asset value, beginning of period | 13.64 | 12.50 | ||
| Investment Operations: | ||||
| Investment income (loss)—netb | .00c | (.04) | ||
| Net realized and unrealized | ||||
| gain (loss) on investments | (5.24) | 1.18 | ||
| Total from Investment Operations | (5.24) | 1.14 | ||
| Distributions: | ||||
| Dividends from net realized gain on investments | (.08) | — | ||
| Net asset value, end of period | 8.32 | 13.64 | ||
| Total Return (%)d | (38.58) | 9.04e | ||
| Ratios/Supplemental Data (%): | ||||
| Ratio of total expenses to average net assets | 2.24 | 2.50f | ||
| Ratio of net expenses to average net assets | 2.20 | 2.21f | ||
| Ratio of net investment income | ||||
| (loss) to average net assets | .03 | (.31)f | ||
| Portfolio Turnover Rate | 13.18 | 13.34e | ||
| Net Assets, end of period ($ x 1,000) | 197 | 445 | ||
| a | From December 29, 2006 (commencement of operations) to November 30, 2007. | |
| b | Based on average shares outstanding at each month end. | |
| c | Amount represents less than $.01 per share. | |
| d | Exclusive of sales charge. | |
| e | Not annualized. | |
| f | Annualized. |
| See notes to financial statements. |
| The Fund 17 |
| FINANCIAL HIGHLIGHTS (continued) |
| Year Ended November 30, | ||||
| Class I Shares | 2008 | 2007a,b | ||
| Per Share Data ($): | ||||
| Net asset value, beginning of period | 13.76 | 12.50 | ||
| Investment Operations: | ||||
| Investment income—netc | .14 | .11 | ||
| Net realized and unrealized | ||||
| gain (loss) on investments | (5.30) | 1.15 | ||
| Total from Investment Operations | (5.16) | 1.26 | ||
| Distributions: | ||||
| Dividends from investment income—net | (.05) | — | ||
| Dividends from net realized gain on investments | (.08) | — | ||
| Total Distributions | (.13) | — | ||
| Net asset value, end of period | 8.47 | 13.76 | ||
| Total Return (%) | (37.82) | 10.08d | ||
| Ratios/Supplemental Data (%): | ||||
| Ratio of total expenses to average net assets | 1.03 | 1.38e | ||
| Ratio of net expenses to average net assets | 1.02 | 1.16e | ||
| Ratio of net investment income | ||||
| to average net assets | 1.19 | .81e | ||
| Portfolio Turnover Rate | 13.18 | 13.34d | ||
| Net Assets, end of period ($ x 1,000) | 119,650 | 69,201 | ||
| a | From December 29, 2006 (commencement of operations) to November 30, 2007. | |
| b | Effective June 1, 2007, Class R shares were redesignated as Class I shares. | |
| c | Based on average shares outstanding at each month end. | |
| d | Not annualized. | |
| e | Annualized. |
| See notes to financial statements. |
18
| Year Ended November 30, | ||||
| Class T Shares | 2008 | 2007a | ||
| Per Share Data ($): | ||||
| Net asset value, beginning of period | 13.71 | 12.50 | ||
| Investment Operations: | ||||
| Investment income—netb | .06 | .04 | ||
| Net realized and unrealized | ||||
| gain (loss) on investments | (5.28) | 1.17 | ||
| Total from Investment Operations | (5.22) | 1.21 | ||
| Distributions: | ||||
| Dividends from net realized gain on investments | (.08) | — | ||
| Net asset value, end of period | 8.41 | 13.71 | ||
| Total Return (%)c | (38.25) | 9.36d | ||
| Ratios/Supplemental Data (%): | ||||
| Ratio of total expenses to average net assets | 2.19 | 2.03e | ||
| Ratio of net expenses to average net assets | 1.70 | 1.74e | ||
| Ratio of net investment income | ||||
| to average net assets | .51 | .32e | ||
| Portfolio Turnover Rate | 13.18 | 13.34d | ||
| Net Assets, end of period ($ x 1,000) | 20 | 14 | ||
| a | From December 29, 2006 (commencement of operations) to November 30, 2007. | |
| b | Based on average shares outstanding at each month end. | |
| c | Exclusive of sales charge. | |
| d | Not annualized. | |
| e | Annualized. |
| See notes to financial statements. |
| The Fund 19 |
NOTES TO FINANCIAL STATEMENTS
NOTE 1—Significant Accounting Policies:
International Stock Fund (the “fund”) is a separate diversified series of Strategic Funds, Inc. (the “Company”) which is registered under the Investment Company Act of 1940, as amended (the “Act”), as a diversified open-end management investment company and operates as a series company currently offering seven series, including the fund.The fund’s investment objective is to pursue long-term total return. The Dreyfus Corporation (the “Manager” or “Dreyfus”), a wholly-owned subsidiary of The Bank of New York Mellon Corporation (“BNY Mellon”), serves as the fund’s investment adviser. Walter Scott & Partners Limited (“Walter Scott”), a subsidiary of BNY Mellon and an affiliate of Dreyfus, serves as the fund’s sub-investment adviser.
Effective July 1, 2008, BNY Mellon has reorganized and consolidated a number of its banking and trust company subsidiaries. As a result of the reorganization, any services previously provided to the fund by Mellon Bank, N.A. or Mellon Trust of New England, N.A. are now provided by The Bank of New York, which has changed its name to The Bank of New York Mellon.
MBSC Securities Corporation (the “Distributor”), a wholly-owned subsidiary of Dreyfus, is the distributor of the fund’s shares.The fund is authorized to issue 100 million shares of $.001 par value Common Stock in each of the following classes of shares: Class A, Class C, Class I and Class T. Class A and Class T shares are subject to a sales charge imposed at the time of purchase. Class C shares are subject to a contingent deferred sales charge (“CDSC”) on Class C shares redeemed within one year of purchase. Class I shares are sold at net asset value per share only to institutional investors. Other differences between the classes include the services offered to and the expenses borne by each class, the allocation of certain transfer agency costs and certain voting rights. Income, expenses (other than expenses attributable to a specific class), and realized and unrealized gains or losses on investments are allocated to each class of shares based on its relative net assets.
20
As of November 30, 2008, MBC Investments Corp., an indirect subsidiary of BNY Mellon, held 1,000 Class T shares.
The Company accounts separately for the assets, liabilities and operations of each series. Expenses directly attributable to each series are charged to that series’ operations; expenses which are applicable to all series are allocated among them on a pro rata basis.
The fund’s financial statements are prepared in accordance with U.S. generally accepted accounting principles, which may require the use of management estimates and assumptions. Actual results could differ from those estimates.
The fund enters into contracts that contain a variety of indemnifications. The fund’s maximum exposure under these arrangements is unknown.The fund does not anticipate recognizing any loss related to these arrangements.
(a) Portfolio valuation: Investments in securities are valued at the last sales price on the securities exchange or national securities market on which such securities are primarily traded. Securities listed on the National Market System for which market quotations are available are valued at the official closing price or, if there is no official closing price that day, at the last sales price. Securities not listed on an exchange or the national securities market, or securities for which there were no transactions, are valued at the average of the most recent bid and asked prices, except for open short positions, where the asked price is used for valuation purposes. Bid price is used when no asked price is available. Registered investment companies that are not traded on an exchange are valued at their net asset value. When market quotations or official closing prices are not readily available, or are determined not to reflect accurately fair value, such as when the value of a security has been significantly affected by events after the close of the exchange or market on which the security is principally traded (for example, a foreign exchange or market), but before the
| The Fund 21 |
| NOTES TO FINANCIAL STATEMENTS (continued) |
fund calculates its net asset value, the fund may value these investments at fair value as determined in accordance with the procedures approved by the Board of Directors. Fair valuing of securities may be determined with the assistance of a pricing service using calculations based on indices of domestic securities and other appropriate indicators, such as prices of relevant ADRs and futures contracts. For other securities that are fair valued by the Board of Directors, certain factors may be considered such as: fundamental analytical data, the nature and duration of restrictions on disposition, an evaluation of the forces that influence the market in which the securities are purchased and sold and public trading in similar securities of the issuer or comparable issuers. Financial futures are valued at the last sales price. Investments denominated in foreign currencies are translated to U.S. dollars at the prevailing rates of exchange. Forward currency exchange contracts are valued at the forward rate.
The fund adopted Statement of Financial Accounting Standards No. 157 “FairValue Measurements” (“FAS 157”). FAS 157 establishes an authoritative definition of fair value, sets out a framework for measuring fair value, and requires additional disclosures about fair-value measurements.
Various inputs are used in determining the value of the fund’s investments relating to FAS 157.These inputs are summarized in the three broad levels listed below.
| Level 1—quoted prices in active markets for identical securities. |
| Level 2—other significant observable inputs (including quoted |
| prices for similar securities, interest rates, prepayment speeds, credit |
| risk, etc.) |
| Level 3—significant unobservable inputs (including the fund’s own |
| assumptions in determining the fair value of investments). |
The inputs or methodology used for valuing securities are not necessarily an indication of the risk associated with investing in those securities.
22
The following is a summary of the inputs used as of November 30, 2008 in valuing the fund’s investments carried at fair value:
| Investments in | Other Financial | |||
| Valuation Inputs | Securities ($) | Instruments ($)† | ||
| Level 1—Quoted Prices | 120,220,415 | 0 | ||
| Level 2—Other Significant | ||||
| Observable Inputs | 0 | 5,785 | ||
| Level 3—Significant | ||||
| Unobservable Inputs | 0 | 0 | ||
| Total | 120,220,415 | 5,785 |
| † | Other financial instruments include derivative instruments, such as futures, forward currency | |
| exchange contracts and swap contracts, which are valued at the unrealized appreciation | ||
| (depreciation) on the instrument. |
(b) Foreign currency transactions: The fund does not isolate that portion of the results of operations resulting from changes in foreign exchange rates on investments from the fluctuations arising from changes in market prices of securities held. Such fluctuations are included with the net realized and unrealized gains or losses on investments.
Net realized foreign exchange gains or losses arise from sales and maturities of short-term securities, sales of foreign currencies, currency gains or losses realized on securities transactions and the difference between the amounts of dividends, interest and foreign withholding taxes recorded on the fund’s books and the U.S. dollar equivalent of the amounts actually received or paid. Net unrealized foreign exchange gains or losses arise from changes in the value of assets and liabilities other than investments in securities, resulting from changes in exchange rates. Such gains and losses are included with net realized and unrealized gains or losses on investments.
(c) Securities transactions and investment income: Securities transactions are recorded on a trade date basis. Realized gains and losses from securities transactions are recorded on the identified cost basis.
| The Fund 23 |
| NOTES TO FINANCIAL STATEMENTS (continued) |
Dividend income is recognized on the ex-dividend date and interest income, including, where applicable, accretion of discount and amortization of premium on investments, is recognized on the accrual basis.
The fund has arrangements with the custodian and cash management banks whereby the fund may receive earnings credits when positive cash balances are maintained, which are used to offset custody and cash management fees. For financial reporting purposes, the fund includes net earnings credits as an expense offset in the Statement of Operations.
Investing in foreign markets may involve special risks and considerations not typically associated with investing in the U.S. These risks include revaluation of currencies, high rates of inflation, repatriation restrictions on income and capital, and adverse political and economic developments. Moreover, securities issued in these markets may be less liquid, subject to government ownership controls, delayed settlements, and their prices may be more volatile than those of comparable securities in the U.S.
(d) Affiliated issuers: Investments in other investment companies advised by Dreyfus are defined as “affiliated” in the Act.
(e) Dividends to shareholders: Dividends are recorded on the ex-dividend date. Dividends from investment income-net and dividends from net realized capital gains, if any, are normally declared and paid annually, but the fund may make distributions on a more frequent basis to comply with the distribution requirements of the Internal Revenue Code of 1986, as amended (the “Code”).To the extent that net realized capital gains can be offset by capital loss carryovers, if any, it is the policy of the fund not to distribute such gains. Income and capital gains distributions are determined in accordance with income tax regulations, which may differ from U.S. generally accepted accounting principles.
(f) Federal income taxes: It is the policy of the fund to continue to qualify as a regulated investment company, if such qualification is in the best interests of its shareholders, by complying with the applicable provisions of the Code, and to make distributions of taxable income sufficient to relieve it from substantially all federal income and excise taxes.
24
The fund adopted Financial Accounting Standards Board (“FASB”) Interpretation No. 48 “Accounting for Uncertainty in Income Taxes” (“FIN 48”). FIN 48 provides guidance for how uncertain tax positions should be recognized, measured, presented and disclosed in the financial statements. FIN 48 requires the evaluation of tax positions taken or expected to be taken in the course of preparing the fund’s tax returns to determine whether the tax positions are “more-likely-than not” of being sustained by the applicable tax authority. Liability for tax positions not deemed to meet the more likely-than-not threshold would be recorded as a tax expense in the current year.The adoption of FIN 48 had no impact on the operations of the fund for the period ended November 30, 2008.
As of and during the period ended November 30, 2008, the fund did not have any liabilities for any unrecognized tax positions. The fund recognizes interest and penalties, if any, related to unrecognized tax positions as income tax expense in the Statement of Operations. During the period, the fund did not incur any interest or penalties.
Each of the tax years for the two-year period ended November 30, 2008 remains subject to examination by the Internal Revenue Service and state taxing authorities.
At November 30, 2008, the components of accumulated earnings on a tax basis were as follows: undistributed ordinary income $1,441,518, accumulated capital losses $1,939,230 and unrealized depreciation $58,484,214. In addition, the fund had $4,592,804 of capital losses and $10,616 of passive foreign investment company losses realized after October 31, 2008, which were deferred for tax purposes to the first day of the following fiscal year.
The accumulated capital loss carryover is available for federal income tax purposes to be applied against future net securities profits, if any, realized subsequent to November 30, 2008. If not applied, the carryover expires in fiscal 2016.
The tax character of distributions paid to shareholders during the fiscal period ended November 30, 2008 was as follows: ordinary income $734,156.
| The Fund 25 |
| NOTES TO FINANCIAL STATEMENTS (continued) |
During the period ended November 30, 2008, as a result of permanent book to tax differences, primarily due to the tax treatment for foreign currency gains and losses and dividend reclassification, the fund increased accumulated undistributed investment income-net by $29,049 and decreased accumulated net realized gain (loss) on investments by the same amount. Net assets and net asset value per share were not affected by this reclassification.
NOTE 2—Bank Lines of Credit:
Prior to October 15, 2008, the fund participated with other Dreyfus managed funds in a $350 million redemption credit facility. Effective October 15, 2008, the fund participates with other Dreyfus-managed funds in a $145 million redemption credit facility (the “Facility”) to be utilized for temporary or emergency purposes, including the financing of redemptions. In connection therewith, the fund has agreed to pay commitment fees on its pro rata portion of the Facility. Interest is charged to the fund based on prevailing market rates in effect at the time of borrowing.
The average daily amount of borrowings outstanding under the Facilities during the period ended November 30, 2008 was approximately $48,100 with a related weighted average annualized interest rate of 2.27% .
NOTE 3—Management Fee, Sub-Investment Advisory Fees and Other Transactions With Affiliates:
(a) Pursuant to a management agreement (“Agreement”) with Dreyfus, the management fee is computed at the annual rate of .85% of the value of the fund’s average daily net assets and is payable monthly. Dreyfus has contractually agreed to waive receipt of its fees and/or assume the expenses of the fund, until April 1, 2010, so that annual fund operating expenses (excluding Rule 12b-1 fees, shareholder services fees, taxes, interest, brokerage commissions, commitment fees on borrowings and extraordinary expenses) do not exceed 1.25% of the value of the
26
fund’s average daily net assets.The reduction in management fee, pursuant to the undertaking, amounted to $425 during the period ended November 30, 2008.
During the period ended November 30, 2008, the Distributor retained $288 and $279 from commissions earned on sales of the fund’s Class A and Class T shares, respectively, and $104 from CDSCs on redemptions of the fund’s Class C shares.
Pursuant to a Sub-Investment Advisory Agreement between Dreyfus and Walter Scott, Dreyfus pays Walter Scott a monthly fee at an annual percentage of the fund’s average daily net assets.
(b) Under the Distribution Plan (the “Plan”) adopted pursuant to Rule 12b-1 under the Act, Class C and Class T shares pay the Distributor for distributing their shares at an annual rate of .75% of the value of the average daily net assets of Class C shares and .25% of the value of the average daily net assets of Class T shares. During the period ended November 30, 2008, Class C and Class T shares were charged $2,794 and $43, respectively, pursuant to the Plan.
(c) Under the Shareholder Services Plan, Class A, Class C and Class T shares pay the Distributor at an annual rate of .25% of the value of their average daily net assets for the provision of certain services.The services provided may include personal services relating to shareholder accounts, such as answering shareholder inquiries regarding Class A, Class C and Class T shares and providing reports and other information, and services related to the maintenance of shareholder accounts. The Distributor may make payments to Service Agents (a securities dealer, financial institution or other industry professional) in respect of these services.The Distributor determines the amounts to be paid to Service Agents. During the period ended November 30, 2008, Class A, Class C and Class T shares were charged $3,425, $931 and $43, respectively, pursuant to the Shareholder Services Plan.
The Fund 27
| NOTES TO FINANCIAL STATEMENTS (continued) |
The fund compensates Dreyfus Transfer, Inc., a wholly-owned subsidiary of Dreyfus, under a transfer agency agreement for providing personnel and facilities to perform transfer agency services for the fund. During the period ended November 30, 2008, the fund was charged $1,926 pursuant to the transfer agency agreement.
The fund compensates The Bank of New York Mellon, a subsidiary of BNY Mellon and an affiliate of Dreyfus, under a cash management agreement for performing cash management services related to fund subscriptions and redemptions. During the period ended November 30, 2008, the fund was charged $155 pursuant to the cash management agreement.
The fund compensates The Bank of New York Mellon under a custody agreement for providing custodial services for the fund. During the period ended November 30, 2008, the fund was charged $85,283 pursuant to the custody agreement.
During the period ended November 30, 2008, the fund was charged $6,086 for services performed by the Chief Compliance Officer.
The components of “Due to The Dreyfus Corporation and affiliates” in the Statement of Assets and Liabilities consist of: management fees $88,775, Rule 12b-1 distribution plan fees $134, shareholder services plan fees $271, custodian fees $28,670, chief compliance officer fees $2,466 and transfer agency per account fees $260,which are offset against an expense reimbursement currently in effect in the amount of $142.
(d) Each Board member also serves as a Board member of other funds within the Dreyfus complex. Annual retainer fees and attendance fees are allocated to each fund based on net assets.
(e) A redemption fee of 2% will be assessed on redemptions (including exchanges) of fund shares purchased and held for less than sixty days.
NOTE 4—Securities Transactions:
The aggregate amount of purchases and sales of investment securities, excluding short-term securities and forward currency exchange con-
28
tracts, during the period ended November 30, 2008, amounted to $136,330,172 and $15,178,012, respectively.
The fund enters into forward currency exchange contracts in order to hedge its exposure to changes in foreign currency exchange rates on its foreign portfolio holdings and to settle foreign currency transactions. When executing forward currency exchange contracts, the fund is obligated to buy or sell a foreign currency at a specified rate on a certain date in the future. With respect to sales of forward currency exchange contracts, the fund would incur a loss if the value of the contract increases between the date the forward contract is opened and the date the forward contract is closed.The fund realizes a gain if the value of the contract decreases between those dates.With respect to purchases of forward currency exchange contracts, the fund would incur a loss if the value of the contract decreases between the date the forward contract is opened and the date the forward contract is closed. The fund realizes a gain if the value of the contract increases between those dates. The fund is also exposed to credit risk associated with counterparty nonperformance on these forward currency exchange contracts which is typically limited to the unrealized gain on each open contract.The following summarizes open forward currency exchange contracts at November 30, 2008:
| Foreign | ||||||||
| Forward Currency | Currency | Unrealized | ||||||
| Exchange Contracts | Amounts | Proceeds ($) | Value ($) | Appreciation ($) | ||||
| Sales: | ||||||||
| Japanese Yen, | ||||||||
| expiring 12/1/2008 | 114,306,869 | 1,201,839 | 1,196,054 | 5,785 |
At November 30, 2008, the cost of investments for federal income tax purposes was $178,720,642; accordingly, accumulated net unrealized depreciation on investments was $58,500,227, consisting of $577,725 gross unrealized appreciation and $59,077,952 gross unrealized depreciation.
In March 2008, the FASB released Statement of Financial Accounting Standards No. 161 “Disclosures about Derivative Instruments and
| The Fund 29 |
| NOTES TO FINANCIAL STATEMENTS (continued) |
Hedging Activities” (“FAS 161”). FAS 161 requires qualitative disclosures about objectives and strategies for using derivatives, quantitative disclosures about fair value amounts of gains and losses on derivative instruments and disclosures about credit-risk-related contingent features in derivative agreements.The application of FAS 161 is required for fiscal years and interim periods beginning after November 15, 2008. At this time, management is evaluating the implications of FAS 161 and its impact on the financial statements and the accompanying notes has not yet been determined.
NOTE 5—Subsequent Event:
Effective on or about February 4, 2009 (the “Effective Date”), the fund will issue to each holder of its Class T shares, in exchange for said shares, Class A shares of the fund having an aggregate net asset value equal to the aggregate net asset value of the shareholder’s Class T shares.Thereafter, the fund will no longer offer Class T shares.
Effective on or about December 3, 2008, no investments for new accounts were permitted in Class T of the fund, except that participants in certain group retirement plans were able to open a new account in Class T of the fund, provided that the fund was established as an investment option under the plans before December 3, 2008. After the Effective Date, subsequent investments in the fund’s Class A shares made by holders of the fund’s Class T shares who received Class A shares of the fund in exchange for their Class T shares will be subject to the front-end sales load schedule currently in effect for Class T shares. Otherwise, all other Class A share attributes will be in effect.
30
REPORT OF INDEPENDENT REGISTERED PUBLIC ACCOUNTING FIRM
| Shareholders and Board of Directors International Stock Fund |
We have audited the accompanying statement of assets and liabilities, including the statement of investments, of International Stock Fund (one of the series comprising Strategic Funds, Inc.) as of November 30, 2008, and the related statement of operations for the year then ended and the statement of changes in net assets and financial highlights for each of the periods indicated therein. These financial statements and financial highlights are the responsibility of the Fund’s management.Our responsibility is to express an opinion on these financial statements and financial highlights based on our audits.
We conducted our audits in accordance with the standards of the Public Company Accounting Oversight Board (United States).Those standards require that we plan and perform the audit to obtain reasonable assurance about whether the financial statements and financial highlights are free of material misstatement.We were not engaged to perform an audit of the Fund’s internal control over financial reporting.Our audits included consideration of internal control over financial reporting as a basis for designing audit procedures that are appropriate in the circumstances,but not for the purpose of expressing an opinion on the effectiveness of the Fund’s internal control over financial reporting.Accordingly, we express no such opinion.An audit also includes examining, on a test basis, evidence supporting the amounts and disclosures in the financial statements and financial highlights, assessing the accounting principles used and significant estimates made by management, and evaluating the overall financial statement presentation. Our procedures included confirmation of securities owned as of November 30, 2008 by correspondence with the custodian. We believe that our audits provide a reasonable basis for our opinion.
In our opinion, the financial statements and financial highlights referred to above present fairly, in all material respects, the financial position of International Stock Fund at November 30, 2008, the results of its operations for the year then ended and the changes in its net assets and the financial highlights for each of the indicated periods, in conformity with U. S. generally accepted accounting principles.
| The Fund 31 |
IMPORTANT TAX INFORMATION (Unaudited)
In accordance with federal tax law, the fund elects to provide each shareholder with their portion of the fund’s foreign taxes paid and the income sourced from foreign countries. Accordingly, the fund hereby makes the following designations regarding its fiscal year ended November 30, 2008:
—the total amount of taxes paid to foreign countries was $170,477
—the total amount of income sourced from foreign countries was $1,531,928.
As required by federal tax law rules, shareholders will receive notification of their proportionate share of foreign taxes paid and foreign sourced income for the 2008 calendar year with Form 1099-DIV which will be mailed by January 31, 2009.
For the fiscal year ended November 30, 2008, certain dividends paid by the fund may be subject to a maximum tax rate of 15%, as provided for by the Jobs and Growth Tax Relief Reconciliation Act of 2003. Of the distributions paid during the fiscal year, $55,329 represents the maximum amount that may be considered qualified dividend income. Also, the fund hereby designates $.0820 per share as a short-term capital gain distribution paid on December 28, 2007.
32
| INFORMATION ABOUT THE REVIEW AND APPROVAL OF THE FUND’S MANAGEMENT AGREEMENT (Unaudited) |
At a meeting of the fund’s Board of Directors held on November 10-11, 2008, the Board considered the re-approval for an annual period of the fund’s Management Agreement,pursuant to which the Manager provides the fund with investment advisory and administrative services, and of the Manager’s Sub-Investment Advisory Agreement with Walter Scott & Partners Limited (“Walter Scott”), pursuant to which Walter Scott serves as sub-investment adviser and provides day-to-day management of the fund’s portfolio.The Board members, none of whom are “interested persons” (as defined in the Investment Company Act of 1940, as amended) of the fund, were assisted in their review by independent legal counsel and met with counsel in executive session separate from representatives of the Manager.
Analysis of Nature, Extent, and Quality of Services Provided to the Fund. The Board members considered information previously provided to them in a presentation from representatives of the Manager regarding services provided to the fund and other funds in the Dreyfus complex, and representatives of the Manager confirmed that there had been no material changes in the information. The Board also discussed the nature, extent, and quality of the services provided to the fund pursuant to the fund’s Management Agreement, and by Walter Scott pursuant to the Sub-Advisory Agreement. The Manager’s representatives reviewed the fund’s distribution of accounts and the relationships the Manager has with various intermediaries and the different needs of each. The Manager’s representatives noted the diversity of distribution of the fund as well as among the funds in the Dreyfus fund complex, and the Manager’s corresponding need for broad, deep, and diverse resources to be able to provide ongoing shareholder services to each of the fund’s distribution channels.The Board also reviewed the number of shareholder accounts in the fund, as well as the fund’s asset size.
The Board members also considered the Manager’s and Walter Scott’s research and portfolio management capabilities and that the Manager also provides oversight of day-to-day fund operations, including fund accounting and administration and assistance in meeting legal and regulatory requirements.The Board members also considered the Manager’s
| The Fund 33 |
| INFORMATION ABOUT THE REVIEW AND APPROVAL OF THE FUND’S MANAGEMENT AGREEMENT (Unaudited) (continued) |
extensive administrative, accounting, and compliance infrastructure, as well as the Manager’s supervisory activities of Walter Scott.
Comparative Analysis of the Fund’s Management Fee and Expense Ratio and Performance. The Board members reviewed reports prepared by Lipper, Inc., an independent provider of investment company data, which included information comparing the fund’s management fee and expense ratio with a group of comparable funds (the “Expense Group”) and with a broader group of funds (the “Expense Universe”) that were selected by Lipper. Included in these reports were comparisons of contractual and actual management fee rates and total operating expenses.
The Board members also reviewed the reports prepared by Lipper that presented the fund’s performance for various periods ended August 31, 2008, and comparisons of total return performance for the fund to the same group of funds as the Expense Group (the “Performance Group”) and to a group of funds that was broader than the Expense Universe (the “Performance Universe”) that also were selected by Lipper. The Manager previously had furnished the Board with a description of the methodology Lipper used to select the fund’s Expense Group and Expense Universe, and Performance Group and Performance Universe.
The Board reviewed the results of the Expense Group and Expense Universe comparisons that were prepared based on financial statements currently available to Lipper as of August 31, 2008.The Board reviewed the range of management fees and expense ratios of the funds in the Expense Group and Expense Universe, and noted that the fund’s contractual management fee was at the Expense Group median and that the fund’s actual management fee approximated, and was higher than the Expense Group and Expense Universe median. The Board also noted that the fund’s total expense ratio was lower than the Expense Group and Expense Universe medians.
With respect to the fund’s performance, the Board noted that the fund was the top ranked fund for total return in the Performance Group, and ranked in the top decile Performance Universe, for the reported 1-year period.The Board noted that the fund commenced operations in December 2006.
34
Representatives of the Manager noted that there were no similarly managed mutual funds, institutional separate accounts, or wrap fee accounts managed by the Manager or Walter Scott, or any other Dreyfus affiliate with similar investment objectives, policies, and strategies and, as to mutual funds only, reported in the same Lipper category, as the fund.
Analysis of Profitability and Economies of Scale. The Manager’s representatives reviewed the dollar amount of expenses allocated and profit received by the Manager and the method used to determine such expenses and profit.The Board considered information, previously provided and discussed, prepared by an independent consulting firm regarding the Manager’s approach to allocating costs to, and determining the profitability of, individual funds and the entire Dreyfus mutual fund complex. The Board members also considered that the methodology had also been reviewed by an independent registered public accounting firm which, like the consultant, found the methodology to be reasonable. The consulting firm also analyzed where any economies of scale might emerge in connection with the management of the fund. The Board members evaluated the profitability analysis in light of the relevant circumstances for the fund, including the change in the fund’s asset size from the prior year, and the extent to which economies of scale would be realized if the fund grows and whether fee levels reflect these economies of scale for the benefit of fund shareholders. The Board members also considered potential benefits to the Manager or Walter Scott from acting as investment adviser and sub-investment adviser, respectively, to the fund and noted the soft dollar arrangements in effect with respect to trading the fund’s portfolio.
It was noted that the Board members should consider the Manager’s profitability with respect to the fund as part of their evaluation of whether the fees under the Management Agreement bear a reasonable relationship to the mix of services provided by the Manager, including the nature, extent, and quality of such services and that a discussion of economies of scale is predicated on increasing assets and that, if a fund’s assets had been decreasing, the possibility that the Manager may have realized any economies of scale would be less. Since the Manager, and
| The Fund 35 |
| INFORMATION ABOUT THE REVIEW AND APPROVAL OF THE FUND’S MANAGEMENT AGREEMENT (Unaudited) (continued) |
not the fund, pays Walter Scott the sub-advisory fee, the Board did not consider Walter Scott’s profitability to be relevant to its deliberations. It was noted that the profitability percentage for managing the fund was within the range determined by appropriate court cases to be reasonable given the services rendered and that the profitability percentage for managing the fund was reasonable given the generally superior service levels provided.
At the conclusion of these discussions, the Board agreed that it had been furnished with sufficient information to make an informed business decision with respect to continuation of the fund’s Management Agreement. Based on the discussions and considerations as described above, the Board reached the following conclusions and determinations.
- The Board concluded that the nature, extent, and quality of the services provided by the Manager and Walter Scott are adequate and appropriate.
- The Board was satisfied with the fund’s performance.
- The Board concluded that the fee paid to the Manager by the fund was reasonable in light of the services provided, comparative perfor- mance and expense and management fee information, costs of the services provided, and profits to be realized and benefits derived or to be derived by the Manager and Walter Scott from its relationship with the fund.
- The Board determined that the economies of scale which may accrue to the Manager and its affiliates in connection with the management of the fund had been adequately considered by the Manager in con- nection with the management fee rate charged to the fund, and that, to the extent in the future it were to be determined that material economies of scale had not been shared with the fund, the Board would seek to have those economies of scale shared with the fund.
The Board members considered these conclusions and determinations, along with the information received on a routine and regular basis throughout the year, and, without any one factor being dispositive, the Board determined that re-approval of the fund’s Management Agreement, and Sub-Investment Advisory Agreement with Walter Scott, was in the best interests of the fund and its shareholders.
36
The Fund 37
38
| The Fund 39 |
OFFICERS OF THE FUND (Unaudited)
J. DAVID OFFICER, President since December 2006.
Chief Operating Officer,Vice Chairman and a Director of the Manager, and an officer of 77 investment companies (comprised of 180 portfolios) managed by the Manager. He is 60 years old and has been an employee of the Manager since April 1998.
PHILLIP N. MAISANO, Executive Vice President since July 2007.
Chief Investment Officer,Vice Chair and a director of the Manager, and an officer of 77 investment companies (comprised of 180 portfolios) managed by the Manager. Mr. Maisano also is an officer and/or Board member of certain other investment management subsidiaries of The Bank of New York Mellon Corporation, each of which is an affiliate of the Manager. He is 61 years old and has been an employee of the Manager since November 2006. Prior to joining the Manager, Mr. Maisano served as Chairman and Chief Executive Officer of EACM Advisors, an affiliate of the Manager, since August 2004, and served as Chief Executive Officer of Evaluation Associates, a leading institutional investment consulting firm, from 1988 until 2004.
MICHAEL A. ROSENBERG, Vice President and Secretary since August 2005.
Assistant General Counsel of BNY Mellon, and an officer of 78 investment companies (comprised of 201 portfolios) managed by the Manager. He is 48 years old and has been an employee of the Manager since October 1991.
JAMES BITETTO, Vice President and Assistant Secretary since August 2005.
Senior Counsel of BNY Mellon and Secretary of the Manager, and an officer of 78 investment companies (comprised of 201 portfolios) managed by the Manager. He is 42 years old and has been an employee of the Manager since December 1996.
JONI LACKS CHARATAN, Vice President and Assistant Secretary since August 2005.
Senior Counsel of BNY Mellon, and an officer of 78 investment companies (comprised of 201 portfolios) managed by the Manager. She is 53 years old and has been an employee of the Manager since October 1988.
JOSEPH M. CHIOFFI, Vice President and Assistant Secretary since August 2005.
Senior Counsel of BNY Mellon, and an officer of 78 investment companies (comprised of 201 portfolios) managed by the Manager. He is 47 years old and has been an employee of the Manager since June 2000.
JANETTE E. FARRAGHER, Vice President and Assistant Secretary since August 2005.
Assistant General Counsel of BNY Mellon, and an officer of 78 investment companies (comprised of 201 portfolios) managed by the Manager. She is 46 years old and has been an employee of the Manager since February 1984.
JOHN B. HAMMALIAN, Vice President and Assistant Secretary since August 2005.
Managing Counsel of BNY Mellon, and an officer of 78 investment companies (comprised of 201 portfolios) managed by the Manager. He is 45 years old and has been an employee of the Manager since February 1991.
ROBERT R. MULLERY, Vice President and Assistant Secretary since August 2005.
Managing Counsel of BNY Mellon, and an officer of 78 investment companies (comprised of 201 portfolios) managed by the Manager. He is 56 years old and has been an employee of the Manager since May 1986.
40
JEFF PRUSNOFSKY, Vice President and Assistant Secretary since August 2005.
Managing Counsel of BNY Mellon, and an officer of 78 investment companies (comprised of 201 portfolios) managed by the Manager. He is 43 years old and has been an employee of the Manager since October 1990.
JAMES WINDELS, Treasurer since November 2001.
Director – Mutual Fund Accounting of the Manager, and an officer of 78 investment companies (comprised of 201 portfolios) managed by the Manager. He is 49 years old and has been an employee of the Manager since April 1985.
RICHARD CASSARO, Assistant Treasurer since January 2008.
Senior Accounting Manager – Money Market and Municipal Bond Funds of the Manager, and an officer of 78 investment companies (comprised of 201 portfolios) managed by the Manager. He is 49 years old and has been an employee of the Manager since September 1982.
GAVIN C. REILLY, Assistant Treasurer since December 2005.
Tax Manager of the Investment Accounting and Support Department of the Manager, and an officer of 78 investment companies (comprised of 201 portfolios) managed by the Manager. He is 40 years old and has been an employee of the Manager since April 1991.
ROBERT ROBOL, Assistant Treasurer since August 2005.
Senior Accounting Manager – Fixed Income Funds of the Manager, and an officer of 78 investment companies (comprised of 201 portfolios) managed by the Manager. He is 44 years old and has been an employee of the Manager since October 1988.
ROBERT SALVIOLO, Assistant Treasurer since July 2007.
Senior Accounting Manager – Equity Funds of the Manager, and an officer of 78 investment companies (comprised of 201 portfolios) managed by the Manager. He is 41 years old and has been an employee of the Manager since June 1989.
ROBERT SVAGNA, Assistant Treasurer since December 2002.
Senior Accounting Manager – Equity Funds of the Manager, and an officer of 78 investment companies (comprised of 201 portfolios) managed by the Manager. He is 41 years old and has been an employee of the Manager since November 1990.
JOSEPH W. CONNOLLY, Chief Compliance Officer since October 2004.
Chief Compliance Officer of the Manager and The Dreyfus Family of Funds (78 investment companies, comprised of 201 portfolios). From November 2001 through March 2004, Mr. Connolly was first Vice-President, Mutual Fund Servicing for Mellon Global Securities Services. In that capacity, Mr. Connolly was responsible for managing Mellon’s Custody, Fund Accounting and Fund Administration services to third-party mutual fund clients. He is 51 years old and has served in various capacities with the Manager since 1980, including manager of the firm’s Fund Accounting Department from 1997 through October 2001.
WILLIAM GERMENIS, Anti-Money Laundering Compliance Officer since September 2002.
Vice President and Anti-Money Laundering Compliance Officer of the Distributor, and the Anti-Money Laundering Compliance Officer of 74 investment companies (comprised of 197 portfolios) managed by the Manager. He is 38 years old and has been an employee of the Distributor since October 1998.
| The Fund 41 |
For More Information
| International | Custodian | |||||
| Stock Fund | The Bank of New York Mellon | |||||
| 200 Park Avenue | One Wall Street | |||||
| New York, NY 10166 | New York, NY 10286 | |||||
| Manager | Transfer Agent & | |||||
| The Dreyfus Corporation | Dividend Disbursing Agent | |||||
| 200 Park Avenue | Dreyfus Transfer, Inc. | |||||
| New York, NY 10166 | 200 Park Avenue | |||||
| Sub-Investment Adviser | New York, NY 10166 | |||||
| Walter Scott & Partners Limited | Distributor | |||||
| (Walter Scott) | MBSC Securities Corporation | |||||
| One Charlotte Square | 200 Park Avenue | |||||
| Edinburgh, Scotland, UK | New York, NY 10166 | |||||
| Ticker Symbols: | Class A: DISAX | Class C: DISCX | Class I: DISRX | |||
| Class T: DISTX | ||||||
Telephone Call your financial representative or 1-800-554-4611
Mail The Dreyfus Family of Funds, 144 Glenn Curtiss Boulevard, Uniondale, NY 11556-0144
The fund files its complete schedule of portfolio holdings with the Securities and Exchange Commission (“SEC”) for the first and third quarters of each fiscal year on Form N-Q. The fund’s Forms N-Q are available on the SEC’s website at http://www.sec.gov and may be reviewed and copied at the SEC’s Public Reference Room in Washington, DC. Information on the operation of the Public Reference Room may be obtained by calling 1-800-SEC-0330.
A description of the policies and procedures that the fund uses to determine how to vote proxies relating to portfolio securities, and information regarding how the fund voted these proxies for the 12-month period ended June 30, 2008, is available at http://www.dreyfus.com and on the SEC’s website at http://www.sec.gov. The description of the policies and procedures is also available without charge, upon request, by calling 1-800-645-6561.

Save time. Save paper. View your next shareholder report online as soon as it’s available. Log into www.dreyfus.com and sign up for Dreyfus eCommunications. It’s simple and only takes a few minutes.
The views expressed in this report reflect those of the portfolio manager only through the end of the period covered and do not necessarily represent the views of Dreyfus or any other person in the Dreyfus organization. Any such views are subject to change at any time based upon market or other conditions and Dreyfus disclaims any responsibility to update such views.These views may not be relied on as investment advice and, because investment decisions for a Dreyfus fund are based on numerous factors, may not be relied on as an indication of trading intent on behalf of any Dreyfus fund.
Not FDIC-Insured Not Bank-Guaranteed May Lose Value
| Contents | ||
| THE FUND | ||
| 2 | A Letter from the CEO | |
| 3 | Discussion of Fund Performance | |
| 6 | Fund Performance | |
| 8 | Understanding Your Fund’s Expenses | |
| 8 | Comparing Your Fund’s Expenses | |
| With Those of Other Funds | ||
| 9 | Statement of Investments | |
| 12 | Statement of Assets and Liabilities | |
| 13 | Statement of Operations | |
| 14 | Statement of Changes in Net Assets | |
| 15 | Financial Highlights | |
| 16 | Notes to Financial Statements | |
| 25 | Report of Independent Registered | |
| Public Accounting Firm | ||
| 26 | Board Members Information | |
| 29 | Officers of the Fund | |
FOR MORE INFORMATION | ||
| Back Cover | ||
| Dreyfus U.S. Equity Fund |
The Fund

| A LETTER FROM THE CEO |
Dear Shareholder:
We present to you this annual report for Dreyfus U.S. Equity Fund, covering the period since the fund’s inception on May 30, 2008, through the end of its annual reporting period on November 30, 2008.
The U.S. and global economies suffered during the reporting period amid a financial crisis that sparked sharp declines in virtually all sectors and capitalization ranges of the stock market. According to our Chief Economist, four key elements fueled the crisis: a sharp decline in home prices; high leverage and an ambiguous private/public status at mortgage agencies Fannie Mae and Freddie Mac; high leverage among financial institutions, especially investment banks; and regulatory policies and behaviors that exacerbated financial stresses.The governments and central banks of major industrialized nations have responded with massive interventions, including nationalizing some troubled financial institutions, providing loans to others and guaranteeing certain financial instruments. However, the U.S. and global financial systems remain fragile, and economic weakness is likely to persist.
In our view, today’s investment environment is rife with near-term challenges and long-term opportunities. Now more than ever, it is important to ensure that your investments are aligned with your current needs, future goals and attitudes toward risk.We urge you to speak regularly with your financial advisor, who can recommend the course of action that is right for you.
For information about how the fund performed during the reporting period, as well as market perspectives, we have provided a Discussion of Fund Performance given by the fund’s Portfolio Manager.
Thank you for your continued confidence and support.
| 2 |

DISCUSSION OF FUND PERFORMANCE
For the period from the fund’s inception on May 30,2008,through November 30, 2008, as provided byWalter Scott & Partners Limited (Walter Scott), Sub-adviser
Fund and Market Performance Overview
For the period from the fund’s inception on May 30, 2008, through the end of its annual reporting period on November 30, 2008, Dreyfus U.S. Equity Fund’s Class A shares produced a return of –26.88%, Class C shares returned –27.12%, Class I shares returned –26.72% and Class T shares returned –26.96% .1 In comparison, the fund’s benchmark index, the Morgan Stanley Capital International USA Index (the “MSCI USA Index”), produced a –35.85% return over the same period.2
U.S. equities declined sharply over the reporting period when an economic slowdown and financial crisis intensified.Although the fund also declined, it produced higher returns than its benchmark, primarily due to strong individual stock selections across a variety of market sectors.
The Fund’s Investment Approach
The fund seeks long-term total return by investing in stocks of companies with any market capitalization that are located in the United States. When selecting stocks,Walter Scott seeks companies with fundamental strengths that indicate the potential for sustainable growth.The firm focuses on individual stock selection through extensive fundamental research.Walter Scott first selects candidates for investment that meet certain broad absolute and trend criteria. Financial statements are restated in an effort to identify the nature of their operating margins and to understand the variables that add value to their businesses. Companies meeting the financial criteria are subjected to a detailed investigation of their products, costs and pricing, competition, industry position and outlook. Stocks are then selected whose expected growth rate is available at a reasonable valuation.
Financial Crisis and Economic Slowdown Intensified
A credit crisis that began in 2007 mushroomed over the summer of 2008, nearly leading to the collapse of the U.S. and global banking sys-
The Fund 3
DISCUSSION OF FUND PERFORMANCE (continued)
tems. Major U.S. financial institutions that had been hit hard by losses in credit markets teetered on the edge of insolvency, causing some to be nationalized, others to receive massive capital infusions from the federal government and some to be acquired by former rivals at fire-sale prices. As the situation worsened, banks and other lenders refrained from lending to even their most trusted customers. Investors also grew more cautious, flocking to the traditional safe haven of U.S. Treasury securities. Conversely, investors fled asset classes they considered risky, including U.S. equities.
Meanwhile, the U.S. economic slowdown gained momentum, led by declining housing prices and rising unemployment. Consumer and business spending fell, reducing the earnings outlook for most market sectors and individual companies. In addition, previously soaring commodity prices, including energy, fell sharply as demand waned.These concurrent developments produced the most extreme market volatility in decades.
Bottom-Up Process Fared Relatively Well
In this highly challenging environment, the bottom-up security selection process led the firm to a number of conservative growth companies that, inWalter Scott’s analysis,are well positioned to weather the current storm and prosper during an eventual recovery.The fund held no exposure to the troubled financials sector, enabling it to avoid some of the market’s worst performers. Conversely, the fund maintained overweighted positions in the traditionally defensive health care and consumer staples sectors, which declined less severely than market averages. Modestly underweighted exposure and strong stock selections in the information technology sector also benefited the fund’s relative performance.
Among individual stocks, biotechnology firm Genentech produced a positive absolute return on the strength of good news regarding a new cancer drug. In the energy sector, oil-and-gas drilling specialist CARBO Ceramics saw orders rise due to increased exploration and production. Consumer staples giants Wal-Mart Stores and Procter & Gamble fared relatively well as consumers sought low-priced goods and investors turned to traditionally defensive stocks, respectively.Among information
4
technology stocks,Automatic Data Processing held up relatively well in an otherwise bleak environment for business-services providers.
As is to be expected in such a difficult market climate, the fund also suffered disappointments. Four of the five most significant laggards during the reporting period were energy companies.A severe hurricane season forced Cimarex Energy’s quarterly earnings lower. Cimarex’s former parent, Helmerich Payne, declined along with oil prices despite announcing record earnings. Schlumberger fell upon reducing future earnings guidance due to weakness in key oil service markets.Anadarko Petroleum lost value amid tumbling natural gas prices. Finally, in the information technology sector, microchip maker Intel declined along with demand for personal computers and other electronics.
Finding Opportunities in Turbulent Markets
Although the financial crisis has persisted and the economic slowdown has intensified, the bottom-up security selection process has continued to identify what the firm believes to be fundamentally sound companies selling at historically attractive valuations.As many U.S. stocks sold off indiscriminately, great businesses with strong long-term prospects for growth have become more inexpensive, signaling potential opportunities for investors with the patience and discipline to wait for an eventual economic and market recovery.
December 15, 2008
| 1 | Total return includes reinvestment of dividends and any capital gains paid, and does not take into | |
| consideration the maximum initial sales charges in the case of Class A and Class T shares, or the | ||
| applicable contingent deferred sales charge imposed on redemptions in the case of Class C shares. | ||
| Had these charges been reflected, returns would have been lower. Past performance is no guarantee | ||
| of future results. Share price and investment return fluctuate such that upon redemption, fund | ||
| shares may be worth more or less than their original cost. Return figures provided reflect the | ||
| absorption of certain fund expenses by The Dreyfus Corporation pursuant to an undertaking in | ||
| effect through April 1, 2010, at which time it may be extended, terminated or modified. Had | ||
| these expenses not been absorbed, the fund’s returns would have been lower. | ||
| 2 | SOURCE: LIPPER INC. – Reflects reinvestment of net dividends and, where applicable, | |
| capital gain distributions.The Morgan Stanley Capital International USA (MSCI USA) Index | ||
| is an unmanaged, market capitalization weighted index that is designed to measure the | ||
| performance of publicly traded stocks issued by companies in the United States. |
The Fund 5
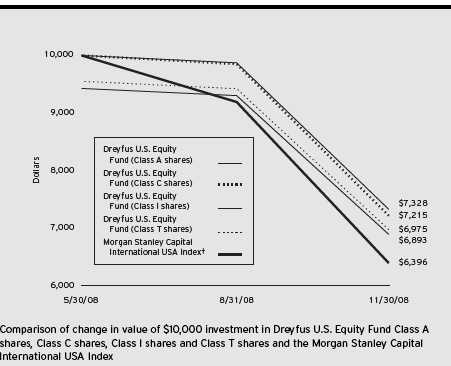
† Source: Lipper Inc.
Past performance is not predictive of future performance.
The above graph compares a $10,000 investment made in Class A, Class C, Class I and Class T shares of Dreyfus U.S. Equity Fund on 5/30/08 (inception date) to a $10,000 investment made in the Morgan Stanley Capital International USA Index (the “Index”) on that date. All dividends and capital gain distributions are reinvested.
The fund’s performance shown in the line graph takes into account the maximum initial sales charges on Class A shares and Class T shares, the applicable contingent deferred sales charge on Class C shares and all other applicable fees and expenses on all classes.The Index is an unmanaged, market capitalization-weighted index that is designed to measure the performance of publicly traded stocks issued by companies in the United States. Unlike a mutual fund, the Index is not subject to charges, fees and other expenses. Investors cannot invest directly in any index. Further information relating to fund performance, including expense reimbursements, if applicable, is contained in the Financial Highlights section of the prospectus and elsewhere in this report.
6
| Actual Aggregate Total Returns as of 11/30/08 | ||||
| Inception | From | |||
| Date | Inception | |||
| Class A shares | ||||
| with maximum sales charge (5.75%) | 5/30/08 | (31.07)% | ||
| without sales charge | 5/30/08 | (26.88)% | ||
| Class C shares | ||||
| with applicable redemption charge † | 5/30/08 | (27.85)% | ||
| without redemption | 5/30/08 | (27.12)% | ||
| Class I shares | 5/30/08 | (26.72)% | ||
| Class T shares | ||||
| with applicable sales charge (4.5%) | 5/30/08 | (30.25)% | ||
| without sales charge | 5/30/08 | (26.96)% | ||
| Past performance is not predictive of future performance.The fund’s performance shown in the graph and table does not |
| reflect the deduction of taxes that a shareholder would pay on fund distributions or the redemption of fund shares. |
| † The maximum contingent deferred sales charge for Class C shares is 1% for shares redeemed within one year of the |
| date of purchase. |
The Fund 7
UNDERSTANDING YOUR FUND’S EXPENSES (Unaudited)
As a mutual fund investor, you pay ongoing expenses, such as management fees and other expenses. Using the information below, you can estimate how these expenses affect your investment and compare them with the expenses of other funds.You also may pay one-time transaction expenses, including sales charges (loads) and redemption fees, which are not shown in this section and would have resulted in higher total expenses. For more information, see your fund’s prospectus or talk to your financial adviser.
Review your fund’s expenses
The table below shows the expenses you would have paid on a $1,000 investment in Dreyfus U.S. Equity Fund from June 1, 2008 to November 30, 2008. It also shows how much a $1,000 investment would be worth at the close of the period, assuming actual returns and expenses.
| Expenses and Value of a $1,000 Investment | ||||||||
| assuming actual returns for the six months ended November 30, 2008 | ||||||||
| Class A | Class C | Class I | Class T | |||||
| Expenses paid per $1,000† | $ 6.06 | $ 9.29 | $ 4.98 | $ 7.14 | ||||
| Ending value (after expenses) | $731.20 | $728.80 | $732.80 | $730.40 | ||||
COMPARING YOUR FUND’S EXPENSES WITH THOSE OF OTHER FUNDS (Unaudited)
Using the SEC’s method to compare expenses
The Securities and Exchange Commission (SEC) has established guidelines to help investors assess fund expenses. Per these guidelines, the table below shows your fund’s expenses based on a $1,000 investment, assuming a hypothetical 5% annualized return You can use this information to compare the ongoing expenses (but not transaction expenses or total cost) of investing in the fund with those of other funds.All mutual fund shareholder reports will provide this information to help you make this comparison Please note that you cannot use this information to estimate your actual ending account balance and expenses paid during the period.
| Expenses and Value of a $1,000 Investment | ||||||||
| assuming a hypothetical 5% annualized return for the six months ended November 30, 2008 | ||||||||
| Class A | Class C | Class I | Class T | |||||
| Expenses paid per $1,000 | $ 7.06 | $ 10.83 | $ 5.81 | $ 8.32 | ||||
| Ending value (after expenses) | $1,018.00 | $1,014.25 | $1,019.25 | $1,016.75 | ||||
† Expenses are equal to the fund’s annualized expense ratio of 1.40% for Class A, 2.15% for Class C, 1.15% for Class I and 1.65% for Class T, multiplied by the average account value over the period, multiplied by 183/366 (to reflect the one-half year period).
8
| STATEMENT OF INVESTMENTS |
| November 30, 2008 |
| Common Stocks—96.5% | Shares | Value ($) | ||
| Consumer Goods—7.1% | ||||
| Colgate-Palmolive | 1,300 | 84,591 | ||
| PepsiCo | 1,460 | 82,782 | ||
| Procter & Gamble | 1,530 | 98,455 | ||
| 265,828 | ||||
| Consumer Services—14.1% | ||||
| Kohl’s | 2,220 a | 72,505 | ||
| Philip Morris International | 1,930 | 81,369 | ||
| Starbucks | 5,450 a | 48,668 | ||
| SYSCO | 3,250 | 76,213 | ||
| TJX Cos. | 3,100 | 70,742 | ||
| Wal-Mart Stores | 1,730 | 96,672 | ||
| Walgreen | 3,200 | 79,168 | ||
| 525,337 | ||||
| Energy—7.8% | ||||
| Anadarko Petroleum | 1,680 | 68,964 | ||
| Cimarex Energy | 1,480 | 41,988 | ||
| EOG Resources | 780 | 66,316 | ||
| Exxon Mobil | 1,400 | 112,210 | ||
| 289,478 | ||||
| Energy Services—5.5% | ||||
| CARBO Ceramics | 2,100 | 100,590 | ||
| Helmerich & Payne | 1,640 | 41,590 | ||
| Schlumberger | 1,240 | 62,918 | ||
| 205,098 | ||||
| Health Care—24.4% | ||||
| Abbott Laboratories | 1,800 | 94,302 | ||
| C.R. Bard | 1,080 | 88,592 | ||
| Eli Lilly & Co. | 2,060 | 70,349 | ||
| Genentech | 1,410 a | 108,006 | ||
| Johnson & Johnson | 1,510 | 88,456 | ||
| Medtronic | 1,970 | 60,124 | ||
| Merck & Co. | 2,570 | 68,670 | ||
| Pharmaceutical Product Development | 2,700 | 71,118 |
The Fund 9
| STATEMENT OF INVESTMENTS (continued) |
| Common Stocks (continued) | Shares | Value ($) | ||
| Health Care (continued) | ||||
| Resmed | 2,540 a | 92,304 | ||
| Varian Medical Systems | 2,110 a | 85,160 | ||
| Wyeth | 2,250 | 81,023 | ||
| 908,104 | ||||
| Industrial—17.8% | ||||
| Boeing | 1,520 | 64,798 | ||
| C.H. Robinson Worldwide | 1,540 | 78,663 | ||
| Donaldson | 2,350 | 80,417 | ||
| Ecolab | 2,230 | 85,610 | ||
| Fastenal | 2,070 | 79,716 | ||
| FLIR Systems | 2,560 a | 79,411 | ||
| Honeywell International | 1,800 | 50,148 | ||
| Rockwell Collins | 2,150 | 73,272 | ||
| United Technologies | 1,420 | 68,913 | ||
| 660,948 | ||||
| Technology—19.8% | ||||
| Amphenol, Cl. A | 2,800 | 65,016 | ||
| Automatic Data Processing | 2,330 | 95,670 | ||
| Cisco Systems | 4,760 a | 78,730 | ||
| Dolby Laboratories, Cl. A | 2,400 a | 71,568 | ||
| Intel | 5,400 | 74,520 | ||
| Linear Technology | 2,750 | 54,862 | ||
| Microsoft | 4,420 | 89,372 | ||
| Oracle | 4,400 a | 70,796 | ||
| Paychex | 2,700 | 76,302 | ||
| QUALCOMM | 1,830 | 61,433 | ||
| 738,269 | ||||
| Total Common Stocks | ||||
| (cost $4,881,963) | 3,593,062 |
10
| Other Investment—3.8% | Shares | Value ($) | ||
| Registered Investment Company; | ||||
| Dreyfus Institutional Preferred | ||||
| Plus Money Market Fund | ||||
| (cost $143,000) | 143,000 b | 143,000 | ||
| Total Investments (cost $5,024,963) | 100.3% | 3,736,062 | ||
| Liabilities, Less Cash and Receivables | (.3%) | (12,126) | ||
| Net Assets | 100.0% | 3,723,936 | ||
| a | Non-income producing security. | |
| b | Investment in affiliated money market mutual fund. |
| Portfolio Summary (Unaudited)† | ||||||
| Value (%) | Value (%) | |||||
| Health Care | 24.4 | Consumer Goods | 7.1 | |||
| Technology | 19.8 | Energy Services | 5.5 | |||
| Industrial | 17.8 | Money Market Investment | 3.8 | |||
| Consumer Services | 14.1 | |||||
| Energy | 7.8 | 100.3 | ||||
| † Based on net assets. |
| See notes to financial statements. |
The Fund 11
| STATEMENT OF ASSETS AND LIABILITIES |
| November 30, 2008 |
| Cost | Value | |||||||
| Assets ($): | ||||||||
| Investments in securities—See Statement of Investments: | ||||||||
| Unaffiliated issuers | 4,881,963 | 3,593,062 | ||||||
| Affiliated issuers | 143,000 | 143,000 | ||||||
| Cash | 23,753 | |||||||
| Dividends and interest receivable | 7,006 | |||||||
| Prepaid expenses | 52,053 | |||||||
| Due from The Dreyfus Corporation and affiliates—Note 3(c) | 54,574 | |||||||
| 3,873,448 | ||||||||
| Liabilities ($): | ||||||||
| Accrued expenses | 149,512 | |||||||
| Net Assets ($) | 3,723,936 | |||||||
| Composition of Net Assets ($): | ||||||||
| Paid-in capital | 5,070,781 | |||||||
| Accumulated undistributed investment income—net | 7,153 | |||||||
| Accumulated net realized gain (loss) on investments | (65,097) | |||||||
| Accumulated net unrealized appreciation | ||||||||
| (depreciation) on investments | (1,288,901) | |||||||
| Net Assets ($) | 3,723,936 | |||||||
| Net Asset Value Per Share | ||||||||
| Class A | Class C | Class I | Class T | |||||
| Net Assets ($) | 2,617,989 | 374,452 | 366,210 | 365,285 | ||||
| Shares Outstanding | 286,338 | 41,108 | 40,000 | 40,000 | ||||
| Net Asset Value Per Share ($) | 9.14 | 9.11 | 9.16 | 9.13 | ||||
See notes to financial statements.
12
| STATEMENT OF OPERATIONS |
| From May 30, 2008 (commencement of operations) to November 30, 2008 |
| Investment Income ($): | ||
| Income: | ||
| Cash dividends: | ||
| Unaffiliated issuers | 35,177 | |
| Affiliated issuers | 4,011 | |
| Total Income | 39,188 | |
| Expenses: | ||
| Management fee—Note 3(a) | 16,986 | |
| Auditing fees | 38,250 | |
| Registration fees | 29,317 | |
| Legal fees | 22,558 | |
| Prospectus and shareholders’ reports | 5,262 | |
| Shareholder servicing costs—Note 3(c) | 5,236 | |
| Distribution fees—Note 3(b) | 2,264 | |
| Custodian fees—Note 3(c) | 833 | |
| Directors’ fees and expenses—Note 3(d) | 349 | |
| Miscellaneous | 5,950 | |
| Total Expenses | 127,005 | |
| Less—expense reimbursement from the Dreyfus | ||
| Corporation due to undertaking—Note 3(a) | (93,365) | |
| Less—reduction in fees due to earnings credits—Note 1(b) | (295) | |
| Net Expenses | 33,345 | |
| Investment Income—Net | 5,843 | |
| Realized and Unrealized Gain (Loss) on Investments—Note 4 ($): | ||
| Net realized gain (loss) on investments | (65,097) | |
| Net unrealized appreciation (depreciation) on investments | (1,288,901) | |
| Net Realized and Unrealized Gain (Loss) on Investments | (1,353,998) | |
| Net (Decrease) in Net Assets Resulting from Operations | (1,348,155) |
See notes to financial statements.
The Fund 13
| STATEMENT OF CHANGES IN NET ASSETS |
| From May 30, 2008 (commencement of operations) to November 30, 2008 |
| Operations ($): | ||
| Investment income—net | 5,843 | |
| Net realized gain (loss) on investments | (65,097) | |
| Net unrealized appreciation | ||
| (depreciation) on investments | (1,288,901) | |
| Net Increase (Decrease) in Net Assets | ||
| Resulting from Operations | (1,348,155) | |
| Capital Stock Transactions ($): | ||
| Net proceeds from shares sold: | ||
| Class A Shares | 3,561,934 | |
| Class C Shares | 510,157 | |
| Class I Shares | 500,000 | |
| Class T Shares | 500,000 | |
| Increase (Decrease) in Net Assets | ||
| from Capital Stock Transactions | 5,072,091 | |
| Total Increase (Decrease) in Net Assets | 3,723,936 | |
| Net Assets ($): | ||
| Beginning of Period | — | |
| End of Period | 3,723,936 | |
| Accumulated investment income—net | 7,153 | |
| Capital Share Transactions (Shares): | ||
| Class A | ||
| Shares sold | 286,338 | |
| Class C | ||
| Shares sold | 41,108 | |
| Class I | ||
| Shares sold | 40,000 | |
| Class T | ||
| Shares sold | 40,000 |
See notes to financial statements.
14
FINANCIAL HIGHLIGHTS
The following table describes the performance for each share class for the period from May 30, 2008 (commencement of operations) to November 30, 2008.All information (except portfolio turnover rate) reflects financial results for a single fund share Total return shows how much your investment in the fund would have increased (or decreased) during each period, assuming you had reinvested all dividends and distributions.These figures have been derived from the fund’s financial statements.
| Class A | Class C | Class I | Class T | |||||
| Shares | Shares | Shares | Shares | |||||
| Per Share Data ($): | ||||||||
| Net asset value, beginning of period | 12.50 | 12.50 | 12.50 | 12.50 | ||||
| Investment Operations: | ||||||||
| Investment income (loss)—neta | .02 | (.02) | .03 | .01 | ||||
| Net realized and unrealized | ||||||||
| gain (loss) on investments | (3.38) | (3.37) | (3.37) | (3.38) | ||||
| Total from Investment Operations | (3.36) | (3.39) | (3.34) | (3.37) | ||||
| Net asset value, end of period | 9.14 | 9.11 | 9.16 | 9.13 | ||||
| Total Return (%)b | (26.88)c | (27.12)c | (26.72) | (26.96)c | ||||
| Ratios/Supplemental Data (%): | ||||||||
| Ratio of total expenses | ||||||||
| to average net assetsd | 5.54 | 6.30 | 5.25 | 5.74 | ||||
| Ratio of net expenses | ||||||||
| to average net assetsd | 1.40 | 2.14 | 1.14 | 1.64 | ||||
| Ratio of net investment income | ||||||||
| (loss) to average net assetsd | .33 | (.41) | .59 | .09 | ||||
| Portfolio Turnover Rateb | 7.98 | 7.98 | 7.98 | 7.98 | ||||
| Net Assets, end of period ($ x 1,000) | 2,618 | 374 | 366 | 365 |
| a | Based on average shares outstanding at each month end. | |
| b | Not annualized. | |
| c | Exclusive of sales charge. | |
| d | Annualized. | |
| See notes to financial statements. | ||
The Fund 15
NOTES TO FINANCIAL STATEMENTS
NOTE 1—Significant Accounting Policies:
Dreyfus U.S. Equity Fund (the “fund”) is a separate diversified series of Strategic Funds, Inc. (the “Company”) which is registered under the Investment Company Act of 1940, as amended (the “Act”), as an open-end management investment company and operates as a series company currently offering six series, including the fund, which commenced operations on May 30, 2008.The fund’s investment objective seeks long-term total return. The Dreyfus Corporation (the “Manager” or “Dreyfus”), a wholly-owned subsidiary of The Bank of New York Mellon Corporation (“BNY Mellon”), serves as the fund’s investment adviser.Walter Scott & Partners Limited (“Walter Scott”), a subsidiary of BNY Mellon and an affiliate of Dreyfus, serves as the fund’s sub-investment adviser.
At a meeting of the fund’s Board of Directors held on July 25, 2008, the Board approved, effective December 1, 2008, a proposal to change the name of the fund from “Dreyfus Premier U.S. Equity Fund” to “Dreyfus U.S. Equity Fund”.
Effective July 1, 2008, BNY Mellon has reorganized and consolidated a number of its banking and trust company subsidiaries. As a result of the reorganization, any services previously provided to the fund by Mellon Bank, N.A. or Mellon Trust of New England, N.A. are now provided by The Bank of New York, which has changed its name to The Bank of New York Mellon.
MBSC Securities Corporation (the “Distributor”), a wholly-owned subsidiary of Dreyfus, is the distributor of the fund’s shares.The fund is authorized to issue 100 million shares of $.001 par value Common Stock in each of the following classes of shares: Class A, Class C, Class I and Class T. Class A and Class T shares are subject to a sales charge imposed at the time of purchase. Class C shares are subject to a contingent deferred sales charge (“CDSC”) on Class C shares redeemed within one year of purchase. Class I shares are sold at net asset value per share only to institutional investors. Other differences between the classes include the services offered to and the expenses borne by each
16
class, the allocation of certain transfer agency costs and certain voting rights. Income, expenses (other than expenses attributable to a specific class), and realized and unrealized gains or losses on investments are allocated to each class of shares based on its relative net assets.
As of November 30, 2008, MBC Investments Corp., an indirect subsidiary of BNY Mellon, held 280,000 Class A shares and 40,000 Class C, Class I and Class T shares.
The Company accounts separately for the assets, liabilities and operations of each series. Expenses directly attributable to each series are charged to that series’ operations; expenses which are applicable to all series are allocated among them on a pro rata basis.
The fund’s financial statements are prepared in accordance with U.S. generally accepted accounting principles, which may require the use of management estimates and assumptions. Actual results could differ from those estimates.
The fund enters into contracts that contain a variety of indemnifications. The fund’s maximum exposure under these arrangements is unknown.The fund does not anticipate recognizing any loss related to these arrangements.
(a) Portfolio valuation: Investments in securities are valued at the last sales price on the securities exchange or national securities market on which such securities are primarily traded. Securities listed on the National Market System for which market quotations are available are valued at the official closing price or, if there is no official closing price that day, at the last sales price. Securities not listed on an exchange or the national securities market, or securities for which there were no transactions, are valued at the average of the most recent bid and asked prices, except for open short positions, where the asked price is used for valuation purposes. Bid price is used when no asked price is available. Registered investment companies that are not traded on an exchange are valued at their net asset value. When market quotations or official
The Fund 17
| NOTES TO FINANCIAL STATEMENTS (continued) |
closing prices are not readily available, or are determined not to reflect accurately fair value, such as when the value of a security has been significantly affected by events after the close of the exchange or market on which the security is principally traded (for example, a foreign exchange or market),but before the fund calculates its net asset value,the fund may value these investments at fair value as determined in accordance with the procedures approved by the Board of Directors. Fair valuing of securities may be determined with the assistance of a pricing service using calculations based on indices of domestic securities and other appropriate indicators, such as prices of relevant ADRs and futures contracts. For other securities that are fair valued by the Board of Directors, certain factors may be considered such as: fundamental analytical data, the nature and duration of restrictions on disposition, an evaluation of the forces that influence the market in which the securities are purchased and sold and public trading in similar securities of the issuer or comparable issuers. Financial futures are valued at the last sales price.
The fund adopted Statement of Financial Accounting Standards No. 157 “FairValue Measurements” (“FAS 157”). FAS 157 establishes an authoritative definition of fair value, sets out a framework for measuring fair value, and requires additional disclosures about fair-value measurements.
Various inputs are used in determining the value of the fund’s investments relating to FAS 157.These inputs are summarized in the three broad levels listed below.
| Level 1—quoted prices in active markets for identical securities. |
| Level 2—other significant observable inputs (including quoted |
| prices for similar securities, interest rates, prepayment speeds, credit |
| risk, etc.) |
| Level 3—significant unobservable inputs (including the fund’s own |
| assumptions in determining the fair value of investments). |
The inputs or methodology used for valuing securities are not necessarily an indication of the risk associated with investing in those securities.
18
The following is a summary of the inputs used as of November 30, 2008 in valuing the fund’s investments carried at fair value:
| Investments in | Other Financial | |||
| Valuation Inputs | Securities ($) | Instruments ($)† | ||
| Level 1—Quoted Prices | 3,736,062 | 0 | ||
| Level 2—Other Significant | ||||
| Observable Inputs | 0 | 0 | ||
| Level 3—Significant | ||||
| Unobservable Inputs | 0 | 0 | ||
| Total | 3,736,062 | 0 |
- Other financial instruments include derivative instruments, such as futures, forward currency exchange contracts and swap contracts, which are valued at the unrealized appreciation (depreciation) on the instrument.
(b) Securities transactions and investment income: Securities transactions are recorded on a trade date basis. Realized gains and losses from securities transactions are recorded on the identified cost basis. Dividend income is recognized on the ex-dividend date and interest income, including, where applicable, accretion of discount and amortization of premium on investments, is recognized on the accrual basis.
The fund has arrangements with the custodian and cash management banks whereby the fund may receive earnings credits when positive cash balances are maintained, which are used to offset custody and cash management fees. For financial reporting purposes, the fund includes net earnings credits as an expense offset in the Statement of Operations.
(c) Affiliated issuers: Investments in other investment companies advised by Dreyfus are defined as “affiliated” in the Act.
(d) Dividends to shareholders: Dividends are recorded on the ex-dividend date. Dividends from investment income-net and dividends from net realized capital gains, if any, are normally declared and paid annually, but the fund may make distributions on a more frequent basis to comply with the distribution requirements of the Internal Revenue Code of 1986, as amended (the “Code”).To the extent that net realized capital
The Fund 19
| NOTES TO FINANCIAL STATEMENTS (continued) |
gains can be offset by capital loss carryovers, if any, it is the policy of the fund not to distribute such gains. Income and capital gains distributions are determined in accordance with income tax regulations, which may differ from U.S. generally accepted accounting principles.
(e) Federal income taxes: It is the policy of the fund to qualify as a regulated investment company, if such qualification is in the best interests of its shareholders, by complying with the applicable provisions of the Code, and to make distributions of taxable income sufficient to relieve it from substantially all federal income and excise taxes.
The fund adopted Financial Accounting Standards Board (“FASB”) Interpretation No. 48 “Accounting for Uncertainty in Income Taxes” (“FIN 48”). FIN 48 provides guidance for how uncertain tax positions should be recognized, measured, presented and disclosed in the financial statements. FIN 48 requires the evaluation of tax positions taken or expected to be taken in the course of preparing the fund’s tax returns to determine whether the tax positions are “more-likely-than not” of being sustained by the applicable tax authority. Liability for tax positions not deemed to meet the more likely-than-not threshold would be recorded as a tax expense in the current year.The adoption of FIN 48 had no impact on the operations of the fund for the period ended November 30, 2008.
As of and during the period ended November 30, 2008, the fund did not have any liabilities for any unrecognized tax positions. The fund recognizes interest and penalties, if any, related to unrecognized tax positions as income tax expense in the Statement of Operations. During the period, the fund did not incur any interest or penalties.
The tax period ended November 30, 2008 remains subject to examination by the Internal Revenue Service and state taxing authorities.
At November 30, 2008, the components of accumulated earnings on a tax basis were as follows: undistributed ordinary income $7,153, accumulated capital losses $47,276 and unrealized depreciation $1,288,901. In addition, the fund had $17,821 of capital losses
20
realized after October 31, 2008, which were deferred for tax purposes to the first day of the following fiscal period.
The accumulated capital loss carryover is available for federal income tax purposes to be applied against future net securities profits, if any, realized subsequent to November 30, 2008. If not applied, the carryover expires in fiscal 2016.
During the period ended November 30, 2008, as a result of permanent book to tax differences, primarily due to fund start-up costs, the fund increased accumulated undistributed investment income-net by $1,310 and decreased paid-in capital by the same amount. Net assets and net asset value per share were not affected by this reclassification.
NOTE 2—Bank Lines of Credit:
Prior to October 15, 2008, the fund participated with other Dreyfus managed funds in a $350 million redemption credit facility. Effective October 15, 2008, the fund participates with other Dreyfus-managed funds in a $145 million redemption credit facility (the “Facility”) to be utilized for temporary or emergency purposes, including the financing of redemptions. In connection therewith, the fund has agreed to pay commitment fees on its pro rata portion of the Facility. Interest is charged to the fund based on prevailing market rates in effect at the time of borrowing. During the period ended November 30, 2008, the fund did not borrow under either Facility.
NOTE 3—Management Fee, Sub-Investment Advisory Fee and Other Transactions With Affiliates:
(a) Pursuant to a management agreement (“Agreement”) with Dreyfus, the management fee is computed at the annual rate of .75% of the value of the fund’s average daily net assets and is payable monthly. Dreyfus has contractually agreed, until April 1, 2010, to waive receipt of its fees and/or assume the expenses of the fund so that annual fund operating expenses (excluding Rule 12b-1 fees, shareholder services fees, taxes, interest, brokerage commissions, commitment fees on borrowings and
The Fund 21
| NOTES TO FINANCIAL STATEMENTS (continued) |
extraordinary expenses) do not exceed 1.15% of the value of the fund’s average daily net assets.The expense reimbursement, pursuant to the undertaking, amounted to $93,365 during the period ended November 30, 2008.
Pursuant to a Sub-Investment Advisory Agreement between Dreyfus and Walter Scott, Dreyfus pays Walter Scott a monthly fee at an annual percentage of the fund’s average daily net assets.
(b) Under the Distribution Plan (the “Plan”) adopted pursuant to Rule 12b-1 under the Act, Class C and Class T shares pay the Distributor for distributing their shares at an annual rate of .75% of the value of the average daily net assets of Class C shares and .25% of the value of the average daily net assets of Class T shares. During the period ended November 30, 2008, Class C and Class T shares were charged $1,700 and $564, respectively, pursuant to the Plan.
(c) Under the Shareholder Services Plan, Class A, Class C and Class T shares pay the Distributor at an annual rate of ..25% of the value of their average daily net assets for the provision of certain services.The services provided may include personal services relating to shareholder accounts, such as answering shareholder inquiries regarding Class A, Class C and Class T shares and providing reports and other information, and services related to the maintenance of shareholder accounts. The Distributor may make payments to Service Agents (a securities dealer, financial institution or other industry professional) in respect of these services.The Distributor determines the amounts to be paid to Service Agents. During the period ended November 30, 2008, Class A, Class C and Class T shares were charged $3,967, $567 and $564, respectively, pursuant to the Shareholder Services Plan.
The fund compensates Dreyfus Transfer, Inc., a wholly-owned subsidiary of Dreyfus, under a transfer agency agreement for providing personnel and facilities to perform transfer agency services for the fund. During the period ended November 30, 2008, the fund was charged $67 pursuant to the transfer agency agreement.
22
The fund compensates The Bank of New York Mellon, a subsidiary of BNY Mellon and an affiliate of Dreyfus, under a cash management agreement for performing cash management services related to fund subscriptions and redemptions. During the period ended November 30, 2008, the fund was charged $5 pursuant to the cash management agreement.
The fund compensates The Bank of New York Mellon under a custody agreement for providing custodial services for the fund. During the period ended November 30, 2008, the fund was charged $833 pursuant to the custody agreement.
During the period ended November 30, 2008, the fund was charged $3,492 for services performed by the Chief Compliance Officer.
The components of “Due from The Dreyfus Corporation and affiliates” in the Statement of Assets and Liabilities consist of: an expense reimbursement of $60,856, which is offset by management fees $2,116, Rule 12b-1 distribution plan fees $300, shareholder services plan fees $675, custodian fees $701, chief compliance officer fees $2,466 and transfer agency per account fees $24.
(d) Each Board member also serves as a Board member of other funds within the Dreyfus complex. Annual retainer fees and attendance fees are allocated to each fund based on net assets.
NOTE 4—Securities Transactions:
The aggregate amount of purchases and sales of investment securities, excluding short-term securities, during the period ended November 30, 2008, amounted to $5,290,583 and $343,523, respectively.
At November 30, 2008, the cost of investments for federal income tax purposes was $5,024,963; accordingly, accumulated net unrealized depreciation on investments was $1,288,901, consisting of $12,584 gross unrealized appreciation and $1,301,485, gross unrealized depreciation.
The Fund 23
| NOTES TO FINANCIAL STATEMENTS (continued) |
In March 2008, the FASB released Statement of Financial Accounting Standards No. 161 “Disclosures about Derivative Instruments and Hedging Activities” (“FAS 161”). FAS 161 requires qualitative disclosures about objectives and strategies for using derivatives, quantitative disclosures about fair value amounts of gains and losses on derivative instruments and disclosures about credit-risk-related contingent features in derivative agreements.The application of FAS 161 is required for fiscal years and interim periods beginning after November 15, 2008. At this time, management is evaluating the implications of FAS 161 and its impact on the financial statements and the accompanying notes has not yet been determined.
NOTE 5—Subsequent Event:
Effective on or about February 4, 2009 (the “Effective Date”), the fund will issue to each holder of its Class T shares, in exchange for said shares, Class A shares of the fund having an aggregate net asset value equal to the aggregate net asset value of the shareholder’s Class T shares.Thereafter, the fund will no longer offer Class T shares.
Effective on or about December 3, 2008, no investments for new accounts were permitted in Class T of the fund, except that participants in certain group retirement plans were able to open a new account in Class T of the fund, provided that the fund was established as an investment option under the plans before December 3, 2008. After the Effective Date, subsequent investments in the fund’s Class A shares made by holders of the fund’s Class T shares who received Class A shares of the fund in exchange for their Class T shares will be subject to the front-end sales load schedule currently in effect for Class T shares. Otherwise, all other Class A share attributes will be in effect.
24
| REPORT OF INDEPENDENT REGISTERED |
| PUBLIC ACCOUNTING FIRM |
| Shareholders and Board of Directors Dreyfus U.S. Equity Fund |
We have audited the accompanying statement of assets and liabilities, including the statement of investments, of Dreyfus U.S. Equity Fund (one of the series comprising Strategic Funds, Inc.) as of November 30, 2008, and the related statements of operations and changes in net assets and financial highlights for the period from May 30, 2008 (commencement of operations) to November 30, 2008.These financial statements and financial highlights are the responsibility of the Fund’s management. Our responsibility is to express an opinion on these financial statements and financial highlights based on our audit.
We conducted our audit in accordance with the standards of the Public Company Accounting Oversight Board (United States). Those standards require that we plan and perform the audit to obtain reasonable assurance about whether the financial statements and financial highlights are free of material misstatement.We were not engaged to perform an audit of the Fund’s internal control over financial reporting. Our audit included consideration of internal control over financial reporting as a basis for designing audit procedures that are appropriate in the circumstances, but not for the purpose of expressing an opinion on the effectiveness of the Fund’s internal control over financial reporting. Accordingly, we express no such opinion. An audit also includes examining, on a test basis, evidence supporting the amounts and disclosures in the financial statements and financial highlights, assessing the accounting principles used and significant estimates made by management, and evaluating the overall financial statement presentation. Our procedures included confirmation of securities owned as of November 30, 2008 by correspondence with the custodian and others.We believe that our audit provides a reasonable basis for our opinion.
In our opinion, the financial statements and financial highlights referred to above present fairly, in all material respects, the financial position of Dreyfus U.S. Equity Fund at November 30, 2008, and the results of its operations, the changes in its net assets and the financial highlights for the period from May 30, 2008 to November 30, 2008, in conformity with U. S. generally accepted accounting principles.
| New York, New York |
| January 22, 2009 |
The Fund 25
BOARD MEMBERS INFORMATION (Unaudited)
| Joseph S. DiMartino (65) Chairman of the Board (1995) Principal Occupation During Past 5Years: |
- Corporate Director and Trustee
Other Board Memberships and Affiliations:
- The Muscular Dystrophy Association, Director
- Century Business Services, Inc., a provider of outsourcing functions for small and medium size companies, Director
- The Newark Group, a provider of a national market of paper recovery facilities, paperboard mills and paperboard converting plants, Director
- Sunair Services Corporation, a provider of certain outdoor-related services to homes and businesses, Director
No. of Portfolios for which Board Member Serves: 181
| ——————— |
| David W. Burke (72) Board Member (1994) Principal Occupation During Past 5Years: |
- Corporate Director and Trustee
Other Board Memberships and Affiliations:
- John F. Kennedy Library Foundation, Director
No. of Portfolios for which Board Member Serves: 90
———————
William Hodding Carter III (73) Board Member (1988)
Principal Occupation During Past 5Years:
- Professor of Leadership & Public Policy, University of North Carolina, Chapel Hill (January 1, 2006-present)
- President and Chief Executive Officer of the John S. and James L. Knight Foundation (February 1, 1998-February 1, 2006)
| Other Board Memberships and Affiliations: |
- The Century Foundation, a tax-exempt research foundation, Emeritus Director
- The Enterprise Corporation of the Delta, a non-profit economic development organization, Director
| No. of Portfolios for which Board Member Serves: 27 |
| ——————— |
| Gordon J. Davis (67) Board Member (2006) Principal Occupation During Past 5Years: |
- Partner in the law firm of Dewey & LeBoeuf LLP
- President, Lincoln Center for the Performing Arts, Inc. (2001)
| Other Board Memberships and Affiliations: |
- Consolidated Edison, Inc., a utility company, Director
- Phoenix Companies, Inc., a life insurance company, Director
- Board Member/Trustee for several not-for-profit groups
| No. of Portfolios for which Board Member Serves: 41 |
26
| Joni Evans (66) Board Member (2006) Principal Occupation During Past 5Years: |
- Chief Executive Officer, www.wowOwow.com an online community dedicated to women’s conversations and publications
- Principal, Joni Evans Ltd.
- Senior Vice President of the William Morris Agency (2005)
| No. of Portfolios for which Board Member Serves: 27 |
| ——————— |
| Ehud Houminer (68) Board Member (1994) |
Principal Occupation During Past 5Years:
- Executive-in-Residence at the Columbia Business School, Columbia University
Other Board Memberships and Affiliations:
- Avnet Inc., an electronics distributor, Director
- International Advisory Board to the MBA Program School of Management, Ben Gurion University, Chairman
| No. of Portfolios for which Board Member Serves: 63 |
| ——————— |
| Richard C. Leone (68) Board Member (1984) Principal Occupation During Past 5Years: |
- President of The Century Foundation (formerly,The Twentieth Century Fund, Inc.), a tax exempt research foundation engaged in the study of economic, foreign policy and domestic issues
| Other Board Memberships and Affiliations: |
- The American Prospect, Director
- Center for American Progress, Director
| No. of Portfolios for which Board Member Serves: 27 |
| ——————— |
| Hans C. Mautner (71) Board Member (1984) Principal Occupation During Past 5Years: |
- President—International Division and an Advisory Director of Simon Property Group, a real estate investment company (1998-present)
- Director and Vice Chairman of Simon Property Group (1998-2003)
- Chairman and Chief Executive Officer of Simon Global Limited (1999-present)
| Other Board Memberships and Affiliations: |
- Capital and Regional PLC, a British co-investing real estate asset manager, Director
- Member, Advisory Board, Lehman Brothers European Real Estate Private Equity Fund
| No. of Portfolios for which Board Member Serves: 27 |
The Fund 27
BOARD MEMBERS INFORMATION (Unaudited) (continued)
| Robin A. Melvin (45) Board Member (1995) Principal Occupation During Past 5Years: |
- Director, Boisi Family Foundation, a private family foundation that supports youth-serving organizations that promote the self sufficiency of youth from disadvantaged circumstances
- Senior Vice President, Mentor, a National non-profit youth mentoring organization (2005)
| No. of Portfolios for which Board Member Serves: 27 |
| ——————— |
| Burton N. Wallack (58) Board Member (2006) |
Principal Occupation During Past 5Years:
- President and co-owner of Wallack Management Company, a real estate management company
No. of Portfolios for which Board Member Serves: 27
| ——————— |
| John E. Zuccotti (71) Board Member (1984) Principal Occupation During Past 5Years: |
- Chairman of Brookfield Financial Properties, Inc.
- Senior Counsel of Weil, Gotshal & Manges, LLP
- Emeritus Chairman of the Real Estate Board of New York
| Other Board Memberships and Affiliations: |
- Emigrant Savings Bank, Director
- Wellpoint, Inc., Director
- Columbia University,Trustee
- Doris Duke Charitable Foundation,Trustee
| No. of Portfolios for which Board Member Serves: 27 |
| ——————— |
Once elected all Board Members serve for an indefinite term, but achieve Emeritus status upon reaching age 80.The address of the Board Members and Officers is in c/o The Dreyfus Corporation, 200 Park Avenue, NewYork, NewYork 10166. Additional information about the Board Members is available in the fund’s Statement of Additional Information which can be obtained from Dreyfus free of charge by calling this toll free number: 1-800-554-4611.
Arnold S. Hiatt, Emeritus Board Member
28
OFFICERS OF THE FUND (Unaudited)
J. DAVID OFFICER, President since December 2006.
Chief Operating Officer,Vice Chairman and a Director of the Manager, and an officer of 77 investment companies (comprised of 180 portfolios) managed by the Manager. He is 60 years old and has been an employee of the Manager since April 1998.
PHILLIP N. MAISANO, Executive Vice President since July 2007.
Chief Investment Officer,Vice Chair and a director of the Manager, and an officer of 77 investment companies (comprised of 180 portfolios) managed by the Manager. Mr. Maisano also is an officer and/or Board member of certain other investment management subsidiaries of The Bank of New York Mellon Corporation, each of which is an affiliate of the Manager. He is 61 years old and has been an employee of the Manager since November 2006. Prior to joining the Manager, Mr. Maisano served as Chairman and Chief Executive Officer of EACM Advisors, an affiliate of the Manager, since August 2004, and served as Chief Executive Officer of Evaluation Associates, a leading institutional investment consulting firm, from 1988 until 2004.
MICHAEL A. ROSENBERG, Vice President and Secretary since August 2005.
Assistant General Counsel of BNY Mellon, and an officer of 78 investment companies (comprised of 201 portfolios) managed by the Manager. He is 48 years old and has been an employee of the Manager since October 1991.
JAMES BITETTO, Vice President and Assistant Secretary since August 2005.
Senior Counsel of BNY Mellon and Secretary of the Manager, and an officer of 78 investment companies (comprised of 201 portfolios) managed by the Manager. He is 42 years old and has been an employee of the Manager since December 1996.
JONI LACKS CHARATAN, Vice President and Assistant Secretary since August 2005.
Senior Counsel of BNY Mellon, and an officer of 78 investment companies (comprised of 201 portfolios) managed by the Manager. She is 53 years old and has been an employee of the Manager since October 1988.
JOSEPH M. CHIOFFI, Vice President and Assistant Secretary since August 2005.
Senior Counsel of BNY Mellon, and an officer of 78 investment companies (comprised of 201 portfolios) managed by the Manager. He is 47 years old and has been an employee of the Manager since June 2000.
JANETTE E. FARRAGHER, Vice President and Assistant Secretary since August 2005.
Assistant General Counsel of BNY Mellon, and an officer of 78 investment companies (comprised of 201 portfolios) managed by the Manager. She is 46 years old and has been an employee of the Manager since February 1984.
JOHN B. HAMMALIAN, Vice President and Assistant Secretary since August 2005.
Managing Counsel of BNY Mellon, and an officer of 78 investment companies (comprised of 201 portfolios) managed by the Manager. He is 45 years old and has been an employee of the Manager since February 1991.
ROBERT R. MULLERY, Vice President and Assistant Secretary since August 2005.
Managing Counsel of BNY Mellon, and an officer of 78 investment companies (comprised of 201 portfolios) managed by the Manager. He is 56 years old and has been an employee of the Manager since May 1986.
The Fund 29
OFFICERS OF THE FUND (Unaudited) (continued)
JEFF PRUSNOFSKY, Vice President and Assistant Secretary since August 2005.
Managing Counsel of BNY Mellon, and an officer of 78 investment companies (comprised of 201 portfolios) managed by the Manager. He is 43 years old and has been an employee of the Manager since October 1990.
JAMES WINDELS, Treasurer since November 2001.
Director – Mutual Fund Accounting of the Manager, and an officer of 78 investment companies (comprised of 201 portfolios) managed by the Manager. He is 49 years old and has been an employee of the Manager since April 1985.
RICHARD CASSARO, Assistant Treasurer since January 2008.
Senior Accounting Manager – Money Market and Municipal Bond Funds of the Manager, and an officer of 78 investment companies (comprised of 201 portfolios) managed by the Manager. He is 49 years old and has been an employee of the Manager since September 1982.
GAVIN C. REILLY, Assistant Treasurer since December 2005.
Tax Manager of the Investment Accounting and Support Department of the Manager, and an officer of 78 investment companies (comprised of 201 portfolios) managed by the Manager. He is 40 years old and has been an employee of the Manager since April 1991.
ROBERT ROBOL, Assistant Treasurer since August 2005.
Senior Accounting Manager – Fixed Income Funds of the Manager, and an officer of 78 investment companies (comprised of 201 portfolios) managed by the Manager. He is 44 years old and has been an employee of the Manager since October 1988.
ROBERT SALVIOLO, Assistant Treasurer since July 2007.
Senior Accounting Manager – Equity Funds of the Manager, and an officer of 78 investment companies (comprised of 201 portfolios) managed by the Manager. He is 41 years old and has been an employee of the Manager since June 1989.
ROBERT SVAGNA, Assistant Treasurer since December 2002.
Senior Accounting Manager – Equity Funds of the Manager, and an officer of 78 investment companies (comprised of 201 portfolios) managed by the Manager. He is 41 years old and has been an employee of the Manager since November 1990.
JOSEPH W. CONNOLLY, Chief Compliance Officer since October 2004.
Chief Compliance Officer of the Manager and The Dreyfus Family of Funds (78 investment companies, comprised of 201 portfolios). From November 2001 through March 2004, Mr. Connolly was first Vice-President, Mutual Fund Servicing for Mellon Global Securities Services. In that capacity, Mr. Connolly was responsible for managing Mellon’s Custody, Fund Accounting and Fund Administration services to third-party mutual fund clients. He is 51 years old and has served in various capacities with the Manager since 1980, including manager of the firm’s Fund Accounting Department from 1997 through October 2001.
WILLIAM GERMENIS, Anti-Money Laundering Compliance Officer since September 2002.
Vice President and Anti-Money Laundering Compliance Officer of the Distributor, and the Anti-Money Laundering Compliance Officer of 74 investment companies (comprised of 197 portfolios) managed by the Manager. He is 38 years old and has been an employee of the Distributor since October 1998.
30
NOTES
Item 2. Code of Ethics.
The Registrant has adopted a code of ethics that applies to the Registrant's principal executive officer, principal financial officer, principal accounting officer or controller, or persons performing similar functions. There have been no amendments to, or waivers in connection with, the Code of Ethics during the period covered by this Report.
Item 3. Audit Committee Financial Expert.
The Registrant's Board has determined that Joseph S. DiMartino, a member of the Audit Committee of the Board, is an audit committee financial expert as defined by the Securities and Exchange Commission (the "SEC"). Joseph S. DiMartino is "independent" as defined by the SEC for purposes of audit committee financial expert determinations.
Item 4. Principal Accountant Fees and Services
(a) Audit Fees. The aggregate fees billed for each of the last two fiscal years (the "Reporting Periods") for professional services rendered by the Registrant's principal accountant (the "Auditor") for the audit of the Registrant's annual financial statements, or services that are normally provided by the Auditor in connection with the statutory and regulatory filings or engagements for the Reporting Periods, were $63,968 in 2007 and $85,434 in 2008.
(b) Audit-Related Fees. The aggregate fees billed in the Reporting Periods for assurance and related services by the Auditor that are reasonably related to the performance of the audit of the Registrant's financial statements and are not reported under paragraph (a) of this Item 4 were $0 in 2007 and $20,796 in 2008.
The aggregate fees billed in the Reporting Periods for non-audit assurance and related services by the Auditor to the Registrant's investment adviser (not including any sub-investment adviser whose role is primarily portfolio management and is subcontracted with or overseen by another investment adviser), and any entity controlling, controlled by or under common control with the investment adviser that provides ongoing services to the Registrant ("Service Affiliates"), that were reasonably related to the performance of the annual audit of the Service Affiliate, which required pre-approval by the Audit Committee were $0 in 2007 and $0 in 2008.
Note: For the second paragraph in each of (b) through (d) of this Item 4, certain of such services were not pre-approved prior to May 6, 2003, when such services were required to be pre-approved. On and after May 6, 2003, 100% of all services provided by the Auditor were pre-approved as required. For comparative purposes, the fees shown assume that all such services were pre-approved, including services that were not pre-approved prior to the compliance date of the pre-approval requirement.
(c) Tax Fees. The aggregate fees billed in the Reporting Periods for professional services rendered by the Auditor for tax compliance, tax advice and tax planning ("Tax Services") were $1,323 in 2007 and $8,528 in 2008. These services consisted of (i) review or preparation of U.S. federal, state, local and excise tax returns; (ii) U.S. federal, state and local tax planning, advice and assistance regarding statutory, regulatory or administrative developments, (iii) tax advice regarding tax qualification matters and/or treatment of various financial instruments held or proposed to be acquired or held, and (iv) determination of Passive Foreign Investment Companies.
The aggregate fees billed in the Reporting Periods for Tax Services by the Auditor to Service Affiliates which required pre-approval by the Audit Committee were $0 in 2007 and $0 in 2008.
(d) All Other Fees. The aggregate fees billed in the Reporting Periods for products and services provided by the Auditor, other than the services reported in paragraphs (a) through (c) of this Item, were $0 in 2007 and $36 in 2008. These services consisted of a review of the Registrant’s anti-money laundering program.
The aggregate fees billed in the Reporting Periods for Non-Audit Services by the Auditor to Service Affiliates, other than the services reported in paragraphs (b) through (c) of this Item, which required pre-approval by the Audit Committee were $0 in 2007 and $0 in 2008.
Audit Committee Pre-Approval Policies and Procedures. The Registrant's Audit Committee has established policies and procedures (the "Policy") for pre-approval (within specified fee limits) of the Auditor's engagements for non-audit services to the Registrant and Service Affiliates without specific case-by-case consideration. Pre-approval considerations include whether the proposed services are compatible with maintaining the Auditor's independence. Pre-approvals pursuant to the Policy are considered annually.
Non-Audit Fees. The aggregate non-audit fees billed by the Auditor for services rendered to the Registrant, and rendered to Service Affiliates, for the Reporting Periods were $1,890,737 in 2007 and $9,452,992 in 2008.
Auditor Independence. The Registrant's Audit Committee has considered whether the provision of non-audit services that were rendered to Service Affiliates which were not pre-approved (not requiring pre-approval) is compatible with maintaining the Auditor's independence.
| Item 5. | Audit Committee of Listed Registrants. | |
| Not applicable. | ||
| Item 6. | Schedule of Investments. | |
| (a) | Not applicable. | |
| Item 7. | Disclosure of Proxy Voting Policies and Procedures for Closed-End Management | |
| Investment Companies. | ||
| Not applicable. | ||
| Item 8. | Portfolio Managers of Closed-End Management Investment Companies. | |
| Not applicable. | ||
| Item 9. | Purchases of Equity Securities by Closed-End Management Investment Companies and | |
| Affiliated Purchasers. | ||
| Not applicable. | ||
| Item 10. | Submission of Matters to a Vote of Security Holders. |
The Registrant has a Nominating Committee (the "Committee"), which is responsible for selecting and nominating persons for election or appointment by the Registrant's Board as Board members. The Committee has adopted a Nominating Committee Charter (the "Charter"). Pursuant to the Charter, the Committee will consider recommendations for nominees from shareholders submitted to the Secretary of the Registrant, c/o The Dreyfus Corporation Legal Department, 200 Park Avenue, 8th Floor East, New York, New York 10166. A nomination submission must include information regarding the recommended nominee
as specified in the Charter. This information includes all information relating to a recommended nominee that is required to be disclosed in solicitations or proxy statements for the election of Board members, as well as information sufficient to evaluate the factors to be considered by the Committee, including character and integrity, business and professional experience, and whether the person has the ability to apply sound and independent business judgment and would act in the interests of the Registrant and its shareholders. Nomination submissions are required to be accompanied by a written consent of the individual to stand for election if nominated by the Board and to serve if elected by the shareholders, and such additional information must be provided regarding the recommended nominee as reasonably requested by the Committee.
Item 11. Controls and Procedures.
(a) The Registrant's principal executive and principal financial officers have concluded, based on their evaluation of the Registrant's disclosure controls and procedures as of a date within 90 days of the filing date of this report, that the Registrant's disclosure controls and procedures are reasonably designed to ensure that information required to be disclosed by the Registrant on Form N-CSR is recorded, processed, summarized and reported within the required time periods and that information required to be disclosed by the Registrant in the reports that it files or submits on Form N-CSR is accumulated and communicated to the Registrant's management, including its principal executive and principal financial officers, as appropriate to allow timely decisions regarding required disclosure.
(b) There were no changes to the Registrant's internal control over financial reporting that occurred during the second fiscal quarter of the period covered by this report that have materially affected, or are reasonably likely to materially affect, the Registrant's internal control over financial reporting.
Item 12. Exhibits.
(a)(1) Code of ethics referred to in Item 2.
(a)(2) Certifications of principal executive and principal financial officers as required by Rule 30a-2(a) under the Investment Company Act of 1940.
(a)(3) Not applicable.
(b) Certification of principal executive and principal financial officers as required by Rule 30a-2(b) under the Investment Company Act of 1940.
| SIGNATURES |
Pursuant to the requirements of the Securities Exchange Act of 1934 and the Investment Company Act of 1940, the Registrant has duly caused this Report to be signed on its behalf by the undersigned, thereunto duly authorized.
STRATEGIC FUNDS, INC
| By: | /s/ J. David Officer | |
| J. David Officer | ||
| President | ||
| Date: | January 26, 2009 | |
Pursuant to the requirements of the Securities Exchange Act of 1934 and the Investment Company Act of 1940, this Report has been signed below by the following persons on behalf of the Registrant and in the capacities and on the dates indicated.
| By: | /s/ J. David Officer | |
| J. David Officer | ||
| President | ||
| Date: | January 26, 2009 | |
| By: | /s/ James Windels | |
| James Windels | ||
| Treasurer | ||
| Date: | January 26, 2009 | |
EXHIBIT INDEX
(a)(1) Code of ethics referred to in Item 2.
(a)(2) Certifications of principal executive and principal financial officers as required by Rule 30a-2(a) under the Investment Company Act of 1940. (EX-99.CERT)
(b) Certification of principal executive and principal financial officers as required by Rule 30a-2(b) under the Investment Company Act of 1940. (EX-99.906CERT)