UNITED STATES
SECURITIES AND EXCHANGE COMMISSION
Washington, D.C. 20549
FORM N-CSR
CERTIFIED SHAREHOLDER REPORT OF REGISTERED MANAGEMENT
INVESTMENT COMPANIES
| Investment Company Act file number | 811-03940 | |||||
| BNY Mellon Strategic Funds, Inc. | ||||||
| (Exact name of Registrant as specified in charter) | ||||||
c/o BNY Mellon Investment Adviser, Inc. 240 Greenwich Street New York, New York 10286 | ||||||
| (Address of principal executive offices) (Zip code) | ||||||
Deirdre Cunnane, Esq. 240 Greenwich Street New York, New York 10286 | ||||||
| (Name and address of agent for service) | ||||||
| Registrant's telephone number, including area code: | (212) 922-6400 | |||||
Date of fiscal year end:
| 05/31 | |||||
| Date of reporting period: | 05/31/22
| |||||
The following N-CSR relates only to the Registrant's series listed below and does not relate to any series of the Registrant with a different fiscal year end and, therefore, different N-CSR reporting requirements. A separate N-CSR will be filed for any series with a different fiscal year end, as appropriate.
BNY Mellon Select Managers Small Cap Growth Fund
FORM N-CSR
Item 1. Reports to Stockholders.
BNY Mellon Select Managers Small Cap Growth Fund
ANNUAL REPORT May 31, 2022 |
|

Save time. Save paper. View your next shareholder report online as soon as it’s available. Log into www.im.bnymellon.com and sign up for eCommunications. It’s simple and only takes a few minutes. |
The views expressed in this report reflect those of the portfolio manager(s) only through the end of the period covered and do not necessarily represent the views of BNY Mellon Investment Adviser, Inc. or any other person in the BNY Mellon Investment Adviser, Inc. organization. Any such views are subject to change at any time based upon market or other conditions and BNY Mellon Investment Adviser, Inc. disclaims any responsibility to update such views. These views may not be relied on as investment advice and, because investment decisions for a fund in the BNY Mellon Family of Funds are based on numerous factors, may not be relied on as an indication of trading intent on behalf of any fund in the BNY Mellon Family of Funds. |
Not FDIC-Insured • Not Bank-Guaranteed • May Lose Value |
Contents
T H E F U N D
F O R M O R E I N F O R M AT I O N
Back Cover
DISCUSSION OF FUND PERFORMANCE (Unaudited)
For the period from June 1, 2021, through May 31, 2022, as provided by portfolio allocation manager Elena Goncharova
Market and Fund Performance Overview
For the 12-month period ended May 31, 2022, BNY Mellon Select Managers Small Cap Growth Fund’s (the “fund”) Class A, Class C, Class I and Class Y shares at NAV produced total returns of −20.28%, −20.84%, −20.01% and −20.00%, respectively.1 In comparison, the Russell 2000® Growth Index (the “Index”), the fund’s benchmark, returned −25.71% for the same period.2
Small-cap growth stocks lost ground over the reporting period as markets began to take into account rising inflation and interest rates. The fund outperformed the Index due to both favorable asset allocation and stock selection decisions.
The Fund’s Investment Approach
The fund seeks capital appreciation. To pursue its goal, the fund normally invests at least 80% of its assets in the stocks of small-cap companies. The fund’s portfolio is constructed to have a growth tilt.
The fund uses a “multi-manager” approach by selecting various sub-advisers to manage its assets. We may hire, terminate or replace sub-advisers and modify material terms and conditions of sub-advisory arrangements without shareholder approval.
The fund’s assets are currently allocated to six sub-advisers, each acting independently and using its own methodology to select portfolio investments. At the end of the reporting period, 13% of the fund’s assets were under the management of Redwood Investments, LLC, which employs a blend of quantitative and qualitative research to build growth and core equity portfolios; approximately 18% of the fund’s assets were under the management of Geneva Capital Management, which employs bottom-up fundamental analysis supplemented by top-down considerations to identify companies with a consistent, sustainable record of growth; approximately 13% of the fund’s assets were under the management of Nicholas Investment Partners, L.P., which uses a bottom-up approach to security selection, combining rigorous fundamental analysis with the discipline and objectivity of quantitative analytics; EAM Investors, LLC, which managed 21% of the fund’s assets, chooses investments through bottom-up fundamental analysis using a blend of a quantitative discovery process and a qualitative analysis process; approximately 10% of the fund’s assets were managed by Granite Investment Partners, LLC, which seeks attractively valued, small-cap companies with catalysts for growth; and 25% of the fund’s assets were managed by Rice Hall James & Associates LLC, which seeks growing companies with high earnings growth, high or improving returns on invested capital and sustainable competitive advantages. The percentages of the fund’s assets allocated to the various sub-advisers can change over time, within ranges described in the prospectus.
Market Hindered by Inflation, Rising Rates
The reporting period was marked by on-and-off recovery from the pandemic, rising concerns about inflation and a shift in policy stance by the Federal Reserve (the “Fed”) from accommodation to tightening. This shift as well as other concerns, including Russia’s invasion of Ukraine and rising prospects of recession, contributed to an increase in volatility.
The spread of the COVID-19 delta variant during the period led the Centers for Disease Control and Prevention (“CDC”) to recommend that indoor mask mandates be reimposed. COVID-19 policies in certain countries led to supply-chain bottlenecks that resulted in shortages of certain
2
products, such as computer chips, which slowed production in other industries, including auto manufacturing.
But the delta variant also injected some uncertainty into the outlook for the ongoing recovery. Although the U.S. economy grew by an annualized rate of 6.7% in the second quarter of 2021, pandemic-related uncertainties, combined with supply-chain issues, caused many economists to reduce their forecasts for the balance of the year. Around the end of the year, the omicron COVID-19 variant led many countries to enact precautionary restrictions, adding uncertainty to the economic outlook heading into 2022.
The reporting period was also marked by a pivot on monetary policy, driven by stronger-than-expected inflation. As late as its September 2021 meeting, the Fed was still not noticeably concerned about pricing pressures, though it did raise its inflation forecast from 3.4% to 4.2% for 2021 and from 2.1% to 2.2% for 2022. Nonetheless, the Fed’s “dot plot” indicated that voting members of the Federal Open Market Committee were split on forecasting a tightening of monetary policy during 2022.
In the fourth quarter of 2021, continuing supply-chain disruptions and rising energy prices helped pushed the Consumer Price Index (“CPI”) to 6.8%, the highest reading since 1982, and high enough to prompt a change in the Fed’s stance. Having begun tapering its bond purchases by $15 billion a month in November 2021, the Fed swiftly accelerated the pace to $30 billion a month later. The new hawkish stance was also reflected at the December 2021 Fed meeting and in a new “dot plot” suggesting that three rate hikes were likely in 2022, followed by three more in in 2023 and another two in 2024. But in retrospect, the Fed seemed behind the curve as its inflation estimate for 2022 was revised up to only 2.6% from 2.2%.
Inflation continued to rise in the first quarter of 2022, and major central banks continued to tighten their policies. As a result, government bonds weakened significantly, with the 10-year U.S. Treasury yield rising by 83 basis points (bps) to 2.34% during the quarter. Credit markets generally declined even more than government bonds, as spreads widened, adding to the higher yields on underlying government bonds.
In March 2022, responding to persistent and higher-than-expected inflation, the Fed raised interest rates for the first time since 2018. As expected, the federal funds target rate was raised by 0.25% to 0.50%. Headline consumer price inflation approached 8.0% year over year early in 2022, the highest in 40 years, and enough to prompt the Fed to indicate that it intends to provide a steady stream of rate increases throughout 2022, and likely beyond. The surge in Treasury yields reflected the ongoing news regarding ever-higher inflation.
Geopolitical events also roiled markets early in 2022. The invasion of Ukraine and the sanctions imposed on Russia led to further spikes in energy and commodity prices. With the two countries being major producers of wheat and corn, those prices, as well as other industrial commodities, rose during the quarter. While Russian authorities may have expected to swiftly achieve their objective, their military advances slowed, leading to expectations that the conflict could persist for months.
Asset Allocation and Security Selection Benefited Performance
The fund’s relative performance versus the Index was mainly the result of favorable asset allocation and stock selections by the fund’s underlying portfolio managers. Positioning in the health care and industrial sectors were the primary drivers of relative performance. Our large underweight to the health care sector was advantageous as this sector was the worst-performing one in the Index. An overweight to the industrial sector was also beneficial. Our cash position,
3
DISCUSSION OF FUND PERFORMANCE (Unaudited) (continued)
which remained between 2% and 3% of the portfolio, added to performance as well. Stock selection also was beneficial, especially in the health care sector, where we were able to avoid many stocks that posted large losses. We also owned stocks in this sector that were beneficial, including Cytokinetics and Intra-Cellular Therapies, two drug makers.
On a less positive note, the fund’s stock selections in the industrial sector hampered performance. While certain holdings in the construction-related industries performed well early in the period, they subsequently lagged, hampering the fund’s returns. In the industrial machinery industry, our position in Kornit Digital, which does custom printing for the apparel and textile industries, was especially detrimental.
Positioned for Uncertainty
We are anticipating a period of uncertainty as the Fed’s efforts to combat inflation proceed over the coming months. The Fed will need to proceed carefully to halt inflation without putting the economy into recession. One positive feature of the current economic environment is the job market, which appears healthy enough to allow the Fed to continue to implement interest-rate increases. On the other hand, some signs indicate that consumer spending may be weakening, potentially hindering the broader economy. On balance, we are positioned neutrally as to the likely result of the Fed’s policy.
June 15, 2022
1 Total return includes reinvestment of dividends and any capital gains paid and does not take into consideration the maximum initial sales charge in the case of Class A shares, or the applicable contingent deferred sales charge imposed on redemptions in the case of Class C shares. Had these charges been reflected, returns would have been lower. Past performance is no guarantee of future results. Share price and investment return fluctuate such that upon redemption, fund shares may be worth more or less than their original cost. Return figures provided reflect the absorption of certain fund expenses by BNY Mellon Investment Adviser, Inc. pursuant to an undertaking in effect through September 30, 2022, at which time it may be extended, terminated or modified. Had these expenses not been absorbed, the fund’s returns would have been lower.
2 Source: Lipper Inc. — The Russell 2000® Growth Index measures the performance of the small-cap growth segment of the U.S. equity universe. It includes those Russell 2000 companies with higher growth earning potential as defined by Russell’s leading style methodology. The Russell 2000® Growth Index is constructed to provide a comprehensive and unbiased barometer for the small-cap growth segment. The index is completely reconstituted annually to ensure larger stocks do not distort the performance and characteristics of the true small-cap opportunity set, and that the represented companies continue to reflect growth characteristics. Investors cannot invest directly in any index.
Equities are subject generally to market, market sector, market liquidity, issuer and investment style risks, among other factors, to varying degrees, all of which are more fully described in the fund’s prospectus.
The prices of small company stocks tend to be more volatile than the prices of large company stocks, mainly because these companies have less established and more volatile earnings histories. They also tend to be less liquid than larger company stocks.
Investing in foreign denominated and/or domiciled securities involves special risks, including changes in currency exchange rates, political, economic, and social instability, limited company information, differing auditing and legal standards, and less market liquidity. These risks generally are greater with emerging market countries.
Multi-manager risk means each sub-adviser makes investment decisions independently, and it is possible that the investment styles of the sub-advisers may not complement one another. Consequently, the fund’s exposure to a given stock, industry or investment style could be greater or smaller than if the fund had a single adviser.
References to specific securities, asset classes and financial markets are for illustrative purposes only and are not intended to be and should not be interpreted as recommendations.
Recent market risks include pandemic risks related to COVID-19. The effects of COVID-19 have contributed to increased volatility in global markets and will likely affect certain countries, companies, industries and market sectors more dramatically than others. To the extent the fund may overweight its investments in certain countries, companies, industries or market sectors, such positions will increase the fund’s exposure to risk of loss from adverse developments affecting those countries, companies, industries or sectors.
4
FUND PERFORMANCE (Unaudited)
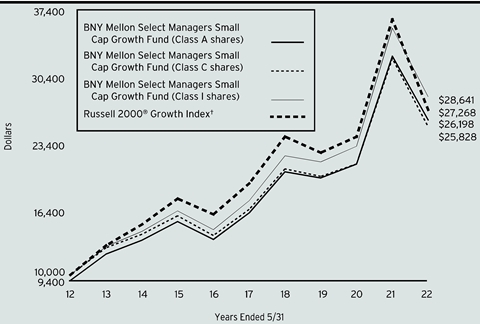
Comparison of change in value of a $10,000 investment in Class A shares, Class C shares and Class I shares of BNY Mellon Select Managers Small Cap Growth Fund with a hypothetical investment of $10,000 in the Russell 2000® Growth Index (the “Index”).
† Source: Lipper Inc.
Past performance is not predictive of future performance.
The above graph compares a hypothetical $10,000 investment made in Class A shares, Class C shares and Class I shares of BNY Mellon Select Managers Small Cap Growth Fund on 5/31/12 to a hypothetical investment of $10,000 made in the Index on that date. All dividends and capital gain distributions are reinvested.
The fund’s performance shown in the line graph above takes into account the maximum initial sales charge on Class A shares and all other applicable fees and expenses on all classes. The Index measures the performance of the small-cap growth segment of the U.S. equity universe. It includes those Russell 2000 companies with higher growth earning potential as defined by Russell’s leading style methodology. The Index is constructed to provide a comprehensive and unbiased barometer for the small-cap growth segment. The Index is completely reconstituted annually to ensure larger stocks do not distort the performance and characteristics of the true small-cap opportunity set and that the represented companies continue to reflect growth characteristics. Unlike a mutual fund, the Index is not subject to charges, fees and other expenses. Investors cannot invest directly in any index. Further information relating to fund performance, including expense reimbursements, if applicable, is contained in the Financial Highlights section of the prospectus and elsewhere in this report.
5
FUND PERFORMANCE (Unaudited) (continued)

Comparison of change in value of a $1,000,000 investment in Class Y shares of BNY Mellon Select Managers Small Cap Growth Fund with a hypothetical investment of $1,000,000 in the Russell 2000® Growth Index (the “Index”).
† Source: Lipper Inc.
†† The total return figures presented for Class Y shares of the fund reflect the performance of the fund’s Class A shares for the period prior to 7/1/13 (the inception date for Class Y shares), not reflecting the applicable sales load for Class A shares.
Past performance is not predictive of future performance.
The above graph compares a hypothetical $1,000,000 investment made in Class Y shares of BNY Mellon Select Managers Small Cap Growth Fund on 5/31/12 to a hypothetical investment of $1,000,000 made in the Index on that date. All dividends and capital gain distributions are reinvested.
The fund’s performance shown in the line graph above takes into account all applicable fees and expenses of the fund’s Class Y shares. The Index measures the performance of the small-cap growth segment of the U.S. equity universe. It includes those Russell 2000 companies with higher growth earning potential as defined by Russell’s leading style methodology. The Index is constructed to provide a comprehensive and unbiased barometer for the small-cap growth segment. The Index is completely reconstituted annually to ensure larger stocks do not distort the performance and characteristics of the true small-cap opportunity set and that the represented companies continue to reflect growth characteristics. Unlike a mutual fund, the Index is not subject to charges, fees and other expenses. Investors cannot invest directly in any index. Further information relating to fund performance, including expense reimbursements, if applicable, is contained in the Financial Highlights section of the prospectus and elsewhere in this report.
6
Average Annual Total Returns as of 5/31/2022 | ||||
Inception Date | 1 Year | 5 Years | 10 Years | |
Class A shares | ||||
with maximum sales charge (5.75%) | 7/1/10 | -24.87% | 8.40% | 10.11% |
without sales charge | 7/1/10 | -20.28% | 9.70% | 10.77% |
Class C shares | ||||
with applicable redemption charge† | 7/1/10 | -21.48% | 8.91% | 9.95% |
without redemption | 7/1/10 | -20.84% | 8.91% | 9.95% |
Class I shares | 7/1/10 | -20.01% | 10.02% | 11.10% |
Class Y shares | 7/1/13 | -20.00% | 10.06% | 11.18%†† |
Russell 2000® Growth Index | 6/30/10 | -25.71% | 6.87% | 10.55% |
† The maximum contingent deferred sales charge for Class C shares is 1% for shares redeemed within one year of the date of purchase.
†† The total return performance figures presented for Class Y shares of the fund reflect the performance of the fund’s Class A shares for the period prior to 7/1/13 (the inception date for Class Y shares), not reflecting the applicable sales load for Class A shares.
The performance data quoted represents past performance, which is no guarantee of future results. Share price and investment return fluctuate and an investor’s shares may be worth more or less than original cost upon redemption. Current performance may be lower or higher than the performance quoted. Go to www.im.bnymellon.com for the fund’s most recent month-end returns.
The fund’s performance shown in the graphs and table does not reflect the deduction of taxes that a shareholder would pay on fund distributions or the redemption of fund shares. In addition to the performance of Class A shares shown with and without a maximum sales charge, the fund's performance shown in the table takes into account all other applicable fees and expenses on all classes.
7
UNDERSTANDING YOUR FUND’S EXPENSES (Unaudited)
As a mutual fund investor, you pay ongoing expenses, such as management fees and other expenses. Using the information below, you can estimate how these expenses affect your investment and compare them with the expenses of other funds. You also may pay one-time transaction expenses, including sales charges (loads) and redemption fees, which are not shown in this section and would have resulted in higher total expenses. For more information, see your fund’s prospectus or talk to your financial adviser.
Review your fund’s expenses
The table below shows the expenses you would have paid on a $1,000 investment in BNY Mellon Select Managers Small Cap Growth Fund from December 1, 2021 to May 31, 2022. It also shows how much a $1,000 investment would be worth at the close of the period, assuming actual returns and expenses.
Expenses and Value of a $1,000 Investment |
| |||||
Assume actual returns for the six months ended May 31, 2022 |
| |||||
|
|
|
|
|
|
|
|
| Class A | Class C | Class I | Class Y |
|
Expenses paid per $1,000† | $5.76 | $9.07 | $4.48 | $4.30 |
| |
Ending value (after expenses) | $778.20 | $775.50 | $779.60 | $779.50 |
| |
COMPARING YOUR FUND’S EXPENSES
WITH THOSE OF OTHER FUNDS (Unaudited)
Using the SEC’s method to compare expenses
The Securities and Exchange Commission (“SEC”) has established guidelines to help investors assess fund expenses. Per these guidelines, the table below shows your fund’s expenses based on a $1,000 investment, assuming a hypothetical 5% annualized return. You can use this information to compare the ongoing expenses (but not transaction expenses or total cost) of investing in the fund with those of other funds. All mutual fund shareholder reports will provide this information to help you make this comparison. Please note that you cannot use this information to estimate your actual ending account balance and expenses paid during the period.
Expenses and Value of a $1,000 Investment |
| |||||
Assuming a hypothetical 5% annualized return for the six months ended May 31, 2022 |
| |||||
|
|
|
|
|
|
|
|
| Class A | Class C | Class I | Class Y |
|
Expenses paid per $1,000† | $6.54 | $10.30 | $5.09 | $4.89 |
| |
Ending value (after expenses) | $1,018.45 | $1,014.71 | $1,019.90 | $1,020.09 |
| |
† | Expenses are equal to the fund’s annualized expense ratio of 1.30% for Class A, 2.05% for Class C, 1.01% for Class I and .97% for Class Y, multiplied by the average account value over the period, multiplied by 182/365 (to reflect the one-half year period). | |||||
8
STATEMENT OF INVESTMENTS
May 31, 2022
Description | Shares | Value ($) | |||||
Common Stocks - 96.6% | |||||||
Automobiles & Components - 2.3% | |||||||
Dana | 21,427 | 354,831 | |||||
Dorman Products | 13,194 | a | 1,333,254 | ||||
Fox Factory Holding | 48,146 | a | 3,948,935 | ||||
LCI Industries | 18,371 | 2,195,702 | |||||
Visteon | 16,987 | a | 1,906,111 | ||||
9,738,833 | |||||||
Banks - 3.2% | |||||||
Axos Financial | 102,332 | a | 3,955,132 | ||||
Bank OZK | 25,389 | 1,052,882 | |||||
Central Pacific Financial | 7,680 | 185,395 | |||||
Eastern Bankshares | 50,303 | 979,399 | |||||
Federal Agricultural Mortgage, Cl. C | 6,429 | 675,109 | |||||
First Financial Bankshares | 21,853 | 901,218 | |||||
Heritage Commerce | 81,178 | 931,112 | |||||
Mr. Cooper Group | 10,042 | a | 435,421 | ||||
National Bank Holdings, Cl. A | 24,958 | 1,017,038 | |||||
Pacific Premier Bancorp | 29,764 | 969,116 | |||||
ServisFirst Bancshares | 5,724 | 477,153 | |||||
Texas Capital Bancshares | 17,061 | a | 964,458 | ||||
The Bancorp | 15,052 | a | 313,533 | ||||
Wintrust Financial | 9,203 | 804,250 | |||||
13,661,216 | |||||||
Capital Goods - 11.6% | |||||||
AAON | 27,915 | 1,495,686 | |||||
AAR | 15,169 | a | 731,449 | ||||
AeroVironment | 13,910 | a | 1,279,164 | ||||
Alamo Group | 8,733 | 1,027,263 | |||||
Ameresco, Cl. A | 14,855 | a,b | 872,286 | ||||
Arcosa | 17,172 | 907,884 | |||||
Armstrong World Industries | 18,211 | 1,520,618 | |||||
Barnes Group | 16,813 | 605,772 | |||||
Beacon Roofing Supply | 23,172 | a | 1,422,993 | ||||
Chart Industries | 7,369 | a | 1,296,060 | ||||
Construction Partners, Cl. A | 62,515 | a | 1,437,220 | ||||
Curtiss-Wright | 3,336 | 473,645 | |||||
Donaldson | 18,419 | 962,945 | |||||
Dycom Industries | 10,370 | a | 965,551 | ||||
Energy Recovery | 12,196 | a | 246,481 | ||||
ESCO Technologies | 22,184 | 1,459,929 | |||||
Evoqua Water Technologies | 44,631 | a | 1,588,417 | ||||
Fluor | 83,480 | a,b | 2,356,641 | ||||
9
STATEMENT OF INVESTMENTS (continued)
Description | Shares | Value ($) | |||||
Common Stocks - 96.6% (continued) | |||||||
Capital Goods - 11.6% (continued) | |||||||
Griffon | 20,893 | 670,039 | |||||
H&E Equipment Services | 33,507 | 1,194,525 | |||||
Hudson Technologies | 79,178 | a | 791,780 | ||||
Kornit Digital | 31,188 | a | 1,308,960 | ||||
Kratos Defense & Security Solutions | 54,785 | a | 790,000 | ||||
Masonite International | 31,311 | a | 2,875,289 | ||||
MSC Industrial Direct, Cl. A | 4,409 | 374,456 | |||||
NV5 Global | 5,876 | a | 723,806 | ||||
PGT Innovations | 45,633 | a | 917,223 | ||||
RADA Electronic Industries | 82,903 | a | 998,152 | ||||
RBC Bearings | 13,924 | a | 2,595,294 | ||||
Regal Rexnord | 5,965 | 745,327 | |||||
Rush Enterprises, Cl. A | 26,136 | 1,332,413 | |||||
Simpson Manufacturing | 19,196 | 2,079,887 | |||||
SiteOne Landscape Supply | 12,970 | a,b | 1,741,482 | ||||
Titan International | 42,676 | a | 777,130 | ||||
Trex | 29,628 | a | 1,887,896 | ||||
Triton International | 7,678 | 489,626 | |||||
Univar Solutions | 63,686 | a | 1,956,434 | ||||
Veritiv | 4,638 | a | 674,133 | ||||
Watts Water Technologies, Cl. A | 4,856 | 635,310 | |||||
WESCO International | 4,225 | a | 530,575 | ||||
WillScot Mobile Mini Holdings | 62,516 | a | 2,233,697 | ||||
48,973,438 | |||||||
Commercial & Professional Services - 4.1% | |||||||
ABM Industries | 13,446 | 650,114 | |||||
CACI International, Cl. A | 6,225 | a | 1,745,303 | ||||
Casella Waste Systems, Cl. A | 15,065 | a | 1,078,353 | ||||
CBIZ | 37,590 | a | 1,539,686 | ||||
CoreCivic | 54,791 | a | 705,160 | ||||
Exponent | 35,122 | 3,174,678 | |||||
Franklin Covey | 11,058 | a | 423,632 | ||||
FTI Consulting | 9,561 | a | 1,606,248 | ||||
Huron Consulting Group | 10,823 | a | 648,514 | ||||
IAA | 29,719 | a | 1,159,933 | ||||
KBR | 19,537 | 972,161 | |||||
Montrose Environmental Group | 24,091 | a | 975,926 | ||||
RCM Technologies | 27,180 | a | 597,416 | ||||
The Brink's Company | 21,426 | 1,303,344 | |||||
Willdan Group | 23,341 | a | 621,804 | ||||
17,202,272 | |||||||
Consumer Durables & Apparel - .7% | |||||||
Clarus | 52,635 | 1,153,233 | |||||
10
Description | Shares | Value ($) | |||||
Common Stocks - 96.6% (continued) | |||||||
Consumer Durables & Apparel - .7% (continued) | |||||||
Mattel | 30,036 | a | 754,504 | ||||
Skyline Champion | 18,277 | a | 971,057 | ||||
2,878,794 | |||||||
Consumer Services - 4.5% | |||||||
Boyd Gaming | 34,933 | 2,053,012 | |||||
Bright Horizons Family Solutions | 15,013 | a | 1,359,427 | ||||
Century Casinos | 70,459 | a | 615,812 | ||||
Chuy's Holdings | 27,101 | a | 612,212 | ||||
Dutch Bros, CI. A | 20,778 | a,b | 780,214 | ||||
European Wax Center, Cl. A | 43,812 | a | 1,161,018 | ||||
H&R Block | 20,461 | 721,046 | |||||
Hilton Grand Vacations | 36,150 | a | 1,653,862 | ||||
Jack in the Box | 5,541 | b | 378,450 | ||||
Strategic Education | 11,691 | 769,502 | |||||
Stride | 90,255 | a | 3,529,873 | ||||
Texas Roadhouse | 42,561 | 3,318,481 | |||||
Udemy | 36,717 | a | 541,576 | ||||
Vail Resorts | 5,264 | 1,327,633 | |||||
18,822,118 | |||||||
Diversified Financials - 1.3% | |||||||
A-Mark Precious Metals | 8,786 | 668,000 | |||||
Donnelley Financial Solutions | 65,650 | a | 2,042,371 | ||||
PJT Partners, Cl. A | 25,590 | 1,940,746 | |||||
StoneX Group | 8,873 | a | 666,096 | ||||
5,317,213 | |||||||
Energy - 7.0% | |||||||
Antero Resources | 18,168 | a | 779,044 | ||||
Cactus, Cl. A | 12,589 | 659,915 | |||||
California Resources | 13,883 | 606,271 | |||||
Chesapeake Energy | 24,553 | b | 2,390,971 | ||||
Comstock Resources | 39,524 | a | 762,813 | ||||
Delek US Holdings | 22,558 | a | 657,791 | ||||
Earthstone Energy, Cl. A | 37,098 | a | 668,506 | ||||
Enviva | 14,096 | 1,097,937 | |||||
Helmerich & Payne | 44,209 | 2,225,923 | |||||
HF Sinclair | 13,548 | 665,207 | |||||
International Seaways | 30,904 | b | 745,714 | ||||
Magnolia Oil & Gas, CI. A | 29,714 | b | 820,404 | ||||
Matador Resources | 30,608 | 1,864,027 | |||||
Murphy Oil | 17,113 | 725,933 | |||||
New Fortress Energy | 16,381 | b | 763,191 | ||||
Nextier Oilfield Solutions | 88,517 | a | 964,835 | ||||
Northern Oil & Gas | 28,250 | 923,492 | |||||
11
STATEMENT OF INVESTMENTS (continued)
Description | Shares | Value ($) | |||||
Common Stocks - 96.6% (continued) | |||||||
Energy - 7.0% (continued) | |||||||
Oasis Petroleum | 3,854 | 611,745 | |||||
Ovintiv | 13,346 | 747,243 | |||||
Patterson-UTI Energy | 37,138 | 708,593 | |||||
PBF Energy, Cl. A | 23,470 | a | 779,204 | ||||
PDC Energy | 8,695 | 688,122 | |||||
Range Resources | 20,016 | a | 679,543 | ||||
Ranger Oil, Cl. A | 31,219 | a | 1,336,485 | ||||
Scorpio Tankers | 27,363 | 904,347 | |||||
Select Energy Services, Cl. A | 73,516 | a | 622,681 | ||||
Southwestern Energy | 123,584 | a | 1,127,086 | ||||
Teekay Tankers, Cl. A | 29,867 | a | 616,754 | ||||
Tellurian | 102,826 | a,b | 490,480 | ||||
TETRA Technologies | 109,315 | a | 548,761 | ||||
U.S. Silica Holdings | 25,874 | a | 457,452 | ||||
Uranium Energy | 96,819 | a,b | 369,849 | ||||
Vertex Energy Inc | 65,136 | a,b | 911,253 | ||||
Whiting Petroleum | 7,686 | 679,904 | |||||
29,601,476 | |||||||
Food & Staples Retailing - 1.3% | |||||||
BJ's Wholesale Club Holdings | 43,933 | a | 2,542,403 | ||||
Grocery Outlet Holding | 38,427 | a,b | 1,469,832 | ||||
Performance Food Group | 29,802 | a | 1,291,619 | ||||
Sprouts Farmers Market | 10,652 | a | 288,563 | ||||
5,592,417 | |||||||
Food, Beverage & Tobacco - 1.8% | |||||||
Freshpet | 14,446 | a | 1,039,679 | ||||
Hostess Brands | 39,699 | a | 843,604 | ||||
J&J Snack Foods | 10,937 | 1,402,342 | |||||
MGP Ingredients | 15,588 | 1,509,854 | |||||
Post Holdings | 7,986 | a | 656,689 | ||||
The Hain Celestial Group | 29,683 | a | 782,147 | ||||
The Simply Good Foods Company | 16,594 | a | 663,096 | ||||
TreeHouse Foods | 19,349 | a | 795,631 | ||||
7,693,042 | |||||||
Health Care Equipment & Services - 9.0% | |||||||
Acadia Healthcare | 10,308 | a | 733,620 | ||||
AMN Healthcare Services | 14,335 | a | 1,389,061 | ||||
Axonics | 23,733 | a | 1,186,650 | ||||
BioLife Solutions | 39,659 | a | 544,121 | ||||
Certara | 32,213 | a | 654,568 | ||||
CryoPort | 71,466 | a | 1,818,810 | ||||
Cutera | 19,811 | a,b | 891,297 | ||||
Establishment Labs Holdings | 9,986 | a,b | 616,136 | ||||
12
Description | Shares | Value ($) | |||||
Common Stocks - 96.6% (continued) | |||||||
Health Care Equipment & Services - 9.0% (continued) | |||||||
Evolent Health, Cl. A | 15,785 | a | 444,032 | ||||
Figs, Cl. A | 21,604 | a | 192,276 | ||||
Globus Medical, Cl. A | 35,776 | a | 2,382,682 | ||||
HealthEquity | 48,680 | a | 3,046,394 | ||||
HealthStream | 38,816 | a | 790,682 | ||||
Inari Medical | 14,738 | a | 969,760 | ||||
Inmode | 27,036 | a | 724,835 | ||||
Inspire Medical Systems | 6,971 | a | 1,232,682 | ||||
Insulet | 1,914 | a | 408,601 | ||||
iRhythm Technologies | 5,962 | a | 839,748 | ||||
Lantheus Holdings | 18,041 | a | 1,236,169 | ||||
LeMaitre Vascular | 22,904 | b | 1,047,171 | ||||
LHC Group | 15,325 | a | 2,554,064 | ||||
Masimo | 7,755 | a | 1,089,035 | ||||
MEDNAX | 29,659 | a | 573,012 | ||||
Neogen | 41,722 | a,b | 1,103,964 | ||||
Omnicell | 35,629 | a | 3,960,520 | ||||
OptimizeRx | 21,700 | a,b | 555,086 | ||||
Option Care Health | 24,403 | a | 740,875 | ||||
PetIQ | 33,364 | a | 572,526 | ||||
Premier, Cl. A | 59,233 | 2,215,907 | |||||
Shockwave Medical | 2,409 | 395,582 | |||||
STAAR Surgical | 24,053 | a | 1,586,055 | ||||
Tandem Diabetes Care | 12,746 | a | 868,895 | ||||
TransMedics Group | 19,513 | a | 569,194 | ||||
37,934,010 | |||||||
Household & Personal Products - 1.3% | |||||||
Inter Parfums | 21,192 | 1,563,970 | |||||
Medifast | 15,782 | 2,631,648 | |||||
Veru | 44,175 | a,b | 571,624 | ||||
WD-40 | 4,593 | b | 867,112 | ||||
5,634,354 | |||||||
Insurance - 1.9% | |||||||
Assurant | 3,877 | 685,027 | |||||
Goosehead Insurance, Cl. A | 12,077 | 625,347 | |||||
Kinsale Capital Group | 24,696 | 5,430,156 | |||||
Palomar Holdings | 8,854 | a | 550,276 | ||||
Unum Group | 18,198 | a | 663,317 | ||||
7,954,123 | |||||||
Materials - 5.8% | |||||||
AdvanSix | 12,923 | 598,723 | |||||
Allegheny Technologies | 27,153 | a | 746,707 | ||||
Aspen Aerogels | 22,167 | a | 388,366 | ||||
13
STATEMENT OF INVESTMENTS (continued)
Description | Shares | Value ($) | |||||
Common Stocks - 96.6% (continued) | |||||||
Materials - 5.8% (continued) | |||||||
Balchem | 18,370 | 2,285,779 | |||||
Cabot | 12,991 | 982,250 | |||||
Commercial Metals | 17,709 | 703,579 | |||||
Element Solutions | 85,744 | 1,825,490 | |||||
Graphic Packaging Holding | 31,176 | 693,978 | |||||
Ingevity | 24,727 | a | 1,722,977 | ||||
Kaiser Aluminum | 13,701 | 1,399,831 | |||||
Livent | 87,621 | a,b | 2,785,472 | ||||
LSB Industries | 32,177 | a | 647,402 | ||||
Materion | 13,558 | 1,111,485 | |||||
Methanex | 35,459 | b | 1,753,448 | ||||
MP Materials | 20,475 | a | 807,329 | ||||
Ranpak Holdings | 95,496 | a | 1,189,880 | ||||
Reliance Steel & Aluminum | 4,257 | 827,561 | |||||
Silgan Holdings | 9,850 | 431,528 | |||||
SunCoke Energy | 58,306 | 471,696 | |||||
Sylvamo | 13,042 | 661,751 | |||||
The Chemours Company | 17,387 | 749,206 | |||||
TimkenSteel | 34,887 | a | 805,890 | ||||
Warrior Met Coal | 20,091 | 675,459 | |||||
24,265,787 | |||||||
Media & Entertainment - 2.3% | |||||||
Lions Gate Entertainment, Cl. A | 74,583 | a,b | 762,984 | ||||
Nexstar Media Group, Cl. A | 3,166 | 554,747 | |||||
TechTarget | 37,715 | a | 2,681,159 | ||||
World Wrestling Entertainment, Cl. A | 47,456 | b | 3,168,637 | ||||
Ziff Davis | 32,470 | a | 2,478,760 | ||||
9,646,287 | |||||||
Pharmaceuticals Biotechnology & Life Sciences - 9.4% | |||||||
ACADIA Pharmaceuticals | 20,858 | a | 336,857 | ||||
Aerie Pharmaceuticals | 79,571 | a,b | 412,178 | ||||
Albireo Pharma | 26,582 | a | 529,779 | ||||
Alpha Teknova | 18,663 | a | 142,772 | ||||
Amicus Therapeutics | 43,204 | a | 329,214 | ||||
Amphastar Pharmaceuticals | 17,846 | a | 662,800 | ||||
Apellis Pharmaceuticals | 4,500 | a | 186,525 | ||||
argenx, ADR | 3,118 | a,b | 964,397 | ||||
Ascendis Pharma, ADR | 10,180 | a,b | 860,312 | ||||
Avid Bioservices | 99,805 | a,b | 1,334,393 | ||||
Azenta | 19,304 | 1,479,459 | |||||
Biohaven Pharmaceutical Holding | 15,853 | a | 2,278,551 | ||||
Bio-Techne | 6,461 | 2,388,825 | |||||
CareDx | 21,678 | a | 545,202 | ||||
14
Description | Shares | Value ($) | |||||
Common Stocks - 96.6% (continued) | |||||||
Pharmaceuticals Biotechnology & Life Sciences - 9.4% (continued) | |||||||
Catalyst Pharmaceuticals | 85,773 | a | 617,566 | ||||
Chinook Therapeutics Inc | 20,035 | a | 304,131 | ||||
Collegium Pharmaceutical | 12,824 | a,b | 200,311 | ||||
CTI BioPharma Corp | 136,975 | a | 743,774 | ||||
Cytokinetics | 18,351 | a,b | 732,205 | ||||
Emergent BioSolutions | 15,470 | a | 509,891 | ||||
Evolus | 52,394 | a | 675,883 | ||||
Fate Therapeutics | 12,085 | a | 279,163 | ||||
Global Blood Therapeutics | 15,662 | a,b | 390,610 | ||||
Halozyme Therapeutics | 94,280 | a | 4,334,994 | ||||
Insmed | 14,326 | a | 269,615 | ||||
Instil Bio | 11,388 | a,b | 68,385 | ||||
Intra-Cellular Therapies | 30,561 | a | 1,754,202 | ||||
Iovance Biotherapeutics | 58,088 | a | 392,094 | ||||
IVERIC bio | 28,562 | a | 298,187 | ||||
Karuna Therapeutics | 1,808 | a,b | 188,611 | ||||
Karyopharm Therapeutics | 52,576 | a,b | 330,177 | ||||
Kiniksa Pharmaceuticals, CI. A | 36,498 | a | 279,575 | ||||
Krystal Biotech | 8,231 | a,b | 484,641 | ||||
LAVA Therapeutics | 17,267 | a | 52,492 | ||||
Ligand Pharmaceuticals | 14,737 | a | 1,310,267 | ||||
Medpace Holdings | 17,719 | a | 2,538,069 | ||||
Mirum Pharmaceuticals | 23,515 | a | 550,016 | ||||
Neurocrine Biosciences | 9,991 | a | 934,059 | ||||
Nkarta | 28,641 | a,b | 413,290 | ||||
Optinose | 36,686 | a | 75,390 | ||||
Pacira Biosciences | 17,963 | a | 1,136,160 | ||||
Prestige Consumer Healthcare | 46,244 | a | 2,581,340 | ||||
Prometheus Biosciences | 11,321 | a | 295,025 | ||||
PTC Therapeutics | 29,121 | a | 855,284 | ||||
Puma Biotechnology | 15,098 | a | 29,290 | ||||
Repligen | 2,492 | a | 409,859 | ||||
Revance Therapeutics | 42,319 | a,b | 578,924 | ||||
SomaLogic | 46,389 | a | 278,334 | ||||
Supernus Pharmaceuticals | 30,529 | a | 850,843 | ||||
Twist Bioscience | 8,769 | a,b | 298,497 | ||||
Ultragenyx Pharmaceutical | 3,843 | a | 180,237 | ||||
United Therapeutics | 2,943 | a | 677,891 | ||||
VistaGen Therapeutics | 135,059 | a | 155,318 | ||||
39,505,864 | |||||||
Real Estate - 2.0% | |||||||
American Assets Trust | 22,519 | c | 767,898 | ||||
15
STATEMENT OF INVESTMENTS (continued)
Description | Shares | Value ($) | |||||
Common Stocks - 96.6% (continued) | |||||||
Real Estate - 2.0% (continued) | |||||||
DigitalBridge Group | 205,882 | a,c | 1,239,410 | ||||
Farmland Partners | 46,239 | c | 694,510 | ||||
Independence Realty Trust | 19,168 | c | 450,640 | ||||
Innovative Industrial Properties | 5,741 | c | 763,840 | ||||
NexPoint Residential Trust | 6,089 | c | 447,420 | ||||
Retail Opportunity Investments | 66,453 | c | 1,200,806 | ||||
Ryman Hospitality Properties | 8,037 | a,c | 717,624 | ||||
Tanger Factory Outlet Centers | 49,505 | b,c | 866,833 | ||||
Terreno Realty | 13,986 | c | 849,090 | ||||
The St. Joe Company | 12,682 | 640,314 | |||||
8,638,385 | |||||||
Retailing - 3.3% | |||||||
Asbury Automotive Group | 7,788 | a | 1,410,796 | ||||
Boot Barn Holdings | 10,311 | a | 832,098 | ||||
Caleres | 22,267 | 633,719 | |||||
Dick's Sporting Goods | 3,156 | b | 256,362 | ||||
Funko, Cl. A | 30,301 | a | 617,231 | ||||
Leslie's | 118,226 | a,b | 2,295,948 | ||||
Murphy USA | 3,241 | 807,398 | |||||
Ollie's Bargain Outlet Holdings | 19,149 | a | 899,429 | ||||
Overstock.com | 45,454 | a | 1,408,619 | ||||
Penske Automotive Group | 5,438 | b | 626,131 | ||||
Points.com | 8,641 | a | 213,173 | ||||
Pool | 2,964 | 1,181,510 | |||||
Shutterstock | 18,072 | 1,087,934 | |||||
Signet Jewelers | 16,835 | 1,003,366 | |||||
Sleep Number | 11,502 | a | 528,287 | ||||
13,802,001 | |||||||
Semiconductors & Semiconductor Equipment - 4.5% | |||||||
Axcelis Technologies | 7,815 | a | 484,999 | ||||
CEVA | 30,349 | a | 1,094,688 | ||||
Credo Technology Group Holding Ltd | 54,217 | a,b | 554,640 | ||||
Lattice Semiconductor | 23,470 | a | 1,220,909 | ||||
Monolithic Power Systems | 2,986 | 1,344,865 | |||||
Onto Innovation | 52,368 | a | 4,209,340 | ||||
Photronics | 31,438 | a | 683,462 | ||||
Rambus | 26,291 | a | 659,904 | ||||
Semtech | 54,816 | a | 3,513,158 | ||||
Silicon Motion Technology, ADR | 25,961 | 2,344,538 | |||||
SiTime | 6,232 | a | 1,327,416 | ||||
Synaptics | 9,828 | a | 1,455,723 | ||||
18,893,642 | |||||||
16
Description | Shares | Value ($) | |||||
Common Stocks - 96.6% (continued) | |||||||
Software & Services - 12.7% | |||||||
ACI Worldwide | 100,369 | a | 2,673,830 | ||||
Agilysys | 29,513 | a | 1,206,196 | ||||
Alarm.com Holdings | 32,741 | a | 2,070,213 | ||||
Amdocs | 7,421 | 644,811 | |||||
Bill.com Holdings | 7,587 | a | 897,087 | ||||
Blackbaud | 18,292 | a | 1,164,286 | ||||
BlackLine | 21,649 | a | 1,585,140 | ||||
Box, Cl. A | 30,820 | a | 804,710 | ||||
Cerence | 9,098 | a | 288,952 | ||||
Consensus Cloud Solutions | 9,987 | a | 479,676 | ||||
CSG Systems International | 10,901 | 677,933 | |||||
Digital Turbine | 42,132 | a | 1,071,417 | ||||
DigitalOcean Holdings | 24,632 | a,b | 1,203,273 | ||||
Domo, Cl. B | 14,409 | a | 459,359 | ||||
Elastic | 8,161 | a | 503,126 | ||||
Envestnet | 27,555 | a,b | 1,835,714 | ||||
Euronet Worldwide | 24,142 | a | 2,925,045 | ||||
Evo Payments, Cl. A | 49,710 | a | 1,145,815 | ||||
ExlService Holdings | 27,683 | a | 3,936,245 | ||||
Fair Isaac | 6,714 | a | 2,749,719 | ||||
Five9 | 6,225 | a | 602,020 | ||||
I3 Verticals, Cl. A | 47,317 | a | 1,103,432 | ||||
International Money Express Inc | 35,123 | a | 724,236 | ||||
Limelight Networks | 127,059 | a | 459,954 | ||||
MAXIMUS | 17,422 | 1,130,514 | |||||
Perficient | 30,760 | a | 3,011,712 | ||||
Q2 Holdings | 19,810 | a | 1,044,581 | ||||
Qualys | 12,983 | a | 1,696,619 | ||||
Rackspace Technology | 130,858 | a,b | 1,207,819 | ||||
Rapid7 | 9,155 | a | 648,815 | ||||
SolarWinds | 9,764 | 113,653 | |||||
Sprout Social, Cl. A | 25,690 | a | 1,308,392 | ||||
SPS Commerce | 8,251 | a | 883,187 | ||||
Switch, Cl. A | 25,115 | 847,631 | |||||
Tenable Holdings | 9,563 | a | 481,019 | ||||
The Descartes Systems Group | 59,900 | a | 3,555,066 | ||||
Tyler Technologies | 2,462 | a | 876,029 | ||||
Varonis Systems | 7,276 | a | 240,617 | ||||
Verra Mobility | 63,433 | a | 1,011,756 | ||||
Wix.com | 6,002 | a | 378,186 | ||||
WNS Holdings, ADR | 45,949 | a | 3,343,709 | ||||
Workiva | 10,296 | a | 751,711 | ||||
53,743,205 | |||||||
17
STATEMENT OF INVESTMENTS (continued)
Description | Shares | Value ($) | |||||
Common Stocks - 96.6% (continued) | |||||||
Technology Hardware & Equipment - 3.8% | |||||||
908 Devices | 10,355 | a,b | 144,142 | ||||
Arlo Technologies | 113,818 | a | 805,831 | ||||
Avnet | 14,121 | 684,162 | |||||
Belden | 22,166 | 1,276,318 | |||||
Calix | 37,930 | a | 1,401,134 | ||||
Cambium Networks | 32,630 | a | 466,283 | ||||
Clearfield | 16,837 | a | 1,040,527 | ||||
CTS | 15,181 | 617,411 | |||||
ePlus | 30,747 | a | 1,744,585 | ||||
Ituran Location & Control | 7,147 | 179,104 | |||||
NETSCOUT Systems | 18,166 | a | 623,639 | ||||
Novanta | 16,697 | a | 2,053,063 | ||||
PAR Technology | 20,100 | a,b | 755,358 | ||||
Radware | 51,447 | a | 1,241,416 | ||||
Rogers | 3,831 | a | 1,016,671 | ||||
Sanmina | 14,700 | a | 645,183 | ||||
ScanSource | 15,053 | a | 583,153 | ||||
Super Micro Computer | 12,173 | a | 609,380 | ||||
15,887,360 | |||||||
Telecommunication Services - .1% | |||||||
Gogo | 31,347 | a | 635,090 | ||||
Transportation - 2.5% | |||||||
Air Transport Services Group | 70,902 | a | 2,142,658 | ||||
Allegiant Travel | 9,370 | a | 1,400,346 | ||||
Eagle Bulk Shipping | 9,147 | b | 670,109 | ||||
Genco Shipping & Trading | 19,342 | 488,385 | |||||
GXO Logistics | 8,349 | a | 453,100 | ||||
Marten Transport | 142,586 | 2,503,810 | |||||
Saia | 5,512 | a | 1,089,116 | ||||
TFI International | 10,771 | 883,761 | |||||
XPO Logistics | 16,177 | a | 864,499 | ||||
10,495,784 | |||||||
Utilities - .2% | |||||||
California Water Service Group | 17,222 | 924,305 | |||||
Total Common Stocks (cost $336,929,157) | 407,441,016 | ||||||
Exchange-Traded Funds - .3% | |||||||
Registered Investment Companies - .3% | |||||||
iShares Russell 2000 Growth ETF | 4,747 | 1,046,571 | |||||
18
Description | 1-Day | Shares | Value ($) | ||||
Investment Companies - 3.5% | |||||||
Registered Investment Companies - 3.5% | |||||||
Dreyfus Institutional Preferred Government Plus Money Market Fund, Institutional Shares | 0.80 | 14,691,745 | d | 14,691,745 | |||
Investment of Cash Collateral for Securities Loaned - 2.0% | |||||||
Registered Investment Companies - 2.0% | |||||||
Dreyfus Institutional Preferred Government Plus Money Market Fund, SL Shares | 0.80 | 8,481,909 | d | 8,481,909 | |||
Total Investments (cost $361,109,961) | 102.4% | 431,661,241 | |||||
Liabilities, Less Cash and Receivables | (2.4%) | (10,074,496) | |||||
Net Assets | 100.0% | 421,586,745 | |||||
ADR—American Depository Receipt
ETF—Exchange-Traded Fund
a Non-income producing security.
b Security, or portion thereof, on loan. At May 31, 2022, the value of the fund’s securities on loan was $34,358,801 and the value of the collateral was $36,798,566, consisting of cash collateral of $8,481,909 and U.S. Government & Agency securities valued at $28,316,657. In addition, the value of collateral may include pending sales that are also on loan.
c Investment in real estate investment trust within the United States.
d Investment in affiliated issuer. The investment objective of this investment company is publicly available and can be found within the investment company’s prospectus.
Portfolio Summary (Unaudited) † | Value (%) |
Information Technology | 20.9 |
Health Care | 18.4 |
Industrials | 18.2 |
Consumer Discretionary | 10.7 |
Energy | 7.0 |
Financials | 6.4 |
Materials | 5.8 |
Investment Companies | 5.8 |
Consumer Staples | 4.5 |
Communication Services | 2.4 |
Real Estate | 2.1 |
Utilities | .2 |
102.4 |
† Based on net assets.
See notes to financial statements.
19
STATEMENT OF INVESTMENTS (continued)
Affiliated Issuers | ||||||
Description | Value ($) 5/31/2021 | Purchases ($)† | Sales ($) | Value ($) 5/31/2022 | Dividends/ | |
Registered Investment Companies - 3.5% | ||||||
Dreyfus Institutional Preferred Government Plus Money Market Fund, Institutional Shares - 3.5% | 19,191,519 | 431,815,132 | (436,314,906) | 14,691,745 | 23,277 | |
Investment of Cash Collateral for Securities Loaned - 2.0% | ||||||
Dreyfus Institutional Preferred Government Plus Money Market Fund, SL Shares - 2.0% | 7,000,373 | 117,596,021 | (116,114,485) | 8,481,909 | 204,080 | †† |
Total - 5.5% | 26,191,892 | 549,411,153 | (552,429,391) | 23,173,654 | 227,357 | |
† Includes reinvested dividends/distributions.
†† Represents securities lending income earned from the reinvestment of cash collateral from loaned securities, net of fees and collateral investment expenses, and other payments to and from borrowers of securities.
See notes to financial statements.
20
STATEMENT OF ASSETS AND LIABILITIES
May 31, 2022
|
|
|
|
|
|
|
|
|
| Cost |
| Value |
|
Assets ($): |
|
|
|
| ||
Investments in securities—See Statement of Investments |
|
|
| |||
Unaffiliated issuers | 337,936,307 |
| 408,487,587 |
| ||
Affiliated issuers |
| 23,173,654 |
| 23,173,654 |
| |
Receivable for investment securities sold |
| 1,897,986 |
| |||
Dividends and securities lending income receivable |
| 230,213 |
| |||
Receivable for shares of Common Stock subscribed |
| 44,000 |
| |||
Tax reclaim receivable—Note 1(b) |
| 3,729 |
| |||
Prepaid expenses |
|
|
|
| 46,903 |
|
|
|
|
|
| 433,884,072 |
|
Liabilities ($): |
|
|
|
| ||
Due to BNY Mellon Investment Adviser, Inc. and affiliates—Note 3(c) |
| 353,929 |
| |||
Liability for securities on loan—Note 1(c) |
| 8,481,909 |
| |||
Payable for investment securities purchased |
| 1,736,279 |
| |||
Payable for shares of Common Stock redeemed |
| 1,629,800 |
| |||
Directors’ fees and expenses payable |
| 8,971 |
| |||
Other accrued expenses |
|
|
|
| 86,439 |
|
|
|
|
|
| 12,297,327 |
|
Net Assets ($) |
|
| 421,586,745 |
| ||
Composition of Net Assets ($): |
|
|
|
| ||
Paid-in capital |
|
|
|
| 337,464,405 |
|
Total distributable earnings (loss) |
|
|
|
| 84,122,340 |
|
Net Assets ($) |
|
| 421,586,745 |
| ||
Net Asset Value Per Share | Class A | Class C | Class I | Class Y |
|
Net Assets ($) | 1,580,552 | 232,438 | 13,564,488 | 406,209,267 |
|
Shares Outstanding | 71,606 | 12,352 | 578,535 | 17,275,967 |
|
Net Asset Value Per Share ($) | 22.07 | 18.82 | 23.45 | 23.51 |
|
|
|
|
|
|
|
See notes to financial statements. |
|
|
|
|
|
21
STATEMENT OF OPERATIONS
Year Ended May 31, 2022
|
|
|
|
|
|
|
|
|
|
|
|
|
|
Investment Income ($): |
|
|
|
| ||
Income: |
|
|
|
| ||
Cash dividends (net of $9,527 foreign taxes withheld at source): |
| |||||
Unaffiliated issuers |
|
| 3,599,628 |
| ||
Affiliated issuers |
|
| 23,277 |
| ||
Income from securities lending—Note 1(c) |
|
| 204,080 |
| ||
Interest |
|
| 2,115 |
| ||
Total Income |
|
| 3,829,100 |
| ||
Expenses: |
|
|
|
| ||
Management fee—Note 3(a) |
|
| 6,022,413 |
| ||
Professional fees |
|
| 98,433 |
| ||
Registration fees |
|
| 67,509 |
| ||
Custodian fees—Note 3(c) |
|
| 54,188 |
| ||
Directors’ fees and expenses—Note 3(d) |
|
| 50,810 |
| ||
Chief Compliance Officer fees—Note 3(c) |
|
| 36,786 |
| ||
Shareholder servicing costs—Note 3(c) |
|
| 17,769 |
| ||
Loan commitment fees—Note 2 |
|
| 10,200 |
| ||
Prospectus and shareholders’ reports |
|
| 9,419 |
| ||
Distribution fees—Note 3(b) |
|
| 2,301 |
| ||
Miscellaneous |
|
| 40,478 |
| ||
Total Expenses |
|
| 6,410,306 |
| ||
Less—reduction in expenses due to undertaking—Note 3(a) |
|
| (1,491) |
| ||
Net Expenses |
|
| 6,408,815 |
| ||
Net Investment (Loss) |
|
| (2,579,715) |
| ||
Realized and Unrealized Gain (Loss) on Investments—Note 4 ($): |
|
| ||||
Net realized gain (loss) on investments | 40,696,884 |
| ||||
Net change in unrealized appreciation (depreciation) on investments | (162,171,451) |
| ||||
Net Realized and Unrealized Gain (Loss) on Investments |
|
| (121,474,567) |
| ||
Net (Decrease) in Net Assets Resulting from Operations |
| (124,054,282) |
| |||
|
|
|
|
|
|
|
See notes to financial statements. | ||||||
22
STATEMENT OF CHANGES IN NET ASSETS
|
|
|
| Year Ended May 31, | |||||
|
|
|
| 2022 |
| 2021 |
| ||
Operations ($): |
|
|
|
|
|
|
|
| |
Net investment (loss) |
|
| (2,579,715) |
|
|
| (3,063,354) |
| |
Net realized gain (loss) on investments |
| 40,696,884 |
|
|
| 153,795,273 |
| ||
Net change in unrealized appreciation |
| (162,171,451) |
|
|
| 103,798,676 |
| ||
Net Increase (Decrease) in Net Assets | (124,054,282) |
|
|
| 254,530,595 |
| |||
Distributions ($): |
| ||||||||
Distributions to shareholders: |
|
|
|
|
|
|
|
| |
Class A |
|
| (332,673) |
|
|
| (131,718) |
| |
Class C |
|
| (70,262) |
|
|
| (26,197) |
| |
Class I |
|
| (3,161,020) |
|
|
| (1,045,357) |
| |
Class Y |
|
| (112,382,784) |
|
|
| (48,153,829) |
| |
Total Distributions |
|
| (115,946,739) |
|
|
| (49,357,101) |
| |
Capital Stock Transactions ($): |
| ||||||||
Net proceeds from shares sold: |
|
|
|
|
|
|
|
| |
Class A |
|
| 314,626 |
|
|
| 334,206 |
| |
Class C |
|
| 100,100 |
|
|
| 7,150 |
| |
Class I |
|
| 14,107,360 |
|
|
| 12,084,948 |
| |
Class Y |
|
| 54,228,948 |
|
|
| 133,815,728 |
| |
Distributions reinvested: |
|
|
|
|
|
|
|
| |
Class A |
|
| 332,673 |
|
|
| 131,718 |
| |
Class C |
|
| 68,374 |
|
|
| 25,345 |
| |
Class I |
|
| 2,456,946 |
|
|
| 811,542 |
| |
Class Y |
|
| 50,024,995 |
|
|
| 21,548,837 |
| |
Cost of shares redeemed: |
|
|
|
|
|
|
|
| |
Class A |
|
| (331,163) |
|
|
| (335,637) |
| |
Class C |
|
| (78,344) |
|
|
| (291,221) |
| |
Class I |
|
| (14,099,945) |
|
|
| (7,687,411) |
| |
Class Y |
|
| (193,744,784) |
|
|
| (90,817,009) |
| |
Increase (Decrease) in Net Assets | (86,620,214) |
|
|
| 69,628,196 |
| |||
Total Increase (Decrease) in Net Assets | (326,621,235) |
|
|
| 274,801,690 |
| |||
Net Assets ($): |
| ||||||||
Beginning of Period |
|
| 748,207,980 |
|
|
| 473,406,290 |
| |
End of Period |
|
| 421,586,745 |
|
|
| 748,207,980 |
| |
23
STATEMENT OF CHANGES IN NET ASSETS (continued)
|
|
|
| Year Ended May 31, | |||||
|
|
|
| 2022 |
| 2021 |
| ||
Capital Share Transactions (Shares): |
| ||||||||
Class Aa,b |
|
|
|
|
|
|
|
| |
Shares sold |
|
| 11,465 |
|
|
| 11,032 |
| |
Shares issued for distributions reinvested |
|
| 12,132 |
|
|
| 4,278 |
| |
Shares redeemed |
|
| (12,041) |
|
|
| (11,380) |
| |
Net Increase (Decrease) in Shares Outstanding | 11,556 |
|
|
| 3,930 |
| |||
Class Ca |
|
|
|
|
|
|
|
| |
Shares sold |
|
| 3,072 |
|
|
| 281 |
| |
Shares issued for distributions reinvested |
|
| 2,915 |
|
|
| 928 |
| |
Shares redeemed |
|
| (3,628) |
|
|
| (12,870) |
| |
Net Increase (Decrease) in Shares Outstanding | 2,359 |
|
|
| (11,661) |
| |||
Class Ib |
|
|
|
|
|
|
|
| |
Shares sold |
|
| 445,197 |
|
|
| 382,577 |
| |
Shares issued for distributions reinvested |
|
| 84,460 |
|
|
| 25,164 |
| |
Shares redeemed |
|
| (469,657) |
|
|
| (247,604) |
| |
Net Increase (Decrease) in Shares Outstanding | 60,000 |
|
|
| 160,137 |
| |||
Class Yb |
|
|
|
|
|
|
|
| |
Shares sold |
|
| 1,735,389 |
|
|
| 4,371,820 |
| |
Shares issued for distributions reinvested |
|
| 1,715,534 |
|
|
| 666,941 |
| |
Shares redeemed |
|
| (6,994,218) |
|
|
| (2,985,307) |
| |
Net Increase (Decrease) in Shares Outstanding | (3,543,295) |
|
|
| 2,053,454 |
| |||
|
|
|
|
|
|
|
|
|
|
a | During the period ended May 31, 2022, 194 Class C shares representing $5,247 were automatically converted to 169 Class A shares and during the period ended May 31, 2021, 788 Class C shares representing $22,425 were automatically converted to 699 Class A shares. | ||||||||
b | During the period ended May 31, 2022, 414,308 Class Y shares representing $13,133,764 were exchanged for 415,311 Class I shares, 1,331 Class A shares representing $28,076 were exchanged for 1,253 Class I shares and 1,696 Class Y shares representing $48,480 were exchanged for 1,804 Class A shares. During the period ended May 31, 2021, 330,551 Class Y shares representing $10,495,865 were exchanged for 331,131 Class I shares. | ||||||||
See notes to financial statements. | |||||||||
24
FINANCIAL HIGHLIGHTS
The following tables describe the performance for each share class for the fiscal periods indicated. All information (except portfolio turnover rate) reflects financial results for a single fund share. Net asset value total return is calculated assuming an initial investment made at the net asset value at the beginning of the period, reinvestment of all dividends and distributions at net asset value during the period, and redemption at net asset value on the last day of the period. Net asset value total return includes adjustments in accordance with accounting principles generally accepted in the United States of America and as such, the net asset value for financial reporting purposes and the returns based upon those net asset values may differ from the net asset value and returns for shareholder transactions. These figures have been derived from the fund’s financial statements.
Year Ended May 31, | ||||||
Class A Shares | 2022 | 2021 | 2020 | 2019 | 2018 | |
Per Share Data ($): | ||||||
Net asset value, beginning of period | 33.26 | 23.63 | 23.18 | 28.94 | 24.54 | |
Investment Operations: | ||||||
Net investment (loss)a | (.21) | (.25) | (.16) | (.18) | (.15) | |
Net realized and unrealized | (5.45) | 12.38 | 1.87 | (1.28) | 6.36 | |
Total from Investment Operations | (5.66) | 12.13 | 1.71 | (1.46) | 6.21 | |
Distributions: | ||||||
Dividends from net realized | (5.53) | (2.50) | (1.26) | (4.30) | (1.81) | |
Net asset value, end of period | 22.07 | 33.26 | 23.63 | 23.18 | 28.94 | |
Total Return (%)b | (20.28) | 52.22 | 7.19 | (3.11) | 26.05 | |
Ratios/Supplemental Data (%): | ||||||
Ratio of total expenses | 1.35 | 1.37 | 1.39 | 1.40 | 1.29 | |
Ratio of net expenses | 1.30 | 1.30 | 1.30 | 1.30 | 1.28 | |
Ratio of net investment (loss) | (.72) | (.82) | (.68) | (.68) | (.56) | |
Portfolio Turnover Rate | 98.16 | 112.92 | 105.26 | 101.14 | 95.50 | |
Net Assets, end of period ($ x 1,000) | 1,581 | 1,998 | 1,326 | 1,630 | 2,090 | |
a Based on average shares outstanding.
b Exclusive of sales charge.
See notes to financial statements.
25
FINANCIAL HIGHLIGHTS (continued)
Year Ended May 31, | ||||||
Class C Shares | 2022 | 2021 | 2020 | 2019 | 2018 | |
Per Share Data ($): | ||||||
Net asset value, beginning of period | 29.38 | 21.24 | 21.10 | 26.95 | 23.13 | |
Investment Operations: | ||||||
Net investment (loss)a | (.37) | (.40) | (.31) | (.35) | (.33) | |
Net realized and unrealized | (4.66) | 11.04 | 1.71 | (1.20) | 5.96 | |
Total from Investment Operations | (5.03) | 10.64 | 1.40 | (1.55) | 5.63 | |
Distributions: | ||||||
Dividends from net realized | (5.53) | (2.50) | (1.26) | (4.30) | (1.81) | |
Net asset value, end of period | 18.82 | 29.38 | 21.24 | 21.10 | 26.95 | |
Total Return (%)b | (20.84) | 50.99 | 6.41 | (3.71) | 25.11 | |
Ratios/Supplemental Data (%): | ||||||
Ratio of total expenses | 2.22 | 2.31 | 2.16 | 2.33 | 2.23 | |
Ratio of net expenses | 2.05 | 2.05 | 2.05 | 2.05 | 2.05 | |
Ratio of net investment (loss) | (1.47) | (1.56) | (1.43) | (1.43) | (1.37) | |
Portfolio Turnover Rate | 98.16 | 112.92 | 105.26 | 101.14 | 95.50 | |
Net Assets, end of period ($ x 1,000) | 232 | 294 | 460 | 479 | 587 | |
a Based on average shares outstanding.
b Exclusive of sales charge.
See notes to financial statements.
26
Year Ended May 31, | ||||||
Class I Shares | 2022 | 2021 | 2020 | 2019 | 2018 | |
Per Share Data ($): | ||||||
Net asset value, beginning of period | 34.89 | 24.63 | 24.05 | 29.76 | 25.12 | |
Investment Operations: | ||||||
Net investment (loss)a | (.13) | (.16) | (.09) | (.10) | (.07) | |
Net realized and unrealized | (5.78) | 12.92 | 1.93 | (1.31) | 6.52 | |
Total from Investment Operations | (5.91) | 12.76 | 1.84 | (1.41) | 6.45 | |
Distributions: | ||||||
Dividends from net realized | (5.53) | (2.50) | (1.26) | (4.30) | (1.81) | |
Net asset value, end of period | 23.45 | 34.89 | 24.63 | 24.05 | 29.76 | |
Total Return (%) | (20.01) | 52.63 | 7.52 | (2.88) | 26.42 | |
Ratios/Supplemental Data (%): | ||||||
Ratio of total expenses | .99 | 1.00 | 1.01 | .98 | .99 | |
Ratio of net expenses | .99 | 1.00 | 1.01 | .98 | .98 | |
Ratio of net investment (loss) | (.41) | (.52) | (.37) | (.35) | (.26) | |
Portfolio Turnover Rate | 98.16 | 112.92 | 105.26 | 101.14 | 95.50 | |
Net Assets, end of period ($ x 1,000) | 13,564 | 18,091 | 8,826 | 12,949 | 16,532 | |
a Based on average shares outstanding.
See notes to financial statements.
27
FINANCIAL HIGHLIGHTS (continued)
Year Ended May 31, | ||||||
Class Y Shares | 2022 | 2021 | 2020 | 2019 | 2018 | |
Per Share Data ($): | ||||||
Net asset value, beginning of period | 34.96 | 24.66 | 24.07 | 29.77 | 25.12 | |
Investment Operations: | ||||||
Net investment (loss)a | (.12) | (.15) | (.08) | (.09) | (.06) | |
Net realized and unrealized | (5.80) | 12.95 | 1.93 | (1.31) | 6.52 | |
Total from Investment Operations | (5.92) | 12.80 | 1.85 | (1.40) | 6.46 | |
Distributions: | ||||||
Dividends from net realized | (5.53) | (2.50) | (1.26) | (4.30) | (1.81) | |
Net asset value, end of period | 23.51 | 34.96 | 24.66 | 24.07 | 29.77 | |
Total Return (%) | (20.00) | 52.73 | 7.56 | (2.84) | 26.46 | |
Ratios/Supplemental Data (%): | ||||||
Ratio of total expenses | .96 | .96 | .97 | .95 | .95 | |
Ratio of net expenses | .96 | .96 | .97 | .95 | .94 | |
Ratio of net investment (loss) | (.38) | (.48) | (.34) | (.34) | (.21) | |
Portfolio Turnover Rate | 98.16 | 112.92 | 105.26 | 101.14 | 95.50 | |
Net Assets, end of period ($ x 1,000) | 406,209 | 727,826 | 462,795 | 519,312 | 798,000 | |
a Based on average shares outstanding.
See notes to financial statements.
28
NOTES TO FINANCIAL STATEMENTS
NOTE 1—Significant Accounting Policies:
BNY Mellon Select Managers Small Cap Growth Fund (the “fund”) is a separate diversified series of BNY Mellon Strategic Funds, Inc. (the “Company”), which is registered under the Investment Company Act of 1940, as amended (the “Act”), as an open-end management investment company and operates as a series company currently offering six series, including the fund. The fund’s investment objective is to seek capital appreciation. BNY Mellon Investment Adviser, Inc. (the “Adviser”), a wholly-owned subsidiary of The Bank of New York Mellon Corporation (“BNY Mellon”), serves as the fund’s investment adviser and the fund’s portfolio allocation manager. Geneva Capital Management LLC (“Geneva”), Nicholas Investment Partners, L.P. (“Nicholas”), EAM Investors, LLC (“EAM”), Granite Investment Partners, LLC (“Granite”), Rice Hall James & Associates, LLC (“Rice Hall”) and Redwood Investments, LLC (“Redwood”), serve as the fund’s sub-advisers (collectively the “Sub-Advisers”), each managing an allocated portion of the fund’s portfolio.
BNY Mellon Securities Corporation (the “Distributor”), a wholly-owned subsidiary of the Adviser, is the distributor of the fund’s shares. The fund is authorized to issue 425 million shares of $.001 par value Common Stock. The fund currently has authorized four classes of shares: Class A (75 million shares authorized), Class C (75 million shares authorized), Class I (75 million shares authorized) and Class Y (200 million shares authorized). Class A and Class C shares are sold primarily to retail investors through financial intermediaries and bear Distribution and/or Shareholder Services Plan fees. Class A shares generally are subject to a sales charge imposed at the time of purchase. Class A shares bought without an initial sales charge as part of an investment of $1 million or more may be charged a contingent deferred sales charge (“CDSC”) of 1.00% if redeemed within one year. Class C shares are subject to a CDSC imposed on Class C shares redeemed within one year of purchase. Class C shares automatically convert to Class A shares eight years after the date of purchase, without the imposition of a sales charge. Class I shares are sold primarily to bank trust departments and other financial service providers (including BNY Mellon and its affiliates), acting on behalf of customers having a qualified trust or an investment account or relationship at such institution, and bear no Distribution or Shareholder Services Plan fees. Class Y shares are sold at net asset value per share generally to institutional investors, and bear no Distribution or Shareholder Services Plan fees. Class I and Class Y shares are offered without a front-end sales charge or CDSC.
29
NOTES TO FINANCIAL STATEMENTS (continued)
Other differences between the classes include the services offered to and the expenses borne by each class, the allocation of certain transfer agency costs and certain voting rights. Income, expenses (other than expenses attributable to a specific class), and realized and unrealized gains or losses on investments are allocated to each class of shares based on its relative net assets.
The Company accounts separately for the assets, liabilities and operations of each series. Expenses directly attributable to each series are charged to that series’ operations; expenses which are applicable to all series are allocated among them on a pro rata basis.
The Financial Accounting Standards Board (“FASB”) Accounting Standards Codification (“ASC”) is the exclusive reference of authoritative U.S. generally accepted accounting principles (“GAAP”) recognized by the FASB to be applied by nongovernmental entities. Rules and interpretive releases of the SEC under authority of federal laws are also sources of authoritative GAAP for SEC registrants. The fund is an investment company and applies the accounting and reporting guidance of the FASB ASC Topic 946 Financial Services-Investment Companies. The fund’s financial statements are prepared in accordance with GAAP, which may require the use of management estimates and assumptions. Actual results could differ from those estimates.
The Company enters into contracts that contain a variety of indemnifications. The fund’s maximum exposure under these arrangements is unknown. The fund does not anticipate recognizing any loss related to these arrangements.
(a) Portfolio valuation: The fair value of a financial instrument is the amount that would be received to sell an asset or paid to transfer a liability in an orderly transaction between market participants at the measurement date (i.e., the exit price). GAAP establishes a fair value hierarchy that prioritizes the inputs of valuation techniques used to measure fair value. This hierarchy gives the highest priority to unadjusted quoted prices in active markets for identical assets or liabilities (Level 1 measurements) and the lowest priority to unobservable inputs (Level 3 measurements).
Additionally, GAAP provides guidance on determining whether the volume and activity in a market has decreased significantly and whether such a decrease in activity results in transactions that are not orderly. GAAP requires enhanced disclosures around valuation inputs and techniques used during annual and interim periods.
30
Various inputs are used in determining the value of the fund’s investments relating to fair value measurements. These inputs are summarized in the three broad levels listed below:
Level 1—unadjusted quoted prices in active markets for identical investments.
Level 2—other significant observable inputs (including quoted prices for similar investments, interest rates, prepayment speeds, credit risk, etc.).
Level 3—significant unobservable inputs (including the fund’s own assumptions in determining the fair value of investments).
The inputs or methodology used for valuing securities are not necessarily an indication of the risk associated with investing in those securities.
Changes in valuation techniques may result in transfers in or out of an assigned level within the disclosure hierarchy. Valuation techniques used to value the fund’s investments are as follows:
Investments in equity securities are valued at the last sales price on the securities exchange or national securities market on which such securities are primarily traded. Securities listed on the National Market System for which market quotations are available are valued at the official closing price or, if there is no official closing price that day, at the last sales price. For open short positions, asked prices are used for valuation purposes. Bid price is used when no asked price is available. Registered investment companies that are not traded on an exchange are valued at their net asset value. All of the preceding securities are generally categorized within Level 1 of the fair value hierarchy.
Securities not listed on an exchange or the national securities market, or securities for which there were no transactions, are valued at the average of the most recent bid and asked prices. These securities are generally categorized within Level 2 of the fair value hierarchy.
Fair valuing of securities may be determined with the assistance of a pricing service using calculations based on indices of domestic securities and other appropriate indicators, such as prices of relevant ADRs and futures. Utilizing these techniques may result in transfers between Level 1 and Level 2 of the fair value hierarchy.
When market quotations or official closing prices are not readily available, or are determined not to accurately reflect fair value, such as when the value of a security has been significantly affected by events after the close of the exchange or market on which the security is principally traded (for
31
NOTES TO FINANCIAL STATEMENTS (continued)
example, a foreign exchange or market), but before the fund calculates its net asset value, the fund may value these investments at fair value as determined in accordance with the procedures approved by the Company’s Board of Directors (the “Board”). Certain factors may be considered when fair valuing investments such as: fundamental analytical data, the nature and duration of restrictions on disposition, an evaluation of the forces that influence the market in which the securities are purchased and sold, and public trading in similar securities of the issuer or comparable issuers. These securities are either categorized within Level 2 or 3 of the fair value hierarchy depending on the relevant inputs used.
For securities where observable inputs are limited, assumptions about market activity and risk are used and such securities are generally categorized within Level 3 of the fair value hierarchy.
The following is a summary of the inputs used as of May 31, 2022 in valuing the fund’s investments:
Level 1-Unadjusted Quoted Prices | Level 2- Other Significant Observable Inputs | Level 3-Significant Unobservable Inputs | Total | |||
Assets ($) | ||||||
Investments in Securities:† | ||||||
Equity Securities - Common Stocks | 407,441,016 | - | - | 407,441,016 | ||
Exchange-Traded Funds | 1,046,571 | - | - | 1,046,571 | ||
Investment Companies | 23,173,654 | - | - | 23,173,654 | ||
† See Statement of Investments for additional detailed categorizations, if any.
(b) Foreign taxes: The fund may be subject to foreign taxes (a portion of which may be reclaimable) on income, stock dividends, realized and unrealized capital gains on investments or certain foreign currency transactions. Foreign taxes are recorded in accordance with the applicable foreign tax regulations and rates that exist in the foreign jurisdictions in which the fund invests. These foreign taxes, if any, are paid by the fund and are reflected in the Statement of Operations, if applicable. Foreign taxes payable or deferred or those subject to reclaims as of May 31, 2022, if any, are disclosed in the fund’s Statement of Assets and Liabilities.
(c) Securities transactions and investment income: Securities transactions are recorded on a trade date basis. Realized gains and losses from securities transactions are recorded on the identified cost basis. Dividend income is recognized on the ex-dividend date and interest income, including, where applicable, accretion of discount and
32
amortization of premium on investments, is recognized on the accrual basis.
Pursuant to a securities lending agreement with BNY Mellon, the fund may lend securities to qualified institutions. It is the fund’s policy that, at origination, all loans are secured by collateral of at least 102% of the value of U.S. securities loaned and 105% of the value of foreign securities loaned. Collateral equivalent to at least 100% of the market value of securities on loan is maintained at all times. Collateral is either in the form of cash, which can be invested in certain money market mutual funds managed by the Adviser, or U.S. Government and Agency securities. The fund is entitled to receive all dividends, interest and distributions on securities loaned, in addition to income earned as a result of the lending transaction. Should a borrower fail to return the securities in a timely manner, BNY Mellon is required to replace the securities for the benefit of the fund or credit the fund with the market value of the unreturned securities and is subrogated to the fund’s rights against the borrower and the collateral. Additionally, the contractual maturity of security lending transactions are on an overnight and continuous basis. During the period ended May 31, 2022, BNY Mellon earned $27,811 from the lending of the fund’s portfolio securities, pursuant to the securities lending agreement.
(d) Affiliated issuers: Investments in other investment companies advised by the Adviser are considered “affiliated” under the Act.
(e) Risk: Certain events particular to the industries in which the fund’s investments conduct their operations, as well as general economic, political and public health conditions, may have a significant negative impact on the investee’s operations and profitability. In addition, turbulence in financial markets and reduced liquidity in equity, credit and/or fixed income markets may negatively affect many issuers, which could adversely affect the fund. Global economies and financial markets are becoming increasingly interconnected, and conditions and events in one country, region or financial market may adversely impact issuers in a different country, region or financial market. These risks may be magnified if certain events or developments adversely interrupt the global supply chain; in these and other circumstances, such risks might affect companies world-wide. Recent examples include pandemic risks related to COVID-19 and aggressive measures taken world-wide in response by governments, including closing borders, restricting international and domestic travel, and the imposition of prolonged quarantines of large populations, and by businesses, including changes to operations and reducing staff. The effects of COVID-19 have contributed to increased volatility in global markets and will likely affect certain countries, companies, industries and market
33
NOTES TO FINANCIAL STATEMENTS (continued)
sectors more dramatically than others. The COVID-19 pandemic has had, and any other outbreak of an infectious disease or other serious public health concern could have, a significant negative impact on economic and market conditions and could trigger a prolonged period of global economic slowdown. To the extent the fund may overweight its investments in certain countries, companies, industries or market sectors, such positions will increase the fund’s exposure to risk of loss from adverse developments affecting those countries, companies, industries or sectors.
(f) Dividends and distributions to shareholders: Dividends and distributions are recorded on the ex-dividend date. Dividends from net investment income and dividends from net realized capital gains, if any, are normally declared and paid annually, but the fund may make distributions on a more frequent basis to comply with the distribution requirements of the Internal Revenue Code of 1986, as amended (the “Code”). To the extent that net realized capital gains can be offset by capital loss carryovers, it is the policy of the fund not to distribute such gains. Income and capital gain distributions are determined in accordance with income tax regulations, which may differ from GAAP.
(g) Federal income taxes: It is the policy of the fund to continue to qualify as a regulated investment company, if such qualification is in the best interests of its shareholders, by complying with the applicable provisions of the Code, and to make distributions of taxable income and net realized capital gain sufficient to relieve it from substantially all federal income and excise taxes.
As of and during the period ended May 31, 2022, the fund did not have any liabilities for any uncertain tax positions. The fund recognizes interest and penalties, if any, related to uncertain tax positions as income tax expense in the Statement of Operations. During the period ended May 31, 2022, the fund did not incur any interest or penalties.
Each tax year for the four-year period ended May 31, 2022 remains subject to examination by the Internal Revenue Service and state taxing authorities.
At May 31, 2022, the components of accumulated earnings on a tax basis were as follows: undistributed capital gains $22,157,521 and unrealized appreciation $61,964,819.
The tax character of distributions paid to shareholders during the fiscal years ended May 31, 2022 and May 31, 2021 were as follows: ordinary income $50,342,193 and $20,200,883, and long-term capital gains $65,604,546 and $29,156,218, respectively.
34
During the period ended May 31, 2022, as a result of permanent book to tax differences, primarily due to the tax treatment for treating a portion of the proceeds from redemptions as a distribution for tax purposes and net operating losses, the fund decreased total distributable earnings (loss) by $3,173,404 and increased paid-in capital by the same amount. Net assets and net asset value per share were not affected by this reclassification.
NOTE 2—Bank Lines of Credit:
The fund participates with other long-term open-end funds managed by the Adviser in a $823.5 million unsecured credit facility led by Citibank, N.A. (the “Citibank Credit Facility”) and a $300 million unsecured credit facility provided by BNY Mellon (the “BNYM Credit Facility”), each to be utilized primarily for temporary or emergency purposes, including the financing of redemptions (each, a “Facility”). The Citibank Credit Facility is available in two tranches: (i) Tranche A is in an amount equal to $688.5 million and is available to all long-term open-ended funds, including the fund, and (ii) Tranche B is an amount equal to $135 million and is available only to BNY Mellon Floating Rate Income Fund, a series of BNY Mellon Investment Funds IV, Inc. In connection therewith, the fund has agreed to pay its pro rata portion of commitment fees for Tranche A of the Citibank Credit Facility and the BNYM Credit Facility. Interest is charged to the fund based on rates determined pursuant to the terms of the respective Facility at the time of borrowing. During the period ended May 31, 2022, the fund did not borrow under the Facilities.
NOTE 3—Management Fee, Sub-Advisory Fee and Other Transactions with Affiliates:
(a) Pursuant to a management agreement with the Adviser, the management fee is computed at the annual rate of .90% of the value of the fund’s average daily net assets and is payable monthly. The Adviser has contractually agreed, from June 1, 2021 through September 30, 2022, to waive receipt of its fees and/or assume the direct expenses of the fund, so that the direct expenses of Class A, Class C, Class I and Class Y shares (excluding Rule 12b-1 Distribution Plan fees, Shareholder Services Plan fees, taxes, interest expense, brokerage commissions, commitment fees on borrowings and extraordinary expenses) do not exceed 1.05%, 1.05%, 1.05% and .98% of the value of the respective class’ average daily net assets. On or after September 30, 2022, the Adviser may terminate these expense limitations at any time. The reduction in expenses, pursuant to the undertaking, amounted to $1,491 during the period ended May 31, 2022.
Pursuant to separate sub-advisory agreements between the Adviser and the Sub-Advisers, each serves as the fund’s sub-adviser responsible for the
35
NOTES TO FINANCIAL STATEMENTS (continued)
day-to-day management of a portion of the fund’s portfolio. The Adviser pays each sub-adviser a monthly fee at an annual percentage of the value of the fund’s average daily net assets. The Adviser has obtained an exemptive order from the SEC (the “Order”), upon which the fund may rely, to use a manager of managers approach that permits the Adviser, subject to certain conditions and approval by the Board, to enter into and materially amend sub-advisory agreements with one or more sub-advisers who are either unaffiliated with the Adviser or are wholly-owned subsidiaries (as defined under the Act) of the Adviser’s ultimate parent company, BNY Mellon, without obtaining shareholder approval. The Order also allows the fund to disclose the sub-advisory fee paid by the Adviser to any unaffiliated sub-adviser in the aggregate with other unaffiliated sub-advisers in documents filed with the SEC and provided to shareholders. In addition, pursuant to the Order, it is not necessary to disclose the sub-advisory fee payable by the Adviser separately to a sub-adviser that is a wholly-owned subsidiary of BNY Mellon in documents filed with the SEC and provided to shareholders; such fees are to be aggregated with fees payable to the Adviser. The Adviser has ultimate responsibility (subject to oversight by the Board) to supervise any sub-adviser and recommend the hiring, termination, and replacement of any sub-adviser to the Board.
During the period ended May 31, 2022, the Distributor retained $216 from commissions earned on sales of the fund’s Class A shares and $1 from CDSC fees on redemptions of the fund’s Class C shares.
(b) Under the Distribution Plan adopted pursuant to Rule 12b-1 under the Act, Class C shares pay the Distributor for distributing its shares at an annual rate of .75% of the value of its average daily net assets. The Distributor may pay one or more Service Agents in respect of advertising, marketing and other distribution services, and determines the amounts, if any, to be paid to Service Agents and the basis on which such payments are made. During the period ended May 31, 2022, Class C shares were charged $2,301 pursuant to the Distribution Plan.
(c) Under the Shareholder Services Plan, Class A and Class C shares pay the Distributor at an annual rate of .25% of the value of their average daily net assets for the provision of certain services. The services provided may include personal services relating to shareholder accounts, such as answering shareholder inquiries regarding the fund, and services related to the maintenance of shareholder accounts. The Distributor may make payments to Service Agents (securities dealers, financial institutions or other industry professionals) with respect to these services. The Distributor determines the amounts to be paid to Service Agents. During
36
the period ended May 31, 2022, Class A and Class C shares were charged $4,812 and $767, respectively, pursuant to the Shareholder Services Plan.
The fund has an arrangement with BNY Mellon Transfer, Inc., (the “Transfer Agent”), a subsidiary of BNY Mellon and an affiliate of the Adviser, whereby the fund may receive earnings credits when positive cash balances are maintained, which are used to offset transfer agency fees. For financial reporting purposes, the fund includes net earnings credits, if any, as shareholder servicing costs in the Statement of Operations.
The fund has an arrangement with The Bank of New York Mellon (the “Custodian”), a subsidiary of BNY Mellon and an affiliate of the Adviser, whereby the fund will receive interest income or be charged overdraft fees when cash balances are maintained. For financial reporting purposes, the fund includes this interest income and overdraft fees, if any, as interest income in the Statement of Operations.
The fund compensates the Transfer Agent, under a transfer agency agreement for providing transfer agency and cash management services inclusive of earnings credits, if any, for the fund. The majority of Transfer Agent fees are comprised of amounts paid on a per account basis, while cash management fees are related to fund subscriptions and redemptions. During the period ended May 31, 2022, the fund was charged $6,575 for transfer agency services, inclusive of earnings credit, if any. These fees are included in Shareholder servicing costs in the Statement of Operations.
The fund compensates the Custodian under a custody agreement, for providing custodial services for the fund. These fees are determined based on net assets, geographic region and transaction activity. During the period ended May 31, 2022, the fund was charged $54,188 pursuant to the custody agreement.
During the period ended May 31, 2022, the fund was charged $36,786 for services performed by the Chief Compliance Officer and his staff. These fees are included in Chief Compliance Officer fees in the Statement of Operations.
The components of “Due to BNY Mellon Investment Adviser, Inc. and affiliates” in the Statement of Assets and Liabilities consist of: management fees of $325,418, Distribution Plan fees of $146, Shareholder Services Plan fees of $381, Custodian fees of $19,033, Chief Compliance Officer fees of $8,324 and Transfer Agent fees of $1,166, which are offset against an expense reimbursement currently in effect in the amount of $539.
37
NOTES TO FINANCIAL STATEMENTS (continued)
(d) Each Board member also serves as a Board member of other funds in the BNY Mellon Family of Funds complex. Annual retainer fees and attendance fees are allocated to each fund based on net assets.
NOTE 4—Securities Transactions:
The aggregate amount of purchases and sales of investment securities, excluding short-term securities, during the period ended May 31, 2022, amounted to $635,600,698 and $837,815,108, respectively.
At May 31, 2022, the cost of investments for federal income tax purposes was $369,696,422; accordingly, accumulated net unrealized appreciation on investments was $61,964,819, consisting of $103,395,485 gross unrealized appreciation and $41,430,666 gross unrealized depreciation.
38
REPORT OF INDEPENDENT REGISTERED PUBLIC ACCOUNTING FIRM
To the Shareholders and the Board of Directors of BNY Mellon Select Managers Small Cap Growth Fund
Opinion on the Financial Statements
We have audited the accompanying statement of assets and liabilities of BNY Mellon Select Managers Small Cap Growth Fund (the “Fund”) (one of the funds constituting BNY Mellon Strategic Funds, Inc.), including the statement of investments, as of May 31, 2022, and the related statement of operations for the year then ended, the statements of changes in net assets for each of the two years in the period then ended, the financial highlights for each of the five years in the period then ended and the related notes (collectively referred to as the “financial statements”). In our opinion, the financial statements present fairly, in all material respects, the financial position of the Fund (one of the funds constituting BNY Mellon Strategic Funds, Inc.) at May 31, 2022, the results of its operations for the year then ended, the changes in its net assets for each of the two years in the period then ended and its financial highlights for each of the five years in the period then ended, in conformity with U.S. generally accepted accounting principles.
Basis for Opinion
These financial statements are the responsibility of the Fund’s management. Our responsibility is to express an opinion on the Fund’s financial statements based on our audits. We are a public accounting firm registered with the Public Company Accounting Oversight Board (United States) (“PCAOB”) and are required to be independent with respect to the Fund in accordance with the U.S. federal securities laws and the applicable rules and regulations of the Securities and Exchange Commission and the PCAOB.
We conducted our audits in accordance with the standards of the PCAOB. Those standards require that we plan and perform the audit to obtain reasonable assurance about whether the financial statements are free of material misstatement, whether due to error or fraud. The Fund is not required to have, nor were we engaged to perform, an audit of the Fund’s internal control over financial reporting. As part of our audits, we are required to obtain an understanding of internal control over financial reporting, but not for the purpose of expressing an opinion on the effectiveness of the Fund’s internal control over financial reporting. Accordingly, we express no such opinion.
Our audits included performing procedures to assess the risks of material misstatement of the financial statements, whether due to error or fraud, and performing procedures that respond to those risks. Such procedures included examining, on a test basis, evidence regarding the amounts and disclosures in the financial statements. Our procedures included confirmation of securities owned as of May 31, 2022, by correspondence with the custodian and others or by other appropriate auditing procedures where replies from others were not received. Our audits also included evaluating the accounting principles used and significant estimates made by management, as well as evaluating the overall presentation of the financial statements. We believe that our audits provide a reasonable basis for our opinion.

We have served as the auditor of one or more investment companies in the BNY Mellon Family of Funds since at least 1957, but we are unable to determine the specific year.
New York, New York
July 22, 2022
39
IMPORTANT TAX INFORMATION (Unaudited)
The fund hereby reports 3.15% of the ordinary dividends paid during the fiscal year ended May 31, 2022 as qualifying for the corporate dividends received deduction. For the fiscal year ended May 31, 2022, certain dividends paid by the fund may be subject to a maximum tax rate of 15%, as provided for by the Jobs and Growth Tax Relief Reconciliation Act of 2003. Of the distributions paid during the fiscal year, $1,627,325 represents the maximum amount that may be considered qualified dividend income. Shareholders will receive notification in early 2023 of the percentage applicable to the preparation of their 2022 income tax returns. The fund hereby reports $2.4016 per share as a short-term capital gain distribution and $3.1292 per share as a long-term capital gain distribution paid on December 16, 2021.
40
LIQUIDITY RISK MANAGEMENT PROGRAM (Unaudited)
Effective June 1, 2019, the fund adopted a liquidity risk management program (the “Liquidity Risk Management Program”) pursuant to the requirements of Rule 22e-4 under the Investment Company Act of 1940, as amended. Rule 22e-4 requires registered open-end funds, including mutual funds and exchange-traded funds but not money market funds, to establish liquidity risk management programs in order to effectively manage fund liquidity and shareholder redemptions. The rule is designed to mitigate the risk that a fund could not meet redemption requests without significantly diluting the interests of remaining investors.
The rule requires the fund to assess, manage and review their liquidity risk at least annually considering applicable factors such as investment strategy and liquidity during normal and foreseeable stressed conditions, including whether the strategy is appropriate for an open-end fund and whether the fund has a relatively concentrated portfolio or large positions in particular issuers. The fund must also assess its use of borrowings and derivatives, short-term and long-term cash flow projections in normal and stressed conditions, holdings of cash and cash equivalents, and borrowing arrangements and other funding sources.
The rule also requires the fund to classify its investments as highly liquid, moderately liquid, less liquid or illiquid based on the number of days the fund expects it would take to liquidate the investment, and to review these classifications at least monthly or more often under certain conditions. The periods range from three or fewer business days for a highly liquid investment to greater than seven calendar days for settlement of a less liquid investment. Illiquid investments are those a fund does not expect to be able to sell or dispose of within seven calendar days without significantly changing the market value. The fund is prohibited from acquiring an investment if, after the acquisition, its holdings of illiquid assets will exceed 15% of its net assets. In addition, if a fund permits redemptions in-kind, the rule requires the fund to establish redemption in-kind policies and procedures governing how and when it will engage in such redemptions.
Pursuant to the rule’s requirements, the Liquidity Risk Management Program has been reviewed and approved by the Board. Furthermore, the Board has received a written report prepared by the Program’s Administrator that addresses the operation of the Program, assesses its adequacy and effectiveness and describes any material changes made to the Program.
Assessment of Program
In the opinion of the Program Administrator, the Program approved by the Board continues to be adequate for the fund and the Program has been implemented effectively. The Program Administrator has monitored the fund’s liquidity risk and the liquidity classification of the securities held by the fund and has determined that the Program is operating effectively.
During the period from January 1, 2021 to December 31, 2021, there were no material changes to the Program and no material liquidity events that impacted the fund. During the period, the fund held sufficient highly liquid assets to meet fund redemptions.
Under normal expected foreseeable fund redemption forecasts and foreseeable stressed fund redemption forecasts, the Program Administrator believes that the fund maintains sufficient highly liquid assets to meet expected fund redemptions.
41
BOARD MEMBERS INFORMATION (Unaudited)
Independent Board Members
Joseph S. DiMartino (78)
Chairman of the Board (1995)
Principal Occupation During Past 5 Years:
· Director and Trustee of funds in the BNY Mellon Family of Funds and certain other entities (as described in the fund’s Statement of Additional Information) (1995-Present)
Other Public Company Board Memberships During Past 5 Years:
· CBIZ, Inc., a public company providing professional business services, products and solutions, Director (1997-Present)
No. of Portfolios for which Board Member Serves: 96
———————
Joni Evans (80)
Board Member (2006)
Principal Occupation During Past 5 Years:
· www.wowOwow.com, an online community dedicated to women’s conversations and publications, Chief Executive Officer (2007-2019)
· Joni Evans Ltd. publishing, Principal (2006-2019)
No. of Portfolios for which Board Member Serves: 18
———————
Joan Gulley (74)
Board Member (2017)
Principal Occupation During Past 5 Years:
· Nantucket Atheneum, public library, Chair (2018-June 2021) and Director (2015-June 2021)
· Orchard Island Club, golf and beach club, Governor (2016-Present)
No. of Portfolios for which Board Member Serves: 42
———————
42
Alan H. Howard (62)
Board Member (2018)
Principal Occupation During Past 5 Years:
· Heathcote Advisors LLC, a financial advisory services firm, Managing Partner (2008-Present)
· Dynatech/MPX Holdings LLC, a global supplier and service provider of military aircraft parts, President (2012-2019); and Board Member of its two operating subsidiaries, Dynatech International LLC and Military Parts Exchange LLC (2012-2019), including Chief Executive Officer of an operating subsidiary, Dynatech International LLC (2013-2019)
· Rossoff & Co., an independent investment banking firm, Senior Advisor (2013-June 2021)
Other Public Company Board Memberships During Past 5 Years:
· Movado Group, Inc., a public company that designs, sources, markets and distributes watches, Director (1997-Present)
· Diamond Offshore Drilling, Inc., a public company that provides contract drilling services, Director (March 2020-April 2021)
No. of Portfolios for which Board Member Serves: 18
———————
Robin A. Melvin (58)
Board Member (1995)
Principal Occupation During Past 5 Years:
· Westover School, a private girls’ boarding school in Middlebury, Connecticut, Trustee (2019-Present)
· Mentor Illinois, a non-profit organization dedicated to increasing the quantity and quality of mentoring services in Illinois. Co-Chair (2014–2020); Board Member, Mentor Illinois (2013-2020)
· JDRF, a non-profit juvenile diabetes research foundation, Board Member (June 2021-Present)
Other Public Company Board Memberships During Past 5 Years:
· HPS Corporate Lending Fund, a closed-end management investment company regulated as a business development company, Trustee (August 2021-Present)
No. of Portfolios for which Board Member Serves: 74
———————
Burton N. Wallack (71)
Board Member (2006)
Principal Occupation During Past 5 Years:
Wallack Management Company, a real estate management company, President and Co-owner (1987-Present)
Other Public Company Board Memberships During Past 5 Years:
Mount Sinai Hospital Urology Board Member (2017-Present)
No. of Portfolios for which Board Member Serves: 18
———————
43
BOARD MEMBERS INFORMATION (Unaudited) (continued)
Benaree Pratt Wiley (76)
Board Member (2016)
Principal Occupation During Past 5 Years:
· The Wiley Group, a firm specializing in strategy and business development. Principal (2005-Present)
Other Public Company Board Memberships During Past 5 Years:
· CBIZ, Inc., a public company providing professional business services, products and solutions, Director (2008-Present)
· Blue Cross-Blue Shield of Massachusetts Director (2004-2020)
No. of Portfolios for which Board Member Serves: 62
———————
Gordon J. Davis (80)
Advisory Board Member (2021)
Principal Occupation During Past 5 Years:
· Venable LLP, a law firm Partner (2012-Present)
No. of Portfolios for which Advisory Board Member Serves: 40
———————
The address of the Board Members and Officers is c/o BNY Mellon Investment Adviser, Inc., 240 Greenwich Street, New York, New York 10286. Additional information about each Board Member is available in the fund’s Statement of Additional Information which can be obtained from the Adviser free of charge by calling this toll free number: 1-800-373-9387.
44
OFFICERS OF THE FUND (Unaudited)
DAVID DIPETRILLO, President since January 2021.
Vice President and Director of the Adviser since February 2021; Head of North America Product, BNY Mellon Investment Management since January 2018; and Director of Product Strategy, BNY Mellon Investment Management from January 2016 to December 2017. He is an officer of 56 investment companies (comprised of 110 portfolios) managed by the Adviser or an affiliate of the Adviser. He is 44 years old and has been an employee of BNY Mellon since 2005.
JAMES WINDELS, Treasurer since November 2001.
Vice President of the Adviser since September 2020; and Director–BNY Mellon Fund Administration. He is an officer of 57 investment companies (comprised of 131 portfolios) managed by the Adviser or an affiliate of the Adviser. He is 63 years old and has been an employee of the Adviser since April 1985.
PETER M. SULLIVAN, Chief Legal Officer since July 2021 and Vice President and Assistant Secretary since March 2019.
Chief Legal Officer of the Adviser and Associate General Counsel of BNY Mellon since July 2021; Senior Managing Counsel of BNY Mellon from December 2020 to July 2021; and Managing Counsel of BNY Mellon from March 2009 to December 2020. He is an officer of 57 investment companies (comprised of 131 portfolios) managed by the Adviser or an affiliate of the Adviser. He is 54 years old and has been an employee of BNY Mellon since April 2004.
JAMES BITETTO, Vice President since August 2005 and Secretary since February 2018.
Senior Managing Counsel of BNY Mellon since December 2019; Managing Counsel of BNY Mellon from April 2014 to December 2019; and Secretary of the Adviser. He is an officer of 57 investment companies (comprised of 131 portfolios) managed by the Adviser or an affiliate of the Adviser. He is 55 years old and has been an employee of the Adviser since December 1996.
DEIRDRE CUNNANE, Vice President and Assistant Secretary since March 2019.
Managing Counsel of BNY Mellon since December 2021, Counsel of BNY Mellon from August 2018 to December 2021; and Senior Regulatory Specialist at BNY Mellon Investment Management Services from February 2016 to August 2018. She is an officer of 57 investment companies (comprised of 131 portfolios) managed by the Adviser or an affiliate of the Adviser. She is 31 years old and has been an employee of the Adviser since August 2018.
SARAH S. KELLEHER, Vice President and Assistant Secretary since April 2014.
Vice President of BNY Mellon ETF Investment Adviser; LLC since February 2020; Senior Managing Counsel of BNY Mellon since September 2021; Managing Counsel of BNY Mellon from December 2017 to September 2021; and Senior Counsel of BNY Mellon from March 2013 to December 2017. She is an officer of 57 investment companies (comprised of 131 portfolios) managed by the Adviser or an affiliate of the Adviser. She is 46 years old and has been an employee of the Adviser since March 2013.
JEFF PRUSNOFSKY, Vice President and Assistant Secretary since August 2005.
Senior Managing Counsel of BNY Mellon. He is an officer of 57 investment companies (comprised of 131 portfolios) managed by the Adviser or an affiliate of the Adviser. He is 57 years old and has been an employee of the Adviser since October 1990.
AMANDA QUINN, Vice President and Assistant Secretary since March 2020.
Counsel of BNY Mellon since June 2019; Regulatory Administration Manager at BNY Mellon Investment Management Services from September 2018 to May 2019; and Senior Regulatory Specialist at BNY Mellon Investment Management Services from April 2015 to August 2018. She is an officer of 57 investment companies (comprised of 131 portfolios) managed by the Adviser or an affiliate of the Adviser. She is 37 years old and has been an employee of the Adviser since June 2019.
45
OFFICERS OF THE FUND (Unaudited) (continued)
NATALYA ZELENSKY, Vice President and Assistant Secretary since March 2017.
Chief Compliance Officer since August 2021 and Vice President since February 2020 of BNY Mellon ETF Investment Adviser, LLC; Chief Compliance Officer since August 2021 and Vice President and Assistant Secretary since February 2020 of BNY Mellon ETF Trust; Managing Counsel of BNY Mellon from December 2019 to August 2021; Counsel of BNY Mellon from May 2016 to December 2019; and Assistant Secretary of the Adviser from April 2018 to August 2021. She is an officer of 56 investment companies (comprised of 130 portfolios) managed by the Adviser or an affiliate of the Adviser. She is 37 years old and has been an employee of BNY Mellon since May 2016.
DANIEL GOLDSTEIN, Vice President since March 2022.
Vice President and Head of Product Development of North America Product, BNY Mellon Investment Management since January 2018; Co-Head of Product Management, Development & Oversight of North America Product, BNY Mellon Investment Management from January 2010 to January 2018; and Senior Vice President, Development & Oversight of North America Product, BNY Mellon Investment Management since 2010. He is an officer of 56 investment companies (comprised of 110 portfolios) managed by the Adviser or an affiliate of the Adviser. He is 53 years old and has been an employee of the Distributor since 1991.
JOSEPH MARTELLA, Vice President since March 2022.
Vice President and Head of Product Management of North America Product, BNY Mellon Investment Management since January 2018; Director of Product Research and Analytics of North America Product, BNY Mellon Investment Management from January 2010 to January 2018; and Senior Vice President of North America Product, BNY Mellon Investment Management since 2010. He is an officer of 56 investment companies (comprised of 110 portfolios) managed by the Adviser or an affiliate of the Adviser. He is 45 years old and has been an employee of the Distributor since 1999.
GAVIN C. REILLY, Assistant Treasurer since December 2005.
Tax Manager–BNY Mellon Fund Administration. He is an officer of 57 investment companies (comprised of 131 portfolios) managed by the Adviser or an affiliate of the Adviser. He is 53 years old and has been an employee of the Adviser since April 1991.
ROBERT SALVIOLO, Assistant Treasurer since July 2007.
Senior Accounting Manager–BNY Mellon Fund Administration. He is an officer of 57 investment companies (comprised of 131 portfolios) managed by the Adviser or an affiliate of the Adviser. He is 55 years old and has been an employee of the Adviser since June 1989.
ROBERT SVAGNA, Assistant Treasurer since August 2005.
Senior Accounting Manager–BNY Mellon Fund Administration. He is an officer of 57 investment companies (comprised of 131 portfolios) managed by the Adviser or an affiliate of the Adviser. He is 55 years old and has been an employee of the Adviser since November 1990.
JOSEPH W. CONNOLLY, Chief Compliance Officer since October 2004.
Chief Compliance Officer of the BNY Mellon Family of Funds and BNY Mellon Funds Trust since 2004; and Chief Compliance Officer of the Adviser from 2004 until June 2021. He is an officer of 56 investment companies (comprised of 117 portfolios) managed by the Adviser. He is 65 years old.
CARIDAD M. CAROSELLA, Anti-Money Laundering Compliance Officer since January 2016.
Anti-Money Laundering Compliance Officer of the BNY Mellon Family of Funds and BNY Mellon Funds Trust. She is an officer of 49 investment companies (comprised of 123 portfolios) managed by the Adviser or an affiliate of the Adviser. She is 53 years old and has been an employee of the Distributor since 1997.
46
This page intentionally left blank.
47
This page intentionally left blank.
48
This page intentionally left blank.
49
BNY Mellon Select Managers Small Cap Growth Fund
240 Greenwich Street
New York, NY 10286
Adviser
BNY Mellon Investment Adviser, Inc.
240 Greenwich Street
New York, NY 10286
Sub-Advisers
Geneva Capital
Management LLC
100 East Wisconsin Avenue,
Suite 2550
Milwaukee, WI 53202
Nicholas Investment Partners, L.P.
6451 El Sicomoro
Rancho Santa Fe, CA 92067
EAM Investors, LLC
215 Highway 101, Suite 216
Solana Beach, CA 92075
Granite Investment Partners, LLC
2121 Rosecrans Avenue, Suite 2360
El Segundo, CA 90245
Rice Hall James & Associates
600 West Broadway, Suite 1000
San Diego, CA 92101
Redwood Investments, LLC
One Gateway Center, Suite 802
Newton, MA 02458
Custodian
The Bank of New York Mellon
240 Greenwich Street
New York, NY 10286
Transfer Agent &
Dividend Disbursing Agent
BNY Mellon Transfer, Inc.
240 Greenwich Street
New York, NY 10286
Distributor
BNY Mellon Securities Corporation
240 Greenwich Street
New York, NY 10286
Ticker Symbols: | Class A: DSGAX Class C: DSGCX Class I: DSGIX Class Y: DSGYX |
Telephone Call your financial representative or 1-800-373-9387
Mail The BNY Mellon Family of Funds, 144 Glenn Curtiss Boulevard, Uniondale, NY 11556-0144
E-mail Send your request to info@bnymellon.com
Internet Information can be viewed online or downloaded at www.im.bnymellon.com
The fund files its complete schedule of portfolio holdings with the Securities and Exchange Commission (“SEC”) for the first and third quarters of each fiscal year on Form N-PORT. The fund’s Forms N-PORT are available on the SEC’s website at www.sec.gov.
A description of the policies and procedures that the fund uses to determine how to vote proxies relating to portfolio securities and information regarding how the fund voted these proxies for the most recent 12-month period ended June 30 is available at www.im.bnymellon.com and on the SEC’s website at www.sec.gov and without charge, upon request, by calling 1-800-373-9387.
© 2022 BNY Mellon Securities Corporation |
|

Item 2. Code of Ethics.
The Registrant has adopted a code of ethics that applies to the Registrant's principal executive officer, principal financial officer, principal accounting officer or controller, or persons performing similar functions. There have been no amendments to, or waivers in connection with, the Code of Ethics during the period covered by this Report.
Item 3. Audit Committee Financial Expert.
The Registrant's Board has determined that Alan H. Howard, a member of the Audit Committee of the Board, is an audit committee financial expert as defined by the Securities and Exchange Commission (the "SEC"). Mr. Howard is "independent" as defined by the SEC for purposes of audit committee financial expert determinations.
Item 4. Principal Accountant Fees and Services.
(a) Audit Fees. The aggregate fees billed for each of the last two fiscal years (the "Reporting Periods") for professional services rendered by the Registrant's principal accountant (the "Auditor") for the audit of the Registrant's annual financial statements or services that are normally provided by the Auditor in connection with the statutory and regulatory filings or engagements for the Reporting Periods, were $34,853 in 2021 and $35,550 in 2022.
(b) Audit-Related Fees. The aggregate fees billed in the Reporting Periods for assurance and related services by the Auditor that are reasonably related to the performance of the audit of the Registrant's financial statements and are not reported under paragraph (a) of this Item 4 were $7,027 in 2021 and $7,047 in 2022. These services consisted of one or more of the following: (i) agreed upon procedures related to compliance with Internal Revenue Code section 817(h), (ii) security counts required by Rule 17f-2 under the Investment Company Act of 1940, as amended, (iii) advisory services as to the accounting or disclosure treatment of Registrant transactions or events and (iv) advisory services to the accounting or disclosure treatment of the actual or potential impact to the Registrant of final or proposed rules, standards or interpretations by the Securities and Exchange Commission, the Financial Accounting Standards Boards or other regulatory or standard-setting bodies.
The aggregate fees billed in the Reporting Periods for non-audit assurance and related services by the Auditor to the Registrant's investment adviser (not including any sub-investment adviser whose role is primarily portfolio management and is subcontracted with or overseen by another investment adviser), and any entity controlling, controlled by or under common control with the investment adviser that provides ongoing services to the Registrant ("Service Affiliates"), that were reasonably related to the performance of the annual audit of the Service Affiliate, which required pre-approval by the Audit Committee were $0 in 2021 and $0 in 2022.
(c) Tax Fees. The aggregate fees billed in the Reporting Periods for professional services rendered by the Auditor for tax compliance, tax advice, and tax planning ("Tax Services") were $5,147 in 2021 and $5,222 in 2022. These services consisted of: (i) review or preparation of U.S. federal, state, local and excise tax returns; (ii) U.S. federal, state and local tax planning, advice and assistance regarding statutory, regulatory or administrative developments; (iii) tax advice regarding tax qualification matters and/or treatment of various financial instruments held or proposed to be acquired or held, and (iv) determination of Passive Foreign Investment Companies. The aggregate fees billed in the Reporting Periods for Tax Services by the Auditor to Service Affiliates, which required pre-approval by the Audit Committee were $0 in 2021 and $6,737 in 2022.
(d) All Other Fees. The aggregate fees billed in the Reporting Periods for products and services provided by the Auditor, other than the services reported in paragraphs (a) through (c) of this Item, were $66 in 2021 and $72 in 2022. These services consisted of a review of the Registrant's anti-money laundering program.
The aggregate fees billed in the Reporting Periods for Non-Audit Services by the Auditor to Service Affiliates, other than the services reported in paragraphs (b) through (c) of this Item, which required pre-approval by the Audit Committee, were $0 in 2021 and $0 in 2022.
(e)(1) Audit Committee Pre-Approval Policies and Procedures. The Registrant's Audit Committee has established policies and procedures (the "Policy") for pre-approval (within specified fee limits) of the Auditor's engagements for non-audit services to the Registrant and Service Affiliates without specific case-by-case consideration. The pre-approved services in the Policy can include pre-approved audit services, pre-approved audit-related services, pre-approved tax services and pre-approved all other services. Pre-approval considerations include whether the proposed services are compatible with maintaining the Auditor's independence. Pre-approvals pursuant to the Policy are considered annually.
(e)(2) Note. None of the services described in paragraphs (b) through (d) of this Item 4 were approved by the Audit Committee pursuant to paragraph (c)(7)(i)(C) of Rule 2-01 of Regulation S-X.
(f) None of the hours expended on the principal accountant's engagement to audit the registrant's financial statements for the most recent fiscal year were attributed to work performed by persons other than the principal accountant's full-time, permanent employees.
Non-Audit Fees. The aggregate non-audit fees billed by the Auditor for services rendered to the Registrant, and rendered to Service Affiliates, for the Reporting Periods were $2,686,546 in 2021 and $2,224,030 in 2022.
Auditor Independence. The Registrant's Audit Committee has considered whether the provision of non-audit services that were rendered to Service Affiliates, which were not pre-approved (not requiring pre-approval), is compatible with maintaining the Auditor's independence.
Item 5. Audit Committee of Listed Registrants.
Not applicable.
Item 6. Investments.
(a) Not applicable.
| Item 7. | Disclosure of Proxy Voting Policies and Procedures for Closed-End Management Investment Companies. |
Not applicable.
Item 8. Portfolio Managers of Closed-End Management Investment Companies.
Not applicable.
| Item 9. | Purchases of Equity Securities by Closed-End Management Investment Companies and Affiliated Purchasers. |
Not applicable.
| Item 10. | Submission of Matters to a Vote of Security Holders. |
There have been no material changes to the procedures applicable to Item 10.
| Item 11. | Controls and Procedures. |
(a) The Registrant's principal executive and principal financial officers have concluded, based on their evaluation of the Registrant's disclosure controls and procedures as of a date within 90 days of the filing date of this report, that the Registrant's disclosure controls and procedures are reasonably designed to ensure that information required to be disclosed by the Registrant on Form N-CSR is recorded, processed, summarized and reported within the required time periods and that information required to be disclosed by the Registrant in the reports that it files or submits on Form N-CSR is accumulated and communicated to the Registrant's management, including its principal executive and principal financial officers, as appropriate to allow timely decisions regarding required disclosure.
(b) There were no changes to the Registrant's internal control over financial reporting that occurred during the period covered by this report that have materially affected, or are reasonably likely to materially affect, the Registrant's internal control over financial reporting.
| Item 12. | Disclosure of Securities Lending Activities for Closed-End Management Investment Companies. |
Not applicable.
| Item 13. | Exhibits. |
(a)(1) Code of ethics referred to in Item 2.
(a)(3) Not applicable.
SIGNATURES
Pursuant to the requirements of the Securities Exchange Act of 1934 and the Investment Company Act of 1940, the Registrant has duly caused this Report to be signed on its behalf by the undersigned, thereunto duly authorized.
BNY Mellon Strategic Funds, Inc.
By: /s/ David DiPetrillo
David DiPetrillo
President (Principal Executive Officer)
Date: July 21, 2022
Pursuant to the requirements of the Securities Exchange Act of 1934 and the Investment Company Act of 1940, this Report has been signed below by the following persons on behalf of the Registrant and in the capacities and on the dates indicated.
By: /s/ David DiPetrillo
David DiPetrillo
President (Principal Executive Officer)
Date: July 21, 2022
By: /s/ James Windels
James Windels
Treasurer (Principal Financial Officer)
Date: July 21, 2022
EXHIBIT INDEX
(a)(1) Code of ethics referred to in Item 2.
(a)(2) Certifications of principal executive and principal financial officers as required by Rule 30a-2(a) under the Investment Company Act of 1940. (EX-99.CERT)
(b) Certification of principal executive and principal financial officers as required by Rule 30a-2(b) under the Investment Company Act of 1940. (EX-99.906CERT)