UNITED STATES
SECURITIES AND EXCHANGE COMMISSION
Washington, D.C. 20549
FORM N-CSR
CERTIFIED SHAREHOLDER REPORT OF REGISTERED
MANAGEMENT INVESTMENT COMPANIES
Investment Company Act file number | 811-03942 |
|
LORD ABBETT MUNICIPAL INCOME FUND, INC. |
(Exact name of registrant as specified in charter) |
|
90 Hudson Street, Jersey City, NJ | | 07302 |
(Address of principal executive offices) | | (Zip code) |
|
Christina T. Simmons, Vice President & Assistant Secretary
90 Hudson Street, Jersey City, NJ 07302 |
(Name and address of agent for service) |
|
Registrant’s telephone number, including area code: | (800) 201-6984 | |
|
Date of fiscal year end: | 9/30 | |
|
Date of reporting period: | 9/30/06 | |
| | | | | | | | |
Item 1: Report to Shareholders.
LORD ABBETT

2006
Annual
Report
Lord Abbett
Municipal Income Fund
Municipal Income Trust
National Tax Free Fund
California Tax Free Fund
Connecticut Tax Free Fund
Hawaii Tax Free Fund
Minnesota Tax Free Fund
Missouri Tax Free Fund
New Jersey Tax Free Fund
New York Tax Free Fund
Texas Tax Free Fund
Washington Tax Free Fund
Insured Intermediate Tax Free Fund
Florida Tax Free Trust
Georgia Tax Free Trust
High Yield Municipal Bond Fund
Michigan Tax Free Trust
Pennsylvania Tax Free Trust
For the fiscal year ended September 30, 2006
Lord Abbett Municipal Income Fund and
Lord Abbett Municipal Income Trust
Annual Report
For the year ended September 30, 2006

From left to right: Robert S. Dow, Director and Chairman of the Lord Abbett Funds; E. Thayer Bigelow, Independent Lead Director of the Lord Abbett Funds; and Daria L. Foster, Director and President of the Lord Abbett Funds.
Dear Shareholders: We are pleased to provide you with this overview of the strategies and performance of Lord Abbett Municipal Income Fund and Lord Abbett Municipal Income Trust for the year ended September 30, 2006. On this page and the following pages, we discuss the major factors that influenced performance. For detailed and more timely information about the Funds, please visit our Website at www.LordAbbett.com, where you also can access the quarterly commentaries of the Funds' portfolio managers.
General information about Lord Abbett mutual funds, as well as in-depth discussion of market trends and investment strategies, is also provided in Lord Abbett Insights, a newsletter accompanying your quarterly account statements. We also encourage you to call Lord Abbett at 800-821-5129 and speak to one of our professionals if you would like more information.
Thank you for investing in Lord Abbett mutual funds. We value the trust that you place in us and look forward to serving your investment needs in the years to come.
Best regards,

Robert S. Dow
Chairman
Q: What were the overall market conditions during the year ended September 30, 2006?
A: From October 2005 until June 2006, the Federal Reserve Board (the Fed) continued to raise the fed funds rate at a measured pace. From the start of the tightening cycle, in June 2004, to June 2006, the Fed hiked the fed funds rate 17 times. But at the two policy meetings in the third quarter, the Fed voted to hold steady the fed funds rate at 5.25%.
The pause in Fed tightening, along with signs of a slowing economy, caused a rally in the bond markets, including the municipal market, especially on the
1
longer end of the yield curve. By September 2006, the average yield on a 30-year, high-grade municipal security was lower than it was in October 2005, while the yield on a 30-year Treasury was slightly higher. Rates on the shorter end for both municipals and Treasuries were higher in September 2006 than they were a year earlier. Because of the rise in short-end rates, the yield curve in the municipal market flattened considerably over the course of the year.
Overall supply was down for the year because of a sharp decline in refundings. New issuances increased for the year as state and local governments sought to finance new projects. From a sector perspective, education and general purpose financings accounted for most of the decline in overall supply, while the number of housing bonds issued increased.
Demand remained strong from both larger investors buying directly and smaller investors buying into municipal bond funds. Given the flatness of the yield curve, demand from retail investors was concentrated on the three- to six-year segment of the yield curve. Property and casualty insurance companies were also large buyers of municipal securities, especially in the 10- to 20-year area of the curve.
For most of 2006, airline bonds, which are issued by state authorities to provide funding for airlines, led the returns in the high-yield municipal sector. Passenger traffic increased and higher fuel costs were covered through ticket surcharges and through hedging contracts that locked in fuel costs. Tobacco bonds outperformed the broader municipal market. In the past year, three major tobacco cases were decided favorably for the tobacco companies.
For the 12 months ended in June 2006 – which is equivalent to the fiscal year for 46 states – tax receipts grew 8.5%, compared with the 12 months ended in June 2005. All states posted increases. Many state legislatures shifted their financing plans to address the problem of high property taxes. For instance, the New Jersey and Idaho legislatures approved proposals to raise their respective sales tax rates in order to provide property tax relief.
Performance data quoted on the following pages reflect past performance and are no guarantee of future results. Current performance may be higher or lower than the performance quoted. The investment return and principal value of an investment in each Fund will fluctuate so that shares, on any given day or when redeemed, may be worth more or less than their original cost. You can obtain performance data current to the most recent month end by calling Lord Abbett at 800-821-5129 or referring to our Website at www.LordAbbett.com.
2
Q: How did each Fund perform over the year ended September 30, 2006?
A: Each Fund (Class A shares) – other than the Insured Intermediate Tax Free Fund and High Yield Municipal Bond Fund, which are benchmarked against different indexes – underperformed its long-only benchmark, the Lehman Brothers Municipal Long Current Coupon Bond Index,1 and, for the most part, underperformed its peer groups, as represented by the Lipper Funds Average.2
The Insured Intermediate Tax Free Fund (Class A shares) outperformed its benchmark, the Lehman Brothers 3-10 Year Insured Tax Exempt Bond Index,3 and outperformed its Lipper peer group.
The High Yield Municipal Bond Fund (Class A shares) underperformed its benchmark, the Lehman Brothers 85% High Yield/15% Investment Grade Municipal Bond Index,4 and outperformed its peer group, as represented by the Lipper High Yield Municipal Debt Funds Average.5
Municipal Income Performance Summary
| | | Class A Shares
@ NAV 9/30/06
1 Year Return | |
Lipper Funds
Average | | Lehman Brothers
Municipal Long Current
Coupon Bond Index | | Lehman Brothers
Municipal
Bond Index(6) | |
| National Tax Free Income Fund | | | 3.9 | % | | | 4.2 | % | | | 5.9 | % | | | 4.5 | % | |
| California Tax Free Income Fund | | | 3.5 | % | | | 4.2 | % | | | 5.9 | % | | | 4.5 | % | |
| Connecticut Tax Free Income Fund | | | 4.0 | % | | | 3.5 | % | | | 5.9 | % | | | 4.5 | % | |
| Hawaii Tax Free Income Fund | | | 3.6 | % | | | 3.8 | % | | | 5.9 | % | | | 4.5 | % | |
| Minnesota Tax Free Income Fund | | | 4.0 | % | | | 3.8 | % | | | 5.9 | % | | | 4.5 | % | |
| Missouri Tax Free Income Fund | | | 3.9 | % | | | 3.9 | % | | | 5.9 | % | | | 4.5 | % | |
| New Jersey Tax Free Income Fund | | | 3.5 | % | | | 4.2 | % | | | 5.9 | % | | | 4.5 | % | |
| New York Tax Free Income Fund | | | 3.9 | % | | | 4.1 | % | | | 5.9 | % | | | 4.5 | % | |
| Texas Tax Free Income Fund | | | 3.3 | % | | | 3.1 | % | | | 5.9 | % | | | 4.5 | % | |
| Washington Tax Free Income Fund | | | 3.7 | % | | | 4.1 | % | | | 5.9 | % | | | 4.5 | % | |
| Insured Intermediate Tax Free Fund | | | 3.7 | % | | | 3.3 | % | | | 3.6 | %+ | | | 4.5 | % | |
| Florida Tax Free Trust | | | 3.7 | % | | | 4.1 | % | | | 5.9 | % | | | 4.5 | % | |
| Georgia Tax Free Trust | | | 3.8 | % | | | 3.8 | % | | | 5.9 | % | | | 4.5 | % | |
| High Yield Municipal Bond Fund | | | 8.0 | % | | | 6.7 | % | | | 9.8 | %++ | | | 4.5 | % | |
| Michigan Tax Free Trust | | | 3.7 | % | | | 3.7 | % | | | 5.9 | % | | | 4.5 | % | |
| Pennsylvania Tax Free Trust | | | 3.1 | % | | | 3.9 | % | | | 5.9 | % | | | 4.5 | % | |
+ Lehman Brothers 3–10 Year Insured Tax-Exempt Bond Index
++ Lehman Brothers 85% High Yield/15% Investment Grade Municipal Bond Index
The Lipper Funds Average for each fund consists of municipal debt funds for the particular state involved, except for the National Tax Free Income Fund, Texas Tax Free Income Fund, Washington Tax Free Income Fund, Insured Intermediate Tax Free Fund, and High Yield Municipal Bond Fund. In the case of those funds, the applicable Lipper Funds Averages are General Municipal Debt Funds, Other States Intermediate Municipal Debt Funds, Other States Municipal Debt Funds, Intermediate Municipal Debt Funds, and High Yield Municipal Debt Funds, respectively.
3
Standardized Average Annual Total Returns
(Class A shares with maximum 3.25% sales charge++, as of 9/30/06)
| | | 1 Year | | 5 Years | | 10 Years/
Since Inception | |
| National Tax Free Income Fund+ | | | 0.55 | % | | | 4.02 | % | | | 5.01 | % | |
| California Tax Free Income Fund+ | | | 0.14 | % | | | 3.63 | % | | | 4.83 | % | |
| Connecticut Tax Free Income Fund+ | | | 0.62 | % | | | 4.15 | % | | | 4.90 | % | |
| Hawaii Tax Free Income Fund+ | | | 0.22 | % | | | 3.62 | % | | | 4.50 | % | |
| Minnesota Tax Free Income Fund+ | | | 0.71 | % | | | 4.31 | % | | | 5.14 | % | |
| Missouri Tax Free Income Fund+ | | | 0.53 | % | | | 3.85 | % | | | 4.82 | % | |
| New Jersey Tax Free Income Fund+ | | | 0.23 | % | | | 3.49 | % | | | 4.65 | % | |
| New York Tax Free Income Fund+ | | | 0.54 | % | | | 4.04 | % | | | 5.03 | % | |
| Texas Tax Free Income Fund+ | | | -0.01 | % | | | 3.91 | % | | | 4.77 | % | |
| Washington Tax Free Income Fund+ | | | 0.35 | % | | | 3.93 | % | | | 4.97 | % | |
| Insured Intermediate Tax Free Fund*+ | | | 0.29 | % | | | — | | | | 1.42 | % | |
| Florida Tax Free Trust+ | | | 0.34 | % | | | 3.51 | % | | | 4.39 | % | |
| Georgia Tax Free Trust+ | | | 0.40 | % | | | 4.30 | % | | | 5.69 | % | |
| High Yield Municipal Bond Fund**+ | | | 4.44 | % | | | — | | | | 5.87 | % | |
| Michigan Tax Free Trust+ | | | 0.30 | % | | | 4.01 | % | | | 5.25 | % | |
| Pennsylvania Tax Free Trust+ | | | -0.29 | % | | | 3.95 | % | | | 5.03 | % | |
* SEC effective date June 30, 2003.
** SEC effective date December 30, 2004.
+During certain periods shown, waivers and/or expense reimbursements were in place. Without such waivers and/or expense reimbursements, the Fund's returns would have been lower.
++ Assumes the reinvestment of all distributions as of September 30, 2006.
Q: What were the most significant factors affecting performance?
A: Overall, in all of the tax free income funds, longer-maturity securities contributed the most to performance for the year ended September 30, 2006. Securities maturing within 20–30 years had a 46.2% weighting in the National Tax Free Income portfolio, but contributed 52.6% of the return. The National Tax Free Income Fund increased the weighting of its lower-rated (BBB) bonds in its portfolio, helping Fund performance. Shorter-maturity securities underperformed. The National Tax Free Income portfolio shortened its duration, which reduced interest-rate volatility without giving up much income.
Over the past year, the Insured Intermediate Tax Free Fund also increased its investment in longer maturity securities while reducing sharply its holdings of securities maturing in less than three years. Given the Fund's structure, the longer-term securities were concentrated in the 3–10 year range. The increase in maturity contributed positively to performance. There was no discernible difference in the performance of general obligation versus revenue bonds when the securities were adjusted for maturity.
4
The High Yield Municipal Bond Fund lowered its average credit rating over the past year, as the Fund increased its weighting of unrated bonds and below investment-grade bonds. Among the high-yield sectors, airline and tobacco bonds contributed positively to the portfolio's performance. Housing bonds underperformed the Fund's overall performance.
Demand was strong all year, with investment flows increasing in the quarter ended in September 2006. Investors were attracted by the higher upward-sloping yield curve for municipals compared to the flatter curves for other fixed-income securities.
Each Fund's portfolio is actively managed and, therefore, its holdings and the weightings of a particular issuer or particular sector as a percentage of portfolio assets are subject to change.
Note: Class A shares purchased subject to a front-end sales charge have no contingent deferred sales charge (CDSC). However, certain purchases of Class A shares made without a front-end sales charge may be subject to a CDSC of 1% if the shares are redeemed within 12 months of the purchase (24th month if shares were purchased prior to November 1, 2004). Please see section "Your Investment—Purchases" in the prospectus for more information on redemptions that may be subject to CDSC.
A prospectus contains important information about a fund, including its investment objectives, risks, charges, and ongoing expenses, which an investor should carefully consider before investing. To obtain a prospectus on any Lord Abbett mutual fund, please contact your investment professional or Lord Abbett Distributor LLC at 800-874-3733 or visit our Website at www.LordAbbett.com. Read the prospectus carefully before investing.
1 Lehman Brothers Municipal Long Current Coupon Bond Index is a total return benchmark designed for long-term municipal assets. The index includes bonds with a minimum credit rating of BAA3; bonds issued as part of a deal of at least $50 million; with an amount outstanding of at least $5 million; a maturity of 22 years or longer; and have been issued after December 31, 1990.
2 Lipper Funds Average: Lipper, Inc. is a nationally recognized organization that reports on mutual fund total return performance and calculates fund rankings. Peer averages are based on universes of funds with similar investment objectives. Peer group averages include reinvested dividends and capital gains, if any, and exclude sales charges. Copyright© 2006 by Reuters. All rights reserved. Any copying, republication, or redistribution of Lipper content is expressly prohibited without the prior written consent of Lipper. An investor cannot invest directly in an average.
3 The Lehman Brothers 3-10 Year Insured Tax-Exempt Bond Index consists of insured tax-free municipal bonds ranging in maturity from 3–10 years.
4 The Lehman Brothers 85% High Yield/15% Investment Grade Municipal Bond Index is a total return benchmark designed for municipal portfolios, which contain both investment and non-investment-grade tax-exempt
5
bonds. The index contains an equal weighting of the Lehman Brothers Municipal Bond Index and the Lehman Brothers Municipal Non-Investment Grade Index.
5 The Lipper High Yield Municipal Debt Funds Average covers funds that invest at least 50% of assets in lower rated municipal debt issues.
6 Lehman Brothers Municipal Bond Index is a broad measure of the municipal bond market with maturities of at least one year. To be included in this index, bonds must have a minimum credit rating of at least Baa, an outstanding par value of at least $3 million, and be issued as part of a transaction of at least $50 million. Includes both zero coupon bonds and bonds subject to the alternative minimum tax.
Indexes are unmanaged, do not reflect the deduction of fees or expenses, and are not available for direct investment.
Important Performance and Other Information
The views of each Fund's management and the portfolio holdings described in this report are as of September 30, 2006; these views and holdings may have changed subsequent to this date, and they do not guarantee the future performance of the markets or the Funds. Information provided in this report should not be considered a recommendation to purchase or sell securities.
A Note About Risk: See Notes to Financial Statements for a discussion of investment risks. For a more detailed discussion of the risks associated with each Fund, please see the prospectus.
Performance: Because of ongoing market volatility, each Fund's performance may be subject to substantial fluctuation. Except where noted, comparative Fund performance does not account for the deduction of sales charges, and would be different if sales charges were included. Each Fund offers additional classes of shares with distinct pricing options. For a full description of the differences in pricing alternatives, please see the prospectus.
Mutual funds are not insured by the FDIC, are not deposits or other obligations of, or guaranteed by, banks, and are subject to investment risks, including possible loss of principal amount invested.
6
National Tax-Free Fund
Investment Comparison
Below is a comparison of a $10,000 investment in Class A shares to the same investment in Lipper's Average of General Municipal Debt Funds, the Lehman Brothers Municipal Bond Index, and the Lehman Brothers Municipal Long Current Coupon Bond Index, assuming reinvestment of all dividends and distributions. The Fund believes that the Lehman Brothers Municipal Bond Index is a less volatile index and a more appropriate benchmark for the Fund and therefore will remove the Lehman Brothers Municipal Long Current Coupon Bond Index in the next Annual Report. The performance of other classes will be greater than or less than the performance shown in the graph below due to different sales loads and expenses applicable to such classes. The graph and performance table below do not reflect the deduction of taxes that a shareholder would pay on Fund distributions or the redemption of Fund shares. Past performance is no guarantee of future results.
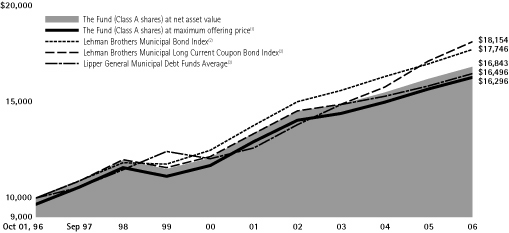
Average Annual Total Returns at Maximum Applicable Sales Charge for the Periods Ended September 30, 2006
| | | 1 Year | | 5 Years | | 10 Years | |
| Class A(4) | | | 0.55 | % | | | 4.02 | % | | | 5.01 | % | |
| Class B(5) | | | -0.67 | % | | | 3.87 | % | | | 4.73 | % | |
| Class C(6) | | | 3.26 | % | | | 4.03 | % | | | 4.67 | % | |
30-Day SEC Yield for the Period Ended September 30, 2006
| Class A | | Class B | | Class C | |
| | 3.91 | % | | | 3.26 | % | | | 3.26 | % | |
(1) Reflects the deduction of the maximum initial sales charge of 3.25%.
(2) Performance for each unmanaged index does not reflect any fees or expenses. The performance of the indexes is not necessarily representative of the Fund's performance.
(3) Source: Lipper, Inc.
(4) Total return, which is the percent change in value, after deduction of the maximum initial sales charge of 3.25% applicable to Class A shares, with all dividends and distributions reinvested for periods shown ended September 30, 2006, is calculated using the SEC required uniform method to compute total return.
(5) Performance reflects the deduction of a CDSC of 4% for 1 year, 1% for 5 years and 0% for 10 years.
(6) The 1% CDSC for Class C shares normally applies before the first anniversary of the purchase date. Performance is at net asset value.
7
California Tax-Free Fund
Investment Comparison
Below is a comparison of a $10,000 investment in Class A shares to the same investment in Lipper's Average of California Municipal Debt Funds, the Lehman Brothers Municipal Bond Index, and the Lehman Brothers Municipal Long Current Coupon Bond Index, assuming reinvestment of all dividends and distributions. The Fund believes that the Lehman Brothers Municipal Bond Index is a less volatile index and a more appropriate benchmark for the Fund and therefore will remove the Lehman Brothers Municipal Long Current Coupon Bond Index in the next Annual Report. The performance of the other class will be greater than or less than the performance shown in the graph below due to different sales loads and expenses applicable to such class. The graph and performance table below do not reflect the deduction of taxes that a shareholder would pay on Fund distributions or the redemption of Fund shares. Past performance is no guarantee of future results.

Average Annual Total Returns at Maximum Applicable Sales Charge for the Periods Ended September 30, 2006
| | | 1 Year | | 5 Years | | 10 Years | |
| Class A(4) | | | 0.14 | % | | | 3.63 | % | | | 4.83 | % | |
| Class C(5) | | | 2.87 | % | | | 3.66 | % | | | 4.50 | % | |
30-Day SEC Yield for the Period Ended September 30, 2006
| Class A | | Class C | |
| | 3.98 | % | | | 3.33 | % | |
(1) Reflects the deduction of the maximum initial sales charge of 3.25%.
(2) Performance for each unmanaged index does not reflect any fees or expenses. The performance of the indexes is not necessarily representative of the Fund's performance. Each index is composed of municipal bonds from many states while the Fund is a single-state municipal bond portfolio.
(3) Source: Lipper, Inc.
(4) Total return, which is the percent change in value, after deduction of the maximum initial sales charge of 3.25% applicable to Class A shares, with all dividends and distributions reinvested for periods shown ended September 30, 2006, is calculated using the SEC required uniform method to compute total return.
(5) The 1% CDSC for Class C shares normally applies before the first anniversary of the purchase date. Performance is at net asset value.
8
Connecticut Tax-Free Fund
Investment Comparison
Below is a comparison of a $10,000 investment in Class A shares to the same investment in Lipper's Average of Connecticut Municipal Debt Funds, the Lehman Brothers Municipal Bond Index, and the Lehman Brothers Municipal Long Current Coupon Bond Index, assuming reinvestment of all dividends and distributions. The Fund believes that the Lehman Brothers Municipal Bond Index is a less volatile index and a more appropriate benchmark for the Fund and therefore will remove the Lehman Brothers Municipal Long Current Coupon Bond Index in the next Annual Report. The graph and performance table below do not reflect the deduction of taxes that a shareholder would pay on Fund distributions or the redemption of Fund shares. Past performance is no guarantee of future results.
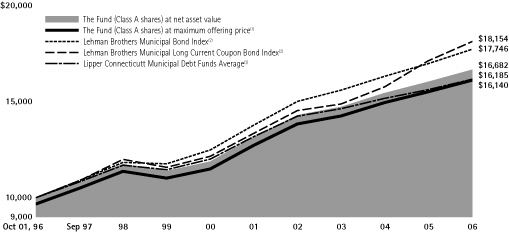
Average Annual Total Returns at Maximum Applicable Sales Charge for the Periods Ended September 30, 2006
| | | 1 Year | | 5 Years | | 10 Years | |
| Class A(4) | | | 0.62 | % | | | 4.15 | % | | | 4.90 | % | |
30-Day SEC Yield for the Period Ended September 30, 2006
(1) Reflects the deduction of the maximum initial sales charge of 3.25%.
(2) Performance for each unmanaged index does not reflect any fees or expenses. The performance of the indexes is not necessarily representative of the Fund's performance. Each index is composed of municipal bonds from many states while the Fund is a single-state municipal bond portfolio.
(3) Source: Lipper, Inc.
(4) Total return, which is the percent change in value, after deduction of the maximum initial sales charge of 3.25% applicable to Class A shares, with all dividends and distributions reinvested for periods shown ended September 30, 2006, is calculated using the SEC required uniform method to compute total return.
9
Hawaii Tax-Free Fund
Investment Comparison
Below is a comparison of a $10,000 investment in Class A shares to the same investment in Lipper's Average of Hawaii Municipal Debt Funds, the Lehman Brothers Municipal Bond Index, and the Lehman Brothers Municipal Long Current Coupon Bond Index, assuming reinvestment of all dividends and distributions. The Fund believes that the Lehman Brothers Municipal Bond Index is a less volatile index and a more appropriate benchmark for the Fund and therefore will remove the Lehman Brothers Municipal Long Current Coupon Bond Index in the next Annual Report. The graph and performance table below do not reflect the deduction of taxes that a shareholder would pay on Fund distributions or the redemption of Fund shares. Past performance is no guarantee of future results.
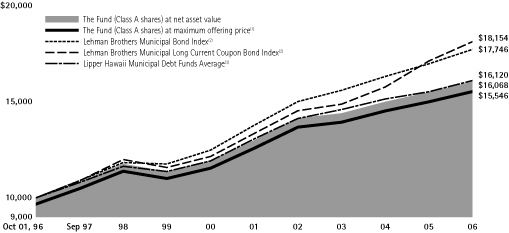
Average Annual Total Returns at Maximum Applicable Sales Charge for the Periods Ended September 30, 2006
| | | 1 Year | | 5 Years | | 10 Years | |
| Class A(4) | | | 0.22 | % | | | 3.62 | % | | | 4.50 | % | |
30-Day SEC Yield for the Period Ended September 30, 2006
(1) Reflects the deduction of the maximum initial sales charge of 3.25%.
(2) Performance for each unmanaged index does not reflect any fees or expenses. The performance of the indexes is not necessarily representative of the Fund's performance. Each index is composed of municipal bonds from many states while the Fund is a single-state municipal bond portfolio.
(3) Source: Lipper, Inc.
(4) Total return, which is the percent change in value, after deduction of the maximum initial sales charge of 3.25% applicable to Class A shares, with all dividends and distributions reinvested for periods shown ended September 30, 2006, is calculated using the SEC required uniform method to compute total return.
10
Minnesota Tax-Free Fund
Investment Comparison
Below is a comparison of a $10,000 investment in Class A shares to the same investment in Lipper's Average of Minnesota Municipal Debt Funds, the Lehman Brothers Municipal Bond Index, and the Lehman Brothers Municipal Long Current Coupon Bond Index, assuming reinvestment of all dividends and distributions. The Fund believes that the Lehman Brothers Municipal Bond Index is a less volatile index and a more appropriate benchmark for the Fund and therefore will remove the Lehman Brothers Municipal Long Current Coupon Bond Index in the next Annual Report. The graph and performance table below do not reflect the deduction of taxes that a shareholder would pay on Fund distributions or the redemption of Fund shares. Past performance is no guarantee of future results.

Average Annual Total Returns at Maximum Applicable Sales Charge for the Periods Ended September 30, 2006
| | | 1 Year | | 5 Years | | 10 Years | |
| Class A(4) | | | 0.71 | % | | | 4.31 | % | | | 5.14 | % | |
30-Day SEC Yield for the Period Ended September 30, 2006
(1) Reflects the deduction of the maximum initial sales charge of 3.25%.
(2) Performance for each unmanaged index does not reflect any fees or expenses. The performance of the indexes is not necessarily representative of the Fund's performance. Each index is composed of municipal bonds from many states while the Fund is a single-state municipal bond portfolio.
(3) Source: Lipper, Inc.
(4) Total return, which is the percent change in value, after deduction of the maximum initial sales charge of 3.25% applicable to Class A shares, with all dividends and distributions reinvested for periods shown ended September 30, 2006, is calculated using the SEC required uniform method to compute total return.
11
Missouri Tax-Free Fund
Investment Comparison
Below is a comparison of a $10,000 investment in Class A shares to the same investment in Lipper's Average of Missouri Municipal Debt Funds, the Lehman Brothers Municipal Bond Index, and the Lehman Brothers Municipal Long Current Coupon Bond Index, assuming reinvestment of all dividends and distributions. The Fund believes that the Lehman Brothers Municipal Bond Index is a less volatile index and a more appropriate benchmark for the Fund and therefore will remove the Lehman Brothers Municipal Long Current Coupon Bond Index in the next Annual Report. The graph and performance table below do not reflect the deduction of taxes that a shareholder would pay on Fund distributions or the redemption of Fund shares. Past performance is no guarantee of future results.
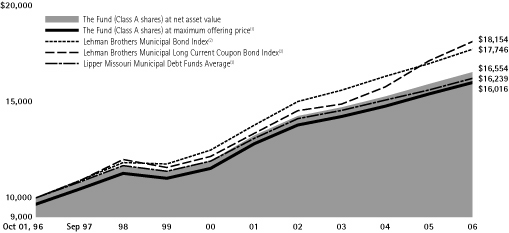
Average Annual Total Returns at Maximum Applicable Sales Charge for the Periods Ended September 30, 2006
| | | 1 Year | | 5 Years | | 10 Years | |
| Class A(4) | | | 0.53 | % | | | 3.85 | % | | | 4.82 | % | |
30-Day SEC Yield for the Period Ended September 30, 2006
(1) Reflects the deduction of the maximum initial sales charge of 3.25%.
(2) Performance for each unmanaged index does not reflect any fees or expenses. The performance of the indexes is not necessarily representative of the Fund's performance. Each index is composed of municipal bonds from many states while the Fund is a single-state municipal bond portfolio.
(3) Source: Lipper, Inc.
(4) Total return, which is the percent change in value, after deduction of the maximum initial sales charge of 3.25% applicable to Class A shares, with all dividends and distributions reinvested for periods shown ended September 30, 2006, is calculated using the SEC required uniform method to compute total return.
12
New Jersey Tax-Free Fund
Investment Comparison
Below is a comparison of a $10,000 investment in Class A shares to the same investment in Lipper's Average of New Jersey Municipal Debt Funds, the Lehman Brothers Municipal Bond Index, and the Lehman Brothers Municipal Long Current Coupon Bond Index, assuming reinvestment of all dividends and distributions. The Fund believes that the Lehman Brothers Municipal Bond Index is a less volatile index and a more appropriate benchmark for the Fund and therefore will remove the Lehman Brothers Municipal Long Current Coupon Bond Index in the next Annual Report. The graph and performance table below do not reflect the deduction of taxes that a shareholder would pay on Fund distributions or the redemption of Fund shares. Past performance is no guarantee of future results.
Average Annual Total Returns at Maximum Applicable Sales Charge for the Periods Ended September 30, 2006
| | | 1 Year | | 5 Years | | 10 Years | |
| Class A(4) | | | 0.23 | % | | | 3.49 | % | | | 4.65 | % | |
30-Day SEC Yield for the Period Ended September 30, 2006
(1) Reflects the deduction of the maximum initial sales charge of 3.25%.
(2) Performance for each unmanaged index does not reflect any fees or expenses. The performance of the indexes is not necessarily representative of the Fund's performance. Each index is composed of municipal bonds from many states while the Fund is a single-state municipal bond portfolio.
(3) Source: Lipper, Inc.
(4) Total return, which is the percent change in value, after deduction of the maximum initial sales charge of 3.25% applicable to Class A shares, with all dividends and distributions reinvested for periods shown ended September 30, 2006, is calculated using the SEC required uniform method to compute total return.
13
New York Tax-Free Fund
Investment Comparison
Below is a comparison of a $10,000 investment in Class A shares to the same investment in Lipper's Average of New York Municipal Debt Funds, the Lehman Brothers Municipal Bond Index, and the Lehman Brothers Municipal Long Current Coupon Bond Index, assuming reinvestment of all dividends and distributions. The Fund believes that the Lehman Brothers Municipal Bond Index is a less volatile index and a more appropriate benchmark for the Fund and therefore will remove the Lehman Brothers Municipal Long Current Coupon Bond Index in the next Annual Report. The performance of the other class will be greater than or less than the performance shown in the graph below due to different sales loads and expenses applicable to such class. The graph and performance table below do not reflect the deduction of taxes that a shareholder would pay on Fund distributions or the redemption of Fund shares. Past performance is no guarantee of future results.
Average Annual Total Returns at Maximum Applicable Sales Charge for the Periods Ended September 30, 2006
| | | 1 Year | | 5 Years | | 10 Years | |
| Class A(4) | | | 0.54 | % | | | 4.04 | % | | | 5.03 | % | |
| Class C(5) | | | 3.25 | % | | | 4.06 | % | | | 4.70 | % | |
30-Day SEC Yield for the Period Ended September 30, 2006
| Class A | | Class C | |
| | 4.16 | % | | | 3.51 | % | |
(1) Reflects the deduction of the maximum initial sales charge of 3.25%.
(2) Performance for each unmanaged index does not reflect any fees or expenses. The performance of the indexes is not necessarily representative of the Fund's performance. Each index is composed of municipal bonds from many states while the Fund is a single-state municipal bond portfolio.
(3) Source: Lipper, Inc.
(4) Total return, which is the percent change in value, after deduction of the maximum initial sales charge of 3.25% applicable to Class A shares, with all dividends and distributions reinvested for periods shown ended September 30, 2006, is calculated using the SEC required uniform method to compute total return.
(5) The 1% CDSC for Class C shares normally applies before the first anniversary of the purchase date. Performance is at net asset value.
14
Texas Tax-Free Fund
Investment Comparison
Below is a comparison of a $10,000 investment in Class A shares to the same investment in Lipper's Average of Other States Intermediate Municipal Debt Funds, the Lehman Brothers Municipal Bond Index, and the Lehman Brothers Municipal Long Current Coupon Bond Index, assuming reinvestment of all dividends and distributions. The Fund believes that the Lehman Brothers Municipal Bond Index is a less volatile index and a more appropriate benchmark for the Fund and therefore will remove the Lehman Brothers Municipal Long Current Coupon Bond Index in the next Annual Report. The graph and performance table below do not reflect the deduction of taxes that a shareholder would pay on Fund distributions or the redemption of Fund shares. Past performance is no guarantee of future results.
Average Annual Total Returns at Maximum Applicable Sales Charge for the Periods Ended September 30, 2006
| | | 1 Year | | 5 Years | | 10 Years | |
| Class A(4) | | | -0.01 | % | | | 3.91 | % | | | 4.77 | % | |
30-Day SEC Yield for the Period Ended September 30, 2006
(1) Reflects the deduction of the maximum initial sales charge of 3.25%.
(2) Performance for each unmanaged index does not reflect any fees or expenses. The performance of the indexes is not necessarily representative of the Fund's performance. Each index is composed of municipal bonds from many states while the Fund is a single-state municipal bond portfolio.
(3) Source: Lipper, Inc.
(4) Total return, which is the percent change in value, after deduction of the maximum initial sales charge of 3.25% applicable to Class A shares, with all dividends and distributions reinvested for periods shown ended September 30, 2006, is calculated using the SEC required uniform method to compute total return.
15
Washington Tax-Free Fund
Investment Comparison
Below is a comparison of a $10,000 investment in Class A shares to the same investment in Lipper's Average of Other States Municipal Debt Funds, the Lehman Brothers Municipal Bond Index, and the Lehman Brothers Municipal Long Current Coupon Bond Index, assuming reinvestment of all dividends and distributions. The Fund believes that the Lehman Brothers Municipal Bond Index is a less volatile index and a more appropriate benchmark for the Fund and therefore will remove the Lehman Brothers Municipal Long Current Coupon Bond Index in the next Annual Report. The graph and performance table below do not reflect the deduction of taxes that a shareholder would pay on Fund distributions or the redemption of Fund shares. Past performance is no guarantee of future results.

Average Annual Total Returns at Maximum Applicable Sales Charge for the Periods Ended September 30, 2006
| | | 1 Year | | 5 Years | | 10 Years | |
| Class A(4) | | | 0.35 | % | | | 3.93 | % | | | 4.97 | % | |
30-Day SEC Yield for the Period Ended September 30, 2006
(1) Reflects the deduction of the maximum initial sales charge of 3.25%.
(2) Performance for each unmanaged index does not reflect any fees or expenses. The performance of the indexes is not necessarily representative of the Fund's performance. Each index is composed of municipal bonds from many states while the Fund is a single-state municipal bond portfolio.
(3) Source: Lipper, Inc.
(4) Total return, which is the percent change in value, after deduction of the maximum initial sales charge of 3.25% applicable to Class A shares, with all dividends and distributions reinvested for periods shown ended September 30, 2006, is calculated using the SEC required uniform method to compute total return.
16
Insured Intermediate Tax-Free Fund
Investment Comparison
Below is a comparison of a $10,000 investment in Class A shares to the same investment in Lipper's Average of Intermediate Municipal Debt Funds and the Lehman Brothers 3-10 Year Insured Tax-Exempt Bond Index, assuming reinvestment of all dividends and distributions. The performance of other classes will be greater than or less than the performance shown in the graph below due to different sales loads and expenses applicable to such classes. The graph and performance table below do not reflect the deduction of taxes that a shareholder would pay on Fund distributions or the redemption of Fund shares. Past performance is no guarantee of future results.
Average Annual Total Returns at Maximum Applicable Sales Charge for the Periods Ended September 30, 2006
| | | 1 Year | | Life of Class | |
| Class A(4) | | | 0.29 | % | | | 1.42 | % | |
| Class B(5) | | | -1.08 | % | | | 0.84 | % | |
| Class C(6) | | | 2.90 | % | | | 1.69 | % | |
| Class P(7) | | | 3.46 | % | | | 2.26 | % | |
��
30-Day SEC Yield for the Period Ended September 30, 2006
| Class A | | Class B | | Class C | | Class P | |
| | 3.55 | % | | | 2.80 | % | | | 2.80 | % | | | 3.38 | % | |
(1) Reflects the deduction of the maximum initial sales charge of 3.25%.
(2) Performance for each unmanaged index does not reflect any fees or expenses. The performance of the indexes is not necessarily representative of the Fund's performance.
(3) Source: Lipper, Inc.
(4) Total return, which is the percent change in value, after deduction of the maximum initial sales charge of 3.25% applicable to Class A shares, with all dividends and distributions reinvested for period shown ended September 30, 2006, is calculated using the SEC required uniform method to compute total return. The Class A share inception date is June 30, 2003.
(5) Class B shares were first offered on June 30, 2003. Performance reflects the deduction of a CDSC of 4% for 1 year and 3% for the life of the Class.
(6) Class C shares were first offered on June 30, 2003. The 1% CDSC for Class C shares normally applies before the first anniversary of the purchase date. Performance is at net asset value.
(7) Class P shares were first offered on June 30, 2003. Performance is at net asset value.
17
Florida Tax-Free Trust
Investment Comparison
Below is a comparison of a $10,000 investment in Class A shares to the same investment in Lipper's Average of Florida Municipal Debt Funds, the Lehman Brothers Municipal Bond Index, and the Lehman Brothers Municipal Long Current Coupon Bond Index, assuming reinvestment of all dividends and distributions. The Fund believes that the Lehman Brothers Municipal Bond Index is a less volatile index and a more appropriate benchmark for the Fund and therefore will remove the Lehman Brothers Municipal Long Current Coupon Bond Index in the next Annual Report. The performance of the other class will be greater than or less than the performance shown in the graph below due to different sales loads and expenses applicable to such class. The graph and performance table below do not reflect the deduction of taxes that a shareholder would pay on Fund distributions or the redemption of Fund shares. Past performance is no guarantee of future results.
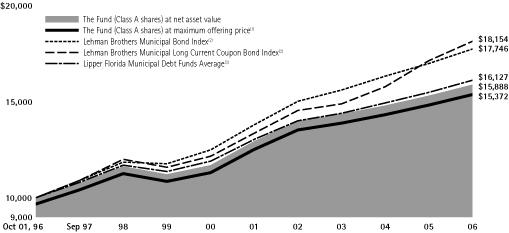
Average Annual Total Returns at Maximum Applicable Sales Charge for the Periods Ended September 30, 2006
| | | 1 Year | | 5 Years | | 10 Years | |
| Class A(4) | | | 0.34 | % | | | 3.51 | % | | | 4.39 | % | |
| Class C(5) | | | 3.29 | % | | | 3.52 | % | | | 4.06 | % | |
30-Day SEC Yield for the Period Ended September 30, 2006
| Class A | | Class C | |
| | 4.21 | % | | | 3.56 | % | |
(1) Reflects the deduction of the maximum initial sales charge of 3.25%.
(2) Performance for each unmanaged index does not reflect any fees or expenses. The performance of the indexes is not necessarily representative of the Fund's performance. Each index is composed of municipal bonds from many states while the Fund is a single-state municipal bond portfolio.
(3) Source: Lipper, Inc.
(4) Total return, which is the percent change in value, after deduction of the maximum initial sales charge of 3.25% applicable to Class A shares, with all dividends and distributions reinvested for periods shown ended September 30, 2006, is calculated using the SEC required uniform method to compute total return.
(5) The 1% CDSC for Class C shares normally applies before the first anniversary of the purchase date. Performance is at net asset value.
18
Georgia Tax-Free Trust
Investment Comparison
Below is a comparison of a $10,000 investment in Class A shares to the same investment in Lipper's Average of Georgia Municipal Debt Funds, the Lehman Brothers Municipal Bond Index, and the Lehman Brothers Municipal Long Current Coupon Bond Index, assuming reinvestment of all dividends and distributions. The Fund believes that the Lehman Brothers Municipal Bond Index is a less volatile index and a more appropriate benchmark for the Fund and therefore will remove the Lehman Brothers Municipal Long Current Coupon Bond Index in the next Annual Report. The graph and performance table below do not reflect the deduction of taxes that a shareholder would pay on Fund distributions or the redemption of Fund shares. Past performance is no guarantee of future results.
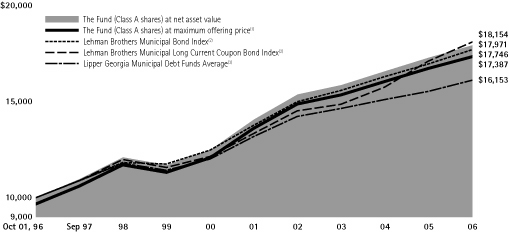
Average Annual Total Returns at Maximum Applicable Sales Charge for the Periods Ended September 30, 2006
| | | 1 Year | | 5 Years | | 10 Years | |
| Class A(4) | | | 0.40 | % | | | 4.30 | % | | | 5.69 | % | |
30-Day SEC Yield for the Period Ended September 30, 2006
(1) Reflects the deduction of the maximum initial sales charge of 3.25%.
(2) Performance for each unmanaged index does not reflect any fees or expenses. The performance of the indexes is not necessarily representative of the Fund's performance. Each index is composed of municipal bonds from many states while the Fund is a single-state municipal bond portfolio.
(3) Source: Lipper, Inc.
(4) Total return, which is the percent change in value, after deduction of the maximum initial sales charge of 3.25% applicable to Class A shares, with all dividends and distributions reinvested for periods shown ended September 30, 2006, is calculated using the SEC required uniform method to compute total return.
19
High Yield Municipal Bond Fund
Investment Comparison
Below is a comparison of a $10,000 investment in Class A shares to the same investment in the Lehman Brothers 85% High Yield/15% Investment Grade Municipal Bond Index, the Lehman Brothers Municipal Bond Index, and the Lipper High Yield Municipal Debt Funds Average, assuming reinvestment of all dividends and distributions. The Fund is replacing the Lehman Brothers Municipal Bond 50-50 Investment Grade/High Yield Index with the Lehman Brothers 85% High Yield/15% Investment Grade Municipal Bond Index because the Lehman Brothers Municipal Bond 50-50 Investment Grade/High Yield Index is no longer available. The performance of other classes will be greater than or less than the performance shown in the graph below due to different sales loads and expenses applicable to such classes. The graph and performance table below do not reflect the deduction of taxes that a shareholder would pay on Fund distributions or the redemption of Fund shares. Past performance is no guarantee of future results.
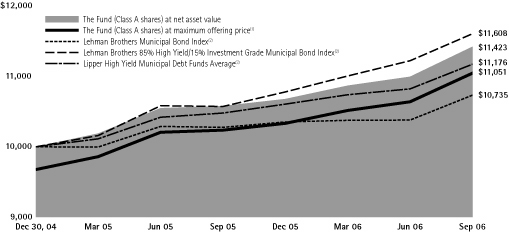
Average Annual Total Returns at Maximum Applicable Sales Charge for the Periods Ended September 30, 2006
| | | 1 Year | | Life of Class | |
| Class A(4) | | | 4.44 | % | | | 5.87 | % | |
| Class B(5) | | | 3.62 | % | | | 5.52 | % | |
| Class C(6) | | | 7.62 | % | | | 7.69 | % | |
| Class P(7) | | | 7.94 | % | | | 7.92 | % | |
30-Day SEC Yield for the Period Ended September 30, 2006
| Class A | | Class B | | Class C | | Class P | |
| | 5.22 | % | | | 4.71 | % | | | 4.72 | % | | | 5.21 | % | |
(1) Reflects the deduction of the maximum initial sales charge of 3.25%.
(2) Performance for each unmanaged index does not reflect any fees or expenses. The performance of the indexes is not necessarily representative of the Fund's performance. Indexes and average are calculated from December 31, 2004 to September 30, 2006.
(3) Source: Lipper, Inc.
(4) Total return, which is the percent change in value, after deduction of the maximum initial sales charge of 3.25% applicable to Class A shares, with all dividends and distributions reinvested for period shown ended September 30, 2006, is calculated using SEC required uniform method to compute total return. The Class A inception date is December 30, 2004.
(5) Class B shares were first offered on December 30, 2004. Performance reflects the deduction of a CDSC of 4% for 1 year and life of Class.
(6) Class C shares were first offered on December 30, 2004. The 1% CDSC for Class C shares normally applies before the first anniversary of the purchase date. Performance is at net asset value.
(7) Class P shares were first offered on December 30, 2004. Performance is at net asset value.
20
Michigan Tax-Free Trust
Investment Comparison
Below is a comparison of a $10,000 investment in Class A shares to the same investment in Lipper's Average of Michigan Municipal Debt Funds, the Lehman Brothers Municipal Bond Index, and the Lehman Brothers Municipal Long Current Coupon Bond Index, assuming reinvestment of all dividends and distributions. The Fund believes that the Lehman Brothers Municipal Bond Index is a less volatile index and a more appropriate benchmark for the Fund and therefore will remove the Lehman Brothers Municipal Long Current Coupon Bond Index in the next Annual Report. The graph and performance table below do not reflect the deduction of taxes that a shareholder would pay on Fund distributions or the redemption of Fund shares. Past performance is no guarantee of future results.
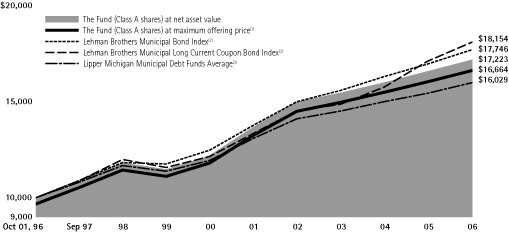
Average Annual Total Returns at Maximum Applicable Sales Charge for the Periods Ended September 30, 2006
| | | 1 Year | | 5 Years | | 10 Years | |
| Class A(4) | | | 0.30 | % | | | 4.01 | % | | | 5.25 | % | |
30-Day SEC Yield for the Period Ended September 30, 2006
(1) Reflects the deduction of the maximum initial sales charge of 3.25%.
(2) Performance for each unmanaged index does not reflect any fees or expenses. The performance of the indexes is not necessarily representative of the Fund's performance. Each index is composed of municipal bonds from many states while the Fund is a single-state municipal bond portfolio.
(3) Source: Lipper, Inc.
(4) Total return, which is the percent change in value, after deduction of the maximum initial sales charge of 3.25% applicable to Class A shares, with all dividends and distributions reinvested for periods shown ended September 30, 2006, is calculated using the SEC required uniform method to compute total return.
21
Pennsylvania Tax-Free Trust
Investment Comparison
Below is a comparison of a $10,000 investment in Class A shares to the same investment in Lipper's Average of Pennsylvania Municipal Debt Funds, the Lehman Brothers Municipal Bond Index, and the Lehman Brothers Municipal Long Current Coupon Bond Index, assuming reinvestment of all dividends and distributions. The Fund believes that the Lehman Brothers Municipal Bond Index is a less volatile index and a more appropriate benchmark for the Fund and therefore will remove the Lehman Brothers Municipal Long Current Coupon Bond Index in the next Annual Report. The graph and performance table below do not reflect the deduction of taxes that a shareholder would pay on Fund distributions or the redemption of Fund shares. Past performance is no guarantee of future results.

Average Annual Total Returns at Maximum Applicable Sales Charge for the Periods Ended September 30, 2006
| | | 1 Year | | 5 Years | | 10 Years | |
| Class A(4) | | | -0.29 | % | | | 3.95 | % | | | 5.03 | % | |
30-Day SEC Yield for the Period Ended September 30, 2006
(1) Reflects the deduction of the maximum initial sales charge of 3.25%.
(2) Performance for each unmanaged index does not reflect any fees or expenses. The performance of the indexes is not necessarily representative of the Fund's performance. Each index is composed of municipal bonds from many states while the Fund is a single-state municipal bond portfolio.
(3) Source: Lipper, Inc.
(4) Total return, which is the percent change in value, after deduction of the maximum initial sales charge of 3.25% applicable to Class A shares, with all dividends and distributions reinvested for periods shown ended September 30, 2006, is calculated using the SEC required uniform method to compute total return.
22
Expense Example
As a shareholder of a Fund, you incur two types of costs: (1) transaction costs, including sales charges on purchase payments (these charges vary among the share classes); and (2) ongoing costs, including management fees; distribution and service (12b-1) fees (these charges vary among the share classes; also, certain Funds do not yet have effective Rule 12b-1 plans under which distribution and service fees are paid); and other Fund expenses. This Example is intended to help you understand your ongoing costs (in dollars) of investing in each Fund and to compare these costs with the ongoing costs of investing in other mutual funds.
The Example is based on an investment of $1,000 invested at the beginning of the period and held for the entire period (April 1, 2006 through September 30, 2006).
Actual Expenses
For each class of each Fund, the first line of the applicable table on the following pages provides information about actual account values and actual expenses. You may use the information in this line, together with the amount you invested, to estimate the expenses that you paid over the period. Simply divide your account value by $1,000 (for example, an $8,600 account value divided by $1,000 = 8.6), then multiply the result by the number in the first line under the heading titled "Expenses Paid During the Period 4/1/06 – 9/30/06" to estimate the expenses you paid on your account during this period.
Hypothetical Example for Comparison Purposes
For each class of each Fund, the second line of the applicable table on the following pages provides information about hypothetical account values and hypothetical expenses based on the Fund's actual expense ratio and an assumed rate of return of 5% per year before expenses, which is not the Fund's actual return. The hypothetical account values and expenses may not be used to estimate the actual ending account balance or expenses you paid for the period. You may use this information to compare the ongoing costs of investing in each Fund and other funds. To do so, compare this 5% hypothetical example with the 5% hypothetical examples that appear in the shareholder reports of the other funds.
23
National Tax-Free Fund
Please note that the expenses shown in the table are meant to highlight your ongoing costs only and do not reflect any transactional costs, such as sales charges. Therefore, the second line of the table is useful in comparing ongoing costs only, and will not help you determine the relative total costs of owning different funds. In addition, if these transactional costs were included, your costs would have been higher.
| | | Beginning
Account
Value | | Ending
Account
Value | | Expenses
Paid During
the Period† | |
| | | 4/1/06 | | 9/30/06 | | 4/1/06 –
9/30/06 | |
| Class A | |
| Actual | | $ | 1,000.00 | | | $ | 1,030.50 | | | $ | 4.63 | | |
| Hypothetical (5% Return Before Expenses) | | $ | 1,000.00 | | | $ | 1,020.51 | | | $ | 4.61 | | |
| Class B | |
| Actual | | $ | 1,000.00 | | | $ | 1,027.90 | | | $ | 7.98 | | |
| Hypothetical (5% Return Before Expenses) | | $ | 1,000.00 | | | $ | 1,017.22 | | | $ | 7.94 | | |
| Class C | |
| Actual | | $ | 1,000.00 | | | $ | 1,027.20 | | | $ | 7.98 | | |
| Hypothetical (5% Return Before Expenses) | | $ | 1,000.00 | | | $ | 1,017.23 | | | $ | 7.94 | | |
† For each class of the Fund, expenses are equal to the annualized expense ratio for such class (0.91% for Class A and 1.57% for Classes B and C) multiplied by the average account value over the period, multiplied by 183/365 (to reflect one-half year period).
Portfolio Holdings Presented by Credit Rating
September 30, 2006
Credit Rating:
S&P or Moody's(a)(b) | | %* | |
| AAA | | | 52.80 | % | |
| AA+ | | | 8.35 | % | |
| Aa1 | | | 0.21 | % | |
| AA | | | 4.38 | % | |
| Aa2 | | | 1.82 | % | |
| AA- | | | 4.76 | % | |
| Aa3 | | | 2.37 | % | |
| A+ | | | 5.02 | % | |
| A | | | 0.66 | % | |
| A2 | | | 0.95 | % | |
| A- | | | 1.99 | % | |
| A3 | | | 2.07 | % | |
| BBB+ | | | 3.75 | % | |
| Baa1 | | | 1.64 | % | |
| BBB | | | 5.82 | % | |
| Baa2 | | | 0.86 | % | |
| BBB- | | | 1.32 | % | |
| Baa3 | | | 0.95 | % | |
| NR | | | 0.25 | % | |
| Short-Term Investments | | | 0.03 | % | |
| Total | | | 100.00 | % | |
(a) Certain investments have not been rated by an independent ratings service but are, in Lord, Abbett & Co. LLC's opinion, of comparable quality to the rating shown.
(b) Certain investments have been rated by Fitch IBCA.
* Represents percent of total investments.
24
California Tax-Free Fund
Please note that the expenses shown in the table are meant to highlight your ongoing costs only and do not reflect any transactional costs, such as sales charges. Therefore, the second line of the table is useful in comparing ongoing costs only, and will not help you determine the relative total costs of owning different funds. In addition, if these transactional costs were included, your costs would have been higher.
| | | Beginning
Account
Value | | Ending
Account
Value | | Expenses
Paid During
the Period† | |
| | | 4/1/06 | | 9/30/06 | | 4/1/06 –
9/30/06 | |
| Class A | |
| Actual | | $ | 1,000.00 | | | $ | 1,027.20 | | | $ | 4.73 | | |
| Hypothetical (5% Return Before Expenses) | | $ | 1,000.00 | | | $ | 1,020.41 | | | $ | 4.71 | | |
| Class C | |
| Actual | | $ | 1,000.00 | | | $ | 1,024.90 | | | $ | 8.02 | | |
| Hypothetical (5% Return Before Expenses) | | $ | 1,000.00 | | | $ | 1,017.15 | | | $ | 7.99 | | |
† For each class of the Fund, expenses are equal to the annualized expense ratio for such class (0.93% for Class A and 1.58% for Class C) multiplied by the average account value over the period, multiplied by 183/365 (to reflect one-half year period).
Portfolio Holdings Presented by Credit Rating
September 30, 2006
Credit Rating:
S&P or Moody's | | %* | |
| AAA | | | 77.65 | % | |
| AA+ | | | 1.57 | % | |
| AA | | | 1.53 | % | |
| AA- | | | 0.38 | % | |
| Aa3 | | | 0.91 | % | |
| A+ | | | 7.04 | % | |
| A1 | | | 2.17 | % | |
| A- | | | 0.25 | % | |
| A3 | | | 0.90 | % | |
| BBB+ | | | 1.49 | % | |
| BBB | | | 2.41 | % | |
| Baa2 | | | 0.59 | % | |
| BBB- | | | 0.59 | % | |
| Baa3 | | | 2.52 | % | |
| Short-Term Investment | | | 0.00 | %** | |
| Total | | | 100.00 | % | |
* Represents percent of total investments.
** Amount is less than 0.01%.
25
Connecticut Tax-Free Fund
Please note that the expenses shown in the table are meant to highlight your ongoing costs only and do not reflect any transactional costs, such as sales charges. Therefore, the second line of the table is useful in comparing ongoing costs only, and will not help you determine the relative total costs of owning different funds. In addition, if these transactional costs were included, your costs would have been higher.
| | | Beginning
Account
Value | | Ending
Account
Value | | Expenses
Paid During
the Period† | |
| | | 4/1/06 | | 9/30/06 | | 4/1/06 –
9/30/06 | |
| Class A | |
| Actual | | $ | 1,000.00 | | | $ | 1,031.70 | | | $ | 2.34 | | |
| Hypothetical (5% Return Before Expenses) | | $ | 1,000.00 | | | $ | 1,022.77 | | | $ | 2.33 | | |
† Expenses are equal to the Fund's annualized expense ratio of 0.46% multiplied by the average account value over the period, multiplied by 183/365 (to reflect one-half year period).
Portfolio Holdings Presented by Credit Rating
September 30, 2006
Credit Rating:
S&P or Moody's | | %* | |
| AAA | | | 66.32 | % | |
| AA+ | | | 1.09 | % | |
| Aa1 | | | 0.12 | % | |
| AA | | | 10.00 | % | |
| AA- | | | 0.45 | % | |
| Aa3 | | | 10.93 | % | |
| A+ | | | 3.54 | % | |
| A2 | | | 3.08 | % | |
| A3 | | | 1.10 | % | |
| BBB | | | 3.03 | % | |
| BBB- | | | 0.29 | % | |
| Short-Term Investment | | | 0.05 | % | |
| Total | | | 100.00 | % | |
* Represents percent of total investments.
26
Hawaii Tax-Free Fund
Please note that the expenses shown in the table are meant to highlight your ongoing costs only and do not reflect any transactional costs, such as sales charges. Therefore, the second line of the table is useful in comparing ongoing costs only, and will not help you determine the relative total costs of owning different funds. In addition, if these transactional costs were included, your costs would have been higher.
| | | Beginning
Account
Value | | Ending
Account
Value | | Expenses
Paid During
the Period† | |
| | | 4/1/06 | | 9/30/06 | | 4/1/06 –
9/30/06 | |
| Class A | |
| Actual | | $ | 1,000.00 | | | $ | 1,031.10 | | | $ | 3.21 | | |
| Hypothetical (5% Return Before Expenses) | | $ | 1,000.00 | | | $ | 1,021.90 | | | $ | 3.19 | | |
† Expenses are equal to the Fund's annualized expense ratio of 0.63% multiplied by the average account value over the period, multiplied by 183/365 (to reflect one-half year period).
Portfolio Holdings Presented by Credit Rating
September 30, 2006
Credit Rating:
S&P or Moody's(a) | | %* | |
| AAA | | | 88.79 | % | |
| AA | | | 3.53 | % | |
| Aa2 | | | 1.23 | % | |
| BBB+ | | | 2.35 | % | |
| BBB | | | 4.10 | % | |
| Total | | | 100.00 | % | |
(a) Certain investments have not been rated by an independent ratings service but are, in Lord, Abbett & Co. LLC's opinion, of comparable quality to the rating shown.
* Represents percent of total investments.
27
Minnesota Tax-Free Fund
Please note that the expenses shown in the table are meant to highlight your ongoing costs only and do not reflect any transactional costs, such as sales charges. Therefore, the second line of the table is useful in comparing ongoing costs only, and will not help you determine the relative total costs of owning different funds. In addition, if these transactional costs were included, your costs would have been higher.
| | | Beginning
Account
Value | | Ending
Account
Value | | Expenses
Paid During
the Period† | |
| | | 4/1/06 | | 9/30/06 | | 4/1/06 –
9/30/06 | |
| Class A | |
| Actual | | $ | 1,000.00 | | | $ | 1,028.60 | | | $ | 3.36 | | |
| Hypothetical (5% Return Before Expenses) | | $ | 1,000.00 | | | $ | 1,021.76 | | | $ | 3.35 | | |
† Expenses are equal to the Fund's annualized expense ratio of 0.66% multiplied by the average account value over the period, multiplied by 183/365 (to reflect one-half year period).
Portfolio Holdings Presented by Credit Rating
September 30, 2006
Credit Rating:
S&P or Moody's | | %* | |
| AAA | | | 54.98 | % | |
| AA+ | | | 13.77 | % | |
| AA | | | 2.13 | % | |
| Aa2 | | | 5.58 | % | |
| Aa3 | | | 0.53 | % | |
| A | | | 1.90 | % | |
| A2 | | | 1.86 | % | |
| A3 | | | 6.79 | % | |
| A- | | | 6.37 | % | |
| BBB+ | | | 1.03 | % | |
| Baa1 | | | 1.85 | % | |
| BBB | | | 0.63 | % | |
| Baa2 | | | 2.58 | % | |
| Total | | | 100.00 | % | |
* Represents percent of total investments.
28
Missouri Tax-Free Fund
Please note that the expenses shown in the table are meant to highlight your ongoing costs only and do not reflect any transactional costs, such as sales charges. Therefore, the second line of the table is useful in comparing ongoing costs only, and will not help you determine the relative total costs of owning different funds. In addition, if these transactional costs were included, your costs would have been higher.
| | | Beginning
Account
Value | | Ending
Account
Value | | Expenses
Paid During
the Period† | |
| | | 4/1/06 | | 9/30/06 | | 4/1/06 –
9/30/06 | |
| Class A | |
| Actual | | $ | 1,000.00 | | | $ | 1,032.00 | | | $ | 2.95 | | |
| Hypothetical (5% Return Before Expenses) | | $ | 1,000.00 | | | $ | 1,022.14 | | | $ | 2.94 | | |
† Expenses are equal to the Fund's annualized expense ratio of 0.58% multiplied by the average account value over the period, multiplied by 183/365 (to reflect one-half year period).
Portfolio Holdings Presented by Credit Rating
September 30, 2006
Credit Rating:
S&P or Moody's(a)(b) | | %* | |
| AAA | | | 65.33 | % | |
| AA+ | | | 7.12 | % | |
| AA | | | 13.01 | % | |
| AA- | | | 1.14 | % | |
| Aa3 | | | 0.99 | % | |
| A+ | | | 1.30 | % | |
| A2 | | | 0.72 | % | |
| A- | | | 3.51 | % | |
| A3 | | | 1.00 | % | |
| BBB+ | | | 2.76 | % | |
| BBB | | | 3.12 | % | |
| Total | | | 100.00 | % | |
(a) Certain investments have not been rated by an independent ratings service but are, in Lord, Abbett & Co. LLC's opinion, of comparable quality to the rating shown.
(b) Certain investments have been rated by Fitch IBCA.
* Represents percent of total investments.
29
New Jersey Tax-Free Fund
Please note that the expenses shown in the table are meant to highlight your ongoing costs only and do not reflect any transactional costs, such as sales charges. Therefore, the second line of the table is useful in comparing ongoing costs only, and will not help you determine the relative total costs of owning different funds. In addition, if these transactional costs were included, your costs would have been higher.
| | | Beginning
Account
Value | | Ending
Account
Value | | Expenses
Paid During
the Period† | |
| | | 4/1/06 | | 9/30/06 | | 4/1/06 –
9/30/06 | |
| Class A | |
| Actual | | $ | 1,000.00 | | | $ | 1,028.20 | | | $ | 4.22 | | |
| Hypothetical (5% Return Before Expenses) | | $ | 1,000.00 | | | $ | 1,020.88 | | | $ | 4.20 | | |
† Expenses are equal to the Fund's annualized expense ratio of 0.83% multiplied by the average account value over the period, multiplied by 183/365 (to reflect one-half year period).
Portfolio Holdings Presented by Credit Rating
September 30, 2006
Credit Rating:
S&P or Moody's(a)(b) | | %* | |
| AAA | | | 74.57 | % | |
| Aa1 | | | 2.65 | % | |
| AA | | | 3.49 | % | |
| AA- | | | 3.87 | % | |
| A | | | 2.46 | % | |
| A2 | | | 3.68 | % | |
| A- | | | 1.35 | % | |
| A3 | | | 0.81 | % | |
| BBB+ | | | 0.42 | % | |
| Baa1 | | | 1.62 | % | |
| BBB | | | 3.00 | % | |
| BBB- | | | 1.40 | % | |
| Baa3 | | | 0.64 | % | |
| Short-Term Investment | | | 0.04 | % | |
| Total | | | 100.00 | % | |
(a) Certain investments have not been rated by an independent ratings service but are, in Lord, Abbett & Co. LLC's opinion, of comparable quality to the rating shown.
(b) Certain investments have been rated by Fitch IBCA.
* Represents percent of total investments.
30
New York Tax-Free Fund
Please note that the expenses shown in the table are meant to highlight your ongoing costs only and do not reflect any transactional costs, such as sales charges. Therefore, the second line of the table is useful in comparing ongoing costs only, and will not help you determine the relative total costs of owning different funds. In addition, if these transactional costs were included, your costs would have been higher.
| | | Beginning
Account
Value | | Ending
Account
Value | | Expenses
Paid During
the Period† | |
| | | 4/1/06 | | 9/30/06 | | 4/1/06 –
9/30/06 | |
| Class A | |
| Actual | | $ | 1,000.00 | | | $ | 1,033.40 | | | $ | 2.91 | | |
| Hypothetical (5% Return Before Expenses) | | $ | 1,000.00 | | | $ | 1,022.23 | | | $ | 2.89 | | |
| Class C | |
| Actual | | $ | 1,000.00 | | | $ | 1,030.20 | | | $ | 6.21 | | |
| Hypothetical (5% Return Before Expenses) | | $ | 1,000.00 | | | $ | 1,018.93 | | | $ | 6.17 | | |
† For each class of the Fund, expenses are equal to the annualized expense ratio for such class (0.57% for Class A and 1.22% for Class C) multiplied by the average account value over the period, multiplied by 183/365 (to reflect one-half year period).
Portfolio Holdings Presented by Credit Rating
September 30, 2006
Credit Rating:
S&P or Moody's(a) | | %* | |
| AAA | | | 45.18 | % | |
| AA+ | | | 7.29 | % | |
| Aa1 | | | 2.49 | % | |
| AA | | | 5.91 | % | |
| Aa2 | | | 1.17 | % | |
| AA- | | | 13.25 | % | |
| Aa3 | | | 2.76 | % | |
| A+ | | | 3.47 | % | |
| A | | | 6.74 | % | |
| A- | | | 0.85 | % | |
| A3 | | | 2.53 | % | |
| BBB+ | | | 0.90 | % | |
| Baa1 | | | 0.52 | % | |
| BBB | | | 5.40 | % | |
| BBB- | | | 0.72 | % | |
| BB | | | 0.81 | % | |
| Short-Term Investment | | | 0.01 | % | |
| Total | | | 100.00 | % | |
(a) Certain investments have not been rated by an independent ratings service but are, in Lord, Abbett & Co. LLC's opinion, of comparable quality to the rating shown.
* Represents percent of total investments.
31
Texas Tax-Free Fund
Please note that the expenses shown in the table are meant to highlight your ongoing costs only and do not reflect any transactional costs, such as sales charges. Therefore, the second line of the table is useful in comparing ongoing costs only, and will not help you determine the relative total costs of owning different funds. In addition, if these transactional costs were included, your costs would have been higher.
| | | Beginning
Account
Value | | Ending
Account
Value | | Expenses
Paid During
the Period† | |
| | | 4/1/06 | | 9/30/06 | | 4/1/06 –
9/30/06 | |
| Class A | |
| Actual | | $ | 1,000.00 | | | $ | 1,027.00 | | | $ | 3.96 | | |
| Hypothetical (5% Return Before Expenses) | | $ | 1,000.00 | | | $ | 1,021.25 | | | $ | 3.95 | | |
† Expenses are equal to the Fund's annualized expense ratio of 0.78% multiplied by the average account value over the period, multiplied by 183/365 (to reflect one-half year period).
Portfolio Holdings Presented by Credit Rating
September 30, 2006
Credit Rating:
S&P or Moody's | | %* | |
| AAA | | | 58.90 | % | |
| AA+ | | | 10.08 | % | |
| Aa1 | | | 8.21 | % | |
| AA | | | 2.60 | % | |
| Aa3 | | | 1.29 | % | |
| A+ | | | 7.57 | % | |
| A | | | 2.39 | % | |
| A3 | | | 1.02 | % | |
| BBB+ | | | 2.71 | % | |
| BBB | | | 4.23 | % | |
| Baa2 | | | 1.00 | % | |
| Short-Term Investment | | | 0.00 | %** | |
| Total | | | 100.00 | % | |
* Represents percent of total investments.
** Amount is less than 0.01%.
32
Washington Tax-Free Fund
Please note that the expenses shown in the table are meant to highlight your ongoing costs only and do not reflect any transactional costs, such as sales charges. Therefore, the second line of the table is useful in comparing ongoing costs only, and will not help you determine the relative total costs of owning different funds. In addition, if these transactional costs were included, your costs would have been higher.
| | | Beginning
Account
Value | | Ending
Account
Value | | Expenses
Paid During
the Period† | |
| | | 4/1/06 | | 9/30/06 | | 4/1/06 –
9/30/06 | |
| Class A | |
| Actual | | $ | 1,000.00 | | | $ | 1,028.10 | | | $ | 3.71 | | |
| Hypothetical (5% Return Before Expenses) | | $ | 1,000.00 | | | $ | 1,021.43 | | | $ | 3.70 | | |
† Expenses are equal to the Fund's annualized expense ratio of 0.73% multiplied by the average account value over the period, multiplied by 183/365 (to reflect one-half year period).
Portfolio Holdings Presented by Credit Rating
September 30, 2006
Credit Rating:
S&P or Moody's(a) | | %* | |
| AAA | | | 83.79 | % | |
| AA | | | 2.49 | % | |
| A | | | 0.71 | % | |
| A3 | | | 4.44 | % | |
| BBB+ | | | 2.46 | % | |
| BBB | | | 4.34 | % | |
| Baa2 | | | 1.77 | % | |
| Short-Term Investment | | | 0.00 | %* | |
| Total | | | 100.00 | % | |
(a) Certain investments have not been rated by an independent ratings service but are, in Lord, Abbett & Co. LLC's opinion, of comparable quality to the rating shown.
* Represents percent of total investments.
** Amount is less than 0.01%.
33
Insured Intermediate Tax-Free Fund
Please note that the expenses shown in the table are meant to highlight your ongoing costs only and do not reflect any transactional costs, such as sales charges. Therefore, the second line of the table is useful in comparing ongoing costs only, and will not help you determine the relative total costs of owning different funds. In addition, if these transactional costs were included, your costs would have been higher.
| | | Beginning
Account
Value | | Ending
Account
Value | | Expenses
Paid During
the Period† | |
| | | 4/1/06 | | 9/30/06 | | 4/1/06 –
9/30/06 | |
| Class A | |
| Actual | | $ | 1,000.00 | | | $ | 1,032.30 | | | $ | 1.27 | | |
| Hypothetical (5% Return Before Expenses) | | $ | 1,000.00 | | | $ | 1,023.82 | | | $ | 1.27 | | |
| Class B | |
| Actual | | $ | 1,000.00 | | | $ | 1,029.70 | | | $ | 5.09 | | |
| Hypothetical (5% Return Before Expenses) | | $ | 1,000.00 | | | $ | 1,020.07 | | | $ | 5.06 | | |
| Class C | |
| Actual | | $ | 1,000.00 | | | $ | 1,029.50 | | | $ | 5.09 | | |
| Hypothetical (5% Return Before Expenses) | | $ | 1,000.00 | | | $ | 1,020.06 | | | $ | 5.06 | | |
| Class P | |
| Actual | | $ | 1,000.00 | | | $ | 1,031.30 | | | $ | 2.29 | | |
| Hypothetical (5% Return Before Expenses) | | $ | 1,000.00 | | | $ | 1,022.80 | | | $ | 2.28 | | |
† For each class of the Fund, expenses are equal to the annualized expense ratio for such class (0.25% for Class A, 1.00% for Classes B and C, and 0.45% for Class P) multiplied by the average account value over the period, multiplied by 183/365 (to reflect one-half year period).
Portfolio Holdings Presented by Credit Rating
September 30, 2006
Credit Rating:
S&P or Moody's | | %* | |
| AAA | | | 99.99 | % | |
| Short-Term Investment | | | 0.01 | % | |
| Total | | | 100.00 | % | |
* Represents percent of total investments.
34
Florida Tax-Free Trust
Please note that the expenses shown in the table are meant to highlight your ongoing costs only and do not reflect any transactional costs, such as sales charges. Therefore, the second line of the table is useful in comparing ongoing costs only, and will not help you determine the relative total costs of owning different funds. In addition, if these transactional costs were included, your costs would have been higher.
| | | Beginning
Account
Value | | Ending
Account
Value | | Expenses
Paid During
the Period† | |
| | | 4/1/06 | | 9/30/06 | | 4/1/06 –
9/30/06 | |
| Class A | |
| Actual | | $ | 1,000.00 | | | $ | 1,030.00 | | | $ | 3.71 | | |
| Hypothetical (5% Return Before Expenses) | | $ | 1,000.00 | | | $ | 1,021.42 | | | $ | 3.70 | | |
| Class C | |
| Actual | | $ | 1,000.00 | | | $ | 1,029.00 | | | $ | 7.02 | | |
| Hypothetical (5% Return Before Expenses) | | $ | 1,000.00 | | | $ | 1,018.15 | | | $ | 6.98 | | |
† For each class of the Fund, expenses are equal to the annualized expense ratio for such class (0.73% for Class A and 1.38% for Class C) multiplied by the average account value over the period, multiplied by 183/365 (to reflect one-half year period).
Portfolio Holdings Presented by Credit Rating
September 30, 2006
Credit Rating:
S&P or Moody's | | %* | |
| AAA | | | 72.99 | % | |
| AA | | | 2.15 | % | |
| Aa3 | | | 0.14 | % | |
| A+ | | | 5.78 | % | |
| A1 | | | 0.34 | % | |
| A | | | 6.73 | % | |
| A2 | | | 3.23 | % | |
| BBB+ | | | 3.71 | % | |
| BBB | | | 4.41 | % | |
| Baa2 | | | 0.52 | % | |
| Short-Term Investment | | | 0.00 | %** | |
| Total | | | 100.00 | % | |
* Represents percent of total investments.
** Amount is less than 0.01%.
35
Georgia Tax-Free Trust
Please note that the expenses shown in the table are meant to highlight your ongoing costs only and do not reflect any transactional costs, such as sales charges. Therefore, the second line of the table is useful in comparing ongoing costs only, and will not help you determine the relative total costs of owning different funds. In addition, if these transactional costs were included, your costs would have been higher.
| | | Beginning
Account
Value | | Ending
Account
Value | | Expenses
Paid During
the Period† | |
| | | 4/1/06 | | 9/30/06 | | 4/1/06 –
9/30/06 | |
| Class A | |
| Actual | | $ | 1,000.00 | | | $ | 1,029.50 | | | $ | 2.70 | | |
| Hypothetical (5% Return Before Expenses) | | $ | 1,000.00 | | | $ | 1,022.39 | | | $ | 2.69 | | |
† Expenses are equal to the Fund's annualized expense ratio of 0.53% multiplied by the average account value over the period, multiplied by 183/365 (to reflect one-half year period).
Portfolio Holdings Presented by Credit Rating
September 30, 2006
Credit Rating:
S&P or Moody's(a) | | %* | |
| AAA | | | 66.10 | % | |
| AA+ | | | 1.94 | % | |
| AA | | | 6.72 | % | |
| Aa2 | | | 5.86 | % | |
| AA- | | | 0.61 | % | |
| Aa3 | | | 1.24 | % | |
| A | | | 2.83 | % | |
| A2 | | | 0.91 | % | |
| A3 | | | 3.75 | % | |
| BBB+ | | | 1.78 | % | |
| BBB | | | 7.41 | % | |
| Baa2 | | | 0.48 | % | |
| Baa3 | | | 0.37 | % | |
| Total | | | 100.00 | % | |
(a) Certain investments have not been rated by an independent ratings service but are, in Lord, Abbett & Co. LLC's opinion, of comparable quality to the rating shown.
* Represents percent of total investments.
36
High Yield Municipal Bond Fund
Please note that the expenses shown in the table are meant to highlight your ongoing costs only and do not reflect any transactional costs, such as sales charges. Therefore, the second line of the table is useful in comparing ongoing costs only, and will not help you determine the relative total costs of owning different funds. In addition, if these transactional costs were included, your costs would have been higher.
| | | Beginning
Account
Value | | Ending
Account
Value | | Expenses
Paid During
the Period† | |
| | | 4/1/06 | | 9/30/06 | | 4/1/06 –
9/30/06 | |
| Class A | |
| Actual | | $ | 1,000.00 | | | $ | 1,050.90 | | | $ | 1.29 | | |
| Hypothetical (5% Return Before Expenses) | | $ | 1,000.00 | | | $ | 1,024.27 | | | $ | 1.27 | | |
| Class B | |
| Actual | | $ | 1,000.00 | | | $ | 1,048.30 | | | $ | 3.85 | | |
| Hypothetical (5% Return Before Expenses) | | $ | 1,000.00 | | | $ | 1,022.82 | | | $ | 3.80 | | |
| Class C | |
| Actual | | $ | 1,000.00 | | | $ | 1,049.00 | | | $ | 3.85 | | |
| Hypothetical (5% Return Before Expenses) | | $ | 1,000.00 | | | $ | 1,022.33 | | | $ | 3.80 | | |
| Class P | |
| Actual | | $ | 1,000.00 | | | $ | 1,051.30 | | | $ | 1.29 | | |
| Hypothetical (5% Return Before Expenses) | | $ | 1,000.00 | | | $ | 1,024.47 | | | $ | 1.27 | | |
† For each class of the Fund, expenses are equal to the annualized expense ratio for such class (0.25% for Class A, 0.75% for Classes B and C, and 0.25% for Class P) multiped by the average account value over the period, multiplied by 183/365 (to reflect one-half year period).
Portfolio Holdings Presented by Credit Rating
September 30, 2006
Credit Rating:
S&P or Moody's(a) | | %* | |
| AAA | | | 5.04 | % | |
| AA | | | 0.66 | % | |
| Aa3 | | | 0.57 | % | |
| A+ | | | 4.54 | % | |
| A1 | | | 0.05 | % | |
| A | | | 1.00 | % | |
| A- | | | 1.19 | % | |
| A3 | | | 0.95 | % | |
| BBB+ | | | 0.05 | % | |
| Baa1 | | | 0.30 | % | |
| BBB | | | 13.75 | % | |
| Baa2 | | | 0.53 | % | |
| BBB- | | | 4.71 | % | |
| Baa3 | | | 1.77 | % | |
Credit Rating:
S&P or Moody's | | %* | |
| BB+ | | | 2.68 | % | |
| Ba1 | | | 1.04 | % | |
| BB | | | 0.68 | % | |
| BB- | | | 0.18 | % | |
| Ba3 | | | 0.47 | % | |
| B1 | | | 0.42 | % | |
| B | | | 10.30 | % | |
| B2 | | | 2.14 | % | |
| B- | | | 1.46 | % | |
| CCC+ | | | 1.37 | % | |
| Caa2 | | | 0.11 | % | |
| NR | | | 44.04 | % | |
| Short-Term Investments | | | 0.00 | %** | |
| Total | | | 100.00 | % | |
(a) Certain investments have been rated by Fitch IBCA.
* Represents percent of total investments.
** Amount is less than 0.01%.
37
Michigan Tax-Free Trust
Please note that the expenses shown in the table are meant to highlight your ongoing costs only and do not reflect any transactional costs, such as sales charges. Therefore, the second line of the table is useful in comparing ongoing costs only, and will not help you determine the relative total costs of owning different funds. In addition, if these transactional costs were included, your costs would have been higher.
| | | Beginning
Account
Value | | Ending
Account
Value | | Expenses
Paid During
the Period† | |
| | | 4/1/06 | | 9/30/06 | | 4/1/06 –
9/30/06 | |
| Class A | |
| Actual | | $ | 1,000.00 | | | $ | 1,029.00 | | | $ | 3.26 | | |
| Hypothetical (5% Return Before Expenses) | | $ | 1,000.00 | | | $ | 1,021.94 | | | $ | 3.24 | | |
† Expenses are equal to the Fund's annualized expense ratio of 0.64% multiplied by the average account value over the period, multiplied by 183/365 (to reflect one-half year period).
Portfolio Holdings Presented by Credit Rating
September 30, 2006
Credit Rating:
S&P or Moody's(a) | | %* | |
| AAA | | | 86.21 | % | |
| AA | | | 7.07 | % | |
| A1 | | | 1.43 | % | |
| BBB+ | | | 1.52 | % | |
| Baa1 | | | 0.53 | % | |
| BBB | | | 2.69 | % | |
| BBB- | | | 0.55 | % | |
| Total | | | 100.00 | % | |
(a) Certain investments have not been rated by an independent ratings service but are, in Lord, Abbett & Co. LLC's opinion, of comparable quality to the rating shown.
* Represents percent of total investments.
38
Pennsylvania Tax-Free Trust
Please note that the expenses shown in the table are meant to highlight your ongoing costs only and do not reflect any transactional costs, such as sales charges. Therefore, the second line of the table is useful in comparing ongoing costs only, and will not help you determine the relative total costs of owning different funds. In addition, if these transactional costs were included, your costs would have been higher.
| | | Beginning
Account
Value | | Ending
Account
Value | | Expenses
Paid During
the Period† | |
| | | 4/1/06 | | 9/30/06 | | 4/1/06 –
9/30/06 | |
| Class A | |
| Actual | | $ | 1,000.00 | | | $ | 1,026.90 | | | $ | 3.15 | | |
| Hypothetical (5% Return Before Expenses) | | $ | 1,000.00 | | | $ | 1,021.97 | | | $ | 3.14 | | |
† Expenses are equal to the Fund's annualized expense ratio of 0.62% multiplied by the average account value over the period, multiplied by 183/365 (to reflect one-half year period).
Portfolio Holdings Presented by Credit Rating
September 30, 2006
Credit Rating:
S&P or Moody's(a)(b) | | %* | |
| AAA | | | 74.24 | % | |
| AA+ | | | 5.49 | % | |
| AA | | | 5.14 | % | |
| AA- | | | 1.65 | % | |
| A+ | | | 1.60 | % | |
| A1 | | | 2.88 | % | |
| A | | | 1.12 | % | |
| A- | | | 2.27 | % | |
| BBB+ | | | 1.11 | % | |
| BBB | | | 3.95 | % | |
| Baa2 | | | 0.55 | % | |
| Short-Term Investment | | | 0.00 | %** | |
| Total | | | 100.00 | % | |
(a) Certain investments have not been rated by an independent ratings service but are, in Lord, Abbett & Co. LLC's opinion, of comparable quality to the rating shown.
(b) Certain investments have been rated by Fitch IBCA.
* Represents percent of total investments.
** Amount is less than 0.01%.
39
Schedule of Investments
NATIONAL TAX-FREE FUND September 30, 2006
| Investments | | Interest
Rate | | Maturity
Date | | Credit
Rating:
S&P or
Moody's(a) | | Principal
Amount
(000) | | Value | |
| MUNICIPAL BONDS 99.37% | |
| Education 10.70% | |
Allegheny Cnty PA Higher Ed
Bldg Auth Rev Carnegie Mellon Univ | | | 5.125 | % | | 3/1/2032 | | AA- | | $ | 2,000 | | | $ | 2,089,580 | | |
Allegheny Cnty PA Higher Ed
Univ Rev Ref Ser A | | | 4.75 | % | | 2/15/2026 | | Baa3 | | | 500 | | | | 505,250 | | |
CA Edl Facs Auth Rev Univ
La Verne Ser A | | | 5.00 | % | | 6/1/2035 | | Baa2 | | | 1,000 | | | | 1,021,080 | | |
| CA Edl Facs Auth Rev USC Ser A | | | 5.00 | % | | 10/1/2033 | | AA+ | | | 10,000 | | | | 10,398,600 | | |
DE St Econ Dev Auth Rev DE
Tech Pk Univ DE Pj(2) | | | 6.00 | % | | 2/1/2021 | | AAA | | | 900 | | | | 972,117 | | |
Dist of Columbia Rev James F
Oyster Elem Sch Pilot(1) | | | 6.25 | % | | 11/1/2021 | | A | | | 450 | | | | 487,125 | | |
Glendale AZ Ind Dev Auth
Midwestern Univ Ser A | | | 5.75 | % | | 5/15/2021 | | A- | | | 1,000 | | | | 1,087,520 | | |
Glendale AZ Ind Dev Auth
Midwestern Univ Ser A | | | 5.875 | % | | 5/15/2031 | | A- | | | 1,000 | | | | 1,077,800 | | |
IA Higher Ed Ln Auth Rev Ref
Wartburg Ser A | | | 5.30 | % | | 10/1/2037 | | BBB-(d) | | | 3,000 | | | | 3,108,000 | | |
LA St Univ & Agric & Mech
College Hlth Sciences Ctr Pj(14) | | | 6.375 | % | | 5/1/2031 | | AAA | | | 2,290 | | | | 2,500,497 | | |
MA St Dev Fin Agy Rev Boston
Univ Ser P | | | 5.375 | % | | 5/15/2039 | | A3 | | | 1,000 | | | | 1,110,380 | | |
MA St Dev Fin Agy Rev Boston
Univ Ser P | | | 6.00 | % | | 5/15/2059 | | A3 | | | 1,000 | | | | 1,194,110 | | |
MA St Hlth & Edl Fac Auth Rev
Boston College Ser N(13)(14) | | | 5.125 | % | | 6/1/2033 | | AAA | | | 3,810 | | | | 4,021,684 | | |
Milledgeville-Baldwin Cnty GA Fndtn
GA St College & St Univ | | | 6.00 | % | | 9/1/2033 | | BBB | | | 3,000 | | | | 3,290,760 | | |
NY St Dorm Auth Rev Fashion
Inst Tech(10) | | | 5.50 | % | | 7/1/2030 | | AAA | | | 400 | | | | 425,948 | | |
OR St Hlth Hsg Ed & Cult
Facs Auth Reed College Pj Ser A | | | 5.75 | % | | 7/1/2032 | | AA- | | | 3,800 | | | | 4,051,902 | | |
TN St Sch Bd Auth Higher Edl
Facs Ser A(10) | | | 5.125 | % | | 5/1/2021 | | AAA | | | 615 | | | | 658,124 | | |
| Tulsa OK Ind Auth Rev Ser A(14) | | | 5.375 | % | | 10/1/2020 | | Aaa | | | 3,170 | | | | 3,368,981 | | |
| Univ NC Sys Pool Rev Ser A(2) | | | 5.00 | % | | 4/1/2027 | | AAA | | | 1,800 | | | | 1,895,058 | | |
| Univ NC Univ Rev Gen | | | 5.00 | % | | 12/1/2028 | | AA+ | | | 2,015 | | | | 2,121,291 | | |
| Univ TX Univ Revs Fing Sys Ser B | | | 5.00 | % | | 8/15/2022 | | AAA | | | 5,675 | | | | 6,095,234 | | |
See Notes to Financial Statements.
40
Schedule of Investments (continued)
NATIONAL TAX-FREE FUND September 30, 2006
| Investments | | Interest
Rate | | Maturity
Date | | Credit
Rating:
S&P or
Moody's(a) | | Principal
Amount
(000) | | Value | |
Univ VA Univ Rev Residuals
Ser 856 RIBs | | | 5.99 | % | | 6/1/2019 | | Aaa | | $ | 1,925 | | | $ | 2,175,673 | | |
Univ VA Univ Rev Residuals
Ser 856 RIBs | | | 5.99 | % | | 6/1/2020 | | Aaa | | | 2,023 | | | | 2,288,337 | | |
Univ VA Univ Rev Residuals
Ser 856 RIBs | | | 5.99 | % | | 6/1/2021 | | Aaa | | | 2,123 | | | | 2,393,798 | | |
| Univ VT & St Agric College VT(2) | | | 5.125 | % | | 10/1/2037 | | AAA | | | 1,150 | | | | 1,210,812 | | |
| WV Univ Rev Univ Sys WV Pj Ser A(2) | | | Zero Coupon | | | 4/1/2024 | | AAA | | | 2,880 | | | | 1,322,323 | | |
| WV Univ Rev Univ Sys WV Pj Ser A(2) | | | Zero Coupon | | | 4/1/2026 | | AAA | | | 800 | | | | 333,480 | | |
| Total | | | | | | | | | | | | | | | 61,205,464 | | |
| General Obligation 10.60% | |
| Bessemer AL School Warrants(2) | | | 5.60 | % | | 2/1/2030 | | Aaa | | | 2,000 | | | | 2,144,020 | | |
| CA St | | | 5.10 | % | | 2/1/2034 | | A+ | | | 4,655 | | | | 4,758,015 | | |
| CA St | | | 5.25 | % | | 4/1/2034 | | A+ | | | 7,500 | | | | 7,981,800 | | |
| CA St Rep | | | 5.25 | % | | 2/1/2029 | | A+ | | | 10,000 | | | | 10,560,300 | | |
Campbell CA Unif Sch Dist
Election 2002 Ser B(9) | | | 5.50 | % | | 8/1/2033 | | AAA | | | 5,000 | | | | 5,495,600 | | |
Delaware Vly PA Regl Fin Auth
Loc Govt Rev Ser C(2) | | | 7.75 | % | | 7/1/2027 | | AAA | | | 1,000 | | | | 1,440,350 | | |
Fairfield OH City Sch Dist
Ref Sch Impt(9) | | | 5.375 | % | | 12/1/2020 | | AAA | | | 1,410 | | | | 1,511,703 | | |
Foothill-De Anza CA Cmnty
College Dist Cap Apprec(14) | | | Zero Coupon | | | 8/1/2030 | | AAA | | | 4,505 | | | | 1,520,933 | | |
| Jefferson Cnty AL Sch Warrants(10) | | | 5.50 | % | | 2/15/2020 | | AAA | | | 1,000 | | | | 1,055,750 | | |
Marion OH City Sch Dist Sch
Fac Constr & Impt(10) | | | 5.625 | % | | 12/1/2022 | | AAA | | | 500 | | | | 537,640 | | |
| New York NY NYC Ser I(14) | | | 5.00 | % | | 8/1/2017 | | AAA | | | 1,500 | | | | 1,613,415 | | |
| New York NY Ser A | | | 5.00 | % | | 8/1/2026 | | AA- | | | 5,000 | | | | 5,290,100 | | |
| New York NY Ser B Sub Ser B4(14) | | | 3.78 | %# | | 8/15/2023 | | AAA | | | 700 | | | | 700,000 | | |
| New York NY Unrefunded Bal Ser A | | | 6.00 | % | | 5/15/2030 | | AA- | | | 20 | | | | 21,597 | | |
| OR St Alternate Energy Pj Ser A AMT | | | 5.00 | % | | 1/1/2015 | | AA- | | | 1,315 | | | | 1,345,403 | | |
| OR St Alternate Energy Pj Ser A AMT | | | 5.05 | % | | 1/1/2016 | | AA- | | | 1,795 | | | | 1,842,675 | | |
| OR St Alternate Energy Pj Ser A AMT | | | 5.10 | % | | 1/1/2017 | | AA- | | | 980 | | | | 1,005,794 | | |
| Powell OH(9) | | | 5.50 | % | | 12/1/2032 | | AAA | | | 1,280 | | | | 1,387,443 | | |
| Richland Cnty SC | | | 5.375 | % | | 3/1/2030 | | AA | | | 1,140 | | | | 1,241,232 | | |
| Richland Cnty SC | | | 5.375 | % | | 3/1/2031 | | AA | | | 1,195 | | | | 1,299,706 | | |
See Notes to Financial Statements.
41
Schedule of Investments (continued)
NATIONAL TAX-FREE FUND September 30, 2006
| Investments | | Interest
Rate | | Maturity
Date | | Credit
Rating:
S&P or
Moody's(a) | | Principal
Amount
(000) | | Value | |
| Richland Cnty SC | | | 5.375 | % | | 3/1/2032 | | AA | | $ | 1,255 | | | $ | 1,365,704 | | |
| Richland Cnty SC | | | 5.375 | % | | 3/1/2033 | | AA | | | 1,320 | | | | 1,434,866 | | |
| Richmond VA(10) | | | 5.50 | % | | 1/15/2018 | | AAA | | | 500 | | | | 538,335 | | |
Washtenaw Cnty MI Multi Lake
Santn Swr Sys Sylvan Twp Wtr(14) | | | 4.75 | % | | 5/1/2021 | | AAA | | | 700 | | | | 715,351 | | |
| Wood Cnty OH Pub Libr Impt(14) | | | 5.875 | % | | 12/1/2022 | | Aaa | | | 1,000 | | | | 1,111,190 | | |
| WV St Ser D(9) | | | 6.50 | % | | 11/1/2026 | | AAA | | | 2,000 | | | | 2,477,740 | | |
Wyandotte Cnty KS Sch Dist No 204
Bonner Springs Unrefunded Bal Ser A(10) | | | 5.60 | % | | 9/1/2020 | | Aaa | | | 235 | | | | 251,189 | | |
| Total | | | | | | | | | | | | | | | 60,647,851 | | |
| Healthcare 17.84% | |
Abag Fin Auth for Nonprofit
Corp CA Woods Oblig COP(1) | | | 6.20 | % | | 11/1/2029 | | A | | | 1,000 | | | | 1,075,490 | | |
AZ Hlth Fac Auth Rev AZ
Hlthcare Pooled Fin C(9) | | | 5.50 | % | | 6/1/2014 | | Aaa | | | 1,130 | | | | 1,257,340 | | |
Birmingham Baptist Med Ctr AL
Baptist Hlth Sys Ser A | | | 5.00 | % | | 11/15/2030 | | Baa1 | | | 3,275 | | | | 3,351,864 | | |
Brazos Cnty TX Hlth Fac Dev
Franciscan Svcs Corp Oblig Grp | | | 5.375 | % | | 1/1/2032 | | A- | | | 1,615 | | | | 1,703,437 | | |
Camden Cnty NJ Impt Auth Hlthcare
Redev Rev Cooper Health Sys Oblig Grp A | | | 5.00 | % | | 2/15/2035 | | BBB | | | 1,180 | | | | 1,209,925 | | |
CA Statewide Cmntys Dev Auth
Rev Daughters of Charity Hlth A | | | 5.25 | % | | 7/1/2035 | | BBB+ | | | 3,000 | | | | 3,130,050 | | |
Chatham Cnty GA Hosp Auth Rev
Hosp Impt Mem Hlth Univ A | | | 5.50 | % | | 1/1/2034 | | A- | | | 1,990 | | | | 2,120,544 | | |
Clackamas Cnty OR Hosp Fac
Legacy Hlth Sys(13)(14) | | | 5.00 | % | | 2/15/2015 | | AAA | | | 1,600 | | | | 1,677,040 | | |
Clackamas Cnty OR Hosp Fac
Legacy Hlth Sys(13)(14) | | | 5.00 | % | | 2/15/2016 | | AAA | | | 1,000 | | | | 1,044,810 | | |
| CO Hlth Fac Auth Rev Catholic Hlth | | | 5.25 | % | | 9/1/2024 | | AA | | | 5,065 | | | | 5,289,329 | | |
Delware Cnty IN Hosp Auth
Hosp Cardinal Hlth Sys Oblig Grp | | | 5.00 | % | | 8/1/2024 | | Baa2 | | | 2,000 | | | | 2,049,820 | | |
Delware Cnty IN Hosp Auth
Hosp Cardinal Hlth Sys Oblig Grp | | | 5.25 | % | | 8/1/2036 | | Baa2 | | | 1,750 | | | | 1,817,935 | | |
Erie Cnty OH Hosp Facs Rev
Firelands Regl Med Ctr Ser A | | | 5.50 | % | | 8/15/2022 | | A | | | 1,000 | | | | 1,059,040 | | |
Fargo ND Hlth Sys Rev
MeritCare Oblig Grp A(14) | | | 5.375 | % | | 6/1/2027 | | AAA | | | 1,000 | | | | 1,029,800 | | |
See Notes to Financial Statements.
42
Schedule of Investments (continued)
NATIONAL TAX-FREE FUND September 30, 2006
| Investments | | Interest
Rate | | Maturity
Date | | Credit
Rating:
S&P or
Moody's(a) | | Principal
Amount
(000) | | Value | |
Glendale AZ Indl Dev Auth
Ref John C Lincoln Hlth Ser B | | | 5.25 | % | | 12/1/2024 | | BBB | | $ | 1,790 | | | $ | 1,877,406 | | |
Halifax Hosp Med Ctr FL Hosp
Rev Ref & Impt Ser A | | | 5.00 | % | | 6/1/2038 | | BBB+ | | | 1,825 | | | | 1,880,444 | | |
Hamilton Cnty OH Hosp Facs
Cincinnati Children's Hosp J(9) | | | 5.25 | % | | 5/15/2034 | | AAA | | | 3,395 | | | | 3,611,431 | | |
Hillsborough Cnty FL Indl Dev Auth
Hosp Rev ROLs RRII R643CE 1 RIBs | | | 6.636 | % | | 10/1/2041 | | Aaa | | | 1,500 | | | | 1,674,510 | | |
IL Fin Auth Rev Northwestern
Mem Hosp Ser A | | | 5.25 | % | | 8/15/2034 | | AA+ | | | 10,000 | | | | 10,682,700 | | |
Johnson City TN Hlth & Edl Facs Bd
Hosp Rev First Mtg Mtn Sts Hlth Ser A | | | 5.50 | % | | 7/1/2036 | | BBB+ | | | 2,000 | | | | 2,139,900 | | |
Kent Hosp Fin Auth MI Rev Met
Hosp Pj Ser A | | | 6.00 | % | | 7/1/2035 | | BBB | | | 2,125 | | | | 2,325,940 | | |
KY Econ Dev Fin Auth Norton
Hlthcare Inc Ser A(14) | | | Zero Coupon | | | 10/1/2025 | | AAA | | | 4,300 | | | | 1,753,282 | | |
Lauderdale Cnty & Florence AL
Hlthcare Rev Coffee Hlth Ser A(14) | | | 6.00 | % | | 7/1/2029 | | AAA | | | 1,000 | | | | 1,091,160 | | |
Lubbock TX Hlth Facs Dev Corp
Rev Sears Plains Pj(11) | | | 5.70 | % | | 1/20/2041 | | AAA | | | 2,490 | | | | 2,657,029 | | |
MA St Hlth & Edl Facs Auth
Rev Milton Hosp Ser D | | | 5.375 | % | | 7/1/2035 | | BBB- | | | 2,500 | | | | 2,593,125 | | |
MA St Hlth & Edl Facs Auth
Rev UMass Mem Issue Ser D | | | 5.00 | % | | 7/1/2033 | | BBB | | | 2,500 | | | | 2,536,950 | | |
MI St Hosp Fin Auth Rev
Marquette Gen Hosp Oblig Grp A | | | 5.00 | % | | 5/15/2034 | | Baa1 | | | 1,250 | | | | 1,273,588 | | |
Minneapolis & St Paul MN Hsg
Hlthpartners Oblig Grp Pj | | | 5.875 | % | | 12/1/2029 | | BBB+ | | | 2,100 | | | | 2,252,334 | | |
MO St Hlth & Edl Facs Auth
Rev PA 1049 RIBs RITES(2) | | | 9.066 | % | | 6/1/2010 | | AAA(c) | | | 855 | | | | 1,087,534 | | |
Monongalia Cnty WV Bldg Cmnty
Monongalia Gen Hosp Ser A | | | 5.25 | % | | 7/1/2035 | | A- | | | 3,000 | | | | 3,136,650 | | |
MS Hosp Equip & Fac Forrest
Cnty Auth Gen Hosp Pj(10) | | | 6.00 | % | | 1/1/2030 | | Aaa | | | 615 | | | | 667,705 | | |
| NH Hlth & Edl Fac Auth Rev | | | 6.00 | % | | 10/1/2024 | | A+ | | | 250 | | | | 275,068 | | |
NH Hlth & Edl Fac Auth Rev
Dartmouth-Hitchcock Oblig Grp(10) | | | 5.50 | % | | 8/1/2027 | | AAA | | | 3,500 | | | | 3,813,810 | | |
NH Hlth & Edl Fac Auth Rev
Exeter Pj | | | 5.75 | % | | 10/1/2031 | | A+ | | | 1,550 | | | | 1,651,742 | | |
NH Hlth & Edl Fac Auth Rev
The Memorial Hosp | | | 5.25 | % | | 6/1/2036 | | Baa3 | | | 1,000 | | | | 1,018,900 | | |
See Notes to Financial Statements.
43
Schedule of Investments (continued)
NATIONAL TAX-FREE FUND September 30, 2006
| Investments | | Interest
Rate | | Maturity
Date | | Credit
Rating:
S&P or
Moody's(a) | | Principal
Amount
(000) | | Value | |
| NH St Hlth & Ed Concord Hosp(10) | | | 5.50 | % | | 10/1/2021 | | Aaa | | $ | 710 | | | $ | 770,968 | | |
NJ Hlthcare Fac Fin Auth Rev
Hunterdon Medical Ctr Ser A | | | 5.125 | % | | 7/1/2035 | | A- | | | 1,000 | | | | 1,046,380 | | |
OR St Hlth Hsg Ed & Cultural
Fac Auth Rev(2) | | | 5.25 | % | | 11/15/2019 | | AAA | | | 2,000 | | | | 2,147,160 | | |
Plymouth MN Hlth Fac Rev West
Hlth Pj Ser A(10) | | | 6.125 | % | | 6/1/2024 | | AAA | | | 2,990 | | | | 3,001,631 | | |
RI St Hlth & Edl Bldg
Roger Williams Rlty(7) | | | 6.50 | % | | 8/1/2029 | | AA | | | 1,240 | | | | 1,369,084 | | |
| Rochester MN Hlthcare Fac Rev RIBs | | | 6.139 | % | | 11/15/2036 | | Aa2 | | | 3,000 | | | | 3,289,080 | | |
| SC Jobs Econ Dev Auth Hosp Facs Rev | | | 6.375 | % | | 8/1/2034 | | BBB+ | | | 240 | | | | 270,074 | | |
St. Cloud MN Hlthcare Rev Hosp
Oblig Grp Ser A(10) | | | 6.25 | % | | 5/1/2018 | | Aaa | | | 3,320 | | | | 3,631,250 | | |
Tyler TX Hlth Fac Dev Corp
Hosp Rev Mother Frances Hosp | | | 6.00 | % | | 7/1/2027 | | Baa1 | | | 1,500 | | | | 1,617,330 | | |
| Univ CO Hosp Auth Rev Ser A | | | 5.00 | % | | 11/15/2037 | | Baa1 | | | 3,000 | | | | 3,092,250 | | |
WI St Hlth & Edl Facs Auth
Rev Marshfield Clinic Ser A | | | 5.125 | % | | 2/15/2026 | | BBB+ | | | 1,300 | | | | 1,359,436 | | |
WI St Hlth & Edl Facs Auth
Rev Marshfield Clinic Ser A | | | 5.375 | % | | 2/15/2034 | | BBB+ | | | 2,500 | | | | 2,638,125 | | |
| Total | | | | | | | | | | | | | | | 102,050,400 | | |
| Housing 4.23% | |
| ID Hsg Agy Sing Fam Mtg Ser F AMT(5)(7) | | | 7.45 | % | | 7/1/2015 | | Aaa | | | 85 | | | | 85,369 | | |
Kansas City MO Ind Dev Auth
No Oak Crossing Sr Ser A-1 AMT(2) | | | 5.30 | % | | 12/1/2020 | | AAA | | | 1,055 | | | | 1,088,992 | | |
| KY Hsg Corp Hsg Rev Ser D AMT | | | 5.25 | % | | 7/1/2022 | | AAA | | | 500 | | | | 516,830 | | |
LA Hsg Fin Agy Mtg Rev Sing
Fam Hmownr B AMT(12) | | | 5.80 | % | | 6/1/2036 | | Aaa | | | 1,360 | | | | 1,455,567 | | |
LA St Citizens Ppty Ins Corp
Assmnt Rev Ser B(2) | | | 5.00 | % | | 6/1/2016 | | AAA | | | 2,700 | | | | 2,936,979 | | |
MD St Cmnty Dev Admin Dept
Hsg & Cmnty Dev Ser B AMT | | | 5.375 | % | | 9/1/2022 | | Aa2 | | | 4,160 | | | | 4,262,003 | | |
MD St Cmnty Dev Admin
Residential Ser F AMT | | | 5.50 | % | | 9/1/2022 | | Aa2 | | | 2,500 | | | | 2,568,675 | | |
Minneapolis St. Paul MN Hsg
Fin Rev Sing Fam Mtg Ser AB AMT(12) | | | 6.25 | % | | 11/1/2030 | | AAA | | | 170 | | | | 180,268 | | |
MN St Hsg Fin Agy Sing Fam
Mtg Ser G-1 AMT | | | 5.60 | % | | 7/1/2022 | | AA+ | | | 185 | | | | 190,853 | | |
See Notes to Financial Statements.
44
Schedule of Investments (continued)
NATIONAL TAX-FREE FUND September 30, 2006
| Investments | | Interest
Rate | | Maturity
Date | | Credit
Rating:
S&P or
Moody's(a) | | Principal
Amount
(000) | | Value | |
MO St Hsg Dev Cmnty Mtg Rev
Sing Fam Hmownr Ln Ser B-1 AMT(12) | | | 6.25 | % | | 3/1/2031 | | AAA | | $ | 120 | | | $ | 123,665 | | |
MO St Hsg Dev Cmnty Mtg Rev
Sing Fam Ser E-1 AMT(12) | | | Zero Coupon | | | 3/1/2029 | | AAA | | | 375 | | | | 111,814 | | |
MT St Bd Hsg Sing Fam Mtg
Ser A-1(5)(7) | | | 6.05 | % | | 12/1/2037 | | AA+ | | | 4,255 | | | | 4,360,396 | | |
NC Hsg Fin Agy Sing Fam Rev
Ser BB AMT | | | 6.25 | % | | 3/1/2012 | | AA | | | 370 | | | | 373,145 | | |
New Orleans LA Fin Auth Mtg
Rev Ser B-2 AMT(12) | | | 6.00 | % | | 12/1/2018 | | Aaa | | | 185 | | | | 187,631 | | |
OK Hsg Fin Agy Sing Fam Mtg
Ser B-1(12) | | | 5.30 | % | | 9/1/2026 | | Aaa | | | 55 | | | | 56,499 | | |
OK Hsg Fin Agy Sing Fam Rev
Cap Apprec Ser D-1(12) | | | Zero Coupon | | | 3/1/2029 | | Aaa | | | 2,275 | | | | 703,203 | | |
OK Hsg Fin Agy Sing Fam Rev
Mtg Hmownr Ser B-1 | | | Zero Coupon | | | 3/1/2029 | | Aaa | | | 1,180 | | | | 355,805 | | |
OK Hsg Fin Agy Sing Fam Rev
Mtg Hmownr Ser D-2 AMT(12) | | | Zero Coupon | | | 9/1/2030 | | Aaa | | | 1,025 | | | | 232,634 | | |
Prince Georges Cnty MD Hsg
Sing Fam Ser A AMT(6)(12) | | | 6.15 | % | | 8/1/2019 | | AAA | | | 5 | | | | 5,199 | | |
VT Hsg Fin Agy Sing Fam Hsg
Ser 16-A AMT(10) | | | 5.50 | % | | 11/1/2021 | | AAA | | | 1,925 | | | | 1,954,010 | | |
| WV St Hsg Dev Fd Hsg Fin Ser B AMT | | | 5.25 | % | | 11/1/2018 | | AAA | | | 2,345 | | | | 2,414,693 | | |
| Total | | | | | | | | | | | | | | | 24,164,230 | | |
| Industrial 5.08% | |
Allegheny Cnty PA Indl Dev Auth Lease
Rev Residential Research Inc Pj | | | 5.10 | % | | 9/1/2026 | | BBB-(d) | | | 1,000 | | | | 1,017,080 | | |
Bayonne NJ Redev Agy Royal
Caribbean Pj Ser A AMT | | | 5.375 | % | | 11/1/2035 | | BBB- | | | 750 | | | | 776,820 | | |
Clark Cnty NV Indl Dev Rev
Ser C AMT(2) | | | 5.95 | % | | 12/1/2038 | | AAA | | | 3,320 | | | | 3,611,164 | | |
Fulton Cnty GA Dev Auth Loc Dist
Cooling Fac Rev Sr Maxon Atlantic
Station A AMT | | | 5.125 | %# | | 3/1/2026 | | BBB | | | 500 | | | | 508,380 | | |
Georgetown Cnty SC Envr
Intl Paper Co Pjs Ser A AMT | | | 5.00 | % | | 8/1/2030 | | BBB | | | 3,000 | | | | 3,022,800 | | |
Jacksonville FL Swr & Solid
Wst Disp Fac Rev Anheuser AMT | | | 5.875 | % | | 2/1/2036 | | A+ | | | 500 | | | | 508,190 | | |
Liberty NY Dev Corp Rev
ROLS RRII R585 RIBs | | | 6.656 | % | | 10/1/2035 | | Aa3 | | | 7,490 | | | | 9,618,583 | | |
NJ Econ Dev Auth Rev
Kapkowski Rd Landfill Pj | | | 6.50 | % | | 4/1/2028 | | Baa3 | | | 2,325 | | | | 2,830,827 | | |
See Notes to Financial Statements.
45
Schedule of Investments (continued)
NATIONAL TAX-FREE FUND September 30, 2006
| Investments | | Interest
Rate | | Maturity
Date | | Credit
Rating:
S&P or
Moody's(a) | | Principal
Amount
(000) | | Value | |
RI St Econ Dev Providence
Place Mall(15) | | | 6.125 | % | | 7/1/2020 | | AA | | $ | 550 | | | $ | 606,722 | | |
Richmond Cnty GA Dev Auth Envr Impt
Rev Intl Paper Co Pjs Ser A AMT | | | 5.00 | % | | 8/1/2030 | | BBB | | | 1,500 | | | | 1,511,400 | | |
Texas City TX Indl Dev Corp
Marine Term Rev Arco Pipe Line | | | 7.375 | % | | 10/1/2020 | | AA+ | | | 650 | | | | 856,889 | | |
| TSASC Inc NY Ser 1 | | | 5.00 | % | | 6/1/2026 | | BBB | | | 4,150 | | | | 4,213,287 | | |
| Total | | | | | | | | | | | | | | | 29,082,142 | | |
| Lease 4.53% | |
| AZ St Ser A COP(14) | | | 5.00 | % | | 11/1/2020 | | AAA | | | 200 | | | | 210,308 | | |
Bemidji MN Lease Rev MN St
Bureau Criminal Appreh(14) | | | 5.75 | % | | 12/1/2018 | | Aaa | | | 555 | | | | 580,358 | | |
Bemidji MN Lease Rev MN St
Bureau Criminal Appreh(14) | | | 5.75 | % | | 12/1/2019 | | Aaa | | | 315 | | | | 329,392 | | |
| Charlotte NC Govt Fac Pj Ser G COP | | | 5.375 | % | | 6/1/2026 | | AA+ | | | 2,250 | | | | 2,416,905 | | |
| District Columbia COP(9) | | | 5.00 | % | | 1/1/2020 | | AAA | | | 2,000 | | | | 2,138,780 | | |
| Grand Rapids MI Pub Sch(14) | | | 5.00 | % | | 11/1/2021 | | AAA | | | 250 | | | | 263,220 | | |
Henrico Cnty VA Econ Dev Auth
Pub Fac Lease Rev Jail Pj | | | 6.125 | % | | 11/1/2019 | | AA+ | | | 1,000 | | | | 1,092,000 | | |
Lancaster Edl Assistance Sch
Dist Lancaster Cnty Pj | | | 5.00 | % | | 12/1/2029 | | BBB+ | | | 1,750 | | | | 1,787,503 | | |
McClain Cnty OK Econ Dev Auth Edl
Facs Lease Rev New Castle Pub Sch Pj | | | 5.00 | % | | 9/1/2012 | | BBB+ | | | 500 | | | | 522,050 | | |
McClain Cnty OK Econ Dev Auth Edl
Facs Lease Rev New Castle Pub Schs Pj | | | 5.00 | % | | 9/1/2013 | | BBB+ | | | 895 | | | | 937,512 | | |
| Miami-Dade Cnty FL Sch Bd Ser C COP(2) | | | 5.00 | % | | 10/1/2021 | | AAA | | | 4,900 | | | | 5,372,948 | | |
Murray City UT Muni Bldg
Auth Lease Rev Ser A(2) | | | 5.30 | % | | 12/1/2021 | | Aaa | | | 2,925 | | | | 3,111,703 | | |
NY New York City Indl Dev Agy
Rev Yankee Stadium Pilot(14) | | | 4.75 | % | | 3/1/2046 | | AAA | | | 5,000 | | | | 5,070,900 | | |
Spartanburg Cnty SC Sch Dist
McCarthy Teszler Pj(16) | | | 5.00 | % | | 3/1/2022 | | AAA | | | 1,000 | | | | 1,044,530 | | |
St. Paul MN Port Auth Lease
Rev Office Bldg | | | 5.00 | % | | 12/1/2022 | | AA+ | | | 1,000 | | | | 1,049,050 | | |
| Total | | | | | | | | | | | | | | | 25,927,159 | | |
| Miscellaneous 6.59% | |
AZ Tourism & Sports Auth Tax
Multipurpose Stadium Fac Ser A(14) | | | 5.00 | % | | 7/1/2031 | | Aaa | | | 670 | | | | 698,348 | | |
See Notes to Financial Statements.
46
Schedule of Investments (continued)
NATIONAL TAX-FREE FUND September 30, 2006
| Investments | | Interest
Rate | | Maturity
Date | | Credit
Rating:
S&P or
Moody's(a) | | Principal
Amount
(000) | | Value | |
George L Smith II GA World
Congress Ctr Auth Rev AMT(14) | | | 5.75 | % | | 7/1/2015 | | AAA | | $ | 1,500 | | | $ | 1,603,215 | | |
George L Smith II GA World
Congress Ctr Rev AMT(14) | | | 5.50 | % | | 7/1/2020 | | AAA | | | 700 | | | | 735,658 | | |
LA Loc Govt Env Fac Pkg Fac
Garage Pj Ser A(2) | | | 5.375 | % | | 10/1/2026 | | AAA | | | 1,500 | | | | 1,591,785 | | |
Larimer Cnty CO Sales & Use
Tax Rev Fairgrounds & Events(14) | | | 5.00 | % | | 12/15/2019 | | AAA | | | 750 | | | | 793,718 | | |
Mashantucket Western Pequot Tribe
CT 2006 Tr Ser A Sub Spl Rev Bd† | | | 5.50 | % | | 9/1/2036 | | Baa3 | | | 1,000 | | | | 1,051,410 | | |
MA St Wtr Pollutn Abatement
Tr PA 1221 RIBs RITES | | | 6.535 | % | | 8/1/2011 | | AAA(d) | | | 4,500 | | | | 5,148,990 | | |
Memphis-Shelby Cnty TN Sports
Memphis Arena Pj(2) | | | 5.25 | % | | 11/1/2023 | | AAA | | | 1,765 | | | | 1,892,733 | | |
Miami-Dade Cnty FL Spl Oblig
Fltg Rate Cap Asset Acq Ser A RIBs(9) | | | 3.676 | % | | 4/1/2014 | | AAA | | | 3,300 | | | | 3,297,591 | | |
New York Convention Ctr Dev
Hotel Unit Fee Secd(2) | | | 5.00 | % | | 11/15/2025 | | AAA | | | 2,375 | | | | 2,528,639 | | |
Omaha Convention Hotel Corp
PA 1078 RIBs RITES(2) | | | 6.265 | % | | 4/1/2010 | | AAA(c) | | | 5,000 | | | | 5,479,400 | | |
Portland OR Urb Ren & Redev
Downtown Wtrfront Ser A(2) | | | 5.50 | % | | 6/15/2020 | | Aaa | | | 650 | | | | 693,166 | | |
Portland OR Urb Ren & Redev
Downtown Wtrfront Ser A(2) | | | 5.75 | % | | 6/15/2019 | | Aaa | | | 1,500 | | | | 1,617,810 | | |
Puerto Rico Pub Bldgs Auth Rev
Govt Facs Ser I GTD | | | 5.25 | % | | 7/1/2033 | | BBB | | | 5,000 | | | | 5,286,000 | | |
| Univ FL Res Fndtn Inc Cap Impt Rev(2) | | | 5.125 | % | | 9/1/2033 | | Aaa | | | 4,000 | | | | 4,121,120 | | |
| Westminster CO Sales & Use Tax Rev(2) | | | 5.25 | % | | 12/1/2022 | | AAA | | | 1,090 | | | | 1,170,431 | | |
| Total | | | | | | | | | | | | | | | 37,710,014 | | |
| Power 2.50% | |
Grant Cnty WA Pub Util Dist No 2
Pwr Rap Hydro 2nd Ser B AMT(14) | | | 5.375 | % | | 1/1/2018 | | AAA | | | 300 | | | | 314,856 | | |
Los Angeles CA Wtr & Pwr Rev
Pwr Sys Ser A-A1(10) | | | 5.25 | % | | 7/1/2020 | | AAA | | | 2,600 | | | | 2,770,144 | | |
MA St Dev Fin Agy Solid Wst Disp Rev
Dominion Energy Brayton Point AMT | | | 5.00 | %# | | 2/1/2036 | | BBB | | | 2,200 | | | | 2,281,180 | | |
| Sacramento CA Muni Util Dist Ser T(9) | | | 5.00 | % | | 5/15/2030 | | AAA | | | 5,000 | | | | 5,258,150 | | |
See Notes to Financial Statements.
47
Schedule of Investments (continued)
NATIONAL TAX-FREE FUND September 30, 2006
| Investments | | Interest
Rate | | Maturity
Date | | Credit
Rating:
S&P or
Moody's(a) | | Principal
Amount
(000) | | Value | |
| SC St Pub Svc(10) | | | 5.25 | % | | 1/1/2019 | | AAA | | $ | 950 | | | $ | 1,025,003 | | |
| TN Energy Acq Corp Gas Rev Ser A | | | 5.00 | % | | 9/1/2013 | | Aa3 | | | 2,500 | | | | 2,669,725 | | |
| Total | | | | | | | | | | | | | | | 14,319,058 | | |
| Pre-Refunded 20.80% | |
| Akron OH Impt | | | 5.80 | % | | 11/1/2020 | | AA- | | | 575 | | | | 628,877 | | |
Athens OH City Sch Dist Fac
Constr & Impt(10) | | | 6.00 | % | | 12/1/2024 | | AAA | | | 500 | | | | 551,465 | | |
| Baltimore MD Rev Wtr Pj Ser A(10) | | | 6.00 | % | | 7/1/2018 | | AAA | | | 285 | | | | 309,661 | | |
| Baltimore MD Rev Wtr Pj Ser A(10) | | | 6.00 | % | | 7/1/2020 | | AAA | | | 275 | | | | 298,796 | | |
Boise City ID Lease Rev Urban
Renewal ADA Cnty Courts(2) | | | 6.25 | % | | 8/15/2019 | | AAA | | | 7,385 | | | | 7,996,109 | | |
Brighton Twp MI Sntn Sew
Drainage Dist(10) | | | 5.25 | % | | 10/1/2018 | | AAA | | | 1,615 | | | | 1,681,086 | | |
Broad River NC Wtr Auth Wtr
Sys Rev(14) | | | 5.375 | % | | 6/1/2026 | | Aaa | | | 400 | | | | 428,476 | | |
| Canton OH Sch Dist Var Purp Ser A(14) | | | 5.625 | % | | 12/1/2023 | | AAA | | | 2,900 | | | | 3,131,739 | | |
Chisholm Creek Util Auth KS
Bel Aire & Park City KS Pj(14) | | | 5.25 | % | | 9/1/2020 | | Aaa | | | 320 | | | | 348,045 | | |
CO Hlth Fac Auth Rev
PorterCare Adventis Hlth | | | 6.625 | % | | 11/15/2026 | | A2 | | | 2,000 | | | | 2,295,840 | | |
Cobb Cnty GA Kennestone Hosp
Auth Rev Ctfs Ser 86 A ETM(14) | | | Zero Coupon | | | 8/1/2015 | | AAA | | | 1,000 | | | | 580,500 | | |
| Culpeper Cnty VA Sch(10) | | | 6.00 | % | | 1/15/2021 | | AAA | | | 690 | | | | 748,243 | | |
| Dallas TX | | | 5.75 | % | | 2/15/2020 | | AA+ | | | 1,615 | | | | 1,722,947 | | |
| DE Transn Auth Transn Sys Rev Sr | | | 6.00 | % | | 7/1/2020 | | AA+ | | | 6,215 | | | | 6,746,010 | | |
Detroit MI Wtr Supply Sys Sr
Lien Ser A(9) | | | 5.75 | % | | 7/1/2028 | | AAA | | | 1,500 | | | | 1,651,305 | | |
Fayette Cnty GA Pub Fac Auth
Criminal Justice Ctr Pj | | | 6.00 | % | | 6/1/2030 | | AA | | | 3,500 | | | | 3,823,610 | | |
| Georgetown Cnty SC Sch Dist(10) | | | 5.25 | % | | 3/1/2020 | | AAA | | | 2,485 | | | | 2,649,631 | | |
Greenville Cnty SC Sch Dist
Installment Purp Rev BEST | | | 5.50 | % | | 12/1/2028 | | AA- | | | 5,500 | | | | 6,103,570 | | |
Harris Cnty TX Hlth Facs Dev Corp
Hosp Rev Mem Hermann
Hlthcare Ser A | | | 6.375 | % | | 6/1/2029 | | A+ | | | 2,500 | | | | 2,811,525 | | |
Highlands Cnty FL Hlth Fac Auth
Rev Hosp Adventist/Sunbelt Ser A | | | 6.00 | % | | 11/15/2031 | | A2 | | | 2,755 | | | | 3,082,790 | | |
| IA Fin Auth Rev ETM | | | 5.25 | % | | 8/15/2021 | | Aa2 | | | 235 | | | | 239,991 | | |
See Notes to Financial Statements.
48
Schedule of Investments (continued)
NATIONAL TAX-FREE FUND September 30, 2006
| Investments | | Interest
Rate | | Maturity
Date | | Credit
Rating:
S&P or
Moody's(a) | | Principal
Amount
(000) | | Value | |
Jackson OH Hosp Fac Rev Cons
Hlth Sys Jackson Hosp(15) | | | 6.125 | % | | 10/1/2023 | | AA | | $ | 680 | | | $ | 736,005 | | |
| Lake Orion MI Cmnty Sch Dist Ser B | | | 5.25 | % | | 5/1/2025 | | AA | | | 4,900 | | | | 5,170,480 | | |
| Lane Cnty OR Sch Dist No 052 | | | 5.625 | % | | 6/15/2020 | | Aa3 | | | 800 | | | | 857,280 | | |
Lauderdale Cnty & Florence AL
Hlthcare Auth Rev(14) | | | 5.75 | % | | 7/1/2019 | | AAA | | | 2,000 | | | | 2,075,620 | | |
| Linn Cnty OR Sch Dist No 55(10) | | | 5.50 | % | | 6/15/2025 | | AAA | | | 1,935 | | | | 2,095,953 | | |
Linn Cnty OR Sch Dist No 55
Sweet Home(10) | | | 5.50 | % | | 6/15/2020 | | AAA | | | 1,000 | | | | 1,083,180 | | |
Linn Cnty OR Sch Dist No 55
Unrefunded Bal(10) | | | 5.50 | % | | 6/15/2025 | | AAA | | | 310 | | | | 335,786 | | |
MD St Hlth & Higher Edl Facs
Auth Rev North Arundel Hosp | | | 6.50 | % | | 7/1/2026 | | A3 | | | 1,000 | | | | 1,110,840 | | |
MD St Hlth & Higher Edl Facs
Catholic Hlth Initiative Ser A ETM | | | 6.00 | % | | 12/1/2024 | | AA | | | 100 | | | | 107,638 | | |
MD St Hlth & Higher Edl Facs
Univ MD Med Sys | | | 6.75 | % | | 7/1/2030 | | A3 | | | 1,950 | | | | 2,179,417 | | |
Mesa AZ Indl Dev Auth
Discovery Hlth Sys Ser A(14) | | | 5.75 | % | | 1/1/2025 | | AAA | | | 750 | | | | 805,792 | | |
| New York NY Ser A | | | 6.00 | % | | 5/15/2030 | | AA- | | | 2,155 | | | | 2,352,247 | | |
NJ St Transn Tr Fd Auth
Transn Sys Ser B | | | 6.00 | % | | 6/15/2019 | | AAA | | | 2,550 | | | | 2,765,449 | | |
NM St Hosp Equip Ln Council
Presbyterian Hlthcare Ser A | | | 5.50 | % | | 8/1/2025 | | AA- | | | 2,000 | | | | 2,178,100 | | |
| North Providence RI Ser A(14) | | | 6.125 | % | | 7/1/2016 | | AAA | | | 1,410 | | | | 1,464,581 | | |
Orange Cnty FL Hlth Facs Auth
Rev Hosp Orlando Regl Hlthcare | | | 5.75 | % | | 12/1/2027 | | A | | | 1,000 | | | | 1,115,420 | | |
| Paragould AR Wtr Swr & Elec Rev(2) | | | 5.65 | % | | 12/1/2025 | | AAA | | | 615 | | | | 664,735 | | |
Paw Paw MI Pub Sch Dist Sch
Bldg & Site | | | 6.00 | % | | 5/1/2030 | | AA | | | 550 | | | | 595,045 | | |
| Philadelphia PA Sch Dist Ser A(10) | | | 5.75 | % | | 2/1/2030 | | AAA | | | 1,200 | | | | 1,304,412 | | |
| Phoenix AZ Civic Impt Corp(9) | | | 6.00 | % | | 7/1/2024 | | AAA | | | 2,400 | | | | 2,626,104 | | |
Providence RI Redev Agy Rev
Pub Safety & Muni Bldgs Ser A(2) | | | 5.75 | % | | 4/1/2029 | | Aaa | | | 415 | | | | 447,125 | | |
| RI St Econ Dev Corp Arpt Rev Ser B(9) | | | 6.00 | % | | 7/1/2020 | | AAA | | | 1,210 | | | | 1,316,879 | | |
| RI St Econ Dev Corp Arpt Rev Ser B(9) | | | 6.00 | % | | 7/1/2028 | | AAA | | | 1,200 | | | | 1,301,616 | | |
RI St Hlth & Edl Bldg Corp
Rev Hosp Fin Lifespan Oblig Grp | | | 6.50 | % | | 8/15/2032 | | A- | | | 1,000 | | | | 1,149,740 | | |
See Notes to Financial Statements.
49
Schedule of Investments (continued)
NATIONAL TAX-FREE FUND September 30, 2006
| Investments | | Interest
Rate | | Maturity
Date | | Credit
Rating:
S&P or
Moody's(a) | | Principal
Amount
(000) | | Value | |
SC Jobs Econ Dev Auth Hosp
Facs Rev Palmetto Hlth C | | | 6.375 | % | | 8/1/2034 | | BBB+ | | $ | 1,780 | | | $ | 2,062,433 | | |
| SC Jobs Economic Hosp Fac Rev | | | 7.375 | % | | 12/15/2021 | | BBB+ | | | 2,000 | | | | 2,318,300 | | |
South Washington Cnty MN
Indpt Sch Dist No 833 Ser A(14) | | | 5.50 | % | | 2/1/2018 | | AAA | | | 5,065 | | | | 5,363,784 | | |
South Washington Cnty MN
Indpt Sch Dist No 833 Ser A(14) | | | 5.50 | % | | 2/1/2019 | | AAA | | | 2,990 | | | | 3,166,380 | | |
Sullivan Cnty TN Hlth Ed Hosp &
Hsg Facs Bd Rev Wellmont Hlth | | | 6.25 | % | | 9/1/2022 | | NR | | | 1,250 | | | | 1,428,513 | | |
Sullivan Cnty TN Hlth Ed Hosp &
Hsg Facs Bd Rev Wellmont Hlth | | | 6.25 | % | | 9/1/2022 | | BBB(d) | | | 750 | | | | 857,107 | | |
Sunman Dearborn IN Inter Sch
Bldg Corp First Mtg(9) | | | 5.00 | % | | 1/15/2021 | | AAA | | | 1,105 | | | | 1,179,278 | | |
Teays Vly OH Loc Sch Dist Sch
Facs Constr & Impt(9) | | | 5.375 | % | | 12/1/2020 | | Aaa | | | 500 | | | | 535,165 | | |
TN St Sch Bd Auth Higher Edl
Facs Ser A | | | 5.625 | % | | 5/1/2030 | | AA- | | | 150 | | | | 160,412 | | |
| Univ Central AR Rev Hsg Sys(10) | | | 6.50 | % | | 1/1/2031 | | AAA | | | 2,425 | | | | 2,647,736 | | |
Univ MA Bldg Auth Facs Rev
Sen Comwlth Ser 4-A(14) | | | 5.125 | % | | 11/1/2034 | | AAA | | | 5,000 | | | | 5,507,950 | | |
| VA St Pub Bldg Auth Pub Fac Rev Ser A | | | 5.75 | % | | 8/1/2020 | | AA+ | | | 600 | | | | 645,900 | | |
West Vly City UT Muni Bldg Auth
Lease Rev Ref Ser A(2) | | | 5.50 | % | | 8/1/2027 | | AAA | | | 1,000 | | | | 1,099,540 | | |
White Hsg Util Dist TN
Robertson/Sumner Cntys Wtr/Swr(10) | | | 6.00 | % | | 1/1/2026 | | Aaa | | | 1,090 | | | | 1,171,369 | | |
| Whitehall MI Dist Sch | | | 5.50 | % | | 5/1/2019 | | AA | | | 1,400 | | | | 1,521,660 | | |
| WV St Road(14) | | | 5.75 | % | | 6/1/2025 | | AAA | | | 1,800 | | | | 1,951,110 | | |
| WV Wtr Dev Auth Infra Rev Ser A(2) | | | 5.50 | % | | 10/1/2023 | | AAA | | | 900 | | | | 1,010,691 | | |
| WV Wtr Dev Auth Infra Rev Ser A(10) | | | 5.625 | % | | 10/1/2026 | | AAA | | | 1,555 | | | | 1,674,704 | | |
Wyandotte Cnty KS Sch Dist No 204
Bonner Springs Ser A(10) | | | 5.60 | % | | 9/1/2020 | | Aaa | | | 620 | | | | 666,215 | | |
| York Cnty VA Swr Rev | | | 5.875 | % | | 6/1/2024 | | Aa3 | | | 330 | | | | 352,549 | | |
| Total | | | | | | | | | | | | | | | 118,990,456 | | |
| Resource Recovery 0.55% | |
Gulf Coast Wst Disp Auth TX
Wst Mgmt of TX Ser A AMT | | | 5.20 | %# | | 5/1/2028 | | BBB | | | 1,825 | | | | 1,905,683 | | |
See Notes to Financial Statements.
50
Schedule of Investments (continued)
NATIONAL TAX-FREE FUND September 30, 2006
| Investments | | Interest
Rate | | Maturity
Date | | Credit
Rating:
S&P or
Moody's(a) | | Principal
Amount
(000) | | Value | |
MO St Envr Impt & Enrg
Unrefunded Bal St Revolving B | | | 7.20 | % | | 7/1/2016 | | Aaa | | $ | 1,245 | | | $ | 1,246,768 | | |
| Total | | | | | | | | | | | | | | | 3,152,451 | | |
| Sales Tax 1.33% | |
Los Angeles Cnty CA Met Trans Auth
Sales Tax Rev Ref Prop C 2nd Sr Ser A(e)(10) | | | 4.50 | % | | 7/1/2030 | | AAA | | | 7,565 | | | | 7,594,201 | | |
| Special Tax 1.10% | |
Ernest N Morial New Orleans
LA Exhibit Hall Auth Spl Tax RIBs | | | 6.606 | % | | 7/15/2028 | | AAA | | | 5,000 | | | | 5,504,900 | | |
Salida CA Area Pub Facs Fing
Agy Cmnty Facs Dist Spl Tax 1988-1(10) | | | 5.25 | % | | 9/1/2028 | | AAA | | | 355 | | | | 367,180 | | |
San Juan Cnty NM Tax/Motor
Ref & Impt(13)(14) | | | 5.25 | % | | 5/15/2022 | | AAA | | | 390 | | | | 419,032 | | |
| Total | | | | | | | | | | | | | | | 6,291,112 | | |
| Toll Roads 1.29% | |
NJ St Tpk Auth Rev Rols RR II
R 323 RIBs(2) | | | 6.139 | % | | 1/1/2035 | | Aaa | | | 7,000 | | | | 7,386,540 | | |
| Transportation 5.70% | |
Alliance Arpt Auth Inc TX Spl
Facs Rev Fedex Corp Pj AMT | | | 4.85 | % | | 4/1/2021 | | BBB | | | 2,220 | | | | 2,252,057 | | |
| Billings MT Arpt Rev AMT(14) | | | 6.10 | % | | 7/1/2016 | | AAA | | | 190 | | | | 206,515 | | |
| Billings MT Arpt Rev AMT(14) | | | 6.20 | % | | 7/1/2020 | | AAA | | | 2,775 | | | | 3,021,697 | | |
| HI St Hbr Sys Rev Ser A AMT(10) | | | 5.00 | % | | 1/1/2031 | | AAA | | | 2,000 | | | | 2,073,260 | | |
| HI St Hbr Sys Rev Ser A AMT(10) | | | 5.25 | % | | 1/1/2027 | | AAA | | | 4,000 | | | | 4,268,160 | | |
Houston TX Arpt Sys Rev Sub
Lien Ser A AMT(9) | | | 5.50 | % | | 7/1/2012 | | AAA | | | 1,610 | | | | 1,731,748 | | |
Muni Secs Trust Ctfs Ser 7006
Tr Ctf Cl B RIBs(2) | | | 6.595 | % | | 1/1/2031 | | Aaa | | | 6,250 | | | | 6,969,000 | | |
NY New York City Indl Dev Agy
Terminal One Group Assn Pj AMT | | | 5.50 | %# | | 1/1/2024 | | A3 | | | 4,750 | | | | 5,131,662 | | |
| PA St Tpk Commn Tpk Rev Ser A(2) | | | 5.25 | % | | 12/1/2032 | | AAA | | | 5,000 | | | | 5,416,650 | | |
| Port Kalama WA Rev Ser B AMT | | | 5.625 | % | | 12/1/2015 | | A3 | | | 1,025 | | | | 1,027,532 | | |
San Francisco CA City & Cnty
Arpt Lease SFO Fuel Ser A AMT(10) | | | 6.125 | % | | 1/1/2027 | | AAA | | | 495 | | | | 515,221 | | |
| Total | | | | | | | | | | | | | | | 32,613,502 | | |
See Notes to Financial Statements.
51
Schedule of Investments (concluded)
NATIONAL TAX-FREE FUND September 30, 2006
| Investments | | Interest
Rate | | Maturity
Date | | Credit
Rating:
S&P or
Moody's(a) | | Principal
Amount
(000) | | Value | |
| Water/Sewer 6.53% | |
Chisholm Creek Util Auth KS
Bel Aire & Park City KS Pj(14) | | | 5.25 | % | | 9/1/2021 | | Aaa | | $ | 1,025 | | | $ | 1,098,472 | | |
| Fort Lauderdale FL Wtr & Swr Rev(e)(14) | | | 4.50 | % | | 9/1/2035 | | AAA | | | 3,000 | | | | 2,966,370 | | |
| Gainesville GA Wtr & Sew Rev(10) | | | 5.375 | % | | 11/15/2020 | | AAA | | | 2,900 | | | | 3,117,326 | | |
| Gautier MI Util Dist Util Sys Rev(9) | | | 5.125 | % | | 3/1/2019 | | Aaa | | | 425 | | | | 449,727 | | |
| Grand Forks ND Wtr Rev Ser D(14) | | | 5.375 | % | | 9/1/2020 | | Aaa | | | 1,150 | | | | 1,216,447 | | |
| Iowa City IA Swr Rev(10) | | | 5.375 | % | | 7/1/2020 | | Aaa | | | 620 | | | | 647,956 | | |
KS St Dev Fin Auth Rev Pub
Wtr Supply Revolving Ln 2 | | | 4.75 | % | | 4/1/2018 | | Aa1 | | | 1,180 | | | | 1,196,107 | | |
| Midlothian TX Wtr Dist(10) | | | Zero Coupon | | | 9/1/2022 | | AAA | | | 2,000 | | | | 965,600 | | |
| NY New York City Muni Wtr Fin | | | 5.125 | % | | 6/15/2031 | | AA+ | | | 5,000 | | | | 5,229,150 | | |
OR St Bd Bk Rev OR Econ Cmnty
Dev Dept Ser A(14) | | | 5.50 | % | | 1/1/2017 | | AAA | | | 570 | | | | 594,048 | | |
| Raleigh NC Comb Entrprse | | | 5.00 | % | | 3/1/2031 | | AAA | | | 11,980 | | | | 12,584,271 | | |
| Rockingham NC COP(2) | | | 5.00 | % | | 4/1/2020 | | AAA | | | 1,205 | | | | 1,279,698 | | |
| SD Conservancy Dist(2) | | | 5.00 | % | | 8/1/2022 | | Aaa | | | 2,700 | | | | 2,817,261 | | |
SD Conservancy Dist Rev Clean
Wtr St Revolving Fd(2) | | | 5.00 | % | | 8/1/2022 | | Aaa | | | 500 | | | | 519,715 | | |
| UT Wtr Fin Agy Rev Pooled Ln Fin Pg(2) | | | 5.125 | % | | 7/1/2023 | | Aaa | | | 1,000 | | | | 1,055,040 | | |
WV St Wtr Dev Auth Rev Loan
Pg III Ser A AMT(2) | | | 6.25 | % | | 7/1/2030 | | AAA | | | 1,470 | | | | 1,601,800 | | |
| Total | | | | | | | | | | | | | | | 37,338,988 | | |
| Total Municipal Bonds (cost $533,570,120) | | | | | | | | | | | | | | | 568,473,568 | | |
| | | | | | | | | Shares
(000) | | | |
| SHORT-TERM INVESTMENTS 0.03% | |
| Money Market Mutual Funds | |
| Dreyfus Municipal Cash Management Plus | | | | | | | | | | | 189 | | | | 189,465 | | |
| SSgA Tax Free Money Market Fund | | | | | | | | | | | 6 | | | | 5,698 | | |
| Total Short-Term Investments (cost $195,163) | | | | | | | | | | | | | | | 195,163 | | |
| Total Investments in Securities 99.40% (cost $533,765,283) | | | | | | | | | | | | | | | 568,668,731 | | |
| Cash and Other Assets in Excess of Liabilities(g) 0.60% | | | | | | | | | | | | | | | 3,430,307 | | |
| Net Assets 100.00% | | | | | | | | | | | | | | $ | 572,099,038 | | |
| Open futures contracts at September 30, 2006: | |
| Type | | Expiration | | Contracts | | Position | | Market Value | | Unrealized
Depreciation | |
| U.S. 20-Year Treasury Bond | | | December 2006 | | | | 388 | | | Short | | $ | (43,613,625 | ) | | $ | (745,352 | ) | |
See Notes to Financial Statements.
52
Schedule of Investments
CALIFORNIA TAX-FREE FUND September 30, 2006
| Investments | | Interest
Rate | | Maturity
Date | | Credit
Rating:
S&P or
Moody's(a) | | Principal
Amount
(000) | | Value | |
| MUNICIPAL BONDS 98.49% | |
| Education 7.81% | |
Abag Fin Auth For Nonprofit
Corp CA Rev Sch of Mech Arts | | | 5.25 | % | | 10/1/2026 | | A3 | | $ | 500 | | | $ | 524,925 | | |
CA Edl Facs Auth Rev Res Ctfs
Ser 113 RIBs | | | 6.355 | % | | 12/1/2027 | | AAA | | | 2,525 | | | | 2,662,309 | | |
CA Edl Facs Auth Rev Scripps
College | | | 5.25 | % | | 8/1/2021 | | A1 | | | 425 | | | | 446,743 | | |
CA Edl Facs Auth Rev Scripps
College | | | 5.25 | % | | 8/1/2026 | | A1 | | | 1,145 | | | | 1,201,540 | | |
CA Edl Facs Auth Rev Univ La
Verne Ser A | | | 5.00 | % | | 6/1/2035 | | Baa2 | | | 1,000 | | | | 1,021,080 | | |
CA Edl Facs Auth Rev Univ of
San Diego(2) | | | 5.00 | % | | 10/1/2028 | | Aaa | | | 1,250 | | | | 1,294,225 | | |
CA Infrastr & Econ Dev Bk Rev
San Francisco Ballet Assoc(9) | | | 3.79 | %# | | 7/1/2036 | | AAA | | | 400 | | | | 400,000 | | |
CA Muni Fin Auth Ed Rev
American Heritage Ed Fndtn Pj A | | | 5.25 | % | | 6/1/2036 | | BBB- | | | 1,000 | | | | 1,023,510 | | |
| Los Angeles CA Unif Sch Dist Ser A(10) | | | 5.00 | % | | 7/1/2022 | | AAA | | | 1,500 | | | | 1,591,425 | | |
| San Rafael CA City Elem Sch(9) | | | 4.50 | % | | 2/1/2030 | | AAA | | | 520 | | | | 520,042 | | |
San Ysidro CA Sch Dist Cap
Apprec Election 1997 Ser D(9) | | | Zero Coupon | | | 8/1/2028 | | AAA | | | 1,000 | | | | 373,800 | | |
| Univ CA Rev Multi Purp Ser K | | | 5.25 | % | | 9/1/2024 | | AA | | | 1,545 | | | | 1,603,957 | | |
| Univ CA Rev Ltd Pj Ser B(10) | | | 5.00 | % | | 5/15/2033 | | AAA | | | 1,000 | | | | 1,048,970 | | |
| Total | | | | | | | | | | | | | | | 13,712,526 | | |
| General Obligation 20.43% | |
| Antelope Vly CA Unif High Sch(14) | | | 5.00 | % | | 8/1/2022 | | AAA | | | 2,080 | | | | 2,207,982 | | |
| Barstow CA Unif Sch Dist Ser A(9) | | | 5.00 | % | | 8/1/2026 | | Aaa | | | 2,500 | | | | 2,620,675 | | |
| CA St | | | 4.75 | % | | 9/1/2030 | | A+ | | | 1,775 | | | | 1,807,252 | | |
| CA St | | | 5.10 | % | | 2/1/2034 | | A+ | | | 2,900 | | | | 2,964,177 | | |
| CA St | | | 5.125 | % | | 6/1/2027 | | A+ | | | 500 | | | | 518,715 | | |
| CA St | | | 5.25 | % | | 2/1/2019 | | A+ | | | 1,000 | | | | 1,081,400 | | |
| CA St Previous Veterans Ser BJ AMT | | | 5.70 | % | | 12/1/2032 | | AA- | | | 640 | | | | 652,416 | | |
| CA St ROLs RRII R623 RIBs(2) | | | 6.149 | % | | 4/1/2031 | | Aaa | | | 5,000 | | | | 5,461,200 | | |
| CA St Var Purp | | | 5.25 | % | | 11/1/2027 | | A+ | | | 520 | | | | 555,402 | | |
Capistrano CA Unif Sch Dist
Facs Impt Dist No 001 Ser A(9) | | | 6.00 | % | | 8/1/2024 | | AAA | | | 2,500 | | | | 2,733,350 | | |
| Escondido CA Unif Sch Dist Ser A(10) | | | 5.25 | % | | 8/1/2022 | | AAA | | | 2,000 | | | | 2,154,480 | | |
See Notes to Financial Statements.
53
Schedule of Investments (continued)
CALIFORNIA TAX-FREE FUND September 30, 2006
| Investments | | Interest
Rate | | Maturity
Date | | Credit
Rating:
S&P or
Moody's(a) | | Principal
Amount
(000) | | Value | |
Mojave CA Unif Sch Dist Sch
Facs Impt Dist No 001(9) | | | 5.00 | % | | 8/1/2024 | | AAA | | $ | 1,060 | | | $ | 1,113,413 | | |
Mojave CA Unif Sch Dist Sch
Facs Impt Dist No 001(9) | | | 5.25 | % | | 8/1/2022 | | AAA | | | 1,230 | | | | 1,325,005 | | |
| Montebello CA Unif Sch Dist(10) | | | 5.00 | % | | 8/1/2020 | | AAA | | | 350 | | | | 370,780 | | |
Mount Pleasant CA Elem Sch
Dist 1998 Election Ser C(10) | | | 5.50 | % | | 3/1/2026 | | AAA | | | 465 | | | | 506,464 | | |
| Oak Vly CA Hosp Dist Election 2004(9) | | | 5.00 | % | | 7/1/2033 | | Aaa | | | 500 | | | | 523,760 | | |
| Oxnard CA Unif High Sch Dist Ser A(14) | | | 6.00 | % | | 2/1/2020 | | AAA | | | 650 | | | | 751,725 | | |
| Oxnard CA Unif High Sch Dist Ser A(14) | | | 6.20 | % | | 8/1/2030 | | AAA | | | 3,000 | | | | 3,459,300 | | |
Pittsburg CA Redev Agy Los
Medanos Cmnty Dev Pj(2) | | | Zero Coupon | | | 8/1/2026 | | AAA | | | 3,500 | | | | 1,442,875 | | |
| Pomona CA Unif Sch Dist(14) | | | 6.15 | % | | 8/1/2030 | | AAA | | | 1,000 | | | | 1,236,040 | | |
| Pomona CA Unif Sch Dist Ser A(14) | | | 6.55 | % | | 8/1/2029 | | AAA | | | 1,000 | | | | 1,308,350 | | |
| Puerto Rico Comwlth Pub Impt Ser A | | | 5.375 | % | | 7/1/2028 | | BBB | | | 995 | | | | 1,040,810 | | |
Riverside CA Cmnty College
Dist Unrefunded Bal Ser A(14) | | | 5.50 | % | | 8/1/2029 | | AAA | | | 15 | | | | 16,572 | | |
| Total | | | | | | | | | | | | | | | 35,852,143 | | |
| Healthcare 4.88% | |
CA Hlth Facs Fin Auth Rev CA
NV Methodist | | | 5.00 | % | | 7/1/2036 | | A+ | | | 1,000 | | | | 1,039,020 | | |
CA Hlth Facs Fin Auth Rev Ref
Cedars Sinai Med Ctr | | | 5.00 | % | | 11/15/2034 | | A3 | | | 1,000 | | | | 1,037,750 | | |
CA Infrastr & Econ Dev Bk Rev
Kaiser Hosp Ser A | | | 5.50 | % | | 8/1/2031 | | A+ | | | 1,300 | | | | 1,386,060 | | |
CA Infrastr & Econ Dev Bk Rev
Kaiser Hosp Ser B | | | 5.55 | % | | 8/1/2031 | | A+ | | | 650 | | | | 694,434 | | |
CA Infrastr & Econ Scripps
Res Instl Ser A | | | 5.75 | % | | 7/1/2030 | | Aa3 | | | 1,500 | | | | 1,570,575 | | |
CA Statewide Cmntys Dev Auth
Rev Daughters of Charity Hlth A | | | 5.25 | % | | 7/1/2035 | | BBB+ | | | 1,675 | | | | 1,747,611 | | |
Torrance CA Hosp Rev Torrance
Memorial Med Ctr Ser A | | | 5.50 | % | | 6/1/2031 | | A+ | | | 500 | | | | 526,340 | | |
Torrance CA Hosp Rev Torrance
Memorial Med Ctr Ser A | | | 6.00 | % | | 6/1/2022 | | A+ | | | 500 | | | | 553,660 | | |
| Total | | | | | | | | | | | | | | | 8,555,450 | | |
| Housing 0.59% | |
CA Statewide Cmntys Dev Auth
Ref CHF Irvine LLC UCI East | | | 5.00 | % | | 5/15/2038 | | Baa3 | | | 1,000 | | | | 1,029,100 | | |
See Notes to Financial Statements.
54
Schedule of Investments (continued)
CALIFORNIA TAX-FREE FUND September 30, 2006
| Investments | | Interest
Rate | | Maturity
Date | | Credit
Rating:
S&P or
Moody's(a) | | Principal
Amount
(000) | | Value | |
| Industrial 3.71% | |
Golden St Tob Securitization Corp
CA Rev ROLs RRII R565 RIBs(9) | | | 6.159 | % | | 6/1/2035 | | Aaa | | $ | 5,000 | | | $ | 5,471,600 | | |
Tob Securitization Auth Lease
North CA Tob Settlmnt Rev
Asset Bkd Bds Ser A 1 | | | 5.375 | % | | 6/1/2038 | | BBB | | | 1,000 | | | | 1,033,120 | | |
| Total | | | | | | | | | | | | | | | 6,504,720 | | |
| Lease 8.29% | |
CA St Pub Wk Bd Lease Rev
Dept Gen Svcs Teale Data(2) | | | 5.25 | % | | 3/1/2020 | | AAA | | | 1,000 | | | | 1,066,220 | | |
Inglewood CA Pub Fin Auth Rev
Ser A(2) | | | 5.25 | % | | 8/1/2021 | | AAA | | | 600 | | | | 637,518 | | |
Palm Springs CA Fin Auth
Convention Ctr Pj Ser A(14) | | | 5.50 | % | | 11/1/2035 | | AAA | | | 1,000 | | | | 1,117,130 | | |
Plumas Cnty CA Cap Impt Pg
Ser A COP(2) | | | 5.25 | % | | 6/1/2023 | | AAA | | | 1,365 | | | | 1,482,622 | | |
Sacramento CA City Fin Auth
Rev Cap Impt Ser A(2) | | | 5.00 | % | | 12/1/2026 | | AAA | | | 900 | | | | 942,147 | | |
| San Buenaventura CA Ser C COP(2) | | | 5.25 | % | | 2/1/2031 | | AAA | | | 2,575 | | | | 2,721,131 | | |
San Francisco CA City & Cnty
San Bruno Jail No 3(2) | | | 5.25 | % | | 10/1/2033 | | AAA | | | 5,000 | | | | 5,236,500 | | |
Santa Ana CA Unif Sch Dist
Fin Pj COP(10) | | | Zero Coupon | | | 4/1/2019 | | AAA | | | 2,295 | | | | 1,342,323 | | |
| Total | | | | | | | | | | | | | | | 14,545,591 | | |
| Miscellaneous 2.07% | |
CA Infrastr & Econ Bk Rev
YMCA Metropolitan LA Pj(2) | | | 5.25 | % | | 2/1/2026 | | AAA | | | 2,000 | | | | 2,138,900 | | |
Fontana CA Pub Fin Auth Tax
North Fontana Redev Pj Ser A(2) | | | 5.50 | % | | 9/1/2032 | | AAA | | | 1,000 | | | | 1,074,910 | | |
Oakland CA Jnt Pwrs Fin Auth
Reassmt Rev | | | 5.50 | % | | 9/2/2024 | | A- | | | 405 | | | | 427,429 | | |
| Total | | | | | | | | | | | | | | | 3,641,239 | | |
| Power 2.12% | |
Los Angeles CA Wtr & Pwr Rev
Pwr Sys Ser A(13)(14) | | | 5.00 | % | | 7/1/2024 | | AAA | | | 850 | | | | 878,058 | | |
Puerto Rico Elec Pwr Auth Pwr
Rev Ser NN(14) | | | 5.00 | % | | 7/1/2032 | | AAA | | | 1,500 | | | | 1,575,120 | | |
| Puerto Rico Elec Pwr Auth Rev Ser II(10) | | | 5.125 | % | | 7/1/2026 | | AAA | | | 500 | | | | 533,350 | | |
See Notes to Financial Statements.
55
Schedule of Investments (continued)
CALIFORNIA TAX-FREE FUND September 30, 2006
| Investments | | Interest
Rate | | Maturity
Date | | Credit
Rating:
S&P or
Moody's(a) | | Principal
Amount
(000) | | Value | |
Shasta CA Jnt Pwrs Fin Auth
Cnty Admin Bldg Pj Ser A(14) | | | 5.25 | % | | 4/1/2023 | | AAA | | $ | 675 | | | $ | 724,815 | | |
| Total | | | | | | | | | | | | | | | 3,711,343 | | |
| Pre-Refunded 17.27% | |
| Anaheim CA Unif High Sch Dist Ser A(10) | | | 5.00 | % | | 8/1/2025 | | AAA | | | 785 | | | | 846,952 | | |
Berryessa CA Unif Sch Dist
Election of 1999 Ser B(10) | | | 5.25 | % | | 8/1/2019 | | AAA | | | 1,015 | | | | 1,103,650 | | |
CA Edl Facs Auth Rev
Pepperdine Univ | | | 5.75 | % | | 9/15/2030 | | A1 | | | 2,000 | | | | 2,104,960 | | |
CA Edl Facs Auth Rev Pooled
College/Univ Ser C ETM | | | 6.50 | % | | 6/1/2020 | | Baa3 | | | 3,000 | | | | 3,316,440 | | |
CA Infrastr & Econ Dev Bk Rev
Asian Museum Fndtn(14) | | | 5.25 | % | | 6/1/2030 | | AAA | | | 115 | | | | 117,515 | | |
| CA Refunded Bal St(9) | | | 5.25 | % | | 9/1/2030 | | AAA | | | 840 | | | | 895,129 | | |
| CA St Univ Fndtn Rev Monterey Bay(14) | | | 5.30 | % | | 6/1/2022 | | AAA | | | 250 | | | | 269,623 | | |
CA St Univ Fndtn Rev
Sacramento Auxiliary Ser A(14) | | | 5.50 | % | | 10/1/2027 | | AAA | | | 400 | | | | 443,132 | | |
| CA St Unrefunded Bal(9) | | | 5.25 | % | | 9/1/2030 | | AAA | | | 50 | | | | 53,282 | | |
CA Statewide Cmntys Dev Auth
Auxiliary Fndtn CA St Univ COP(14) | | | 5.20 | % | | 6/1/2024 | | AAA | | | 525 | | | | 547,622 | | |
Centinela Vly CA Unif High
Sch Election 2000 Ser D ETM(9) | | | 5.25 | % | | 8/1/2024 | | AAA | | | 1,145 | | | | 1,228,184 | | |
| El Monte CA City Sch Dist Ser A(10) | | | 6.25 | % | | 5/1/2025 | | AAA | | | 1,230 | | | | 1,353,996 | | |
| El Monte CA Wtr Auth Rev Wtr Sys Pj(2) | | | 5.60 | % | | 9/1/2029 | | AAA | | | 2,000 | | | | 2,191,660 | | |
| Franklin-McKinley CA Sch Dist Ser B(10) | | | 5.00 | % | | 8/1/2027 | | AAA | | | 675 | | | | 735,109 | | |
Fremont CA Unif High Sch Dist
Santa Clara Cnty Ser B(9) | | | 5.25 | % | | 9/1/2025 | | AAA | | | 1,000 | | | | 1,065,630 | | |
| Los Angeles CA Unif Sch Dist Ser D(9) | | | 5.375 | % | | 7/1/2025 | | AAA | | | 1,000 | | | | 1,067,340 | | |
MSR Pub Pwr Agy CA San Juan
Pj Rev Ser D ETM(14) | | | 6.75 | % | | 7/1/2020 | | AAA | | | 880 | | | | 1,047,816 | | |
| Pittsburg CA Unif Sch Dist Ser E(10) | | | 6.00 | % | | 8/1/2024 | | AAA | | | 1,380 | | | | 1,456,121 | | |
Puerto Rico Comwlth Bal
Pub Impt Ser A | | | 5.375 | % | | 7/1/2028 | | AAA | | | 505 | | | | 545,784 | | |
| Puerto Rico Pub Fin Corp Approp E | | | 5.50 | % | | 8/1/2029 | | Aaa | | | 750 | | | | 818,835 | | |
| Riverside CA Cmnty College Ser A(14) | | | 5.50 | % | | 8/1/2029 | | AAA | | | 1,340 | | | | 1,516,116 | | |
Sacramento CA City Fin Auth
Rev Cap Impt Ser A(2) | | | 5.00 | % | | 12/1/2020 | | AAA | | | 2,000 | | | | 2,131,380 | | |
Santa Cruz CA City Elem Sch
Dist Ser B(9) | | | 6.00 | % | | 8/1/2029 | | AAA | | | 2,500 | | | | 2,717,575 | | |
| Santa Cruz CA City High Sch Ser B(9) | | | 6.00 | % | | 8/1/2029 | | AAA | | | 1,000 | | | | 1,087,030 | | |
| Southwestern Cmnty College Dist CA(2) | | | 5.375 | % | | 8/1/2025 | | AAA | | | 1,500 | | | | 1,639,275 | | |
| Total | | | | | | | | | | | | | | | 30,300,156 | | |
See Notes to Financial Statements.
56
Schedule of Investments (continued)
CALIFORNIA TAX-FREE FUND September 30, 2006
| Investments | | Interest
Rate | | Maturity
Date | | Credit
Rating:
S&P or
Moody's(a) | | Principal
Amount
(000) | | Value | |
| Resource Recovery 2.42% | |
CA Pollutn Ctrl Fin Auth Rev
Pacific Gas/Elec Ser A AMT(14) | | | 5.35 | % | | 12/1/2016 | | AAA | | $ | 2,000 | | | $ | 2,156,360 | | |
CA Pollutn Ctrl Fin Auth Solid Wst
Disp Rev Mgmt Inc Pj Ser B AMT | | | 5.00 | % | | 7/1/2027 | | BBB | | | 1,000 | | | | 1,032,640 | | |
CA Pollutn Ctrl Fin Auth Solid Wst
Mgmt Inc Pj Ser A2 AMT | | | 5.40 | % | | 4/1/2025 | | BBB | | | 1,000 | | | | 1,064,130 | | |
| Total | | | | | | | | | | | | | | | 4,253,130 | | |
| Sales Tax 3.25% | |
Los Angeles Cnty CA Met Trans Auth
Sales Tax Rev Sr Ser A(e)(10) | | | 4.50 | % | | 7/1/2030 | | AAA | | | 2,500 | | | | 2,509,650 | | |
San Francisco CA Bay Area Rapid
Transn Dist Sales Tax Rev Ser A(14) | | | 5.00 | % | | 7/1/2024 | | AAA | | | 3,000 | | | | 3,203,310 | | |
| Total | | | | | | | | | | | | | | | 5,712,960 | | |
| Special Assessment 0.59% | |
CA Statewide Cmntys Dev Auth
Rev John Muir Hlth Ser A | | | 5.00 | % | | 8/15/2034 | | A+ | | | 1,000 | | | | 1,041,040 | | |
| Special Tax 10.20% | |
CSUCI Fin Auth Rev CA East
Campus Cmnty Ser A(14) | | | 5.25 | % | | 9/1/2026 | | AAA | | | 5,500 | | | | 5,805,965 | | |
Irvine CA Unif Sch Fin Auth
Spl Tax Ser A(2) | | | 5.00 | % | | 9/1/2030 | | AAA | | | 1,500 | | | | 1,571,310 | | |
Lafayette CA Redev Agy Tax
Alloc Redev Pj(15) | | | 5.00 | % | | 8/1/2035 | | AA | | | 1,000 | | | | 1,035,800 | | |
Redding CA Redev Agy Tax
Alloc Shastec Redev Pj | | | 5.00 | % | | 9/1/2029 | | BBB+ | | | 600 | | | | 616,536 | | |
Riverside Cnty CA Redev Agy
Tax Alloc Jupura Vly Pj(2) | | | 5.25 | % | | 10/1/2035 | | AAA | | | 2,000 | | | | 2,130,840 | | |
RNR Sch Fin Auth CA Spl Tax
Cmnty Fac Dist No 92-1 Ser A(2) | | | 5.625 | % | | 9/1/2030 | | AAA | | | 3,985 | | | | 4,336,796 | | |
South Orange Cnty CA Pub Fin Auth
Spl Tax Rev Ladera Ranch Ser A(2) | | | 4.625 | % | | 8/15/2026 | | AAA | | | 310 | | | | 315,741 | | |
South Orange Cnty CA Pub Fin Auth
Spl Tax Rev Ladera Ranch Ser A(2) | | | 5.00 | % | | 8/15/2032 | | AAA | | | 2,000 | | | | 2,081,220 | | |
| Total | | | | | | | | | | | | | | | 17,894,208 | | |
| Transportation 6.43% | |
Bay Area Govt Assn CA Rev
Bart SFO Extn Arpt Premium A(2) | | | 5.00 | % | | 8/1/2026 | | AAA | | | 2,000 | | | | 2,080,760 | | |
| Fresno CA Arpt Rev Ser A(10) | | | 5.50 | % | | 7/1/2030 | | AAA | | | 1,500 | | | | 1,601,640 | | |
See Notes to Financial Statements.
57
Schedule of Investments (concluded)
CALIFORNIA TAX-FREE FUND September 30, 2006
| Investments | | Interest
Rate | | Maturity
Date | | Credit
Rating:
S&P or
Moody's(a) | | Principal
Amount
(000) | | Value | |
| Port Oakland CA Port Rev Ser J(14) | | | 5.50 | % | | 11/1/2026 | | AAA | | $ | 3,000 | | | $ | 3,121,440 | | |
Puerto Rico Comwlth Hwy &
Transn Auth Transn Rev Ser G(9) | | | 5.25 | % | | 7/1/2021 | | AAA | | | 1,000 | | | | 1,087,320 | | |
Puerto Rico Comwlth Hwy
Transn Auth Hwy Rev Ser Y | | | 5.00 | % | | 7/1/2036 | | BBB+ | | | 210 | | | | 217,690 | | |
San Francisco CA City & Cnty
Arpt Lease SFO Fuel Ser A AMT(10) | | | 6.125 | % | | 1/1/2027 | | AAA | | | 490 | | | | 510,017 | | |
San Francisco CA City & Cnty
Commn Intl Arpt Rev AMT(10) | | | 5.75 | % | | 1/1/2014 | | AAA | | | 500 | | | | 523,790 | | |
San Francisco CA City & Cnty
Ref Second Ser 28B(14) | | | 5.25 | % | | 5/1/2023 | | AAA | | | 2,000 | | | | 2,140,260 | | |
| Total | | | | | | | | | | | | | | | 11,282,917 | | |
| Water/Sewer 8.43% | |
| Imperial CA Ref Wtr Fac COP(9) | | | 5.00 | % | | 10/15/2020 | | AAA | | | 3,250 | | | | 3,441,295 | | |
Metropolitan Wtr Dist Southern CA
Wtr Wks Rev Auth Ser C | | | 5.00 | % | | 7/1/2031 | | AA+ | | | 2,550 | | | | 2,707,361 | | |
| Orange Cnty CA Santn Dist COP(9) | | | 5.25 | % | | 2/1/2027 | | AAA | | | 4,265 | | | | 4,585,685 | | |
Oxnard CA Fin Auth Wstwtr
Redwood Trunk Swr & Headwk A(9) | | | 5.25 | % | | 6/1/2034 | | AAA | | | 2,000 | | | | 2,151,120 | | |
| San Luis Opispo Cnty CA Ser A(14) | | | 5.375 | % | | 8/1/2030 | | AAA | | | 1,800 | | | | 1,899,936 | | |
| Total | | | | | | | | | | | | | | | 14,785,397 | | |
| Total Municipal Bonds (cost $163,800,326) | | | | | | | | | | | | | | | 172,821,920 | | |
| | | | | | | | | Shares
(000) | | | |
| SHORT-TERM INVESTMENT 0.00% | |
| Money Market Mutual Fund | |
Dreyfus General CA Municipal Money
Market Fund Class A (cost $897) | | | | | | | | | | | 1 | | | | 897 | | |
| Total Investments in Securities 98.49% (cost $163,801,223) | | | | | | | | | | | | | | | 172,822,817 | | |
| Cash and Other Assets in Excess of Liabilities(g)1.51% | | | | | | | | | | | | | | | 2,645,500 | | |
| Net Assets 100.00% | | | | | | | | | | | | | | $ | 175,468,317 | | |
| Open futures contracts at September 30, 2006: | |
| Type | | Expiration | | Contracts | | Position | | Market Value | | Unrealized
Depreciation | |
| U.S. 20-Year Treasury Bond | | | December 2006 | | | | 79 | | | Short | | $ | (8,880,094 | ) | | $ | (151,717 | ) | |
See Notes to Financial Statements.
58
Schedule of Investments
CONNECTICUT TAX-FREE FUND September 30, 2006
| Investments | | Interest
Rate | | Maturity
Date | | Credit
Rating:
S&P or
Moody's(a) | | Principal
Amount
(000) | | Value | |
| MUNICIPAL BONDS 99.69% | |
| Education 15.21% | |
CT St Higher Ed Ln Auth Rev
Ref Sr Fam Ed Ln Pg Ser A AMT(14) | | | 4.80 | % | | 11/15/2022 | | Aaa | | $ | 2,185 | | | $ | 2,270,106 | | |
CT St Hlth & Edl Facs Auth Rev
Canterbury Sch Ser B(15) | | | 5.00 | % | | 7/1/2031 | | AA | | | 975 | | | | 1,009,924 | | |
CT St Hlth & Edl Facs Auth Rev
Canterbury Sch Ser B(15) | | | 5.00 | % | | 7/1/2036 | | AA | | | 125 | | | | 128,684 | | |
CT St Hlth & Edl Facs Auth Rev
CT College Ser E(14) | | | 5.25 | % | | 7/1/2022 | | AAA | | | 400 | | | | 432,864 | | |
CT St Hlth & Edl Facs Auth
Rev CT St Univ Sys Ser E(9) | | | 5.00 | % | | 11/1/2033 | | AAA | | | 750 | | | | 780,630 | | |
CT St Hlth & Edl Facs Auth
Rev Gunnery Sch(15) | | | 5.35 | % | | 7/1/2031 | | AA | | | 695 | | | | 735,421 | | |
CT St Hlth & Edl Facs Auth
Rev Loomis Chaffee Sch Ser F(2) | | | 4.00 | % | | 7/1/2022 | | Aaa | | | 320 | | | | 318,502 | | |
CT St Hlth & Edl Facs Auth Rev
Norwich Free Academy Ser A(2) | | | 5.00 | % | | 7/1/2034 | | AAA | | | 1,250 | | | | 1,312,900 | | |
CT St Hlth & Edl Facs Auth
Rev Suffield Academy Ser A(14) | | | 5.40 | % | | 7/1/2027 | | AAA | | | 1,350 | | | | 1,395,671 | | |
CT St Hlth & Edl Facs Auth
Rev Trinity College Ser G(2) | | | 5.00 | % | | 7/1/2021 | | AAA | | | 1,000 | | | | 1,053,690 | | |
CT St Hlth & Edl Facs Auth
Rev Trinity College Ser H(14) | | | 4.75 | % | | 7/1/2023 | | AAA | | | 1,030 | | | | 1,071,890 | | |
CT St Hlth & Edl Facs Auth
Rev Univ CT Fndtn Ser A | | | 5.375 | % | | 7/1/2029 | | Aa3 | | | 215 | | | | 224,122 | | |
CT St Hlth & Edl Facs Auth
Rev Univ Hartford Ser E(15) | | | 5.25 | % | | 7/1/2032 | | AA | | | 2,900 | | | | 3,071,999 | | |
CT St Hlth & Edl Facs Auth
Rev Unrefunded Bal Sacrd Hrt Ser C | | | 6.50 | % | | 7/1/2016 | | BBB- | | | 275 | | | | 281,760 | | |
CT St Hlth & Edl Facs Auth
Rev Yale Univ Ser Y-2 | | | 3.75 | %# | | 7/1/2035 | | AAA | | | 600 | | | | 600,000 | | |
| Total | | | | | | | | | | | | | | | 14,688,163 | | |
| General Obligation 17.73% | |
| Bridgeport CT Ser C(9) | | | 4.75 | % | | 8/15/2021 | | AAA | | | 1,000 | | | | 1,028,800 | | |
| Montville CT | | | 6.70 | % | | 6/15/2009 | | Aa3 | | | 550 | | | | 593,560 | | |
| Montville CT | | | 6.70 | % | | 6/15/2010 | | Aa3 | | | 575 | | | | 635,939 | | |
Muni Secs Trust Ctfs Ser
2006-7008 Cl B RIBs | | | 5.80 | % | | 5/1/2025 | | Aa3 | | | 5,000 | | | | 5,596,850 | | |
| New Haven CT Unrefunded Bal(14) | | | 5.00 | % | | 2/1/2017 | | AAA | | | 1,475 | | | | 1,603,531 | | |
See Notes to Financial Statements.
59
Schedule of Investments (continued)
CONNECTICUT TAX-FREE FUND September 30, 2006
| Investments | | Interest
Rate | | Maturity
Date | | Credit
Rating:
S&P or
Moody's(a) | | Principal
Amount
(000) | | Value | |
New Haven CT Unrefunded
Bal Ser A(2) | | | 5.00 | % | | 11/1/2021 | | AAA | | $ | 970 | | | $ | 1,028,947 | | |
New Haven CT Unrefunded
Bal Ser B(9) | | | 5.00 | % | | 11/1/2019 | | AAA | | | 560 | | | | 599,956 | | |
| Puerto Rico Comwlth Bal Pub Impt | | | Zero Coupon | | | 7/1/2018 | | BBB | | | 2,035 | | | | 1,217,948 | | |
Puerto Rico Comwlth
Unrefunded Bal Pub Impt(10) | | | 5.125 | % | | 7/1/2030 | | AAA | | | 945 | | | | 992,524 | | |
| Redding CT | | | 6.60 | % | | 4/15/2010 | | Aa1 | | | 100 | | | | 110,280 | | |
| Waterbury CT Ser A(10) | | | 5.00 | % | | 4/1/2019 | | AAA | | | 1,250 | | | | 1,320,537 | | |
| Waterbury CT Ser A(10) | | | 5.125 | % | | 4/1/2022 | | AAA | | | 2,250 | | | | 2,388,487 | | |
| Total | | | | | | | | | | | | | | | 17,117,359 | | |
| Healthcare 10.02% | |
| CT St Dev Auth Rev Duncaster Inc Pj(15) | | | 5.125 | % | | 8/1/2022 | | AA | | | 235 | | | | 247,960 | | |
CT St Hlth & Edl Eastern CT
Hlth Network C(15) | | | 5.125 | % | | 7/1/2030 | | AA | | | 500 | | | | 521,975 | | |
CT St Hlth & Edl Facs Auth
Rev Bridgeport Hosp Ser A(14) | | | 6.625 | % | | 7/1/2018 | | AAA | | | 1,250 | | | | 1,251,487 | | |
CT St Hlth & Edl Facs Auth
Rev Bristol Hosp Ser B(15) | | | 5.50 | % | | 7/1/2021 | | AA | | | 1,000 | | | | 1,090,080 | | |
CT St Hlth & Edl Facs Auth
Rev Catholic Hlth East Ser F(14) | | | 5.625 | % | | 11/15/2020 | | AAA | | | 325 | | | | 345,534 | | |
CT St Hlth & Edl Facs Auth
Rev Child Care Fac Pg Ser C(2) | | | 5.625 | % | | 7/1/2029 | | AAA | | | 1,000 | | | | 1,064,800 | | |
CT St Hlth & Edl Facs Auth
Rev CT College Ser E(14) | | | 5.00 | % | | 7/1/2032 | | AAA | | | 1,050 | | | | 1,105,734 | | |
CT St Hlth & Edl Facs Auth
Rev Griffin Hosp Ser B(15) | | | 5.00 | % | | 7/1/2023 | | Aa3 | | | 500 | | | | 525,990 | | |
CT St Hlth & Edl Facs Auth
Rev Kent Sch Ser D(14) | | | 4.375 | % | | 7/1/2023 | | Aaa | | | 200 | | | | 202,684 | | |
CT St Hlth & Edl Facs Auth
Rev St Francis Hosp & Med(15) | | | 5.00 | % | | 7/1/2022 | | AA | | | 1,000 | | | | 1,049,480 | | |
CT St Hlth & Edl Facs Auth
Rev Waterbury Hosp Issue Ser C(15) | | | 5.75 | % | | 7/1/2029 | | AA | | | 650 | | | | 684,352 | | |
CT St Hlth & Edl Facs Auth
Rev William W Backus Hosp Ser G(10) | | | 5.00 | % | | 7/1/2035 | | AAA | | | 1,000 | | | | 1,051,980 | | |
CT St Hlth & Edl Facs Auth Rev
Yale New Haven Hosp Ser J-1(2) | | | 5.00 | % | | 7/1/2031 | | AAA | | | 500 | | | | 531,680 | | |
| Total | | | | | | | | | | | | | | | 9,673,736 | | |
See Notes to Financial Statements.
60
Schedule of Investments (continued)
CONNECTICUT TAX-FREE FUND September 30, 2006
| Investments | | Interest
Rate | | Maturity
Date | | Credit
Rating:
S&P or
Moody's(a) | | Principal
Amount
(000) | | Value | |
| Housing 5.28% | |
CT St Hsg Fin Auth Hsg Mtg
Fin Pg Sub Ser A-1 AMT | | | 4.875 | % | | 11/15/2036 | | AAA | | $ | 2,000 | | | $ | 2,034,520 | | |
CT St Hsg Fin Auth Hsg Mtg
Fin Ser F AMT(e)(2) | | | 4.90 | % | | 11/15/2035 | | AAA | | | 1,000 | | | | 1,011,910 | | |
CT St Hsg Fin Auth Mtg Fin
Sub Ser D-2 AMT | | | 4.85 | % | | 11/15/2036 | | AAA | | | 1,500 | | | | 1,515,975 | | |
CT St Hsg Fin Auth Spl Oblig
Grp Home Mtg(2) | | | 5.85 | % | | 6/15/2030 | | AAA | | | 500 | | | | 529,605 | | |
| Total | | | | | | | | | | | | | | | 5,092,010 | | |
| Industrial 1.20% | |
Childrens Tr Fd Puerto Rico
Tob Settlmnt Rev Asset Bkd Bds | | | 5.50 | % | | 5/15/2039 | | BBB | | | 635 | | | | 658,190 | | |
| CT St Dev Auth Govt Lease Rev(14) | | | 6.60 | % | | 6/15/2014 | | AAA | | | 500 | | | | 500,510 | | |
| Total | | | | | | | | | | | | | | | 1,158,700 | | |
| Miscellaneous 1.08% | |
Puerto Rico Pub Bldgs Auth Rev
Unrefunded Bal Govt Facs Ser D GTD | | | 5.25 | % | | 7/1/2036 | | BBB | | | 1,000 | | | | 1,043,680 | | |
| Power 7.06% | |
Puerto Rico Elec Pwr Auth Pwr
Rev Ser HH(10) | | | 5.25 | % | | 7/1/2029 | | AAA | | | 1,000 | | | | 1,061,280 | | |
Puerto Rico Elec Pwr Auth Pwr
Rev Ser II(10) | | | 5.125 | % | | 7/1/2026 | | AAA | | | 2,925 | | | | 3,120,098 | | |
Puerto Rico Elec Pwr Auth Pwr
Rev Ser II | | | 5.25 | % | | 7/1/2031 | | A3 | | | 1,000 | | | | 1,055,020 | | |
Puerto Rico Elec Pwr Auth Pwr
Rev Ser NN(14) | | | 5.00 | % | | 7/1/2032 | | AAA | | | 1,500 | | | | 1,575,120 | | |
| Total | | | | | | | | | | | | | | | 6,811,518 | | |
| Pre-Refunded 27.36% | |
| Bridgeport CT Ser C(9) | | | 5.00 | % | | 8/15/2020 | | AAA | | | 500 | | | | 531,875 | | |
CT St Hlth & Edl Facs Auth
Rev Fairfield Univ Ser I(14) | | | 5.25 | % | | 7/1/2019 | | AAA | | | 600 | | | | 632,322 | | |
CT St Hlth & Edl Facs Auth
Rev Fairfield Univ Ser I(14) | | | 5.50 | % | | 7/1/2029 | | AAA | | | 1,235 | | | | 1,309,532 | | |
CT St Hlth & Edl Facs Auth
Rev Loomis Chaffee Sch Ser D | | | 5.25 | % | | 7/1/2031 | | A2 | | | 2,750 | | | | 2,967,992 | | |
CT St Hlth & Edl Facs Auth
Rev Miss Porters Sch Ser A | | | 5.75 | % | | 7/1/2029 | | A+ | | | 3,200 | | | | 3,409,504 | | |
See Notes to Financial Statements.
61
Schedule of Investments (continued)
CONNECTICUT TAX-FREE FUND September 30, 2006
| Investments | | Interest
Rate | | Maturity
Date | | Credit
Rating:
S&P or
Moody's(a) | | Principal
Amount
(000) | | Value | |
| CT St Ser A | | | 5.625 | % | | 4/15/2020 | | Aa3 | | $ | 1,000 | | | $ | 1,075,720 | | |
| CT St Ser A | | | 6.00 | % | | 4/15/2015 | | AA | | | 1,000 | | | | 1,088,050 | | |
| CT St Ser B | | | 5.60 | % | | 6/15/2020 | | Aa3 | | | 250 | | | | 267,240 | | |
| CT St Ser D | | | 5.125 | % | | 11/15/2018 | | Aa3 | | | 1,500 | | | | 1,605,195 | | |
Muni Secs Trust Ctfs Ser 7005
Cl B ETM RIBs† | | | 7.134 | % | | 10/1/2040 | | Aaa | | | 1,000 | | | | 1,149,720 | | |
| New Haven CT Ser A(2) | | | 5.00 | % | | 11/1/2021 | | AAA | | | 30 | | | | 31,681 | | |
| New Haven CT Ser C ETM(14) | | | 5.00 | % | | 11/1/2021 | | AAA | | | 10 | | | | 11,184 | | |
| Puerto Rico Comwlth | | | 6.00 | % | | 7/1/2026 | | AAA | | | 1,000 | | | | 1,033,300 | | |
Puerto Rico Comwlth Hwy &
Transn Auth Transn Rev Ser D | | | 5.25 | % | | 7/1/2038 | | AAA | | | 1,000 | | | | 1,088,090 | | |
| Puerto Rico Comwlth Pub Impt(10) | | | 5.125 | % | | 7/1/2030 | | AAA | | | 1,505 | | | | 1,610,245 | | |
| Puerto Rico Comwlth Pub Impt Ser A | | | 5.00 | % | | 7/1/2027 | | AAA | | | 670 | | | | 720,384 | | |
| Puerto Rico Comwlth Pub Impt Ser A(9) | | | 5.00 | % | | 7/1/2032 | | AAA | | | 4,285 | | | | 4,607,232 | | |
| Puerto Rico Pub Fin Corp Approp E | | | 5.50 | % | | 8/1/2029 | | Aaa | | | 750 | | | | 818,835 | | |
| Stamford CT Parking Garage | | | 5.25 | % | | 2/1/2023 | | AAA | | | 155 | | | | 170,701 | | |
| Univ CT Rev Student Fee Ser A(9) | | | 5.75 | % | | 11/15/2020 | | AAA | | | 205 | | | | 223,969 | | |
| Univ CT Rev Student Fee Ser A | | | 6.00 | % | | 11/15/2021 | | AA- | | | 390 | | | | 429,788 | | |
| Univ CT Rev Student Fee Ser A(9) | | | 6.00 | % | | 11/15/2025 | | AAA | | | 500 | | | | 551,010 | | |
| Univ CT Ser A(9) | | | 5.625 | % | | 3/1/2020 | | AAA | | | 1,000 | | | | 1,075,230 | | |
| Total | | | | | | | | | | | | | | | 26,408,799 | | |
| Resource Recovery 1.36% | |
Naugatuck CT Incineration Facs Pj
Ser A AMT COP(2) | | | 5.00 | % | | 6/15/2022 | | Aaa | | | 250 | | | | 260,928 | | |
Stamford CT Wtr Pollutn Ctrl
Sys & Fac Rev Ser A | | | 5.00 | % | | 11/15/2032 | | AA+ | | | 1,000 | | | | 1,050,600 | | |
| Total | | | | | | | | | | | | | | | 1,311,528 | | |
| Transportation 5.25% | |
CT St Spl Tax Oblig Rev PA
1039 R-A RIBs RITES(10) | | | 6.785 | % | | 1/1/2010 | | AAA | | | 500 | | | | 591,820 | | |
CT St Spl Tax Oblig Rev PA
1039 R-B RIBs RITES(10) | | | 6.785 | % | | 1/1/2010 | | AAA | | | 785 | | | | 925,751 | | |
CT St Spl Tax Oblig Rev PA
1039 R-C RIBs(10) | | | 6.035 | % | | 7/1/2017 | | AAA | | | 2,250 | | | | 2,504,565 | | |
Puerto Rico Comwlth Hwy &
Transn Auth Rev Ser D(10) | | | 5.00 | % | | 7/1/2032 | | AAA | | | 1,000 | | | | 1,044,010 | | |
| Total | | | | | | | | | | | | | | | 5,066,146 | | |
See Notes to Financial Statements.
62
Schedule of Investments (concluded)
CONNECTICUT TAX-FREE FUND September 30, 2006
| Investments | | Interest
Rate | | Maturity
Date | | Credit
Rating:
S&P or
Moody's(a) | | Principal
Amount
(000) | | Value | |
| Water/Sewer 8.14% | |
CT St Dev Auth Wtr Fac Rev
Bridgeport AMT TCRS(2) | | | 6.15 | % | | 4/1/2035 | | AAA | | $ | 500 | | | $ | 515,160 | | |
| CT St Revolving Fd Ser A | | | 5.00 | % | | 7/1/2021 | | AAA | | | 1,350 | | | | 1,461,348 | | |
| CT St Revolving Fd Ser A | | | 5.00 | % | | 7/1/2022 | | AAA | | | 2,000 | | | | 2,159,940 | | |
South Central CT Regl Wtr
Auth Sys Rev 16th Ser(2) | | | 5.375 | % | | 8/1/2025 | | AAA | | | 1,000 | | | | 1,069,720 | | |
South Central CT Regl Wtr
Auth Sys Rev 16th Ser(2) | | | 5.375 | % | | 8/1/2030 | | AAA | | | 1,000 | | | | 1,070,090 | | |
South Central CT Regl Wtr
Auth Sys Rev 20th Ser(14) | | | 5.00 | % | | 8/1/2035 | | AAA | | | 1,500 | | | | 1,581,975 | | |
| Total | | | | | | | | | | | | | | | 7,858,233 | | |
| Total Municipal Bonds (cost $90,899,339) | | | | | | | | | | | | | | | 96,229,872 | | |
| | | | | | | | | Shares
(000) | | | |
| SHORT-TERM INVESTMENT 0.05% | |
| Money Market Mutual Fund | |
| Dreyfus CT Municipal Cash Management (cost $43,736) | | | | | | | | | | | 44 | | | | 43,736 | | |
| Total Investments in Securities 99.74% (cost $90,943,075) | | | | | | | | | | | | | | | 96,273,608 | | |
| Cash and Other Assets in Excess of Liabilities(g) 0.26% | | | | | | | | | | | | | | | 256,136 | | |
| Net Assets 100.00% | | | | | | | | | | | | | | $ | 96,529,744 | | |
| Open futures contracts at September 30, 2006: | |
| Type | | Expiration | | Contracts | | Position | | Market Value | | Unrealized
Depreciation | |
| U.S. 20-Year Treasury Bond | | | December 2006 | | | | 71 | | | Short | | $ | (7,980,844 | ) | | $ | (136,349 | ) | |
See Notes to Financial Statements.
63
Schedule of Investments
HAWAII TAX-FREE FUND September 30, 2006
| Investments | | Interest
Rate | | Maturity
Date | | Credit
Rating:
S&P or
Moody's(a) | | Principal
Amount
(000) | | Value | |
| MUNICIPAL BONDS 98.77% | |
| Education 9.23% | |
HI St Dept Bdgt & Fin Spl Purp Rev
Chaminade Univ Honolulu(15) | | | 4.75 | % | | 1/1/2036 | | AA | | $ | 1,505 | | | $ | 1,516,107 | | |
HI St Dept Bdgt & Fin Spl Purp Rev
Chaminade Univ Honolulu(15) | | | 5.00 | % | | 1/1/2026 | | AA | | | 100 | | | | 104,896 | | |
HI St Dept Bdgt & Fin Spl Purp Rev
Mid Pacific Institute(15) | | | 4.625 | % | | 1/1/2036 | | AA | | | 500 | | | | 501,275 | | |
HI St Dept Bdgt & Fin Spl Purp Rev
Mid Pacific Institute(15) | | | 5.00 | % | | 1/1/2026 | | AA | | | 1,000 | | | | 1,060,690 | | |
HI St Hsg Fin & Dev Corp Rev
Univ of HI Faculty Hsg Pj(2) | | | 5.65 | % | | 10/1/2016 | | AAA | | | 1,000 | | | | 1,005,940 | | |
HI St Hsg Fin & Dev Corp Rev
Univ of HI Faculty Hsg Pj(2) | | | 5.70 | % | | 10/1/2025 | | AAA | | | 380 | | | | 382,268 | | |
| Univ HI Univ Sys Rev(9) | | | 5.125 | % | | 7/15/2032 | | AAA | | | 1,100 | | | | 1,154,549 | | |
| Univ HI Univ Sys Rev Ser A(9) | | | 5.50 | % | | 7/15/2029 | | AAA | | | 2,500 | | | | 2,703,725 | | |
| Total | | | | | | | | | | | | | | | 8,429,450 | | |
| General Obligation 29.24% | |
| HI Cnty HI Ser A(10) | | | 5.00 | % | | 7/15/2023 | | AAA | | | 1,000 | | | | 1,053,960 | | |
| HI Cnty HI Ser A(14) | | | 5.00 | % | | 7/15/2024 | | AAA | | | 1,000 | | | | 1,058,690 | | |
| HI Cnty HI Ser A(14) | | | 5.25 | % | | 7/15/2023 | | AAA | | | 595 | | | | 646,343 | | |
| HI Cnty HI Ser A(9) | | | 5.50 | % | | 7/15/2017 | | AAA | | | 1,045 | | | | 1,125,716 | | |
| HI Cnty HI Ser A(9) | | | 5.60 | % | | 5/1/2013 | | AAA | | | 1,780 | | | | 1,980,125 | | |
| HI Cnty HI Ser A(10) | | | 5.625 | % | | 5/15/2019 | | AAA | | | 545 | | | | 577,237 | | |
| HI St Ser BZ | | | 6.00 | % | | 10/1/2010 | | Aa2 | | | 500 | | | | 544,245 | | |
| HI St Ser BZ | | | 6.00 | % | | 10/1/2012 | | Aa2 | | | 500 | | | | 562,435 | | |
| HI St Ser CA(9) | | | 8.00 | % | | 1/1/2013 | | AAA | | | 2,000 | | | | 2,467,700 | | |
| HI St Ser CZ(10) | | | 5.25 | % | | 7/1/2018 | | AAA | | | 1,000 | | | | 1,071,980 | | |
| HI St Ser DE(14) | | | 5.00 | % | | 10/1/2024 | | AAA | | | 1,000 | | | | 1,060,100 | | |
| HI St Ser DI(10) | | | 5.00 | % | | 3/1/2025 | | AAA | | | 1,000 | | | | 1,067,220 | | |
| HI St Unrefunded Bal Ser CP(9) | | | 5.00 | % | | 10/1/2016 | | AAA | | | 260 | | | | 266,050 | | |
| Honolulu HI City & Cnty Ser B(14) | | | 5.00 | % | | 7/1/2018 | | AAA | | | 1,000 | | | | 1,081,530 | | |
| Honolulu HI City & Cnty Ser D(14) | | | 5.00 | % | | 7/1/2023 | | AAA | | | 2,000 | | | | 2,134,020 | | |
| Honolulu HI City & Cnty Ser F(9) | | | 5.00 | % | | 7/1/2029 | | AAA | | | 1,000 | | | | 1,057,210 | | |
| Kauai Cnty HI Ser A(9) | | | 5.00 | % | | 8/1/2026 | | AAA | | | 250 | | | | 265,555 | | |
| Kauai Cnty HI Ser A(9) | | | 5.00 | % | | 8/1/2028 | | AAA | | | 1,000 | | | | 1,059,190 | | |
| Kauai Cnty HI Ser A(9) | | | 5.00 | % | | 8/1/2029 | | AAA | | | 1,000 | | | | 1,057,670 | | |
| Kauai Cnty HI Ser A(14) | | | 5.50 | % | | 8/1/2021 | | AAA | | | 1,630 | | | | 1,751,011 | | |
See Notes to Financial Statements.
64
Schedule of Investments (continued)
HAWAII TAX-FREE FUND September 30, 2006
| Investments | | Interest
Rate | | Maturity
Date | | Credit
Rating:
S&P or
Moody's(a) | | Principal
Amount
(000) | | Value | |
| Maui Cnty HI(14) | | | 5.00 | % | | 3/1/2025 | | AAA | | $ | 1,000 | | | $ | 1,061,240 | | |
| Maui Cnty HI Ser A(14) | | | 5.00 | % | | 7/1/2018 | | AAA | | | 1,150 | | | | 1,253,592 | | |
| Maui Cnty HI Ser A(14) | | | 5.00 | % | | 7/1/2023 | | AAA | | | 1,040 | | | | 1,117,085 | | |
Puerto Rico Comwlth
Unrefunded Bal Pub Impt Ser A | | | 5.375 | % | | 7/1/2028 | | BBB | | | 1,330 | | | | 1,391,233 | | |
| Total | | | | | | | | | | | | | | | 26,711,137 | | |
| Healthcare 0.16% | |
Puerto Rico Indl Tourist Edl
Mutuo Oblig Grp Ser A(14) | | | 6.25 | % | | 7/1/2024 | | AAA | | | 150 | | | | 150,913 | | |
| Housing 2.08% | |
HI St Hsg Fin & Dev Corp Sing
Fam Mtg Purp Rev Ser B(8) | | | 5.30 | % | | 7/1/2028 | | AAA | | | 850 | | | | 875,466 | | |
HI St Hsg Fin & Dev Corp Sing
Fam Mtg Purp Rev Ser B(8) | | | 5.45 | % | | 7/1/2017 | | AAA | | | 1,000 | | | | 1,027,150 | | |
| Total | | | | | | | | | | | | | | | 1,902,616 | | |
| Industrial 0.77% | |
Childrens Tr Fd Puerto Rico
Tob Settlmnt Rev Asset Bkd Bds | | | 5.50 | % | | 5/15/2039 | | BBB | | | 675 | | | | 699,651 | | |
| Miscellaneous 7.27% | |
HI St Cap Dist Kapolei St
Office Ser A COP(2) | | | 5.00 | % | | 5/1/2018 | | AAA | | | 475 | | | | 492,290 | | |
| HI St Cap Dist St Office COP(14) | | | 5.50 | % | | 5/1/2020 | | AAA | | | 500 | | | | 530,035 | | |
Honolulu HI City & Cnty Wst Wtr
Sys Rev Rols RR II R 570 RIBs(9) | | | 6.139 | % | | 7/1/2035 | | Aaa | | | 5,040 | | | | 5,615,316 | | |
| Total | | | | | | | | | | | | | | | 6,637,641 | | |
| Power 2.89% | |
HI St Dept Bdgt & Fin Spl Purp Rev
Elec Co & Subsidiaries Ser A AMT(9) | | | 4.80 | % | | 1/1/2025 | | AAA | | | 1,000 | | | | 1,016,270 | | |
Muni Secs Trust Ctfs
Ser 2000 107 Cl A(10)† | | | 3.72 | %# | | 5/19/2009 | | AAA | | | 200 | | | | 200,000 | | |
| Puerto Rico Elec Pwr Auth Rev Ser II(10) | | | 5.125 | % | | 7/1/2026 | | AAA | | | 1,330 | | | | 1,418,711 | | |
| Total | | | | | | | | | | | | | | | 2,634,981 | | |
| Pre-Refunded 25.48% | |
HI St Dept Bdgt & Fin Spl
Purp Rev Kaiser Permanente Ser A | | | 5.15 | % | | 3/1/2015 | | AAA | | | 1,250 | | | | 1,299,862 | | |
See Notes to Financial Statements.
65
Schedule of Investments (continued)
HAWAII TAX-FREE FUND September 30, 2006
| Investments | | Interest
Rate | | Maturity
Date | | Credit
Rating:
S&P or
Moody's(a) | | Principal
Amount
(000) | | Value | |
HI St Dept Bdgt & Fin Spl
Purp Rev The Queens Hlth Sys Ser B(14) | | | 5.25 | % | | 7/1/2023 | | AAA | | $ | 1,000 | | | $ | 1,048,270 | | |
| HI St Hwy Rev(10) | | | 5.50 | % | | 7/1/2020 | | AAA | | | 1,100 | | | | 1,174,866 | | |
| HI St Ser CP(9) | | | 5.00 | % | | 10/1/2016 | | AAA | | | 640 | | | | 655,648 | | |
| HI St Ser CT(10) | | | 5.875 | % | | 9/1/2019 | | AAA | | | 1,175 | | | | 1,261,433 | | |
| HI St Ser CU(14) | | | 5.25 | % | | 10/1/2020 | | AAA | | | 1,700 | | | | 1,807,321 | | |
Honolulu HI City & Cnty Bd
Wtr Supply Wtr Sys Rev(10) | | | 5.25 | % | | 7/1/2031 | | AAA | | | 100 | | | | 107,308 | | |
| Honolulu HI City & Cnty Ser A(14) | | | 5.00 | % | | 11/1/2015 | | AAA | | | 405 | | | | 411,472 | | |
| Honolulu HI City & Cnty Ser A(10) | | | 5.125 | % | | 9/1/2021 | | AAA | | | 600 | | | | 641,928 | | |
| Honolulu HI City & Cnty Ser A(9) | | | 5.50 | % | | 9/1/2016 | | AAA | | | 555 | | | | 575,402 | | |
| Honolulu HI City & Cnty Ser B(9) | | | 5.00 | % | | 11/1/2016 | | AAA | | | 500 | | | | 512,810 | | |
| Honolulu HI City & Cnty Wtr ETM TCRS(9) | | | 6.00 | % | | 12/1/2015 | | AAA | | | 1,000 | | | | 1,177,230 | | |
| Kauai Cnty HI(9) | | | 6.125 | % | | 8/1/2024 | | AAA | | | 580 | | | | 633,163 | | |
| Kauai Cnty HI Pub Impt Ser B(14) | | | 5.25 | % | | 8/1/2017 | | AAA | | | 95 | | | | 97,282 | | |
| Kauai Cnty HI Ser A(14) | | | 5.50 | % | | 8/1/2021 | | AAA | | | 865 | | | | 938,750 | | |
| Maui Cnty HI Ser A(14) | | | 5.00 | % | | 3/1/2022 | | AAA | | | 750 | | | | 801,540 | | |
| Maui Cnty HI Ser A(9) | | | 6.10 | % | | 3/1/2020 | | AAA | | | 500 | | | | 545,175 | | |
Muni Secs Trust Ctfs Ser 7005
Cl B ETM RIBs† | | | 7.134 | % | | 10/1/2040 | | Aaa | | | 1,250 | | | | 1,437,150 | | |
Puerto Rico Comwlth Hwy &
Transn Auth Transn Rev Ser D | | | 5.25 | % | | 7/1/2038 | | AAA | | | 1,000 | | | | 1,088,090 | | |
Puerto Rico Comwlth Hwy &
Transn Auth Transn Rev Ser D | | | 5.75 | % | | 7/1/2041 | | AAA | | | 1,000 | | | | 1,113,860 | | |
Puerto Rico Comwlth Infra Fin
Auth Spl Ser A | | | 5.375 | % | | 10/1/2024 | | AAA | | | 300 | | | | 322,815 | | |
Puerto Rico Comwlth Infra Fin
Auth Spl Ser A | | | 5.50 | % | | 10/1/2032 | | AAA | | | 200 | | | | 215,746 | | |
| Puerto Rico Comwlth Pub Impt Ser A | | | 5.00 | % | | 7/1/2027 | | AAA | | | 500 | | | | 537,600 | | |
| Puerto Rico Comwlth Pub Impt Ser A | | | 5.375 | % | | 7/1/2028 | | AAA | | | 670 | | | | 724,109 | | |
| Puerto Rico Comwlth Pub Impt Ser A | | | 6.00 | % | | 7/1/2026 | | AAA | | | 1,000 | | | | 1,033,300 | | |
Puerto Rico Pub Fin Corp
Comwlth Approp Ser E | | | 5.75 | % | | 8/1/2030 | | Aaa | | | 500 | | | | 503,690 | | |
Puerto Rico Pub Bldgs Auth Rev
Govt Facs Ser B GTD(2) | | | 5.00 | % | | 7/1/2027 | | AAA | | | 1,000 | | | | 1,026,050 | | |
Puerto Rico Pub Impt Bldgs Auth Rev
Govt Facs Ser D GTD | | | 5.25 | % | | 7/1/2036 | | BBB | | | 1,465 | | | | 1,586,141 | | |
| Total | | | | | | | | | | | | | | | 23,278,011 | | |
See Notes to Financial Statements.
66
Schedule of Investments (concluded)
HAWAII TAX-FREE FUND September 30, 2006
| Investments | | Interest
Rate | | Maturity
Date | | Credit
Rating:
S&P or
Moody's(a) | | Principal
Amount
(000) | | Value | |
| Sales Tax 0.54% | |
Virgin Islands Pub Fin Auth Rev
Gross Rcpts Taxes Ln Nts(9) | | | 4.25 | % | | 10/1/2029 | | AAA | | $ | 500 | | | $ | 497,815 | | |
| Special Tax 3.08% | |
Puerto Rico Comwlth
Infra Fin Auth Spl Ser B | | | 5.00 | % | | 7/1/2046 | | BBB+ | | | 1,000 | | | | 1,032,640 | | |
Puerto Rico Comwlth Infra
Fin Auth Spl Ref Ser C(2) | | | 5.50 | % | | 7/1/2028 | | AAA | | | 1,500 | | | | 1,785,675 | | |
| Total | | | | | | | | | | | | | | | 2,818,315 | | |
| Transportation 10.87% | |
| HI St Hbr Sys Rev Ser A AMT(10) | | | 5.00 | % | | 1/1/2031 | | AAA | | | 3,500 | | | | 3,628,205 | | |
| HI St Hbr Sys Rev Ser A AMT(10) | | | 5.25 | % | | 1/1/2027 | | AAA | | | 1,450 | | | | 1,547,208 | | |
| HI St Hwy Rev Ser A(10) | | | 5.00 | % | | 7/1/2023 | | AAA | | | 2,000 | | | | 2,134,020 | | |
Puerto Rico Comwlth Hwy &
Transn Auth Rev PA 1052 RIBs RITES | | | 7.259 | % | | 1/1/2010 | | AAA(c) | | | 1,000 | | | | 1,227,720 | | |
Puerto Rico Comwlth Hwy &
Transn Auth Rev St Infrastr Bk | | | 5.00 | % | | 7/1/2022 | | BBB | | | 20 | | | | 20,430 | | |
Puerto Rico Comwlth Hwy &
Transn Auth Hwy Rev Ser Y(13)(14) | | | 5.50 | % | | 7/1/2036 | | AAA | | | 250 | | | | 280,638 | | |
Puerto Rico Comwlth Hwy &
Transn Auth Hwy Rev Ser Y | | | 5.50 | % | | 7/1/2036 | | BBB+ | | | 1,000 | | | | 1,092,120 | | |
| Total | | | | | | | | | | | | | | | 9,930,341 | | |
| Water/Sewer 7.16% | |
Honolulu HI City & Cnty Bd Wtr Supply
Wtr Sys Rev Ser B AMT(14) | | | 5.25 | % | | 7/1/2021 | | AAA | | | 1,335 | | | | 1,444,924 | | |
Honolulu HI City & Cnty Bd
Wtr Supply Wtr Sys Rev Ser A(9) | | | 5.00 | % | | 7/1/2033 | | AAA | | | 1,000 | | | | 1,050,320 | | |
Honolulu HI City & Cnty Wst
First Bd Res Sr Ser A(14) | | | 5.00 | % | | 7/1/2021 | | AAA | | | 1,000 | | | | 1,079,130 | | |
Honolulu HI City & Cnty Wst
Sr Ser A(9) | | | 5.00 | % | | 7/1/2024 | | AAA | | | 2,785 | | | | 2,965,301 | | |
| Total | | | | | | | | | | | | | | | 6,539,675 | | |
| Total Investments in Municipal Bonds 98.77% (cost $86,006,348) | | | | | | | | | | | | | | | 90,230,546 | | |
| Cash and Other Assets in Excess of Liabilities(g) 1.23% | | | | | | | | | | | | | | | 1,126,120 | | |
| Net Assets 100.00% | | | | | | | | | | | | | | $ | 91,356,666 | | |
| Open futures contracts at September 30, 2006: | |
| Type | | Expiration | | Contracts | | Position | | Market Value | | Unrealized
Depreciation | |
| U.S. 20-Year Treasury Bond | | | December 2006 | | | | 54 | | | Short | | $ | (6,069,938 | ) | | $ | (103,820 | ) | |
See Notes to Financial Statements.
67
Schedule of Investments
MINNESOTA TAX-FREE FUND September 30, 2006
| Investments | | Interest
Rate | | Maturity
Date | | Credit
Rating:
S&P or
Moody's(a) | | Principal
Amount
(000) | | Value | |
| MUNICIPAL BONDS 98.51% | |
| Education 15.44% | |
| Bloomington MN Indpt Sch Dist Ser A(10) | | | 5.125 | % | | 2/1/2024 | | Aaa | | $ | 1,000 | | | $ | 1,057,350 | | |
MN St Higher Edl Facs Auth Rev
Augsburg Coll Ser 6 J1 | | | 5.00 | % | | 5/1/2028 | | Baa2 | | | 1,000 | | | | 1,033,060 | | |
MN St Higher Edl Facs Auth Rev
Hamline Univ Ser 5-B | | | 6.00 | % | | 10/1/2029 | | Baa1 | | | 500 | | | | 525,630 | | |
MN St Higher Edl Facs Auth Rev
St John Univ Ser 6-G | | | 4.50 | % | | 10/1/2026 | | A2 | | | 650 | | | | 657,670 | | |
Moorhead MN Edl Facs Rev
Concordia College Corp Pj A | | | 5.00 | % | | 12/15/2022 | | A3 | | | 1,125 | | | | 1,193,006 | | |
Pequot Lakes MN Indpt Sch
Dist No 186(9) | | | 5.25 | % | | 2/1/2022 | | AAA | | | 1,550 | | | | 1,658,113 | | |
Prior Lake MN Indpt Sch Dist
No 719 Ser A(9) | | | 5.25 | % | | 2/1/2023 | | Aaa | | | 1,470 | | | | 1,570,342 | | |
| Total | | | | | | | | | | | | | | | 7,695,171 | | |
| General Obligation 4.96% | |
Cambridge MN Indpt Sch Dist
No 911 Ser A(14) | | | 4.75 | % | | 2/1/2030 | | Aaa | | | 500 | | | | 515,225 | | |
| Minneapolis MN Ser E | | | 5.00 | % | | 3/1/2026 | | AAA | | | 500 | | | | 512,970 | | |
North St. Paul Maplewood MN
Indpt Sch Dist No 622 | | | 5.125 | % | | 2/1/2025 | | AAA | | | 400 | | | | 402,088 | | |
North St. Paul Maplewood MN
Indpt Sch Dist No 622 Ser A | | | 5.125 | % | | 2/1/2020 | | AAA | | | 100 | | | | 100,522 | | |
Puerto Rico Comwlth
Unrefunded Pub Impt(13)(14) | | | 5.00 | % | | 7/1/2028 | | AAA | | | 175 | | | | 179,389 | | |
| Ramsey Cnty MN St Aid Str Ser C | | | 5.00 | % | | 2/1/2024 | | AAA | | | 500 | | | | 528,530 | | |
Todd Morrison Cass & Wadena Cntys
MN Utd Hosp Dist Hlthcare FacLakewood | | | 5.00 | % | | 12/1/2034 | | Baa2 | | | 225 | | | | 232,598 | | |
| Total | | | | | | | | | | | | | | | 2,471,322 | | |
| Healthcare 19.31% | |
Bemidji MN Hlthcare Fac North
Country Hlth Svcs(15) | | | 5.00 | % | | 9/1/2024 | | AA | | | 500 | | | | 519,925 | | |
Bemidji MN Hlthcare Fac North
County Hlth Svcs | | | 5.00 | % | | 9/1/2024 | | A | | | 505 | | | | 529,518 | | |
Breckenridge MN Rev Catholic
Hlth Initiatives A | | | 5.00 | % | | 5/1/2030 | | AA | | | 500 | | | | 527,365 | | |
Duluth MN Econ Dev
Benedictine Hlth Sys St Marys | | | 5.25 | % | | 2/15/2028 | | A- | | | 1,000 | | | | 1,048,430 | | |
See Notes to Financial Statements.
68
Schedule of Investments (continued)
MINNESOTA TAX-FREE FUND September 30, 2006
| Investments | | Interest
Rate | | Maturity
Date | | Credit
Rating:
S&P or
Moody's(a) | | Principal
Amount
(000) | | Value | |
Duluth MN Econ Dev
Benedictine Hlth Sys St Marys | | | 5.25 | % | | 2/15/2033 | | A- | | $ | 1,000 | | | $ | 1,041,420 | | |
Hastings MN Hlthcare Fac Rev
Regina Med Ctr(1) | | | 5.30 | % | | 9/15/2028 | | A | | | 400 | | | | 404,184 | | |
Marshall MN Med Ctr Gross
Re Avera Marshall Regl Med Ctr Pj(e) | | | 4.75 | % | | 11/1/2028 | | BBB+ | | | 500 | | | | 506,610 | | |
| Minneapolis MN Hlthcare Sys Rev(14) | | | 5.00 | % | | 5/15/2021 | | AAA | | | 250 | | | | 264,063 | | |
MN Agric & Econ Dev Bd Rev
Unrefunded Bal Hlthcare Sys A(14) | | | 5.50 | % | | 11/15/2017 | | AAA | | | 45 | | | | 46,793 | | |
| Rochester MN Hlthcare Fac Rev(13)(14) | | | 5.50 | % | | 11/15/2027 | | AAA | | | 500 | | | | 518,505 | | |
| Rochester MN Hlthcare Fac Rev RIBs | | | 6.139 | % | | 11/15/2036 | | Aa2 | | | 2,500 | | | | 2,740,900 | | |
St Paul MN Hsg & Redev Auth
Franciscan Hlth Pj(7)(11) | | | 5.30 | % | | 11/20/2022 | | AAA | | | 50 | | | | 52,583 | | |
Stillwater MN Hlthcare Rev
Hlth Sys Oblig Grp | | | 5.00 | % | | 6/1/2035 | | A- | | | 1,000 | | | | 1,037,650 | | |
Virginia MN Hsg & Redev Auth
Hlthcare Fac Lease Rev | | | 5.375 | % | | 10/1/2030 | | Baa1 | | | 365 | | | | 379,910 | | |
| Total | | | | | | | | | | | | | | | 9,617,856 | | |
| Housing 21.57% | |
| Crow Wing Cnty MN Hsg Ser A GTD(14) | | | 4.90 | % | | 1/1/2034 | | Aaa | | | 490 | | | | 508,713 | | |
Dakota Cnty MN Hsg & Redev
Auth Sing Fam Mtg Rev AMT(12) | | | 5.85 | % | | 10/1/2030 | | AAA | | | 51 | | | | 52,167 | | |
Fairbault MN Hsg & Redev Auth
Govt Trails Edge Apts Ser A | | | 5.25 | % | | 2/1/2028 | | A3 | | | 300 | | | | 306,921 | | |
Minneapolis MN Multi Fam Hsg
Rev Mtg East Village South(7)(11) | | | 6.10 | % | | 7/20/2020 | | Aaa | | | 1,000 | | | | 1,061,870 | | |
Minneapolis MN Multi Fam Rev
Hsg East Phillips AMT(11) | | | 5.25 | % | | 8/20/2044 | | Aaa | | | 300 | | | | 306,579 | | |
Minneapolis St Paul MN Hsg Fin Bd Sing
Fam Mtg Rev City Living A4 AMT(6)(12) | | | 5.00 | % | | 11/1/2038 | | AAA | | | 1,000 | | | | 1,027,180 | | |
MN St Hsg Fin Agy Res Hsg Fin
Ser B AMT | | | 4.85 | % | | 7/1/2031 | | AA+ | | | 1,865 | | | | 1,900,808 | | |
MN St Hsg Fin Agy Res Hsg Fin
Ser F AMT | | | 5.40 | % | | 7/1/2030 | | AA+ | | | 1,105 | | | | 1,136,028 | | |
MN St Hsg Fin Agy Residential
Hsg Fin G AMT | | | 4.85 | % | | 7/1/2021 | | AA+ | | | 1,365 | | | | 1,398,129 | | |
MN St Hsg Fin Agy Sing Fam
Mtg Ser D AMT | | | 5.85 | % | | 7/1/2019 | | AA+ | | | 60 | | | | 60,641 | | |
MN St Hsg Fin Agy Sing Fam
Mtg Ser E | | | 5.90 | % | | 7/1/2025 | | AA+ | | | 125 | | | | 125,389 | | |
See Notes to Financial Statements.
69
Schedule of Investments (continued)
MINNESOTA TAX-FREE FUND September 30, 2006
| Investments | | Interest
Rate | | Maturity
Date | | Credit
Rating:
S&P or
Moody's(a) | | Principal
Amount
(000) | | Value | |
MN St Hsg Fin Agy Sing Fam
Mtg Ser G AMT | | | 6.25 | % | | 7/1/2026 | | AA+ | | $ | 25 | | | $ | 25,320 | | |
Pine City MN Hlthcare & Hsg Rev
Mtg North Branch A(11) | | | 4.75 | % | | 10/20/2021 | | Aaa | | | 325 | | | | 333,278 | | |
Pine City MN Hlthcare & Hsg Rev
Mtg North Branch A(11) | | | 4.80 | % | | 10/20/2026 | | Aaa | | | 1,205 | | | | 1,230,209 | | |
St Paul MN Hsg & Redev Auth
Multi Fam Hsg Rev Selby AMT(7)(11) | | | 5.50 | % | | 9/20/2044 | | Aaa | | | 750 | | | | 770,910 | | |
St Paul MN Port Auth Hsg
Burlington Apt(11) | | | 5.35 | % | | 5/1/2031 | | AAA | | | 500 | | | | 505,235 | | |
| Total | | | | | | | | | | | | | | | 10,749,377 | | |
| Industrial 0.62% | |
Childrens Tr Fd Puerto Rico
Tob Sttlmnt Rev Asset Bkd Bds | | | 5.50 | % | | 5/15/2039 | | BBB | | | 300 | | | | 310,956 | | |
| Lease 2.89% | |
| Olmsted Cnty MN Hsg & Redev | | | 5.00 | % | | 2/1/2023 | | AAA | | | 275 | | | | 288,494 | | |
Rochester MN Indpt Sch Dist
No 535 COP(10) | | | 5.125 | % | | 2/1/2020 | | AAA | | | 85 | | | | 89,518 | | |
St Paul MN Port Auth Lease
Rev Office Bldg | | | 5.25 | % | | 12/1/2027 | | AA+ | | | 1,000 | | | | 1,061,410 | | |
| Total | | | | | | | | | | | | | | | 1,439,422 | | |
| Miscellaneous 2.73% | |
Bemidji MN Lease Rev MN St
Bureau Crim Appreh(14) | | | 5.80 | % | | 12/1/2021 | | Aaa | | | 460 | | | | 480,130 | | |
Douglas Cnty MN Hsg & Redev
Governmental Hsg Ser A(14) | | | 5.50 | % | | 1/1/2032 | | Aaa | | | 560 | | | | 607,874 | | |
| MN St Retirement Sys Bldg Rev | | | 6.00 | % | | 6/1/2030 | | AAA | | | 250 | | | | 269,758 | | |
| Total | | | | | | | | | | | | | | | 1,357,762 | | |
| Power 7.49% | |
Chaska MN Elec Rev Ref
Generating Facs Ser A | | | 5.00 | % | | 10/1/2030 | | A3 | | | 500 | | | | 521,325 | | |
| MN St Muni Pwr Agy Elec Rev | | | 5.00 | % | | 10/1/2035 | | A3 | | | 1,000 | | | | 1,038,140 | | |
Puerto Rico Elec Pwr Auth
Rev Ser DD(10) | | | 4.50 | % | | 7/1/2019 | | AAA | | | 95 | | | | 97,161 | | |
| Rochester MN Elec Util Rev TCRS(2) | | | 5.25 | % | | 12/1/2030 | | AAA | | | 1,000 | | | | 1,052,480 | | |
See Notes to Financial Statements.
70
Schedule of Investments (continued)
MINNESOTA TAX-FREE FUND September 30, 2006
| Investments | | Interest
Rate | | Maturity
Date | | Credit
Rating:
S&P or
Moody's(a) | | Principal
Amount
(000) | | Value | |
| Western MN Muni Pwr Agy Ser A(14) | | | 5.00 | % | | 1/1/2026 | | Aaa | | $ | 400 | | | $ | 420,524 | | |
| Western MN Muni Pwr Agy Pj Ser A(2) | | | 5.50 | % | | 1/1/2016 | | Aaa | | | 565 | | | | 602,951 | | |
| Total | | | | | | | | | | | | | | | 3,732,581 | | |
| Pre-Refunded 15.06% | |
| Chaska MN Elec Rev Ser A | | | 6.00 | % | | 10/1/2025 | | A3 | | | 250 | | | | 272,220 | | |
Elk River MN Indpt Sch Dist
No 728 Ser A(14) | | | 5.50 | % | | 2/1/2021 | | Aaa | | | 500 | | | | 537,085 | | |
Lake Superior MN Indpt Sch
Dist No 381 Bldg Ser A(10) | | | 5.00 | % | | 4/1/2023 | | Aaa | | | 500 | | | | 536,015 | | |
| Medford MN Indpt Sch No 763 Ser A(10) | | | 5.50 | % | | 2/1/2031 | | Aaa | | | 500 | | | | 537,295 | | |
Minneapolis MN Spl Sch Dist
No 001 COP | | | 5.75 | % | | 2/1/2015 | | AAA | | | 100 | | | | 102,896 | | |
Minneapolis MN Spl Sch Dist
No 001 COP | | | 5.75 | % | | 2/1/2017 | | AAA | | | 1,120 | | | | 1,152,435 | | |
MN Agric & Econ Dev Bd Rev
Hlthcare Sys A(14) | | | 5.50 | % | | 11/15/2017 | | AAA | | | 175 | | | | 182,210 | | |
MN St Higher Edl Facs Auth
Rev Macalester Coll Ser 4-J | | | 5.55 | % | | 3/1/2017 | | Aa3 | | | 260 | | | | 261,979 | | |
MN St Higher Edl Facs Auth
Rev Univ of St Thomas Ser 4-M | | | 5.35 | % | | 4/1/2017 | | A2 | | | 250 | | | | 252,210 | | |
Morris MN Indpt Sch Dist No
769 Bldg(14) | | | 5.00 | % | | 2/1/2028 | | AAA | | | 1,000 | | | | 1,070,340 | | |
| Princeton MN Indpt Sch Dist No 477(10) | | | 5.125 | % | | 2/1/2024 | | Aaa | | | 1,000 | | | | 1,005,150 | | |
Puerto Rico Comwlth Hwy &
Transn Auth Transn Rev Ser D | | | 5.375 | % | | 7/1/2036 | | AAA | | | 100 | | | | 109,453 | | |
| Puerto Rico Comwlth Pub Impt(13)(14) | | | 5.00 | % | | 7/1/2028 | | AAA | | | 325 | | | | 336,544 | | |
Puerto Rico Pub Fin Corp
Comwlth Approp Ser E | | | 5.75 | % | | 8/1/2030 | | Aaa | | | 500 | | | | 503,690 | | |
Robbinsdale MN Hsg Dev Sr Hsg
Pj Ser B(9) | | | 5.75 | % | | 1/1/2023 | | Aaa | | | 250 | | | | 266,765 | | |
Scott Cnty MN Hsg & Redev
Savage City Hamilton Apts Pj GTD(2) | | | 5.60 | % | | 2/1/2019 | | Aaa | | | 80 | | | | 84,433 | | |
| University MN Ser A | | | 5.75 | % | | 7/1/2018 | | Aaa | | | 250 | | | | 294,775 | | |
| Total | | | | | | | | | | | | | | | 7,505,495 | | |
| Transportation 8.44% | |
Minneapolis & St Paul MN Met
Commn Arpt Rev Sub Ser A(14) | | | 5.00 | % | | 1/1/2023 | | AAA | | | 1,000 | | | | 1,047,940 | | |
Minneapolis & St. Paul MN Met
Commn Arpt Rev Sub Ser C(9) | | | 5.25 | % | | 1/1/2026 | | AAA | | | 2,000 | | | | 2,106,900 | | |
See Notes to Financial Statements.
71
Schedule of Investments (concluded)
MINNESOTA TAX-FREE FUND September 30, 2006
| Investments | | Interest
Rate | | Maturity
Date | | Credit
Rating:
S&P or
Moody's(a) | | Principal
Amount
(000) | | Value | |
St Paul MN Port Auth Lease
Rev Office Bldg at Robnert St 3-11 | | | 5.00 | % | | 12/1/2027 | | AA+ | | $ | 1,000 | | | $ | 1,048,330 | | |
| Total | | | | | | | | | | | 4,203,170 | | |
| Total Investments in Municipal Bonds 98.51% (cost $47,149,265) | | | | | | | | | | | 49,083,112 | | |
| Cash and Other Assets in Excess of Liabilities(g) 1.49% | | | | | | | | | | | 741,643 | | |
| Net Assets 100.00% | | | | | | | | | | $ | 49,824,755 | | |
| Open futures contracts at September 30, 2006: | |
| Type | | Expiration | | Contracts | | Position | | Market Value | | Unrealized
Depreciation | |
| U.S. 20-Year Treasury Bond | | December 2006 | | | 44 | | | Short | | $ | (4,945,875 | ) | | $ | (84,524 | ) | |
See Notes to Financial Statements.
72
Schedule of Investments
MISSOURI TAX-FREE FUND September 30, 2006
| Investments | | Interest
Rate | | Maturity
Date | | Credit
Rating:
S&P or
Moody's(a) | | Principal
Amount
(000) | | Value | |
| MUNICIPAL BONDS 99.07% | |
| Education 12.51% | |
| Curators Univ MO Sys Facs Rev Ser A | | | 5.00 | % | | 11/1/2031 | | AA | | $ | 3,000 | | | $ | 3,145,500 | | |
Kansas Cnty MO Met Cmnty
Colleges Bldg Corp Rev(9) | | | 5.00 | % | | 7/1/2021 | | Aaa | | | 1,000 | | | | 1,047,580 | | |
MO St Hlth & Edl Facs Auth Rev
Ref Washington Univ Ser B | | | 5.00 | % | | 3/1/2030 | | AAA | | | 1,800 | | | | 1,866,132 | | |
MO St Hlth & Edl Facs Auth Rev
Washington Univ Ser A | | | 4.75 | % | | 11/15/2037 | | AAA | | | 2,050 | | | | 2,075,871 | | |
MO St Hlth & Edl Facs Auth Rev
Washington Univ Ser A | | | 5.00 | % | | 2/15/2022 | | AAA | | | 600 | | | | 640,506 | | |
MO St Hlth & Edl Facs Auth Rev
Webster Univ(14) | | | 5.25 | % | | 4/1/2021 | | Aaa | | | 2,000 | | | | 2,120,400 | | |
MO St Hlth & Edl Facs Auth Rev
Washington Univ Ser A | | | 5.00 | % | | 2/15/2033 | | AAA | | | 6,995 | | | | 7,292,427 | | |
MO St Hlth & Edl Facs Auth
SSM Hlth Care Ser C-1(10) | | | 3.85 | %# | | 6/1/2019 | | AAA | | | 200 | | | | 200,000 | | |
University MO Univ Rev
Sys Facs Ser B(13)(14) | | | 5.00 | % | | 11/1/2027 | | AAA | | | 1,500 | | | | 1,564,740 | | |
| Total | | | | | | | | | | | | | | | 19,953,156 | | |
| General Obligation 10.98% | |
| Belton MO(14) | | | 5.00 | % | | 3/1/2020 | | Aaa | | | 300 | | | | 324,786 | | |
Franklin Cnty MO Reorg Sch
Dist No R-XV | | | 6.00 | % | | 3/1/2020 | | AA+ | | | 390 | | | | 419,624 | | |
Hazelwood MO Sch Dist Impt MO
Direct Dep Pg | | | 5.25 | % | | 3/1/2020 | | AA+ | | | 630 | | | | 684,860 | | |
Jackson Cnty MO Reorg Sch
Dist No 7 Lee's Summit Sch Bldg(14) | | | 5.25 | % | | 3/1/2022 | | Aaa | | | 1,000 | | | | 1,097,170 | | |
MO St Brd Pub Bldgs Spl Oblig
PA 1391-R RIBs | | | 6.06 | % | | 10/15/2027 | | AA+(d) | | | 5,000 | | | | 5,538,500 | | |
| Platte Cnty MO Sch Dist Park Hill(10) | | | 5.25 | % | | 3/1/2018 | | Aaa | | | 1,000 | | | | 1,108,760 | | |
| Puerto Rico Comwlth Pub Impt Ser A(13)(14) | | | 5.50 | % | | 7/1/2029 | | AAA | | | 1,000 | | | | 1,202,390 | | |
| St. Louis Cnty MO Pkwy Sch Ser A | | | 5.00 | % | | 3/1/2024 | | AA+ | | | 3,320 | | | | 3,537,493 | | |
St. Louis Cnty MO Sch Dist No
R 8 Lindbergh(14) | | | Zero Coupon | | | 3/1/2018 | | AAA | | | 2,080 | | | | 1,304,743 | | |
St. Louis MO Bd Ed MO Direct
Dep Pg Ser A(14) | | | 5.00 | % | | 4/1/2025 | | AAA | | | 1,000 | | | | 1,068,550 | | |
| University City MO Sch Dist(14) | | | 10.00 | % | | 2/15/2008 | | AAA | | | 1,175 | | | | 1,226,806 | | |
| Total | | | | | | | | | | | | | | | 17,513,682 | | |
See Notes to Financial Statements.
73
Schedule of Investments (continued)
MISSOURI TAX-FREE FUND September 30, 2006
| Investments | | Interest
Rate | | Maturity
Date | | Credit
Rating:
S&P or
Moody's(a) | | Principal
Amount
(000) | | Value | |
| Healthcare 9.71% | |
Cape Girardeau Cnty MO Indl Dev Auth
Hlthcare Facs Rev Southeast MO
Hosp Assoc | | | 5.75 | % | | 6/1/2032 | | A-(d) | | $ | 1,600 | | | $ | 1,684,128 | | |
Hannibal MO Indl Dev Auth
Hlth Facs Rev | | | 5.00 | % | | 3/1/2022 | | BBB+ | | | 835 | | | | 868,651 | | |
Joplin MO Indl Dev Auth
Hlth Facs Rev Freeman Hlth Sys Pj | | | 5.75 | % | | 2/15/2035 | | BBB+ | | | 2,500 | | | | 2,724,475 | | |
| MO St Hlth & Edl Facs Auth BJC Hlth | | | 5.25 | % | | 5/15/2032 | | AA | | | 5,000 | | | | 5,250,150 | | |
MO St Hlth & Edl Facs Auth Rev
PA 1049 RIBs RITES(2) | | | 9.066 | % | | 6/1/2010 | | AAA(c) | | | 855 | | | | 1,087,534 | | |
MO St Hlth & Edl Facs Auth Rev
Sr Living Facs Lutheran Ser A | | | 5.375 | % | | 2/1/2035 | | A-(d) | | | 3,680 | | | | 3,867,349 | | |
| Total | | | | | | | | | | | | | | | 15,482,287 | | |
| Housing 9.77% | |
MO St Hsg Dev Commn Rev
Multi Fam Hsg Ashley Pk 2 AMT(7) | | | 4.75 | % | | 7/1/2026 | | AA | | | 1,000 | | | | 1,015,640 | | |
MO St Hsg Dev Commn Rev
Multi Fam Hsg Ashley Pk 2 AMT(7) | | | 4.75 | % | | 7/1/2030 | | AA | | | 1,000 | | | | 1,011,870 | | |
MO St Hsg Dev Commn Rev
Multi Fam Hsg Ashley Pk 2 AMT(7) | | | 4.875 | % | | 7/1/2037 | | AA | | | 1,500 | | | | 1,523,895 | | |
MO St Hsg Dev Commn Rev
Multi Fam Hsg Meadow Ridge 1 AMT(7) | | | 4.75 | % | | 7/1/2025 | | AA | | | 605 | | | | 612,641 | | |
MO St Hsg Dev Commn Rev
Multi Fam Hsg Meadow Ridge 1 AMT(7) | | | 4.875 | % | | 7/1/2030 | | AA | | | 530 | | | | 534,479 | | |
MO St Hsg Dev Commn Rev
Multi Fam Hsg Meadow Ridge 1 AMT(7) | | | 5.00 | % | | 7/1/2037 | | AA | | | 900 | | | | 911,898 | | |
MO St Hsg Dev Commn Rev
Multi Fam Hsg Met Vlg-5 AMT(7) | | | 4.75 | % | | 7/1/2021 | | AA | | | 615 | | | | 627,466 | | |
MO St Dev Fin Bd Rev Multi Fam
Rev Ref Hsg Quality Hill Pj Ser A(15) | | | 5.60 | % | | 9/15/2028 | | AA | | | 2,115 | | | | 2,144,970 | | |
MO St Hsg Dev Cmnty Mtg Rev
Sing Fam Hmownrship Ln Pg A AMT(12) | | | 4.75 | % | | 9/1/2026 | | AAA | | | 1,200 | | | | 1,212,984 | | |
MO St Hsg Dev Cmnty Mtg Rev
Sing Fam Hmownrship Ln Pg B AMT(12) | | | 4.70 | % | | 9/1/2026 | | AAA | | | 2,000 | | | | 2,021,700 | | |
MO St Hsg Dev Cmnty Mtg Rev
Sing Fam Hmownrship Ln Pg B AMT(12) | | | 4.80 | % | | 9/1/2031 | | AAA | | | 2,000 | | | | 2,023,060 | | |
MO St Hsg Dev Cmnty Mtg Rev
Sing Fam Hmownrship Ln Pg A-1 AMT(12) | | | 5.90 | % | | 9/1/2035 | | AAA | | | 940 | | | | 993,505 | | |
MO St Hsg Dev Cmnty Mtg Rev
Sing Fam Hmownrship Ln Pg B-1 AMT(12) | | | 5.375 | % | | 9/1/2022 | | AAA | | | 720 | | | | 728,150 | | |
See Notes to Financial Statements.
74
Schedule of Investments (continued)
MISSOURI TAX-FREE FUND September 30, 2006
| Investments | | Interest
Rate | | Maturity
Date | | Credit
Rating:
S&P or
Moody's(a) | | Principal
Amount
(000) | | Value | |
MO St Hsg Dev Cmnty Mtg Rev
Sing Fam Corp Apprec
Ser E-1 AMT(12) | | | Zero Coupon | | | 3/1/2029 | | AAA | | $ | 730 | | | $ | 217,664 | | |
| Total | | | | | | | | | | | | | | | 15,579,922 | | |
| Industrial 0.71% | |
Childrens Tr Fd Puerto Rico
Tob Settlmnt Rev Asset Bkd Bds | | | 5.50 | % | | 5/15/2039 | | BBB | | | 1,100 | | | | 1,140,172 | | |
| Lease 6.56% | |
Cape Girardeau Cnty MO Bldg Corp
Reorg Sch Dist R-02 Leasehold
Jackson R-II HS Pj(14) | | | 5.25 | % | | 3/1/2026 | | AAA | | | 1,000 | | | | 1,087,360 | | |
| Gladstone MO Ser A COP(2) | | | 5.35 | % | | 6/15/2016 | | Aaa | | | 1,095 | | | | 1,159,945 | | |
| Grandview MO COP(9) | | | 5.00 | % | | 1/1/2027 | | Aaa | | | 1,700 | | | | 1,788,179 | | |
Jackson Cnty MO Pub Bldg Corp
Leasehold Rev Cap Impts Pj | | | 5.00 | % | | 12/1/2029 | | Aa3 | | | 1,500 | | | | 1,565,220 | | |
Jackson Cnty MO Pub Bldg Corp
Leasehold Rev Cap Impts Pj Ser A(14) | | | 5.00 | % | | 12/1/2018 | | Aaa | | | 1,385 | | | | 1,492,421 | | |
Kansas City MO Spl Fac Rev
MCI Overhaul Base Pj Ser G AMT | | | 4.50 | % | | 9/1/2026 | | AA- | | | 530 | | | | 521,080 | | |
MO St Dev Fin Bd Infrastr Facs
Rev Branson Landing Pj Ser A | | | 5.00 | % | | 6/1/2035 | | BBB+ | | | 220 | | | | 223,854 | | |
MO St Regl Convtn & Sports
Complex Auth Ref Convtn(2) | | | 5.25 | % | | 8/15/2016 | | AAA | | | 2,405 | | | | 2,633,619 | | |
| Total | | | | | | | | | | | | | | | 10,471,678 | | |
| Miscellaneous 6.08% | |
Kansas City MO Muni Assistance
Corp Rev Leasehold Ser 2001A(2) | | | 5.00 | % | | 3/1/2019 | | AAA | | | 1,500 | | | | 1,578,210 | | |
Kansas City MO Muni
Assistance Corp Rev Ser A | | | 5.125 | % | | 3/1/2019 | | A2 | | | 1,100 | | | | 1,143,505 | | |
MO St Dev Fin Bd Infrastr Facs
Rev Crackerneck Creek Pj Ser C | | | 5.00 | % | | 3/1/2028 | | A+ | | | 1,000 | | | | 1,034,860 | | |
MO St Dev Fin Bd Infrastr Facs
Rev Hartman Hrtge Ctr Ser A(2) | | | 5.875 | % | | 4/1/2020 | | Aaa | | | 1,000 | | | | 1,053,510 | | |
Puerto Rico Pub Bldgs Auth Rev
Ref Govt Facs Ser C GTD | | | 5.75 | % | | 7/1/2018 | | BBB | | | 1,000 | | | | 1,141,440 | | |
Puerto Rico Pub Bldgs Auth
Rev Govt Facs Ser I GTD | | | 5.25 | % | | 7/1/2033 | | BBB | | | 2,500 | | | | 2,643,000 | | |
St. Louis MO Ind Dev Auth Rev
Convtn Ctr Hotel(2) | | | Zero Coupon | | | 7/15/2020 | | AAA | | | 2,000 | | | | 1,099,360 | | |
| Total | | | | | | | | | | | | | | | 9,693,885 | | |
See Notes to Financial Statements.
75
Schedule of Investments (continued)
MISSOURI TAX-FREE FUND September 30, 2006
| Investments | | Interest
Rate | | Maturity
Date | | Credit
Rating:
S&P or
Moody's(a) | | Principal
Amount
(000) | | Value | |
| Power 5.73% | |
MO Jnt Muni Elec Util Cmnty
Pwr Iatan 2 Pj Ser A(2) | | | 4.50 | % | | 1/1/2036 | | Aaa | | $ | 500 | | | $ | 502,225 | | |
MO Jnt Muni Elec Util Cmnty
Pwr Iatan 2 Pj Ser A(2) | | | 5.00 | % | | 1/1/2034 | | Aaa | | | 1,000 | | | | 1,054,420 | | |
MO Jnt Muni Elec Util Cmnty
Pwr Pj RIBs(14) | | | 6.045 | % | | 1/1/2034 | | AAA(d) | | | 3,500 | | | | 3,880,940 | | |
Puerto Rico Elec Pwr Auth Pwr
Rev Ser NN | | | 5.125 | % | | 7/1/2029 | | A3 | | | 1,500 | | | | 1,575,240 | | |
Puerto Rico Elec Pwr Auth Pwr
Rev Ser RR(16) | | | 5.00 | % | | 7/1/2025 | | AAA | | | 2,000 | | | | 2,131,000 | | |
| Total | | | | | | | | | | | | | | | 9,143,825 | | |
| Pre-Refunded 20.66% | |
Belton MO Sch Dist No 124 MO
Direct Deposit Pg(10) | | | 6.00 | % | | 3/1/2020 | | AAA | | | 1,770 | | | | 1,908,573 | | |
| Boone Cnty MO Reorg Sch Dist No R-6 | | | 6.00 | % | | 3/1/2020 | | AA+ | | | 500 | | | | 537,980 | | |
Bowling Green MO Sch Dist R-I
Bldg Corp Leasehold Rev(14) | | | 5.85 | % | | 3/1/2020 | | AAA | | | 1,000 | | | | 1,073,520 | | |
Mehlville MO Sch Dist No R9
MO Cap Impt Pj COP(10) | | | 5.25 | % | | 9/1/2013 | | AAA | | | 1,000 | | | | 1,087,640 | | |
MO Dev Fin Bd Cultural Facs Rev
Nelson Gallery Fndtn Ser A(14) | | | 5.00 | % | | 12/1/2030 | | AAA | | | 3,300 | | | | 3,436,653 | | |
MO Sch Brds Assoc Lease Partn
NIXA Reorg Sch Dist R-2(15) | | | 5.40 | % | | 3/1/2020 | | AA | | | 850 | | | | 886,558 | | |
MO St Bonne Terre Prison Pj
Ser A COP(2) | | | 5.15 | % | | 6/1/2018 | | AAA | | | 1,015 | | | | 1,056,585 | | |
MO St Hlth & Edl Facs Auth Rev
Washington Univ Ser A | | | 6.00 | % | | 3/1/2030 | | Aaa | | | 850 | | | | 922,667 | | |
MO St Hlth & Edl Facs Auth Rev SSM
Hlthcare Ser A(2) | | | 5.25 | % | | 6/1/2028 | | AAA | | | 5,000 | | | | 5,401,950 | | |
Muni Secs Trust Ctfs Ser 7005
Cl B ETM RIBs† | | | 7.134 | % | | 10/1/2040 | | Aaa | | | 3,050 | | | | 3,506,646 | | |
Puerto Rico Comwlth Infrastr Fin
Auth Spl Ser A | | | 5.50 | % | | 10/1/2040 | | AAA | | | 2,700 | | | | 2,902,122 | | |
| Puerto Rico Comwlth Pub Impt Ser A | | | 5.125 | % | | 7/1/2031 | | AAA | | | 1,210 | | | | 1,294,615 | | |
Springfield MO Sch Dist No
R12 MO Direct Deposit Pg | | | 5.85 | % | | 3/1/2020 | | AA+ | | | 500 | | | | 535,600 | | |
St. Louis MO Muni Fin Corp Leasehold
Rev Carnahan Courthouse Ser A(9) | | | 5.125 | % | | 2/15/2027 | | Aaa | | | 1,500 | | | | 1,611,375 | | |
St. Louis MO Muni Fin Corp Rev
City Justice Ctr Ser A(2) | | | 6.00 | % | | 2/15/2020 | | Aaa | | | 760 | | | | 825,520 | | |
See Notes to Financial Statements.
76
Schedule of Investments (continued)
MISSOURI TAX-FREE FUND September 30, 2006
| Investments | | Interest
Rate | | Maturity
Date | | Credit
Rating:
S&P or
Moody's(a) | | Principal
Amount
(000) | | Value | |
| St. Louis MO Pub Safety(9) | | | 5.125 | % | | 2/15/2018 | | AAA | | $ | 270 | | | $ | 281,696 | | |
St. Louis Cnty MO Pattonville
No R-3 Sch Dist(9) | | | 6.00 | % | | 3/1/2019 | | AAA | | | 845 | | | | 918,659 | | |
St. Louis MO Arpt Rev Arpt
Dev Pg Ser A(14) | | | 5.25 | % | | 7/1/2031 | | AAA | | | 2,000 | | | | 2,146,160 | | |
| St. Louis MO Pkg Fac Rev ETM(14) | | | 5.375 | % | | 12/15/2021 | | AAA | | | 10 | | | | 10,232 | | |
| St. Louis MO Sch Dist(9) | | | 6.00 | % | | 4/1/2012 | | AAA | | | 575 | | | | 582,113 | | |
| University MO Univ Rev Sys Facs | | | 5.80 | % | | 11/1/2027 | | AA | | | 1,975 | | | | 2,041,064 | | |
| Total | | | | | | | | | | | | | | | 32,967,928 | | |
| Resource Recovery 2.41% | |
MO St Dev Fin Bd Solid Wst
Disp Rev P & G Paper Pj AMT | | | 5.20 | % | | 3/15/2029 | | AA- | | | 1,130 | | | | 1,278,990 | | |
MO St Envr Impt & Enrg
Unrefunded Bal St Revolving B | | | 7.20 | % | | 7/1/2016 | | Aaa | | | 1,085 | | | | 1,086,541 | | |
MO St Envr Impt & Enrg
Unrefunded Bal St Revolving D | | | 5.625 | % | | 7/1/2016 | | Aaa | | | 220 | | | | 222,495 | | |
MO St Envr Impt & Enrg
Unrefunded Bal St Revolving E | | | 5.90 | % | | 1/1/2019 | | Aaa | | | 240 | | | | 242,450 | | |
St. Louis MO Ind Dev Auth
Anheuser-Busch Pj AMT | | | 5.875 | % | | 11/1/2026 | | A+ | | | 1,005 | | | | 1,016,477 | | |
| Total | | | | | | | | | | | | | | | 3,846,953 | | |
| Special Tax 0.53% | |
Riverside-Quindaro Bend Levee
Dist MO Impt Rev Ref L-385 Pj(15) | | | 5.00 | % | | 3/1/2017 | | AA | | | 795 | | | | 851,612 | | |
| Transportation 8.80% | |
Bi St Dev Agy MO Met Dist
Rev Metrolink Cross Cnty Pj B(10) | | | 5.00 | % | | 10/1/2032 | | AAA | | | 3,500 | | | | 3,663,800 | | |
MO St Hwys & Trans Commn St Rd
Rev Ser A | | | 5.00 | % | | 2/1/2022 | | AAA | | | 1,970 | | | | 2,069,327 | | |
MO St Hwys & Trans Commn St Rd
Rev Ser A | | | 5.25 | % | | 2/1/2020 | | AAA | | | 1,830 | | | | 1,947,578 | | |
Puerto Rico Comwlth Hwy &
Transn Auth Rev PA 1052 RIBs RITES | | | 7.259 | % | | 1/1/2010 | | AAA(c) | | | 2,500 | | | | 3,069,300 | | |
Puerto Rico Comwlth Hwy &
Transn Auth Hwy Rev Ser Y | | | 5.50 | % | | 7/1/2036 | | BBB+ | | | 500 | | | | 546,060 | | |
St. Louis MO Arpt Rev
Arpt Dev Pg Ser A(14) | | | 5.125 | % | | 7/1/2022 | | AAA | | | 2,000 | | | | 2,103,240 | | |
St. Louis MO Arpt Rev Lambert
Int'l Ser B AMT(9) | | | 5.25 | % | | 7/1/2027 | | AAA | | | 625 | | | | 635,625 | | |
| Total | | | | | | | | | | | | | | | 14,034,930 | | |
See Notes to Financial Statements.
77
Schedule of Investments (concluded)
MISSOURI TAX-FREE FUND September 30, 2006
| Investments | | Interest
Rate | | Maturity
Date | | Credit
Rating:
S&P or
Moody's(a) | | Principal
Amount
(000) | | Value | |
| Water/Sewer 4.62% | |
Metropolitan St. Louis MO Swr
Dist Wstwtr Sys Rev Ser A(14) | | | 5.00 | % | | 5/1/2034 | | AAA | | $ | 4,000 | | | $ | 4,210,960 | | |
St. Charles Cnty MO Pub Wtr
Supply Dist No 2 COP(14) | | | 5.125 | % | | 12/1/2027 | | Aaa | | | 3,000 | | | | 3,157,170 | | |
| Total | | | | | | | | | | | | | 7,368,130 | | |
| Total Investments in Municipal Bonds 99.07% (cost $150,294,291) | | | | | | | | | | | | | 158,048,160 | | |
| Cash and Other Assets in Excess of Liabilities(g) 0.93% | | | | | | | | | | | | | 1,481,838 | | |
| Net Assets 100.00% | | | | | | | | | | | | $ | 159,529,998 | | |
| Open futures contracts at September 30, 2006: | |
| Type | | Expiration | | Contracts | | Position | | Market Value | | Unrealized
Depreciation | |
| U.S. 20-Year Treasury Bond | | December 2006 | | | 156 | | | Short | | $ | (17,535,375 | ) | | $ | (299,678 | ) | |
See Notes to Financial Statements.
78
Schedule of Investments
NEW JERSEY TAX-FREE FUND September 30, 2006
| Investments | | Interest
Rate | | Maturity
Date | | Credit
Rating:
S&P or
Moody's(a) | | Principal
Amount
(000) | | Value | |
| MUNICIPAL BONDS 98.63% | |
| Education 12.53% | |
Higher Ed Stud Assist Auth NJ
Student Loan Rev Ser A AMT(14) | | | 6.15 | % | | 6/1/2019 | | AAA | | $ | 575 | | | $ | 590,836 | | |
NJ Econ Dev Auth Rev Sch Facs
Constr Ser 0 | | | 5.25 | % | | 3/1/2025 | | AA- | | | 1,085 | | | | 1,170,541 | | |
NJ Econ Dev Auth Rev Sch Facs
Constr Ser P | | | 5.25 | % | | 9/1/2024 | | AA- | | | 1,625 | | | | 1,761,955 | | |
NJ Econ Dev Auth Rev Sch Facs
Constr Ser P | | | 5.25 | % | | 9/1/2026 | | AA- | | | 1,000 | | | | 1,081,960 | | |
NJ St Ed Facs Auth Rev Kean
Univ Ser D(9) | | | 5.00 | % | | 7/1/2033 | | AAA | | | 2,500 | | | | 2,614,725 | | |
NJ St Ed Facs Auth Rev
Princeton Theological Seminary | | | 5.00 | % | | 7/1/2026 | | AAA | | | 2,500 | | | | 2,641,775 | | |
| NJ St Ed Facs Auth Rev Ser I Rowan(9) | | | 5.125 | % | | 7/1/2030 | | AAA | | | 2,650 | | | | 2,818,037 | | |
NJ St Edl Facs Auth Rev
Princeton Univ Ser B | | | 3.62 | %# | | 7/1/2022 | | AAA | | | 300 | | | | 300,000 | | |
NJ St Edl Facs Auth Rev
William Paterson Univ Ser E(16) | | | 5.00 | % | | 7/1/2027 | | AAA | | | 2,500 | | | | 2,624,350 | | |
| Rutgers St Univ NJ Ser A | | | 5.20 | % | | 5/1/2027 | | AA | | | 750 | | | | 772,230 | | |
| Total | | | | | | | | | | | | | | | 16,376,409 | | |
| General Obligation 3.86% | |
| Millburn Twp NJ Sch Dist | | | 5.35 | % | | 7/15/2018 | | Aa1 | | | 1,050 | | | | 1,205,494 | | |
| Millburn Twp NJ Sch Dist | | | 5.35 | % | | 7/15/2019 | | Aa1 | | | 250 | | | | 289,478 | | |
| Montville Twp NJ Fire Dist No 23 | | | 5.25 | % | | 7/15/2016 | | A2 | | | 410 | | | | 448,413 | | |
| Pohatcong Twp NJ Sch Dist(10) | | | 5.25 | % | | 7/15/2026 | | AAA | | | 1,335 | | | | 1,553,806 | | |
| Puerto Rico Comwlth Pub Impt CR(10) | | | 4.50 | % | | 7/1/2023 | | AAA | | | 1,000 | | | | 1,018,290 | | |
| Puerto Rico Comwlth Pub Impt Ser A | | | 5.25 | % | | 7/1/2030 | | BBB | | | 500 | | | | 534,160 | | |
| Total | | | | | | | | | | | | | | | 5,049,641 | | |
| Healthcare 11.50% | |
Camden Cnty NJ Impt Auth Hlthcare
Redev Rev Cooper Hlth Sys Oblig Grp A | | | 5.00 | % | | 2/15/2035 | | BBB | | | 500 | | | | 512,680 | | |
NJ Econ Dev Auth Rev
Masonic Charity Fndtn Pj | | | 6.00 | % | | 6/1/2025 | | A- | | | 1,000 | | | | 1,096,770 | | |
NJ Hlthcare Facs Fin Auth Rev
Cap Hlth Sys Oblig Grp Ser A | | | 5.375 | % | | 7/1/2033 | | Baa1 | | | 2,000 | | | | 2,090,000 | | |
See Notes to Financial Statements.
79
Schedule of Investments (continued)
NEW JERSEY TAX-FREE FUND September 30, 2006
| Investments | | Interest
Rate | | Maturity
Date | | Credit
Rating:
S&P or
Moody's(a) | | Principal
Amount
(000) | | Value | |
NJ Hlthcare Facs Fin Auth Rev
Holy Name Hosp | | | 5.00 | % | | 7/1/2036 | | BBB | | $ | 700 | | | $ | 717,311 | | |
NJ Hlthcare Fac Fin Auth Rev
Hunterdon Med Ctr Ser A | | | 5.25 | % | | 7/1/2025 | | A- | | | 600 | | | | 642,960 | | |
NJ Hlthcare Fac Fin Auth Rev
Robert Wood Johnson Univ Hosp | | | 5.75 | % | | 7/1/2031 | | A2 | | | 4,000 | | | | 4,296,840 | | |
NJ Hlthcare Fac Fin Auth Rev
Spectrum For Living Ser B(7) | | | 6.50 | % | | 2/1/2022 | | AAA | | | 705 | | | | 705,818 | | |
NJ Hlthcare Fac Fin Auth Rev
St Clare's Hosp Ser A(15) | | | 4.75 | % | | 7/1/2025 | | AA | | | 1,100 | | | | 1,122,781 | | |
NJ Hlthcare Facs Fin Auth Dept Human
Svcs Greystone Pk Psychiatric Hosp(2) | | | 5.00 | % | | 9/15/2027 | | AAA | | | 1,200 | | | | 1,273,716 | | |
Puerto Rico Indl Tourist Ed &
Envr Ctrl Fac Hosp Ser A | | | 6.125 | % | | 11/15/2030 | | AA | | | 1,000 | | | | 1,106,360 | | |
Puerto Rico Indl Tourist Ed &
Envr Ctrl Fac Hosp Ser A | | | 6.125 | % | | 11/15/2025 | | AA | | | 415 | | | | 459,475 | | |
Puerto Rico Indl Tourist Ed &
Mutuo Oblig Grp Ser A(14) | | | 6.25 | % | | 7/1/2024 | | AAA | | | 1,000 | | | | 1,006,090 | | |
| Total | | | | | | | | | | | | | | | 15,030,801 | | |
| Housing 0.86% | |
NJ Econ Dev Auth Rev
Ref Cranes Mill Pj A | | | 5.00 | % | | 6/1/2015 | | BBB-(d) | | | 1,000 | | | | 1,027,020 | | |
Virgin Islands Hsg Fin Auth
Sing Fam Rev Ser A AMT(11) | | | 6.50 | % | | 3/1/2025 | | AAA(c) | | | 100 | | | | 100,632 | | |
| Total | | | | | | | | | | | | | | | 1,127,652 | | |
| Industrial 7.76% | |
Bayonne NJ Redev Agy Royal
Caribbean Pj Ser A AMT | | | 5.375 | % | | 11/1/2035 | | BBB- | | | 750 | | | | 776,820 | | |
NJ Econ Dev Auth Amer Wtr
Co Inc Ser B AMT(9) | | | 5.375 | % | | 5/1/2032 | | AAA | | | 5,000 | | | | 5,185,250 | | |
NJ Econ Dev Auth Middlesex
Wtr Co Pj AMT(14) | | | 5.35 | % | | 2/1/2038 | | AAA | | | 2,500 | | | | 2,580,375 | | |
NJ Econ Dev Auth Econ Dev Rev
Kapkowski Rd Landfill Pj | | | 6.50 | % | | 4/1/2028 | | Baa3 | | | 675 | | | | 821,853 | | |
| Tob Sttlmnt Fin Corp NJ | | | 5.75 | % | | 6/1/2032 | | BBB | | | 745 | | | | 784,172 | | |
| Total | | | | | | | | | | | | | | | 10,148,470 | | |
See Notes to Financial Statements.
80
Schedule of Investments (continued)
NEW JERSEY TAX-FREE FUND September 30, 2006
| Investments | | Interest
Rate | | Maturity
Date | | Credit
Rating:
S&P or
Moody's(a) | | Principal
Amount
(000) | | Value | |
| Lease 2.40% | |
| Morris-Union Jointure Commn NJ COP(15) | | | 5.00 | % | | 5/1/2027 | | AA | | $ | 1,000 | | | $ | 1,045,350 | | |
| Rutgers St Univ NJ COP(2) | | | 5.00 | % | | 1/1/2038 | | AAA | | | 2,000 | | | | 2,091,260 | | |
| Total | | | | | | | | | | | | | | | 3,136,610 | | |
| Miscellaneous 4.26% | |
Hudson Cnty NJ Impt Auth
Hudson Regl Fire/Rescue Ser A(2) | | | 5.625 | % | | 9/1/2019 | | Aaa | | | 100 | | | | 106,128 | | |
Middlesex Cnty NJ Impt Auth
Cnty Open Space Tr Fd GTD | | | 5.25 | % | | 9/15/2022 | | AAA | | | 1,910 | | | | 2,072,808 | | |
Monmouth Cnty NJ Impt Auth
Rev Unrefunded Bal Govtl Ln(14) | | | 6.40 | % | | 12/1/2009 | | AAA | | | 195 | | | | 195,819 | | |
NJ Econ Dev Auth Rev Motor
Vehicle Sur Rev Ser A(14) | | | 5.00 | % | | 7/1/2034 | | AAA | | | 285 | | | | 299,917 | | |
| NJ Econ Dev Auth Muni Rehab(2) | | | 5.00 | % | | 4/1/2028 | | AAA | | | 1,130 | | | | 1,180,895 | | |
Puerto Rico Pub Bldgs Auth
Rev Govt Facs Ser I GTD | | | 5.25 | % | | 7/1/2033 | | BBB | | | 1,250 | | | | 1,321,500 | | |
| Rahway NJ COP(14) | | | 5.625 | % | | 2/15/2020 | | Aaa | | | 365 | | | | 388,689 | | |
| Total | | | | | | | | | | | | | | | 5,565,756 | | |
| Power 4.58% | |
| Brick Twp NJ Muni Util Auth(9) | | | 5.00 | % | | 12/1/2025 | | Aaa | | | 2,000 | | | | 2,114,820 | | |
Puerto Rico Elec Pwr Auth Pwr
Rev Ser NN(14) | | | 5.00 | % | | 7/1/2032 | | AAA | | | 2,000 | | | | 2,100,160 | | |
Puerto Rico Elec Pwr Auth Pwr
Rev Ser NN | | | 5.125 | % | | 7/1/2029 | | A3 | | | 1,000 | | | | 1,050,160 | | |
Puerto Rico Elec Pwr Auth Pwr
Rev Ser RR(16) | | | 5.00 | % | | 7/1/2025 | | AAA | | | 675 | | | | 719,213 | | |
| Total | | | | | | | | | | | | | | | 5,984,353 | | |
| Pre-Refunded 28.75% | |
| Carteret NJ Bd Ed COP(14) | | | 5.75 | % | | 1/15/2030 | | Aaa | | | 80 | | | | 85,574 | | |
| Carteret NJ Bd Ed COP(14) | | | 6.00 | % | | 1/15/2024 | | Aaa | | | 430 | | | | 465,045 | | |
Casino Reinvestment Dev Auth
NJ Parking Fee Rev Ser A(10) | | | 5.25 | % | | 10/1/2015 | | AAA | | | 100 | | | | 101,720 | | |
| Chatham Dist NJ Bd Ed(14) | | | 5.00 | % | | 1/15/2019 | | Aaa | | | 1,020 | | | | 1,077,783 | | |
| Chatham Dist NJ Bd Ed(14) | | | 5.125 | % | | 1/15/2024 | | Aaa | | | 595 | | | | 631,634 | | |
See Notes to Financial Statements.
81
Schedule of Investments (continued)
NEW JERSEY TAX-FREE FUND September 30, 2006
| Investments | | Interest
Rate | | Maturity
Date | | Credit
Rating:
S&P or
Moody's(a) | | Principal
Amount
(000) | | Value | |
| Chatham Dist NJ Bd Ed(14) | | | 5.25 | % | | 1/15/2026 | | Aaa | | $ | 1,500 | | | $ | 1,599,750 | | |
| LaFayette Yard NJ Cmnty Dev GTD(14) | | | 5.625 | % | | 4/1/2021 | | Aaa | | | 200 | | | | 215,352 | | |
Muni Secs Trust Ctfs Ser 7005
Cl B ETM RIBs† | | | 7.134 | % | | 10/1/2040 | | Aaa | | | 1,000 | | | | 1,149,720 | | |
| NJ Bldg Auth St Bldg Rev | | | 5.375 | % | | 6/15/2019 | | AA- | | | 450 | | | | 471,276 | | |
| NJ Envr Infra Ser 2000A | | | 5.25 | % | | 9/1/2020 | | AAA | | | 2,000 | | | | 2,141,180 | | |
NJ St Edl Facs Auth Rev
Princeton Univ Ser B | | | 5.125 | % | | 7/1/2019 | | AAA | | | 355 | | | | 369,747 | | |
NJ St Edl Facs Auth Rev
Princeton Univ Ser H | | | 5.25 | % | | 7/1/2017 | | AAA | | | 700 | | | | 741,566 | | |
NJ St Edl Facs Auth Rev
Princeton Univ Ser H | | | 5.25 | % | | 7/1/2022 | | AAA | | | 2,560 | | | | 2,712,013 | | |
NJ St Edl Facs Auth Rev
Princeton Univ Ser H | | | 5.25 | % | | 7/1/2026 | | AAA | | | 2,350 | | | | 2,489,543 | | |
NJ St Edl Facs Auth Rev
Princeton Univ Ser H | | | 5.375 | % | | 7/1/2024 | | AAA | | | 2,550 | | | | 2,712,486 | | |
NJ St Hwy Auth Garden St
Pkwy Gen Rev Sr Pkwy(9) | | | 5.75 | % | | 1/1/2015 | | AAA | | | 200 | | | | 215,198 | | |
| NJ St Tpk Auth Rev Ser A | | | 5.50 | % | | 1/1/2027 | | A | | | 3,000 | | | | 3,173,700 | | |
| NJ St Tpk Auth Rev Ser A(14) | | | 5.50 | % | | 1/1/2030 | | AAA | | | 1,500 | | | | 1,589,205 | | |
NJ St Transn Tr Fd Auth
Transn Sys Ser B | | | 6.00 | % | | 6/15/2019 | | AAA | | | 6,500 | | | | 7,049,185 | | |
NJ St Transn Tr Fd Auth Transn
Sys Ser D(10) | | | 5.00 | % | | 6/15/2016 | | AAA | | | 1,000 | | | | 1,095,870 | | |
| North Bergen Twp NJ Bd Ed COP(10) | | | 6.125 | % | | 12/15/2022 | | Aaa | | | 1,185 | | | | 1,313,655 | | |
| Ocean Cnty NJ Gen Impt | | | 5.125 | % | | 9/1/2020 | | Aa1 | | | 1,800 | | | | 1,918,926 | | |
| Puerto Rico Comwlth Pub Impt Ser A | | | 5.125 | % | | 7/1/2031 | | AAA | | | 620 | | | | 663,356 | | |
| South Brunswick Twp NJ(9) | | | 5.625 | % | | 12/1/2023 | | AAA | | | 45 | | | | 47,806 | | |
| Summit NJ | | | 5.70 | % | | 6/1/2020 | | AAA | | | 325 | | | | 342,813 | | |
| Trenton NJ Pkg Auth Pkg Rev GTD(9) | | | 6.00 | % | | 4/1/2017 | | Aaa | | | 1,000 | | | | 1,080,130 | | |
| Washington Twp NJ Bd Ed Mercer Cnty(9) | | | 5.00 | % | | 1/1/2027 | | Aaa | | | 2,000 | | | | 2,133,540 | | |
| Total | | | | | | | | | | | | | | | 37,587,773 | | |
| Toll Roads 1.61% | |
NJ St Tpk Auth Rev ROLs RR II
R 323 RIBs(2) | | | 6.139 | % | | 1/1/2035 | | Aaa | | | 2,000 | | | | 2,110,440 | | |
| Transportation 19.56% | |
Delaware River Port Auth PA &
NJ Ref Port Dist Pj Ser B(10) | | | 5.10 | % | | 1/1/2021 | | AAA | | | 1,435 | | | | 1,531,260 | | |
See Notes to Financial Statements.
82
Schedule of Investments (concluded)
NEW JERSEY TAX-FREE FUND September 30, 2006
| Investments | | Interest
Rate | | Maturity
Date | | Credit
Rating:
S&P or
Moody's(a) | | Principal
Amount
(000) | | Value | |
Delaware River Port Auth PA &
NJ Ref Port Dist Pj Ser B(10) | | | 5.20 | % | | 1/1/2025 | | AAA | | $ | 1,700 | | | $ | 1,814,546 | | |
| Delaware River Port Auth PA & NJ Rev(9) | | | 5.50 | % | | 1/1/2026 | | AAA | | | 1,000 | | | | 1,014,220 | | |
Muni Secs Trust Ctfs Ser
2006-7009 Cl B RIBs†(14) | | | 6.58 | % | | 12/15/2021 | | Aaa | | | 5,000 | | | | 6,363,600 | | |
| Port Auth NY & NJ(10) | | | 5.00 | % | | 4/15/2032 | | AAA | | | 4,725 | | | | 4,978,402 | | |
| Port Auth NY & NJ Cons 109th Ser | | | 5.375 | % | | 1/15/2032 | | AA- | | | 500 | | | | 507,300 | | |
Port Auth NY & NJ Cons 119th
Ser AMT(9) | | | 5.50 | % | | 9/15/2019 | | AAA | | | 150 | | | | 151,710 | | |
| Port Auth NY & NJ Cons 125th Ser(10) | | | 5.00 | % | | 10/15/2027 | | AAA | | | 5,000 | | | | 5,296,200 | | |
Puerto Rico Comwlth Hwy &
Transn Auth Rev PA 1052 RIBs RITES | | | 7.259 | % | | 1/1/2010 | | AAA(c) | | | 2,750 | | | | 3,376,230 | | |
Puerto Rico Comwlth Hwy
Transn Auth Hwy Rev Ser Y | | | 5.50 | % | | 7/1/2036 | | BBB+ | | | 500 | | | | 546,060 | | |
| Total | | | | | | | | | | | | | | | 25,579,528 | | |
| Water/Sewer 0.96% | |
| North Hudson Swr Auth NJ Rev Ser C(14) | | | 5.00 | % | | 8/1/2022 | | Aaa | | | 1,025 | | | | 1,071,802 | | |
| Ocean Twp NJ Swr Auth Ser B(9) | | | 5.25 | % | | 12/1/2011 | | Aaa | | | 170 | | | | 183,671 | | |
| Total | | | | | | | | | | | | | | | 1,255,473 | | |
| Total Municipal Bonds (cost $120,476,597) | | | | | | | | | | | | | | | 128,952,906 | | |
| | | | | | | | | Shares
(000) | | | |
| SHORT-TERM INVESTMENT 0.04% | |
| Money Market Mutual Fund | |
| Dreyfus NJ Municipal Cash Management (cost $55,149) | | | | | | | | | | | 55 | | | | 55,149 | | |
| Total Investments in Securities 98.67% (cost $120,531,746) | | | | | | | | | | | | | | | 129,008,055 | | |
| Cash and Other Assets in Excess of Liabilities(g) 1.33% | | | | | | | | | | | | | | | 1,734,188 | | |
| Net Assets 100.00% | | | | | | | | | | | | | | $ | 130,742,243 | | |
| Open futures contracts at September 30, 2006: | |
| Type | | Expiration | | Contracts | | Position | | Market Value | | Unrealized
Depreciation | |
| U.S. 20-Year Treasury Bond | | | December 2006 | | | | 91 | | | Short | | $ | (10,228,969 | ) | | $ | (174,769 | ) | |
See Notes to Financial Statements.
83
Schedule of Investments
NEW YORK TAX-FREE FUND September 30, 2006
| Investments | | Interest
Rate | | Maturity
Date | | Credit
Rating:
S&P or
Moody's(a) | | Principal
Amount
(000) | | Value | |
| MUNICIPAL BONDS 98.93% | |
| Education 7.92% | |
Albany Cnty NY Indl Dev Agy
Albany College of Pharmacy A | | | 5.625 | % | | 12/1/2034 | | BBB- | | $ | 700 | | | $ | 747,320 | | |
Cattaraugus Cnty NY Indl Dev Agy
Civic Fac Rev St Bonaventure Univ | | | 5.00 | % | | 5/1/2023 | | BBB- | | | 500 | | | | 513,380 | | |
Cattaraugus Cnty NY Indl Dev Agy
Civic Fac Rev St Bonaventure Univ | | | 5.10 | % | | 5/1/2031 | | BBB- | | | 500 | | | | 512,160 | | |
Hempstead Twn NY Ind Dev Agy
Civic Fac Rev Hofstra Univ Pj(14) | | | 5.80 | % | | 7/1/2015 | | AAA | | | 750 | | | | 766,005 | | |
NY New York City Indl Dev Agy
Civic Rev NY Institute of Tech(14) | | | 5.25 | % | | 3/1/2023 | | AAA | | | 100 | | | | 107,880 | | |
NY St Dorm Auth Lease Rev Cap
Apprec Court Fac | | | Zero Coupon | | | 8/1/2021 | | AA+ | | | 3,265 | | | | 1,763,067 | | |
NY St Dorm Auth Rev 4201
Schools Pg | | | 6.25 | % | | 7/1/2020 | | AA- | | | 1,685 | | | | 1,845,951 | | |
NY St Dorm Auth Rev Colgate
Univ(14) | | | 6.00 | % | | 7/1/2016 | | AAA | | | 1,000 | | | | 1,166,130 | | |
NY St Dorm Auth Rev New York
Univ Ser A(2) | | | 5.75 | % | | 7/1/2015 | | AAA | | | 2,000 | | | | 2,300,500 | | |
NY St Dorm Auth Rev Pratt
Institute(15) | | | 6.00 | % | | 7/1/2024 | | AA | | | 1,000 | | | | 1,075,560 | | |
NY St Dorm Auth Rev Pratt
Institute(15) | | | 6.00 | % | | 7/1/2028 | | AA | | | 2,000 | | | | 2,148,940 | | |
NY St Dorm Auth Rev Spl Act
Sch Dist Pj(14) | | | 6.00 | % | | 7/1/2016 | | AAA | | | 1,400 | | | | 1,414,994 | | |
NY St Dorm Auth Revs New York
Univ A(9) | | | 5.00 | % | | 7/1/2034 | | AAA | | | 3,125 | | | | 3,284,344 | | |
Rensselaer Cnty NY Indl Dev
Polytech Inst Ser B TCRS(2) | | | 5.50 | % | | 8/1/2022 | | AAA | | | 200 | | | | 210,812 | | |
Schenectady NY Indl Dev Agy
Civic Fac Rev Union College(2) | | | 5.625 | % | | 7/1/2031 | | Aaa | | | 1,500 | | | | 1,657,260 | | |
St. Lawrence Cnty NY Indl
Civic Fac Rev Clarkson Univ Pj | | | 5.125 | % | | 7/1/2021 | | A3 | | | 250 | | | | 257,900 | | |
| Total | | | | | | | | | | | | | | | 19,772,203 | | |
| General Obligation 5.37% | |
Erie Cnty NY Indl Dev Agy Sch
Fac Rev City of Buffalo Pj(10) | | | 5.75 | % | | 5/1/2023 | | AAA | | | 1,250 | | | | 1,364,825 | | |
| New York NY Ser B | | | 5.75 | % | | 8/1/2016 | | AA- | | | 1,000 | | | | 1,105,380 | | |
See Notes to Financial Statements.
84
Schedule of Investments (continued)
NEW YORK TAX-FREE FUND September 30, 2006
| Investments | | Interest
Rate | | Maturity
Date | | Credit
Rating:
S&P or
Moody's(a) | | Principal
Amount
(000) | | Value | |
| New York NY Sub Ser C-1 | | | 5.25 | % | | 8/15/2026 | | AA- | | $ | 2,500 | | | $ | 2,679,325 | | |
| New York NY Ser J | | | 5.50 | % | | 6/1/2022 | | AA- | | | 1,510 | | | | 1,654,099 | | |
| Puerto Rico Comwlth Pub Impt | | | 5.25 | % | | 7/1/2018 | | BBB | | | 2,000 | | | | 2,200,760 | | |
| Puerto Rico Comwlth Pub Impt Ser A | | | 5.00 | % | | 7/1/2033 | | BBB | | | 500 | | | | 513,780 | | |
| Puerto Rico Comwlth Pub Impt Ser A | | | 5.25 | % | | 7/1/2024 | | BBB | | | 1,500 | | | | 1,587,030 | | |
Puerto Rico Comwlth
Unrefunded Pub Impt Ser A | | | 5.25 | % | | 7/1/2030 | | BBB | | | 500 | | | | 534,160 | | |
Puerto Rico Comwlth
Unrefunded Pub Impt(13)(14) | | | 5.00 | % | | 7/1/2028 | | AAA | | | 605 | | | | 620,173 | | |
Puerto Rico Comwlth
Unrefunded Bal Pub Impt Ser A | | | 5.375 | % | | 7/1/2028 | | BBB | | | 1,090 | | | | 1,140,184 | | |
| Total | | | | | | | | | | | | | | | 13,399,716 | | |
| Healthcare 5.62% | |
Cortland Cnty NY Indl Dev Agy
Cortland Mem Hosp Pj(15) | | | 5.625 | % | | 7/1/2024 | | AA | | | 1,750 | | | | 1,901,848 | | |
NY New York City Indl Dev Agy
Rev Harbor House Pj A(11) | | | 5.875 | % | | 5/20/2044 | | AA+ | | | 610 | | | | 690,459 | | |
NY St Dorm Auth Rev NY
St Rehab Assn Ser A(2) | | | 5.50 | % | | 7/1/2016 | | AAA | | | 935 | | | | 1,012,586 | | |
NY St Dorm Auth Rev Mental
Hlth Svc Fac(13)(14) | | | 6.00 | % | | 8/15/2012 | | AAA | | | 1,460 | | | | 1,636,295 | | |
NY St Dorm Auth Rev Mtg
Nursing Home A(7)(14) | | | 5.40 | % | | 2/1/2031 | | AAA | | | 300 | | | | 320,589 | | |
NY St Dorm Auth Rev Mtg
Nursing Home A(7)(14) | | | 5.50 | % | | 8/1/2030 | | AAA | | | 1,000 | | | | 1,061,610 | | |
NY St Dorm Auth Rev Mtg
Nursing Home A(7)(14) | | | 5.50 | % | | 8/1/2038 | | AAA | | | 1,000 | | | | 1,058,690 | | |
NY St Dorm Auth Rev Utd
Cerebral Palsy Aff No 1-A(2) | | | 5.75 | % | | 7/1/2018 | | AAA | | | 1,000 | | | | 1,102,830 | | |
NY St Dorm Auth Revs Bishop
Henry B Hucles Nursing | | | 5.00 | % | | 7/1/2017 | | Aa1 | | | 850 | | | | 914,413 | | |
NY St Dorm Auth Revs Catholic
Hlth Long Island Oblig Grp | | | 5.00 | % | | 7/1/2027 | | Baa1 | | | 1,250 | | | | 1,289,563 | | |
NY St Dorm Auth Revs
Mtg Hosp Kaleida Hlth(7) | | | 4.70 | % | | 2/15/2035 | | AAA | | | 1,000 | | | | 1,010,970 | | |
NY St Dorm Auth Revs NYU
Hosps Ctr Ser A(e) | | | 5.00 | % | | 7/1/2020 | | BB | | | 1,935 | | | | 2,001,235 | | |
See Notes to Financial Statements.
85
Schedule of Investments (continued)
NEW YORK TAX-FREE FUND September 30, 2006
| Investments | | Interest
Rate | | Maturity
Date | | Credit
Rating:
S&P or
Moody's(a) | | Principal
Amount
(000) | | Value | |
NY St Dorm Auth Revs Unrefunded
Mental Hlth Svcs B(14) | | | 6.00 | % | | 2/15/2025 | | AAA | | $ | 15 | | | $ | 16,066 | | |
NY St Dorm Auth Revs Unrefunded
Mental Hlth Svcs B(14) | | | 6.00 | % | | 2/15/2030 | | AAA | | | 15 | | | | 16,042 | | |
| Total | | | | | | | | | | | | | | | 14,033,196 | | |
| Housing 6.68% | |
NY New York City Hsg Dev Corp
Multi Fam Hsg Rev Ser A AMT | | | 5.50 | % | | 11/1/2034 | | AA | | | 1,500 | | | | 1,552,995 | | |
NY New York City Hsg Dev Corp
Multi Fam Hsg Rev Ser A-1(13)(14) | | | 4.50 | % | | 11/1/2027 | | AAA | | | 1,345 | | | | 1,367,946 | | |
NY New York City Hsg Dev Corp
Multi Fam Rev Hsg Ser L AMT | | | 4.85 | % | | 11/1/2025 | | AA | | | 3,205 | | | | 3,261,408 | | |
NY New York City Hsg Dev Corp
Ser B-2 AMT | | | 5.30 | % | | 5/1/2036 | | AA | | | 2,000 | | | | 2,076,960 | | |
NY New York City Hsg Dev Corp
Ser D-1 | | | 4.95 | % | | 11/1/2036 | | AA | | | 2,510 | | | | 2,595,189 | | |
NY St Dorm Auth Revs 05
Unrefunded Mental D(13)(14) | | | 6.00 | % | | 8/15/2021 | | AAA | | | 20 | | | | 20,560 | | |
NY St Dorm Auth Revs Upstate
Cmnty Colleges Ser B | | | 5.25 | % | | 7/1/2021 | | AA- | | | 1,000 | | | | 1,081,760 | | |
NY St Hsg Fin Agy Multi Fam
Hsg Rev Division Street Ser A AMT | | | 5.00 | % | | 2/15/2026 | | Aa1 | | | 650 | | | | 666,868 | | |
| NY St Mtg Agy Hmownr Ser 133 AMT | | | 4.95 | % | | 10/1/2021 | | Aa1 | | | 2,000 | | | | 2,051,720 | | |
NY St Mtg Agy Rev Hmownr Mtg
Ser 70 | | | 5.40 | % | | 4/1/2022 | | Aa1 | | | 70 | | | | 71,765 | | |
NY St Mtg Agy Rev Hmownr Mtg
Ser 111 AMT(14) | | | 4.55 | % | | 4/1/2023 | | AAA | | | 250 | | | | 252,213 | | |
NY St Mtg Agy Rev Hmownr Mtg
Ser 130 AMT | | | 4.80 | % | | 10/1/2037 | | Aa1 | | | 1,670 | | | | 1,681,573 | | |
| Total | | | | | | | | | | | | | | | 16,680,957 | | |
| Industrial 5.98% | |
Broome Cnty NY Indl Dev Agy Civic
Fac Rev Univ Plaza Phase II Pj Ser B(1) | | | 5.10 | % | | 8/1/2036 | | A | | | 500 | | | | 515,910 | | |
Liberty NY Dev Corp Rev
ROLs RRII R585 RIBs | | | 6.656 | % | | 10/1/2035 | | Aa3 | | | 5,000 | | | | 6,420,950 | | |
NY Indl Dev Agy Pkg Fac Rev
Royal Charter NY Presbyterian(10) | | | 5.75 | % | | 12/15/2029 | | AAA | | | 1,000 | | | | 1,102,570 | | |
NY New York City Indl Dev Agy
United Jewish Appeal Fed Pj A | | | 5.00 | % | | 7/1/2027 | | Aa2 | | | 1,250 | | | | 1,316,275 | | |
See Notes to Financial Statements.
86
Schedule of Investments (continued)
NEW YORK TAX-FREE FUND September 30, 2006
| Investments | | Interest
Rate | | Maturity
Date | | Credit
Rating:
S&P or
Moody's(a) | | Principal
Amount
(000) | | Value | |
Onondaga Cnty NY Indl Dev Agy Pollutn
Ctrl Rev Ref Anheuser Busch Pj Ser A | | | 4.875 | % | | 7/1/2041 | | A+ | | $ | 3,000 | | | $ | 3,047,370 | | |
| TSASC Inc NY Ser 1 | | | 5.00 | % | | 6/1/2026 | | BBB | | | 1,750 | | | | 1,776,687 | | |
Yonkers NY Indl Dev Agy Rev
Sacred Heart Assocs Pj Ser A AMT | | | 4.80 | % | | 10/1/2026 | | Aa1 | | | 750 | | | | 757,710 | | |
| Total | | | | | | | | | | | | | | | 14,937,472 | | |
| Lease 8.31% | |
NY New York City Indl Dev Agy Rev
Queens Baseball Stadium Pilot(2) | | | 5.00 | % | | 1/1/2031 | | AAA | | | 1,000 | | | | 1,061,690 | | |
NY New York City Indl Dev Agy Rev
Queens Baseball Stadium Pilot(2) | | | 5.00 | % | | 1/1/2046 | | AAA | | | 2,000 | | | | 2,101,320 | | |
NY New York City Indl Dev Agy Rev
Yankee Stadium Pilot(9) | | | 4.50 | % | | 3/1/2039 | | AAA | | | 2,500 | | | | 2,491,450 | | |
NY New York City Indl Dev Agy Rev
Yankee Stadium Pilot(14) | | | 4.75 | % | | 3/1/2046 | | AAA | | | 5,000 | | | | 5,070,900 | | |
NY New York City Indl Dev Agy Rev
Yankee Stadium Pilot(9) | | | 5.00 | % | | 3/1/2046 | | AAA | | | 5,000 | | | | 5,246,850 | | |
| NY St Urban Dev Corp Rev St Fac | | | 5.70 | % | | 4/1/2020 | | AA- | | | 4,150 | | | | 4,782,792 | | |
| Total | | | | | | | | | | | | | | | 20,755,002 | | |
| Miscellaneous 1.06% | |
Broome Cnty NY Indl Dev Agy Civic
Fac Rev Univ Plaza LLC Phase 1 Pj A(1) | | | 5.20 | % | | 8/1/2030 | | A | | | 750 | | | | 782,250 | | |
Broome Cnty NY Indl Dev Agy Civic
Fac Rev Univ Plaza LLC Phase 1 Pj A(1) | | | 5.20 | % | | 8/1/2036 | | A | | | 1,000 | | | | 1,038,320 | | |
NY NY City Tr Cultr Res Rev
Museum of American Art(1) | | | 6.00 | % | | 7/1/2022 | | A | | | 500 | | | | 541,975 | | |
Puerto Rico Pub Bldgs Auth Rev
Unrefunded Bal Govt Facs Ser D | | | 5.25 | % | | 7/1/2027 | | BBB | | | 265 | | | | 277,532 | | |
| Total | | | | | | | | | | | | | | | 2,640,077 | | |
| Power 5.54% | |
Long Island Pwr Auth NY Elec
Sys Rev Gen Ser C | | | 5.00 | % | | 9/1/2035 | | A- | | | 2,000 | | | | 2,090,540 | | |
NY St Enrg Res & Dev Auth Gas
Fac Rev Bklyn Ser B AMT RIBs | | | 9.919 | % | | 7/1/2026 | | A+ | | | 4,000 | | | | 4,216,800 | | |
Puerto Rico Elec Pwr Auth Pwr
Rev Ser NN(14) | | | 5.00 | % | | 7/1/2032 | | AAA | | | 1,500 | | | | 1,575,120 | | |
| Puerto Rico Elec Pwr Auth Rev Ser II | | | 5.25 | % | | 7/1/2031 | | A3 | | | 3,625 | | | | 3,824,448 | | |
| Puerto Rico Elec Pwr Auth Ser PP(9) | | | 5.00 | % | | 7/1/2025 | | AAA | | | 2,000 | | | | 2,131,900 | | |
| Total | | | | | | | | | | | | | | | 13,838,808 | | |
See Notes to Financial Statements.
87
Schedule of Investments (continued)
NEW YORK TAX-FREE FUND September 30, 2006
| Investments | | Interest
Rate | | Maturity
Date | | Credit
Rating:
S&P or
Moody's(a) | | Principal
Amount
(000) | | Value | |
| Pre-Refunded 26.85% | |
Albany NY Muni Wtr Fin Auth
Wtr & Swr Sys Rev Ser A(9) | | | 6.375 | % | | 12/1/2017 | | AAA | | $ | 650 | | | $ | 711,822 | | |
Buffalo NY Muni Wtr Fin Auth
Wtr Sys Rev(10) | | | 6.00 | % | | 7/1/2029 | | AAA | | | 500 | | | | 537,330 | | |
Metropolitan Transn Auth NY
Commuter Fac Rev Ser A(9) | | | 6.00 | % | | 7/1/2016 | | AAA | | | 2,000 | | | | 2,085,720 | | |
Metropolitan Transn Auth NY
Dedicated Tax Fd Ser A(9) | | | 4.75 | % | | 4/1/2028 | | AAA | | | 2,500 | | | | 2,709,175 | | |
Metropolitan Transn Auth NY
Tran Fac Rev Svc Cntrct Ser R | | | 5.50 | % | | 7/1/2017 | | AAA | | | 1,000 | | | | 1,137,340 | | |
Muni Secs Trust Ctfs Ser 7005
Cl B ETM RIBs† | | | 7.134 | % | | 10/1/2040 | | Aaa | | | 2,000 | | | | 2,299,440 | | |
New York City Transn Fin Auth
Auth Fut Tax 2004 Ser C | | | 5.50 | % | | 5/1/2025 | | AAA | | | 5 | | | | 5,294 | | |
New York City Transn Fin Auth
Auth Fut Tax 2005 C | | | 5.50 | % | | 5/1/2025 | | AAA | | | 550 | | | | 582,296 | | |
New York City Transn Fin Auth
Fut Tax Seed C | | | 5.50 | % | | 5/1/2025 | | AAA | | | 445 | | | | 471,130 | | |
New York City Transn Fin Auth
Rev Fut Tax 2nd Ser A | | | 6.00 | % | | 8/15/2029 | | AAA | | | 200 | | | | 215,484 | | |
New York City Transn Fin Auth
Rev Fut Tax 2nd Ser B | | | 6.00 | % | | 11/15/2024 | | AAA | | | 950 | | | | 1,038,645 | | |
New York City Transn Fin Auth
Rev Fut Tax 2nd Ser B | | | 6.00 | % | | 11/15/2029 | | AAA | | | 2,000 | | | | 2,186,620 | | |
| New York NY C(10) | | | 5.75 | % | | 3/15/2027 | | AAA | | | 1,000 | | | | 1,108,600 | | |
New York NY City Transn Fin
Auth Rev 2005 Fat Tax C | | | 5.00 | % | | 5/1/2029 | | AAA | | | 595 | | | | 622,668 | | |
| New York NY Prerefunded J | | | 5.50 | % | | 6/1/2022 | | AA- | | | 3,585 | | | | 3,991,647 | | |
| New York NY Ser C | | | 5.625 | % | | 3/15/2020 | | AAA | | | 1,000 | | | | 1,099,850 | | |
NY New York City Muni Wtr Fin
Auth Wtr & Swr Sys Rev | | | 5.50 | % | | 6/15/2033 | | AAA | | | 3,585 | | | | 3,864,272 | | |
NY New York City Muni Wtr Fin
Auth Wtr & Swr Sys Rev Ser B | | | 6.00 | % | | 6/15/2033 | | AA+ | | | 1,470 | | | | 1,599,639 | | |
NY New York City Muni Wtr Fin
Wtr & Sew Sys Rev Ser B | | | 6.00 | % | | 6/15/2033 | | AA+ | | | 3,360 | | | | 3,679,536 | | |
NY St Dorm Auth Lease Rev
Court Facs Ser A | | | 5.50 | % | | 5/15/2020 | | A+ | | | 1,180 | | | | 1,309,399 | | |
See Notes to Financial Statements.
88
Schedule of Investments (continued)
NEW YORK TAX-FREE FUND September 30, 2006
| Investments | | Interest
Rate | | Maturity
Date | | Credit
Rating:
S&P or
Moody's(a) | | Principal
Amount
(000) | | Value | |
NY St Dorm Auth Lease Rev St
Univ Dorm Facs Ser A | | | 6.00 | % | | 7/1/2030 | | AA- | | $ | 3,500 | | | $ | 3,829,735 | | |
NY St Dorm Auth Lease Rev St
Univ Dorm Facs Ser A | | | 6.25 | % | | 7/1/2020 | | AA- | | | 1,250 | | | | 1,378,612 | | |
NY St Dorm Auth Rev City Univ
Sys Cons 4th Gen A | | | 5.50 | % | | 7/1/2023 | | AA- | | | 1,215 | | | | 1,316,938 | | |
| NY St Dorm Auth Rev Pace Univ(14) | | | 6.00 | % | | 7/1/2029 | | AAA | | | 1,610 | | | | 1,764,640 | | |
NY St Dorm Auth Rev St Univ
Adl Facs Ser B(10) | | | 5.75 | % | | 5/15/2017 | | AAA | | | 395 | | | | 428,532 | | |
NY St Dorm Auth Rev Upstate
Cmnty Colleges Ser A(10) | | | 6.00 | % | | 7/1/2015 | | AAA | | | 300 | | | | 328,815 | | |
| NY St Dorm Auth Revs Mental D(13)(14) | | | 6.00 | % | | 8/15/2021 | | AAA | | | 980 | | | | 1,008,351 | | |
NY St Dorm Auth Revs Mental
Hlth Svcs B(14) | | | 6.00 | % | | 2/15/2025 | | AAA | | | 985 | | | | 1,062,785 | | |
NY St Dorm Auth Revs Mental
Hlth Svcs B(14) | | | 6.00 | % | | 2/15/2030 | | AAA | | | 985 | | | | 1,062,785 | | |
NY St Envr Fac Corp St Clean
Wtr & Drinking | | | 6.00 | % | | 6/15/2019 | | AAA | | | 80 | | | | 85,164 | | |
Puerto Rico Comwlth Aqueduct &
Swr Auth Rev ETM | | | 10.25 | % | | 7/1/2009 | | AAA | | | 455 | | | | 497,147 | | |
Puerto Rico Comwlth Hwy &
Transn Auth Transn Rev Ser B(14) | | | 5.875 | % | | 7/1/2035 | | AAA | | | 750 | | | | 818,774 | | |
Puerto Rico Comwlth Hwy &
Transn Auth Transn Rev Ser B | | | 6.50 | % | | 7/1/2027 | | BBB+ | | | 2,000 | | | | 2,219,440 | | |
Puerto Rico Comwlth Hwy &
Transn Auth Transn Rev Ser D | | | 5.25 | % | | 7/1/2038 | | AAA | | | 6,000 | | | | 6,528,540 | | |
| Puerto Rico Comwlth Pub Impt(14) | | | 5.00 | % | | 7/1/2024 | | AAA | | | 1,000 | | | | 1,035,520 | | |
| Puerto Rico Comwlth Pub Impt(13)(14) | | | 5.00 | % | | 7/1/2028 | | AAA | | | 1,130 | | | | 1,170,138 | | |
| Puerto Rico Comwlth Pub Impt | | | 5.375 | % | | 7/1/2025 | | BBB | | | 1,640 | | | | 1,661,976 | | |
| Puerto Rico Comwlth Pub Impt Ser A | | | 5.375 | % | | 7/1/2028 | | AAA | | | 555 | | | | 599,822 | | |
| Puerto Rico Comwlth Pub Impt Ser A(14) | | | 5.75 | % | | 7/1/2026 | | AAA | | | 3,000 | | | | 3,224,820 | | |
| Puerto Rico Pub Fin Corp Approp E | | | 5.50 | % | | 8/1/2029 | | Aaa | | | 1,000 | | | | 1,091,780 | | |
Puerto Rico Pub Fin Corp
Comwlth Approp Ser E | | | 5.70 | % | | 8/1/2025 | | Aaa | | | 2,000 | | | | 2,134,280 | | |
Puerto Rico Pub Bldgs Auth Rev
Govt Facs Ser D | | | 5.25 | % | | 7/1/2027 | | BBB | | | 735 | | | | 795,777 | | |
See Notes to Financial Statements.
89
Schedule of Investments (continued)
NEW YORK TAX-FREE FUND September 30, 2006
| Investments | | Interest
Rate | | Maturity
Date | | Credit
Rating:
S&P or
Moody's(a) | | Principal
Amount
(000) | | Value | |
Tompkins Cnty NY Indl Dev Agy
Civic Fac Cornell Univ Lake | | | 5.625 | % | | 7/1/2020 | | AA+ | | $ | 115 | | | $ | 124,546 | | |
Tompkins Cnty NY Indl Dev Agy
Civic Fac Cornell Univ Lake | | | 5.75 | % | | 7/1/2030 | | AA+ | | | 1,500 | | | | 1,631,040 | | |
| Total | | | | | | | | | | | | | | | 67,055,864 | | |
| Resource Recovery 0.61% | |
NY St Envr Facs Corp Solid Wst
Disp Rev Wst Mgmnt Pj Ser A AMT | | | 4.55 | %# | | 5/1/2012 | | BBB | | | 1,500 | | | | 1,509,180 | | |
| Sales Tax 0.83% | |
New York City Transn Fin
Auth Fut Tax 2nd Ser E | | | 5.00 | % | | 2/1/2033 | | AAA | | | 2,000 | | | | 2,081,180 | | |
| Special Tax 0.54% | |
New York NY City Transn Fin Auth Rev
Unrefunded Bal 2005 Fut B | | | 5.00 | % | | 5/1/2029 | | AAA | | | 1,310 | | | | 1,351,265 | | |
| Tobacco 0.13% | |
| TSASC Inc NY Ser 1 | | | 5.125 | % | | 6/1/2042 | | BBB | | | 320 | | | | 324,237 | | |
| Transportation 19.19% | |
Metropolitan Transn Auth NY Rev
Transn Ser A | | | 5.00 | % | | 11/15/2021 | | A | | | 5,000 | | | | 5,365,000 | | |
Metropolitan Transn Auth NY Rev
Transn Ser A | | | 5.00 | % | | 11/15/2031 | | A | | | 5,000 | | | | 5,263,400 | | |
Metropolitan Transn Auth NY Rev
Transn Ser F | | | 5.00 | % | | 11/15/2030 | | A | | | 3,000 | | | | 3,149,910 | | |
Muni Secs Trust Ctfs Ser
2000-109 CL A CTF† | | | 3.83 | %# | | 3/15/2016 | | Aa3 | | | 400 | | | | 400,000 | | |
NY New York City Transn Auth Met
Transn Auth Triborough ID COP RIBs(2) | | | 7.71 | % | | 1/1/2030 | | Aaa | | | 5,000 | | | | 5,813,800 | | |
Niagara NY Frontier Auth Arpt
Buffalo Niagara Intl Ser B(14) | | | 5.50 | % | | 4/1/2019 | | AAA | | | 690 | | | | 726,446 | | |
NY New York City Indl Dev Agy Spl Fac
Rev Terminal One Group Assn Pj AMT | | | 5.50 | %# | | 1/1/2024 | | A3 | | | 2,000 | | | | 2,160,700 | | |
| NY St Twy Auth Gen Rev Ser G(10) | | | 5.25 | % | | 1/1/2027 | | AAA | | | 10,000 | | | | 10,921,600 | | |
| Port Auth NY & NJ Cons 93rd Ser | | | 6.125 | % | | 6/1/2094 | | AA- | | | 7,500 | | | | 9,066,000 | | |
Puerto Rico Comwlth Hwy &
Transn Auth Rev PA 1052 RIBs RITES | | | 7.259 | % | | 1/1/2010 | | AAA(c) | | | 2,000 | | | | 2,455,440 | | |
See Notes to Financial Statements.
90
Schedule of Investments (concluded)
NEW YORK TAX-FREE FUND September 30, 2006
| Investments | | Interest
Rate | | Maturity
Date | | Credit
Rating:
S&P or
Moody's(a) | | Principal
Amount
(000) | | Value | |
Puerto Rico Comwlth Hwy &
Transn Auth Sub PR St Infra | | | 5.00 | % | | 7/1/2028 | | BBB | | $ | 1,000 | | | $ | 1,018,480 | | |
Triborough Brdg & Tunl Auth
NY Gen Ser A | | | 5.00 | % | | 11/15/2035 | | Aa2 | | | 1,500 | | | | 1,581,540 | | |
| Total | | | | | | | | | | | | | | | 47,922,316 | | |
| Water/Sewer 4.30% | |
New York NY City Muni Fin Auth Rev
Wtr & Swr Sys Rev ROLs RRII R504 RIBs | | | 6.149 | % | | 6/15/2039 | | AA+ | | | 5,000 | | | | 5,458,500 | | |
New York NY City Muni Fin Auth
Wtr & Swr Sys Rev Ref Ser C | | | 4.75 | % | | 6/15/2033 | | AA+ | | | 3,000 | | | | 3,079,590 | | |
NY St Envr Fac Corp St Clean
Wtr & Drinking | | | 6.00 | % | | 6/15/2019 | | AAA | | | 1,420 | | | | 1,509,020 | | |
Upper Mohawk NY Regl Wtr Fin
Auth NY Wtr Sys Rev(2) | | | 5.75 | % | | 4/1/2020 | | Aaa | | | 650 | | | | 699,432 | | |
| Total | | | | | | | | | | | | | | | 10,746,542 | | |
| Total Municipal Bonds (cost $232,951,681) | | | | | | | | | | | | | | | 247,048,015 | | |
| | | | | | | | | Shares
(000) | | | |
| SHORT-TERM INVESTMENT 0.01% | |
| Money Market Mutual Fund | |
| Dreyfus New York Municipal Cash Management (cost $30,600) | | | | | | | | | | | 31 | | | | 30,600 | | |
| Total Investments in Securities 98.94% (cost $232,982,281) | | | | | | | | | | | | | | | 247,078,615 | | |
| Cash and Other Assets in Excess of Liabilities(g) 1.06% | | | | | | | | | | | | | | | 2,644,323 | | |
| Net Assets 100.00% | | | | | | | | | | | | | | $ | 249,722,938 | | |
| Open futures contracts at September 30, 2006: | |
| Type | | Expiration | | Contracts | | Position | | Market Value | | Unrealized
Depreciation | |
| U.S. 20-Year Treasury Bond | | | December 2006 | | | | 156 | | | Short | | $ | (17,535,375 | ) | | $ | (299,677 | ) | |
See Notes to Financial Statements.
91
Schedule of Investments
TEXAS TAX-FREE FUND September 30, 2006
| Investments | | Interest
Rate | | Maturity
Date | | Credit
Rating:
S&P or
Moody's(a) | | Principal
Amount
(000) | | Value | |
| MUNICIPAL BONDS 100.39% | |
| Education 6.69% | |
Fort Bend TX Indpt Sch Dist
Ser A PSF GTD | | | 5.25 | % | | 8/15/2027 | | AAA | | $ | 500 | | | $ | 540,740 | | |
Lake Worth TX Indpt Sch Dist
Sch Bldg Ser A(2) | | | 5.25 | % | | 2/15/2031 | | AAA | | | 1,020 | | | | 1,098,550 | | |
Rockwall TX Indpt Sch Dist
Sch Bldg PSF GTD | | | 5.25 | % | | 2/15/2029 | | AAA | | | 2,000 | | | | 2,137,980 | | |
TX St Pub Fin Auth Charter Sch
Fin Corp Rev Kipp Inc Ed Ser A(1) | | | 5.00 | % | | 2/15/2036 | | A | | | 1,500 | | | | 1,531,395 | | |
| Total | | | | | | | | | | | | | | | 5,308,665 | | |
| General Obligation 26.45% | |
| Argyle TX Indpt Sch Dist(10) | | | 5.25 | % | | 8/15/2040 | | AAA | | | 1,000 | | | | 1,071,030 | | |
Clear Creek TX Indpt Sch Dist
PSF GTD | | | 5.50 | % | | 2/15/2021 | | AAA | | | 1,000 | | | | 1,118,630 | | |
Crowley TX Indpt Sch Dist Sch
Bldg PSF GTD | | | 5.50 | % | | 8/1/2029 | | AAA | | | 1,000 | | | | 1,111,370 | | |
| Dallas Cnty TX Ref & Impt Ser A | | | 5.00 | % | | 8/15/2020 | | AAA | | | 250 | | | | 263,425 | | |
| Dallas TX Indpt Sch Dist PSF GTD | | | 5.00 | % | | 2/15/2021 | | AAA | | | 300 | | | | 314,046 | | |
Iraan Gen Hosp Pecos Cnty TX
Hosp Dist(e)(15) | | | 5.00 | % | | 2/15/2036 | | Aa3 | | | 1,000 | | | | 1,031,170 | | |
Jacksboro TX Indpt Sch Dist
Sch Bldg PSF GTD | | | 5.125 | % | | 2/15/2031 | | AAA | | | 1,000 | | | | 1,065,700 | | |
| Mansfield TX Indpt Sch Dist PSF GTD | | | 5.25 | % | | 2/15/2023 | | AAA | | | 1,000 | | | | 1,063,920 | | |
Mineral Wells TX Indpt Sch
Ref Sch Bldg PSF GTD | | | 5.125 | % | | 2/15/2036 | | Aaa | | | 1,000 | | | | 1,062,990 | | |
| Pflugerville TX Indpt Sch Dist PSF GTD | | | 5.00 | % | | 8/15/2026 | | AAA | | | 1,000 | | | | 1,038,830 | | |
| Puerto Rico Comwlth Ser PMD-8 RIBs(14) | | | 7.46 | % | | 7/1/2026 | | Aaa | | | 500 | | | | 574,940 | | |
Puerto Rico Comwlth
Unrefunded Bal Pub Impt Ser A | | | 5.125 | % | | 7/1/2031 | | BBB | | | 745 | | | | 766,232 | | |
| Snyder TX Indpt Sch Dist Sch Bldg(2) | | | 5.25 | % | | 2/15/2030 | | AAA | | | 500 | | | | 539,240 | | |
Socorro TX Indpt Sch Dist
Unrefunded Bal PSF GTD | | | 6.00 | % | | 2/15/2015 | | AAA | | | 35 | | | | 35,302 | | |
| TX St Ser B RIBs | | | 8.618 | % | | 9/30/2011 | | Aa1 | | | 5,500 | | | | 6,541,810 | | |
Tyler TX Indpt Sch Dist Sch
Bldg PSF GTD | | | 5.125 | % | | 2/15/2031 | | AAA | | | 700 | | | | 744,093 | | |
| United Indpt Sch Dist TX PSF GTD | | | 5.125 | % | | 8/15/2026 | | AAA | | | 1,000 | | | | 1,049,710 | | |
| Webster TX Bal Cfts Oblig Ser A(10) | | | 6.00 | % | | 3/1/2017 | | AAA | | | 500 | | | | 537,485 | | |
| Winker County TX(15) | | | 5.25 | % | | 2/15/2031 | | AA | | | 1,000 | | | | 1,060,660 | | |
| Total | | | | | | | | | | | | | | | 20,990,583 | | |
See Notes to Financial Statements.
92
Schedule of Investments (continued)
TEXAS TAX-FREE FUND September 30, 2006
| Investments | | Interest
Rate | | Maturity
Date | | Credit
Rating:
S&P or
Moody's(a) | | Principal
Amount
(000) | | Value | |
| Healthcare 2.12% | |
Delware Cnty IN Hosp Auth
Hosp Cardinal Hlth Sys Oblig Corp | | | 5.25 | % | | 8/1/2036 | | Baa2 | | $ | 400 | | | $ | 415,528 | | |
Puerto Rico Indl Tourist Edls &
Envr Ctrl Fac Hosp Ser A | | | 6.125 | % | | 11/15/2025 | | AA | | | 910 | | | | 1,007,525 | | |
Richardson TX Hosp Auth Hosp
Ref & Impt Baylor/Richardson | | | 5.625 | % | | 12/1/2028 | | BBB | | | 250 | | | | 259,075 | | |
| Total | | | | | | | | | | | | | | | 1,682,128 | | |
| Housing 1.27% | |
TX St Dept Hsg & Cmnty Affairs Sing
Fam Mtg Rev Ser D AMT | | | 4.95 | % | | 9/1/2028 | | AAA | | | 990 | | | | 1,009,354 | | |
| Industrial 14.27% | |
Cass Cnty TX Ind Dev Corp
Envr Impt Rev Ser A AMT | | | 6.00 | % | | 9/1/2025 | | BBB | | | 1,000 | | | | 1,068,840 | | |
Orange Cnty TX Nav & Port Dist
Indl Dev Rev North Star Steel TX Pj | | | 6.375 | % | | 2/1/2017 | | A+ | | | 2,400 | | | | 2,444,400 | | |
Texas City TX Indl Dev Corp
Marine Term Rev Arco Pipe Line | | | 7.375 | % | | 10/1/2020 | | AA+ | | | 5,500 | | | | 7,250,595 | | |
| TSASC Inc NY Ser 1 | | | 5.00 | % | | 6/1/2026 | | BBB | | | 550 | | | | 558,387 | | |
| Total | | | | | | | | | | | | | | | 11,322,222 | | |
| Lease 1.34% | |
Harris Cnty Houston TX Sports
Auth Rev Sr Lien Ser G(14) | | | 5.25 | % | | 11/15/2021 | | AAA | | | 1,000 | | | | 1,063,430 | | |
| Miscellaneous 0.47% | |
Aleutians East Burough AK Pj Rev
Aleutian Pribilof Islands Inc(1) | | | 5.50 | % | | 6/1/2036 | | A | | | 350 | | | | 369,845 | | |
| Power 0.47% | |
Brazos River Auth TX Pollutn
Ctrl Rev TXU Energy Co LLC Pj AMT | | | 5.00 | % | | 3/1/2041 | | Baa2 | | | 375 | | | | 377,737 | | |
| Pre-Refunded 34.94% | |
| Blanco TX Ctfs Oblig(16) | | | 5.50 | % | | 8/15/2027 | | AAA | | | 665 | | | | 730,489 | | |
Fort Bend Cnty TX Muni Util
Dist No 25(14) | | | 6.00 | % | | 10/1/2028 | | AAA | | | 2,170 | | | | 2,222,405 | | |
Gregory Portland TX Indpt Sch
Dist PSF GTD | | | 5.50 | % | | 8/15/2020 | | AAA | | | 1,075 | | | | 1,149,218 | | |
Harris Cnty TX Hlth Fac Dev
St Lukes Episcopal Hosp Ser A | | | 5.375 | % | | 2/15/2026 | | AAA | | | 1,000 | | | | 1,076,660 | | |
See Notes to Financial Statements.
93
Schedule of Investments (continued)
TEXAS TAX-FREE FUND September 30, 2006
| Investments | | Interest
Rate | | Maturity
Date | | Credit
Rating:
S&P or
Moody's(a) | | Principal
Amount
(000) | | Value | |
Harris Cnty TX Hlth Facs Dev Corp
Hosp Rev Mem Hermann
Hlthcare Ser A | | | 6.375 | % | | 6/1/2029 | | A+ | | $ | 1,750 | | | $ | 1,968,068 | | |
Houston TX Higher Ed Fin Corp
Higher Ed Rev Rice Univ Pj Ser A | | | 5.375 | % | | 11/15/2029 | | AAA | | | 1,000 | | | | 1,062,270 | | |
Katy TX Indpt Sch Dist Ltd
Tax PSF GTD | | | 6.125 | % | | 2/15/2032 | | AAA | | | 1,000 | | | | 1,057,840 | | |
| Laredo TX Indpt Sch Dist PSF GTD | | | 5.25 | % | | 8/1/2024 | | AAA | | | 1,000 | | | | 1,045,260 | | |
Muni Secs Trust Ctfs Ser 7005
Cl B ETM RIBs† | | | 7.134 | % | | 10/1/2040 | | Aaa | | | 500 | | | | 574,860 | | |
Pearland TX Indpt Sch Dist Bd
Ser A PSF GTD | | | 5.875 | % | | 2/15/2019 | | AAA | | | 1,000 | | | | 1,091,490 | | |
| Pearland TX Indpt Sch Dist PSF GTD | | | 5.125 | % | | 2/15/2022 | | AAA | | | 1,500 | | | | 1,553,055 | | |
Puerto Rico Comwlth Hwy &
Transn Auth Rev Ser B | | | 6.00 | % | | 7/1/2031 | | BBB+ | | | 1,980 | | | | 2,162,893 | | |
Puerto Rico Comwlth Hwy &
Transn Auth Rev Ser C | | | 6.00 | % | | 7/1/2029 | | AAA | | | 1,000 | | | | 1,092,370 | | |
| Puerto Rico Comwlth Pub Impt Ser A | | | 5.125 | % | | 7/1/2031 | | AAA | | | 380 | | | | 406,573 | | |
Raven Hills TX Higher Ed Corp
Student Hsg Rev Cardinal Vlg LLC
Lamar Univ A(14) | | | 5.50 | % | | 8/1/2028 | | Aaa | | | 1,000 | | | | 1,110,820 | | |
| San Antonio TX Indpt Sch Dist PSF GTD | | | 5.50 | % | | 8/15/2024 | | AAA | | | 1,000 | | | | 1,052,610 | | |
| Socorro TX Indpt Sch Dist PSF GTD | | | 6.00 | % | | 2/15/2015 | | AAA | | | 885 | | | | 892,859 | | |
| Univ TX Univ Rev Fin Sys Ser A | | | 5.375 | % | | 8/15/2017 | | AAA | | | 3,030 | | | | 3,179,197 | | |
Upper Trinity Regl Wtr Dist
TX Wtr Rev Sys Ser 4(9) | | | 6.00 | % | | 8/1/2026 | | AAA | | | 3,025 | | | | 3,285,453 | | |
| Webster TX Ctfs Oblig Ser A(10) | | | 6.00 | % | | 3/1/2017 | | AAA | | | 940 | | | | 1,012,662 | | |
| Total | | | | | | | | | | | | | | | 27,727,052 | | |
| Resource Recovery 2.56% | |
Gulf Coast Wst Disp Auth TX
Swr & Solid Wst Disp Rev AMT | | | 5.90 | % | | 4/1/2036 | | A+ | | | 1,500 | | | | 1,616,280 | | |
Gulf Coast Wst Disp Auth TX
Wst Mgmt of TX Ser A AMT | | | 5.20 | %# | | 5/1/2028 | | BBB | | | 400 | | | | 417,684 | | |
| Total | | | | | | | | | | | | | | | 2,033,964 | | |
| Special Tax 0.87% | |
San Antonio TX Hotel Occ
TX Rev Ref Sub Lien(e)(10) | | | 4.00 | % | | 8/15/2018 | | AAA | | | 700 | | | | 689,570 | | |
See Notes to Financial Statements.
94
Schedule of Investments (concluded)
TEXAS TAX-FREE FUND September 30, 2006
| Investments | | Interest
Rate | | Maturity
Date | | Credit
Rating:
S&P or
Moody's(a) | | Principal
Amount
(000) | | Value | |
| Transportation 4.02% | |
Alliance Arpt Auth Inc TX Spl
Facs Rev Fedex Corp Pj AMT | | | 4.85 | % | | 4/1/2021 | | BBB | | $ | 300 | | | $ | 304,332 | | |
Dallas Fort Worth TX Intl
Arpt Impt Jnt Ser B AMT(10) | | | 5.00 | % | | 11/1/2035 | | AAA | | | 1,000 | | | | 1,013,310 | | |
Houston TX Arpt Sys Rev Sub
Lien Ser B(10) | | | 5.50 | % | | 7/1/2030 | | AAA | | | 1,000 | | | | 1,059,780 | | |
NY New York City Indl Dev Agy Spl Fac
Rev Terminal One Group Assn Pj AMT | | | 5.50 | %# | | 1/1/2024 | | A3 | | | 750 | | | | 810,263 | | |
| Total | | | | | | | | | | | | | | | 3,187,685 | | |
| Water/Sewer 4.92% | |
Brazos River Auth TX Wtr Rev
Supply Sys Ser A AMT(14) | | | 5.00 | % | | 2/15/2028 | | AAA | | | 1,000 | | | | 1,033,650 | | |
| Dallas TX Wtr Wks & Swr Sys Rev | | | 5.00 | % | | 10/1/2012 | | AA+ | | | 750 | | | | 779,528 | | |
El Paso TX Wtr & Swr Rev Ref &
Impt Ser A(10) | | | 5.25 | % | | 3/1/2027 | | AAA | | | 1,000 | | | | 1,057,230 | | |
| San Antonio TX Wtr Rev Sys(10) | | | 5.00 | % | | 5/15/2028 | | AAA | | | 1,000 | | | | 1,038,580 | | |
| Total | | | | | | | | | | | | | | | 3,908,988 | | |
| Total Municipal Bonds (cost $73,886,768) | | | | | | | | | | | | | | | 79,671,223 | | |
| | | | | | | | | Shares
(000) | | | |
| SHORT-TERM INVESTMENT 0.00% | |
| Money Market Mutual Fund | |
| Dreyfus Municipal Cash Management Plus (cost $1,096) | | | | | | | | | | | 1 | | | | 1,096 | | |
| Total Investments in Securities 100.39% (cost $73,887,864) | | | | | | | | | | | | | | | 79,672,319 | | |
| Liabilities in Excess of Cash and Other Assets(g) (0.39%) | | | | | | | | | | | | | | | (309,991 | ) | |
| Net Assets 100.00% | | | | | | | | | | | | | | $ | 79,362,328 | | |
| Open futures contracts at September 30, 2006: | |
| Type | | Expiration | | Contracts | | Position | | Market Value | | Unrealized
Depreciation | |
| U.S. 20-Year Treasury Bond | | | December 2006 | | | | 17 | | | Short | | $ | (1,910,906 | ) | | $ | (32,700 | ) | |
See Notes to Financial Statements.
95
Schedule of Investments
WASHINGTON TAX-FREE FUND September 30, 2006
| Investments | | Interest
Rate | | Maturity
Date | | Credit
Rating:
S&P or
Moody's(a) | | Principal
Amount
(000) | | Value | |
| MUNICIPAL BONDS 101.05% | |
| Education 16.17% | |
| Central WA Univ Sys Rev(9) | | | 5.00 | % | | 5/1/2034 | | Aaa | | $ | 1,000 | | | $ | 1,044,160 | | |
Seattle WA Museum Dev Auth
Spl Oblig GTD | | | 5.125 | % | | 4/1/2031 | | AAA | | | 1,000 | | | | 1,066,960 | | |
Univ WA Ed Resh Rev
Roosevelt Pj(13)(14) | | | 5.375 | % | | 6/1/2029 | | AAA | | | 1,100 | | | | 1,143,351 | | |
WA St Higher Ed Facs Auth Rev
Gonzaga Univ Pj(14) | | | 4.75 | % | | 4/1/2022 | | AAA | | | 1,000 | | | | 1,009,310 | | |
WA St Higher Ed Facs Gonzaga
Univ Pj(14) | | | 5.125 | % | | 4/1/2034 | | AAA | | | 2,080 | | | | 2,202,221 | | |
Western WA Univ Rev
Unrefunded Bal Student Rec Fee(14) | | | 5.00 | % | | 5/1/2033 | | AAA | | | 630 | | | | 651,634 | | |
| Total | | | | | | | | | | | | | | | 7,117,636 | | |
| General Obligation 18.03% | |
| Bremerton WA(2) | | | 5.25 | % | | 12/1/2027 | | Aaa | | | 1,440 | | | | 1,532,462 | | |
| King Cnty WA Pub Transn Sales Tax(14) | | | 5.375 | % | | 6/1/2029 | | AAA | | | 1,000 | | | | 1,088,500 | | |
King Cnty WA Sch Dist
No 405 Bellevue(9) | | | 5.00 | % | | 12/1/2020 | | AAA | | | 2,000 | | | | 2,112,580 | | |
| King Cnty WA Ser B | | | 4.50 | % | | 1/1/2024 | | AAA | | | 320 | | | | 320,208 | | |
| King Cnty WA Ser B(14) | | | 5.00 | % | | 1/1/2030 | | AAA | | | 1,000 | | | | 1,017,920 | | |
| Port Seattle WA Ser B AMT | | | 5.75 | % | | 12/1/2025 | | AAA | | | 750 | | | | 796,823 | | |
Skagit Cnty WA Pub Hosp
Dist No 002(14) | | | 5.25 | % | | 12/1/2026 | | Aaa | | | 1,000 | | | | 1,070,410 | | |
| Total | | | | | | | | | | | | | | | 7,938,903 | | |
| Healthcare 7.88% | |
Puerto Rico Indl Tourist Edl
& Envr Ctrl Fac Hosp Ser A | | | 6.125 | % | | 11/15/2030 | | AA | | | 1,000 | | | | 1,106,360 | | |
Skagit Cnty WA Pub Hosp Dist
No 1 Rev Skagit Vly Hosp | | | 5.50 | % | | 12/1/2030 | | Baa2 | | | 750 | | | | 789,623 | | |
WA St Hlth Care Facs Auth Rev
Providence Hlthcare Svcs A(9) | | | 5.00 | % | | 10/1/2036 | | AAA | | | 1,500 | | | | 1,574,595 | | |
| Total | | | | | | | | | | | | | | | 3,470,578 | | |
| Housing 3.43% | |
NY New York City Muni Wtr Fin
Auth Wtr & Swr Sys Rev Ser C(9) | | | 3.78 | %# | | 6/15/2022 | | AAA | | | 500 | | | | 500,000 | | |
WA St Hsg Fin Commn
Sing Fam Pg Ser 5A AMT(e)(6)(12) | | | 4.90 | % | | 6/1/2037 | | Aaa | | | 1,000 | | | | 1,008,380 | | |
| Total | | | | | | | | | | | | | | | 1,508,380 | | |
See Notes to Financial Statements.
96
Schedule of Investments (continued)
WASHINGTON TAX-FREE FUND September 30, 2006
| Investments | | Interest
Rate | | Maturity
Date | | Credit
Rating:
S&P or
Moody's(a) | | Principal
Amount
(000) | | Value | |
| Industrial 1.01% | |
Tob Sttlment Auth WA
Tob Sttlment Asset Bkd | | | 6.50 | % | | 6/1/2026 | | BBB | | $ | 405 | | | $ | 445,261 | | |
| Miscellaneous 7.13% | |
Aleutians East Burough AK Pj
Aleutian Pribilof Islands Inc(1) | | | 5.50 | % | | 6/1/2036 | | A | | | 300 | | | | 317,010 | | |
Bellevue WA Convtn Ctr
Auth Spl Oblig Rev(14) | | | Zero Coupon | | | 2/1/2024 | | AAA | | | 1,400 | | | | 644,294 | | |
Puerto Rico Pub Bldgs Auth Rev
Govt Facs Ser I GTD | | | 5.375 | % | | 7/1/2034 | | BBB | | | 1,000 | | | | 1,068,050 | | |
Spokane WA Pub Fac Dist Hotel
Motel & Sales Use Tax(14) | | | 5.75 | % | | 12/1/2028 | | AAA | | | 1,000 | | | | 1,109,910 | | |
| Total | | | | | | | | | | | | | | | 3,139,264 | | |
| Power 9.16% | |
Chelan Cnty WA Pub Util Dist
No 1 Cons Rev Ser A AMT(14) | | | 6.40 | % | | 7/1/2017 | | AAA | | | 1,000 | | | | 1,037,240 | | |
Clark Cnty WA Pub Util Dist
No 1 Rev(10) | | | 5.125 | % | | 1/1/2020 | | AAA | | | 400 | | | | 418,164 | | |
Grant Cnty WA Pub Util Dist
No 2 Elec Rev Ser H(10) | | | 5.00 | % | | 1/1/2022 | | AAA | | | 1,000 | | | | 1,002,800 | | |
Puerto Rico Elec Pwr Auth Pwr
Rev Ser NN | | | 5.125 | % | | 7/1/2029 | | A3 | | | 1,500 | | | | 1,575,240 | | |
| Total | | | | | | | | | | | | | | | 4,033,444 | | |
| Pre-Refunded 19.75% | |
King Cnty WA Sch Dist No 414
Lake Washington CR(10) | | | 5.50 | % | | 12/1/2019 | | AAA | | | 1,000 | | | | 1,075,120 | | |
Muni Secs Trust Ctfs Ser 7005
Cl B ETM RIBs† | | | 7.134 | % | | 10/1/2040 | | Aaa | | | 1,000 | | | | 1,149,720 | | |
| Ocean Shores WA Wtr & Swr(10) | | | 5.50 | % | | 12/1/2021 | | Aaa | | | 1,000 | | | | 1,082,550 | | |
Port Seattle WA Spl Fac Rev
Ser C AMT(14) | | | 6.00 | % | | 9/1/2029 | | AAA | | | 915 | | | | 990,158 | | |
Puerto Rico Comwlth Hwy &
Transn Auth Rev Ser B | | | 6.00 | % | | 7/1/2031 | | BBB+ | | | 1,000 | | | | 1,092,370 | | |
Univ WA Univ Revs Student
Facs Fee(10) | | | 5.50 | % | | 6/1/2019 | | AAA | | | 810 | | | | 871,114 | | |
| Vancouver WA Ltd Tax(2) | | | 5.50 | % | | 12/1/2025 | | AAA | | | 1,255 | | | | 1,349,276 | | |
| Vancouver WA Wtr & Swr Rev(9) | | | 6.00 | % | | 6/1/2020 | | AAA | | | 1,000 | | | | 1,062,360 | | |
Western WA Univ Rev Student
Rec Fee(14) | | | 5.00 | % | | 5/1/2033 | | AAA | | | 20 | | | | 21,413 | | |
| Total | | | | | | | | | | | | | | | 8,694,081 | | |
See Notes to Financial Statements.
97
Schedule of Investments (concluded)
WASHINGTON TAX-FREE FUND September 30, 2006
| Investments | | Interest
Rate | | Maturity
Date | | Credit
Rating:
S&P or
Moody's(a) | | Principal
Amount
(000) | | Value | |
| Resource Recovery 0.53% | |
Gulf Coast Wst Disp Auth TX
Wst Mgmt of TX Ser A AMT | | | 5.20 | %# | | 5/1/2028 | | BBB | | $ | 225 | | | $ | 234,947 | | |
| Transportation 15.36% | |
Alliance Arpt Auth Inc TX Spl
Facs Rev Ref Fedex Corp Pj AMT | | | 4.85 | % | | 4/1/2021 | | BBB | | | 180 | | | | 182,599 | | |
Central Puget Sound WA Regl
Transit Auth Sales Tax & Motor(9) | | | 5.25 | % | | 2/1/2021 | | AAA | | | 1,750 | | | | 1,959,160 | | |
| Port Kalama WA Rev Ser B AMT | | | 5.625 | % | | 12/1/2015 | | A3 | | | 400 | | | | 400,988 | | |
Port Seattle WA Spl Fac Rev
Unrefunded Bal Ser C AMT(14) | | | 6.00 | % | | 9/1/2029 | | AAA | | | 1,085 | | | | 1,158,997 | | |
| Port Tacoma WA Ser A(2) | | | 5.25 | % | | 12/1/2034 | | AAA | | | 2,000 | | | | 2,139,400 | | |
Puerto Rico Comwlth Hwy &
Transn Auth Rev PA 1052 RIBs RITES | | | 7.259 | % | | 1/1/2010 | | AAA(c) | | | 750 | | | | 920,790 | | |
| Total | | | | | | | | | | | | | | | 6,761,934 | | |
| Water/Sewer 2.60% | |
| Pierce Cnty WA Swr Rev(2) | | | 5.00 | % | | 8/1/2021 | | AAA | | | 1,100 | | | | 1,146,299 | | |
| Total Municipal Bonds (cost $41,476,839) | | | | | | | | | | | | | | | 44,490,727 | | |
| | | | | | | | | Shares
(000) | | | |
| SHORT-TERM INVESTMENT 0.00% | |
| Money Market Mutual Fund | |
| Dreyfus Municipal Cash Management Plus (cost $647) | | | | | | | | | | | 1 | | | | 647 | | |
| Total Investments in Securities 101.05% (cost $41,477,486) | | | | | | | | | | | | | | | 44,491,374 | | |
| Liabilities in Excess of Cash and Other Assets(g) (1.05%) | | | | | | | | | | | | | | | (461,443 | ) | |
| Net Assets 100.00% | | | | | | | | | | | | | | $ | 44,029,931 | | |
| Open futures contracts at September 30, 2006: | |
| Type | | Expiration | | Contracts | | Position | | Market Value | | Unrealized
Depreciation | |
| U.S. 20-Year Treasury Bond | | | December 2006 | | | | 9 | | | Short | | $ | (1,011,656 | ) | | $ | (17,332 | ) | |
See Notes to Financial Statements.
98
Schedule of Investments
INSURED INTERMEDIATE TAX-FREE FUND September 30, 2006
| Investments | | Interest
Rate | | Maturity
Date | | Credit
Rating:
S&P or
Moody's(a) | | Principal
Amount
(000) | | Value | |
| MUNICIPAL BONDS 96.74% | |
| Education 15.36% | |
Allegheny Cnty PA Higher Ed
Duquesne Univ Ser A(9) | | | 5.00 | % | | 3/1/2013 | | AAA | | $ | 150 | | | $ | 161,651 | | |
Delaware Cnty PA Auth Univ
Rev Ref Villanova Univ(9) | | | 5.00 | % | | 8/1/2010 | | AAA | | | 200 | | | | 210,496 | | |
PA St Higher Edl Facs Auth Rev
Temple Univ(14) | | | 5.00 | % | | 4/1/2010 | | AAA | | | 250 | | | | 262,140 | | |
Pierce Cnty WA Sch Dist No 416
White River(10) | | | 5.00 | % | | 12/1/2015 | | Aaa | | | 250 | | | | 272,807 | | |
| Univ TX Univ Rev Fin Sys Ser D | | | 5.25 | % | | 8/15/2016 | | AAA | | | 350 | | | | 383,208 | | |
University AR Univ Revs Facs
Fayetteville Campus(2) | | | 5.00 | % | | 11/1/2014 | | Aaa | | | 350 | | | | 380,737 | | |
| Total | | | | | | | | | | | | | | | 1,671,039 | | |
| General Obligation 37.17% | |
| Arlington TX(10) | | | 5.00 | % | | 8/15/2011 | | AAA | | | 325 | | | | 345,121 | | |
| Austin TX Indpt Sch Dist PSF GTD | | | 5.25 | % | | 8/1/2015 | | AAA | | | 250 | | | | 277,147 | | |
| Hancock Cnty MS Sch Dist(2) | | | 5.00 | % | | 4/15/2010 | | Aaa | | | 160 | | | | 167,579 | | |
Hemet CA Univ Sch Dist 2002
Election Ser C(14) | | | 5.00 | % | | 8/1/2011 | | AAA | | | 200 | | | | 213,752 | | |
| HI St Ser DG(2) | | | 5.00 | % | | 7/1/2015 | | AAA | | | 240 | | | | 262,358 | | |
| Jersey City NJ Ref Pub Impt Ser A(14) | | | 5.25 | % | | 9/1/2015 | | AAA | | | 250 | | | | 274,910 | | |
| Maui Cnty HI Ser A(14) | | | 5.00 | % | | 7/1/2018 | | AAA | | | 300 | | | | 327,024 | | |
| NC St Ser A | | | 5.00 | % | | 6/1/2010 | | AAA | | | 150 | | | | 157,815 | | |
| NJ St Ser L(2) | | | 5.25 | % | | 7/15/2013 | | AAA | | | 300 | | | | 328,584 | | |
| Philadelphia PA(4) | | | 4.50 | % | | 8/1/2012 | | AAA | | | 250 | | | | 261,583 | | |
| River Rouge MI Sch Dist(9) | | | 5.00 | % | | 5/1/2011 | | AAA | | | 300 | | | | 317,823 | | |
| Salem Keizer OR Sch Dist No 24J(10) | | | 5.00 | % | | 6/15/2011 | | AAA | | | 200 | | | | 212,168 | | |
St Louis Park MN Indpt Sch
Dist No 283 Ref Sch Bldg Ser B(10) | | | 5.00 | % | | 2/1/2015 | | Aaa | | | 300 | | | | 324,408 | | |
| Tantasqua MA Regl Sch Dist(10) | | | 4.50 | % | | 10/1/2013 | | Aaa | | | 235 | | | | 247,822 | | |
| Washoe Cnty NV Sch Dist Ser B(14) | | | 5.00 | % | | 6/1/2014 | | AAA | | | 300 | | | | 324,957 | | |
| Total | | | | | | | | | | | | | | | 4,043,051 | | |
See Notes to Financial Statements.
99
Schedule of Investments (continued)
INSURED INTERMEDIATE TAX-FREE FUND September 30, 2006
| Investments | | Interest
Rate | | Maturity
Date | | Credit
Rating:
S&P or
Moody's(a) | | Principal
Amount
(000) | | Value | |
| Healthcare 2.43% | |
SC Jobs Econ Dev Auth Hosp Facs
Rev Tuomey(4) | | | 5.00 | % | | 11/1/2011 | | AAA | | $ | 250 | | | $ | 263,840 | | |
| Housing 3.00% | |
LA St Citizens Ppty Ins Corp
Assmnt Rev Ser B(2) | | | 5.00 | % | | 6/1/2016 | | AAA | | | 300 | | | | 326,331 | | |
| Industrial 3.01% | |
Rensselaer Cnty NY Indl Dev
Agy Civic Fac Rev Rensselaer
Polytechnic Institute(16) | | | 5.00 | % | | 3/1/2016 | | AAA | | | 300 | | | | 327,498 | | |
| Lease 5.37% | |
CA St Pub Wks Bd Hlth Svcs
Richmond Lab B(16) | | | 5.00 | % | | 11/1/2017 | | AAA | | | 315 | | | | 341,010 | | |
| OR St Dept Admin Svcs Ser A COP(10) | | | 5.00 | % | | 5/1/2018 | | AAA | | | 225 | | | | 242,716 | | |
| Total | | | | | | | | | | | | | | | 583,726 | | |
| Miscellaneous 8.84% | |
| CA St Econ Recovery Ser A(9) | | | 5.25 | % | | 7/1/2014 | | AAA | | | 200 | | | | 221,542 | | |
FL St Dept Envr Protn Preservation
Rev FL Forever Ser B(14) | | | 5.00 | % | | 7/1/2012 | | AAA | | | 300 | | | | 320,952 | | |
| MI St(13)(14) | | | 5.50 | % | | 12/1/2013 | | AAA | | | 100 | | | | 111,423 | | |
Miami-Dade Cnty FL Spl Oblig
Fltg Rate Cap Asset Acq Ser A(9) | | | 3.676 | %# | | 4/1/2014 | | AAA | | | 200 | | | | 199,854 | | |
| OR St Dept Admin Svcs(10) | | | 5.00 | % | | 9/1/2012 | | AAA | | | 100 | | | | 107,333 | | |
| Total | | | | | | | | | | | | | | | 961,104 | | |
| Power 6.08% | |
Houston TX Util Sys Rev
Combined First Lien(10) | | | 5.00 | % | | 11/15/2016 | | AAA | | | 250 | | | | 273,887 | | |
MI Pub Pwr Agy Rev Ref Belle
River Pj Ser A(14) | | | 5.25 | % | | 1/1/2016 | | AAA | | | 250 | | | | 276,985 | | |
| Puerto Rico Elec Pwr Auth Ser JJ(14) | | | 5.25 | % | | 7/1/2013 | | AAA | | | 100 | | | | 109,919 | | |
| Total | | | | | | | | | | | | | | | 660,791 | | |
See Notes to Financial Statements.
100
Schedule of Investments (concluded)
INSURED INTERMEDIATE TAX-FREE FUND September 30, 2006
| Investments | | Interest
Rate | | Maturity
Date | | Credit
Rating:
S&P or
Moody's(a) | | Principal
Amount
(000) | | Value | |
| Sales Tax 4.46% | |
| IL St Sales Tax Rev First Ser(10) | | | 5.25 | % | | 6/15/2013 | | AAA | | $ | 100 | | | $ | 109,115 | | |
| MI St Trunk Line(9) | | | 5.00 | % | | 11/1/2012 | | AAA | | | 350 | | | | 376,317 | | |
| Total | | | | | | | | | | | | | | | 485,432 | | |
| Transportation 6.52% | |
Clark Cnty NV Arpt Rev Sub
Lien Ser A(2) | | | 5.00 | % | | 7/1/2016 | | AAA | | | 250 | | | | 272,945 | | |
| New Haven CT Air Rights Pkg(2) | | | 5.375 | % | | 12/1/2012 | | AAA | | | 100 | | | | 109,837 | | |
NJ St Transn Tr Fd Auth Grant
Antic Bds Ser A(9) | | | 5.00 | % | | 6/15/2017 | | AAA | | | 300 | | | | 326,670 | | |
| Total | | | | | | | | | | | | | | | 709,452 | | |
| Water/Sewer 4.50% | |
| Columbus GA Wtr & Sew Rev(10) | | | 5.25 | % | | 5/1/2013 | | AAA | | | 100 | | | | 109,459 | | |
| Lansing MI Sew Disp Sys(9) | | | 5.00 | % | | 5/1/2014 | | AAA | | | 150 | | | | 162,879 | | |
| Pima Cnty AZ Swr Rev(10) | | | 5.00 | % | | 7/1/2014 | | AAA | | | 200 | | | | 217,492 | | |
| Total | | | | | | | | | | | | | | | 489,830 | | |
| Total Municipal Bonds (cost $10,345,222) | | | | | | | | | | | | | | | 10,522,094 | | |
| | | | | | | | | Shares
(000) | | | |
| SHORT-TERM INVESTMENT 0.01% | |
| Money Market Mutual Fund | |
| Dreyfus Municipal Cash Management Plus (cost $836) | | | | | | | | | | | 1 | | | | 836 | | |
| Total Investments in Securities 96.75% (cost $10,346,058) | | | | | | | | | | | | | | | 10,522,930 | | |
| Cash and Other Assets in Excess of Liabilities 3.25% | | | | | | | | | | | | | | | 353,860 | | |
| Net Assets 100.00% | | | | | | | | | | | | | | $ | 10,876,790 | | |
See Notes to Financial Statements.
101
Schedule of Investments
FLORIDA TAX-FREE TRUST September 30, 2006
| Investments | | Interest
Rate | | Maturity
Date | | Credit
Rating:
S&P or
Moody's(a) | | Principal
Amount
(000) | | Value | |
| MUNICIPAL BONDS 98.11% | |
| Education 5.44% | |
Jacksonville FL Pollutn Rev
Daily Ref FL Pwr & Lt Co Pj | | | 3.86 | %# | | 5/1/2029 | | Aa3 | | $ | 100 | | | $ | 100,000 | | |
Miami-Dade Cnty FL Edl Facs
Auth Rev Ser A(2) | | | 6.00 | % | | 4/1/2023 | | AAA | | | 2,000 | | | | 2,164,240 | | |
Pinellas Cnty FL Edl Facs
Auth Rev Eckerd College Pj(1) | | | 5.25 | % | | 10/1/2029 | | A | | | 500 | | | | 530,735 | | |
| Tampa FL Rev Univ Tampa Pj(4) | | | 5.00 | % | | 4/1/2035 | | Aaa | | | 1,000 | | | | 1,050,100 | | |
| Total | | | | | | | | | | | | | | | 3,845,075 | | |
| General Obligation 7.18% | |
| Hillsborough Cnty FL Sch Bd COP(14) | | | 5.00 | % | | 7/1/2029 | | AAA | | | 1,000 | | | | 1,047,680 | | |
| Puerto Rico Comwlth PMD 8 RIBs(14) | | | 7.46 | % | | 7/1/2026 | | Aaa | | | 3,500 | | | | 4,024,580 | | |
| Total | | | | | | | | | | | | | | | 5,072,260 | | |
| Healthcare 14.21% | |
Brevard Cnty FL Hlth Facs Auth
Hlthcare Facs Rev Hlth First Inc Pj | | | 5.00 | % | | 4/1/2034 | | A | | | 1,000 | | | | 1,037,490 | | |
Delware Cnty IN Hosp Auth Hosp
Rev Cardinal Hlth Sys Oblig Grp | | | 5.25 | % | | 8/1/2036 | | Baa2 | | | 350 | | | | 363,587 | | |
Halifax Hosp Med Ctr FL Hosp
Rev Ref & Impt Ser A | | | 5.00 | % | | 6/1/2038 | | BBB+ | | | 175 | | | | 180,316 | | |
Halifax Hosp Med Ctr FL Hosp
Rev Ref & Impt Ser A | | | 5.25 | % | | 6/1/2026 | | BBB+ | | | 175 | | | | 185,038 | | |
Highlands Cnty FL Hlth Fac Auth
Rev Hosp Adventist Hlth Sys Ser C | | | 5.25 | % | | 11/15/2036 | | A+ | | | 1,000 | | | | 1,061,190 | | |
Highlands Cnty FL Hlth Fac Auth
Rev Hosp Adventist Hlth Sys Ser D | | | 5.875 | % | | 11/15/2029 | | A+ | | | 2,000 | | | | 2,183,520 | | |
Hilsborough Cnty FL Indl Dev
Auth Hosp Rev RIBs | | | 6.636 | % | | 10/1/2041 | | Aaa | | | 1,000 | | | | 1,116,340 | | |
Miami FL Hlth Facs Auth
Catholic Hlth East Ser B | | | 5.25 | % | | 11/15/2033 | | A1 | | | 225 | | | | 236,142 | | |
Orange Cnty FL Hlth Facs Auth
Hosp Orlando Regl Hlthcare B | | | 4.75 | % | | 11/15/2036 | | A | | | 1,000 | | | | 1,009,950 | | |
Puerto Rico Indl Tourist Edls Med
Envr Ctrl Fac Hosp de la Concepcion A | | | 6.50 | % | | 11/15/2020 | | AA | | | 410 | | | | 458,774 | | |
Sarasota Cnty FL Pub Hosp Bd
Rev Sarasota Mem Hosp Ser B(14) | | | 5.50 | % | | 7/1/2028 | | AAA | | | 1,875 | | | | 2,205,319 | | |
| Total | | | | | | | | | | | | | | | 10,037,666 | | |
See Notes to Financial Statements.
102
Schedule of Investments (continued)
FLORIDA TAX-FREE TRUST September 30, 2006
| Investments | | Interest
Rate | | Maturity
Date | | Credit
Rating:
S&P or
Moody's(a) | | Principal
Amount
(000) | | Value | |
| Housing 2.29% | |
FL Hsg Fin Corp Rev
Hmownr Mtg Ser 4 AMT(6)(12) | | | 5.00 | % | | 7/1/2021 | | AA | | $ | 1,000 | | | $ | 1,032,740 | | |
Lee Cnty FL Hsg Fin Auth Sing
Fam Mtg Rev AMT(6)(12) | | | 6.40 | % | | 3/1/2029 | | Aaa | | | 495 | | | | 499,301 | | |
Orange Cnty FL Hsg Fin Auth
Hmowner Rev Cap App
Ser A1 AMT(12) | | | Zero Coupon | | | 3/1/2028 | | Aaa | | | 265 | | | | 84,824 | | |
| Total | | | | | | | | | | | | | | | 1,616,865 | | |
| Industrial 3.37% | |
Escambia Cnty FL Env Impt
Rev Ref Intl Paper Co Pjs A AMT | | | 5.00 | % | | 8/1/2026 | | BBB | | | 500 | | | | 503,370 | | |
Lee Cnty FL Ind Dev Auth Ref
Bonita Springs Util Pj AMT(2) | | | 5.125 | % | | 11/1/2019 | | AAA | | | 1,250 | | | | 1,317,500 | | |
| TSASC Inc NY Ser 1 | | | 5.00 | % | | 6/1/2026 | | BBB | | | 550 | | | | 558,388 | | |
| Total | | | | | | | | | | | | | | | 2,379,258 | | |
| Miscellaneous 18.66% | |
Aleutians East Burough AK Pj
Rev Aleutian Pribilof Islands Inc(1) | | | 5.50 | % | | 6/1/2036 | | A | | | 350 | | | | 369,845 | | |
Jacksonville FL Excise Taxes
Ref Ser C AMT(14) | | | 5.25 | % | | 10/1/2020 | | AAA | | | 1,000 | | | | 1,067,410 | | |
Jacksonville FL Sales Tax Rev
Ref & Impt Loc Govt(9) | | | 5.375 | % | | 10/1/2018 | | AAA | | | 1,000 | | | | 1,085,920 | | |
Miami-Dade Cnty FL Spl Oblig
Fltg Rate Cap Asset Acq Ser A(9) | | | 3.676 | %# | | 4/1/2014 | | AAA | | | 1,500 | | | | 1,498,905 | | |
Miami-Dade Cnty FL Spl Oblig
Sub Ser A(14) | | | Zero Coupon | | | 10/1/2024 | | AAA | | | 3,000 | | | | 1,197,060 | | |
Miami-Dade Cnty FL Spl Oblig
Sub Ser B(14) | | | 5.00 | % | | 10/1/2037 | | AAA | | | 1,000 | | | | 1,023,440 | | |
| Orange Cnty FL Sales Tax Rev Ser B(9) | | | 5.125 | % | | 1/1/2032 | | AAA | | | 1,425 | | | | 1,506,239 | | |
| Orange Cnty FL Tourist Dev Sub(2) | | | 5.125 | % | | 10/1/2025 | | AAA | | | 1,445 | | | | 1,537,625 | | |
Osceola Cnty Tourist Dev Tax
Rev Ser A(9) | | | 5.00 | % | | 10/1/2032 | | AAA | | | 1,400 | | | | 1,463,308 | | |
Puerto Rico Pub Bldgs Auth
Rev Govt Facs Ser I GTD | | | 5.25 | % | | 7/1/2033 | | BBB | | | 1,250 | | | | 1,321,500 | | |
Tampa FL Sports Auth Rev
Tampa Bay Arena Pj(14) | | | 6.00 | % | | 10/1/2015 | | AAA | | | 450 | | | | 507,762 | | |
West Palm Beach FL Cmnty Cnty Redev
Agy Northwood-Pleasant Cmnty Redev | | | 5.00 | % | | 3/1/2029 | | A | | | 575 | | | | 597,281 | | |
| Total | | | | | | | | | | | | | | | 13,176,295 | | |
See Notes to Financial Statements.
103
Schedule of Investments (continued)
FLORIDA TAX-FREE TRUST September 30, 2006
| Investments | | Interest
Rate | | Maturity
Date | | Credit
Rating:
S&P or
Moody's(a) | | Principal
Amount
(000) | | Value | |
| Power 1.67% | |
| Emerald Coast FL Utils Auth Rev Sys(9) | | | 5.25 | % | | 1/1/2036 | | AAA | | $ | 1,000 | | | $ | 1,078,080 | | |
| Orange Cnty FL Sch Bd Ser B COP(2) | | | 3.85 | %# | | 8/1/2025 | | Aaa | | | 100 | | | | 100,000 | | |
| Total | | | | | | | | | | | | | | | 1,178,080 | | |
| Pre-Refunded 27.41% | |
| Boca Raton FL | | | 5.25 | % | | 7/1/2016 | | AAA | | | 1,615 | | | | 1,702,000 | | |
| Boca Raton FL | | | 5.25 | % | | 7/1/2017 | | AAA | | | 1,000 | | | | 1,053,870 | | |
| FL St Bd of Ed Pub Ed Cap Outlay Ser A | | | 5.25 | % | | 6/1/2024 | | AAA | | | 2,000 | | | | 2,133,880 | | |
| FL St Bd of Ed Pub Ed Cap Outlay Ser E | | | 5.625 | % | | 6/1/2025 | | AAA | | | 1,000 | | | | 1,079,700 | | |
Highlands Cnty FL Hlth Facs Auth
Rev Hosp Adventist/Sunbelt Ser A | | | 6.00 | % | | 11/15/2031 | | A2 | | | 2,000 | | | | 2,237,960 | | |
Miami-Dade Cnty FL Expwy Auth
Toll Sys Rev(9) | | | 6.375 | % | | 7/1/2029 | | AAA | | | 1,250 | | | | 1,384,050 | | |
Muni Secs Trust Ctfs Ser 7005
Cl B ETM RIBs† | | | 7.134 | % | | 10/1/2040 | | Aaa | | | 1,250 | | | | 1,437,150 | | |
Orange Cnty FL Hlth Facs Auth
Rev Hosp Orlando Regl Hlthcare | | | 5.75 | % | | 12/1/2032 | | A | | | 1,000 | | | | 1,115,420 | | |
Orange Cnty FL Tourist Dev
Tax Rev ETM(2) | | | 6.00 | % | | 10/1/2016 | | AAA | | | 710 | | | | 721,644 | | |
Puerto Rico Comwlth Hwy &
Transn Auth Rev Ser B | | | 6.00 | % | | 7/1/2031 | | BBB+ | | | 1,000 | | | | 1,092,370 | | |
Puerto Rico Comwlth Hwy &
Transn Auth Rev Ser B | | | 6.50 | % | | 7/1/2027 | | BBB+ | | | 1,000 | | | | 1,109,720 | | |
Puerto Rico Comwlth Hwy &
Transn Auth Rev Ser C | | | 6.00 | % | | 7/1/2029 | | AAA | | | 880 | | | | 961,286 | | |
| Tampa Bay Wtr FL Util Sys Rev(9) | | | 6.00 | % | | 10/1/2024 | | AAA | | | 3,000 | | | | 3,332,070 | | |
| Total | | | | | | | | | | | | | | | 19,361,120 | | |
| Resource Recovery 1.60% | |
Gulf Coast Wst Disp Auth TX
Wst Mgmt of TX Ser A AMT | | | 5.20 | %# | | 5/1/2028 | | BBB | | | 350 | | | | 365,474 | | |
Jacksonville FL Pollutn Rev
Anheuser-Busch Pj | | | 5.70 | % | | 8/1/2031 | | A+ | | | 750 | | | | 761,991 | | |
| Total | | | | | | | | | | | | | | | 1,127,465 | | |
| Transportation 8.29% | |
Alliance Arpt Auth Inc TX Spl
Facs Rev Ref Fedex Corp Pj AMT | | | 4.85 | % | | 4/1/2021 | | BBB | | | 300 | | | | 304,332 | | |
FL Ports Fin Commn Rev St
Transn Tr Fd Intermodal Pg AMT(9) | | | 5.50 | % | | 10/1/2029 | | AAA | | | 1,295 | | | | 1,347,370 | | |
See Notes to Financial Statements.
104
Schedule of Investments (concluded)
FLORIDA TAX-FREE TRUST September 30, 2006
| Investments | | Interest
Rate | | Maturity
Date | | Credit
Rating:
S&P or
Moody's(a) | | Principal
Amount
(000) | | Value | |
Miami-Dade Cnty FL Aviation
Rev Miami Intl Arpt Ser A AMT(16) | | | 5.00 | % | | 10/1/2037 | | AAA | | $ | 2,000 | | | $ | 2,085,300 | | |
Miami-Dade Cnty FL Expwy Auth
Toll Sys Rev(9) | | | 5.125 | % | | 7/1/2025 | | Aaa | | | 750 | | | | 793,282 | | |
| Pensacola FL Arpt Rev Ser A AMT(14) | | | 6.125 | % | | 10/1/2018 | | AAA | | | 1,250 | | | | 1,320,988 | | |
| Total | | | | | | | | | | | | | | | 5,851,272 | | |
| Water/Sewer 7.99% | |
Melbourne FL Wtr & Swr Rev
Ref & Impt Ser A(9) | | | 5.00 | % | | 10/1/2032 | | AAA | | | 1,000 | | | | 1,045,220 | | |
| Miami Beach FL Stormwater Rev(9) | | | 5.25 | % | | 9/1/2020 | | AAA | | | 1,000 | | | | 1,063,430 | | |
| Miami Beach FL Wtr & Swr Rev(2) | | | 5.25 | % | | 9/1/2020 | | AAA | | | 1,000 | | | | 1,063,430 | | |
| Miami Beach FL Wtr & Swr Rev(2) | | | 5.50 | % | | 9/1/2027 | | AAA | | | 1,000 | | | | 1,069,050 | | |
| Ocala FL Wtr & Swr Rev(9) | | | 5.25 | % | | 10/1/2027 | | Aaa | | | 800 | | | | 858,544 | | |
| Sebring FL Wtr & Wastewtr Rev(9) | | | 5.25 | % | | 1/1/2020 | | AAA | | | 500 | | | | 540,495 | | |
| Total | | | | | | | | | | | | | | | 5,640,169 | | |
| Total Municipal Bonds (cost $64,251,363) | | | | | | | | | | | | | | | 69,285,525 | | |
| | | | | | | | | Shares
(000) | | | |
| SHORT-TERM INVESTMENT 0.00% | |
| Money Market Mutual Fund | |
| Dreyfus FL Municipal Cash Management (cost $429) | | | | | | | | | | | — | (b) | | | 429 | | |
| Total Investments in Securities 98.11% (cost $64,251,792) | | | | | | | | | | | | | | | 69,285,954 | | |
| Cash and Other Assets in Excess of Liabilities(g) 1.89% | | | | | | | | | | | | | | | 1,337,184 | | |
| Net Assets 100.00% | | | | | | | | | | | | | | $ | 70,623,138 | | |
| Open futures contracts at September 30, 2006: | |
| Type | | Expiration | | Contracts | | Position | | Market Value | | Unrealized
Depreciation | |
| U.S. 20-Year Treasury Bond | | | December 2006 | | | | 20 | | | Short | | $ | (2,248,125 | ) | | $ | (38,420 | ) | |
See Notes to Financial Statements.
105
Schedule of Investments
GEORGIA TAX-FREE TRUST September 30, 2006
| Investments | | Interest
Rate | | Maturity
Date | | Credit
Rating:
S&P or
Moody's(a) | | Principal
Amount
(000) | | Value | |
| MUNICIPAL BONDS 97.56% | |
| Education 20.46% | |
Albany-Dougherty GA Inner City Auth
Rev Albany St Univ Student Hsg A(16) | | | 5.00 | % | | 7/1/2031 | | AAA | | $ | 1,000 | | | $ | 1,050,490 | | |
Americus-Sumter GA Payroll Dev Auth
Rev GSW Fndtn Student Hsg Pj(4) | | | 5.00 | % | | 6/1/2036 | | AAA | | | 2,285 | | | | 2,395,457 | | |
Athens GA Hsg Auth Student Hsg
Lease Rev Univ of GA East Campus(2) | | | 5.00 | % | | 12/1/2027 | | Aaa | | | 2,000 | | | | 2,095,880 | | |
Athens GA Hsg Auth Student Hsg
Lease Rev Univ of GA East Campus(2) | | | 5.25 | % | | 12/1/2023 | | Aaa | | | 775 | | | | 832,187 | | |
Athens-Clarke Cnty GA Univ
Govt UGA Rev CCRC Bldg LLC Pj(2) | | | 5.00 | % | | 12/15/2032 | | AAA | | | 1,050 | | | | 1,095,350 | | |
Bulloch Cnty GA Dev Auth GA
South Univ Pj(2) | | | 5.00 | % | | 8/1/2021 | | Aaa | | | 400 | | | | 421,428 | | |
Fulton Cnty GA Dev Auth Rev
GA Tech Athletic Assoc(2) | | | 5.50 | % | | 10/1/2017 | | AAA | | | 1,000 | | | | 1,098,090 | | |
Fulton Cnty GA Dev Auth Rev
GA Tech Fndtn Sac II Pj Ser A | | | 5.125 | % | | 11/1/2021 | | AA+ | | | 750 | | | | 798,660 | | |
Fulton Cnty GA Dev Auth Rev
GA Tech Fndtn Fdg Ser A | | | 5.00 | % | | 11/1/2031 | | AA+ | | | 1,400 | | | | 1,455,104 | | |
Fulton Cnty GA Dev Auth Rev
Molecular Science Bldg Pj(14) | | | 5.00 | % | | 5/1/2034 | | AAA | | | 2,000 | | | | 2,092,260 | | |
Fulton Cnty GA Dev Auth Rev
Morehouse College Pj(2) | | | 5.875 | % | | 12/1/2030 | | AAA | | | 1,850 | | | | 2,014,317 | | |
Fulton Cnty GA Dev Auth Rev
Tuff Morehouse Pj Ser A(2) | | | 5.50 | % | | 2/1/2022 | | AAA | | | 1,000 | | | | 1,088,240 | | |
Marietta GA Dev Auth Rev Ser
Student Hsg SPSU Student Hsg I | | | 5.125 | % | | 9/15/2023 | | A2 | | | 1,000 | | | | 1,057,300 | | |
Peach Cnty GA Dev Auth Student Hsg
Facs Rev Fort Vly St Unitv Fndtn PPTY(2) | | | 5.00 | % | | 6/1/2023 | | AAA | | | 1,115 | | | | 1,197,075 | | |
Peach Cnty GA Dev Auth Student Hsg
Facs Rev Fort Vly St Univ Fndtn PPTY LLC(2) | | | 5.00 | % | | 6/1/2034 | | AAA | | | 1,000 | | | | 1,050,760 | | |
Private Colleges & Univs Auth
GA Rev Spelman College | | | 5.25 | % | | 6/1/2021 | | Aa3 | | | 1,340 | | | | 1,436,185 | | |
Richmond Cnty GA Dev Auth ASU
Jaguar Student Hsg LLC A | | | 5.25 | % | | 2/1/2030 | | A3 | | | 2,000 | | | | 2,074,900 | | |
Richmond Cnty GA Dev Auth Edl Facs
Rev ASU Jaguar Student Ctr Ser A(16) | | | 5.00 | % | | 7/1/2034 | | Aaa | | | 1,000 | | | | 1,054,220 | | |
| Total | | | | | | | | | | | | | | | 24,307,903 | | |
See Notes to Financial Statements.
106
Schedule of Investments (continued)
GEORGIA TAX-FREE TRUST September 30, 2006
| Investments | | Interest
Rate | | Maturity
Date | | Credit
Rating:
S&P or
Moody's(a) | | Principal
Amount
(000) | | Value | |
| General Obligation 3.39% | |
| GA St Ser F | | | 5.00 | % | | 11/1/2018 | | AAA | | $ | 1,000 | | | $ | 1,066,760 | | |
| Puerto Rico Comwlth Pub Impt Ser A | | | 5.25 | % | | 7/1/2030 | | BBB | | | 1,000 | | | | 1,068,320 | | |
Puerto Rico Comwlth
Unrefunded Bal Pub Impt Ser A | | | 5.125 | % | | 7/1/2031 | | BBB | | | 665 | | | | 683,953 | | |
Puerto Rico Comwlth
Unrefunded Bal Pub Impt Ser A | | | 5.375 | % | | 7/1/2028 | | BBB | | | 1,155 | | | | 1,208,176 | | |
| Total | | | | | | | | | | | | | | | 4,027,209 | | |
| Healthcare 5.80% | |
Athens-Clarke Cnty GA Univ
Govt Catholic Hlth East Issue | | | 5.50 | % | | 11/15/2032 | | A | | | 1,000 | | | | 1,062,210 | | |
Clarke Cnty GA Hosp Auth Rev
Ctfs Athens Regl Med Ctr Pj(14) | | | 5.125 | % | | 1/1/2032 | | AAA | | | 500 | | | | 524,290 | | |
Cobb Cnty GA Hosp Auth Rev
Ref & Impt Rev Antic Ctfs(2) | | | 5.25 | % | | 4/1/2024 | | AAA | | | 1,000 | | | | 1,078,210 | | |
Coffee Cnty GA Hosp Auth Rev
Ref Coffee Regl Med Ctr Inc Pj | | | 5.00 | % | | 12/1/2026 | | BBB+ | | | 1,000 | | | | 1,016,680 | | |
Coffee Cnty GA Hosp Auth Rev
Ref Coffee Regl Med Ctr Inc Pj | | | 5.25 | % | | 12/1/2022 | | BBB+ | | | 1,000 | | | | 1,042,350 | | |
Glynn-Brunswick Mem Hosp Auth GA
Rev Unrefunded Bal 2005 Antic Ctfs(14) | | | 6.00 | % | | 8/1/2016 | | AAA | | | 100 | | | | 102,147 | | |
Puerto Rico Indl Tourist Ed & Med Envr
Ctrl Facs Hosp de la Concepcion A | | | 6.50 | % | | 11/15/2020 | | AA | | | 410 | | | | 458,774 | | |
Ware Cnty GA Hosp Auth Rev
Antic Ctfs GTD(14) | | | 5.50 | % | | 3/1/2021 | | Aaa | | | 500 | | | | 539,895 | | |
| Wayne Cnty GA Hosp Auth Rev GTD(16) | | | 5.00 | % | | 3/1/2023 | | Aaa | | | 1,000 | | | | 1,064,010 | | |
| Total | | | | | | | | | | | | | | | 6,888,566 | | |
| Housing 3.19% | |
GA St Hsg & Fin Auth Rev
Sing Fam Mtg Ser B AMT | | | 5.05 | % | | 12/1/2031 | | AAA | | | 1,000 | | | | 1,022,010 | | |
GA St Hsg & Fin Auth Rev
Sing Fam Mtg Sub Ser A-2 AMT | | | 4.90 | % | | 12/1/2031 | | AAA | | | 2,000 | | | | 2,050,780 | | |
GA St Hsg & Fin Auth Rev
Sing Fam Sub Ser D-2 AMT | | | 5.75 | % | | 12/1/2031 | | AAA | | | 90 | | | | 93,594 | | |
GA St Hsg & Fin Auth Rev Sub
Ser A-2 AMT | | | 4.875 | % | | 12/1/2024 | | AAA | | | 100 | | | | 102,090 | | |
Savannah GA Econ Dev Auth
Multi Fam Hsg Rev AMT(11) | | | 5.15 | % | | 11/20/2022 | | AAA | | | 500 | | | | 521,200 | | |
| Total | | | | | | | | | | | | | | | 3,789,674 | | |
See Notes to Financial Statements.
107
Schedule of Investments (continued)
GEORGIA TAX-FREE TRUST September 30, 2006
| Investments | | Interest
Rate | | Maturity
Date | | Credit
Rating:
S&P or
Moody's(a) | | Principal
Amount
(000) | | Value | |
| Industrial 2.44% | |
Albany Dougherty GA Payroll
Dev Auth Procter & Gamble AMT | | | 5.20 | % | | 5/15/2028 | | AA- | | $ | 545 | | | $ | 610,275 | | |
Childrens Tr Fd Puerto Rico
Tob Settlmnt Rev Asset Bkd Bds | | | 5.50 | % | | 5/15/2039 | | BBB | | | 750 | | | | 777,390 | | |
Fulton Cnty GA Dev Auth Loc Dist
Cooling Fac Rev Sr Maxon Atlantic
Station A AMT | | | 5.125 | %# | | 3/1/2026 | | BBB | | | 500 | | | | 508,380 | | |
Richmond Cnty GA Dev Auth Envr
Impt Rev Intl Paper Co Pjs Ser A AMT | | | 5.00 | % | | 8/1/2030 | | BBB | | | 1,000 | | | | 1,007,600 | | |
| Total | | | | | | | | | | | | | | | 2,903,645 | | |
| Lease 4.42% | |
Assoc Cnty Commnrs GA Leasing Pj
Unrefunded Bal Pub Purp Pj COP(2) | | | 5.625 | % | | 7/1/2020 | | AAA | | | 10 | | | | 10,775 | | |
Atlanta GA Dev Auth Rev Tuff
ATDC Pj Ser A | | | 5.00 | % | | 1/1/2035 | | A3 | | | 1,250 | | | | 1,279,575 | | |
Atlanta GA Dev Auth Rev Tuff
ATDC Pj Ser C | | | 4.625 | % | | 1/1/2035 | | A3 | | | 1,000 | | | | 988,270 | | |
Fayette Cnty GA Pub Fac Auth
Rev Criminal Justice Ctr Pj | | | 5.00 | % | | 6/1/2026 | | AA | | | 1,040 | | | | 1,089,993 | | |
GA Muni Assn Inc Ctfs City
Court Atlanta Pj(2) | | | 5.25 | % | | 12/1/2026 | | AAA | | | 750 | | | | 804,975 | | |
GA Sch Bds Assoc Inc
Dekalb Cnty Pub Schs Pj COP(14) | | | 5.00 | % | | 12/1/2023 | | AAA | | | 1,000 | | | | 1,074,410 | | |
| Total | | | | | | | | | | | | | | | 5,247,998 | | |
| Miscellaneous 1.44% | |
Cobb Marietta GA Coliseum &
Exhibit Hall Auth Rev(14) | | | 5.625 | % | | 10/1/2026 | | AAA | | | 1,000 | | | | 1,179,600 | | |
George L Smith II GA World
Congress Ctr Auth Rev AMT(14) | | | 5.75 | % | | 7/1/2015 | | AAA | | | 500 | | | | 534,405 | | |
| Total | | | | | | | | | | | | | | | 1,714,005 | | |
| Power 7.90% | |
Appling Cnty GA Dev Auth Pollutn
Ctrl Rev GA Pwr Co Plant Hatch Pj(2) | | | 4.40 | % | | 7/1/2016 | | AAA | | | 1,000 | | | | 1,018,800 | | |
Burke Cnty GA Dev Auth Pollutn Ctrl
Rev Oglethorpe Pwr Corp Vogtle(2) | | | 3.84 | %# | | 1/1/2022 | | AAA | | | 300 | | | | 300,000 | | |
Cobb Cnty GA Dev Auth Pollutn Ctrl
Rev GA Pwr Co Plant Pj | | | 3.84 | %# | | 7/1/2011 | | A | | | 1,200 | | | | 1,200,000 | | |
Monroe Cnty GA Dev Auth GA Pollutn
Ctrl Rev Pwr Co Scherer Pj 1st Ser(2) | | | 4.90 | %# | | 7/1/2036 | | AAA | | | 2,000 | | | | 2,033,680 | | |
See Notes to Financial Statements.
108
Schedule of Investments (continued)
GEORGIA TAX-FREE TRUST September 30, 2006
| Investments | | Interest
Rate | | Maturity
Date | | Credit
Rating:
S&P or
Moody's(a) | | Principal
Amount
(000) | | Value | |
Muni Elec Auth GA Combustion
Cycle Pj Ser A(14) | | | 5.00 | % | | 11/1/2020 | | AAA | | $ | 1,000 | | | $ | 1,062,330 | | |
Muni Elec Auth GA Combustion
Cycle Pj Ser A | | | 5.00 | % | | 11/1/2023 | | A | | | 1,000 | | | | 1,017,300 | | |
Muni Elec Auth GA Combustion
Turbine Pj Ser A(14) | | | 5.25 | % | | 11/1/2022 | | AAA | | | 1,445 | | | | 1,555,239 | | |
Puerto Rico Elec Pwr Auth Pwr Rev
Ser HH(10) | | | 5.25 | % | | 7/1/2029 | | AAA | | | 1,135 | | | | 1,204,553 | | |
| Total | | | | | | | | | | | | | | | 9,391,902 | | |
| Pre-Refunded 24.17% | |
Assoc Cnty Commnrs GA
Leasing Pg Pub Purp Pj COP(2) | | | 5.625 | % | | 7/1/2020 | | AAA | | | 15 | | | | 16,218 | | |
Atlanta GA Arpt Facs Rev Ref
Gen Ser A(9) | | | 5.60 | % | | 1/1/2030 | | AAA | | | 1,500 | | | | 1,607,145 | | |
| Atlanta GA ETM | | | 5.60 | % | | 12/1/2015 | | AA- | | | 95 | | | | 97,249 | | |
Cobb Cnty GA Kennestone Hosp
Auth Rev Ctfs Ser 86 A ETM(14) | | | Zero Coupon | | | 8/1/2015 | | AAA | | | 395 | | | | 229,298 | | |
College Park GA Business & Indl
Dev Auth Civic Ctr Pj Rev(2) | | | 5.75 | % | | 9/1/2026 | | AAA | | | 450 | | | | 493,834 | | |
Fayette Cnty GA Pub Facs Auth Rev
Criminal Justice Ctr Pj | | | 6.00 | % | | 6/1/2030 | | AA | | | 1,000 | | | | 1,092,460 | | |
| Forsyth Cnty GA Sch Dist | | | 6.00 | % | | 2/1/2016 | | AA | | | 2,000 | | | | 2,185,220 | | |
| Forsyth Cnty GA Wtr & Swr Auth Rev | | | 6.25 | % | | 4/1/2021 | | AA | | | 750 | | | | 821,542 | | |
Muni Secs Trust Ctfs Ser 7005
Cl B ETM RIBs† | | | 7.134 | % | | 10/1/2040 | | Aaa | | | 1,000 | | | | 1,149,720 | | |
Private Colleges & Univs Auth
GA Rev Emory Univ Pj Ser A | | | 5.50 | % | | 11/1/2020 | | AA | | | 1,000 | | | | 1,080,430 | | |
Private Colleges & Univs Auth
GA Rev Emory Univ Pj Ser A | | | 5.50 | % | | 11/1/2025 | | AA | | | 1,000 | | | | 1,064,670 | | |
Private Colleges & Univs Auth
GA Rev Mercer Univ Pj | | | 5.75 | % | | 10/1/2031 | | Baa2 | | | 500 | | | | 555,625 | | |
Puerto Rico Comwlth Hwy &
Transn Auth Rev Ser C | | | 6.00 | % | | 7/1/2029 | | AAA | | | 250 | | | | 273,092 | | |
Puerto Rico Comwlth Hwy &
Transn Auth Transn Rev Ser B(14) | | | 5.875 | % | | 7/1/2020 | | AAA | | | 1,000 | | | | 1,091,700 | | |
Puerto Rico Comwlth Hwy &
Transn Auth Transn Rev Ser D | | | 5.25 | % | | 7/1/2038 | | AAA | | | 1,500 | | | | 1,632,135 | | |
Puerto Rico Comwlth Hwy &
Transn Auth Transn Rev Ser D | | | 5.375 | % | | 7/1/2036 | | AAA | | | 1,405 | | | | 1,537,815 | | |
See Notes to Financial Statements.
109
Schedule of Investments (continued)
GEORGIA TAX-FREE TRUST September 30, 2006
| Investments | | Interest
Rate | | Maturity
Date | | Credit
Rating:
S&P or
Moody's(a) | | Principal
Amount
(000) | | Value | |
Puerto Rico Comwlth Hwy &
Transn Auth Transn Rev Ser D | | | 5.75 | % | | 7/1/2041 | | AAA | | $ | 1,885 | | | $ | 2,099,626 | | |
| Puerto Rico Comwlth Pub Impt Ser A | | | 5.00 | % | | 7/1/2027 | | AAA | | | 370 | | | | 397,824 | | |
| Puerto Rico Comwlth Pub Impt Ser A | | | 5.125 | % | | 7/1/2031 | | AAA | | | 335 | | | | 358,427 | | |
| Puerto Rico Comwlth Pub Impt Ser A | | | 5.375 | % | | 7/1/2028 | | AAA | | | 580 | | | | 626,841 | | |
Puerto Rico Comwlth Pub Impt
Ser A(14) | | | 5.75 | % | | 7/1/2026 | | AAA | | | 1,990 | | | | 2,139,131 | | |
Puerto Rico Pub Fin Corp
Comwlth Approp Ser A(14) | | | 5.50 | % | | 8/1/2020 | | AAA | | | 1,500 | | | | 1,631,355 | | |
Puerto Rico Pub Fin Corp
Comwlth Approp Ser E | | | 5.70 | % | | 8/1/2025 | | Aaa | | | 3,000 | | | | 3,201,420 | | |
Puerto Rico Pub Bldgs Auth Rev
Govt Facs Ser D GTD | | | 5.375 | % | | 7/1/2033 | | BBB | | | 1,685 | | | | 1,835,150 | | |
Puerto Rico Pub Bldgs Auth Rev
Unrefunded Govt Facs Ser D GTD | | | 5.25 | % | | 7/1/2036 | | BBB | | | 915 | | | | 990,661 | | |
Savannah GA Econ Dev Auth Rev
Sub Ser C ETM | | | Zero Coupon | | | 12/1/2021 | | Aaa | | | 1,000 | | | | 514,690 | | |
| Total | | | | | | | | | | | | | | | 28,723,278 | | |
| Resource Recovery 2.24% | |
Atlanta GA Wtr & Wstwtr Rev
Ser A Unrefunded Bal(9) | | | 5.00 | % | | 11/1/2029 | | AAA | | | 2,090 | | | | 2,154,288 | | |
Cobb Cnty GA Dev Auth Solid Wst
Disp Rev GA Wst Mngt Pj Ser A AMT | | | 5.00 | % | | 4/1/2033 | | BBB | | | 500 | | | | 506,105 | | |
| Total | | | | | | | | | | | | | | | 2,660,393 | | |
| Sales Tax 1.09% | |
Metropolitan Atlanta Rapid Transn
Auth GA Sales Tax Rev Ser N(13)(14) | | | 6.25 | % | | 7/1/2018 | | AAA | | | 465 | | | | 545,399 | | |
Virgin Islands Pub Fin Auth Rev
Gross Rcpts Taxes Ln Nts(9) | | | 4.25 | % | | 10/1/2029 | | AAA | | | 750 | | | | 746,722 | | |
| Total | | | | | | | | | | | | | | | 1,292,121 | | |
| Special Tax 1.01% | |
Atlanta GA Dev Auth Rev
Opportunity Pj(2) | | | 5.00 | % | | 12/1/2018 | | AAA | | | 1,105 | | | | 1,202,240 | | |
| Transportation 5.91% | |
| Atlanta GA Arpt Fac Rev AMT(14) | | | Zero Coupon | | | 1/1/2010 | | AAA | | | 760 | | | | 632,449 | | |
Atlanta GA Arpt Passenger Fac
Charge Rev Sub Lien Gen Purp Ser J(10) | | | 5.00 | % | | 1/1/2034 | | AAA | | | 2,000 | | | | 2,093,340 | | |
| Atlanta GA Arpt Rev Gen Ser A AMT(10) | | | 5.125 | % | | 1/1/2030 | | AAA | | | 100 | | | | 104,907 | | |
See Notes to Financial Statements.
110
Schedule of Investments (concluded)
GEORGIA TAX-FREE TRUST September 30, 2006
| Investments | | Interest
Rate | | Maturity
Date | | Credit
Rating:
S&P or
Moody's(a) | | Principal
Amount
(000) | | Value | |
Augusta GA Arpt Rev
Gen Passenger Fac Charge A | | | 5.15 | % | | 1/1/2035 | | Baa3 | | $ | 420 | | | $ | 433,339 | | |
College Park GA Business Indl
Dev Auth Rev Civic Ctr Pj(2) | | | 5.25 | % | | 9/1/2026 | | AAA | | | 1,000 | | | | 1,091,130 | | |
Macon Bibb Cnty GA Indl Auth
Arpt Impt Rev Atlantic AMT(2) | | | 5.00 | % | | 4/1/2018 | | AAA | | | 500 | | | | 519,930 | | |
Puerto Rico Comwlth Hwy & Transn
Auth Rev PA 1052 RIBs RITES | | | 7.259 | % | | 1/1/2010 | | AAA(c) | | | 1,750 | | | | 2,148,510 | | |
| Total | | | | | | | | | | | | | | | 7,023,605 | | |
| Water/Sewer 14.10% | |
| Atlanta GA Wtr & Wstwtr Rev(10) | | | 5.00 | % | | 11/1/2037 | | AAA | | | 3,820 | | | | 3,998,012 | | |
| Augusta GA Wtr & Swr Rev(10) | | | 5.25 | % | | 10/1/2022 | | AAA | | | 500 | | | | 538,245 | | |
| Augusta GA Wtr & Swr Rev(10) | | | 5.25 | % | | 10/1/2030 | | AAA | | | 1,110 | | | | 1,180,341 | | |
| Augusta GA Wtr & Swr Rev(10) | | | 5.25 | % | | 10/1/2034 | | AAA | | | 1,000 | | | | 1,083,360 | | |
Carroll Cnty GA Wtr Auth Wtr &
Swr Rev(2) | | | 5.25 | % | | 7/1/2021 | | Aaa | | | 500 | | | | 540,275 | | |
DeKalb Cnty GA Wtr & Swr Rev
ROLS RR II R 567 RIBs | | | 6.139 | % | | 10/1/2035 | | Aa2 | | | 6,270 | | | | 6,795,175 | | |
Elberton GA Combined Util Sys
Rev Ref & Impt(2) | | | 5.50 | % | | 1/1/2019 | | Aaa | | | 550 | | | | 596,744 | | |
| Fulton Cnty GA Wtr & Swr Rev(9) | | | 4.75 | % | | 1/1/2028 | | AAA | | | 1,215 | | | | 1,227,357 | | |
Glynn Cnty GA Wtr & Swr Rev
Ref & Impt(2) | | | 5.00 | % | | 4/1/2023 | | Aaa | | | 750 | | | | 791,625 | | |
| Total | | | | | | | | | | | | | | | 16,751,134 | | |
| Total Investments in Municipal Bonds 97.56% (cost $111,216,074) | | | | | | | | | | | | | | | 115,923,673 | | |
| Cash and Other Assets in Excess of Liabilities(g) 2.44% | | | | | | | | | | | | | | | 2,895,110 | | |
| Net Assets 100.00% | | | | | | | | | | | | | | $ | 118,818,783 | | |
| Open futures contracts at September 30, 2006: | |
| Type | | Expiration | | Contracts | | Position | | Market Value | | Unrealized
Depreciation | |
| U.S.-20 Year Treasury Bond | | | December 2006 | | | | 99 | | | Short | | $ | (11,128,219 | ) | | $ | (190,137 | ) | |
See Notes to Financial Statements.
111
Schedule of Investments
HIGH YIELD MUNICIPAL BOND FUND September 30, 2006
| Investments | | Interest
Rate | | Maturity
Date | | Credit
Rating:
S&P or
Moody's(a) | | Principal
Amount
(000) | | Value | |
| MUNICIPAL BONDS 102.27% | |
| Acute Care Hospital 1.30% | |
Fulton Cnty PA Indl Dev Auth Hosp
Rev Fulton Cnty Med Ctr Pj | | | 5.875 | % | | 7/1/2031 | | NR | | $ | 1,500 | | | $ | 1,552,125 | | |
MI St Hosp Fin Auth Rev
Chelsea Cmnty Hosp Oblig | | | 5.00 | % | | 5/15/2030 | | BBB | | | 3,175 | | | | 3,234,912 | | |
NY St Dorm Auth Revs Mt
Sinai NYU Hlth Rmkt | | | 5.50 | % | | 7/1/2026 | | Baa2 | | | 1,500 | | | | 1,526,250 | | |
St Paul MN Hsg & Redev Auth
Hosp Rev Hltheast Pj | | | 6.00 | % | | 11/15/2035 | | Baa3 | | | 5,750 | | | | 6,240,015 | | |
Washington Cnty AR Hosp Rev
Ref Regl Med Ctr Ser B | | | 5.00 | % | | 2/1/2030 | | BBB | | | 1,500 | | | | 1,533,720 | | |
| Total | | | | | | | | | | | | | | | 14,087,022 | | |
| Airlines 3.93% | |
Charlotte NC Spl Facs Rev Ref
Charlotte/Douglas Intl Arpt AMT | | | 5.60 | % | | 7/1/2027 | | NR | | | 2,020 | | | | 2,029,272 | | |
Houston TX Arpt Sys Rev Spl
Facs Continental Airlines C AMT | | | 6.125 | % | | 7/15/2027 | | B- | | | 3,120 | | | | 3,122,340 | | |
NJ Econ Dev Auth Spl Fac Rev
Continental Airlines Inc Pj AMT | | | 6.25 | % | | 9/15/2019 | | B | | | 3,130 | | | | 3,223,055 | | |
NJ Econ Dev Auth Spl Fac Rev
Continental Airlines Inc Pj AMT | | | 7.20 | %# | | 11/15/2030 | | B | | | 755 | | | | 799,666 | | |
NY New York City Indl Dev Agy Spl Fac
Rev American Airlines JFK Intl Arpt AMT | | | 7.625 | %# | | 8/1/2025 | | B | | | 28,300 | | | | 33,311,930 | | |
| Total | | | | | | | | | | | | | | | 42,486,263 | | |
| Airport Passenger Facility Charge 1.14% | |
| Augusta GA Arpt Rev Gen Ser C AMT | | | 5.45 | % | | 1/1/2031 | | Baa3 | | | 2,410 | | | | 2,502,110 | | |
Phoenix AZ Indl Dev Auth Arpt Fac Rev
America West Airlines Inc Pj AMT | | | 6.25 | % | | 6/1/2019 | | Caa2 | | | 1,200 | | | | 1,234,956 | | |
Tulsa OK Muni Arpt Tr Rev
Ref AMR Corp Ser B AMT | | | 5.65 | %# | | 12/1/2035 | | B | | | 8,610 | | | | 8,649,090 | | |
| Total | | | | | | | | | | | | | | | 12,386,156 | | |
| Airport Special Facility 2.50% | |
Greater Orlando Aviation Auth Orlando FL
Spl Arpt Facs JetBlue Airways Corp AMT | | | 6.375 | % | | 11/15/2026 | | NR | | | 2,305 | | | | 2,401,741 | | |
Greater Orlando Aviation Auth Orlando FL
Spl Arpt Facs JetBlue Airways Corp AMT | | | 6.50 | % | | 11/15/2036 | | NR | | | 5,000 | | | | 5,214,650 | | |
NJ Econ Dev Auth Spl Fac Rev
Continental Airlines Inc Pj AMT | | | 6.25 | % | | 9/15/2029 | | B | | | 8,900 | | | | 9,164,597 | | |
See Notes to Financial Statements.
112
Schedule of Investments (continued)
HIGH YIELD MUNICIPAL BOND FUND September 30, 2006
| Investments | | Interest
Rate | | Maturity
Date | | Credit
Rating:
S&P or
Moody's(a) | | Principal
Amount
(000) | | Value | |
NJ Econ Dev Auth Spl Fac Rev
Continental Airlines Inc Pj AMT | | | 6.625 | % | | 9/15/2012 | | B | | $ | 2,360 | | | $ | 2,516,397 | | |
NY New York City Indl Dev Agy Spl Fac
Rev American Airlines JFK Intl Arpt AMT | | | 7.125 | % | | 8/1/2011 | | B | | | 5,425 | | | | 5,734,876 | | |
Tulsa OK Muni Arpt Tr
Rev Ref AMR Corp Ser A AMT | | | 5.375 | %# | | 12/1/2035 | | B | | | 2,000 | | | | 2,000,980 | | |
| Total | | | | | | | | | | | | | | | 27,033,241 | | |
| Charter Schools 4.36% | |
| Charyl Stockwell Academy MI COP | | | 5.75 | % | | 10/1/2025 | | NR | | | 4,130 | | | | 4,222,801 | | |
Chester Cnty PA Indl Dev Auth
Rev Renaissance Academy Pj A | | | 5.625 | % | | 10/1/2015 | | NR | | | 1,870 | | | | 1,887,915 | | |
Detroit Cmnty High Sch
MI Pub Sch Academy Rev | | | 5.65 | % | | 11/1/2025 | | BB | | | 1,000 | | | | 1,003,470 | | |
Detroit Cmnty High Sch
MI Pub Sch Academy Rev | | | 5.75 | % | | 11/1/2030 | | BB | | | 1,255 | | | | 1,263,747 | | |
FL Dev Fin Corp Rev Palm
Bay Academy Inc Pj A | | | 6.00 | % | | 5/15/2036 | | BB- | | | 2,000 | | | | 2,011,440 | | |
Kansas City MO Indl Dev Auth Rev
Allen Vlg Sch Pj A† | | | 6.125 | % | | 8/1/2026 | | NR | | | 1,550 | | | | 1,564,772 | | |
Kansas City MO Indl Dev Auth
Allen Vlg Sch Pj A† | | | 6.25 | % | | 8/1/2036 | | NR | | | 2,815 | | | | 2,842,812 | | |
MI Pub Edl Facs Auth Rev Ltd
Oblig Old Redford Pj Ser A | | | 5.875 | % | | 12/1/2030 | | BBB- | | | 3,720 | | | | 3,810,917 | | |
Milwaukee WI Redev Auth Rev
Science Ed Consortium Pj Ser A | | | 5.625 | % | | 8/1/2025 | | BB+ | | | 1,715 | | | | 1,733,333 | | |
Milwaukee WI Redev Auth Rev
Science Ed Consortium Pj Ser A | | | 5.75 | % | | 8/1/2035 | | BB+ | | | 1,000 | | | | 1,009,970 | | |
Palm Bay FL Edl Facs Rev
Patriot Charter Sch Pj Ser A | | | 6.75 | % | | 7/1/2022 | | NR | | | 1,460 | | | | 1,563,762 | | |
Palm Bay FL Edl Facs Rev
Patriot Charter Sch Pj Ser A | | | 7.00 | % | | 7/1/2036 | | NR | | | 5,000 | | | | 5,351,400 | | |
Palm Beach Cnty FL Rev
G-Star Sch of Arts Ser A | | | 6.75 | % | | 5/15/2035 | | BB | | | 2,455 | | | | 2,626,629 | | |
Pima Cnty AZ Indl Dev Auth Ed Rev
Ref Horizon Cmnty Learning Ctr | | | 5.25 | % | | 6/1/2035 | | BBB- | | | 10,000 | | | | 9,881,000 | | |
Pima Cnty AZ Indl Dev Auth Ed Rev
Ref Paradise Ed Ctr Pj | | | 5.875 | % | | 6/1/2022 | | BB+ | | | 250 | | | | 255,615 | | |
Pima Cnty AZ Indl Dev Auth Ed Rev
Ref Paradise Ed Ctr Pj | | | 6.00 | % | | 6/1/2036 | | BB+ | | | 800 | | | | 814,000 | | |
See Notes to Financial Statements.
113
Schedule of Investments (continued)
HIGH YIELD MUNICIPAL BOND FUND September 30, 2006
| Investments | | Interest
Rate | | Maturity
Date | | Credit
Rating:
S&P or
Moody's(a) | | Principal
Amount
(000) | | Value | |
Plymouth MI Edl Ctr Chrtr Sch
Pub Sch Academy Rev | | | 5.375 | % | | 11/1/2030 | | BBB- | | $ | 1,500 | | | $ | 1,512,255 | | |
Summit Academy MI
Pub Sch Academy Rev | | | 6.375 | % | | 11/1/2035 | | BB+ | | | 3,795 | | | | 3,803,805 | | |
| Total | | | | | | | | | | | | | | | 47,159,643 | | |
Continuing Care Retirement
Communities 9.14% | |
Bremer Cnty IA Ret Fac
Rev Bartels Lutheran Ser A | | | 5.125 | % | | 11/15/2020 | | NR | | | 800 | | | | 815,416 | | |
Bremer Cnty IA Ret Fac
Rev Bartels Lutheran Ser A | | | 5.375 | % | | 11/15/2027 | | NR | | | 1,400 | | | | 1,432,830 | | |
Bremer Cnty IA Ret Fac
Rev Bremer Lutheran Ser A | | | 5.00 | % | | 11/15/2017 | | NR | | | 1,140 | | | | 1,162,515 | | |
Bucks Cnty PA Indl Dev Auth Ret
Cmnty Rev Ann's Choice Inc Fac Ser A | | | 6.125 | % | | 1/1/2025 | | NR | | | 3,500 | | | | 3,724,595 | | |
Carlton MN Hlthcare & Hsg Facs
Rev Ref Inter Faith Care Ctr Pj | | | 5.50 | % | | 4/1/2024 | | NR | | | 1,080 | | | | 1,102,723 | | |
Director St NV Dept Business &
Industry Las Ventanas Ret Pj A | | | 7.00 | % | | 11/15/2034 | | NR | | | 6,000 | | | | 6,132,480 | | |
Director St NV Dept Business &
Industry Las Ventanas Ret Pj B | | | 6.00 | % | | 11/15/2014 | | NR | | | 3,655 | | | | 3,680,366 | | |
East Rochester NY Hsg Auth
Rev Ref Sr Living Woodland Vlg Pj | | | 5.50 | % | | 8/1/2033 | | NR | | | 1,700 | | | | 1,727,965 | | |
IL Fin Auth Rev Clare
at Wtr Tower Pj Ser C | | | 5.125 | % | | 5/15/2012 | | NR | | | 5,000 | | | | 5,017,300 | | |
IL Fin Auth Rev Clare at Wtr
Tower Pj Ser A | | | 6.00 | % | | 5/15/2025 | | NR | | | 4,000 | | | | 4,196,840 | | |
| IL Fin Auth Rev Clare Oaks Pj Ser A | | | 6.00 | % | | 11/15/2027 | | NR | | | 2,000 | | | | 2,089,260 | | |
| IL Fin Auth Rev Clare Oaks Pj Ser A | | | 6.125 | % | | 11/15/2040 | | NR | | | 2,500 | | | | 2,619,800 | | |
IL Fin Auth Rev Friendship
Vlg Schaumburg A | | | 5.375 | % | | 2/15/2025 | | BB+(d) | | | 4,000 | | | | 4,071,160 | | |
IL Fin Auth Rev Friendship
Vlg Schaumburg A | | | 5.625 | % | | 2/15/2037 | | BB+(d) | | | 5,255 | | | | 5,386,638 | | |
| IL Fin Auth Rev Smith Vlg Pj Ser A | | | 5.25 | % | | 11/15/2016 | | NR | | | 4,290 | | | | 4,370,652 | | |
IL Fin Auth Rev Three
Crowns Pk Plaza A | | | 5.875 | % | | 2/15/2026 | | NR | | | 1,250 | | | | 1,303,363 | | |
IL Fin Auth Rev Three
Crowns Pk Plaza A | | | 5.875 | % | | 2/15/2038 | | NR | | | 3,000 | | | | 3,103,440 | | |
James City Cnty VA Econ Dev Auth Resdl
Care Fac First Mtg Williamsburg Ldg A | | | 5.50 | % | | 9/1/2034 | | NR | | | 1,000 | | | | 1,039,190 | | |
See Notes to Financial Statements.
114
Schedule of Investments (continued)
HIGH YIELD MUNICIPAL BOND FUND September 30, 2006
| Investments | | Interest
Rate | | Maturity
Date | | Credit
Rating:
S&P or
Moody's(a) | | Principal
Amount
(000) | | Value | |
Lebanon Cnty PA Hlth Facs Auth Hlth
Ctr Rev Pleasant View Rt Ser A | | | 5.125 | % | | 12/15/2020 | | NR | | $ | 1,400 | | | $ | 1,415,302 | | |
Lebanon Cnty PA Hlth Facs Auth Hlth
Ctr Rev Pleasant View Rt Ser A | | | 5.30 | % | | 12/15/2026 | | NR | | | 500 | | | | 506,925 | | |
MD St Hlth & Higher Edl Facs Auth
Rev Edenwald Ser A | | | 5.40 | % | | 1/1/2031 | | NR | | | 2,000 | | | | 2,071,860 | | |
Mesquite TX Hlth Facs Dev
Ret Fac Christian Care | | | 5.50 | % | | 2/15/2025 | | BBB- | | | 2,000 | | | | 2,099,860 | | |
Mesquite TX Hlth Facs Dev
Ret Fac Christian Care | | | 5.625 | % | | 2/15/2035 | | BBB- | | | 1,750 | | | | 1,845,865 | | |
MI St Hosp Fin Auth
Rev Ref Presbyterian Vlg | | | 5.25 | % | | 11/15/2025 | | BB+(d) | | | 1,500 | | | | 1,513,455 | | |
NC Med Care Cmnty Hlthcare Facs Rev
First Mtg Presbyterian Homes | | | 5.50 | % | | 10/1/2031 | | NR | | | 2,000 | | | | 2,082,680 | | |
NC Med Care Commn Ret Facs Rev
Ref First Mtg UTD Methodist C | | | 5.25 | % | | 10/1/2024 | | NR | | | 750 | | | | 770,550 | | |
NC Med Care Commn Ret Facs Rev
Ref First Mtg UTD Methodist C | | | 5.50 | % | | 10/1/2032 | | NR | | | 3,600 | | | | 3,735,648 | | |
Olathe KS Sr Living Fac Rev
Catholic Care Campus Inc A | | | 5.65 | % | | 11/15/2027 | | NR | | | 620 | | | | 635,419 | | |
Olathe KS Sr Living Fac Rev
Catholic Care Campus Inc A | | | 6.00 | % | | 11/15/2026 | | NR | | | 4,555 | | | | 4,842,193 | | |
Olathe KS Sr Living Fac Rev
Catholic Care Campus Inc A | | | 6.00 | % | | 11/15/2038 | | NR | | | 4,000 | | | | 4,226,400 | | |
Shelby Cnty TN Health Edl & Hsg Facs
Bd Rev Trezevant Manor Pj Ser A | | | 5.625 | % | | 9/1/2026 | | NR | | | 1,500 | | | | 1,530,165 | | |
St Joseph Cnty Indl Econ Dev
Rev Holy Cross Vlg Notre Dame Pj A | | | 5.70 | % | | 5/15/2028 | | NR | | | 265 | | | | 270,902 | | |
St Joseph Cnty Indl Econ Dev
Rev Holy Cross Vlg Notre Dame Pj A | | | 6.00 | % | | 5/15/2026 | | NR | | | 250 | | | | 266,107 | | |
St Joseph Cnty Indl Econ Dev
Rev Holy Cross Vlg Notre Dame Pj A | | | 6.00 | % | | 5/15/2038 | | NR | | | 475 | | | | 501,557 | | |
Sussex Cnty DE Rev Adj First
Mtg Cadbury Lewes A | | | 5.90 | % | | 1/1/2026 | | NR | | | 500 | | | | 521,800 | | |
VT Econ Dev Auth Mtg
Wake Robin Corp Pj Ser A | | | 5.25 | % | | 5/1/2026 | | NR | | | 750 | | | | 762,382 | | |
Virginia Beach VA Dev Auth Resdl Care
Fac Mtg Rev Ref Westminster Canterbury | | | 5.25 | % | | 11/1/2026 | | NR | | | 3,000 | | | | 3,087,150 | | |
Virginia Beach VA Dev Auth Resdl Care
Fac Mtg Rev Ref Westminster Canterbury | | | 5.375 | % | | 11/1/2032 | | NR | | | 7,100 | | | | 7,322,869 | | |
See Notes to Financial Statements.
115
Schedule of Investments (continued)
HIGH YIELD MUNICIPAL BOND FUND September 30, 2006
| Investments | | Interest
Rate | | Maturity
Date | | Credit
Rating:
S&P or
Moody's(a) | | Principal
Amount
(000) | | Value | |
Westmoreland Cnty PA Indl Dev
Auth Rev Ret Cmnty Redstone A | | | 5.75 | % | | 1/1/2026 | | NR | | $ | 1,200 | | | $ | 1,260,420 | | |
Winchester VA Indl Dev Auth Resdl Care
Fac Rev Westminster Canterbury Ser A | | | 5.20 | % | | 1/1/2027 | | NR | | | 2,500 | | | | 2,551,850 | | |
Winchester VA Indl Dev Auth Resdl Care
Fac Rev Westminster Canterbury Ser A | | | 5.30 | % | | 1/1/2035 | | NR | | | 2,000 | | | | 2,042,680 | | |
| Total | | | | | | | | | | | | | | | 98,840,572 | | |
| Correctional Facilities 1.68% | |
| Garza Cnty TX Pub Fac Corp Pj Rev | | | 5.25 | % | | 10/1/2017 | | BBB | | | 1,000 | | | | 1,039,550 | | |
| Garza Cnty TX Pub Fac Corp Pj Rev | | | 5.50 | % | | 10/1/2019 | | BBB | | | 1,600 | | | | 1,680,848 | | |
Madison Cnty FL Rev First
Mtg Twin Oaks Pj Ser A | | | 6.00 | % | | 7/1/2025 | | NR | | | 1,280 | | | | 1,330,662 | | |
San Luis AZ Fac Dev Corp Rev
Sr Lien Pj Regl Detention Ctr | | | 7.00 | % | | 5/1/2020 | | NR | | | 1,000 | | | | 1,020,960 | | |
San Luis AZ Fac Dev Corp Rev
Sr Lien Pj Regl Detention Ctr | | | 7.25 | % | | 5/1/2027 | | NR | | | 1,200 | | | | 1,234,692 | | |
Two Rivers Auth Inc
Mont Pj Rev Sr Lien | | | 7.375 | % | | 11/1/2027 | | NR | | | 2,400 | | | | 2,413,128 | | |
| Willacy Cnty TX Loc Govt Corp Rev Pj | | | 6.00 | % | | 3/1/2009 | | NR | | | 9,300 | | | | 9,488,139 | | |
| Total | | | | | | | | | | | | | | | 18,207,979 | | |
| Dirt Bonds, Tax Increment/Allocation 1.35% | |
Allegheny Cnty PA Redev Auth
Rev Pittsburgh Mills Pj | | | 5.60 | % | | 7/1/2023 | | NR | | | 500 | | | | 529,595 | | |
Atlanta GA Tax Allocation
Eastside Pj Ser A AMT | | | 5.625 | % | | 1/1/2016 | | NR | | | 1,500 | | | | 1,553,880 | | |
Atlanta GA Tax Allocation
Eastside Pj Ser B | | | 5.60 | % | | 1/1/2030 | | NR | | | 1,000 | | | | 1,039,830 | | |
Beaumont CA Fin Auth
Loc Agy Rev Ser D | | | 5.80 | % | | 9/1/2035 | | NR | | | 500 | | | | 529,905 | | |
Branson MO Indl Dev Auth Tax Increment
Rev Branson Landing Retail Pj | | | 5.50 | % | | 6/1/2029 | | NR | | | 6,220 | | | | 6,356,964 | | |
Etiwanda Sch Dist CA Spl Tax
Cmnty Facs Dist No 2004-1 | | | 5.45 | % | | 9/1/2029 | | NR | | | 1,000 | | | | 1,021,300 | | |
Poway CA Unif Sch Dist Spl
Tax Cmnty Facs Dist No 11 Area B | | | 5.00 | % | | 9/1/2030 | | NR | | | 1,000 | | | | 1,003,840 | | |
San Francisco CA City & Cnty Rd Agy
Dist No 6 Mission Bay South Ser A | | | 5.15 | % | | 8/1/2035 | | NR | | | 1,500 | | | | 1,525,530 | | |
Temecula Vly CA Unif Sch Dist
Cmnty Facs Dist Spl Tax No 02-1 | | | 5.125 | % | | 9/1/2035 | | NR | | | 1,000 | | | | 1,014,560 | | |
| Total | | | | | | | | | | | | | | | 14,575,404 | | |
See Notes to Financial Statements.
116
Schedule of Investments (continued)
HIGH YIELD MUNICIPAL BOND FUND September 30, 2006
| Investments | | Interest
Rate | | Maturity
Date | | Credit
Rating:
S&P or
Moody's(a) | | Principal
Amount
(000) | | Value | |
| Education 1.21% | |
| Charyl Stockwell Academy MI COP | | | 5.90 | % | | 10/1/2035 | | NR | | $ | 3,000 | | | $ | 3,067,020 | | |
IA Higher Ed Ln Auth Rev Ref
Private College Grand View | | | 5.00 | % | | 10/1/2031 | | NR | | | 6,000 | | | | 6,059,040 | | |
IA Higher Ed Ln Auth Rev Ref
Private College Grand View | | | 5.10 | % | | 10/1/2036 | | NR | | | 3,895 | | | | 3,933,171 | | |
| Total | | | | | | | | | | | | | | | 13,059,231 | | |
| Electric 0.56% | |
MS Business Fin Corp MS
Pollutn Ctrl Sys Energy Res Inc Pj | | | 5.875 | % | | 4/1/2022 | | BBB- | | | 6,060 | | | | 6,089,694 | | |
| Gaming 0.59% | |
Mohegan Tribe Indians CT
Gaming Auth Pub Impt Priority Dist | | | 5.375 | % | | 1/1/2011 | | BB+ | | | 1,400 | | | | 1,433,656 | | |
Mohegan Tribe Indians CT
Pub Impt Priority Dist | | | 5.125 | % | | 1/1/2023 | | BB+ | | | 3,350 | | | | 3,438,373 | | |
Mohegan Tribe Indians CT
Pub Impt Priority Dist | | | 5.25 | % | | 1/1/2033 | | BB+ | | | 1,500 | | | | 1,534,770 | | |
| Total | | | | | | | | | | | | | | | 6,406,799 | | |
| General Airport 1.11% | |
Dallas-Fort Worth TX Intl Arpt Fac Impt
Corp Rev Ref A Sub Ser 1 Rmkt AMT | | | 8.50 | %# | | 5/1/2029 | | CCC+ | | | 1,000 | | | | 1,046,600 | | |
Dallas-Fort Worth TX Intl Arpt Fac Impt
Corp Rev Ref A Sub Ser 2 Rmkt AMT | | | 9.00 | %# | | 5/1/2029 | | CCC+ | | | 7,500 | | | | 9,097,350 | | |
Dallas-Fort Worth TX Intl Arpt Fac Impt
Corp Rev Ref A Sub Ser 3 Rmkt AMT | | | 9.125 | % | | 5/1/2029 | | CCC+ | | | 1,500 | | | | 1,835,460 | | |
| Total | | | | | | | | | | | | | | | 11,979,410 | | |
| General Obligation 1.85% | |
| CA St PA 1300 RIBs RITES | | | 6.275 | % | | 11/1/2024 | | A+ | | | 5,000 | | | | 5,579,600 | | |
| IA Fin Auth Child Svcs | | | 5.55 | % | | 6/1/2036 | | NR | | | 5,960 | | | | 6,029,911 | | |
Little River Cnty AR Rev Ref
Georgia Pacific Corp Pj AMT | | | 5.60 | % | | 10/1/2026 | | B2 | | | 3,465 | | | | 3,496,254 | | |
| New York NY Ser B Sub Ser B4(14) | | | 3.78 | %# | | 8/15/2023 | | AAA | | | 2,500 | | | | 2,500,000 | | |
| New York NY Ser B2 Sub Ser B5(14) | | | 3.76 | %# | | 8/15/2011 | | AAA | | | 2,100 | | | | 2,100,000 | | |
Todd Morrison Cass & Wadena
Cntys MN Hlthcare Fac Lakewood | | | 5.00 | % | | 12/1/2034 | | Baa2 | | | 250 | | | | 258,443 | | |
| Total | | | | | | | | | | | | | | | 19,964,208 | | |
See Notes to Financial Statements.
117
Schedule of Investments (continued)
HIGH YIELD MUNICIPAL BOND FUND September 30, 2006
| Investments | | Interest
Rate | | Maturity
Date | | Credit
Rating:
S&P or
Moody's(a) | | Principal
Amount
(000) | | Value | |
| Healthcare 9.04% | |
Flint MI Hosp Bldg Auth Rev
Rental Hurley Med Ctr Ser B | | | 5.375 | % | | 7/1/2028 | | Ba1 | | $ | 1,030 | | | $ | 1,024,026 | | |
Hillsborough Cnty FL Indl Dev Auth
Hosp Rev ROLs RRII R 643CE 1 RIBs | | | 6.636 | % | | 10/1/2041 | | Aaa | | | 2,500 | | | | 2,790,850 | | |
| IL Fin Auth Rev Kewanee Hosp Pj | | | 5.10 | % | | 8/15/2031 | | NR | | | 1,250 | | | | 1,273,213 | | |
IL Fin Auth Rev Landing
at Plymouth Pl Pj A | | | 6.00 | % | | 5/15/2025 | | NR | | | 3,000 | | | | 3,179,580 | | |
IN Hlth & Edl Facs Fin Auth Hosp Rev
Ref Clarian Hlth Oblig Group B | | | 5.00 | % | | 2/15/2033 | | A+ | | | 12,280 | | | | 12,687,450 | | |
IN Hlth & Edl Fac Fin Auth
Hosp Rev RIBs RITES | | | 5.981 | % | | 2/15/2033 | | A+ | | | 10,000 | | | | 10,679,000 | | |
Kerrville TX Hlth Facs Dev Corp Hosp
Rev Sid Peterson Mem Hosp Pj | | | 5.125 | % | | 8/15/2026 | | BBB- | | | 1,125 | | | | 1,147,995 | | |
Kerrville TX Hlth Facs Dev Corp Hosp
Rev Sid Peterson Mem Hosp Pj | | | 5.375 | % | | 8/15/2035 | | BBB- | | | 6,875 | | | | 7,091,425 | | |
Knox Cnty TN Hlth Ed & Hsg
Fac Bd Rev Univ Hlth Sys Inc | | | 5.625 | % | | 4/1/2029 | | Baa1 | | | 1,000 | | | | 1,037,820 | | |
Louisville & Jefferson Cnty KY Metro Govt &
Hlth Sys Rev PA 1416 RIBs RITES(e) | | | 6.594 | % | | 10/1/2036 | | A- | | | 10,000 | | | | 11,034,800 | | |
MA St Hlth & Edl Facs Auth
Rev Milton Hosp Ser D | | | 5.25 | % | | 7/1/2030 | | BBB- | | | 2,000 | | | | 2,067,820 | | |
NC Med Care Cmnty Ref 1st
Mtg Presbyterian Ser A | | | 5.25 | % | | 7/1/2021 | | NR | | | 1,720 | | | | 1,752,456 | | |
NJ Hlthcare Facs Fin Auth
Rev PA 1402 RIBs RITES | | | 6.422 | % | | 7/1/2030 | | BBB | | | 9,620 | | | | 10,731,110 | | |
St Paul MN Hsg & Redev Auth
Hosp Rev Hltheast Pj | | | 6.00 | % | | 11/15/2030 | | Baa3 | | | 2,500 | | | | 2,724,600 | | |
Sylacauga AL Hlthcare Auth
Rev Ser A Coosa Vly Med Ctr | | | 6.00 | % | | 8/1/2035 | | NR | | | 3,000 | | | | 3,117,930 | | |
University AL Birmingham Hosp
Rev PA 1412 RIBs RITES | | | 5.981 | % | | 9/1/2041 | | A+ | | | 20,000 | | | | 21,228,000 | | |
Washington Cnty IA Hosp Rev
Washington Cnty Hosp Pj | | | 5.375 | % | | 7/1/2026 | | NR | | | 1,525 | | | | 1,567,365 | | |
Washington Cnty IA Hosp Rev
Washington Cnty Hosp Pj | | | 5.50 | % | | 7/1/2032 | | NR | | | 2,540 | | | | 2,617,013 | | |
| Total | | | | | | | | | | | | | | | 97,752,453 | | |
| Healthcare System 4.70% | |
Franklin Cnty OH Hlthcare
Facs Rev OH Presbyterian Svcs A | | | 5.00 | % | | 7/1/2026 | | BBB | | | 1,200 | | | | 1,230,672 | | |
Joplin MO Indl Dev Auth
Hlth Facs Rev Freeman Hlth Pj | | | 5.75 | % | | 2/15/2035 | | BBB+ | | | 500 | | | | 544,895 | | |
See Notes to Financial Statements.
118
Schedule of Investments (continued)
HIGH YIELD MUNICIPAL BOND FUND September 30, 2006
| Investments | | Interest
Rate | | Maturity
Date | | Credit
Rating:
S&P or
Moody's(a) | | Principal
Amount
(000) | | Value | |
KY Econ Dev Fin Auth Hlth Sys
Norton Hlthcare Inc Ser A | | | 6.50 | % | | 10/1/2020 | | A-(d) | | $ | 1,465 | | | $ | 1,593,862 | | |
Lubbock TX Hlth Facs Dev Corp
Rev Ref 1st Mtg Carillon Pj A | | | 6.30 | % | | 7/1/2019 | | NR | | | 4,010 | | | | 4,084,706 | | |
MA St Hlth & Edl Fac Auth Rev
Caritas Christi Oblig Grp A | | | 5.625 | % | | 7/1/2020 | | BBB | | | 1,015 | | | | 1,057,244 | | |
MA St Hlth & Edl Facs Auth
Rev PA 1385 RIBs RITES | | | 6.175 | % | | 7/1/2025 | | BBB | | | 5,280 | | | | 5,761,008 | | |
Miami Beach FL Hlth Facs Rev
Hosp Auth Mt Sinai Med Ctr FL Pj | | | 5.375 | % | | 11/15/2028 | | BB+ | | | 3,630 | | | | 3,663,324 | | |
NC Med Care Cmnty Hlthcare Facs Rev
Ref 1st Mtg Presbyterian Ser A | | | 5.125 | % | | 7/1/2018 | | NR | | | 1,000 | | | | 1,019,330 | | |
NJ Hlthcare Fac Fin Auth Rev
Somerset Med Ctr | | | 5.50 | % | | 7/1/2033 | | Baa3 | | | 1,700 | | | | 1,744,761 | | |
NY St Dorm Auth Revs Non St Supported
Debt Mt Sinai NYU Hlth C Rmkt | | | 5.50 | % | | 7/1/2026 | | Baa2 | | | 4,000 | | | | 4,070,000 | | |
Orange Cnty FL Hlth Facs Auth
Ref Hlthcare Orlando Lutheran | | | 5.375 | % | | 7/1/2020 | | NR | | | 1,100 | | | | 1,105,698 | | |
Orange Cnty FL Hlth Facs Auth
Ref Hlthcare Orlando Lutheran | | | 5.70 | % | | 7/1/2026 | | NR | | | 1,920 | | | | 1,954,310 | | |
RI St Health & Edl Bldg Corp
Rev PA 1384 RIBs RITES | | | 6.65 | % | | 10/1/2029 | | BBB- | | | 7,735 | | | | 8,169,088 | | |
St Mary Hosp Auth PA Hlth Sys
Rev Catholic Hlth Ser B | | | 5.375 | % | | 11/15/2034 | | A1 | | | 500 | | | | 532,585 | | |
St Paul MN Port Auth Lease
Rev Hltheast Midway Campus 03 A | | | 5.75 | % | | 5/1/2025 | | BB | | | 1,520 | | | | 1,592,382 | | |
Sylacauga AL Hlthcare Auth
Ser A Coosa Vly Medical Ctr | | | 6.00 | % | | 8/1/2025 | | NR | | | 3,000 | | | | 3,137,640 | | |
| Tomball TX Hosp Auth Rev Ref Hosp | | | 5.00 | % | | 7/1/2020 | | Baa3 | | | 5,000 | | | | 5,073,900 | | |
VT Econ Dev Auth Mtg Rev
Wake Robin Corp Pj Ser A | | | 5.375 | % | | 5/1/2036 | | NR | | | 2,250 | | | | 2,299,748 | | |
Virginia MN Hsg & Redev Auth
Hlthcare Fac Lease Rev | | | 5.375 | % | | 10/1/2030 | | Baa1 | | | 2,165 | | | | 2,253,440 | | |
| Total | | | | | | | | | | | | | | | 50,888,593 | | |
| Hotel Convention 1.71% | |
AK Indl Dev & Expt Auth Sports Facs Rev
Anchorage Sportsplex Pj Ser A | | | 6.15 | % | | 8/1/2031 | | NR | | | 3,285 | | | | 3,327,541 | | |
Baltimore MD Convention Ctr
Hotel Rev Sub Ser B | | | 5.875 | % | | 9/1/2039 | | Ba1 | | | 4,000 | | | | 4,266,160 | | |
MD St Econ Dev Corp Rev
Ref Sr Lien Chesapeake Bay A(e) | | | 5.00 | % | | 12/1/2031 | | NR | | | 10,000 | | | | 9,886,400 | | |
See Notes to Financial Statements.
119
Schedule of Investments (continued)
HIGH YIELD MUNICIPAL BOND FUND September 30, 2006
| Investments | | Interest
Rate | | Maturity
Date | | Credit
Rating:
S&P or
Moody's(a) | | Principal
Amount
(000) | | Value | |
MD St Econ Dev Corp Rev
Sr Lien Pj Chesapeake Bay B(e) | | | 5.25 | % | | 12/1/2031 | | NR | | $ | 1,000 | | | $ | 1,011,710 | | |
| Total | | | | | | | | | | | | | | | 18,491,811 | | |
| Housing 1.55% | |
Floater Tr Ser 2006 FR/RI Lehman Bros Inc
as Trustor RI TRS Ser K25 AMT RIBs† | | | 6.035 | % | | 9/1/2031 | | Aaa | | | 10,000 | | | | 10,468,400 | | |
MA St Hsg Fin Agy Hsg
Rev Ser K20 RIBs | | | 6.604 | % | | 12/1/2048 | | Aa3 | | | 5,930 | | | | 6,269,789 | | |
| Total | | | | | | | | | | | | | | | 16,738,189 | | |
| Industrial 9.45% | |
Allegheny Cnty PA Indl Dev
Auth Rev Ref Envr Impt | | | 5.50 | % | | 11/1/2016 | | Ba1 | | | 1,500 | | | | 1,592,895 | | |
Butler AL Indl Dev Bd Solid Wst Disp
Rev Ref Georgia Pacific Corp Pj AMT | | | 5.75 | % | | 9/1/2028 | | B | | | 2,500 | | | | 2,565,275 | | |
Clark Cnty NV Indl Dev Rev
NV Pwr Co Pj Ser A AMT | | | 5.60 | % | | 10/1/2030 | | B | | | 7,690 | | | | 7,700,151 | | |
Coshocton Cnty OH Envr Rev Ref
Smurfit Stone Container† | | | 5.125 | % | | 8/1/2013 | | CCC+ | | | 3,100 | | | | 3,109,517 | | |
Courtland AL Indl Dev Bd Solid Wst Disp
Rev Intl Paper Co Pj A AMT | | | 5.20 | % | | 6/1/2025 | | BBB | | | 7,500 | | | | 7,726,050 | | |
Courtland AL Indl Dev Bd Solid Wst Disp
Rev Intl Paper Co Pj B AMT | | | 5.20 | % | | 6/1/2025 | | BBB | | | 2,305 | | | | 2,374,473 | | |
Fulton Cnty GA Dev Auth Loc Dist Cooling
Fac Rev Sr Maxon Atlantic Station A AMT | | | 5.125 | %# | | 3/1/2026 | | BBB | | | 1,000 | | | | 1,016,760 | | |
IL Fin Auth Solid Wst Disp
Wst Mgmt Inc Pj AMT | | | 5.05 | % | | 8/1/2029 | | NR | | | 1,500 | | | | 1,542,765 | | |
MI St Strategic Fd Pollutn Ctrl Rev
Ref General Motors Corp | | | 6.20 | %# | | 9/1/2020 | | B- | | | 4,630 | | | | 4,656,020 | | |
NJ Econ Dev Auth Rev Glimcher
Pptys LP Pj AMT | | | 6.00 | % | | 11/1/2028 | | NR | | | 5,000 | | | | 5,075,350 | | |
OR St Econ Dev Rev Ref Georgia
Pacific Corp Pj Ser 183 AMT | | | 5.70 | % | | 12/1/2025 | | B2 | | | 1,305 | | | | 1,325,958 | | |
PA Econ Dev Fin Auth Exempt Facs Rev
Reliant Energy Seward Ser A AMT | | | 6.75 | %# | | 12/1/2036 | | B2 | | | 6,500 | | | | 6,997,770 | | |
Port Corpus Christi Auth TX
Celanese Pj Ser A | | | 6.45 | % | | 11/1/2030 | | B | | | 6,700 | | | | 7,341,324 | | |
Tob Securitization Auth So CA
Tob Settlmnt Auth Ser A1 Snr | | | 5.125 | % | | 6/1/2046 | | BBB | | | 35,000 | | | | 35,383,950 | | |
Tob Settlement Fin Corp
RI Asset Bkd Ser A | | | 6.125 | % | | 6/1/2032 | | BBB | | | 1,490 | | | | 1,579,132 | | |
See Notes to Financial Statements.
120
Schedule of Investments (continued)
HIGH YIELD MUNICIPAL BOND FUND September 30, 2006
| Investments | | Interest
Rate | | Maturity
Date | | Credit
Rating:
S&P or
Moody's(a) | | Principal
Amount
(000) | | Value | |
Tulsa OK Muni Arpt Tr Rev
American Airlines Pj | | | 6.25 | % | | 6/1/2020 | | B | | $ | 4,770 | | | $ | 4,783,499 | | |
Tulsa OK Muni Arpt Tr Rev
Ref AMR Corp Ser B AMT | | | 6.00 | %# | | 6/1/2035 | | B | | | 7,400 | | | | 7,485,692 | | |
| Total | | | | | | | | | | | | | | | 102,256,581 | | |
| Investor Owned Utility 1.76% | |
Floater Tr Ser 2006 FR/RI Lehman Bros
Inc as Trustor K17 AMT RIBs(2) | | | 6.445 | % | | 11/1/2028 | | Aaa | | | 5,925 | | | | 7,196,268 | | |
PA Econ Dev Fin Auth Exempt Facs Rev
Reliant Energy A AMT | | | 6.75 | %# | | 12/1/2036 | | B2 | | | 1,500 | | | | 1,614,870 | | |
PA Econ Dev Fin Auth Exempt Facs Rev
Reliant Energy B Conv AMT | | | 6.75 | %# | | 12/1/2036 | | B2 | | | 9,500 | | | | 10,227,510 | | |
| Total | | | | | | | | | | | | | | | 19,038,648 | | |
| Miscellaneous 1.66% | |
Beauregard Parish LA Rev Ref
Boise Cascade Corp Pj | | | 6.80 | % | | 2/1/2027 | | Ba3 | | | 4,750 | | | | 5,241,008 | | |
De Kalb Cnty GA Dev Auth Pollutn
Ctrl Rev Ref General Motors Corp Pj | | | 6.00 | % | | 3/15/2021 | | B- | | | 5,060 | | | | 5,147,740 | | |
Red River Auth TX Pollutn
Ctrl Celanese Pj Ser A | | | 6.45 | % | | 11/1/2030 | | B | | | 2,495 | | | | 2,733,821 | | |
Sweetwater Cnty WY Solid Wst
Disp Ref FMC Corp Pj AMT | | | 5.60 | % | | 12/1/2035 | | BBB- | | | 4,500 | | | | 4,801,725 | | |
| Total | | | | | | | | | | | | | | | 17,924,294 | | |
| Multi-Family Housing 2.41% | |
El Paso Cnty TX Hsg Fin Corp Multi
Fam Hsg Rev Las Lomas Apts Ser A~ | | | 5.60 | % | | 12/1/2009 | | Ba1 | | | 365 | | | | 353,258 | | |
El Paso Cnty TX Hsg Fin Corp Multi
Fam Hsg Rev Las Lomas Apts Ser A~ | | | 6.375 | % | | 12/1/2029 | | Ba1 | | | 3,280 | | | | 2,896,633 | | |
El Paso Cnty TX Hsg Fin Corp Multi
Fam Hsg Rev Las Lomas Apts Ser A~ | | | 6.45 | % | | 12/1/2019 | | Ba1 | | | 1,515 | | | | 1,387,710 | | |
| Garza Cnty TX Pub Fac Corp Pj Rev | | | 5.50 | % | | 10/1/2018 | | BBB | | | 1,000 | | | | 1,054,110 | | |
Harrisonburg VA Redev & Hsg Auth
Multi Fam Hsg Rev Brooke Ridge Apts
Pj Ser E AMT | | | 5.15 | % | | 12/1/2038 | | NR | | | 12,300 | | | | 12,312,177 | | |
Met Govt Nashville & Davidson Cnty TN
Facs Bd Rev Multi Fam Hsg Prestige A | | | 7.50 | % | | 12/20/2040 | | NR | | | 4,000 | | | | 4,001,200 | | |
MuniMae TE Bond Subsidiary
LLC Perp Sub Pfd Shs Ser B 3†(f) | | | 5.90 | % | | 9/30/2015 | | NR | | | 2,000 | | | | 2,049,000 | | |
See Notes to Financial Statements.
121
Schedule of Investments (continued)
HIGH YIELD MUNICIPAL BOND FUND September 30, 2006
| Investments | | Interest
Rate | | Maturity
Date | | Credit
Rating:
S&P or
Moody's(a) | | Principal
Amount
(000) | | Value | |
MuniMae TE Bond Subsidiary
LLC Perp Sub Pfd Shs Ser D†(f) | | | 5.30 | % | | 9/30/2015 | | NR | | $ | 2,000 | | | $ | 2,067,880 | | |
| Total | | | | | | | | | | | | | | | 26,121,968 | | |
| Not For Profit 0.17% | |
| IA Fin Auth Child Svcs | | | 5.375 | % | | 6/1/2026 | | NR | | | 1,795 | | | | 1,815,176 | | |
| Nursing Home 0.49% | |
IL Fin Auth Rev Clare At
Wtr Tower Pj Ser A | | | 5.20 | % | | 5/15/2012 | | NR | | | 1,000 | | | | 1,005,260 | | |
IL Fin Auth Rev Clare At
Wtr Tower Pj Ser A | | | 5.30 | % | | 5/15/2013 | | NR | | | 1,000 | | | | 1,006,810 | | |
Kerrville TX Hlth Facs Dev Corp
Hosp Rev Sid Peterson Mem Hosp Pj | | | 5.45 | % | | 8/15/2035 | | BBB- | | | 1,500 | | | | 1,509,555 | | |
NH Hlth & Ed Facs Auth Rev
Havenwood Heritage Heights A | | | 5.35 | % | | 1/1/2026 | | NR | | | 1,035 | | | | 1,040,910 | | |
NH Hlth & Ed Facs Auth Rev
Havenwood Heritage Heights A | | | 5.40 | % | | 1/1/2030 | | NR | | | 750 | | | | 754,267 | | |
| Total | | | | | | | | | | | | | | | 5,316,802 | | |
Nursing Home Continuing Care
Retirement Communities 1.70% | |
CO Hlth Fac Auth Rev Covenant
Ret Cmntys Inc | | | 5.00 | % | | 12/1/2035 | | BBB | | | 4,000 | | | | 4,033,960 | | |
HFDC Cent TX Inc
Ret Fac Rev Ser A(e) | | | 5.625 | % | | 11/1/2026 | | NR | | | 1,850 | | | | 1,889,090 | | |
HFDC Cent TX Inc
Ret Fac Rev Ser A(e) | | | 5.75 | % | | 11/1/2036 | | NR | | | 2,750 | | | | 2,802,442 | | |
Inver Grove Heights MN Rev Ref
Presbyterian Homes Care | | | 5.50 | % | | 10/1/2033 | | NR | | | 525 | | | | 529,048 | | |
Inver Grove Heights MN Rev Ref
Presbyterian Homes Care | | | 5.50 | % | | 10/1/2041 | | NR | | | 3,000 | | | | 3,009,600 | | |
SC Jobs Econ Dev Auth Hlth Facs Rev
Ref First Mtg Wesley Commons(e) | | | 5.125 | % | | 10/1/2026 | | NR | | | 1,400 | | | | 1,392,202 | | |
SC Jobs Econ Dev Auth Hlth Facs Rev
Ref First Mtg Wesley Commons(e) | | | 5.30 | % | | 10/1/2036 | | NR | | | 2,250 | | | | 2,250,113 | | |
St Johns Cnty FL Indl Dev Auth Hlthcare
Glenmoor Pj Ser A(e) | | | 5.375 | % | | 1/1/2040 | | NR | | | 2,000 | | | | 2,005,000 | | |
WI Hlth & Edl Facs Auth Hlth Facs Rev
Three Pillars Sr Living A | | | 5.50 | % | | 8/15/2034 | | A-(d) | | | 500 | | | | 518,690 | | |
| Total | | | | | | | | | | | | | | | 18,430,145 | | |
See Notes to Financial Statements.
122
Schedule of Investments (continued)
HIGH YIELD MUNICIPAL BOND FUND September 30, 2006
| Investments | | Interest
Rate | | Maturity
Date | | Credit
Rating:
S&P or
Moody's(a) | | Principal
Amount
(000) | | Value | |
| Port Facilities 0.81% | |
Lehman Muni Tr Rcpts Los Angeles CA RI
Tr Ser 06 K51 AMT RIBs(14)† | | | 7.648 | % | | 8/1/2031 | | Aaa | | $ | 4,775 | | | $ | 5,443,309 | | |
Port Of Bay City Auth TX Rev Matagorda
Cnty Rev Hoechst Celanese Corp Pj AMT | | | 6.50 | % | | 5/1/2026 | | B | | | 3,200 | | | | 3,268,096 | | |
| Total | | | | | | | | | | | | | | | 8,711,405 | | |
| Pre-Refunded 0.34% | |
Northern Tob Securitization Corp AK
Tob Settlmnt Asset Bkd Bds | | | 6.50 | % | | 6/1/2031 | | AAA | | | 1,125 | | | | 1,234,204 | | |
Pocahontas Pkwy Assoc VA Toll
Rd Rev Sr Ser A | | | 5.50 | % | | 8/15/2028 | | AAA | | | 2,280 | | | | 2,404,647 | | |
| Total | | | | | | | | | | | | | | | 3,638,851 | | |
| Resource Recovery 1.46% | |
Burlington KS Pollution Ctrl
RI TRS Ser K RIBs | | | 8.069 | % | | 6/1/2031 | | AAA | | | 4,500 | | | | 5,481,450 | | |
CA Polltn Cntrl Fin Auth
Solid Wst Mgmt Inc Pj Ser A2 AMT | | | 5.40 | % | | 4/1/2025 | | BBB | | | 1,000 | | | | 1,064,130 | | |
Gaston Cnty NC Facs & Pollutn
Exempt Facs Natl Gypsum Co Pj AMT | | | 5.75 | % | | 8/1/2035 | | NR | | | 4,890 | | | | 5,215,185 | | |
Moraine OH Solid Wst Disp Rev
General Motors Corp Pj AMT | | | 6.75 | % | | 7/1/2014 | | B- | | | 330 | | | | 353,110 | | |
Niagara Cnty NY Indl Dev Agy
Solid Wst Disposal Ser B AMT | | | 5.55 | %# | | 11/15/2024 | | Baa3 | | | 750 | | | | 805,770 | | |
OH St Pollutn Ctrl Rev Ref
General Motors Corp Pj | | | 5.625 | % | | 3/1/2015 | | B- | | | 2,845 | | | | 2,870,434 | | |
| Total | | | | | | | | | | | | | | | 15,790,079 | | |
| Sales Tax 0.67% | |
| NJ Econ Dev Auth PA 1304 RIBs RITES(10) | | | 8.616 | % | | 9/1/2025 | | AAA | | | 3,350 | | | | 5,217,592 | | |
Wyandotte Cnty/Kans City KS Unif Govt
Spl Oblig Rev Ref Sales Tax 2nd Lien Area B | | | 5.00 | % | | 12/1/2020 | | BBB-(d) | | | 2,000 | | | | 2,080,060 | | |
| Total | | | | | | | | | | | | | | | 7,297,652 | | |
| Single Family Housing 1.34% | |
AK St Hsg Fin Corp PA
1298 RIBs RITES(14) | | | 6.555 | % | | 12/1/2025 | | AA | | | 5,000 | | | | 5,838,100 | | |
Middlesex Cnty NJ Impt Auth Rev
Sub Heldrich Ctr Hotel Ser B | | | 6.125 | % | | 1/1/2025 | | NR | | | 1,290 | | | | 1,334,879 | | |
Middlesex Cnty NJ Impt Auth Rev
Sub Heldrich Ctr Hotel Ser B | | | 6.25 | % | | 1/1/2037 | | NR | | | 1,255 | | | | 1,300,594 | | |
See Notes to Financial Statements.
123
Schedule of Investments (continued)
HIGH YIELD MUNICIPAL BOND FUND September 30, 2006
| Investments | | Interest
Rate | | Maturity
Date | | Credit
Rating:
S&P or
Moody's(a) | | Principal
Amount
(000) | | Value | |
UT Hsg Corp Sing Fam Mtg Rev
Ser A 1 CL II AMT | | | 4.95 | % | | 7/1/2028 | | AA | | $ | 1,430 | | | $ | 1,471,584 | | |
VT Hsg Fin Agy Sing Fam
Hsg Rev Ser 25A AMT(10) | | | 5.10 | % | | 11/1/2031 | | AAA | | | 4,430 | | | | 4,549,965 | | |
| Total | | | | | | | | | | | | | | | 14,495,122 | | |
| Special Assessment 15.52% | |
Amelia Walk Cmnty Dev
Dist FL Spl Assmt Ser A | | | 5.50 | % | | 5/1/2037 | | NR | | | 1,000 | | | | 1,025,770 | | |
Arborwood Cmnty Dev Dist FL
Cap Impt Rev Master Infras Pj A | | | 5.35 | % | | 5/1/2036 | | NR | | | 5,000 | | | | 5,049,350 | | |
Arborwood Cmnty Dev Dist FL Cap
Impt Rev Centex Homes Pj Ser A1 | | | 5.50 | % | | 5/1/2036 | | NR | | | 2,920 | | | | 2,973,786 | | |
Arborwood Cmnty Dev Dist FL Cap
Impt Rev Centex Homes Pj Ser B2 | | | 5.10 | % | | 5/1/2016 | | NR | | | 4,000 | | | | 4,046,360 | | |
Bartram Pk Cmnty Dev
Dist FL Spl Assmt | | | 5.30 | % | | 5/1/2035 | | NR | | | 2,000 | | | | 2,040,560 | | |
Baywinds Cmnty Dev
Dist FL Spl Assmt Ser A | | | 5.25 | % | | 5/1/2037 | | NR | | | 4,435 | | | | 4,501,525 | | |
| Brentwood CA Infrast Auth Rev CIFP-1 | | | 5.00 | % | | 9/2/2025 | | NR | | | 2,500 | | | | 2,538,975 | | |
| Brentwood CA Infrast Auth Rev CIFP-1 | | | 5.15 | % | | 9/2/2035 | | NR | | | 1,000 | | | | 1,011,570 | | |
Chula Vista CA Cmnty Facs Dist Spl
Tax No 13 I Otay Ranch Vlg Seven | | | 5.25 | % | | 9/1/2026 | | NR | | | 2,755 | | | | 2,814,646 | | |
Cypress Creek Hillsborough
Cnty Cmnty Dev Dist FL Cap | | | 5.35 | % | | 5/1/2037 | | NR | | | 7,000 | | | | 7,143,430 | | |
Durbin Crossing Cmnty Dev
Dist FL Spl Assmt Ser A | | | 5.50 | % | | 5/1/2037 | | NR | | | 6,000 | | | | 6,145,200 | | |
East Homestead Cmnty Dev Dist
FL Spl Assmt Rev | | | 5.45 | % | | 5/1/2036 | | NR | | | 1,000 | | | | 1,022,410 | | |
East Homestead Cmnty Dev Dist
FL Spl Assmt Rev Ser B | | | 5.00 | % | | 5/1/2011 | | NR | | | 1,485 | | | | 1,504,676 | | |
Grandview MO Indl Dev Auth
Tax Grandview Crossing Pj 1 | | | 5.75 | % | | 12/1/2028 | | NR | | | 1,000 | | | | 1,011,980 | | |
Henderson NV Loc
Impt Dists No T-18 | | | 5.25 | % | | 9/1/2026 | | NR | | | 8,155 | | | | 8,298,773 | | |
| IA Fin Auth Child Svcs | | | 5.50 | % | | 6/1/2031 | | NR | | | 4,260 | | | | 4,294,080 | | |
K-Bar Ranch Cmnty
Dev Dist FL Spl Assmt | | | 5.45 | % | | 5/1/2036 | | NR | | | 1,000 | | | | 1,012,230 | | |
Lake Elsinore CA Unif Sch
Cmnty Facs Dist Spl Tax No 2004-03 | | | 5.25 | % | | 9/1/2029 | | NR | | | 1,650 | | | | 1,684,848 | | |
Lancaster Cnty SC Assmt Rev
Sun City Carolina Lakes Impt | | | 5.45 | % | | 12/1/2037 | | NR | | | 1,000 | | | | 1,017,960 | | |
See Notes to Financial Statements.
124
Schedule of Investments (continued)
HIGH YIELD MUNICIPAL BOND FUND September 30, 2006
| Investments | | Interest
Rate | | Maturity
Date | | Credit
Rating:
S&P or
Moody's(a) | | Principal
Amount
(000) | | Value | |
| Mariposa East Pub Impt Dist NM | | | 5.75 | % | | 9/1/2021 | | NR | | $ | 500 | | | $ | 520,665 | | |
| Mariposa East Pub Impt Dist NM | | | 6.00 | % | | 9/1/2032 | | NR | | | 1,000 | | | | 1,040,840 | | |
Mediterranea Cmnty Dev Dist
FL Spl Assmt Ser A | | | 5.60 | % | | 5/1/2037 | | NR | | | 1,500 | | | | 1,539,270 | | |
Modesto CA Spl Tax Cmnty
Facs Dist No 04 1Vlg 2 | | | 5.15 | % | | 9/1/2036 | | NR | | | 2,000 | | | | 2,048,420 | | |
Murrieta CA Cmnty Facs Dist Spl Tax
No 3 Creekside Vlg Impt Area 1 | | | 5.20 | % | | 9/1/2035 | | NR | | | 1,500 | | | | 1,522,005 | | |
Northstar Cmnty Svcs Dist CA
Spl Tax Cmnty Facs Dist No1 | | | 5.45 | % | | 9/1/2028 | | NR | | | 7,000 | | | | 7,228,620 | | |
Palm Glades Cmnty Dev
Dist FL Spl Assmt Ser A | | | 5.30 | % | | 5/1/2036 | | NR | | | 1,250 | | | | 1,273,437 | | |
Palma Sola Trace Cmnty Dev
Dist FL Cap Impt Rev | | | 5.75 | % | | 5/1/2035 | | NR | | | 875 | | | | 893,244 | | |
Panther Trace II FL Cmnty Dev
Dist Rev Spl Assmt Ser A | | | 5.60 | % | | 5/1/2035 | | NR | | | 1,835 | | | | 1,874,636 | | |
Pine Isl Cmnty Dev Dist FL
Spl Assmt | | | 5.75 | % | | 5/1/2035 | | NR | | | 3,210 | | | | 3,363,502 | | |
Poway CA Unif Sch Dist Spl
Tax Cmnty Facs Dist 6-4S Ranch | | | 5.125 | % | | 9/1/2035 | | NR | | | 2,100 | | | | 2,138,241 | | |
Poway CA Unif Sch Dist Spl
Tax Cmnty Facs Dist No 14 | | | 5.25 | % | | 9/1/2036 | | NR | | | 1,500 | | | | 1,526,715 | | |
Prince Georges Cnty MD Spl Oblig
Natl Harbor Pj Rmkt | | | 5.20 | % | | 7/1/2034 | | NR | | | 10,250 | | | | 10,480,317 | | |
Prince Georges Cnty MD Spl
Tax Victoria Falls Pj | | | 5.25 | % | | 7/1/2035 | | NR | | | 1,250 | | | | 1,266,525 | | |
Rancho Cordova Cmnty Facs Dist CA
Spl Tax No 2003 1 Sunridge Anatolia | | | 5.375 | % | | 9/1/2030 | | NR | | | 1,500 | | | | 1,529,160 | | |
Rio CA Elem Sch Dist Cmnty
Facs Dist Spl Tax No 1 | | | 5.125 | % | | 9/1/2028 | | NR | | | 3,000 | | | | 3,035,820 | | |
River Bend Cmnty Dev Dist FL
Cap Impt Rev | | | 5.45 | % | | 5/1/2035 | | NR | | | 945 | | | | 959,241 | | |
Roseville CA Spl Tax Cmnty
Facs Dist No 1 Westpark | | | 5.15 | % | | 9/1/2030 | | NR | | | 2,000 | | | | 2,028,440 | | |
Roseville CA Spl Tax Cmnty
Facs Dist No 1 Westpark | | | 5.20 | % | | 9/1/2036 | | NR | | | 3,500 | | | | 3,552,185 | | |
Roseville CA Spl Tax
Fiddyment Ranch Cmnty Facs 1 | | | 5.25 | % | | 9/1/2036 | | NR | | | 5,635 | | | | 5,738,459 | | |
Saugus CA Unif Sch Dist Spl
Tax Cmnty Facs Dist No 2005-1 | | | 5.25 | % | | 9/1/2026 | | NR | | | 1,135 | | | | 1,163,341 | | |
Saugus CA Unif Sch Dist Spl
Tax Cmnty Facs Dist No 2005-1 | | | 5.30 | % | | 9/1/2036 | | NR | | | 1,265 | | | | 1,297,435 | | |
See Notes to Financial Statements.
125
Schedule of Investments (continued)
HIGH YIELD MUNICIPAL BOND FUND September 30, 2006
| Investments | | Interest
Rate | | Maturity
Date | | Credit
Rating:
S&P or
Moody's(a) | | Principal
Amount
(000) | | Value | |
Seal Beach CA Cmnty Facs Dist No 05 01
Spl Tax Pacific Gateway Business Ctr | | | 5.30 | % | | 9/1/2026 | | NR | | $ | 1,125 | | | $ | 1,155,488 | | |
Seal Beach CA Cmnty Facs Dist No 05 01
Spl Tax Pacific Gateway Business Ctr | | | 5.30 | % | | 9/1/2036 | | NR | | | 750 | | | | 765,615 | | |
Shingle Creek Cmnty Dev Dist
FL Cap Impt Rev | | | 6.10 | % | | 5/1/2025 | | NR | | | 5,000 | | | | 5,297,100 | | |
Shingle Creek Cmnty Dev Dist
FL Cap Impt Rev | | | 6.125 | % | | 5/1/2037 | | NR | | | 2,000 | | | | 2,108,740 | | |
Tern Bay Cmnty Dev Dist
FL Cap Impt Rev Ser A | | | 5.375 | % | | 5/1/2037 | | NR | | | 11,000 | | | | 11,153,120 | | |
Tolomato Cmnty Dev Dist
FL Spl Assmt | | | 5.40 | % | | 5/1/2037 | | NR | | | 3,000 | | | | 3,053,220 | | |
Tracy CA Cmnty Facs Dist
No 1 Spl Tax NEI Phase II | | | 5.70 | % | | 9/1/2026 | | NR | | | 1,020 | | | | 1,041,522 | | |
Watson Rd Cmnty Facs
Dist AZ Spl Assmt Rev | | | 5.75 | % | | 7/1/2022 | | NR | | | 3,960 | | | | 4,103,035 | | |
Westridge Cmnty Dev
Dist FL Cap Impt Rev | | | 5.80 | % | | 5/1/2037 | | NR | | | 15,000 | | | | 15,356,400 | | |
Winter Garden Vlg at Fowler Groves
Cmnty Dev Dist FL Spl Assmt | | | 5.65 | % | | 5/1/2037 | | NR | | | 1,000 | | | | 1,035,850 | | |
William S Hart CA Unif High Sch Dist
Spl Tax Cmnty Facs Dist No 2005-1 | | | 5.25 | % | | 9/1/2026 | | NR | | | 845 | | | | 866,100 | | |
William S Hart CA Unif High Sch Dist
Spl Tax Cmnty Facs Dist No 2005-1 | | | 5.30 | % | | 9/1/2036 | | NR | | | 1,895 | | | | 1,943,588 | | |
| Woodmen Heights Met Dist No 1 CO Rev | | | 6.75 | % | | 12/1/2020 | | NR | | | 1,500 | | | | 1,599,990 | | |
| Woodmen Heights Met Dist No 1 Co Rev | | | 7.00 | % | | 12/1/2030 | | NR | | | 3,000 | | | | 3,220,710 | | |
| Total | | | | | | | | | | | | | | | 167,859,125 | | |
| Special Tax 4.95% | |
Atlanta GA Tax Allocation
Princeton Lakes Pj | | | 5.50 | % | | 1/1/2031 | | NR | | | 1,235 | | | | 1,262,713 | | |
Brunswick MD Spl Oblig
Brunswick Crossing Spl Taxing | | | 5.50 | % | | 7/1/2036 | | NR | | | 8,000 | | | | 8,155,760 | | |
Farms New Kent VA Cmnty Dev
Auth Spl Assmt Ser B | | | 5.45 | % | | 3/1/2036 | | NR | | | 3,000 | | | | 3,030,270 | | |
Farms New Kent VA Cmnty Dev
Auth Spl Assmt Ser C | | | 5.80 | % | | 3/1/2036 | | NR | | | 2,000 | | | | 2,014,860 | | |
| Henderson NV Loc Impt Dists No T 18 | | | 5.30 | % | | 9/1/2035 | | NR | | | 8,150 | | | | 8,304,605 | | |
Lake Elsinore CA Spl Tax
Cmnty Facs Dist 3 Impt Area 1 | | | 5.25 | % | | 9/1/2030 | | NR | | | 1,195 | | | | 1,234,041 | | |
Lake Elsinore CA Spl Tax
Cmnty Facs Dist No 2004-3 A(e) | | | 5.20 | % | | 9/1/2026 | | NR | | | 920 | | | | 927,673 | | |
See Notes to Financial Statements.
126
Schedule of Investments (continued)
HIGH YIELD MUNICIPAL BOND FUND September 30, 2006
| Investments | | Interest
Rate | | Maturity
Date | | Credit
Rating:
S&P or
Moody's(a) | | Principal
Amount
(000) | | Value | |
Lake Elsinore CA Spl Tax
Cmnty Facs Dist No 2004-3 A(e) | | | 5.25 | % | | 9/1/2037 | | NR | | $ | 2,800 | | | $ | 2,827,636 | | |
Lathrop CA Spl Tax Cmnty
Facs Dist No 06-1 | | | 5.30 | % | | 9/1/2026 | | NR | | | 3,000 | | | | 3,040,230 | | |
Lathrop CA Spl Tax Cmnty
Facs Dist No 06-1 | | | 5.375 | % | | 9/1/2036 | | NR | | | 7,000 | | | | 7,115,220 | | |
Menifee CA Unif Sch Dist Spl
Tax Cmnty Facs Dist No 2002-5 | | | 5.50 | % | | 9/1/2034 | | NR | | | 500 | | | | 510,645 | | |
Midtown Miami FL Cmnty Dev FL
Spl Assmt Rev Ser A | | | 6.25 | % | | 5/1/2037 | | NR | | | 1,915 | | | | 2,098,936 | | |
Minneapolis MN Tax Increment Rev
Grant Park Pj | | | 5.35 | % | | 2/1/2030 | | NR | | | 1,500 | | | | 1,511,895 | | |
Myrtle Beach SC Tax Increment Rev
Myrtle Beach Air Force Base A(e) | | | 5.25 | % | | 11/1/2026 | | NR | | | 1,000 | | | | 996,400 | | |
Myrtle Beach SC Tax Increment Rev
Myrtle Beach Air Force Base A(e) | | | 5.30 | % | | 11/1/2035 | | NR | | | 1,000 | | | | 996,250 | | |
OH Cnty W VA Cnty Commn Spl Dist Excise
Tax Rev Ref & Impt Ft Henry Econ Dev B | | | 5.625 | % | | 3/1/2036 | | NR | | | 3,850 | | | | 4,011,931 | | |
Pine Ridge Plantation Cmnty Dev Dist
FL Cap Impt Rev Ser A | | | 5.40 | % | | 5/1/2037 | | NR | | | 1,500 | | | | 1,514,895 | | |
Pine Ridge Plantation Cmnty Dev Dist
FL Cap Impt Rev Ser B | | | 5.00 | % | | 5/1/2011 | | NR | | | 1,000 | | | | 1,004,970 | | |
South Fork East Cmnty Dev
Dist FL Cap Impt Rev | | | 5.35 | % | | 5/1/2036 | | NR | | | 2,925 | | | | 2,967,588 | | |
| Total | | | | | | | | | | | | | | | 53,526,518 | | |
| Tobacco 7.59% | |
Badger Tob Asset Securitization
Corp WI Asset Bkd | | | 6.375 | % | | 6/1/2032 | | BBB | | | 3,340 | | | | 3,611,442 | | |
Golden St Tob Securitization Corp
CA F C1 RIBs | | | 5.976 | % | | 6/1/2045 | | A3 | | | 10,000 | | | | 10,550,400 | | |
Golden St Tob Securitization Corp
CA Tob Settlmnt Rev Ser 2003 A 1 | | | 6.75 | % | | 6/1/2039 | | BBB | | | 1,290 | | | | 1,457,674 | | |
Nassau Cnty NY Tob
Settlmnt Corp Asset Bkd Sr A 3 | | | 5.125 | % | | 6/1/2046 | | BBB | | | 5,000 | | | | 5,066,200 | | |
Tob Settlmnt Fin Corp RI
Asset Bkd Ser A | | | 6.00 | % | | 6/1/2023 | | BBB | | | 4,165 | | | | 4,399,240 | | |
Tob Settlmnt Fin Corp RI
Asset Bkd Ser A | | | 6.25 | % | | 6/1/2042 | | BBB | | | 2,960 | | | | 3,140,146 | | |
| Tob Settlment Fin Corp NJ | | | 6.75 | % | | 6/1/2039 | | BBB | | | 1,000 | | | | 1,120,810 | | |
See Notes to Financial Statements.
127
Schedule of Investments (continued)
HIGH YIELD MUNICIPAL BOND FUND September 30, 2006
| Investments | | Interest
Rate | | Maturity
Date | | Credit
Rating:
S&P or
Moody's(a) | | Principal
Amount
(000) | | Value | |
Tob Settlmnt Auth IA Tob Settlmnt
Asset Bkd Ser C | | | 5.625 | % | | 6/1/2046 | | BBB | | $ | 3,100 | | | $ | 3,201,587 | | |
Tob Settlmnt Auth IA Tob
Settlmnt Rev Asst Bkd Ser C | | | 5.375 | % | | 6/1/2038 | | BBB | | | 8,050 | | | | 8,231,125 | | |
Tob Settlmnt Fin Corp
VA PA 1383 RIBs RITES | | | 6.925 | % | | 6/1/2037 | | BBB | | | 6,925 | | | | 7,605,727 | | |
| Tob Settlmnt Fin Corp VA Asset Bkd | | | 5.50 | % | | 6/1/2026 | | BBB | | | 5,000 | | | | 5,252,450 | | |
| Tob Settlmnt Rev Mgmt Auth SC Sec B | | | 6.375 | % | | 5/15/2028 | | BBB | | | 2,800 | | | | 3,008,908 | | |
| Tob Settlmnt Rev Mgmt Auth Ser B | | | 6.375 | % | | 5/15/2030 | | BBB | | | 8,005 | | | | 9,191,501 | | |
| TSASC Inc NY Ser 1 | | | 5.00 | % | | 6/1/2034 | | BBB | | | 5,000 | | | | 5,068,550 | | |
| TSASC Inc NY Ser 1 | | | 5.125 | % | | 6/1/2042 | | BBB | | | 10,000 | | | | 10,132,400 | | |
Westchester Tob Asset
Securitization Corp NY | | | 5.125 | % | | 6/1/2038 | | BBB | | | 1,060 | | | | 1,076,589 | | |
| Total | | | | | | | | | | | | | | | 82,114,749 | | |
| Toll Roads 0.05% | |
NJ St Tpk Auth Rev ROLs RR II
R 323 RIBs(2) | | | 6.139 | % | | 1/1/2035 | | Aaa | | | 500 | | | | 527,610 | | |
| Transportation 3.55% | |
Augusta GA Arpt Rev Gen Arprt
Passenger B AMT | | | 5.35 | % | | 1/1/2028 | | Baa3 | | | 500 | | | | 516,780 | | |
Director St NV Dept Business &
Industry Las Vegas Monorail Pj 2nd Tier | | | 7.25 | % | | 1/1/2023 | | NR | | | 5,000 | | | | 5,224,400 | | |
Director St NV Dept Business &
Industry Las Vegas Monorail Pj 2nd Tier | | | 7.375 | % | | 1/1/2030 | | NR | | | 3,000 | | | | 3,145,500 | | |
Metropolitan Transn Auth NY
Rev K3 RIBs | | | 6.134 | % | | 11/15/2035 | | A | | | 10,000 | | | | 11,091,800 | | |
| Santa Rosa Bay Bridge Auth FL Rev | | | 6.25 | % | | 7/1/2028 | | B1 | | | 4,610 | | | | 4,689,476 | | |
St. Paul MN Port Auth Lease
Rev Hltheast Midway Campus 03 A | | | 5.875 | % | | 5/1/2030 | | BB | | | 1,000 | | | | 1,044,910 | | |
Tulsa OK Muni Arpt Tr Rev
Ser A Rmkt AMT | | | 7.75 | %# | | 6/1/2035 | | B | | | 11,000 | | | | 12,639,440 | | |
| Total | | | | | | | | | | | | | | | 38,352,306 | | |
| Universities 0.09% | |
MA St Dev Fin Agy Rev Eastern
Nazarene College | | | 5.625 | % | | 4/1/2029 | | BB+ | | | 1,000 | | | | 1,020,470 | | |
See Notes to Financial Statements.
128
Schedule of Investments (concluded)
HIGH YIELD MUNICIPAL BOND FUND September 30, 2006
| Investments | | Interest
Rate | | Maturity
Date | | Credit
Rating:
S&P or
Moody's(a) | | Principal
Amount
(000) | | Value | |
| Water/Sewer 0.54% | |
New York NY City Muni Wtr Fin
Adj Ser G(9) | | | 3.80 | %# | | 6/15/2024 | | AAA | | $ | 5,800 | | | $ | 5,800,000 | | |
| Total Municipal Bonds (cost $1,073,124,410) | | | | | | | | | | | | | 1,106,184,169 | | |
| | | | | | | | | Shares
(000) | | | |
| SHORT-TERM INVESTMENTS 0.00% | |
| Money Market Mutual Funds | |
| Dreyfus Municipal Cash Management Plus | | | | | | | | | 6 | | | | 5,662 | | |
| SSgA Tax Free Money Market Fund | | | | | | | | | 6 | | | | 6,045 | | |
| Total Short-Term Investments (cost $11,707) | | | | | | | | | | | | | 11,707 | | |
| Total Investments in Securities 102.27% (cost $1,073,136,117) | | | | | | | | | | | | | 1,106,195,876 | | |
| Liabilities in Excess of Cash and Other Assets(g) (2.27%) | | | | | | | | | | | | | (24,535,910 | ) | |
| Net Assets 100.00% | | | | | | | | | | | | $ | 1,081,659,966 | | |
| Open futures contracts at September 30, 2006: | |
| Type | | Expiration | | Contracts | | Position | | Market Value | | Unrealized
Depreciation | |
| U.S. 20-Year Treasury Bond | | December 2006 | | | 1,731 | | | Short | | $ | (194,575,219 | ) | | $ | (2,887,606 | ) | |
See Notes to Financial Statements.
129
Schedule of Investments
MICHIGAN TAX-FREE TRUST September 30, 2006
| Investments | | Interest
Rate | | Maturity
Date | | Credit
Rating:
S&P or
Moody's(a) | | Principal
Amount
(000) | | Value | |
| MUNICIPAL BONDS 99.69% | |
| Education 4.52% | |
| Grand Vly MI St Univ Rev(9) | | | 5.50 | % | | 2/1/2018 | | AAA | | $ | 1,150 | | | $ | 1,283,653 | | |
MI Higher Ed Student Ln Auth
Rev Student Ln Ser XVII-P AMT GTD(2) | | | 4.875 | % | | 3/1/2030 | | AAA | | | 1,000 | | | | 1,022,810 | | |
Plymouth MI Edl Ctr Chrtr Sch
Pub Sch Academy Rev | | | 5.375 | % | | 11/1/2035 | | BBB- | | | 400 | | | | 402,408 | | |
| Wayne Cnty MI Cmnty College Impt(2) | | | 5.50 | % | | 7/1/2019 | | AAA | | | 565 | | | | 595,448 | | |
| Total | | | | | | | | | | | | | | | 3,304,319 | | |
| General Obligation 24.84% | |
| Adrian MI City Sch Dist(10) | | | 5.00 | % | | 5/1/2034 | | AAA | | | 1,500 | | | | 1,572,165 | | |
Anchor Bay MI Sch Dist Sch
Bldg & Site | | | 5.00 | % | | 5/1/2033 | | AA | | | 1,000 | | | | 1,042,900 | | |
| Belding MI Area Sch(2) | | | 5.00 | % | | 5/1/2026 | | AAA | | | 400 | | | | 406,832 | | |
Birmingham MI City Sch Dist
Sch Bldg & Site(10) | | | 5.00 | % | | 11/1/2033 | | AAA | | | 1,000 | | | | 1,052,880 | | |
| Caledonia MI Cmnty Schs CR(10) | | | 5.25 | % | | 5/1/2022 | | AAA | | | 1,025 | | | | 1,103,310 | | |
| Carman-Ainsworth MI Cmnty Sch(9) | | | 5.00 | % | | 5/1/2027 | | AAA | | | 1,000 | | | | 1,044,420 | | |
Grand Blanc MI Cmnty Schs Sch
Bldg & Site(10) | | | 5.00 | % | | 5/1/2021 | | AAA | | | 500 | | | | 531,375 | | |
Grand Rapids MI Smartzone Loc
Dev Auth(2) | | | 5.375 | % | | 6/1/2028 | | AAA | | | 1,125 | | | | 1,229,220 | | |
| Huron MI Sch Dist(10) | | | 5.25 | % | | 5/1/2021 | | AAA | | | 250 | | | | 264,760 | | |
Mason Cnty MI Central Sch Dist
Sch Bldg & Site Ser A(10) | | | 5.00 | % | | 5/1/2024 | | AAA | | | 1,070 | | | | 1,141,230 | | |
New Lothrop MI Area Pub Schs
Sch Bldg & Site(10) | | | 5.00 | % | | 5/1/2028 | | AAA | | | 750 | | | | 795,442 | | |
| Royal Oak MI Ref Cap Impt Ser B(14) | | | 4.375 | % | | 5/1/2026 | | AAA | | | 1,000 | | | | 1,005,810 | | |
Saginaw MI City Sch Dist Sch
Bldg & Site(10) | | | 5.00 | % | | 5/1/2034 | | AAA | | | 1,125 | | | | 1,176,154 | | |
South Lyon MI Cmnty Schs Sch
Bldg & Site(9) | | | 5.25 | % | | 5/1/2022 | | AAA | | | 1,000 | | | | 1,075,720 | | |
Southfield MI Pub Schs Sch
Bldg & Site Ser A(9) | | | 5.25 | % | | 5/1/2021 | | AAA | | | 1,025 | | | | 1,107,625 | | |
Southfield MI Pub Schs Sch
Bldg & Site Ser B(10) | | | 5.00 | % | | 5/1/2029 | | AAA | | | 1,000 | | | | 1,054,730 | | |
Warren MI Cons Sch Dist Sch
Bldg & Site(9) | | | 5.00 | % | | 5/1/2027 | | AAA | | | 1,000 | | | | 1,051,380 | | |
Wayne Cnty MI Bldg Auth Cap
Impt Ser A(14) | | | 5.25 | % | | 6/1/2016 | | AAA | | | 500 | | | | 510,450 | | |
See Notes to Financial Statements.
130
Schedule of Investments (continued)
MICHIGAN TAX-FREE TRUST September 30, 2006
| Investments | | Interest
Rate | | Maturity
Date | | Credit
Rating:
S&P or
Moody's(a) | | Principal
Amount
(000) | | Value | |
Woodhaven Brownstown MI Sch
Dist Ser B(e)(9) | | | 4.25 | % | | 5/1/2027 | | AAA | | $ | 1,000 | | | $ | 977,150 | | |
| Total | | | | | | | | | | | | | | | 18,143,553 | | |
| Healthcare 3.99% | |
Kent Hosp Fin Auth MI Rev Met
Hosp Pj Ser A | | | 6.00 | % | | 7/1/2035 | | BBB | | | 375 | | | | 410,460 | | |
MI St Hosp Fin Auth Rev
Marquette Gen Hosp Oblig Grp A | | | 5.00 | % | | 5/15/2034 | | Baa1 | | | 375 | | | | 382,076 | | |
MI St Hosp Fin Auth Rev
Henry Ford Hlth Sys A | | | 5.00 | % | | 11/15/2038 | | A1 | | | 1,000 | | | | 1,037,750 | | |
MI St Hosp Fin Auth Rev
Trinity Hlth Ser A TCRS(2) | | | 6.00 | % | | 12/1/2027 | | AAA | | | 1,000 | | | | 1,087,150 | | |
| Total | | | | | | | | | | | | | | | 2,917,436 | | |
| Housing 0.99% | |
MI St Hsg Dev Auth Ltd Oblig Multi
Fam Hsg Rev College Pg Deaconess
Tower AMT(11) | | | 5.20 | % | | 8/20/2038 | | Aaa | | | 700 | | | | 720,370 | | |
| Industrial 0.75% | |
Childrens Tr Fd Puerto Rico
Tob Settlmnt Rev Asset Bkd Bds | | | 5.50 | % | | 5/15/2039 | | BBB | | | 525 | | | | 544,173 | | |
| Lease 2.57% | |
| Grand Rapids MI Pub Sch(14) | | | 5.00 | % | | 11/1/2021 | | AAA | | | 250 | | | | 263,220 | | |
| MI St Hse Reps Cap Apprec COP(2) | | | Zero Coupon | | | 8/15/2024 | | AAA | | | 3,565 | | | | 1,615,587 | | |
| Total | | | | | | | | | | | | | | | 1,878,807 | | |
| Power 2.12% | |
| MI St Strategic Fd Ltd Oblig(2) | | | 7.00 | % | | 5/1/2021 | | AAA | | | 500 | | | | 654,005 | | |
MI St Strategic Fd Ltd Oblig
Rev Detroit Fd Ser BB(14) | | | 7.00 | % | | 7/15/2008 | | AAA | | | 350 | | | | 370,507 | | |
Puerto Rico Elec Pwr Auth Pwr
Rev Ser NN(14) | | | 5.00 | % | | 7/1/2032 | | AAA | | | 500 | | | | 525,040 | | |
| Total | | | | | | | | | | | | | | | 1,549,552 | | |
| Pre-Refunded 36.28% | |
| Alpena MI Pub Sch(14) | | | 5.625 | % | | 5/1/2022 | | AAA | | | 500 | | | | 506,065 | | |
Anchor Bay MI Sch Dist Sch
Bldg & Site Ser I(9) | | | 6.00 | % | | 5/1/2023 | | AAA | | | 1,100 | | | | 1,166,561 | | |
| Bloomingdale MI Pub Sch Dist No 16 | | | 5.50 | % | | 5/1/2021 | | AA | | | 450 | | | | 485,559 | | |
See Notes to Financial Statements.
131
Schedule of Investments (continued)
MICHIGAN TAX-FREE TRUST September 30, 2006
| Investments | | Interest
Rate | | Maturity
Date | | Credit
Rating:
S&P or
Moody's(a) | | Principal
Amount
(000) | | Value | |
| Central Montcalm MI Pub Sch(14) | | | 5.90 | % | | 5/1/2019 | | AAA | | $ | 1,000 | | | $ | 1,058,070 | | |
Crawford Ausable MI Sch Dist
Sch Bldg & Site | | | 5.00 | % | | 5/1/2021 | | AA | | | 350 | | | | 370,339 | | |
Detroit MI City Sch Dist Sch
Bldg & Site Impt Ser A(9) | | | 5.25 | % | | 5/1/2028 | | AAA | | | 1,000 | | | | 1,094,590 | | |
| Eastern MI Univ Rev(9) | | | 5.50 | % | | 6/1/2027 | | AAA | | | 500 | | | | 506,575 | | |
| Eastern MI Univ Rev Gen Ser B(9) | | | 5.60 | % | | 6/1/2025 | | AAA | | | 1,430 | | | | 1,530,172 | | |
| Elkton Pigeon Bay Port MI Sch Dist | | | 5.375 | % | | 5/1/2025 | | AA | | | 700 | | | | 742,756 | | |
| Greenville MI Pub Sch(10) | | | 6.00 | % | | 5/1/2025 | | AAA | | | 1,000 | | | | 1,060,510 | | |
| Hartland MI Cons Sch Dist(9) | | | 6.00 | % | | 5/1/2021 | | AAA | | | 1,950 | | | | 2,109,705 | | |
| Howell MI Pub Sch(14) | | | 6.00 | % | | 5/1/2025 | | AAA | | | 1,100 | | | | 1,115,675 | | |
| Huron Vly MI Sch Dist(9) | | | 5.75 | % | | 5/1/2022 | | AAA | | | 250 | | | | 253,210 | | |
Kalamazoo MI Hosp Fin Auth Hosp
Fac Rev ETM RIBs(9) | | | 6.708 | % | | 6/1/2011 | | AAA | | | 2,000 | | | | 2,011,480 | | |
Kaleva Norman ETC MI Sch Dist
Bldg & Site(9) | | | 6.00 | % | | 5/1/2025 | | Aaa | | | 600 | | | | 636,306 | | |
Laingsburg MI Cmnty Sch Dist
Sch Bldg & Site Bd | | | 5.25 | % | | 5/1/2026 | | AA | | | 450 | | | | 481,833 | | |
| Lake Orion MI Cmnty Sch Dist | | | 5.125 | % | | 5/1/2022 | | AA | | | 550 | | | | 590,859 | | |
Lake Orion MI Cmnty Sch Dist
Ser A(9) | | | 6.00 | % | | 5/1/2017 | | AAA | | | 1,335 | | | | 1,439,677 | | |
| Lakeview MI Cmnty Sch(9) | | | 5.60 | % | | 5/1/2022 | | AAA | | | 210 | | | | 212,518 | | |
| Memphis MI Cmnty Sch(9) | | | 5.25 | % | | 5/1/2029 | | Aaa | | | 150 | | | | 156,330 | | |
MI St Comprehensive Transn
Ser B(10) | | | 5.25 | % | | 5/15/2020 | | AAA | | | 1,000 | | | | 1,081,040 | | |
| MI St ETM COP(2) | | | Zero Coupon | | | 6/1/2022 | | AAA | | | 2,000 | | | | 1,032,080 | | |
Muskegon Heights MI Wtr Sys
Ser A(14) | | | 5.625 | % | | 11/1/2020 | | Aaa | | | 300 | | | | 323,532 | | |
Muskegon Heights MI Wtr Sys
Ser A(14) | | | 5.625 | % | | 11/1/2025 | | Aaa | | | 320 | | | | 345,101 | | |
Paw Paw MI Pub Sch Dist Sch
Bldg & Site | | | 6.00 | % | | 5/1/2030 | | AA | | | 1,325 | | | | 1,433,517 | | |
| Potterville MI Pub Sch(10) | | | 6.00 | % | | 5/1/2029 | | AAA | | | 1,000 | | | | 1,060,510 | | |
Puerto Rico Comwlth Hwy &
Transn Auth Transn Rev Ser B | | | 6.50 | % | | 7/1/2027 | | BBB+ | | | 1,000 | | | | 1,109,720 | | |
Puerto Rico Comwlth Infra Fing
Auth Spl Ser A | | | 5.50 | % | | 10/1/2040 | | AAA | | | 1,000 | | | | 1,074,860 | | |
| South Lyon MI Cmnty Schs(10) | | | 5.50 | % | | 5/1/2023 | | AAA | | | 1,425 | | | | 1,517,981 | | |
| Total | | | | | | | | | | | | | | | 26,507,131 | | |
See Notes to Financial Statements.
132
Schedule of Investments (concluded)
MICHIGAN TAX-FREE TRUST September 30, 2006
| Investments | | Interest
Rate | | Maturity
Date | | Credit
Rating:
S&P or
Moody's(a) | | Principal
Amount
(000) | | Value | |
| Resource Recovery 1.38% | |
MI St Strategic Fd Solid Wst Disp
Ltd Oblig Wst Mgmt AMT | | | 4.50 | % | | 12/1/2013 | | BBB | | $ | 1,000 | | | $ | 1,005,420 | | |
| Transportation 4.80% | |
MI St Comprehensive Transn
Ref Ser A(10) | | | 5.00 | % | | 11/1/2021 | | AAA | | | 700 | | | | 732,172 | | |
| MI St Trunk Line(9) | | | 5.00 | % | | 11/1/2021 | | AAA | | | 2,000 | | | | 2,161,000 | | |
Puerto Rico Comwlth Hwy &
Transn Auth Rev PA 1052 RIBs RITES | | | 7.259 | % | | 1/1/2010 | | AAA(c) | | | 500 | | | | 613,860 | | |
| Total | | | | | | | | | | | | | | | 3,507,032 | | |
| Water/Sewer 17.45% | |
| Detroit MI Disp Rev Sr Lien Ser A(10) | | | 5.00 | % | | 7/1/2028 | | AAA | | | 1,000 | | | | 1,042,310 | | |
Detroit MI Wtr Supply Sys Sr
Lien Ser A(14) | | | 5.00 | % | | 7/1/2034 | | AAA | | | 1,000 | | | | 1,044,100 | | |
Grand Rapids MI Santn Swr Sys
Rev Ref & Impt Ser A(9) | | | 4.75 | % | | 1/1/2028 | | AAA | | | 1,050 | | | | 1,063,661 | | |
| Grand Rapids MI Water Supply(9) | | | 5.00 | % | | 1/1/2035 | | AAA | | | 1,000 | | | | 1,057,550 | | |
Lansing MI Bd Wtr & Lt Wtr
Supply Steam & Elec Util Sys(10) | | | 5.00 | % | | 7/1/2022 | | AAA | | | 1,865 | | | | 1,969,626 | | |
MI Muni Bd Auth Rev Drinking
Wtr St Revolving Fd | | | 5.00 | % | | 10/1/2024 | | AAA | | | 1,000 | | | | 1,053,350 | | |
Muni Secs Trust Ctfs Ser 7012
Cl B RIBs(10) | | | 6.05 | % | | 7/1/2034 | | Aaa | | | 5,000 | | | | 5,519,100 | | |
| Total | | | | | | | | | | | | | | | 12,749,697 | | |
| Total Investments in Municipal Bonds 99.69% (cost $68,526,842) | | | | | | | | | | | | | | | 72,827,490 | | |
| Cash and Other Assets in Excess of Liabilities(g) 0.31% | | | | | | | | | | | | | | | 228,826 | | |
| Net Assets 100.00% | | | | | | | | | | | | | | $ | 73,056,316 | | |
| Open futures contracts at September 30, 2006: | |
| Type | | Expiration | | Contracts | | Position | | Market Value | | Unrealized
Depreciation | |
| U.S. 20-Year Treasury Bond | | | December 2006 | | | | 66 | | | Short | | $ | (7,418,813 | ) | | $ | (126,873 | ) | |
See Notes to Financial Statements.
133
Schedule of Investments
PENNSYLVANIA TAX-FREE TRUST September 30, 2006
| Investments | | Interest
Rate | | Maturity
Date | | Credit
Rating:
S&P or
Moody's(a) | | Principal
Amount
(000) | | Value | |
| MUNICIPAL BONDS 98.67% | |
| Education 16.20% | |
Lehigh Cnty PA Gen Purp Auth
Rev Desales Univ Pj(15) | | | 5.125 | % | | 12/15/2023 | | AA | | $ | 1,000 | | | $ | 1,053,300 | | |
PA St Higher Edl Facs Auth Rev
Drexel Univ Ser A | | | 5.20 | % | | 5/1/2032 | | A+ | | | 600 | | | | 632,184 | | |
PA St Higher Edl Facs Auth Rev
Lafayette College Pj | | | 6.00 | % | | 5/1/2030 | | AA- | | | 1,425 | | | | 1,529,808 | | |
PA St Higher Edl Facs Auth College &
Univ Revs Allegheny College | | | 4.80 | % | | 5/1/2036 | | A- | | | 1,000 | | | | 1,013,770 | | |
PA St Higher Edl Facs Auth College &
Univ Revs Moravian College Pj(15) | | | 5.375 | % | | 7/1/2031 | | AA | | | 1,000 | | | | 1,048,660 | | |
PA St Higher Edl Facs Auth College &
Univ Revs Ursinus College(15) | | | 5.50 | % | | 1/1/2024 | | AA | | | 1,000 | | | | 1,078,000 | | |
PA St Higher Edl Facs Auth
Rev York College PA Pj Ser EE 1(16) | | | 5.00 | % | | 11/1/2033 | | AAA | | | 1,000 | | | | 1,051,340 | | |
PA St Higher Edl Facs Auth College &
Univ Revs Univ of the Arts(15) | | | 5.625 | % | | 3/15/2025 | | AA | | | 1,000 | | | | 1,045,920 | | |
PA St Higher Edl Facs Auth College &
Univ Revs Univ of the Arts(15) | | | 5.75 | % | | 3/15/2030 | | AA | | | 500 | | | | 526,095 | | |
Philadelphia PA Auth Indl Dev
Rev Ed Cmnty Fgn Med Grads(14) | | | 5.00 | % | | 6/1/2015 | | AAA | | | 250 | | | | 256,590 | | |
| Philadelphia PA Sch Dist(9) | | | 5.25 | % | | 6/1/2034 | | AAA | | | 3,000 | | | | 3,212,400 | | |
St Pub Sch Bldg Auth PA
College Rev(2) | | | Zero Coupon | | | 7/15/2014 | | AAA | | | 295 | | | | 216,108 | | |
St Pub Sch Bldg Auth PA
College Rev(2) | | | Zero Coupon | | | 7/15/2015 | | AAA | | | 295 | | | | 206,919 | | |
St Pub Sch Bldg Auth PA
College Rev(2) | | | Zero Coupon | | | 7/15/2016 | | AAA | | | 295 | | | | 197,780 | | |
St Pub Sch Bldg Auth PA
Jefferson Cnty Dubois Tech Sch(9) | | | 5.00 | % | | 2/1/2029 | | AAA | | | 1,000 | | | | 1,054,870 | | |
St Pub Sch Bldg Auth PA
Sch Rev Lease Phil Sch(10) | | | 5.25 | % | | 6/1/2027 | | AAA | | | 1,000 | | | | 1,071,780 | | |
| Total | | | | | | | | | | | | | | | 15,195,524 | | |
| General Obligation 6.56% | |
Delaware Vly PA Regl Fin Auth
Loc Govt Rev Ser C(2) | | | 7.75 | % | | 7/1/2027 | | AAA | | | 1,000 | | | | 1,440,350 | | |
| Montgomery Cnty PA | | | 5.00 | % | | 9/15/2022 | | Aaa | | | 625 | | | | 657,081 | | |
| Pennsbury PA Sch Dist(9) | | | 5.50 | % | | 1/15/2020 | | Aaa | | | 1,000 | | | | 1,090,670 | | |
See Notes to Financial Statements.
134
Schedule of Investments (continued)
PENNSYLVANIA TAX-FREE TRUST September 30, 2006
| Investments | | Interest
Rate | | Maturity
Date | | Credit
Rating:
S&P or
Moody's(a) | | Principal
Amount
(000) | | Value | |
Puerto Rico Comwlth
Unrefunded Bal Ser A | | | 5.375 | % | | 7/1/2028 | | BBB | | $ | 1,825 | | | $ | 1,909,023 | | |
| West Middlesex Area Sch Dist PA(9) | | | 5.15 | % | | 12/15/2030 | | AAA | | | 1,000 | | | | 1,054,860 | | |
| Total | | | | | | | | | | | | | | | 6,151,984 | | |
| Healthcare 5.73% | |
Allegheny Cnty PA Hosp Dev
Catholic Hlth East Issue | | | 5.50 | % | | 11/15/2032 | | A1 | | | 1,500 | | | | 1,591,665 | | |
Allegheny Cnty PA Hosp Dev Auth
Rev OH Vly Gen Hosp Pj A | | | 5.125 | % | | 4/1/2035 | | Baa2 | | | 500 | | | | 512,625 | | |
Delaware Cnty PA Auth Hosp
Rev Crozer Chester Med Ctr(1)(3) | | | 5.375 | % | | 12/1/2018 | | A | | | 1,000 | | | | 1,038,550 | | |
Geisinger Auth PA Hlth Sys
Geisinger Hlth Sys Ser B | | | 3.89 | %# | | 8/1/2022 | | AAA | | | 300 | | | | 300,000 | | |
Montgomery Cnty PA Higher Ed &
Hlth Sys Catholic Hlth East C | | | 5.375 | % | | 11/15/2034 | | A1 | | | 1,000 | | | | 1,072,220 | | |
Puerto Rico Indl Tourist Edl
Mutuo Oblig Grp Ser A(14) | | | 6.25 | % | | 7/1/2024 | | AAA | | | 850 | | | | 855,176 | | |
| Total | | | | | | | | | | | | | | | 5,370,236 | | |
| Housing 5.42% | |
PA Hsg Fin Agy Sing Fam Mtg Rev
Ser 90 A AMT | | | 4.70 | % | | 10/1/2025 | | AA+ | | | 990 | | | | 992,099 | | |
PA Hsg Fin Agy Sing Fam Mtg Rev
Ser 93 A AMT | | | 4.85 | % | | 10/1/2021 | | AA+ | | | 3,000 | | | | 3,077,460 | | |
PA Hsg Fin Agy Sing Fam Mtg Rev
Ser 95 A AMT | | | 4.90 | % | | 10/1/2037 | | AA+ | | | 1,000 | | | | 1,010,500 | | |
| Total | | | | | | | | | | | | | | | 5,080,059 | | |
| Industrial 4.51% | |
Allegheny Cnty PA Indl Dev
Auth Rev Envr Impt USX Pj | | | 6.10 | % | | 7/15/2020 | | BBB+ | | | 1,000 | | | | 1,026,900 | | |
Childrens Tr Fd Puerto Rico
Tob Settlmnt Rev Asset Bkd Bds | | | 5.50 | % | | 5/15/2039 | | BBB | | | 650 | | | | 673,738 | | |
Philadelphia PA Auth For Indl
Dev Lease Rev Ser B(10) | | | 5.125 | % | | 10/1/2026 | | AAA | | | 1,000 | | | | 1,055,860 | | |
York Cnty PA Ind Dev Auth
Pollutn Ctrl Rev Svc Elec & Gas Ser A(14) | | | 6.45 | % | | 10/1/2019 | | AAA | | | 1,475 | | | | 1,476,977 | | |
| Total | | | | | | | | | | | | | | | 4,233,475 | | |
See Notes to Financial Statements.
135
Schedule of Investments (continued)
PENNSYLVANIA TAX-FREE TRUST September 30, 2006
| Investments | | Interest
Rate | | Maturity
Date | | Credit
Rating:
S&P or
Moody's(a) | | Principal
Amount
(000) | | Value | |
| Lease 7.46% | |
St Pub Sch Bldg Auth PA Sch Rev
ROLs RR II R566 RIBs(10) | | | 6.139 | % | | 6/1/2033 | | Aaa | | $ | 5,000 | | | $ | 5,412,800 | | |
York PA Gen Auth Rev York
City Recreation Corp GTD(2) | | | 5.50 | % | | 5/1/2018 | | AAA | | | 1,475 | | | | 1,579,342 | | |
| Total | | | | | | | | | | | | | | | 6,992,142 | | |
| Miscellaneous 3.13% | |
Allegheny Cnty PA Redev Auth
Tax Inc Rev Wtrfrt Pj Ser A | | | 6.30 | % | | 12/15/2018 | | A-(d) | | | 1,000 | | | | 1,085,550 | | |
Puerto Rico Pub Bldgs Auth Rev
Govt Facs Ser I GTD | | | 5.375 | % | | 7/1/2034 | | BBB | | | 1,000 | | | | 1,068,050 | | |
Washington Cnty PA Auth Rev
Cap Fdg Rev Pj & Equip Pg(2) | | | 6.15 | % | | 12/1/2029 | | AAA | | | 730 | | | | 781,677 | | |
| Total | | | | | | | | | | | | | | | 2,935,277 | | |
| Pre-Refunded 36.75% | |
Allegheny Cnty PA Port Auth
Spl Rev Transn(14) | | | 6.125 | % | | 3/1/2029 | | AAA | | | 500 | | | | 534,400 | | |
| Allegheny Cnty PA San Auth Swr Rev(14) | | | 5.375 | % | | 12/1/2024 | | AAA | | | 2,000 | | | | 2,078,900 | | |
Bucks Cnty PA Wtr & Swr Auth
Neshaminy Interceptor Swr Sys(2) | | | 5.50 | % | | 6/1/2017 | | Aaa | | | 465 | | | | 488,148 | | |
| Mifflin Cnty PA(9) | | | 5.625 | % | | 9/1/2031 | | AAA | | | 2,500 | | | | 2,730,525 | | |
Montgomery Cnty PA Indl Dev
Auth Rev Hill Sch Pj(14) | | | 5.35 | % | | 8/15/2027 | | Aaa | | | 2,250 | | | | 2,285,595 | | |
| PA Conv Ctr Auth Rev Ser A ETM(9) | | | 6.70 | % | | 9/1/2016 | | AAA | | | 855 | | | | 993,553 | | |
PA St Higher Edl Facs Auth Rev
Univ of Scranton(2) | | | 5.75 | % | | 11/1/2017 | | AAA | | | 1,000 | | | | 1,091,680 | | |
PA St Higher Edl Facs Auth Rev
Univ Sciences Phil(14) | | | 5.25 | % | | 11/1/2025 | | AAA | | | 1,000 | | | | 1,034,910 | | |
PA St Higher Edl Facs Auth
Rev Drexel Univ | | | 6.00 | % | | 5/1/2029 | | A+ | | | 800 | | | | 847,400 | | |
| PA St Tpk Commn(2) | | | 5.50 | % | | 7/15/2033 | | AAA | | | 3,000 | | | | 3,278,940 | | |
Philadelphia PA Gas Wks Rev
12th Ser B ETM(14) | | | 7.00 | % | | 5/15/2020 | | AAA | | | 2,130 | | | | 2,549,503 | | |
| Philadelphia PA Sch Dist Ser A(10) | | | 5.50 | % | | 2/1/2031 | | AAA | | | 500 | | | | 545,890 | | |
| Philadelphia PA Sch Dist Ser A(10) | | | 5.75 | % | | 2/1/2019 | | AAA | | | 450 | | | | 489,154 | | |
| Philadelphia PA Sch Dist Ser A(10) | | | 5.75 | % | | 2/1/2020 | | AAA | | | 250 | | | | 271,752 | | |
| Philadelphia PA Sch Dist Ser A(10) | | | 5.75 | % | | 2/1/2021 | | AAA | | | 500 | | | | 543,505 | | |
| Philadelphia PA Sch Dist Ser A(10) | | | 5.75 | % | | 2/1/2030 | | AAA | | | 1,250 | | | | 1,358,763 | | |
| Philadelphia PA Sch Dist Ser B(9) | | | 5.625 | % | | 8/1/2021 | | AAA | | | 1,000 | | | | 1,106,050 | | |
See Notes to Financial Statements.
136
Schedule of Investments (continued)
PENNSYLVANIA TAX-FREE TRUST September 30, 2006
| Investments | | Interest
Rate | | Maturity
Date | | Credit
Rating:
S&P or
Moody's(a) | | Principal
Amount
(000) | | Value | |
| Philadelphia PA Sch Dist Ser B(9) | | | 5.625 | % | | 8/1/2022 | | AAA | | $ | 1,000 | | | $ | 1,106,050 | | |
| Plum Boro PA Sch Dist(9) | | | 5.25 | % | | 9/15/2030 | | AAA | | | 1,000 | | | | 1,076,020 | | |
Puerto Rico Comwlth Hwy &
Transn Auth Transn Rev Ser D | | | 5.75 | % | | 7/1/2041 | | AAA | | | 2,000 | | | | 2,227,720 | | |
| Puerto Rico Comwlth Pub Impt Ser A | | | 5.375 | % | | 7/1/2028 | | AAA | | | 925 | | | | 999,703 | | |
| Quaker Vly PA Sch Dist(10) | | | 5.50 | % | | 4/1/2025 | | Aaa | | | 800 | | | | 895,688 | | |
| Riverside PA Sch Dist(9) | | | 5.50 | % | | 10/15/2020 | | AAA | | | 1,000 | | | | 1,069,130 | | |
St Pub Sch Bldg Auth PA
Northhampton Area Cmnty Colleg(2) | | | 5.75 | % | | 3/1/2020 | | AAA | | | 1,775 | | | | 1,916,947 | | |
St Pub Sch Bldg Auth PA Rev
Del Cnty Cmnty College Pj(14) | | | 5.50 | % | | 10/1/2020 | | AAA | | | 800 | | | | 848,712 | | |
| Tredyffrin Easttown PA Sch Dist | | | 5.50 | % | | 2/15/2017 | | Aaa | | | 1,000 | | | | 1,070,160 | | |
York Cnty PA Hosp Auth Rev
York Hosp(2) | | | 5.25 | % | | 7/1/2017 | | AAA | | | 1,000 | | | | 1,022,610 | | |
| Total | | | | | | | | | | | | | | | 34,461,408 | | |
| Transportation 8.71% | |
| Allegheny Cnty PA Arpt Rev(14) | | | 5.00 | % | | 1/1/2017 | | AAA | | | 1,000 | | | | 1,026,240 | | |
Delaware River Port Auth PA &
NJ Ref Port Dist Pj Ser A(10) | | | 5.20 | % | | 1/1/2027 | | AAA | | | 1,000 | | | | 1,062,980 | | |
Delaware River Port Auth PA &
NJ Rev(10) | | | 6.00 | % | | 1/1/2019 | | AAA | | | 1,000 | | | | 1,073,380 | | |
| PA St Tpk Commn Tpk Rev Ser A(2) | | | 5.25 | % | | 12/1/2032 | | AAA | | | 1,000 | | | | 1,083,330 | | |
Puerto Rico Comwlth Hwy &
Transn Auth Rev PA 1052 RIBs RITES | | | 7.259 | % | | 1/1/2010 | | AAA(c) | | | 2,750 | | | | 3,376,230 | | |
Puerto Rico Comwlth Hwy &
Transn Ser G(9) | | | 5.25 | % | | 7/1/2020 | | AAA | | | 500 | | | | 543,970 | | |
| Total | | | | | | | | | | | | | | | 8,166,130 | | |
| Water/Sewer 4.20% | |
Bucks Cnty PA Wtr & Swr Auth
Rev Ser A(2) | | | 5.00 | % | | 6/1/2024 | | AAA | | | 1,000 | | | | 1,044,990 | | |
Delaware Cnty PA Indl Dev
Auth Wtr Facs Aqua PA Inc Pj Ser A AMT(9) | | | 5.00 | % | | 11/1/2036 | | AAA | | | 1,000 | | | | 1,037,640 | | |
Luzerne Cnty PA Indl Dev Auth
PA American Wtr Co Ser A AMT(2) | | | 5.10 | % | | 9/1/2034 | | AAA | | | 1,000 | | | | 1,040,190 | | |
| North Huntingdon Twp PA GTD(2) | | | 5.25 | % | | 4/1/2019 | | AAA | | | 760 | | | | 816,468 | | |
| Total | | | | | | | | | | | | | | | 3,939,288 | | |
| Total Municipal Bonds (cost $86,600,867) | | | | | | | | | | | | | | | 92,525,523 | | |
See Notes to Financial Statements.
137
Schedule of Investments (continued)
PENNSYLVANIA TAX-FREE TRUST September 30, 2006
| | | | | | | | | Shares
(000) | | | |
| SHORT-TERM INVESTMENT 0.00% | |
| Money Market Mutual Fund | |
| Dreyfus PA Municipal Money Market Fund (cost $311) | | | | | | | | | — | (b) | | $ | 311 | | |
| Total Investments in Securities 98.67% (cost $86,601,178) | | | | | | | | | | | 92,525,834 | | |
| Cash and Other Assets in Excess of Liabilities(g) 1.33% | | | | | | | | | | | 1,244,316 | | |
| Net Assets 100.00% | | | | | | | | | | $ | 93,770,150 | | |
| Open futures contracts at September 30, 2006: | |
| Type | | Expiration | | Contracts | | Position | | Market Value | | Unrealized
Depreciation | |
| U.S. 20-Year Treasury Bond | | December 2006 | | | 63 | | | Short | | $ | (7,081,594 | ) | | $ | (120,981 | ) | |
See Notes to Financial Statements.
138
Schedule of Investments (concluded)
September 30, 2006
AMT Income from this security may be subject to Alternative Minimum Tax.
COP Certificates of Participation.
CR Custodial Receipt.
ETM Escrow to Maturity.
GTD Guaranteed.
Pre-Refunded Bonds A second bond has been issued in order to pay off the first bond issue. Proceeds from the sale of the second bond are held in an "escrow fund" consisting of U.S. Government debt until the first bond issue reaches maturity.
PSF Permanent School Fund.
RIBs Residual Interest Bonds. The interest rate is subject to change periodically and inversely to the prevailing market rate. The interest rate shown is the rate in effect at September 30, 2006.
RITES Residual Interest Tax-Exempt Security. The interest rate is subject to change periodically and inversely to the prevailing market rate.
ROLs Reset Option Longs
TCRS Transferable Custodial Receipt.
NR Not Rated.
(a) Unaudited.
(b) Amount is less than 1,000 shares.
(c) This investment has not been rated by an independent ratings service but is, in Lord, Abbett & Co. LLC's opinion, of comparable quality to the rating shown.
(d) This investment has been rated by Fitch IBCA.
(e) Security purchased on a when-issued basis (See Note 2).
(f) Effective Maturity Date. Average life of sinking fund due to mandatory or expected principal payments prior to maturity.
(g) Cash and Other Assets in Excess of Liabilities (Liabilities in Excess of Cash and Other Assets) include net unrealized appreciation (depreciation) on financial futures contracts.
† Security was purchased pursuant to Rule 144A under the Securities Act of 1933 or is a private placement and, unless registered under the Act or exempted from registration, may only be resold to qualified institutional investors. Unless otherwise noted, 144A securities are deemed to be liquid.
# Variable Rate Security. The interest rate represents the rate at September 30, 2006.
~ Fair Valued Security. (See Note 2).
Insured or guaranteed by the indicated municipal bond insurance corporation or Federal agency:
(1) American Capital Access Holdings Ltd.
(2) AMBAC Assurance Corporation
(3) Certified Bond Insurance
(4) CIFG Guaranty
(5) Department of Veterans Affairs
(6) Federal Home Loan Mortgage Corporation
(7) Federal Housing Administration
(8) Federal National Mortgage Association
(9) Financial Guaranty Insurance Company
(10) Financial Security Assurance Inc.
(11) Government National Mortgage Association
(12) Government National Mortgage Association/Federal National Mortgage Association
(13) Insurance Bond Certificate
(14) Municipal Bond Investors Assurance Corporation
(15) Radian Asset Assurance, Inc.
(16) XL Capital Assurance, Inc.
See Notes to Financial Statements.
139
Statements of Assets and Liabilities
September 30, 2006
| | | National | | California | | Connecticut | | Hawaii | |
| ASSETS: | |
| Investments in securities, at cost | | $ | 533,765,283 | | | $ | 163,801,223 | | | $ | 90,943,075 | | | $ | 86,006,348 | | |
| Investments in securities, at value | | $ | 568,668,731 | | | $ | 172,822,817 | | | $ | 96,273,608 | | | $ | 90,230,546 | | |
| Cash | | | 212,115 | | | | 215,547 | | | | 198,646 | | | | 135,960 | | |
| Deposits with brokers for futures collateral | | | 349,200 | | | | 71,100 | | | | 63,900 | | | | 48,600 | | |
| Receivables: | |
| Interest | | | 7,922,029 | | | | 2,255,115 | | | | 1,297,188 | | | | 1,185,892 | | |
| Investment securities sold | | | 5,022 | | | | 2,692,800 | | | | – | | | | – | | |
| Capital shares sold | | | 825,191 | | | | 147,040 | | | | 95,990 | | | | 114,499 | | |
| From advisor | | | – | | | | – | | | | 39,429 | | | | 30,416 | | |
| Variation margin | | | 52,733 | | | | 49,943 | | | | 44,804 | | | | 34,719 | | |
| Prepaid expenses | | | 40,067 | | | | 17,659 | | | | 10,498 | | | | 9,949 | | |
| Total assets | | | 578,075,088 | | | | 178,272,021 | | | | 98,024,063 | | | | 91,790,581 | | |
| LIABILITIES: | |
| Payables: | |
| Investment securities purchased | | | 2,961,630 | | | | 1,820,210 | | | | 1,000,000 | | | | – | | |
| Capital shares reacquired | | | 440,265 | | | | 80,162 | | | | 45,521 | | | | 36,356 | | |
| Management fees | | | 210,640 | | | | 64,395 | | | | 35,336 | | | | 33,162 | | |
| 12b-1 distribution fees | | | 267,320 | | | | 84,856 | | | | 41,751 | | | | 43,504 | | |
| Fund administration | | | 20,042 | | | | 6,201 | | | | 2,933 | | | | 3,090 | | |
| Directors' fees | | | 324,732 | | | | 180,622 | | | | 32,088 | | | | 24,216 | | |
| Distributions payable | | | 1,598,987 | | | | 469,428 | | | | 289,236 | | | | 257,867 | | |
| Accrued expenses and other liabilities | | | 152,434 | | | | 97,830 | | | | 47,454 | | | | 35,720 | | |
| Total liabilities | | | 5,976,050 | | | | 2,803,704 | | | | 1,494,319 | | | | 433,915 | | |
| NET ASSETS | | $ | 572,099,038 | | | $ | 175,468,317 | | | $ | 96,529,744 | | | $ | 91,356,666 | | |
| COMPOSITION OF NET ASSETS: | |
| Paid-in capital | | $ | 557,075,280 | | | $ | 169,861,408 | | | $ | 93,536,603 | | | $ | 89,933,507 | | |
| Distributions in excess of net investment income | | | (1,701,851 | ) | | | (310,068 | ) | | | (304,879 | ) | | | (257,257 | ) | |
| Accumulated net realized loss on investments and futures contracts | | | (17,432,487 | ) | | | (2,952,900 | ) | | | (1,896,164 | ) | | | (2,439,962 | ) | |
| Net unrealized appreciation on investments and futures contracts | | | 34,158,096 | | | | 8,869,877 | | | | 5,194,184 | | | | 4,120,378 | | |
| Net Assets | | $ | 572,099,038 | | | $ | 175,468,317 | | | $ | 96,529,744 | | | $ | 91,356,666 | | |
| Net assets by class: | |
| Class A Shares | | $ | 499,777,522 | | | $ | 160,416,435 | | | $ | 96,529,744 | | | $ | 91,356,666 | | |
| Class B Shares | | $ | 27,871,042 | | | | – | | | | – | | | | – | | |
| Class C Shares | | $ | 44,450,474 | | | $ | 15,051,882 | | | | – | | | | – | | |
| Outstanding shares by class*: | |
| Class A Shares | | | 43,385,109 | | | | 14,707,815 | | | | 9,184,028 | | | | 18,228,351 | | |
| Class B Shares | | | 2,410,387 | | | | – | | | | – | | | | – | | |
| Class C Shares | | | 3,850,386 | | | | 1,378,521 | | | | – | | | | – | | |
Net asset value, offering and redemption price per share
(Net assets divided by outstanding shares): | | | | | |
| Class A Shares–Net asset value | | $ | 11.52 | | | $ | 10.91 | | | $ | 10.51 | | | $ | 5.01 | | |
Class A Shares–Maximum offering price
(Net asset value plus sales charge of 3.25%) | | $ | 11.91 | | | $ | 11.28 | | | $ | 10.86 | | | $ | 5.18 | | |
| Class B Shares–Net asset value | | $ | 11.56 | | | | – | | | | – | | | | – | | |
| Class C Shares–Net asset value | | $ | 11.54 | | | $ | 10.92 | | | | – | | | | – | | |
*Lord Abbett Municipal Income Fund, Inc. has 1,000,000,000 authorized shares of capital stock (par value $.001) of
which 900,000,000 are issued and allocated as follows: 150,000,000 to National, 110,000,000 to each of California,
New Jersey, and New York, and 70,000,000 to each of Connecticut, Hawaii, Minnesota, Missouri, Texas, and
Washington. The Lord Abbett Municipal Income Trust has an unlimited number of shares of beneficial interest authorized.
See Notes to Financial Statements.
140
| | | Minnesota | | Missouri | | New Jersey | | New York | |
| ASSETS: | |
| Investments in securities, at cost | | $ | 47,149,265 | | | $ | 150,294,291 | | | $ | 120,531,746 | | | $ | 232,982,281 | | |
| Investments in securities, at value | | $ | 49,083,112 | | | $ | 158,048,160 | | | $ | 129,008,055 | | | $ | 247,078,615 | | |
| Cash | | | 243,505 | | | | 47,931 | | | | 62,741 | | | | 157,719 | | |
| Deposits with brokers for futures collateral | | | 39,600 | | | | 140,400 | | | | 81,900 | | | | 140,400 | | |
| Receivables: | |
| Interest | | | 640,701 | | | | 2,003,153 | | | | 1,817,529 | | | | 3,382,226 | | |
| Investment securities sold | | | 266,000 | | | | – | | | | 488,486 | | | | 4,186,615 | | |
| Capital shares sold | | | 265,864 | | | | 170,235 | | | | 217 | | | | 868,605 | | |
| From advisor | | | – | | | | 33,459 | | | | 21,977 | | | | 69,867 | | |
| Variation margin | | | 28,356 | | | | 98,460 | | | | 57,162 | | | | 98,469 | | |
| Prepaid expenses | | | 8,337 | | | | 12,102 | | | | 10,811 | | | | 20,225 | | |
| Total assets | | | 50,575,475 | | | | 160,553,900 | | | | 131,548,878 | | | | 256,002,741 | | |
| LIABILITIES: | |
| Payables: | |
| Investment securities purchased | | | 508,000 | | | | – | | | | – | | | | 5,056,899 | | |
| Capital shares reacquired | | | 38,631 | | | | 352,768 | | | | 209,364 | | | | 36,425 | | |
| Management fees | | | 17,780 | | | | 58,650 | | | | 48,428 | | | | 91,096 | | |
| 12b-1 distribution fees | | | – | | | | 54,694 | | | | 63,466 | | | | 122,830 | | |
| Fund administration | | | 1,665 | | | | 5,557 | | | | 4,644 | | | | 8,677 | | |
| Directors' fees | | | 4,225 | | | | 39,100 | | | | 52,124 | | | | 155,254 | | |
| Distributions payable | | | 140,679 | | | | 450,352 | | | | 364,565 | | | | 728,045 | | |
| Accrued expenses and other liabilities | | | 39,740 | | | | 62,781 | | | | 64,044 | | | | 80,577 | | |
| Total liabilities | | | 750,720 | | | | 1,023,902 | | | | 806,635 | | | | 6,279,803 | | |
| NET ASSETS | | $ | 49,824,755 | | | $ | 159,529,998 | | | $ | 130,742,243 | | | $ | 249,722,938 | | |
| COMPOSITION OF NET ASSETS: | |
| Paid-in capital | | $ | 48,817,372 | | | $ | 153,142,430 | | | $ | 128,325,391 | | | $ | 238,330,971 | | |
| Distributions in excess of net investment income | | | (14,046 | ) | | | (386,614 | ) | | | (356,886 | ) | | | (849,284 | ) | |
| Accumulated net realized loss on investments and futures contracts | | | (827,894 | ) | | | (680,009 | ) | | | (5,527,802 | ) | | | (1,555,406 | ) | |
| Net unrealized appreciation on investments and futures contracts | | | 1,849,323 | | | | 7,454,191 | | | | 8,301,540 | | | | 13,796,657 | | |
| Net Assets | | $ | 49,824,755 | | | $ | 159,529,998 | | | $ | 130,742,243 | | | $ | 249,722,938 | | |
| Net assets by class: | |
| Class A Shares | | $ | 49,824,755 | | | $ | 159,529,998 | | | $ | 130,742,243 | | | $ | 233,100,895 | | |
| Class B Shares | | | – | | | | – | | | | – | | | | – | | |
| Class C Shares | | | – | | | | – | | | | – | | | $ | 16,622,043 | | |
| Outstanding shares by class*: | |
| Class A Shares | | | 9,622,196 | | | | 29,954,028 | | | | 25,281,822 | | | | 20,686,853 | | |
| Class B Shares | | | – | | | | – | | | | – | | | | – | | |
| Class C Shares | | | – | | | | – | | | | – | | | | 1,475,027 | | |
Net asset value, offering and redemption price per share
(Net assets divided by outstanding shares): | |
| Class A Shares–Net asset value | | $ | 5.18 | | | $ | 5.33 | | | $ | 5.17 | | | $ | 11.27 | | |
Class A Shares–Maximum offering price
(Net asset value plus sales charge of 3.25%) | | $ | 5.35 | | | $ | 5.51 | | | $ | 5.34 | | | $ | 11.65 | | |
| Class B Shares–Net asset value | | | – | | | | – | | | | – | | | | – | | |
| Class C Shares–Net asset value | | | – | | | | – | | | | – | | | $ | 11.27 | | |
See Notes to Financial Statements.
141
Statements of Assets and Liabilities (concluded)
September 30, 2006
| | | Texas | | Washington | | Insured
Intermediate | | Florida | |
| ASSETS: | |
| Investments in securities, at cost | | $ | 73,887,864 | | | $ | 41,477,486 | | | $ | 10,346,058 | | | $ | 64,251,792 | | |
| Investments in securities, at value | | $ | 79,672,319 | | | $ | 44,491,374 | | | $ | 10,522,930 | | | $ | 69,285,954 | | |
| Cash | | | 17,669 | | | | 221,501 | | | | 82,164 | | | | 235,772 | | |
| Deposits with brokers for futures collateral | | | 15,300 | | | | 8,100 | | | | – | | | | 18,000 | | |
| Receivables: | |
| Interest | | | 1,190,528 | | | | 684,577 | | | | 133,490 | | | | 1,201,857 | | |
| Investment securities sold | | | 298,100 | | | | – | | | | – | | | | 10,053 | | |
| Capital shares sold | | | 575,633 | | | | 9,465 | | | | 173,095 | | | | 200,202 | | |
| From advisor | | | 19,788 | | | | – | | | | 13,532 | | | | 13,409 | | |
| Variation margin | | | 10,714 | | | | 5,664 | | | | – | | | | 12,591 | | |
| Prepaid expenses | | | 11,219 | | | | 7,127 | | | | 25,220 | | | | 16,212 | | |
| Total assets | | | 81,811,270 | | | | 45,427,808 | | | | 10,950,431 | | | | 70,994,050 | | |
| LIABILITIES: | |
| Payables: | |
| Investment securities purchased | | | 2,020,463 | | | | 1,000,000 | | | | – | | | | – | | |
| Capital shares reacquired | | | 10,408 | | | | 185,799 | | | | – | | | | 38 | | |
| Management fees | | | 28,970 | | | | 17,071 | | | | 3,453 | | | | 26,437 | | |
| 12b-1 distribution fees | | | 67,487 | | | | – | | | | 6,080 | | | | 44,584 | | |
| Fund administration | | | 2,846 | | | | 1,537 | | | | 346 | | | | 2,506 | | |
| Directors'/Trustees' fees | | | 36,003 | | | | 18,877 | | | | 4,595 | | | | 42,961 | | |
| Distributions payable | | | 238,892 | | | | 134,448 | | | | 25,094 | | | | 205,001 | | |
| Accrued expenses and other liabilities | | | 43,873 | | | | 40,145 | | | | 34,073 | | | | 49,385 | | |
| Total liabilities | | | 2,448,942 | | | | 1,397,877 | | | | 73,641 | | | | 370,912 | | |
| NET ASSETS | | $ | 79,362,328 | | | $ | 44,029,931 | | | $ | 10,876,790 | | | $ | 70,623,138 | | |
| COMPOSITION OF NET ASSETS: | |
| Paid-in capital | | $ | 77,836,922 | | | $ | 43,404,181 | | | $ | 10,992,473 | | | $ | 72,315,279 | | |
| Undistributed (distributions in excess of) net investment income | | | (233,811 | ) | | | 141,929 | | | | 2,063 | | | | (216,837 | ) | |
| Accumulated net realized loss on investments and futures contracts | | | (3,992,538 | ) | | | (2,512,735 | ) | | | (294,618 | ) | | | (6,471,046 | ) | |
| Net unrealized appreciation on investments and futures contracts | | | 5,751,755 | | | | 2,996,556 | | | | 176,872 | | | | 4,995,742 | | |
| Net Assets | | $ | 79,362,328 | | | $ | 44,029,931 | | | $ | 10,876,790 | | | $ | 70,623,138 | | |
| Net assets by class: | |
| Class A Shares | | $ | 79,362,328 | | | $ | 44,029,931 | | | $ | 7,233,843 | | | $ | 64,392,136 | | |
| Class B Shares | | | – | | | | – | | | $ | 848,254 | | | | – | | |
| Class C Shares | | | – | | | | – | | | $ | 2,783,969 | | | $ | 6,231,002 | | |
| Class P Shares | | | – | | | | – | | | $ | 10,724 | | | | – | | |
| Outstanding shares by class*: | |
| Class A Shares | | | 7,880,558 | | | | 8,624,944 | | | | 737,029 | | | | 13,555,203 | | |
| Class B Shares | | | – | | | | – | | | | 86,524 | | | | – | | |
| Class C Shares | | | – | | | | – | | | | 283,984 | | | | 1,309,920 | | |
| Class P Shares | | | – | | | | – | | | | 1,093 | | | | – | | |
Net asset value, offering and redemption price per share
(Net assets divided by outstanding shares): | | | | | |
| Class A Shares–Net asset value | | $ | 10.07 | | | $ | 5.10 | | | $ | 9.81 | | | $ | 4.75 | | |
| Class A Shares–Maximum offering price | |
| (Net asset value plus sales charge of 3.25%) | | $ | 10.41 | | | $ | 5.27 | | | $ | 10.14 | | | $ | 4.91 | | |
| Class B Shares–Net asset value | | | – | | | | – | | | $ | 9.80 | | | | – | | |
| Class C Shares–Net asset value | | | – | | | | – | | | $ | 9.80 | | | $ | 4.76 | | |
| Class P Shares–Net asset value | | | – | | | | – | | | $ | 9.81 | | | | – | | |
*Lord Abbett Municipal Income Fund, Inc. has 1,000,000,000 authorized shares of capital stock (par value $.001) of
which 900,000,000 are issued and allocated as follows: 150,000,000 to National, 110,000,000 to each of California,
New Jersey, and New York, and 70,000,000 to each of Connecticut, Hawaii, Minnesota, Missouri, Texas, and Washington.
The Lord Abbett Municipal Income Trust has an unlimited number of shares of beneficial interest authorized.
See Notes to Financial Statements.
142
| | | Georgia | | High Yield | | Michigan | | Pennsylvania | |
| ASSETS: | |
| Investments in securities, at cost | | $ | 111,216,074 | | | $ | 1,073,136,117 | | | $ | 68,526,842 | | | $ | 86,601,178 | | |
| Investments in securities, at value | | $ | 115,923,673 | | | $ | 1,106,195,876 | | | $ | 72,827,490 | | | $ | 92,525,834 | | |
| Cash | | | 137,738 | | | | 6,337,702 | | | | 107,168 | | | | 94,917 | | |
| Deposits with brokers for futures collateral | | | 89,100 | | | | 1,557,900 | | | | 59,400 | | | | 56,700 | | |
| Receivables: | |
| Interest | | | 1,826,602 | | | | 15,842,553 | | | | 1,168,755 | | | | 1,348,800 | | |
| Investment securities sold | | | – | | | | 15,000 | | | | – | | | | 5,000 | | |
| Capital shares sold | | | 1,499,899 | | | | 15,629,788 | | | | 167,746 | | | | 126,036 | | |
| From advisor | | | 23,911 | | | | 700,108 | | | | – | | | | 22,933 | | |
| Variation margin | | | 62,823 | | | | 72,354 | | | | 41,347 | | | | 39,447 | | |
| Prepaid expenses | | | 11,275 | | | | 87,126 | | | | 10,881 | | | | 12,060 | | |
| Total assets | | | 119,575,021 | | | | 1,146,438,407 | | | | 74,382,787 | | | | 94,231,727 | | |
| LIABILITIES: | |
| Payables: | |
| Investment securities purchased | | | 104,165 | | | | 55,541,300 | | | | 973,240 | | | | – | | |
| Capital shares reacquired | | | 159,498 | | | | 4,653,113 | | | | 46,510 | | | | 25,738 | | |
| Management fees | | | 42,284 | | | | 400,341 | | | | 26,782 | | | | 34,573 | | |
| 12b-1 distribution fees | | | 57,005 | | | | 499,385 | | | | – | | | | 51,783 | | |
| Fund administration | | | 3,965 | | | | 32,249 | | | | 2,528 | | | | 3,291 | | |
| Directors'/Trustees' fees | | | 7,724 | | | | 20,962 | | | | 14,363 | | | | 26,513 | | |
| Distributions payable | | | 327,289 | | | | 3,412,724 | | | | 212,662 | | | | 272,780 | | |
| Accrued expenses and other liabilities | | | 54,308 | | | | 218,367 | | | | 50,386 | | | | 46,899 | | |
| Total liabilities | | | 756,238 | | | | 64,778,441 | | | | 1,326,471 | | | | 461,577 | | |
| NET ASSETS | | $ | 118,818,783 | | | $ | 1,081,659,966 | | | $ | 73,056,316 | | | $ | 93,770,150 | | |
| COMPOSITION OF NET ASSETS: | |
| Paid-in capital | | $ | 115,014,762 | | | $ | 1,057,493,652 | | | $ | 71,520,142 | | | $ | 89,511,830 | | |
| Undistributed (distributions in excess of) net investment income | | | 22,384 | | | | 1,277,602 | | | | (191,410 | ) | | | (266,747 | ) | |
| Accumulated net realized loss on investments and futures contracts | | | (735,825 | ) | | | (7,283,441 | ) | | | (2,446,191 | ) | | | (1,278,608 | ) | |
| Net unrealized appreciation on investments and futures contracts | | | 4,517,462 | | | | 30,172,153 | | | | 4,173,775 | | | | 5,803,675 | | |
| Net Assets | | $ | 118,818,783 | | | $ | 1,081,659,966 | | | $ | 73,056,316 | | | $ | 93,770,150 | | |
| Net assets by class: | |
| Class A Shares | | $ | 118,818,783 | | | $ | 731,726,307 | | | $ | 73,056,316 | | | $ | 93,770,150 | | |
| Class B Shares | | | – | | | $ | 11,495 | | | | – | | | | – | | |
| Class C Shares | | | – | | | $ | 349,910,626 | | | | – | | | | – | | |
| Class P Shares | | | – | | | $ | 11,538 | | | | – | | | | – | | |
| Outstanding shares by class*: | |
| Class A Shares | | | 21,061,302 | | | | 46,277,908 | | | | 13,894,518 | | | | 17,888,329 | | |
| Class B Shares | | | – | | | | 727 | | | | – | | | | – | | |
| Class C Shares | | | – | | | | 22,133,196 | | | | – | | | | – | | |
| Class P Shares | | | – | | | | 729.427 | | | | – | | | | – | | |
Net asset value, offering and redemption price per share
(Net assets divided by outstanding shares): | |
| Class A Shares–Net asset value | | $ | 5.64 | | | $ | 15.81 | | | $ | 5.26 | | | $ | 5.24 | | |
| Class A Shares–Maximum offering price | |
| (Net asset value plus sales charge of 3.25%) | | $ | 5.83 | | | $ | 16.34 | | | $ | 5.44 | | | $ | 5.42 | | |
| Class B Shares–Net asset value | | | – | | | $ | 15.81 | | | | – | | | | – | | |
| Class C Shares–Net asset value | | | – | | | $ | 15.81 | | | | – | | | | – | | |
| Class P Shares–Net asset value | | | – | | | $ | 15.82 | | | | – | | | | – | | |
See Notes to Financial Statements.
143
Statements of Operations
For the Year Ended September 30, 2006
| | | National | | California | | Connecticut | | Hawaii | |
| Investment Income: | |
| Interest | | $ | 28,093,378 | | | $ | 8,344,567 | | | $ | 4,468,090 | | | $ | 3,908,590 | | |
| Dividends | | | 90,203 | | | | 21,025 | | | | 15,454 | | | | – | | |
| Total investment Income | | | 28,183,581 | | | | 8,365,592 | | | | 4,483,544 | | | | 3,908,590 | | |
| Expenses: | |
| Management fees | | | 2,556,940 | | | | 796,993 | | | | 415,276 | | | | 371,919 | | |
| 12b-1 distribution plan–Class A | | | 1,710,936 | | | | 568,407 | | | | 322,993 | | | | 285,672 | | |
| 12b-1 distribution plan–Class B | | | 292,178 | | | | – | | | | – | | | | – | | |
| 12b-1 distribution plan–Class C | | | 423,134 | | | | 147,077 | | | | – | | | | – | | |
| Shareholder servicing | | | 239,165 | | | | 71,275 | | | | 36,413 | | | | 30,638 | | |
| Professional | | | 53,938 | | | | 39,959 | | | | 34,566 | | | | 34,388 | | |
| Reports to shareholders | | | 75,554 | | | | 10,655 | | | | 11,793 | | | | 13,525 | | |
| Fund administration | | | 227,283 | | | | 70,844 | | | | 36,914 | | | | 33,060 | | |
| Custody | | | 51,889 | | | | 20,856 | | | | 10,751 | | | | 6,209 | | |
| Directors' fees | | | 20,017 | | | | 6,262 | | | | 3,232 | | | | 2,831 | | |
| Registration | | | 50,058 | | | | 24,798 | | | | 14,311 | | | | 13,726 | | |
| Other | | | 11,783 | | | | 4,459 | | | | 2,186 | | | | 2,190 | | |
| Gross expenses | | | 5,712,875 | | | | 1,761,585 | | | | 888,435 | | | | 794,158 | | |
| Expense reductions (See Note 7) | | | (19,844 | ) | | | (6,108 | ) | | | (4,407 | ) | | | (7,819 | ) | |
| Expenses assumed by advisor (See Note 3) | | | (8 | ) | | | (5,472 | ) | | | (403,121 | ) | | | (197,886 | ) | |
| Net expenses | | | 5,693,023 | | | | 1,750,005 | | | | 480,907 | | | | 588,453 | | |
| Net investment income | | | 22,490,558 | | | | 6,615,587 | | | | 4,002,637 | | | | 3,320,137 | | |
| Net realized and unrealized gain (loss): | |
| Net realized loss on investments and futures contracts | | | (1,747,471 | ) | | | (189,621 | ) | | | (307,296 | ) | | | (122,329 | ) | |
Net increase from payment by an affiliate for net loss realized on
disposal of investments purchased/sold in error (See Note 3) | | | 7,480 | | | | 1,835 | | | | 1,649 | | | | 1,337 | | |
Net change in unrealized appreciation (depreciation) on investments
and futures contracts | | | 931,207 | | | | (532,881 | ) | | | (18,039 | ) | | | (47,094 | ) | |
| Net realized and unrealized loss | | | (808,784 | ) | | | (720,667 | ) | | | (323,686 | ) | | | (168,086 | ) | |
| Net Increase in Net Assets Resulting From Operations | | $ | 21,681,774 | | | $ | 5,894,920 | | | $ | 3,678,951 | | | $ | 3,152,051 | | |
See Notes to Financial Statements.
144
| | | Minnesota | | Missouri | | New Jersey | | New York | |
| Investment Income: | |
| Interest | | $ | 2,209,473 | | | $ | 7,495,949 | | | $ | 6,507,990 | | | $ | 11,738,620 | | |
| Dividends | | | – | | | | – | | | | 6,729 | | | | 46,769 | | |
| Total investment Income | | | 2,209,473 | | | | 7,495,949 | | | | 6,514,719 | | | | 11,785,389 | | |
| Expenses: | |
| Management fees | | | 206,632 | | | | 717,144 | | | | 599,958 | | | | 1,082,386 | | |
| 12b-1 distribution plan–Class A | | | – | | | | 557,779 | | | | 466,449 | | | | 770,278 | | |
| 12b-1 distribution plan–Class B | | | – | | | | – | | | | – | | | | – | | |
| 12b-1 distribution plan–Class C | | | – | | | | – | | | | – | | | | 151,211 | | |
| Shareholder servicing | | | 26,479 | | | | 85,908 | | | | 66,436 | | | | 108,787 | | |
| Professional | | | 34,065 | | | | 38,361 | | | | 37,452 | | | | 44,271 | | |
| Reports to shareholders | | | 7,224 | | | | 28,182 | | | | 18,533 | | | | 25,882 | | |
| Fund administration | | | 18,367 | | | | 63,746 | | | | 53,330 | | | | 96,212 | | |
| Custody | | | 5,652 | | | | 18,695 | | | | 36,553 | | | | 29,248 | | |
| Directors' fees | | | 1,582 | | | | 5,625 | | | | 4,743 | | | | 8,459 | | |
| Registration | | | 11,374 | | | | 17,507 | | | | 14,269 | | | | 25,441 | | |
| Other | | | 1,327 | | | | 3,483 | | | | 2,834 | | | | 5,010 | | |
| Gross expenses | | | 312,702 | | | | 1,536,430 | | | | 1,300,557 | | | | 2,347,185 | | |
| Expense reductions (See Note 7) | | | (5,637 | ) | | | (22,203 | ) | | | (4,386 | ) | | | (8,636 | ) | |
| Expenses assumed by advisor (See Note 3) | | | – | | | | (610,328 | ) | | | (153,337 | ) | | | (731,445 | ) | |
| Net expenses | | | 307,065 | | | | 903,899 | | | | 1,142,834 | | | | 1,607,104 | | |
| Net investment income | | | 1,902,408 | | | | 6,592,050 | | | | 5,371,885 | | | | 10,178,285 | | |
| Net realized and unrealized gain (loss): | |
| Net realized loss on investments and futures contracts | | | (177,937 | ) | | | (632,220 | ) | | | (406,121 | ) | | | (886,726 | ) | |
Net increase from payment by an affiliate for net loss realized on
disposal of investments purchased/sold in error (See Note 3) | | | 1,022 | | | | 2,439 | | | | 2,114 | | | | 2,228 | | |
Net change in unrealized appreciation (depreciation) on investments
and futures contracts | | | 153,650 | | | | 75,461 | | | | (464,718 | ) | | | (225,280 | ) | |
| Net realized and unrealized loss | | | (23,265 | ) | | | (554,320 | ) | | | (868,725 | ) | | | (1,109,778 | ) | |
| Net Increase in Net Assets Resulting From Operations | | $ | 1,879,143 | | | $ | 6,037,730 | | | $ | 4,503,160 | | | $ | 9,068,507 | | |
See Notes to Financial Statements.
145
Statements of Operations (concluded)
For the Year Ended September 30, 2006
| | | Texas | | Washington | | Insured
Intermediate | | Florida | |
| Investment Income: | |
| Interest | | $ | 4,009,663 | | | $ | 2,239,849 | | | $ | 421,576 | | | $ | 3,651,446 | | |
| Dividends | | | 29,090 | | | | 6,238 | | | | 5,193 | | | | 16,829 | | |
| Total investment income | | | 4,038,753 | | | | 2,246,087 | | | | 426,769 | | | | 3,668,275 | | |
| Expenses: | |
| Management fees | | | 350,335 | | | | 205,813 | | | | 47,543 | | | | 326,419 | | |
| 12b-1 distribution plan–Class A | | | 270,451 | | | | – | | | | 26,760 | | | | 245,002 | | |
| 12b-1 distribution plan–Class B | | | – | | | | – | | | | 7,964 | | | | – | | |
| 12b-1 distribution plan–Class C | | | – | | | | – | | | | 34,331 | | | | 65,502 | | |
| 12b-1 distribution plan–Class P | | | – | | | | – | | | | 48 | | | | – | | |
| Shareholder servicing | | | 33,078 | | | | 26,914 | | | | 6,823 | | | | 37,752 | | |
| Professional | | | 34,974 | | | | 34,732 | | | | 32,340 | | | | 35,855 | | |
| Reports to shareholders | | | 10,990 | | | | 6,749 | | | | 1,362 | | | | 7,973 | | |
| Fund administration | | | 31,141 | | | | 18,294 | | | | 4,754 | | | | 29,015 | | |
| Custody | | | 12,227 | | | | 10,003 | | | | 5,992 | | | | 15,108 | | |
| Directors'/Trustees' fees | | | 2,727 | | | | 1,630 | | | | 423 | | | | 2,582 | | |
| Registration | | | 13,287 | | | | 13,057 | | | | 54,438 | | | | 22,015 | | |
| Other | | | 1,862 | | | | 1,124 | | | | 2,290 | | | | 2,194 | | |
| Gross expenses | | | 761,072 | | | | 318,316 | | | | 225,068 | | | | 789,417 | | |
| Expense reductions (See Note 7) | | | (3,930 | ) | | | (2,644 | ) | | | (2,848 | ) | | | (3,912 | ) | |
| Expenses assumed by advisor (See Note 3) | | | (107,930 | ) | | | – | | | | (160,806 | ) | | | (196,307 | ) | |
| Net expenses | | | 649,212 | | | | 315,672 | | | | 61,414 | | | | 589,198 | | |
| Net investment income | | | 3,389,541 | | | | 1,930,415 | | | | 365,355 | | | | 3,079,077 | | |
| Net realized and unrealized gain (loss): | |
| Net realized loss on investments and futures contracts | | | (138,598 | ) | | | (77,360 | ) | | | (156,652 | ) | | | (348,913 | ) | |
Net increase from payment by an affiliate for net loss realized on
disposal of investments purchased/sold in error (See Note 3) | | | 395 | | | | 209 | | | | – | | | | 465 | | |
Net change in unrealized appreciation (depreciation) on investments
and futures contracts | | | (707,020 | ) | | | (183,267 | ) | | | 162,395 | | | | (109,581 | ) | |
| Net realized and unrealized gain (loss) | | | (845,223 | ) | | | (260,418 | ) | | | 5,743 | | | | (458,029 | ) | |
| Net Increase in Net Assets Resulting From Operations | | $ | 2,544,318 | | | $ | 1,669,997 | | | $ | 371,098 | | | $ | 2,621,048 | | |
See Notes to Financial Statements.
146
| | | Georgia | | High Yield | | Michigan | | Pennsylvania | |
| Investment Income: | |
| Interest | | $ | 4,822,579 | | | $ | 39,181,561 | | | $ | 3,568,245 | | | $ | 4,624,087 | | |
| Dividends | | | – | | | | 100,165 | | | | – | | | | 311 | | |
| Total investment income | | | 4,822,579 | | | | 39,281,726 | | | | 3,568,245 | | | | 4,624,398 | | |
| Expenses: | |
| Management fees | | | 489,108 | | | | 3,604,027 | | | | 332,498 | | | | 427,724 | | |
| 12b-1 distribution plan–Class A | | | 309,367 | | | | 1,733,647 | | | | – | | | | 298,392 | | |
| 12b-1 distribution plan–Class B | | | – | | | | 110 | | | | – | | | | – | | |
| 12b-1 distribution plan–Class C | | | – | | | | 2,234,896 | | | | – | | | | – | | |
| 12b-1 distribution plan–Class P | | | – | | | | 49 | | | | – | | | | – | | |
| Shareholder servicing | | | 63,215 | | | | 355,832 | | | | 48,195 | | | | 48,027 | | |
| Professional | | | 36,071 | | | | 58,371 | | | | 33,312 | | | | 33,431 | | |
| Reports to shareholders | | | 17,247 | | | | 116,319 | | | | 9,782 | | | | 9,426 | | |
| Fund administration | | | 43,476 | | | | 288,417 | | | | 29,555 | | | | 38,020 | | |
| Custody | | | 11,476 | | | | 97,766 | | | | 19,916 | | | | 21,421 | | |
| Directors'/Trustees' fees | | | 3,735 | | | | 21,476 | | | | 2,619 | | | | 3,372 | | |
| Registration | | | 18,093 | | | | 184,021 | | | | 16,994 | | | | 13,755 | | |
| Other | | | 2,782 | | | | 10,438 | | | | 1,743 | | | | 2,082 | | |
| Gross expenses | | | 994,570 | | | | 8,705,369 | | | | 494,614 | | | | 895,650 | | |
| Expense reductions (See Note 7) | | | (13,838 | ) | | | (89,853 | ) | | | (6,423 | ) | | | (9,825 | ) | |
| Expenses assumed by advisor (See Note 3) | | | (502,691 | ) | | | (6,666,264 | ) | | | (48,925 | ) | | | (247,047 | ) | |
| Net expenses | | | 478,041 | | | | 1,949,252 | | | | 439,266 | | | | 638,778 | | |
| Net investment income | | | 4,344,538 | | | | 37,332,474 | | | | 3,128,979 | | | | 3,985,620 | | |
| Net realized and unrealized gain (loss): | |
| Net realized loss on investments and futures contracts | | | (675,095 | ) | | | (6,548,414 | ) | | | (498,759 | ) | | | (367,834 | ) | |
Net increase from payment by an affiliate for net loss realized on
disposal of investments purchased/sold in error (See Note 3) | | | 2,300 | | | | – | | | | 424 | | | | 1,463 | | |
Net change in unrealized appreciation (depreciation) on investments
and futures contracts | | | 432,358 | | | | 30,000,604 | | | | (71,258 | ) | | | (664,199 | ) | |
| Net realized and unrealized gain (loss) | | | (240,437 | ) | | | 23,452,190 | | | | (569,593 | ) | | | (1,030,570 | ) | |
| Net Increase in Net Assets Resulting From Operations | | $ | 4,104,101 | | | $ | 60,784,664 | | | $ | 2,559,386 | | | $ | 2,955,050 | | |
See Notes to Financial Statements.
147
Statements of Changes in Net Assets
For the Year Ended September 30, 2006
| INCREASE (DECREASE) IN NET ASSETS | | National | | California | | Connecticut | | Hawaii | |
| Operations: | |
| Net investment income | | $ | 22,490,558 | | | $ | 6,615,587 | | | $ | 4,002,637 | | | $ | 3,320,137 | | |
| Net realized loss on investments and futures contracts | | | (1,747,471 | ) | | | (189,621 | ) | | | (307,296 | ) | | | (122,329 | ) | |
Net increase from payment by an affiliate for net loss realized on
disposal of investments purchased/sold in error (See Note 3) | | | 7,480 | | | | 1,835 | | | | 1,649 | | | | 1,337 | | |
Net change in unrealized appreciation (depreciation) on investments
and futures contracts | | | 931,207 | | | | (532,881 | ) | | | (18,039 | ) | | | (47,094 | ) | |
| Net increase in net assets resulting from operations | | | 21,681,774 | | | | 5,894,920 | | | | 3,678,951 | | | | 3,152,051 | | |
| Distributions to shareholders from: | |
| Net investment income | |
| Class A | | | (20,510,801 | ) | | | (6,371,013 | ) | | | (4,020,361 | ) | | | (3,420,720 | ) | |
| Class B | | | (1,006,019 | ) | | | – | | | | – | | | | – | | |
| Class C | | | (1,468,117 | ) | | | (483,299 | ) | | | – | | | | – | | |
| Net realized gain | | | | | | | | | | | | | | | | | |
| Class A | | | – | | | | – | | | | – | | | | – | | |
| Total distributions to shareholders | | | (22,984,937 | ) | | | (6,854,312 | ) | | | (4,020,361 | ) | | | (3,420,720 | ) | |
| Capital share transactions (See Note 11): | |
| Net proceeds from sales of shares | | | 70,020,603 | | | | 14,893,601 | | | | 15,548,176 | | | | 20,929,784 | | |
| Reinvestment of distributions | | | 15,895,778 | | | | 4,304,407 | | | | 2,171,918 | | | | 2,417,923 | | |
| Cost of shares reacquired | | | (82,355,426 | ) | | | (22,949,895 | ) | | | (11,926,976 | ) | | | (9,939,801 | ) | |
Net increase (decrease) in net assets
resulting from capital share transactions | | | 3,560,955 | | | | (3,751,887 | ) | | | 5,793,118 | | | | 13,407,906 | | |
| Net increase (decrease) in net assets | | | 2,257,792 | | | | (4,711,279 | ) | | | 5,451,708 | | | | 13,139,237 | | |
| NET ASSETS: | |
| Beginning of year | | | 569,841,246 | | | | 180,179,596 | | | | 91,078,036 | | | | 78,217,429 | | |
| End of year | | $ | 572,099,038 | | | $ | 175,468,317 | | | $ | 96,529,744 | | | $ | 91,356,666 | | |
| Distributions in excess of net investment income | | $ | (1,701,851 | ) | | $ | (310,068 | ) | | $ | (304,879 | ) | | $ | (257,257 | ) | |
See Notes to Financial Statements.
148
| INCREASE (DECREASE) IN NET ASSETS | | Minnesota | | Missouri | | New Jersey | | New York | |
| Operations: | |
| Net investment income | | $ | 1,902,408 | | | $ | 6,592,050 | | | $ | 5,371,885 | | | $ | 10,178,285 | | |
| Net realized loss on investments and futures contracts | | | (177,937 | ) | | | (632,220 | ) | | | (406,121 | ) | | | (886,726 | ) | |
Net increase from payment by an affiliate for net loss realized on
disposal of investments purchased/sold in error (See Note 3) | | | 1,022 | | | | 2,439 | | | | 2,114 | | | | 2,228 | | |
Net change in unrealized appreciation (depreciation) on investments
and futures contracts | | | 153,650 | | | | 75,461 | | | | (464,718 | ) | | | (225,280 | ) | |
| Net increase in net assets resulting from operations | | | 1,879,143 | | | | 6,037,730 | | | | 4,503,160 | | | | 9,068,507 | | |
| Distributions to shareholders from: | |
| Net investment income | |
| Class A | | | (1,892,036 | ) | | | (6,501,513 | ) | | | (5,375,403 | ) | | | (9,665,212 | ) | |
| Class B | | | – | | | | – | | | | – | | | | – | | |
| Class C | | | – | | | | – | | | | – | | | | (550,916 | ) | |
| Net realized gain | | | | | | | | | | | | | | | | | |
| Class A | | | – | | | | (223,724 | ) | | | – | | | | – | | |
| Total distributions to shareholders | | | (1,892,036 | ) | | | (6,725,237 | ) | | | (5,375,403 | ) | | | (10,216,128 | ) | |
| Capital share transactions (See Note 11): | |
| Net proceeds from sales of shares | | | 10,976,320 | | | | 13,703,246 | | | | 6,743,902 | | | | 26,075,091 | | |
| Reinvestment of distributions | | | 1,662,593 | | | | 5,657,370 | | | | 2,908,469 | | | | 6,351,061 | | |
| Cost of shares reacquired | | | (5,983,519 | ) | | | (20,766,978 | ) | | | (15,357,276 | ) | | | (25,655,829 | ) | |
Net increase (decrease) in net assets
resulting from capital share transactions | | | 6,655,394 | | | | (1,406,362 | ) | | | (5,704,905 | ) | | | 6,770,323 | | |
| Net increase (decrease) in net assets | | | 6,642,501 | | | | (2,093,869 | ) | | | (6,577,148 | ) | | | 5,622,702 | | |
| NET ASSETS: | |
| Beginning of year | | | 43,182,254 | | | | 161,623,867 | | | | 137,319,391 | | | | 244,100,236 | | |
| End of year | | $ | 49,824,755 | | | $ | 159,529,998 | | | $ | 130,742,243 | | | $ | 249,722,938 | | |
| Distributions in excess of net investment income | | $ | (14,046 | ) | | $ | (386,614 | ) | | $ | (356,886 | ) | | $ | (849,284 | ) | |
See Notes to Financial Statements.
149
Statements of Changes in Net Assets (continued)
For the Year Ended September 30, 2006
| INCREASE (DECREASE) IN NET ASSETS | | Texas | | Washington | | Insured
Intermediate | | Florida | |
| Operations: | |
| Net investment income | | $ | 3,389,541 | | | $ | 1,930,415 | | | $ | 365,355 | | | $ | 3,079,077 | | |
| Net realized loss on investments and futures contracts | | | (138,598 | ) | | | (77,360 | ) | | | (156,652 | ) | | | (348,913 | ) | |
Net increase from payment by an affiliate for net loss realized on
disposal of investments purchased/sold in error (See Note 3) | | | 395 | | | | 209 | | | | – | | | | 465 | | |
Net change in unrealized appreciation (depreciation) on investments
and futures contracts | | | (707,020 | ) | | | (183,267 | ) | | | 162,395 | | | | (109,581 | ) | |
| Net increase in net assets resulting from operations | | | 2,544,318 | | | | 1,669,997 | | | | 371,098 | | | | 2,621,048 | | |
| Distributions to shareholders from: | |
| Net investment income | |
| Class A | | | (3,399,287 | ) | | | (2,007,376 | ) | | | (265,545 | ) | | | (2,814,257 | ) | |
| Class B | | | – | | | | – | | | | (22,144 | ) | | | – | | |
| Class C | | | – | | | | – | | | | (94,416 | ) | | | (239,523 | ) | |
| Class P | | | – | | | | – | | | | (345 | ) | | | – | | |
| Total distributions to shareholders | | | (3,399,287 | ) | | | (2,007,376 | ) | | | (382,450 | ) | | | (3,053,780 | ) | |
| Capital share transactions (See Note 11): | |
| Net proceeds from sales of shares | | | 9,751,864 | | | | 2,505,824 | | | | 5,327,011 | | | | 5,231,473 | | |
| Reinvestment of distributions | | | 2,579,479 | | | | 1,549,271 | | | | 245,314 | | | | 1,626,126 | | |
| Cost of shares reacquired | | | (8,138,690 | ) | | | (7,397,010 | ) | | | (7,185,544 | ) | | | (11,320,232 | ) | |
Net increase (decrease) in net assets
resulting from capital share transactions | | | 4,192,653 | | | | (3,341,915 | ) | | | (1,613,219 | ) | | | (4,462,633 | ) | |
| Net increase (decrease) in net assets | | | 3,337,684 | | | | (3,679,294 | ) | | | (1,624,571 | ) | | | (4,895,365 | ) | |
| NET ASSETS: | |
| Beginning of year | | | 76,024,644 | | | | 47,709,225 | | | | 12,501,361 | | | | 75,518,503 | | |
| End of year | | $ | 79,362,328 | | | $ | 44,029,931 | | | $ | 10,876,790 | | | $ | 70,623,138 | | |
| Undistributed (distributions in excess of) net investment income | | $ | (233,811 | ) | | $ | 141,929 | | | $ | 2,063 | | | $ | (216,837 | ) | |
See Notes to Financial Statements.
150
| INCREASE (DECREASE) IN NET ASSETS | | Georgia | | High Yield | | Michigan | | Pennsylvania | |
| Operations: | |
| Net investment income | | $ | 4,344,538 | | | $ | 37,332,474 | | | $ | 3,128,979 | | | $ | 3,985,620 | | |
| Net realized loss on investments and futures contracts | | | (675,095 | ) | | | (6,548,414 | ) | | | (498,759 | ) | | | (367,834 | ) | |
Net increase from payment by an affiliate for net loss realized on
disposal of investments purchased/sold in error (See Note 3) | | | 2,300 | | | | – | | | | 424 | | | | 1,463 | | |
Net change in unrealized appreciation (depreciation) on investments
and futures contracts | | | 432,358 | | | | 30,000,604 | | | | (71,258 | ) | | | (664,199 | ) | |
| Net increase in net assets resulting from operations | | | 4,104,101 | | | | 60,784,664 | | | | 2,559,386 | | | | 2,955,050 | | |
| Distributions to shareholders from: | |
| Net investment income | |
| Class A | | | (4,411,251 | ) | | | (25,120,264 | ) | | | (3,114,405 | ) | | | (3,986,795 | ) | |
| Class B | | | – | | | | (525 | ) | | | – | | | | – | | |
| Class C | | | – | | | | (10,469,289 | ) | | | – | | | | – | | |
| Class P | | | – | | | | (559 | ) | | | – | | | | – | | |
| Total distributions to shareholders | | | (4,411,251 | ) | | | (35,590,637 | ) | | | (3,114,405 | ) | | | (3,986,795 | ) | |
| Capital share transactions (See Note 11): | |
| Net proceeds from sales of shares | | | 24,478,398 | | | | 722,189,407 | | | | 5,905,712 | | | | 4,694,173 | | |
| Reinvestment of distributions | | | 3,610,374 | | | | 19,526,867 | | | | 2,289,942 | | | | 2,324,459 | | |
| Cost of shares reacquired | | | (12,849,618 | ) | | | (123,538,303 | ) | | | (10,446,629 | ) | | | (9,285,564 | ) | |
Net increase (decrease) in net assets
resulting from capital share transactions | | | 15,239,154 | | | | 618,177,971 | | | | (2,250,975 | ) | | | (2,266,932 | ) | |
| Net increase (decrease) in net assets | | | 14,932,004 | | | | 643,371,998 | | | | (2,805,994 | ) | | | (3,298,677 | ) | |
| NET ASSETS: | |
| Beginning of year | | | 103,886,779 | | | | 438,287,968 | | | | 75,862,310 | | | | 97,068,827 | | |
| End of year | | $ | 118,818,783 | | | $ | 1,081,659,966 | | | $ | 73,056,316 | | | $ | 93,770,150 | | |
| Undistributed (distributions in excess of) net investment income | | $ | 22,384 | | | $ | 1,277,602 | | | $ | (191,410 | ) | | $ | (266,747 | ) | |
See Notes to Financial Statements.
151
Statements of Changes in Net Assets (continued)
For the Year Ended September 30, 2005
| INCREASE (DECREASE) IN NET ASSETS | | National | | California | | Connecticut | | Hawaii | |
| Operations: | |
| Net investment income | | $ | 22,733,743 | | | $ | 7,145,593 | | | $ | 3,745,433 | | | $ | 2,856,901 | | |
| Net realized gain on investments | | | 2,290,948 | | | | 1,322,239 | | | | 66,847 | | | | 157,963 | | |
| Net change in unrealized appreciation (depreciation) on investments | | | 28,933 | | | | 55,949 | | | | (523,627 | ) | | | (836,876 | ) | |
| Net increase in net assets resulting from operations | | | 25,053,624 | | | | 8,523,781 | | | | 3,288,653 | | | | 2,177,988 | | |
| Distributions to shareholders from: | |
| Net investment income | |
| Class A | | | (19,625,604 | ) | | | (6,411,414 | ) | | | (3,778,140 | ) | | | (2,890,561 | ) | |
| Class B | | | (1,070,508 | ) | | | – | | | | – | | | | – | | |
| Class C | | | (1,353,655 | ) | | | (441,459 | ) | | | – | | | | – | | |
| Total distributions to shareholders | | | (22,049,767 | ) | | | (6,852,873 | ) | | | (3,778,140 | ) | | | (2,890,561 | ) | |
| Capital share transactions (See Note 11): | |
| Net proceeds from sales of shares | | | 51,842,238 | | | | 17,495,318 | | | | 10,013,892 | | | | 15,258,859 | | |
| Reinvestment of distributions | | | 14,994,262 | | | | 4,038,026 | | | | 2,046,626 | | | | 1,726,144 | | |
| Cost of shares reacquired | | | (78,189,654 | ) | | | (22,248,071 | ) | | | (10,477,934 | ) | | | (7,652,681 | ) | |
Net increase (decrease) in net assets
resulting from capital share transactions | | | (11,353,154 | ) | | | (714,727 | ) | | | 1,582,584 | | | | 9,332,322 | | |
| Net increase (decrease) in net assets | | | (8,349,297 | ) | | | 956,181 | | | | 1,093,097 | | | | 8,619,749 | | |
| NET ASSETS: | |
| Beginning of year | | | 578,190,543 | | | | 179,223,415 | | | | 89,984,939 | | | | 69,597,680 | | |
| End of year | | $ | 569,841,246 | | | $ | 180,179,596 | | | $ | 91,078,036 | | | $ | 78,217,429 | | |
| Distributions in excess of net investment income | | $ | (1,327,652 | ) | | $ | (70,560 | ) | | $ | (298,911 | ) | | $ | (228,848 | ) | |
See Notes to Financial Statements.
152
| INCREASE (DECREASE) IN NET ASSETS | | Minnesota | | Missouri | | New Jersey | | New York | |
| Operations: | |
| Net investment income | | $ | 1,639,902 | | | $ | 6,403,640 | | | $ | 5,638,340 | | | $ | 10,241,498 | | |
| Net realized gain on investments | | | 32,645 | | | | 539,000 | | | | 488,086 | | | | 1,951,497 | | |
| Net change in unrealized appreciation (depreciation) on investments | | | 103,849 | | | | (263,132 | ) | | | 20,011 | | | | (3,675,093 | ) | |
| Net increase in net assets resulting from operations | | | 1,776,396 | | | | 6,679,508 | | | | 6,146,437 | | | | 8,517,902 | | |
| Distributions to shareholders from: | |
| Net investment income | |
| Class A | | | (1,561,827 | ) | | | (6,364,236 | ) | | | (5,542,184 | ) | | | (9,760,245 | ) | |
| Class B | | | – | | | | – | | | | – | | | | – | | |
| Class C | | | – | | | | – | | | | – | | | | (479,301 | ) | |
| Total distributions to shareholders | | | (1,561,827 | ) | | | (6,364,236 | ) | | | (5,542,184 | ) | | | (10,239,546 | ) | |
| Capital share transactions (See Note 11): | |
| Net proceeds from sales of shares | | | 8,422,579 | | | | 16,167,260 | | | | 10,342,291 | | | | 15,718,365 | | |
| Reinvestment of distributions | | | 1,370,007 | | | | 5,356,878 | | | | 3,087,893 | | | | 6,319,031 | | |
| Cost of shares reacquired | | | (5,312,810 | ) | | | (16,121,749 | ) | | | (16,176,894 | ) | | | (25,881,447 | ) | |
Net increase (decrease) in net assets
resulting from capital share transactions | | | 4,479,776 | | | | 5,402,389 | | | | (2,746,710 | ) | | | (3,844,051 | ) | |
| Net increase (decrease) in net assets | | | 4,694,345 | | | | 5,717,661 | | | | (2,142,457 | ) | | | (5,565,695 | ) | |
| NET ASSETS: | |
| Beginning of year | | | 38,487,909 | | | | 155,906,206 | | | | 139,461,848 | | | | 249,665,931 | | |
| End of year | | $ | 43,182,254 | | | $ | 161,623,867 | | | $ | 137,319,391 | | | $ | 244,100,236 | | |
| Distributions in excess of net investment income | | $ | (24,402 | ) | | $ | (466,214 | ) | | $ | (367,648 | ) | | $ | (861,779 | ) | |
See Notes to Financial Statements.
153
Statements of Changes in Net Assets (concluded)
For the Year Ended September 30, 2005
| INCREASE (DECREASE) IN NET ASSETS | | Texas | | Washington | | Insured
Intermediate | | Florida | |
| Operations: | |
| Net investment income | | $ | 3,269,965 | | | $ | 2,105,496 | | | $ | 294,444 | | | $ | 3,205,938 | | |
| Net realized gain (loss) on investments | | | 3,114 | | | | 80,130 | | | | 2,164 | | | | 305,623 | | |
| Net change in unrealized appreciation (depreciation) on investments | | | (737,907 | ) | | | (239,466 | ) | | | (165,184 | ) | | | (896,541 | ) | |
| Net increase in net assets resulting from operations | | | 2,535,172 | | | | 1,946,160 | | | | 131,424 | | | | 2,615,020 | | |
| Distributions to shareholders from: | |
| Net investment income | |
| Class A | | | (3,272,796 | ) | | | (2,194,346 | ) | | | (190,340 | ) | | | (3,022,602 | ) | |
| Class B | | | – | | | | – | | | | (10,816 | ) | | | – | | |
| Class C | | | – | | | | – | | | | (76,343 | ) | | | (231,091 | ) | |
| Class P | | | – | | | | – | | | | (276 | ) | | | – | | |
| Total distributions to shareholders | | | (3,272,796 | ) | | | (2,194,346 | ) | | | (277,775 | ) | | | (3,253,693 | ) | |
| Capital share transactions (See Note 11): | |
| Net proceeds from sales of shares | | | 4,539,764 | | | | 4,413,729 | | | | 6,773,004 | | | | 6,471,601 | | |
| Reinvestment of distributions | | | 2,472,778 | | | | 1,669,761 | | | | 191,241 | | | | 1,662,964 | | |
| Cost of shares reacquired | | | (5,836,564 | ) | | | (6,960,562 | ) | | | (4,294,792 | ) | | | (10,896,560 | ) | |
Net increase (decrease) in net assets
resulting from capital share transactions | | | 1,175,978 | | | | (877,072 | ) | | | 2,669,453 | | | | (2,761,995 | ) | |
| Net increase (decrease) in net assets | | | 438,354 | | | | (1,125,258 | ) | | | 2,523,102 | | | | (3,400,668 | ) | |
| NET ASSETS: | |
| Beginning of year | | | 75,586,290 | | | | 48,834,483 | | | | 9,978,259 | | | | 78,919,171 | | |
| End of year | | $ | 76,024,644 | | | $ | 47,709,225 | | | $ | 12,501,361 | | | $ | 75,518,503 | | |
| Undistributed (distributions in excess of) net investment income | | $ | (224,065 | ) | | $ | 219,243 | | | $ | 19,158 | | | $ | (246,382 | ) | |
*For the period 12/1/2004 (commencement of investment operations) to 9/30/2005.
See Notes to Financial Statements.
154
| INCREASE (DECREASE) IN NET ASSETS | | Georgia | | High Yield* | | Michigan | | Pennsylvania | |
| Operations: | |
| Net investment income | | $ | 3,764,927 | | | $ | 6,244,293 | | | $ | 3,060,313 | | | $ | 3,978,249 | | |
| Net realized gain (loss) on investments | | | 212,639 | | | | (737,293 | ) | | | 69,684 | | | | 78,667 | | |
| Net change in unrealized appreciation (depreciation) on investments | | | (134,845 | ) | | | 171,549 | | | | (470,326 | ) | | | 226,197 | | |
| Net increase in net assets resulting from operations | | | 3,842,721 | | | | 5,678,549 | | | | 2,659,671 | | | | 4,283,113 | | |
| Distributions to shareholders from: | |
| Net investment income | |
| Class A | | | (3,756,535 | ) | | | (4,944,903 | ) | | | (3,079,723 | ) | | | (4,015,282 | ) | |
| Class B | | | – | | | | (442 | ) | | | – | | | | – | | |
| Class C | | | – | | | | (1,760,470 | ) | | | – | | | | – | | |
| Class P | | | – | | | | (447 | ) | | | – | | | | – | | |
| Total distributions to shareholders | | | (3,756,535 | ) | | | (6,706,262 | ) | | | (3,079,723 | ) | | | (4,015,282 | ) | |
| Capital share transactions (See Note 11): | |
| Net proceeds from sales of shares | | | 23,571,680 | | | | 448,982,126 | | | | 8,951,088 | | | | 8,199,297 | | |
| Reinvestment of distributions | | | 3,147,985 | | | | 3,142,187 | | | | 2,186,282 | | | | 2,248,356 | | |
| Cost of shares reacquired | | | (12,399,318 | ) | | | (12,808,632 | ) | | | (8,145,069 | ) | | | (9,600,486 | ) | |
Net increase (decrease) in net assets
resulting from capital share transactions | | | 14,320,347 | | | | 439,315,681 | | | | 2,992,301 | | | | 847,167 | | |
| Net increase (decrease) in net assets | | | 14,406,533 | | | | 438,287,968 | | | | 2,572,249 | | | | 1,114,998 | | |
| NET ASSETS: | |
| Beginning of year | | | 89,480,246 | | | | – | | | | 73,290,061 | | | | 95,953,829 | | |
| End of year | | $ | 103,886,779 | | | $ | 438,287,968 | | | $ | 75,862,310 | | | $ | 97,068,827 | | |
| Undistributed (distributions in excess of) net investment income | | $ | 89,562 | | | $ | (461,975 | ) | | $ | (215,682 | ) | | $ | (291,303 | ) | |
See Notes to Financial Statements.
155
Financial Highlights
NATIONAL TAX-FREE FUND
| | | Year Ended 9/30 | |
| | | 2006 | | 2005 | | 2004 | | 2003 | | 2002 | |
| Per Share Operating Performance (Class A Shares) | |
| Net asset value, beginning of year | | $ | 11.55 | | | $ | 11.49 | | | $ | 11.50 | | | $ | 11.73 | | | $ | 11.33 | | |
| Investment operations: | |
| Net investment income(a) | | | .46 | | | | .47 | | | | .47 | | | | .50 | | | | .54 | | |
Net increase from payment by an
affiliate for net loss realized on
disposal of investments purchased/
sold in error | | | – | (c) | | | – | | | | – | | | | – | | | | – | | |
| Net realized and unrealized gain (loss) | | | (.02 | ) | | | .05 | | | | (.01 | ) | | | (.22 | ) | | | .40 | | |
| Total from investment operations | | | .44 | | | | .52 | | | | .46 | | | | .28 | | | | .94 | | |
Distributions to shareholders from net
investment income | | | (.47 | ) | | | (.46 | ) | | | (.47 | ) | | | (.51 | ) | | | (.54 | ) | |
| Net asset value, end of year | | $ | 11.52 | | | $ | 11.55 | | | $ | 11.49 | | | $ | 11.50 | | | $ | 11.73 | | |
| Total Return(b) | | | 3.94 | %(d) | | | 4.53 | % | | | 4.10 | % | | | 2.48 | % | | | 8.57 | % | |
| Ratios to Average Net Assets: | |
Expenses, including expense
reductions and expenses assumed | | | .92 | % | | | .93 | % | | | .96 | % | | | .98 | % | | | 1.03 | % | |
Expenses, excluding expense
reductions and expenses assumed | | | .92 | % | | | .94 | % | | | 1.00 | % | | | .98 | % | | | 1.04 | % | |
| Net investment income | | | 4.04 | % | | | 4.03 | % | | | 4.07 | % | | | 4.33 | % | | | 4.74 | % | |
| | | Year Ended 9/30 | |
| Supplemental Data: | | 2006 | | 2005 | | 2004 | | 2003 | | 2002 | |
| Net assets, end of year (000) | | $ | 499,778 | | | $ | 497,310 | | | $ | 500,519 | | | $ | 515,694 | | | $ | 530,563 | | |
| Portfolio turnover rate | | | 79.27 | % | | | 129.11 | % | | | 183.06 | % | | | 209.07 | % | | | 63.74 | % | |
See Notes to Financial Statements.
156
Financial Highlights (continued)
NATIONAL TAX-FREE FUND
| | | Year Ended 9/30 | |
| | | 2006 | | 2005 | | 2004 | | 2003 | | 2002 | |
| Per Share Operating Performance (Class B Shares) | |
| Net asset value, beginning of year | | $ | 11.58 | | | $ | 11.52 | | | $ | 11.53 | | | $ | 11.76 | | | $ | 11.36 | | |
| Investment operations: | |
| Net investment income(a) | | | .39 | | | | .39 | | | | .39 | | | | .42 | | | | .47 | | |
Net increase from payment by an
affiliate for net loss realized on
disposal of investments purchased/
sold in error | | | – | (c) | | | – | | | | – | | | | – | | | | – | | |
| Net realized and unrealized gain (loss) | | | (.02 | ) | | | .05 | | | | (.01 | ) | | | (.21 | ) | | | .40 | | |
| Total from investment operations | | | .37 | | | | .44 | | | | .38 | | | | .21 | | | | .87 | | |
Distributions to shareholders from net
investment income | | | (.39 | ) | | | (.38 | ) | | | (.39 | ) | | | (.44 | ) | | | (.47 | ) | |
| Net asset value, end of year | | $ | 11.56 | | | $ | 11.58 | | | $ | 11.52 | | | $ | 11.53 | | | $ | 11.76 | | |
| Total Return(b) | | | 3.32 | %(d) | | | 3.83 | % | | | 3.40 | % | | | 1.86 | % | | | 7.88 | % | |
| Ratios to Average Net Assets: | |
Expenses, including expense
reductions and expenses assumed | | | 1.58 | % | | | 1.58 | % | | | 1.61 | % | | | 1.63 | % | | | 1.65 | % | |
Expenses, excluding expense
reductions and expenses assumed | | | 1.58 | % | | | 1.59 | % | | | 1.65 | % | | | 1.63 | % | | | 1.66 | % | |
| Net investment income | | | 3.39 | % | | | 3.38 | % | | | 3.42 | % | | | 3.68 | % | | | 4.12 | % | |
| | | Year Ended 9/30 | |
| Supplemental Data: | | 2006 | | 2005 | | 2004 | | 2003 | | 2002 | |
| Net assets, end of year (000) | | $ | 27,871 | | | $ | 31,209 | | | $ | 34,263 | | | $ | 39,122 | | | $ | 36,250 | | |
| Portfolio turnover rate | | | 79.27 | % | | | 129.11 | % | | | 183.06 | % | | | 209.07 | % | | | 63.74 | % | |
See Notes to Financial Statements.
157
Financial Highlights (concluded)
NATIONAL TAX-FREE FUND
| | | Year Ended 9/30 | |
| | | 2006 | | 2005 | | 2004 | | 2003 | | 2002 | |
| Per Share Operating Performance (Class C Shares) | |
| Net asset value, beginning of year | | $ | 11.57 | | | $ | 11.50 | | | $ | 11.52 | | | $ | 11.76 | | | $ | 11.35 | | |
| Investment operations: | |
| Net investment income(a) | | | .39 | | | | .39 | | | | .39 | | | | .42 | | | | .47 | | |
Net increase from payment by an
affiliate for net loss realized on
disposal of investments purchased/
sold in error | | | – | (c) | | | – | | | | – | | | | – | | | | – | | |
| Net realized and unrealized gain (loss) | | | (.02 | ) | | | .06 | | | | (.02 | ) | | | (.22 | ) | | | .41 | | |
| Total from investment operations | | | .37 | | | | .45 | | | | .37 | | | | .20 | | | | .88 | | |
Distributions to shareholders from net
investment income | | | (.40 | ) | | | (.38 | ) | | | (.39 | ) | | | (.44 | ) | | | (.47 | ) | |
| Net asset value, end of year | | $ | 11.54 | | | $ | 11.57 | | | $ | 11.50 | | | $ | 11.52 | | | $ | 11.76 | | |
| Total Return(b) | | | 3.26 | %(d) | | | 3.93 | % | | | 3.32 | % | | | 1.80 | % | | | 7.95 | % | |
| Ratios to Average Net Assets: | |
Expenses, including expense
reductions and expenses assumed | | | 1.58 | % | | | 1.58 | % | | | 1.61 | % | | | 1.63 | % | | | 1.61 | % | |
Expenses, excluding expense
reductions and expenses assumed | | | 1.58 | % | | | 1.59 | % | | | 1.65 | % | | | 1.63 | % | | | 1.62 | % | |
| Net investment income | | | 3.39 | % | | | 3.38 | % | | | 3.42 | % | | | 3.68 | % | | | 4.16 | % | |
| | | Year Ended 9/30 | |
| Supplemental Data: | | 2006 | | 2005 | | 2004 | | 2003 | | 2002 | |
| Net assets, end of year (000) | | $ | 44,450 | | | $ | 41,322 | | | $ | 43,409 | | | $ | 49,474 | | | $ | 44,727 | | |
| Portfolio turnover rate | | | 79.27 | % | | | 129.11 | % | | | 183.06 | % | | | 209.07 | % | | | 63.74 | % | |
(a) Calculated using average shares outstanding during the period.
(b) Total return does not consider the effects of sales loads and assumes the reinvestment of all distributions.
(c) Amount is less than $.01.
(d) The effect of payment by an affiliate for loss realized due to a trading error on total return is less than .01%.
See Notes to Financial Statements.
158
Financial Highlights
CALIFORNIA TAX-FREE FUND
| | | Year Ended 9/30 | |
| | | 2006 | | 2005 | | 2004 | | 2003 | | 2002 | |
| Per Share Operating Performance (Class A Shares) | |
| Net asset value, beginning of year | | $ | 10.96 | | | $ | 10.86 | | | $ | 10.80 | | | $ | 11.19 | | | $ | 10.89 | | |
| Investment operations: | |
| Net investment income(a) | | | .41 | | | | .44 | | | | .43 | | | | .46 | | | | .52 | | |
Net increase from payment by an
affiliate for net loss realized on
disposal of investments purchased/
sold in error | | | – | (c) | | | – | | | | – | | | | – | | | | – | | |
| Net realized and unrealized gain (loss) | | | (.03 | ) | | | .08 | | | | .07 | | | | (.36 | ) | | | .29 | | |
| Total from investment operations | | | .38 | | | | .52 | | | | .50 | | | | .10 | | | | .81 | | |
Distributions to shareholders from net
investment income | | | (.43 | ) | | | (.42 | ) | | | (.44 | ) | | | (.49 | ) | | | (.51 | ) | |
| Net asset value, end of year | | $ | 10.91 | | | $ | 10.96 | | | $ | 10.86 | | | $ | 10.80 | | | $ | 11.19 | | |
| Total Return(b) | | | 3.52 | %(d) | | | 4.88 | % | | | 4.73 | % | | | .94 | % | | | 7.65 | % | |
| Ratios to Average Net Assets: | |
Expenses, including expense
reductions and expenses assumed | | | .93 | % | | | .94 | % | | | .99 | % | | | .99 | % | | | 1.03 | % | |
Expenses, excluding expense
reductions and expenses assumed | | | .94 | % | | | .94 | % | | | .99 | % | | | .99 | % | | | 1.04 | % | |
| Net investment income | | | 3.79 | % | | | 4.01 | % | | | 3.97 | % | | | 4.27 | % | | | 4.82 | % | |
| | | Year Ended 9/30 | |
| Supplemental Data: | | 2006 | | 2005 | | 2004 | | 2003 | | 2002 | |
| Net assets, end of year (000) | | $ | 160,416 | | | $ | 166,227 | | | $ | 165,270 | | | $ | 178,156 | | | $ | 192,181 | | |
| Portfolio turnover rate | | | 56.83 | % | | | 43.42 | % | | | 28.81 | % | | | 86.47 | % | | | 45.31 | % | |
See Notes to Financial Statements.
159
Financial Highlights (concluded)
CALIFORNIA TAX-FREE FUND
| | | Year Ended 9/30 | |
| | | 2006 | | 2005 | | 2004 | | 2003 | | 2002 | |
| Per Share Operating Performance (Class C Shares) | |
| Net asset value, beginning of year | | $ | 10.97 | | | $ | 10.87 | | | $ | 10.80 | | | $ | 11.20 | | | $ | 10.91 | | |
| Investment operations: | |
| Net investment income(a) | | | .34 | | | | .37 | | | | .36 | | | | .39 | | | | .46 | | |
Net increase from payment by an
affiliate for net loss realized on
disposal of investments purchased/
sold in error | | | – | (c) | | | – | | | | – | | | | – | | | | – | | |
| Net realized and unrealized gain (loss) | | | (.03 | ) | | | .08 | | | | .08 | | | | (.37 | ) | | | .27 | | |
| Total from investment operations | | | .31 | | | | .45 | | | | .44 | | | | .02 | | | | .73 | | |
Distributions to shareholders from net
investment income | | | (.36 | ) | | | (.35 | ) | | | (.37 | ) | | | (.42 | ) | | | (.44 | ) | |
| Net asset value, end of year | | $ | 10.92 | | | $ | 10.97 | | | $ | 10.87 | | | $ | 10.80 | | | $ | 11.20 | | |
| Total Return(b) | | | 2.87 | %(d) | | | 4.20 | % | | | 4.14 | % | | | .26 | % | | | 6.94 | % | |
| Ratios to Average Net Assets: | |
Expenses, including expense
reductions and expenses assumed | | | 1.58 | % | | | 1.58 | % | | | 1.63 | % | | | 1.63 | % | | | 1.61 | % | |
Expenses, excluding expense
reductions and expenses assumed | | | 1.59 | % | | | 1.58 | % | | | 1.63 | % | | | 1.63 | % | | | 1.62 | % | |
| Net investment income | | | 3.14 | % | | | 3.37 | % | | | 3.32 | % | | | 3.63 | % | | | 4.22 | % | |
| | | Year Ended 9/30 | |
| Supplemental Data: | | 2006 | | 2005 | | 2004 | | 2003 | | 2002 | |
| Net assets, end of year (000) | | $ | 15,052 | | | $ | 13,953 | | | $ | 13,953 | | | $ | 16,183 | | | $ | 14,290 | | |
| Portfolio turnover rate | | | 56.83 | % | | | 43.42 | % | | | 28.81 | % | | | 86.47 | % | | | 45.31 | % | |
(a) Calculated using average shares outstanding during the period.
(b) Total return does not consider the effects of sales loads and assumes the reinvestment of all distributions.
(a) Amount is less than $0.01.
(d) The effect of payment by an affiliate for loss realized due to a trading error on total return is less than .01%.
See Notes to Financial Statements.
160
Financial Highlights
CONNECTICUT TAX-FREE FUND
| | | Year Ended 9/30 | |
| | | 2006 | | 2005 | | 2004 | | 2003 | | 2002 | |
| Per Share Operating Performance (Class A Shares) | |
| Net asset value, beginning of year | | $ | 10.56 | | | $ | 10.61 | | | $ | 10.55 | | | $ | 10.71 | | | $ | 10.32 | | |
| Investment operations: | |
| Net investment income(a) | | | .45 | | | | .44 | | | | .43 | | | | .46 | | | | .50 | | |
Net increase from payment by an
affiliate for net loss realized on
disposal of investments purchased/
sold in error | | | – | (c) | | | – | | | | – | | | | – | | | | – | | |
| Net realized and unrealized gain (loss) | | | (.04 | ) | | | (.05 | ) | | | .08 | | | | (.16 | ) | | | .38 | | |
| Total from investment operations | | | .41 | | | | .39 | | | | .51 | | | | .30 | | | | .88 | | |
Distributions to shareholders from net
investment income | | | (.46 | ) | | | (.44 | ) | | | (.45 | ) | | | (.46 | ) | | | (.49 | ) | |
| Net asset value, end of year | | $ | 10.51 | | | $ | 10.56 | | | $ | 10.61 | | | $ | 10.55 | | | $ | 10.71 | | |
| Total Return(b) | | | 3.96 | %(d) | | | 3.74 | % | | | 4.92 | % | | | 2.95 | % | | | 8.79 | % | |
| Ratios to Average Net Assets: | |
Expenses, including expense
reductions and expenses assumed | | | .52 | % | | | .79 | % | | | 1.00 | % | | | 1.01 | % | | | 1.03 | % | |
Expenses, excluding expense
reductions and expenses assumed | | | .96 | % | | | .96 | % | | | 1.00 | % | | | 1.01 | % | | | 1.04 | % | |
| Net investment income | | | 4.34 | % | | | 4.11 | % | | | 4.09 | % | | | 4.33 | % | | | 4.82 | % | |
| | | Year Ended 9/30 | |
| Supplemental Data: | | 2006 | | 2005 | | 2004 | | 2003 | | 2002 | |
| Net assets, end of year (000) | | $ | 96,530 | | | $ | 91,078 | | | $ | 89,985 | | | $ | 96,469 | | | $ | 100,358 | | |
| Portfolio turnover rate | | | 45.35 | % | | | 10.25 | % | | | 20.16 | % | | | 41.50 | % | | | 48.64 | % | |
(a) Calculated using average shares outstanding during the period.
(b) Total return does not consider the effects of sales loads and assumes the reinvestment of all distributions.
(c) Amount is less than $0.01.
(d) The effect of payment by an affiliate for loss realized due to a trading error on total return is less than .01%.
See Notes to Financial Statements.
161
Financial Highlights
HAWAII TAX-FREE FUND
| | | Year Ended 9/30 | |
| | | 2006 | | 2005 | | 2004 | | 2003 | | 2002 | |
| Per Share Operating Performance (Class A Shares) | |
| Net asset value, beginning of year | | $ | 5.04 | | | $ | 5.08 | | | $ | 5.08 | | | $ | 5.20 | | | $ | 5.01 | | |
| Investment operations: | |
| Net investment income(a) | | | .20 | | | | .20 | | | | .21 | | | | .21 | | | | .23 | | |
Net increase from payment by an
affiliate for net loss realized on
disposal of investments purchased/
sold in error | | | – | (c) | | | – | | | | – | | | | – | | | | – | | |
| Net realized and unrealized gain (loss) | | | (.02 | ) | | | (.04 | ) | | | – | (c) | | | (.12 | ) | | | .20 | | |
| Total from investment operations | | | .18 | | | | .16 | | | | .21 | | | | .09 | | | | .43 | | |
Distributions to shareholders from net
investment income | | | (.21 | ) | | | (.20 | ) | | | (.21 | ) | | | (.21 | ) | | | (.24 | ) | |
| Net asset value, end of year | | $ | 5.01 | | | $ | 5.04 | | | $ | 5.08 | | | $ | 5.08 | | | $ | 5.20 | | |
| Total Return(b) | | | 3.60 | %(d) | | | 3.28 | % | | | 4.18 | % | | | 1.86 | % | | | 8.78 | % | |
| Ratios to Average Net Assets: | |
Expenses, including expense
reductions and expenses assumed | | | .71 | % | | | .95 | % | | | 1.01 | % | | | .99 | % | | | 1.05 | % | |
Expenses, excluding expense
reductions and expenses assumed | | | .96 | % | | | .96 | % | | | 1.01 | % | | | 1.00 | % | | | 1.06 | % | |
| Net investment income | | | 4.01 | % | | | 3.98 | % | | | 4.13 | % | | | 4.20 | % | | | 4.60 | % | |
| | | Year Ended 9/30 | |
| Supplemental Data: | | 2006 | | 2005 | | 2004 | | 2003 | | 2002 | |
| Net assets, end of year (000) | | $ | 91,357 | | | $ | 78,217 | | | $ | 69,598 | | | $ | 75,117 | | | $ | 79,988 | | |
| Portfolio turnover rate | | | 53.12 | % | | | 18.80 | % | | | 6.31 | % | | | 27.90 | % | | | 30.99 | % | |
(a) Calculated using average shares outstanding during the period.
(b) Total return does not consider the effects of sales loads and assumes the reinvestment of all distributions.
(c) Amount is less than $0.01.
(d) The effect of payment by an affiliate for loss realized due to a trading error on total return is less than .01%.
See Notes to Financial Statements.
162
Financial Highlights
MINNESOTA TAX-FREE FUND
| | | Year Ended 9/30 | |
| | | 2006 | | 2005 | | 2004 | | 2003 | | 2002 | |
| Per Share Operating Performance (Class A Shares) | |
| Net asset value, beginning of year | | $ | 5.19 | | | $ | 5.15 | | | $ | 5.14 | | | $ | 5.18 | | | $ | 5.00 | | |
| Investment operations: | |
| Net investment income(a) | | | .21 | | | | .21 | | | | .20 | | | | .21 | | | | .24 | | |
Net increase from payment by an
affiliate for net loss realized on
disposal of investments purchased/
sold in error | | | – | (c) | | | – | | | | – | | | | – | | | | – | | |
| Net realized and unrealized gain (loss) | | | (.01 | ) | | | .03 | | | | .01 | | | | (.03 | ) | | | .18 | | |
| Total from investment operations | | | .20 | | | | .24 | | | | .21 | | | | .18 | | | | .42 | | |
Distributions to shareholders from net
investment income | | | (.21 | ) | | | (.20 | ) | | | (.20 | ) | | | (.22 | ) | | | (.24 | ) | |
| Net asset value, end of year | | $ | 5.18 | | | $ | 5.19 | | | $ | 5.15 | | | $ | 5.14 | | | $ | 5.18 | | |
| Total Return(b) | | | 4.00 | %(d) | | | 4.74 | % | | | 4.24 | % | | | 3.57 | % | | | 8.56 | % | |
| Ratios to Average Net Assets: | |
| Expenses, including expense reductions | | | .67 | % | | | .67 | % | | | .68 | % | | | .69 | % | | | .46 | % | |
| Expenses, excluding expense reductions | | | .68 | % | | | .68 | % | | | .68 | % | | | .72 | % | | | .75 | % | |
| Net investment income | | | 4.14 | % | | | 4.05 | % | | | 4.00 | % | | | 4.03 | % | | | 4.79 | % | |
| | | Year Ended 9/30 | |
| Supplemental Data: | | 2006 | | 2005 | | 2004 | | 2003 | | 2002 | |
| Net assets, end of year (000) | | $ | 49,825 | | | $ | 43,182 | | | $ | 38,488 | | | $ | 37,016 | | | $ | 27,568 | | |
| Portfolio turnover rate | | | 36.70 | % | | | 17.42 | % | | | 24.67 | % | | | 35.15 | % | | | 22.33 | % | |
(a) Calculated using average shares outstanding during the period.
(b) Total return does not consider the effects of sales loads and assumes the reinvestment of all distributions.
(c) Amount represents less than $.01.
(d) The effect of payment by an affiliate for loss realized due to a trading error on total return is less than .01%.
See Notes to Financial Statements.
163
Financial Highlights
MISSOURI TAX-FREE FUND
| | | Year Ended 9/30 | |
| | | 2006 | | 2005 | | 2004 | | 2003 | | 2002 | |
| Per Share Operating Performance (Class A Shares) | |
| Net asset value, beginning of year | | $ | 5.35 | | | $ | 5.34 | | | $ | 5.36 | | | $ | 5.41 | | | $ | 5.25 | | |
| Investment operations: | |
| Net investment income(a) | | | .22 | | | | .22 | | | | .20 | | | | .22 | | | | .23 | | |
Net increase from payment by an
affiliate for net loss realized on
disposal of investments purchased/
sold in error | | | – | (c) | | | – | | | | – | | | | – | | | | – | | |
| Net realized and unrealized gain (loss) | | | (.02 | ) | | | – | (c) | | | – | (c) | | | (.05 | ) | | | .16 | | |
| Total from investment operations | | | .20 | | | | .22 | | | | .20 | | | | .17 | | | | .39 | | |
| Distributions to shareholders from: | |
| Net investment income | | | (.21 | ) | | | (.21 | ) | | | (.22 | ) | | | (.22 | ) | | | (.23 | ) | |
| Net realized gain | | | (.01 | ) | | | – | | | | – | | | | – | | | | – | | |
| Total distributions | | | (.22 | ) | | | (.21 | ) | | | (.22 | ) | | | (.22 | ) | | | (.23 | ) | |
| Net asset value, end of year | | $ | 5.33 | | | $ | 5.35 | | | $ | 5.34 | | | $ | 5.36 | | | $ | 5.41 | | |
| Total Return(b) | | | 3.92 | %(d) | | | 4.26 | % | | | 3.77 | % | | | 3.18 | % | | | 7.67 | % | |
| Ratios to Average Net Assets: | |
Expenses, including expense
reductions and expenses assumed | | | .57 | % | | | .67 | % | | | 1.02 | % | | | 1.00 | % | | | 1.03 | % | |
Expenses, excluding expense
reductions and expenses assumed | | | .96 | % | | | .95 | % | | | 1.01 | % | | | 1.01 | % | | | 1.06 | % | |
| Net investment income | | | 4.14 | % | | | 4.02 | % | | | 3.85 | % | | | 4.19 | % | | | 4.44 | % | |
| | | Year Ended 9/30 | |
| Supplemental Data: | | 2006 | | 2005 | | 2004 | | 2003 | | 2002 | |
| Net assets, end of year (000) | | $ | 159,530 | | | $ | 161,624 | | | $ | 155,906 | | | $ | 153,488 | | | $ | 145,006 | | |
| Portfolio turnover rate | | | 33.84 | % | | | 29.31 | % | | | 41.82 | % | | | 48.47 | % | | | 80.04 | % | |
(a) Calculated using average shares outstanding during the period.
(b) Total return does not consider the effects of sales loads and assumes the reinvestment of all distributions.
(c) Amount is less than $0.01.
(d) The effect of payment by an affiliate for loss realized due to a trading error on total return is less than .01%.
See Notes to Financial Statements.
164
Financial Highlights
NEW JERSEY TAX-FREE FUND
| | | Year Ended 9/30 | |
| | | 2006 | | 2005 | | 2004 | | 2003 | | 2002 | |
| Per Share Operating Performance (Class A Shares) | |
| Net asset value, beginning of year | | $ | 5.20 | | | $ | 5.18 | | | $ | 5.20 | | | $ | 5.37 | | | $ | 5.21 | | |
| Investment operations: | |
| Net investment income(a) | | | .21 | | | | .21 | | | | .22 | | | | .24 | | | | .25 | | |
Net increase from payment by an
affiliate for net loss realized on
disposal of investments purchased/
sold in error | | | – | (c) | | | – | | | | – | | | | – | | | | – | | |
| Net realized and unrealized gain (loss) | | | (.03 | ) | | | .02 | | | | (.02 | ) | | | (.17 | ) | | | .15 | | |
| Total from investment operations | | | .18 | | | | .23 | | | | .20 | | | | .07 | | | | .40 | | |
Distributions to shareholders from net
investment income | | | (.21 | ) | | | (.21 | ) | | | (.22 | ) | | | (.24 | ) | | | (.24 | ) | |
| Net asset value, end of year | | $ | 5.17 | | | $ | 5.20 | | | $ | 5.18 | | | $ | 5.20 | | | $ | 5.37 | | |
| Total Return(b) | | | 3.51 | %(d) | | | 4.42 | % | | | 3.89 | % | | | 1.31 | % | | | 7.96 | % | |
| Ratios to Average Net Assets: | |
Expenses, including expense
reductions and expenses assumed | | | .86 | % | | | .95 | % | | | 1.00 | % | | | 1.00 | % | | | 1.03 | % | |
Expenses, excluding expense
reductions and expenses assumed | | | .98 | % | | | .95 | % | | | 1.00 | % | | | 1.00 | % | | | 1.05 | % | |
| Net investment income | | | 4.03 | % | | | 4.02 | % | | | 4.18 | % | | | 4.49 | % | | | 4.77 | % | |
| | | Year Ended 9/30 | |
| Supplemental Data: | | 2006 | | 2005 | | 2004 | | 2003 | | 2002 | |
| Net assets, end of year (000) | | $ | 130,742 | | | $ | 137,319 | | | $ | 139,462 | | | $ | 153,797 | | | $ | 164,733 | | |
| Portfolio turnover rate | | | 36.94 | % | | | 36.15 | % | | | 32.57 | % | | | 70.02 | % | | | 97.76 | % | |
(a) Calculated using average shares outstanding during the period.
(b) Total return does not consider the effects of sales loads and assumes the reinvestment of all distributions.
(c) Amount is less than $0.01.
(d) The effect of payment by an affiliate for loss realized due to a trading error on total return is less than .01%.
See Notes to Financial Statements.
165
Financial Highlights
NEW YORK TAX-FREE FUND
| | | Year Ended 9/30 | |
| | | 2006 | | 2005 | | 2004 | | 2003 | | 2002 | |
| Per Share Operating Performance (Class A Shares) | |
| Net asset value, beginning of year | | $ | 11.32 | | | $ | 11.41 | | | $ | 11.42 | | | $ | 11.66 | | | $ | 11.16 | | |
| Investment operations: | |
| Net investment income(a) | | | .48 | | | | .48 | | | | .48 | | | | .52 | | | | .54 | | |
Net increase from payment by an
affiliate for net loss realized on
disposal of investments purchased/
sold in error | | | – | (c) | | | – | | | | – | | | | – | | | | – | | |
| Net realized and unrealized gain (loss) | | | (.05 | ) | | | (.09 | ) | | | – | (c) | | | (.24 | ) | | | .49 | | |
| Total from investment operations | | | .43 | | | | .39 | | | | .48 | | | | .28 | | | | 1.03 | | |
Distributions to shareholders from net
investment income | | | (.48 | ) | | | (.48 | ) | | | (.49 | ) | | | (.52 | ) | | | (.53 | ) | |
| Net asset value, end of year | | $ | 11.27 | | | $ | 11.32 | | | $ | 11.41 | | | $ | 11.42 | | | $ | 11.66 | | |
| Total Return(b) | | | 3.92 | %(d) | | | 3.43 | % | | | 4.33 | % | | | 2.55 | % | | | 9.50 | % | |
| Ratios to Average Net Assets: | |
Expenses, including expense
reductions and expenses assumed | | | .62 | % | | | .76 | % | | | .94 | % | | | .96 | % | | | 1.03 | % | |
Expenses, excluding expense
reductions and expenses assumed | | | .93 | % | | | .94 | % | | | .99 | % | | | .96 | % | | | 1.04 | % | |
| Net investment income | | | 4.27 | % | | | 4.16 | % | | | 4.27 | % | | | 4.54 | % | | | 4.80 | % | |
| | | Year Ended 9/30 | |
| Supplemental Data: | | 2006 | | 2005 | | 2004 | | 2003 | | 2002 | |
| Net assets, end of year (000) | | $ | 233,101 | | | $ | 229,598 | | | $ | 237,349 | | | $ | 247,153 | | | $ | 252,831 | | |
| Portfolio turnover rate | | | 78.83 | % | | | 60.01 | % | | | 48.17 | % | | | 47.94 | % | | | 51.72 | % | |
See Notes to Financial Statements.
166
Financial Highlights (concluded)
NEW YORK TAX-FREE FUND
| | | Year Ended 9/30 | |
| | | 2006 | | 2005 | | 2004 | | 2003 | | 2002 | |
| Per Share Operating Performance (Class C Shares) | |
| Net asset value, beginning of year | | $ | 11.32 | | | $ | 11.40 | | | $ | 11.42 | | | $ | 11.67 | | | $ | 11.17 | | |
| Investment operations: | |
| Net investment income(a) | | | .40 | | | | .40 | | | | .41 | | | | .44 | | | | .48 | | |
Net increase from payment by an
affiliate for net loss realized on
disposal of investments purchased/
sold in error | | | – | (c) | | | – | | | | – | | | | – | | | | – | | |
| Net realized and unrealized gain (loss) | | | (.04 | ) | | | (.08 | ) | | | (.01 | ) | | | (.23 | ) | | | .49 | | |
| Total from investment operations | | | .36 | | | | .32 | | | | .40 | | | | .21 | | | | .97 | | |
Distributions to shareholders from net
investment income | | | (.41 | ) | | | (.40 | ) | | | (.42 | ) | | | (.46 | ) | | | (.47 | ) | |
| Net asset value, end of year | | $ | 11.27 | | | $ | 11.32 | | | $ | 11.40 | | | $ | 11.42 | | | $ | 11.67 | | |
| Total Return(b) | | | 3.25 | %(d) | | | 2.87 | % | | | 3.57 | % | | | 1.88 | % | | | 8.90 | % | |
| Ratios to Average Net Assets: | |
Expenses, including expense
reductions and expenses assumed | | | 1.28 | % | | | 1.41 | % | | | 1.59 | % | | | 1.63 | % | | | 1.51 | % | |
Expenses, excluding expense
reductions and expenses assumed | | | 1.59 | % | | | 1.59 | % | | | 1.64 | % | | | 1.63 | % | | | 1.52 | % | |
| Net investment income | | | 3.61 | % | | | 3.51 | % | | | 3.62 | % | | | 3.87 | % | | | 4.32 | % | |
| | | Year Ended 9/30 | |
| Supplemental Data: | | 2006 | | 2005 | | 2004 | | 2003 | | 2002 | |
| Net assets, end of year (000) | | $ | 16,622 | | | $ | 14,502 | | | $ | 12,317 | | | $ | 12,379 | | | $ | 8,798 | | |
| Portfolio turnover rate | | | 78.83 | % | | | 60.01 | % | | | 48.17 | % | | | 47.94 | % | | | 51.72 | % | |
(a) Calculated using average shares outstanding during the period.
(b) Total return does not consider the effects of sales loads and assumes the reinvestment of all distributions.
(c) Amount is less than $0.01.
(d) The effect of payment by an affiliate for loss realized due to a trading error on total return is less than .01%.
See Notes to Financial Statements.
167
Financial Highlights
TEXAS TAX-FREE FUND
| | | Year Ended 9/30 | |
| | | 2006 | | 2005 | | 2004 | | 2003 | | 2002 | |
| Per Share Operating Performance (Class A Shares) | |
| Net asset value, beginning of year | | $ | 10.18 | | | $ | 10.28 | | | $ | 10.36 | | | $ | 10.47 | | | $ | 9.99 | | |
| Investment operations: | |
| Net investment income(a) | | | .44 | | | | .44 | | | | .44 | | | | .46 | | | | .45 | | |
Net increase from payment by an
affiliate for net loss realized on
disposal of investments purchased/
sold in error | | | – | (c) | | | – | | | | – | | | | – | | | | – | | |
| Net realized and unrealized gain (loss) | | | (.11 | ) | | | (.10 | ) | | | (.07 | ) | | | (.13 | ) | | | .48 | | |
| Total from investment operations | | | .33 | | | | .34 | | | | .37 | | | | .33 | | | | .93 | | |
Distributions to shareholders from net
investment income | | | (.44 | ) | | | (.44 | ) | | | (.45 | ) | | | (.44 | ) | | | (.45 | ) | |
| Net asset value, end of year | | $ | 10.07 | | | $ | 10.18 | | | $ | 10.28 | | | $ | 10.36 | | | $ | 10.47 | | |
| Total Return(b) | | | 3.33 | %(d) | | | 3.35 | % | | | 3.62 | % | | | 3.32 | % | | | 9.55 | % | |
| Ratios to Average Net Assets: | |
Expenses, including expense
reductions and expenses assumed | | | .84 | % | | | .95 | % | | | 1.06 | % | | | 1.02 | % | | | 1.00 | % | |
Expenses, excluding expense
reductions and expenses assumed | | | .98 | % | | | .98 | % | | | 1.06 | % | | | 1.02 | % | | | 1.05 | % | |
| Net investment income | | | 4.35 | % | | | 4.28 | % | | | 4.29 | % | | | 4.44 | % | | | 4.49 | % | |
| | | Year Ended 9/30 | |
| Supplemental Data: | | 2006 | | 2005 | | 2004 | | 2003 | | 2002 | |
| Net assets, end of year (000) | | $ | 79,362 | | | $ | 76,025 | | | $ | 75,586 | | | $ | 79,185 | | | $ | 81,369 | | |
| Portfolio turnover rate | | | 35.81 | % | | | 44.71 | % | | | 21.33 | % | | | 58.09 | % | | | 89.30 | % | |
(a) Calculated using average shares outstanding during the period.
(b) Total return does not consider the effects of sales loads and assumes the reinvestment of all distributions.
(c) Amount is less than $0.01.
(d) The effect of payment by an affiliate for loss realized due to a trading error on total return is less than .01%.
See Notes to Financial Statements.
168
Financial Highlights
WASHINGTON TAX-FREE FUND
| | | Year Ended 9/30 | |
| | | 2006 | | 2005 | | 2004 | | 2003 | | 2002 | |
| Per Share Operating Performance (Class A Shares) | |
| Net asset value, beginning of year | | $ | 5.14 | | | $ | 5.16 | | | $ | 5.21 | | | $ | 5.32 | | | $ | 5.15 | | |
| Investment operations: | |
| Net investment income(a) | | | .21 | | | | .23 | | | | .23 | | | | .24 | | | | .26 | | |
Net increase from payment by an
affiliate for net loss realized on
disposal of investments purchased/
sold in error | | | – | (c) | | | – | | | | – | | | | – | | | | – | | |
| Net realized and unrealized gain (loss) | | | (.03 | ) | | | (.01 | ) | | | (.04 | ) | | | (.10 | ) | | | .17 | | |
| Total from investment operations | | | .18 | | | | .22 | | | | .19 | | | | .14 | | | | .43 | | |
Distributions to shareholders from net
investment income | | | (.22 | ) | | | (.24 | ) | | | (.24 | ) | | | (.25 | ) | | | (.26 | ) | |
| Net asset value, end of year | | $ | 5.10 | | | $ | 5.14 | | | $ | 5.16 | | | $ | 5.21 | | | $ | 5.32 | | |
| Total Return(b) | | | 3.67 | %(d) | | | 4.24 | % | | | 3.75 | % | | | 2.75 | % | | | 8.71 | % | |
| Ratios to Average Net Assets: | |
| Expenses, including expense reductions | | | .69 | % | | | .65 | % | | | .70 | % | | | .68 | % | | | .71 | % | |
| Expenses, excluding expense reductions | | | .70 | % | | | .65 | % | | | .70 | % | | | .68 | % | | | .72 | % | |
| Net investment income | | | 4.22 | % | | | 4.36 | % | | | 4.49 | % | | | 4.68 | % | | | 5.14 | % | |
| | | Year Ended 9/30 | |
| Supplemental Data: | | 2006 | | 2005 | | 2004 | | 2003 | | 2002 | |
| Net assets, end of year (000) | | $ | 44,030 | | | $ | 47,709 | | | $ | 48,834 | | | $ | 50,497 | | | $ | 49,049 | | |
| Portfolio turnover rate | | | 26.35 | % | | | 39.36 | % | | | 49.05 | % | | | 58.05 | % | | | 40.20 | % | |
(a) Calculated using average shares outstanding during the period.
(b) Total return does not consider the effects of sales loads and assumes the reinvestment of all distributions.
(c) Amount is less than $0.01.
(d) The effect of payment by an affiliate for loss realized due to a trading error on total return is less than .01%.
See Notes to Financial Statements.
169
Financial Highlights
INSURED INTERMEDIATE TAX-FREE FUND
| | | Year Ended 9/30 | | 6/23/2003(a)
to | |
| | | 2006 | | 2005 | | 2004 | | 9/30/2003 | |
| Per Share Operating Performance (Class A Shares) | |
| Net asset value, beginning of period | | $ | 9.80 | | | $ | 9.95 | | | $ | 9.94 | | | $ | 10.00 | | |
| Unrealized depreciation on investments | | | | | | | | | | | | | | | (.01 | ) | |
| Net asset value on SEC Effective Date, June 30, 2003 | | | | | | | | | | | | | | $ | 9.99 | | |
| Investment operations: | |
| Net investment income(b) | | | .32 | | | | .30 | | | | .27 | | | | .06 | | |
| Net realized and unrealized gain (loss) | | | .03 | | | | (.17 | ) | | | .01 | | | | (.05 | ) | |
| Total from investment operations | | | .35 | | | | .13 | | | | .28 | | | | .01 | | |
Distributions to shareholders from net
investment income | | | (.34 | ) | | | (.28 | ) | | | (.27 | ) | | | (.06 | ) | |
| Net asset value, end of period | | $ | 9.81 | | | $ | 9.80 | | | $ | 9.95 | | | $ | 9.94 | | |
| Total Return(d) | | | | | | | | | | | | | | | (.10 | )%(e)(f) | |
| Total Return(d) | | | 3.67 | % | | | 1.36 | % | | | 2.84 | % | | | .16 | %(e)(g) | |
| Ratios to Average Net Assets: | |
Expenses, including expense
reductions and expenses assumed | | | .25 | % | | | .25 | % | | | .25 | %† | | | .07 | %(e)† | |
Expenses, excluding expense
reductions and expenses assumed | | | 1.66 | % | | | 1.42 | % | | | 2.35 | %† | | | 2.47 | %(e)† | |
| Net investment income | | | 3.34 | % | | | 3.01 | % | | | 2.70 | %† | | | .66 | %(e)† | |
| | | Year Ended 9/30 | | 6/23/2003(a)
to | |
| Supplemental Data: | | 2006 | | 2005 | | 2004 | | 9/30/2003 | |
| Net assets, end of period (000) | | $ | 7,234 | | | $ | 7,941 | | | $ | 6,360 | | | $ | 3,673 | | |
| Portfolio turnover rate | | | 100.82 | % | | | 42.10 | % | | | 60.08 | % | | | 107.99 | % | |
See Notes to Financial Statements.
170
Financial Highlights (continued)
INSURED INTERMEDIATE TAX-FREE FUND
| | | Year Ended 9/30 | | 6/23/2003(a)
to | |
| | | 2006 | | 2005 | | 2004 | | 9/30/2003 | |
| Per Share Operating Performance (Class B Shares) | |
| Net asset value, beginning of period | | $ | 9.79 | | | $ | 9.94 | | | $ | 9.93 | | | $ | 10.00 | | |
| Unrealized depreciation on investments | | | | | | | | | | | | | | | (.02 | ) | |
| Net asset value on SEC Effective Date, June 30, 2003 | | | | | | | | | | | | | | $ | 9.98 | | |
| Investment operations: | |
| Net investment income(b) | | | .26 | | | | .21 | | | | .20 | | | | .05 | | |
| Net realized and unrealized gain (loss) | | | .02 | | | | (.16 | ) | | | – | (c) | | | (.05 | ) | |
| Total from investment operations | | | .28 | | | | .05 | | | | .20 | | | | – | | |
Distributions to shareholders from net
investment income | | | (.27 | ) | | | (.20 | ) | | | (.19 | ) | | | (.05 | ) | |
| Net asset value, end of period | | $ | 9.80 | | | $ | 9.79 | | | $ | 9.94 | | | $ | 9.93 | | |
| Total Return(d) | | | | | | | | | | | | | | | (.20 | )%(e)(f) | |
| Total Return(d) | | | 2.92 | % | | | .55 | % | | | 2.09 | % | | | .04 | %(e)(g) | |
| Ratios to Average Net Assets: | |
Expenses, including expense
reductions and expenses assumed | | | 1.00 | % | | | 1.00 | % | | | 1.00 | %† | | | .27 | %(e)† | |
Expenses, excluding expense
reductions and expenses assumed | | | 2.32 | % | | | 2.11 | % | | | 3.00 | %† | | | 2.64 | %(e)† | |
| Net investment income | | | 2.67 | % | | | 2.15 | % | | | 1.95 | %† | | | .46 | %(e)† | |
| | | Year Ended 9/30 | | 6/23/2003(a)
to | |
| Supplemental Data: | | 2006 | | 2005 | | 2004 | | 9/30/2003 | |
| Net assets, end of period (000) | | $ | 848 | | | $ | 775 | | | $ | 311 | | | $ | 312 | | |
| Portfolio turnover rate | | | 100.82 | % | | | 42.10 | % | | | 60.08 | % | | | 107.99 | % | |
See Notes to Financial Statements.
171
Financial Highlights (continued)
INSURED INTERMEDIATE TAX-FREE FUND
| | | Year Ended 9/30 | | 6/23/2003(a)
to | |
| | | 2006 | | 2005 | | 2004 | | 9/30/2003 | |
| Per Share Operating Performance (Class C Shares) | |
| Net asset value, beginning of period | | $ | 9.79 | | | $ | 9.94 | | | $ | 9.93 | | | $ | 10.00 | | |
| Unrealized depreciation on investments | | | | | | | | | | | | | | | (.02 | ) | |
| Net asset value on SEC Effective Date, June 30, 2003 | | | | | | | | | | | | | | $ | 9.98 | | |
| Investment operations: | |
| Net investment income(b) | | | .25 | | | | .23 | | | | .20 | | | | .05 | | |
| Net realized and unrealized gain (loss) | | | .03 | | | | (.17 | ) | | | – | (c) | | | (.05 | ) | |
| Total from investment operations | | | .28 | | | | .06 | | | | .20 | | | | – | | |
Distributions to shareholders from net
investment income | | | (.27 | ) | | | (.21 | ) | | | (.19 | ) | | | (.05 | ) | |
| Net asset value, end of period | | $ | 9.80 | | | $ | 9.79 | | | $ | 9.94 | | | $ | 9.93 | | |
| Total Return(d) | | | | | | | | | | | | | | | (.20 | )%(e)(f) | |
| Total Return(d) | | | 2.90 | % | | | .61 | % | | | 2.05 | % | | | (.04 | )%(e)(g) | |
| Ratios to Average Net Assets: | |
Expenses, including expense
reductions and expenses assumed | | | 1.00 | % | | | 1.00 | % | | | 1.00 | %† | | | .27 | %(e)† | |
Expenses, excluding expense
reductions and expenses assumed | | | 2.31 | % | | | 2.06 | % | | | 3.00 | %† | | | 2.64 | %(e)† | |
| Net investment income | | | 2.59 | % | | | 2.28 | % | | | 1.95 | %† | | | .46 | %(e)† | |
| | | Year Ended 9/30 | | 6/23/2003(a)
to | |
| Supplemental Data: | | 2006 | | 2005 | | 2004 | | 9/30/2003 | |
| Net assets, end of period (000) | | $ | 2,784 | | | $ | 3,775 | | | $ | 3,297 | | | $ | 313 | | |
| Portfolio turnover rate | | | 100.82 | % | | | 42.10 | % | | | 60.08 | % | | | 107.99 | % | |
See Notes to Financial Statements.
172
Financial Highlights (concluded)
INSURED INTERMEDIATE TAX-FREE FUND
| | | Year Ended 9/30 | | 6/23/2003(a)
to | |
| | | 2006 | | 2005 | | 2004 | | 9/30/2003 | |
| Per Share Operating Performance (Class P Shares) | |
| Net asset value, beginning of period | | $ | 9.80 | | | $ | 9.95 | | | $ | 9.94 | | | $ | 10.00 | | |
| Unrealized depreciation on investments | | | | | | | | | | | | | | | (.01 | ) | |
| Net asset value on SEC Effective Date, June 30, 2003 | | | | | | | | | | | | | | $ | 9.99 | | |
| Investment operations: | |
| Net investment income(b) | | | .31 | | | | .28 | | | | .25 | | | | .06 | | |
| Net realized and unrealized gain (loss) | | | .02 | | | | (.17 | ) | | | .01 | | | | (.05 | ) | |
| Total from investment operations | | | .33 | | | | .11 | | | | .26 | | | | .01 | | |
Distributions to shareholders from net
investment income | | | (.32 | ) | | | (.26 | ) | | | (.25 | ) | | | (.06 | ) | |
| Net asset value, end of period | | $ | 9.81 | | | $ | 9.80 | | | $ | 9.95 | | | $ | 9.94 | | |
| Total Return(d) | | | | | | | | | | | | | | | (.10 | )%(e)(f) | |
| Total Return(d) | | | 3.46 | % | | | 1.16 | % | | | 2.65 | % | | | .11 | %(e)(g) | |
| Ratios to Average Net Assets: | |
Expenses, including expense
reductions and expenses assumed | | | .45 | % | | | .45 | % | | | .45 | %† | | | .12 | %(e)† | |
Expenses, excluding expense
reductions and expenses assumed | | | 1.77 | % | | | 1.50 | % | | | 2.45 | %† | | | 2.49 | %(e)† | |
| Net investment income | | | 3.15 | % | | | 2.83 | % | | | 2.50 | %† | | | .61 | %(e)† | |
| | | Year Ended 9/30 | | 6/23/2003(a)
to | |
| Supplemental Data: | | 2006 | | 2005 | | 2004 | | 9/30/2003 | |
| Net assets, end of period (000) | | $ | 11 | | | $ | 10 | | | $ | 10 | | | $ | 10 | | |
| Portfolio turnover rate | | | 100.82 | % | | | 42.10 | % | | | 60.08 | % | | | 107.99 | % | |
† The ratios have been determined on a Fund basis.
(a) Commencement of investment operations; SEC effective date and date shares first became available to the public was 6/30/2003.
(b) Calculated using average shares outstanding during the period.
(c) Amount is less than $0.01.
(d) Total return does not consider the effects of sales loads and assumes the reinvestment of all distributions.
(e) Not annualized.
(f) Total return for the period 6/23/2003 through 6/30/2003.
(g) Total return for the period 6/30/2003 through 9/30/2003.
See Notes to Financial Statements.
173
Financial Highlights
FLORIDA TAX-FREE TRUST
| | | Year Ended 9/30 | |
| | | 2006 | | 2005 | | 2004 | | 2003 | | 2002 | |
| Per Share Operating Performance (Class A Shares) | |
| Net asset value, beginning of year | | $ | 4.78 | | | $ | 4.82 | | | $ | 4.88 | | | $ | 4.97 | | | $ | 4.82 | | |
| Investment operations: | |
| Net investment income(a) | | | .20 | | | | .20 | | | | .20 | | | | .21 | | | | .23 | | |
Net increase from payment by an
affiliate for net loss realized on
disposal of investments purchased/
sold in error | | | – | (c) | | | – | | | | – | | | | – | | | | – | | |
| Net realized and unrealized gain (loss) | | | (.03 | ) | | | (.03 | ) | | | (.05 | ) | | | (.09 | ) | | | .15 | | |
| Total from investment operations | | | .17 | | | | .17 | | | | .15 | | | | .12 | | | | .38 | | |
Distributions to shareholders from net
investment income | | | (.20 | ) | | | (.21 | ) | | | (.21 | ) | | | (.21 | ) | | | (.23 | ) | |
| Net asset value, end of year | | $ | 4.75 | | | $ | 4.78 | | | $ | 4.82 | | | $ | 4.88 | | | $ | 4.97 | | |
| Total Return(b) | | | 3.70 | %(d) | | | 3.48 | % | | | 3.13 | % | | | 2.62 | % | | | 8.10 | % | |
| Ratios to Average Net Assets: | |
Expenses, including expense
reductions and expenses assumed | | | .75 | % | | | .76 | % | | | 1.02 | % | | | 1.04 | % | | | 1.07 | % | |
Expenses, excluding expense
reductions and expenses assumed | | | 1.03 | % | | | 1.00 | % | | | 1.02 | % | | | 1.04 | % | | | 1.08 | % | |
| Net investment income | | | 4.30 | % | | | 4.21 | % | | | 4.24 | % | | | 4.33 | % | | | 4.74 | % | |
| | | Year Ended 9/30 | |
| Supplemental Data: | | 2006 | | 2005 | | 2004 | | 2003 | | 2002 | |
| Net assets, end of year (000) | | $ | 64,392 | | | $ | 68,633 | | | $ | 72,995 | | | $ | 78,278 | | | $ | 84,325 | | |
| Portfolio turnover rate | | | 53.31 | % | | | 52.43 | % | | | 74.33 | % | | | 86.95 | % | | | 82.90 | % | |
See Notes to Financial Statements.
174
Financial Highlights (concluded)
FLORIDA TAX-FREE TRUST
| | | Year Ended 9/30 | |
| | | 2006 | | 2005 | | 2004 | | 2003 | | 2002 | |
| Per Share Operating Performance (Class C Shares) | |
| Net asset value, beginning of year | | $ | 4.78 | | | $ | 4.83 | | | $ | 4.89 | | | $ | 4.98 | | | $ | 4.83 | | |
| Investment operations: | |
| Net investment income(a) | | | .17 | | | | .17 | | | | .17 | | | | .18 | | | | .20 | | |
Net increase from payment by an
affiliate for net loss realized on
disposal of investments purchased/
sold in error | | | – | (c) | | | – | | | | – | | | | – | | | | – | | |
| Net realized and unrealized gain (loss) | | | (.02 | ) | | | (.04 | ) | | | (.05 | ) | | | (.09 | ) | | | .14 | | |
| Total from investment operations | | | .15 | | | | .13 | | | | .12 | | | | .09 | | | | .34 | | |
Distributions to shareholders from net
investment income | | | (.17 | ) | | | (.18 | ) | | | (.18 | ) | | | (.18 | ) | | | (.19 | ) | |
| Net asset value, end of year | | $ | 4.76 | | | $ | 4.78 | | | $ | 4.83 | | | $ | 4.89 | | | $ | 4.98 | | |
| Total Return(b) | | | 3.29 | %(d) | | | 2.65 | % | | | 2.44 | % | | | 1.97 | % | | | 7.32 | % | |
| Ratios to Average Net Assets: | |
Expenses, including expense
reductions and expenses assumed | | | 1.40 | % | | | 1.40 | % | | | 1.67 | % | | | 1.71 | % | | | 1.73 | % | |
Expenses, excluding expense
reductions and expenses assumed | | | 1.66 | % | | | 1.62 | % | | | 1.67 | % | | | 1.71 | % | | | 1.74 | % | |
| Net investment income | | | 3.65 | % | | | 3.55 | % | | | 3.59 | % | | | 3.66 | % | | | 4.08 | % | |
| | | Year Ended 9/30 | |
| Supplemental Data: | | 2006 | | 2005 | | 2004 | | 2003 | | 2002 | |
| Net assets, end of year (000) | | $ | 6,231 | | | $ | 6,886 | | | $ | 5,924 | | | $ | 6,514 | | | $ | 5,927 | | |
| Portfolio turnover rate | | | 53.31 | % | | | 52.43 | % | | | 74.33 | % | | | 86.95 | % | | | 82.90 | % | |
(a) Calculated using average shares outstanding during the period.
(b) Total return does not consider the effects of sales loads and assumes the reinvestment of all distributions.
(c) Amount is less than $0.01.
(d) The effect of payment by an affiliate for loss realized due to a trading error on total return is less than .01%.
See Notes to Financial Statements.
175
Financial Highlights
GEORGIA TAX-FREE TRUST
| | | Year Ended 9/30 | |
| | | 2006 | | 2005 | | 2004 | | 2003 | | 2002 | |
| Per Share Operating Performance (Class A Shares) | |
| Net asset value, beginning of year | | $ | 5.66 | | | $ | 5.65 | | | $ | 5.63 | | | $ | 5.70 | | | $ | 5.44 | | |
| Investment operations: | |
| Net investment income(a) | | | .22 | | | | .23 | | | | .23 | | | | .24 | | | | .23 | | |
Net increase from payment by an
affiliate for net loss realized on
disposal of investments purchased/
sold in error | | | – | (c) | | | – | | | | – | | | | – | | | | – | | |
| Net realized and unrealized gain (loss) | | | (.01 | ) | | | .01 | | | | .02 | | | | (.06 | ) | | | .26 | | |
| Total from investment operations | | | .21 | | | | .24 | | | | .25 | | | | .18 | | | | .49 | | |
| Distributions to shareholders from: | |
| Net investment income | | | (.23 | ) | | | (.23 | ) | | | (.23 | ) | | | (.23 | ) | | | (.23 | ) | |
| Net realized gain | | | – | | | | – | | | | – | | | | (.02 | ) | | | – | | |
| Total distributions | | | (.23 | ) | | | (.23 | ) | | | (.23 | ) | | | (.25 | ) | | | (.23 | ) | |
| Net asset value, end of year | | $ | 5.64 | | | $ | 5.66 | | | $ | 5.65 | | | $ | 5.63 | | | $ | 5.70 | | |
| Total Return(b) | | | 3.77 | %(d) | | | 4.24 | % | | | 4.54 | % | | | 3.21 | % | | | 9.27 | % | |
| Ratios to Average Net Assets: | |
Expenses, including expense
reductions and expenses assumed | | | .44 | % | | | .61 | % | | | .67 | % | | | .68 | % | | | .69 | % | |
Expenses, excluding expense
reductions and expenses assumed | | | .91 | % | | | .62 | % | | | .67 | % | | | .69 | % | | | .72 | % | |
| Net investment income | | | 3.99 | % | | | 3.98 | % | | | 4.14 | % | | | 4.26 | % | | | 4.24 | % | |
| | | Year Ended 9/30 | |
| Supplemental Data: | | 2006 | | 2005 | | 2004 | | 2003 | | 2002 | |
| Net assets, end of year (000) | | $ | 118,819 | | | $ | 103,887 | | | $ | 89,480 | | | $ | 85,441 | | | $ | 69,836 | | |
| Portfolio turnover rate | | | 50.70 | % | | | 26.01 | % | | | 21.27 | % | | | 34.13 | % | | | 48.66 | % | |
(a) Calculated using average shares outstanding during the period.
(b) Total return does not consider the effects of sales loads and assumes the reinvestment of all distributions.
(c) Amount is less than $0.01.
(d) The effect of payment by an affiliate for loss realized due to a trading error on total return is less than .01%.
See Notes to Financial Statements.
176
Financial Highlights
HIGH YIELD MUNICIPAL BOND FUND
| | |
Year Ended
9/30/2006 | | 12/1/2004(a)
to
9/30/2005 | |
| Per Share Operating Performance (Class A Shares) | |
| Net asset value, beginning of period | | $ | 15.41 | | | $ | 15.00 | | |
| Investment operations: | |
| Net investment income(b) | | | | | | | .03 | | |
| Net realized and unrealized gain | | | | | | | .17 | | |
| Total from investment operations | | | | | | | .20 | | |
| Distributions to shareholders from net investment income | | | | | | | (.03 | ) | |
| Net asset value on SEC Effective Date, December 30, 2004 | | | | | | $ | 15.17 | | |
| Investment operations: | |
| Net investment income(b) | | | .82 | | | | .56 | | |
| Net realized and unrealized gain | | | .37 | | | | .31 | | |
| Total from investment operations | | | 1.19 | | | | .87 | | |
| Distributions to shareholders from net investment income | | | (.79 | ) | | | (.63 | ) | |
| Net asset value, end of period | | $ | 15.81 | | | $ | 15.41 | | |
| Total Return(c) | | | | | | | 1.36 | %(d)(e) | |
| Total Return(c) | | | 7.97 | % | | | 5.79 | %(d)(f) | |
| Ratios to Average Net Assets: | |
| Expenses, including expense reductions and expenses assumed | | | .16 | % | | | .00 | %(d)(g) | |
| Expenses, excluding expense reductions and expenses assumed | | | 1.01 | % | | | 1.00 | %(h) | |
| Net investment income | | | 5.28 | % | | | 4.80 | %(h) | |
| Supplemental Data: | |
Year Ended
9/30/2006 | | 12/1/2004(a)
to
9/30/2005 | |
| Net assets, end of period (000) | | $ | 731,726 | | | $ | 312,948 | | |
| Portfolio turnover rate | | | 89.78 | % | | | 112.47 | % | |
See Notes to Financial Statements.
177
Financial Highlights (continued)
HIGH YIELD MUNICIPAL BOND FUND
| | | Year Ended
9/30/2006 | | 12/1/2004(a)
to
9/30/2005 | |
| Per Share Operating Performance (Class B Shares) | |
| Net asset value, beginning of period | | $ | 15.41 | | | $ | 15.00 | | |
| Investment operations: | |
| Net investment income(b) | | | | | | | .02 | | |
| Net realized and unrealized gain | | | | | | | .17 | | |
| Total from investment operations | | | | | | | .19 | | |
| Distributions to shareholders from net investment income | | | | | | | (.02 | ) | |
| Net asset value on SEC Effective Date, December 30, 2004 | | | | | | $ | 15.17 | | |
| Investment operations: | |
| Net investment income(b) | | | .77 | | | | .58 | | |
| Net realized and unrealized gain | | | .37 | | | | .29 | | |
| Total from investment operations | | | 1.14 | | | | .87 | | |
| Distributions to shareholders from net investment income | | | (.74 | ) | | | (.63 | ) | |
| Net asset value, end of period | | $ | 15.81 | | | $ | 15.41 | | |
| Total Return(c) | | | | | | | 1.29 | %(d)(e) | |
| Total Return(c) | | | 7.62 | % | | | 5.80 | %(d)(f) | |
| Ratios to Average Net Assets: | |
| Expenses, including expense reductions and expenses assumed | | | .47 | % | | | .07 | %(d) | |
| Expenses, excluding expense reductions and expenses assumed | | | 1.63 | % | | | 1.71 | %(h) | |
| Net investment income | | | 4.99 | % | | | 4.74 | %(h) | |
| Supplemental Data: | | Year Ended
9/30/2006 | | 12/1/2004(a)
to
9/30/2005 | |
| Net assets, end of period (000) | | $ | 11 | | | $ | 10 | | |
| Portfolio turnover rate | | | 89.78 | % | | | 112.47 | % | |
See Notes to Financial Statements.
178
Financial Highlights (continued)
HIGH YIELD MUNICIPAL BOND FUND
| | | Year Ended
9/30/2006 | | 12/1/2004(a)
to
9/30/2005 | |
| Per Share Operating Performance (Class C Shares) | |
| Net asset value, beginning of period | | $ | 15.41 | | | $ | 15.00 | | |
| Investment operations: | |
| Net investment income(b) | | | | | | | .02 | | |
| Net realized and unrealized gain | | | | | | | .17 | | |
| Total from investment operations | | �� | | | | | .19 | | |
| Distributions to shareholders from net investment income | | | | | | | (.02 | ) | |
| Net asset value on SEC Effective Date, December 30, 2004 | | | | | | $ | 15.17 | | |
| Investment operations: | |
| Net investment income(b) | | | .76 | | | | .56 | | |
| Net realized and unrealized gain | | | .38 | | | | .31 | | |
| Total from investment operations | | | 1.14 | | | | .87 | | |
| Distributions to shareholders from net investment income | | | (.74 | ) | | | (.63 | ) | |
| Net asset value, end of period | | $ | 15.81 | | | $ | 15.41 | | |
| Total Return(c) | | | | | | | 1.29 | %(d)(e) | |
| Total Return(c) | | | 7.62 | % | | | 5.79 | %(d)(f) | |
| Ratios to Average Net Assets: | |
| Expenses, including expense reductions and expenses assumed | | | .54 | % | | | .00 | %(d)(g) | |
| Expenses, excluding expense reductions and expenses assumed | | | 1.65 | % | | | 1.64 | %(h) | |
| Net investment income | | | 4.89 | % | | | 4.79 | %(h) | |
| Supplemental Data: | | Year Ended
9/30/2006 | | 12/1/2004(a)
to
9/30/2005 | |
| Net assets, end of period (000) | | $ | 349,911 | | | $ | 125,319 | | |
| Portfolio turnover rate | | | 89.78 | % | | | 112.47 | % | |
See Notes to Financial Statements.
179
Financial Highlights (concluded)
HIGH YIELD MUNICIPAL BOND FUND
| | | Year Ended
9/30/2006 | | 12/1/2004(a)
to
9/30/2005 | |
| Per Share Operating Performance (Class P Shares) | |
| Net asset value, beginning of period | | $ | 15.42 | | | $ | 15.00 | | |
| Investment operations: | |
| Net investment income(b) | | | | | | | .03 | | |
| Net realized and unrealized gain | | | | | | | .17 | | |
| Total from investment operations | | | | | | | .20 | | |
| Distributions to shareholders from net investment income | | | | | | | (.03 | ) | |
| Net asset value on SEC Effective Date, December 30, 2004 | | | | | | $ | 15.17 | | |
| Investment operations: | |
| Net investment income(b) | | | .83 | | | | .58 | | |
| Net realized and unrealized gain | | | .36 | | | | .30 | | |
| Total from investment operations | | | 1.19 | | | | .88 | | |
| Distributions to shareholders from net investment income | | | (.79 | ) | | | (.63 | ) | |
| Net asset value, end of period | | $ | 15.82 | | | $ | 15.42 | | |
| Total Return(c) | | | | | | | 1.34 | %(d)(e) | |
| Total Return(c) | | | 7.94 | % | | | 5.86 | %(d)(f) | |
| Ratios to Average Net Assets: | |
| Expenses, including expense reductions and expenses assumed | | | .13 | % | | | .03 | %(d) | |
| Expenses, excluding expense reductions and expenses assumed | | | 1.12 | % | | | 1.20 | %(h) | |
| Net investment income | | | 5.41 | % | | | 4.80 | %(h) | |
| Supplemental Data: | | Year Ended
9/30/2006 | | 12/1/2004(a)
to
9/30/2005 | |
| Net assets, end of period (000) | | $ | 12 | | | $ | 11 | | |
| Portfolio turnover rate | | | 89.78 | % | | | 112.47 | % | |
(a) Commencement of investment operations was 12/1/2004; SEC effective date was 12/30/2004; date shares first became available to the public was 1/3/2005.
(b) Calculated using average shares outstanding during the period.
(c) Total return does not consider the effects of sales loads and assumes the reinvestment of all distributions.
(d) Not annualized.
(e) Total return for the period 12/1/2004 through 1/3/2005.
(f) Total return for the period 1/3/2005 through 9/30/2005.
(g) Amount is less than 0.01%.
(h) Annualized.
See Notes to Financial Statements.
180
Financial Highlights
MICHIGAN TAX-FREE TRUST
| | | Year Ended 9/30 | |
| | | 2006 | | 2005 | | 2004 | | 2003 | | 2002 | |
| Per Share Operating Performance (Class A Shares) | |
| Net asset value, beginning of year | | $ | 5.29 | | | $ | 5.32 | | | $ | 5.36 | | | $ | 5.43 | | | $ | 5.20 | | |
| Investment operations: | |
| Net investment income(a) | | | .22 | | | | .22 | | | | .22 | | | | .23 | | | | .25 | | |
Net increase from payment by an
affiliate for net loss realized on
disposal of investments purchased/
sold in error | | | – | (c) | | | – | | | | – | | | | – | | | | – | | |
| Net realized and unrealized gain (loss) | | | (.03 | ) | | | (.03 | ) | | | (.04 | ) | | | (.07 | ) | | | .23 | | |
| Total from investment operations | | | .19 | | | | .19 | | | | .18 | | | | .16 | | | | .48 | | |
Distributions to shareholders from net
investment income | | | (.22 | ) | | | (.22 | ) | | | (.22 | ) | | | (.23 | ) | | | (.25 | ) | |
| Net asset value, end of year | | $ | 5.26 | | | $ | 5.29 | | | $ | 5.32 | | | $ | 5.36 | | | $ | 5.43 | | |
| Total Return(b) | | | 3.71 | %(d) | | | 3.60 | % | | | 3.48 | % | | | 3.16 | % | | | 9.57 | % | |
| Ratios to Average Net Assets: | |
Expenses, including expense
reductions and expenses assumed | | | .60 | % | | | .62 | % | | | .67 | % | | | .71 | % | | | .73 | % | |
Expenses, excluding expense
reductions and expenses assumed | | | .67 | % | | | .63 | % | | | .67 | % | | | .73 | % | | | .75 | % | |
| Net investment income | | | 4.23 | % | | | 4.08 | % | | | 4.19 | % | | | 4.28 | % | | | 4.77 | % | |
| | | Year Ended 9/30 | |
| Supplemental Data: | | 2006 | | 2005 | | 2004 | | 2003 | | 2002 | |
| Net assets, end of year (000) | | $ | 73,056 | | | $ | 75,862 | | | $ | 73,290 | | | $ | 68,290 | | | $ | 58,632 | | |
| Portfolio turnover rate | | | 63.38 | % | | | 39.37 | % | | | 34.92 | % | | | 59.46 | % | | | 48.09 | % | |
(a) Calculated using average shares outstanding during the period.
(b) Total return does not consider the effects of sales loads and assumes the reinvestment of all distributions.
(c) Amount is less than $0.01.
(d) The effect of payment by an affiliate for loss realized due to a trading error on total return is less than .01%.
See Notes to Financial Statements.
181
Financial Highlights
PENNSYLVANIA TAX-FREE TRUST
| | | Year Ended 9/30 | |
| | | 2006 | | 2005 | | 2004 | | 2003 | | 2002 | |
| Per Share Operating Performance (Class A Shares) | |
| Net asset value, beginning of year | | $ | 5.30 | | | $ | 5.28 | | | $ | 5.27 | | | $ | 5.37 | | | $ | 5.18 | | |
| Investment operations: | |
| Net investment income(a) | | | .22 | | | | .22 | | | | .22 | | | | .23 | | | | .24 | | |
Net increase from payment by an
affiliate for net loss realized on
disposal of investments purchased/
sold in error | | | – | (c) | | | – | | | | – | | | | – | | | | – | | |
| Net realized and unrealized gain (loss) | | | (.06 | ) | | | .02 | | | | .01 | | | | (.10 | ) | | | .19 | | |
| Total from investment operations | | | .16 | | | | .24 | | | | .23 | | | | .13 | | | | .43 | | |
Distributions to shareholders from net
investment income | | | (.22 | ) | | | (.22 | ) | | | (.22 | ) | | | (.23 | ) | | | (.24 | ) | |
| Net asset value, end of year | | $ | 5.24 | | | $ | 5.30 | | | $ | 5.28 | | | $ | 5.27 | | | $ | 5.37 | | |
| Total Return(b) | | | 3.10 | %(d) | | | 4.57 | % | | | 4.48 | % | | | 2.52 | % | | | 8.57 | % | |
| Ratios to Average Net Assets: | |
Expenses, including expense
reductions and expenses assumed | | | .67 | % | | | .88 | % | | | .97 | % | | | .94 | % | | | 1.08 | % | |
Expenses, excluding expense
reductions and expenses assumed | | | .94 | % | | | .92 | % | | | .97 | % | | | .95 | % | | | 1.10 | % | |
| Net investment income | | | 4.19 | % | | | 4.06 | % | | | 4.20 | % | | | 4.37 | % | | | 4.66 | % | |
| | | Year Ended 9/30 | |
| Supplemental Data: | | 2006 | | 2005 | | 2004 | | 2003 | | 2002 | |
| Net assets, end of year (000) | | $ | 93,770 | | | $ | 97,069 | | | $ | 95,954 | | | $ | 99,280 | | | $ | 101,502 | | |
| Portfolio turnover rate | | | 50.71 | % | | | 21.18 | % | | | 27.80 | % | | | 29.76 | % | | | 60.87 | % | |
(a) Calculated using average shares outstanding during the period.
(b) Total return does not consider the effects of sales loads and assumes the reinvestment of all distributions.
(c) Amount is less than $0.01.
(d) The effect of payment by an affiliate for loss realized due to a trading error on total return is less than .01%.
See Notes to Financial Statements.
182
Notes to Financial Statements
1. ORGANIZATION
Lord Abbett Municipal Income Fund, Inc. (the "Company") and Lord Abbett Municipal Income Trust (the "Trust") are registered under the Investment Company Act of 1940 (the "Act") as open-end management investment companies. The Company was organized as a Maryland corporation on December 27, 1983. The Trust was organized as a Massachusetts Business Trust on September 11, 1991 and was reorganized as a Delaware Statutory Trust on July 22, 2002.
The Company consists of the following ten portfolios and their respective classes (separately, a "Fund" and collectively, the "Funds"):
| Funds | | Classes offered | |
| Lord Abbett National Tax-Free Income Fund ("National") | | A,B,C and P | |
| Lord Abbett California Tax-Free Income Fund ("California") | | A,C and P | |
| Lord Abbett New York Tax-Free Income Fund ("New York") | | A,C and P | |
| Lord Abbett Connecticut Tax-Free Income Fund ("Connecticut") | | A and P | |
| Lord Abbett Hawaii Tax-Free Income Fund ("Hawaii") | | A and P | |
| Lord Abbett Minnesota Tax-Free Income Fund ("Minnesota") | | A and P | |
| Lord Abbett Missouri Tax-Free Income Fund ("Missouri") | | A and P | |
| Lord Abbett New Jersey Tax-Free Income Fund ("New Jersey") | | A and P | |
| Lord Abbett Texas Tax-Free Income Fund ("Texas") | | A and P | |
| Lord Abbett Washington Tax-Free Income Fund ("Washington") | | A and P | |
The Trust consists of the following six portfolios and their respective classes (separately, a "Fund" and collectively, the "Funds"):
| Funds | | Classes offered | |
| Lord Abbett Insured Intermediate Tax-Free Fund ("Insured") | | A,B,C and P | |
| Lord Abbett High Yield Municipal Bond Fund ("High Yield") | | A,B,C and P | |
| Florida Series ("Florida") | | A,C and P | |
| Georgia Series ("Georgia") | | A and P | |
| Michigan Series ("Michigan") | | A and P | |
| Pennsylvania Series ("Pennsylvania") | | A and P | |
Each Fund is non-diversified as defined under the Act, except for National and Insured. As of the date of this report, only Insured and High Yield have issued class P shares.
The investment objective of each Fund (except for High Yield) is to seek the maximum amount of interest income exempt from Federal income tax as is consistent with reasonable risk. Each Fund (except for National, Insured and High Yield) also seeks as high a level of interest income exempt from the personal income tax of its state as is consistent with reasonable risk. The investment objective of High Yield is to seek a high level of income exempt from Federal income tax. New York also seeks as high a level of interest income exempt from New York City personal income tax as is consistent with reasonable risk.
Each class has different expenses and dividends. A front-end sales charge is normally added to the Net Asset Value ("NAV") for Class A shares. There is no front-end sales charge in the case of the Classes B, C and P shares, although there may be a contingent deferred sales charge ("CDSC") as follows: certain redemptions of Class A shares made within 12 months (24 months if shares were purchased prior to November 1, 2004) following certain purchases made without a sales charge; Class B shares redeemed before the sixth anniversary of purchase; and Class C shares redeemed before the first anniversary of purchase. Class B shares will convert to Class A shares on the eighth anniversary of the original purchase of Class B shares.
183
Notes to Financial Statements (continued)
The preparation of financial statements in conformity with accounting principles generally accepted in the United States of America requires management to make estimates and assumptions that affect the reported amounts of assets and liabilities and disclosure of contingent assets and liabilities at the date of the financial statements and the reported amounts of increases and decreases in net assets from operations during the reporting period. Actual results could differ from those estimates.
2. SIGNIFICANT ACCOUNTING POLICIES
(a) Investment Valuation–Securities are valued at the mean between the bid and asked prices on the basis of prices supplied by independent pricing services, which reflect broker/dealer supplied valuations and electronic data processing techniques. Exchange traded options and futures contracts are valued at the last sale price in the market where they are principally traded. Securities for which market quotations are not readily available are valued at fair value as determined by management and approved in good faith by the Board of Directors/Trustees. Short-term securities with 60 days or less remaining to maturity are valued using the amortized cost method, which approximates current value.
(b) Security Transactions–Security transactions are recorded as of the date that the securities are purchased or sold (trade date). Realized gains and losses from sales of portfolio securities are calculated using the identified-cost method. Realized and unrealized gains (losses) are allocated to each class of shares based upon the relative proportion of net assets at the beginning of the day.
(c) Futures Contracts–The Funds may purchase and sell futures contracts for bona fide hedging purposes including hedging against changes in interest rates and securities prices. At the time of entering into a futures transaction, an investor is required to deposit and maintain a specified amount of cash or eligible securities called "initial margin." Subsequent payments called "variation margin" are made on a daily basis as the market price of the futures contract fluctuates. The Funds will record an unrealized gain (loss) based on the amount of variation margin. When a contract is closed, a realized gain (loss) is recorded equal to the difference between the opening and closing value of the contract. Generally, open futures contracts are marked to market for Federal income tax purposes at fiscal year-end. As of September 30, 2006, each Fund except Insured had open futures contracts.
(d) Investment Income–Dividend income is recorded on the ex-dividend date. Interest income is recorded on the accrual basis. Discounts are accreted and premiums are amortized using the effective interest method. Investment income is allocated to each class of shares based upon the relative proportion of net assets at the beginning of the day.
(e) Federal Taxes–It is the policy of each Fund to meet the requirements of Subchapter M of the Internal Revenue Code applicable to regulated investment companies and to distribute substantially all taxable income and capital gains to its shareholders. Therefore, no Federal income tax provision is required.
(f) Expenses–Expenses incurred by the Company and Trust that do not specifically relate to an individual Fund are generally allocated to the Funds on a pro-rata basis. Expenses, excluding class specific expenses, are allocated to each class of shares based upon the relative proportion of net assets at the beginning of the day. Classes A, B, C and P shares bear their class-specific share of all expenses and fees relating to the Funds' 12b-1 Distribution Plan (the "Plan").
184
Notes to Financial Statements (continued)
(g) When-Issued Municipal Bonds–Each Fund may purchase new issues of municipal bonds, which are generally offered on a when-issued basis, with delivery and payment normally taking place approximately one month after the purchase date.
3. MANAGEMENT FEES AND OTHER TRANSACTIONS WITH AFFILIATES
Management Fees
The Company and Trust each have a management agreement with Lord, Abbett & Co. LLC ("Lord Abbett"), pursuant to which Lord Abbett supplies each Fund with investment management services and executive and other personnel, pays the remuneration of officers, provides office space and pays for ordinary and necessary office and clerical expenses relating to research and statistical work and supervision of each Fund's investment portfolio. The management fee is based on each Fund's average daily net assets at the following annual rates, for all Funds, other than Insured and High Yield:
| First $1 Billion | | | .45 | % | |
| Next $1 Billion | | | .40 | % | |
| Over $2 Billion | | | .35 | % | |
The management fee for Insured is based on the Fund's average daily net assets at the following annual rates:
| First $2 Billion | | | .40 | % | |
| Next $3 Billion | | | .375 | % | |
| Over $5 Billion | | | .35 | % | |
The management fee for High Yield is based on the Fund's average daily net assets at the following annual rates:
| First $1 Billion | | | .50 | % | |
| Next $1 Billion | | | .45 | % | |
| Over $2 Billion | | | .40 | % | |
For the fiscal year ended September 30, 2006, Lord Abbett contractually agreed to reimburse expenses for each Fund, other than Insured and High Yield, to the extent necessary so that each class' total annual operating expenses did not exceed the following annual rates:
| Class | | % of Average Daily Net Assets | |
| A | | | 0.95 | % | |
| B | | | 1.60 | % | |
| C | | | 1.60 | % | |
| P | | | 1.05 | % | |
For the fiscal year ended September 30, 2006, Lord Abbett voluntarily reimbursed approximately an additional $392,000, $194,000, $605,000, $122,000, $729,000, $90,000, $141,000, $189,000, $49,000 and $240,000 of expenses for Connecticut, Hawaii, Missouri, New Jersey, New York, Texas, Florida, Georgia, Michigan and Pennsylvania, respectively. In addition, Lord Abbett is voluntarily reimbursing Georgia's Class A 12b-1 distribution plan fees. Lord Abbett may stop the voluntary reimbursements at any time.
185
Notes to Financial Statements (continued)
For the fiscal year ended September 30, 2006, Lord Abbett contractually agreed to reimburse expenses for Insured to the extent necessary so that each class' net annual operating expenses did not exceed the following annual rates:
| Class | | % of Average Daily Net Assets | |
| A | | | 0.25 | % | |
| B | | | 1.00 | % | |
| C | | | 1.00 | % | |
| P | | | 0.45 | % | |
For the fiscal year ended September 30, 2006, Lord Abbett contractually agreed to reimburse expenses for High Yield to the extent necessary so that each class' net annual operating expenses did not exceed the following annual rates:
| Class | | % of Average Daily Net Assets | |
| A | | | 0.25 | %(1) | |
| B | | | 1.00 | %(2) | |
| C | | | 1.00 | %(2) | |
| P | | | 0.45 | %(3) | |
(1) For the period October 1, 2005 through March 31, 2006, Lord Abbett voluntarily reimbursed all expenses for Class A shares.
(2) For the period October 1, 2005 through January 31, 2006, Lord Abbett voluntarily reimbursed all expenses for Class B and Class C shares. For the period February 1, 2006 through March 31, 2006, Lord Abbett voluntarily reimbursed expenses necessary to maintain net operating expenses at an annualized rate of 0.50% of average daily net assets. For the period April 1, 2006 through September 30, 2006, Lord Abbett voluntarily reimbursed expenses necessary to maintain net operating expenses at an annualized rate of 0.75% of average daily net assets.
(3) For the period October 31, 2005 through March 31, 2006, Lord Abbett voluntarily reimbursed all expenses for Class P shares.
Lord Abbett may stop the voluntary reimbursements at any time.
Lord Abbett provides certain administrative services to each Fund pursuant to an Administrative Services Agreement at an annual rate of .04% of each Fund's average daily net assets.
Payments Made by Affiliates
During the fiscal year ended September 30, 2006, Lord Abbett fully reimbursed the Funds $25,360 for losses incurred on a trade executed incorrectly. The amount of reimbursement to each Fund was as follows:
| | | Reimbursement | |
| National | | $ | 7,480 | | |
| California | | | 1,835 | | |
| Connecticut | | | 1,649 | | |
| Hawaii | | | 1,337 | | |
| Minnesota | | | 1,022 | | |
| Missouri | | | 2,439 | | |
| New Jersey | | | 2,114 | | |
| New York | | | 2,228 | | |
| Texas | | | 395 | | |
| Washington | | | 209 | | |
| Florida | | | 465 | | |
| Georgia | | | 2,300 | | |
| Michigan | | | 424 | | |
| Pennsylvania | | | 1,463 | | |
186
Notes to Financial Statements (continued)
12b-1 Distribution Plan
Each Fund has adopted a distribution plan with respect to Class A, B, C and P shares pursuant to Rule 12b-1 under the Act, which provides for the payment of ongoing distribution and service fees to Lord Abbett Distributor LLC ("Distributor"), an affiliate of Lord Abbett. The fees are accrued daily at annual rates based upon average daily net assets as follows:
| Fee | | Class A(1) | | Class B | | Class C | | Class P | |
| Service | | | .25 | %(2) | | | .25 | % | | | .25 | % | | | .20 | % | |
| Distribution | | | .10 | % | | | .75 | % | | | .75 | % | | | .25 | % | |
(1) The Plan as it relates to Minnesota, Washington, and Michigan will not go into effect with respect to Class A shares until the quarter subsequent to the net assets of each of these Funds reaching $100 million. As of September 30, 2006, the net assets of each such Fund had not reached $100 million.
(2) Annual service fee is .15% of the average daily net assets attributable to Class A shares sold prior to the following dates:
| | | Date | |
| National, New York, Texas | | June 1, 1990 | |
| Hawaii | | January 1, 1993 | |
| New Jersey | | July 1, 1992 | |
| Florida | | October 1, 1992 | |
| Pennsylvania | | March 31, 1998 | |
| Georgia | | October 1, 2005 | |
Commissions
Distributor received the following commissions on sales of shares of the Funds, after concessions were paid to authorized dealers, for the fiscal year ended September 30, 2006:
| | | Distributor
Commissions | | Dealers'
Concessions | |
| National | | $ | 90,694 | | | $ | 430,940 | | |
| California | | | 25,022 | | | | 115,118 | | |
| Connecticut | | | 39,056 | | | | 183,597 | | |
| Hawaii | | | 55,390 | | | | 250,209 | | |
| Minnesota | | | 29,923 | | | | 145,603 | | |
| Missouri | | | 50,794 | | | | 231,135 | | |
| New Jersey | | | 13,455 | | | | 64,030 | | |
| New York | | | 25,088 | | | | 114,992 | | |
| Texas | | | 6,580 | | | | 30,729 | | |
| Washington | | | 7,682 | | | | 38,640 | | |
| Insured | | | 6,137 | | | | 27,869 | | |
| Florida | | | 6,343 | | | | 30,162 | | |
| Georgia | | | 70,921 | | | | 340,151 | | |
| High Yield | | | 766,523 | | | | 3,614,817 | | |
| Michigan | | | 21,607 | | | | 102,594 | | |
| Pennsylvania | | | 16,129 | | | | 72,770 | | |
187
Notes to Financial Statements (continued)
Distributor received the following amount of CDSCs for the year ended September 30, 2006:
| | | Class A | | Class C | |
| National | | $ | 4,939 | | | $ | 2,807 | | |
| California | | | – | | | | 1,746 | | |
| Connecticut | | | 9,622 | | | | – | | |
| New Jersey | | | 999 | | | | – | | |
| New York | | | 6,500 | | | | 2,077 | | |
| Insured | | | 97 | | | | 1,282 | | |
| Florida | | | 14,791 | | | | 818 | | |
| High Yield | | | 68,833 | | | | 52,242 | | |
Two Directors/Trustees and certain of the Company's and Trust's officers have an interest in Lord Abbett.
4. DISTRIBUTIONS AND CAPITAL LOSS CARRYFORWARDS
Dividends from net investment income, if any, are declared daily and paid monthly. Taxable net realized gains from investment transactions, reduced by capital loss carryforwards, if any, are declared and distributed to shareholders at least annually. The capital loss carryforward amount, if any, is available to offset future net capital gains. Dividends and distributions to shareholders are recorded on the ex-dividend date. The amount of dividends and distributions from net investment income and net realized capital gains are determined in accordance with Federal income tax regulations which may differ from accounting principles generally accepted in the United States of America. These book/tax differences are either considered temporary or permanent in nature. To the extent these differences are permanent in nature, such amounts are reclassified within the components of net assets based on their federal tax basis treatment; temporary differ ences do not require reclassification. Dividends and distributions which exceed earnings and profits for tax purposes are reported as a tax return of capital.
The tax character of the distributions paid during the fiscal years ended September 30, 2006 and 2005 are as follows:
| | | National | | California | |
| | | 9/30/2006 | | 9/30/2005 | | 9/30/2006 | | 9/30/2005 | |
| Distributions paid from: | |
| Tax-exempt income | | $ | 22,984,937 | | | $ | 22,049,767 | | | $ | 6,854,312 | | | $ | 6,852,873 | | |
| Total distributions paid | | $ | 22,984,937 | | | $ | 22,049,767 | | | $ | 6,854,312 | | | $ | 6,852,873 | | |
| | | Connecticut | | Hawaii | |
| | | 9/30/2006 | | 9/30/2005 | | 9/30/2006 | | 9/30/2005 | |
| Distributions paid from: | |
| Tax-exempt income | | $ | 4,020,361 | | | $ | 3,778,140 | | | $ | 3,420,720 | | | $ | 2,890,561 | | |
| Total distributions paid | | $ | 4,020,361 | | | $ | 3,778,140 | | | $ | 3,420,720 | | | $ | 2,890,561 | | |
188
Notes to Financial Statements (continued)
| | | Minnesota | | Missouri | |
| | | 9/30/2006 | | 9/30/2005 | | 9/30/2006 | | 9/30/2005 | |
| Distributions paid from: | |
| Tax-exempt income | | $ | 1,892,036 | | | $ | 1,561,827 | | | $ | 6,501,832 | | | $ | 6,364,236 | | |
| Ordinary income | | | - | | | | - | | | | 14,346 | | | | - | | |
| Net long-term capital gains | | | - | | | | - | | | | 209,059 | | | | - | | |
| Total distributions paid | | $ | 1,892,036 | | | $ | 1,561,827 | | | $ | 6,725,237 | | | $ | 6,364,236 | | |
| | | New Jersey | | New York | |
| | | 9/30/2006 | | 9/30/2005 | | 9/30/2006 | | 9/30/2005 | |
| Distributions paid from: | |
| Tax-exempt income | | $ | 5,375,403 | | | $ | 5,542,184 | | | $ | 10,216,128 | | | $ | 10,239,546 | | |
| Total distributions paid | | $ | 5,375,403 | | | $ | 5,542,184 | | | $ | 10,216,128 | | | $ | 10,239,546 | | |
| | | Texas | | Washington | |
| | | 9/30/2006 | | 9/30/2005 | | 9/30/2006 | | 9/30/2005 | |
| Distributions paid from: | |
| Tax-exempt income | | $ | 3,399,287 | | | $ | 3,272,796 | | | $ | 2,007,376 | | | $ | 2,194,346 | | |
| Total distributions paid | | $ | 3,399,287 | | | $ | 3,272,796 | | | $ | 2,007,376 | | | $ | 2,194,346 | | |
| | | Insured | | Florida | |
| | | 9/30/2006 | | 9/30/2005 | | 9/30/2006 | | 9/30/2005 | |
| Distributions paid from: | |
| Tax-exempt income | | $ | 382,450 | | | $ | 277,775 | | | $ | 3,053,780 | | | $ | 3,253,693 | | |
| Total distributions paid | | $ | 382,450 | | | $ | 277,775 | | | $ | 3,053,780 | | | $ | 3,253,693 | | |
| | | Georgia | | High Yield | |
| | | 9/30/2006 | | 9/30/2005 | | 9/30/2006 | | 9/30/2005* | |
| Distributions paid from: | |
| Tax-exempt income | | $ | 4,411,251 | | | $ | 3,756,535 | | | $ | 35,590,637 | | | $ | 6,706,262 | | |
| Total distributions paid | | $ | 4,411,251 | | | $ | 3,756,535 | | | $ | 35,590,637 | | | $ | 6,706,262 | | |
| | | Michigan | | Pennsylvania | |
| | | 9/30/2006 | | 9/30/2005 | | 9/30/2006 | | 9/30/2005 | |
| Distributions paid from: | |
| Tax-exempt income | | $ | 3,114,405 | | | $ | 3,079,723 | | | $ | 3,986,795 | | | $ | 4,015,282 | | |
| Total distributions paid | | $ | 3,114,405 | | | $ | 3,079,723 | | | $ | 3,986,795 | | | $ | 4,015,282 | | |
* For the period December 1, 2004 (commencement of investment operations) to September 30, 2005.
189
Notes to Financial Statements (continued)
As of September 30, 2006, the components of accumulated earnings on a tax-basis are as follows:
| | | National | | California | |
| Undistributed tax-exempt income - net | | $ | - | | | $ | 322,375 | | |
| Total undistributed earnings | | $ | - | | | $ | 322,375 | | |
| Capital loss carryforwards* | | $ | (16,225,639 | ) | | $ | (2,688,753 | ) | |
| Temporary differences | | | (3,856,136 | ) | | | (1,065,915 | ) | |
| Unrealized gains - net | | | 35,105,533 | | | | 9,039,202 | | |
| Total accumulated earnings - net | | $ | 15,023,758 | | | $ | 5,606,909 | | |
| | | Connecticut | | Hawaii | |
| Capital loss carryforwards* | | $ | (1,685,234 | ) | | $ | (2,285,714 | ) | |
| Temporary differences | | | (663,647 | ) | | | (540,151 | ) | |
| Unrealized gains - net | | | 5,342,022 | | | | 4,249,024 | | |
| Total accumulated earnings-net | | $ | 2,993,141 | | | $ | 1,423,159 | | |
| | | Minnesota | | Missouri | |
| Undistributed tax-exempt income - net | | $ | 112,402 | | | $ | 67,082 | | |
| Total undistributed earnings | | $ | 112,402 | | | $ | 67,082 | | |
| Capital loss carryforwards* | | $ | (644,003 | ) | | $ | (1,242 | ) | |
| Temporary differences | | | (406,327 | ) | | | (1,407,051 | ) | |
| Unrealized gains - net | | | 1,945,311 | | | | 7,728,779 | | |
| Total accumulated earnings - net | | $ | 1,007,383 | | | $ | 6,387,568 | | |
| | | New Jersey | | New York | |
| Capital loss carryforwards* | | $ | (5,211,532 | ) | | $ | (1,385,935 | ) | |
| Temporary differences | | | (906,287 | ) | | | (1,352,447 | ) | |
| Unrealized gains - net | | | 8,534,671 | | | | 14,130,349 | | |
| Total accumulated earnings - net | | $ | 2,416,852 | | | $ | 11,391,967 | | |
| | | Texas | | Washington | |
| Undistributed tax-exempt income - net | | $ | 19,469 | | | $ | 260,930 | | |
| Total undistributed earnings | | $ | 19,469 | | | $ | 260,930 | | |
| Capital loss carryforwards* | | $ | (3,854,335 | ) | | $ | (2,452,296 | ) | |
| Temporary differences | | | (445,798 | ) | | | (230,649 | ) | |
| Unrealized gains - net | | | 5,806,070 | | | | 3,047,765 | | |
| Total accumulated earnings - net | | $ | 1,525,406 | | | $ | 625,750 | | |
| | | Insured | | Florida | |
| Undistributed tax-exempt income - net | | $ | 31,752 | | | $ | - | | |
| Total undistributed earnings | | $ | 31,752 | | | $ | - | | |
| Capital loss carryforwards* | | $ | (154,098 | ) | | $ | (6,182,005 | ) | |
| Temporary differences | | | (170,209 | ) | | | (575,423 | ) | |
| Unrealized gains - net | | | 176,872 | | | | 5,065,287 | | |
| Total accumulated loss - net | | $ | (115,683 | ) | | $ | (1,692,141 | ) | |
| | | Georgia | | High Yield | |
| Undistributed tax-exempt income - net | | $ | 352,368 | | | $ | 4,461,969 | | |
| Total undistributed earnings | | $ | 352,368 | | | $ | 4,461,969 | | |
| Capital loss carryforwards* | | $ | (67,060 | ) | | $ | (1,834,116 | ) | |
| Temporary differences | | | (1,193,399 | ) | | | (11,562,300 | ) | |
| Unrealized gains - net | | | 4,712,112 | | | | 33,100,761 | | |
| Total accumulated earnings - net | | $ | 3,804,021 | | | $ | 24,166,314 | | |
190
Notes to Financial Statements (continued)
| | | Michigan | | Pennsylvania | |
| Capital loss carryforwards* | | $ | (1,968,543 | ) | | $ | (924,096 | ) | |
| Temporary differences | | | (831,546 | ) | | | (773,762 | ) | |
| Unrealized gains - net | | | 4,336,263 | | | | 5,956,178 | | |
| Total accumulated earnings - net | | $ | 1,536,174 | | | $ | 4,258,320 | | |
* As of September 30, 2006, the capital loss carryforwards, along with the related expiration dates, are as follows:
| | | 2007 | | 2008 | | 2009 | | 2011 | | 2012 | | 2013 | | 2014 | | Total | |
| National | | $ | - | | | $ | 11,236,555 | | | $ | 385,136 | | | $ | 255,373 | | | $ | 3,799,776 | | | $ | - | | | $ | 548,799 | | | $ | 16,225,639 | | |
| California | | | - | | | | 1,876,106 | | | | - | | | | 34,990 | | | | 777,657 | | | | - | | | | - | | | | 2,688,753 | | |
| Connecticut | | | - | | | | 610,291 | | | | 518,107 | | | | - | | | | 457,625 | | | | - | | | | 99,211 | | | | 1,685,234 | | |
| Hawaii | | | - | | | | 424,033 | | | | 268,000 | | | | - | | | | 1,593,681 | | | | - | | | | - | | | | 2,285,714 | | |
| Minnesota | | | - | | | | - | | | | 535,589 | | | | - | | | | 108,414 | | | | - | | | | - | | | | 644,003 | | |
| Missouri | | | - | | | | - | | | | - | | | | - | | | | - | | | | - | | | | 1,242 | | | | 1,242 | | |
| New Jersey | | | - | | | | 3,141,664 | | | | - | | | | 405,467 | | | | 1,576,989 | | | | - | | | | 87,412 | | | | 5,211,532 | | |
| New York | | | - | | | | - | | | | 505,114 | | | | 25,993 | | | | 141,028 | | | | - | | | | 713,800 | | | | 1,385,935 | | |
| Texas | | | - | | | | 2,722,282 | | | | 579,267 | | | | - | | | | 528,705 | | | | - | | | | 24,081 | | | | 3,854,335 | | |
| Washington | | | - | | | | 947,474 | | | | 710,842 | | | | 42,693 | | | | 496,718 | | | | 238,210 | | | | 16,359 | | | | 2,452,296 | | |
| Insured | | | - | | | | - | | | | - | | | | - | | | | 74,668 | | | | 63,298 | | | | 16,132 | | | | 154,098 | | |
| Florida | | | 3,752,714 | | | | 1,479,660 | | | | - | | | | 763,887 | | | | 126,337 | | | | - | | | | 59,407 | | | | 6,182,005 | | |
| Georgia | | | - | | | | - | | | | - | | | | - | | | | 62,979 | | | | - | | | | 4,081 | | | | 67,060 | | |
| High Yield | | | - | | | | - | | | | - | | | | - | | | | - | | | | - | | | | 1,834,116 | | | | 1,834,116 | | |
| Michigan | | | 998,605 | | | | 711,637 | | | | - | | | | - | | | | 204,581 | | | | 33,033 | | | | 20,687 | | | | 1,968,543 | | |
| Pennsylvania | | | - | | | | 683,645 | | | | - | | | | 1,955 | | | | 225,617 | | | | - | | | | 12,879 | | | | 924,096 | | |
Capital losses incurred after October 31 ("Post-October losses"), within the taxable year are deemed to arise on the first business day of the Fund's next taxable year. Each Fund incurred and will elect to defer net capital losses during fiscal 2006 as follows:
| | | Post-October
Losses | |
| National | | $ | 1,932,417 | | |
| California | | | 415,864 | | |
| Connecticut | | | 342,323 | | |
| Hawaii | | | 258,068 | | |
| Minnesota | | | 261,423 | | |
| Missouri | | | 917,599 | | |
| New Jersey | | | 489,597 | | |
| New York | | | 469,148 | | |
| Texas | | | 170,903 | | |
| Washington | | | 77,324 | | |
| Insured | | | 140,520 | | |
| Florida | | | 327,461 | | |
| Georgia | | | 858,386 | | |
| High Yield | | | 8,332,081 | | |
| Michigan | | | 604,521 | | |
| Pennsylvania | | | 474,469 | | |
191
Notes to Financial Statements (continued)
As of September 30, 2006, the aggregate unrealized security gains and losses based on cost for U.S. Federal income tax purposes are as follows:
| | | Tax Cost | | Gross
Unrealized
Gain | | Gross
Unrealized
Loss | | Net
Unrealized
Gain | |
| National | | $ | 533,563,198 | | | $ | 35,121,531 | | | $ | (15,998 | ) | | $ | 35,105,533 | | |
| California | | | 163,783,615 | | | | 9,044,900 | | | | (5,698 | ) | | | 9,039,202 | | |
| Connecticut | | | 90,931,586 | | | | 5,342,022 | | | | - | | | | 5,342,022 | | |
| Hawaii | | | 85,981,522 | | | | 4,249,024 | | | | - | | | | 4,249,024 | | |
| Minnesota | | | 47,137,801 | | | | 1,946,041 | | | | (730 | ) | | | 1,945,311 | | |
| Missouri | | | 150,319,381 | | | | 7,769,381 | | | | (40,602 | ) | | | 7,728,779 | | |
| New Jersey | | | 120,473,384 | | | | 8,534,671 | | | | - | | | | 8,534,671 | | |
| New York | | | 232,948,266 | | | | 14,130,350 | | | | (1 | ) | | | 14,130,349 | | |
| Texas | | | 73,866,249 | | | | 5,806,070 | | | | - | | | | 5,806,070 | | |
| Washington | | | 41,443,609 | | | | 3,047,765 | | | | - | | | | 3,047,765 | | |
| Insured | | | 10,346,058 | | | | 177,294 | | | | (422 | ) | | | 176,872 | | |
| Florida | | | 64,220,667 | | | | 5,073,001 | | | | (7,714 | ) | | | 5,065,287 | | |
| Georgia | | | 111,211,561 | | | | 4,727,621 | | | | (15,509 | ) | | | 4,712,112 | | |
| High Yield | | | 1,073,095,115 | | | | 34,198,764 | | | | (1,098,003 | ) | | | 33,100,761 | | |
| Michigan | | | 68,491,227 | | | | 4,336,263 | | | | - | | | | 4,336,263 | | |
| Pennsylvania | | | 86,569,656 | | | | 5,956,178 | | | | - | | | | 5,956,178 | | |
The difference between book-basis and tax-basis unrealized gains (losses) is primarily attributable to tax treatment of accretion and other temporary adjustments.
Permanent items identified during the year ended September 30, 2006 have been reclassified among the components of net assets based on their tax basis treatment as follows:
| | | Undistributed/
(Distributions
in Excess of)
Net Investment
Income | | Accumulated
Net Realized
Loss | | Paid-in
Capital | |
| National | | $ | 120,180 | | | $ | 4,127 | | | $ | (124,307 | ) | |
| California | | | (783 | ) | | | 783 | | | | - | | |
| Connecticut | | | 11,756 | | | | 462 | | | | (12,218 | ) | |
| Hawaii | | | 72,174 | | | | 4,366 | | | | (76,540 | ) | |
| Minnesota | | | (16 | ) | | | 16 | | | | - | | |
| Missouri | | | (10,937 | ) | | | 10,937 | | | | - | | |
| New Jersey | | | 14,280 | | | | 2,454 | | | | (16,734 | ) | |
| New York | | | 50,338 | | | | 1,227 | | | | (51,565 | ) | |
| Washington | | | (353 | ) | | | 353 | | | | - | | |
| Florida | | | 4,248 | | | | - | | | | (4,248 | ) | |
| Georgia | | | (465 | ) | | | 465 | | | | - | | |
| High Yield | | | (2,260 | ) | | | 2,260 | | | | - | | |
| Michigan | | | 9,698 | | | | - | | | | (9,698 | ) | |
| Pennsylvania | | | 25,731 | | | | 4 | | | | (25,735 | ) | |
The permanent differences are primarily attributable to the tax treatment of accretion and the tax treatment of certain distributions.
192
Notes to Financial Statements (continued)
5. PORTFOLIO SECURITIES TRANSACTIONS
Purchases and sales of investment securities (excluding short-term investments) for the fiscal year ended September 30, 2006 are as follows:
| | | Purchases | | Sales | |
| National | | $ | 449,709,571 | | | $ | 454,157,101 | | |
| California | | | 99,879,128 | | | | 105,503,368 | | |
| Connecticut | | | 45,886,363 | | | | 41,402,395 | | |
| Hawaii | | | 58,720,732 | | | | 43,126,459 | | |
| Minnesota | | | 22,972,125 | | | | 16,613,739 | | |
| Missouri | | | 53,518,123 | | | | 54,935,669 | | |
| New Jersey | | | 49,057,850 | | | | 57,857,318 | | |
| New York | | | 199,455,310 | | | | 188,068,062 | | |
| Texas | | | 32,916,089 | | | | 27,722,939 | | |
| Washington | | | 11,968,430 | | | | 14,952,445 | | |
| Insured | | | 11,778,210 | | | | 13,113,238 | | |
| Florida | | | 38,388,168 | | | | 42,672,793 | | |
| Georgia | | | 69,664,326 | | | | 54,331,977 | | |
| High Yield | | | 1,298,434,256 | | | | 653,690,264 | | |
| Michigan | | | 47,016,259 | | | | 47,980,965 | | |
| Pennsylvania | | | 48,096,174 | | | | 52,204,926 | | |
There were no purchases or sales of U.S. Government securities for the fiscal year ended September 30, 2006.
6. DIRECTORS'/TRUSTEES' REMUNERATION
The Company's and Trust's officers and the two Directors/Trustees who are associated with Lord Abbett do not receive any compensation from the Company or Trust for serving in such capacities. Outside Directors'/Trustees' fees are allocated among all Lord Abbett-sponsored funds based on the net assets of each fund. There is an equity based plan available to all outside Directors/Trustees under which outside Directors/Trustees must defer receipt of a portion of, and may elect to defer receipt of an additional portion of, their fees. The deferred amounts are treated as though equivalent dollar amounts have been invested proportionately in the funds. Such amounts and earnings accrued thereon are included in Directors'/Trustees' fees on the Statements of Operations and in Directors'/Trustees' fees payable on the Statements of Assets and Liabilities and are not deductible for U.S. Federal income tax purposes until such amounts are paid.
7. EXPENSE REDUCTIONS
The Company and Trust have entered into agreements with their transfer agent and custodian whereby credits realized as a result of uninvested cash balances are used to reduce a portion of each Fund's expenses.
8. LINE OF CREDIT
High Yield, along with certain other funds managed by Lord Abbett, has available a $250,000,000 unsecured revolving credit facility ("Facility") from a consortium of banks, to be used for temporary or emergency purposes as an additional source of liquidity to fund redemptions of
193
Notes to Financial Statements (continued)
investor shares. Any borrowings under this Facility will bear interest at current market rates as defined in the agreement. The fee for this Facility is at an annual rate of .08%. As of September 30, 2006, there were no loans outstanding pursuant to this Facility nor was the Facility utilized at any time during the fiscal year ended September 30, 2006.
9. CUSTODIAN AND ACCOUNTING AGENT
State Street Bank & Trust Company ("SSB") is the Funds' custodian and accounting agent. SSB performs custodial, accounting and recordkeeping functions, relating to portfolio transactions and calculating each Fund's NAV.
10. INVESTMENT RISKS
Each Fund's performance and the value of its investments will vary in response to changes in interest rates and other market factors. As interest rates rise, a Fund's investments typically will lose value. This risk is usually greater for long-term bonds and particularly for inverse floaters than for short-term bonds. As a result, the Funds, which tend to invest in longer-term bonds and inverse floaters to a greater degree than some municipal bond funds, normally will have greater market risk than those funds.
Additional risks that could reduce each Fund's performance or increase volatility include call risk, governmental risk, legislative risk, management risk, reclassification risk and credit risk. Credit risk varies among states based upon the economic and fiscal conditions of each state and the municipalities within the state.
There is the risk that an issuer of a municipal bond may fail to make timely payments of principal or interest to a Fund, a risk that is greater with municipal bonds rated below investment grade (sometimes called "lower rated bonds" or "junk bonds"). High Yield invests a significant portion of its assets in such bonds. Some issuers, particularly of junk bonds, may default as to principal and/or interest payments after a Fund purchases their securities. A default, or concerns in the market about an increase in risk of default or the deterioration in the creditworthiness of an issuer, may result in losses to the Fund. Junk bonds are considered predominantly speculative by traditional investment standards. In addition, the market for lower rated municipal bonds generally is less liquid than the market for higher rated bonds, subjecting them to greater price fluctuations which could result in losses.
Each Fund (except National and Insured) is non-diversified, which means that it may invest a greater portion of its assets in a single issuer than a diversified fund. Thus, it may be exposed to greater risk.
Because each Fund other than National, Insured and High Yield, focuses on a particular state or territory, each Fund's performance may be more affected by local, state and regional factors than a fund that invests in municipal bonds issued in many states, such as National, Insured and High Yield. These factors may, for example, include economic or political developments, erosion of the tax base and the possibility of credit problems. In addition, downturns or developments in the U.S. economy or in foreign economies or significant world events may harm the performance of each Fund, and may do so disproportionately as a result of the corresponding disproportionate impact of such occurrences on particular state, territory, or local economies.
194
Notes to Financial Statements (continued)
Each Fund may invest up to 20% of its net assets in private activity bonds (sometimes called "AMT paper") except High Yield, which may invest up to 100% in AMT paper. The credit quality of such bonds usually is directly related to the credit standing of the private user of the facilities.
Each Fund may invest in residual interest bonds ("RIBs") although each Fund other than High Yield may invest no more than 20% of its assets in such bonds. High Yield may invest in RIBs without such limitation. A RIB, sometimes referred to as an inverse floater, is a type of "derivative" debt instrument with a floating or variable interest rate that moves in the opposite direction of the interest rate on another specific fixed-rate security ("specific fixed-rate security"). Changes in the interest rate on the specific fixed-rate security inversely affect the residual interest paid on the RIB, with the result that when interest rates rise, RIBs' interest payments are lowered and their value falls faster than securities similar to the specific fixed-rate security. When interest rates fall, not only do RIBs provide interest payments that are higher than securities similar to the specific fixed-rate security, but their values also rise faster tha n such similar securities.
In addition, loss may result from a Fund's investments in certain derivative transactions such as futures contracts, swap transactions, interest rate caps, inverse floaters and similar transactions. These instruments may be leveraged so that small changes may produce disproportionate and substantial losses to the Fund. They also may increase a Fund's interest rate risk.
Each Fund may purchase securities on a forward commitment or when-issued basis. Delivery and payment for such securities can take place a month or more after the transaction date. During this period such securities are subject to market fluctuations.
11. SUMMARY OF CAPITAL TRANSACTIONS
Transactions in shares of capital stock or shares of beneficial interest are as follows:
| | | Year Ended September 30, 2006 | |
| | | Connecticut | | Hawaii | | Minnesota | | Missouri | | New Jersey | |
| Shares sold | | | 1,491,410 | | | | 4,212,072 | | | | 2,134,306 | | | | 2,593,379 | | | | 1,311,811 | | |
| Reinvestment of distributions | | | 208,167 | | | | 486,595 | | | | 323,670 | | | | 1,071,279 | | | | 566,220 | | |
| Shares reacquired | | | (1,142,405 | ) | | | (1,997,806 | ) | | | (1,162,872 | ) | | | (3,933,638 | ) | | | (2,993,035 | ) | |
| Increase (decrease) | | | 557,172 | | | | 2,700,861 | | | | 1,295,104 | | | | (268,980 | ) | | | (1,115,004 | ) | |
| | | Year Ended September 30, 2006 | |
| | | Texas | | Washington | | Georgia | | Michigan | | Pennsylvania | |
| Shares sold | | | 967,905 | | | | 493,123 | | | | 4,365,795 | | | | 1,126,209 | | | | 897,700 | | |
| Reinvestment of distributions | | | 257,075 | | | | 305,265 | | | | 644,681 | | | | 438,309 | | | | 444,965 | | |
| Shares reacquired | | | (811,760 | ) | | | (1,457,203 | ) | | | (2,293,347 | ) | | | (1,998,196 | ) | | | (1,776,667 | ) | |
| Increase (decrease) | | | 413,220 | | | | (658,815 | ) | | | 2,717,129 | | | | (433,678 | ) | | | (434,002 | ) | |
| | | Year Ended September 30, 2005 | |
| | | Connecticut | | Hawaii | | Minnesota | | Missouri | | New Jersey | |
| Shares sold | | | 942,888 | | | | 3,005,809 | | | | 1,617,199 | | | | 3,011,985 | | | | 1,987,138 | | |
| Reinvestment of distributions | | | 192,640 | | | | 339,910 | | | | 263,779 | | | | 999,869 | | | | 592,791 | | |
| Shares reacquired | | | (986,441 | ) | | | (1,507,010 | ) | | | (1,022,538 | ) | | | (3,004,221 | ) | | | (3,100,677 | ) | |
| Increase (decrease) | | | 149,087 | | | | 1,838,709 | | | | 858,440 | | | | 1,007,633 | | | | (520,748 | ) | |
195
Notes to Financial Statements (continued)
| | | Year Ended September 30, 2005 | |
| | | Texas | | Washington | | Georgia | | Michigan | | Pennsylvania | |
| Shares sold | | | 441,641 | | | | 851,879 | | | | 4,142,897 | | | | 1,679,661 | | | | 1,541,500 | | |
| Reinvestment of distributions | | | 240,825 | | | | 322,452 | | | | 554,608 | | | | 410,376 | | | | 423,203 | | |
| Shares reacquired | | | (568,912 | ) | | | (1,347,358 | ) | | | (2,184,770 | ) | | | (1,529,104 | ) | | | (1,807,266 | ) | |
| Increase (decrease) | | | 113,554 | | | | (173,027 | ) | | | 2,512,735 | | | | 560,933 | | | | 157,437 | | |
Transactions (both shares and dollars) in Funds with multiple classes are as follows:
| National | | Year Ended
September 30, 2006 | | Year Ended
September 30, 2005 | |
| Class A Shares | | Shares | | Amount | | Shares | | Amount | |
| Shares sold | | | 4,956,569 | | | $ | 56,701,844 | | | | 3,618,865 | | | $ | 41,899,432 | | |
| Reinvestment of distributions | | | 1,280,377 | | | | 14,620,221 | | | | 1,182,800 | | | | 13,685,145 | | |
| Shares reacquired | | | (5,918,839 | ) | | | (67,664,916 | ) | | | (5,302,289 | ) | | | (61,390,981 | ) | |
| Increase (decrease) | | | 318,107 | | | $ | 3,657,149 | | | | (500,624 | ) | | $ | (5,806,404 | ) | |
| Class B Shares | |
| Shares sold | | | 426,087 | | | $ | 4,886,772 | | | | 384,421 | | | $ | 4,462,574 | | |
| Reinvestment of distributions | | | 46,437 | | | | 531,980 | | | | 49,453 | | | | 573,512 | | |
| Shares reacquired | | | (757,769 | ) | | | (8,688,475 | ) | | | (713,322 | ) | | | (8,274,368 | ) | |
| Decrease | | | (285,245 | ) | | $ | (3,269,723 | ) | | | (279,448 | ) | | $ | (3,238,282 | ) | |
| Class C Shares | |
| Shares sold | | | 736,078 | | | $ | 8,431,987 | | | | 471,773 | | | $ | 5,480,232 | | |
| Reinvestment of distributions | | | 65,006 | | | | 743,577 | | | | 63,502 | | | | 735,605 | | |
| Shares reacquired | | | (523,297 | ) | | | (6,002,035 | ) | | | (736,018 | ) | | | (8,524,305 | ) | |
| Increase (decrease) | | | 277,787 | | | $ | 3,173,529 | | | | (200,743 | ) | | $ | (2,308,468 | ) | |
| California | | Year Ended
September 30, 2006 | | Year Ended
September 30, 2005 | |
| Class A Shares | | Shares | | Amount | | Shares | | Amount | |
| Shares sold | | | 1,102,212 | | | $ | 11,949,936 | | | | 1,400,162 | | | $ | 15,358,552 | | |
| Reinvestment of distributions | | | 380,682 | | | | 4,124,535 | | | | 353,603 | | | | 3,872,266 | | |
| Shares reacquired | | | (1,935,551 | ) | | | (20,988,910 | ) | | | (1,808,892 | ) | | | (19,818,278 | ) | |
| Decrease | | | (452,657 | ) | | $ | (4,914,439 | ) | | | (55,127 | ) | | $ | (587,460 | ) | |
| Class C Shares | |
| Shares sold | | | 270,931 | | | $ | 2,943,665 | | | | 194,458 | | | $ | 2,136,766 | | |
| Reinvestment of distributions | | | 16,586 | | | | 179,872 | | | | 15,129 | | | | 165,760 | | |
| Shares reacquired | | | (180,619 | ) | | | (1,960,985 | ) | | | (221,629 | ) | | | (2,429,793 | ) | |
| Increase (decrease) | | | 106,898 | | | $ | 1,162,552 | | | | (12,042 | ) | | $ | (127,267 | ) | |
| New York | | Year Ended
September 30, 2006 | | Year Ended
September 30, 2005 | |
| Class A Shares | | Shares | | Amount | | Shares | | Amount | |
| Shares sold | | | 1,938,189 | | | $ | 21,654,474 | | | | 1,027,449 | | | $ | 11,714,924 | | |
| Reinvestment of distributions | | | 544,624 | | | | 6,080,007 | | | | 533,770 | | | | 6,083,437 | | |
| Shares reacquired | | | (2,069,540 | ) | | | (23,124,144 | ) | | | (2,098,029 | ) | | | (23,928,159 | ) | |
| Increase (decrease) | | | 413,273 | | | $ | 4,610,337 | | | | (536,810 | ) | | $ | (6,129,798 | ) | |
| Class C Shares | |
| Shares sold | | | 396,709 | | | $ | 4,420,617 | | | | 351,373 | | | $ | 4,003,441 | | |
| Reinvestment of distributions | | | 24,287 | | | | 271,054 | | | | 20,674 | | | | 235,594 | | |
| Shares reacquired | | | (226,829 | ) | | | (2,531,685 | ) | | | (171,253 | ) | | | (1,953,288 | ) | |
| Increase | | | 194,167 | | | $ | 2,159,986 | | | | 200,794 | | | $ | 2,285,747 | | |
196
Notes to Financial Statements (continued)
| Insured | | Year Ended
September 30, 2006 | | Year Ended
September 30, 2005 | |
| Class A Shares | | Shares | | Amount | | Shares | | Amount | |
| Shares sold | | | 440,316 | | | $ | 4,284,445 | | | | 493,199 | | | $ | 4,864,004 | | |
| Reinvestment of distributions | | | 20,209 | | | | 196,061 | | | | 16,319 | | | | 161,254 | | |
| Shares reacquired | | | (533,451 | ) | | | (5,183,869 | ) | | | (338,719 | ) | | | (3,356,769 | ) | |
| Increase (decrease) | | | (72,926 | ) | | $ | (703,363 | ) | | | 170,799 | | | $ | 1,668,489 | | |
| Class B Shares | |
| Shares sold | | | 36,254 | | | $ | 351,925 | | | | 70,689 | | | $ | 696,503 | | |
| Reinvestment of distributions | | | 1,021 | | | | 9,896 | | | | 597 | | | | 5,890 | | |
| Shares reacquired | | | (29,901 | ) | | | (291,392 | ) | | | (23,434 | ) | | | (231,254 | ) | |
| Increase | | | 7,374 | | | $ | 70,429 | | | | 47,852 | | | $ | 471,139 | | |
| Class C Shares | |
| Shares sold | | | 71,286 | | | $ | 690,641 | | | | 123,369 | | | $ | 1,212,497 | | |
| Reinvestment of distributions | | | 4,025 | | | | 39,021 | | | | 2,417 | | | | 23,819 | | |
| Shares reacquired | | | (176,908 | ) | | | (1,710,283 | ) | | | (71,966 | ) | | | (706,769 | ) | |
| Increase (decrease) | | | (101,597 | ) | | $ | (980,621 | ) | | | 53,820 | | | $ | 529,547 | | |
| Class P Shares | |
| Reinvestment of distributions | | | 35 | | | $ | 336 | | | | 28 | | | $ | 278 | | |
| Increase | | | 35 | | | $ | 336 | | | | 28 | | | $ | 278 | | |
| Florida | | Year Ended
September 30, 2006 | | Year Ended
September 30, 2005 | |
| Class A Shares | | Shares | | Amount | | Shares | | Amount | |
| Shares Sold | | | 972,950 | | | $ | 4,600,765 | | | | 980,633 | | | $ | 4,723,476 | | |
| Reinvestment of distributions | | | 326,447 | | | | 1,539,791 | | | | 328,051 | | | | 1,579,023 | | |
| Shares reacquired | | | (2,114,035 | ) | | | (9,992,282 | ) | | | (2,095,723 | ) | | | (10,087,661 | ) | |
| Decrease | | | (814,638 | ) | | $ | (3,851,726 | ) | | | (787,039 | ) | | $ | (3,785,162 | ) | |
| Class C Shares | |
| Shares Sold | | | 133,507 | | | $ | 630,708 | | | | 361,986 | | | $ | 1,748,125 | | |
| Reinvestment of distributions | | | 18,285 | | | | 86,335 | | | | 17,402 | | | | 83,941 | | |
| Shares reacquired | | | (281,527 | ) | | | (1,327,950 | ) | | | (167,552 | ) | | | (808,899 | ) | |
| Increase (decrease) | | | (129,735 | ) | | $ | (610,907 | ) | | | 211,836 | | | $ | 1,023,167 | | |
197
Notes to Financial Statements (concluded)
| High Yield | | Year Ended
September 30, 2006 | | Period Ended
September 30, 2005* | |
| Class A Shares | | Shares | | Amount | | Shares | | Amount | |
| Shares sold | | | 31,539,791 | | | $ | 487,501,456 | | | | 20,819,162 | | | $ | 321,556,851 | | |
| Reinvestment of distributions | | | 958,110 | | | | 14,772,141 | | | | 167,915 | | | | 2,603,530 | | |
| Shares reacquired | | | (6,522,595 | ) | | | (100,554,180 | ) | | | (684,475 | ) | | | (10,614,735 | ) | |
| Increase | | | 25,975,306 | | | $ | 401,719,417 | | | | 20,302,602 | | | $ | 313,545,646 | | |
| Class B Shares | |
| Shares sold | | | - | | | $ | - | | | | 667 | | | $ | 10,000 | | |
| Reinvestment of distributions | | | 34 | | | | 515 | | | | 26 | | | | 401 | | |
| Increase | | | 34 | | | $ | 515 | | | | 693 | | | $ | 10,401 | | |
| Class C Shares | |
| Shares sold | | | 15,179,814 | | | $ | 234,687,951 | | | | 8,238,022 | | | $ | 127,405,275 | | |
| Reinvestment of distributions | | | 308,358 | | | | 4,753,649 | | | | 34,624 | | | | 537,851 | | |
| Shares reacquired | | | (1,485,892 | ) | | | (22,984,123 | ) | | | (141,730 | ) | | | (2,193,897 | ) | |
| Increase | | | 14,002,280 | | | $ | 216,457,477 | | | | 8,130,916 | | | $ | 125,749,229 | | |
| Class P Shares | |
| Shares sold | | | - | | | $ | - | | | | 667 | | | $ | 10,000 | | |
| Reinvestment of distributions | | | 36.427 | | | | 562 | | | | 26 | | | | 405 | | |
| Increase | | | 36.427 | | | $ | 562 | | | | 693 | | | $ | 10,405 | | |
* For the period December 1, 2004 (commencement of investment operations) to September 30, 2005.
12. RECENT ACCOUNTING PRONOUNCEMENTS
In July 2006, the Financial Accounting Standards Board (FASB) issued Interpretation 48, Accounting for Uncertainty in Income Taxes – an interpretation of FASB Statement 109 (FIN 48). FIN 48 clarifies the accounting for income taxes by prescribing the minimum recognition threshold a tax position must meet before being recognized in the financial statements. FIN 48 is effective for fiscal years beginning after December 15, 2006. The Funds will adopt FIN 48 during 2007 and the impact to each Fund's financial statements, if any, is currently being assessed.
In September 2006, Statement of Financial Accounting Standards No.157, Fair Value Measurements (SFAS 157) was issued and is effective for fiscal years beginning after November 15, 2007. SFAS 157 defines fair value, establishes a framework for measuring fair value and expands disclosures about fair value measurements. Management is currently evaluating the impact the adoption of SFAS 157 will have on each Fund's financial statement disclosures.
198
Report of Independent Registered Public Accounting Firm
The Board of Directors and Shareholders,
Lord Abbett Municipal Income Fund, Inc.:
We have audited the accompanying statements of assets and liabilities, including the schedules of investments, of Lord Abbett Municipal Income Fund, Inc. (the "Company"), comprising Lord Abbett National Tax-Free Income Fund, Lord Abbett California Tax-Free Income Fund, Lord Abbett Connecticut Tax-Free Income Fund, Lord Abbett Hawaii Tax-Free Income Fund, Lord Abbett Minnesota Tax-Free Income Fund, Lord Abbett Missouri Tax-Free Income Fund, Lord Abbett New Jersey Tax-Free Income Fund, Lord Abbett New York Tax-Free Income Fund, Lord Abbett Texas Tax-Free Income Fund, and Lord Abbett Washington Tax-Free Income Fund, as of September 30, 2006, and the related statements of operations for the year then ended, the statements of changes in net assets for each of the two years in the period then ended, and the financial highlights for each of the five years in the period then ended. These financial statements and financial highlights are the responsi bility of the Company's management. Our responsibility is to express an opinion on these financial statements and financial highlights based on our audits.
We conducted our audits in accordance with standards of the Public Company Accounting Oversight Board (United States). Those standards require that we plan and perform the audit to obtain reasonable assurance about whether the financial statements and financial highlights are free of material misstatement. The Company is not required to have, nor were we engaged to perform, an audit of its internal control over financial reporting. Our audits included consideration of internal control over financial reporting as a basis for designing audit procedures that are appropriate in the circumstances, but not for the purpose of expressing an opinion on the effectiveness of the Company's internal control over financial reporting. Accordingly, we express no such opinion. An audit also includes examining, on a test basis, evidence supporting the amounts and disclosures in the financial statements, assessing the accounting principles used and significant estimates made by management, as well as evaluating the overall financial statement presentation. Our procedures included confirmation of securities owned as of September 30, 2006 by correspondence with the custodian and brokers; where replies were not received from brokers, we performed other auditing procedures. We believe that our audits provide a reasonable basis for our opinion.
In our opinion, the financial statements and financial highlights referred to above present fairly, in all material respects, the financial position of each of the Funds constituting Lord Abbett Municipal Income Fund, Inc. as of September 30, 2006, the results of their operations for the year then ended, the changes in their net assets for each of the two years in the period then ended, and the financial highlights for each of the five years in the period then ended, in conformity with accounting principles generally accepted in the United States of America.
DELOITTE & TOUCHE LLP
New York, New York
November 28, 2006
199
Report of Independent Registered Public Accounting Firm
The Board of Trustees and Shareholders,
Lord Abbett Municipal Income Trust:
We have audited the accompanying statements of assets and liabilities, including the schedules of investments, of Lord Abbett Municipal Income Trust (the "Trust"), comprising Lord Abbett Insured Intermediate Tax-Free Fund, Florida Series, Georgia Series, Lord Abbett High Yield Municipal Bond Fund, Michigan Series, and Pennsylvania Series, as of September 30, 2006, and the related statements of operations for the year then ended and the statements of changes in net assets and the financial highlights for each of the periods presented. These financial statements and financial highlights are the responsibility of the Trust's management. Our responsibility is to express an opinion on these financial statements and financial highlights based on our audits.
We conducted our audits in accordance with standards of the Public Company Accounting Oversight Board (United States). Those standards require that we plan and perform the audit to obtain reasonable assurance about whether the financial statements and financial highlights are free of material misstatement. The Trust is not required to have, nor were we engaged to perform, an audit of its internal control over financial reporting. Our audits included consideration of internal control over financial reporting as a basis for designing audit procedures that are appropriate in the circumstances, but not for the purpose of expressing an opinion on the effectiveness of the Trust's internal control over financial reporting. Accordingly, we express no such opinion. An audit also includes examining, on a test basis, evidence supporting the amounts and disclosures in the financial statements, assessing the accounting principles used and significant est imates made by management, as well as evaluating the overall financial statement presentation. Our procedures included confirmation of securities owned as of September 30, 2006 by correspondence with the custodian and brokers; where replies were not received from brokers, we performed other auditing procedures. We believe that our audits provide a reasonable basis for our opinion.
In our opinion, the financial statements and financial highlights referred to above present fairly, in all material respects, the financial position of each of the Funds constituting Lord Abbett Municipal Income Trust as of September 30, 2006, the results of their operations for the year then ended and the changes in their net assets and the financial highlights for each of the periods presented, in conformity with accounting principles generally accepted in the United States of America.
DELOITTE & TOUCHE LLP
New York, New York
November 28, 2006
200
Basic Information About Management
The Company's Board of Directors and the Trust's Board of Trustees (the "Board") are responsible for the management of the business and affairs of the Company and Trust in accordance with the laws of the States of Maryland and Delaware, respectively. Each Board appoints officers who are responsible for the day-to-day operations of the Company and Trust who execute policies authorized by the Board. Each Board also approves an investment adviser to the Company and Trust and continues to monitor the cost and quality of the services provided by the investment adviser, and annually considers whether to renew the contract with the adviser. Generally, each Director and Trustee holds office until his/her successor is elected and qualified or until his/her earlier resignation or removal, as provided in the Company's and Trust's organizational documents.
Lord, Abbett & Co. LLC ("Lord Abbett"), a Delaware limited liability company, is the Company's and Trust's investment adviser.
Interested Trustees and Directors
The following Trustees and Directors are Partners of Lord Abbett and are "interested persons" of the Fund as defined in the Act. Mr. Dow is an officer, director, or trustee of each of the fourteen Lord Abbett-sponsored funds, which consist of 55 portfolios or series. Ms. Foster is a director or trustee of thirteen of the fourteen Lord Abbett-sponsored funds, consisting of 54 portfolios or series, and is not a trustee of the Large-Cap Growth Fund. Ms. Foster is an officer of each of the fourteen Lord Abbett-sponsored funds.
Name, Address and
Year of Birth | | Current Position
Length of Service
with Company
and Trust | |
Principal Occupation
During Past Five Years | |
Other
Directorships | |
Robert S. Dow
Lord, Abbett & Co. LLC
90 Hudson Street
Jersey City, NJ 07302
(1945) | | Director since 1989; Trustee since 1991and Chairman since 1996 | | Managing Partner and Chief Executive Officer of Lord Abbett since 1996. | | N/A | |
|
Daria L. Foster
Lord, Abbett & Co. LLC
90 Hudson Street
Jersey City, NJ 07302
(1954) | | Trustee/Director since 2006 | | Partner and Director of Marketing and Client Service of Lord Abbett since 1990. | | N/A | |
|
201
Basic Information About Management (continued)
Independent Trustees and Directors
Unless indicated otherwise, the following independent or outside Trustees and Directors are also directors or trustees of each of the fourteen Lord Abbett-sponsored funds, which consist of 55 portfolios or series.
Name, Address and
Year of Birth | | Current Position
Length of Service
with Company
and Trust | |
Principal Occupation
During Past Five Years | |
Other
Directorships | |
E. Thayer Bigelow
Lord, Abbett & Co. LLC
c/o Legal Dept.
90 Hudson Street
Jersey City, NJ 07302
(1941) | | Trustee/Director since 1994 | | Managing General Partner, Bigelow Media, LLC (since 2000); Senior Adviser, Time Warner Inc. (1998 - 2000); Acting Chief Executive Officer of Courtroom Television Network (1997 – 1998); President and Chief Executive Officer of Time Warner Cable Programming, Inc. (1991 – 1997). | | Currently serves as director of Adelphia Communications, Inc.; Crane Co.; and Huttig Building Products Inc. | |
|
William H.T. Bush
Lord, Abbett & Co. LLC
c/o Legal Dept.
90 Hudson Street
Jersey City, NJ 07302
(1938) | | Trustee/Director since 1998 | | Co-founder and Chairman of the Board of the financial advisory firm of Bush-O'Donnell & Company (since 1986). | | Currently serves as director of WellPoint, Inc. (since 2002). | |
|
Robert B. Calhoun, Jr.
Lord, Abbett & Co. LLC
c/o Legal Dept.
90 Hudson Street
Jersey City, NJ 07302
(1942) | | Trustee/Director since 1998 | | Managing Director of Monitor Clipper Partners (since 1997) and President of Clipper Asset Management Corp. (since 1991), both private equity investment funds. | | Currently serves as director of Avondale, Inc. and Interstate Bakeries Corp. | |
|
Julie A. Hill
Lord, Abbett & Co. LLC
c/o Legal Dept.
90 Hudson Street
Jersey City, NJ 07302
(1946) | | Trustee/Director since 2004 | | Owner and CEO of The Hill Company, a business consulting firm (since 1998); Founder, President and Owner of the Hiram-Hill and Hillsdale Development Company, a residential real estate development firm (1998 - 2000). | | Currently serves as director of WellPoint, Inc.; Resources Connection Inc.; Holcim (US) Inc. (a subsidiary of Holcim Ltd.); and Lend Lease Corporation Limited. | |
|
202
Basic Information About Management (continued)
Name, Address and
Year of Birth | | Current Position
Length of Service
with Company
and Trust | |
Principal Occupation
During Past Five Years | |
Other
Directorships | |
Franklin W. Hobbs
Lord, Abbett & Co. LLC
c/o Legal Dept.
90 Hudson Street
Jersey City, NJ 07302
(1947) | | Trustee/Director since 2000 | | Advisor of One Equity Partners, a private equity firm (since 2004); Chief Executive Officer of Houlihan Lokey Howard & Zukin, an investment bank (2002 - 2003); Chairman of Warburg Dillon Read, an investment bank (1999 - 2001); Global Head of Corporate Finance of SBC Warburg Dillon Read (1997 - 1999); Chief Executive Officer of Dillon, Read & Co. (1994 - 1997). | | Currently serves as director of Molson Coors Brewing Company. | |
|
Thomas J. Neff
Lord, Abbett & Co. LLC
c/o Legal Dept.
90 Hudson Street
Jersey City, NJ 07302
(1937) | | Trustee/Director since 1982 | | Chairman of Spencer Stuart (U.S.), an executive search consulting firm (since 1996); President of Spencer Stuart (1979 -1996). | | Currently serves as director of Ace, Ltd. (since 1997) and Hewitt Associates, Inc. | |
|
James L.L. Tullis*
Lord, Abbett & Co. LLC
c/o Legal Dept.
90 Hudson Street
Jersey City, NJ 07302
(1947) | | Trustee/Director since 2006 | | CEO of Tullis-Dickerson and Co. Inc, a venture capital management firm (since 1990). | | Currently serves as director of Crane Co. (since 1998) and Viacell Inc. (since 2002). | |
|
* Mr. Tullis is a director or trustee of thirteen of the fourteen Lord Abbett-sponsored funds, consisting of 54 portfolios or series, and is not trustee of Lord Abbett Large-Cap Growth Fund.
Officers
None of the officers listed below have received compensation from the Company or the Trust. All the officers of the Company and Trust may also be officers of the other Lord Abbett-sponsored funds and maintain offices at 90 Hudson Street, Jersey City, NJ 07302.
Name and
Year of Birth | | Current Position
with Company
and Trust | | Length of Service
of Current Position | | Principal Occupation
During Past Five Years | |
Robert S. Dow
(1945) | | Chief Executive Officer and Chairman | | Elected in 1996 | | Managing Partner and Chief Executive Officer of Lord Abbett (since 1996). | |
|
Daria L. Foster
(1954) | | President | | Elected in 2006 | | Partner and Director of Marketing and Client Service of Lord Abbett (since 1990). | |
|
Philip P. Fang
(1965) | | Executive Vice President | | Elected in 1994 | | Investment Manager, joined Lord Abbett in 1991. | |
|
203
Basic Information About Management (continued)
Name and
Year of Birth | | Current Position
with Company
and Trust | | Length of Service
of Current Position | | Principal Occupation
During Past Five Years | |
Peter Scott Smith
(1966) | | Executive Vice President | | Elected in 2000 | | Investment Manager, joined Lord Abbett in 1992. | |
|
Daniel S. Solender
(1965) | | Executive Vice President | | Elected in 2006 | | Director of Municipal Bond Management, joined Lord Abbett in 2006; formerly served as a Vice President and Portfolio Manager at Nuveen Investments from 1991 to 1993 and 2003 to 2006; prior thereto he served as a Principal and Portfolio Manager at Vanguard Group from 1999 to 2003. | |
|
Joan A. Binstock
(1954) | | Chief Financial Officer and Vice President | | Elected in 1999 | | Partner and Chief Operations Officer, joined Lord Abbett in 1999. | |
|
James Bernaiche
(1956) | | Chief Compliance Officer | | Elected in 2005 | | Chief Compliance Officer, joined Lord Abbett in 2001; formerly Vice President and Chief Compliance Officer with Credit Suisse Asset Management. | |
|
John K. Forst
(1960) | | Vice President and Assistant Secretary | | Elected in 2005 | | Deputy General Counsel, joined Lord Abbett in 2004; prior thereto Managing Director and Associate General Counsel at New York Life Investment Management LLC (2002 - 2003); formerly attorney at Dechert LLP (2000 - 2002). | |
|
Robert I. Gerber
(1954) | | Executive Vice President | | Elected in 2006 | | Partner and Director of Taxable Fixed Income Management, joined Lord Abbett in 1997. | |
|
Lawrence H. Kaplan
(1957) | | Vice President and Secretary | | Elected in 1997 | | Partner and General Counsel, joined Lord Abbett in 1997. | |
|
Robert G. Morris
(1944) | | Vice President | | Elected in 2005 | | Partner and Chief Investment Officer, joined Lord Abbett in 1991. | |
|
A. Edward Oberhaus, III
(1959) | | Vice President | | Elected in 1996 | | Partner and Manager of Equity Trading, joined Lord Abbett in 1983. | |
|
204
Basic Information About Management (concluded)
Name and
Year of Birth | | Current Position
with Company
and Trust | | Length of Service
of Current Position | | Principal Occupation
During Past Five Years | |
Christina T. Simmons
(1957) | | Vice President and Assistant Secretary | | Elected in 2000 | | Assistant General Counsel, joined Lord Abbett in 1999. | |
|
Bernard J. Grzelak
(1971) | | Treasurer | | Elected in 2003 | | Director of Fund Administration, joined Lord Abbett in 2003; formerly Vice President, Lazard Asset Management LLC. | |
|
Please call 888-522-2388 for a copy of the Statement of Additional Information (SAI), which contains further information about the Company's Directors and the Trust's Trustees. It is available free upon request.
205
Householding
The Company and Trust have adopted a policy that allows them to send only one copy of each Fund's Prospectus, proxy material, annual report and semiannual report to certain shareholders residing at the same "household." This reduces Fund expenses, which benefits you and other shareholders. If you need additional copies or do not want your mailings to be "householded," please call Lord Abbett at 800-821-5129 or send a written request with your name, the name of your fund or funds and your account number or numbers to Lord Abbett Family of Funds, P.O. Box 219336, Kansas City, MO 64121.
Proxy Voting Policies, Procedures and Record
A description of the policies and procedures that Lord Abbett uses to vote proxies related to each Fund's portfolio securities, and information on how Lord Abbett voted the Funds' proxies during the 12-month period ended June 30, 2006 are available without charge, upon request, (i) by calling 888-522-2388; (ii) on Lord Abbett's website at www.LordAbbett.com; and (iii) on the Securities and Exchange Commission's ("SEC") website at www.sec.gov.
Shareholder Reports and Quarterly Portfolio Disclosure
The Funds are required to file their complete schedule of portfolio holdings with the SEC for their first and third fiscal quarters on Form N-Q. Copies of the filings are available without charge, upon request, on the SEC's website at www.sec.gov and may be available by calling Lord Abbett at 800-821-5129. You can also obtain copies of Form N-Q by (i) visiting the SEC's Public Reference Room in Washington, DC (information on the operation of the Public Reference Room may be obtained by calling 800-SEC-0330); (ii) sending your request and duplicating fee to the SEC's Public Reference Room, Washington, DC 20549-0102; or (iii) sending your request electronically to publicinfo@sec.gov.
Tax Information
100% of the income distributions paid by each Fund during the fiscal year 2006 is tax-exempt dividend income.
Of the distributions paid to shareholders by the Missouri Tax-Free Fund during the fiscal year ended September 30, 2006, $209,059 and $14,346 represent long-term capital gains and short-term capital gains, respectively.
206
Lord Abbett Municipal Income Fund Inc.
Lord Abbett National Tax-Free Income Fund
Lord Abbett California Tax-Free Income Fund
Lord Abbett Connecticut Tax-Free Income Fund
Lord Abbett Hawaii Tax-Free Income Fund
Lord Abbett Minnesota Tax-Free Income Fund
Lord Abbett Missouri Tax-Free Income Fund
Lord Abbett New Jersey Tax-Free Income Fund
Lord Abbett New York Tax-Free Income Fund
Lord Abbett Texas Tax-Free Income Fund
Lord Abbett Washington Tax-Free Income Fund
Lord Abbett Municipal Income Trust
Lord Abbett Insured Intermediate Tax-Free Fund
Florida Series
Georgia Series
High Yield Municipal Bond Fund
Michigan Series
Pennsylvania Series
LATFI-2-906
(11/06)

This report, when not used for the general
information of shareholders of the Fund, is to
be distributed only if preceded or accompanied
by a current fund prospectus.
Lord Abbett mutual fund shares are distributed by
LORD ABBETT DISTRIBUTOR LLC.
Item 2: Code of Ethics.
(a) In accordance with applicable requirements, the Registrant adopted a Sarbanes-Oxley Code of Ethics on June 19, 2003 that applies to the principal executive officer and senior financial officers of the Registrant (“Code of Ethics”). The Code of Ethics was in effect during the fiscal year ended September 30, 2006 (the “Period”).
(b) Not applicable.
(c) The Registrant has not amended the Code of Ethics as described in Form N-CSR during the Period.
(d) The Registrant has not granted any waiver, including an implicit waiver, from a provision of the Code of Ethics as described in Form N-CSR during the Period.
(e) Not applicable.
(f) See Item 12(a)(1) concerning the filing of the Code of Ethics. The Registrant will provide a copy of the Code of Ethics to any person without charge, upon request. To obtain a copy, please call Lord Abbett at 800-821-5129.
Item 3: Audit Committee Financial Expert.
The Registrant’s Board of Directors has determined that each of the following independent Directors who are members of the audit committee are audit committee financial experts: E. Thayer Bigelow, Robert B. Calhoun, and Franklin W. Hobbs. Each of these persons is independent within the meaning of the Form N-CSR.
Item 4: Principal Accountant Fees and Services.
In response to sections (a), (b), (c) and (d) of Item 4, the aggregate fees billed to the Registrant for the fiscal years ended September 30, 2006 and 2005 by the Registrant’s principal accounting firm, Deloitte & Touche LLP, the member firms of Deloitte Touche Tohmatsu and their respective affiliates (collectively, “Deloitte”) were as follows:
| | Fiscal year ended: | |
| | 2006 | | 2005 | |
Audit Fees {a} | | $ | 270,000 | | $ | 261,000 | |
Audit-Related Fees {b} | | 228 | | 212 | |
Total audit and audit-related fees | | 270,228 | | 261,212 | |
| | | | | |
Tax Fees {c} | | 68,197 | | 60,235 | |
All Other Fees | | -0- | | -0- | |
| | | | | |
Total Fees | | $ | 338,425 | | $ | 321,447 | |
{a} Consists of fees for audits of the Registrant’s annual financial statements.
{b} Consists of the Registrant’s proportionate share of fees for performing certain agreed-upon procedures regarding compliance with the provisions of Rule 17a-7 of the Investment Company Act of 1940 and related Board approved procedures.
{c} Fees for the fiscal year ended September 30, 2006 and 2005 consist of fees for preparing the U.S. Income Tax Return for Regulated Investment Companies, New Jersey Corporation Business Tax Return, New Jersey Annual Report Form, U.S. Return of Excise Tax on Undistributed Income of Investment Companies, IRS Forms 1099-MISC and 1096 Annual Summary and Transmittal of U.S. Information Returns.
(e) (1) Pursuant to Rule 2-01(c) (7) of Regulation S-X, the Registrant’s Audit Committee has adopted pre-approval policies and procedures. Such policies and procedures generally provide that the Audit Committee must pre-approve:
· any audit, audit-related, tax, and other services to be provided to the Lord Abbett Funds, including the Registrant, and
· any audit-related, tax, and other services to be provided to the Registrant’s investment adviser and any entity controlling, controlled by or under common control with the investment adviser that provides ongoing services to one or more Funds comprising the Registrant if the engagement relates directly to operations and financial reporting of a Fund, by the independent auditor to assure that the provision of such services does not impair the auditor’s independence.
The Audit Committee has delegated pre-approval authority to its Chairman, subject to a fee limit of $10,000 per event, and not to exceed $25,000 annually. The Chairman will report any pre-approval decisions to the Audit Committee at its next scheduled meeting. Unless a type of service to be provided by the independent auditor has received general pre-approval, it must be pre-approved
by the Audit Committee. Any proposed services exceeding pre-approved cost levels will require specific pre-approval by the Audit Committee.
(e) (2) The Registrant’s Audit Committee has approved 100% of the services described in this Item 4 (b) through (d).
(f) Not applicable.
(g) The aggregate non-audit fees billed by Deloitte for services rendered to the Registrant are shown above in the response to Item 4 (a), (b), (c) and (d) as “All Other Fees”.
The aggregate non-audit fees billed by Deloitte for services rendered to the Registrant’s investment adviser, Lord, Abbett & Co. LLC (“Lord Abbett”), for the fiscal years ended September 30, 2006 and 2005 were:
| | Fiscal year ended: | |
| | 2006 | | 2005 | |
All Other Fees {a} | | $ | 5,500 | | $ | 165,650 | |
| | | | | | | |
{a} Consist of fees for Independent Services Auditors’ Report on Controls Placed in Operation and Tests of Operating Effectiveness related to Lord Abbett’s Asset Management Services (“SAS 70 Report”).
The aggregate non-audit fees billed by Deloitte for services rendered to entities under the common control of Lord Abbett (i.e., Lord Abbett Distributor LLC, the Registrant’s principal underwriter) for the fiscal years ended September 30, 2006 and 2005 were:
| | Fiscal year ended: | |
| | 2006 | | 2005 | |
All Other Fees | | $ | - 0 - | | $ | - 0- | |
| | | | | | | |
(h) The Registrant’s Audit Committee has considered the provision of non-audit services that were rendered to the Registrant’s investment adviser, and any entity controlling, controlled by or under common control with the investment adviser that provides ongoing services to the Registrant, that were not pre-approved pursuant to Rule 2-01 (c)(7)(ii) of Regulation S-X and has determined that the provision of such services is compatible with maintaining Deloitte’s independence.
Item 5: Audit Committee of Listed Registrants.
Not applicable.
Item 6: �� Schedule of Investments.
Not applicable.
Item 7: Disclosure of Proxy Voting Policies and Procedures for Closed-End Management Investment Companies.
Not applicable.
Item 8: Portfolio Managers of Closed-End Management Investment Companies.
Not applicable.
Item 9: Purchases of Equity Securities by Closed-End Management Investment Company and Affiliated Purchasers.
Not applicable.
Item 10: Submission of Matters to a Vote of Security Holders.
At the June 22, 2006 meetings of the Nominating and Governance Committees (the “Committee”) of the Boards of each of the Lord Abbett Funds, the Committee adopted policies and procedures for the nomination of independent directors/trustees (“Procedures”). The Procedures provide criteria for the nomination of independent directors/trustees, as well as a process for identifying and evaluating candidates. With respect to shareholder recommendations, it is the Committee’s policy to consider director/trustee nominations recommended by shareholders using the same criteria the Committee uses in considering potential director/trustee nominations from other sources. The Committee believes that directors/trustees must represent all shareholders and not just a limited set of shareholders. A copy of the Procedures may be found at www.LordAbbett.com.
Item 11: Controls and Procedures.
(a) Based on their evaluation of the Registrant’s disclosure controls and procedures (as defined in Rule 30a-3(c) under the Investment Company Act of 1940) as of a date within 90 days prior to the filing date of this report, the Chief Executive
Officer and Chief Financial Officer of the Registrant have concluded that such disclosure controls and procedures are reasonably designed and effective to ensure that material information relating to the Registrant, including its consolidated subsidiaries, is made known to them by others within those entities.
(b) There were no significant changes in the Registrant’s internal control over financial reporting (as defined in Rule 30a-3(d) under the Investment Company Act of 1940) that occurred during the second fiscal quarter of the period covered by this report that have materially affected, or are reasonably likely to materially affect, the Registrant’s internal control over financial reporting.
Item 12: Exhibits.
(a)(1) Amendments to Code of Ethics – Not applicable.
(a)(2) Certification of each principal executive officer and principal financial officer of the Registrant as required by Rule 30a-2 under the Act (17 CFR 270.30a-2) is attached hereto as a part of EX-99.CERT.
(a)(3) Not applicable.
(b) Certification of each principal executive officer and principal financial officer of the Registrant as required by Section 906 of the Sarbanes-Oxley Act of 2002 is attached hereto as a part of EX-99.906CERT.
SIGNATURES
Pursuant to the requirements of the Securities Exchange Act of 1934 and the Investment Company Act of 1940, the Registrant has duly caused this report to be signed on its behalf by the undersigned, thereunto duly authorized.
| LORD ABBETT MUNICIPAL INCOME FUND, INC. |
| |
| |
| | /s/ Robert S. Dow | |
| | Robert S. Dow |
| | Chief Executive Officer and Chairman |
| | |
| | |
| | /s/ Joan A.Binstock | |
| | Joan A. Binstock |
| | Chief Financial Officer and Vice President |
| | |
| |
Date: November 28, 2006 | |
Pursuant to the requirements of the Securities Exchange Act of 1934 and the Investment Company Act of 1940, this report has been signed below by the following persons on behalf of the Registrant and in the capacities and on the dates indicated.
| LORD ABBETT MUNICIPAL INCOME FUND, INC. |
| |
| |
| | /s/ Robert S. Dow | |
| | Robert S. Dow |
| | Chief Executive Officer and Chairman |
| | |
| | |
| | /s/ Joan A. Binstock | |
| | Joan A. Binstock |
| | Chief Financial Officer and Vice President |
| | |
| |
Date: November 28, 2006 | |