|
| UNITED STATES |
| SECURITIES AND EXCHANGE COMMISSION |
| WASHINGTON, D.C. 20549 |
| -------- |
| |
| FORM N-CSR |
| -------- |
| |
| CERTIFIED SHAREHOLDER REPORT OF REGISTERED MANAGEMENT |
| INVESTMENT COMPANIES |
| |
| INVESTMENT COMPANY ACT FILE NUMBER 811-3967 |
FIRST INVESTORS INCOME FUNDS
(Exact name of registrant as specified in charter)
55 Broadway
New York, NY 10006
(Address of principal executive offices) (Zip code)
Joseph I. Benedek
First Investors Management Company, Inc.
Raritan Plaza I
Edison, NJ 08837-3620
(Name and address of agent for service)
REGISTRANT'S TELEPHONE NUMBER, INCLUDING AREA CODE: 1-212-858-8000
DATE OF FISCAL YEAR END: SEPTEMBER 30
DATE OF REPORTING PERIOD: MARCH 31, 2013
Item 1. Reports to Stockholders
The semi-annual report to stockholders follows
This report is for the information of the shareholders of the Funds. It is the policy of each Fund described in this report to mail only one copy of a Fund’s prospectus, annual report, semi-annual report and proxy statements to all shareholders who share the same mailing address and share the same last name and have invested in a Fund covered by the same document. You are deemed to consent to this policy unless you specifically revoke this policy and request that separate copies of such documents be mailed to you. In such case, you will begin to receive your own copies within 30 days after our receipt of the revocation. You may request that separate copies of these disclosure documents be mailed to you by writing to us at: Administrative Data Management Corp., Raritan Plaza I, Edison, NJ 08837-3620 or calling us at 1-800-423-4026.
You may obtain a free prospectus for any of the Funds by contacting your representative, calling 1-800-423-4026, writing to us at the following address: First Investors Corporation, 55 Broadway, New York, NY 10006, or by visiting our website at www.firstinvestors.com. You should consider the investment objectives, risks, charges and expenses of a Fund carefully before investing. The prospectus contains this and other information about the Fund, and should be read carefully before investing.
An investment in a Fund is not a bank deposit and is not insured or guaranteed by the Federal Deposit Insurance Corporation (FDIC) or any other government agency. Although the Cash Management Fund seeks to preserve a net asset value at $1.00 per share, it is possible to lose money by investing in it, just as it is possible to lose money by investing in any of the other Funds. Past performance is no guarantee of future results.
A Statement of Additional Information (“SAI”) for any of the Funds may also be obtained, without charge, upon request by calling 1-800-423-4026, writing to us at our address or by visiting our website listed above. The SAI contains more detailed information about the Funds, including information about its Trustees.
Market Overview
FIRST INVESTORS INCOME FUNDS
FIRST INVESTORS EQUITY FUNDS
Dear Investor:
During the six-month reporting period ending March 31, 2013, the U.S. economy continued to improve at a slow but steady pace, with positive readings on housing, manufacturing and unemployment. In particular, growth accelerated from an anemic 0.4% in the fourth quarter of 2012 to 2.5% in the first quarter of 2013, as the unemployment rate fell to a four-year low of 7.5%.
Inflation remained subdued as the Consumer Price Index – excluding the volatile food and energy components – remained under 2%. While concerns about November’s presidential election quickly turned into worries over the impact of the “fiscal cliff,” the crisis was averted when President Obama and the Congress struck a deal on New Year’s Day. Lastly, the financial markets were underpinned by the Federal Reserve’s (“the Fed’s”) continuation of its very accommodative monetary policy.
Bond Markets
The low interest rate environment continued during the review period, as benchmark U.S. Treasury yields moved in a relatively narrow range. Yields reached their lows in mid-November due to concerns over the fiscal cliff. After the fiscal cliff was avoided, yields gradually moved to 11-month highs in March in response to stronger-than-expected economic data, only to retrace much of the move because of concern over the bailout of Cyprus. The ten-year Treasury note yield ended the review period at 1.85%, up from 1.63%. The two-year Treasury note yield, which is anchored by the Fed’s commitment to keep short-term rates very low, moved from 0.23% to 0.24%.
The broad bond market gained 0.2% during the reporting period, according to the Bank of America Merrill Lynch US Broad Market Index. Riskier sectors had the best returns, as high yield bonds gained 6.2%. Investment grade corporate bonds advanced 1.3%, while high-quality mortgage-backed and Treasury securities had returns of -0.3% and -0.4%, respectively. Municipal bonds gained 1.0% for the quarter, despite a very weak December when investors became concerned that the fiscal cliff deal would include a cap on the value of their tax exemption (which did not occur). Money market rates remained close to zero, reflecting the Fed’s commitment to keep short-term interest rates at an exceptionally low level.
Equity Markets
Equities posted positive results during the reporting period. Stocks ended 2012 with a flourish, as the S&P 500 Index concluded the calendar year up 16.0%, on a total return basis. Issues such as the U.S. presidential election in November and the impending year-end fiscal cliff of tax hikes and budget cuts weighed on investors’ minds, but did not derail a strong market rally. Strong corporate profit growth and positive economic news lifted the markets during the first half of the reporting period with stocks having gained in excess of 10%. Overall economic news flow had a positive bias,
Market Overview (continued)
FIRST INVESTORS INCOME FUNDS
FIRST INVESTORS EQUITY FUNDS
as notable headlines included a rise in consumer spending, higher retail sales, lower unemployment and increased factory orders. New housing and existing home sales also surprised positively. However, economic growth remained below optimal levels, and was highly subject to swings in sentiment, forcing the Fed to remain active in supporting monetary stimulus.
By the end of the reporting period, a review of the markets had every sector but one posting positive absolute results. The S&P 500 Index gained an additional 10.6% through March 31. Investors favored shares exhibiting earnings and sales growth and share price momentum. Factors such as positive earnings surprise, share repurchase, lower valuation and low price-to-sales led performers. Returns were best in: financials, health care, consumer discretionary and industrials sectors. The worst-performing sectors were technology, telecom and energy. Markets favored smaller-cap size, particularly among mid-caps, which were the strongest category by size. Among styles, “value” outperformed “growth” with the highest returns within smaller-cap sizes.
Thank you for placing your trust in First Investors. As always, we appreciate the opportunity to serve your investment needs.

This Market Overview is not part of the Funds’ financial report and is submitted for the general information of the shareholders of the Funds. It is not authorized for distribution to prospective investors in the Funds, unless preceded or accompanied by an effective prospectus. The Market Overview reflects conditions through the end of the period as stated on the cover. Market conditions are subject to change. This Market Overview may not be relied upon as investment advice or as an indication of current or future trading intent on behalf of any Fund.
There are a variety of risks associated with investing in mutual funds. For stock funds, the risks include market risk (the risk that the entire stock market will decline because of an event such as deterioration in the economy or a rise in interest rates), as well as special risks associated with investing in certain types of stock funds, such as small-cap, global and international funds. For bond funds, the risks include interest rate risk and credit risk. Interest rate risk is the risk that bonds will decrease in value as interest rates rise. As a general matter, longer-term bonds fluctuate more than shorter-term bonds in reaction to changes in interest rates. Credit risk is the risk that bonds will decline in value as the result of a decline in the credit rating of the bonds or the economy as a whole, or that the issuer will be unable to pay interest and/or principal when due. There are also special risks associated with investing in certain types of bond funds, including liquidity risk and prepayment and extension risk. You should consult your prospectus for a precise explanation of the risks associated with your Fund.
Understanding Your Fund’s Expenses (unaudited)
FIRST INVESTORS INCOME FUNDS
FIRST INVESTORS EQUITY FUNDS
As a mutual fund shareholder, you incur two types of costs: (1) transaction costs, including a sales charge (load) on purchase payments (on Class A shares only) and a contingent deferred sales charge on redemptions (on Class B shares only); and (2) ongoing costs, including advisory fees; distribution and service fees (12b-1); and other expenses. This example is intended to help you understand your ongoing costs (in dollars) of investing in the Funds and to compare these costs with the ongoing costs of investing in other mutual funds.
The examples are based on an investment of $1,000 in each Fund at the beginning of the period, October 1, 2012, and held for the entire six-month period ended March 31, 2013. The calculations assume that no shares were bought or sold during the period. Your actual costs may have been higher or lower, depending on the amount of your investment and the timing of any purchases or redemptions.
Actual Expenses Example:
These amounts help you to estimate the actual expenses that you paid over the period. The “Ending Account Value” shown is derived from the Fund’s actual return, and the “Expenses Paid During Period” shows the dollar amount that would have been paid by an investor who started with $1,000 in the Fund. You may use the information here, together with the amount you invested, to estimate the expenses that you paid over the period.
To estimate the expenses you paid on your account during this period, simply divide your ending account value by $1,000 (for example, an $8,600 account value divided by $1,000 = 8.60), then multiply the result by the number given for your Fund under the heading “Expenses Paid During Period”.
Hypothetical Expenses Example:
These amounts provide information about hypothetical account values and hypothetical expenses based on the Fund’s actual expense ratio for Class A and Class B shares, and an assumed rate of return of 5% per year before expenses, which is not the Fund’s actual return. The hypothetical account values and expenses may not be used to estimate the actual ending account balance or expenses you paid for the period. You may use this information to compare the ongoing costs of investing in the Fund and other funds. To do so, compare this 5% hypothetical example with the 5% hypothetical examples that appear in the shareholder reports of the other funds.
Please note that the expenses shown in the table are meant to highlight and help you compare your ongoing costs only and do not reflect any transaction costs, such as front-end or contingent deferred sales charges (loads). Therefore, the hypothetical expenses example is useful in comparing ongoing costs only and will not help you determine the relative total costs of owning different funds. In addition, if these transaction costs were included, your costs would have been higher.
Fund Expenses (unaudited)
CASH MANAGEMENT FUND
The examples below show the ongoing costs (in dollars) of investing in your Fund and will help you in comparing these costs with costs of other mutual funds. Please refer to page 4 for a detailed explanation of the information presented in these examples.
| | | |
| |
| | Beginning | Ending | |
| | Account | Account | Expenses Paid |
| | Value | Value | During Period |
| | (10/1/12) | (3/31/13) | (10/1/12–3/31/13)* |
| Expense Example – Class A Shares | | | |
| Actual | $1,000.00 | $1,000.00 | $0.65 |
| Hypothetical | | | |
| (5% annual return before expenses) | $1,000.00 | $1,024.28 | $0.66 |
| Expense Example – Class B Shares | | | |
| Actual | $1,000.00 | $1,000.00 | $0.65 |
| Hypothetical | | | |
| (5% annual return before expenses) | $1,000.00 | $1,024.28 | $0.66 |
| |
| * | Expenses are equal to the annualized expense ratio of .13% for Class A shares and .13% for Class B |
| shares, multiplied by the average account value over the period, multiplied by 182/365 (to reflect the |
| one-half year period). Expenses paid during the period are net of expenses waived and/or assumed. |
Portfolio Composition
BY SECTOR
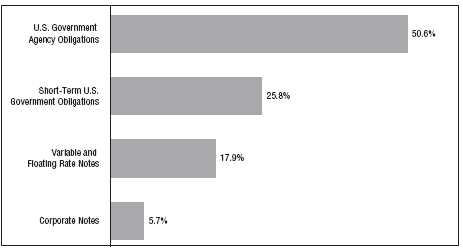
Portfolio holdings and allocations are subject to change. Percentages are as of March 31, 2013, and are based on the total value of investments.
Portfolio of Investments
CASH MANAGEMENT FUND
March 31, 2013
| | | | | | | |
| |
| | | | | | | | |
| | | | | | | | |
| Principal | | | | | Interest | | |
| Amount | | Security | | | Rate | * | Value |
| | | U.S. GOVERNMENT AGENCY | | | | | |
| | | OBLIGATIONS—50.3% | | | | | |
| $ 6,500M | | Fannie Mae, 8/1/2013 | | | 0.12 | % | $ 6,497,467 |
| | | Federal Home Loan Bank: | | | | | |
| 8,600M | | 4/17/13 | | | 0.10 | | 8,599,637 |
| 6,400M | | 4/19/13 | | | 0.08 | | 6,399,760 |
| 3,000M | | 4/26/13 | | | 0.09 | | 2,999,812 |
| 5,500M | | 6/7/13 | | | 0.11 | | 5,498,874 |
| | | Freddie Mac: | | | | | |
| 5,500M | | 4/4/13 | | | 0.11 | | 5,499,950 |
| 1,400M | | 4/15/13 | | | 0.10 | | 1,399,948 |
| 12,000M | | 4/22/13 | | | 0.08 | | 11,999,440 |
| 2,100M | | 4/23/13 | | | 0.08 | | 2,099,897 |
| 7,258M | | 6/3/13 | | | 0.12 | | 7,256,476 |
| 2,720M | | 7/1/13 | | | 0.11 | | 2,719,244 |
| 6,500M | | 7/1/13 | | | 0.14 | | 6,497,699 |
| 3,500M | | 7/15/13 | | | 0.13 | | 3,544,585 |
| Total Value of U.S. Government Agency Obligations (cost $71,012,789) | | 71,012,789 |
| | | VARIABLE AND FLOATING RATE NOTES—17.9% | | |
| | | Federal Farm Credit Bank: | | | | | |
| 3,000M | | 9/16/13 | | | 0.37 | | 3,002,795 |
| 1,000M | | 10/15/13 | | | 0.26 | | 1,000,491 |
| | | Federal Home Loan Bank: | | | | | |
| 2,800M | | 7/25/13 | | | 0.14 | | 2,799,910 |
| 1,850M | | 11/8/13 | | | 0.21 | | 1,850,227 |
| 5,000M | | 12/20/13 | | | 0.22 | | 5,001,460 |
| 5,700M | | Mississippi Business Finance Corp. | | | | | |
| | | (Chevron USA, Inc.), 12/1/2030 | | | 0.14 | | 5,700,000 |
| 5,835M | | Valdez, Alaska Marine Terminal Rev. | | | | | |
| | | (Exxon Pipeline Co., Project B), 12/1/2033 | | | 0.13 | | 5,835,000 |
| Total Value of Variable and Floating Rate Notes (cost $25,189,883) | | | | | 25,189,883 |
| | | CORPORATE NOTES—5.7% | | | | | |
| 4,000M | | Abbott Laboratories, 5/16/2013 (a) | | | 0.13 | | 3,999,350 |
| 4,000M | | Coca-Cola Co., 8/2/2013 (a) | | | 0.16 | | 3,997,813 |
| Total Value of Corporate Notes (cost $7,997,163) | | | | | 7,997,163 |
| | | | | | | |
| |
| | | | | | | | |
| | | | | | | | |
| Principal | | | | | Interest | | |
| Amount | | Security | | | Rate | * | Value |
| | | SHORT-TERM U.S. GOVERNMENT | | | | | |
| | | OBLIGATIONS—25.7% | | | | | |
| | | U.S. Treasury Bills: | | | | | |
| $ 9,000M | | 4/4/13 | | | 0.08 | % | $ 8,999,938 |
| 3,000M | | 5/9/13 | | | 0.08 | | 2,999,753 |
| 2,500M | | 5/9/13 | | | 0.08 | | 2,499,786 |
| 5,000M | | 5/16/13 | | | 0.12 | | 4,999,247 |
| 7,000M | | 6/13/13 | | | 0.09 | | 6,998,679 |
| 6,000M | | 7/18/13 | | | 0.11 | | 5,998,110 |
| 3,700M | | 7/25/13 | | | 0.11 | | 3,698,694 |
| Total Value of Short-Term U.S. Government Obligations (cost $36,194,207) | | 36,194,207 |
| Total Value of Investments (cost $140,394,042)** | 99.6 | % | | | 140,394,042 |
| Other Assets, Less Liabilities | .4 | | | | 633,097 |
| Net Assets | | | 100.0 | % | | | $141,027,139 |
| |
| * | The interest rates shown are the effective rates at the time of purchase by the Fund. The interest |
| rates shown on variable and floating rate notes are adjusted periodically; the rates shown are the |
| rates in effect at March 31, 2013. |
| |
| ** | Aggregate cost for federal income tax purposes is the same. |
| |
| (a) | Security exempt from registration under Section 4(2) of the Securities Act of 1933 (see Note 4). |
Portfolio of Investments (continued)
CASH MANAGEMENT FUND
March 31, 2013
Accounting Standards Codification (“ASC”) 820 established a three-tier hierarchy of inputs to establish a classification of fair value measurements for disclosure purposes. The three-tier hierarchy of inputs is summarized in the three broad Levels listed below:
| Level 1 — Unadjusted quoted prices in active markets for identical securities that the Fund has the ability to access. |
| Level 2 — Observable inputs other than quoted prices included in Level 1 that are observable for the asset or liability, either directly or indirectly. These inputs may include quoted prices for the identical instrument on an inactive market, prices for similar instruments, interest rates, prepayment speeds, credit risk, yield curves, default rates and similar data. |
| Level 3 — Unobservable inputs for the asset or liability, to the extent relevant observable inputs are not available, representing the Fund’s own assumption about the assumptions a market participant would use in valuing the asset or liability, and would be based on the best information available. |
The inputs methodology used for valuing securities are not necessarily an indication of the risk associated with investing in those securities.
The following is a summary, by category of Level, of inputs used to value the Fund’s investments as of March 31, 2013:
| | | | | | | | | | | | |
| | | | Level 1 | | | Level 2 | | | Level 3 | | | Total |
| U.S. Government Agency | | | | | | | | | | | | |
| Obligations | | $ | — | | $ | 71,012,789 | | $ | — | | $ | 71,012,789 |
| Variable and Floating Rate Notes: | | | | | | | | | | | | |
| U.S. Government Agency | | | | | | | | | | | | |
| Obligations | | | — | | | 13,654,883 | | | — | | | 13,654,883 |
| Corporate Notes | | | — | | | 5,835,000 | | | — | | | 5,835,000 |
| Municipal Bonds | | | — | | | 5,700,000 | | | — | | | 5,700,000 |
| Corporate Notes | | | — | | | 7,997,163 | | | — | | | 7,997,163 |
| Short-Term U.S. Government | | | | | | | | | | | | |
| Obligations | | | — | | | 36,194,207 | | | — | | | 36,194,207 |
| Total Investments in Securities | | $ | — | | $ | 140,394,042 | | $ | — | | $ | 140,394,042 |
There were no transfers into or from Level 1 or Level 2 by the Fund during the year ended March 31, 2013. Transfers, if any, between Levels are recognized at the end of the reporting period.
| | |
| 8 | See notes to financial statements | |
Fund Expenses (unaudited)
GOVERNMENT FUND
The examples below show the ongoing costs (in dollars) of investing in your Fund and will help you in comparing these costs with costs of other mutual funds. Please refer to page 4 for a detailed explanation of the information presented in these examples.
| | | |
| |
| | Beginning | Ending | |
| | Account | Account | Expenses Paid |
| | Value | Value | During Period |
| | (10/1/12) | (3/31/13) | (10/1/12–3/31/13)* |
| Expense Example – Class A Shares | | | |
| Actual | $1,000.00 | $994.06 | $5.52 |
| Hypothetical | | | |
| (5% annual return before expenses) | $1,000.00 | $1,019.40 | $5.59 |
| Expense Example – Class B Shares | | | |
| Actual | $1,000.00 | $991.57 | $8.99 |
| Hypothetical | | | |
| (5% annual return before expenses) | $1,000.00 | $1,015.90 | $9.10 |
| |
| * | Expenses are equal to the annualized expense ratio of 1.11% for Class A shares and 1.81% for |
| Class B shares, multiplied by the average account value over the period, multiplied by 182/365 (to |
| reflect the one-half year period). Expenses paid during the period are net of expenses waived. |
Portfolio Composition
BY SECTOR
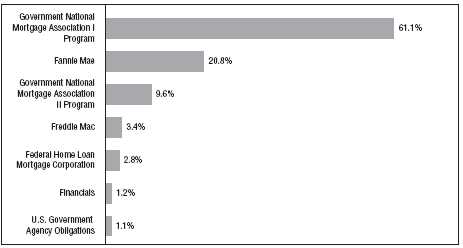
Portfolio holdings and allocations are subject to change. Percentages are as of March 31, 2013, and are based on the total value of investments.
Portfolio of Investments
GOVERNMENT FUND
March 31, 2013
| | | | |
| |
| | | | | |
| | | | | |
| Principal | | | | |
| Amount | | Security | | Value |
| | | RESIDENTIAL MORTGAGE-BACKED | | |
| | | SECURITIES—95.3% | | |
| | | Fannie Mae—20.0% | | |
| $ 9,766M | | 2.5%, 11/1/2027 – 12/1/2027 | | $ 10,145,154 |
| 7,923M | | 3%, 1/1/2043 | | 8,183,356 |
| 11,190M | | 3.5%, 8/1/2026 – 10/1/2042 | | 11,878,569 |
| 23,217M | | 4%, 12/1/2040 – 10/1/2041 (a) | | 25,198,506 |
| 8,484M | | 4.5%, 11/1/2040 – 8/1/2041 (a) | | 9,206,680 |
| 5,697M | | 5%, 8/1/2039 – 11/1/2039 | | 6,305,085 |
| 5,069M | | 5.5%, 7/1/2033 – 10/1/2039 | | 5,624,612 |
| | | | | 76,541,962 |
| | | Federal Home Loan Mortgage Corporation—1.4% | | |
| 5,071M | | FHLMC, 3%, 8/15/2039 | | 5,341,537 |
| | | Freddie Mac—3.4% | | |
| 4,889M | | 2.5%, 1/1/2028 | | 5,072,617 |
| 7,308M | | 4%, 11/1/2040 (a) | | 7,867,321 |
| | | | | 12,939,938 |
| | | Government National Mortgage Association I | | |
| | | Program—61.0% | | |
| 22,490M | | 3%, 11/15/2042 – 12/15/2042 | | 23,580,777 |
| 13,695M | | 4%, 7/15/2040 – 1/15/2042 | | 15,124,445 |
| 60,724M | | 4.5%, 9/15/2033 – 7/15/2041 | | 67,048,685 |
| 54,140M | | 5%, 6/15/2033 – 6/15/2040 | | 59,894,872 |
| 29,147M | | 5.5%, 3/15/2033 – 10/15/2039 | | 32,713,764 |
| 26,151M | | 6%, 3/15/2031 – 5/15/2040 | | 29,729,071 |
| 2,017M | | 6.5%, 6/15/2034 – 3/15/2038 | | 2,307,780 |
| 2,867M | | 7%, 6/15/2023 – 4/15/2034 | | 3,253,319 |
| | | | | 233,652,713 |
| | | Government National Mortgage Association II | | |
| | | Program—9.5% | | |
| 13,119M | | 3.5%, 1/20/2041 – 10/20/2042 | | 14,051,788 |
| 20,811M | | 4%, 3/20/2040 – 7/20/2042 | | 22,569,503 |
| | | | | 36,621,291 |
| Total Value of Residential Mortgage-Backed Securities (cost $353,927,560) | | 365,097,441 |
| | | | | | | |
| |
| | | | | | | | |
| | | | | | | | |
| Principal | | | | | | | |
| Amount | | Security | | | | | Value |
| | | COMMERCIAL MORTGAGE-BACKED | | | | |
| | | SECURITIES—2.1% | | | | | |
| | | Fannie Mae DUS—.8% | | | | | |
| $ 2,991M | | 2.27%, 1/1/2023 | | | | | $ 2,999,243 |
| | | Federal Home Loan Mortgage Corporation—1.3% | | | | |
| 5,000M | | FHLMC Multifamily Structured Pass Thru, 2.13%, 1/25/2019 | | | | 5,205,295 |
| Total Value of Commercial Mortgage-Backed Securities (cost $8,161,527) | | | | 8,204,538 |
| | | CORPORATE BONDS—1.2% | | | | | |
| | | Financials | | | | | |
| 4,500M | | Excalibur One 77B, LLC, 1.491%, 1/1/2025 (cost $4,476,397) | | | | 4,477,343 |
| | | U.S. GOVERNMENT AGENCY | | | | | |
| | | OBLIGATIONS—1.2% | | | | | |
| 4,400M | | Federal Home Loan Bank, 1%, 2/15/2028 (cost $4,394,200) | | | | 4,397,021 |
| Total Value of Investments (cost $370,959,684) | 99.8 | % | | | 382,176,343 |
| Other Assets, Less Liabilities | .2 | | | | 792,224 |
| Net Assets | | | 100.0 | % | | | $382,968,567 |
| |
| (a) | A portion or all of the security purchased on a when-issued or delayed delivery basis |
| (see Note 1G). |
Portfolio of Investments (continued)
GOVERNMENT FUND
March 31, 2013
Accounting Standards Codification (“ASC”) 820 established a three-tier hierarchy of inputs to establish a classification of fair value measurements for disclosure purposes. The three-tier hierarchy of inputs is summarized in the three broad Levels listed below:
| Level 1 — Unadjusted quoted prices in active markets for identical securities that the Fund has the ability to access. |
| Level 2 — Observable inputs other than quoted prices included in Level 1 that are observable for the asset or liability, either directly or indirectly. These inputs may include quoted prices for the identical instrument on an inactive market, prices for similar instruments, interest rates, prepayment speeds, credit risk, yield curves, default rates and similar data. |
| Level 3 — Unobservable inputs for the asset or liability, to the extent relevant observable inputs are not available, representing the Fund’s own assumption about the assumptions a market participant would use in valuing the asset or liability, and would be based on the best information available. |
The inputs methodology used for valuing securities are not necessarily an indication of the risk associated with investing in those securities.
The following is a summary, by category of Level, of inputs used to value the Fund’s investments as of March 31, 2013:
| | | | | | | | | | | | |
| | | | Level 1 | | | Level 2 | | | Level 3 | | | Total |
| Residential Mortgage-Backed | | | | | | | | | | | | |
| Securities | | $ | — | | $ | 365,097,441 | | $ | — | | $ | 365,097,441 |
| Commercial Mortgage-Backed | | | | | | | | | | | | |
| Securities | | | — | | | 8,204,538 | | | — | | | 8,204,538 |
| Corporate Bonds | | | — | | | 4,477,343 | | | — | | | 4,477,343 |
| U.S. Government Agency | | | | | | | | | | | | |
| Obligations | | | — | | | 4,397,021 | | | — | | | 4,397,021 |
| Total Investments in Securities* | | $ | — | | $ | 382,176,343 | | $ | — | | $ | 382,176,343 |
| |
| * | The Portfolio of Investments provides information on the industry categorization for the portfolio. |
| |
| There were no transfers into or from Level 1 or Level 2 by the Fund during the period ended |
| March 31, 2013. Transfers, if any, between Levels are recognized at the end of the reporting period. |
| | |
| 12 | See notes to financial statements | |
Fund Expenses (unaudited)
INVESTMENT GRADE FUND
The examples below show the ongoing costs (in dollars) of investing in your Fund and will help you in comparing these costs with costs of other mutual funds. Please refer to page 4 for a detailed explanation of the information presented in these examples.
| | | |
| |
| | Beginning | Ending | |
| | Account | Account | Expenses Paid |
| | Value | Value | During Period |
| | (10/1/12) | (3/31/13) | (10/1/12–3/31/13)* |
| Expense Example – Class A Shares | | | |
| Actual | $1,000.00 | $1,013.50 | $5.42 |
| Hypothetical | | | |
| (5% annual return before expenses) | $1,000.00 | $1,019.54 | $5.44 |
| Expense Example – Class B Shares | | | |
| Actual | $1,000.00 | $1,013.44 | $8.94 |
| Hypothetical | | | |
| (5% annual return before expenses) | $1,000.00 | $1,016.05 | $8.95 |
| |
| * | Expenses are equal to the annualized expense ratio of 1.08% for Class A shares and 1.78% for |
| Class B shares, multiplied by the average account value over the period, multiplied by 182/365 (to |
| reflect the one-half year period). Expenses paid during the period are net of expenses waived. |
Portfolio Composition
BY SECTOR
Portfolio holdings and allocations are subject to change. Percentages are as of March 31, 2013, and are based on the total value of investments.
Portfolio of Investments
INVESTMENT GRADE FUND
March 31, 2013
| | | | |
| |
| | | | | |
| | | | | |
| Principal | | | | |
| Amount | | Security | | Value |
| | | CORPORATE BONDS—98.2% | | |
| | | Aerospace/Defense—.3% | | |
| $1,800M | | BAE Systems Holdings, Inc., 4.95%, 6/1/2014 (a) | | $ 1,877,123 |
| | | Agriculture—.6% | | |
| 2,725M | | Cargill, Inc., 6%, 11/27/2017 (a) | | 3,250,723 |
| | | Automotive—.7% | | |
| 4,000M | | Daimler Finance NA, LLC, 2.95%, 1/11/2017 (a) | | 4,199,856 |
| | | Chemicals—1.7% | | |
| 4,000M | | CF Industries, Inc., 7.125%, 5/1/2020 | | 4,963,140 |
| 4,000M | | Dow Chemical Co., 4.25%, 11/15/2020 | | 4,407,080 |
| | | | | 9,370,220 |
| | | Consumer Durables—1.1% | | |
| 2,300M | | Newell Rubbermaid, Inc., 4.7%, 8/15/2020 | | 2,555,992 |
| 3,000M | | Stanley Black & Decker, 5.2%, 9/1/2040 | | 3,377,307 |
| | | | | 5,933,299 |
| | | Energy—11.1% | | |
| 4,000M | | Canadian Oil Sands, Ltd., 7.75%, 5/15/2019 (a) | | 5,048,248 |
| 4,800M | | DCP Midstream, LLC, 9.75%, 3/15/2019 (a) | | 6,328,997 |
| 5,000M | | Enbridge Energy Partners, LP, 4.2%, 9/15/2021 | | 5,278,770 |
| 5,000M | | Kinder Morgan Energy Partners, LP, 3.45%, 2/15/2023 | | 5,063,835 |
| 1,716M | | Maritime & Northeast Pipeline, LLC, 7.5%, 5/31/2014 (a) | | 1,789,622 |
| 4,000M | | Nabors Industries, Inc., 6.15%, 2/15/2018 | | 4,552,824 |
| 4,000M | | ONEOK Partners, LP, 3.375%, 10/1/2022 | | 3,981,012 |
| 5,000M | | Petrobras International Finance Co., 5.375%, 1/27/2021 | | 5,419,965 |
| 4,100M | | Reliance Holdings USA, Inc., 4.5%, 10/19/2020 (a) | | 4,304,770 |
| 5,800M | | Spectra Energy Capital, LLC, 6.2%, 4/15/2018 | | 7,013,412 |
| 4,400M | | Suncor Energy, Inc., 6.85%, 6/1/2039 | | 5,827,510 |
| 2,700M | | Valero Energy Corp., 9.375%, 3/15/2019 | | 3,688,011 |
| 4,000M | | Weatherford International, Inc., 6.35%, 6/15/2017 | | 4,591,264 |
| | | | | 62,888,240 |
| | | Financial Services—13.8% | | |
| 2,250M | | Aflac, Inc., 8.5%, 5/15/2019 | | 3,044,707 |
| 6,000M | | American Express Co., 7%, 3/19/2018 | | 7,500,258 |
| | | American International Group, Inc.: | | |
| 3,100M | | 4.875%, 9/15/2016 | | 3,452,479 |
| 3,200M | | 8.25%, 8/15/2018 | | 4,155,024 |
| | | | |
| |
| | | | | |
| | | | | |
| Principal | | | | |
| Amount | | Security | | Value |
| |
| | | Financial Services (continued) | | |
| $3,800M | | Berkshire Hathaway, Inc., 3.4%, 1/31/2022 | | $ 4,012,431 |
| 4,000M | | BlackRock, Inc., 5%, 12/10/2019 | | 4,752,908 |
| 3,510M | | CoBank, ACB, 7.875%, 4/16/2018 (a) | | 4,458,472 |
| 1,800M | | Compass Bank, 6.4%, 10/1/2017 | | 1,958,353 |
| 5,750M | | ERAC USA Finance Co., 4.5%, 8/16/2021 (a) | | 6,346,384 |
| 6,200M | | Ford Motor Credit Co., LLC, 5%, 5/15/2018 | | 6,844,242 |
| | | General Electric Capital Corp.: | | |
| 2,000M | | 5.625%, 9/15/2017 | | 2,346,302 |
| 4,700M | | 5.3%, 2/11/2021 | | 5,396,770 |
| 4,000M | | Glencore Funding, LLC, 6%, 4/15/2014 (a) | | 4,191,008 |
| 3,800M | | Harley-Davidson Funding Corp., 5.75%, 12/15/2014 (a) | | 4,107,412 |
| 4,000M | | Liberty Mutual Group, Inc., 4.95%, 5/1/2022 (a) | | 4,394,088 |
| 4,000M | | Protective Life Corp., 7.375%, 10/15/2019 | | 4,916,540 |
| | | Prudential Financial, Inc.: | | |
| 2,300M | | 6%, 12/1/2017 | | 2,747,028 |
| 3,000M | | 5.625%, 6/15/2043 | | 3,120,000 |
| | | | | 77,744,406 |
| | | Financials—18.8% | | |
| | | Bank of America Corp.: | | |
| 2,900M | | 5.65%, 5/1/2018 | | 3,358,502 |
| 1,800M | | 5%, 5/13/2021 | | 2,021,045 |
| 2,500M | | 5.7%, 1/24/2022 | | 2,933,543 |
| 6,000M | | Barclays Bank, PLC, 5.125%, 1/8/2020 | | 6,912,192 |
| 3,168M | | Bear Stearns Cos., Inc., 7.25%, 2/1/2018 | | 3,941,226 |
| | | Citigroup, Inc.: | | |
| 3,400M | | 5%, 9/15/2014 | | 3,571,357 |
| 6,800M | | 6.125%, 11/21/2017 | | 8,048,398 |
| 2,000M | | 4.5%, 1/14/2022 | | 2,227,704 |
| 4,000M | | Fifth Third Bancorp, 3.5%, 3/15/2022 | | 4,175,640 |
| | | Goldman Sachs Group, Inc.: | | |
| 6,000M | | 6.15%, 4/1/2018 | | 7,077,948 |
| 1,900M | | 5.75%, 1/24/2022 | | 2,213,078 |
| 3,000M | | 3.625%, 1/22/2023 | | 3,027,300 |
| 1,600M | | 6.125%, 2/15/2033 | | 1,845,880 |
| 2,750M | | 6.75%, 10/1/2037 | | 3,091,341 |
| | | JPMorgan Chase & Co.: | | |
| 6,000M | | 6%, 1/15/2018 | | 7,137,684 |
| 2,000M | | 4.5%, 1/24/2022 | | 2,195,862 |
Portfolio of Investments (continued)
INVESTMENT GRADE FUND
March 31, 2013
| | | | |
| |
| | | | | |
| | | | | |
| Principal | | | | |
| Amount | | Security | | Value |
| | | Financials (continued) | | |
| | | Merrill Lynch & Co., Inc.: | | |
| $2,000M | | 5%, 1/15/2015 | | $ 2,128,490 |
| 4,600M | | 6.4%, 8/28/2017 | | 5,404,264 |
| | | Morgan Stanley: | | |
| 5,800M | | 5.95%, 12/28/2017 | | 6,721,980 |
| 5,000M | | 6.625%, 4/1/2018 | | 5,983,505 |
| 6,000M | | SunTrust Banks, Inc., 6%, 9/11/2017 | | 7,090,062 |
| 2,928M | | UBS AG, 4.875%, 8/4/2020 | | 3,396,907 |
| | | Wells Fargo & Co.: | | |
| 5,800M | | 4.6%, 4/1/2021 | | 6,635,154 |
| 1,800M | | 3.5%, 3/8/2022 | | 1,895,429 |
| 3,000M | | 3.45%, 2/13/2023 | | 3,026,439 |
| | | | | 106,060,930 |
| | | Food/Beverage/Tobacco—7.7% | | |
| 4,000M | | Altria Group, Inc., 9.7%, 11/10/2018 | | 5,573,080 |
| 4,000M | | Anheuser-Busch InBev Worldwide, Inc., 5.375%, 1/15/2020 | | 4,831,376 |
| 2,700M | | Bottling Group, LLC, 5.125%, 1/15/2019 | | 3,194,176 |
| 3,000M | | Bunge Ltd., Finance Corp., 3.2%, 6/15/2017 | | 3,106,221 |
| 4,165M | | Corn Products International, Inc., 4.625%, 11/1/2020 | | 4,646,332 |
| 4,000M | | Dr. Pepper Snapple Group, Inc., 6.82%, 5/1/2018 | | 5,018,796 |
| 4,000M | | Lorillard Tobacco Co., 6.875%, 5/1/2020 | | 4,858,188 |
| 3,000M | | Mead Johnson Nutrition Co., 4.9%, 11/1/2019 | | 3,414,648 |
| 4,000M | | Philip Morris International, Inc., 5.65%, 5/16/2018 | | 4,808,440 |
| 4,000M | | SABMiller Holdings, Inc., 3.75%, 1/15/2022 (a) | | 4,289,440 |
| | | | | 43,740,697 |
| | | Food/Drug—.8% | | |
| 4,000M | | Safeway, Inc., 4.75%, 12/1/2021 | | 4,313,552 |
| | | Forest Products/Containers—.5% | | |
| 2,200M | | International Paper Co., 9.375%, 5/15/2019 | | 3,027,248 |
| | | Gaming/Leisure—.7% | | |
| 4,000M | | Marriott International, Inc., 3.25%, 9/15/2022 | | 4,024,140 |
| | | | |
| |
| | | | | |
| | | | | |
| Principal | | | | |
| Amount | | Security | | Value |
| | | Health Care—3.8% | | |
| $4,000M | | Biogen IDEC, Inc., 6.875%, 3/1/2018 | | $ 4,901,424 |
| 4,050M | | Express Scripts Holding Co., 4.75%, 11/15/2021 | | 4,606,272 |
| 4,000M | | Laboratory Corp. of America Holdings, 3.75%, 8/23/2022 | | 4,114,268 |
| 4,000M | | Mylan, Inc., 3.125%, 1/15/2023 (a) | | 3,946,948 |
| 2,400M | | Novartis Securities Investment, Ltd., 5.125%, 2/10/2019 | | 2,869,342 |
| 1,000M | | Roche Holdings, Inc., 6%, 3/1/2019 (a) | | 1,245,293 |
| | | | | 21,683,547 |
| | | Information Technology—4.0% | | |
| 4,000M | | Corning, Inc., 4.75%, 3/15/2042 | | 4,092,140 |
| 4,000M | | Harris Corp., 4.4%, 12/15/2020 | | 4,392,708 |
| 5,000M | | Motorola Solutions, Inc., 6%, 11/15/2017 | | 5,858,395 |
| 4,000M | | Pitney Bowes, Inc., 5.75%, 9/15/2017 | | 4,371,260 |
| 4,000M | | Symantec Corp., 3.95%, 6/15/2022 | | 4,117,392 |
| | | | | 22,831,895 |
| | | Manufacturing—3.7% | | |
| 3,000M | | CRH America, Inc., 8.125%, 7/15/2018 | | 3,732,552 |
| 2,700M | | General Electric Co., 5.25%, 12/6/2017 | | 3,166,088 |
| 4,000M | | Ingersoll-Rand Global Holdings Co., Ltd., 6.875%, 8/15/2018 | | 4,833,404 |
| 3,200M | | Johnson Controls, Inc., 5%, 3/30/2020 | | 3,647,699 |
| 2,725M | | Tyco Electronics Group SA, 6.55%, 10/1/2017 | | 3,261,890 |
| 2,500M | | Tyco Flow Control International, Ltd., 3.15%, 9/15/2022 (a) | | 2,462,945 |
| | | | | 21,104,578 |
| | | Media-Broadcasting—3.4% | | |
| 3,950M | | British Sky Broadcasting Group, PLC, 9.5%, 11/15/2018 (a) | | 5,404,694 |
| 6,500M | | Comcast Corp., 4.25%, 1/15/2033 | | 6,564,851 |
| 3,000M | | DirecTV Holdings, LLC, 3.8%, 3/15/2022 | | 3,072,312 |
| 3,000M | | Time Warner Entertainment Co., LP, 8.375%, 3/15/2023 | | 4,109,031 |
| | | | | 19,150,888 |
| | | Media-Diversified—1.6% | | |
| | | McGraw-Hill Cos., Inc.: | | |
| 1,800M | | 5.9%, 11/15/2017 | | 2,033,449 |
| 2,300M | | 6.55%, 11/15/2037 | | 2,426,268 |
| 4,000M | | Vivendi SA, 6.625%, 4/4/2018 (a) | | 4,682,672 |
| | | | | 9,142,389 |
Portfolio of Investments (continued)
INVESTMENT GRADE FUND
March 31, 2013
| | | | |
| |
| | | | | |
| | | | | |
| Principal | | | | |
| Amount | | Security | | Value |
| | | Metals/Mining—5.0% | | |
| $5,000M | | Alcoa, Inc., 6.15%, 8/15/2020 | | $ 5,451,900 |
| 4,000M | | ArcelorMittal, 6.125%, 6/1/2018 | | 4,324,796 |
| 3,800M | | Newmont Mining Corp., 5.125%, 10/1/2019 | | 4,399,477 |
| 5,000M | | Rio Tinto Finance USA, Ltd., 3.75%, 9/20/2021 | | 5,276,895 |
| 4,000M | | Vale Overseas, Ltd., 5.625%, 9/15/2019 | | 4,530,268 |
| 4,000M | | Xstrata Canada Financial Corp., 4.95%, 11/15/2021 (a) | | 4,309,560 |
| | | | | 28,292,896 |
| | | Real Estate Investment Trusts—5.9% | | |
| 5,000M | | Boston Properties, LP, 5.875%, 10/15/2019 | | 6,024,680 |
| 5,000M | | Digital Realty Trust, LP, 5.25%, 3/15/2021 | | 5,553,465 |
| 5,000M | | HCP, Inc., 5.375%, 2/1/2021 | | 5,817,475 |
| 4,000M | | ProLogis, LP, 6.625%, 5/15/2018 | | 4,815,448 |
| 2,000M | | Realty Income Corp., 3.25%, 10/15/2022 | | 1,962,294 |
| 4,000M | | Simon Property Group, LP, 5.75%, 12/1/2015 | | 4,469,268 |
| 4,000M | | Ventas Realty, LP, 4.75%, 6/1/2021 | | 4,452,760 |
| | | | | 33,095,390 |
| | | Retail-General Merchandise—2.1% | | |
| 6,000M | | GAP, Inc., 5.95%, 4/12/2021 | | 6,869,844 |
| 4,000M | | Home Depot, Inc., 5.875%, 12/16/2036 | | 4,988,908 |
| | | | | 11,858,752 |
| | | Telecommunications—3.7% | | |
| 3,700M | | BellSouth Corp., 6.55%, 6/15/2034 | | 4,387,231 |
| 1,200M | | BellSouth Telecommunications, 6.375%, 6/1/2028 | | 1,455,036 |
| 3,000M | | Deutsche Telekom International Finance BV, 4.875%, 3/6/2042 (a) | | 3,023,148 |
| 3,300M | | GTE Corp., 6.84%, 4/15/2018 | | 4,082,542 |
| 3,000M | | Rogers Communications, Inc., 3%, 3/15/2023 | | 3,016,923 |
| 4,045M | | Verizon New York, Inc., 7.375%, 4/1/2032 | | 5,095,919 |
| | | | | 21,060,799 |
| | | Transportation—2.5% | | |
| 3,000M | | Burlington Northern Santa Fe, LLC, 3%, 3/15/2023 | | 3,029,286 |
| 3,000M | | Con-way, Inc., 7.25%, 1/15/2018 | | 3,537,636 |
| 3,200M | | GATX Corp., 4.75%, 6/15/2022 | | 3,399,757 |
| 4,000M | | Penske Truck Leasing Co., LP, 4.875%, 7/11/2022 (a) | | 4,226,128 |
| | | | | 14,192,807 |
| | | | | | | |
| | | | | | | | |
| | | | | | | | |
| | | | | | | | |
| Principal | | | | | | | |
| Amount | | Security | | | | | Value |
| | | Utilities—4.7% | | | | | |
| $3,000M | | E.ON International Finance BV, 5.8%, 4/30/2018 (a) | | | | $ 3,593,250 |
| 1,900M | | Electricite de France SA, 6.5%, 1/26/2019 (a) | | | | 2,322,602 |
| 3,240M | | Entergy Arkansas, Inc., 3.75%, 2/15/2021 | | | | | 3,548,383 |
| 4,000M | | Exelon Generation Co., LLC, 5.2%, 10/1/2019 | | | | 4,533,440 |
| | | Great River Energy Co.: | | | | | |
| 496M | | 5.829%, 7/1/2017 (a) | | | | | 538,951 |
| 3,652M | | 4.478%, 7/1/2030 (a) | | | | | 4,025,903 |
| 3,000M | | Ohio Power Co., 5.375%, 10/1/2021 | | | | | 3,617,148 |
| 2,881M | | Sempra Energy, 9.8%, 2/15/2019 | | | | | 4,054,549 |
| | | | | | | | 26,234,226 |
| Total Value of Corporate Bonds (cost $504,779,708) | 98.2 | % | | | 555,078,601 |
| Other Assets, Less Liabilities | 1.8 | | | | 10,154,339 |
| Net Assets | | | 100.0 | % | | | $565,232,940 |
| |
| (a) | Security exempt from registration under Rule 144A of the Securities Act of 1933 (see Note 4). |
Portfolio of Investments (continued)
INVESTMENT GRADE FUND
March 31, 2013
Accounting Standards Codification (“ASC”) 820 established a three-tier hierarchy of inputs to establish a classification of fair value measurements for disclosure purposes. The three-tier hierarchy of inputs is summarized in the three broad Levels listed below:
| Level 1 — Unadjusted quoted prices in active markets for identical securities that the Fund has the ability to access. |
| Level 2 — Observable inputs other than quoted prices included in Level 1 that are observable for the asset or liability, either directly or indirectly. These inputs may include quoted prices for the identical instrument on an inactive market, prices for similar instruments, interest rates, prepayment speeds, credit risk, yield curves, default rates and similar data. |
| Level 3 — Unobservable inputs for the asset or liability, to the extent relevant observable inputs are not available, representing the Fund’s own assumption about the assumptions a market participant would use in valuing the asset or liability, and would be based on the best information available. |
The inputs methodology used for valuing securities are not necessarily an indication of the risk associated with investing in those securities.
The following is a summary, by category of Level, of inputs used to value the Fund’s investments as of March 31, 2013:
| | | | | | | | | | | | |
| | | | Level 1 | | | Level 2 | | | Level 3 | | | Total |
| Corporate Bonds* | | $ | — | | $ | 555,078,601 | | $ | — | | $ | 555,078,601 |
| |
| * | The Portfolio of Investments provides information on the industry categorization for corporate bonds. |
| |
| There were no transfers into or from Level 1 or Level 2 by the Fund during the period ended |
| March 31, 2013. Transfers, if any, between Levels are recognized at the end of the reporting period. |
| | |
| 20 | See notes to financial statements | |
Fund Expenses (unaudited)
INTERNATIONAL OPPORTUNITIES BOND FUND
The examples below show the ongoing costs (in dollars) of investing in your Fund and will help you in comparing these costs with costs of other mutual funds. Please refer to page 4 for a detailed explanation of the information presented in these examples.
| | | |
| | | | |
| | Beginning | Ending | |
| | Account | Account | Expenses Paid |
| | Value | Value | During Period |
| | (10/1/12) | (3/31/13) | (10/1/12–3/31/13)* |
| Expense Example | | | |
| Actual | $1,000.00 | $1,015.73 | $6.53 |
| Hypothetical | | | |
| (5% annual return before expenses) | $1,000.00 | $1,018.45 | $6.54 |
| |
| * | Expenses are equal to the annualized expense ratio of 1.30% for Class A shares multiplied by the |
| average account value over the period, multiplied by 182/365 (to reflect the one-half year period). |
| Expenses paid during the period are net of expenses waived and/or assumed. |
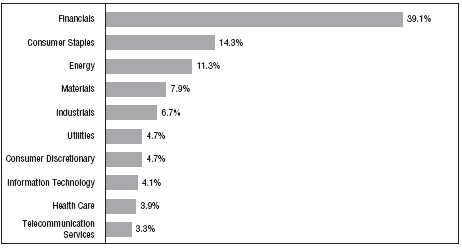
Portfolio Composition
BY SECTOR
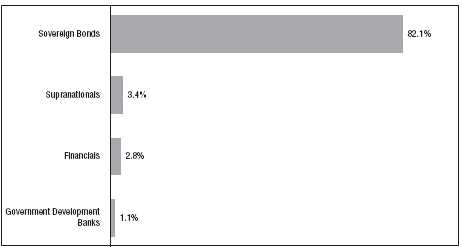
Portfolio holdings and allocations are subject to change. Percentages are as of March 31, 2013, and are based on the total value of investments.
Portfolio of Investments
INTERNATIONAL OPPORTUNITIES BOND FUND
March 31, 2013
| | | | |
| |
| | | | | |
| | | | | |
| Principal | | | | |
| Amount | | Security | | Value |
| | | SOVEREIGN BONDS—80.3% | | |
| | | United Kingdom—16.1% | | |
| | | United Kingdom Gilt: | | |
| 2,865M | GBP | 4.25%, 3/7/2036 | | $ 5,291,939 |
| 4,430M | GBP | 2.25%, 3/7/2014 | | 6,853,581 |
| | | | | 12,145,520 |
| | | Mexico—14.8% | | |
| | | United Mexican States: | | |
| 236M | MXN | 7%, 6/19/2014 | | 1,988,405 |
| 453M | MXN | 8.5%, 5/31/2029 | | 4,835,363 |
| 249M | MXN | 8.5%, 11/18/2038 | | 2,724,610 |
| 185M | MXN | 9.5%, 12/18/2014 | | 1,632,170 |
| | | | | 11,180,548 |
| | | Australia—10.5% | | |
| 2,680M | AUD | New South Wales Treasury Corp., 6%, 4/1/2016 | | 3,007,454 |
| | | Queensland Treasury Corp.: | | |
| 2,155M | AUD | 6.25%, 2/21/2020 | | 2,521,817 |
| 735M | AUD | 6%, 7/21/2022 | | 855,020 |
| 1,365M | AUD | Treasury Corp. of Victoria, 5.75%, 11/15/2016 | | 1,537,289 |
| | | | | 7,921,580 |
| | | Italy—8.3% | | |
| 4,990M | EUR | Italy Buoni Poliennali Del Tesoro, 5%, 8/1/2039 | | 6,285,326 |
| | | Poland—6.1% | | |
| | | Republic of Poland: | | |
| 14,110M | PLN | 5%, 10/24/2013 | | 4,385,920 |
| 680M | PLN | 5.25%, 10/25/2020 | | 231,179 |
| | | | | 4,617,099 |
| | | South Korea—4.4% | | |
| | | Republic of Korea: | | |
| 556,000M | KRW | 3%, 12/10/2013 | | 501,519 |
| 2,725,000M | KRW | 5.75%, 9/10/2018 | | 2,850,165 |
| | | | | 3,351,684 |
| | | | |
| |
| | | | | |
| | | | | |
| Principal | | | | |
| Amount | | Security | | Value |
| | | New Zealand—4.1% | | |
| | | New Zealand Government Bonds: | | |
| 1,690M | NZD | 5%, 3/15/2019 | | $ 1,566,983 |
| 1,590M | NZD | 5.5%, 4/15/2023 | | 1,557,148 |
| | | | | 3,124,131 |
| | | Malaysia—4.1% | | |
| | | Federation of Malaysia: | | |
| 8,240M | MYR | 3.741%, 2/27/2015 | | 2,695,881 |
| 1,300M | MYR | 3.172%, 7/15/2016 | | 421,409 |
| | | | | 3,117,290 |
| | | Turkey—3.4% | | |
| 4,480M | TRY | Republic of Turkey, 9%, 3/5/2014 | | 2,550,097 |
| | | Hungary—3.3% | | |
| | | Hungary Government Bond: | | |
| 505,000M | HUF | 5.5%, 2/12/2016 | | 2,162,134 |
| 69,000M | HUF | 7.5%, 11/12/2020 | | 317,712 |
| | | | | 2,479,846 |
| | | South Africa—3.3% | | |
| | | Republic of South Africa: | | |
| 7,685M | ZAR | 6.75%, 3/31/2021 | | 849,657 |
| 18,270M | ZAR | 6.5%, 2/28/2041 | | 1,618,660 |
| | | | | 2,468,317 |
| | | Ireland—1.9% | | |
| | | Republic of Ireland: | | |
| 450M | EUR | 4.5%, 4/18/2020 | | 606,083 |
| 575M | EUR | 5%, 10/18/2020 | | 797,882 |
| | | | | 1,403,965 |
| Total Value of Sovereign Bonds (cost $60,334,128) | | 60,645,403 |
Portfolio of Investments (continued)
INTERNATIONAL OPPORTUNITIES BOND FUND
March 31, 2013
| | | | | | | |
| |
| | | | | | | | |
| | | | | | | | |
| Principal | | | | | | | |
| Amount | | Security | | | | | Value |
| | | CORPORATE BONDS—7.1% | | | | | |
| | | Germany—2.7% | | | | | |
| | | Financials | | | | | |
| 1,735M | AUD | Kreditanstalt fuer Wiederaufbau, 6.25%, 12/4/2019 (a) | | | | $ 2,033,446 |
| | | United States—1.8% | | | | | |
| | | Supranationals | | | | | |
| 2,800M | BRL | Inter-American Development Bank, 5.25%, 7/19/2016 | | | | 1,342,753 |
| | | Canada—1.1% | | | | | |
| | | Government Development Banks | | | | | |
| 1,677M | BRL | Export Development Canada, 5.125%, 7/31/2014 (b) | | | | 823,966 |
| | | Philippines—0.8% | | | | | |
| | | Supranationals | | | | | |
| 1,272M | BRL | Asian Development Bank, 5.25%, 9/25/2015 | | | | 620,939 |
| | | Luxembourg—0.7% | | | | | |
| | | Supranationals | | | | | |
| 1,150M | BRL | European Investment Bank, 6%, 1/25/2016 (b)(c) | | | | 565,248 |
| Total Value of Corporate Bonds (cost $5,485,069) | | | | | 5,386,352 |
| | | SHORT-TERM U.S. GOVERNMENT | | | | |
| | | OBLIGATIONS—10.4% | | | | | |
| | | U.S. Treasury Bills: | | | | | |
| $5,115M | USD | 0.105%, 11/14/2013 | | | | | 5,111,614 |
| 2,750M | USD | 0.13%, 11/14/2013 | | | | | 2,747,693 |
| Total Value of Short-Term U.S. Government Obligations (cost $7,859,307) | | | | 7,859,307 |
| Total Value of Investments (cost $73,678,504) | 97.8 | % | | | 73,891,062 |
| Other Assets, Less Liabilities | 2.2 | | | | 1,642,417 |
| Net Assets | | | 100.0 | % | | | $75,533,479 |
| |
| (a) | The Federal Republic of Germany guarantees all existing and future obligations of Kreditanstalt |
| fuer Wiederaufbau (“KFW”) in respect of money borrowed, bonds issued, and derivative trans- |
| actions entered into by KFW, as well as third party obligations that are expressly guaranteed |
| by KFW. |
| |
| (b) | Security exempt from registration under Rule 144A of the Securities Act of 1933 (see Note 4). |
| |
| (c) | A portion or all of the security purchased on a when-issued or delayed delivery basis |
| (see Note 1G). |
| |
| Abbreviations: |
| AUD | Australian Dollar |
| BRL | Brazilian Real |
| EUR | Euro |
| GBP | British Pound |
| HUF | Hungarian Forint |
| KRW | South Korean Won |
| MXN | Mexican Peso |
| MYR | Malaysian Ringgit |
| NZD | New Zealand Dollar |
| PLN | Polish Zloty |
| TRY | Turkish Lira |
| USD | United States Dollar |
| ZAR | South African Rand |
Accounting Standards Codification (“ASC”) 820 established a three-tier hierarchy of inputs to establish a classification of fair value measurements for disclosure purposes. The three-tier hierarchy of inputs is summarized in the three broad Levels listed below:
| Level 1 — Unadjusted quoted prices in active markets for identical securities that the Fund has the ability to access. |
| Level 2 — Observable inputs other than quoted prices included in Level 1 that are observable for the asset or liability, either directly or indirectly. These inputs may include quoted prices for the identical instrument on an inactive market, prices for similar instruments, interest rates, prepayment speeds, credit risk, yield curves, default rates and similar data. |
| Level 3 — Unobservable inputs for the asset or liability, to the extent relevant observable inputs are not available, representing the Fund’s own assumption about the assumptions a market participant would use in valuing the asset or liability, and would be based on the best information available. |
The inputs methodology used for valuing securities are not necessarily an indication of the risk associated with investing in those securities.
Portfolio of Investments (continued)
INTERNATIONAL OPPORTUNITIES BOND FUND
March 31, 2013
The following is a summary, by category of Level, of inputs used to value the Fund’s investments as of March 31, 2013:
| | | | | | | | | | | | |
| | | | Level 1 | | | Level 2 | | | Level 3 | | | Total |
| Sovereign Bonds | | | | | | | | | | | | |
| United Kingdom | | $ | — | | $ | 12,145,520 | | $ | — | | $ | 12,145,520 |
| Mexico | | | — | | | 11,180,548 | | | — | | | 11,180,548 |
| Australia | | | — | | | 7,921,580 | | | — | | | 7,921,580 |
| Italy | | | — | | | 6,285,326 | | | — | | | 6,285,326 |
| Poland | | | — | | | 4,617,099 | | | — | | | 4,617,099 |
| South Korea | | | — | | | 3,351,684 | | | — | | | 3,351,684 |
| New Zealand | | | — | | | 3,124,131 | | | — | | | 3,124,131 |
| Malaysia | | | — | | | 3,117,290 | | | — | | | 3,117,290 |
| Turkey | | | — | | | 2,550,097 | | | — | | | 2,550,097 |
| Hungary | | | — | | | 2,479,846 | | | — | | | 2,479,846 |
| South Africa | | | — | | | 2,468,317 | | | — | | | 2,468,317 |
| Ireland | | | — | | | 1,403,965 | | | — | | | 1,403,965 |
| Corporate Bonds | | | | | | | | | | | | |
| Germany | | | — | | | 2,033,446 | | | — | | | 2,033,446 |
| United States | | | — | | | 1,342,753 | | | — | | | 1,342,753 |
| Canada | | | — | | | 823,966 | | | — | | | 823,966 |
| Philippines | | | — | | | 620,939 | | | — | | | 620,939 |
| Luxembourg | | | — | | | 565,248 | | | — | | | 565,248 |
| Short-Term U.S. Government | | | | | | | | | | | | |
| Obligations | | | — | | | 7,859,307 | | | — | | | 7,859,307 |
| Total Investments in Securities | | $ | — | | $ | 73,891,062 | | $ | — | | $ | 73,891,062 |
| Other Financial Instruments* | | $ | — | | $ | (90,369) | | $ | — | | $ | (90,369) |
| |
| * | Other financial instruments are foreign exchange contracts and are considered derivative instruments, |
| which are valued at the net unrealized depreciation on the instruments. |
| |
| During the period ended March 31, 2013, there were no transfers between Level 1 investments and |
| Level 2 investments that had a material impact to the Fund. Transfers, if any, between Levels are |
| recognized at the end of the reporting period. |
| | |
| 26 | See notes to financial statements | |
Fund Expenses (unaudited)
FUND FOR INCOME
The examples below show the ongoing costs (in dollars) of investing in your Fund and will help you in comparing these costs with costs of other mutual funds. Please refer to page 4 for a detailed explanation of the information presented in these examples.
| | | |
| |
| | Beginning | Ending | |
| | Account | Account | Expenses Paid |
| | Value | Value | During Period |
| | (10/1/12) | (3/31/13) | (10/1/12–3/31/13)* |
| Expense Example – Class A Shares | | | |
| Actual | $1,000.00 | $1,053.13 | $6.40 |
| Hypothetical | | | |
| (5% annual return before expenses) | $1,000.00 | $1,018.70 | $6.29 |
| Expense Example – Class B Shares | | | |
| Actual | $1,000.00 | $1,053.98 | $9.99 |
| Hypothetical | | | |
| (5% annual return before expenses) | $1,000.00 | $1,015.21 | $9.80 |
| |
| * | Expenses are equal to the annualized expense ratio of 1.25% for Class A shares and 1.95% for |
| Class B shares, multiplied by the average account value over the period, multiplied by 182/365 (to |
| reflect the one-half year period). Expenses paid during the period are net of expenses waived. |
Portfolio Composition
TOP TEN SECTORS
Portfolio holdings and allocations are subject to change. Percentages are as of March 31, 2013, and are based on the total value of investments.
Portfolio of Investments
FUND FOR INCOME
March 31, 2013
| | | | |
| |
| | | | | |
| | | | | |
| Principal | | | | |
| Amount | | Security | | Value |
| | | CORPORATE BONDS—89.0% | | |
| | | Aerospace/Defense—.5% | | |
| $ 2,875M | | Meccanica Holdings USA, Inc., 6.25%, 7/15/2019 (a) | | $ 2,965,640 |
| | | Automotive—3.0% | | |
| | | American Axle & Manufacturing, Inc.: | | |
| 2,250M | | 6.625%, 10/15/2022 | | 2,340,000 |
| 2,350M | | 6.25%, 3/15/2021 | | 2,420,500 |
| 3,000M | | Cooper Tire & Rubber Co., 8%, 12/15/2019 | | 3,472,500 |
| 2,825M | | Cooper-Standard Automotive, Inc., 8.5%, 5/1/2018 | | 3,093,375 |
| 1,925M | | Exide Technologies, 8.625%, 2/1/2018 | | 1,662,720 |
| 2,100M | | Oshkosh Corp., 8.5%, 3/1/2020 | | 2,362,500 |
| | | Schaeffler Finance BV: | | |
| 1,725M | | 7.75%, 2/15/2017 (a) | | 1,951,406 |
| 1,900M | | 8.5%, 2/15/2019 (a) | | 2,170,750 |
| | | | | 19,473,751 |
| | | Building Materials—1.8% | | |
| | | Building Materials Corp.: | | |
| 3,625M | | 6.875%, 8/15/2018 (a) | | 3,905,937 |
| 1,375M | | 7.5%, 3/15/2020 (a) | | 1,509,062 |
| 1,325M | | Cemex Finance, LLC, 9.375%, 10/12/2022 (a) | | 1,546,937 |
| | | Cemex SAB de CV: | | |
| 1,350M | | 9.5%, 6/15/2018 (a) | | 1,576,125 |
| 525M | | 5.875%, 3/25/2019 (a) | | 531,562 |
| 2,150M | | Texas Industries, Inc., 9.25%, 8/15/2020 | | 2,359,625 |
| | | | | 11,429,248 |
| | | Chemicals—3.4% | | |
| 2,950M | | Ferro Corp., 7.875%, 8/15/2018 | | 3,090,125 |
| 1,625M | | Huntsman International, LLC, 8.625%, 3/15/2020 | | 1,824,063 |
| 2,575M | | Orion Engineered Carbons Bondco GmbH, 9.625%, 6/15/2018 (a) | | 2,877,563 |
| 2,475M | | PolyOne Corp., 7.375%, 9/15/2020 | | 2,747,250 |
| 3,650M | | Rhodia SA, 6.875%, 9/15/2020 (a) | | 4,134,804 |
| 4,175M | | TPC Group, Inc., 8.75%, 12/15/2020 (a) | | 4,368,094 |
| 3,000M | | US Coatings Acquisition, Inc., 7.375%, 5/1/2021 (a) | | 3,168,750 |
| | | | | 22,210,649 |
| | | | |
| |
| | | | | |
| | | | | |
| Principal | | | | |
| Amount | | Security | | Value |
| | | Consumer Non-Durables—2.5% | | |
| $ 1,650M | | Hanesbrands, Inc., 6.375%, 12/15/2020 | | $ 1,804,687 |
| | | Levi Strauss & Co.: | | |
| 925M | | 7.625%, 5/15/2020 | | 1,022,125 |
| 2,625M | | 6.875%, 5/1/2022 | | 2,887,500 |
| 1,125M | | Libbey Glass, Inc., 6.875%, 5/15/2020 | | 1,219,219 |
| 3,025M | | Phillips Van-Heusen Corp., 7.375%, 5/15/2020 | | 3,388,000 |
| 3,600M | | Reynolds Group Issuer, Inc., 5.75%, 10/15/2020 | | 3,676,500 |
| | | Spectrum Brands Escrow Corp.: | | |
| 825M | | 6.375%, 11/15/2020 (a) | | 887,906 |
| 1,075M | | 6.625%, 11/15/2022 (a) | | 1,169,063 |
| | | | | 16,055,000 |
| | | Energy—16.2% | | |
| | | AmeriGas Finance, LLC: | | |
| 500M | | 6.75%, 5/20/2020 | | 546,250 |
| 1,325M | | 7%, 5/20/2022 | | 1,447,562 |
| 1,300M | | Antero Resources Finance Corp., 6%, 12/1/2020 (a) | | 1,365,000 |
| 3,150M | | Atlas Pipeline Partners, LP, 5.875%, 8/1/2023 (a) | | 3,150,000 |
| | | Basic Energy Services, Inc.: | | |
| 1,025M | | 7.75%, 2/15/2019 | | 1,053,187 |
| 2,100M | | 7.75%, 10/15/2022 | | 2,173,500 |
| | | Berry Petroleum Co.: | | |
| 675M | | 6.75%, 11/1/2020 | | 732,375 |
| 2,275M | | 6.375%, 9/15/2022 | | 2,428,562 |
| 2,650M | | Calumet Specialty Products Partners, LP, 9.625%, 8/1/2020 (a) | | 3,001,125 |
| | | Chesapeake Energy Corp.: | | |
| 1,525M | | 7.25%, 12/15/2018 | | 1,738,500 |
| 275M | | 6.875%, 11/15/2020 | | 301,125 |
| 2,750M | | 6.625%, 8/15/2020 | | 3,018,125 |
| 1,225M | | 5.75%, 3/15/2023 (d) | | 1,244,906 |
| | | Concho Resources, Inc.: | | |
| 2,300M | | 8.625%, 10/1/2017 | | 2,478,250 |
| 1,275M | | 5.5%, 4/1/2023 | | 1,329,187 |
| | | Consol Energy, Inc.: | | |
| 1,875M | | 8%, 4/1/2017 | | 2,029,687 |
| 3,825M | | 8.25%, 4/1/2020 | | 4,255,312 |
| 700M | | Crosstex Energy, LP, 8.875%, 2/15/2018 | | 761,250 |
| 2,500M | | Eagle Rock Energy Partners, LP, 8.375%, 6/1/2019 | | 2,650,000 |
| 2,750M | | El Paso Corp., 6.5%, 9/15/2020 | | 3,051,958 |
| 3,426M | | Expro Finance Luxembourg SCA, 8.5%, 12/15/2016 (a) | | 3,648,690 |
Portfolio of Investments (continued)
FUND FOR INCOME
March 31, 2013
| | | | |
| |
| | | | | |
| | | | | |
| Principal | | | | |
| Amount | | Security | | Value |
| | | Energy (continued) | | |
| | | Ferrellgas Partners, LP: | | |
| $ 3,450M | | 9.125%, 10/1/2017 | | $ 3,717,375 |
| 1,363M | | 8.625%, 6/15/2020 | | 1,390,260 |
| 1,900M | | Forest Oil Corp., 7.25%, 6/15/2019 | | 1,909,500 |
| | | Genesis Energy, LP: | | |
| 3,375M | | 7.875%, 12/15/2018 | | 3,720,937 |
| 600M | | 5.75%, 2/15/2021 (a) | | 620,625 |
| 1,700M | | Inergy Midstream, LP, 6%, 12/15/2020 (a) | | 1,776,500 |
| 2,850M | | Legacy Reserves, LP, 8%, 12/1/2020 (a) | | 2,964,000 |
| | | Linn Energy, LLC: | | |
| 1,100M | | 6.25%, 11/1/2019 (a) | | 1,130,250 |
| 475M | | 6.5%, 5/15/2019 | | 499,344 |
| 1,975M | | 7.75%, 2/1/2021 | | 2,128,063 |
| 1,225M | | 8.625%, 4/15/2020 | | 1,356,688 |
| 3,100M | | Murray Energy Corp., 10.25%, 10/15/2015 (a) | | 3,127,125 |
| | | Newfield Exploration Co.: | | |
| 450M | | 7.125%, 5/15/2018 | | 469,688 |
| 1,100M | | 5.75%, 1/30/2022 | | 1,182,500 |
| | | Offshore Group Investment, Ltd.: | | |
| 525M | | 7.5%, 11/1/2019 (a) | | 559,125 |
| 1,075M | | 7.125%, 4/1/2023 (a) | | 1,101,875 |
| | | Penn Virginia Resource Partners, LP: | | |
| 2,100M | | 8.25%, 4/15/2018 | | 2,236,500 |
| 1,000M | | 8.375%, 6/1/2020 | | 1,055,000 |
| 1,525M | | Petrohawk Energy Corp., 10.5%, 8/1/2014 | | 1,613,090 |
| 475M | | PetroLogistics, LP, 6.25%, 4/1/2020 (a) | | 480,344 |
| | | Plains Exploration & Production Co.: | | |
| 1,125M | | 6.125%, 6/15/2019 | | 1,237,500 |
| 600M | | 6.5%, 11/15/2020 | | 666,000 |
| | | Quicksilver Resources, Inc.: | | |
| 975M | | 8.25%, 8/1/2015 | | 964,031 |
| 2,100M | | 9.125%, 8/15/2019 | | 1,942,500 |
| 2,300M | | Rain CII Carbon, LLC, 8.25%, 1/15/2021 (a) | | 2,495,500 |
| 1,725M | | Range Resources Corp., 5%, 3/15/2023 (a) | | 1,768,125 |
| 3,200M | | Samson Investment Co., 9.75%, 2/15/2020 (a) | | 3,416,000 |
| 5,200M | | SandRidge Energy, Inc., 7.5%, 2/15/2023 | | 5,421,000 |
| 1,125M | | SESI, LLC, 6.375%, 5/1/2019 | | 1,215,000 |
| | | SM Energy Co.: | | |
| 600M | | 6.625%, 2/15/2019 | | 646,500 |
| 1,175M | | 6.5%, 11/15/2021 | | 1,289,563 |
| 1,150M | | 6.5%, 1/1/2023 | | 1,265,000 |
| | | | |
| |
| | | | | |
| | | | | |
| Principal | | | | |
| Amount | | Security | | Value |
| | | Energy (continued) | | |
| | | Suburban Propane Partners, LP: | | |
| $ 2,089M | | 7.5%, 10/1/2018 | | $ 2,277,010 |
| 603M | | 7.375%, 8/1/2021 | | 667,823 |
| 1,300M | | Tesoro Logistics, LP, 5.875%, 10/1/2020 (a) | | 1,378,000 |
| 2,075M | | Unit Corp., 6.625%, 5/15/2021 | | 2,183,938 |
| | | | | 104,276,830 |
| | | Financials—3.9% | | |
| | | Algeco Scotsman Global Finance, PLC: | | |
| 1,650M | | 8.5%, 10/15/2018 (a) | | 1,777,875 |
| 800M | | 10.75%, 10/15/2019 (a) | | 832,000 |
| | | Ally Financial, Inc.: | | |
| 5,175M | | 6.25%, 12/1/2017 | | 5,806,624 |
| 4,400M | | 8%, 3/15/2020 | | 5,478,000 |
| 675M | | CNH Capital, LLC, 6.25%, 11/1/2016 | | 749,250 |
| | | International Lease Finance Corp.: | | |
| 2,975M | | 8.625%, 9/15/2015 | | 3,395,219 |
| 4,275M | | 8.75%, 3/15/2017 | | 5,049,844 |
| 1,500M | | 8.25%, 12/15/2020 | | 1,841,250 |
| | | | | 24,930,062 |
| | | Food/Beverage/Tobacco—.3% | | |
| 550M | | Chiquita Brands International, Inc., 7.875%, 2/1/2021 (a) | | 578,187 |
| 1,125M | | Vector Group, Ltd., 7.75%, 2/15/2021 (a) | | 1,186,875 |
| | | | | 1,765,062 |
| | | Food/Drug—1.0% | | |
| 3,600M | | NBTY, Inc., 9%, 10/1/2018 | | 4,041,000 |
| 2,450M | | Tops Holding Corp., 8.875%, 12/15/2017 (a) | | 2,701,125 |
| | | | | 6,742,125 |
| | | Forest Products/Containers—3.2% | | |
| | | Ardagh Packaging Finance, PLC: | | |
| 2,050M | | 7.375%, 10/15/2017 (a) | | 2,254,094 |
| 3,500M | | 7%, 11/15/2020 (a) | | 3,605,000 |
| 2,450M | | Ball Corp., 7.375%, 9/1/2019 | | 2,725,625 |
| 2,375M | | Clearwater Paper Corp., 7.125%, 11/1/2018 | | 2,594,687 |
| 1,925M | | CROWN Americas, LLC, 4.5%, 1/15/2023 (a) | | 1,876,875 |
| 2,200M | | Greif, Inc., 7.75%, 8/1/2019 | | 2,574,000 |
Portfolio of Investments (continued)
FUND FOR INCOME
March 31, 2013
| | | | |
| |
| | | | | |
| | | | | |
| Principal | | | | |
| Amount | | Security | | Value |
| | | Forest Products/Containers (continued) | | |
| | | Sealed Air Corp.: | | |
| $ 1,500M | | 8.125%, 9/15/2019 (a) | | $ 1,704,375 |
| 600M | | 8.375%, 9/15/2021 (a) | | 690,000 |
| 2,150M | | Tekni-Plex, Inc., 9.75%, 6/1/2019 (a) | | 2,386,500 |
| | | | | 20,411,156 |
| | | Gaming/Leisure—.6% | | |
| 1,950M | | National CineMedia, LLC, 7.875%, 7/15/2021 | | 2,181,563 |
| 1,675M | | Six Flags Entertainment Corp., 5.25%, 1/15/2021 (a) | | 1,681,281 |
| | | | | 3,862,844 |
| | | Health Care—5.3% | | |
| 850M | | Aviv Healthcare Properties, LP, 7.75%, 2/15/2019 | | 918,000 |
| 1,249M | | Biomet, Inc., 6.5%, 8/1/2020 (a) | | 1,330,185 |
| | | Community Health Systems, Inc.: | | |
| 3,175M | | 8%, 11/15/2019 | | 3,532,187 |
| 1,750M | | 7.125%, 7/15/2020 | | 1,900,937 |
| | | DaVita, Inc.: | | |
| 1,425M | | 6.375%, 11/1/2018 | | 1,519,406 |
| 1,025M | | 5.75%, 8/15/2022 | | 1,069,844 |
| 1,150M | | Fresenius Medical Care US Finance II, Inc., 5.625%, 7/31/2019 (a) | | 1,267,875 |
| 4,400M | | Genesis Health Ventures, Inc., 9.75%, 6/15/2005 (b)(c) | | 2,750 |
| | | HCA, Inc.: | | |
| 375M | | 6.375%, 1/15/2015 | | 402,656 |
| 2,075M | | 8%, 10/1/2018 | | 2,432,937 |
| 675M | | 8.5%, 4/15/2019 | | 746,719 |
| 475M | | 7.25%, 9/15/2020 | | 526,656 |
| 1,050M | | 6.25%, 2/15/2021 | | 1,122,188 |
| 1,950M | | 7.75%, 5/15/2021 | | 2,177,906 |
| 1,525M | | 7.5%, 2/15/2022 | | 1,757,562 |
| | | HealthSouth Corp.: | | |
| 411M | | 7.25%, 10/1/2018 | | 444,908 |
| 725M | | 8.125%, 2/15/2020 | | 802,938 |
| 945M | | 7.75%, 9/15/2022 | | 1,032,413 |
| | | Universal Hospital Services, Inc.: | | |
| 525M | | 7.625%, 8/15/2020 (a) | | 567,000 |
| 1,975M | | 7.625%, 8/15/2020 | | 2,135,469 |
| 675M | | Valeant Pharmaceuticals International, Inc., 6.375%, 10/15/2020 (a) | | 713,391 |
| | | | |
| |
| | | | | |
| | | | | |
| Principal | | | | |
| Amount | | Security | | Value |
| | | Health Care (continued) | | |
| | | Vanguard Health Holding Co. II, LLC: | | |
| $ 2,250M | | 8%, 2/1/2018 | | $ 2,404,688 |
| 1,325M | | 7.75%, 2/1/2019 | | 1,424,375 |
| 3,450M | | VPI Escrow Corp., 6.375%, 10/15/2020 (a) | | 3,652,688 |
| | | | | 33,885,678 |
| | | Information Technology—2.6% | | |
| 2,500M | | Advanced Micro Devices, Inc., 7.5%, 8/15/2022 (a) | | 2,281,250 |
| 2,000M | | Audatex North America, Inc., 6.75%, 6/15/2018 (a) | | 2,155,000 |
| 1,475M | | CyrusOne, LP, 6.375%, 11/15/2022 (a) | | 1,552,437 |
| | | Equinix, Inc.: | | |
| 1,875M | | 8.125%, 3/1/2018 | | 2,073,047 |
| 1,250M | | 7%, 7/15/2021 | | 1,392,187 |
| 2,400M | | Fidelity National Information Services, Inc., 7.875%, 7/15/2020 | | 2,718,000 |
| | | Hewlett-Packard Co.: | | |
| 550M | | 4.3%, 6/1/2021 | | 559,296 |
| 425M | | 4.375%, 9/15/2021 | | 434,060 |
| 1,825M | | Lender Processing Services, Inc., 5.75%, 4/15/2023 | | 1,911,688 |
| 2,100M | | MEMC Electronic Materials, Inc., 7.75%, 4/1/2019 | | 1,953,000 |
| | | | | 17,029,965 |
| | | Manufacturing—3.9% | | |
| 1,550M | | Amsted Industries, 8.125%, 3/15/2018 (a) | | 1,674,000 |
| | | Bombardier, Inc.: | | |
| 2,425M | | 7.5%, 3/15/2018 (a) | | 2,779,656 |
| 2,575M | | 7.75%, 3/15/2020 (a) | | 2,974,125 |
| 1,500M | | 6.125%, 1/15/2023 (a) | | 1,563,750 |
| 3,850M | | Case New Holland, Inc., 7.875%, 12/1/2017 | | 4,523,750 |
| 2,450M | | Dematic SA, 7.75%, 12/15/2020 (a) | | 2,560,250 |
| 3,350M | | Edgen Murray Corp., 8.75%, 11/1/2020 (a) | | 3,492,375 |
| 1,550M | | EDP Finance BV, 6%, 2/2/2018 (a) | | 1,639,125 |
| | | Rexel SA: | | |
| 3,075M | | 6.125%, 12/15/2019 (a) | | 3,251,813 |
| 975M | | 5.25%, 6/15/2020 (a)(d) | | 992,063 |
| | | | | 25,450,907 |
Portfolio of Investments (continued)
FUND FOR INCOME
March 31, 2013
| | | | |
| |
| | | | | |
| | | | | |
| Principal | | | | |
| Amount | | Security | | Value |
| | | Media-Broadcasting—2.9% | | |
| $ 2,450M | | Allbritton Communication Co., 8%, 5/15/2018 | | $ 2,664,375 |
| | | Belo Corp.: | | |
| 725M | | 7.75%, 6/1/2027 | | 775,750 |
| 150M | | 7.25%, 9/15/2027 | | 155,250 |
| 2,825M | | Block Communications, Inc., 7.25%, 2/1/2020 (a) | | 3,086,312 |
| | | Nexstar Broadcasting, Inc.: | | |
| 2,475M | | 8.875%, 4/15/2017 | | 2,734,875 |
| 3,175M | | 6.875%, 11/15/2020 (a) | | 3,365,500 |
| | | Sinclair Television Group, Inc.: | | |
| 4,000M | | 9.25%, 11/1/2017 (a) | | 4,355,000 |
| 1,825M | | 5.375%, 4/1/2021 (a)(d) | | 1,820,438 |
| | | | | 18,957,500 |
| | | Media-Cable TV—6.7% | | |
| | | Cablevision Systems Corp.: | | |
| 2,750M | | 8.625%, 9/15/2017 | | 3,217,500 |
| 500M | | 7.75%, 4/15/2018 | | 563,125 |
| | | CCO Holdings, LLC: | | |
| 1,200M | | 7.25%, 10/30/2017 | | 1,297,500 |
| 1,700M | | 7.875%, 4/30/2018 | | 1,812,625 |
| 1,150M | | 7%, 1/15/2019 | | 1,244,875 |
| 1,175M | | 7.375%, 6/1/2020 | | 1,308,656 |
| 650M | | 5.25%, 3/15/2021 (a) | | 649,187 |
| 875M | | 5.125%, 2/15/2023 | | 853,125 |
| | | Cequel Communications Holdings I, LLC: | | |
| 1,900M | | 8.625%, 11/15/2017 (a) | | 2,035,375 |
| 1,625M | | 6.375%, 9/15/2020 (a) | | 1,694,062 |
| | | Clear Channel Worldwide Holdings, Inc.: | | |
| 200M | | 7.625%, 3/15/2020 Series “A” | | 207,750 |
| 2,850M | | 7.625%, 3/15/2020 Series “B” | | 2,988,937 |
| 1,025M | | 6.5%, 11/15/2022 Series “A” (a) | | 1,073,687 |
| 2,375M | | 6.5%, 11/15/2022 Series “B” (a) | | 2,517,500 |
| | | DISH DBS Corp.: | | |
| 3,900M | | 7.875%, 9/1/2019 | | 4,641,000 |
| 950M | | 5%, 3/15/2023 (a) | | 939,312 |
| 1,800M | | Echostar DBS Corp., 7.125%, 2/1/2016 | | 2,009,250 |
| 3,025M | | Gray Television, Inc., 7.5%, 10/1/2020 | | 3,244,312 |
| 1,625M | | Harron Communications, LP, 9.125%, 4/1/2020 (a) | | 1,811,875 |
| 1,200M | | Lynx II Corp., 6.375%, 4/15/2023 (a) | | 1,263,000 |
| | | | |
| |
| | | | | |
| | | | | |
| Principal | | | | |
| Amount | | Security | | Value |
| | | Media-Cable TV (continued) | | |
| $ 3,025M | | Nara Cable Funding, Ltd., 8.875%, 12/1/2018 (a) | | $ 3,183,813 |
| 450M | | Quebecor Media, Inc., 5.75%, 1/15/2023 (a) | | 461,250 |
| 3,850M | | UPC Holding BV, 9.875%, 4/15/2018 (a) | | 4,316,813 |
| | | | | 43,334,529 |
| | | Media-Diversified—1.5% | | |
| 2,882M | | Entravision Communications Corp., 8.75%, 8/1/2017 | | 3,134,175 |
| 2,750M | | Griffey Intermediate, Inc., 7%, 10/15/2020 (a) | | 2,818,750 |
| 3,625M | | Lamar Media Corp., 7.875%, 4/15/2018 | | 3,964,844 |
| | | | | 9,917,769 |
| | | Metals/Mining—8.5% | | |
| 2,475M | | Alcoa, Inc., 6.15%, 8/15/2020 | | 2,698,690 |
| 1,625M | | Aleris International, Inc., 7.875%, 11/1/2020 | | 1,738,750 |
| | | ArcelorMittal: | | |
| 475M | | 5%, 2/25/2017 | | 497,526 |
| 1,175M | | 6.125%, 6/1/2018 | | 1,270,409 |
| 5,306M | | 10.35%, 6/1/2019 | | 6,708,381 |
| 1,450M | | 6.75%, 2/25/2022 | | 1,587,331 |
| | | Arch Coal, Inc.: | | |
| 325M | | 7%, 6/15/2019 | | 294,937 |
| 2,775M | | 7.25%, 10/1/2020 | | 2,511,375 |
| 2,950M | | 7.25%, 6/15/2021 | | 2,662,375 |
| 1,650M | | Coeur d’Alene Mines Corp., 7.875%, 2/1/2021 (a) | | 1,751,062 |
| | | FMG Resources (August 2006) Property, Ltd.: | | |
| 1,250M | | 6.375%, 2/1/2016 (a) | | 1,292,187 |
| 975M | | 6%, 4/1/2017 (a) | | 1,006,687 |
| 2,275M | | 6.875%, 2/1/2018 (a) | | 2,400,125 |
| 1,525M | | 8.25%, 11/1/2019 (a) | | 1,652,719 |
| 850M | | 6.875%, 4/1/2022 (a) | | 893,562 |
| 3,125M | | JMC Steel Group, 8.25%, 3/15/2018 (a) | | 3,328,125 |
| 1,000M | | Kaiser Aluminum Corp., 8.25%, 6/1/2020 | | 1,125,000 |
| 2,975M | | Molycorp, Inc., 10%, 6/1/2020 | | 2,945,250 |
| | | Novelis, Inc.: | | |
| 5,425M | | 8.375%, 12/15/2017 | | 5,967,500 |
| 400M | | 8.75%, 12/15/2020 | | 453,000 |
| | | Peabody Energy Corp.: | | |
| 2,050M | | 6%, 11/15/2018 | | 2,185,813 |
| 1,700M | | 6.5%, 9/15/2020 | | 1,819,000 |
| 2,525M | | 6.25%, 11/15/2021 | | 2,638,625 |
Portfolio of Investments (continued)
FUND FOR INCOME
March 31, 2013
| | | | |
| |
| | | | | |
| | | | | |
| Principal | | | | |
| Amount | | Security | | Value |
| | | Metals/Mining (continued) | | |
| | | Steel Dynamics, Inc.: | | |
| $ 1,200M | | 6.125%, 8/15/2019 (a) | | $ 1,302,000 |
| 675M | | 6.375%, 8/15/2022 (a) | | 732,375 |
| | | United States Steel Corp.: | | |
| 550M | | 7%, 2/1/2018 | | 594,000 |
| 1,275M | | 7.375%, 4/1/2020 | | 1,341,938 |
| 425M | | 6.875%, 4/1/2021 | | 438,813 |
| 900M | | 7.5%, 3/15/2022 | | 947,250 |
| | | | | 54,784,805 |
| | | Real Estate Investment Trusts—.6% | | |
| | | Omega Healthcare Investors, Inc.: | | |
| 100M | | 7.5%, 2/15/2020 | | 111,500 |
| 1,800M | | 6.75%, 10/15/2022 | | 1,993,500 |
| 1,400M | | Taylor Morrison Communities, Inc., 7.75%, 4/15/2020 (a) | | 1,508,500 |
| | | | | 3,613,500 |
| | | Retail-General Merchandise—3.3% | | |
| 1,150M | | ARAMARK Corp., 5.75%, 3/15/2020 (a) | | 1,181,625 |
| 2,063M | | CKE Restaurants, Inc., 11.375%, 7/15/2018 | | 2,403,395 |
| 2,125M | | Landry’s, Inc., 9.375%, 5/1/2020 (a) | | 2,300,313 |
| 2,050M | | Limited Brands, Inc., 8.5%, 6/15/2019 | | 2,526,625 |
| 1,675M | | Michaels Stores, Inc., 7.75%, 11/1/2018 | | 1,838,313 |
| 1,975M | | Monitronics International, Inc., 9.125%, 4/1/2020 | | 2,098,438 |
| 4,485M | | Needle Merger Sub Corp., 8.125%, 3/15/2019 (a) | | 4,709,250 |
| 2,250M | | Party City Holdings, Inc., 8.875%, 8/1/2020 (a) | | 2,480,625 |
| 1,525M | | Sally Holdings, LLC, 6.875%, 11/15/2019 | | 1,696,563 |
| | | | | 21,235,147 |
| | | Services—3.2% | | |
| 3,150M | | 313 Group, Inc., 6.375%, 12/1/2019 (a) | | 3,142,125 |
| 2,850M | | Brickman Group Holdings, Inc., 9.125%, 11/1/2018 (a) | | 3,113,625 |
| 2,050M | | CoreLogic, Inc., 7.25%, 6/1/2021 | | 2,275,500 |
| 1,550M | | Covanta Holding Corp., 6.375%, 10/1/2022 | | 1,694,785 |
| 1,700M | | H&E Equipment Services, Inc., 7%, 9/1/2022 (a) | | 1,878,500 |
| 1,525M | | Iron Mountain, Inc., 7.75%, 10/1/2019 | | 1,702,281 |
| 1,450M | | Live Nation Entertainment, Inc., 7%, 9/1/2020 (a) | | 1,566,000 |
| | | | |
| |
| | | | | |
| | | | | |
| Principal | | | | |
| Amount | | Security | | Value |
| | | Services (continued) | | |
| | | PHH Corp.: | | |
| $ 825M | | 9.25%, 3/1/2016 | | $ 967,313 |
| 1,350M | | 7.375%, 9/1/2019 | | 1,532,250 |
| 2,375M | | Reliance Intermediate Holdings, LP, 9.5%, 12/15/2019 (a) | | 2,660,000 |
| | | | | 20,532,379 |
| | | Telecommunications—6.6% | | |
| | | CenturyLink, Inc.: | | |
| 275M | | 5.625%, 4/1/2020 | | 281,591 |
| 1,500M | | 5.8%, 3/15/2022 | | 1,521,383 |
| | | Citizens Communications Co.: | | |
| 5,500M | | 7.125%, 3/15/2019 | | 5,967,500 |
| 2,175M | | 9%, 8/15/2031 | | 2,256,562 |
| | | Frontier Communications Corp.: | | |
| 100M | | 8.5%, 4/15/2020 | | 113,750 |
| 275M | | 7.625%, 4/15/2024 (d) | | 283,594 |
| 2,525M | | GCI, Inc., 8.625%, 11/15/2019 | | 2,676,500 |
| 5,850M | | Inmarsat Finance, PLC, 7.375%, 12/1/2017 (a) | | 6,259,500 |
| | | Intelsat Jackson Holdings SA: | | |
| 3,850M | | 8.5%, 11/1/2019 | | 4,326,438 |
| 975M | | 7.25%, 10/15/2020 | | 1,074,938 |
| 800M | | PAETEC Holding Corp., 9.875%, 12/1/2018 | | 922,000 |
| 1,125M | | Qwest Communications International, Inc., 7.125%, 4/1/2018 | | 1,174,219 |
| 425M | | Qwest Corp., 6.5%, 6/1/2017 | | 492,134 |
| | | Sprint Capital Corp.: | | |
| 2,000M | | 6.9%, 5/1/2019 | | 2,205,000 |
| 3,125M | | 6.875%, 11/15/2028 | | 3,210,938 |
| 1,700M | | Telesat Canada, 6%, 5/15/2017 (a) | | 1,785,000 |
| | | Wind Acquisition Finance SA: | | |
| 750M | | 11.75%, 7/15/2017 (a) | | 798,750 |
| 2,175M | | 7.25%, 2/15/2018 (a) | | 2,275,594 |
| | | Windstream Corp.: | | |
| 1,725M | | 7.875%, 11/1/2017 | | 1,979,438 |
| 1,775M | | 7.75%, 10/15/2020 | | 1,934,750 |
| 875M | | 6.375%, 8/1/2023 (a) | | 872,813 |
| | | | | 42,412,392 |
Portfolio of Investments (continued)
FUND FOR INCOME
March 31, 2013
| | | | |
| |
| | | | | |
| | | | | |
| Principal | | | | |
| Amount | | Security | | Value |
| | | Transportation—1.0% | | |
| $ 1,900M | | Aircastle, Ltd., 6.25%, 12/1/2019 | | $ 2,085,250 |
| | | Navios Maritime Holdings: | | |
| 1,825M | | 8.875%, 11/1/2017 | | 1,872,906 |
| 2,550M | | 8.125%, 2/15/2019 | | 2,320,500 |
| | | | | 6,278,656 |
| | | Utilities—3.2% | | |
| | | AES Corp.: | | |
| 875M | | 9.75%, 4/15/2016 | | 1,047,812 |
| 800M | | 8%, 10/15/2017 | | 945,000 |
| 1,275M | | 7.375%, 7/1/2021 | | 1,485,375 |
| 3,275M | | Atlantic Power Corp., 9%, 11/15/2018 | | 3,438,750 |
| 2,600M | | Calpine Construction Finance Co., LP, 8%, 6/1/2016 (a) | | 2,739,750 |
| 331M | | Calpine Corp., 7.875%, 7/31/2020 (a) | | 364,100 |
| 1,248M | | Indiantown Cogeneration Utilities, LP, 9.77%, 12/15/2020 | | 1,387,510 |
| 3,475M | | Intergen NV, 9%, 6/30/2017 (a) | | 3,431,563 |
| 2,350M | | NRG Energy, Inc., 7.625%, 5/15/2019 | | 2,549,750 |
| 3,010M | | NSG Holdings, LLC, 7.75%, 12/15/2025 (a) | | 3,175,550 |
| | | | | 20,565,160 |
| | | Waste Management—.3% | | |
| 2,050M | | ADS Waste Holdings, Inc., 8.25%, 10/1/2020 (a) | | 2,219,125 |
| | | Wireless Communications—3.0% | | |
| 1,325M | | Cricket Communications, Inc., 7.75%, 10/15/2020 | | 1,328,312 |
| 850M | | DigitalGlobe, Inc., 5.25%, 2/1/2021 (a) | | 847,875 |
| 2,800M | | Intelsat Luxembourg SA, 8.125%, 6/1/2023 (a)(d) | | 2,856,000 |
| | | MetroPCS Wireless, Inc.: | | |
| 2,100M | | 7.875%, 9/1/2018 | | 2,304,750 |
| 1,200M | | 6.625%, 11/15/2020 | | 1,258,500 |
| 2,025M | | 6.25%, 4/1/2021 (a) | | 2,068,031 |
| 2,275M | | 6.625%, 4/1/2023 (a) | | 2,329,031 |
| | | Sprint Nextel Corp.: | | |
| 2,050M | | 9.125%, 3/1/2017 | | 2,434,375 |
| 1,250M | | 8.375%, 8/15/2017 | | 1,460,938 |
| 975M | | 7%, 8/15/2020 | | 1,077,375 |
| 1,300M | | 6%, 11/15/2022 | | 1,342,250 |
| | | | | 19,307,437 |
| Total Value of Corporate Bonds (cost $546,941,131) | | 573,647,316 |
| | | | |
| |
| | | | | |
| | | | | |
| Principal | | | | |
| Amount | | Security | | Value |
| | | LOAN PARTICIPATIONS—7.2% | | |
| | | Building Materials—.3% | | |
| $ 2,065M | | MRC Global, Inc., 6.25%, 10/15/2019 (e) | | $ 2,096,885 |
| | | Chemicals—.2% | | |
| 1,500M | | Dupont Performance Coatings, Inc., 4.75%, 1/31/2020 (e) | | 1,522,313 |
| | | Consumer Non-Durables—.3% | | |
| 1,850M | | Sun Products Corp., 6.5%, 3/15/2020 (d)(e) | | 1,876,016 |
| | | Energy—.3% | | |
| 1,925M | | Samson Investment Co., 6%, 9/25/2018 (e) | | 1,948,822 |
| | | Financial—.5% | | |
| 2,985M | | Ocwen Financial Corp., 5%, 1/31/2018 (e) | | 3,040,223 |
| | | Food/Beverage/Tobacco—.1% | | |
| 615M | | H.J. Heinz Company, 3.5%, 3/27/2020 (d)(e) | | 620,893 |
| | | Food/Drug—1.0% | | |
| 3,925M | | Albertson’s, LLC, 5.75%, 2/20/2016 (d)(e) | | 3,993,688 |
| 2,700M | | Supervalu, Inc., 5%, 3/21/2019 (d)(e) | | 2,752,593 |
| | | | | 6,746,281 |
| | | Forest Products/Containers—.3% | | |
| 1,995M | | Sealed Air Corp., 4%, 10/31/2019 (e) | | 2,027,662 |
| | | Information Technology—.6% | | |
| 1,343M | | Genpact, Ltd., 4.25%, 8/17/2019 (e) | | 1,361,160 |
| 2,414M | | Kronos, Inc., 5.5%, 10/30/2019 (e) | | 2,444,728 |
| | | | | 3,805,888 |
| | | Manufacturing—.4% | | |
| 2,235M | | Apex Tool Group, LLC, 4.5%, 1/8/2020 (e) | | 2,269,363 |
| | | Media-Diversified—.5% | | |
| 2,968M | | Getty Images, Inc., 4.75%, 10/18/2019 (e) | | 3,010,592 |
| | | Metals/Mining—.9% | | |
| 2,853M | | Arch Coal, Inc., 5.75%, 5/16/2018 (e) | | 2,904,271 |
| 2,993M | | Metals USA, Inc., 6.25%, 10/31/2018 (e) | | 3,016,814 |
| | | | | 5,921,085 |
Portfolio of Investments (continued)
FUND FOR INCOME
March 31, 2013
| | | | | | | |
|
| | | | | | | | |
| Principal | | | | | | | |
| Amount | | | | | | | |
| or Shares | | Security | | | | | Value |
| | | Retail-General Merchandise—1.0% | | | | | |
| $ 2,680M | | Academy, Ltd., 4.75%, 8/3/2018 (e) | | | | | $ 2,721,850 |
| 1,244M | | Burger King Corp., 3.75%, 9/27/2019 (e) | | | | | 1,259,446 |
| 2,696M | | General Nutrition Centers, Inc., 3.75%, 3/2/2018 (e) | | | | 2,724,967 |
| | | | | | | | 6,706,263 |
| | | Telecommunications—.8% | | | | | |
| 2,185M | | Arris Group, Inc., 3.5%, 2/7/2020 (d)(e) | | | | | 2,190,917 |
| 2,700M | | Intelsat Jackson Holdings, Ltd., 3.2047%, 2/1/2014 (e) | | | | 2,707,312 |
| | | | | | | | 4,898,229 |
| Total Value of Loan Participations (cost $45,707,869) | | | | | 46,490,515 |
| | | COMMON STOCKS—.0% | | | | | |
| | | Automotive—.0% | | | | | |
| 2,523 | * | Safelite Realty Corporation (b) | | | | | 25 |
| | | Telecommunications—.0% | | | | | |
| 8 | * | Viatel Holding (Bermuda), Ltd. (b) | | | | | — |
| 18,224 | * | World Access, Inc. (b) | | | | | — |
| | | | | | | | — |
| Total Value of Common Stocks (cost $385,770) | | | | | 25 |
| Total Value of Investments (cost $593,034,770) | 96.2 | % | | | 620,137,856 |
| Other Assets, Less Liabilities | 3.8 | | | | 24,430,553 |
| Net Assets | | | 100.0 | % | | | $644,568,409 |
| |
| * | Non-income producing |
| |
| (a) | Security exempt from registration under Rule 144A of the Securities Act of 1933 (see Note 4). |
| |
| (b) | Securities valued at fair value (see Note 1A). |
| |
| (c) | In default as to principal and/or interest payment |
| |
| (d) | A portion or all of the security purchased on a when-issued or delayed delivery basis (see Note 1G). |
| |
| (e) | Interest rates are determined and reset periodically. The interest rates above are the rates in effect |
| at March 31, 2013. |
Accounting Standards Codification (“ASC”) 820 established a three-tier hierarchy of inputs to establish a classification of fair value measurements for disclosure purposes. The three-tier hierarchy of inputs is summarized in the three broad Levels listed below:
| Level 1 — Unadjusted quoted prices in active markets for identical securities that the Fund has the ability to access. |
| Level 2 — Observable inputs other than quoted prices included in Level 1 that are observable for the asset or liability, either directly or indirectly. These inputs may include quoted prices for the identical instrument on an inactive market, prices for similar instruments, interest rates, prepayment speeds, credit risk, yield curves, default rates and similar data. |
| Level 3 — Unobservable inputs for the asset or liability, to the extent relevant observable inputs are not available, representing the Fund’s own assumption about the assumptions a market participant would use in valuing the asset or liability, and would be based on the best information available. |
The inputs methodology used for valuing securities are not necessarily an indication of the risk associated with investing in those securities.
The following is a summary, by category of Level, of inputs used to value the Fund’s investments as of March 31, 2013:
| | | | | | | | | | | | |
| | | | Level 1 | | | Level 2 | | | Level 3 | | | Total |
| Corporate Bonds | | $ | — | | $ | 573,644,566 | | $ | 2,750 | | $ | 573,647,316 |
| Loan Participations | | | — | | | 46,490,515 | | | — | | | 46,490,515 |
| Common Stocks | | | — | | | — | | | 25 | | | 25 |
| Total Investments in Securities* | | $ | — | | $ | 620,135,081 | | $ | 2,775 | | $ | 620,137,856 |
| |
| * | The Portfolio of Investments provides information on the industry categorization for corporate bonds, |
| loan participations and common stocks. |
| |
| There were no transfers into or from Level 1 or Level 2 by the Fund during the period ended |
| March 31, 2013. Transfers, if any, between Levels are recognized at the end of the reporting period. |
Portfolio of Investments (continued)
FUND FOR INCOME
March 31, 2013
The following is a reconciliation of Fund investments valued using Level 3 inputs for the period:
| | | | | | | | | | | | |
| | | Investments | | | Investments | | | | | | |
| | | | in | | | in | | | | | | |
| | | | Corporate | | | Common | | | | | | |
| | | | Bonds | | | Stocks | | | Total | | | |
| Balance, September 30, 2012 | | $ | 2,750 | | $ | 25 | | $ | 2,775 | | | |
| Net purchases (sales) | | | — | | | — | | | — | | | |
| Change in unrealized | | | | | | | | | | | | |
| appreciation (depreciation) | | | — | | | — | | | — | | | |
| Realized gain (loss) | | | — | | | — | | | — | | | |
| Transfer in and/or out of Level 3 | | | — | | | — | | | — | | | |
| Balance, March 31, 2013 | | $ | 2,750 | | $ | 25 | | $ | 2,775 | | | |
| | | | |
| The following is a summary of Level 3 inputs by industry: | | | | | | |
| Automotive | | $ | 25 | | | | | | | | | |
| Health Care | | | 2,750 | | | | | | | | | |
| Telecommunications | | | — | | | | | | | | | |
| | | $ | 2,775 | | | | | | | | | |
The following table presents additional information about valuation methodologies and inputs used for investments that are measured at fair value and categorized within Level 3 as of March 31, 2013.
| | | | | | | | | | | |
| | | | | | | | | | | | Impact to |
| | | | | | | | | | | | Valuation |
| | | Fair Value | | | | | | | | from and |
| | | March 31, | | Valuation | | Unobservable | | | | Increase in |
| | | 2013 | | Methodologies | | Input(s)(1) | | Range | | Input(2) |
| Corporate Bonds | | $ | 2,750 | | Market | | Market | | 100% | | Increase |
| | | | | | Comparables | | Comparables/ | | | | |
| | | | | | | | Bankruptcy | | | | |
| | | | | | | | | | | | |
| Common Stocks | | $ | 25 | | Market | | Market | | 100% | | Increase |
| | | | | | Comparables | | Comparables/ | | | | |
| | | | | | | | Bankruptcy | | | | |
| |
| (1) | In determining certain of these inputs, management evaluates a variety of factors including eco- |
| nomic conditions, industry and market developments, market valuations of comparable compa- |
| nies and company specific developments including exit strategies and realization opportunities. |
| Management has determined that market participants would take these inputs into account when |
| valuing the investments. |
| |
| (2) | This column represents the directional change in the fair value of the Level 3 investments |
| that would result from an increase to the corresponding unobservable input. A decrease to the |
| unobservable input would have the opposite effect. |
| | |
| 42 | See notes to financial statements | |
Fund Expenses (unaudited)
TOTAL RETURN FUND
The examples below show the ongoing costs (in dollars) of investing in your Fund and will help you in comparing these costs with costs of other mutual funds. Please refer to page 4 for a detailed explanation of the information presented in these examples.
| | | |
| | | | |
| | Beginning | Ending | |
| | Account | Account | Expenses Paid |
| | Value | Value | During Period |
| | (10/1/12) | (3/31/13) | (10/1/12–3/31/13)* |
| Expense Example – Class A Shares | | | |
| Actual | $1,000.00 | $1,084.85 | $6.81 |
| Hypothetical | | | |
| (5% annual return before expenses) | $1,000.00 | $1,018.40 | $6.59 |
| Expense Example – Class B Shares | | | |
| Actual | $1,000.00 | $1,114.10 | $10.59 |
| Hypothetical | | | |
| (5% annual return before expenses) | $1,000.00 | $1,014.91 | $10.10 |
| |
| * | Expenses are equal to the annualized expense ratio of 1.31% for Class A shares and 2.01% for |
| Class B shares, multiplied by the average account value over the period, multiplied by 182/365 (to |
| reflect the one-half year period). |
Portfolio Composition
TOP TEN SECTORS
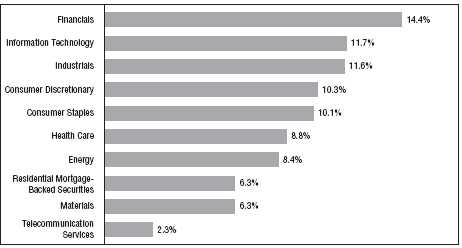
Portfolio holdings and allocations are subject to change. Percentages are as of March 31, 2013, and are based on the total market value of investments.
Portfolio of Investments
TOTAL RETURN FUND
March 31, 2013
| | | | |
| |
| | | | | |
| | | | | |
| | | | | |
| Shares | | Security | | Value |
| | | COMMON STOCKS—59.5% | | |
| | | Consumer Discretionary—8.9% | | |
| 52,200 | | Allison Transmission Holdings, Inc. | | $ 1,253,322 |
| 112,900 | | Best Buy Company, Inc. | | 2,500,735 |
| 31,400 | * | BorgWarner, Inc. | | 2,428,476 |
| 112,000 | | CBS Corporation – Class “B” | | 5,229,280 |
| 11,000 | | Coach, Inc. | | 549,890 |
| 172,000 | | Dana Holding Corporation | | 3,066,760 |
| 81,600 | | Delphi Automotive, PLC | | 3,623,040 |
| 115,800 | | GNC Holdings, Inc. – Class “A” | | 4,548,624 |
| 42,300 | | Home Depot, Inc. | | 2,951,694 |
| 85,900 | | L Brands, Inc. | | 3,836,294 |
| 8,700 | | Lowe’s Companies, Inc. | | 329,904 |
| 27,300 | | McDonald’s Corporation | | 2,721,537 |
| 130,000 | | Newell Rubbermaid, Inc. | | 3,393,000 |
| 113,900 | | Pier 1 Imports, Inc. | | 2,619,700 |
| 52,000 | * | Select Comfort Corporation | | 1,028,040 |
| 203,300 | | Staples, Inc. | | 2,730,319 |
| 53,800 | * | Steiner Leisure, Ltd. | | 2,601,768 |
| 210,500 | | Stewart Enterprises, Inc – Class “A” | | 1,955,545 |
| 27,700 | * | TRW Automotive Holdings Corporation | | 1,523,500 |
| 28,000 | | Tupperware Brands Corporation | | 2,288,720 |
| 54,260 | | Wyndham Worldwide Corporation | | 3,498,685 |
| | | | | 54,678,833 |
| | | Consumer Staples—5.7% | | |
| 115,000 | | Altria Group, Inc. | | 3,954,850 |
| 117,300 | | Avon Products, Inc. | | 2,431,629 |
| 114,300 | | Coca-Cola Company | | 4,622,292 |
| 77,700 | | CVS Caremark Corporation | | 4,272,723 |
| 39,000 | | Herbalife, Ltd. | | 1,460,550 |
| 92,100 | | Nu Skin Enterprises, Inc. – Class “A” | | 4,070,820 |
| 29,100 | | PepsiCo, Inc. | | 2,302,101 |
| 75,000 | | Philip Morris International, Inc. | | 6,953,250 |
| 26,700 | | Procter & Gamble Company | | 2,057,502 |
| 42,200 | | Wal-Mart Stores, Inc. | | 3,157,826 |
| | | | | 35,283,543 |
| | | | |
| | | | | |
| | | | | |
| | | | | |
| | | | | |
| Shares | | Security | | Value |
| | | Energy—6.2% | | |
| 36,900 | | Anadarko Petroleum Corporation | | $ 3,226,905 |
| 20,200 | | Chevron Corporation | | 2,400,164 |
| 61,500 | | ConocoPhillips | | 3,696,150 |
| 12,000 | | Devon Energy Corporation | | 677,040 |
| 44,000 | | Ensco, PLC – Class “A” | | 2,640,000 |
| 65,427 | | ExxonMobil Corporation | | 5,895,627 |
| 8,200 | | Hess Corporation | | 587,202 |
| 1,897 | | Hugoton Royalty Trust | | 17,699 |
| 94,886 | | Marathon Oil Corporation | | 3,199,556 |
| 38,843 | | Marathon Petroleum Corporation | | 3,480,333 |
| 36,100 | | National Oilwell Varco, Inc. | | 2,554,075 |
| 97,900 | | Noble Corporation | | 3,734,885 |
| 31,400 | | Phillips 66 | | 2,197,058 |
| 14,300 | | Sasol, Ltd. (ADR) | | 634,062 |
| 13,100 | | Schlumberger, Ltd. | | 981,059 |
| 86,200 | | Suncor Energy, Inc. | | 2,586,862 |
| | | | | 38,508,677 |
| | | Financials—6.0% | | |
| 60,100 | | American Express Company | | 4,054,346 |
| 37,400 | | Ameriprise Financial, Inc. | | 2,754,510 |
| 61,100 | | Brookline Bancorp, Inc. | | 558,454 |
| 71,650 | | Discover Financial Services | | 3,212,786 |
| 27,300 | | Financial Select Sector SPDR Fund (ETF) | | 496,587 |
| 78,800 | | FirstMerit Corporation | | 1,302,564 |
| 46,300 | * | Health Insurance Innovations, Inc. – Class “A” | | 698,667 |
| 33,800 | | Invesco, Ltd. | | 978,848 |
| 108,100 | | JPMorgan Chase & Company | | 5,130,426 |
| 34,000 | | M&T Bank Corporation | | 3,507,440 |
| 26,000 | | MetLife, Inc. | | 988,520 |
| 23,700 | | Morgan Stanley | | 520,926 |
| 44,900 | | PNC Financial Services Group, Inc. | | 2,985,850 |
| 27,300 | | SPDR S&P Regional Banking (ETF) | | 868,140 |
| 117,672 | * | Sunstone Hotel Investors, Inc. (REIT) | | 1,448,542 |
| 96,800 | | U.S. Bancorp | | 3,284,424 |
| 100,500 | | Urstadt Biddle Properties, Inc. – Class “A” (REIT) | | 2,186,880 |
| 62,600 | | Wells Fargo & Company | | 2,315,574 |
| | | | | 37,293,484 |
Portfolio of Investments (continued)
TOTAL RETURN FUND
March 31, 2013
| | | | |
| |
| | | | | |
| | | | | |
| | | | | |
| Shares | | Security | | Value |
| | | Health Care—7.4% | | |
| 92,200 | | Abbott Laboratories | | $ 3,256,504 |
| 79,200 | | AbbVie, Inc. | | 3,229,776 |
| 41,800 | * | Actavis, Inc. | | 3,850,198 |
| 26,200 | | Baxter International, Inc. | | 1,903,168 |
| 20,800 | | Covidien, PLC | | 1,411,072 |
| 54,617 | * | Express Scripts Holding Company | | 3,148,670 |
| 106,200 | * | Gilead Sciences, Inc. | | 5,196,366 |
| 71,700 | | Johnson & Johnson | | 5,845,701 |
| 15,900 | | McKesson Corporation | | 1,716,564 |
| 82,700 | | Merck & Company, Inc. | | 3,657,821 |
| 232,380 | | Pfizer, Inc. | | 6,706,487 |
| 70,800 | | Thermo Fisher Scientific, Inc. | | 5,415,492 |
| 45,200 | | Warner Chilcott, PLC – Class “A” | | 612,460 |
| | | | | 45,950,279 |
| | | Industrials—9.4% | | |
| 50,100 | | 3M Company | | 5,326,131 |
| 50,737 | | ADT Corporation | | 2,483,069 |
| 68,800 | | Altra Holdings, Inc. | | 1,872,736 |
| 33,800 | * | Armstrong World Industries, Inc. | | 1,889,082 |
| 29,100 | | Caterpillar, Inc. | | 2,530,827 |
| 32,900 | | Chicago Bridge & Iron Company NV – NY Shares | | 2,043,090 |
| 40,000 | * | Esterline Technologies Corporation | | 3,028,000 |
| 24,200 | | Gardner Denver, Inc. | | 1,817,662 |
| 88,200 | | Generac Holdings, Inc. | | 3,116,988 |
| 105,000 | | General Electric Company | | 2,427,600 |
| 56,800 | | Honeywell International, Inc. | | 4,279,880 |
| 18,600 | | IDEX Corporation | | 993,612 |
| 44,100 | | ITT Corporation | | 1,253,763 |
| 10,800 | | Lockheed Martin Corporation | | 1,042,416 |
| 61,900 | | Pentair, Ltd. | | 3,265,225 |
| 10,500 | | Raytheon Company | | 617,295 |
| 27,300 | | Snap-on, Inc. | | 2,257,710 |
| 96,300 | | TAL International Group, Inc. | | 4,363,353 |
| 86,500 | | Textainer Group Holdings, Ltd. | | 3,421,075 |
| 39,550 | | Triumph Group, Inc. | | 3,104,675 |
| 99,775 | | Tyco International, Ltd. | | 3,192,800 |
| 42,200 | | United Technologies Corporation | | 3,942,746 |
| | | | | 58,269,735 |
| | | | |
| | | | | |
| | | | | |
| | | | | |
| | | | | |
| Shares | | Security | | Value |
| | | Information Technology—10.5% | | |
| 12,000 | | Apple, Inc. | | $ 5,311,560 |
| 164,500 | * | Arris Group, Inc. | | 2,824,465 |
| 50,000 | | Avago Technologies, Ltd. | | 1,796,000 |
| 18,700 | * | CACI International, Inc. – Class “A” | | 1,082,169 |
| 223,200 | | Cisco Systems, Inc. | | 4,667,112 |
| 25,600 | * | eBay, Inc. | | 1,388,032 |
| 165,600 | * | EMC Corporation | | 3,956,184 |
| 13,000 | | Global Payments, Inc. | | 645,580 |
| 65,600 | | Hewlett-Packard Company | | 1,563,904 |
| 159,200 | | Intel Corporation | | 3,478,520 |
| 40,900 | | International Business Machines Corporation | | 8,723,970 |
| 75,800 | | Intersil Corporation – Class “A” | | 660,218 |
| 240,000 | | Microsoft Corporation | | 6,866,400 |
| 72,900 | * | NeuStar, Inc. – Class “A” | | 3,392,037 |
| 94,700 | | Oracle Corporation | | 3,062,598 |
| 44,300 | * | PTC, Inc. | | 1,129,207 |
| 70,900 | | QUALCOMM, Inc. | | 4,746,755 |
| 122,800 | * | Symantec Corporation | | 3,030,704 |
| 70,500 | | TE Connectivity, Ltd. | | 2,956,065 |
| 165,000 | * | Yahoo!, Inc. | | 3,882,450 |
| | | | | 65,163,930 |
| | | Materials—3.7% | | |
| 42,800 | | Celanese Corporation – Series “A” | | 1,885,340 |
| 44,900 | | Cytec Industries, Inc. | | 3,326,192 |
| 73,700 | | Freeport-McMoRan Copper & Gold, Inc. | | 2,439,470 |
| 110,000 | | International Paper Company | | 5,123,800 |
| 45,800 | | Kronos Worldwide, Inc. | | 716,770 |
| 60,300 | | LyondellBasell Industries NV – Class “A” | | 3,816,387 |
| 11,100 | | Praxair, Inc. | | 1,238,094 |
| 35,500 | | Rock-Tenn Company – Class “A” | | 3,294,045 |
| 38,000 | | RPM International, Inc. | | 1,200,040 |
| | | | | 23,040,138 |
| | | Telecommunication Services—1.6% | | |
| 118,700 | | AT&T, Inc. | | 4,355,103 |
| 109,200 | | Verizon Communications, Inc. | | 5,367,180 |
| | | | | 9,722,283 |
Portfolio of Investments (continued)
TOTAL RETURN FUND
March 31, 2013
| | | | |
| |
| | | | | |
| Shares or | | | | |
| Principal | | | | |
| Amount | | Security | | Value |
| | | Utilities—.1% | | |
| 13,000 | | Atmos Energy Corporation | | $ 554,970 |
| Total Value of Common Stocks (cost $246,725,263) | | 368,465,872 |
| | | CORPORATE BONDS—25.8% | | |
| | | Aerospace/Defense—.4% | | |
| $ 1,000M | | BAE Systems Holdings, Inc., 4.95%, 6/1/2014 (a) | | 1,042,846 |
| 1,000M | | United Technologies Corp., 6.125%, 2/1/2019 | | 1,248,908 |
| | | | | 2,291,754 |
| | | Agriculture—.2% | | |
| 1,000M | | Cargill, Inc., 6%, 11/27/2017 (a) | | 1,192,926 |
| | | Automotive—.2% | | |
| 1,000M | | Daimler Finance NA, LLC, 2.95%, 1/11/2017 (a) | | 1,049,964 |
| | | Chemicals—.6% | | |
| 1,500M | | CF Industries, Inc., 7.125%, 5/1/2020 | | 1,861,178 |
| 1,500M | | Dow Chemical Co., 4.25%, 11/15/2020 | | 1,652,655 |
| | | | | 3,513,833 |
| | | Consumer Durables—.4% | | |
| 1,000M | | Black & Decker Corp., 5.75%, 11/15/2016 | | 1,160,591 |
| 1,000M | | Newell Rubbermaid, Inc., 4.7%, 8/15/2020 | | 1,111,301 |
| | | | | 2,271,892 |
| | | Energy—2.1% | | |
| 1,000M | | Canadian Oil Sands, Ltd., 7.75%, 5/15/2019 (a) | | 1,262,062 |
| 1,000M | | DCP Midstream, LLC, 9.75%, 3/15/2019 (a) | | 1,318,541 |
| 1,000M | | Enbridge Energy Partners, LP, 4.2%, 9/15/2021 | | 1,055,754 |
| 1,500M | | Kinder Morgan Energy Partners, LP, 3.45%, 2/15/2023 | | 1,519,150 |
| 1,000M | | ONEOK Partners, LP, 3.375%, 10/1/2022 | | 995,253 |
| 1,000M | | Petrobras International Finance Co., 5.375%, 1/27/2021 | | 1,083,993 |
| 1,000M | | Reliance Holdings USA, Inc., 4.5%, 10/19/2020 (a) | | 1,049,944 |
| 500M | | Spectra Energy Capital, LLC, 6.2%, 4/15/2018 | | 604,604 |
| 1,000M | | Suncor Energy, Inc., 6.1%, 6/1/2018 | | 1,210,996 |
| 1,000M | | Valero Energy Corp., 9.375%, 3/15/2019 | | 1,365,930 |
| 1,500M | | Weatherford International, Inc., 6.35%, 6/15/2017 | | 1,721,724 |
| | | | | 13,187,951 |
| | | | |
| | | | | |
| | | | | |
| | | | | |
| Principal | | | | |
| Amount | | Security | | Value |
| | | Financial Services—3.4% | | |
| $ 1,000M | | Aflac, Inc., 8.5%, 5/15/2019 | | $ 1,353,203 |
| | | American Express Co.: | | |
| 500M | | 6.15%, 8/28/2017 | | 598,691 |
| 1,000M | | 7%, 3/19/2018 | | 1,250,043 |
| | | American International Group, Inc.: | | |
| 750M | | 4.875%, 9/15/2016 | | 835,277 |
| 750M | | 8.25%, 8/15/2018 | | 973,834 |
| 1,000M | | Ameriprise Financial, Inc., 5.3%, 3/15/2020 | | 1,191,378 |
| 1,000M | | Berkshire Hathaway, Inc., 3.4%, 1/31/2022 | | 1,055,903 |
| 1,000M | | BlackRock, Inc., 5%, 12/10/2019 | | 1,188,227 |
| 1,000M | | Caterpillar Financial Services Corp., 5.85%, 9/1/2017 | | 1,191,589 |
| 1,000M | | CoBank, ACB, 7.875%, 4/16/2018 (a) | | 1,270,220 |
| | | ERAC USA Finance Co.: | | |
| 1,000M | | 4.5%, 8/16/2021 (a) | | 1,103,719 |
| 500M | | 3.3%, 10/15/2022 (a) | | 504,733 |
| 1,500M | | Ford Motor Credit Co., LLC, 5%, 5/15/2018 | | 1,655,865 |
| | | General Electric Capital Corp.: | | |
| 1,000M | | 5.625%, 9/15/2017 | | 1,173,151 |
| 1,000M | | 5.3%, 2/11/2021 | | 1,148,249 |
| 1,000M | | Harley-Davidson Funding Corp., 5.75%, 12/15/2014 (a) | | 1,080,898 |
| 1,000M | | Liberty Mutual Group, Inc., 4.95%, 5/1/2022 (a) | | 1,098,522 |
| 750M | | Protective Life Corp., 7.375%, 10/15/2019 | | 921,851 |
| 1,000M | | Prudential Financial, Inc., 6%, 12/1/2017 | | 1,194,360 |
| | | | | 20,789,713 |
| | | Financials—3.7% | | |
| 2,000M | | Bank of America Corp., 5.65%, 5/1/2018 | | 2,316,208 |
| | | Barclays Bank, PLC: | | |
| 1,000M | | 6.75%, 5/22/2019 | | 1,245,493 |
| 1,000M | | 5.125%, 1/8/2020 | | 1,152,032 |
| | | Citigroup, Inc.: | | |
| 1,000M | | 5%, 9/15/2014 | | 1,050,399 |
| 1,000M | | 6.125%, 11/21/2017 | | 1,183,588 |
| 1,500M | | Fifth Third Bancorp, 3.5%, 3/15/2022 | | 1,565,865 |
| 2,100M | | Goldman Sachs Group, Inc., 6.15%, 4/1/2018 | | 2,477,282 |
| 2,500M | | JPMorgan Chase & Co., 6%, 1/15/2018 | | 2,974,035 |
| | | Merrill Lynch & Co., Inc.: | | |
| 500M | | 5%, 1/15/2015 | | 532,122 |
| 1,000M | | 6.4%, 8/28/2017 | | 1,174,840 |
| 1,800M | | Morgan Stanley, 6.625%, 4/1/2018 | | 2,154,062 |
| 1,000M | | Siemens Financieringsmaatschappij NV, 5.75%, 10/17/2016 (a) | | 1,157,325 |
Portfolio of Investments (continued)
TOTAL RETURN FUND
March 31, 2013
| | | | |
| |
| | | | | |
| | | | | |
| Principal | | | | |
| Amount | | Security | | Value |
| | | Financials (continued) | | |
| $ 1,000M | | SunTrust Banks, Inc., 6%, 9/11/2017 | | $ 1,181,677 |
| 488M | | UBS AG, 4.875%, 8/4/2020 | | 566,151 |
| | | Wells Fargo & Co.: | | |
| 1,500M | | 4.6%, 4/1/2021 | | 1,715,988 |
| 500M | | 3.45%, 2/13/2023 | | 504,407 |
| | | | | 22,951,474 |
| | | Food/Beverage/Tobacco—2.7% | | |
| 1,500M | | Altria Group, Inc., 9.7%, 11/10/2018 | | 2,089,905 |
| 1,000M | | Anheuser-Busch InBev Worldwide, Inc., 6.875%, 11/15/2019 | | 1,297,098 |
| 1,000M | | Bottling Group, LLC, 5.125%, 1/15/2019 | | 1,183,028 |
| 1,500M | | Bunge Ltd., Finance Corp., 3.2%, 6/15/2017 | | 1,553,111 |
| 1,000M | | ConAgra Foods, Inc., 5.875%, 4/15/2014 | | 1,050,295 |
| 1,000M | | Corn Products International, Inc., 4.625%, 11/1/2020 | | 1,115,566 |
| 1,000M | | Diageo Capital, PLC, 5.75%, 10/23/2017 | | 1,192,785 |
| 1,000M | | Dr. Pepper Snapple Group, Inc., 6.82%, 5/1/2018 | | 1,254,699 |
| 1,500M | | Lorillard Tobacco Co., 6.875%, 5/1/2020 | | 1,821,820 |
| 1,000M | | Mead Johnson Nutrition Co., 4.9%, 11/1/2019 | | 1,138,216 |
| 1,000M | | Philip Morris International, Inc., 5.65%, 5/16/2018 | | 1,202,110 |
| 1,500M | | SABMiller Holdings, Inc., 3.75%, 1/15/2022 (a) | | 1,608,540 |
| | | | | 16,507,173 |
| | | Food/Drug—.2% | | |
| 1,000M | | Safeway, Inc., 4.75%, 12/1/2021 | | 1,078,388 |
| | | Forest Products/Containers—.2% | | |
| 1,000M | | International Paper Co., 9.375%, 5/15/2019 | | 1,376,022 |
| | | Gaming/Leisure—.2% | | |
| 1,000M | | Marriott International, Inc., 3.25%, 9/15/2022 | | 1,006,035 |
| | | Health Care—1.3% | | |
| 1,000M | | Biogen IDEC, Inc., 6.875%, 3/1/2018 | | 1,225,356 |
| 1,000M | | Express Scripts Holding Co., 4.75%, 11/15/2021 | | 1,137,351 |
| 1,000M | | Laboratory Corp. of America Holdings, 3.75%, 8/23/2022 | | 1,028,567 |
| 1,000M | | Mylan, Inc., 3.125%, 1/15/2023 (a) | | 986,737 |
| 1,000M | | Novartis Securities Investments, Ltd., 5.125%, 2/10/2019 | | 1,195,559 |
| 1,000M | | Quest Diagnostics, Inc., 6.4%, 7/1/2017 | | 1,170,152 |
| 1,000M | | Roche Holdings, Inc., 6%, 3/1/2019 (a) | | 1,245,293 |
| | | | | 7,989,015 |
| | | | |
| |
| | | | | |
| | | | | |
| Principal | | | | |
| Amount | | Security | | Value |
| | | Household Products—.2% | | |
| $ 1,000M | | Clorox Co., 3.05%, 9/15/2022 | | $ 1,010,917 |
| | | Information Technology—1.1% | | |
| 1,000M | | Corning, Inc., 4.75%, 3/15/2042 | | 1,023,035 |
| 1,000M | | Harris Corp., 4.4%, 12/15/2020 | | 1,098,177 |
| 1,500M | | Motorola Solutions, Inc., 6%, 11/15/2017 | | 1,757,518 |
| 1,000M | | Pitney Bowes, Inc., 5.75%, 9/15/2017 | | 1,092,815 |
| 1,500M | | Symantec Corp., 3.95%, 6/15/2022 | | 1,544,022 |
| | | | | 6,515,567 |
| | | Manufacturing—1.1% | | |
| 1,000M | | CRH America, Inc., 8.125%, 7/15/2018 | | 1,244,184 |
| 1,000M | | Ingersoll-Rand Global Holdings Co., Ltd., 6.875%, 8/15/2018 | | 1,208,351 |
| 1,000M | | John Deere Capital Corp., 5.35%, 4/3/2018 | | 1,189,572 |
| 1,000M | | Johnson Controls, Inc., 5%, 3/30/2020 | | 1,139,906 |
| 1,000M | | Tyco Electronics Group SA, 6.55%, 10/1/2017 | | 1,197,024 |
| 1,000M | | Tyco Flow Control International, Ltd., 3.15%, 9/15/2022 (a) | | 985,178 |
| | | | | 6,964,215 |
| | | Media-Broadcasting—1.0% | | |
| 1,000M | | British Sky Broadcasting Group, PLC, 9.5%, 11/15/2018 (a) | | 1,368,277 |
| 1,000M | | CBS Corp., 8.875%, 5/15/2019 | | 1,337,283 |
| 1,500M | | Comcast Corp., 5.15%, 3/1/2020 | | 1,779,701 |
| 1,000M | | Time Warner Cable, Inc., 6.2%, 7/1/2013 | | 1,013,392 |
| 500M | | Time Warner Entertainment Co., LP, 8.375%, 3/15/2023 | | 684,838 |
| | | | | 6,183,491 |
| | | Media-Diversified—.3% | | |
| 1,000M | | McGraw-Hill Cos., Inc., 5.9%, 11/15/2017 | | 1,129,694 |
| 1,000M | | Vivendi SA, 6.625%, 4/4/2018 (a) | | 1,170,668 |
| | | | | 2,300,362 |
| | | Metals/Mining—1.5% | | |
| 1,500M | | Alcoa, Inc., 6.15%, 8/15/2020 | | 1,635,570 |
| 1,500M | | ArcelorMittal, 6.125%, 6/1/2018 | | 1,621,799 |
| 1,500M | | Newmont Mining Corp., 5.125%, 10/1/2019 | | 1,736,636 |
| 1,500M | | Rio Tinto Finance USA, Ltd., 3.75%, 9/20/2021 | | 1,583,068 |
| 1,500M | | Vale Overseas, Ltd., 5.625%, 9/15/2019 | | 1,698,851 |
| 1,000M | | Xstrata Canada Financial Corp., 4.95%, 11/15/2021 (a) | | 1,077,390 |
| | | | | 9,353,314 |
Portfolio of Investments (continued)
TOTAL RETURN FUND
March 31, 2013
| | | | |
| |
| | | | | |
| | | | | |
| Principal | | | | |
| Amount | | Security | | Value |
| | | Real Estate Investment Trusts—1.2% | | |
| $ 1,500M | | Boston Properties, LP, 5.875%, 10/15/2019 | | $ 1,807,404 |
| 1,000M | | Digital Realty Trust, LP, 5.25%, 3/15/2021 | | 1,110,693 |
| 1,000M | | HCP, Inc., 5.375%, 2/1/2021 | | 1,163,495 |
| 1,000M | | ProLogis, LP, 6.625%, 5/15/2018 | | 1,203,862 |
| 1,000M | | Simon Property Group, LP, 5.75%, 12/1/2015 | | 1,117,317 |
| 1,000M | | Ventas Realty, LP, 4.75%, 6/1/2021 | | 1,113,190 |
| | | | | 7,515,961 |
| | | Retail-General Merchandise—.5% | | |
| 1,500M | | GAP, Inc., 5.95%, 4/12/2021 | | 1,717,461 |
| 1,000M | | Home Depot, Inc., 5.875%, 12/16/2036 | | 1,247,227 |
| | | | | 2,964,688 |
| | | Telecommunications—.7% | | |
| 1,000M | | BellSouth Telecommunications, 6.375%, 6/1/2028 | | 1,212,530 |
| 1,000M | | GTE Corp., 6.84%, 4/15/2018 | | 1,237,134 |
| 1,000M | | Rogers Communications, Inc., 3%, 3/15/2023 | | 1,005,641 |
| 649M | | Verizon Communications, Inc., 8.75%, 11/1/2018 | | 873,809 |
| | | | | 4,329,114 |
| | | Transportation—.6% | | |
| 1,500M | | Burlington Northern Santa Fe, LLC, 3%, 3/15/2023 | | 1,514,643 |
| 1,000M | | Con-way, Inc., 7.25%, 1/15/2018 | | 1,179,212 |
| 1,000M | | Penske Truck Leasing Co., LP, 4.875%, 7/11/2022 (a) | | 1,056,532 |
| | | | | 3,750,387 |
| | | Utilities—1.8% | | |
| 925M | | Arizona Public Service Co., 8.75%, 3/1/2019 | | 1,251,127 |
| 1,000M | | Atmos Energy Corp., 8.5%, 3/15/2019 | | 1,350,865 |
| 1,000M | | Consolidated Edison Co. of New York, 7.125%, 12/1/2018 | | 1,299,120 |
| 1,000M | | E.ON International Finance BV, 5.8%, 4/30/2018 (a) | | 1,197,750 |
| 1,000M | | Electricite de France SA, 6.5%, 1/26/2019 (a) | | 1,222,422 |
| 1,500M | | Exelon Generation Co., LLC, 5.2%, 10/1/2019 | | 1,700,040 |
| 451M | | Great River Energy Co., 5.829%, 7/1/2017 (a) | | 489,955 |
| 1,000M | | Ohio Power Co., 5.375%, 10/1/2021 | | 1,205,716 |
| 1,000M | | Sempra Energy, 9.8%, 2/15/2019 | | 1,407,341 |
| | | | | 11,124,336 |
| | | | |
| |
| | | | | |
| | | | | |
| Principal | | | | |
| Amount | | Security | | Value |
| | | Waste Management—.2% | | |
| $ 1,000M | | Republic Services, Inc., 3.8%, 5/15/2018 | | $ 1,100,931 |
| Total Value of Corporate Bonds (cost $146,098,947) | | 158,319,423 |
| | | RESIDENTIAL MORTGAGE-BACKED | | |
| | | SECURITIES—6.3% | | |
| | | Fannie Mae—3.7% | | |
| 3,449M | | 3%, 3/1/2027 – 4/11/2043 (b) | | 3,602,631 |
| 2,702M | | 3.5%, 8/1/2042 – 9/1/2042 | | 2,856,270 |
| 3,633M | | 4%, 12/1/2040 – 10/1/2041 | | 3,914,256 |
| 2,077M | | 5%, 4/1/2040 | | 2,321,615 |
| 5,289M | | 5.5%, 5/1/2033 – 10/1/2039 | | 5,869,945 |
| 2,421M | | 6%, 5/1/2036 – 8/1/2037 | | 2,675,091 |
| 748M | | 6.5%, 11/1/2033 – 6/1/2036 | | 838,179 |
| 695M | | 7%, 3/1/2032 – 8/1/2032 | | 781,238 |
| | | | | 22,859,225 |
| | | Freddie Mac—1.1% | | |
| 1,169M | | 4%, 11/1/2040 (b) | | 1,258,771 |
| 1,609M | | 4.5%, 10/1/2040 | | 1,775,565 |
| 2,935M | | 5.5%, 5/1/2038 – 10/1/2039 | | 3,262,383 |
| 347M | | 6%, 9/1/2032 – 6/1/2035 | | 387,918 |
| | | | | 6,684,637 |
| | | Government National Mortgage Association II | | |
| | | Program—1.5% | | |
| 1,799M | | 3%, 11/20/2042 | | 1,886,597 |
| 3,372M | | 3.5%, 9/20/2042 | | 3,610,634 |
| 3,409M | | 4.5%, 7/20/2041 | | 3,756,826 |
| | | | | 9,254,057 |
| Total Value of Residential Mortgage-Backed Securities (cost $37,348,025) | | 38,797,919 |
Portfolio of Investments (continued)
TOTAL RETURN FUND
March 31, 2013
| | | | | | | |
| |
| | | | | | | | |
| | | | | | | | |
| Principal | | | | | | | |
| Amount | | Security | | | | | Value |
| | | U.S. GOVERNMENT OBLIGATIONS—1.8% | | | | |
| $11,000M | | U.S. Treasury Note, 1.375%, 12/31/2018 (cost $11,017,827) | | | | $ 11,271,568 |
| | | U.S. GOVERNMENT AGENCY | | | | | |
| | | OBLIGATIONS—1.8% | | | | | |
| | | Fannie Mae: | | | | | |
| 3,000M | | 0.875%, 10/26/2017 | | | | | 3,007,377 |
| 1,000M | | 0.875%, 2/8/2018 | | | | | 998,245 |
| | | Freddie Mac: | | | | | |
| 1,000M | | 5.125%, 10/18/2016 | | | | | 1,162,646 |
| 1,000M | | 1.25%, 5/12/2017 | | | | | 1,022,927 |
| 1,500M | | 5.125%, 11/17/2017 | | | | | 1,793,830 |
| 1,000M | | 0.75%, 1/12/2018 | | | | | 995,058 |
| | | Tennessee Valley Authority: | | | | | |
| 1,000M | | 4.375%, 6/15/2015 | | | | | 1,088,336 |
| 1,000M | | 4.5%, 4/1/2018 | | | | | 1,173,295 |
| Total Value of U.S. Government Agency Obligations (cost $10,832,760) | | | | 11,241,714 |
| | | MUNICIPAL BONDS—1.5% | | | | | |
| 2,500M | | Dallas-Fort Worth TX Int’l. Arpt. Rev., 5%, 11/1/2042 | | | | 2,658,675 |
| 6,000M | | Massachusetts State Port Auth. Rev., 5%, 7/1/2042 | | | | 6,554,760 |
| Total Value of Municipal Bonds (cost $9,320,561) | | | | | 9,213,435 |
| | | SHORT-TERM U.S. GOVERNMENT AGENCY | | | | |
| | | OBLIGATIONS—2.5% | | | | | |
| | | Federal Home Loan Bank: | | | | | |
| 1,000M | | 0.09%, 4/3/2013 | | | | | 999,995 |
| 14,500M | | 0.077%, 4/24/2013 | | | | | 14,499,287 |
| Total Value of Short-Term Corporate Notes (cost $15,499,282) | | | | 15,499,282 |
| | | SHORT-TERM U.S. GOVERNMENT | | | | | |
| | | OBLIGATIONS—.3% | | | | | |
| 2,000M | | U.S. Treasury Bills, 0.077%, 4/18/2013 (cost $1,999,927) | | | | 1,999,927 |
| Total Value of Investments (cost $478,842,592) | 99.5 | % | | | 614,809,140 |
| Other Assets, Less Liabilities | .5 | | | | 3,356,681 |
| Net Assets | | | 100.0 | % | | | $618,165,821 |
| |
| * | Non-income producing |
| (a) | Security exempt from registration under Rule 144A of the Securities Act of 1933 (see Note 4). |
| (b) | A portion or all of the security purchased on a when-issued or delayed delivery basis (see Note 1G). |
| |
| Summary of Abbreviations: |
| ADR | American Depositary Receipts |
| ETF | Exchange Traded Fund |
| REIT | Real Estate Investment Trust |
Accounting Standards Codification (“ASC”) 820 established a three-tier hierarchy of inputs to establish a classification of fair value measurements for disclosure purposes. The three-tier hierarchy of inputs is summarized in the three broad Levels listed below:
| Level 1 — Unadjusted quoted prices in active markets for identical securities that the Fund has the ability to access. |
| Level 2 — Observable inputs other than quoted prices included in Level 1 that are observable for the asset or liability, either directly or indirectly. These inputs may include quoted prices for the identical instrument on an inactive market, prices for similar instruments, interest rates, prepayment speeds, credit risk, yield curves, default rates and similar data. |
| Level 3 — Unobservable inputs for the asset or liability, to the extent relevant observable inputs are not available, representing the Fund’s own assumption about the assumptions a market participant would use in valuing the asset or liability, and would be based on the best information available. |
The inputs methodology used for valuing securities are not necessarily an indication of the risk associated with investing in those securities.
The following is a summary, by category of Level, of inputs used to value the Fund’s investments as of March 31, 2013:
| | | | | | | | | | | | |
| | | | Level 1 | | | Level 2 | | | Level 3 | | | Total |
| Common Stocks | | $ | 368,465,872 | | $ | — | | $ | — | | $ | 368,465,872 |
| Corporate Bonds | | | — | | 158,319,423 | | | — | | | 158,319,423 |
| Residential Mortgage-Backed | | | | | | | | | | | | |
| Securities | | | — | | | 38,797,919 | | | — | | | 38,797,919 |
| U.S. Government Obligations | | | — | | | 11,271,568 | | | — | | | 11,271,568 |
| U.S. Government Agency | | | | | | | | | | | | |
| Obligations | | | — | | | 11,241,714 | | | — | | | 11,241,714 |
| Municipal Bonds | | | — | | | 9,213,435 | | | — | | | 9,213,435 |
| Short-Term U.S. Government | | | | | | | | | | | | |
| Agency Obligations | | | — | | | 15,499,282 | | | — | | | 15,499,282 |
| Short-Term U.S. Government | | | | | | | | | | | | |
| Obligations | | | — | | | 1,999,927 | | | — | | | 1,999,927 |
| Total Investments in Securities* | | $ | 368,465,872 | | $ | 246,343,268 | | $ | — | | $ | 614,809,140 |
| |
| * | The Portfolio of Investments provides information on the industry categorization for common stocks |
| and corporate bonds. |
| |
| There were no transfers into or from Level 1 or Level 2 by the Fund during the period ended March 31, |
| 2013. Transfers, if any, between Levels are recognized at the end of the reporting period. |
| | |
| See notes to financial statements | 55 |
Fund Expenses (unaudited)
EQUITY INCOME FUND
The examples below show the ongoing costs (in dollars) of investing in your Fund and will help you in comparing these costs with costs of other mutual funds. Please refer to page 4 for a detailed explanation of the information presented in these examples.
| | | |
| | | | |
| | Beginning | Ending | |
| | Account | Account | Expenses Paid |
| | Value | Value | During Period |
| | (10/1/12) | (3/31/13) | (10/1/12–3/31/13)* |
| Expense Example – Class A Shares | | | |
| Actual | $1,000.00 | $1,114.54 | $6.91 |
| Hypothetical | | | |
| (5% annual return before expenses) | $1,000.00 | $1,018.40 | $6.59 |
| Expense Example – Class B Shares | | | |
| Actual | $1,000.00 | $1,107.91 | $10.56 |
| Hypothetical | | | |
| (5% annual return before expenses) | $1,000.00 | $1,014.91 | $10.10 |
| |
| * | Expenses are equal to the annualized expense ratio of 1.31% for Class A shares and 2.01% for |
| Class B shares, multiplied by the average account value over the period, multiplied by 182/365 (to |
| reflect the one-half year period). |
Portfolio Composition
BY SECTOR
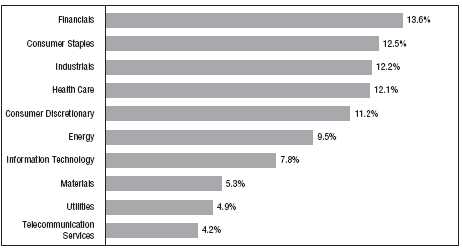
Portfolio holdings and allocations are subject to change. Percentages are as of March 31, 2013, and are based on the total market value of investments.
Portfolio of Investments
EQUITY INCOME FUND
March 31, 2013
| | | | |
| | | | | |
| | | | | |
| | | | | |
| | | | | |
| Shares | | Security | | Value |
| | | COMMON STOCKS—92.7% | | |
| | | Consumer Discretionary—11.1% | | |
| 153,000 | | Comcast Corporation – Special Shares “A” | | $ 6,061,860 |
| 130,300 | | Dana Holding Corporation | | 2,323,249 |
| 112,500 | | Delphi Automotive, PLC | | 4,995,000 |
| 22,900 | | Genuine Parts Company | | 1,786,200 |
| 90,000 | | GNC Holdings, Inc. – Class “A” | | 3,535,200 |
| 49,300 | | Home Depot, Inc. | | 3,440,154 |
| 69,500 | | Lowe’s Companies, Inc. | | 2,635,440 |
| 23,600 | | McDonald’s Corporation | | 2,352,684 |
| 169,900 | | Newell Rubbermaid, Inc. | | 4,434,390 |
| 115,000 | * | Orient-Express Hotels, Ltd. – Class “A” | | 1,133,900 |
| 138,400 | | Regal Entertainment Group – Class “A” | | 2,307,128 |
| 150,000 | | Staples, Inc. | | 2,014,500 |
| 43,400 | | Target Corporation | | 2,970,730 |
| 64,633 | | Time Warner, Inc. | | 3,724,153 |
| 20,000 | | Tupperware Brands Corporation | | 1,634,800 |
| 69,400 | | Walt Disney Company | | 3,941,920 |
| | | | | 49,291,308 |
| | | Consumer Staples—12.5% | | |
| 230,000 | | Altria Group, Inc. | | 7,909,700 |
| 89,300 | | Avon Products, Inc. | | 1,851,189 |
| 28,800 | | Beam, Inc. | | 1,829,952 |
| 84,200 | | Coca-Cola Company | | 3,405,048 |
| 152,500 | | ConAgra Foods, Inc. | | 5,461,025 |
| 91,700 | | CVS Caremark Corporation | | 5,042,583 |
| 45,000 | | Dr. Pepper Snapple Group, Inc. | | 2,112,750 |
| 22,300 | | Herbalife, Ltd. | | 835,135 |
| 38,300 | | Kimberly-Clark Corporation | | 3,752,634 |
| 63,066 | | Kraft Foods Group, Inc. | | 3,249,791 |
| 20,000 | | Nu Skin Enterprises, Inc. – Class “A” | | 884,000 |
| 48,500 | | PepsiCo, Inc. | | 3,836,835 |
| 54,800 | | Philip Morris International, Inc. | | 5,080,508 |
| 89,700 | * | Prestige Brands Holdings, Inc. | | 2,304,393 |
| 55,400 | | Procter & Gamble Company | | 4,269,124 |
| 45,900 | | Wal-Mart Stores, Inc. | | 3,434,697 |
| | | | | 55,259,364 |
Portfolio of Investments (continued)
EQUITY INCOME FUND
March 31, 2013
| | | | |
| | | | | |
| | | | | |
| | | | | |
| | | | | |
| Shares | | Security | | Value |
| | | Energy—9.4% | | |
| 69,400 | | Chevron Corporation | | $ 8,246,108 |
| 66,500 | | ConocoPhillips | | 3,996,650 |
| 59,600 | | Devon Energy Corporation | | 3,362,632 |
| 45,000 | | Ensco, PLC – Class “A” | | 2,700,000 |
| 77,400 | | ExxonMobil Corporation | | 6,974,514 |
| 69,600 | | Marathon Oil Corporation | | 2,346,912 |
| 28,000 | | Marathon Petroleum Corporation | | 2,508,800 |
| 25,000 | | Noble Corporation | | 953,750 |
| 44,500 | | Occidental Petroleum Corporation | | 3,487,465 |
| 65,500 | | Royal Dutch Shell, PLC – Class “A” (ADR) | | 4,267,980 |
| 76,000 | | Seadrill, Ltd. | | 2,827,960 |
| | | | | 41,672,771 |
| | | Financials—13.3% | | |
| 52,600 | | ACE, Ltd. | | 4,679,822 |
| 21,300 | | Ameriprise Financial, Inc. | | 1,568,745 |
| 123,000 | | Berkshire Hills Bancorp, Inc. | | 3,141,420 |
| 22,856 | | Chubb Corporation | | 2,000,586 |
| 65,000 | | Discover Financial Services | | 2,914,600 |
| 125,000 | | Financial Select Sector SPDR Fund (ETF) | | 2,273,750 |
| 150,600 | | FirstMerit Corporation | | 2,489,418 |
| 39,600 | | Invesco, Ltd. | | 1,146,816 |
| 30,000 | | iShares S&P U.S. Preferred Stock Index Fund (ETF) | | 1,215,600 |
| 157,800 | | JPMorgan Chase & Company | | 7,489,188 |
| 43,900 | | M&T Bank Corporation | | 4,528,724 |
| 52,900 | | PNC Financial Services Group, Inc. | | 3,517,850 |
| 66,500 | | Protective Life Corporation | | 2,380,700 |
| 54,300 | | Select Income REIT (REIT) | | 1,436,235 |
| 55,100 | | Tompkins Financial Corporation | | 2,329,628 |
| 32,800 | | Travelers Companies, Inc. | | 2,761,432 |
| 83,300 | | U.S. Bancorp | | 2,826,369 |
| 88,500 | | Urstadt Biddle Properties, Inc. – Class “A” (REIT) | | 1,925,760 |
| 188,500 | | Wells Fargo & Company | | 6,972,615 |
| 130,500 | | Westfield Financial, Inc. | | 1,015,290 |
| | | | | 58,614,548 |
| | | Health Care—12.1% | | |
| 86,100 | | Abbott Laboratories | | 3,041,052 |
| 86,100 | | AbbVie, Inc | | 3,511,158 |
| 44,600 | | Baxter International, Inc. | | 3,239,744 |
| 55,000 | | Covidien, PLC | | 3,731,200 |
| | | | |
| | | | | |
| | | | | |
| | | | | |
| | | | | |
| Shares | | Security | | Value |
| | | Health Care (continued) | | |
| 87,400 | | GlaxoSmithKline, PLC (ADR) | | $ 4,099,934 |
| 123,900 | | Johnson & Johnson | | 10,101,567 |
| 210,211 | | Merck & Company, Inc. | | 9,297,632 |
| 49,000 | | Novartis AG (ADR) | | 3,490,760 |
| 371,300 | | Pfizer, Inc. | | 10,715,718 |
| 161,500 | | Warner Chilcott, PLC – Class “A” | | 2,188,325 |
| | | | | 53,417,090 |
| | | Industrials—12.2% | | |
| 38,600 | | 3M Company | | 4,103,566 |
| 64,537 | | ADT Corporation | | 3,158,441 |
| 63,000 | | Altra Holdings, Inc. | | 1,714,860 |
| 35,700 | | Dover Corporation | | 2,601,816 |
| 30,000 | | Eaton Corporation, PLC | | 1,837,500 |
| 19,800 | * | Esterline Technologies Corporation | | 1,498,860 |
| 52,000 | | G&K Services, Inc. – Class “A” | | 2,366,520 |
| 75,000 | | Generac Holdings, Inc. | | 2,650,500 |
| 17,800 | | General Dynamics Corporation | | 1,255,078 |
| 323,600 | | General Electric Company | | 7,481,632 |
| 71,900 | | Honeywell International, Inc. | | 5,417,665 |
| 56,450 | | ITT Corporation | | 1,604,873 |
| 31,372 | | Pentair, Ltd. | | 1,654,873 |
| 23,800 | | TAL International Group, Inc. | | 1,078,378 |
| 35,800 | | Textainer Group Holdings, Ltd. | | 1,415,890 |
| 56,500 | | Triumph Group, Inc. | | 4,435,250 |
| 89,075 | | Tyco International, Ltd. | | 2,850,400 |
| 34,200 | | United Parcel Service, Inc. – Class “B” | | 2,937,780 |
| 40,000 | | United Technologies Corporation | | 3,737,200 |
| | | | | 53,801,082 |
| | | Information Technology—7.8% | | |
| 39,100 | | Automatic Data Processing, Inc. | | 2,542,282 |
| 257,000 | | Cisco Systems, Inc. | | 5,373,870 |
| 299,700 | | Intel Corporation | | 6,548,445 |
| 228,700 | | Intersil Corporation – Class “A” | | 1,991,977 |
| 38,700 | | Maxim Integrated Products, Inc. | | 1,263,555 |
| 290,000 | | Microsoft Corporation | | 8,296,900 |
| 39,800 | | Molex, Inc. | | 1,165,344 |
Portfolio of Investments (continued)
EQUITY INCOME FUND
March 31, 2013
| | | | |
| |
| | | | | |
| | | | | |
| | | | | |
| Shares | | Security | | Value |
| | | Information Technology (continued) | | |
| 50,000 | | Oracle Corporation | | $ 1,617,000 |
| 52,800 | | QUALCOMM, Inc. | | 3,534,960 |
| 49,200 | | TE Connectivity, Ltd. | | 2,062,956 |
| | | | | 34,397,289 |
| | | Materials—5.2% | | |
| 28,300 | | Cytec Industries, Inc. | | 2,096,464 |
| 66,900 | | Dow Chemical Company | | 2,130,096 |
| 62,600 | | DuPont (E.I.) de Nemours & Company | | 3,077,416 |
| 65,000 | | Freeport-McMoRan Copper & Gold, Inc. | | 2,151,500 |
| 105,400 | | International Paper Company | | 4,909,532 |
| 51,700 | | LyondellBasell Industries NV – Class “A” | | 3,272,093 |
| 38,000 | | Rock-Tenn Company – Class “A” | | 3,526,020 |
| 59,100 | | Sonoco Products Company | | 2,067,909 |
| | | | | 23,231,030 |
| | | Telecommunication Services—4.2% | | |
| 223,230 | | AT&T, Inc. | | 8,190,309 |
| 63,800 | | CenturyLink, Inc. | | 2,241,294 |
| 87,100 | | NTELOS Holdings Corporation | | 1,115,751 |
| 140,500 | | Verizon Communications, Inc. | | 6,905,575 |
| | | | | 18,452,929 |
| | | Utilities—4.9% | | |
| 89,500 | | American Electric Power Company, Inc. | | 4,352,385 |
| 50,100 | | NextEra Energy, Inc. | | 3,891,768 |
| 120,900 | | NiSource, Inc. | | 3,547,206 |
| 112,600 | | Portland General Electric Company | | 3,415,158 |
| 90,000 | | PPL Corporation | | 2,817,900 |
| 106,400 | | Vectren Corporation | | 3,768,688 |
| | | | | 21,793,105 |
| Total Value of Common Stocks (cost $309,945,403) | | 409,930,516 |
| | | PREFERRED STOCKS—.3% | | |
| | | Financials | | |
| 46,000 | | Urstadt Biddle Properties, Inc., 7.125% Series F (cost $1,150,000) | | 1,240,160 |
| | | | | | | |
| | | | | | | | |
| | | | | | | | |
| | | | | | | | |
| Principal | | | | | | | |
| Amount | | Security | | | | | Value |
| | | SHORT-TERM U.S. GOVERNMENT AGENCY | | | | |
| | | OBLIGATIONS—3.8% | | | | | |
| | | Federal Home Loan Bank: | | | | | |
| $ 6,000M | | 0.09%, 4/3/2013 | | | | | $ 5,999,970 |
| 10,000M | | 0.077%, 4/24/2013 | | | | | 9,999,508 |
| 1,000M | | Freddie Mac, 0.1%, 4/17/2013 | | | | | 999,956 |
| Total Value of Short-Term U.S. Government Agency Obligations (cost $16,999,434) 16,999,434 |
| | | SHORT-TERM U.S. GOVERNMENT | | | | | |
| | | OBLIGATIONS—2.8% | | | | | |
| | | U.S. Treasury Bills: | | | | | |
| 6,500M | | 0.07%, 4/11/2013 | | | | | 6,499,873 |
| 6,000M | | 0.077%, 4/18/2013 | | | | | 5,999,782 |
| Total Value of Short-Term U.S. Government Obligations (cost $12,499,655) | | | | 12,499,655 |
| Total Value of Investments (cost $340,594,492) | 99.6 | % | | | 440,669,765 |
| Other Assets, Less Liabilities | .4 | | | | 1,637,851 |
| Net Assets | | | 100.0 | % | | | $442,307,616 |
| | |
| * | Non-income producing |
| |
| Summary of Abbreviations: |
| ADR | American Depositary Receipts |
| ETF | Exchange Traded Fund |
| REIT | Real Estate Investment Trust |
Portfolio of Investments (continued)
EQUITY INCOME FUND
March 31, 2013
Accounting Standards Codification (“ASC”) 820 established a three-tier hierarchy of inputs to establish a classification of fair value measurements for disclosure purposes. The three-tier hierarchy of inputs is summarized in the three broad Levels listed below:
| Level 1 — Unadjusted quoted prices in active markets for identical securities that the Fund has the ability to access. |
| Level 2 — Observable inputs other than quoted prices included in Level 1 that are observable for the asset or liability, either directly or indirectly. These inputs may include quoted prices for the identical instrument on an inactive market, prices for similar instruments, interest rates, prepayment speeds, credit risk, yield curves, default rates and similar data. |
| Level 3 — Unobservable inputs for the asset or liability, to the extent relevant observable inputs are not available, representing the Fund’s own assumption about the assumptions a market participant would use in valuing the asset or liability, and would be based on the best information available. |
The inputs methodology used for valuing securities are not necessarily an indication of the risk associated with investing in those securities.
The following is a summary, by category of Level, of inputs used to value the Fund’s investments as of March 31, 2013:
| | | | | | | | | | | | |
| | | | Level 1 | | | Level 2 | | | Level 3 | | | Total |
| Common Stocks | | $ | 409,930,516 | | $ | — | | $ | — | | $ | 409,930,516 |
| Preferred Stocks | | | 1,240,160 | | | — | | | — | | | 1,240,160 |
| Short-Term U.S. Government | | | | | | | | | | | | |
| Agency Obligations | | | — | | | 16,999,434 | | | — | | | 16,999,434 |
| Short-Term U.S. Government | | | | | | | | | | | | |
| Obligations | | | — | | | 12,499,655 | | | — | | | 12,499,655 |
| Total Investments in Securities* | | $ | 411,170,676 | | $ | 29,499,089 | | $ | — | | $ | 440,669,765 |
| |
| * | The Portfolio of Investments provides information on the industry categorization for common and |
| preferred stocks. |
| |
| There were no transfers into or from Level 1 or Level 2 by the Fund during the period ended |
| March 31, 2013. Transfers, if any, between Levels are recognized at the end of the reporting period. |
| | |
| 62 | See notes to financial statements | |
Fund Expenses (unaudited)
GROWTH & INCOME FUND
The examples below show the ongoing costs (in dollars) of investing in your Fund and will help you in comparing these costs with costs of other mutual funds. Please refer to page 4 for a detailed explanation of the information presented in these examples.
| | | |
| | | | |
| | Beginning | Ending | |
| | Account | Account | Expenses Paid |
| | Value | Value | During Period |
| | (10/1/12) | (3/31/13) | (10/1/12–3/31/13)* |
| Expense Example – Class A Shares | | | |
| Actual | $1,000.00 | $1,130.10 | $6.74 |
| Hypothetical | | | |
| (5% annual return before expenses) | $1,000.00 | $1,018.60 | $6.39 |
| Expense Example – Class B Shares | | | |
| Actual | $1,000.00 | $1,124.96 | $10.44 |
| Hypothetical | | | |
| (5% annual return before expenses) | $1,000.00 | $1,015.11 | $9.90 |
| |
| * | Expenses are equal to the annualized expense ratio of 1.27% for Class A shares and 1.97% for |
| Class B shares, multiplied by the average account value over the period, multiplied by 182/365 (to |
| reflect the one-half year period). |
Portfolio Composition
BY SECTOR
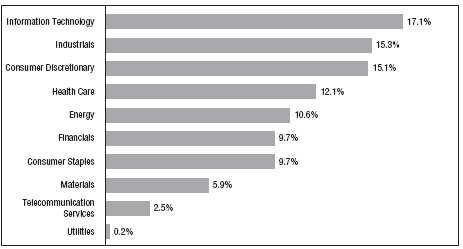
Portfolio holdings and allocations are subject to change. Percentages are as of March 31, 2013, and are based on the total market value of investments.
Portfolio of Investments
GROWTH & INCOME FUND
March 31, 2013
| | | | |
| | | | | |
| | | | | |
| | | | | |
| | | | | |
| Shares | | Security | | Value |
| | | COMMON STOCKS—98.2% | | |
| | | Consumer Discretionary—15.1% | | |
| 190,000 | | Allison Transmission Holdings, Inc. | | $ 4,561,900 |
| 410,000 | | Best Buy Company, Inc. | | 9,081,500 |
| 115,000 | * | BorgWarner, Inc. | | 8,894,100 |
| 430,000 | | CBS Corporation – Class “B” | | 20,076,700 |
| 41,700 | | Coach, Inc. | | 2,084,583 |
| 650,000 | | Dana Holding Corporation | | 11,589,500 |
| 305,000 | | Delphi Automotive, PLC | | 13,542,000 |
| 425,000 | | GNC Holdings, Inc. – Class “A” | | 16,694,000 |
| 180,000 | | Home Depot, Inc. | | 12,560,400 |
| 315,000 | | L Brands, Inc. | | 14,067,900 |
| 30,000 | | Lowe’s Companies, Inc. | | 1,137,600 |
| 114,100 | | McDonald’s Corporation | | 11,374,629 |
| 475,000 | | Newell Rubbermaid, Inc. | | 12,397,500 |
| 400,000 | | Pier 1 Imports, Inc. | | 9,200,000 |
| 200,000 | * | Select Comfort Corporation | | 3,954,000 |
| 750,000 | | Staples, Inc. | | 10,072,500 |
| 150,000 | * | Steiner Leisure, Ltd. | | 7,254,000 |
| 631,800 | | Stewart Enterprises, Inc. – Class “A” | | 5,869,422 |
| 110,000 | * | TRW Automotive Holdings Corporation | | 6,050,000 |
| 100,000 | | Tupperware Brands Corporation | | 8,174,000 |
| 160,000 | | Walt Disney Company | | 9,088,000 |
| 230,000 | | Wyndham Worldwide Corporation | | 14,830,400 |
| | | | | 212,554,634 |
| | | Consumer Staples—9.7% | | |
| 420,000 | | Altria Group, Inc. | | 14,443,800 |
| 450,000 | | Avon Products, Inc. | | 9,328,500 |
| 432,600 | | Coca-Cola Company | | 17,494,344 |
| 285,000 | | CVS Caremark Corporation | | 15,672,150 |
| 150,000 | | Herbalife, Ltd. | | 5,617,500 |
| 340,000 | | Nu Skin Enterprises, Inc. – Class “A” | | 15,028,000 |
| 126,000 | | PepsiCo, Inc. | | 9,967,860 |
| 275,000 | | Philip Morris International, Inc. | | 25,495,250 |
| 135,562 | | Procter & Gamble Company | | 10,446,408 |
| 175,000 | | Wal-Mart Stores, Inc. | | 13,095,250 |
| | | | | 136,589,062 |
| | | | |
| | | | | |
| | | | | |
| | | | | |
| | | | | |
| Shares | | Security | | Value |
| | | Energy—10.6% | | |
| 138,000 | | Anadarko Petroleum Corporation | | $ 12,068,100 |
| 144,800 | | Chevron Corporation | | 17,205,136 |
| 230,000 | | ConocoPhillips | | 13,823,000 |
| 51,500 | | Devon Energy Corporation | | 2,905,630 |
| 145,000 | | Ensco, PLC – Class “A” | | 8,700,000 |
| 240,490 | | ExxonMobil Corporation | | 21,670,554 |
| 31,700 | | Hess Corporation | | 2,270,037 |
| 6,920 | | Hugoton Royalty Trust | | 64,564 |
| 348,019 | | Marathon Oil Corporation | | 11,735,201 |
| 142,509 | | Marathon Petroleum Corporation | | 12,768,806 |
| 132,500 | | National Oilwell Varco, Inc. | | 9,374,375 |
| 353,600 | | Noble Corporation | | 13,489,840 |
| 115,000 | | Phillips 66 | | 8,046,550 |
| 60,000 | | Sasol, Ltd. (ADR) | | 2,660,400 |
| 48,300 | | Schlumberger, Ltd. | | 3,617,187 |
| 302,900 | | Suncor Energy, Inc. | | 9,090,029 |
| | | | | 149,489,409 |
| | | Financials—9.7% | | |
| 230,000 | | American Express Company | | 15,515,800 |
| 140,000 | | Ameriprise Financial, Inc. | | 10,311,000 |
| 212,000 | | Brookline Bancorp, Inc. | | 1,937,680 |
| 255,000 | | Discover Financial Services | | 11,434,200 |
| 100,000 | | Financial Select Sector SPDR Fund (ETF) | | 1,819,000 |
| 290,000 | | FirstMerit Corporation | | 4,793,700 |
| 170,600 | * | Health Insurance Innovations, Inc. – Class “A” | | 2,574,354 |
| 130,000 | | Invesco, Ltd. | | 3,764,800 |
| 396,730 | | JPMorgan Chase & Company | | 18,828,806 |
| 125,000 | | M&T Bank Corporation | | 12,895,000 |
| 100,000 | | MetLife, Inc. | | 3,802,000 |
| 100,000 | | Morgan Stanley | | 2,198,000 |
| 165,000 | | PNC Financial Services Group, Inc. | | 10,972,500 |
| 100,000 | | SPDR S&P Regional Banking (ETF) | | 3,180,000 |
| 357,666 | * | Sunstone Hotel Investors, Inc. (REIT) | | 4,402,868 |
| 355,000 | | U.S. Bancorp | | 12,045,150 |
| 350,000 | | Urstadt Biddle Properties, Inc. – Class “A” (REIT) | | 7,616,000 |
| 237,050 | | Wells Fargo & Company | | 8,768,479 |
| | | | | 136,859,337 |
Portfolio of Investments (continued)
GROWTH & INCOME FUND
March 31, 2013
| | | | |
| |
| | | | | |
| | | | | |
| | | | | |
| Shares | | Security | | Value |
| | | Health Care—12.1% | | |
| 341,600 | | Abbott Laboratories | | $ 12,065,312 |
| 291,600 | | AbbVie, Inc. | | 11,891,448 |
| 155,000 | * | Actavis, Inc. | | 14,277,050 |
| 100,000 | | Baxter International, Inc. | | 7,264,000 |
| 75,000 | | Covidien, PLC | | 5,088,000 |
| 200,000 | * | Express Scripts Holding Company | | 11,530,000 |
| 390,000 | * | Gilead Sciences, Inc. | | 19,082,700 |
| 270,625 | | Johnson & Johnson | | 22,064,056 |
| 60,000 | | McKesson Corporation | | 6,477,600 |
| 303,300 | | Merck & Company, Inc. | | 13,414,959 |
| 853,453 | | Pfizer, Inc. | | 24,630,653 |
| 260,000 | | Thermo Fisher Scientific, Inc. | | 19,887,400 |
| 175,000 | | Warner Chilcott, PLC – Class “A” | | 2,371,250 |
| | | | | 170,044,428 |
| | | Industrials—15.3% | | |
| 185,000 | | 3M Company | | 19,667,350 |
| 186,237 | | ADT Corporation | | 9,114,439 |
| 250,000 | | Altra Holdings, Inc. | | 6,805,000 |
| 129,400 | * | Armstrong World Industries, Inc. | | 7,232,166 |
| 107,000 | | Caterpillar, Inc. | | 9,305,790 |
| 120,000 | | Chicago Bridge & Iron Company NV – NY Shares | | 7,452,000 |
| 140,000 | * | Esterline Technologies Corporation | | 10,598,000 |
| 90,000 | | Gardner Denver, Inc. | | 6,759,900 |
| 325,000 | | Generac Holdings, Inc. | | 11,485,500 |
| 385,000 | | General Electric Company | | 8,901,200 |
| 209,700 | | Honeywell International, Inc. | | 15,800,895 |
| 65,000 | | IDEX Corporation | | 3,472,300 |
| 170,000 | | ITT Corporation | | 4,833,100 |
| 45,000 | | Lockheed Martin Corporation | | 4,343,400 |
| 227,072 | | Pentair, Ltd. | | 11,978,048 |
| 62,500 | | Raytheon Company | | 3,674,375 |
| 100,000 | | Snap-on, Inc. | | 8,270,000 |
| 330,000 | | TAL International Group, Inc. | | 14,952,300 |
| 315,000 | | Textainer Group Holdings, Ltd. | | 12,458,250 |
| 145,000 | | Triumph Group, Inc. | | 11,382,500 |
| 372,475 | | Tyco International, Ltd. | | 11,919,200 |
| 154,700 | | United Technologies Corporation | | 14,453,621 |
| | | | | 214,859,334 |
| | | | |
| | | | | |
| | | | | |
| | | | | |
| | | | | |
| Shares | | Security | | Value |
| | | Information Technology—17.1% | | |
| 43,500 | | Apple, Inc. | | $ 19,254,405 |
| 604,800 | * | Arris Group, Inc. | | 10,384,416 |
| 180,000 | | Avago Technologies, Ltd. | | 6,465,600 |
| 69,500 | * | CACI International, Inc. – Class “A” | | 4,021,965 |
| 825,000 | | Cisco Systems, Inc. | | 17,250,750 |
| 100,000 | * | eBay, Inc. | | 5,422,000 |
| 600,000 | * | EMC Corporation | | 14,334,000 |
| 50,000 | | Global Payments, Inc. | | 2,483,000 |
| 321,300 | | Hewlett-Packard Company | | 7,659,792 |
| 583,775 | | Intel Corporation | | 12,755,484 |
| 151,425 | | International Business Machines Corporation | | 32,298,952 |
| 301,200 | | Intersil Corporation – Class “A” | | 2,623,452 |
| 876,345 | | Microsoft Corporation | | 25,072,230 |
| 267,100 | * | NeuStar, Inc. – Class “A” | | 12,428,163 |
| 350,000 | | Oracle Corporation | | 11,319,000 |
| 163,600 | * | PTC, Inc. | | 4,170,164 |
| 260,000 | | QUALCOMM, Inc. | | 17,407,000 |
| 455,200 | * | Symantec Corporation | | 11,234,336 |
| 235,000 | | TE Connectivity, Ltd. | | 9,853,550 |
| 605,000 | * | Yahoo!, Inc. | | 14,235,650 |
| | | | | 240,673,909 |
| | | Materials—5.9% | | |
| 156,900 | | Celanese Corporation – Series “A” | | 6,911,445 |
| 165,000 | | Cytec Industries, Inc. | | 12,223,200 |
| 270,000 | | Freeport-McMoRan Copper & Gold, Inc. | | 8,937,000 |
| 405,000 | | International Paper Company | | 18,864,900 |
| 74,400 | | Kronos Worldwide, Inc. | | 1,164,360 |
| 220,000 | | LyondellBasell Industries NV – Class “A” | | 13,923,800 |
| 40,000 | | Praxair, Inc. | | 4,461,600 |
| 130,000 | | Rock-Tenn Company – Class “A” | | 12,062,700 |
| 135,000 | | RPM International, Inc. | | 4,263,300 |
| | | | | 82,812,305 |
| | | Telecommunication Services—2.5% | | |
| 435,300 | | AT&T, Inc. | | 15,971,157 |
| 396,400 | | Verizon Communications, Inc. | | 19,483,060 |
| | | | | 35,454,217 |
Portfolio of Investments (continued)
GROWTH & INCOME FUND
March 31, 2013
| | | | | | | |
| | | | | | | | |
| | | | | | | | |
| Shares or | | | | | | | |
| Principal | | | | | | | |
| Amount | | Security | | | | | Value |
| | | Utilities—.2% | | | | | |
| 50,000 | | Atmos Energy Corporation | | | | | $ 2,134,500 |
| Total Value of Common Stocks (cost $937,183,389) | | | | | 1,381,471,135 |
| | | SHORT-TERM U.S. GOVERNMENT | | | | | |
| | | OBLIGATIONS—1.0% | | | | | |
| | | U.S. Treasury Bills: | | | | | |
| $8,500M | | 0.07%, 4/11/2013 | | | | | 8,499,835 |
| 6,000M | | 0.077%, 4/18/2013 | | | | | 5,999,782 |
| Total Value of Short-Term U.S. Government Obligations (cost $14,499,617) | | | | 14,499,617 |
| | | SHORT-TERM U.S. GOVERNMENT AGENCY | | | | |
| | | OBLIGATIONS—.8% | | | | | |
| 8,000M | | Federal Home Loan Bank, 0.09%, 4/3/2013 | | | | | 7,999,960 |
| 3,269M | | Freddie Mac, 0.07%, 4/24/2013 | | | | | 3,268,854 |
| Total Value of Short-Term U.S. Government Agency Obligations (cost $11,268,814) | | | 11,268,814 |
| Total Value of Investments (cost $962,951,820) | 100.0 | % | | | 1,407,239,566 |
| Excess of Liabilities Over Other Assets | — | | | | (229,283) |
| Net Assets | | | 100.0 | % | | | $1,407,010,283 |
| | |
| * | Non-income producing |
| |
| Summary of Abbreviations: |
| ADR | American Depositary Receipts |
| ETF | Exchange Traded Fund |
| REIT | Real Estate Investment Trust |
Accounting Standards Codification (“ASC”) 820 established a three-tier hierarchy of inputs to establish a classification of fair value measurements for disclosure purposes. The three-tier hierarchy of inputs is summarized in the three broad Levels listed below:
| Level 1 — Unadjusted quoted prices in active markets for identical securities that the Fund has the ability to access. |
| Level 2 — Observable inputs other than quoted prices included in Level 1 that are observable for the asset or liability, either directly or indirectly. These inputs may include quoted prices for the identical instrument on an inactive market, prices for similar instruments, interest rates, prepayment speeds, credit risk, yield curves, default rates and similar data. |
| Level 3 — Unobservable inputs for the asset or liability, to the extent relevant observable inputs are not available, representing the Fund’s own assumption about the assumptions a market participant would use in valuing the asset or liability, and would be based on the best information available. |
The inputs methodology used for valuing securities are not necessarily an indication of the risk associated with investing in those securities.
The following is a summary, by category of Level, of inputs used to value the Fund’s investments as of March 31, 2013:
| | | | | | | | | | | | |
| | | | Level 1 | | | Level 2 | | | Level 3 | | | Total |
| Common Stocks | | $ | 1,381,471,135 | | $ | — | | $ | — | | $ | 1,381,471,135 |
| Short-Term U.S. Government | | | | | | | | | | | | |
| Obligations | | | — | | | 14,499,617 | | | — | | | 14,499,617 |
| Short-Term U.S. Government | | | | | | | | | | | | |
| Agency Obligations | | | — | | | 11,268,814 | | | — | | | 11,268,814 |
| Total Investments in Securities* | | $ | 1,381,471,135 | | $ | 25,768,431 | | $ | — | | $ | 1,407,239,566 |
| |
| * | The Portfolio of Investments provides information on the industry categorization for common stocks. |
| |
| There were no transfers into or from Level 1 or Level 2 by the Fund during the period ended |
| March 31, 2013. Transfers, if any, between Levels are recognized at the end of the reporting period. |
| | |
| See notes to financial statements | 69 |
Fund Expenses (unaudited)
GLOBAL FUND
The examples below show the ongoing costs (in dollars) of investing in your Fund and will help you in comparing these costs with costs of other mutual funds. Please refer to page 4 for a detailed explanation of the information presented in these examples.
| | | |
| | | | |
| | Beginning | Ending | |
| | Account | Account | Expenses Paid |
| | Value | Value | During Period |
| | (10/1/12) | (3/31/13) | (10/1/12–3/31/13)* |
| Expense Example – Class A Shares | | | |
| Actual | $1,000.00 | $1,083.44 | $8.73 |
| Hypothetical | | | |
| (5% annual return before expenses) | $1,000.00 | $1,016.55 | $8.45 |
| Expense Example – Class B Shares | | | |
| Actual | $1,000.00 | $1,079.57 | $12.34 |
| Hypothetical | | | |
| (5% annual return before expenses) | $1,000.00 | $1,013.06 | $11.94 |
| |
| * | Expenses are equal to the annualized expense ratio of 1.68% for Class A shares and 2.38% for |
| Class B shares, multiplied by the average account value over the period, multiplied by 182/365 (to |
| reflect the one-half year period). |
Portfolio Composition
TOP TEN SECTORS
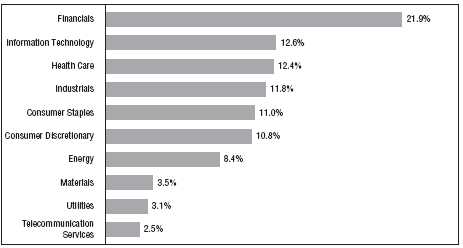
Portfolio holdings and allocations are subject to change. Percentages are as of March 31, 2013, and are based on the total market value of investments.
Portfolio of Investments
GLOBAL FUND
March 31, 2013
| | | | |
| | | | | |
| | | | | |
| | | | | |
| | | | | |
| Shares | | Security | | Value |
| | | COMMON STOCKS—97.2% | | |
| | | United States—48.9% | | |
| 8,100 | | Accenture, PLC – Class “A” | | $ 615,357 |
| 18,700 | | Aetna, Inc. | | 955,944 |
| 52,245 | | Aflac, Inc. | | 2,717,785 |
| 43,155 | | AGCO Corporation | | 2,249,239 |
| 85,250 | | Altria Group, Inc. | | 2,931,747 |
| 24,280 | * | American International Group, Inc. | | 942,550 |
| 21,715 | | Ameriprise Financial, Inc. | | 1,599,310 |
| 40,755 | | Amgen, Inc. | | 4,177,795 |
| 30,945 | | Anadarko Petroleum Corporation | | 2,706,140 |
| 28,700 | | Analog Devices, Inc. | | 1,334,263 |
| 8,070 | | Apple, Inc. | | 3,572,024 |
| 50,300 | | Assured Guaranty, Ltd. | | 1,036,683 |
| 92,335 | | AT&T, Inc. | | 3,387,771 |
| 3,820 | * | AutoZone, Inc. | | 1,515,661 |
| 18,500 | * | Bed Bath & Beyond, Inc. | | 1,191,770 |
| 14,415 | | BlackRock, Inc. | | 3,702,925 |
| 13,500 | * | Cameron International Corporation | | 880,200 |
| 42,255 | | Cardinal Health, Inc. | | 1,758,653 |
| 33,900 | | Carnival Corporation | | 1,162,770 |
| 40,990 | | CBS Corporation – Class “B” | | 1,913,823 |
| 21,265 | * | Check Point Software Technologies, Ltd. | | 999,242 |
| 42,395 | | Chevron Corporation | | 5,037,374 |
| 6,340 | | Chicago Bridge & Iron Company NV – NY Shares | | 393,714 |
| 18,665 | | Cigna Corporation | | 1,164,136 |
| 203,770 | | Cisco Systems, Inc. | | 4,260,831 |
| 96,495 | | Citigroup, Inc. | | 4,268,939 |
| 28,420 | | Comcast Corporation – Class “A” | | 1,193,924 |
| 27,140 | | Covidien, PLC | | 1,841,178 |
| 38,000 | | CVS Caremark Corporation | | 2,089,620 |
| 53,800 | | D.R. Horton, Inc. | | 1,307,340 |
| 11,600 | | Deere & Company | | 997,368 |
| 36,750 | * | Dollar Tree, Inc. | | 1,779,802 |
| 49,960 | | Eaton Corporation, PLC | | 3,060,050 |
| 39,970 | * | eBay, Inc. | | 2,167,173 |
| 44,970 | | Eli Lilly & Company | | 2,553,846 |
| 122,810 | * | EMC Corporation | | 2,933,931 |
| 54,165 | | Ensco, PLC – Class “A” | | 3,249,900 |
| 14,200 | * | Express Scripts Holding Company | | 818,630 |
| 24,950 | | FedEx Corporation | | 2,450,090 |
| 5,730 | | Flowserve Corporation | | 960,978 |
| 142,360 | | General Electric Company | | 3,291,363 |
Portfolio of Investments (continued)
GLOBAL FUND
March 31, 2013
| | | | |
| | | | | |
| | | | | |
| | | | | |
| | | | | |
| Shares | | Security | | Value |
| | | United States (continued) | | |
| 9,200 | * | Gilead Sciences, Inc. | | $ 450,156 |
| 5,010 | * | Google, Inc. – Class “A” | | 3,978,090 |
| 31,310 | * | Green Mountain Coffee Roasters, Inc. | | 1,777,156 |
| 12,650 | | Honeywell International, Inc. | | 953,178 |
| 3,600 | | International Business Machines Corporation | | 767,880 |
| 48,500 | | Interpublic Group of Companies., Inc. | | 631,955 |
| 23,540 | | Johnson & Johnson | | 1,919,216 |
| 109,800 | | JPMorgan Chase & Company | | 5,211,108 |
| 22,900 | | Las Vegas Sands Corporation | | 1,290,415 |
| 86,150 | | Lowe’s Companies, Inc. | | 3,266,808 |
| 20,335 | | Mattel, Inc. | | 890,470 |
| 7,500 | | McKesson Corporation | | 809,700 |
| 116,785 | | Microsoft Corporation | | 3,341,219 |
| 18,735 | | NextEra Energy, Inc. | | 1,455,335 |
| 95,750 | | Oracle Corporation | | 3,096,555 |
| 32,380 | | PepsiCo, Inc. | | 2,561,582 |
| 121,390 | | Pfizer, Inc. | | 3,503,315 |
| 8,900 | | Philip Morris International, Inc. | | 825,119 |
| 46,375 | | PNC Financial Services Group, Inc. | | 3,083,938 |
| 43,100 | | Procter & Gamble Company | | 3,321,286 |
| 38,670 | | QUALCOMM, Inc. | | 2,588,957 |
| 14,500 | | Ross Stores, Inc. | | 878,990 |
| 30,885 | | St. Jude Medical, Inc. | | 1,248,989 |
| 19,540 | | Starwood Hotels & Resorts Worldwide, Inc. | | 1,245,284 |
| 10,300 | | United Parcel Service, Inc. – Class “B” | | 884,770 |
| 19,700 | | UnitedHealth Group, Inc. | | 1,127,037 |
| 22,000 | | Waddell & Reed Financial, Inc. – Class “A” | | 963,160 |
| 41,475 | | Walgreen Company | | 1,977,528 |
| 22,860 | | Wal-Mart Stores, Inc. | | 1,710,614 |
| 10,300 | | Walt Disney Company | | 585,040 |
| 33,000 | | Wells Fargo & Company | | 1,220,670 |
| 21,050 | * | WESCO International, Inc. | | 1,528,440 |
| 29,200 | * | Whiting Petroleum Corporation | | 1,484,528 |
| | | | | 147,750,327 |
| | | United Kingdom—7.2% | | |
| 93,260 | | Aberdeen Asset Management, PLC | | 607,789 |
| 17,400 | | AstraZeneca, PLC (ADR) | | 869,652 |
| 129,490 | | BG Group, PLC | | 2,219,874 |
| 396,589 | | BP, PLC | | 2,769,505 |
| 45,205 | | BP, PLC (ADR) | | 1,914,432 |
| 37,630 | | Diageo, PLC (a) | | 1,185,633 |
| | | | |
| | | | | |
| | | | | |
| | | | | |
| | | | | |
| Shares | | Security | | Value |
| | | United Kingdom (continued) | | |
| 284,699 | | Direct Line Insurance Group, PLC | | $ 881,025 |
| 64,020 | | Imperial Tobacco Group, PLC | | 2,234,872 |
| 1,844,402 | * | Lloyds Banking Group, PLC | | 1,363,620 |
| 268,761 | | National Grid, PLC | | 3,121,949 |
| 166,923 | | Rexam, PLC | | 1,337,016 |
| 194,208 | * | Rolls-Royce Holdings, PLC | | 3,332,296 |
| | | | | 21,837,663 |
| | | France—7.0% | | |
| 38,355 | | Accor SA | | 1,334,712 |
| 28,608 | | Air Liquide SA | | 3,481,774 |
| 180,597 | | AXA SA | | 3,109,823 |
| 36,680 | | BNP Paribas SA (a) | | 1,885,905 |
| 7,091 | | Bureau Veritas SA | | 884,144 |
| 14,168 | | Essilor International SA | | 1,578,245 |
| 18,850 | | Pernod Ricard SA | | 2,352,982 |
| 13,839 | | Renault SA | | 868,536 |
| 76,851 | | Rexel SA | | 1,680,092 |
| 27,389 | | Safran SA | | 1,223,741 |
| 11,698 | | Unibail-Rodamco | | 2,729,373 |
| | | | | 21,129,327 |
| | | Japan—7.0% | | |
| 37,300 | | Aisin Seiki Company, Ltd. | | 1,366,715 |
| 31,900 | | Daiichi Sankyo Company, Ltd. | | 614,114 |
| 7,500 | | Daito Trust Construction Company, Ltd. | | 642,948 |
| 37,100 | | Eisai Company, Ltd. | | 1,659,280 |
| 37,200 | | FamilyMart Company, Ltd. | | 1,699,362 |
| 11,200 | | FANUC, Ltd. | | 1,714,188 |
| 29,700 | | Honda Motor Company, Ltd. | | 1,137,205 |
| 29,800 | | Japan Tobacco, Inc. | | 952,446 |
| 521,600 | | Mitsubishi UFJ Financial Group, Inc. | | 3,128,934 |
| 22,000 | | Mitsui Fudosan Company, Ltd. | | 625,229 |
| 191,700 | | Nomura Holdings, Inc. | | 1,182,578 |
| 71,500 | | Rakuten, Inc. | | 730,818 |
| 66,000 | | Shizuoka Bank, Ltd. | | 743,395 |
| 27,600 | | Softbank Corporation | | 1,268,156 |
| 50,500 | | Tokio Marine Holdings, Inc. | | 1,452,372 |
| 421,000 | | Toshiba Corporation | | 2,131,419 |
| | | | | 21,049,159 |
Portfolio of Investments (continued)
GLOBAL FUND
March 31, 2013
| | | | |
| | | | | |
| | | | | |
| | | | | |
| | | | | |
| Shares | | Security | | Value |
| | | Switzerland—4.8% | | |
| 12,925 | | Compagnie Financiere Richemont SA | | $ 1,016,857 |
| 43,636 | * | Credit Suisse Group AG – Registered | | 1,147,867 |
| 1,061 | | Givaudan SA | | 1,306,432 |
| 62,230 | | Julius Baer Group, Ltd. | | 2,425,587 |
| 1,263 | | Partners Group Holding AG | | 312,499 |
| 24,156 | | Roche Holding AG – Genusscheine | | 5,637,548 |
| 14,684 | * | Swiss Reinsurance Company, Ltd. | | 1,197,111 |
| 83,800 | * | UBS AG – Registered | | 1,287,597 |
| | | | | 14,331,498 |
| | | Canada—3.6% | | |
| 53,600 | | Barrick Gold Corporation | | 1,575,840 |
| 41,700 | | Canadian National Railway Company | | 4,179,645 |
| 18,800 | * | MEG Energy Corporation | | 603,258 |
| 67,800 | | Suncor Energy, Inc. | | 2,033,433 |
| 47,600 | | Tim Hortons, Inc. | | 2,585,332 |
| | | | | 10,977,508 |
| | | China—2.4% | | |
| 1,549,000 | | China Construction Bank Corporation | | 1,265,117 |
| 612,600 | | China Pacific Insurance Group Company, Ltd. | | 2,016,313 |
| 166,000 | | ENN Energy Holdings, Ltd. | | 919,531 |
| 1,580,000 | | Lenovo Group, Ltd. | | 1,569,283 |
| 184,000 | | Shandong Weigao Group Medical Polymer Company, Ltd. | | 166,634 |
| 117,500 | * | Shanghai Fosun Pharmaceutical Group Company, Ltd. | | 211,912 |
| 80,400 | | Sinopharm Group Company | | 259,450 |
| 786,000 | | Skyworth Digital Holdings, Ltd. | | 527,534 |
| 212,500 | | Zhongsheng Group Holdings, Ltd. | | 257,322 |
| | | | | 7,193,096 |
| | | Belgium—1.9% | | |
| 48,855 | | Anheuser-Busch InBev NV | | 4,846,228 |
| 5,600 | | Anheuser-Busch InBev NV (ADR) | | 557,480 |
| 9,510 | | Umicore SA | | 447,499 |
| | | | | 5,851,207 |
| | | | |
| | | | | |
| | | | | |
| | | | | |
| | | | | |
| Shares | | Security | | Value |
| | | Hong Kong—1.9% | | |
| 595,600 | | AIA Group, Ltd. | | $ 2,608,697 |
| 130,500 | | Link REIT (REIT) | | 711,117 |
| 456,295 | | Shangri-La Asia, Ltd. | | 893,469 |
| 114,056 | | Sun Hung Kai Properties, Ltd. | | 1,536,879 |
| | | | | 5,750,162 |
| | | Italy—1.8% | | |
| 710,888 | | Intesa Sanpaolo | | 1,042,470 |
| 307,080 | | Mediaset SpA | | 628,150 |
| 820,534 | | Snam Rete Gas SpA | | 3,746,750 |
| | | | | 5,417,370 |
| | | Germany—1.1% | | |
| 5,606 | | Brenntag AG | | 876,792 |
| 2,749 | | Continental AG | | 329,240 |
| 32,802 | | Deutsche Wohnen AG | | 597,273 |
| 8,743 | | GSW Immobilien AG | | 346,460 |
| 6,350 | | Volkswagen AG | | 1,263,868 |
| | | | | 3,413,633 |
| | | Australia—1.0% | | |
| 222,652 | | Transurban Group | | 1,480,958 |
| 138,178 | | Westfield Group | | 1,563,018 |
| | | | | 3,043,976 |
| | | Israel—.9% | | |
| 69,600 | | Teva Pharmaceutical Industries, Ltd. (ADR) | | 2,761,728 |
| | | Spain—.9% | | |
| 63,323 | | Banco Bilbao Vizcaya Argentaria SA | | 549,917 |
| 12,285 | | Repsol SA | | 250,035 |
| 133,769 | | Telefonica SA | | 1,801,886 |
| | | | | 2,601,838 |
| | | India—.8% | | |
| 77,836 | * | Bharti Infratel, Ltd. | | 256,279 |
| 164,987 | | ITC, Ltd. | | 939,379 |
| 63,732 | | Reliance Industries, Ltd. | | 906,319 |
| 12,150 | | United Spirits, Ltd. | | 424,557 |
| | | | | 2,526,534 |
Portfolio of Investments (continued)
GLOBAL FUND
March 31, 2013
| | | | |
| | | | | |
| | | | | |
| | | | | |
| | | | | |
| Shares | | Security | | Value |
| | | Sweden—.8% | | |
| 57,990 | | Assa Abloy AB – Class “B” | | $ 2,373,291 |
| | | Portugal—.7% | | |
| 246,886 | * | Banco Espirito Santo SA | | 253,302 |
| 78,882 | | Galp Energia SGPS SA | | 1,237,786 |
| 147,026 | | Portugal Telecom SGPS SA | | 729,504 |
| | | | | 2,220,592 |
| | | Brazil—.7% | | |
| 64,900 | | Banco Santander Brasil SA (ADR) | | 471,174 |
| 52,300 | | BR Malls Participacoes SA | | 655,971 |
| 15,300 | | BR Properties SA | | 170,577 |
| 27,200 | | Mills Estruturas e Servicos | | 437,202 |
| 44,691 | | Raia Drogasil SA | | 477,641 |
| | | | | 2,212,565 |
| | | Taiwan—.7% | | |
| 117,700 | | Taiwan Semiconductor Manufacturing Company, Ltd. (ADR) | | 2,023,263 |
| | | Ireland—.6% | | |
| 81,946 | | CRH, PLC | | 1,806,727 |
| | | Russia—.5% | | |
| 39,800 | | Sberbank of Russia (ADR) | | 507,450 |
| 39,700 | * | Yandex NV | | 917,864 |
| | | | | 1,425,314 |
| | | South Korea—.3% | | |
| 657 | | Samsung Electronics Company, Ltd. | | 891,668 |
| | | Mexico—.3% | | |
| 183,300 | | Fibra Uno Administracion SA | | 605,348 |
| 102,800 | * | Macquarie Mexico Real Estate Management SA de CV (REIT) | | 229,108 |
| | | | | 834,456 |
| | | Austria—.3% | | |
| 27,243 | * | Erste Group Bank AG | | 760,171 |
| | | Norway—.2% | | |
| 18,217 | * | Algeta ASA | | 614,414 |
| | | | | | | |
| | | | | | | | |
| | | | | | | | |
| Shares or | | | | | | | |
| Principal | | | | | | | |
| Amount | | Security | | | | | Value |
| | | Colombia—.2% | | | | | |
| 80,410 | * | Cemex Latam Holdings SA | | | | | $ 603,515 |
| | | Netherlands—.2% | | | | | |
| 7,785 | | ASML Holding NV – NY Shares (ADR) | | | | | 529,458 |
| | | Finland—.2% | | | | | |
| 11,494 | | Nokian Renkaat Oyj | | | | | 512,150 |
| | | United Arab Emirates—.1% | | | | | |
| 87,385 | * | NMC Health, PLC | | | | | 435,220 |
| | | Malaysia—.1% | | | | | |
| 375,100 | | Airasia Berhad | | | | | 346,451 |
| | | Poland—.1% | | | | | |
| 15,940 | * | Alior Bank SA | | | | | 340,614 |
| Total Value of Common Stocks (cost $234,242,296) | | | | | 293,564,895 |
| | | SHORT-TERM U.S. GOVERNMENT | | | | | |
| | | OBLIGATIONS—1.2% | | | | | |
| | | United States | | | | | |
| $3,500M | | U.S. Treasury Bills, 0.07%, 4/11/2013 (cost $3,499,932) | | | | 3,499,932 |
| | | SHORT-TERM U.S. GOVERNMENT AGENCY | | | | |
| | | OBLIGATIONS—.8% | | | | | |
| | | United States | | | | | |
| 2,500M | | Federal Home Loan Bank, 0.09%, 4/3/2013 (cost $2,499,988) | | | | 2,499,988 |
| Total Value of Investments (cost $240,242,216) | 99.2 | % | | | 299,564,815 |
| Other Assets, Less Liabilities | 0.8 | | | | 2,453,503 |
| Net Assets | | | 100.0 | % | | | $302,018,318 |
| | |
| * | Non-income producing |
| |
| (a) | A portion or all of the security purchased on a when-issued or delayed delivery basis (see Note 1G). |
| |
| Summary of Abbreviations: |
| ADR | American Depositary Receipts |
| REIT | Real Estate Investment Trust |
Portfolio of Investments (continued)
GLOBAL FUND
March 31, 2013
Accounting Standards Codification (“ASC”) 820 established a three-tier hierarchy of inputs to establish a classification of fair value measurements for disclosure purposes. The three-tier hierarchy of inputs is summarized in the three broad Levels listed below:
| Level 1 — Unadjusted quoted prices in active markets for identical securities that the Fund has the ability to access. |
| Level 2 — Observable inputs other than quoted prices included in Level 1 that are observable for the asset or liability, either directly or indirectly. These inputs may include quoted prices for the identical instrument on an inactive market, prices for similar instruments, interest rates, prepayment speeds, credit risk, yield curves, default rates and similar data. |
| Level 3 — Unobservable inputs for the asset or liability, to the extent relevant observable inputs are not available, representing the Fund’s own assumption about the assumptions a market participant would use in valuing the asset or liability, and would be based on the best information available. |
The inputs methodology used for valuing securities are not necessarily an indication of the risk associated with investing in those securities.
The following is a summary, by category of Level, of inputs used to value the Fund’s investments as of March 31, 2013:
| | | | | | | | | | | | |
| | | | Level 1 | | | Level 2 | | | Level 3 | | | Total |
| Common Stocks | | | | | | | | | | | | |
| United States | | $ | 147,750,327 | | $ | — | | $ | — | | $ | 147,750,327 |
| United Kingdom | | | 21,837,663 | | | — | | | — | | | 21,837,663 |
| France | | | 21,129,327 | | | — | | | — | | | 21,129,327 |
| Japan | | | 21,049,159 | | | — | | | — | | | 21,049,159 |
| Switzerland | | | 14,331,498 | | | — | | | — | | | 14,331,498 |
| Canada | | | 10,977,508 | | | — | | | — | | | 10,977,508 |
| China | | | 7,193,096 | | | — | | | — | | | 7,193,096 |
| Belgium | | | 5,851,207 | | | — | | | — | | | 5,851,207 |
| Hong Kong | | | 5,750,162 | | | — | | | — | | | 5,750,162 |
| Italy | | | 5,417,370 | | | — | | | — | | | 5,417,370 |
| Germany | | | 3,413,633 | | | — | | | — | | | 3,413,633 |
| Australia | | | 3,043,976 | | | — | | | — | | | 3,043,976 |
| Israel | | | 2,761,728 | | | — | | | — | | | 2,761,728 |
| Spain | | | 2,601,838 | | | — | | | — | | | 2,601,838 |
| India | | | 2,526,534 | | | — | | | — | | | 2,526,534 |
| Sweden | | | 2,373,291 | | | — | | | — | | | 2,373,291 |
| | | | | | | | | | | | |
| | | | Level 1 | | | Level 2 | | | Level 3 | | | Total |
| Common Stocks (continued) | | | | | | | | | | | | |
| Portugal | | $ | 2,220,592 | | $ | — | | $ | — | | $ | 2,220,592 |
| Brazil | | | 2,212,565 | | | — | | | — | | | 2,212,565 |
| Taiwan | | | 2,023,263 | | | — | | | — | | | 2,023,263 |
| Ireland | | | 1,806,727 | | | — | | | — | | | 1,806,727 |
| Russia | | | 1,425,314 | | | — | | | — | | | 1,425,314 |
| South Korea | | | 891,668 | | | — | | | — | | | 891,668 |
| Mexico | | | — | | | 834,456 | | | — | | | 834,456 |
| Austria | | | 760,171 | | | — | | | — | | | 760,171 |
| Norway | | | — | | | 614,414 | | | — | | | 614,414 |
| Colombia | | | — | | | 603,515 | | | — | | | 603,515 |
| Netherlands | | | 529,458 | | | — | | | — | | | 529,458 |
| Finland | | | 512,150 | | | — | | | — | | | 512,150 |
| United Arab Emirates | | | 435,220 | | | — | | | — | | | 435,220 |
| Malaysia | | | 346,451 | | | — | | | — | | | 346,451 |
| Poland | | | 340,614 | | | — | | | — | | | 340,614 |
| Short-Term U.S. Government | | | | | | | | | | | | |
| Obligations | | | — | | | 3,499,932 | | | — | | | 3,499,932 |
| Short-Term U.S. Government | | | | | | | | | | | | |
| Agency Obligations | | | — | | | 2,499,988 | | | — | | | 2,499,988 |
| Total Investments in Securities | | $ | 291,512,510 | | $ | 8,052,305 | * | $ | — | | $ | 299,564,815 |
| |
| * | Includes certain foreign securities that were fair valued due to fluctuations in U.S. securities markets |
| exceeding a predetermined level or a foreign market being closed; therefore, $2,052,385 of investment |
| securities were classified as Level 2 instead of Level 1. |
| |
| During the period ended March 31, 2013, there were no transfers between Level 1 investments and |
| Level 2 investments that had a material impact to the Fund. This does not include transfers between |
| Level 1 investments and Level 2 investments due to the Fund utilizing international fair value pric- |
| ing during the period (see Note 1A). Transfers, if any, between Levels are recognized at the end of the |
| reporting period. |
| | |
| See notes to financial statements | 79 |
Fund Expenses (unaudited)
SELECT GROWTH FUND
The examples below show the ongoing costs (in dollars) of investing in your Fund and will help you in comparing these costs with costs of other mutual funds. Please refer to page 4 for a detailed explanation of the information presented in these examples.
| | | |
| | | | |
| | Beginning | Ending | |
| | Account | Account | Expenses Paid |
| | Value | Value | During Period |
| | (10/1/12) | (3/31/13) | (10/1/12–3/31/13)* |
| Expense Example – Class A Shares | | | |
| Actual | $1,000.00 | $1,066.41 | $7.16 |
| Hypothetical | | | |
| (5% annual return before expenses) | $1,000.00 | $1,018.00 | $6.99 |
| Expense Example – Class B Shares | | | |
| Actual | $1,000.00 | $1,063.45 | $10.75 |
| Hypothetical | | | |
| (5% annual return before expenses) | $1,000.00 | $1,014.51 | $10.50 |
| |
| * | Expenses are equal to the annualized expense ratio of 1.39% for Class A shares and 2.09% for |
| Class B shares, multiplied by the average account value over the period, multiplied by 182/365 (to |
| reflect the one-half year period). |
Portfolio Composition
BY SECTOR
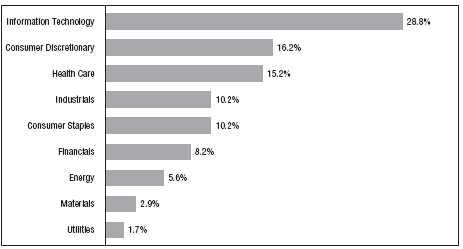
Portfolio holdings and allocations are subject to change. Percentages are as of March 31, 2013, and are based on the total market value of investments.
Portfolio of Investments
SELECT GROWTH FUND
March 31, 2013
| | | | |
| | | | | |
| | | | | |
| | | | | |
| | | | | |
| Shares | | Security | | Value |
| | | COMMON STOCKS—98.8% | | |
| | | Consumer Discretionary—16.1% | | |
| 118,800 | | Abercrombie & Fitch Company – Class “A” | | $ 5,488,560 |
| 137,800 | | Home Depot, Inc. | | 9,615,684 |
| 127,700 | | Mattel, Inc. | | 5,591,983 |
| 159,000 | | Ross Stores, Inc. | | 9,638,580 |
| 220,800 | | TJX Companies, Inc. | | 10,322,400 |
| 86,700 | | Tupperware Brands Corporation | | 7,086,858 |
| | | | | 47,744,065 |
| | | Consumer Staples—10.1% | | |
| 67,000 | | Costco Wholesale Corporation | | 7,109,370 |
| 100,200 | | Ingredion, Inc. | | 7,246,464 |
| 71,800 | | Kimberly-Clark Corporation | | 7,034,964 |
| 260,100 | | Kroger Company | | 8,619,714 |
| | | | | 30,010,512 |
| | | Energy—5.7% | | |
| 44,300 | | Chevron Corporation | | 5,263,726 |
| 47,700 | | ExxonMobil Corporation | | 4,298,247 |
| 72,700 | | Helmerich & Payne, Inc. | | 4,412,890 |
| 34,900 | | Occidental Petroleum Corporation | | 2,735,113 |
| | | | | 16,709,976 |
| | | Financials—8.2% | | |
| 153,000 | | American Express Company | | 10,321,380 |
| 184,000 | | East West Bancorp, Inc. | | 4,723,280 |
| 55,400 | | Travelers Companies, Inc. | | 4,664,126 |
| 129,700 | | U.S. Bancorp | | 4,400,721 |
| | | | | 24,109,507 |
| | | Health Care—15.1% | | |
| 106,900 | * | Actavis, Inc. | | 9,846,559 |
| 84,600 | | Cooper Companies, Inc. | | 9,126,648 |
| 57,500 | | Johnson & Johnson | | 4,687,975 |
| 70,600 | | McKesson Corporation | | 7,621,976 |
| 111,100 | | Omnicare, Inc. | | 4,523,992 |
| 193,500 | | ResMed, Inc. | | 8,970,660 |
| | | | | 44,777,810 |
Portfolio of Investments (continued)
SELECT GROWTH FUND
March 31, 2013
| | | | | | | |
| |
| | | | | | | | |
| Shares or | | | | | | | |
| Principal | | | | | | | |
| Amount | | Security | | | | | Value |
| | | Industrials—10.2% | | | | | |
| 108,000 | * | Alaska Air Group, Inc. | | | | | $ 6,907,680 |
| 202,800 | | AMETEK, Inc. | | | | | 8,793,408 |
| 164,500 | | Robert Half International, Inc. | | | | | 6,173,685 |
| 82,000 | | Wabtec Corporation | | | | | 8,373,020 |
| | | | | | | | 30,247,793 |
| | | Information Technology—28.8% | | | | | |
| 140,810 | | Accenture, PLC – Class “A” | | | | | 10,697,336 |
| 54,700 | * | Alliance Data Systems Corporation | | | | | 8,855,383 |
| 28,100 | | Apple, Inc. | | | | | 12,437,903 |
| 922,300 | * | Brocade Communications Systems, Inc. | | | | | 5,321,671 |
| 763,700 | * | Cadence Design Systems, Inc. | | | | | 10,638,341 |
| 27,800 | | International Business Machines Corporation | | | | | 5,929,740 |
| 106,900 | | Motorola Solutions, Inc. | | | | | 6,844,807 |
| 248,600 | * | NetApp, Inc. | | | | | 8,492,176 |
| 206,200 | | Oracle Corporation | | | | | 6,668,508 |
| 156,100 | * | Solarwinds, Inc. | | | | | 9,225,510 |
| | | | | | | | 85,111,375 |
| | | Materials—2.9% | | | | | |
| 44,500 | | CF Industries Holdings, Inc. | | | | | 8,471,465 |
| | | Utilities—1.7% | | | | | |
| 210,200 | | Centerpoint Energy, Inc. | | | | | 5,036,392 |
| Total Value of Common Stocks (cost $216,518,017) | | | | | 292,218,895 |
| | | SHORT-TERM U.S. GOVERNMENT AGENCY | | | | |
| | | OBLIGATIONS—1.0% | | | | | |
| $2,000M | | Federal Home Loan Bank, 0.09%, 4/3/2013 | | | | | 1,999,990 |
| 1,000M | | Freddie Mac, 0.07%, 4/24/2013 | | | | | 999,955 |
| Total Value of Short-Term U.S. Government Agency Obligations (cost $2,999,945) | 2,999,945 |
| Total Value of Investments (cost $219,517,962) | 99.8 | % | | | 295,218,840 |
| Other Assets, Less Liabilities | .2 | | | | 606,109 |
| Net Assets | | | 100.0 | % | | $295,824,949 |
Accounting Standards Codification (“ASC”) 820 established a three-tier hierarchy of inputs to establish a classification of fair value measurements for disclosure purposes. The three-tier hierarchy of inputs is summarized in the three broad Levels listed below:
| Level 1 — Unadjusted quoted prices in active markets for identical securities that the Fund has the ability to access. |
| Level 2 — Observable inputs other than quoted prices included in Level 1 that are observable for the asset or liability, either directly or indirectly. These inputs may include quoted prices for the identical instrument on an inactive market, prices for similar instruments, interest rates, prepayment speeds, credit risk, yield curves, default rates and similar data. |
| Level 3 — Unobservable inputs for the asset or liability, to the extent relevant observable inputs are not available, representing the Fund’s own assumption about the assumptions a market participant would use in valuing the asset or liability, and would be based on the best information available. |
The inputs methodology used for valuing securities are not necessarily an indication of the risk associated with investing in those securities.
The following is a summary, by category of Level, of inputs used to value the Fund’s investments as of March 31, 2013:
| | | | | | | | | | | | |
| | | | Level 1 | | | Level 2 | | | Level 3 | | | Total |
| Common Stocks | | $ | 292,218,895 | | $ | — | | $ | — | | $ | 292,218,895 |
| Short-Term U.S. Government | | | | | | | | | | | | |
| Agency Obligations | | | — | | | 2,999,945 | | | — | | | 2,999,945 |
| Total Investments in Securities* | | $ | 292,218,895 | | $ | 2,999,945 | | $ | — | | $ | 295,218,840 |
| |
| * | The Portfolio of Investments provides information on the industry categorization for common stocks. |
| |
| There were no transfers into or from Level 1 or Level 2 by the Fund during the period ended |
| March 31, 2013. Transfers, if any, between Levels are recognized at the end of the reporting period. |
| | |
| See notes to financial statements | 83 |
Fund Expenses (unaudited)
OPPORTUNITY FUND
The examples below show the ongoing costs (in dollars) of investing in your Fund and will help you in comparing these costs with costs of other mutual funds. Please refer to page 4 for a detailed explanation of the information presented in these examples.
| | | |
| | | | |
| | Beginning | Ending | |
| | Account | Account | Expenses Paid |
| | Value | Value | During Period |
| | (10/1/12) | (3/31/13) | (10/1/12–3/31/13)* |
| Expense Example – Class A Shares | | | |
| Actual | $1,000.00 | $1,180.39 | $7.23 |
| Hypothetical | | | |
| (5% annual return before expenses) | $1,000.00 | $1,018.30 | $6.69 |
| Expense Example – Class B Shares | | | |
| Actual | $1,000.00 | $1,176.04 | $11.01 |
| Hypothetical | | | |
| (5% annual return before expenses) | $1,000.00 | $1,014.81 | $10.20 |
| |
| * | Expenses are equal to the annualized expense ratio of 1.33% for Class A shares and 2.03% for |
| Class B shares, multiplied by the average account value over the period, multiplied by 182/365 (to |
| reflect the one-half year period). |
Portfolio Composition
BY SECTOR
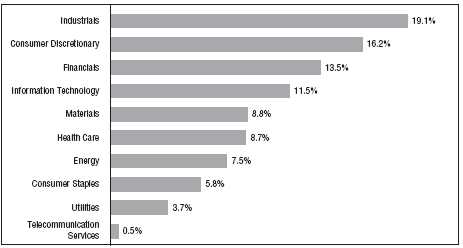
Portfolio holdings and allocations are subject to change. Percentages are as of March 31, 2013, and are based on the total market value of investments.
Portfolio of Investments
OPPORTUNITY FUND
March 31, 2013
| | | | |
| |
| | | | | |
| | | | | |
| | | | | |
| Shares | | Security | | Value |
| | | COMMON STOCKS—95.3% | | |
| | | Consumer Discretionary—16.2% | | |
| 170,000 | | Allison Transmission Holdings, Inc. | | $ 4,081,700 |
| 70,000 | * | BorgWarner, Inc. | | 5,413,800 |
| 41,600 | | Coach, Inc. | | 2,079,584 |
| 450,000 | | Dana Holding Corporation | | 8,023,500 |
| 310,050 | * | Del Frisco’s Restaurant Group, Inc. | | 5,146,830 |
| 245,000 | | Delphi Automotive, PLC | | 10,878,000 |
| 240,000 | | GNC Holdings, Inc. – Class “A” | | 9,427,200 |
| 165,000 | | L Brands, Inc. | | 7,368,900 |
| 235,000 | | Newell Rubbermaid, Inc. | | 6,133,500 |
| 50,000 | | Nordstrom, Inc. | | 2,761,500 |
| 225,000 | * | Orient-Express Hotels, Ltd. – Class “A” | | 2,218,500 |
| 6,900 | | Oxford Industries, Inc. | | 366,390 |
| 310,000 | | Pier 1 Imports, Inc. | | 7,130,000 |
| 25,000 | | Ralph Lauren Corporation | | 4,232,750 |
| 75,000 | * | Select Comfort Corporation | | 1,482,750 |
| 547,200 | | Stewart Enterprises, Inc. – Class “A” | | 5,083,488 |
| 10,000 | * | Tempur-Pedic International, Inc. | | 496,300 |
| 135,000 | * | TRW Automotive Holdings Corporation | | 7,425,000 |
| 95,000 | | Tupperware Brands Corporation | | 7,765,300 |
| 100,000 | | Wyndham Worldwide Corporation | | 6,448,000 |
| | | | | 103,962,992 |
| | | Consumer Staples—5.9% | | |
| 215,000 | | Avon Products, Inc. | | 4,456,950 |
| 110,000 | | Herbalife, Ltd. | | 4,119,500 |
| 35,000 | | McCormick & Company, Inc. | | 2,574,250 |
| 236,300 | | Nu Skin Enterprises, Inc. – Class “A” | | 10,444,460 |
| 1,000 | * | Pinnacle Foods, Inc. | | 22,210 |
| 538,500 | * | Prestige Brands Holdings, Inc. | | 13,834,065 |
| 69,408 | | Tootsie Roll Industries, Inc. | | 2,075,981 |
| | | | | 37,527,416 |
| | | Energy—7.5% | | |
| 30,000 | * | Dril-Quip, Inc. | | 2,615,100 |
| 130,000 | | Ensco, PLC – Class “A” | | 7,800,000 |
| 40,000 | | EOG Resources, Inc. | | 5,122,800 |
| 90,000 | | EQT Corporation | | 6,097,500 |
| 43,000 | | Hess Corporation | | 3,079,230 |
| 139,700 | | National Oilwell Varco, Inc. | | 9,883,775 |
Portfolio of Investments (continued)
OPPORTUNITY FUND
March 31, 2013
| | | | |
| |
| | | | | |
| | | | | |
| | | | | |
| Shares | | Security | | Value |
| | | Energy (continued) | | |
| 112,000 | | Noble Corporation | | $ 4,272,800 |
| 110,000 | * | Plains Exploration & Production Company | | 5,221,700 |
| 225,000 | | Talisman Energy, Inc. | | 2,756,250 |
| 125,000 | * | Weatherford International, Ltd. | | 1,517,500 |
| | | | | 48,366,655 |
| | | Financials—13.5% | | |
| 60,000 | | Ameriprise Financial, Inc. | | 4,419,000 |
| 180,000 | | Berkshire Hills Bancorp, Inc. | | 4,597,200 |
| 164,000 | | Brookline Bancorp, Inc. | | 1,498,960 |
| 105,000 | | City National Corporation | | 6,185,550 |
| 210,000 | | Discover Financial Services | | 9,416,400 |
| 150,000 | | Douglas Emmett, Inc. (REIT) | | 3,739,500 |
| 32,500 | | Federal Realty Investment Trust (REIT) | | 3,511,300 |
| 90,000 | | Financial Select Sector SPDR Fund (ETF) | | 1,637,100 |
| 225,000 | | FirstMerit Corporation | | 3,719,250 |
| 155,600 | * | Health Insurance Innovations, Inc. – Class “A” | | 2,348,004 |
| 51,000 | | IBERIABANK Corporation | | 2,551,020 |
| 138,200 | | Invesco, Ltd. | | 4,002,272 |
| 75,000 | | M&T Bank Corporation | | 7,737,000 |
| 220,000 | | NASDAQ OMX Group, Inc. | | 7,106,000 |
| 100,000 | | Oritani Financial Corporation | | 1,549,000 |
| 250,000 | | Protective Life Corporation | | 8,950,000 |
| 92,000 | | SPDR S&P Regional Banking (ETF) | | 2,925,600 |
| 73,800 | | Tompkins Financial Corporation | | 3,120,264 |
| 175,000 | | Waddell & Reed Financial, Inc. – Class “A” | | 7,661,500 |
| | | | | 86,674,920 |
| | | Health Care—8.7% | | |
| 130,300 | * | Actavis, Inc. | | 12,001,933 |
| 75,000 | | DENTSPLY International, Inc. | | 3,181,500 |
| 160,000 | * | Gilead Sciences, Inc. | | 7,828,800 |
| 87,500 | | McKesson Corporation | | 9,446,500 |
| 20,000 | | Perrigo Company | | 2,374,600 |
| 90,000 | * | Sirona Dental Systems, Inc. | | 6,635,700 |
| 125,000 | | Thermo Fisher Scientific, Inc. | | 9,561,250 |
| 365,000 | | Warner Chilcott, PLC – Class “A” | | 4,945,750 |
| | | | | 55,976,033 |
| | | | |
| |
| | | | | |
| | | | | |
| | | | | |
| Shares | | Security | | Value |
| | | Industrials—19.0% | | |
| 70,000 | | A.O. Smith Corporation | | $ 5,149,900 |
| 180,000 | | Altra Holdings, Inc. | | 4,899,600 |
| 95,000 | * | Armstrong World Industries, Inc. | | 5,309,550 |
| 120,000 | | Chicago Bridge & Iron Company NV – NY Shares | | 7,452,000 |
| 120,000 | * | Esterline Technologies Corporation | | 9,084,000 |
| 70,800 | | G&K Services, Inc. – Class “A” | | 3,222,108 |
| 65,000 | | Gardner Denver, Inc. | | 4,882,150 |
| 235,000 | | Generac Holdings, Inc. | | 8,304,900 |
| 80,000 | | IDEX Corporation | | 4,273,600 |
| 160,000 | | ITT Corporation | | 4,548,800 |
| 82,500 | | J.B. Hunt Transport Services, Inc. | | 6,144,600 |
| 131,400 | | Pentair, Ltd. | | 6,931,350 |
| 76,000 | | Regal-Beloit Corporation | | 6,198,560 |
| 40,000 | | Roper Industries, Inc. | | 5,092,400 |
| 85,500 | | Snap-on, Inc. | | 7,070,850 |
| 135,000 | | TAL International Group, Inc. | | 6,116,850 |
| 156,500 | | Textainer Group Holdings, Ltd. | | 6,189,575 |
| 185,000 | | Triumph Group, Inc. | | 14,522,500 |
| 125,000 | * | United Rentals, Inc. | | 6,871,250 |
| | | | | 122,264,543 |
| | | Information Technology—11.5% | | |
| 453,400 | * | Arris Group, Inc. | | 7,784,878 |
| 150,000 | * | ATMI, Inc. | | 3,364,500 |
| 200,000 | | Avago Technologies, Ltd. | | 7,184,000 |
| 73,300 | * | CACI International, Inc. – Class “A” | | 4,241,871 |
| 150,000 | * | Cirrus Logic, Inc. | | 3,412,500 |
| 45,000 | * | Fiserv, Inc. | | 3,952,350 |
| 55,000 | | Global Payments, Inc. | | 2,731,300 |
| 130,000 | | Intersil Corporation – Class “A” | | 1,132,300 |
| 67,500 | | Intuit, Inc. | | 4,431,375 |
| 243,600 | * | NeuStar, Inc. – Class “A” | | 11,334,708 |
| 325,000 | * | Symantec Corporation | | 8,021,000 |
| 190,000 | | TE Connectivity, Ltd. | | 7,966,700 |
| 275,000 | | Technology Select Sector SPDR Fund (ETF) | | 8,324,250 |
| | | | | 73,881,732 |
| | | Materials—8.8% | | |
| 80,000 | | Agrium, Inc. | | 7,800,000 |
| 155,200 | * | Clearwater Paper Corporation | | 8,177,488 |
| 101,000 | | Cytec Industries, Inc. | | 7,482,080 |
Portfolio of Investments (continued)
OPPORTUNITY FUND
March 31, 2013
| | | | | | | |
| | | | | | | | |
| | | | | | | | |
| Shares or | | | | | | | |
| Principal | | | | | | | |
| Amount | | Security | | | | | Value |
| | | Materials (continued) | | | | | |
| 90,000 | | Freeport-McMoRan Copper & Gold, Inc. | | | | | $ 2,979,000 |
| 210,000 | | International Paper Company | | | | | 9,781,800 |
| 32,600 | | Kronos Worldwide, Inc. | | | | | 510,190 |
| 40,000 | | Praxair, Inc. | | | | | 4,461,600 |
| 117,500 | | Rock-Tenn Company – Class “A” | | | | | 10,902,825 |
| 55,000 | | Sigma-Aldrich Corporation | | | | | 4,272,400 |
| | | | | | | | 56,367,383 |
| | | Telecommunication Services—.5% | | | | | |
| 250,000 | | NTELOS Holdings Corporation | | | | | 3,202,500 |
| | | Utilities—3.7% | | | | | |
| 111,000 | | AGL Resources, Inc. | | | | | 4,656,450 |
| 110,000 | | Portland General Electric Company | | | | | 3,336,300 |
| 135,000 | | SCANA Corporation | | | | | 6,906,600 |
| 200,000 | | Wisconsin Energy Corporation | | | | | 8,578,000 |
| | | | | | | | 23,477,350 |
| Total Value of Common Stocks (cost $400,050,165) | | | | | 611,701,524 |
| | | SHORT-TERM U.S. GOVERNMENT | | | | | |
| | | OBLIGATIONS—3.9% | | | | | |
| | | U.S. Treasury Bills: | | | | | |
| $14,000M | | 0.07%, 4/11/2013 | | | | | 13,999,727 |
| 11,000M | | 0.077%, 4/18/2013 | | | | | 10,999,600 |
| Total Value of Short-Term U.S. Government Obligations (cost $24,999,327) | | | | 24,999,327 |
| | | SHORT-TERM U.S. GOVERNMENT AGENCY | | | | |
| | | OBLIGATIONS—.8% | | | | | |
| 5,000M | | Freddie Mac, 0.1%, 4/17/2013 (cost $4,999,779) | | | | 4,999,779 |
| Total Value of Investments (cost $430,049,271) | 100.0 | % | | | 641,700,630 |
| Other Assets, Less Liabilities | — | | | | 245,463 |
| Net Assets | | | 100.0 | % | | | $641,946,093 |
| | |
| * | Non-income producing |
| |
| Summary of Abbreviations: |
| ETF | Exchange Traded Fund |
| REIT | Real Estate Investment Trust |
Accounting Standards Codification (“ASC”) 820 established a three-tier hierarchy of inputs to establish a classification of fair value measurements for disclosure purposes. The three-tier hierarchy of inputs is summarized in the three broad Levels listed below:
| Level 1 — Unadjusted quoted prices in active markets for identical securities that the Fund has the ability to access. |
| Level 2 — Observable inputs other than quoted prices included in Level 1 that are observable for the asset or liability, either directly or indirectly. These inputs may include quoted prices for the identical instrument on an inactive market, prices for similar instruments, interest rates, prepayment speeds, credit risk, yield curves, default rates and similar data. |
| Level 3 — Unobservable inputs for the asset or liability, to the extent relevant observable inputs are not available, representing the Fund’s own assumption about the assumptions a market participant would use in valuing the asset or liability, and would be based on the best information available. |
The inputs methodology used for valuing securities are not necessarily an indication of the risk associated with investing in those securities.
The following is a summary, by category of Level, of inputs used to value the Fund’s investments as of March 31, 2013:
| | | | | | | | | | | | |
| | | | Level 1 | | | Level 2 | | | Level 3 | | | Total |
| Common Stocks | | $ | 611,701,524 | | $ | — | | $ | — | | $ | 611,701,524 |
| Short-Term U.S. Government | | | | | | | | | | | | |
| Obligations | | | — | | | 24,999,327 | | | — | | | 24,999,327 |
| Short-Term U.S. Government | | | | | | | | | | | | |
| Agency Obligations | | | — | | | 4,999,779 | | | — | | | 4,999,779 |
| Total Investments in Securities* | | $ | 611,701,524 | | $ | 29,999,106 | | $ | — | | $ | 641,700,630 |
| |
| * | The Portfolio of Investments provides information on the industry categorization for common stocks. |
| |
| There were no transfers into or from Level 1 or Level 2 by the Fund during the period ended |
| March 31, 2013. Transfers, if any, between Levels are recognized at the end of the reporting period. |
| | |
| See notes to financial statements | 89 |
Fund Expenses (unaudited)
SPECIAL SITUATIONS FUND
The examples below show the ongoing costs (in dollars) of investing in your Fund and will help you in comparing these costs with costs of other mutual funds. Please refer to page 4 for a detailed explanation of the information presented in these examples.
| | | |
| | | | |
| | Beginning | Ending | |
| | Account | Account | Expenses Paid |
| | Value | Value | During Period |
| | (10/1/12) | (3/31/13) | (10/1/12–3/31/13)* |
| Expense Example – Class A Shares | | | |
| Actual | $1,000.00 | $1,117.56 | $7.55 |
| Hypothetical | | | |
| (5% annual return before expenses) | $1,000.00 | $1,017.80 | $7.19 |
| Expense Example – Class B Shares | | | |
| Actual | $1,000.00 | $1,114.10 | $11.23 |
| Hypothetical | | | |
| (5% annual return before expenses) | $1,000.00 | $1,014.31 | $10.70 |
| |
| * | Expenses are equal to the annualized expense ratio of 1.43% for Class A shares and 2.13% for |
| Class B shares, multiplied by the average account value over the period, multiplied by 182/365 (to |
| reflect the one-half year period). Expenses paid during the period are net of expenses waived. |
Portfolio Composition
BY SECTOR
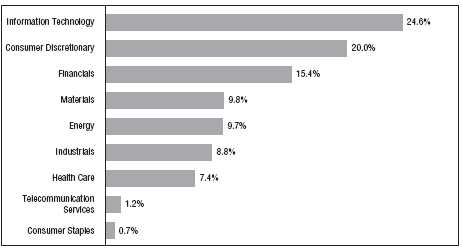
Portfolio holdings and allocations are subject to change. Percentages are as of March 31, 2013, and are based on the total market value of investments.
Portfolio of Investments
SPECIAL SITUATIONS FUND
March 31, 2013
| | | | |
| | | | | |
| | | | | |
| | | | | |
| | | | | |
| Shares | | Security | | Value |
| | | COMMON STOCKS—96.9% | | |
| | | Consumer Discretionary—19.9% | | |
| 187,004 | | American Eagle Outfitters, Inc. | | $ 3,496,975 |
| 181,850 | | Best Buy Company, Inc. | | 4,027,978 |
| 132,050 | * | Deckers Outdoor Corporation | | 7,353,864 |
| 375,950 | * | Express, Inc. | | 6,695,669 |
| 149,950 | | Foot Locker, Inc. | | 5,134,288 |
| 175,150 | | Hillenbrand, Inc. | | 4,427,792 |
| 149,575 | * | Iconix Brand Group, Inc. | | 3,869,505 |
| 693,825 | * | Live Nation Entertainment, Inc. | | 8,582,615 |
| 158,925 | | Men’s Wearhouse, Inc. | | 5,311,273 |
| 50,025 | | PVH Corporation | | 5,343,170 |
| 531,575 | | Regal Entertainment Group – Class “A” | | 8,861,355 |
| 270,726 | * | Starz-Liberty Capital | | 5,996,581 |
| 44,144 | * | Visteon Corporation | | 2,547,109 |
| 199,875 | * | WMS Industries, Inc. | | 5,038,849 |
| | | | | 76,687,023 |
| | | Consumer Staples—.6% | | |
| 228,942 | * | Dole Food Company, Inc. | | 2,495,468 |
| | | Energy—9.7% | | |
| 258,275 | * | Approach Resources, Inc. | | 6,356,148 |
| 110,125 | | Calumet Specialty Products Partners, LP | | 4,102,156 |
| 194,200 | * | Denbury Resources, Inc. | | 3,621,830 |
| 277,291 | * | Matrix Service Company | | 4,131,636 |
| 290,750 | * | Midstates Petroleum Company, Inc. | | 2,485,913 |
| 698,222 | * | PetroQuest Energy, Inc. | | 3,100,106 |
| 224,475 | * | Stone Energy Corporation | | 4,882,331 |
| 118,100 | | Western Refining, Inc. | | 4,181,921 |
| 85,200 | * | Whiting Petroleum Corporation | | 4,331,568 |
| | | | | 37,193,609 |
| | | Financials—15.3% | | |
| 16,612 | * | Alleghany Corporation | | 6,577,023 |
| 135,600 | | American Financial Group, Inc. | | 6,424,728 |
| 593,400 | | Anworth Mortgage Asset Corporation (REIT) | | 3,756,222 |
| 210,900 | | Aspen Insurance Holdings, Ltd. | | 8,136,522 |
| 271,572 | | Capitol Federal Financial, Inc. | | 3,277,874 |
| 258,600 | * | EZCORP, Inc. – Class “A” | | 5,508,180 |
| 886,625 | | MFA Financial, Inc. (REIT) | | 8,263,345 |
Portfolio of Investments (continued)
SPECIAL SITUATIONS FUND
March 31, 2013
| | | | |
| | | | | |
| | | | | |
| | | | | |
| | | | | |
| Shares | | Security | | Value |
| | | Financials (continued) | | |
| 128,975 | | Mid-America Apartment Communities, Inc. (REIT) | | $ 8,907,014 |
| 168,150 | | Montpelier Re Holdings, Ltd. | | 4,380,308 |
| 177,775 | * | PHH Corporation | | 3,903,939 |
| | | | | 59,135,155 |
| | | Health Care—7.4% | | |
| 56,178 | * | Life Technologies Corporation | | 3,630,784 |
| 166,563 | * | Magellan Health Services, Inc. | | 7,923,402 |
| 267,450 | | Masimo Corporation | | 5,247,369 |
| 31,025 | * | MEDNAX, Inc. | | 2,780,771 |
| 250,036 | * | Myriad Genetics, Inc. | | 6,350,914 |
| 72,875 | | PerkinElmer, Inc. | | 2,451,515 |
| | | | | 28,384,755 |
| | | Industrials—8.7% | | |
| 145,400 | | Applied Industrial Technologies, Inc. | | 6,543,000 |
| 95,625 | | EMCOR Group, Inc. | | 4,053,544 |
| 131,550 | | GATX Corporation | | 6,836,653 |
| 138,900 | | Kennametal, Inc. | | 5,422,656 |
| 33,750 | | Precision Castparts Corporation | | 6,399,675 |
| 73,975 | | Ryder System, Inc. | | 4,420,006 |
| | | | | 33,675,534 |
| | | Information Technology—24.4% | | |
| 248,400 | * | Avnet, Inc. | | 8,992,080 |
| 59,812 | * | Comverse, Inc. | | 1,677,128 |
| 303,675 | | Convergys Corporation | | 5,171,585 |
| 331,350 | | Cypress Semiconductor Corporation | | 3,654,791 |
| 349,300 | * | Demand Media, Inc. | | 3,014,459 |
| 1,025,450 | * | Emulex Corporation | | 6,696,188 |
| 126,850 | | IAC/InterActiveCorp | | 5,667,658 |
| 163,175 | | j2 Global, Inc. | | 6,398,092 |
| 191,875 | | Jabil Circuit, Inc. | | 3,545,850 |
| 220,392 | * | Kulicke and Soffa Industries, Inc. | | 2,547,732 |
| 238,275 | | Lender Processing Services, Inc. | | 6,066,481 |
| 67,050 | | Loral Space & Communications, Inc. | | 4,149,054 |
| 332,801 | * | Microsemi Corporation | | 7,710,999 |
| 144,100 | * | Progress Software Corporation | | 3,282,598 |
| 731,625 | * | QLogic Corporation | | 8,486,850 |
| | | | | | | |
| |
| | | | | | | | |
| Shares or | | | | | | | |
| Principal | | | | | | | |
| Amount | | Security | | | | | Value |
| | | Information Technology (continued) | | | | | |
| 1,261,790 | * | TriQuint Semiconductor, Inc. | | | | | $ 6,372,040 |
| 117,848 | * | Verint Systems, Inc. | | | | | 4,307,344 |
| 461,650 | * | Vishay Intertechnology, Inc. | | | | | 6,283,057 |
| | | | | | | | 94,023,986 |
| | | Materials—9.7% | | | | | |
| 290,975 | * | Allied Nevada Gold Corporation | | | | | 4,789,449 |
| 103,000 | | AptarGroup, Inc. | | | | | 5,907,050 |
| 23,850 | * | Boise Cascade Company | | | | | 809,469 |
| 296,500 | * | Chemtura Corporation | | | | | 6,407,365 |
| 150,425 | * | First Majestic Silver Corporation | | | | | 2,432,372 |
| 64,924 | | Innospec, Inc. | | | | | 2,874,835 |
| 175,800 | | Olin Corporation | | | | | 4,433,676 |
| 90,000 | | Sensient Technologies Corporation | | | | | 3,518,100 |
| 68,115 | | Westlake Chemical Corporation | | | | | 6,368,753 |
| | | | | | | | 37,541,069 |
| | | Telecommunication Services—1.2% | | | | | |
| 431,175 | * | Premiere Global Services, Inc. | | | | | 4,738,613 |
| Total Value of Common Stocks (cost $288,507,684) | | | | | 373,875,212 |
| | | SHORT-TERM U.S. GOVERNMENT AGENCY | | | | |
| | | OBLIGATIONS—1.6% | | | | | |
| | | Federal Home Loan Bank: | | | | | |
| $4,000M | | 0.09%, 4/3/2013 | | | | | 3,999,980 |
| 1,000M | | 0.077%, 4/24/2013 | | | | | 999,951 |
| 1,000M | | Freddie Mac, 0.1%, 4/17/2013 | | | | | 999,955 |
| Total Value of Short-Term U.S. Government Agency Obligations (cost $5,999,886) | 5,999,886 |
| | | SHORT-TERM U.S. GOVERNMENT | | | | | |
| | | OBLIGATIONS—.8% | | | | | |
| 3,000M | | U.S. Treasury Bills, 0.07%, 4/11/2013 (cost $2,999,942) | | | | 2,999,942 |
| Total Value of Investments (cost $297,507,512) | 99.3 | % | | | 382,875,040 |
| Other Assets, Less Liabilities | .7 | | | | 2,644,938 |
| Net Assets | | | 100.0 | % | | $385,519,978 |
| | |
| * | Non-income producing |
| |
| Summary of Abbreviations: |
| REIT | Real Estate Investment Trust |
Portfolio of Investments (continued)
SPECIAL SITUATIONS FUND
March 31, 2013
Accounting Standards Codification (“ASC”) 820 established a three-tier hierarchy of inputs to establish a classification of fair value measurements for disclosure purposes. The three-tier hierarchy of inputs is summarized in the three broad Levels listed below:
| Level 1 — Unadjusted quoted prices in active markets for identical securities that the Fund has the ability to access. |
| Level 2 — Observable inputs other than quoted prices included in Level 1 that are observable for the asset or liability, either directly or indirectly. These inputs may include quoted prices for the identical instrument on an inactive market, prices for similar instruments, interest rates, prepayment speeds, credit risk, yield curves, default rates and similar data. |
| Level 3 — Unobservable inputs for the asset or liability, to the extent relevant observable inputs are not available, representing the Fund’s own assumption about the assumptions a market participant would use in valuing the asset or liability, and would be based on the best information available. |
The inputs methodology used for valuing securities are not necessarily an indication of the risk associated with investing in those securities.
The following is a summary, by category of Level, of inputs used to value the Fund’s investments as of March 31, 2013:
| | | | | | | | | | | | |
| | | | Level 1 | | | Level 2 | | | Level 3 | | | Total |
| Common Stocks | | $ | 373,875,212 | | $ | — | | $ | — | | $ | 373,875,212 |
| Short-Term U.S. Government | | | | | | | | | | | | |
| Obligations | | | — | | | 5,999,886 | | | — | | | 5,999,886 |
| Short-Term U.S. Government | | | | | | | | | | | | |
| Agency Obligations | | | — | | | 2,999,942 | | | — | | | 2,999,942 |
| Total Investments in Securities* | | $ | 373,875,212 | | $ | 8,999,828 | | $ | — | | $ | 382,875,040 |
| |
| * | The Portfolio of Investments provides information on the industry categorization for common stocks. |
| |
| There were no transfers into or from Level 1 or Level 2 by the Fund during the period ended |
| March 31, 2013. Transfers, if any, between Levels are recognized at the end of the reporting period. |
| | |
| 94 | See notes to financial statements | |
Fund Expenses (unaudited)
INTERNATIONAL FUND
The examples below show the ongoing costs (in dollars) of investing in your Fund and will help you in comparing these costs with costs of other mutual funds. Please refer to page 4 for a detailed explanation of the information presented in these examples.
| | | |
| | | | |
| | Beginning | Ending | |
| | Account | Account | Expenses Paid |
| | Value | Value | During Period |
| | (10/1/12) | (3/31/13) | (10/1/12–3/31/13)* |
| Expense Example – Class A Shares | | | |
| Actual | $1,000.00 | $1,096.74 | $9.10 |
| Hypothetical | | | |
| (5% annual return before expenses) | $1,000.00 | $1,016.25 | $8.75 |
| Expense Example – Class B Shares | | | |
| Actual | $1,000.00 | $1,093.33 | $12.73 |
| Hypothetical | | | |
| (5% annual return before expenses) | $1,000.00 | $1,012.76 | $12.24 |
| |
| * | Expenses are equal to the annualized expense ratio of 1.74% for Class A shares and 2.44% for |
| Class B shares, multiplied by the average account value over the period, multiplied by 182/365 (to |
| reflect the one-half year period). |
Portfolio Composition
BY SECTOR
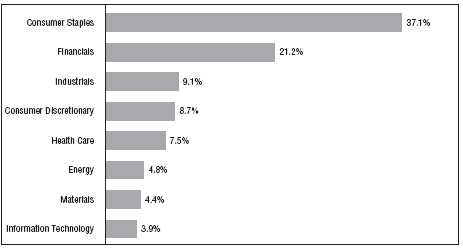
Portfolio holdings and allocations are subject to change. Percentages are as of March 31, 2013, and are based on the total market value of investments.
Portfolio of Investments
INTERNATIONAL FUND
March 31, 2013
| | | | |
| |
| | | | | |
| | | | | |
| | | | | |
| Shares | | Security | | Value |
| | | COMMON STOCKS—97.1% | | |
| | | United Kingdom—23.9% | | |
| 318,997 | * | Barratt Developments, PLC (a) | | $ 1,327,681 |
| 216,808 | | British American Tobacco, PLC (a) | | 11,611,246 |
| 171,720 | | Diageo, PLC (a) | | 5,410,495 |
| 274,847 | | Domino’s Pizza Group, PLC (a) | | 2,514,468 |
| 124,248 | | Fresnillo, PLC | | 2,558,275 |
| 581,895 | | HSBC Holdings, PLC | | 6,207,104 |
| 146,426 | * | Persimmon, PLC (a) | | 2,376,807 |
| 201,458 | * | Rolls-Royce Holdings, PLC (a) | | 3,456,695 |
| 124,038 | | SABMiller, PLC (a) | | 6,524,251 |
| 230,506 | | Standard Chartered, PLC (a) | | 5,962,418 |
| | | | | 47,949,440 |
| | | Switzerland—13.3% | | |
| 28,045 | * | DKSH Holding, Ltd. (a) | | 2,517,372 |
| 868 | | Lindt & Spruengli AG | | 3,348,439 |
| 110,220 | | Nestle SA – Registered (a) | | 7,990,499 |
| 2,445 | | SGS SA – Registered (a) | | 6,010,835 |
| 451,234 | * | UBS AG – Registered (a) | | 6,933,264 |
| | | | | 26,800,409 |
| | | India—11.0% | | |
| 530,386 | | HDFC Bank, Ltd. | | 6,102,611 |
| 369 | | HDFC Bank, Ltd. (ADR) | | 13,808 |
| 238,534 | | Hindustan Unilever, Ltd. | | 2,049,374 |
| 561,513 | | Housing Development Finance Corporation, Ltd. | | 8,536,341 |
| 935,062 | | ITC, Ltd. | | 5,323,918 |
| | | | | 22,026,052 |
| | | France—10.2% | | |
| 57,071 | | BNP Paribas SA | | 2,934,309 |
| 51,019 | | Bureau Veritas SA (a) | | 6,361,324 |
| 29,580 | | Essilor International SA (a) | | 3,295,065 |
| 4,750 | | Hermes International (a) | | 1,652,033 |
| 19,298 | | L’Oreal SA (a) | | 3,065,338 |
| 26,237 | | Pernod Ricard SA (a) | | 3,275,077 |
| | | | | 20,583,146 |
| | | | |
| |
| | | | | |
| | | | | |
| | | | | |
| Shares | | Security | | Value |
| | | Canada—7.6% | | |
| 49,529 | | Bank of Nova Scotia | | $ 2,883,159 |
| 86,103 | | Enbridge, Inc. | | 4,006,190 |
| 101,678 | | Goldcorp, Inc. | | 3,416,789 |
| 67,008 | * | Valeant Pharmaceuticals International, Inc. | | 5,027,826 |
| | | | | 15,333,964 |
| | | Netherlands—7.3% | | |
| 41,608 | | Core Laboratories NV | | 5,738,575 |
| 218,564 | | Unilever NV – CVA (a) | | 8,968,376 |
| | | | | 14,706,951 |
| | | United States—6.7% | | |
| 36,724 | | Accenture, PLC – Class “A” | | 2,789,922 |
| 115,051 | | Philip Morris International, Inc. | | 10,666,378 |
| | | | | 13,456,300 |
| | | Hong Kong—3.3% | | |
| 185,207 | | Link REIT (REIT) | | 1,009,224 |
| 453,955 | | L’Occitane International SA | | 1,380,113 |
| 799,528 | | Sands China, Ltd. | | 4,145,621 |
| | | | | 6,534,958 |
| | | Germany—2.5% | | |
| 63,688 | | SAP AG | | 5,111,331 |
| | | Australia—2.5% | | |
| 139,273 | | Newcrest Mining, Ltd. | | 2,911,231 |
| 61,786 | | Ramsay Health Care, Ltd. (a) | | 2,080,597 |
| | | | | 4,991,828 |
| | | Denmark—2.4% | | |
| 29,597 | | Novo Nordisk A/S – Series “B” (a) | | 4,779,464 |
| | | Belgium—2.2% | | |
| 44,864 | | Anheuser-Busch Inbev NV (a) | | 4,450,336 |
| | | Ireland—1.4% | | |
| 31,919 | | Paddy Power, PLC (a) | | 2,878,104 |
Portfolio of Investments (continued)
INTERNATIONAL FUND
March 31, 2013
| | | | | | | |
| |
| | | | | | | | |
| Shares or | | | | | | | |
| Principal | | | | | | | |
| Amount | | Security | | | | | Value |
| | | Japan—1.1% | | | | | |
| 25,700 | | Daito Trust Construction Company, Ltd. | | | | | $ 2,203,170 |
| | | Mexico—1.0% | | | | | |
| 618,567 | | Wal-Mart de Mexico SAB de CV (a) | | | | | 2,020,257 |
| | | Italy—.7% | | | | | |
| 25,815 | | Luxottica Group SpA | | | | | 1,296,452 |
| Total Value of Common Stocks (cost $142,616,935) | | | | | 195,122,162 |
| | | SHORT-TERM U.S. GOVERNMENT AGENCY | | | | |
| | | OBLIGATIONS—2.2% | | | | | |
| | | United States | | | | | |
| $1,000M | | Federal Home Loan Bank, 0.09%, 4/3/2013 | | | | | 999,995 |
| 3,500M | | Freddie Mac, 0.07%, 4/24/2013 | | | | | 3,499,844 |
| Total Value of Short-Term U.S. Government Agency Obligations (cost $4,499,839) | 4,499,839 |
| | | SHORT-TERM U.S. GOVERNMENT | | | | | |
| | | OBLIGATIONS—1.0% | | | | | |
| | | United States | | | | | |
| 2,000M | | U.S. Treasury Bills, 0.077%, 4/18/2013 (cost $1,999,927) | | | | 1,999,927 |
| Total Value of Investments (cost $149,116,701) | 100.3 | % | | | 201,621,928 |
| Excess of Liabilities Over Other Assets | (0.3 | ) | | | (658,224) |
| Net Assets | | | 100.0 | % | | $200,963,704 |
| | |
| * | Non-income producing |
| |
| (a) | A portion or all of the security purchased on a when-issued or delayed delivery basis |
| (see Note 1G). |
| |
| Summary of Abbreviations: |
| ADR | American Depositary Receipts |
| REIT | Real Estate Investment Trust |
Accounting Standards Codification (“ASC”) 820 established a three-tier hierarchy of inputs to establish a classification of fair value measurements for disclosure purposes. The three-tier hierarchy of inputs is summarized in the three broad Levels listed below:
| Level 1 — Unadjusted quoted prices in active markets for identical securities that the Fund has the ability to access. |
| Level 2 — Observable inputs other than quoted prices included in Level 1 that are observable for the asset or liability, either directly or indirectly. These inputs may include quoted prices for the identical instrument on an inactive market, prices for similar instruments, interest rates, prepayment speeds, credit risk, yield curves, default rates and similar data. |
| Level 3 — Unobservable inputs for the asset or liability, to the extent relevant observable inputs are not available, representing the Fund’s own assumption about the assumptions a market participant would use in valuing the asset or liability, and would be based on the best information available. |
The inputs methodology used for valuing securities are not necessarily an indication of the risk associated with investing in those securities.
The following is a summary, by category of Level, of inputs used to value the Fund’s investments as of March 31, 2013:
| | | | | | | | | | | | |
| | | | Level 1 | | | Level 2 | | | Level 3 | | | Total |
| Common Stocks | | | | | | | | | | | | |
| United Kingdom | | $ | 47,949,440 | | $ | — | | $ | — | | $ | 47,949,440 |
| Switzerland | | | 26,800,409 | | | — | | | — | | | 26,800,409 |
| India | | | 22,026,052 | | | — | | | — | | | 22,026,052 |
| France | | | 20,583,146 | | | — | | | — | | | 20,583,146 |
| Canada | | | 15,333,964 | | | — | | | — | | | 15,333,964 |
| Netherlands | | | 14,706,951 | | | — | | | — | | | 14,706,951 |
| United States | | | 13,456,300 | | | — | | | — | | | 13,456,300 |
| Hong Kong | | | 6,534,958 | | | — | | | — | | | 6,534,958 |
| Germany | | | 5,111,331 | | | — | | | — | | | 5,111,331 |
| Australia | | | 4,991,828 | | | — | | | — | | | 4,991,828 |
| Denmark | | | — | | | 4,779,464 | | | — | | | 4,779,464 |
| Belgium | | | 4,450,336 | | | — | | | — | | | 4,450,336 |
| Ireland | | | 2,878,104 | | | — | | | — | | | 2,878,104 |
| Japan | | | 2,203,170 | | | — | | | — | | | 2,203,170 |
| Mexico | | | — | | | 2,020,257 | | | — | | | 2,020,257 |
| Italy | | | 1,296,452 | | | — | | | — | | | 1,296,452 |
| Short-Term U.S. Government | | | | | | | | | | | | |
| Agency Obligations | | | — | | | 4,499,839 | | | — | | | 4,499,839 |
| Short-Term U.S. Government | | | | | | | | | | | | |
| Agency Obligations | | | — | | | 1,999,927 | | | — | | | 1,999,927 |
| Total Investments in Securities | | $ | 188,322,441 | | $ | 13,299,487 | * | $ | — | | $ | 201,621,928 |
| |
| * | Includes certain foreign securities that were fair valued due to fluctuations in U.S. securities markets |
| exceeding a predetermined level or a foreign market being closed; therefore, $6,799,721 of investment |
| securities were classified as Level 2 instead of Level 1. |
| |
| During the period ended March 31, 2013, there were no transfers between Level 1 investments and |
| Level 2 investments that had a material impact to the Fund. This does not include transfers between |
| Level 1 investments and Level 2 investments due to the Fund utilizing international fair value pric- |
| ing during the period (see Note 1A). Transfers, if any, between Levels are recognized at the end of the |
| reporting period. |
| | |
| See notes to financial statements | 99 |
Statements of Assets and Liabilities
FIRST INVESTORS INCOME FUNDS
March 31, 2013
| | | | | | | | | | | |
| | | | | | | | | | | |
| | | | | | | | INTERNATIONAL | | | |
| | | CASH | | | | INVESTMENT | OPPORTUNITIES | | | |
| | | MANAGEMENT | | GOVERNMENT | | GRADE | | BOND | | INCOME | |
| Assets | | | | | | | | | | | |
| Investments in securities: | | | | | | | | | | | |
| At identified cost | $ | 140,394,042 | $ | 370,959,684 | $ | 504,779,708 | $ | 73,678,504 | $ | 593,034,770 | |
| At value (Note 1A) | $ | 140,394,042 | $ | 382,176,343 | $ | 555,078,601 | $ | 73,891,062 | $ | 620,137,856 | |
| Cash | | 1,069,319 | | 4,159,610 | | 3,466,848 | | 3,681,848 | | 31,510,877 | |
| Receivables: | | | | | | | | | | | |
| Investment securities sold | | — | | 19,381,263 | | 7,014,366 | | — | | 1,929,143 | |
| Interest | | 37,195 | | 1,247,570 | | 7,487,675 | | 850,626 | | 11,189,279 | |
| Shares sold | | — | | 446,042 | | 759,126 | | 795,111 | | 992,709 | |
| Unrealized appreciation of foreign exchange | | | | | | | | | | | |
| contracts (Note 6) | | — | | — | | — | | 233,273 | | — | |
| Deferred offering costs (Note 3) | | — | | — | | — | | 61,411 | | — | |
| Other assets | | 18,507 | | 47,810 | | 63,869 | | 1,477 | | 76,442 | |
| Total Assets | | 141,519,063 | | 407,458,638 | | 573,870,485 | | 79,514,808 | | 665,836,306 | |
| | | | | | | | | | | | |
| Liabilities | | | | | | | | | | | |
| Payables: | | | | | | | | | | | |
| Investment securities purchased | | — | | 22,894,249 | | 7,039,285 | | 3,338,346 | | 19,103,571 | |
| Shares redeemed | | 422,586 | | 1,248,081 | | 1,072,903 | | 126,170 | | 1,154,017 | |
| Dividends payable | | — | | 54,107 | | 127,117 | | 5,353 | | 458,993 | |
| Unrealized depreciation of foreign exchange | | | | | | | | | | | |
| contracts (Note 6) | | — | | — | | — | | 323,642 | | — | |
| Accrued advisory fees | | — | | 178,936 | | 262,836 | | 22,115 | | 379,961 | |
| Accrued shareholder servicing costs | | 43,979 | | 63,351 | | 83,924 | | 26,688 | | 110,005 | |
| Due to advisor (Note 3) | | — | | — | | — | | 61,411 | | — | |
| Accrued expenses | | 25,359 | | 51,347 | | 51,480 | | 77,604 | | 61,350 | |
| Total Liabilities | | 491,924 | | 24,490,071 | | 8,637,545 | | 3,981,329 | | 21,267,897 | |
| Net Assets | $ | 141,027,139 | $ | 382,968,567 | $ | 565,232,940 | $ | 75,533,479 | $ | 644,568,409 | |
| | | | | | | | | | | | |
| Net Assets Consist of: | | | | | | | | | | | |
| Capital paid in | $ | 141,027,139 | $ | 379,977,819 | $ | 535,302,774 | $ | 75,437,304 | $ | 789,208,647 | |
| Undistributed net investment deficit | | — | | (2,732,311 | ) | (5,408,906 | ) | (220,028 | ) | (2,590,417 | ) |
| Accumulated net realized gain (loss) on investments and | | | | | | | | | | |
| foreign currency transactions | | — | | (5,493,600 | ) | (14,959,821 | ) | 191,463 | | (169,152,907 | ) |
| Net unrealized appreciation in value of investments and | | | | | | | | | |
| foreign currency transactions | | — | | 11,216,659 | | 50,298,893 | | 124,740 | | 27,103,086 | |
| Total | $ | 141,027,139 | $ | 382,968,567 | $ | 565,232,940 | $ | 75,533,479 | $ | 644,568,409 | |
| Net Assets: | | | | | | | | | | | |
| Class A | $ | 140,401,045 | $ | 377,341,389 | $ | 558,025,048 | $ | 75,533,479 | $ | 639,237,070 | |
| Class B | $ | 626,094 | $ | 5,627,178 | $ | 7,207,892 | | N/A | $ | 5,331,339 | |
| Shares outstanding (Note 7): | | | | | | | | | | | |
| Class A | | 140,401,045 | | 33,449,170 | | 54,584,088 | | 7,384,973 | | 240,489,164 | |
| Class B | | 626,094 | | 499,599 | | 706,026 | | N/A | | 2,006,585 | |
| Net asset value and redemption price | | | | | | | | | | | |
| per share – Class A | $ | 1.00 | # | $ | 11.28 | $ | 10.22 | $ | 10.23 | $ | 2.66 | |
| Maximum offering price per share – Class A | | | | | | | | | | | |
| (Net asset value/.9425)* | | N/A | $ | 11.97 | $ | 10.84 | $ | 10.85 | $ | 2.82 | |
| Net asset value and offering price per share – | | | | | | | | | | | |
| Class B | $ | 1.00 | $ | 11.26 | $ | 10.21 | | N/A | $ | 2.66 | |
# Also maximum offering price per share.
* On purchases of $100,000 or more, the sales charge is reduced.
| | |
| 100 | See notes to financial statements | 101 |
Statements of Assets and Liabilities
FIRST INVESTORS EQUITY FUNDS
March 31, 2013
| | | | | | | | | |
| | | | | | | | | | |
| | | TOTAL | | EQUITY | | GROWTH & | | | |
| | | RETURN | | INCOME | | INCOME | | GLOBAL | |
| Assets | | | | | | | | | |
| Investments in securities: | | | | | | | | | |
| At identified cost | $ | 478,842,592 | $ | 340,594,492 | $ | 962,951,820 | $ | 240,242,216 | |
| At value (Note 1A) | $ | 614,809,140 | $ | 440,669,765 | $ | 1,407,239,566 | $ | 299,564,815 | |
| Cash | | 1,753,745 | | 1,666,139 | | 1,045,051 | | 1,484,201 | |
| Receivables: | | | | | | | | | |
| Investment securities sold | 2,247,883 | | 2,648,766 | | 2,778,691 | | 3,799,025 | |
| Dividends and interest | 2,990,542 | | 938,020 | | 1,449,705 | | 439,677 | |
| Shares sold | 1,355,657 | | 416,458 | | 1,637,651 | | 169,067 | |
| Other assets | | 61,832 | | 49,112 | | 150,668 | | 37,314 | |
| Total Assets | | 623,218,799 | | 446,388,260 | | 1,414,301,332 | | 305,494,099 | |
| | | | | | | | | | |
| Liabilities | | | | | | | | | |
| Payables: | | | | | | | | | |
| Investment securities purchased | | 3,049,612 | | 2,862,143 | | 2,911,812 | | 2,398,367 | |
| Shares redeemed | | 1,422,650 | | 788,707 | | 3,151,057 | | 684,783 | |
| Dividends payable | | 30,194 | | 16,654 | | 14,325 | | — | |
| Accrued advisory fees | | 377,325 | | 274,401 | | 814,636 | | 243,594 | |
| Accrued shareholder servicing costs | | 131,528 | | 90,682 | | 318,805 | | 83,326 | |
| Accrued expenses | | 41,669 | | 48,057 | | 80,414 | | 65,711 | |
| Total Liabilities | | 5,052,978 | | 4,080,644 | | 7,291,049 | | 3,475,781 | |
| Net Assets | $ | 618,165,821 | $ | 442,307,616 | $ | 1,407,010,283 | $ | 302,018,318 | |
| Net Assets Consist of: | | | | | | | | | |
| Capital paid in | $ | 482,829,589 | $ | 350,253,072 | $ | 954,048,010 | $ | 259,894,762 | |
| Undistributed net investment income (deficit) | | (2,641,028 | ) | 2,214,165 | | 1,868,286 | | (383,056 | ) |
| Accumulated net realized gain (loss) on investments | | | | | | | | | |
| and foreign currency transactions | | 2,010,712 | | (10,234,894 | ) | 6,806,241 | | (16,818,783 | ) |
| Net unrealized appreciation in value of investments | | | | | | | | | |
| and foreign currency transactions | | 135,966,548 | | 100,075,273 | | 444,287,746 | | 59,325,395 | |
| Total | $ | 618,165,821 | $ | 442,307,616 | $ | 1,407,010,283 | $ | 302,018,318 | |
| Net Assets: | | | | | | | | | |
| Class A | $ | 607,541,778 | $ | 435,648,410 | $ | 1,379,427,705 | $ | 297,555,776 | |
| Class B | $ | 10,624,043 | $ | 6,659,206 | $ | 27,582,578 | $ | 4,462,542 | |
| Shares outstanding (Note 7): | | | | | | | | | |
| Class A | | 34,332,323 | | 51,638,049 | | 74,090,632 | | 40,621,949 | |
| Class B | | 610,633 | | 802,398 | | 1,579,044 | | 707,962 | |
| | |
| Net asset value and redemption price per share – Class A | $ | 17.70 | $ | 8.44 | $ | 18.62 | $ | 7.32 | |
| Maximum offering price per share – Class A | | | | | | | | | |
| (Net asset value/.9425)* | $ | 18.78 | $ | 8.95 | $ | 19.76 | $ | 7.77 | |
| | |
| Net asset value and offering price per share – Class B (Note 8) | $ | 17.40 | $ | 8.30 | $ | 17.47 | $ | 6.30 | |
* On purchases of $100,000 or more, the sales charge is reduced.
| | |
| 102 | See notes to financial statements | 103 |
Statements of Assets and Liabilities
FIRST INVESTORS EQUITY FUNDS
March 31, 2013
| | | | | | | | | |
| | | | | | | | | | |
| | | SELECT | | | | SPECIAL | | | |
| | | GROWTH | | OPPORTUNITY | | SITUATIONS | | INTERNATIONAL | |
| Assets | | | | | | | | | |
| Investments in securities: | | | | | | | | | |
| At identified cost | $ | 219,517,962 | $ | 430,049,271 | $ | 297,507,512 | $ | 149,116,701 | |
| At value (Note 1A) | $ | 295,218,840 | $ | 641,700,630 | $ | 382,875,040 | $ | 201,621,928 | |
| Cash | | 1,088,279 | | 1,192,230 | | 1,144,363 | | 1,197,522 | |
| Receivables: | | | | | | | | | |
| Investment securities sold | | — | | 3,705,169 | | 5,968,232 | | 1,265 | |
| Dividends and interest | | 239,530 | | 560,737 | | 629,627 | | 893,569 | |
| Shares sold | | 374,696 | | 748,282 | | 427,683 | | 359,079 | |
| Other assets | | 31,190 | | 64,086 | | 42,179 | | 19,926 | |
| Total Assets | | 296,952,535 | | 647,971,134 | | 391,087,124 | | 204,093,289 | |
| Liabilities | | | | | | | | | |
| Payables: | | | | | | | | | |
| Investment securities purchased | | — | | 3,806,792 | | 4,116,437 | | 2,316,241 | |
| Shares redeemed | | 836,379 | | 1,645,084 | | 1,064,608 | | 541,168 | |
| Accrued advisory fees | | 185,504 | | 390,069 | | 259,311 | | 164,454 | |
| Accrued shareholder servicing costs | | 73,418 | | 139,349 | | 94,077 | | 54,165 | |
| Accrued expenses | | 32,285 | | 43,747 | | 32,713 | | 53,557 | |
| Total Liabilities | | 1,127,586 | | 6,025,041 | | 5,567,146 | | 3,129,585 | |
| Net Assets | $ | 295,824,949 | $ | 641,946,093 | $ | 385,519,978 | $ | 200,963,704 | |
| Net Assets Consist of: | | | | | | | | | |
| Capital paid in | $ | 272,797,156 | $ | 410,929,459 | $ | 288,577,087 | $ | 177,578,745 | |
| Undistributed net investment income (deficit) | | 120,372 | | 1,098,363 | | 181,811 | | (115,007 | ) |
| Accumulated net realized gain (loss) on investments | | | | | | | | | |
| and foreign currency transactions | | (52,793,457 | ) | 18,266,912 | | 11,393,552 | | (29,009,124 | ) |
| Net unrealized appreciation in value of investments | | | | | | | | | |
| and foreign currency transactions | | 75,700,878 | | 211,651,359 | | 85,367,528 | | 52,509,090 | |
| Total | $ | 295,824,949 | $ | 641,946,093 | $ | 385,519,978 | $ | 200,963,704 | |
| Net Assets: | | | | | | | | | |
| Class A | $ | 290,398,277 | $ | 628,272,128 | $ | 380,413,010 | $ | 197,399,788 | |
| Class B | $ | 5,426,672 | $ | 13,673,965 | $ | 5,106,968 | $ | 3,563,916 | |
| Shares outstanding (Note 7): | | | | | | | | | |
| Class A | | 34,114,035 | | 18,772,266 | | 14,608,100 | | 15,405,949 | |
| Class B | | 704,068 | | 480,911 | | 233,857 | | 289,848 | |
| | |
| Net asset value and redemption price per share – Class A | $ | 8.51 | $ | 33.47 | $ | 26.04 | $ | 12.81 | |
| Maximum offering price per share – Class A | | | | | | | | | |
| (Net asset value/.9425)* | $ | 9.03 | $ | 35.51 | $ | 27.63 | $ | 13.59 | |
| | |
| Net asset value and offering price per share – Class B (Note 8) | $ | 7.71 | $ | 28.43 | $ | 21.84 | $ | 12.30 | |
* On purchases of $100,000 or more, the sales charge is reduced.
| | |
| 104 | See notes to financial statements | 105 |
Statements of Operations
FIRST INVESTORS INCOME FUNDS
Six Months Ended March 31, 2013
| | | | | | | | | | | | |
| | | | | | | | | | | |
| | | | | | | | | INTERNATIONAL | | | |
| | | | CASH | | | | INVESTMENT | OPPORTUNITIES | | | |
| | | | MANAGEMENT | GOVERNMENT | | GRADE | | BOND | | INCOME | |
| | |
| Investment Income | | | | | | | | | | | | |
| Interest | | $ | 88,387 | $ | 5,116,092 | $ | 11,978,780 | $ | 823,472 | (a) | $ | 20,365,343 | |
| Dividend | | | — | | — | | — | | — | | 2,081 | |
| | |
| Total Income | | $ | 88,387 | $ | 5,116,092 | $ | 11,978,780 | $ | 823,472 | $ | 20,367,424 | |
| | |
| Expenses (Notes 1 and 3): | | | | | | | | | | | | |
| Advisory fees | | | 351,328 | | 1,273,622 | | 1,822,844 | | 183,352 | | 2,250,197 | |
| Distribution plan expenses – Class A | | | — | | 570,009 | | 819,791 | | 73,341 | | 921,551 | |
| Distribution plan expenses – Class B | | | 2,585 | | 29,700 | | 37,645 | | — | | 26,709 | |
| Shareholder servicing costs | | | 257,028 | | 348,937 | | 472,186 | | 115,919 | | 568,507 | |
| Professional fees | | | 14,868 | | 29,949 | | 40,745 | | 101,329 | | 46,883 | |
| Registration fees | | | 30,500 | | 28,500 | | 32,450 | | 36,431 | | 23,961 | |
| Custodian fees | | | 9,832 | | 17,654 | | 18,607 | | 9,192 | | 19,064 | |
| Reports to shareholders | | | 7,348 | | 7,040 | | 9,092 | | 3,836 | | 14,311 | |
| Trustees’ fees | | | 4,314 | | 11,966 | | 17,015 | | 1,265 | | 19,069 | |
| Other expenses | | | 9,097 | | 56,403 | | 58,050 | | 6,323 | | 70,509 | |
| | |
| Total expenses | | | 686,900 | | 2,373,780 | | 3,328,425 | | 530,988 | | 3,960,761 | |
| Less: Expenses waived and/or assumed | | | (597,862 | ) | (212,270 | ) | (300,638 | ) | (214,226 | ) | (81,213 | ) |
| Expenses paid indirectly | | | (651 | ) | (390 | ) | (527 | ) | (11 | ) | (601 | ) |
| | |
| Net expenses | | | 88,387 | | 2,161,120 | | 3,027,260 | | 316,751 | | 3,878,947 | |
| | |
| Net investment income | | | — | | 2,954,972 | | 8,951,520 | | 506,721 | | 16,488,477 | |
| | |
| Realized and Unrealized Gain (Loss) on Investments and | | | | | | | | | | | | |
| Foreign Currency Transactions (Notes 2 and 6): | | | | | | | | | | | | |
| Net realized gain on: | | | | | | | | | | | | |
| Investments | | | — | | 1,147,178 | | 4,466,715 | | 219,771 | | 12,771,065 | |
| Foreign currency transactions | | | — | | — | | — | | 38,639 | | — | |
| Net realized gain on investments | | | | | | | | | | | | |
| and foreign currency transactions | | | — | | 1,147,178 | | 4,466,715 | | 258,410 | | 12,771,065 | |
| | |
| Net unrealized appreciation (depreciation) of : | | | | | | | | | | | | |
| Investments | | | — | | (6,563,701 | ) | (5,710,699 | ) | (134,682 | ) | 2,767,815 | |
| Foreign currency transactions | | | — | | — | | — | | (116,023 | ) | — | |
| Net unrealized appreciation (depreciation) on | | | | | | | | | | | | |
| investments and foreign currency transactions | | | — | | (6,563,701 | ) | (5,710,699 | ) | (250,705 | ) | 2,767,815 | |
| Net gain (loss) on investments and foreign | | | | | | | | | | | | |
| currency transactions | | | — | | (5,416,523 | ) | (1,243,984 | ) | 7,705 | | 15,538,880 | |
| | |
| Net Increase (Decrease) in Net Assets Resulting | | | | | | | | | | | | |
| from Operations | | $ | — | $ | (2,461,551 | ) | $ | 7,707,536 | $ | 514,426 | $ | 32,027,357 | |
(a) Net of $11,027 foreign taxes withheld.
| | |
| 106 | See notes to financial statements | 107 |
Statements of Operations
FIRST INVESTORS EQUITY FUNDS
Six Months Ended March 31, 2013
| | | | | | | | | |
| | | | | | | | | | |
| | | TOTAL | | EQUITY | | GROWTH & | | | |
| | | RETURN | | INCOME | | INCOME | | GLOBAL | |
| Investment Income | | | | | | | | | |
| Dividends | $ | 4,011,359 | (a) | $ | 6,339,400 | (b) | $ | 15,329,747 | (c) | $ | 2,861,249 | (d) |
| Interest | | 3,877,907 | | 9,825 | | 6,411 | | 2,127 | |
| | |
| Total income | | 7,889,266 | | 6,349,225 | | 15,336,158 | | 2,863,376 | |
| | |
| Expenses (Notes 1 and 3): | | | | | | | | | |
| Advisory fees | | 2,085,474 | | 1,519,880 | | 4,488,038 | | 1,386,063 | |
| Distribution plan expenses – Class A | | 838,918 | | 604,874 | | 1,897,162 | | 431,151 | |
| Distribution plan expenses – Class B | | 52,597 | | 32,371 | | 132,589 | | 21,844 | |
| Shareholder servicing costs | | 628,815 | | 431,524 | | 1,477,903 | | 412,599 | |
| Professional fees | | 34,409 | | 30,904 | | 78,018 | | 21,626 | |
| Custodian fees | | 13,406 | | 9,760 | | 20,861 | | 99,000 | |
| Registration fees | | 32,524 | | 28,770 | | 25,679 | | 22,282 | |
| Reports to shareholders | | 13,943 | | 9,323 | | 33,296 | | 10,812 | |
| Trustees’ fees | | 17,251 | | 12,436 | | 39,134 | | 8,932 | |
| Other expenses | | 42,328 | | 29,795 | | 80,409 | | 52,306 | |
| | |
| Total expenses | | 3,759,665 | | 2,709,637 | | 8,273,089 | | 2,466,615 | |
| Less expenses paid indirectly | | (1,743 | ) | (1,386 | ) | (4,023 | ) | (352 | ) |
| | |
| Net expenses | | 3,757,922 | | 2,708,251 | | 8,269,066 | | 2,466,263 | |
| | |
| Net investment income | | 4,131,344 | | 3,640,974 | | 7,067,092 | | 397,113 | |
| | |
| Realized and Unrealized Gain (Loss) on Investments | | | | | | | | | |
| and Foreign Currency Transactions (Note 2): | | | | | | | | | |
| Net realized gain (loss) on: | | | | | | | | | |
| Investments | | 5,654,169 | | 9,756,513 | | 13,047,708 | | 15,678,637 | |
| Foreign currency transactions | | — | | — | | — | | (53,265) | |
| | |
| Net realized gain on investments and | | | | | | | | | |
| foreign currency transactions | | 5,654,169 | | 9,756,513 | | 13,047,708 | | 15,625,372 | |
| | |
| Net unrealized appreciation of investments | | 35,349,703 | | 30,498,320 | | 140,383,449 | | 7,710,116 | |
| | |
| Net gain on investments and foreign currency transactions | | 41,003,872 | | 40,254,833 | | 153,431,157 | | 23,335,488 | |
| | |
| Net Increase in Net Assets Resulting from Operations | $ | 45,135,216 | $ | 43,895,807 | $ | 160,498,249 | $ | 23,732,601 | |
(a) Net of $22,518 foreign taxes withheld.
(b) Net of $62,200 foreign taxes withheld.
(c) Net of $67,913 foreign taxes withheld.
(d) Net of $121,647 foreign taxes withheld.
| | |
| 108 | See notes to financial statements | 109 |
Statements of Operations
FIRST INVESTORS EQUITY FUNDS
Six Months Ended March 31, 2013
| | | | | | | | | | |
| | | | | | | | | | |
| | | SELECT | | | | | SPECIAL | | | |
| | | GROWTH | | | OPPORTUNITY | | SITUATIONS | | INTERNATIONAL | |
| Investment Income | | | | | | | | | | |
| Dividends | $ | 2,732,267 | | $ | 5,120,259 | (e) | $ | 4,334,625 | $ | $ 1,684,308 | (f) |
| Interest | | 209 | | | 7,005 | | 10,151 | | 2,392 | |
| | |
| Total income | | 2,732,476 | | | 5,127,264 | | 4,344,776 | | 1,686,700 | |
| | |
| Expenses (Notes 1 and 3): | | | | | | | | | | |
| Advisory fees | | 1,042,446 | | | 2,121,276 | | 1,587,643 | | 899,063 | |
| Distribution plan expenses – Class A | | 408,836 | | | 850,664 | | 527,949 | | 270,112 | |
| Distribution plan expenses – Class B | | 27,141 | | | 65,328 | | 24,609 | | 17,039 | |
| Shareholder servicing costs | | 391,396 | | | 720,982 | | 481,184 | | 279,780 | |
| Professional fees | | 19,875 | | | 35,710 | | 23,248 | | 14,043 | |
| Custodian fees | | 3,710 | | | 10,849 | | 11,920 | | 71,698 | |
| Registration fees | | 23,000 | | | 24,000 | | 25,650 | | 21,000 | |
| Reports to shareholders | | 9,851 | | | 15,866 | | 10,354 | | 6,453 | |
| Trustees’ fees | | 8,491 | | | 17,493 | | 10,844 | | 5,526 | |
| Other expenses | | 19,042 | | | 38,035 | | 25,731 | | 25,339 | |
| | |
| Total expenses | | 1,953,788 | | | 3,900,203 | | 2,729,132 | | 1,610,053 | |
| Less: Expenses waived | | — | | | — | | (160,093 | ) | — | |
| Expenses paid indirectly | | (329 | ) | | (1,780 | ) | (430 | ) | (200 | ) |
| | |
| Net expenses | | 1,953,459 | | | 3,898,423 | | 2,568,609 | | 1,609,853 | |
| | |
| Net investment income | | 779,017 | | | 1,228,841 | | 1,776,167 | | 76,847 | |
| | |
| Realized and Unrealized Gain (Loss) on Investments | | | | | | | | | | |
| and Foreign Currency Transactions (Note 2): | | | | | | | | | | |
| Net realized gain (loss) on: | | | | | | | | | | |
| Investments | | 16,073,623 | | | 18,473,119 | | 20,247,132 | | 4,784,539 | |
| Foreign currency transactions | | — | | | — | | — | | (28,311 | ) |
| Net realized gain on investments | | | | | | | | | | |
| and foreign currency transactions | | 16,073,623 | | | 18,473,119 | | 20,247,132 | | 4,756,228 | |
| | |
| Net unrealized appreciation of investments | | 1,697,321 | | | 78,236,242 | | 18,666,891 | | 12,252,753 | |
| | |
| Net gain on investments and foreign currency transactions | | 17,770,944 | | | 96,709,361 | | 38,914,023 | | 17,008,981 | |
| | |
| Net Increase in Net Assets Resulting from Operations | $ | 18,549,961 | | $ | 97,938,202 | $ | 40,690,190 | $ | 17,085,828 | |
(e) Net of $18,206 foreign taxes withheld.
(f) Net of $169,403 foreign taxes withheld.
| | |
| 110 | See notes to financial statements | 111 |
Statements of Changes in Net Assets
FIRST INVESTORS INCOME FUNDS
| | | | | | | | | | | | | | | | | |
| | | | | | | | | | | | | | | | |
| | | | | | | | | | | | | | | INTERNATIONAL | |
| | | CASH MANAGEMENT | | GOVERNMENT | | INVESTMENT GRADE | | OPPORTUNITIES BOND | |
| | | 10/1/12 to | | 10/1/11 to | | 10/1/12 to | | 10/1/11 to | | 10/1/12 to | | 10/1/11 to | | 10/1/12 to | | 8/20/12** to | |
| | | 3/31/13 | | 9/30/12 | | 3/31/13 | | 9/30/12 | | 3/31/13 | | 9/30/12 | | 3/31/13 | | 9/30/12 | |
| Increase (Decrease) in Net Assets From Operations | | | | | | | | | | | | | | | | | |
| Net investment income | $ | — | $ | — | $ | 2,954,972 | $ | 8,431,847 | $ | 8,951,520 | $ | 17,238,565 | $ | 506,721 | $ | 19,972 | |
| Net realized gain (loss) on investments and foreign | | | | | | | | | | | | | | | | | |
| currency transactions | | — | | — | | 1,147,178 | | 2,747,134 | | 4,466,715 | | 6,126,339 | | 258,410 | | (1,473 | ) |
| Net unrealized appreciation (depreciation) of investments and | | | | | | | | | | | | | | | |
| foreign currency transactions | | — | | — | | (6,563,701 | ) | (1,091,454 | ) | (5,710,699 | ) | 29,262,123 | | (250,705 | ) | 375,445 | |
| Net increase (decrease) in net assets resulting | | | | | | | | | | | | | | | | | |
| from operations | | — | | — | | (2,461,551 | ) | 10,087,527 | | 7,707,536 | | 52,627,027 | | 514,426 | | 393,944 | |
| | | | | | | | | | | | | | | | | | |
| Distributions to Shareholders | | | | | | | | | | | | | | | | | |
| Net investment income – Class A | | — | | — | | (5,666,004 | ) | (11,975,470 | ) | (10,248,810 | ) | (19,773,424 | ) | (728,028 | ) | (24,887 | ) |
| Net investment income – Class B | | — | | — | | (68,419 | ) | (180,107 | ) | (118,008 | ) | (300,972 | ) | N/A | | N/A | |
| Net realized gains – Class A | | — | | — | | — | | — | | — | | — | | (64,140 | ) | — | |
| Net realized gains – Class B | | — | | — | | — | | — | | — | | — | | N/A | | N/A | |
| Total distributions | | — | | — | | (5,734,423 | ) | (12,155,577 | ) | (10,366,818 | ) | (20,074,396 | ) | (792,168 | ) | (24,887 | ) |
| Share Transactions* | | | | | | | | | | | | | | | | | |
| Class A: | | | | | | | | | | | | | | | | | |
| Proceeds from shares sold | | 73,014,824 | | 138,654,875 | | 39,542,195 | | 80,703,297 | | 72,423,155 | | 110,514,618 | | 56,980,209 | | 23,507,430 | |
| Reinvestment of distributions | | — | | — | | 5,285,336 | | 11,116,817 | | 9,461,860 | | 18,092,318 | | 766,487 | | 23,798 | |
| Cost of shares redeemed | | (67,641,373 | ) | (151,798,288 | ) | (41,482,427 | ) | (54,554,693 | ) | (53,134,087 | ) | (65,812,986 | ) | (1,498,969 | ) | (4,336,791 | ) |
| | | 5,373,451 | | (13,143,413 | ) | 3,345,104 | | 37,265,421 | | 28,750,928 | | 62,793,950 | | 56,247,727 | | 19,194,437 | |
| Class B: | | | | | | | | | | | | | | | | | |
| Proceeds from shares sold | | 184,360 | | 256,141 | | 230,184 | | 1,106,976 | | 421,114 | | 995,491 | | N/A | | N/A | |
| Reinvestment of distributions | | — | | — | | 64,862 | | 170,501 | | 113,258 | | 286,900 | | N/A | | N/A | |
| Cost of shares redeemed | | (453,985 | ) | (879,445 | ) | (932,711 | ) | (2,129,656 | ) | (1,324,857 | ) | (3,767,140 | ) | N/A | | N/A | |
| | | (269,625 | ) | (623,304 | ) | (637,665 | ) | (852,179 | ) | (790,485 | ) | (2,484,749 | ) | N/A | | N/A | |
| Net increase (decrease) from share transactions | | 5,103,826 | | (13,766,717 | ) | 2,707,439 | | 36,413,242 | | 27,960,443 | | 60,309,201 | | 56,247,727 | | 19,194,437 | |
| Net increase (decrease) in net assets | | 5,103,826 | | (13,766,717 | ) | (5,488,535 | ) | 34,345,192 | | 25,301,161 | | 92,861,832 | | 55,969,985 | | 19,563,494 | |
| Net Assets | | | | | | | | | | | | | | | | | |
| Beginning of period | | 135,923,313 | | 149,690,030 | | 388,457,102 | | 354,111,910 | | 539,931,779 | | 447,069,947 | | 19,563,494 | | — | |
| End of period† | $ | 141,027,139 | $ | 135,923,313 | $ | 382,968,567 | $ | 388,457,102 | $ | 565,232,940 | $ | 539,931,779 | $ | 75,533,479 | $ | 19,563,494 | |
| | |
| †Includes undistributed net investment income (deficit) of | $ | — | $ | — | $ | (2,732,311 | ) | $ | 47,140 | $ | (5,408,906 | ) | $ | (3,993,608 | ) | $ | (220,028 | ) | $ | (4,166 | ) |
| | |
| * Shares Issued and Redeemed | | | | | | | | | | | | | | | | | |
| Class A: | | | | | | | | | | | | | | | | | |
| Sold | | 73,014,824 | | 138,654,875 | | 3,475,966 | | 6,982,798 | | 7,052,418 | | 11,192,864 | | 5,542,356 | | 2,339,380 | |
| Issued for distributions reinvested | | — | | — | | 465,331 | | 961,810 | | 921,210 | | 1,825,614 | | 74,374 | | 2,329 | |
| Redeemed | | (67,641,373 | ) | (151,798,288 | ) | (3,651,683 | ) | (4,720,673 | ) | (5,176,817 | ) | (6,656,099 | ) | (145,557 | ) | (427,909 | ) |
| Net increase (decrease) in Class A shares outstanding | | 5,373,451 | | (13,143,413 | ) | 289,614 | | 3,223,935 | | 2,796,811 | | 6,362,379 | | 5,471,173 | | 1,913,800 | |
| | |
| Class B: | | | | | | | | | | | | | | | | | |
| Sold | | 184,360 | | 256,141 | | 20,263 | | 95,856 | | 41,051 | | 100,837 | | N/A | | N/A | |
| Issued for distributions reinvested | | — | | — | | 5,717 | | 14,766 | | 11,038 | | 29,041 | | N/A | | N/A | |
| Redeemed | | (453,985 | ) | (879,445 | ) | (82,059 | ) | (184,393 | ) | (129,154 | ) | (383,906 | ) | N/A | | N/A | |
| | |
| Net decrease in Class B shares outstanding | | (269,625 | ) | (623,304 | ) | (56,079 | ) | (73,771 | ) | (77,065 | ) | (254,028 | ) | N/A | | N/A | |
** Commencement of operations.
| | |
| 112 | See notes to financial statements | 113 |
Statements of Changes in Net Assets
FIRST INVESTORS INCOME FUNDS
| | | | | | | | | | | |
| | | | | | | | | | |
| | | INCOME | | | | | | | |
| | | 10/1/12 to | | 10/1/11 to | | | | | | | |
| | | 3/31/13 | | 9/30/12 | | | | | | | |
| Increase (Decrease) in Net Assets From Operations | | | | | | | | | | | |
| Net investment income | $ | 16,488,477 | $ | 34,058,067 | | | | | | | |
| Net realized gain on investments | | 12,771,065 | | 8,841,108 | | | | | | | |
| Net unrealized appreciation of investments | | 2,767,815 | | 49,079,702 | | | | | | | |
| Net increase in net assets resulting from operations | | 32,027,357 | | 91,978,877 | | | | | | | |
| | | | | | | | | | | | |
| Dividends to Shareholders | | | | | | | | | | | |
| Net investment income – Class A | | (17,841,613 | ) | (35,292,367 | ) | | | | | | |
| Net investment income – Class B | | (136,909 | ) | (372,652 | ) | | | | | | |
| Total dividends | | (17,978,522 | ) | (35,665,019 | ) | | | | | | |
| | | | | | | | | | | | |
| Share Transactions * | | | | | | | | | | | |
| Class A: | | | | | | | | | | | |
| Proceeds from shares sold | | 52,816,720 | | 75,841,881 | | | | | | | |
| Reinvestment of dividends | | 15,084,091 | | 29,568,927 | | | | | | | |
| Cost of shares redeemed | | (44,961,285 | ) | (63,479,906 | ) | | | | | | |
| | | 22,939,526 | | 41,930,902 | | | | | | | |
| Class B: | | | | | | | | | | | |
| Proceeds from shares sold | | 414,702 | | 607,441 | | | | | | | |
| Reinvestment of dividends | | 110,981 | | 313,420 | | | | | | | |
| Cost of shares redeemed | | (974,437 | ) | (3,555,468 | ) | | | | | | |
| | | (448,754 | ) | (2,634,607 | ) | | | This page left intentionally blank. | |
| Net increase from share transactions | | 22,490,772 | | 39,296,295 | | | | | | | |
| Net increase in net assets | | 36,539,607 | | 95,610,153 | | | | | | | |
| | | | | | | | | | | | |
| Net Assets | | | | | | | | | | | |
| Beginning of period | | 608,028,802 | | 512,418,649 | | | | | | | |
| End of period † | $ | 644,568,409 | $ | 608,028,802 | | | | | | | |
| | | | | | | | |
| †Includes undistributed net investment deficit of | $ | (2,590,417 | ) | $ | (1,100,372 | ) | | | | | | |
| | | | | | | | |
| *Shares Issued and Redeemed | | | | | | | | | | | |
| Class A: | | | | | | | | | | | |
| Sold | | 20,054,978 | | 30,109,659 | | | | | | | |
| Issued for dividends reinvested | | 5,727,988 | | 11,711,571 | | | | | | | |
| Redeemed | | (17,103,963 | ) | (25,241,060 | ) | | | | | | |
| Net increase in Class A shares outstanding | | 8,679,003 | | 16,580,170 | | | | | | | |
| | | | | | | | |
| Class B: | | | | | | | | | | | |
| Sold | | 157,622 | | 241,388 | | | | | | | |
| Issued for dividends reinvested | | 42,157 | | 124,477 | | | | | | | |
| Redeemed | | (371,328 | ) | (1,418,398 | ) | | | | | | |
| Net decrease in Class B shares outstanding | | (171,549 | ) | (1,052,533 | ) | | | | | | |
| | |
| 114 | See notes to financial statements | 115 |
Statements of Changes in Net Assets
FIRST INVESTORS EQUITY FUNDS
| | | | | | | | | | | | | | | | | |
| | | | | | | | | | |
| | | TOTAL RETURN | | EQUITY INCOME | | GROWTH & INCOME | | GLOBAL | |
| | | 10/1/12 to | | 10/1/11 to | | 10/1/12 to | | 10/1/11 to | | 10/1/12 to | | 10/1/11 to | | 10/1/12 to | | 10/1/11 to | |
| | | 3/31/13 | | 9/30/12 | | 3/31/13 | | 9/30/12 | | 3/31/13 | | 9/30/12 | | 3/31/13 | | 9/30/12 | |
| | |
| Increase (Decrease) in Net Assets From Operations | | | | | | | | | | | | | | | | | |
| Net investment income | $ | 4,131,344 | $ | 8,427,411 | $ | 3,640,974 | $ | 6,560,611 | $ | 7,067,092 | $ | 14,690,454 | $ | 397,113 | $ | 1,199,577 | |
| Net realized gain (loss) on investments and foreign | | | | | | | | | | | | | | | | | |
| currency transactions | | 5,654,169 | | 9,889,479 | | 9,756,513 | | (1,363,199 | ) | 13,047,708 | | 25,391,281 | | 15,625,372 | | (1,867,392 | ) |
| Net unrealized appreciation of investments and foreign | | | | | | | | | | | | | | | | | |
| currency transactions | | 35,349,703 | | 69,162,630 | | 30,498,320 | | 76,643,044 | | 140,383,449 | | 221,517,657 | | 7,710,116 | | 56,227,236 | |
| Net increase in net assets resulting from operations | | 45,135,216 | | 87,479,520 | | 43,895,807 | | 81,840,456 | | 160,498,249 | | 261,599,392 | | 23,732,601 | | 55,559,421 | |
| | |
| Distributions to Shareholders | | | | | | | | | | | | | | | | | |
| Net investment income – Class A | | (6,329,563 | ) | (8,802,366 | ) | (3,880,051 | ) | (4,992,799 | ) | (12,056,390 | ) | (9,050,725 | ) | (1,424,621 | ) | (682,596 | ) |
| Net investment income – Class B | | (81,696 | ) | (137,606 | ) | (39,241 | ) | (47,943 | ) | (183,968 | ) | (78,713 | ) | (18,090 | ) | (6,148 | ) |
| Net realized gains – Class A | | (7,978,527 | ) | — | | — | | — | | — | | — | | — | | — | |
| Net realized gains – Class B | | (154,042 | ) | — | | — | | — | | — | | — | | — | | — | |
| Total distributions | | (14,543,828 | ) | (8,939,972 | ) | (3,919,292 | ) | (5,040,742 | ) | (12,240,358 | ) | (9,129,438 | ) | (1,442,711 | ) | (688,744 | ) |
| | |
| Share Transactions * | | | | | | | | | | | | | | | | | |
| Class A: | | | | | | | | | | | | | | | | | |
| Proceeds from shares sold | | 77,149,370 | | 120,347,723 | | 35,084,189 | | 49,928,915 | | 98,812,875 | | 132,897,199 | | 12,765,255 | | 27,171,178 | |
| Value of shares issued for acquisition** | | — | | — | | — | | — | | — | | 364,273,402 | | — | | — | |
| Reinvestment of distributions | | 14,180,566 | | 8,680,216 | | 3,832,840 | | 4,929,086 | | 11,959,990 | | 8,979,608 | | 1,405,678 | | 673,450 | |
| Cost of shares redeemed | | (45,388,826 | ) | (58,568,275 | ) | (34,636,687 | ) | (55,551,297 | ) | (102,325,836 | ) | (151,874,850 | ) | (21,910,294 | ) | (39,969,343 | ) |
| | | 45,941,110 | | 70,459,664 | | 4,280,342 | | (693,296 | ) | 8,447,029 | | 354,275,359 | | (7,739,361 | ) | (12,124,715 | ) |
| | |
| Class B: | | | | | | | | | | | | | | | | | |
| Proceeds from shares sold | | 886,948 | | 1,403,987 | | 226,021 | | 448,256 | | 1,033,089 | | 2,527,142 | | 166,337 | | 403,551 | |
| Value of shares issued for acquisition** | | — | | — | | — | | — | | — | | 9,713,143 | | — | | — | |
| Reinvestment of distributions | | 235,738 | | 137,125 | | 39,240 | | 47,905 | | 183,800 | | 78,581 | | 18,090 | | 6,147 | |
| Cost of shares redeemed | | (1,911,561 | ) | (5,798,871 | ) | (1,155,263 | ) | (3,159,724 | ) | (3,901,627 | ) | (11,271,586 | ) | (432,881 | ) | (1,449,049 | ) |
| | | (788,875 | ) | (4,257,759 | ) | (890,002 | ) | (2,663,563 | ) | (2,684,738 | ) | 1,047,280 | | (248,454 | ) | (1,039,351 | ) |
| Net increase (decrease) from share transactions | | 45,152,235 | | 66,201,905 | | 3,390,340 | | (3,356,859 | ) | 5,762,291 | | 355,322,639 | | (7,987,815 | ) | (13,164,066 | ) |
| Net increase in net assets | | 75,743,623 | | 144,741,453 | | 43,366,855 | | 73,442,855 | | 154,020,182 | | 607,792,593 | | 14,302,075 | | 41,706,611 | |
| | |
| Net Assets | | | | | | | | | | | | | | | | | |
| | |
| Beginning of period | | 542,422,198 | | 397,680,745 | | 398,940,761 | | 325,497,906 | | 1,252,990,101 | | 645,197,508 | | 287,716,243 | | 246,009,632 | |
| End of period† | $ | 618,165,821 | $ | 542,422,198 | $ | 442,307,616 | $ | 398,940,761 | $ | 1,407,010,283 | $ | 1,252,990,101 | $ | 302,018,318 | $ | 287,716,243 | |
| | |
| †Includes undistributed net investment income (deficit) of | $ | (2,641,028) | ) | $ | (361,113 | ) | $ | 2,214,165 | $ | 2,492,483 | $ | 1,868,286 | $ | 7,041,552 | $ | (383,056 | ) | $ | 662,542 | |
| | |
| *Shares Issued and Redeemed | | | | | | | | | | | | | | | | | |
| Class A: | | | | | | | | | | | | | | | | | |
| Sold | | 4,532,421 | | 7,481,618 | | 4,467,751 | | 6,889,242 | | 5,758,987 | | 8,594,359 | | 1,820,643 | | 4,270,231 | |
| Issued for acquisition** | | — | | — | | — | | — | | — | | 25,233,878 | | — | | — | |
| Issued for distributions reinvested | | 846,262 | | 538,948 | | 484,324 | | 665,487 | | 707,014 | | 583,170 | | 202,547 | | 112,055 | |
| Redeemed | | (2,667,809 | ) | (3,674,671 | ) | (4,410,291 | ) | (7,653,713 | ) | (5,963,847 | ) | (9,780,526 | ) | (3,132,976 | ) | (6,246,526 | ) |
| Net increase (decrease) in Class A shares outstanding | | 2,710,874 | | 4,345,895 | | 541,784 | | (98,984 | ) | 502,154 | | 24,630,881 | | (1,109,786 | ) | (1,864,240 | ) |
| | |
| Class B: | | | | | | | | | | | | | | | | | |
| Sold | | 53,170 | | 89,506 | | 29,104 | | 63,260 | | 64,275 | | 174,925 | | 27,489 | | 72,915 | |
| Issued for acquisition** | | — | | — | | — | | — | | — | | 715,868 | | — | | — | |
| Issued for distributions reinvested | | 14,368 | | 8,728 | | 5,081 | | 6,579 | | 11,775 | | 5,836 | | 3,025 | | 1,180 | |
| Redeemed | | (114,417 | ) | (374,806 | ) | (151,230 | ) | (452,496 | ) | (242,718 | ) | (785,200 | ) | (71,624 | ) | (264,395 | ) |
| Net increase (decrease) in Class B shares outstanding | | (46,879 | ) | (276,572 | ) | (117,045 | ) | (382,657 | ) | (166,668 | ) | 111,429 | | (41,110 | ) | (190,300 | ) |
** See Note 10
| | |
| 116 | See notes to financial statements | 117 |
Statements of Changes in Net Assets
FIRST INVESTORS EQUITY FUNDS
| | | | | | | | | | | | | | | | | |
| | | | | | | | | | |
| | | SELECT GROWTH | | OPPORTUNITY | | SPECIAL SITUATIONS | | INTERNATIONAL | |
| | | 10/1/12 to | | 10/1/11 to | | 10/1/12 to | | 10/1/11 to | | 10/1/12 to | | 10/1/11 to | | 10/1/12 to | | 10/1/11 to | |
| | | 3/31/13 | | 9/30/12 | | 3/31/13 | | 9/30/12 | | 3/31/13 | | 9/30/12 | | 3/31/13 | | 9/30/12 | |
| | |
| Increase (Decrease) in Net Assets From Operations | | | | | | | | | | | | | | | | | |
| Net investment income (loss) | $ | 779,017 | $ | (944,001 | ) | $ | 1,228,841 | $ | 4,684,227 | $ | 1,776,167 | $ | 59,936 | $ | 76,847 | $ | 1,276,176 | |
| Net realized gain on investments | | | | | | | | | | | | | | | | | |
| and foreign currency transactions | | 16,073,623 | | 6,874,740 | | 18,473,119 | | 14,703,906 | | 20,247,132 | | 8,831,864 | | 4,756,228 | | 11,215,665 | |
| Net unrealized appreciation of investments | | | | | | | | | | | | | | | | | |
| and foreign currency transactions | | 1,697,321 | | 50,284,387 | | 78,236,242 | | 96,340,656 | | 18,666,891 | | 52,595,947 | | 12,252,753 | | 19,972,563 | |
| | |
| Net increase in net assets resulting from operations | | 18,549,961 | | 56,215,126 | | 97,938,202 | | 115,728,789 | | 40,690,190 | | 61,487,747 | | 17,085,828 | | 32,464,404 | |
| Distributions to Shareholders | | | | | | | | | | | | | | | | | |
| Net investment income – Class A | | — | | — | | (4,707,638 | ) | (2,858,976 | ) | (1,635,146 | ) | (387,088 | ) | — | | (2,142,019 | ) |
| Net investment income – Class B | | — | | — | | (106,969 | ) | (81,714 | ) | (19,139 | ) | — | | — | | (43,360 | ) |
| Net realized gains – Class A | | — | | — | | (14,500,437 | ) | (15,298,237 | ) | (14,034,907 | ) | (22,980,160 | ) | — | | — | |
| Net realized gains – Class B | | — | | — | | (394,685 | ) | (575,152 | ) | (232,335 | ) | (499,531 | ) | — | | — | |
| | |
| Total distributions | | — | | — | | (19,709,729 | ) | (18,814,079 | ) | (15,921,527 | ) | (23,866,779 | ) | — | | (2,185,379 | ) |
| | |
| Share Transactions * | | | | | | | | | | | | | | | | | |
| Class A: | | | | | | | | | | | | | | | | | |
| Proceeds from shares sold | | 24,537,135 | | 45,428,727 | | 50,070,787 | | 71,370,721 | | 25,966,097 | | 43,391,077 | | 28,508,509 | | 27,195,451 | |
| Reinvestment of distributions | | — | | — | | 19,127,611 | | 18,082,699 | | 15,590,531 | | 23,250,649 | | — | | 2,131,981 | |
| Cost of shares redeemed | | (23,383,268 | ) | (32,353,171 | ) | (47,396,827 | ) | (69,018,854 | ) | (28,567,512 | ) | (45,918,661 | ) | (13,686,749 | ) | (21,671,006 | ) |
| | |
| | | 1,153,867 | | 13,075,556 | | 21,801,571 | | 20,434,566 | | 12,989,116 | | 20,723,065 | | 14,821,760 | | 7,656,426 | |
| | |
| Class B: | | | | | | | | | | | | | | | | | |
| Proceeds from shares sold | | 184,302 | | 466,306 | | 547,267 | | 1,148,482 | | 163,709 | | 592,309 | | 149,774 | | 212,184 | |
| Reinvestment of distributions | | — | | — | | 500,972 | | 655,289 | | 251,359 | | 499,190 | | — | | 43,332 | |
| Cost of shares redeemed | | (935,276 | ) | (2,820,737 | ) | (2,147,615 | ) | (6,554,117 | ) | (676,658 | ) | (2,515,486 | ) | (218,945 | ) | (528,475 | ) |
| | |
| | | (750,974 | ) | (2,354,431 | ) | (1,099,376 | ) | (4,750,346 | ) | (261,590 | ) | (1,423,987 | ) | (69,171 | ) | (272,959 | ) |
| | |
| Net increase from share transactions | | 402,893 | | 10,721,125 | | 20,702,195 | | 15,684,220 | | 12,727,526 | | 19,299,078 | | 14,752,589 | | 7,383,467 | |
| | |
| Net increase in net assets | | 18,952,854 | | 66,936,251 | | 98,930,668 | | 112,598,930 | | 37,496,189 | | 56,920,046 | | 31,838,417 | | 37,662,492 | |
| | |
| Net Assets | | | | | | | | | | | | | | | | | |
| | |
| Beginning of period | | 276,872,095 | | 209,935,844 | | 543,015,425 | | 430,416,495 | | 348,023,789 | | 291,103,743 | | 169,125,287 | | 131,462,795 | |
| | |
| End of period† | $ | 295,824,949 | $ | 276,872,095 | $ | 641,946,093 | $ | 543,015,425 | $ | 385,519,978 | $ | 348,023,789 | $ | 200,963,704 | $ | 169,125,287 | |
| | |
| †Includes undistributed net investment income (deficit) of | $ | 120,372 | $ | (658,645 | ) | $ | 1,098,363 | $ | 4,684,129 | $ | 181,811 | $ | 59,929 | $ | (115,007 | ) | $ | (191,854 | ) |
| | |
| *Shares Issued and Redeemed | | | | | | | | | | | | | | | | | |
| Class A: | | | | | | | | | | | | | | | | | |
| Sold | | 3,063,052 | | 6,092,740 | | 1,623,122 | | 2,548,556 | | 1,056,643 | | 1,789,639 | | 2,340,860 | | 2,533,422 | |
| Issued for distributions reinvested | | — | | — | | 645,331 | | 698,983 | | 658,662 | | 1,025,613 | | — | | 211,506 | |
| Redeemed | | (2,920,602 | ) | (4,326,019 | ) | (1,538,724 | ) | (2,461,213 | ) | (1,163,450 | ) | (1,890,583 | ) | (1,124,218 | ) | (2,016,988 | ) |
| | |
| Net increase in Class A shares outstanding | | 142,450 | | 1,766,721 | | 729,729 | | 786,326 | | 551,855 | | 924,669 | | 1,216,642 | | 727,940 | |
| | |
| Class B: | | | | | | | | | | | | | | | | | |
| Sold | | 25,307 | | 69,714 | | 20,936 | | 47,887 | | 7,888 | | 28,575 | | 12,714 | | 20,483 | |
| Issued for distributions reinvested | | — | | — | | 19,864 | | 29,425 | | 12,644 | | 25,851 | | — | | 4,440 | |
| Redeemed | | (128,753 | ) | (421,243 | ) | (81,969 | ) | (275,737 | ) | (32,630 | ) | (122,401 | ) | (18,652 | ) | (51,884 | ) |
| | |
| Net decrease in Class B shares outstanding | | (103,446 | ) | (351,529 | ) | (41,169 | ) | (198,425 | ) | (12,098 | ) | (67,975 | ) | (5,938 | ) | (26,961 | ) |
| | |
| 118 | See notes to financial statements | 119 |
Notes to Financial Statements
FIRST INVESTORS INCOME FUNDS
FIRST INVESTORS EQUITY FUNDS
March 31, 2013
1. Significant Accounting Policies—First Investors Income Funds (“Income Funds”) and First Investors Equity Funds (“Equity Funds”), each a Delaware statutory trust (each a “Trust”, collectively, “the Trusts”), are registered under the Investment Company Act of 1940 (the “1940 Act”) as diversified open-end management investment companies and operate as series funds. The International Opportunities Bond Fund is registered as a non-diversified series of the Income Funds. The Income Funds issue shares of beneficial interest in the Cash Management Fund, Government Fund, Investment Grade Fund, International Opportunities Bond Fund and Fund For Income. The Equity Funds issue shares of beneficial interest in the Total Return Fund, Equity Income Fund (formerly Value Fund), Growth & Income Fund, Global Fund, Select Growth Fund, Opportunity Fund, Special Situations Fund and International Fund (each a “Fund”, collectively, “the Funds”). The Trusts account separately for the assets, liabilities and operations of each Fund. The objective of each Fund as of March 31, 2013 is as follows:
Cash Management Fund seeks to earn a high rate of current income consistent with the preservation of capital and maintenance of liquidity.
Government Fund seeks to achieve a significant level of current income which is consistent with security and liquidity of principal.
Investment Grade Fund seeks to generate a maximum level of income consistent with investment in investment grade debt securities.
International Opportunities Bond Fund seeks total return consisting of income and capital appreciation.
Fund For Income seeks high current income.
Total Return Fund seeks high, long-term total investment return consistent with moderate investment risk.
Equity Income Fund seeks total return.
Growth & Income Fund seeks long-term growth of capital and current income.
Global Fund seeks long-term capital growth.
Select Growth Fund seeks long-term growth of capital.
Opportunity Fund seeks long-term capital growth.
Special Situations Fund seeks long-term growth of capital.
International Fund primarily seeks long-term capital growth.
A. Security Valuation—Except as provided below, a security listed or traded on an exchange or the Nasdaq Stock Market is valued at its last sale price on the exchange or market where the security is principally traded, and lacking any sales, the security is valued at the mean between the closing bid and asked prices. Securities traded in the over-the-counter ("OTC") market (including securities listed on exchanges whose primary market is believed to be OTC) are valued at the mean between the last bid and asked prices based on quotes furnished by a market maker for such securities. Securities may also be priced by pricing services approved by the Trusts’ Board of Trustees (the “Board”). The pricing services consider security type, rating, market condition and yield data as well as market quotations, prices provided by market makers and other available information in determining value. Short-term debt securities that mature in 60 days or less are valued at amortized cost.
The Funds monitor for significant events occurring prior to the close of trading on the New York Stock Exchange that could have a material impact on the value of any securities that are held by the Funds. Examples of such events include trading halts, natural disasters, political events and issuer-specific developments. If the Valuation Committee of First Investors Management Company, Inc. (“FIMCO”) decides that such events warrant using fair value estimates, it will take such events into consideration in determining the fair values of such securities. If market quotations or prices are not readily available or determined to be unreliable, the securities will be valued at fair value as determined in good faith pursuant to procedures adopted by the Board. The Funds also use a pricing service to fair value foreign equity securities in the event that fluctuation in U.S. securities markets exceed a predetermined level or if a foreign market is closed. For valuation purposes, where applicable, quotations of foreign securities in foreign currency are translated to U.S. dollar equivalents using the foreign exchange quotation in effect. As of March 31, 2013, Fund For Income held four securities that were fair valued by FIMCO’s Valuation Committee with an aggregate value of $2,775, representing 0% of the Fund’s net assets.
The Cash Management Fund values its portfolio securities in accordance with the amortized cost method of valuation under Rule 2a-7 of the 1940 Act. Amortized cost is an approximation of market value of an instrument, whereby the difference between its acquisition cost and market value at maturity is amortized on a straight-line basis over the remaining life of the instrument. The effect of changes in the market value of a security as a result of fluctuating interest rates is not taken into account and thus the amortized cost method of valuation may result in the value of a security being higher or lower than its actual market value.
Notes to Financial Statements (continued)
FIRST INVESTORS INCOME FUNDS
FIRST INVESTORS EQUITY FUNDS
March 31, 2013
In accordance with Accounting Standards Codification (“ASC”) 820 “Fair Value Measurements and Disclosures” (“ASC 820”), investments held by the Funds are carried at “fair value”. As defined by ASC 820, fair value is the price that a Fund would receive upon selling an investment in an orderly transaction to an independent buyer in the principal or most advantageous market for the investment under current market conditions. Various inputs are used in determining the value of the Funds’ investments.
In addition to defining fair value, ASC 820 established a three-tier hierarchy of inputs to establish a classification of fair value measurements for disclosure purposes. The three-tier hierarchy of inputs is summarized in the three broad Levels listed below:
Level 1 — Unadjusted quoted prices in active markets for identical securities that the Fund has the ability to access.
Level 2 — Observable inputs other than quoted prices included in Level 1 that are observable for the asset or liability, either directly or indirectly. These inputs may include quoted prices for the identical instrument on an inactive market, prices for similar instruments, interest rates, prepayment speeds, credit risk, yield curves, default rates and similar data.
Level 3 — Unobservable inputs for the asset or liability, to the extent relevant observable inputs are not available, representing the Fund's own assumption about the assumptions a market participant would use in valuing the asset or liability, and would be based on the best information available.
Equity securities traded on an exchange or the Nasdaq Stock Market are categorized in Level 1 of the fair value hierarchy to the extent that they are actively traded and valuation adjustments are not applied. Foreign securities that are fair valued in the event that fluctuations in U.S. securities markets exceed a predetermined level or if a foreign market is closed are categorized in Level 2. Corporate, sovereign and municipal bonds, asset backed, U.S. Government and U.S. Government Agency securities and Loan Participations are categorized in Level 2 to the extent that the inputs are observable and timely, otherwise they would be categorized as Level 3. Short-term notes that are valued at amortized cost are categorized in Level 2. Foreign exchange contracts that are considered derivative instruments and are valued at the net unrealized appreciation or depreciation on the instruments are categorized in Level 2. Restricted securities and securities that are fair valued by the Valuation Committee may be categorized in either Level 2 or Level 3 of the fair value hierarchy depending on the relative significance of valuation inputs.
The aggregate value by input level, as of March 31, 2013, for each Fund’s investments is included at the end of each Fund’s portfolio of investments.
B. Federal Income Taxes—No provision has been made for federal income taxes on net income or capital gains since it is the policy of each Fund to continue to comply with the special provisions of the Internal Revenue Code applicable to investment companies, and to make sufficient distributions of income and capital gains (in excess of any available capital loss carryovers) to relieve it from all, or substantially all, such taxes. At September 30, 2012, capital loss carryovers were as follows:
| | | | | | | | | | | | | | | | | | | | |
| | | | | | | | | | | | | | | | | | | Not Subject to |
| | | | | Year Capital Loss Carryovers Expire | | Expiration |
| | | | | | | | | | | | | | | | | | | Long | | Short |
| Fund | | Total | | 2013 | | 2014 | | 2015 | | 2016 | | 2017 | | 2018 | | 2019 | | Term | | Term |
| Government | | $3,660,378 | | $ — | | $ 646,760 | | $ 1,909,473 | | $1,063,550 | | $ — | | $ — | | $ 40,595 | | $ — | | $ — |
| Investment | | | | | | | | | | | | | | | | | | | | |
| Grade | | 19,426,536 | | — | | — | | — | | — | | 19,426,536 | | — | | — | | — | | — |
| Fund For | | | | | | | | | | | | | | | | | | | | |
| Income | | 181,922,972 | | 10,200,012 | | 7,456,986 | | 24,660,250 | | 5,033,118 | | 23,949,720 | | 110,622,886 | | — | | — | | — |
| Equity | | | | | | | | | | | | | | | | | | | | |
| Income | | 18,542,271 | | — | | — | | — | | — | | — | | 18,524,300 | | — | | 17,971 | | — |
| Growth & | | | | | | | | | | | | | | | | | | | | |
| Income* | | 271,818 | | — | | — | | — | | — | | — | | — | | 271,818 | | — | | — |
| Global | | 26,490,247 | | — | | — | | — | | — | | — | | 24,434,029 | | — | | — | | 2,056,218 |
| Select | | | | | | | | | | | | | | | | | | | | |
| Growth | | 68,076,131 | | — | | — | | — | | — | | 23,869,023 | | 44,207,108 | | — | | — | | — |
| International | | 33,194,023 | | — | | — | | — | | — | | 10,097,507 | | 20,905,274 | | 2,191,242 | | — | | — |
*Due to a tax free reorganization on December 9, 2011 with the Blue Chip Fund that was approved by the Equity Funds’ Board of Trustees, the Fund will have available for utilization $527,496 in capital loss carryovers that will become available for taxable year 2013 and will expire in 2019 (see Note 10).
As a result of the passage of the Regulated Investment Company Modernization Act of 2010 (“the Modernization Act of 2010”), losses incurred in this fiscal year and beyond retain their character as short-term or long-term, have no expiration date and are utilized prior to capital loss carryovers occurring prior to the enactment of the Modernization Act of 2010.
The Funds recognize the tax benefits of uncertain tax positions only where the position is “more likely than not” to be sustained assuming examination by tax authorities. Management has analyzed the Funds’ tax positions, and has concluded that no liability for unrecognized tax benefits should be recorded related to uncertain tax positions taken on returns filed for open tax years 2009 – 2011, or expected to be taken in the Funds’ 2012 tax returns. The Funds identify their major tax jurisdictions as U.S. Federal, New York State, New York City and foreign jurisdictions where the Funds make significant investments; however, the Funds are not aware of any tax position for which it is reasonably possible that the total amounts of unrecognized tax benefits will change materially in the next twelve months.
Notes to Financial Statements (continued)
FIRST INVESTORS INCOME FUNDS
FIRST INVESTORS EQUITY FUNDS
March 31, 2013
C. Distributions to Shareholders—Dividends from net investment income of the Government Fund, Investment Grade Fund, International Opportunities Bond Fund and Fund For Income are generally declared daily and paid monthly. The Cash Management Fund declares distributions, if any, daily and pays distributions monthly. Distributions are declared from the total of net investment income plus or minus all realized short-term gains and losses on investments. Dividends from net investment income, if any, of Total Return Fund, Equity Income Fund and Growth & Income Fund are declared and paid quarterly. Dividends from net investment income, if any, of Global Fund, Select Growth Fund, Opportunity Fund, Special Situations Fund and International Fund are declared and paid annually. Distributions from net realized capital gains, if any, of each of the Funds are normally declared and paid annually. Income dividends and capital gain distributions are determined in accordance with income tax regulations which may differ from accounting principles generally accepted in the United States of America. These differences are primarily due to differing treatments for capital loss carryforwards, deferral of wash sales losses, post-October capital losses, late loss deferrals, net operating losses and foreign currency transactions.
D. Expense Allocation—Expenses directly charged or attributable to a Fund are paid from the assets of that Fund. General expenses of the Trusts are allocated among and charged to the assets of each Fund on a fair and equitable basis, which may be based on the relative assets of each Fund or the nature of the services performed and relative applicability to each Fund.
E. Use of Estimates—The preparation of the financial statements in conformity with accounting principles generally accepted in the United States of America requires management to make estimates and assumptions that affect the reported amounts of assets and liabilities at the date of the financial statements and the reported amounts of revenue and expense during the reporting period. Actual results could differ from those estimates.
F. Foreign Currency Translations and Transactions—The accounting records of the International Opportunities Bond Fund, Global Fund and International Fund are maintained in U.S. dollars. Portfolio securities and other assets and liabilities denominated in foreign currencies are translated into U.S. dollars at the date of valuation. Purchases and sales of investment securities, dividend income and certain expenses are translated to U.S. dollars at the prevailing rates of exchange on the respective dates of such transactions.
The International Opportunities Bond Fund, Global Fund and International Fund do not isolate that portion of gains and losses on investments which is due to changes
in foreign exchange rates from that which is due to changes in market prices of the investments. These changes are included with the net realized and unrealized gains and losses from investments.
The International Opportunities Bond Fund, Global Fund and International Fund may enter into spot currency transactions in connection with the settlement of transactions in securities traded in foreign currency to manage exposure to foreign exchange risk between the trade date and the settlement date of such transactions. The Funds could be exposed to risk if counter parties to the contracts are unable to meet the terms of their contracts or if the value of the foreign currency changes unfavorably. Net realized and unrealized gains and losses on foreign currency transactions include gains and losses from the sales of spot currency transactions and gains and losses on accrued foreign dividends and related withholding taxes.
G. Other—Security transactions are generally accounted for on the first business day following the date the securities are purchased or sold, except for financial reporting purposes, which is trade date. Investments in securities issued on a when-issued or delayed delivery basis are generally reflected in the assets of the Funds on the first business day following the date the securities are purchased and the Funds segregate assets for these transactions. Cost is determined and gains and losses are based on the identified cost basis for securities for both financial statement and federal income tax purposes. Dividend income is recorded on the ex-dividend date or for certain foreign dividends, as soon as the Fund becomes aware of the dividends. Interest income and estimated expenses are accrued daily. Bond discounts and premiums are accreted or amortized using the interest method. Withholding taxes on foreign dividends have been provided in accordance with the Funds’ understanding of the applicable country’s tax rules and rates. The Bank of New York Mellon, custodian for the Cash Management Fund, Government Fund, Investment Grade Fund and Fund For Income, may provide credits against custodian charges based on uninvested cash balance of the Funds. For the six months ended March 31, 2013, the Bank of New York Mellon has provided credits in the amount of $13. Brown Brothers Harriman & Co. serves as custodian for the International Opportunities Bond Fund and each Fund in the Equity Funds. The Funds reduced expenses through brokerage service arrangements. For the six months ended March 31, 2013, expenses were reduced by $2,167 for the Income Funds and by $10,243 for the Equity Funds under these arrangements.
2. Security Transactions—For the six months ended March 31, 2013, purchases and sales of securities and long-term U.S. Government obligations (excluding U.S. Treasury bills, short-term securities and foreign currencies) were as follows:
Notes to Financial Statements (continued)
FIRST INVESTORS INCOME FUNDS
FIRST INVESTORS EQUITY FUNDS
March 31, 2013
| | | | | | | |
| | | | | | Long-Term U.S. |
| | Securities | | Government Obligations |
| | Cost of | | Proceeds | | Cost of | | Proceeds |
| Fund | Purchases | | of Sales | | Purchases | | of Sales |
| Government | $130,941,521 | | $135,582,687 | | $13,865,213 | | $5,028,906 |
| Investment Grade | 113,115,171 | | 85,916,135 | | — | | — |
| International | | | | | | | |
| Opportunities Bond | 64,436,621 | | 14,722,944 | | — | | — |
| Fund For Income | 225,850,646 | | 207,504,919 | | — | | — |
| Total Return | 104,268,160 | | 71,196,349 | | 6,028,531 | | 2,135,369 |
| Equity Income | 67,815,982 | | 72,813,362 | | — | | — |
| Growth & Income | 114,591,299 | | 134,510,618 | | — | | — |
| Global | 141,006,188 | | 151,675,621 | | — | | — |
| Select Growth | 92,153,516 | | 92,402,998 | | — | | — |
| Opportunity | 88,702,066 | | 108,302,854 | | — | | — |
| Special Situations | 148,912,799 | | 136,155,905 | | — | | — |
| International | 42,801,628 | | 30,405,530 | | — | | — |
At March 31, 2013, aggregate cost and net unrealized appreciation of securities for federal income tax purposes were as follows:
| | | | | | | | |
| | | | | Gross | | Gross | | Net |
| | | Aggregate | | Unrealized | | Unrealized | | Unrealized |
| Fund | | Cost | | Appreciation | | Depreciation | | Appreciation |
| Government | | $370,959,684 | | $ 12,389,084 | | $ 1,172,425 | | $ 11,216,659 |
| Investment Grade | | 509,906,803 | | 45,722,282 | | 550,484 | | 45,171,798 |
| International | | | | | | | | |
| Opportunities Bond | | 73,842,798 | | 972,523 | | 924,260 | | 48,263 |
| Fund For Income | | 595,526,095 | | 32,010,921 | | 7,399,160 | | 24,611,761 |
| Total Return | | 482,410,231 | | 136,558,946 | | 4,160,037 | | 132,398,909 |
| Equity Income | | 340,707,595 | | 104,343,221 | | 4,381,051 | | 99,962,170 |
| Growth & Income | | 968,302,098 | | 455,833,777 | | 16,896,309 | | 438,937,468 |
| Global | | 243,933,296 | | 58,952,456 | | 3,320,936 | | 55,631,520 |
| Select Growth | | 219,517,962 | | 76,753,308 | | 1,052,430 | | 75,700,878 |
| Opportunity | | 430,216,160 | | 216,433,370 | | 4,948,900 | | 211,484,470 |
| Special Situations | | 298,531,572 | | 90,556,779 | | 6,213,311 | | 84,343,468 |
| International | | 149,682,172 | | 55,925,715 | | 3,985,959 | | 51,939,756 |
3. Advisory Fee and Other Transactions With Affiliates—Certain officers of the Trusts are officers and directors of the Trusts’ investment adviser, FIMCO, their underwriter, First Investors Corporation (“FIC”), and their transfer agent,
Administrative Data Management Corp. (“ADM”). Trustees of the Trusts who are not officers or directors of FIMCO or its affiliates are remunerated by the Funds. For the six months ended March 31, 2013, total trustees fees accrued by the Income Funds and Equity Funds amounted to $53,629 and $120,107, respectively.
The Investment Advisory Agreements provide as compensation to FIMCO for each Fund, an annual fee, payable monthly, at the following rates:
Cash Management Fund—.50% of the Fund’s average daily net assets. For the six months ended March 31, 2013, FIMCO has voluntarily waived $238,614 in advisory fees to limit the Fund’s overall expense ratio to .60% on Class A shares and 1.35% on Class B shares. Also, FIMCO has voluntarily waived an additional $112,714 in advisory fees and assumed $222,993 of other Fund expenses to prevent a negative yield on the Fund’s shares.
Government and Investment Grade Funds—.66% on the first $500 million of each Fund’s average daily net assets, declining by .02% on each $500 million thereafter, down to .60% on average daily net assets over $1.5 billion. For the six months ended March 31, 2013, FIMCO has voluntarily waived $212,270 in advisory fees on Government Fund and $300,638 in advisory fees on Investment Grade Fund to limit the advisory fee to .55% of each Fund’s average daily net assets.
International Opportunities Bond Fund and Fund For Income—.75% on the first $250 million of each Fund’s average daily net assets, .72% on the next $250 million, .69% on the next $250 million, .66% on the next $500 million, declining by .02% on each $500 million thereafter, down to .60% on average daily net assets over $2.25 billion. For the six months ended March 31, 2013, FIMCO has waived, pursuant to an expense limitation agreement, $183,352 in advisory fees and assumed $30,874 in other Fund expenses to limit the International Opportunities Bond Fund’s overall expense ratio to 1.30% on Class A shares. For the six months ended March 31, 2013, FIMCO has voluntarily waived $81,213 in advisory fees on Fund For Income to limit the advisory fee to .70% of the Fund’s average daily net assets.
Total Return, Equity Income, Growth & Income, Select Growth, and Opportunity Funds—.75% on the first $300 million of each Fund’s average daily net assets, .72% on the next $200 million, .69% on the next $250 million, .66% on the next $500 million, declining by .02% on each $500 million thereafter, down to .60% on average daily net assets over $2.25 billion.
Special Situations Fund—1% on the first $200 million of the Fund’s average daily net assets, .75% on the next $300 million, .72% on the next $250 million, .69% on the next $250 million, .66% on the next $500 million, and .64% on average daily
Notes to Financial Statements (continued)
FIRST INVESTORS INCOME FUNDS
FIRST INVESTORS EQUITY FUNDS
March 31, 2013
net assets over $1.5 billion. For the six months ended March 31, 2013, FIMCO has voluntarily waived $160,093 in advisory fees to limit the advisory fee to .80% of the Fund’s average daily net assets.
Global Fund—.95% on the first $600 million of the Fund’s average daily net assets, .92% on the next $400 million, .90% on the next $500 million and .88% on average daily net assets over $1.5 billion.
International Fund—.98% on the first $300 million of the Fund’s average daily net assets, .95% on the next $300 million, .92% on the next $400 million, .90% on the next $500 million and .88% on average daily net assets over $1.5 billion.
For the six months ended March 31, 2013, total advisory fees accrued to FIMCO by the Income Funds and Equity Funds were $5,881,343 and $15,129,883, respectively, of which $1,128,819 and $160,093, respectively, was voluntarily waived by FIMCO as noted above.
FIMCO has entered into an expense limitation agreement with the International Opportunities Bond Fund (“IOBF”) to limit IOBF’s total annual fund operating expenses (exclusive of interest expenses, taxes, brokerage commissions, acquired fund fees and expenses, dividend costs related to short sales, and extraordinary expenses, such as litigation expenses, if any) to 1.30% of the average daily net assets on the Class A shares. The agreement expires on January 31, 2014. For the six months ended March 31, 2013, FIMCO assumed $214,226, including $78,710 of offering expenses amortized in connection with the organization of IOBF under the terms of the agreement. FIMCO and IOBF have agreed that any expenses of IOBF assumed by FIMCO pursuant to this agreement be repaid to FIMCO by IOBF within three years after the date the fee limitation and/or expense reimbursement has been made by FIMCO, provided that such repayment does not cause the expenses of IOBF’s Class A shares to exceed the foregoing limits. The expense limitation agreement may be terminated or amended prior to January 31, 2014 with the approval of IOBF’s Board of Trustees. For the period August 20, 2012 (commencement of operations) to March 31, 2013, the total organizational expenses and expenses incurred in excess of the above stated limitations was $352,353.
For the six months ended March 31, 2013, FIC, as underwriter, received from the Income Funds and Equity Funds $3,321,902 and $9,563,465, respectively, in commissions in connection with the sale of shares of the Funds, after allowing $7,253 and $20,166, respectively, to other dealers. For the six months ended March 31, 2013, shareholder servicing costs for the Income Funds and Equity Funds included $1,162,271 (of which $23,541 was voluntarily waived by ADM on the Cash Management Fund) and $3,469,164,
respectively, in transfer agent fees accrued to ADM and $228,300 and $1,003,068, respectively, in retirement accounts custodian fees accrued to ADM.
Pursuant to Distribution Plans adopted under Rule 12b-1 of the 1940 Act, each Fund, other than the Cash Management Fund, is authorized to pay FIC a fee up to .30% of the average daily net assets of the Class A shares and 1% of the average daily net assets of the Class B shares on an annualized basis each fiscal year, payable monthly. The Cash Management Fund is authorized to pay FIC a fee up to 1% of the average daily net assets of the Class B shares. The fee consists of a distribution fee and a service fee. The service fee is paid for the ongoing servicing of clients who are shareholders of that Fund. For the six months ended March 31, 2013, total distribution plan fees accrued to FIC by the Income Funds and Equity Funds amounted to $2,481,331 and $6,203,184, respectively.
Brandywine Global Investment Management, LLC, serves as investment subadviser to International Opportunities Bond Fund, Muzinich & Co., Inc., serves as investment subadviser to Fund For Income, Wellington Management Company, LLP serves as investment subadviser to Global Fund, Smith Asset Management Group, L.P. serves as investment subadviser to Select Growth Fund, Paradigm Capital Management, Inc. serves as investment subadviser to Special Situations Fund, and Vontobel Asset Management, Inc. serves as investment subadviser to International Fund. The subadvisers are paid by FIMCO and not by the Funds.
4. Restricted Securities—Certain restricted securities are exempt from the registration requirements under Rule 144A of the Securities Act of 1933 and may only be sold to qualified institutional investors. Unless otherwise noted, these 144A securities are deemed to be liquid. At March 31, 2013, Investment Grade Fund held twenty-five 144A securities with an aggregate value of $94,368,237 representing 16.7% of the Fund’s net assets, International Opportunities Bond Fund held two 144A securities with a value of $1,389,214 representing 1.8% of the Fund’s net assets, Fund For Income held one hundred-eight 144A securities with an aggregate value of $226,781,014 representing 35.2% of the Fund’s net assets, Total Return Fund held twenty-three securities with an aggregate value of $25,540,442 representing 4.1% of the Fund’s net assets. Certain restricted securities are exempt from the registration requirements under Section 4(2) of the Securities Act of 1933 and may only be sold to qualified investors. Unless otherwise noted, these Section 4(2) securities are deemed to be liquid. At March 31, 2013, Cash Management Fund held two Section 4(2) securities with an aggregate value of $7,997,163 representing 5.7% of the Fund’s net assets. These securities are valued as set forth in Note 1A.
Notes to Financial Statements (continued)
FIRST INVESTORS INCOME FUNDS
FIRST INVESTORS EQUITY FUNDS
March 31, 2013
5. High Yield Credit Risk—The investments of Fund For Income in high yield securities whether rated or unrated may be considered speculative and subject to greater market fluctuations and risks of loss of income and principal than lower-yielding, higher-rated, fixed-income securities. The risk of loss due to default by the issuer may be significantly greater for holders of high-yielding securities, because such securities are generally unsecured and are often subordinated to other creditors of the issuer.
6. Foreign Exchange Contracts—The International Opportunities Bond Fund may enter into foreign exchange contracts for the purchase or sale of foreign currencies at negotiated rates at future dates. These contracts are considered derivative instruments and are used to decrease exposure to foreign exchange risk associated with foreign currency denominated securities held by the Fund. The Fund could be exposed to risk if counter parties to the contracts are unable to meet the terms of their contracts or if the value of the foreign currency changes unfavorably. Foreign exchange contracts are “marked-to-market” daily at the applicable translation rate and the resulting unrealized gains and losses are reflected in the Fund’s assets.
The International Opportunities Bond Fund had the following foreign exchange contracts open at March 31, 2013:
| | | | | | | |
| Contracts to Buy | | | | | | | Unrealized |
| Foreign Currency | | | In Exchange for | | Settlement Date | | Gain (Loss) |
| 1,946,000 | Euro | | US $2,581,741 | | 5/7/13 | | US $(82,897) |
| 1,115,000,000 | Colombian Peso | | 2,276,427 | | 5/15/13 | | 87,113 |
| 220,000,000 | Colombian Peso | | 461,168 | | 6/10/13 | | 5,181 |
| 170,000,000 | Indian Rupee | | 3,074,141 | | 6/19/13 | | 53,734 |
| 1,150,000 | Brazilian Real | | 573,220 | | 8/30/13 | | (2,883) |
| | | | $8,966,697 | | | | $60,248 |
| |
| Contracts to Sell | | | | | | | Unrealized |
| Foreign Currency | | | In Exchange for | | Settlement Date | | Gain (Loss) |
| 3,803,000 | Euro | | US $ 4,962,592 | | 5/7/13 | | US $ 79,187 |
| 9,640,000 | Australian Dollar | | 9,892,111 | | 5/10/13 | | (158,035) |
| 1,393,000,000 | Korean Won | | 1,260,080 | | 5/13/13 | | 8,057 |
| 3,671,000 | New Zealand Dollar | | 3,001,080 | | 6/14/13 | | (75,211) |
| 1,150,000 | Brazilian Real | | 565,722 | | 8/30/13 | | (4,615) |
| | | | $19,681,585 | | | | $(150,617) |
| Net Unrealized Loss on Foreign Exchange Contracts | | | | $ (90,369) |
Fair Value of Derivative Instruments — The fair value of derivative instruments on the International Opportunities Bond Fund as of March 31, 2013, was as follows:
| | | | | | | | |
| | | Asset Derivatives | | Liability Derivatives |
| Derivatives not accounted for | | | | | | | | |
| as hedging instruments under | | Statements of Assets | | | | Statements of Assets | | |
| ASC 815 | | and Liabilities Location | | Value | | and Liabilities Location | | Value |
| Foreign exchange contracts: | | Unrealized appreciation | | | | Unrealized depreciation | | |
| | | of foreign exchange | | | | of foreign exchange | | |
| | | contracts | | $233,273 | | contracts | | $323,642 |
The effect of International Opportunities Bond Fund’s derivative instruments on the Statement of Operations is as follows:
| |
| Amount of Realized Gain or Loss Recognized on Derivatives | |
| Derivatives not accounted | Net Realized Gain |
| for as hedging instruments | on Foreign Currency |
| under ASC 815 | Transactions |
| Foreign exchange currency contract transactions: | |
| International Opportunities Bond Fund | | $182,417 |
| |
| |
| Amount of Change in Unrealized Gain or Loss Recognized on Derivatives | |
| Derivatives not accounted | Net Unrealized Depreciation |
| for as hedging instruments | on Foreign Currency |
| under ASC 815 | Transactions |
| Foreign exchange currency contract transactions: | |
| International Opportunities Bond Fund | | $(116,750) |
7. Capital—The Trusts are authorized to issue an unlimited number of shares of beneficial interest without par value. The Trusts consist of the Funds listed on the cover page, each of which is a separate and distinct series of the Trusts. Each Fund has designated four classes of shares, Class A shares, Class B shares, Institutional Class shares and Advisor Class shares (each, a “Class”) except for Cash Management Fund, which has only designated Class A, Class B and Institutional Class shares and International Opportunities Bond Fund, which has only designated Class A, Institutional Class and Advisor Class shares. Each share of each Class has an equal beneficial interest in the assets, has identical voting, dividend, liquidation and other rights and is subject to the same terms and conditions except that expenses allocated to a Class may be borne solely by that Class as determined by the Trustees and a Class may have exclusive voting rights with respect to matters affecting only that Class. Cash Management Fund’s Class A and Class B shares are sold without an initial sales charge; however, its Class B shares may only be acquired through an exchange of
Notes to Financial Statements (continued)
FIRST INVESTORS INCOME FUNDS
FIRST INVESTORS EQUITY FUNDS
March 31, 2013
Class B shares from another First Investors eligible Fund or through the reinvestment of dividends on Class B shares and are generally subject to a contingent deferred sales charge at the rate of 4% in the first year and declining to 0% over a six-year period, which is payable to FIC as underwriter of the Trusts. The Class A and Class B shares sold by the other Funds have a public offering price that reflects different sales charges and expense levels. Class A shares are sold with an initial sales charge of up to 5.75% of the amount invested and together with the Class B shares are subject to distribution plan fees as described in Note 3. Class B shares are sold without an initial sales charge, but are generally subject to a contingent deferred sales charge which declines in steps from 4% to 0% over a six-year period. Class B shares automatically convert into Class A shares after eight years. Realized and unrealized gains or losses, investment income and expenses (other than distribution plan fees) are allocated daily to each class of shares based upon the relative proportion of net assets to each class. Institutional Class shares were made available for sale on April 1, 2013. Advisor Class shares will not be offered for sale until September 2013. Not all Classes of shares of a Fund may be available for sale in all jurisdictions. Institutional Class shares and Advisor Class shares are sold without an initial or contingent deferred sales charge.
8. New Accounting Pronouncements—In December 2011, Financial Accounting Standards Board issued Accounting Standards Update (“ASU”) No. 2011-11, Balance Sheet (Topic 210): Disclosures about Offsetting Assets and Liabilities (“ASU 2011-11”). ASU 2011-11 relates to disclosures about offsetting assets and liabilities.
In January 2013, the Financial Accounting Standards Board issued Accounting Standards Update No. 2013-01, Clarifying the Scope of Disclosures about Offsetting Assets and Liabilities (“ASU 2013-01”). This update gives additional clarifications to ASU 2011-11. The amendments in ASU 2013-01 require and entity to disclose information about offsetting and related arrangements to enable user of its financial statements to understand the effect of those arrangements on its financial position. ASU 2013-01 is effective for annual reporting periods beginning on or after January 1, 2013, and interim periods within those annual periods. The guidance requires retrospective applications for all comparative periods presented. At this time, management is evaluating the implications of ASU 2013-01 and its impact on the financial statements.
9. Subsequent Events—Subsequent events occurring after March 31, 2013 have been evaluated for potential impact to this report through the date the financial statements were issued. There were no subsequent events to report that would have a material impact on the Funds’ financial statements.
10. Reorganization of Blue Chip Fund into Growth & Income Fund—On December 9, 2011, the Growth & Income Fund acquired all of the net assets of the Blue Chip Fund in connection with a tax-free reorganization that was approved by the Equity Funds’ Board of Trustees. The Growth & Income Fund issued 25,233,878 Class A shares and 715,868 Class B shares to the Blue Chip Fund in connection with the reorganization. In return, it received net assets of $373,986,545 from the Blue Chip Fund (which included $31,271,862 of unrealized appreciation and $17,652,665 of accumulated net realized losses). The Growth & Income Fund’s shares were issued at their current net asset values as of the date of the reorganization. The aggregate net assets of the Growth & Income Fund and Blue Chip Fund immediately before the acquisition were $1,106,393,661 consisting of, with respect to Growth & Income Fund, $732,407,116 ($712,314,779 Class A and $20,092,337 Class B) and, with respect to Blue Chip Fund, $373,986,545 ($364,273,402 Class A and $9,713,143 Class B).
11. Litigation—The Blue Chip and Equity Income Funds have been named, and have received notice that they may be putative members of the proposed defendant class of shareholders, in a lawsuit filed in the United States Bankruptcy Court for the District of Delaware on November 1, 2010, by the Official Committee of Unsecured Creditors of Tribune Company (the "Committee"). The Committee is seeking to recover all payments made to beneficial owners of common stock in connection with a leveraged buyout of the Tribune Company (“LBO”), including payments made in connection with a 2007 tender offer into which the Blue Chip and Equity Income Funds tendered their shares of common stock of the Tribune Company. On December 9, 2011, the Blue Chip Fund was reorganized into the Growth & Income Fund pursuant to a Plan of Reorganization and Termination, whereby all of the assets of the Blue Chip Fund were transferred to the Growth & Income Fund, the Growth & Income Fund assumed all of the liabilities of the Blue Chip Fund, including any contingent liabilities with respect to pending or threatened litigation or actions, and shareholders of Blue Chip Fund became shareholders of Growth & Income Fund. The adversary proceeding by the Committee has been stayed since it was filed (other than for limited discovery and service of the complaint). The adversary proceeding brought by the Committee has been transferred to the Southern District of New York and consolidated with other similar suits as discussed below. In addition, on June 2, 2011, the Blue Chip and Equity Income Funds were named as defendants in a lawsuit brought in connection with the Tribune Company's LBO by Deutsche Bank Trust Company Americas, in its capacity as successor indenture trustee for a certain series of Senior Notes, Law Debenture Trust Company of New York, in its capacity as successor indenture trustee for a certain series of Senior Notes, and Wilmington Trust Company, in its capacity as successor indenture trustee for the PHONES Notes
Notes to Financial Statements (continued)
FIRST INVESTORS INCOME FUNDS
FIRST INVESTORS EQUITY FUNDS
March 31, 2013
(together, the "Bondholder Plaintiffs") in the Supreme Court of the State of New York. This suit has been removed to the United States District Court for the Southern District of New York and consolidated with other substantially similar suits against other former Tribune shareholders. The Bondholder Plaintiffs also seek to recover payments of the proceeds of the LBO. The extent of the Funds' potential liability in any such actions has not been determined. The Funds have been advised by counsel that the Funds could be held liable to return all or part of the proceeds received in any of these actions, as well as interest and court costs, even though the Funds had no knowledge of, or participation in, any misconduct. The Equity Income Fund received proceeds of $1,526,566 in connection with the LBO, representing 0.35% of its net assets as of March 31, 2013. The Blue Chip Fund received proceeds of $790,772 in connection with the LBO, representing 0.06% of the net assets of Growth & Income Fund as of March 31, 2013. The Equity Income and Growth & Income Funds cannot predict the outcomes of these proceedings, and thus have not accrued any of the amounts sought in the various actions in the accompanying financial statements.
12. New Fund—On December 13, 2012, the Board approved the establishment of a new series of the First Investors Income Funds, First Investors Strategic Income Fund (the “Strategic Income Fund”). The Strategic Income Fund is registered under the Investment Company Act of 1940 as a diversified fund and is authorized to issue an unlimited number of shares of beneficial interest of Class A and Advisor Class. The Fund is structured as a fund of funds which invests primarily in shares of other First Investors funds (the underlying funds). The investment objective of the Fund is to seek a high level of current income. The Fund commenced operations on April 3, 2013.
|
| This page left intentionally blank. |
Financial Highlights
FIRST INVESTORS INCOME FUNDS
The following table sets forth the per share operating performance data for a share outstanding,
total return, ratios to average net assets and other supplemental data for each fiscal period indicated.
| | | | | | | | | | | | | | | | | | | | | | | | | | | | | | | | | | | | | | | | | | |
| | | | P E R S H A R E D A T A | | | | | | | | R A T I O S / S U P P L E M E N T A L D A T A | | | | |
| | | | | | | | | | | | | Less Distributions | | | | | | | | | | | | | | | | | | | | Ratio to Average Net | | | | |
| | | | | Investment Operations | | | from | | | | | | | | | | | Ratio to Average Net | | | Assets Before Expenses | | | | |
| | | Net Asset | | | | Net Realized | | | | | | | | | | | | Net Asset | | | | | | | Assets** | | | Waived or Assumed | | | | |
| | | Value, | | Net | | and Unrealized | | | Total from | | | Net | | Net | | | | Value, | | | | | Net Assets | | Net Expenses | | | Net Expenses | | | Net | | | | | | Net | | | Portfolio | |
| | | Beginning | | Investment | | Gain (Loss) on | | | Investment | | | Investment | | Realized | | Total | | End of | | Total | | | End of Period | | After Fee | | | Before Fee | | | Investment | | | | | | Investment | | | Turnover | |
| | | of Period | | Income | | Investments | | | Operations | | | Income | | Gain | | Distributions | | Period | | Return | * | | (in millions) | | Credits | | | Credits | (a) | | Income | | | Expenses | | | Income (Loss) | | | Rate | |
| CASH MANAGEMENT FUND | | | | | | | | | | | | | | | | | | | | | | | | | | | | | | | | | | | |
| | |
| Class A | | | | | | | | | | | | | | | | | | | | | | | | | | | | | | | | | | | | | | | | | |
| 2008 | | $ 1.00 | | $.027 | | — | | | $.027 | | | $.027 | | — | | $.027 | | $ 1.00 | | 2.69 | % | | $234 | | .80 | % | | .80 | % | | 2.63 | % | | .92 | % | | 2.51 | % | | N/A | |
| 2009 | | 1.00 | | .005 | | — | | | .005 | | | .005 | | — | | .005 | | 1.00 | | 0.54 | | | 172 | | .71 | | | .71 | | | .58 | | | 1.03 | | | .26 | | | N/A | |
| 2010 | | 1.00 | | — | | — | | | — | | | — | | — | | — | | 1.00 | | 0.00 | | | 134 | | .30 | | | .30 | | | .00 | | | 1.08 | | | (.78 | ) | | N/A | |
| 2011 | | 1.00 | | — | | — | | | — | | | — | | — | | — | | 1.00 | | 0.00 | | | 148 | | .17 | | | .17 | | | .00 | | | 1.06 | | | (.89 | ) | | N/A | |
| 2012 | | 1.00 | | — | | — | | | — | | | — | | — | | — | | 1.00 | | 0.00 | | | 135 | | .12 | | | .12 | | | .00 | | | 1.02 | | | (.90 | ) | | N/A | |
| 2013(b) | | 1.00 | | — | | — | | | — | | | — | | — | | — | | 1.00 | | 0.00 | † | | 140 | | .13 | †† | | .13 | †† | | .00 | †† | | .97 | †† | | (.84 | )†† | | N/A | |
| Class B | | | | | | | | | | | | | | | | | | | | | | | | | | | | | | | | | | | | | | | | | |
| 2008 | | 1.00 | | .019 | | — | | | .019 | | | .019 | | — | | .019 | | 1.00 | | 1.92 | | | 4 | | 1.55 | | | 1.55 | | | 1.88 | | | 1.67 | | | 1.76 | | | N/A | |
| 2009 | | 1.00 | | .001 | | — | | | .001 | | | .001 | | — | | .001 | | 1.00 | | 0.14 | | | 3 | | 1.13 | | | 1.13 | | | .16 | | | 1.78 | | | (.49 | ) | | N/A | |
| 2010 | | 1.00 | | — | | — | | | — | | | — | | — | | — | | 1.00 | | 0.00 | | | 2 | | .30 | | | .30 | | | .00 | | | 1.83 | | | (1.53 | ) | | N/A | |
| 2011 | | 1.00 | | — | | — | | | — | | | — | | — | | — | | 1.00 | | 0.00 | | | 2 | | .17 | | | .17 | | | .00 | | | 1.81 | | | (1.64 | ) | | N/A | |
| 2012 | | 1.00 | | — | | — | | | — | | | — | | — | | — | | 1.00 | | 0.00 | | | 1 | | .12 | | | .12 | | | .00 | | | 1.77 | | | (1.65 | ) | | N/A | |
| 2013(b) | | 1.00 | | — | | — | | | — | | | — | | — | | — | | 1.00 | | 0.00 | † | | 1 | | .13 | †† | | .13 | †† | | .00 | †† | | 1.72 | †† | | (1.59 | )†† | | N/A | |
| GOVERNMENT FUND | | | | | | | | | | | | | | | | | | | | | | | | | | | | | | | | | | | |
| | |
| Class A | | | | | | | | | | | | | | | | | | | | | | | | | | | | | | | | | | | | | | | | | |
| 2008 | | $10.64 | | $ .49 | | $.11 | | | $ .60 | | | $ .48 | | — | | $ .48 | | $10.76 | | 5.73 | % | | $228 | | 1.10 | % | | 1.10 | % | | 4.29 | % | | 1.24 | % | | 4.15 | % | | 37 | % |
| 2009 | | 10.76 | | .47 | | .44 | | | .91 | | | .47 | | — | | .47 | | 11.20 | | 8.59 | | | 287 | | 1.10 | | | 1.10 | | | 4.03 | | | 1.26 | | | 3.87 | | | 43 | |
| 2010 | | 11.20 | | .43 | | .16 | | | .59 | | | .43 | | — | | .43 | | 11.36 | | 5.39 | | | 326 | | 1.13 | | | 1.13 | | | 3.44 | | | 1.24 | | | 3.33 | | | 42 | |
| 2011 | | 11.36 | | .36 | | .28 | | | .64 | | | .41 | | — | | .41 | | 11.59 | | 5.73 | | | 347 | | 1.12 | | | 1.12 | | | 3.12 | | | 1.23 | | | 3.01 | | | 35 | |
| 2012 | | 11.59 | | .27 | | .04 | | | .31 | | | .38 | | — | | .38 | | 11.52 | | 2.71 | | | 382 | | 1.10 | | | 1.10 | | | 2.28 | | | 1.21 | | | 2.17 | | | 36 | |
| 2013(b) | | 11.52 | | .09 | | (.16 | ) | | (.07 | ) | | .17 | | — | | .17 | | 11.28 | | (0.62 | )† | | 377 | | 1.11 | †† | | 1.11 | †† | | 1.54 | †† | | 1.22 | †† | | 1.43 | †† | | 36 | |
| Class B | | | | | | | | | | | | | | | | | | | | | | | | | | | | | | | | | | | | | | | | | |
| 2008 | | 10.64 | | .41 | | .12 | | | .53 | | | .41 | | — | | .41 | | 10.76 | | 4.99 | | | 12 | | 1.80 | | | 1.80 | | | 3.59 | | | 1.94 | | | 3.45 | | | 37 | |
| 2009 | | 10.76 | | .39 | | .43 | | | .82 | | | .39 | | — | | .39 | | 11.19 | | 7.75 | | | 13 | | 1.80 | | | 1.80 | | | 3.33 | | | 1.96 | | | 3.17 | | | 43 | |
| 2010 | | 11.19 | | .35 | | .17 | | | .52 | | | .36 | | — | | .36 | | 11.35 | | 4.70 | | | 11 | | 1.83 | | | 1.83 | | | 2.74 | | | 1.94 | | | 2.63 | | | 42 | |
| 2011 | | 11.35 | | .26 | | .29 | | | .55 | | | .33 | | — | | .33 | | 11.57 | | 4.94 | | | 7 | | 1.82 | | | 1.82 | | | 2.42 | | | 1.93 | | | 2.31 | | | 35 | |
| 2012 | | 11.57 | | .17 | | .07 | | | .24 | | | .30 | | — | | .30 | | 11.51 | | 2.11 | | | 6 | | 1.80 | | | 1.80 | | | 1.59 | | | 1.91 | | | 1.47 | | | 36 | |
| 2013(b) | | 11.51 | | .04 | | (.16 | ) | | (.12 | ) | | .13 | | — | | .13 | | 11.26 | | (1.05 | )† | | 6 | | 1.81 | †† | | 1.81 | †† | | .84 | †† | | 1.92 | †† | | .73 | †† | | 36 | |
Financial Highlights (continued)
FIRST INVESTORS INCOME FUNDS
| | | | | | | | | | | | | | | | | | | | | | | | | | | | | | | | | | | | | | | | | | |
| | | P E R S H A R E D A T A | | | | | | | | R A T I O S / S U P P L E M E N T A L D A T A | | | | |
| | | | | | | | | | | | | Less Distributions | | | | | | | | | | | | | | | | | | | | Ratio to Average Net | | | | |
| | | | | Investment Operations | | | from | | | | | | | | | | | Ratio to Average Net | | | Assets Before Expenses | | | | |
| | | Net Asset | | | | Net Realized | | | | | | | | | | | | Net Asset | | | | | | | Assets** | | | Waived or Assumed | | | | |
| | | Value, | | Net | | and Unrealized | | | Total from | | | Net | | Net | | | | Value, | | | | | Net Assets | | Net Expenses | | | Net Expenses | | | Net | | | | | | Net | | | Portfolio | |
| | | Beginning | | Investment | | Gain (Loss) on | | | Investment | | | Investment | | Realized | | Total | | End of | | Total | | | End of Period | | After Fee | | | Before Fee | | | Investment | | | | | | Investment | | | Turnover | |
| | | of Period | | Income | | Investments | | | Operations | | | Income | | Gain | | Distributions | | Period | | Return | * | | (in millions) | | Credits | | | Credits | (a) | | Income | | | Expenses | | | Income (Loss) | | | Rate | |
| INVESTMENT GRADE FUND | | | | | | | | | | | | | | | | | | | | | | | | | | | | | | | | |
| | |
| Class A | | | | | | | | | | | | | | | | | | | | | | | | | | | | | | | | | | | | | | | | | |
| 2008 | | $ 9.42 | | $.48 | | $(1.20 | ) | | $ (.72 | ) | | $.47 | | — | | $.47 | | $ 8.23 | | (8.12 | )% | | $268 | | 1.10 | % | | 1.10 | % | | 4.80 | % | | 1.23 | % | | 4.67 | % | | 127 | % |
| 2009 | | 8.23 | | .49 | | .85 | | | 1.34 | | | .47 | | — | | .47 | | 9.10 | | 17.06 | | | 325 | | 1.10 | | | 1.10 | | | 5.29 | | | 1.27 | | | 5.12 | | | 79 | |
| 2010 | | 9.10 | | .44 | | .72 | | | 1.16 | | | .45 | | — | | .45 | | 9.81 | | 13.09 | | | 405 | | 1.12 | | | 1.12 | | | 4.75 | | | 1.23 | | | 4.64 | | | 56 | |
| 2011 | | 9.81 | | .40 | | (.16 | ) | | .24 | | | .43 | | — | | .43 | | 9.62 | | 2.48 | | | 437 | | 1.11 | | | 1.11 | | | 3.94 | | | 1.22 | | | 3.83 | | | 34 | |
| 2012 | | 9.62 | | .38 | | .68 | | | 1.06 | | | .41 | | — | | .41 | | 10.27 | | 11.22 | | | 532 | | 1.08 | | | 1.08 | | | 3.54 | | | 1.19 | | | 3.43 | | | 40 | |
| 2013(b) | | 10.27 | | .17 | | (.03 | ) | | .14 | | | .19 | | — | | .19 | | 10.22 | | 1.39 | † | | 558 | | 1.08 | †† | | 1.08 | †† | | 3.24 | †† | | 1.19 | †† | | 3.13 | †† | | 16 | |
| Class B | | | | | | | | | | | | | | | | | | | | | | | | | | | | | | | | | | | | | | | | | |
| 2008 | | 9.41 | | .42 | | (1.21 | ) | | (.79 | ) | | .40 | | — | | .40 | | 8.22 | | (8.78 | ) | | 17 | | 1.80 | | | 1.80 | | | 4.10 | | | 1.93 | | | 3.97 | | | 127 | |
| 2009 | | 8.22 | | .44 | | .85 | | | 1.29 | | | .40 | | — | | .40 | | 9.11 | | 16.35 | | | 16 | | 1.80 | | | 1.80 | | | 4.59 | | | 1.97 | | | 4.42 | | | 79 | |
| 2010 | | 9.11 | | .39 | | .70 | | | 1.09 | | | .39 | | — | | .39 | | 9.81 | | 12.20 | | | 14 | | 1.82 | | | 1.82 | | | 4.05 | | | 1.93 | | | 3.94 | | | 56 | |
| 2011 | | 9.81 | | .33 | | (.16 | ) | | .17 | | | .36 | | — | | .36 | | 9.62 | | 1.81 | | | 10 | | 1.81 | | | 1.81 | | | 3.24 | | | 1.92 | | | 3.13 | | | 34 | |
| 2012 | | 9.62 | | .32 | | .66 | | | .98 | | | .34 | | — | | .34 | | 10.26 | | 10.41 | | | 8 | | 1.78 | | | 1.78 | | | 2.84 | | | 1.89 | | | 2.74 | | | 40 | |
| 2013(b) | | 10.26 | | .14 | | (.03 | ) | | .11 | | | .16 | | — | | .16 | | 10.21 | | 1.08 | † | | 7 | | 1.78 | †† | | 1.78 | †† | | 2.54 | †† | | 1.89 | †† | | 2.43 | †† | | 16 | |
| INTERNATIONAL OPPORTUNITIES BOND FUND | | | | | | | | | | | | | | | | | | | | | | | | | | | |
| | |
| Class A | | | | | | | | | | | | | | | | | | | | | | | | | | | | | | | | | | | | | | | | | |
| 2012(c) | | $10.00 | | $.01 | | $ .23 | | | $ .24 | | | $.02 | | $ — | | $.02 | | $10.22 | | 2.35 | %† | | $ 20 | | 1.30 | %†† | | 1.30 | %†† | | 1.10 | %†† | | 9.76 | %†† | | (6.12 | )%†† | | 5 | % |
| 2013(b) | | 10.22 | | .12 | | .05 | | | .17 | | | .15 | | .01 | | .16 | | 10.23 | | 1.67 | † | | 76 | | 1.30 | †† | | 1.30 | †† | | 2.07 | †† | | 2.17 | †† | | 1.20 | †† | | 36 | |
| FUND FOR INCOME | | | | | | | | | | | | | | | | | | | | | | | | | | | | | | | | |
| | |
| Class A | | | | | | | | | | | | | | | | | | | | | | | | | | | | | | | | | | | | | | | | | |
| 2008 | | $ 2.99 | | $.21 | | $ (.54 | ) | | (.33 | ) | | $.21 | | — | | $.21 | | $ 2.45 | | (11.58 | )% | | $460 | | 1.29 | % | | 1.29 | % | | 7.40 | % | | 1.30 | % | | 7.39 | % | | 17 | % |
| 2009 | | 2.45 | | .20 | | (.13 | ) | | .07 | | | .20 | | — | | .20 | | 2.32 | | 4.28 | | | 438 | | 1.38 | | | 1.38 | | | 9.10 | | | 1.42 | | | 9.06 | | | 73 | |
| 2010 | | 2.32 | | .17 | | .18 | | | .35 | | | .18 | | — | | .18 | | 2.49 | | 15.68 | | | 505 | | 1.29 | | | 1.29 | | | 7.32 | | | 1.33 | | | 7.28 | | | 78 | |
| 2011 | | 2.49 | | .17 | | (.14 | ) | | .03 | | | .17 | | — | | .17 | | 2.35 | | 1.00 | | | 505 | | 1.27 | | | 1.27 | | | 6.43 | | | 1.30 | | | 6.40 | | | 75 | |
| 2012 | | 2.35 | | .16 | | .25 | | | .41 | | | .16 | | — | | .16 | | 2.60 | | 17.79 | | | 602 | | 1.26 | | | 1.26 | | | 6.01 | | | 1.29 | | | 5.98 | | | 54 | |
| 2013(b) | | 2.60 | | .07 | | .07 | | | .14 | | | .08 | | — | | .08 | | 2.66 | | 5.30 | † | | 639 | | 1.25 | †† | | 1.25 | †† | | 5.33 | †† | | 1.27 | †† | | 5.30 | †† | | 34 | |
| Class B | | | | | | | | | | | | | | | | | | | | | | | | | | | | | | | | | | | | | | | | | |
| 2008 | | 2.99 | | .19 | | (.54 | ) | | (.35 | ) | | .19 | | — | | .19 | | 2.45 | | (12.25 | ) | | 15 | | 1.99 | | | 1.99 | | | 6.70 | | | 2.00 | | | 6.69 | | | 17 | |
| 2009 | | 2.45 | | .19 | | (.13 | ) | | .06 | | | .18 | | — | | .18 | | 2.33 | | 3.75 | | | 12 | | 2.08 | | | 2.08 | | | 8.40 | | | 2.12 | | | 8.36 | | | 73 | |
| 2010 | | 2.33 | | .16 | | .16 | | | .32 | | | .16 | | — | | .16 | | 2.49 | | 14.43 | | | 11 | | 1.99 | | | 1.99 | | | 6.62 | | | 2.03 | | | 6.58 | | | 78 | |
| 2011 | | 2.49 | | .15 | | (.13 | ) | | .02 | | | .16 | | — | | .16 | | 2.35 | | .38 | | | 8 | | 1.97 | | | 1.97 | | | 5.75 | | | 2.00 | | | 5.72 | | | 75 | |
| 2012 | | 2.35 | | .13 | | .26 | | | .39 | | | .14 | | — | | .14 | | 2.60 | | 17.01 | | | 6 | | 1.96 | | | 1.96 | | | 5.31 | | | 1.99 | | | 5.28 | | | 54 | |
| 2013(b) | | 2.60 | | .07 | | .06 | | | .13 | | | .07 | | — | | .07 | | 2.66 | | 4.95 | † | | 5 | | 1.95 | †† | | 1.95 | †† | | 4.61 | †† | | 1.97 | †† | | 4.58 | †† | | 34 | |
| |
| * | Calculated without sales charges. |
| ** | Net of expenses waived or assumed by FIMCO and ADM (Note 3). |
| (a) | The ratios do not include a reduction of expenses from cash balances maintained with the custodian |
| or from brokerage service arrangements (Note 1G). |
| (b) | For the period October 1, 2012 to March 31, 2013. |
| (c) | For the period August 20, 2012 (commencement of operations) to September 30, 2012. |
| † | Not annualized |
| †† | Annualized |
Financial Highlights
FIRST INVESTORS EQUITY FUNDS
The following table sets forth the per share operating performance data for a share outstanding,
total return, ratios to average net assets and other supplemental data for each period indicated.
| | | | | | | | | | | | | | | | | | | | | | | | | | | | | | | | | | | | | | | | |
| | | P E R S H A R E D A T A | | | | | | | | R A T I O S / S U P P L E M E N T A L D A T A | | | |
| | | | | | | | | | | | | Less Distributions | | | | | | | | | | | | | | | | | | | | Ratio to Average Net | | | |
| | | | | Investment Operations | | | from | | | | | | | | | | | Ratio to Average | | | Assets Before Expenses | | | |
| | | Net Asset | | | | Net Realized | | | | | | | | | | | | Net Asset | | | | | | | Net Assets** | | | Waived or Assumed | | | |
| | | Value, | | Net | | and Unrealized | | | Total from | | | Net | | Net | | | | Value, | | | | | Net Assets | | Net Expenses | | | Net Expenses | | | Net | | | | | Net | | Portfolio | |
| | | Beginning | | Investment | | Gain (Loss) on | | | Investment | | | Investment | | Realized | | Total | | End of | | Total | | | End of Period | | After Fee | | | Before Fee | | | Investment | | | | | Investment | | Turnover | |
| | | of Period | | Income | | Investments | | | Operations | | | Income | | Gain | | Distributions | | Period | | Return | * | | (in millions) | | Credits | | | Credits | (a) | | Income | | | Expenses | | Income | | Rate | |
| TOTAL RETURN FUND | | | | | | | | | | | | | | | | | | | | | | | | | | | | | |
| | |
| Class A | | | | | | | | | | | | | | | | | | | | | | | | | | | | | | | | | | | | | | | |
| 2008 | | $15.86 | | $.36 | | $(2.31 | ) | | $(1.95 | ) | | $.37 | | $.30 | | $.67 | | $13.24 | | (12.66 | )% | | $304 | | 1.34 | % | | 1.34 | % | | 2.32 | % | | N/A | | N/A | | 59 | % |
| 2009 | | 13.24 | | .30 | | .03 | | | .33 | | | .32 | | — | | .32 | | 13.25 | | 2.77 | | | 316 | | 1.43 | | | 1.43 | | | 2.35 | | | N/A | | N/A | | 53 | |
| 2010 | | 13.25 | | .28 | | .95 | | | 1.23 | | | .29 | | — | | .29 | | 14.19 | | 9.38 | | | 361 | | 1.37 | | | 1.37 | | | 2.02 | | | N/A | | N/A | | 40 | |
| 2011 | | 14.19 | | .31 | | (.06 | ) | | .25 | | | .34 | | — | | .34 | | 14.10 | | 1.65 | | | 385 | | 1.33 | | | 1.33 | | | 1.97 | | | N/A | | N/A | | 36 | |
| 2012 | | 14.10 | | .30 | | 2.71 | | | 3.01 | | | .30 | | — | | .30 | | 16.81 | | 21.46 | | | 532 | | 1.32 | | | 1.32 | | | 1.79 | | | N/A | | N/A | | 32 | |
| 2013(b) | | 16.81 | | .12 | | 1.20 | | | 1.32 | | | .19 | | .24 | | .43 | | 17.70 | | 8.04 | † | | 608 | | 1.31 | †† | | 1.31 | †† | | 1.46 | †† | | N/A | | N/A | | 13 | |
| Class B | | | | | | | | | | | | | | | | | | | | | | | | | | | | | | | | | | | | | | | |
| 2008 | | 15.63 | | .26 | | (2.29 | ) | | (2.03 | ) | | .27 | | .30 | | .57 | | 13.03 | | (13.35 | ) | | 25 | | 2.04 | | | 2.04 | | | 1.62 | | | N/A | | N/A | | 59 | |
| 2009 | | 13.03 | | .21 | | .03 | | | .24 | | | .23 | | — | | .23 | | 13.04 | | 2.10 | | | 21 | | 2.13 | | | 2.13 | | | 1.65 | | | N/A | | N/A | | 53 | |
| 2010 | | 13.04 | | .18 | | .94 | | | 1.12 | | | .20 | | — | | .20 | | 13.96 | | 8.62 | | | 17 | | 2.07 | | | 2.07 | | | 1.32 | | | N/A | | N/A | | 40 | |
| 2011 | | 13.96 | | .19 | | (.04 | ) | | .15 | | | .23 | | — | | .23 | | 13.88 | | 1.01 | | | 13 | | 2.03 | | | 2.03 | | | 1.30 | | | N/A | | N/A | | 36 | |
| 2012 | | 13.88 | | .18 | | 2.65 | | | 2.83 | | | .18 | | — | | .18 | | 16.53 | | 20.49 | | | 11 | | 2.02 | | | 2.02 | | | 1.09 | | | N/A | | N/A | | 32 | |
| 2013(b) | | 16.53 | | .08 | | 1.16 | | | 1.24 | | | .13 | | .24 | | .37 | | 17.40 | | 7.68 | † | | 11 | | 2.01 | †† | | 2.01 | †† | | .77 | †† | | N/A | | N/A | | 13 | |
| EQUITY INCOME(c) | | | | | | | | | | | | | | | | | | | | | | | | | |
| | |
| Class A | | | | | | | | | | | | | | | | | | | | | | | | | | | | | | | | | | | | | | | |
| 2008 | | $ 8.14 | | $.12 | | $(1.49 | ) | | $(1.37 | ) | | $.12 | | — | | $.12 | | $ 6.65 | | (16.91 | )% | | $334 | | 1.35 | % | | 1.35 | % | | 1.62 | % | | N/A | | N/A | | 17 | % |
| 2009 | | 6.65 | | .11 | | (.64 | ) | | (.53 | ) | | .11 | | — | | .11 | | 6.01 | | (7.81 | ) | | 308 | | 1.48 | | | 1.48 | | | 2.14 | | | N/A | | N/A | | 15 | |
| 2010 | | 6.01 | | .09 | | .49 | | | .58 | | | .09 | | — | | .09 | | 6.50 | | 9.76 | | | 335 | | 1.38 | | | 1.38 | | | 1.45 | | | N/A | | N/A | | 21 | |
| 2011 | | 6.50 | | .11 | | (.30 | ) | | (.19 | ) | | .11 | | — | | .11 | | 6.20 | | (3.12 | ) | | 318 | | 1.35 | | | 1.35 | | | 1.60 | | | N/A | | N/A | | 29 | |
| 2012 | | 6.20 | | .13 | | 1.44 | | | 1.57 | | | .10 | | — | | .10 | | 7.67 | | 25.36 | | | 392 | | 1.33 | | | 1.33 | | | 1.75 | | | N/A | | N/A | | 38 | |
| 2013(b) | | 7.67 | | .07 | | .78 | | | .85 | | | .08 | | — | | .08 | | 8.44 | | 11.09 | † | | 436 | | 1.31 | †† | | 1.31 | †† | | 1.79 | †† | | N/A | | N/A | | 18 | |
| Class B | | | | | | | | | | | | | | | | | | | | | | | | | | | | | | | | | | | | | | | |
| 2008 | | 8.01 | | .07 | | (1.46 | ) | | (1.39 | ) | | .07 | | — | | .07 | | 6.55 | | (17.42 | ) | | 17 | | 2.05 | | | 2.05 | | | .92 | | | N/A | | N/A | | 17 | |
| 2009 | | 6.55 | | .08 | | (.64 | ) | | (.56 | ) | | .07 | | — | | .07 | | 5.92 | | (8.43 | ) | | 12 | | 2.18 | | | 2.18 | | | 1.44 | | | N/A | | N/A | | 15 | |
| 2010 | | 5.92 | | .05 | | .48 | | | .53 | | | .05 | | — | | .05 | | 6.40 | | 8.97 | | | 11 | | 2.08 | | | 2.08 | | | .75 | | | N/A | | N/A | | 21 | |
| 2011 | | 6.40 | | .06 | | (.30 | ) | | (.24 | ) | | .06 | | — | | .06 | | 6.10 | | (3.87 | ) | | 8 | | 2.05 | | | 2.05 | | | .90 | | | N/A | | N/A | | 29 | |
| 2012 | | 6.10 | | .08 | | 1.42 | | | 1.50 | | | .05 | | — | | .05 | | 7.55 | | 24.56 | | | 7 | | 2.03 | | | 2.03 | | | 1.02 | | | N/A | | N/A | | 38 | |
| 2013(b) | | 7.55 | | .05 | | .75 | | | .80 | | | .05 | | — | | .05 | | 8.30 | | 10.61 | † | | 7 | | 2.01 | †† | | 2.01 | †† | | 1.09 | †† | | N/A | | N/A | | 18 | |
Financial Highlights (continued)
FIRST INVESTORS EQUITY FUNDS
| | | | | | | | | | | | | | | | | | | | | | | | | | | | | | | | | | | | | | | | | | | | | |
| | | P E R S H A R E D A T A | | | | | | | | R A T I O S / S U P P L E M E N T A L D A T A | | | | |
| | | | | | | | | | | | | | Less Distributions | | | | | | | | | | | | | | | | | | | | Ratio to Average Net | | | | |
| | | | | Investment Operations | | | from | | | | | | | | | | | Ratio to Average | | | Assets Before Expenses | | | | |
| | | Net Asset | | Net | | | Net Realized | | | | | | | | | | Distributions | | | | Net Asset | | | | | | | Net Assets** | | | Waived or Assumed | | | | |
| | | Value, | | Investment | | | and Unrealized | | | Total from | | | Net | | Net | | in Excess of | | | | Value, | | | | | Net Assets | | Net Expenses | | | Net Expenses | | | Net | | | | | | Net | | | Portfolio | |
| | | Beginning | | Income | | | Gain (Loss) on | | | Investment | | | Investment | | Realized | | Net Investment | | Total | | End of | | Total | | | End of Period | | After Fee | | | Before Fee | | | Investment | | | | | | Investment | | | Turnover | |
| | | of Period | | (Loss) | | | Investments | | | Operations | | | Income | | Gain | | Income | | Distributions | | Period | | Return | * | | (in millions) | | Credits | | | Credits | (a) | | Income (Loss) | | | Expenses | | | Income (Loss) | | | Rate | |
| GROWTH & INCOME FUND | | | | | | | | | | | | | | | | | | | | | | | | | | | | | | | | | | |
| | |
| Class A | | | | | | | | | | | | | | | | | | | | | | | | | | | | | | | | | | | | | | | | | | | | |
| 2008 | | $16.86 | | $.14 | | | $(3.66 | ) | | $(3.52 | ) | | $.11 | | $ .23 | | — | | $ .34 | | $13.00 | | (21.23 | )% | | $ 623 | | 1.35 | % | | 1.35 | % | | .94 | % | | N/A | | | N/A | | | 24 | % |
| 2009 | | 13.00 | | .09 | | | (1.02 | ) | | (.93 | ) | | .14 | | .02 | | — | | .16 | | 11.91 | | (6.93 | ) | | 578 | | 1.51 | | | 1.51 | | | .90 | | | N/A | | | N/A | | | 26 | |
| 2010 | | 11.91 | | .09 | | | .98 | | | 1.07 | | | .07 | | — | | — | | .07 | | 12.91 | | 9.01 | | | 626 | | 1.39 | | | 1.39 | | | .68 | | | N/A | | | N/A | | | 25 | |
| 2011 | | 12.91 | | .19 | | | (.14 | ) | | .05 | | | .18 | | — | | — | | .18 | | 12.78 | | .25 | | | 626 | | 1.34 | | | 1.34 | | | 1.33 | | | N/A | | | N/A | | | 24 | |
| 2012 | | 12.78 | | .21 | | | 3.81 | | | 4.02 | | | .14 | | — | | — | | .14 | | 16.66 | | 31.60 | | | 1,226 | | 1.29 | | | 1.29 | | | 1.35 | | | N/A | | | N/A | | | 22 | |
| 2013(b) | | 16.66 | | .10 | | | 2.02 | | | 2.12 | | | .16 | | — | | — | | .16 | | 18.62 | | 12.85 | † | | 1,379 | | 1.27 | †† | | 1.27 | †† | | 1.11 | †† | | N/A | | | N/A | | | 9 | |
| Class B | | | | | | | | | | | | | | | | | | | | | | | | | | | | | | | | | | | | | | | | | | | | |
| 2008 | | 15.99 | | .03 | | | (3.47 | ) | | (3.44 | ) | | .02 | | .23 | | — | | .25 | | 12.30 | | (21.82 | ) | | 41 | | 2.05 | | | 2.05 | | | .24 | | | N/A | | | N/A | | | 24 | |
| 2009 | | 12.30 | | .01 | | | (.97 | ) | | (.96 | ) | | .10 | | .02 | | — | | .12 | | 11.22 | | (7.59 | ) | | 30 | | 2.21 | | | 2.21 | | | .20 | | | N/A | | | N/A | | | 26 | |
| 2010 | | 11.22 | | (.03 | ) | | .95 | | | .92 | | | — | | — | | — | | — | | 12.14 | | 8.23 | | | 26 | | 2.09 | | | 2.09 | | | (.02 | ) | | N/A | | | N/A | | | 25 | |
| 2011 | | 12.14 | | .08 | | | (.12 | ) | | (.04 | ) | | .09 | | — | | — | | .09 | | 12.01 | | (.44 | ) | | 20 | | 2.04 | | | 2.04 | | | .66 | | | N/A | | | N/A | | | 24 | |
| 2012 | | 12.01 | | .10 | | | 3.58 | | | 3.68 | | | .05 | | — | | — | | .05 | | 15.64 | | 30.71 | | | 27 | | 1.99 | | | 1.99 | | | .63 | | | N/A | | | N/A | | | 22 | |
| 2013(b) | | 15.64 | | .03 | | | 1.91 | | | 1.94 | | | .11 | | — | | — | | .11 | | 17.47 | | 12.50 | † | | 28 | | 1.97 | †† | | 1.97 | †† | | .42 | †† | | N/A | | | N/A | | | 9 | |
| GLOBAL FUND | | | | | | | | | | | | | | | | | | | | | | | | | | | | | | | | | | | | |
| | |
| Class A | | | | | | | | | | | | | | | | | | | | | | | | | | | | | | | | | | | | | | | | | | | | |
| 2008 | | $ 8.82 | | $.03 | | | $(1.97 | ) | | $(1.94 | ) | | $.01 | | $1.12 | | $ — | | $1.13 | | $ 5.75 | | (25.44 | )% | | $ 249 | | 1.70 | % | | 1.70 | % | | .39 | % | | 1.73 | % | | .36 | % | | 133 | % |
| 2009 | | 5.75 | | .02 | | | — | | | .02 | | | .02 | | — | | .02 | | .04 | | 5.73 | | .53 | | | 249 | | 1.90 | | | 1.90 | | | .38 | | | 1.93 | | | .35 | | | 141 | |
| 2010 | | 5.73 | | — | | | .42 | | | .42 | | | .01 | | — | | — | | .01 | | 6.14 | | 7.33 | | | 269 | | 1.72 | | | 1.72 | | | .04 | | | 1.75 | | | .01 | | | 92 | |
| 2011 | | 6.14 | | .01 | | | (.61 | ) | | (.60 | ) | | — | | — | | — | | — | | 5.54 | | (9.77 | ) | | 241 | | 1.67 | | | 1.67 | | | .18 | | | 1.70 | | | .15 | | | 103 | |
| 2012 | | 5.54 | | .03 | | | 1.24 | | | 1.27 | | | .02 | | — | | — | | .02 | | 6.79 | | 22.88 | | | 283 | | 1.68 | | | 1.69 | | | .44 | | | 1.70 | | | .42 | | | 94 | |
| 2013(b) | | 6.79 | | .01 | | | .55 | | | .56 | | | .03 | | — | | — | | .03 | | 7.32 | | 8.34 | † | | 298 | | 1.68 | †† | | 1.68 | †† | | .28 | †† | | 1.68 | †† | | .28 | †† | | 49 | |
| Class B | | | | | | | | | | | | | | | | | | | | | | | | | | | | | | | | | | | | | | | | | | | | |
| 2008 | | 7.98 | | (.02 | ) | | (1.75 | ) | | (1.77 | ) | | — | | 1.12 | | — | | 1.12 | | 5.09 | | (25.91 | ) | | 9 | | 2.40 | | | 2.40 | | | (.31 | ) | | 2.43 | | | (.34 | ) | | 133 | |
| 2009 | | 5.09 | | (.03 | ) | | — | | | (.03 | ) | | .01 | | — | | .02 | | .03 | | 5.03 | | (.37 | ) | | 7 | | 2.60 | | | 2.60 | | | (.32 | ) | | 2.63 | | | (.35 | ) | | 141 | |
| 2010 | | 5.03 | | (.06 | ) | | .39 | | | .33 | | | — | | — | | — | | — | | 5.36 | | 6.56 | | | 7 | | 2.42 | | | 2.42 | | | (.66 | ) | | 2.45 | | | (.69 | ) | | 92 | |
| 2011 | | 5.36 | | (.09 | ) | | (.46 | ) | | (.55 | ) | | — | | — | | — | | — | | 4.81 | | (10.26 | ) | | 5 | | 2.37 | | | 2.37 | | | (.55 | ) | | 2.40 | | | (.58 | ) | | 103 | |
| 2012 | | 4.81 | | (.09 | ) | | 1.15 | | | 1.06 | | | .01 | | — | | — | | .01 | | 5.86 | | 21.99 | | | 4 | | 2.38 | | | 2.39 | | | (.27 | ) | | 2.40 | | | (.29 | ) | | 94 | |
| 2013(b) | | 5.86 | | (.04 | ) | | .50 | | | .46 | | | .02 | | — | | — | | .02 | | 6.30 | | 7.96 | † | | 4 | | 2.38 | †† | | 2.38 | †† | | (.42 | )†† | | 2.38 | †† | | (.42 | )†† | | 49 | |
Financial Highlights (continued)
FIRST INVESTORS EQUITY FUNDS
| | | | | | | | | | | | | | | | | | | | | | | | | | | | | | | | | | | | | | | | | |
| | | P E R S H A R E D A T A | | | | | | | | R A T I O S / S U P P L E M E N T A L D A T A | | | |
| | | | | | | | | | | | | | Less Distributions | | | | | | | | | | | | | | | | | | | | Ratio to Average Net | | | |
| | | | | Investment Operations | | | from | | | | | | | | | | | Ratio to Average | | | Assets Before Expenses | | | |
| | | Net Asset | | Net | | | Net Realized | | | | | | | | | | | | Net Asset | | | | | | | Net Assets** | | | Waived or Assumed | | | |
| | | Value, | | Investment | | | and Unrealized | | | Total from | | | Net | | Net | | | | Value, | | | | | Net Assets | | Net Expenses | | | Net Expenses | | | Net | | | | | Net | | Portfolio | |
| | | Beginning | | Income | | | Gain (Loss) on | | | Investment | | | Investment | | Realized | | Total | | End of | | Total | | | End of Period | | After Fee | | | Before Fee | | | Investment | | | | | Investment | | Turnover | |
| | | of Period | | (Loss) | | | Investments | | | Operations | | | Income | | Gain | | Distributions | | Period | | Return | * | | (in millions) | | Credits | | | Credits | (a) | | Income (Loss) | | | Expenses | | Income | | Rate | |
| SELECT GROWTH FUND | | | | | | | | | | | | | | | | | | | | | | | | | | | |
| | |
| Class A | | | | | | | | | | | | | | | | | | | | | | | | | | | | | | | | | | | | | | | | |
| 2008 | | $10.21 | | $(.04 | ) | | $(2.06 | ) | | $(2.10 | ) | | — | | $1.42 | | $1.42 | | $ 6.69 | | (23.84 | )% | | $207 | | 1.46 | % | | 1.47 | % | | (.52 | )% | | N/A | | N/A | | 99 | % |
| 2009 | | 6.69 | | (.02 | ) | | (1.34 | ) | | (1.36 | ) | | — | | — | | — | | 5.33 | | (20.33 | ) | | 170 | | 1.67 | | | 1.67 | | | (.51 | ) | | N/A | | N/A | | 120 | |
| 2010 | | 5.33 | | (.03 | ) | | .49 | | | .46 | | | — | | — | | — | | 5.79 | | 8.63 | | | 184 | | 1.56 | | | 1.56 | | | (.48 | ) | | N/A | | N/A | | 98 | |
| 2011 | | 5.79 | | (.02 | ) | | .54 | | | .52 | | | — | | — | | — | | 6.31 | | 8.98 | | | 203 | | 1.45 | | | 1.45 | | | (.28 | ) | | N/A | | N/A | | 62 | |
| 2012 | | 6.31 | | (.03 | ) | | 1.70 | | | 1.67 | | | — | | — | | — | | 7.98 | | 26.47 | | | 271 | | 1.42 | | | 1.42 | | | (.35 | ) | | N/A | | N/A | | 53 | |
| 2013(b) | | 7.98 | | .02 | | | .51 | | | .53 | | | — | | — | | — | | 8.51 | | 6.64 | † | | 290 | | 1.39 | †† | | 1.39 | †† | | .57 | †† | | N/A | | N/A | | 33 | |
| Class B | | | | | | | | | | | | | | | | | | | | | | | | | | | | | | | | | | | | | | | | |
| 2008 | | 9.70 | | (.09 | ) | | (1.94 | ) | | (2.03 | ) | | — | | 1.42 | | 1.42 | | 6.25 | | (24.43 | ) | | 18 | | 2.16 | | | 2.17 | | | (1.22 | ) | | N/A | | N/A | | 99 | |
| 2009 | | 6.25 | | (.06 | ) | | (1.25 | ) | | (1.31 | ) | | — | | — | | — | | 4.94 | | (20.96 | ) | | 10 | | 2.37 | | | 2.37 | | | (1.21 | ) | | N/A | | N/A | | 120 | |
| 2010 | | 4.94 | | (.07 | ) | | .46 | | | .39 | | | — | | — | | — | | 5.33 | | 7.90 | | | 8 | | 2.26 | | | 2.26 | | | (1.18 | ) | | N/A | | N/A | | 98 | |
| 2011 | | 5.33 | | (.07 | ) | | .51 | | | .44 | | | — | | — | | — | | 5.77 | | 8.26 | | | 7 | | 2.15 | | | 2.15 | | | (.98 | ) | | N/A | | N/A | | 62 | |
| 2012 | | 5.77 | | (.09 | ) | | 1.57 | | | 1.48 | | | — | | — | | — | | 7.25 | | 25.65 | | | 6 | | 2.12 | | | 2.12 | | | (1.07 | ) | | N/A | | N/A | | 53 | |
| 2013(b) | | 7.25 | | (.02 | ) | | .48 | | | .46 | | | — | | — | | — | | 7.71 | | 6.35 | † | | 5 | | 2.09 | †† | | 2.09 | †† | | (.13 | )†† | | N/A | | N/A | | 33 | |
| OPPORTUNITY FUND(d) | | | | | | | | | | | | | | | | | | | | | | | | | | | | | |
| | |
| Class A | | | | | | | | | | | | | | | | | | | | | | | | | | | | | | | | | | | | | | | | |
| 2008 | | $31.32 | | $ — | | | $(5.53 | ) | | $(5.53 | ) | | $.14 | | $2.66 | | $2.80 | | $22.99 | | (19.40 | )% | | $377 | | 1.39 | % | | 1.40 | % | | (.01 | )% | | N/A | | N/A | | 40 | % |
| 2009 | | 22.99 | | .01 | | | (1.61 | ) | | (1.60 | ) | | — | | .63 | | .63 | | 20.76 | | (6.24 | ) | | 355 | | 1.58 | | | 1.58 | | | .09 | | | N/A | | N/A | | 35 | |
| 2010 | | 20.76 | | .05 | | | 2.65 | | | 2.70 | | | — | | — | | — | | 23.46 | | 13.01 | | | 402 | | 1.44 | | | 1.44 | | | .24 | | | N/A | | N/A | | 40 | |
| 2011 | | 23.46 | | .17 | | | .49 | | | .66 | | | .05 | | — | | .05 | | 24.07 | | 2.77 | | | 415 | | 1.36 | | | 1.36 | | | .62 | | | N/A | | N/A | | 37 | |
| 2012 | | 24.07 | | .26 | | | 6.10 | | | 6.36 | | | .17 | | .89 | | 1.06 | | 29.37 | | 26.99 | | | 530 | | 1.35 | | | 1.35 | | | .94 | | | N/A | | N/A | | 36 | |
| 2013(b) | | 29.37 | | .07 | | | 5.09 | | | 5.16 | | | .26 | | .80 | | 1.06 | | 33.47 | | 18.04 | † | | 628 | | 1.33 | †† | | 1.33 | †† | | .44 | †† | | N/A | | N/A | | 16 | |
| Class B | | | | | | | | | | | | | | | | | | | | | | | | | | | | | | | | | | | | | | | | |
| 2008 | | 28.31 | | (.21 | ) | | (4.89 | ) | | (5.10 | ) | | .14 | | 2.66 | | 2.80 | | 20.41 | | (19.99 | ) | | 32 | | 2.09 | | | 2.10 | | | (.71 | ) | | N/A | | N/A | | 40 | |
| 2009 | | 20.41 | | (.10 | ) | | (1.47 | ) | | (1.57 | ) | | — | | .63 | | .63 | | 18.21 | | (6.90 | ) | | 23 | | 2.28 | | | 2.28 | | | (.61 | ) | | N/A | | N/A | | 35 | |
| 2010 | | 18.21 | | (.14 | ) | | 2.37 | | | 2.23 | | | — | | — | | — | | 20.44 | | 12.25 | | | 20 | | 2.14 | | | 2.14 | | | (.52 | ) | | N/A | | N/A | | 40 | |
| 2011 | | 20.44 | | (.10 | ) | | .52 | | | .42 | | | .01 | | — | | .01 | | 20.85 | | 2.04 | | | 15 | | 2.06 | | | 2.06 | | | (.04 | ) | | N/A | | N/A | | 37 | |
| 2012 | | 20.85 | | .01 | | | 5.31 | | | 5.32 | | | .13 | | .89 | | 1.02 | | 25.15 | | 26.12 | | | 13 | | 2.05 | | | 2.05 | | | .15 | | | N/A | | N/A | | 36 | |
| 2013(b) | | 25.15 | | (.05 | ) | | 4.35 | | | 4.30 | | | .22 | | .80 | | 1.02 | | 28.43 | | 17.60 | † | | 14 | | 2.03 | †† | | 2.03 | †† | | (.26 | )†† | | N/A | | N/A | | 16 | |
Financial Highlights (continued)
FIRST INVESTORS EQUITY FUNDS
| | | | | | | | | | | | | | | | | | | | | | | | | | | | | | | | | | | | | | | | | | | |
| | | P E R S H A R E D A T A | | | | | | | | R A T I O S / S U P P L E M E N T A L D A T A | | | | |
| | | | | | | | | | | | | | Less Distributions | | | | | | | | | | | | | | | | | | | | Ratio to Average Net | | | | |
| | | | | Investment Operations | | | from | | | | | | | | | | | Ratio to Average | | | Assets Before Expenses | | | | |
| | | | | | | | | | | | | | | | | | | | | | | | | | | Net Assets** | | | Waived or Assumed | | | | |
| | | Net Asset | | Net | | | Net Realized | | | | | | | | | | | | Net Asset | | | | | | | | | | | | | | | | | | | | | | | |
| | | Value, | | Investment | | | and Unrealized | | | Total from | | | Net | | Net | | | | Value, | | | | | Net Assets | | Net Expenses | | | Net Expenses | | | Net | | | | | | Net | | | Portfolio | |
| | | Beginning | | Income | | | Gain (Loss) on | | | Investment | | | Investment | | Realized | | Total | | End of | | Total | | | End of Period | | After Fee | | | Before Fee | | | Investment | | | | | | Investment | | | Turnover | |
| | | of Period | | (Loss) | | | Investments | | | Operations | | | Income | | Gain | | Distributions | | Period | | Return | * | | (in millions) | | Credits | | | Credits | (a) | | Income (Loss) | | | Expenses | | | Income (Loss) | | | Rate | |
| SPECIAL SITUATIONS FUND | | | | | | | | | | | | | | | | | | | | | | | | | | | | | | | | |
| | |
| Class A | | | | | | | | | | | | | | | | | | | | | | | | | | | | | | | | | | | | | | | | | | |
| 2008 | | $24.27 | | $ .03 | | | $(2.93 | ) | | $(2.90 | ) | | $ — | | $1.22 | | $1.22 | | $20.15 | | (12.67 | )% | | $258 | | 1.49 | % | | 1.50 | % | | .14 | % | | 1.61 | % | | .02 | % | | 52 | % |
| 2009 | | 20.15 | | .03 | | | (1.23 | ) | | (1.20 | ) | | .02 | | .53 | | .55 | | 18.40 | | (5.28 | ) | | 246 | | 1.64 | | | 1.64 | | | .22 | | | 1.82 | | | .04 | | | 55 | |
| 2010 | | 18.40 | | (.05 | ) | | 2.31 | | | 2.26 | | | — | | — | | — | | 20.66 | | 12.28 | | | 274 | | 1.52 | | | 1.52 | | | (.28 | ) | | 1.65 | | | (.41 | ) | | 64 | |
| 2011 | | 20.66 | | .03 | | | 1.03 | | | 1.06 | | | — | | — | | — | | 21.72 | | 5.13 | | | 285 | | 1.44 | | | 1.44 | | | .13 | | | 1.54 | | | .03 | | | 73 | |
| 2012 | | 21.72 | | .01 | | | 4.46 | | | 4.47 | | | .03 | | 1.76 | | 1.79 | | 24.40 | | 21.19 | | | 343 | | 1.43 | | | 1.43 | | | .03 | | | 1.53 | | | (.07 | ) | | 41 | |
| 2013(b) | | 24.40 | | .13 | | | 2.63 | | | 2.76 | | | .12 | | 1.00 | | 1.12 | | 26.04 | | 11.76 | † | | 380 | | 1.43 | †† | | 1.43 | †† | | 1.00 | †† | | 1.52 | †† | | .91 | †† | | 40 | |
| Class B | | | | | | | | | | | | | | | | | | | | | | | | | | | | | | | | | | | | | | | | | | |
| 2008 | | 21.73 | | (.13 | ) | | (2.57 | ) | | (2.70 | ) | | — | | 1.22 | | 1.22 | | 17.81 | | (13.26 | ) | | 12 | | 2.19 | | | 2.20 | | | (.56 | ) | | 2.31 | | | (.68 | ) | | 52 | |
| 2009 | | 17.81 | | (.10 | ) | | (1.09 | ) | | (1.19 | ) | | — | | .53 | | .53 | | 16.09 | | (5.99 | ) | | 9 | | 2.34 | | | 2.34 | | | (.48 | ) | | 2.52 | | | (.66 | ) | | 55 | |
| 2010 | | 16.09 | | (.25 | ) | | 2.11 | | | 1.86 | | | — | | — | | — | | 17.95 | | 11.56 | | | 8 | | 2.22 | | | 2.22 | | | (.94 | ) | | 2.35 | | | (1.07 | ) | | 64 | |
| 2011 | | 17.95 | | (.13 | ) | | .92 | | | .79 | | | — | | — | | — | | 18.74 | | 4.40 | | | 6 | | 2.14 | | | 2.14 | | | (.55 | ) | | 2.24 | | | (.65 | ) | | 73 | |
| 2012 | | 18.74 | | (.15 | ) | | 3.84 | | | 3.69 | | | — | | 1.76 | | 1.76 | | 20.67 | | 20.33 | | | 5 | | 2.13 | | | 2.13 | | | (.67 | ) | | 2.23 | | | (.77 | ) | | 41 | |
| 2013(b) | | 20.67 | | .03 | | | 2.22 | | | 2.25 | | | .08 | | 1.00 | | 1.08 | | 21.84 | | 11.41 | † | | 5 | | 2.13 | †† | | 2.13 | †† | | .31 | †† | | 2.22 | †† | | .22 | †† | | 40 | |
| INTERNATIONAL FUND | | | | | | | | | | | | | | | | | | | | | | | | | | | | | | |
| | |
| Class A | | | | | | | | | | | | | | | | | | | | | | | | | | | | | | | | | | | | | | | | | | |
| 2008 | | $13.18 | | $ .07 | | | $(3.45 | ) | | $(3.38 | ) | | $ — | | $ .32 | | $ .32 | | $ 9.48 | | (26.37 | )% | | $105 | | 1.95 | % | | 1.95 | % | | .20 | % | | 1.94 | % | | .20 | % | | 122 | % |
| 2009 | | 9.48 | | .29 | | | (.74 | ) | | (.45 | ) | | .13 | | — | | .13 | | 8.90 | | (4.52 | ) | | 108 | | 2.20 | | | 2.20 | | | 1.16 | | | N/A | | | N/A | | | 60 | |
| 2010 | | 8.90 | | .15 | | | 1.15 | | | 1.30 | | | .02 | | — | | .02 | | 10.18 | | 14.63 | | | 130 | | 1.97 | | | 1.97 | | | 1.33 | | | N/A | | | N/A | | | 32 | |
| 2011 | | 10.18 | | .12 | | | (.59 | ) | | (.47 | ) | | .17 | | — | | .17 | | 9.54 | | (4.70 | ) | | 128 | | 1.88 | | | 1.88 | | | 1.20 | | | N/A | | | N/A | | | 30 | |
| 2012 | | 9.54 | | .10 | | | 2.20 | | | 2.30 | | | .16 | | — | | .16 | | 11.68 | | 24.34 | | | 166 | | 1.82 | | | 1.82 | | | .86 | | | N/A | | | N/A | | | 41 | |
| 2013(b) | | 11.68 | | .01 | | | 1.12 | | | 1.13 | | | — | | — | | — | | 12.81 | | 9.67 | † | | 197 | | 1.74 | †† | | 1.74 | †† | | .10 | †† | | N/A | | | N/A | | | 17 | |
| Class B | | | | | | | | | | | | | | | | | | | | | | | | | | | | | | | | | | | | | | | | | | |
| 2008 | | 13.07 | | (.02 | ) | | (3.40 | ) | | (3.42 | ) | | — | | .32 | | .32 | | 9.33 | | (26.91 | ) | | 4 | | 2.65 | | | 2.65 | | | (.50 | ) | | 2.64 | | | (.50 | ) | | 122 | |
| 2009 | | 9.33 | | .22 | | | (.72 | ) | | (.50 | ) | | .12 | | — | | .12 | | 8.71 | | (5.19 | ) | | 3 | | 2.90 | | | 2.90 | | | .46 | | | N/A | | | N/A | | | 60 | |
| 2010 | | 8.71 | | .08 | | | 1.12 | | | 1.20 | | | — | | — | | — | | 9.91 | | 13.78 | | | 4 | | 2.67 | | | 2.67 | | | .59 | | | N/A | | | N/A | | | 32 | |
| 2011 | | 9.91 | | .01 | | | (.52 | ) | | (.51 | ) | | .16 | | — | | .16 | | 9.24 | | (5.30 | ) | | 3 | | 2.58 | | | 2.58 | | | .30 | | | N/A | | | N/A | | | 30 | |
| 2012 | | 9.24 | | (.04 | ) | | 2.19 | | | 2.15 | | | .14 | | — | | .14 | | 11.25 | | 23.50 | | | 3 | | 2.52 | | | 2.52 | | | (.02 | ) | | N/A | | | N/A | | | 41 | |
| 2013(b) | | 11.25 | | (.05 | ) | | 1.10 | | | 1.05 | | | — | | — | | — | | 12.30 | | 9.33 | † | | 4 | | 2.44 | †† | | 2.44 | †† | | (.64 | )†† | | N/A | | | N/A | | | 17 | |
| |
| * | Calculated without sales charges. |
| ** | Net of expenses waived or assumed by FIMCO (Note 3). |
| (a) | The ratios do not include a reduction of expenses from cash balances maintained |
| with the custodian or from brokerage service arrangements (Note 1G). |
| (b) | For the period October 1, 2012 to March 31, 2013 |
| (c) | Prior to September 4, 2012, known as Value Fund. |
| (d) | Prior to January 31, 2008, known as Mid-Cap Opportunity Fund. |
| † | Not annualized |
| †† | Annualized |
| | |
| 146 | See notes to financial statements | 147 |
Report of Independent Registered Public
Accounting Firm
To the Shareholders and Board of Trustees of
First Investors Income Funds and First Investors Equity Funds
We have audited the accompanying statements of assets and liabilities, including the portfolios of investments of the Cash Management Fund, Government Fund, Investment Grade Fund, International Opportunities Bond Fund and Fund For Income (each a series of First Investors Income Funds), and the Total Return Fund, Equity Income Fund, Growth & Income Fund, Global Fund, Select Growth Fund, Opportunity Fund, Special Situations Fund, and International Fund (each a series of First Investors Equity Funds), as of March 31, 2013, the related statements of operations, the statements of changes in net assets, and the financial highlights for each of the periods indicated thereon. These financial statements and financial highlights are the responsibility of the Funds’ management. Our responsibility is to express an opinion on these financial statements and financial highlights based on our audits.
We conducted our audits in accordance with the standards of the Public Company Accounting Oversight Board (United States). Those standards require that we plan and perform the audit to obtain reasonable assurance about whether the financial statements and financial highlights are free of material misstatement. The Funds are not required to have, nor were we engaged to perform an audit of the Funds’ internal control over financial reporting. Our audits included consideration of internal control over financial reporting as a basis for designing audit procedures that are appropriate in the circumstances, but not for the purpose of expressing an opinion on the effectiveness of the Funds’ internal control over financial reporting. Accordingly, we express no such opinion. An audit includes examining, on a test basis, evidence supporting the amounts and disclosures in the financial statements. Our procedures included confirmation of securities owned as of March 31, 2013, by correspondence with the custodian and brokers. Where brokers have not replied to our confirmation requests, we have carried out other appropriate auditing procedures. An audit also includes assessing the accounting principles used and significant estimates made by management, as well as evaluating the overall financial statement presentation. We believe that our audits provide a reasonable basis for our opinion.
In our opinion, the financial statements and financial highlights referred to above present fairly, in all material respects, the financial position of the Cash Management Fund, Government Fund, Investment Grade Fund, International Opportunities Bond Fund, Fund For Income, Total Return Fund, Equity Income Fund, Growth & Income Fund, Global Fund, Select Growth Fund, Opportunity Fund, Special Situations Fund and International Fund, as of March 31, 2013, and the results of their operations, changes in their net assets, and their financial highlights for the periods presented, in conformity with accounting principles generally accepted in the United States of America.
| |
| | Tait, Weller & Baker LLP |
| |
| Philadelphia, Pennsylvania | |
| May 28, 2013 | |
Board Considerations of Advisory Contracts and Fees
(unaudited)
STRATEGIC INCOME FUND
Consideration of the Investment Advisory Agreement with First Investors Management Company, Inc. with respect to the First Investors Strategic Income Fund
At the December 13, 2012 meeting (the “Meeting”) of the Board of Trustees (the “Board”) of the First Investors Income Funds (the “Trust”), the Board, including a majority of the Independent Trustees, discussed and approved, for the new First Investors Strategic Income Fund (the “New Fund”), the investment advisory agreement (the “Advisory Agreement”) with First Investors Management Company, Inc. (“FIMCO”).
The Trustees were provided with detailed materials relating to the New Fund in advance of and at the Meeting. The material factors and conclusions that formed the basis for the approval of the New Fund’s Advisory Agreement are discussed below. In addition, the Trustees met in person with FIMCO, Trust counsel, independent legal counsel to the Independent Trustees (“Independent Legal Counsel”) and others to receive information on, and discuss the approval of, the New Fund’s Advisory Agreement.
In making their determinations, the Trustees took into account management style, investment strategies, investment philosophy and process, FIMCO’s past performance in managing other bond-focused funds and FIMCO’s personnel that would be serving the Fund. In evaluating the New Fund’s Advisory Agreement, the Trustees also reviewed information provided by FIMCO, including the terms of the Advisory Agreement and information regarding fee arrangements, including the structure of the advisory fees, the method of computing fees, and the frequency of payment of fees. The Trustees also reviewed information comparing the New Fund’s advisory fee and total expenses with a peer group of other similar funds.
After extensive discussion and consideration among themselves, and with FIMCO, Trust counsel and Independent Legal Counsel, including during an executive session with Independent Legal Counsel held the previous day, the Trustees concluded the following with respect to the New Fund:
• The nature and extent of the investment advisory services to be provided to the New Fund by FIMCO were consistent with the terms of the Advisory Agreement.
• The prospects for satisfactory investment performance of the New Fund were reasonable;
• Although the advisory fee schedule included no breakpoints in its schedule, the Trustees concluded that the flat advisory fee was set low from date of initial launch; and
• The cost of services to be provided by FIMCO to the New Fund and the profits to be realized by FIMCO and its affiliates from their relationship with the New Fund would be assessed after a reasonable period of New Fund operations.
Based on all relevant information and factors, none of which was individually determinative of the outcome, the Board, including a majority of the Independent Trustees, concluded that the approval of the New Fund’s Advisory Agreement was in the best interests of the New Fund and its shareholders and unanimously approved such Agreement.
| |
| FIRST INVESTORS INCOME FUNDS | |
| FIRST INVESTORS EQUITY FUNDS | |
| | |
| Trustees | |
| | |
| Susan E. Artmann* | |
| | |
| Mary J. Barneby* | |
| | |
| Charles R. Barton, III | |
| | |
| Stefan L. Geiringer** | |
| | |
| Robert M. Grohol*** | |
| | |
| Arthur M. Scutro, Jr. | |
| | |
| Mark R. Ward | |
| | |
| Officers | |
| | |
| Derek Burke | |
| President | |
| | |
| Marc S. Milgram | |
| Chief Compliance Officer | |
| | |
| Joseph I. Benedek | |
| Treasurer | |
| | |
| Mark S. Spencer | |
| Assistant Treasurer | |
| | |
| Mary C. Carty | |
| Secretary | |
| | |
| Carol Lerner Brown | |
| Assistant Secretary | |
| | |
| * Since 11/1/12 | |
| ** Resigned effective 4/10/13 | |
| *** Retired effective 12/31/12 | |
| | |
| Shareholder Information | | |
| |
| Investment Adviser | | Underwriter |
| First Investors Management | | First Investors Corporation |
| Company, Inc. | | 55 Broadway |
| 55 Broadway | | New York, NY 10006 |
| New York, NY 10006 | | |
| |
| Subadviser | | Custodian |
| (International Opportunities Bond Fund) | | (Income Funds except International |
| Brandywine Global Investment | | Opportunities Bond Fund) |
| Management, LLC | | The Bank of New York Mellon |
| 2929 Arch Street | | One Wall Street |
| Philadelphia, PA 19104 | | New York, NY 10286 |
| |
| Subadviser | | Custodian |
| (Fund For Income) | | (International Opportunities Bond Fund and |
| Muzinich & Co., Inc. | | the Equity Funds) |
| 450 Park Avenue | | Brown Brothers Harriman & Co. |
| New York, NY 10022 | | 40 Water Street |
| | | Boston, MA 02109 |
| |
| Subadviser | | Transfer Agent |
| (Global Fund) | | Administrative Data Management Corp. |
| Wellington Management Company, LLP | | Raritan Plaza I — 8th Floor |
| 280 Congress Street | | Edison, NJ 08837-3620 |
| Boston, MA 02210 | | |
| |
| Subadviser | | Independent Registered Public |
| (Select Growth Fund) | | Accounting Firm |
| Smith Asset Management Group, L.P. | | Tait, Weller & Baker LLP |
| 100 Crescent Court | | 1818 Market Street |
| Dallas, TX 75201 | | Philadelphia, PA 19103 |
| |
| Subadviser | | Legal Counsel |
| (Special Situations Fund) | | K&L Gates LLP |
| Paradigm Capital Management, Inc. | | 1601 K Street, N.W. |
| Nine Elk Street | | Washington, D.C. 20006 |
| Albany, NY 12207 | | |
| |
| Subadviser | | |
| (International Fund) | | |
| Vontobel Asset Management, Inc. | | |
| 1540 Broadway | | |
| New York, NY 10036 | | |
A description of the policies and procedures that the Funds use to vote proxies relating to a portfolio’s securities is available, without charge, upon request by calling toll free 1-800-423-4026 or can be viewed online or downloaded from the EDGAR database on the Securities and Exchange Commission’s (“SEC”) internet website at http://www.sec.gov. In addition, information regarding how the Funds voted proxies relating to portfolio securities during the most recent 12-month period ended June 30, is available, without charge, upon request in writing or by calling 1-800-423-4026 and on the SEC’s internet website at http://www.sec.gov.
The Funds file their complete schedule of portfolio holdings with the SEC on Form N-Q for the first and third quarters of each fiscal year. The Funds’ Form N-Q is available on the SEC’s website at http://www.sec.gov; and may also be reviewed and copied at the SEC’s Public Reference Room in Washington D.C. Information on the operation of the Public Reference Room may be obtained by calling 1-800-SEC-0330. The schedule of portfolio holdings is available, without charge, upon request in writing or by calling 1-800-423-4026.

Item 2. Code of Ethics
Not applicable
Item 3. Audit Committee Financial Expert
Not applicable
Item 4. Principal Accountant Fees and Services
Not applicable
Item 5. Audit Committee of Listed Registrants
Not applicable
Item 6. Schedule of Investments
Schedule of investments is included as part of the report to shareholders filed under Item 1 of this Form.
Item 7. Disclosure of Proxy Voting Policies & Procedures for Closed-End Management Investment Companies
Not applicable
Item 8. Portfolio Managers of Closed-End Management Investment Companies
Not applicable
Item 9. Purchases of Equity Securities by Closed-End Management Investment Companies and Affiliated Purchasers
Not applicable
Item 10. Submission of Matters to a Vote of Security Holders
There were no material changes to the procedure by which shareholders may recommend nominees to the Registrant's Board of Trustees.
Item 11. Controls and Procedures
(a) The Registrant's Principal Executive Officer and Principal Financial Officer have concluded that the Registrant's disclosure controls and procedures (as defined in Rule 30a-3(c) under the Investment Company Act of 1940, as amended) are effective, based on their evaluation of these disclosure controls and procedures as of a date within 90 days of the filing date of this report.
(b) There were no changes in the Registrant's internal control over financial reporting that occurred during the second fiscal quarter of the period covered by this report that have materially affected, or are reasonably likely to materially affect, the Registrant's internal control over financial reporting.
Item 12. Exhibits
(a)(1) Code of Ethics - Not applicable
(a)(2) Certifications pursuant to Section 302 of the Sarbanes-Oxley Act of 2002 - Filed herewith
(b) Certifications pursuant to Section 906 of the Sarbanes-Oxley Act of 2002 - Filed herewith
SIGNATURES
Pursuant to the requirements of the Securities Exchange Act of 1934 and the Investment Company Act of 1940, the Registrant has duly caused this report to be signed on its behalf by the undersigned, thereunto duly authorized.
First Investors Income Funds
| |
| By | /S/ DEREK BURKE |
| | Derek Burke |
| | President and Principal Executive Officer |
| |
| Date: | May 28, 2013 |
Pursuant to the requirements of the Securities Exchange Act of 1934 and the Investment Company Act of 1940, this report has been signed below by the following persons on behalf of the Registrant and in the capacities and on the dates indicated.
| |
| By | /S/ DEREK BURKE |
| | Derek Burke |
| | President and Principal Executive Officer |
| |
| By | /S/ JOSEPH I. BENEDEK |
| | Joseph I. Benedek |
| | Treasurer and Principal Financial Officer |
| |
| Date: | May 28, 2013 |