UNITED STATES
SECURITIES AND EXCHANGE COMMISSION
WASHINGTON, D.C. 20549
FORM N-CSR
CERTIFIED SHAREHOLDER REPORT OF REGISTERED MANAGEMENT
INVESTMENT COMPANIES
INVESTMENT COMPANY ACT FILE NUMBER 811-3967
FIRST INVESTORS INCOME FUNDS
(Exact name of registrant as specified in charter)
40 Wall Street
New York, NY 10005
(Address of principal executive offices) (Zip code)
Joseph I. Benedek
Foresters Investment Management Company, Inc.
Raritan Plaza I
Edison, NJ 08837-3620
(Name and address of agent for service)
REGISTRANT'S TELEPHONE NUMBER, INCLUDING AREA CODE:
1-212-858-8000
DATE OF FISCAL YEAR END: SEPTEMBER 30
DATE OF REPORTING PERIOD: MARCH 31, 2019
Item 1. Reports to Stockholders
The semi-annual report to stockholders follows

| First Investors Funds |
| | Income Funds |
| | ■ Floating Rate |
| | ■ Fund For Income |
| | ■ Government Cash Management |
| | ■ International Opportunities Bond |
| | ■ Investment Grade |
| | ■ Limited Duration Bond |
| | ■ Strategic Income |
| | Equity Funds |
| | ■ Covered Call Strategy |
| | ■ Equity Income |
| | ■ Global |
| | ■ Growth & Income |
| | ■ Hedged U.S. Equity Opportunities |
| | ■ International |
| | ■ Opportunity |
| | ■ Premium Income |
| | ■ Select Growth |
| | ■ Special Situations |
| | ■ Total Return |
Semi-Annual Report | March 31, 2019 |
FOREWORD
This report is for the information of the shareholders of the Funds. It is the policy of each Fund described in this report to mail only one copy of a Fund’s prospectus, annual report, semi-annual report and proxy statements to all shareholders who share the same mailing address and share the same last name and have invested in a Fund covered by the same document. You are deemed to consent to this policy unless you specifically revoke this policy and request that separate copies of such documents be mailed to you. In such case, you will begin to receive your own copies within 30 days after our receipt of the revocation. You may request that separate copies of these disclosure documents be mailed to you by writing to us at: Foresters Investor Services, Inc., Raritan Plaza I, Edison, NJ 08837-3620 or calling us at 1-800-423-4026.
You may obtain a free prospectus for any of the Funds by contacting your representative, calling 1-800-423-4026, writing to us at the following address: Foresters Financial Services, Inc., 40 Wall Street, New York, NY 10005, or by visiting our website atwww.foresters.com. You should consider the investment objectives, risks, charges and expenses of a Fund carefully before investing. The prospectus contains this and other information about the Fund, and should be read carefully before investing.
An investment in a Fund is not a bank deposit and is not insured or guaranteed by the Federal Deposit Insurance Corporation (FDIC) or any other government agency. Although the Government Cash Management Fund seeks to preserve a net asset value at $1.00 per share, it is possible to lose money by investing in it, just as it is possible to lose money by investing in any of the other Funds. Past performance is no guarantee of future results. There is no guarantee that a Fund’s investment objective will be achieved.
A Statement of Additional Information (“SAI”) for any of the Funds may also be obtained, without charge, upon request by calling 1-800-423-4026, writing to us at our address or by visiting our website listed above. The SAI contains more detailed information about the Funds, including information about its Trustees.
Foresters FinancialTM and ForestersTM are the trade names and trademarks of The Independent Order of Foresters (Foresters), a fraternal benefit society, 789 Don Mills Road, Toronto, Canada M3C 1T9 and its subsidiaries.
Understanding Your Fund’s Expenses(unaudited)
FIRST INVESTORS INCOME FUNDS
FIRST INVESTORS EQUITY FUNDS
As a mutual fund shareholder, you incur two types of costs: (1) transaction costs, including a sales charge (load) on purchase payments (on Class A shares only) and a contingent deferred sales charge on redemptions (on Class B shares and, under certain circumstances when a Class A load was waived, on Class A shares); and (2) ongoing costs, including advisory fees; distribution and service fees (12b-1) (on Class A and Class B shares only); and other expenses. This example is intended to help you understand your ongoing costs (in dollars) of investing in the Funds and to compare these costs with the ongoing costs of investing in other mutual funds.
The examples are based on an investment of $1,000 in each Fund at the beginning of the period, October 1, 2018, and held for the entire six-month period ended March 31, 2019. The calculations assume that no shares were bought or sold during the period. Your actual costs may have been higher or lower, depending on the amount of your investment and the timing of any purchases or redemptions.
Actual Expenses Example:
These amounts help you to estimate the actual expenses that you paid over the period. The “Ending Account Value” shown is derived from the Fund’s actual return, and the “Expenses Paid During Period” shows the dollar amount that would have been paid by an investor who started with $1,000 in the Fund. You may use the information here, together with the amount you invested, to estimate the expenses that you paid over the period.
To estimate the expenses you paid on your account during this period, simply divide your ending account value by $1,000 (for example, an $8,600 account value divided by $1,000 = 8.60), then multiply the result by the number given for your Fund under the heading “Expenses Paid During Period”.
Hypothetical Expenses Example:
These amounts provide information about hypothetical account values and hypothetical expenses based on the Fund’s actual expense ratio for each class of shares of a Fund, and an assumed rate of return of 5% per year before expenses, which is not the Fund’s actual return. The hypothetical account values and expenses may not be used to estimate the actual ending account balance or expenses you paid for the period. You may use this information to compare the ongoing costs of investing in the Fund and other funds. To do so, compare this 5% hypothetical example with the 5% hypothetical examples that appear in the shareholder reports of the other funds.
Please note that the expenses shown in the table are meant to highlight and help you compare your ongoing costs only and do not reflect any transaction costs, such as front-end or contingent deferred sales charges (loads) or account fees that are charged to certain types of accounts, such as an annual custodial fee of $15 for certain IRA accounts and certain other retirement accounts or an annual custodial fee of $30 for 403(b) custodial accounts (subject to exceptions and certain waivers as described in the Funds’ Statement of Additional Information). Therefore, the hypothetical expenses example is useful in comparing ongoing costs only and will not help you determine the relative total costs of owning different funds. In addition, if these costs were included, your costs would have been higher.
1
Fund Expenses(unaudited)
FLOATING RATE FUND
The examples below show the ongoing costs (in dollars) of investing in your Fund and will help you in comparing these costs with costs of other mutual funds. Please refer to page 1 for a detailed explanation of the information presented in these examples.
Expense Example | Annualized
Expense
Ratio | Beginning
Account Value
(10/1/18) | Ending
Account Value
(3/31/19) | Expenses Paid
During Period
(10/1/18-3/31/19)* |
Class A Shares | 1.10% | | | |
Actual | | $1,000.00 | $1,002.53 | $ 5.49 |
Hypothetical** | | $1,000.00 | $1,019.45 | $ 5.54 |
Advisor Class Shares | 0.90% | | | |
Actual | | $1,000.00 | $1,014.23 | $ 4.52 |
Hypothetical** | | $1,000.00 | $1,020.44 | $ 4.53 |
Institutional Class Shares | 0.74% | | | |
Actual | | $1,000.00 | $1,003.55 | $ 3.70 |
Hypothetical** | | $1,000.00 | $1,021.24 | $ 3.73 |
* | Expenses are equal to the annualized expense ratio, multiplied by the average account value over the period, multiplied by 182/365 (to reflect the one-half year period). Expenses paid during the period are net of expenses waived and/or assumed. |
** | Assumed rate of return of 5% before expenses |
Portfolio Composition
BY SECTOR
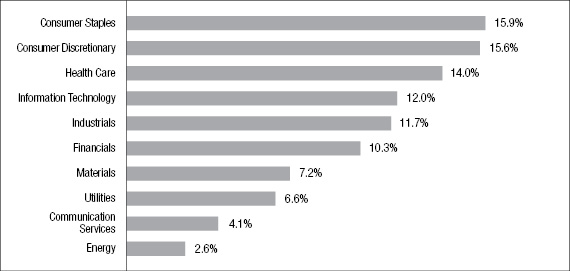
Portfolio holdings and allocations are subject to change. Percentages are as of March 31, 2019, and are based on the total market value of investments.
2
Portfolio of Investments
FLOATING RATE FUND
March 31, 2019
| |
Principal
Amount
| | Security | | Value | |
| | | | | LOAN PARTICIPATIONS†—88.3% | | | | |
| | | | | Aerospace/Defense—1.0% | | | | |
| | | | | TransDigm, Inc.: | | | | |
| | $ | 1,333M | | 4.9986%, 5/30/2025 | | $ | 1,299,356 | |
| | | 1,329M | | 4.9986%, 8/22/2024 | | | 1,295,733 | |
| | | | | | | | 2,595,089 | |
| | | | | Automotive—2.4% | | | | |
| | | 497M | | Dexko Global, Inc., 5.9986%, 7/24/2024 | | | 495,000 | |
| | | 733M | | Innovative XCessories & Services, LLC, 7.25%, 11/29/2022 | | | 729,961 | |
| | | 1,125M | | Panther BF Aggeregator 2, LP, 3.5%, 3/18/2026(a) | | | 1,116,214 | |
| | | 1,056M | | Superior Industries International, Inc., 6.4986%, 3/22/2024 | | | 1,029,254 | |
| | | 2,484M | | Trico Group, LLC, 9.601%, 2/2/2024 | | | 2,347,734 | |
| | | 500M | | Truck Hero, Inc., 10.7486%, 4/21/2025 | | | 482,815 | |
| | | | | | | | 6,200,978 | |
| | | | | Building Materials—.8% | | | | |
| | | 2,469M | | Yak Access, LLC, 7.4986%, 7/11/2025 | | | 2,147,813 | |
| | | | | Chemicals—4.2% | | | | |
| | | | | Flint Group: | | | | |
| | | 349M | | 5.7793%, 9/6/2021 | | | 321,410 | |
| | | 2,113M | | 5.7793%, 9/7/2021 | | | 1,944,267 | |
| | | | | Invictus U.S. Newco, LLC: | | | | |
| | | 496M | | 5.5791%, 3/28/2025 | | | 492,531 | |
| | | 1,000M | | 9.3291%, 3/30/2025 | | | 995,000 | |
| | | 1,150M | | MacDermid, Inc., 4.7486%, 11/17/2025 | | | 1,139,938 | |
| | | 2,400M | | Messer Industries USA, Inc., 2.5%, 3/2/2026(a) | | | 2,356,500 | |
| | | 1,233M | | PQ Group Holdings, Inc., 5.2444%, 2/7/2025 | | | 1,220,226 | |
| | | 2,425M | | Univar USA, Inc., 4.9986%, 7/1/2024 | | | 2,402,775 | |
| | | | | | | | 10,872,647 | |
| | | | | Consumer Durables—.9% | | | | |
| | | 2,477M | | TGP Holdings III, LLC, 6.851%, 9/25/2024 | | | 2,301,416 | |
3
Portfolio of Investments(continued)
FLOATING RATE FUND
March 31, 2019
| |
Principal
Amount
| | Security | | Value | |
| | | | | Consumer Non-Durables—1.5% | | | | |
| | $ | 2,494M | | Energizer Holdings, Inc., 4.7338%, 6/23/2025 | | $ | 2,482,840 | |
| | | 1,343M | | frontdoor, inc., 5%, 8/14/2025 | | | 1,338,220 | |
| | | | | | | | 3,821,060 | |
| | | | | Energy—1.2% | | | | |
| | | 474M | | Centurion Pipeline, LLC, 5.851%, 9/26/2025 | | | 473,516 | |
| | | 1,985M | | Consolidated Energy Finance SA, 4.9886%, 5/7/2025 | | | 1,925,450 | |
| | | 671M | | Triton Solar U.S. Acqusition Co, 8.4986%, 10/29/2024 | | | 628,442 | |
| | | | | | | | 3,027,408 | |
| | | | | Financial Services—3.2% | | | | |
| | | 1,872M | | Alliant Holdings Intermediate, LLC, 5.2318%, 5/9/2025 | | | 1,807,567 | |
| | | 2,695M | | NFP Corp., 5.4986%, 1/8/2024 | | | 2,608,963 | |
| | | 3,960M | | USI Holdings Corp., 5.601%, 5/16/2024 | | | 3,828,650 | |
| | | | | | | | 8,245,180 | |
| | | | | Financials—5.4% | | | | |
| | | | | Acrisure, LLC: | | | | |
| | | 496M | | 6.3789%, 11/22/2023 | | | 491,288 | |
| | | 493M | | 6.8789%, 11/22/2023 | | | 490,038 | |
| | | 2,300M | | AssuredPartners, Inc., 5.7486%, 10/22/2024 | | | 2,233,699 | |
| | | 1,241M | | Cision, Inc., 5.351%, 6/16/2023 | | | 1,230,256 | |
| | | 249M | | Global Business Group Service BV, 5.188%, 8/13/2025 | | | 248,439 | |
| | | 1,496M | | Ineos U.S. Finance, LLC, 4.4986%, 4/1/2024 | | | 1,472,460 | |
| | | 1,485M | | Paysafe, LLC, 5.9986%, 1/3/2025 | | | 1,459,480 | |
| | | 1,521M | | Sedgwick Claims Management Services, Inc.,
5.743%, 12/31/2025 | | | 1,499,320 | |
| | | 1,489M | | TransUnion, LLC, 4.4986%, 6/30/2025 | | | 1,471,540 | |
| | | 1,250M | | Travelport Finance Luxembourg, 5%, 3/18/2026(a) | | | 1,218,281 | |
| | | 2,050M | | VFH Parent, LLC, 6.1261%, 3/2/2026 | | | 2,056,663 | |
| | | | | | | | 13,871,464 | |
| | | | | Food/Beverage/Tobacco—5.6% | | | | |
| | | 623M | | 8th Avenue Food and Provisions, 6.2404%, 10/1/2025 | | | 625,258 | |
4
| |
Principal
Amount
| | Security | | Value | |
| | | | | Food/Beverage/Tobacco (continued) |
| | $ | 2,126M | | Chobani, LLC, 5.9986%, 10/9/2023 | | $ | 2,035,612 | |
| | | 736M | | Dole Food Co., Inc., 5.2462%, 4/6/2024 | | | 710,752 | |
| | | 3,474M | | Hearthside Food Holdings, LLC, 6.1861%, 5/23/2025 | | | 3,395,591 | |
| | | 1,890M | | HLF Financing Sarl, LLC, 5.7486%, 8/18/2025 | | | 1,895,439 | |
| | | 950M | | Jacobs Douwe Egberts International BV, 2%, 10/23/2025(a) | | | 946,438 | |
| | | 2,000M | | Prestige Brands, Inc., 2%, 1/26/2024(a) | | | 1,980,830 | |
| | | 990M | | Refresco BV, 5.9338%, 1/22/2025 | | | 972,551 | |
| | | 1,737M | | Sigma Bidco BV, 5.6031%, 7/2/2025 | | | 1,692,732 | |
| | | | | | | | 14,255,203 | |
| | | | | Food/Drug—.8% | | | | |
| | | 1,995M | | Albertson’s, LLC, 5.4986%, 11/17/2025 | | | 1,971,319 | |
| | | | | Forest Products/Containers—.8% | | | | |
| | | 1,985M | | Multi-Color Corp., 4.4986%, 10/31/2024 | | | 1,983,684 | |
| | | | | Gaming/Leisure—6.2% | | | | |
| | | | | AMC Entertainment Holdings, Inc.: | | | | |
| | | 1,853M | | 4.7338%, 12/15/2022 | | | 1,844,859 | |
| | | 368M | | 4.7338%, 12/15/2023 | | | 365,846 | |
| | | 2,992M | | Boyd Gaming Corp., 4.6576%, 9/15/2023 | | | 2,970,785 | |
| | | 1,733M | | Casablanca U.S. Holdings, Inc., 6.7443%, 3/29/2024 | | | 1,678,359 | |
| | | 2,000M | | Dorna Sports SL, 5.883%, 4/12/2024 | | | 1,961,670 | |
| | | 1,000M | | Eldorado Resorts, Inc., 4.875%, 4/17/2024 | | | 993,440 | |
| | | 865M | | Lakeland Tours, 6.6146%, 12/16/2024 | | | 863,037 | |
| | | 1,995M | | Penn National Gaming, Inc., 4.7486%, 10/15/2025 | | | 1,977,544 | |
| | | 2,122M | | Stars Group Holdings BV, 6.101%, 7/10/2025 | | | 2,121,527 | |
| | | 992M | | Station Casinos, LLC, 5%, 6/8/2023 | | | 983,598 | |
| | | | | | | | 15,760,665 | |
| | | | | Health Care—11.4% | | | | |
| | | 974M | | Air Methods Corp., 6.101%, 4/22/2024 | | | 734,204 | |
| | | 250M | | Albany Molecular Research, Inc., 9.493%, 7/28/2025 | | | 248,750 | |
5
Portfolio of Investments(continued)
FLOATING RATE FUND
March 31, 2019
| |
Principal
Amount
| | Security | | Value | |
| | | | | Health Care (continued) |
| | $ | 1,624M | | Bausch Health Cos., Inc., 5.4809%, 6/2/2025 | | $ | 1,615,860 | |
| | | 176M | | Carestream Finance, LP, 8.2486%, 3/1/2021 | | | 171,490 | |
| | | 675M | | Civitas Solutions, Inc., 6.75%, 3/9/2026 | | | 677,700 | |
| | | 1,534M | | DaVita, Inc., 5.2486%, 6/18/2021 | | | 1,535,813 | |
| | | 3,491M | | Envision Healthcare Corp., 6.2486%, 10/10/2025 | | | 3,271,965 | |
| | | 1,481M | | Equian Buyer Corp., 5.7486%, 5/20/2024 | | | 1,451,533 | |
| | | | | Heartland Dental, LLC: | | | | |
| | | 2,302M | | 6.2486%, 4/30/2025(a) | | | 2,232,589 | |
| | | 43M | | 6.1623%, 4/30/2025 | | | 50,164 | |
| | | 1,489M | | Jordan Health, Inc., 7.4906%, 5/16/2025 | | | 1,451,531 | |
| | | | | Mallinckrodt International Finance SA: | | | | |
| | | 2,564M | | 5.351%, 9/24/2024 | | | 2,388,401 | |
| | | 338M | | 5.6929%, 2/24/2025 | | | 318,592 | |
| | | | | NMN Holdings III Corp: | | | | |
| | | 236M | | 1.875%, 11/13/2025(a) | | | 234,478 | |
| | | 1,111M | | 6.3237%, 11/13/2025 | | | 1,102,843 | |
| | | 1,089M | | Parexel International Corp., 5.2486%, 9/27/2024 | | | 1,053,012 | |
| | | | | PetVet Care Centers, LLC: | | | | |
| | | 549M | | 5.7355%, 2/14/2025 | | | 530,106 | |
| | | 500M | | 8.7355%, 2/13/2026 | | | 487,500 | |
| | | 496M | | R1 RCM, Inc., 7.7486%, 5/8/2025 | | | 493,769 | |
| | | 2,394M | | RegionalCare Hospital Partners Holdings, Inc., 6.9818%, 11/17/2025 | | | 2,377,170 | |
| | | | | Sound Inpatient Physicians, LLC: | | | | |
| | | 998M | | 5.2486%, 6/25/2025 | | | 986,387 | |
| | | 250M | | 9.2486%, 6/25/2026 | | | 249,375 | |
| | | 1,000M | | Syneos Health, Inc., 2%, 8/1/2024(a) | | | 993,750 | |
| | | 2,478M | | U.S. Renal Care, 6.851%, 12/30/2022 | | | 2,478,231 | |
| | | 500M | | Universal Hospital Services, 5.5%, 1/5/2026 | | | 498,750 | |
| | | 1,475M | | WC Holding Corp., 7.197%, 2/11/2026 | | | 1,458,406 | |
| | | | | | | | 29,092,369 | |
| | | | | Information Technology—9.9% | | | | |
| | | 1,767M | | Cabot Microelectronics Corp., 4.75%, 11/14/2025 | | | 1,762,124 | |
| | | 2,010M | | Change Healthcare Holdings, LLC, 5.2486%, 3/1/2024 | | | 1,985,970 | |
6
| |
Principal
Amount
| | Security | | Value | |
| | | | | Information Technology (continued) |
| | $ | 1,281M | | Corel Corp., 7.6289%, 6/5/2024 | | $ | 1,278,887 | |
| | | 4,096M | | DigiCert Holdings, Inc., 6.4986%, 10/31/2024 | | | 4,037,365 | |
| | | 748M | | EagleView Technology Corp., 5.9818%, 8/14/2025 | | | 730,043 | |
| | | 1,418M | | Inovalon Holdings, Inc., 6%, 4/2/2025 | | | 1,414,330 | |
| | | 1,421M | | MacDonald Dettwiler, Inc., 5.25%, 10/4/2024 | | | 1,112,247 | |
| | | 1,275M | | Microchip Technology, Inc., 4.5%, 5/29/2025 | | | 1,266,702 | |
| | | 1,838M | | Plantronics, Inc., 4.9986%, 7/2/2025 | | | 1,807,128 | |
| | | 1,975M | | Solarwinds, Inc., 5.2486%, 2/5/2024 | | | 1,956,899 | |
| | | 623M | | SuperMoose Borrower, LLC, 6.2486%, 8/29/2025 | | | 616,814 | |
| | | | | VeriFone Systems, Inc.: | | | | |
| | | 1,995M | | 6.6829%, 8/20/2025 | | | 1,967,569 | |
| | | 1,000M | | 10.6829%, 8/10/2026 | | | 980,000 | |
| | | 1,817M | | Web.com Group, Inc., 6.2428%, 10/10/2025 | | | 1,794,635 | |
| | | 2,580M | | Western Digital Corp., 4.2486%, 4/28/2023 | | | 2,527,970 | |
| | | | | | | | 25,238,683 | |
| | | | | Manufacturing—8.0% | | | | |
| | | 1,250M | | AI Alpine U.S. Bidco, Inc., 5.9875%, 10/24/2025 | | | 1,232,813 | |
| | | 1,980M | | Altran Technologies SA, 4.8826%, 3/20/2025 | | | 1,954,022 | |
| | | 2,173M | | AMG Advanced Metallurgical, 5.5791%, 1/30/2025 | | | 2,145,022 | |
| | | 3,439M | | Brand Energy & Infrastructure Services, Inc.,
6.9563%, 6/21/2024 | | | 3,296,901 | |
| | | 673M | | Brooks Automation, Inc., 5.4837%, 10/4/2024 | | | 672,887 | |
| | | 1,485M | | Clark Equipment Co., 4.601%, 5/17/2024 | | | 1,462,731 | |
| | | 988M | | Duravant, 5.851%, 7/24/2024 | | | 952,938 | |
| | | 1,337M | | Filtration Group Corp., 5.4986%, 3/31/2025 | | | 1,329,817 | |
| | | 1,379M | | GrafTech International, Ltd., 5.9986%, 2/12/2025 | | | 1,370,547 | |
| | | 1,240M | | Hillman Group, Inc., 6.4986%, 6/2/2025 | | | 1,186,689 | |
| | | 2,448M | | Houghton International Corp., 5.7486%, 12/31/2019 | | | 2,449,311 | |
| | | 1,493M | | Minimax Viking GmbH, 5.4989%, 7/25/2025 | | | 1,490,634 | |
| | | 475M | | MKS Instruments, Inc., 4.7393%, 1/16/2026 | | | 475,594 | |
| | | 550M | | Tank Holding Corp., 4%, 3/25/2026(a) | | | 551,513 | |
| | | | | | | | 20,571,419 | |
7
Portfolio of Investments(continued)
FLOATING RATE FUND
March 31, 2019
| |
Principal
Amount
| | Security | | Value | |
| | | | | Media-Broadcasting—1.7% | | | | |
| | $ | 2,198M | | Altice Financing SA, 5.2338%, 7/28/2025 | | $ | 2,088,574 | |
| | | 347M | | Mission Broadcasting, Inc., 4.7393%, 1/17/2024 | | | 341,467 | |
| | | 1,884M | | Nexstar Broadcasting, Inc., 4.7455%, 1/17/2024 | | | 1,855,330 | |
| | | | | | | | 4,285,371 | |
| | | | | Media-Cable TV—5.0% | | | | |
| | | 3,747M | | Atlantic Broadband, 4.8736%, 1/3/2025 | | | 3,692,829 | |
| | | | | CSC Holdings, LLC: | | | | |
| | | 1,838M | | 4.7338%, 7/17/2025 | | | 1,789,914 | |
| | | 248M | | 4.9838%, 1/26/2026 | | | 242,852 | |
| | | | | Gray Television, Inc.: | | | | |
| | | 1,210M | | 4.7319%, 2/7/2024 | | | 1,198,599 | |
| | | 625M | | 4.9819%, 1/2/2026 | | | 619,338 | |
| | | 995M | | Midcontinent Communications, 4.4906%, 12/29/2023 | | | 988,693 | |
| | | 1,990M | | SFR Group, LLC, 5.2486%, 7/31/2025 | | | 1,823,222 | |
| | | 2,000M | | Unitymedia Hessen GmbH & Co., 4.7338%, 9/30/2025 | | | 1,982,190 | |
| | | 600M | | Ziggo Secured Finance Partnership, 4.9838%, 4/15/2025 | | | 585,000 | |
| | | | | | | | 12,922,637 | |
| | | | | Media-Diversified—.7% | | | | |
| | | 900M | | DiscoverOrg., LLC, 7.2363%, 1/29/2026 | | | 893,812 | |
| | | 962M | | Tribune Media Co., 5.4986%, 1/29/2024 | | | 960,802 | |
| | | | | | | | 1,854,614 | |
| | | | | Metals/Mining—.8% | | | | |
| | | 1,354M | | Big River Steel, LLC, 7.803%, 8/23/2023 | | | 1,361,147 | |
| | | 783M | | TMS International Corp., 5.4003%, 8/14/2024 | | | 763,250 | |
| | | | | | | | 2,124,397 | |
| | | | | Retail-General Merchandise—2.9% | | | | |
| | | 1,989M | | Burger King, 4.7486%, 2/17/2024 | | | 1,959,166 | |
| | | 1,495M | | Harbor Freight Tools USA, Inc., 4.9986%, 8/16/2023 | | | 1,462,105 | |
| | | 821M | | SRS Distribution, Inc., 5.7486%, 5/23/2025 | | | 784,962 | |
| | | 1,975M | | Staples, Inc., 6.4893%, 9/12/2024 | | | 1,963,891 | |
8
| |
Principal
Amount
| | Security | | Value | |
| | | | | Retail-General Merchandise (continued) |
| | $ | 1,136M | | Varsity Brands, Inc., 5.9986%, 12/16/2024 | | $ | 1,121,909 | |
| | | | | | | | 7,292,033 | |
| | | | | Services—4.7% | | | | |
| | | 1,265M | | Capri Acquistion BidCo., 5.9944%, 11/1/2024 | | | 1,235,744 | |
| | | 249M | | Comet Acquisition, Inc., 5.9986%, 10/24/2025 | | | 245,011 | |
| | | 2,347M | | Dawn Acquisition, LLC, 6.351%, 12/31/2025(a) | | | 2,223,427 | |
| | | 1,820M | | Empower Payments, Inc., 6.7486%, 10/6/2025 | | | 1,799,958 | |
| | | 448M | | Garrett LX III Sarl, 5.11%, 9/26/2025 | | | 436,556 | |
| | | 2,978M | | IQVIA, Inc., 4.2486%, 6/9/2025 | | | 2,948,663 | |
| | | 2,500M | | Prime Security Services Borrower, 2.75%, 5/2/2022(a) | | | 2,477,088 | |
| | | 748M | | R.R. Donnelley & Sons Co., 7.4986%, 1/4/2024 | | | 748,361 | |
| | | | | | | | 12,114,808 | |
| | | | | Telecommunication Services—1.0% | | | | |
| | | 2,497M | | CenturyLink, Inc., 5.2486%, 1/31/2025(a) | | | 2,445,577 | |
| | | | | Utilities—5.5% | | | | |
| | | 500M | | Brookfield WEC Holdings Inc., 9.2486%, 7/27/2026 | | | 502,918 | |
| | | 2,835M | | Calpine Corp., 5.11%, 1/15/2024 | | | 2,811,471 | |
| | | 2,437M | | Edgewater Generation, LLC, 6.2486%, 12/12/2025(a) | | | 2,434,203 | |
| | | 2,288M | | ExGen Renewables I, LLC, 5.63%, 11/28/2024 | | | 2,150,370 | |
| | | 1,613M | | HD Supply, Inc., 4.2486%, 10/17/2023 | | | 1,594,571 | |
| | | 1,991M | | Talen Energy Supply, LLC, 6.5%, 7/6/2023 | | | 1,980,488 | |
| | | 2,726M | | USIC Holdings, Inc., 5.7486%, 12/11/2023 | | | 2,661,354 | |
| | | | | | | | 14,135,375 | |
| | | | | Waste Management—1.5% | | | | |
| | | 2,978M | | GFL Environmental, Inc., 5.4986%, 5/30/2025 | | | 2,888,037 | |
| | | 1,051M | | Gopher Resource, LLC, 5.7486%, 3/6/2025 | | | 1,045,961 | |
| | | | | | | | 3,933,998 | |
9
Portfolio of Investments(continued)
FLOATING RATE FUND
March 31, 2019
| |
Principal
Amount
| | Security | | Value | |
| | | | | Wireless Communications—1.2% | | | | |
| | $ | 1,421M | | Sprint Communications, Inc., 5%, 2/2/2024 | | $ | 1,384,288 | |
| | | 1,672M | | Telesat Canada, 5.11%, 11/17/2023 | | | 1,652,271 | |
| | | | | | | | 3,036,559 | |
Total Value of Loan Participations (cost $229,088,618) | | | 226,101,766 | |
| | | | | CORPORATE BONDS—8.2% | | | | |
| | | | | Automotive—.3% | | | | |
| | | 650M | | American Axle & Manufacturing, Inc., 6.625%, 10/15/2022 | | | 667,063 | |
| | | | | Energy—1.6% | | | | |
| | | 1,250M | | CITGO Petroleum Corp., 6.25%, 8/15/2022(b) | | | 1,246,875 | |
| | | 650M | | Genesis Energy, LP, 6%, 5/15/2023 | | | 656,500 | |
| | | 650M | | Global Partners, LP, 6.25%, 7/15/2022 | | | 645,125 | |
| | | 175M | | Range Resources Corp., 5%, 8/15/2022 | | | 174,125 | |
| | | 1,250M | | Sunoco, LP, 4.875%, 1/15/2023 | | | 1,273,000 | |
| | | | | | | | 3,995,625 | |
| | | | | Financials—.6% | | | | |
| | | 350M | | DAE Funding, LLC, 4.5%, 8/1/2022(b) | | | 353,500 | |
| | | 1,250M | | Springleaf Finance Corp., 6.875%, 3/15/2025 | | | 1,292,188 | |
| | | | | | | | 1,645,688 | |
| | | | | Forest Products/Containers—.6% | | | | |
| | | 600M | | Ardagh Holdings USA, Inc., 7.25%, 5/15/2024(b) | | | 634,320 | |
| | | 900M | | BWAY Holding Co., 5.5%, 4/15/2024(b) | | | 896,895 | |
| | | | | | | | 1,531,215 | |
| | | | | Health Care—.9% | | | | |
| | | | | Bausch Health Cos., Inc.: | | | | |
| | | 1,375M | | 5.5%, 3/1/2023(b) | | | 1,387,031 | |
| | | 400M | | 7%, 3/15/2024(b) | | | 424,200 | |
| | | 175M | | 6.125%, 4/15/2025(b) | | | 173,688 | |
| | | 250M | | Tenet Healthcare Corp., 5.125%, 5/1/2025 | | | 251,888 | |
| | | | | | | | 2,236,807 | |
10
| |
Principal
Amount
| | Security | | Value | |
| | | | | Manufacturing—.5% | | | | |
| | $ | 1,250M | | Cloud Crane, LLC, 10.125%, 8/1/2024(b) | | $ | 1,346,875 | |
| | | | | Media-Cable TV—.5% | | | | |
| | | 1,175M | | Clear Channel Worldwide Holdings, Inc. - Series “A”, 6.5%, 11/15/2022 | | | 1,208,781 | |
| | | | | Metals/Mining—1.1% | | | | |
| | | 650M | | AK Steel Corp., 7.625%, 10/1/2021 | | | 654,875 | |
| | | 1,000M | | Commercial Metals Co., 4.875%, 5/15/2023 | | | 1,007,500 | |
| | | 1,100M | | First Quantum Minerals, Ltd., 7.25%, 5/15/2022(b) | | | 1,111,000 | |
| | | | | | | | 2,773,375 | |
| | | | | Telecommunications—.3% | | | | |
| | | 650M | | GCI, Inc., 6.875%, 4/15/2025 | | | 681,688 | |
| | | | | Transportation—.4% | | | | |
| | | 1,000M | | XPO Logistics, Inc., 6.5%, 6/15/2022(b) | | | 1,022,500 | |
| | | | | Utilities—.8% | | | | |
| | | 1,150M | | Calpine Corp., 5.375%, 1/15/2023 | | | 1,154,313 | |
| | | 1,000M | | Targa Resources Partners, LP, 4.25%, 11/15/2023 | | | 998,750 | |
| | | | | | | | 2,153,063 | |
| | | | | Wireless Communications—.6% | | | | |
| | | 1,550M | | Sprint Corp., 7.875%, 9/15/2023 | | | 1,627,500 | |
Total Value of Corporate Bonds (cost $20,390,993) | | | 20,890,180 | |
| | | | | |
Total Value of Investments (cost $249,479,611) | | | 96.5 | % | | | 246,991,946 | |
Other Assets, Less Liabilities | | | 3.5 | | | | 9,090,773 | |
Net Assets | | | 100.0 | % | | $ | 256,082,719 | |
(a) | A portion or all of the security purchased on a when-issued or delayed delivery basis. |
(b) | Security exempt from registration under Rule 144A of the Securities Act of 1933 (see Note 4). |
† | Interest rates are determined and reset periodically. The interest rates above are the rates in effect at March 31, 2019. |
11
Portfolio of Investments(continued)
FLOATING RATE FUND
March 31, 2019
The Fund’s assets and liabilities are classified into the following three levels based on the inputs used to value the assets and liabilities:
| | Level 1 – | Unadjusted quoted prices in active markets for identical securities that the Fund has the ability to access. |
| | Level 2 – | Observable inputs other than quoted prices included in Level 1 that are observable for the asset or liability, either directly or indirectly. These inputs may include quoted prices for the identical instrument on an inactive market, prices for similar instruments, interest rates, prepayment speeds, credit risk, yield curves, default rates and similar data. |
| | Level 3 – | Unobservable inputs for the asset or liability, to the extent relevant observable inputs are not available, representing the Fund’s own assumption about the assumptions a market participant would use in valuing the asset or liability, and would be based on the best information available. |
The inputs methodology used for valuing securities are not necessarily an indication of the risk associated with investing in those securities. For example, U.S. government securities are reflected as Level 2 because the inputs used to determine fair value may not always be quoted prices in an active market.
The following is a summary, by category of Level, of inputs used to value the Fund’s investments as of March 31, 2019:
| | | Level 1 | | | Level 2 | | | Level 3 | | | Total | |
Loan Participations | | $ | — | | | $ | 226,101,766 | | | $ | — | | | $ | 226,101,766 | |
Corporate Bonds | | | — | | | | 20,890,180 | | | | — | | | | 20,890,180 | |
Total Investments in Securities* | | $ | — | | | $ | 246,991,946 | | | $ | — | | | $ | 246,991,946 | |
* | The Portfolio of Investments provides information on the industry categorization of loan participations and corporate bonds. |
There were no transfers into or from Level 1 and Level 2 by the Fund for the period ended March 31, 2019. Transfers, if any, between Levels are recognized at the end of the reporting period.
See notes to financial statements
12
Fund Expenses(unaudited)
FUND FOR INCOME
The examples below show the ongoing costs (in dollars) of investing in your Fund and will help you in comparing these costs with costs of other mutual funds. Please refer to page 1 for a detailed explanation of the information presented in these examples.
Expense Example | Annualized
Expense
Ratio | Beginning
Account Value
(10/1/18) | Ending
Account Value
(3/31/19) | Expenses Paid
During Period
(10/1/18-3/31/19)* |
Class A Shares | 1.23% | | | |
Actual | | $1,000.00 | $1,022.57 | $ 6.20 |
Hypothetical** | | $1,000.00 | $1,018.80 | $ 6.19 |
Class B Shares | 2.07% | | | |
Actual | | $1,000.00 | $1,014.23 | $ 10.40 |
Hypothetical** | | $1,000.00 | $1,014.61 | $ 10.40 |
Advisor Class Shares | 1.04% | | | |
Actual | | $1,000.00 | $1,023.55 | $ 5.25 |
Hypothetical** | | $1,000.00 | $1,019.74 | $ 5.24 |
Institutional Class Shares | 0.80% | | | |
Actual | | $1,000.00 | $1,024.73 | $ 4.04 |
Hypothetical** | | $1,000.00 | $1,020.94 | $ 4.03 |
* | Expenses are equal to the annualized expense ratio, multiplied by the average account value over the period, multiplied by 182/365 (to reflect the one-half year period). Expenses paid during the period are net of expenses waived. |
** | Assumed rate of return of 5% before expenses |
Portfolio Composition
TOP TEN SECTORS
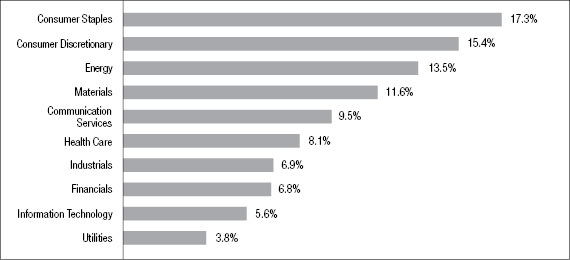
Portfolio holdings and allocations are subject to change. Percentages are as of March 31, 2019, and are based on the total market value of investments.
13
Portfolio of Investments
FUND FOR INCOME
March 31, 2019
| |
Principal
Amount
| | Security | | Value | |
| | | | | CORPORATE BONDS—91.7% | | | | |
| | | | | Aerospace/Defense—1.6% | | | | |
| | | | | Bombardier, Inc.: | | | | |
| | $ | 2,600M | | 6%, 10/15/2022(a) | | $ | 2,635,750 | |
| | | 1,950M | | 7.5%, 12/1/2024(a) | | | 2,030,437 | |
| | | | | TransDigm, Inc.: | | | | |
| | | 1,550M | | 6.5%, 7/15/2024 | | | 1,598,438 | |
| | | 1,600M | | 6.25%, 3/15/2026(a) | | | 1,670,400 | |
| | | 2,050M | | Triumph Group, Inc., 5.25%, 6/1/2022 | | | 1,978,250 | |
| | | | | | | | 9,913,275 | |
| | | | | Automotive—2.9% | | | | |
| | | 2,875M | | Adient Global Holdings, Ltd., 4.875%, 8/15/2026(a) | | | 2,120,312 | |
| | | 3,125M | | American Axle & Manufacturing, Inc., 6.25%, 4/1/2025 | | | 3,054,687 | |
| | | 700M | | Asbury Automotive Group, Inc., 6%, 12/15/2024 | | | 723,415 | |
| | | 1,700M | | Avis Budget Group, Inc., 6.375%, 4/1/2024(a) | | | 1,736,125 | |
| | | 1,675M | | Cooper Standard Automotive, Inc., 5.625%, 11/15/2026(a) | | | 1,479,025 | |
| | | 1,425M | | Dana Holding Corp., 6%, 9/15/2023 | | | 1,465,969 | |
| | | 1,650M | | Hertz Corp., 7.625%, 6/1/2022(a) | | | 1,692,900 | |
| | | 1,825M | | J.B. Poindexter & Co., 7.125%, 4/15/2026(a) | | | 1,839,290 | |
| | | 1,538M | | LKQ Corp., 4.75%, 5/15/2023 | | | 1,554,995 | |
| | | | | Panther BF Aggeregator 2, LP: | | | | |
| | | 250M | | 6.25%, 5/15/2026(a)(b) | | | 255,625 | |
| | | 625M | | 8.5%, 5/15/2027(a)(b) | | | 628,125 | |
| | | 1,875M | | Tenneco, Inc., 5%, 7/15/2026 | | | 1,509,375 | |
| | | | | | | | 18,059,843 | |
| | | | | Building Materials—1.0% | | | | |
| | | 2,000M | | Building Materials Corp., 5.375%, 11/15/2024(a) | | | 2,057,500 | |
| | | 1,425M | | Griffon Corp., 5.25%, 3/1/2022 | | | 1,407,188 | |
| | | 1,600M | | New Enterprise Stone & Lime Co., 6.25%, 3/15/2026(a) | | | 1,560,176 | |
| | | 925M | | Standard Industries, Inc., 5.5%, 2/15/2023(a) | | | 943,500 | |
| | | | | | | | 5,968,364 | |
14
| |
Principal
Amount
| | Security | | Value | |
| | | | | Chemicals—2.4% | | | | |
| | $ | 1,375M | | Avantor, Inc., 9%, 10/1/2025(a) | | $ | 1,493,594 | |
| | | 1,800M | | Blue Cube Spinco, Inc., 10%, 10/15/2025 | | | 2,068,290 | |
| | | 375M | | CF Industries, Inc., 4.95%, 6/1/2043 | | | 322,969 | |
| | | 950M | | CVR Partners, LP, 9.25%, 6/15/2023(a) | | | 998,687 | |
| | | 1,525M | | Kraton Polymers, LLC, 7%, 4/15/2025(a) | | | 1,547,875 | |
| | | 1,125M | | Neon Holdings, Inc., 10.125%, 4/1/2026(a) | | | 1,150,313 | |
| | | 1,600M | | PQ Corp., 6.75%, 11/15/2022(a) | | | 1,666,000 | |
| | | 2,225M | | Rain CII Carbon, LLC, 7.25%, 4/1/2025(a) | | | 1,980,250 | |
| | | 650M | | Rayonier AM Products, Inc., 5.5%, 6/1/2024(a) | | | 612,625 | |
| | | 850M | | Tronox, Inc., 6.5%, 4/15/2026(a) | | | 814,428 | |
| | | 2,400M | | Univar USA, Inc., 6.75%, 7/15/2023(a) | | | 2,464,800 | |
| | | | | | | | 15,119,831 | |
| | | | | Consumer Non-Durables—2.0% | | | | |
| | | 1,675M | | Eagle Intermediate Global Holding, 7.5%, 5/1/2025(a) | | | 1,658,250 | |
| | | | | Energizer Holdings, Inc.: | | | | |
| | | 1,700M | | 5.5%, 6/15/2025(a) | | | 1,686,706 | |
| | | 850M | | 6.375%, 7/15/2026(a) | | | 873,375 | |
| | | 450M | | 7.75%, 1/15/2027(a) | | | 480,375 | |
| | | 2,925M | | First Quality Finance Co., 4.625%, 5/15/2021(a) | | | 2,932,312 | |
| | | 1,575M | | KGA Escrow, LLC, 7.5%, 8/15/2023(a) | | | 1,604,531 | |
| | | 3,028M | | Reynolds Group Holdings, Inc., 5.75%, 10/15/2020 | | | 3,036,033 | |
| | | | | | | | 12,271,582 | |
| | | | | Energy—13.7% | | | | |
| | | 1,700M | | Andeavor Logistics, LP, 6.875%, 12/29/2049 | | | 1,709,495 | |
| | | 950M | | Antero Resources Corp., 5.375%, 11/1/2021 | | | 957,125 | |
| | | 1,650M | | Apergy Corp., 6.375%, 5/1/2026 | | | 1,676,812 | |
| | | 3,461M | | Baytex Energy Corp., 5.125%, 6/1/2021(a) | | | 3,435,042 | |
| | | | | Blue Racer Midstream, LLC: | | | | |
| | | 1,375M | | 6.125%, 11/15/2022(a) | | | 1,402,500 | |
| | | 1,500M | | 6.625%, 7/15/2026(a) | | | 1,537,500 | |
| | | 2,000M | | California Resources Corp., 8%, 12/15/2022(a) | | | 1,575,600 | |
| | | 1,300M | | Callon Petroleum Co., 6.375%, 7/1/2026 | | | 1,309,750 | |
15
Portfolio of Investments(continued)
FUND FOR INCOME
March 31, 2019
| |
Principal
Amount
| | Security | | Value | |
| | | | | Energy (continued) |
| | | | | Carrizo Oil & Gas, Inc.: | | | | |
| | $ | 500M | | 6.25%, 4/15/2023 | | $ | 494,375 | |
| | | 600M | | 8.25%, 7/15/2025 | | | 621,000 | |
| | | | | Chesapeake Energy Corp.: | | | | |
| | | 975M | | 4.875%, 4/15/2022 | | | 965,250 | |
| | | 2,425M | | 7%, 10/1/2024 | | | 2,428,031 | |
| | | 1,650M | | 8%, 6/15/2027 | | | 1,633,500 | |
| | | 3,050M | | CITGO Petroleum Corp., 6.25%, 8/15/2022(a) | | | 3,042,375 | |
| | | | | Consolidated Energy Finance SA: | | | | |
| | | 2,425M | | 6.3609%, 6/15/2022(a)† | | | 2,417,817 | |
| | | 1,550M | | 6.875%, 6/15/2025(a) | | | 1,569,375 | |
| | | 1,675M | | Covey Park Energy, LLC, 7.5%, 5/15/2025(a) | | | 1,557,750 | |
| | | | | Crestwood Midstream Partners, LP: | | | | |
| | | 2,175M | | 6.25%, 4/1/2023 | | | 2,240,250 | |
| | | 1,375M | | 5.75%, 4/1/2025 | | | 1,416,250 | |
| | | 1,700M | | CrownRock, LP, 5.625%, 10/15/2025(a) | | | 1,638,375 | |
| | | | | DCP Midstream Operating, LP: | | | | |
| | | 1,600M | | 3.875%, 3/15/2023 | | | 1,596,000 | |
| | | 1,775M | | 5.85%, 5/21/2043(a) | | | 1,664,062 | |
| | | 1,775M | | Delek Logistics Partners, LP, 6.75%, 5/15/2025 | | | 1,766,125 | |
| | | | | Diamondback Energy, Inc.: | | | | |
| | | 775M | | 4.75%, 11/1/2024(a) | | | 795,189 | |
| | | 500M | | 4.75%, 11/1/2024 | | | 513,025 | |
| | | 2,325M | | EnLink Midstream Partners, LP, 4.85%, 7/15/2026 | | | 2,316,746 | |
| | | 2,267M | | Exterran Partners, LP, 6%, 10/1/2022 | | | 2,295,337 | |
| | | | | Genesis Energy, LP: | | | | |
| | | 1,400M | | 6.75%, 8/1/2022 | | | 1,438,500 | |
| | | 500M | | 5.625%, 6/15/2024 | | | 482,500 | |
| | | 1,875M | | Global Partners, LP, 6.25%, 7/15/2022 | | | 1,860,937 | |
| | | | | Gulfport Energy Corp.: | | | | |
| | | 1,250M | | 6.625%, 5/1/2023 | | | 1,218,750 | |
| | | 1,150M | | 6.375%, 5/15/2025 | | | 1,045,062 | |
| | | | | Laredo Petroleum, Inc.: | | | | |
| | | 1,275M | | 5.625%, 1/15/2022 | | | 1,171,406 | |
| | | 1,550M | | 6.25%, 3/15/2023 | | | 1,391,125 | |
16
| |
Principal
Amount
| | Security | | Value | |
| | | | | Energy (continued) |
| | $ | 725M | | Matador Resources Co., 5.875%, 9/15/2026 | | $ | 726,813 | |
| | | 2,050M | | McDermott Escrow 1, Inc., 10.625%, 5/1/2024(a) | | | 1,704,063 | |
| | | 1,425M | | MEG Energy Corp., 6.375%, 1/30/2023(a) | | | 1,323,469 | |
| | | 500M | | Murphy Oil Corp., 4.45%, 12/1/2022 | | | 502,814 | |
| | | 1,850M | | Nabors Industries, Inc., 5.75%, 2/1/2025 | | | 1,667,276 | |
| | | 852M | | Northern Oil and Gas, Inc., 9.5%, 5/15/2023 | | | 886,210 | |
| | | | | Oasis Petroleum, Inc.: | | | | |
| | | 1,750M | | 6.875%, 1/15/2023 | | | 1,754,375 | |
| | | 1,125M | | 6.25%, 5/1/2026(a) | | | 1,074,375 | |
| | | 1,650M | | Parkland Fuel Corp., 6%, 4/1/2026(a) | | | 1,673,183 | |
| | | | | Parsley Energy, LLC: | | | | |
| | | 875M | | 5.25%, 8/15/2025(a) | | | 866,250 | |
| | | 300M | | 5.625%, 10/15/2027(a) | | | 300,000 | |
| | | | | Precision Drilling Corp.: | | | | |
| | | 776M | | 6.5%, 12/15/2021 | | | 786,190 | |
| | | 950M | | 7.125%, 1/15/2026(a) | | | 946,735 | |
| | | 1,350M | | QEP Resources, Inc., 6.875%, 3/1/2021 | | | 1,390,500 | |
| | | | | Range Resources Corp.: | | | | |
| | | 800M | | 5.75%, 6/1/2021 | | | 816,000 | |
| | | 375M | | 5%, 8/15/2022(a) | | | 373,125 | |
| | | 1,950M | | SM Energy Co., 5%, 1/15/2024 | | | 1,813,500 | |
| | | 600M | | Southwestern Energy Co., 7.5%, 4/1/2026 | | | 615,000 | |
| | | 2,425M | | Suburban Propane Partners, LP, 5.875%, 3/1/2027 | | | 2,309,813 | |
| | | | | Sunoco, LP: | | | | |
| | | 1,975M | | 4.875%, 1/15/2023 | | | 2,011,340 | |
| | | 1,125M | | 5.875%, 3/15/2028 | | | 1,119,375 | |
| | | 685M | | Transocean Guardian, Ltd., 5.875%, 1/15/2024(a) | | | 698,828 | |
| | | 992M | | Transocean Pontus, Ltd., 6.125%, 8/1/2025(a) | | | 1,009,614 | |
| | | 1,550M | | Tullow Oil, PLC, 6.25%, 4/15/2022(a) | | | 1,561,238 | |
| | | 1,125M | | USA Compression Partners, LP, 6.875%, 9/1/2027(a) | | | 1,148,906 | |
| | | | | Whiting Petroleum Corp.: | | | | |
| | | 825M | | 6.25%, 4/1/2023 | | | 833,250 | |
| | | 1,250M | | 6.625%, 1/15/2026 | | | 1,231,250 | |
17
Portfolio of Investments(continued)
FUND FOR INCOME
March 31, 2019
| |
Principal
Amount
| | Security | | Value | |
| | | | | Energy (continued) |
| | | | | WPX Energy, Inc.: | | | | |
| | $ | 619M | | 6%, 1/15/2022 | | $ | 645,307 | |
| | | 250M | | 5.75%, 6/1/2026 | | | 254,688 | |
| | | | | | | | 85,226,423 | |
| | | | | Financials—5.9% | | | | |
| | | 1,125M | | Acrisure, LLC, 8.125%, 2/15/2024(a) | | | 1,167,789 | |
| | | 1,225M | | Ally Financial, Inc., 8%, 11/1/2031 | | | 1,526,656 | |
| | | 600M | | Arch Merger Sub, Inc., 8.5%, 9/15/2025(a) | | | 657,750 | |
| | | | | Colfax Corp.: | | | | |
| | | 725M | | 6%, 2/15/2024(a) | | | 757,625 | |
| | | 425M | | 6.375%, 2/15/2026(a) | | | 452,888 | |
| | | 1,525M | | Credit Suisse Group AG, 7.5%, 12/11/2023(a) | | | 1,615,956 | |
| | | 1,900M | | CSTN Merger Sub, Inc., 6.75%, 8/15/2024(a) | | | 1,795,500 | |
| | | | | DAE Funding, LLC: | | | | |
| | | 775M | | 5.75%, 11/15/2023(a) | | | 798,250 | |
| | | 3,600M | | 5%, 8/1/2024(a) | | | 3,654,000 | |
| | | | | Icahn Enterprises, LP: | | | | |
| | | 2,225M | | 6.25%, 2/1/2022 | | | 2,288,079 | |
| | | 1,450M | | 6.75%, 2/1/2024 | | | 1,517,063 | |
| | | 1,050M | | Intesa Sanpaolo SpA, 5.017%, 6/26/2024(a) | | | 1,015,562 | |
| | | | | Ladder Capital Finance Holdings, LLLP: | | | | |
| | | 1,350M | | 5.25%, 3/15/2022(a) | | | 1,373,625 | |
| | | 2,700M | | 5.25%, 10/1/2025(a) | | | 2,598,750 | |
| | | 2,500M | | Navient Corp., 5.875%, 3/25/2021 | | | 2,590,625 | |
| | | | | Park Aerospace Holdings: | | | | |
| | | 550M | | 4.5%, 3/15/2023(a) | | | 548,625 | |
| | | 3,375M | | 5.5%, 2/15/2024(a) | | | 3,512,194 | |
| | | | | Springleaf Finance Corp.: | | | | |
| | | 425M | | 7.75%, 10/1/2021 | | | 459,531 | |
| | | 1,450M | | 5.625%, 3/15/2023 | | | 1,473,563 | |
| | | 800M | | 6.125%, 3/15/2024 | | | 819,984 | |
| | | 1,600M | | 6.875%, 3/15/2025 | | | 1,654,000 | |
| | | 1,950M | | 7.125%, 3/15/2026 | | | 1,988,990 | |
18
| |
Principal
Amount
| | Security | | Value | |
| | | | | Financials (continued) |
| | $ | 1,325M | | UniCredit SpA, 5.861%, 6/19/2032(a) | | $ | 1,222,735 | |
| | | 1,475M | | Wand Merger Corp., 8.125%, 7/15/2023(a) | | | 1,522,938 | |
| | | | | | | | 37,012,678 | |
| | | | | Food/Beverage/Tobacco—1.7% | | | | |
| | | 2,050M | | JBS USA LUX SA, 6.75%, 2/15/2028(a) | | | 2,129,437 | |
| | | 1,825M | | Pilgrim’s Pride Corp., 5.875%, 9/30/2027(a) | | | 1,843,250 | |
| | | | | Post Holdings, Inc.: | | | | |
| | | 1,725M | | 5.5%, 3/1/2025(a) | | | 1,750,875 | |
| | | 1,650M | | 5.75%, 3/1/2027(a) | | | 1,664,438 | |
| | | 3,575M | | Sigma Holdco BV, 7.875%, 5/15/2026(a) | | | 3,315,813 | |
| | | | | | | | 10,703,813 | |
| | | | | Food/Drug—.3% | | | | |
| | | | | Albertson’s Cos., LLC: | | | | |
| | | 1,325M | | 5.75%, 3/15/2025 | | | 1,263,719 | |
| | | 625M | | 7.5%, 3/15/2026(a) | | | 646,094 | |
| | | | | | | | 1,909,813 | |
| | | | | Forest Products/Containers—2.7% | | | | |
| | | | | Ardagh Holdings USA, Inc.: | | | | |
| | | 1,400M | | 4.625%, 5/15/2023(a) | | | 1,412,250 | |
| | | 3,425M | | 7.25%, 5/15/2024(a) | | | 3,620,910 | |
| | | | | Berry Global, Inc.: | | | | |
| | | 1,525M | | 5.5%, 5/15/2022 | | | 1,553,594 | |
| | | 1,475M | | 7%, 2/15/2026(a) | | | 1,467,625 | |
| | | 1,675M | | BWAY Holding Co., 5.5%, 4/15/2024(a) | | | 1,669,221 | |
| | | 1,075M | | Crown Americas, LLC, 4.5%, 1/15/2023 | | | 1,088,437 | |
| | | 1,200M | | Greif, Inc., 6.5%, 3/1/2027(a) | | | 1,230,000 | |
| | | | | Mercer International, Inc.: | | | | |
| | | 350M | | 7.75%, 12/1/2022 | | | 364,437 | |
| | | 1,175M | | 6.5%, 2/1/2024 | | | 1,207,313 | |
| | | 825M | | 7.375%, 1/15/2025(a) | | | 868,313 | |
| | | 1,054M | | Multi-Color Corp., 4.875%, 11/1/2025(a) | | | 1,090,890 | |
19
Portfolio of Investments(continued)
FUND FOR INCOME
March 31, 2019
| |
Principal
Amount
| | Security | | Value | |
| | | | | Forest Products/Containers (continued) |
| | $ | 1,500M | | Schweitzer-Mauduit International, Inc.,
6.875%, 10/1/2026(a) | | $ | 1,503,750 | |
| | | | | | | | 17,076,740 | |
| | | | | Gaming/Leisure—5.9% | | | | |
| | | 1,150M | | AMC Entertainment, Inc., 5.75%, 6/15/2025 | | | 1,079,332 | |
| | | | | AMC Networks, Inc.: | | | | |
| | | 1,700M | | 5%, 4/1/2024 | | | 1,712,580 | |
| | | 775M | | 4.75%, 8/1/2025 | | | 771,125 | |
| | | 2,725M | | Boyd Gaming Corp., 6.875%, 5/15/2023 | | | 2,840,812 | |
| | | 1,225M | | Cedar Fair, LP, 5.375%, 6/1/2024 | | | 1,257,083 | |
| | | 6,425M | | CRC Escrow Issuer, LLC, 5.25%, 10/15/2025(a) | | | 6,204,108 | |
| | | 2,475M | | Golden Nugget, Inc., 8.75%, 10/1/2025(a) | | | 2,604,938 | |
| | | 2,900M | | IRB Holding Corp., 6.75%, 2/15/2026(a) | | | 2,733,250 | |
| | | 3,725M | | Jack Ohio Finance, LLC, 6.75%, 11/15/2021(a) | | | 3,846,063 | |
| | | 575M | | Lions Gate Entertainment Corp., 5.875%, 11/1/2024(a) | | | 594,406 | |
| | | 1,200M | | MGM Resorts International, 6%, 3/15/2023 | | | 1,269,000 | |
| | | 1,650M | | National CineMedia, LLC, 6%, 4/15/2022 | | | 1,674,750 | |
| | | 3,650M | | Scientific Games International, Inc., 5%, 10/15/2025(a) | | | 3,586,125 | |
| | | 1,125M | | Silversea Cruise Finance, Ltd., 7.25%, 2/1/2025(a) | | | 1,222,313 | |
| | | | | Viking Cruises, Ltd.: | | | | |
| | | 4,150M | | 6.25%, 5/15/2025(a) | | | 4,233,000 | |
| | | 1,150M | | 5.875%, 9/15/2027(a) | | | 1,121,825 | |
| | | | | | | | 36,750,710 | |
| | | | | Health Care—7.5% | | | | |
| | | 800M | | AMN Healthcare, Inc, 5.125%, 10/1/2024(a) | | | 791,000 | |
| | | | | Bausch Health Cos., Inc.: | | | | |
| | | 400M | | 6.5%, 3/15/2022(a) | | | 414,500 | |
| | | 950M | | 5.5%, 3/1/2023(a) | | | 958,313 | |
| | | 3,650M | | 7%, 3/15/2024(a) | | | 3,870,825 | |
| | | 2,250M | | 6.125%, 4/15/2025(a) | | | 2,233,125 | |
| | | 3,200M | | 9%, 12/15/2025(a) | | | 3,488,160 | |
| | | 925M | | 8.5%, 1/31/2027(a) | | | 982,813 | |
20
| |
Principal
Amount
| | Security | | Value | |
| | | | | Health Care (continued) |
| | | | | CHS/Community Health Systems, Inc.: | | | | |
| | $ | 950M | | 5.125%, 8/1/2021 | | $ | 938,695 | |
| | | 2,450M | | 6.25%, 3/31/2023 | | | 2,314,392 | |
| | | 650M | | Cimpress NV, 7%, 6/15/2026(a) | | | 628,875 | |
| | | 5,575M | | DaVita, Inc., 5.125%, 7/15/2024 | | | 5,519,250 | |
| | | | | Endo Finance, LLC: | | | | |
| | | 1,575M | | 6%, 7/15/2023(a) | | | 1,220,625 | |
| | | 375M | | 6%, 2/1/2025(a) | | | 273,105 | |
| | | | | HCA, Inc.: | | | | |
| | | 3,600M | | 6.25%, 2/15/2021 | | | 3,792,060 | |
| | | 1,800M | | 5.875%, 5/1/2023 | | | 1,923,750 | |
| | | 1,475M | | 5.375%, 2/1/2025 | | | 1,567,187 | |
| | | 1,150M | | HealthSouth Corp., 5.125%, 3/15/2023 | | | 1,170,433 | |
| | | | | Mallinckrodt Finance SB: | | | | |
| | | 2,575M | | 5.75%, 8/1/2022(a) | | | 2,407,625 | |
| | | 1,025M | | 5.5%, 4/15/2025(a) | | | 804,625 | |
| | | 1,750M | | MEDNAX, Inc., 6.25%, 1/15/2027(a) | | | 1,771,875 | |
| | | 1,925M | | Molina Healthcare, Inc., 5.375%, 11/15/2022 | | | 2,005,581 | |
| | | 775M | | MPH Operating Partnership, LP, 7.125%, 6/1/2024(a) | | | 775,000 | |
| | | 1,050M | | Par Pharmaceutical, Inc., 7.5%, 4/1/2027(a) | | | 1,067,325 | |
| | | 1,775M | | Polaris Intermediate Corp., 8.5%, 12/1/2022(a) | | | 1,757,694 | |
| | | 3,314M | | Syneos Health, Inc., 7.5%, 10/1/2024(a) | | | 3,504,555 | |
| | | 625M | | Tenet Healthcare Corp., 5.125%, 5/1/2025 | | | 629,719 | |
| | | | | | | | 46,811,107 | |
| | | | | Home-Building—.3% | | | | |
| | | 1,650M | | William Lyon Homes, Inc., 6%, 9/1/2023 | | | 1,604,625 | |
| | | | | Information Technology—5.3% | | | | |
| | | 5,950M | | Alliance Data Systems Corp., 5.375%, 8/1/2022(a) | | | 6,039,250 | |
| | | 1,650M | | Anixter, Inc., 6%, 12/1/2025(a) | | | 1,736,625 | |
| | | 1,650M | | CDW, LLC, 5%, 9/1/2025 | | | 1,697,437 | |
| | | | | CommScope Finance, LLC: | | | | |
| | | 450M | | 5.5%, 3/1/2024(a) | | | 461,380 | |
| | | 650M | | 6%, 3/1/2026(a) | | | 673,965 | |
21
Portfolio of Investments(continued)
FUND FOR INCOME
March 31, 2019
| |
Principal
Amount
| | Security | | Value | |
| | | | | Information Technology (continued) |
| | $ | 3,025M | | CommScope Technologies, LLC, 6%, 6/15/2025(a) | | $ | 2,952,249 | |
| | | | | Diamond 1 Finance Corp.: | | | | |
| | | 2,425M | | 5.875%, 6/15/2021(a) | | | 2,471,405 | |
| | | 1,150M | | 7.125%, 6/15/2024(a) | | | 1,219,436 | |
| | | 925M | | J2 Cloud Services, LLC, 6%, 7/15/2025(a) | | | 964,313 | |
| | | 1,000M | | Nielsen Finance, LLC, 5%, 4/15/2022(a) | | | 992,500 | |
| | | | | Nuance Communications, Inc.: | | | | |
| | | 1,875M | | 6%, 7/1/2024 | | | 1,928,906 | |
| | | 1,200M | | 5.625%, 12/15/2026 | | | 1,235,916 | |
| | | 2,125M | | Rackspace Hosting, Inc., 8.625%, 11/15/2024(a) | | | 1,898,433 | |
| | | 3,975M | | Solera, LLC, 10.5%, 3/1/2024(a) | | | 4,328,457 | |
| | | 2,050M | | Symantec Corp., 5%, 4/15/2025(a) | | | 2,055,000 | |
| | | 525M | | VeriSign, Inc., 4.75%, 7/15/2027 | | | 527,032 | |
| | | 1,800M | | Verscend Holding Corp., 9.75%, 8/15/2026(a) | | | 1,802,250 | |
| | | | | | | | 32,984,554 | |
| | | | | Manufacturing—2.7% | | | | |
| | | 2,525M | | ATS Automation Tooling Systems, Inc., 6.5%, 6/15/2023(a) | | | 2,622,844 | |
| | | 3,150M | | Brand Energy & Infrastructure Services, Inc., 8.5%, 7/15/2025(a) | | | 2,842,875 | |
| | | 1,250M | | Cloud Crane, LLC, 10.125%, 8/1/2024(a) | | | 1,346,875 | |
| | | 2,925M | | Grinding Media, Inc., 7.375%, 12/15/2023(a) | | | 2,822,625 | |
| | | 2,050M | | H&E Equipment Services, Inc., 5.625%, 9/1/2025 | | | 2,052,562 | |
| | | 1,850M | | Manitowoc Co., Inc., 9%, 4/1/2026(a) | | | 1,877,750 | |
| | | 1,300M | | Park-Ohio Industries, Inc., 6.625%, 4/15/2027 | | | 1,300,000 | |
| | | 2,275M | | Wabash National Corp., 5.5%, 10/1/2025(a) | | | 2,132,813 | |
| | | | | | | | 16,998,344 | |
| | | | | Media-Broadcasting—2.6% | | | | |
| | | | | Belo Corp.: | | | | |
| | | 725M | | 7.75%, 6/1/2027 | | | 795,687 | |
| | | 1,474M | | 7.25%, 9/15/2027 | | | 1,580,865 | |
| | | 3,600M | | LIN Television Corp., 5.875%, 11/15/2022 | | | 3,703,500 | |
| | | 1,175M | | Nexstar Broadcasting, Inc., 5.625%, 8/1/2024(a) | | | 1,195,563 | |
22
| |
Principal
Amount
| | Security | | Value | |
| | | | | Media-Broadcasting (continued) |
| | | | | Sinclair Television Group, Inc.: | | | | |
| | $ | 2,175M | | 5.375%, 4/1/2021 | | $ | 2,180,437 | |
| | | 475M | | 5.625%, 8/1/2024(a) | | | 480,344 | |
| | | 650M | | 5.875%, 3/15/2026(a) | | | 657,312 | |
| | | 1,400M | | 5.125%, 2/15/2027(a) | | | 1,347,500 | |
| | | 4,350M | | Sirius XM Radio, Inc., 6%, 7/15/2024(a) | | | 4,524,000 | |
| | | | | | | | 16,465,208 | |
| | | | | Media-Cable TV—10.1% | | | | |
| | | | | Altice Financing SA: | | | | |
| | | 3,675M | | 6.625%, 2/15/2023(a) | | | 3,766,875 | |
| | | 1,150M | | 7.5%, 5/15/2026(a) | | | 1,137,925 | |
| | | 625M | | Altice Finco SA, 7.625%, 2/15/2025(a) | | | 571,094 | |
| | | | | Altice France SA: | | | | |
| | | 3,225M | | 6.25%, 5/15/2024(a) | | | 3,261,281 | |
| | | 1,325M | | 8.125%, 2/1/2027(a) | | | 1,343,219 | |
| | | | | CCO Holdings, LLC: | | | | |
| | | 1,300M | | 5.25%, 9/30/2022 | | | 1,326,812 | |
| | | 2,275M | | 5.125%, 2/15/2023 | | | 2,320,500 | |
| | | 925M | | 5.75%, 9/1/2023 | | | 945,812 | |
| | | 3,675M | | 5.875%, 4/1/2024(a) | | | 3,849,967 | |
| | | 2,575M | | 5.875%, 5/1/2027(a) | | | 2,678,772 | |
| | | 975M | | 5%, 2/1/2028(a) | | | 963,934 | |
| | | 3,744M | | Clear Channel International, 8.75%, 12/15/2020(a) | | | 3,861,000 | |
| | | | | Clear Channel Worldwide Holdings, Inc.: | | | | |
| | | 2,900M | | Series “A”, 6.5%, 11/15/2022 | | | 2,983,375 | |
| | | 3,775M | | Series “B”, 6.5%, 11/15/2022 | | | 3,874,094 | |
| | | 1,775M | | 9.25%, 2/15/2024(a) | | | 1,885,937 | |
| | | | | CSC Holdings, LLC: | | | | |
| | | 3,225M | | 5.375%, 7/15/2023(a) | | | 3,293,531 | |
| | | 1,700M | | 7.75%, 7/15/2025(a) | | | 1,827,500 | |
| | | 1,475M | | 6.625%, 10/15/2025(a) | | | 1,567,188 | |
| | | 5,375M | | 10.875%, 10/15/2025(a) | | | 6,218,875 | |
| | | 1,625M | | 7.5%, 4/1/2028(a) | | | 1,749,394 | |
23
Portfolio of Investments(continued)
FUND FOR INCOME
March 31, 2019
| |
Principal
Amount
| | Security | | Value | |
| | | | | Media-Cable TV (continued) |
| | | | | DISH DBS Corp.: | | | | |
| | $ | 1,650M | | 5%, 3/15/2023 | | $ | 1,491,187 | |
| | | 1,750M | | 5.875%, 11/15/2024 | | | 1,476,562 | |
| | | | | Gray Television, Inc.: | | | | |
| | | 350M | | 5.125%, 10/15/2024(a) | | | 352,293 | |
| | | 1,575M | | 5.875%, 7/15/2026(a) | | | 1,606,815 | |
| | | 4,980M | | Midcontinent Communications & Finance Corp., 6.875%, 8/15/2023(a) | | | 5,205,534 | |
| | | 725M | | Netflix, Inc., 4.875%, 4/15/2028 | | | 719,562 | |
| | | 2,250M | | Unitymedia GmbH, 6.125%, 1/15/2025(a) | | | 2,346,525 | |
| | | | | | | | 62,625,563 | |
| | | | | Media-Diversified—1.5% | | | | |
| | | 2,150M | | Gannett Co., Inc., 6.375%, 10/15/2023 | | | 2,230,625 | |
| | | 1,750M | | Outdoor Americas Capital, LLC, 5.875%, 3/15/2025 | | | 1,798,125 | |
| | | 5,150M | | Tribune Media Co., 5.875%, 7/15/2022 | | | 5,281,969 | |
| | | | | | | | 9,310,719 | |
| | | | | Metals/Mining—4.0% | | | | |
| | | 1,480M | | Allegheny Technologies, Inc., 7.875%, 8/15/2023 | | | 1,609,500 | |
| | | 900M | | Big River Steel, LLC, 7.25%, 9/1/2025(a) | | | 943,020 | |
| | | 1,375M | | Cliffs Natural Resources, Inc., 5.75%, 3/1/2025 | | | 1,320,000 | |
| | | | | Commercial Metals Co.: | | | | |
| | | 3,225M | | 4.875%, 5/15/2023 | | | 3,249,187 | |
| | | 1,100M | | 5.375%, 7/15/2027 | | | 1,061,500 | |
| | | 1,550M | | Constellium NV, 5.75%, 5/15/2024(a) | | | 1,553,875 | |
| | | 1,525M | | First Quantum Minerals, Ltd., 6.5%, 3/1/2024(a) | | | 1,433,500 | |
| | | 3,000M | | Joseph T. Ryerson & Son, Inc., 11%, 5/15/2022(a) | | | 3,172,500 | |
| | | 750M | | Mountain Province Diamonds, Inc., 8%, 12/15/2022(a) | | | 750,937 | |
| | | 1,550M | | Natural Resource Partners, LP, 10.5%, 3/15/2022 | | | 1,637,187 | |
| | | 1,625M | | Northwest Acquisitions, ULC, 7.125%, 11/1/2022(a) | | | 1,434,063 | |
| | | 1,800M | | Novelis, Inc., 5.875%, 9/30/2026(a) | | | 1,797,750 | |
| | | 3,075M | | SunCoke Energy Partners, LP, 7.5%, 6/15/2025(a) | | | 3,121,125 | |
24
| |
Principal
Amount
| | Security | | Value | |
| | | | | Metals/Mining (continued) |
| | $ | 2,100M | | TMS International Corp., 7.25%, 8/15/2025(a) | | $ | 2,039,142 | |
| | | | | | | | 25,123,286 | |
| | | | | Real Estate—1.4% | | | | |
| | | | | Geo Group, Inc.: | | | | |
| | | 400M | | 5.125%, 4/1/2023 | | | 357,000 | |
| | | 1,575M | | 6%, 4/15/2026 | | | 1,326,937 | |
| | | 1,125M | | Greystar Real Estate Partners, 5.75%, 12/1/2025(a) | | | 1,130,625 | |
| | | | | Iron Mountain, Inc.: | | | | |
| | | 875M | | 5.75%, 8/15/2024 | | | 885,938 | |
| | | 1,800M | | 5.25%, 3/15/2028(a) | | | 1,748,250 | |
| | | 1,350M | | Lennar Corp., 4.875%, 12/15/2023 | | | 1,395,563 | |
| | | 625M | | MPT Operating Partnership, LP, 6.375%, 3/1/2024 | | | 654,688 | |
| | | 1,500M | | Sabra Health Care, LP, 5.125%, 8/15/2026 | | | 1,469,793 | |
| | | | | | | | 8,968,794 | |
| | | | | Retail-General Merchandise—2.0% | | | | |
| | | | | 1011778 B.C., ULC: | | | | |
| | | 2,875M | | 4.625%, 1/15/2022(a) | | | 2,895,729 | |
| | | 1,750M | | 5%, 10/15/2025(a) | | | 1,733,025 | |
| | | | | AmeriGas Partners, LP: | | | | |
| | | 775M | | 5.625%, 5/20/2024 | | | 791,469 | |
| | | 1,725M | | 5.5%, 5/20/2025 | | | 1,727,156 | |
| | | 1,450M | | J.C. Penney Co., Inc., 8.625%, 3/15/2025 | | | 855,500 | |
| | | 1,075M | | KFC Holding Co., LLC, 5%, 6/1/2024(a) | | | 1,099,188 | |
| | | 2,800M | | L Brands, Inc., 6.75%, 7/1/2036 | | | 2,366,000 | |
| | | 875M | | SRS Distribution, Inc., 8.25%, 7/1/2026(a) | | | 844,375 | |
| | | | | | | | 12,312,442 | |
| | | | | Services—1.4% | | | | |
| | | 1,400M | | AECOM, 5.125%, 3/15/2027 | | | 1,359,750 | |
| | | 2,250M | | GW Honos Security Corp., 8.75%, 5/15/2025(a) | | | 2,148,750 | |
| | | 1,214M | | Prime Security Services Borrower, LLC,
9.25%, 5/15/2023(a) | | | 1,277,735 | |
25
Portfolio of Investments(continued)
FUND FOR INCOME
March 31, 2019
| |
Principal
Amount
| | Security | | Value | |
| | | | | Services (continued) |
| | | | | United Rentals, Inc.: | | | | |
| | $ | 975M | | 4.625%, 10/15/2025 | | $ | 965,250 | |
| | | 575M | | 6.5%, 12/15/2026 | | | 606,625 | |
| | | 2,150M | | 5.5%, 5/15/2027 | | | 2,176,875 | |
| | | | | | | | 8,534,985 | |
| | | | | Telecommunications—3.6% | | | | |
| | | | | Frontier Communications Corp.: | | | | |
| | | 2,800M | | 11%, 9/15/2025 | | | 1,856,750 | |
| | | 1,450M | | 8.5%, 4/1/2026(a) | | | 1,352,125 | |
| | | 625M | | 8%, 4/1/2027(a) | | | 646,875 | |
| | | | | GCI, Inc.: | | | | |
| | | 2,023M | | 6.75%, 6/1/2021 | | | 2,035,644 | |
| | | 5,375M | | 6.875%, 4/15/2025 | | | 5,637,031 | |
| | | 1,575M | | Qwest Corp., 7.25%, 9/15/2025 | | | 1,697,168 | |
| | | 1,425M | | Telecom Italia Capital SA, 7.2%, 7/18/2036 | | | 1,454,070 | |
| | | 2,350M | �� | Telesat Canada, 8.875%, 11/15/2024(a) | | | 2,538,000 | |
| | | | | Zayo Group, LLC: | | | | |
| | | 1,050M | | 6%, 4/1/2023 | | | 1,068,375 | |
| | | 2,850M | | 6.375%, 5/15/2025 | | | 2,874,938 | |
| | | 1,525M | | 5.75%, 1/15/2027(a) | | | 1,525,457 | |
| | | | | | | | 22,686,433 | |
| | | | | Transportation—1.6% | | | | |
| | | 2,650M | | BCD Acquisition, Inc., 9.625%, 9/15/2023(a) | | | 2,822,250 | |
| | | | | Fly Leasing, Ltd.: | | | | |
| | | 925M | | 6.375%, 10/15/2021 | | | 938,875 | |
| | | 1,625M | | 5.25%, 10/15/2024 | | | 1,568,125 | |
| | | 1,750M | | Mobile Mini, Inc., 5.875%, 7/1/2024 | | | 1,785,000 | |
| | | 2,925M | | XPO Logistics, Inc., 6.125%, 9/1/2023(a) | | | 2,957,906 | |
| | | | | | | | 10,072,156 | |
26
| |
Principal
Amount
| | Security | | Value | |
| | | | | Utilities—3.0% | | | | |
| | | | | Calpine Corp.: | | | | |
| | $ | 775M | | 5.75%, 1/15/2025 | | $ | 773,062 | |
| | | 1,800M | | 5.25%, 6/1/2026(a) | | | 1,797,750 | |
| | | 1,675M | | Cheniere Corpus Christi Holdings, 5.125%, 6/30/2027 | | | 1,760,844 | |
| | | 425M | | Clearway Energy Operating, LLC, 5.75%, 10/15/2025(a) | | | 428,187 | |
| | | 1,850M | | Drax Finco, PLC, 6.625%, 11/1/2025(a) | | | 1,882,375 | |
| | | 1,956M | | Dynegy, Inc., 7.375%, 11/1/2022 | | | 2,034,240 | |
| | | 214M | | Indiantown Cogeneration Utilities, LP, 9.77%, 12/15/2020 | | | 222,346 | |
| | | 1,000M | | NRG Yield Operating, LLC, 5%, 9/15/2026 | | | 957,500 | |
| | | 2,294M | | NSG Holdings, LLC, 7.75%, 12/15/2025(a) | | | 2,465,601 | |
| | | 5,000M | | Targa Resources Partners, LP, 4.25%, 11/15/2023 | | | 4,993,750 | |
| | | 1,675M | | Terraform Power Operating, LLC, 5%, 1/31/2028(a) | | | 1,622,656 | |
| | | | | | | | 18,938,311 | |
| | | | | Waste Management—.2% | | | | |
| | | 1,175M | | GFL Environmental, Inc., 5.625%, 5/1/2022(a) | | | 1,145,625 | |
| | | | | Wireless Communications—4.4% | | | | |
| | | 775M | | Inmarsat Finance, PLC, 4.875%, 5/15/2022(a) | | | 790,655 | |
| | | 3,000M | | Intelsat Jackson Holdings SA, 8.5%, 10/15/2024(a) | | | 2,932,500 | |
| | | | | Level 3 Financing, Inc.: | | | | |
| | | 1,500M | | 6.125%, 1/15/2021 | | | 1,515,300 | |
| | | 450M | | 5.375%, 8/15/2022 | | | 453,375 | |
| | | 2,150M | | 5.125%, 5/1/2023 | | | 2,176,875 | |
| | | 1,475M | | 5.375%, 1/15/2024 | | | 1,506,123 | |
| | | 5,750M | | Sprint Communications, Inc., 6%, 11/15/2022 | | | 5,809,225 | |
| | | | | Sprint Corp.: | | | | |
| | | 4,575M | | 7.875%, 9/15/2023 | | | 4,803,750 | |
| | | 950M | | 7.125%, 6/15/2024 | | | 966,625 | |
| | | 650M | | 7.625%, 2/15/2025 | | | 664,625 | |
| | | 1,325M | | 7.625%, 3/1/2026 | | | 1,346,200 | |
| | | 4,250M | | T-Mobile USA, Inc., 6%, 4/15/2024 | | | 4,425,313 | |
| | | | | | | | 27,390,566 | |
Total Value of Corporate Bonds (cost $570,508,067) | | | 571,985,790 | |
27
Portfolio of Investments(continued)
FUND FOR INCOME
March 31, 2019
| |
Principal
Amount
| | Security | | Value | |
| | | | | LOAN PARTICIPATIONS†—5.8% | | | | |
| | | | | Chemicals—.9% | | | | |
| | | | | Flint Group: | | | | |
| | $ | 456M | | 5.7793%, 9/6/2021 | | $ | 419,780 | |
| | | 2,752M | | 5.7793%, 9/7/2021 | | | 2,531,589 | |
| | | 2,900M | | Univar USA, Inc., 4.9986%, 7/1/2024 | | | 2,873,422 | |
| | | | | | | | 5,824,791 | |
| | | | | Consumer Non-Durables—.2% | | | | |
| | | 1,546M | | Reynolds Group Holdings, Inc., 5.2486%, 2/5/2023 | | | 1,530,199 | |
| | | | | Energy—.1% | | | | |
| | | 424M | | Centurion Pipeline, LLC, 5.851%, 9/26/2025 | | | 423,673 | |
| | | | | Food/Beverage/Tobacco—.8% | | | | |
| | | 3,209M | | Chobani, LLC, 5.9986%, 10/9/2023 | | | 3,072,666 | |
| | | 2,258M | | Sigma Bidco BV, 5.6031%, 7/2/2025 | | | 2,200,552 | |
| | | | | | | | 5,273,218 | |
| | | | | Gaming/Leisure—.9% | | | | |
| | | 2,600M | | Dorna Sports SL, 5.883%, 4/12/2024 | | | 2,550,171 | |
| | | 2,908M | | Stars Group Holdings BV, 6.101%, 7/10/2025 | | | 2,907,528 | |
| | | | | | | | 5,457,699 | |
| | | | | Health Care—.4% | | | | |
| | | 2,313M | | Inovalon Holdings, Inc., 6%, 4/2/2025 | | | 2,307,592 | |
| | | | | Media-Diversified—.6% | | | | |
| | | 825M | | DiscoverOrg., LLC, 7.2363%, 2/2/2026 | | | 819,328 | |
| | | 3,000M | | Tribune Media Co., 5.4986%, 1/29/2024 | | | 3,003,750 | |
| | | | | | | | 3,823,078 | |
| | | | | Metals/Mining—.5% | | | | |
| | | 3,000M | | Zekelman Industries, Inc., 4.74%, 6/14/2021 | | | 2,973,749 | |
| | | | | Telecommunication Services—.8% | | | | |
| | | 5,000M | | Intelsat Jackson Holdings SA, 6.9898%, 1/2/2024 | | | 5,022,675 | |
28
| |
Principal
Amount
| | Security | | Value | |
| | | | | Telecommunications—.5% | | | | |
| | $ | 2,992M | | CenturyLink, Inc., 5.2486%, 1/31/2025 | | $ | 2,930,242 | |
| | | | | Utilities—.1% | | | | |
| | | 725M | | Edgewater Generation, 3.75%, 12/12/2025(b) | | | 724,094 | |
Total Value of Loan Participations (cost $36,508,254) | | | 36,291,010 | |
Total Value of Investments (cost $607,016,321) | | | 97.5 | % | | | 608,276,800 | |
Other Assets, Less Liabilities | | | 2.5 | | | | 15,500,025 | |
Net Assets | | | 100.0 | % | | $ | 623,776,825 | |
(a) | Security exempt from registration under Rule 144A of the Securities Act of 1933 (see Note 4). |
(b) | A portion or all of the security purchased on a when-issued or delayed delivery basis (see Note 1G). |
† | Interest rates are determined and reset periodically. The interest rates above are the rates in efffect at March 31, 2019 |
Summary of Abbreviations:
LLLP | Limited Liability Limited Partnership |
ULC | Unlimited Liability Corporation |
The Fund’s assets and liabilities are classified into the following three levels based on the inputs used to value the assets and liabilities:
| Level 1 – | Unadjusted quoted prices in active markets for identical securities that the Fund has the ability to access. |
| Level 2 – | Observable inputs other than quoted prices included in Level 1 that are observable for the asset or liability, either directly or indirectly. These inputs may include quoted prices for the identical instrument on an inactive market, prices for similar instruments, interest rates, prepayment speeds, credit risk, yield curves, default rates and similar data. |
| Level 3 – | Unobservable inputs for the asset or liability, to the extent relevant observable inputs are not available, representing the Fund’s own assumption about the assumptions a market participant would use in valuing the asset or liability, and would be based on the best information available. |
The inputs methodology used for valuing securities are not necessarily an indication of the risk associated with investing in those securities. For example, U.S. government securities are reflected as Level 2 because the inputs used to determine fair value may not always be quoted prices in an active market.
29
Portfolio of Investments(continued)
FUND FOR INCOME
March 31, 2019
The following is a summary, by category of Level, of inputs used to value the Fund’s investments as of March 31, 2019:
| | | Level 1 | | | Level 2 | | | Level 3 | | | Total | |
Corporate Bonds | | $ | — | | | $ | 571,985,790 | | | $ | — | | | $ | 571,985,790 | |
Loan Participations | | | — | | | | 36,291,010 | | | | — | | | | 36,291,010 | |
Total Investments in Securities* | | $ | — | | | $ | 608,276,800 | | | $ | — | | | $ | 608,276,800 | |
* | The Portfolio of Investments provides information on the industry categorization for corporate bonds, loan participations. |
There were no transfers into or from Level 1 and Level 2 by the Fund during the period ended March 31, 2019. Transfers, if any, between Levels are recognized at the end of the reporting period.
See notes to financial statements
30
Fund Expenses(unaudited)
GOVERNMENT CASH MANAGEMENT FUND
The examples below show the ongoing costs (in dollars) of investing in your Fund and will help you in comparing these costs with costs of other mutual funds. Please refer to page 1 for a detailed explanation of the information presented in these examples.
Expense Example | Annualized
Expense
Ratio | Beginning
Account Value
(10/1/18) | Ending
Account Value
(3/31/19) | Expenses Paid
During Period
(10/1/18-3/31/19)* |
Class A Shares | 0.60% | | | |
Actual | | $1,000.00 | $1,008.67 | $ 3.00 |
Hypothetical** | | $1,000.00 | $1,021.94 | $ 3.02 |
Class B Shares | 1.35% | | | |
Actual | | $1,000.00 | $1,004.91 | $ 6.75 |
Hypothetical** | | $1,000.00 | $1,018.20 | $ 6.79 |
Institutional Class Shares | 0.60% | | | |
Actual | | $1,000.00 | $1,008.70 | $ 3.00 |
Hypothetical** | | $1,000.00 | $1,021.94 | $ 3.02 |
* | Expenses are equal to the annualized expense ratio, multiplied by the average account value over the period, multiplied by 182/365 (to reflect the one-half year period). Expenses paid during the period are net of expenses waived and/or assumed. |
** | Assumed rate of return of 5% before expenses |
Portfolio Composition
BY SECTOR
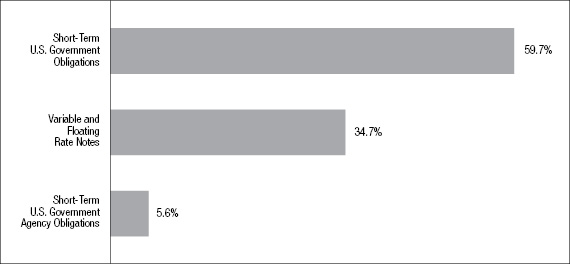
Portfolio holdings and allocations are subject to change. Percentages are as of March 31, 2019, and are based on the total market value of investments.
31
Portfolio of Investments
GOVERNMENT CASH MANAGEMENT FUND
March 31, 2019
| |
Principal
Amount
| | Security | | Interest
Rate* | | | Value | |
| | | | | SHORT-TERM U.S. GOVERNMENT OBLIGATIONS—59.4% | | | | | | | | |
| | | | | U.S. Treasury Bills: | | | | | | | | |
| | $ | 5,000M | | 4/2/2019 | | | 2.36 | % | | $ | 4,999,671 | |
| | | 2,000M | | 4/11/2019 | | | 2.40 | | | | 1,998,653 | |
| | | 2,000M | | 4/18/2019 | | | 2.36 | | | | 1,997,766 | |
| | | 2,000M | | 5/2/2019 | | | 2.36 | | | | 1,995,923 | |
| | | 2,800M | | 5/2/2019 | | | 2.38 | | | | 2,794,252 | |
| | | 3,500M | | 5/2/2019 | | | 2.40 | | | | 3,492,762 | |
| | | 3,500M | | 5/7/2019 | | | 2.40 | | | | 3,491,594 | |
| | | 7,000M | | 5/7/2019 | | | 2.41 | | | | 6,983,107 | |
| | | 4,000M | | 5/9/2019 | | | 2.36 | | | | 3,990,004 | |
| | | 3,000M | | 5/9/2019 | | | 2.39 | | | | 2,992,412 | |
| | | 1,500M | | 5/9/2019 | | | 2.43 | | | | 1,496,112 | |
| | | 9,000M | | 5/14/2019 | | | 2.42 | | | | 8,973,966 | |
| | | 3,500M | | 5/16/2019 | | | 2.39 | | | | 3,489,507 | |
| | | 4,000M | | 5/16/2019 | | | 2.43 | | | | 3,987,717 | |
| | | 4,000M | | 5/23/2019 | | | 2.36 | | | | 3,986,332 | |
| | | 8,000M | | 5/30/2019 | | | 2.40 | | | | 7,968,486 | |
| | | 6,500M | | 6/6/2019 | | | 2.36 | | | | 6,471,788 | |
| | | 2,000M | | 6/13/2019 | | | 2.37 | | | | 1,990,370 | |
| | | 5,000M | | 6/13/2019 | | | 2.38 | | | | 4,975,826 | |
| | | 2,000M | | 6/13/2019 | | | 2.40 | | | | 1,990,270 | |
| | | 2,000M | | 6/13/2019 | | | 2.45 | | | | 1,989,990 | |
| | | 1,900M | | 6/20/2019 | | | 2.38 | | | | 1,889,916 | |
| | | 4,800M | | 6/20/2019 | | | 2.39 | | | | 4,774,473 | |
| | | 9,000M | | 6/27/2019 | | | 2.40 | | | | 8,947,864 | |
| | | 2,000M | | 7/11/2019 | | | 2.39 | | | | 1,986,564 | |
| | | 4,000M | | 7/11/2019 | | | 2.41 | | | | 3,972,889 | |
| | | 2,000M | | 7/18/2019 | | | 2.41 | | | | 1,985,432 | |
Total Value of Short-Term U.S. Government Obligations (cost $105,613,646) | | | 105,613,646 | |
32
| |
Principal
Amount
| | Security | | Interest
Rate* | | | Value | |
| | | | | VARIABLE AND FLOATING RATE NOTES—34.6% | | | | | | | | |
| | | | | Federal Farm Credit Bank: | | | | | | | | |
| | $ | 1,715M | | 4/3/2019 | | | 2.43 | % | | $ | 1,715,002 | |
| | | 3,273M | | 4/24/2019 | | | 2.45 | | | | 3,273,076 | |
| | | 4,000M | | 5/30/2019 | | | 2.41 | | | | 3,999,890 | |
| | | 10,000M | | 7/26/2019 | | | 2.69 | | | | 10,008,657 | |
| | | 4,700M | | 11/14/2019 | | | 2.66 | | | | 4,705,820 | |
| | | 2,000M | | 11/19/2019 | | | 2.42 | | | | 1,999,503 | |
| | | 1,005M | | 2/10/2020 | | | 2.54 | | | | 1,005,585 | |
| | | | | Federal Home Loan Bank: | | | | | | | | |
| | | 6,500M | | 4/9/2019 | | | 2.48 | | | | 6,499,818 | |
| | | 6,000M | | 6/12/2019 | | | 2.44 | | | | 6,001,375 | |
| | | 8,200M | | 7/5/2019 | | | 2.63 | | | | 8,202,962 | |
| | | 1,000M | | 8/7/2019 | | | 2.37 | | | | 999,786 | |
| | | 3,950M | | 10/11/2019 | | | 2.54 | | | | 3,950,325 | |
| | | 2,100M | | 12/6/2019 | | | 2.43 | | | | 2,099,494 | |
| | | 7,000M | | 12/19/2019 | | | 2.49 | | | | 7,005,065 | |
Total Value of Variable and Floating Rate Notes (cost $61,466,358) | | | 61,466,358 | |
| | | | | SHORT-TERM U.S. GOVERNMENT AGENCY OBLIGATIONS—5.6% | | | | | | | | |
| | | | | Federal Home Loan Bank: | | | | | | | | |
| | | 5,000M | | 4/15/2019 | | | 2.40 | | | | 4,995,312 | |
| | | 5,000M | | 6/5/2019 | | | 2.42 | | | | 4,978,107 | |
Total Value of Short-Term U.S. Government Agency Obligations(cost $9,973,419) | | | 9,973,419 | |
Total Value of Investments (cost $177,053,423)** | | | 99.6 | % | | | 177,053,423 | |
Other Assets, Less Liabilities | | | .4 | | | | 687,679 | |
Net Assets | | | 100.0 | % | | $ | 177,741,102 | |
* | The interest rates shown are the effective rates at the time of purchase by the Fund. The interest rates shown on floating rate notes are adjusted periodically; the rates shown are the rates in effect at March 31, 2019. |
** | Aggregate cost for federal income tax purposes is the same. |
33
Portfolio of Investments(continued)
GOVERNMENT CASH MANAGEMENT FUND
March 31, 2019
The Fund’s assets and liabilities are classified into the following three levels based on the inputs used to value the assets and liabilities:
| | Level 1 – | Unadjusted quoted prices in active markets for identical securities that the Fund has the ability to access. |
| | Level 2 – | Observable inputs other than quoted prices included in Level 1 that are observable for the asset or liability, either directly or indirectly. These inputs may include quoted prices for the identical instrument on an inactive market, prices for similar instruments, interest rates, prepayment speeds, credit risk, yield curves, default rates and similar data. |
| | Level 3 – | Unobservable inputs for the asset or liability, to the extent relevant observable inputs are not available, representing the Fund’s own assumption about the assumptions a market participant would use in valuing the asset or liability, and would be based on the best information available. |
The inputs methodology used for valuing securities are not necessarily an indication of the risk associated with investing in those securities. For example, U.S. government securities are reflected as Level 2 because the inputs used to determine fair value may not always be quoted prices in an active market.
The following is a summary, by category of Level, of inputs used to value the Fund’s investments as of March 31, 2019:
| | | Level 1 | | | Level 2 | | | Level 3 | | | Total | |
Short-Term U.S. Government Obligations | | $ | — | | | $ | 105,613,646 | | | $ | — | | | $ | 105,613,646 | |
Variable and Floating Rate Notes: | | | | | | | | | | | | | | | | |
U.S. Government Agency Obligations | | | — | | | | 61,466,358 | | | | — | | | | 61,466,358 | |
Short-Term U.S. Government Agency Obligations | | | — | | | | 9,973,419 | | | | — | | | | 9,973,419 | |
Total Investments in Securities | | $ | — | | | $ | 177,053,423 | | | $ | — | | | $ | 177,053,423 | |
There were no transfers into or from Level 1 and Level 2 by the Fund during the period ended March 31, 2019. Transfers, if any, between Levels are recognized at the end of the reporting period.
See notes to financial statements
34
Fund Expenses(unaudited)
INTERNATIONAL OPPORTUNITIES BOND FUND
The examples below show the ongoing costs (in dollars) of investing in your Fund and will help you in comparing these costs with costs of other mutual funds. Please refer to page 1 for a detailed explanation of the information presented in these examples.
Expense Example | Annualized
Expense
Ratio | Beginning
Account Value
(10/1/18) | Ending
Account Value
(3/31/19) | Expenses Paid
During Period
(10/1/18-3/31/19)* |
Class A Shares | 1.44% | | | |
Actual | | $1,000.00 | $ 997.87 | $ 7.17 |
Hypothetical** | | $1,000.00 | $ 1,017.75 | $ 7.24 |
Advisor Class Shares | 1.14% | | | |
Actual | | $1,000.00 | $ 999.28 | $ 5.68 |
Hypothetical** | | $1,000.00 | $ 1,019.25 | $ 5.74 |
Institutional Class Shares | 0.97% | | | |
Actual | | $1,000.00 | $ 999.79 | $ 4.84 |
Hypothetical** | | $1,000.00 | $ 1,020.09 | $ 4.89 |
* | Expenses are equal to the annualized expense ratio, multiplied by the average account value over the period, multiplied by 182/365 (to reflect the one-half year period). Expenses paid during the period are net of expenses waived and/or assumed. |
** | Assumed rate of return of 5% before expenses |
Portfolio Composition
BY SECTOR
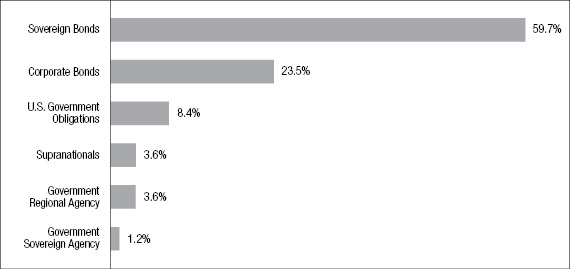
Portfolio holdings and allocations are subject to change. Percentages are as of March 31, 2019, and are based on the total market value of investments.
35
Portfolio of Investments
INTERNATIONAL OPPORTUNITIES BOND FUND
March 31, 2019
| |
Principal
Amount
| | | Security | | Value | |
| | | | | | SOVEREIGN BONDS—57.0% | | | | |
| | | | | | Mexico—12.8% | | | | |
| | | | | | United Mexican States: | | | | |
| | | 288M | | MXN | 7.75%, 11/23/2034 | | $ | 1,412,799 | |
| | | 1,437M | | MXN | 7.75%, 11/13/2042 | | | 6,882,853 | |
| | | 533M | | MXN | 8%, 11/7/2047 | | | 2,608,863 | |
| | | 822M | | MXN | 8.5%, 5/31/2029 | | | 4,356,756 | |
| | | 956M | | MXN | 8.5%, 11/18/2038 | | | 4,964,536 | |
| | | | | | | | | 20,225,807 | |
| | | | | | Malaysia—7.5% | | | | |
| | | | | | Federation of Malaysia: | | | | |
| | | 14,190M | | MYR | 3.48%, 3/15/2023 | | | 3,463,062 | |
| | | 1,750M | | MYR | 3.62%, 11/30/2021 | | | 430,591 | |
| | | 7,020M | | MYR | 3.659%, 10/15/2020 | | | 1,727,548 | |
| | | 8,435M | | MYR | 3.882%, 3/10/2022 | | | 2,094,318 | |
| | | 6,610M | | MYR | 3.899%, 11/16/2027 | | | 1,626,447 | |
| | | 890M | | MYR | 3.9%, 11/30/2026 | | | 221,545 | |
| | | 2,405M | | MYR | 3.955%, 9/15/2025 | | | 598,442 | |
| | | 6,540M | | MYR | 4.048%, 9/30/2021 | | | 1,626,200 | |
| | | | | | | | | 11,788,153 | |
| | | | | | Poland—6.6% | | | | |
| | | 9,845M | | PLN | Poland Government Bond, 2%, 4/25/2021 | | | 2,584,204 | |
| | | | | | Republic of Poland: | | | | |
| | | 14,085M | | PLN | 1.5%, 4/25/2020 | | | 3,672,357 | |
| | | 7,330M | | PLN | 3.25%, 7/25/2019 | | | 1,921,711 | |
| | | 8,400M | | PLN | 5.25%, 10/25/2020 | | | 2,311,236 | |
| | | | | | | | | 10,489,508 | |
| | | | | | South Africa—5.7% | | | | |
| | | | | | Republic of South Africa: | | | | |
| | | 54,690M | | ZAR | 6.5%, 2/28/2041 | | | 2,685,652 | |
| | | 100,650M | | ZAR | 8.75%, 2/28/2048 | | | 6,300,413 | |
| | | | | | | | | 8,986,065 | |
36
| |
Principal
Amount
| | | Security | | Value | |
| | | | | | Chile—4.6% | | | | |
| | | 4,800,000M | | CLP | Bonos Tesoreria Pesos, 4.5%, 3/1/2021 | | $ | 7,227,456 | |
| | | | | | Brazil—4.6% | | | | |
| | | | | | Nota Do Tesouro Nacional: | | | | |
| | | 11M | | BRL | 10%, 1/1/2021 | | | 2,996,555 | |
| | | 15M | | BRL | 10%, 1/1/2027 | | | 4,209,084 | |
| | | | | | | | | 7,205,639 | |
| | | | | | United Kingdom—4.5% | | | | |
| | | 5,410M | | GBP | United Kingdom Gilt, 1.75%, 7/22/2019 | | | 7,067,992 | |
| | | | | | Colombia—4.4% | | | | |
| | | 20,300,000M | | COP | Titulos De Tesoreria, 7.5%, 8/26/2026 | | | 6,887,417 | |
| | | | | | Indonesia—2.7% | | | | |
| | | | | | Republic of Indonesia: | | | | |
| | | 34,800,000M | | IDR | 8.375%, 3/15/2034 | | | 2,514,593 | |
| | | 23,800,000M | | IDR | 9%, 3/15/2029 | | | 1,822,450 | |
| | | | | | | | | 4,337,043 | |
| | | | | | Peru—2.0% | | | | |
| | | 10,000M | | PEN | Bonos De Tesoreria, 6.15%, 8/12/2032(c) | | | 3,175,691 | |
| | | | | | Australia—1.6% | | | | |
| | | 3,625M | | AUD | Commonwealth of Australia, 2.75%, 10/21/2019 | | | 2,592,049 | |
Total Value of Sovereign Bonds (cost $105,159,288) | | | 89,982,820 | |
| | | | | | CORPORATE BONDS—22.4% | | | | |
| | | | | | United States—19.4% | | | | |
| | | 1,390M | | USD | American Express Co., 3.3326%, 11/5/2021(a) | | | 1,395,418 | |
| | | 2,490M | | USD | Caterpillar Financial Service, 2.8409%, 3/15/2021(a) | | | 2,492,605 | |
| | | 2,100M | | USD | Citibank NA, 3.0478%, 2/12/2021(a) | | | 2,101,438 | |
| | | 1,650M | | USD | Citigroup, Inc., 3.5725%, 1/10/2020(a) | | | 1,657,154 | |
| | | 2,395M | | USD | Daimler Finance NA, LLC, 3.1134%, 2/22/2021(a)(b) | | | 2,389,602 | |
37
Portfolio of Investments(continued)
INTERNATIONAL OPPORTUNITIES BOND FUND
March 31, 2019
| |
Principal
Amount
| | | Security | | Value | |
| | | | | | United States(continued) | | | | |
| | | | | | Ford Motor Credit Co., LLC: | | | | |
| | | 2,055M | | USD | 3.7968%, 1/9/2020(a) | | $ | 2,054,891 | |
| | | 930M | | USD | 3.605%, 4/5/2021(a) | | | 908,334 | |
| | | 2,505M | | USD | General Motors Financial Co., Inc.,
3.7269%, 4/13/2020(a) | | | 2,509,051 | |
| | | 4,180M | | USD | Goldman Sachs Group, Inc., 3.401%, 2/23/2023(a) | | | 4,145,753 | |
| | | 1,505M | | USD | HP Enterprise Co., 6.35%, 10/15/2045 | | | 1,579,502 | |
| | | | | | Metropolitan Life Global Funding I: | | | | |
| | | 1,410M | | USD | 2.8453%, 9/19/2019(a)(b) | | | 1,410,984 | |
| | | 2,290M | | USD | 3.0339%, 1/8/2021(a)(b) | | | 2,287,804 | |
| | | 2,410M | | USD | NBCUniversal Enterprise, Inc.,
3.197%, 4/1/2021(a)(b) | | | 2,413,858 | |
| | | 1,555M | | USD | New York Life Global Funding,
2.957%, 10/1/2020(a)(b) | | | 1,555,781 | |
| | | 1,760M | | USD | Wells Fargo & Co., 3.7898%, 7/26/2021(a) | | | 1,782,882 | |
| | | | | | | | | 30,685,057 | |
| | | | | | Australia—1.8% | | | | |
| | | 1,395M | | USD | Macquarie Bank, Ltd., 3.1439%, 4/4/2019(a)(b) | | | 1,395,050 | |
| | | 1,500M | | USD | National Australia Bank, Ltd.,
3.1734%, 5/22/2020(a)(b) | | | 1,505,917 | |
| | | | | | | | | 2,900,967 | |
| | | | | | Germany—1.2% | | | | |
| | | 1,825M | | USD | BMW U.S. Capital, LLC, 3.175%, 4/6/2020(a)(b) | | | 1,827,172 | |
Total Value of Corporate Bonds (cost $35,327,191) | | | 35,413,196 | |
| | | | | | U.S. GOVERNMENT OBLIGATIONS—8.0% | | | | |
| | | | | | United States | | | | |
| | | | | | U.S. Treasury Notes: | | | | |
| | | 7,290M | | USD | 2.4578%, 4/30/2020(a) | | | 7,286,224 | |
| | | 5,360M | | USD | 2.4698%, 10/31/2020(a) | | | 5,353,118 | |
Total Value of U.S. Government Obligations (cost $12,651,199) | | | 12,639,342 | |
38
| |
Principal
Amount
| | | Security | | Value | |
| | | | | | SUPRANATIONALS—3.5% | | | | |
| | | | | | United States—2.8% | | | | |
| | | 4,410M | | USD | Inter-American Development Bank,
2.4928%, 10/9/2020(a) | | $ | 4,408,386 | |
| | | | | | Venezuela—.7% | | | | |
| | | 1,075M | | USD | Corp. Andina De Formento, 2%, 5/10/2019 | | | 1,074,459 | |
Total Value of Supranational (cost $5,482,295) | | | 5,482,845 | |
| | | | | | GOVERNMENT REGIONAL AGENCY—3.4% | | | | |
| | | | | | Australia | | | | |
| | | 970M | | AUD | New South Wales Treasury Corp., 4%, 4/8/2021 | | | 721,286 | |
| | | 3,700M | | AUD | Queensland Treasury Corp., 4%, 6/21/2019(c) | | | 2,640,917 | |
| | | 2,740M | | AUD | Western Australia Treasury Corp., 7%, 10/15/2019 | | | 2,001,477 | |
Total Value of Government Regional Agency (cost $5,859,979) | | | 5,363,680 | |
| | | | | | GOVERNMENT SOVEREIGN AGENCY—1.2% | | | | |
| | | | | | Norway | | | | |
| | | 1,872M | | USD | Kommunalbanken AS, 2.9446%, 6/16/2020 (cost $1,882,801) (a)(b) | | | 1,879,739 | |
Total Value of Investments (cost $166,362,753) | | | 95.5 | % | | | 150,761,622 | |
Other Assets, Less Liabilities | | | 4.5 | | | | 7,203,606 | |
Net Assets | | | 100.0 | % | | $ | 157,965,228 | |
(a) | Interest rates are determined and reset periodically. The interest rates above are the rates in effect at March 31, 2019. |
(b) | Security exempt from registration under Rule 144A of the Securities Act of 1933 (see Note 4). |
(c) | Security exempt from registration under Regulation S of the Securities Act of 1933 (see Note 4). |
39
Portfolio of Investments(continued)
INTERNATIONAL OPPORTUNITIES BOND FUND
March 31, 2019
At March 31, 2019, International Opportunities Bond Fund has open foreign exchange contracts as described below.
The unrealized appreciation (depreciation) on the open contracts were as follows:
International Opportunities Bond Fund
Counterparty | | Settlement
Date | | Foreign
Currency | | Receive
(Deliver) | | | Asset | | | Liability | | | Unrealized
Appreciation
(Depreciation) | |
MS | | | 4/10/19 | | PLN | | | (2,860,000 | ) | | $ | 744,908 | | | $ | 765,754 | | | $ | 20,846 | |
BCI | | | 4/10/19 | | PLN | | | 2,860,000 | | | | 759,199 | | | | 744,908 | | | | (14,291 | ) |
HSBC | | | 4/15/19 | | SEK | | | 55,400,000 | | | | 6,197,561 | | | | 5,958,719 | | | | (238,842 | ) |
CITI | | | 4/15/19 | | SEK | | | (7,100,000 | ) | | | 763,662 | | | | 787,720 | | | | 24,058 | |
GS | | | 4/16/19 | | CAD | | | 12,290,000 | | | | 9,284,932 | | | | 9,196,693 | | | | (88,239 | ) |
GS | | | 4/16/19 | | CAD | | | 450,000 | | | | 341,767 | | | | 336,738 | | | | (5,029 | ) |
GS | | | 4/16/19 | | CAD | | | (4,100,000 | ) | | | 3,068,058 | | | | 3,052,753 | | | | (15,305 | ) |
GS | | | 4/16/19 | | CAD | | | (8,640,000 | ) | | | 6,465,372 | | | | 6,441,032 | | | | (24,340 | ) |
HSBC | | | 4/26/19 | | NOK | | | 20,500,000 | | | | 2,412,659 | | | | 2,376,825 | | | | (35,834 | ) |
HSBC | | | 5/15/19 | | SEK | | | 37,700,000 | | | | 4,288,233 | | | | 4,054,941 | | | | (233,292 | ) |
HSBC | | | 5/15/19 | | ZAR | | | (21,100,000 | ) | | | 1,462,358 | | | | 1,557,127 | | | | 94,769 | |
HSBC | | | 5/15/19 | | ZAR | | | (19,500,000 | ) | | | 1,351,468 | | | | 1,415,772 | | | | 64,304 | |
JPM | | | 5/21/19 | | JPY | | | 1,054,000,000 | | | | 9,591,497 | | | | 9,510,060 | | | | (81,437 | ) |
HSBC | | | 5/23/19 | | NOK | | | 20,900,000 | | | | 2,439,637 | | | | 2,423,202 | | | | (16,435 | ) |
MS | | | 5/24/19 | | AUD | | | 1,480,000 | | | | 1,062,433 | | | | 1,050,875 | | | | (11,558 | ) |
HSBC | | | 6/14/19 | | SEK | | | 37,700,000 | | | | 4,298,354 | | | | 4,054,941 | | | | (243,413 | ) |
CITI | | | 6/17/19 | | GBP | | | 8,710,000 | | | | 11,527,232 | | | | 11,344,396 | | | | (182,836 | ) |
BCI | | | 6/18/19 | | ZAR | | | (27,400,000 | ) | | | 1,898,986 | | | | 1,871,431 | | | | (27,555 | ) |
HSBC | | | 6/24/19 | | NOK | | | 20,800,000 | | | | 2,445,390 | | | | 2,411,608 | | | | (33,782 | ) |
CITI | | | 6/26/19 | | JPY | | | 723,000,000 | | | | 6,569,114 | | | | 6,523,504 | | | | (45,610 | ) |
Net unrealized depreciation on open foreign exchange contracts | | $ | (1,093,821 | ) |
A summary of abbreviations for counterparties to foreign exchange contracts are as follows:
CITI | Citigroup Global Markets |
BCI | Barclays Capital, Inc. |
JPM | J.P. Morgan Securities, Inc. |
Summary of Abbreviations:
40
The Fund’s assets and liabilities are classified into the following three levels based on the inputs used to value the assets and liabilities:
| | Level 1 – | Unadjusted quoted prices in active markets for identical securities that the Fund has the ability to access. |
| | Level 2 – | Observable inputs other than quoted prices included in Level 1 that are observable for the asset or liability, either directly or indirectly. These inputs may include quoted prices for the identical instrument on an inactive market, prices for similar instruments, interest rates, prepayment speeds, credit risk, yield curves, default rates and similar data. |
| | Level 3 – | Unobservable inputs for the asset or liability, to the extent relevant observable inputs are not available, representing the Fund’s own assumption about the assumptions a market participant would use in valuing the asset or liability, and would be based on the best information available. |
The inputs methodology used for valuing securities are not necessarily an indication of the risk associated with investing in those securities. For example, U.S. government securities are reflected as Level 2 because the inputs used to determine fair value may not always be quoted prices in an active market.
41
Portfolio of Investments(continued)
INTERNATIONAL OPPORTUNITIES BOND FUND
March 31, 2019
The following is a summary, by category of Level, of inputs used to value the Fund’s investments as of March 31, 2019:
| | | Level 1 | | | Level 2 | | | Level 3 | | | Total | |
Sovereign Bonds | | | | | | | | | | | | | | | | |
Mexico | | $ | — | | | $ | 20,225,807 | | | $ | — | | | $ | 20,225,807 | |
Malaysia | | | — | | | | 11,788,153 | | | | — | | | | 11,788,153 | |
Poland | | | — | | | | 10,489,508 | | | | — | | | | 10,489,508 | |
South Africa | | | — | | | | 8,986,065 | | | | — | | | | 8,986,065 | |
Chile | | | — | | | | 7,227,456 | | | | — | | | | 7,227,456 | |
Brazil | | | — | | | | 7,205,639 | | | | — | | | | 7,205,639 | |
United Kingdom | | | — | | | | 7,067,992 | | | | — | | | | 7,067,992 | |
Colombia | | | — | | | | 6,887,417 | | | | — | | | | 6,887,417 | |
Indonesia | | | — | | | | 4,337,043 | | | | — | | | | 4,337,043 | |
Peru | | | — | | | | 3,175,691 | | | | — | | | | 3,175,691 | |
Australia | | | — | | | | 2,592,049 | | | | — | | | | 2,592,049 | |
Corporate Bonds | | | | | | | | | | | | | | | | |
United States | | | — | | | | 30,685,057 | | | | — | | | | 30,685,057 | |
Australia | | | — | | | | 2,900,967 | | | | — | | | | 2,900,967 | |
Germany | | | — | | | | 1,827,172 | | | | — | | | | 1,827,172 | |
U.S. Government Obligations | | | — | | | | 12,639,342 | | | | — | | | | 12,639,342 | |
Supranationals | | | | | | | | | | | | | | | | |
United States | | | — | | | | 4,408,386 | | | | — | | | | 4,408,386 | |
Venezuela | | | — | | | | 1,074,459 | | | | — | | | | 1,074,459 | |
Government Regional Agency | | | | | | | | | | | | | | | | |
Australia | | | — | | | | 5,363,680 | | | | — | | | | 5,363,680 | |
Government Sovereign Agency | | | | | | | | | | | | | | | | |
Norway | | | — | | | | 1,879,739 | | | | — | | | | 1,879,739 | |
Total Investments in Securities | | $ | — | | | $ | 150,761,622 | | | $ | — | | | $ | 150,761,622 | |
Other Financial Instruments* | | $ | — | | | $ | (1,093,821 | ) | | $ | — | | | $ | (1,093,821 | ) |
* | Other financial instruments are foreign exchange contracts and are considered derivative instruments, which are valued at the net unrealized depreciation on the instruments. |
During the period ended March 31, 2019, there were no transfers between Level 1 investments and Level 2 investments that had a material impact to the Fund. Transfers, if any, between Levels are recognized at the end of the reporting period.
See notes to financial statements
42
Fund Expenses(unaudited)
INVESTMENT GRADE FUND
The examples below show the ongoing costs (in dollars) of investing in your Fund and will help you in comparing these costs with costs of other mutual funds. Please refer to page 1 for a detailed explanation of the information presented in these examples.
Expense Example | Annualized
Expense
Ratio | Beginning
Account Value
(10/1/18) | Ending
Account Value
(3/31/19) | Expenses Paid
During Period
(10/1/18-3/31/19)* |
Class A Shares | 1.08% | | | |
Actual | | $1,000.00 | $1,046.82 | $ 5.51 |
Hypothetical** | | $1,000.00 | $1,019.54 | $ 5.44 |
Class B Shares | 1.94% | | | |
Actual | | $1,000.00 | $1,041.46 | $ 9.87 |
Hypothetical** | | $1,000.00 | $1,015.26 | $ 9.75 |
Advisor Class Shares | 0.74% | | | |
Actual | | $1,000.00 | $1,047.29 | $ 3.78 |
Hypothetical** | | $1,000.00 | $1,021.24 | $ 3.73 |
Institutional Class Shares | 0.66% | | | |
Actual | | $1,000.00 | $1,047.82 | $ 3.37 |
Hypothetical** | | $1,000.00 | $1,021.64 | $ 3.33 |
* | Expenses are equal to the annualized expense ratio, multiplied by the average account value over the period, multiplied by 182/365 (to reflect the one-half year period). Expenses paid during the period are net of expenses waived. |
** | Assumed rate of return of 5% before expenses |
Portfolio Composition
TOP TEN SECTORS
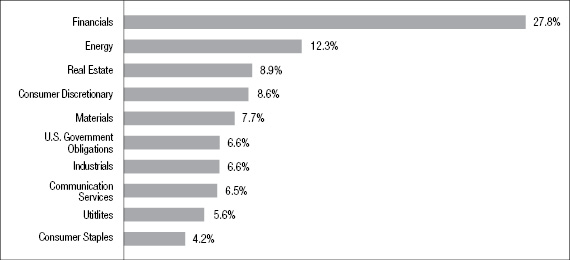
Portfolio holdings and allocations are subject to change. Percentages are as of March 31, 2019, and are based on the total market value of investments.
43
Portfolio of Investments
INVESTMENT GRADE FUND
March 31, 2019
| |
Principal
Amount
| | Security | | Value | |
| | | | | CORPORATE BONDS—91.3% | | | | |
| | | | | Aerospace/Defense—.9% | | | | |
| | $ | 150M | | Bombardier, Inc., 6%, 10/15/2022(a) | | $ | 152,062 | |
| | | 5,000M | | Rockwell Collins, Inc., 3.5%, 3/15/2027 | | | 4,941,685 | |
| | | | | TransDigm, Inc.: | | | | |
| | | 75M | | 6.5%, 7/15/2024 | | | 77,344 | |
| | | 75M | | 6.25%, 3/15/2026(a) | | | 78,300 | |
| | | 100M | | Triumph Group, Inc., 5.25%, 6/1/2022 | | | 96,500 | |
| | | | | | | | 5,345,891 | |
| | | | | Automotive—6.0% | | | | |
| | | 275M | | American Axle & Manufacturing, Inc., 6.25%, 4/1/2025 | | | 268,812 | |
| | | 50M | | Asbury Automotive Group, Inc., 6%, 12/15/2024 | | | 51,672 | |
| | | 275M | | Cooper Standard Automotive, Inc., 5.625%, 11/15/2026(a) | | | 242,825 | |
| | | 5,500M | | Daimler Finance NA, LLC, 3.3%, 5/19/2025(a) | | | 5,432,372 | |
| | | 545M | | Dana Holding Corp., 5.5%, 12/15/2024 | | | 545,000 | |
| | | | | Ford Motor Credit Co., LLC: | | | | |
| | | 6,200M | | 8.125%, 1/15/2020 | | | 6,427,056 | |
| | | 5,000M | | 3.81%, 1/9/2024 | | | 4,737,300 | |
| | | | | General Motors Financial Co., Inc.: | | | | |
| | | 4,000M | | 5.25%, 3/1/2026 | | | 4,131,816 | |
| | | 900M | | 5.65%, 1/17/2029 | | | 931,378 | |
| | | 75M | | Hertz Corp., 5.875%, 10/15/2020 | | | 75,075 | |
| | | 75M | | J.B. Poindexter & Co., 7.125%, 4/15/2026(a) | | | 75,587 | |
| | | | | Lear Corp.: | | | | |
| | | 3,600M | | 5.25%, 1/15/2025 | | | 3,744,065 | |
| | | 3,000M | | 3.8%, 9/15/2027 | | | 2,877,414 | |
| | | 75M | | LKQ Corp., 4.75%, 5/15/2023 | | | 75,829 | |
| | | 4,000M | | O’Reilly Automotive, Inc., 3.55%, 3/15/2026 | | | 3,990,564 | |
| | | | | Panther BF Aggeregator 2, LP: | | | | |
| | | 25M | | 6.25%, 5/15/2026(a)(b) | | | 25,563 | |
| | | 25M | | 8.5%, 5/15/2027(a)(b) | | | 25,125 | |
| | | 75M | | Tenneco, Inc., 5%, 7/15/2026 | | | 60,375 | |
| | | 2,700M | | Volkswagen Group America, 4%, 11/12/2021 | | | 2,755,696 | |
| | | | | | | | 36,473,524 | |
44
| |
Principal
Amount
| | Security | | Value | |
| | | | | Building Materials—.1% | | | | |
| | $ | 100M | | Building Materials Corp., 5.375%, 11/15/2024(a) | | $ | 102,875 | |
| | | 125M | | Griffon Corp., 5.25%, 3/1/2022 | | | 123,437 | |
| | | 50M | | New Enterprise Stone & Lime Co., 6.25%, 3/15/2026(a) | | | 48,756 | |
| | | 75M | | Standard Industries, Inc., 5.5%, 2/15/2023(a) | | | 76,500 | |
| | | | | | | | 351,568 | |
| | | | | Chemicals—3.2% | | | | |
| | | 275M | | Blue Cube Spinco, Inc., 10%, 10/15/2025 | | | 315,989 | |
| | | 25M | | CF Industries, Inc., 4.95%, 6/1/2043 | | | 21,531 | |
| | | 100M | | Chemours Co., 6.625%, 5/15/2023 | | | 103,759 | |
| | | 4,020M | | Dow Chemical Co., 3.5%, 10/1/2024 | | | 4,081,333 | |
| | | 4,500M | | DowDuPont, Inc., 4.725%, 11/15/2028 | | | 4,866,025 | |
| | | 75M | | Kraton Polymers, LLC, 7%, 4/15/2025(a) | | | 76,125 | |
| | | 5,000M | | LyondellBasell Industries NV, 6%, 11/15/2021 | | | 5,349,725 | |
| | | 50M | | Neon Holdings, Inc., 10.125%, 4/1/2026(a) | | | 51,125 | |
| | | 4,000M | | Nutrien, Ltd., 3.375%, 3/15/2025 | | | 3,948,596 | |
| | | 125M | | Rain CII Carbon, LLC, 7.25%, 4/1/2025(a) | | | 111,250 | |
| | | 70M | | Rayonier AM Products, Inc., 5.5%, 6/1/2024(a) | | | 65,975 | |
| | | 50M | | Tronox, Inc., 6.5%, 4/15/2026(a) | | | 47,908 | |
| | | 100M | | Univar USA, Inc., 6.75%, 7/15/2023(a) | | | 102,700 | |
| | | | | | | | 19,142,041 | |
| | | | | Consumer Non-Durables—.2% | | | | |
| | | 175M | | Eagle Intermediate Global Holding, 7.5%, 5/1/2025(a) | | | 173,250 | |
| | | | | Energizer Holdings, Inc.: | | | | |
| | | 75M | | 5.5%, 6/15/2025(a) | | | 74,413 | |
| | | 50M | | 6.375%, 7/15/2026(a) | | | 51,375 | |
| | | 25M | | 7.75%, 1/15/2027(a) | | | 26,687 | |
| | | 150M | | First Quality Finance Co., 4.625%, 5/15/2021(a) | | | 150,375 | |
| | | 75M | | KGA Escrow, LLC, 7.5%, 8/15/2023(a) | | | 76,406 | |
| | | | | Reynolds Group Holdings, Inc.: | | | | |
| | | 145M | | 5.75%, 10/15/2020 | | | 145,730 | |
| | | 275M | | 5.125%, 7/15/2023(a) | | | 279,813 | |
| | | | | | | | 978,049 | |
45
Portfolio of Investments(continued)
INVESTMENT GRADE FUND
March 31, 2019
| |
Principal
Amount
| | Security | | Value | |
| | | | | Energy—12.1% | | | | |
| | $ | 6,600M | | Andeavor Logistics, LP, 5.25%, 1/15/2025 | | $ | 6,857,149 | |
| | | 75M | | Apergy Corp., 6.375%, 5/1/2026 | | | 76,219 | |
| | | 150M | | Baytex Energy Corp., 5.125%, 6/1/2021(a) | | | 148,875 | |
| | | | | Blue Racer Midstream, LLC: | | | | |
| | | 275M | | 6.125%, 11/15/2022(a) | | | 280,500 | |
| | | 75M | | 6.625%, 7/15/2026(a) | | | 76,875 | |
| | | 100M | | California Resources Corp., 8%, 12/15/2022(a) | | | 78,780 | |
| | | 50M | | Callon Petroleum Co., 6.375%, 7/1/2026 | | | 50,375 | |
| | | 5,000M | | Canadian Oil Sands, Ltd., 7.75%, 5/15/2019(a) | | | 5,037,070 | |
| | | | | Chesapeake Energy Corp.: | | | | |
| | | 50M | | 4.875%, 4/15/2022 | | | 49,500 | |
| | | 125M | | 7%, 10/1/2024 | | | 125,156 | |
| | | 75M | | 8%, 6/15/2027 | | | 74,250 | |
| | | 1,800M | | Cimarex Energy Co., 4.375%, 3/15/2029 | | | 1,856,083 | |
| | | 150M | | CITGO Petroleum Corp., 6.25%, 8/15/2022(a) | | | 149,625 | |
| | | | | Consolidated Energy Finance SA: | | | | |
| | | 150M | | 6.3609%, 6/15/2022(a)† | | | 149,556 | |
| | | 150M | | 6.875%, 6/15/2025(a) | | | 151,875 | |
| | | 4,000M | | Continental Resources, Inc., 5%, 9/15/2022 | | | 4,032,936 | |
| | | 75M | | Covey Park Energy, LLC, 7.5%, 5/15/2025(a) | | | 69,750 | |
| | | 75M | | CrownRock, LP, 5.625%, 10/15/2025(a) | | | 72,281 | |
| | | 75M | | DCP Midstream Operating, LP, 3.875%, 3/15/2023 | | | 74,812 | |
| | | 25M | | Diamondback Energy, Inc., 4.75%, 11/1/2024(a) | | | 25,651 | |
| | | 4,000M | | Enable Midstream Partners, LP, 4.4%, 3/15/2027 | | | 3,910,884 | |
| | | 5,000M | | Enbridge Energy Partners, LP, 4.2%, 9/15/2021 | | | 5,121,435 | |
| | | 100M | | EnLink Midstream Partners, LP, 4.85%, 7/15/2026 | | | 99,645 | |
| | | | | Enterprise Products Operating: | | | | |
| | | 4,031M | | 7.55%, 4/15/2038 | | | 5,439,379 | |
| | | 1,800M | | 4.8%, 2/1/2049 | | | 1,917,479 | |
| | | 270M | | Exterran Partners, LP, 6%, 10/1/2022 | | | 273,375 | |
| | | 275M | | Global Partners, LP, 6.25%, 7/15/2022 | | | 272,937 | |
| | | 50M | | Gulfport Energy Corp., 6.625%, 5/1/2023 | | | 48,750 | |
| | | 5,000M | | Kinder Morgan Energy Partners, LP, 3.45%, 2/15/2023 | | | 5,060,005 | |
| | | 4,750M | | Kinder Morgan, Inc., 5.625%, 11/15/2023(a) | | | 5,190,159 | |
46
| |
Principal
Amount
| | Security | | Value | |
| | | | | Energy (continued) |
| | | | | Laredo Petroleum, Inc.: | | | | |
| | $ | 50M | | 5.625%, 1/15/2022 | | $ | 45,938 | |
| | | 75M | | 6.25%, 3/15/2023 | | | 67,313 | |
| | | | | Magellan Midstream Partners, LP: | | | | |
| | | 5,000M | | 5%, 3/1/2026 | | | 5,430,110 | |
| | | 3,600M | | 4.85%, 2/1/2049 | | | 3,826,332 | |
| | | 25M | | Matador Resources Co., 5.875%, 9/15/2026 | | | 25,063 | |
| | | 75M | | McDermott Escrow 1, Inc., 10.625%, 5/1/2024(a) | | | 62,344 | |
| | | 4,000M | | Midwest Connector Capital Co., LLC, 4.625%, 4/1/2029(a) | | | 4,136,692 | |
| | | 4,300M | | Noble Energy, Inc., 3.85%, 1/15/2028 | | | 4,239,787 | |
| | | 50M | | Northern Oil and Gas, Inc., 9.5%, 5/15/2023 | | | 52,130 | |
| | | | | Oasis Petroleum, Inc.: | | | | |
| | | 275M | | 6.875%, 1/15/2023 | | | 275,688 | |
| | | 50M | | 6.25%, 5/1/2026(a) | | | 47,750 | |
| | | 75M | | Parkland Fuel Corp., 6%, 4/1/2026(a) | | | 76,054 | |
| | | 100M | | Parsley Energy, LLC, 5.25%, 8/15/2025(a) | | | 99,000 | |
| | | | | Range Resources Corp.: | | | | |
| | | 50M | | 5.75%, 6/1/2021 | | | 51,000 | |
| | | 25M | | 5%, 8/15/2022(a) | | | 24,875 | |
| | | 25M | | SM Energy Co., 6.625%, 1/15/2027 | | | 23,875 | |
| | | 100M | | Suburban Propane Partners, LP, 5.875%, 3/1/2027 | | | 95,250 | |
| | | | | Sunoco, LP: | | | | |
| | | 75M | | 4.875%, 1/15/2023 | | | 76,380 | |
| | | 75M | | 5.875%, 3/15/2028 | | | 74,625 | |
| | | 47M | | Transocean Guardian, Ltd., 5.875%, 1/15/2024(a) | | | 48,195 | |
| | | 47M | | Transocean Pontus, Ltd., 6.125%, 8/1/2025(a) | | | 48,077 | |
| | | 50M | | USA Compression Partners, LP, 6.875%, 9/1/2027(a) | | | 51,063 | |
| | | | | Valero Energy Corp.: | | | | |
| | | 2,700M | | 4.35%, 6/1/2028 | | | 2,805,856 | |
| | | 3,500M | | 6.625%, 6/15/2037 | | | 4,293,331 | |
| | | | | Whiting Petroleum Corp.: | | | | |
| | | 275M | | 5.75%, 3/15/2021 | | | 279,538 | |
| | | 50M | | 6.25%, 4/1/2023 | | | 50,500 | |
| | | 75M | | 6.625%, 1/15/2026 | | | 73,875 | |
47
Portfolio of Investments(continued)
INVESTMENT GRADE FUND
March 31, 2019
| |
Principal
Amount
| | Security | | Value | |
| | | | | Energy (continued) |
| | | | | WPX Energy, Inc.: | | | | |
| | $ | 270M | | 5.25%, 9/15/2024 | | $ | 274,050 | |
| | | 25M | | 5.75%, 6/1/2026 | | | 25,469 | |
| | | | | | | | 73,451,526 | |
| | | | | Financial Services—8.5% | | | | |
| | | 5,400M | | Assured Guaranty U.S. Holding, Inc., 5%, 7/1/2024 | | | 5,793,476 | |
| | | 6,750M | | Brookfield Finance, Inc., 4.85%, 3/29/2029 | | | 6,946,708 | |
| | | 3,750M | | ERAC USA Finance, LLC, 4.5%, 8/16/2021(a) | | | 3,866,212 | |
| | | 2,500M | | GE Capital International Funding Services, Ltd.,
4.418%, 11/15/2035 | | | 2,314,922 | |
| | | 6,400M | | General Electric Capital Corp., 4.65%, 10/17/2021 | | | 6,635,654 | |
| | | 4,500M | | International Lease Finance Corp., 8.25%, 12/15/2020 | | | 4,861,966 | |
| | | 5,000M | | Key Bank NA, 3.4%, 5/20/2026 | | | 4,959,895 | |
| | | 4,000M | | Liberty Mutual Group, Inc., 4.95%, 5/1/2022(a) | | | 4,203,980 | |
| | | 75M | | Nationstar Mortgage, LLC, 6.5%, 7/1/2021 | | | 75,188 | |
| | | | | Protective Life Corp.: | | | | |
| | | 5,135M | | 7.375%, 10/15/2019 | | | 5,255,539 | |
| | | 3,600M | | 4.3%, 9/30/2028(a) | | | 3,689,406 | |
| | | 3,000M | | Prudential Financial, Inc., 7.375%, 6/15/2019 | | | 3,026,418 | |
| | | | | | | | 51,629,364 | |
| | | | | Financials—18.8% | | | | |
| | | 50M | | Acrisure, LLC, 8.125%, 2/15/2024(a) | | | 51,902 | |
| | | 75M | | Ally Financial, Inc., 8%, 11/1/2031 | | | 93,469 | |
| | | | | Bank of America Corp.: | | | | |
| | | 6,000M | | 4.2%, 8/26/2024 | | | 6,213,426 | |
| | | 2,000M | | 4%, 1/22/2025 | | | 2,040,826 | |
| | | 4,725M | | 5.875%, 2/7/2042 | | | 5,907,734 | |
| | | 3,800M | | Barclays Bank, PLC, 3.75%, 5/15/2024 | | | 3,850,289 | |
| | | 3,200M | | Capital One Financial Corp., 3.75%, 4/24/2024 | | | 3,250,954 | |
| | | | | Colfax Corp.: | | | | |
| | | 50M | | 6%, 2/15/2024(a) | | | 52,250 | |
| | | 25M | | 6.375%, 2/15/2026(a) | | | 26,640 | |
48
| |
Principal
Amount
| | Security | | Value | |
| | | | | Financials (continued) |
| | | | | Citigroup, Inc.: | | | | |
| | $ | 2,250M | | 2.9%, 12/8/2021 | | $ | 2,250,414 | |
| | | 6,200M | | 4.5%, 1/14/2022 | | | 6,469,223 | |
| | | 4,500M | | 4.3%, 11/20/2026 | | | 4,577,760 | |
| | | 2,900M | | 4.075%, 4/23/2029 | | | 2,977,868 | |
| | | | | DAE Funding, LLC: | | | | |
| | | 50M | | 5.75%, 11/15/2023(a) | | | 51,500 | |
| | | 275M | | 5%, 8/1/2024(a) | | | 279,125 | |
| | | 1,200M | | Deutsche Bank AG of New York, 3.7%, 5/30/2024 | | | 1,152,558 | |
| | | | | Goldman Sachs Group, Inc.: | | | | |
| | | 2,350M | | 3.85%, 7/8/2024 | | | 2,396,939 | |
| | | 8,450M | | 3.5%, 11/16/2026 | | | 8,345,195 | |
| | | 4,550M | | 4.223%, 5/1/2029 | | | 4,654,113 | |
| | | 3,750M | | HSBC Holdings, PLC, 3.95%, 5/18/2024 | | | 3,826,181 | |
| | | 200M | | Icahn Enterprises, LP, 6.75%, 2/1/2024 | | | 209,250 | |
| | | | | JPMorgan Chase & Co.: | | | | |
| | | 5,450M | | 3.54%, 5/1/2028† | | | 5,458,491 | |
| | | 2,500M | | 4.452%, 12/5/2029 | | | 2,663,182 | |
| | | 5,900M | | 6.4%, 5/15/2038 | | | 7,662,466 | |
| | | 275M | | Ladder Capital Finance Holdings, LLLP,
5.25%, 10/1/2025(a) | | | 264,688 | |
| | | | | Morgan Stanley: | | | | |
| | | 4,000M | | 4.1%, 5/22/2023 | | | 4,121,148 | |
| | | 3,000M | | 4%, 7/23/2025 | | | 3,090,489 | |
| | | 3,600M | | 3.625%, 1/20/2027 | | | 3,611,822 | |
| | | 150M | | Navient Corp., 5.875%, 3/25/2021 | | | 155,438 | |
| | | | | Park Aerospace Holdings: | | | | |
| | | 25M | | 4.5%, 3/15/2023(a) | | | 24,938 | |
| | | 150M | | 5.5%, 2/15/2024(a) | | | 156,098 | |
| | | | | Springleaf Finance Corp.: | | | | |
| | | 175M | | 5.625%, 3/15/2023 | | | 177,844 | |
| | | 75M | | 6.875%, 3/15/2025 | | | 77,531 | |
| | | 100M | | 7.125%, 3/15/2026 | | | 102,000 | |
| | | 4,000M | | UBS AG, 4.875%, 8/4/2020 | | | 4,114,736 | |
49
Portfolio of Investments(continued)
INVESTMENT GRADE FUND
March 31, 2019
| |
Principal
Amount
| | Security | | Value | |
| | | | | Financials (continued) |
| | | | | UBS Group Funding (Switzerland) AG: | | | | |
| | $ | 3,000M | | 3.491%, 5/23/2023(a) | | $ | 3,015,657 | |
| | | 3,000M | | 4.253%, 3/23/2028(a) | | | 3,122,445 | |
| | | 75M | | Wand Merger Corp., 8.125%, 7/15/2023(a) | | | 77,438 | |
| | | | | Wells Fargo & Co.: | | | | |
| | | 7,100M | | 3.45%, 2/13/2023 | | | 7,180,180 | |
| | | 3,250M | | 4.75%, 12/7/2046 | | | 3,415,418 | |
| | | | | Wells Fargo Bank, NA: | | | | |
| | | 2,350M | | 5.85%, 2/1/2037 | | | 2,842,309 | |
| | | 3,250M | | 6.6%, 1/15/2038 | | | 4,250,568 | |
| | | | | | | | 114,262,502 | |
| | | | | Food/Beverage/Tobacco—2.7% | | | | |
| | | 2,700M | | Anheuser-Busch InBev Worldwide, 4.15%, 1/23/2025 | | | 2,815,147 | |
| | | 9,000M | | Anheuser-Busch Co, 4.7%, 2/1/2036 | | | 9,004,383 | |
| | | 25M | | HLF Financing Sarl, LLC, 7.25%, 8/15/2026(a) | | | 25,781 | |
| | | 3,875M | | Maple Escrow Subsidiary, Inc., 3.551%, 5/25/2021(a) | | | 3,918,160 | |
| | | 275M | | Post Holdings, Inc., 5.75%, 3/1/2027(a) | | | 277,406 | |
| | | 200M | | Sigma Holdco BV, 7.875%, 5/15/2026(a) | | | 185,500 | |
| | | | | | | | 16,226,377 | |
| | | | | Food/Drug—.0% | | | | |
| | | | | Albertson’s Cos., LLC: | | | | |
| | | 50M | | 5.75%, 3/15/2025 | | | 47,687 | |
| | | 50M | | 7.5%, 3/15/2026(a) | | | 51,687 | |
| | | | | | | | 99,374 | |
| | | | | Forest Products/Containers—1.2% | | | | |
| | | | | Ardagh Holdings USA, Inc.: | | | | |
| | | 200M | | 4.625%, 5/15/2023(a) | | | 201,750 | |
| | | 200M | | 7.25%, 5/15/2024(a) | | | 211,440 | |
| | | | | Berry Global, Inc.: | | | | |
| | | 75M | | 5.5%, 5/15/2022 | | | 76,406 | |
| | | 100M | | 5.125%, 7/15/2023 | | | 102,030 | |
50
| |
Principal
Amount
| | Security | | Value | |
| | | | | Forest Products/Containers (continued) |
| | $ | 75M | | BWAY Holding Co., 5.5%, 4/15/2024(a) | | $ | 74,741 | |
| | | 50M | | Crown Americas, LLC, 4.5%, 1/15/2023 | | | 50,625 | |
| | | 50M | | Greif, Inc., 6.5%, 3/1/2027(a) | | | 51,250 | |
| | | 50M | | Mercer International, Inc., 7.375%, 1/15/2025(a) | | | 52,625 | |
| | | 50M | | Multi-Color Corp., 4.875%, 11/1/2025(a) | | | 51,750 | |
| | | 4,000M | | Packaging Corp. of America, 3.4%, 12/15/2027 | | | 3,895,824 | |
| | | 2,500M | | Rock-Tenn Co., 4.9%, 3/1/2022 | | | 2,613,577 | |
| | | 50M | | Schweitzer-Mauduit International, Inc.,
6.875%, 10/1/2026(a) | | | 50,125 | |
| | | | | | | | 7,432,143 | |
| | | | | Gaming/Leisure—.3% | | | | |
| | | 50M | | AMC Entertainment, Inc., 5.75%, 6/15/2025 | | | 46,927 | |
| | | 150M | | AMC Networks, Inc., 5%, 4/1/2024 | | | 151,110 | |
| | | | | Boyd Gaming Corp.: | | | | |
| | | 50M | | 6.875%, 5/15/2023 | | | 52,125 | |
| | | 175M | | 6%, 8/15/2026 | | | 180,031 | |
| | | 50M | | Cedar Fair, LP, 5.375%, 6/1/2024 | | | 51,309 | |
| | | 325M | | CRC Escrow Issuer, LLC, 5.25%, 10/15/2025(a) | | | 313,826 | |
| | | 125M | | Golden Nugget, Inc., 8.75%, 10/1/2025(a) | | | 131,562 | |
| | | 150M | | IRB Holding Corp., 6.75%, 2/15/2026(a) | | | 141,375 | |
| | | 75M | | MGM Resorts International, 6%, 3/15/2023 | | | 79,313 | |
| | | 75M | | National CineMedia, LLC, 6%, 4/15/2022 | | | 76,125 | |
| | | 25M | | Six Flags Entertainment Corp., 4.875%, 7/31/2024(a) | | | 24,766 | |
| | | 50M | | Stars Group Holdings BV, 7%, 7/15/2026(a) | | | 52,250 | |
| | | 325M | | Viking Cruises, Ltd., 6.25%, 5/15/2025(a) | | | 331,500 | |
| | | 50M | | Wynn Las Vegas, LLC, 5.5%, 3/1/2025(a) | | | 49,500 | |
| | | | | | | | 1,681,719 | |
| | | | | Health Care—2.6% | | | | |
| | | | | Bausch Health Cos., Inc.: | | | | |
| | | 100M | | 5.5%, 3/1/2023(a) | | | 100,875 | |
| | | 275M | | 6.5%, 3/15/2022(a) | | | 284,969 | |
| | | 50M | | 7%, 3/15/2024(a) | | | 53,025 | |
51
Portfolio of Investments(continued)
INVESTMENT GRADE FUND
March 31, 2019
| |
Principal
Amount
| | Security | | Value | |
| | | | | Health Care (continued) |
| | | | | Bausch Health Cos., Inc. (continued) | | | | |
| | $ | 50M | | 8.5%, 1/31/2027(a) | | $ | 53,125 | |
| | | 125M | | 9%, 12/15/2025(a) | | | 136,256 | |
| | | 275M | | CHS/Community Health Systems, Inc., 6.25%, 3/31/2023 | | | 259,779 | |
| | | 150M | | Cimpress NV, 7%, 6/15/2026(a) | | | 145,125 | |
| | | | | CVS Health Corp.: | | | | |
| | | 4,000M | | 3.875%, 7/20/2025 | | | 4,051,692 | |
| | | 1,800M | | 4.3%, 3/25/2028 | | | 1,825,502 | |
| | | 3,000M | | 5.05%, 3/25/2048 | | | 3,026,772 | |
| | | 275M | | DaVita, Inc., 5.125%, 7/15/2024 | | | 272,250 | |
| | | 4,050M | | Express Scripts Holding Co., 4.75%, 11/15/2021 | | | 4,232,485 | |
| | | 275M | | HCA, Inc., 6.25%, 2/15/2021 | | | 289,671 | |
| | | 275M | | HealthSouth Corp., 5.75%, 11/1/2024 | | | 279,469 | |
| | | 275M | | Mallinckrodt Finance SB, 5.75%, 8/1/2022(a) | | | 257,125 | |
| | | 100M | | MEDNAX, Inc., 6.25%, 1/15/2027(a) | | | 101,250 | |
| | | 275M | | Molina Healthcare, Inc., 4.875%, 6/15/2025(a) | | | 272,938 | |
| | | 75M | | MPH Operating Partnership, LP, 7.125%, 6/1/2024(a) | | | 75,000 | |
| | | 50M | | Par Pharmaceutical, Inc., 7.5%, 4/1/2027(a) | | | 50,825 | |
| | | 200M | | Syneos Health, Inc., 7.5%, 10/1/2024(a) | | | 211,500 | |
| | | 50M | | Tenet Healthcare Corp., 5.125%, 5/1/2025 | | | 50,378 | |
| | | | | | | | 16,030,011 | |
| | | | | Home-Building—.0% | | | | |
| | | 75M | | William Lyon Homes, Inc., 6%, 9/1/2023 | | | 72,938 | |
| | | | | Information Technology—2.5% | | | | |
| | | 275M | | Alliance Data Systems Corp., 5.375%, 8/1/2022(a) | | | 279,125 | |
| | | 75M | | Anixter, Inc., 6%, 12/1/2025(a) | | | 78,937 | |
| | | | | CommScope Finance, LLC: | | | | |
| | | 25M | | 5.5%, 3/1/2024(a) | | | 25,632 | |
| | | 25M | | 6%, 3/1/2026(a) | | | 25,922 | |
| | | 275M | | CommScope Technologies, LLC, 6%, 6/15/2025(a) | | | 268,386 | |
| | | 4,000M | | Corning, Inc., 7.25%, 8/15/2036 | | | 4,723,784 | |
| | | | | Diamond 1 Finance Corp.: | | | | |
| | | 8,550M | | 4.42%, 6/15/2021(a) | | | 8,775,053 | |
52
| |
Principal
Amount
| | Security | | Value | |
| | | | | Information Technology (continued) |
| | $ | 100M | | 5.875%, 6/15/2021(a) | | $ | 101,914 | |
| | | 50M | | 7.125%, 6/15/2024(a) | | | 53,019 | |
| | | 50M | | NCR Corp., 4.625%, 2/15/2021 | | | 50,038 | |
| | | 50M | | Nielsen Finance, LLC, 5%, 4/15/2022(a) | | | 49,625 | |
| | | 100M | | Nuance Communications, Inc., 6%, 7/1/2024 | | | 102,875 | |
| | | 125M | | Rackspace Hosting, Inc., 8.625%, 11/15/2024(a) | | | 111,672 | |
| | | 275M | | Solera, LLC, 10.5%, 3/1/2024(a) | | | 299,453 | |
| | | 75M | | Symantec Corp., 5%, 4/15/2025(a) | | | 75,183 | |
| | | 25M | | VeriSign, Inc., 4.75%, 7/15/2027 | | | 25,097 | |
| | | 75M | | Verscend Holding Corp., 9.75%, 8/15/2026(a) | | | 75,094 | |
| | | | | | | | 15,120,809 | |
| | | | | Manufacturing—2.0% | | | | |
| | | 275M | | ATS Automation Tooling Systems, Inc., 6.5%, 6/15/2023(a) | | | 285,656 | |
| | | 150M | | Brand Energy & Infrastructure Services, Inc., 8.5%, 7/15/2025(a) | | | 135,375 | |
| | | 75M | | Cloud Crane, LLC, 10.125%, 8/1/2024(a) | | | 80,812 | |
| | | 4,000M | | Crane Co., 4.2%, 3/15/2048 | | | 3,781,372 | |
| | | 2,250M | | CRH America, Inc., 3.4%, 5/9/2027(a) | | | 2,156,348 | |
| | | 275M | | Grinding Media, Inc., 7.375%, 12/15/2023(a) | | | 265,375 | |
| | | 5,000M | | Johnson Controls International, PLC, 5%, 3/30/2020 | | | 5,105,490 | |
| | | 100M | | Manitowoc Co., Inc., 9%, 4/1/2026(a) | | | 101,500 | |
| | | | | | | | 11,911,928 | |
| | | | | Media-Broadcasting—.5% | | | | |
| | | 1,800M | | ABC, Inc., 8.75%, 8/15/2021 | | | 2,041,465 | |
| | | 100M | | Belo Corp., 7.25%, 9/15/2027 | | | 107,250 | |
| | | 25M | | Gray Escrow, Inc., 7%, 5/15/2027(a) | | | 26,625 | |
| | | 50M | | LIN Television Corp., 5.875%, 11/15/2022 | | | 51,438 | |
| | | 200M | | Nexstar Broadcasting, Inc., 5.625%, 8/1/2024(a) | | | 203,500 | |
| | | 125M | | Sinclair Television Group, Inc., 5.625%, 8/1/2024(a) | | | 126,406 | |
| | | 300M | | Sirius XM Radio, Inc., 6%, 7/15/2024(a) | | | 312,000 | |
| | | | | | | | 2,868,684 | |
53
Portfolio of Investments(continued)
INVESTMENT GRADE FUND
March 31, 2019
| |
Principal
Amount
| | Security | | Value | |
| | | | | Media-Cable TV—2.4% | | | | |
| | $ | 275M | | Altice Financing SA, 6.625%, 2/15/2023(a) | | $ | 281,875 | |
| | | 200M | | Altice France SA, 8.125%, 2/1/2027(a) | | | 202,750 | |
| | | | | CCO Holdings, LLC: | | | | |
| | | 275M | | 5.125%, 2/15/2023 | | | 280,500 | |
| | | 275M | | 5.875%, 4/1/2024(a) | | | 288,093 | |
| | | 175M | | Clear Channel International, 8.75%, 12/15/2020(a) | | | 180,469 | |
| | | | | Clear Channel Worldwide Holdings, Inc.: | | | | |
| | | 300M | | Series “A”, 6.5%, 11/15/2022 | | | 308,625 | |
| | | 100M | | 9.25%, 2/15/2024(a) | | | 106,250 | |
| | | | | Comcast Corp.: | | | | |
| | | 5,800M | | 4.25%, 1/15/2033 | | | 6,127,085 | |
| | | 3,250M | | 4.2%, 8/15/2034 | | | 3,386,419 | |
| | | 1,800M | | 4.7%, 10/15/2048 | | | 1,954,260 | |
| | | | | CSC Holdings, LLC: | | | | |
| | | 275M | | 5.375%, 7/15/2023(a) | | | 280,844 | |
| | | 375M | | 10.875%, 10/15/2025(a) | | | 433,875 | |
| | | 275M | | DISH DBS Corp., 5%, 3/15/2023 | | | 248,531 | |
| | | 250M | | Gray Television, Inc., 5.875%, 7/15/2026(a) | | | 255,050 | |
| | | 275M | | Midcontinent Communications & Finance Corp.,
6.875%, 8/15/2023(a) | | | 287,454 | |
| | | | | | | | 14,622,080 | |
| | | | | Media-Diversified—1.2% | | | | |
| | | 2,700M | | Fox Corp., 4.03%, 1/25/2024(a) | | | 2,800,610 | |
| | | 100M | | Gannett Co., Inc., 6.375%, 10/15/2023 | | | 103,750 | |
| | | 175M | | Outdoor Americas Capital, LLC, 5.875%, 3/15/2025 | | | 179,812 | |
| | | 4,000M | | Time Warner, Inc., 3.6%, 7/15/2025 | | | 3,993,756 | |
| | | 350M | | Tribune Media Co., 5.875%, 7/15/2022 | | | 358,969 | |
| | | | | | | | 7,436,897 | |
| | | | | Metals/Mining—3.1% | | | | |
| | | 125M | | Allegheny Technologies, Inc., 7.875%, 8/15/2023 | | | 135,937 | |
| | | 2,700M | | ArcelorMittal, 4.55%, 3/11/2026 | | | 2,763,285 | |
| | | 5,000M | | Arconic, Inc., 6.15%, 8/15/2020 | | | 5,170,025 | |
54
| |
Principal
Amount
| | Security | | Value | |
| | | | | Metals/Mining (continued) |
| | $ | 50M | | Big River Steel, LLC, 7.25%, 9/1/2025(a) | | $ | 52,390 | |
| | | 75M | | Cliffs Natural Resources, Inc., 5.75%, 3/1/2025 | | | 72,000 | |
| | | 275M | | Commercial Metals Co., 4.875%, 5/15/2023 | | | 277,062 | |
| | | 5,000M | | Glencore Funding, LLC, 4.625%, 4/29/2024(a) | | | 5,169,665 | |
| | | 275M | | HudBay Minerals, Inc., 7.25%, 1/15/2023(a) | | | 286,000 | |
| | | 125M | | Joseph T. Ryerson & Son, Inc., 11%, 5/15/2022(a) | | | 132,188 | |
| | | 4,200M | | Newmont Mining Corp., 5.125%, 10/1/2019 | | | 4,247,099 | |
| | | 75M | | Northwest Acquisitions, ULC, 7.125%, 11/1/2022(a) | | | 66,188 | |
| | | 225M | | Novelis, Inc., 5.875%, 9/30/2026(a) | | | 224,719 | |
| | | 170M | | SunCoke Energy Partners, LP, 7.5%, 6/15/2025(a) | | | 172,550 | |
| | | | | | | | 18,769,108 | |
| | | | | Real Estate—8.7% | | | | |
| | | | | Alexandria Real Estate Equities, Inc.: | | | | |
| | | 4,600M | | 3.95%, 1/15/2028 | | | 4,632,554 | |
| | | 2,800M | | 4.85%, 4/15/2049 | | | 2,939,017 | |
| | | | | Digital Realty Trust, LP: | | | | |
| | | 3,200M | | 5.25%, 3/15/2021 | | | 3,317,555 | |
| | | 6,700M | | 4.75%, 10/1/2025 | | | 7,110,408 | |
| | | 1,500M | | 3.7%, 8/15/2027 | | | 1,486,623 | |
| | | 2,800M | | Duke Realty Corp., 3.25%, 6/30/2026 | | | 2,761,760 | |
| | | 3,700M | | Duke Realty, LP, 4%, 9/15/2028 | | | 3,826,647 | |
| | | 275M | | Equinix, Inc., 5.375%, 4/1/2023 | | | 280,844 | |
| | | 3,500M | | Essex Portfolio, LP, 3.875%, 5/1/2024 | | | 3,585,869 | |
| | | 270M | | Geo Group, Inc., 5.875%, 10/15/2024 | | | 237,600 | |
| | | 275M | | Greystar Real Estate Partners, 5.75%, 12/1/2025(a) | | | 276,375 | |
| | | 2,200M | | HCP, Inc., 4.25%, 11/15/2023 | | | 2,293,614 | |
| | | 350M | | Iron Mountain, Inc., 5.75%, 8/15/2024 | | | 354,375 | |
| | | 25M | | MGM Growth Properties Operating Partnership, LP, 5.75%, 2/1/2027(a) | | | 25,906 | |
| | | 4,500M | | National Retail Properties, Inc., 4%, 11/15/2025 | | | 4,617,684 | |
| | | 5,000M | | Realty Income Corp., 3.875%, 4/15/2025 | | | 5,181,140 | |
| | | 6,000M | | STORE Capital Corp., 4.5%, 3/15/2028 | | | 6,055,326 | |
| | | 4,125M | | Vornado Realty, LP, 3.5%, 1/15/2025 | | | 4,097,610 | |
| | | | | | | | 53,080,907 | |
55
Portfolio of Investments(continued)
INVESTMENT GRADE FUND
March 31, 2019
| |
Principal
Amount
| | Security | | Value | |
| | | | | Retail-General Merchandise—1.2% | | | | |
| | $ | 150M | | 1011778 B.C., ULC, 4.625%, 1/15/2022(a) | | $ | 151,082 | |
| | | 275M | | AmeriGas Partners, LP, 5.5%, 5/20/2025 | | | 275,344 | |
| | | 5,300M | | Home Depot, Inc., 5.875%, 12/16/2036 | | | 6,676,829 | |
| | | 50M | | J.C. Penney Co., Inc., 8.625%, 3/15/2025 | | | 29,500 | |
| | | 275M | | KFC Holding Co., LLC, 5%, 6/1/2024(a) | | | 281,188 | |
| | | 25M | | SRS Distribution, Inc., 8.25%, 7/1/2026(a) | | | 24,125 | |
| | | | | | | | 7,438,068 | |
| | | | | Services—.2% | | | | |
| | | 400M | | AECOM, 5.125%, 3/15/2027 | | | 388,500 | |
| | | 200M | | First Data Corp., 5.375%, 8/15/2023(a) | | | 204,750 | |
| | | 75M | | Prime Security Services Borrower, LLC, 9.25%, 5/15/2023 (a) | | | 78,938 | |
| | | 275M | | United Rentals, Inc., 4.625%, 10/15/2025 | | | 272,250 | |
| | | | | | | | 944,438 | |
| | | | | Telecommunications—4.2% | | | | |
| | | | | AT&T, Inc.: | | | | |
| | | 4,500M | | 4.25%, 3/1/2027 | | | 4,630,873 | |
| | | 6,000M | | 4.85%, 3/1/2039 | | | 6,047,502 | |
| | | | | Frontier Communications Corp.: | | | | |
| | | 50M | | 11%, 9/15/2025 | | | 33,156 | |
| | | 50M | | 8.5%, 4/1/2026(a) | | | 46,625 | |
| | | 25M | | 8%, 4/1/2027(a) | | | 25,875 | |
| | | 350M | | GCI, Inc., 6.875%, 4/15/2025 | | | 367,062 | |
| | | 100M | | Qwest Corp., 7.25%, 9/15/2025 | | | 107,757 | |
| | | 100M | | Telesat Canada, 8.875%, 11/15/2024(a) | | | 108,000 | |
| | | | | Verizon Communications, Inc.: | | | | |
| | | 6,100M | | 4.329%, 9/21/2028 | | | 6,456,746 | |
| | | 7,100M | | 4.272%, 1/15/2036 | | | 7,191,988 | |
| | | | | Zayo Group, LLC: | | | | |
| | | 150M | | 6%, 4/1/2023 | | | 152,625 | |
| | | 250M | | 6.375%, 5/15/2025 | | | 252,188 | |
| | | | | | | | 25,420,397 | |
56
| |
Principal
Amount
| | Security | | Value | |
| | | | | Transportation—2.9% | | | | |
| | $ | 4,250M | | Air Lease Corp., 3.875%, 7/3/2023 | | $ | 4,298,696 | |
| | | 2,700M | | Aviation Capital Group, LLC, 3.5%, 11/1/2027(a) | | | 2,565,454 | |
| | | 275M | | BCD Acquisition, Inc., 9.625%, 9/15/2023(a) | | | 292,875 | |
| | | | | Burlington Northern Santa Fe, LLC: | | | | |
| | | 1,800M | | 5.75%, 5/1/2040 | | | 2,236,307 | |
| | | 4,000M | | 5.15%, 9/1/2043 | | | 4,719,228 | |
| | | 200M | | Fly Leasing, Ltd., 5.25%, 10/15/2024 | | | 193,000 | |
| | | 3,000M | | Penske Truck Leasing Co., LP, 4.875%, 7/11/2022(a) | | | 3,140,028 | |
| | | 207M | | XPO Logistics, Inc., 6.5%, 6/15/2022(a) | | | 211,658 | |
| | | | | | | | 17,657,246 | |
| | | | | Utilities—5.5% | | | | |
| | | 1,800M | | Appalachian Power Co., 4.5%, 3/1/2049 | | | 1,880,631 | |
| | | | | Calpine Corp.: | | | | |
| | | 25M | | 5.75%, 1/15/2025 | | | 24,937 | |
| | | 275M | | 5.25%, 6/1/2026(a) | | | 274,656 | |
| | | 5,000M | | Duke Energy Progress, Inc., 4.15%, 12/1/2044 | | | 5,214,480 | |
| | | 1,800M | | Energy Transfer Partners, LP, 5.25%, 4/15/2029 | | | 1,931,913 | |
| | | 3,150M | | Entergy Arkansas, Inc., 4.95%, 12/15/2044 | | | 3,277,764 | |
| | | 4,000M | | Exelon Generation Co., LLC, 3.4%, 3/15/2022 | | | 4,056,900 | |
| | | 250M | | NRG Yield Operating, LLC, 5%, 9/15/2026 | | | 239,375 | |
| | | 3,850M | | Ohio Power Co., 5.375%, 10/1/2021 | | | 4,102,256 | |
| | | | | ONEOK, Inc.: | | | | |
| | | 4,000M | | 7.5%, 9/1/2023 | | | 4,631,792 | |
| | | 4,500M | | 4.55%, 7/15/2028 | | | 4,657,977 | |
| | | 2,700M | | Sempra Energy, 3.28731%, 1/15/2021† | | | 2,678,262 | |
| | | 225M | | Targa Resources Partners, LP, 4.25%, 11/15/2023 | | | 224,719 | |
| | | | | | | | 33,195,662 | |
| | | | | Waste Management—.0% | | | | |
| | | 275M | | Covanta Holding Corp., 5.875%, 3/1/2024 | | | 282,562 | |
57
Portfolio of Investments(continued)
INVESTMENT GRADE FUND
March 31, 2019
| |
Principal
Amount
| | Security | | Value | |
| | | | | Wireless Communications—.3% | | | | |
| | | | | Intelsat Jackson Holdings SA: | | | | |
| | $ | 350M | | 8%, 2/15/2024(a) | | $ | 365,750 | |
| | | 175M | | 8.5%, 10/15/2024(a) | | | 171,062 | |
| | | | | Level 3 Financing, Inc.: | | | | |
| | | 50M | | 5.375%, 8/15/2022 | | | 50,375 | |
| | | 275M | | 5.375%, 1/15/2024 | | | 280,803 | |
| | | 275M | | Sprint Communications, Inc., 6%, 11/15/2022 | | | 277,833 | |
| | | 275M | | Sprint Corp., 7.125%, 6/15/2024 | | | 279,813 | |
| | | 275M | | T-Mobile USA, Inc., 6%, 3/1/2023 | | | 283,250 | |
| | | | | | | | 1,708,886 | |
Total Value of Corporate Bonds (cost $545,160,576) | | | 553,634,699 | |
| | | | | U.S. GOVERNMENT OBLIGATIONS—6.5% | | | | |
| | | | | U.S. Treasury Bonds: | | | | |
| | | 6,500M | | 3%, 2/15/2048 | | | 6,726,739 | |
| | | 6,500M | | 3%, 8/15/2048 | | | 6,729,911 | |
| | | 4,000M | | 3.375%, 11/15/2048 | | | 4,452,580 | |
| | | | | U.S. Treasury Notes: | | | | |
| | | 3,500M | | 2.125%, 3/31/2024 | | | 3,480,929 | |
| | | 2,000M | | 2.25%, 3/31/2021 | | | 1,999,218 | |
| | | 6,500M | | 2.375%, 2/29/2024 | | | 6,543,290 | |
| | | 4,000M | | 2.625%, 2/15/2029 | | | 4,073,984 | |
| | | 4,000M | | 2.75%, 6/30/2025 | | | 4,103,828 | |
| | | 1,430M | | 3.125%, 11/15/2028 | | | 1,517,113 | |
Total Value of U.S. Government Obligations (cost $38,251,151) | | | 39,627,592 | |
| | | | | PASS-THROUGH CERTIFICATES—.7% | | | | |
| | | | | Transportation | | | | |
| | | 4,378M | | American Airlines 17-2 AA PTT, 3.35%, 10/15/2029
(cost $4,378,225) | | | 4,284,120 | |
Total Value of Investments (cost $587,789,952) | | | 98.5 | % | | | 597,546,411 | |
Other Assets, Less Liabilities | | | 1.5 | | | | 9,135,593 | |
Net Assets | | | 100.0 | % | | $ | 606,682,004 | |
58
(a) | Security exempt from registration under Rule 144A of the Securities Act of 1933 (see Note 4). |
† | Interest rates are determined and reset periodically. The interest rates above are the rates in effect at March 31, 2019. |
Summary of Abbreviations:
LLLP | Limited Liability Limited Partnership |
ULC | Unlimited Liability Corporation |
The Fund’s assets and liabilities are classified into the following three levels based on the inputs used to value the assets and liabilities:
| | Level 1 – | Unadjusted quoted prices in active markets for identical securities that the Fund has the ability to access. |
| | Level 2 – | Observable inputs other than quoted prices included in Level 1 that are observable for the asset or liability, either directly or indirectly. These inputs may include quoted prices for the identical instrument on an inactive market, prices for similar instruments, interest rates, prepayment speeds, credit risk, yield curves, default rates and similar data. |
| | Level 3 – | Unobservable inputs for the asset or liability, to the extent relevant observable inputs are not available, representing the Fund’s own assumption about the assumptions a market participant would use in valuing the asset or liability, and would be based on the best information available. |
The inputs methodology used for valuing securities are not necessarily an indication of the risk associated with investing in those securities. For example, U.S. government securities are reflected as Level 2 because the inputs used to determine fair value may not always be quoted prices in an active market.
The following is a summary, by category of Level, of inputs used to value the Fund’s investments as of March 31, 2019:
| | | Level 1 | | | Level 2 | | | Level 3 | | | Total | |
Corporate Bonds | | $ | — | | | $ | 553,634,699 | | | $ | — | | | $ | 553,634,699 | |
U.S. Government Obligations | | | — | | | | 39,627,592 | | | | — | | | | 39,627,592 | |
Pass-Through Certificates | | | — | | | | 4,284,120 | | | | — | | | | 4,284,120 | |
Total Investments in Securities* | | $ | — | | | $ | 597,546,411 | | | $ | — | | | $ | 597,546,411 | |
* | The Portfolio of Investments provides information on the industry categorization for corporate bonds and pass-through certificates. |
There were no transfers into or from Level 1 and Level 2 by the Fund during the period ended March 31, 2019. Transfers, if any, between Levels are recognized at the end of the reporting period.
See notes to financial statements
59
Fund Expenses(unaudited)
LIMITED DURATION BOND FUND
The examples below show the ongoing costs (in dollars) of investing in your Fund and will help you in comparing these costs with costs of other mutual funds. Please refer to page 1 for a detailed explanation of the information presented in these examples.
Expense Example | Annualized
Expense
Ratio | Beginning
Account Value
(10/1/18) | Ending
Account Value
(3/31/19) | Expenses Paid
During Period
(10/1/18-3/31/19)* |
Class A Shares | 0.79% | | | |
Actual | | $1,000.00 | $1,022.09 | $ 3.98 |
Hypothetical** | | $1,000.00 | $1,020.99 | $ 3.98 |
Advisor Class Shares | 0.51% | | | |
Actual | | $1,000.00 | $1,022.36 | $ 2.57 |
Hypothetical** | | $1,000.00 | $1,022.39 | $ 2.57 |
Institutional Class Shares | 0.36% | | | |
Actual | | $1,000.00 | $1,024.35 | $ 1.82 |
Hypothetical** | | $1,000.00 | $1,023.13 | $ 1.82 |
* | Expenses are equal to the annualized expense ratio, multiplied by the average account value over the period, multiplied by 182/365 (to reflect the one-half year period). Expenses paid during the period are net of expenses waived and/or assumed. |
** | Assumed rate of return of 5% before expenses |
Portfolio Composition
TOP TEN SECTORS
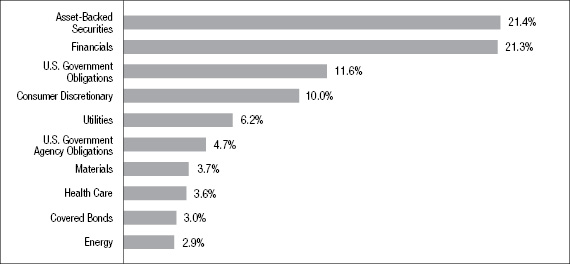
Portfolio holdings and allocations are subject to change. Percentages are as of March 31, 2019, and are based on the total market value of investments.
60
Portfolio of Investments
LIMITED DURATION BOND FUND
March 31, 2019
| |
Principal
Amount
| | Security | | Value | |
| | | | | CORPORATE BONDS—55.3% | | | | |
| | | | | Aerospace/Defense—.1% | | | | |
| | $ | 225M | | Bombardier, Inc., 6%, 10/15/2022(a) | | $ | 228,094 | |
| | | 100M | | TransDigm, Inc., 6%, 7/15/2022 | | | 101,875 | |
| | | 50M | | Triumph Group, Inc., 5.25%, 6/1/2022 | | | 48,250 | |
| | | | | | | | 378,219 | |
| | | | | Automotive—9.3% | | | | |
| | | 100M | | Avis Budget Group, Inc., 5.5%, 4/1/2023 | | | 101,125 | |
| | | | | Daimler Finance NA, LLC: | | | | |
| | | 1,800M | | 3.1275%, 5/4/2020(a)† | | | 1,798,848 | |
| | | 2,000M | | 3.4%, 2/22/2022(a) | | | 2,018,590 | |
| | | 310M | | Dana Holding Corp., 5.5%, 12/15/2024 | | | 310,000 | |
| | | | | General Motors Financial Co., Inc.: | | | | |
| | | 2,800M | | 3.55%, 4/9/2021 | | | 2,816,397 | |
| | | 1,900M | | 4.2%, 11/6/2021 | | | 1,933,904 | |
| | | 1,400M | | 4.3469%, 1/14/2022† | | | 1,404,465 | |
| | | 100M | | Group 1 Automotive, Inc., 5.25%, 12/15/2023(a) | | | 101,000 | |
| | | 5,130M | | Harley Davidson Financial Services, Inc.,
2.15%, 2/26/2020(a) | | | 5,085,892 | |
| | | 25M | | Hertz Corp., 5.875%, 10/15/2020 | | | 25,025 | |
| | | 1,500M | | Hyundai Capital America, 3.7439%, 7/8/2021(a)† | | | 1,500,271 | |
| | | 3,120M | | Lear Corp., 5.375%, 3/15/2024 | | | 3,206,365 | |
| | | 25M | | LKQ Corp., 4.75%, 5/15/2023 | | | 25,276 | |
| | | 2,000M | | O’Reilly Automotive, Inc., 4.625%, 9/15/2021 | | | 2,083,352 | |
| | | 3,000M | | Toyota Motor Credit Corp., 2.7846%, 9/18/2020† | | | 3,002,883 | |
| | | | | Volkswagen Group America: | | | | |
| | | 3,000M | | 3.875%, 11/13/2020(a) | | | 3,039,639 | |
| | | 1,900M | | 4%, 11/12/2021 | | | 1,939,193 | |
| | | | | | | | 30,392,225 | |
| | | | | Building Materials—.1% | | | | |
| | | 100M | | Building Materials Corp., 5.375%, 11/15/2024(a) | | | 102,875 | |
| | | 75M | | Griffon Corp., 5.25%, 3/1/2022 | | | 74,062 | |
61
Portfolio of Investments(continued)
LIMITED DURATION BOND FUND
March 31, 2019
| |
Principal
Amount
| | Security | | Value | |
| | | | | Building Materials (continued) |
| | $ | 75M | | Standard Industries, Inc., 5.5%, 2/15/2023(a) | | $ | 76,500 | |
| | | | | | | | 253,437 | |
| | | | | Chemicals—1.1% | | | | |
| | | | | Blue Cube Spinco, Inc.: | | | | |
| | | 100M | | 9.75%, 10/15/2023 | | | 111,500 | |
| | | 100M | | 10%, 10/15/2025 | | | 114,905 | |
| | | 75M | | Chemours Co., 6.625%, 5/15/2023 | | | 77,819 | |
| | | 1,000M | | Dow Chemical Co., 4.25%, 11/15/2020 | | | 1,019,309 | |
| | | 1,800M | | DowDuPont, Inc., 3.766%, 11/15/2020 | | | 1,833,550 | |
| | | 175M | | PQ Corp., 6.75%, 11/15/2022(a) | | | 182,219 | |
| | | 40M | | Rain CII Carbon, LLC, 7.25%, 4/1/2025(a) | | | 35,600 | |
| | | 35M | | Rayonier AM Products, Inc., 5.5%, 6/1/2024(a) | | | 32,988 | |
| | | 50M | | Univar USA, Inc., 6.75%, 7/15/2023(a) | | | 51,350 | |
| | | | | | | | 3,459,240 | |
| | | | | Consumer Non-Durables—.1% | | | | |
| | | 125M | | First Quality Finance Co., 4.625%, 5/15/2021(a) | | | 125,312 | |
| | | 50M | | KGA Escrow, LLC, 7.5%, 8/15/2023(a) | | | 50,938 | |
| | | | | Reynolds Group Holdings, Inc.: | | | | |
| | | 73M | | 5.75%, 10/15/2020 | | | 72,865 | |
| | | 175M | | 5.125%, 7/15/2023(a) | | | 178,063 | |
| | | | | | | | 427,178 | |
| | | | | Energy—2.8% | | | | |
| | | 50M | | Baytex Energy Corp., 5.125%, 6/1/2021(a) | | | 49,625 | |
| | | 50M | | Blue Racer Midstream, LLC, 6.125%, 11/15/2022(a) | | | 51,000 | |
| | | 50M | | California Resources Corp., 8%, 12/15/2022(a) | | | 39,390 | |
| | | 125M | | Carrizo Oil & Gas, Inc., 6.25%, 4/15/2023 | | | 123,594 | |
| | | 25M | | Chesapeake Energy Corp., 4.875%, 4/15/2022 | | | 24,750 | |
| | | 75M | | CITGO Petroleum Corp., 6.25%, 8/15/2022(a) | | | 74,812 | |
| | | | | Continental Resources, Inc.: | | | | |
| | | 2,720M | | 5%, 9/15/2022 | | | 2,742,396 | |
| | | 50M | | 4.5%, 4/15/2023 | | | 51,804 | |
62
| |
Principal
Amount
| | Security | | Value | |
| | | | | Energy (continued) |
| | $ | 125M | | Crestwood Midstream Partners, LP, 6.25%, 4/1/2023 | | $ | 128,750 | |
| | | 50M | | DCP Midstream Operating, LP, 3.875%, 3/15/2023 | | | 49,875 | |
| | | 2,000M | | Enterprise Products Operating, 5.2%, 9/1/2020 | | | 2,067,402 | |
| | | 60M | | Exterran Partners, LP, 6%, 10/1/2022 | | | 60,750 | |
| | | 100M | | Genesis Energy, LP, 5.625%, 6/15/2024 | | | 96,500 | |
| | | 50M | | Global Partners, LP, 6.25%, 7/15/2022 | | | 49,625 | |
| | | 25M | | Gulfport Energy Corp., 6.625%, 5/1/2023 | | | 24,375 | |
| | | | | Laredo Petroleum, Inc.: | | | | |
| | | 25M | | 5.625%, 1/15/2022 | | | 22,969 | |
| | | 100M | | 6.25%, 3/15/2023 | | | 89,750 | |
| | | 2,700M | | Midwest Connector Capital Co., LLC, 3.625%, 4/1/2022(a) | | | 2,739,987 | |
| | | 60M | | NGPL Pipeco, LLC, 4.375%, 8/15/2022(a) | | | 61,050 | |
| | | 50M | | Oasis Petroleum, Inc., 6.875%, 1/15/2023 | | | 50,125 | |
| | | 50M | | QEP Resources, Inc., 6.875%, 3/1/2021 | | | 51,500 | |
| | | 25M | | Range Resources Corp., 5.75%, 6/1/2021 | | | 25,500 | |
| | | 50M | | SM Energy Co., 5%, 1/15/2024 | | | 46,500 | |
| | | 50M | | Suburban Propane Partners, LP, 5.875%, 3/1/2027 | | | 47,625 | |
| | | 125M | | Sunoco, LP, 4.875%, 1/15/2023 | | | 127,300 | |
| | | 95M | | Transocean Guardian, Ltd., 5.875%, 1/15/2024(a) | | | 96,390 | |
| | | | | Whiting Petroleum Corp.: | | | | |
| | | 50M | | 5.75%, 3/15/2021 | | | 50,825 | |
| | | 75M | | 6.25%, 4/1/2023 | | | 75,750 | |
| | | 135M | | WPX Energy, Inc., 5.25%, 9/15/2024 | | | 137,025 | |
| | | | | | | | 9,256,944 | |
| | | | | Financial Services—5.2% | | | | |
| | | 5,000M | | American International Group, Inc., 6.4%, 12/15/2020 | | | 5,289,315 | |
| | | 1,000M | | Compass Bank, 5.5%, 4/1/2020 | | | 1,022,116 | |
| | | 2,145M | | International Lease Finance Corp., 8.25%, 12/15/2020 | | | 2,317,537 | |
| | | 75M | | Nationstar Mortgage, LLC, 6.5%, 7/1/2021 | | | 75,188 | |
| | | 3,000M | | PNC Bank, NA, 2.7%, 11/1/2022 | | | 2,986,272 | |
| | | 1,500M | | Protective Life Corp., 7.375%, 10/15/2019 | | | 1,535,211 | |
| | | 3,900M | | SunTrust Bank, 2.59%, 1/29/2021† | | | 3,891,623 | |
| | | | | | | | 17,117,262 | |
63
Portfolio of Investments(continued)
LIMITED DURATION BOND FUND
March 31, 2019
| |
Principal
Amount
| | Security | | Value | |
| | | | | Financials—15.6% | | | | |
| | $ | 25M | | Acrisure, LLC, 8.125%, 2/15/2024(a) | | $ | 25,951 | |
| | | 1,600M | | Bank of America Corp., 2.369%, 7/21/2021† | | | 1,589,434 | |
| | | 900M | | Bank of Montreal, 1.9%, 8/27/2021 | | | 884,769 | |
| | | 2,100M | | Capital One NA, 2.25%, 9/13/2021 | | | 2,067,467 | |
| | | 2,000M | | Capital One Financial Corp., 3.05%, 3/9/2022 | | | 2,011,208 | |
| | | | | Colfax Corp.: | | | | |
| | | 25M | | 6%, 2/15/2024(a) | | | 26,125 | |
| | | 25M | | 6.375%, 2/15/2026(a) | | | 26,640 | |
| | | 1,000M | | Citigroup, Inc., 2.65%, 10/26/2020 | | | 997,873 | |
| | | | | DAE Funding, LLC: | | | | |
| | | 125M | | 4.5%, 8/1/2022(a) | | | 126,250 | |
| | | 100M | | 5.75%, 11/15/2023(a) | | | 103,000 | |
| | | 1,000M | | DNB Bank ASA, 2.375%, 6/2/2021(a) | | | 990,368 | |
| | | 4,500M | | DNB Boligkreditt AS, 2.5%, 3/28/2022(a) | | | 4,488,075 | |
| | | | | Goldman Sachs Group, Inc.: | | | | |
| | | 3,000M | | 2.6%, 4/23/2020 | | | 2,992,065 | |
| | | 2,000M | | 2.6%, 12/27/2020 | | | 1,989,728 | |
| | | 4,000M | | 5.75%, 1/24/2022 | | | 4,291,756 | |
| | | 2,700M | | HSBC Holdings, PLC, 3.803%, 3/11/2025 | | | 2,738,785 | |
| | | 125M | | Icahn Enterprises, LP, 6.25%, 2/1/2022 | | | 128,544 | |
| | | 1,000M | | ING Groep NV, 3.15%, 3/29/2022 | | | 1,000,950 | |
| | | 6,100M | | JPMorgan Chase & Co., 4.5%, 1/24/2022 | | | 6,383,650 | |
| | | 50M | | Ladder Capital Finance Holdings, LLLP,
5.25%, 3/15/2022(a) | | | 50,875 | |
| | | | | Lloyds Bank, PLC: | | | | |
| | | 1,000M | | 6.375%, 1/21/2021 | | | 1,059,430 | |
| | | 800M | | 3%, 1/11/2022 | | | 796,417 | |
| | | 1,000M | | Lloyds Banking Group, PLC, 3.9%, 3/12/2024 | | | 1,013,917 | |
| | | | | Morgan Stanley: | | | | |
| | | 6,100M | | 5.5%, 7/28/2021 | | | 6,456,850 | |
| | | 3,500M | | 2.75%, 5/19/2022 | | | 3,480,449 | |
| | | 75M | | Navient Corp., 5.875%, 3/25/2021 | | | 77,719 | |
| | | | | Park Aerospace Holdings: | | | | |
| | | 100M | | 4.5%, 3/15/2023(a) | | | 99,750 | |
64
| |
Principal
Amount
| | Security | | Value | |
| | | | | Financials (continued) |
| | $ | 50M | | 5.5%, 2/15/2024(a) | | $ | 52,033 | |
| | | | | Springleaf Finance Corp.: | | | | |
| | | 50M | | 7.75%, 10/1/2021 | | | 54,063 | |
| | | 100M | | 5.625%, 3/15/2023 | | | 101,625 | |
| | | 3,100M | | Wells Fargo & Co., 3.45%, 2/13/2023 | | | 3,135,008 | |
| | | 1,800M | | Wells Fargo Bank, NA, 2.6%, 1/15/2021 | | | 1,795,493 | |
| | | | | | | | 51,036,267 | |
| | | | | Food/Beverage/Tobacco—1.8% | | | | |
| | | 2,000M | | Constellation Brands, Inc., 3.38375%, 11/15/2021 | | | 2,001,224 | |
| | | 900M | | General Mills, Inc., 3.31894%, 4/16/2021† | | | 898,643 | |
| | | 1,000M | | Ingredion, Inc., 4.625%, 11/1/2020 | | | 1,023,630 | |
| | | 2,000M | | Maple Escrow Subsidiary, Inc., 3.551%, 5/25/2021(a) | | | 2,022,276 | |
| | | | | | | | 5,945,773 | |
| | | | | Food/Drug—.0% | | | | |
| | | 50M | | Albertson’s Cos., LLC, 5.75%, 3/15/2025 | | | 47,687 | |
| | | | | Forest Products/Containers—1.9% | | | | |
| | | | | Berry Global, Inc.: | | | | |
| | | 50M | | 5.5%, 5/15/2022 | | | 50,937 | |
| | | 125M | | 5.125%, 7/15/2023 | | | 127,537 | |
| | | 125M | | BWAY Holding Co., 5.5%, 4/15/2024(a) | | | 124,569 | |
| | | 25M | | Crown Americas, LLC, 4.5%, 1/15/2023 | | | 25,312 | |
| | | 5,487M | | Georgia-Pacific, LLC, 5.4%, 11/1/2020(a) | | | 5,705,827 | |
| | | 25M | | Greif, Inc., 6.5%, 3/1/2027(a) | | | 25,625 | |
| | | 100M | | Mercer International, Inc., 6.5%, 2/1/2024 | | | 102,750 | |
| | | 100M | | Owens-Brockway Glass Container, 5.875%, 8/15/2023(a) | | | 105,115 | |
| | | 50M | | Sealed Air Corp., 4.875%, 12/1/2022(a) | | | 51,787 | |
| | | | | | | | 6,319,459 | |
| | | | | Gaming/Leisure—.2% | | | | |
| | | 75M | | AMC Networks, Inc., 5%, 4/1/2024 | | | 75,555 | |
| | | 25M | | Boyd Gaming Corp., 6.875%, 5/15/2023 | | | 26,062 | |
| | | 100M | | Jack Ohio Finance, LLC, 6.75%, 11/15/2021(a) | | | 103,250 | |
65
Portfolio of Investments(continued)
LIMITED DURATION BOND FUND
March 31, 2019
| |
Principal
Amount
| | Security | | Value | |
| | | | | Gaming/Leisure (continued) |
| | $ | 75M | | Lions Gate Entertainment Corp., 6.375%, 2/1/2024(a) | | $ | 78,750 | |
| | | 150M | | MGM Resorts International, 6%, 3/15/2023 | | | 158,625 | |
| | | 25M | | National CineMedia, LLC, 6%, 4/15/2022 | | | 25,375 | |
| | | 75M | | Six Flags Entertainment Corp., 4.875%, 7/31/2024(a) | | | 74,297 | |
| | | 50M | | Viking Cruises, Ltd., 6.25%, 5/15/2025(a) | | | 51,000 | |
| | | 75M | | Wynn Las Vegas, LLC, 4.25%, 5/30/2023(a) | | | 73,969 | |
| | | | | | | | 666,883 | |
| | | | | Health Care—3.5% | | | | |
| | | 150M | | AMN Healthcare, Inc, 5.125%, 10/1/2024(a) | | | 148,312 | |
| | | 125M | | Avantor, Inc., 6%, 10/1/2024(a) | | | 130,000 | |
| | | | | Bausch Health Cos., Inc.: | | | | |
| | | 50M | | 6.5%, 3/15/2022(a) | | | 51,813 | |
| | | 175M | | 5.5%, 3/1/2023(a) | | | 176,531 | |
| | | 100M | | 7%, 3/15/2024(a) | | | 106,050 | |
| | | 50M | | Centene Corp., 5.625%, 2/15/2021 | | | 50,812 | |
| | | 50M | | CHS/Community Health Systems, Inc., 6.25%, 3/31/2023 | | | 47,232 | |
| | | 2,400M | | CVS Health Corp., 2.8%, 7/20/2020 | | | 2,397,528 | |
| | | 150M | | DaVita, Inc., 5.125%, 7/15/2024 | | | 148,500 | |
| | | 1,632M | | Gilead Sciences, Inc., 2.55%, 9/1/2020 | | | 1,630,446 | |
| | | 6,000M | | Halfmoon Parent, Inc., 3.2%, 9/17/2020(a) | | | 6,034,566 | |
| | | 100M | | HCA, Inc., 6.25%, 2/15/2021 | | | 105,335 | |
| | | 150M | | HealthSouth Corp., 5.125%, 3/15/2023 | | | 152,665 | |
| | | 50M | | Mallinckrodt Finance SB, 5.75%, 8/1/2022(a) | | | 46,750 | |
| | | 75M | | MEDNAX, Inc., 5.25%, 12/1/2023(a) | | | 76,125 | |
| | | 50M | | Molina Healthcare, Inc., 5.375%, 11/15/2022 | | | 52,093 | |
| | | 100M | | RegionalCare Hospital Partners Holdings, Inc.,
8.25%, 5/1/2023(a) | | | 106,438 | |
| | | 150M | | Syneos Health, Inc., 7.5%, 10/1/2024(a) | | | 158,625 | |
| | | 25M | | Tenet Healthcare Corp., 5.125%, 5/1/2025 | | | 25,189 | |
| | | | | | | | 11,645,010 | |
| | | | | Home-Building—.0% | | | | |
| | | 50M | | William Lyon Homes, Inc., 6%, 9/1/2023 | | | 48,625 | |
66
| |
Principal
Amount
| | Security | | Value | |
| | | | | Information Technology—.8% | | | | |
| | $ | 175M | | Alliance Data Systems Corp., 5.375%, 8/1/2022(a) | | $ | 177,625 | |
| | | 25M | | CommScope Finance, LLC, 6%, 3/1/2026(a) | | | 25,922 | |
| | | 150M | | CommScope Technologies, LLC, 5.5%, 6/15/2024(a) | | | 147,427 | |
| | | | | Diamond 1 Finance Corp.: | | | | |
| | | 1,800M | | 4.42%, 6/15/2021(a) | | | 1,847,380 | |
| | | 50M | | 5.875%, 6/15/2021(a) | | | 50,957 | |
| | | 125M | | Nielsen Finance, LLC, 5%, 4/15/2022(a) | | | 124,063 | |
| | | 150M | | Open Text Corp., 5.625%, 1/15/2023(a) | | | 154,500 | |
| | | 50M | | Rackspace Hosting, Inc., 8.625%, 11/15/2024(a) | | | 44,669 | |
| | | 100M | | Solera, LLC, 10.5%, 3/1/2024(a) | | | 108,892 | |
| | | | | | | | 2,681,435 | |
| | | | | Manufacturing—.1% | | | | |
| | | 50M | | ATS Automation Tooling Systems, Inc., 6.5%, 6/15/2023(a) | | | 51,937 | |
| | | 50M | | Cloud Crane, LLC, 10.125%, 8/1/2024(a) | | | 53,875 | |
| | | 150M | | Grinding Media, Inc., 7.375%, 12/15/2023(a) | | | 144,750 | |
| | | 125M | | SPX Flow, Inc., 5.625%, 8/15/2024(a) | | | 126,250 | |
| | | | | | | | 376,812 | |
| | | | | Media-Broadcasting—.1% | | | | |
| | | 50M | | Netflix, Inc., 5.5%, 2/15/2022 | | | 52,625 | |
| | | 100M | | Nexstar Broadcasting, Inc., 5.625%, 8/1/2024(a) | | | 101,750 | |
| | | 125M | | Sinclair Television Group, Inc., 5.625%, 8/1/2024(a) | | | 126,406 | |
| | | 125M | | Sirius XM Radio, Inc., 4.625%, 5/15/2023(a) | | | 127,031 | |
| | | | | | | | 407,812 | |
| | | | | Media-Cable TV—1.4% | | | | |
| | | 200M | | Altice France SA, 6.25%, 5/15/2024(a) | | | 202,250 | |
| | | 75M | | Cable One, Inc., 5.75%, 6/15/2022(a) | | | 76,312 | |
| | | | | CCO Holdings, LLC: | | | | |
| | | 125M | | 5.125%, 2/15/2023 | | | 127,500 | |
| | | 25M | | 5.75%, 9/1/2023 | | | 25,562 | |
| | | 125M | | 5.875%, 4/1/2024(a) | | | 130,951 | |
| | | 75M | | Clear Channel International, 8.75%, 12/15/2020(a) | | | 77,344 | |
67
Portfolio of Investments(continued)
LIMITED DURATION BOND FUND
March 31, 2019
| |
Principal
Amount
| | Security | | Value | |
| | | | | Media-Cable TV (continued) |
| | | | | Clear Channel Worldwide Holdings, Inc.: | | | | |
| | $ | 200M | | Series “A”, 6.5%, 11/15/2022 | | $ | 205,750 | |
| | | 50M | | 9.25%, 2/15/2024(a) | | | 53,125 | |
| | | 3,000M | | Comcast Corp., 3.3%, 10/1/2020 | | | 3,029,358 | |
| | | | | CSC Holdings, LLC: | | | | |
| | | 100M | | 6.75%, 11/15/2021 | | | 107,125 | |
| | | 75M | | 5.125%, 12/15/2021(a) | | | 75,281 | |
| | | 200M | | 5.375%, 7/15/2023(a) | | | 204,250 | |
| | | 50M | | DISH DBS Corp., 5%, 3/15/2023 | | | 45,187 | |
| | | 125M | | Gray Television, Inc., 5.125%, 10/15/2024(a) | | | 125,819 | |
| | | 150M | | Midcontinent Communications & Finance Corp.,
6.875%, 8/15/2023(a) | | | 156,793 | |
| | | | | | | | 4,642,607 | |
| | | | | Media-Diversified—.1% | | | | |
| | | 175M | | Gannett Co., Inc., 6.375%, 10/15/2023 | | | 181,562 | |
| | | 100M | | Outdoor Americas Capital, LLC, 5.625%, 2/15/2024 | | | 103,000 | |
| | | 75M | | Tribune Media Co., 5.875%, 7/15/2022 | | | 76,922 | |
| | | | | | | | 361,484 | |
| | | | | Metals/Mining—.6% | | | | |
| | | 50M | | AK Steel Corp., 7.5%, 7/15/2023 | | | 51,515 | |
| | | 150M | | Allegheny Technologies, Inc., 7.875%, 8/15/2023 | | | 163,125 | |
| | | 50M | | Cleveland-Cliffs, Inc., 4.875%, 1/15/2024(a) | | | 49,500 | |
| | | 125M | | Commercial Metals Co., 4.875%, 5/15/2023 | | | 125,937 | |
| | | 100M | | HudBay Minerals, Inc., 7.25%, 1/15/2023(a) | | | 104,000 | |
| | | 125M | | Joseph T. Ryerson & Son, Inc., 11%, 5/15/2022(a) | | | 132,188 | |
| | | 25M | | Northwest Acquisitions, ULC, 7.125%, 11/1/2022(a) | | | 22,063 | |
| | | 200M | | Novelis, Inc., 6.25%, 8/15/2024(a) | | | 205,000 | |
| | | 85M | | SunCoke Energy Partners, LP, 7.5%, 6/15/2025(a) | | | 86,275 | |
| | | 900M | | Viterra, Inc., 5.95%, 8/1/2020 | | | 930,683 | |
| | | | | | | | 1,870,286 | |
68
| |
Principal
Amount
| | Security | | Value | |
| | | | | Real Estate—1.6% | | | | |
| | | | | Digital Realty Trust, LP: | | | | |
| | $ | 1,671M | | 3.95%, 7/1/2022 | | $ | 1,715,305 | |
| | | 1,825M | | 2.75%, 2/1/2023 | | | 1,787,994 | |
| | | 50M | | Equinix, Inc., 5.375%, 4/1/2023 | | | 51,062 | |
| | | 50M | | Geo Group, Inc., 5.125%, 4/1/2023 | | | 44,625 | |
| | | 50M | | Greystar Real Estate Partners, 5.75%, 12/1/2025(a) | | | 50,250 | |
| | | 175M | | Iron Mountain, Inc., 5.75%, 8/15/2024 | | | 177,188 | |
| | | 175M | | MPT Operating Partnership, LP, 6.375%, 3/1/2024 | | | 183,313 | |
| | | 1,250M | | Realty Income Corp., 3.25%, 10/15/2022 | | | 1,271,645 | |
| | | | | | | | 5,281,382 | |
| | | | | Retail-General Merchandise—.2% | | | | |
| | | 150M | | 1011778 B.C., ULC, 4.625%, 1/15/2022(a) | | | 151,082 | |
| | | 200M | | AmeriGas Partners, LP, 5.625%, 5/20/2024 | | | 204,250 | |
| | | 25M | | J.C. Penney Co., Inc., 8.625%, 3/15/2025 | | | 14,750 | |
| | | 150M | | KFC Holding Co., LLC, 5%, 6/1/2024(a) | | | 153,375 | |
| | | | | | | | 523,457 | |
| | | | | Services—.1% | | | | |
| | | | | First Data Corp.: | | | | |
| | | 150M | | 5.375%, 8/15/2023(a) | | | 153,562 | |
| | | 100M | | 5%, 1/15/2024(a) | | | 102,650 | |
| | | 100M | | Prime Security Services Borrower, LLC,
9.25%, 5/15/2023(a) | | | 105,250 | |
| | | 50M | | Reliance Intermediate Holdings, LP, 6.5%, 4/1/2023(a) | | | 51,750 | |
| | | | | | | | 413,212 | |
| | | | | Telecommunications—.1% | | | | |
| | | 75M | | CenturyLink, Inc., 6.75%, 12/1/2023 | | | 78,469 | |
| | | 25M | | Frontier Communications Corp., 11%, 9/15/2025 | | | 16,578 | |
| | | 100M | | GCI, Inc., 6.75%, 6/1/2021 | | | 100,625 | |
| | | 175M | | Zayo Group, LLC, 6%, 4/1/2023 | | | 178,063 | |
| | | | | | | | 373,735 | |
69
Portfolio of Investments(continued)
LIMITED DURATION BOND FUND
March 31, 2019
| |
Principal
Amount
| | Security | | Value | |
| | | | | Transportation—2.1% | | | | |
| | $ | 3,600M | | Aviation Capital Group, LLC, 7.125%, 10/15/2020(a) | | $ | 3,800,783 | |
| | | 100M | | BCD Acquisition, Inc., 9.625%, 9/15/2023(a) | | | 106,500 | |
| | | 1,000M | | Heathrow Funding, Ltd., 4.875%, 7/15/2021(a) | | | 1,034,127 | |
| | | 150M | | Mobile Mini, Inc., 5.875%, 7/1/2024 | | | 153,000 | |
| | | 500M | | Penske Truck Leasing Co., LP, 3.65%, 7/29/2021(a) | | | 506,942 | |
| | | 1,000M | | Southwest Airlines Co., 2.65%, 11/5/2020 | | | 998,787 | |
| | | | | XPO Logistics, Inc.: | | | | |
| | | 30M | | 6.5%, 6/15/2022(a) | | | 30,675 | |
| | | 100M | | 6.125%, 9/1/2023(a) | | | 101,125 | |
| | | | | | | | 6,731,939 | |
| | | | | Utilities—6.0% | | | | |
| | | 150M | | AES Corp., 4.875%, 5/15/2023 | | | 152,437 | |
| | | | | Calpine Corp.: | | | | |
| | | 50M | | 5.875%, 1/15/2024(a) | | | 51,375 | |
| | | 150M | | 5.5%, 2/1/2024 | | | 149,625 | |
| | | 3,000M | | DTE Energy Co., 3.3%, 6/15/2022 | | | 3,026,349 | |
| | | 2,000M | | Energy Transfer Partners, LP, 4.5%, 4/15/2024 | | | 2,086,448 | |
| | | 2,385M | | Entergy Corp., 5.125%, 9/15/2020 | | | 2,436,743 | |
| | | 1,375M | | Exelon Generation Co., LLC, 3.4%, 3/15/2022 | | | 1,394,559 | |
| | | 2,402M | | Nextera Energy Capital Holding, 2.4%, 9/15/2019 | | | 2,399,447 | |
| | | 100M | | NRG Yield Operating, LLC, 5.375%, 8/15/2024 | | | 100,250 | |
| | | 500M | | Public Service Electric and Gas Co., 1.8%, 6/1/2019 | | | 499,284 | |
| | | | | Sempra Energy: | | | | |
| | | 1,500M | | 1.625%, 10/7/2019 | | | 1,489,517 | |
| | | 5,700M | | 3.06088%, 3/15/2021† | | | 5,649,173 | |
| | | 160M | | Targa Resources Partners, LP, 4.25%, 11/15/2023 | | | 159,800 | |
| | | 100M | | Terraform Power Operating, LLC, 4.25%, 1/31/2023(a) | | | 99,299 | |
| | | | | | | | 19,694,306 | |
| | | | | Waste Management—.1% | | | | |
| | | 50M | | Covanta Holding Corp., 5.875%, 3/1/2024 | | | 51,375 | |
| | | 125M | | GFL Environmental, Inc., 5.625%, 5/1/2022(a) | | | 121,875 | |
| | | | | | | | 173,250 | |
70
| |
Principal
Amount
| | Security | | Value | |
| | | | | Wireless Communications—.3% | | | | |
| | | | | Intelsat Jackson Holdings SA: | | | | |
| | $ | 200M | | 8%, 2/15/2024(a) | | $ | 209,000 | |
| | | 75M | | 8.5%, 10/15/2024(a) | | | 73,313 | |
| | | | | Level 3 Financing, Inc.: | | | | |
| | | 25M | | 5.375%, 8/15/2022 | | | 25,188 | |
| | | 150M | | 5.375%, 1/15/2024 | | | 153,165 | |
| | | 150M | | SBA Communications Corp., 4.875%, 7/15/2022 | | | 152,438 | |
| | | 125M | | Sprint Communications, Inc., 6%, 11/15/2022 | | | 126,288 | |
| | | 150M | | Sprint Corp., 7.875%, 9/15/2023 | | | 157,500 | |
| | | | | T-Mobile USA, Inc.: | | | | |
| | | 50M | | 6%, 3/1/2023 | | | 51,500 | |
| | | 25M | | 6%, 4/15/2024 | | | 26,031 | |
| | | | | | | | 974,423 | |
Total Value of Corporate Bonds (cost $180,259,131) | | | 181,500,349 | |
| | | | | ASSET-BACKED SECURITIES—21.0% | | | | |
| | | | | Fixed Autos—9.9% | | | | |
| | | 1,200M | | AmeriCredit Automobile Receivables Trust, 3.13%, 2/18/2025 | | | 1,210,141 | |
| | | | | BMW Vehicle Lease Trust: | | | | |
| | | 1,400M | | 2.07%, 10/20/2020 | | | 1,396,427 | |
| | | 900M | | 3.26%, 7/20/2021 | | | 907,925 | |
| | | 1,850M | | CarMax Auto Owner Trust, 3.37%, 10/16/2023 | | | 1,871,654 | |
| | | 1,500M | | Drive Auto Receivables Trust, 3.41%, 6/15/2023 | | | 1,511,818 | |
| | | | | GM Financial Automobile Leasing Trust: | | | | |
| | | 3,250M | | 3.18%, 6/21/2021 | | | 3,273,150 | |
| | | 1,400M | | 3.31%, 4/20/2022 | | | 1,406,184 | |
| | | | | Hertz Vehicle Financing Trust: | | | | |
| | | 2,435M | | 2.27%, 7/25/2020 | | | 2,430,103 | |
| | | 2,500M | | 2.96%, 10/25/2021 | | | 2,494,772 | |
| | | 4,000M | | 3.29%, 2/25/2024(a) | | | 3,986,128 | |
| | | | | Santander Drive Auto Receivables Trust: | | | | |
| | | 1,190M | | 3.03%, 9/15/2022 | | | 1,192,345 | |
| | | 2,700M | | 3.21%, 9/15/2023 | | | 2,712,798 | |
71
Portfolio of Investments(continued)
LIMITED DURATION BOND FUND
March 31, 2019
| |
Principal
Amount
| | Security | | Value | |
| | | | | Fixed Autos (continued) |
| | $ | 5,287M | | Tesla Auto Lease Trust, 3.71%, 8/20/2021(a) | | $ | 5,349,246 | |
| | | 2,800M | | Volkswagen Auto Loan Enhanced Trust, 3.05%, 8/20/2021 | | | 2,808,221 | |
| | | | | | | | 32,550,912 | |
| | | | | Fixed Communication Services—2.9% | | | | |
| | | | | Verizon Owner Trust: | | | | |
| | | 5,230M | | 1.92%, 12/20/2021(a) | | | 5,201,340 | |
| | | 1,670M | | 3.23%, 4/20/2023 | | | 1,690,807 | |
| | | 2,700M | | 2.93%, 9/20/2023 | | | 2,721,392 | |
| | | | | | | | 9,613,539 | |
| | | | | Fixed Credit Cards—6.5% | | | | |
| | | 1,504M | | American Credit Acceptance Trust, 2.61%, 5/10/2021(a) | | | 1,503,174 | |
| | | 3,905M | | Barclays DryRock Issuance Trust, 2.2%, 12/15/2022 | | | 3,889,138 | |
| | | 5,400M | | Citibank Credit Card Issuance Trust, 2.49%, 1/20/2023 | | | 5,394,028 | |
| | | 4,150M | | Discover Card Execution Note Trust, 2.19%, 4/17/2023† | | | 4,133,205 | |
| | | | | Synchrony Credit Card Master Trust: | | | | |
| | | 5,100M | | 1.93%, 6/15/2023 | | | 5,052,162 | |
| | | 1,500M | | 2.38%, 9/15/2023 | | | 1,493,562 | |
| | | | | | | | 21,465,269 | |
| | | | | Fixed Manufacturing—1.7% | | | | |
| | | 1,800M | | John Deere Owner Trust, 2.91%, 7/17/2023 | | | 1,812,442 | |
| | | 3,600M | | Kubota Credit Owner Trust, 3.1%, 8/15/2022(a) | | | 3,621,064 | |
| | | | | | | | 5,433,506 | |
Total Value of Asset-Backed Securities (cost $68,533,000) | | | 69,063,226 | |
| | | | | U.S. GOVERNMENT OBLIGATIONS—11.3% | | | | |
| | | | | U.S. Treasury Notes: | | | | |
| | | 2,000M | | 1.125%, 8/31/2021 | | | 1,947,032 | |
| | | 13,730M | | 1.375%, 10/31/2020 | | | 13,524,585 | |
| | | 4,550M | | 2.375%, 2/29/2024 | | | 4,580,303 | |
| | | 8,000M | | 2.5%, 1/15/2022 | | | 8,055,160 | |
| | | 1,000M | | 2.5%, 1/31/2024 | | | 1,011,797 | |
72
| |
Principal
Amount
| | Security | | Value | |
| | | | | U.S. GOVERNMENT OBLIGATIONS (continued) |
| | $ | 8,000M | | 2.625%, 12/31/2023 | | $ | 8,137,184 | |
Total Value of U.S. Government Obligations (cost $37,104,061) | | | 37,256,061 | |
| | | | | U.S. GOVERNMENT AGENCY OBLIGATIONS—4.6% | | | | |
| | | | | Fannie Mae: | | | | |
| | | 3,500M | | 1.25%, 5/6/2021 | | | 3,425,499 | |
| | | 1,700M | | 1.375%, 2/26/2021 | | | 1,670,313 | |
| | | 5,000M | | 1.5%, 2/28/2020 | | | 4,958,890 | |
| | | 5,000M | | Federal Home Loan Bank, 2.375%, 3/30/2020 | | | 4,997,440 | |
Total Value of U.S. Government Agency Obligations (cost $15,111,122) | | | 15,052,142 | |
| | | | | COVERED BONDS—3.0% | | | | |
| | | | | Financial Services | | | | |
| | | 4,750M | | Canadian Imperial Bank of Commerce, 2.35%, 7/27/2022(a) | | | 4,703,360 | |
| | | 5,000M | | Royal Bank of Canada, 2.3%, 3/22/2021 | | | 4,974,210 | |
Total Value of Covered Bonds (cost $9,759,291) | | | 9,677,570 | |
| | | | | COMMERCIAL MORTGAGE-BACKED SECURITIES—1.6% | | | | |
| | | | | Fannie Mae—.9% | | | | |
| | | 2,912M | | Fannie Mae, 2.995%, 11/1/2022 | | | 2,951,269 | |
| | | | | Federal Home Loan Mortgage Corporation—.7% | | | | |
| | | 2,324M | | Multi-Family Structured Pass-Throughs, 2.8604%, 5/25/2024† | | | 2,318,418 | |
Total Value of Commercial Mortgage-Backed Securities (cost $5,276,867) | | | 5,269,687 | |
| | | | | COLLATERALIZED MORTGAGE OBLIGATIONS—1.4% | | | | |
| | | 4,534M | | Fannie Mae, 4%, 2/25/2025 (cost $4,651,453) | | | 4,684,018 | |
Total Value of Investments (cost $320,694,925) | | | 98.2 | % | | | 322,503,053 | |
Other Assets, Less Liabilities | | | 1.8 | | | | 5,811,495 | |
Net Assets | | | 100.0 | % | | $ | 328,314,548 | |
(a) | Security exempt from registration under Rule 144A of the Securities Act of 1933 (see Note 4). |
73
Portfolio of Investments(continued)
LIMITED DURATION BOND FUND
March 31, 2019
† | Interest rates are determined and reset periodically. The interest rates above are the rates in effect at March 31, 2019. |
Summary of Abbreviations:
LLLP | Limited Liability Limited Partnership |
ULC | Unlimited Liability Corporation |
The Fund’s assets and liabilities are classified into the following three levels based on the inputs used to value the assets and liabilities:
| | Level 1 – | Unadjusted quoted prices in active markets for identical securities that the Fund has the ability to access. |
| | Level 2 – | Observable inputs other than quoted prices included in Level 1 that are observable for the asset or liability, either directly or indirectly. These inputs may include quoted prices for the identical instrument on an inactive market, prices for similar instruments, interest rates, prepayment speeds, credit risk, yield curves, default rates and similar data. |
| | Level 3 – | Unobservable inputs for the asset or liability, to the extent relevant observable inputs are not available, representing the Fund’s own assumption about the assumptions a market participant would use in valuing the asset or liability, and would be based on the best information available. |
The inputs methodology used for valuing securities are not necessarily an indication of the risk associated with investing in those securities. For example, U.S. government securities are reflected as Level 2 because the inputs used to determine fair value may not always be quoted prices in an active market.
The following is a summary, by category of Level, of inputs used to value the Fund’s investments as of March 31, 2019:
| | | Level 1 | | | Level 2 | | | Level 3 | | | Total | |
Corporate Bonds | | $ | — | | | $ | 181,500,349 | | | $ | — | | | $ | 181,500,349 | |
Asset-Backed Securities | | | — | | | | 69,063,226 | | | | — | | | | 69,063,226 | |
U.S. Government Obligations | | | — | | | | 37,256,061 | | | | — | | | | 37,256,061 | |
U.S. Government Agency Obligations | | | — | | | | 15,052,142 | | | | — | | | | 15,052,142 | |
Covered Bonds | | | — | | | | 9,677,570 | | | | — | | | | 9,677,570 | |
Commercial Mortgage-Backed Securities | | | — | | | | 5,269,687 | | | | — | | | | 5,269,687 | |
Collateralized Mortgage Obligations | | | — | | | | 4,684,018 | | | | — | | | | 4,684,018 | |
Total Investments in Securities* | | $ | — | | | $ | 322,503,053 | | | $ | — | | | $ | 322,503,053 | |
* | The Portfolio of Investments provides information on the industry categorization for corporate bonds, asset backed securities and covered bonds. |
There were no transfers into or from Level 1 and Level 2 by the Fund during the period ended March 31, 2019. Transfers, if any, between Levels are recognized at the end of the reporting period.
See notes to financial statements
74
Fund Expenses(unaudited)
STRATEGIC INCOME FUND
The examples below show the ongoing costs (in dollars) of investing in your Fund and will help you in comparing these costs with costs of other mutual funds. Please refer to page 1 for a detailed explanation of the information presented in these examples.
Expense Example | Annualized
Expense
Ratio | Beginning
Account Value
(10/1/18) | Ending
Account Value
(3/31/19) | Expenses Paid
During Period
(10/1/18-3/31/19)* |
Class A Shares | 0.60% | | | |
Actual | | $1,000.00 | $1,016.43 | $ 3.02 |
Hypothetical** | | $1,000.00 | $1,021.94 | $ 3.02 |
Advisor Class Shares | 0.27% | | | |
Actual | | $1,000.00 | $1,018.48 | $ 1.36 |
Hypothetical** | | $1,000.00 | $1,023.58 | $ 1.36 |
* | Expenses are equal to the annualized expense ratio, multiplied by the average account value over the period, multiplied by 182/365 (to reflect the one-half year period). |
** | Assumed rate of return of 5% before expenses |
Portfolio Composition
BY SECTOR
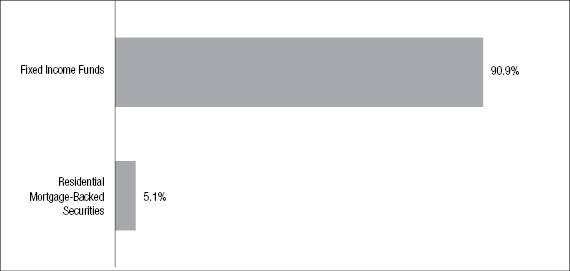
Portfolio holdings and allocations are subject to change. Percentages are as of March 31, 2019, and are based on the total market value of investments.
75
Portfolio of Investments
STRATEGIC INCOME FUND
March 31, 2019
| | Shares or
Principal
Amount | | Security | | Value | |
| | | | | MUTUAL FUNDS—90.2% | | | | |
| | | | | Fixed Income Funds | | | | |
| | | 2,701,223 | | Floating Rate Fund - Institutional Class Shares | | $ | 25,769,672 | |
| | | 13,934,373 | | Fund For Income - Institutional Class Shares | | | 33,999,871 | |
| | | 2,093,784 | | International Opportunities Bond Fund - Institutional Class Shares | | | 18,404,364 | |
| | | 1,985,774 | | Investment Grade Fund - Institutional Class Shares | | | 18,765,562 | |
| | | 3,970,087 | | Limited Duration Bond Fund - Institutional Class Shares | | | 36,842,405 | |
Total Value of Mutual Funds (cost $140,238,758) | | | 133,781,874 | |
| | | | | RESIDENTIAL MORTGAGE-BACKED SECURITIES—5.0% | | | | |
| | | | | Fannie Mae—4.5% | | | | |
| | $ | 3,548M | | 4.5%, 6/1/2048 - 1/1/2049 | | | 3,709,641 | |
| | | 2,919M | | 4%, 9/1/2048 - 12/1/2048 | | | 3,007,410 | |
| | | | | | | | 6,717,051 | |
| | | | | Freddie Mac—.5% | | | | |
| | | 703M | | 5%, 10/1/2048 | | | 745,092 | |
Total Value of Residential Mortgage-Backed Securities (cost $7,391,328) | | | 7,462,143 | |
| | | | | SHORT-TERM U.S. GOVERNMENT OBLIGATIONS—4.1% | | | | |
| | | 6,000M | | U.S. Treasury Bills, 2.396%, 4/11/2019 (cost $5,996,023) | | | 5,996,052 | |
Total Value of Investments (cost $153,626,109) | | | 99.3 | % | | | 147,240,069 | |
Other Assets, Less Liabilities | | | .7 | | | | 1,091,238 | |
Net Assets | | | 100.0 | % | | $ | 148,331,307 | |
The Fund’s assets and liabilities are classified into the following three levels based on the inputs used to value the assets and liabilities:
| | Level 1 – | Unadjusted quoted prices in active markets for identical securities that the Fund has the ability to access. |
76
| | Level 2 – | Observable inputs other than quoted prices included in Level 1 that are observable for the asset or liability, either directly or indirectly. These inputs may include quoted prices for the identical instrument on an inactive market, prices for similar instruments, interest rates, prepayment speeds, credit risk, yield curves, default rates and similar data. |
| | Level 3 – | Unobservable inputs for the asset or liability, to the extent relevant observable inputs are not available, representing the Fund’s own assumption about the assumptions a market participant would use in valuing the asset or liability, and would be based on the best information available. |
The inputs methodology used for valuing securities are not necessarily an indication of the risk associated with investing in those securities. For example, U.S. government securities are reflected as Level 2 because the inputs used to determine fair value may not always be quoted prices in an active market.
The following is a summary, by category of Level, of inputs used to value the Fund’s investments as of March 31, 2019:
| | | Level 1 | | | Level 2 | | | Level 3 | | | Total | |
Mutual Funds | | | | | | | | | | | | | | | | |
Fixed Income Funds | | $ | 133,781,874 | | | $ | — | | | $ | — | | | $ | 133,781,874 | |
Residential Mortgage-Backed Securities | | | — | | | | 7,462,143 | | | | — | | | | 7,462,143 | |
Short-Term U.S. Government Agency Obligations | | | — | | | | 5,996,052 | | | | — | | | | 5,996,052 | |
Total Investments in Securities | | $ | 133,781,874 | | | $ | 13,458,195 | | | $ | — | | | $ | 147,240,069 | |
There were no transfers into or from Level 1 and Level 2 by the Fund during the period ended March 31, 2019. Transfers, if any, between Levels are recognized at the end of the reporting period.
See notes to financial statements
77
Fund Expenses(unaudited)
COVERED CALL STRATEGY FUND
The examples below show the ongoing costs (in dollars) of investing in your Fund and will help you in comparing these costs with costs of other mutual funds. Please refer to page 1 for a detailed explanation of the information presented in these examples.
Expense Example | Annualized
Expense
Ratio | Beginning
Account Value
(10/1/18) | Ending
Account Value
(3/31/19) | Expenses Paid
During Period
(10/1/18-3/31/19)* |
Class A Shares | 1.34% | | | |
Actual | | $1,000.00 | $ 959.97 | $ 6.55 |
Hypothetical** | | $1,000.00 | $ 1,018.25 | $ 6.74 |
Advisor Class Shares | 1.17% | | | |
Actual | | $1,000.00 | $ 960.06 | $ 5.72 |
Hypothetical** | | $1,000.00 | $ 1,019.10 | $ 5.89 |
Institutional Class Shares | 0.88% | | | |
Actual | | $1,000.00 | $ 961.90 | $ 4.30 |
Hypothetical** | | $1,000.00 | $ 1,020.54 | $ 4.43 |
* | Expenses are equal to the annualized expense ratio, multiplied by the average account value over the period, multiplied by 182/365 (to reflect the one-half year period). Expenses paid during the period are net of expenses waived. |
** | Assumed rate of return of 5% before expenses |
Portfolio Composition
BY SECTOR
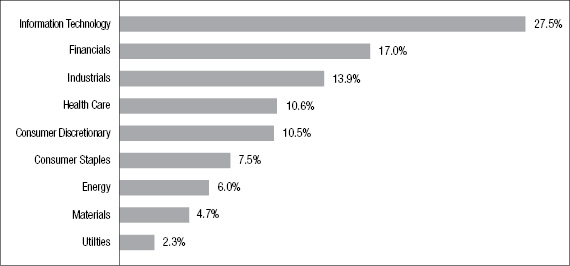
Portfolio holdings and allocations are subject to change. Percentages are as of March 31, 2019, and are based on the total market value of investments.
78
Portfolio of Investments
COVERED CALL STRATEGY FUND
March 31, 2019
| |
Shares
| | | Security | | Value | |
| | | | | | COMMON STOCKS—102.7% | | | | |
| | | | | | Consumer Discretionary—10.7% | | | | |
| | | 71,900 | | | Best Buy Co., Inc. | | $ | 5,109,214 | |
| | | 53,500 | | | Carnival Corp. | | | 2,713,520 | |
| | | 52,900 | | | Home Depot, Inc. | | | 10,150,981 | |
| | | 75,000 | | | Ross Stores, Inc. | | | 6,982,500 | |
| | | 68,000 | | | Whirlpool Corp. | | | 9,036,520 | |
| | | | | | | | | 33,992,735 | |
| | | | | | Consumer Staples—7.7% | | | | |
| | | 53,200 | | | Costco Wholesale Corp. | | | 12,881,848 | |
| | | 61,400 | | | Mondelez International, Inc. - Class “A” | | | 3,065,088 | |
| | | 37,200 | | | Philip Morris International, Inc. | | | 3,288,108 | |
| | | 80,100 | | | Walgreens Boots Alliance, Inc. | | | 5,067,927 | |
| | | | | | | | | 24,302,971 | |
| | | | | | Energy—6.2% | | | | |
| | | 112,400 | | | Chevron Corp. | | | 13,845,432 | |
| | | 88,000 | | | Occidental Petroleum Corp. | | | 5,825,600 | |
| | | | | | | | | 19,671,032 | |
| | | | | | Financials—17.4% | | | | |
| | | 69,200 | | | Allstate Corp. | | | 6,517,256 | |
| | | 78,100 | | | American Express Co. | | | 8,536,330 | |
| | | 282,100 | | | Bank of America Corp. | | | 7,783,139 | |
| | | 129,800 | | | BB&T Corp. | | | 6,039,594 | |
| | | 21,200 | | | BlackRock, Inc. | | | 9,060,244 | |
| | | 131,300 | | | JPMorgan Chase & Co. | | | 13,291,499 | |
| | | 94,000 | | | Morgan Stanley | | | 3,966,800 | |
| | | | | | | | | 55,194,862 | |
| | | | | | Health Care—10.9% | | | | |
| | | 75,500 | | * | Celgene Corp. | | | 7,122,670 | |
| | | 172,700 | | | Medtronic, PLC | | | 15,729,516 | |
| | | 80,300 | | | Merck & Co., Inc. | | | 6,678,551 | |
79
Portfolio of Investments(continued)
COVERED CALL STRATEGY FUND
March 31, 2019
| |
Shares
| | | Security | | Value | |
| | | | | | Health Care (continued) | | | | |
| | | 25,800 | | | Stryker Corp. | | $ | 5,096,016 | |
| | | | | | | | | 34,626,753 | |
| | | | | | Industrials—14.2% | | | | |
| | | 128,900 | | | Delta Air Lines, Inc. | | | 6,657,685 | |
| | | 87,300 | | | Honeywell International, Inc. | | | 13,873,716 | |
| | | 24,200 | | | Lockheed Martin Corp. | | | 7,263,872 | |
| | | 41,000 | | | Parker Hannifin Corp. | | | 7,036,420 | |
| | | 35,800 | | | Raytheon Co. | | | 6,518,464 | |
| | | 22,300 | | | Union Pacific Corp. | | | 3,728,560 | |
| | | | | | | | | 45,078,717 | |
| | | | | | Information Technology—28.3% | | | | |
| | | 88,800 | | | Apple, Inc. | | | 16,867,560 | |
| | | 37,600 | | | Broadcom, Inc. | | | 11,306,696 | |
| | | 273,200 | | | Cisco Systems, Inc. | | | 14,750,068 | |
| | | 151,900 | | | Intel Corp. | | | 8,157,030 | |
| | | 45,400 | | | International Business Machines Corp. | | | 6,405,940 | |
| | | 51,700 | | | Mastercard, Inc. - Class “A” | | | 12,172,765 | |
| | | 135,200 | | | Microsoft Corp. | | | 15,945,488 | |
| | | 37,700 | | | Texas Instruments, Inc. | | | 3,998,839 | |
| | | | | | | | | 89,604,386 | |
| | | | | | Materials—4.9% | | | | |
| | | 187,300 | | | DowDuPont, Inc. | | | 9,984,963 | |
| | | 91,200 | | | Nucor Corp. | | | 5,321,520 | |
| | | | | | | | | 15,306,483 | |
80
| |
Shares
| | | Security | | Value | |
| | | | | | Utilities—2.4% | | | | |
| | | 39,500 | | | NextEra Energy, Inc. | | $ | 7,636,140 | |
Total Value of Common Stocks (cost $284,529,893) | | | 102.7 | % | | | 325,414,079 | |
Excess of Liabilities Over Other Assets | | | (2.7 | ) | | | (8,429,290 | ) |
Net Assets | | | 100.0 | % | | $ | 316,984,789 | |
CALL OPTIONS
WRITTEN—(3.6)% | | Expiration
Date | | | Exercise
Price | | | Contracts | | | Value | |
Allstate Corp. | | | 4/18/19 | | | $ | 97.50 | | | | (692 | ) | | $ | (18,338 | ) |
American Express Co. | | | 7/19/19 | | | | 120.00 | | | | (781 | ) | | | (84,348 | ) |
Apple, Inc. | | | 6/21/19 | | | | 200.00 | | | | (888 | ) | | | (399,600 | ) |
Bank of America Corp. | | | 4/18/19 | | | | 30.00 | | | | (2,821 | ) | | | (15,515 | ) |
BB&T, Inc. | | | 6/21/19 | | | | 55.00 | | | | (1,298 | ) | | | (6,490 | ) |
Best Buy Co., Inc. | | | 6/21/19 | | | | 55.00 | | | | (719 | ) | | | (1,211,515 | ) |
BlackRock, Inc. | | | 4/18/19 | | | | 440.00 | | | | (212 | ) | | | (85,860 | ) |
Broadcom, Inc. | | | 6/21/19 | | | | 310.00 | | | | (376 | ) | | | (430,520 | ) |
Carnival Corp. | | | 4/18/19 | | | | 60.00 | | | | (535 | ) | | | (2,675 | ) |
Celgene Corp. | | | 7/19/19 | | | | 90.00 | | | | (755 | ) | | | (543,600 | ) |
Chevron Corp. | | | 6/21/19 | | | | 125.00 | | | | (1,124 | ) | | | (341,696 | ) |
Cisco Systems, Inc. | | | 6/21/19 | | | | 55.00 | | | | (2,732 | ) | | | (423,460 | ) |
Costco Wholesale Corp. | | | 6/21/19 | | | | 220.00 | | | | (532 | ) | | | (1,322,020 | ) |
Delta Air Lines, Inc. | | | 4/18/19 | | | | 52.50 | | | | (1,289 | ) | | | (136,634 | ) |
DowDuPont, Inc. | | | 6/21/19 | | | | 57.50 | | | | (1,873 | ) | | | (184,491 | ) |
Home Depot, Inc. | | | 6/21/19 | | | | 190.00 | | | | (529 | ) | | | (421,878 | ) |
Honeywell International, Inc. | | | 4/18/19 | | | | 160.00 | | | | (873 | ) | | | (197,734 | ) |
Intel Corp. | | | 4/18/19 | | | | 52.50 | | | | (1,519 | ) | | | (268,104 | ) |
International Business Machines Corp. | | | 6/21/19 | | | | 135.00 | | | | (454 | ) | | | (412,005 | ) |
JPMorgan Chase & Co. | | | 4/18/19 | | | | 110.00 | | | | (1,313 | ) | | | (5,252 | ) |
Lockheed Martin Corp. | | | 1/17/20 | | | | 290.00 | | | | (242 | ) | | | (627,990 | ) |
Mastercard, Inc. - Class "A” | | | 6/21/19 | | | | 220.00 | | | | (517 | ) | | | (1,075,360 | ) |
Medtronic, PLC | | | 6/21/19 | | | | 97.50 | | | | (1,727 | ) | | | (147,658 | ) |
Merck & Co., Inc. | | | 4/26/19 | | | | 83.00 | | | | (803 | ) | | | (116,033 | ) |
Microsoft Corp. | | | 4/18/19 | | | | 110.00 | | | | (226 | ) | | | (187,580 | ) |
81
Portfolio of Investments(continued)
COVERED CALL STRATEGY FUND
March 31, 2019
CALL OPTIONS
WRITTEN—(3.6)% | | Expiration
Date | | | Exercise
Price | | | Contracts | | | Value | |
Microsoft Corp. | | | 6/21/19 | | | $ | 115.00 | | | | (1,126 | ) | | $ | (731,900 | ) |
Mondelez International, Inc. - Class "A” | | | 5/17/19 | | | | 50.00 | | | | (614 | ) | | | (83,197 | ) |
Morgan Stanley | | | 4/18/19 | | | | 46.00 | | | | (940 | ) | | | (10,810 | ) |
NextEra Energy, Inc. | | | 6/21/19 | | | | 185.00 | | | | (395 | ) | | | (442,400 | ) |
Occidental Petroleum Corp. | | | 4/18/19 | | | | 67.50 | | | | (880 | ) | | | (61,600 | ) |
Parker Hannifin Corp. | | | 4/18/19 | | | | 175.00 | | | | (410 | ) | | | (72,775 | ) |
Phillip Morris International, Inc. | | | 4/18/19 | | | | 90.00 | | | | (372 | ) | | | (44,082 | ) |
Raytheon Co. | | | 1/17/20 | | | | 185.00 | | | | (358 | ) | | | (421,545 | ) |
Ross Stores, Inc. | | | 5/17/19 | | | | 95.00 | | | | (750 | ) | | | (155,625 | ) |
Stryker Corp. | | | 6/21/19 | | | | 200.00 | | | | (129 | ) | | | (79,980 | ) |
Stryker Corp. | | | 6/21/19 | | | | 195.00 | | | | (129 | ) | | | (116,100 | ) |
Texas Instruments, Inc. | | | 6/21/19 | | | | 115.00 | | | | (377 | ) | | | (52,403 | ) |
Union Pacific Corp. | | | 4/18/19 | | | | 170.00 | | | | (223 | ) | | | (50,621 | ) |
Walgreens Boots Alliance, Inc. | | | 7/19/19 | | | | 65.00 | | | | (801 | ) | | | (234,293 | ) |
Whirlpool Corp. | | | 6/21/19 | | | | 140.00 | | | | (680 | ) | | | (309,400 | ) |
Total Value of Call Options Written (premium received $7,567,379) | | $ | (11,533,087 | ) |
The Fund’s assets and liabilities are classified into the following three levels based on the inputs used to value the assets and liabilities:
| | Level 1 – | Unadjusted quoted prices in active markets for identical securities that the Fund has the ability to access. |
| | Level 2 – | Observable inputs other than quoted prices included in Level 1 that are observable for the asset or liability, either directly or indirectly. These inputs may include quoted prices for the identical instrument on an inactive market, prices for similar instruments, interest rates, prepayment speeds, credit risk, yield curves, default rates and similar data. |
| | Level 3 – | Unobservable inputs for the asset or liability, to the extent relevant observable inputs are not available, representing the Fund’s own assumption about the assumptions a market participant would use in valuing the asset or liability, and would be based on the best information available. |
The inputs methodology used for valuing securities are not necessarily an indication of the risk associated with investing in those securities. For example, U.S. government securities are reflected as Level 2 because the inputs used to determine fair value may not always be quoted prices in an active market.
82
The following is a summary, by category of Level, of inputs used to value the Fund’s investments as of March 31, 2019:
| | | Level 1 | | | Level 2 | | | Level 3 | | | Total | |
Assets | | | | | | | | | | | | | | | | |
Common Stocks* | | $ | 325,414,079 | | | $ | — | | | $ | — | | | $ | 325,414,079 | |
| | | | | | | | | | | | | | | | | |
Liabilities | | | | | | | | | | | | | | | | |
Call Options Written | | $ | — | | | $ | (11,533,087 | ) | | $ | — | | | $ | (11,533,087 | ) |
* | The Portfolio of Investments provides information on the industry categorization for common stocks. |
There were no transfers into or from Level 1 and Level 2 by the Fund during the period ended March 31, 2019. Transfers, if any, between Levels are recognized at the end of the reporting period.
83
See notes to financial statements
Fund Expenses(unaudited)
EQUITY INCOME FUND
The examples below show the ongoing costs (in dollars) of investing in your Fund and will help you in comparing these costs with costs of other mutual funds. Please refer to page 1 for a detailed explanation of the information presented in these examples.
Expense Example | Annualized
Expense
Ratio | Beginning
Account Value
(10/1/18) | Ending
Account Value
(3/31/19) | Expenses Paid
During Period
(10/1/18-3/31/19)* |
Class A Shares | 1.22% | | | |
Actual | | $1,000.00 | $ 965.90 | $ 5.98 |
Hypothetical** | | $1,000.00 | $ 1,018.85 | $ 6.14 |
Class B Shares | 2.06% | | | |
Actual | | $1,000.00 | $ 960.97 | $ 10.07 |
Hypothetical** | | $1,000.00 | $ 1,014.66 | $ 10.35 |
Advisor Class Shares | 0.85% | | | |
Actual | | $1,000.00 | $ 967.59 | $ 4.17 |
Hypothetical** | | $1,000.00 | $ 1,020.69 | $ 4.28 |
Institutional Class Shares | 0.81% | | | |
Actual | | $1,000.00 | $ 967.62 | $ 3.97 |
Hypothetical** | | $1,000.00 | $ 1,020.89 | $ 4.08 |
* | Expenses are equal to the annualized expense ratio, multiplied by the average account value over the period, multiplied by 182/365 (to reflect the one-half year period). |
** | Assumed rate of return of 5% before expenses |
Portfolio Composition
TOP TEN SECTORS
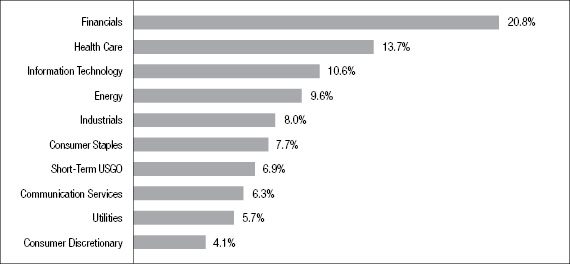
Portfolio holdings and allocations are subject to change. Percentages are as of March 31, 2019, and are based on the total market value of investments.
84
Portfolio of Investments
EQUITY INCOME FUND
March 31, 2019
| |
Shares
| | | Security | | Value | |
| | | | | | COMMON STOCKS—91.1% | | | | |
| | | | | | Communication Services—6.2% | | | | |
| | | 290,630 | | | AT&T, Inc. | | $ | 9,114,157 | |
| | | 257,000 | | | Comcast Corp. - Special Shares “A” | | | 10,274,860 | |
| | | 212,800 | | | Verizon Communications, Inc. | | | 12,582,864 | |
| | | 38,550 | | | Walt Disney Co. | | | 4,280,206 | |
| | | | | | | | | 36,252,087 | |
| | | | | | Consumer Discretionary—4.1% | | | | |
| | | 53,100 | | | Acushnet Holdings Corp. | | | 1,228,734 | |
| | | 143,000 | | | American Eagle Outfitters, Inc. | | | 3,170,310 | |
| | | 113,850 | | | DSW, Inc. - Class “A” | | | 2,529,747 | |
| | | 41,600 | | | Lowe’s Cos., Inc. | | | 4,553,952 | |
| | | 27,200 | | | McDonald’s Corp. | | | 5,165,280 | |
| | | 29,650 | | | Oxford Industries, Inc. | | | 2,231,459 | |
| | | 28,700 | | | Penske Automotive Group, Inc. | | | 1,281,455 | |
| | | 111,150 | | | Tapestry, Inc. | | | 3,611,264 | |
| | | | | | | | | 23,772,201 | |
| | | | | | Consumer Staples—7.7% | | | | |
| | | 161,050 | | | Coca-Cola Co. | | | 7,546,803 | |
| | | 47,250 | | | Kimberly-Clark Corp. | | | 5,854,275 | |
| | | 74,400 | | | PepsiCo, Inc. | | | 9,117,720 | |
| | | 65,900 | | | Philip Morris International, Inc. | | | 5,824,901 | |
| | | 86,450 | | | Procter & Gamble Co. | | | 8,995,123 | |
| | | 73,550 | | | Walmart, Inc. | | | 7,173,332 | |
| | | | | | | | | 44,512,154 | |
| | | | | | Energy—9.5% | | | | |
| | | 46,350 | | | Anadarko Petroleum Corp. | | | 2,107,998 | |
| | | 209,257 | | | BP, PLC (ADR) | | | 9,148,716 | |
| | | 106,000 | | | Chevron Corp. | | | 13,057,080 | |
| | | 71,500 | | | ConocoPhillips | | | 4,771,910 | |
| | | 366,350 | | | EnCana Corp. | | | 2,652,374 | |
| | | 109,150 | | | ExxonMobil Corp. | | | 8,819,320 | |
85
Portfolio of Investments(continued)
EQUITY INCOME FUND
March 31, 2019
| | Shares | | | Security | | Value | |
| | | | | | Energy (continued) |
| | | 70,843 | | | Marathon Petroleum Corp. | | $ | 4,239,954 | |
| | | 44,200 | | | Royal Dutch Shell, PLC - Class “A” (ADR) | | | 2,766,478 | |
| | | 70,050 | | | Schlumberger, Ltd. | | | 3,052,079 | |
| | | 147,450 | | | Suncor Energy, Inc. | | | 4,781,804 | |
| | | | | | | | | 55,397,713 | |
| | | | | | Financials—19.6% | | | | |
| | | 140,900 | | * | AllianceBernstein Holding, LP (MLP) | | | 4,070,601 | |
| | | 52,100 | | | American Express Co. | | | 5,694,530 | |
| | | 343,050 | | | Bank of America Corp. | | | 9,464,749 | |
| | | 103,850 | | | Bank of New York Mellon Corp. | | | 5,237,155 | |
| | | 29,100 | | * | Berkshire Hathaway, Inc. - Class “B” | | | 5,845,899 | |
| | | 8,000 | | | BlackRock, Inc. | | | 3,418,960 | |
| | | 69,110 | | | Chubb, Ltd. | | | 9,680,929 | |
| | | 92,800 | | | Citigroup, Inc. | | | 5,774,016 | |
| | | 21,800 | | | Goldman Sachs Group, Inc. | | | 4,185,382 | |
| | | 69,095 | | | Hamilton Lane, Inc. - Class “A” | | | 3,011,160 | |
| | | 298,050 | | | Investors Bancorp, Inc. | | | 3,531,892 | |
| | | 119,200 | | | iShares S&P U.S. Preferred Stock Index Fund (ETF) | | | 4,356,760 | |
| | | 134,550 | | | JPMorgan Chase & Co. | | | 13,620,496 | |
| | | 64,100 | | | MetLife, Inc. | | | 2,728,737 | |
| | | 156,700 | | | Old National Bancorp of Indiana | | | 2,569,880 | |
| | | 37,400 | | | PNC Financial Services Group, Inc. | | | 4,587,484 | |
| | | 52,100 | | | Popular, Inc. | | | 2,715,973 | |
| | | 226,950 | | | Regions Financial Corp. | | | 3,211,343 | |
| | | 208,300 | | | Sterling Bancorp | | | 3,880,629 | |
| | | 45,700 | | | Travelers Cos., Inc. | | | 6,268,212 | |
| | | 207,900 | | | Wells Fargo & Co. | | | 10,045,728 | |
| | | | | | | | | 113,900,515 | |
| | | | | | Health Care—13.6% | | | | |
| | | 62,850 | | | Abbott Laboratories | | | 5,024,229 | |
| | | 15,450 | | | Anthem, Inc. | | | 4,433,841 | |
| | | 89,200 | | | Bristol-Myers Squibb Co. | | | 4,255,732 | |
86
| | Shares | | | Security | | Value | |
| | | | | | Health Care (continued) |
| | | 14,900 | | | CVS Health Corp. | | $ | 803,557 | |
| | | 36,850 | | | Eli Lilly & Co. | | | 4,781,656 | |
| | | 108,450 | | | GlaxoSmithKline, PLC (ADR) | | | 4,532,125 | |
| | | 75,450 | | | Johnson & Johnson | | | 10,547,156 | |
| | | 88,694 | | | Medtronic, PLC | | | 8,078,250 | |
| | | 150,061 | | | Merck & Co., Inc. | | | 12,480,573 | |
| | | 272,224 | | | Pfizer, Inc. | | | 11,561,353 | |
| | | 80,100 | | | Phibro Animal Health Corp. - Class “A” | | | 2,643,300 | |
| | | 119,000 | | | Smith & Nephew, PLC (ADR) | | | 4,773,090 | |
| | | 21,100 | | | UnitedHealth Group, Inc. | | | 5,217,186 | |
| | | | | | | | | 79,132,048 | |
| | | | | | Industrials—8.0% | | | | |
| | | 11,900 | | | 3M Co. | | | 2,472,582 | |
| | | 73,500 | | | Eaton Corp., PLC | | | 5,921,160 | |
| | | 21,400 | | | General Dynamics Corp. | | | 3,622,592 | |
| | | 36,200 | | | Honeywell International, Inc. | | | 5,752,904 | |
| | | 51,100 | | | Ingersoll-Rand, PLC | | | 5,516,245 | |
| | | 38,150 | | | Kansas City Southern, Inc. | | | 4,424,637 | |
| | | 20,200 | | | Lockheed Martin Corp. | | | 6,063,232 | |
| | | 45,150 | | | United Parcel Service, Inc. - Class “B” | | | 5,045,061 | |
| | | 60,700 | | | United Technologies Corp. | | | 7,823,623 | |
| | | | | | | | | 46,642,036 | |
| | | | | | Information Technology—10.6% | | | | |
| | | 25,350 | | | Apple, Inc. | | | 4,815,232 | |
| | | 244,000 | | | Cisco Systems, Inc. | | | 13,173,560 | |
| | | 201,200 | | | HP Enterprise Co. | | | 3,104,516 | |
| | | 148,050 | | | HP, Inc. | | | 2,876,611 | |
| | | 216,800 | | | Intel Corp. | | | 11,642,160 | |
| | | 68,950 | | | Maxim Integrated Products, Inc. | | | 3,666,072 | |
| | | 109,900 | | | Microsoft Corp. | | | 12,961,606 | |
| | | 127,900 | | | QUALCOMM, Inc. | | | 7,294,137 | |
87
Portfolio of Investments(continued)
EQUITY INCOME FUND
March 31, 2019
| |
Shares
| | | Security | | Value | |
| | | | | | Information Technology (continued) |
| | | 17,250 | | | Texas Instruments, Inc. | | $ | 1,829,708 | |
| | | | | | | | | 61,363,602 | |
| | | | | | Materials—3.4% | | | | |
| | | 130,523 | | | DowDuPont, Inc. | | | 6,958,181 | |
| | | 37,300 | | | Eastman Chemical Co. | | | 2,830,324 | |
| | | 62,700 | | | FMC Corp. | | | 4,816,614 | |
| | | 18,300 | | | Linde, PLC | | | 3,219,519 | |
| | | 58,643 | | * | Livent Corp. | | | 720,137 | |
| | | 16,500 | | | LyondellBasell Industries NV - Class “A” | | | 1,387,320 | |
| | | | | | | | | 19,932,095 | |
| | | | | | Real Estate—2.7% | | | | |
| | | 131,400 | | | Americold Realty Trust (REIT) | | | 4,009,014 | |
| | | 158,720 | | | Brookfield Property Partners (REIT) | | | 3,264,870 | |
| | | 85,600 | | | Douglas Emmett, Inc. (REIT) | | | 3,459,952 | |
| | | 27,800 | | | Federal Realty Investment Trust (REIT) | | | 3,832,230 | |
| | | 48,280 | | | Urstadt Biddle Properties, Inc. (REIT) | | | 996,499 | |
| | | | | | | | | 15,562,565 | |
| | | | | | Utilities—5.7% | | | | |
| | | 39,900 | | | American Electric Power Co., Inc. | | | 3,341,625 | |
| | | 113,100 | | | CenterPoint Energy, Inc. | | | 3,472,170 | |
| | | 50,000 | | | Dominion Energy, Inc. | | | 3,833,000 | |
| | | 35,000 | | | Duke Energy Corp. | | | 3,150,000 | |
| | | 92,300 | | | Exelon Corp. | | | 4,626,999 | |
| | | 72,250 | | | FirstEnergy Corp. | | | 3,006,322 | |
| | | 25,700 | | | NextEra Energy, Inc. | | | 4,968,324 | |
| | | 73,800 | | | PPL Corp. | | | 2,342,412 | |
| | | 74,650 | | | Utilities Select Sector SPDR Fund (ETF) | | | 4,342,391 | |
| | | | | | | | | 33,083,243 | |
Total Value of Common Stocks (cost $388,421,959) | | | 529,550,259 | |
88
| | Shares or
Principal
Amount | | | Security | | Value | |
| | | | | | PREFERRED STOCKS—1.7% | | | | |
| | | | | | Financials—1.1% | | | | |
| | | 800 | | | Citizens Financial Group, Inc., Series A, 5.5%, 2049 | | $ | 808,164 | |
| | | 102,800 | | | JPMorgan Chase & Co., Series Y, 6.125%, 2020 | | | 2,671,772 | |
| | | 120,000 | | | U.S. Bancorp, Series K, 5.5%, 2023 | | | 3,049,200 | |
| | | | | | | | | 6,529,136 | |
| | | | | | Real Estate—.6% | | | | |
| | | 50,500 | | | Digital Realty Trust, Inc. (REIT), Series G,
5.875%, 2049 | | | 1,260,480 | |
| | | | | | Urstadt Biddle Properties, Inc. (REIT): | | | | |
| | | 49,000 | | | Series G, 6.75%, 2049 | | | 1,268,120 | |
| | | 41,700 | | | Series H, 6.25%, 2022 | | | 1,097,127 | |
| | | | | | | | | 3,625,727 | |
Total Value of Preferred Stocks (cost $9,889,446) | | | 10,154,863 | |
| | | | | | SHORT-TERM U.S. GOVERNMENT OBLIGATIONS—6.9% | | | | |
| | | | | | U.S. Treasury Bills: | | | | |
| | $ | 10,000M | | | 2.37%, 4/9/2019 | | | 9,994,730 | |
| | | 30,000M | | | 2.396%, 4/11/2019 | | | 29,980,260 | |
Total Value of Short-Term U.S. Government Obligations (cost $39,974,741) | | | 39,974,990 | |
Total Value of Investments (cost $438,286,146) | | | 99.7 | % | | | 579,680,112 | |
Other Assets, Less Liabilities | | | .3 | | | | 1,890,608 | |
Net Assets | | | 100.0 | % | | $ | 581,570,720 | |
Summary of Abbreviations:
ADR | American Depositary Receipts |
MLP | Master Limited Partnership |
REIT | Real Estate Investment Trust |
SPDR | Standard & Poor’s Depository Receipts |
89
Portfolio of Investments(continued)
EQUITY INCOME FUND
March 31, 2019
CALL OPTIONS
WRITTEN—(0.0)% | | Expiration
Date | | | Exercise
Price | | | Contracts | | | Value | |
Apple, Inc. | | | 4/18/19 | | | $ | 190.00 | | | | (100 | ) | | $ | (37,250 | ) |
CVS Health Corp. | | | 4/12/19 | | | | 56.50 | | | | (100 | ) | | | (3,200 | ) |
Johnson & Johnson | | | 4/18/19 | | | | 140.00 | | | | (100 | ) | | | (20,250 | ) |
Microsoft Corp | | | 4/5/19 | | | | 115.00 | | | | (100 | ) | | | (31,750 | ) |
Total Value of Call Options Written (premium received $71,997) | | $ | (92,450 | ) |
The Fund’s assets and liabilities are classified into the following three levels based on the inputs used to value the assets and liabilities:
| | Level 1 – | Unadjusted quoted prices in active markets for identical securities that the Fund has the ability to access. |
| | Level 2 – | Observable inputs other than quoted prices included in Level 1 that are observable for the asset or liability, either directly or indirectly. These inputs may include quoted prices for the identical instrument on an inactive market, prices for similar instruments, interest rates, prepayment speeds, credit risk, yield curves, default rates and similar data. |
| | Level 3 – | Unobservable inputs for the asset or liability, to the extent relevant observable inputs are not available, representing the Fund’s own assumption about the assumptions a market participant would use in valuing the asset or liability, and would be based on the best information available. |
The inputs methodology used for valuing securities are not necessarily an indication of the risk associated with investing in those securities. For example, U.S. government securities are reflected as Level 2 because the inputs used to determine fair value may not always be quoted prices in an active market.
90
The following is a summary, by category of Level, of inputs used to value the Fund’s investments as of March 31, 2019:
| | | Level 1 | | | Level 2 | | | Level 3 | | | Total | |
Common Stocks | | $ | 529,550,259 | | | $ | — | | | $ | — | | | $ | 529,550,259 | |
Preferred Stocks | | | 10,154,863 | | | | — | | | | — | | | | 10,154,863 | |
Short-Term U.S. Government Obligations | | | — | | | | 39,974,990 | | | | — | | | | 39,974,990 | |
Total Investments in Securities* | | $ | 539,705,122 | | | $ | 39,974,990 | | | $ | — | | | $ | 579,680,112 | |
| | | | | | | | | | | | | | | | | |
Liabilities | | | | | | | | | | | | | | | | |
Call Options Written | | $ | — | | | $ | (92,450 | ) | | $ | — | | | $ | (92,450 | ) |
* | The Portfolio of Investments provides information on the industry categorization for common stocks and preferred stocks. |
There were no transfers into or from Level 1 and Level 2 by the Fund during the period ended March 31, 2019. Transfers, if any, between Levels are recognized at the end of the reporting period.
See notes to financial statements
91
Fund Expenses(unaudited)
GLOBAL FUND
The examples below show the ongoing costs (in dollars) of investing in your Fund and will help you in comparing these costs with costs of other mutual funds. Please refer to page 1 for a detailed explanation of the information presented in these examples.
Expense Example | Annualized
Expense
Ratio | Beginning
Account Value
(10/1/18) | Ending
Account Value
(3/31/19) | Expenses Paid
During Period
(10/1/18-3/31/19)* |
Class A Shares | 1.46% | | | |
Actual | | $1,000.00 | $ 940.52 | $ 7.06 |
Hypothetical** | | $1,000.00 | $ 1,017.65 | $ 7.34 |
Class B Shares | 2.25% | | | |
Actual | | $1,000.00 | $ 937.25 | $ 10.87 |
Hypothetical** | | $1,000.00 | $ 1,013.71 | $ 11.30 |
Advisor Class Shares | 1.08% | | | |
Actual | | $1,000.00 | $ 942.06 | $ 5.23 |
Hypothetical** | | $1,000.00 | $ 1,019.54 | $ 5.44 |
Institutional Class Shares | 1.02% | | | |
Actual | | $1,000.00 | $ 942.27 | $ 4.94 |
Hypothetical** | | $1,000.00 | $ 1,019.84 | $ 5.14 |
* | Expenses are equal to the annualized expense ratio, multiplied by the average account value over the period, multiplied by 182/365 (to reflect the one-half year period). Expenses paid during the period are net of expenses waived. |
** | Assumed rate of return of 5% before expenses |
Portfolio Composition
TOP TEN SECTORS
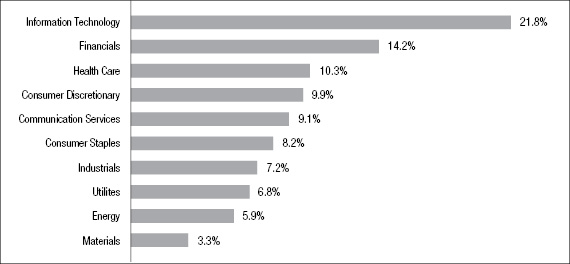
Portfolio holdings and allocations are subject to change. Percentages are as of March 31, 2019, and are based on the total market value of investments.
92
Portfolio of Investments
GLOBAL FUND
March 31, 2019
| |
Shares
| | | Security | | Value | |
| | | | | | COMMON STOCKS—95.8% | | | | |
| | | | | | United States—56.1% | | | | |
| | | 33,850 | | | Abbott Laboratories | | $ | 2,705,969 | |
| | | 23,300 | | * | Adobe, Inc. | | | 6,209,217 | |
| | | 17,700 | | | Air Products & Chemicals, Inc. | | | 3,379,992 | |
| | | 13,775 | | * | Alphabet, Inc. - Class “A” | | | 16,211,660 | |
| | | 8,000 | | * | Alphabet, Inc. - Class “C” | | | 9,386,480 | |
| | | 4,700 | | * | Amazon.com, Inc. | | | 8,369,525 | |
| | | 55,000 | | | American Eagle Outfitters, Inc. | | | 1,219,350 | |
| | | 35,500 | | | Apple, Inc. | | | 6,743,225 | |
| | | 24,000 | | * | Autodesk, Inc. | | | 3,739,680 | |
| | | 52,000 | | | Ball Corp. | | | 3,008,720 | |
| | | 185,012 | | | Bank of America Corp. | | | 5,104,481 | |
| | | 26,000 | | * | Berkshire Hathaway, Inc. - Class “B” | | | 5,223,140 | |
| | | 69,200 | | | Chevron Corp. | | | 8,524,056 | |
| | | 20,000 | | | Chubb, Ltd. | | | 2,801,600 | |
| | | 116,000 | | | CMS Energy Corp. | | | 6,442,640 | |
| | | 90,000 | | | Coca-Cola Co. | | | 4,217,400 | |
| | | 75,000 | | | Comcast Corp. - Special Shares “A” | | | 2,998,500 | |
| | | 14,500 | | | Concho Resources, Inc. | | | 1,608,920 | |
| | | 34,000 | | | ConocoPhillips | | | 2,269,160 | |
| | | 135,000 | | * | Cree, Inc. | | | 7,724,700 | |
| | | 72,000 | | | Duke Energy Corp. | | | 6,480,000 | |
| | | 18,000 | | | Eli Lilly & Co. | | | 2,335,680 | |
| | | 47,000 | | | Entergy Corp. | | | 4,494,610 | |
| | | 28,200 | | | EOG Resources, Inc. | | | 2,684,076 | |
| | | 44,000 | | | Eversource Energy | | | 3,121,800 | |
| | | 70,000 | | * | Facebook, Inc. | | | 11,668,300 | |
| | | 100,000 | | | FirstEnergy Corp. | | | 4,161,000 | |
| | | 5,000 | | | Goldman Sachs Group, Inc. | | | 959,950 | |
| | | 8,000 | | * | IAC/InterActiveCorp | | | 1,680,880 | |
| | | 3,500 | | * | Illumina, Inc. | | | 1,087,415 | |
| | | 131,000 | | | Intel Corp. | | | 7,034,700 | |
| | | 67,000 | | | Jacobs Engineering Group, Inc. | | | 5,037,730 | |
93
Portfolio of Investments(continued)
GLOBAL FUND
March 31, 2019
| |
Shares
| | | Security | | Value | |
| | | | | | United States (continued) |
| | | 18,000 | | | Johnson & Johnson | | $ | 2,516,220 | |
| | | 52,000 | | | JPMorgan Chase & Co. | | | 5,263,960 | |
| | | 24,000 | | | Kimberly-Clark Corp. | | | 2,973,600 | |
| | | 20,000 | | | KLA-Tencor Corp. | | | 2,388,200 | |
| | | 103,000 | | | Kroger Co. | | | 2,533,800 | |
| | | 27,000 | | | Lockheed Martin Corp. | | | 8,104,320 | |
| | | 20,000 | | | Lowe’s Cos., Inc. | | | 2,189,400 | |
| | | 25,000 | | | McDonald’s Corp. | | | 4,747,500 | |
| | | 22,000 | | | Medtronic, PLC | | | 2,003,760 | |
| | | 176,300 | | | Merck & Co., Inc. | | | 14,662,871 | |
| | | 65,763 | | | Microsoft Corp. | | | 7,756,088 | |
| | | 78,800 | | | Morgan Stanley | | | 3,325,360 | |
| | | 50,000 | | | Noble Energy, Inc. | | | 1,236,500 | |
| | | 8,000 | | | Northrop Grumman Corp. | | | 2,156,800 | |
| | | 16,209 | | | NVIDIA Corp. | | | 2,910,488 | |
| | | 62,000 | | | PepsiCo, Inc. | | | 7,598,100 | |
| | | 132,000 | | | Pfizer, Inc. | | | 5,606,040 | |
| | | 21,500 | | | Philip Morris International, Inc. | | | 1,900,385 | |
| | | 8,500 | | | Pioneer Natural Resources Co. | | | 1,294,380 | |
| | | 89,500 | | | Procter & Gamble Co. | | | 9,312,475 | |
| | | 15,000 | | * | Proofpoint, Inc. | | | 1,821,450 | |
| | | 49,000 | | | QUALCOMM, Inc. | | | 2,794,470 | |
| | | 22,500 | | | Raytheon Co. | | | 4,096,800 | |
| | | 40,198 | | * | salesforce.com, inc. | | | 6,366,157 | |
| | | 9,000 | | * | ServiceNow, Inc. | | | 2,218,410 | |
| | | 42,600 | | * | Synopsys, Inc. | | | 4,905,390 | |
| | | 60,500 | | * | Take-Two Interactive Software, Inc. | | | 5,709,385 | |
| | | 22,500 | | | Tapestry, Inc. | | | 731,025 | |
| | | 26,000 | | | Texas Instruments, Inc. | | | 2,757,820 | |
| | | 7,000 | | | Thermo Fisher Scientific, Inc. | | | 1,916,040 | |
| | | 31,200 | | | Union Pacific Corp. | | | 5,216,640 | |
| | | 16,500 | | | United Technologies Corp. | | | 2,126,685 | |
| | | 29,970 | | | UnitedHealth Group, Inc. | | | 7,410,382 | |
| | | 28,000 | | | Valero Energy Corp. | | | 2,375,240 | |
94
| |
Shares
| | | Security | | Value | |
| | | | | | United States (continued) |
| | | 230,000 | | | Verizon Communications, Inc. | | $ | 13,599,900 | |
| | | 34,942 | | | Visa, Inc. - Class “A” | | | 5,457,591 | |
| | | 28,800 | | | Vulcan Materials Co. | | | 3,409,920 | |
| | | 76,000 | | | WEC Energy Group, Inc. | | | 6,010,080 | |
| | | 51,400 | | | Wells Fargo & Co. | | | 2,483,648 | |
| | | | | | | | | 330,521,836 | |
| | | | | | United Kingdom—6.1% | | | | |
| | | 175,000 | | | Anglo American, PLC | | | 4,680,540 | |
| | | 300,000 | | | Arrow Global Group, PLC | | | 851,807 | |
| | | 69,700 | | | Ashtead Group, PLC | | | 1,681,722 | |
| | | 225,000 | | | Babcock International Group, PLC | | | 1,446,215 | |
| | | 844,140 | | | BP, PLC | | | 6,140,459 | |
| | | 130,000 | | | Burford Capital, Ltd. | | | 2,854,724 | |
| | | 55,000 | | | Diageo, PLC | | | 2,247,910 | |
| | | 310,000 | | | Glaxosmithkline, PLC | | | 6,447,264 | |
| | | 13,500 | | * | GW Pharmaceuticals, PLC | | | 2,275,695 | |
| | | 196,237 | | | Keywords Studios, PLC | | | 2,954,622 | |
| | | 3,300,000 | | | Lloyds Banking Group, PLC | | | 2,670,843 | |
| | | 110,000 | | * | Ocado Group, PLC | | | 1,963,518 | |
| | | | | | | | | 36,215,319 | |
| | | | | | Japan—5.6% | | | | |
| | | 80,000 | | | en-japan, inc. | | | 2,324,280 | |
| | | 6,000 | | | Keyence Corp. | | | 3,733,827 | |
| | | 720,000 | | | Mitsubishi UFJ Financial Group, Inc. | | | 3,573,040 | |
| | | 36,000 | | | Murata Manufacturing Co., Ltd. | | | 1,790,418 | |
| | | 18,000 | | | Nidec Corp. | | | 2,277,813 | |
| | | 27,700 | | | Nintendo Co., Ltd. | | | 7,887,864 | |
| | | 45,000 | | | Pan Pacific Holdings Corp. | | | 2,976,180 | |
| | | 111,871 | | | Sony Corp. | | | 4,688,629 | |
| | | 70,000 | | | THK Co., Ltd. | | | 1,726,789 | |
| | | 48,000 | | | TIS, Inc. | | | 2,269,422 | |
| | | | | | | | | 33,248,262 | |
95
Portfolio of Investments(continued)
GLOBAL FUND
March 31, 2019
| |
Shares
| | | Security | | Value | |
| | | | | | China—5.3% | | | | |
| | | 25,542 | | * | Alibaba Group Holding, Ltd. (ADR) | | $ | 4,660,138 | |
| | | 750,000 | | | Citic Securities Co., Ltd. | | | 1,746,508 | |
| | | 300,000 | | | Ping An Insurance (Group) Co. of China, Ltd. | | | 3,359,257 | |
| | | 957,600 | | | Sands China, Ltd. | | | 4,812,428 | |
| | | 165,791 | | | Tencent Holdings, Ltd. | | | 7,624,323 | |
| | | 320,000 | | * | Xtrackers Harvest CSI 300 China - Class “A” (ETF) | | | 9,193,600 | |
| | | | | | | | | 31,396,254 | |
| | | | | | Germany—5.0% | | | | |
| | | 15,250 | | | Adidas AG | | | 3,705,326 | |
| | | 32,400 | | | Allianz AG | | | 7,206,461 | |
| | | 25,000 | | | Fuchs Petrolub SE | | | 1,029,211 | |
| | | 25,100 | | | Muenchener Rueckver AG | | | 5,940,928 | |
| | | 4,600 | | | Puma SE | | | 2,667,758 | |
| | | 90,000 | | * | PVA TePla AG | | | 1,135,777 | |
| | | 25,000 | | | Siemens AG | | | 2,690,530 | |
| | | 36,100 | | | Stroeer SE & Co. KGaA | | | 2,113,858 | |
| | | 17,000 | | | Volkswagen AG Preferred Shares | | | 2,675,880 | |
| | | | | | | | | 29,165,729 | |
| | | | | | Switzerland—4.7% | | | | |
| | | 850 | | | Barry Callebaut AG | | | 1,534,823 | |
| | | 850 | | | Interroll Holding AG | | | 1,724,328 | |
| | | 7,100 | | * | Lonza Group AG | | | 2,201,838 | |
| | | 105,122 | | | Nestle SA | | | 10,018,657 | |
| | | 86,000 | | | Novartis AG | | | 8,272,237 | |
| | | 40,000 | | | Swiss Re AG | | | 3,907,808 | |
| | | | | | | | | 27,659,691 | |
| | | | | | France—2.1% | | | | |
| | | 83,000 | | | AXA SA | | | 2,088,361 | |
| | | 14,800 | | | LVMH Moet Hennessy Louis Vuitton SE | | | 5,443,789 | |
| | | 26,000 | | | Safran SA | | | 3,565,499 | |
96
| |
Shares
| | | Security | | Value | |
| | | | | | France (continued) |
| | | 35,000 | | | Valeo SA | | $ | 1,014,908 | |
| | | | | | | | | 12,112,557 | |
| | | | | | Canada—1.1% | | | | |
| | | 55,000 | | | Emera, Inc. | | | 2,056,609 | |
| | | 290,000 | | | EnCana Corp. | | | 2,099,600 | |
| | | 75,600 | | | Suncor Energy, Inc. | | | 2,451,708 | |
| | | | | | | | | 6,607,917 | |
| | | | | | Italy—1.1% | | | | |
| | | 450,000 | | | Enel SpA | | | 2,879,322 | |
| | | 278,200 | | | UniCredit SpA | | | 3,566,363 | |
| | | | | | | | | 6,445,685 | |
| | | | | | Netherlands—1.0% | | | | |
| | | 31,000 | | | ASML Holding NV | | | 5,814,282 | |
| | | | | | India—.9% | | | | |
| | | 60,000 | | | HDFC Bank, Ltd. | | | 2,008,430 | |
| | | 181,000 | | | Reliance Industries, Ltd. | | | 3,561,866 | |
| | | | | | | | | 5,570,296 | |
| | | | | | Thailand—.9% | | | | |
| | | 400,000 | | | Kasikornbank Public Co., Ltd. | | | 2,369,623 | |
| | | 4,500,000 | | | Thai Beverage, PCL | | | 2,805,755 | |
| | | | | | | | | 5,175,378 | |
| | | | | | Hong Kong—.9% | | | | |
| | | 300,000 | | | AIA Group, Ltd. | | | 2,986,643 | |
| | | 581,000 | | * | China Mengniu Dairy Co., Ltd. | | | 2,161,186 | |
| | | | | | | | | 5,147,829 | |
| | | | | | South Korea—.8% | | | | |
| | | 119,564 | | | Samsung Electronics Co., Ltd. | | | 4,703,139 | |
97
Portfolio of Investments(continued)
GLOBAL FUND
March 31, 2019
| |
Shares
| | | Security | | Value | |
| | | | | | Spain—.6% | | | | |
| | | 430,000 | | | Iberdrola SA | | $ | 3,774,909 | |
| | | | | | Australia—.6% | | | | |
| | | 50,000 | | | Rio Tinto, Ltd. | | | 3,476,054 | |
| | | | | | Taiwan—.5% | | | | |
| | | 75,176 | | | Taiwan Semiconductor Manufacturing Co., Ltd. (ADR) | | | 3,079,209 | |
| | | | | | Poland—.5% | | | | |
| | | 56,000 | | * | CD Projekt SA | | | 2,917,122 | |
| | | | | | Indonesia—.5% | | | | |
| | | 10,000,000 | | | PT Bank Rakyat Indonesia | | | 2,893,258 | |
| | | | | | Israel—.5% | | | | |
| | | 23,000 | | * | Mellanox Technologies, Ltd. | | | 2,722,280 | |
| | | | | | Luxembourg—.4% | | | | |
| | | 320,000 | | | Aroundtown SA | | | 2,638,369 | |
| | | | | | Philippines—.4% | | | | |
| | | 2,600,000 | | | Ayala Land, Inc. | | | 2,223,196 | |
| | | | | | Sweden—.2% | | | | |
| | | 53,000 | | | HMS Networks AB | | | 920,074 | |
Total Value of Common Stocks (cost $510,044,565) | | | 564,428,645 | |
98
| |
Principal
Amount
| | | Security | | Value | |
| | | | | | SHORT-TERM U.S. GOVERNMENT OBLIGATIONS—2.5% | | | | |
| | | | | | U.S. Treasury Bills: | | | | |
| | $ | 7,000M | | | 2.37%, 4/9/2019 | | $ | 6,996,311 | |
| | | 8,000M | | | 2.396%, 4/11/2019 | | | 7,994,736 | |
Total Value of Short-Term U.S. Government Obligations (cost $14,990,979) | | | 14,991,047 | |
Total Value of Investments (cost $525,035,544) | | | 98.3 | % | | | 579,419,692 | |
Other Assets, Less Liabilities | | | 1.7 | | | | 9,716,821 | |
Net Assets | | | 100.0 | % | | $ | 589,136,513 | |
Summary of Abbreviations:
ADR | American Depositary Receipts |
The Fund’s assets and liabilities are classified into the following three levels based on the inputs used to value the assets and liabilities:
| | Level 1 – | Unadjusted quoted prices in active markets for identical securities that the Fund has the ability to access. |
| | Level 2 – | Observable inputs other than quoted prices included in Level 1 that are observable for the asset or liability, either directly or indirectly. These inputs may include quoted prices for the identical instrument on an inactive market, prices for similar instruments, interest rates, prepayment speeds, credit risk, yield curves, default rates and similar data. |
| | Level 3 – | Unobservable inputs for the asset or liability, to the extent relevant observable inputs are not available, representing the Fund’s own assumption about the assumptions a market participant would use in valuing the asset or liability, and would be based on the best information available. |
The inputs methodology used for valuing securities are not necessarily an indication of the risk associated with investing in those securities. For example, U.S. government securities are reflected as Level 2 because the inputs used to determine fair value may not always be quoted prices in an active market.
99
Portfolio of Investments(continued)
GLOBAL FUND
March 31, 2019
The following is a summary, by category of Level, of inputs used to value the Fund’s investments as of March 31, 2019:
| | | Level 1 | | | Level 2 | | | Level 3 | | | Total | |
Common Stocks | | | | | | | | | | | | | | | | |
United States | | $ | 330,521,836 | | | $ | — | | | $ | — | | | $ | 330,521,836 | |
United Kingdom | | | 36,215,319 | | | | — | | | | — | | | | 36,215,319 | |
Japan | | | 33,248,262 | | | | — | | | | — | | | | 33,248,262 | |
China | | | 31,396,254 | | | | — | | | | — | | | | 31,396,254 | |
Germany | | | 29,165,729 | | | | — | | | | — | | | | 29,165,729 | |
Switzerland | | | 27,659,691 | | | | — | | | | — | | | | 27,659,691 | |
France | | | 12,112,557 | | | | — | | | | — | | | | 12,112,557 | |
Canada | | | 6,607,917 | | | | — | | | | — | | | | 6,607,917 | |
Italy | | | 6,445,685 | | | | — | | | | — | | | | 6,445,685 | |
Netherlands | | | 5,814,282 | | | | — | | | | — | | | | 5,814,282 | |
India | | | 5,570,296 | | | | — | | | | — | | | | 5,570,296 | |
Thailand | | | 5,175,378 | | | | — | | | | — | | | | 5,175,378 | |
Hong Kong | | | 5,147,829 | | | | — | | | | — | | | | 5,147,829 | |
South Korea | | | 4,703,139 | | | | — | | | | — | | | | 4,703,139 | |
Spain | | | 3,774,909 | | | | — | | | | — | | | | 3,774,909 | |
Australia | | | 3,476,054 | | | | — | | | | — | | | | 3,476,054 | |
Taiwan | | | 3,079,209 | | | | — | | | | — | | | | 3,079,209 | |
Poland | | | 2,917,122 | | | | — | | | | — | | | | 2,917,122 | |
Indonesia | | | 2,893,258 | | | | — | | | | — | | | | 2,893,258 | |
Israel | | | 2,722,280 | | | | — | | | | — | | | | 2,722,280 | |
Luxembourg | | | 2,638,369 | | | | — | | | | — | | | | 2,638,369 | |
Philippines | | | 2,223,196 | | | | — | | | | — | | | | 2,223,196 | |
Sweden | | | 920,074 | | | | — | | | | — | | | | 920,074 | |
Short-Term U.S. Government Obligations | | | — | | | | 14,991,047 | | | | — | | | | 14,991,047 | |
Total Investments in Securities | | $ | 564,428,645 | | | $ | 14,991,047 | | | $ | — | | | $ | 579,419,692 | |
During the period ended March 31, 2019, there were no transfers between Level 1 investments and Level 2 investments that had a material inpact to the Fund. This does not include transfers between Level 1 investments and Level 2 investments due to the Fund utilizing international fair value pricing during the period (see Note 1A). Transfers, if any, between Levels are recognized at the end of the reporting period.
See notes to financial statements
100
Fund Expenses(unaudited)
GROWTH & INCOME FUND
The examples below show the ongoing costs (in dollars) of investing in your Fund and will help you in comparing these costs with costs of other mutual funds. Please refer to page 1 for a detailed explanation of the information presented in these examples.
Expense Example | Annualized
Expense
Ratio | Beginning
Account Value
(10/1/18) | Ending
Account Value
(3/31/19) | Expenses Paid
During Period
(10/1/18-3/31/19)* |
Class A Shares | 1.16% | | | |
Actual | | $1,000.00 | $ 957.30 | $ 5.66 |
Hypothetical** | | $1,000.00 | $ 1,019.15 | $ 5.84 |
Class B Shares | 1.95% | | | |
Actual | | $1,000.00 | $ 953.71 | $ 9.50 |
Hypothetical** | | $1,000.00 | $ 1,015.21 | $ 9.80 |
Advisor Class Shares | 0.84% | | | |
Actual | | $1,000.00 | $ 959.15 | $ 4.10 |
Hypothetical** | | $1,000.00 | $ 1,020.74 | $ 4.23 |
Institutional Class Shares | 0.75% | | | |
Actual | | $1,000.00 | $ 959.05 | $ 3.66 |
Hypothetical** | | $1,000.00 | $ 1,021.19 | $ 3.78 |
* | Expenses are equal to the annualized expense ratio, multiplied by the average account value over the period, multiplied by 182/365 (to reflect the one-half year period). |
** | Assumed rate of return of 5% before expenses |
Portfolio Composition
TOP TEN SECTORS
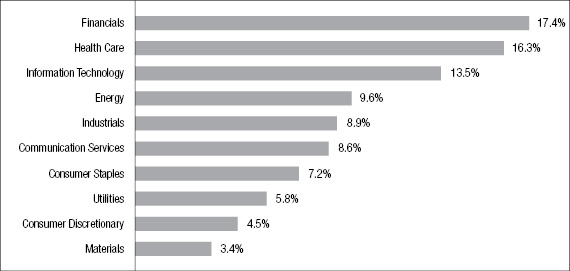
Portfolio holdings and allocations are subject to change. Percentages are as of March 31, 2019, and are based on the total market value of investments.
101
Portfolio of Investments
GROWTH & INCOME FUND
March 31, 2019
| |
Shares
| | | Security | | Value | |
| | | | | | COMMON STOCKS—94.6% | | | | |
| | | | | | Communication Services—8.4% | | | | |
| | | 11,500 | | * | Alphabet, Inc. - Class “A” | | $ | 13,534,235 | |
| | | 773,800 | | | AT&T, Inc. | | | 24,266,368 | |
| | | 174,700 | | | CBS Corp. - Class “B” | | | 8,303,491 | |
| | | 740,750 | | | Comcast Corp. - Special Shares “A” | | | 29,615,185 | |
| | | 295,066 | | | Fox Corp. - Class “B” | | | 10,586,968 | |
| | | 46,550 | | * | Take-Two Interactive Software, Inc. | | | 4,392,924 | |
| | | 554,550 | | | Verizon Communications, Inc. | | | 32,790,542 | |
| | | 154,110 | | | Walt Disney Co. | | | 17,110,833 | |
| | | | | | | | | 140,600,546 | |
| | | | | | Consumer Discretionary—4.5% | | | | |
| | | 122,350 | | | Aptiv, PLC | | | 9,725,602 | |
| | | 169,750 | | | Aramark Holdings Corp. | | | 5,016,113 | |
| | | 33,100 | | * | Burlington Stores, Inc. | | | 5,186,108 | |
| | | 69,950 | | | Home Depot, Inc. | | | 13,422,705 | |
| | | 125,300 | | | Lowe’s Cos., Inc. | | | 13,716,591 | |
| | | 64,900 | | | McDonald’s Corp. | | | 12,324,510 | |
| | | 53,600 | | | Ross Stores, Inc. | | | 4,990,160 | |
| | | 306,200 | | | Tapestry, Inc. | | | 9,948,438 | |
| | | | | | | | | 74,330,227 | |
| | | | | | Consumer Staples—7.1% | | | | |
| | | 75,050 | | | Altria Group, Inc. | | | 4,310,121 | |
| | | 363,800 | | | Coca-Cola Co. | | | 17,047,668 | |
| | | 387,954 | | | Koninklijke Ahold Delhaize NV (ADR) | | | 10,309,878 | |
| | | 169,400 | | | Mondelez International, Inc. - Class “A” | | | 8,456,448 | |
| | | 168,300 | | | PepsiCo, Inc. | | | 20,625,165 | |
| | | 172,400 | | | Philip Morris International, Inc. | | | 15,238,436 | |
| | | 213,150 | | | Procter & Gamble Co. | | | 22,178,257 | |
| | | 213,000 | | | Walmart, Inc. | | | 20,773,890 | |
| | | | | | | | | 118,939,863 | |
102
| |
Shares
| | | Security | | Value | |
| | | | | | Energy—9.5% | | | | |
| | | 565,636 | | | BP, PLC (ADR) | | $ | 24,729,606 | |
| | | 250,150 | | | Chevron Corp. | | | 30,813,477 | |
| | | 260,600 | | | ConocoPhillips | | | 17,392,444 | |
| | | 77,900 | | | EOG Resources, Inc. | | | 7,414,522 | |
| | | 346,250 | | | ExxonMobil Corp. | | | 27,977,000 | |
| | | 158,000 | | | Hess Corp. | | | 9,516,340 | |
| | | 190,750 | | | Marathon Petroleum Corp. | | | 11,416,387 | |
| | | 485,000 | | | Suncor Energy, Inc. | | | 15,728,550 | |
| | | 146,300 | | | Valero Energy Corp. | | | 12,410,629 | |
| | | | | | | | | 157,398,955 | |
| | | | | | Financials—17.2% | | | | |
| | | 151,300 | | | American Express Co. | | | 16,537,090 | |
| | | 1,018,250 | | | Bank of America Corp. | | | 28,093,517 | |
| | | 320,550 | | | Bank of New York Mellon Corp. | | | 16,165,336 | |
| | | 124,900 | | * | Berkshire Hathaway, Inc. - Class “B” | | | 25,091,161 | |
| | | 189,600 | | | Chubb, Ltd. | | | 26,559,168 | |
| | | 317,950 | | | Citigroup, Inc. | | | 19,782,849 | |
| | | 207,300 | | | Citizens Financial Group, Inc. | | | 6,737,250 | |
| | | 99,450 | | | Discover Financial Services | | | 7,076,862 | |
| | | 54,350 | | | Goldman Sachs Group, Inc. | | | 10,434,656 | |
| | | 376,330 | | | JPMorgan Chase & Co. | | | 38,095,886 | |
| | | 189,400 | | | Morgan Stanley | | | 7,992,680 | |
| | | 117,400 | | | PNC Financial Services Group, Inc. | | | 14,400,284 | |
| | | 184,950 | | | Sterling Bancorp | | | 3,445,619 | |
| | | 94,200 | | | Travelers Cos., Inc. | | | 12,920,472 | |
| | | 410,000 | | | U.S. Bancorp | | | 19,757,900 | |
| | | 685,600 | | | Wells Fargo & Co. | | | 33,128,192 | |
| | | | | | | | | 286,218,922 | |
| | | | | | Health Care—16.1% | | | | |
| | | 180,050 | | | Abbott Laboratories | | | 14,393,197 | |
| | | 61,200 | | | Anthem, Inc. | | | 17,563,176 | |
| | | 75,550 | | * | Centene Corp. | | | 4,011,705 | |
103
Portfolio of Investments(continued)
GROWTH & INCOME FUND
March 31, 2019
| |
Shares
| | | Security | | Value | |
| | | | | | Health Care (continued) |
| | | 77,379 | | | CVS Health Corp. | | $ | 4,173,049 | |
| | | 132,350 | | | Eli Lilly & Co. | | | 17,173,736 | |
| | | 188,300 | | | Gilead Sciences, Inc. | | | 12,241,383 | |
| | | 131,250 | | | Hill-Rom Holdings, Inc. | | | 13,894,125 | |
| | | 153,875 | | | Johnson & Johnson | | | 21,510,186 | |
| | | 228,500 | | | Koninklijke Philips NV (ADR) | | | 9,336,510 | |
| | | 243,150 | | | Medtronic, PLC | | | 22,146,102 | |
| | | 378,450 | | | Merck & Co., Inc. | | | 31,475,686 | |
| | | 681,801 | | | Pfizer, Inc. | | | 28,956,088 | |
| | | 207,250 | | | Smith & Nephew, PLC (ADR) | | | 8,312,798 | |
| | | 77,700 | | | Thermo Fisher Scientific, Inc. | | | 21,268,044 | |
| | | 54,900 | | | UnitedHealth Group, Inc. | | | 13,574,574 | |
| | | 130,900 | | | Zimmer Biomet Holdings, Inc. | | | 16,715,930 | |
| | | 112,800 | | | Zoetis, Inc. | | | 11,355,576 | |
| | | | | | | | | 268,101,865 | |
| | | | | | Industrials—8.8% | | | | |
| | | 32,000 | | | 3M Co. | | | 6,648,960 | |
| | | 15,500 | | | Boeing Co. | | | 5,912,010 | |
| | | 154,700 | | | Eaton Corp., PLC | | | 12,462,632 | |
| | | 270,550 | | * | Gardner Denver Holdings, Inc. | | | 7,523,995 | |
| | | 145,400 | | | Honeywell International, Inc. | | | 23,106,968 | |
| | | 142,150 | | | Ingersoll-Rand, PLC | | | 15,345,093 | |
| | | 57,250 | | | Lockheed Martin Corp. | | | 17,184,160 | |
| | | 91,950 | | | Owens Corning | | | 4,332,684 | |
| | | 56,550 | | | Stanley Black & Decker, Inc. | | | 7,700,414 | |
| | | 140,000 | | | Union Pacific Corp. | | | 23,408,000 | |
| | | 178,700 | | | United Technologies Corp. | | | 23,032,643 | |
| | | | | | | | | 146,657,559 | |
| | | | | | Information Technology—13.3% | | | | |
| | | 59,950 | | | Apple, Inc. | | | 11,387,502 | |
| | | 302,800 | | | Applied Materials, Inc. | | | 12,009,048 | |
| | | 62,250 | | | ASML Holdings NV | | | 11,706,113 | |
104
| |
Shares
| | | Security | | Value | |
| | | | | | Information Technology (continued) |
| | | 622,700 | | | Cisco Systems, Inc. | | $ | 33,619,573 | |
| | | 247,900 | | | Corning, Inc. | | | 8,205,490 | |
| | | 339,450 | | | eBay, Inc. | | | 12,607,173 | |
| | | 45,000 | | * | FleetCor Technologies, Inc. | | | 11,096,550 | |
| | | 576,875 | | | Intel Corp. | | | 30,978,187 | |
| | | 246,350 | | | Microsoft Corp. | | | 29,054,519 | |
| | | 45,550 | | | NXP Semiconductors NV | | | 4,026,165 | |
| | | 154,300 | | | Oracle Corp. | | | 8,287,453 | |
| | | 346,650 | | | QUALCOMM, Inc. | | | 19,769,450 | |
| | | 104,800 | | * | Synopsys, Inc. | | | 12,067,720 | |
| | | 102,050 | | | TE Connectivity, Ltd. | | | 8,240,538 | |
| | | 86,100 | | | Texas Instruments, Inc. | | | 9,132,627 | |
| | | | | | | | | 222,188,108 | |
| | | | | | Materials—3.3% | | | | |
| | | 67,800 | | | Celanese Corp. | | | 6,685,758 | |
| | | 296,550 | | | DowDuPont, Inc. | | | 15,809,080 | |
| | | 161,950 | | | FMC Corp. | | | 12,440,999 | |
| | | 69,350 | | | Linde, PLC | | | 12,200,746 | |
| | | 98,200 | | | LyondellBasell Industries NV - Class “A” | | | 8,256,656 | |
| | | | | | | | | 55,393,239 | |
| | | | | | Real Estate—.7% | | | | |
| | | 46,450 | | | Crown Castle International Corp. (REIT) | | | 5,945,600 | |
| | | 43,950 | | | Federal Realty Investment Trust (REIT) | | | 6,058,508 | |
| | | | | | | | | 12,004,108 | |
| | | | | | Utilities—5.7% | | | | |
| | | 109,650 | | | American Electric Power Co., Inc. | | | 9,183,187 | |
| | | 186,550 | | | CMS Energy Corp. | | | 10,360,987 | |
| | | 92,150 | | | Entergy Corp. | | | 8,812,304 | |
| | | 185,200 | | | Exelon Corp. | | | 9,284,076 | |
| | | 218,400 | | | FirstEnergy Corp. | | | 9,087,624 | |
| | | 53,150 | | | NextEra Energy, Inc. | | | 10,274,958 | |
105
Portfolio of Investments(continued)
GROWTH & INCOME FUND
March 31, 2019
| | Shares or
Principal
Amount | | | Security | | Value | |
| | | | | | Utilities (continued) |
| | | 107,850 | | | Pinnacle West Capital Corp. | | $ | 10,308,303 | |
| | | 160,450 | | | Utilities Select Sector SPDR Fund (ETF) | | | 9,333,377 | |
| | | 120,300 | | | WEC Energy Group, Inc. | | | 9,513,324 | |
| | | 167,050 | | | Xcel Energy, Inc. | | | 9,389,881 | |
| | | | | | | | | 95,548,021 | |
Total Value of Common Stocks (cost $1,122,197,047) | | | 1,577,381,413 | |
| | | | | | SHORT-TERM U.S. GOVERNMENT OBLIGATIONS—3.9% | | | | |
| | | | | | U.S. Treasury Bills: | | | | |
| | $ | 15,000M | | | 2.37%, 4/9/2019 | | | 14,992,095 | |
| | | 50,000M | | | 2.396%, 4/11/2019 | | | 49,967,100 | |
Total Value of Short-Term U.S. Government Obligations (cost $64,958,780) | | | 64,959,195 | |
Total Value of Investments (cost $1,187,155,827) | | | 98.5 | % | | | 1,642,340,608 | |
Other Assets, Less Liabilities | | | 1.5 | | | | 25,478,128 | |
Net Assets | | | 100.0 | % | | $ | 1,667,818,736 | |
Summary of Abbreviations:
ADR | American Depositary Receipts |
REIT | Real Estate Investment Trust |
SPDR | Standard & Poor’s Depository Receipts |
106
CALL OPTIONS
WRITTEN—(0.0)% | | Expiration
Date | | | Exercise
Price | | | Contracts | | | Value | |
Apple, Inc. | | | 4/18/19 | | | $ | 190.00 | | | | (100 | ) | | $ | (37,250 | ) |
CVS Health Corp. | | | 4/12/19 | | | | 56.50 | | | | (200 | ) | | | (6,400 | ) |
FleetCor Technlogies, Inc. | | | 4/18/19 | | | | 240.00 | | | | (100 | ) | | | (84,000 | ) |
Johnson & Johnson | | | 4/18/19 | | | | 140.00 | | | | (100 | ) | | | (20,250 | ) |
Microsoft Corp. | | | 4/5/19 | | | | 115.00 | | | | (100 | ) | | | (31,750 | ) |
Total Value of Call Options Written(premium received $127,039) | | $ | (179,650 | ) |
The Fund’s assets and liabilities are classified into the following three levels based on the inputs used to value the assets and liabilities:
| | Level 1 – | Unadjusted quoted prices in active markets for identical securities that the Fund has the ability to access. |
| | Level 2 – | Observable inputs other than quoted prices included in Level 1 that are observable for the asset or liability, either directly or indirectly. These inputs may include quoted prices for the identical instrument on an inactive market, prices for similar instruments, interest rates, prepayment speeds, credit risk, yield curves, default rates and similar data. |
| | Level 3 – | Unobservable inputs for the asset or liability, to the extent relevant observable inputs are not available, representing the Fund’s own assumption about the assumptions a market participant would use in valuing the asset or liability, and would be based on the best information available. |
The inputs methodology used for valuing securities are not necessarily an indication of the risk associated with investing in those securities. For example, U.S. government securities are reflected as Level 2 because the inputs used to determine fair value may not always be quoted prices in an active market.
The following is a summary, by category of Level, of inputs used to value the Fund’s investments as of March 31, 2019:
| | | Level 1 | | | Level 2 | | | Level 3 | | | Total | |
Common Stocks | | $ | 1,577,381,413 | | | $ | — | | | $ | — | | | $ | 1,577,381,413 | |
Short-Term U.S. Government Agency Obligations | | | — | | | | 64,959,195 | | | | — | | | | 64,959,195 | |
Total Investments in Securities* | | $ | 1,577,381,413 | | | $ | 64,959,195 | | | $ | — | | | $ | 1,642,340,608 | |
| | | | | | | | | | | | | | | | | |
Liabilities | | | | | | | | | | | | | | | | |
Call Options Written | | $ | — | | | $ | (179,650 | ) | | $ | — | | | $ | (179,650 | ) |
* | The Portfolio of Investments provides information on the industry categorization for common stocks. |
There were no transfers into or from Level 1 and Level 2 by the Fund during the period ended March 31, 2019. Transfers, if any, between Levels are recognized at the end of the reporting period.
See notes to financial statements
107
Fund Expenses(unaudited)
HEDGED U.S. EQUITY OPPORTUNITIES FUND
The examples below show the ongoing costs (in dollars) of investing in your Fund and will help you in comparing these costs with costs of other mutual funds. Please refer to page 1 for a detailed explanation of the information presented in these examples.
Expense Example | Annualized
Expense
Ratio | Beginning
Account Value
(10/1/18) | Ending
Account Value
(3/31/19) | Expenses Paid
During Period
(10/1/18-3/31/19)* |
Class A Shares | 1.75% | | | |
Actual | | $1,000.00 | $ 999.23 | $ 8.72 |
Hypothetical** | | $1,000.00 | $ 1,016.20 | $ 8.80 |
Advisor Class Shares | 1.42% | | | |
Actual | | $1,000.00 | $ 1,000.12 | $ 7.08 |
Hypothetical** | | $1,000.00 | $ 1,017.85 | $ 7.14 |
Institutional Class Shares | 1.31% | | | |
Actual | | $1,000.00 | $ 1,001.88 | $ 6.54 |
Hypothetical** | | $1,000.00 | $ 1,018.40 | $ 6.59 |
* | Expenses are equal to the annualized expense ratio, multiplied by the average account value over the period, multiplied by 182/365 (to reflect the one-half year period). Expenses paid during the period are net of expenses waived. |
** | Assumed rate of return of 5% before expenses |
Portfolio Composition
TOP TEN SECTORS
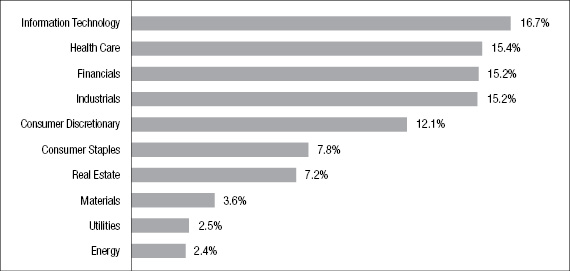
Portfolio holdings and allocations are subject to change. Percentages are as of March 31, 2019, and are based on the total market value of investments.
108
Portfolio of Investments
HEDGED U.S. EQUITY OPPORTUNITIES FUND
March 31, 2019
| |
Shares
| | | Security | | Value | |
| | | | | | COMMON STOCKS—92.6% | | | | |
| | | | | | Communication Services—1.7% | | | | |
| | | 44,543 | | | AT&T, Inc. | | $ | 1,396,868 | |
| | | 5,744 | | | CBS Corp. - Class “B” | | | 273,012 | |
| | | 19,025 | | | Comcast Corp. - Special Shares “A” | | | 760,619 | |
| | | 12,115 | | | Verizon Communications, Inc. | | | 716,360 | |
| | | | | | | | | 3,146,859 | |
| | | | | | Consumer Discretionary—11.2% | | | | |
| | | 1,082 | | * | Amazon.com, Inc. | | | 1,926,771 | |
| | | 864 | | | Autoliv, Inc. | | | 63,530 | |
| | | 194 | | * | Booking Holdings, Inc. | | | 338,513 | |
| | | 8,466 | | | Caleres, Inc. | | | 209,026 | |
| | | 8,581 | | * | CarMax, Inc. | | | 598,954 | |
| | | 3,241 | | | Carter’s, Inc. | | | 326,660 | |
| | | 10,362 | | | Choice Hotels International, Inc. | | | 805,542 | |
| | | 31,801 | | | Compass Group, PLC (United Kingdom) | | | 747,413 | |
| | | 8,481 | | | D.R. Horton, Inc. | | | 350,944 | |
| | | 4,436 | | | Expedia, Inc. | | | 527,884 | |
| | | 7,888 | | | General Motors Corp. | | | 292,645 | |
| | | 5,625 | | | Genuine Parts Co. | | | 630,169 | |
| | | 9,018 | | | Home Depot, Inc. | | | 1,730,464 | |
| | | 2,094 | | | Marriott International, Inc. - Class “A” | | | 261,938 | |
| | | 5,609 | | | Marriott Vacations Worldwide Corp. | | | 524,442 | |
| | | 10,103 | | | McDonald’s Corp. | | | 1,918,560 | |
| | | 3,009 | | * | Netflix, Inc. | | | 1,072,889 | |
| | | 29,449 | | | Newell Brands, Inc. | | | 451,748 | |
| | | 17,283 | | | NIKE, Inc. - Class “B” | | | 1,455,401 | |
| | | 5,690 | | * | Norwegian Cruise Line Holdings, Inc. | | | 312,722 | |
| | | 394 | | * | NVR, Inc. | | | 1,090,198 | |
| | | 5,994 | | * | Ocean Outdoors, Ltd. (Virgin Islands) | | | 47,353 | |
| | | 10,429 | | | Ross Stores, Inc. | | | 970,940 | |
| | | 4,542 | | | Royal Caribbean Cruises, Ltd. | | | 520,604 | |
| | | 9,265 | | * | Skechers USA, Inc. | | | 311,397 | |
| | | 24,790 | | | TJX Cos., Inc. | | | 1,319,076 | |
109
Portfolio of Investments(continued)
HEDGED U.S. EQUITY OPPORTUNITIES FUND
March 31, 2019
| |
Shares
| | | Security | | Value | |
| | | | | | Consumer Discretionary (continued) |
| | | 5,082 | | | Tractor Supply Co. | | $ | 496,816 | |
| | | 29,251 | | * | Under Armour, Inc. - Class “A” | | | 618,366 | |
| | | 811 | | * | Veoneer, Inc. | | | 18,548 | |
| | | 1,341 | | * | Wayfair, Inc. - Class “A” | | | 199,071 | |
| | | 562 | | | Whirlpool Corp. | | | 74,684 | |
| | | 2,008 | | | Wyndham Destinations, Inc. | | | 81,304 | |
| | | 2,008 | | | Wyndham Hotels & Resorts, Inc. | | | 100,380 | |
| | | | | | | | | 20,394,952 | |
| | | | | | Consumer Staples—7.2% | | | | |
| | | 23,211 | | | Altria Group, Inc. | | | 1,333,008 | |
| | | 3,589 | | | Archer-Daniels-Midland Co. | | | 154,794 | |
| | | 8,051 | | | British American Tobacco, PLC (United Kingdom) | | | 334,925 | |
| | | 875 | | | Bunge, Ltd. | | | 46,436 | |
| | | 38,441 | | | Coca-Cola Co. | | | 1,801,345 | |
| | | 22,425 | | | Colgate-Palmolive Co. | | | 1,537,009 | |
| | | 3,775 | | | Costco Wholesale Corp. | | | 914,078 | |
| | | 16,103 | | | Coty, Inc. - Class “A” | | | 185,185 | |
| | | 42,064 | | | Diageo, PLC (United Kingdom) | | | 1,719,201 | |
| | | 3,312 | | | Hershey Co. | | | 380,317 | |
| | | 1,194 | | | J.M. Smucker Co. | | | 139,101 | |
| | | 3,014 | | | Kellogg Co. | | | 172,943 | |
| | | 11,240 | | | Kroger Co. | | | 276,504 | |
| | | 8,000 | | | Lamb Weston Holdings, Inc. | | | 599,520 | |
| | | 6,491 | | * | Monster Beverage Corp. | | | 354,279 | |
| | | 14,188 | | | PepsiCo, Inc. | | | 1,738,739 | |
| | | 5,908 | | | Philip Morris International, Inc. | | | 522,208 | |
| | | 16,094 | | * | U.S. Foods Holding Corp. | | | 561,842 | |
| | | 5,070 | | | Walgreens Boots Alliance, Inc. | | | 320,779 | |
| | | | | | | | | 13,092,213 | |
| | | | | | Energy—2.2% | | | | |
| | | 4,516 | | | Anadarko Petroleum Corp. | | | 205,388 | |
| | | 883 | | * | Apergy Corp. | | | 36,256 | |
110
| |
Shares
| | | Security | | Value | |
| | | | | | Energy (continued) |
| | | 16,706 | | | Canadian Natural Resources, Ltd. (ADR) (Canada) | | $ | 459,415 | |
| | | 4,401 | | | Chevron Corp. | | | 542,115 | |
| | | 4,412 | | | Cimarex Energy Co. | | | 308,399 | |
| | | 4,167 | | | Concho Resources, Inc. | | | 462,370 | |
| | | 7,680 | | | Diamondback Energy, Inc. | | | 779,750 | |
| | | 7,967 | | | Enbridge, Inc. (ADR) (Canada) | | | 288,883 | |
| | | 51,712 | | | EnCana Corp. | | | 374,395 | |
| | | 8,444 | | | Halliburton Co. | | | 247,409 | |
| | | 1,249 | | | Marathon Petroleum Corp. | | | 74,753 | |
| | | 8,287 | | | Tenaris SA (ADR) (Italy) | | | 234,108 | |
| | | | | | | | | 4,013,241 | |
| | | | | | Financials—14.1% | | | | |
| | | 22,764 | | | Aflac, Inc. | | | 1,138,200 | |
| | | 523 | | | Alleghany Corp. | | | 320,285 | |
| | | 4,189 | | | Allstate Corp. | | | 394,520 | |
| | | 18,907 | | | American Express Co. | | | 2,066,535 | |
| | | 5,215 | | | American International Group, Inc. | | | 224,558 | |
| | | 3,524 | | | Assurant, Inc. | | | 334,463 | |
| | | 5,950 | | * | Athene Holding, Ltd. - Class “A” | | | 242,760 | |
| | | 8,479 | | | Bank OZK | | | 245,721 | |
| | | 3,793 | | * | Berkshire Hathaway, Inc. - Class “B” | | | 761,976 | |
| | | 11,728 | | | Chubb, Ltd. | | | 1,642,858 | |
| | | 9,054 | | | Citigroup, Inc. | | | 563,340 | |
| | | 37,655 | | | CNO Financial Group, Inc. | | | 609,258 | |
| | | 5,853 | | | Comerica, Inc. | | | 429,142 | |
| | | 1,847 | | * | Credit Acceptance Corp. | | | 834,715 | |
| | | 2,313 | | | FactSet Research Systems, Inc. | | | 574,249 | |
| | | 677 | | | Fairfax Financial Holdings, Ltd. (Canada) | | | 313,588 | |
| | | 11,908 | | | Fidelity National Financial, Inc. | | | 435,237 | |
| | | 558 | | | First Citizens BancShares, Inc. - Class “A” | | | 227,218 | |
| | | 4,933 | | | First Republic Bank | | | 495,569 | |
| | | 6,734 | | | IBERIABANK Corp. | | | 482,895 | |
| | | 13,200 | | * | J2 Acquisition, Ltd. (ADR) (Virgin Islands) | | | 119,460 | |
111
Portfolio of Investments(continued)
HEDGED U.S. EQUITY OPPORTUNITIES FUND
March 31, 2019
| |
Shares
| | | Security | | Value | |
| | | | | | Financials (continued) |
| | | 30,305 | | | KeyCorp | | $ | 477,304 | |
| | | 20,378 | | | Lancashire Holdings, Ltd. (United Kingdom) | | | 173,448 | |
| | | 12,162 | | | Lincoln National Corp. | | | 713,909 | |
| | | 8,894 | | | M&T Bank Corp. | | | 1,396,536 | |
| | | 1,394 | | * | Markel Corp. | | | 1,388,759 | |
| | | 11,092 | | | Marsh & McLennan Cos., Inc. | | | 1,041,539 | |
| | | 17,432 | | | MetLife, Inc. | | | 742,080 | |
| | | 1,593 | | | Moody’s Corp. | | | 288,476 | |
| | | 22,300 | | | People’s United Financial, Inc. | | | 366,612 | |
| | | 13,886 | | | PNC Financial Services Group, Inc. | | | 1,703,257 | |
| | | 2,439 | | | Raymond James Financial, Inc. | | | 196,120 | |
| | | 3,832 | | | Reinsurance Group of America, Inc. | | | 544,067 | |
| | | 4,811 | | | RenaissanceRe Holdings | | | 690,379 | |
| | | 28,325 | | | SLM Corp. | | | 280,701 | |
| | | 6,945 | | | TD Ameritrade Holding Corp. | | | 347,181 | |
| | | 4,750 | | | Travelers Cos., Inc. | | | 651,510 | |
| | | 11,007 | | | Unum Group | | | 372,367 | |
| | | 4,137 | | | Voya Financial, Inc. | | | 206,685 | |
| | | 13,275 | | | Wells Fargo & Co. | | | 641,448 | |
| | | 464 | | | White Mountain Insurance Group | | | 429,423 | |
| | | 12,634 | | | Zions Bancorp | | | 573,710 | |
| | | | | | | | | 25,682,058 | |
| | | | | | Health Care—14.3% | | | | |
| | | 7,281 | | * | Acadia Healthcare Co., Inc. | | | 213,406 | |
| | | 5,401 | | | Agilent Technologies, Inc. | | | 434,132 | |
| | | 3,263 | | * | Align Technology, Inc. | | | 927,769 | |
| | | 5,841 | | * | Alkermes, PLC (Ireland) | | | 213,138 | |
| | | 2,034 | | | Allergan, PLC | | | 297,798 | |
| | | 4,273 | | * | Alnylam Pharmaceuticals, Inc. | | | 399,312 | |
| | | 3,744 | | | AstraZeneca, PLC (ADR) (United Kingdom) | | | 151,370 | |
| | | 19,742 | | | Baxter International, Inc. | | | 1,605,222 | |
| | | 5,552 | | | Becton, Dickinson & Co. | | | 1,386,501 | |
| | | 883 | | * | Biogen, Inc. | | | 208,724 | |
112
| |
Shares
| | | Security | | Value | |
| | | | | | Health Care (continued) |
| | | 6,295 | | | Bristol-Myers Squibb Co. | | $ | 300,334 | |
| | | 13,440 | | | CVS Health Corp. | | | 724,819 | |
| | | 11,066 | | | Danaher Corp. | | | 1,460,933 | |
| | | 2,711 | | | Dentsply Sirona, Inc. | | | 134,438 | |
| | | 8,397 | | * | Exact Sciences Corp. | | | 727,348 | |
| | | 2,311 | | * | Five Prime Therapeutics, Inc. | | | 30,967 | |
| | | 7,758 | | * | Haemonetics Corp. | | | 678,670 | |
| | | 5,558 | | | Hill-Rom Holdings, Inc. | | | 588,370 | |
| | | 2,256 | | * | Incyte Corp. | | | 194,039 | |
| | | 8,726 | | * | Insulet Corp. | | | 829,755 | |
| | | 5,805 | | * | Ionis Pharmaceuticals, Inc. | | | 471,192 | |
| | | 18,717 | | | Johnson & Johnson | | | 2,616,449 | |
| | | 9,298 | | | Koninklijke Philips NV (ADR) (Netherlands) | | | 379,916 | |
| | | 3,596 | | * | Laboratory Corp. of America | | | 550,116 | |
| | | 2,750 | | | McKesson Corp. | | | 321,915 | |
| | | 18,974 | | | Medtronic, PLC | | | 1,728,152 | |
| | | 17,832 | | | Merck & Co., Inc. | | | 1,483,087 | |
| | | 578 | | * | Mettler Toledo International, Inc. | | | 417,894 | |
| | | 5,388 | | * | Mylan NV | | | 152,696 | |
| | | 4,787 | | * | Penumbra, Inc. | | | 703,737 | |
| | | 41,731 | | | Pfizer, Inc. | | | 1,772,316 | |
| | | 2,875 | | * | Seattle Genetic, Inc. | | | 210,565 | |
| | | 7,345 | | | Stryker Corp. | | | 1,450,784 | |
| | | 1,376 | | | Teleflex, Inc. | | | 415,772 | |
| | | 3,077 | | | UnitedHealth Group, Inc. | | | 760,819 | |
| | | 5,256 | | * | Veeva Systems, Inc. - Class “A” | | | 666,776 | |
| | | 1,284 | | * | WellCare Health Plans, Inc. | | | 346,359 | |
| | | | | | | | | 25,955,590 | |
| | | | | | Industrials—14.1% | | | | |
| | | 4,534 | | | 3M Co. | | | 942,075 | |
| | | 2,093 | | | AMERCO | | | 777,570 | |
| | | 22,137 | | | Canadian National Railway Co. (Canada) | | | 1,981,703 | |
| | | 2,730 | | * | Cimpress NV | | | 218,755 | |
113
Portfolio of Investments(continued)
HEDGED U.S. EQUITY OPPORTUNITIES FUND
March 31, 2019
| | Shares | | | Security | | Value | |
| | | | | | Industrials (continued) |
| | | 5,097 | | | Cintas Corp. | | $ | 1,030,155 | |
| | | 6,883 | | * | Clean Harbors, Inc. | | | 492,341 | |
| | | 2,507 | | * | CoStar Group, Inc. | | | 1,169,315 | |
| | | 8,156 | | | CSX Corp. | | | 610,232 | |
| | | 1,444 | | | Cummins, Inc. | | | 227,964 | |
| | | 5,982 | | | Delta Air Lines, Inc. | | | 308,970 | |
| | | 3,730 | | | Dover Corp. | | | 349,874 | |
| | | 3,938 | | | Equifax, Inc. | | | 466,653 | |
| | | 10,338 | | | Expeditors International of Washington, Inc. | | | 784,654 | |
| | | 7,120 | | | Fastenal Co. | | | 457,887 | |
| | | 7,121 | | | Fortune Brands Home & Security, Inc. | | | 339,031 | |
| | | 5,524 | | | General Dynamics Corp. | | | 935,103 | |
| | | 17,753 | | * | Genesee & Wyoming, Inc. - Class “A” | | | 1,546,996 | |
| | | 7,994 | | | Herman Miller, Inc. | | | 281,229 | |
| | | 518 | | | Huntington Ingalls Industries, Inc. | | | 107,330 | |
| | | 7,042 | | | IDEX Corp. | | | 1,068,553 | |
| | | 7,546 | | | Ingersoll-Rand, PLC | | | 814,591 | |
| | | 6,406 | | * | Itron, Inc. | | | 298,840 | |
| | | 14,548 | | * | JELD-WEN Holding, Inc. | | | 256,918 | |
| | | 7,134 | | | Johnson Controls International, PLC | | | 263,530 | |
| | | 3,049 | | | L3 Technologies, Inc. | | | 629,222 | |
| | | 4,868 | | | Lennox International, Inc. | | | 1,287,099 | |
| | | 2,728 | | | Lockheed Martin Corp. | | | 818,836 | |
| | | 1,201 | | * | Middleby Corp. | | | 156,166 | |
| | | 25,602 | | * | Milacron Holdings Corp. | | | 289,815 | |
| | | 10,805 | | | PACCAR, Inc. | | | 736,253 | |
| | | 13,627 | | | Republic Services, Inc. | | | 1,095,338 | |
| | | 4,186 | | | Rockwell Automation, Inc. | | | 734,476 | |
| | | 25,443 | | | Sanwa Holdings Corp. (Japan) | | | 302,341 | |
| | | 8,090 | | | Southwest Airlines Co. | | | 419,952 | |
| | | 22,018 | | | Steelcase, Inc. - Class “A” | | | 320,362 | |
| | | 6,638 | | | TransUnion | | | 443,684 | |
| | | 7,759 | | | Union Pacific Corp. | | | 1,297,305 | |
| | | 4,437 | | | Wabtec Corp. | | | 327,096 | |
114
| |
Shares
| | | Security | | Value | |
| | | | | | Industrials (continued) |
| | | 4,312 | | | Waste Connections, Inc. | | $ | 382,000 | |
| | | 8,071 | | | Xylem, Inc. | | | 637,932 | |
| | | | | | | | | 25,608,146 | |
| | | | | | Information Technology—15.4% | | | | |
| | | 2,986 | | * | 2U, Inc. | | | 211,558 | |
| | | 6,229 | | | Accenture, PLC - Class “A” | | | 1,096,429 | |
| | | 31,384 | | * | Advanced Micro Devices, Inc. | | | 800,920 | |
| | | 2,104 | | * | Alibaba Group Holding, Ltd. (ADR) (China) | | | 383,875 | |
| | | 32,200 | | * | Allscripts Healthcare Solution, Inc. | | | 307,188 | |
| | | 9,556 | | | Amdocs, Ltd. | | | 517,075 | |
| | | 11,456 | | * | Black Knight, Inc. | | | 624,352 | |
| | | 1,438 | | | Broadcom, Inc. | | | 432,421 | |
| | | 4,202 | | | CDW Corp. | | | 404,947 | |
| | | 3,085 | | * | Coherent, Inc. | | | 437,206 | |
| | | 1,044 | | | Constellation Software, Inc. (Canada) | | | 884,746 | |
| | | 7,190 | | * | Delivery Hero AG (Germany) | | | 259,707 | |
| | | 2,458 | | * | Electronic Arts, Inc. | | | 249,807 | |
| | | 4,570 | | * | FleetCor Technologies, Inc. | | | 1,126,916 | |
| | | 25,017 | | | Genpact, Ltd. | | | 880,098 | |
| | | 3,303 | | | Global Payments, Inc. | | | 450,926 | |
| | | 15,681 | | * | GoDaddy, Inc. - Class “A” | | | 1,179,054 | |
| | | 7,923 | | * | Guidewire Software, Inc. | | | 769,799 | |
| | | 3,894 | | | Harris Corp. | | | 621,911 | |
| | | 17,677 | | * | Ichor Holdings, Ltd. | | | 399,147 | |
| | | 11,506 | | | Intel Corp. | | | 617,872 | |
| | | 3,568 | | | International Business Machines Corp. | | | 503,445 | |
| | | 35,892 | | * | Just Eat, PLC (United Kingdom) | | | 351,076 | |
| | | 3,289 | | | KLA-Tencor Corp. | | | 392,739 | |
| | | 5,701 | | | Leidos Holdings, Inc. | | | 365,377 | |
| | | 8,441 | | | Marvell Technology Group, Ltd. | | | 167,891 | |
| | | 6,273 | | | Maxim Integrated Products, Inc. | | | 333,535 | |
| | | 3,187 | | * | Micron Technology, Inc. | | | 131,719 | |
| | | 13,166 | | | Microsoft Corp. | | | 1,552,798 | |
115
Portfolio of Investments(continued)
HEDGED U.S. EQUITY OPPORTUNITIES FUND
March 31, 2019
| |
Shares
| | | Security | | Value | |
| | | | | | Information Technology (continued) |
| | | 2,985 | | | Motorola Solutions, Inc. | | $ | 419,154 | |
| | | 5,449 | | | Samsung Electronics Co., Ltd. (South Korea) | | | 214,340 | |
| | | 5,302 | | | ServiceNow, Inc. | | | 1,306,890 | |
| | | 3,730 | | * | Shopify, Inc. - Class “A” (ADR) (Canada) | | | 770,693 | |
| | | 8,100 | | | Silicon Motion Technology Corp. (ADR) (Taiwan) | | | 321,084 | |
| | | 3,806 | | * | Splunk, Inc. | | | 474,228 | |
| | | 8,368 | | * | Spotify Technology SA | | | 1,161,478 | |
| | | 22,698 | | | SS&C Technologies Holdings, Inc. | | | 1,445,636 | |
| | | 13,780 | | | TE Connectivity, Ltd. | | | 1,112,735 | |
| | | 2,574 | | * | VeriSign, Inc. | | | 467,335 | |
| | | 6,843 | | | Visa, Inc. - Class “A” | | | 1,068,808 | |
| | | 4,739 | | | VMware, Inc. - Class”A” | | | 855,437 | |
| | | 9,369 | | | Western Digital Corp. | | | 450,274 | |
| | | 1,259 | | * | Wex, Inc. | | | 241,715 | |
| | | 4,753 | | * | Workday, Inc. - Class “A” | | | 916,616 | |
| | | 11,409 | | * | Yandex NV - Class “A” (ADR) (Russia) | | | 391,785 | |
| | | | | | | | | 28,072,742 | |
| | | | | | Materials—3.4% | | | | |
| | | 4,902 | | * | Alcoa Corp. | | | 138,040 | |
| | | 9,715 | | | Ball Corp. | | | 562,110 | |
| | | 4,382 | | | Cabot Corp. | | | 182,423 | |
| | | 8,691 | | | Celanese Corp. - Class “A” | | | 857,020 | |
| | | 7,270 | | | CRH, PLC (Ireland) | | | 224,885 | |
| | | 5,944 | | | Eastman Chemical Co. | | | 451,031 | |
| | | 10,531 | | | FMC Corp. | | | 808,991 | |
| | | 6,524 | | | Linde, PLC | | | 1,147,767 | |
| | | 3,265 | | * | Livent Corp. | | | 40,094 | |
| | | 8,126 | | | Nucor Corp. | | | 474,152 | |
| | | 3,282 | | | Nutrien, Ltd. (Canada) | | | 173,095 | |
| | | 5,137 | | | Reliance Steel & Aluminum Co. | | | 463,666 | |
| | | 1,446 | | | Sherwin-Williams Co. | | | 622,807 | |
| | | | | | | | | 6,146,081 | |
116
| |
Shares
| | | Security | | Value | |
| | | | | | Real Estate—6.7% | | | | |
| | | 7,958 | | | Acadia Realty Trust (REIT) | | $ | 217,015 | |
| | | 2,013 | | | Alexandria Real Estate Equities, Inc. (REIT) | | | 286,973 | |
| | | 13,715 | | | American Tower Corp. (REIT) | | | 2,702,678 | |
| | | 4,140 | | | AvalonBay Communities, Inc. (REIT) | | | 831,022 | |
| | | 41,603 | | | Brixmor Property Group, Inc. (REIT) | | | 764,247 | |
| | | 11,659 | | | Columbia Property Trust, Inc. (REIT) | | | 262,444 | |
| | | 6,061 | | | Crown Castle International Corp. (REIT) | | | 775,808 | |
| | | 1,886 | | | Equinix, Inc. (REIT) | | | 854,660 | |
| | | 880 | | | Federal Realty Investment Trust (REIT) | | | 121,308 | |
| | | 23,965 | | | Host Hotels & Resorts, Inc. (REIT) | | | 452,939 | |
| | | 14,374 | | | Kimco Realty Corp. (REIT) | | | 265,919 | |
| | | 1,124 | | | Mid-America Apartment Communities, Inc. (REIT) | | | 122,887 | |
| | | 3,558 | | | PS Business Park, Inc. (REIT) | | | 558,001 | |
| | | 9,398 | | | Public Storage (REIT) | | | 2,046,696 | |
| | | 1,640 | | | Simon Property Group, Inc. (REIT) | | | 298,824 | |
| | | 814 | | | SL Green Realty Corp. (REIT) | | | 73,195 | |
| | | 16,885 | | | STORE Capital Corp. (REIT) | | | 565,648 | |
| | | 5,524 | | | UDR, Inc. (REIT) | | | 251,121 | |
| | | 9,567 | | | Welltower, Inc. (REIT) | | | 742,399 | |
| | | | | | | | | 12,193,784 | |
| | | | | | Utilities—2.3% | | | | |
| | | 5,074 | | | CMS Energy Corp. | | | 281,810 | |
| | | 5,150 | | | Dominion Energy, Inc. | | | 394,799 | |
| | | 4,476 | | | Eversourse Energy | | | 317,572 | |
| | | 7,417 | | | Iberdrola SA (ADR) (Spain) | | | 260,930 | |
| | | 10,133 | | | NRG Energy, Inc. | | | 430,450 | |
| | | 2,970 | | | OGE Energy Corp. | | | 128,066 | |
| | | 2,057 | | | Pinnacle West Capital Corp. | | | 196,608 | |
| | | 1,900 | | | Sempra Energy | | | 239,134 | |
| | | 20,584 | | | Southern Co. | | | 1,063,781 | |
117
Portfolio of Investments(continued)
HEDGED U.S. EQUITY OPPORTUNITIES FUND
March 31, 2019
| |
Shares
| | | Security | | Value | |
| | | | | | Utilities (continued) | | | | |
| | | 17,070 | | | UGI Corp. | | $ | 946,019 | |
| | | | | | | | | 4,259,169 | |
Total Value of Common Stocks (cost $150,037,589) | | | 168,564,835 | |
PUT OPTIONS PURCHASED—.7% |
| | Contracts | | S&P 500 Index | | Exercise Price | | | Notional Amount | | | Value | |
| | | 44 | | Expiration 6/21/2019 | | $ | 2,450 | | | $ | 12,471,360 | | | $ | 39,600 | |
| | | 43 | | Expiration 9/20/2019 | | | 2,650 | | | | 12,187,920 | | | | 243,165 | |
| | | 60 | | Expiration 12/20/2019 | | | 2,525 | | | | 17,006,400 | | | | 341,400 | |
| | | 63 | | Expiration 3/20/2020 | | | 2,625 | | | | 17,856,720 | | | | 608,265 | |
Total Value of Put Options Purchased (premium paid $1,749,638) | | | 1,232,430 | |
| | | | | | WARRANTS—.0% | | | | |
| | | | | | Financials | | | | |
| | | 13,200 | | * | J2 Acquisition, Ltd. (Virgin Islands)
(Expires 9/7/2027) (cost $132) | | | 2,343 | |
Total Value of Investments(cost $151,787,359) | | | 93.3 | % | | | 169,799,608 | |
Other Assets, Less Liabilities | | | 6.7 | | | | 12,175,976 | |
Net Assets | | | 100.0 | % | | $ | 181,975,584 | |
118
PUT OPTIONS WRITTEN—(.3)% |
| | Contracts | | S&P 500 Index | | Exercise Price | | | Notional Amount | | | Value | |
| | | (43 | ) | Expiration 9/20/2019 | | $ | 2,425 | | | $ | (12,187,920 | ) | | $ | (112,230 | ) |
| | | (60 | ) | Expiration 12/20/2019 | | | 2,325 | | | | (17,006,400 | ) | | | (191,100 | ) |
| | | (63 | ) | Expiration 3/20/2020 | | | 2,325 | | | | (17,856,720 | ) | | | (311,220 | ) |
Total Value of Put Options Written(premium received $771,615) | | $ | (614,550 | ) |
Futures contracts outstanding at March 31, 2019:
| | Number of
Contracts | | Type | | Expiration | | | Notional
Amounts | | | Value at
March 31,
2019 | | | Unrealized
Depreciation | |
| | | (13 | ) | E-mini Russell 2000 Index | | | June 2019 | | | $ | (1,002,398 | ) | | $ | (1,003,496 | ) | | $ | (1,098 | ) |
| | | (58 | ) | E-mini S&P 500 | | | June 2019 | | | | (8,051,850 | ) | | | (8,229,735 | ) | | | (177,885 | ) |
| | | (54 | ) | E-mini S&P MidCap 400 | | | June 2019 | | | | (10,190,880 | ) | | | (10,265,513 | ) | | | (74,633 | ) |
| | | (49 | ) | Euro STOXX 50 Index | | | June 2019 | | | | (1,760,438 | ) | | | (1,798,587 | ) | | | (38,149 | ) |
| | | (45 | ) | FTSE 100 Index | | | June 2019 | | | | (4,124,769 | ) | | | (4,226,774 | ) | | | (102,005 | ) |
| | | (32 | ) | MSCI EAFE Index | | | June 2019 | | | | (2,930,560 | ) | | | (2,986,298 | ) | | | (55,738 | ) |
| | | (18 | ) | MSCI EM Index | | | June 2019 | | | | (939,340 | ) | | | (951,695 | ) | | | (12,355 | ) |
| | | (38 | ) | S&P/TSE 60 Index | | | June 2019 | | | | (5,423,819 | ) | | | (5,443,237 | ) | | | (19,418 | ) |
(Premium received $602) | | | | | | $ | (481,281 | ) |
At March 31, 2019, the Fund has open foreign exchange contracts as described below.
The unrealized appreciation on the open contracts were as follows:
Counterparty | | Settlement
Date | | Foreign
Currency | | Receive
(Deliver) | | | Asset | | | Liability | | | Unrealized
Appreciation | |
MS | | | 6/19/19 | | JPY | | | (16,318,000 | ) | | $ | 147,234 | | | $ | 147,519 | | | $ | 285 | |
GS | | | 6/19/19 | | EUR | | | (89,000 | ) | | | 99,836 | | | | 101,353 | | | | 1,517 | |
Net unrealized appreciation on open foreign exchange contracts | | $ | 1,802 | |
A summary of abbreviations for counterparties to foreign exchange contracts are as follows:
119
Portfolio of Investments(continued)
HEDGED U.S. EQUITY OPPORTUNITIES FUND
March 31, 2019
Summary of Abbreviations:
ADR | American Depositary Receipts |
REIT | Real Estate Investment Trust |
The Fund’s assets and liabilities are classified into the following three levels based on the inputs used to value the assets and liabilities:
| | Level 1 – | Unadjusted quoted prices in active markets for identical securities that the Fund has the ability to access. |
| | Level 2 – | Observable inputs other than quoted prices included in Level 1 that are observable for the asset or liability, either directly or indirectly. These inputs may include quoted prices for the identical instrument on an inactive market, prices for similar instruments, interest rates, prepayment speeds, credit risk, yield curves, default rates and similar data. |
| | Level 3 – | Unobservable inputs for the asset or liability, to the extent relevant observable inputs are not available, representing the Fund’s own assumption about the assumptions a market participant would use in valuing the asset or liability, and would be based on the best information available. |
The inputs methodology used for valuing securities are not necessarily an indication of the risk associated with investing in those securities. For example, U.S. government securities are reflected as Level 2 because the inputs used to determine fair value may not always be quoted prices in an active market.
The following is a summary, by category of Level, of inputs used to value the Fund’s investments as of March 31, 2019:
| | | Level 1 | | | Level 2 | | | Level 3 | | | Total | |
Assets | | | | | | | | | | | | | | | | |
Common Stocks | | $ | 168,564,835 | | | $ | — | | | $ | — | | | $ | 168,564,835 | |
Put Options Purchased | | | — | | | | 1,232,430 | | | | — | | | | 1,232,430 | |
Warrants | | | 2,343 | | | | — | | | | — | | | | 2,343 | |
Total Investments in Securities* | | $ | 168,567,178 | | | $ | 1,232,430 | | | $ | — | | | $ | 169,799,608 | |
| | | | | | | | | | | | | | | | | |
Liabilities | | | | | | | | | | | | | | | | |
Put Options Written | | $ | — | | | $ | (614,550 | ) | | $ | — | | | $ | (614,550 | ) |
| | | | | | | | | | | | | | | | | |
Other Liabilities | | | | | | | | | | | | | | | | |
Futures Contracts | | $ | (480,679 | ) | | $ | — | | | $ | — | | | $ | (480,679 | ) |
| | | | | | | | | | | | | | | | | |
Other Financial Instruments** | | $ | — | | | $ | 1,802 | | | $ | — | | | $ | 1,802 | |
* | The Portfolio of Investments provides information on the industry categorization for common stocks and warrants. |
** | Other financial instruments are foreign exchange contracts and are considered derivative instruments, which are valued at the net unrealized appreciation on the instrument. |
Transfers from Level 2 to Level 1 as of March 31, 2019 were $47,353. Transfers, if any, between Levels are recognized at the end of the reporting period.
See notes to financial statements
120
Fund Expenses(unaudited)
INTERNATIONAL FUND
The examples below show the ongoing costs (in dollars) of investing in your Fund and will help you in comparing these costs with costs of other mutual funds. Please refer to page 1 for a detailed explanation of the information presented in these examples.
Expense Example | Annualized
Expense
Ratio | Beginning
Account Value
(10/1/18) | Ending
Account Value
(3/31/19) | Expenses Paid
During Period
(10/1/18-3/31/19)* |
Class A Shares | 1.58% | | | |
Actual | | $1,000.00 | $ 994.93 | $ 7.86 |
Hypothetical** | | $1,000.00 | $ 1,017.05 | $ 7.95 |
Class B Shares | 2.41% | | | |
Actual | | $1,000.00 | $ 995.05 | $ 11.99 |
Hypothetical** | | $1,000.00 | $ 1,012.91 | $ 12.09 |
Advisor Class Shares | 1.22% | | | |
Actual | | $1,000.00 | $ 1,000.85 | $ 6.09 |
Hypothetical** | | $1,000.00 | $ 1,018.85 | $ 6.14 |
Institutional Class Shares | 1.09% | | | |
Actual | | $1,000.00 | $ 1,001.35 | $ 5.44 |
Hypothetical** | | $1,000.00 | $ 1,019.49 | $ 5.49 |
* | Expenses are equal to the annualized expense ratio, multiplied by the average account value over the period, multiplied by 182/365 (to reflect the one-half year period). |
** | Assumed rate of return of 5% before expenses |
Portfolio Composition
BY SECTOR
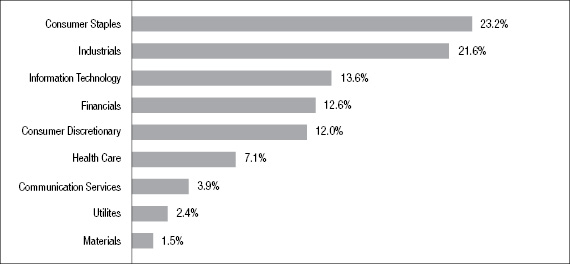
Portfolio holdings and allocations are subject to change. Percentages are as of March 31, 2019, and are based on the total market value of investments.
121
Portfolio of Investments
INTERNATIONAL FUND
March 31, 2019
| |
Shares
| | | Security | | Value | |
| | | | | | COMMON STOCKS—95.7% | | | | |
| | | | | | United Kingdom—14.1% | | | | |
| | | 199,615 | | | Ashtead Group, PLC | | $ | 4,816,312 | |
| | | 362,484 | | | Bunzl, PLC | | | 11,954,069 | |
| | | 89,571 | | | DCC, PLC | | | 7,740,545 | |
| | | 158,042 | | | Diageo, PLC | | | 6,459,348 | |
| | | 97,771 | | | London Stock Exchange | | | 6,050,041 | |
| | | 75,859 | | | Reckitt Benckiser Group, PLC | | | 6,305,610 | |
| | | 443,593 | | | RELX NV | | | 9,479,334 | |
| | | 836,255 | | | Rentokil Initial, PLC | | | 3,848,093 | |
| | | | | | | | | 56,653,352 | |
| | | | | | France—11.7% | | | | |
| | | 45,358 | | | Air Liquide SA | | | 5,767,313 | |
| | | 28,837 | | | L’Oreal SA | | | 7,757,064 | |
| | | 11,785 | | | LVMH Moet Hennessy Louis Vuitton SE | | | 4,334,801 | |
| | | 75,349 | | | Safran SA | | | 10,332,954 | |
| | | 57,111 | | | Teleperformance SE | | | 10,263,144 | |
| | | 88,778 | | | VINCI SA | | | 8,636,201 | |
| | | | | | | | | 47,091,477 | |
| | | | | | United States—10.7% | | | | |
| | | 8,603 | | * | Alphabet, Inc. - Class “C” | | | 10,093,986 | |
| | | 7,650 | | * | Booking Holdings, Inc. | | | 13,348,561 | |
| | | 58,375 | | | Mastercard, Inc. - Class “A” | | | 13,744,394 | |
| | | 65,735 | | | Medtronic, PLC | | | 5,987,144 | |
| | | | | | | | | 43,174,085 | |
| | | | | | Canada—10.2% | | | | |
| | | 275,005 | | | Alimentation Couch-Tard, Inc. - Class “B” | | | 16,199,644 | |
| | | 135,526 | | | Canadian National Railway Co. | | | 12,132,282 | |
| | | 15,213 | | | Constellation Software, Inc. | | | 12,892,373 | |
| | | | | | | | | 41,224,299 | |
122
| |
Shares
| | | Security | | Value | |
| | | | | | India—8.3% | | | | |
| | | 566,186 | | | HDFC Bank, Ltd. | | $ | 18,952,417 | |
| | | 290,337 | | | Housing Development Finance Corp., Ltd. | | | 8,249,091 | |
| | | 2,153,766 | | | Power Grid Corp. of India, Ltd. | | | 6,152,729 | |
| | | | | | | | | 33,354,237 | |
| | | | | | Germany—5.1% | | | | |
| | | 160,677 | | | Fresenius SE & Co KGaA | | | 8,968,756 | |
| | | 101,934 | | | SAP SE | | | 11,777,536 | |
| | | | | | | | | 20,746,292 | |
| | | | | | Netherlands—5.1% | | | | |
| | | 62,744 | | | Heineken NV | | | 6,621,672 | |
| | | 242,053 | | | Unilever NV - CVA | | | 14,059,525 | |
| | | | | | | | | 20,681,197 | |
| | | | | | Spain—3.8% | | | | |
| | | 238,003 | | | Grifols SA - Class “A” | | | 6,663,849 | |
| | | 297,553 | | | Industria de Diseno Textil SA | | | 8,745,079 | |
| | | | | | | | | 15,408,928 | |
| | | | | | Switzerland—3.6% | | | | |
| | | 152,844 | | | Nestle SA | | | 14,566,805 | |
| | | | | | China—3.5% | | | | |
| | | 49,552 | | * | Alibaba Group Holding, Ltd. (ADR) | | | 9,040,762 | |
| | | 113,634 | | | Tencent Holdings, Ltd. | | | 5,225,750 | |
| | | | | | | | | 14,266,512 | |
| | | | | | Belgium—3.4% | | | | |
| | | 165,828 | | | Anheuser-Busch InBev SA | | | 13,906,739 | |
| | | | | | Japan—2.7% | | | | |
| | | 17,736 | | | Keyence Corp. | | | 11,037,191 | |
123
Portfolio of Investments(continued)
INTERNATIONAL FUND
March 31, 2019
| | Shares | | | Security | | Value | |
| | | | | | Ireland—2.4% | | | | |
| | | 132,557 | | | Kingspan Group, PLC | | $ | 6,135,218 | |
| | | 47,027 | | | Paddy Power Betfair, PLC | | | 3,626,754 | |
| | | | | | | | | 9,761,972 | |
| | | | | | Brazil—2.2% | | | | |
| | | 169,691 | | | Equatorial Energia SA | | | 3,460,694 | |
| | | 595,347 | | | Itau Unibanco Holding SA (ADR) | | | 5,245,007 | |
| | | | | | | | | 8,705,701 | |
| | | | | | Hong Kong—2.0% | | | | |
| | | 1,197,821 | | | Techtronic Industries Co., Ltd | | | 8,049,103 | |
| | | | | | Singapore—1.9% | | | | |
| | | 405,700 | | | United Overseas Bank | | | 7,540,736 | |
| | | | | | Australia—1.6% | | | | |
| | | 45,456 | | | CSL, Ltd. | | | 6,291,897 | |
| | | | | | Mexico—1.4% | | | | |
| | | 2,137,892 | | | Walmart de Mexico SAB de CV | | | 5,715,290 | |
| | | | | | Taiwan—1.1% | | | | |
| | | 104,034 | | | Taiwan Semiconductor Manufacuring Co., Ltd. (ADR) | | | 4,261,233 | |
| | | | | | Sweden—.9% | | | | |
| | | 329,425 | | | Svenska Handelsbanken AB - Class “A” | | | 3,475,912 | |
Total Value of Common Stocks (cost $304,782,100) | | | 385,912,958 | |
124
| | Principal
Amount | | | Security | | Value | |
| | | | | | SHORT-TERM U.S. GOVERNMENT OBLIGATIONS—2.1% | | | | |
| | | | | | U.S. Treasury Bills: | | | | |
| | $ | 4,500M | | | 2.37%, 4/9/2019 | | $ | 4,497,629 | |
| | | 4,000M | | | 2.396%, 4/11/2019 | | | 3,997,368 | |
Total Value of Short-Term U.S. Government Obligations (cost $8,494,962) | | | 8,494,997 | |
Total Value of Investments (cost $313,277,062) | | | 97.8 | % | | | 394,407,955 | |
Other Assets, Less Liabilities | | | 2.2 | | | | 8,658,642 | |
Net Assets | | | 100.0 | % | | $ | 403,066,597 | |
Summary of Abbreviations:
ADR | American Depositary Receipts |
The Fund’s assets and liabilities are classified into the following three levels based on the inputs used to value the assets and liabilities:
| | Level 1 – | Unadjusted quoted prices in active markets for identical securities that the Fund has the ability to access. |
| | Level 2 – | Observable inputs other than quoted prices included in Level 1 that are observable for the asset or liability, either directly or indirectly. These inputs may include quoted prices for the identical instrument on an inactive market, prices for similar instruments, interest rates, prepayment speeds, credit risk, yield curves, default rates and similar data. |
| | Level 3 – | Unobservable inputs for the asset or liability, to the extent relevant observable inputs are not available, representing the Fund’s own assumption about the assumptions a market participant would use in valuing the asset or liability, and would be based on the best information available. |
The inputs methodology used for valuing securities are not necessarily an indication of the risk associated with investing in those securities. For example, U.S. government securities are reflected as Level 2 because the inputs used to determine fair value may not always be quoted prices in an active market.
125
Portfolio of Investments(continued)
INTERNATIONAL FUND
March 31, 2019
The following is a summary, by category of Level, of inputs used to value the Fund’s investments as of March 31, 2019:
| | | Level 1 | | | Level 2 | | | Level 3 | | | Total | |
Common Stocks | | | | | | | | | | | | | | | | |
United Kingdom | | $ | 56,653,352 | | | $ | — | | | $ | — | | | $ | 56,653,352 | |
France | | | 47,091,477 | | | | — | | | | — | | | | 47,091,477 | |
United States | | | 43,174,085 | | | | — | | | | — | | | | 43,174,085 | |
Canada | | | 41,224,299 | | | | — | | | | — | | | | 41,224,299 | |
India | | | 33,354,237 | | | | — | | | | — | | | | 33,354,237 | |
Germany | | | 20,746,292 | | | | — | | | | — | | | | 20,746,292 | |
Netherlands | | | 20,681,197 | | | | — | | | | — | | | | 20,681,197 | |
Spain | | | 15,408,928 | | | | — | | | | — | | | | 15,408,928 | |
Switzerland | | | 14,566,805 | | | | — | | | | — | | | | 14,566,805 | |
China | | | 14,266,512 | | | | — | | | | — | | | | 14,266,512 | |
Belgium | | | 13,906,739 | | | | — | | | | — | | | | 13,906,739 | |
Japan | | | 11,037,191 | | | | — | | | | — | | | | 11,037,191 | |
Ireland | | | 9,761,972 | | | | — | | | | — | | | | 9,761,972 | |
Brazil | | | 8,705,701 | | | | — | | | | — | | | | 8,705,701 | |
Hong Kong | | | 8,049,103 | | | | — | | | | — | | | | 8,049,103 | |
Singapore | | | 7,540,736 | | | | — | | | | — | | | | 7,540,736 | |
Australia | | | 6,291,897 | | | | — | | | | — | | | | 6,291,897 | |
Mexico | | | 5,715,290 | | | | — | | | | — | | | | 5,715,290 | |
Taiwan | | | 4,261,233 | | | | — | | | | — | | | | 4,261,233 | |
Sweden | | | 3,475,912 | | | | — | | | | — | | | | 3,475,912 | |
Short-Term U.S. Government Obligations | | | — | | | | 8,494,997 | | | | — | | | | 8,494,997 | |
Total Investments in Securities | | $ | 385,912,958 | | | $ | 8,494,997 | | | $ | — | | | $ | 394,407,955 | |
During the period ended March 31, 2019, there were no transfers between Level 1 investments and Level 2 investments that had a material inpact to the Fund. This does not include transfers between Level 1 investments and Level 2 investments due to the Fund utilizing international fair value pricing during the period (see Note 1A). Transfers, if any, between Levels are recognized at the end of the reporting period.
See notes to financial statements
126
Fund Expenses(unaudited)
OPPORTUNITY FUND
The examples below show the ongoing costs (in dollars) of investing in your Fund and will help you in comparing these costs with costs of other mutual funds. Please refer to page 1 for a detailed explanation of the information presented in these examples.
Expense Example | Annualized
Expense
Ratio | Beginning
Account Value
(10/1/18) | Ending
Account Value
(3/31/19) | Expenses Paid
During Period
(10/1/18–3/31/19)* |
Class A Shares | 1.26% | | | |
Actual | | $1,000.00 | $ 960.26 | $ 6.16 |
Hypothetical** | | $1,000.00 | $ 1,018.65 | $ 6.34 |
Class B Shares | 1.98% | | | |
Actual | | $1,000.00 | $ 956.97 | $ 9.66 |
Hypothetical** | | $1,000.00 | $ 1,015.06 | $ 9.95 |
Advisor Class Shares | 0.90% | | | |
Actual | | $1,000.00 | $ 961.82 | $ 4.40 |
Hypothetical** | | $1,000.00 | $ 1,020.44 | $ 4.53 |
Institutional Class Shares | 0.78% | | | |
Actual | | $1,000.00 | $ 962.58 | $ 3.82 |
Hypothetical** | | $1,000.00 | $ 1,021.04 | $ 3.93 |
* | Expenses are equal to the annualized expense ratio, multiplied by the average account value over the period, multiplied by 182/365 (to reflect the one-half year period). |
** | Assumed rate of return of 5% before expenses |
Portfolio Composition
TOP TEN SECTORS
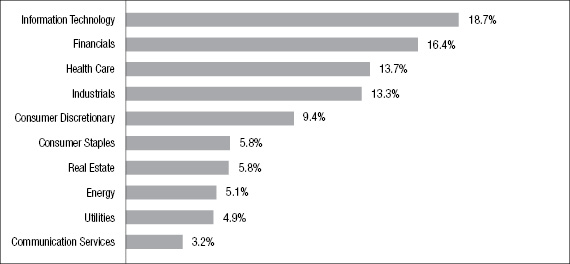
Portfolio holdings and allocations are subject to change. Percentages are as of March 31, 2019, and are based on the total market value of investments.
127
Portfolio of Investments
OPPORTUNITY FUND
March 31, 2019
| |
Shares
| | | Security | | Value | |
| | | | | | COMMON STOCKS—96.4% | | | | |
| | | | | | Communication Services—3.1% | | | | |
| | | 71,200 | | * | IAC/InterActive Corp. | | $ | 14,959,832 | |
| | | 169,300 | | | Meredith Corp. | | | 9,355,518 | |
| | | 109,400 | | * | Take-Two Interactive Software, Inc. | | | 10,324,078 | |
| | | | | | | | | 34,639,428 | |
| | | | | | Consumer Discretionary—9.3% | | | | |
| | | 353,600 | | | Acushnet Holdings Corp. | | | 8,182,304 | |
| | | 267,400 | | | Aramark Holdings Corp. | | | 7,901,670 | |
| | | 44,500 | | * | Burlington Stores, Inc. | | | 6,972,260 | |
| | | 241,200 | | | DSW, Inc. - Class “A” | | | 5,359,464 | |
| | | 35,200 | | | Lear Corp. | | | 4,776,992 | |
| | | 308,000 | | * | LKQ Corp. | | | 8,741,040 | |
| | | 72,700 | | | Oxford Industries, Inc. | | | 5,471,402 | |
| | | 149,100 | | | Penske Automotive Group, Inc. | | | 6,657,315 | |
| | | 89,100 | | | Ross Stores, Inc. | | | 8,295,210 | |
| | | 326,600 | | * | ServiceMaster Holdings, Inc. | | | 15,252,220 | |
| | | 278,700 | | | Tapestry, Inc. | | | 9,054,963 | |
| | | 401,700 | | * | Taylor Morrison Home Corp. - Class “A” | | | 7,130,175 | |
| | | 172,300 | | | Wyndham Hotels & Resorts, Inc. | | | 8,613,277 | |
| | | | | | | | | 102,408,292 | |
| | | | | | Consumer Staples—5.7% | | | | |
| | | 244,900 | | | Conagra Brands, Inc. | | | 6,793,526 | |
| | | 569,700 | | | Koninklijke Ahold Delhaize NV (ADR) | | | 15,139,778 | |
| | | 37,100 | | | Lancaster Colony Corp. | | | 5,813,199 | |
| | | 69,000 | | | McCormick & Co., Inc. | | | 10,393,470 | |
| | | 304,100 | | * | Performance Food Group Co. | | | 12,054,524 | |
| | | 376,800 | | * | U.S. Foods Holding Corp. | | | 13,154,088 | |
| | | | | | | | | 63,348,585 | |
| | | | | | Energy—5.0% | | | | |
| | | 281,700 | | | Cabot Oil & Gas Corp. | | | 7,352,370 | |
| | | 1,005,300 | | | EnCana Corp. | | | 7,278,372 | |
128
| |
Shares
| | | Security | | Value | |
| | | | | | Energy (continued) |
| | | 95,000 | | | EOG Resources, Inc. | | $ | 9,042,100 | |
| | | 407,500 | | | Noble Energy, Inc. | | | 10,077,475 | |
| | | 194,200 | | | PBF Energy, Inc. - Class “A” | | | 6,047,388 | |
| | | 398,500 | | * | ProPetro Holding Corp. | | | 8,982,190 | |
| | | 76,400 | | | Valero Energy Corp. | | | 6,481,012 | |
| | | | | | | | | 55,260,907 | |
| | | | | | Financials—16.1% | | | | |
| | | 77,900 | | | American Financial Group, Inc. | | | 7,494,759 | |
| | | 83,100 | | | Ameriprise Financial, Inc. | | | 10,645,110 | |
| | | 373,000 | | | Brown & Brown, Inc. | | | 11,007,230 | |
| | | 570,100 | | | Citizens Financial Group, Inc. | | | 18,528,250 | |
| | | 103,400 | | | Comerica, Inc. | | | 7,581,288 | |
| | | 124,300 | | | Discover Financial Services | | | 8,845,188 | |
| | | 375,300 | | | Fidelity National Financial, Inc. | | | 13,717,215 | |
| | | 129,000 | | | First Republic Bank | | | 12,959,340 | |
| | | 114,600 | | | IBERIABANK Corp. | | | 8,217,966 | |
| | | 175,300 | | | iShares Russell Mid-Cap (ETF) | | | 9,457,435 | |
| | | 161,800 | | | Nasdaq, Inc. | | | 14,155,882 | |
| | | 226,200 | | | Popular, Inc. | | | 11,791,806 | |
| | | 170,000 | | | Selective Insurance Group, Inc. | | | 10,757,600 | |
| | | 560,300 | | | Sterling Bancorp | | | 10,438,389 | |
| | | 364,100 | | | Synchrony Financial | | | 11,614,790 | |
| | | 133,300 | | | Torchmark Corp. | | | 10,923,935 | |
| | | | | | | | | 178,136,183 | |
| | | | | | Health Care—13.5% | | | | |
| | | 262,200 | | * | Centene Corp. | | | 13,922,820 | |
| | | 116,900 | | * | Charles River Laboratories International, Inc. | | | 16,979,725 | |
| | | 112,100 | | | Gilead Sciences, Inc. | | | 7,287,621 | |
| | | 188,800 | | | Hill-Rom Holdings, Inc. | | | 19,986,368 | |
| | | 54,900 | | | iShares Nasdaq Biotechnology (ETF) | | | 6,137,820 | |
| | | 84,600 | | * | Jazz Pharmaceuticals, PLC | | | 12,093,570 | |
| | | 124,300 | | | PerkinElmer, Inc. | | | 11,977,548 | |
129
Portfolio of Investments(continued)
OPPORTUNITY FUND
March 31, 2019
| |
Shares
| | | Security | | Value | |
| | | | | | Health Care (continued) |
| | | 285,400 | | | Phibro Animal Health Corp. - Class “A” | | $ | 9,418,200 | |
| | | 89,900 | | | Quest Diagnostics, Inc. | | | 8,083,808 | |
| | | 258,400 | | | Smith & Nephew, PLC (ADR) | | | 10,364,424 | |
| | | 71,200 | | | Thermo Fisher Scientific, Inc. | | | 19,488,864 | |
| | | 51,900 | | * | Waters Corp. | | | 13,063,749 | |
| | | | | | | | | 148,804,517 | |
| | | | | | Industrials—13.0% | | | | |
| | | 155,800 | | | ESCO Technologies, Inc. | | | 10,443,274 | |
| | | 419,500 | | * | Gardner Denver Holdings, Inc. | | | 11,666,295 | |
| | | 114,600 | | | Ingersoll-Rand, PLC | | | 12,371,070 | |
| | | 185,800 | | | ITT, Inc. | | | 10,776,400 | |
| | | 91,400 | | | J. B. Hunt Transport Services, Inc. | | | 9,257,906 | |
| | | 141,000 | | | Jacobs Engineering Group | | | 10,601,790 | |
| | | 81,500 | | | Kansas City Southern, Inc. | | | 9,452,370 | |
| | | 289,900 | | | Korn/Ferry International | | | 12,981,722 | |
| | | 311,600 | | | Masco Corp. | | | 12,248,996 | |
| | | 175,300 | | * | MasTec, Inc. | | | 8,431,930 | |
| | | 156,600 | | | Owens Corning | | | 7,378,992 | |
| | | 32,200 | | | Roper Technologies, Inc. | | | 11,011,434 | |
| | | 265,700 | | | Schneider National, Inc. - Class “B” | | | 5,592,985 | |
| | | 44,500 | | | Snap-On, Inc. | | | 6,965,140 | |
| | | 148,400 | | | Triton International, Ltd. | | | 4,615,240 | |
| | | | | | | | | 143,795,544 | |
| | | | | | Information Technology—18.4% | | | | |
| | | 97,900 | | * | Aspen Technology, Inc. | | | 10,207,054 | |
| | | 76,400 | | * | Autodesk, Inc. | | | 11,904,648 | |
| | | 133,600 | | * | Cadence Design Systems, Inc. | | | 8,484,936 | |
| | | 43,400 | | * | Cree, Inc. | | | 2,483,348 | |
| | | 178,300 | | * | Fiserv, Inc. | | | 15,740,324 | |
| | | 54,000 | | * | FleetCor Technologies, Inc. | | | 13,315,860 | |
| | | 71,200 | | | KLA-Tencor Corp. | | | 8,501,992 | |
| | | 89,000 | | | Leidos Holdings, Inc. | | | 5,704,010 | |
130
| |
Shares
| | | Security | | Value | |
| | | | | | Information Technology (continued) |
| | | 106,100 | | | LogMeIn, Inc. | | $ | 8,498,610 | |
| | | 185,300 | | | Maxim Integrated Products, Inc. | | | 9,852,401 | |
| | | 65,200 | | * | Mellanox Technologies, Ltd. | | | 7,717,072 | |
| | | 122,100 | | | NetApp, Inc. | | | 8,466,414 | |
| | | 56,400 | | * | Proofpoint, Inc. | | | 6,848,652 | |
| | | 140,900 | | * | Qorvo, Inc. | | | 10,106,757 | |
| | | 25,200 | | * | ServiceNow, Inc. | | | 6,211,548 | |
| | | 247,200 | | | SS&C Technologies Holdings, Inc. | | | 15,744,168 | |
| | | 150,600 | | * | Synopsys, Inc. | | | 17,341,590 | |
| | | 719,100 | | | Travelport Worldwide, Ltd. | | | 11,311,443 | |
| | | 28,500 | | * | Ultimate Software Group, Inc. | | | 9,408,705 | |
| | | 71,900 | | * | Zebra Technologies Corp. - Class “A” | | | 15,065,207 | |
| | | | | | | | | 202,914,739 | |
| | | | | | Materials—1.8% | | | | |
| | | 128,800 | | | FMC Corp. | | | 9,894,416 | |
| | | 56,200 | | | Linde, PLC | | | 9,887,266 | |
| | | | | | | | | 19,781,682 | |
| | | | | | Real Estate—5.7% | | | | |
| | | 230,000 | | | Alexander & Baldwin, Inc. (REIT) | | | 5,851,200 | |
| | | 203,800 | | | American Campus Communities, Inc. (REIT) | | | 9,696,804 | |
| | | 545,300 | | | Brixmor Property Group, Inc. (REIT) | | | 10,017,161 | |
| | | 273,100 | | | Douglas Emmett, Inc. (REIT) | | | 11,038,702 | |
| | | 83,850 | | | Federal Realty Investment Trust (REIT) | | | 11,558,722 | |
| | | 102,600 | | | iShares U.S. Real Estate (ETF) | | | 8,930,304 | |
| | | 115,700 | | | Liberty Property Trust (REIT) | | | 5,602,194 | |
| | | | | | | | | 62,695,087 | |
| | | | | | Utilities—4.8% | | | | |
| | | 443,500 | | | CenterPoint Energy, Inc. | | | 13,615,450 | |
| | | 235,200 | | | CMS Energy Corp. | | | 13,063,008 | |
| | | 169,300 | | | Portland General Electric Co. | | | 8,776,512 | |
131
Portfolio of Investments(continued)
OPPORTUNITY FUND
March 31, 2019
| | Shares or
Principal
Amounts | | | Security | | Value | |
| | | | | | Utilities (continued) |
| | | 227,000 | | | WEC Energy Group, Inc. | | $ | 17,951,160 | |
| | | | | | | | | 53,406,130 | |
Total Value of Common Stocks (cost $827,878,416) | | | 1,065,191,094 | |
| | | | | | SHORT-TERM U.S. GOVERNMENT OBLIGATIONS—1.8% | | | | |
| | $ | 20,000M | | | U.S. Treasury Bills, 2.396%, 4/11/2019 (cost $19,986,676) | | | 19,986,840 | |
Total Value of Investments (cost $847,865,092) | | | 98.2 | % | | | 1,085,177,934 | |
Other Assets, Less Liabilities | | | 1.8 | | | | 19,533,077 | |
Net Assets | | | 100.0 | % | | $ | 1,104,711,011 | |
Summary of Abbreviations:
ADR | American Depositary Receipts |
REIT | Real Estate Investment Trust |
The Fund’s assets and liabilities are classified into the following three levels based on the inputs used to value the assets and liabilities:
| | Level 1 – | Unadjusted quoted prices in active markets for identical securities that the Fund has the ability to access. |
| | Level 2 – | Observable inputs other than quoted prices included in Level 1 that are observable for the asset or liability, either directly or indirectly. These inputs may include quoted prices for the identical instrument on an inactive market, prices for similar instruments, interest rates, prepayment speeds, credit risk, yield curves, default rates and similar data. |
| | Level 3 – | Unobservable inputs for the asset or liability, to the extent relevant observable inputs are not available, representing the Fund’s own assumption about the assumptions a market participant would use in valuing the asset or liability, and would be based on the best information available. |
The inputs methodology used for valuing securities are not necessarily an indication of the risk associated with investing in those securities. For example, U.S. government securities are reflected as Level 2 because the inputs used to determine fair value may not always be quoted prices in an active market.
132
The following is a summary, by category of Level, of inputs used to value the Fund’s investments as of March 31, 2019:
| | | Level 1 | | | Level 2 | | | Level 3 | | | Total | |
Common Stocks | | $ | 1,065,191,094 | | | $ | — | | | $ | — | | | $ | 1,065,191,094 | |
Short-Term U.S. Government Obligations | | | — | | | | 19,986,840 | | | | — | | | | 19,986,840 | |
Total Investments in Securities* | | $ | 1,065,191,094 | | | $ | 19,986,840 | | | $ | — | | | $ | 1,085,177,934 | |
* | The Portfolio of Investments provides information on the industry categorization for common stocks. |
There were no transfers into or from Level 1 and Level 2 by the Fund during the period ended March 31, 2019. Transfers, if any, between Levels are recognized at the end of the reporting period.
See notes to financial statements
133
Fund Expenses(unaudited)
PREMIUM INCOME FUND
The examples below show the ongoing costs (in dollars) of investing in your Fund and will help you in comparing these costs with costs of other mutual funds. Please refer to page 1 for a detailed explanation of the information presented in these examples.
Expense Example | Annualized
Expense
Ratio | Beginning
Account Value
(10/1/18) | Ending
Account Value
(3/31/19) | Expenses Paid
During Period
(10/1/18–3/31/19)* |
Class A Shares | 1.30% | | | |
Actual | | $1,000.00 | $1,008.99 | $ 6.51 |
Hypothetical** | | $1,000.00 | $1,018.45 | $ 6.54 |
Advisor Class Shares | 1.04% | | | |
Actual | | $1,000.00 | $1,010.27 | $ 5.21 |
Hypothetical** | | $1,000.00 | $1,019.74 | $ 5.24 |
Institutional Class Shares | 0.90% | | | |
Actual | | $1,000.00 | $1,011.86 | $ 4.51 |
Hypothetical** | | $1,000.00 | $1,020.44 | $ 4.53 |
* | Commencement of Operations |
** | Expenses are equal to the annualized expense ratio, multiplied by the average account value over the period, multiplied by 182/365 (to reflect the one-half year period). Expenses paid during the period are net of expenses waived. |
*** | Assumed rate of return of 5% before expenses |
Portfolio Composition
BY SECTOR
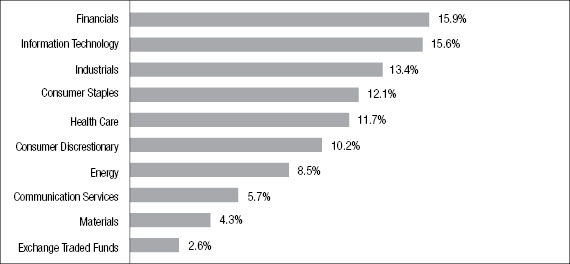
Portfolio holdings and allocations are subject to change. Percentages are as of March 31, 2019, and are based on the total market value of investments.
134
Portfolio of Investments
PREMIUM INCOME FUND
March 31, 2019
| |
Shares
| | | Security | | Value | |
| | | | | | COMMON STOCKS—119.5% | | | | |
| | | | | | Communication Services—6.9% | | | | |
| | | 79,200 | | | AT&T, Inc. | | $ | 2,483,712 | |
| | | 63,700 | | | CBS Corp. - Class “B” | | | 3,027,661 | |
| | | 26,900 | | | Walt Disney Co. | | | 2,986,707 | |
| | | | | | | | | 8,498,080 | |
| | | | | | Consumer Discretionary—12.2% | | | | |
| | | 24,700 | | | Best Buy Co., Inc. | | | 1,755,182 | |
| | | 46,200 | | | Carnival Corp. | | | 2,343,264 | |
| | | 18,900 | | | Home Depot, Inc. | | | 3,626,721 | |
| | | 37,400 | | | Ross Stores, Inc. | | | 3,481,940 | |
| | | 11,400 | | | TJX Cos., Inc. | | | 606,594 | |
| | | 24,600 | | | Whirlpool Corp. | | | 3,269,094 | |
| | | | | | | | | 15,082,795 | |
| | | | | | Consumer Staples—14.5% | | | | |
| | | 59,200 | | | Coca-Cola Co. | | | 2,774,112 | |
| | | 39,800 | | | Colgate-Palmolive Co. | | | 2,727,892 | |
| | | 14,700 | | | Constellation Brands, Inc. | | | 2,577,351 | |
| | | 60,100 | | | Mondelez International, Inc. - Class “A” | | | 3,000,192 | |
| | | 4,900 | | | PepsiCo, Inc. | | | 600,495 | |
| | | 35,000 | | | Philip Morris International, Inc. | | | 3,093,650 | |
| | | 50,300 | | | Walgreens Boots Alliance, Inc. | | | 3,182,481 | |
| | | | | | | | | 17,956,173 | |
| | | | | | Energy—10.1% | | | | |
| | | 25,500 | | | Chevron Corp. | | | 3,141,090 | |
| | | 16,200 | | | ExxonMobil Corp. | | | 1,308,960 | |
| | | 88,800 | | | Halliburton Co. | | | 2,601,840 | |
| | | 153,400 | | | Kinder Morgan, Inc. | | | 3,069,534 | |
| | | 35,800 | | | Occidental Petroleum Corp. | | | 2,369,960 | |
| | | | | | | | | 12,491,384 | |
135
Portfolio of Investments(continued)
PREMIUM INCOME FUND
March 31, 2019
| |
Shares
| | | Security | | Value | |
| | | | | | Exchange Traded Funds—3.1% | | | | |
| | | 5,900 | | | SPDR DJIA ETF Trust (ETF) | | $ | 1,528,867 | |
| | | 8,200 | | | SPDR S&P 500 ETF Trust (ETF) | | | 2,316,336 | |
| | | | | | | | | 3,845,203 | |
| | | | | | Financials—19.1% | | | | |
| | | 27,500 | | | Allstate Corp. | | | 2,589,950 | |
| | | 39,200 | | | American Express Co. | | | 4,284,560 | |
| | | 72,600 | | | Bank of America Corp. | | | 2,003,034 | |
| | | 18,400 | | | BB&T Corp. | | | 856,152 | |
| | | 8,200 | | | BlackRock, Inc. | | | 3,504,434 | |
| | | 34,500 | | | Discover Financial Services | | | 2,455,020 | |
| | | 33,900 | | | JPMorgan Chase & Co. | | | 3,431,697 | |
| | | 70,300 | | | Morgan Stanley | | | 2,966,660 | |
| | | 30,600 | | | U.S. Bancorp | | | 1,474,614 | |
| | | | | | | | | 23,566,121 | |
| | | | | | Health Care—13.9% | | | | |
| | | 16,100 | | | Amgen, Inc. | | | 3,058,678 | |
| | | 68,100 | | | Bristol-Myers Squibb Co. | | | 3,249,051 | |
| | | 38,800 | | * | Celgene Corp. | | | 3,660,392 | |
| | | 44,100 | | | Medtronic, PLC | | | 4,016,628 | |
| | | 1,200 | | | Merck & Co., Inc. | | | 99,804 | |
| | | 15,900 | | | Stryker Corp. | | | 3,140,568 | |
| | | | | | | | | 17,225,121 | |
| | | | | | Industrials—16.0% | | | | |
| | | 50,700 | | | Delta Air Lines, Inc. | | | 2,618,655 | |
| | | 14,500 | | | Eaton Corp., PLC | | | 1,168,120 | |
| | | 9,700 | | | General Dynamics Corp. | | | 1,642,016 | |
| | | 24,600 | | | Honeywell International, Inc. | | | 3,909,432 | |
| | | 8,700 | | | Lockheed Martin Corp. | | | 2,611,392 | |
| | | 18,800 | | | Raytheon Co. | | | 3,423,104 | |
| | | 24,000 | | | United Parcel Service, Inc. - Class “B” | | | 2,681,760 | |
136
| |
Shares
| | | Security | | Value | |
| | | | | | Industrials (continued) |
| | | 13,900 | | | United Technologies Corp. | | $ | 1,791,571 | |
| | | | | | | | | 19,846,050 | |
| | | | | | Information Technology—18.6% | | | | |
| | | 19,900 | | | Apple, Inc. | | | 3,780,005 | |
| | | 13,900 | | | Broadcom, Inc. | | | 4,179,870 | |
| | | 80,400 | | | Cisco Systems, Inc. | | | 4,340,796 | |
| | | 77,700 | | | Intel Corp. | | | 4,172,490 | |
| | | 16,900 | | | International Business Machines Corp. | | | 2,384,590 | |
| | | 12,700 | | | Microsoft Corp. | | | 1,497,838 | |
| | | 24,800 | | | Texas Instruments, Inc. | | | 2,630,536 | |
| | | | | | | | | 22,986,125 | |
| | | | | | Materials—5.1% | | | | |
| | | 61,700 | | | DowDuPont, Inc. | | | 3,289,227 | |
| | | 51,800 | | | Nucor Corp. | | | 3,022,530 | |
| | | | | | | | | 6,311,757 | |
Total Value of Common Stocks (cost $146,028,564) | | | 119.5 | % | | | 147,808,809 | |
Excess of Liabilities Over Other Assets | | | (19.5 | ) | | | (24,077,694 | ) |
Net Assets | | | 100.0 | % | | $ | 123,731,115 | |
Summary of Abbreviations:
SPDR | Standard & Poor’s Depository Receipts |
137
Portfolio of Investments(continued)
PREMIUM INCOME FUND
March 31, 2019
CALL OPTIONS
WRITTEN—(21.7)% | | Expiration
Date | | | Exercise
Price | | | Contracts | | | Value | |
AT&T, Inc. | | | 4/18/19 | | | $ | 28.00 | | | | (80 | ) | | $ | (26,800 | ) |
AT&T, Inc. | | | 6/21/19 | | | | 29.00 | | | | (382 | ) | | | (94,354 | ) |
AT&T, Inc. | | | 7/19/19 | | | | 27.00 | | | | (330 | ) | | | (144,375 | ) |
Allstate Corp. | | | 1/17/20 | | | | 82.50 | | | | (275 | ) | | | (400,125 | ) |
American Express Co. | | | 4/18/19 | | | | 95.00 | | | | (104 | ) | | | (148,980 | ) |
American Express Co. | | | 4/18/19 | | | | 90.00 | | | | (250 | ) | | | (489,375 | ) |
American Express Co. | | | 1/17/20 | | | | 85.00 | | | | (22 | ) | | | (57,640 | ) |
American Express Co. | | | 1/17/20 | | | | 82.50 | | | | (16 | ) | | | (46,120 | ) |
Amgen, Inc. | | | 1/17/20 | | | | 160.00 | | | | (52 | ) | | | (181,350 | ) |
Amgen, Inc. | | | 1/17/20 | | | | 155.00 | | | | (109 | ) | | | (423,737 | ) |
Apple, Inc. | | | 6/21/19 | | | | 175.00 | | | | (59 | ) | | | (109,297 | ) |
Apple, Inc. | | | 6/21/19 | | | | 170.00 | | | | (28 | ) | | | (63,210 | ) |
Apple, Inc. | | | 1/17/20 | | | | 160.00 | | | | (51 | ) | | | (178,882 | ) |
Apple, Inc. | | | 1/17/20 | | | | 150.00 | | | | (61 | ) | | | (269,010 | ) |
BB&T Corp. | | | 9/20/19 | | | | 43.00 | | | | (184 | ) | | | (86,940 | ) |
Bank of America Corp. | | | 1/17/20 | | | | 20.00 | | | | (726 | ) | | | (580,800 | ) |
Best Buy Co., Inc. | | | 9/20/19 | | | | 57.50 | | | | (247 | ) | | | (384,085 | ) |
BlackRock, Inc. | | | 4/18/19 | | | | 410.00 | | | | (26 | ) | | | (56,160 | ) |
BlackRock, Inc. | | | 10/18/19 | | | | 370.00 | | | | (14 | ) | | | (93,800 | ) |
BlackRock, Inc. | | | 1/17/20 | | | | 380.00 | | | | (36 | ) | | | (230,940 | ) |
BlackRock, Inc. | | | 1/17/20 | | | | 350.00 | | | | (6 | ) | | | (53,100 | ) |
Bristol-Meyers Squibb Co. | | | 6/21/19 | | | | 45.00 | | | | (180 | ) | | | (71,550 | ) |
Bristol-Meyers Squibb Co. | | | 6/21/19 | | | | 43.00 | | | | (120 | ) | | | (64,800 | ) |
Bristol-Meyers Squibb Co. | | | 1/17/20 | | | | 43.00 | | | | (276 | ) | | | (187,680 | ) |
Bristol-Meyers Squibb Co. | | | 1/17/20 | | | | 40.00 | | | | (105 | ) | | | (93,187 | ) |
Broadcom, Inc. | | | 1/17/20 | | | | 250.00 | | | | (53 | ) | | | (329,925 | ) |
Broadcom, Inc. | | | 1/17/20 | | | | 230.00 | | | | (45 | ) | | | (348,750 | ) |
Broadcom, Inc. | | | 1/17/20 | | | | 220.00 | | | | (41 | ) | | | (353,215 | ) |
CBS Corp. - Class "B” | | | 6/21/19 | | | | 47.50 | | | | (25 | ) | | | (5,800 | ) |
CBS Corp. - Class "B” | | | 9/20/19 | | | | 45.00 | | | | (304 | ) | | | (148,960 | ) |
CBS Corp. - Class "B” | | | 9/20/19 | | | | 40.00 | | | | (39 | ) | | | (33,832 | ) |
CBS Corp. - Class "B” | | | 1/17/20 | | | | 47.50 | | | | (269 | ) | | | (121,722 | ) |
Carnival Corp. | | | 7/19/19 | | | | 47.50 | | | | (57 | ) | | | (25,080 | ) |
Carnival Corp. | | | 10/18/19 | | | | 50.00 | | | | (405 | ) | | | (149,850 | ) |
Celgene Corp. | | | 6/21/19 | | | | 70.00 | | | | (49 | ) | | | (118,090 | ) |
Celgene Corp. | | | 10/18/19 | | | | 70.00 | | | | (102 | ) | | | (257,805 | ) |
Celgene Corp. | | | 1/17/20 | | | | 75.00 | | | | (14 | ) | | | (28,350 | ) |
Celgene Corp. | | | 1/17/20 | | | | 50.00 | | | | (223 | ) | | | (1,007,960 | ) |
Chevron Corp. | | | 1/17/20 | | | | 100.00 | | | | (255 | ) | | | (628,575 | ) |
138
CALL OPTIONS
WRITTEN—(21.7)% | | Expiration
Date | | | Exercise
Price | | | Contracts | | | Value | |
Cisco Systems, Inc. | | | 6/21/19 | | | $ | 40.00 | | | | (204 | ) | | $ | (284,070 | ) |
Cisco Systems, Inc. | | | 6/21/19 | | | | 38.00 | | | | (200 | ) | | | (319,000 | ) |
Cisco Systems, Inc. | | | 6/21/19 | | | | 39.00 | | | | (59 | ) | | | (87,467 | ) |
Cisco Systems, Inc. | | | 1/17/20 | | | | 37.00 | | | | (341 | ) | | | (569,470 | ) |
Coca-Cola Co. | | | 1/17/20 | | | | 40.00 | | | | (592 | ) | | | (441,040 | ) |
Colgate-Palmolive Co. | | | 5/17/19 | | | | 55.00 | | | | (167 | ) | | | (225,450 | ) |
Colgate-Palmolive Co. | | | 8/16/19 | | | | 52.50 | | | | (75 | ) | | | (122,625 | ) |
Colgate-Palmolive Co. | | | 1/17/20 | | | | 55.00 | | | | (156 | ) | | | (224,250 | ) |
Constellation Brands, Inc. | | | 10/18/19 | | | | 145.00 | | | | (147 | ) | | | (510,825 | ) |
Delta Air Lines, Inc. | | | 6/21/19 | | | | 45.00 | | | | (116 | ) | | | (83,810 | ) |
Delta Air Lines, Inc. | | | 1/17/20 | | | | 43.00 | | | | (180 | ) | | | (186,750 | ) |
Delta Air Lines, Inc. | | | 1/17/20 | | | | 40.00 | | | | (211 | ) | | | (269,025 | ) |
Discover Financial Services | | | 4/18/19 | | | | 67.50 | | | | (30 | ) | | | (12,150 | ) |
Discover Financial Services | | | 4/18/19 | | | | 65.00 | | | | (165 | ) | | | (105,600 | ) |
Discover Financial Services | | | 1/17/20 | | | | 62.50 | | | | (86 | ) | | | (98,040 | ) |
Discover Financial Services | | | 1/17/20 | | | | 60.00 | | | | (21 | ) | | | (28,035 | ) |
Discover Financial Services | | | 1/17/20 | | | | 55.00 | | | | (43 | ) | | | (75,035 | ) |
DowDuPont, Inc. | | | 6/21/19 | | | | 47.50 | | | | (63 | ) | | | (42,052 | ) |
DowDuPont, Inc. | | | 9/20/19 | | | | 42.50 | | | | (233 | ) | | | (269,115 | ) |
DowDuPont, Inc. | | | 1/17/20 | | | | 47.50 | | | | (321 | ) | | | (264,022 | ) |
Eaton Corp., PLC | | | 1/17/20 | | | | 67.50 | | | | (145 | ) | | | (208,800 | ) |
ExxonMobil Corp. | | | 4/18/19 | | | | 72.50 | | | | (52 | ) | | | (43,940 | ) |
ExxonMobil Corp. | | | 4/18/19 | | | | 70.00 | | | | (23 | ) | | | (25,415 | ) |
ExxonMobil Corp. | | | 6/21/19 | | | | 72.50 | | | | (14 | ) | | | (12,285 | ) |
ExxonMobil Corp. | | | 6/21/19 | | | | 70.00 | | | | (54 | ) | | | (60,075 | ) |
ExxonMobil Corp. | | | 7/19/19 | | | | 70.00 | | | | (19 | ) | | | (21,517 | ) |
General Dynamics Corp. | | | 6/21/19 | | | | 165.00 | | | | (21 | ) | | | (19,320 | ) |
General Dynamics Corp. | | | 8/16/19 | | | | 145.00 | | | | (45 | ) | | | (118,125 | ) |
General Dynamics Corp. | | | 1/17/20 | | | | 130.00 | | | | (31 | ) | | | (128,960 | ) |
Halliburton Co. | | | 4/18/19 | | | | 30.00 | | | | (333 | ) | | | (17,149 | ) |
Halliburton Co. | | | 6/21/19 | | | | 30.00 | | | | (133 | ) | | | (19,285 | ) |
Halliburton Co. | | | 1/17/20 | | | | 25.00 | | | | (422 | ) | | | (250,035 | ) |
Home Depot, Inc. | | | 6/21/19 | | | | 170.00 | | | | (33 | ) | | | (79,942 | ) |
Home Depot, Inc. | | | 6/21/19 | | | | 165.00 | | | | (48 | ) | | | (136,080 | ) |
Home Depot, Inc. | | | 11/15/19 | | | | 160.00 | | | | (33 | ) | | | (114,922 | ) |
Home Depot, Inc. | | | 1/17/20 | | | | 160.00 | | | | (75 | ) | | | (259,875 | ) |
Honeywell International, Inc. | | | 6/21/19 | | | | 130.00 | | | | (209 | ) | | | (620,207 | ) |
Honeywell International, Inc. | | | 1/17/20 | | | | 120.00 | | | | (37 | ) | | | (149,572 | ) |
Intel Corp. | | | 6/21/19 | | | | 45.00 | | | | (39 | ) | | | (35,198 | ) |
139
Portfolio of Investments(continued)
PREMIUM INCOME FUND
March 31, 2019
CALL OPTIONS
WRITTEN—(21.7)% | | Expiration
Date | | | Exercise
Price | | | Contracts | | | Value | |
Intel Corp. | | | 6/21/19 | | | $ | 40.00 | | | | (89 | ) | | $ | (123,265 | ) |
Intel Corp. | | | 1/17/20 | | | | 42.00 | | | | (649 | ) | | | (843,700 | ) |
International Business Machines Corp. | | | 6/21/19 | | | | 110.00 | | | | (2 | ) | | | (6,280 | ) |
International Business Machines Corp. | | | 10/18/19 | | | | 120.00 | | | | (83 | ) | | | (189,863 | ) |
International Business Machines Corp. | | | 1/17/20 | | | | 120.00 | | | | (84 | ) | | | (195,300 | ) |
JPMorgan Chase & Co. | | | 6/21/19 | | | | 100.00 | | | | (224 | ) | | | (95,760 | ) |
JPMorgan Chase & Co. | | | 6/21/19 | | | | 95.00 | | | | (63 | ) | | | (48,195 | ) |
JPMorgan Chase & Co. | | | 1/17/20 | | | | 95.00 | | | | (37 | ) | | | (39,683 | ) |
JPMorgan Chase & Co. | | | 1/17/20 | | | | 90.00 | | | | (15 | ) | | | (21,263 | ) |
Kinder Morgan, Inc. | | | 1/17/20 | | | | 15.00 | | | | (1,534 | ) | | | (774,670 | ) |
Lockheed Martin Corp. | | | 6/21/19 | | | | 285.00 | | | | (31 | ) | | | (64,480 | ) |
Lockheed Martin Corp. | | | 6/21/19 | | | | 275.00 | | | | (4 | ) | | | (11,540 | ) |
Lockheed Martin Corp. | | | 1/17/20 | | | | 260.00 | | | | (52 | ) | | | (243,100 | ) |
Medtronic, PLC | | | 6/21/19 | | | | 80.00 | | | | (105 | ) | | | (126,525 | ) |
Medtronic, PLC | | | 1/17/20 | | | | 80.00 | | | | (269 | ) | | | (376,600 | ) |
Medtronic, PLC | | | 1/17/20 | | | | 77.50 | | | | (67 | ) | | | (107,367 | ) |
Merck & Co., Inc. | | | 6/21/19 | | | | 52.50 | | | | (12 | ) | | | (36,690 | ) |
Microsoft Corp. | | | 1/17/20 | | | | 92.50 | | | | (127 | ) | | | (359,728 | ) |
Mondelez International, Inc. - Class "A” | | | 6/21/19 | | | | 35.00 | | | | (2 | ) | | | (2,975 | ) |
Mondelez International, Inc. - Class "A” | | | 1/17/20 | | | | 40.00 | | | | (218 | ) | | | (233,805 | ) |
Mondelez International, Inc. - Class "A” | | | 1/17/20 | | | | 35.00 | | | | (269 | ) | | | (414,933 | ) |
Mondelez International, Inc. - Class "A” | | | 1/17/20 | | | | 33.00 | | | | (112 | ) | | | (194,040 | ) |
Morgan Stanley | | | 6/21/19 | | | | 45.00 | | | | (37 | ) | | | (3,145 | ) |
Morgan Stanley | | | 6/21/19 | | | | 40.00 | | | | (281 | ) | | | (93,433 | ) |
Morgan Stanley | | | 7/19/19 | | | | 39.00 | | | | (67 | ) | | | (28,978 | ) |
Morgan Stanley | | | 1/17/20 | | | | 35.00 | | | | (318 | ) | | | (270,300 | ) |
Nucor Corp. | | | 7/19/19 | | | | 55.00 | | | | (223 | ) | | | (118,190 | ) |
Nucor Corp. | | | 7/19/19 | | | | 50.00 | | | | (258 | ) | | | (238,650 | ) |
Nucor Corp. | | | 1/17/20 | | | | 50.00 | | | | (37 | ) | | | (37,278 | ) |
Occidental Petroleum Corp. | | | 5/17/19 | | | | 60.00 | | | | (28 | ) | | | (19,460 | ) |
Occidental Petroleum Corp. | | | 1/17/20 | | | | 57.50 | | | | (250 | ) | | | (265,625 | ) |
Occidental Petroleum Corp. | | | 1/17/20 | | | | 55.00 | | | | (80 | ) | | | (100,000 | ) |
PepsiCo, Inc. | | | 1/17/20 | | | | 95.00 | | | | (49 | ) | | | (139,895 | ) |
140
CALL OPTIONS
WRITTEN—(21.7)% | | Expiration
Date | | | Exercise
Price | | | Contracts | | | Value | |
Phillip Morris International, Inc. | | | 1/17/20 | | | $ | 80.00 | | | | (350 | ) | | $ | (403,375 | ) |
Raytheon Co. | | | 5/17/19 | | | | 175.00 | | | | (35 | ) | | | (33,775 | ) |
Raytheon Co. | | | 5/17/19 | | | | 170.00 | | | | (16 | ) | | | (21,840 | ) |
Raytheon Co. | | | 5/17/19 | | | | 155.00 | | | | (10 | ) | | | (27,225 | ) |
Raytheon Co. | | | 1/17/20 | | | | 160.00 | | | | (56 | ) | | | (153,720 | ) |
Raytheon Co. | | | 1/17/20 | | | | 155.00 | | | | (30 | ) | | | (94,650 | ) |
Raytheon Co. | | | 1/17/20 | | | | 130.00 | | | | (41 | ) | | | (215,865 | ) |
Ross Stores, Inc. | | | 8/16/19 | | | | 77.50 | | | | (64 | ) | | | (111,040 | ) |
Ross Stores, Inc. | | | 1/17/20 | | | | 77.50 | | | | (53 | ) | | | (103,615 | ) |
Ross Stores, Inc. | | | 1/17/20 | | | | 67.50 | | | | (257 | ) | | | (690,045 | ) |
SPDR S&P 500 ETF Trust (ETF) | | | 6/21/19 | | | | 245.00 | | | | (82 | ) | | | (328,615 | ) |
SPDR DJIA ETF Trust (ETF) | | | 6/21/19 | | | | 230.00 | | | | (59 | ) | | | (182,163 | ) |
Stryker Corp. | | | 6/21/19 | | | | 140.00 | | | | (125 | ) | | | (728,750 | ) |
Stryker Corp. | | | 1/17/20 | | | | 130.00 | | | | (34 | ) | | | (238,170 | ) |
TJX Companies, Inc. | | | 1/17/20 | | | | 42.50 | | | | (114 | ) | | | (135,090 | ) |
Texas Instruments, Inc. | | | 6/21/19 | | | | 95.00 | | | | (22 | ) | | | (27,555 | ) |
Texas Instruments, Inc. | | | 6/21/19 | | | | 90.00 | | | | (50 | ) | | | (84,000 | ) |
Texas Instruments, Inc. | | | 6/21/19 | | | | 85.00 | | | | (67 | ) | | | (144,385 | ) |
Texas Instruments, Inc. | | | 6/21/19 | | | | 80.00 | | | | (12 | ) | | | (31,770 | ) |
Texas Instruments, Inc. | | | 1/17/20 | | | | 90.00 | | | | (57 | ) | | | (111,008 | ) |
Texas Instruments, Inc. | | | 1/17/20 | | | | 85.00 | | | | (40 | ) | | | (93,800 | ) |
U.S. Bancorp | | | 6/21/19 | | | | 47.50 | | | | (195 | ) | | | (44,168 | ) |
U.S. Bancorp | | | 1/17/20 | | | | 45.00 | | | | (111 | ) | | | (59,385 | ) |
United Parcel Service, Inc. - Class "B” | | | 4/18/19 | | | | 105.00 | | | | (90 | ) | | | (67,950 | ) |
United Parcel Service, Inc. - Class "B” | | | 1/17/20 | | | | 95.00 | | | | (35 | ) | | | (66,938 | ) |
United Parcel Service, Inc. - Class "B” | | | 1/17/20 | | | | 92.50 | | | | (48 | ) | | | (99,000 | ) |
United Parcel Service, Inc. - Class "B” | | | 1/17/20 | | | | 90.00 | | | | (67 | ) | | | (156,278 | ) |
United Technologies Corp. | | | 6/21/19 | | | | 110.00 | | | | (45 | ) | | | (86,625 | ) |
United Technologies Corp. | | | 8/16/19 | | | | 110.00 | | | | (47 | ) | | | (95,528 | ) |
United Technologies Corp. | | | 8/16/19 | | | | 100.00 | | | | (47 | ) | | | (139,473 | ) |
Walt Disney Co | | | 7/19/19 | | | | 95.00 | | | | (191 | ) | | | (319,447 | ) |
Walt Disney Co | | | 9/20/19 | | | | 95.00 | | | | (78 | ) | | | (139,425 | ) |
Walgreens Boots Alliance, Inc. | | | 10/18/19 | | | | 52.50 | | | | (309 | ) | | | (387,795 | ) |
Walgreens Boots Alliance, Inc. | | | 10/18/19 | | | | 50.00 | | | | (194 | ) | | | (280,330 | ) |
141
Portfolio of Investments(continued)
PREMIUM INCOME FUND
March 31, 2019
CALL OPTIONS
WRITTEN—(21.7)% | | Expiration
Date | | | Exercise
Price | | | Contracts | | | Value | |
Whirlpool Corp. | | | 9/20/19 | | | $ | 115.00 | | | | (246 | ) | | $ | (545,505 | ) |
Total Value of Call Options Written (premium received $25,173,212) | | $ | (26,905,763 | ) |
The Fund’s assets and liabilities are classified into the following three levels based on the inputs used to value the assets and liabilities:
| | Level 1 – | Unadjusted quoted prices in active markets for identical securities that the Fund has the ability to access. |
| | Level 2 – | Observable inputs other than quoted prices included in Level 1 that are observable for the asset or liability, either directly or indirectly. These inputs may include quoted prices for the identical instrument on an inactive market, prices for similar instruments, interest rates, prepayment speeds, credit risk, yield curves, default rates and similar data. |
| | Level 3 – | Unobservable inputs for the asset or liability, to the extent relevant observable inputs are not available, representing the Fund’s own assumption about the assumptions a market participant would use in valuing the asset or liability, and would be based on the best information available. |
The inputs methodology used for valuing securities are not necessarily an indication of the risk associated with investing in those securities. For example, U.S. government securities are reflected as Level 2 because the inputs used to determine fair value may not always be quoted prices in an active market.
The following is a summary, by category of Level, of inputs used to value the Fund’s investments as of March 31, 2019:
| | | Level 1 | | | Level 2 | | | Level 3 | | | Total | |
Assets | | | | | | | | | | | | | | | | |
Common Stocks* | | $ | 147,808,809 | | | $ | — | | | $ | — | | | $ | 147,808,809 | |
| | | | | | | | | | | | | | | | | |
Liabilities | | | | | | | | | | | | | | | | |
Call Options Written | | $ | — | | | $ | (26,905,763 | ) | | $ | — | | | $ | (26,905,763 | ) |
* | The Portfolio of Investments provides information on the industry categorization for common stocks. |
Transfers from Level 1 to Level 2 as of March 31, 2019 were $2,700,872. Transfers, if any, between Levels are recognized at the end of the reporting period.
See notes to financial statements
142
Fund Expenses(unaudited)
SELECT GROWTH FUND
The examples below show the ongoing costs (in dollars) of investing in your Fund and will help you in comparing these costs with costs of other mutual funds. Please refer to page 1 for a detailed explanation of the information presented in these examples.
Expense Example | Annualized
Expense
Ratio | Beginning
Account Value
(10/1/18) | Ending
Account Value
(3/31/19) | Expenses Paid
During Period
(10/1/18-3/31/19)* |
Class A Shares | 1.22% | | | |
Actual | | $1,000.00 | $ 961.68 | $ 5.97 |
Hypothetical** | | $1,000.00 | $ 1,018.85 | $ 6.14 |
Class B Shares | 1.98% | | | |
Actual | | $1,000.00 | $ 958.82 | $ 9.67 |
Hypothetical** | | $1,000.00 | $ 1,015.06 | $ 9.95 |
Advisor Class Shares | 0.89% | | | |
Actual | | $1,000.00 | $ 963.18 | $ 4.36 |
Hypothetical** | | $1,000.00 | $ 1,020.49 | $ 4.48 |
Institutional Class Shares | 0.79% | | | |
Actual | | $1,000.00 | $ 963.84 | $ 3.87 |
Hypothetical** | | $1,000.00 | $ 1,020.99 | $ 3.98 |
* | Expenses are equal to the annualized expense ratio, multiplied by the average account value over the period, multiplied by 182/365 (to reflect the one-half year period). |
** | Assumed rate of return of 5% before expenses |
Portfolio Composition
BY SECTOR
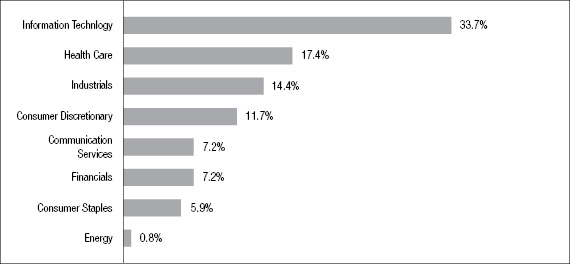
Portfolio holdings and allocations are subject to change. Percentages are as of March 31, 2019, and are based on the total market value of investments.
143
Portfolio of Investments
SELECT GROWTH FUND
March 31, 2019
| |
Shares
| | | Security | | Value | |
| | | | | | COMMON STOCKS—97.6% | | | | |
| | | | | | Communication Services—7.2% | | | | |
| | | 22,180 | | * | Alphabet, Inc. - Class “A” | | $ | 26,103,420 | |
| | | 330,733 | | | Cinemark Holdings, Inc. | | | 13,226,013 | |
| | | 308,600 | | * | TripAdvisor, Inc. | | | 15,877,470 | |
| | | | | | | | | 55,206,903 | |
| | | | | | Consumer Discretionary—11.6% | | | | |
| | | 24,600 | | * | AutoZone, Inc. | | | 25,193,352 | |
| | | 130,000 | | * | Deckers Outdoor Corp. | | | 19,108,700 | |
| | | 232,541 | | | Foot Locker, Inc. | | | 14,091,985 | |
| | | 119,260 | | | PVH Corp. | | | 14,543,757 | |
| | | 201,000 | | | Target Corp. | | | 16,132,260 | |
| | | | | | | | | 89,070,054 | |
| | | | | | Consumer Staples—5.9% | | | | |
| | | 144,912 | | | Procter & Gamble Co. | | | 15,078,094 | |
| | | 208,000 | | | Walgreens Boots Alliance, Inc. | | | 13,160,160 | |
| | | 174,120 | | | Walmart, Inc. | | | 16,981,924 | |
| | | | | | | | | 45,220,178 | |
| | | | | | Energy—.8% | | | | |
| | | 50,100 | | | Chevron Corp. | | | 6,171,318 | |
| | | | | | Financials—7.2% | | | | |
| | | 520,000 | | | Bank of America Corp. | | | 14,346,800 | |
| | | 145,490 | | | Discover Financial Services | | | 10,353,068 | |
| | | 258,500 | | | Progressive Corp. | | | 18,635,265 | |
| | | 244,530 | | | U.S. Bancorp | | | 11,783,901 | |
| | | | | | | | | 55,119,034 | |
| | | | | | Health Care—17.2% | | | | |
| | | 105,600 | | | Allergan, PLC | | | 15,460,896 | |
| | | 267,710 | | | Baxter International, Inc. | | | 21,767,500 | |
| | | 49,110 | | * | Biogen, Inc. | | | 11,608,622 | |
| | | 306,800 | | | Bristol-Myers Squibb Co. | | | 14,637,428 | |
144
| | Shares | | | Security | | Value | |
| | | | | | Health Care (continued) |
| | | 430,940 | | * | Centene Corp. | | $ | 22,882,914 | |
| | | 127,367 | | * | Elanco Animal Health, Inc. | | | 4,084,660 | |
| | | 179,372 | | | Eli Lilly & Co. | | | 23,275,311 | |
| | | 133,180 | | * | Varian Medical Systems, Inc. | | | 18,874,270 | |
| | | | | | | | | 132,591,601 | |
| | | | | | Industrials—14.3% | | | | |
| | | 60,320 | | | Boeing Co. | | | 23,007,254 | |
| | | 200,800 | | | Dover Corp. | | | 18,835,040 | |
| | | 168,790 | | | Eaton Corp., PLC | | | 13,597,722 | |
| | | 88,592 | | | Huntington Ingalls Industries, Inc. | | | 18,356,262 | |
| | | 138,800 | | | Landstar Systems, Inc. | | | 15,183,332 | |
| | | 112,200 | | | Norfolk Southern Corp. | | | 20,969,058 | |
| | | | | | | | | 109,948,668 | |
| | | | | | Information Technology—33.4% | | | | |
| | | 112,700 | | * | Adobe Systems, Inc. | | | 30,033,423 | |
| | | 104,110 | | * | Arista Networks, Inc. | | | 32,738,430 | |
| | | 159,064 | | | Automatic Data Processing, Inc. | | | 25,408,883 | |
| | | 498,950 | | * | Cadence Design Systems, Inc. | | | 31,688,314 | |
| | | 112,700 | | * | F5 Networks, Inc. | | | 17,686,011 | |
| | | 275,000 | | * | Fortinet, Inc. | | | 23,091,750 | |
| | | 220,650 | | | Microsoft Corp. | | | 26,023,461 | |
| | | 341,720 | | | NetApp, Inc. | | | 23,694,865 | |
| | | 94,000 | | * | Palo Alto Networks, Inc. | | | 22,830,720 | |
| | | 232,540 | | * | PayPal Holdings, Inc. | | | 24,146,954 | |
| | | | | | | | | 257,342,811 | |
Total Value of Common Stocks (cost $606,280,479) | | | 750,670,567 | |
145
Portfolio of Investments(continued)
SELECT GROWTH FUND
March 31, 2019
| |
Principal
Amount
| | | Security | | Value | |
| | | | | | SHORT-TERM U.S. GOVERNMENT OBLIGATIONS—1.6% | | | | |
| | | | | | U.S. Treasury Bills: | | | | |
| | $ | 4,500M | | | 2.37%, 4/9/2019 | | $ | 4,497,628 | |
| | | 8,000M | | | 2.396%, 4/11/2019 | | | 7,994,736 | |
Total Value of Short-Term U.S. Government Obligations (cost $12,492,297) | | | 12,492,364 | |
Total Value of Investments (cost $618,772,776) | | | 99.2 | % | | | 763,162,931 | |
Other Assets, Less Liabilities | | | .8 | | | | 6,153,845 | |
Net Assets | | | 100.0 | % | | $ | 769,316,776 | |
The Fund’s assets and liabilities are classified into the following three levels based on the inputs used to value the assets and liabilities:
| | Level 1 – | Unadjusted quoted prices in active markets for identical securities that the Fund has the ability to access. |
| | Level 2 – | Observable inputs other than quoted prices included in Level 1 that are observable for the asset or liability, either directly or indirectly. These inputs may include quoted prices for the identical instrument on an inactive market, prices for similar instruments, interest rates, prepayment speeds, credit risk, yield curves, default rates and similar data. |
| | Level 3 – | Unobservable inputs for the asset or liability, to the extent relevant observable inputs are not available, representing the Fund’s own assumption about the assumptions a market participant would use in valuing the asset or liability, and would be based on the best information available. |
The inputs methodology used for valuing securities are not necessarily an indication of the risk associated with investing in those securities. For example, U.S. government securities are reflected as Level 2 because the inputs used to determine fair value may not always be quoted prices in an active market.
146
The following is a summary, by category of Level, of inputs used to value the Fund’s investments as of March 31, 2019:
| | | Level 1 | | | Level 2 | | | Level 3 | | | Total | |
Common Stocks | | $ | 750,670,567 | | | $ | — | | | $ | — | | | $ | 750,670,567 | |
Short-Term U.S. Government Obligations | | | — | | | | 12,492,364 | | | | — | | | | 12,492,364 | |
Total Investments in Securities* | | $ | 750,670,567 | | | $ | 12,492,364 | | | $ | — | | | $ | 763,162,931 | |
* | The Portfolio of Investments provides information on the industry categorization for common stocks. |
There were no transfers into or from Level 1 and Level 2 by the Fund during the period ended March 31, 2019. Transfers, if any, between Levels are recognized at the end of the reporting period.
See notes to financial statements
147
Fund Expenses(unaudited)
SPECIAL SITUATIONS FUND
The examples below show the ongoing costs (in dollars) of investing in your Fund and will help you in comparing these costs with costs of other mutual funds. Please refer to page 1 for a detailed explanation of the information presented in these examples.
Expense Example | Annualized
Expense
Ratio | Beginning
Account Value
(10/1/18) | Ending
Account Value
(3/31/19) | Expenses Paid
During Period
(10/1/18-3/31/19)* |
Class A Shares | 1.32% | | | |
Actual | | $1,000.00 | $ 899.18 | $ 6.25 |
Hypothetical** | | $1,000.00 | $ 1,018.35 | $ 6.64 |
Class B Shares | 2.10% | | | |
Actual | | $1,000.00 | $ 895.60 | $ 9.92 |
Hypothetical** | | $1,000.00 | $ 1,014.46 | $ 10.55 |
Advisor Class Shares | 1.02% | | | |
Actual | | $1,000.00 | $ 900.30 | $ 4.83 |
Hypothetical** | | $1,000.00 | $ 1,019.84 | $ 5.14 |
Institutional Class Shares | 0.87% | | | |
Actual | | $1,000.00 | $ 900.95 | $ 4.12 |
Hypothetical** | | $1,000.00 | $ 1,020.59 | $ 4.38 |
* | Expenses are equal to the annualized expense ratio, multiplied by the average account value over the period, multiplied by 182/365 (to reflect the one-half year period). Expenses paid during the period are net of expenses waived. |
** | Assumed rate of return of 5% before expenses |
Portfolio Composition
TOP TEN SECTORS
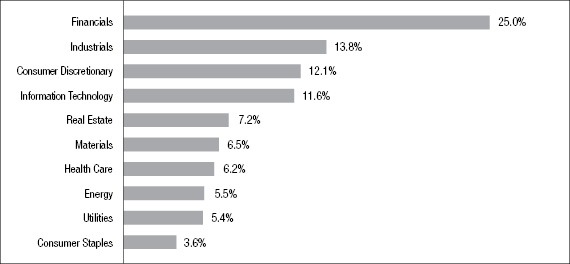
Portfolio holdings and allocations are subject to change. Percentages are as of March 31, 2019, and are based on the total market value of investments.
148
Portfolio of Investments
SPECIAL SITUATIONS FUND
March 31, 2019
| |
Shares
| | | Security | | Value | |
| | | | | | COMMON STOCKS—96.2% | | | | |
| | | | | | Communication Services—.8% | | | | |
| | | 99,300 | | | Meredith Corp. | | $ | 5,487,318 | |
| | | | | | Consumer Discretionary—11.9% | | | | |
| | | 233,100 | | | American Eagle Outfitters, Inc. | | | 5,167,827 | |
| | | 79,400 | | | Cheesecake Factory, Inc. | | | 3,884,248 | |
| | | 39,400 | | | Children’s Place, Inc. | | | 3,832,832 | |
| | | 301,600 | | | Dana, Inc. | | | 5,350,384 | |
| | | 198,500 | | | DSW, Inc. - Class “A” | | | 4,410,670 | |
| | | 201,600 | | * | frontdoor, inc. | | | 6,939,072 | |
| | | 145,400 | | | Haverty Furniture Cos., Inc. | | | 3,181,352 | |
| | | 56,000 | | * | Helen of Troy, Ltd. | | | 6,493,760 | |
| | | 178,600 | | * | MasterCraft Boat Holdings, Inc. | | | 4,031,002 | |
| | | 50,700 | | | Oxford Industries, Inc. | | | 3,815,682 | |
| | | 109,300 | | | Penske Automotive Group, Inc. | | | 4,880,245 | |
| | | 230,400 | | | Ruth’s Hospitality Group, Inc. | | | 5,895,936 | |
| | | 84,500 | | * | ServiceMaster Holdings, Inc. | | | 3,946,150 | |
| | | 430,400 | | * | TRI Pointe Group, Inc. | | | 5,440,256 | |
| | | 47,700 | | * | Visteon Corp. | | | 3,212,595 | |
| | | 197,500 | | | Wolverine World Wide, Inc. | | | 7,056,675 | |
| | | | | | | | | 77,538,686 | |
| | | | | | Consumer Staples—3.5% | | | | |
| | | 159,200 | | | Energizer Holdings, Inc. | | | 7,152,856 | |
| | | 112,700 | | * | Performance Food Group Co. | | | 4,467,428 | |
| | | 191,271 | | | Tootsie Roll Industries, Inc. | | | 7,122,932 | |
| | | 124,000 | | * | U.S. Foods Holding Corp. | | | 4,328,840 | |
| | | | | | | | | 23,072,056 | |
| | | | | | Energy—5.4% | | | | |
| | | 255,700 | | * | Carrizo Oil & Gas, Inc. | | | 3,188,579 | |
| | | 177,600 | | | Delek U.S. Holdings, Inc. | | | 6,468,192 | |
| | | 351,300 | | * | Jagged Peak Energy, Inc. | | | 3,678,111 | |
| | | 468,500 | | * | Keane Group, Inc. | | | 5,101,965 | |
| | | 318,600 | | | Liberty Oilfield Services, Inc. - Class “A” | | | 4,903,254 | |
149
Portfolio of Investments(continued)
SPECIAL SITUATIONS FUND
March 31, 2019
| |
Shares
| | | Security | | Value | |
| | | | | | Energy (continued) |
| | | 477,400 | | * | Oasis Petroleum, Inc. | | $ | 2,883,496 | |
| | | 148,000 | | | PBF Energy, Inc. - Class “A” | | | 4,608,720 | |
| | | 338,200 | | * | WPX Energy, Inc. | | | 4,433,802 | |
| | | | | | | | | 35,266,119 | |
| | | | | | Financials—24.6% | | | | |
| | | 317,500 | | * | AllianceBernstein Holding, LP (MLP) | | | 9,172,575 | |
| | | 250,729 | | | Amalgamated Bank - Class “A” | | | 3,923,909 | |
| | | 77,600 | | | American Financial Group, Inc. | | | 7,465,896 | |
| | | 258,900 | | | Berkshire Hills Bancorp, Inc. | | | 7,052,436 | |
| | | 177,500 | | | Brown & Brown, Inc. | | | 5,238,025 | |
| | | 207,300 | | | Capstar Financial Holdings, Inc. | | | 2,993,412 | |
| | | 521,800 | | | CNO Financial Group, Inc. | | | 8,442,724 | |
| | | 248,200 | | | Great Western Bancorp, Inc. | | | 7,840,638 | |
| | | 73,800 | | | IBERIABANK Corp. | | | 5,292,198 | |
| | | 101,600 | | | Independent Bank Group, Inc. | | | 5,211,064 | |
| | | 50,900 | | | iShares Russell 2000 Value (ETF) | | | 6,102,910 | |
| | | 120,300 | | | James River Group Holdings, Ltd. | | | 4,821,624 | |
| | | 94,400 | | | Kemper Corp. | | | 7,187,616 | |
| | | 272,400 | | | OceanFirst Financial Corp. | | | 6,553,944 | |
| | | 506,300 | | | Old National Bancorp of Indiana | | | 8,303,320 | |
| | | 116,000 | | | Prosperity Bancshares, Inc. | | | 8,010,960 | |
| | | 105,400 | | | QCR Holdings, Inc. | | | 3,575,168 | |
| | | 218,000 | | * | Seacoast Banking Corp. | | | 5,744,300 | |
| | | 335,600 | | | Simmons First National Corp. - Class “A” | | | 8,215,488 | |
| | | 559,100 | | | Sterling Bancorp | | | 10,416,033 | |
| | | 169,000 | | | Synovus Financial Corp. | | | 5,806,840 | |
| | | 429,000 | | | TCF Financial Corp. | | | 8,876,010 | |
| | | 266,000 | | | Veritex Holdings, Inc. | | | 6,442,520 | |
| | | 442,900 | | | Waddell & Reed Financial, Inc. - Class “A” | | | 7,657,741 | |
| | | | | | | | | 160,347,351 | |
| | | | | | Health Care—6.1% | | | | |
| | | 45,100 | | * | Charles River Laboratories International, Inc. | | | 6,550,775 | |
150
| |
Shares
| | | Security | | Value | |
| | | | | | Health Care (continued) |
| | | 60,900 | | | Hill-Rom Holdings, Inc. | | $ | 6,446,874 | |
| | | 47,600 | | * | ICON, PLC | | | 6,501,208 | |
| | | 187,300 | | | Phibro Animal Health Corp. - Class “A” | | | 6,180,900 | |
| | | 320,100 | | * | Prestige Brands, Inc. | | | 9,574,191 | |
| | | 48,500 | | | SPDR S&P Biotech (ETF) | | | 4,391,190 | |
| | | | | | | | | 39,645,138 | |
| | | | | | Industrials—13.6% | | | | |
| | | 163,400 | | | AAR Corp. | | | 5,312,134 | |
| | | 267,800 | | * | Atkore International Group Co. | | | 5,765,734 | |
| | | 181,300 | | | Columbus McKinnon Corp. | | | 6,227,655 | |
| | | 98,000 | | | Comfort Systems USA, Inc. | | | 5,134,220 | |
| | | 111,100 | | | ESCO Technologies, Inc. | | | 7,447,033 | |
| | | 216,200 | | * | Gardner Denver Holdings, Inc. | | | 6,012,522 | |
| | | 26,800 | | | ICF International, Inc. | | | 2,038,944 | |
| | | 98,600 | | | Kennametal, Inc. | | | 3,623,550 | |
| | | 120,900 | | | Korn/Ferry International | | | 5,413,902 | |
| | | 112,300 | | | Park-Ohio Holdings Corp. | | | 3,636,274 | |
| | | 79,200 | | | Regal Beloit Corp. | | | 6,484,104 | |
| | | 155,000 | | | Schneider National, Inc. - Class “B” | | | 3,262,750 | |
| | | 64,800 | | | SPDR S&P Transportation (ETF) | | | 3,915,851 | |
| | | 242,400 | | * | SPX Corp. | | | 8,433,096 | |
| | | 58,600 | | | Standex International Corp. | | | 4,301,240 | |
| | | 167,700 | | | Timken Co. | | | 7,315,074 | |
| | | 145,000 | | | Triton International, Ltd. | | | 4,509,500 | |
| | | | | | | | | 88,833,583 | |
| | | | | | Information Technology—11.5% | | | | |
| | | 49,900 | | * | Alpha & Omega Semiconductor, Ltd. | | | 574,349 | |
| | | 236,600 | | * | ARRIS International, PLC | | | 7,478,926 | |
| | | 112,700 | | * | Cree, Inc. | | | 6,448,694 | |
| | | 132,600 | | * | Diodes, Inc. | | | 4,601,220 | |
| | | 174,700 | | * | Ichor Holdings, Ltd. | | | 3,944,726 | |
| | | 25,400 | | * | MicroStrategy, Inc. | | | 3,663,950 | |
151
Portfolio of Investments(continued)
SPECIAL SITUATIONS FUND
March 31, 2019
| |
Shares
| | | Security | | Value | |
| | | | | | Information Technology (continued) |
| | | 69,100 | | | MKS Instruments, Inc. | | $ | 6,429,755 | |
| | | 156,400 | | * | NETGEAR, Inc. | | | 5,179,968 | |
| | | 657,900 | | * | PDF Solutions, Inc. | | | 8,125,065 | |
| | | 242,500 | | * | Perficient, Inc. | | | 6,642,075 | |
| | | 580,400 | | | Travelport Worldwide, Ltd. | | | 9,129,692 | |
| | | 473,800 | | * | TTM Technologies, Inc. | | | 5,557,674 | |
| | | 115,700 | | * | Verint Systems, Inc. | | | 6,925,802 | |
| | | | | | | | | 74,701,896 | |
| | | | | | Materials—6.4% | | | | |
| | | 59,000 | | | AptarGroup, Inc. | | | 6,277,010 | |
| | | 204,700 | | * | Ferro Corp. | | | 3,874,971 | |
| | | 67,600 | | | Greif, Inc. | | | 2,788,500 | |
| | | 155,000 | | * | Livent Corp. | | | 1,903,400 | |
| | | 201,500 | | | Louisiana-Pacific Corp. | | | 4,912,570 | |
| | | 347,700 | | * | PQ Group Holdings, Inc. | | | 5,274,609 | |
| | | 91,600 | | | Schweitzer-Mauduit International., Inc. | | | 3,546,752 | |
| | | 100,400 | | | Sensient Technologies Corp. | | | 6,806,116 | |
| | | 155,200 | | | SPDR S&P Metals & Mining (ETF) | | | 4,606,336 | |
| | | 39,500 | | | Trinseo SA | | | 1,789,350 | |
| | | | | | | | | 41,779,614 | |
| | | | | | Real Estate—7.1% | | | | |
| | | 292,500 | | | Americold Realty Trust (REIT) | | | 8,924,175 | |
| | | 344,800 | | | Brixmor Property Group, Inc. (REIT) | | | 6,333,976 | |
| | | 171,900 | | | Douglas Emmett, Inc. (REIT) | | | 6,948,198 | |
| | | 47,900 | | | Federal Realty Investment Trust (REIT) | | | 6,603,015 | |
| | | 227,868 | | | Industrial Logistics Properties Trust (REIT) | | | 4,596,097 | |
| | | 130,400 | | | JBG SMITH Properties (REIT) | | | 5,392,040 | |
| | | 312,700 | | | Sunstone Hotel Investors, Inc. (REIT) | | | 4,502,880 | |
| | | 127,000 | | | Tanger Factory Outlet Centers, Inc. (REIT) | | | 2,664,460 | |
| | | | | | | | | 45,964,841 | |
152
| | Shares or
Principal
Amount | | | Security | | Value | |
| | | | | | Utilities—5.3% | | | | |
| | | 147,300 | | | Black Hills Corp. | | $ | 10,910,511 | |
| | | 76,600 | | | IDACORP, Inc. | | | 7,624,764 | |
| | | 81,900 | | | Pinnacle West Capital Corp. | | | 7,828,002 | |
| | | 160,100 | | | Portland General Electric Co. | | | 8,299,584 | |
| | | | | | | | | 34,662,861 | |
Total Value of Common Stocks (cost $568,754,327) | | | 627,299,463 | |
| | | | | | SHORT-TERM U.S. GOVERNMENT OBLIGATIONS—2.3% | | | | |
| | | | | | U.S. Treasury Bills: | | | | |
| | $ | 5,000M | | | 2.37%, 4/9/2019 | | | 4,997,365 | |
| | | 10,000M | | | 2.396%, 4/11/2019 | | | 9,993,420 | |
Total Value of Short-Term U.S. Government Obligations (cost $14,990,701) | | | 14,990,785 | |
Total Value of Investments (cost $583,745,028) | | | 98.5 | % | | | 642,290,248 | |
Other Assets, Less Liabilities | | | 1.5 | | | | 10,002,595 | |
Net Assets | | | 100.0 | % | | $ | 652,292,843 | |
Summary of Abbreviations:
MLP | Master Limited Partnership |
REIT | Real Estate Investment Trust |
SPDR | Standard & Poor’s Depository Receipts |
The Fund’s assets and liabilities are classified into the following three levels based on the inputs used to value the assets and liabilities:
| | Level 1 – | Unadjusted quoted prices in active markets for identical securities that the Fund has the ability to access. |
| | Level 2 – | Observable inputs other than quoted prices included in Level 1 that are observable for the asset or liability, either directly or indirectly. These inputs may include quoted prices for the identical instrument on an inactive market, prices for similar instruments, interest rates, prepayment speeds, credit risk, yield curves, default rates and similar data. |
153
Portfolio of Investments(continued)
SPECIAL SITUATIONS FUND
March 31, 2019
| | Level 3 – | Unobservable inputs for the asset or liability, to the extent relevant observable inputs are not available, representing the Fund’s own assumption about the assumptions a market participant would use in valuing the asset or liability, and would be based on the best information available. |
The inputs methodology used for valuing securities are not necessarily an indication of the risk associated with investing in those securities. For example, U.S. government securities are reflected as Level 2 because the inputs used to determine fair value may not always be quoted prices in an active market.
The following is a summary, by category of Level, of inputs used to value the Fund’s investments as of March 31, 2019:
| | | Level 1 | | | Level 2 | | | Level 3 | | | Total | |
Common Stocks | | $ | 627,299,463 | | | $ | — | | | $ | — | | | $ | 627,299,463 | |
Short-Term U.S. Government Agency Obligations | | | — | | | | 14,990,785 | | | | — | | | | 14,990,785 | |
Total Investments in Securities* | | $ | 627,299,463 | | | $ | 14,990,785 | | | $ | — | | | $ | 642,290,248 | |
* | The Portfolio of Investments provides information on the industry categorization for common stocks. |
There were no transfers into or from Level 1 and Level 2 by the Fund during the period ended March 31, 2019. Transfers, if any, between Levels are recognized at the end of the reporting period.
154
See notes to financial statements
Fund Expenses(unaudited)
TOTAL RETURN FUND
The examples below show the ongoing costs (in dollars) of investing in your Fund and will help you in comparing these costs with costs of other mutual funds. Please refer to page 1 for a detailed explanation of the information presented in these examples.
Expense Example | Annualized
Expense
Ratio | Beginning
Account Value
(10/1/18) | Ending
Account Value
(3/31/19) | Expenses Paid
During Period
(10/1/18-3/31/19)* |
Class A Shares | 1.20% | | | |
Actual | | $1,000.00 | $ 985.53 | $ 5.94 |
Hypothetical** | | $1,000.00 | $ 1,018.95 | $ 6.04 |
Class B Shares | 1.95% | | | |
Actual | | $1,000.00 | $ 981.56 | $ 9.63 |
Hypothetical** | | $1,000.00 | $ 1,015.21 | $ 9.80 |
Advisor Class Shares | 0.98% | | | |
Actual | | $1,000.00 | $ 986.01 | $ 4.85 |
Hypothetical** | | $1,000.00 | $ 1,020.04 | $ 4.94 |
Institutional Class Shares | 0.79% | | | |
Actual | | $1,000.00 | $ 987.42 | $ 3.91 |
Hypothetical** | | $1,000.00 | $ 1,020.99 | $ 3.98 |
* | Expenses are equal to the annualized expense ratio, multiplied by the average account value over the period, multiplied by 182/365 (to reflect the one-half year period). |
** | Assumed rate of return of 5% before expenses |
Portfolio Composition
TOP TEN SECTORS
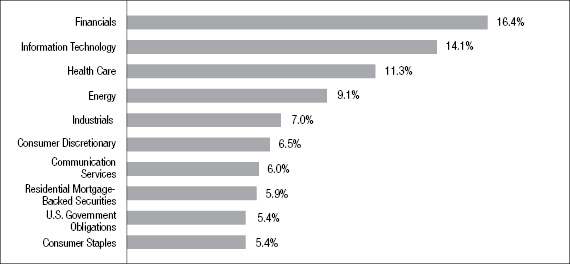
Portfolio holdings and allocations are subject to change. Percentages are as of March 31, 2019, and are based on the total market value of investments.
155
Portfolio of Investments
TOTAL RETURN FUND
March 31, 2019
| | Shares | | | Security | | Value | |
| | | | | | COMMON STOCKS—55.9% | | | | |
| | | | | | Communication Services—4.6% | | | | |
| | | 7,400 | | * | Alphabet, Inc. - Class “A” | | $ | 8,708,986 | |
| | | 138,500 | | | AT&T, Inc. | | | 4,343,360 | |
| | | 84,225 | | | CBS Corp. - Class “B” | | | 4,003,214 | |
| | | 111,200 | | | Comcast Corp. - Special Shares “A” | | | 4,445,776 | |
| | | 41,700 | | * | Take-Two Interactive Software, Inc. | | | 3,935,229 | |
| | | 119,275 | | | Verizon Communications, Inc. | | | 7,052,731 | |
| | | 63,100 | | | Walt Disney Co. | | | 7,005,993 | |
| | | | | | | | | 39,495,289 | |
| | | | | | Consumer Discretionary—3.6% | | | | |
| | | 2,600 | | * | Amazon.com, Inc. | | | 4,629,950 | |
| | | 119,200 | | | American Eagle Outfitters, Inc. | | | 2,642,664 | |
| | | 108,100 | | | Aramark Holdings Corp. | | | 3,194,355 | |
| | | 21,000 | | * | Burlington Stores, Inc. | | | 3,290,280 | |
| | | 26,330 | | | Home Depot, Inc. | | | 5,052,464 | |
| | | 53,200 | | | Lowe’s Cos., Inc. | | | 5,823,804 | |
| | | 27,700 | | | Ross Stores, Inc. | | | 2,578,870 | |
| | | 123,450 | | | Tapestry, Inc. | | | 4,010,891 | |
| | | | | | | | | 31,223,278 | |
| | | | | | Consumer Staples—4.4% | | | | |
| | | 161,340 | | | Coca-Cola Co. | | | 7,560,392 | |
| | | 89,630 | | | Koninklijke Ahold Delhaize NV (ADR) | | | 2,381,917 | |
| | | 75,250 | | | Mondelez International, Inc. - Class “A” | | | 3,756,480 | |
| | | 65,660 | | | PepsiCo, Inc. | | | 8,046,633 | |
| | | 57,610 | | | Philip Morris International, Inc. | | | 5,092,148 | |
| | | 55,250 | | | Procter & Gamble Co. | | | 5,748,762 | |
| | | 60,870 | | | Walmart, Inc. | | | 5,936,651 | |
| | | | | | | | | 38,522,983 | |
| | | | | | Energy—5.1% | | | | |
| | | 186,073 | | | BP, PLC (ADR) | | | 8,135,112 | |
| | | 62,850 | | | Chevron Corp. | | | 7,741,863 | |
156
| | Shares | | | Security | | Value | |
| | | | | | Energy (continued) |
| | | 49,550 | | | ConocoPhillips | | $ | 3,306,967 | |
| | | 415,250 | | | EnCana Corp. | | | 3,006,410 | |
| | | 18,100 | | | EOG Resources, Inc. | | | 1,722,758 | |
| | | 69,752 | | | ExxonMobil Corp. | | | 5,635,962 | |
| | | 68,200 | | | Marathon Petroleum Corp. | | | 4,081,770 | |
| | | 59,900 | | | Schlumberger, Ltd. | | | 2,609,843 | |
| | | 116,910 | | | Suncor Energy, Inc. | | | 3,791,391 | |
| | | 51,150 | | | Valero Energy Corp. | | | 4,339,055 | |
| | | | | | | | | 44,371,131 | |
| | | | | | Financials—9.8% | | | | |
| | | 42,320 | | | American Express Co. | | | 4,625,576 | |
| | | 210,300 | | | Bank of America Corp. | | | 5,802,177 | |
| | | 43,950 | | | Chubb, Ltd. | | | 6,156,516 | |
| | | 68,450 | | | Citigroup, Inc. | | | 4,258,959 | |
| | | 37,800 | | | Citizens Financial Group, Inc. | | | 1,228,500 | |
| | | 23,150 | | | Goldman Sachs Group, Inc. | | | 4,444,569 | |
| | | 95,300 | | | Hamilton Lane, Inc. - Class “A” | | | 4,153,174 | |
| | | 100,030 | | | JPMorgan Chase & Co. | | | 10,126,037 | |
| | | 47,750 | | | MetLife, Inc. | | | 2,032,717 | |
| | | 95,180 | | | Morgan Stanley | | | 4,016,596 | |
| | | 44,725 | | | PNC Financial Services Group, Inc. | | | 5,485,968 | |
| | | 90,650 | | | Popular, Inc. | | | 4,725,584 | |
| | | 86,600 | | | Regions Financial Corp. | | | 1,225,390 | |
| | | 173,150 | | | Sterling Bancorp | | | 3,225,785 | |
| | | 157,850 | | | Synchrony Financial | | | 5,035,415 | |
| | | 42,150 | | | Travelers Cos., Inc. | | | 5,781,294 | |
| | | 124,945 | | | U.S. Bancorp | | | 6,021,100 | |
| | | 143,270 | | | Wells Fargo & Co. | | | 6,922,806 | |
| | | | | | | | | 85,268,163 | |
| | | | | | Health Care—9.7% | | | | |
| | | 66,460 | | | Abbott Laboratories | | | 5,312,812 | |
| | | 16,750 | | | Anthem, Inc. | | | 4,806,915 | |
| | | 28,269 | | | Baxter International, Inc. | | | 2,298,552 | |
157
Portfolio of Investments(continued)
TOTAL RETURN FUND
March 31, 2019
| | Shares | | | Security | | Value | |
| | | | | | Health Care (continued) |
| | | 10,150 | | * | Centene Corp. | | $ | 538,965 | |
| | | 24,200 | | * | Charles River Laboratories International, Inc. | | | 3,515,050 | |
| | | 24,550 | | | Eli Lilly & Co. | | | 3,185,608 | |
| | | 40,750 | | * | Exact Sciences Corp. | | | 3,529,765 | |
| | | 62,450 | | | Hill-Rom Holdings, Inc. | | | 6,610,957 | |
| | | 21,900 | | | Johnson & Johnson | | | 3,061,401 | |
| | | 85,150 | | | Koninklijke Philips NV (ADR) | | | 3,479,229 | |
| | | 61,200 | | | Medtronic, PLC | | | 5,574,096 | |
| | | 85,545 | | | Merck & Co., Inc. | | | 7,114,778 | |
| | | 101,329 | | | Pfizer, Inc. | | | 4,303,443 | |
| | | 147,300 | | | Smith & Nephew, PLC (ADR) | | | 5,908,203 | |
| | | 29,845 | | | Thermo Fisher Scientific, Inc. | | | 8,169,173 | |
| | | 24,250 | | * | Vertex Pharmaceuticals, Inc. | | | 4,460,788 | |
| | | 57,350 | | | Zimmer Biomet Holdings, Inc. | | | 7,323,595 | |
| | | 48,865 | | | Zoetis, Inc. | | | 4,919,240 | |
| | | | | | | | | 84,112,570 | |
| | | | | | Industrials—5.1% | | | | |
| | | 118,200 | | * | Gardner Denver Holdings, Inc. | | | 3,287,142 | |
| | | 49,150 | | | Honeywell International, Inc. | | | 7,810,918 | |
| | | 43,800 | | | Ingersoll-Rand, PLC | | | 4,728,210 | |
| | | 37,800 | | | Kansas City Southern, Inc. | | | 4,384,044 | |
| | | 22,620 | | | Lockheed Martin Corp. | | | 6,789,619 | |
| | | 37,250 | | | Stanley Black & Decker, Inc. | | | 5,072,333 | |
| | | 25,850 | | | Union Pacific Corp. | | | 4,322,120 | |
| | | 57,430 | | | United Technologies Corp. | | | 7,402,153 | |
| | | | | | | | | 43,796,539 | |
| | | | | | Information Technology—12.6% | | | | |
| | | 11,900 | | * | Adobe Systems, Inc. | | | 3,171,231 | |
| | | 23,055 | | | Apple, Inc. | | | 4,379,297 | |
| | | 155,247 | | | Cisco Systems, Inc. | | | 8,381,786 | |
| | | 83,900 | | * | Cree, Inc. | | | 4,800,758 | |
| | | 75,600 | | * | Fiserv, Inc. | | | 6,673,968 | |
| | | 11,300 | | * | FleetCor Technologies, Inc. | | | 2,786,467 | |
158
| | Shares or
Principal
Amount | | | Security | | Value | |
| | | | | | Information Technology (continued) |
| | | 176,425 | | | Intel Corp. | | $ | 9,474,022 | |
| | | 109,300 | | | Maxim Integrated Products, Inc. | | | 5,811,481 | |
| | | 69,350 | | * | Mellanox Technologies, Ltd. | | | 8,208,266 | |
| | | 71,335 | | | Microsoft Corp. | | | 8,413,250 | |
| | | 149,350 | | | Nintendo Co., Ltd. (ADR) | | | 5,357,184 | |
| | | 13,800 | | | NVIDIA Corp. | | | 2,477,928 | |
| | | 64,050 | | | Oracle Corp. | | | 3,440,125 | |
| | | 132,020 | | | QUALCOMM, Inc. | | | 7,529,101 | |
| | | 43,750 | | * | salesforce.com, inc. | | | 6,928,687 | |
| | | 57,750 | | * | Synopsys, Inc. | | | 6,649,913 | |
| | | 32,350 | | | Texas Instruments, Inc. | | | 3,431,365 | |
| | | 46,800 | | | Visa, Inc. - Class “A” | | | 7,309,692 | |
| | | 39,900 | | * | Worldpay, Inc. - Class “A” | | | 4,528,650 | |
| | | | | | | | | 109,753,171 | |
| | | | | | Materials—1.0% | | | | |
| | | 81,650 | | | DowDuPont, Inc. | | | 4,352,761 | |
| | | 25,830 | | | Linde, PLC | | | 4,544,272 | |
| | | | | | | | | 8,897,033 | |
Total Value of Common Stocks (cost $365,730,702) | | | 485,440,157 | |
| | | | | | CORPORATE BONDS—23.1% | | | | |
| | | | | | Aerospace/Defense—.3% | | | | |
| | $ | 100M | | | Bombardier, Inc., 6%, 10/15/2022(a) | | | 101,375 | |
| | | 2,500M | | | Rockwell Collins, Inc., 3.5%, 3/15/2027 | | | 2,470,842 | |
| | | | | | TransDigm, Inc.: | | | | |
| | | 50M | | | 6.5%, 7/15/2024 | | | 51,563 | |
| | | 25M | | | 6.25%, 3/15/2026(a) | | | 26,100 | |
| | | 50M | | | Triumph Group, Inc., 5.25%, 6/1/2022 | | | 48,250 | |
| | | | | | | | | 2,698,130 | |
| | | | | | Automotive—1.6% | | | | |
| | | 175M | | | American Axle & Manufacturing, Inc.,
6.25%, 4/1/2025 | | | 171,062 | |
159
Portfolio of Investments(continued)
TOTAL RETURN FUND
March 31, 2019
| |
Principal
Amount
| | | Security | | Value | |
| | | | | | Automotive (continued) | | | | |
| | $ | 50M | | | Asbury Automotive Group, Inc., 6%, 12/15/2024 | | $ | 51,672 | |
| | | 175M | | | Cooper Standard Automotive, Inc.,
5.625%, 11/15/2026(a) | | | 154,525 | |
| | | 320M | | | Dana Holding Corp., 5.5%, 12/15/2024 | | | 320,000 | |
| | | 2,500M | | | Ford Motor Credit Co., LLC, 8.125%, 1/15/2020 | | | 2,591,555 | |
| | | 4,345M | | | General Motors Financial Co., Inc., 5.25%, 3/1/2026 | | | 4,488,185 | |
| | | 50M | | | Hertz Corp., 5.875%, 10/15/2020 | | | 50,050 | |
| | | 75M | | | J.B. Poindexter & Co., 7.125%, 4/15/2026(a) | | | 75,587 | |
| | | 3,380M | | | Lear Corp., 5.25%, 1/15/2025 | | | 3,515,261 | |
| | | 50M | | | LKQ Corp., 4.75%, 5/15/2023 | | | 50,552 | |
| | | 2,500M | | | O’Reilly Automotive, Inc., 3.55%, 3/15/2026 | | | 2,494,102 | |
| | | 25M | | | Panther BF Aggeregator 2, LP, 8.5%, 5/15/2027(a)(b) | | | 25,125 | |
| | | 50M | | | Tenneco, Inc., 5%, 7/15/2026 | | | 40,250 | |
| | | | | | | | | 14,027,926 | |
| | | | | | Building Materials—.0% | | | | |
| | | 75M | | | Building Materials Corp., 5.375%, 11/15/2024(a) | | | 77,156 | |
| | | 75M | | | Griffon Corp., 5.25%, 3/1/2022 | | | 74,062 | |
| | | 25M | | | New Enterprise Stone & Lime Co., 6.25%, 3/15/2026 (a) | | | 24,378 | |
| | | 25M | | | Standard Industries, Inc., 5.5%, 2/15/2023(a) | | | 25,500 | |
| | | | | | | | | 201,096 | |
| | | | | | Chemicals—.3% | | | | |
| | | 175M | | | Blue Cube Spinco, Inc., 10%, 10/15/2025 | | | 201,084 | |
| | | 75M | | | Chemours Co., 6.625%, 5/15/2023 | | | 77,819 | |
| | | 50M | | | Kraton Polymers, LLC, 7%, 4/15/2025(a) | | | 50,750 | |
| | | 2,100M | | | LyondellBasell Industries NV, 6%, 11/15/2021 | | | 2,246,884 | |
| | | 50M | | | Neon Holdings, Inc., 10.125%, 4/1/2026(a) | | | 51,125 | |
| | | 125M | | | Rain CII Carbon, LLC, 7.25%, 4/1/2025(a) | | | 111,250 | |
| | | 70M | | | Rayonier AM Products, Inc., 5.5%, 6/1/2024(a) | | | 65,975 | |
| | | 50M | | | Tronox, Inc., 6.5%, 4/15/2026(a) | | | 47,908 | |
| | | 50M | | | Univar USA, Inc., 6.75%, 7/15/2023(a) | | | 51,350 | |
| | | | | | | | | 2,904,145 | |
160
| |
Principal
Amount
| | | Security | | Value | |
| | | | | | Consumer Non-Durables—.1% | | | | |
| | | | | | Energizer Holdings, Inc.: | | | | |
| | $ | 50M | | | 5.5%, 6/15/2025(a) | | $ | 49,609 | |
| | | 25M | | | 6.375%, 7/15/2026(a) | | | 25,687 | |
| | | 75M | | | First Quality Finance Co., 4.625%, 5/15/2021(a) | | | 75,187 | |
| | | 25M | | | KGA Escrow, LLC, 7.5%, 8/15/2023(a) | | | 25,469 | |
| | | | | | Reynolds Group Holdings, Inc.: | | | | |
| | | 97M | | | 5.75%, 10/15/2020 | | | 97,153 | |
| | | 175M | | | 5.125%, 7/15/2023(a) | | | 178,063 | |
| | | | | | | | | 451,168 | |
| | | | | | Energy—3.8% | | | | |
| | | 5,000M | | | Andeavor Logistics, LP, 5.25%, 1/15/2025 | | | 5,194,810 | |
| | | 50M | | | Apergy Corp., 6.375%, 5/1/2026 | | | 50,812 | |
| | | 75M | | | Baytex Energy Corp., 5.125%, 6/1/2021(a) | | | 74,437 | |
| | | | | | Blue Racer Midstream, LLC: | | | | |
| | | 175M | | | 6.125%, 11/15/2022(a) | | | 178,500 | |
| | | 50M | | | 6.625%, 7/15/2026(a) | | | 51,250 | |
| | | 75M | | | California Resources Corp., 8%, 12/15/2022(a) | | | 59,085 | |
| | | 25M | | | Callon Petroleum Co., 6.375%, 7/1/2026 | | | 25,187 | |
| | | 3,400M | | | Canadian Oil Sands, Ltd., 7.75%, 5/15/2019(a) | | | 3,425,208 | |
| | | | | | Chesapeake Energy Corp.: | | | | |
| | | 25M | | | 4.875%, 4/15/2022 | | | 24,750 | |
| | | 75M | | | 7%, 10/1/2024 | | | 75,094 | |
| | | 50M | | | 8%, 6/15/2027 | | | 49,500 | |
| | | 2,700M | | | Cimarex Energy Co., 4.375%, 3/15/2029 | | | 2,784,124 | |
| | | 75M | | | CITGO Petroleum Corp., 6.25%, 8/15/2022(a) | | | 74,812 | |
| | | 2,700M | | | Continental Resources, Inc., 5%, 9/15/2022 | | | 2,722,232 | |
| | | 50M | | | Covey Park Energy, LLC, 7.5%, 5/15/2025(a) | | | 46,500 | |
| | | 75M | | | Crestwood Midstream Partners, LP, 5.75%, 4/1/2025 | | | 77,250 | |
| | | 25M | | | CrownRock, LP, 5.625%, 10/15/2025(a) | | | 24,094 | |
| | | 50M | | | DCP Midstream Operating, LP, 3.875%, 3/15/2023 | | | 49,875 | |
| | | 25M | | | Diamondback Energy, Inc., 4.75%, 11/1/2024(a) | | | 25,651 | |
| | | 50M | | | EnLink Midstream Partners, LP, 4.85%, 7/15/2026 | | | 49,822 | |
| | | 2,500M | | | Enterprise Products Operating, 7.55%, 4/15/2038 | | | 3,373,467 | |
161
Portfolio of Investments(continued)
TOTAL RETURN FUND
March 31, 2019
| |
Principal
Amount
| | | Security | | Value | |
| | | | | | Energy (continued) | | | | |
| | $ | 170M | | | Exterran Partners, LP, 6%, 10/1/2022 | | $ | 172,125 | |
| | | 175M | | | Global Partners, LP, 6.25%, 7/15/2022 | | | 173,687 | |
| | | 25M | | | Gulfport Energy Corp., 6.625%, 5/1/2023 | | | 24,375 | |
| | | 1,600M | | | Kinder Morgan Energy Partners, LP, 3.45%, 2/15/2023 | | | 1,619,202 | |
| | | 3,000M | | | Kinder Morgan, Inc., 5.625%, 11/15/2023(a) | | | 3,277,995 | |
| | | | | | Laredo Petroleum, Inc.: | | | | |
| | | 25M | | | 5.625%, 1/15/2022 | | | 22,969 | |
| | | 50M | | | 6.25%, 3/15/2023 | | | 44,875 | |
| | | 4,000M | | | Magellan Midstream Partners, LP, 5%, 3/1/2026 | | | 4,344,088 | |
| | | 25M | | | Matador Resources Co., 5.875%, 9/15/2026 | | | 25,063 | |
| | | 50M | | | McDermott Escrow 1, Inc., 10.625%, 5/1/2024(a) | | | 41,563 | |
| | | 3,300M | | | Midwest Connector Capital Co., LLC, 4.625%, 4/1/2029(a) | | | 3,412,771 | |
| | | 25M | | | Northern Oil and Gas, Inc., 9.5%, 5/15/2023 | | | 26,064 | |
| | | | | | Oasis Petroleum, Inc.: | | | | |
| | | 175M | | | 6.875%, 1/15/2023 | | | 175,438 | |
| | | 50M | | | 6.25%, 5/1/2026(a) | | | 47,750 | |
| | | 75M | | | Parkland Fuel Corp., 6%, 4/1/2026(a) | | | 76,054 | |
| | | 75M | | | Parsley Energy, LLC, 5.25%, 8/15/2025(a) | | | 74,250 | |
| | | 25M | | | Range Resources Corp., 5.75%, 6/1/2021 | | | 25,500 | |
| | | 50M | | | Suburban Propane Partners, LP, 5.875%, 3/1/2027 | | | 47,625 | |
| | | | | | Sunoco, LP: | | | | |
| | | 75M | | | 4.875%, 1/15/2023 | | | 76,380 | |
| | | 75M | | | 5.875%, 3/15/2028 | | | 74,625 | |
| | | 24M | | | Transocean Guardian, Ltd., 5.875%, 1/15/2024(a) | | | 24,098 | |
| | | 24M | | | Transocean Pontus, Ltd., 6.125%, 8/1/2025(a) | | | 24,038 | |
| | | 50M | | | USA Compression Partners, LP, 6.875%, 9/1/2027(a) | | | 51,063 | |
| | | | | | Whiting Petroleum Corp.: | | | | |
| | | 175M | | | 5.75%, 3/15/2021 | | | 177,888 | |
| | | 25M | | | 6.25%, 4/1/2023 | | | 25,250 | |
| | | 50M | | | 6.625%, 1/15/2026 | | | 49,250 | |
| | | 170M | | | WPX Energy, Inc., 5.25%, 9/15/2024 | | | 172,550 | |
| | | | | | | | | 32,742,996 | |
162
| |
Principal
Amount
| | | Security | | Value | |
| | | | | | Financial Services—1.7% | | | | |
| | $ | 4,700M | | | Brookfield Finance, Inc., 4%, 4/1/2024 | | $ | 4,768,761 | |
| | | 1,000M | | | ERAC USA Finance, LLC, 4.5%, 8/16/2021(a) | | | 1,030,990 | |
| | | 4,100M | | | Key Bank NA, 3.4%, 5/20/2026 | | | 4,067,114 | |
| | | 2,000M | | | Liberty Mutual Group, Inc., 4.95%, 5/1/2022(a) | | | 2,101,990 | |
| | | 25M | | | Nationstar Mortgage, LLC, 6.5%, 7/1/2021 | | | 25,063 | |
| | | 1,000M | | | Protective Life Corp., 7.375%, 10/15/2019 | | | 1,023,474 | |
| | | 2,000M | | | Prudential Financial, Inc., 7.375%, 6/15/2019 | | | 2,017,612 | |
| | | | | | | | | 15,035,004 | |
| | | | | | Financials—4.4% | | | | |
| | | 25M | | | Acrisure, LLC, 8.125%, 2/15/2024(a) | | | 25,951 | |
| | | 50M | | | Ally Financial, Inc., 8%, 11/1/2031 | | | 62,312 | |
| | | | | | Bank of America Corp.: | | | | |
| | | 2,000M | | | 4%, 1/22/2025 | | | 2,040,826 | |
| | | 2,400M | | | 5.875%, 2/7/2042 | | | 3,000,754 | |
| | | 1,100M | | | Barclays Bank, PLC, 6.75%, 5/22/2019 | | | 1,105,799 | |
| | | | | | Colfax Corp.: | | | | |
| | | 25M | | | 6%, 2/15/2024(a) | | | 26,125 | |
| | | 25M | | | 6.375%, 2/15/2026(a) | | | 26,640 | |
| | | | | | Citigroup, Inc.: | | | | |
| | | 1,000M | | | 2.9%, 12/8/2021 | | | 1,000,184 | |
| | | 1,000M | | | 4.5%, 1/14/2022 | | | 1,043,423 | |
| | | 1,600M | | | 4.3%, 11/20/2026 | | | 1,627,648 | |
| | | 50M | | | DAE Funding, LLC, 5.75%, 11/15/2023(a) | | | 51,500 | |
| | | 1,500M | | | Deutsche Bank AG of New York, 3.7%, 5/30/2024 | | | 1,440,697 | |
| | | | | | Goldman Sachs Group, Inc.: | | | | |
| | | 1,650M | | | 3.85%, 7/8/2024 | | | 1,682,957 | |
| | | 3,050M | | | 3.5%, 11/16/2026 | | | 3,012,171 | |
| | | 125M | | | Icahn Enterprises, LP, 6.75%, 2/1/2024 | | | 130,781 | |
| | | 1,000M | | | JPMorgan Chase & Co., 4.452%, 12/5/2029 | | | 1,065,273 | |
| | | 175M | | | Ladder Capital Finance Holdings, LLLP, 5.25%, 10/1/2025(a) | | | 168,437 | |
| | | | | | Morgan Stanley: | | | | |
| | | 5,550M | | | 5.5%, 7/28/2021 | | | 5,874,675 | |
| | | 2,500M | | | 4%, 7/23/2025 | | | 2,575,407 | |
163
Portfolio of Investments(continued)
TOTAL RETURN FUND
March 31, 2019
| |
Principal
Amount
| | | Security | | Value | |
| | | | | | Financials (continued) | | | | |
| | $ | 150M | | | Navient Corp., 5.875%, 3/25/2021 | | $ | 155,438 | |
| | | | | | Park Aerospace Holdings: | | | | |
| | | 25M | | | 4.5%, 3/15/2023(a) | | | 24,938 | |
| | | 100M | | | 5.5%, 2/15/2024(a) | | | 104,065 | |
| | | | | | Springleaf Finance Corp.: | | | | |
| | | 125M | | | 5.625%, 3/15/2023 | | | 127,031 | |
| | | 25M | | | 6.875%, 3/15/2025 | | | 25,844 | |
| | | 50M | | | 7.125%, 3/15/2026 | | | 51,000 | |
| | | 1,500M | | | UBS AG, 4.875%, 8/4/2020 | | | 1,543,026 | |
| | | | | | UBS Group Funding (Switzerland) AG: | | | | |
| | | 2,000M | | | 3.491%, 5/23/2023(a) | | | 2,010,438 | |
| | | 3,000M | | | 4.253%, 3/23/2028(a) | | | 3,122,445 | |
| | | 25M | | | Wand Merger Corp., 8.125%, 7/15/2023(a) | | | 25,813 | |
| | | 5,100M | | | Wells Fargo & Co., 3.45%, 2/13/2023 | | | 5,157,594 | |
| | | | | | | | | 38,309,192 | |
| | | | | | Food/Beverage/Tobacco—.5% | | | | |
| | | 1,300M | | | Anheuser-Busch Co, 4.7%, 2/1/2036 | | | 1,300,633 | |
| | | 3,000M | | | Maple Escrow Subsidiary, Inc., 3.551%, 5/25/2021(a) | | | 3,033,414 | |
| | | 175M | | | Post Holdings, Inc., 5.75%, 3/1/2027(a) | | | 176,531 | |
| | | | | | | | | 4,510,578 | |
| | | | | | Food/Drug—.0% | | | | |
| | | | | | Albertson’s Cos., LLC: | | | | |
| | | 25M | | | 5.75%, 3/15/2025 | | | 23,844 | |
| | | 25M | | | 7.5%, 3/15/2026(a) | | | 25,844 | |
| | | | | | | | | 49,688 | |
| | | | | | Forest Products/Containers—.6% | | | | |
| | | 200M | | | Ardagh Holdings USA, Inc., 4.625%, 5/15/2023(a) | | | 201,750 | |
| | | | | | Berry Global, Inc.: | | | | |
| | | 50M | | | 5.5%, 5/15/2022 | | | 50,937 | |
| | | 75M | | | 5.125%, 7/15/2023 | | | 76,522 | |
164
| |
Principal
Amount
| | | Security | | Value | |
| | | | | | Forest Products/Containers (continued) | | | | |
| | $ | 50M | | | BWAY Holding Co., 5.5%, 4/15/2024(a) | | $ | 49,827 | |
| | | 25M | | | Crown Americas, LLC, 4.5%, 1/15/2023 | | | 25,312 | |
| | | 50M | | | Greif, Inc., 6.5%, 3/1/2027(a) | | | 51,250 | |
| | | 25M | | | Mercer International, Inc., 7.375%, 1/15/2025(a) | | | 26,313 | |
| | | 25M | | | Multi-Color Corp., 4.875%, 11/1/2025(a) | | | 25,875 | |
| | | 2,835M | | | Packaging Corp. of America, 3.4%, 12/15/2027 | | | 2,761,165 | |
| | | 2,000M | | | Rock-Tenn Co., 4.9%, 3/1/2022 | | | 2,090,862 | |
| | | 50M | | | Schweitzer-Mauduit International, Inc.,
6.875%, 10/1/2026(a) | | | 50,125 | |
| | | | | | | | | 5,409,938 | |
| | | | | | Gaming/Leisure—.1% | | | | |
| | | 25M | | | AMC Entertainment Holdings, Inc., 5.75%, 6/15/2025 | | | 23,464 | |
| | | 100M | | | AMC Networks, Inc., 5%, 4/1/2024 | | | 100,740 | |
| | | | | | Boyd Gaming Corp.: | | | | |
| | | 50M | | | 6.875%, 5/15/2023 | | | 52,125 | |
| | | 125M | | | 6%, 8/15/2026 | | | 128,594 | |
| | | 25M | | | Cedar Fair, LP, 5.375%, 6/1/2024 | | | 25,655 | |
| | | 200M | | | CRC Escrow Issuer, LLC, 5.25%, 10/15/2025(a) | | | 193,124 | |
| | | 75M | | | Golden Nugget, Inc., 8.75%, 10/1/2025(a) | | | 78,937 | |
| | | 100M | | | IRB Holding Corp., 6.75%, 2/15/2026(a) | | | 94,250 | |
| | | 50M | | | MGM Resorts International, 6%, 3/15/2023 | | | 52,875 | |
| | | 25M | | | National CineMedia, LLC, 6%, 4/15/2022 | | | 25,375 | |
| | | 25M | | | Stars Group Holdings BV, 7%, 7/15/2026(a) | | | 26,125 | |
| | | 200M | | | Viking Cruises, Ltd., 6.25%, 5/15/2025(a) | | | 204,000 | |
| | | 50M | | | Wynn Las Vegas, LLC, 5.5%, 3/1/2025(a) | | | 49,500 | |
| | | | | | | | | 1,054,764 | |
| | | | | | Health Care—1.3% | | | | |
| | | | | | Bausch Health Cos., Inc.: | | | | |
| | | 175M | | | 6.5%, 3/15/2022(a) | | | 181,344 | |
| | | 50M | | | 5.5%, 3/1/2023(a) | | | 50,438 | |
| | | 100M | | | 9%, 12/15/2025(a) | | | 109,005 | |
| | | 25M | | | 8.5%, 1/31/2027(a) | | | 26,563 | |
165
Portfolio of Investments(continued)
TOTAL RETURN FUND
March 31, 2019
| |
Principal
Amount
| | | Security | | Value | |
| | | | | | Health Care (continued) | | | | |
| | $ | 150M | | | Centene Corp., 5.625%, 2/15/2021 | | $ | 152,437 | |
| | | 175M | | | CHS/Community Health Systems, Inc.,
6.25%, 3/31/2023 | | | 165,314 | |
| | | | | | CVS Health Corp.: | | | | |
| | | 2,400M | | | 3.875%, 7/20/2025 | | | 2,431,015 | |
| | | 5,000M | | | 5.05%, 3/25/2048 | | | 5,044,620 | |
| | | 175M | | | DaVita, Inc., 5.125%, 7/15/2024 | | | 173,250 | |
| | | 2,100M | | | Express Scripts Holding Co., 4.75%, 11/15/2021 | | | 2,194,622 | |
| | | 175M | | | HCA, Inc., 6.25%, 2/15/2021 | | | 184,336 | |
| | | 175M | | | HealthSouth Corp., 5.75%, 11/1/2024 | | | 177,844 | |
| | | 175M | | | Mallinckrodt Finance SB, 5.75%, 8/1/2022(a) | | | 163,625 | |
| | | 50M | | | MEDNAX, Inc., 6.25%, 1/15/2027(a) | | | 50,625 | |
| | | 175M | | | Molina Healthcare, Inc., 4.875%, 6/15/2025(a) | | | 173,688 | |
| | | 50M | | | MPH Operating Partnership, LP, 7.125%, 6/1/2024(a) | | | 50,000 | |
| | | 25M | | | Par Pharmaceutical, Inc., 7.5%, 4/1/2027(a) | | | 25,413 | |
| | | 125M | | | Syneos Health, Inc., 7.5%, 10/1/2024(a) | | | 132,187 | |
| | | | | | | | | 11,486,326 | |
| | | | | | Home-Building—.0% | | | | |
| | | 50M | | | William Lyon Homes, Inc., 6%, 9/1/2023 | | | 48,625 | |
| | | | | | Information Technology—1.1% | | | | |
| | | 175M | | | Alliance Data Systems Corp., 5.375%, 8/1/2022(a) | | | 177,625 | |
| | | 50M | | | Anixter, Inc., 6%, 12/1/2025(a) | | | 52,625 | |
| | | | | | CommScope Finance, LLC: | | | | |
| | | 25M | | | 5.5%, 3/1/2024(a) | | | 25,632 | |
| | | 25M | | | 6%, 3/1/2026(a) | | | 25,922 | |
| | | 175M | | | CommScope Technologies, LLC, 6%, 6/15/2025(a) | | | 170,791 | |
| | | 4,300M | | | Corning, Inc., 7.25%, 8/15/2036 | | | 5,078,068 | |
| | | | | | Diamond 1 Finance Corp.: | | | | |
| | | 3,000M | | | 4.42%, 6/15/2021(a) | | | 3,078,966 | |
| | | 50M | | | 5.875%, 6/15/2021(a) | | | 50,957 | |
| | | 50M | | | 7.125%, 6/15/2024(a) | | | 53,019 | |
| | | 50M | | | NCR Corp., 4.625%, 2/15/2021 | | | 50,038 | |
| | | 25M | | | Nielsen Finance, LLC, 5%, 4/15/2022(a) | | | 24,813 | |
166
| |
Principal
Amount
| | | Security | | Value | |
| | | | | | Information Technology (continued) | | | | |
| | $ | 75M | | | Nuance Communications, Inc., 6%, 7/1/2024 | | $ | 77,156 | |
| | | 75M | | | Rackspace Hosting, Inc., 8.625%, 11/15/2024(a) | | | 67,003 | |
| | | 175M | | | Solera, LLC, 10.5%, 3/1/2024(a) | | | 190,561 | |
| | | 50M | | | Symantec Corp., 5%, 4/15/2025(a) | | | 50,122 | |
| | | 25M | | | VeriSign, Inc., 4.75%, 7/15/2027 | | | 25,097 | |
| | | 50M | | | Verscend Holding Corp., 9.75%, 8/15/2026(a) | | | 50,063 | |
| | | | | | | | | 9,248,458 | |
| | | | | | Manufacturing—.6% | | | | |
| | | 175M | | | ATS Automation Tooling Systems, Inc.,
6.5%, 6/15/2023(a) | | | 181,781 | |
| | | 100M | | | Brand Energy & Infrastructure Services, Inc.,
8.5%, 7/15/2025(a) | | | 90,250 | |
| | | 50M | | | Cloud Crane, LLC, 10.125%, 8/1/2024(a) | | | 53,875 | |
| | | 3,245M | | | Crane Co., 4.2%, 3/15/2048 | | | 3,067,638 | |
| | | 175M | | | Grinding Media, Inc., 7.375%, 12/15/2023(a) | | | 168,875 | |
| | | 1,100M | | | Johnson Controls International, PLC, 5%, 3/30/2020 | | | 1,123,208 | |
| | | 50M | | | Manitowoc Co., Inc., 9%, 4/1/2026(a) | | | 50,750 | |
| | | | | | | | | 4,736,377 | |
| | | | | | Media-Broadcasting—.1% | | | | |
| | | 50M | | | Belo Corp., 7.25%, 9/15/2027 | | | 53,625 | |
| | | 25M | | | Gray Escrow, Inc., 7%, 5/15/2027(a) | | | 26,625 | |
| | | 50M | | | LIN Television Corp., 5.875%, 11/15/2022 | | | 51,438 | |
| | | 125M | | | Nexstar Broadcasting, Inc., 5.625%, 8/1/2024(a) | | | 127,188 | |
| | | 75M | | | Sinclair Television Group, Inc., 5.625%, 8/1/2024(a) | | | 75,844 | |
| | | 175M | | | Sirius XM Radio, Inc., 6%, 7/15/2024(a) | | | 182,000 | |
| | | | | | | | | 516,720 | |
| | | | | | Media-Cable TV—.8% | | | | |
| | | 200M | | | Altice Financing SA, 6.625%, 2/15/2023(a) | | | 205,000 | |
| | | 200M | | | Altice France SA, 6.25%, 5/15/2024(a) | | | 202,250 | |
167
Portfolio of Investments(continued)
TOTAL RETURN FUND
March 31, 2019
| |
Principal
Amount
| | | Security | | Value | |
| | | | | | Media-Cable TV (continued) | | | | |
| | | | | | CCO Holdings, LLC: | | | | |
| | $ | 175M | | | 5.125%, 2/15/2023 | | $ | 178,500 | |
| | | 175M | | | 5.875%, 4/1/2024(a) | | | 183,332 | |
| | | 100M | | | Clear Channel International, 8.75%, 12/15/2020(a) | | | 103,125 | |
| | | | | | Clear Channel Worldwide Holdings, Inc.: | | | | |
| | | 200M | | | Series “A”, 6.5%, 11/15/2022 | | | 205,750 | |
| | | 50M | | | 9.25%, 2/15/2024(a) | | | 53,125 | |
| | | | | | Comcast Corp.: | | | | |
| | | 1,600M | | | 5.15%, 3/1/2020 | | | 1,635,304 | |
| | | 3,000M | | | 4.25%, 1/15/2033 | | | 3,169,182 | |
| | | | | | CSC Holdings, LLC: | | | | |
| | | 200M | | | 5.375%, 7/15/2023(a) | | | 204,250 | |
| | | 200M | | | 10.875%, 10/15/2025(a) | | | 231,400 | |
| | | 175M | | | DISH DBS Corp., 5%, 3/15/2023 | | | 158,156 | |
| | | 175M | | | Gray Television, Inc., 5.875%, 7/15/2026(a) | | | 178,535 | |
| | | 175M | | | Midcontinent Communications & Finance Corp., 6.875%, 8/15/2023(a) | | | 182,925 | |
| | | | | | | | | 6,890,834 | |
| | | | | | Media-Diversified—.2% | | | | |
| | | 75M | | | Gannett Co., Inc., 6.375%, 10/15/2023 | | | 77,813 | |
| | | 125M | | | Outdoor Americas Capital, LLC, 5.875%, 3/15/2025 | | | 128,437 | |
| | | 1,000M | | | Time Warner, Inc., 3.6%, 7/15/2025 | | | 998,439 | |
| | | 125M | | | Tribune Media Co., 5.875%, 7/15/2022 | | | 128,203 | |
| | | | | | | | | 1,332,892 | |
| | | | | | Metals/Mining—.6% | | | | |
| | | 75M | | | Allegheny Technologies, Inc., 7.875%, 8/15/2023 | | | 81,562 | |
| | | 50M | | | Big River Steel, LLC, 7.25%, 9/1/2025(a) | | | 52,390 | |
| | | 50M | | | Cliffs Natural Resources, Inc., 5.75%, 3/1/2025 | | | 48,000 | |
| | | 175M | | | Commercial Metals Co., 4.875%, 5/15/2023 | | | 176,312 | |
| | | 3,000M | | | Glencore Funding, LLC, 4.625%, 4/29/2024(a) | | | 3,101,799 | |
| | | 175M | | | HudBay Minerals, Inc., 7.25%, 1/15/2023(a) | | | 182,000 | |
| | | 50M | | | Joseph T. Ryerson & Son, Inc., 11%, 5/15/2022(a) | | | 52,875 | |
168
| |
Principal
Amount
| | | Security | | Value | |
| | | | | | Metals/Mining (continued) | | | | |
| | $ | 1,500M | | | Newmont Mining Corp., 5.125%, 10/1/2019 | | $ | 1,516,821 | |
| | | 50M | | | Northwest Acquisitions, ULC, 7.125%, 11/1/2022(a) | | | 44,125 | |
| | | 150M | | | Novelis, Inc., 5.875%, 9/30/2026(a) | | | 149,813 | |
| | | 120M | | | SunCoke Energy Partners, LP, 7.5%, 6/15/2025(a) | | | 121,800 | |
| | | | | | | | | 5,527,497 | |
| | | | | | Real Estate—1.7% | | | | |
| | | 2,300M | | | Alexandria Real Estate Equities, Inc.,
3.95%, 1/15/2028 | | | 2,316,277 | |
| | | 2,886M | | | Digital Realty Trust, LP, 4.75%, 10/1/2025 | | | 3,062,782 | |
| | | 175M | | | Equinix, Inc., 5.375%, 4/1/2023 | | | 178,719 | |
| | | 170M | | | Geo Group, Inc., 5.875%, 10/15/2024 | | | 149,600 | |
| | | 175M | | | Greystar Real Estate Partners, 5.75%, 12/1/2025(a) | | | 175,875 | |
| | | 1,000M | | | HCP, Inc., 4.25%, 11/15/2023 | | | 1,042,552 | |
| | | 325M | | | Iron Mountain, Inc., 5.75%, 8/15/2024 | | | 329,062 | |
| | | 25M | | | MGM Growth Properties Operating Partnership, LP,
5.75%, 2/1/2027(a) | | | 25,906 | |
| | | 2,500M | | | Realty Income Corp., 3.875%, 4/15/2025 | | | 2,590,570 | |
| | | 3,700M | | | STORE Capital Corp., 4.5%, 3/15/2028 | | | 3,734,118 | |
| | | 1,500M | | | Vornado Realty, LP, 3.5%, 1/15/2025 | | | 1,490,040 | |
| | | | | | | | | 15,095,501 | |
| | | | | | Retail-General Merchandise—.6% | | | | |
| | | 100M | | | 1011778 B.C., ULC, 4.625%, 1/15/2022(a) | | | 100,721 | |
| | | 175M | | | AmeriGas Partners, LP, 5.5%, 5/20/2025 | | | 175,219 | |
| | | 3,500M | | | Home Depot, Inc., 5.875%, 12/16/2036 | | | 4,409,227 | |
| | | 50M | | | J.C. Penney Co., Inc., 8.625%, 3/15/2025 | | | 29,500 | |
| | | 175M | | | KFC Holding Co., LLC, 5%, 6/1/2024(a) | | | 178,937 | |
| | | 25M | | | SRS Distribution, Inc., 8.25%, 7/1/2026(a) | | | 24,125 | |
| | | | | | | | | 4,917,729 | |
| | | | | | Schools—.2% | | | | |
| | | 1,750M | | | Yale University, 2.086%, 4/15/2019 | | | 1,749,561 | |
169
Portfolio of Investments(continued)
TOTAL RETURN FUND
March 31, 2019
| |
Principal
Amount
| | | Security | | Value | |
| | | | | | Services—.1% | | | | |
| | $ | 225M | | | AECOM, 5.125%, 3/15/2027 | | $ | 218,531 | |
| | | 100M | | | First Data Corp., 5.375%, 8/15/2023(a) | | | 102,375 | |
| | | 50M | | | Prime Security Services Borrower, LLC,
9.25%, 5/15/2023(a) | | | 52,625 | |
| | | 175M | | | United Rentals, Inc., 4.625%, 10/15/2025 | | | 173,250 | |
| | | | | | | | | 546,781 | |
| | | | | | Telecommunications—.7% | | | | |
| | | 3,000M | | | AT&T, Inc., 4.25%, 3/1/2027 | | | 3,087,249 | |
| | | 25M | | | Frontier Communications Corp., 8.5%, 4/1/2026(a) | | | 23,312 | |
| | | 225M | | | GCI, Inc., 6.875%, 4/15/2025 | | | 235,969 | |
| | | 75M | | | Qwest Corp., 7.25%, 9/15/2025 | | | 80,818 | |
| | | 50M | | | Telesat Canada, 8.875%, 11/15/2024(a) | | | 54,000 | |
| | | 1,800M | | | Verizon Communications, Inc., 4.272%, 1/15/2036 | | | 1,823,321 | |
| | | | | | Zayo Group, LLC: | | | | |
| | | 75M | | | 6%, 4/1/2023 | | | 76,313 | |
| | | 175M | | | 6.375%, 5/15/2025 | | | 176,531 | |
| | | | | | | | | 5,557,513 | |
| | | | | | Transportation—.5% | | | | |
| | | 4,250M | | | Air Lease Corp., 3.875%, 7/3/2023 | | | 4,298,696 | |
| | | 175M | | | BCD Acquisition, Inc., 9.625%, 9/15/2023(a) | | | 186,375 | |
| | | 127M | | | XPO Logistics, Inc., 6.5%, 6/15/2022(a) | | | 129,858 | |
| | | | | | | | | 4,614,929 | |
| | | | | | Utilities—1.1% | | | | |
| | | | | | Calpine Corp.: | | | | |
| | | 25M | | | 5.75%, 1/15/2025 | | | 24,937 | |
| | | 175M | | | 5.25%, 6/1/2026(a) | | | 174,781 | |
| | | 2,335M | | | Duke Energy Progress, Inc., 4.15%, 12/1/2044 | | | 2,435,162 | |
| | | 2,500M | | | Entergy Arkansas, Inc., 4.95%, 12/15/2044 | | | 2,601,400 | |
| | | 150M | | | NRG Yield Operating, LLC, 5%, 9/15/2026 | | | 143,625 | |
| | | 2,000M | | | Ohio Power Co., 5.375%, 10/1/2021 | | | 2,131,042 | |
| | | 2,000M | | | Oklahoma Gas & Electric Co., 4%, 12/15/2044 | | | 1,962,494 | |
170
| |
Principal
Amount
| | | Security | | Value | |
| | | | | | Services (continued) | | | | |
| | $ | 150M | | | Targa Resources Partners, LP, 4.25%, 11/15/2023 | | $ | 149,813 | |
| | | | | | | | | 9,623,254 | |
| | | | | | Waste Management—.0% | | | | |
| | | 175M | | | Covanta Holding Corp., 5.875%, 3/1/2024 | | | 179,812 | |
| | | | | | Wireless Communications—.1% | | | | |
| | | | | | Intelsat Jackson Holdings SA: | | | | |
| | | 200M | | | 8%, 2/15/2024(a) | | | 209,000 | |
| | | 100M | | | 8.5%, 10/15/2024(a) | | | 97,750 | |
| | | | | | Level 3 Financing, Inc.: | | | | |
| | | 25M | | | 5.375%, 8/15/2022 | | | 25,188 | |
| | | 175M | | | 5.375%, 1/15/2024 | | | 178,693 | |
| | | 175M | | | Sprint Communications, Inc., 6%, 11/15/2022 | | | 176,803 | |
| | | 150M | | | Sprint Corp., 7.125%, 6/15/2024 | | | 152,625 | |
| | | 175M | | | T-Mobile USA, Inc., 6%, 3/1/2023 | | | 180,250 | |
| | | | | | | | | 1,020,309 | |
Total Value of Corporate Bonds (cost $199,702,106) | | | 200,487,743 | |
| | | | | | RESIDENTIAL MORTGAGE-BACKED SECURITIES—5.8% | | | | |
| | | | | | Fannie Mae—4.7% | | | | |
| | | 4,036M | | | 3%, 3/1/2027 - 2/1/2031 | | | 4,080,179 | |
| | | 3,124M | | | 3.5%, 11/1/2028 - 12/1/2047 | | | 3,183,531 | |
| | | 16,178M | | | 4%, 12/1/2040 - 8/1/2047 | | | 16,749,979 | |
| | | 12,568M | | | 4.5%, 9/1/2040 - 8/1/2048(b) | | | 13,161,859 | |
| | | 1,475M | | | 5%, 4/1/2040 - 3/1/2042 | | | 1,593,641 | |
| | | 475M | | | 5.5%, 5/1/2033 - 10/1/2039 | | | 522,011 | |
| | | 370M | | | 6%, 5/1/2036 - 10/1/2040 | | | 407,286 | |
| | | 213M | | | 6.5%, 11/1/2033 - 6/1/2036 | | | 235,488 | |
| | | 495M | | | 7%, 3/1/2032 - 8/1/2032 | | | 531,115 | |
| | | | | | | | | 40,465,089 | |
171
Portfolio of Investments(continued)
TOTAL RETURN FUND
March 31, 2019
| |
Principal
Amount
| | | Security | | Value | |
| | | | | | Freddie Mac—1.1% | | | | |
| | $ | 4,903M | | | 3.5%, 8/1/2026 - 7/1/2044 | | $ | 5,033,185 | |
| | | 720M | | | 4%, 7/1/2044 - 4/1/2045 | | | 745,483 | |
| | | 2,849M | | | 4.5%, 10/1/2040 - 5/1/2044 | | | 2,998,651 | |
| | | 640M | | | 5.5%, 5/1/2038 - 10/1/2039 | | | 694,993 | |
| | | | | | | | | 9,472,312 | |
Total Value of Residential Mortgage-Backed Securities (cost $49,974,128) | | | 49,937,401 | |
| | | | | | U.S. GOVERNMENT OBLIGATIONS—5.3% | | | | |
| | | | | | U.S. Treasury Bonds: | | | | |
| | | 4,300M | | | 3%, 8/15/2048 | | | 4,452,095 | |
| | | 5,000M | | | 3.125%, 8/15/2044 | | | 5,301,075 | |
| | | 18,000M | | | 3.375%, 11/15/2048 | | | 20,036,610 | |
| | | | | | U.S. Treasury Notes: | | | | |
| | | 1,500M | | | 2%, 11/30/2022 | | | 1,487,930 | |
| | | 2,000M | | | 2%, 11/15/2026 | | | 1,951,718 | |
| | | 1,400M | | | 2.625%, 12/31/2023 | | | 1,424,007 | |
| | | 10,500M | | | 3.125%, 11/15/2028 | | | 11,139,639 | |
Total Value of U.S. Government Obligations (cost $44,361,695) | | | 45,793,074 | |
| | | | | | ASSET-BACKED SECURITIES—2.0% | | | | |
| | | | | | Fixed Autos—1.4% | | | | |
| | | 1,200M | | | AmeriCredit Automobile Receivables Trust,
3.13%, 2/18/2025 | | | 1,210,141 | |
| | | 1,300M | | | BMW Vehicle Lease Trust, 2.07%, 10/20/2020 | | | 1,296,682 | |
| | | 9,500M | | | Hertz Vehicle Financing Trust, 2.96%, 10/25/2021 | | | 9,480,136 | |
| | | | | | | | | 11,986,959 | |
| | | | | | Fixed Communication Services—.6% | | | | |
| | | | | | Verizon Owner Trust: | | | | |
| | | 3,350M | | | 1.92%, 12/20/2021(a) | | | 3,331,642 | |
| | | 1,670M | | | 3.23%, 4/20/2023 | | | 1,690,807 | |
| | | | | | | | | 5,022,449 | |
Total Value of Asset-Backed Securities (cost $16,894,305) | | | 17,009,408 | |
172
| |
Principal
Amount
| | | Security | | Value | |
| | | | | | COMMERCIAL MORTGAGE-BACKED SECURITIES—1.0% | | | | |
| | | | | | Federal Home Loan Mortgage Corporation | | | | |
| | $ | 8,339M | | | Multi-Family Structured Pass-Throughs,
3.725%, 12/25/2027 (cost $8,524,575) | | $ | 8,802,483 | |
| | | | | | COLLATERALIZED MORTGAGE OBLIGATIONS—.5% | | | | |
| | | 4,625M | | | Fannie Mae, 2.9865%, 12/25/2027 (cost $4,432,954)† | | | 4,643,995 | |
| | | | | | PASS-THROUGH CERTIFICATES—.3% | | | | |
| | | | | | Transportation | | | | |
| | | 2,850M | | | American Airlines 17-2 AA PTT,
3.35%, 10/15/2029 (cost $2,870,571) | | | 2,788,486 | |
| | | | | | U.S. GOVERNMENT AGENCY OBLIGATIONS—.2% | | | | |
| | | 1,800M | | | Federal Farm Credit Bank,
3%, 9/13/2029 (cost $1,700,818) | | | 1,780,535 | |
| | | | | | SHORT-TERM U.S. GOVERNMENT OBLIGATIONS—3.1% | | | | |
| | | | | | U.S. Treasury Bills: | | | | |
| | | 15,000M | | | 2.37%, 4/9/2019 | | | 14,992,095 | |
| | | 12,000M | | | 2.396%, 4/11/2019 | | | 11,992,104 | |
Total Value of Short-Term U.S. Government Obligations (cost $26,984,095) | | | 26,984,199 | |
Total Value of Investments (cost $721,175,949) | | | 97.2 | % | | | 843,667,481 | |
Other Assets, Less Liabilities | | | 2.8 | | | | 24,653,733 | |
Net Assets | | | 100.0 | % | | $ | 868,321,214 | |
(a) | Security exempt from registration under Rule 144A of the Securities Act of 1933 (see Note 4). |
(b) | A portion or all of the security purchased on a when-issued or delayed delivery basis (see Note 1G). |
† | Interest rates on adjustable rate bonds are determined and reset periodically. The interest rates shown are the rates in effect of March 31, 2019. |
173
Portfolio of Investments(continued)
TOTAL RETURN FUND
March 31, 2019
Summary of Abbreviations:
ADR | American Depositary Receipts |
LLLP | Limited Liability Limited Partnership |
ULC | Unlimited Liability Corporation |
The Fund’s assets and liabilities are classified into the following three levels based on the inputs used to value the assets and liabilities:
| | Level 1 – | Unadjusted quoted prices in active markets for identical securities that the Fund has the ability to access. |
| | Level 2 – | Observable inputs other than quoted prices included in Level 1 that are observable for the asset or liability, either directly or indirectly. These inputs may include quoted prices for the identical instrument on an inactive market, prices for similar instruments, interest rates, prepayment speeds, credit risk, yield curves, default rates and similar data. |
| | Level 3 – | Unobservable inputs for the asset or liability, to the extent relevant observable inputs are not available, representing the Fund’s own assumption about the assumptions a market participant would use in valuing the asset or liability, and would be based on the best information available. |
The inputs methodology used for valuing securities are not necessarily an indication of the risk associated with investing in those securities. For example, U.S. government securities are reflected as Level 2 because the inputs used to determine fair value may not always be quoted prices in an active market.
174
The following is a summary, by category of Level, of inputs used to value the Fund’s investments as of March 31, 2019:
| | | Level 1 | | | Level 2 | | | Level 3 | | | Total | |
Common Stocks | | $ | 485,440,157 | | | $ | — | | | $ | — | | | $ | 485,440,157 | |
Corporate Bonds | | | — | | | | 200,487,743 | | | | — | | | | 200,487,743 | |
Residential Mortgage-Backed Securities | | | — | | | | 49,937,401 | | | | — | | | | 49,937,401 | |
U.S. Government Obligations | | | — | | | | 45,793,074 | | | | — | | | | 45,793,074 | |
Asset-Backed Securities | | | — | | | | 17,009,408 | | | | — | | | | 17,009,408 | |
Commercial Mortgage-Backed Securities | | | — | | | | 8,802,483 | | | | — | | | | 8,802,483 | |
Collateralized Mortgage Obligations | | | — | | | | 4,643,995 | | | | — | | | | 4,643,995 | |
Pass-Through Certificates | | | — | | | | 2,788,486 | | | | — | | | | 2,788,486 | |
U.S. Government Agency Obligations | | | — | | | | 1,780,535 | | | | — | | | | 1,780,535 | |
Short-Term U.S. Government Obligations | | | — | | | | 26,984,199 | | | | — | | | | 26,984,199 | |
Total Investments in Securities* | | $ | 485,440,157 | | | $ | 358,227,324 | | | $ | — | | | $ | 843,667,481 | |
* | The Portfolio of Investments provides information on the industry categorization for common stocks, corporate bonds, asset-backed securities and pass-through certificates. |
There were no transfers into or from Level 1 and Level 2 by the Fund during the period ended March 31, 2019. Transfers, if any, between Levels are recognized at the end of the reporting period.
See notes to financial statements
175
Statements of Assets and Liabilities
FIRST INVESTORS INCOME FUNDS
March 31, 2019
| | | FLOATING
RATE | | |
Assets | | | | | | |
Investments in securities | | | | | | |
At identified cost | | | $ | 249,479,611 | | |
At value (Note 1A) | | | $ | 246,991,946 | | |
Cash | | | | 22,249,378 | | |
Receivables: | | | | | | |
Investment securities sold | | | | 2,728,104 | | |
Interest and dividends | | | | 756,642 | | |
Shares sold | | | | 363,493 | | |
Unrealized appreciation on foreign exchange contracts (Note 5) | | | | — | | |
Other assets | | | | 15,590 | | |
Total Assets | | | | 273,105,153 | | |
| | | | | | | |
Liabilities | | | | | | |
Payables: | | | | | | |
Investment securities purchased | | | | 16,321,519 | | |
Shares redeemed | | | | 289,414 | | |
Dividends payable | | | | 112,705 | | |
Unrealized depreciation on foreign exchange contracts (Note 5) | | | | — | | |
Accrued advisory fees | | | | 114,372 | | |
Accrued shareholder servicing costs | | | | 39,268 | | |
Accrued expenses | | | | 145,156 | | |
Total Liabilities | | | | 17,022,434 | | |
Net Assets | | | $ | 256,082,719 | | |
| | | | | | | |
Net Assets Consist of: | | | | | | |
Capital paid in | | | $ | 262,375,346 | | |
Distributable earnings | | | | (6,292,627 | ) | |
Total | | | $ | 256,082,719 | | |
See notes to financial statements
176
FUND FOR
INCOME | | | GOVERNMENT
CASH
MANAGEMENT | | | INTERNATIONAL
OPPORTUNITIES
BOND | |
| | | | | | | | | | | |
| | | | | | | | | | | |
| $ | 607,016,321 | | | $ | 177,053,423 | | | $ | 166,362,753 | |
| $ | 608,276,800 | | | $ | 177,053,423 | | | $ | 150,761,622 | |
| | 7,599,174 | | | | 1,735,393 | | | | 6,631,241 | |
| | | | | | | | | | | |
| | 1,580,746 | | | | — | | | | — | |
| | 10,308,668 | | | | 158,016 | | | | 1,943,240 | |
| | 496,520 | | | | 5,939 | | | | 79,326 | |
| | — | | | | — | | | | 203,977 | |
| | 38,787 | | | | 9,470 | | | | 9,222 | |
| | 628,300,695 | | | | 178,962,241 | | | | 159,628,628 | |
| | | | | | | | | | | |
| | | | | | | | | | | |
| | | | | | | | | | | |
| | 2,575,091 | | | | — | | | | — | |
| | 930,182 | | | | 1,007,215 | | | | 164,914 | |
| | 435,505 | | | | 3,846 | | | | — | |
| | — | | | | — | | | | 1,297,798 | |
| | 383,604 | | | | 34,525 | | | | 99,456 | |
| | 112,771 | | | | 38,958 | | | | 40,255 | |
| | 86,717 | | | | 136,595 | | | | 60,977 | |
| | 4,523,870 | | | | 1,221,139 | | | | 1,663,400 | |
| $ | 623,776,825 | | | $ | 177,741,102 | | | $ | 157,965,228 | |
| | | | | | | | | | | |
| | | | | | | | | | | |
| $ | 669,360,105 | | | $ | 177,741,102 | | | $ | 180,669,339 | |
| | (45,583,280 | ) | | | — | | | | (22,704,111 | ) |
| $ | 623,776,825 | | | $ | 177,741,102 | | | $ | 157,965,228 | |
177
Statements of Assets and Liabilities
FIRST INVESTORS INCOME FUNDS
March 31, 2019
| | | FLOATING
RATE | | |
Net Assets: | | | | | | |
Class A | | | $ | 70,501,793 | | |
Class B | | | | N/A | | |
Advisor Class | | | $ | 159,109,125 | | |
Institutional Class | | | $ | 26,471,801 | | |
| | | | | | | |
Shares outstanding (Note 7): | | | | | | |
Class A | | | | 7,389,605 | | |
Class B | | | | N/A | | |
Advisor Class | | | | 16,665,564 | | |
Institutional Class | | | | 2,774,526 | | |
| | | | | | | |
Net asset value and redemption price per share - Class A | | | $ | 9.54 | | |
| | | | | | | |
Maximum offering price per share - Class A* | | | $ | 9.78 | ++ | |
| | | | | | | |
Net asset value and offering price per share - Class B** | | | | N/A | | |
| | | | | | | |
Net asset value, offering price and redemptionprice per share - Advisor Class | | | $ | 9.55 | | |
| | | | | | | |
Net asset value, offering price and redemptionprice per share - Institutional Class | | | $ | 9.54 | | |
# | Also maximum offering price per share. |
* | On purchases of $100,000 or more, the sales charge is reduced (Note 7). |
+ | Net asset value/.96 |
++ | Net asset value/.975 |
** | Redemption price is equal to net asset value less contingent deferred sales charges, if applicable (Note 7). |
See notes to financial statements
178
FUND FOR
INCOME | | | GOVERNMENT
CASH
MANAGEMENT | | | INTERNATIONAL
OPPORTUNITIES
BOND | |
| | | | | | | | | | | |
| $ | 505,329,471 | | | $ | 177,585,610 | | | $ | 49,290,939 | |
| $ | 1,517,063 | | | $ | 154,473 | | | | N/A | |
| $ | 80,263,864 | | | | N/A | | | $ | 89,838,716 | |
| $ | 36,666,427 | | | $ | 1,019 | | | $ | 18,835,573 | |
| | | | | | | | | | | |
| | | | | | | | | | | |
| | 208,158,890 | | | | 177,585,610 | | | | 5,730,554 | |
| | 623,880 | | | | 154,473 | | | | N/A | |
| | 33,084,205 | | | | N/A | | | | 10,331,944 | |
| | 15,028,711 | | | | 1,019 | | | | 2,143,609 | |
| | | | | | | | | | | |
| $ | 2.43 | | | $ | 1.00 | # | | $ | 8.60 | |
| | | | | | | | | | | |
| $ | 2.53 | + | | | N/A | | | $ | 8.96 | + |
| | | | | | | | | | | |
| $ | 2.43 | | | $ | 1.00 | | | | N/A | |
| | | | | | | | | | | |
| $ | 2.43 | | | | N/A | | | $ | 8.70 | |
| | | | | | | | | | | |
| $ | 2.44 | | | $ | 1.00 | | | $ | 8.79 | |
179
Statements of Assets and Liabilities
FIRST INVESTORS INCOME FUNDS
March 31, 2019
| | | INVESTMENT
GRADE | | |
Assets | | | | | | |
Investments in securities: | | | | | | |
Cost - Unaffiliated issuers | | | $ | 587,789,952 | | |
Cost - Affiliated issuers (Note 2) | | | | — | | |
Total cost of investments | | | $ | 587,789,952 | | |
Value - Unaffiliated issuers (Note 1A) | | | $ | 597,546,411 | | |
Value - Affiliated issuers (Note 2) | | | | — | | |
Total value of investments | | | | 597,546,411 | | |
Cash | | | | 5,480,900 | | |
Receivables: | | | | | | |
Investment securities sold | | | | 611,548 | | |
Dividends and interest | | | | 6,656,981 | | |
Shares sold | | | | 366,450 | | |
Other assets | | | | 36,786 | | |
Total Assets | | | | 610,699,076 | | |
| | | | | | | |
Liabilities | | | | | | |
Payables: | | | | | | |
Investment securities purchased | | | | 1,699,493 | | |
Shares redeemed | | | | 1,750,790 | | |
Dividends payable | | | | 127,203 | | |
Accrued advisory fees | | | | 301,272 | | |
Accrued shareholder servicing costs | | | | 88,301 | | |
Accrued expenses | | | | 50,013 | | |
Total Liabilities | | | | 4,017,072 | | |
Net Assets | | | $ | 606,682,004 | | |
| | | | | | | |
Net Assets Consist of: | | | | | | |
Capital paid in | | | $ | 621,517,073 | | |
Distributable earnings | | | | (14,835,069 | ) | |
Total | | | $ | 606,682,004 | | |
See notes to financial statements
180
LIMITED
DURATION
BOND | | | STRATEGIC
INCOME | |
| | | | | | | |
| | | | | | | |
| $ | 320,694,925 | | | $ | 13,387,351 | |
| | — | | | | 140,238,758 | |
| $ | 320,694,925 | | | $ | 153,626,109 | |
| $ | 322,503,053 | | | $ | 13,458,195 | |
| | — | | | | 133,781,874 | |
| | 322,503,053 | | | | 147,240,069 | |
| | 4,337,373 | | | | 651,211 | |
| | | | | | | |
| | 550,449 | | | | 725,285 | |
| | 2,104,558 | | | | 436,759 | |
| | 319,455 | | | | 315,550 | |
| | 20,437 | | | | 9,251 | |
| | 329,835,325 | | | | 149,378,125 | |
| | | | | | | |
| | | | | | | |
| | | | | | | |
| | 630,355 | | | | 769,017 | |
| | 574,271 | | | | 205,722 | |
| | 125,517 | | | | 16,995 | |
| | 59,539 | | | | 6,291 | |
| | 48,915 | | | | 19,459 | |
| | 82,180 | | | | 29,334 | |
| | 1,520,777 | | | | 1,046,818 | |
| $ | 328,314,548 | | | $ | 148,331,307 | |
| | | | | | | |
| | | | | | | |
| $ | 364,403,859 | | | $ | 159,018,853 | |
| | (36,089,311 | ) | | | (10,687,546 | ) |
| $ | 328,314,548 | | | $ | 148,331,307 | |
181
Statements of Assets and Liabilities
FIRST INVESTORS INCOME FUNDS
March 31, 2019
| | | INVESTMENT
GRADE | | |
Net Assets: | | | | | | |
Class A | | | $ | 387,909,177 | | |
Class B | | | $ | 1,444,111 | | |
Advisor Class | | | $ | 197,001,583 | | |
Institutional Class | | | $ | 20,327,133 | | |
| | | | | | | |
Shares outstanding(Note 7): | | | | | | |
Class A | | | | 41,153,496 | | |
Class B | | | | 153,942 | | |
Advisor Class | | | | 20,773,405 | | |
Institutional Class | | | | 2,150,201 | | |
| | | | | | | |
Net asset value and redemption price per share - Class A | | | $ | 9.43 | | |
| | | | | | | |
Maximum offering price per share - Class A* | | | $ | 9.82 | + | |
| | | | | | | |
Net asset value and offering price per share - Class B** | | | $ | 9.38 | | |
| | | | | | | |
Net asset value, offering price and redemptionprice per share - Advisor Class | | | $ | 9.48 | | |
| | | | | | | |
Net asset value, offering price and redemptionprice per share - Institutional Class | | | $ | 9.45 | | |
* | On purchases of $100,000 or more, the sales charge is reduced (Note 7). |
+ | Net asset value/.96 |
++ | Net asset value/.975 |
** | Redemption price is equal to net asset value less contingent deferred sales charges, if applicable (Note 7). |
See notes to financial statements
182
LIMITED
DURATION
BOND | | | STRATEGIC
INCOME | |
| | | | | | | |
| $ | 241,719,729 | | | $ | 147,501,023 | |
| | N/A | | | | N/A | |
| $ | 49,032,171 | | | $ | 830,284 | |
| $ | 37,562,648 | | | | N/A | |
| | | | | | | |
| | | | | | | |
| | 26,168,419 | | | | 16,047,047 | |
| | N/A | | | | N/A | |
| | 5,293,759 | | | | 90,455 | |
| | 4,048,640 | | | | N/A | |
| | | | | | | |
| $ | 9.24 | | | $ | 9.19 | |
| | | | | | | |
| $ | 9.48 | ++ | | $ | 9.57 | + |
| | | | | | | |
| | N/A | | | | N/A | |
| | | | | | | |
| $ | 9.26 | | | $ | 9.18 | |
| | | | | | | |
| $ | 9.28 | | | | N/A | |
183
Statements of Assets and Liabilities
FIRST INVESTORS EQUITY FUNDS
March 31, 2019
| | | COVERED CALL
STRATEGY | | |
Assets | | | | | | |
Investments in securities | | | | | | |
At identified cost | | | $ | 284,529,893 | | |
At value (Note 1A) | | | $ | 325,414,079 | | |
Cash | | | | 3,320,252 | | |
Receivables: | | | | | | |
Investment securities sold | | | | — | | |
Deposits at broker for futures contracts | | | | — | | |
Dividends and interest | | | | 377,973 | | |
Shares sold | | | | 232,693 | | |
Due from broker - variation margin futures | | | | — | | |
Unrealized appreciation on foreign exchange contracts (Note 5) | | | | — | | |
Other assets | | | | 21,633 | | |
Total Assets | | | | 329,366,630 | | |
| | | | | | | |
Liabilities | | | | | | |
Options written, at value (Note 5) | | | | 11,533,087 | (a) | |
Payables: | | | | | | |
Investment securities purchased | | | | — | | |
Shares redeemed | | | | 432,366 | | |
Unrealized depreciation on foreign exchange and futures contracts (Note 5) | | | | — | | |
Accrued advisory fees | | | | 214,150 | | |
Accrued shareholder servicing costs | | | | 158,698 | | |
Accrued expenses | | | | 43,540 | | |
Total Liabilities | | | | 12,381,841 | | |
Net Assets | | | $ | 316,984,789 | | |
| | | | | | | |
Net Assets Consist of: | | | | | | |
Capital paid in | | | $ | 300,799,452 | | |
Distributable earnings | | | | 16,185,337 | | |
Total | | | $ | 316,984,789 | | |
(a) | Premiums received from written options $7,567,379 |
(b) | Premiums received from written options $71,997 |
(c) | Premiums received from written options $127,039 |
(d) | Premiums received from written options $771,615 |
See notes to financial statements
184
EQUITY
INCOME | | | GLOBAL | | | GROWTH &
INCOME | | | HEDGED
U.S. EQUITY
OPPORTUNITIES | |
| | | | | | | | | | | | | | | |
| | | | | | | | | | | | | | | |
| $ | 438,286,146 | | | $ | 525,035,544 | | | $ | 1,187,155,827 | | | $ | 151,787,359 | |
| $ | 579,680,112 | | | $ | 579,419,692 | | | $ | 1,642,340,608 | | | $ | 169,799,608 | |
| | 2,673,818 | | | | 11,715,733 | | | | 33,936,819 | | | | 11,105,012 | |
| | | | | | | | | | | | | | | |
| | 608,695 | | | | — | | | | 3,472,366 | | | | 207,630 | |
| | — | | | | — | | | | — | | | | 337,072 | |
| | 852,946 | | | | 1,447,045 | | | | 1,591,211 | | | | 220,251 | |
| | 622,775 | | | | 307,159 | | | | 480,481 | | | | 340,481 | |
| | — | | | | — | | | | — | | | | 1,700,192 | |
| | — | | | | — | | | | — | | | | 1,802 | |
| | 38,644 | | | | 38,651 | | | | 112,475 | | | | 9,850 | |
| | 584,476,990 | | | | 592,928,280 | | | | 1,681,933,960 | | | | 183,721,898 | |
| | | | | | | | | | | | | | | |
| | | | | | | | | | | | | | | |
| | 92,450 | (b) | | | — | | | | 179,650 | (c) | | | 614,550 | (d) |
| | | | | | | | | | | | | | | |
| | 1,365,642 | | | | 2,410,937 | | | | 10,010,837 | | | | 89,216 | |
| | 936,554 | | | | 733,445 | | | | 2,561,560 | | | | 260,118 | |
| | — | | | | — | | | | — | | | | 480,679 | |
| | 361,241 | | | | 470,726 | | | | 966,412 | | | | 204,330 | |
| | 88,263 | | | | 88,859 | | | | 262,040 | | | | 30,820 | |
| | 62,120 | | | | 87,800 | | | | 134,725 | | | | 66,601 | |
| | 2,906,270 | | | | 3,791,767 | | | | 14,115,224 | | | | 1,746,314 | |
| $ | 581,570,720 | | | $ | 589,136,513 | | | $ | 1,667,818,736 | | | $ | 181,975,584 | |
| | | | | | | | | | | | | | | |
| | | | | | | | | | | | | | | |
| $ | 432,916,251 | | | $ | 559,701,141 | | | $ | 1,149,435,374 | | | $ | 165,826,497 | |
| | 148,654,469 | | | | 29,435,372 | | | | 518,383,362 | | | | 16,149,087 | |
| $ | 581,570,720 | | | $ | 589,136,513 | | | $ | 1,667,818,736 | | | $ | 181,975,584 | |
185
Statements of Assets and Liabilities
FIRST INVESTORS EQUITY FUNDS
March 31, 2019
| | | COVERED CALL
STRATEGY | | |
Net Assets: | | | | | | |
Class A | | | $ | 228,790,961 | | |
Class B | | | | N/A | | |
Advisor Class | | | $ | 85,884,702 | | |
Institutional Class | | | $ | 2,309,126 | | |
| | | | | | | |
Shares outstanding (Note 7): | | | | | | |
Class A | | | | 20,287,296 | | |
Class B | | | | N/A | | |
Advisor Class | | | | 7,639,042 | | |
Institutional Class | | | | 206,690 | | |
| | | | | | | |
Net asset value and redemption price per share - Class A | | | $ | 11.28 | | |
| | | | | | | |
Maximum offering price per share - Class A (Net asset value/.9425)* | | | $ | 11.97 | | |
| | | | | | | |
Net asset value and offering price per share - Class B** | | | | N/A | | |
| | | | | | | |
Net asset value, offering price and redemptionprice per share - Advisor Class | | | $ | 11.24 | | |
| | | | | | | |
Net asset value, offering price and redemptionprice per share - Institutional Class | | | $ | 11.17 | | |
* | On purchases of $50,000 or more, the sales charge is reduced (Note 7). |
** | Redemption price is equal to net asset value less contingent deferred sales charges, if applicable (Note 7). |
See notes to financial statements
186
EQUITY
INCOME | | | GLOBAL | | | GROWTH &
INCOME | | | HEDGED
U.S. EQUITY
OPPORTUNITIES | |
| | | | | | | | | | | | | | | |
| $ | 498,833,996 | | | $ | 356,080,363 | | | $ | 1,505,650,398 | | | $ | 76,399,415 | |
| $ | 2,199,526 | | | $ | 1,938,405 | | | $ | 9,994,625 | | | | N/A | |
| $ | 78,538,799 | | | $ | 227,833,091 | | | $ | 143,755,117 | | | $ | 105,027,243 | |
| $ | 1,998,399 | | | $ | 3,284,654 | | | $ | 8,418,596 | | | $ | 548,926 | |
| | | | | | | | | | | | | | | |
| | | | | | | | | | | | | | | |
| | 53,828,772 | | | | 49,752,928 | | | | 80,241,475 | | | | 6,550,370 | |
| | 243,283 | | | | 369,426 | | | | 585,971 | | | | N/A | |
| | 8,411,812 | | | | 30,869,277 | | | | 7,595,435 | | | | 8,927,562 | |
| | 215,906 | | | | 441,929 | | | | 446,564 | | | | 46,523 | |
| | | | | | | | | | | | | | | |
| $ | 9.27 | | | $ | 7.16 | | | $ | 18.76 | | | $ | 11.66 | |
| | | | | | | | | | | | | | | |
| $ | 9.84 | | | $ | 7.60 | | | $ | 19.90 | | | $ | 12.37 | |
| | | | | | | | | | | | | | | |
| $ | 9.04 | | | $ | 5.25 | | | $ | 17.06 | | | | N/A | |
| | | | | | | | | | | | | | | |
| $ | 9.34 | | | $ | 7.38 | | | $ | 18.93 | | | $ | 11.76 | |
| | | | | | | | | | | | | | | |
| $ | 9.26 | | | $ | 7.43 | | | $ | 18.85 | | | $ | 11.80 | |
187
Statements of Assets and Liabilities
FIRST INVESTORS EQUITY FUNDS
March 31, 2019
| | | INTERNATIONAL | | |
Assets | | | | | | |
Investments in securities: | | | | | | |
At identified cost | | | $ | 313,277,062 | | |
At value (Note 1A) | | | $ | 394,407,955 | | |
Cash | | | | 7,790,079 | | |
Receivables: | | | | | | |
Investment securities sold | | | | — | | |
Options contracts written | | | | — | | |
Dividends and interest | | | | 1,524,926 | | |
Shares sold | | | | 473,365 | | |
Other assets | | | | 24,720 | | |
Total Assets | | | | 404,221,045 | | |
| | | | | | | |
Liabilities | | | | | | |
Options written, at value (Note 5) | | | | — | | |
Payables: | | | | | | |
Investment securities purchased | | | | — | | |
Shares redeemed | | | | 680,689 | | |
Accrued advisory fees | | | | 328,214 | | |
Accrued shareholder servicing costs | | | | 86,894 | | |
Accrued expenses | | | | 58,651 | | |
Total Liabilities | | | | 1,154,448 | | |
Net Assets | | | $ | 403,066,597 | | |
| | | | | | | |
Net Assets Consist of: | | | | | | |
Capital paid in | | | $ | 335,374,711 | | |
Distributable earnings | | | | 67,691,886 | | |
Total | | | $ | 403,066,597 | | |
(e) | Premiums received from written options $25,173,212 |
See notes to financial statements
188
OPPORTUNITY | | | PREMIUM
INCOME | | | SELECT
GROWTH | | | SPECIAL
SITUATIONS | | | TOTAL
RETURN | |
| | | | | | | | | | | | | | | | | | | |
| | | | | | | | | | | | | | | | | | | |
| $ | 847,865,092 | | | $ | 146,028,564 | | | $ | 618,772,776 | | | $ | 583,745,028 | | | $ | 721,175,949 | |
| $ | 1,085,177,934 | | | $ | 147,808,809 | | | $ | 763,162,931 | | | $ | 642,290,248 | | | $ | 843,667,481 | |
| | 26,399,457 | | | | 3,490,874 | | | | 6,580,326 | | | | 6,055,165 | | | | 13,174,760 | |
| | | | | | | | | | | | | | | | | | | |
| | — | | | | — | | | | — | | | | 9,847,179 | | | | 14,553,566 | |
| | — | | | | 282,361 | | | | — | | | | — | | | | — | |
| | 815,649 | | | | 201,779 | | | | 359,285 | | | | 569,838 | | | | 3,529,866 | |
| | 734,537 | | | | 616,397 | | | | 1,175,378 | | | | 712,637 | | | | 339,744 | |
| | 71,994 | | | | 5,912 | | | | 47,109 | | | | 44,759 | | | | 58,576 | |
| | 1,113,199,571 | | | | 152,406,132 | | | | 771,325,029 | | | | 659,519,826 | | | | 875,323,993 | |
| | | | | | | | | | | | | | | | | | | |
| | | | | | | | | | | | | | | | | | | |
| | — | | | | 26,905,763 | (e) | | | — | | | | — | | | | — | |
| | | | | | | | | | | | | | | | | | | |
| | 5,465,552 | | | | 1,559,657 | | | | — | | | | 5,375,614 | | | | 4,979,578 | |
| | 1,818,943 | | | | 79,109 | | | | 1,384,993 | | | | 1,236,129 | | | | 1,192,087 | |
| | 654,787 | | | | 64,583 | | | | 465,946 | | | | 439,611 | | | | 511,102 | |
| | 400,148 | | | | 27,007 | | | | 108,489 | | | | 130,947 | | | | 139,353 | |
| | 149,130 | | | | 38,898 | | | | 48,825 | | | | 44,682 | | | | 180,659 | |
| | 8,488,560 | | | | 28,675,017 | | | | 2,008,253 | | | | 7,226,983 | | | | 7,002,779 | |
| $ | 1,104,711,011 | | | $ | 123,731,115 | | | $ | 769,316,776 | | | $ | 652,292,843 | | | $ | 868,321,214 | |
| | | | | | | | | | | | | | | | | | | |
| | | | | | | | | | | | | | | | | | | |
| $ | 836,718,706 | | | $ | 123,442,072 | | | $ | 586,381,149 | | | $ | 577,025,814 | | | $ | 722,196,109 | |
| | 267,992,305 | | | | 289,043 | | | | 182,935,627 | | | | 75,267,029 | | | | 146,125,105 | |
| $ | 1,104,711,011 | | | $ | 123,731,115 | | | $ | 769,316,776 | | | $ | 652,292,843 | | | $ | 868,321,214 | |
189
Statements of Assets and Liabilities
FIRST INVESTORS EQUITY FUNDS
March 31, 2019
| | | INTERNATIONAL | | |
Net Assets: | | | | | | |
Class A | | | $ | 254,908,513 | | |
Class B | | | $ | 1,091,626 | | |
Advisor Class | | | $ | 144,283,356 | | |
Institutional Class | | | $ | 2,783,102 | | |
| | | | | | | |
Shares outstanding(Note 7): | | | | | | |
Class A | | | | 17,200,088 | | |
Class B | | | | 80,162 | | |
Advisor Class | | | | 9,539,977 | | |
Institutional Class | | | | 183,340 | | |
| | | | | | | |
Net asset value and redemption price per share - Class A | | | $ | 14.82 | | |
| | | | | | | |
Maximum offering price per share - Class A (Net asset value/.9425)* | | | $ | 15.72 | | |
| | | | | | | |
Net asset value and offering price per share - Class B** | | | $ | 13.62 | | |
| | | | | | | |
Net asset value, offering price and redemptionprice per share - Advisor Class | | | $ | 15.12 | | |
| | | | | | | |
Net asset value, offering price and redemptionprice per share - Institutional Class | | | $ | 15.18 | | |
* | On purchases of $50,000 or more, the sales charge is reduced (Note 7). |
** | Redemption price is equal to net asset value less contingent deferred sales charges, if applicable (Note 7). |
See notes to financial statements
190
OPPORTUNITY | | | PREMIUM
INCOME | | | SELECT
GROWTH | | | SPECIAL
SITUATIONS | | | TOTAL
RETURN | |
| | | | | | | | | | | | | | | | | | | |
| $ | 943,677,938 | | | $ | 60,448,829 | | | $ | 557,067,882 | | | $ | 512,210,506 | | | $ | 828,821,963 | |
| $ | 5,275,980 | | | | N/A | | | $ | 2,543,887 | | | $ | 2,107,820 | | | $ | 5,405,912 | |
| $ | 151,156,650 | | | $ | 63,243,380 | | | $ | 203,091,694 | | | $ | 130,646,785 | | | $ | 1,010,910 | |
| $ | 4,600,443 | | | $ | 38,906 | | | $ | 6,613,313 | | | $ | 7,327,732 | | | $ | 33,082,429 | |
| | | | | | | | | | | | | | | | | | | |
| | | | | | | | | | | | | | | | | | | |
| | 26,216,450 | | | | 5,945,826 | | | | 45,022,170 | | | | 20,524,292 | | | | 45,827,643 | |
| | 199,566 | | | | N/A | | | | 253,153 | | | | 121,016 | | | | 303,974 | |
| | 4,101,535 | | | | 6,214,656 | | | | 16,054,196 | | | | 5,157,185 | | | | 55,593 | |
| | 124,991 | | | | 7,028 | | | | 519,603 | | | | 286,906 | | | | 1,812,983 | |
| | | | | | | | | | | | | | | | | | | |
| $ | 36.00 | | | $ | 10.17 | | | $ | 12.37 | | | $ | 24.96 | | | $ | 18.09 | |
| | | | | | | | | | | | | | | | | | | |
| $ | 38.20 | | | $ | 10.79 | | | $ | 13.12 | | | $ | 26.48 | | | $ | 19.19 | |
| | | | | | | | | | | | | | | | | | | |
| $ | 26.44 | | | | N/A | | | $ | 10.05 | | | $ | 17.42 | | | $ | 17.78 | |
| | | | | | | | | | | | | | | | | | | |
| $ | 36.85 | | | $ | 10.18 | | | $ | 12.65 | | | $ | 25.33 | | | $ | 18.18 | |
| | | | | | | | | | | | | | | | | | | |
| $ | 36.81 | | | $ | 5.54 | | | $ | 12.73 | | | $ | 25.54 | | | $ | 18.25 | |
191
Statements of Operations
FIRST INVESTORS INCOME FUNDS
Six Months Ended March 31, 2019
| | | FLOATING
RATE | | |
Investment Income | | | | | | |
Interest | | | $ | 6,256,744 | | |
Dividends | | | | — | | |
Total income | | | | 6,256,744 | | |
Expenses (Notes 1 and 3): | | | | | | |
Advisory fees | | | | 741,440 | | |
Distribution plan expenses-Class A | | | | 103,425 | | |
Distribution plan expenses-Class B | | | | N/A | | |
Shareholder servicing costs-Class A | | | | 52,112 | | |
Shareholder servicing costs-Class B | | | | N/A | | |
Shareholder servicing costs-Advisor Class | | | | 99,608 | | |
Shareholder servicing costs-Institutional Class | | | | 4,227 | | |
Professional fees | | | | 25,501 | | |
Custodian fees | | | | 41,441 | | |
Registration fees | | | | 45,123 | | |
Reports to shareholders | | | | 20,175 | | |
Trustees' fees | | | | 7,590 | | |
Other expenses | | | | 41,816 | | |
Total expenses | | | | 1,182,458 | | |
Less: Expenses waived and/or assumed (Note 3) | | | | (21,067 | ) | |
Expenses paid indirectly (Note 1G) | | | | (661 | ) | |
Net expenses | | | | 1,160,730 | | |
Net investment income | | | | 5,096,014 | | |
| | | | | | | |
Realized and Unrealized Gain (Loss) on Investments and Foreign Exchange Contracts (Notes 2 and 5): | | | | | | |
Net realized loss on: | | | | | | |
Investments | | | | (114,212 | ) | |
Foreign exchange contracts | | | | — | | |
Net realized loss on investments and foreign exchange contracts | | | | (114,212 | ) | |
Net unrealized appreciation (depreciation) on: | | | | | | |
Investments | | | | (4,083,600 | ) | |
Foreign exchange contracts | | | | — | | |
Net unrealized appreciation (depreciation) on investments and foreign exchange contracts | | | | (4,083,600 | ) | |
Net loss on investments and foreign exchange contracts | | | | (4,197,812 | ) | |
Net Increase (Decrease) in Net Assets Resulting from Operations | | | $ | 898,202 | | |
(a) | Net of $19,947 foreign taxes withheld |
See notes to financial statements
192
FUND FOR
INCOME | | | GOVERNMENT
CASH
MANAGEMENT | | | INTERNATIONAL
OPPORTUNITIES
BOND | |
| | | | | | | | | | | |
| $ | 18,827,174 | | | $ | 1,924,485 | | | $ | 3,445,312 | (a) |
| | — | | | | — | | | | — | |
| | 18,827,174 | | | | 1,924,485 | | | | 3,445,312 | |
| | | | | | | | | | | |
| | 2,238,775 | | | | 411,659 | | | | 570,290 | |
| | 753,245 | | | | N/A | | | | 76,130 | |
| | 7,886 | | | | 545 | | | | N/A | |
| | 381,423 | | | | 239,588 | | | | 52,475 | |
| | 2,351 | | | | 266 | | | | N/A | |
| | 101,941 | | | | N/A | | | | 90,326 | |
| | 5,437 | | | | 2 | | | | 2,044 | |
| | 50,800 | | | | 28,481 | | | | 16,200 | |
| | 17,209 | | | | 3,052 | | | | 40,545 | |
| | 38,499 | | | | 34,660 | | | | 28,999 | |
| | 25,645 | | | | 11,726 | | | | 21,635 | |
| | 19,028 | | | | 5,065 | | | | 4,677 | |
| | 51,396 | | | | 13,701 | | | | 26,277 | |
| | 3,693,635 | | | | 748,745 | | | | 929,598 | |
| | (54,695 | ) | | | (252,334 | ) | | | — | |
| | — | | | | (2,078 | ) | | | (782 | ) |
| | 3,638,940 | | | | 494,333 | | | | 928,816 | |
| | 15,188,234 | | | | 1,430,152 | | | | 2,516,496 | |
| | | | | | | | | | | |
| | | | | | | | | | | |
| | | | | | | | | | | |
| | (2,484,919 | ) | | | — | | | | (38,161 | ) |
| | — | | | | — | | | | (900,253 | ) |
| | (2,484,919 | ) | | | — | | | | (938,414 | ) |
| | | | | | | | | | | |
| | 161,339 | | | | — | | | | (835,551 | ) |
| | — | | | | — | | | | (868,055 | ) |
| | 161,339 | | | | — | | | | (1,703,606 | ) |
| | (2,323,580 | ) | | | — | | | | (2,642,020 | ) |
| $ | 12,864,654 | | | $ | 1,430,152 | | | $ | (125,524 | ) |
193
Statements of Operations
FIRST INVESTORS INCOME FUNDS
Six Months Ended March 31, 2019
| | | INVESTMENT
GRADE | | |
Investment Income | | | | | | |
Interest | | | $ | 12,048,660 | | |
Dividends from affiliate (Note 2) | | | | — | | |
Total income | | | | 12,048,660 | | |
Expenses (Notes 1 and 3): | | | | | | |
Advisory fees | | | | 1,937,610 | | |
Distribution plan expenses-Class A | | | | 575,396 | | |
Distribution plan expenses-Class B | | | | 7,083 | | |
Shareholder servicing costs-Class A | | | | 295,540 | | |
Shareholder servicing costs-Class B | | | | 2,196 | | |
Shareholder servicing costs-Advisor Class | | | | 102,620 | | |
Shareholder servicing costs-Institutional Class | | | | 3,033 | | |
Professional fees | | | | 54,348 | | |
Custodian fees | | | | 13,609 | | |
Registration fees | | | | 53,434 | | |
Reports to shareholders | | | | 27,122 | | |
Trustees' fees | | | | 18,165 | | |
Other expenses | | | | 36,914 | | |
Total expenses | | | | 3,127,070 | | |
Less: Expenses waived and/or assumed (Note 3) | | | | (276,627 | ) | |
Expenses paid indirectly (Note 1G) | | | | (7,269 | ) | |
Net expenses | | | | 2,843,174 | | |
Net investment income | | | | 9,205,486 | | |
| | | | | | | |
Realized and Unrealized Gain (Loss) on Investments and Affiliate(Notes 2 and 5): | | | | | | |
Net realized loss on: | | | | | | |
Investments | | | | (383,084 | ) | |
Affiliate | | | | — | | |
Net realized loss on investments and affiliate | | | | (383,084 | ) | |
Net unrealized appreciation on: | | | | | | |
Investments | | | | 18,337,977 | | |
Affiliate | | | | — | | |
Net unrealized appreciation on investments and affiliate | | | | 18,337,977 | | |
Net gain (loss) on investments and affiliate | | | | 17,954,893 | | |
Net Increase in Net Assets Resulting from Operations | | | $ | 27,160,379 | | |
See notes to financial statements
194
LIMITED
DURATION
BOND | | | STRATEGIC
INCOME | |
| | | | | | | |
| $ | 4,884,823 | | | $ | 170,564 | |
| | — | | | | 2,804,558 | |
| | 4,884,823 | | | | 2,975,122 | |
| | | | | | | |
| | 647,498 | | | | 36,970 | |
| | 361,536 | | | | 220,637 | |
| | N/A | | | | N/A | |
| | 209,938 | | | | 98,334 | |
| | N/A | | | | N/A | |
| | 55,591 | | | | 381 | |
| | 4,730 | | | | N/A | |
| | 92,387 | | | | 35,461 | |
| | 24,148 | | | | 6,349 | |
| | 64,450 | | | | 27,750 | |
| | 22,879 | | | | 5,486 | |
| | 9,750 | | | | 4,563 | |
| | 35,190 | | | | 9,607 | |
| | 1,528,097 | | | | 445,538 | |
| | (405,794 | ) | | | — | |
| | (3,893 | ) | | | (1,843 | ) |
| | 1,118,410 | | | | 443,695 | |
| | 3,766,413 | | | | 2,531,427 | |
| | | | | | | |
| | | | | | | |
| | | | | | | |
| | (869,237 | ) | | | (92,864 | ) |
| | — | | | | (871,802 | ) |
| | (869,237 | ) | | | (964,666 | ) |
| | | | | | | |
| | 4,077,109 | | | | 155,962 | |
| | — | | | | 654,613 | |
| | 4,077,109 | | | | 810,575 | |
| | 3,207,872 | | | | (154,091 | ) |
| $ | 6,974,285 | | | $ | 2,377,336 | |
195
Statements of Operations
FIRST INVESTORS EQUITY FUNDS
Six Months Ended March 31, 2019
| | | COVERED CALL
STRATEGY | | |
Investment Income | | | | | | |
Dividends | | | $ | 4,221,151 | | |
Interest | | | | — | | |
Total income | | | | 4,221,151 | | |
Expenses (Notes 1 and 3): | | | | | | |
Advisory fees | | | | 1,268,358 | | |
Distribution plan expenses-Class A | | | | 276,442 | | |
Distribution plan expenses-Class B | | | | N/A | | |
Shareholder servicing costs-Class A | | | | 198,160 | | |
Shareholder servicing costs-Class B | | | | N/A | | |
Shareholder servicing costs-Advisor Class | | | | 103,284 | | |
Shareholder servicing costs-Institutional Class | | | | 388 | | |
Professional fees | | | | 18,865 | | |
Custodian fees | | | | 4,851 | | |
Registration fees | | | | 54,946 | | |
Reports to shareholders | | | | 17,972 | | |
Trustees' fees | | | | 9,873 | | |
Other expenses | | | | 18,652 | | |
Total expenses | | | | 1,971,791 | | |
Less: Expenses (waived and/or assumed) repaid to advisor (Note 3) | | | | 76,010 | | |
Expenses paid indirectly (Note 1G) | | | | (4,002 | ) | |
Net expenses | | | | 2,043,799 | | |
Net investment income | | | | 2,177,352 | | |
| | | | | | | |
Realized and Unrealized Gain (Loss) on Investments, Options and Futures Contracts,
and Foreign Exchange Contracts(Note 2 and 5): | | | | | | |
Net realized gain (loss) on: | | | | | | |
Investments | | | | (8,445,898 | ) | |
Options contracts | | | | (83,741 | ) | |
Futures contracts | | | | — | | |
Foreign exchange contracts | | | | — | | |
Net realized gain (loss) on investments, options and futures contracts, and foreign exchange contracts | | | | (8,529,639 | ) | |
Net unrealized appreciation (depreciation) on: | | | | | | |
Investments | | | | (5,191,229 | ) | |
Options contracts | | | | (3,966,842 | ) | |
Futures contracts | | | | — | | |
Foreign exchange contracts | | | | — | | |
Net unrealized depreciation on investments, options and futures contracts, and foreign exchange contracts | | | | (9,158,071 | ) | |
Net gain (loss) on investments, options and futures contracts, and foreign exchange contracts | | | | (17,687,710 | ) | |
Net Increase (Decrease) in Net Assets Resulting from Operations | | | $ | (15,510,358 | ) | |
(a) | Net of $31,719 foreign taxes withheld |
(b) | Net of $95,427 foreign taxes withheld |
(c) | Net of $42,039 foreign taxes withheld |
(d) | Net of $12,226 foreign taxes withheld |
See notes to financial statements
196
EQUITY
INCOME | | | GLOBAL | | | GROWTH &
INCOME | | | HEDGED
U.S. EQUITY
OPPORTUNITIES | |
| | | | | | | | | | | | | | | |
| $ | 8,204,241 | (a) | | $ | 4,770,250 | (b) | | $ | 20,197,689 | (c) | | $ | 1,463,421 | (d) |
| | 229,276 | | | | 104,690 | | | | 695,484 | | | | — | |
| | 8,433,517 | | | | 4,874,940 | | | | 20,893,173 | | | | 1,463,421 | |
| | | | | | | | | | | | | | | |
| | 2,118,048 | | | | 2,691,451 | | | | 5,654,886 | | | | 925,945 | |
| | 747,191 | | | | 522,553 | | | | 2,248,460 | | | | 85,890 | |
| | 11,401 | | | | 9,843 | | | | 51,865 | | | | N/A | |
| | 337,963 | | | | 290,247 | | | | 1,019,963 | | | | 58,120 | |
| | 3,155 | | | | 2,570 | | | | 11,713 | | | | N/A | |
| | 25,131 | | | | 98,019 | | | | 81,318 | | | | 79,724 | |
| | 341 | | | | 506 | | | | 1,328 | | | | 80 | |
| | 31,664 | | | | 44,677 | | | | 78,399 | | | | 15,402 | |
| | 7,788 | | | | 33,626 | | | | 21,963 | | | | 21,073 | |
| | 40,500 | | | | 42,149 | | | | 55,000 | | | | 37,500 | |
| | 19,336 | | | | 27,363 | | | | 46,703 | | | | 12,020 | |
| | 17,962 | | | | 17,470 | | | | 51,297 | | | | 5,032 | |
| | 32,086 | | | | 40,263 | | | | 61,547 | | | | 21,911 | |
| | 3,392,566 | | | | 3,820,737 | | | | 9,384,442 | | | | 1,262,697 | |
| | — | | | | (94,873 | ) | | | — | | | | 12,756 | |
| | (9,219 | ) | | | (6,572 | ) | | | (26,537 | ) | | | (1,815 | ) |
| | 3,383,347 | | | | 3,719,292 | | | | 9,357,905 | | | | 1,273,638 | |
| | 5,050,170 | | | | 1,155,648 | | | | 11,535,268 | | | | 189,783 | |
| | | | | | | | | | | | | | | |
| | | | | | | | | | | | | | | |
| | | | | | | | | | | | | | | |
| | 9,816,737 | | | | (23,479,818 | ) | | | 110,315,540 | | | | 188,231 | |
| | 83,687 | | | | — | | | | 67,727 | | | | (662,665 | ) |
| | — | | | | — | | | | — | | | | 1,940,561 | |
| | — | | | | (294,625 | ) | | | — | | | | 5,084 | |
| | 9,900,424 | | | | (23,774,443 | ) | | | 110,383,267 | | | | 1,471,211 | |
| | | | | | | | | | | | | | | |
| | (37,176,106 | ) | | | (14,508,857 | ) | | | (201,010,895 | ) | | | (639,554 | ) |
| | (20,453 | ) | | | — | | | | (52,612 | ) | | | 237,329 | |
| | — | | | | — | | | | — | | | | (321,967 | ) |
| | — | | | | (10,266 | ) | | | — | | | | (3,381 | ) |
| | (37,196,559 | ) | | | (14,519,123 | ) | | | (201,063,507 | ) | | | (727,573 | ) |
| | (27,296,135 | ) | | | (38,293,566 | ) | | | (90,680,240 | ) | | | 743,638 | |
| $ | (22,245,965 | ) | | $ | (37,137,918 | ) | | $ | (79,144,972 | ) | | $ | 933,421 | |
197
Statements of Operations
FIRST INVESTORS EQUITY FUNDS
Six Months Ended March 31, 2019
| | | INTERNATIONAL | | |
Investment Income | | | | | | |
Dividends | | | $ | 2,328,857 | (e) | |
Interest | | | | 82,489 | | |
Total income | | | | 2,411,346 | | |
Expenses (Notes 1 and 3): | | | | | | |
Advisory fees | | | | 1,844,896 | | |
Distribution plan expenses-Class A | | | | 363,526 | | |
Distribution plan expenses-Class B | | | | 5,405 | | |
Shareholder servicing costs-Class A | | | | 267,395 | | |
Shareholder servicing costs-Class B | | | | 1,853 | | |
Shareholder servicing costs-Advisor Class | | | | 104,155 | | |
Shareholder servicing costs-Institutional Class | | | | 432 | | |
Professional fees | | | | 22,949 | | |
Custodian fees | | | | 42,116 | | |
Registration fees | | | | 39,001 | | |
Reports to shareholders | | | | 22,482 | | |
Trustees' fees | | | | 11,679 | | |
Other expenses | | | | 24,978 | | |
Total expenses | | | | 2,750,867 | | |
Less: Expenses waived and/or assumed (Note 3) | | | | — | | |
Expenses paid indirectly (Note 1G) | | | | (788 | ) | |
Net expenses | | | | 2,750,079 | | |
Net investment income (loss) | | | | (338,733 | ) | |
| | | | | | | |
Realized and Unrealized Gain (Loss) on Investments, Options Contracts and Foreign Exchange Contracts (Note 2): | | | | | | |
Net realized gain (loss) on: | | | | | | |
Investments | | | | (4,113,794 | ) | |
Options contracts | | | | — | | |
Foreign exchange contracts | | | | (31,861 | ) | |
Net realized gain (loss) on investments, options contracts and foreign exchange contracts | | | | (4,145,655 | ) | |
Net unrealized appreciation (depreciation) of: | | | | | | |
Investments | | | | 4,679,156 | | |
Options contracts | | | | — | | |
Foreign exchange contracts | | | | (5,938 | ) | |
Net unrealized appreciation (depreciation) of investments, options contracts and foreign exchange contracts | | | | 4,673,218 | | |
Net gain (loss) on investments | | | | 527,563 | | |
Net Increase (Decrease) in Net Assets Resulting from Operations | | | $ | 188,830 | | |
(e) | Net of $225,837 foreign taxes withheld |
(f) | Net of $5,220 foreign taxes withheld |
(g) | Net of $2,895 foreign taxes withheld |
(h) | Net of $16,107 foreign taxes withheld |
See notes to financial statements
198
OPPORTUNITY | | | PREMIUM
INCOME | | | SELECT
GROWTH | | | SPECIAL
SITUATIONS | | | TOTAL
RETURN | |
| | | | | | | | | | | | | | | | | | | |
| $ | 7,833,454 | (f) | | $ | 1,589,140 | | | $ | 5,327,314 | | | $ | 5,705,838 | (g) | | $ | 5,297,265 | (h) |
| | 257,834 | | | | — | | | | 130,079 | | | | 132,430 | | | | 6,430,959 | |
| | 8,091,288 | | | | 1,589,140 | | | | 5,457,393 | | | | 5,838,268 | | | | 11,728,224 | |
| | | | | | | | | | | | | | | | | | | |
| | 3,739,127 | | | | 418,841 | | | | 2,614,171 | | | | 2,564,125 | | | | 2,999,547 | |
| | 1,367,052 | | | | 64,993 | | | | 794,363 | | | | 769,673 | | | | 1,233,910 | |
| | 26,666 | | | | N/A | | | | 12,715 | | | | 10,968 | | | | 27,331 | |
| | 956,249 | | | | 39,092 | | | | 401,822 | | | | 454,921 | | | | 574,800 | |
| | 6,213 | | | | N/A | | | | 2,730 | | | | 2,891 | | | | 5,201 | |
| | 106,665 | | | | 32,677 | | | | 114,711 | | | | 112,394 | | | | 1,073 | |
| | 690 | | | | 448 | | | | 954 | | | | 1,373 | | | | 4,846 | |
| | 48,735 | | | | 20,299 | | | | 33,744 | | | | 30,539 | | | | 136,451 | |
| | 13,429 | | | | 3,076 | | | | 9,929 | | | | 8,500 | | | | 11,294 | |
| | 55,500 | | | | 62,501 | | | | 38,501 | | | | 42,500 | | | | — | |
| | 45,827 | | | | 15,337 | | | | 25,320 | | | | 31,803 | | | | 30,075 | |
| | 33,023 | | | | 3,190 | | | | 22,409 | | | | 20,245 | | | | 26,651 | |
| | 45,119 | | | | 9,359 | | | | 26,636 | | | | 29,535 | | | | 70,269 | |
| | 6,444,295 | | | | 669,813 | | | | 4,098,005 | | | | 4,079,467 | | | | 5,121,448 | |
| | — | | | | (59,444 | ) | | | — | | | | — | | | | — | |
| | (17,018 | ) | | | (1,508 | ) | | | (8,987 | ) | | | (10,492 | ) | | | (13,674 | ) |
| | 6,427,277 | | | | 608,861 | | | | 4,089,018 | | | | 4,068,975 | | | | 5,107,774 | |
| | 1,664,011 | | | | 980,279 | | | | 1,368,375 | | | | 1,769,293 | | | | 6,620,450 | |
| | | | | | | | | | | | | | | | | | | |
| | | | | | | | | | | | | | | | | | | |
| | | | | | | | | | | | | | | | | | | |
| | 51,403,182 | | | | (1,934,882 | ) | | | 37,500,198 | | | | 21,038,359 | | | | 39,184,700 | |
| | — | | | | 3,632,730 | | | | — | | | | — | | | | — | |
| | — | | | | — | | | | — | | | | — | | | | — | |
| | 51,403,182 | | | | 1,697,848 | | | | 37,500,198 | | | | 21,038,359 | | | | 39,184,700 | |
| | | | | | | | | | | | | | | | | | | |
| | (100,053,375 | ) | | | (683,533 | ) | | | (66,827,904 | ) | | | (96,910,387 | ) | | | (60,950,410 | ) |
| | — | | | | (407,356 | ) | | | — | | | | — | | | | — | |
| | — | | | | — | | | | — | | | | — | | | | — | |
| | (100,053,375 | ) | | | (1,090,889 | ) | | | (66,827,904 | ) | | | (96,910,387 | ) | | | (60,950,410 | ) |
| | (48,650,193 | ) | | | 606,959 | | | | (29,327,706 | ) | | | (75,872,028 | ) | | | (21,765,710 | ) |
| $ | (46,986,182 | ) | | $ | 1,587,238 | | | $ | (27,959,331 | ) | | $ | (74,102,735 | ) | | $ | (15,145,260 | ) |
199
Statements of Changes in Net Assets
FIRST INVESTORS INCOME FUNDS
| | | | FLOATING
RATE | | |
| | | 10/1/2018 to
3/31/2019 | | | 10/1/2017 to
9/30/2018 | | |
Increase (Decrease) in Net Assets From Operations | | | | | | | | | | |
Net investment income | | | $ | 5,096,014 | | | $ | 7,145,470 | | |
Net realized gain (loss) on investments and foreign exchange contracts | | | | (114,212 | ) | | | 691,427 | | |
Net unrealized appreciation (depreciation) of investments and foreign exchange contracts | | | | (4,083,600 | ) | | | 366,130 | | |
Net increase (decrease) in net assets resulting from operations | | | | 898,202 | | | | 8,203,027 | | |
| | | | | | | | | | | |
Distribution to Shareholders1 | | | | | | | | | | |
Class A | | | | (1,394,064 | ) | | | (2,208,169 | ) | |
Class B | | | | N/A | | | | N/A | | |
Advisor Class | | | | (3,179,443 | ) | | | (4,156,168 | ) | |
Institutional Class | | | | (635,533 | ) | | | (967,368 | ) | |
Total distributions | | | | (5,209,040 | ) | | | (7,331,705 | ) | |
| | | | | | | | | | | |
Share Transactions | | | | | | | | | | |
Class A: | | | | | | | | | | |
Proceeds from shares sold | | | | 11,639,768 | | | | 17,357,693 | | |
Reinvestment of distributions | | | | 1,323,000 | | | | 2,103,112 | | |
Cost of shares redeemed | | | | (9,849,479 | ) | | | (17,921,450 | ) | |
| | | | | 3,113,289 | | | | 1,539,355 | | |
Class B: | | | | | | | | | | |
Proceeds from shares sold | | | | N/A | | | | N/A | | |
Reinvestment of distributions | | | | N/A | | | | N/A | | |
Cost of shares redeemed | | | | N/A | | | | N/A | | |
| | | | | N/A | | | | N/A | | |
Advisor Class: | | | | | | | | | | |
Proceeds from shares sold | | | | 27,499,915 | | | | 61,262,253 | | |
Reinvestment of distributions | | | | 3,161,849 | | | | 4,032,114 | | |
Cost of shares redeemed | | | | (13,747,707 | ) | | | (19,959,407 | ) | |
| | | | | 16,914,057 | | | | 45,334,960 | | |
Institutional Class | | | | | | | | | | |
Proceeds from shares sold | | | | 3,117,695 | | | | 12,262,644 | | |
Reinvestment of distributions | | | | 15,700 | | | | 30,703 | | |
Cost of shares redeemed | | | | (8,152,187 | ) | | | (1,657,595 | ) | |
| | | | | (5,018,792 | ) | | | 10,635,752 | | |
Net increase (decrease) from share transactions | | | | 15,008,554 | | | | 57,510,067 | | |
Net increase (decrease) in net assets | | | | 10,697,716 | | | | 58,381,389 | | |
| | | | | | | | | | | |
Net Assets | | | | | | | | | | |
Beginning of period | | | | 245,385,003 | | | | 187,003,614 | | |
End of period2 | | | $ | 256,082,719 | | | $ | 245,385,003 | | |
1 | The SEC eliminated the requirement to disclose components of distributions paid to shareholders in September 2018. The distributions for the year ended September 30, 2018 were all from net investment income. |
2 | The SEC eliminated the requirement to disclose undistributed net investment income in September 2018. For the year ended September 30, 2018, net assets included undistributed net investment income (deficit) of $(39,540), $(2,879,872), $0 and $(880,816), respectively on the Floating Rate, Fund For Income, Government Cash Management and International Opportunities Bond Funds. |
See notes to financial statements
200
FUND FOR
INCOME | | | GOVERNMENT
CASH
MANAGEMENT | | | INTERNATIONAL OPPORTUNITIES BOND | |
10/1/2018 to
3/31/2019 | | | 10/1/2017 to
9/30/2018 | | | 10/1/2018 to
3/31/2019 | | | 10/1/2017 to
9/30/2018 | | | 10/1/2018 to
3/31/2019 | | | 10/1/2017 to
9/30/2018 | |
| | | | | | | | | | | | | | | | | | | | | | | |
| $ | 15,188,234 | | | $ | 31,116,677 | | | $ | 1,430,152 | | | $ | 1,351,094 | | | $ | 2,516,496 | | | $ | 3,960,014 | |
| | (2,484,919 | ) | | | 2,892,551 | | | | — | | | | — | | | | (938,414 | ) | | | (2,315,047 | ) |
| | 161,339 | | | | (22,306,970 | ) | | | — | | | | — | | | | (1,703,606 | ) | | | (8,484,204 | ) |
| | 12,864,654 | | | | 11,702,258 | | | | 1,430,152 | | | | 1,351,094 | | | | (125,524 | ) | | | (6,839,237 | ) |
| | | | | | | | | | | | | | | | | | | | | | | |
| | | | | | | | | | | | | | | | | | | | | | | |
| | (13,335,097 | ) | | | (27,698,833 | ) | | | (1,429,414 | ) | | | (1,328,144 | ) | | | (928,347 | ) | | | (1,886,224 | ) |
| | (35,335 | ) | | | (85,725 | ) | | | (729 | ) | | | (163 | ) | | | N/A | | | | N/A | |
| | (2,099,794 | ) | | | (4,671,312 | ) | | | N/A | | | | N/A | | | | (1,600,584 | ) | | | (2,402,791 | ) |
| | (1,036,845 | ) | | | (2,952,485 | ) | | | (9 | ) | | | (22,787 | ) | | | (219,516 | ) | | | (271,216 | ) |
| | (16,507,071 | ) | | | (35,408,355 | ) | | | (1,430,152 | ) | | | (1,351,094 | ) | | | (2,748,447 | ) | | | (4,560,231 | ) |
| | | | | | | | | | | | | | | | | | | | | | | |
| | | | | | | | | | | | | | | | | | | | | | | |
| | | | | | | | | | | | | | | | | | | | | | | |
| | 15,152,669 | | | | 35,731,994 | | | | 150,550,090 | | | | 270,861,015 | | | | 2,014,539 | | | | 11,126,773 | |
| | 11,607,378 | | | | 23,989,477 | | | | 1,387,227 | | | | 1,284,209 | | | | 888,921 | | | | 1,808,009 | |
| | (42,286,008 | ) | | | (89,758,885 | ) | | | (128,046,693 | ) | | | (245,529,644 | ) | | | (6,572,345 | ) | | | (14,137,804 | ) |
| | (15,525,961 | ) | | | (30,037,414 | ) | | | 23,890,624 | | | | 26,615,580 | | | | (3,668,885 | ) | | | (1,203,022 | ) |
| | | | | | | | | | | | | | | | | | | | | | | |
| | 84,182 | | | | 126,756 | | | | 110,338 | | | | 85,114 | | | | N/A | | | | N/A | |
| | 29,068 | | | | 67,913 | | | | 712 | | | | 163 | | | | N/A | | | | N/A | |
| | (368,650 | ) | | | (695,133 | ) | | | (57,996 | ) | | | (144,650 | ) | | | N/A | | | | N/A | |
| | (255,400 | ) | | | (500,464 | ) | | | 53,054 | | | | (59,373 | ) | | | N/A | | | | N/A | |
| | | | | | | | | | | | | | | | | | | | | | | |
| | 9,213,410 | | | | 39,762,430 | | | | N/A | | | | N/A | | | | 9,706,288 | | | | 37,576,303 | |
| | 2,078,398 | | | | 4,509,257 | | | | N/A | | | | N/A | | | | 1,596,425 | | | | 1,992,072 | |
| | (10,545,177 | ) | | | (34,950,872 | ) | | | N/A | | | | N/A | | | | (7,303,270 | ) | | | (14,261,300 | ) |
| | 746,631 | | | | 9,320,815 | | | | N/A | | | | N/A | | | | 3,999,443 | | | | 25,307,075 | |
| | | | | | | | | | | | | | | | | | | | | | | |
| | 9,387,098 | | | | 11,973,731 | | | | — | | | | 1,640,026 | | | | 9,889,674 | | | | 5,921,591 | |
| | 77,641 | | | | 324,515 | | | | 9 | | | | 20,317 | | | | 8,115 | | | | 20,279 | |
| | (6,152,887 | ) | | | (55,406,840 | ) | | | — | | | | (4,053,823 | ) | | | (808,228 | ) | | | (3,839,839 | ) |
| | 3,311,852 | | | | (43,108,594 | ) | | | 9 | | | | (2,393,480 | ) | | | 9,089,561 | | | | 2,102,031 | |
| | (11,722,878 | ) | | | (64,325,657 | ) | | | 23,943,687 | | | | 24,162,727 | | | | 9,420,119 | | | | 26,206,084 | |
| | (15,365,295 | ) | | | (88,031,754 | ) | | | 23,943,687 | | | | 24,162,727 | | | | 6,546,148 | | | | 14,806,616 | |
| | | | | | | | | | | | | | | | | | | | | | | |
| | | | | | | | | | | | | | | | | | | | | | | |
| | 639,142,120 | | | | 727,173,874 | | | | 153,797,415 | | | | 129,634,688 | | | | 151,419,080 | | | | 136,612,464 | |
| $ | 623,776,825 | | | $ | 639,142,120 | | | $ | 177,741,102 | | | $ | 153,797,415 | | | $ | 157,965,228 | | | $ | 151,419,080 | |
201
Statements of Changes in Net Assets
FIRST INVESTORS INCOME FUNDS
| | | | FLOATING
RATE | | |
| | | 10/1/2018 to
3/31/2019 | | | 10/1/2017 to
9/30/2018 | | |
Shares Issued and Redeemed | | | | | | | | | | |
Class A: | | | | | | | | | | |
Sold | | | | 1,216,153 | | | | 1,791,647 | | |
Issued for distributions reinvested | | | | 138,793 | | | | 217,095 | | |
Redeemed | | | | (1,027,820 | ) | | | (1,850,470 | ) | |
Net increase (decrease) in Class A shares outstanding | | | | 327,126 | | | | 158,272 | | |
| | | | | | | | | | | |
Class B: | | | | | | | | | | |
Sold | | | | N/A | | | | N/A | | |
Issued for distributions reinvested | | | | N/A | | | | N/A | | |
Redeemed | | | | N/A | | | | N/A | | |
Net increase (decrease) in Class B shares outstanding | | | | N/A | | | | N/A | | |
| | | | | | | | | | | |
Advisor Class: | | | | | | | | | | |
Sold | | | | 2,869,736 | | | | 6,320,958 | | |
Issued for distributions reinvested | | | | 331,531 | | | | 415,961 | | |
Redeemed | | | | (1,439,868 | ) | | | (2,058,862 | ) | |
Net increase in Advisor Class shares outstanding | | | | 1,761,399 | | | | 4,678,057 | | |
| | | | | | | | | | | |
Institutional Class: | | | | | | | | | | |
Sold | | | | 325,836 | | | | 1,264,275 | | |
Issued for distributions reinvested | | | | 1,647 | | | | 3,169 | | |
Redeemed | | | | (849,574 | ) | | | (171,044 | ) | |
Net increase (decrease) in Institutional Class shares outstanding | | | | (522,091 | ) | | | 1,096,400 | | |
See notes to financial statements
202
FUND FOR
INCOME | | | GOVERNMENT
CASH
MANAGEMENT | | | INTERNATIONAL OPPORTUNITIES BOND | |
10/1/2018 to
3/31/2019 | | | 10/1/2017 to
9/30/2018 | | | 10/1/2018 to
3/31/2019 | | | 10/1/2017 to
9/30/2018 | | | 10/1/2018 to
3/31/2019 | | | 10/1/2017 to
9/30/2018 | |
| | | | | | | | | | | | | | | | | | | | | | | |
| | | | | | | | | | | | | | | | | | | | | | | |
| | 6,336,174 | | | | 14,449,467 | | | | 150,550,090 | | | | 270,861,015 | | | | 234,533 | | | | 1,202,275 | |
| | 4,864,921 | | | | 9,735,758 | | | | 1,387,227 | | | | 1,284,209 | | | | 105,950 | | | | 194,863 | |
| | (17,705,314 | ) | | | (36,347,934 | ) | | | (128,046,693 | ) | | | (245,529,644 | ) | | | (763,821 | ) | | | (1,541,669 | ) |
| | (6,504,219 | ) | | | (12,162,709 | ) | | | 23,890,624 | | | | 26,615,580 | | | | (423,338 | ) | | | (144,531 | ) |
| | | | | | | | | | | | | | | | | | | | | | | |
| | | | | | | | | | | | | | | | | | | | | | | |
| | 36,251 | | | | 51,091 | | | | 110,338 | | | | 85,114 | | | | N/A | | | | N/A | |
| | 12,177 | | | | 27,480 | | | | 712 | | | | 163 | | | | N/A | | | | N/A | |
| | (154,982 | ) | | | (279,926 | ) | | | (57,996 | ) | | | (144,650 | ) | | | N/A | | | | N/A | |
| | (106,554 | ) | | | (201,355 | ) | | | 53,054 | | | | (59,373 | ) | | | N/A | | | | N/A | |
| | | | | | | | | | | | | | | | | | | | | | | |
| | | | | | | | | | | | | | | | | | | | | | | |
| | 3,862,486 | | | | 16,125,451 | | | | N/A | | | | N/A | | | | 1,118,993 | | | | 4,081,994 | |
| | 871,981 | | | | 1,833,501 | | | | N/A | | | | N/A | | | | 188,480 | | | | 212,335 | |
| | (4,399,413 | ) | | | (14,292,625 | ) | | | N/A | | | | N/A | | | | (841,840 | ) | | | (1,560,329 | ) |
| | 335,054 | | | | 3,666,327 | | | | N/A | | | | N/A | | | | 465,633 | | | | 2,734,000 | |
| | | | | | | | | | | | | | | | | | | | | | | |
| | | | | | | | | | | | | | | | | | | | | | | |
| | 3,891,252 | | | | 4,841,690 | | | | — | | | | 1,640,026 | | | | 1,127,981 | | | | 629,288 | |
| | 32,404 | | | | 130,520 | | | | 9 | | | | 20,317 | | | | 948 | | | | 2,165 | |
| | (2,573,239 | ) | | | (22,365,155 | ) | | | — | | | | (4,053,823 | ) | | | (92,158 | ) | | | (428,971 | ) |
| | 1,350,417 | | | | (17,392,945 | ) | | | 9 | | | | (2,393,480 | ) | | | 1,036,771 | | | | 202,482 | |
203
Statements of Changes in Net Assets
FIRST INVESTORS INCOME FUNDS
| | | | INVESTMENT
GRADE | | |
| | | 10/1/2018 to
3/31/2019 | | | 10/1/2017 to
9/30/2018 | | |
Increase (Decrease) in Net Assets From Operations | | | | | | | | | | |
Net investment income | | | $ | 9,205,486 | | | $ | 17,925,632 | | |
Net realized loss on investments | | | | (383,084 | ) | | | (1,645,013 | ) | |
Net unrealized appreciation (depreciation) of investments | | | | 18,337,977 | | | | (26,239,627 | ) | |
Net unrealized appreciation (depreciation) of affiliate (Note 2) | | | | — | | | | — | | |
Net increase (decrease) in net assets resulting from operations | | | | 27,160,379 | | | | (9,959,008 | ) | |
| | | | | | | | | | | |
Distribution to Shareholders1 | | | | | | | | | | |
Class A | | | | (6,874,122 | ) | | | (15,179,813 | ) | |
Class B | | | | (19,284 | ) | | | (45,111 | ) | |
Advisor Class | | | | (3,625,679 | ) | | | (5,965,579 | ) | |
Institutional Class | | | | (402,924 | ) | | | (970,661 | ) | |
Total distributions | | | | (10,922,009 | ) | | | (22,161,164 | ) | |
| | | | | | | | | | | |
Share Transactions | | | | | | | | | | |
Class A: | | | | | | | | | | |
Proceeds from shares sold | | | | 15,995,899 | | | | 42,681,411 | | |
Reinvestment of distributions | | | | 6,489,559 | | | | 14,260,185 | | |
Cost of shares redeemed | | | | (45,570,116 | ) | | | (96,469,770 | ) | |
Shares issued from merger | | | | — | | | | — | | |
| | | | | (23,084,658 | ) | | | (39,528,174 | ) | |
Class B: | | | | | | | | | | |
Proceeds from shares sold | | | | 70,099 | | | | 188,297 | | |
Reinvestment of distributions | | | | 19,174 | | | | 44,209 | | |
Cost of shares redeemed | | | | (159,308 | ) | | | (847,464 | ) | |
Shares issued from merger | | | | — | | | | — | | |
| | | | | (70,035 | ) | | | (614,958 | ) | |
Advisor Class: | | | | | | | | | | |
Proceeds from shares sold | | | | 22,502,857 | | | | 67,872,202 | | |
Reinvestment of distributions | | | | 3,605,944 | | | | 5,728,814 | | |
Cost of shares redeemed | | | | (14,759,497 | ) | | | (21,719,878 | ) | |
Shares issued from merger | | | | — | | | | — | | |
| | | | | 11,349,304 | | | | 51,881,138 | | |
Institutional Class | | | | | | | | | | |
Proceeds from shares sold | | | | 257,882 | | | | 4,522,217 | | |
Reinvestment of distributions | | | | 28,013 | | | | 69,351 | | |
Cost of shares redeemed | | | | (4,445,215 | ) | | | (5,422,878 | ) | |
Shares issued from merger | | | | — | | | | — | | |
| | | | | (4,159,320 | ) | | | (831,310 | ) | |
Net increase (decrease) from share transactions | | | | (15,964,709 | ) | | | 10,906,696 | | |
Net increase (decrease) in net assets | | | | 273,661 | | | | (21,213,476 | ) | |
Net Assets | | | | | | | | | | |
Beginning of period | | | | 606,408,343 | | | | 627,621,819 | | |
End of period2 | | | $ | 606,682,004 | | | $ | 606,408,343 | | |
1 | The SEC eliminated the requirement to disclose components of distributions paid to shareholders in September 2018. The distributions for the year ended September 30, 2018 were all from net investment income. |
2 | The SEC eliminated the requirement to disclose undistributed net investment income in September 2018. For the year ended September 30, 2018, net assets included undistributed net investment income (deficit) of $(11,310,857), $(2,914,002) and $69,208, respectively on the Investment Grade, Limited Duration Bond and Strategic Income Funds. |
See notes to financial statements
204
LIMITED
DURATION
BOND | | | STRATEGIC
INCOME | |
10/1/2018 to
3/31/2019 | | | 10/1/2017 to
9/30/2018 | | | 10/1/2018 to
3/31/2019 | | | 10/1/2017 to
9/30/2018 | |
| | | | | | | | | | | | | | | |
| $ | 3,766,413 | | | $ | 275,664 | | | $ | 2,531,427 | | | $ | 5,380,029 | |
| | (869,237 | ) | | | (397,136 | ) | | | (964,666 | ) | | | (1,108,887 | ) |
| | 4,077,109 | | | | (185,198 | ) | | | 155,962 | | | | (85,116 | ) |
| | — | | | | — | | | | 654,613 | | | | (4,391,296 | ) |
| | 6,974,285 | | | | (306,670 | ) | | | 2,377,336 | | | | (205,270 | ) |
| | | | | | | | | | | | | | | |
| | | | | | | | | | | | | | | |
| | (3,449,479 | ) | | | (1,772,750 | ) | | | (2,585,469 | ) | | | (5,462,343 | ) |
| | N/A | | | | N/A | | | | N/A | | | | N/A | |
| | (659,369 | ) | | | (1,003,221 | ) | | | (15,328 | ) | | | (29,421 | ) |
| | (536,090 | ) | | | (1,078,886 | ) | | | N/A | | | | N/A | |
| | (4,644,938 | ) | | | (3,854,857 | ) | | | (2,600,797 | ) | | | (5,491,764 | ) |
| | | | | | | | | | | | | | | |
| | | | | | | | | | | | | | | |
| | | | | | | | | | | | | | | |
| | 21,042,519 | | | | 20,386,749 | | | | 8,882,518 | | | | 25,716,213 | |
| | 3,310,901 | | | | 1,726,388 | | | | 2,473,468 | | | | 5,225,611 | |
| | (32,257,603 | ) | | | (21,855,129 | ) | | | (15,811,160 | ) | | | (35,879,785 | ) |
| | — | | | | 186,810,690 | | | | — | | | | — | |
| | (7,904,183 | ) | | | 187,068,698 | | | | (4,455,174 | ) | | | (4,937,961 | ) |
| | | | | | | | | | | | | | | |
| | N/A | | | | N/A | | | | N/A | | | | N/A | |
| | N/A | | | | N/A | | | | N/A | | | | N/A | |
| | N/A | | | | N/A | | | | N/A | | | | N/A | |
| | N/A | | | | N/A | | | | N/A | | | | N/A | |
| | N/A | | | | N/A | | | | N/A | | | | N/A | |
| | | | | | | | | | | | | | | |
| | 22,681,961 | | | | 10,192,449 | | | | 205,797 | | | | 276,262 | |
| | 654,976 | | | | 971,339 | | | | 15,115 | | | | 28,321 | |
| | (10,225,512 | ) | | | (6,712,312 | ) | | | (150,272 | ) | | | (482,278 | ) |
| | — | | | | 485,702 | | | | — | | | | — | |
| | 13,111,425 | | | | 4,937,178 | | | | 70,640 | | | | (177,695 | ) |
| | | | | | | | | | | | | | | |
| | 14,982,221 | | | | 18,363,649 | | | | N/A | | | | N/A | |
| | 10,996 | | | | 6,137 | | | | N/A | | | | N/A | |
| | (16,437,236 | ) | | | (19,537,354 | ) | | | N/A | | | | N/A | |
| | — | | | | 1,024 | | | | N/A | | | | N/A | |
| | (1,444,019 | ) | | | (1,166,544 | ) | | | N/A | | | | N/A | |
| | 3,763,223 | | | | 190,839,332 | | | | (4,384,534 | ) | | | (5,115,656 | ) |
| | 6,092,570 | | | | 186,677,805 | | | | (4,607,995 | ) | | | (10,812,690 | ) |
| | | | | | | | | | | | | | | |
| | 322,221,978 | | | | 135,544,173 | | | | 152,939,302 | | | | 163,751,992 | |
| $ | 328,314,548 | | | $ | 322,221,978 | | | $ | 148,331,307 | | | $ | 152,939,302 | |
205
Statements of Changes in Net Assets
FIRST INVESTORS INCOME FUNDS
| | | | INVESTMENT
GRADE | | |
| | | 10/1/2018 to
3/31/2019 | | | 10/1/2017 to
9/30/2018 | | |
Shares Issued and Redeemed | | | | | | | | | | |
Class A: | | | | | | | | | | |
Sold | | | | 1,744,099 | | | | 4,532,773 | | |
Issued for distributions reinvested | | | | 707,832 | | | | 1,521,041 | | |
Redeemed | | | | (4,986,529 | ) | | | (10,297,688 | ) | |
Shares issued from merger | | | | — | | | | — | | |
Net increase (decrease) in Class A shares outstanding | | | | (2,534,598 | ) | | | (4,243,874 | ) | |
| | | | | | | | | | | |
Class B: | | | | | | | | | | |
Sold | | | | 7,696 | | | | 19,966 | | |
Issued for distributions reinvested | | | | 2,102 | | | | 4,735 | | |
Redeemed | | | | (17,501 | ) | | | (90,020 | ) | |
Shares issued from merger | | | | — | | | | — | | |
Net decrease in Class B shares outstanding | | | | (7,703 | ) | | | (65,319 | ) | |
| | | | | | | | | | | |
Advisor Class: | | | | | | | | | | |
Sold | | | | 2,447,084 | | | | 7,214,671 | | |
Issued for distributions reinvested | | | | 390,878 | | | | 609,298 | | |
Redeemed | | | | (1,603,771 | ) | | | (2,317,779 | ) | |
Shares issued from merger | | | | — | | | | — | | |
Net increase (decrease) in Advisor Class shares outstanding | | | | 1,234,191 | | | | 5,506,190 | | |
| | | | | | | | | | | |
Institutional Class: | | | | | | | | | | |
Sold | | | | 27,806 | | | | 469,939 | | |
Issued for distributions reinvested | | | | 3,047 | | | | 7,379 | | |
Redeemed | | | | (486,942 | ) | | | (568,845 | ) | |
Shares issued from merger | | | | — | | | | — | | |
Net decrease in Institutional Class shares outstanding | | | | (456,089 | ) | | | (91,527 | ) | |
See notes to financial statements
206
LIMITED
DURATION
BOND | | | STRATEGIC
INCOME | |
10/1/2018 to
3/31/2019 | | | 10/1/2017 to
9/30/2018 | | | 10/1/2018 to
3/31/2019 | | | 10/1/2017 to
9/30/2018 | |
| | | | | | | | | | | | | | | |
| | | | | | | | | | | | | | | |
| | 2,295,984 | | | | 2,201,214 | | | | 974,000 | | | | 2,751,301 | |
| | 361,004 | | | | 186,493 | | | | 271,784 | | | | 559,375 | |
| | (3,520,622 | ) | | | (2,359,440 | ) | | | (1,735,064 | ) | | | (3,850,452 | ) |
| | — | | | | 20,370,413 | | | | — | | | | — | |
| | (863,634 | ) | | | 20,398,680 | | | | (489,280 | ) | | | (539,776 | ) |
| | | | | | | | | | | | | | | |
| | | | | | | | | | | | | | | |
| | N/A | | | | N/A | | | | N/A | | | | N/A | |
| | N/A | | | | N/A | | | | N/A | | | | N/A | |
| | N/A | | | | N/A | | | | N/A | | | | N/A | |
| | N/A | | | | N/A | | | | N/A | | | | N/A | |
| | N/A | | | | N/A | | | | N/A | | | | N/A | |
| | | | | | | | | | | | | | | |
| | | | | | | | | | | | | | | |
| | 2,470,109 | | | | 1,094,702 | | | | 22,685 | | | | 29,671 | |
| | 71,183 | | | | 104,635 | | | | 1,663 | | | | 3,038 | |
| | (1,107,831 | ) | | | (722,594 | ) | | | (16,485 | ) | | | (51,305 | ) |
| | — | | | | 52,807 | | | | — | | | | — | |
| | 1,433,461 | | | | 529,550 | | | | 7,863 | | | | (18,596 | ) |
| | | | | | | | | | | | | | | |
| | | | | | | | | | | | | | | |
| | 1,625,500 | | | | 1,982,606 | | | | N/A | | | | N/A | |
| | 1,193 | | | | 660 | | | | N/A | | | | N/A | |
| | (1,792,456 | ) | | | (2,084,636 | ) | | | N/A | | | | N/A | |
| | — | | | | 111 | | | | N/A | | | | N/A | |
| | (165,763 | ) | | | (101,259 | ) | | | N/A | | | | N/A | |
207
Statements of Changes in Net Assets
FIRST INVESTORS EQUITY FUNDS
| | | | COVERED
CALL
STRATEGY | | |
| | | 10/1/2018 to
3/31/2019 | | | 10/1/2017 to
9/30/2018 | | |
Increase (Decrease) in Net Assets From Operations | | | | | | | | | | |
Net investment income (loss) | | | $ | 2,177,352 | | | $ | 3,655,040 | | |
Net realized gain (loss) on investments, options contracts and foreign exchange contracts | | | | (8,529,639 | ) | | | (11,113,260 | ) | |
Net unrealized appreciation (depreciation) of investments, options contracts, and foreign exchange contracts | | | | (9,158,071 | ) | | | 28,590,946 | | |
Net increase (decrease) in net assets resulting from operations | | | | (15,510,358 | ) | | | 21,132,726 | | |
| | | | | | | | | | | |
Distributions to Shareholders1 | | | | | | | | | | |
Class A | | | | (1,449,154 | ) | | | | | |
Class B | | | | N/A | | | | | | |
Advisor Class | | | | (698,803 | ) | | | | | |
Institutional Class | | | | (19,955 | ) | | | | | |
Total distributions | | | | (2,167,912 | ) | | | | | |
| | | | | | | | | | | |
Net investment income-Class A | | | | | | | | (1,952,791 | ) | |
Net investment income-Class B | | | | | | | | N/A | | |
Net investment income-Advisor Class | | | | | | | | (1,622,620 | ) | |
Net investment income-Institutional Class | | | | | | | | (70,317 | ) | |
Net realized gains-Class A | | | | | | | | — | | |
Net realized gains-Class B | | | | | | | | N/A | | |
Net realized gains-Advisor Class | | | | | | | | — | | |
Net realized gains-Institutional Class | | | | | | | | — | | |
Total distributions | | | | | | | | (3,645,728 | ) | |
| | | | | | | | | | | |
Share Transactions | | | | | | | | | | |
Class A: | | | | | | | | | | |
Proceeds from shares sold | | | | 26,178,817 | | | | 94,094,747 | | |
Reinvestment of distributions | | | | 1,423,939 | | | | 1,920,181 | | |
Cost of shares redeemed | | | | (25,098,929 | ) | | | (37,816,465 | ) | |
| | | | | 2,503,827 | | | | 58,198,463 | | |
Class B: | | | | | | | | | | |
Proceeds from shares sold | | | | N/A | | | | N/A | | �� |
Reinvestment of distributions | | | | N/A | | | | N/A | | |
Cost of shares redeemed | | | | N/A | | | | N/A | | |
| | | | | N/A | | | | N/A | | |
Advisor Class | | | | | | | | | | |
Proceeds from shares sold | | | | 13,233,399 | | | | 78,790,539 | | |
Reinvestment of distributions | | | | 646,427 | | | | 1,471,618 | | |
Cost of shares redeemed | | | | (35,539,482 | ) | | | (80,989,357 | ) | |
| | | | | (21,659,656 | ) | | | (727,200 | ) | |
Institutional Class | | | | | | | | | | |
Proceeds from shares sold | | | | 209,520 | | | | 4,814,072 | | |
Reinvestment of distributions | | | | 19,955 | | | | 53,560 | | |
Cost of shares redeemed | | | | (701,657 | ) | | | (9,324,730 | ) | |
| | | | | (472,182 | ) | | | (4,457,098 | ) | |
Net increase (decrease) from share transactions | | | | (19,628,011 | ) | | | 53,014,165 | | |
Net increase (decrease) in net assets | | | | (37,306,281 | ) | | | 70,501,163 | | |
1 | The SEC eliminated the requirement to disclose components of distributions paid to shareholders in September 2018. |
See notes to financial statements
208
EQUITY
INCOME | | | GLOBAL | | | GROWTH &
INCOME | |
10/1/2018 to
3/31/2019 | | | 10/1/2017 to
9/30/2018 | | | 10/1/2018 to
3/31/2019 | | | 10/1/2017 to
9/30/2018 | | | 10/1/2018 to
3/31/2019 | | | 10/1/2017 to
9/30/2018 | |
| | | | | | | | | | | | | | | | | | | | | | | |
| $ | 5,050,170 | | | $ | 15,912,426 | | | $ | 1,155,648 | | | $ | (95,148 | ) | | $ | 11,535,268 | | | $ | 20,857,373 | |
| | 9,900,424 | | | | 66,166,488 | | | | (23,774,443 | ) | | | 76,449,694 | | | | 110,383,267 | | | | 251,442,108 | |
| | (37,196,559 | ) | | | (28,255,152 | ) | | | (14,519,123 | ) | | | (14,156,614 | ) | | | (201,063,507 | ) | | | (88,486,835 | ) |
| | (22,245,965 | ) | | | 53,823,762 | | | | (37,137,918 | ) | | | 62,197,932 | | | | (79,144,972 | ) | | | 183,812,646 | |
| | | | | | | | | | | | | | | | | | | | | | | |
| | | | | | | | | | | | | | | | | | | | | | | |
| | (63,317,824 | ) | | | | | | | (43,940,031 | ) | | | | | | | (274,996,276 | ) | | | | |
| | (286,459 | ) | | | | | | | (324,786 | ) | | | | | | | (2,023,413 | ) | | | | |
| | (9,709,769 | ) | | | | | | | (25,969,559 | ) | | | | | | | (24,895,218 | ) | | | | |
| | (267,270 | ) | | | | | | | (407,474 | ) | | | | | | | (1,612,965 | ) | | | | |
| | (73,581,322 | ) | | | | | | | (70,641,850 | ) | | | | | | | (303,527,872 | ) | | | | |
| | | | | | | | | | | | | | | | | | | | | | | |
| | | | | | (8,670,001 | ) | | | | | | | (1,904,849 | ) | | | | | | | (22,103,552 | ) |
| | | | | | (25,598 | ) | | | | | | | (11,555 | ) | | | | | | | (49,489 | ) |
| | | | | | (1,505,409 | ) | | | | | | | (1,156,269 | ) | | | | | | | (2,741,388 | ) |
| | | | | | (45,395 | ) | | | | | | | (22,952 | ) | | | | | | | (192,263 | ) |
| | | | | | (18,700,796 | ) | | | | | | | (27,517,933 | ) | | | | | | | (66,425,749 | ) |
| | | | | | (94,816 | ) | | | | | | | (225,878 | ) | | | | | | | (577,823 | ) |
| | | | | | (2,533,033 | ) | | | | | | | (14,205,335 | ) | | | | | | | (6,908,711 | ) |
| | | | | | (76,275 | ) | | | | | | | (273,391 | ) | | | | | | | (435,766 | ) |
| | | | | | (31,651,323 | ) | | | | | | | (45,318,162 | ) | | | | | | | (99,434,741 | ) |
| | | | | | | | | | | | | | | | | | | | | | | |
| | | | | | | | | | | | | | | | | | | | | | | |
| | | | | | | | | | | | | | | | | | | | | | | |
| | 19,796,139 | | | | 44,822,381 | | | | 13,619,872 | | | | 34,440,747 | | | | 46,069,231 | | | | 105,256,985 | |
| | 62,318,866 | | | | 27,012,430 | | | | 43,193,288 | | | | 29,037,446 | | | | 272,345,251 | | | | 87,791,227 | |
| | (46,311,359 | ) | | | (110,386,174 | ) | | | (26,346,584 | ) | | | (59,239,612 | ) | | | (118,778,681 | ) | | | (292,506,030 | ) |
| | 35,803,646 | | | | (38,551,363 | ) | | | 30,466,576 | | | | 4,238,581 | | | | 199,635,801 | | | | (99,457,818 | ) |
| | | | | | | | | | | | | | | | | | | | | | | |
| | 48,597 | | | | 201,399 | | | | 60,755 | | | | 219,425 | | | | 291,879 | | | | 1,021,175 | |
| | 286,459 | | | | 120,221 | | | | 324,786 | | | | 237,434 | | | | 2,019,655 | | | | 624,919 | |
| | (309,626 | ) | | | (855,935 | ) | | | (280,981 | ) | | | (785,500 | ) | | | (1,746,295 | ) | | | (4,493,704 | ) |
| | 25,430 | | | | (534,315 | ) | | | 104,560 | | | | (328,641 | ) | | | 565,239 | | | | (2,847,610 | ) |
| | | | | | | | | | | | | | | | | | | | | | | |
| | 8,048,457 | | | | 28,883,060 | | | | 27,085,495 | | | | 71,565,214 | | | | 18,336,101 | | | | 52,008,514 | |
| | 9,641,282 | | | | 3,361,847 | | | | 25,895,633 | | | | 14,647,751 | | | | 24,719,202 | | | | 9,135,941 | |
| | (7,215,583 | ) | | | (26,068,634 | ) | | | (14,812,741 | ) | | | (56,286,039 | ) | | | (11,026,507 | ) | | | (91,647,543 | ) |
| | 10,474,156 | | | | 6,176,273 | | | | 38,168,387 | | | | 29,926,926 | | | | 32,028,796 | | | | (30,503,088 | ) |
| | | | | | | | | | | | | | | | | | | | | | | |
| | 1,683,394 | | | | 1,347,183 | | | | 237,330 | | | | 572,083 | | | | 405,821 | | | | 887,827 | |
| | 267,270 | | | | 121,670 | | | | 407,474 | | | | 296,343 | | | | 1,612,965 | | | | 628,029 | |
| | (2,113,194 | ) | | | (1,209,375 | ) | | | (1,126,714 | ) | | | (383,485 | ) | | | (2,630,508 | ) | | | (1,802,340 | ) |
| | (162,530 | ) | | | 259,478 | | | | (481,910 | ) | | | 484,941 | | | | (611,722 | ) | | | (286,484 | ) |
| | 46,140,702 | | | | (32,649,927 | ) | | | 68,257,613 | | | | 34,321,807 | | | | 231,618,114 | | | | (133,095,000 | ) |
| | (49,686,585 | ) | | | (10,477,488 | ) | | | (39,522,155 | ) | | | 51,201,577 | | | | (151,054,730 | ) | | | (48,717,095 | ) |
209
Statements of Changes in Net Assets
FIRST INVESTORS EQUITY FUNDS
| | | | COVERED
CALL
STRATEGY |
| | | 10/1/2018 to
3/31/2019 | | | 10/1/2017 to
9/30/2018 | |
Net Assets | | | | | | | | | |
Beginning of period | | | $ | 354,291,070 | | | $ | 283,789,907 | |
End of period2 | | | $ | 316,984,789 | | | $ | 354,291,070 | |
| | | | | | | | | | |
Shares Issued and Redeemed | | | | | | | | | |
Class A: | | | | | | | | | |
Sold | | | | 2,392,920 | | | | 8,228,315 | |
Issued for distributions reinvested | | | | 134,641 | | | | 168,270 | |
Redeemed | | | | (2,276,013 | ) | | | (3,301,288 | ) |
Net increase (decrease) in Class A shares outstanding | | | | 251,548 | | | | 5,095,297 | |
| | | | | | | | | | |
Class B: | | | | | | | | | |
Sold | | | | N/A | | | | N/A | |
Issued for distributions reinvested | | | | N/A | | | | N/A | |
Redeemed | | | | N/A | | | | N/A | |
Net increase (decrease) in Class B shares outstanding | | | | N/A | | | | N/A | |
| | | | | | | | | | |
Advisor Class | | | | | | | | | |
Sold | | | | 1,197,867 | | | | 6,898,774 | |
Issued for distributions reinvested | | | | 61,863 | | | | 129,933 | |
Redeemed | | | | (3,303,773 | ) | | | (7,147,405 | ) |
Net increase (decrease) in Advisor Class shares outstanding | | | | (2,044,043 | ) | | | (118,698 | ) |
| | | | | | | | | | |
Institutional Class: | | | | | | | | | |
Sold | | | | 19,510 | | | | 414,848 | |
Issued for distributions reinvested | | | | 1,903 | | | | 4,796 | |
Redeemed | | | | (63,175 | ) | | | (827,929 | ) |
Net increase (decrease) in Institutional Class shares outstanding | | | | (41,762 | ) | | | (408,285 | ) |
| | | | | | | | | | |
| | | | | | | $ | 41,035 | |
| 2 | For the year ended September 30, 2018 net assets includes undistributed net investment income (deficit) of |
See notes to financial statements
210
EQUITY
INCOME | | GLOBAL | | | GROWTH &
INCOME |
10/1/2018 to
3/31/2019 | | | 10/1/2017 to
9/30/2018 | | | 10/1/2018 to
3/31/2019 | | | 10/1/2017 to
9/30/2018 | | | 10/1/2018 to
3/31/2019 | | | 10/1/2017 to
9/30/2018 | |
| | | | | | | | | | | | | | | | | | | | | | | |
| $ | 631,257,305 | | | $ | 641,734,793 | | | $ | 628,658,668 | | | $ | 577,457,091 | | | $ | 1,818,873,466 | | | $ | 1,867,590,561 | |
| $ | 581,570,720 | | | $ | 631,257,305 | | | $ | 589,136,513 | | | $ | 628,658,668 | | | $ | 1,667,818,736 | | | $ | 1,818,873,466 | |
| | | | | | | | | | | | | | | | | | | | | | | |
| | | | | | | | | | | | | | | | | | | | | | | |
| | | | | | | | | | | | | | | | | | | | | | | |
| | 2,042,633 | | | | 4,119,724 | | | | 1,836,869 | | | | 3,964,795 | | | | 2,266,445 | | | | 4,423,019 | |
| | 7,341,000 | | | | 2,490,655 | | | | 6,812,821 | | | | 3,469,229 | | | | 16,069,200 | | | | 3,692,262 | |
| | (4,770,095 | ) | | | (10,148,853 | ) | | | (3,584,433 | ) | | | (6,828,948 | ) | | | (5,827,662 | ) | | | (12,290,013 | ) |
| | 4,613,538 | | | | (3,538,474 | ) | | | 5,065,257 | | | | 605,076 | | | | 12,507,983 | | | | (4,174,732 | ) |
| | | | | | | | | | | | | | | | | | | | | | | |
| | | | | | | | | | | | | | | | | | | | | | | |
| | 4,958 | | | | 18,977 | | | | 10,581 | | | | 32,543 | | | | 15,303 | | | | 46,327 | |
| | 34,734 | | | | 11,300 | | | | 69,696 | | | | 36,528 | | | | 131,251 | | | | 28,301 | |
| | (32,897 | ) | | | (80,753 | ) | | | (50,269 | ) | | | (116,586 | ) | | | (92,192 | ) | | | (204,976 | ) |
| | 6,795 | | | | (50,476 | ) | | | 30,008 | | | | (47,515 | ) | | | 54,362 | | | | (130,348 | ) |
| | | | | | | | | | | | | | | | | | | | | | | |
| | | | | | | | | | | | | | | | | | | | | | | |
| | 823,230 | | | | 2,642,494 | | | | 3,577,930 | | | | 8,059,994 | | | | 901,144 | | | | 2,169,824 | |
| | 1,127,144 | | | | 308,539 | | | | 3,965,641 | | | | 1,711,186 | | | | 1,445,855 | | | | 381,959 | |
| | (742,713 | ) | | | (2,396,645 | ) | | | (1,942,629 | ) | | | (6,358,513 | ) | | | (537,113 | ) | | | (3,879,094 | ) |
| | 1,207,661 | | | | 554,388 | | | | 5,600,942 | | | | 3,412,667 | | | | 1,809,886 | | | | (1,327,311 | ) |
| | | | | | | | | | | | | | | | | | | | | | | |
| | | | | | | | | | | | | | | | | | | | | | | |
| | 160,024 | | | | 123,985 | | | | 31,018 | | | | 64,095 | | | | 20,305 | | | | 37,066 | |
| | 31,512 | | | | 11,208 | | | | 61,926 | | | | 34,458 | | | | 94,674 | | | | 26,328 | |
| | (200,419 | ) | | | (114,962 | ) | | | (137,476 | ) | | | (42,873 | ) | | | (119,864 | ) | | | (75,271 | ) |
| | (8,883 | ) | | | 20,231 | | | | (44,532 | ) | | | 55,680 | | | | (4,885 | ) | | | (11,877 | ) |
| | | | | $ | 5,666,088 | | | | | | | $ | (426,580 | ) | | | | | | $ | 147,252 | |
211
Statements of Changes in Net Assets
FIRST INVESTORS EQUITY FUNDS
| | | | HEDGED
U.S. EQUITY
OPPORTUNITIES | | |
| | | 10/1/2018 to
3/31/2019 | | | 10/1/2017 to
9/30/2018 | | |
Increase (Decrease) in Net Assets From Operations | | | | | | | | | | |
Net investment income (loss) | | | $ | 189,783 | | | $ | (23,541 | ) | |
Net realized gain (loss) on investments, options and futures contracts, and foreign exchange contracts | | | | 1,471,211 | | | | 1,451,960 | | |
Net unrealized appreciation (depreciation) of investments, options and futures contracts, and foreign exchange contracts | | | | (727,573 | ) | | | 11,112,390 | | |
Net increase (decrease) in net assets resulting from operations | | | | 933,421 | | | | 12,540,809 | | |
| | | | | | | | | | | |
Distributions to Shareholders1 | | | | | | | | | | |
Class A | | | | (1,268,295 | ) | | | | | |
Class B | | | | N/A | | | | | | |
Advisor Class | | | | (1,748,223 | ) | | | | | |
Institutional Class | | | | (9,534 | ) | | | | | |
| | | | | (3,026,052 | ) | | | | | |
| | | | | | | | | | | |
Net investment income-Class A | | | | | | | | — | | |
Net investment income-Class B | | | | | | | | N/A | | |
Net investment income-Advisor Class | | | | | | | | — | | |
Net investment income-Institutional Class | | | | | | | | — | | |
Net realized gains-Class A | | | | | | | | — | | |
Net realized gains-Class B | | | | | | | | N/A | | |
Net realized gains-Advisor Class | | | | | | | | — | | |
Net realized gains-Institutional Class | | | | | | | | — | | |
Total distributions | | | | | | | | — | | |
| | | | | | | | | | | |
Share Transactions | | | | | | | | | | |
Class A: | | | | | | | | | | |
Proceeds from shares sold | | | | 14,974,580 | | | | 29,210,518 | | |
Reinvestment of distributions | | | | 1,255,236 | | | | — | | |
Cost of shares redeemed | | | | (5,696,021 | ) | | | (12,110,889 | ) | |
| | | | | 10,533,795 | | | | 17,099,629 | | |
Class B: | | | | | | | | | | |
Proceeds from shares sold | | | | N/A | | | | N/A | | |
Reinvestment of distributions | | | | N/A | | | | N/A | | |
Cost of shares redeemed | | | | N/A | | | | N/A | | |
| | | | | N/A | | | | N/A | | |
Advisor Class: | | | | | | | | | | |
Proceeds from shares sold | | | | 19,017,690 | | | | 76,712,079 | | |
Reinvestment of distributions | | | | 1,740,439 | | | | — | | |
Cost of shares redeemed | | | | (9,482,568 | ) | | | (22,597,701 | ) | |
| | | | | 11,275,561 | | | | 54,114,378 | | |
Institutional Class | | | | | | | | | | |
Proceeds from shares sold | | | | 118,895 | | | | 276,139 | | |
Reinvestment of distributions | | | | 9,534 | | | | — | | |
Cost of shares redeemed | | | | (144,105 | ) | | | (226,176 | ) | |
| | | | | (15,676 | ) | | | 49,963 | | |
Net increase from share transactions | | | | 21,793,680 | | | | 71,263,970 | | |
Net increase (decrease) in net assets | | | | 19,701,049 | | | | 83,804,779 | | |
1 | The SEC eliminated the requirement to disclose components of distributions paid to shareholders in September 2018. |
See notes to financial statements
212
INTERNATIONAL | | | OPPORTUNITY | | | PREMIUM
INCOME | |
10/1/2018 to
3/31/2019 | | | 10/1/2017 to
9/30/2018 | | | 10/1/2018 to
3/31/2019 | | | 10/1/2017 to
9/30/2018 | | | 10/1/2018 to
3/31/2019 | | | 10/1/2017 to
9/30/2018 | |
| | | | | | | | | | | | | | | | | | | | | | | |
| $ | (338,733 | ) | | $ | 846,265 | | | $ | 1,664,011 | | | $ | 11,171,649 | | | $ | 980,279 | | | $ | 366,478 | |
| | (4,145,655 | ) | | | 28,737,160 | | | | 51,403,182 | | | | 75,396,234 | | | | 1,697,848 | | | | (375,632 | ) |
| | 4,673,218 | | | | (23,085,239 | ) | | | (100,053,375 | ) | | | (14,746,162 | ) | | | (1,090,889 | ) | | | 1,138,583 | |
| | 188,830 | | | | 6,498,186 | | | | (46,986,182 | ) | | | 71,821,721 | | | | 1,587,238 | | | | 1,129,429 | |
| | | | | | | | | | | | | | | | | | | | | | | |
| | | | | | | | | | | | | | | | | | | | | | | |
| | (16,053,838 | ) | | | | | | | (89,968,893 | ) | | | | | | | (990,646 | ) | | | | |
| | (72,818 | ) | | | | | | | (687,500 | ) | | | | | | | N/A | | | | | |
| | (8,663,047 | ) | | | | | | | (13,689,378 | ) | | | | | | | (1,069,473 | ) | | | | |
| | (183,424 | ) | | | | | | | (437,317 | ) | | | | | | | (20,315 | ) | | | | |
| | (24,973,127 | ) | | | | | | | (104,783,088 | ) | | | | | | | (2,080,434 | ) | | | | |
| | | | | | | | | | | | | | | | | | | | | | | |
| | | | | | (275,588 | ) | | | | | | | (2,804,178 | ) | | | | | | | (148,277 | ) |
| | | | | | — | | | | | | | | (14,370 | ) | | | | | | | N/A | |
| | | | | | (239,073 | ) | | | | | | | (288,632 | ) | | | | | | | (114,909 | ) |
| | | | | | (7,737 | ) | | | | | | | (22,342 | ) | | | | | | | (84,004 | ) |
| | | | | | — | | | | | | | | (56,621,327 | ) | | | | | | | — | |
| | | | | | — | | | | | | | | (518,174 | ) | | | | | | | N/A | |
| | | | | | — | | | | | | | | (4,684,317 | ) | | | | | | | — | |
| | | | | | — | | | | | | | | (323,573 | ) | | | | | | | — | |
| | | | | | (522,398 | ) | | | | | | | (65,276,913 | ) | | | | | | | (347,190 | ) |
| | | | | | | | | | | | | | | | | | | | | | | |
| | | | | | | | | | | | | | | | | | | | | | | |
| | | | | | | | | | | | | | | | | | | | | | | |
| | 16,361,263 | | | | 58,126,902 | | | | 42,997,023 | | | | 103,692,905 | | | | 23,970,518 | | | | 44,677,901 | |
| | 15,918,971 | | | | 273,396 | | | | 89,198,488 | | | | 59,060,707 | | | | 965,695 | | | | 143,012 | |
| | (20,567,131 | ) | | | (41,313,524 | ) | | | (67,669,256 | ) | | | (160,025,421 | ) | | | (6,014,621 | ) | | | (3,460,167 | ) |
| | 11,713,103 | | | | 17,086,774 | | | | 64,526,255 | | | | 2,728,191 | | | | 18,921,592 | | | | 41,360,746 | |
| | | | | | | | | | | | | | | | | | | | | | | |
| | 34,642 | | | | 126,139 | | | | 188,588 | | | | 551,389 | | | | N/A | | | | N/A | |
| | 72,635 | | | | — | | | | 684,857 | | | | 530,291 | | | | N/A | | | | N/A | |
| | (168,050 | ) | | | (369,272 | ) | | | (829,091 | ) | | | (2,298,990 | ) | | | N/A | | | | N/A | |
| | (60,773 | ) | | | (243,133 | ) | | | 44,354 | | | | (1,217,310 | ) | | | N/A | | | | N/A | |
| | | | | | | | | | | | | | | | | | | | | | | |
| | 17,231,547 | | | | 52,322,028 | | | | 20,014,174 | | | | 80,413,897 | | | | 44,123,382 | | | | 35,759,296 | |
| | 8,630,971 | | | | 222,902 | | | | 13,608,679 | | | | 4,553,410 | | | | 1,017,805 | | | | 108,996 | |
| | (10,203,285 | ) | | | (29,315,834 | ) | | | (12,960,113 | ) | | | (18,910,762 | ) | | | (16,008,819 | ) | | | (1,946,404 | ) |
| | 15,659,233 | | | | 23,229,096 | | | | 20,662,740 | | | | 66,056,545 | | | | 29,132,368 | | | | 33,921,888 | |
| | | | | | | | | | | | | | | | | | | | | | | |
| | 228,243 | | | | 896,876 | | | | 429,999 | | | | 1,044,609 | | | | 27,464 | | | | 16,026,765 | |
| | 183,424 | | | | 7,737 | | | | 437,317 | | | | 345,915 | | | | 15,074 | | | | 20,648 | |
| | (931,064 | ) | | | (737,330 | ) | | | (1,409,499 | ) | | | (1,339,746 | ) | | | (3,607,206 | ) | | | (12,377,267 | ) |
| | (519,397 | ) | | | 167,283 | | | | (542,183 | ) | | | 50,778 | | | | (3,564,668 | ) | | | 3,670,146 | |
| | 26,792,166 | | | | 40,240,020 | | | | 84,691,166 | | | | 67,618,204 | | | | 44,489,292 | | | | 78,952,780 | |
| | 2,007,869 | | | | 46,215,808 | | | | (67,078,104 | ) | | | 74,163,012 | | | | 43,996,096 | | | | 79,735,019 | |
213
Statements of Changes in Net Assets
FIRST INVESTORS EQUITY FUNDS
| | | | HEDGED
U.S. EQUITY
OPPORTUNITIES |
| | | 10/1/2018 to
3/31/2019 | | | 10/1/2017 to
9/30/2018 | |
Net Assets | | | | | | | | | |
Beginning of period | | | $ | 162,274,535 | | | $ | 78,469,756 | |
End of period2 | | | $ | 181,975,584 | | | $ | 162,274,535 | |
| | | | | | | | | | |
Shares Issued and Redeemed | | | | | | | | | |
Class A: | | | | | | | | | |
Sold | | | | 1,328,743 | | | | 2,558,901 | |
Issued for distributions reinvested | | | | 119,206 | | | | — | |
Redeemed | | | | (504,625 | ) | | | (1,057,699 | ) |
Net increase in Class A shares outstanding | | | | 943,324 | | | | 1,501,202 | |
| | | | | | | | | | |
Class B: | | | | | | | | | |
Sold | | | | N/A | | | | N/A | |
Issued for distributions reinvested | | | | N/A | | | | N/A | |
Redeemed | | | | N/A | | | | N/A | |
Net increase (decrease) in Class B shares outstanding | | | | N/A | | | | N/A | |
| | | | | | | | | | |
Advisor Class: | | | | | | | | | |
Sold | | | | 1,676,530 | | | | 6,763,670 | |
Issued for distributions reinvested | | | | 164,038 | | | | — | |
Redeemed | | | | (835,167 | ) | | | (1,965,792 | ) |
Net increase in Advisor Class shares outstanding | | | | 1,005,401 | | | | 4,797,878 | |
| | | | | | | | | | |
Institutional Class: | | | | | | | | | |
Sold | | | | 10,331 | | | | 24,135 | |
Issued for distributions reinvested | | | | 896 | | | | — | |
Redeemed | | | | (12,487 | ) | | | (19,944 | ) |
Net increase (decrease) in Institutional Class shares outstanding | | | | (1,260 | ) | | | 4,191 | |
| | | | | | | | | | |
| 2For the year ended September 30, 2018 net assets includes undistributed net investment income (deficit) of | | | | | | | $ | (4,522 | ) |
See notes to financial statements
214
INTERNATIONAL | | OPPORTUNITY | | | PREMIUM
INCOME | |
10/1/2018 to
3/31/2019 | | | 10/1/2017 to
9/30/2018 | | | 10/1/2018 to
3/31/2019 | | | 10/1/2017 to
9/30/2018 | | | 10/1/2018 to
3/31/2019 | | | 10/1/2017 to
9/30/2018 | |
| | | | | | | | | | | | | | | | | | | | | | | |
| $ | 401,058,728 | | | $ | 354,842,920 | | | $ | 1,171,789,115 | | | $ | 1,097,626,103 | | | $ | 79,735,019 | | | $ | — | |
| $ | 403,066,597 | | | $ | 401,058,728 | | | $ | 1,104,711,011 | | | $ | 1,171,789,115 | | | $ | 123,731,115 | | | $ | 79,735,019 | |
| | | | | | | | | | | | | | | | | | | | | | | |
| | | | | | | | | | | | | | | | | | | | | | | |
| | | | | | | | | | | | | | | | | | | | | | | |
| | 1,127,378 | | | | 3,590,666 | | | | 1,185,069 | | | | 2,472,473 | | | | 2,382,224 | | | | 4,385,757 | |
| | 1,218,910 | | | | 16,773 | | | | 2,871,812 | | | | 1,413,612 | | | | 97,115 | | | | 14,023 | |
| | (1,426,051 | ) | | | (2,553,601 | ) | | | (1,862,615 | ) | | | (3,815,117 | ) | | | (595,054 | ) | | | (338,239 | ) |
| | 920,237 | | | | 1,053,838 | | | | 2,194,266 | | | | 70,968 | | | | 1,884,285 | | | | 4,061,541 | |
| | | | | | | | | | | | | | | | | | | | | | | |
| | | | | | | | | | | | | | | | | | | | | | | |
| | 2,681 | | | | 8,386 | | | | 6,885 | | | | 17,104 | | | | N/A | | | | N/A | |
| | 6,043 | | | | — | | | | 29,959 | | | | 16,499 | | | | N/A | | | | N/A | |
| | (12,385 | ) | | | (24,704 | ) | | | (30,111 | ) | | | (71,493 | ) | | | N/A | | | | N/A | |
| | (3,661 | ) | | | (16,318 | ) | | | 6,733 | | | | (37,890 | ) | | | N/A | | | | N/A | |
| | | | | | | | | | | | | | | | | | | | | | | |
| | | | | | | | | | | | | | | | | | | | | | | |
| | 1,169,800 | | | | 3,187,640 | | | | 540,599 | | | | 1,895,352 | | | | 4,386,476 | | | | 3,508,615 | |
| | 648,458 | | | | 13,468 | | | | 428,350 | | | | 107,063 | | | | 102,299 | | | | 10,710 | |
| | (690,648 | ) | | | (1,782,051 | ) | | | (351,122 | ) | | | (439,869 | ) | | | (1,603,200 | ) | | | (190,244 | ) |
| | 1,127,610 | | | | 1,419,057 | | | | 617,827 | | | | 1,562,546 | | | | 2,885,575 | | | | 3,329,081 | |
| | | | | | | | | | | | | | | | | | | | | | | |
| | | | | | | | | | | | | | | | | | | | | | | |
| | 15,574 | | | | 54,037 | | | | 11,641 | | | | 24,450 | | | | 2,832 | | | | 1,581,172 | |
| | 13,730 | | | | 466 | | | | 13,787 | | | | 8,149 | | | | 2,851 | | | | 2,046 | |
| | (61,304 | ) | | | (44,299 | ) | | | (35,565 | ) | | | (31,085 | ) | | | (380,178 | ) | | | (1,201,695 | ) |
| | (32,000 | ) | | | 10,204 | | | | (10,137 | ) | | | 1,514 | | | | (374,495 | ) | | | 381,523 | |
| | | | | $ | 619,607 | | | | | | | $ | 10,465,942 | | | | | | | $ | 19,288 | |
215
Statements of Changes in Net Assets
FIRST INVESTORS EQUITY FUNDS
| | | | SELECT
GROWTH | | |
| | | 10/1/2018 to
3/31/2019 | | | 10/1/2017 to
9/30/2018 | | |
Increase (Decrease) in Net Assets From Operations | | | | | | | | | | |
Net investment income | | | $ | 1,368,375 | | | $ | 150,706 | | |
Net realized gain on investments | | | | 37,500,198 | | | | 36,073,320 | | |
Net unrealized appreciation (depreciation) of investments | | | | (66,827,904 | ) | | | 98,924,921 | | |
Net increase (decrease) in net assets resulting from operations | | | | (27,959,331 | ) | | | 135,148,947 | | |
| | | | | | | | | | | |
Distributions to Shareholders1 | | | | | | | | | | |
Class A | | | | (26,782,811 | ) | | | | | |
Class B | | | | (154,240 | ) | | | | | |
Advisor Class | | | | (9,136,425 | ) | | | | | |
Institutional Class | | | | (308,565 | ) | | | | | |
| | | | | (36,382,041 | ) | | | | | |
| | | | | | | | | | | |
Net investment income-Class A | | | | | | | | (239,159 | ) | |
Net investment income-Class B | | | | | | | | — | | |
Net investment income-Advisor Class | | | | | | | | (130,189 | ) | |
Net investment income-Institutional Class | | | | | | | | (8,316 | ) | |
Net realized gains-Class A | | | | | | | | (39,548,693 | ) | |
Net realized gains-Class B | | | | | | | | (318,093 | ) | |
Net realized gains-Advisor Class | | | | | | | | (7,349,893 | ) | |
Net realized gains-Institutional Class | | | | | | | | (445,150 | ) | |
Total distributions | | | | | | | | (48,039,493 | ) | |
| | | | | | | | | | | |
Share Transactions | | | | | | | | | | |
Class A: | | | | | | | | | | |
Proceeds from shares sold | | | | 54,064,071 | | | | 104,868,480 | | |
Reinvestment of distributions | | | | 26,527,802 | | | | 39,481,516 | | |
Cost of shares redeemed | | | | (45,546,020 | ) | | | (83,751,760 | ) | |
Shares issued from merger | | | | — | | | | — | | |
| | | | | 35,045,853 | | | | 60,598,236 | | |
Class B: | | | | | | | | | | |
Proceeds from shares sold | | | | 131,861 | | | | 272,956 | | |
Reinvestment of distributions | | | | 150,066 | | | | 310,573 | | |
Cost of shares redeemed | | | | (448,937 | ) | | | (1,051,710 | ) | |
Shares issued from merger | | | | — | | | | — | | |
| | | | | (167,010 | ) | | | (468,181 | ) | |
Advisor Class: | | | | | | | | | | |
Proceeds from shares sold | | | | 30,611,786 | | | | 129,714,140 | | |
Reinvestment of distributions | | | | 9,075,112 | | | | 7,092,254 | | |
Cost of shares redeemed | | | | (15,973,905 | ) | | | (44,628,910 | ) | |
Shares issued from merger | | | | — | | | | — | | |
| | | | | 23,712,993 | | | | 92,177,484 | | |
Institutional Class | | | | | | | | | | |
Proceeds from shares sold | | | | 857,265 | | | | 2,115,173 | | |
Reinvestment of distributions | | | | 308,565 | | | | 453,466 | | |
Cost of shares redeemed | | | | (1,795,723 | ) | | | (538,910 | ) | |
Shares issued from merger | | | | — | | | | — | | |
| | | | | (629,893 | ) | | | 2,029,729 | | |
Net increase (decrease) from share transactions | | | | 57,961,943 | | | | 154,337,268 | | |
Net increase (decrease) in net assets | | | | (6,379,429 | ) | | | 241,446,722 | | |
1 | The SEC eliminated the requirement to disclose components of distributions paid to shareholders in September 2018. |
See notes to financial statements
216
SPECIAL
SITUATIONS | | | TOTAL
RETURN | |
10/1/2018 to
3/31/2019 | | | 10/1/2017 to
9/30/2018 | | | 10/1/2018 to
3/31/2019 | | | 10/1/2017 to
9/30/2018 | |
| | | | | | | | | | | | | | | |
| $ | 1,769,293 | | | $ | 1,131,375 | | | $ | 6,620,450 | | | $ | 14,170,068 | |
| | 21,038,359 | | | | 82,755,122 | | | | 39,184,700 | | | | 63,414,992 | |
| | (96,910,387 | ) | | | (31,396,357 | ) | | | (60,950,410 | ) | | | (30,583,626 | ) |
| | (74,102,735 | ) | | | 52,490,140 | | | | (15,145,260 | ) | | | 47,001,434 | |
| | | | | | | | | | | | | | | |
| | | | | | | | | | | | | | | |
| | (69,289,188 | ) | | | | | | | (72,696,681 | ) | | | | |
| | (397,669 | ) | | | | | | | (471,925 | ) | | | | |
| | (16,747,438 | ) | | | | | | | (90,956 | ) | | | | |
| | (988,798 | ) | | | | | | | (2,853,110 | ) | | | | |
| | (87,423,093 | ) | | | | | | | (76,112,672 | ) | | | | |
| | | | | | | | | | | | | | | |
| | | | | | (223,805 | ) | | | | | | | (15,396,814 | ) |
| | | | | | — | | | | | | | | (57,491 | ) |
| | | | | | (152,568 | ) | | | | | | | (21,110 | ) |
| | | | | | (12,819 | ) | | | | | | | (769,762 | ) |
| | | | | | (15,226,717 | ) | | | | | | | (15,297,108 | ) |
| | | | | | (105,510 | ) | | | | | | | (119,932 | ) |
| | | | | | (3,496,476 | ) | | | | | | | (17,418 | ) |
| | | | | | (235,100 | ) | | | | | | | (575,977 | ) |
| | | | | | (19,452,995 | ) | | | | | | | (32,255,612 | ) |
| | | | | | | | | | | | | | | |
| | | | | | | | | | | | | | | |
| | | | | | | | | | | | | | | |
| | 30,472,702 | | | | 80,670,471 | | | | 31,942,910 | | | | 73,816,412 | |
| | 68,590,690 | | | | 15,336,562 | | | | 71,774,969 | | | | 30,309,443 | |
| | (39,494,500 | ) | | | (90,637,765 | ) | | | (77,141,002 | ) | | | (156,488,239 | ) |
| | — | | | | — | | | | — | | | | 50,464,265 | |
| | 59,568,892 | | | | 5,369,268 | | | | 26,576,877 | | | | (1,898,119 | ) |
| | | | | | | | | | | | | | | |
| | 91,915 | | | | 219,160 | | | | 274,223 | | | | 480,372 | |
| | 395,996 | | | | 105,121 | | | | 471,902 | | | | 177,049 | |
| | (337,118 | ) | | | (864,654 | ) | | | (801,425 | ) | | | (1,645,557 | ) |
| | — | | | | — | | | | — | | | | — | |
| | 150,793 | | | | (540,373 | ) | | | (55,300 | ) | | | (988,136 | ) |
| | | | | | | | | | | | | | | |
| | 20,334,196 | | | | 61,323,950 | | | | 219,591 | | | | 262,074 | |
| | 16,649,603 | | | | 3,459,240 | | | | 80,292 | | | | 33,393 | |
| | (16,118,402 | ) | | | (51,953,688 | ) | | | (184,831 | ) | | | (357,281 | ) |
| | — | | | | — | | | | — | | | | 51,815 | |
| | 20,865,397 | | | | 12,829,502 | | | | 115,052 | | | | (9,999 | ) |
| | | | | | | | | | | | | �� | | |
| | 418,260 | | | | 1,382,471 | | | | 228,936 | | | | 534,750 | |
| | 987,844 | | | | 247,919 | | | | 2,853,110 | | | | 1,345,739 | |
| | (1,778,536 | ) | | | (1,205,420 | ) | | | (1,233,922 | ) | | | (1,426,515 | ) |
| | — | | | | — | | | | — | | | | — | |
| | (372,432 | ) | | | 424,970 | | | | 1,848,124 | | | | 453,974 | |
| | 80,212,650 | | | | 18,083,367 | | | | 28,484,753 | | | | (2,442,280 | ) |
| | (81,313,178 | ) | | | 51,120,512 | | | | (62,773,179 | ) | | | 12,303,542 | |
217
Statements of Changes in Net Assets
FIRST INVESTORS EQUITY FUNDS
| | | | SELECT
GROWTH | | |
| | | 10/1/2018 to
3/31/2019 | | | 10/1/2017 to
9/30/2018 | | |
Net Assets | | | | | | | | | | |
Beginning of period | | | $ | 775,696,205 | | | $ | 534,249,483 | | |
End of period2 | | | $ | 769,316,776 | | | $ | 775,696,205 | | |
| | | | | | | | | | | |
Shares Issued and Redeemed | | | | | | | | | | |
Class A: | | | | | | | | | | |
Sold | | | | 4,435,048 | | | | 4,294,908 | | |
Reinvestment of distributions | | | | 2,467,702 | | | | 5,154,994 | | |
Redeemed | | | | (3,786,480 | ) | | | (5,689,031 | ) | |
Issued from merger | | | | — | | | | — | | |
Net increase (decrease) in Class A shares outstanding | | | | 3,116,270 | | | | 3,760,871 | | |
| | | | | | | | | | | |
Class B: | | | | | | | | | | |
Sold | | | | 13,791 | | | | 29,073 | | |
Reinvestment of distributions | | | | 17,170 | | | | 57,376 | | |
Redeemed | | | | (44,546 | ) | | | (121,992 | ) | |
Issued from merger | | | | — | | | | — | | |
Net increase (decrease) in Class B shares outstanding | | | | (13,585 | ) | | | (35,543 | ) | |
| | | | | | | | | | | |
Advisor Class: | | | | | | | | | | |
Sold | | | | 2,504,515 | | | | 2,306,144 | | |
Reinvestment of distributions | | | | 826,513 | | | | 957,774 | | |
Redeemed | | | | (1,288,368 | ) | | | (2,480,897 | ) | |
Issued from merger | | | | — | | | | — | | |
Net increase (decrease) in Advisor Class shares outstanding | | | | 2,042,660 | | | | 783,021 | | |
| | | | | | | | | | | |
Institutional Class: | | | | | | | | | | |
Sold | | | | 68,365 | | | | 81,566 | | |
Reinvestment of distributions | | | | 27,950 | | | | 52,639 | | |
Redeemed | | | | (137,859 | ) | | | (74,392 | ) | |
Issued from merger | | | | — | | | | — | | |
Net increase (decrease) in Institutional Class shares outstanding | | | | (41,544 | ) | | | 59,813 | | |
| | | | | | | | | | | |
| 2 For the year ended September 30, 2018 net assets includes undistributed net investment income (deficit) of | | | | | | | $ | — | | |
See notes to financial statements
218
SPECIAL
SITUATIONS | | TOTAL
RETURN | |
10/1/2018 to
3/31/2019 | | | 10/1/2017 to
9/30/2018 | | | 10/1/2018 to
3/31/2019 | | | 10/1/2017 to
9/30/2018 | |
| | | | | | | | | | | | | | | |
| $ | 733,606,021 | | | $ | 682,485,509 | | | $ | 931,094,393 | | | $ | 918,790,851 | |
| $ | 652,292,843 | | | $ | 733,606,021 | | | $ | 868,321,214 | | | $ | 931,094,393 | |
| | | | | | | | | | | | | | | |
| | | | | | | | | | | | | | | |
| | | | | | | | | | | | | | | |
| | 1,138,575 | | | | 2,502,430 | | | | 1,733,506 | | | | 3,674,984 | |
| | 3,073,060 | | | | 478,221 | | | | 4,284,286 | | | | 1,507,141 | |
| | (1,488,035 | ) | | | (2,812,100 | ) | | | (4,181,184 | ) | | | (7,795,384 | ) |
| | — | | | | — | | | | — | | | | 2,466,173 | |
| | 2,723,600 | | | | 168,551 | | | | 1,836,608 | | | | (147,086 | ) |
| | | | | | | | | | | | | | | |
| | | | | | | | | | | | | | | |
| | 4,800 | | | | 9,120 | | | | 15,504 | | | | 24,453 | |
| | 25,368 | | | | 4,378 | | | | 28,672 | | | | 8,913 | |
| | (17,314 | ) | | | (35,942 | ) | | | (44,556 | ) | | | (83,813 | ) |
| | — | | | | — | | | | — | | | | — | |
| | 12,854 | | | | (22,444 | ) | | | (380 | ) | | | (50,447 | ) |
| | | | | | | | | | | | | | | |
| | | | | | | | | | | | | | | |
| | 753,284 | | | | 1,882,451 | | | | 11,685 | | | | 13,080 | |
| | 735,406 | | | | 106,833 | | | | 4,766 | | | | 1,653 | |
| | (590,638 | ) | | | (1,571,891 | ) | | | (10,375 | ) | | | (17,571 | ) |
| | — | | | | — | | | | — | | | | 2,516 | |
| | 898,052 | | | | 417,393 | | | | 6,076 | | | | (322 | ) |
| | | | | | | | | | | | | | | |
| | | | | | | | | | | | | | | |
| | 15,671 | | | | 42,180 | | | | 12,341 | | | | 26,378 | |
| | 43,307 | | | | 7,610 | | | | 168,675 | | | | 66,432 | |
| | (60,542 | ) | | | (36,480 | ) | | | (63,681 | ) | | | (70,281 | ) |
| | — | | | | — | | | | — | | | | — | |
| | (1,564 | ) | | | 13,310 | | | | 117,335 | | | | 22,529 | |
219
Notes to Financial Statements
FIRST INVESTORS INCOME FUNDS
FIRST INVESTORS EQUITY FUNDS
March 31, 2019
1. Significant Accounting Policies—First Investors Income Funds (“Income Funds”) and First Investors Equity Funds (“Equity Funds”), each a Delaware statutory trust (each a “Trust”, collectively, “the Trusts”), are registered under the Investment Company Act of 1940 (the “1940 Act”) as open-end management investment companies and operate as series funds. Each Fund is an investment company and accordingly follows the investment company accounting and reporting guidance of the Financial Accounting Standard Board (FASB) Accounting Standard Codification Topic 946 “Financial Services – Investment Companies” including FASB Accounting Standard Update ASU 2013-08.The Income Funds issues shares of beneficial interest in the Floating Rate Fund, Fund For Income, Government Cash Management Fund, International Opportunities Bond Fund, Investment Grade Fund, Limited Duration Bond Fund and Strategic Income Fund. All Funds in the Income Funds are diversified funds except for International Opportunities Bond Fund which is a non-diversified fund. The Equity Funds issues shares of beneficial interest in the Covered Call Strategy Fund, Equity Income Fund, Global Fund, Growth & Income Fund, Hedged U.S. Equity Opportunities Fund, International Fund, Opportunity Fund, Premium Income Fund, Select Growth Fund, Special Situations Fund and Total Return Fund. All Funds in the Equity Funds are diversified funds. Each Fund in the Income Funds and Equity Funds is referred to as a “Fund” and collectively, “the Funds”. The Trusts account separately for the assets, liabilities and operations of each Fund. The objective of each Fund as of March 31, 2019, is as follows:
Floating Rate Fund seeks a high level of current income.
Fund For Income seeks high current income.
Government Cash Management Fund seeks to earn a high rate of current income consistent with the preservation of capital and maintenance of liquidity.
International Opportunities Bond Fund seeks total return consisting of income and capital appreciation.
Investment Grade Fund seeks to generate a maximum level of income consistent with investment primarily in investment grade debt securities.
Limited Duration Bond Fund seeks current income consistent with low volatility of principal.
Strategic Income Fund seeks a high level of current income.
Covered Call Strategy Fund seeks long-term capital appreciation.
Equity Income Fund seeks total return.
Global Fund seeks long-term capital growth.
Growth & Income Fund seeks long-term growth of capital and current income.
220
Hedged U.S. Equity Opportunities Fund seeks total return and, secondarily, capital preservation.
International Fund primarily seeks long-term capital growth.
Opportunity Fund seeks long-term capital growth.
Premium Income Fund seeks to generate income.
Select Growth Fund seeks long-term growth of capital.
Special Situations Fund seeks long-term growth of capital.
Total Return Fund seeks high, long-term total investment return consistent with moderate investment risk.
A. Security Valuation—Except as provided below, a security listed or traded on an exchange or the Nasdaq Stock Market is valued at its last sale price on the exchange or market where the security is principally traded, and lacking any sales, the security is valued at the mean between the closing bid and asked prices. Securities traded in the over-the-counter (“OTC”) market (including securities listed on exchanges whose primary market is believed to be OTC) and call and put options are valued at the mean between the last bid and asked prices based on quotes furnished by a market maker for such securities or an authorized pricing service. Fixed income securities, other than short-term debt securities held by the Government Cash Management Fund, are priced based upon evaluated prices that are provided by a pricing service approved by the Trusts’ Board of Trustees (the “Board”). Other securities may also be priced based upon valuations that are provided by pricing services approved by the Board. The pricing services consider security type, rating, market condition and yield data as well as market quotations, prices provided by market makers and other available information in determining evaluated prices. The net asset value of the Strategic Income Fund is derived from the net asset values of the underlying Funds in which it invests.
The Funds monitor for significant events occurring prior to the close of trading on the New York Stock Exchange that could have a material impact on the value of any securities that are held by the Funds. Examples of such events include trading halts, natural disasters, political events and issuer-specific developments. If the Valuation Committee of Foresters Investment Management Company, Inc. (“FIMCO”) decides that such events warrant using fair value estimates, it will take such events into consideration in determining the fair values of such securities. If market quotations or prices are not readily available or are deemed to be unreliable, or do not appear to reflect significant events that have occurred prior to the time as of which the net assets value is calculated, the securities may be valued at fair value as determined in good faith pursuant to procedures adopted by the Board. The Funds also use evaluated prices from a pricing service to fair value certain foreign equity securities in the event that fluctuation in U.S. securities markets exceed a predetermined level or if a foreign market is closed. For valuation purposes, where
221
Notes to Financial Statements(continued)
FIRST INVESTORS INCOME FUNDS
FIRST INVESTORS EQUITY FUNDS
March 31, 2019
applicable, quotations of foreign securities in foreign currencies are translated to U.S. dollar equivalents using the foreign exchange quotation in effect.
The Government Cash Management Fund values its portfolio securities in accordance with the amortized cost method of valuation under Rule 2a-7 under the 1940 Act. Amortized cost is an approximation of market value of an instrument, whereby the difference between its acquisition cost and market value at maturity is amortized on a straight-line basis over the remaining life of the instrument. The effect of changes in the market value of a security as a result of fluctuating interest rates is not taken into account and thus the amortized cost method of valuation may result in the value of a security being higher or lower than its actual market value.
In accordance with Accounting Standards Codification 820 “Fair Value Measurements and Disclosures” (“ASC 820”), investments held by the Funds are carried at “fair value”. As defined by ASC 820, fair value is the price that a fund would receive upon selling an investment in an orderly transaction to an independent buyer in the principal or most advantageous market for the investment under current market conditions. Various inputs are used in determining the value of the fund’s investments.
In addition to defining fair value, ASC 820 established a three-tier hierarchy of inputs to establish a classification of fair value measurements for disclosure purposes. The three-tier hierarchy of inputs is summarized in the three broad Levels listed below:
Level 1—Unadjusted quoted prices in active markets for identical securities that the Fund has the ability to access.
Level 2—Observable inputs other than quoted prices included in Level 1 that are observable for the asset or liability, either directly or indirectly. These inputs may include quoted prices for the identical instrument on an inactive market, prices for similar instruments, interest rates, prepayment speeds, credit risk, yield curves, default rates and similar data.
Level 3—Unobservable inputs for the asset or liability, to the extent relevant observable inputs are not available, representing the Fund’s own assumption about the assumptions a market participant would use in valuing the asset or liability, and would be based on the best information available.
Equity securities and futures contracts traded on an exchange or the Nasdaq Stock Market are categorized in Level 1 of the fair value hierarchy to the extent that they are actively traded and valuation adjustments are not applied. The underlying Funds in which Strategic Income Fund invests are also categorized in Level 1. Foreign equity securities that are fair valued in the event that fluctuations in U.S. securities markets exceed a predetermined level or if a foreign market is closed are categorized in Level 2. Variable and floating rate, corporate, sovereign and municipal bonds, asset backed, U.S. Government and U.S. Government Agency securities, pass-through certificates and loan participations are categorized in Level 2 to the extent that the inputs are observable and timely, otherwise they would be categorized in Level 3. Short-term notes that are valued at amortized cost by the Government Cash Management Fund are categorized in
222
Level 2. Call and put options contracts are categorized in Level 2 to the extent that the inputs are observable and timely. Foreign exchange contracts that are considered derivative instruments and are valued at the net unrealized appreciation or depreciation on the instruments are categorized in Level 2. Securities that are fair valued by the Valuation Committee may be categorized in either Level 2 or Level 3 of the fair value hierarchy depending on the relative significance of the unobservable valuation inputs.
The aggregate value by input level, as of March 31, 2019, for each Fund’s investments is included following each Fund’s portfolio of investments.
B. Federal Income Taxes—No provision has been made for federal income taxes on net income or capital gains since it is the policy of each Fund to continue to comply with the special provisions of the Internal Revenue Code applicable to investment companies, and to make sufficient distributions of income and capital gains (in excess of any available capital loss carryovers) to relieve it from all, or substantially all, such taxes. At September 30, 2018, capital loss carryovers were as follows:
| | | | | | | Capital Loss Carryovers
Not Subject to Expiration | | | | | | | | | |
Fund | | Total | | | Long-Term | | | Short-Term | | | Utilized | | | Expired | |
Floating Rate | | $ | 3,538,184 | | | $ | 2,992,449 | | | $ | 545,735 | | | $ | 380,941 | | | $ | — | |
Fund For Income | | | 38,335,803 | | | | 34,401,802 | | | | 3,934,001 | | | | 650,564 | | | | 110,622,886 | |
International Opportunities Bond. | | | 3,796,728 | | | | 3,796,728 | | | | — | | | | 604,318 | | | | — | |
Investment Grade | | | 3,898,294 | | | | 3,898,294 | | | | — | | | | 346,460 | | | | — | |
Limited Duration Bond | | | 2,312,808 | | | | 1,348,052 | | | | 964,756 | | | | — | | | | — | |
Strategic Income | | | 2,239,990 | | | | 2,239,990 | | | | — | | | | — | | | | — | |
Covered Call Strategy | | | 7,958,614 | | | | — | | | | 7,958,614 | | | | — | | | | — | |
Hedged U.S. Equity Opportunities | | | 316,853 | | | | 316,853 | | | | — | | | | 1,558,008 | | | | — | |
International | | | — | | | | — | | | | — | | | | 13,051,390 | | | | — | |
Premium Income | | | 206,166 | | | | — | | | | 206,166 | | | | — | | | | — | |
The Funds recognize the tax benefits of uncertain tax positions only where the position is “more likely than not” to be sustained assuming examination by tax authorities. Management has analyzed the Funds’ tax positions and has concluded that no liability for unrecognized tax benefits should be recorded related to uncertain tax positions taken on returns filed for open tax years 2016 – 2018, or expected to be taken in the Funds’ 2019 tax returns. The Funds identify their major tax jurisdictions as U.S. Federal, New York State, New York City and foreign jurisdictions where the Funds make significant investments; however, the Funds are not aware of any tax position for which it is reasonably possible that the total amounts of unrecognized tax benefits will change materially in the next twelve months.
223
Notes to Financial Statements(continued)
FIRST INVESTORS INCOME FUNDS
FIRST INVESTORS EQUITY FUNDS
March 31, 2019
C. Distributions to Shareholders—Dividends from net investment income of Floating Rate Fund, Fund For Income, Investment Grade Fund, Limited Duration Bond Fund, and Strategic Income Fund are generally declared daily and paid monthly. The Government Cash Management Fund declares distributions, if any, daily and pays distributions monthly, from the total of net investment income plus or minus all realized short-term gains and losses on investments. Dividends from net investment income, if any, of International Opportunities Bond Fund, Covered Call Strategy Fund, Equity Income Fund, Growth & Income Fund, Premium Income Fund and Total Return Fund are declared and paid quarterly. Dividends from net investment income, if any, of Global Fund, Hedged U.S. Equity Opportunities Fund, International Fund, Opportunity Fund, Select Growth Fund and Special Situations Fund are declared and paid annually. Premium Income Fund may distribute net short term capital gains, if any, on a quarterly basis. Distributions from net realized capital gains, if any, of each of the Funds are normally declared and paid annually. Income dividends and capital gain distributions are determined in accordance with income tax regulations which may differ from accounting principles generally accepted in the United States of America. These differences are primarily due to differing treatments for capital loss carryforwards, deferral of wash sales losses, post-October capital losses, late loss deferrals, net operating losses and foreign currency transactions.
D. Expense Allocation—Expenses directly charged or attributable to a Fund are paid from the assets of that Fund. General expenses of the Trusts are allocated among and charged to the assets of each Fund on a fair and equitable basis, which may be based on the relative assets of each Fund or the nature of the services performed and relative applicability to each Fund.
E. Use of Estimates—The preparation of the financial statements in conformity with accounting principles generally accepted in the United States of America requires management to make estimates and assumptions that affect the reported amounts of assets and liabilities at the date of the financial statements and the reported amounts of revenue and expense during the reporting period. Actual results could differ from those estimates.
F. Foreign Currency Translations—The accounting records of all of the Funds are maintained in U.S. dollars, including those Funds that invest in foreign securities. Portfolio securities and other assets and liabilities denominated in foreign currencies are translated to U.S. dollars at the date of valuation. Purchases and sales of foreign investment securities, dividend income and certain expenses are translated to U.S. dollars at the rates of exchange prevailing on the respective dates of such transactions.
International Opportunities Bond Fund, Global Fund, Hedged U.S. Equity Opportunities Fund and International Fund do not isolate that portion of gains and losses on foreign investments which is due to changes in foreign exchange rates from that which is due to changes in market prices of the investments. These changes are included with the net realized and unrealized gains and losses from investments.
224
Net realized and unrealized gains and losses on foreign currency transactions include gains and losses from the sales of foreign currency and gains and losses on accrued foreign dividends and related withholding taxes.
G. Other—Security transactions are generally accounted for on the first business day following the date the securities are purchased or sold, except for financial reporting purposes, which is trade date. Investments in securities issued on a when-issued or delayed delivery basis are generally reflected in the assets of the Funds on the first business day following the date the securities are purchased and the Funds segregate assets for these transactions. Cost of securities is determined and gains and losses are based on the identified cost basis for both financial statement and federal income tax purposes. Dividend income is recorded on the ex-dividend date or for certain foreign dividends, as soon as the Fund becomes aware of the dividends. Interest income and estimated expenses are accrued daily. Bond discounts and premiums are accreted or amortized using the interest method. Withholding taxes on foreign dividends have been provided in accordance with the Funds’ understanding of the applicable country’s tax rules and rates. The Bank of New York Mellon serves as custodian for the Funds and may provide credits against custodian charges based on uninvested cash balance of the Funds. For the six months ended March 31, 2019, the Income Funds and Equity Funds received credits in the amount of $16,526 and $80,949, respectively. Certain of the Equity Funds reduced expenses through brokerage service arrangements. For the six months ended March 31, 2019, expenses were reduced by a total of $19,663 for certain of the Equity Funds under these arrangements.
225
Notes to Financial Statements(continued)
FIRST INVESTORS INCOME FUNDS
FIRST INVESTORS EQUITY FUNDS
March 31, 2019
2. Security Transactions—For the six months ended March 31, 2019, purchases and sales of securities and long-term U.S. Government obligations (excluding U.S. Treasury bills, short-term securities and foreign currencies) were as follows:
| | | Securities | | | Long-Term U.S.
Government Obligations | |
Fund | | Cost of
Purchases | | | Proceeds
of Sales | | | Cost of
Purchases | | | Proceeds
of Sales | |
Floating Rate | | $ | 80,238,535 | | | $ | 69,817,766 | | | $ | — | | | $ | — | |
Fund For Income | | | 198,996,634 | | | | 211,308,254 | | | | — | | | | — | |
International Opportunities Bond | | | 22,551,878 | | | | 8,899,629 | | | | 9,886,503 | | | | 15,726,447 | |
Investment Grade | | | 160,501,057 | | | | 207,142,368 | | | | 31,900,220 | | | | — | |
Limited Duration Bond | | | 88,597,690 | | | | 95,463,622 | | | | 21,536,117 | | | | 15,001,430 | |
Strategic Income | | | 55,238,780 | | | | 56,447,975 | | | | 4,307,235 | | | | 6,243,760 | |
Covered Call Strategy | | | 50,357,842 | | | | 61,659,869 | | | | — | | | | — | |
Equity Income | | | 143,845,708 | | | | 187,453,429 | | | | — | | | | — | |
Global | | | 456,865,244 | | | | 467,292,920 | | | | — | | | | — | |
Growth & Income | | | 653,622,613 | | | | 734,917,489 | | | | — | | | | — | |
Hedged U.S. Equity Opportunities | | | 48,238,770 | | | | 31,197,292 | | | | — | | | | — | |
International | | | 148,925,454 | | | | 152,795,932 | | | | — | | | | — | |
Opportunity | | | 416,018,229 | | | | 437,611,173 | | | | — | | | | — | |
Premium Income | | | 95,941,897 | | | | 38,506,488 | | | | — | | | | — | |
Select Growth | | | 157,660,289 | | | | 142,996,851 | | | | — | | | | — | |
Special Situations | | | 233,749,861 | | | | 250,110,967 | | | | — | | | | — | |
Total Return | | | 305,910,403 | | | | 398,295,142 | | | | 51,629,049 | | | | 29,191,650 | |
226
At March 31, 2019, aggregate cost and net unrealized appreciation (depreciation) of securities for federal income tax purposes were as follows:
Fund | | Aggregate
Cost | | | Gross
Unrealized
Appreciation | | | Gross
Unrealized
Depreciation | | | Net
Unrealized
Appreciation
(Depreciation) | |
Floating Rate | | $ | 249,735,109 | | | $ | 944,984 | | | $ | 3,688,147 | | | $ | (2,743,163 | ) |
Fund For Income | | | 610,510,205 | | | | 8,917,399 | | | | 11,150,804 | | | | (2,233,405 | ) |
International Opportunities Bond | | | 167,496,176 | | | | 399,016 | | | | 17,133,570 | | | | (16,734,554 | ) |
Investment Grade | | | 596,537,281 | | | | 11,274,806 | | | | 10,265,676 | | | | 1,009,130 | |
Limited Duration Bond | | | 322,492,773 | | | | 1,989,181 | | | | 1,978,901 | | | | 10,280 | |
Strategic Income | | | 153,775,093 | | | | 72,518 | | | | 6,607,542 | | | | (6,535,024 | ) |
Covered Call Strategy | | | 277,489,827 | | | | 51,211,749 | | | | 14,820,584 | | | | 36,391,165 | |
Equity Income | | | 438,225,597 | | | | 152,184,487 | | | | 10,822,422 | | | | 141,362,065 | |
Global | | | 525,618,110 | | | | 64,401,507 | | | | 10,599,925 | | | | 53,801,582 | |
Growth & Income | | | 1,190,723,231 | | | | 466,046,827 | | | | 14,609,100 | | | | 451,437,727 | |
Hedged U.S. Equity Opportunities | | | 151,384,769 | | | | 22,908,768 | | | | 5,108,479 | | | | 17,800,289 | |
International | | | 313,582,622 | | | | 87,985,111 | | | | 7,159,778 | | | | 80,825,333 | |
Opportunity | | | 847,900,409 | | | | 270,185,369 | | | | 32,907,844 | | | | 237,277,525 | |
Premium Income | | | 120,938,791 | | | | 11,071,923 | | | | 11,107,668 | | | | (35,745 | ) |
Select Growth | | | 618,772,776 | | | | 164,069,992 | | | | 19,679,837 | | | | 144,390,155 | |
Special Situations | | | 583,857,004 | | | | 95,994,693 | | | | 37,561,449 | | | | 58,433,244 | |
Total Return | | | 726,416,963 | | | | 132,542,483 | | | | 15,291,965 | | | | 117,250,518 | |
227
Notes to Financial Statements(continued)
FIRST INVESTORS INCOME FUNDS
FIRST INVESTORS EQUITY FUNDS
March 31, 2019
The Strategic Income Fund may invest in Institutional Class shares of the Floating Rate Fund, Fund For Income, Government Cash Management Fund, International Opportunities Bond Fund, Investment Grade Fund, Limited Duration Bond Fund, Covered Call Strategy Fund, Equity Income Fund, Premium Income Fund, Tax Exempt Income Fund and Tax Exempt Opportunities Fund. During the six months ended March 31, 2019, purchases and sales of shares, dividends, capital gain distributions received and realized gains (losses) recognized by Strategic Income Fund from investments in these Funds were as follows:
Fund | | Balance of
Shares Held
9/30/2018 | | | Purchases/
Additions | | | Sales/
Reductions | | | Balance of
Shares Held
3/31/2019 | | | Value
3/31/2019 | | | Dividend
Income | | | Capital Gain
Distributions | | | Realized
Gain (Loss)
on Security
Transactions | |
Floating Rate | | | 3,205,012 | | | | 300,083 | | | | (803,872 | ) | | | 2,701,223 | | | $ | 25,769,672 | | | $ | 616,648 | | | $ | — | | | $ | (23,495 | ) |
Fund For Income | | | 12,394,911 | | | | 3,845,835 | | | | (2,306,373 | ) | | | 13,934,373 | | | | 33,999,871 | | | | 953,755 | | | | — | | | | (26,321 | ) |
International Opportunities Bond | | | 1,032,932 | | | | 1,119,084 | | | | (58,232 | ) | | | 2,093,784 | | | | 18,404,364 | | | | 211,401 | | | | — | | | | 1,557 | |
Investment Grade | | | 2,422,818 | | | | — | | | | (437,044 | ) | | | 1,985,774 | | | | 18,765,562 | | | | 372,956 | | | | — | | | | (265,313 | ) |
Limited Duration Bond | | | 4,139,759 | | | | 1,607,125 | | | | (1,776,797 | ) | | | 3,970,087 | | | | 36,842,405 | | | | 523,347 | | | | — | | | | (290,695 | ) |
Equity Income | | | — | | | | 142,156 | | | | (142,156 | ) | | | — | | | | — | | | | — | | | | — | | | | 14,244 | |
Premium Income | | | 377,554 | | | | — | | | | (377,554 | ) | | | — | | | | — | | | | — | | | | — | | | | (237,475 | ) |
Tax Exempt Income | | | 424,153 | | | | 382,193 | | | | (806,346 | ) | | | — | | | | — | | | | 47,806 | | | | — | | | | (127,788 | ) |
Tax Exempt Opportunities | | | 237,635 | | | | 241,599 | | | | (479,234 | ) | | | — | | | | — | | | | 78,645 | | | | — | | | | 83,484 | |
| | | | 24,234,774 | | | | 7,638,075 | | | | (7,187,608 | ) | | | 24,685,241 | | | $ | 133,781,874 | | | $ | 2,804,558 | | | $ | — | | | $ | (871,802 | ) |
The Strategic Income Fund operates as a fund of funds - also referred to as a multi-manager investment - an investment strategy in which a fund invests in other types of funds. This strategy invests in a portfolio that contains different underlying assets instead of investing directly in bonds, stocks and other types of securities.
The financial statements of each of the Funds in which Strategic Income Fund had investments during the six months ended March 31, 2019, are included in this report except Tax Exempt Income Fund and Tax Exempt Opportunities Fund, whose most recent financial statements as of December 31, 2018, are available and can be viewed by visiting our websitewww.foresters.com, by calling 1-800-423-4026 or by writing to us at the following address: Foresters Financial Services, Inc., 40 Wall Street, New York, NY 10005.
3.Advisory Fee and Other Transactions With Affiliates—Certain officers of the Trusts are officers of the Trusts’ investment adviser,Foresters Investment Management Company, Inc. (“FIMCO”), their underwriter, Foresters Financial Services, Inc. (“FFS”) and their transfer agent, Foresters Investor Services, Inc. (“FIS”).Trustees of the Trusts who are not officers or directors of FIMCO or its affiliates are remunerated by the Funds.For the six months ended March 31,
228
2019, total trustees fees accrued by the Income Funds and Equity Funds amounted to $68,838 and $218,831, respectively.
The Investment Advisory Agreements provide as compensation to FIMCO for each Fund, an annual fee, payable monthly, at the following rates:
Floating Rate Fund—.60% on the first $250 million of the Fund’s average daily net assets, .55% on the next $250 million, .50% on the next $500 million, .45% on the next $1 billion and .40% on average daily net assets over $2 billion.During the period October 1, 2018 to January 31, 2019 (expiration of expense limitation agreement), FIMCO has assumed, pursuant to an expense limitation agreement, $8,398 in other expenses to limit the Fund’s overall expense ratio (exclusive of certain expenses) to 1.10% on Class A shares, .90% on Advisor Class shares and .70% on Institutional Class shares.For the period February 1, 2019 to March 31, 2019, FIMCO has assumed, pursuant to an expense limitation agreement, $12,669 in other expenses to limit the Fund’s overall expense ratio (exclusive of certain expenses) to 1.10% on Class A shares.
Fund For Income and International Opportunities Bond Fund—.75% on the first $250 million of each Fund’s average daily net assets, .72% on the next $250 million, .69% on the next $250 million, .66% on the next $500 million, declining by .02% on each $500 million thereafter, down to .60% on average daily net assets over $2.25 billion. During the period October 1, 2018 through January 31, 2019 (expiration of advisory fee waiver), FIMCO has waived $54,695 in advisory fees on Fund For Income to limit the advisory fee to .70% of its average daily net assets.
Government Cash Management Fund—.50% of the Fund’s average daily net assets.For the six months ended March 31, 2019, FIMCO has waived $228,368 in advisory fees and assumed $49 in other expenses to limit the Fund’s overall expense ratio (exclusive of certain expenses) to .60% on Class A shares, 1.35% on Class B shares and .60% on Institutional Class shares.
Investment Grade Fund—.66%on the first $500 million of the Fund’s average daily net assets, declining by .02% on each $500 million thereafter, down to .60% on average daily net assets over $1.5 billion.During the period October 1, 2018 to January 31, 2019, FIMCO has waived $212,088 in advisory fees on Investment Grade Fund to limit the advisory fee to .55% of its average daily net assets. During the period February 1, 2019 to March 31, 2019, FIMCO has waived $64,539 in advisory fees on Investment Grade Fund to limit the advisory fee to .59% of its average daily net assets.
Limited Duration Bond Fund—.41% on the first $500 million of the Fund’s average daily net assets, .39% on the next $500 million, .37% on the next $500 million and .35% on average daily net assets over $1.5 billion. For the six months ended March 31, 2019, FIMCO has waived $366,985 in advisory fees and assumed $38,809 in other expenses to limit the Fund’s overall expense ratio (exclusive of certain expenses) to .79%on Class a shares, .51% on Advisor Class shares and .36% on Institutional Class shares.
Strategic Income Fund—.05% of the Fund’s average daily net assets.
229
Notes to Financial Statements(continued)
FIRST INVESTORS INCOME FUNDS
FIRST INVESTORS EQUITY FUNDS
March 31, 2019
Covered Call Strategy and Premium Income Funds—.80% on the first $300 million of each Fund’s average daily net assets, .75% on the next $200 million, .70% on the next $500 million, declining by .05% on each $1 billion thereafter, down to .55% on average daily net assets over $3 billion. During the period October 1, 2018 through January 31, 2019, FIMCO has waived, pursuant to an expense limitation agreement $17,774 in advisory fees and assumed $5,607 in other expenses to limit the Premium Income Fund’s overall expense ratio (exclusive of certain expenses)to 1.30% on Class A shares, 1.02% on Advisor Class shares and .89% on Institutional Class shares. During the period February 1, 2019 through March 31, 2019, FIMCO has assumed, pursuant to an expense limitation agreement that became effective on February 1, 2019, $36,063 in other expenses to limit the Premium Income Fund’s overall expense ratio (exclusive of certain expenses) to 1.30% on Class A shares, 1.06% on Advisor Class shares and .99% on Institutional Class shares.
Equity Income, Growth & Income, Opportunity, and Select Growth Funds—.75% on the first $300 million of each Fund’s average daily net assets, .72% on the next $200 million, .69% on the next $250 million, .66% on the next $500 million, declining by .02% on each $500 million thereafter, down to .60% on average daily net assets over $2.25 billion.
Global Fund—.95% on the first $600 million, .92% on the next $400 million, .90% on the next $500 million and .88% on average daily net assets over $1.5 billion.During the period October 1, 2018 through January 31, 2019 (expiration of advisory fee waiver), FIMCO has waived $94,873 in advisory fees to limit the advisory fee to .90% of the Fund’s average daily net assets.
Hedged U.S. Equity Opportunities Fund—1.15% on the first $100 million of each Fund’s average daily net assets, 1.10% on the next $400 million, 1.05% on the next $500 million, declining by .05% on each $1 billion thereafter, down to .90% on average daily net assets over $3 billion.
International Fund—.98% on the first $300 million of the Fund’s average daily net assets, .95% on the next $300 million, .92% on the next $400 million, .90% on the next $500 million and .88% on average daily net assets over $1.5 billion.
Special Situations Fund—.90% on the first $200 million of the Fund’s average daily net assets, .75% on the next $300 million, .72% on the next $250 million, .69% on the next $250 million, .66% on the next $500 million and .64% on average daily net assets over $1.5 billion.
Total Return Fund—.75% on the first $300 million of the Fund’s average daily net assets, .70% on the next $200 million, .65% on the next $500 million, .60% on the next $1 billion, .55% on the next $1 billion, down to .50% on average daily net assets over $3 billion.
For the six months ended March 31, 2019, total advisory fees accrued to FIMCO by the Income Funds and Equity Funds were $6,584,242 and $26,839,395, respectively, of which $1,010,517 and $154,317, respectively, was waived by FIMCO as noted above.
230
FIMCO has entered into an expense limitation agreement with the Floating Rate (“FRF”) on January 31, 2019, to limit FRF’s total annual fund operating expenses (exclusive of interest expenses, taxes, brokerage commissions, acquired fund fees and expenses, dividend costs related to short sales, and extraordinary expenses, such as litigation expenses, if any) to 1.10% of the average daily net assets on Class A shares. The agreement expires on January 31, 2020. During the period January 31, 2019 to March 31, 2019, FIMCO assumed $12,669 under the terms of the agreement of which $12,669 expires on September 30, 2022. FIMCO and FRF have agreed that any expenses of FRF assumed by FIMCO pursuant to this agreement be repaid to FIMCO by FRF within three years after the date the fee limitation and/or expense reimbursement has been made by FIMCO, provided that such repayment does not cause the expenses of FRF’s Class A shares to exceed the applicable expense ratio in place at the time the expenses are waived or assumed or the current limits established under the expense limitation agreement. The expense limitation agreement may be terminated or amended prior to January 31, 2020, with the approval of the Board. FIMCO had entered into an expense limitation agreement with the Floating Rate Fund (“FRF”) to limit FRF’s total annual fund operating expenses (exclusive of interest expenses, taxes, brokerage commissions, acquired fund fees and expenses, dividend costs related to short sales, and extraordinary expenses, such as litigation expenses, if any) to 1.10% of the average daily net assets on Class A shares, .90% of the average daily net assets on Advisor Class shares and .70% of the average daily net assets on Institutional Class shares. The agreement expired on January 31, 2019. During the period October 1, 2018 to January 31, 2019 (expiration of the expense limitation agreement), FIMCO assumed $8,398, under the terms of the agreement. FIMCO and FRF have agreed that any expenses of FRF assumed by FIMCO pursuant to this agreement be repaid to FIMCO by FRF within three years after the date the fee limitation and/or expense reimbursement has been made by FIMCO, provided that such repayment does not cause the expenses of FRF’s Class A shares, Advisor Class shares and Institutional Class shares to exceed the applicable expense ratio in place at the time the expenses are waived or assumed or the current limits established under the expense limitation agreement. For the period October 21, 2013 (commencement of operations) through January 31, 2019 (expiration of the expense limitation agreement), FIMCO assumed $766,764 under the terms of the agreement of which $223,534 expired on September 30, 2017, $198,431 expired on September 30, 2018, $161,613 expires on September 30, 2019, $131,427 expires on September 30, 2020, $43,361 expires on September 30, 2021 and $8,398 expires on September 30, 2022.
Effective June 1, 2018, FIMCO has entered into an expense limitation agreement with the Government Cash Management Fund (“GCM”) to limit GCM’s total annual fund operating expenses (exclusive of interest expenses, taxes, brokerage commissions, acquired fund fees and expenses, dividend costs related to short sales, and extraordinary expenses, such as litigation expenses, if any) to .80% of the average daily net assets on Class A shares, 1.55% of the average daily net assets on Class B shares and .80% of the average daily net assets on Institutional Class shares. The agreement expires on January 31, 2020. For the period ended March 31, 2019, FIMCO assumed $228,417 under the terms of the agreement. FIMCO and GCM have agreed that any expenses of GCM assumed by FIMCO and/or FIS pursuant to this agreement be repaid to FIMCO by GCM within three years after the date the fee limitation and/or expense
231
Notes to Financial Statements(continued)
FIRST INVESTORS INCOME FUNDS
FIRST INVESTORS EQUITY FUNDS
March 31, 2019
reimbursement has been made by FIMCO, provided that such repayment does not cause the expenses of GCM’s Class A shares, Class B shares and Institutional Class shares to exceed the applicable expense ratio in place at the time the expenses are waived or assumed or the current limits established under the expense limitation agreement. For the period June 1, 2018 (commencement of expense limitation agreement) through March 31, 2019, FIMCO assumed $319,596 under the terms of the agreement of which expires $91,179 September 30, 2021 and $228,417 expires on September 30, 2022. The expense limitation agreement may be terminated or amended prior to January 31, 2020, with the approval of the Board.
FIMCO had entered into an expense limitation agreement with the International Opportunities Bond Fund (“IOBF”) to limit IOBF’s total annual fund operating expenses (exclusive of interest expenses, taxes, brokerage commissions, acquired fund fees and expenses, dividend costs related to short sales, and extraordinary expenses, such as litigation expenses, if any) to 1.30% of the average daily net assets on Class A shares. The agreement expired on January 31, 2016. FIMCO and IOBF have agreed that any expenses of IOBF assumed by FIMCO pursuant to this agreement be repaid to FIMCO by IOBF within three years after the date the fee limitation and/or expense reimbursement has been made by FIMCO, provided that such repayment does not cause the expenses of IOBF’s Class A shares to exceed the applicable expense ratio in place at the time the expenses are waived or assumed or the current limits established under the expense limitation agreement. For the period August 20, 2012 (commencement of operations) to January 31, 2016 (expiration of the expense limitation agreement), FIMCO assumed $684,479 under the terms of the agreement of which $278,248 expired on September 30, 2015, $228,243 expired on September 30, 2016, $94,746 expired on September 30, 2017, $62,359 expired on September 30, 2018, and $20,883 expires on September 30, 2019.
FIMCO has entered into an expense limitation agreement with the Limited Duration Bond Fund (“LDB”) on March 14, 2018, to limit LDB’s total annual fund operating expenses (exclusive of interest expenses, taxes, brokerage commissions, acquired fund fees and expenses, dividend costs related to short sales, and extraordinary expenses, such as litigation expenses, if any) to .79% of the average daily net assets on Class A shares, .51% of the average daily net assets on Advisor Class shares and .36% of the average daily net assets on Institutional Class shares. The agreement expires on January 31, 2020. For the period ended March 31, 2019, FIMCO assumed $405,794 under the terms of the agreement. FIMCO and LDB have agreed that any expenses of LDB assumed by FIMCO pursuant to this agreement be repaid to FIMCO by LDB within three years after the date the fee limitation and/or expense reimbursement has been made by FIMCO, provided that such repayment does not cause the expenses of LDB’s Class A shares, Advisor Class shares and Institutional Class shares to exceed the applicable expense ratio in place at the time the expenses are waived or assumed or the current limits established under the expense limitation agreement. For the period March 14, 2018 to March 31, 2019, FIMCO assumed $622,481 under the terms of the agreement of which $216,687 expires on September 30, 2021 and $405,794 expires on September 30, 2022. The expense limitation agreement may be terminated or amended prior to January 31, 2020, with the approval of the Board. FIMCO had previously entered into an expense limitation agreement with LDB to limit LDB’s total annual fund operating expenses (exclusive of interest expenses, taxes, brokerage commissions,
232
acquired fund fees and expenses, dividend costs related to short sales, and extraordinary expenses, such as litigation expenses, if any) to 1.05% of the average daily net assets on Class A shares, .75% of the average daily net assets on Advisor Class shares and .60% of the average daily net assets on Institutional Class shares. The agreement expired on January 31, 2018. FIMCO and LDB have agreed that any expenses of LDB assumed by FIMCO pursuant to this agreement be repaid to FIMCO by LDB within three years after the date the fee limitation and/or expense reimbursement has been made by FIMCO, provided that such repayment does not cause the expenses of LDB’s Class A shares, Advisor Class shares and Institutional Class shares to exceed the applicable expense ratio in place at the time the expenses are waived or assumed or the current limits established under the expense limitation agreement. For the period May 19, 2014 (commencement of operations) to January 31, 2018 (expiration of the expense limitation agreement), FIMCO assumed $894,488 under the terms of the agreement of which $143,148 expired on September 30, 2017, $179,140 expired on September 30, 2019, $224,276 expires on September 30, 2019, $274,706 expires on September 30, 2020, and $73,218 expires on September 30, 2021.
FIMCO had entered into an expense limitation agreement with the Covered Call Strategy Fund (“CCS”) to limit CCS’s total annual fund operating expenses (exclusive of interest expenses, taxes, brokerage commissions, acquired fund fees and expenses, dividend costs related to short sales, and extraordinary expenses, such as litigation expenses, if any) to 1.30% of the average daily net assets on Class A shares, .97% of the average daily net assets on Advisor Class shares and .84% of the average daily net assets on Institutional Class shares. The agreement expired on January 31, 2019. FIMCO and CCS have agreed that any expenses of CCS assumed by FIMCO pursuant to this agreement be repaid to FIMCO by CCS within three years after the date the fee limitation and/or expense reimbursement has been made by FIMCO, provided that such repayment does not cause the expenses of CCS’s Class A shares, Advisor Class shares and Institutional Class shares to exceed the applicable expense ratio in place at the time the expenses are waived or assumed or the current limits established under the expense limitation agreement. For the period ended March 31, 2019, CCS repaid FIMCO $76,010 under the terms of the agreement. For the period April 1, 2016 (commencement of operations) through January 31, 2019, (expiration of the expense limitation agreement), FIMCO assumed $304,868, of which CCS repaid $76,010, and under the terms of the agreement of which $54,491 expires on September 30, 2019, $137,941 expires on September 30, 2020 and $36,426 expires on September 30, 2021.
FIMCO had entered into an expense limitation agreement with the Hedged U.S. Equity Opportunities Fund (“HUSEO”) to limit HUSEO’s total annual fund operating expenses (exclusive of interest expenses, taxes, brokerage commissions, acquired fund fees and expenses, dividend costs related to short sales, and extraordinary expenses, such as litigation expenses, if any) to 1.75% of the average daily net assets on Class A shares, 1.42% of the average daily net assets on Advisor Class shares and 1.31% of the average daily net assets on Institutional Class shares. The agreement expired on January 31, 2019. FIMCO and HUSEO have agreed that any expenses of HUSEO assumed by FIMCO pursuant to this agreement be repaid to FIMCO by HUSEO within three years after the date the fee limitation and/or expense reimbursement
233
Notes to Financial Statements(continued)
FIRST INVESTORS INCOME FUNDS
FIRST INVESTORS EQUITY FUNDS
March 31, 2019
has been made by FIMCO, provided that such repayment does not cause the expenses of HUSEO’s Class A shares, Advisor Class shares and Institutional Class shares to exceed the applicable expense ratio in place at the time the expenses are waived or assumed or the current limits established under the expense limitation agreement. For the period ended March 31, 2019, HUSEO repaid $12,756 under terms of the agreement. For the period August 1, 2016 (commencement of operations) to January 31, 2019 (expiration of the expense limitation agreement), FIMCO assumed $274,086, of which HUSEO repaid $14,688 under the terms of the agreement and of which $44,567 expires on September 30, 2019 and $214,831 expires on September 30, 2020.
FIMCO has entered into an expense limitation agreement with the Premium Income Fund (“PIF”) on January 31, 2019, to limit PIF’s total annual fund operating expenses (exclusive of interest expenses, taxes, brokerage commissions, acquired fund fees and expenses, dividend costs related to short sales, and extraordinary expenses, such as litigation expenses, if any) to 1.30% of the average daily net assets on Class A shares, 1.06% of the average daily net assets on Advisor Class shares and .99% of the average daily net assets on Institutional Class shares. The agreement expires on January 31, 2020. During the period January 31, 2019 to March 31, 2019, FIMCO assumed $36,063 under the terms of the agreement of which expires on September 30, 2022. FIMCO and PIF have agreed that any expenses of PIF assumed by FIMCO pursuant to this agreement be repaid to FIMCO by PIF within three years after the date the fee limitation and/or expense reimbursement has been made by FIMCO, provided that such repayment does not cause the expenses of PIF’s Class A shares, Advisor Class shares and Institutional Class shares to exceed the applicable expense ratio in place at the time the expenses are waived or assumed or the current limits established under the expense limitation agreement. FIMCO had previously entered into an expense limitation agreement with PIF to limit PIF’s total annual fund operating expenses (exclusive of interest expenses, taxes, brokerage commissions, acquired fund fees and expenses, dividend costs related to short sales, and extraordinary expenses, such as litigation expenses, if any) to 1.30% of the average daily net assets on Class A shares, 1.02% of the average daily net assets on Advisor Class shares and .89% of the average daily net assets on Institutional Class shares. The agreement expired on January 31, 2019. FIMCO and PIF have agreed that any expenses of PIF assumed by FIMCO pursuant to this agreement be repaid to FIMCO by PIF within three years after the date the fee limitation and/or expense reimbursement has been made by FIMCO, provided that such repayment does not cause the expenses of PIF’s Class A shares, Advisor Class shares and Institutional Class shares to exceed the applicable expense ratio in place at the time the expenses are waived or assumed or the current limits established under the expense limitation agreement. For the period October 1, 2018 to January 31, 2019, FIMCO assumed $23,381 under the terms of the agreement. For the period April 2, 2018 (commencement of operations) to January 31, 2019 (expiration of the expense limitation agreement), FIMCO assumed $179,141 under the terms of the agreement of which $155,760 expires on September 30, 2021 and $23,381 expires on September 30, 2022.
For the six months ended March 31, 2019, FFS, as underwriter, received from the Income Funds and Equity Funds $789,753 and $7,591,280, respectively, in commissions in connection with the sale of shares of the Funds, after allowing $19,175 and $195,909, respectively, to other dealers.
234
For the six months ended March 31, 2019, shareholder servicing costs for the Income Funds and Equity Funds included $1,587,878 and $4,632,407, respectively, in transfer agent fees accrued to FIS, of which FIS voluntarily waived $23,917 on the Government Cash Management Fund.
Pursuant to Distribution Plans adopted under Rule 12b-1 of the 1940 Act, each Fund, other than the Government Cash Management Fund, is authorized to pay FFS a fee up to .30% (and for certain Funds, up to .25%) of the average daily net assets of the Class A shares and 1% of the average daily net assets of the Class B shares on an annualized basis each fiscal year, payable monthly. The Government Cash Management Fund is authorized to pay FFS a fee up to 1% of the average daily net assets of the Class B shares. The fee consists of a distribution fee and a service fee. The service fee is paid for the ongoing servicing of clients who are shareholders of that Fund. For the six months ended March 31, 2019, total distribution plan fees accrued to FFS by the Income Funds and Equity Funds amounted to $2,105,883 and $8,630,247, respectively.
Brandywine Global Investment Management, LLC, serves as investment subadviser to International Opportunities Bond Fund. Muzinich & Co., Inc. serves as investment subadviser to Floating Rate Fund and Fund For Income. Effective January 31, 2018, Muzinich & Co., Inc. serves as investment subadviser to Investment Grade Fund, Limited Duration Bond Fund and Total Return Fund. Ziegler Capital Management, LLC serves as investment subadviser to Covered Call Strategy Fund and Premium Income Fund. Wellington Management Company, LLP serves as investment subadviser to Hedged U.S. Equity Opportunities Fund. Vontobel Asset Management, Inc. serves as investment subadviser to International Fund. Smith Asset Management Group, L.P. serves as investment subadviser to Select Growth Fund. The subadvisers are paid by FIMCO and not by the Funds.
4. Restricted Securities—Certain restricted securities are exempt from the registration requirements under Rule 144A of the Securities Act of 1933 and may only be sold to qualified institutional investors. Unless otherwise noted, these 144A securities are deemed to be liquid. At March 31, 2019, Floating Rate Fund held ten 144A securities with an aggregate value of $8,596,884 representing 3.4% of the Fund’s net assets, Fund For Income held one hundred eighty 144A securities with an aggregate value of $326,896,752 representing 52.4% of the Fund’s net assets, International Opportunities Bond Fund held nine 144A securities with an aggregate value of $16,665,907 representing 10.6% of the Fund’s net assets, Investment Grade Fund held one hundred forty-five 144A securities with an aggregate value of $83,746,754 representing 13.8% of the Fund’s net assets, Limited Duration Bond Fund held one hundred nine 144A securities with an aggregate value of $75,543,005 representing 23.0% of the Fund’s net assets and Total Return Fund held one hundred twenty-seven 144A securities with an aggregate value of $41,291,636 representing 4.8% of the Fund’s net assets. These securities are valued as set forth in Note 1A. Certain restricted securities are exempt from the registration requirements under Regulation S of the Securities Act of 1933 and may only be sold to qualified investors. Unless otherwise noted, these Regulation S securities are deemed to be liquid. At March 31, 2019, International Opportunities Bond Fund held two Regulation S securities with an aggregate value of $5,816,608 representing 3.7% of the Fund’s net assets. These securities are valued as set forth in Note 1A.
235
Notes to Financial Statements(continued)
FIRST INVESTORS INCOME FUNDS
FIRST INVESTORS EQUITY FUNDS
March 31, 2019
5. Derivatives—Some of the Funds may invest in various derivatives. A derivative is a financial instrument which has a value that is based on – or “derived from” – the values of other assets, reference rates, or indices. The Funds may invest in derivatives for hedging purposes.
Derivatives may relate to a wide variety of underlying references, such as commodities, stocks, bonds, interest rates, currency exchange rates, and related indices. Derivatives include futures contracts and options on futures contracts, forward-commitment transactions, options on securities, caps, floors, collars, swap contracts, and other financial instruments. Some derivatives, such as futures contracts and certain options, are traded on U.S. commodity and securities exchanges, while other derivatives, such as swap contracts, are privately negotiated and entered into in the over-the-counter market (“OTC”). The risks associated with the use of derivatives are different from, and possibly greater than, the risks associated with investing directly in securities and other traditional investments.
The use of a derivative involves the risk that a loss may be sustained as a result of the insolvency or bankruptcy of the other party to the contract (usually referred to as a “counterparty”) or the failure of the counterparty to make required payments or otherwise comply with the terms of the contract. Additionally, the use of credit derivatives can result in losses if FIMCO, or a Fund’s subadviser, as applicable, does not correctly evaluate the creditworthiness of the issuer on which the credit derivative is based.
Derivatives may be subject to liquidity risk, which exists when a particular derivative is difficult to purchase or sell. If a derivative transaction is particularly large or if the relevant market is relatively illiquid (as is the case with many OTC derivatives), it may not be possible to initiate a transaction or liquidate a position at an advantageous time or price.
Derivatives may be subject to pricing or “basis” risk, which exists when a particular derivative becomes extraordinarily expensive relative to historical prices or the prices of corresponding cash market instruments. Under certain market conditions, it may not be economically feasible to initiate a transaction or liquidate a position in time to avoid a loss or take advantage of an opportunity.
Because many derivatives have leverage or borrowing components, adverse changes in the value or level of the underlying asset, reference rate, or index can result in a loss substantially greater than the amount invested in the derivative itself. Certain derivatives have the potential for unlimited loss, regardless of the size of the initial investment.
Like most other investments, derivative instruments are subject to the risk that the market value of the instrument will change in a way detrimental to the Funds’ interest. The Funds bear the risk that FIMCO will incorrectly forecast future market trends or the values of assets, reference rates, indices, or other financial or economic factors in establishing derivative positions for the Funds. If FIMCO attempts to use a derivative as a hedge against, or as a substitute for, a portfolio investment, the Funds will be exposed to the risk that the derivative will have or will develop an imperfect or no correlation with the portfolio investment. This could cause substantial losses
236
for the Funds. While hedging strategies involving derivative instruments can reduce the risk of loss, they can also reduce the opportunity for gain or even result in losses by offsetting favorable price movements in other investments. Many derivatives, in particular OTC derivatives, are complex and often valued subjectively. Improper valuations can result in increased cash payment requirements to counterparties or a loss of value to a Fund.
The following provides more information on specific types of derivatives and activity in the Funds.
Options Contracts—Some of the Funds may write covered call and put options on securities, derivative instruments, or currencies the Fund owns or in which it may invest. Writing put options tends to increase a Fund’s exposure to the underlying instrument. Writing call options tends to decrease a Fund’s exposure to the underlying instrument. When a Fund writes a call or put option, an amount equal to the premium received is recorded as a liability and subsequently marked to market to reflect the current value of the option written. These liabilities are reflected as written options outstanding in the Statement of Assets and Liabilities. Payments received or made, if any, from writing options with premiums to be determined on a future date are reflected as such on the Statement of Assets and Liabilities. Premiums received from writing options which expire are treated as realized gains. Premiums received from writing options which are exercised or closed are added to the proceeds or offset against amounts paid on the underlying future, swap, security or currency transaction to determine the realized gain or loss. A Fund, as a writer of an option, has no control over whether the underlying future, swap, security or currency may be sold (call) or purchased (put) and, as a result, bears the market risk of an unfavorable change in the price of the future, swap, security or currency underlying the written option. The risk exists that a Fund may not be able to enter into a closing transaction because of an illiquid market.
Some of the Funds may also purchase put and call options. Purchasing call options tends to increase a Fund’s exposure to the underlying instrument. Purchasing put options tends to decrease a Fund’s exposure to the underlying instrument. A Fund pays a premium which is included in its Statement of Assets and Liabilities as an investment and subsequently marked to market to reflect the current value of the option. Premiums paid for purchasing options which expire are treated as realized losses. The risk associated with purchasing put and call options is limited to the premium paid. Premiums paid for purchasing options which are exercised or closed are added to the amounts paid or offset against the proceeds on the underlying future, swap, security or currency transaction to determine the realized gain or loss.
237
Notes to Financial Statements(continued)
FIRST INVESTORS INCOME FUNDS
FIRST INVESTORS EQUITY FUNDS
March 31, 2019
The premium amount and the number of option contracts written or purchased by the Funds during the six months ended March 31, 2019, were as follows:
| | | Covered Call Strategy | | | Equity Income | | | Growth & Income | |
| | | Call Options | | | Call Options | | | Call Options | |
| | | Number of
Contracts | | | Premium
Amount | | | Number of
Contracts | | | Premium
Amount | | | Number of
Contracts | | | Premium
Amount | |
Options outstanding at September 30, 2018 | | | (37,287 | ) | | $ | (4,894,698 | ) | | | — | | | $ | — | | | | — | | | $ | — | |
Call options written | | | (119,341 | ) | | | (21,746,234 | ) | | | (1,050 | ) | | | (170,030 | ) | | | (1,380 | ) | | | (267,866 | ) |
Call options exercised | | | — | | | | — | | | | 200 | | | | 14,346 | | | | 430 | | | | 73,101 | |
Call options purchased to cover | | | 88,593 | | | | 14,401,560 | | | | — | | | | — | | | | — | | | | — | |
Call options expirations | | | 35,021 | | | | 4,671,993 | | | | 450 | | | | 83,687 | | | | 350 | | | | 67,726 | |
Options outstanding at March 31, 2019 | | | (33,014 | ) | | $ | (7,567,379 | ) | | | (400 | ) | | $ | (71,997 | ) | | | (600 | ) | | $ | (127,039 | ) |
| | | Hedged U.S. Equity Opportunities | | | Premium Income | |
| | | Put Options | | | Call Options | |
| | | Number of
Contracts | | | Premium
Amount | | | Number of
Contracts | | | Premium
Amount | | | Number of
Contracts | | | Premium
Amount | |
Options outstanding at September 30, 2018 | | | 177 | | | $ | 1,516,217 | | | | (132 | ) | | | (608,359 | ) | | | (13,818 | ) | | $ | (15,158,255 | ) |
Put options written | | | — | | | | — | | | | (184 | ) | | | (951,735 | ) | | | — | | | | — | |
Put options purchased to cover | | | — | | | | — | | | | 127 | | | | 724,529 | | | | — | | | | — | |
Put options written expirations | | | — | | | | — | | | | 23 | | | | 63,950 | | | | — | | | | — | |
Put options purchased | | | 184 | | | | 1,700,439 | | | | — | | | | — | | | | — | | | | — | |
Put options sold | | | (61 | ) | | | (705,485 | ) | | | — | | | | — | | | | — | | | | — | |
Put options purchased expired | | | (90 | ) | | | (761,533 | ) | | | — | | | | — | | | | — | | | | — | |
Call options written | | | — | | | | — | | | | — | | | | — | | | | (24,961 | ) | | | (32,851,406 | ) |
Call options exercised | | | — | | | | — | | | | — | | | | — | | | | 2,359 | | | | 2,683,965 | |
Call options purchased to cover | | | — | | | | — | | | | — | | | | — | | | | 16,409 | | | | 19,776,269 | |
Call options expirations | | | — | | | | — | | | | — | | | | — | | | | 262 | | | | 376,215 | |
Options outstanding at March 31, 2019 | | | 210 | | | $ | 1,749,638 | | | | (166 | ) | | $ | (771,615 | ) | | | (19,749 | ) | | $ | (25,173,212 | ) |
238
Derivative Investment Holdings Categorized by Risk Exposure—The following table sets forth the fair value and the location in the Statement of Assets and Liabilities of the Funds’ derivative contracts by primary risk exposure as of March 31, 2019:
| | | Asset derivatives | | Liability derivatives |
| Risk exposure category | | Statement of Assets
and Liabilities
location | | Value | | | Statement of Assets
and Liabilities
location | | Value | | | |
| Options Contracts: | | | | | | | | | | | | | | | |
| Covered Call Strategy | | N/A | | | N/A | | | Written options, at value | | $ | 11,533,087 | | | Purchased Options, at value | | | N/A | |
| Equity Income | | N/A | | | N/A | | | Written options, at value | | $ | 92,450 | | | Purchased Options, at value | | | N/A | |
| Growth & Income | | N/A | | | N/A | | | Written options, at value | | $ | 179,650 | | | Purchased Options, at value | | | N/A | |
| Hedged U.S. Equity Opportunities | | Purchased Options, at value | | $ | 1,232,430 | | | Written options, at value | | $ | 614,550 | | | Purchased Options, at value | | | N/A | |
| Premium Income | | N/A | | | N/A | | | Written options, at value | | $ | 26,905,763 | | | Purchased Options, at value | | | N/A | |
The following table sets forth the Funds’ realized gain (loss), as reflected in the Statement of Operations, by primary risk exposure and by type of derivative contract for the six months ended March 31, 2019:
Risk exposure category | | Written options | | | Purchased options | |
Options Contracts: | | | | | | | | |
Covered Call Strategy | | $ | (83,741 | ) | | | N/A | |
Equity Income | | $ | 83,687 | | | | N/A | |
Growth & Income | | $ | 67,727 | | | | N/A | |
Hedged U.S. Equity Opportunities | | $ | 528,958 | | | $ | (1,191,623 | ) |
Premium Income | | $ | 3,632,730 | | | | N/A | |
The following table sets forth the Funds’ change in unrealized appreciation (depreciation) by primary risk exposure and by type of derivative contract for the six months ended March 31, 2019:
Risk exposure category | | Written options | | | Purchased options | |
Options Contracts: | | | | | | | | |
Covered Call Strategy | | $ | (3,966,842 | ) | | | N/A | |
Equity Income | | $ | (20,453 | ) | | | N/A | |
Growth & Income | | $ | (52,612 | ) | | | N/A | |
Hedged U.S. Equity Opportunities | | $ | (136,350 | ) | | $ | 373,679 | |
Premium Income | | $ | (407,356 | ) | | | N/A | |
239
Notes to Financial Statements(continued)
FIRST INVESTORS INCOME FUNDS
FIRST INVESTORS EQUITY FUNDS
March 31, 2019
Futures Contracts—The Funds may enter into futures contracts including interest rate futures contracts and index futures, including futures on equity market indices and debt market indices. A futures contract is an agreement between two parties to buy or sell a specified underlying instrument for a fixed price at a specified future date. The Funds may use futures contracts to manage exposure to the stock market. Upon entering into a futures contract, a fund is required to deposit either cash or securities (initial margin) with a clearing broker in an amount equal to a certain percentage of the face value of the contract. Futures contracts are marked-to-market daily and subsequent daily payments (variation margin) are made or received by a fund depending on the daily fluctuations in the value of the futures contracts and are recorded as unrealized appreciation or (depreciation). This receivable and/or payable, if any, is included in daily variation margin on futures contracts in the Statement of Assets and Liabilities. Realized gain or (loss) is recorded upon the expiration or closing of a futures contract. The net realized gain (loss) and change in net unrealized appreciation (depreciation) on futures contracts during the period is presented in the Statement of Operations. Any open futures contracts at period end are presented in the Schedule of Investments under the caption “Futures Contracts”. The notional amount at value reflects each contract’s exposure to the underlying instrument or index at period end.
The Funds may enter into interest rate futures contracts on U.S. Treasury obligations and options thereon that are traded on a U.S. exchange. An interest rate futures contract provides for the future sale by one party and the purchase by another party of a specified amount of a particular financial instrument (debt security) at a specified price, date, time and place. Such investments may be used for, among other purposes, the purpose of hedging against changes in the value of a Fund’s portfolio securities due to anticipated changes in interest rates and market conditions. A public market exists for interest rate futures contracts covering a number of debt securities, including long-term U.S. Treasury Bonds, 10-year U.S. Treasury Notes and three-month U.S. Treasury Bills. No price is paid upon entering into futures contracts. Instead, upon entering into a futures contract, a Fund is required to deposit with its custodian in a segregated account in the name of the futures broker through which the transaction is effected an amount of cash or U.S. Government securities generally equal to 3%-5% or less of the contract value. This amount is known as “initial margin.”
An option on an interest rate futures contract generally gives the purchaser the right, in return for the premium paid, to assume a position in a futures contract at a specified exercise price at any time prior to the expiration date of the option. The Funds may purchase put and call options on interest rate futures contracts on U.S. Treasury obligations which are traded on a U.S. exchange as a hedge against changes in interest rates, and may enter into closing transactions with respect to such options to terminate existing positions. There is no guarantee such closing transactions can be effected. When writing a call or put option on a futures contract, margin also must be deposited in accordance with applicable exchange rules. Initial margin on futures contracts is in the nature of a performance bond or good-faith deposit that is returned to a Fund upon termination of the transaction, assuming all obligations have been satisfied. Under certain circumstances, such as periods of high volatility, a Fund may be required by an exchange to increase the level of its initial margin payment. Subsequent payments, called “variation margin,” to and from the broker, are made on a daily basis as the value of the futures position varies, a
240
process known as “marking to market.” Variation margin does not involve borrowing to finance the futures transactions, but rather represents a daily settlement of a Fund’s obligation to or from a clearing organization. A Fund is also obligated to make initial and variation margin payments when it writes options on futures contracts.
To the extent that a Fund participates in the futures or options markets, it will incur investment risks and transaction costs to which it would not be subject absent the use of these strategies. The use of these strategies involves certain special risks, including: (1) dependence on the ability of the Funds’ investment adviser, FIMCO, or a Fund’s subadviser, as applicable, to predict correctly movements in the direction of interest rates and securities prices; (2) imperfect correlation between the price of futures contracts and options thereon and movements in the prices of the securities or currencies being hedged; (3) the fact that skills needed to use these strategies are different from those needed to select portfolio securities; (4) the leverage (if any) that is created by investing in the option or futures contract; and (5) the possible absence of a liquid secondary market for any particular instrument at any time. If FIMCO’s, or a Fund’s subadviser, as applicable, prediction of movements in the direction of the securities and interest rate markets is inaccurate, the adverse consequences to that Fund may leave it in a worse position than if such strategies were not used. Derivatives may be difficult to sell, unwind or value.
The following table summarizes the value of the Funds’ futures contracts held as of March 31, 2019 and the related location in the Statement of Assets and Liabilities:
| | | Statement of Assets
and Liabilities | |
Futures Contracts | | Unrealized
depreciation on
futures contracts | |
Hedged U.S. Equity Opportunities | | $ | (480,679 | ) |
The amount of unrealized appreciation (depreciation) on futures contracts recognized by the Funds in the accompanying Statement of Operations for the six months ended March 31, 2019 are summarized in the following table:
| | | Statement of
Operations Location | |
Futures Contracts | | Unrealized
depreciation on
futures contracts | |
Hedged U.S. Equity Opportunities | | $ | (321,967 | ) |
241
Notes to Financial Statements(continued)
FIRST INVESTORS INCOME FUNDS
FIRST INVESTORS EQUITY FUNDS
March 31, 2019
The following table summarizes the value of the Funds’ futures contracts held as of March 31, 2019, and the related location in the accompanying Statement of Operations.
| | | Statement of
Operations | |
Futures Contracts | | Realized gain on
futures contracts | |
Hedged U.S. Equity Opportunities | | $ | 1,940,561 | |
Foreign Exchange Contracts—The International Opportunities Bond Fund, Global Fund and Hedged U.S. Equity Opportunities Fund may enter into foreign exchange contracts for the purchase or sale of foreign currencies at negotiated rates at future dates. These contracts are considered derivative instruments and a Fund may invest in them in order to hedge its currency exposure in bond positions or to gain currency exposure held by the Fund. A Fund could be exposed to risk if counterparties to the contracts are unable to meet the terms of their contracts or if the value of the foreign currency changes unfavorably. Foreign exchange contracts are “marked-to-market” daily at the applicable translation rate and the resulting unrealized gains and losses are reflected in the Funds’ assets. During the period, the Funds used currency forwards to hedge currency exposure from certain bonds as well as to gain currency exposure in certain countries.
Disclosures about Offsetting Assets and Liabilities—Disclosures about Offsetting Assets and Liabilities requires an entity to disclose information about offsetting and related arrangements to enable users of its financial statements to understand the effect of those arrangements on its financial position. The guidance requires retrospective application for all comparative periods presented.
A Fund may mitigate credit risk with respect to OTC derivative counterparties through credit support annexes included with an International Swaps and Derivatives Association, Inc. Master Agreements or other Master Netting Agreements which are the standard contracts governing most derivative transactions between the Fund and each of its counterparties. These agreements may allow the Fund and each counterparty to offset certain derivative financial instruments’ payables and/or receivables against each other and/or with collateral, which is generally held by the Fund’s custodian. The amount of collateral moved to/from applicable counterparties is based upon minimum transfer amounts specified in the agreement. To the extent amounts due to the Fund from its counterparties are not fully collateralized contractually or otherwise, the Fund bears the risk of loss from counterparty non-performance.
The Funds’ Statement of Assets and Liabilities (“SOAL”) presents financial instruments on a gross basis, therefore there are no net amounts and no offset amounts within the SOAL to present
242
below. Gross amounts of the financial instruments, amounts related to financial instruments/cash collateral not offset in the SOAL and net amounts are presented below:
International Opportunities Bond
Description/Financial
Instrument/Statement of
Assets and Liabilities Category | Counterparty | | Gross Amounts
Presented in
Statement of Assets
and Liabilities | | | Financial
Instruments* | | | Net Amount | |
Unrealized appreciation on foreign exchange contracts | CITI | | $ | 24,058 | | | $ | (24,058 | ) | | $ | — | |
| | HSBC | | | 159,073 | | | | (159,073 | ) | | | — | |
| | MS | | | 20,846 | | | | (11,558 | ) | | | 9,288 | |
| | Total | | $ | 203,977 | | | $ | (194,689 | ) | | $ | 9,288 | |
Unrealized depreciation on foreign exchange contracts | BCI | | $ | (41,846 | ) | | $ | — | | | $ | (41,846 | ) |
| | CITI | | | (228,446 | ) | | | 24,058 | | | | (204,388 | ) |
| | GS | | | (132,913 | ) | | | — | | | | (132,913 | ) |
| | HSBC | | | (801,598 | ) | | | 159,073 | | | | (642,525 | ) |
| | JPM | | | (81,437 | ) | | | — | | | | (81,437 | ) |
| | MS | | | (11,558 | ) | | | 11,558 | | | | — | |
| | Total | | $ | (1,297,798 | ) | | $ | 194,689 | | | $ | (1,103,109 | ) |
Hedged U.S. Equity Opportunities
Description/Financial
Instrument/Statement of
Assets and Liabilities Category | Counterparty | | Gross Amounts
Presented in
Statement of Assets
and Liabilities | | | Financial
Instruments* | | | Net Amount | |
Unrealized appreciation on foreign exchange contracts | MS | | $ | 285 | | | $ | — | | | $ | 285 | |
| | GS | | | 1,517 | | | | — | | | | 1,517 | |
| | Total | | $ | 1,802 | | | $ | — | | | $ | 1,802 | |
* | Amounts related to master netting arrangements (for example, ISDA) which have been determined by the Fund to be legally enforceable in the event of default and where certain other criteria are met in accordance with applicable offsetting accounting guidance. |
A summary of abbreviations for counterparties appear at the end of the Portfolio of Investments for the respective Funds.
243
Notes to Financial Statements(continued)
FIRST INVESTORS INCOME FUNDS
FIRST INVESTORS EQUITY FUNDS
March 31, 2019
During the six months ended March 31, 2019, the volume of derivative activity for the Funds based on average monthly market values for forward foreign currency contracts (to buy) and for forward foreign currency contracts (to sell) were as follows:
| | | Forward Foreign Currency Contracts | |
| | | to Buy | | | to Sell | |
International Opportunities Bond | | $ | 62,702,238 | | | $ | 7,103,868 | |
Hedged U.S. Equity Opportunities | | | — | | | | 247,731 | |
Fair Value of Derivative Instruments—The fair value of derivative instruments held by the Funds as of March 31, 2019, was as follows:
| | | Assets Derivatives | | | Liability Derivatives | |
Derivatives not
accounted for as hedging
instruments under ASC 815 | | Statements of Assets
and Liabilities Location | | | Statements of Assets
and Liabilities Location | |
Foreign exchange and
futures contracts: | | Unrealized
appreciation on
foreign exchange
contracts | | | Value | | | Unrealized
depreciation on
foreign exchange
contracts | | | Value | |
International Opportunities Bond | | | | | | $ | 203,977 | | | | | | | $ | (1,297,798 | ) |
Hedged U.S. Equity Opportunities | | | | | | $ | 1,802 | | | | | | | $ | — | |
The effect of the Funds’ derivative instruments on the Statement of Operations are as follows:
Amount of Realized Gain or Loss Recognized on Derivatives | | | | |
Derivatives not accounted for as hedging instruments under ASC 815 | | Net Realized
Gain (Loss) on
Foreign Exchange
Transactions | |
Foreign exchange transactions: | | | | |
International Opportunities Bond | | $ | (900,253 | ) |
Global | | $ | (294,625 | ) |
Hedged U.S. Equity Opportunities | | $ | 5,084 | |
International | | $ | (31,861 | ) |
244
Amount of Change in Unrealized Appreciation or Depreciation Recognized on Derivatives |
Derivatives not accounted for as hedging instruments under ASC 815 | | Net Unrealized
Depreciation on
Foreign Exchange
Transactions | |
Foreign exchange transactions: | | | | |
International Opportunities Bond | | $ | (868,055 | ) |
Global | | $ | (10,266 | ) |
Hedged U.S. Equity Opportunities | | $ | (3,381 | ) |
International | | $ | (5,938 | ) |
6. High Yield Credit Risk—The investments in high yield securities of Floating Rate Fund, Fund For Income, Investment Grade Fund, Limited Duration Bond Fund and Total Return Fund, whether rated or unrated, may be considered speculative and subject to greater market fluctuations and risks of loss of income and principal than lower-yielding, higher-rated, fixed-income securities. The risk of loss due to default by the issuer may be significantly greater for holders of high-yielding securities, because such securities are generally unsecured and are often subordinated to other creditors of the issuer.
7. Capital—The Trusts are authorized to issue an unlimited number of shares of beneficial interest without par value. The Trusts consist of the Funds listed on the cover page, each of which is a separate and distinct series of the Trusts. Each Fund has designated four classes of shares, Class A, Class B, Advisor Class and Institutional Class shares (each, a “Class”) except for Government Cash Management Fund which has designated only Class A, Class B and Institutional Class shares, Strategic Income Fund which has designated only Class A and Advisor Class shares and Floating Rate Fund, International Opportunities Bond Fund, Limited Duration Bond Fund, Covered Call Strategy Fund, Hedged U.S. Equity Opportunities Fund and Premium Income Fund, which have designated only Class A, Advisor Class and Institutional Class shares. Advisor Class and Institutional Class shares became available for sale to the public, for those Funds in existence at the time, in May 2013 and October 2013, respectively. Not all classes of shares of each Fund may be available in all jurisdictions. Effective February 1, 2019, class B shares are no longer offered for sale to the public. Each share of each Class has an equal beneficial interest in the assets, has identical voting, dividend, liquidation and other rights and is subject to the same terms and conditions except that expenses allocated to a Class may be borne solely by that Class as determined by the Board and a Class may have exclusive voting rights with respect to matters affecting only that Class. Government Cash Management Fund’s Class A, Class B and Institutional Class shares are sold without an initial sales charge; however, its Class B shares may only be acquired through an exchange of Class B shares from another First Investors eligible Fund or through the reinvestment of dividends on Class B shares and are generally subject to a contingent deferred sales charge at the rate of 4% in the first year and declining to 0% over a six-year period, which is payable to FFS as underwriter of the Trusts. The shares sold by the other Funds have a public offering price that reflects different sales charges and expense levels. Class A shares are sold with an initial sales charge of up to 4% for the First
245
Notes to Financial Statements(continued)
FIRST INVESTORS INCOME FUNDS
FIRST INVESTORS EQUITY FUNDS
March 31, 2019
Investors Income Funds, except for Floating Rate Fund and Limited Duration Bond Fund which have an initial sales charge of up to 2.5% (effective June 12, 2017, the maximum sales charge on Class A shares was changed from 5.75% to 4% on the Income Funds, except for Floating Rate Fund and Limited Duration Bond Fund which was changed to 2.5%) and 5.75% for the First Investors Equity Funds and together with the Class B shares are subject to distribution plan fees as described in Note 3. Class B shares are sold without an initial sales charge, but are generally subject to a contingent deferred sales charge which declines in steps from 4% to 0% over a six-year period. Class B shares automatically convert into Class A shares after eight years. There are no sales charges associated with the purchase of Advisor Class and Institutional Class shares. Realized and unrealized gains or losses, investment income and expenses (other than distribution plan fees and shareholder servicing costs) are allocated daily to each class of shares based upon the relative proportion of net assets to each class.
Effective on or about June 14, 2019, the issued and outstanding Class B shares of each Fund will convert to Class A shares without the imposition of any front-end or deferred sales load, fees or other charges. If you are a shareholder of Class B shares on that date, your Class B shares will automatically convert to Class A shares on the basis of their relative net asset value per share. This conversion is not expected to be a taxable event for shareholders and the aggregate tax basis of your Class A shares will be the same as the aggregate tax basis of the Class B shares being converted. You should consult your tax adviser for any tax-related questions you may have. Any applicable Contingent Deferred Sales Charges (CDSC) will not be applied on Class B share redemptions effective as of May 31, 2019. Following the conversion of the Funds’ Class B shares, Class B shares will be terminated. Accordingly, on or about June 14, 2019, all references to Class B shares in the Prospectuses, Summary Prospectuses and Statement of Additional Information are hereby deleted.
8. Litigation—The Blue Chip and Equity Income Funds have been named, and have received notice that they may be putative members of the proposed defendant class of shareholders, in a lawsuit filed in the United States Bankruptcy Court for the District of Delaware on November 1, 2010, by the Official Committee of Unsecured Creditors of Tribune Company (the “Committee”). The Committee is seeking to recover all payments made to beneficial owners of common stock in connection with a leveraged buyout of the Tribune Company (“LBO”), including payments made in connection with a 2007 tender offer into which the Blue Chip and Equity Income Funds tendered their shares of common stock of the Tribune Company. On December 9, 2011, the Blue Chip Fund was reorganized into the Growth & Income Fund pursuant to a Plan of Reorganization and Termination, whereby all of the assets of the Blue Chip Fund were transferred to the Growth & Income Fund, the Growth & Income Fund assumed all of the liabilities of the Blue Chip Fund, including any contingent liabilities with respect to pending or threatened litigation or actions, and shareholders of Blue Chip Fund became shareholders of Growth & Income Fund. The adversary proceeding brought by the Committee has been transferred to the Southern District of New York and administratively consolidated with other similar suits as discussed below. In addition, on June 2, 2011, the Blue Chip and Equity Income Funds were named as defendants in a lawsuit brought in connection with the Tribune Company’s LBO by Deutsche Bank Trust Company Americas, in its capacity as successor indenture
246
trustee for a certain series of Senior Notes, Law Debenture Trust Company of New York, in its capacity as successor indenture trustee for a certain series of Senior Notes, and Wilmington Trust Company, in its capacity as successor indenture trustee for the PHONES Notes (together, the “Bondholder Plaintiffs”) in the Supreme Court of the State of New York. The Blue Chip and Equity Income Funds have also been named in a similar suit filed on behalf of participants in Tribune defined-compensation plans (the “Retiree Plaintiffs”). As with the Bondholder Plaintiffs and the Committee, the Retiree Plaintiffs seek to recover payments of the proceeds of the LBO. (All of these suits have been removed to the United States District Court for the Southern District of New York and administratively consolidated with other substantially similar suits against other former Tribune shareholders (the “MDL Proceeding”)). On September 23, 2013, the Judge in the MDL Proceeding dismissed various state law constructive fraudulent transfer suits, resulting in the Funds being dismissed from the Bondholder and Retiree Plaintiffs’ actions. On September 30, 2013, counsel for the plaintiffs in those suits appealed the MDL Judge’s dismissal ruling to the Second Circuit. On March 24, 2016, the Second Circuit Court of Appeals affirmed the MDL Judge’s dismissal of the various state law constructive fraudulent transfer suits. In September 2016, the Bondholder and Retiree Plaintiffs petitioned the U.S. Supreme Court to review the Second Circuit’s decision. The Supreme Court has not yet ruled on that request. On January 9, 2017, the Tribune MDL judge granted the defendants’ motion to dismiss the Committee lawsuit alleging a single claim for intentional fraudulent transfer. An appeal of that decision to the Second Circuit is expected, but has not yet been made. The extent of the Funds’ potential liability in any such actions has not been determined. The Funds have been advised by counsel that the Funds could be held liable to return all or part of the proceeds received in any of these actions, as well as interest and court costs, even though the Funds had no knowledge of, or participation in, any misconduct. The Equity Income Fund received proceeds of $1,526,566 in connection with the LBO, representing 0.26% of its net assets as of March 31, 2019. The Blue Chip Fund received proceeds of $790,772 in connection with the LBO, representing 0.05% of the net assets of Growth & Income Fund as of March 31, 2019. The Equity Income and Growth & Income Funds cannot predict the outcomes of these proceedings, and thus have not accrued any of the amounts sought in the various actions in the accompanying financial statements.
9. Matters to be Submitted to a Vote by Shareholders—On April 9, 2019, The Independent Order of Foresters, the ultimate parent company of Foresters Investment Management Company, Inc. (“FIMCO”), which is the investment adviser to the separate series of the First Investors Income Funds, First Investors Equity Funds, First Investors Tax Exempt Funds and First Investors Life Series Funds (the “Funds”), Foresters Financial Services, Inc. (“FFS”), which is the Funds’ distributor, and Foresters Investor Services, Inc. (“FIS”), which is the Funds’ transfer agent, announced that it has entered into the two definitive purchase agreements described below that, once completed, will result in the sale of its U.S. North American Asset Management businesses.
First, FIMCO has entered into an Asset Purchase Agreement with Macquarie Management Holdings, Inc. (“Macquarie”) whereby Macquarie, a global investment management firm headquartered in Philadelphia, Pennsylvania, will purchase FIMCO’s assets related to the mutual fund management business, including the Funds (the “Transaction”). The Transaction is not
247
Notes to Financial Statements(continued)
FIRST INVESTORS INCOME FUNDS
FIRST INVESTORS EQUITY FUNDS
March 31, 2019
expected to result in any material changes to the Funds’ investment objectives and principal investment strategies. However, upon the completion of the Transaction, Macquarie expects that each Fund will be reorganized into a substantially similar fund that is managed by Delaware Management Company, a subsidiary of Macquarie (the “Reorganizations”). The Transaction is expected to be completed during the fourth calendar quarter of 2019, pending the satisfaction of certain closing conditions and approvals, including approvals of the Reorganizations by the Funds’ Board of Trustees and Fund shareholders at a special shareholder meeting.
Second, FFS and Foresters Advisory Services, LLC (“FAS”) has entered into an Asset Purchase Agreement with Cetera Financial Group, Inc. (“Cetera”), a U.S.-based wealth management firm headquartered in Denver, Colorado, whereby Cetera will purchase FFS’ retail brokerage business and FAS’ retail advisory business. This transaction is expected to be completed in the second calendar quarter of 2019.
Shareholders will receive a forthcoming proxy statement.
10. Subsequent Events—Subsequent events occurring after March 31, 2019 have been evaluated for potential impact to this report through the date the financial statements were issued. There were no subsequent events to report that would have a material impact on the Funds’ financial statements.
248
This page left intentionally blank.
249
Financial Highlights
FIRST INVESTORS INCOME FUNDS
The following table sets forth the per share operating performance data for a share outstanding, total return, ratios to average net assets and other supplemental data for each fiscal year ended September 30 unless otherwise indicated.
| | | P E R S H A R E D A T A |
| | | | | | | Investment Operations | | Less Distributions from | | | | |
| | Net Asset Value, Beginning of Period/ Year | | | Net Investment Income(c) | | | Net Realized and Unrealized Gain (Loss) on Investments | | | Total From Investment Operations | | | Net Investment Income | | | Net Realized Gain | | | Total Distributions | | | Net Asset Value, End of Period/ Year | |
FLOATING RATE FUND | | | | | | | | | | | | | | | | | | |
Class A | | | | | | | | | | | | | | | | | | |
2014(h) | | $ | 10.00 | | | $ | .21 | | | $ | (.10 | ) | | $ | .11 | | | $ | .23 | | | | — | | | $ | .23 | | | $ | 9.88 | |
2015 | | | 9.88 | | | | .26 | | | | (.27 | ) | | | (.01 | ) | | | .29 | | | | — | | | | .29 | | | | 9.58 | |
2016 | | | 9.58 | | | | .27 | | | | .09 | | | | .36 | | | | .28 | | | | — | | | | .28 | | | | 9.66 | |
2017 | | | 9.66 | | | | .27 | | | | .05 | | | | .32 | | | | .31 | | | | — | | | | .31 | | | | 9.67 | |
2018 | | | 9.67 | | | | .32 | | | | .04 | | | | .36 | | | | .32 | | | | — | | | | .32 | | | | 9.71 | |
2019(i) | | | 9.71 | | | | .18 | | | | (.16 | ) | | | .02 | | | | .19 | | | | — | | | | .19 | | | | 9.54 | |
Advisor Class | | | | | | | | | | | | | | | | | | |
2014(h) | | | 10.00 | | | | .25 | | | | (.11 | ) | | | .14 | | | | .26 | | | | — | | | | .26 | | | | 9.88 | |
2015 | | | 9.88 | | | | .28 | | | | (.26 | ) | | | .02 | | | | .32 | | | | — | | | | .32 | | | | 9.58 | |
2016 | | | 9.58 | | | | .29 | | | | .08 | | | | .37 | | | | .30 | | | | — | | | | .30 | | | | 9.65 | |
2017 | | | 9.65 | | | | .26 | | | | .09 | | | | .35 | | | | .32 | | | | — | | | | .32 | | | | 9.68 | |
2018 | | | 9.68 | | | | .34 | | | | .04 | | | | .38 | | | | .34 | | | | — | | | | .34 | | | | 9.72 | |
2019(i) | | | 9.72 | | | | .19 | | | | (.16 | ) | | | .03 | | | | .20 | | | | — | | | | .20 | | | | 9.55 | |
Institutional Class | | | | | | | | | | | | | | | | | |
2014(h) | | | 10.00 | | | | .27 | | | | (.13 | ) | | | .14 | | | | .28 | | | | — | | | | .28 | | | | 9.86 | |
2015 | | | 9.86 | | | | .30 | | | | (.25 | ) | | | .05 | | | | .34 | | | | — | | | | .34 | | | | 9.57 | |
2016 | | | 9.57 | | | | .31 | | | | .08 | | | | .39 | | | | .32 | | | | — | | | | .32 | | | | 9.64 | |
2017 | | | 9.64 | | | | .26 | | | | .11 | | | | .37 | | | | .34 | | | | — | | | | .34 | | | | 9.67 | |
2018 | | | 9.67 | | | | .36 | | | | .04 | | | | .40 | | | | .36 | | | | — | | | | .36 | | | | 9.71 | |
2019(i) | | | 9.71 | | | | .20 | | | | (.16 | ) | | | .04 | | | | .21 | | | | — | | | | .21 | | | | 9.54 | |
250
See notes to financial statements
R A T I O S / S U P P L E M E N T A L D A T A | |
| | | | | | | | | Ratio to Average Net Assets** | | Ratio to Average Net Assets Before Expenses Waived or Assumed | | | | |
Total Return* | | | Net Assets End of Period/ Year (in thousands) | | | Net Expenses After Fee Credits | | | Net Expenses Before Fee Credits*** | | | Net Investment Income | | | Expenses*** | | | Net Investment Income | | | Portfolio Turnover Rate | |
| | | | | | | | | | | | | | | | | | | | | | | | | | | | | | | |
| | | | | | | | | | | | | | | | | | | | | | | | | | | | | | | |
| | 1.12 | %†† | | $ | 50,361 | | | | 1.10 | %† | | | 1.10 | %† | | | 2.21 | %† | | | 1.58 | %† | | | 1.73 | %† | | | 26 | %†† |
| | (.08 | ) | | | 57,101 | | | | 1.10 | | | | 1.10 | | | | 2.72 | | | | 1.33 | | | | 2.49 | | | | 49 | |
| | 3.69 | | | | 61,243 | | | | 1.10 | | | | 1.10 | | | | 2.86 | | | | 1.27 | | | | 2.69 | | | | 38 | |
| | 3.47 | | | | 66,769 | | | | 1.10 | | | | 1.10 | | | | 2.90 | | | | 1.24 | | | | 2.76 | | | | 89 | |
| | 3.83 | | | | 68,567 | | | | 1.10 | | | | 1.10 | | | | 3.25 | | | | 1.21 | | | | 3.14 | | | | 60 | |
| | .25 | †† | | | 70,502 | | | | 1.10 | † | | | 1.10 | † | | | 3.96 | † | | | 1.20 | † | | | 3.86 | † | | | 29 | †† |
| | | | | | | | | | | | | | | | | | | | | | | | | | | | | | | |
| | 1.43 | †† | | | 34,942 | | | | .90 | † | | | .90 | † | | | 2.63 | † | | | .95 | † | | | 2.58 | † | | | 26 | †† |
| | .18 | | | | 50,122 | | | | .90 | | | | .90 | | | | 2.92 | | | | 1.03 | | | | 2.79 | | | | 49 | |
| | 3.92 | | | | 61,844 | | | | .90 | | | | .90 | | | | 3.06 | | | | .98 | | | | 2.98 | | | | 38 | |
| | 3.70 | | | | 98,958 | | | | .90 | | | | .90 | | | | 3.07 | | | | .92 | | | | 3.05 | | | | 89 | |
| | 4.03 | | | | 144,799 | | | | .90 | | | | .90 | | | | 3.46 | | | | .86 | | | | 3.50 | | | | 60 | |
| | .35 | †† | | | 159,109 | | | | .90 | † | | | .90 | † | | | 4.16 | † | | | .88 | † | | | 4.18 | † | | | 29 | †† |
| | | | | | | | | | | | | | | | | | | | | | | | | | | | | | | |
| | 1.36 | †† | | | 5,329 | | | | .70 | † | | | .70 | † | | | 2.76 | † | | | 1.06 | † | | | 2.40 | † | | | 26 | †† |
| | .47 | | | | 10,458 | | | | .70 | | | | .70 | | | | 3.17 | | | | .90 | | | | 2.97 | | | | 49 | |
| | 4.14 | | | | 11,456 | | | | .70 | | | | .70 | | | | 3.27 | | | | .83 | | | | 3.14 | | | | 38 | |
| | 3.87 | | | | 21,277 | | | | .70 | | | | .70 | | | | 3.23 | | | | .80 | | | | 3.13 | | | | 89 | |
| | 4.20 | | | | 32,019 | | | | .70 | | | | .70 | | | | 3.68 | | | | .75 | | | | 3.63 | | | | 60 | |
| | .47 | †† | | | 26,472 | | | | .74 | † | | | .74 | † | | | 4.32 | † | | | .77 | † | | | 4.29 | † | | | 29 | †† |
251
Financial Highlights(continued)
FIRST INVESTORS INCOME FUNDS
| | | P E R S H A R E D A T A | |
| | | | | | | Investment Operations | | Less Distributions from | | | | | | | | |
| | Net Asset Value, Beginning of Period/ Year | | | Net Investment Income(c) | | | Net Realized and Unrealized Gain (Loss) on Investments | | | Total From Investment Operations | | | Net Investment Income | | | Net Realized Gain | | | Total Distributions | | | Net Asset Value, End of Period/ Year | |
FUND FOR INCOME | | | | | | | | | | | | | | |
Class A | | | | | | | | | | | | | | | | | | |
2014 | | $ | 2.59 | | | $ | .12 | | | $ | .02 | | | $ | .14 | | | $ | .14 | | | | — | | | $ | .14 | | | $ | 2.59 | |
2015 | | | 2.59 | | | | .11 | | | | (.18 | ) | | | (.07 | ) | | | .13 | | | | — | | | | .13 | | | | 2.39 | |
2016 | | | 2.39 | | | | .11 | | | | .10 | | | | .21 | | | | .12 | | | | — | | | | .12 | | | | 2.48 | |
2017 | | | 2.48 | | | | .11 | | | | .05 | | | | .16 | | | | .12 | | | | — | | | | .12 | | | | 2.52 | |
2018 | | | 2.52 | | | | .11 | | | | (.06 | ) | | | .05 | | | | .13 | | | | — | | | | .13 | | | | 2.44 | |
2019(i) | | | 2.44 | | | | .05 | | | | — | | | | .05 | | | | .06 | | | | — | | | | .06 | | | | 2.43 | |
Class B | | | | | | | | | | | | | | | | |
2014 | | | 2.59 | | | | .10 | | | | .02 | | | | .12 | | | | .12 | | | | — | | | | .12 | | | | 2.59 | |
2015 | | | 2.59 | | | | .09 | | | | (.18 | ) | | | (.09 | ) | | | .11 | | | | — | | | | .11 | | | | 2.39 | |
2016 | | | 2.39 | | | | .09 | | | | .10 | | | | .19 | | | | .10 | | | | — | | | | .10 | | | | 2.48 | |
2017 | | | 2.48 | | | | .10 | | | | .05 | | | | .15 | | | | .10 | | | | — | | | | .10 | | | | 2.53 | |
2018 | | | 2.53 | | | | .09 | | | | (.06 | ) | | | .03 | | | | .11 | | | | — | | | | .11 | | | | 2.45 | |
2019(i) | | | 2.45 | | | | .04 | | | | (.01 | ) | | | .03 | | | | .05 | | | | — | | | | .05 | | | | 2.43 | |
Advisor Class | | | | | | | | | | | | | | | | | | |
2014 | | | 2.59 | | | | .12 | | | | .02 | | | | .14 | | | | .14 | | | | — | | | | .14 | | | | 2.59 | |
2015 | | | 2.59 | | | | .12 | | | | (.18 | ) | | | (.06 | ) | | | .14 | | | | — | | | | .14 | | | | 2.39 | |
2016 | | | 2.39 | | | | .12 | | | | .10 | | | | .22 | | | | .13 | | | | — | | | | .13 | | | | 2.48 | |
2017 | | | 2.48 | | | | .12 | | | | .05 | | | | .17 | | | | .13 | | | | — | | | | .13 | | | | 2.52 | |
2018 | | | 2.52 | | | | .12 | | | | (.07 | ) | | | .05 | | | | .13 | | | | — | | | | .13 | | | | 2.44 | |
2019(i) | | | 2.44 | | | | .06 | | | | — | | | | .06 | | | | .07 | | | | — | | | | .07 | | | | 2.43 | |
Institutional Class | | | | | | | | | | | | | | |
2014 | | | 2.60 | | | | .13 | | | | .02 | | | | .15 | | | | .15 | | | | — | | | | .15 | | | | 2.60 | |
2015 | | | 2.60 | | | | .12 | | | | (.17 | ) | | | (.05 | ) | | | .15 | | | | — | | | | .15 | | | | 2.40 | |
2016 | | | 2.40 | | | | .12 | | | | .10 | | | | .22 | | | | .13 | | | | — | | | | .13 | | | | 2.49 | |
2017 | | | 2.49 | | | | .13 | | | | .05 | | | | .18 | | | | .13 | | | | — | | | | .13 | | | | 2.54 | |
2018 | | | 2.54 | | | | .12 | | | | (.07 | ) | | | .05 | | | | .14 | | | | — | | | | .14 | | | | 2.45 | |
2019(i) | | | 2.45 | | | | .06 | | | | — | | | | .06 | | | | .07 | | | | — | | | | .07 | | | | 2.44 | |
252
See notes to financial statements
R A T I O S / S U P P L E M E N T A L D A T A | |
| | | | | | | | | Ratio to Average Net Assets** | | Ratio to Average Net Assets Before Expenses Waived or Assumed | | | | |
Total Return* | | | Net Assets End of Period/ Year (in thousands) | | | Net Expenses After Fee Credits | | | Net Expenses Before Fee Credits*** | | | Net Investment Income | | | Expenses*** | | | Net Investment Income | | | Portfolio Turnover Rate | |
| | | | | | | | | | | | | | | | | | | | | | | | | | | | | | | |
| | | | | | | | | | | | | | | | | | | | | | | | | | | | | | | |
| | 5.38 | % | | $ | 621,618 | | | | 1.21 | % | | | 1.21 | % | | | 4.67 | % | | | 1.23 | % | | | 4.65 | % | | | 47 | % |
| | (2.85 | ) | | | 567,249 | | | | 1.21 | | | | 1.21 | | | | 4.39 | | | | 1.23 | | | | 4.37 | | | | 47 | |
| | 9.07 | | | | 571,028 | | | | 1.22 | | | | 1.22 | | | | 4.76 | | | | 1.24 | | | | 4.74 | | | | 55 | |
| | 6.79 | | | | 572,631 | | | | 1.21 | | | | 1.21 | | | | 4.57 | | | | 1.23 | | | | 4.55 | | | | 65 | |
| | 1.88 | | | | 523,932 | | | | 1.22 | | | | 1.22 | | | | 4.46 | | | | 1.24 | | | | 4.44 | | | | 67 | |
| | 2.26 | †† | | | 505,329 | | | | 1.23 | † | | | 1.23 | † | | | 4.89 | † | | | 1.25 | † | | | 4.87 | † | | | 33 | †† |
| | | | | | | | | | | | | | | | | | | | | | | | | | | | | | | |
| | 4.67 | | | | 4,690 | | | | 2.02 | | | | 2.02 | | | | 3.86 | | | | 2.04 | | | | 3.84 | | | | 47 | |
| | (3.65 | ) | | | 3,376 | | | | 2.01 | | | | 2.01 | | | | 3.60 | | | | 2.03 | | | | 3.58 | | | | 47 | |
| | 7.99 | | | | 2,923 | | | | 2.04 | | | | 2.04 | | | | 3.94 | | | | 2.07 | | | | 3.92 | | | | 55 | |
| | 6.15 | | | | 2,356 | | | | 1.98 | | | | 1.98 | | | | 3.79 | | | | 2.00 | | | | 3.77 | | | | 65 | |
| | 1.06 | | | | 1,786 | | | | 2.02 | | | | 2.02 | | | | 3.66 | | | | 2.04 | | | | 3.64 | | | | 67 | |
| | 1.42 | †† | | | 1,517 | | | | 2.07 | † | | | 2.07 | † | | | 4.04 | † | | | 2.09 | † | | | 4.02 | † | | | 33 | †† |
| | | | | | | | | | | | | | | | | | | | | | | | | | | | | | | |
| | 5.42 | | | | 31,132 | | | | .91 | | | | .91 | | | | 4.83 | | | | .93 | | | | 4.81 | | | | 47 | |
| | (2.47 | ) | | | 41,699 | | | | .93 | | | | .93 | | | | 4.65 | | | | .95 | | | | 4.63 | | | | 47 | |
| | 9.34 | | | | 68,198 | | | | .93 | | | | .94 | | | | 5.02 | | | | .96 | | | | 5.00 | | | | 55 | |
| | 7.05 | | | | 73,403 | | | | .94 | | | | .94 | | | | 4.84 | | | | .96 | | | | 4.82 | | | | 65 | |
| | 2.17 | | | | 79,880 | | | | .93 | | | | .93 | | | | 4.76 | | | | .95 | | | | 4.74 | | | | 67 | |
| | 2.36 | †† | | | 80,264 | | | | 1.04 | † | | | 1.04 | † | | | 5.07 | † | | | 1.06 | † | | | 5.05 | † | | | 33 | †† |
| | | | | | | | | | | | | | | | | | | | | | | | | | | | | | | |
| | 5.59 | | | | 42,941 | | | | .78 | | | | .78 | | | | 5.07 | | | | .80 | | | | 5.05 | | | | 47 | |
| | (2.28 | ) | | | 51,704 | | | | .78 | | | | .78 | | | | 4.81 | | | | .80 | | | | 4.79 | | | | 47 | |
| | 9.58 | | | | 62,340 | | | | .79 | | | | .79 | | | | 5.19 | | | | .81 | | | | 5.17 | | | | 55 | |
| | 7.59 | | | | 78,784 | | | | .78 | | | | .78 | | | | 4.99 | | | | .80 | | | | 4.97 | | | | 65 | |
| | 1.91 | | | | 33,545 | | | | .79 | | | | .79 | | | | 4.88 | | | | .81 | | | | 4.86 | | | | 67 | |
| | 2.47 | †† | | | 36,666 | | | | .80 | † | | | .80 | † | | | 5.30 | † | | | .82 | † | | | 5.28 | † | | | 33 | †† |
253
Financial Highlights(continued)
FIRST INVESTORS INCOME FUNDS
| | | P E R S H A R E D A T A | |
| | | | | | | Investment Operations | | Less Distributions from | | | | | | | | |
| | Net Asset Value, Beginning of Period/ Year | | | Net Investment Income(c) | | | Net Realized and Unrealized Gain on Investments | | | Total From Investment Operations | | | Net Investment Income | | | Net Realized Gain | | | Total Distributions | | | Net Asset Value, End of Period/ Year | |
GOVERNMENT CASH MANAGEMENT FUND(f) | | | | | | | | | | |
Class A | | | | | | | | | | | | | | |
2014 | | $ | 1.00 | | | $ | — | | | | — | | | $ | — | | | $ | — | | | | — | | | $ | — | | | $ | 1.00 | |
2015 | | | 1.00 | | | | — | | | | — | | | | — | | | | — | | | | — | | | | — | | | | 1.00 | |
2016 | | | 1.00 | | | | — | | | | — | | | | — | | | | — | | | | — | | | | — | | | | 1.00 | |
2017 | | | 1.00 | | | | .00 | (d) | | | — | | | | .00 | (d) | | | .00 | (d) | | | — | | | | .00 | (d) | | | 1.00 | |
2018 | | | 1.00 | | | | .01 | | | | — | | | | .01 | | | | .01 | | | | — | | | | .01 | | | | 1.00 | |
2019(i) | | | 1.00 | | | | .01 | | | | — | | | | .01 | | | | .01 | | | | — | | | | .01 | | | | 1.00 | |
Class B | | | | | | | | | | | | | | |
2014 | | | 1.00 | | | | — | | | | — | | | | — | | | | — | | | | — | | | | — | | | | 1.00 | |
2015 | | | 1.00 | | | | — | | | | — | | | | — | | | | — | | | | — | | | | — | | | | 1.00 | |
2016 | | | 1.00 | | | | — | | | | — | | | | — | | | | — | | | | — | | | | — | | | | 1.00 | |
2017 | | | 1.00 | | | | — | | | | — | | | | — | | | | — | | | | — | | | | — | | | | 1.00 | |
2018 | | | 1.00 | | | | .00 | (d) | | | — | | | | .00 | (d) | | | .00 | (d) | | | — | | | | .00 | (d) | | | 1.00 | |
2019(i) | | | 1.00 | | | | .01 | | | | — | | | | .01 | | | | .01 | | | | — | | | | .01 | | | | 1.00 | |
Institutional Class | | | | | | | | | | | | | | |
2014 | | | 1.00 | | | | — | | | | — | | | | — | | | | — | | | | — | | | | — | | | | 1.00 | |
2015 | | | 1.00 | | | | — | | | | — | | | | — | | | | — | | | | — | | | | — | | | | 1.00 | |
2016 | | | 1.00 | | | | — | | | | — | | | | — | | | | — | | | | — | | | | — | | | | 1.00 | |
2017 | | | 1.00 | | | | .00 | (d) | | | — | | | | .00 | (d) | | | .00 | (d) | | | — | | | | .00 | (d) | | | 1.00 | |
2018 | | | 1.00 | | | | .01 | | | | — | | | | .01 | | | | .01 | | | | — | | | | .01 | | | | 1.00 | |
2019(i) | | | 1.00 | | | | .01 | | | | — | | | | .01 | | | | .01 | | | | — | | | | .01 | | | | 1.00 | |
254
See notes to financial statements
R A T I O S / S U P P L E M E N T A L D A T A | |
| | | | | | | | | Ratio to Average Net Assets** | | Ratio to Average Net Assets Before Expenses Waived or Assumed | | | | |
Total Return* | | | Net Assets End of Period/ Year (in thousands) | | | Net Expenses After Fee Credits | | | Net Expenses Before Fee Credits*** | | | Net Investment Income | | | Expenses*** | | | Net Investment Income (Loss) | | | Portfolio Turnover Rate | |
| | | | | | | | | | | | | | | | | | | | | | | | | | | | | | | |
| | | | | | | | | | | | | | | | | | | | | | | | | | | | | | | |
| | .00 | % | | $ | 108,088 | | | | .08 | % | | | .08 | % | | | .00 | % | | | 1.02 | % | | | (.94 | )% | | | N/A | |
| | .00 | | | | 109,566 | | | | .10 | | | | .10 | | | | .00 | | | | 1.08 | | | | (.98 | ) | | | N/A | |
| | .00 | | | | 122,037 | | | | .33 | | | | .33 | | | | .00 | | | | 1.05 | | | | (.72 | ) | | | N/A | |
| | .08 | | | | 127,079 | | | | .60 | | | | .60 | | | | .08 | | | | 1.02 | | | | (.34 | ) | | | N/A | |
| | .96 | | | | 153,695 | | | | .60 | | | | .60 | | | | .98 | | | | 1.01 | | | | .57 | | | | N/A | |
| | .87 | †† | | | 177,586 | | | | .60 | † | | | .60 | † | | | 1.74 | † | | | .91 | † | | | 1.43 | † | | | N/A | |
| | | | | | | | | | | | | | | | | | | | | | | | | | | | | | | |
| | .00 | | | | 404 | | | | .08 | | | | .08 | | | | .00 | | | | 1.64 | | | | (1.56 | ) | | | N/A | |
| | .00 | | | | 287 | | | | .10 | | | | .10 | | | | .00 | | | | 1.72 | | | | (1.62 | ) | | | N/A | |
| | .00 | | | | 248 | | | | .33 | | | | .33 | | | | .00 | | | | 1.77 | | | | (1.44 | ) | | | N/A | |
| | .00 | | | | 161 | | | | .64 | | | | .64 | | | | .00 | | | | 1.76 | | | | (1.12 | ) | | | N/A | |
| | .17 | | | | 101 | | | | 1.35 | | | | 1.35 | | | | .14 | | | | 1.92 | | | | (.43 | ) | | | N/A | |
| | .49 | †† | | | 154 | | | | 1.35 | † | | | 1.35 | † | | | 1.00 | † | | | 1.73 | † | | | .62 | † | | | N/A | |
| | | | | | | | | | | | | | | | | | | | | | | | | | | | | | | |
| | .00 | | | | 2,595 | | | | .08 | | | | .08 | | | | .00 | | | | .66 | | | | (.58 | ) | | | N/A | |
| | .00 | | | | 2,267 | | | | .10 | | | | .10 | | | | .00 | | | | .67 | | | | (.57 | ) | | | N/A | |
| | .00 | | | | 2,844 | | | | .33 | | | | .33 | | | | .00 | | | | .68 | | | | (.35 | ) | | | N/A | |
| | .07 | | | | 2,394 | | | | .60 | | | | .60 | | | | .06 | | | | .68 | | | | (.02 | ) | | | N/A | |
| | .97 | | | | 1 | | | | .60 | | | | .60 | | | | .96 | | | | .68 | | | | .88 | | | | N/A | |
| | .87 | †† | | | 1 | | | | .60 | † | | | .60 | † | | | 1.78 | † | | | .80 | † | | | 1.58 | † | | | N/A | |
255
Financial Highlights(continued)
FIRST INVESTORS INCOME FUNDS
| | | P E R S H A R E D A T A | |
| | | | | | | Investment Operations | | Less Distributions from | | | | | | | | |
| | Net Asset Value, Beginning of Period/ Year | | | Net Investment Income(c) | | | Net Realized and Unrealized Gain (Loss) on Investments | | | Total From Investment Operations | | | Net Investment Income | | | Net Realized Gain | | | Total Distributions | | | Net Asset Value, End of Period/ Year | |
INTERNATIONAL OPPORTUNITIES BOND FUND | | | | | | | | | | | | | | |
Class A | | | | | | | | | | | | | | | | | | |
2014 | | $ | 9.84 | | | $ | .21 | | | $ | .07 | | | $ | .28 | | | $ | .27 | | | | — | | | $ | .27 | | | $ | 9.85 | |
2015 | | | 9.85 | | | | .12 | | | | (1.06 | ) | | | (.94 | ) | | | .28 | | | | — | | | | .28 | | | | 8.63 | |
2016 | | | 8.63 | | | | .20 | | | | .51 | | | | .71 | | | | .13 | | | | — | | | | .13 | | | | 9.21 | |
2017 | | | 9.21 | | | | .22 | | | | .21 | | | | .43 | | | | .15 | | | | — | | | | .15 | | | | 9.49 | |
2018 | | | 9.49 | | | | .23 | | | | (.64 | ) | | | (.41 | ) | | | .30 | | | | — | | | | .30 | | | | 8.78 | |
2019(i) | | | 8.78 | | | | .13 | | | | (.15 | ) | | | (.02 | ) | | | .16 | | | | — | | | | .16 | | | | 8.60 | |
Advisor Class | | | | | | | | | | | | | | | | | | |
2014 | | | 9.85 | | | | .24 | | | | .04 | | | | .28 | | | | .28 | | | | — | | | | .28 | | | | 9.85 | |
2015 | | | 9.85 | | | | .14 | | | | (1.06 | ) | | | (.92 | ) | | | .29 | | | | — | | | | .29 | | | | 8.64 | |
2016 | | | 8.64 | | | | .23 | | | | .51 | | | | .74 | | | | .13 | | | | — | | | | .13 | | | | 9.25 | |
2017 | | | 9.25 | | | | .24 | | | | .23 | | | | .47 | | | | .16 | | | | — | | | | .16 | | | | 9.56 | |
2018 | | | 9.56 | | | | .27 | | | | (.66 | ) | | | (.39 | ) | | | .30 | | | | — | | | | .30 | | | | 8.87 | |
2019(i) | | | 8.87 | | | | .14 | | | | (.15 | ) | | | (.01 | ) | | | .16 | | | | — | | | | .16 | | | | 8.70 | |
Institutional Class | | | | | | | | | | | | | | | | | | |
2014 | | | 9.85 | | | | .25 | | | | .06 | | | | .31 | | | | .28 | | | | — | | | | .28 | | | | 9.88 | |
2015 | | | 9.88 | | | | .17 | | | | (1.08 | ) | | | (.91 | ) | | | .30 | | | | — | | | | .30 | | | | 8.67 | |
2016 | | | 8.67 | | | | .24 | | | | .52 | | | | .76 | | | | .14 | | | | — | | | | .14 | | | | 9.29 | |
2017 | | | 9.29 | | | | .22 | | | | .27 | | | | .49 | | | | .19 | | | | — | | | | .19 | | | | 9.59 | |
2018 | | | 9.59 | | | | .28 | | | | (.65 | ) | | | (.37 | ) | | | .30 | | | | — | | | | .30 | | | | 8.92 | |
2019(i) | | | 8.92 | | | | .15 | | | | (.16 | ) | | | (.01 | ) | | | .12 | | | | — | | | | .12 | | | | 8.79 | |
256
See notes to financial statements
R A T I O S / S U P P L E M E N T A L D A T A | |
| | | | | | | | | Ratio to Average Net Assets** | | Ratio to Average Net Assets Before Expenses Waived or Assumed | | | | |
Total Return* | | | Net Assets End of Period/ Year (in thousands) | | | Net Expenses After Fee Credits | | | Net Expenses Before Fee Credits*** | | | Net Investment Income | | | Expenses*** | | | Net Investment Income | | | Portfolio Turnover Rate | |
| | | | | | | | | | | | | | | �� | | | | | | | | | | | | | | | | |
| | | | | | | | | | | | | | | | | | | | | | | | | | | | | | | |
| | 2.84 | % | | $ | 80,197 | | | | 1.30 | % | | | 1.30 | % | | | 2.06 | % | | | 1.41 | % | | | 1.95 | % | | | 76 | % |
| | (9.72 | ) | | | 69,394 | | | | 1.30 | | | | 1.30 | | | | 1.29 | | | | 1.38 | | | | 1.21 | | | | 61 | |
| | 8.30 | | | | 65,456 | | | | 1.38 | | | | 1.38 | | | | 2.29 | | | | 1.41 | | | | 2.26 | | | | 72 | |
| | 4.70 | | | | 59,782 | | | | 1.41 | | | | 1.41 | | | | 2.35 | | | | N/A | | | | N/A | | | | 76 | |
| | (4.50 | ) | | | 54,060 | | | | 1.40 | | | | 1.40 | | | | 2.49 | | | | N/A | | | | N/A | | | | 41 | |
| | (.21 | )†† | | | 49,291 | | | | 1.44 | † | | | 1.44 | † | | | 3.10 | † | | | N/A | | | | N/A | | | | 17 | †† |
| | | | | | | | | | | | | | | | | | | | | | | | | | | | | | | |
| | 2.81 | | | | 33,851 | | | | 1.10 | | | | 1.10 | | | | 2.21 | | | | N/A | | | | N/A | | | | 76 | |
| | (9.51 | ) | | | 50,912 | | | | 1.04 | | | | 1.04 | | | | 1.56 | | | | N/A | | | | N/A | | | | 61 | |
| | 8.70 | | | | 50,749 | | | | 1.08 | | | | 1.08 | | | | 2.60 | | | | N/A | | | | N/A | | | | 72 | |
| | 5.07 | | | | 68,162 | | | | 1.11 | | | | 1.11 | | | | 2.66 | | | | N/A | | | | N/A | | | | 76 | |
| | (4.17 | ) | | | 87,491 | | | | 1.08 | | | | 1.08 | | | | 2.82 | | | | N/A | | | | N/A | | | | 41 | |
| | (.07 | )†† | | | 89,839 | | | | 1.14 | † | | | 1.14 | † | | | 3.40 | † | | | N/A | | | | N/A | | | | 17 | †† |
| | | | | | | | | | | | | | | | | | | | | | | | | | | | | | | |
| | 3.19 | | | | 16,014 | | | | .93 | | | | .93 | | | | 2.43 | | | | N/A | | | | N/A | | | | 76 | |
| | (9.36 | ) | | | 19,097 | | | | .90 | | | | .90 | | | | 1.69 | | | | N/A | | | | N/A | | | | 61 | |
| | 8.85 | | | | 8,289 | | | | .93 | | | | .93 | | | | 2.75 | | | | N/A | | | | N/A | | | | 72 | |
| | 5.27 | | | | 8,669 | | | | .94 | | | | .95 | | | | 2.80 | | | | N/A | | | | N/A | | | | 76 | |
| | (4.03 | ) | | | 9,868 | | | | .93 | | | | .93 | | | | 2.98 | | | | N/A | | | | N/A | | | | 41 | |
| | (.02 | )†† | | | 18,836 | | | | .97 | † | | | .97 | † | | | 3.57 | † | | | N/A | | | | N/A | | | | 17 | †† |
257
Financial Highlights(continued)
FIRST INVESTORS INCOME FUNDS
| | | P E R S H A R E D A T A | |
| | | | | | | Investment Operations | | Less Distributions from | | | | | | | | |
| | Net Asset Value, Beginning of Period/ Year | | | Net Investment Income(c) | | | Net Realized and Unrealized Gain (Loss) on Investments | | | Total From Investment Operations | | | Net Investment Income | | | Net Realized Gain | | | Total Distributions | | | Net Asset Value, End of Period/ Year | |
INVESTMENT GRADE FUND | | | | | | | | | | | | | | | | | | |
Class A | | | | | | | | | | | | | | | | | | |
2014 | | $ | 9.78 | | | $ | .31 | | | $ | .22 | | | $ | .53 | | | $ | .39 | | | | — | | | $ | .39 | | | $ | 9.92 | |
2015 | | | 9.92 | | | | .28 | | | | (.17 | ) | | | .11 | | | | .39 | | | | — | | | | .39 | | | | 9.64 | |
2016 | | | 9.64 | | | | .27 | | | | .35 | | | | .62 | | | | .36 | | | | — | | | | .36 | | | | 9.90 | |
2017 | | | 9.90 | | | | .26 | | | | (.17 | ) | | | .09 | | | | .33 | | | | — | | | | .33 | | | | 9.66 | |
2018 | | | 9.66 | | | | .26 | | | | (.42 | ) | | | (.16 | ) | | | .33 | | | | — | | | | .33 | | | | 9.17 | |
2019(i) | | | 9.17 | | | | .13 | | | | .29 | | | | .42 | | | | .16 | | | | — | | | | .16 | | | | 9.43 | |
Class B | | | | | | | | | | | | | | | | | | |
2014 | | | 9.76 | | | | .22 | | | | .22 | | | | .44 | | | | .33 | | | | — | | | | .33 | | | | 9.87 | |
2015 | | | 9.87 | | | | .20 | | | | (.17 | ) | | | .03 | | | | .33 | | | | — | | | | .33 | | | | 9.57 | |
2016 | | | 9.57 | | | | .19 | | | | .34 | | | | .53 | | | | .27 | | | | — | | | | .27 | | | | 9.83 | |
2017 | | | 9.83 | | | | .19 | | | | (.18 | ) | | | .01 | | | | .23 | | | | — | | | | .23 | | | | 9.61 | |
2018 | | | 9.61 | | | | .18 | | | | (.42 | ) | | | (.24 | ) | | | .24 | | | | — | | | | .24 | | | | 9.13 | |
2019(i) | | | 9.13 | | | | .09 | | | | .28 | | | | .37 | | | | .12 | | | | — | | | | .12 | | | | 9.38 | |
Advisor Class | | | | | | | | | | | | | | | | | | |
2014 | | | 9.78 | | | | .34 | | | | .20 | | | | .54 | | | | .40 | | | | — | | | | .40 | | | | 9.92 | |
2015 | | | 9.92 | | | | .31 | | | | (.16 | ) | | | .15 | | | | .40 | | | | — | | | | .40 | | | | 9.67 | |
2016 | | | 9.67 | | | | .30 | | | | .34 | | | | .64 | | | | .37 | | | | — | | | | .37 | | | | 9.94 | |
2017 | | | 9.94 | | | | .26 | | | | (.14 | ) | | | .12 | | | | .35 | | | | — | | | | .35 | | | | 9.71 | |
2018 | | | 9.71 | | | | .30 | | | | (.42 | ) | | | (.12 | ) | | | .36 | | | | — | | | | .36 | | | | 9.23 | |
2019(i) | | | 9.23 | | | | .15 | | | | .28 | | | | .43 | | | | .18 | | | | — | | | | .18 | | | | 9.48 | |
Institutional Class | | | | | | | | | | | | | | | | | | |
2014 | | | 9.79 | | | | .35 | | | | .23 | | | | .58 | | | | .43 | | | | — | | | | .43 | | | | 9.94 | |
2015 | | | 9.94 | | | | .32 | | | | (.17 | ) | | | .15 | | | | .43 | | | | — | | | | .43 | | | | 9.66 | |
2016 | | | 9.66 | | | | .31 | | | | .35 | | | | .66 | | | | .40 | | | | — | | | | .40 | | | | 9.92 | |
2017 | | | 9.92 | | | | .31 | | | | (.18 | ) | | | .13 | | | | .37 | | | | — | | | | .37 | | | | 9.68 | |
2018 | | | 9.68 | | | | .31 | | | | (.42 | ) | | | (.11 | ) | | | .37 | | | | — | | | | .37 | | | | 9.20 | |
2019(i) | | | 9.20 | | | | .15 | | | | .28 | | | | .43 | | | | .18 | | | | — | | | | .18 | | | | 9.45 | |
258
See notes to financial statements
R A T I O S / S U P P L E M E N T A L D A T A | |
| | | | | | | | | Ratio to Average Net Assets** | | Ratio to Average Net Assets Before Expenses Waived, Assumed or Reimbursed | | | | |
Total Return* | | | Net Assets End of Period/ Year (in thousands) | | | Net Expenses After Fee Credits | | | Net Expenses Before Fee Credits*** | | | Net Investment Income | | | Expenses*** | | | Net Investment Income | | | Portfolio Turnover Rate | |
| | | | | | | | | | | | | | | | | | | | | | | | | | | | | | | |
| | | | | | | | | | | | | | | | | | | | | | | | | | | | | | | |
| | 5.50 | % | | $ | 475,090 | | | | 1.05 | % | | | 1.05 | % | | | 3.11 | % | | | 1.16 | % | | | 3.00 | % | | | 49 | % |
| | 1.12 | | | | 458,704 | | | | 1.04 | | | | 1.04 | | | | 2.85 | | | | 1.15 | | | | 2.74 | | | | 36 | |
| | 6.55 | | | | 477,010 | | | | 1.04 | | | | 1.05 | | | | 2.78 | | | | 1.15 | | | | 2.68 | | | | 37 | |
| | .97 | | | | 462,999 | | | | 1.04 | | | | 1.04 | | | | 2.68 | | | | 1.15 | | | | 2.57 | | | | 52 | |
| | (1.69 | ) | | | 400,673 | | | | 1.06 | | | | 1.06 | | | | 2.80 | | | | 1.17 | | | | 2.69 | | | | 58 | |
| | 4.68 | †† | | | 387,909 | | | | 1.08 | † | | | 1.08 | † | | | 3.00 | † | | | 1.18 | † | | | 2.90 | † | | | 33 | †† |
| | | | | | | | | | | | | | | | | | | | | | | | | | | | | | | |
| | 4.53 | | | | 4,727 | | | | 1.92 | | | | 1.92 | | | | 2.24 | | | | 2.03 | | | | 2.13 | | | | 49 | |
| | .27 | | | | 3,623 | | | | 1.92 | | | | 1.92 | | | | 1.98 | | | | 2.03 | | | | 1.87 | | | | 36 | |
| | 5.61 | | | | 2,907 | | | | 1.92 | | | | 1.92 | | | | 1.91 | | | | 2.03 | | | | 1.80 | | | | 37 | |
| | .12 | | | | 2,181 | | | | 1.90 | | | | 1.90 | | | | 1.84 | | | | 2.01 | | | | 1.73 | | | | 52 | |
| | (2.50 | ) | | | 1,475 | | | | 1.93 | | | | 1.93 | | | | 1.93 | | | | 2.04 | | | | 1.82 | | | | 58 | |
| | 4.15 | †† | | | 1,444 | | | | 1.94 | † | | | 1.94 | † | | | 2.14 | † | | | 2.04 | † | | | 2.04 | † | | | 33 | †† |
| | | | | | | | | | | | | | | | | | | | | | | | | | | | | | | |
| | 5.61 | | | | 44,351 | | | | .69 | | | | .69 | | | | 3.38 | | | | .80 | | | | 3.27 | | | | 49 | |
| | 1.53 | | | | 63,614 | | | | .73 | | | | .73 | | | | 3.17 | | | | .84 | | | | 3.06 | | | | 36 | |
| | 6.78 | | | | 83,659 | | | | .74 | | | | .74 | | | | 3.08 | | | | .85 | | | | 2.97 | | | | 37 | |
| | 1.32 | | | | 136,316 | | | | .72 | | | | .72 | | | | 2.99 | | | | .82 | | | | 2.89 | | | | 52 | |
| | (1.25 | ) | | | 180,286 | | | | .72 | | | | .72 | | | | 3.15 | | | | .83 | | | | 3.04 | | | | 58 | |
| | 4.73 | †† | | | 197,002 | | | | .74 | † | | | .74 | † | | | 3.34 | † | | | .84 | † | | | 3.24 | † | | | 33 | †† |
| | | | | | | | | | | | | | | | | | | | | | | | | | | | | | | |
| | 5.98 | | | | 22,269 | | | | .63 | | | | .63 | | | | 3.51 | | | | .74 | | | | 3.40 | | | | 49 | |
| | 1.48 | | | | 15,025 | | | | .63 | | | | .63 | | | | 3.26 | | | | .74 | | | | 3.15 | | | | 36 | |
| | 6.97 | | | | 31,395 | | | | .63 | | | | .63 | | | | 3.17 | | | | .74 | | | | 3.06 | | | | 37 | |
| | 1.41 | | | | 26,127 | | | | .63 | | | | .63 | | | | 3.10 | | | | .74 | | | | 2.99 | | | | 52 | |
| | (1.18 | ) | | | 23,974 | | | | .64 | | | | .64 | | | | 3.23 | | | | .75 | | | | 3.12 | | | | 58 | |
| | 4.78 | †† | | | 20,327 | | | | .66 | † | | | .66 | † | | | 3.42 | † | | | .76 | † | | | 3.32 | † | | | 33 | †† |
259
Financial Highlights(continued)
FIRST INVESTORS INCOME FUNDS
| | | P E R S H A R E D A T A | |
| | | | | | | Investment Operations | | Less Distributions from | | | | | | | | |
| | Net Asset Value, Beginning of Period/ Year | | | Net Investment Income (Loss)(c) | | | Net Realized and Unrealized Gain (Loss) on Investments | | | Total From Investment Operations | | | Net Investment Income | | | Net Realized Gain | | | Total Distributions | | | Net Asset Value, End of Period/ Year | |
LIMITED DURATION BOND FUND(e) | | | | | | | | | | | | | | | | | | |
Class A | | | | | | | | | | | | | | | | | | |
2014(g) | | $ | 10.00 | | | $ | — | | | $ | (.05 | ) | | $ | (.05 | ) | | $ | .06 | | | | — | | | $ | .06 | | | $ | 9.89 | |
2015 | | | 9.89 | | | | .03 | | | | .04 | | | | .07 | | | | .20 | | | | — | | | | .20 | | | | 9.76 | |
2016 | | | 9.76 | | | | (.03 | ) | | | .15 | | | | .12 | | | | .22 | | | | — | | | | .22 | | | | 9.66 | |
2017 | | | 9.66 | | | | .08 | | | | (.06 | ) | | | .02 | | | | .21 | | | | — | | | | .21 | | | | 9.47 | |
2018 | | | 9.47 | | | | — | | | | (.05 | ) | | | (.05 | ) | | | .25 | | | | — | | | | .25 | | | | 9.17 | |
2019(i) | | | 9.17 | | | | .11 | | | | .09 | | | | .20 | | | | .13 | | | | — | | | | .13 | | | | 9.24 | |
Advisor Class | | | | | | | | | | | | | | | | | | |
2014(g) | | | 10.00 | | | | .02 | | | | (.05 | ) | | | (.03 | ) | | | .06 | | | | — | | | | .06 | | | | 9.91 | |
2015 | | | 9.91 | | | | .06 | | | | .05 | | | | .11 | | | | .22 | | | | — | | | | .22 | | | | 9.80 | |
2016 | | | 9.80 | | | | — | | | | .14 | | | | .14 | | | | .25 | | | | — | | | | .25 | | | | 9.69 | |
2017 | | | 9.69 | | | | .13 | | | | (.08 | ) | | | .05 | | | | .24 | | | | — | | | | .24 | | | | 9.50 | |
2018 | | | 9.50 | | | | .03 | | | | (.05 | ) | | | (.02 | ) | | | .28 | | | | — | | | | .28 | | | | 9.20 | |
2019(i) | | | 9.20 | | | | .12 | | | | .08 | | | | .20 | | | | .14 | | | | — | | | | .14 | | | | 9.26 | |
Institutional Class | | | | | | | | | | | | | | | | | | |
2014(g) | | | 10.00 | | | | .02 | | | | (.03 | ) | | | (.01 | ) | | | .07 | | | | — | | | | .07 | | | | 9.92 | |
2015 | | | 9.92 | | | | .08 | | | | .04 | | | | .12 | | | | .23 | | | | — | | | | .23 | | | | 9.81 | |
2016 | | | 9.81 | | | | .02 | | | | .14 | | | | .16 | | | | .27 | | | | — | | | | .27 | | | | 9.70 | |
2017 | | | 9.70 | | | | .11 | | | | (.04 | ) | | | .07 | | | | .25 | | | | — | | | | .25 | | | | 9.52 | |
2018 | | | 9.52 | | | | .04 | | | | (.06 | ) | | | (.02 | ) | | | .29 | | | | — | | | | .29 | | | | 9.21 | |
2019(i) | | | 9.21 | | | | .13 | | | | .09 | | | | .22 | | | | .15 | | | | — | | | | .15 | | | | 9.28 | |
260
See notes to financial statements
R A T I O S / S U P P L E M E N T A L D A T A | |
| | | | | | | | | Ratio to Average Net Assets** | | Ratio to Average Net Assets Before Expenses Waived, Assumed or Reimbursed | | | | |
Total Return* | | | Net Assets End of Period/ Year (in thousands) | | | Net Expenses After Fee Credits | | | Net Expenses Before Fee Credits*** | | | Net Investment Income (Loss) | | | Expenses*** | | | Net Investment Income (Loss) | | | Portfolio Turnover Rate | |
| | | | | | | | | | | | | | | | | | | | | | | | | | | | | | | |
| | | | | | | | | | | | | | | | | | | | | | | | | | | | | | | |
| | (.50 | )%†† | | $ | 8,911 | | | | 1.05 | %† | | | 1.05 | %† | | | .15 | %† | | | 3.37 | %† | | | (2.17 | )%† | | | 19 | %†† |
| | .67 | | | | 26,852 | | | | 1.05 | | | | 1.05 | | | | .37 | | | | 1.32 | | | | .10 | | | | 57 | |
| | 1.21 | | | | 48,342 | | | | 1.05 | | | | 1.05 | | | | (.25 | ) | | | 1.23 | | | | (.43 | ) | | | 54 | |
| | .22 | | | | 62,841 | | | | 1.05 | | | | 1.05 | | | | .85 | | | | 1.22 | | | | .68 | | | | 60 | |
| | (.52 | ) | | | 247,902 | | | | .89 | | | | .89 | | | | .02 | | | | 1.11 | | | | (.20 | ) | | | 102 | |
| | 2.21 | †† | | | 241,720 | | | | .79 | † | | | .79 | † | | | 2.30 | † | | | 1.04 | † | | | 2.05 | † | | | 35 | †† |
| | | | | | | | | | | | | | | | | | | | | | | | | | | | | | | |
| | (.28 | )†† | | | 25,649 | | | | .75 | † | | | .75 | † | | | .46 | † | | | 1.02 | † | | | .19 | † | | | 19 | †† |
| | 1.08 | | | | 40,502 | | | | .75 | | | | .75 | | | | .66 | | | | 1.09 | | | | .32 | | | | 57 | |
| | 1.47 | | | | 50,645 | | | | .75 | | | | .75 | | | | .04 | | | | 1.01 | | | | (.22 | ) | | | 54 | |
| | .54 | | | | 31,638 | | | | .75 | | | | .75 | | | | 1.14 | | | | 1.02 | | | | .87 | | | | 60 | |
| | (.25 | ) | | | 35,498 | | | | .62 | | | | .62 | | | | .33 | | | | .84 | | | | .11 | | | | 102 | |
| | 2.24 | †† | | | 49,032 | | | | .51 | † | | | .51 | † | | | 2.58 | † | | | .84 | † | | | 2.25 | † | | | 35 | †† |
| | | | | | | | | | | | | | | | | | | | | | | | | | | | | | | |
| | (.14 | )†† | | | 5,125 | | | | .60 | † | | | .60 | † | | | .53 | † | | | 3.32 | † | | | (2.19 | )† | | | 19 | †† |
| | 1.21 | | | | 6,747 | | | | .60 | | | | .60 | | | | .81 | | | | .92 | | | | .49 | | | | 57 | |
| | 1.64 | | | | 22,296 | | | | .60 | | | | .60 | | | | .20 | | | | .82 | | | | (.02 | ) | | | 54 | |
| | .77 | | | | 41,065 | | | | .60 | | | | .60 | | | | 1.30 | | | | .82 | | | | 1.08 | | | | 60 | |
| | (.19 | ) | | | 38,822 | | | | .47 | | | | .47 | | | | .46 | | | | .68 | | | | .25 | | | | 102 | |
| | 2.43 | †† | | | 37,563 | | | | .36 | † | | | .36 | † | | | 2.71 | † | | | .59 | † | | | 2.48 | † | | | 35 | †† |
261
Financial Highlights(continued)
FIRST INVESTORS INCOME FUNDS
| | | P E R S H A R E D A T A | |
| | | | | | | Investment Operations | | Less Distributions from | | | | | | | | |
| | Net Asset Value, Beginning of Period/ Year | | | Net Investment Income(a)(c) | | | Net Realized and Unrealized Gain (Loss) on Investments | | | Total From Investment Operations | | | Net Investment Income | | | Net Realized Gain | | | Total Distributions | | | Net Asset Value, End of Period/ Year | |
STRATEGIC INCOME FUND | | | | | | | | | | | | | | | | | | |
Class A | | | | | | | | | | | | | | | | | | |
2014 | | $ | 9.78 | | | $ | .32 | | | $ | .12 | | | $ | .44 | | | $ | .28 | | | $ | .00 | (d) | | $ | .28 | | | $ | 9.94 | |
2015 | | | 9.94 | | | | .34 | | | | (.57 | ) | | | (.23 | ) | | | .34 | | | | .07 | | | | .41 | | | | 9.30 | |
2016 | | | 9.30 | | | | .30 | | | | .22 | | | | .52 | | | | .32 | | | | .02 | | | | .34 | | | | 9.48 | |
2017 | | | 9.48 | | | | .30 | | | | .05 | | | | .35 | | | | .30 | | | | — | | | | .30 | | | | 9.53 | |
2018 | | | 9.53 | | | | .31 | | | | (.32 | ) | | | (.01 | ) | | | .32 | | | | — | | | | .32 | | | | 9.20 | |
2019(i) | | | 9.20 | | | | .16 | | | | (.01 | ) | | | .15 | | | | .16 | | | | — | | | | .16 | | | | 9.19 | |
Advisor Class | | | | | | | | | | | | | | | | | | |
2014 | | | 9.77 | | | | .36 | | | | .11 | | | | .47 | | | | .32 | | | $ | .00 | (d) | | | .32 | | | | 9.92 | |
2015 | | | 9.92 | | | | .38 | | | | (.56 | ) | | | (.18 | ) | | | .38 | | | | .07 | | | | .45 | | | | 9.29 | |
2016 | | | 9.29 | | | | .33 | | | | .23 | | | | .56 | | | | .36 | | | | .02 | | | | .38 | | | | 9.47 | |
2017 | | | 9.47 | | | | .29 | | | | .09 | | | | .38 | | | | .33 | | | | — | | | | .33 | | | | 9.52 | |
2018 | | | 9.52 | | | | .34 | | | | (.32 | ) | | | .02 | | | | .35 | | | | — | | | | .35 | | | | 9.19 | |
2019(i) | | | 9.19 | | | | .17 | | | | — | | | | .17 | | | | .18 | | | | — | | | | .18 | | | | 9.18 | |
* | Calculated without sales charges. |
** | Net of expenses waived or assumed (Note 3). |
*** | The ratios do not include a reduction of expenses from cash balances maintained with the custodian or from brokerage service arrangements (Note1G). |
† | Annualized |
†† | Not annualized |
(a) | Recognition of net investment income by the Fund is affected by the timing of the declaration of dividends by the underlying investment companies in which the Fund invests. The ratio does not include net investment income of the investment companies in which the Fund invests. |
(b) | Does not include expenses of the investment companies in which the Fund invests. |
(c) | Based on average shares during the period. |
(d) | Due to rounding, amount is less than .005 per share. |
(e) | Prior to January 31, 2018, known as Limited Duration High Quality Bond Fund. |
(f) | Prior to October 3, 2016, known as Cash Management Fund. |
(g) | For the period May 19, 2014 (commencement of operations) to September 30, 2014. |
(h) | For the period October 21, 2013 (commencement of operations) to September 30, 2014. |
(i) | For the period October 1, 2018 to March 31, 2019. |
262
See notes to financial statements
R A T I O S / S U P P L E M E N T A L D A T A | |
| | | | | | | | | Ratio to Average Net Assets** | | Ratio to Average Net Assets Before Expenses Waived, Assumed or Reimbursed | | | | |
Total Return* | | | Net Assets End of Period/ Year (in thousands) | | | Net Expenses After Fee Credits(b) | | | Net Expenses Before FeeCredits***(b) | | | Net Investment Income(a) | | | Expenses*** | | | Net Investment Income | | | Portfolio Turnover Rate | |
| | | | | | | | | | | | | | | | | | | | | | | | | | | | | | | |
| | | | | | | | | | | | | | | | | | | | | | | | | | | | | | | |
| | 4.55 | % | | $ | 101,540 | | | | .80 | % | | | .80 | % | | | 3.18 | % | | | .68 | %(b) | | | 3.30 | %(a) | | | 20 | % |
| | (2.37 | ) | | | 131,734 | | | | .59 | | | | .59 | | | | 3.55 | | | | N/A | | | | N/A | | | | 40 | |
| | 5.64 | | | | 149,190 | | | | .58 | | | | .58 | | | | 3.19 | | | | N/A | | | | N/A | | | | 49 | |
| | 3.73 | | | | 162,789 | | | | .57 | | | | .57 | | | | 3.24 | | | | N/A | | | | N/A | | | | 37 | |
| | (.10 | ) | | | 152,180 | | | | .56 | | | | .56 | | | | 3.36 | | | | N/A | | | | N/A | | | | 58 | |
| | 1.66 | †† | | | 147,501 | | | | .60 | † | | | .60 | † | | | 3.42 | † | | | N/A | | | | N/A | | | | 43 | †† |
| | | | | | | | | | | | | | | | | | | | | | | | | | | | | | | |
| | 4.82 | | | | 323 | | | | .36 | | | | .36 | | | | 3.62 | | | | .29 | (b) | | | 3.69 | (a) | | | 20 | |
| | (1.93 | ) | | | 306 | | | | .19 | | | | .19 | | | | 3.95 | | | | N/A | | | | N/A | | | | 40 | |
| | 6.14 | | | | 415 | | | | .17 | | | | .17 | | | | 3.59 | | | | N/A | | | | N/A | | | | 49 | |
| | 4.14 | | | | 963 | | | | .18 | | | | .18 | | | | 3.66 | | | | N/A | | | | N/A | | | | 37 | |
| | .22 | | | | 759 | | | | .21 | | | | .21 | | | | 3.70 | | | | N/A | | | | N/A | | | | 58 | |
| | 1.85 | †† | | | 830 | | | | .27 | † | | | .27 | † | | | 3.77 | † | | | N/A | | | | N/A | | | | 43 | †† |
263
Financial Highlights
FIRST INVESTORS EQUITY FUNDS
The following table sets forth the per share operating performance data for a share outstanding, total return, ratios to average net assets and other supplemental data for each fiscal year ended September 30, except as otherwise indicated.
| | | P E R S H A R E D A T A | |
| | | | | | | Investment Operations | | Less Distributions from | | | | | | | | |
| | Net Asset Value, Beginning of Period/ Year | | | Net Investment Income(a) | | | Net Realized and Unrealized Gain (Loss) on Investments | | | Total From Investment Operations | | | Net Investment Income | | | Net Realized Gain | | | Total Distributions | | | Net Asset Value, End of Period/ Year | |
COVERED CALL STRATEGY FUND | | | | | | | | | | | | | | | | | | |
Class A | | | | | | | | | | | | | | | | | | |
2016(d) | | $ | 10.00 | | | $ | .06 | | | $ | .33 | | | $ | .39 | | | $ | .03 | | | $ | — | | | $ | .03 | | | $ | 10.36 | |
2017 | | | 10.36 | | | | .10 | | | | .85 | | | | .95 | | | | .11 | | | | .02 | | | | .13 | | | | 11.18 | |
2018 | | | 11.18 | | | | .11 | | | | .64 | | | | .75 | | | | .10 | | | | — | | | | .10 | | | | 11.83 | |
2019(f) | | | 11.83 | | | | .07 | | | | (.55 | ) | | | (.48 | ) | | | .07 | | | | — | | | | .07 | | | | 11.28 | |
Advisor Class | | | | | | | | | | | | | | | | | | |
2016(d) | | | 10.00 | | | | .08 | | | | .32 | | | | .40 | | | | .06 | | | | — | | | | .06 | | | | 10.34 | |
2017 | | | 10.34 | | | | .13 | | | | .86 | | | | .99 | | | | .15 | | | | .02 | | | | .17 | | | | 11.16 | |
2018 | | | 11.16 | | | | .14 | | | | .64 | | | | .78 | | | | .14 | | | | — | | | | .14 | | | | 11.80 | |
2019(f) | | | 11.80 | | | | .08 | | | | (.56 | ) | | | (.48 | ) | | | .08 | | | | — | | | | .08 | | | | 11.24 | |
Institutional Class | | | | | | | | | | | | | | | | | | |
2016(d) | | | 10.00 | | | | .09 | | | | .33 | | | | .42 | | | | .07 | | | | — | | | | .07 | | | | 10.35 | |
2017 | | | 10.35 | | | | .16 | | | | .85 | | | | 1.01 | | | | .17 | | | | .02 | | | | .19 | | | | 11.17 | |
2018 | | | 11.17 | | | | .16 | | | | .63 | | | | .79 | | | | .24 | | | | — | | | | .24 | | | | 11.72 | |
2019(f) | | | 11.72 | | | | .10 | | | | (.55 | ) | | | (.45 | ) | | | .10 | | | | — | | | | .10 | | | | 11.17 | |
264
See notes to financial statements
R A T I O S / S U P P L E M E N T A L D A T A | |
| | | | | | | | | Ratio to Average Net Assets** | | Ratio to Average Net Assets Before Expenses Waived or Assumed | | | | |
Total Return* | | | Net Assets End of Period/ Year (in thousands) | | | Net Expenses After Fee Credits | | | Net Expenses Before Fee Credits*** | | | Net Investment Income | | | Expenses*** | | | Net Investment Income | | | Portfolio Turnover Rate | |
| | | | | | | | | | | | | | | | | | | | | | | | | | | | | | | |
| | | | | | | | | | | | | | | | | | | | | | | | | | | | | | | |
| | 3.94 | %†† | | $ | 48,514 | | | | 1.30 | %† | | | 1.30 | %† | | | 1.19 | %† | | | 1.73 | %† | | | .76 | %† | | | 83 | %†† |
| | 9.17 | | | | 167,906 | | | | 1.30 | | | | 1.30 | | | | 1.18 | | | | 1.36 | | | | 1.12 | | | | 121 | |
| | 6.79 | | | | 237,103 | | | | 1.30 | | | | 1.30 | | | | .95 | | | | 1.28 | | | | .97 | | | | 107 | |
| | (4.00 | )†† | | | 228,791 | | | | 1.34 | † | | | 1.34 | † | | | 1.32 | † | | | 1.31 | | | | 1.35 | | | | 16 | †† |
| | | | | | | | | | | | | | | | | | | | | | | | | | | | | | | |
| | 4.05 | †† | | | 39,129 | | | | .97 | † | | | .97 | † | | | 1.64 | † | | | 1.50 | † | | | 1.11 | † | | | 83 | †† |
| | 9.62 | | | | 109,360 | | | | .97 | | | | .97 | | | | 1.53 | | | | 1.06 | | | | 1.44 | | | | 121 | |
| | 7.09 | | | | 114,275 | | | | .97 | | | | .97 | | | | 1.25 | | | | 1.03 | | | | 1.19 | | | | 107 | |
| | (3.99 | )†† | | | 85,855 | | | | 1.17 | † | | | 1.17 | † | | | 1.47 | † | | | 1.09 | | | | 1.55 | | | | 16 | †† |
| | | | | | | | | | | | | | | | | | | | | | | | | | | | | | | |
| | 4.18 | †† | | | 4,214 | | | | .84 | † | | | .84 | † | | | 1.76 | † | | | 1.25 | † | | | 1.35 | † | | | 83 | †† |
| | 9.77 | | | | 7,334 | | | | .84 | | | | .84 | | | | 1.65 | | | | .96 | | | | 1.53 | | | | 121 | |
| | 7.19 | | | | 2,913 | | | | .84 | | | | .84 | | | | 1.38 | | | | .89 | | | | 1.33 | | | | 107 | |
| | (3.81 | )†† | | | 2,309 | | | | .88 | † | | | .88 | † | | | 1.78 | † | | | .91 | | | | 1.75 | | | | 16 | †† |
265
Financial Highlights(continued)
FIRST INVESTORS EQUITY FUNDS
| | | P E R S H A R E D A T A | |
| | | | | | | Investment Operations | | Less Distributions from | | | | | | | | |
| | Net Asset Value, Beginning of Period/ Year | | | Net Investment Income(a) | | | Net Realized and Unrealized Gain (Loss) on Investments | | | Total From Investment Operations | | | Net Investment Income | | | Net Realized Gain | | | Total Distributions | | | Net Asset Value, End of Period/ Year | |
EQUITY INCOME FUND | | | | | | | | | | | | | | | | | | |
Class A | | | | | | | | | | | | | | | | | | |
2014 | | $ | 8.99 | | | $ | .13 | | | $ | 1.16 | | | $ | 1.29 | | | $ | .14 | | | $ | .15 | | | $ | .29 | | | $ | 9.99 | |
2015 | | | 9.99 | | | | .15 | | | | (.54 | ) | | | (.39 | ) | | | .15 | | | | .46 | | | | .61 | | | | 8.99 | |
2016 | | | 8.99 | | | | .16 | | | | 1.08 | | | | 1.24 | | | | .16 | | | | .35 | | | | .51 | | | | 9.72 | |
2017 | | | 9.72 | | | | .16 | | | | 1.22 | | | | 1.38 | | | | .21 | | | | .18 | | | | .39 | | | | 10.71 | |
2018 | | | 10.71 | | | | .26 | | | | .65 | | | | .91 | | | | .17 | | | | .36 | | | | .53 | | | | 11.09 | |
2019(f) | | | 11.09 | | | | .08 | | | | (.59 | ) | | | (.51 | ) | | | .17 | | | | 1.14 | | | | 1.31 | | | | 9.27 | |
Class B | | | | | | | | | | | | | | | | | | |
2014 | | | 8.84 | | | | .05 | | | | 1.13 | | | | 1.18 | | | | .05 | | | | .15 | | | | .20 | | | | 9.82 | |
2015 | | | 9.82 | | | | .06 | | | | (.53 | ) | | | (.47 | ) | | | .07 | | | | .46 | | | | .53 | | | | 8.82 | |
2016 | | | 8.82 | | | | .08 | | | | 1.06 | | | | 1.14 | | | | .09 | | | | .35 | | | | .44 | | | | 9.52 | |
2017 | | | 9.52 | | | | .08 | | | | 1.19 | | | | 1.27 | | | | .12 | | | | .18 | | | | .30 | | | | 10.49 | |
2018 | | | 10.49 | | | | .16 | | | | .65 | | | | .81 | | | | .10 | | | | .36 | | | | .46 | | | | 10.84 | |
2019(f) | | | 10.84 | | | | .04 | | | | (.59 | ) | | | (.55 | ) | | | .11 | | | | 1.14 | | | | 1.25 | | | | 9.04 | |
Advisor Class | | | | | | | | | | | | | | | | | | |
2014 | | | 8.99 | | | | .17 | | | | 1.13 | | | | 1.30 | | | | .15 | | | | .15 | | | | .30 | | | | 9.99 | |
2015 | | | 9.99 | | | | .19 | | | | (.55 | ) | | | (.36 | ) | | | .17 | | | | .46 | | | | .63 | | | | 9.00 | |
2016 | | | 9.00 | | | | .20 | | | | 1.08 | | | | 1.28 | | | | .19 | | | | .35 | | | | .54 | | | | 9.74 | |
2017 | | | 9.74 | | | | .19 | | | | 1.23 | | | | 1.42 | | | | .21 | | | | .18 | | | | .39 | | | | 10.77 | |
2018 | | | 10.77 | | | | .31 | | | | .65 | | | | .96 | | | | .21 | | | | .36 | | | | .57 | | | | 11.16 | |
2019(f) | | | 11.16 | | | | .10 | | | | (.60 | ) | | | (.50 | ) | | | .18 | | | | 1.14 | | | | 1.32 | | | | 9.34 | |
Institutional Class | | | | | | | | | | | | | | | | | | |
2014 | | | 9.02 | | | | .17 | | | | 1.16 | | | | 1.33 | | | | .17 | | | | .15 | | | | .32 | | | | 10.03 | |
2015 | | | 10.03 | | | | .19 | | | | (.55 | ) | | | (.36 | ) | | | .17 | | | | .46 | | | | .63 | | | | 9.04 | |
2016 | | | 9.04 | | | | .20 | | | | 1.09 | | | | 1.29 | | | | .20 | | | | .35 | | | | .55 | | | | 9.78 | |
2017 | | | 9.78 | | | | .37 | | | | 1.06 | | | | 1.43 | | | | .31 | | | | .18 | | | | .49 | | | | 10.72 | |
2018 | | | 10.72 | | | | .31 | | | | .66 | | | | .97 | | | | .21 | | | | .36 | | | | .57 | | | | 11.12 | |
2019(f) | | | 11.12 | | | | .10 | | | | (.60 | ) | | | (.50 | ) | | | .22 | | | | 1.14 | | | | 1.36 | | | | 9.26 | |
266
See notes to financial statements
R A T I O S / S U P P L E M E N T A L D A T A | |
| | | | | | | | | Ratio to Average Net Assets** | | Ratio to Average Net Assets Before Expenses Waived or Assumed | | | | |
Total Return* | | | Net Assets End of Period/ Year (in thousands) | | | Net Expenses After Fee Credits | | | Net Expenses Before Fee Credits*** | | | Net Investment Income | | | Expenses*** | | | Net Investment Income | | | Portfolio Turnover Rate | |
| | | | | | | | | | | | | | | | | | | | | | | | | | | | | | | |
| | | | | | | | | | | | | | | | | | | | | | | | | | | | | | | |
| | 14.48 | % | | $ | 510,981 | | | | 1.21 | % | | | 1.22 | % | | | 1.33 | % | | | N/A | | | | N/A | | | | 27 | % |
| | (4.31 | ) | | | 485,342 | | | | 1.21 | | | | 1.21 | | | | 1.52 | | | | N/A | | | | N/A | | | | 23 | |
| | 14.16 | | | | 529,327 | | | | 1.22 | | | | 1.22 | | | | 1.72 | | | | N/A | | | | N/A | | | | 22 | |
| | 14.46 | | | | 564,918 | | | | 1.20 | | | | 1.20 | | | | 1.58 | | | | N/A | | | | N/A | | | | 15 | |
| | 8.68 | | | | 545,810 | | | | 1.20 | | | | 1.20 | | | | 2.42 | | | | N/A | | | | N/A | | | | 35 | |
| | (3.41 | )†† | | | 498,834 | | | | 1.22 | † | | | 1.22 | † | | | 1.70 | † | | | N/A | | | | N/A | | | | 26 | †† |
| | | | | | | | | | | | | | | | | | | | | | | | | | | | | | | |
| | 13.49 | | | | 5,721 | | | | 2.06 | | | | 2.06 | | | | .49 | | | | N/A | | | | N/A | | | | 27 | |
| | (5.16 | ) | | | 3,847 | | | | 2.06 | | | | 2.06 | | | | .67 | | | | N/A | | | | N/A | | | | 23 | |
| | 13.20 | | | | 3,446 | | | | 2.07 | | | | 2.07 | | | | .87 | | | | N/A | | | | N/A | | | | 22 | |
| | 13.48 | | | | 3,012 | | | | 2.03 | | | | 2.03 | | | | .76 | | | | N/A | | | | N/A | | | | 15 | |
| | 7.89 | | | | 2,562 | | | | 2.04 | | | | 2.04 | | | | 1.54 | | | | N/A | | | | N/A | | | | 35 | |
| | (3.90 | )†† | | | 2,200 | | | | 2.06 | † | | | 2.06 | † | | | .86 | † | | | N/A | | | | N/A | | | | 26 | †† |
| | | | | | | | | | | | | | | | | | | | | | | | | | | | | | | |
| | 14.57 | | | | 32,160 | | | | .81 | | | | .81 | | | | 1.71 | | | | N/A | | | | N/A | | | | 27 | |
| | (3.96 | ) | | | 38,482 | | | | .84 | | | | .84 | | | | 1.90 | | | | N/A | | | | N/A | | | | 23 | |
| | 14.63 | | | | 54,576 | | | | .85 | | | | .85 | | | | 2.08 | | | | N/A | | | | N/A | | | | 22 | |
| | 14.87 | | | | 71,611 | | | | .84 | | | | .84 | | | | 1.94 | | | | N/A | | | | N/A | | | | 15 | |
| | 9.09 | | | | 80,387 | | | | .85 | | | | .85 | | | | 2.79 | | | | N/A | | | | N/A | | | | 35 | |
| | (3.25 | )†† | | | 78,539 | | | | .85 | † | | | .85 | † | | | 2.07 | † | | | N/A | | | | N/A | | | | 26 | †† |
| | | | | | | | | | | | | | | | | | | | | | | | | | | | | | | |
| | 14.88 | | | | 7,399 | | | | .80 | | | | .80 | | | | 1.76 | | | | N/A | | | | N/A | | | | 27 | |
| | (3.97 | ) | | | 9,773 | | | | .81 | | | | .81 | | | | 1.93 | | | | N/A | | | | N/A | | | | 23 | |
| | 14.67 | | | | 2,448 | | | | .78 | | | | .78 | | | | 2.08 | | | | N/A | | | | N/A | | | | 22 | |
| | 14.84 | | | | 2,193 | | | | .80 | | | | .80 | | | | 2.02 | | | | N/A | | | | N/A | | | | 15 | |
| | 9.21 | | | | 2,499 | | | | .80 | | | | .80 | | | | 2.81 | | | | N/A | | | | N/A | | | | 35 | |
| | (3.24 | )†† | | | 1,998 | | | | .81 | † | | | .81 | † | | | 2.05 | † | | | N/A | | | | N/A | | | | 26 | †† |
267
Financial Highlights(continued)
FIRST INVESTORS EQUITY FUNDS
| | | P E R S H A R E D A T A | |
| | | | | | | Investment Operations | | Less Distributions from | | | | | | | | |
| | Net Asset Value, Beginning of Period/ Year | | | Net Investment Income (Loss)(a) | | | Net Realized and Unrealized Gain (Loss) on Investments | | | Total From Investment Operations | | | Net Investment Income | | | Net Realized Gain | | | Total Distributions | | | Net Asset Value, End of Period/ Year | |
GLOBAL FUND | | | | | | | | | | | | | | |
Class A | | | | | | | | | | | | | | |
2014 | | $ | 8.01 | | | $ | — | | | $ | .80 | | | $ | .80 | | | $ | .04 | | | $ | .11 | | | $ | .15 | | | $ | 8.66 | |
2015 | | | 8.66 | | | | — | | | | .11 | | | | .11 | | | | — | | | | 1.51 | | | | 1.51 | | | | 7.26 | |
2016 | | | 7.26 | | | | .01 | | | | .43 | | | | .44 | | | | .00 | (b) | | | .40 | | | | .40 | | | | 7.30 | |
2017 | | | 7.30 | | | | .02 | | | | 1.29 | | | | 1.31 | | | | .01 | | | | — | | | | .01 | | | | 8.60 | |
2018 | | | 8.60 | | | | (.01 | ) | | | .89 | | | | .88 | | | | .04 | | | | .63 | | | | .67 | | | | 8.81 | |
2019(f) | | | 8.81 | | | | .01 | | | | (.66 | ) | | | (.65 | ) | | | — | | | | 1.00 | | | | 1.00 | | | | 7.16 | |
Class B | | | | | | | | | | | | | | |
2014 | | | 6.86 | | | | (.06 | ) | | | .69 | | | | .63 | | | | — | | | | .11 | | | | .11 | | | | 7.38 | |
2015 | | | 7.38 | | | | (.05 | ) | | | .10 | | | | .05 | | | | — | | | | 1.51 | | | | 1.51 | | | | 5.92 | |
2016 | | | 5.92 | | | | (.04 | ) | | | .36 | | | | .32 | | | | — | | | | .40 | | | | .40 | | | | 5.84 | |
2017 | | | 5.84 | | | | (.03 | ) | | | 1.02 | | | | .99 | | | | .00 | (b) | | | — | | | | .00 | (b) | | | 6.83 | |
2018 | | | 6.83 | | | | (.07 | ) | | | .70 | | | | .63 | | | | .03 | | | | .63 | | | | .66 | | | | 6.80 | |
2019(f) | | | 6.80 | | | | (.01 | ) | | | (.54 | ) | | | (.55 | ) | | | — | | | | 1.00 | | | | 1.00 | | | | 5.25 | |
Advisor Class | | | | | | | | | | | | | | |
2014 | | | 8.01 | | | | — | | | | .82 | | | | .82 | | | | — | | | | .11 | | | | .11 | | | | 8.72 | |
2015 | | | 8.72 | | | | .03 | | | | .12 | | | | .15 | | | | — | | | | 1.51 | | | | 1.51 | | | | 7.36 | |
2016 | | | 7.36 | | | | .04 | | | | .44 | | | | .48 | | | | .01 | | | | .40 | | | | .41 | | | | 7.43 | |
2017 | | | 7.43 | | | | .06 | | | | 1.31 | | | | 1.37 | | | | .02 | | | | — | | | | .02 | | | | 8.78 | |
2018 | | | 8.78 | | | | .02 | | | | .91 | | | | .93 | | | | .05 | | | | .63 | | | | .68 | | | | 9.03 | |
2019(f) | | | 9.03 | | | | .02 | | | | (.67 | ) | | | (.65 | ) | | | — | | | | 1.00 | | | | 1.00 | | | | 7.38 | |
Institutional Class | | | | | | | | | | | | | | |
2014 | | | 8.02 | | | | — | | | | .84 | | | | .84 | | | | — | | | | .11 | | | | .11 | | | | 8.75 | |
2015 | | | 8.75 | | | | .04 | | | | .11 | | | | .15 | | | | — | | | | 1.51 | | | | 1.51 | | | | 7.39 | |
2016 | | | 7.39 | | | | .04 | | | | .45 | | | | .49 | | | | .01 | | | | .40 | | | | .41 | | | | 7.47 | |
2017 | | | 7.47 | | | | .06 | | | | 1.31 | | | | 1.37 | | | | .02 | | | | — | | | | .02 | | | | 8.82 | |
2018 | | | 8.82 | | | | .03 | | | | .91 | | | | .94 | | | | .05 | | | | .63 | | | | .68 | | | | 9.08 | |
2019(f) | | | 9.08 | | | | .03 | | | | (.68 | ) | | | (.65 | ) | | | — | | | | 1.00 | | | | 1.00 | | | | 7.43 | |
268
See notes to financial statements
R A T I O S / S U P P L E M E N T A L D A T A | |
| | | | | | | | | Ratio to Average Net Assets** | | Ratio to Average Net Assets Before Expenses Waived or Assumed | | | | |
Total Return* | | | Net Assets End of Period/ Year (in thousands) | | | Net Expenses After Fee Credits | | | Net Expenses Before Fee Credits*** | | | Net Investment Income (Loss) | | | Expenses*** | | | Net Investment Income (Loss) | | | Portfolio Turnover Rate | |
| | | | | | | | | | | | | | | | | | | | | | | | | | | | | | | |
| | | | | | | | | | | | | | | | | | | | | | | | | | | | | | | |
| | 10.00 | % | | $ | 332,416 | | | | 1.49 | % | | | 1.49 | % | | | .03 | % | | | 1.54 | % | | | (.02 | )% | | | 154 | % |
| | .87 | | | | 331,382 | | | | 1.47 | | | | 1.47 | | | | (.01 | ) | | | 1.52 | | | | (.06 | ) | | | 97 | |
| | 6.03 | | | | 339,956 | | | | 1.47 | | | | 1.47 | | | | .09 | | | | 1.52 | | | | .04 | | | | 94 | |
| | 17.99 | | | | 379,176 | | | | 1.44 | | | | 1.44 | | | | .30 | | | | 1.49 | | | | .25 | | | | 117 | |
| | 10.69 | | | | 393,697 | | | | 1.43 | | | | 1.43 | | | | (.16 | ) | | | 1.48 | | | | (.21 | ) | | | 132 | |
| | (5.95 | )†† | | | 356,080 | | | | 1.46 | † | | | 1.46 | † | | | .26 | † | | | 1.49 | | | | .23 | | | | 81 | †† |
| | | | | | | | | | | | | | | | | | | | | | | | | | | | | | | |
| | 9.18 | | | | 4,023 | | | | 2.31 | | | | 2.31 | | | | (.79 | ) | | | 2.36 | | | | (.84 | ) | | | 154 | |
| | .09 | | | | 3,405 | | | | 2.28 | | | | 2.28 | | | | (.82 | ) | | | 2.33 | | | | (.87 | ) | | | 97 | |
| | 5.29 | | | | 2,937 | | | | 2.27 | | | | 2.27 | | | | (.72 | ) | | | 2.32 | | | | (.77 | ) | | | 94 | |
| | 16.98 | | | | 2,642 | | | | 2.24 | | | | 2.24 | | | | (.52 | ) | | | 2.29 | | | | (.57 | ) | | | 117 | |
| | 9.70 | | | | 2,309 | | | | 2.23 | | | | 2.23 | | | | (.97 | ) | | | 2.28 | | | | (1.02 | ) | | | 132 | |
| | (6.28 | )†† | | | 1,938 | | | | 2.25 | † | | | 2.25 | † | | | .54 | † | | | 2.29 | | | | (.58 | ) | | | 81 | †† |
| | | | | | | | | | | | | | | | | | | | | | | | | | | | | | | |
| | 10.24 | | | | 66,590 | | | | 1.06 | | | | 1.06 | | | | .53 | | | | 1.11 | | | | .48 | | | | 154 | |
| | 1.37 | | | | 114,556 | | | | 1.06 | | | | 1.06 | | | | .43 | | | | 1.11 | | | | .38 | | | | 97 | |
| | 6.48 | | | | 169,088 | | | | 1.05 | | | | 1.05 | | | | .53 | | | | 1.10 | | | | .48 | | | | 94 | |
| | 18.46 | | | | 191,839 | | | | 1.04 | | | | 1.04 | | | | .70 | | | | 1.09 | | | | .65 | | | | 117 | |
| | 11.03 | | | | 228,234 | | | | 1.05 | | | | 1.05 | | | | .25 | | | | 1.10 | | | | .20 | | | | 132 | |
| | (5.79 | )†† | | | 227,833 | | | | 1.08 | † | | | 1.08 | † | | | .65 | † | | | 1.12 | | | | .61 | | | | 81 | †† |
| | | | | | | | | | | | | | | | | | | | | | | | | | | | | | | |
| | 10.48 | | | | 3,001 | | | | 1.03 | | | | 1.03 | | | | .48 | | | | 1.08 | | | | .43 | | | | 154 | |
| | 1.37 | | | | 2,955 | | | | 1.02 | | | | 1.02 | | | | .45 | | | | 1.07 | | | | .40 | | | | 97 | |
| | 6.61 | | | | 3,288 | | | | 1.01 | | | | 1.01 | | | | .55 | | | | 1.06 | | | | .50 | | | | 94 | |
| | 18.38 | | | | 3,800 | | | | 1.00 | | | | 1.00 | | | | .74 | | | | 1.05 | | | | .69 | | | | 117 | |
| | 11.12 | | | | 4,419 | | | | 1.00 | | | | 1.00 | | | | .29 | | | | 1.05 | | | | .24 | | | | 132 | |
| | (5.77 | )†† | | | 3,285 | | | | 1.02 | † | | | 1.02 | † | | | .69 | † | | | 1.05 | | | | .66 | | | | 81 | †† |
269
Financial Highlights(continued)
FIRST INVESTORS EQUITY FUNDS
| | | P E R S H A R E D A T A | |
| | | | | | | Investment Operations | | Less Distributions from | | | | | | | | |
| | Net Asset Value, Beginning of Period/ Year | | | Net Investment Income(a) | | | Net Realized and Unrealized Gain (Loss) on Investments | | | Total From Investment Operations | | | Net Investment Income | | | Net Realized Gain | | | Total Distributions | | | Net Asset Value, End of Period/ Year | |
GROWTH & INCOME FUND | | | | | | | | | | | | | | |
Class A | | | | | | | | | | | | | | |
2014 | | $ | 20.54 | | | $ | .18 | | | $ | 2.92 | | | $ | 3.10 | | | $ | .20 | | | $ | .68 | | | $ | .88 | | | $ | 22.76 | |
2015 | | | 22.76 | | | | .20 | | | | (1.37 | ) | | | (1.17 | ) | | | .19 | | | | 1.05 | | | | 1.24 | | | | 20.35 | |
2016 | | | 20.35 | | | | .26 | | | | 2.07 | | | | 2.33 | | | | .24 | | | | .93 | | | | 1.17 | | | | 21.51 | |
2017 | | | 21.51 | | | | .25 | | | | 2.66 | | | | 2.91 | | | | .37 | | | | .75 | | | | 1.12 | | | | 23.30 | |
2018 | | | 23.30 | | | | .26 | | | | 2.11 | | | | 2.37 | | | | .32 | | | | .94 | | | | 1.26 | | | | 24.41 | |
2019(f) | | | 24.41 | | | | .14 | | | | (1.64 | ) | | | (1.50 | ) | | | .13 | | | | 4.02 | | | | 4.15 | | | | 18.76 | |
Class B | | | | | | | | | | | | | | |
2014 | | | 19.26 | | | | — | | | | 2.73 | | | | 2.73 | | | | — | | | | .68 | | | | .68 | | | | 21.31 | |
2015 | | | 21.31 | | | | .02 | | | | (1.27 | ) | | | (1.25 | ) | | | .04 | | | | 1.05 | | | | 1.09 | | | | 18.97 | |
2016 | | | 18.97 | | | | .10 | | | | 1.91 | | | | 2.01 | | | | .08 | | | | .93 | | | | 1.01 | | | | 19.97 | |
2017 | | | 19.97 | | | | .08 | | | | 2.45 | | | | 2.53 | | | | .13 | | | | .75 | | | | .88 | | | | 21.62 | |
2018 | | | 21.62 | | | | .06 | | | | 1.96 | | | | 2.02 | | | | .08 | | | | .94 | | | | 1.02 | | | | 22.62 | |
2019(f) | | | 22.62 | | | | .05 | | | | (1.54 | ) | | | (1.49 | ) | | | .05 | | | | 4.02 | | | | 4.07 | | | | 17.06 | |
Advisor Class | | | | | | | | | | | | | | |
2014 | | | 20.54 | | | | .27 | | | | 2.91 | | | | 3.18 | | | | .20 | | | | .68 | | | | .88 | | | | 22.84 | |
2015 | | | 22.84 | | | | .29 | | | | (1.38 | ) | | | (1.09 | ) | | | .24 | | | | 1.05 | | | | 1.29 | | | | 20.46 | |
2016 | | | 20.46 | | | | .35 | | | | 2.08 | | | | 2.43 | | | | .29 | | | | .93 | | | | 1.22 | | | | 21.67 | |
2017 | | | 21.67 | | | | .33 | | | | 2.69 | | | | 3.02 | | | | .48 | | | | .75 | | | | 1.23 | | | | 23.46 | |
2018 | | | 23.46 | | | | .35 | | | | 2.11 | | | | 2.46 | | | | .40 | | | | .94 | | | | 1.34 | | | | 24.58 | |
2019(f) | | | 24.58 | | | | .17 | | | | (1.64 | ) | | | (1.47 | ) | | | .16 | | | | 4.02 | | | | 4.18 | | | | 18.93 | |
Institutional Class | | | | | | | | | | | | | | |
2014 | | | 20.55 | | | | .27 | | | | 2.92 | | | | 3.19 | | | | .28 | | | | .68 | | | | .96 | | | | 22.78 | |
2015 | | | 22.78 | | | | .29 | | | | (1.39 | ) | | | (1.10 | ) | | | .24 | | | | 1.05 | | | | 1.29 | | | | 20.39 | |
2016 | | | 20.39 | | | | .35 | | | | 2.07 | | | | 2.42 | | | | .30 | | | | .93 | | | | 1.23 | | | | 21.58 | |
2017 | | | 21.58 | | | | .34 | | | | 2.67 | | | | 3.01 | | | | .45 | | | | .75 | | | | 1.20 | | | | 23.39 | |
2018 | | | 23.39 | | | | .36 | | | | 2.12 | | | | 2.48 | | | | .41 | | | | .94 | | | | 1.35 | | | | 24.52 | |
2019(f) | | | 24.52 | | | | .18 | | | | (1.65 | ) | | | (1.47 | ) | | | .18 | | | | 4.02 | | | | 4.20 | | | | 18.85 | |
270
See notes to financial statements
R A T I O S / S U P P L E M E N T A L D A T A | |
| | | | | | | | | Ratio to Average Net Assets** | | Ratio to Average Net Assets Before Expenses Waived or Assumed | | | | |
Total Return* | | | Net Assets End of Period/ Year (in thousands) | | | Net Expenses After Fee Credits | | | Net Expenses Before Fee Credits*** | | | Net Investment Income | | | Expenses*** | | | Net Investment Income | | | Portfolio Turnover Rate | |
| | | | | | | | | | | | | | | | | | | | | | | | | | | | | | | |
| | | | | | | | | | | | | | | | | | | | | | | | | | | | | | | |
| | 15.26 | % | | $ | 1,632,920 | | | | 1.15 | % | | | 1.15 | % | | | .80 | % | | | N/A | | | | N/A | | | | 22 | % |
| | (5.62 | ) | | | 1,496,803 | | | | 1.15 | | | | 1.15 | | | | .89 | | | | N/A | | | | N/A | | | | 23 | |
| | 11.72 | | | | 1,588,423 | | | | 1.16 | | | | 1.16 | | | | 1.28 | | | | N/A | | | | N/A | | | | 23 | |
| | 13.99 | | | | 1,675,590 | | | | 1.15 | | | | 1.15 | | | | 1.13 | | | | N/A | | | | N/A | | | | 16 | |
| | 10.35 | | | | 1,653,563 | | | | 1.14 | | | | 1.14 | | | | 1.08 | | | | N/A | | | | N/A | | | | 34 | |
| | (4.27 | )†† | | | 1,505,650 | | | | 1.16 | † | | | 1.16 | † | | | 1.37 | † | | | N/A | | | | N/A | | | | 41 | †† |
| | | | | | | | | | | | | | | | | | | | | | | | | | | | | | | |
| | 14.32 | | | | 25,497 | | | | 1.93 | | | | 1.93 | | | | .02 | | | | N/A | | | | N/A | | | | 22 | |
| | (6.33 | ) | | | 19,316 | | | | 1.93 | | | | 1.93 | | | | .11 | | | | N/A | | | | N/A | | | | 23 | |
| | 10.82 | | | | 17,047 | | | | 1.94 | | | | 1.94 | | | | .50 | | | | N/A | | | | N/A | | | | 23 | |
| | 13.14 | | | | 14,310 | | | | 1.93 | | | | 1.93 | | | | .35 | | | | N/A | | | | N/A | | | | 16 | |
| | 9.49 | | | | 12,023 | | | | 1.93 | | | | 1.93 | | | | .29 | | | | N/A | | | | N/A | | | | 34 | |
| | (4.63 | )†† | | | 9,995 | | | | 1.95 | † | | | 1.95 | † | | | .58 | † | | | N/A | | | | N/A | | | | 41 | †† |
| | | | | | | | | | | | | | | | | | | | | | | | | | | | | | | |
| | 15.67 | | | | 123,039 | | | | .74 | | | | .74 | | | | 1.17 | | | | N/A | | | | N/A | | | | 22 | |
| | (5.24 | ) | | | 141,229 | | | | .75 | | | | .75 | | | | 1.29 | | | | N/A | | | | N/A | | | | 23 | |
| | 12.18 | | | | 132,486 | | | | .77 | | | | .77 | | | | 1.68 | | | | N/A | | | | N/A | | | | 23 | |
| | 14.42 | | | | 166,851 | | | | .78 | | | | .78 | | | | 1.50 | | | | N/A | | | | N/A | | | | 16 | |
| | 10.73 | | | | 142,220 | | | | .79 | | | | .79 | | | | 1.44 | | | | N/A | | | | N/A | | | | 34 | |
| | (4.09 | )†† | | | 143,755 | | | | .84 | † | | | .84 | † | | | 1.69 | † | | | N/A | | | | N/A | | | | 41 | †† |
| | | | | | | | | | | | | | | | | | | | | | | | | | | | | | | |
| | 15.75 | | | | 9,746 | | | | .74 | | | | .74 | | | | 1.21 | | | | N/A | | | | N/A | | | | 22 | |
| | (5.27 | ) | | | 9,380 | | | | .75 | | | | .75 | | | | 1.29 | | | | N/A | | | | N/A | | | | 23 | |
| | 12.18 | | | | 10,596 | | | | .74 | | | | .74 | | | | 1.70 | | | | N/A | | | | N/A | | | | 23 | |
| | 14.47 | | | | 10,839 | | | | .74 | | | | .74 | | | | 1.54 | | | | N/A | | | | N/A | | | | 16 | |
| | 10.85 | | | | 11,067 | | | | .74 | | | | .74 | | | | 1.49 | | | | N/A | | | | N/A | | | | 34 | |
| | (4.10 | )†† | | | 8,419 | | | | .75 | † | | | .75 | † | | | 1.78 | † | | | N/A | | | | N/A | | | | 41 | †† |
271
Financial Highlights(continued)
FIRST INVESTORS EQUITY FUNDS
| | | P E R S H A R E D A T A | |
| | | | | | | Investment Operations | | Less Distributions from | | | | | | | | |
| | Net Asset Value, Beginning of Period/ Year | | | Net Investment Income (Loss)(a) | | | Net Realized and Unrealized Gain (Loss) on Investments | | | Total From Investment Operations | | | Net Investment Income | | | Net Realized Gain | | | Total Distributions | | | Net Asset Value, End of Period/ Year | |
HEDGED U.S. EQUITY OPPORTUNITIES FUND | | | | | | | | | | | | | | |
Class A | | | | | | | | | | | | | | |
2016(c) | | $ | 10.00 | | | $ | — | | | $ | (.09 | ) | | $ | (.09 | ) | | $ | — | | | $ | — | | | $ | — | | | $ | 9.91 | |
2017 | | | 9.91 | | | | (.02 | ) | | | .88 | | | | .86 | | | | — | | | | — | | | | — | | | | 10.77 | |
2018 | | | 10.77 | | | | (.03 | ) | | | 1.16 | | | | 1.13 | | | | — | | | | — | | | | — | | | | 11.90 | |
2019(f) | | | 11.90 | | | | — | | | | (.03 | ) | | | (.03 | ) | | | — | | | | .21 | | | | .21 | | | | 11.66 | |
Advisor Class | | | | | | | | | | | | | | |
2016(c) | | | 10.00 | | | | — | | | | (.09 | ) | | | (.09 | ) | | | — | | | | — | | | | — | | | | 9.91 | |
2017 | | | 9.91 | | | | .01 | | | | .89 | | | | .90 | | | | .00 | (b) | | | — | | | | .00 | (b) | | | 10.81 | |
2018 | | | 10.81 | | | | .02 | | | | 1.16 | | | | 1.18 | | | | — | | | | — | | | | — | | | | 11.99 | |
2019(f) | | | 11.99 | | | | .02 | | | | (.04 | ) | | | (.02 | ) | | | — | | | | .21 | | | | .21 | | | | 11.76 | |
Institutional Class | | | | | | | | | | | | | | |
2016(c) | | | 10.00 | | | | .01 | | | | (.10 | ) | | | (.09 | ) | | | — | | | | — | | | | — | | | | 9.91 | |
2017 | | | 9.91 | | | | .02 | | | | .89 | | | | .91 | | | | .00 | (b) | | | — | | | | .00 | (b) | | | 10.82 | |
2018 | | | 10.82 | | | | .02 | | | | 1.17 | | | | 1.19 | | | | — | | | | — | | | | — | | | | 12.01 | |
2019(f) | | | 12.01 | | | | .03 | | | | (.03 | ) | | | — | | | | — | | | | .21 | | | | .21 | | | | 11.80 | |
272
See notes to financial statements
R A T I O S / S U P P L E M E N T A L D A T A | |
| | | | | | | | | Ratio to Average Net Assets** | | Ratio to Average Net Assets Before Expenses Waived or Assumed | | | | |
Total Return* | | | Net Assets End of Period/ Year (in thousands) | | | Net Expenses After Fee Credits | | | Net Expenses Before Fee Credits*** | | | Net Investment Income (Loss) | | | Expenses*** | | | Net Investment Income (Loss) | | | Portfolio Turnover Rate | |
| | | | | | | | | | | | | | | | | | | | | | | | | | | | | | | |
| | | | | | | | | | | | | | | | | | | | | | | | | | | | | | | |
| | (.90 | )%†† | | $ | 9,265 | | | | 1.75 | %† | | | 1.75 | %† | | | (.02 | )%† | | | 4.24 | %† | | | (2.51 | )%† | | | 7 | %†† |
| | 8.68 | | | | 44,228 | | | | 1.75 | | | | 1.75 | | | | (.21 | ) | | | 2.09 | | | | (.55 | ) | | | 75 | |
| | 10.49 | | | | 66,746 | | | | 1.75 | | | | 1.75 | | | | (.22 | ) | | | 1.76 | | | | (.23 | ) | | | 56 | |
| | (0.08 | )†† | | | 76,399 | | | | 1.75 | † | | | 1.75 | † | | | .04 | † | | | 1.69 | † | | | .10 | † | | | 20 | †† |
| | | | | | | | | | | | | | | | | | | | | | | | | | | | | | | |
| | (.90 | )†† | | | 24,539 | | | | 1.42 | † | | | 1.42 | † | | | .26 | † | | | 3.37 | † | | | (1.69 | )† | | | 7 | †† |
| | 9.11 | | | | 33,770 | | | | 1.42 | | | | 1.42 | | | | .10 | | | | 1.76 | | | | (.24 | ) | | | 75 | |
| | 10.92 | | | | 94,955 | | | | 1.42 | | | | 1.42 | | | | .16 | | | | 1.40 | | | | .18 | | | | 56 | |
| | 0.01 | †† | | | 105,027 | | | | 1.42 | † | | | 1.42 | † | | | .37 | † | | | 1.44 | † | | | .35 | † | | | 20 | †† |
| | | | | | | | | | | | | | | | | | | | | | | | | | | | | | | |
| | (.90 | )†† | | | 99 | | | | 1.31 | † | | | 1.31 | † | | | .30 | † | | | 3.24 | † | | | (1.63 | )† | | | 7 | †† |
| | 9.21 | | | | 472 | | | | 1.31 | | | | 1.31 | | | | .23 | | | | 1.74 | | | | (.20 | ) | | | 75 | |
| | 11.00 | | | | 574 | | | | 1.31 | | | | 1.31 | | | | .21 | | | | 1.39 | | | | .13 | | | | 56 | |
| | 0.19 | †† | | | 549 | | | | 1.31 | † | | | 1.31 | † | | | .47 | † | | | 1.30 | † | | | .48 | † | | | 20 | †† |
273
Financial Highlights(continued)
FIRST INVESTORS EQUITY FUNDS
| | | P E R S H A R E D A T A | |
| | | | | | | Investment Operations | | Less Distributions from | | | | | | | | |
| | Net Asset Value, Beginning of Period/ Year | | | Net Investment Income (Loss)(a) | | | Net Realized and Unrealized Gain (Loss) on Investments | | | Total From Investment Operations | | | Net Investment Income | | | Net Realized Gain | | | Total Distributions | | | Net Asset Value, End of Period/ Year | |
INTERNATIONAL FUND | | | | | | | | | | | | | | |
Class A | | | | | | | | | | | | | | |
2014 | | $ | 12.53 | | | $ | .05 | | | $ | .50 | | | $ | .55 | | | $ | .02 | | | $ | — | | | $ | .02 | | | $ | 13.06 | |
2015 | | | 13.06 | | | | .05 | | | | (.41 | ) | | | (.36 | ) | | | .05 | | | | — | | | | .05 | | | | 12.65 | |
2016 | | | 12.65 | | | | .06 | | | | 1.05 | | | | 1.11 | | | | .05 | | | | — | | | | .05 | | | | 13.71 | |
2017 | | | 13.71 | | | | .02 | | | | 2.02 | | | | 2.04 | | | | .07 | | | | — | | | | .07 | | | | 15.68 | |
2018 | | | 15.68 | | | | .01 | | | | .28 | | | | .29 | | | | .02 | | | | — | | | | .02 | | | | 15.95 | |
2019(f) | | | 15.95 | | | | (.02 | ) | | | (.12 | ) | | | (.14 | ) | | | .03 | | | | .96 | | | | .99 | | | | 14.82 | |
Class B | | | | | | | | | | | | | | |
2014 | | | 11.98 | | | | (.05 | ) | | | .47 | | | | .42 | | | | — | | | | — | | | | — | | | | 12.40 | |
2015 | | | 12.40 | | | | (.06 | ) | | | (.38 | ) | | | (.44 | ) | | | — | | | | — | | | | — | | | | 11.96 | |
2016 | | | 11.96 | | | | (.06 | ) | | | 1.00 | | | | .94 | | | | .03 | | | | — | | | | .03 | | | | 12.87 | |
2017 | | | 12.87 | | | | (.09 | ) | | | 1.90 | | | | 1.81 | | | | .05 | | | | — | | | | .05 | | | | 14.63 | |
2018 | | | 14.63 | | | | (.11 | ) | | | .26 | | | | .15 | | | | — | | | | — | | | | — | | | | 14.78 | |
2019(f) | | | 14.78 | | | | (.08 | ) | | | (.12 | ) | | | (.20 | ) | | | — | | | | .96 | | | | .96 | | | | 13.62 | |
Advisor Class | | | | | | | | | | | | | | | |
2014 | | | 12.55 | | | | .14 | | | | .44 | | | | .58 | | | | — | | | | — | | | | — | | | | 13.13 | |
2015 | | | 13.13 | | | | .11 | | | | (.43 | ) | | | (.32 | ) | | | .05 | | | | — | | | | .05 | | | | 12.76 | |
2016 | | | 12.76 | | | | .11 | | | | 1.06 | | | | 1.17 | | | | .06 | | | | — | | | | .06 | | | | 13.87 | |
2017 | | | 13.87 | | | | .08 | | | | 2.05 | | | | 2.13 | | | | .08 | | | | — | | | | .08 | | | | 15.92 | |
2018 | | | 15.92 | | | | .08 | | | | .27 | | | | .35 | | | | .03 | | | | — | | | | .03 | | | | 16.24 | |
2019(f) | | | 16.24 | | | | — | | | | (.12 | ) | | | (.12 | ) | | | .04 | | | | .96 | | | | 1.00 | | | | 15.12 | |
Institutional Class | | | | | | | | | | | | | | | |
2014 | | | 12.56 | | | | .12 | | | | .51 | | | | .63 | | | | — | | | | — | | | | — | | | | 13.19 | |
2015 | | | 13.19 | | | | .12 | | | | (.43 | ) | | | (.31 | ) | | | .10 | | | | — | | | | .10 | | | | 12.78 | |
2016 | | | 12.78 | | | | .13 | | | | 1.07 | | | | 1.20 | | | | .07 | | | | — | | | | .07 | | | | 13.91 | |
2017 | | | 13.91 | | | | .09 | | | | 2.05 | | | | 2.14 | | | | .09 | | | | — | | | | .09 | | | | 15.96 | |
2018 | | | 15.96 | | | | .09 | | | | .29 | | | | .38 | | | | .04 | | | | — | | | | .04 | | | | 16.30 | |
2019(f) | | | 16.30 | | | | .01 | | | | (.12 | ) | | | (.11 | ) | | | .05 | | | | .96 | | | | 1.01 | | | | 15.18 | |
274
See notes to financial statements
R A T I O S / S U P P L E M E N T A L D A T A | |
| | | | | | | | | Ratio to Average Net Assets** | | Ratio to Average Net Assets Before Expenses Waived or Assumed | | | | |
Total Return* | | | Net Assets End of Period/ Year (in thousands) | | | Net Expenses After Fee Credits | | | Net Expenses Before Fee Credits*** | | | Net Investment Income (Loss) | | | Expenses*** | | | Net Investment Income | | | Portfolio Turnover Rate | |
| | | | | | | | | | | | | | | | | | | | | | | | | | | | | | | |
| | | | | | | | | | | | | | | | | | | | | | | | | | | | | | | |
| | 4.43 | % | | $ | 193,174 | | | | 1.66 | % | | | 1.66 | % | | | .39 | % | | | N/A | | | | N/A | | | | 34 | % |
| | (2.78 | ) | | | 194,991 | | | | 1.64 | | | | 1.64 | | | | .40 | | | | N/A | | | | N/A | | | | 27 | |
| | 8.80 | | | | 209,205 | | | | 1.61 | | | | 1.61 | | | | .45 | | | | N/A | | | | N/A | | | | 28 | |
| | 15.00 | | | | 238,770 | | | | 1.58 | | | | 1.58 | | | | .17 | | | | N/A | | | | N/A | | | | 38 | |
| | 1.83 | | | | 259,683 | | | | 1.56 | | | | 1.56 | | | | .09 | | | | N/A | | | | N/A | | | | 36 | |
| | (.07 | )†† | | | 254,909 | | | | 1.58 | † | | | 1.58 | † | | | (.31 | )† | | | N/A | | | | N/A | | | | 40 | †† |
| | | | | | | | | | | | | | | | | | | | | | | | | | | | | | | |
| | 3.51 | | | | 2,893 | | | | 2.49 | | | | 2.49 | | | | (.42 | ) | | | N/A | | | | N/A | | | | 34 | |
| | (3.55 | ) | | | 2,094 | | | | 2.47 | | | | 2.47 | | | | (.49 | ) | | | N/A | | | | N/A | | | | 27 | |
| | 7.83 | | | | 1,607 | | | | 2.45 | | | | 2.45 | | | | (.45 | ) | | | N/A | | | | N/A | | | | 28 | |
| | 14.12 | | | | 1,465 | | | | 2.40 | | | | 2.40 | | | | (.68 | ) | | | N/A | | | | N/A | | | | 38 | |
| | 1.03 | | | | 1,239 | | | | 2.38 | | | | 2.38 | | | | (.76 | ) | | | N/A | | | | N/A | | | | 36 | |
| | (.50 | )†† | | | 1,092 | | | | 2.41 | † | | | 2.41 | † | | | (1.15 | )† | | | N/A | | | | N/A | | | | 40 | †† |
| | | | | | | | | | | | | | | | | | | | | | | | | | | | | | | |
| | 4.62 | | | | 35,249 | | | | 1.27 | | | | 1.27 | | | | .98 | | | | N/A | | | | N/A | | | | 34 | |
| | (2.45 | ) | | | 57,623 | | | | 1.24 | | | | 1.24 | | | | .83 | | | | N/A | | | | N/A | | | | 27 | |
| | 9.22 | | | | 81,525 | | | | 1.23 | | | | 1.24 | | | | .85 | | | | N/A | | | | N/A | | | | 28 | |
| | 15.50 | | | | 111,334 | | | | 1.18 | | | | 1.18 | | | | .59 | | | | N/A | | | | N/A | | | | 38 | |
| | 2.21 | | | | 136,628 | | | | 1.18 | | | | 1.18 | | | | .48 | | | | N/A | | | | N/A | | | | 36 | |
| | .09 | †† | | | 144,283 | | | | 1.22 | † | | | 1.22 | † | | | .06 | † | | | N/A | | | | N/A | | | | 40 | †† |
| | | | | | | | | | | | | | | | | | | | | | | | | | | | | | | �� |
| | 5.02 | | | | 2,357 | | | | 1.17 | | | | 1.17 | | | | .93 | | | | N/A | | | | N/A | | | | 34 | |
| | (2.33 | ) | | | 2,347 | | | | 1.14 | | | | 1.14 | | | | .89 | | | | N/A | | | | N/A | | | | 27 | |
| | 9.39 | | | | 2,695 | | | | 1.12 | | | | 1.12 | | | | .95 | | | | N/A | | | | N/A | | | | 28 | |
| | 15.54 | | | | 3,274 | | | | 1.09 | | | | 1.09 | | | | .65 | | | | N/A | | | | N/A | | | | 38 | |
| | 2.36 | | | | 3,509 | | | | 1.09 | | | | 1.09 | | | | .56 | | | | N/A | | | | N/A | | | | 36 | |
| | .14 | †† | | | 2,783 | | | | 1.09 | † | | | 1.09 | † | | | .17 | † | | | N/A | | | | N/A | | | | 40 | †† |
275
Financial Highlights(continued)
FIRST INVESTORS EQUITY FUNDS
| | | P E R S H A R E D A T A | |
| | | | | | | Investment Operations | | Less Distributions from | | | | | | | | |
| | Net Asset Value, Beginning of Period/ Year | | | Net Investment Income (Loss)(a) | | | Net Realized and Unrealized Gain (Loss) on Investments | | | Total From Investment Operations | | | Net Investment Income | | | Net Realized Gain | | | Total Distributions | | | Net Asset Value, End of Period/ Year | |
OPPORTUNITY FUND | | | | | | | | | | | | | | |
Class A | | | | | | | | | | | | | | | | | | |
2014 | | $ | 38.13 | | | $ | .07 | | | $ | 5.29 | | | $ | 5.36 | | | $ | .16 | | | $ | 2.43 | | | $ | 2.59 | | | $ | 40.90 | |
2015 | | | 40.90 | | | | .04 | | | | (.39 | ) | | | (.35 | ) | | | .06 | | | | 2.70 | | | | 2.76 | | | | 37.79 | |
2016 | | | 37.79 | | | | .20 | | | | 2.52 | | | | 2.72 | | | | .04 | | | | 3.18 | | | | 3.22 | | | | 37.29 | |
2017 | | | 37.29 | | | | .11 | | | | 6.03 | | | | 6.14 | | | | .22 | | | | 1.35 | | | | 1.57 | | | | 41.86 | |
2018 | | | 41.86 | | | | .39 | | | | 2.31 | | | | 2.70 | | | | .12 | | | | 2.38 | | | | 2.50 | | | | 42.06 | |
2019(f) | | | 42.06 | | | | .05 | | | | (2.32 | ) | | | (2.27 | ) | | | .38 | | | | 3.41 | | | | 3.79 | | | | 36.00 | |
Class B | | | | | | | | | | | | | | | |
2014 | | | 32.27 | | | | (.21 | ) | | | 4.47 | | | | 4.26 | | | | — | | | | 2.43 | | | | 2.43 | | | | 34.10 | |
2015 | | | 34.10 | | | | (.23 | ) | | | (.29 | ) | | | (.52 | ) | | | — | | | | 2.70 | | | | 2.70 | | | | 30.88 | |
2016 | | | 30.88 | | | | (.07 | ) | | | 2.05 | | | | 1.98 | | | | — | | | | 3.18 | | | | 3.18 | | | | 29.68 | |
2017 | | | 29.68 | | | | (.16 | ) | | | 4.77 | | | | 4.61 | | | | .18 | | | | 1.35 | | | | 1.53 | | | | 32.76 | |
2018 | | | 32.76 | | | | .04 | | | | 1.81 | | | | 1.85 | | | | .07 | | | | 2.38 | | | | 2.45 | | | | 32.16 | |
2019(f) | | | 32.16 | | | | (.07 | ) | | | (1.90 | ) | | | (1.97 | ) | | | .34 | | | | 3.41 | | | | 3.75 | | | | 26.44 | |
Advisor Class | | | | | | | | | | | | | | | |
2014 | | | 38.18 | | | | .23 | | | | 5.22 | | | | 5.45 | | | | — | | | | 2.43 | | | | 2.43 | | | | 41.20 | |
2015 | | | 41.20 | | | | .16 | | | | (.40 | ) | | | (.24 | ) | | | .08 | | | | 2.70 | | | | 2.78 | | | | 38.18 | |
2016 | | | 38.18 | | | | .30 | | | | 2.56 | | | | 2.86 | | | | .07 | | | | 3.18 | | | | 3.25 | | | | 37.79 | |
2017 | | | 37.79 | | | | .24 | | | | 6.12 | | | | 6.36 | | | | .24 | | | | 1.35 | | | | 1.59 | | | | 42.56 | |
2018 | | | 42.56 | | | | .61 | | | | 2.27 | | | | 2.88 | | | | .15 | | | | 2.38 | | | | 2.53 | | | | 42.91 | |
2019(f) | | | 42.91 | | | | .12 | | | | (2.37 | ) | | | (2.25 | ) | | | .40 | | | | 3.41 | | | | 3.81 | | | | 36.85 | |
Institutional Class | | | | | | | | | | | | | | | |
2014 | | | 38.21 | | | | .24 | | | | 5.30 | | | | 5.54 | | | | .17 | | | | 2.43 | | | | 2.60 | | | | 41.15 | |
2015 | | | 41.15 | | | | .22 | | | | (.40 | ) | | | (.18 | ) | | | .20 | | | | 2.70 | | | | 2.90 | | | | 38.07 | |
2016 | | | 38.07 | | | | .36 | | | | 2.54 | | | | 2.90 | | | | .08 | | | | 3.18 | | | | 3.26 | | | | 37.71 | |
2017 | | | 37.71 | | | | .27 | | | | 6.12 | | | | 6.39 | | | | .26 | | | | 1.35 | | | | 1.61 | | | | 42.49 | |
2018 | | | 42.49 | | | | .59 | | | | 2.33 | | | | 2.92 | | | | .16 | | | | 2.38 | | | | 2.54 | | | | 42.87 | |
2019(f) | | | 42.87 | | | | .14 | | | | (2.36 | ) | | | (2.22 | ) | | | .43 | | | | 3.41 | | | | 3.84 | | | | 36.81 | |
276
See notes to financial statements
R A T I O S / S U P P L E M E N T A L D A T A | |
| | | | | | | | | Ratio to Average Net Assets** | | Ratio to Average Net Assets Before Expenses Waived or Assumed | | | | |
Total Return* | | | Net Assets End of Period/ Year (in thousands) | | | Net Expenses After Fee Credits | | | Net Expenses Before Fee Credits*** | | | Net Investment Income (Loss) | | | Expenses*** | | | Net Investment Income | | | Portfolio Turnover Rate | |
| | | | | | | | | | | | | | | | | | | | | | | | | | | | | | | |
| | | | | | | | | | | | | | | | | | | | | | | | | | | | | | | |
| | 14.20 | % | | $ | 805,113 | | | | 1.20 | % | | | 1.20 | % | | | .16 | % | | | N/A | | | | N/A | | | | 34 | % |
| | (1.16 | ) | | | 818,955 | | | | 1.20 | | | | 1.20 | | | | .11 | | | | N/A | | | | N/A | | | | 37 | |
| | 7.39 | | | | 880,274 | | | | 1.22 | | | | 1.22 | | | | .54 | | | | N/A | | | | N/A | | | | 36 | |
| | 16.99 | | | | 1,002,618 | | | | 1.20 | | | | 1.20 | | | | .27 | | | | N/A | | | | N/A | | | | 32 | |
| | 6.49 | | | | 1,010,312 | | | | 1.20 | | | | 1.20 | | | | .93 | | | | N/A | | | | N/A | | | | 35 | |
| | (3.97 | )†† | | | 943,678 | | | | 1.26 | † | | | 1.26 | † | | | .27 | † | | | N/A | | | | N/A | | | | 40 | †† |
| | | | | | | | | | | | | | | | | | | | | | | | | | | | | | | |
| | 13.32 | | | | 12,145 | | | | 1.99 | | | | 1.99 | | | | (.63 | ) | | | N/A | | | | N/A | | | | 34 | |
| | (1.94 | ) | | | 9,691 | | | | 1.97 | | | | 1.97 | | | | (.67 | ) | | | N/A | | | | N/A | | | | 37 | |
| | 6.58 | | | | 8,606 | | | | 1.99 | | | | 1.99 | | | | (.22 | ) | | | N/A | | | | N/A | | | | 36 | |
| | 16.12 | | | | 7,557 | | | | 1.96 | | | | 1.96 | | | | (.49 | ) | | | N/A | | | | N/A | | | | 32 | |
| | 5.65 | | | | 6,202 | | | | 1.96 | | | | 1.96 | | | | .12 | | | | N/A | | | | N/A | | | | 35 | |
| | (4.30 | )†† | | | 5,276 | | | | 1.98 | † | | | 1.98 | † | | | (.46 | )† | | | N/A | | | | N/A | | | | 40 | †† |
| | | | | | | | | | | | | | | | | | | | | | | | | | | | | | | |
| | 14.43 | | | | 35,733 | | | | .90 | | | | .90 | | | | .51 | | | | N/A | | | | N/A | | | | 34 | |
| | (.87 | ) | | | 48,322 | | | | .91 | | | | .91 | | | | .40 | | | | N/A | | | | N/A | | | | 37 | |
| | 7.69 | | | | 73,477 | | | | .93 | | | | .93 | | | | .83 | | | | N/A | | | | N/A | | | | 36 | |
| | 17.37 | | | | 81,773 | | | | .88 | | | | .88 | | | | .59 | | | | N/A | | | | N/A | | | | 32 | |
| | 6.82 | | | | 149,481 | | | | .89 | | | | .89 | | | | 1.42 | | | | N/A | | | | N/A | | | | 35 | |
| | (3.82 | )†† | | | 151,157 | | | | .90 | † | | | .90 | † | | | .63 | † | | | N/A | | | | N/A | | | | 40 | †† |
| | | | | | | | | | | | | | | | | | | | | | | | | | | | | | | |
| | 14.66 | | | | 3,838 | | | | .79 | | | | .79 | | | | .58 | | | | N/A | | | | N/A | | | | 34 | |
| | (.74 | ) | | | 4,228 | | | | .78 | | | | .78 | | | | .52 | | | | N/A | | | | N/A | | | | 37 | |
| | 7.84 | | | | 4,975 | | | | .79 | | | | .79 | | | | .98 | | | | N/A | | | | N/A | | | | 36 | |
| | 17.49 | | | | 5,678 | | | | .78 | | | | .78 | | | | .70 | | | | N/A | | | | N/A | | | | 32 | |
| | 6.95 | | | | 5,793 | | | | .77 | | | | .77 | | | | 1.38 | | | | N/A | | | | N/A | | | | 35 | |
| | (3.74 | )†† | | | 4,600 | | | | .78 | † | | | .78 | † | | | .74 | † | | | N/A | | | | N/A | | | | 40 | †† |
277
Financial Highlights(continued)
FIRST INVESTORS EQUITY FUNDS
| | | P E R S H A R E D A T A | |
| | | | | | | Investment Operations | | Less Distributions from | | | | | | | | |
| | Net Asset Value, Beginning of Period/ Year | | | Net Investment Income (Loss)(a) | | | Net Realized and Unrealized Gain (Loss) on Investments | | | Total From Investment Operations | | | Net Investment Income | | | Net Realized Gain | | | Total Distributions | | | Net Asset Value, End of Period/ Year | |
PREMIUM INCOME FUND | | | | | | | | | | | | | | | | | | |
Class A | | | | | | | | | | | | | | | | | | | | | | | | | | | | | | | | |
2018(e) | | $ | 10.00 | | | $ | .08 | | | $ | .23 | | | $ | .31 | | | $ | .05 | | | $ | — | | | $ | .05 | | | $ | 10.26 | |
2019(f) | | | 10.26 | | | | .09 | | | | — | | | | .09 | | | | .08 | | | | .10 | | | | .18 | | | | 10.17 | |
Advisor Class | | | | | | | | | | | | | | | | | | |
2018(e) | | | 10.00 | | | | .10 | | | | .22 | | | | .32 | | | | .06 | | | | — | | | | .06 | | | | 10.26 | |
2019(f) | | | 10.26 | | | | .10 | | | | — | | | | .10 | | | | .08 | | | | .10 | | | | .18 | | | | 10.18 | |
Institutional Class | | | | | | | | | | | | | | | | | | |
2018(e) | | | 10.00 | | | | .10 | | | | .23 | | | | .33 | | | | .17 | | | | — | | | | .17 | | | | 10.16 | |
2019(f) | | | 10.16 | | | | .10 | | | | (.26 | ) | | | (.16 | ) | | | 4.36 | | | | .10 | | | | 4.46 | | | | 5.54 | |
| | | | | | | | | | | | | | | | | | | | | | | | | | | | | | | | | |
SELECT GROWTH FUND | | | | | | | | | | | | | | |
Class A | | | | | | | | | | | | | | | | | | |
2014 | | $ | 9.24 | | | $ | — | | | $ | 1.73 | | | $ | 1.73 | | | $ | .00 | (b) | | $ | — | | | $ | .00 | (b) | | $ | 10.97 | |
2015 | | | 10.97 | | | | .02 | | | | .65 | | | | .67 | | | | .00 | (b) | | | — | | | | .00 | (b) | | | 11.64 | |
2016 | | | 11.64 | | | | .02 | | | | .73 | | | | .75 | | | | .02 | | | | 1.13 | | | | 1.15 | | | | 11.24 | |
2017 | | | 11.24 | | | | — | | | | 2.38 | | | | 2.38 | | | | .03 | | | | 1.55 | | | | 1.58 | | | | 12.04 | |
2018 | | | 12.04 | | | | (.01 | ) | | | 2.66 | | | | 2.65 | | | | .01 | | | | 1.07 | | | | 1.08 | | | | 13.61 | |
2019(f) | | | 13.61 | | | | .02 | | | | (.64 | ) | | | (.62 | ) | | | — | | | | .62 | | | | .62 | | | | 12.37 | |
Class B | | | | | | | | | | | | | | | | | | | | | | |
2014 | | | 8.34 | | | | (.07 | ) | | | 1.55 | | | | 1.48 | | | | — | | | | — | | | | — | | | | 9.82 | |
2015 | | | 9.82 | | | | (.07 | ) | | | .59 | | | | .52 | | | | — | | | | — | | | | — | | | | 10.34 | |
2016 | | | 10.34 | | | | (.06 | ) | | | .65 | | | | .59 | | | | .00 | (b) | | | 1.13 | | | | 1.13 | | | | 9.80 | |
2017 | | | 9.80 | | | | (.07 | ) | | | 2.02 | | | | 1.95 | | | | .02 | | | | 1.55 | | | | 1.57 | | | | 10.18 | |
2018 | | | 10.18 | | | | (.09 | ) | | | 2.21 | | | | 2.12 | | | | — | | | | 1.07 | | | | 1.07 | | | | 11.23 | |
2019(f) | | | 11.23 | | | | (.02 | ) | | | (.54 | ) | | | (.56 | ) | | | — | | | | .62 | | | | .62 | | | | 10.05 | |
Advisor Class | | | | | | | | | | | | | | | | | | |
2014 | | | 9.26 | | | | .06 | | | | 1.69 | | | | 1.75 | | | | — | | | | — | | | | — | | | | 11.01 | |
2015 | | | 11.01 | | | | .07 | | | | .66 | | | | .73 | | | | .01 | | | | — | | | | .01 | | | | 11.73 | |
2016 | | | 11.73 | | | | .07 | | | | .73 | | | | .80 | | | | .03 | | | | 1.13 | | | | 1.16 | | | | 11.37 | |
2017 | | | 11.37 | | | | .05 | | | | 2.40 | | | | 2.45 | | | | .04 | | | | 1.55 | | | | 1.59 | | | | 12.23 | |
2018 | | | 12.23 | | | | .04 | | | | 2.71 | | | | 2.75 | | | | .02 | | | | 1.07 | | | | 1.09 | | | | 13.89 | |
2019(f) | | | 13.89 | | | | .04 | | | | (.65 | ) | | | (.61 | ) | | | .01 | | | | .62 | | | | .63 | | | | 12.65 | |
Institutional Class | | | | | | | | | | | | | | | | | | |
2014 | | | 9.27 | | | | .05 | | | | 1.74 | | | | 1.79 | | | | — | | | | — | | | | — | | | | 11.06 | |
2015 | | | 11.06 | | | | .07 | | | | .66 | | | | .73 | | | | .02 | | | | — | | | | .02 | | | | 11.77 | |
2016 | | | 11.77 | | | | .07 | | | | .74 | | | | .81 | | | | .03 | | | | 1.13 | | | | 1.16 | | | | 11.42 | |
2017 | | | 11.42 | | | | .05 | | | | 2.41 | | | | 2.46 | | | | .04 | | | | 1.55 | | | | 1.59 | | | | 12.29 | |
2018 | | | 12.29 | | | | .05 | | | | 2.72 | | | | 2.77 | | | | .02 | | | | 1.07 | | | | 1.09 | | | | 13.97 | |
2019(f) | | | 13.97 | | | | .04 | | | | (.65 | ) | | | (.61 | ) | | | .01 | | | | .62 | | | | .63 | | | | 12.73 | |
278
See notes to financial statements
R A T I O S / S U P P L E M E N T A L D A T A | |
| | | | | | | | | Ratio to Average Net Assets** | | Ratio to Average Net Assets Before Expenses Waived or Assumed | | | | |
Total Return* | | | Net Assets End of Period/ Year (in thousands) | | | Net Expenses After Fee Credits | | | Net Expenses Before Fee Credits*** | | | Net Investment Income (Loss) | | | Expenses*** | | | Net Investment Income | | | Portfolio Turnover Rate | |
| | | | | | | | | | | | | | | | | | | | | | | | | | | | | | | |
| | | | | | | | | | | | | | | | | | | | | | | | | | | | | | | |
| | 3.06 | %†† | | $ | 41,688 | | | | 1.30 | %† | | | 1.30 | %† | | | 1.57 | %† | | | 2.07 | %† | | | .80 | %† | | | 77 | %†† |
| | .90 | †† | | | 60,449 | | | | 1.30 | † | | | 1.30 | † | | | 1.73 | † | | | 1.42 | † | | | 1.61 | † | | | 32 | †† |
| | | | | | | | | | | | | | | | | | | | | | | | | | | | | | | |
| | 3.18 | †† | | | 34,170 | | | | 1.02 | † | | | 1.02 | † | | | 1.86 | † | | | 1.52 | † | | | 1.36 | † | | | 77 | †† |
| | 1.03 | †† | | | 63,243 | | | | 1.04 | † | | | 1.04 | † | | | 2.01 | † | | | 1.14 | † | | | 1.91 | † | | | 32 | †† |
| | | | | | | | | | | | | | | | | | | | | | | | | | | | | | | |
| | 3.27 | †† | | | 3,877 | | | | .89 | † | | | .89 | † | | | 1.88 | † | | | 1.88 | † | | | .89 | † | | | 77 | †† |
| | 1.19 | †† | | | 39 | | | | .90 | † | | | .90 | † | | | 2.06 | † | | | 1.05 | † | | | 1.91 | † | | | 32 | †† |
| | | | | | | | | | | | | | | | | | | | | | | | | | | | | | | |
| | | | | | | | | | | | | | | | | | | | | | | | | | | | | | | |
| | | | | | | | | | | | | | | | | | | | | | | | | | | | | | | |
| | 18.77 | % | | $ | 330,595 | | | | 1.27 | % | | | 1.27 | % | | | .03 | % | | | N/A | | | | N/A | | | | 33 | % |
| | 6.12 | | | | 352,651 | | | | 1.25 | | | | 1.25 | | | | .16 | | | | N/A | | | | N/A | | | | 48 | |
| | 6.50 | | | | 373,279 | | | | 1.27 | | | | 1.27 | | | | .22 | | | | N/A | | | | N/A | | | | 59 | |
| | 24.16 | | | | 444,933 | | | | 1.25 | | | | 1.25 | | | | .00 | | | | N/A | | | | N/A | | | | 58 | |
| | 23.22 | | | | 570,309 | | | | 1.22 | | | | 1.22 | | | | (.06 | ) | | | N/A | | | | N/A | | | | 37 | |
| | (3.83 | )†† | | | 557,068 | | | | 1.22 | † | | | 1.22 | † | | | .29 | † | | | N/A | | | | N/A | | | | 20 | †† |
| | | | | | | | | | | | | | | | | | | | | | | | | | | | | | | |
| | 17.75 | | | | 4,868 | | | | 2.06 | | | | 2.06 | | | | (.76 | ) | | | N/A | | | | N/A | | | | 33 | |
| | 5.30 | | | | 4,101 | | | | 2.03 | | | | 2.03 | | | | (.63 | ) | | | N/A | | | | N/A | | | | 48 | |
| | 5.71 | | | | 3,393 | | | | 2.03 | | | | 2.03 | | | | (.56 | ) | | | N/A | | | | N/A | | | | 59 | |
| | 23.13 | | | | 3,163 | | | | 2.01 | | | | 2.01 | | | | (.75 | ) | | | N/A | | | | N/A | | | | 58 | |
| | 22.21 | | | | 2,997 | | | | 1.98 | | | | 1.98 | | | | (.82 | ) | | | N/A | | | | N/A | | | | 37 | |
| | (4.12 | )†† | | | 2,544 | | | | 1.98 | † | | | 1.98 | † | | | (.47 | )† | | | N/A | | | | N/A | | | | 20 | †† |
| | | | | | | | | | | | | | | | | | | | | | | | | | | | | | | |
| | 18.90 | | | | 31,902 | | | | .83 | | | | .83 | | | | .51 | | | | N/A | | | | N/A | | | | 33 | |
| | 6.61 | | | | 46,793 | | | | .84 | | | | .84 | | | | .57 | | | | N/A | | | | N/A | | | | 48 | |
| | 6.93 | | | | 66,588 | | | | .85 | | | | .86 | | | | .62 | | | | N/A | | | | N/A | | | | 59 | |
| | 24.61 | | | | 81,203 | | | | .84 | | | | .84 | | | | .40 | | | | N/A | | | | N/A | | | | 58 | |
| | 23.74 | | | | 194,554 | | | | .83 | | | | .83 | | | | .34 | | | | N/A | | | | N/A | | | | 37 | |
| | (3.68 | )†† | | | 203,092 | | | | .89 | † | | | .89 | † | | | .62 | † | | | N/A | | | | N/A | | | | 20 | †† |
| | | | | | | | | | | | | | | | | | | | | | | | | | | | | | | |
| | 19.31 | | | | 3,057 | | | | .83 | | | | .83 | | | | .48 | | | | N/A | | | | N/A | | | | 33 | |
| | 6.56 | | | | 3,608 | | | | .82 | | | | .82 | | | | .59 | | | | N/A | | | | N/A | | | | 48 | |
| | 7.00 | | | | 3,915 | | | | .83 | | | | .83 | | | | .66 | | | | N/A | | | | N/A | | | | 59 | |
| | 24.61 | | | | 4,950 | | | | .82 | | | | .82 | | | | .43 | | | | N/A | | | | N/A | | | | 58 | |
| | 23.81 | | | | 7,836 | | | | .80 | | | | .80 | | | | .35 | | | | N/A | | | | N/A | | | | 37 | |
| | (3.62 | )†† | | | 6,613 | | | | .79 | † | | | .79 | † | | | .71 | † | | | N/A | | | | N/A | | | | 20 | †† |
279
Financial Highlights(continued)
FIRST INVESTORS EQUITY FUNDS
| | | P E R S H A R E D A T A | |
| | | | | | | Investment Operations | | Less Distributions from | | | | | | | | |
| | Net Asset Value, Beginning of Period/ Year | | | Net Investment Income (Loss)(a) | | | Net Realized and Unrealized Gain (Loss) on Investments | | | Total From Investment Operations | | | Net Investment Income | | | Net Realized Gain | | | Total Distributions | | | Net Asset Value, End of Period/ Year | |
SPECIAL SITUATIONS FUND | | | | | | | | | | | | | | | | | | |
Class A | | | | | | | | | | | | | | | | | | |
2014 | | $ | 28.07 | | | $ | .02 | | | $ | 3.16 | | | $ | 3.18 | | | $ | — | | | $ | 4.60 | | | $ | 4.60 | | | $ | 26.65 | |
2015 | | | 26.65 | | | | .02 | | | | .07 | | | | .09 | | | | .04 | | | | 1.43 | | | | 1.47 | | | | 25.27 | |
2016 | | | 25.27 | | | | .17 | | | | 2.36 | | | | 2.53 | | | | .02 | | | | 1.44 | | | | 1.46 | | | | 26.34 | |
2017 | | | 26.34 | | | | — | | | | 5.24 | | | | 5.24 | | | | .16 | | | | .24 | | | | .40 | | | | 31.18 | |
2018 | | | 31.18 | | | | .03 | | | | 2.29 | | | | 2.32 | | | | .01 | | | | .87 | | | | .88 | | | | 32.62 | |
2019(f) | | | 32.62 | | | | .06 | | | | (3.81 | ) | | | (3.75 | ) | | | .08 | | | | 3.83 | | | | 3.91 | | | | 24.96 | |
Class B | | | | | | | | | | | | | | | | | | | |
2014 | | | 23.45 | | | | (.17 | ) | | | 2.62 | | | | 2.45 | | | | — | | | | 4.60 | | | | 4.60 | | | | 21.30 | |
2015 | | | 21.30 | | | | (.16 | ) | | | .08 | | | | (.08 | ) | | | — | | | | 1.43 | | | | 1.43 | | | | 19.79 | |
2016 | | | 19.79 | | | | (.02 | ) | | | 1.81 | | | | 1.79 | | | | — | | | | 1.44 | | | | 1.44 | | | | 20.14 | |
2017 | | | 20.14 | | | | (.19 | ) | | | 4.01 | | | | 3.82 | | | | .13 | | | | .24 | | | | .37 | | | | 23.59 | |
2018 | | | 23.59 | | | | (.17 | ) | | | 1.73 | | | | 1.56 | | | | — | | | | .87 | | | | .87 | | | | 24.28 | |
2019(f) | | | 24.28 | | | | (.03 | ) | | | (2.95 | ) | | | (2.98 | ) | | | .05 | | | | 3.83 | | | | 3.88 | | | | 17.42 | |
Advisor Class | | | | | | | | | | | | | | | | | | |
2014 | | | 28.09 | | | | .12 | | | | 3.10 | | | | 3.22 | | | | — | | | | 4.60 | | | | 4.60 | | | | 26.71 | |
2015 | | | 26.71 | | | | .10 | | | | .08 | | | | .18 | | | | .08 | | | | 1.43 | | | | 1.51 | | | | 25.38 | |
2016 | | | 25.38 | | | | .23 | | | | 2.39 | | | | 2.62 | | | | .04 | | | | 1.44 | | | | 1.48 | | | | 26.52 | |
2017 | | | 26.52 | | | | .08 | | | | 5.29 | | | | 5.37 | | | | .18 | | | | .24 | | | | .42 | | | | 31.47 | |
2018 | | | 31.47 | | | | .14 | | | | 2.32 | | | | 2.46 | | | | .04 | | | | .87 | | | | .91 | | | | 33.02 | |
2019(f) | | | 33.02 | | | | .11 | | | | (3.87 | ) | | | (3.76 | ) | | | .10 | | | | 3.83 | | | | 3.93 | | | | 25.33 | |
Institutional Class | | | | | | | | | | | | | | | | | | |
2014 | | | 28.14 | | | | .14 | | | | 3.16 | | | | 3.30 | | | | — | | | | 4.60 | | | | 4.60 | | | | 26.84 | |
2015 | | | 26.84 | | | | .14 | | | | .08 | | | | .22 | | | | .16 | | | | 1.43 | | | | 1.59 | | | | 25.47 | |
2016 | | | 25.47 | | | | .28 | | | | 2.39 | | | | 2.67 | | | | .05 | | | | 1.44 | | | | 1.49 | | | | 26.65 | |
2017 | | | 26.65 | | | | .12 | | | | 5.31 | | | | 5.43 | | | | .18 | | | | .24 | | | | .42 | | | | 31.66 | |
2018 | | | 31.66 | | | | .17 | | | | 2.34 | | | | 2.51 | | | | .05 | | | | .87 | | | | .92 | | | | 33.25 | |
2019(f) | | | 33.25 | | | | .13 | | | | (3.89 | ) | | | (3.76 | ) | | | .12 | | | | 3.83 | | | | 3.95 | | | | 25.54 | |
280
See notes to financial statements
R A T I O S / S U P P L E M E N T A L D A T A | |
| | | | | | | | | Ratio to Average Net Assets** | | Ratio to Average Net Assets Before Expenses Waived or Assumed | | | | |
Total Return* | | | Net Assets End of Period/ Year (in thousands) | | | Net Expenses After Fee Credits | | | Net Expenses Before Fee Credits*** | | | Net Investment Income (Loss) | | | Expenses*** | | | Net Investment Income (Loss) | | | Portfolio Turnover Rate | |
| | | | | | | | | | | | | | | | | | | | | | | | | | | | | | | |
| | | | | | | | | | | | | | | | | | | | | | | | | | | | | | | |
| | 11.65 | % | | $ | 425,957 | | | | 1.33 | % | | | 1.33 | % | | | .06 | % | | | 1.38 | % | | | .01 | % | | | 55 | % |
| | .12 | | | | 432,235 | | | | 1.32 | | | | 1.32 | | | | .07 | | | | 1.33 | | | | .06 | | | | 43 | |
| | 10.35 | | | | 472,720 | | | | 1.33 | | | | 1.34 | | | | .68 | | | | 1.34 | | | | .68 | | | | 39 | |
| | 20.06 | | | | 549,780 | | | | 1.31 | | | | 1.31 | | | | (.01 | ) | | | N/A | | | | N/A | | | | 27 | |
| | 7.50 | | | | 580,730 | | | | 1.29 | | | | 1.29 | | | | .08 | | | | N/A | | | | N/A | | | | 48 | |
| | (10.08 | )†† | | | 512,211 | | | | 1.32 | † | | | 1.32 | † | | | .48 | † | | | N/A | | | | N/A | | | | 37 | †† |
| | | | | | | | | | | | | | | | | | | | | | | | | | | | | | | |
| | 10.71 | | | | 4,441 | | | | 2.16 | | | | 2.16 | | | | (.77 | ) | | | 2.21 | | | | (.82 | ) | | | 55 | |
| | (.67 | ) | | | 3,618 | | | | 2.13 | | | | 2.13 | | | | (.74 | ) | | | 2.14 | | | | (.75 | ) | | | 43 | |
| | 9.43 | | | | 3,301 | | | | 2.14 | | | | 2.14 | | | | (.12 | ) | | | 2.15 | | | | (.13 | ) | | | 39 | |
| | 19.13 | | | | 3,081 | | | | 2.10 | | | | 2.10 | | | | (.80 | ) | | | N/A | | | | N/A | | | | 27 | |
| | 6.65 | | | | 2,626 | | | | 2.07 | | | | 2.07 | | | | (.71 | ) | | | N/A | | | | N/A | | | | 48 | |
| | (10.44 | )†† | | | 2,108 | | | | 2.10 | † | | | 2.10 | † | | | (.31 | )† | | | N/A | | | | N/A | | | | 37 | †† |
| | | | | | | | | | | | | | | | | | | | | | | | | | | | | | | |
| | 11.82 | | | | 26,458 | | | | 1.01 | | | | 1.01 | | | | .39 | | | | 1.06 | | | | .34 | | | | 55 | |
| | .46 | | | | 38,790 | | | | 1.02 | | | | 1.03 | | | | .37 | | | | 1.04 | | | | .36 | | | | 43 | |
| | 10.67 | | | | 59,159 | | | | 1.03 | | | | 1.03 | | | | .94 | | | | 1.04 | | | | .93 | | | | 39 | |
| | 20.45 | | | | 120,912 | | | | .97 | | | | .97 | | | | .34 | | | | N/A | | | | N/A | | | | 27 | |
| | 7.86 | | | | 140,657 | | | | .95 | | | | .95 | | | | .43 | | | | N/A | | | | N/A | | | | 48 | |
| | (9.97 | )†† | | | 130,647 | | | | 1.02 | † | | | 1.02 | † | | | .79 | † | | | N/A | | | | N/A | | | | 37 | †† |
| | | | | | | | | | | | | | | | | | | | | | | | | | | | | | | |
| | 12.10 | | | | 5,750 | | | | .89 | | | | .89 | | | | .51 | | | | .94 | | | | .46 | | | | 55 | |
| | .60 | | | | 5,905 | | | | .88 | | | | .88 | | | | .51 | | | | .89 | | | | .50 | | | | 43 | |
| | 10.84 | | | | 6,914 | | | | .88 | | | | .89 | | | | 1.11 | | | | .90 | | | | 1.10 | | | | 39 | |
| | 20.56 | | | | 8,712 | | | | .87 | | | | .87 | | | | .42 | | | | N/A | | | | N/A | | | | 27 | |
| | 7.98 | | | | 9,592 | | | | .86 | | | | .86 | | | | .52 | | | | N/A | | | | N/A | | | | 48 | |
| | (9.90 | )†† | | | 7,328 | | | | .87 | † | | | .87 | † | | | .92 | † | | | N/A | | | | N/A | | | | 37 | †† |
281
Financial Highlights(continued)
FIRST INVESTORS EQUITY FUNDS
| | | P E R S H A R E D A T A | |
| | | | | | | Investment Operations | | Less Distributions from | | | | | | | | |
| | Net Asset Value, Beginning of Period/ Year | | | Net Investment Income(a) | | | Net Realized and Unrealized Gain (Loss) on Investments | | | Total From Investment Operations | | | Net Investment Income | | | Net Realized Gain | | | Total Distributions | | | Net Asset Value, End of Period/ Year | |
TOTAL RETURN FUND | | | | | | | | | | | | | | |
Class A | | | | | | | | | | | | | | | | | | | |
2014 | | $ | 18.49 | | | $ | .22 | | | $ | 1.65 | | | $ | 1.87 | | | $ | .31 | | | $ | .42 | | | $ | .73 | | | $ | 19.63 | |
2015 | | | 19.63 | | | | .21 | | | | (.68 | ) | | | (.47 | ) | | | .28 | | | | .67 | | | | .95 | | | | 18.21 | |
2016 | | | 18.21 | | | | .23 | | | | 1.26 | | | | 1.49 | | | | .27 | | | | .43 | | | | .70 | | | | 19.00 | |
2017 | | | 19.00 | | | | .23 | | | | 1.27 | | | | 1.50 | | | | .32 | | | | .30 | | | | .62 | | | | 19.88 | |
2018 | | | 19.88 | | | | .31 | | | | .74 | | | | 1.05 | | | | .36 | | | | .35 | | | | .71 | | | | 20.22 | |
2019(f) | | | 20.22 | | | | .14 | | | | (.57 | ) | | | (.43 | ) | | | .18 | | | | 1.52 | | | | 1.70 | | | | 18.09 | |
Class B | | | | | | | | | | | | | | | | | | |
2014 | | | 18.17 | | | | .07 | | | | 1.61 | | | | 1.68 | | | | .16 | | | | .42 | | | | .58 | | | | 19.27 | |
2015 | | | 19.27 | | | | .06 | | | | (.68 | ) | | | (.62 | ) | | | .06 | | | | .67 | | | | .73 | | | | 17.92 | |
2016 | | | 17.92 | | | | .09 | | | | 1.25 | | | | 1.34 | | | | .13 | | | | .43 | | | | .56 | | | | 18.70 | |
2017 | | | 18.70 | | | | .09 | | | | 1.24 | | | | 1.33 | | | | .17 | | | | .30 | | | | .47 | | | | 19.56 | |
2018 | | | 19.56 | | | | .16 | | | | .72 | | | | .88 | | | | .18 | | | | .35 | | | | .53 | | | | 19.91 | |
2019(f) | | | 19.91 | | | | .07 | | | | (.57 | ) | | | (.50 | ) | | | .11 | | | | 1.52 | | | | 1.63 | | | | 17.78 | |
Advisor Class | | | | | | | | | | | | | | | | | | |
2014 | | | 18.49 | | | | .29 | | | | 1.60 | | | | 1.89 | | | | .32 | | | | .42 | | | | .74 | | | | 19.64 | |
2015 | | | 19.64 | | | | .29 | | | | (.69 | ) | | | (.40 | ) | | | .31 | | | | .67 | | | | .98 | | | | 18.26 | |
2016 | | | 18.26 | | | | .26 | | | | 1.27 | | | | 1.53 | | | | .32 | | | | .43 | | | | .75 | | | | 19.04 | |
2017 | | | 19.04 | | | | .32 | | | | 1.30 | | | | 1.62 | | | | .38 | | | | .30 | | | | .68 | | | | 19.98 | |
2018 | | | 19.98 | | | | .37 | | | | .75 | | | | 1.12 | | | | .43 | | | | .35 | | | | .78 | | | | 20.32 | |
2019(f) | | | 20.32 | | | | .16 | | | | (.59 | ) | | | (.43 | ) | | | .19 | | | | 1.52 | | | | 1.71 | | | | 18.18 | |
Institutional Class | | | | | | | | | | | | | | | | | | |
2014 | | | 18.50 | | | | .30 | | | | 1.63 | | | | 1.93 | | | | .36 | | | | .42 | | | | .78 | | | | 19.65 | |
2015 | | | 19.65 | | | | .29 | | | | (.70 | ) | | | (.41 | ) | | | .28 | | | | .67 | | | | .95 | | | | 18.29 | |
2016 | | | 18.29 | | | | .31 | | | | 1.28 | | | | 1.59 | | | | .32 | | | | .43 | | | | .75 | | | | 19.13 | |
2017 | | | 19.13 | | | | .32 | | | | 1.27 | | | | 1.59 | | | | .37 | | | | .30 | | | | .67 | | | | 20.05 | |
2018 | | | 20.05 | | | | .40 | | | | .74 | | | | 1.14 | | | | .46 | | | | .35 | | | | .81 | | | | 20.38 | |
2019(f) | | | 20.38 | | | | .17 | | | | (.57 | ) | | | (.40 | ) | | | .21 | | | | 1.52 | | | | 1.73 | | | | 18.25 | |
* | Calculated without sales charges. |
** | Net of expenses waived or assumed (Note 3). |
*** | The ratios do not include a reduction of expenses from cash balances maintained with the custodian or from brokerage service arrangements (Note 1G). |
† | Annualized |
†† | Not annualized |
(a) | Based on average shares during the period. |
282
See notes to financial statements
R A T I O S / S U P P L E M E N T A L D A T A |
| | | | | | | | | Ratio to Average Net Assets** | | Ratio to Average Net Assets Before Expenses Waived or Assumed | | | | |
| | Total Return* | | | Net Assets End of Period/ Year (in thousands) | | | Net Expenses After Fee Credits | | | Net Expenses Before Fee Credits*** | | | Net Investment Income | | | Expenses*** | | | Net Investment Income | | | Portfolio Turnover Rate | |
| | | | | | | | | | | | | | | | | | | | | | | | | | | | | | | |
| | | | | | | | | | | | | | | | | | | | | | | | | | | | | | | |
| | 10.18 | % | | $ | 767,354 | | | | 1.19 | % | | | 1.19 | % | | | 1.14 | % | | | N/A | | | | N/A | | | | 44 | % |
| | (2.65 | ) | | | 784,281 | | | | 1.18 | | | | 1.18 | | | | 1.05 | | | | N/A | | | | N/A | | | | 40 | |
| | 8.36 | | | | 845,726 | | | | 1.19 | | | | 1.19 | | | | 1.27 | | | | N/A | | | | N/A | | | | 63 | |
| | 8.09 | | | | 877,311 | | | | 1.19 | | | | 1.19 | | | | 1.22 | | | | N/A | | | | N/A | | | | 39 | |
| | 5.32 | | | | 889,473 | | | | 1.18 | | | | 1.18 | | | | 1.55 | | | | N/A | | | | N/A | | | | 53 | |
| | (1.45 | )†† | | | 828,822 | | | | 1.20 | † | | | 1.20 | † | | | 1.52 | † | | | N/A | | | | N/A | | | | 42 | †† |
| | | | | | | | | | | | | | | | | | | | | | | | | | | | | | | |
| | 9.29 | | | | 10,016 | | | | 1.97 | | | | 1.97 | | | | .36 | | | | N/A | | | | N/A | | | | 44 | |
| | (3.44 | ) | | | 8,270 | | | | 1.96 | | | | 1.96 | | | | .27 | | | | N/A | | | | N/A | | | | 40 | |
| | 7.61 | | | | 7,774 | | | | 1.96 | | | | 1.96 | | | | .50 | | | | N/A | | | | N/A | | | | 63 | |
| | 7.23 | | | | 6,939 | | | | 1.93 | | | | 1.93 | | | | .48 | | | | N/A | | | | N/A | | | | 39 | |
| | 4.52 | | | | 6,061 | | | | 1.94 | | | | 1.94 | | | | .79 | | | | N/A | | | | N/A | | | | 53 | |
| | (1.84 | )†† | | | 5,406 | | | | 1.95 | † | | | 1.95 | † | | | .77 | † | | | N/A | | | | N/A | | | | 42 | †† |
| | | | | | | | | | | | | | | | | | | | | | | | | | | | | | | |
| | 10.34 | | | | 2,106 | | | | .78 | | | | .78 | | | | 1.46 | | | | N/A | | | | N/A | | | | 44 | |
| | (2.24 | ) | | | 976 | | | | .78 | | | | .78 | | | | 1.44 | | | | N/A | | | | N/A | | | | 40 | |
| | 8.55 | | | | 1,213 | | | | .82 | | | | .82 | | | | 1.63 | | | | N/A | | | | N/A | | | | 63 | |
| | 8.69 | | | | 996 | | | | .80 | | | | .80 | | | | 1.61 | | | | N/A | | | | N/A | | | | 39 | |
| | 5.69 | | | | 1,006 | | | | .84 | | | | .84 | | | | 1.83 | | | | N/A | | | | N/A | | | | 53 | |
| | (1.40 | )†† | | | 1,011 | | | | .98 | † | | | .98 | † | | | 1.74 | † | | | N/A | | | | N/A | | | | 42 | †† |
| | | | | | | | | | | | | | | | | | | | | | | | | | | | | | | |
| | 10.55 | | | | 2,885 | | | | .78 | | | | .78 | | | | 1.55 | | | | N/A | | | | N/A | | | | 44 | |
| | (2.28 | ) | | | 30,644 | | | | .77 | | | | .77 | | | | 1.47 | | | | N/A | | | | N/A | | | | 40 | |
| | 8.88 | | | | 32,525 | | | | .77 | | | | .77 | | | | 1.68 | | | | N/A | | | | N/A | | | | 63 | |
| | 8.50 | | | | 33,545 | | | | .77 | | | | .77 | | | | 1.65 | | | | N/A | | | | N/A | | | | 39 | |
| | 5.77 | | | | 34,555 | | | | .77 | | | | .77 | | | | 1.96 | | | | N/A | | | | N/A | | | | 53 | |
| | (1.26 | )†† | | | 33,082 | | | | .79 | † | | | .79 | † | | | 1.93 | † | | | N/A | | | | N/A | | | | 42 | †† |
(b) | Due to rounding, amount is less than .005 per share. |
(c) | For the period August 1, 2016 (commencement of operations) to September 30, 2016. |
(d) | For the period April 1, 2016 (commencement of operations) to September 30, 2016. |
(e) | For the period April 2, 2018 (commencement of operations) to September 30, 2018. |
(f) | For the period October 1, 2018 to March 31, 2019. |
283
Report of Independent Registered Public
Accounting Firm
To the Shareholders and Board of Trustees of
First Investors Income Funds
First Investors Equity Funds
Opinion on the Financial Statements
We have audited the accompanying statement of assets and liabilities of the Floating Rate Fund, Fund For Income, Government Cash Management Fund, International Opportunities Bond Fund, Investment Grade Fund, Limited Duration Bond Fund and Strategic Income Fund, (the “Income Funds”), each a series of the First Investors Income Funds and the Covered Call Strategy Fund, Equity Income Fund, Global Fund, Growth & Income Fund, Hedged U.S. Equity Opportunities Fund, International Fund, Opportunity Fund, Premium Income Fund, Select Growth Fund, Special Situations Fund and Total Return Fund (the “Equity Funds”), each a series of First Investors Equity Funds, including the portfolio of investments, as of March 31, 2019, the related statement of operations, the statements of changes in net assets for each of the periods indicated, and financial highlights for each of the periods indicated thereon, and the related notes (collectively referred to as the “financial statements”). In our opinion, the financial statements present fairly, in all material respects, the financial position of the Income Funds and Equity Funds as of March 31, 2019, the results of their operations, the changes in their net assets, and their financial highlights for each of the periods indicated thereon, in conformity with accounting principles generally accepted in the United States of America.
Basis for Opinion
These financial statements are the responsibility of the Income Funds’ and Equity Funds’ management. Our responsibility is to express an opinion on the Income Funds’ and Equity Funds’ financial statements based on our audits. We are a public accounting firm registered with the Public Company Accounting Oversight Board (United States) (“PCAOB”) and are required to be independent with respect to the Income Funds and Equity Funds in accordance with the U.S. federal securities laws and the applicable rules and regulations of the Securities and Exchange Commission and the PCAOB. We have served as the auditor of one or more of the funds in the First Investors Family of Funds since 1978.
We conducted our audits in accordance with the standards of the PCAOB. Those standards require that we plan and perform the audit to obtain reasonable assurance about whether the financial statements are free of material misstatement, whether due to error or fraud. The Income Funds and Equity Funds are not required to have, nor were we engaged to perform, an audit of their internal control over financial reporting. As part of our audits we are required to obtain an understanding of internal control over financial reporting, but not for the purpose of expressing an opinion on the effectiveness of the Income Funds’ and Equity Funds’ internal control over financial reporting. Accordingly, we express no such opinion.
Our audits included performing procedures to assess the risks of material misstatement of the financial statements, whether due to error or fraud, and performing procedures that respond to those risks. Such procedures included examining, on a test basis, evidence regarding the amounts and disclosures in the financial statements. Our audits also included evaluating the accounting principles used and significant estimates made by management, as well as evaluating the overall
284
presentation of the financial statements. Our procedures included confirmation of securities owned as of March 31, 2019 by correspondence with the custodian and brokers; when replies were not received from brokers, we performed other auditing procedures. We believe that our audits provide a reasonable basis for our opinion.
TAIT, WELLER & BAKER LLP
Philadelphia, Pennsylvania
May 30, 2019
285
FIRST INVESTORS INCOME FUNDS
FIRST INVESTORS EQUITY FUNDS
Trustees
Susan E. Artmann
Mary J. Barneby
Charles R. Barton, III
Arthur M. Scutro, Jr.
Mark R. Ward
Officers
E. Blake Moore Jr.
President
Marc S. Milgram
Chief Compliance Officer
Joseph I. Benedek
Treasurer
Mark S. Spencer
Assistant Treasurer
Scott K. Richardson
Secretary
Carol Lerner Brown
Assistant Secretary
286
Shareholder Information
Investment Adviser
Foresters Investment Management Company, Inc.
40 Wall Street
New York, NY 10005
Subadviser
(Floating Rate Fund, Fund For Income, Investment Grade Fund, Limited Duration Bond Fund and Total Return Fund)
Muzinich & Co., Inc.
450 Park Avenue
New York, NY 10022
Subadviser
(International Opportunities Bond Fund)
Brandywine Global Investment Management, LLC
2929 Arch Street
Philadelphia, PA 19104
Subadviser
(Covered Call Strategy Fund andPremium Income Fund)
Ziegler Capital Management, LLC
70 W. Madison Street
Chicago, IL 60602
Subadviser
(Hedged U.S. Equity Opportunities Fund)
Wellington Management Company LLP
280 Congress Street
Boston, MA 02210
Subadviser
(International Fund)
Vontobel Asset Management, Inc.
1540 Broadway
New York, NY 10036
Subadviser
(Select Growth Fund)
Smith Asset Management Group, L.P.
100 Crescent Court
Dallas, TX 75201
Underwriter
Foresters Financial Services, Inc.
40 Wall Street
New York, NY 10005
Custodian
The Bank of New York Mellon
240 Greenwich Street
New York, NY 10286
Transfer Agent
Foresters Investor Services, Inc.
Raritan Plaza I – 8th Floor
Edison, NJ 08837-3620
Independent Registered Public
Accounting Firm
Tait, Weller & Baker LLP
Two Liberty Place
50 South 16th Street
Philadelphia, PA 19102
Legal Counsel
K&L Gates LLP
1601 K Street, N.W.
Washington, D.C. 20006
287
A description of the policies and procedures that the Funds use to vote proxies relating to a portfolio’s securities is available, without charge, upon request by calling toll free 1-800-423-4026 or can be viewed online or downloaded from the EDGAR database on the U.S. Securities and Exchange Commission’s (“SEC”) internet website athttp://www.sec.gov. In addition, information regarding how the Funds voted proxies relating to portfolio securities during the most recent 12-month period ended June 30, is available, without charge, upon request in writing or by calling 1-800-423-4026 and on the SEC’s internet website athttp://www.sec.gov.
The Funds file their complete schedule of portfolio holdings with the SEC on Form N-Q for the first and third quarters of each fiscal year. The Funds’ Form N-Q is available on the SEC’s website athttp://www.sec.gov; and may also be reviewed and copied at the SEC’s Public Reference Room in Washington D.C. Information on the operation of the Public Reference Room may be obtained by calling 1-800-SEC-0330. The schedule of portfolio holdings is available, without charge, upon request in writing or by calling 1-800-423-4026.
288
NOTES
289
Foresters Financial
40 Wall Street
New York, NY 10005

IESAR319
Item 2. Code of Ethics
Not applicable for semi-annual report
Item 3. Audit Committee Financial Expert
Not applicable for semi-annual report
Item 4. Principal Accountant Fees and Services
Not applicable for semi-annual report
Item 5. Audit Committee of Listed Registrants
Not applicable
Item 6. Schedule of Investments
| (a) | Schedule is included as part of the report to shareholders filed under Item 1 of this Form. |
Item 7. Disclosure of Proxy Voting Policies & Procedures for Closed-End Management Investment Companies
Not applicable to open-end investment companies
Item 8. Portfolio Managers of Closed-End Management Investment Companies
Not applicable to open-end investment companies
Item 9. Purchases of Equity Securities by Closed-End Management Investment Companies and Affiliated Purchasers
Not applicable to open-end investment companies
Item 10. Submission of Matters to a Vote of Security Holders
There were no material changes to the procedure by which shareholders may recommend nominees to the Registrant's Board of Trustees.
Item 11. Controls and Procedures
(a) The Registrant's Principal Executive Officer and Principal Financial Officer have concluded that the Registrant's disclosure controls and procedures (as defined in Rule 30a-3(c) under the Investment Company Act of 1940, as amended) are effective, based on their evaluation of these disclosure controls and procedures as of a date within 90 days of the filing date of this report.
(b) There were no changes in the Registrant's internal control over financial reporting (as defined in Rule 30a-3(d) under the Investment Company Act of 1940 as amended) that occurred during the second fiscal quarter of the period covered by this report that have materially affected, or are reasonably likely to materially affect, the Registrant's internal control over financial reporting.
Item 12. Disclosure of Securities Lending Activities for Closed-End Management Investment Companies
Not applicable open-end investment companies
Item 13. Exhibits
| (a)(1) | Code of Ethics - Not applicable for semi-annual report |
| (a)(2) | Certifications pursuant to Section 302 of the Sarbanes-Oxley Act of 2002 - Filed herewith |
| (b) | Certifications pursuant to Section 906 of the Sarbanes-Oxley Act of 2002 - Filed herewith |
SIGNATURES
Pursuant to the requirements of the Securities Exchange Act of 1934 and the Investment Company Act of 1940, the Registrant has duly caused this report to be signed on its behalf by the undersigned, thereunto duly authorized.
First Investors Income Funds
| By | /s/ E. Blake Moore Jr. | |
| | E. Blake Moore Jr. | |
| | President and Principal Executive Officer | |
| | | |
| Date: | May 30, 2019 | |
Pursuant to the requirements of the Securities Exchange Act of 1934 and the Investment Company Act of 1940, this report has been signed below by the following persons on behalf of the Registrant and in the capacities and on the dates indicated.
| By | /s/ E. Blake Moore Jr. | |
| | E. Blake Moore Jr. | |
| | President and Principal Executive Officer | |
| By | /s/ Joseph I. Benedek | |
| | Joseph I. Benedek | |
| | Treasurer and Principal Financial Officer | |
| | | |
| Date: | May 30, 2019 | |