UNITED STATES
SECURITIES AND EXCHANGE COMMISSION
WASHINGTON, D.C. 20549
FORM N-CSR
CERTIFIED SHAREHOLDER REPORT OF REGISTERED MANAGEMENT
INVESTMENT COMPANIES
INVESTMENT COMPANY ACT FILE NUMBER 811-3967
FIRST INVESTORS INCOME FUNDS
(Exact name of registrant as specified in charter)
40 Wall Street
New York, NY 10005
(Address of principal executive offices) (Zip code)
Joseph I. Benedek
Foresters Investment Management Company, Inc.
Raritan Plaza I
Edison, NJ 08837-3620
(Name and address of agent for service)
REGISTRANT'S TELEPHONE NUMBER, INCLUDING AREA CODE:
1-212-858-8000
DATE OF FISCAL YEAR END: SEPTEMBER 30
DATE OF REPORTING PERIOD: SEPTEMBER 30, 2019
| Item 1. | Reports to Stockholders |
The annual report to stockholders follows

| First Investors Funds |
Income Funds |
■ Floating Rate |
■ Fund For Income |
■ Government Cash Management |
■ International Opportunities Bond |
■ Investment Grade |
■ Limited Duration Bond |
■ Strategic Income |
Equity Funds |
■ Covered Call Strategy |
■ Equity Income |
■ Global |
■ Growth & Income |
■ Hedged U.S. Equity Opportunities |
■ International |
■ Opportunity |
■ Premium Income |
■ Select Growth |
■ Special Situations |
■ Total Return |
Beginning on or about June 1, 2021, copies of your Fund’s shareholder reports will not automatically be sent to you by mail. Please see inside the front cover for important information. |
| | Annual Report September 30, 2019 |
FOREWORD
This report is for the information of the shareholders of the Funds. It is the policy of each Fund described in this report to mail only one copy of a Fund’s prospectus, annual report, semi-annual report and proxy statements to all shareholders who share the same mailing address and share the same last name and have invested in a Fund covered by the same document. You are deemed to consent to this policy unless you specifically revoke this policy and request that separate copies of such documents be mailed to you. In such case, you will begin to receive your own copies within 30 days after our receipt of the revocation. You may request that separate copies of these disclosure documents be mailed to you by writing to us at: Foresters Investor Services, Inc., Raritan Plaza I, Edison, NJ 08837-3620 or calling us at 1-800-423-4026.
Beginning on or about June 1, 2021, as permitted by regulations adopted by the Securities and Exchange Commission, paper copies of your Fund’s shareholder reports will no longer be sent to you by mail, unless you specifically request them from the Fund or from your financial intermediary, such as a broker/dealer, bank, or insurance company. Instead, you will be notified by mail each time a report is posted on the website and provided with a link to access the report.
If you already elected to receive shareholder reports electronically, you will not be affected by this change and you do not need to take any action. You may elect to receive shareholder reports and other communications from the Fund electronically by signing up at delawarefunds.com/edelivery. If you own these shares through a financial intermediary, you may contact your financial intermediary.
You may elect to receive paper copies of all future shareholder reports free of charge. You can inform the Fund that you wish to continue receiving paper copies of your shareholder reports by contacting us at 1-800-423-4026. If you own these shares through a financial intermediary, you may contact your financial intermediary to elect to continue to receive paper copies of your shareholder reports. Your election to receive reports in paper will apply to all funds held with the Delaware Funds® by Macquarie or your financial intermediary.
The views expressed in the portfolio manager letters reflect those views of the portfolio managers only through the end of the period covered. Any such views are subject to change at any time based upon market or other conditions and we disclaim any responsibility to update such views. These views may not be relied on as investment advice.
You may obtain a free prospectus for any of the Funds by contacting your representative, calling 1-800-423-4026, writing to us at the following address: Foresters Financial Services, Inc., 40 Wall Street, New York, NY 10005. You should consider the investment objectives, risks, charges and expenses of a Fund carefully before investing. The prospectus contains this and other information about the Fund, and should be read carefully before investing.
An investment in a Fund is not a bank deposit and is not insured or guaranteed by the Federal Deposit Insurance Corporation (“FDIC”) or any other government agency. Although the Government Cash Management Fund seeks to preserve a net asset value at $1.00 per share, it is possible to lose money by investing in it, just as it is possible to lose money by investing in any of the other Funds. Past performance is no guarantee of future results. There is no guarantee that a Fund’s investment objective will be achieved.
Carefully consider the Funds’ investment objectives, risk factors, charges, and expenses before investing. This and other information can be found in the Funds’ prospectus and their summary prospectuses, which may be obtained by visiting delawarefunds.com/literature or calling 1-800-423-4026. Investors should read the prospectus and the summary prospectus carefully before investing.
A Statement of Additional Information (“SAI”) for any of the Funds may also be obtained, without charge, upon request by calling 1-800-423-4026, writing to us at our address or by visiting our website listed above. The SAI contains more detailed information about the Funds, including information about its Trustees.
Other than Macquarie Bank Limited (“MBL”), none of the entities noted are authorized deposit-taking institutions for the purposes of the Banking Act 1959 (Commonwealth of Australia). The obligations of these entities do not represent deposits or other liabilities of MBL. MBL does not guarantee or otherwise provide assurance in respect of the obligations of these entities, unless noted otherwise. The funds are governed by U.S. laws and regulations
Foresters FinancialTM and ForestersTM are the trade names and trademarks of The Independent Order of Foresters (Foresters), a fraternal benefit society, 789 Don Mills Road, Toronto, Canada M3C 1T9 and its subsidiaries.
Understanding Your Fund’s Expenses (unaudited)
FIRST INVESTORS INCOME FUNDS
FIRST INVESTORS EQUITY FUNDS
As a mutual fund shareholder, you incur two types of costs: (1) transaction costs, including a sales charge (load) on purchase payments (on Class A shares only) and a contingent deferred sales charge on redemptions (on Class B shares and, under certain circumstances when a Class A load was waived, on Class A shares); and (2) ongoing costs, including advisory fees; distribution and service fees (12b-1) (on Class A and Class B shares only); and other expenses. This example is intended to help you understand your ongoing costs (in dollars) of investing in the Funds and to compare these costs with the ongoing costs of investing in other mutual funds.
The examples are based on an investment of $1,000 in each Fund at the beginning of the period, April 1, 2019, and held for the entire six-month period ended September 30, 2019. The calculations assume that no shares were bought or sold during the period. Your actual costs may have been higher or lower, depending on the amount of your investment and the timing of any purchases or redemptions.
Actual Expenses Example:
These amounts help you to estimate the actual expenses that you paid over the period. The “Ending Account Value” shown is derived from a Fund’s actual return, and the “Expenses Paid During Period” shows the dollar amount that would have been paid by an investor who started with $1,000 in the Fund. You may use the information here, together with the amount you invested, to estimate the expenses that you paid over the period.
To estimate the expenses you paid on your account during this period, simply divide your ending account value by $1,000 (for example, an $8,600 account value divided by $1,000 = 8.60), then multiply the result by the number given for your Fund under the heading “Expenses Paid During Period”.
Hypothetical Expenses Example:
These amounts provide information about hypothetical account values and hypothetical expenses based on the Fund’s actual expense ratio for each class of shares of a Fund, and an assumed rate of return of 5% per year before expenses, which is not the Fund’s actual return. The hypothetical account values and expenses may not be used to estimate the actual ending account balance or expenses you paid for the period. You may use this information to compare the ongoing costs of investing in the Fund and other funds. To do so, compare this 5% hypothetical example with the 5% hypothetical examples that appear in the shareholder reports of the other funds.
Please note that the expenses shown in the table are meant to highlight and help you compare your ongoing costs only and do not reflect any transaction costs, such as front-end or contingent deferred sales charges (loads) or account fees that are charged to certain types of accounts, such as an annual custodial fee of $15 for certain IRA accounts and certain other retirement accounts or an annual custodial fee of $30 for 403(b) custodial accounts (subject to exceptions and certain waivers as described in the Funds’ Statement of Additional Information). Therefore, the hypothetical expenses example is useful in comparing ongoing costs only and will not help you determine the relative total costs of owning different funds. In addition, if these costs were included, your costs would have been higher.
1
Portfolio Manager’s Letter
FLOATING RATE FUND
Dear Investor:
This is the annual report for the First Investors Floating Rate Fund for the fiscal year ended September 30, 2019. During the period, the Fund’s return on a net asset value basis was 2.71% for Class A shares, 2.72% for Advisor Class shares and 3.21% for Institutional Class shares, including dividends of 38.5 cents per share on Class A shares, 40.6 cents per share on Advisor Class shares and 42.2 cents per share on Institutional Class shares.
The Markets
The Fund’s fiscal year through September 30, 2019 launched with a sharp turn into murkier waters. After an optimistic early 2018, starting in mid-October, risk assets experienced significant declines initially on Federal Reserve (“Fed”) tightening, but—by the end of the period— on weaker U.S. economic data which softened hawkish rate language from the Fed and caused markets to sharply reduce their view on rate increases for 2019. The constant, underlying source of market unease permeating the quarter, however, was political, with investors questioning the outcome of the U.S. elections and their impact on trade wars with China and on Congressional budgets. Even global political disarray, including failure of the U.K. government to hold a Brexit vote, ongoing budget wrangling between Italy and the European Central Bank, the election of populist leaders in Latin America, and rioting in Paris over increased fuel taxes, impacted domestic U.S. markets. Some of these issues would settle but others—particularly trade war headlines, Brexit uncertainty, and, increasingly—falling oil prices in an environment of lower global growth—would continue to cloud the investment horizon at intervals throughout the year even if, in the end, there were no real storms.
In this late 2018 environment, high yield declined, with more equity-like portions of the market—those rated CCC and below—declining most (and with actual equity markets declining by a multiple of the declines seen in high yield). Syndicated loans which comprise this portfolio managed to stay resilient for October and November as investors continued to worry about future rate increases, but capitulated to the general swoon in lower rated credit in December. Higher-rated fixed income performed as one might have expected with Treasurys attracting assets (and rallying in price) in a flight to quality and outperforming all other segments of the bond (or loan) market.
While the Fed had clearly telegraphed that it would raise rates at the December meeting, an equity market downdraft in early December and public remarks from President Trump pressing the Fed not to raise rates gave some investors the (false) impression the Fed might pause. While the Fed did raise in December, markets correctly interpreted that future Fed increases were off the table and that the Fed would face increasing pressure throughout 2019 to lower fast enough and far enough to support growth (and, by extension, asset prices) when corporate tax relief stimulus and quantitative easing were running out of steam. This shift in sentiment set all bond markets, but particularly interest rate-sensitive investment grade markets, off and running. While loan markets performed well to in the New Year, loan market flows had entered a period of outflows as investors no longer feared rate increases. Also, as loans had maintained their value better than similarly-rated high yield in the fourth quarter of 2018, they had just a little less “bounce” in them in the New Year. More significantly, in the absence of rate pressure, loans (and high yield bonds alike) lagged Treasurys and higher-rated, more U.S. Treasury-sensitive investment grade over 2019.
2
We note one interesting trend for the loan market vs. high yield bonds over the period; namely, returns were more evenly distributed across the loan market. High yield was particularly challenged by the performance of its energy related bonds as oil prices fell, even as OPEC worked credibly to limit supply in the face of softer global economic data. As in late 2014 and 2015, the energy sector saw an uptick in high yield defaults or anticipated restructuring processes. For better or worse, the U.S. loan market has just not included many energy company issuers—typically less than 2% of the market versus the 15% of the U.S. high yield market comprised of energy bonds.
The Fund
In fiscal year 2019, the Fund returned attractively, delivering gross performance higher than that of the benchmark. Net performance, after deduction of fees and expenses, was lower than the benchmark. The Fund gained most against the index through better preservation of capital in the fourth quarter of 2018 and the third quarter of 2019.
Through the period, the Fund’s positioning vs. market peers improved. While we had, before the period, expanded the investment target universe slightly to include the potential for lower-rated loans, we continued to focus on loans we perceived to be of generally higher credit quality. For example, in the fourth quarter, while we expanded exposure to B rated loans, we remained underweight in the market in lower rated CCC—a strategy which helped outperformance during the fourth quarter market downdraft, but disadvantaged the portfolio modestly during the first quarter’s market bounce and beyond. Starting in the second quarter, the market faced significant headwinds not from the market, but from a series of large redemptions that forced sales and moved much of the Fund to cash in a rising market. We overcame most—but not all—of this drag on performance through strong credit selection, as well as through strong performance of the small percentage of high yield bonds we continued to hold in the portfolio for performance and liquidity. From an industry perspective, we focused on judiciously reducing exposure to cyclicals over the year. An underweight in more speculative IT and retail sectors hurt the Fund relative to the market in the first quarter of 2019 snap back, but rewarded the Fund thereafter. The Fund also exhibited strong credit selection in metals and mining and financials. Healthcare, where we were overweight, helped relative performance early in the period, but became a headwind as the year aged, even as we reduced exposure.
Thank you for placing your trust in Foresters Financial. As always, we have appreciated the opportunity to serve your investment needs for the past decade.
Sincerely,

|
Bryan Petermann |
Portfolio Manager |
Muzinich & Co., Inc. |
October 4, 2019
3
Fund Expenses (unaudited)
FLOATING RATE FUND
The examples below show the ongoing costs (in dollars) of investing in your Fund and will help you in comparing these costs with costs of other mutual funds. Please refer to page 1 for a detailed explanation of the information presented in these examples.
Expense Example | Annualized
Expense
Ratio | Beginning
Account Value
(4/1/19) | Ending
Account Value
(9/30/19) | Expenses Paid
During Period
(4/1/19-9/30/19)* |
Class A Shares | 1.10% | | | |
Actual | | $1,000.00 | $1,024.49 | $ 5.58 |
Hypothetical** | | $1,000.00 | $1,019.55 | $ 5.57 |
Advisor Class Shares | 0.90% | | | |
Actual | | $1,000.00 | $1,023.54 | $ 4.57 |
Hypothetical** | | $1,000.00 | $1,020.56 | $ 4.56 |
Institutional Class Shares | 0.76% | | | |
Actual | | $1,000.00 | $1,027.36 | $ 3.86 |
Hypothetical** | | $1,000.00 | $1,021.26 | $ 3.85 |
* | Expenses are equal to the annualized expense ratio, multiplied by the average account value over the period, multiplied by 183/365 (to reflect the one-half year period). Expenses paid during the period are net of expenses waived and/or assumed. |
** | Assumed rate of return of 5% before expenses |
Portfolio Composition
TOP TEN SECTOR
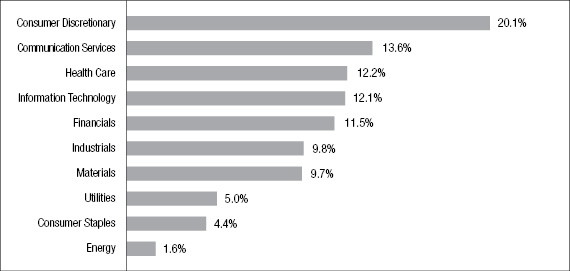
Portfolio holdings and allocations are subject to change. Percentages are as of September 30, 2019, and are based on the total market value of investments.
4
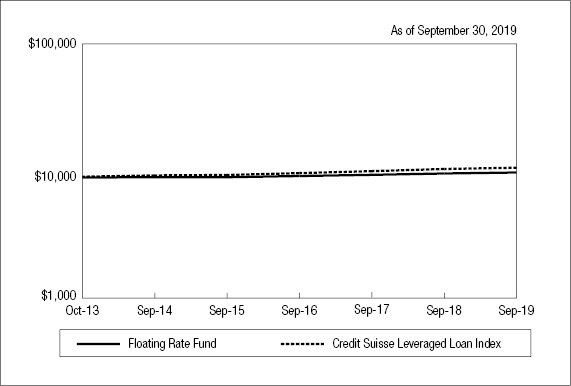
Cumulative Performance Information (unaudited)
FLOATING RATE FUND
Comparison of change in value of $10,000 investment in the First Investors Floating Rate Fund (Class A shares) and the Credit Suisse Leveraged Loan Index.
| | Average Annual Total Returns* |
N.A.V. Only | Class A | Advisor
Class | Institutional
Class | Credit Suisse
Leveraged
Loan Index |
One Year | 2.71% | 2.72% | 3.21% | 3.11% |
Five Years | 2.72% | 2.90% | 3.17% | 4.11% |
Since Inception** | 2.47% | 2.67% | 2.89% | 4.12% |
| | | | | |
S.E.C. Standardized | Class A | Advisor
Class | Institutional
Class | |
One Year | 0.13% | 2.72% | 3.21% | |
Five Years | 2.20% | 2.90% | 3.17% | |
Since Inception** | 2.03% | 2.67% | 2.89% | |
S.E.C. 30-Day Yield*** | 3.88% | 3.78% | 4.28% | |
The graph compares a $10,000 investment in the First Investors Floating Rate Fund (Class A shares) beginning 10/21/13 (commencement of operations) with a theoretical investment in the Credit Suisse Leveraged Loan Index (the “Index”). The Index is designed to mirror the investable universe of the U.S. dollar-denominated leveraged loan market. Loans included in the Index must be issued from companies in developed countries, rated below investment grade by at least one ratings provider, and be fully funded term loans with a remaining term of at least one year. It is not possible to invest directly in this Index. In addition, the Index does not reflect fees and expenses associated with the active management of a mutual fund portfolio. For purposes of the graph and the accompanying table it is assumed that all dividends and distributions were reinvested. Advisor Class shares and Institutional Class shares performance will be
5
Cumulative Performance Information (unaudited) (continued)
FLOATING RATE FUND
greater than that shown in the line graph above for Class A shares based on differences in sales loads and fees paid by shareholders investing in the different classes.
* Average Annual Total Return figures (for the periods ended 9/30/19) include the reinvestment of all dividends and distributions. “N.A.V. Only” returns are calculated without sales charges. The Class A “S.E.C. Standardized” returns shown are based on the current maximum sales charge of 2.50% and assume the current sales charge of 2.50% was in effect at the beginning of the stated periods (prior to 6/12/17, the maximum sales charge was 5.75%). The Advisor Class and Institutional Class “S.E.C. Standardized” returns shown are the same as the N.A.V. Only returns since these classes are sold without sales charges. During the periods shown, some of the expenses of the Fund were waived or assumed. If such expenses had been paid by the Fund, the Class A “S.E.C. Standardized” Average Annual Total Return for Five Years and Since Inception would have been 2.07% and 1.85%, respectively. The Advisor Class “S.E.C. Standardized” Average Annual Total Return for Five Years and Since Inception would have been 2.86% and 2.61%, respectively. The Institutional Class “S.E.C. Standardized” Average Annual Total Return for One Year, Five Years and Since Inception would have been 3.18%, 3.08% and 2.74%, respectively, and the S.E.C. 30-Day Yield for September 2019 would have been 4.26%. Results represent past performance and do not indicate future results. The graph and the returns shown do not reflect the deduction of taxes that a shareholder would pay on distributions or the redemption of fund shares. Investment return and principal value of an investment will fluctuate so that an investor’s shares, when redeemed, may be worth more or less than the original cost. Index figures are from Credit Suisse and all other figures are from Foresters Investment Management Company, Inc.
** The Since Inception returns for Class A shares, Advisor Class shares and Institutional Class shares are for the period beginning 10/21/13 (commencement of operations).
*** The S.E.C. 30-Day Yield shown is for September 2019.
6
Portfolio of Investments
FLOATING RATE FUND
September 30, 2019
| |
Principal
Amount
| | Security | | Value | |
| | | | | LOAN PARTICIPATIONS†—91.9% | | | | |
| | | | | Aerospace/Defense—.9% | | | | |
| | | | | TransDigm, Inc.: | | | | |
| | $ | 497M | | 4.5435%, 8/22/2022 | | $ | 496,229 | |
| | | 497M | | 4.5435%, 5/30/2025 | | | 496,074 | |
| | | | | | | | 992,303 | |
| | | | | Automotive—2.1% | | | | |
| | | 1,250M | | Panther BF Aggregator 2, LP, 3.5%, 4/30/2026 (a) | | | 1,241,150 | |
| | | 247M | | Superior Industries International, Inc., 6.0435%, 5/22/2024 | | | 236,849 | |
| | | 736M | | Trico Group, LLC, 9.1043%, 2/2/2024 | | | 722,047 | |
| | | | | | | | 2,200,046 | |
| | | | | Building Materials—.6% | | | | |
| | | 741M | | Yak Access, LLC, 7.0434%, 7/11/2025 | | | 681,266 | |
| | | | | Chemicals—4.5% | | | | |
| | | | | Flint Group: | | | | |
| | | 100M | | 5.2827%, 9/6/2021 | | | 85,121 | |
| | | 604M | | 5.2827%, 9/7/2021 | | | 514,907 | |
| | | 398M | | MacDermid, Inc., 4.2935%, 1/30/2026 | | | 399,898 | |
| | | 1,194M | | Messer Industries USA, Inc., 4.8298%, 3/2/2026 | | | 1,192,322 | |
| | | 1,493M | | Perstorp Holding AB, 6.8543%, 4/6/2026 | | | 1,414,144 | |
| | | 365M | | PQ Group Holdings, Inc., 4.7555%, 2/7/2025 | | | 366,665 | |
| | | 750M | | Univar USA, Inc., 4.5435%, 7/1/2024 | | | 753,750 | |
| | | | | | | | 4,726,807 | |
| | | | | Consumer Durables—1.1% | | | | |
| | | 1,221M | | TGP Holdings III, LLC, 6.2934%, 9/25/2024 | | | 1,171,829 | |
| | | | | Consumer Non-Durables—1.9% | | | | |
| | | 777M | | Energizer Holdings, Inc., 4.375%, 12/17/2025 | | | 776,962 | |
| | | 497M | | frontdoor, inc., 4.5625%, 8/14/2025 | | | 495,622 | |
7
Portfolio of Investments (continued)
FLOATING RATE FUND
September 30, 2019
| |
Principal
Amount
| | Security | | Value | |
| | | | | Consumer Non-Durables (continued) |
| | | | | Safety Products: | | | | |
| | $ | 617M | | 6.5434%, 6/29/2026 | | $ | 615,870 | |
| | | 75M | | 1%, 6/29/2026 (a) | | | 75,294 | |
| | | | | | | | 1,963,748 | |
| | | | | Energy—.9% | | | | |
| | | 746M | | Consolidated Energy Finance SA, 4.5472%, 5/7/2025 | | | 725,701 | |
| | | 247M | | Triton Solar U.S Acquisition Co, 8.0434%, 10/29/2024 | | | 232,642 | |
| | | | | | | | 958,343 | |
| | | | | Financial Services—2.9% | | | | |
| | | 696M | | Alliant Holdings Intermediate, LLC, 5.0536%, 5/9/2025 | | | 685,156 | |
| | | 995M | | NFP Corp., 5.0434%, 1/8/2024 | | | 979,031 | |
| | | 700M | | Teneo Holdings, LLC, 7.2886%, 7/14/2025 | | | 670,250 | |
| | | 744M | | USI Holdings Corp., 5.1043%, 5/16/2024 | | | 732,899 | |
| | | | | | | | 3,067,336 | |
| | | | | Financials—7.4% | | | | |
| | | 1,244M | | Acrisure, LLC, 5.8486%, 11/22/2023 | | | 1,229,711 | |
| | | 1,243M | | AssuredPartners, Inc., 5.5435%, 10/22/2024 | | | 1,238,931 | |
| | | 497M | | Paysafe, LLC, 5.2935%, 1/3/2025 | | | 496,853 | |
| | | | | Sedgwick Claims Management Services, Inc.: | | | | |
| | | 497M | | 5.2935%, 12/31/2025 | | | 490,031 | |
| | | 499M | | 6.0435%, 8/10/2026 | | | 500,074 | |
| | | 675M | | Sunshine Luxembourg VII Sarl., 6.3486%, 7/17/2026 (a) | | | 678,655 | |
| | | 1,244M | | TransUnion, LLC, 4.0435%, 6/19/2025 | | | 1,249,921 | |
| | | 1,250M | | Travelport Finance Luxembourg, 7.1043%, 5/29/2026 | | | 1,134,375 | |
| | | 725M | | VFH Parent, LLC, 6.0437%, 3/2/2026 | | | 727,041 | |
| | | | | | | | 7,745,592 | |
| | | | | Food/Beverage/Tobacco—3.7% | | | | |
| | | 360M | | Chobani, LLC, 5.5434%, 10/9/2023 | | | 356,867 | |
| | | 247M | | Dole Food Co., Inc., 4.795%, 4/6/2024 | | | 243,956 | |
| | | 1,244M | | Hearthside Food Holdings, LLC, 5.731%, 5/23/2025 | | | 1,172,190 | |
8
| |
Principal
Amount
| | Security | | Value | |
| | | | | Food/Beverage/Tobacco (continued) |
| | $ | 746M | | HLF Financing Sarl, LLC, 5.2935%, 8/18/2025 | | $ | 750,272 | |
| | | 250M | | Refresco BV, 5.4081%, 1/22/2025 | | | 251,043 | |
| | | 497M | | Sigma Bidco BV, 5.3198%, 7/2/2025 | | | 496,232 | |
| | | 575M | | US Foods, Inc., 4.0435%, 8/17/2026 | | | 577,757 | |
| | | | | | | | 3,848,317 | |
| | | | | Food/Drug—.7% | | | | |
| | | 700M | | Curium BidCo Sarl, 6.0996%, 6/26/2026 | | | 699,125 | |
| | | | | Forest Products/Containers—2.0% | | | | |
| | | 1,247M | | Berry Global, Inc., 4.549%, 7/1/2026 | | | 1,254,861 | |
| | | 825M | | Liqui-Box Corp., 4.5%, 6/3/2026 (a) | | | 818,813 | |
| | | | | | | | 2,073,674 | |
| | | | | Gaming/Leisure—6.4% | | | | |
| | | 697M | | AMC Entertainment Holdings, Inc., 5.23%, 4/22/2026 | | | 699,481 | |
| | | 923M | | Boyd Gaming Corp., 4.1661%, 9/15/2023 | | | 926,990 | |
| | | 1,244M | | Casablanca U.S. Holdings, Inc., 6.2555%, 3/29/2024 | | | 1,206,376 | |
| | | 748M | | Caesars Entertainment Operating Co., LLC, 4.7935%, 12/23/2024 | | | 744,472 | |
| | | 250M | | Diamond Sports Group, LLC, 5.3%, 8/24/2026 | | | 251,563 | |
| | | 1,000M | | Dorna Sports SL, 5.1997%, 4/12/2024 | | | 995,625 | |
| | | 232M | | Eldorado Resorts, Inc., 3.5351%, 4/17/2024 | | | 231,564 | |
| | | 248M | | Lakeland Tours, 5.8951%, 12/16/2024 | | | 249,351 | |
| | | 499M | | Six Flags Theme Parks, Inc., 4.05%, 4/17/2026 | | | 499,790 | |
| | | 692M | | Stars Group Holdings BV, 5.6043%, 7/10/2025 | | | 695,953 | |
| | | 249M | | Station Casinos, LLC, 4.55%, 6/8/2023 | | | 250,102 | |
| | | | | | | | 6,751,267 | |
| | | | | Health Care—10.6% | | | | |
| | | 1,244M | | Air Methods Corp., 5.6043%, 4/22/2024 | | | 1,013,564 | |
| | | 449M | | Auris Luxembourg III Sarl, 5.7934%, 2/23/2026 | | | 446,347 | |
| | | 1,244M | | Envision Healthcare Corp., 5.7935%, 10/10/2025 | | | 1,016,753 | |
9
Portfolio of Investments (continued)
FLOATING RATE FUND
September 30, 2019
| |
Principal
Amount
| | Security | | Value | |
| | | | | Health Care (continued) |
| | | | | Heartland Dental, LLC: | | | | |
| | $ | 913M | | 5.7935%, 4/30/2025 | | $ | 895,853 | |
| | | 21M | | 3.75%, 4/30/2025 (a) | | | 20,136 | |
| | | 497M | | Jordan Health, Inc., 7.0536%, 5/16/2025 | | | 417,884 | |
| | | | | Mallinckrodt International Finance SA: | | | | |
| | | 1,792M | | 4.8543%, 9/24/2024 | | | 1,361,984 | |
| | | 129M | | 5.1752%, 2/24/2025 | | | 97,654 | |
| | | 1,250M | | MPH Acquisition Holdings, LLC, 4.8543%, 6/7/2023 | | | 1,195,313 | |
| | | | | NMN Holdings III Corp.: | | | | |
| | | 398M | | 5.7935%, 11/13/2025 | | | 388,190 | |
| | | 85M | | 3.75%, 11/13/2025 (a) | | | 82,875 | |
| | | 1,031M | | Parexel International Corp., 4.7934%, 9/27/2024 | | | 980,181 | |
| | | 998M | | PetVet Care Centers, LLC, 4.7935%, 2/14/2025 (a) | | | 972,667 | |
| | | 746M | | RegionalCare Hospital Partners Holdings, Inc., 6.5536%, 11/17/2025 | | | 747,326 | |
| | | 399M | | Sotera Health Holdings LLC, 5.5668%, 5/16/2022 | | | 398,501 | |
| | | 600M | | U.S. Renal Care, 7.0625%, 6/15/2026 | | | 565,500 | |
| | | 498M | | VVC Holdings Co., 6.681%, 2/11/2026 | | | 495,945 | |
| | | | | | | | 11,096,673 | |
| | | | | Information Technology—11.5% | | | | |
| | | 1,246M | | Capri Acquisition BidCo, Ltd., 5.2555%, 11/1/2024 | | | 1,233,127 | |
| | | 1,020M | | Change Healthcare Holdings, LLC, 4.5434%, 3/1/2024 | | | 1,016,542 | |
| | | 900M | | Dcert Buyer Inc., 4%, 8/10/2026 (a) | | | 898,313 | |
| | | 1,492M | | DigiCert Holdings, Inc., 6.0434%, 10/31/2024 | | | 1,489,664 | |
| | | 1,244M | | EagleView Technology Corp., 5.5435%, 8/14/2025 | | | 1,209,532 | |
| | | 499M | | Inovalon Holdings, Inc., 5.5625%, 4/2/2025 | | | 502,272 | |
| | | 551M | | MacDonald, Detwiler, Inc., 4.8535%, 10/4/2024 | | | 486,547 | |
| | | 459M | | Microchip Technology, Inc., 4.05%, 5/29/2025 | | | 460,668 | |
| | | 587M | | Plantronics, Inc., 4.5434%, 7/2/2025 | | | 586,098 | |
| | | 823M | | SCS Holdings I, Inc., 6.3543%, 7/1/2026 | | | 826,542 | |
| | | 997M | | SuperMoose Borrower, LLC, 5.7934%, 8/29/2025 | | | 937,166 | |
| | | 1,245M | | VeriFone Systems, Inc., 6.1358%, 8/20/2025 | | | 1,194,145 | |
| | | 1,250M | | Web.com Group, Inc., 5.7775%, 10/10/2025 | | | 1,230,475 | |
| | | | | | | | 12,071,091 | |
10
| |
Principal
Amount
| | Security | | Value | |
| | | | | Manufacturing—7.8% | | | | |
| | $ | 1,242M | | AI Alpine U.S. Bidco, Inc., 4.8365%, 10/24/2025 | | $ | 1,216,088 | |
| | | 746M | | Altran Technologies SA, 4.4058%, 3/20/2025 | | | 749,477 | |
| | | 746M | | AMG Advanced Metallurgical, 5.0435%, 2/3/2025 | | | 735,010 | |
| | | 1,244M | | Brand Energy & Infrastructure Services, Inc., 6.5141%, 6/21/2024 | | | 1,220,321 | |
| | | 367M | | Clark Equipment Co., 4.1043%, 5/17/2024 | | | 368,672 | |
| | | 1,129M | | Columbus McKinnon Corp. of New York, 4.6043%, 1/31/2024 | | | 1,129,213 | |
| | | 249M | | Duravant, Inc., 5.3543%, 7/19/2024 | | | 245,003 | |
| | | 479M | | Filtration Group Corp., 5.0434%, 3/31/2025 | | | 480,780 | |
| | | 1,250M | | GrafTech International, Ltd., 5.5435%, 2/12/2025 | | | 1,218,750 | |
| | | 398M | | Hillman Group, Inc., 6.0435%, 6/2/2025 | | | 387,040 | |
| | | 495M | | Minimax Viking GmbH, 5.112%, 7/25/2025 | | | 497,912 | |
| | | | | | | | 8,248,266 | |
| | | | | Media-Broadcasting—1.7% | | | | |
| | | 137M | | Mission Broadcasting, Inc., 4.3502%, 1/17/2024 | | | 137,736 | |
| | | | | Nexstar Broadcasting, Inc.: | | | | |
| | | 690M | | 4.2934%, 1/17/2024 | | | 691,416 | |
| | | 250M | | 4.807%, 6/19/2026 | | | 251,408 | |
| | | 725M | | Sinclair Television Group, Inc., 4.54%, 9/30/2026 | | | 728,625 | |
| | | | | | | | 1,809,185 | |
| | | | | Media-Cable TV—5.8% | | | | |
| | | 743M | | Altice Financing SA, 4.7775%, 7/28/2025 | | | 723,943 | |
| | | 579M | | Atlantic Broadband, LLC, 4.2935%, 1/3/2025 | | | 579,612 | |
| | | 1,192M | | Cablevision, 4.2775%, 7/17/2025 | | | 1,193,765 | |
| | | 450M | | Clear Channel Worldwide Holdings, 5.5435%, 8/10/2026 | | | 451,874 | |
| | | | | Gray Television, Inc.: | | | | |
| | | 450M | | 4.5818%, 2/7/2024 | | | 450,844 | |
| | | 231M | | 4.8318%, 1/2/2026 | | | 231,920 | |
| | | 1,245M | | SFR Group, LLC, 4.7934%, 7/31/2025 | | | 1,216,897 | |
| | | 1,250M | | Ziggo Secured Finance Partnership, 4.5275%, 4/15/2025 | | | 1,247,656 | |
| | | | | | | | 6,096,511 | |
11
Portfolio of Investments (continued)
FLOATING RATE FUND
September 30, 2019
| |
Principal
Amount
| | Security | | Value | |
| | | | | Media-Diversified—3.5% | | | | |
| | $ | 1,393M | | DiscoverOrg., LLC, 6.612%, 2/2/2026 | | $ | 1,390,395 | |
| | | 993M | | E.W. Scripps Co., 4.7934%, 5/1/2026 | | | 995,026 | |
| | | 1,246M | | R.R. Donnelley & Sons Co., 7.0435%, 1/15/2024 | | | 1,248,833 | |
| | | | | | | | 3,634,254 | |
| | | | | Retail-General Merchandise—2.7% | | | | |
| | | 718M | | Burger King, 4.2935%, 2/17/2024 | | | 721,661 | |
| | | 500M | | Harbor Freight Tools USA, Inc., 4.5434%, 8/16/2023 | | | 486,879 | |
| | | 750M | | Prestige Brands, Inc., 4.0435%, 1/26/2024 | | | 752,812 | |
| | | 946M | | Varsity Brands, Inc., 2.7338%, 12/16/2024 | | | 912,147 | |
| | | | | | | | 2,873,499 | |
| | | | | Services—5.8% | | | | |
| | | 645M | | Dawn Acquisition, LLC, 5.8543%, 12/31/2025 | | | 612,980 | |
| | | 497M | | Empower Payments, Inc., 6.0435%, 10/6/2025 | | | 494,541 | |
| | | 798M | | Gems Menasa Cayman, Ltd., 7.0435%, 7/30/2026 | | | 794,010 | |
| | | 995M | | IQVIA, Inc., 3.8543%, 6/9/2025 | | | 996,519 | |
| | | 1,940M | | Prime Security Services Borrower, LLC, 4.862%, 5/2/2022 | | | 1,942,992 | |
| | | 1,269M | | Servpro Borrower, LLC, 7.5%, 4/13/2026 | | | 1,269,424 | |
| | | | | | | | 6,110,466 | |
| | | | | Telecommunication Services—1.1% | | | | |
| | | 1,189M | | GCI Holdings, LLC, 4.6119%, 2/2/2022 | | | 1,171,075 | |
| | | | | Utilities—3.4% | | | | |
| | | 995M | | Calpine Corp., 4.61%, 1/15/2024 | | | 998,536 | |
| | | 943M | | Edgewater Generation, LLC, 5.7935%, 12/12/2025 | | | 932,639 | |
| | | 650M | | Heritage Power, LLC, 8.2048%, 7/8/2026 | | | 637,000 | |
| | | 995M | | USIC Holdings, Inc., 5.2935%, 12/8/2023 | | | 987,595 | |
| | | | | | | | 3,555,770 | |
12
| |
Principal
Amount
| | Security | | Value | |
| | | | | Waste Management—2.0% | | | | |
| | $ | 995M | | GFL Environmental, Inc., 5.0435%, 5/30/2025 | | $ | 988,331 | |
| | | 1,170M | | Gopher Resource, LLC, 5.2935%, 3/6/2025 | | | 1,153,360 | |
| | | | | | | | 2,141,691 | |
| | | | | Wireless Communications—.9% | | | | |
| | | 497M | | Sprint Communications, Inc., 4.5625%, 2/2/2024 | | | 494,340 | |
| | | 497M | | Telesat Canada, 4.61%, 11/17/2023 | | | 499,654 | |
| | | | | | | | 993,994 | |
Total Value of Loan Participations (cost $97,983,696) | | | 96,682,128 | |
| | | | | CORPORATE BONDS—7.2% | | | | |
| | | | | Energy—1.4% | | | | |
| | | 1,250M | | CITGO Petroleum Corp., 6.25%, 8/15/2022 (b) | | | 1,268,750 | |
| | | 175M | | Range Resources Corp., 5%, 8/15/2022 | | | 164,937 | |
| | | | | | | | 1,433,687 | |
| | | | | Forest Products/Containers—.9% | | | | |
| | | 900M | | BWAY Holding Co., 5.5%, 4/15/2024 (b) | | | 928,080 | |
| | | | | Health Care—.6% | | | | |
| | | 400M | | Bausch Health Cos., Inc., 7%, 3/15/2024 (b) | | | 421,384 | |
| | | 250M | | Tenet Healthcare Corp., 5.125%, 5/1/2025 | | | 254,075 | |
| | | | | | | | 675,459 | |
| | | | | Metals/Mining—1.6% | | | | |
| | | 1,000M | | Commercial Metals Co., 4.875%, 5/15/2023 | | | 1,042,500 | |
| | | 600M | | First Quantum Minerals, Ltd., 7.25%, 5/15/2022 (b) | | | 597,258 | |
| | | | | | | | 1,639,758 | |
| | | | | Utilities—1.6% | | | | |
| | | 650M | | Calpine Corp., 5.375%, 1/15/2023 | | | 659,750 | |
| | | 1,000M | | Targa Resources Partners, LP, 4.25%, 11/15/2023 | | | 1,011,250 | |
| | | | | | | | 1,671,000 | |
13
Portfolio of Investments (continued)
FLOATING RATE FUND
September 30, 2019
| |
Principal
Amount
| | Security | | Value | |
| | | | | Wireless Communications—1.1% | | | | |
| | $ | 1,050M | | Sprint Corp., 7.875%, 9/15/2023 | | $ | 1,156,008 | |
Total Value of Corporate Bonds (cost $7,256,720) | | | 7,503,992 | |
Total Value of Investments (cost $105,240,416) | | | 99.1 | % | | | 104,186,120 | |
Other Assets, Less Liabilities | | | .9 | | | | 989,313 | |
Net Assets | | | 100.0 | % | | $ | 105,175,433 | |
(a) | A portion or all of the security purchased on a when-issued or delayed delivery basis (see Note 1G). |
(b) | Security exempt from registration under Rule 144A of the Securities Act of 1933 (see Note 4). |
† | Interest rates are determined and reset periodically. The interest rates above are the rates in effect at September 30, 2019. |
The Fund’s assets and liabilities are classified into the following three levels based on the inputs used to value the assets and liabilities:
| | Level 1 – | Unadjusted quoted prices in active markets for identical securities that the Fund has the ability to access. |
| | Level 2 – | Observable inputs other than quoted prices included in Level 1 that are observable for the asset or liability, either directly or indirectly. These inputs may include quoted prices for the identical instrument on an inactive market, prices for similar instruments, interest rates, prepayment speeds, credit risk, yield curves, default rates and similar data. |
| | Level 3 – | Unobservable inputs for the asset or liability, to the extent relevant observable inputs are not available, representing the Fund’s own assumption about the assumptions a market participant would use in valuing the asset or liability, and would be based on the best information available. |
The inputs methodology used for valuing securities are not necessarily an indication of the risk associated with investing in those securities. For example, U.S. Government securities are reflected as Level 2 because the inputs used to determine fair value may not always be quoted prices in an active market.
14
The following is a summary, by category of Level, of inputs used to value the Fund’s investments as of September 30, 2019:
| | | Level 1 | | | Level 2 | | | Level 3 | | | Total | |
Loan Participations | | $ | — | | | $ | 96,682,128 | | | $ | — | | | $ | 96,682,128 | |
Corporate Bonds | | | — | | | | 7,503,992 | | | | — | | | | 7,503,992 | |
Total Investments in Securities* | | $ | — | | | $ | 104,186,120 | | | $ | — | | | $ | 104,186,120 | |
* | The Portfolio of Investments provides information on the industry categorization of loan participations and corporate bonds. |
There were no transfers into or from Level 1 and Level 2 by the Fund for the year ended September 30, 2019. Transfers, if any, between Levels are recognized at the end of the reporting period.
See notes to financial statements
15
Portfolio Manager’s Letter
FUND FOR INCOME
Dear Investor:
This is the annual report for the First Investors Fund For Income for the fiscal year ended September 30, 2019. During the period, the Fund’s return on a net asset value basis was 5.80% for Class A shares, 5.13% for Advisor Class shares and 6.23% for Institutional Class shares, including dividends of 12.7 cents per share on Class A shares, 13.1 cents on Advisor Class shares and 13.7 cents on Institutional Class shares.
Markets
The Fund’s fiscal year through September 30, 2019 launched with a sharp turn into murkier waters. After an optimistic early 2018, starting in mid-October, risk assets experienced significant declines initially on Federal Reserve (Fed) tightening, but—by the end of the period— on weaker U.S. economic data which softened hawkish rate language from the Fed and caused markets to sharply reduce their view on rate increases for 2019. The constant, underlying source of market unease permeating the quarter, however, was political, with investors questioning the outcome of the U.S. elections and their impact on trade wars with China and on Congressional budgets. Even global political disarray, including failure of the U.K. government to hold a Brexit vote, ongoing budget wrangling between Italy and the European Central Bank, the election of populist leaders in Latin America, and rioting in Paris over increased fuel taxes, impacted domestic U.S. markets. Some of these issues would settle but others—particularly trade war headlines, Brexit uncertainty, and, increasingly—falling oil prices in an environment of lower global growth—would continue to cloud the investment horizon at intervals throughout the year even if, in the end, there were no real storms.
In this late 2018 environment, high yield declined, with more equity-like portions of the market—those rated CCC and below—declining most (and with actual equity markets declining by a multiple of the declines seen in high yield). Syndicated loans (typically a small inclusion in this portfolio) managed to stay resilient for October and November as investors continued to worry about future rate increases, but capitulated to the general swoon in lower rated credit in December. Higher-rated fixed income performed as one might have expected with Treasuries attracting assets (and rallying in price) in a flight to quality and outperforming all other segments of the bond market.
While the Fed had clearly telegraphed that it would raise rates at the December meeting, an equity market downdraft in early December and public remarks from President Trump pressing the Fed not to raise rates gave some investors the (false) impression the Fed might pause. While the Fed did raise in December, markets correctly interpreted that future Fed increases were off the table and that the Fed would face increasing pressure throughout 2019 to lower fast enough and far enough to support growth (and, by extension, asset prices) when corporate tax relief stimulus and quantitative easing were running out of steam. This shift in sentiment set all bond markets, but particularly interest rate-sensitive investment grade markets, off and running. High yield paused again only in May, largely under geopolitical pressure and concerns of global growth, and accompanied by a second inversion of the U.S. yield curve (which is often seen as a pre-cursor for inflation). This stress was short-lived however as a market bounce-back rewarded those who provided liquidity straight through September.
16
Overall, investment grade credit was the period’s outstanding performer. High yield outperformed equities, delivering a rare “coupon-like” return over the period. A closer look at high yield, however, reveals wide return disparity within the asset class as the BB and B rated bonds in this Fund’s benchmark delivered returns of nearly 8% even as lower rated, more speculative CCC bonds lost considerable ground, returning a -5.21% as they declined straight through the third quarter. Falling oil prices appeared largely to blame, even as OPEC worked credibly to limit supply in the face of softer global economic data. As in late 2014 and 2015, the energy sector saw an uptick in defaults or anticipated restructuring processes.
The Fund
In fiscal year 2019, the Fund returned attractively, but delivered gross asset performance between that of its higher quality benchmark and the full high yield market. A few credit stories—some of which we do not believe have played out—have accounted for much of the underperformance. Drug manufacturer Mallinckrodt has declined on opioid and other headlines and has sold off, we believe, below the bond’s eventual value. Similarly, mining company, Dominion Diamond, has seen its bond price drop with falling diamond prices, but we believe the company—which was taken private in 2017—is well-supported by its owner and positioned to recognize better operating margins.
The Fund has delivered strong credit selection compared to the market most notably in the energy, services, food/beverage/tobacco, diversified media, and diversified financial service sectors. While we spent a good part of the year cautiously building up toward the market’s weight in energy in the portfolio, we stayed away from key areas of the business we perceived as weak, especially oil field services. The performance story can also be viewed—and may be more important to view—from ratings and duration perspectives as well. In hindsight, we have been overweight credit in a market that continued to offer strong balance sheet fundamentals for most companies outside the energy sector, and underweight duration risk. Once December 2018 passed, duration has been king, with the markets confident that the Fed would keep lowering, sparking an ongoing rally in the most treasury-sensitive corporates. Loans, a small, tactical portion of this portfolio (under 10%), have lagged as investors found their floating rate structures less compelling in an era of declining Fed Funds rates.
Thank you for placing your trust in Foresters Financial. As always, we have appreciated the opportunity to serve your investment needs for the past decade.
Sincerely,

Clinton J. Comeaux
Portfolio Manager
Muzinich & Co, Inc.
October 4, 2019
17
Fund Expenses (unaudited)
FUND FOR INCOME
The examples below show the ongoing costs (in dollars) of investing in your Fund and will help you in comparing these costs with costs of other mutual funds. Please refer to page 1 for a detailed explanation of the information presented in these examples.
Expense Example | Annualized
Expense
Ratio | Beginning
Account Value
(4/1/19) | Ending
Account Value
(9/30/19) | Expenses Paid
During Period
(4/1/19-9/30/19)* |
Class A Shares | 1.18% | | | |
Actual | | $1,000.00 | $1,034.70 | $ 6.02 |
Hypothetical** | | $1,000.00 | $1,019.15 | $ 5.97 |
Advisor Class Shares | 0.93% | | | |
Actual | | $1,000.00 | $1,027.12 | $ 4.73 |
Hypothetical** | | $1,000.00 | $1,020.41 | $ 4.71 |
Institutional Class Shares | 0.80% | | | |
Actual | | $1,000.00 | $1,036.69 | $ 4.08 |
Hypothetical** | | $1,000.00 | $1,021.06 | $ 4.05 |
* | Expenses are equal to the annualized expense ratio, multiplied by the average account value over the period, multiplied by 183/365 (to reflect the one-half year period). Expenses paid during the period are net of expenses waived. |
** | Assumed rate of return of 5% before expenses |
Portfolio Composition
TOP TEN SECTORS
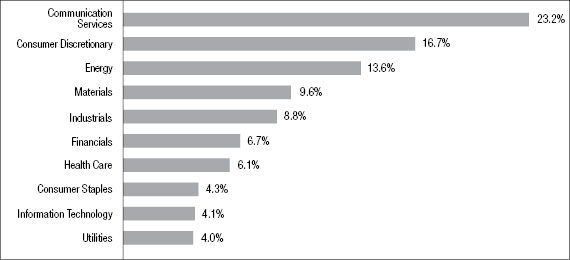
Portfolio holdings and allocations are subject to change. Percentages are as of September 30, 2019, and are based on the total market value of investments.
18
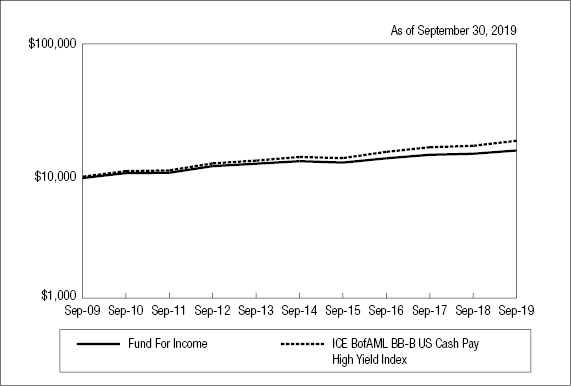
Cumulative Performance Information (unaudited)
FUND FOR INCOME
Comparison of change in value of $10,000 investment in the First Investors Fund For Income (Class A shares), the ICE BofAML BB-B U.S. Cash Pay High Yield Constrained Index.
| | Average Annual Total Returns* |
N.A.V. Only | Class A | Advisor
Class | Institutional
Class | ICE BofAML
BB-B U.S.
Cash Pay
High Yield
Index |
One Year | 5.80% | 5.13% | 6.23% | 7.87% |
Five Years | 4.05% | 4.16% | 4.52% | 5.49% |
Ten Years or Since Inception** | 6.44% | 4.07% | 4.43% | 7.62%† |
| | | | | |
S.E.C. Standardized | Class A | Advisor
Class | Institutional
Class | |
One Year | 1.64% | 5.13% | 6.23% | |
Five Years | 3.19% | 4.16% | 4.52% | |
Ten Years or Since Inception** | 5.99% | 4.07% | 4.43% | |
S.E.C. 30-Day Yield*** | 4.97% | 5.85% | 5.53% | |
The graph compares a $10,000 investment in the First Investors Fund For Income (Class A shares) beginning 9/30/09 with a theoretical investment in the ICE BofAML BB-B U.S. Cash Pay High Yield Constrained Index (the “Index”). The Index contains all securities in the ICE BofAML U.S. Cash Pay High Yield Index rated BB1 through B3, based on an average of Moody’s, S&P and Fitch, but caps issuer exposure at 2%. It is not possible to invest directly in this Index. In addition, the Index does not reflect fees and expenses associated with the active management of a mutual fund portfolio. For purposes of the graph and the accompanying table it is assumed that all dividends and distributions were reinvested. Advisor Class
19
Cumulative Performance Information (unaudited) (continued)
FUND FOR INCOME
shares and Institutional Class shares performance may be greater than or less than that shown in the line graph above for Class A shares based on differences in sales loads and fees paid by shareholders investing in the different classes.
* Average Annual Total Return figures (for the periods ended 9/30/19) include the reinvestment of all dividends and distributions. “N.A.V. Only” returns are calculated without sales charges. The Class A “S.E.C. Standardized” returns shown are based on the current maximum sales charge of 4% and assume the current sales charge of 4% was in effect at the beginning of the stated periods (prior to 6/12/17, the maximum sales charge was 5.75%). The Advisor Class and Institutional Class “S.E.C. Standardized” returns shown are the same as the N.A.V. Only returns since these classes are sold without sales charges. During the periods shown, some of the expenses of the Fund were waived or assumed. If such expenses had been paid by the Fund, the Class A “S.E.C. Standardized” Average Annual Total Return for One Year, Five Years and Ten Years would have been 1.62%, 3.17% and 5.97%, respectively, and the S.E.C. 30-Day Yield for September 2019 would have been 4.96%. The Advisor Class “S.E.C. Standardized” Average Annual Total Return for One Year, Five Years and Since Inception would have been 5.11%, 4.15% and 3.46%, respectively, and the S.E.C. 30-Day Yield for September 2019 would have been 5.83%. The Institutional Class “S.E.C. Standardized” Average Annual Total Return for One Year, Five Years and Since Inception would have been 6.21%, 4.50% and 4.41%, respectively, and the S.E.C. 30-Day Yield for September 2019 would have been 5.52%. Results represent past performance and do not indicate future results. The graph and the returns shown do not reflect the deduction of taxes that a shareholder would pay on distributions or the redemption of fund shares. Investment return and principal value of an investment will fluctuate so that an investor’s shares, when redeemed, may be worth more or less than the original cost. The issuers of high yield bonds, in which the Fund primarily invests, pay higher interest rates because they have a greater likelihood of financial difficulty, which could result in their inability to repay the bonds fully when due. Prices of high yield bonds are also subject to greater fluctuations. Index figures are from ICE Data Services and all other figures are from Foresters Investment Management Company, Inc.
** The Since Inception returns for Advisor Class shares and Institutional Class shares are for the periods beginning 4/1/13 (commencement of operations for those classes).
*** The S.E.C. 30-Day Yield shown is for September 2019.
† The Index return is for ten years. The Index return since inception of the Advisor Class shares and Institutional Class shares is 5.41%.
20
Portfolio of Investments
FUND FOR INCOME
September 30, 2019
| |
Principal
Amount
| | Security | | Value | |
| | | | | CORPORATE BONDS—92.9% | | | | |
| | | | | Aerospace/Defense—2.0% | | | | |
| | | | | Bombardier, Inc.: | | | | |
| | $ | 1,300M | | 6%, 10/15/2022 (a) | | $ | 1,304,875 | |
| | | 1,950M | | 7.5%, 12/1/2024 (a) | | | 1,954,875 | |
| | | | | TransDigm, Inc.: | | | | |
| | | 1,925M | | 6%, 7/15/2022 | | | 1,958,688 | |
| | | 1,550M | | 6.5%, 7/15/2024 | | | 1,604,250 | |
| | | 1,600M | | 6.25%, 3/15/2026 (a) | | | 1,722,000 | |
| | | 2,050M | | Triumph Group, Inc., 5.25%, 6/1/2022 | | | 2,049,180 | |
| | | | | | | | 10,593,868 | |
| | | | | Automotive—2.4% | | | | |
| | | 1,675M | | Adient Global Holdings, Ltd., 4.875%, 8/15/2026 (a) | | | 1,369,312 | |
| | | 2,625M | | American Axle & Manufacturing, Inc., 6.25%, 4/1/2025 | | | 2,559,375 | |
| | | 700M | | Asbury Automotive Group, Inc., 6%, 12/15/2024 | | | 728,000 | |
| | | 1,225M | | Cooper Standard Automotive, Inc., 5.625%, 11/15/2026 (a) | | | 1,122,406 | |
| | | 1,650M | | Hertz Corp., 7.625%, 6/1/2022 (a) | | | 1,720,125 | |
| | | 1,825M | | J.B. Poindexter & Co., 7.125%, 4/15/2026 (a) | | | 1,898,000 | |
| | | 1,538M | | LKQ Corp., 4.75%, 5/15/2023 | | | 1,564,915 | |
| | | 1,950M | | Panther BF Aggregator 2, LP, 8.5%, 5/15/2027 (a) | | | 1,979,250 | |
| | | 275M | | Tenneco, Inc., 5%, 7/15/2026 | | | 226,188 | |
| | | | | | | | 13,167,571 | |
| | | | | Building Materials—1.1% | | | | |
| | | 550M | | Beacon Roofing Supply, Inc., 4.5%, 11/15/2026 (a)(b) | | | 556,187 | |
| | | 2,425M | | Building Materials Corp., 5.375%, 11/15/2024 (a) | | | 2,506,844 | |
| | | 225M | | Griffon Corp., 5.25%, 3/1/2022 | | | 227,813 | |
| | | 1,500M | | New Enterprise Stone & Lime Co., 6.25%, 3/15/2026 (a) | | | 1,537,500 | |
| | | 1,300M | | Standard Industries, Inc., 5%, 2/15/2027 (a) | | | 1,349,140 | |
| | | | | | | | 6,177,484 | |
| | | | | Chemicals—2.5% | | | | |
| | | 1,375M | | Avantor, Inc., 9%, 10/1/2025 (a) | | | 1,543,437 | |
| | | 800M | | Blue Cube Spinco, Inc., 10%, 10/15/2025 | | | 899,470 | |
21
Portfolio of Investments (continued)
FUND FOR INCOME
September 30, 2019
| |
Principal
Amount
| | Security | | Value | |
| | | | | Chemicals (continued) |
| | $ | 2,425M | | CF Industries, Inc., 4.95%, 6/1/2043 | | $ | 2,385,594 | |
| | | 1,425M | | Chemours Co., 5.375%, 5/15/2027 | | | 1,236,230 | |
| | | 950M | | CVR Partners, LP, 9.25%, 6/15/2023 (a) | | | 993,937 | |
| | | 1,375M | | Koppers, Inc., 6%, 2/15/2025 (a) | | | 1,382,741 | |
| | | 1,525M | | Kraton Polymers, LLC, 7%, 4/15/2025 (a) | | | 1,597,438 | |
| | | 1,125M | | Neon Holdings, Inc., 10.125%, 4/1/2026 (a) | | | 1,136,250 | |
| | | 1,925M | | Rain CII Carbon, LLC, 7.25%, 4/1/2025 (a) | | | 1,848,000 | |
| | | 850M | | Tronox, Inc., 6.5%, 4/15/2026 (a) | | | 813,875 | |
| | | | | | | | 13,836,972 | |
| | | | | Consumer Non-Durables—.7% | | | | |
| | | | | Energizer Holdings, Inc.: | | | | |
| | | 1,700M | | 5.5%, 6/15/2025 (a) | | | 1,764,311 | |
| | | 850M | | 6.375%, 7/15/2026 (a) | | | 912,594 | |
| | | 1,125M | | KGA Escrow, LLC, 7.5%, 8/15/2023 (a) | | | 1,182,656 | |
| | | | | | | | 3,859,561 | |
| | | | | Energy—13.3% | | | | |
| | | 1,450M | | Antero Resources Corp., 5.625%, 6/1/2023 | | | 1,261,500 | |
| | | 1,650M | | Apergy Corp., 6.375%, 5/1/2026 | | | 1,645,875 | |
| | | 236M | | Baytex Energy Corp., 5.125%, 6/1/2021 (a) | | | 231,870 | |
| | | 1,475M | | Berry Petroleum Co., 7%, 2/15/2026 (a) | | | 1,419,687 | |
| | | | | Blue Racer Midstream, LLC: | | | | |
| | | 875M | | 6.125%, 11/15/2022 (a) | | | 884,012 | |
| | | 850M | | 6.625%, 7/15/2026 (a) | | | 843,625 | |
| | | | | Buckeye Partners, LP: | | | | |
| | | 1,750M | | 3.95%, 12/1/2026 | | | 1,542,214 | |
| | | 1,000M | | 5.6%, 10/15/2044 | | | 807,302 | |
| | | 1,800M | | Callon Petroleum Co., 6.375%, 7/1/2026 | | | 1,765,530 | |
| | | 600M | | Carrizo Oil & Gas, Inc., 8.25%, 7/15/2025 | | | 590,760 | |
| | | | | Chesapeake Energy Corp.: | | | | |
| | | 975M | | 4.875%, 4/15/2022 | | | 792,187 | |
| | | 925M | | 7%, 10/1/2024 | | | 667,156 | |
| | | 1,175M | | 8%, 6/15/2027 | | | 805,110 | |
| | | 3,050M | | CITGO Petroleum Corp., 6.25%, 8/15/2022 (a) | | | 3,095,750 | |
22
| |
Principal
Amount
| | Security | | Value | |
| | | | | Energy (continued) |
| | $ | 2,425M | | Consolidated Energy Finance SA, 5.8685%, 6/15/2022 (a)† | | $ | 2,420,228 | |
| | | 1,675M | | Covey Park Energy, LLC, 7.5%, 5/15/2025 (a) | | | 1,348,375 | |
| | | | | Crestwood Midstream Partners, LP: | | | | |
| | | 2,175M | | 6.25%, 4/1/2023 | | | 2,242,969 | |
| | | 1,375M | | 5.75%, 4/1/2025 | | | 1,419,687 | |
| | | 1,700M | | CrownRock, LP, 5.625%, 10/15/2025 (a) | | | 1,716,966 | |
| | | | | DCP Midstream Operating, LP: | | | | |
| | | 1,100M | | 3.875%, 3/15/2023 | | | 1,115,125 | |
| | | 925M | | 5.125%, 5/15/2029 | | | 943,500 | |
| | | 1,775M | | Delek Logistics Partners, LP, 6.75%, 5/15/2025 | | | 1,766,125 | |
| | | 225M | | Diamondback Energy, Inc., 4.75%, 11/1/2024 | | | 230,906 | |
| | | | | EnLink Midstream Partners, LP: | | | | |
| | | 2,325M | | 4.85%, 7/15/2026 | | | 2,217,469 | |
| | | 700M | | 5.45%, 6/1/2047 | | | 574,000 | |
| | | 2,267M | | Exterran Partners, LP, 6%, 10/1/2022 | | | 2,298,171 | |
| | | 1,600M | | Genesis Energy, LP, 6.5%, 10/1/2025 | | | 1,566,000 | |
| | | | | Gulfport Energy Corp.: | | | | |
| | | 1,250M | | 6.625%, 5/1/2023 | | | 981,250 | |
| | | 1,150M | | 6.375%, 5/15/2025 | | | 822,250 | |
| | | 1,550M | | 6.375%, 1/15/2026 | | | 1,092,750 | |
| | | 1,750M | | Ithaca Energy (North Sea), PLC, 9.375%, 7/15/2024 (a) | | | 1,828,313 | |
| | | | | Laredo Petroleum, Inc.: | | | | |
| | | 1,275M | | 5.625%, 1/15/2022 | | | 1,204,875 | |
| | | 1,550M | | 6.25%, 3/15/2023 | | | 1,367,875 | |
| | | 725M | | Matador Resources Co., 5.875%, 9/15/2026 | | | 730,003 | |
| | | 1,425M | | MEG Energy Corp., 6.375%, 1/30/2023 (a) | | | 1,380,469 | |
| | | 1,219M | | Murphy Oil Corp., 5.875%, 12/1/2042 | | | 1,078,815 | |
| | | 875M | | Murphy Oil USA, Inc., 4.75%, 9/15/2029 | | | 896,875 | |
| | | 1,850M | | Nabors Industries, Inc., 5.75%, 2/1/2025 | | | 1,378,250 | |
| | | 854M | | Northern Oil and Gas, Inc., 8.5%, 5/15/2023 | | | 884,154 | |
| | | 1,125M | | Oasis Petroleum, Inc., 6.25%, 5/1/2026 (a) | | | 916,875 | |
| | | | | Parkland Fuel Corp.: | | | | |
| | | 1,650M | | 6%, 4/1/2026 (a) | | | 1,749,000 | |
| | | 1,175M | | 5.875%, 7/15/2027 (a) | | | 1,235,877 | |
| | | 875M | | Parsley Energy, LLC, 5.25%, 8/15/2025 (a) | | | 892,246 | |
23
Portfolio of Investments (continued)
FUND FOR INCOME
September 30, 2019
| |
Principal
Amount
| | Security | | Value | |
| | | | | Energy (continued) |
| | | | | Precision Drilling Corp.: | | | | |
| | $ | 242M | | 6.5%, 12/15/2021 | | $ | 238,135 | |
| | | 950M | | 7.125%, 1/15/2026 (a) | | | 881,125 | |
| | | | | Range Resources Corp.: | | | | |
| | | 1,375M | | 5%, 8/15/2022 | | | 1,295,938 | |
| | | 900M | | 4.875%, 5/15/2025 | | | 747,000 | |
| | | 1,950M | | SM Energy Co., 5%, 1/15/2024 | | | 1,759,875 | |
| | | | | Southwestern Energy Co.: | | | | |
| | | 1,550M | | 6.7%, 1/23/2025 | | | 1,371,719 | |
| | | 600M | | 7.5%, 4/1/2026 | | | 526,500 | |
| | | | | Suburban Propane Partners, LP: | | | | |
| | | 900M | | 5.5%, 6/1/2024 | | | 922,500 | |
| | | 2,425M | | 5.875%, 3/1/2027 | | | 2,490,524 | |
| | | 1,975M | | Sunoco, LP, 4.875%, 1/15/2023 | | | 2,031,781 | |
| | | 935M | | Transocean Pontus, Ltd., 6.125%, 8/1/2025 (a) | | | 953,190 | |
| | | 1,550M | | Tullow Oil, PLC, 6.25%, 4/15/2022 (a) | | | 1,571,700 | |
| | | 1,125M | | USA Compression Partners, LP, 6.875%, 9/1/2027 (a) | | | 1,167,188 | |
| | | 2,450M | | Whiting Petroleum Corp., 6.625%, 1/15/2026 | | | 1,666,000 | |
| | | | | | | | 72,275,151 | |
| | | | | Financial Services—.3% | | | | |
| | | 1,450M | | GTCR (AP) Finance, Inc., 8%, 5/15/2027 (a) | | | 1,493,500 | |
| | | | | Financials—5.9% | | | | |
| | | 1,125M | | Acrisure, LLC, 8.125%, 2/15/2024 (a) | | | 1,214,297 | |
| | | 1,050M | | Ally Financial, Inc., 8%, 11/1/2031 | | | 1,456,875 | |
| | | 1,525M | | Credit Suisse Group AG, 7.5%, 12/11/2023 (a) | | | 1,689,020 | |
| | | 1,250M | | CSTN Merger Sub, Inc., 6.75%, 8/15/2024 (a) | | | 1,160,575 | |
| | | | | DAE Funding, LLC: | | | | |
| | | 1,125M | | 5.75%, 11/15/2023 (a) | | | 1,185,019 | |
| | | 3,975M | | 5%, 8/1/2024 (a) | | | 4,153,875 | |
| | | 1,600M | | Dresdner Funding Trust I, 8.151%, 6/30/2031 (a) | | | 2,164,600 | |
24
| |
Principal
Amount
| | Security | | Value | |
| | | | | Financials (continued) |
| | | | | Icahn Enterprises, LP: | | | | |
| | $ | 2,225M | | 6.25%, 2/1/2022 | | $ | 2,288,413 | |
| | | 1,450M | | 6.75%, 2/1/2024 | | | 1,513,438 | |
| | | 2,075M | | 6.25%, 5/15/2026 (a) | | | 2,181,344 | |
| | | 1,575M | | Intesa Sanpaolo SpA, 5.017%, 6/26/2024 (a) | | | 1,621,894 | |
| | | | | Ladder Capital Finance Holdings, LLLP: | | | | |
| | | 1,350M | | 5.25%, 3/15/2022 (a) | | | 1,408,523 | |
| | | 2,700M | | 5.25%, 10/1/2025 (a) | | | 2,767,500 | |
| | | 1,250M | | Navient Corp., 5.875%, 3/25/2021 | | | 1,299,219 | |
| | | | | Springleaf Finance Corp.: | | | | |
| | | 1,450M | | 5.625%, 3/15/2023 | | | 1,547,875 | |
| | | 800M | | 6.125%, 3/15/2024 | | | 863,000 | |
| | | 600M | | 6.875%, 3/15/2025 | | | 662,625 | |
| | | 1,225M | | 7.125%, 3/15/2026 | | | 1,361,220 | |
| | | 1,475M | | Wand Merger Corp., 8.125%, 7/15/2023 (a) | | | 1,541,375 | |
| | | | | | | | 32,080,687 | |
| | | | | Food/Beverage/Tobacco—3.3% | | | | |
| | | 1,325M | | HLF Financing Sarl, LLC, 7.25%, 8/15/2026 (a) | | | 1,339,906 | |
| | | | | JBS USA LUX SA: | | | | |
| | | 2,050M | | 6.75%, 2/15/2028 (a) | | | 2,278,062 | |
| | | 3,475M | | 5.5%, 1/15/2030 (a) | | | 3,692,118 | |
| | | 575M | | JBS USA, LLC, 5.875%, 7/15/2024 (a) | | | 593,357 | |
| | | 725M | | Performance Food Group, Inc., 5.5%, 10/15/2027 (a) | | | 766,688 | |
| | | 1,825M | | Pilgrim’s Pride Corp., 5.875%, 9/30/2027 (a) | | | 1,966,894 | |
| | | | | Post Holdings, Inc.: | | | | |
| | | 1,150M | | 5.75%, 3/1/2027 (a) | | | 1,224,980 | |
| | | 1,325M | | 5.5%, 12/15/2029 (a) | | | 1,386,281 | |
| | | 3,575M | | Sigma Holdco BV, 7.875%, 5/15/2026 (a) | | | 3,583,938 | |
| | | 1,175M | | Simmons Foods, Inc., 5.75%, 11/1/2024 (a) | | | 1,151,500 | |
| | | | | | | | 17,983,724 | |
25
Portfolio of Investments (continued)
FUND FOR INCOME
September 30, 2019
| |
Principal
Amount
| | Security | | Value | |
| | | | | Food/Drug—.6% | | | | |
| | | | | Albertson’s Cos., LLC: | | | | |
| | $ | 1,325M | | 5.75%, 3/15/2025 | | $ | 1,369,189 | |
| | | 625M | | 7.5%, 3/15/2026 (a) | | | 698,437 | |
| | | 575M | | 5.875%, 2/15/2028 (a) | | | 610,040 | |
| | | 675M | | B & G Foods, Inc., 5.25%, 9/15/2027 | | | 691,099 | |
| | | | | | | | 3,368,765 | |
| | | | | Forest Products/Containers—1.7% | | | | |
| | | 1,400M | | Ardagh Holdings USA, Inc., 4.625%, 5/15/2023 (a) | | | 1,436,750 | |
| | | | | Berry Global Escrow Corp.: | | | | |
| | | 1,325M | | 4.875%, 7/15/2026 (a) | | | 1,372,899 | |
| | | 1,550M | | 5.625%, 7/15/2027 (a) | | | 1,608,125 | |
| | | 1,675M | | BWAY Holding Co., 5.5%, 4/15/2024 (a) | | | 1,727,260 | |
| | | 1,075M | | Crown Americas, LLC, 4.5%, 1/15/2023 | | | 1,131,437 | |
| | | 1,050M | | Graphic Packaging International, LLC, 4.75%, 7/15/2027 (a) | | | 1,105,125 | |
| | | 475M | | Mercer International, Inc., 7.375%, 1/15/2025 | | | 495,948 | |
| | | 400M | | Owens-Brockway Glass Container, 5.875%, 8/15/2023 (a) | | | 426,000 | |
| | | | | | | | 9,303,544 | |
| | | | | Gaming/Leisure—7.1% | | | | |
| | | 1,150M | | AMC Entertainment, Inc., 5.75%, 6/15/2025 | | | 1,100,435 | |
| | | | | AMC Networks, Inc.: | | | | |
| | | 1,625M | | 5%, 4/1/2024 | | | 1,677,861 | |
| | | 775M | | 4.75%, 8/1/2025 | | | 802,125 | |
| | | 1,925M | | Boyd Gaming Corp., 6.875%, 5/15/2023 | | | 2,004,406 | |
| | | 1,225M | | Cedar Fair, LP, 5.375%, 6/1/2024 | | | 1,263,281 | |
| | | 6,425M | | CRC Escrow Issuer, LLC, 5.25%, 10/15/2025 (a) | | | 6,584,982 | |
| | | | | Diamond Sports Group, LLC: | | | | |
| | | 1,425M | | 5.375%, 8/15/2026 (a) | | | 1,482,000 | |
| | | 2,550M | | 6.625%, 8/15/2027 (a) | | | 2,652,000 | |
| | | 1,025M | | Golden Nugget, Inc., 8.75%, 10/1/2025 (a) | | | 1,071,125 | |
| | | 3,975M | | IRB Holding Corp., 6.75%, 2/15/2026 (a) | | | 4,004,813 | |
| | | 2,425M | | Jack Ohio Finance, LLC, 6.75%, 11/15/2021 (a) | | | 2,482,594 | |
26
| |
Principal
Amount
| | Security | | Value | |
| | | | | Gaming/Leisure (continued) |
| | $ | 1,025M | | Lions Gate Entertainment Corp., 5.875%, 11/1/2024 (a) | | $ | 1,058,312 | |
| | | 500M | | Marriott Ownership Resorts, Inc, 4.75%, 1/15/2028 (a)(b) | | | 506,250 | |
| | | 1,200M | | MGM Resorts International, 6%, 3/15/2023 | | | 1,325,040 | |
| | | 1,650M | | National CineMedia, LLC, 6%, 4/15/2022 | | | 1,672,688 | |
| | | | | Scientific Games International, Inc.: | | | | |
| | | 1,850M | | 5%, 10/15/2025 (a) | | | 1,913,455 | |
| | | 1,250M | | 8.25%, 3/15/2026 (a) | | | 1,329,188 | |
| | | 825M | | Stars Group Holdings BV, 7%, 7/15/2026 (a) | | | 880,688 | |
| | | | | Viking Cruises, Ltd.: | | | | |
| | | 3,150M | | 6.25%, 5/15/2025 (a) | | | 3,307,500 | |
| | | 1,150M | | 5.875%, 9/15/2027 (a) | | | 1,221,415 | |
| | | | | | | | 38,340,158 | |
| | | | | Health Care—5.5% | | | | |
| | | 800M | | AMN Healthcare, Inc, 5.125%, 10/1/2024 (a) | | | 832,000 | |
| | | | | Bausch Health Cos., Inc.: | | | | |
| | | 3,650M | | 7%, 3/15/2024 (a) | | | 3,845,129 | |
| | | 3,575M | | 9%, 12/15/2025 (a) | | | 4,026,344 | |
| | | 925M | | 8.5%, 1/31/2027 (a) | | | 1,040,440 | |
| | | 650M | | Cimpress NV, 7%, 6/15/2026 (a) | | | 674,245 | |
| | | 4,525M | | DaVita, Inc., 5.125%, 7/15/2024 | | | 4,609,844 | |
| | | 1,575M | | Endo Finance, LLC, 6%, 7/15/2023 (a) | | | 973,901 | |
| | | | | HCA, Inc.: | | | | |
| | | 1,800M | | 5.875%, 5/1/2023 | | | 1,984,500 | |
| | | 2,075M | | 5.375%, 2/1/2025 | | | 2,272,125 | |
| | | 1,150M | | HealthSouth Corp., 5.125%, 3/15/2023 | | | 1,175,875 | |
| | | | | Mallinckrodt Finance SB: | | | | |
| | | 1,475M | | 5.75%, 8/1/2022 (a) | | | 560,500 | |
| | | 1,025M | | 5.5%, 4/15/2025 (a) | | | 307,807 | |
| | | 1,100M | | MEDNAX, Inc., 6.25%, 1/15/2027 (a) | | | 1,094,423 | |
| | | 775M | | MPH Operating Partnership, LP, 7.125%, 6/1/2024 (a) | | | 717,844 | |
| | | 1,050M | | Par Pharmaceutical, Inc., 7.5%, 4/1/2027 (a) | | | 964,688 | |
| | | 1,775M | | Polaris Intermediate Corp., 8.5%, 12/1/2022 (a) | | | 1,517,625 | |
| | | 2,564M | | Syneos Health, Inc., 7.5%, 10/1/2024 (a) | | | 2,656,945 | |
27
Portfolio of Investments (continued)
FUND FOR INCOME
September 30, 2019
| |
Principal
Amount
| | Security | | Value | |
| | | | | Health Care (continued) |
| | $ | 625M | | Tenet Healthcare Corp., 5.125%, 5/1/2025 | | $ | 635,188 | |
| | | | | | | | 29,889,423 | |
| | | | | Home-Building—1.5% | | | | |
| | | 1,625M | | Brookfield Residential Properties, Inc., 6.25%, 9/15/2027 (a) | | | 1,637,187 | |
| | | 1,300M | | Century Communities, Inc., 6.75%, 6/1/2027 (a) | | | 1,399,450 | |
| | | 925M | | Taylor Morrison Communities, Inc., 5.75%, 1/15/2028 (a) | | | 1,005,938 | |
| | | 1,050M | | Toll Brothers Finance Corp., 3.8%, 11/1/2029 | | | 1,036,224 | |
| | | | | William Lyon Homes, Inc.: | | | | |
| | | 1,650M | | 6%, 9/1/2023 | | | 1,724,250 | |
| | | 1,350M | | 6.625%, 7/15/2027 (a) | | | 1,407,375 | |
| | | | | | | | 8,210,424 | |
| | | | | Information Technology—3.7% | | | | |
| | | 1,650M | | Anixter, Inc., 6%, 12/1/2025 | | | 1,827,375 | |
| | | 650M | | CommScope Finance, LLC, 6%, 3/1/2026 (a) | | | 675,870 | |
| | | | | Diamond 1 Finance Corp.: | | | | |
| | | 2,425M | | 5.875%, 6/15/2021 (a) | | | 2,466,831 | |
| | | 1,150M | | 7.125%, 6/15/2024 (a) | | | 1,213,537 | |
| | | 1,875M | | J2 Cloud Services, LLC, 6%, 7/15/2025 (a) | | | 1,986,750 | |
| | | 2,200M | | Nielsen Finance, LLC, 5%, 4/15/2022 (a) | | | 2,217,160 | |
| | | | | Nuance Communications, Inc.: | | | | |
| | | 1,875M | | 6%, 7/1/2024 | | | 1,959,375 | |
| | | 1,200M | | 5.625%, 12/15/2026 | | | 1,272,000 | |
| | | 1,225M | | Rackspace Hosting, Inc., 8.625%, 11/15/2024 (a) | | | 1,133,003 | |
| | | 1,975M | | Solera, LLC, 10.5%, 3/1/2024 (a) | | | 2,097,687 | |
| | | 1,550M | | Symantec Corp., 5%, 4/15/2025 (a) | | | 1,568,186 | |
| | | 1,800M | | Verscend Holding Corp., 9.75%, 8/15/2026 (a) | | | 1,923,516 | |
| | | | | | | | 20,341,290 | |
| | | | | Manufacturing—3.3% | | | | |
| | | 1,625M | | Amsted Industries, Inc., 5.625%, 7/1/2027 (a) | | | 1,718,437 | |
| | | 2,525M | | ATS Automation Tooling Systems, Inc., 6.5%, 6/15/2023 (a) | | | 2,613,375 | |
28
| |
Principal
Amount
| | Security | | Value | |
| | | | | Manufacturing (continued) |
| | $ | 3,825M | | Brand Energy & Infrastructure Services, Inc., 8.5%, 7/15/2025 (a) | | $ | 3,633,750 | |
| | | 625M | | Cloud Crane, LLC, 10.125%, 8/1/2024 (a) | | | 670,312 | |
| | | 1,400M | | Grinding Media, Inc., 7.375%, 12/15/2023 (a) | | | 1,344,000 | |
| | | 2,050M | | H&E Equipment Services, Inc., 5.625%, 9/1/2025 | | | 2,117,957 | |
| | | 950M | | HAT Holdings I, LLC, 5.25%, 7/15/2024 (a) | | | 1,001,063 | |
| | | 1,950M | | Manitowoc Co., Inc., 9%, 4/1/2026 (a) | | | 1,915,875 | |
| | | 375M | | MTS Systems Corp, 5.75%, 8/15/2027 (a) | | | 390,938 | |
| | | 1,300M | | Park-Ohio Industries, Inc., 6.625%, 4/15/2027 | | | 1,248,000 | |
| | | 1,125M | | Patrick Industries, Inc., 7.5%, 10/15/2027 (a) | | | 1,161,675 | |
| | | | | | | | 17,815,382 | |
| | | | | Media-Broadcasting—3.2% | | | | |
| | | | | Belo Corp.: | | | | |
| | | 1,250M | | 7.75%, 6/1/2027 | | | 1,446,875 | |
| | | 1,474M | | 7.25%, 9/15/2027 | | | 1,680,360 | |
| | | 3,600M | | LIN Television Corp., 5.875%, 11/15/2022 | | | 3,690,000 | |
| | | 725M | | Nexstar Escrow, Inc., 5.625%, 7/15/2027 (a) | | | 761,250 | |
| | | | | Sinclair Television Group, Inc.: | | | | |
| | | 1,325M | | 5.625%, 8/1/2024 (a) | | | 1,366,406 | |
| | | 650M | | 5.875%, 3/15/2026 (a) | | | 682,500 | |
| | | 1,400M | | 5.125%, 2/15/2027 (a) | | | 1,414,000 | |
| | | 2,325M | | Sirius XM Radio, Inc., 4.625%, 7/15/2024 (a) | | | 2,416,442 | |
| | | 3,725M | | TEGNA, Inc., 5%, 9/15/2029 (a) | | | 3,781,322 | |
| | | | | | | | 17,239,155 | |
| | | | | Media-Cable TV—9.5% | | | | |
| | | | | Altice Financing SA: | | | | |
| | | 2,675M | | 6.625%, 2/15/2023 (a) | | | 2,751,906 | |
| | | 1,150M | | 7.5%, 5/15/2026 (a) | | | 1,224,738 | |
| | | | | Altice France SA: | | | | |
| | | 725M | | 6.25%, 5/15/2024 (a) | | | 750,919 | |
| | | 2,075M | | 7.375%, 5/1/2026 (a) | | | 2,230,023 | |
| | | 1,325M | | 8.125%, 2/1/2027 (a) | | | 1,465,781 | |
29
Portfolio of Investments (continued)
FUND FOR INCOME
September 30, 2019
| |
Principal
Amount
| | Security | | Value | |
| | | | | Media-Cable TV (continued) |
| | $ | 2,500M | | Altice Luxembourg SA, 10.5%, 5/15/2027 (a) | | $ | 2,823,750 | |
| | | | | CCO Holdings, LLC: | | | | |
| | | 925M | | 5.75%, 9/1/2023 | | | 945,812 | |
| | | 3,675M | | 5.875%, 4/1/2024 (a) | | | 3,843,903 | |
| | | 1,025M | | 5.5%, 5/1/2026 (a) | | | 1,076,147 | |
| | | 1,550M | | 5.875%, 5/1/2027 (a) | | | 1,643,000 | |
| | | 975M | | 5%, 2/1/2028 (a) | | | 1,010,344 | |
| | | 625M | | 5.375%, 6/1/2029 (a) | | | 667,187 | |
| | | 1,125M | | 4.75%, 3/1/2030 (a)(b) | | | 1,144,924 | |
| | | | | Clear Channel Worldwide Holdings, Inc.: | | | | |
| | | 1,511M | | 9.25%, 2/15/2024 (a) | | | 1,663,853 | |
| | | 3,425M | | 5.125%, 8/15/2027 (a) | | | 3,576,899 | |
| | | | | CSC Holdings, LLC: | | | | |
| | | 3,225M | | 5.375%, 7/15/2023 (a) | | | 3,317,719 | |
| | | 1,475M | | 6.625%, 10/15/2025 (a) | | | 1,582,380 | |
| | | 1,425M | | 7.5%, 4/1/2028 (a) | | | 1,611,889 | |
| | | 2,075M | | 5.75%, 1/15/2030 (a)(b) | | | 2,171,218 | |
| | | | | DISH DBS Corp.: | | | | |
| | | 1,650M | | 5%, 3/15/2023 | | | 1,673,182 | |
| | | 1,750M | | 5.875%, 11/15/2024 | | | 1,741,250 | |
| | | 2,300M | | Midcontinent Communications & Finance Corp., 5.375%, 8/15/2027 (a) | | | 2,426,500 | |
| | | 1,775M | | Netflix, Inc., 4.875%, 4/15/2028 | | | 1,810,411 | |
| | | 7,850M | | UPC Holding BV, 5.5%, 1/15/2028 (a) | | | 8,164,000 | |
| | | | | | | | 51,317,735 | |
| | | | | Media-Diversified—.8% | | | | |
| | | 2,450M | | iHeart Communications, 8.375%, 5/1/2027 | | | 2,658,985 | |
| | | 1,750M | | Outdoor Americas Capital, LLC, 5.875%, 3/15/2025 | | | 1,811,250 | |
| | | | | | | | 4,470,235 | |
| | | | | Metals/Mining—4.1% | | | | |
| | | 2,480M | | Allegheny Technologies, Inc., 7.875%, 8/15/2023 | | | 2,699,530 | |
| | | 1,375M | | Cleveland-Cliffs, Inc., 5.875%, 6/1/2027 (a) | | | 1,305,700 | |
30
| |
Principal
Amount
| | Security | | Value | |
| | | | | Metals/Mining (continued) |
| | $ | 3,225M | | Commercial Metals Co., 4.875%, 5/15/2023 | | $ | 3,362,062 | |
| | | 1,550M | | Constellium NV, 5.75%, 5/15/2024 (a) | | | 1,596,500 | |
| | | 550M | | HudBay Minerals, Inc., 7.625%, 1/15/2025 (a) | | | 560,312 | |
| | | 3,000M | | Joseph T. Ryerson & Son, Inc., 11%, 5/15/2022 (a) | | | 3,172,500 | |
| | | 1,625M | | Northwest Acquisitions, ULC, 7.125%, 11/1/2022 (a) | | | 962,813 | |
| | | 1,977M | | Novelis, Inc., 5.875%, 9/30/2026 (a) | | | 2,078,222 | |
| | | 4,225M | | SunCoke Energy Partners, LP, 7.5%, 6/15/2025 (a) | | | 3,776,094 | |
| | | 2,850M | | TMS International Corp., 7.25%, 8/15/2025 (a) | | | 2,451,000 | |
| | | | | | | | 21,964,733 | |
| | | | | Real Estate—2.9% | | | | |
| | | | | Geo Group, Inc.: | | | | |
| | | 400M | | 5.125%, 4/1/2023 | | | 355,000 | |
| | | 1,575M | | 6%, 4/15/2026 | | | 1,278,900 | |
| | | 2,150M | | Greystar Real Estate Partners, 5.75%, 12/1/2025 (a) | | | 2,217,188 | |
| | | 1,000M | | Hilton Domestic Operating Co., LLC, 4.875%, 1/15/2030 (a) | | | 1,058,350 | |
| | | 1,050M | | Iron Mountain, Inc., 5.25%, 3/15/2028 (a) | | | 1,090,656 | |
| | | 4,225M | | iStar, Inc., 4.75%, 10/1/2024 | | | 4,309,838 | |
| | | 1,300M | | MGM Growth Properties Operating Partnership, LP, 5.75%, 2/1/2027 (a) | | | 1,461,265 | |
| | | 975M | | MPT Operating Partnership, LP, 4.625%, 8/1/2029 | | | 1,006,078 | |
| | | 1,700M | | Realogy Group, LLC, 9.375%, 4/1/2027 (a)(b) | | | 1,587,834 | |
| | | 1,500M | | Sabra Health Care, LP, 5.125%, 8/15/2026 | | | 1,604,721 | |
| | | | | | | | 15,969,830 | |
| | | | | Retail-General Merchandise—2.5% | | | | |
| | | | | 1011778 B.C., ULC: | | | | |
| | | 2,875M | | 4.625%, 1/15/2022 (a) | | | 2,875,575 | |
| | | 1,750M | | 5%, 10/15/2025 (a) | | | 1,813,962 | |
| | | 1,425M | | 3.875%, 1/15/2028 (a) | | | 1,437,626 | |
| | | | | AmeriGas Partners, LP: | | | | |
| | | 400M | | 5.625%, 5/20/2024 | | | 430,250 | |
| | | 1,575M | | 5.5%, 5/20/2025 | | | 1,699,031 | |
| | | 1,450M | | J.C. Penney Co., Inc., 8.625%, 3/15/2025 | | | 913,616 | |
31
Portfolio of Investments (continued)
FUND FOR INCOME
September 30, 2019
| |
Principal
Amount
| | Security | | Value | |
| | | | | Retail-General Merchandise (continued) |
| | $ | 2,050M | | L Brands, Inc., 6.75%, 7/1/2036 | | $ | 1,749,368 | |
| | | 1,975M | | SRS Distribution, Inc., 8.25%, 7/1/2026 (a) | | | 2,019,438 | |
| | | 500M | | Yum! Brands, Inc., 4.75%, 1/15/2030 (a) | | | 517,580 | |
| | | | | | | | 13,456,446 | |
| | | | | Services—2.5% | | | | |
| | | 3,175M | | ADT Corp., 3.5%, 7/15/2022 | | | 3,198,812 | |
| | | 1,400M | | AECOM, 5.125%, 3/15/2027 | | | 1,474,900 | |
| | | 2,975M | | GCI, Inc., 6.875%, 4/15/2025 | | | 3,146,062 | |
| | | 3,175M | | GW Honos Security Corp., 8.75%, 5/15/2025 (a) | | | 3,276,917 | |
| | | 2,150M | | United Rentals, Inc., 5.5%, 5/15/2027 | | | 2,287,062 | |
| | | | | | | | 13,383,753 | |
| | | | | Telecommunication Services—2.6% | | | | |
| | | | | Frontier Communications Corp.: | | | | |
| | | 825M | | 8.5%, 4/1/2026 (a) | | | 826,980 | |
| | | 625M | | 8%, 4/1/2027 (a) | | | 661,562 | |
| | | 1,875M | | GCI, LLC, 6.625%, 6/15/2024 (a) | | | 2,027,344 | |
| | | 1,575M | | Qwest Corp., 7.25%, 9/15/2025 | | | 1,781,564 | |
| | | 1,425M | | Telecom Italia Capital SA, 7.2%, 7/18/2036 | | | 1,667,264 | |
| | | 2,950M | | Telesat Canada, 8.875%, 11/15/2024 (a) | | | 3,168,300 | |
| | | | | Zayo Group, LLC: | | | | |
| | | 2,350M | | 6.375%, 5/15/2025 | | | 2,428,843 | |
| | | 1,525M | | 5.75%, 1/15/2027 (a) | | | 1,562,820 | |
| | | | | | | | 14,124,677 | |
| | | | | Transportation—1.8% | | | | |
| | | 2,650M | | BCD Acquisition, Inc., 9.625%, 9/15/2023 (a) | | | 2,716,250 | |
| | | | | Fly Leasing, Ltd.: | | | | |
| | | 925M | | 6.375%, 10/15/2021 | | | 942,922 | |
| | | 1,625M | | 5.25%, 10/15/2024 | | | 1,681,875 | |
| | | 1,000M | | Mobile Mini, Inc., 5.875%, 7/1/2024 | | | 1,032,500 | |
| | | 1,625M | | VistaJet Malta Finance, PLC, 10.5%, 6/1/2024 (a) | | | 1,580,313 | |
32
| |
Principal
Amount
| | Security | | Value | |
| | | | | Transportation (continued) |
| | $ | 1,705M | | XPO Logistics, Inc., 6.125%, 9/1/2023 (a) | | $ | 1,764,675 | |
| | | | | | | | 9,718,535 | |
| | | | | Utilities—3.6% | | | | |
| | | 1,800M | | Calpine Corp., 5.25%, 6/1/2026 (a) | | | 1,869,750 | |
| | | 1,350M | | Cheniere Energy Partners, LP, 4.5%, 10/1/2029 (a) | | | 1,385,437 | |
| | | 425M | | Clearway Energy Operating, LLC, 5.75%, 10/15/2025 (a) | | | 448,906 | |
| | | 1,850M | | Drax Finco, PLC, 6.625%, 11/1/2025 (a) | | | 1,933,250 | |
| | | | | Global Partners, LP: | | | | |
| | | 1,325M | | 7%, 6/15/2023 | | | 1,369,719 | |
| | | 1,350M | | 7%, 8/1/2027 (a) | | | 1,393,875 | |
| | | 152M | | Indiantown Cogeneration Utilities, LP, 9.77%, 12/15/2020 | | | 158,163 | |
| | | 1,975M | | Nextera Energy Operating Partners, 4.25%, 7/15/2024 (a) | | | 2,039,188 | |
| | | 1,000M | | NRG Yield Operating, LLC, 5%, 9/15/2026 | | | 1,027,500 | |
| | | 2,185M | | NSG Holdings, LLC, 7.75%, 12/15/2025 (a) | | | 2,354,380 | |
| | | | | Talen Energy Supply, LLC: | | | | |
| | | 600M | | 7.25%, 5/15/2027 (a) | | | 612,780 | |
| | | 875M | | 6.625%, 1/15/2028 (a) | | | 864,063 | |
| | | 2,500M | | Targa Resources Partners, LP, 4.25%, 11/15/2023 | | | 2,528,125 | |
| | | 1,675M | | Terraform Power Operating, LLC, 5%, 1/31/2028 (a) | | | 1,750,375 | |
| | | | | | | | 19,735,511 | |
| | | | | Waste Management—.6% | | | | |
| | | 475M | | Clean Harbors, Inc., 4.875%, 7/15/2027 (a) | | | 496,969 | |
| | | | | GFL Environmental, Inc.: | | | | |
| | | 1,175M | | 5.625%, 5/1/2022 (a) | | | 1,207,313 | |
| | | 1,325M | | 8.5%, 5/1/2027 (a) | | | 1,472,406 | |
| | | | | | | | 3,176,688 | |
| | | | | Wireless Communications—3.9% | | | | |
| | | 1,650M | | Consolidated Communications, Inc., 6.5%, 10/1/2022 | | | 1,534,500 | |
| | | 850M | | Hughes Satellite Systems Corp., 6.625%, 8/1/2026 | | | 924,766 | |
| | | 1,525M | | Intelsat Jackson Holdings SA, 8.5%, 10/15/2024 (a) | | | 1,539,777 | |
33
Portfolio of Investments (continued)
FUND FOR INCOME
September 30, 2019
| |
Principal
Amount
| | Security | | Value | |
| | | | | Wireless Communications (continued) |
| | | | | Level 3 Financing, Inc.: | | | | |
| | $ | 2,150M | | 5.125%, 5/1/2023 | | $ | 2,180,315 | |
| | | 1,475M | | 5.375%, 1/15/2024 | | | 1,507,966 | |
| | | 1,175M | | Sprint Capital Corp., 8.75%, 3/15/2032 | | | 1,452,241 | |
| | | | | Sprint Corp.: | | | | |
| | | 7,050M | | 7.875%, 9/15/2023 | | | 7,761,768 | |
| | | 650M | | 7.625%, 2/15/2025 | | | 716,625 | |
| | | 1,325M | | 7.625%, 3/1/2026 | | | 1,465,781 | |
| | | 1,875M | | T-Mobile USA, Inc., 6%, 4/15/2024 | | | 1,950,000 | |
| | | | | | | | 21,033,739 | |
Total Value of Corporate Bonds (cost $498,028,825) | | | 504,328,541 | |
| | | | | LOAN PARTICIPATIONS†—5.1% | | | | |
| | | | | Chemicals—.5% | | | | |
| | | | | Flint Group: | | | | |
| | | 453M | | 5.2827%, 9/6/2021 | | | 385,934 | |
| | | 2,739M | | 5.2827%, 9/7/2021 | | | 2,334,576 | |
| | | | | | | | 2,720,510 | |
| | | | | Financials—.4% | | | | |
| | | 1,990M | | TransUnion, LLC, 4.0434%, 6/19/2025 | | | 1,999,874 | |
| | | | | Food/Beverage/Tobacco—.3% | | | | |
| | | 1,539M | | Chobani, LLC, 5.5435%, 10/9/2023 | | | 1,526,941 | |
| | | | | Gaming/Leisure—.6% | | | | |
| | | 650M | | Diamond Sports Group, LLC, 5.3%, 8/24/2026 | | | 654,063 | |
| | | 2,600M | | Dorna Sports SL, 5.1997%, 4/12/2024 | | | 2,588,625 | |
| | | | | | | | 3,242,688 | |
| | | | | Health Care—.4% | | | | |
| | | 2,302M | | Inovalon Holdings, Inc., 5.5625%, 4/2/2025 | | | 2,318,046 | |
| | | | | Media-Cable TV—.2% | | | | |
| | | 975M | | Nexstar Broadcasting, Inc., 4.807%, 6/19/2026 | | | 980,489 | |
34
| |
Principal
Amount
| | Security | | Value | |
| | | | | Media-Diversified—.7% | | | | |
| | $ | 821M | | DiscoverOrg., LLC, 6.612%, 2/2/2026 | | $ | 819,340 | |
| | | 2,750M | | iHeart Communications, 4%, 5/1/2026 | | | 2,770,625 | |
| | | | | | | | 3,589,965 | |
| | | | | Metals/Mining—.5% | | | | |
| | | 3,000M | | Zekelman Industries, Inc., 4.3036%, 6/14/2021 | | | 3,000,015 | |
| | | | | Telecommunication Services—.3% | | | | |
| | | 1,820M | | GCI Holdings, Inc., 4.612%, 2/2/2022 | | | 1,793,000 | |
| | | | | Utilities—.3% | | | | |
| | | 1,479M | | Edgewater Generation, 5.7935%, 12/12/2025 | | | 1,462,812 | |
| | | | | Wireless Communication—.9% | | | | |
| | | 5,000M | | Intelsat Jackson Holdings SA, 6.5536%, 1/2/2024 | | | 5,076,575 | |
Total Value of Loan Participations (cost $27,898,571) | | | 27,710,915 | |
Total Value of Investments (cost $525,927,396) | | | 98.0 | % | | | 532,039,456 | |
Other Assets, Less Liabilities | | | 2.0 | | | | 10,711,553 | |
Net Assets | | | 100.0 | % | | $ | 542,751,009 | |
(a) | Security exempt from registration under Rule 144A of the Securities Act of 1933 (see Note 4). |
(b) | A portion or all of the security purchased on a when-issued or delayed delivery basis (see Note 1G). |
† | Interest rates are determined and reset periodically. The interest rates above are the rates in effect at September 30, 2019. |
Summary of Abbreviations:
LLLP | Limited Liability Limited Partnership |
ULC | Unlimited Liability Corporation |
The Fund’s assets and liabilities are classified into the following three levels based on the inputs used to value the assets and liabilities:
| | Level 1 – | Unadjusted quoted prices in active markets for identical securities that the Fund has the ability to access. |
| | Level 2 – | Observable inputs other than quoted prices included in Level 1 that are observable for the asset or liability, either directly or indirectly. These inputs may include quoted prices for the identical instrument on an inactive market, prices for similar instruments, interest rates, prepayment speeds, credit risk, yield curves, default rates and similar data. |
35
Portfolio of Investments (continued)
FUND FOR INCOME
September 30, 2019
| | Level 3 – | Unobservable inputs for the asset or liability, to the extent relevant observable inputs are not available, representing the Fund’s own assumption about the assumptions a market participant would use in valuing the asset or liability, and would be based on the best information available. |
The inputs methodology used for valuing securities are not necessarily an indication of the risk associated with investing in those securities. For example, U.S. Government securities are reflected as Level 2 because the inputs used to determine fair value may not always be quoted prices in an active market.
The following is a summary, by category of Level, of inputs used to value the Fund’s investments as of September 30, 2019:
| | | Level 1 | | | Level 2 | | | Level 3 | | | Total | |
Corporate Bonds | | $ | — | | | $ | 504,328,541 | | | $ | — | | | $ | 504,328,541 | |
Loan Participations | | | — | | | | 27,710,915 | | | | — | | | | 27,710,915 | |
Total Investments in Securities* | | $ | — | | | $ | 532,039,456 | | | $ | — | | | $ | 532,039,456 | |
* | The Portfolio of Investments provides information on the industry categorization of corporate bonds and loan participations. |
There were no transfers into or from Level 1 and Level 2 by the Fund for the year ended September 30, 2019. Transfers, if any, between Levels are recognized at the end of the reporting period.
36
Portfolio Composition (Unaudited)
FUND FOR INCOME
The dollar weighted average of credit ratings of all bonds held by the Fund during the fiscal year ended September 30, 2019, computed on a monthly basis, are set forth below. This information reflects the average composition of the Fund’s assets during the 2019 fiscal year and is not necessarily representative of the Fund as of the end of its 2019 fiscal year, the current fiscal year or at any other time in the future.
| Rated by
Moody’s | Comparable Quality of
Unrated Securities to Bonds
Rated by Moody’s |
Baa1 | 0.04% | 0.00% |
Baa2 | 0.06 | 0.00 |
Baa3 | 0.60 | 0.00 |
Ba1 | 4.00 | 0.00 |
Ba2 | 9.30 | 0.00 |
Ba3 | 17.33 | 0.00 |
BB+ | 0.00 | 0.43 |
BB | 0.00 | 0.29 |
BB- | 0.00 | 0.01 |
B1 | 17.61 | 0.00 |
B2 | 17.72 | 0.00 |
B3 | 22.93 | 0.00 |
Caa1 | 5.90 | 0.00 |
Caa2 | 4.41 | 0.00 |
See notes to financial statements
37
Portfolio Manager’s Letter
GOVERNMENT CASH MANAGEMENT FUND
Dear Investor:
This is the annual report for the First Investors Government Cash Management Fund for the fiscal year ended September 30, 2019. During the period, the Fund’s return on a net asset value basis was 1.73% for Class A shares and 1.76% for Institutional shares, including dividends of 1.7 cents per share for Class A shares and Institutional Class shares. The Fund maintained a $1.00 net asset value per share for each class of shares throughout the year.
U.S. bond market
The review period began with a continuation of financial market volatility. Rising interest rates, a prolonged trade war between U.S. and China, the midterm elections, and a strong U.S. dollar overshadowed strong economic fundamentals, causing a broad market selloff. The corporate bond market continued to underperform as credit spreads moved wider.
The U.S. Federal Reserve (Fed) raised rates by 25 basis points in its December meeting, however, Fed policy moved from a tightening to a more accommodative policy. In fact, the Fed cut rates by 25 basis points twice following the rate hike in December. U.S. Treasuries rallied strongly across the yield curve in a risk-off environment. There is an inverse relationship between bond prices and yields. The 2-year U.S. Treasury note yield, which is very sensitive to changes in Fed policy, fell by 120 basis points to 1.62%. The 10-year U.S. Treasury note yield, which is controlled by other factors such as GDP, inflation and investor sentiment, fell by 140 basis points to 1.67%. The yield curve continued to flatten, with the spread between 2- and 10-year U.S. Treasury yields narrowing to just four basis points by the end of the period.
Credit spreads marched tighter as investors continued to support the corporate credit market in the search for yield. The positive performance of the corporate bond market during the review period was the result of longer duration and tighter credit spreads. Of note, corporate bonds with maturities greater than 10 years significantly outperformed shorter-maturity debt (i.e., one to three years) as U.S. Treasury yields moved lower across the curve. During the review period, Telecommunication and Utility sectors outperformed.
Amid volatility in commodity-driven sectors, the high yield bond market returned 6.30% during the review period. Municipal bonds benefited from favorable supply-demand dynamics and returned 7.93%.
The Fund
The Fund maintained a longer-than-average weighted average maturity during most of the review period as the direction of interest rates was not clear but biased lower. That said, the Fund maintained a weighted average maturity of fewer than 60 days during the review period in order to comply with current SEC rules designed to limit interest rate risk. Floating rate securities were successfully employed during the period for incremental yield.
38
Foresters Investment Management Company, Inc., the Fund’s Investment Adviser during the period, continued to waive certain expenses during the period.
Thank you for placing your trust in Foresters Financial. As always, we appreciate the opportunity to serve your investment needs.
Sincerely,

Michael J. O’Keefe
Portfolio Manager,
Foresters Investment Management Company, Inc.
October 4, 2019
39
Fund Expenses (unaudited)
GOVERNMENT CASH MANAGEMENT FUND
The examples below show the ongoing costs (in dollars) of investing in your Fund and will help you in comparing these costs with costs of other mutual funds. Please refer to page 1 for a detailed explanation of the information presented in these examples.
Expense Example | Annualized
Expense
Ratio | Beginning
Account Value
(4/1/19) | Ending
Account Value
(9/30/19) | Expenses Paid
During Period
(4/1/19-9/30/19)* |
Class A Shares | 0.60% | | | |
Actual | | $1,000.00 | $1,008.56 | $ 3.02 |
Hypothetical** | | $1,000.00 | $1,022.06 | $ 3.04 |
Institutional Class Shares | 0.60% | | | |
Actual | | $1,000.00 | $1,008.82 | $ 3.02 |
Hypothetical** | | $1,000.00 | $1,022.06 | $ 3.04 |
* | Expenses are equal to the annualized expense ratio, multiplied by the average account value over the period, multiplied by 183/365 (to reflect the one-half year period). Expenses paid during the period are net of expenses waived and/or assumed. |
** | Assumed rate of return of 5% before expenses |
Portfolio Composition
BY SECTOR
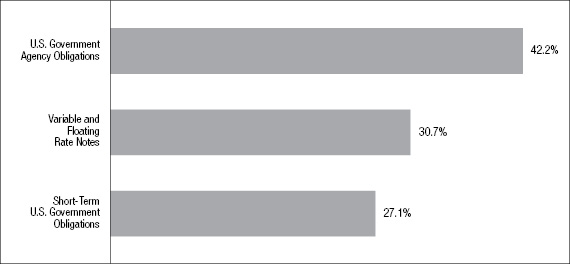
Portfolio holdings and allocations are subject to change. Percentages are as of September 30, 2019, and are based on the total market value of investments.
40
Portfolio of Investments
GOVERNMENT CASH MANAGEMENT FUND
September 30, 2019
| |
Principal
Amount
| | Security | | Interest
Rate* | | | Value | |
| | | | | U.S. GOVERNMENT AGENCY OBLIGATIONS—42.2% | | | | | | | | |
| | | | | Federal Home Loan Bank: | | | | | | | | |
| | $ | 2,000M | | 10/3/2019 | | | 1.99 | % | | $ | 1,999,778 | |
| | | 8,000M | | 10/10/2019 | | | 1.97 | | | | 7,996,051 | |
| | | 8,000M | | 10/15/2019 | | | 2.00 | | | | 7,993,761 | |
| | | 10,000M | | 10/18/2019 | | | 1.99 | | | | 9,990,581 | |
| | | 8,000M | | 10/30/2019 | | | 1.98 | | | | 7,987,207 | |
| | | 6,000M | | 11/4/2019 | | | 1.96 | | | | 5,988,881 | |
| | | 9,000M | | 11/7/2019 | | | 1.93 | | | | 8,982,109 | |
| | | 6,000M | | 11/8/2019 | | | 1.96 | | | | 5,987,573 | |
| | | 5,000M | | 11/13/2019 | | | 2.35 | | | | 4,985,836 | |
| | | 5,000M | | 11/26/2019 | | | 1.93 | | | | 4,985,021 | |
| | | 4,500M | | 12/10/2019 | | | 1.91 | | | | 4,483,281 | |
Total Value of U.S. Government Agency Obligations (cost $71,380,079) | | | 71,380,079 | |
| | | | | VARIABLE AND FLOATING RATE NOTES—30.8% | | | | | | | | |
| | | | | Federal Farm Credit Bank: | | | | | | | | |
| | | 4,700M | | 11/14/2019 | | | 2.20 | | | | 4,701,133 | |
| | | 2,000M | | 11/19/2019 | | | 2.00 | | | | 1,999,894 | |
| | | 1,005M | | 2/10/2020 | | | 2.10 | | | | 1,005,246 | |
| | | 5,060M | | 2/21/2020 | | | 2.10 | | | | 5,061,532 | |
| | | 1,000M | | 6/1/2020 | | | 2.02 | | | | 999,398 | |
| | | 7,000M | | 6/25/2020 | | | 2.02 | | | | 6,999,712 | |
| | | 3,000M | | 7/30/2020 | | | 2.05 | | | | 2,999,876 | |
| | | | | Federal Home Loan Bank: | | | | | | | | |
| | | 12,150M | | 10/11/2019 | | | 2.08 | | | | 12,149,793 | |
| | | 7,000M | | 11/29/2019 | | | 2.07 | | | | 6,999,773 | |
| | | 2,100M | | 12/6/2019 | | | 2.01 | | | | 2,099,865 | |
| | | 7,000M | | 12/19/2019 | | | 2.02 | | | | 7,001,529 | |
Total Value of Variable and Floating Rate Notes (cost $52,017,751) | | | 52,017,751 | |
41
Portfolio of Investments (continued)
GOVERNMENT CASH MANAGEMENT FUND
September 30, 2019
| |
Principal
Amount
| | Security | | Interest
Rate* | | | Value | |
| | | | | SHORT-TERM U.S. GOVERNMENT OBLIGATIONS—27.2% | | | | | | | | |
| | | | | U.S. Treasury Bills: | | | | | | | | |
| | $ | 5,000M | | 10/17/2019 | | | 2.30 | % | | $ | 4,994,856 | |
| | | 4,000M | | 10/22/2019 | | | 2.00 | | | | 3,995,331 | |
| | | 12,000M | | 10/22/2019 | | | 2.01 | | | | 11,985,939 | |
| | | 2,000M | | 10/29/2019 | | | 1.99 | | | | 1,996,905 | |
| | | 5,000M | | 10/31/2019 | | | 2.35 | | | | 4,990,106 | |
| | | 8,000M | | 11/14/2019 | | | 2.24 | | | | 7,977,905 | |
| | | 10,000M | | 12/19/2019 | | | 1.90 | | | | 9,958,175 | |
Total Value of Short-Term U.S. Government Obligations(cost $45,899,217) | | | 45,899,217 | |
Total Value of Investments (cost $169,297,047)** | | | 100.2 | % | | | 169,297,047 | |
Excess of Liabilities Over Other Assets | | | (.2 | ) | | | (391,296 | ) |
Net Assets | | | 100.0 | % | | $ | 168,905,751 | |
* | The interest rates shown are the effective rates at the time of purchase by the Fund. The interest rates shown on floating rate notes are adjusted periodically; the rates shown are the rates in effect at September 30, 2019. |
** | Aggregate cost for federal income tax purposes is the same. |
The Fund’s assets and liabilities are classified into the following three levels based on the inputs used to value the assets and liabilities:
| | Level 1 – | Unadjusted quoted prices in active markets for identical securities that the Fund has the ability to access. |
| | Level 2 – | Observable inputs other than quoted prices included in Level 1 that are observable for the asset or liability, either directly or indirectly. These inputs may include quoted prices for the identical instrument on an inactive market, prices for similar instruments, interest rates, prepayment speeds, credit risk, yield curves, default rates and similar data. |
| | Level 3 – | Unobservable inputs for the asset or liability, to the extent relevant observable inputs are not available, representing the Fund’s own assumption about the assumptions a market participant would use in valuing the asset or liability, and would be based on the best information available. |
The inputs methodology used for valuing securities are not necessarily an indication of the risk associated with investing in those securities. For example, U.S. Government securities are reflected as Level 2 because the inputs used to determine fair value may not always be quoted prices in an active market.
42
The following is a summary, by category of Level, of inputs used to value the Fund’s investments as of September 30, 2019:
| | | Level 1 | | | Level 2 | | | Level 3 | | | Total | |
U.S. Government Agency Obligations | | $ | — | | | $ | 71,380,079 | | | $ | — | | | $ | 71,380,079 | |
Variable and Floating Rate Notes: | | | | | | | | | | | | | | | | |
U.S. Government Agency Obigations | | | — | | | | 52,017,751 | | | | — | | | | 52,017,751 | |
Short-Term U.S. Government Obigations | | | — | | | | 45,899,217 | | | | — | | | | 45,899,217 | |
Total Investments in Securities | | $ | — | | | $ | 169,297,047 | | | $ | — | | | $ | 169,297,047 | |
There were no transfers into or from Level 1 and Level 2 by the Fund for the year ended September 30, 2019. Transfers, if any, between Levels are recognized at the end of the reporting period.
See notes to financial statements
43
Portfolio Managers’ Letter
INTERNATIONAL OPPORTUNITIES BOND FUND
Dear Investor:
This is the annual report for the First Investors International Opportunities Bond Fund for the fiscal year ended September 30, 2019. During the period, the Fund’s return on a net asset value basis was -0.56% for Class A shares, -0.30% for Advisor Class shares and -0.25% for Institutional Class shares, including dividends of 15.7 cents per share on Class A shares, 15.9 cents per share for Advisor Class shares and 12.4 cents per share for Institutional Class shares.
The Market
A cascade of negative developments pounded investors during the third quarter. These included an escalation in the U.S.-China trade war, threats of a financial war, a U.S. congressional push for presidential impeachment, uncertainty heading into the 2020 U.S. elections, the Hong Kong riots, British political upheavals ahead of Brexit, the attack on Saudi oil production, Federal Reserve (Fed) Chair Powell’s milquetoast position on future rate cuts, and disruptions in the U.S. repo market. In the background, the persistent slowdown in the global economy was confirmed during the quarter by the announcement of negative guidance from the Fed. The share price of this global bellwether ended the quarter down almost 50% from its early 2018 peak, the starting point of the current global slump.
The bomblets of pessimism seemed to break the back of already dour global economic sentiment. Developed country sovereign bond yields collapsed during the quarter, leaving nearly $15 trillion of negative-yielding debt and an average yield on non-U.S. developed country sovereign debt only slightly above zero, at roughly 11 basis points (bps). Equity risk premiums rose steadily, and volatility spiked in July and August. Throughout the quarter, the U.S. dollar also rose, helping exacerbate dollar funding pressure and contributing to the increasingly deflationary global economic environment.
The Fund
The First Investors International Opportunities Bond Fund underperformed the 6.78% return for the FTSE World Government Bond Index (ex-U.S.). The Fund’s weak absolute performance during the third quarter was due almost entirely to currency contribution, however, bond positioning detracted significantly from relative performance. Duration provided positive absolute returns that came from holdings of EM bonds, with Mexican bonds powering the gains. Yields fell across the curve as the 10-year U.S. Treasury posted its largest quarterly decline in several years, and the 30-year bond yield hit a record low in August. This drop in global rates sent investors on a search for yield during the quarter, and EM debt generally rallied modestly. Mexico made rare back-to-back interest-rate cuts to offset declining inflation, and bonos rallied in response, delivering sizable gains to performance. Relative duration performance suffered, however, owing to an absence of holdings in Japanese government bonds and other low- or negative-yielding European debt, particularly Italian BTPs, U.K. gilts, and French OATs. Core and peripheral European sovereigns rallied against deteriorating economic growth and fresh stimulus from the European Central Bank (ECB), with the yield on Germany’s 30-year sovereign turning negative for the first time. Despite their weightings in the benchmark and the possibility
44
of negative yields becoming more negative in the near term, we can find no logical case to justify thinking these developed market securities offer even a smidgen of value.
As for the substantial negative drag from currency contribution, your portfolio owns very few U.S. dollars, yet the dollar rose steadily throughout the quarter against almost all currencies. The sustainability of this trend is the key issue for positioning going forward. An underweight to the euro was a positive exception, but exposure to a basket of international currencies was detrimental amid the strong U.S. dollar environment. The Norwegian krone fell despite another rate increase by Norges Bank and a surge in oil prices following the attack on Saudi Arabia’s refining facilities while the export-sensitive Swedish krona sank against weak economic data, including softer demand from Europe and a contraction in manufacturing. The surrounding weakness in Europe also pulled the Polish zloty to multi-year lows. Commodity-sensitive currencies in Latin America, including the Mexican peso, Chilean peso, Colombian peso, and Brazilian real, also dragged on returns. Under pressure from the trade war, the Australian dollar tested 10-year lows.
Fund positioning
Very little changed in portfolio positioning during the third quarter. In terms of duration, the Fund continues to shun G-7 duration in favor of the emerging world, with particular emphasis on Mexican sovereign bonds. We have been believers that EM bonds offered tremendous value and were vindicated during the third quarter. Despite dollar strength and EM currency weakness, local-currency bonds across the emerging world continued to rally in step with developed country markets. The breadth of the rally attests to the deflationary forces at play in the global economy.
We think that the extraordinary gains in the dollar during the third quarter are not sustainable. Pressure is building, which we believe will materialize in a gradual decline in the dollar over the course of the next six to 12 months.
1. | Our price discovery process continues to flag the U.S. dollar as an expensive currency. Correspondingly, real net exports have been weakening ever since the dollar surged in 2014. More recently, the collapse in the ISM Manufacturing Report on Business Exports to its lowest level since the GFC is a warning that the drag from trade on the rest of the economy has become more severe. |
2. | In terms of the three critical variables that have reached make-or-break phases, improvement in these factors would be dollar bearish: |
| | a) | A rapprochement in the trade impasse would be constructive for world trade and global growth and would ease deflationary worries. These factors would be negative for the dollar. |
| | b) | An expansionist Fed would be dollar negative. The Fed’s focus on ending the dollar stringency caused by the balance sheet reduction could be particularly significant, depending on the details of the renewed expansion. |
45
Portfolio Managers’ Letter (continued)
INTERNATIONAL OPPORTUNITIES BOND FUND
| | c) | Economic stabilization in China would contribute significantly to global stability and growth, always a draw to capital, and would be negative for the dollar. |
3. | There is a small but growing possibility of some form of intervention in containing the dollar’s strength. President Trump has been critical of the Fed for helping support the dollar at a time when balance-of-payments factors argue that the euro is structurally very cheap. The weakness in the renminbi that largely corresponded in proportion to the increase in U.S. tariffs on China was not lost on the President either, as he declared China a currency manipulator. We are not sure what tactics the administration might consider to cap the rise in the greenback, but some form of intervention is on the radar. |
Thank you for placing your trust in Foresters Financial. As always, we appreciate the opportunity to serve your investment needs.

| 
|
Stephen S. Smith | David F. Hoffman, CFA |
Brandywine Global Investment
Management, LLC | Brandywine Global Investment
Management, LLC |
Managing Director & Portfolio Manager | Managing Director& Portfolio Manager |

| 
|
Jack P. McIntyre, CFA | Anujeet Sareen, CFA |
Brandywine Global Investment
Management, LLC | Brandywine Global Investment
Management, LLC |
Portfolio Manager | Portfolio Manager |
October 4, 2019
46
Fund Expenses (unaudited)
INTERNATIONAL OPPORTUNITIES BOND FUND
The examples below show the ongoing costs (in dollars) of investing in your Fund and will help you in comparing these costs with costs of other mutual funds. Please refer to page 1 for a detailed explanation of the information presented in these examples.
Expense Example | Annualized
Expense
Ratio | Beginning
Account Value
(4/1/19) | Ending
Account Value
(9/30/19) | Expenses Paid
During Period
(4/1/19-9/30/19)* |
Class A Shares | 1.28% | | | |
Actual | | $1,000.00 | $ 996.51 | $ 6.41 |
Hypothetical** | | $1,000.00 | $ 1,018.65 | $ 6.48 |
Advisor Class Shares | 0.98% | | | |
Actual | | $1,000.00 | $ 997.71 | $ 4.91 |
Hypothetical** | | $1,000.00 | $ 1,020.16 | $ 4.96 |
Institutional Class Shares | 0.86% | | | |
Actual | | $1,000.00 | $ 997.73 | $ 4.31 |
Hypothetical** | | $1,000.00 | $ 1,020.76 | $ 4.36 |
* | Expenses are equal to the annualized expense ratio, multiplied by the average account value over the period, multiplied by 183/365 (to reflect the one-half year period). Expenses paid during the period are net of expenses waived and/or assumed. |
** | Assumed rate of return of 5% before expenses |
Portfolio Composition
BY SECTOR
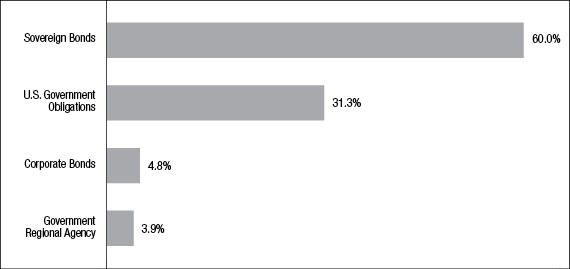
Portfolio holdings and allocations are subject to change. Percentages are as of September 30, 2019, and are based on the total market value of investments.
47
Cumulative Performance Information (unaudited)
INTERNATIONAL OPPORTUNITIES BOND FUND
Comparison of change in value of $10,000 investment in the First Investors International Opportunities Bond Fund (Class A shares) and the FTSE World Government Bond Index (“WGBI”).
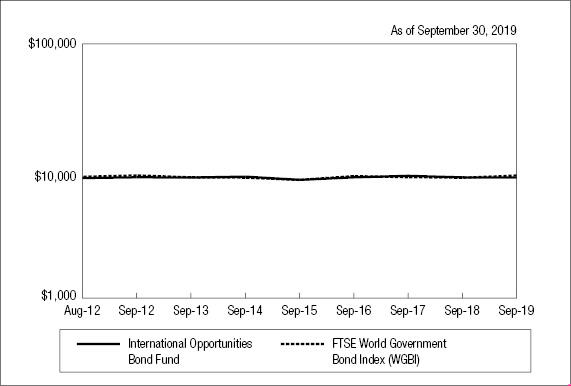
| | Average Annual Total Returns* |
N.A.V. Only | Class A | Advisor
Class | Institutional
Class | FTSE World
Government
Bond Index
(WGBI) |
One Year | -0.56% | -0.30% | -0.25% | 6.78% |
Five Years | -0.59% | -0.25% | -0.12% | 1.28% |
Since Inception** | 0.22% | -0.12% | 0.04% | 0.49%† |
| | | | | |
S.E.C. Standardized | Class A | Advisor
Class | Institutional
Class | |
One Year | -4.58% | -0.30% | -0.25% | |
Five Years | -1.39% | -0.25% | -0.12% | |
Since Inception** | -0.36% | -0.12% | 0.04% | |
S.E.C. 30-Day Yield*** | 1.80% | 2.06% | 2.27% | |
The graph compares a $10,000 investment in the First Investors International Opportunities Bond Fund (Class A shares) beginning 8/20/12 (commencement of operations) with a theoretical investment in the FTSE World Government Bond Index (WGBI). The Index encompasses an all-inclusive universe of institutionally traded bonds, including all fixed-rate bonds with remaining maturities of one year or longer with amounts outstanding of at least the equivalent of $25 million. It is not possible to invest directly in this Index. In addition, the Index does not reflect fees and expenses associated with the active management of a mutual fund portfolio. For purposes of the graph and the accompanying table it is assumed that all dividends and
48
distributions were reinvested. Advisor Class shares and Institutional Class shares performance will be greater than that shown in the line graph above for Class A shares based on differences in sales loads and fees paid by shareholders investing in the different classes.
* Average Annual Total Return figures (for the periods ended 9/30/19) include the reinvestment of all dividends and distributions. “N.A.V. Only” returns are calculated without sales charges. The Class A “S.E.C. Standardized” returns shown are based on the current maximum sales charge of 4% and assume the current sales charge of 4% was in effect at the beginning of the stated periods (prior to 6/12/17, the maximum sales charge was 5.75%). The Advisor Class and Institutional Class “S.E.C. Standardized” returns shown are the same as the N.A.V. Only returns since these classes are sold without sales charges. During the periods shown, some of the expenses of the Fund were waived or assumed. If such expenses had been paid by the Fund, the Class A “S.E.C. Standardized” Average Annual Total Return for One Year, Five Years and Since Inception would have been -4.63%, -1.43% and -0.47%, respectively and the S.E.C. 30-Day Yield for September 2019 would have been 1.65%. The Advisor Class “S.E.C. Standardized” Average Annual Total Return for One Year, Five Years and Since Inception would have been -0.33%, -0.26% and -0.78%, respectively and the S.E.C. 30-Day Yield for September 2019 would have been 1.90%. The Institutional Class “S.E.C. Standardized” Average Annual Total Return for One Year, Five Years and Since Inception would have been -0.30%, -0.13% and 0.03%, respectively, and the S.E.C. 30-Day Yield for September 2019 would have been 2.12%. Results represent past performance and do not indicate future results. The graph and the returns shown do not reflect the deduction of taxes that a shareholder would pay on distributions or the redemption of fund shares. Investment return and principal value of an investment will fluctuate so that an investor’s shares, when redeemed, may be worth more or less than the original cost. Index figures are from FTSE Russell and all other figures are from Foresters Investment Management Company, Inc.
** The Since Inception returns for Class A shares are for the period beginning 8/17/12 (commencement of operations). The returns for Advisor Class shares and Institutional Class shares are for the periods beginning 4/1/13 (commencement of operations for those classes).
*** The S.E.C. 30-Day Yield shown is for September 2019.
† The Index return is since the inception of Class A shares. The Index return since inception of the Advisor Class and Institutional Class shares is -.13%.
49
Portfolio of Investments
INTERNATIONAL OPPORTUNITIES BOND FUND
September 30, 2019
| |
Principal
Amount
| | | Security | | Value | |
| | | | | | SOVEREIGN BONDS—58.8% | | | | |
| | | | | | Mexico—14.0% | | | | |
| | | | | | United Mexican States: | | | | |
| | | 145M | | MXN | 7.75%, 11/23/2034 | | $ | 776,993 | |
| | | 959M | | MXN | 7.75%, 11/13/2042 | | | 5,088,473 | |
| | | 371M | | MXN | 8%, 11/7/2047 | | | 2,024,257 | |
| | | 609M | | MXN | 8.5%, 5/31/2029 | | | 3,437,853 | |
| | | 650M | | MXN | 8.5%, 11/18/2038 | | | 3,712,187 | |
| | | | | | | | | 15,039,763 | |
| | | | | | United Kingdom—7.9% | | | | |
| | | 6,795M | | GBP | United Kingdom Gilt, 2%, 7/22/2020 | | | 8,452,076 | |
| | | | | | Malaysia—6.8% | | | | |
| | | | | | Federation of Malaysia: | | | | |
| | | 10,095M | | MYR | 3.48%, 3/15/2023 | | | 2,435,629 | |
| | | 5,460M | | MYR | 3.882%, 3/10/2022 | | | 1,327,517 | |
| | | 5,255M | | MYR | 3.899%, 11/16/2027 | | | 1,291,070 | |
| | | 2,405M | | MYR | 3.955%, 9/15/2025 | | | 593,347 | |
| | | 6,540M | | MYR | 4.048%, 9/30/2021 | | | 1,590,434 | |
| | | | | | | | | 7,237,997 | |
| | | | | | Chile—5.9% | | | | |
| | | 4,400,000M | | CLP | Bonos Tesoreria Pesos, 4.5%, 3/1/2021 | | | 6,289,982 | |
| | | | | | Poland—5.2% | | | | |
| | | 7,265M | | PLN | Poland Government Bond, 2%, 4/25/2021 | | | 1,826,984 | |
| | | | | | Republic of Poland: | | | | |
| | | 8,550M | | PLN | 1.5%, 4/25/2020 | | | 2,136,338 | |
| | | 6,405M | | PLN | 5.25%, 10/25/2020 | | | 1,665,498 | |
| | | | | | | | | 5,628,820 | |
50
| |
Principal
Amount
| | | Security | | Value | |
| | | | | | Indonesia—4.6% | | | | |
| | | | | | Republic of Indonesia: | | | | |
| | | 13,100,000M | | IDR | 8.375%, 3/15/2034 | | $ | 978,140 | |
| | | 50,400,000M | | IDR | 9%, 3/15/2029 | | | 3,939,615 | |
| | | | | | | | | 4,917,755 | |
| | | | | | Brazil—4.5% | | | | |
| | | | | | Nota Do Tesouro Nacional: | | | | |
| | | 8M | | BRL | 10%, 1/1/2021 | | | 1,993,458 | |
| | | 10M | | BRL | 10%, 1/1/2027 | | | 2,820,102 | |
| | | | | | | | | 4,813,560 | |
| | | | | | Colombia—4.2% | | | | |
| | | 14,130,000M | | COP | Titulos De Tesoreria, 7.5%, 8/26/2026 | | | 4,520,170 | |
| | | | | | South Africa—4.0% | | | | |
| | | | | | Republic of South Africa: | | | | |
| | | 39,430M | | ZAR | 6.5%, 2/28/2041 | | | 1,831,952 | |
| | | 41,415M | | ZAR | 8.75%, 2/28/2048 | | | 2,419,043 | |
| | | | | | | | | 4,250,995 | |
| | | | | | Australia—1.7% | | | | |
| | | 2,655M | | AUD | Commonwealth of Australia, 2.75%, 10/21/2019 | | | 1,793,755 | |
Total Value of Sovereign Bonds (cost $75,007,774) | | | 62,944,873 | |
| | | | | | U.S. GOVERNMENT OBLIGATIONS—30.7% | | | | |
| | | | | | United States | | | | |
| | | | | | U.S. Treasury Notes: | | | | |
| | | 27,880M | | USD | 2.0532%, 4/30/2021 (a) | | | 27,840,940 | |
| | | 5,045M | | USD | 2.1342%, 7/31/2021 (a) | | | 5,041,504 | |
Total Value of U.S. Government Obligations (cost $32,921,712) | | | 32,882,444 | |
51
Portfolio of Investments (continued)
INTERNATIONAL OPPORTUNITIES BOND FUND
September 30, 2019
| |
Principal
Amount
| | | Security | | Value | |
| | | | | | CORPORATE BONDS—4.6% | | | | |
| | | | | | United States | | | | |
| | | 3,230M | | USD | Goldman Sachs Group, Inc., 2.8976%, 2/23/2023 (a) | | $ | 3,229,247 | |
| | | 1,505M | | USD | HP Enterprise Co., 6.35%, 10/15/2045 | | | 1,758,039 | |
Total Value of Corporate Bonds (cost $4,718,001) | | | 4,987,286 | |
| | | | | | GOVERNMENT REGIONAL AGENCY—3.8% | | | | |
| | | | | | Australia | | | | |
| | | 970M | | AUD | New South Wales Treasury Corp., 4%, 4/8/2021 | | | 685,653 | |
| | | 2,650M | | AUD | Queensland Treasury Corp., 5.5%, 6/21/2021 | | | 1,928,849 | |
| | | 2,150M | | AUD | Western Australia Treasury Corp., 7%, 10/15/2019 | | | 1,454,761 | |
Total Value of Government Regional Agency (cost $4,362,296) | | | 4,069,263 | |
Total Value of Investments (cost $117,009,783) | | | 97.9 | % | | | 104,883,866 | |
Other Assets, Less Liabilities | | | 2.1 | | | | 2,264,971 | |
Net Assets | | | 100.0 | % | | $ | 107,148,837 | |
(a) | Interest rates are determined and reset periodically. The interest rates above are the rates in effect at September 30, 2019. |
At September 30, 2019, the Fund has open foreign exchange contracts as described on next page.
52
The unrealized appreciation (depreciation) on the open contracts were as follows:
International Opportunities Bond Fund
Counterparty | | Settlement
Date | | | Foreign
Currency | | | Receive
(Deliver) | | | Asset | | | Liability | | | Unrealized
Appreciation
(Depreciation) | |
CITI | | | 10/11/19 | | | | PLN | | | | 2,610,000 | | | $ | 650,857 | | | $ | 689,018 | | | $ | (38,161 | ) |
HSBC | | | 10/18/19 | | | | SEK | | | | 44,500,000 | | | | 4,520,497 | | | | 4,771,862 | | | | (251,365 | ) |
HSBC | | | 10/18/19 | | | | SEK | | | | 12,200,000 | | | | 1,239,327 | | | | 1,283,002 | | | | (43,675 | ) |
MS | | | 10/24/19 | | | | AUD | | | | 4,710,000 | | | | 3,179,017 | | | | 3,329,716 | | | | (150,699 | ) |
HSBC | | | 10/28/19 | | | | NOK | | | | 8,600,000 | | | | 945,299 | | | | 956,416 | | | | (11,117 | ) |
CITI | | | 10/30/19 | | | | PLN | | | | 5,320,000 | | | | 1,326,650 | | | | 1,396,857 | | | | (70,207 | ) |
HSBC | | | 11/15/19 | | | | ZAR | | | | (36,590,000 | ) | | | 2,343,215 | | | | 2,415,979 | | | | (72,764 | ) |
CITI | | | 11/19/19 | | | | MXN | | | | (56,800,000 | ) | | | 2,846,205 | | | | 2,878,281 | | | | (32,076 | ) |
MS | | | 11/22/19 | | | | AUD | | | | 4,840,000 | | | | 3,266,760 | | | | 3,292,555 | | | | (25,795 | ) |
GS | | | 12/6/19 | | | | NOK | | | | 44,600,000 | | | | 4,902,365 | | | | 4,992,500 | | | | (90,135 | ) |
HSBC | | | 12/9/19 | | | | GBP | | | | 4,850,000 | | | | 5,963,286 | | | | 5,996,152 | | | | (32,866 | ) |
HSBC | | | 12/11/19 | | | | ZAR | | | | (27,400,000 | ) | | | 1,835,637 | | | | 1,809,178 | | | | 26,459 | |
HSBC | | | 1/17/20 | | | | NOK | | | | 10,400,000 | | | | 1,143,152 | | | | 1,161,881 | | | | (18,729 | ) |
CITI | | | 1/24/20 | | | | GBP | | | | 6,390,000 | | | | 7,856,783 | | | | 8,027,693 | | | | (170,910 | ) |
Net unrealized depreciation on open foreign exchange contracts | | $ | (982,040 | ) |
A summary of abbreviations for counterparties to foeign exchange contracts are as follows:
CITI | Citigroup Global Markets |
Summary of Abbreviations:
53
Portfolio of Investments (continued)
INTERNATIONAL OPPORTUNITIES BOND FUND
September 30, 2019
The Fund’s assets and liabilities are classified into the following three levels based on the inputs used to value the assets and liabilities:
| | Level 1 – | Unadjusted quoted prices in active markets for identical securities that the Fund has the ability to access. |
| | Level 2 – | Observable inputs other than quoted prices included in Level 1 that are observable for the asset or liability, either directly or indirectly. These inputs may include quoted prices for the identical instrument on an inactive market, prices for similar instruments, interest rates, prepayment speeds, credit risk, yield curves, default rates and similar data. |
| | Level 3 – | Unobservable inputs for the asset or liability, to the extent relevant observable inputs are not available, representing the Fund’s own assumption about the assumptions a market participant would use in valuing the asset or liability, and would be based on the best information available. |
The inputs methodology used for valuing securities are not necessarily an indication of the risk associated with investing in those securities. For example, U.S. Government securities are reflected as Level 2 because the inputs used to determine fair value may not always be quoted prices in an active market.
The following is a summary, by category of Level, of inputs used to value the Fund’s investments as of September 30, 2019:
| | | Level 1 | | | Level 2 | | | Level 3 | | | Total | |
Sovereign Bonds | | | | | | | | | | | | | | | | |
Mexico | | $ | — | | | $ | 15,039,763 | | | $ | — | | | $ | 15,039,763 | |
United Kingdom | | | — | | | | 8,452,076 | | | | — | | | | 8,452,076 | |
Malaysia | | | — | | | | 7,237,997 | | | | — | | | | 7,237,997 | |
Chile | | | — | | | | 6,289,982 | | | | — | | | | 6,289,982 | |
Poland | | | — | | | | 5,628,820 | | | | — | | | | 5,628,820 | |
Indonesia | | | — | | | | 4,917,755 | | | | — | | | | 4,917,755 | |
Brazil | | | — | | | | 4,813,560 | | | | — | | | | 4,813,560 | |
Colombia | | | — | | | | 4,520,170 | | | | — | | | | 4,520,170 | |
South Africa | | | — | | | | 4,250,995 | | | | — | | | | 4,250,995 | |
Australia | | | — | | | | 1,793,755 | | | | — | | | | 1,793,755 | |
U.S. Government Obligations | | | | | | | | | | | | | | | | |
United States | | | — | | | | 32,882,444 | | | | — | | | | 32,882,444 | |
Corporate Bonds | | | | | | | | | | | | | | | | |
United States | | | — | | | | 4,987,286 | | | | — | | | | 4,987,286 | |
Government Regional Agency | | | | | | | | | | | | | | | | |
Australia | | | — | | | | 4,069,263 | | | | — | | | | 4,069,263 | |
Total Investments in Securities | | $ | — | | | $ | 104,883,866 | | | $ | — | | | $ | 104,883,866 | |
Other Financial Instruments* | | $ | — | | | $ | (982,040 | ) | | $ | — | | | $ | (982,040 | ) |
* | Other financial instruments are foreign exchange contracts and are considered derivative instruments, which are valued at the net unrealized appreciation (depreciation) on the instrument. |
54
During the year ended September 30, 2019, there were no transfers between Level 1 investments and Level 2 investments that had a material inpact to the Fund. Transfers, if any, between Levels are recognized at the end of the reporting period.
See notes to financial statements
55
Portfolio Manager’s Letter
INVESTMENT GRADE FUND
Dear Investor:
This is the annual report for the First Investors Investment Grade Fund for the fiscal year ended September 30, 2019. During the period, the Fund’s return on a net asset value basis was 12.00% for Class A shares, 12.37% for Advisor shares and 12.43% for Institutional shares, including dividends of 31.9 cents per share on Class A shares, 35.7 cents per share on Advisor shares and 35.8 cents per share on Institutional shares.
Bond market
The review period began with a continuation of financial market volatility. Rising interest rates, a prolonged trade war between U.S. and China, the midterm elections, and a strong U.S. dollar overshadowed strong economic fundamentals, causing a broad market selloff. The corporate bond market continued to underperform as credit spreads moved wider.
The U.S. Federal Reserve (Fed) raised rates by 25 basis points in its December meeting, however, Fed policy moved from a tightening to a more accommodative policy. In fact, the Fed cut rates by 25 basis points twice following the rate hike in December. U.S. Treasurys rallied strongly across the yield curve in a risk-off environment. There is an inverse relationship between bond prices and yields. The 2-year U.S. Treasury note yield, which is very sensitive to changes in Fed policy, fell by 120 basis points to 1.62%. The 10-year U.S. Treasury note yield, which is controlled by other factors such as GDP, inflation and investor sentiment, fell by 140 basis points to 1.67%. The yield curve continued to flatten, with the spread between 2- and 10-year U.S. Treasury yields narrowing to just four basis points by the end of the period.
Credit spreads marched tighter as investors continued to support the corporate credit market in the search for yield. The positive performance of the corporate bond market during the review period was the result of longer duration and tighter credit spreads. Of note, corporate bonds with maturities greater than 10 years significantly outperformed shorter-maturity debt (i.e., one to three years) as U.S. Treasury yields moved lower across the curve. During the review period, Telecommunication and Utility sectors outperformed.
Amid volatility in commodity-driven sectors, the high yield bond market returned 6.30% during the review period. Municipal bonds benefited from favorable supply-demand dynamics and returned 7.93%.
The Fund
The Fund invests in investment grade fixed income securities, with the majority of the Fund’s assets being invested in investment grade corporate bonds. The Fund also had as much as 5.0% of its assets invested in high yield securities and 3.0% invested in U.S. Treasurys.
The Fund underperformed the ICE BofAML Corporate Index during the review period. The relative underperformance was predominantly a function of the Fund’s underweight in corporate bonds with maturities greater than 10 years, which had the largest returns during the review period. The Fund benefitted from its overweight in the BBB rated bonds, which had the highest returns among different rating categories. Exposure to high yield detracted from fund
56
performance as the high yield market underperformed investment grade corporate bonds during the review period.
Thank you for placing your trust in Foresters Financial. As always, we appreciate the opportunity to serve your investment needs.
Sincerely,

Rajeev Sharma
Portfolio Manager and
Director of Fixed Income,
Foresters Investment Management Company, Inc.
October 4, 2019
57
Fund Expenses (unaudited)
INVESTMENT GRADE FUND
The examples below show the ongoing costs (in dollars) of investing in your Fund and will help you in comparing these costs with costs of other mutual funds. Please refer to page 1 for a detailed explanation of the information presented in these examples.
Expense Example | Annualized
Expense
Ratio | Beginning
Account Value
(4/1/19) | Ending
Account Value
(9/30/19) | Expenses Paid
During Period
(4/1/19-9/30/19)* |
Class A Shares | 1.06% | | | |
Actual | | $1,000.00 | $1,069.97 | $ 5.50 |
Hypothetical** | | $1,000.00 | $1,019.76 | $ 5.37 |
Advisor Class Shares | 0.77% | | | |
Actual | | $1,000.00 | $1,072.93 | $ 4.00 |
Hypothetical** | | $1,000.00 | $1,021.21 | $ 3.90 |
Institutional Class Shares | 0.68% | | | |
Actual | | $1,000.00 | $1,072.98 | $ 3.53 |
Hypothetical** | | $1,000.00 | $1,021.66 | $ 3.45 |
* | Expenses are equal to the annualized expense ratio, multiplied by the average account value over the period, multiplied by 183/365 (to reflect the one-half year period). Expenses paid during the period are net of expenses waived. |
** | Assumed rate of return of 5% before expenses |
Portfolio Composition
TOP TEN SECTORS
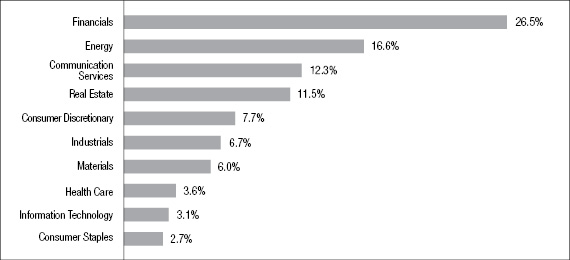
Portfolio holdings and allocations are subject to change. Percentages are as of September 30, 2019, and are based on the total market value of investments.
58
Cumulative Performance Information (unaudited)
INVESTMENT GRADE FUND
Comparison of change in value of $10,000 investment in the First Investors Investment Grade Fund (Class A shares) and the ICE BofAML U.S. Corporate Master Index.
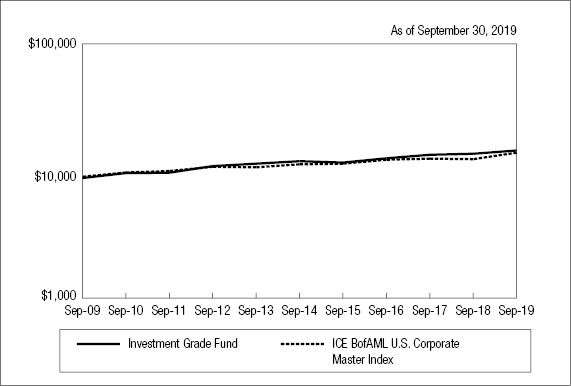
| | Average Annual Total Returns* |
N.A.V. Only | Class A | Advisor
Class | Institutional
Class | ICE BofAML
U.S.
Corporate
Master Index |
One Year | 12.00% | 12.37% | 12.43% | 12.87% |
Five Years | 3.69% | 4.04% | 4.11% | 4.65% |
Ten Years or Since Inception** | 4.89% | 3.55% | 3.69% | 5.60%† |
| | | | | |
S.E.C. Standardized | Class A | Advisor
Class | Institutional
Class | |
One Year | 7.55% | 12.37% | 12.43% | |
Five Years | 2.85% | 4.04% | 4.11% | |
Ten Years or Since Inception** | 4.46% | 3.55% | 3.69% | |
S.E.C. 30-Day Yield*** | 1.95% | 1.67% | 2.38% | |
The graph compares a $10,000 investment in the First Investors Investment Grade Fund (Class A shares) beginning 9/30/09 with a theoretical investment in the ICE BofAML U.S. Corporate Master Index (the “Index”). The Index includes publicly-issued, fixed rate, non-convertible investment grade dollar-denominated, S.E.C.-registered corporate debt having at least one year to maturity and an outstanding par value of at least $250 million. Bonds must be rated investment grade based on a composite of Moody’s and S&P. It is not possible to invest directly in this Index. In addition, the Index does not reflect fees and expenses associated with the active management of a mutual fund portfolio. For purposes of the graph and the accompanying table, unless otherwise indicated, it has been assumed that the maximum sales charge was
59
Cumulative Performance Information (unaudited) (continued)
INVESTMENT GRADE FUND
deducted from the initial $10,000 investment in the Fund and all dividends and distributions were reinvested. Advisor Class shares and Institutional Class shares performance may be greater than or less than that shown in the line graph above for Class A shares based on differences in sales loads and fees paid by shareholders investing in the different classes.
* Average Annual Total Return figures (for the periods ended 9/30/19) include the reinvestment of all dividends and distributions. “N.A.V. Only” returns are calculated without sales charges. The Class A “S.E.C. Standardized” returns shown are based on the current maximum sales charge of 4% and assume the current sales charge of 4% was in effect at the beginning of the stated periods (prior to 6/12/17, the maximum sales charge was 5.75%). The Advisor Class and Institutional Class “S.E.C. Standardized” returns shown are the same as the N.A.V. Only returns since these classes are sold without sales charges. During the periods shown, some of the expenses of the Fund were waived or assumed. If such expenses had been paid by the Fund, the Class A “S.E.C. Standardized” Average Annual Total Return for One Year, Five Years and Ten Years would have been 7.45%, 2.75% and 4.37%, respectively, and the S.E.C. 30-Day Yield for September 2019 would have been 1.88%. The Advisor Class “S.E.C. Standardized” Average Annual Total Return for One Year, Five Years and Since Inception would have been 12.27%, 3.94% and 2.72%, respectively, and the S.E.C. 30-Day Yield for September 2019 would have been 1.60%. The Institutional Class “S.E.C. Standardized” Average Annual Total Return for One Year, Five Years and Since Inception would have been 12.34%, 4.01% and 3.58%, respectively, and the S.E.C. 30-Day Yield for September 2019 would have been 2.30%. Results represent past performance and do not indicate future results. The graph and the returns shown do not reflect the deduction of taxes that a shareholder would pay on distributions or the redemption of fund shares. Investment return and principal value of an investment will fluctuate so that an investor’s shares, when redeemed, may be worth more or less than the original cost. Index figures are from ICE Data Services and all other figures are from Foresters Investment Management Company, Inc.
** The Since Inception returns for Advisor Class shares and Institutional Class share are for the periods beginning 4/1/13 (commencement of operations for those classes).
*** The S.E.C. 30-day yield shown is for September 2019.
† The Index return is for ten years. The Index return since inception of the Advisor Class shares and Institutional Class shares is 4.25%.
60
Portfolio of Investments
INVESTMENT GRADE FUND
September 30, 2019
| |
Principal
Amount
| | Security | | Value | |
| | | | | CORPORATE BONDS—94.1% | | | | |
| | | | | Automotive—4.3% | | | | |
| | $ | 6,200M | | Ford Motor Credit Co., LLC, 8.125%, 1/15/2020 | | $ | 6,302,976 | |
| | | 4,000M | | General Motors Financial Co., Inc., 5.25%, 3/1/2026 | | | 4,342,256 | |
| | | 3,600M | | Lear Corp., 5.25%, 1/15/2025 | | | 3,718,782 | |
| | | 2,700M | | Volkswagen Group America, 4%, 11/12/2021 | | | 2,791,303 | |
| | | | | | | | 17,155,317 | |
| | | | | Chemicals—2.3% | | | | |
| | | 4,500M | | DowDuPont, Inc., 4.725%, 11/15/2028 | | | 5,151,424 | |
| | | 4,000M | | Nutrien, Ltd., 3.375%, 3/15/2025 | | | 4,146,876 | |
| | | | | | | | 9,298,300 | |
| | | | | Energy—16.0% | | | | |
| | | 2,749M | | Continental Resources, Inc., 5%, 9/15/2022 | | | 2,775,003 | |
| | | 4,000M | | Enable Midstream Partners, LP, 4.4%, 3/15/2027 | | | 4,011,680 | |
| | | 5,000M | | Enbridge Energy Partners, LP, 4.2%, 9/15/2021 | | | 5,151,260 | |
| | | | | Enterprise Products Operating: | | | | |
| | | 4,031M | | 7.55%, 4/15/2038 | | | 5,950,639 | |
| | | 1,800M | | 4.8%, 2/1/2049 | | | 2,098,993 | |
| | | 5,000M | | Kinder Morgan Energy Partners, LP, 3.45%, 2/15/2023 | | | 5,154,445 | |
| | | 4,750M | | Kinder Morgan, Inc., 5.625%, 11/15/2023 (a) | | | 5,274,353 | |
| | | | | Magellan Midstream Partners, LP: | | | | |
| | | 5,000M | | 5%, 3/1/2026 | | | 5,616,615 | |
| | | 3,600M | | 4.85%, 2/1/2049 | | | 4,186,847 | |
| | | 4,000M | | Midwest Connector Capital Co., LLC, 4.625%, 4/1/2029 (a) | | | 4,398,020 | |
| | | 6,600M | | MPLX, LP, 5.25%, 1/15/2025 (a) | | | 6,968,867 | |
| | | 4,300M | | Noble Energy, Inc., 3.85%, 1/15/2028 | | | 4,466,251 | |
| | | | | Valero Energy Corp.: | | | | |
| | | 2,700M | | 4.35%, 6/1/2028 | | | 2,933,269 | |
| | | 3,500M | | 6.625%, 6/15/2037 | | | 4,535,045 | |
| | | | | | | | 63,521,287 | |
| | | | | Financial Services—7.5% | | | | |
| | | 6,750M | | Brookfield Finance, Inc., 4.85%, 3/29/2029 | | | 7,645,630 | |
61
Portfolio of Investments (continued)
INVESTMENT GRADE FUND
September 30, 2019
| |
Principal
Amount
| | Security | | Value | |
| | | | | Financial Services (continued) |
| | $ | 3,750M | | ERAC USA Finance, LLC, 4.5%, 8/16/2021 (a) | | $ | 3,903,956 | |
| | | 2,500M | | GE Capital International Funding Services, Ltd., 4.418%, 11/15/2035 | | | 2,620,695 | |
| | | 6,400M | | General Electric Capital Corp., 4.65%, 10/17/2021 | | | 6,659,392 | |
| | | | | Protective Life Corp.: | | | | |
| | | 5,135M | | 7.375%, 10/15/2019 | | | 5,144,377 | |
| | | 3,600M | | 4.3%, 9/30/2028 (a) | | | 3,937,000 | |
| | | | | | | | 29,911,050 | |
| | | | | Financials—18.0% | | | | |
| | | | | Bank of America Corp.: | | | | |
| | | 2,000M | | 4%, 1/22/2025 | | | 2,125,092 | |
| | | 2,700M | | 3.559%, 4/23/2027 | | | 2,850,125 | |
| | | 4,725M | | 5.875%, 2/7/2042 | | | 6,551,567 | |
| | | 3,200M | | Capital One Financial Corp., 3.75%, 4/24/2024 | | | 3,364,554 | |
| | | | | Citigroup, Inc.: | | | | |
| | | 4,500M | | 4.3%, 11/20/2026 | | | 4,851,607 | |
| | | 2,900M | | 4.45%, 9/29/2027 | | | 3,166,794 | |
| | | | | Goldman Sachs Group, Inc.: | | | | |
| | | 2,350M | | 3.85%, 7/8/2024 | | | 2,489,216 | |
| | | 8,450M | | 3.5%, 11/16/2026 | | | 8,785,042 | |
| | | | | JPMorgan Chase & Co.: | | | | |
| | | 2,500M | | 4.452%, 12/5/2029 | | | 2,828,212 | |
| | | 8,600M | | 6.4%, 5/15/2038 | | | 12,326,767 | |
| | | | | Morgan Stanley: | | | | |
| | | 4,000M | | 4.10%, 5/22/2023 | | | 4,214,988 | |
| | | 3,000M | | 4%, 7/23/2025 | | | 3,238,863 | |
| | | 3,000M | | UBS Group Funding (Switzerland) AG, 4.253%, 3/23/2028 (a) | | | 3,274,839 | |
| | | 3,250M | | Wells Fargo & Co., 4.75%, 12/7/2046 | | | 3,842,420 | |
| | | | | Wells Fargo Bank, NA: | | | | |
| | | 2,350M | | 5.85%, 2/1/2037 | | | 3,120,196 | |
| | | 3,250M | | 6.6%, 1/15/2038 | | | 4,640,896 | |
| | | | | | | | 71,671,178 | |
62
| |
Principal
Amount
| | Security | | Value | |
| | | | | Food/Beverage/Tobacco—2.6% | | | | |
| | $ | 9,000M | | Anheuser-Busch Cos., LLC, 4.7%, 2/1/2036 | | $ | 10,412,037 | |
| | | | | Forest Products/Containers—1.0% | | | | |
| | | 4,000M | | Packaging Corp. of America, 3.4%, 12/15/2027 | | | 4,154,444 | |
| | | | | Health Care—3.5% | | | | |
| | | | | CVS Health Corp.: | | | | |
| | | 4,000M | | 3.875%, 7/20/2025 | | | 4,235,524 | |
| | | 1,800M | | 4.3%, 3/25/2028 | | | 1,948,030 | |
| | | 3,000M | | 5.05%, 3/25/2048 | | | 3,410,148 | |
| | | 4,050M | | Express Scripts Holding Co., 4.75%, 11/15/2021 | | | 4,257,652 | |
| | | | | | | | 13,851,354 | |
| | | | | Information Technology—3.0% | | | | |
| | | 2,000M | | Apple, Inc., 2.2%, 9/11/2029 | | | 1,967,716 | |
| | | 4,000M | | Corning, Inc., 7.25%, 8/15/2036 | | | 4,891,472 | |
| | | 4,500M | | International Business Machines Corp., 4.25%, 5/15/2049 | | | 5,185,112 | |
| | | | | | | | 12,044,300 | |
| | | | | Manufacturing—2.9% | | | | |
| | | 4,000M | | Crane Co., 4.2%, 3/15/2048 | | | 4,201,160 | |
| | | 2,250M | | CRH America, Inc., 3.4%, 5/9/2027 (a) | | | 2,325,958 | |
| | | 5,000M | | Johnson Controls International, PLC, 5%, 3/30/2020 | | | 5,067,240 | |
| | | | | | | | 11,594,358 | |
| | | | | Media-Broadcasting—.9% | | | | |
| | | 1,325M | | ABC, Inc., 8.75%, 8/15/2021 | | | 1,486,718 | |
| | | 1,800M | | Fox Corp., 4.709%, 1/25/2029 (a) | | | 2,057,652 | |
| | | | | | | | 3,544,370 | |
| | | | | Media-Cable TV—3.2% | | | | |
| | | | | Comcast Corp.: | | | | |
| | | 5,800M | | 4.25%, 1/15/2033 | | | 6,675,974 | |
| | | 3,250M | | 4.2%, 8/15/2034 | | | 3,719,823 | |
63
Portfolio of Investments (continued)
INVESTMENT GRADE FUND
September 30, 2019
| |
Principal
Amount
| | Security | | Value | |
| | | | | Media-Cable TV (continued) |
| | $ | 1,800M | | 4.7%, 10/15/2048 | | $ | 2,207,176 | |
| | | | | | | | 12,602,973 | |
| | | | | Metals/Mining—2.4% | | | | |
| | | 5,000M | | Arconic, Inc., 6.15%, 8/15/2020 | | | 5,160,950 | |
| | | 4,200M | | Newmont Mining Corp., 5.125%, 10/1/2019 | | | 4,200,000 | |
| | | | | | | | 9,360,950 | |
| | | | | Real Estate—11.1% | | | | |
| | | | | Alexandria Real Estate Equities, Inc.: | | | | |
| | | 4,600M | | 3.95%, 1/15/2028 | | | 4,964,090 | |
| | | 2,800M | | 4.85%, 4/15/2049 | | | 3,464,104 | |
| | | | | Digital Realty Trust, LP: | | | | |
| | | 6,700M | | 4.75%, 10/1/2025 | | | 7,375,641 | |
| | | 3,750M | | 3.7%, 8/15/2027 | | | 3,938,512 | |
| | | | | Duke Realty, LP: | | | | |
| | | 2,800M | | 3.25%, 6/30/2026 | | | 2,900,215 | |
| | | 3,700M | | 4%, 9/15/2028 | | | 4,036,467 | |
| | | 3,500M | | Essex Portfolio, LP, 3.875%, 5/1/2024 | | | 3,693,557 | |
| | | 5,000M | | Realty Income Corp., 3.875%, 4/15/2025 | | | 5,374,245 | |
| | | 1,800M | | Simon Property Group, LP, 2.45%, 9/13/2029 | | | 1,763,366 | |
| | | 6,000M | | STORE Capital Corp., 4.5%, 3/15/2028 | | | 6,480,684 | |
| | | | | | | | 43,990,881 | |
| | | | | Retail-General Merchandise—1.8% | | | | |
| | | 5,300M | | Home Depot, Inc., 5.875%, 12/16/2036 | | | 7,338,799 | |
| | | | | Telecommunication Services—7.8% | | | | |
| | | | | AT&T, Inc.: | | | | |
| | | 4,000M | | 3.6%, 7/15/2025 | | | 4,215,984 | |
| | | 6,000M | | 4.85%, 3/1/2039 | | | 6,815,628 | |
| | | 4,500M | | 4.25%, 3/1/2027 | | | 4,900,014 | |
64
| |
Principal
Amount
| | Security | | Value | |
| | | | | Telecommunication Services (continued) |
| | | | | Verizon Communications, Inc.: | | | | |
| | $ | 6,100M | | 4.329%, 9/21/2028 | | $ | 6,921,749 | |
| | | 7,100M | | 4.272%, 1/15/2036 | | | 7,996,020 | |
| | | | | | | | 30,849,395 | |
| | | | | Transportation—3.7% | | | | |
| | | 4,250M | | Air Lease Corp., 4.25%, 2/1/2024 | | | 4,503,079 | |
| | | 2,700M | | Aviation Capital Group, LLC, 3.5%, 11/1/2027 (a) | | | 2,694,174 | |
| | | | | Burlington Northern Santa Fe, LLC: | | | | |
| | | 1,800M | | 5.75%, 5/1/2040 | | | 2,425,338 | |
| | | 4,000M | | 5.15%, 9/1/2043 | | | 5,126,344 | |
| | | | | | | | 14,748,935 | |
| | | | | Utilities—2.1% | | | | |
| | | 3,150M | | Entergy Arkansas, Inc., 4.95%, 12/15/2044 | | | 3,402,769 | |
| | | 4,500M | | ONEOK, Inc., 4.55%, 7/15/2028 | | | 4,876,110 | |
| | | | | | | | 8,278,879 | |
Total Value of Corporate Bonds (cost $347,888,768) | | | 374,328,807 | |
| | | | | PASS-THROUGH CERTIFICATES—1.1% | | | | |
| | | | | Transportation | | | | |
| | | 4,256M | | American Airlines 17-2 AA PTT, 3.35%, 10/15/2029 (cost $4,256,450) | | | 4,389,187 | |
| | | | | U.S. GOVERNMENT OBLIGATIONS—1.0% | | | | |
| | | 3,500M | | U.S. Treasury Bonds, 3%, 2/15/2049 (cost $3,612,271) | | | 4,173,887 | |
Total Value of Investments (cost $355,757,489) | | | 96.2 | % | | | 382,891,881 | |
Other Assets, Less Liabilities | | | 3.8 | | | | 15,074,838 | |
Net Assets | | | 100.0 | % | | $ | 397,966,719 | |
(a) | Security exempt from registration under Rule 144A of the Securities Act of 1933 (see Note 4). |
Summary of Abbreviations:
65
Portfolio of Investments (continued)
INVESTMENT GRADE FUND
September 30, 2019
The Fund’s assets and liabilities are classified into the following three levels based on the inputs used to value the assets and liabilities:
| | Level 1 – | Unadjusted quoted prices in active markets for identical securities that the Fund has the ability to access. |
| | Level 2 – | Observable inputs other than quoted prices included in Level 1 that are observable for the asset or liability, either directly or indirectly. These inputs may include quoted prices for the identical instrument on an inactive market, prices for similar instruments, interest rates, prepayment speeds, credit risk, yield curves, default rates and similar data. |
| | Level 3 – | Unobservable inputs for the asset or liability, to the extent relevant observable inputs are not available, representing the Fund’s own assumption about the assumptions a market participant would use in valuing the asset or liability, and would be based on the best information available. |
The inputs methodology used for valuing securities are not necessarily an indication of the risk associated with investing in those securities. For example, U.S. Government securities are reflected as Level 2 because the inputs used to determine fair value may not always be quoted prices in an active market.
The following is a summary, by category of Level, of inputs used to value the Fund’s investments as of September 30, 2019:
| | | Level 1 | | | Level 2 | | | Level 3 | | | Total | |
Corporate Bonds | | $ | — | | | $ | 374,328,807 | | | $ | — | | | $ | 374,328,807 | |
Pass-Through Certificates | | | — | | | | 4,389,187 | | | | — | | | | 4,389,187 | |
U.S. Government Obligations | | | — | | | | 4,173,887 | | | | — | | | | 4,173,887 | |
Total Investments in Securities* | | $ | — | | | $ | 382,891,881 | | | $ | — | | | $ | 382,891,881 | |
* | The Portfolio of Investments provides information on the industry categorization for corporate bonds and pass-through certificates. |
There were no transfers into or from Level 1 and Level 2 by the Fund for the year ended September 30, 2019. Transfers, if any, between Levels are recognized at the end of the reporting period.
See notes to financial statements
66
Portfolio Managers’ Letter
LIMITED DURATION BOND FUND
Dear Investor:
This is the annual report for the First Investors Limited Duration Bond Fund for the fiscal year ended September 30, 2019. During the period, the Fund’s return on a net asset value basis was 4.37% for Class A shares, 4.65% for Advisor Class shares and 4.83% for Institutional Class shares, including dividends of 25.5 cents per share on Class A shares, 28.2 cents per share on Advisor Class shares and 29.7 cents per share on Institutional Class shares.
Bond market
The review period began with a continuation of financial market volatility. Rising interest rates, a prolonged trade war between U.S. and China, the midterm elections, and a strong U.S. dollar overshadowed strong economic fundamentals, causing a broad market selloff. The corporate bond market continued to underperform as credit spreads moved wider.
The U.S. Federal Reserve (Fed) raised rates by 25 basis points in its December meeting, however, Fed policy moved from a tightening to a more accommodative policy. In fact, the Fed cut rates by 25 basis points twice following the rate hike in December. U.S. Treasurys rallied strongly across the yield curve in a risk-off environment. There is an inverse relationship between bond prices and yields. The 2-year U.S. Treasury note yield, which is very sensitive to changes in Fed policy, fell by 120 basis points to 1.62%. The 10-year U.S. Treasury note yield, which is controlled by other factors such as GDP, inflation and investor sentiment, fell by 140 basis points to 1.67%. The yield curve continued to flatten, with the spread between 2- and 10-year U.S. Treasury yields narrowing to just four basis points by the end of the period.
Credit spreads marched tighter as investors continued to support the corporate credit market in the search for yield. The positive performance of the corporate bond market during the review period was the result of longer duration and tighter credit spreads. Of note, corporate bonds with maturities greater than 10 years significantly outperformed shorter-maturity debt (i.e., one to three years) as U.S. Treasury yields moved lower across the curve. During the review period, Telecommunication and Utility sectors outperformed.
Amid volatility in commodity-driven sectors, the high yield bond market returned 6.30% during the review period. Municipal bonds benefited from favorable supply-demand dynamics and returned 7.93%.
The Fund
The Fund outperformed the Bloomberg Barclays 1-3 Year US Government/Credit Index during the period under review. The Fund’s outperformance was driven by several factors. First, the Fund was overweight investment grade corporate bonds. Second, the Fund was overweight asset backed securities relative to the index. Third, the Fund had exposure to covered bond securities which was additive to its relative outperformance. Fourth, the Fund benefited from its exposure to agency CMBS as well as agency CMOs maturing between two and three years. Lastly, the Fund’s average duration was longer than its benchmark over the period under review. The longer relative duration helped the Fund’s performance as yields declined during the review period.
67
Portfolio Managers’ Letter (continued)
LIMITED DURATION BOND FUND
Thank you for placing your trust in Foresters Financial. As always, we appreciate the opportunity to serve your investment needs.
Sincerely,

Rodwell Chadehumbe
Portfolio Manager
Foresters Investment Management Company, Inc.
October 4, 2019
68
Fund Expenses (unaudited)
LIMITED DURATION BOND FUND
The examples below show the ongoing costs (in dollars) of investing in your Fund and will help you in comparing these costs with costs of other mutual funds. Please refer to page 1 for a detailed explanation of the information presented in these examples.
Expense Example | Annualized
Expense
Ratio | Beginning
Account Value
(4/1/19) | Ending
Account Value
(9/30/19) | Expenses Paid
During Period
(4/1/19-9/30/19)* |
Class A Shares | 0.79% | | | |
Actual | | $1,000.00 | $1,021.12 | $ 4.00 |
Hypothetical** | | $1,000.00 | $1,021.11 | $ 4.00 |
Advisor Class Shares | 0.51% | | | |
Actual | | $1,000.00 | $1,023.65 | $ 2.59 |
Hypothetical** | | $1,000.00 | $1,022.51 | $ 2.59 |
Institutional Class Shares | 0.36% | | | |
Actual | | $1,000.00 | $1,023.32 | $ 1.83 |
Hypothetical** | | $1,000.00 | $1,023.27 | $ 1.83 |
* | Expenses are equal to the annualized expense ratio, multiplied by the average account value over the period, multiplied by 183/365 (to reflect the one-half year period). Expenses paid during the period are net of expenses waived and/or assumed. |
** | Assumed rate of return of 5% before expenses |
Portfolio Composition
TOP TEN SECTORS
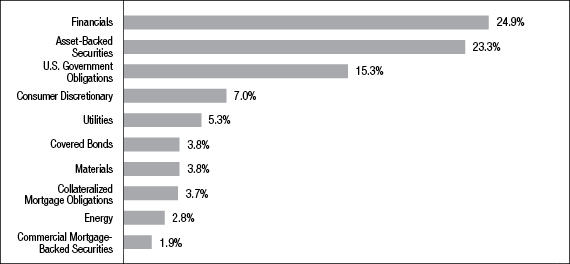
Portfolio holdings and allocations are subject to change. Percentages are as of September 30, 2019, and are based on the total market value of investments.
69
Cumulative Performance Information (unaudited)
LIMITED DURATION BOND FUND
Comparison of change in value of $10,000 investment in the First Investors Limited Duration Bond Fund (Class A shares), the Bloomberg Barclays 1-3 Year U.S. Government/Credit Bond Index† and the ICE BofAML 1–5 Year U.S. Broad Market Index.
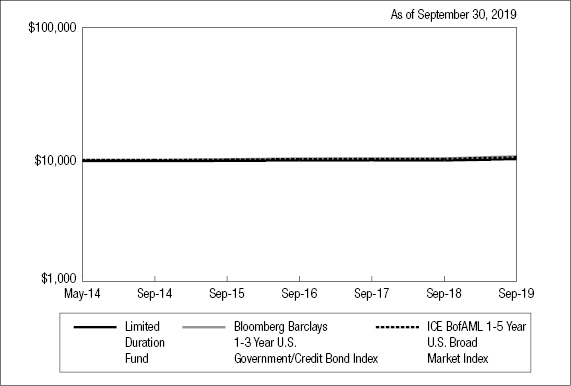
| | Average Annual Total Returns* |
N.A.V. Only | Class A | Advisor
Class | Institutional
Class | Bloomberg
Barclays 1-3
Year U.S.
Government/
Credit Bond
Index | ICE BofAML
1-5 Year
U.S. Broad
Market Index |
One Year | 4.37% | 4.65% | 4.83% | 4.64% | 6.13% |
Five Years | 1.19% | 1.49% | 1.63% | 1.59% | 2.10% |
Since Inception** | 1.00% | 1.33% | 1.49% | 1.48% | 1.98% |
| | | | | | |
S.E.C. Standardized | Class A | Advisor
Class | Institutional
Class | | |
One Year | 1.71% | 4.65% | 4.83% | | |
Five Years | 0.68% | 1.49% | 1.63% | | |
Since Inception** | 0.52% | 1.33% | 1.49% | | |
S.E.C. 30-Day Yield*** | 1.42% | 1.69% | 1.72% | | |
The graph compares a $10,000 investment in the First Investors Limited Duration Bond Fund (Class A shares) beginning 5/19/14 (commencement of operations) with theoretical investments in the Bloomberg Barclays 1-3 Year U.S. Government/Credit Bond Index and the ICE BofAML 1-5 Year U.S. Broad Market
70
Index (the “Indices”). The Bloomberg Barclays 1-3 Year U.S. Government/Credit Bond Index is the one- to three-year component of the Bloomberg Barclays U.S. Government/Credit Bond Index that includes securities in the Government and Credit Indices. The Government Index includes Treasurys (that is, public obligations of the U.S. Treasury that have remaining maturities of more than one year) and agencies (that is, publicly issued debt of U.S. government agencies, quasi-federal corporations, and corporate or foreign debt guaranteed by the U.S. government). The Credit Index includes publicly issued U.S. corporate and foreign debentures and secured notes that meet specified maturity, liquidity, and quality requirements. The ICE BofAML 1-5 Year U.S. Broad Market Index is a subset of the ICE BofAML U.S. Broad Market Index which tracks the performance of U.S. dollar-denominated investment grade debt publicly issued in the U.S. domestic market, including U.S. Treasury, quasi-government, corporate, securitized and collateralized securities. The Index includes all securities with a remaining term to final maturity or an average life less than 5 years. It is not possible to invest directly in these Indices. In addition, the Indices do not reflect fees and expenses associated with the active management of a mutual fund portfolio. For purposes of the graph and the accompanying table it is assumed that all dividends and distributions were reinvested. Advisor Class and Institutional Class shares performance will be greater than that shown in the line graph above for Class A shares based on differences in sales loads and fees paid by shareholders investing in the different classes.
* Average Annual Total Return figures (for the periods ended 9/30/19) include the reinvestment of all dividends and distributions. “N.A.V. Only” returns are calculated without sales charges. The Class A “S.E.C. Standardized” returns shown are based on the current maximum sales charge of 2.5% and assume the current sales charge of 2.5% was in effect at the beginning of the stated periods (prior to 6/12/17, the maximum sales charge was 5.75%). The Advisor Class and Institutional Class “S.E.C. Standardized” returns shown are the same as the N.A.V. Only returns since these classes are sold without sales charges. During the periods shown, some of the expenses of the Fund were waived or assumed. If such expenses had been paid by the Fund, the Class A “S.E.C. Standardized” Average Annual Total Return for One Year, Five Years and Since Inception would have been 1.51%, 0.48% and -0.09%, respectively, and the S.E.C. 30-Day Yield for September 2019 would have been 1.27%. The Advisor Class “S.E.C. Standardized” Average Annual Total Return for One Year, Five Years and Since Inception would have been 4.47%, 1.24% and 1.05%, respectively, and the S.E.C. 30-Day Yield for September 2019 would have been 1.17%. The Institutional Class “S.E.C. Standardized” Average Annual Total Return for One Year, Five Years and Since Inception would have been 4.62%, 1.45% and 0.79%, respectively, and the S.E.C. 30-Day Yield for September 2019 would have been 1.50%. Results represent past performance and do not indicate future results. The graph and the returns shown do not reflect the deduction of taxes that a shareholder would pay on distributions or the redemption of fund shares. Investment return and principal value of an investment will fluctuate so that an investor’s shares, when redeemed, may be worth more or less than the original cost. Index figures are from Bloomberg and ICE Data Services and all other figures are from Foresters Investment Management Company, Inc.
** The Since Inception returns for Class A shares, Advisor Class shares and Institutional Class shares are for the period beginning 5/19/14 (commencement of operations).
*** The S.E.C. 30-Day Yield shown is for September 2019.
† During the fiscal year, the Fund changed its primary broad-based securities index to the Bloomberg Barclays 1-3 Year U.S. Government/Credit Bond Index from the ICE BofAML 1–5 Year U.S. Broad Market Index since it more closely reflects the Fund’s investment strategies. After this fiscal year, we will not show a comparison to the ICE BofAML 1–5 Year U.S. Broad Market Index.
71
Portfolio of Investments
LIMITED DURATION BOND FUND
September 30, 2019
| |
Principal
Amount
| | Security | | Value | |
| | | | | CORPORATE BONDS—48.1% | | | | |
| | | | | Automotive—6.7% | | | | |
| | $ | 2,000M | | Daimler Finance NA, LLC, 3.4%, 2/22/2022 (a) | | $ | 2,046,728 | |
| | | | | General Motors Financial Co., Inc.: | | | | |
| | | 1,900M | | 4.2%, 11/6/2021 | | | 1,960,733 | |
| | | 2,800M | | 3.55%, 7/8/2022 | | | 2,858,321 | |
| | | 5,130M | | Harley Davidson Financial Services, 2.15%, 2/26/2020 (a) | | | 5,120,992 | |
| | | 2,463M | | Lear Corp., 5.25%, 1/15/2025 | | | 2,544,267 | |
| | | 2,000M | | O’Reilly Automotive, Inc., 4.625%, 9/15/2021 | | | 2,080,778 | |
| | | | | Volkswagen Group America: | | | | |
| | | 3,000M | | 3.875%, 11/13/2020 (a) | | | 3,049,419 | |
| | | 1,900M | | 4%, 11/12/2021 | | | 1,964,250 | |
| | | | | | | | 21,625,488 | |
| | | | | Energy—2.7% | | | | |
| | | 2,934M | | Continental Resources, Inc., 5%, 9/15/2022 | | | 2,961,753 | |
| | | 2,000M | | Enterprise Products Operating, 5.2%, 9/1/2020 | | | 2,055,356 | |
| | | 3,700M | | Midwest Connector Capital Co., LLC, 3.625%, 4/1/2022 (a) | | | 3,796,770 | |
| | | | | | | | 8,813,879 | |
| | | | | Financial Services—5.6% | | | | |
| | | 1,000M | | Compass Bank, 5.5%, 4/1/2020 | | | 1,015,649 | |
| | | 4,445M | | International Lease Finance Corp., 8.25%, 12/15/2020 | | | 4,757,052 | |
| | | 3,000M | | PNC Bank, NA, 2.7%, 11/1/2022 | | | 3,044,481 | |
| | | 1,500M | | Protective Life Corp., 7.375%, 10/15/2019 | | | 1,502,739 | |
| | | | | SunTrust Bank: | | | | |
| | | 4,900M | | 2.59%, 1/29/2021 † | | | 4,904,459 | |
| | | 2,900M | | 2.8%, 5/17/2022 | | | 2,951,484 | |
| | | | | | | | 18,175,864 | |
| | | | | Financials—18.2% | | | | |
| | | 3,600M | | Bank of America Corp., 2.369%, 7/21/2021 † | | | 3,606,163 | |
| | | 900M | | Bank of Montreal, 1.9%, 8/27/2021 | | | 898,936 | |
| | | 2,000M | | Capital One Financial Corp., 3.05%, 3/9/2022 | | | 2,040,476 | |
| | | 2,100M | | Capital One NA, 2.25%, 9/13/2021 | | | 2,100,962 | |
72
| |
Principal
Amount
| | Security | | Value | |
| | | | | Financials (continued) |
| | | | | Citigroup, Inc.: | | | | |
| | $ | 1,000M | | 2.65%, 10/26/2020 | | $ | 1,006,297 | |
| | | 5,349M | | 2.9%, 12/8/2021 | | | 5,429,743 | |
| | | 1,000M | | DNB Bank ASA, 2.375%, 6/2/2021 (a) | | | 1,003,492 | |
| | | 4,500M | | DNB Boligkreditt AS, 2.5%, 3/28/2022 (a) | | | 4,570,425 | |
| | | 4,000M | | Goldman Sachs Group, Inc., 5.75%, 1/24/2022 | | | 4,310,972 | |
| | | 2,700M | | HSBC Holdings, PLC, 3.803%, 3/11/2025 | | | 2,815,036 | |
| | | 1,000M | | ING Groep NV, 3.15%, 3/29/2022 | | | 1,022,885 | |
| | | 4,000M | | JPMorgan Chase & Co., 4.5%, 1/24/2022 | | | 4,221,136 | |
| | | 1,000M | | Lloyds Bank, PLC, 6.375%, 1/21/2021 | | | 1,053,285 | |
| | | | | Lloyds Banking Group, PLC: | | | | |
| | | 800M | | 3%, 1/11/2022 | | | 808,485 | |
| | | 6,000M | | 3.9%, 3/12/2024 | | | 6,282,672 | |
| | | | | Morgan Stanley: | | | | |
| | | 6,100M | | 5.5%, 7/28/2021 | | | 6,474,656 | |
| | | 4,500M | | 2.75%, 5/19/2022 | | | 4,566,955 | |
| | | 4,100M | | Wells Fargo & Co., 3.45%, 2/13/2023 | | | 4,236,842 | |
| | | 2,800M | | Wells Fargo Bank, NA, 2.6%, 1/15/2021 | | | 2,821,090 | |
| | | | | | | | 59,270,508 | |
| | | | | Food/Beverage/Tobacco—.9% | | | | |
| | | 1,000M | | Ingredion, Inc., 4.625%, 11/1/2020 | | | 1,023,586 | |
| | | 2,000M | | Keurig Dr Pepper, Inc., 3.551%, 5/25/2021 | | | 2,043,336 | |
| | | | | | | | 3,066,922 | |
| | | | | Forest Products/Containers—1.8% | | | | |
| | | 5,487M | | Georgia-Pacific, LLC, 5.4%, 11/1/2020 (a) | | | 5,676,806 | |
| | | | | Health Care—1.2% | | | | |
| | | 2,400M | | CVS Health Corp., 2.8%, 7/20/2020 | | | 2,411,042 | |
| | | 1,632M | | Gilead Sciences, Inc., 2.55%, 9/1/2020 | | | 1,640,139 | |
| | | | | | | | 4,051,181 | |
| | | | | Information Technology—.9% | | | | |
| | | 2,800M | | Diamond 1 Finance Corp., 4.42%, 6/15/2021 (a) | | | 2,887,892 | |
73
Portfolio of Investments (continued)
LIMITED DURATION BOND FUND
September 30, 2019
| |
Principal
Amount
| | Security | | Value | |
| | | | | Metals/Mining—1.9% | | | | |
| | $ | 5,000M | | Glencore Finance Canada, Ltd., 4.95%, 11/15/2021 (a) | | $ | 5,231,740 | |
| | | 900M | | Viterra, Inc., 5.95%, 8/1/2020 | | | 925,248 | |
| | | | | | | | 6,156,988 | |
| | | | | Real Estate—1.5% | | | | |
| | | | | Digital Realty Trust, LP: | | | | |
| | | 1,671M | | 3.95%, 7/1/2022 | | | 1,745,019 | |
| | | 1,825M | | 2.75%, 2/1/2023 | | | 1,844,597 | |
| | | 1,250M | | Realty Income Corp., 3.25%, 10/15/2022 | | | 1,290,349 | |
| | | | | | | | 4,879,965 | |
| | | | | Transportation—1.6% | | | | |
| | | 3,600M | | Aviation Capital Group, LLC, 7.125%, 10/15/2020 (a) | | | 3,767,065 | |
| | | 1,000M | | Heathrow Funding, Ltd., 4.875%, 7/15/2021 (a) | | | 1,043,896 | |
| | | 500M | | Penske Truck Leasing Co., LP, 3.65%, 7/29/2021 (a) | | | 511,733 | |
| | | | | | | | 5,322,694 | |
| | | | | Utilities—5.1% | | | | |
| | | 3,000M | | DTE Energy Co., 3.3%, 6/15/2022 | | | 3,075,300 | |
| | | | | Energy Transfer Partners, LP: | | | | |
| | | 5,986M | | 7.5%, 10/15/2020 | | | 6,292,244 | |
| | | 2,000M | | 4.5%, 4/15/2024 | | | 2,133,218 | |
| | | 1,375M | | Exelon Generation Co., LLC, 3.4%, 3/15/2022 | | | 1,410,376 | |
| | | 2,000M | | NRG Energy, Inc., 3.75%, 6/15/2024 (a) | | | 2,059,760 | |
| | | 1,500M | | Sempra Energy, 1.625%, 10/7/2019 | | | 1,499,862 | |
| | | | | | | | 16,470,760 | |
Total Value of Corporate Bonds (cost $153,592,872) | | | 156,398,947 | |
| | | | | ASSET-BACKED SECURITIES—22.3% | | | | |
| | | | | Fixed Autos—11.3% | | | | |
| | | 1,200M | | AmeriCredit Automobile Receivables Trust, 3.13%, 2/18/2025 | | | 1,222,844 | |
| | | 900M | | BMW Vehicle Lease Trust, 3.26%, 7/20/2021 | | | 910,576 | |
74
| |
Principal
Amount
| | Security | | Value | |
| | | | | Fixed Autos (continued) |
| | | | | CarMax Auto Owner Trust: | | | | |
| | $ | 2,000M | | 2.68%, 3/15/2024 | | $ | 2,034,782 | |
| | | 1,850M | | 3.37%, 10/16/2023 | | | 1,902,612 | |
| | | 1,500M | | Drive Auto Receivables Trust, 3.41%, 6/15/2023 | | | 1,517,221 | |
| | | | | GM Financial Automobile Leasing Trust: | | | | |
| | | 3,250M | | 3.18%, 6/21/2021 | | | 3,272,571 | |
| | | 1,400M | | 3.31%, 4/20/2022 | | | 1,413,744 | |
| | | | | Hertz Vehicle Financing Trust: | | | | |
| | | 2,500M | | 2.96%, 10/25/2021 | | | 2,520,542 | |
| | | 5,400M | | 3.29%, 2/25/2024 (a) | | | 5,541,707 | |
| | | 3,000M | | Nissan Auto Receivables Owner Trust, 2.5%, 11/15/2023 | | | 3,040,050 | |
| | | 2,700M | | Santander Drive Auto Receivables Trust, 3.21%, 9/15/2023 | | | 2,732,130 | |
| | | 4,000M | | Santander Retail Auto Lease Trust, 2.77%, 6/20/2022 (a) | | | 4,065,772 | |
| | | 4,512M | | Tesla Auto Lease Trust, 3.71%, 8/20/2021 (a) | | | 4,585,682 | |
| | | 1,912M | | Volkswagen Auto Loan Enhanced Trust, 3.05%, 8/20/2021 | | | 1,917,843 | |
| | | | | | | | 36,678,076 | |
| | | | | Fixed Communication Services—3.0% | | | | |
| | | | | Verizon Owner Trust: | | | | |
| | | 3,679M | | 1.92%, 12/20/2021 (a) | | | 3,675,576 | |
| | | 4,240M | | 2.93%, 9/20/2023 | | | 4,318,432 | |
| | | 1,670M | | 3.23%, 4/20/2023 | | | 1,702,909 | |
| | | | | | | | 9,696,917 | |
| | | | | Fixed Credit Cards—4.4% | | | | |
| | | 7,030M | | Citibank Credit Card Issuance Trust, 2.49%, 1/20/2023 | | | 7,083,372 | |
| | | | | Synchrony Credit Card Master Trust: | | | | |
| | | 5,100M | | 1.93%, 6/15/2023 | | | 5,092,702 | |
| | | 2,050M | | 2.38%, 9/15/2023 | | | 2,056,150 | |
| | | | | | | | 14,232,224 | |
75
Portfolio of Investments (continued)
LIMITED DURATION BOND FUND
September 30, 2019
| |
Principal
Amount
| | Security | | Value | |
| | | | | Fixed Manufacturing—3.6% | | | | |
| | $ | 8,000M | | John Deere Owner Trust, 2.91%, 7/17/2023 | | $ | 8,146,312 | |
| | | 3,600M | | Kubota Credit Owner Trust, 3.1%, 8/15/2022 (a) | | | 3,645,173 | |
| | | | | | | | 11,791,485 | |
Total Value of Asset-Backed Securities (cost $71,270,662) | | | 72,398,702 | |
| | | | | U.S. GOVERNMENT OBLIGATIONS—14.6% | | | | |
| | | | | U.S. Treasury Notes: | | | | |
| | | 5,000M | | 1.5%, 8/31/2021 | | | 4,985,940 | |
| | | 5,000M | | 1.5%, 9/15/2022 | | | 4,991,115 | |
| | | 9,500M | | 2%, 5/31/2024 | | | 9,690,741 | |
| | | 15,000M | | 2.125%, 5/15/2022 | | | 15,198,930 | |
| | | 9,000M | | 2.25%, 4/30/2021 | | | 9,073,656 | |
| | | 2,570M | | 2.5%, 1/15/2022 | | | 2,620,195 | |
| | | 1,000M | | 2.5%, 1/31/2024 | | | 1,038,848 | |
Total Value of U.S. Government Obligations (cost $47,180,284) | | | 47,599,425 | |
| | | | | COVERED BONDS—3.6% | | | | |
| | | | | Financial Services | | | | |
| | | 4,750M | | Canadian Imperial Bank of Commerce, 2.35%, 7/27/2022 (a) | | | 4,819,046 | |
| | | 7,000M | | Royal Bank of Canada, 2.3%, 3/22/2021 | | | 7,037,800 | |
Total Value of Covered Bonds (cost $11,751,182) | | | 11,856,846 | |
| | | | | COLLATERALIZED MORTGAGE OBLIGATIONS—3.5% | | | | |
| | | | | Fannie Mae: | | | | |
| | | 4,186M | | 4%, 2/25/2025 | | | 4,351,527 | |
| | | 6,964M | | 3%, 1/25/2034 | | | 7,162,329 | |
Total Value of Collateralized Mortgage Obligations (cost $11,330,729) | | | 11,513,856 | |
76
| |
Principal
Amount
| | Security | | Value | |
| | | | | COMMERCIAL MORTGAGE-BACKED SECURITIES—1.9% | | | | |
| | | | | Fannie Mae—.9% | | | | |
| | $ | 2,697M | | Fannie Mae, 2.995%, 11/1/2022 | | $ | 2,771,695 | |
| | | | | Federal Home Loan Mortgage Corporation—1.0% | | | | |
| | | 2,983M | | Multi-Family Structured Pass-Throughs, 3.139%, 6/25/2025 | | | 3,132,267 | |
Total Value of Commercial Mortgage-Backed Securities (cost $5,771,141) | | | 5,903,962 | |
| | | | | U.S. GOVERNMENT AGENCY OBLIGATIONS—1.6% | | | | |
| | | | | Fannie Mae: | | | | |
| | | 3,500M | | 1.25%, 5/6/2021 | | | 3,473,960 | |
| | | 1,700M | | 1.375%, 2/26/2021 | | | 1,691,067 | |
Total Value of U.S. Government Agency Obligations (cost $5,132,313) | | | 5,165,027 | |
Total Value of Investments (cost $306,029,183) | | | 95.6 | % | | | 310,836,765 | |
Other Assets, Less Liabilities | | | 4.4 | | | | 14,166,662 | |
Net Assets | | | 100.0 | % | | $ | 325,003,427 | |
(a) | Security exempt from registration under Rule 144A of the Securities Act of 1933 (see Note 4). |
† | Interest rates are determined and reset periodically. The interest rates above are the rates in effect at September 30, 2019. |
The Fund’s assets and liabilities are classified into the following three levels based on the inputs used to value the assets and liabilities:
| | Level 1 – | Unadjusted quoted prices in active markets for identical securities that the Fund has the ability to access. |
| | Level 2 – | Observable inputs other than quoted prices included in Level 1 that are observable for the asset or liability, either directly or indirectly. These inputs may include quoted prices for the identical instrument on an inactive market, prices for similar instruments, interest rates, prepayment speeds, credit risk, yield curves, default rates and similar data. |
| | Level 3 – | Unobservable inputs for the asset or liability, to the extent relevant observable inputs are not available, representing the Fund’s own assumption about the assumptions a market participant would use in valuing the asset or liability, and would be based on the best information available. |
77
Portfolio of Investments (continued)
LIMITED DURATION BOND FUND
September 30, 2019
The inputs methodology used for valuing securities are not necessarily an indication of the risk associated with investing in those securities. For example, U.S. Government securities are reflected as Level 2 because the inputs used to determine fair value may not always be quoted prices in an active market.
The following is a summary, by category of Level, of inputs used to value the Fund’s investments as of September 30, 2019:
| | | Level 1 | | | Level 2 | | | Level 3 | | | Total | |
Corporate Bonds | | $ | — | | | $ | 156,398,947 | | | $ | — | | | $ | 156,398,947 | |
Asset-Backed Securities | | | — | | | | 72,398,702 | | | | — | | | | 72,398,702 | |
U.S. Government Obligations | | | — | | | | 47,599,425 | | | | — | | | | 47,599,425 | |
Covered Bonds | | | — | | | | 11,856,846 | | | | — | | | | 11,856,846 | |
Collateralized Mortgage Obligations | | | — | | | | 11,513,856 | | | | — | | | | 11,513,856 | |
Commercial Mortgage-Backed Securities | | | — | | | | 5,903,962 | | | | — | | | | 5,903,962 | |
U.S. Government Agency Obligations | | | — | | | | 5,165,027 | | | | — | | | | 5,165,027 | |
Total Investments in Securities* | | $ | — | | | $ | 310,836,765 | | | $ | — | | | $ | 310,836,765 | |
* | The Portfolio of Investments provides information on the industry categorization for corporate bonds, asset-backed securities and covered bonds. |
There were no transfers into or from Level 1 and Level 2 by the Fund for the year ended September 30, 2019. Transfers, if any, between Levels are recognized at the end of the reporting period.
See notes to financial statements
78
Portfolio Managers’ Letter
STRATEGIC INCOME FUND
Dear Investor:
This is the annual report for the First Investors Strategic Income Fund for the fiscal year ended September 30, 2019. During the period, the Fund’s return on a net asset value basis was 4.67% for Class A shares and 5.11% for Advisor Class shares, including dividends of 30.1 cents per share on Class A shares and 32.9 cents per share on Advisor Class shares.
Bond market
The review period began with a continuation of financial market volatility. Rising interest rates, a prolonged trade war between U.S. and China, the midterm elections, and a strong U.S. dollar overshadowed strong economic fundamentals, causing a broad market selloff. The corporate bond market continued to underperform as credit spreads moved wider.
The U.S. Federal Reserve (Fed) raised rates by 25 basis points in its December meeting, however, Fed policy moved from a tightening to a more accommodative policy. In fact, the Fed cut rates by 25 basis points twice following the rate hike in December. U.S. Treasurys rallied strongly across the yield curve in a risk-off environment. There is an inverse relationship between bond prices and yields. The 2-year U.S. Treasury note yield, which is very sensitive to changes in Fed policy, fell by 120 basis points to 1.62%. The 10-year U.S. Treasury note yield, which is controlled by other factors such as GDP, inflation and investor sentiment, fell by 140 basis points to 1.67%. The yield curve continued to flatten, with the spread between 2- and 10-year U.S. Treasury yields narrowing to just four basis points by the end of the period.
Credit spreads marched tighter as investors continued to support the corporate credit market in the search for yield. The positive performance of the corporate bond market during the review period was the result of longer duration and tighter credit spreads. Of note, corporate bonds with maturities greater than 10 years significantly outperformed shorter-maturity debt (i.e., one to three years) as U.S. Treasury yields moved lower across the curve. During the review period, Telecommunication and Utility sectors outperformed.
Amid volatility in commodity-driven sectors, the high yield bond market returned 6.30% during the review period. Municipal bonds benefited from favorable supply-demand dynamics and returned 7.93%.
The Fund
The Fund can invest through institutional class shares in a number of First Investors Funds (Underlying Funds). The average allocations to Underlying Funds as a percentage of the Fund’s
79
Portfolio Managers’ Letter (continued)
STRATEGIC INCOME FUND
net assets, the total returns for the review period and the allocations as a percentage of net assets as of the end of the period are shown in the table below.
| | Average
allocations,
Review period | Total return | Allocations,
9/30/19 |
Equity Income Fund | 0.1% | 2.18% | 0.0% |
Premium Income Fund | 0.6% | 2.90% | 0.0% |
Floating Rate Fund | 15.8% | 3.21% | 0.0% |
Fund For Income | 23.1% | 6.23% | 24.8% |
International Opportunities Bond Fund | 9.5% | -.25% | 9.8% |
Investment Grade Fund | 14.1% | 12.43% | 15.5% |
Limited Duration Bond Fund | 24.5% | 4.83% | 33.6% |
Tax Exempt Income Fund | 0.8% | 7.36% | 0.0% |
Tax Exempt Opportunities Fund | 2.5% | 8.60% | 4.9% |
U.S. Government Agency Obligations | 8.6% | N/A | 8.5% |
Cash | 0.4% | N/A | 2.9% |
For the annual reporting period ended September 30, 2019, the Fund returned 4.67% for Class A shares, compared to a return of 10.55% for its benchmark, the ICE BofA Merrill Lynch U.S. Broad Market Index. The Fund underperformed its benchmark primarily because it had a large allocation to underlying funds that did not fully benefit from the substantial decline in interest rates during the review period, in particular the Limited Duration Bond Fund and the Floating Rate Fund. A secondary factor was the significant underperformance of the International Opportunities Bond Fund, one of the underlying funds, versus comparable funds.
Thank you for placing your trust in Foresters Financial. As always, we appreciate the opportunity to serve your investment needs.
Sincerely,

Clark D. Wagner
Portfolio Manager and
Chief Investment Officer,
Foresters Investment Management Company, Inc.
October 4, 2019
80
Fund Expenses (unaudited)
STRATEGIC INCOME FUND
The examples below show the ongoing costs (in dollars) of investing in your Fund and will help you in comparing these costs with costs of other mutual funds. Please refer to page 1 for a detailed explanation of the information presented in these examples.
Expense Example | Annualized
Expense
Ratio | Beginning
Account Value
(4/1/19) | Ending
Account Value
(9/30/19) | Expenses Paid
During Period
(4/1/19-9/30/19)* |
Class A Shares | 0.46% | | | |
Actual | | $1,000.00 | $1,029.68 | $ 2.34 |
Hypothetical** | | $1,000.00 | $1,022.76 | $ 2.33 |
Advisor Class Shares | 0.09% | | | |
Actual | | $1,000.00 | $1,032.02 | $ 0.46 |
Hypothetical** | | $1,000.00 | $1,024.62 | $ 0.46 |
* | Expenses are equal to the annualized expense ratio, multiplied by the average account value over the period, multiplied by 183/365 (to reflect the one-half year period). Expenses paid during the period are net of expenses waived. |
** | Assumed rate of return of 5% before expenses |
Portfolio Composition
BY SECTOR
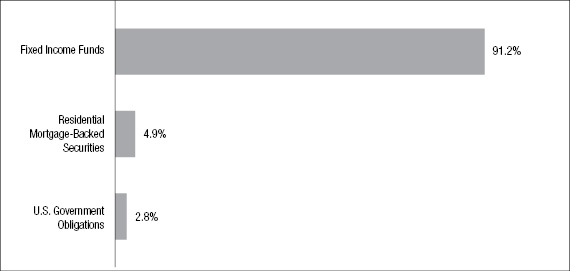
Portfolio holdings and allocations are subject to change. Percentages are as of September 30, 2019, and are based on the total market value of investments.
81
Cumulative Performance Information (unaudited)
STRATEGIC INCOME FUND
Comparison of change in value of $10,000 investment in the First Investors Strategic Income Fund (Class A shares) and the ICE BofAML U.S. Broad Market Index.
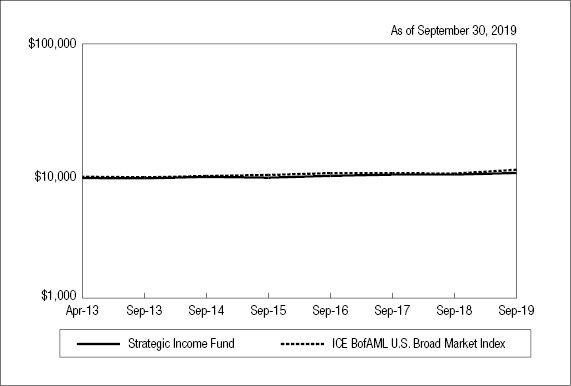
| | Average Annual Total Returns* |
N.A.V. Only | Class A | Advisor
Class | ICE BofAML
U.S. Broad
Market Index |
One Year | 4.67% | 5.11% | 10.55% |
Five Years | 2.27% | 2.69% | 3.46% |
Since Inception** | 2.30% | 2.68% | 2.98% |
| | | | |
S.E.C. Standardized | Class A | Advisor
Class | |
One Year | 0.51% | 5.11% | |
Five Years | 1.45% | 2.69% | |
Since Inception** | 1.66% | 2.68% | |
The graph compares a $10,000 investment in the First Investors Strategic Income Fund (Class A shares) beginning 4/3/13 (commencement of operations) with a theoretical investment in the ICE BofAML U.S. Broad Market Index (the “Index”). The Index tracks the performance of U.S. dollar-denominated investment grade debt publicly issued in the U.S. domestic market, including U.S. Treasury, quasi-government, corporate, securitized and collateralized securities. It is not possible to invest directly in this Index. In addition, the Index does not reflect fees and expenses associated with the active management of a mutual fund portfolio. For purposes of the graph and the accompanying table it is assumed that all dividends and distributions were reinvested. Advisor Class shares performance will be greater than that shown in the line graph above for Class A shares based on differences in sales loads and fees paid by shareholders investing in the different classes.
82
* Average Annual Total Return figures (for the periods ended 9/30/19) include the reinvestment of all dividends and distributions. “N.A.V. Only” returns are calculated without sales charges. The Class A “S.E.C. Standardized” returns shown are based on the current maximum sales charge of 4% and assume the current sales charge of 4% was in effect at the beginning of the stated periods (prior to 6/12/17, the maximum sales charge was 5.75%). The Advisor Class “S.E.C. Standardized” returns shown are the same as the N.A.V. Only returns since this class is sold without sales charges. During the periods shown, some of the expenses of the Fund were waived or assumed. If such expenses had been paid by the Fund, the Class A “S.E.C. Standardized” Average Annual Total Return for One Year, Five Years and Since Inception would have been 0.49%, 1.44% and 1.55%, respectively. The Advisor Class “S.E.C. Standardized” Average Annual Total Return for One Year, Five Years and Since Inception would have been 5.10%, 2.42% and 2.58%, respectively. Results represent past performance and do not indicate future results. The graph and the returns shown do not reflect the deduction of taxes that a shareholder would pay on distributions or the redemption of fund shares. Investment return and principal value of an investment will fluctuate so that an investor’s shares, when redeemed, may be worth more or less than the original cost. Index figures are from ICE Data Services and all other figures are from Foresters Investment Management Company, Inc.
** The Since Inception returns for Class A shares and Advisor Class shares are for the period beginning 4/3/13 (commencement of operations).
83
Portfolio of Investments
STRATEGIC INCOME FUND
September 30, 2019
| | Shares or
Principal
Amount | | Security | | Value | |
| | | | | MUTUAL FUNDS—90.6% | | | | |
| | | | | Fixed Income Funds | | | | |
| | | 14,201,182 | | Fund For Income - Institutional Class Shares | | $ | 34,934,908 | |
| | | 1,570,463 | | International Opportunities Bond Fund - Institutional Class Shares | | | 13,772,958 | |
| | | 2,187,959 | | Investment Grade Fund - Institutional Class Shares | | | 21,792,074 | |
| | | 5,065,805 | | Limited Duration Bond Fund - Institutional Class Shares | | | 47,365,275 | |
| | | 411,527 | | Tax Exempt Opportunities Fund - Institutional Class Shares | | | 6,888,970 | |
Total Value of Mutual Funds (cost $129,375,448) | | | 124,754,185 | |
| | | | | RESIDENTIAL MORTGAGE-BACKED SECURITIES—4.8% | | | | |
| | | | | Fannie Mae—4.4% | | | | |
| | $ | 2,672M | | 4%, 9/1/2048-12/1/2048 | | | 2,779,975 | |
| | | 3,098M | | 4.5%, 6/1/2048-1/1/2049 | | | 3,269,106 | |
| | | | | | | | 6,049,081 | |
| | | | | Freddie Mac—.4% | | | | |
| | | 573M | | 5%, 10/1/2048 | | | 614,278 | |
Total Value of Residential Mortgage-Backed Securities (cost $6,535,518) | | | 6,663,359 | |
| | | | | U.S. GOVERNMENT OBLIGATIONS—2.8% | | | | |
| | | 3,600M | | U.S. Treasury Notes, 2.375%, 5/15/2029 (cost $3,664,266) | | | 3,823,592 | |
| | | | | SHORT-TERM U.S. GOVERNMENT OBLIGATIONS—1.1% | | | | |
| | | 1,500M | | U.S. Treasury Bills, 1.78%, 10/22/2019 (cost $1,498,442) | | | 1,498,435 | |
Total Value of Investments (cost $141,073,674) | | | 99.3 | % | | | 136,739,571 | |
Other Assets, Less Liabilities | | | .7 | | | | 981,612 | |
Net Assets | | | 100.0 | % | | $ | 137,721,183 | |
84
The Fund’s assets and liabilities are classified into the following three levels based on the inputs used to value the assets and liabilities:
| | Level 1 – | Unadjusted quoted prices in active markets for identical securities that the Fund has the ability to access. |
| | Level 2 – | Observable inputs other than quoted prices included in Level 1 that are observable for the asset or liability, either directly or indirectly. These inputs may include quoted prices for the identical instrument on an inactive market, prices for similar instruments, interest rates, prepayment speeds, credit risk, yield curves, default rates and similar data. |
| | Level 3 – | Unobservable inputs for the asset or liability, to the extent relevant observable inputs are not available, representing the Fund’s own assumption about the assumptions a market participant would use in valuing the asset or liability, and would be based on the best information available. |
The inputs methodology used for valuing securities are not necessarily an indication of the risk associated with investing in those securities. For example, U.S. Government securities are reflected as Level 2 because the inputs used to determine fair value may not always be quoted prices in an active market.
The following is a summary, by category of Level, of inputs used to value the Fund’s investments as of September 30, 2019:
| | | Level 1 | | | Level 2 | | | Level 3 | | | Total | |
Mutual Funds | | | | | | | | | | | | | | | | |
Fixed Income Funds | | $ | 124,754,185 | | | $ | — | | | $ | — | | | $ | 124,754,185 | |
Residential Mortgage-Backed Securities | | | | | | | 6,663,359 | | | | — | | | | 6,663,359 | |
U.S. Government Obligations | | | — | | | | 3,823,592 | | | | — | | | | 3,823,592 | |
Short-Term U.S. Government Obligations | | | — | | | | 1,498,435 | | | | — | | | | 1,498,435 | |
Total Investments in Securities | | $ | 124,754,185 | | | $ | 11,985,386 | | | $ | — | | | $ | 136,739,571 | |
There were no transfers into or from Level 1 and Level 2 by the Fund for the year ended September 30, 2019. Transfers, if any, between Levels are recognized at the end of the reporting period.
See notes to financial statements
85
Portfolio Managers’ Letter
COVERED CALL STRATEGY FUND
Dear Investor:
This is the annual report for the First Investors Covered Call Strategy Fund for the fiscal year ended September 30, 2019. During the period, the Fund’s return on a net asset value basis was 0.97% for Class A shares, 1.25% for Advisor Class shares and 1.42% for Institutional Class shares, including dividends of 12.4 cents per share for Class A shares, 15.6 cents per share for Advisor Class shares and 18.3 cents per share for Institutional Class shares.
Market Environment
Stocks produced modest returns during a volatile 12-month period that ended September 30, 2019. The S&P 500 returned 4.25% over the past year, but this return masks a peak to trough decline of -19.37% and subsequent rally of 30.20% during the period. Interest rates declined significantly, leading to strong returns in the bond market. The 10-year U.S. Treasury yield began the period at 3.06%, but declined to 1.46% by September 2019, near its record low. As a result, the yield curve flattened significantly, with parts of it inverting, which we are closely monitoring. This change in the direction of long-term interest rates coincided with a marked shift in monetary policy, as the Federal Reserve switched from a tightening bias to an easing bias over the past twelve months. Developed market centrals banks have also adopted an easing bias for the most part, with negative interest rates across many maturities in a large number of these countries. A record $17 trillion worth of global bonds now have negative yields.
As of the most recent report, U.S. GDP grew 2.3% over the past 12 months, in-line with the current cycle average. Growth was supported by a healthy consumer, with rising wages and an unemployment rate that touched 3.6%, the lowest in 49 years. Trade concerns have waxed and waned over the past year, impacting market sentiment and stock returns. Since the beginning of the “trade war” nearly 18 months ago, most of the negative tariff impact in the U.S. has been offset by a stronger dollar and devaluation of the renminbi, which makes Chinese goods cheaper to U.S. purchasers.
Unlike the past five years, during which growth stocks significantly outperformed value stocks, there has been no clear winner over the past 12 months, as performance of the two styles has flipped multiple times. This change in the market has created an environment that is more favorable to stock picking. As a result, the actively managed stocks in the covered call strategy have outperformed the S&P 500 over the past year.
The Fund
The call options in the Fund outperformed the call options in the benchmark by 212 basis points (bps) over the past year, as the active options strategy of the Fund was able to adapt to changing market conditions and take advantage of the heightened volatility. For example, the volatility spike during December 2018 allowed the Fund to “lock-in” high call premiums on longer term options, which gradually decayed during 2019. In comparison, the rules-based CBOE S&P 500 Buy Write (“BXM”) Index is limited to one-month options, and as a result, cannot take advantage of volatility spikes by writing longer-term options. The Fund also tended to write further out-of-the-money options, particularly in the beginning of 2019, as valuations were
86
attractive and these options provide for more upside participation during market rallies versus the BXM’s at-the-money options, which limit upside capture. Lastly, the single stock call options in the Fund tend to provide higher premiums than the Index options of the benchmark— a consistent feature of the Fund relative to the BXM. The actively managed stocks in the Fund outperformed the S&P 500 by 123 bps during the year, as positive stock selection more than offset negative sector allocation. Allocation detracted from returns as the defensive, bond-proxy sectors (Utilities, Real Estate, and Consumer Staples) were the top three performing sectors, each of which the Fund was underweight in due to valuation concerns. Stock selection was strong overall, particularly for Technology, Health Care, and Consumer Discretionary.
Thank you for placing your trust in our covered call fund. As always, we appreciate the opportunity to serve your investment needs.
Sincerely,

| 
|
Wiley D. Angell | Sean C. Hughes, CFA |
Portfolio Manager
Zeigler Capital Management, LLC | Portfolio Manager
Zeigler Capital Management, LLC |
October 4, 2019
87
Fund Expenses (unaudited)
COVERED CALL STRATEGY FUND
The examples below show the ongoing costs (in dollars) of investing in your Fund and will help you in comparing these costs with costs of other mutual funds. Please refer to page 1 for a detailed explanation of the information presented in these examples.
Expense Example | Annualized
Expense
Ratio | Beginning
Account Value
(4/1/19) | Ending
Account Value
(9/30/19) | Expenses Paid
During Period
(4/1/19-9/30/19)* |
Class A Shares | 1.26% | | | |
Actual | | $1,000.00 | $1,051.74 | $ 6.48 |
Hypothetical** | | $1,000.00 | $1,018.75 | $ 6.38 |
Advisor Class Shares | 0.80% | | | |
Actual | | $1,000.00 | $1,054.64 | $ 4.12 |
Hypothetical** | | $1,000.00 | $1,021.06 | $ 4.05 |
Institutional Class Shares | 0.86% | | | |
Actual | | $1,000.00 | $1,054.40 | $ 4.43 |
Hypothetical** | | $1,000.00 | $1,020.76 | $ 4.36 |
* | Expenses are equal to the annualized expense ratio, multiplied by the average account value over the period, multiplied by 183/365 (to reflect the one-half year period). Expenses paid during the period are net of expenses waived. |
** | Assumed rate of return of 5% before expenses |
Portfolio Composition
BY SECTOR
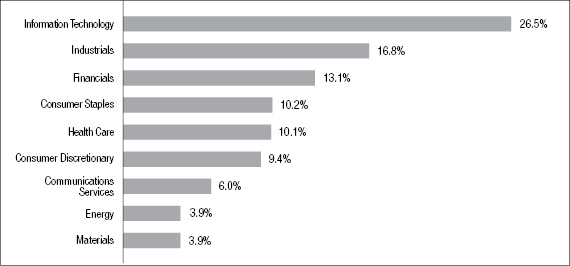
Portfolio holdings and allocations are subject to change. Percentages are as of September 30, 2019, and are based on the total market value of investments.
88
Cumulative Performance Information (unaudited)
COVERED CALL STRATEGY FUND
Comparison of change in value of $10,000 investment in the First Investors Covered Call Strategy Fund (Class A shares) and the Cboe S&P 500 BuyWrite Index.
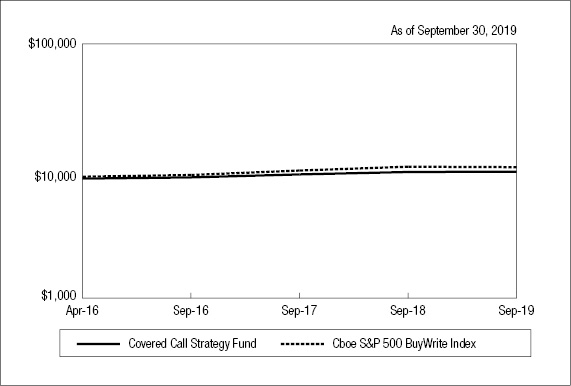
| | Average Annual Total Returns* |
N.A.V. Only | Class A | Advisor
Class | Institutional
Class | Cboe S&P
500 BuyWrite
Index |
One Year | 0.97% | 1.25% | 1.42% | -1.11% |
Since Inception** | 5.94% | 6.26% | 6.42% | 7.48% |
| | | | | |
S.E.C. Standardized | Class A | Advisor
Class | Institutional
Class | |
One Year | -4.83% | 1.25% | 1.42% | |
Since Inception** | 4.16% | 6.26% | 6.42% | |
The graph compares a $10,000 investment in the First Investors Covered Call Strategy Fund (Class A shares) beginning 4/1/16 (commencement of operations) with a theoretical investment in the Cboe S&P 500 BuyWrite Index (the “Index”). The Index is a benchmark index designed to track the performance of a hypothetical buy-write strategy on the S&P 500 Index. The Index is a passive total return index based on (1) buying an S&P 500 stock index portfolio, and (2) “writing” (or selling) the near-term S&P 500 Index (“SPX”) “covered” call option, generally on the third Friday of each month. The SPX call written will have about one month remaining to expiration, with an exercise price just above the prevailing index level (i.e., slightly out of the money). The SPX call is held until expiration and cash settled, at which time a new one-month, near-the-money call is written. It is not possible to invest directly in this Index. In addition, the Index does not reflect fees and expenses associated with the active management of a mutual fund portfolio. For purposes of the graph and the accompanying table, unless otherwise indicated, it has been assumed that the maximum sales charge was deducted from the initial $10,000 investment in the Fund and all dividends and distributions were reinvested. Advisor Class shares and Institutional Class shares performance may
89
Cumulative Performance Information (unaudited) (continued)
COVERED CALL STRATEGY FUND
be greater than or less than that shown in the line graph above for Class A shares based on differences in sales loads and fees paid by shareholders investing in the different classes.
* Average Annual Total Return figures (for the periods ended 9/30/19) include the reinvestment of all dividends and distributions. “N.A.V. Only” returns are calculated without sales charges. The Class A “S.E.C. Standardized” returns shown are based on the maximum sales charge of 5.75%. The Advisor Class and Institutional Class “S.E.C. Standardized” returns shown are the same as the N.A.V. Only returns since these classes are sold without sales charges. During the periods shown, some of the expenses of the Fund were waived or assumed. If such expenses had been paid by the Fund, the Class A “S.E.C. Standardized” Average Annual Total Return Since Inception would have been 4.04%. The Advisor Class “S.E.C. Standardized” Average Annual Total Return Since Inception would have been 6.08%. The Institutional Class “S.E.C. Standardized” Average Annual Total Return Since Inception would have been 6.26%. Results represent past performance and do not indicate future results. The graph and the returns shown do not reflect the deduction of taxes that a shareholder would pay on distributions or the redemption of fund shares. Investment return and principal value of an investment will fluctuate so that an investor’s shares, when redeemed, may be worth more or less than the original cost. Index figures are from Cboe and all other figures are from Foresters Investment Management Company, Inc.
** The Since Inception returns for Class A shares, Advisor Class shares and Institutional Class shares are for the period beginning 4/1/16 (commencement of operations).
90
Portfolio of Investments
COVERED CALL STRATEGY FUND
September 30, 2019
| |
Shares
| | | Security | | Value | |
| | | | | | COMMON STOCKS—101.6% | | | | |
| | | | | | Communication Services—6.1% | | | | |
| | | 180,200 | | | AT&T, Inc. | | $ | 6,818,768 | |
| | | 92,700 | | | CBS Corp. - Class “B” | | | 3,742,299 | |
| | | 107,000 | | | Verizon Communications, Inc. | | | 6,458,520 | |
| | | | | | | | | 17,019,587 | |
| | | | | | Consumer Discretionary—9.5% | | | | |
| | | 43,500 | | | Home Depot, Inc. | | | 10,092,870 | |
| | | 68,500 | | | Ross Stores, Inc. | | | 7,524,725 | |
| | | 56,900 | | | Whirlpool Corp. | | | 9,010,684 | |
| | | | | | | | | 26,628,279 | |
| | | | | | Consumer Staples—10.4% | | | | |
| | | 23,000 | | | Constellation Brands, Inc. - Class “A” | | | 4,767,440 | |
| | | 36,900 | | | Costco Wholesale Corp. | | | 10,631,259 | |
| | | 80,800 | | | General Mills, Inc. | | | 4,453,696 | |
| | | 115,500 | | | Mondelez International, Inc. - Class “A” | | | 6,389,460 | |
| | | 37,200 | | | Philip Morris International, Inc. | | | 2,824,596 | |
| | | | | | | | | 29,066,451 | |
| | | | | | Energy—4.0% | | | | |
| | | 94,900 | | | Chevron Corp. | | | 11,255,140 | |
| | | | | | Financials—13.3% | | | | |
| | | 64,000 | | | Allstate Corp. | | | 6,955,520 | |
| | | 70,800 | | | American Express Co. | | | 8,374,224 | |
| | | 19,900 | | | BlackRock, Inc. | | | 8,868,236 | |
| | | 109,800 | | | JPMorgan Chase & Co. | | | 12,922,362 | |
| | | | | | | | | 37,120,342 | |
| | | | | | Health Care—10.3% | | | | |
| | | 39,100 | | * | Celgene Corp. | | | 3,882,630 | |
| | | 123,600 | | | Medtronic, PLC | | | 13,425,432 | |
| | | 80,300 | | | Merck & Co., Inc. | | | 6,759,654 | |
91
Portfolio of Investments (continued)
COVERED CALL STRATEGY FUND
September 30, 2019
| |
Shares
| | | Security | | Value | |
| | | | | | Health Care (continued) |
| | | 16,500 | | | Thermo Fisher Scientific, Inc. | | $ | 4,805,955 | |
| | | | | | | | | 28,873,671 | |
| | | | | | Industrials—17.1% | | | | |
| | | 118,000 | | | Delta Air Lines, Inc. | | | 6,796,800 | |
| | | 73,800 | | | Honeywell International, Inc. | | | 12,486,960 | |
| | | 31,000 | | | Lockheed Martin Corp. | | | 12,091,860 | |
| | | 35,800 | | | Raytheon Co. | | | 7,023,602 | |
| | | 22,300 | | | Union Pacific Corp. | | | 3,612,154 | |
| | | 42,900 | | | United Technologies Corp. | | | 5,856,708 | |
| | | | | | | | | 47,868,084 | |
| | | | | | Information Technology—26.9% | | | | |
| | | 74,400 | | | Apple, Inc. | | | 16,663,368 | |
| | | 32,800 | | | Broadcom, Inc. | | | 9,055,096 | |
| | | 244,900 | | | Cisco Systems, Inc. | | | 12,100,509 | |
| | | 32,500 | | | International Business Machines Corp. | | | 4,726,150 | |
| | | 43,700 | | | Mastercard, Inc. - Class “A” | | | 11,867,609 | |
| | | 113,900 | | | Microsoft Corp. | | | 15,835,517 | |
| | | 90,900 | | | Oracle Corp. | | | 5,002,227 | |
| | | | | | | | | 75,250,476 | |
| | | | | | Materials—4.0% | | | | |
| | | 62,400 | | | Dow, Inc. | | | 2,973,360 | |
| | | 112,700 | | | DuPont de Nemours, Inc. | | | 8,036,637 | |
| | | | | | | | | 11,009,997 | |
Total Value of Common Stocks (cost $225,887,741) | | | 101.6 | % | | | 284,092,027 | |
Excess of Liabilities Over Other Assets | | | (1.6 | ) | | | (4,586,850 | ) |
Net Assets | | | 100.0 | % | | $ | 279,505,177 | |
92
CALL OPTIONS
WRITTEN—(4.9)% | | Expiration
Date | | | Exercise
Price | | | Contracts | | | Value | |
Allstate Corp. | | | 1/17/20 | | | $ | 105.00 | | | | (640 | ) | | $ | (432,000 | ) |
American Express Co. | | | 1/17/20 | | | | 125.00 | | | | (708 | ) | | | (180,186 | ) |
Apple, Inc. | | | 11/15/19 | | | | 215.00 | | | | (409 | ) | | | (589,983 | ) |
Apple, Inc. | | | 12/20/19 | | | | 215.00 | | | | (335 | ) | | | (548,562 | ) |
AT&T, Inc. | | | 1/17/20 | | | | 38.00 | | | | (1,802 | ) | | | (254,983 | ) |
BlackRock, Inc. | | | 1/17/20 | | | | 440.00 | | | | (199 | ) | | | (520,385 | ) |
Broadcom, Inc. | | | 10/18/19 | | | | 290.00 | | | | (328 | ) | | | (60,680 | ) |
CBS Corp. - Class “B” | | | 12/20/19 | | | | 45.00 | | | | (927 | ) | | | (62,109 | ) |
Celgene Corp. | | | 10/18/19 | | | | 92.50 | | | | (391 | ) | | | (296,183 | ) |
Chevron Corp. | | | 11/15/19 | | | | 120.00 | | | | (949 | ) | | | (267,618 | ) |
Cisco Systems, Inc. | | | 10/18/19 | | | | 49.00 | | | | (2,449 | ) | | | (254,696 | ) |
Constellation Brands, Inc. - Class “A” | | | 1/17/20 | | | | 205.00 | | | | (230 | ) | | | (325,450 | ) |
Costco Wholesale Corp. | | | 10/18/19 | | | | 280.00 | | | | (369 | ) | | | (484,312 | ) |
Delta Air Lines, Inc. | | | 12/20/19 | | | | 60.00 | | | | (1,180 | ) | | | (200,600 | ) |
Dow, Inc. | | | 12/20/19 | | | | 45.00 | | | | (624 | ) | | | (268,320 | ) |
DuPont de Nemours, Inc. | | | 12/20/19 | | | | 67.50 | | | | (1,127 | ) | | | (693,105 | ) |
General Mills, Inc. | | | 1/17/20 | | | | 55.00 | | | | (808 | ) | | | (201,596 | ) |
Home Depot, Inc. | | | 1/17/20 | | | | 225.00 | | | | (435 | ) | | | (640,538 | ) |
Honeywell International, Inc. | | | 12/20/19 | | | | 175.00 | | | | (347 | ) | | | (114,510 | ) |
Honeywell International, Inc. | | | 12/20/19 | | | | 170.00 | | | | (391 | ) | | | (219,937 | ) |
International Business Machines Corp. | | | 1/17/20 | | | | 140.00 | | | | (325 | ) | | | (327,438 | ) |
JPMorgan Chase & Co. | | | 12/20/19 | | | | 105.00 | | | | (1,098 | ) | | | (1,496,025 | ) |
Lockheed Martin Corp. | | | 1/17/20 | | | | 410.00 | | | | (310 | ) | | | (251,100 | ) |
Mastercard, Inc. - Class “A” | | | 1/17/20 | | | | 280.00 | | | | (437 | ) | | | (445,740 | ) |
Medtronic, PLC | | | 1/17/20 | | | | 115.00 | | | | (1,236 | ) | | | (235,458 | ) |
Merck & Co., Inc. | | | 1/17/20 | | | | 87.50 | | | | (803 | ) | | | (176,660 | ) |
Microsoft Corp. | | | 12/20/19 | | | | 140.00 | | | | (1,139 | ) | | | (663,467 | ) |
Mondelez International, Inc. - Class “A” | | | 12/20/19 | | | | 55.00 | | | | (1,155 | ) | | | (262,763 | ) |
Oracle Corp. | | | 12/20/19 | | | | 55.00 | | | | (909 | ) | | | (220,887 | ) |
Philip Morris International, Inc. | | | 12/20/19 | | | | 90.00 | | | | (372 | ) | | | (8,184 | ) |
Raytheon Co. | | | 1/17/20 | | | | 185.00 | | | | (358 | ) | | | (615,760 | ) |
Ross Stores, Inc. | | | 11/15/19 | | | | 105.00 | | | | (685 | ) | | | (517,175 | ) |
Thermo Fisher Scientific, Inc. | | | 12/20/19 | | | | 310.00 | | | | (165 | ) | | | (88,275 | ) |
Union Pacific Corp. | | | 1/17/20 | | | | 175.00 | | | | (223 | ) | | | (81,952 | ) |
United Technologies Corp. | | | 1/17/20 | | | | 130.00 | | | | (429 | ) | | | (474,045 | ) |
Verizon Communications, Inc. | | | 1/17/20 | | | | 57.50 | | | | (1,070 | ) | | | (409,275 | ) |
93
Portfolio of Investments (continued)
COVERED CALL STRATEGY FUND
September 30, 2019
CALL OPTIONS
WRITTEN—(4.9)% | | Expiration
Date | | | Exercise
Price | | | Contracts | | | Value | |
Whirlpool Corp. | | | 12/20/19 | | | $ | 150.00 | | | | (569 | ) | | $ | (842,120 | ) |
Total Value of Call Options Written (premium received $10,468,889) | | $ | (13,732,077 | ) |
The Fund’s assets and liabilities are classified into the following three levels based on the inputs used to value the assets and liabilities:
| | Level 1 – | Unadjusted quoted prices in active markets for identical securities that the Fund has the ability to access. |
| | Level 2 – | Observable inputs other than quoted prices included in Level 1 that are observable for the asset or liability, either directly or indirectly. These inputs may include quoted prices for the identical instrument on an inactive market, prices for similar instruments, interest rates, prepayment speeds, credit risk, yield curves, default rates and similar data. |
| | Level 3 – | Unobservable inputs for the asset or liability, to the extent relevant observable inputs are not available, representing the Fund’s own assumption about the assumptions a market participant would use in valuing the asset or liability, and would be based on the best information available. |
The inputs methodology used for valuing securities are not necessarily an indication of the risk associated with investing in those securities. For example, U.S. Government securities are reflected as Level 2 because the inputs used to determine fair value may not always be quoted prices in an active market.
The following is a summary, by category of Level, of inputs used to value the Fund’s investments as of September 30, 2019:
| | | Level 1 | | | Level 2 | | | Level 3 | | | Total | |
Assets | | | | | | | | | | | | | | | | |
Common Stocks* | | $ | 284,092,027 | | | $ | — | | | $ | — | | | $ | 284,092,027 | |
| | | | | | | | | | | | | | | | | |
Liabilities | | | | | | | | | | | | | | | | |
Call Options Written | | $ | — | | | $ | (13,732,077 | ) | | $ | — | | | $ | (13,732,077 | ) |
* | The Portfolio of Investments provides information on the industry categorization for common stocks. |
There were no transfers into or from Level 1 and Level 2 by the Fund for the year ended September 30, 2019. Transfers, if any, between Levels are recognized at the end of the reporting period.
See notes to financial statements
94
Portfolio Manager’s Letter
EQUITY INCOME FUND
Dear Investor:
This is the annual report for the First Investors Equity Income Fund for the fiscal year ended September 30, 2019. During the period, the Fund’s return on a net asset value basis was 1.83% for Class A shares, 1.97% for Advisor Class shares and 2.18% for Institutional Class shares, including dividends of 26.1 cents per share for Class A shares, 29.4 cents per share for Advisor Class shares and 32.9 cents per share for Institutional Class shares. In addition, the Fund distributed capital gains of $1.14 per share on each class of shares.
U.S. equity market
The U.S. stock market began the review period with a very weak quarter. The S&P 500 fell -9.0% in the month of December alone. The start of 2019 saw a meaningful reversal in the equity markets following the sharp sell-off in December. Quantitative tightening by the Fed, coupled with slowing earnings and increased trade disputes, sparked the sell-off. January started very strong with the S&P 500 posting a +8.0% total return, the best monthly showing since 1987. By the end of January, the S&P had erased most of the losses incurred during the month of December and sat 15% above its Christmas Eve low. The January rally was led by higher-beta, lower-quality and smaller-cap names. Fueled by a dovish Fed and more optimism about a potential trade deal, the S&P 500 posted its best quarterly return since 2009. The first quarter rally in small-cap stocks was the best since 1991.
As the second quarter progressed, the dominant themes were global trade war, the slowing global economy, and the Fed becoming more accommodative and starting to lower rates again. The S&P 500 gained 17% during the first six months of the year (its best performance since 1997). The market’s gains were predominantly built upon defensive sectors like Utilities, REITs and Consumer Staples. These sectors all made new highs along with the S&P 500, as lower global interest rates seemingly accelerated investors’ appetite for yield.
The start of the summer saw global economic data begin to weaken as the effect of the trade war began to manifest itself. The 2- to 10-year U.S. Treasury yield curve inverted for the first time since the Global Financial Crisis, raising recession concerns. The market continued to move on trade talk and the economy. In September, oil spiked with attacks on a Saudi processing plant and we saw a rotation from momentum stocks to value stocks for the first time. High-growth stocks came down off their highs and valuations in the private market began to correct as well. Nevertheless, the S&P 500 remained near its all-time highs posting a return of 20.55% on a year-to-date basis.
The Fund
The Fund underperformed its benchmark for the review period. The Fund’s underweight of the Consumer Discretionary sector and poor stock selection within that sector were the largest contributors to the underperformance. Designer Brands was down significantly off its highs after the company made an acquisition that was not well received by investors. Tractor Supply has underperformed after the Chinese have curtailed their agriculture purchases and mid-west flooding put tremendous pressure on their customers purchasing power. The current
95
Portfolio Manager’s Letter (continued)
EQUITY INCOME FUND
administration’s use of tariffs also had a negative impact on Tapestry, the parent company of Coach and Kate Spade, as higher tariffs on goods made in China will have a negative impact on margins.
The Fund’s underperformance in Energy was led by poor stock selection with Encana, a small-cap oil producer which sold off after surprising Wall Street analysts with a large acquisition. The Fund underperformed its peers in Healthcare due to poor stock selection and an underweight of medical technology names as result of the lack of dividend paying stocks in that sector. The Fund’s position in Phibro Animal Health, which provides vaccines and medicines for herd animals, was also hurt by the curtailing of herd animals purchases by the Chinese because of the current trade dispute.
With the Utilities sector having one of its best years in terms of performance, our underweighting of the sector has hurt our relative performance. The Fed has reversed it earlier tightening cycle and bond yields have begun to move lower; as yield move lower, investors searching for yield are forced to increase the exposure to the sector. We felt that most of the Utilities were close to fully valued, selling at multiples that are at all-time highs.
The Fund had a strong year in stock selection within the Industrial sector. Its two defense names, Lockheed Martin and Northrop Grumman, were up significantly this year as defense budgets were expanded and both companies picked up sizeable contract wins. Ingersoll Rand rose significantly because of strong demand in the core air conditioning markets and the selling of their lower margin industrial business. The Fund’s performance in the Telecommunication sector was led by Comcast and Verizon as both companies have grown earnings above expectations and, with their healthy dividend yields, are attractive opportunities for investors seeking yield. The Fund’s performance in the Consumer Staples sector was also strong, with both Coca-Cola and Pepsi having a strong performance year. Our largest position in this sector, Walmart, also has had a good year with improvement in their online retail sales.
Thank you for placing your trust in Foresters Financial. As always, we appreciate the opportunity to serve your investment needs.
Sincerely,

Sean Reidy
Portfolio Manager and
Director of Equities,
Foresters Investment Management Company, Inc.
October 4, 2019
96
Fund Expenses (unaudited)
EQUITY INCOME FUND
The examples below show the ongoing costs (in dollars) of investing in your Fund and will help you in comparing these costs with costs of other mutual funds. Please refer to page 1 for a detailed explanation of the information presented in these examples.
Expense Example | Annualized
Expense
Ratio | Beginning
Account Value
(4/1/19) | Ending
Account Value
(9/30/19) | Expenses Paid
During Period
(4/1/19-9/30/19)* |
Class A Shares | 1.16% | | | |
Actual | | $1,000.00 | $1,054.21 | $ 5.97 |
Hypothetical** | | $1,000.00 | $1,019.25 | $ 5.87 |
Advisor Class Shares | 0.91% | | | |
Actual | | $1,000.00 | $1,053.85 | $ 4.69 |
Hypothetical** | | $1,000.00 | $1,020.51 | $ 4.61 |
Institutional Class Shares | 0.80% | | | |
Actual | | $1,000.00 | $1,056.01 | $ 4.12 |
Hypothetical** | | $1,000.00 | $1,021.06 | $ 4.05 |
* | Expenses are equal to the annualized expense ratio, multiplied by the average account value over the period, multiplied by 183/365 (to reflect the one-half year period). |
** | Assumed rate of return of 5% before expenses |
Portfolio Composition
TOP TEN SECTORS
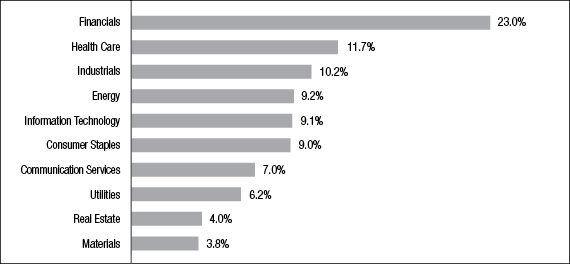
Portfolio holdings and allocations are subject to change. Percentages are as of September 30, 2019, and are based on the total market value of investments.
97
Cumulative Performance Information (unaudited)
EQUITY INCOME FUND
Comparison of change in value of $10,000 investment in the First Investors Equity Income Fund (Class A shares), the MSCI USA Value Index† and the Russell 1000® Value Index.
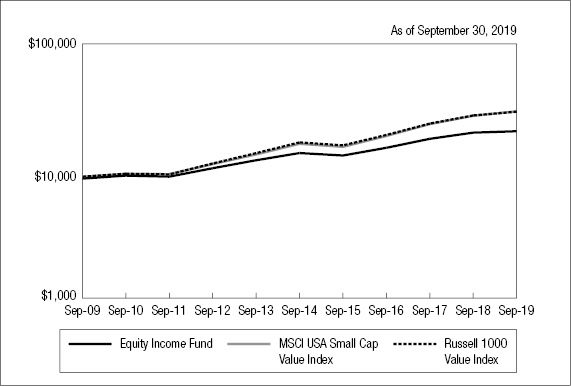
| | Average Annual Total Returns* |
N.A.V. Only | Class A | Advisor
Class | Institutional
Class | MSCI USA
Value Index | Russell 1000
Value Index |
One Year | 1.83% | 1.97% | 2.18% | 4.71% | 4.00% |
Five Years | 6.71% | 7.06% | 7.13% | 8.30% | 7.79% |
Ten Years or Since Inception** | 9.66% | 8.88% | 8.99% | 11.50%†† | 11.46%†† |
| | | | | | |
S.E.C. Standardized | Class A | Advisor
Class | Institutional
Class | | |
One Year | -4.06% | 1.97% | 2.18% | | |
Five Years | 5.45% | 7.06% | 7.13% | | |
Ten Years or Since Inception** | 9.01% | 8.88% | 8.99% | | |
The graph compares a $10,000 investment in the First Investors Equity Income Fund (Class A shares) beginning 9/30/09 with theoretical investments in the MSCI USA Value Index and the Russell 1000 Value Index (the “Indices”). The MSCI USA Value Index captures large and mid-cap U.S. securities exhibiting overall value characteristics. The value investment style characteristics for index constructions are defined using book value to price 12-month forward earnings to price and dividend yield. The Russell 1000 Value Index is an unmanaged index that measures the performance of the large-cap value segment of the U.S. equity universe. It includes those Russell 1000 companies with lower price-to-book ratios and lower expected growth values. It is not possible to invest directly in these Indices. In addition, the Indices do not reflect fees and expenses associated with the active management of a mutual fund portfolio. For purposes of the graph and the accompanying table, unless otherwise indicated, it has been assumed that the maximum sales charge was deducted from the initial $10,000 investment in the Fund and all dividends and distributions were
98
reinvested. Advisor Class shares and Institutional Class shares performance may be greater than or less than that shown in the line graph above for Class A shares based on differences in sales loads and fees paid by shareholders investing in the different classes.
* Average Annual Total Return figures (for the periods ended 9/30/19) include the reinvestment of all dividends and distributions. “N.A.V. Only” returns are calculated without sales charges. The Class A “S.E.C. Standardized” returns shown are based on the maximum sales charge of 5.75%. The Advisor Class and Institutional Class “S.E.C. Standardized” returns shown are the same as the N.A.V. Only returns since these classes are sold without sales charges. During the periods shown, some of the expenses of the Advisor Class were waived or assumed. If such expenses had been paid by the Fund, the Advisor Class “S.E.C. Standardized” Average Annual Total Return Since Inception would have been 8.36%. Results represent past performance and do not indicate future results. The graph and the returns shown do not reflect the deduction of taxes that a shareholder would pay on distributions or the redemption of fund shares. Investment return and principal value of an investment will fluctuate so that an investor’s shares, when redeemed, may be worth more or less than the original cost. Index figures are from FTSE Russell and Standard & Poor’s and all other figures are from Foresters Investment Management Company, Inc.
** The Since Inception returns for Advisor Class shares and Institutional Class shares are for the periods beginning 4/1/13 (commencement of operations for those classes).
† During the fiscal year, the Fund changed its primary broad-based securities index to the MSCI USA Value Index from the Russell 1000 Value Index since it more closely reflects the Fund’s investment strategies. After this fiscal year, we will not show a comparison to the Russell 1000 Value Index.
†† The Index return is for ten years. The MSCI USA Value Index return and the Russell 1000 Value Index return since inception of the Advisor Class shares and Institutional Class shares are 10.41% and 9.96%, respectively.
99
Portfolio of Investments
EQUITY INCOME FUND
September 30, 2019
| |
Shares
| | | Security | | Value | |
| | | | | | COMMON STOCKS—95.3% | | | | |
| | | | | | Communication Services—7.0% | | | | |
| | | 238,230 | | | AT&T, Inc. | | $ | 9,014,623 | |
| | | 236,400 | | | Comcast Corp. - Special Shares “A” | | | 10,656,912 | |
| | | 183,200 | | | Verizon Communications, Inc. | | | 11,057,952 | |
| | | 15,750 | | | Walt Disney Co. | | | 2,052,540 | |
| | | | | | | | | 32,782,027 | |
| | | | | | Consumer Discretionary—3.0% | | | | |
| | | 28,350 | | | Lowe’s Cos., Inc. | | | 3,117,366 | |
| | | 21,900 | | | McDonald’s Corp. | | | 4,702,149 | |
| | | 23,750 | | | Oxford Industries, Inc. | | | 1,702,875 | |
| | | 51,600 | | | Penske Automotive Group, Inc. | | | 2,439,648 | |
| | | 25,850 | | | Tractor Supply Co. | | | 2,337,874 | |
| | | | | | | | | 14,299,912 | |
| | | | | | Consumer Staples—8.9% | | | | |
| | | 161,050 | | | Coca-Cola Co. | | | 8,767,562 | |
| | | 34,250 | | | Kimberly-Clark Corp. | | | 4,865,212 | |
| | | 57,150 | | | PepsiCo, Inc. | | | 7,835,265 | |
| | | 44,750 | | | Philip Morris International, Inc. | | | 3,397,868 | |
| | | 69,200 | | | Procter & Gamble Co. | | | 8,607,096 | |
| | | 73,550 | | | Walmart, Inc. | | | 8,728,914 | |
| | | | | | | | | 42,201,917 | |
| | | | | | Energy—9.1% | | | | |
| | | 138,707 | | | BP, PLC (ADR) | | | 5,269,479 | |
| | | 66,250 | | | Chevron Corp. | | | 7,857,250 | |
| | | 71,500 | | | ConocoPhillips | | | 4,074,070 | |
| | | 94,050 | | | ExxonMobil Corp. | | | 6,640,870 | |
| | | 178,950 | | | Kinder Morgan, Inc. | | | 3,688,159 | |
| | | 75,993 | | | Marathon Petroleum Corp. | | | 4,616,575 | |
| | | 158,850 | | | PBF Energy, Inc. - Class “A” | | | 4,319,132 | |
| | | 29,100 | | | Royal Dutch Shell, PLC - Class “A” (ADR) | | | 1,712,535 | |
100
| |
Shares
| | | Security | | Value | |
| | | | | | Energy (continued) |
| | | 156,000 | | | Suncor Energy, Inc. | | $ | 4,926,480 | |
| | | | | | | | | 43,104,550 | |
| | | | | | Financials—22.7% | | | | |
| | | 125,300 | | * | AllianceBernstein Holding, LP (MLP) | | | 3,677,555 | |
| | | 29,200 | | | American Express Co. | | | 3,453,776 | |
| | | 285,250 | | | Bank of America Corp. | | | 8,320,742 | |
| | | 56,500 | | | Bank of New York Mellon Corp. | | | 2,554,365 | |
| | | 40,650 | | * | Berkshire Hathaway, Inc. - Class “B” | | | 8,456,013 | |
| | | 6,300 | | | BlackRock, Inc. | | | 2,807,532 | |
| | | 48,460 | | | Chubb, Ltd. | | | 7,823,382 | |
| | | 92,800 | | | Citigroup, Inc. | | | 6,410,624 | |
| | | 21,800 | | | Goldman Sachs Group, Inc. | | | 4,517,614 | |
| | | 99,845 | | | Hamilton Lane, Inc. - Class “A” | | | 5,687,171 | |
| | | 213,450 | | | Investors Bancorp, Inc. | | | 2,424,792 | |
| | | 119,200 | | | iShares S&P U.S. Preferred Stock Index Fund (ETF) | | | 4,473,576 | |
| | | 104,050 | | | JPMorgan Chase & Co. | | | 12,245,644 | |
| | | 64,100 | | | MetLife, Inc. | | | 3,022,956 | |
| | | 156,700 | | | Old National Bancorp of Indiana | | | 2,696,024 | |
| | | 24,700 | | | PNC Financial Services Group, Inc. | | | 3,461,952 | |
| | | 52,100 | | | Popular, Inc. | | | 2,817,568 | |
| | | 208,450 | | | Regions Financial Corp. | | | 3,297,679 | |
| | | 122,900 | | | Sterling Bancorp | | | 2,465,374 | |
| | | 45,700 | | | Travelers Cos., Inc. | | | 6,795,133 | |
| | | 97,900 | | | Wells Fargo & Co. | | | 4,938,076 | |
| | | 24,700 | | | Willis Towers Watson, PLC | | | 4,766,359 | |
| | | | | | | | | 107,113,907 | |
| | | | | | Health Care—11.6% | | | | |
| | | 62,850 | | | Abbott Laboratories | | | 5,258,659 | |
| | | 15,450 | | | Anthem, Inc. | | | 3,709,545 | |
| | | 72,050 | | | Bristol-Myers Squibb Co. | | | 3,653,655 | |
| | | 12,550 | | | Eli Lilly & Co. | | | 1,403,467 | |
| | | 108,450 | | | GlaxoSmithKline, PLC (ADR) | | | 4,628,646 | |
101
Portfolio of Investments (continued)
EQUITY INCOME FUND
September 30, 2019
| |
Shares
| | | Security | | Value | |
| | | | | | Health Care (continued) |
| | | 39,700 | | | Johnson & Johnson | | $ | 5,136,386 | |
| | | 88,694 | | | Medtronic, PLC | | | 9,633,942 | |
| | | 85,261 | | | Merck & Co., Inc. | | | 7,177,271 | |
| | | 191,674 | | | Pfizer, Inc. | | | 6,886,847 | |
| | | 100,850 | | | Smith & Nephew, PLC (ADR) | | | 4,853,911 | |
| | | 10,900 | | | UnitedHealth Group, Inc. | | | 2,368,788 | |
| | | | | | | | | 54,711,117 | |
| | | | | | Industrials—10.1% | | | | |
| | | 55,250 | | | Eaton Corp., PLC | | | 4,594,038 | |
| | | 23,700 | | | General Dynamics Corp. | | | 4,330,701 | |
| | | 34,400 | | | Honeywell International, Inc. | | | 5,820,480 | |
| | | 39,550 | | | Ingersoll-Rand, PLC | | | 4,872,956 | |
| | | 38,150 | | | Kansas City Southern, Inc. | | | 5,074,331 | |
| | | 15,850 | | | Lockheed Martin Corp. | | | 6,182,451 | |
| | | 15,900 | | | Northrop Grumman Corp. | | | 5,959,161 | |
| | | 57,650 | | | Republic Services, Inc. | | | 4,989,608 | |
| | | 42,200 | | | United Technologies Corp. | | | 5,761,144 | |
| | | | | | | | | 47,584,870 | |
| | | | | | Information Technology—9.0% | | | | |
| | | 155,900 | | | Cisco Systems, Inc. | | | 7,703,019 | |
| | | 83,700 | | | Corning, Inc. | | | 2,387,124 | |
| | | 77,700 | | | HP, Inc. | | | 1,470,084 | |
| | | 153,700 | | | Intel Corp. | | | 7,920,161 | |
| | | 41,650 | | | Maxim Integrated Products, Inc. | | | 2,411,952 | |
| | | 78,150 | | | Microsoft Corp. | | | 10,865,195 | |
| | | 68,300 | | | QUALCOMM, Inc. | | | 5,209,924 | |
| | | 39,500 | | | Teradyne, Inc. | | | 2,287,445 | |
| | | 17,250 | | | Texas Instruments, Inc. | | | 2,229,390 | |
| | | | | | | | | 42,484,294 | |
| | | | | | Materials—3.8% | | | | |
| | | 27,500 | | | Avery Dennison Corp. | | | 3,123,175 | |
102
| |
Shares
| | | Security | | Value | |
| | | | | | Materials (continued) |
| | | 57,807 | | | Dow, Inc. | | $ | 2,754,504 | |
| | | 30,941 | | | DuPont de Nemours, Inc. | | | 2,206,403 | |
| | | 16,800 | | | Eastman Chemical Co. | | | 1,240,344 | |
| | | 27,900 | | | FMC Corp. | | | 2,446,272 | |
| | | 18,300 | | | Linde, PLC | | | 3,545,076 | |
| | | 27,150 | | | LyondellBasell Industries NV - Class “A” | | | 2,429,111 | |
| | | | | | | | | 17,744,885 | |
| | | | | | Real Estate—4.0% | | | | |
| | | 111,950 | | | Americold Realty Trust (REIT) | | | 4,149,986 | |
| | | 158,720 | | | Brookfield Property Partners (REIT) | | | 3,222,016 | |
| | | 49,500 | | | CyrusOne, Inc. (REIT) | | | 3,915,450 | |
| | | 85,600 | | | Douglas Emmett, Inc. (REIT) | | | 3,666,248 | |
| | | 27,800 | | | Federal Realty Investment Trust (REIT) | | | 3,784,692 | |
| | | | | | | | | 18,738,392 | |
| | | | | | Utilities—6.1% | | | | |
| | | 39,900 | | | American Electric Power Co., Inc. | | | 3,738,231 | |
| | | 113,100 | | | CenterPoint Energy, Inc. | | | 3,413,358 | |
| | | 50,000 | | | Dominion Energy, Inc. | | | 4,052,000 | |
| | | 35,000 | | | Duke Energy Corp. | | | 3,355,100 | |
| | | 65,450 | | | Exelon Corp. | | | 3,161,889 | |
| | | 72,250 | | | FirstEnergy Corp. | | | 3,484,617 | |
| | | 19,900 | | | NextEra Energy, Inc. | | | 4,636,501 | |
| | | 46,150 | | | Utilities Select Sector SPDR Fund (ETF) | | | 2,987,751 | |
| | | | | | | | | 28,829,447 | |
Total Value of Common Stocks (cost $309,056,581) | | | 449,595,318 | |
103
Portfolio of Investments (continued)
EQUITY INCOME FUND
September 30, 2019
| |
Principal
Amount
| | | Security | | Value | |
| | | | | | SHORT-TERM U.S. GOVERNMENT AGENCY OBLIGATIONS—2.1% | | | | |
| | $ | 10,000M | | | Federal Home Loan Bank, 1.93%, 10/25/2019 (cost $9,987,125) | | $ | 9,987,530 | |
| | | | | | SHORT-TERM U.S. GOVERNMENT OBLIGATIONS—1.5% | | | | |
| | | 7,000M | | | U.S. Treasury Bills, 1.78%, 10/22/2019 (cost $6,992,731) | | | 6,992,699 | |
Total Value of Investments (cost $326,036,437) | | | 98.9 | % | | | 466,575,547 | |
Other Assets, Less Liabilities | | | 1.1 | | | | 5,254,565 | |
Net Assets | | | 100.0 | % | | $ | 471,830,112 | |
Summary of Abbreviations:
ADR | American Depositary Receipts |
REIT | Real Estate Investment Trust |
SPDR | Standard & Poor’s Depository Receipts |
The Fund’s assets and liabilities are classified into the following three levels based on the inputs used to value the assets and liabilities:
| | Level 1 – | Unadjusted quoted prices in active markets for identical securities that the Fund has the ability to access. |
| | Level 2 – | Observable inputs other than quoted prices included in Level 1 that are observable for the asset or liability, either directly or indirectly. These inputs may include quoted prices for the identical instrument on an inactive market, prices for similar instruments, interest rates, prepayment speeds, credit risk, yield curves, default rates and similar data. |
| | Level 3 – | Unobservable inputs for the asset or liability, to the extent relevant observable inputs are not available, representing the Fund’s own assumption about the assumptions a market participant would use in valuing the asset or liability, and would be based on the best information available. |
The inputs methodology used for valuing securities are not necessarily an indication of the risk associated with investing in those securities. For example, U.S. Government securities are reflected as Level 2 because the inputs used to determine fair value may not always be quoted prices in an active market.
104
The following is a summary, by category of Level, of inputs used to value the Fund’s investments as of September 30, 2019:
| | | Level 1 | | | Level 2 | | | Level 3 | | | Total | |
Common Stocks | | $ | 449,595,318 | | | $ | — | | | $ | — | | | $ | 449,595,318 | |
Short-Term U.S. Government Agency Obligations | | | — | | | | 9,987,530 | | | | — | | | | 9,987,530 | |
Short-Term U.S. Government Obligations | | | — | | | | 6,992,699 | | | | — | | | | 6,992,699 | |
Total Investments in Securities* | | $ | 449,595,318 | | | $ | 16,980,229 | | | $ | — | | | $ | 466,575,547 | |
* | The Portfolio of Investments provides information on the industry categorization for common stocks. |
There were no transfers into or from Level 1 and Level 2 by the Fund for the year ended September 30, 2019. Transfers, if any, between Levels are recognized at the end of the reporting period.
See notes to financial statements
105
Portfolio Manager’s Letter
GLOBAL FUND
Dear Investor:
This is the annual report for the First Investors Global Fund for the fiscal year ended September 30, 2019. During the period, the Fund’s return on a net asset value basis was -1.48% for Class A shares, -1.20% for Advisor Class shares and -1.08% for Institutional Class shares. The Fund distributed capital gains of 99.7 cents per share on each class of shares.
International equities
Global equities, as measured by the MSCI All Country World Index (“ACWI”), advanced 1.95% during the trailing one year ending September 30, 2019. Despite this moderate rise, global equity markets exhibited extreme volatility during the year primarily driven by the Fed’s policy and the U.S. administration’s trade policy with China. The Fed’s desire to raise interest rates, while shrinking its balance sheet, brought significant losses across global financial markets in the fourth quarter of 2018. As measured by the ACWI, global stocks fell 13.1% in U. S. dollars during the last quarter of 2018.
After the turbulent decline in the fourth quarter, the U.S. administration appeared to change tack—the government moderated its position towards reaching an agreement with China, and the Fed reversed course and ceased tightening following their January 2019 meeting. This dramatic pivot away from the Fed’s December tightening policy decision collapsed bond yields and drove prices of global risk assets higher with the MSCI AC World Index rising 12.18%. Global equity markets continued their march higher in the second quarter of 2019 and the MSCI AC World Index rose 2.93%. Positive returns were driven by continued low interest rates and expectations that monetary policy was likely to remain accommodating.
Equity markets dropped slightly in the third quarter. The ACWI fell 0.53%, driven by weaker overseas markets, despite continued low interest rates and expectations that monetary policy was likely to remain accommodative. European markets sold off and remained susceptible to political news flow. U.K. headlines were dominated by negative stories around Brexit after Boris Johnson replaced Theresa May as prime minister. Additionally, because the European Union is sensitive to trade, economic uncertainty fueled by comments around further tariffs continued to weigh on industrial confidence and economic activity.
Overall, including all the volatility and drama during the 12-month period, markets collapsed and then rallied back, leaving the ACWI little changed with a small positive 1.95% U.S. dollar return for the trailing one-year period ended September 30, 2019.
The Fund
The Fund underperformed the ACWI for the trailing one-year period ended September 30, 2019. Underperformance was driven by both sector allocation and stock selection. The largest contributors to underperformance were the Energy, Financials, Healthcare, Information Technology and Real Estate sectors, with the Energy sector the largest contributor to the Fund’s underperformance due to the substantial decline in oil prices during the review period.
106
Conversely, Materials, Utilities, Industrials, Consumer Discretionary and Consumer Staples contributed to performance.
From a regional perspective, North America and Western Europe were the largest contributors to underperformance of the Fund, led by the U.S. and the U.K. In contrast, Asia Pacific and the Middle East were the largest contributors to regional returns, led by Japan and Israel.
Thank you for placing your trust in Foresters Financial. As always, we appreciate the opportunity to serve your investment needs.
Sincerely,

Pedro V. Marcal
Portfolio Manager and
Director of International Equities,
Foresters Investment Management Company, Inc.
October 4, 2019
107
Fund Expenses (unaudited)
GLOBAL FUND
The examples below show the ongoing costs (in dollars) of investing in your Fund and will help you in comparing these costs with costs of other mutual funds. Please refer to page 1 for a detailed explanation of the information presented in these examples.
Expense Example | Annualized
Expense
Ratio | Beginning
Account Value
(4/1/19) | Ending
Account Value
(9/30/19) | Expenses Paid
During Period
(4/1/19-9/30/19)* |
Class A Shares | 1.42% | | | |
Actual | | $1,000.00 | $1,047.49 | $ 7.29 |
Hypothetical** | | $1,000.00 | $1,017.95 | $ 7.18 |
Advisor Class Shares | 1.10% | | | |
Actual | | $1,000.00 | $1,048.78 | $ 5.65 |
Hypothetical** | | $1,000.00 | $1,019.55 | $ 5.57 |
Institutional Class Shares | 1.03% | | | |
Actual | | $1,000.00 | $1,049.80 | $ 5.29 |
Hypothetical** | | $1,000.00 | $1,019.91 | $ 5.22 |
* | Expenses are equal to the annualized expense ratio, multiplied by the average account value over the period, multiplied by 183/365 (to reflect the one-half year period). Expenses paid during the period are net of expenses waived. |
** | Assumed rate of return of 5% before expenses |
Portfolio Composition
TOP TEN SECTORS
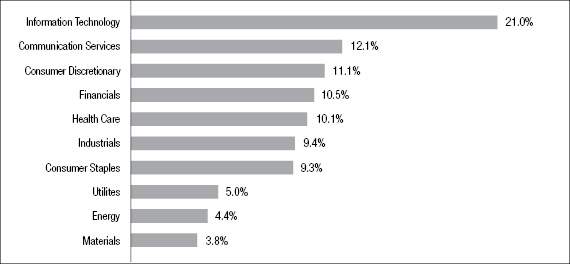
Portfolio holdings and allocations are subject to change. Percentages are as of September 30, 2019, and are based on the total market value of investments.
108
Cumulative Performance Information (unaudited)
GLOBAL FUND
Comparison of change in value of $10,000 investment in the First Investors Global Fund (Class A shares) and the Morgan Stanley Capital International (“MSCI”) All Country World Index.
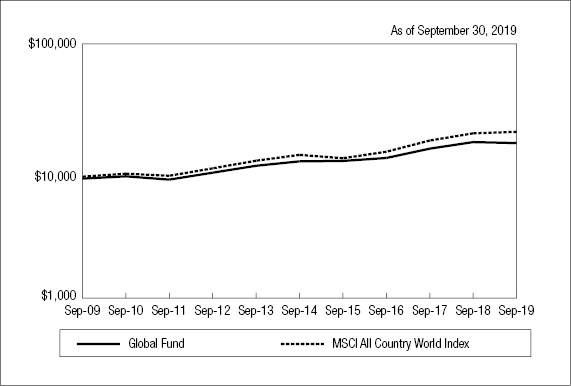
| | Average Annual Total Returns* |
N.A.V. Only | Class A | Advisor
Class | Institutional
Class | MSCI All
Country
World Index |
One Year | -1.48% | -1.20% | -1.08% | 1.95% |
Five Years | 6.59% | 7.00% | 7.06% | 7.23% |
Ten Years or Since Inception** | 7.88% | 8.52% | 8.62% | 8.93%† |
| | | | | |
S.E.C. Standardized | Class A | Advisor
Class | Institutional
Class | |
One Year | -7.17% | -1.20% | -1.08% | |
Five Years | 5.33% | 7.00% | 7.06% | |
Ten Years or Since Inception** | 7.25% | 8.52% | 8.62% | |
The graph compares a $10,000 investment in the First Investors Global Fund (Class A shares) beginning 9/30/09 with a theoretical investment in the MSCI All Country World Index (the “Index”). The Index is a free float-adjusted market capitalization weighted index designed to measure the equity market performance of developed and emerging market country indices. The Index consists of 47 country indices including 23 developed and 24 emerging market country indices. It is not possible to invest directly in this Index. In addition, the Index does not reflect fees and expenses associated with the active management of a mutual fund portfolio. For purposes of the graph and the accompanying table, unless otherwise indicated, it has been assumed that the maximum sales charge was deducted from the initial $10,000 investment in the Fund and all dividends and distributions were reinvested. Advisor Class shares and Institutional Class shares
109
Cumulative Performance Information (unaudited) (continued)
GLOBAL FUND
performance may be greater than or less than that shown in the line graph above for Class A shares based on differences in sales loads and fees paid by shareholders investing in the different classes.
* Average Annual Total Return figures (for the periods ended 9/30/19) include the reinvestment of all dividends and distributions. “N.A.V. Only” returns are calculated without sales charges. The Class A “S.E.C. Standardized” returns shown are based on the maximum sales charge of 5.75%. The Advisor Class and Institutional Class “S.E.C. Standardized” returns shown are the same as the N.A.V. Only returns since these classes are sold without sales charges. During the periods shown, some of the expenses of the Fund were waived or assumed. If such expenses had been paid by the Fund, the Class A “S.E.C. Standardized” Average Annual Total Return for One Year, Five Years and Ten Years would have been -7.19%, 5.29% and 7.22%, respectively. The Advisor Class “S.E.C. Standardized” Average Annual Total Return for One Year, Five Years and Since Inception would have been -1.22%, 6.97% and 8.48%, respectively. The Institutional Class “S.E.C. Standardized” Average Annual Total Return for One Year, Five Years and Since Inception would have been -1.09%, 7.02% and 8.58%, respectively. Results represent past performance and do not indicate future results. The graph and the returns shown do not reflect the deduction of taxes that a shareholder would pay on distributions or the redemption of fund shares. Investment return and principal value of an investment will fluctuate so that an investor’s shares, when redeemed, may be worth more or less than the original cost. Index figures are from Morgan Stanley & Co., Inc. and all other figures are from Foresters Investment Management Company, Inc.
** The Since Inception returns for Advisor Class shares and Institutional Class shares are for the periods beginning 4/1/13 (commencement of operations for those classes).
† The Index return is for ten years. The Index return since inception of the Advisor Class shares and Institutional Class shares is 8.60%.
110
Portfolio of Investments
GLOBAL FUND
September 30, 2019
| |
Shares
| | | Security | | Value | |
| | | | | | COMMON STOCKS—95.5% | | | | |
| | | | | | United States—59.5% | | | | |
| | | 22,000 | | | Abbott Laboratories | | $ | 1,840,740 | |
| | | 28,000 | | * | Adobe, Inc. | | | 7,735,000 | |
| | | 15,000 | | | Air Products & Chemicals, Inc. | | | 3,327,900 | |
| | | 14,000 | | * | Alphabet, Inc. - Class “A” | | | 17,095,960 | |
| | | 4,000 | | * | Alphabet, Inc. - Class “C” | | | 4,876,000 | |
| | | 3,000 | | * | Amazon.com, Inc. | | | 5,207,730 | |
| | | 20,000 | | * | Autodesk, Inc. | | | 2,954,000 | |
| | | 48,000 | | | Ball Corp. | | | 3,494,880 | |
| | | 160,000 | | | Bank of America Corp. | | | 4,667,200 | |
| | | 21,000 | | * | Berkshire Hathaway, Inc. - Class “B” | | | 4,368,420 | |
| | | 57,000 | | | Chevron Corp. | | | 6,760,200 | |
| | | 10,000 | | | Chubb, Ltd. | | | 1,614,400 | |
| | | 70,000 | | | CMS Energy Corp. | | | 4,476,500 | |
| | | 75,000 | | | Coca-Cola Co. | | | 4,083,000 | |
| | | 28,000 | | | ConocoPhillips | | | 1,595,440 | |
| | | 114,000 | | * | Cree, Inc. | | | 5,586,000 | |
| | | 17,000 | | | Eli Lilly & Co. | | | 1,901,110 | |
| | | 16,000 | | | EOG Resources, Inc. | | | 1,187,520 | |
| | | 62,000 | | * | Facebook, Inc. | | | 11,040,960 | |
| | | 40,000 | | | HDFC Bank, Ltd. | | | 2,282,000 | |
| | | 3,000 | | * | Illumina, Inc. | | | 912,660 | |
| | | 117,000 | | | Intel Corp. | | | 6,029,010 | |
| | | 63,000 | | | Jacobs Engineering Group, Inc. | | | 5,764,500 | |
| | | 42,000 | | | JPMorgan Chase & Co. | | | 4,942,980 | |
| | | 20,000 | | | Kimberly-Clark Corp. | | | 2,841,000 | |
| | | 20,000 | | | KLA-Tencor Corp. | | | 3,189,000 | |
| | | 13,000 | | | Lockheed Martin Corp. | | | 5,070,780 | |
| | | 15,000 | | | Lowe’s Cos., Inc. | | | 1,649,400 | |
| | | 20,000 | | | McDonald’s Corp. | | | 4,294,200 | |
| | | 19,000 | | | Medtronic, PLC | | | 2,063,780 | |
| | | 120,000 | | | Merck & Co., Inc. | | | 10,101,600 | |
| | | 72,000 | | | Microsoft Corp. | | | 10,010,160 | |
| | | 47,000 | | | Noble Energy, Inc. | | | 1,055,620 | |
111
Portfolio of Investments (continued)
GLOBAL FUND
September 30, 2019
| |
Shares
| | | Security | | Value | |
| | | | | | United States (continued) |
| | | 28,000 | | | Northrop Grumman Corp. | | $ | 10,494,120 | |
| | | 30,000 | | | NVIDIA Corp. | | | 5,222,100 | |
| | | 47,000 | | | PepsiCo, Inc. | | | 6,443,700 | |
| | | 64,000 | | | Procter & Gamble Co. | | | 7,960,320 | |
| | | 78,000 | | | QUALCOMM, Inc. | | | 5,949,840 | |
| | | 18,000 | | * | salesforce.com, inc. | | | 2,671,920 | |
| | | 42,000 | | * | Synopsys, Inc. | | | 5,764,500 | |
| | | 39,000 | | * | Take-Two Interactive Software, Inc. | | | 4,888,260 | |
| | | 5,000 | | | Thermo Fisher Scientific, Inc. | | | 1,456,350 | |
| | | 24,000 | | | Union Pacific Corp. | | | 3,887,520 | |
| | | 39,000 | | | United Technologies Corp. | | | 5,324,280 | |
| | | 19,000 | | | UnitedHealth Group, Inc. | | | 4,129,080 | |
| | | 140,000 | | | Utilities Select Sector SPDR Fund (ETF) | | | 9,063,600 | |
| | | 20,000 | | | Valero Energy Corp. | | | 1,704,800 | |
| | | 200,000 | | | Verizon Communications, Inc. | | | 12,072,000 | |
| | | 29,000 | | | Visa, Inc. - Class “A” | | | 4,988,290 | |
| | | 20,000 | | | Vulcan Materials Co. | | | 3,024,800 | |
| | | 36,000 | | | Wells Fargo & Co. | | | 1,815,840 | |
| | | | | | | | | 250,880,970 | |
| | | | | | Germany—7.9% | | | | |
| | | 13,000 | | | Adidas AG | | | 4,047,489 | |
| | | 520,000 | | * | Aixtron SE | | | 5,305,024 | |
| | | 24,000 | | | Allianz AG | | | 5,594,079 | |
| | | 64,000 | | | Fresenius Medical Care AG & Co. | | | 4,304,010 | |
| | | 18,000 | | | Muenchener Rueckver AG | | | 4,657,591 | |
| | | 40,000 | | | Puma SE | | | 3,095,469 | |
| | | 19,000 | | | Siemens AG | | | 2,034,671 | |
| | | 25,000 | | | Stroeer SE & Co. KGaA | | | 1,903,332 | |
| | | 14,000 | | | Volkswagen AG Preferred Shares | | | 2,381,375 | |
| | | | | | | | | 33,323,040 | |
| | | | | | Switzerland—5.0% | | | | |
| | | 1,000 | | | Barry Callebaut AG | | | 2,062,021 | |
| | | 8,000 | | * | Lonza Group AG | | | 2,704,474 | |
112
| |
Shares
| | | Security | | Value | |
| | | | | | Switzerland (continued) |
| | | 94,000 | | | Nestle SA | | $ | 10,198,207 | |
| | | 72,000 | | | Novartis AG | | | 6,243,054 | |
| | | | | | | | | 21,207,756 | |
| | | | | | United Kingdom—5.0% | | | | |
| | | 150,000 | | | Anglo American, PLC | | | 3,451,083 | |
| | | 60,000 | | | Ashtead Group, PLC | | | 1,670,212 | |
| | | 740,000 | | | BP, PLC | | | 4,693,069 | |
| | | 45,000 | | | Diageo, PLC | | | 1,844,131 | |
| | | 220,000 | | | Glaxosmithkline, PLC | | | 4,719,135 | |
| | | 10,000 | | * | GW Pharmaceuticals, PLC | | | 1,150,300 | |
| | | 2,800,000 | | | Lloyds Banking Group, PLC | | | 1,863,201 | |
| | | 110,000 | | * | Ocado Group, PLC | | | 1,788,678 | |
| | | | | | | | | 21,179,809 | |
| | | | | | China—3.7% | | | | |
| | | 28,000 | | * | Alibaba Group Holding, Ltd. (ADR) | | | 4,682,440 | |
| | | 500,000 | | | Citic Securities Co., Ltd. | | | 936,499 | |
| | | 260,000 | | | Ping An Insurance (Group) Co. of China, Ltd. | | | 2,987,228 | |
| | | 170,000 | | | Tencent Holdings, Ltd. | | | 7,162,050 | |
| | | | | | | | | 15,768,217 | |
| | | | | | Japan—3.5% | | | | |
| | | 10,000 | | | Daikin Industries, Ltd. | | | 1,311,445 | |
| | | 200,000 | | | Mitsubishi UFJ Financial Group, Inc. | | | 1,014,382 | |
| | | 20,000 | | | Nintendo Co., Ltd. | | | 7,402,543 | |
| | | 85,000 | | | Sony Corp. | | | 4,989,549 | |
| | | | | | | | | 14,717,919 | |
| | | | | | France—2.2% | | | | |
| | | 70,000 | | | AXA SA | | | 1,787,633 | |
| | | 11,000 | | | LVMH Moet Hennessy Louis Vuitton SE | | | 4,371,969 | |
| | | 20,000 | | | Safran SA | | | 3,148,877 | |
| | | | | | | | | 9,308,479 | |
113
Portfolio of Investments (continued)
GLOBAL FUND
September 30, 2019
| |
Shares
| | | Security | | Value | |
| | | | | | Netherlands—1.4% | | | | |
| | | 24,000 | | | ASML Holdings NV | | $ | 5,944,609 | |
| | | | | | Italy—1.4% | | | | |
| | | 410,000 | | | Enel SpA | | | 3,061,582 | |
| | | 240,000 | | | UniCredit SpA | | | 2,830,392 | |
| | | | | | | | | 5,891,974 | |
| | | | | | Taiwan—1.0% | | | | |
| | | 92,000 | | | Taiwan Semiconductor Manufacturing Co., Ltd. (ADR) | | | 4,276,160 | |
| | | | | | Spain—1.0% | | | | |
| | | 400,000 | | | Iberdrola SA | | | 4,157,520 | |
| | | | | | Luxembourg—1.0% | | | | |
| | | 500,000 | | | Aroundtown SA | | | 4,089,507 | |
| | | | | | Poland—.9% | | | | |
| | | 60,000 | | | CD Projekt SA | | | 3,641,804 | |
| | | | | | Thailand—.7% | | | | |
| | | 4,500,000 | | | Thai Beverage, PCL | | | 2,881,381 | |
| | | | | | Australia—.6% | | | | |
| | | 40,000 | | | Rio Tinto, Ltd. | | | 2,501,907 | |
| | | | | | Hong Kong—.5% | | | | |
| | | 200,000 | | | AIA Group, Ltd. | | | 1,889,585 | |
| | | | | | Canada—.2% | | | | |
| | | 225,000 | | | EnCana Corp. | | | 1,035,000 | |
Total Value of Common Stocks (cost $338,734,385) | | | 402,695,637 | |
114
| |
Principal
Amount
| | | Security | | Value | |
| | | | | | SHORT-TERM U.S. GOVERNMENT OBLIGATIONS—2.4% | | | | |
| | | | | | United States | | | | |
| | $ | 10,000M | | | U.S. Treasury Bills, 1.78%, 10/22/2019 (cost $9,989,616) | | $ | 9,989,570 | |
Total Value of Investments (cost $348,724,001) | | | 97.9 | % | | | 412,685,207 | |
Other Assets, Less Liabilities | | | 2.1 | | | | 8,930,269 | |
Net Assets | | | 100.0 | % | | $ | 421,615,476 | |
Summary of Abbreviations:
ADR | American Depositary Receipts |
SPDR | Standard & Poor’s Depository Receipts |
The Fund’s assets and liabilities are classified into the following three levels based on the inputs used to value the assets and liabilities:
| Level 1 – | Unadjusted quoted prices in active markets for identical securities that the Fund has the ability to access. |
| Level 2 – | Observable inputs other than quoted prices included in Level 1 that are observable for the asset or liability, either directly or indirectly. These inputs may include quoted prices for the identical instrument on an inactive market, prices for similar instruments, interest rates, prepayment speeds, credit risk, yield curves, default rates and similar data. |
| Level 3 – | Unobservable inputs for the asset or liability, to the extent relevant observable inputs are not available, representing the Fund’s own assumption about the assumptions a market participant would use in valuing the asset or liability, and would be based on the best information available. |
The inputs methodology used for valuing securities are not necessarily an indication of the risk associated with investing in those securities. For example, U.S. Government securities are reflected as Level 2 because the inputs used to determine fair value may not always be quoted prices in an active market.
115
Portfolio of Investments (continued)
GLOBAL FUND
September 30, 2019
The following is a summary, by category of Level, of inputs used to value the Fund’s investments as of September 30, 2019:
| | | Level 1 | | | Level 2 | | | Level 3 | | | Total | |
Common Stocks | | | | | | | | | | | | | | | | |
United States | | $ | 250,880,970 | | | $ | — | | | $ | — | | | $ | 250,880,970 | |
Germany | | | 33,323,040 | | | | — | | | | — | | | | 33,323,040 | |
Switzerland | | | 21,207,756 | | | | — | | | | — | | | | 21,207,756 | |
United Kingdom | | | 21,179,809 | | | | — | | | | — | | | | 21,179,809 | |
China | | | 15,768,217 | | | | — | | | | — | | | | 15,768,217 | |
Japan | | | 14,717,919 | | | | — | | | | — | | | | 14,717,919 | |
France | | | 9,308,479 | | | | — | | | | — | | | | 9,308,479 | |
Netherlands | | | 5,944,609 | | | | — | | | | — | | | | 5,944,609 | |
Italy | | | 5,891,974 | | | | — | | | | — | | | | 5,891,974 | |
Taiwan | | | 4,276,160 | | | | — | | | | — | | | | 4,276,160 | |
Spain | | | 4,157,520 | | | | — | | | | — | | | | 4,157,520 | |
Luxembourg | | | 4,089,507 | | | | — | | | | — | | | | 4,089,507 | |
Poland | | | 3,641,804 | | | | — | | | | — | | | | 3,641,804 | |
Thailand | | | 2,881,381 | | | | — | | | | — | | | | 2,881,381 | |
Australia | | | 2,501,907 | | | | — | | | | — | | | | 2,501,907 | |
Hong Kong | | | 1,889,585 | | | | — | | | | — | | | | 1,889,585 | |
Canada | | | 1,035,000 | | | | — | | | | — | | | | 1,035,000 | |
Short-Term U.S. Government Obligations | | | — | | | | 9,989,570 | | | | — | | | | 9,989,570 | |
Total Investments in Securities | | $ | 402,695,637 | | | $ | 9,989,570 | | | $ | — | | | $ | 412,685,207 | |
During the year ended September 30, 2019, there were no transfers between Level 1 investments and Level 2 investments that had a material inpact to the Fund. This does not include transfers between Level 1 investments and Level 2 investments due to the Fund utilizing international fair value pricing during the year (see Note 1A). Transfers, if any, between Levels are recognized at the end of the reporting period.
See notes to financial statements
116
Portfolio Manager’s Letter
GROWTH & INCOME FUND
Dear Investor:
This is the annual report for the First Investors Growth & Income Fund for the fiscal year ended September 30, 2019. During the period, the Fund’s return on a net asset value basis was 2.02% for Class A shares, 2.26% for Advisor Class shares and 2.34% for Institutional Class shares, including dividends of 27.4 cents per share for Class A shares, 47.2 cents per share for Advisor Class shares and 37.4 cents per share for Institutional Class shares. In addition, the Fund distributed capital gains of $4.02 per share on each class of shares.
U.S. equity market
The U.S. stock market began the review period with a very weak quarter. The S&P 500 fell -9.0% in the month of December alone. Quantitative tightening by the Fed, coupled with slowing earnings and increased trade disputes, sparked the sell-off. The start of 2019 saw a meaningful reversal in the equity markets following the sharp sell-off in December. January started very strong with the S&P 500 posting a +8.0% total return, the best monthly showing since 1987. By the end of January, the S&P had erased most of the losses incurred during the month of December and sat 15% above its Christmas Eve low. The January rally was led by higher-beta, lower-quality and smaller-cap names. Fueled by a dovish Fed and more optimism about a potential trade deal, the S&P 500 posted its best quarterly return since 2009. The first quarter rally in small-cap stocks was the best since 1991.
As the second quarter progressed, the dominant themes were global trade war, the slowing global economy, and the Fed becoming more accommodative and starting to lower rates again. The S&P 500 gained 17% during the first six months of the year (its best performance since 1997). The market’s gains were predominantly built upon defensive sectors like Utilities, REITs and Consumer Staples. These sectors all made new highs along with the S&P 500, as lower global interest rates seemingly accelerated investors’ appetite for yield.
The start of the summer saw global economic data begin to weaken as the effect of the trade war began to manifest itself. The 2- to 10-year U.S. Treasury yield curve inverted for the first time since the Global Financial Crisis, raising recession concerns. The market continued to move on trade talk and the economy. In September, oil spiked with attacks on a Saudi processing plant and we saw a rotation from momentum stocks to value stocks for the first time. High-growth stocks came down off their highs and valuations in the private market began to correct as well. Nevertheless, the S&P 500 remained near its all-time highs posting a return of 20.55% on a year-to-date basis.
The Fund
The Fund’s total return for the period underperformed that of both the Russell 1000® Value index and the MSCI USA Value Index. Significantly contributing to this underperformance was the Fund’s underweight positioning in Real Estate and Utilities sectors, both of which meaningfully outperformed the broader market amidst general anxiety around the direction of global growth and falling government bond yields. Although the Fund did benefit from positive overall stock selection within individual sectors, pockets of negative selection did detract from performance.
117
Portfolio Manager’s Letter (continued)
GROWTH & INCOME FUND
Negative stock selection within the Communications Services segment was driven by the company’s media investments, which suffered increased investor concerns over advertising trends and changing consumer viewing habits; CBS Corporation (-29%) also announced a poorly-received (re)combination with Viacom, whereas Fox Corporation (-15%) unveiled disappointing spending guidance. The Fund also suffered negative stock selection within the Consumer Discretionary sector; Tapestry (-38%), the parent company of Coach and Kate Spade, faced headwinds of higher tariff heads on imported goods from China, while also seeing disappointing traction in its new product launches. Negative stock selection extended into the Healthcare sector; managed care provider Centene Corporation (-40%) saw increased investor concern over the fate of the Affordable Care Act (due to the ruling of a federal judge in Texas) and the loss of a Medicaid contract in Louisiana.
On the positive side, the Fund enjoyed strong stock selection in the Industrial and Materials sectors. Two of the Fund’s defense investments, Lockheed Martin (+16%) and Northrup Grumman (+29%), benefited as defense budgets were expanded and both companies picked up sizeable contract wins. Ingersoll Rand (+23%) benefited from strong demand in its core air conditioning market and saw investor approval of its planned divestiture of lower-margin industrial businesses. Agricultural chemical provider FMC Corporation (+18%) also benefited from strong global demand for its products, more than offsetting flood-related challenges it its North American business.
Thank you for placing your trust in Foresters Financial. As always, we appreciate the opportunity to serve your investment needs.
Sincerely,

Sean Reidy
Portfolio Manager and
Director of Equities,
Foresters Investment Management Company, Inc.
October 4, 2019
118
Fund Expenses (unaudited)
GROWTH & INCOME FUND
The examples below show the ongoing costs (in dollars) of investing in your Fund and will help you in comparing these costs with costs of other mutual funds. Please refer to page 1 for a detailed explanation of the information presented in these examples.
Expense Example | Annualized
Expense
Ratio | Beginning
Account Value
(4/1/19) | Ending
Account Value
(9/30/19) | Expenses Paid
During Period
(4/1/19-9/30/19)* |
Class A Shares | 1.11% | | | |
Actual | | $1,000.00 | $1,065.73 | $ 5.75 |
Hypothetical** | | $1,000.00 | $1,019.50 | $ 5.62 |
Advisor Class Shares | 0.83% | | | |
Actual | | $1,000.00 | $1,066.16 | $ 4.30 |
Hypothetical** | | $1,000.00 | $1,020.91 | $ 4.20 |
Institutional Class Shares | 0.74% | | | |
Actual | | $1,000.00 | $1,067.13 | $ 3.83 |
Hypothetical** | | $1,000.00 | $1,021.36 | $ 3.75 |
* | Expenses are equal to the annualized expense ratio, multiplied by the average account value over the period, multiplied by 183/365 (to reflect the one-half year period). |
** | Assumed rate of return of 5% before expenses |
Portfolio Composition
TOP TEN SECTORS
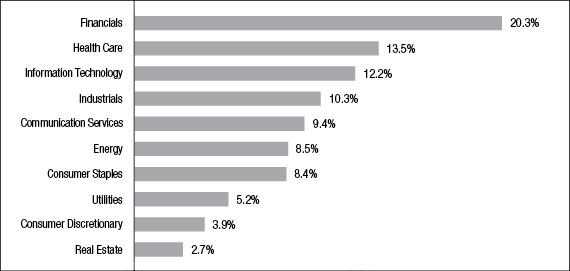
Portfolio holdings and allocations are subject to change. Percentages are as of September 30, 2019, and are based on the total market value of investments.
119
Cumulative Performance Information (unaudited)
GROWTH & INCOME FUND
Comparison of change in value of $10,000 investment in the First Investors Growth & Income Fund (Class A shares), the MSCI USA Value Index† and the Russell 1000 Value Index.
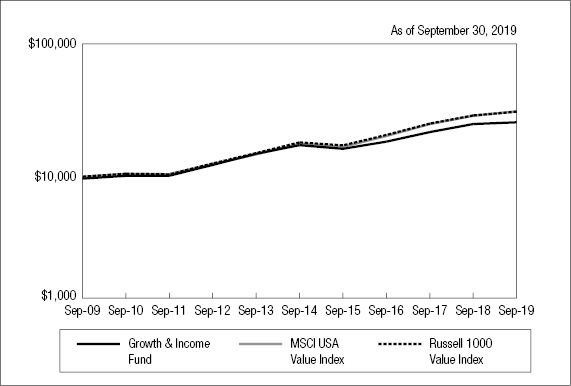
| | Average Annual Total Returns* |
N.A.V. Only | Class A | Advisor
Class | Institutional
Class | MSCI USA
Value Index | Russell 1000
Value Index |
One Year | 2.02% | 2.26% | 2.34% | 4.71% | 4.00% |
Five Years | 6.24% | 6.61% | 6.65% | 8.30% | 7.79% |
Ten Years or Since Inception** | 10.85% | 9.25% | 9.31% | 11.50%†† | 11.46%†† |
| | | | | | |
S.E.C. Standardized | Class A | Advisor
Class | Institutional
Class | | |
One Year | -3.85% | 2.26% | 2.34% | | |
Five Years | 4.98% | 6.61% | 6.65% | | |
Ten Years or Since Inception** | 10.19% | 9.25% | 9.31% | | |
The graph compares a $10,000 investment in the First Investors Growth & Income Fund (Class A shares) beginning 9/30/09 with theoretical investments in the MSCI USA Value Index and the Russell 1000 Value Index (the “Indices”). The MSCI USA Value Index captures large and mid-cap U.S. securities exhibiting overall value characteristics. The value investment style characteristics for index constructions are defined using book value to price 12-month forward earnings to price and dividend yield. The Russell 1000 Value Index is an unmanaged index that measures the performance of the large-cap value segment of the U.S. equity universe. It includes those Russell 1000 companies with lower price-to-book ratios and lower expected growth values. It is not possible to invest directly in these Indices. In addition, the Indices do not reflect fees and expenses associated with the active management of a mutual fund portfolio. For purposes of the graph and the accompanying table, unless otherwise indicated, it has been assumed that the maximum sales charge was deducted from the initial $10,000 investment in the Fund and all dividends and distributions were
120
reinvested. Advisor Class shares and Institutional Class shares performance may be greater than or less than that shown in the line graph above for Class A shares based on differences in sales loads and fees paid by shareholders investing in the different classes.
* Average Annual Total Return figures (for the periods ended 9/30/19) include the reinvestment of all dividends and distributions. “N.A.V. Only” returns are calculated without sales charges. The Class A “S.E.C. Standardized” returns shown are based on the maximum sales charge of 5.75%. The Advisor Class and Institutional Class “S.E.C. Standardized” returns shown are the same as the N.A.V. Only returns since these classes are sold without sales charges. During the periods shown, some of the expenses of the Advisor Class and Institutional Class were waived or assumed. If such expenses had been paid by the Fund, the Advisor Class “S.E.C. Standardized” Average Annual Total Return Since Inception would have been 8.60% and the Institutional Class “S.E.C. Standardized” Average Annual Total Return Since Inception would have been 8.69%. Results represent past performance and do not indicate future results. The graph and the returns shown do not reflect the deduction of taxes that a shareholder would pay on distributions or the redemption of fund shares. Investment return and principal value of an investment will fluctuate so that an investor’s shares, when redeemed, may be worth more or less than the original cost. Index figures are from FTSE Russell and Standard & Poor’s and all other figures are from Foresters Investment Management Company, Inc.
** The Since Inception returns for Advisor Class shares and Institutional Class shares are for the periods beginning 4/1/13 (commencement of operations for those classes).
† During the fiscal year, the Fund changed its primary broad-based securities index to the MSCI USA Value Index from the Russell 1000 Value Index since it more closely reflects the Fund’s investment strategies. After this fiscal year, we will not show a comparison to the Russell 1000 Value Index.
†† The Index return is for ten years. The MSCI USA Value Index return and the Russell 1000 Value Index return since inception of the Advisor Class shares and Institutional Class shares are 10.41% and 9.96%, respectively.
121
Portfolio of Investments
GROWTH & INCOME FUND
September 30, 2019
| |
Shares
| | | Security | | Value | |
| | | | | | COMMON STOCKS—96.4% | | | | |
| | | | | | Communication Services—9.4% | | | | |
| | | 10,200 | | * | Alphabet, Inc. - Class “A” | | $ | 12,455,628 | |
| | | 721,600 | | | AT&T, Inc. | | | 27,305,344 | |
| | | 210,500 | | | CBS Corp. - Class “B” | | | 8,497,885 | |
| | | 670,400 | | | Comcast Corp. - Special Shares “A” | | | 30,221,632 | |
| | | 331,116 | | | Fox Corp. - Class “B” | | | 10,443,399 | |
| | | 99,600 | | * | Take-Two Interactive Software, Inc. | | | 12,483,864 | |
| | | 493,750 | | | Verizon Communications, Inc. | | | 29,802,750 | |
| | | 63,988 | | | Walt Disney Co. | | | 8,338,916 | |
| | | | | | | | | 139,549,418 | |
| | | | | | Consumer Discretionary—3.9% | | | | |
| | | 67,550 | | | Aptiv, PLC | | | 5,905,221 | |
| | | 5,650 | | * | Booking Holdings, Inc. | | | 11,088,746 | |
| | | 15,850 | | * | Burlington Stores, Inc. | | | 3,167,147 | |
| | | 56,250 | | | Home Depot, Inc. | | | 13,051,125 | |
| | | 87,000 | | | Lowe’s Cos., Inc. | | | 9,566,520 | |
| | | 49,750 | | | McDonald’s Corp. | | | 10,681,823 | |
| | | 38,450 | | | Ross Stores, Inc. | | | 4,223,733 | |
| | | | | | | | | 57,684,315 | |
| | | | | | Consumer Staples—8.3% | | | | |
| | | 411,700 | | | Coca-Cola Co. | | | 22,412,948 | |
| | | 221,204 | | | Koninklijke Ahold Delhaize NV (ADR) | | | 5,532,312 | |
| | | 248,400 | | | Mondelez International, Inc. - Class “A” | | | 13,741,488 | |
| | | 148,300 | | | PepsiCo, Inc. | | | 20,331,930 | |
| | | 172,400 | | | Philip Morris International, Inc. | | | 13,090,332 | |
| | | 200,600 | | | Procter & Gamble Co. | | | 24,950,628 | |
| | | 201,900 | | | Walmart, Inc. | | | 23,961,492 | |
| | | | | | | | | 124,021,130 | |
| | | | | | Energy—8.5% | | | | |
| | | 449,786 | | | BP, PLC (ADR) | | | 17,087,370 | |
| | | 224,350 | | | Chevron Corp. | | | 26,607,910 | |
122
| |
Shares
| | | Security | | Value | |
| | | | | | Energy (continued) |
| | | 180,300 | | | ConocoPhillips | | $ | 10,273,494 | |
| | | 346,250 | | | ExxonMobil Corp. | | | 24,448,712 | |
| | | 119,050 | | | Hess Corp. | | | 7,200,144 | |
| | | 261,480 | | | Marathon Petroleum Corp. | | | 15,884,910 | |
| | | 381,950 | | | Suncor Energy, Inc. | | | 12,061,981 | |
| | | 154,950 | | | Valero Energy Corp. | | | 13,207,938 | |
| | | | | | | | | 126,772,459 | |
| | | | | | Financials—20.2% | | | | |
| | | 105,800 | | | American Express Co. | | | 12,514,024 | |
| | | 158,100 | | | American International Group, Inc. | | | 8,806,170 | |
| | | 959,300 | | | Bank of America Corp. | | | 27,982,781 | |
| | | 281,850 | | | Bank of New York Mellon Corp. | | | 12,742,438 | |
| | | 108,400 | | * | Berkshire Hathaway, Inc. - Class “B” | | | 22,549,368 | |
| | | 189,600 | | | Chubb, Ltd. | | | 30,609,024 | |
| | | 317,950 | | | Citigroup, Inc. | | | 21,963,986 | |
| | | 355,500 | | | Citizens Financial Group, Inc. | | | 12,574,035 | |
| | | 99,450 | | | Discover Financial Services | | | 8,064,400 | |
| | | 61,950 | | | Goldman Sachs Group, Inc. | | | 12,837,898 | |
| | | 307,080 | | | JPMorgan Chase & Co. | | | 36,140,245 | |
| | | 173,750 | | | MetLife, Inc. | | | 8,194,050 | |
| | | 189,400 | | | Morgan Stanley | | | 8,081,698 | |
| | | 117,400 | | | PNC Financial Services Group, Inc. | | | 16,454,784 | |
| | | 71,500 | | | Travelers Cos., Inc. | | | 10,631,335 | |
| | | 377,950 | | | U.S. Bancorp | | | 20,915,753 | |
| | | 590,200 | | | Wells Fargo & Co. | | | 29,769,688 | |
| | | | | | | | | 300,831,677 | |
| | | | | | Health Care—13.4% | | | | |
| | | 154,500 | | | Abbott Laboratories | | | 12,927,015 | |
| | | 29,416 | | | Anthem, Inc. | | | 7,062,782 | |
| | | 148,650 | | * | Centene Corp. | | | 6,430,599 | |
| | | 68,650 | | | Eli Lilly & Co. | | | 7,677,130 | |
| | | 150,100 | | | Gilead Sciences, Inc. | | | 9,513,338 | |
123
Portfolio of Investments (continued)
GROWTH & INCOME FUND
September 30, 2019
| |
Shares
| | | Security | | Value | |
| | | | | | Health Care (continued) |
| | | 109,500 | | | Hill-Rom Holdings, Inc. | | $ | 11,522,685 | |
| | | 125,225 | | | Johnson & Johnson | | | 16,201,610 | |
| | | 185,500 | | | Koninklijke Philips NV (ADR) | | | 8,557,115 | |
| | | 224,400 | | | Medtronic, PLC | | | 24,374,328 | |
| | | 292,300 | | | Merck & Co., Inc. | | | 24,605,814 | |
| | | 579,601 | | | Pfizer, Inc. | | | 20,825,064 | |
| | | 154,799 | | | Smith & Nephew, PLC (ADR) | | | 7,450,476 | |
| | | 50,650 | | | Thermo Fisher Scientific, Inc. | | | 14,752,826 | |
| | | 22,801 | | | UnitedHealth Group, Inc. | | | 4,955,113 | |
| | | 120,800 | | | Zimmer Biomet Holdings, Inc. | | | 16,582,216 | |
| | | 53,450 | | | Zoetis, Inc. | | | 6,659,336 | |
| | | | | | | | | 200,097,447 | |
| | | | | | Industrials—10.2% | | | | |
| | | 87,197 | | | Eaton Corp., PLC | | | 7,250,431 | |
| | | 201,000 | | * | Gardner Denver Holdings, Inc. | | | 5,686,290 | |
| | | 106,926 | | | Honeywell International, Inc. | | | 18,091,879 | |
| | | 109,550 | | | Ingersoll-Rand, PLC | | | 13,497,656 | |
| | | 186,300 | | | Jacobs Engineering Group, Inc. | | | 17,046,450 | |
| | | 46,107 | | | Lockheed Martin Corp. | | | 17,984,496 | |
| | | 236,350 | | | Masco Corp. | | | 9,851,068 | |
| | | 51,450 | | | Northrop Grumman Corp. | | | 19,282,946 | |
| | | 28,163 | | | Stanley Black & Decker, Inc. | | | 4,067,019 | |
| | | 104,600 | | | Union Pacific Corp. | | | 16,943,108 | |
| | | 168,450 | | | United Technologies Corp. | | | 22,996,794 | |
| | | | | | | | | 152,698,137 | |
| | | | | | Information Technology—12.2% | | | | |
| | | 237,200 | | * | Advanced Micro Devices, Inc. | | | 6,876,428 | |
| | | 249,013 | | | Applied Materials, Inc. | | | 12,425,749 | |
| | | 40,713 | | | ASML Holdings NV | | | 10,113,923 | |
| | | 548,300 | | | Cisco Systems, Inc. | | | 27,091,503 | |
| | | 444,650 | | | Corning, Inc. | | | 12,681,418 | |
| | | 276,250 | | | eBay, Inc. | | | 10,768,225 | |
124
| |
Shares
| | | Security | | Value | |
| | | | | | Information Technology (continued) |
| | | 18,900 | | * | FleetCor Technologies, Inc. | | $ | 5,420,142 | |
| | | 286,225 | | | Intel Corp. | | | 14,749,174 | |
| | | 187,350 | | | Microsoft Corp. | | | 26,047,271 | |
| | | 186,450 | | | Oracle Corp. | | | 10,260,344 | |
| | | 238,250 | | | QUALCOMM, Inc. | | | 18,173,710 | |
| | | 94,500 | | * | Synopsys, Inc. | | | 12,970,125 | |
| | | 102,050 | | | TE Connectivity, Ltd. | | | 9,509,019 | |
| | | 34,400 | | | Texas Instruments, Inc. | | | 4,445,856 | |
| | | | | | | | | 181,532,887 | |
| | | | | | Materials—2.5% | | | | |
| | | 74,250 | | | Celanese Corp. | | | 9,080,032 | |
| | | 98,850 | | | DuPont de Nemours, Inc. | | | 7,048,993 | |
| | | 50,980 | | | FMC Corp. | | | 4,469,926 | |
| | | 44,800 | | | Linde, PLC | | | 8,678,656 | |
| | | 98,200 | | | LyondellBasell Industries NV - Class “A” | | | 8,785,954 | |
| | | | | | | | | 38,063,561 | |
| | | | | | Real Estate—2.6% | | | | |
| | | 36,050 | | | American Tower Corp. (REIT) | | | 7,971,737 | |
| | | 84,750 | | | Crown Castle International Corp. (REIT) | | | 11,781,098 | |
| | | 43,950 | | | Federal Realty Investment Trust (REIT) | | | 5,983,353 | |
| | | 147,086 | | | iShares U.S. Real Estate (ETF) | | | 13,758,424 | |
| | | | | | | | | 39,494,612 | |
| | | | | | Utilities—5.2% | | | | |
| | | 95,550 | | | American Electric Power Co., Inc. | | | 8,952,079 | |
| | | 129,361 | | | CMS Energy Corp. | | | 8,272,636 | |
| | | 77,230 | | | Entergy Corp. | | | 9,063,713 | |
| | | 171,500 | | | Exelon Corp. | | | 8,285,165 | |
| | | 182,005 | | | FirstEnergy Corp. | | | 8,778,101 | |
| | | 44,800 | | | NextEra Energy, Inc. | | | 10,437,952 | |
| | | 125,650 | | | Utilities Select Sector SPDR Fund (ETF) | | | 8,134,581 | |
125
Portfolio of Investments (continued)
GROWTH & INCOME FUND
September 30, 2019
| | Shares or
Principal
Amounts | | | Security | | Value | |
| | | | | | Utilities (continued) |
| | | 82,350 | | | WEC Energy Group, Inc. | | $ | 7,831,485 | |
| | | 116,857 | | | Xcel Energy, Inc. | | | 7,582,851 | |
| | | | | | | | | 77,338,563 | |
Total Value of Common Stocks (cost $971,866,334) | | | 1,438,084,206 | |
| | | | | | SHORT-TERM U.S. GOVERNMENT OBLIGATIONS—3.0% | | | | |
| | $ | 45,000M | | | U.S. Treasury Bills, 1.78%, 10/22/2019 (cost $44,953,273) | | | 44,953,065 | |
Total Value of Investments (cost $1,016,819,607) | | | 99.4 | % | | | 1,483,037,271 | |
Other Assets, Less Liabilities | | | .6 | | | | 8,549,375 | |
Net Assets | | | 100.0 | % | | $ | 1,491,586,646 | |
Summary of Abbreviations:
ADR | American Depositary Receipts |
REIT | Real Estate Investment Trust |
SPDR | Standard & Poor’s Depository Receipts |
The Fund’s assets and liabilities are classified into the following three levels based on the inputs used to value the assets and liabilities:
| | Level 1 – | Unadjusted quoted prices in active markets for identical securities that the Fund has the ability to access. |
| | Level 2 – | Observable inputs other than quoted prices included in Level 1 that are observable for the asset or liability, either directly or indirectly. These inputs may include quoted prices for the identical instrument on an inactive market, prices for similar instruments, interest rates, prepayment speeds, credit risk, yield curves, default rates and similar data. |
| | Level 3 – | Unobservable inputs for the asset or liability, to the extent relevant observable inputs are not available, representing the Fund’s own assumption about the assumptions a market participant would use in valuing the asset or liability, and would be based on the best information available. |
126
The inputs methodology used for valuing securities are not necessarily an indication of the risk associated with investing in those securities. For example, U.S. Government securities are reflected as Level 2 because the inputs used to determine fair value may not always be quoted prices in an active market.
The following is a summary, by category of Level, of inputs used to value the Fund’s investments as of September 30, 2019:
| | | Level 1 | | | Level 2 | | | Level 3 | | | Total | |
Common Stocks | | $ | 1,438,084,206 | | | $ | — | | | $ | — | | | $ | 1,438,084,206 | |
Short-Term U.S. Government Obligations | | | — | | | | 44,953,065 | | | | — | | | | 44,953,065 | |
Total Investments in Securities* | | $ | 1,438,084,206 | | | $ | 44,953,065 | | | $ | — | | | $ | 1,483,037,271 | |
* | The Portfolio of Investments provides information on the industry categorization for common stocks. |
There were no transfers into or from Level 1 and Level 2 by the Fund for the year ended September 30, 2019. Transfers, if any, between Levels are recognized at the end of the reporting period.
See notes to financial statements
127
Portfolio Managers’ Letter
HEDGED U.S. EQUITY OPPORTUNITIES FUND
Dear Investor:
This is the annual report for the First Investors Hedged U.S. Equity Opportunities Fund for the fiscal year ended September 30, 2019. During the period, the Fund’s return on a net asset value basis was 5.92% for Class A shares, 6.14% for Advisor Class shares and 6.39% for Institutional Class shares, including dividends of 0.03 cents per share for Advisor Class shares and 0.12 cents per share for Institutional Class shares. The Fund distributed capital gains of 20.8 cents per share on each class of shares
The Market
Markets ended 2018 on a weak note and U.S. equities suffered their largest quarterly loss since 2011. Volatility was elevated as markets contended with a confluence of moderating growth, tighter liquidity and monetary policy, trade uncertainty, swelling fiscal deficits, and political turmoil.
U.S. equities rebounded at the beginning of 2019 buoyed by a dovish shift in Federal Reserve (Fed) policy and guidance, optimism for a U.S.-China trade deal, relatively strong fourth-quarter earnings, and corporate buybacks. However, unresolved U.S. trade frictions with China, Mexico, Japan and the European Union unsettled markets and escalated concerns about the potential risks to U.S. economic growth from increasing cost pressures, supply chain disruptions, and waning business confidence and investment plans. Specifically, tensions between the U.S. and China were particularly volatile, with negotiations abruptly breaking down in May prior to the two countries agreeing to halt incremental tariffs and resume trade negotiations when they met at the G20 conference in June. U.S.-China trade relations continued to deteriorate in the absence of meaningful compromises on key structural issues, and expectations for a protracted trade war and the potential for a longer-term decoupling of the world’s two largest economies has eroded consumer and business confidence and curtailed capital spending. Tensions between the two countries eased in September ahead of high-level trade negotiations scheduled for October.
On the monetary policy front, as expected, the Fed raised short-term interest rates by 25 basis points (bps) in December 2018, but indicated that rising economic headwinds and expectations for slower domestic growth have created significant uncertainty about the path of interest rates in 2019. While the Fed left its benchmark interest rate unchanged during the first half of 2019, it has noted that increasing uncertainties to its outlook have strengthened the case for additional policy accommodation. The Fed ultimately lowered its benchmark interest rate in July and September by a combined 50 bps in an effort to sustain economic expansion and mitigate the risks of moderating growth and trade frictions.
The Fund
The Fund outperformed its custom benchmark (70% Russell 3000, 30% ICE BofA Merrill Lynch US 3-Month Treasury Bill Index) for the period. Within the equity strategies, security selection contributed to results. Strong selection, particularly within the health care, industrials, and consumer discretionary sectors contributed to relative performance, but was partially offset by weaker selection in the communication services, energy, and consumer staples sectors. Sector
128
allocation, a residual of our bottom-up stock selection process, also contributed to performance, driven mainly by an underweight to energy and overweight to real estate, but was partially offset by an underweight allocation to the information technology sector.
American Tower (Real Estate) was the largest relative contributor. American Tower is a real estate investment trust which owns, operates, and develops multitenant communications real estate. At the end of the second fiscal quarter, American Tower reported results that beat high expectations across the board, backed by strong growth in data usage and the subsequent investment by data carriers. U.S. organic growth remains strong, and international growth has picked up as well, due to carrier consolidation in India stabilizing and American Tower’s recent expansion into the fast-growing African market. American Tower continues to invest in its innovation platform as a means of better capturing the impacts of 5G. We believe that the company’s low maintenance capex business model, solid balance sheet that is not heavily debt financed, and strong management team with an excellent capital allocation track record should help to generate high cash flow and powerful dividend growth.
Our underweight position in Microsoft (Information Technology) was the biggest relative detractor during the quarter. Microsoft engages in the development and support of software, services, devices, and solutions. The stock price rose after the company reported better that expected fiscal earning for the third quarter of 2019 within all three major units: Productivity and Business Processes, Intelligent Cloud, and Personal Computing. We maintained our positioning in the stock but continued to be underweight relative to the benchmark as of the end of the period.
The hedging strategy contributed to results. The beta hedge, which is designed to reduce the Fund’s equity exposure by selling futures on U.S. indices, contributed to results. The beta hedging strategy was particularly additive during the fourth quarter of 2018 when the U.S. markets experienced negative performance. The Fund’s tail risk management strategy, which is designed to mitigate capital losses in periods when equities experience a sharp decline, detracted during the period due to rising U.S. markets.
Macro challenges continue to weigh on markets, however, we remain confident that opportunities to generate alpha exist. In particular, unresolved trade tensions, slowing global growth, and growing policy uncertainty have dampened investor risk appetite and impacted corporate fundamentals for companies and industries most exposed to these risks. We believe that this provides ample opportunity for alpha generation from security selection by fundamental managers with deep insights into companies. Further, we believe that a multi-strategy factor-diversified approach to capital allocation can help manage risk amidst uncertainty and reduce excess drawdowns in the event of market shocks.
129
Portfolio Managers’ Letter (continued)
HEDGED U.S. EQUITY OPPORTUNITIES FUND
Thank you for placing your trust in Foresters Financial. As always, we appreciate the opportunity to serve your investment needs.
Sincerely,

| 
|
Gregg R. Thomas, CFA | Roberto J. Isch, CFA |
Portfolio Manager | Portfolio Manager |
Wellington Management Company LLP | Wellington Management Company LLP |
October 4, 2019
130
Fund Expenses (unaudited)
HEDGED U.S. EQUITY OPPORTUNITIES FUND
The examples below show the ongoing costs (in dollars) of investing in your Fund and will help you in comparing these costs with costs of other mutual funds. Please refer to page 1 for a detailed explanation of the information presented in these examples.
Expense Example | Annualized
Expense
Ratio | Beginning
Account Value
(4/1/19) | Ending
Account Value
(9/30/19) | Expenses Paid
During Period
(4/1/19-9/30/19)* |
Class A Shares | 1.75% | | | |
Actual | | $1,000.00 | $1,060.03 | $ 9.04 |
Hypothetical** | | $1,000.00 | $1,016.30 | $ 8.85 |
Advisor Class Shares | 1.42% | | | |
Actual | | $1,000.00 | $1,061.22 | $ 7.34 |
Hypothetical** | | $1,000.00 | $1,017.95 | $ 7.18 |
Institutional Class Shares | 1.31% | | | |
Actual | | $1,000.00 | $1,061.87 | $ 6.77 |
Hypothetical** | | $1,000.00 | $1,018.50 | $ 6.63 |
* | Expenses are equal to the annualized expense ratio, multiplied by the average account value over the period, multiplied by 183/365 (to reflect the one-half year period). Expenses paid during the period are net of expenses waived. |
** | Assumed rate of return of 5% before expenses |
Portfolio Composition
TOP TEN SECTORS

Portfolio holdings and allocations are subject to change. Percentages are as of September 30, 2019, and are based on the total market value of investments.
131
Cumulative Performance Information (unaudited)
HEDGED U.S. EQUITY OPPORTUNITIES FUND
Comparison of change in value of $10,000 investment in the First Investors Hedged U.S. Equity Opportunities Fund (Class A shares), the Russell 3000® Index and the ICE BofAML U.S. T-Bill 0-3 Month Index
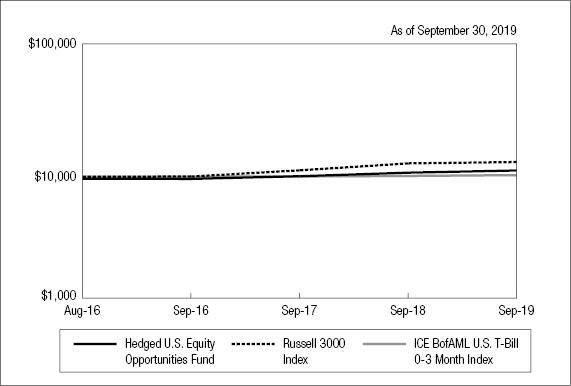
| | Average Annual Total Returns* |
N.A.V. Only | Class A | Advisor
Class | Institutional
Class | Russell 3000 | ICE BofAML
T-Bill 0-3
Month Index |
One Year | 5.92% | 6.14% | 6.39% | 2.92% | 2.39% |
Since Inception** | 7.59% | 7.92% | 8.06% | 12.25% | 1.48% |
| | | | | | |
S.E.C. Standardized | Class A | Advisor
Class | Institutional
Class | | |
One Year | -0.20% | 6.14% | 6.39% | | |
Since Inception** | 5.60% | 7.92% | 8.06% | | |
The graph compares a $10,000 investment in the First Investors Hedged U.S. Equity Opportunities Fund (Class A shares) beginning 8/1/16 (commencement of operations) with theoretical investments in the Russell 3000 Index and the ICE BofAML U.S. T-Bill 0-3 Month Index (the “Indices”). The Russell 3000 Index is a market capitalization weighted equity index that provides exposure to the entire U.S. stock market. The Index tracks the performance of the 3,000 largest U.S.-traded stocks which represent about 98% of all U.S incorporated equity securities. The ICE BofAML U.S. T-Bill 0-3 Month Index tracks the performance of the U.S. dollar denominated U.S. Treasury Bills publicly issued in the U.S. domestic market with a remaining term to final maturity of less than 3 months. It is not possible to invest directly in these Indices. In addition, the Indices do not reflect fees and expenses associated with the active management of a mutual fund portfolio. For purposes of the graph and the accompanying table, unless otherwise indicated, it has been assumed that the maximum sales charge was deducted from the initial $10,000 investment in the Fund
132
and all dividends and distributions were reinvested. Advisor Class shares and Institutional Class shares performance may be greater than or less than that shown in the line graph above for Class A shares based on differences in sales loads and fees paid by shareholders investing in the different classes.
* Average Annual Total Return figures (for the periods ended 9/30/19) include the reinvestment of all dividends and distributions. “N.A.V. Only” returns are calculated without sales charges. The Class A “S.E.C. Standardized” returns shown are based on the maximum sales charge of 5.75%. The Advisor Class and Institutional Class “S.E.C. Standardized” returns shown are the same as the N.A.V. Only returns since these classes are sold without sales charges. During the periods shown, some of the expenses of the Fund were waived or assumed. If such expenses had been paid by the Fund, the Class A “S.E.C. Standardized” Average Annual Total Return Since Inception would have been 4.82%. The Advisor Class “S.E.C. Standardized” Average Annual Total Return Since Inception would have been 7.21%. The Institutional Class “S.E.C. Standardized” Average Annual Total Return Since Inception would have been 7.29%. Results represent past performance and do not indicate future results. The graph and the returns shown do not reflect the deduction of taxes that a shareholder would pay on distributions or the redemption of fund shares. Investment return and principal value of an investment will fluctuate so that an investor’s shares, when redeemed, may be worth more or less than the original cost. Index figures are from FTSE Russell and ICE Data Services and all other figures are from Foresters Investment Management Company, Inc.
** The Since Inception returns for Class A shares, Advisor Class shares and Institutional Class shares are for the period beginning 8/1/16 (commencement of operations).
133
Portfolio of Investments
HEDGED U.S. EQUITY OPPORTUNITIES FUND
September 30, 2019
| |
Shares
| | | Security | | Value | |
| | | | | | COMMON STOCKS—90.3% | | | | |
| | | | | | Communication Services—2.9% | | | | |
| | | 150 | | * | Alphabet, Inc. - Class “A” | | $ | 183,171 | |
| | | 27,308 | | | AT&T, Inc. | | | 1,033,335 | |
| | | 3,506 | | | CBS Corp. - Class “B” | | | 141,537 | |
| | | 426 | | * | Charter Communications, Inc. | | | 175,563 | |
| | | 9,609 | | | Cinemark Holdings, Inc. | | | 371,292 | |
| | | 12,362 | | | Comcast Corp. - Special Shares “A” | | | 557,279 | |
| | | 1,429 | | * | T-Mobile U.S., Inc. | | | 112,562 | |
| | | 3,463 | | * | TripAdvisor, Inc. | | | 133,949 | |
| | | 6,262 | | | Verizon Communications, Inc. | | | 377,974 | |
| | | 3,842 | | | Walt Disney Co. | | | 500,689 | |
| | | | | | | | | 3,587,351 | |
| | | | | | Consumer Discretionary—11.6% | | | | |
| | | 723 | | * | Amazon.com, Inc. | | | 1,255,063 | |
| | | 517 | | | Autoliv, Inc. | | | 40,781 | |
| | | 1,180 | | * | Burlington Stores, Inc. | | | 235,788 | |
| | | 3,915 | | * | CarMax, Inc. | | | 344,520 | |
| | | 3,429 | | | Carter’s, Inc. | | | 312,759 | |
| | | 4,728 | | | Choice Hotels International, Inc. | | | 420,603 | |
| | | 15,879 | | | Compass Group, PLC (United Kingdom) | | | 408,636 | |
| | | 4,868 | | | Expedia, Inc. | | | 654,308 | |
| | | 1,459 | | * | Five Below, Inc. | | | 183,980 | |
| | | 4,558 | | * | Floor & Decor Holdings, Inc. | | | 233,142 | |
| | | 5,383 | | | General Motors Corp. | | | 201,755 | |
| | | 3,472 | | | Genuine Parts Co. | | | 345,776 | |
| | | 2,034 | | * | Grand Canyon Education, Inc. | | | 199,739 | |
| | | 5,542 | | | Home Depot, Inc. | | | 1,285,855 | |
| | | 1,497 | | | Lowe’s Cos., Inc. | | | 164,610 | |
| | | 1,271 | | | Marriott International, Inc. - Class “A” | | | 158,074 | |
| | | 2,169 | | | Marriott Vacations Worldwide Corp. | | | 224,730 | |
| | | 5,445 | | | McDonald’s Corp. | | | 1,169,096 | |
| | | 1,880 | | * | Netflix, Inc. | | | 503,126 | |
| | | 12,323 | | | NIKE, Inc. - Class “B” | | | 1,157,376 | |
134
| |
Shares
| | | Security | | Value | |
| | | | | | Consumer Discretionary (continued) |
| | | 180 | | * | NVR, Inc. | | $ | 669,123 | |
| | | 4,645 | | * | Ocean Outdoors, Ltd. (Virgin Islands) | | | 35,999 | |
| | | 4,400 | | * | Peloton Interactive, Inc. | | | 110,440 | |
| | | 24,216 | | * | Pinterest, Inc. - Class “A” | | | 640,513 | |
| | | 2,433 | | * | Planet Fitness, Inc. - Class “A” | | | 140,798 | |
| | | 6,412 | | | Ross Stores, Inc. | | | 704,358 | |
| | | 2,771 | | | Royal Caribbean Cruises, Ltd. | | | 300,182 | |
| | | 15,678 | | | Steve Madden, Ltd. | | | 561,116 | |
| | | 15,365 | | | TJX Cos., Inc. | | | 856,445 | |
| | | 3,120 | | | Tractor Supply Co. | | | 282,173 | |
| | | 10,627 | | * | Under Armour, Inc. - Class “A” | | | 211,902 | |
| | | 734 | | | Vail Resorts, Inc. | | | 167,029 | |
| | | 481 | | * | Veoneer, Inc. | | | 7,210 | |
| | | 363 | | | Whirlpool Corp. | | | 57,485 | |
| | | 1,216 | | | Wyndham Destinations, Inc. | | | 55,960 | |
| | | 1,216 | | | Wyndham Hotels & Resorts, Inc. | | | 62,916 | |
| | | | | | | | | 14,363,366 | |
| | | | | | Consumer Staples—6.1% | | | | |
| | | 14,220 | | | Altria Group, Inc. | | | 581,598 | |
| | | 3,690 | | | Archer-Daniels-Midland Co. | | | 151,548 | |
| | | 524 | | | Bunge, Ltd. | | | 29,669 | |
| | | 22,162 | | | Coca-Cola Co. | | | 1,206,499 | |
| | | 13,653 | | | Colgate-Palmolive Co. | | | 1,003,632 | |
| | | 1,652 | | | Costco Wholesale Corp. | | | 475,958 | |
| | | 23,463 | | | Diageo, PLC (United Kingdom) | | | 961,530 | |
| | | 731 | | | J.M. Smucker Co. | | | 80,425 | |
| | | 1,866 | | | Kellogg Co. | | | 120,077 | |
| | | 11,797 | | | Kroger Co. | | | 304,127 | |
| | | 4,310 | | | Lamb Weston Holdings, Inc. | | | 313,423 | |
| | | 5,209 | | * | Monster Beverage Corp. | | | 302,435 | |
| | | 7,119 | | | PepsiCo, Inc. | | | 976,015 | |
135
Portfolio of Investments (continued)
HEDGED U.S. EQUITY OPPORTUNITIES FUND
September 30, 2019
| |
Shares
| | | Security | | Value | |
| | | | | | Consumer Staples (continued) |
| | | 6,625 | | | Philip Morris International, Inc. | | $ | 503,036 | |
| | | 11,891 | | * | U.S. Foods Holding Corp. | | | 488,720 | |
| | | | | | | | | 7,498,692 | |
| | | | | | Energy—1.8% | | | | |
| | | 530 | | * | Apergy Corp. | | | 14,336 | |
| | | 10,592 | | | Canadian Natural Resources, Ltd. (ADR) (Canada) | | | 282,065 | |
| | | 2,990 | | | Chevron Corp. | | | 354,614 | |
| | | 2,414 | | | Cimarex Energy Co. | | | 115,727 | |
| | | 2,990 | | | Concho Resources, Inc. | | | 203,021 | |
| | | 5,822 | | | Diamondback Energy, Inc. | | | 523,456 | |
| | | 3,471 | | | Enbridge, Inc. (ADR) (Canada) | | | 121,763 | |
| | | 5,549 | | | Halliburton Co. | | | 104,599 | |
| | | 766 | | | Marathon Petroleum Corp. | | | 46,534 | |
| | | 13,673 | | | Noble Energy, Inc. | | | 307,096 | |
| | | 5,290 | | | Tenaris SA (ADR) (Italy) | | | 112,042 | |
| | | | | | | | | 2,185,253 | |
| | | | | | Financials—13.7% | | | | |
| | | 13,973 | | | Aflac, Inc. | | | 731,067 | |
| | | 239 | | * | Alleghany Corp. | | | 190,665 | |
| | | 2,584 | | | Allstate Corp. | | | 280,829 | |
| | | 9,411 | | | American Express Co. | | | 1,113,133 | |
| | | 10,036 | | * | API Group Corp. (ADR) (Virgin Islands) (a) | | | 98,855 | |
| | | 3,289 | | | Assurant, Inc. | | | 413,822 | |
| | | 4,748 | | * | Athene Holding, Ltd. - Class “A” | | | 199,701 | |
| | | 3,500 | | | Atlantic Union Bankshares Corp | | | 130,358 | |
| | | 12,550 | | | Bank of America Corp. | | | 366,083 | |
| | | 5,567 | | | Bank OZK | | | 151,812 | |
| | | 1,882 | | * | Berkshire Hathaway, Inc. - Class “B” | | | 391,494 | |
| | | 3,530 | | | Blackstone Group. Inc. - Class “A” | | | 172,405 | |
| | | 8,803 | | | Charles Schwab Corp. | | | 368,229 | |
| | | 7,121 | | | Chubb, Ltd. | | | 1,149,614 | |
| | | 5,161 | | | Citigroup, Inc. | | | 356,522 | |
136
| |
Shares
| | | Security | | Value | |
| | | | | | Financials (continued) |
| | | 35,454 | | | CNO Financial Group, Inc. | | $ | 561,237 | |
| | | 6,841 | | | Comerica, Inc. | | | 451,438 | |
| | | 843 | | * | Credit Acceptance Corp. | | | 388,884 | |
| | | 780 | | | FactSet Research Systems, Inc. | | | 189,517 | |
| | | 7,327 | | | Fidelity National Financial, Inc. | | | 325,392 | |
| | | 256 | | | First Citizens BancShares, Inc. - Class “A” | | | 120,717 | |
| | | 2,254 | | | First Republic Bank | | | 217,962 | |
| | | 10,864 | | | Highwoods Properties, Inc. | | | 488,228 | |
| | | 5,341 | | | IBERIABANK Corp. | | | 403,459 | |
| | | 18,600 | | | KeyCorp | | | 331,824 | |
| | | 12,188 | | | Lancashire Holdings, Ltd. (United Kingdom) | | | 110,819 | |
| | | 7,448 | | | Lincoln National Corp. | | | 449,263 | |
| | | 1,483 | | | London Stock Exchange (United Kingdom) | | | 133,255 | |
| | | 4,048 | | | M&T Bank Corp. | | | 639,463 | |
| | | 636 | | * | Markel Corp. | | | 751,688 | |
| | | 7,112 | | | Marsh & McLennan Cos., Inc. | | | 711,556 | |
| | | 10,755 | | | MetLife, Inc. | | | 507,206 | |
| | | 736 | | | Moody’s Corp. | | | 150,755 | |
| | | 13,671 | | | People’s United Financial, Inc. | | | 213,746 | |
| | | 5,969 | | | PNC Financial Services Group, Inc. | | | 836,615 | |
| | | 4,330 | | | Raymond James Financial, Inc. | | | 357,052 | |
| | | 2,943 | | | Reinsurance Group of America, Inc. | | | 470,527 | |
| | | 20,936 | | | SLM Corp. | | | 184,760 | |
| | | 4,373 | | | TD Ameritrade Holding Corp. | | | 204,219 | |
| | | 2,905 | | | Travelers Cos., Inc. | | | 431,944 | |
| | | 7,506 | | | Unum Group | | | 223,078 | |
| | | 2,918 | | | Voya Financial, Inc. | | | 158,856 | |
| | | 212 | | | White Mountain Insurance Group | | | 228,960 | |
| | | 13,247 | | | Zions Bancorp | | | 589,756 | |
| | | | | | | | | 16,946,765 | |
| | | | | | Health Care—14.6% | | | | |
| | | 9,025 | | * | Acadia Healthcare Co., Inc. | | | 280,497 | |
| | | 3,711 | | | Agilent Technologies, Inc. | | | 284,374 | |
137
Portfolio of Investments (continued)
HEDGED U.S. EQUITY OPPORTUNITIES FUND
September 30, 2019
| |
Shares
| | | Security | | Value | |
| | | | | | Health Care (continued) |
| | | 3,199 | | * | Alnylam Pharmaceuticals, Inc. | | $ | 257,264 | |
| | | 7,232 | | | AstraZeneca, PLC (ADR) (United Kingdom) | | | 322,330 | |
| | | 11,672 | | | Baxter International, Inc. | | | 1,020,950 | |
| | | 3,425 | | | Becton, Dickinson & Co. | | | 866,388 | |
| | | 569 | | * | Biogen, Inc. | | | 132,475 | |
| | | 4,238 | | | Bristol-Myers Squibb Co. | | | 214,909 | |
| | | 3,613 | | * | Centene Corp. | | | 156,298 | |
| | | 8,657 | | | CVS Health Corp. | | | 545,997 | |
| | | 5,034 | | | Danaher Corp. | | | 727,061 | |
| | | 1,669 | | | Dentsply Sirona, Inc. | | | 88,974 | |
| | | 842 | | * | DexCom, Inc. | | | 125,660 | |
| | | 8,797 | | * | Elanco Animal Health, Inc. | | | 233,912 | |
| | | 6,109 | | | Encompass Health Corp. | | | 386,578 | |
| | | 3,074 | | * | Exact Sciences Corp. | | | 277,797 | |
| | | 1,506 | | * | Galapagos NV | | | 229,906 | |
| | | 2,644 | | * | Haemonetics Corp. | | | 333,514 | |
| | | 4,177 | | | Hill-Rom Holdings, Inc. | | | 439,546 | |
| | | 1,345 | | | Humana, Inc. | | | 343,876 | |
| | | 3,297 | | * | Insulet Corp. | | | 543,774 | |
| | | 563 | | * | Intuitive Surgical, Inc. | | | 303,981 | |
| | | 3,989 | | * | Ionis Pharmaceuticals, Inc. | | | 238,981 | |
| | | 14,783 | | | Johnson & Johnson | | | 1,912,625 | |
| | | 5,071 | | | Koninklijke Philips NV (ADR) (Netherlands) | | | 233,925 | |
| | | 1,499 | | * | Laboratory Corp. of America Holdings | | | 251,832 | |
| | | 1,841 | | | McKesson Corp. | | | 251,591 | |
| | | 10,958 | | | Medtronic, PLC | | | 1,190,258 | |
| | | 10,951 | | | Merck & Co., Inc. | | | 921,855 | |
| | | 397 | | * | Mettler Toledo International, Inc. | | | 279,647 | |
| | | 1,697 | | * | Penumbra, Inc. | | | 228,230 | |
| | | 25,615 | | | Pfizer, Inc. | | | 920,347 | |
| | | 3,392 | | * | Seattle Genetic, Inc. | | | 289,677 | |
| | | 4,500 | | | Stryker Corp. | | | 973,350 | |
| | | 1,025 | | | Teleflex, Inc. | | | 348,244 | |
| | | 1,464 | | | Thermo Fisher Scientific, Inc. | | | 426,419 | |
138
| |
Shares
| | | Security | | Value | |
| | | | | | Health Care (continued) |
| | | 5,210 | | | UnitedHealth Group, Inc. | | $ | 1,132,237 | |
| | | 882 | | * | WellCare Health Plans, Inc. | | | 228,588 | |
| | | | | | | | | 17,943,867 | |
| | | | | | Industrials—13.4% | | | | |
| | | 2,949 | | | A.O. Smith Corp. | | | 140,697 | |
| | | 955 | | | AMERCO | | | 372,488 | |
| | | 11,583 | | | Canadian National Railway Co. (Canada) | | | 1,040,053 | |
| | | 2,251 | | | Cintas Corp. | | | 603,493 | |
| | | 5,618 | | * | Clean Harbors, Inc. | | | 433,710 | |
| | | 935 | | * | CoStar Group, Inc. | | | 554,642 | |
| | | 893 | | | Cummins, Inc. | | | 145,264 | |
| | | 3,531 | | | Delta Air Lines, Inc. | | | 203,386 | |
| | | 3,940 | | | Dover Corp. | | | 392,266 | |
| | | 2,421 | | | Equifax, Inc. | | | 340,562 | |
| | | 6,828 | | | Expeditors International of Washington, Inc. | | | 507,252 | |
| | | 6,508 | | | Fastenal Co. | | | 212,616 | |
| | | 3,900 | | | Fortive Corp. | | | 267,384 | |
| | | 3,833 | | | Fortune Brands Home & Security, Inc. | | | 209,665 | |
| | | 4,444 | | | General Dynamics Corp. | | | 812,052 | |
| | | 5,621 | | * | Genesee & Wyoming, Inc. - Class “A” | | | 621,177 | |
| | | 4,863 | | | Herman Miller, Inc. | | | 224,136 | |
| | | 334 | | | Huntington Ingalls Industries, Inc. | | | 70,738 | |
| | | 3,213 | | | IDEX Corp. | | | 526,546 | |
| | | 6,646 | | | Ingersoll-Rand, PLC | | | 818,854 | |
| | | 4,371 | | * | Itron, Inc. | | | 323,279 | |
| | | 16,450 | | * | JELD-WEN Holding, Inc. | | | 317,320 | |
| | | 4,875 | | | L3Harris Technologies, Inc. | | | 1,017,120 | |
| | | 2,117 | | | Lennox International, Inc. | | | 514,367 | |
| | | 1,366 | | | Lockheed Martin Corp. | | | 532,822 | |
| | | 5,203 | | | PACCAR, Inc. | | | 364,262 | |
| | | 2,551 | | | Pentair, PLC | | | 96,428 | |
| | | 938 | | | Raytheon Co. | | | 184,026 | |
| | | 8,356 | | | Republic Services, Inc. | | | 723,212 | |
139
Portfolio of Investments (continued)
HEDGED U.S. EQUITY OPPORTUNITIES FUND
September 30, 2019
| |
Shares
| | | Security | | Value | |
| | | | | | Industrials (continued) |
| | | 2,583 | | | Rockwell Automation, Inc. | | $ | 425,678 | |
| | | 14,843 | | | Sanwa Holdings Corp. (Japan) | | | 165,830 | |
| | | 5,860 | | | Southwest Airlines Co. | | | 316,499 | |
| | | 10,195 | | * | SPX FLOW, Inc. | | | 402,295 | |
| | | 14,277 | | | Steelcase, Inc. - Class “A” | | | 262,697 | |
| | | 4,452 | | | TransUnion | | | 361,102 | |
| | | 7,687 | | * | Uber Technologies, Inc. | | | 234,223 | |
| | | 4,678 | | | Union Pacific Corp. | | | 757,742 | |
| | | 5,710 | | | Wabtec Corp. | | | 410,321 | |
| | | 2,963 | | | Waste Connections, Inc. | | | 272,596 | |
| | | 4,972 | | | Xylem, Inc. | | | 395,871 | |
| | | | | | | | | 16,574,671 | |
| | | | | | Information Technology—13.1% | | | | |
| | | 3,425 | | | Accenture, PLC - Class “A” | | | 658,799 | |
| | | 12,114 | | * | Advanced Micro Devices, Inc. | | | 351,185 | |
| | | 1,604 | | * | Alibaba Group Holding, Ltd. (ADR) (China) | | | 268,237 | |
| | | 8,702 | | | Amdocs, Ltd. | | | 575,289 | |
| | | 5,227 | | * | Black Knight, Inc. | | | 319,161 | |
| | | 664 | | | Broadcom, Inc. | | | 183,310 | |
| | | 2,814 | | | CDW Corp. | | | 346,797 | |
| | | 3,049 | | * | Coherent, Inc. | | | 468,692 | |
| | | 476 | | | Constellation Software, Inc. (Canada) | | | 475,389 | |
| | | 4,394 | | * | Delivery Hero AG (Germany) | | | 195,210 | |
| | | 1,920 | | * | Electronic Arts, Inc. | | | 187,814 | |
| | | 1,254 | | * | Facebook, Inc. - Class “A” | | | 223,312 | |
| | | 685 | | * | Fair Isaac Corp. | | | 207,911 | |
| | | 1,222 | | * | FleetCor Technologies, Inc. | | | 350,445 | |
| | | 14,394 | | | Genpact, Ltd. | | | 557,767 | |
| | | 2,137 | | | Global Payments, Inc. | | | 339,783 | |
| | | 7,715 | | * | GoDaddy, Inc. - Class “A” | | | 509,036 | |
| | | 3,045 | | * | Guidewire Software, Inc. | | | 320,882 | |
| | | 10,099 | | * | Ichor Holdings, Ltd. | | | 244,194 | |
| | | 7,443 | | | Intel Corp. | | | 383,538 | |
140
| |
Shares
| | | Security | | Value | |
| | | | | | Information Technology (continued) |
| | | 2,182 | | | International Business Machines Corp. | | $ | 317,306 | |
| | | 1,906 | | | KLA-Tencor Corp. | | | 303,912 | |
| | | 4,174 | | | Leidos Holdings, Inc. | | | 358,463 | |
| | | 5,370 | | * | Lumentum Holdings, Inc. | | | 287,617 | |
| | | 9,659 | | | Marvell Technology Group, Ltd. | | | 241,185 | |
| | | 3,850 | | | Maxim Integrated Products, Inc. | | | 222,953 | |
| | | 3,074 | | * | Micron Technology, Inc. | | | 131,721 | |
| | | 6,985 | | | Microsoft Corp. | | | 971,125 | |
| | | 3,522 | | | MKS Instruments, Inc. | | | 325,010 | |
| | | 972 | | | Motorola Solutions, Inc. | | | 165,639 | |
| | | 2,580 | | * | PayPal Holdings, Inc. | | | 267,262 | |
| | | 380 | | * | Roku, Inc. | | | 38,669 | |
| | | 2,766 | | * | ServiceNow, Inc. | | | 702,149 | |
| | | 3,635 | | * | Splunk, Inc. | | | 428,421 | |
| | | 2,447 | | * | Spotify Technology SA | | | 278,958 | |
| | | 2,505 | | * | Square, Inc. - Class “A” | | | 155,185 | |
| | | 7,091 | | | SS&C Technologies Holdings, Inc. | | | 365,683 | |
| | | 8,454 | | | TE Connectivity, Ltd. | | | 787,744 | |
| | | 1,670 | | * | VeriSign, Inc. | | | 315,012 | |
| | | 3,445 | | | Visa, Inc. - Class “A” | | | 592,574 | |
| | | 8,121 | | | Western Digital Corp. | | | 484,336 | |
| | | 1,192 | | * | Wex, Inc. | | | 240,867 | |
| | | 2,469 | | * | Workday, Inc. - Class “A” | | | 419,631 | |
| | | 6,687 | | * | Yandex NV - Class “A” (ADR) (Russia) | | | 234,112 | |
| | | 1,437 | | * | Zebra Technologies Corp. - Class “A” | | | 296,554 | |
| | | | | | | | | 16,098,839 | |
| | | | | | Materials—4.1% | | | | |
| | | 3,850 | | * | Alcoa Corp. | | | 77,269 | |
| | | 4,275 | | | Ball Corp. | | | 311,263 | |
| | | 10,150 | | | Cabot Corp. | | | 459,998 | |
| | | 5,703 | | | Carpenter Technology Corp. | | | 294,617 | |
| | | 6,761 | | | Celanese Corp. | | | 826,803 | |
| | | 4,835 | | | CRH, PLC (Ireland) | | | 165,742 | |
141
Portfolio of Investments (continued)
HEDGED U.S. EQUITY OPPORTUNITIES FUND
September 30, 2019
| |
Shares
| | | Security | | Value | |
| | | | | | Materials (continued) |
| | | 3,637 | | | Eastman Chemical Co. | | $ | 268,520 | |
| | | 8,472 | | | FMC Corp. | | | 742,825 | |
| | | 4,372 | | | Linde, PLC | | | 846,944 | |
| | | 5,006 | | | Nucor Corp. | | | 254,855 | |
| | | 2,120 | | | Nutrien, Ltd. (Canada) | | | 105,612 | |
| | | 3,062 | | | Reliance Steel & Aluminum Co. | | | 305,159 | |
| | | 660 | | | Sherwin-Williams Co. | | | 362,914 | |
| | | | | | | | | 5,022,521 | |
| | | | | | Real Estate—6.5% | | | | |
| | | 5,081 | | | Acadia Realty Trust (REIT) | | | 145,215 | |
| | | 1,545 | | | Alexandria Real Estate Equities, Inc. (REIT) | | | 237,992 | |
| | | 5,340 | | | American Tower Corp. (REIT) | | | 1,180,834 | |
| | | 7,079 | | | Americold Realty Trust (REIT) | | | 262,419 | |
| | | 2,554 | | | AvalonBay Communities, Inc. (REIT) | | | 549,953 | |
| | | 1,803 | | | Boston Properties, Inc. (REIT) | | | 233,777 | |
| | | 7,818 | | | Brixmor Property Group, Inc. (REIT) | | | 158,627 | |
| | | 7,514 | | | Columbia Property Trust, Inc. (REIT) | | | 158,921 | |
| | | 1,172 | | | Crown Castle International Corp. (REIT) | | | 162,920 | |
| | | 1,090 | | | Equinix, Inc. (REIT) | | | 628,712 | |
| | | 526 | | | Federal Realty Investment Trust (REIT) | | | 71,610 | |
| | | 11,856 | | | Gaming and Leisure Properties (REIT) | | | 453,373 | |
| | | 13,523 | | | Host Hotels & Resorts, Inc. (REIT) | | | 233,813 | |
| | | 8,839 | | | Kimco Realty Corp. (REIT) | | | 184,558 | |
| | | 12,840 | | | Lennar Corp. (REIT) | | | 717,114 | |
| | | 4,072 | | | Life Storage, Inc. (REIT) | | | 429,230 | |
| | | 685 | | | Mid-America Apartment Communities, Inc. (REIT) | | | 89,057 | |
| | | 4,924 | | | Public Storage (REIT) | | | 1,207,709 | |
| | | 1,061 | | | Simon Property Group, Inc. (REIT) | | | 165,145 | |
| | | 485 | | | SL Green Realty Corp. (REIT) | | | 39,649 | |
| | | 3,407 | | | UDR, Inc. (REIT) | | | 165,171 | |
| | | 5,855 | | | Welltower, Inc. (REIT) | | | 530,756 | |
| | | | | | | | | 8,006,555 | |
142
| |
Shares
| | | Security | | Value | |
| | | | | | Utilities—2.5% | | | | |
| | | 3,115 | | | CMS Energy Corp. | | $ | 199,204 | |
| | | 3,164 | | | Dominion Energy, Inc. | | | 256,411 | |
| | | 2,728 | | | Eversourse Energy | | | 233,162 | |
| | | 4,645 | | | Iberdrola SA (ADR) (Spain) | | | 193,093 | |
| | | 7,619 | | | NRG Energy, Inc. | | | 301,712 | |
| | | 1,246 | | | Pinnacle West Capital Corp. | | | 120,949 | |
| | | 1,160 | | | Sempra Energy | | | 171,228 | |
| | | 12,647 | | | Southern Co. | | | 781,205 | |
| | | 15,856 | | | UGI Corp. | | | 797,081 | |
| | | | | | | | | 3,054,045 | |
Total Value of Common Stocks (cost $89,570,811) | | | 111,281,925 | |
PUT OPTIONS PURCHASED—.6% |
| | Contracts | | S&P 500 Index | | Exercise Price | | | Notional Amount | | | Value | |
| | | 60 | | Expiration 12/20/2019 | | $ | 2,525 | | | $ | 17,860,440 | | | | 63,600 | |
| | | 63 | | Expiration 3/20/2020 | | | 2,625 | | | | 18,753,462 | | | | 296,415 | |
| | | 43 | | Expiration 6/19/2020 | | | 2,700 | | | | 12,799,982 | | | | 371,950 | |
Total Value of Put Options Purchased (premium paid $1,437,568) | | | 731,965 | |
| | | | | | WARRANTS—.0% | | | | |
| | | | | | Financials | | | | |
| | | 6,600 | | * | API Group Corp. (Virgin Islands) (Expires 9/7/2027) (cost $66) (a) | | | 1,914 | |
Total Value of Investments (cost $91,008,445) | 90.9 | % | | | 112,015,804 | |
Other Assets, Less Liabilities | 9.1 | | | | 11,165,500 | |
Net Assets | | | 100.0 | % | | $ | 123,181,304 | |
(a) | Security valued at fair value (see Note 1A) |
143
Portfolio of Investments (continued)
HEDGED U.S. EQUITY OPPORTUNITIES FUND
September 30, 2019
PUT OPTIONS WRITTEN—(.3)% |
| | Contracts | | S&P 500 Index | | Exercise Price | | | Notional Amount | | | Value | |
| | | (60 | ) | Expiration 12/20/2019 | | $ | 2,325 | | | $ | (17,860,440 | ) | | $ | (23,100 | ) |
| | | (63 | ) | Expiration 3/20/2020 | | | 2,350 | | | | (18,753,462 | ) | | | (118,755 | ) |
| | | (43 | ) | Expiration 6/19/2020 | | | 2,475 | | | | (12,799,982 | ) | | | (210,485 | ) |
Total Value of Put Options Written (premium received $786,652) | | $ | (352,340 | ) |
Futures contracts outstanding at September 30, 2019:
| | Number of
Contracts | | Type | | Expiration | | | Notional
Amounts | | | Value at
September 30,
2019 | | | Unrealized
Appreciation
(Depreciation) | |
| | | (9 | ) | E-mini Russell 2000 Index | | | Dec. 2019 | | | $ | 771,585 | | | $ | 796,901 | | | $ | 25,316 | |
| | | (53 | ) | E-mini S&P 500 | | | Dec. 2019 | | | | 7,965,928 | | | | 8,034,301 | | | | 68,373 | |
| | | (39 | ) | E-mini S&P MidCap 400 | | | Dec. 2019 | | | | 5,915,910 | | | | 6,005,025 | | | | 89,115 | |
| | | (20 | ) | FTSE 100 Index | | | Dec. 2019 | | | | 1,462,200 | | | | 1,444,340 | | | | (17,860 | ) |
| | | (13 | ) | MSCI EAFE Index | | | Dec. 2019 | | | | 603,515 | | | | 603,285 | | | | (230 | ) |
| | | (11 | ) | MSCI EM Index | | | Dec. 2019 | | | | 1,233,755 | | | | 1,242,423 | | | | 8,668 | |
| | | (15 | ) | S&P/TSE 60 Index | | | Dec. 2019 | | | | 2,977,980 | | | | 2,970,158 | | | | (7,822 | ) |
(Premium received $325) | | | | | | $ | 165,560 | |
At September 30, 2019, the Fund has open foreign exchange contracts as described below.
The unrealized appreciation (depreciation) on the open contracts were as follows:
Counterparty | | Settlement
Date | | | Foreign
Currency | | | Receive
(Deliver) | | | Asset | | | Liability | | | Unrealized
Appreciation
(Depreciation) | |
UBS | | | 10/7/19 | | | | GBP | | | | (1,854,000 | ) | | $ | 2,291,943 | | | $ | 2,279,574 | | | $ | 12,369 | |
DMG | | | 10/7/19 | | | | GBP | | | | 559,000 | | | | 687,315 | | | | 691,428 | | | | (4,113 | ) |
BAM | | | 10/7/19 | | | | JPY | | | | (16,318,000 | ) | | | 152,152 | | | | 150,918 | | | | 1,234 | |
DMG | | | 10/7/19 | | | | CAD | | | | (2,720,000 | ) | | | 2,069,152 | | | | 2,053,063 | | | | 16,089 | |
BOM | | | 10/7/19 | | | | CAD | | | | 905,000 | | | | 683,096 | | | | 688,652 | | | | (5,556 | ) |
Net unrealized appreciation on open foreign exchange contracts | | $ | 20,023 | |
A summary of abbreviations for counterparties to foreign exchange contracts are as follows:
BAM | Bank of America/Merrill Lynch |
DMG | Deutsche Bank Securities Inc. |
144
Summary of Abbreviations:
ADR | American Depositary Receipts |
REIT | Real Estate Investment Trust |
The Fund’s assets and liabilities are classified into the following three levels based on the inputs used to value the assets and liabilities:
| | Level 1 – | Unadjusted quoted prices in active markets for identical securities that the Fund has the ability to access. |
| | Level 2 – | Observable inputs other than quoted prices included in Level 1 that are observable for the asset or liability, either directly or indirectly. These inputs may include quoted prices for the identical instrument on an inactive market, prices for similar instruments, interest rates, prepayment speeds, credit risk, yield curves, default rates and similar data. |
| | Level 3 – | Unobservable inputs for the asset or liability, to the extent relevant observable inputs are not available, representing the Fund’s own assumption about the assumptions a market participant would use in valuing the asset or liability, and would be based on the best information available. |
The inputs methodology used for valuing securities are not necessarily an indication of the risk associated with investing in those securities. For example, U.S. Government securities are reflected as Level 2 because the inputs used to determine fair value may not always be quoted prices in an active market.
145
Portfolio of Investments (continued)
HEDGED U.S. EQUITY OPPORTUNITIES FUND
September 30, 2019
The following is a summary, by category of Level, of inputs used to value the Fund’s investments as of September 30, 2019:
| | | Level 1 | | | Level 2 | | | Level 3 | | | Total | |
Assets | | | | | | | | | | | | | | | | |
Common Stocks* | | $ | 111,183,070 | | | $ | 98,855 | | | $ | — | | | $ | 111,281,925 | |
Put Options Purchased | | | — | | | | 731,965 | | | | — | | | | 731,965 | |
Warrants* | | | — | | | | 1,914 | | | | — | | | | 1,914 | |
| | | $ | 111,183,070 | | | $ | 832,734 | | | $ | — | | | $ | 112,015,804 | |
| | | | | | | | | | | | | | | | | |
Other Assets | | | | | | | | | | | | | | | | |
Futures Contracts | | $ | 165,885 | | | $ | — | | | $ | — | | | $ | 165,885 | |
| | | | | | | | | | | | | | | | | |
Liabilities | | | | | | | | | | | | | | | | |
Put Options Written | | $ | — | | | $ | (352,340 | ) | | $ | — | | | $ | (352,340 | ) |
| | | | | | | | | | | | | | | | | |
Other Financial Instruments** | | $ | — | | | $ | 20,023 | | | $ | — | | | $ | 20,023 | |
* | The Portfolio of Investments provides information on the industry categorization for common stocks and warrants. |
** | Other financial instruments are foreign exchange contracts and are considered derivative instruments, which are valued at the net unrealized appreciation on the instrument. |
Transfers between Level 1 and Level 2 securities as of September 30, 2019 resulted from securities priced previously with an official close price (Level 1 securities) or securities fair valued by the Valuation Committee (Level 2 securities). Transfers from Level 1 to Level 2 as of September 30, 2019, were $100,769. Transfers from Level 2 to Level 1 as of September 30, 2019, were $35,999.Transfers, if any, between Levels are recognized at the end of the reporting period.
See notes to financial statements
146
Portfolio Manager’s Letter
INTERNATIONAL FUND
Dear Investor:
This is the annual report for the First Investors International Fund for the fiscal year ended September 30, 2019. During the period, the Fund’s return on a net asset value basis was 7.01% for Class A shares, 7.43% for Advisor Class shares and 7.46% for Institutional Class shares, including dividends of 2.8 cents per share for Class A shares, 4.0 cents per share for Advisor Class shares and 4.7 cents per share for Institutional Class shares. In addition, the Fund distributed capital gains of 95.8 cents per share on each class of shares.
Market Review
In the fourth quarter of 2018, international equity markets faced significant pressure as volatility escalated. Equities alternated between panic and relief depending on the prevailing direction of news regarding trade tensions, monetary tightening and slowing growth in China. Both the U.S. Federal Reserve (“Fed”) and the European Central Bank (“ECB”) indicated an intent to proceed with the unwind of the quantitative easing (“QE”) program begun in the wake of the 2008 crisis, reigniting anxiety that the end of easy money would usher in weaker economic growth. Meanwhile, an unresolved Brexit agreement between the U.K. and E.U. continued to add uncertainty as Parliament’s vote on Prime Minister May’s plan was delayed until January. On the European Continent, the Italian government passed a budget late in the quarter; however, Italy’s fiscal woes continue to attract the market’s attention. Emerging market performance fared only slightly better than the U.S. and Europe.
International equity markets had a strong first quarter of 2019, bolstered by the Fed’s pause in interest rate increases and improving sentiment on U.S.-China trade tensions. While there was still lingering uncertainty about the trade negotiations between the U.S. and China, news that the two countries were making progress on a trade agreement also drove optimism and lifted Chinese equities, as did MSCI’s plan to reweight its indices. The rest of the emerging markets joined the rally over the quarter on the prospect that the pause in U.S. interest rate increases would relieve pressure on dollar-denominated debt and expectations that capital would continue to flow into the developing world. Despite a mixed picture across the continent, European equities rose 10.84% for the quarter. Political uncertainty continued as the U.K. extended its European Union exit deadline. While Germany narrowly missed a recession, Italy became the first Eurozone economy to go into decline, prompting a softer approach from the ECB. President Mario Draghi announced that the ECB would support the Eurozone economy through cheap loans for banks and maintain its key interest rate at minus 0.4%, at least through 2019.
Geopolitical pressures around the world marked the second quarter of 2019, as equity investors faced a rocky ride as sentiment on global trade tensions shifted from concern to optimism, a softer stance by central banks drove share prices upwards. At the start of the quarter, markets were primed for an “epic” trade deal between the U.S. and China. However, by early May the tariff war continued with another round of tit-for-tat measures. In Europe, deteriorating sentiment in Germany over global trade, as well as the ongoing vehicle emissions scandal, continued to hamper growth in the country and across the wider Euro zone. Inflation also slowed, prompting the ECB’s Mario Draghi to pledge more monetary support if needed. The U.K. remained mired
147
Portfolio Manager’s Letter (continued)
INTERNATIONAL FUND
in Brexit negotiations as politicians repeatedly failed to agree on a deal to leave the E.U. Country returns were mixed across emerging markets.
Intense political turmoil once again fueled market volatility in the third quarter. And stalling economic growth sent central bankers and policymakers around the globe to their armories for monetary and fiscal weapons to combat the slowdown. The uncertainty caused sharp swings in the international equity markets, with the MSCI All Country World Index ex U.S. ending the quarter in negative territory. The U.S.-China trade war roiled markets over the period and as the quarter drew to a close, reports emerged that Washington was considering capital markets restrictions on Chinese companies that might prevent them listing on US exchanges. Although an imminent move was denied by the U.S. Department of the Treasury, it nevertheless shook markets. Following Boris Johnson’s selection as prime minister in July, tensions between the U.K. and Europe mounted, and divisions in the British parliament widened, increasing the risk of a no-deal Brexit. Eurozone growth slowed to 0.2% in the second quarter, and inflation flagged to just 1% in August, prompting ECB President Draghi to cut the reserve rate for banks to -0.5% and restart QE measures. Emerging markets performance was mixed with many countries unleashing fiscal stimulus.
The Fund
The following discussion highlights specific stocks—those that provided the largest contribution to absolute performance and those that were the largest detractors for the fiscal year for the Fund.
Among the positive contributors, Constellation Software, benefited from vibrant acquisition opportunities and stable organic growth. The company also announced a special dividend for investors early in 2019. Constellation Software is a leading Canadian-listed conglomerate of mission-critical niche software businesses in the private and public sectors specializing in vertical market solutions – back office/operational software in a wide range of verticals such as health care, law and public transit. The company grows through bolt-on acquisitions and the industry is still quite fragmented. We believe the business is predictable because customers usually do not switch to a competitor’s product and they pay annual maintenance fees.
Nestlé’s organic growth exceeded expectations early in the year with particularly strong growth from its Petcare and Nutrition & Health Science units. We continue to believe Nestlé is well positioned with strong brands and meaningful exposure to faster growing emerging markets, roughly 42% of sales, and faster growing categories such as Coffee, PetCare, Infant Nutrition and Nutrition & Health Science. During the second quarter, Nestle continued its steady progress following good results in the first quarter, an informative investor conference, and progress on the $10 billion sale of its skin health business. Nestle is one of the largest food companies in the world with a vast product and geographic sales mix. The company delivers low to mid-single-digit constant currency organic sales growth consistently, driven by its focus on health and wellness, its diversified geographic exposure, and its wide product range from value to super premium. Under its new CEO it is also more quickly focused on margin improvement and focusing on its faster growing categories and disposing those that grow slower.
148
Among detractors, Reckitt Benckiser underperformed during the year, as Indivior, a pharma company Reckitt Benckiser spun off five years ago, was indicted on charges by the U.S. DOJ concerning the sale of an opioid treatment beginning in 2010. The market worried over the amount of risk this might entail for Reckitt. We sold Reckitt and reallocated capital to better opportunities.
British American Tobacco also underperformed following PMI’s announcement that uptake in Japan of its leading Heat not Burn (HNB) product was weaker than expected. It highlighted to investors the current uncertainty in the nicotine delivery space. British American Tobacco is the world’s largest tobacco company with market leadership in more than 50 countries around the world. It has global brands including Dunhill, Kent, Lucky Strike, Pall Mall and Rothmans. We sold British American Tobacco and reallocated capital to better opportunities.
Thank you for placing your trust in Foresters Financial. As always, we appreciate the opportunity to serve your investment needs.
Sincerely,

Matthew Benkendorf
Portfolio Manager
Vontobel Asset Management, Inc.
October 4, 2019
149
Fund Expenses (unaudited)
INTERNATIONAL FUND
The examples below show the ongoing costs (in dollars) of investing in your Fund and will help you in comparing these costs with costs of other mutual funds. Please refer to page 1 for a detailed explanation of the information presented in these examples.
Expense Example | Annualized
Expense
Ratio | Beginning
Account Value
(4/1/19) | Ending
Account Value
(9/30/19) | Expenses Paid
During Period
(4/1/19-9/30/19)* |
Class A Shares | 1.51% | | | |
Actual | | $1,000.00 | $1,070.84 | $ 7.84 |
Hypothetical** | | $1,000.00 | $1,017.50 | $ 7.64 |
Advisor Class Shares | 1.13% | | | |
Actual | | $1,000.00 | $1,073.42 | $ 5.87 |
Hypothetical** | | $1,000.00 | $1,019.40 | $ 5.72 |
Institutional Class Shares | 1.08% | | | |
Actual | | $1,000.00 | $1,073.12 | $ 5.61 |
Hypothetical** | | $1,000.00 | $1,019.66 | $ 5.47 |
* | Expenses are equal to the annualized expense ratio, multiplied by the average account value over the period, multiplied by 183/365 (to reflect the one-half year period). |
** | Assumed rate of return of 5% before expenses |
Portfolio Composition
BY SECTOR
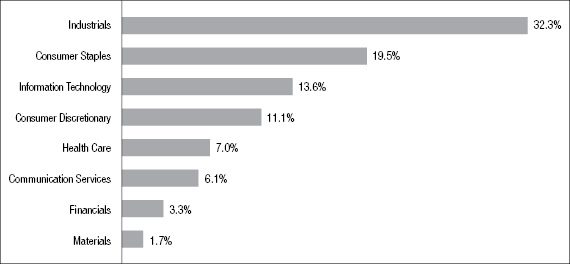
Portfolio holdings and allocations are subject to change. Percentages are as of September 30, 2019, and are based on the total market value of investments.
150
Cumulative Performance Information (unaudited)
INTERNATIONAL FUND
Comparison of change in value of $10,000 investment in the First Investors International Fund (Class A shares), the Morgan Stanley Capital International (“MSCI”) EAFE Index (Gross) and the MSCI EAFE Index (Net).
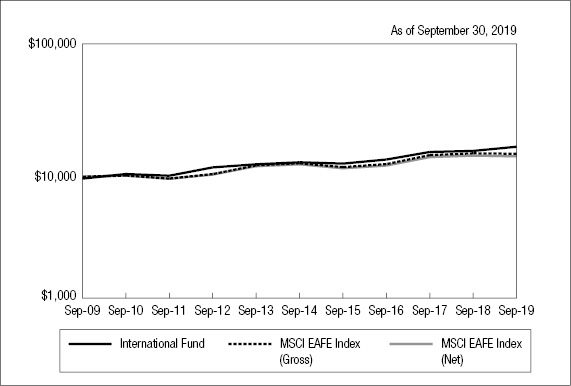
| | Average Annual Total Returns* |
N.A.V. Only | Class A | Advisor
Class | Institutional
Class | MSCI EAFE
Index (Gross) | MSCI EAFE
Index (Net) |
One Year | 7.01% | 7.43% | 7.46% | -0.82% | -1.34% |
Five Years | 5.80% | 6.21% | 6.31% | 3.77% | 3.27% |
Since Inception** | 7.27% | 5.16% | 5.31% | 5.39%† | 4.90%† |
| | | | | | |
S.E.C. Standardized | Class A | Advisor
Class | Institutional
Class | | |
One Year | 0.87% | 7.43% | 7.46% | | |
Five Years | 4.55% | 6.21% | 6.31% | | |
Since Inception** | 6.64% | 5.16% | 5.31% | | |
The graph compares a $10,000 investment in the First Investors International Fund (Class A shares) beginning 9/30/09 with theoretical investments in the MSCI EAFE Index (Gross) and the MSCI EAFE Index (Net) (the “Indices”). The Indices are free float-adjusted market capitalization indices that measure developed foreign market equity performance, excluding the U.S. and Canada. The Indices consist of 21 developed market country indices. The MSCI EAFE Index (Gross) is calculated on a total-return basis with the maximum possible dividend reinvestment (before taxes). The MSCI EAFE Index (Net) is calculated on a total-return basis with the minimum possible dividend reinvestment (after taxes). The Indices are unmanaged and it is not possible to invest directly in these Indices. In addition, the Indices do not reflect fees and expenses associated with the active management of a mutual fund portfolio. For purposes of the graph and the accompanying table, unless otherwise indicated, it has been assumed that the maximum sales charge was
151
Cumulative Performance Information (unaudited) (continued)
INTERNATIONAL FUND
deducted from the initial $10,000 investment in the Fund and all dividends and distributions were reinvested. Advisor Class shares and Institutional Class shares performance may be greater than or less than that shown in the line graph above for Class A shares based on differences in sales loads and fees paid by shareholders investing in the different classes.
* Average Annual Total Return figures (for the periods ended 9/30/19) include the reinvestment of all dividends and distributions. “N.A.V. Only” returns are calculated without sales charges. The Class A “S.E.C. Standardized” returns shown are based on the maximum sales charge of 5.75%. The Advisor Class and Institutional Class “S.E.C. Standardized” returns shown are the same as the N.A.V. Only returns since these classes are sold without sales charges. During the periods shown, some of the expenses of the Fund were waived or assumed. If such expenses had been paid by the Fund, the Advisor Class “S.E.C. Standardized” Average Annual Total Return Since Inception would have been 4.64% and the Institutional Class “S.E.C. Standardized” Average Annual Total Return Since Inception would have been 4.82%. Results represent past performance and do not indicate future results. The graph and the returns shown do not reflect the deduction of taxes that a shareholder would pay on distributions or the redemption of fund shares. Investment return and principal value of an investment will fluctuate so that an investor’s shares, when redeemed, may be worth more or less than the original cost. Indices figures are from Morgan Stanley & Co., Inc. and all other figures are from Foresters Investment Management Company, Inc.
** The Since Inception returns for Advisor Class shares and Institutional Class shares are for the periods beginning 4/1/13 (commencement of operations for those classes).
† The Index return is for ten years. The MSCI EAFE Index (Gross) return and MSCI EAFE Index (Net) return since inception of the Advisor Class shares and Institutional Class shares are 5.26% and 4.76%, respectively.
152
Portfolio of Investments
INTERNATIONAL FUND
September 30, 2019
| |
Shares
| | | Security | | Value | |
| | | | | | COMMON STOCKS—88.5% | | | | |
| | | | | | United Kingdom—12.7% | | | | |
| | | 239,666 | | | Ashtead Group, PLC | | $ | 6,671,550 | |
| | | 363,120 | | | Bunzl, PLC | | | 9,487,526 | |
| | | 96,584 | | | DCC, PLC | | | 8,426,800 | |
| | | 81,982 | | | London Stock Exchange | | | 7,366,496 | |
| | | 554,662 | | | RELX NV | | | 13,197,458 | |
| | | 2,098,244 | | | Rentokil Initial, PLC | | | 12,068,689 | |
| | | | | | | | | 57,218,519 | |
| | | | | | France—11.3% | | | | |
| | | 49,110 | | | Air Liquide SA | | | 6,990,709 | |
| | | 16,894 | | | LVMH Moet Hennessy Louis Vuitton SE | | | 6,714,549 | |
| | | 96,453 | | | Safran SA | | | 15,185,931 | |
| | | 55,146 | | | Teleperformance | | | 11,955,202 | |
| | | 95,629 | | | VINCI SA | | | 10,300,127 | |
| | | | | | | | | 51,146,518 | |
| | | | | | Canada—10.2% | | | | |
| | | 561,778 | | | Alimentation Couche-Tard, Inc. - Class “B” | | | 17,215,675 | |
| | | 361,986 | | | CAE, Inc. | | | 9,196,851 | |
| | | 110,327 | | | Canadian National Railway Co. | | | 9,906,404 | |
| | | 9,832 | | | Constellation Software, Inc. | | | 9,819,384 | |
| | | | | | | | | 46,138,314 | |
| | | | | | United States—9.7% | | | | |
| | | 9,017 | | * | Alphabet, Inc. - Class “C” | | | 10,991,723 | |
| | | 6,711 | | * | Booking Holdings, Inc. | | | 13,171,076 | |
| | | 55,321 | | | Mastercard, Inc. - Class “A” | | | 15,023,524 | |
| | | 41,980 | | | Medtronic, PLC | | | 4,559,868 | |
| | | | | | | | | 43,746,191 | |
| | | | | | Netherlands—8.1% | | | | |
| | | 41,956 | | | Heineken NV | | | 4,534,597 | |
| | | 29,323 | | | IMCD NV | | | 2,168,535 | |
| | | 271,473 | | | Unilever NV | | | 16,318,502 | |
153
Portfolio of Investments (continued)
INTERNATIONAL FUND
September 30, 2019
| |
Shares
| | | Security | | Value | |
| | | | | | Netherlands (continued) |
| | | 184,870 | | | Wolters Kluwer NV | | $ | 13,496,455 | |
| | | | | | | | | 36,518,089 | |
| | | | | | Switzerland—5.5% | | | | |
| | | 116,183 | | * | Alcon, Inc. | | | 6,775,062 | |
| | | 164,473 | | | Nestle SA | | | 17,843,932 | |
| | | | | | | | | 24,618,994 | |
| | | | | | Spain—4.9% | | | | |
| | | 231,893 | | | Cellnex Telecom SA | | | 9,579,326 | |
| | | 421,007 | | | Grifols SA - Class “A” | | | 12,408,067 | |
| | | | | | | | | 21,987,393 | |
| | | | | | Germany—4.5% | | | | |
| | | 29,497 | | | Adidas AG | | | 9,183,753 | |
| | | 94,677 | | | SAP SE | | | 11,132,522 | |
| | | | | | | | | 20,316,275 | |
| | | | | | China—4.0% | | | | |
| | �� | 78,377 | | * | Alibaba Group Holding, Ltd. (ADR) | | | 13,106,986 | |
| | | 122,393 | | | Tencent Holdings, Ltd. | | | 5,156,381 | |
| | | | | | | | | 18,263,367 | |
| | | | | | Belgium—3.8% | | | | |
| | | 178,624 | | | Anheuser-Busch InBev SA | | | 17,019,968 | |
| | | | | | Taiwan—2.7% | | | | |
| | | 257,263 | | | Taiwan Semiconductor Manufacturing Co., Ltd. (ADR) | | | 11,957,584 | |
| | | | | | Ireland—2.5% | | | | |
| | | 50,604 | | | Flutter Entertainment, PLC | | | 4,730,181 | |
| | | 136,260 | | | Kingspan Group, PLC | | | 6,653,567 | |
| | | | | | | | | 11,383,748 | |
154
| | Shares or
Principal
Amounts | | | Security | | Value | |
| | | | | | Japan—2.1% | | | | |
| | | 15,182 | | | Keyence Corp. | | $ | 9,393,533 | |
| | | | | | Mexico—2.1% | | | | |
| | | 3,162,618 | | | Walmart de Mexico SAB de CV | | | 9,373,747 | |
| | | | | | Hong Kong—1.7% | | | | |
| | | 1,070,221 | | | Techtronic Industries Co., Ltd. | | | 7,448,685 | |
| | | | | | Brazil—1.4% | | | | |
| | | 758,844 | | | Itau Unibanco Holding SA (ADR) | | | 6,381,878 | |
| | | | | | Australia—1.3% | | | | |
| | | 36,998 | | | CSL, Ltd. | | | 5,835,665 | |
Total Value of Common Stocks (cost $315,441,006) | | | 398,748,468 | |
| | | | | | SHORT-TERM U.S. GOVERNMENT OBLIGATIONS—3.8% | | | | |
| | $ | 17,000M | | | U.S. Treasury Bills, 1.78%, 10/22/2019 (cost $16,982,347) | | | 16,982,269 | |
| | | | | | SHORT-TERM U.S. GOVERNMENT AGENCY OBLIGATIONS—1.3% | | | | |
| | | 6,000M | | | Federal Home Loan Bank, 1.93%, 10/25/2019 (cost $5,992,275) | | | 5,992,518 | |
Total Value of Investments (cost $338,415,628) | | | 93.6 | % | | | 421,723,255 | |
Other Assets, Less Liabilities | | | 6.4 | | | | 28,649,944 | |
Net Assets | | | 100.0 | % | | $ | 450,373,199 | |
Summary of Abbreviations:
ADR | American Depositary Receipts |
The Fund’s assets and liabilities are classified into the following three levels based on the inputs used to value the assets and liabilities:
| | Level 1 – | Unadjusted quoted prices in active markets for identical securities that the Fund has the ability to access. |
155
Portfolio of Investments (continued)
INTERNATIONAL FUND
September 30, 2019
| | Level 2 – | Observable inputs other than quoted prices included in Level 1 that are observable for the asset or liability, either directly or indirectly. These inputs may include quoted prices for the identical instrument on an inactive market, prices for similar instruments, interest rates, prepayment speeds, credit risk, yield curves, default rates and similar data. |
| | Level 3 – | Unobservable inputs for the asset or liability, to the extent relevant observable inputs are not available, representing the Fund’s own assumption about the assumptions a market participant would use in valuing the asset or liability, and would be based on the best information available. |
The inputs methodology used for valuing securities are not necessarily an indication of the risk associated with investing in those securities. For example, U.S. Government securities are reflected as Level 2 because the inputs used to determine fair value may not always be quoted prices in an active market.
The following is a summary, by category of Level, of inputs used to value the Fund’s investments as of September 30, 2019:
| | | Level 1 | | | Level 2 | | | Level 3 | | | Total | |
Common Stocks | | | | | | | | | | | | | | | | |
United Kingdom | | $ | 57,218,519 | | | $ | — | | | $ | — | | | $ | 57,218,519 | |
France | | | 51,146,518 | | | | — | | | | — | | | | 51,146,518 | |
Canada | | | 46,138,314 | | | | — | | | | — | | | | 46,138,314 | |
United States | | | 43,746,191 | | | | — | | | | — | | | | 43,746,191 | |
Netherlands | | | 36,518,089 | | | | — | | | | — | | | | 36,518,089 | |
Switzerland | | | 24,618,994 | | | | — | | | | — | | | | 24,618,994 | |
Spain | | | 21,987,393 | | | | — | | | | — | | | | 21,987,393 | |
Germany | | | 20,316,275 | | | | — | | | | — | | | | 20,316,275 | |
China | | | 18,263,367 | | | | — | | | | — | | | | 18,263,367 | |
Belgium | | | 17,019,968 | | | | — | | | | — | | | | 17,019,968 | |
Taiwan | | | 11,957,584 | | | | — | | | | — | | | | 11,957,584 | |
Ireland | | | 11,383,748 | | | | — | | | | — | | | | 11,383,748 | |
Japan | | | 9,393,533 | | | | — | | | | — | | | | 9,393,533 | |
Mexico | | | 9,373,747 | | | | — | | | | — | | | | 9,373,747 | |
Hong Kong | | | 7,448,685 | | | | — | | | | — | | | | 7,448,685 | |
Brazil | | | 6,381,878 | | | | — | | | | — | | | | 6,381,878 | |
Australia | | | 5,835,665 | | | | — | | | | — | | | | 5,835,665 | |
Short-Term U.S Government Obligations | | | — | | | | 16,982,269 | | | | — | | | | 16,982,269 | |
Short-Term U.S Government Agency Obligations | | | — | | | | 5,992,518 | | | | — | | | | 5,992,518 | |
Total Investments in Securities | | $ | 398,748,468 | | | $ | 22,974,787 | | | $ | — | | | $ | 421,723,255 | |
During the year ended September 30, 2019, there were no transfers between Level 1 investments and Level 2 investments that had a material inpact to the Fund. This does not include transfers between Level 1 investments and Level 2 investments due to the Fund utilizing international fair value pricing during the year (see Note 1A). Transfers, if any, between Levels are recognized at the end of the reporting period.
See notes to financial statements
156
Portfolio Manager’s Letter
OPPORTUNITY FUND
Dear Investor:
This is the annual report for the First Investors Opportunity Fund for the fiscal year ended September 30, 2019. During the period, the Fund’s return on a net asset value basis was 0.80% for Class A shares, 1.14% for Advisor Class shares and 1.23% for Institutional Class shares, including dividends of 38.0 cents per share for Class A shares, 40.4 cents per share for Advisor Class shares and 43.4 cents per share for Institutional Class shares. In addition, the Fund distributed capital gains of $3.41 per share on each class of shares.
U.S. equity market
The U.S. stock market began the review period with a very weak quarter. The S&P 500 fell -9.0% in the month of December alone. Quantitative tightening by the Fed, coupled with slowing earnings and increased trade disputes, sparked the sell-off. The start of 2019 saw a meaningful reversal in the equity markets following the sharp sell-off in December. January started very strong with the S&P 500 posting a +8.0% total return, the best monthly showing since 1987. By the end of January, the S&P had erased most of the losses incurred during the month of December and sat 15% above its Christmas Eve low. The January rally was led by higher-beta, lower-quality and smaller-cap names. Fueled by a dovish Fed and more optimism about a potential trade deal, the S&P 500 posted its best quarterly return since 2009. The first quarter rally in small-cap stocks was the best since 1991.
As the second quarter progressed, the dominant themes were global trade war, the slowing global economy, and the Fed becoming more accommodative and starting to lower rates again. The S&P 500 gained 17% during the first six months of the year (its best performance since 1997). The market’s gains were predominantly built upon defensive sectors like Utilities, REITs and Consumer Staples. These sectors all made new highs along with the S&P 500, as lower global interest rates seemingly accelerated investors’ appetite for yield.
The start of the summer saw global economic data begin to weaken as the effect of the trade war began to manifest itself. The 2- to 10-year U.S. Treasury yield curve inverted for the first time since the Global Financial Crisis, raising recession concerns. The market continued to move on trade talk and the economy. In September, oil spiked with attacks on a Saudi processing plant and we saw a rotation from momentum stocks to value stocks for the first time. High-growth stocks came down off their highs and valuations in the private market began to correct as well. Nevertheless, the S&P 500 remained near its all-time highs posting a return of 20.55% on a year-to-date basis.
The Fund
The Fund’s absolute performance was mainly attributable to investments in Information Technology, Industrials and Financial stocks. Information Technology, positions in Synopsys, FleetCor Technologies and Fiserv drove solid performance. In Industrials, Jacobs Engineering benefitted from strong earnings guidance and a successful acquisition. Finally, in Financials, Fidelity National Financial—helped by housing market strength - and Ameriprise Financial—helped by lowering cost expectations—drove strong performance.
157
Portfolio Manager’s Letter (continued)
OPPORTUNITY FUND
On a relative basis, the Fund outperformed the S&P Midcap 400 Index primarily due to stock selection in Industrials, Financials and Consumer Staples. Performance in the industrials and financials was driven by the factors discussed above. In Consumer Staples, Performance Food Group and US Foods Holding were helped by a rotation to higher quality names and continued growth in comparable sales.
Thank you for placing your trust in Foresters Financial. As always, we appreciate the opportunity to serve your investment needs.
Sincerely,

|
Steven S. Hill |
Senior Portfolio Manager |
Foresters Investment Management Company, Inc. |
October 4, 2019
158
Fund Expenses (unaudited)
OPPORTUNITY FUND
The examples below show the ongoing costs (in dollars) of investing in your Fund and will help you in comparing these costs with costs of other mutual funds. Please refer to page 1 for a detailed explanation of the information presented in these examples.
Expense Example | Annualized
Expense
Ratio | Beginning
Account Value
(4/1/19) | Ending
Account Value
(9/30/19) | Expenses Paid
During Period
(4/1/19-9/30/19)* |
Class A Shares | 1.13% | | | |
Actual | | $1,000.00 | $1,049.73 | $ 5.81 |
Hypothetical** | | $1,000.00 | $1,019.40 | $ 5.72 |
Advisor Class Shares | 0.94% | | | |
Actual | | $1,000.00 | $1,051.56 | $ 4.83 |
Hypothetical** | | $1,000.00 | $1,020.36 | $ 4.76 |
Institutional Class Shares | 0.77% | | | |
Actual | | $1,000.00 | $1,051.63 | $ 3.96 |
Hypothetical** | | $1,000.00 | $1,021.21 | $ 3.90 |
* | Expenses are equal to the annualized expense ratio, multiplied by the average account value over the period, multiplied by 183/365 (to reflect the one-half year period). |
** | Assumed rate of return of 5% before expenses |
Portfolio Composition
TOP TEN SECTORS
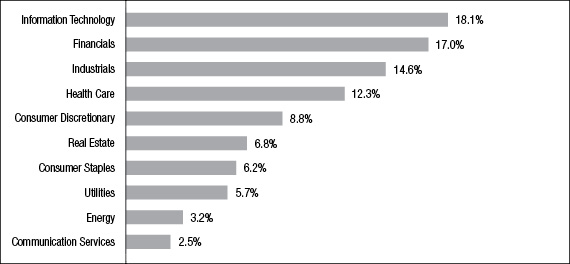
Portfolio holdings and allocations are subject to change. Percentages are as of September 30, 2019, and are based on the total market value of investments.
159
Cumulative Performance Information (unaudited)
OPPORTUNITY FUND
Comparison of change in value of $10,000 investment in the First Investors Opportunity Fund (Class A shares) and the Standard & Poor’s MidCap 400 Index.
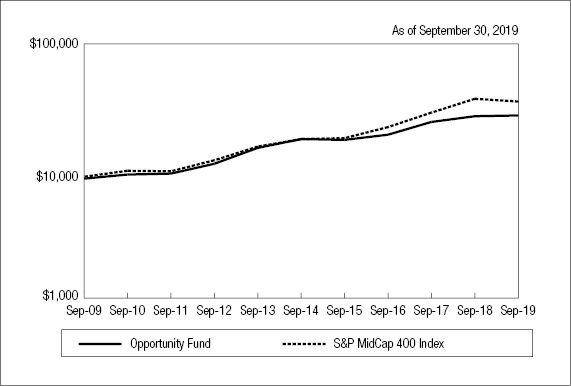
| | Average Annual Total Returns* |
N.A.V. Only | Class A | Advisor
Class | Institutional
Class | S&P MidCap
400 Index |
One Year | 0.80% | 1.14% | 1.23% | -2.49% |
Five Years | 5.91% | 6.24% | 6.37% | 8.88% |
Ten Years or Since Inception** | 11.68% | 9.32% | 9.47% | 12.56%† |
| | | | | |
S.E.C. Standardized | Class A | Advisor
Class | Institutional
Class | |
One Year | -5.01% | 1.14% | 1.23% | |
Five Years | 4.67% | 6.24% | 6.37% | |
Ten Years or Since Inception** | 11.02% | 9.32% | 9.47% | |
The graph compares a $10,000 investment in the First Investors Opportunity Fund (Class A shares) beginning 9/30/09 with a theoretical investment in the Standard & Poor’s MidCap 400 Index (the “Index”). The Index is an unmanaged capitalization-weighted index of 400 stocks designed to measure performance of the mid-range sector of the U.S. stock market. It is not possible to invest directly in this Index. In addition, the Index does not reflect fees and expenses associated with the active management of a mutual fund portfolio. For purposes of the graph and the accompanying table, unless otherwise indicated, it has been assumed that the maximum sales charge was deducted from the initial $10,000 investment in the Fund and all dividends and distributions were reinvested.
* Average Annual Total Return figures (for the periods ended 9/30/19) include the reinvestment of all dividends and distributions. “N.A.V. Only” returns are calculated without sales charges. The Class A “S.E.C. Standardized” returns shown are based on the maximum sales charge of 5.75%. The Advisor Class and
160
Institutional Class “S.E.C. Standardized” returns shown are the same as the N.A.V. Only returns since these classes are sold without sales charges. During the periods shown, some of the expenses of the Fund were waived or assumed. If such expenses had been paid by the Fund, the Advisor Class “S.E.C. Standardized” Average Annual Total Return Since Inception would have been 8.67% and the Institutional Class “S.E.C. Standardized” Average Annual Total Return Since Inception would have been 8.86%. Results represent past performance and do not indicate future results. The graph and the returns shown do not reflect the deduction of taxes that a shareholder would pay on distributions or the redemption of fund shares. Investment return and principal value of an investment will fluctuate so that an investor’s shares, when redeemed, may be worth more or less than the original cost. Index figures are from Standard & Poor’s and all other figures are from Foresters Investment Management Company, Inc.
** The Since Inception returns for Advisor Class shares and Institutional Class shares are for the periods beginning 4/1/13 (commencement of operations for those classes).
† The Index return is for ten years. The Index return since inception of the Advisor Class shares and Institutional Class shares is 9.99%.
161
Portfolio of Investments
OPPORTUNITY FUND
September 30, 2019
| |
Shares
| | | Security | | Value | |
| | | | | | COMMON STOCKS—95.8% | | | | |
| | | | | | Communication Services—2.5% | | | | |
| | | 56,200 | | * | IAC/InterActive Corp. | | $ | 12,249,914 | |
| | | 83,700 | | * | Take-Two Interactive Software, Inc. | | | 10,490,958 | |
| | | | | | | | | 22,740,872 | |
| | | | | | Consumer Discretionary—8.7% | | | | |
| | | 312,700 | | | Acushnet Holdings Corp. | | | 8,255,280 | |
| | | 220,800 | | | Aramark Holdings Corp. | | | 9,622,464 | |
| | | 38,700 | | * | Burlington Stores, Inc. | | | 7,733,034 | |
| | | 298,100 | | * | LKQ Corp. | | | 9,375,245 | |
| | | 144,700 | | | Penske Automotive Group, Inc. | | | 6,841,416 | |
| | | 77,900 | | | Ross Stores, Inc. | | | 8,557,315 | |
| | | 259,400 | | * | ServiceMaster Global Holdings, Inc. | | | 14,500,460 | |
| | | 270,000 | | | Tapestry, Inc. | | | 7,033,500 | |
| | | 166,300 | | | Wyndham Hotels & Resorts, Inc. | | | 8,604,362 | |
| | | | | | | | | 80,523,076 | |
| | | | | | Consumer Staples—6.1% | | | | |
| | | 237,800 | | | Conagra Brands, Inc. | | | 7,295,704 | |
| | | 471,400 | | | Koninklijke Ahold Delhaize NV (ADR) | | | 11,789,714 | |
| | | 32,800 | | | Lancaster Colony Corp. | | | 4,547,720 | |
| | | 56,200 | | | McCormick & Co., Inc. | | | 8,784,060 | |
| | | 246,000 | | * | Performance Food Group Co. | | | 11,318,460 | |
| | | 309,200 | | * | U.S. Foods Holding Corp. | | | 12,708,120 | |
| | | | | | | | | 56,443,778 | |
| | | | | | Energy—3.2% | | | | |
| | | 272,300 | | | Cabot Oil & Gas Corp. | | | 4,784,311 | |
| | | 973,300 | | | EnCana Corp. | | | 4,477,180 | |
| | | 391,800 | | | Noble Energy, Inc. | | | 8,799,828 | |
| | | 188,600 | | | PBF Energy, Inc. - Class “A” | | | 5,128,034 | |
| | | 73,800 | | | Valero Energy Corp. | | | 6,290,712 | |
| | | | | | | | | 29,480,065 | |
162
| |
Shares
| | | Security | | Value | |
| | | | | | Financials—16.7% | | | | |
| | | 75,000 | | | American Financial Group, Inc. | | $ | 8,088,750 | |
| | | 72,000 | | | Ameriprise Financial, Inc. | | | 10,591,200 | |
| | | 392,400 | | | Brown & Brown, Inc. | | | 14,149,944 | |
| | | 439,200 | | | Citizens Financial Group, Inc. | | | 15,534,504 | |
| | | 344,400 | | | Fidelity National Financial, Inc. | | | 15,294,804 | |
| | | 102,561 | | | First Republic Bank | | | 9,917,648 | |
| | | 128,800 | | | Global Life, Inc. | | | 12,333,888 | |
| | | 111,900 | | | IBERIABANK Corp. | | | 8,452,926 | |
| | | 165,100 | | | Nasdaq, Inc. | | | 16,402,685 | |
| | | 219,600 | | | Popular, Inc. | | | 11,875,968 | |
| | | 151,700 | | | Selective Insurance Group, Inc. | | | 11,406,323 | |
| | | 544,100 | | | Sterling Bancorp | | | 10,914,646 | |
| | | 296,300 | | | Synchrony Financial | | | 10,100,867 | |
| | | | | | | | | 155,064,153 | |
| | | | | | Health Care—12.1% | | | | |
| | | 234,800 | | * | Centene Corp. | | | 10,157,448 | |
| | | 123,000 | | * | Charles River Laboratories International, Inc. | | | 16,281,510 | |
| | | 110,100 | | | Gilead Sciences, Inc. | | | 6,978,138 | |
| | | 107,800 | | | Hill-Rom Holdings, Inc. | | | 11,343,794 | |
| | | 82,000 | | * | Jazz Pharmaceuticals, PLC | | | 10,507,480 | |
| | | 103,100 | | | PerkinElmer, Inc. | | | 8,781,027 | |
| | | 276,372 | | | Phibro Animal Health Corp. - Class “A” | | | 5,895,015 | |
| | | 87,800 | | | Quest Diagnostics, Inc. | | | 9,397,234 | |
| | | 241,300 | | | Smith & Nephew, PLC (ADR) | | | 11,613,769 | |
| | | 41,000 | | | Thermo Fisher Scientific, Inc. | | | 11,942,070 | |
| | | 41,600 | | * | Waters Corp. | | | 9,286,368 | |
| | | | | | | | | 112,183,853 | |
| | | | | | Industrials—14.3% | | | | |
| | | 134,700 | | | ESCO Technologies, Inc. | | | 10,716,732 | |
| | | 376,600 | | * | Gardner Denver Holdings, Inc. | | | 10,654,014 | |
| | | 116,500 | | | Ingersoll-Rand, PLC | | | 14,353,965 | |
| | | 179,200 | | | ITT, Inc. | | | 10,965,248 | |
163
Portfolio of Investments (continued)
OPPORTUNITY FUND
September 30, 2019
| |
Shares
| | | Security | | Value | |
| | | | | | Industrials (continued) |
| | | 173,300 | | | Jacobs Engineering Group, Inc. | | $ | 15,856,950 | |
| | | 90,200 | | | Kansas City Southern, Inc. | | | 11,997,502 | |
| | | 263,000 | | | Korn/Ferry International | | | 10,162,320 | |
| | | 331,500 | | | Masco Corp. | | | 13,816,920 | |
| | | 159,300 | | * | MasTec, Inc. | | | 10,343,349 | |
| | | 142,300 | | | Owens Corning | | | 8,993,360 | |
| | | 26,950 | | | Roper Technologies, Inc. | | | 9,610,370 | |
| | | 35,100 | | | Snap-On, Inc. | | | 5,494,554 | |
| | | | | | | | | 132,965,284 | |
| | | | | | Information Technology—17.8% | | | | |
| | | 94,900 | | * | Aspen Technology, Inc. | | | 11,680,292 | |
| | | 56,200 | | * | Autodesk, Inc. | | | 8,300,740 | |
| | | 119,500 | | * | Cadence Design Systems, Inc. | | | 7,896,560 | |
| | | 92,500 | | * | Cree, Inc. | | | 4,532,500 | |
| | | 113,600 | | * | Fiserv, Inc. | | | 11,767,824 | |
| | | 35,100 | | * | FleetCor Technologies, Inc. | | | 10,065,978 | |
| | | 58,600 | | | KLA-Tencor Corp. | | | 9,343,770 | |
| | | 90,200 | | | Leidos Holdings, Inc. | | | 7,746,376 | |
| | | 101,900 | | | LogMeIn, Inc. | | | 7,230,824 | |
| | | 183,900 | | | Maxim Integrated Products, Inc. | | | 10,649,649 | |
| | | 87,800 | | | MKS Instruments, Inc. | | | 8,102,184 | |
| | | 96,600 | | | NetApp, Inc. | | | 5,072,466 | |
| | | 66,800 | | * | Proofpoint, Inc. | | | 8,620,540 | |
| | | 144,100 | | * | Qorvo, Inc. | | | 10,683,574 | |
| | | 243,600 | | | SS&C Technologies Holdings, Inc. | | | 12,562,452 | |
| | | 133,500 | | * | Synopsys, Inc. | | | 18,322,875 | |
| | | 62,100 | | * | Zebra Technologies Corp. - Class “A” | | | 12,815,577 | |
| | | | | | | | | 165,394,181 | |
| | | | | | Materials—2.2% | | | | |
| | | 125,300 | | | FMC Corp. | | | 10,986,304 | |
| | | 48,600 | | | Linde, PLC | | | 9,414,792 | |
| | | | | | | | | 20,401,096 | |
164
| | Shares or
Principal
Amounts | | | Security | | Value | |
| | | | | | Real Estate—6.6% | | | | |
| | | 206,100 | | | Alexander & Baldwin, Inc. (REIT) | | $ | 5,051,511 | |
| | | 198,500 | | | American Campus Communities, Inc. (REIT) | | | 9,543,880 | |
| | | 202,600 | | | Americold Realty Trust (REIT) | | | 7,510,382 | |
| | | 523,600 | | | Brixmor Property Group, Inc. (REIT) | | | 10,623,844 | |
| | | 264,700 | | | Douglas Emmett, Inc. (REIT) | | | 11,337,101 | |
| | | 86,650 | | | Federal Realty Investment Trust (REIT) | | | 11,796,531 | |
| | | 112,400 | | | Liberty Property Trust (REIT) | | | 5,769,492 | |
| | | | | | | | | 61,632,741 | |
| | | | | | Utilities—5.6% | | | | |
| | | 401,200 | | | CenterPoint Energy, Inc. | | | 12,108,216 | |
| | | 227,800 | | | CMS Energy Corp. | | | 14,567,810 | |
| | | 164,000 | | | Portland General Electric Co. | | | 9,244,680 | |
| | | 168,700 | | | WEC Energy Group, Inc. | | | 16,043,370 | |
| | | | | | | | | 51,964,076 | |
Total Value of Common Stocks (cost $659,644,682) | | | 888,793,175 | |
| | | | | | SHORT-TERM U.S. GOVERNMENT OBLIGATIONS—1.3% | | | | |
| | $ | 12,000M | | | U.S. Treasury Bills, 1.78%, 10/22/2019 (cost $11,987,539) | | | 11,987,484 | |
| | | | | | SHORT-TERM U.S. GOVERNMENT AGENCY OBLIGATIONS—1.3% | | | | |
| | | 12,000M | | | Federal Home Loan Bank, 1.93%, 10/25/2019 (cost $11,984,550) | | | 11,985,036 | |
Total Value of Investments (cost $683,616,771) | | | 98.4 | % | | | 912,765,695 | |
Other Assets, Less Liabilities | | | 1.6 | | | | 15,236,222 | |
Net Assets | | | 100.0 | % | | $ | 928,001,917 | |
Summary of Abbreviations:
ADR | American Depositary Receipts |
REIT | Real Estate Investment Trust |
165
Portfolio of Investments (continued)
OPPORTUNITY FUND
September 30, 2019
The Fund’s assets and liabilities are classified into the following three levels based on the inputs used to value the assets and liabilities:
| | Level 1 – | Unadjusted quoted prices in active markets for identical securities that the Fund has the ability to access. |
| | Level 2 – | Observable inputs other than quoted prices included in Level 1 that are observable for the asset or liability, either directly or indirectly. These inputs may include quoted prices for the identical instrument on an inactive market, prices for similar instruments, interest rates, prepayment speeds, credit risk, yield curves, default rates and similar data. |
| | Level 3 – | Unobservable inputs for the asset or liability, to the extent relevant observable inputs are not available, representing the Fund’s own assumption about the assumptions a market participant would use in valuing the asset or liability, and would be based on the best information available. |
The inputs methodology used for valuing securities are not necessarily an indication of the risk associated with investing in those securities. For example, U.S. Government securities are reflected as Level 2 because the inputs used to determine fair value may not always be quoted prices in an active market.
The following is a summary, by category of Level, of inputs used to value the Fund’s investments as of September 30, 2019:
| | | Level 1 | | | Level 2 | | | Level 3 | | | Total | |
Common Stocks | | $ | 888,793,175 | | | $ | — | | | $ | — | | | $ | 888,793,175 | |
Short-Term U.S. Government Obligations | | | — | | | | 11,987,484 | | | | — | | | | 11,987,484 | |
Short-Term U.S. Government Agency Obligations | | | — | | | | 11,985,036 | | | | — | | | | 11,985,036 | |
Total Investments in Securities* | | $ | 888,793,175 | | | $ | 23,972,520 | | | $ | — | | | $ | 912,765,695 | |
* | The Portfolio of Investments provides information on the industry categorization for common stocks. |
There were no transfers into or from Level 1 and Level 2 by the Fund for the year ended September 30, 2019. Transfers, if any, between Levels are recognized at the end of the reporting period.
See notes to financial statements
166
Portfolio Managers’ Letter
PREMIUM INCOME FUND
Dear Investor:
This is the annual report for the First Investors Premium Income Fund for the fiscal year ended September 30, 2019. During the period, the Fund’s return on a net asset value basis was 2.33% for Class A shares, 2.67% for Advisor Class shares and 2.90% for Institutional Class shares, including dividends of 17.2 cents per share for Class A shares, 18.6 cents per share for Advisor Class shares and $4.38 per share for Institutional Class shares. In addition, the Fund distributed capital gains of 17.9 cents per share on each class of shares.
Market Environment
Stocks produced modest returns during a volatile twelve month period that ended September 30, 2019. The S&P 500 returned 4.25% over the past year, but this return masks a peak to trough decline of -19.37% and subsequent rally of 30.20% during the period. Interest rates declined significantly, leading to strong returns in the bond market. The 10-year U.S. Treasury yield began the period at 3.06%, but declined to 1.46% by September 2019, near its record low. As a result, the yield curve flattened significantly, with parts of it inverting, which we are closely monitoring. This change in the direction of long-term interest rates coincided with a marked shift in monetary policy, as the Federal Reserve switched from a tightening bias to an easing bias over the past twelve months. Developed market centrals banks have also adopted an easing bias for the most part, with negative interest rates across many maturities in a large number of these countries. A record $17 trillion worth of global bonds now have negative yields.
As of the most recent report, U.S. GDP grew 2.3% over the past twelve months, in-line with the current cycle average. Growth was supported by a healthy consumer, with rising wages and an unemployment rate that touched 3.6%, the lowest in 49 years. Trade concerns have waxed and waned over the past year, impacting market sentiment and stock returns. Since the beginning of the “trade war” nearly 18 months ago, most of the negative tariff impact in the U.S. has been offset by a stronger dollar and devaluation of the renminbi, which makes Chinese goods cheaper to U.S. purchasers.
Unlike the past five years, during which growth stocks significantly outperformed value stocks, there has been no clear winner over the past twelve months, as performance of the two styles has flipped multiple times. This change in the market has created an environment that is more favorable to stock picking.
Fund Performance Discussion
For the year ended September 30, 2019, the First Investors Premium Income Fund’s return outperformed the CBOE S&P 500 BuyWrite Index (BXM). This absolute return was accomplished with less risk than the S&P 500 Index (SPX). The standard deviation over the period was 60% less than the SPX’s standard deviation. As a result, the Fund’s risk-adjusted return was more than double the S&P 500 during the period. While the Fund’s risk-adjusted return outperformed both the broad equity market (SPX) and the covered call benchmark (BXM), it underperformed the Bloomberg Barclays Aggregate Bond Index because the significant decline in interest rates over the past year produced strong bond returns.
167
Portfolio Managers’ Letter (continued)
PREMIUM INCOME FUND
Due to the heightened volatility in the markets during the last 12 months, we have been able to write deeper in-the-money options and still maintain attractive call premiums. Over the past twelve months, the calls have averaged 14.3% in-the-money. As a result, the call options have provided both a historically attractive income component, and a large amount of downside protection, which has helped to smooth out the return profile of the Fund relative to the broad equity markets. For example, during the rapid market decline in the fourth quarter of 2018, the Fund’s downside participation was only 32% relative to the SPX, while the upside participation during the first quarter rally was 45%. Due to the implied volatility spike during December 2018, the call options in the Fund began 2019 at the most attractive levels in the history of the strategy. Linking the return from the fourth quarter with the return from the first quarter produces a gain of 1.48% for the Fund, versus a return of (1.72%) and (4.78%) for the SPX and BXM, respectively. The Fund had a positive return and outperformed both indices with less risk during a volatile period for the market. From the market bottom on December 24, 2018, it took the S&P 500 nearly four months to return to its original peak, while the Premium Income Fund made the retraced its path to its original height in less than two months.
While implied volatility has generally been below average for the most recent two quarters, in-the-money, single stock call premiums remain attractive. For example, the average implied volatility of the Fund’s call options ended the fiscal year at 28.9%, versus a year-end implied volatility of only 11.8% for the BXM’s at-the-money, 1-month index options. The BXM ended the fiscal year with its call options providing only 0.6% downside protection, versus the Fund’s call options providing 18.9% downside protection.
Thank you for placing your trust in our covered call strategy. As always, we appreciate the opportunity to serve your investment needs.
Sincerely,

| 
|
Wiley D. Angell | Sean C. Hughes, CFA |
Portfolio Manager | Portfolio Manager |
Zeigler Capital Management, LLC | Zeigler Capital Management, LLC |
October 4, 2019
168
Fund Expenses (unaudited)
PREMIUM INCOME FUND
The examples below show the ongoing costs (in dollars) of investing in your Fund and will help you in comparing these costs with costs of other mutual funds. Please refer to page 1 for a detailed explanation of the information presented in these examples.
Expense Example | Annualized
Expense
Ratio | Beginning
Account Value
(10/1/18) | Ending
Account Value
(9/30/19) | Expenses Paid
During Period
(4/1/19-9/30/19)* |
Class A Shares | 1.30% | | | |
Actual | | $1,000.00 | $1,014.16 | $ 6.56 |
Hypothetical** | | $1,000.00 | $1,018.55 | $ 6.58 |
Advisor Class Shares | 1.06% | | | |
Actual | | $1,000.00 | $1,016.28 | $ 5.36 |
Hypothetical** | | $1,000.00 | $1,019.76 | $ 5.37 |
Institutional Class Shares | 0.99% | | | |
Actual | | $1,000.00 | $1,016.94 | $ 5.01 |
Hypothetical** | | $1,000.00 | $1,020.11 | $ 5.01 |
* | Commencement of Operations |
** | Expenses are equal to the annualized expense ratio, multiplied by the average account value over the period, multiplied by 183/365 (to reflect the one-half year period). Expenses paid during the period are net of expenses waived. |
*** | Assumed rate of return of 5% before expenses |
Portfolio Composition
TOP TEN SECTORS
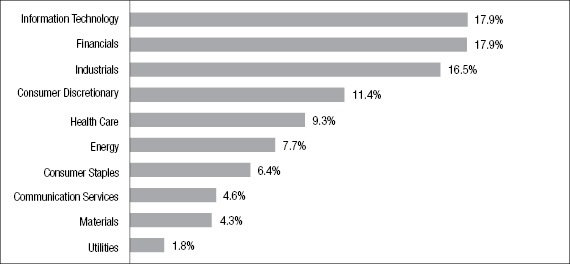
Portfolio holdings and allocations are subject to change. Percentages are as of September 30, 2019, and are based on the total market value of investments.
169
Cumulative Performance Information (unaudited)
PREMIUM INCOME FUND
Comparison of change in value of $10,000 investment in the First Investors Premium Income Fund (Class A shares) and the CBOE S&P 500 BuyWrite Index.
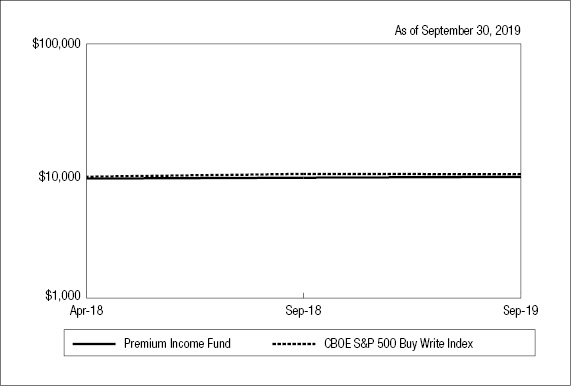
| | Average Annual Total Returns* |
N.A.V. Only | Class A | Advisor
Class | Institutional
Class | CBOE S&P
500 BuyWrite
Index |
One Year | 2.33% | 2.67% | 2.90% | -1.11% |
Since Inception** | 3.61% | 3.92% | 4.14% | 4.76% |
| | | | | |
S.E.C. Standardized | Class A | Advisor
Class | Institutional
Class | |
One Year | -3.59% | 2.67% | 2.90% | |
Since Inception** | -0.41% | 3.92% | 4.14% | |
The graph compares a $10,000 investment in the First Investors Premium Income Fund (Class A shares) beginning 4/2/18 (commencement of operations) with a theoretical investment in the Cboe S&P 500 BuyWrite Index (the “Index”). The Index is a benchmark index designed to track the performance of a hypothetical buy-write strategy on the S&P 500 Index. The Index is a passive total return index based on (1) buying an S&P 500 stock index portfolio, and (2) “writing” (or selling) the near-term S&P 500 Index (“SPX”) “covered” call option, generally on the third Friday of each month. The SPX call written will have about one month remaining to expiration, with an exercise price just above the prevailing index level (i.e., slightly out of the money). The SPX call is held until expiration and cash settled, at which time a new one-month, near-the-money call is written. It is not possible to invest directly in this Index. In addition, the Index does not reflect fees and expenses associated with the active management of a mutual fund portfolio. For purposes of the graph and the accompanying table, unless otherwise indicated, it has been assumed that the maximum sales charge was deducted from the initial $10,000 investment in the Fund and all dividends and distributions were reinvested. Advisor Class shares and Institutional Class shares performance may
170
be greater than or less than that shown in the line graph above for Class A shares based on differences in sales loads and fees paid by shareholders investing in the different classes.
* Average Annual Total Return figures (for the periods ended 9/30/19) include the reinvestment of all dividends and distributions. “N.A.V. Only” returns are calculated without sales charges. The Class A “S.E.C. Standardized” returns shown are based on the maximum sales charge of 5.75%. The Advisor Class and Institutional Class “S.E.C. Standardized” returns shown are the same as the N.A.V. Only returns since these classes are sold without sales charges. During the periods shown, some of the expenses of the Fund were waived or assumed. If such expenses had been paid by the Fund, the Class A “S.E.C. Standardized” Average Annual Total Return for One Year and Since Inception would have been -3.69% and -0.95%, respectively. The Advisor Class “S.E.C. Standardized” Average Annual Total Return for One Year and Since Inception would have been 2.62% and 3.56%, respectively. The Institutional Class “S.E.C. Standardized” Average Annual Total Return for One Year and Since Inception would have been 2.76% and 3.38%, respectively. Results represent past performance and do not indicate future results. The graph and the returns shown do not reflect the deduction of taxes that a shareholder would pay on distributions or the redemption of fund shares. Investment return and principal value of an investment will fluctuate so that an investor’s shares, when redeemed, may be worth more or less than the original cost. Index figures are from Cboe and all other figures are from Foresters Investment Management Company, Inc.
** The Since Inception returns for Class A shares, Advisor Class shares and Institutional Class shares are for the period beginning 4/2/18 (commencement of operations).
171
Portfolio of Investments
PREMIUM INCOME FUND
September 30, 2019
| |
Shares
| | | Security | | Value | |
| | | | | | COMMON STOCKS—119.5% | | | | |
| | | | | | Communication Services—5.5% | | | | |
| | | 37,600 | | | AT&T, Inc. | | $ | 1,422,784 | |
| | | 63,700 | | | CBS Corp. - Class “B” | | | 2,571,569 | |
| | | 50,600 | | | Verizon Communications, Inc. | | | 3,054,216 | |
| | | | | | | | | 7,048,569 | |
| | | | | | Consumer Discretionary—13.6% | | | | |
| | | 24,700 | | | Best Buy Co., Inc. | | | 1,704,053 | |
| | | 46,200 | | | Carnival Corp. | | | 2,019,402 | |
| | | 15,300 | | | Home Depot, Inc. | | | 3,549,906 | |
| | | 31,000 | | | Ross Stores, Inc. | | | 3,405,350 | |
| | | 52,700 | | | TJX Cos., Inc. | | | 2,937,498 | |
| | | 24,600 | | | Whirlpool Corp. | | | 3,895,656 | |
| | | | | | | | | 17,511,865 | |
| | | | | | Consumer Staples—7.6% | | | | |
| | | 15,600 | | | Colgate-Palmolive Co. | | | 1,146,756 | |
| | | 5,700 | | | Constellation Brands, Inc. - Class “A” | | | 1,181,496 | |
| | | 35,500 | | | General Mills, Inc. | | | 1,956,760 | |
| | | 11,400 | | | Kellogg Co. | | | 733,590 | |
| | | 52,600 | | | Kroger Co. | | | 1,356,028 | |
| | | 45,700 | | | Philip Morris International, Inc. | | | 3,470,001 | |
| | | | | | | | | 9,844,631 | |
| | | | | | Energy—9.2% | | | | |
| | | 33,100 | | | Chevron Corp. | | | 3,925,660 | |
| | | 28,100 | | | ConocoPhillips | | | 1,601,138 | |
| | | 16,200 | | | ExxonMobil Corp. | | | 1,143,882 | |
| | | 88,800 | | | Halliburton Co. | | | 1,673,880 | |
| | | 73,500 | | | Kinder Morgan, Inc. | | | 1,514,835 | |
| | | 45,000 | | | Occidental Petroleum Corp. | | | 2,001,150 | |
| | | | | | | | | 11,860,545 | |
172
| |
Shares
| | | Security | | Value | |
| | | | | | Exchange Traded Funds—1.0% | | | | |
| | | 4,400 | | | SPDR S&P 500 ETF Trust | | $ | 1,305,788 | |
| | | | | | Financials—21.4% | | | | |
| | | 27,500 | | | Allstate Corp. | | | 2,988,700 | |
| | | 39,200 | | | American Express Co. | | | 4,636,576 | |
| | | 99,700 | | | Bank of America Corp. | | | 2,908,249 | |
| | | 18,400 | | | BB&T Corp. | | | 982,008 | |
| | | 9,100 | | | BlackRock, Inc. | | | 4,055,324 | |
| | | 34,500 | | | Discover Financial Services | | | 2,797,605 | |
| | | 37,500 | | | JPMorgan Chase & Co. | | | 4,413,375 | |
| | | 70,300 | | | Morgan Stanley | | | 2,999,701 | |
| | | 30,600 | | | U.S. Bancorp | | | 1,693,404 | |
| | | | | | | | | 27,474,942 | |
| | | | | | Health Care—11.1% | | | | |
| | | 19,100 | | | Amgen, Inc. | | | 3,696,041 | |
| | | 78,800 | | | Bristol-Myers Squibb Co. | | | 3,995,948 | |
| | | 1,400 | | * | Celgene Corp. | | | 139,020 | |
| | | 9,800 | | | Johnson & Johnson | | | 1,267,924 | |
| | | 65,100 | | | Pfizer, Inc. | | | 2,339,043 | |
| | | 3,400 | | | Stryker Corp. | | | 735,420 | |
| | | 7,300 | | | Thermo Fisher Scientific, Inc. | | | 2,126,271 | |
| | | | | | | | | 14,299,667 | |
| | | | | | Industrials—19.7% | | | | |
| | | 30,200 | | | CSX Corp. | | | 2,091,954 | |
| | | 41,100 | | | Delta Air Lines, Inc. | | | 2,367,360 | |
| | | 14,500 | | | Eaton Corp., PLC | | | 1,205,675 | |
| | | 9,700 | | | General Dynamics Corp. | | | 1,772,481 | |
| | | 24,600 | | | Honeywell International, Inc. | | | 4,162,320 | |
| | | 8,700 | | | Lockheed Martin Corp. | | | 3,393,522 | |
| | | 20,800 | | | Raytheon Co. | | | 4,080,752 | |
| | | 31,300 | | | United Parcel Service, Inc. - Class “B” | | | 3,750,366 | |
| | | 18,600 | | | United Technologies Corp. | | | 2,539,272 | |
| | | | | | | | | 25,363,702 | |
173
Portfolio of Investments (continued)
PREMIUM INCOME FUND
September 30, 2019
| |
Shares
| | | Security | | Value | |
| | | | | | Information Technology—21.4% | | | | |
| | | 19,900 | | | Apple, Inc. | | $ | 4,457,003 | |
| | | 13,900 | | | Broadcom, Inc. | | | 3,837,373 | |
| | | 77,600 | | | Cisco Systems, Inc. | | | 3,834,216 | |
| | | 25,500 | | | Citrix Systems, Inc. | | | 2,461,260 | |
| | | 77,700 | | | Intel Corp. | | | 4,003,881 | |
| | | 21,200 | | | International Business Machines Corp. | | | 3,082,904 | |
| | | 12,700 | | | Microsoft Corp. | | | 1,765,681 | |
| | | 43,200 | | | Oracle Corp. | | | 2,377,296 | |
| | | 13,700 | | | Texas Instruments, Inc. | | | 1,770,588 | |
| | | | | | | | | 27,590,202 | |
| | | | | | Materials—5.2% | | | | |
| | | 20,500 | | | Dow, Inc. | | | 976,825 | |
| | | 43,000 | | | DuPont de Nemours, Inc. | | | 3,066,330 | |
| | | 51,800 | | | Nucor Corp. | | | 2,637,138 | |
| | | | | | | | | 6,680,293 | |
| | | | | | Real Estate—1.6% | | | | |
| | | 13,000 | | | Simon Property Group, Inc. (REIT) | | | 2,023,450 | |
| | | | | | Utilities—2.2% | | | | |
| | | 58,000 | | | Exelon Corp. | | | 2,801,980 | |
Total Value of Common Stocks (cost $150,802,030) | | | 119.5 | % | | | 153,805,634 | |
Excess of Liabilities Over Other Assets | | | (19.5 | ) | | | (25,103,497 | ) |
Net Assets | | | 100.0 | % | | $ | 128,702,137 | |
Summary of Abbreviations:
REIT | Real Estate Investment Trust |
174
CALL OPTIONS
WRITTEN—(22.6)% | | Expiration
Date | | | Exercise
Price | | | Contracts | | | Value | |
Allstate Corp. | | | 1/17/20 | | | $ | 90.00 | | | | (275 | ) | | $ | (537,625 | ) |
American Express Co. | | | 4/17/20 | | | | 105.00 | | | | (38 | ) | | | (62,795 | ) |
American Express Co. | | | 4/17/20 | | | | 100.00 | | | | (354 | ) | | | (723,045 | ) |
Amgen, Inc. | | | 4/17/20 | | | | 175.00 | | | | (191 | ) | | | (466,995 | ) |
Apple, Inc. | | | 1/17/20 | | | | 185.00 | | | | (59 | ) | | | (245,735 | ) |
Apple, Inc. | | | 1/17/20 | | | | 165.00 | | | | (28 | ) | | | (166,810 | ) |
Apple, Inc. | | | 1/17/20 | | | | 160.00 | | | | (51 | ) | | | (330,480 | ) |
Apple, Inc. | | | 3/20/20 | | | | 165.00 | | | | (61 | ) | | | (367,983 | ) |
AT&T, Inc. | | | 1/17/20 | | | | 30.00 | | | | (376 | ) | | | (295,160 | ) |
Bank of America Corp. | | | 6/19/20 | | | | 23.00 | | | | (997 | ) | | | (687,930 | ) |
BB&T Corp. | | | 3/20/20 | | | | 41.00 | | | | (184 | ) | | | (232,300 | ) |
Best Buy Co., Inc. | | | 1/17/20 | | | | 52.50 | | | | (247 | ) | | | (421,753 | ) |
BlackRock, Inc. | | | 1/17/20 | | | | 410.00 | | | | (26 | ) | | | (121,810 | ) |
BlackRock, Inc. | | | 1/17/20 | | | | 380.00 | | | | (36 | ) | | | (261,180 | ) |
BlackRock, Inc. | | | 1/17/20 | | | | 370.00 | | | | (14 | ) | | | (113,750 | ) |
BlackRock, Inc. | | | 1/17/20 | | | | 350.00 | | | | (6 | ) | | | (59,730 | ) |
BlackRock, Inc. | | | 4/17/20 | | | | 380.00 | | | | (9 | ) | | | (68,085 | ) |
Bristol-Myers Squibb Co. | | | 1/17/20 | | | | 43.00 | | | | (241 | ) | | | (192,800 | ) |
Bristol-Myers Squibb Co. | | | 1/17/20 | | | | 42.00 | | | | (120 | ) | | | (106,800 | ) |
Bristol-Myers Squibb Co. | | | 3/20/20 | | | | 42.00 | | | | (142 | ) | | | (130,640 | ) |
Bristol-Myers Squibb Co. | | | 6/19/20 | | | | 43.00 | | | | (105 | ) | | | (93,450 | ) |
Bristol-Myers Squibb Co. | | | 6/19/20 | | | | 40.00 | | | | (180 | ) | | | (204,750 | ) |
Broadcom, Inc. | | | 1/17/20 | | | | 250.00 | | | | (53 | ) | | | (184,970 | ) |
Broadcom, Inc. | | | 1/17/20 | | | | 230.00 | | | | (45 | ) | | | (229,950 | ) |
Broadcom, Inc. | | | 6/19/20 | | | | 240.00 | | | | (41 | ) | | | (199,875 | ) |
Carnival Corp. | | | 1/17/20 | | | | 47.50 | | | | (57 | ) | | | (5,700 | ) |
Carnival Corp. | | | 1/17/20 | | | | 37.50 | | | | (405 | ) | | | (277,425 | ) |
CBS Corp. - Class “B” | | | 1/17/20 | | | | 42.50 | | | | (25 | ) | | | (4,125 | ) |
CBS Corp. - Class “B” | | | 3/20/20 | | | | 40.00 | | | | (269 | ) | | | (95,495 | ) |
CBS Corp. - Class “B” | | | 3/20/20 | | | | 37.50 | | | | (343 | ) | | | (172,357 | ) |
Celgene Corp. | | | 1/17/20 | | | | 75.00 | | | | (14 | ) | | | (34,580 | ) |
Chevron Corp. | | | 1/17/20 | | | | 105.00 | | | | (255 | ) | | | (380,588 | ) |
Chevron Corp. | | | 6/19/20 | | | | 100.00 | | | | (76 | ) | | | (151,810 | ) |
Cisco Systems, Inc. | | | 6/19/20 | | | | 42.50 | | | | (129 | ) | | | (108,360 | ) |
Cisco Systems, Inc. | | | 6/19/20 | | | | 40.00 | | | | (647 | ) | | | (669,645 | ) |
Citrix Systems, Inc. | | | 12/20/19 | | | | 85.00 | | | | (59 | ) | | | (74,930 | ) |
Citrix Systems, Inc. | | | 12/20/19 | | | | 80.00 | | | | (129 | ) | | | (219,945 | ) |
Citrix Systems, Inc. | | | 3/20/20 | | | | 82.50 | | | | (67 | ) | | | (107,200 | ) |
Colgate-Palmolive Co. | | | 1/17/20 | | | | 55.00 | | | | (156 | ) | | | (292,110 | ) |
175
Portfolio of Investments (continued)
PREMIUM INCOME FUND
September 30, 2019
CALL OPTIONS
WRITTEN—(22.6)% | | Expiration
Date | | | Exercise
Price | | | Contracts | | | Value | |
ConocoPhillips Co. | | | 5/15/20 | | | $ | 52.50 | | | | (281 | ) | | $ | (221,990 | ) |
Constellation Brands, Inc. - Class “A” | | | 10/18/19 | | | | 145.00 | | | | (57 | ) | | | (358,530 | ) |
CSX Corp. | | | 2/21/20 | | | | 60.00 | | | | (302 | ) | | | (337,485 | ) |
Delta Air Lines, Inc. | | | 1/17/20 | | | | 47.00 | | | | (77 | ) | | | (86,817 | ) |
Delta Air Lines, Inc. | | | 1/17/20 | | | | 45.00 | | | | (116 | ) | | | (151,090 | ) |
Delta Air Lines, Inc. | | | 3/20/20 | | | | 50.00 | | | | (38 | ) | | | (34,865 | ) |
Delta Air Lines, Inc. | | | 6/19/20 | | | | 50.00 | | | | (180 | ) | | | (179,100 | ) |
Discover Financial Services | | | 1/17/20 | | | | 70.00 | | | | (21 | ) | | | (26,250 | ) |
Discover Financial Services | | | 1/17/20 | | | | 65.00 | | | | (238 | ) | | | (409,360 | ) |
Discover Financial Services | | | 4/17/20 | | | | 70.00 | | | | (86 | ) | | | (115,670 | ) |
Dow, Inc. | | | 1/17/20 | | | | 50.00 | | | | (98 | ) | | | (19,355 | ) |
Dow, Inc. | | | 1/17/20 | | | | 45.00 | | | | (107 | ) | | | (49,220 | ) |
DuPont de Nemours, Inc. | | | 1/17/20 | | | | 60.00 | | | | (430 | ) | | | (533,200 | ) |
Eaton Corp., PLC | | | 1/17/20 | | | | 72.50 | | | | (145 | ) | | | (170,375 | ) |
Exelon Corp. | | | 1/17/20 | | | | 42.00 | | | | (580 | ) | | | (385,700 | ) |
ExxonMobil Corp. | | | 11/15/19 | | | | 72.50 | | | | (129 | ) | | | (13,932 | ) |
ExxonMobil Corp. | | | 1/17/20 | | | | 70.00 | | | | (33 | ) | | | (10,478 | ) |
General Dynamics Corp. | | | 1/17/20 | | | | 150.00 | | | | (78 | ) | | | (264,810 | ) |
General Dynamics Corp. | | | 2/21/20 | | | | 155.00 | | | | (19 | ) | | | (56,905 | ) |
General Mills, Inc. | | | 1/17/20 | | | | 45.00 | | | | (119 | ) | | | (122,272 | ) |
General Mills, Inc. | | | 1/17/20 | | | | 42.50 | | | | (236 | ) | | | (299,130 | ) |
Halliburton Co. | | | 1/17/20 | | | | 17.50 | | | | (133 | ) | | | (31,920 | ) |
Halliburton Co. | | | 1/17/20 | | | | 15.00 | | | | (755 | ) | | | (320,875 | ) |
Home Depot, Inc. | | | 1/17/20 | | | | 175.00 | | | | (33 | ) | | | (189,585 | ) |
Home Depot, Inc. | | | 1/17/20 | | | | 170.00 | | | | (48 | ) | | | (301,320 | ) |
Home Depot, Inc. | | | 1/17/20 | | | | 160.00 | | | | (39 | ) | | | (283,238 | ) |
Home Depot, Inc. | | | 6/19/20 | | | | 175.00 | | | | (33 | ) | | | (196,102 | ) |
Honeywell International, Inc. | | | 3/20/20 | | | | 140.00 | | | | (37 | ) | | | (116,180 | ) |
Honeywell International, Inc. | | | 6/19/20 | | | | 145.00 | | | | (209 | ) | | | (591,993 | ) |
Intel Corp. | | | 1/17/20 | | | | 42.00 | | | | (777 | ) | | | (784,770 | ) |
International Business Machines Corp. | | | 1/17/20 | | | | 120.00 | | | | (167 | ) | | | (450,900 | ) |
International Business Machines Corp. | | | 4/17/20 | | | | 115.00 | | | | (45 | ) | | | (141,187 | ) |
Johnson & Johnson | | | 3/20/20 | | | | 115.00 | | | | (98 | ) | | | (161,455 | ) |
JPMorgan Chase & Co. | | | 1/17/20 | | | | 100.00 | | | | (287 | ) | | | (526,645 | ) |
JPMorgan Chase & Co. | | | 1/17/20 | | | | 95.00 | | | | (37 | ) | | | (85,008 | ) |
JPMorgan Chase & Co. | | | 6/19/20 | | | | 97.50 | | | | (51 | ) | | | (112,710 | ) |
176
CALL OPTIONS
WRITTEN—(22.6)% | | Expiration
Date | | | Exercise
Price | | | Contracts | | | Value | |
Kellogg Co. | | | 3/20/20 | | | $ | 55.00 | | | | (86 | ) | | $ | (88,580 | ) |
Kellogg Co. | | | 3/20/20 | | | | 47.50 | | | | (28 | ) | | | (48,300 | ) |
Kinder Morgan, Inc. | | | 1/17/20 | | | | 16.00 | | | | (409 | ) | | | (192,230 | ) |
Kinder Morgan, Inc. | | | 6/19/20 | | | | 17.00 | | | | (326 | ) | | | (124,695 | ) |
Kroger Co. | | | 1/17/20 | | | | 19.00 | | | | (526 | ) | | | (364,255 | ) |
Lockheed Martin Corp. | | | 3/20/20 | | | | 325.00 | | | | (35 | ) | | | (243,775 | ) |
Lockheed Martin Corp. | | | 3/20/20 | | | | 320.00 | | | | (52 | ) | | | (385,580 | ) |
Microsoft Corp. | | | 1/17/20 | | | | 92.50 | | | | (127 | ) | | | (594,995 | ) |
Morgan Stanley | | | 1/17/20 | | | | 34.00 | | | | (348 | ) | | | (313,200 | ) |
Morgan Stanley | | | 6/19/20 | | | | 38.00 | | | | (355 | ) | | | (233,412 | ) |
Nucor Corp. | | | 1/17/20 | | | | 50.00 | | | | (37 | ) | | | (13,783 | ) |
Nucor Corp. | | | 1/17/20 | | | | 47.50 | | | | (258 | ) | | | (137,385 | ) |
Nucor Corp. | | | 1/17/20 | | | | 45.00 | | | | (223 | ) | | | (160,560 | ) |
Occidental Petroleum Corp. | | | 1/17/20 | | | | 45.00 | | | | (28 | ) | | | (7,462 | ) |
Occidental Petroleum Corp. | | | 2/21/20 | | | | 40.00 | | | | (80 | ) | | | (48,200 | ) |
Occidental Petroleum Corp. | | | 2/21/20 | | | | 37.50 | | | | (342 | ) | | | (270,180 | ) |
Oracle Corp. | | | 6/19/20 | | | | 47.50 | | | | (216 | ) | | | (203,040 | ) |
Oracle Corp. | | | 6/19/20 | | | | 45.00 | | | | (216 | ) | | | (245,700 | ) |
Pfizer, Inc. | | | 1/17/20 | | | | 35.00 | | | | (222 | ) | | | (47,508 | ) |
Pfizer, Inc. | | | 3/20/20 | | | | 32.00 | | | | (323 | ) | | | (146,965 | ) |
Pfizer, Inc. | | | 3/20/20 | | | | 31.00 | | | | (106 | ) | | | (56,445 | ) |
Philip Morris International, Inc. | | | 1/17/20 | | | | 72.50 | | | | (107 | ) | | | (62,863 | ) |
Philip Morris International, Inc. | | | 3/20/20 | | | | 65.00 | | | | (350 | ) | | | (431,375 | ) |
Raytheon Co. | | | 1/17/20 | | | | 160.00 | | | | (56 | ) | | | (210,420 | ) |
Raytheon Co. | | | 1/17/20 | | | | 150.00 | | | | (36 | ) | | | (169,110 | ) |
Raytheon Co. | | | 6/19/20 | | | | 165.00 | | | | (116 | ) | | | (426,880 | ) |
Ross Stores, Inc. | | | 1/17/20 | | | | 77.50 | | | | (53 | ) | | | (173,840 | ) |
Ross Stores, Inc. | | | 1/17/20 | | | | 67.50 | | | | (257 | ) | | | (1,094,820 | ) |
Simon Property Group, Inc. (REIT) | | | 1/17/20 | | | | 145.00 | | | | (114 | ) | | | (153,900 | ) |
Simon Property Group, Inc. (REIT) | | | 1/17/20 | | | | 135.00 | | | | (16 | ) | | | (35,360 | ) |
SPDR S&P 500 ETF Trust (ETF) | | | 1/17/20 | | | | 255.00 | | | | (44 | ) | | | (199,848 | ) |
Stryker Corp. | | | 1/17/20 | | | | 130.00 | | | | (34 | ) | | | (295,630 | ) |
Texas Instruments, Inc. | | | 1/17/20 | | | | 92.50 | | | | (79 | ) | | | (284,400 | ) |
Texas Instruments, Inc. | | | 1/17/20 | | | | 90.00 | | | | (54 | ) | | | (213,840 | ) |
Texas Instruments, Inc. | | | 1/17/20 | | | | 85.00 | | | | (4 | ) | | | (17,730 | ) |
Thermo Fisher Scientific, Inc. | | | 3/20/20 | | | | 250.00 | | | | (56 | ) | | | (277,760 | ) |
177
Portfolio of Investments (continued)
PREMIUM INCOME FUND
September 30, 2019
CALL OPTIONS
WRITTEN—(22.6)% | | Expiration
Date | | | Exercise
Price | | | Contracts | | | Value | |
Thermo Fisher Scientific, Inc. | | | 3/20/20 | | | $ | 240.00 | | | | (17 | ) | | $ | (98,685 | ) |
TJX Companies, Inc. | | | 1/17/20 | | | | 46.25 | | | | (109 | ) | | | (111,180 | ) |
TJX Companies, Inc. | | | 1/17/20 | | | | 42.50 | | | | (114 | ) | | | (155,610 | ) |
TJX Companies, Inc. | | | 4/17/20 | | | | 47.50 | | | | (70 | ) | | | (65,800 | ) |
TJX Companies, Inc. | | | 4/17/20 | | | | 45.00 | | | | (234 | ) | | | (276,120 | ) |
U.S. Bancorp | | | 12/20/19 | | | | 45.00 | | | | (195 | ) | | | (210,112 | ) |
U.S. Bancorp | | | 1/17/20 | | | | 45.00 | | | | (111 | ) | | | (120,713 | ) |
United Parcel Service, Inc. - Class “B” | | | 6/19/20 | | | | 100.00 | | | | (313 | ) | | | (712,857 | ) |
United Technologies Corp. | | | 6/19/20 | | | | 110.00 | | | | (186 | ) | | | (550,560 | ) |
Verizon Communications, Inc. | | | 1/17/20 | | | | 50.00 | | | | (393 | ) | | | (408,720 | ) |
Verizon Communications, Inc. | | | 1/17/20 | | | | 47.00 | | | | (113 | ) | | | (151,137 | ) |
Whirlpool Corp. | | | 3/20/20 | | | | 120.00 | | | | (246 | ) | | | (1,011,675 | ) |
Total Value of Call Options Written (premium received $25,094,769) | | $ | (29,088,288 | ) |
The Fund’s assets and liabilities are classified into the following three levels based on the inputs used to value the assets and liabilities:
| | Level 1 – | Unadjusted quoted prices in active markets for identical securities that the Fund has the ability to access. |
| | Level 2 – | Observable inputs other than quoted prices included in Level 1 that are observable for the asset or liability, either directly or indirectly. These inputs may include quoted prices for the identical instrument on an inactive market, prices for similar instruments, interest rates, prepayment speeds, credit risk, yield curves, default rates and similar data. |
| | Level 3 – | Unobservable inputs for the asset or liability, to the extent relevant observable inputs are not available, representing the Fund’s own assumption about the assumptions a market participant would use in valuing the asset or liability, and would be based on the best information available. |
The inputs methodology used for valuing securities are not necessarily an indication of the risk associated with investing in those securities. For example, U.S. Government securities are reflected as Level 2 because the inputs used to determine fair value may not always be quoted prices in an active market.
178
The following is a summary, by category of Level, of inputs used to value the Fund’s investments as of September 30, 2019:
| | | Level 1 | | | Level 2 | | | Level 3 | | | Total | |
Assets | | | | | | | | | | | | | | | | |
Common Stocks* | | | $153,805,634 | | | $ | — | | | $ | — | | | | $153,805,634 | |
| | | | | | | | | | | | | | | | | |
Liabilities | | | | | | | | | | | | | | | | |
Call Options Written | | $ | — | | | $ | (29,088,288 | ) | | $ | — | | | $ | (29,088,288 | ) |
* | The Portfolio of Investments provides information on the industry categorization for common stocks. |
There were no transfers into or from Level 1 and Level 2 by the Fund for the year ended September 30, 2019. Transfers, if any, between Levels are recognized at the end of the reporting period.
See notes to financial statements
179
Portfolio Manager’s Letter
SELECT GROWTH FUND
Dear Investor:
This is the annual report for the First Investors Select Growth Fund for the fiscal year ended September 30, 2019. During the period, the Fund’s return on a net asset value basis was -6.01% for Class A shares, -5.74% for Advisor Class shares and -5.66% for Institutional Class shares, including dividends of 0.8 cents per share for Advisor Class shares and 1.3 cents per share for Institutional Class shares. In addition, the Fund distributed capital gains of 62.4 cents per share on each class of shares.
The Market
The fiscal year started with a correction as global economic data appeared less robust while the Federal Reserve (Fed) indicated it would stay the course with rate increases. The market perceived a heightened risk of a policy mistake and stocks experienced a selloff. This was quickly followed by a rally during the first quarter of calendar 2019 as Fed actions and commentary suggested an easier stance and softer economic data seemed better reflected in earnings expectations. Corporate America earnings are still expected to show some modest growth with operating earnings for the Standard & Poor’s 500 forecasted at $166 per share, a year-over-year increase of 2.5%.
The Smith Group investment process is centered on a very specific and clearly defined fundamental outcome—companies that can sustainably grow earnings faster than expected will have strong price appreciation. Significantly, even when the equity markets do not reward our investment process with excess returns, our client portfolios continue to capture a higher earnings growth premium—higher realized earnings growth relative to forecasted growth—than their respective performance benchmarks. That is, the companies in our client portfolios realize a larger earnings growth premium than the benchmarks.
The past twelve months have provided dramatic shifts in both soft and hard economic indicators. In many cases, the change in trajectory has been swift and severe. Expectations for U.S. growth has sunk to the zero bound from 3% to 4% a year ago while the slope of the yield curve briefly suggested a recession could be around the corner. Global monetary policy once again shifted towards aggressive support resulting in a quarter of the global bond market trading at negative rates. Haphazard U.S. trade policy has, remarkably, become even more disorganized causing American manufacturing and consumer confidence to weaken during the12-month period. This rapid deterioration caused an earnings centric investment process like ours to fall significantly out of favor. In fact, the reward associated with the criteria we use to select stocks is similar to the experience during the technology- and telecom-bubble in 1998-99 and the rebound after the Global Financial Crisis in 2009. We find comfort in the fact that as the market reverts back to rewarding strong earnings performance again, the Fund should be in a position to generate better relative performance going forward.
The Fund
With the selection criteria and the process out of favor during the period, the Fund’s underperformance for the year was spread across most sectors. The largest sector exposures,
180
Information Technology and Healthcare, were responsible for most of the underperformance. Another notable negative was the Fund’s lack of exposure to Real Estate, which was the best performing sector in the benchmark with a 26.7% return. This caused almost 0.5% of negative relative allocation effect. One bright spot in the Fund was the Energy sector. Although a small weight at less than 1% in both the Fund and the benchmark, the Fund’s position in Chevron posted a gain of 3.0% which easily outperformed the benchmark sector return of -24.3%.
Fund performance was hurt by the Fund’s Information Technology holdings turning negative after several years of solid performance. NetApp, an enterprise data storage systems developer, and F5 Networks, a network security and applications systems provider, declining 46.4% and 33.2%, respectively, were the largest contributors to the negative performance. Also notable was that the Fund’s underweight in Microsoft, which gained 20.7%, and no exposure to MasterCard and Visa, which gained 21.9% and 17.3%, respectively, caused almost 1.0% of relative underperformance. In Health Care, the Fund’s large position in Centene, a Medicaid managed-care company, and exposure to Biogen, a biotechnology company, hurt performance as the stocks both declined more than 30%.
While we are disappointed that the Fund underperformed for the period, we continue to believe that the holdings in the Fund should be able to generate healthy returns going forward as the market eventually returns to rewarding earnings as it has in the past. Continued economic growth should provide a good foundation for solid earnings growth by the companies held by the Fund and we continue to believe our focus on high quality companies where earnings will exceed market expectations is the key to generating excess returns over the long term.
Thank you for placing your trust in Foresters Financial. As always, we appreciate the opportunity to serve your investment needs.
Sincerely,

John D. Brim
Portfolio Manager
Smith Asset Management Group L.P.
October 4, 2019
181
Fund Expenses (unaudited)
SELECT GROWTH FUND
The examples below show the ongoing costs (in dollars) of investing in your Fund and will help you in comparing these costs with costs of other mutual funds. Please refer to page 1 for a detailed explanation of the information presented in these examples.
Expense Example | Annualized
Expense
Ratio | Beginning
Account Value
(4/1/19) | Ending
Account Value
(9/30/19) | Expenses Paid
During Period
(4/1/19-9/30/19)* |
Class A Shares | 1.16% | | | |
Actual | | $1,000.00 | $ 977.37 | $ 5.75 |
Hypothetical** | | $1,000.00 | $ 1,019.25 | $ 5.87 |
Advisor Class Shares | 0.86% | | | |
Actual | | $1,000.00 | $ 978.65 | $ 4.27 |
Hypothetical** | | $1,000.00 | $ 1,020.76 | $ 4.36 |
Institutional Class Shares | 0.78% | | | |
Actual | | $1,000.00 | $ 978.80 | $ 3.87 |
Hypothetical** | | $1,000.00 | $ 1,021.16 | $ 3.95 |
* | Expenses are equal to the annualized expense ratio, multiplied by the average account value over the period, multiplied by 183/365 (to reflect the one-half year period). Expenses paid during the period are net of expenses waived. |
** | Assumed rate of return of 5% before expenses |
Portfolio Composition
BY SECTOR
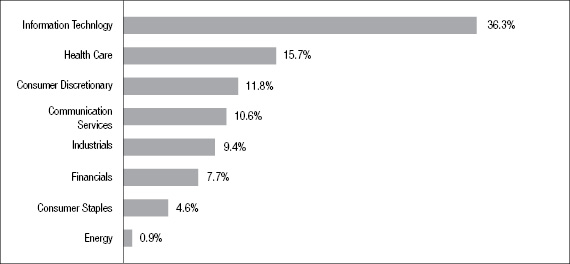
Portfolio holdings and allocations are subject to change. Percentages are as of September 30, 2019, and are based on the total market value of investments.
182
Cumulative Performance Information (unaudited)
SELECT GROWTH FUND
Comparison of change in value of $10,000 investment in the First Investors Select Growth Fund (Class A shares), the Russell 1000® Growth Index† and the Russell 3000 Growth Index.
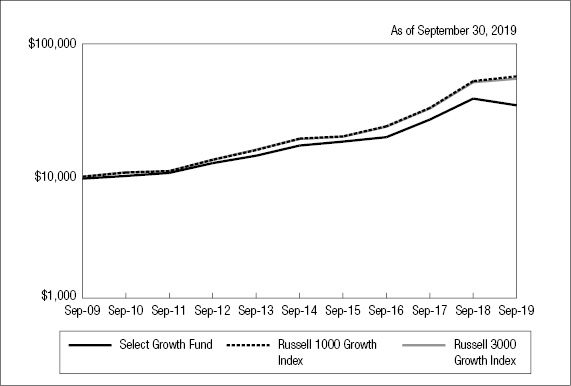
| | Average Annual Total Returns* |
N.A.V. Only | Class A | Advisor
Class | Institutional
Class | Russell 1000
Growth
Index | Russell 3000
Growth
Index |
One Year | -6.01% | -5.74% | -5.66% | 3.71% | 2.70% |
Five Years | 10.20% | 10.62% | 10.66% | 13.39% | 13.07% |
Ten Years or Since Inception** | 12.84% | 12.54% | 12.65% | 14.94%†† | 14.73%†† |
| | | | | | |
S.E.C. Standardized | Class A | Advisor
Class | Institutional
Class | | |
One Year | -11.41% | -5.74% | -5.66% | | |
Five Years | 8.90% | 10.62% | 10.66% | | |
Ten Years or Since Inception** | 12.16% | 12.54% | 12.65% | | |
The graph compares a $10,000 investment in the First Investors Select Growth Fund (Class A shares) beginning 9/30/09 theoretical investments in the Russell 1000 Growth Index and the Russell 3000 Growth Index (the “Indices”). The Russell 1000 Growth Index is an unmanaged index that measures the performance of the large-cap growth segment of the U.S. economy. It includes Russell 1000 companies with higher price-to-book ratios and higher forecasted growth. The Russell 3000 Growth Index is an unmanaged index that measures the performance of those Russell 3000 Index companies with higher price-to-book ratios and higher forecasted growth values (the Russell 3000 Index is an unmanaged index that measures the performance of the 3,000 largest U.S. companies based on total market capitalization). It is not possible to invest directly in these Indices. In addition, the Indices do not reflect fees and expenses associated with the active management of a mutual fund portfolio. For purposes of the graph and the accompanying table,
183
Cumulative Performance Information (unaudited) (continued)
SELECT GROWTH FUND
unless otherwise indicated, it has been assumed that the maximum sales charge was deducted from the initial $10,000 investment in the Fund. Advisor Class shares and Institutional Class shares performance may be greater than or less than that shown in the line graph above for Class A shares based on differences in sales loads and fees paid by shareholders investing in the different classes.
* Average Annual Total Return figures (for the periods ended 9/30/19) include the reinvestment of all dividends and distributions. “N.A.V. Only” returns are calculated without sales charges. The Class A “S.E.C. Standardized” returns shown are based on the maximum sales charge of 5.75%. The Advisor Class and Institutional Class “S.E.C. Standardized” returns shown are the same as the N.A.V. Only returns since these classes are sold without sales charges. During the periods shown, some of the expenses of the Fund were waived or assumed. If such expenses had been paid by the Fund, the Class A “S.E.C. Standardized” Average Annual Total Return for One Year would have been -11.42%. The Advisor Class “S.E.C. Standardized” Average Annual Total Return for One Year and Since Inception would have been -5.75% and 12.04%, respectively, and the Institutional Class “S.E.C. Standardized” Average Annual Total Return for One Year and Since Inception would have been -5.67% and 12.00%, respectively. Results represent past performance and do not indicate future results. The graph and the returns shown do not reflect the deduction of taxes that a shareholder would pay on distributions or the redemption of fund shares. Investment return and principal value of an investment will fluctuate so that an investor’s shares, when redeemed, may be worth more or less than the original cost. Index figures are from FTSE Russell and Company and all other figures are from Foresters Investment Management Company, Inc.
** The Since Inception returns for Advisor Class shares and Institutional Class shares are for the periods beginning 4/1/13 (commencement of operations for those classes).
† During the fiscal year, the Fund changed its primary broad-based securities index to the Russell 1000 Growth Index from the Russell 3000 Growth Index since it more closely reflects the Fund’s investment strategies. After this fiscal year we will not show a comparison to the Russell 3000 Growth Index.
†† The Index return is for ten years. The Russell 1000 Growth Index return and the Russell 3000 Growth Index return since inception of the Advisor Class shares and Institutional Class shares are 14.86% and 12.17%, respectively.
184
Portfolio of Investments
SELECT GROWTH FUND
September 30, 2019
| |
Shares
| | | Security | | Value | |
| | | | | | COMMON STOCKS—96.6% | | | | |
| | | | | | Communication Services—10.6% | | | | |
| | | 18,580 | | * | Alphabet, Inc. - Class “A” | | $ | 22,688,781 | |
| | | 295,233 | | | Cinemark Holdings, Inc. | | | 11,407,803 | |
| | | 352,000 | | | Comcast Corp. - Special Shares “A” | | | 15,868,160 | |
| | | 109,300 | | * | Facebook, Inc. - Class “A” | | | 19,464,144 | |
| | | | | | | | | 69,428,888 | |
| | | | | | Consumer Discretionary—11.8% | | | | |
| | | 14,500 | | * | AutoZone, Inc. | | | 15,726,990 | |
| | | 75,000 | | * | Burlington Stores, Inc. | | | 14,986,500 | |
| | | 113,800 | | * | Deckers Outdoor Corp. | | | 16,769,568 | |
| | | 190,100 | | | Dunkin’ Brands Group, Inc. | | | 15,086,336 | |
| | | 136,191 | | | Target Corp. | | | 14,560,180 | |
| | | | | | | | | 77,129,574 | |
| | | | | | Consumer Staples—4.5% | | | | |
| | | 121,912 | | | Procter & Gamble Co. | | | 15,163,415 | |
| | | 122,712 | | | Walmart, Inc. | | | 14,563,460 | |
| | | | | | | | | 29,726,875 | |
| | | | | | Energy—.8% | | | | |
| | | 47,300 | | | Chevron Corp. | | | 5,609,780 | |
| | | | | | Financials—7.7% | | | | |
| | | 457,200 | | | Bank of America Corp. | | | 13,336,524 | |
| | | 126,990 | | | Discover Financial Services | | | 10,297,619 | |
| | | 189,100 | | | Progressive Corp. | | | 14,607,975 | |
| | | 217,030 | | | U.S. Bancorp | | | 12,010,440 | |
| | | | | | | | | 50,252,558 | |
185
Portfolio of Investments (continued)
SELECT GROWTH FUND
September 30, 2019
| |
Shares
| | | Security | | Value | |
| | | | | | Health Care—15.7% | | | | |
| | | 221,210 | | | Baxter International, Inc. | | $ | 19,349,239 | |
| | | 43,710 | | * | Biogen, Inc. | | | 10,176,562 | |
| | | 275,800 | | | Bristol-Myers Squibb Co. | | | 13,985,818 | |
| | | 336,440 | | * | Centene Corp. | | | 14,554,395 | |
| | | 158,772 | | | Eli Lilly & Co. | | | 17,755,473 | |
| | | 150,600 | | | Merck & Co., Inc. | | | 12,677,508 | |
| | | 117,780 | | * | Varian Medical Systems, Inc. | | | 14,026,420 | |
| | | | | | | | | 102,525,415 | |
| | | | | | Industrials—9.4% | | | | |
| | | 177,300 | | | Dover Corp. | | | 17,651,988 | |
| | | 152,490 | | | Eaton Corp., PLC | | | 12,679,543 | |
| | | 170,000 | | | EMCOR Group, Inc. | | | 14,640,400 | |
| | | 78,192 | | | Huntington Ingalls Industries, Inc. | | | 16,560,284 | |
| | | | | | | | | 61,532,215 | |
| | | | | | Information Technology—36.1% | | | | |
| | | 92,100 | | * | Adobe Systems, Inc. | | | 25,442,625 | |
| | | 171,700 | | * | Akamai Technologies, Inc. | | | 15,689,946 | |
| | | 76,500 | | | Apple, Inc. | | | 17,133,705 | |
| | | 138,464 | | | Automatic Data Processing, Inc. | | | 22,350,859 | |
| | | 385,650 | | * | Cadence Design Systems, Inc. | | | 25,483,752 | |
| | | 380,000 | | * | Ciena Corp. | | | 14,907,400 | |
| | | 88,600 | | * | EPAM Systems, Inc. | | | 16,153,552 | |
| | | 274,280 | | * | Fortinet, Inc. | | | 21,053,733 | |
| | | 185,050 | | | Microsoft Corp. | | | 25,727,501 | |
| | | 226,200 | | | Oracle Corp. | | | 12,447,786 | |
| | | 199,340 | | * | PayPal Holdings, Inc. | | | 20,649,631 | |
| | | 94,500 | | * | Zebra Technologies Corp. - Class “A” | | | 19,501,965 | |
| | | | | | | | | 236,542,455 | |
Total Value of Common Stocks (cost $528,037,291) | | | 632,747,760 | |
186
| |
Principal
Amount
| | | Security | | Value | |
| | | | | | SHORT-TERM U.S. GOVERNMENT OBLIGATIONS—2.6% | | | | |
| | $ | 17,000M | | | U.S. Treasury Bills, 1.78%, 10/22/2019 (cost $16,982,348) | | $ | 16,982,269 | |
| | | | | | SHORT-TERM U.S. GOVERNMENT AGENCY OBLIGATIONS—.4% | | | | |
| | | 2,500M | | | Federal Home Loan Bank, 1.93%, 10/25/2019 (cost $2,496,781) | | | 2,496,883 | |
Total Value of Investments (cost $547,516,420) | | | 99.6 | % | | | 652,226,912 | |
Other Assets, Less Liabilities | | | .4 | | | | 2,472,440 | |
Net Assets | | | 100.0 | % | | $ | 654,699,352 | |
The Fund’s assets and liabilities are classified into the following three levels based on the inputs used to value the assets and liabilities:
| | Level 1 – | Unadjusted quoted prices in active markets for identical securities that the Fund has the ability to access. |
| | Level 2 – | Observable inputs other than quoted prices included in Level 1 that are observable for the asset or liability, either directly or indirectly. These inputs may include quoted prices for the identical instrument on an inactive market, prices for similar instruments, interest rates, prepayment speeds, credit risk, yield curves, default rates and similar data. |
| | Level 3 – | Unobservable inputs for the asset or liability, to the extent relevant observable inputs are not available, representing the Fund’s own assumption about the assumptions a market participant would use in valuing the asset or liability, and would be based on the best information available. |
The inputs methodology used for valuing securities are not necessarily an indication of the risk associated with investing in those securities. For example, U.S. Government securities are reflected as Level 2 because the inputs used to determine fair value may not always be quoted prices in an active market.
187
Portfolio of Investments (continued)
SELECT GROWTH FUND
September 30, 2019
The following is a summary, by category of Level, of inputs used to value the Fund’s investments as of September 30, 2019:
| | | Level 1 | | | Level 2 | | | Level 3 | | | Total | |
Common Stocks | | $ | 632,747,760 | | | $ | — | | | $ | — | | | $ | 632,747,760 | |
Short-Term U.S. Government Obligations | | | — | | | | 16,982,269 | | | | — | | | | 16,982,269 | |
Short-Term U.S. Government Agency Obligations | | | — | | | | 2,496,883 | | | | — | | | | 2,496,883 | |
Total Investments in Securities* | | $ | 632,747,760 | | | $ | 19,479,152 | | | $ | — | | | $ | 652,226,912 | |
* | The Portfolio of Investments provides information on the industry categorization for common stocks. |
There were no transfers into or from Level 1 and Level 2 by the Fund for the year ended September 30, 2019. Transfers, if any, between Levels are recognized at the end of the reporting period.
See notes to financial statements
188
Portfolio Manager’s Letter
SPECIAL SITUATIONS FUND
Dear Investor:
This is the annual report for the First Investors Special Situations Fund for the fiscal year ended September 30, 2019. During the period, the Fund’s return on a net asset value basis was -9.54% for Class A shares, -9.19% for Advisor Class shares and -9.16% for Institutional Class shares, including dividends of 8.0 cents per share for Class A shares, 10.2 cents per share for Advisor Class shares and 11.6 for Institutional Class shares. In addition, the Fund distributed capital gains of $3.83 per share on each class of shares.
U.S. equity market
The U.S. stock market began the review period with a very weak quarter. The S&P 500 fell -9.0% in the month of December alone. Quantitative tightening by the Fed, coupled with slowing earnings and increased trade disputes, sparked the sell-off. The start of 2019 saw a meaningful reversal in the equity markets following the sharp sell-off in December. January started very strong with the S&P 500 posting a +8.0% total return, the best monthly showing since 1987. By the end of January, the S&P had erased most of the losses incurred during the month of December and sat 15% above its Christmas Eve low. The January rally was led by higher-beta, lower-quality and smaller-cap names. Fueled by a dovish Fed and more optimism about a potential trade deal, the S&P 500 posted its best quarterly return since 2009. The first quarter rally in small-cap stocks was the best since 1991.
As the second quarter progressed, the dominant themes were global trade war, the slowing global economy, and the Fed becoming more accommodative and starting to lower rates again. The S&P 500 gained 17% during the first six months of the year (its best performance since 1997). The market’s gains were predominantly built upon defensive sectors like Utilities, REITs and Consumer Staples. These sectors all made new highs along with the S&P 500®, as lower global interest rates seemingly accelerated investors’ appetite for yield.
The start of the summer saw global economic data begin to weaken as the effect of the trade war began to manifest itself. The 2- to 10-year U.S. Treasury yield curve inverted for the first time since the Global Financial Crisis, raising recession concerns. The market continued to move on trade talk and the economy. In September, oil spiked with attacks on a Saudi processing plant and we saw a rotation from momentum stocks to value stocks for the first time. High-growth stocks came down off their highs and valuations in the private market began to correct as well. Nevertheless, the S&P 500 remained near its all-time highs posting a return of 20.55% on a year-to-date basis.
The Fund
The Fund’s absolute performance was mainly attributable to investments in Financials, Information Technology and Industrials. In Financials, our investments in Sterling Bancorp, which executed on balance sheet restructuring, and American Financial Group, which continued its steady performance and capital returns, drove performance. In Information Technology, Perficient—helped by solid organic growth and stronger margins—and PDF Solutions—helped
189
Portfolio Manager’s Letter (continued)
SPECIAL SITUATIONS FUND
by new product launches—were the main drivers of performance. Finally, in Industrials, SPX Corp benefitted from solid growth in its less cyclical lines of business.
On a basis relative to the Russell 2000® Value Index, the Fund underperformed primarily due to our underweights of the Real Estate and Financial sectors. In Financials, our underweight of thrifts hurt relative performance as the industry benefited from lower interest rates. In the Real Estate sector, our underweight of healthcare REITs was the largest source of relative underperformance.
As always, thank you for placing your trust in Foresters Financial.
Sincerely,

|
Steven S. Hill |
Senior Portfolio Manager |
Foresters Investment Management Company, Inc. |
October 4, 2019
190
Fund Expenses (unaudited)
SPECIAL SITUATIONS FUND
The examples below show the ongoing costs (in dollars) of investing in your Fund and will help you in comparing these costs with costs of other mutual funds. Please refer to page 1 for a detailed explanation of the information presented in these examples.
Expense Example | Annualized
Expense
Ratio | Beginning
Account Value
(4/1/19) | Ending
Account Value
(9/30/19) | Expenses Paid
During Period
(4/1/19-9/30/19)* |
Class A Shares | 1.29% | | | |
Actual | | $1,000.00 | $1,006.01 | $ 6.49 |
Hypothetical** | | $1,000.00 | $1,018.60 | $ 6.53 |
Advisor Class Shares | 1.00% | | | |
Actual | | $1,000.00 | $1,008.69 | $ 5.04 |
Hypothetical** | | $1,000.00 | $1,020.06 | $ 5.06 |
Institutional Class Shares | 0.88% | | | |
Actual | | $1,000.00 | $1,008.22 | $ 4.43 |
Hypothetical** | | $1,000.00 | $1,020.66 | $ 4.46 |
* | Expenses are equal to the annualized expense ratio, multiplied by the average account value over the period, multiplied by 183/365 (to reflect the one-half year period). |
** | Assumed rate of return of 5% before expenses |
Portfolio Composition
BY SECTOR
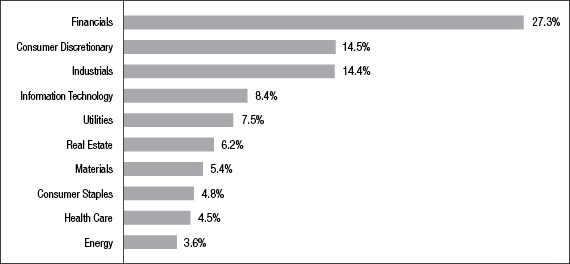
Portfolio holdings and allocations are subject to change. Percentages are as of September 30, 2019, and are based on the total market value of investments.
191
Cumulative Performance Information (unaudited)
SPECIAL SITUATIONS FUND
Comparison of change in value of $10,000 investment in the First Investors Special Situations Fund (Class A shares), the MSCI USA Small Cap Value Index† and the Russell 2000 Value Index.
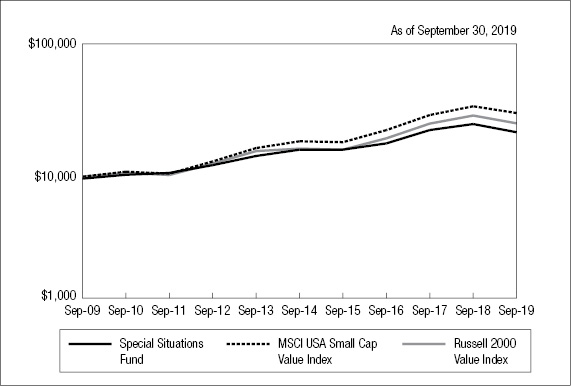
| | Average Annual Total Returns* |
N.A.V. Only | Class A | Advisor
Class | Institutional
Class | MSCI USA
Small Cap
Value Index | Russell 2000
Value Index |
One Year | -9.54% | -9.19% | -9.16% | -6.55% | -8.27% |
Five Years | 5.22% | 5.57% | 5.69% | 7.14% | 7.16% |
Ten Years or Since Inception** | 9.52% | 7.52% | 7.68% | 11.30%†† | 10.06%†† |
| | | | | | |
S.E.C. Standardized | Class A | Advisor
Class | Institutional
Class | | |
One Year | -14.74% | -9.19% | -9.16% | | |
Five Years | 3.98% | 5.57% | 5.69% | | |
Ten Years or Since Inception** | 8.87% | 7.52% | 7.68% | | |
The graph compares a $10,000 investment in the First Investors Special Situations Fund (Class A shares) beginning 9/30/09 with theoretical investments in the MSCI USA Small Cap Value Index and the Russell 2000 Value Index (the “Indices”). The MSCI USA Small Cap Value Index captures small cap securities exhibiting overall value style characteristics across the U.S. Equity markets. The value investment style characteristics for index construction are defined using book value to price, 12-month forward earnings to price and dividend yield. The Russell 2000 Value Index is an unmanaged index that measures the performance of the small-cap value segment of the U.S. equity universe. It includes those Russell 2000 companies with lower price-to-book ratios and lower forecasted growth values. It is not possible to invest directly in these Indices. In addition, the Indices do not reflect fees and expenses associated with the active
192
management of a mutual fund portfolio. For purposes of the graph and the accompanying table, unless otherwise indicated, it has been assumed that the maximum sales charge was deducted from the initial $10,000 investment in the Fund and all dividends and distributions were reinvested. Advisor Class shares and Institutional Class shares performance may be greater than or less than that shown in the line graph above for Class A shares based on differences in sales loads and fees paid by shareholders investing in the different classes.
* Average Annual Total Return figures (for the periods ended 9/30/19) include the reinvestment of all dividends and distributions. “N.A.V. Only” returns are calculated without sales charges. The Class A “S.E.C. Standardized” returns shown are based on the maximum sales charge of 5.75%. The Advisor Class and Institutional Class “S.E.C. Standardized” returns shown are the same as the N.A.V. Only returns since these classes are sold without sales charges. During some of the periods shown, some of the expenses of the Fund were waived or assumed. If such expenses had been paid by the Fund, the Class A “S.E.C. Standardized” Average Annual Total Return for Ten Years would have been 8.83%. The Advisor Class “S.E.C. Standardized” Average Annual Total Return for Five Years and Since Inception would have been 5.56% and 6.95%, respectively. The Institutional Class “S.E.C. Standardized” Average Annual Total Return for Five Years and Since Inception would have been 5.67% and 6.99%. Results represent past performance and do not indicate future results. The graph and the returns shown do not reflect the deduction of taxes that a shareholder would pay on distributions or the redemption of fund shares. Investment return and principal value of an investment will fluctuate so that an investor’s shares, when redeemed, may be worth more or less than the original cost. Index figures are from FTSE Russell and all other figures are from Foresters Investment Management Company, Inc.
** The Since Inception returns for Advisor Class shares and Institutional Class shares are for the periods beginning 4/1/13 (commencement of operations for those classes).
† During the fiscal year, the Fund changed its primary broad-based securities index to the MSCI USA Small Cap Value Index from the Russell 2000 Value Index since it more closely reflects the Fund’s investment strategies. After this fiscal year we will not show a comparison to the Russell 2000 Value Index.
†† The Index return is for ten years. The MSCI USA Small Cap Value Index return and The Russell 2000 Value Index return since inception of the Advisor Class shares and Institutional Class shares are 8.43% and 7.72%, respectively.
193
Portfolio of Investments
SPECIAL SITUATIONS FUND
September 30, 2019
| |
Shares
| | | Security | | Value | |
| | | | | | COMMON STOCKS—96.3% | | | | |
| | | | | | Consumer Discretionary—14.4% | | | | |
| | | 241,600 | | | American Eagle Outfitters, Inc. | | $ | 3,918,752 | |
| | | 82,400 | | | Cheesecake Factory, Inc. | | | 3,434,432 | |
| | | 40,900 | | | Children’s Place, Inc. | | | 3,148,891 | |
| | | 312,600 | | | Dana Holding Corp. | | | 4,513,944 | |
| | | 378,350 | | | Designer Brands, Inc. - Class “A” | | | 6,477,352 | |
| | | 171,200 | | | Haverty Furniture Cos., Inc. | | | 3,470,224 | |
| | | 40,100 | | * | Helen of Troy, Ltd. | | | 6,322,166 | |
| | | 148,100 | | * | MasterCraft Boat Holdings, Inc. | | | 2,210,392 | |
| | | 105,500 | | | Oxford Industries, Inc. | | | 7,564,350 | |
| | | 113,300 | | | Penske Automotive Group, Inc. | | | 5,356,824 | |
| | | 145,000 | | | Ruth’s Hospitality Group, Inc. | | | 2,960,175 | |
| | | 273,550 | | * | Taylor Morrison Home Corp. - Class “A” | | | 7,095,887 | |
| | | 394,000 | | * | TRI Pointe Group, Inc. | | | 5,925,760 | |
| | | 34,700 | | * | Visteon Corp. | | | 2,864,138 | |
| | | 204,500 | | | Wolverine World Wide, Inc. | | | 5,779,170 | |
| | | | | | | | | 71,042,457 | |
| | | | | | Consumer Staples—4.8% | | | | |
| | | 164,700 | | | Energizer Holdings, Inc. | | | 7,177,626 | |
| | | 107,500 | | * | Performance Food Group Co. | | | 4,946,075 | |
| | | 175,371 | | | Tootsie Roll Industries, Inc. | | | 6,513,279 | |
| | | 119,000 | | * | U.S. Foods Holding Corp. | | | 4,890,900 | |
| | | | | | | | | 23,527,880 | |
| | | | | | Energy—3.6% | | | | |
| | | 167,300 | | | Delek U.S. Holdings, Inc. | | | 6,072,990 | |
| | | 451,500 | | * | Keane Group, Inc. | | | 2,736,090 | |
| | | 330,200 | | | Liberty Oilfield Services, Inc. - Class “A” | | | 3,576,066 | |
| | | 153,000 | | | PBF Energy, Inc. - Class “A” | | | 4,160,070 | |
| | | 143,300 | | * | ProPetro Holding Corp. | | | 1,302,597 | |
| | | | | | | | | 17,847,813 | |
194
| |
Shares
| | | Security | | Value | |
| | | | | | Financials—27.2% | | | | |
| | | 290,300 | | * | AllianceBernstein Holding, LP (MLP) | | $ | 8,520,305 | |
| | | 229,629 | | | Amalgamated Bank - Class “A” | | | 3,678,657 | |
| | | 80,100 | | | American Financial Group, Inc. | | | 8,638,785 | |
| | | 210,900 | | | Berkshire Hills Bancorp, Inc. | | | 6,177,261 | |
| | | 67,200 | | | Brown & Brown, Inc. | | | 2,423,232 | |
| | | 184,100 | | | Capstar Financial Holdings, Inc. | | | 3,052,378 | |
| | | 511,000 | | | CNO Financial Group, Inc. | | | 8,089,130 | |
| | | 209,200 | | | Great Western Bancorp, Inc. | | | 6,903,600 | |
| | | 49,000 | | | IBERIABANK Corp. | | | 3,701,460 | |
| | | 107,100 | | | Independent Bank Group, Inc. | | | 5,634,531 | |
| | | 82,400 | | | James River Group Holdings, Ltd. | | | 4,222,176 | |
| | | 49,850 | | | Kemper Corp. | | | 3,885,807 | |
| | | 236,500 | | | OceanFirst Financial Corp. | | | 5,581,400 | |
| | | 524,300 | | | Old National Bancorp of Indiana | | | 9,020,581 | |
| | | 93,900 | | | Prosperity Bancshares, Inc. | | | 6,632,157 | |
| | | 100,400 | | | QCR Holdings, Inc. | | | 3,813,192 | |
| | | 103,100 | | * | Seacoast Banking Corp. | | | 2,609,461 | |
| | | 306,700 | | | Simmons First National Corp. - Class “A” | | | 7,636,830 | |
| | | 471,300 | | | Sterling Bancorp | | | 9,454,278 | |
| | | 175,000 | | | Synovus Financial Corp. | | | 6,258,000 | |
| | | 165,640 | | | TCF Financial Corp. | | | 6,305,915 | |
| | | 199,300 | | | Veritex Holdings, Inc. | | | 4,836,015 | |
| | | 407,000 | | | Waddell & Reed Financial, Inc. - Class “A” | | | 6,992,260 | |
| | | | | | | | | 134,067,411 | |
| | | | | | Health Care—4.5% | | | | |
| | | 13,600 | | * | Charles River Laboratories International, Inc. | | | 1,800,232 | |
| | | 33,000 | | | Hill-Rom Holdings, Inc. | | | 3,472,590 | |
| | | 23,600 | | * | ICON, PLC | | | 3,477,224 | |
| | | 194,300 | | | Phibro Animal Health Corp. - Class “A” | | | 4,144,419 | |
| | | 272,000 | | * | Prestige Brands, Inc. | | | 9,435,680 | |
| | | | | | | | | 22,330,145 | |
195
Portfolio of Investments (continued)
SPECIAL SITUATIONS FUND
September 30, 2019
| |
Shares
| | | Security | | Value | |
| | | | | | Industrials—14.4% | | | | |
| | | 157,000 | | | AAR Corp. | | $ | 6,469,970 | |
| | | 200,100 | | * | Atkore International Group Co. | | | 6,073,035 | |
| | | 162,800 | | | Columbus McKinnon Corp. | | | 5,930,804 | |
| | | 103,400 | | | Comfort Systems USA, Inc. | | | 4,573,382 | |
| | | 223,700 | | * | Gardner Denver Holdings, Inc. | | | 6,328,473 | |
| | | 47,700 | | | ICF International, Inc. | | | 4,029,219 | |
| | | 111,000 | | | Kennametal, Inc. | | | 3,412,140 | |
| | | 124,900 | | | Korn/Ferry International | | | 4,826,136 | |
| | | 84,200 | | | Park-Ohio Holdings Corp. | | | 2,514,212 | |
| | | 73,200 | | | Regal Beloit Corp. | | | 5,332,620 | |
| | | 228,600 | | * | SPX Corp. | | | 9,146,286 | |
| | | 156,900 | | | Timken Co. | | | 6,826,719 | |
| | | 154,700 | | | Triton International, Ltd. | | | 5,235,048 | |
| | | | | | | | | 70,698,044 | |
| | | | | | Information Technology—8.4% | | | | |
| | | 49,200 | | * | Cree, Inc. | | | 2,410,800 | |
| | | 124,100 | | * | Diodes, Inc. | | | 4,982,615 | |
| | | 181,200 | | * | Ichor Holdings, Ltd. | | | 4,381,416 | |
| | | 28,100 | | * | MicroStrategy, Inc. - Class “A” | | | 4,169,197 | |
| | | 73,700 | | * | NETGEAR, Inc. | | | 2,374,614 | |
| | | 401,700 | | * | PDF Solutions, Inc. | | | 5,250,219 | |
| | | 208,400 | | * | Perficient, Inc. | | | 8,040,072 | |
| | | 416,700 | | * | TTM Technologies, Inc. | | | 5,081,657 | |
| | | 110,900 | | * | Verint Systems, Inc. | | | 4,744,302 | |
| | | | | | | | | 41,434,892 | |
| | | | | | Materials—5.4% | | | | |
| | | 27,700 | | | AptarGroup, Inc. | | | 3,281,065 | |
| | | 124,900 | | * | Berry Global Group, Inc. | | | 4,904,823 | |
| | | 212,200 | | * | Ferro Corp. | | | 2,516,692 | |
| | | 302,610 | | * | PQ Group Holdings, Inc. | | | 4,823,603 | |
| | | 117,100 | | | Schweitzer-Mauduit International., Inc. | | | 4,384,224 | |
196
| | Shares or
Principal
Amount | | | Security | | Value | |
| | | | | | Materials (continued) |
| | | 96,500 | | | Sensient Technologies Corp. | | $ | 6,624,725 | |
| | | | | | | | | 26,535,132 | |
| | | | | | Real Estate—6.1% | | | | |
| | | 315,000 | | | Brixmor Property Group, Inc. (REIT) | | | 6,391,350 | |
| | | 145,200 | | | Douglas Emmett, Inc. (REIT) | | | 6,218,916 | |
| | | 24,900 | | | Federal Realty Investment Trust (REIT) | | | 3,389,886 | |
| | | 234,368 | | | Industrial Logistics Properties Trust (REIT) | | | 4,980,320 | |
| | | 133,700 | | | JBG SMITH Properties (REIT) | | | 5,242,377 | |
| | | 294,800 | | | Sunstone Hotel Investors, Inc. (REIT) | | | 4,050,552 | |
| | | | | | | | | 30,273,401 | |
| | | | | | Utilities—7.5% | | | | |
| | | 133,000 | | | Black Hills Corp. | | | 10,205,090 | |
| | | 79,600 | | | IDACORP, Inc. | | | 8,968,532 | |
| | | 84,100 | | | Pinnacle West Capital Corp. | | | 8,163,587 | |
| | | 166,100 | | | Portland General Electric Co. | | | 9,363,057 | |
| | | | | | | | | 36,700,266 | |
Total Value of Common Stocks (cost $429,120,225) | | | 474,457,441 | |
| | | | | | SHORT-TERM U.S. GOVERNMENT OBLIGATIONS—2.0% | | | | |
| | $ | 10,000M | | | U.S. Treasury Bills, 1.78%, 10/22/2019 (cost $9,989,616) | | | 9,989,570 | |
| | | | | | SHORT-TERM U.S. GOVERNMENT AGENCY OBLIGATIONS—1.4% | | | | |
| | | 7,000M | | | Federal Home Loan Bank, 1.93%, 10/25/2019 (cost $6,990,988) | | | 6,991,271 | |
Total Value of Investments (cost $446,100,829) | | | 99.7 | % | | | 491,438,282 | |
Other Assets, Less Liabilities | | | .3 | | | | 1,513,927 | |
Net Assets | | | 100.0 | % | | $ | 492,952,209 | |
197
Portfolio of Investments (continued)
SPECIAL SITUATIONS FUND
September 30, 2019
Summary of Abbreviations:
MLP | Master Limited Partnership |
REIT | Real Estate Investment Trust |
The Fund’s assets and liabilities are classified into the following three levels based on the inputs used to value the assets and liabilities:
| | Level 1 – | Unadjusted quoted prices in active markets for identical securities that the Fund has the ability to access. |
| | Level 2 – | Observable inputs other than quoted prices included in Level 1 that are observable for the asset or liability, either directly or indirectly. These inputs may include quoted prices for the identical instrument on an inactive market, prices for similar instruments, interest rates, prepayment speeds, credit risk, yield curves, default rates and similar data. |
| | Level 3 – | Unobservable inputs for the asset or liability, to the extent relevant observable inputs are not available, representing the Fund’s own assumption about the assumptions a market participant would use in valuing the asset or liability, and would be based on the best information available. |
The inputs methodology used for valuing securities are not necessarily an indication of the risk associated with investing in those securities. For example, U.S. Government securities are reflected as Level 2 because the inputs used to determine fair value may not always be quoted prices in an active market.
The following is a summary, by category of Level, of inputs used to value the Fund’s investments as of September 30, 2019:
| | | Level 1 | | | Level 2 | | | Level 3 | | | Total | |
Common Stocks | | $ | 474,457,441 | | | $ | — | | | $ | — | | | $ | 474,457,441 | |
Short-Term U.S. Government Obligations | | | — | | | | 9,989,570 | | | | — | | | | 9,989,570 | |
Short-Term U.S. Government Agency Obligations | | | — | | | | 6,991,271 | | | | — | | | | 6,991,271 | |
Total Investments in Securities* | | $ | 474,457,441 | | | $ | 16,980,841 | | | $ | — | | | $ | 491,438,282 | |
* | The Portfolio of Investments provides information on the industry categorization for common stocks. |
There were no transfers into or from Level 1 and Level 2 by the Fund for the year ended September 30, 2019. Transfers, if any, between Levels are recognized at the end of the reporting period.
See notes to financial statements
198
Portfolio Managers’ Letter
TOTAL RETURN FUND
Dear Investor:
This is the annual report for the First Investors Total Return Fund for the fiscal year ended September 30, 2019. During the period, the Fund’s return on a net asset value basis was 4.58% for Class A shares, 4.93% for Advisor Class shares and 5.06% for Institutional Class shares, including dividends of 34.0 cents per share for Class A shares, 43.8 cents per share for Advisor Class shares and 48.3 cents per share for Institutional Class shares. In addition, the Fund distributed capital gains of $1.52 per share on each class of shares.
U.S. equity market
The U.S. stock market began the review period with a very weak quarter. The S&P 500 fell -9.0% in the month of December alone. Quantitative tightening by the Fed, coupled with slowing earnings and increased trade disputes, sparked the sell-off. The start of 2019 saw a meaningful reversal in the equity markets following the sharp sell-off in December. January started very strong with the S&P 500 posting a +8.0% total return, the best monthly showing since 1987. By the end of January, the S&P had erased most of the losses incurred during the month of December and sat 15% above its Christmas Eve low. The January rally was led by higher-beta, lower-quality and smaller-cap names. Fueled by a dovish Federal Reserve (“Fed”) and more optimism about a potential trade deal, the S&P 500 posted its best quarterly return since 2009. The first quarter rally in small-cap stocks was the best since 1991.
As the second quarter progressed, the dominant themes were global trade war, the slowing global economy, and the Fed becoming more accommodative and starting to lower rates again. The S&P 500 gained 17% during the first six months of the year (its best performance since 1997). The market’s gains were predominantly built upon defensive sectors like Utilities, REITs and Consumer Staples. These sectors all made new highs along with the S&P 500, as lower global interest rates seemingly accelerated investors’ appetite for yield.
The start of the summer saw global economic data begin to weaken as the effect of the trade war began to manifest itself. The 2- to 10-year U.S. Treasury yield curve inverted for the first time since the Global Financial Crisis, raising recession concerns. The market continued to move on trade talk and the economy. In September, oil spiked with attacks on a Saudi processing plant and we saw a rotation from momentum stocks to value stocks for the first time. High-growth stocks came down off their highs and valuations in the private market began to correct as well. Nevertheless, the S&P 500 remained near its all-time highs posting a return of 20.55% on a year-to-date basis.
Bond market
The review period began with a continuation of financial market volatility. Rising interest rates, a prolonged trade war between U.S. and China, the midterm elections, and a strong U.S. dollar overshadowed strong economic fundamentals, causing a broad market selloff. The corporate bond market continued to underperform as credit spreads moved wider.
199
Portfolio Managers’ Letter (continued)
TOTAL RETURN FUND
The Fed raised rates by 25 basis points in its December meeting, however, its policy moved from a tightening to a more accommodative policy. In fact, the Fed cut rates by 25 basis points twice following the rate hike in December. U.S. Treasurys rallied strongly across the yield curve in a risk-off environment. There is an inverse relationship between bond prices and yields. The 2-year U.S. Treasury note yield, which is very sensitive to changes in Fed policy, fell by 120 basis points to 1.62%. The 10-year U.S. Treasury note yield, which is controlled by other factors such as GDP, inflation and investor sentiment, fell by 140 basis points to 1.67%. The yield curve continued to flatten, with the spread between 2- and 10-year U.S. Treasury yields narrowing to just four basis points by the end of the period.
Credit spreads marched tighter as investors continued to support the corporate credit market in the search for yield. The positive performance of the corporate bond market during the review period was the result of longer duration and tighter credit spreads. Of note, corporate bonds with maturities greater than 10 years significantly outperformed shorter-maturity debt (i.e., one to three years) as U.S. Treasury yields moved lower across the curve. During the review period, Telecommunication and Utility sectors outperformed.
Amid volatility in commodity-driven sectors, the high yield bond market returned 6.30% during the review period. Municipal bonds benefited from favorable supply-demand dynamics and returned 7.93%.
The Fund—Equities
Overall, the Fund’s Class A shares underperformed its equity benchmark, the Standard & Poor’s 500 Index, which returned 10.63% for the annual reporting period ended September 30, 2019, but outperformed its fixed income benchmark, the ICE BofA Merrill Lynch U.S. Corporate, Government & Mortgage Master Index, which rose 4.25%.
The Fund’s worst relative performing sector was energy led by its investment in Encana a small cap oil producer that sold off after surprising investors with a large acquisition. The Funds investment in Marathon Petroleum has been disappointing over the past year as well as margins have taken a hit.
The current U.S. administration’s renewed focus on tariffs had a negative impact on Tapestry, the parent company of Coach and Kate Spade, as higher tariffs on goods made in China will have a negative impact on margins and earnings will likely be under pressure.
The Fund also underperformed in both the Real Estate and Utilities sectors. With the Fund’s mandate to have at least 35% of the assets in fixed income, the equity portion does not invest in high yielding stocks like REITs or Utilities which hurt performance, compared to the benchmark that does invest in those sectors.
In the Industrial sector, the Fund’s investment in defense stocks led strong returns with Lockheed Martin and Northrop Grumman both reaching all-time highs. Gardner Denver also had a strong year after they announced an accretive acquisition earlier in the year. The Fund’s purchase of Kansas City Southern has worked out well as the stock has traded recently at its all-time high. In
200
Healthcare, our investment in Exact Sciences has been a solid winner with the stock trading near its high.
The Fund—Bonds
During the review period, the Fund had average bond and cash allocations of 41.2% and 1.8%, respectively. As a percentage of the Fund’s total assets, investment grade corporate bonds were the largest bond allocation at 25.6%, followed by mortgage-backed securities at 9.0%, U.S. government securities at 5.7%, high yield bonds at 4.9%, municipal bonds at 0.5%, and asset-backed securities at 0.4%.
The Fund’s fixed income holdings significantly outperformed the return of its benchmark, the BofA Merrill Lynch U.S. Corporate, Government & Mortgage Index. The Fund’s relative outperformance was predominantly a function of its overweight to corporate bonds, the best performing asset class during the review period. The Fund’s overweight of 30-year U.S. Treasurys compared to the Index was also a positive contributor to performance, benefiting from the substantial decline in interest rates during the review period.
Thank you for placing your trust in Foresters Financial. As always, we appreciate the opportunity to serve your investment needs.
Sincerely,

| 
|
Sean Reidy | Rajeev Sharma |
Portfolio Manager and
Director of Equities,
Foresters Investment Management Company, Inc. | Portfolio Manager and
Director of Fixed Income,
Foresters Investment Management Company, Inc. |
October 4, 2019
201
Fund Expenses (unaudited)
TOTAL RETURN FUND
The examples below show the ongoing costs (in dollars) of investing in your Fund and will help you in comparing these costs with costs of other mutual funds. Please refer to page 1 for a detailed explanation of the information presented in these examples.
Expense Example | Annualized
Expense
Ratio | Beginning
Account Value
(4/1/19) | Ending
Account Value
(9/30/19) | Expenses Paid
During Period
(4/1/19-9/30/19)* |
Class A Shares | 1.13% | | | |
Actual | | $1,000.00 | $1,061.19 | $ 5.84 |
Hypothetical** | | $1,000.00 | $1,019.40 | $ 5.72 |
Advisor Class Shares | 0.73% | | | |
Actual | | $1,000.00 | $1,064.23 | $ 3.78 |
Hypothetical** | | $1,000.00 | $1,021.41 | $ 3.70 |
Institutional Class Shares | 0.78% | | | |
Actual | | $1,000.00 | $1,064.03 | $ 4.04 |
Hypothetical** | | $1,000.00 | $1,021.16 | $ 3.95 |
* | Expenses are equal to the annualized expense ratio, multiplied by the average account value over the period, multiplied by 183/365 (to reflect the one-half year period). |
** | Assumed rate of return of 5% before expenses |
Portfolio Composition
TOP TEN SECTORS
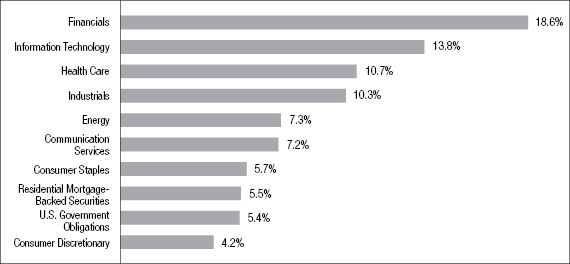
Portfolio holdings and allocations are subject to change. Percentages are as of September 30, 2019, and are based on the total market value of investments.
202
Cumulative Performance Information (unaudited)
TOTAL RETURN FUND
Comparison of change in value of $10,000 investment in the First Investors Total Return Fund (Class A shares), the ICE BofAML U.S. Corporate, Government & Mortgage Index and the Standard & Poor’s 500 Index.
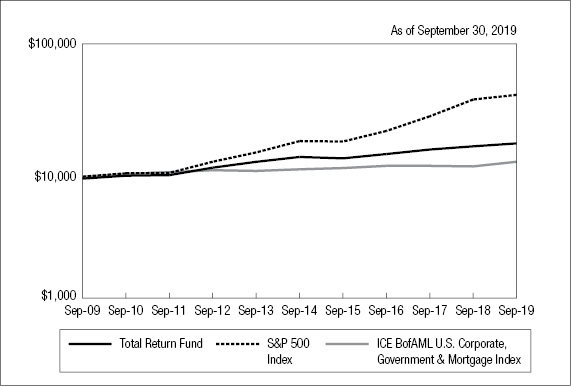
| | Average Annual Total Returns* |
N.A.V. Only | Class A | Advisor
Class | Institutional
Class | S&P 500
Index | ICE BofAML
U.S.
Corporate,
Government
& Mortgage
Index |
One Year | 4.58% | 4.93% | 5.06% | 4.25% | 10.63% |
Five Years | 4.66% | 5.05% | 5.11% | 10.84% | 3.47% |
Ten Years or Since Inception** | 7.83% | 6.38% | 6.47% | 13.24%† | 3.79%† |
| | | | | | |
S.E.C. Standardized | Class A | Advisor
Class | Institutional
Class | | |
One Year | -1.42% | 4.93% | 5.06% | | |
Five Years | 3.43% | 5.05% | 5.11% | | |
Ten Years or Since Inception** | 7.20% | 6.38% | 6.47% | | |
The graph compares a $10,000 investment in the First Investors Total Return Fund (Class A shares) beginning 9/30/09 with theoretical investments in the ICE BofAML U.S. Corporate, Government & Mortgage Index and the Standard & Poor’s 500 Index (the “Indices”). The ICE BofAML U.S. Corporate, Government & Mortgage Index tracks the performance of U.S. dollar denominated investment grade debt publicly issued in the U.S. domestic market, including U.S. Treasuries, quasi-government securities, corporates, covered
203
Cumulative Performance Information (unaudited) (continued)
TOTAL RETURN FUND
bonds and residential mortgage pass-through securities. The Standard & Poor’s 500 Index is an unmanaged capitalization-weighted index of 500 stocks designed to measure performance of the broad domestic economy through changes in the aggregate market value of such stocks, which represent all major industries. It is not possible to invest directly in these Indices. In addition, the Indices do not reflect fees and expenses associated with the active management of a mutual fund portfolio. For purposes of the graph and the accompanying table, unless otherwise indicated, it has been assumed that the maximum sales charge was deducted from the initial $10,000 investment in the Fund and all dividends and distributions were reinvested. Advisor Class shares and Institutional Class shares performance may be greater than or less than that shown in the line graph above for Class A shares based on differences in sales loads and fees paid by shareholders investing in the different classes.
* Average Annual Total Return figures (for the periods ended 9/30/19) include the reinvestment of all dividends and distributions. “N.A.V. Only” returns are calculated without sales charges. The Class A “S.E.C. Standardized” returns shown are based on the maximum sales charge of 5.75%. The Advisor Class and Institutional Class “S.E.C. Standardized” returns shown are the same as the N.A.V. Only returns since these classes are sold without sales charges. During the periods shown, some of the expenses of the Fund were waived or assumed. If such expenses had been paid by the Fund, the Advisor Class “S.E.C. Standardized” Average Annual Total Return Since Inception would have been 5.84%. The Institutional Class “S.E.C. Standardized” Average Annual Total Return Since Inception would have been 5.85%. Results represent past performance and do not indicate future results. The graph and the returns shown do not reflect the deduction of taxes that a shareholder would pay on distributions or the redemption of fund shares. Investment return and principal value of an investment will fluctuate so that an investor’s shares, when redeemed, may be worth more or less than the original cost. ICE BofAML U.S. Corporate, Government & Mortgage Index figures are from ICE Data Services and Standard & Poor’s 500 Index figures are from Standard & Poor’s and all other figures are from Foresters Investment Management Company, Inc.
** The Since Inception returns for Advisor Class shares and Institutional Class shares are for the periods beginning 4/1/13 (commencement of operations for those classes).
† The Index return is for ten years. The S&P 500 Index return and ICE BofAML U.S. Corporate, Government & Mortgage Index return since inception of the Advisor Class shares and Institutional Class shares are 14.25% and 1.66%, respectively.
204
Portfolio of Investments
TOTAL RETURN FUND
September 30, 2019
| |
Shares
| | | Security | | Value | |
| | | | | | COMMON STOCKS—58.5% | | | | |
| | | | | | Communication Services—4.8% | | | | |
| | | 4,700 | | * | Alphabet, Inc. - Class “A” | | $ | 5,739,358 | |
| | | 138,500 | | | AT&T, Inc. | | | 5,240,840 | |
| | | 105,875 | | | CBS Corp. - Class “B” | | | 4,274,174 | |
| | | 131,300 | | | Comcast Corp. - Special Shares “A” | | | 5,919,004 | |
| | | 48,300 | | * | Take-Two Interactive Software, Inc. | | | 6,053,922 | |
| | | 119,275 | | | Verizon Communications, Inc. | | | 7,199,439 | |
| | | 36,500 | | | Walt Disney Co. | | | 4,756,680 | |
| | | | | | | | | 39,183,417 | |
| | | | | | Consumer Discretionary—2.1% | | | | |
| | | 1,650 | | * | Amazon.com, Inc. | | | 2,864,251 | |
| | | 11,250 | | * | Burlington Stores, Inc. | | | 2,247,975 | |
| | | 26,330 | | | Home Depot, Inc. | | | 6,109,087 | |
| | | 30,950 | | | Lowe’s Cos., Inc. | | | 3,403,262 | |
| | | 18,350 | | | Ross Stores, Inc. | | | 2,015,748 | |
| | | | | | | | | 16,640,323 | |
| | | | | | Consumer Staples—5.2% | | | | |
| | | 145,340 | | | Coca-Cola Co. | | | 7,912,310 | |
| | | 89,630 | | | Koninklijke Ahold Delhaize NV (ADR) | | | 2,241,646 | |
| | | 71,900 | | | Mondelez International, Inc. - Class “A” | | | 3,977,508 | |
| | | 60,560 | | | PepsiCo, Inc. | | | 8,302,776 | |
| | | 68,260 | | | Philip Morris International, Inc. | | | 5,182,982 | |
| | | 55,250 | | | Procter & Gamble Co. | | | 6,871,995 | |
| | | 60,870 | | | Walmart, Inc. | | | 7,224,052 | |
| | | | | | | | | 41,713,269 | |
| | | | | | Energy—3.9% | | | | |
| | | 122,973 | | | BP, PLC (ADR) | | | 4,671,744 | |
| | | 62,850 | | | Chevron Corp. | | | 7,454,010 | |
| | | 49,550 | | | ConocoPhillips | | | 2,823,359 | |
| | | 69,752 | | | ExxonMobil Corp. | | | 4,925,189 | |
205
Portfolio of Investments (continued)
TOTAL RETURN FUND
September 30, 2019
| |
Shares
| | | Security | | Value | |
| | | | | | Energy (continued) | | | | |
| | | 102,100 | | | Marathon Petroleum Corp. | | $ | 6,202,575 | |
| | | 63,600 | | | Valero Energy Corp. | | | 5,421,264 | |
| | | | | | | | | 31,498,141 | |
| | | | | | Financials—12.1% | | | | |
| | | 42,320 | | | American Express Co. | | | 5,005,610 | |
| | | 24,850 | | | Aon, PLC | | | 4,810,215 | |
| | | 285,200 | | | Bank of America Corp. | | | 8,319,284 | |
| | | 52,500 | | | Chubb, Ltd. | | | 8,475,600 | |
| | | 86,800 | | | Citigroup, Inc. | | | 5,996,144 | |
| | | 30,507 | | | Fidelity National Information Services, Inc. | | | 4,050,109 | |
| | | 26,100 | | | Goldman Sachs Group, Inc. | | | 5,408,703 | |
| | | 65,400 | | | Hamilton Lane, Inc. - Class “A” | | | 3,725,184 | |
| | | 87,280 | | | JPMorgan Chase & Co. | | | 10,271,983 | |
| | | 81,200 | | | MetLife, Inc. | | | 3,829,392 | |
| | | 95,180 | | | Morgan Stanley | | | 4,061,331 | |
| | | 44,725 | | | PNC Financial Services Group, Inc. | | | 6,268,656 | |
| | | 73,850 | | | Popular, Inc. | | | 3,993,808 | |
| | | 157,850 | | | Synchrony Financial | | | 5,381,107 | |
| | | 42,150 | | | Travelers Cos., Inc. | | | 6,267,284 | |
| | | 124,945 | | | U.S. Bancorp | | | 6,914,456 | |
| | | 92,770 | | | Wells Fargo & Co. | | | 4,679,319 | |
| | | | | | | | | 97,458,185 | |
| | | | | | Health Care—9.4% | | | | |
| | | 66,460 | | | Abbott Laboratories | | | 5,560,708 | |
| | | 12,900 | | | Anthem, Inc. | | | 3,097,290 | |
| | | 60,450 | | * | Centene Corp. | | | 2,615,067 | |
| | | 19,850 | | * | Charles River Laboratories International, Inc. | | | 2,627,544 | |
| | | 11,600 | | | Eli Lilly & Co. | | | 1,297,228 | |
| | | 47,750 | | * | Exact Sciences Corp. | | | 4,315,167 | |
| | | 48,700 | | | Hill-Rom Holdings, Inc. | | | 5,124,701 | |
| | | 21,900 | | | Johnson & Johnson | | | 2,833,422 | |
| | | 65,950 | | | Koninklijke Philips NV (ADR) | | | 3,042,273 | |
206
| |
Shares
| | | Security | | Value | |
| | | | | | Health Care (continued) |
| | | 61,200 | | | Medtronic, PLC | | $ | 6,647,544 | |
| | | 74,795 | | | Merck & Co., Inc. | | | 6,296,243 | |
| | | 131,479 | | | Pfizer, Inc. | | | 4,724,040 | |
| | | 136,000 | | | Smith & Nephew, PLC (ADR) | | | 6,545,680 | |
| | | 17,745 | | | Thermo Fisher Scientific, Inc. | | | 5,168,586 | |
| | | 22,100 | | * | Vertex Pharmaceuticals, Inc. | | | 3,744,182 | |
| | | 57,350 | | | Zimmer Biomet Holdings, Inc. | | | 7,872,435 | |
| | | 35,065 | | | Zoetis, Inc. | | | 4,368,748 | |
| | | | | | | | | 75,880,858 | |
| | | | | | Industrials—8.3% | | | | |
| | | 79,700 | | * | Gardner Denver Holdings, Inc. | | | 2,254,713 | |
| | | 49,150 | | | Honeywell International, Inc. | | | 8,316,180 | |
| | | 73,500 | | | Ingersoll-Rand, PLC | | | 9,055,935 | |
| | | 54,250 | | | Jacobs Engineering Group, Inc. | | | 4,963,875 | |
| | | 40,300 | | | Kansas City Southern, Inc. | | | 5,360,303 | |
| | | 22,620 | | | Lockheed Martin Corp. | | | 8,823,157 | |
| | | 18,100 | | | Northrop Grumman Corp. | | | 6,783,699 | |
| | | 72,450 | | | Republic Services, Inc. | | | 6,270,547 | |
| | | 12,500 | | | Stanley Black & Decker, Inc. | | | 1,805,125 | |
| | | 32,450 | | | Union Pacific Corp. | | | 5,256,251 | |
| | | 58,680 | | | United Technologies Corp. | | | 8,010,994 | |
| | | | | | | | | 66,900,779 | |
| | | | | | Information Technology—11.8% | | | | |
| | | 24,750 | | * | Adobe Systems, Inc. | | | 6,837,187 | |
| | | 106,700 | | * | Advanced Micro Devices, Inc. | | | 3,093,233 | |
| | | 117,747 | | | Cisco Systems, Inc. | | | 5,817,879 | |
| | | 158,700 | | | Corning, Inc. | | | 4,526,124 | |
| | | 119,100 | | * | Cree, Inc. | | | 5,835,900 | |
| | | 66,200 | | * | Fiserv, Inc. | | | 6,857,658 | |
| | | 124,875 | | | Intel Corp. | | | 6,434,809 | |
| | | 58,950 | | | Maxim Integrated Products, Inc. | | | 3,413,794 | |
| | | 54,100 | | * | Mellanox Technologies, Ltd. | | | 5,928,819 | |
| | | 64,185 | | | Microsoft Corp. | | | 8,923,641 | |
207
Portfolio of Investments (continued)
TOTAL RETURN FUND
September 30, 2019
| | Shares or
Principal
Amount | | | Security | | Value | |
| | | | | | Information Technology (continued) |
| | | 133,750 | | | Nintendo Co., Ltd. (ADR) | | $ | 6,232,750 | |
| | | 20,250 | | | NVIDIA Corp. | | | 3,524,917 | |
| | | 95,500 | | | Oracle Corp. | | | 5,255,365 | |
| | | 72,220 | | | QUALCOMM, Inc. | | | 5,508,942 | |
| | | 42,550 | | * | Synopsys, Inc. | | | 5,839,987 | |
| | | 24,100 | | | Texas Instruments, Inc. | | | 3,114,684 | |
| | | 42,550 | | | Visa, Inc. - Class “A” | | | 7,319,026 | |
| | | | | | | | | 94,464,715 | |
| | | | | | Materials—.9% | | | | |
| | | 27,216 | | | DuPont de Nemours, Inc. | | | 1,940,773 | |
| | | 25,830 | | | Linde, PLC | | | 5,003,788 | |
| | | | | | | | | 6,944,561 | |
Total Value of Common Stocks (cost $334,283,948) | | | 470,684,248 | |
| | | | | | CORPORATE BONDS—20.6% | | | | |
| | | | | | Aerospace/Defense—.7% | | | | |
| | $ | 2,700M | | | Boeing Co., 2.95%, 2/1/2030 | | | 2,771,963 | |
| | | 100M | | | Bombardier, Inc., 6%, 10/15/2022 (a) | | | 100,375 | |
| | | 2,500M | | | Rockwell Collins, Inc., 3.5%, 3/15/2027 | | | 2,669,677 | |
| | | | | | TransDigm, Inc.: | | | | |
| | | 75M | | | 6%, 7/15/2022 | | | 76,313 | |
| | | 50M | | | 6.5%, 7/15/2024 | | | 51,750 | |
| | | 25M | | | 6.25%, 3/15/2026 (a) | | | 26,906 | |
| | | 50M | | | Triumph Group, Inc., 5.25%, 6/1/2022 | | | 49,980 | |
| | | | | | | | | 5,746,964 | |
| | | | | | Automotive—1.0% | | | | |
| | | 125M | | | American Axle & Manufacturing, Inc., 6.25%, 4/1/2025 | | | 121,875 | |
| | | 50M | | | Asbury Automotive Group, Inc., 6%, 12/15/2024 | | | 52,000 | |
| | | 50M | | | Cooper Standard Automotive, Inc., 5.625%, 11/15/2026 (a) | | | 45,812 | |
208
| |
Principal
Amount
| | | Security | | Value | |
| | | | | | Automotive (continued) | | | | |
| | $ | 320M | | | Dana Holding Corp., 5.5%, 12/15/2024 | | $ | 327,200 | |
| | | 2,500M | | | Ford Motor Credit Co., LLC, 8.125%, 1/15/2020 | | | 2,541,522 | |
| | | 4,345M | | | General Motors Financial Co., Inc., 5.25%, 3/1/2026 | | | 4,716,776 | |
| | | 75M | | | J.B. Poindexter & Co., 7.125%, 4/15/2026 (a) | | | 78,000 | |
| | | 50M | | | LKQ Corp., 4.75%, 5/15/2023 | | | 50,875 | |
| | | 75M | | | Panther BF Aggregator 2, LP, 8.5%, 5/15/2027 (a) | | | 76,125 | |
| | | | | | | | | 8,010,185 | |
| | | | | | Building Materials—.0% | | | | |
| | | 25M | | | Beacon Roofing Supply, Inc., 4.5%, 11/15/2026 (a) | | | 25,281 | |
| | | | | | Building Materials Corp.: | | | | |
| | | 100M | | | 5.375%, 11/15/2024 (a) | | | 103,375 | |
| | | 50M | | | 6%, 10/15/2025 (a) | | | 52,673 | |
| | | 100M | | | Griffon Corp., 5.25%, 3/1/2022 | | | 101,250 | |
| | | 50M | | | New Enterprise Stone & Lime Co., 6.25%, 3/15/2026 (a) | | | 51,250 | |
| | | 50M | | | Standard Industries, Inc., 5%, 2/15/2027 (a) | | | 51,890 | |
| | | | | | | | | 385,719 | |
| | | | | | Chemicals—.3% | | | | |
| | | 75M | | | Blue Cube Spinco, Inc., 10%, 10/15/2025 | | | 84,325 | |
| | | 50M | | | CF Industries, Inc., 4.95%, 6/1/2043 | | | 49,187 | |
| | | 50M | | | Chemours Co., 5.375%, 5/15/2027 | | | 43,376 | |
| | | 50M | | | Koppers, Inc., 6%, 2/15/2025 (a) | | | 50,282 | |
| | | 50M | | | Kraton Polymers, LLC, 7%, 4/15/2025 (a) | | | 52,375 | |
| | | 2,100M | | | LyondellBasell Industries NV, 6%, 11/15/2021 | | | 2,239,957 | |
| | | 50M | | | Neon Holdings, Inc., 10.125%, 4/1/2026 (a) | | | 50,500 | |
| | | 100M | | | Rain CII Carbon, LLC, 7.25%, 4/1/2025 (a) | | | 96,000 | |
| | | 50M | | | Tronox, Inc., 6.5%, 4/15/2026 (a) | | | 47,875 | |
| | | | | | | | | 2,713,877 | |
209
Portfolio of Investments (continued)
TOTAL RETURN FUND
September 30, 2019
| |
Principal
Amount
| | | Security | | Value | |
| | | | | | Consumer Non-Durables—.0% | | | | |
| | | | | | Energizer Holdings, Inc.: | | | | |
| | $ | 50M | | | 5.5%, 6/15/2025 (a) | | $ | 51,892 | |
| | | 25M | | | 6.375%, 7/15/2026 (a) | | | 26,841 | |
| | | 25M | | | KGA Escrow, LLC, 7.5%, 8/15/2023 (a) | | | 26,281 | |
| | | | | | Reynolds Group Holdings, Inc.: | | | | |
| | | 97M | | | 5.75%, 10/15/2020 | | | 97,235 | |
| | | 175M | | | 5.125%, 7/15/2023 (a) | | | 179,594 | |
| | | | | | | | | 381,843 | |
| | | | | | Energy—3.0% | | | | |
| | | 50M | | | Antero Resources Corp., 5.625%, 6/1/2023 | | | 43,500 | |
| | | 50M | | | Apergy Corp., 6.375%, 5/1/2026 | | | 49,875 | |
| | | 25M | | | Baytex Energy Corp., 5.125%, 6/1/2021 (a) | | | 24,562 | |
| | | | | | Berry Petroleum Co.: | | | | |
| | | 50M | | | 5.5%, 5/15/2022 | | | 50,875 | |
| | | 75M | | | 5.125%, 7/15/2023 | | | 77,250 | |
| | | | | | Blue Racer Midstream, LLC: | | | | |
| | | 175M | | | 6.125%, 11/15/2022 (a) | | | 176,802 | |
| | | 25M | | | 6.625%, 7/15/2026 (a) | | | 24,812 | |
| | | 50M | | | Callon Petroleum Co., 6.375%, 7/1/2026 | | | 49,042 | |
| | | | | | Chesapeake Energy Corp.: | | | | |
| | | 25M | | | 4.875%, 4/15/2022 | | | 20,312 | |
| | | 75M | | | 7%, 10/1/2024 | | | 54,094 | |
| | | 25M | | | 8%, 6/15/2027 | | | 17,130 | |
| | | 2,700M | | | Cimarex Energy Co., 4.375%, 3/15/2029 | | | 2,843,861 | |
| | | 75M | | | CITGO Petroleum Corp., 6.25%, 8/15/2022 (a) | | | 76,125 | |
| | | 1,856M | | | Continental Resources, Inc., 5%, 9/15/2022 | | | 1,873,556 | |
| | | 50M | | | Covey Park Energy, LLC, 7.5%, 5/15/2025 (a) | | | 40,250 | |
| | | 75M | | | Crestwood Midstream Partners, LP, 5.75%, 4/1/2025 | | | 77,437 | |
| | | 50M | | | CrownRock, LP, 5.625%, 10/15/2025 (a) | | | 50,499 | |
| | | | | | DCP Midstream Operating, LP: | | | | |
| | | 50M | | | 3.875%, 3/15/2023 | | | 50,687 | |
| | | 25M | | | 5.125%, 5/15/2029 | | | 25,500 | |
210
| |
Principal
Amount
| | | Security | | Value | |
| | | | | | Energy (continued) |
| | | | | | EnLink Midstream Partners, LP: | | | | |
| | $ | 50M | | | 4.85%, 7/15/2026 | | $ | 47,688 | |
| | | 50M | | | 5.45%, 6/1/2047 | | | 41,000 | |
| | | 2,500M | | | Enterprise Products Operating, 7.55%, 4/15/2038 | | | 3,690,547 | |
| | | 170M | | | Exterran Partners, LP, 6%, 10/1/2022 | | | 172,338 | |
| | | 50M | | | Genesis Energy, LP, 6.5%, 10/1/2025 | | | 48,938 | |
| | | | | | Gulfport Energy Corp.: | | | | |
| | | 25M | | | 6.625%, 5/1/2023 | | | 19,625 | |
| | | 50M | | | 6.375%, 1/15/2026 | | | 35,250 | |
| | | 1,600M | | | Kinder Morgan Energy Partners, LP, 3.45%, 2/15/2023 | | | 1,649,422 | |
| | | 3,000M | | | Kinder Morgan, Inc., 5.625%, 11/15/2023 (a) | | | 3,331,170 | |
| | | | | | Laredo Petroleum, Inc.: | | | | |
| | | 25M | | | 5.625%, 1/15/2022 | | | 23,625 | |
| | | 50M | | | 6.25%, 3/15/2023 | | | 44,125 | |
| | | 4,000M | | | Magellan Midstream Partners, LP, 5%, 3/1/2026 | | | 4,493,292 | |
| | | 25M | | | Matador Resources Co., 5.875%, 9/15/2026 | | | 25,173 | |
| | | 3,300M | | | Midwest Connector Capital Co., LLC, 4.625%, 4/1/2029 (a) | | | 3,628,366 | |
| | | 50M | | | Murphy Oil Corp., 5.875%, 12/1/2042 | | | 44,250 | |
| | | 25M | | | Murphy Oil USA, Inc., 4.75%, 9/15/2029 | | | 25,625 | |
| | | 25M | | | Northern Oil and Gas, Inc., 8.5%, 5/15/2023 | | | 26,003 | |
| | | | | | Oasis Petroleum, Inc.: | | | | |
| | | 175M | | | 6.875%, 1/15/2023 | | | 161,000 | |
| | | 50M | | | 6.25%, 5/1/2026 (a) | | | 40,750 | |
| | | | | | Parkland Fuel Corp.: | | | | |
| | | 75M | | | 6%, 4/1/2026 (a) | | | 79,500 | |
| | | 50M | | | 5.875%, 7/15/2027 (a) | | | 52,591 | |
| | | 75M | | | Parsley Energy, LLC, 5.25%, 8/15/2025 (a) | | | 76,478 | |
| | | | | | Range Resources Corp.: | | | | |
| | | 50M | | | 5%, 8/15/2022 | | | 47,125 | |
| | | 25M | | | 4.875%, 5/15/2025 | | | 20,750 | |
| | | 50M | | | Southwestern Energy Co., 6.7%, 1/23/2025 | | | 44,249 | |
| | | | | | Suburban Propane Partners, LP: | | | | |
| | | 25M | | | 5.5%, 6/1/2024 | | | 25,625 | |
| | | 50M | | | 5.875%, 3/1/2027 | | | 51,351 | |
211
Portfolio of Investments (continued)
TOTAL RETURN FUND
September 30, 2019
| |
Principal
Amount
| | | Security | | Value | |
| | | | | | Energy (continued) |
| | $ | 75M | | | Sunoco, LP, 4.875%, 1/15/2023 | | $ | 77,156 | |
| | | 22M | | | Transocean Pontus, Ltd., 6.125%, 8/1/2025 (a) | | | 22,695 | |
| | | 50M | | | USA Compression Partners, LP, 6.875%, 9/1/2027 (a) | | | 51,875 | |
| | | | | | Whiting Petroleum Corp.: | | | | |
| | | 175M | | | 5.75%, 3/15/2021 | | | 167,787 | |
| | | 75M | | | 6.625%, 1/15/2026 | | | 51,000 | |
| | | | | | | | | 23,942,538 | |
| | | | | | Financial Services—1.7% | | | | |
| | | 4,700M | | | Brookfield Finance, Inc., 4%, 4/1/2024 | | | 5,005,505 | |
| | | 1,000M | | | ERAC USA Finance, LLC, 4.5%, 8/16/2021 (a) | | | 1,041,055 | |
| | | 50M | | | GTCR (AP) Finance, Inc., 8%, 5/15/2027 (a) | | | 51,500 | |
| | | 4,100M | | | Key Bank NA, 3.4%, 5/20/2026 | | | 4,277,067 | |
| | | 2,000M | | | Liberty Mutual Group, Inc., 4.95%, 5/1/2022 (a) | | | 2,120,774 | |
| | | 25M | | | Nationstar Mortgage, LLC, 6.5%, 7/1/2021 | | | 25,125 | |
| | | 1,000M | | | Protective Life Corp., 7.375%, 10/15/2019 | | | 1,001,826 | |
| | | | | | | | | 13,522,852 | |
| | | | | | Financials—3.8% | | | | |
| | | 25M | | | Acrisure, LLC, 8.125%, 2/15/2024 (a) | | | 26,984 | |
| | | 3,700M | | | Air Lease Corp., 3.25%, 10/1/2029 | | | 3,655,652 | |
| | | 50M | | | Ally Financial, Inc., 8%, 11/1/2031 | | | 69,375 | |
| | | 2,400M | | | Bank of America Corp., 5.875%, 2/7/2042 | | | 3,327,780 | |
| | | | | | Citigroup, Inc.: | | | | |
| | | 1,000M | | | 2.9%, 12/8/2021 | | | 1,015,095 | |
| | | 1,000M | | | 4.5%, 1/14/2022 | | | 1,051,579 | |
| | | 1,600M | | | 4.3%, 11/20/2026 | | | 1,725,016 | |
| | | 25M | | | Colfax Corp., 6%, 2/15/2024 (a) | | | 26,552 | |
| | | 75M | | | DAE Funding, LLC, 5.75%, 11/15/2023 (a) | | | 79,001 | |
| | | | | | Goldman Sachs Group, Inc.: | | | | |
| | | 1,650M | | | 3.85%, 7/8/2024 | | | 1,747,748 | |
| | | 3,050M | | | 3.5%, 11/16/2026 | | | 3,170,932 | |
| | | | | | Icahn Enterprises, LP: | | | | |
| | | 125M | | | 6.75%, 2/1/2024 | | | 130,469 | |
| | | 100M | | | 6.25%, 5/15/2026 (a) | | | 105,125 | |
212
| |
Principal
Amount
| | | Security | | Value | |
| | | | | | Financials (continued) |
| | | | | | JPMorgan Chase & Co.: | | | | |
| | $ | 1,000M | | | 4.452%, 12/5/2029 | | $ | 1,131,285 | |
| | | 1,800M | | | 3.702%, 5/6/2030 | | | 1,930,257 | |
| | | 175M | | | Ladder Capital Finance Holdings, LLLP, 5.25%, 10/1/2025 (a) | | | 179,375 | |
| | | 2,500M | | | Morgan Stanley, 4%, 7/23/2025 | | | 2,699,052 | |
| | | 150M | | | Navient Corp., 5.875%, 3/25/2021 | | | 155,906 | |
| | | | | | Springleaf Finance Corp.: | | | | |
| | | 125M | | | 5.625%, 3/15/2023 | | | 133,438 | |
| | | 25M | | | 6.875%, 3/15/2025 | | | 27,609 | |
| | | 50M | | | 7.125%, 3/15/2026 | | | 55,560 | |
| | | 1,500M | | | UBS AG, 4.875%, 8/4/2020 | | | 1,536,289 | |
| | | 3,000M | | | UBS Group Funding (Switzerland) AG, 4.253%, 3/23/2028 (a) | | | 3,274,839 | |
| | | 25M | | | Wand Merger Corp., 8.125%, 7/15/2023 (a) | | | 26,125 | |
| | | 3,000M | | | Wells Fargo & Co., 3.196%, 6/17/2027 | | | 3,102,624 | |
| | | | | | | | | 30,383,667 | |
| | | | | | Food/Beverage/Tobacco—.3% | | | | |
| | | 1,300M | | | Anheuser-Busch Cos., LLC, 4.7%, 2/1/2036 | | | 1,503,961 | |
| | | 50M | | | HLF Financing Sarl, LLC, 7.25%, 8/15/2026 (a) | | | 50,563 | |
| | | 125M | | | JBS USA LUX SA, 5.5%, 1/15/2030 (a) | | | 132,810 | |
| | | 25M | | | JBS USA, LLC, 5.875%, 7/15/2024 (a) | | | 25,798 | |
| | | 25M | | | Performance Food Group, Inc., 5.5%, 10/15/2027 (a) | | | 26,438 | |
| | | | | | Post Holdings, Inc.: | | | | |
| | | 175M | | | 5.75%, 3/1/2027 (a) | | | 186,410 | |
| | | 50M | | | 5.5%, 12/15/2029 (a) | | | 52,313 | |
| | | 25M | | | Simmons Foods, Inc., 5.75%, 11/1/2024 (a) | | | 24,500 | |
| | | | | | | | | 2,002,793 | |
| | | | | | Food/Drug—.0% | | | | |
| | | | | | Albertson’s Cos., LLC: | | | | |
| | | 25M | | | 5.75%, 3/15/2025 | | | 25,834 | |
| | | 25M | | | 7.5%, 3/15/2026 (a) | | | 27,937 | |
| | | 25M | | | 5.875%, 2/15/2028 (a) | | | 26,523 | |
213
Portfolio of Investments (continued)
TOTAL RETURN FUND
September 30, 2019
| |
Principal
Amount
| | | Security | | Value | |
| | | | | | Food/Drug (continued) |
| | $ | 25M | | | B & G Foods, Inc., 5.25%, 9/15/2027 | | $ | 25,596 | |
| | | | | | | | | 105,890 | |
| | | | | | Forest Products/Containers—.4% | | | | |
| | | 200M | | | Ardagh Holdings USA, Inc., 4.625%, 5/15/2023 (a) | | | 205,250 | |
| | | | | | Berry Global Escrow Corp.: | | | | |
| | | 50M | | | 4.875%, 7/15/2026 (a) | | | 51,807 | |
| | | 50M | | | 5.625%, 7/15/2027 (a) | | | 51,875 | |
| | | 50M | | | BWAY Holding Co., 5.5%, 4/15/2024 (a) | | | 51,560 | |
| | | 25M | | | Crown Americas, LLC, 4.5%, 1/15/2023 | | | 26,312 | |
| | | 50M | | | Graphic Packaging International, LLC, 4.75%, 7/15/2027 (a) | | | 52,625 | |
| | | 50M | | | Greif, Inc., 6.5%, 3/1/2027 (a) | | | 53,150 | |
| | | 25M | | | Mercer International, Inc., 7.375%, 1/15/2025 | | | 26,103 | |
| | | 2,835M | | | Packaging Corp. of America, 3.4%, 12/15/2027 | | | 2,944,462 | |
| | | 50M | | | Schweitzer-Mauduit International, Inc., 6.875%, 10/1/2026 (a) | | | 53,000 | |
| | | | | | | | | 3,516,144 | |
| | | | | | Gaming/Leisure—.2% | | | | |
| | | 25M | | | AMC Entertainment, Inc., 5.75%, 6/15/2025 | | | 23,922 | |
| | | 100M | | | AMC Networks, Inc., 5%, 4/1/2024 | | | 103,253 | |
| | | 50M | | | Boyd Gaming Corp., 6.875%, 5/15/2023 | | | 52,062 | |
| | | 25M | | | Cedar Fair, LP, 5.375%, 6/1/2024 | | | 25,781 | |
| | | 200M | | | CRC Escrow Issuer, LLC, 5.25%, 10/15/2025 (a) | | | 204,980 | |
| | | | | | Diamond Sports Group, LLC: | | | | |
| | | 50M | | | 5.375%, 8/15/2026 (a) | | | 52,000 | |
| | | 100M | | | 6.625%, 8/15/2027 (a) | | | 104,000 | |
| | | 50M | | | Golden Nugget, Inc., 8.75%, 10/1/2025 (a) | | | 52,250 | |
| | | 150M | | | IRB Holding Corp., 6.75%, 2/15/2026 (a) | | | 151,125 | |
| | | 25M | | | Marriott Ownership Resorts, Inc, 4.75%, 1/15/2028 (a) | | | 25,313 | |
| | | 50M | | | MGM Resorts International Operations, Inc., 6%, 3/15/2023 | | | 55,210 | |
| | | 25M | | | National CineMedia, LLC, 6%, 4/15/2022 | | | 25,344 | |
214
| |
Principal
Amount
| | | Security | | Value | |
| | | | | | Gaming/Leisure (continued) |
| | $ | 50M | | | Scientific Games International, Inc., 8.25%, 3/15/2026 (a) | | $ | 53,168 | |
| | | 50M | | | Stars Group Holdings BV, 7%, 7/15/2026 (a) | | | 53,375 | |
| | | 200M | | | Viking Cruises, Ltd., 6.25%, 5/15/2025 (a) | | | 210,000 | |
| | | 50M | | | Wynn Las Vegas, LLC, 5.5%, 3/1/2025 (a) | | | 52,765 | |
| | | | | | | | | 1,244,548 | |
| | | | | | Health Care—.8% | | | | |
| | | | | | Bausch Health Cos., Inc.: | | | | |
| | | 175M | | | 6.5%, 3/15/2022 (a) | | | 181,125 | |
| | | 125M | | | 9%, 12/15/2025 (a) | | | 140,781 | |
| | | 25M | | | 8.5%, 1/31/2027 (a) | | | 28,120 | |
| | | 150M | | | Centene Corp., 5.625%, 2/15/2021 | | | 152,206 | |
| | | 2,400M | | | CVS Health Corp., 3.875%, 7/20/2025 | | | 2,541,314 | |
| | | 125M | | | DaVita, Inc., 5.125%, 7/15/2024 | | | 127,344 | |
| | | 2,100M | | | Express Scripts Holding Co., 4.75%, 11/15/2021 | | | 2,207,671 | |
| | | 175M | | | HCA, Inc., 6.25%, 2/15/2021 | | | 183,680 | |
| | | 161M | | | HealthSouth Corp., 5.75%, 11/1/2024 | | | 163,286 | |
| | | 125M | | | Mallinckrodt Finance SB, 5.75%, 8/1/2022 (a) | | | 47,500 | |
| | | 25M | | | MEDNAX, Inc., 6.25%, 1/15/2027 (a) | | | 24,873 | |
| | | 175M | | | Molina Healthcare, Inc., 4.875%, 6/15/2025 (a) | | | 176,531 | |
| | | 50M | | | MPH Operating Partnership, LP, 7.125%, 6/1/2024 (a) | | | 46,313 | |
| | | 25M | | | Par Pharmaceutical, Inc., 7.5%, 4/1/2027 (a) | | | 22,969 | |
| | | 125M | | | Syneos Health, Inc., 7.5%, 10/1/2024 (a) | | | 129,531 | |
| | | | | | | | | 6,173,244 | |
| | | | | | Home-Building—.0% | | | | |
| | | 50M | | | Brookfield Residential Properties, 6.25%, 9/15/2027 (a) | | | 50,375 | |
| | | 50M | | | Century Communities, Inc., 6.75%, 6/1/2027 (a) | | | 53,825 | |
| | | 25M | | | Taylor Morrison Communities, Inc., 5.75%, 1/15/2028 (a) | | | 27,188 | |
215
Portfolio of Investments (continued)
TOTAL RETURN FUND
September 30, 2019
| |
Principal
Amount
| | | Security | | Value | |
| | | | | | Home-Building (continued) |
| | $ | 50M | | | Toll Bros. Finance Corp., 3.8%, 11/1/2029 | | $ | 49,344 | |
| | | | | | William Lyon Homes, Inc.: | | | | |
| | | 50M | | | 6%, 9/1/2023 | | | 52,250 | |
| | | 50M | | | 6.625%, 7/15/2027 (a) | | | 52,125 | |
| | | | | | | | | 285,107 | |
| | | | | | Information Technology—1.4% | | | | |
| | | 2,000M | | | Apple, Inc., 2.2%, 9/11/2029 | | | 1,967,716 | |
| | | 25M | | | CommScope Finance, LLC, 6%, 3/1/2026 (a) | | | 25,995 | |
| | | 4,300M | | | Corning, Inc., 7.25%, 8/15/2036 | | | 5,258,332 | |
| | | | | | Diamond 1 Finance Corp.: | | | | |
| | | 3,000M | | | 4.42%, 6/15/2021 (a) | | | 3,094,170 | |
| | | 50M | | | 5.875%, 6/15/2021 (a) | | | 50,862 | |
| | | 50M | | | 7.125%, 6/15/2024 (a) | | | 52,763 | |
| | | 50M | | | Nielsen Finance, LLC, 5%, 4/15/2022 (a) | | | 50,390 | |
| | | 75M | | | Nuance Communications, Inc., 6%, 7/1/2024 | | | 78,375 | |
| | | 50M | | | Rackspace Hosting, Inc., 8.625%, 11/15/2024 (a) | | | 46,245 | |
| | | 100M | | | Solera, LLC, 10.5%, 3/1/2024 (a) | | | 106,212 | |
| | | 50M | | | Symantec Corp., 5%, 4/15/2025 (a) | | | 50,587 | |
| | | 25M | | | VeriSign, Inc., 4.75%, 7/15/2027 | | | 26,281 | |
| | | 50M | | | Verscend Holding Corp., 9.75%, 8/15/2026 (a) | | | 53,431 | |
| | | | | | | | | 10,861,359 | |
| | | | | | Manufacturing—.6% | | | | |
| | | 75M | | | Amsted Industries, Inc., 5.625%, 7/1/2027 (a) | | | 79,312 | |
| | | 175M | | | ATS Automation Tooling Systems, Inc., 6.5%, 6/15/2023 (a) | | | 181,125 | |
| | | 125M | | | Brand Energy & Infrastructure Services, Inc., 8.5%, 7/15/2025 (a) | | | 118,750 | |
| | | 25M | | | Cloud Crane, LLC, 10.125%, 8/1/2024 (a) | | | 26,812 | |
| | | 3,245M | | | Crane Co., 4.2%, 3/15/2048 | | | 3,408,191 | |
| | | 50M | | | Grinding Media, Inc., 7.375%, 12/15/2023 (a) | | | 48,000 | |
| | | 25M | | | HAT Holdings I, LLC, 5.25%, 7/15/2024 (a) | | | 26,344 | |
| | | 1,100M | | | Johnson Controls International, PLC, 5%, 3/30/2020 | | | 1,114,793 | |
216
| |
Principal
Amount
| | | Security | | Value | |
| | | | | | Manufacturing (continued) |
| | $ | 75M | | | Manitowoc Co., Inc., 9%, 4/1/2026 (a) | | $ | 73,688 | |
| | | 25M | | | MTS Systems Corp, 5.75%, 8/15/2027 (a) | | | 26,063 | |
| | | 50M | | | Patrick Industries, Inc., 7.5%, 10/15/2027 (a) | | | 51,630 | |
| | | | | | | | | 5,154,708 | |
| | | | | | Media-Broadcasting—.1% | | | | |
| | | 50M | | | Belo Corp., 7.25%, 9/15/2027 | | | 57,000 | |
| | | 50M | | | LIN Television Corp., 5.875%, 11/15/2022 | | | 51,250 | |
| | | 125M | | | Nexstar Broadcasting, Inc., 5.625%, 8/1/2024 (a) | | | 130,419 | |
| | | 25M | | | Nexstar Escrow, Inc., 5.625%, 7/15/2027 (a) | | | 26,250 | |
| | | | | | Sinclair Television Group, Inc.: | | | | |
| | | 75M | | | 5.625%, 8/1/2024 (a) | | | 77,344 | |
| | | 50M | | | 5.125%, 2/15/2027 (a) | | | 50,500 | |
| | | 75M | | | Sirius XM Radio, Inc., 4.625%, 7/15/2024 (a) | | | 77,950 | |
| | | 150M | | | TEGNA, Inc., 5%, 9/15/2029 (a) | | | 152,268 | |
| | | | | | | | | 622,981 | |
| | | | | | Media-Cable TV—.7% | | | | |
| | | 200M | | | Altice Financing SA, 6.625%, 2/15/2023 (a) | | | 205,750 | |
| | | 200M | | | Altice France SA, 7.375%, 5/1/2026 (a) | | | 214,942 | |
| | | | | | CCO Holdings, LLC: | | | | |
| | | 175M | | | 5.125%, 2/15/2023 | | | 178,281 | |
| | | 175M | | | 5.875%, 4/1/2024 (a) | | | 183,043 | |
| | | 25M | | | 5.375%, 6/1/2029 (a) | | | 26,687 | |
| | | 50M | | | 4.75%, 3/1/2030 (a) | | | 50,885 | |
| | | | | | Clear Channel Worldwide Holdings, Inc.: | | | | |
| | | 42M | | | 9.25%, 2/15/2024 (a) | | | 46,249 | |
| | | 125M | | | 5.125%, 8/15/2027 (a) | | | 130,544 | |
| | | 3,000M | | | Comcast Corp., 4.25%, 1/15/2033 | | | 3,453,090 | |
| | | | | | CSC Holdings, LLC: | | | | |
| | | 200M | | | 5.375%, 7/15/2023 (a) | | | 205,750 | |
| | | 200M | | | 10.875%, 10/15/2025 (a) | | | 226,865 | |
| | | 175M | | | DISH DBS Corp., 5%, 3/15/2023 | | | 177,459 | |
| | | 175M | | | Gray Television, Inc., 5.875%, 7/15/2026 (a) | | | 182,438 | |
217
Portfolio of Investments (continued)
TOTAL RETURN FUND
September 30, 2019
| |
Principal
Amount
| | | Security | | Value | |
| | | | | | Media-Cable TV (continued) |
| | $ | 75M | | | Midcontinent Communications & Finance Corp., 5.375%, 8/15/2027 (a) | | $ | 79,125 | |
| | | | | | Netflix, Inc.: | | | | |
| | | 75M | | | 5.875%, 2/15/2025 | | | 82,548 | |
| | | 25M | | | 4.875%, 4/15/2028 | | | 25,499 | |
| | | | | | | | | 5,469,155 | |
| | | | | | Media-Diversified—.0% | | | | |
| | | 75M | | | Gannett Co., Inc., 6.375%, 10/15/2023 | | | 77,438 | |
| | | 75M | | | iHeart Communications, 8.375%, 5/1/2027 | | | 81,398 | |
| | | 125M | | | Outdoor Americas Capital, LLC, 5.875%, 3/15/2025 | | | 129,375 | |
| | | | | | | | | 288,211 | |
| | | | | | Metals/Mining—.7% | | | | |
| | | 75M | | | Allegheny Technologies, Inc., 7.875%, 8/15/2023 | | | 81,639 | |
| | | 50M | | | Cleveland-Cliffs, Inc., 5.875%, 6/1/2027 (a) | | | 47,480 | |
| | | 175M | | | Commercial Metals Co., 4.875%, 5/15/2023 | | | 182,437 | |
| | | 3,000M | | | Glencore Funding, LLC, 4.625%, 4/29/2024 (a) | | | 3,212,277 | |
| | | | | | HudBay Minerals, Inc.: | | | | |
| | | 175M | | | 7.25%, 1/15/2023 (a) | | | 181,344 | |
| | | 25M | | | 7.625%, 1/15/2025 (a) | | | 25,469 | |
| | | 50M | | | Joseph T. Ryerson & Son, Inc., 11%, 5/15/2022 (a) | | | 52,875 | |
| | | 1,500M | | | Newmont Mining Corp., 5.125%, 10/1/2019 | | | 1,500,000 | |
| | | 50M | | | Northwest Acquisitions, ULC, 7.125%, 11/1/2022 (a) | | | 29,625 | |
| | | 100M | | | Novelis, Inc., 5.875%, 9/30/2026 (a) | | | 105,120 | |
| | | 145M | | | SunCoke Energy Partners, LP, 7.5%, 6/15/2025 (a) | | | 129,594 | |
| | | | | | | | | 5,547,860 | |
| | | | | | Real Estate—2.0% | | | | |
| | | 2,300M | | | Alexandria Real Estate Equities, Inc., 3.95%, 1/15/2028 | | | 2,482,045 | |
| | | | | | Digital Realty Trust, LP: | | | | |
| | | 2,886M | | | 4.75%, 10/1/2025 | | | 3,177,030 | |
| | | 2,250M | | | 3.7%, 8/15/2027 | | | 2,363,107 | |
218
| |
Principal
Amount
| | | Security | | Value | |
| | | | | | Real Estate (continued) |
| | $ | 175M | | | Equinix, Inc., 5.375%, 4/1/2023 | | $ | 179,323 | |
| | | 170M | | | Geo Group, Inc., 5.875%, 10/15/2024 | | | 147,050 | |
| | | 200M | | | Greystar Real Estate Partners, 5.75%, 12/1/2025 (a) | | | 206,250 | |
| | | 50M | | | Hilton Domestic Operating Co., LLC, 4.875%, 1/15/2030 (a) | | | 52,918 | |
| | | 325M | | | Iron Mountain, Inc., 5.75%, 8/15/2024 | | | 329,063 | |
| | | 150M | | | iStar, Inc., 4.75%, 10/1/2024 | | | 153,012 | |
| | | 50M | | | MGM Growth Properties Operating Partnership, LP, 5.75%, 2/1/2027 (a) | | | 56,203 | |
| | | 50M | | | MPT Operating Partnership, LP, 4.625%, 8/1/2029 | | | 51,594 | |
| | | 50M | | | Realogy Group/Co-Issuer, 9.375%, 4/1/2027 (a) | | | 46,701 | |
| | | 2,500M | | | Realty Income Corp., 3.875%, 4/15/2025 | | | 2,687,122 | |
| | | 3,700M | | | STORE Capital Corp., 4.5%, 3/15/2028 | | | 3,996,422 | |
| | | | | | | | | 15,927,840 | |
| | | | | | Retail-General Merchandise—.7% | | | | |
| | | | | | 1011778 B.C., ULC: | | | | |
| | | 100M | | | 4.625%, 1/15/2022 (a) | | | 100,020 | |
| | | 50M | | | 3.875%, 1/15/2028 (a) | | | 50,443 | |
| | | 150M | | | AmeriGas Partners, LP, 5.5%, 5/20/2025 | | | 161,812 | |
| | | 3,500M | | | Home Depot, Inc., 5.875%, 12/16/2036 | | | 4,846,377 | |
| | | 50M | | | J.C. Penney Co., Inc., 8.625%, 3/15/2025 | | | 31,504 | |
| | | 175M | | | KFC Holding Co., LLC, 5%, 6/1/2024 (a) | | | 182,000 | |
| | | 75M | | | SRS Distribution, Inc., 8.25%, 7/1/2026 (a) | | | 76,688 | |
| | | 25M | | | Yum! Brands, Inc., 4.75%, 1/15/2030 (a) | | | 25,879 | |
| | | | | | | | | 5,474,723 | |
| | | | | | Services—.1% | | | | |
| | | 100M | | | ADT Corp., 3.5%, 7/15/2022 | | | 100,750 | |
| | | 225M | | | AECOM, 5.125%, 3/15/2027 | | | 237,037 | |
| | | 225M | | | GCI, Inc., 6.875%, 4/15/2025 | | | 237,938 | |
| | | 175M | | | United Rentals, Inc., 4.625%, 10/15/2025 | | | 179,242 | |
| | | | | | | | | 754,967 | |
219
Portfolio of Investments (continued)
TOTAL RETURN FUND
September 30, 2019
| |
Principal
Amount
| | | Security | | Value | |
| | | | | | Telecommunication Services—1.0% | | | | |
| | | | | | AT&T, Inc.: | | | | |
| | $ | 1,000M | | | 3.6%, 7/15/2025 | | $ | 1,053,996 | |
| | | 4,000M | | | 4.25%, 3/1/2027 | | | 4,355,568 | |
| | | 25M | | | Frontier Communications Corp., 8.5%, 4/1/2026 (a) | | | 25,060 | |
| | | 50M | | | GCI, LLC, 6.625%, 6/15/2024 (a) | | | 54,063 | |
| | | 75M | | | Qwest Corp., 7.25%, 9/15/2025 | | | 84,836 | |
| | | 50M | | | Sprint Capital Corp., 8.75%, 3/15/2032 | | | 61,798 | |
| | | 75M | | | Telesat Canada, 8.875%, 11/15/2024 (a) | | | 80,550 | |
| | | 1,800M | | | Verizon Communications, Inc., 4.272%, 1/15/2036 | | | 2,027,160 | |
| | | | | | Zayo Group, LLC: | | | | |
| | | 75M | | | 6%, 4/1/2023 | | | 77,344 | |
| | | 175M | | | 6.375%, 5/15/2025 | | | 180,871 | |
| | | | | | | | | 8,001,246 | |
| | | | | | Transportation—.0% | | | | |
| | | 175M | | | BCD Acquisition, Inc., 9.625%, 9/15/2023 (a) | | | 179,375 | |
| | | 75M | | | VistaJet Malta Finance, PLC, 10.5%, 6/1/2024 (a) | | | 72,938 | |
| | | | | | | | | 252,313 | |
| | | | | | Utilities—1.0% | | | | |
| | | 175M | | | Calpine Corp., 5.25%, 6/1/2026 (a) | | | 181,781 | |
| | | 50M | | | Cheniere Energy Partners, LP, 4.5%, 10/1/2029 (a) | | | 51,312 | |
| | | 2,500M | | | Entergy Arkansas, Inc., 4.95%, 12/15/2044 | | | 2,700,610 | |
| | | | | | Global Partners, LP: | | | | |
| | | 50M | | | 7%, 6/15/2023 | | | 51,688 | |
| | | 50M | | | 7%, 8/1/2027 (a) | | | 51,625 | |
| | | 75M | | | Nextera Energy Operating Partners, 4.25%, 7/15/2024 (a) | | | 77,438 | |
| | | 150M | | | NRG Yield Operating, LLC, 5%, 9/15/2026 | | | 154,125 | |
| | | 2,000M | | | Ohio Power Co., 5.375%, 10/1/2021 | | | 2,123,628 | |
| | | 2,000M | | | Oklahoma Gas & Electric Co., 4%, 12/15/2044 | | | 2,180,338 | |
| | | | | | Talen Energy Supply, LLC: | | | | |
| | | 25M | | | 7.25%, 5/15/2027 (a) | | | 25,533 | |
| | | 25M | | | 6.625%, 1/15/2028 (a) | | | 24,688 | |
220
| |
Principal
Amount
| | | Security | | Value | |
| | | | | | Utilities (continued) |
| | $ | 100M | | | Targa Resources Partners, LP, 4.25%, 11/15/2023 | | $ | 101,125 | |
| | | | | | | | | 7,723,891 | |
| | | | | | Waste Management—.0% | | | | �� |
| | | 25M | | | Clean Harbors, Inc., 4.875%, 7/15/2027 (a) | | | 26,156 | |
| | | 175M | | | Covanta Holding Corp., 5.875%, 3/1/2024 | | | 180,687 | |
| | | | | | | | | 206,843 | |
| | | | | | Wireless Communications—.1% | | | | |
| | | 50M | | | Consolidated Communications, Inc., 6.5%, 10/1/2022 | | | 46,500 | |
| | | 25M | | | Hughes Satellite Systems Corp., 6.625%, 8/1/2026 | | | 27,199 | |
| | | | | | Intelsat Jackson Holdings SA: | | | | |
| | | 200M | | | 8%, 2/15/2024 (a) | | | 208,250 | |
| | | 50M | | | 8.5%, 10/15/2024 (a) | | | 50,485 | |
| | | 175M | | | Level 3 Financing, Inc., 5.375%, 1/15/2024 | | | 178,911 | |
| | | | | | Sprint Corp.: | | | | |
| | | 125M | | | 7.875%, 9/15/2023 | | | 137,620 | |
| | | 150M | | | 7.125%, 6/15/2024 | | | 162,045 | |
| | | 50M | | | 7.625%, 3/1/2026 | | | 55,313 | |
| | | | | | T-Mobile USA, Inc.: | | | | |
| | | 175M | | | 6%, 3/1/2023 | | | 178,708 | |
| | | 25M | | | 6.375%, 3/1/2025 | | | 25,962 | |
| | | | | | | | | 1,070,993 | |
Total Value of Corporate Bonds (cost $157,808,816) | | | 165,772,461 | |
221
Portfolio of Investments (continued)
TOTAL RETURN FUND
September 30, 2019
| |
Principal
Amount
| | | Security | | Value | |
| | | | | | RESIDENTIAL MORTGAGE-BACKED SECURITIES—5.2% | | | | |
| | | | | | Fannie Mae—4.1% | | | | |
| | $ | 3,615M | | | 3%, 3/1/2027 - 2/1/2031 | | $ | 3,714,469 | |
| | | 2,941M | | | 3.5%, 11/1/2028 - 12/1/2047 | | | 3,062,660 | |
| | | 14,699M | | | 4%, 12/1/2040 - 8/1/2047 | | | 15,521,413 | |
| | | 7,345M | | | 4.5%, 9/1/2040 - 8/1/2048 | | | 7,762,197 | |
| | | 1,338M | | | 5%, 4/1/2040 - 3/1/2042 | | | 1,477,174 | |
| | | 436M | | | 5.5%, 5/1/2033 - 10/1/2039 | | | 491,869 | |
| | | 340M | | | 6%, 5/1/2036 - 10/1/2040 | | | 388,863 | |
| | | 162M | | | 6.5%, 11/1/2033 - 6/1/2036 | | | 181,031 | |
| | | 476M | | | 7%, 3/1/2032 - 8/1/2032 | | | 517,249 | |
| | | | | | | | | 33,116,925 | |
| | | | | | Freddie Mac—1.1% | | | | |
| | | 4,504M | | | 3.5%, 8/1/2026 - 7/1/2044 | | | 4,713,035 | |
| | | 679M | | | 4%, 7/1/2044 - 4/1/2045 | | | 718,413 | |
| | | 2,577M | | | 4.5%, 10/1/2040 - 5/1/2044 | | | 2,791,127 | |
| | | 503M | | | 5.5%, 5/1/2038 - 10/1/2039 | | | 557,981 | |
| | | | | | | | | 8,780,556 | |
Total Value of Residential Mortgage-Backed Securities (cost $41,153,707) | | | 41,897,481 | |
| | | | | | U.S. GOVERNMENT OBLIGATIONS—5.1% | | | | |
| | | 18,000M | | | U.S. Treasury Bonds, 3.375%, 11/15/2048 | | | 22,939,812 | |
| | | | | | U.S. Treasury Notes: | | | | |
| | | 1,500M | | | 2%, 11/30/2022 | | | 1,519,131 | |
| | | 2,000M | | | 2%, 11/15/2026 | | | 2,051,368 | |
| | | 1,600M | | | 2.125%, 3/31/2024 | | | 1,638,905 | |
| | | 1,400M | | | 2.625%, 12/31/2023 | | | 1,460,567 | |
| | | 10,500M | | | 3.125%, 11/15/2028 | | | 11,789,736 | |
Total Value of U.S. Government Obligations (cost $36,517,220) | | | 41,399,519 | |
222
| |
Principal
Amount
| | | Security | | Value | |
| | | | | | ASSET-BACKED SECURITIES—2.0% | | | | |
| | | | | | Fixed Autos—1.5% | | | | |
| | $ | 1,200M | | | AmeriCredit Automobile Receivables Trust, 3.13%, 2/18/2025 | | $ | 1,222,844 | |
| | | 866M | | | BMW Vehicle Lease Trust, 2.07%, 10/20/2020 | | | 867,328 | |
| | | 9,500M | | | Hertz Vehicle Financing Trust, 2.96%, 10/25/2021 | | | 9,578,061 | |
| | | | | | | | | 11,668,233 | |
| | | | | | Fixed Communication Services—.5% | | | | |
| | | | | | Verizon Owner Trust: | | | | |
| | | 2,356M | | | 1.92%, 12/20/2021 (a) | | | 2,354,337 | |
| | | 1,670M | | | 3.23%, 4/20/2023 | | | 1,702,909 | |
| | | | | | | | | 4,057,246 | |
Total Value of Asset-Backed Securities (cost $15,503,021) | | | 15,725,479 | |
| | | | | | COMMERCIAL MORTGAGE-BACKED SECURITIES—1.5% | | | | |
| | | | | | Federal Home Loan Mortgage Corporation | | | | |
| | | | | | Multi-Family Structured Pass-Throughs: | | | | |
| | | 2,800M | | | 3.422%, 2/25/2052 | | | 3,091,446 | |
| | | 8,273M | | | 3.725%, 12/25/2027 | | | 9,014,034 | |
Total Value of Commercial Mortgage-Backed Securities(cost $11,337,115) | | | 12,105,480 | |
| | | | | | COLLATERALIZED MORTGAGE OBLIGATIONS—1.0% | | | | |
| | | | | | Fannie Mae: | | | | |
| | | 4,625M | | | 3.085%, 12/25/2027 † | | | 4,919,844 | |
| | | 2,700M | | | 3.273%, 1/25/2029 | | | 2,946,621 | |
Total Value of Collateralized Mortgage Obligations (cost $7,173,400) | | | 7,866,465 | |
| | | | | | PASS-THROUGH CERTIFICATES—.4% | | | | |
| | | | | | Transportation | | | | |
| | | 2,770M | | | American Airlines 17-2 AA PTT, 3.35%, 10/15/2029 (cost $2,790,036) | | | 2,856,873 | |
223
Portfolio of Investments (continued)
TOTAL RETURN FUND
September 30, 2019
| |
Principal
Amount
| | | Security | | Value | |
| | | | | | SHORT-TERM U.S. GOVERNMENT OBLIGATIONS—.6% | | | | |
| | $ | 5,000M | | | U.S. Treasury Bills, 1.78%, 10/22/2019 (cost $4,994,808) | | $ | 4,994,785 | |
Total Value of Investments (cost $611,562,071) | | | 94.9 | % | | | 763,302,791 | |
Other Assets, Less Liabilities | | | 5.1 | | | | 40,748,560 | |
Net Assets | | | 100.0 | % | | $ | 804,051,351 | |
(a) | Security exempt from registration under Rule 144A of the Securities Act of 1933 (see Note 4). |
† | Interest rates on adjustable rate bonds are determined and reset periodically. The interest rates shown are the rates in effect of September 30, 2019. |
Summary of Abbreviations:
ADR | American Depositary Receipts |
LLLP | Limited Liability Limited Partnership |
ULC | Unlimited Liability Corporation |
The Fund’s assets and liabilities are classified into the following three levels based on the inputs used to value the assets and liabilities:
| | Level 1 – | Unadjusted quoted prices in active markets for identical securities that the Fund has the ability to access. |
| | Level 2 – | Observable inputs other than quoted prices included in Level 1 that are observable for the asset or liability, either directly or indirectly. These inputs may include quoted prices for the identical instrument on an inactive market, prices for similar instruments, interest rates, prepayment speeds, credit risk, yield curves, default rates and similar data. |
| | Level 3 – | Unobservable inputs for the asset or liability, to the extent relevant observable inputs are not available, representing the Fund’s own assumption about the assumptions a market participant would use in valuing the asset or liability, and would be based on the best information available. |
The inputs methodology used for valuing securities are not necessarily an indication of the risk associated with investing in those securities. For example, U.S. Government securities are reflected as Level 2 because the inputs used to determine fair value may not always be quoted prices in an active market.
224
The following is a summary, by category of Level, of inputs used to value the Fund’s investments as of September 30, 2019:
| | | Level 1 | | | Level 2 | | | Level 3 | | | Total | |
Common Stocks | | $ | 470,684,248 | | | $ | — | | | $ | — | | | $ | 470,684,248 | |
Corporate Bonds | | | — | | | | 165,772,461 | | | | — | | | | 165,772,461 | |
Residential Mortgage-Backed Securities | | | — | | | | 41,897,481 | | | | — | | | | 41,897,481 | |
U.S. Government Obligations | | | — | | | | 41,399,519 | | | | — | | | | 41,399,519 | |
Asset-Backed Securities | | | — | | | | 15,725,479 | | | | — | | | | 15,725,479 | |
Commercial Mortgage-Backed Securities | | | — | | | | 12,105,480 | | | | — | | | | 12,105,480 | |
Collateralized Mortgage Obligations | | | — | | | | 7,866,465 | | | | — | | | | 7,866,465 | |
Pass-Through Certificates | | | — | | | | 2,856,873 | | | | — | | | | 2,856,873 | |
Short-Term U.S. Government Agency Obligations | | | — | | | | 4,994,785 | | | | — | | | | 4,994,785 | |
Total Investments in Securities* | | $ | 470,684,248 | | | $ | 292,618,543 | | | $ | — | | | $ | 763,302,791 | |
* | The Portfolio of Investments provides information on the industry categorization for common stocks, corporate bonds, asset-backed securities and pass-through certificates. |
There were no transfers into or from Level 1 and Level 2 by the Fund for the year ended September 30, 2019. Transfers, if any, between Levels are recognized at the end of the reporting period.
See notes to financial statements
225
Statements of Assets and Liabilities
FIRST INVESTORS INCOME FUNDS
September 30, 2019
| | | FLOATING
RATE | |
Assets | | | | | |
Investments in securities | | | | | |
At identified cost | | | $ | 105,240,416 | |
At value (Note 1A) | | | $ | 104,186,120 | |
Cash | | | | 4,463,352 | |
Receivables: | | | | | |
Investment securities sold | | | | 993,928 | |
Interest and dividends | | | | 294,617 | |
Shares sold | | | | 81,785 | |
Unrealized appreciation on foreign exchange contracts (Note 5) | | | | — | |
Other assets | | | | 10,595 | |
Total Assets | | | | 110,030,397 | |
| | | | | | |
Liabilities | | | | | |
Payables: | | | | | |
Investment securities purchased | | | | 3,854,110 | |
Shares redeemed | | | | 675,689 | |
Dividends payable | | | | 60,222 | |
Unrealized depreciation on foreign exchange contracts (Note 5) | | | | — | |
Accrued advisory fees | | | | 178,155 | |
Accrued shareholder servicing costs | | | | 15,778 | |
Accrued expenses | | | | 71,010 | |
Total Liabilities | | | | 4,854,964 | |
Net Assets | | | $ | 105,175,433 | |
| | | | | | |
Net Assets Consist of: | | | | | |
Capital paid in | | | $ | 110,040,483 | |
Distributable earnings | | | | (4,865,050 | ) |
Total | | | $ | 105,175,433 | |
See notes to financial statements
226
| | FUND FOR
INCOME | | | GOVERNMENT
CASH
MANAGEMENT | | | INTERNATIONAL
OPPORTUNITIES
BOND | |
| | | | | | | | | | | | | |
| | | | | | | | | | | | | |
| | | $ | 525,927,396 | | | $ | 169,297,047 | | | $ | 117,009,783 | |
| | | $ | 532,039,456 | | | $ | 169,297,047 | | | $ | 104,883,866 | |
| | | | 10,355,407 | | | | 787,077 | | | | 2,602,296 | |
| | | | | | | | | | | | | |
| | | | 2,063 | | | | — | | | | — | |
| | | | 8,636,041 | | | | 91,882 | | | | 1,019,913 | |
| | | | 378,153 | | | | 9,763 | | | | 108,546 | |
| | | | — | | | | — | | | | 26,459 | |
| | | | 26,987 | | | | 6,509 | | | | 6,417 | |
| | | | 551,438,107 | | | | 170,192,278 | | | | 108,647,497 | |
| | | | | | | | | | | | | |
| | | | | | | | | | | | | |
| | | | | | | | | | | | | |
| | | | 6,073,889 | | | | — | | | | — | |
| | | | 1,696,398 | | | | 1,033,636 | | | | 363,083 | |
| | | | 431,287 | | | | 12,388 | | | | — | |
| | | | — | | | | — | | | | 1,008,499 | |
| | | | 331,057 | | | | 143,985 | | | | 55,773 | |
| | | | 68,416 | | | | 38,537 | | | | 15,473 | |
| | | | 86,051 | | | | 57,981 | | | | 55,832 | |
| | | | 8,687,098 | | | | 1,286,527 | | | | 1,498,660 | |
| | | $ | 542,751,009 | | | $ | 168,905,751 | | | $ | 107,148,837 | |
| | | | | | | | | | | | | |
| | | | | | | | | | | | | |
| | | $ | 583,289,462 | | | $ | 168,905,751 | | | $ | 130,758,292 | |
| | | | (40,538,453 | ) | | | — | | | | (23,609,455 | ) |
| | | $ | 542,751,009 | | | $ | 168,905,751 | | | $ | 107,148,837 | |
227
Statements of Assets and Liabilities
FIRST INVESTORS INCOME FUNDS
September 30, 2019
| | | FLOATING
RATE | |
Net Assets: | | | | | |
Class A | | | $ | 64,136,348 | |
Advisor Class | | | $ | 40,541,690 | |
Institutional Class | | | $ | 497,395 | |
| | | | | | |
Shares outstanding (Note 7): | | | | | |
Class A | | | | 6,697,661 | |
Advisor Class | | | | 4,237,853 | |
Institutional Class | | | | 51,856 | |
| | | | | | |
Net asset value and redemption price per share - Class A | | | $ | 9.58 | |
| | | | | | |
Maximum offering price per share - Class A* | | | $ | 9.83 | ++ |
| | | | | | |
Net asset value, offering price and redemption price per share - Advisor Class | | | $ | 9.57 | |
| | | | | | |
Net asset value, offering price and redemption price per share - Institutional Class | | | $ | 9.59 | |
# | Also maximum offering price per share. |
* | On purchases of $100,000 or more, the sales charge is reduced (Note 7). |
+ | Net asset value/.96 |
++ | Net asset value/.975 |
See notes to financial statements
228
| | FUND FOR
INCOME | | | GOVERNMENT
CASH
MANAGEMENT | | | INTERNATIONAL
OPPORTUNITIES
BOND | |
| | | | | | | | | | | | | |
| | | $ | 477,951,591 | | | $ | 168,904,723 | | | $ | 42,814,111 | |
| | | $ | 28,107,269 | | | | N/A | | | $ | 50,335,055 | |
| | | $ | 36,692,149 | | | $ | 1,028 | | | $ | 13,999,671 | |
| | | | | | | | | | | | | |
| | | | | | | | | | | | | |
| | | | 195,082,711 | | | | 168,904,723 | | | | 4,996,948 | |
| | | | 11,556,653 | | | | N/A | | | | 5,800,412 | |
| | | | 14,903,777 | | | | 1,028 | | | | 1,596,072 | |
| | | | | | | | | | | | | |
| | | $ | 2.45 | | | $ | 1.00# | | | $ | 8.57 | |
| | | | | | | | | | | | | |
| | | $ | 2.55 | + | | | N/A | | | $ | 8.93 | + |
| | | | | | | | | | | | | |
| | | $ | 2.43 | | | | N/A | | | $ | 8.68 | |
| | | | | | | | | | | | | |
| | | $ | 2.46 | | | $ | 1.00 | | | $ | 8.77 | |
229
Statements of Assets and Liabilities
FIRST INVESTORS INCOME FUNDS
September 30, 2019
| | | INVESTMENT
GRADE | |
Assets | | | | | |
Investments in securities: | | | | | |
Cost - Unaffiliated issuers | | | $ | 355,757,489 | |
Cost - Affiliated issuers (Note 2) | | | | — | |
Total cost of investments | | | $ | 355,757,489 | |
Value - Unaffiliated issuers (Note 1A) | | | $ | 382,891,881 | |
Value - Affiliated issuers (Note 2) | | | | — | |
Total value of investments | | | | 382,891,881 | |
Cash | | | | 13,393,153 | |
Receivables: | | | | | |
Dividends and interest | | | | 3,796,583 | |
Shares sold | | | | 398,656 | |
Other assets | | | | 25,631 | |
Total Assets | | | | 400,505,904 | |
| | | | | | |
Liabilities | | | | | |
Payables: | | | | | |
Shares redeemed | | | | 2,079,501 | |
Dividends payable | | | | 129,341 | |
Accrued advisory fees | | | | 205,517 | |
Accrued shareholder servicing costs | | | | 51,434 | |
Accrued expenses | | | | 73,392 | |
Total Liabilities | | | | 2,539,185 | |
Net Assets | | | $ | 397,966,719 | |
| | | | | | |
Net Assets Consist of: | | | | | |
Capital paid in | | | $ | 386,993,340 | |
Distributable earnings | | | | 10,973,379 | |
Total | | | $ | 397,966,719 | |
See notes to financial statements
230
| | LIMITED
DURATION
BOND | | | STRATEGIC
INCOME | |
| | | | | | | | | |
| | | | | | | | | |
| | | $ | 306,029,183 | | | $ | 11,698,226 | |
| | | | — | | | | 129,375,448 | |
| | | $ | 306,029,183 | | | $ | 141,073,674 | |
| | | $ | 310,836,765 | | | $ | 11,985,386 | |
| | | | — | | | | 124,754,185 | |
| | | | 310,836,765 | | | | 136,739,571 | |
| | | | 12,727,700 | | | | 1,166,428 | |
| | | | | | | | | |
| | | | 2,186,341 | | | | 446,887 | |
| | | | 1,166,436 | | | | 129,849 | |
| | | | 13,982 | | | | 6,454 | |
| | | | 326,931,224 | | | | 138,489,189 | |
| | | | | | | | | |
| | | | | | | | | |
| | | | | | | | | |
| | | | 1,633,543 | | | | 698,679 | |
| | | | 137,141 | | | | 18,808 | |
| | | | 53,838 | | | | — | |
| | | | 41,914 | | | | 16,543 | |
| | | | 61,361 | | | | 33,976 | |
| | | | 1,927,797 | | | | 768,006 | |
| | | $ | 325,003,427 | | | $ | 137,721,183 | |
| | | | | | | | | |
| | | | | | | | | |
| | | $ | 357,701,590 | | | $ | 146,327,928 | |
| | | | (32,698,163 | ) | | | (8,606,745 | ) |
| | | $ | 325,003,427 | | | $ | 137,721,183 | |
231
Statements of Assets and Liabilities
FIRST INVESTORS INCOME FUNDS
September 30, 2019
| | | INVESTMENT
GRADE | |
Net Assets: | | | | | |
Class A | | | $ | 363,366,346 | |
Advisor Class | | | $ | 11,517,551 | |
Institutional Class | | | $ | 23,082,822 | |
| | | | | | |
Shares outstanding (Note 7): | | | | | |
Class A | | | | 36,594,709 | |
Advisor Class | | | | 1,153,485 | |
Institutional Class | | | | 2,317,817 | |
| | | | | | |
Net asset value and redemption price per share - Class A | | | $ | 9.93 | |
| | | | | | |
Maximum offering price per share - Class A* | | | $ | 10.34 | + |
| | | | | | |
Net asset value, offering price and redemption price per share - Advisor Class | | | $ | 9.99 | |
| | | | | | |
Net asset value, offering price and redemption price per share - Institutional Class | | | $ | 9.96 | |
* | On purchases of $100,000 or more, the sales charge is reduced (Note 7). |
+ | Net asset value/.96 |
++ | Net asset value/.975 |
See notes to financial statements
232
| | LIMITED
DURATION
BOND | | | STRATEGIC
INCOME | |
| | | | | | | | | |
| | | $ | 220,829,879 | | | $ | 137,155,372 | |
| | | $ | 56,208,767 | | | $ | 565,811 | |
| | | $ | 47,964,781 | | | | N/A | |
| | | | | | | | | |
| | | | | | | | | |
| | | | 23,718,868 | | | | 14,712,359 | |
| | | | 6,021,116 | | | | 60,732 | |
| | | | 5,128,411 | | | | N/A | |
| | | | | | | | | |
| | | $ | 9.31 | | | $ | 9.32 | |
| | | | | | | | | |
| | | $ | 9.55 | ++ | | $ | 9.71 | + |
| | | | | | | | | |
| | | $ | 9.34 | | | $ | 9.32 | |
| | | | | | | | | |
| | | $ | 9.35 | | | | N/A | |
233
Statements of Assets and Liabilities
FIRST INVESTORS EQUITY FUNDS
September 30, 2019
| | | COVERED CALL
STRATEGY | |
Assets | | | | | |
Investments in securities | | | | | |
At identified cost | | | $ | 225,887,741 | |
At value (Note 1A) | | | $ | 284,092,027 | |
Cash | | | | 2,881,594 | |
Receivables: | | | | | |
Investment securities sold | | | | 8,138,072 | |
Deposits at broker for futures contracts | | | | — | |
Dividends and interest | | | | 333,084 | |
Shares sold | | | | 307,886 | |
Unrealized appreciation on foreign exchange and futures contracts (Note 5) | | | | — | |
Other assets | | | | 15,066 | |
Total Assets | | | | 295,767,729 | |
| | | | | | |
Liabilities | | | | | |
Options written, at value (Note 5) | | | | 13,732,077 | (a) |
Payables: | | | | | |
Shares redeemed | | | | 2,233,060 | |
Unrealized depreciation on foreign exchange and futures contracts (Note 5) | | | | — | |
Accrued advisory fees | | | | 209,249 | |
Accrued shareholder servicing costs | | | | 47,441 | |
Accrued expenses | | | | 40,725 | |
Total Liabilities | | | | 16,262,552 | |
Net Assets | | | $ | 279,505,177 | |
| | | | | | |
Net Assets Consist of: | | | | | |
Capital paid in | | | $ | 249,253,795 | |
Distributable earnings | | | | 30,251,382 | |
Total | | | $ | 279,505,177 | |
(a) | Premiums received from written options $10,468,889 |
(b) | Premiums received from written options $786,652 |
See notes to financial statements
234
| | EQUITY
INCOME | | | GLOBAL | | | GROWTH &
INCOME | | | HEDGED
U.S. EQUITY
OPPORTUNITIES | |
| | | | | | | | | | | | | | | | | |
| | | | | | | | | | | | | | | | | |
| | | $ | 326,036,437 | | | $ | 348,724,001 | | | $ | 1,016,819,607 | | | $ | 91,008,445 | |
| | | $ | 466,575,547 | | | $ | 412,685,207 | | | $ | 1,483,037,271 | | | $ | 112,015,804 | |
| | | | 6,890,571 | | | | 6,629,895 | | | | 12,193,003 | | | | 11,128,232 | |
| | | | | | | | | | | | | | | | | |
| | | | — | | | | 3,558,307 | | | | — | | | | 227,469 | |
| | | | — | | | | — | | | | — | | | | 706,103 | |
| | | | 607,108 | | | | 963,234 | | | | 1,320,838 | | | | 149,971 | |
| | | | 283,357 | | | | 373,038 | | | | 817,917 | | | | 159,200 | |
| | | | — | | | | — | | | | — | | | | 195,577 | |
| | | | 26,857 | | | | 26,808 | | | | 77,827 | | | | 6,855 | |
| | | | 474,383,440 | | | | 424,236,489 | | | | 1,497,446,856 | | | | 124,589,211 | |
| | | | | | | | | | | | | | | | | |
| | | | | | | | | | | | | | | | | |
| | | | — | | | | — | | | | — | | | | 352,340 | (b) |
| | | | | | | | | | | | | | | | | |
| | | | 2,126,891 | | | | 2,139,787 | | | | 4,670,806 | | | | 897,777 | |
| | | | — | | | | — | | | | — | | | | 9,669 | |
| | | | 299,519 | | | | 355,243 | | | | 883,588 | | | | 72,444 | |
| | | | 63,088 | | | | 63,532 | | | | 195,561 | | | | 20,386 | |
| | | | 63,830 | | | | 62,451 | | | | 110,255 | | | | 55,291 | |
| | | | 2,553,328 | | | | 2,621,013 | | | | 5,860,210 | | | | 1,407,907 | |
| | | $ | 471,830,112 | | | $ | 421,615,476 | | | $ | 1,491,586,646 | | | $ | 123,181,304 | |
| | | | | | | | | | | | | | | | | |
| | | | | | | | | | | | | | | | | |
| | | $ | 300,893,299 | | | $ | 362,929,828 | | | $ | 881,494,944 | | | $ | 91,948,449 | |
| | | | 170,936,813 | | | | 58,685,648 | | | | 610,091,702 | | | | 31,232,855 | |
| | | $ | 471,830,112 | | | $ | 421,615,476 | | | $ | 1,491,586,646 | | | $ | 123,181,304 | |
235
Statements of Assets and Liabilities
FIRST INVESTORS EQUITY FUNDS
September 30, 2019
| | | COVERED CALL
STRATEGY | |
Net Assets: | | | | | |
Class A | | | $ | 211,776,885 | |
Advisor Class | | | $ | 66,251,667 | |
Institutional Class | | | $ | 1,476,625 | |
| | | | | | |
Shares outstanding (Note 7): | | | | | |
Class A | | | | 17,933,624 | |
Advisor Class | | | | 5,623,868 | |
Institutional Class | | | | 126,339 | |
| | | | | | |
Net asset value and redemption price per share - Class A | | | $ | 11.81 | |
| | | | | | |
Maximum offering price per share - Class A (Net asset value/.9425)* | | | $ | 12.53 | |
| | | | | | |
Net asset value, offering price and redemption price per share - Advisor Class | | | $ | 11.78 | |
| | | | | | |
Net asset value, offering price and redemption price per share - Institutional Class | | | $ | 11.69 | |
* | On purchases of $50,000 or more, the sales charge is reduced (Note 7). |
See notes to financial statements
236
| | EQUITY
INCOME | | | GLOBAL | | | GROWTH &
INCOME | | | HEDGED
U.S. EQUITY
OPPORTUNITIES | |
| | | | | | | | | | | | | | | | | |
| | | $ | 468,633,609 | | | $ | 344,592,470 | | | $ | 1,464,393,233 | | | $ | 78,296,693 | |
| | | $ | 1,785,583 | | | $ | 75,077,077 | | | $ | 21,596,690 | | | $ | 44,543,266 | |
| | | $ | 1,410,920 | | | $ | 1,945,929 | | | $ | 5,596,723 | | | $ | 341,345 | |
| | | | | | | | | | | | | | | | | |
| | | | | | | | | | | | | | | | | |
| | | | 48,387,578 | | | | 45,961,025 | | | | 73,791,517 | | | | 6,335,772 | |
| | | | 183,523 | | | | 9,697,154 | | | | 1,086,825 | | | | 3,567,879 | |
| | | | 145,840 | | | | 249,433 | | | | 280,923 | | | | 27,246 | |
| | | | | | | | | | | | | | | | | |
| | | $ | 9.68 | | | $ | 7.50 | | | $ | 19.85 | | | $ | 12.36 | |
| | | | | | | | | | | | | | | | | |
| | | $ | 10.27 | | | $ | 7.96 | | | $ | 21.06 | | | $ | 13.11 | |
| | | | | | | | | | | | | | | | | |
| | | $ | 9.73 | | | $ | 7.74 | | | $ | 19.87 | | | $ | 12.48 | |
| | | | | | | | | | | | | | | | | |
| | | $ | 9.67 | | | $ | 7.80 | | | $ | 19.92 | | | $ | 12.53 | |
237
Statements of Assets and Liabilities
FIRST INVESTORS EQUITY FUNDS
September 30, 2019
| | | INTERNATIONAL | |
Assets | | | | | |
Investments in securities: | | | | | |
At identified cost | | | $ | 338,415,628 | |
At value (Note 1A) | | | $ | 421,723,255 | |
Cash | | | | 19,006,384 | |
Receivables: | | | | | |
Investment securities sold | | | | 19,910,399 | |
Dividends and interest | | | | 838,269 | |
Shares sold | | | | 341,453 | |
Other assets | | | | 17,159 | |
Total Assets | | | | 461,836,919 | |
| | | | | | |
Liabilities | | | | | |
Options written, at value (Note 5) | | | | — | |
Cash overdrafts | | | | 9,269,507 | |
Payables: | | | | | |
Investment securities purchased | | | | — | |
Shares redeemed | | | | 1,691,788 | |
Accrued advisory fees | | | | 374,897 | |
Accrued shareholder servicing costs | | | | 67,837 | |
Accrued expenses | | | | 59,691 | |
Total Liabilities | | | | 11,463,720 | |
Net Assets | | | $ | 450,373,199 | |
| | | | | | |
Net Assets Consist of: | | | | | |
Capital paid in | | | $ | 353,320,982 | |
Distributable earnings | | | | 97,052,217 | |
Total | | | $ | 450,373,199 | |
(c) | Premiums received from written options $25,094,769 |
See notes to financial statements
238
| | OPPORTUNITY | | | PREMIUM
INCOME | | | SELECT
GROWTH | | | SPECIAL
SITUATIONS | | | TOTAL
RETURN | |
| | | | | | | | | | | | | | | | | | | | | |
| | | | | | | | | | | | | | | | | | | | | |
| | | $ | 683,616,771 | | | $ | 150,802,030 | | | $ | 547,516,420 | | | $ | 446,100,829 | | | $ | 611,562,071 | |
| | | $ | 912,765,695 | | | $ | 153,805,634 | | | $ | 652,226,912 | | | $ | 491,438,282 | | | $ | 763,302,791 | |
| | | | 6,731,535 | | | | 2,310,192 | | | | 5,934,765 | | | | 3,170,612 | | | | 14,021,855 | |
| | | | | | | | | | | | | | | | | | | | | |
| | | | 11,310,323 | | | | 1,986,979 | | | | — | | | | — | | | | 27,221,832 | |
| | | | 575,913 | | | | 206,235 | | | | 334,433 | | | | 489,800 | | | | 2,915,759 | |
| | | | 596,486 | | | | 45,755 | | | | 764,537 | | | | 339,402 | | | | 448,407 | |
| | | | 49,937 | | | | 4,179 | | | | 32,763 | | | | 31,156 | | | | 40,188 | |
| | | | 932,029,889 | | | | 158,358,974 | | | | 659,293,410 | | | | 495,469,252 | | | | 807,950,832 | |
| | | | | | | | | | | | | | | | | | | | | |
| | | | | | | | | | | | | | | | | | | | | |
| | | | — | | | | 29,088,288 | (c) | | | — | | | | — | | | | — | |
| | | | — | | | | — | | | | — | | | | — | | | | — | |
| | | | | | | | | | | | | | | | | | | | | |
| | | | — | | | | — | | | | — | | | | — | | | | 100,000 | |
| | | | 3,196,888 | | | | 403,137 | | | | 4,049,853 | | | | 2,030,944 | | | | 3,103,108 | |
| | | | 565,524 | | | | 98,504 | | | | 397,312 | | | | 342,949 | | | | 499,548 | |
| | | | 174,586 | | | | 16,094 | | | | 91,670 | | | | 84,557 | | | | 109,932 | |
| | | | 90,974 | | | | 50,814 | | | | 55,223 | | | | 58,593 | | | | 86,893 | |
| | | | 4,027,972 | | | | 29,656,837 | | | | 4,594,058 | | | | 2,517,043 | | | | 3,899,481 | |
| | | $ | 928,001,917 | | | $ | 128,702,137 | | | $ | 654,699,352 | | | $ | 492,952,209 | | | $ | 804,051,351 | |
| | | | | | | | | | | | | | | | | | | | | |
| | | | | | | | | | | | | | | | | | | | | |
| | | $ | 609,818,772 | | | $ | 128,675,289 | | | $ | 489,141,240 | | | $ | 413,987,904 | | | $ | 613,375,961 | |
| | | | 318,183,145 | | | | 26,848 | | | | 165,558,112 | | | | 78,964,305 | | | | 190,675,390 | |
| | | $ | 928,001,917 | | | $ | 128,702,137 | | | $ | 654,699,352 | | | $ | 492,952,209 | | | $ | 804,051,351 | |
239
Statements of Assets and Liabilities
FIRST INVESTORS EQUITY FUNDS
September 30, 2019
| | | INTERNATIONAL | |
Net Assets: | | | | | |
Class A | | | $ | 248,301,688 | |
Advisor Class | | | $ | 200,719,710 | |
Institutional Class | | | $ | 1,351,801 | |
| | | | | | |
Shares outstanding (Note 7): | | | | | |
Class A | | | | 15,643,935 | |
Advisor Class | | | | 12,369,624 | |
Institutional Class | | | | 82,973 | |
| | | | | | |
Net asset value and redemption price per share - Class A | | | $ | 15.87 | |
| | | | | | |
Maximum offering price per share - Class A (Net asset value/.9425)* | | | $ | 16.84 | |
| | | | | | |
Net asset value, offering price and redemption price per share - Advisor Class | | | $ | 16.23 | |
| | | | | | |
Net asset value, offering price and redemption price per share - Institutional Class | | | $ | 16.29 | |
* | On purchases of $50,000 or more, the sales charge is reduced (Note 7). |
See notes to financial statements
240
| | OPPORTUNITY | | | PREMIUM
INCOME | | | SELECT
GROWTH | | | SPECIAL
SITUATIONS | | | TOTAL
RETURN | |
| | | | | | | | | | | | | | | | | | | | | |
| | | $ | 915,338,684 | | | $ | 60,829,833 | | | $ | 507,351,352 | | | $ | 476,826,052 | | | $ | 800,910,024 | |
| | | $ | 10,325,226 | | | $ | 67,843,775 | | | $ | 143,303,888 | | | $ | 12,227,803 | | | $ | 1,165,786 | |
| | | $ | 2,338,007 | | | $ | 28,529 | | | $ | 4,044,112 | | | $ | 3,898,354 | | | $ | 1,975,541 | |
| | | | | | | | | | | | | | | | | | | | | |
| | | | | | | | | | | | | | | | | | | | | |
| | | | 24,220,919 | | | | 5,996,698 | | | | 41,969,559 | | | | 18,990,912 | | | | 42,081,549 | |
| | | | 266,458 | | | | 6,680,490 | | | | 11,579,019 | | | | 478,568 | | | | 61,052 | |
| | | | 60,396 | | | | 5,163 | | | | 324,627 | | | | 151,402 | | | | 103,229 | |
| | | | | | | | | | | | | | | | | | | | | |
| | | $ | 37.79 | | | $ | 10.14 | | | $ | 12.09 | | | $ | 25.11 | | | $ | 19.03 | |
| | | | | | | | | | | | | | | | | | | | | |
| | | $ | 40.10 | | | $ | 10.76 | | | $ | 12.83 | | | $ | 26.64 | | | $ | 20.19 | |
| | | | | | | | | | | | | | | | | | | | | |
| | | $ | 38.75 | | | $ | 10.16 | | | $ | 12.38 | | | $ | 25.55 | | | $ | 19.10 | |
| | | | | | | | | | | | | | | | | | | | | |
| | | $ | 38.71 | | | $ | 5.53 | | | $ | 12.46 | | | $ | 25.75 | | | $ | 19.14 | |
241
Statements of Operations
FIRST INVESTORS INCOME FUNDS
Year Ended September 30, 2019
| | | FLOATING
RATE | |
Investment Income | | | | | |
Interest | | | $ | 10,178,598 | |
| | | | | | |
Expenses (Notes 1 and 3): | | | | | |
Advisory fees | | | | 1,201,386 | |
Distribution plan expenses-Class A | | | | 189,532 | |
Distribution plan expenses-Class B (a) | | | | N/A | |
Shareholder servicing costs-Class A | | | | 110,003 | |
Shareholder servicing costs-Class B (a) | | | | N/A | |
Shareholder servicing costs-Advisor Class | | | | 145,670 | |
Shareholder servicing costs-Institutional Class | | | | 7,362 | |
Professional fees | | | | 23,139 | |
Custodian fees | | | | 57,919 | |
Registration fees | | | | 46,560 | |
Reports to shareholders | | | | 33,474 | |
Trustees’ fees | | | | 15,515 | |
Other expenses | | | | 15,000 | |
Total expenses | | | | 1,845,560 | |
Less: Expenses (waived and/or assumed) repaid to advisor (Note 3) | | | | 59,757 | |
Expenses paid indirectly (Note 1G) | | | | (1,030 | ) |
Net expenses | | | | 1,904,287 | |
Net investment income | | | | 8,274,311 | |
| | | | | | |
Realized and Unrealized Gain (Loss) on Investments and Foreign Exchange Contracts (Notes 2 and 5): | | | | | |
Net realized loss on: | | | | | |
Investments | | | | (231,419 | ) |
Foreign exchange contracts | | | | — | |
Net realized loss on investments and foreign currency transactions | | | | (231,419 | ) |
Net unrealized appreciation (depreciation) on: | | | | | |
Investments | | | | (2,650,231 | ) |
Foreign exchange contracts | | | | — | |
Net unrealized appreciation (depreciation) on investments and Foreign exchange contracts | | | | (2,650,231 | ) |
Net gain (loss) on investments and foreign currency transactions | | | | (2,881,650 | ) |
Net Increase (Decrease) in Net Assets Resulting from Operations | | | $ | 5,392,661 | |
(a) | All Class B shares were converted into Class A on June 14, 2019. |
(b) | Net of $52,920 foreign taxes withheld |
See notes to financial statements
242
| | FUND FOR
INCOME | | | GOVERNMENT
CASH
MANAGEMENT | | | INTERNATIONAL
OPPORTUNITIES
BOND | |
| | | | | | | | | | | | | |
| | | $ | 35,078,464 | | | $ | 3,972,706 | | | $ | 5,867,822 | (b) |
| | | | | | | | | | | | | |
| | | | | | | | | | | | | |
| | | | 4,303,509 | | | | 857,145 | | | | 1,021,590 | |
| | | | 1,373,366 | | | | — | | | | 134,753 | |
| | | | 10,976 | | | | 776 | | | | N/A | |
| | | | 763,924 | | | | 517,139 | | | | 99,797 | |
| | | | 5,974 | | | | 339 | | | | N/A | |
| | | | 128,335 | | | | N/A | | | | 135,776 | |
| | | | 11,161 | | | | — | | | | 4,457 | |
| | | | 83,254 | | | | 7,434 | | | | 27,939 | |
| | | | 23,015 | | | | 12,306 | | | | 70,742 | |
| | | | 52,484 | | | | 15,235 | | | | 41,272 | |
| | | | 62,561 | | | | 27,047 | | | | 32,370 | |
| | | | 43,468 | | | | 12,535 | | | | 10,232 | |
| | | | 97,141 | | | | 14,757 | | | | 56,167 | |
| | | | 6,959,168 | | | | 1,464,713 | | | | 1,635,095 | |
| | | | (106,648 | ) | | | (430,911 | ) | | | (54,020 | ) |
| | | | — | | | | (4,406 | ) | | | (1,286 | ) |
| | | | 6,852,520 | | | | 1,029,396 | | | | 1,579,789 | |
| | | | 28,225,944 | | | | 2,943,310 | | | | 4,288,033 | |
| | | | | | | | | | | | | |
| | | | | | | | | | | | | |
| | | | | | | | | | | | | |
| | | | (554,649 | ) | | | — | | | | (3,682,631 | ) |
| | | | — | | | | — | | | | (3,529,943 | ) |
| | | | (554,649 | ) | | | — | | | | (7,212,574 | ) |
| | | | | | | | | | | | | |
| | | | 5,012,920 | | | | — | | | | 2,690,454 | |
| | | | — | | | | — | | | | (796,780 | ) |
| | | | 5,012,920 | | | | — | | | | 1,893,674 | |
| | | | 4,458,271 | | | | — | | | | (5,318,900 | ) |
| | | $ | 32,684,215 | | | $ | 2,943,310 | | | $ | (1,030,867 | ) |
243
Statements of Operations
FIRST INVESTORS INCOME FUNDS
Year Ended September 30, 2019
| | | INVESTMENT
GRADE | |
Investment Income | | | | | |
Interest | | | $ | 21,325,214 | |
Dividends from affiliate (Note 2) | | | | — | |
Total income | | | | 21,325,214 | |
Expenses (Notes 1 and 3): | | | | | |
Advisory fees | | | | 3,589,935 | |
Distribution plan expenses-Class A | | | | 1,053,949 | |
Distribution plan expenses-Class B (a) | | | | 9,960 | |
Shareholder servicing costs-Class A | | | | 587,763 | |
Shareholder servicing costs-Class B (a) | | | | 2,556 | |
Shareholder servicing costs-Advisor Class | | | | 162,652 | |
Shareholder servicing costs-Institutional Class | | | | 6,617 | |
Professional fees | | | | 91,567 | |
Custodian fees | | | | 26,448 | |
Registration fees | | | | 73,620 | |
Reports to shareholders | | | | 62,431 | |
Trustees’ fees | | | | 41,062 | |
Other expenses | | | | 70,586 | |
Total expenses | | | | 5,779,146 | |
Less: Expenses waived and/or assumed (Note 3) | | | | (449,311 | ) |
Expenses paid indirectly (Note 1G) | | | | (13,841 | ) |
Net expenses | | | | 5,315,994 | |
Net investment income | | | | 16,009,220 | |
| | | | | | |
Realized and Unrealized Gain (Loss) on Investments and Affiliate (Notes 2 and 5): | | | | | |
Net realized gain (loss) on: | | | | | |
Investments | | | | 9,505,082 | |
Affiliate | | | | — | |
Net realized gain (loss) on investments and affiliate | | | | 9,505,082 | |
Net unrealized appreciation (depreciation) on: | | | | | |
Investments | | | | 35,715,910 | |
Affiliate | | | | — | |
Net unrealized appreciation on investments and affiliate | | | | 35,715,910 | |
Net gain on investments and affiliate | | | | 45,220,992 | |
Net Increase in Net Assets Resulting from Operations | | | $ | 61,230,212 | |
(a) | All Class B shares were converted into Class A on June 14, 2019. |
See notes to financial statements
244
| | LIMITED
DURATION
BOND | | | STRATEGIC
INCOME | |
| | | | | | | | | |
| | | $ | 10,307,836 | | | $ | 334,121 | |
| | | | — | | | | 5,216,412 | |
| | | | 10,307,836 | | | | 5,550,533 | |
| | | | | | | | | |
| | | | 1,406,002 | | | | 73,504 | |
| | | | 654,389 | | | | 402,454 | |
| | | | N/A | | | | N/A | |
| | | | 422,910 | | | | 197,059 | |
| | | | N/A | | | | N/A | |
| | | | 125,690 | | | | 421 | |
| | | | 10,447 | | | | N/A | |
| | | | 104,920 | | | | 51,134 | |
| | | | 33,260 | | | | 13,121 | |
| | | | 87,457 | | | | 37,172 | |
| | | | 60,733 | | | | 16,204 | |
| | | | 25,134 | | | | 10,728 | |
| | | | 96,308 | | | | 7,958 | |
| | | | 3,027,250 | | | | 809,755 | |
| | | | (659,118 | ) | | | (24,157 | ) |
| | | | (6,237 | ) | | | (3,719 | ) |
| | | | 2,361,895 | | | | 781,879 | |
| | | | 7,945,941 | | | | 4,768,654 | |
| | | | | | | | | |
| | | | | | | | | |
| | | | | | | | | |
| | | | 490,159 | | | | (92,831 | ) |
| | | | — | | | | (858,002 | ) |
| | | | 490,159 | | | | (950,833 | ) |
| | | | | | | | | |
| | | | 7,076,563 | | | | 372,276 | |
| | | | — | | | | 2,490,234 | |
| | | | 7,076,563 | | | | 2,862,510 | |
| | | | 7,566,722 | | | | 1,911,677 | |
| | | $ | 15,512,663 | | | $ | 6,680,331 | |
245
Statements of Operations
FIRST INVESTORS EQUITY FUNDS
Year Ended September 30, 2019
| | | COVERED CALL
STRATEGY | |
Investment Income | | | | | |
Dividends | | | $ | 7,543,121 | |
Interest | | | | — | |
Total income | | | | 7,543,121 | |
Expenses (Notes 1 and 3): | | | | | |
Advisory fees | | | | 2,497,132 | |
Distribution plan expenses-Class A | | | | 558,458 | |
Distribution plan expenses-Class B (a) | | | | N/A | |
Shareholder servicing costs-Class A | | | | 384,901 | |
Shareholder servicing costs-Class B (a) | | | | N/A | |
Shareholder servicing costs-Advisor Class | | | | 91,058 | |
Shareholder servicing costs-Institutional Class | | | | 730 | |
Professional fees | | | | 36,318 | |
Custodian fees | | | | 12,445 | |
Registration fees | | | | 64,726 | |
Reports to shareholders | | | | 38,658 | |
Trustees’ fees | | | | 23,030 | |
Other expenses | | | | 17,391 | |
Total expenses | | | | 3,724,847 | |
Less: Expenses (waived and/or assumed) repaid to advisor (Note 3) | | | | 76,322 | |
Expenses paid indirectly (Note 1G) | | | | (8,058 | ) |
Net expenses | | | | 3,793,111 | |
Net investment income | | | | 3,750,010 | |
| | | | | | |
Realized and Unrealized Gain (Loss) on Investments, Options and Futures Contracts, and Foreign Exchange Contracts (Note 2 and 5): | | | | | |
Net realized gain (loss) on: | | | | | |
Investments | | | | (6,025,127 | ) |
Options contracts | | | | (6,548,114 | ) |
Futures contracts | | | | — | |
Foreign exchange contracts | | | | — | |
Net realized gain (loss) on investments, options and futures contracts, and foreign exchange contracts | | | | (12,573,241 | ) |
Net unrealized appreciation (depreciation) on: | | | | | |
Investments | | | | 12,128,871 | |
Options contracts | | | | (3,264,321 | ) |
Futures contracts | | | | — | |
Foreign exchange contracts | | | | — | |
Net unrealized appreciation (depreciation) on investments, options and futures contracts, and foreign exchange contracts | | | | 8,864,550 | |
Net gain (loss) on investments, options and futures contracts, and foreign exchange contracts | | | | (3,708,691 | ) |
Net Increase (Decrease) in Net Assets Resulting from Operations | | | $ | 41,319 | |
(a) | All Class B shares were converted into Class A shares on June 14, 2019. |
(b) | Net of $56,032 foreign taxes withheld |
(c) | Net of $408,231 foreign taxes withheld |
(d) | Net of $180,745 foreign taxes withheld |
(e) | Net of $22,839 foreign taxes withheld |
See notes to financial statements
246
| | EQUITY
INCOME | | | GLOBAL | | | GROWTH &
INCOME | | | HEDGED
U.S. EQUITY
OPPORTUNITIES | |
| | | | | | | | | | | | | | | | | |
| | | $ | 14,763,202 | (b) | | $ | 11,187,703 | (c) | | $ | 39,550,977 | (d) | | $ | 3,271,933 | (e) |
| | | | 434,838 | | | | 164,325 | | | | 1,416,593 | | | | — | |
| | | | 15,198,040 | | | | 11,352,028 | | | | 40,967,570 | | | | 3,271,933 | |
| | | | | | | | | | | | | | | | | |
| | | | 4,010,000 | | | | 5,384,673 | | | | 11,233,686 | | | | 2,171,686 | |
| | | | 1,359,128 | | | | 969,640 | | | | 4,130,019 | | | | 186,123 | |
| | | | 15,842 | | | | 13,779 | | | | 71,856 | | | | N/A | |
| | | | 668,862 | | | | 582,884 | | | | 2,042,486 | | | | 121,125 | |
| | | | 3,378 | | | | 2,612 | | | | 15,363 | | | | N/A | |
| | | | 32,690 | | | | 196,576 | | | | 146,302 | | | | 167,804 | |
| | | | 608 | | | | 908 | | | | 2,409 | | | | 156 | |
| | | | 55,507 | | | | 69,645 | | | | 141,351 | | | | 24,211 | |
| | | | 17,825 | | | | 43,806 | | | | 29,652 | | | | 67,803 | |
| | | | 60,932 | | | | 56,724 | | | | 50,445 | | | | 62,725 | |
| | | | 46,624 | | | | 62,546 | | | | 117,399 | | | | 30,691 | |
| | | | 40,555 | | | | 42,554 | | | | 121,014 | | | | 14,545 | |
| | | | 22,714 | | | | 64,425 | | | | 73,651 | | | | 54,590 | |
| | | | 6,334,665 | | | | 7,490,772 | | | | 18,175,633 | | | | 2,901,459 | |
| | | | — | | | | (94,872 | ) | | | — | | | | 86,400 | |
| | | | (16,471 | ) | | | (11,758 | ) | | | (49,403 | ) | | | (4,495 | ) |
| | | | 6,318,194 | | | | 7,384,142 | | | | 18,126,230 | | | | 2,983,364 | |
| | | | 8,879,846 | | | | 3,967,886 | | | | 22,841,340 | | | | 288,569 | |
| | | | | | | | | | | | | | | | | |
| | | | | | | | | | | | | | | | | |
| | | | | | | | | | | | | | | | | |
| | | | 33,645,994 | | | | (6,471,772 | ) | | | 191,174,591 | | | | 13,294,135 | |
| | | | 167,018 | | | | — | | | | 241,845 | | | | (1,219,543 | ) |
| | | | — | | | | — | | | | — | | | | 364,036 | |
| | | | — | | | | (416,670 | ) | | | — | | | | 79,013 | |
| | | | 33,813,012 | | | | (6,888,442 | ) | | | 191,416,436 | | | | 12,517,641 | |
| | | | | | | | | | | | | | | | | |
| | | | (38,030,962 | ) | | | (4,934,221 | ) | | | (189,978,012 | ) | | | 2,543,951 | |
| | | | — | | | | — | | | | — | | | | 326,178 | |
| | | | — | | | | — | | | | — | | | | 324,875 | |
| | | | — | | | | (32,865 | ) | | | — | | | | 15,975 | |
| | | | (38,030,962 | ) | | | (4,967,086 | ) | | | (189,978,012 | ) | | | 3,210,979 | |
| | | | (4,217,950 | ) | | | (11,855,528 | ) | | | 1,438,424 | | | | 15,728,620 | |
| | | $ | 4,661,896 | | | $ | (7,887,642 | ) | | $ | 24,279,764 | | | $ | 16,017,189 | |
247
Statements of Operations
FIRST INVESTORS EQUITY FUNDS
Year Ended September 30, 2019
| | | INTERNATIONAL | |
Investment Income | | | | | |
Dividends | | | $ | 6,617,043 | (f) |
Interest | | | | 198,411 | |
Total income | | | | 6,815,454 | |
Expenses (Notes 1 and 3): | | | | | |
Advisory fees | | | | 3,953,167 | |
Distribution plan expenses-Class A | | | | 685,363 | |
Distribution plan expenses-Class B (a) | | | | 7,569 | |
Shareholder servicing costs-Class A | | | | 527,376 | |
Shareholder servicing costs-Class B (a) | | | | 2,370 | |
Shareholder servicing costs-Advisor Class | | | | 174,766 | |
Shareholder servicing costs-Institutional Class | | | | 787 | |
Professional fees | | | | 38,286 | |
Custodian fees | | | | 95,691 | |
Registration fees | | | | 70,175 | |
Reports to shareholders | | | | 48,944 | |
Trustees’ fees | | | | 29,339 | |
Other expenses | | | | 45,902 | |
Total expenses | | | | 5,679,735 | |
Less: Expenses waived and/or assumed (Note 3) | | | | — | |
Expenses paid indirectly (Note 1G) | | | | (1,777 | ) |
Net expenses | | | | 5,677,958 | |
Net investment income | | | | 1,137,496 | |
| | | | | | |
Realized and Unrealized Gain (Loss) on Investments, Options Contracts and Foreign Exchange Contracts (Note 2): | | | | | |
Net realized gain (loss) on: | | | | | |
Investments | | | | 21,958,806 | |
Options contracts | | | | — | |
Foreign exchange contracts | | | | (309,025 | ) |
Net realized gain on investments, options contracts and foreign exchange contracts | | | | 21,649,781 | |
Net unrealized appreciation (depreciation) of: | | | | | |
Investments | | | | 6,777,677 | |
Options contracts | | | | — | |
Foreign exchange contracts | | | | (15,793 | ) |
Net unrealized appreciation (depreciation) of investments, options contracts and foreign exchange contracts | | | | 6,761,884 | |
Net gain (loss) on investments, options contracts and foreign exchange contracts | | | | 28,411,665 | |
Net Increase (Decrease) in Net Assets Resulting from Operations | | | $ | 29,549,161 | |
(a) | All Class B shares were converted into Class A shares on June 14, 2019. |
(f) | Net of $910,738 foreign taxes withheld |
(g) | Net of $107,491 foreign taxes withheld |
(h) | Net of $2,895 foreign taxes withheld |
(i) | Net of $49,807 foreign taxes withheld |
See notes to financial statements
248
| | OPPORTUNITY | | | PREMIUM
INCOME | | | SELECT
GROWTH | | | SPECIAL
SITUATIONS | | | TOTAL
RETURN | |
| | | | | | | | | | | | | | | | | | | | | |
| | | $ | 15,306,983 | (g) | | $ | 3,453,613 | | | $ | 9,453,944 | | | $ | 9,909,778 | (h) | | $ | 10,376,403 | (i) |
| | | | 441,012 | | | | — | | | | 210,805 | | | | 261,337 | | | | 12,555,190 | |
| | | | 15,747,995 | | | | 3,453,613 | | | | 9,664,749 | | | | 10,171,115 | | | | 22,931,593 | |
| | | | | | | | | | | | | | | | | | | | | |
| | | | 7,336,688 | | | | 911,457 | | | | 5,162,745 | | | | 4,841,866 | | | | 6,017,346 | |
| | | | 2,547,888 | | | | 143,456 | | | | 1,471,857 | | | | 1,395,372 | | | | 2,272,494 | |
| | | | 37,218 | | | | N/A | | | | 17,613 | | | | 15,219 | | | | 38,214 | |
| | | | 1,603,688 | | | | 83,770 | | | | 822,095 | | | | 919,650 | | | | 1,155,023 | |
| | | | 8,997 | | | | N/A | | | | 2,797 | | | | 4,354 | | | | 7,000 | |
| | | | 174,251 | | | | 88,998 | | | | 207,453 | | | | 161,597 | | | | 1,104 | |
| | | | 1,276 | | | | 467 | | | | 1,801 | | | | 2,271 | | | | 9,908 | |
| | | | 81,380 | | | | 21,537 | | | | 62,189 | | | | 63,159 | | | | 171,966 | |
| | | | 30,257 | | | | 8,234 | | | | 23,426 | | | | 20,550 | | | | 25,484 | |
| | | | 23,555 | | | | 82,107 | | | | 58,881 | | | | 63,409 | | | | 10,000 | |
| | | | 104,525 | | | | 25,481 | | | | 59,220 | | | | 71,652 | | | | 72,008 | |
| | | | 77,460 | | | | 8,323 | | | | 52,935 | | | | 45,778 | | | | 63,088 | |
| | | | 58,953 | | | | 24,605 | | | | 49,103 | | | | 38,663 | | | | 78,378 | |
| | | | 12,086,136 | | | | 1,398,435 | | | | 7,992,115 | | | | 7,643,540 | | | | 9,922,013 | |
| | | | — | | | | (58,291 | ) | | | (69,729 | ) | | | — | | | | — | |
| | | | (31,441 | ) | | | (3,432 | ) | | | (18,109 | ) | | | (18,618 | ) | | | (25,750 | ) |
| | | | 12,054,695 | | | | 1,336,712 | | | | 7,904,277 | | | | 7,624,922 | | | | 9,896,263 | |
| | | | 3,693,300 | | | | 2,116,901 | | | | 1,760,472 | | | | 2,546,193 | | | | 13,035,330 | |
| | | | | | | | | | | | | | | | | | | | | |
| | | | | | | | | | | | | | | | | | | | | |
| | | | | | | | | | | | | | | | | | | | | |
| | | | 107,728,650 | | | | 1,163,859 | | | | 59,410,250 | | | | 37,166,502 | | | | 55,471,198 | |
| | | | — | | | | 2,288,508 | | | | — | | | | — | | | | — | |
| | | | — | | | | — | | | | — | | | | — | | | | — | |
| | | | 107,728,650 | | | | 3,452,367 | | | | 59,410,250 | | | | 37,166,502 | | | | 55,471,198 | |
| | | | | | | | | | | | | | | | | | | | | |
| | | | (108,217,293 | ) | | | 539,826 | | | | (106,507,568 | ) | | | (110,118,154 | ) | | | (31,701,223 | ) |
| | | | — | | | | (2,668,324 | ) | | | — | | | | — | | | | — | |
| | | | — | | | | — | | | | — | | | | — | | | | — | |
| | | | (108,217,293 | ) | | | (2,128,498 | ) | | | (106,507,568 | ) | | | (110,118,154 | ) | | | (31,701,223 | ) |
| | | | (488,643 | ) | | | 1,323,869 | | | | (47,097,318 | ) | | | (72,951,652 | ) | | | 23,769,975 | |
| | | $ | 3,204,657 | | | $ | 3,440,770 | | | $ | (45,336,846 | ) | | $ | (70,405,459 | ) | | $ | 36,805,305 | |
249
Statements of Changes in Net Assets
FIRST INVESTORS INCOME FUNDS
| | | | FLOATING
RATE | |
Year Ended September 30 | | | 2019 | | | 2018 | |
Increase (Decrease) in Net Assets From Operations | | | | | | | | | |
Net investment income | | | $ | 8,274,311 | | | $ | 7,145,470 | |
Net realized gain (loss) on investments and foreign currency transactions | | | | (231,419 | ) | | | 691,427 | |
Net unrealized appreciation (depreciation) of investments and foreign exchange contracts | | | | (2,650,231 | ) | | | 366,130 | |
Net increase (decrease) in net assets resulting from operations | | | | 5,392,661 | | | | 8,203,027 | |
| | | | | | | | | | |
Distribution to Shareholders1 | | | | | | | | | |
Class A | | | | (2,770,276 | ) | | | (2,208,169 | ) |
Class B | | | | N/A | | | | N/A | |
Advisor Class | | | | (4,436,212 | ) | | | (4,156,168 | ) |
Institutional Class | | | | (1,069,434 | ) | | | (967,368 | ) |
Total distributions | | | | (8,275,922 | ) | | | (7,331,705 | ) |
| | | | | | | | | | |
Share Transactions | | | | | | | | | |
Class A: | | | | | | | | | |
Proceeds from shares sold | | | | 19,796,406 | | | | 17,357,693 | |
Reinvestment of distributions | | | | 2,621,576 | | | | 2,103,112 | |
Cost of shares redeemed | | | | (25,931,302 | ) | | | (17,921,450 | ) |
Shares issued in conversion (a) | | | | N/A | | | | — | |
| | | | | (3,513,320 | ) | | | 1,539,355 | |
Class B: | | | | | | | | | |
Proceeds from shares sold | | | | N/A | | | | N/A | |
Reinvestment of distributions | | | | N/A | | | | N/A | |
Cost of shares redeemed | | | | N/A | | | | N/A | |
Shares converted to Class A (a) | | | | N/A | | | | N/A | |
| | | | | N/A | | | | N/A | |
Advisor Class: | | | | | | | | | |
Proceeds from shares sold | | | | 55,959,610 | | | | 61,262,253 | |
Reinvestment of distributions | | | | 4,303,144 | | | | 4,032,114 | |
Cost of shares redeemed | | | | (162,934,169 | ) | | | (19,959,407 | ) |
| | | | | (102,671,415 | ) | | | 45,334,960 | |
Institutional Class | | | | | | | | | |
Proceeds from shares sold | | | | 3,204,376 | | | | 12,262,644 | |
Reinvestment of distributions | | | | 30,284 | | | | 30,703 | |
Cost of shares redeemed | | | | (34,376,234 | ) | | | (1,657,595 | ) |
| | | | | (31,141,574 | ) | | | 10,635,752 | |
Net increase (decrease) from share transactions | | | | (137,326,309 | ) | | | 57,510,067 | |
Net increase (decrease) in net assets | | | | (140,209,570 | ) | | | 58,381,389 | |
| | | | | | | | | | |
Net Assets | | | | | | | | | |
Beginning of year | | | | 245,385,003 | | | | 187,003,614 | |
End of year2 | | | $ | 105,175,433 | | | $ | 245,385,003 | |
1 | The S.E.C. eliminated the requirement to disclose components of distributions paid to shareholders in September 2018. The distributions for the year ended 2018 were all from net investment income. |
2 | The S.E.C. eliminated the requirement to disclose undistributed net investment income in September 2018. For the year ended September 30, 2018 net assets included undistributed net investment income (deficit) of $(39,540), $(2,879,872), $0 and $(880,816), respectively on the Floating Rate, Fund For Income, Government Cash Management and International Opportunities Bond Funds. |
(a) | All Class B shares were converted into Class A on June 14, 2019. |
See notes to financial statements
250
| | | FUND FOR
INCOME | | | GOVERNMENT
CASH
MANAGEMENT | | | INTERNATIONAL OPPORTUNITIES BOND | |
| | 2019 | | | 2018 | | | 2019 | | | 2018 | | | 2019 | | | 2018 | |
| | | | | | | | | | | | | | | | | | | | | | | | | |
| | | $ | 28,225,944 | | | $ | 31,116,677 | | | $ | 2,943,310 | | | $ | 1,351,094 | | | $ | 4,288,033 | | | $ | 3,960,014 | |
| | | | (554,649 | ) | | | 2,892,551 | | | | — | | | | — | | | | (7,212,574 | ) | | | (2,315,047 | ) |
| | | | 5,012,920 | | | | (22,306,970 | ) | | | — | | | | — | | | | 1,893,674 | | | | (8,484,204 | ) |
| | | | 32,684,215 | | | | 11,702,258 | | | | 2,943,310 | | | | 1,351,094 | | | | (1,030,867 | ) | | | (6,839,237 | ) |
| | | | | | | | | | | | | | | | | | | | | | | | | |
| | | | | | | | | | | | | | | | | | | | | | | | | |
| | | | (26,190,928 | ) | | | (27,698,833 | ) | | | (2,942,231 | ) | | | (1,328,144 | ) | | | (928,347 | ) | | | (1,886,224 | ) |
| | | | (49,755 | ) | | | (85,725 | ) | | | (1,061 | ) | | | (163 | ) | | | N/A | | | | N/A | |
| | | | (2,944,295 | ) | | | (4,671,312 | ) | | | N/A | | | | N/A | | | | (1,600,584 | ) | | | (2,402,791 | ) |
| | | | (2,093,656 | ) | | | (2,952,485 | ) | | | (18 | ) | | | (22,787 | ) | | | (219,517 | ) | | | (271,216 | ) |
| | | | (31,278,634 | ) | | | (35,408,355 | ) | | | (2,943,310 | ) | | | (1,351,094 | ) | | | (2,748,448 | ) | | | (4,560,231 | ) |
| | | | | | | | | | | | | | | | | | | | | | | | | |
| | | | | | | | | | | | | | | | | | | | | | | | | |
| | | | | | | | | | | | | | | | | | | | | | | | | |
| | | | 31,095,455 | | | | 35,731,994 | | | | 243,798,173 | | | | 270,861,015 | | | | 4,177,875 | | | | 11,126,773 | |
| | | | 22,732,227 | | | | 23,989,477 | | | | 2,848,143 | | | | 1,284,209 | | | | 888,921 | | | | 1,808,009 | |
| | | | (102,791,798 | ) | | | (89,758,885 | ) | | | (231,576,163 | ) | | | (245,529,644 | ) | | | (15,079,450 | ) | | | (14,137,804 | ) |
| | | | 1,493,683 | | | | — | | | | 139,584 | | | | — | | | | N/A | | | | — | |
| | | | (47,470,433 | ) | | | (30,037,414 | ) | | | 15,209,737 | | | | 26,615,580 | | | | (10,012,654 | ) | | | (1,203,022 | ) |
| | | | | | | | | | | | | | | | | | | | | | | | | |
| | | | 104,665 | | | | 126,756 | | | | 119,589 | | | | 85,114 | | | | N/A | | | | N/A | |
| | | | 41,153 | | | | 67,913 | | | | 1,039 | | | | 163 | | | | N/A | | | | N/A | |
| | | | (423,513 | ) | | | (695,133 | ) | | | (82,463 | ) | | | (144,650 | ) | | | N/A | | | | N/A | |
| | | | (1,493,683 | ) | | | — | | | | (139,584 | ) | | | — | | | | N/A | | | | N/A | |
| | | | (1,771,378 | ) | | | (500,464 | ) | | | (101,419 | ) | | | (59,373 | ) | | | N/A | | | | N/A | |
| | | | | | | | | | | | | | | | | | | | | | | | | |
| | | | 44,665,685 | | | | 39,762,430 | | | | N/A | | | | N/A | | | | 36,535,536 | | | | 37,576,303 | |
| | | | 2,736,588 | | | | 4,509,257 | | | | N/A | | | | N/A | | | | 1,596,425 | | | | 1,992,072 | |
| | | | (99,019,284 | ) | | | (34,950,872 | ) | | | N/A | | | | N/A | | | | (72,895,176 | ) | | | (14,261,300 | ) |
| | | | (51,617,011 | ) | | | 9,320,815 | | | | N/A | | | | N/A | | | | (34,763,215 | ) | | | 25,307,075 | |
| | | | | | | | | | | | | | | | | | | | | | | | | |
| | | | 18,118,700 | | | | 11,973,731 | | | | — | | | | 1,640,026 | | | | 9,908,986 | | | | 5,921,591 | |
| | | | 167,967 | | | | 324,515 | | | | 18 | | | | 20,317 | | | | 8,115 | | | | 20,279 | |
| | | | (15,224,537 | ) | | | (55,406,840 | ) | | | — | | | | (4,053,823 | ) | | | (5,632,160 | ) | | | (3,839,839 | ) |
| | | | 3,062,130 | | | | (43,108,594 | ) | | | 18 | | | | (2,393,480 | ) | | | 4,284,941 | | | | 2,102,031 | |
| | | | (97,796,692 | ) | | | (64,325,657 | ) | | | 15,108,336 | | | | 24,162,727 | | | | (40,490,928 | ) | | | 26,206,084 | |
| | | | (96,391,111 | ) | | | (88,031,754 | ) | | | 15,108,336 | | | | 24,162,727 | | | | (44,270,243 | ) | | | 14,806,616 | |
| | | | | | | | | | | | | | | | | | | | | | | | | |
| | | | | | | | | | | | | | | | | | | | | | | | | |
| | | | 639,142,120 | | | | 727,173,874 | | | | 153,797,415 | | | | 129,634,688 | | | | 151,419,080 | | | | 136,612,464 | |
| | | $ | 542,751,009 | | | $ | 639,142,120 | | | $ | 168,905,751 | | | $ | 153,797,415 | | | $ | 107,148,837 | | | $ | 151,419,080 | |
251
Statements of Changes in Net Assets
FIRST INVESTORS INCOME FUNDS
| | | | FLOATING
RATE | |
Year Ended September 30 | | | 2019 | | | 2018 | |
Shares Issued and Redeemed | | | | | | | | | |
Class A: | | | | | | | | | |
Sold | | | | 2,065,800 | | | | 1,791,647 | |
Issued for distributions reinvested | | | | 274,136 | | | | 217,095 | |
Redeemed | | | | (2,704,754 | ) | | | (1,850,470 | ) |
Issued in conversion (a) | | | | N/A | | | | N/A | |
Net increase (decrease) in Class A shares outstanding | | | | (364,818 | ) | | | 158,272 | |
| | | | | | | | | | |
Class B: | | | | | | | | | |
Sold | | | | N/A | | | | N/A | |
Issued for distributions reinvested | | | | N/A | | | | N/A | |
Redeemed | | | | N/A | | | | N/A | |
Converted to Class A (a) | | | | N/A | | | | N/A | |
Net decrease in Class B shares outstanding | | | | N/A | | | | N/A | |
| | | | | | | | | | |
Advisor Class: | | | | | | | | | |
Sold | | | | 5,835,139 | | | | 6,320,958 | |
Issued for distributions reinvested | | | | 450,372 | | | | 415,961 | |
Redeemed | | | | (16,951,823 | ) | | | (2,058,862 | ) |
Net increase (decrease) in Advisor Class shares outstanding | | | | (10,666,312 | ) | | | 4,678,057 | |
| | | | | | | | | | |
Institutional Class: | | | | | | | | | |
Sold | | | | 334,873 | | | | 1,264,275 | |
Issued for distributions reinvested | | | | 3,167 | | | | 3,169 | |
Redeemed | | | | (3,582,801 | ) | | | (171,044 | ) |
Net increase (decrease) in Institutional Class shares outstanding | | | | (3,244,761 | ) | | | 1,096,400 | |
(a) | All Class B shares were converted into Class A on June 14, 2019. |
See notes to financial statements
252
| | | FUND FOR
INCOME | | | GOVERNMENT
CASH
MANAGEMENT | | | INTERNATIONAL OPPORTUNITIES BOND | |
| | 2019 | | | 2018 | | | 2019 | | | 2018 | | | 2019 | | | 2018 | |
| | | | | | | | | | | | | | | | | | | | | | | | | |
| | | | | | | | | | | | | | | | | | | | | | | | | |
| | | | 12,862,176 | | | | 14,449,467 | | | | 243,798,173 | | | | 270,861,015 | | | | 485,499 | | | | 1,202,274 | |
| | | | 9,418,798 | | | | 9,735,758 | | | | 2,848,143 | | | | 1,284,209 | | | | 105,950 | | | | 194,863 | |
| | | | (42,476,056 | ) | | | (36,347,934 | ) | | | (231,576,163 | ) | | | (245,529,644 | ) | | | (1,748,393 | ) | | | (1,541,669 | ) |
| | | | 614,684 | | | | — | | | | 139,584 | | | | — | | | | N/A | | | | N/A | |
| | | | (19,580,398 | ) | | | (12,162,709 | ) | | | 15,209,737 | | | | 26,615,580 | | | | (1,156,944 | ) | | | (144,532 | ) |
| | | | | | | | | | | | | | | | | | | | | | | | | |
| | | | | | | | | | | | | | | | | | | | | | | | | |
| | | | 44,612 | | | | 51,091 | | | | 119,589 | | | | 85,114 | | | | N/A | | | | N/A | |
| | | | 17,139 | | | | 27,480 | | | | 1,039 | | | | 163 | | | | N/A | | | | N/A | |
| | | | (177,501 | ) | | | (279,926 | ) | | | (82,463 | ) | | | (144,650 | ) | | | N/A | | | | N/A | |
| | | | (614,684 | ) | | | — | | | | (139,584 | ) | | | — | | | | N/A | | | | N/A | |
| | | | (730,434 | ) | | | (201,355 | ) | | | (101,419 | ) | | | (59,373 | ) | | | N/A | | | | N/A | |
| | | | | | | | | | | | | | | | | | | | | | | | | |
| | | | | | | | | | | | | | | | | | | | | | | | | |
| | | | 18,487,987 | | | | 16,125,451 | | | | N/A | | | | N/A | | | | 4,176,296 | | | | 4,081,995 | |
| | | | 1,141,753 | | | | 1,833,501 | | | | N/A | | | | N/A | | | | 188,480 | | | | 212,335 | |
| | | | (40,822,238 | ) | | | (14,292,625 | ) | | | N/A | | | | N/A | | | | (8,430,675 | ) | | | (1,560,329 | ) |
| | | | (21,192,498 | ) | | | 3,666,327 | | | | N/A | | | | N/A | | | | (4,065,899 | ) | | | 2,734,001 | |
| | | | | | | | | | | | | | | | | | | | | | | | | |
| | | | | | | | | | | | | | | | | | | | | | | | | |
| | | | 7,440,769 | | | | 4,841,690 | | | | — | | | | 1,640,026 | | | | 1,130,170 | | | | 629,288 | |
| | | | 69,202 | | | | 130,520 | | | | 18 | | | | 20,317 | | | | 948 | | | | 2,165 | |
| | | | (6,284,488 | ) | | | (22,365,155 | ) | | | — | | | | (4,053,823 | ) | | | (641,884 | ) | | | (428,971 | ) |
| | | | 1,225,483 | | | | (17,392,945 | ) | | | 18 | | | | (2,393,480 | ) | | | 489,234 | | | | 202,482 | |
253
Statements of Changes in Net Assets
FIRST INVESTORS INCOME FUNDS
| | | | INVESTMENT
GRADE | |
Year Ended September 30 | | | 2019 | | | 2018 | |
Increase (Decrease) in Net Assets From Operations | | | | | | | | | |
Net investment income | | | $ | 16,009,220 | | | $ | 17,925,632 | |
Net realized gain (loss) on investments | | | | 9,505,082 | | | | (1,645,013 | ) |
Net unrealized appreciation (depreciation) of investments | | | | 35,715,910 | | | | (26,239,627 | ) |
Net unrealized depreciation of affiliate (Note 2) | | | | — | | | | — | |
Net increase in net assets resulting from operations | | | | 61,230,212 | | | | (9,959,008 | ) |
| | | | | | | | | | |
Distribution to Shareholders1 | | | | | | | | | |
Class A | | | | (13,019,432 | ) | | | (15,179,813 | ) |
Class B | | | | (26,417 | ) | | | (45,111 | ) |
Advisor Class | | | | (5,307,664 | ) | | | (5,965,579 | ) |
Institutional Class | | | | (829,881 | ) | | | (970,661 | ) |
Total distributions | | | | (19,183,394 | ) | | | (22,161,164 | ) |
| | | | | | | | | | |
Share Transactions | | | | | | | | | |
Class A: | | | | | | | | | |
Proceeds from shares sold | | | | 34,755,165 | | | | 42,681,411 | |
Reinvestment of distributions | | | | 12,267,106 | | | | 14,260,185 | |
Cost of shares redeemed | | | | (116,043,630 | ) | | | (96,469,770 | ) |
Shares issued from merger (Note 9) | | | | — | | | | — | |
Shares issued in conversion (a) | | | | 1,406,515 | | | | — | |
| | | | | (67,614,844 | ) | | | (39,528,174 | ) |
Class B: | | | | | | | | | |
Proceeds from shares sold | | | | 103,617 | | | | 188,297 | |
Reinvestment of distributions | | | | 26,215 | | | | 44,209 | |
Cost of shares redeemed | | | | (263,874 | ) | | | (847,464 | ) |
Shares converted to Class A (a) | | | | (1,406,515 | ) | | | — | |
| | | | | (1,540,557 | ) | | | (614,958 | ) |
Advisor Class: | | | | | | | | | |
Proceeds from shares sold | | | | 37,872,470 | | | | 67,872,202 | |
Reinvestment of distributions | | | | 5,266,597 | | | | 5,728,814 | |
Cost of shares redeemed | | | | (221,815,011 | ) | | | (21,719,878 | ) |
Shares issued from merger (Note 9) | | | | — | | | | — | |
| | | | | (178,675,944 | ) | | | 51,881,138 | |
Institutional Class | | | | | | | | | |
Proceeds from shares sold | | | | 4,059,470 | | | | 4,522,217 | |
Reinvestment of distributions | | | | 53,717 | | | | 69,351 | |
Cost of shares redeemed | | | | (6,770,284 | ) | | | (5,422,878 | ) |
Shares issued from merger (Note 9) | | | | — | | | | — | |
| | | | | (2,657,097 | ) | | | (831,310 | ) |
Net increase (decrease) from share transactions | | | | (250,488,442 | ) | | | 10,906,696 | |
Net increase (decrease) in net assets | | | | (208,441,624 | ) | | | (21,213,476 | ) |
Net Assets | | | | | | | | | |
Beginning of year | | | | 606,408,343 | | | | 627,621,819 | |
End of year2 | | | $ | 397,966,719 | | | $ | 606,408,343 | |
1 | The S.E.C. eliminated the requirement to disclose components of distributions paid to shareholders in September 2018. The distributions for the year ended 2018 were all from net investment income. |
2 | The S.E.C. eliminated the requirement to disclose undistributed net investment income in September 2018. For the year ended September 30, 2018 net assets included undistributed net investment income (deficit) of $(11,310,857), $(2,914,002) and $69,208, respectively on the Investment Grade, Limited Duration Bond and Strategic Income Funds. |
(a) | All Class B shares were converted into Class A on June 14, 2019. |
See notes to financial statements
254
| | | LIMITED
DURATION
BOND | | | STRATEGIC
INCOME | |
| | 2019 | | | 2018 | | | 2019 | | | 2018 | |
| | | | | | | | | | | | | | | | | |
| | | $ | 7,945,941 | | | $ | 275,664 | | | $ | 4,768,654 | | | $ | 5,380,029 | |
| | | | 490,159 | | | | (397,136 | ) | | | (950,833 | ) | | | (1,108,887 | ) |
| | | | 7,076,563 | | | | (185,198 | ) | | | 2,862,510 | | | | (85,116 | ) |
| | | | — | | | | — | | | | — | | | | (4,391,296 | ) |
| | | | 15,512,663 | | | | (306,670 | ) | | | 6,680,331 | | | | (205,270 | ) |
| | | | | | | | | | | | | | | | | |
| | | | | | | | | | | | | | | | | |
| | | | (6,578,036 | ) | | | (1,772,750 | ) | | | (4,796,353 | ) | | | (5,462,343 | ) |
| | | | N/A | | | | N/A | | | | N/A | | | | N/A | |
| | | | (2,085,773 | ) | | | (1,003,221 | ) | | | (26,638 | ) | | | (29,421 | ) |
| | | | (1,128,359 | ) | | | (1,078,886 | ) | | | N/A | | | | N/A | |
| | | | (9,792,168 | ) | | | (3,854,857 | ) | | | (4,822,991 | ) | | | (5,491,764 | ) |
| | | | | | | | | | | | | | | | | |
| | | | | | | | | | | | | | | | | |
| | | | | | | | | | | | | | | | | |
| | | | 37,598,776 | | | | 20,386,749 | | | | 19,197,484 | | | | 25,716,213 | |
| | | | 6,298,169 | | | | 1,726,388 | | | | 4,582,076 | | | | 5,225,611 | |
| | | | (74,562,975 | ) | | | (21,855,129 | ) | | | (40,650,338 | ) | | | (35,879,785 | ) |
| | | | — | | | | 186,810,690 | | | | — | | | | — | |
| | | | N/A | | | | — | | | | N/A | | | | — | |
| | | | (30,666,030 | ) | | | 187,068,698 | | | | (16,870,778 | ) | | | (4,937,961 | ) |
| | | | | | | | | | | | | | | | | |
| | | | N/A | | | | N/A | | | | N/A | | | | N/A | |
| | | | N/A | | | | N/A | | | | N/A | | | | N/A | |
| | | | N/A | | | | N/A | | | | N/A | | | | N/A | |
| | | | N/A | | | | N/A | | | | N/A | | | | N/A | |
| | | | N/A | | | | N/A | | | | N/A | | | | N/A | |
| | | | | | | | | | | | | | | | | |
| | | | 176,696,611 | | | | 10,192,449 | | | | 457,470 | | | | 276,262 | |
| | | | 2,061,691 | | | | 971,339 | | | | 26,041 | | | | 28,321 | |
| | | | (159,637,535 | ) | | | (6,712,312 | ) | | | (688,192 | ) | | | (482,278 | ) |
| | | | — | | | | 485,702 | | | | — | | | | — | |
| | | | 19,120,767 | | | | 4,937,178 | | | | (204,681 | ) | | | (177,695 | ) |
| | | | | | | | | | | | | | | | | |
| | | | 35,842,234 | | | | 18,363,649 | | | | N/A | | | | N/A | |
| | | | 21,676 | | | | 6,137 | | | | N/A | | | | N/A | |
| | | | (27,257,693 | ) | | | (19,537,354 | ) | | | N/A | | | | N/A | |
| | | | — | | | | 1,024 | | | | N/A | | | | N/A | |
| | | | 8,606,217 | | | | (1,166,544 | ) | | | N/A | | | | N/A | |
| | | | (2,939,046 | ) | | | 190,839,332 | | | | (17,075,459 | ) | | | (5,115,656 | ) |
| | | | 2,781,449 | | | | 186,677,805 | | | | (15,218,119 | ) | | | (10,812,690 | ) |
| | | | | | | | | | | | | | | | | |
| | | | 322,221,978 | | | | 135,544,173 | | | | 152,939,302 | | | | 163,751,992 | |
| | | $ | 325,003,427 | | | $ | 322,221,978 | | | $ | 137,721,183 | | | $ | 152,939,302 | |
255
Statements of Changes in Net Assets
FIRST INVESTORS INCOME FUNDS
| | | | INVESTMENT
GRADE | |
Year Ended September 30 | | | 2019 | | | 2018 | |
Shares Issued and Redeemed | | | | | | | | | |
Class A: | | | | | | | | | |
Sold | | | | 3,682,672 | | | | 4,532,773 | |
Issued for distributions reinvested | | | | 1,301,394 | | | | 1,521,041 | |
Redeemed | | | | (12,223,963 | ) | | | (10,297,688 | ) |
Issued from merger (Note 9) | | | | — | | | | — | |
Issued in conversion (a) | | | | 146,512 | | | | — | |
Net increase (decrease) in Class A shares outstanding | | | | (7,093,385 | ) | | | (4,243,874 | ) |
| | | | | | | | | | |
Class B: | | | | | | | | | |
Sold | | | | 11,272 | | | | 19,966 | |
Issued for distributions reinvested | | | | 2,845 | | | | 4,735 | |
Redeemed | | | | (28,637 | ) | | | (90,020 | ) |
Converted to Class A (a) | | | | (147,125 | ) | | | — | |
Net decrease in Class B shares outstanding | | | | (161,645 | ) | | | (65,319 | ) |
| | | | | | | | | | |
Advisor Class: | | | | | | | | | |
Sold | | | | 4,017,946 | | | | 7,214,671 | |
Issued for distributions reinvested | | | | 562,605 | | | | 609,298 | |
Redeemed | | | | (22,966,280 | ) | | | (2,317,779 | ) |
Issued from merger (Note 9) | | | | — | | | | — | |
Net increase (decrease) in Advisor Class shares outstanding | | | | (18,385,729 | ) | | | 5,506,190 | |
| | | | | | | | | | |
Institutional Class: | | | | | | | | | |
Sold | | | | 430,263 | | | | 469,939 | |
Issued for distributions reinvested | | | | 5,680 | | | | 7,379 | |
Redeemed | | | | (724,416 | ) | | | (568,845 | ) |
Issued from merger (Note 9) | | | | — | | | | — | |
Net increase (decrease) in Institutional Class shares outstanding | | | | (288,473 | ) | | | (91,527 | ) |
(a) | All Class B shares were converted into Class A on June 14, 2019. |
See notes to financial statements
256
| | | LIMITED
DURATION
BOND | | | STRATEGIC
INCOME | |
| | 2019 | | | 2018 | | | 2019 | | | 2018 | |
| | | | | | | | | | | | | | | | | |
| | | | | | | | | | | | | | | | | |
| | | | 4,079,233 | | | | 2,201,214 | | | | 2,087,007 | | | | 2,751,301 | |
| | | | 682,501 | | | | 186,493 | | | | 498,900 | | | | 559,375 | |
| | | | (8,074,919 | ) | | | (2,359,440 | ) | | | (4,409,875 | ) | | | (3,850,452 | ) |
| | | | — | | | | 20,370,413 | | | | — | | | | — | |
| | | | N/A | | | | N/A | | | | N/A | | | | N/A | |
| | | | (3,313,185 | ) | | | 20,398,680 | | | | (1,823,968 | ) | | | (539,776 | ) |
| | | | | | | | | | | | | | | | | |
| | | | | | | | | | | | | | | | | |
| | | | N/A | | | | N/A | | | | N/A | | | | N/A | |
| | | | N/A | | | | N/A | | | | N/A | | | | N/A | |
| | | | N/A | | | | N/A | | | | N/A | | | | N/A | |
| | | | N/A | | | | N/A | | | | N/A | | | | N/A | |
| | | | N/A | | | | N/A | | | | N/A | | | | N/A | |
| | | | | | | | | | | | | | | | | |
| | | | | | | | | | | | | | | | | |
| | | | 19,055,875 | | | | 1,094,702 | | | | 49,781 | | | | 29,671 | |
| | | | 222,074 | | | | 104,635 | | | | 2,842 | | | | 3,038 | |
| | | | (17,117,131 | ) | | | (722,594 | ) | | | (74,483 | ) | | | (51,305 | ) |
| | | | — | | | | 52,807 | | | | — | | | | — | |
| | | | 2,160,818 | | | | 529,550 | | | | (21,860 | ) | | | (18,596 | ) |
| | | | | | | | | | | | | | | | | |
| | | | | | | | | | | | | | | | | |
| | | | 3,860,217 | | | | 1,982,606 | | | | N/A | | | | N/A | |
| | | | 2,338 | | | | 660 | | | | N/A | | | | N/A | |
| | | | (2,948,547 | ) | | | (2,084,636 | ) | | | N/A | | | | N/A | |
| | | | — | | | | 111 | | | | N/A | | | | N/A | |
| | | | 914,008 | | | | (101,259 | ) | | | N/A | | | | N/A | |
257
Statements of Changes in Net Assets
FIRST INVESTORS EQUITY FUNDS
| | | | COVERED
CALL
STRATEGY | |
Year Ended September 30 | | | 2019 | | | 2018 | |
Increase (Decrease) in Net Assets From Operations | | | | | | | | | |
Net investment income (loss) | | | $ | 3,750,010 | | | $ | 3,655,040 | |
Net realized gain (loss) on investments, options contracts and foreign exchange contracts | | | | (12,573,241 | ) | | | (11,113,260 | ) |
Net unrealized appreciation (depreciation) of investments, options contracts, and foreign exchange contracts | | | | 8,864,550 | | | | 28,590,946 | |
Net increase (decrease) in net assets resulting from operations | | | | 41,319 | | | | 21,132,726 | |
| | | | | | | | | | |
Distributions to Shareholders1 | | | | | | | | | |
Class A | | | | (2,445,494 | ) | | | | |
Class B | | | | N/A | | | | | |
Advisor Class | | | | (1,174,712 | ) | | | | |
Institutional Class | | | | (33,338 | ) | | | | |
Total distributions | | | | (3,653,544 | ) | | | | |
| | | | | | | | | | |
Net investment income-Class A | | | | | | | | (1,952,791 | ) |
Net investment income-Class B | | | | | | | | N/A | |
Net investment income-Advisor Class | | | | | | | | (1,622,620 | ) |
Net investment income-Institutional Class | | | | | | | | (70,317 | ) |
Net realized gains-Class A | | | | | | | | — | |
Net realized gains-Class B | | | | | | | | N/A | |
Net realized gains-Advisor Class | | | | | | | | — | |
Net realized gains-Institutional Class | | | | | | | | — | |
Total distributions | | | | | | | | (3,645,728 | ) |
| | | | | | | | | | |
Share Transactions | | | | | | | | | |
Class A: | | | | | | | | | |
Proceeds from shares sold | | | | 44,574,129 | | | | 94,094,747 | |
Reinvestment of distributions | | | | 2,403,312 | | | | 1,920,181 | |
Cost of shares redeemed | | | | (71,836,104 | ) | | | (37,816,465 | ) |
Shares issued in conversion (a) | | | | N/A | | | | — | |
| | | | | (24,858,663 | ) | | | 58,198,463 | |
Class B: | | | | | | | | | |
Proceeds from shares sold | | | | N/A | | | | N/A | |
Reinvestment of distributions | | | | N/A | | | | N/A | |
Cost of shares redeemed | | | | N/A | | | | N/A | |
Shares converted to Class A (a) | | | | N/A | | | | N/A | |
| | | | | N/A | | | | N/A | |
Advisor Class | | | | | | | | | |
Proceeds from shares sold | | | | 55,309,828 | | | | 78,790,539 | |
Reinvestment of distributions | | | | 1,083,507 | | | | 1,471,618 | |
Cost of shares redeemed | | | | (101,320,736 | ) | | | (80,989,357 | ) |
| | | | | (44,927,401 | ) | | | (727,200 | ) |
Institutional Class | | | | | | | | | |
Proceeds from shares sold | | | | 307,194 | | | | 4,814,072 | |
Reinvestment of distributions | | | | 33,020 | | | | 53,560 | |
Cost of shares redeemed | | | | (1,727,818 | ) | | | (9,324,730 | ) |
| | | | | (1,387,604 | ) | | | (4,457,098 | ) |
Net increase (decrease) from share transactions | | | | (71,173,668 | ) | | | 53,014,165 | |
Net increase (decrease) in net assets | | | | (74,785,893 | ) | | | 70,501,163 | |
1 | The S.E.C. eliminated the requirement to disclose components of distributions paid to shareholders in September 2018. |
(a) | All Class B shares were converted into Class A shares on June 14, 2019. |
See notes to financial statements
258
| | | EQUITY
INCOME | | | GLOBAL | | | GROWTH &
INCOME | |
| | 2019 | | | 2018 | | | 2019 | | | 2018 | | | 2019 | | | 2018 | |
| | | | | | | | | | | | | | | | | | | | | | | | | |
| | | $ | 8,879,846 | | | $ | 15,912,426 | | | $ | 3,967,886 | | | $ | (95,148 | ) | | $ | 22,841,340 | | | $ | 20,857,373 | |
| | | | 33,813,012 | | | | 66,166,488 | | | | (6,888,442 | ) | | | 76,449,694 | | | | 191,416,436 | | | | 251,442,108 | |
| | | | (38,030,962 | ) | | | (28,255,152 | ) | | | (4,967,086 | ) | | | (14,156,614 | ) | | | (189,978,012 | ) | | | (88,486,835 | ) |
| | | | 4,661,896 | | | | 53,823,762 | | | | (7,887,642 | ) | | | 62,197,932 | | | | 24,279,764 | | | | 183,812,646 | |
| | | | | | | | | | | | | | | | | | | | | | | | | |
| | | | | | | | | | | | | | | | | | | | | | | | | |
| | | | (67,899,359 | ) | | | | | | | (43,940,031 | ) | | | | | | | (285,704,754 | ) | | | | |
| | | | (286,459 | ) | | | | | | | (324,786 | ) | | | | | | | (2,023,413 | ) | | | | |
| | | | (9,736,043 | ) | | | | | | | (25,969,559 | ) | | | | | | | (25,839,515 | ) | | | | |
| | | | (284,978 | ) | | | | | | | (407,474 | ) | | | | | | | (1,676,586 | ) | | | | |
| | | | (78,206,839 | ) | | | | | | | (70,641,850 | ) | | | | | | | (315,244,268 | ) | | | | |
| | | | | | | | | | | | | | | | | | | | | | | | | |
| | | | | | | | (8,670,001 | ) | | | | | | | (1,904,849 | ) | | | | | | | (22,103,552 | ) |
| | | | | | | | (25,598 | ) | | | | | | | (11,555 | ) | | | | | | | (49,489 | ) |
| | | | | | | | (1,505,409 | ) | | | | | | | (1,156,269 | ) | | | | | | | (2,741,388 | ) |
| | | | | | | | (45,395 | ) | | | | | | | (22,952 | ) | | | | | | | (192,263 | ) |
| | | | | | | | (18,700,796 | ) | | | | | | | (27,517,933 | ) | | | | | | | (66,425,749 | ) |
| | | | | | | | (94,816 | ) | | | | | | | (225,878 | ) | | | | | | | (577,823 | ) |
| | | | | | | | (2,533,033 | ) | | | | | | | (14,205,335 | ) | | | | | | | (6,908,711 | ) |
| | | | | | | | (76,275 | ) | | | | | | | (273,391 | ) | | | | | | | (435,766 | ) |
| | | | | | | | (31,651,323 | ) | | | | | | | (45,318,162 | ) | | | | | | | (99,434,741 | ) |
| | | | | | | | | | | | | | | | | | | | | | | | | |
| | | | | | | | | | | | | | | | | | | | | | | | | |
| | | | | | | | | | | | | | | | | | | | | | | | | |
| | | | 39,233,964 | | | | 44,822,381 | | | | 25,951,227 | | | | 34,440,747 | | | | 95,233,130 | | | | 105,256,985 | |
| | | | 66,810,971 | | | | 27,012,430 | | | | 43,193,288 | | | | 29,037,446 | | | | 282,926,826 | | | | 87,791,227 | |
| | | | (124,019,685 | ) | | | (110,386,174 | ) | | | (68,689,497 | ) | | | (59,239,612 | ) | | | (313,279,311 | ) | | | (292,506,030 | ) |
| | | | 2,122,225 | | | | — | | | | 1,867,835 | | | | — | | | | 9,465,453 | | | | — | |
| | | | (15,852,525 | ) | | | (38,551,363 | ) | | | 2,322,853 | | | | 4,238,581 | | | | 74,346,098 | | | | (99,457,818 | ) |
| | | | | | | | | | | | | | | | | | | | | | | | | |
| | | | 93,212 | | | | 201,399 | | | | 77,755 | | | | 219,425 | | | | 320,127 | | | | 1,021,175 | |
| | | | 286,459 | | | | 120,221 | | | | 324,786 | | | | 237,434 | | | | 2,019,655 | | | | 624,919 | |
| | | | (464,378 | ) | | | (855,935 | ) | | | (398,084 | ) | | | (785,500 | ) | | | (2,518,784 | ) | | | (4,493,704 | ) |
| | | | (2,122,225 | ) | | | — | | | | (1,867,835 | ) | | | — | | | | (9,465,453 | ) | | | — | |
| | | | (2,206,932 | ) | | | (534,315 | ) | | | (1,863,378 | ) | | | (328,641 | ) | | | (9,644,455 | ) | | | (2,847,610 | ) |
| | | | | | | | | | | | | | | | | | | | | | | | | |
| | | | 9,803,002 | | | | 28,883,060 | | | | 118,947,331 | | | | 71,565,214 | | | | 92,583,930 | | | | 52,008,514 | |
| | | | 9,664,501 | | | | 3,361,847 | | | | 25,895,633 | | | | 14,647,751 | | | | 25,657,982 | | | | 9,135,941 | |
| | | | (86,468,280 | ) | | | (26,068,634 | ) | | | (271,864,556 | ) | | | (56,286,039 | ) | | | (215,436,743 | ) | | | (91,647,543 | ) |
| | | | (67,000,777 | ) | | | 6,176,273 | | | | (127,021,592 | ) | | | 29,926,926 | | | | (97,194,831 | ) | | | (30,503,088 | ) |
| | | | | | | | | | | | | | | | | | | | | | | | | |
| | | | 1,785,192 | | | | 1,347,183 | | | | 357,949 | | | | 572,083 | | | | 709,788 | | | | 887,827 | |
| | | | 284,977 | | | | 121,670 | | | | 407,474 | | | | 296,343 | | | | 1,676,586 | | | | 628,029 | |
| | | | (2,892,185 | ) | | | (1,209,375 | ) | | | (2,717,006 | ) | | | (383,485 | ) | | | (6,215,502 | ) | | | (1,802,340 | ) |
| | | | (822,016 | ) | | | 259,478 | | | | (1,951,583 | ) | | | 484,941 | | | | (3,829,128 | ) | | | (286,484 | ) |
| | | | (85,882,250 | ) | | | (32,649,927 | ) | | | (128,513,700 | ) | | | 34,321,807 | | | | (36,322,316 | ) | | | (133,095,000 | ) |
| | | | (159,427,193 | ) | | | (10,477,488 | ) | | | (207,043,192 | ) | | | 51,201,577 | | | | (327,286,820 | ) | | | (48,717,095 | ) |
259
Statements of Changes in Net Assets
FIRST INVESTORS EQUITY FUNDS
| | | | COVERED
CALL
STRATEGY | |
Year Ended September 30 | | | 2019 | | | 2018 | |
Net Assets | | | | | | | | | |
Beginning of year | | | $ | 354,291,070 | | | $ | 283,789,907 | |
End of year2 | | | $ | 279,505,177 | | | $ | 354,291,070 | |
| | | | | | | | | | |
Shares Issued and Redeemed | | | | | | | | | |
Class A: | | | | | | | | | |
Sold | | | | 3,985,940 | | | | 8,228,315 | |
Issued for distributions reinvested | | | | 218,650 | | | | 168,270 | |
Redeemed | | | | (6,306,714 | ) | | | (3,301,288 | ) |
Issued in conversion (a) | | | | N/A | | | | N/A | |
Net increase (decrease) in Class A shares outstanding | | | | (2,102,124 | ) | | | 5,095,297 | |
| | | | | | | | | | |
Class B: | | | | | | | | | |
Sold | | | | N/A | | | | N/A | |
Issued for distributions reinvested | | | | N/A | | | | N/A | |
Redeemed | | | | N/A | | | | N/A | |
Converted to Class A (a) | | | | N/A | | | | N/A | |
Net decrease in Class B shares outstanding | | | | N/A | | | | N/A | |
| | | | | | | | | | |
Advisor Class | | | | | | | | | |
Sold | | | | 4,880,542 | | | | 6,898,774 | |
Issued for distributions reinvested | | | | 99,537 | | | | 129,933 | |
Redeemed | | | | (9,039,296 | ) | | | (7,147,405 | ) |
Net increase (decrease) in Advisor Class shares outstanding | | | | (4,059,217 | ) | | | (118,698 | ) |
| | | | | | | | | | |
Institutional Class: | | | | | | | | | |
Sold | | | | 28,045 | | | | 414,848 | |
Issued for distributions reinvested | | | | 3,036 | | | | 4,796 | |
Redeemed | | | | (153,194 | ) | | | (827,929 | ) |
Net increase (decrease) in Institutional Class shares outstanding | | | | (122,113 | ) | | | (408,285 | ) |
2 | The S.E.C. eliminated the requirement to disclose undistributed net investment income in September 2018. For the year ended September 30, 2018 net assets included undistributed net investment income (deficit) of $41,035, $5,660,088, $(426,580) and $147,252, respectively on the Covered Call Strategy, Equity Income, Global and Growth & Income Funds. |
(a) | All Class B shares were converted into Class A shares on June 14, 2019. |
See notes to financial statements
260
| | | EQUITY
INCOME | | | GLOBAL | | | GROWTH &
INCOME | |
| | 2019 | | | 2018 | | | 2019 | | | 2018 | | | 2019 | | | 2018 | |
| | | | | | | | | | | | | | | | | | | | | | | | | |
| | | $ | 631,257,305 | | | $ | 641,734,793 | | | $ | 628,658,668 | | | $ | 577,457,091 | | | $ | 1,818,873,466 | | | $ | 1,867,590,561 | |
| | | $ | 471,830,112 | | | $ | 631,257,305 | | | $ | 421,615,476 | | | $ | 628,658,668 | | | $ | 1,491,586,646 | | | $ | 1,818,873,466 | |
| | | | | | | | | | | | | | | | | | | | | | | | | |
| | | | | | | | | | | | | | | | | | | | | | | | | |
| | | | | | | | | | | | | | | | | | | | | | | | | |
| | | | 4,093,224 | | | | 4,119,724 | | | | 3,505,101 | | | | 3,964,795 | | | | 4,806,672 | | | | 4,423,019 | |
| | | | 7,811,540 | | | | 2,490,655 | | | | 6,812,821 | | | | 3,469,229 | | | | 16,609,882 | | | | 3,692,262 | |
| | | | (12,957,709 | ) | | | (10,148,853 | ) | | | (9,301,139 | ) | | | (6,828,948 | ) | | | (15,851,008 | ) | | | (12,290,013 | ) |
| | | | 225,289 | | | | — | | | | 256,571 | | | | — | | | | 492,479 | | | | — | |
| | | | (827,656 | ) | | | (3,538,474 | ) | | | 1,273,354 | | | | 605,076 | | | | 6,058,025 | | | | (4,174,732 | ) |
| | | | | | | | | | | | | | | | | | | | | | | | | |
| | | | | | | | | | | | | | | | | | | | | | | | | |
| | | | 9,779 | | | | 18,977 | | | | 13,695 | | | | 32,543 | | | | 16,927 | | | | 46,327 | |
| | | | 34,733 | | | | 11,300 | | | | 69,696 | | | | 36,528 | | | | 131,250 | | | | 28,301 | |
| | | | (49,821 | ) | | | (80,753 | ) | | | (72,371 | ) | | | (116,586 | ) | | | (137,042 | ) | | | (204,976 | ) |
| | | | (231,179 | ) | | | — | | | | (350,438 | ) | | | — | | | | (542,744 | ) | | | — | |
| | | | (236,488 | ) | | | (50,476 | ) | | | (339,418 | ) | | | (47,515 | ) | | | (531,609 | ) | | | (130,348 | ) |
| | | | | | | | | | | | | | | | | | | | | | | | | |
| | | | | | | | | | | | | | | | | | | | | | | | | |
| | | | 1,007,631 | | | | 2,642,494 | | | | 15,755,958 | | | | 8,059,994 | | | | 4,759,495 | | | | 2,169,824 | |
| | | | 1,129,571 | | | | 308,539 | | | | 3,965,640 | | | | 1,711,186 | | | | 1,493,783 | | | | 381,959 | |
| | | | (9,157,830 | ) | | | (2,396,645 | ) | | | (35,292,779 | ) | | | (6,358,513 | ) | | | (10,952,002 | ) | | | (3,879,094 | ) |
| | | | (7,020,628 | ) | | | 554,388 | | | | (15,571,181 | ) | | | 3,412,667 | | | | (4,698,724 | ) | | | (1,327,311 | ) |
| | | | | | | | | | | | | | | | | | | | | | | | | |
| | | | | | | | | | | | | | | | | | | | | | | | | |
| | | | 170,775 | | | | 123,985 | | | | 46,725 | | | | 64,095 | | | | 35,949 | | | | 37,066 | |
| | | | 33,369 | | | | 11,208 | | | | 61,926 | | | | 34,458 | | | | 97,916 | | | | 26,328 | |
| | | | (283,093 | ) | | | (114,962 | ) | | | (345,679 | ) | | | (42,873 | ) | | | (304,391 | ) | | | (75,271 | ) |
| | | | (78,949 | ) | | | 20,231 | | | | (237,028 | ) | | | 55,680 | | | | (170,526 | ) | | | (11,877 | ) |
261
Statements of Changes in Net Assets
FIRST INVESTORS EQUITY FUNDS
| | | | HEDGED
U.S. EQUITY
OPPORTUNITIES | |
Year Ended September 30 | | | 2019 | | | 2018 | |
Increase (Decrease) in Net Assets From Operations | | | | | | | | | |
Net investment income (loss) | | | $ | 288,569 | | | $ | (23,541 | ) |
Net realized gain (loss) on investments, options and futures contracts, and foreign exchange contracts | | | | 12,517,641 | | | | 1,451,960 | |
Net unrealized appreciation (depreciation) of investments, options and futures contracts, and foreign exchange contracts | | | | 3,210,979 | | | | 11,112,390 | |
Net increase in net assets resulting from operations | | | | 16,017,189 | | | | 12,540,809 | |
| | | | | | | | | | |
Distributions to Shareholders1 | | | | | | | | | |
Class A | | | | (1,268,295 | ) | | | | |
Class B | | | | N/A | | | | | |
Advisor Class | | | | (1,748,223 | ) | | | | |
Institutional Class | | | | (9,534 | ) | | | | |
| | | | | (3,026,052 | ) | | | | |
| | | | | | | | | | |
Net investment income-Class A | | | | | | | | — | |
Net investment income-Class B | | | | | | | | N/A | |
Net investment income-Advisor Class | | | | | | | | — | |
Net investment income-Institutional Class | | | | | | | | — | |
Net realized gains-Class A | | | | | | | | — | |
Net realized gains-Class B | | | | | | | | N/A | |
Net realized gains-Advisor Class | | | | | | | | — | |
Net realized gains-Institutional Class | | | | | | | | — | |
Total distributions | | | | | | | | — | |
| | | | | | | | | | |
Share Transactions | | | | | | | | | |
Class A: | | | | | | | | | |
Proceeds from shares sold | | | | 24,887,381 | | | | 29,210,518 | |
Reinvestment of distributions | | | | 1,255,237 | | | | — | |
Cost of shares redeemed | | | | (18,330,956 | ) | | | (12,110,889 | ) |
Shares issued in conversion (a) | | | | N/A | | | | — | |
| | | | | 7,811,662 | | | | 17,099,629 | |
Class B: | | | | | | | | | |
Proceeds from shares sold | | | | N/A | | | | N/A | |
Reinvestment of distributions | | | | N/A | | | | N/A | |
Cost of shares redeemed | | | | N/A | | | | N/A | |
Shares converted to Class A (a) | | | | N/A | | | | N/A | |
| | | | | N/A | | | | N/A | |
Advisor Class: | | | | | | | | | |
Proceeds from shares sold | | | | 157,532,297 | | | | 76,712,079 | |
Reinvestment of distributions | | | | 1,740,439 | | | | — | |
Cost of shares redeemed | | | | (218,918,208 | ) | | | (22,597,701 | ) |
| | | | | (59,645,472 | ) | | | 54,114,378 | |
Institutional Class | | | | | | | | | |
Proceeds from shares sold | | | | 254,983 | | | | 276,139 | |
Reinvestment of distributions | | | | 9,534 | | | | — | |
Cost of shares redeemed | | | | (515,075 | ) | | | (226,176 | ) |
| | | | | (250,558 | ) | | | 49,963 | |
Net increase (decrease) from share transactions | | | | (52,084,368 | ) | | | 71,263,970 | |
Net increase (decrease) in net assets | | | | (39,093,231 | ) | | | 83,804,779 | |
1 | The S.E.C. eliminated the requirement to disclose components of distributions paid to shareholders in September 2018. |
(a) | All Class B shares were converted into Class A shares on June 14, 2019. |
See notes to financial statements
262
| | | INTERNATIONAL | | | OPPORTUNITY | | | PREMIUM
INCOME | |
| | 2019 | | | 2018 | | | 2019 | | | 2018 | | | 2019 | | | 2018 | |
| | | | | | | | | | | | | | | | | | | | | | | | | |
| | | $ | 1,137,496 | | | $ | 846,265 | | | $ | 3,693,300 | | | $ | 11,171,649 | | | $ | 2,116,901 | | | $ | 366,478 | |
| | | | 21,649,781 | | | | 28,737,160 | | | | 107,728,650 | | | | 75,396,234 | | | | 3,452,367 | | | | (375,632 | ) |
| | | | 6,761,884 | | | | (23,085,239 | ) | | | (108,217,293 | ) | | | (14,746,162 | ) | | | (2,128,498 | ) | | | 1,138,583 | |
| | | | 29,549,161 | | | | 6,498,186 | | | | 3,204,657 | | | | 71,821,721 | | | | 3,440,770 | | | | 1,129,429 | |
| | | | | | | | | | | | | | | | | | | | | | | | | |
| | | | | | | | | | | | | | | | | | | | | | | | | |
| | | | (16,053,838 | ) | | | | | | | (89,968,893 | ) | | | | | | | (2,048,419 | ) | | | | |
| | | | (72,818 | ) | | | | | | | (687,500 | ) | | | | | | | N/A | | | | | |
| | | | (8,663,047 | ) | | | | | | | (13,689,378 | ) | | | | | | | (2,126,770 | ) | | | | |
| | | | (183,424 | ) | | | | | | | (437,316 | ) | | | | | | | (20,972 | ) | | | | |
| | | | (24,973,127 | ) | | | | | | | (104,783,087 | ) | | | | | | | (4,196,161 | ) | | | | |
| | | | | | | | | | | | | | | | | | | | | | | | | |
| | | | | | | | (275,588 | ) | | | | | | | (2,804,178 | ) | | | | | | | (148,277 | ) |
| | | | | | | | — | | | | | | | | (14,370 | ) | | | | | | | N/A | |
| | | | | | | | (239,073 | ) | | | | | | | (288,632 | ) | | | | | | | (114,909 | ) |
| | | | | | | | (7,737 | ) | | | | | | | (22,342 | ) | | | | | | | (84,004 | ) |
| | | | | | | | — | | | | | | | | (56,621,327 | ) | | | | | | | — | |
| | | | | | | | — | | | | | | | | (518,174 | ) | | | | | | | N/A | |
| | | | | | | | — | | | | | | | | (4,684,317 | ) | | | | | | | — | |
| | | | | | | | — | | | | | | | | (323,573 | ) | | | | | | | — | |
| | | | | | | | (522,398 | ) | | | | | | | (65,276,913 | ) | | | | | | | (347,190 | ) |
| | | | | | | | | | | | | | | | | | | | | | | | | |
| | | | | | | | | | | | | | | | | | | | | | | | | |
| | | | | | | | | | | | | | | | | | | | | | | | | |
| | | | 29,586,000 | | | | 58,126,902 | | | | 80,865,931 | | | | 103,692,905 | | | | 32,786,671 | | | | 44,677,901 | |
| | | | 15,918,971 | | | | 273,396 | | | | 89,198,488 | | | | 59,060,707 | | | | 2,001,143 | | | | 143,012 | |
| | | | (59,056,317 | ) | | | (41,313,524 | ) | | | (184,561,093 | ) | | | (160,025,421 | ) | | | (15,332,080 | ) | | | (3,460,167 | ) |
| | | | 1,047,200 | | | | — | | | | 4,981,232 | | | | — | | | | N/A | | | | — | |
| | | | (12,504,146 | ) | | | 17,086,774 | | | | (9,515,442 | ) | | | 2,728,191 | | | | 19,455,734 | | | | 41,360,746 | |
| | | | | | | | | | | | | | | | | | | | | | | | | |
| | | | 34,643 | | | | 126,139 | | | | 202,837 | | | | 551,389 | | | | N/A | | | | N/A | |
| | | | 72,635 | | | | — | | | | 684,857 | | | | 530,291 | | | | N/A | | | | N/A | |
| | | | (242,292 | ) | | | (369,272 | ) | | | (1,207,443 | ) | | | (2,298,990 | ) | | | N/A | | | | N/A | |
| | | | (1,047,200 | ) | | | — | | | | (4,981,232 | ) | | | — | | | | N/A | | | | N/A | |
| | | | (1,182,214 | ) | | | (243,133 | ) | | | (5,300,981 | ) | | | (1,217,310 | ) | | | N/A | | | | N/A | |
| | | | | | | | | | | | | | | | | | | | | | | | | |
| | | | 138,845,397 | | | | 52,322,028 | | | | 25,710,508 | | | | 80,413,897 | | | | 77,670,239 | | | | 35,759,296 | |
| | | | 8,630,971 | | | | 222,902 | | | | 13,608,679 | | | | 4,553,410 | | | | 2,001,731 | | | | 108,996 | |
| | | | (86,942,993 | ) | | | (29,315,834 | ) | | | (163,748,110 | ) | | | (18,910,762 | ) | | | (45,830,176 | ) | | | (1,946,404 | ) |
| | | | 60,533,375 | | | | 23,229,096 | | | | (124,428,923 | ) | | | 66,056,545 | | | | 33,841,794 | | | | 33,921,888 | |
| | | | | | | | | | | | | | | | | | | | | | | | | |
| | | | 333,252 | | | | 896,876 | | | | 652,202 | | | | 1,044,609 | | | | 27,464 | | | | 16,026,765 | |
| | | | 183,425 | | | | 7,737 | | | | 437,316 | | | | 345,915 | | | | 15,731 | | | | 20,648 | |
| | | | (2,625,255 | ) | | | (737,330 | ) | | | (4,052,940 | ) | | | (1,339,746 | ) | | | (3,618,214 | ) | | | (12,377,267 | ) |
| | | | (2,108,578 | ) | | | 167,283 | | | | (2,963,422 | ) | | | 50,778 | | | | (3,575,019 | ) | | | 3,670,146 | |
| | | | 44,738,437 | | | | 40,240,020 | | | | (142,208,768 | ) | | | 67,618,204 | | | | 49,722,509 | | | | 78,952,780 | |
| | | | 49,314,471 | | | | 46,215,808 | | | | (243,787,198 | ) | | | 74,163,012 | | | | 48,967,118 | | | | 79,735,019 | |
263
Statements of Changes in Net Assets
FIRST INVESTORS EQUITY FUNDS
| | | | HEDGED
U.S. EQUITY
OPPORTUNITIES | |
Year Ended September 30 | | | 2019 | | | 2018 | |
Net Assets | | | | | | | | | |
Beginning of year | | | $ | 162,274,535 | | | $ | 78,469,756 | |
End of year2 | | | $ | 123,181,304 | | | $ | 162,274,535 | |
| | | | | | | | | | |
Shares Issued and Redeemed | | | | | | | | | |
Class A: | | | | | | | | | |
Sold | | | | 2,150,509 | | | | 2,558,901 | |
Issued for distributions reinvested | | | | 119,206 | | | | — | |
Redeemed | | | | (1,540,989 | ) | | | (1,057,699 | ) |
Issued in conversion (a) | | | | N/A | | | | N/A | |
Net increase (decrease) in Class A shares outstanding | | | | 728,726 | | | | 1,501,202 | |
| | | | | | | | | | |
Class B: | | | | | | | | | |
Sold | | | | N/A | | | | N/A | |
Issued for distributions reinvested | | | | N/A | | | | N/A | |
Redeemed | | | | N/A | | | | N/A | |
Converted to Class A (a) | | | | N/A | | | | N/A | |
Net decrease in Class B shares outstanding | | | | N/A | | | | N/A | |
| | | | | | | | | | |
Advisor Class: | | | | | | | | | |
Sold | | | | 13,176,303 | | | | 6,763,670 | |
Issued for distributions reinvested | | | | 164,038 | | | | — | |
Redeemed | | | | (17,694,623 | ) | | | (1,965,792 | ) |
Net increase (decrease) in Advisor Class shares outstanding | | | | (4,354,282 | ) | | | 4,797,878 | |
| | | | | | | | | | |
Institutional Class: | | | | | | | | | |
Sold | | | | 21,405 | | | | 24,135 | |
Issued for distributions reinvested | | | | 896 | | | | — | |
Redeemed | | | | (42,838 | ) | | | (19,944 | ) |
Net increase (decrease) in Institutional Class shares outstanding | | | | (20,537 | ) | | | 4,191 | |
2 | The S.E.C. eliminated the requirement to disclose undistributed net investment income in September 2018. For the year ended September 30, 2018 net assets included undistributed net investment income (deficit) of $(4,522), $619,607, $10,465,942 and $19,288, respectively on the Hedged U.S. Equity Opportunities, International, Opportunity and Premium Income Funds. |
(a) | All Class B shares were converted into Class A shares on June 14, 2019. |
See notes to financial statements
264
| | | INTERNATIONAL | | | OPPORTUNITY | | | PREMIUM
INCOME | |
| | 2019 | | | 2018 | | | 2019 | | | 2018 | | | 2019 | | | 2018 | |
| | | | | | | | | | | | | | | | | | | | | | | | | |
| | | $ | 401,058,728 | | | $ | 354,842,920 | | | $ | 1,171,789,115 | | | $ | 1,097,626,103 | | | $ | 79,735,019 | | | $ | — | |
| | | $ | 450,373,199 | | | $ | 401,058,728 | | | $ | 928,001,917 | | | $ | 1,171,789,115 | | | $ | 128,702,137 | | | $ | 79,735,019 | |
| | | | | | | | | | | | | | | | | | | | | | | | | |
| | | | | | | | | | | | | | | | | | | | | | | | | |
| | | | | | | | | | | | | | | | | | | | | | | | | |
| | | | 1,984,404 | | | | 3,590,666 | | | | 2,208,172 | | | | 2,472,473 | | | | 3,248,351 | | | | 4,385,757 | |
| | | | 1,218,911 | | | | 16,773 | | | | 2,871,812 | | | | 1,413,612 | | | | 199,417 | | | | 14,023 | |
| | | | (3,907,855 | ) | | | (2,553,601 | ) | | | (5,017,572 | ) | | | (3,815,117 | ) | | | (1,512,611 | ) | | | (338,239 | ) |
| | | | 68,624 | | | | — | | | | 136,323 | | | | — | | | | N/A | | | | N/A | |
| | | | (635,916 | ) | | | 1,053,838 | | | | 198,735 | | | | 70,968 | | | | 1,935,157 | | | | 4,061,541 | |
| | | | | | | | | | | | | | | | | | | | | | | | | |
| | | | | | | | | | | | | | | | | | | | | | | | | |
| | | | 2,681 | | | | 8,386 | | | | 7,413 | | | | 17,104 | | | | N/A | | | | N/A | |
| | | | 6,043 | | | | — | | | | 29,959 | | | | 16,499 | | | | N/A | | | | N/A | |
| | | | (17,747 | ) | | | (24,704 | ) | | | (44,269 | ) | | | (71,493 | ) | | | N/A | | | | N/A | |
| | | | (74,800 | ) | | | — | | | | (185,936 | ) | | | — | | | | N/A | | | | N/A | |
| | | | (83,823 | ) | | | (16,318 | ) | | | (192,833 | ) | | | (37,890 | ) | | | N/A | | | | N/A | |
| | | | | | | | | | | | | | | | | | | | | | | | | |
| | | | | | | | | | | | | | | | | | | | | | | | | |
| | | | 8,826,954 | | | | 3,187,640 | | | | 691,255 | | | | 1,895,352 | | | | 7,684,713 | | | | 3,508,615 | |
| | | | 648,458 | | | | 13,468 | | | | 428,350 | | | | 107,063 | | | | 199,392 | | | | 10,710 | |
| | | | (5,518,155 | ) | | | (1,782,051 | ) | | | (4,336,855 | ) | | | (439,869 | ) | | | (4,532,696 | ) | | | (190,244 | ) |
| | | | 3,957,257 | | | | 1,419,057 | | | | (3,217,250 | ) | | | 1,562,546 | | | | 3,351,409 | | | | 3,329,081 | |
| | | | | | | | | | | | | | | | | | | | | | | | | |
| | | | | | | | | | | | | | | | | | | | | | | | | |
| | | | 22,233 | | | | 54,037 | | | | 17,522 | | | | 24,450 | | | | 2,832 | | | | 1,581,172 | |
| | | | 13,729 | | | | 466 | | | | 13,787 | | | | 8,149 | | | | 2,970 | | | | 2,046 | |
| | | | (168,329 | ) | | | (44,299 | ) | | | (106,041 | ) | | | (31,085 | ) | | | (382,162 | ) | | | (1,201,695 | ) |
| | | | (132,367 | ) | | | 10,204 | | | | (74,732 | ) | | | 1,514 | | | | (376,360 | ) | | | 381,523 | |
265
Statements of Changes in Net Assets
FIRST INVESTORS EQUITY FUNDS
| | | | SELECT
GROWTH | |
Year Ended September 30 | | | 2019 | | | 2018 | |
Increase (Decrease) in Net Assets From Operations | | | | | | | | | |
Net investment income | | | $ | 1,760,472 | | | $ | 150,706 | |
Net realized gain on investments | | | | 59,410,250 | | | | 36,073,320 | |
Net unrealized appreciation (depreciation) of investments | | | | (106,507,568 | ) | | | 98,924,921 | |
Net increase (decrease) in net assets resulting from operations | | | | (45,336,846 | ) | | | 135,148,947 | |
| | | | | | | | | | |
Distributions to Shareholders1 | | | | | | | | | |
Class A | | | | (26,782,811 | ) | | | | |
Class B | | | | (154,240 | ) | | | | |
Advisor Class | | | | (9,136,425 | ) | | | | |
Institutional Class | | | | (308,565 | ) | | | | |
| | | | | (36,382,041 | ) | | | | |
| | | | | | | | | | |
Net investment income-Class A | | | | | | | | (239,159 | ) |
Net investment income-Class B | | | | | | | | — | |
Net investment income-Advisor Class | | | | | | | | (130,189 | ) |
Net investment income-Institutional Class | | | | | | | | (8,316 | ) |
Net realized gains-Class A | | | | | | | | (39,548,693 | ) |
Net realized gains-Class B | | | | | | | | (318,093 | ) |
Net realized gains-Advisor Class | | | | | | | | (7,349,893 | ) |
Net realized gains-Institutional Class | | | | | | | | (445,150 | ) |
Total distributions | | | | | | | | (48,039,493 | ) |
| | | | | | | | | | |
Share Transactions | | | | | | | | | |
Class A: | | | | | | | | | |
Proceeds from shares sold | | | | 89,725,264 | | | | 104,868,480 | |
Reinvestment of distributions | | | | 26,527,802 | | | | 39,481,516 | |
Cost of shares redeemed | | | | (120,862,330 | ) | | | (83,751,760 | ) |
Shares issued from merger (Note 9) | | | | — | | | | — | |
Shares issued in conversion (a) | | | | 2,274,251 | | | | — | |
| | | | | (2,335,013 | ) | | | 60,598,236 | |
Class B: | | | | | | | | | |
Proceeds from shares sold | | | | 165,997 | | | | 272,956 | |
Reinvestment of distributions | | | | 150,066 | | | | 310,573 | |
Cost of shares redeemed | | | | (688,182 | ) | | | (1,051,710 | ) |
Shares converted to Class A (a) | | | | (2,274,251 | ) | | | — | |
| | | | | (2,646,370 | ) | | | (468,181 | ) |
Advisor Class: | | | | | | | | | |
Proceeds from shares sold | | | | 118,768,769 | | | | 129,714,140 | |
Reinvestment of distributions | | | | 9,075,112 | | | | 7,092,254 | |
Cost of shares redeemed | | | | (159,103,061 | ) | | | (44,628,910 | ) |
Shares issued from merger (Note 9) | | | | — | | | | — | |
| | | | | (31,259,180 | ) | | | 92,177,484 | |
Institutional Class | | | | | | | | | |
Proceeds from shares sold | | | | 1,197,203 | | | | 2,115,173 | |
Reinvestment of distributions | | | | 308,565 | | | | 453,466 | |
Cost of shares redeemed | | | | (4,543,171 | ) | | | (538,910 | ) |
| | | | | (3,037,403 | ) | | | 2,029,729 | |
Net increase (decrease) from share transactions | | | | (39,277,966 | ) | | | 154,337,268 | |
Net increase (decrease) in net assets | | | | (120,996,853 | ) | | | 241,446,722 | |
1 | The S.E.C. eliminated the requirement to disclose components of distributions paid to shareholders in September 2018. |
(a) | All Class B shares were converted into Class A shares on June 14, 2019. |
See notes to financial statements
266
| | | SPECIAL
SITUATIONS | | | TOTAL
RETURN | |
| | 2019 | | | 2018 | | | 2019 | | | 2018 | |
| | | | | | | | | | | | | | | | | |
| | | $ | 2,546,193 | | | $ | 1,131,375 | | | $ | 13,035,330 | | | $ | 14,170,068 | |
| | | | 37,166,502 | | | | 82,755,122 | | | | 55,471,198 | | | | 63,414,992 | |
| | | | (110,118,154 | ) | | | (31,396,357 | ) | | | (31,701,223 | ) | | | (30,583,626 | ) |
| | | | (70,405,459 | ) | | | 52,490,140 | | | | 36,805,305 | | | | 47,001,434 | |
| | | | | | | | | | | | | | | | | |
| | | | | | | | | | | | | | | | | |
| | | | (69,289,188 | ) | | | | | | | (79,846,565 | ) | | | | |
| | | | (397,669 | ) | | | | | | | (471,925 | ) | | | | |
| | | | (16,747,438 | ) | | | | | | | (105,598 | ) | | | | |
| | | | (988,798 | ) | | | | | | | (3,088,864 | ) | | | | |
| | | | (87,423,093 | ) | | | | | | | (83,512,952 | ) | | | | |
| | | | | | | | | | | | | | | | | |
| | | | | | | | (223,805 | ) | | | | | | | (15,396,814 | ) |
| | | | | | | | — | | | | | | | | (57,491 | ) |
| | | | | | | | (152,568 | ) | | | | | | | (21,110 | ) |
| | | | | | | | (12,819 | ) | | | | | | | (769,762 | ) |
| | | | | | | | (15,226,717 | ) | | | | | | | (15,297,108 | ) |
| | | | | | | | (105,510 | ) | | | | | | | (119,932 | ) |
| | | | | | | | (3,496,476 | ) | | | | | | | (17,418 | ) |
| | | | | | | | (235,100 | ) | | | | | | | (575,977 | ) |
| | | | | | | | (19,452,995 | ) | | | | | | | (32,255,612 | ) |
| | | | | | | | | | | | | | | | | |
| | | | | | | | | | | | | | | | | |
| | | | | | | | | | | | | | | | | |
| | | | 55,763,572 | | | | 80,670,471 | | | | 64,939,840 | | | | 73,816,412 | |
| | | | 68,590,690 | | | | 15,336,562 | | | | 78,807,381 | | | | 30,309,443 | |
| | | | (104,992,077 | ) | | | (90,637,765 | ) | | | (192,814,710 | ) | | | (156,488,239 | ) |
| | | | — | | | | — | | | | — | | | | 50,464,265 | |
| | | | 1,961,695 | | | | — | | | | 5,190,520 | | | | — | |
| | | | 21,323,880 | | | | 5,369,268 | | | | (43,876,969 | ) | | | (1,898,119 | ) |
| | | | | | | | | | | | | | | | | |
| | | | 105,962 | | | | 219,160 | | | | 361,645 | | | | 480,372 | |
| | | | 395,996 | | | | 105,121 | | | | 471,902 | | | | 177,049 | |
| | | | (467,854 | ) | | | (864,654 | ) | | | (1,228,424 | ) | | | (1,645,557 | ) |
| | | | (1,961,695 | ) | | | — | | | | (5,190,520 | ) | | | — | |
| | | | (1,927,591 | ) | | | (540,373 | ) | | | (5,585,397 | ) | | | (988,136 | ) |
| | | | | | | | | | | | | | | | | |
| | | | 27,517,981 | | | | 61,323,950 | | | | 696,193 | | | | 262,074 | |
| | | | 16,649,603 | | | | 3,459,240 | | | | 91,540 | | | | 33,393 | |
| | | | (142,584,431 | ) | | | (51,953,688 | ) | | | (568,268 | ) | | | (357,281 | ) |
| | | | — | | | | — | | | | — | | | | 51,815 | |
| | | | (98,416,847 | ) | | | 12,829,502 | | | | 219,465 | | | | (9,999 | ) |
| | | | | | | | | | | | | | | | | |
| | | | 675,600 | | | | 1,382,471 | | | | 347,661 | | | | 534,750 | |
| | | | 987,844 | | | | 247,919 | | | | 3,088,864 | | | | 1,345,739 | |
| | | | (5,468,146 | ) | | | (1,205,420 | ) | | | (34,529,019 | ) | | | (1,426,515 | ) |
| | | | (3,804,702 | ) | | | 424,970 | | | | (31,092,494 | ) | | | 453,974 | |
| | | | (82,825,260 | ) | | | 18,083,367 | | | | (80,335,395 | ) | | | (2,442,280 | ) |
| | | | (240,653,812 | ) | | | 51,120,512 | | | | (127,043,042 | ) | | | 12,303,542 | |
267
Statements of Changes in Net Assets
FIRST INVESTORS EQUITY FUNDS
| | | | SELECT
GROWTH | |
Year Ended September 30 | | | 2019 | | | 2018 | |
Net Assets | | | | | | | | | |
Beginning of year | | | $ | 775,696,205 | | | $ | 534,249,483 | |
End of year2 | | | $ | 654,699,352 | | | $ | 775,696,205 | |
| | | | | | | | | | |
Shares Issued and Redeemed | | | | | | | | | |
Class A: | | | | | | | | | |
Sold | | | | 7,344,999 | | | | 4,294,908 | |
Reinvestment of distributions | | | | 2,467,703 | | | | 5,154,994 | |
Redeemed | | | | (9,937,934 | ) | | | (5,689,031 | ) |
Issued from merger (Note 9) | | | | — | | | | — | |
Issued in conversion (a) | | | | 188,891 | | | | — | |
Net increase (decrease) in Class A shares outstanding | | | | 63,659 | | | | 3,760,871 | |
| | | | | | | | | | |
Class B: | | | | | | | | | |
Sold | | | | 17,259 | | | | 29,073 | |
Reinvestment of distributions | | | | 17,170 | | | | 57,376 | |
Redeemed | | | | (68,388 | ) | | | (121,992 | ) |
Converted to Class A (a) | | | | (232,779 | ) | | | — | |
Net decrease in Class B shares outstanding | | | | (266,738 | ) | | | (35,543 | ) |
| | | | | | | | | | |
Advisor Class: | | | | | | | | | |
Sold | | | | 9,508,471 | | | | 2,306,144 | |
Reinvestment of distributions | | | | 826,513 | | | | 957,774 | |
Redeemed | | | | (12,767,501 | ) | | | (2,480,897 | ) |
Issued from merger (Note 9) | | | | — | | | | — | |
Net increase (decrease) in Advisor Class shares outstanding | | | | (2,432,517 | ) | | | 783,021 | |
| | | | | | | | | | |
Institutional Class: | | | | | | | | | |
Sold | | | | 95,065 | | | | 81,566 | |
Reinvestment of distributions | | | | 27,950 | | | | 52,639 | |
Redeemed | | | | (359,535 | ) | | | (74,392 | ) |
Net increase (decrease) in Institutional Class shares outstanding | | | | (236,520 | ) | | | 59,813 | |
2 | The S.E.C. eliminated the requirement to disclose undistributed net investment income in September 2018. For the year ended September 30, 2018 net assets included undistributed net investment income (deficit) of $0, $812,257 and $(4,254,853), respectively on the Select Growth, Special Situations and Total Return Funds. |
(a) | All Class B shares were converted into Class A shares on June 14, 2019. |
See notes to financial statements
268
| | | SPECIAL
SITUATIONS | | | TOTAL
RETURN | |
| | 2019 | | | 2018 | | | 2019 | | | 2018 | |
| | | | | | | | | | | | | | | | | |
| | | $ | 733,606,021 | | | $ | 682,485,509 | | | $ | 931,094,393 | | | $ | 918,790,851 | |
| | | $ | 492,952,209 | | | $ | 733,606,021 | | | $ | 804,051,351 | | | $ | 931,094,393 | |
| | | | | | | | | | | | | | | | | |
| | | | | | | | | | | | | | | | | |
| | | | | | | | | | | | | | | | | |
| | | | 2,147,930 | | | | 2,502,430 | | | | 3,498,020 | | | | 3,674,984 | |
| | | | 3,073,060 | | | | 478,221 | | | | 4,657,392 | | | | 1,507,141 | |
| | | | (4,110,417 | ) | | | (2,812,100 | ) | | | (10,344,862 | ) | | | (7,795,384 | ) |
| | | | — | | | | — | | | | — | | | | 2,466,173 | |
| | | | 79,647 | | | | — | | | | 279,964 | | | | — | |
| | | | 1,190,220 | | | | 168,551 | | | | (1,909,486 | ) | | | (147,086 | ) |
| | | | | | | | | | | | | | | | | |
| | | | | | | | | | | | | | | | | |
| | | | 5,576 | | | | 9,120 | | | | 20,382 | | | | 24,453 | |
| | | | 25,368 | | | | 4,378 | | | | 28,672 | | | | 8,913 | |
| | | | (24,788 | ) | | | (35,942 | ) | | | (68,215 | ) | | | (83,813 | ) |
| | | | (114,318 | ) | | | — | | | | (285,193 | ) | | | — | |
| | | | (108,162 | ) | | | (22,444 | ) | | | (304,354 | ) | | | (50,447 | ) |
| | | | | | | | | | | | | | | | | |
| | | | | | | | | | | | | | | | | |
| | | | 1,032,850 | | | | 1,882,451 | | | | 36,742 | | | | 13,080 | |
| | | | 735,406 | | | | 106,833 | | | | 5,359 | | | | 1,653 | |
| | | | (5,548,821 | ) | | | (1,571,891 | ) | | | (30,566 | ) | | | (17,571 | ) |
| | | | — | | | | — | | | | — | | | | 2,516 | |
| | | | (3,780,565 | ) | | | 417,393 | | | | 11,535 | | | | (322 | ) |
| | | | | | | | | | | | | | | | | |
| | | | | | | | | | | | | | | | | |
| | | | 25,687 | | | | 42,180 | | | | 18,636 | | | | 26,378 | |
| | | | 43,308 | | | | 7,610 | | | | 181,206 | | | | 66,432 | |
| | | | (206,063 | ) | | | (36,480 | ) | | | (1,792,261 | ) | | | (70,281 | ) |
| | | | (137,068 | ) | | | 13,310 | | | | (1,592,419 | ) | | | 22,529 | |
269
Notes to Financial Statements
FIRST INVESTORS INCOME FUNDS
FIRST INVESTORS EQUITY FUNDS
September 30, 2019
1. Significant Accounting Policies—First Investors Income Funds (“Income Funds”) and First Investors Equity Funds (“Equity Funds”), each a Delaware statutory trust (each a “Trust”, collectively, “the Trusts”), are registered under the Investment Company Act of 1940 (the “1940 Act”) as open-end management investment companies and operate as series funds. Each Fund is an investment company and accordingly follows the investment company accounting and reporting guidance of the Financial Accounting Standard Board (“FASB”) Accounting Standard Codification Topic 946 “Financial Services – Investment Companies” including FASB Accounting Standard Update ASU 2013-08.The Income Funds issues shares of beneficial interest in the Floating Rate Fund, Fund For Income, Government Cash Management Fund, International Opportunities Bond Fund, Investment Grade Fund, Limited Duration Bond Fund and Strategic Income Fund. All Funds in the Income Funds are diversified funds except for International Opportunities Bond Fund, which is a non-diversified fund. The Equity Funds issues shares of beneficial interest in the Covered Call Strategy Fund, Equity Income Fund, Global Fund, Growth & Income Fund, Hedged U.S. Equity Opportunities Fund, International Fund, Opportunity Fund, Premium Income Fund, Select Growth Fund, Special Situations Fund and Total Return Fund. All Funds in the Equity Funds are diversified funds. The Trusts account separately for the assets, liabilities and operations of each Fund. The objective of each Fund as of September 30, 2019, is as follows:
Floating Rate Fund seeks a high level of current income.
Fund For Income seeks high current income.
Government Cash Management Fund seeks to earn a high rate of current income consistent with the preservation of capital and maintenance of liquidity.
International Opportunities Bond Fund seeks total return consisting of income and capital appreciation.
Investment Grade Fund seeks to generate a maximum level of income consistent with investment primarily in investment grade debt securities.
Limited Duration Bond Fund seeks current income consistent with low volatility of principal.
Strategic Income Fund seeks a high level of current income.
Covered Call Strategy Fund seeks long-term capital appreciation.
Equity Income Fund seeks total return.
Global Fund seeks long-term capital growth.
Growth & Income Fund seeks long-term growth of capital and current income.
270
Hedged U.S. Equity Opportunities Fund seeks total return and, secondarily, capital preservation.
International Fund primarily seeks long-term capital growth.
Opportunity Fund seeks long-term capital growth.
Premium Income Fund seeks to generate income.
Select Growth Fund seeks long-term growth of capital.
Special Situations Fund seeks long-term growth of capital.
Total Return Fund seeks high, long-term total investment return consistent with moderate investment risk.
A. Security Valuation—Except as provided below, a security listed or traded on an exchange or the Nasdaq Stock Market is valued at its last sale price on the exchange or market where the security is principally traded, and lacking any sales, the security is valued at the mean between the closing bid and asked prices. Securities traded in the over-the-counter (“OTC”) market (including securities listed on exchanges whose primary market is believed to be OTC) and call and put options are valued at the mean between the last bid and asked prices based on quotes furnished by a market maker for such securities or an authorized pricing service. Fixed income securities, other than short-term debt securities held by the Government Cash Management Fund, are priced based upon evaluated prices that are provided by a pricing service approved by the Trusts’ Board of Trustees (the “Board”). Other securities may also be priced based upon valuations that are provided by pricing services approved by the Board. The pricing services consider security type, rating, market condition and yield data as well as market quotations, prices provided by market makers and other available information in determining evaluated prices. The net asset value of the Strategic Income Fund is derived from the net asset values of the underlying Funds in which it invests.
The Funds monitor for significant events occurring prior to the close of trading on the New York Stock Exchange that could have a material impact on the value of any securities that are held by the Funds. Examples of such events include trading halts, natural disasters, political events and issuer-specific developments. If the Valuation Committee of Foresters Investment Management Company, Inc. (“FIMCO”) decides that such events warrant using fair value estimates, it will take such events into consideration in determining the fair values of such securities. If market quotations or prices are not readily available or are deemed to be unreliable, or do not appear to reflect significant events that have occurred prior to the time as of which the net assets value is calculated, the securities may be valued at fair value as determined in good faith pursuant to procedures adopted by the Board. The Funds also use evaluated prices from a pricing service to fair value certain foreign equity securities in the event that fluctuation in U.S. securities markets exceed a predetermined level or if a foreign market is closed. For valuation purposes, where applicable, quotations of foreign securities in foreign currencies are translated to U.S. dollar
271
Notes to Financial Statements (continued)
FIRST INVESTORS INCOME FUNDS
FIRST INVESTORS EQUITY FUNDS
September 30, 2019
equivalents using the foreign exchange quotation in effect. At September 30, 2019, the Hedged U.S. Equity Opportunities Bond Fund held two securities that were fair valued at a value of $100,769 representing 0.1% of the Fund’s net assets.
The Government Cash Management Fund values its portfolio securities in accordance with the amortized cost method of valuation under Rule 2a-7 under the 1940 Act. Amortized cost is an approximation of market value of an instrument, whereby the difference between its acquisition cost and market value at maturity is amortized on a straight-line basis over the remaining life of the instrument. The effect of changes in the market value of a security as a result of fluctuating interest rates is not taken into account and thus the amortized cost method of valuation may result in the value of a security being higher or lower than its actual market value.
In accordance with Accounting Standards Codification 820 “Fair Value Measurements and Disclosures” (“ASC 820”), investments held by the Funds are carried at “fair value”. As defined by ASC 820, fair value is the price that a fund would receive upon selling an investment in an orderly transaction to an independent buyer in the principal or most advantageous market for the investment under current market conditions. Various inputs are used in determining the value of the fund’s investments.
In addition to defining fair value, ASC 820 established a three-tier hierarchy of inputs to establish a classification of fair value measurements for disclosure purposes. The three-tier hierarchy of inputs is summarized in the three broad Levels listed below:
Level 1—Unadjusted quoted prices in active markets for identical securities that the Fund has the ability to access.
Level 2—Observable inputs other than quoted prices included in Level 1 that are observable for the asset or liability, either directly or indirectly. These inputs may include quoted prices for the identical instrument on an inactive market, prices for similar instruments, interest rates, prepayment speeds, credit risk, yield curves, default rates and similar data.
Level 3—Unobservable inputs for the asset or liability, to the extent relevant observable inputs are not available, representing the Fund’s own assumption about the assumptions a market participant would use in valuing the asset or liability, and would be based on the best information available.
Equity securities and futures contracts traded on an exchange or the Nasdaq Stock Market are categorized in Level 1 of the fair value hierarchy to the extent that they are actively traded and valuation adjustments are not applied. The underlying Funds in which Strategic Income Fund invests are also categorized in Level 1. Foreign equity securities that are fair valued in the event that fluctuations in U.S. securities markets exceed a predetermined level or if a foreign market is closed are categorized in Level 2. Variable and floating rate, corporate, sovereign and municipal bonds, asset backed, U.S. Government and U.S. Government Agency securities, pass-through certificates and loan participations are categorized in Level 2 to the extent that the inputs are observable and timely, otherwise they would be categorized in Level 3. Short-term notes that
272
are valued at amortized cost by the Government Cash Management Fund are categorized in Level 2. Call and put options contracts are categorized in Level 2 to the extent that the inputs are observable and timely. Foreign exchange contracts that are considered derivative instruments and are valued at the net unrealized appreciation or depreciation on the instruments are categorized in Level 2. Securities that are fair valued by the Valuation Committee may be categorized in either Level 2 or Level 3 of the fair value hierarchy depending on the relative significance of the unobservable valuation inputs.
The aggregate value by input level, as of September 30, 2019, for each Fund’s investments is included following each Fund’s portfolio of investments.
B. Federal Income Taxes—No provision has been made for federal income taxes on net income or capital gains since it is the policy of each Fund to continue to comply with the special provisions of the Internal Revenue Code applicable to investment companies, and to make sufficient distributions of income and capital gains (in excess of any available capital loss carryovers) to relieve it from all, or substantially all, such taxes. At September 30, 2019, capital loss carryovers were as follows:
| | | | | | | Capital Loss Carryovers
Not Subject to Expiration | | | Capital Loss
Carryovers
Utilized* | |
Fund | | Total | | | Long-Term | | | Short-Term | | | Utilized | |
Floating Rate | | $ | 3,294,146 | | | $ | 2,807,821 | | | $ | 486,325 | | | $ | 244,038 | |
Fund For Income | | | 40,084,848 | | | | 33,034,947 | | | | 7,049,901 | | | | — | |
International Opportunities Bond | | | 3,918,295 | | | | 3,918,295 | | | | — | | | | — | |
Investment Grade | | | 5,860,069 | | | | 5,860,069 | | | | — | | | | — | |
Limited Duration Bond | | | 10,981,230 | | | | 8,926,600 | | | | 2,054,630 | | | | — | |
Strategic Income | | | 3,308,655 | | | | 2,357,236 | | | | 951,419 | | | | — | |
Covered Call Strategy | | | 9,178,030 | | | | — | | | | 9,178,030 | | | | — | |
Global | | | 5,175,460 | | | | — | | | | 5,175,460 | | | | — | |
Hedged U.S. Equity Opportunities | | | — | | | | — | | | | — | | | | 316,853 | |
Premium Income | | | — | | | | — | | | | — | | | | 206,166 | |
* | During the year ended September 30, 2019, the Funds utilized capital loss carryovers in the amounts indicated. |
The Funds recognize the tax benefits of uncertain tax positions only where the position is “more likely than not” to be sustained assuming examination by tax authorities. Management has analyzed the Funds’ tax positions and has concluded that no liability for unrecognized tax benefits should be recorded related to uncertain tax positions taken on returns filed for open tax years 2016 – 2018, or expected to be taken in the Funds’ 2019 tax returns. The Funds identify their major tax jurisdictions as U.S. Federal, New York State, New York City and foreign jurisdictions where the Funds make significant investments; however, the Funds are not aware
273
Notes to Financial Statements (continued)
FIRST INVESTORS INCOME FUNDS
FIRST INVESTORS EQUITY FUNDS
September 30, 2019
of any tax position for which it is reasonably possible that the total amounts of unrecognized tax benefits will change materially in the next twelve months.
C. Distributions to Shareholders—Dividends from net investment income of Floating Rate Fund, Fund For Income, Investment Grade Fund, Limited Duration Bond Fund, and Strategic Income Fund are generally declared daily and paid monthly. The Government Cash Management Fund declares distributions, if any, daily and pays distributions monthly, from the total of net investment income plus or minus all realized short-term gains and losses on investments. Dividends from net investment income, if any, of International Opportunities Bond Fund, Covered Call Strategy Fund, Equity Income Fund, Growth & Income Fund, Premium Income Fund and Total Return Fund are declared and paid quarterly. Dividends from net investment income, if any, of Global Fund, Hedged U.S. Equity Opportunities Fund, International Fund, Opportunity Fund, Select Growth Fund and Special Situations Fund are declared and paid annually. Distributions from net realized capital gains, if any, of each of the Funds are normally declared and paid annually. Premium Income Fund may distribute net short-term capital gains, if any, on a quarterly basis. Income dividends and capital gain distributions are determined in accordance with income tax regulations which may differ from accounting principles generally accepted in the United States of America. These differences are primarily due to differing treatments for capital loss carryforwards, deferral of wash sales losses, post-October capital losses, late loss deferrals, net operating losses and foreign currency transactions.
D. Expense Allocation—Expenses directly charged or attributable to a Fund are paid from the assets of that Fund. General expenses of the Trusts are allocated among and charged to the assets of each Fund on a fair and equitable basis, which may be based on the relative assets of each Fund or the nature of the services performed and relative applicability to each Fund.
E. Use of Estimates—The preparation of the financial statements in conformity with accounting principles generally accepted in the United States of America requires management to make estimates and assumptions that affect the reported amounts of assets and liabilities at the date of the financial statements and the reported amounts of revenue and expense during the reporting period. Actual results could differ from those estimates.
F. Foreign Currency Translations—The accounting records of all of the Funds are maintained in U.S. dollars, including those Funds that invest in foreign securities. Portfolio securities and other assets and liabilities denominated in foreign currencies are translated to U.S. dollars at the date of valuation. Purchases and sales of foreign investment securities, dividend income and certain expenses are translated to U.S. dollars at the rates of exchange prevailing on the respective dates of such transactions.
International Opportunities Bond Fund, Global Fund, Hedged U.S. Equity Opportunities Fund and International Fund do not isolate that portion of gains and losses on foreign investments which is due to changes in foreign exchange rates from that which is due to changes in market prices of the investments. These changes are included with the net realized and unrealized gains and losses from investments.
274
Net realized and unrealized gains and losses on foreign currency transactions include gains and losses from the sales of foreign currency and gains and losses on accrued foreign dividends and related withholding taxes.
G. Other—Security transactions are generally accounted for on the first business day following the date the securities are purchased or sold, except for financial reporting purposes, which is trade date. Investments in securities issued on a when-issued or delayed delivery basis are generally reflected in the assets of the Funds on the first business day following the date the securities are purchased and the Funds segregate assets for these transactions. Cost of securities is determined and gains and losses are based on the identified cost basis for both financial statement and federal income tax purposes. Dividend income is recorded on the ex-dividend date or for certain foreign dividends, as soon as the Fund becomes aware of the dividends. Interest income and estimated expenses are accrued daily. Bond discounts and premiums are accreted or amortized using the interest method. Withholding taxes on foreign dividends have been provided in accordance with the Funds’ understanding of the applicable country’s tax rules and rates. The Bank of New York Mellon serves as custodian for the Funds and may provide credits against custodian charges based on uninvested cash balance of the Funds. For the year ended September 30, 2019, the Income Funds and Equity Funds received credits in the amount of $30,519 and $163,422, respectively. Certain of the Equity Funds reduced expenses through brokerage service arrangements. For the year ended September 30, 2019, expenses were reduced by a total of $25,890 for certain of the Equity Funds under these arrangements.
275
Notes to Financial Statements (continued)
FIRST INVESTORS INCOME FUNDS
FIRST INVESTORS EQUITY FUNDS
September 30, 2019
2. Security Transactions—For the year ended September 30, 2019, purchases and sales of securities and long-term U.S. Government obligations (excluding U.S. Treasury bills, short-term securities and foreign currencies) were as follows:
| | | Securities | | | Long-Term U.S.
Government Obligations | |
Fund | | Cost of
Purchases | | | Proceeds
of Sales | | | Cost of
Purchases | | | Proceeds
of Sales | |
Floating Rate | | $ | 132,394,581 | | | $ | 266,251,691 | | | $ | 24,981,934 | | | $ | 24,994,974 | |
Fund For Income | | | 407,565,993 | | | | 501,602,731 | | | | — | | | | — | |
International Opportunities Bond | | | 45,967,078 | | | | 97,999,343 | | | | 65,594,239 | | | | 51,224,945 | |
Investment Grade | | | 225,726,360 | | | | 476,435,936 | | | | 93,823,058 | | | | 98,394,673 | |
Limited Duration Bond | | | 196,517,020 | | | | 228,289,010 | | | | 94,180,492 | | | | 78,075,902 | |
Strategic Income | | | 90,543,401 | | | | 103,456,837 | | | | 7,971,500 | | | | 6,243,760 | |
Covered Call Strategy | | | 107,247,865 | | | | 179,612,816 | | | | — | | | | — | |
Equity Income | | | 201,763,097 | | | | 358,454,847 | | | | — | | | | — | |
Global | | | 653,339,181 | | | | 852,085,849 | | | | — | | | | — | |
Growth & Income | | | 856,466,789 | | | | 1,168,951,802 | | | | — | | | | — | |
Hedged U.S. Equity Opportunities | | | 216,443,722 | | | | 272,974,991 | | | | — | | | | — | |
International | | | 295,508,416 | | | | 314,792,670 | | | | — | | | | — | |
Opportunity | | | 471,521,268 | | | | 717,673,740 | | | | — | | | | — | |
Premium Income | | | 143,278,510 | | | | 84,168,376 | | | | — | | | | — | |
Select Growth | | | 353,654,431 | | | | 439,144,370 | | | | — | | | | — | |
Special Situations | | | 300,059,187 | | | | 472,182,723 | | | | — | | | | — | |
Total Return | | | 441,100,856 | | | | 627,007,015 | | | | 53,214,361 | | | | 40,264,084 | |
276
At September 30, 2019, aggregate cost and net unrealized appreciation (depreciation) of securities for federal income tax purposes were as follows:
Fund | | Aggregate
Cost | | | Gross
Unrealized
Appreciation | | | Gross
Unrealized
Depreciation | | | Net
Unrealized
Appreciation
(Depreciation) | |
Floating Rate | | $ | 105,346,528 | | | $ | 530,159 | | | $ | 1,690,567 | | | $ | (1,160,408 | ) |
Fund For Income | | | 528,202,441 | | | | 16,114,666 | | | | 12,277,651 | | | | 3,837,015 | |
International Opportunities Bond | | | 118,096,249 | | | | 391,846 | | | | 13,604,229 | | | | (13,212,383 | ) |
Investment Grade | | | 361,530,306 | | | | 25,416,264 | | | | 4,054,689 | | | | 21,361,575 | |
Limited Duration Bond | | | 308,216,412 | | | | 4,041,488 | | | | 1,421,135 | | | | 2,620,353 | |
Strategic Income | | | 141,086,556 | | | | 287,167 | | | | 4,634,152 | | | | (4,346,985 | ) |
Covered Call Strategy | | | 215,467,890 | | | | 62,426,377 | | | | 7,534,317 | | | | 54,892,060 | |
Equity Income | | | 328,211,502 | | | | 144,872,636 | | | | 6,508,591 | | | | 138,364,045 | |
Global | | | 351,918,644 | | | | 67,355,392 | | | | 6,588,829 | | | | 60,766,563 | |
Growth & Income | | | 1,021,012,893 | | | | 473,741,015 | | | | 11,716,637 | | | | 462,024,378 | |
Hedged U.S. Equity Opportunities | | | 91,142,465 | | | | 21,381,119 | | | | 694,235 | | | | 20,686,884 | |
International | | | 339,191,887 | | | | 84,897,876 | | | | 2,366,508 | | | | 82,531,368 | |
Opportunity | | | 684,351,311 | | | | 256,133,304 | | | | 27,718,920 | | | | 228,414,384 | |
Premium Income | | | 126,251,034 | | | | 13,277,296 | | | | 14,810,984 | | | | (1,533,688 | ) |
Select Growth | | | 547,516,420 | | | | 114,517,929 | | | | 9,807,437 | | | | 104,710,492 | |
Special Situations | | | 448,159,417 | | | | 76,073,466 | | | | 32,794,601 | | | | 43,278,865 | |
Total Return | | | 617,719,427 | | | | 152,934,702 | | | | 7,351,338 | | | | 145,583,364 | |
277
Notes to Financial Statements (continued)
FIRST INVESTORS INCOME FUNDS
FIRST INVESTORS EQUITY FUNDS
September 30, 2019
The Strategic Income Fund may invest in Institutional Class shares of the Floating Rate Fund, Fund For Income, Government Cash Management Fund, International Opportunities Bond Fund, Investment Grade Fund, Limited Duration Bond Fund, Covered Call Strategy Fund, Equity Income Fund, Premium Income Fund, Tax Exempt Income Fund and Tax Exempt Opportunities Fund. During the year ended September 30, 2019, purchases and sales of shares, dividends, capital gain distributions received and realized gains (losses) recognized by Strategic Income Fund from investments in these Funds were as follows:
Fund | | Balance of
Shares Held
9/30/2018 | | | Purchases/
Additions | | | Sales/
Reductions | | | Balance of
Shares Held
9/30/2019 | | | Value
9/30/2019 | | | Dividend
Income | | | Capital Gain
Distributions | | | Realized
Gain (Loss)
on Security
Transactions | |
Floating Rate | | | 3,205,012 | | | | 300,083 | | | | (3,505,095 | ) | | | — | | | $ | — | | | $ | 1,038,513 | | | $ | — | | | $ | (313,344 | ) |
Fund For Income | | | 12,394,911 | | | | 5,338,818 | | | | (3,532,547 | ) | | | 14,201,182 | | | | 34,934,908 | | | | 1,925,690 | | | | — | | | | 4,876 | |
International Opportunities Bond | | | 1,032,932 | | | | 1,119,085 | | | | (581,554 | ) | | | 1,570,463 | | | | 13,772,958 | | | | 211,401 | | | | — | | | | 46,541 | |
Investment Grade | | | 2,422,818 | | | | 389,356 | | | | (624,215 | ) | | | 2,187,959 | | | | 21,792,074 | | | | 776,164 | | | | — | | | | (207,014 | ) |
Limited Duration Bond | | | 4,139,759 | | | | 3,827,341 | | | | (2,901,295 | ) | | | 5,065,805 | | | | 47,365,275 | | | | 1,107,319 | | | | — | | | | (121,289 | ) |
Equity Income | | | — | | | | 142,155 | | | | (142,155 | ) | | | — | | | | — | | | | — | | | | — | | | | 14,244 | |
Premium Income | | | 377,554 | | | | — | | | | (377,554 | ) | | | — | | | | — | | | | — | | | | — | | | | (237,475 | ) |
Tax Exempt Income | | | 424,153 | | | | 382,193 | | | | (806,346 | ) | | | — | | | | — | | | | 48,479 | | | | — | | | | (127,788 | ) |
Tax Exempt Opportunities | | | 237,635 | | | | 671,515 | | | | (497,623 | ) | | | 411,527 | | | | 6,888,970 | | | | 108,846 | | | | — | | | | 83,247 | |
| | | | 24,234,774 | | | | 12,170,546 | | | | (12,968,384 | ) | | | 23,436,936 | | | $ | 124,754,185 | | | $ | 5,216,412 | | | $ | — | | | $ | (858,002 | ) |
The Strategic Income Fund operates as a fund of funds - also referred to as a multi-manager investment - an investment strategy in which a fund invests in other types of funds. This strategy invests in a portfolio that contains different underlying assets instead of investing directly in bonds, stocks and other types of securities.
The financial statements of each of the Funds in which Strategic Income Fund had investments during the year ended September 30, 2019, are included in this report except Tax Exempt Income Fund and Tax Exempt Opportunities Fund, whose most recent financial statements as of June 30, 2019, are available by calling 1-800-423-4026 or by writing to us at the following address: Foresters Financial Services, Inc., 40 Wall Street, New York, NY 10005.
3. Advisory Fee and Other Transactions With Affiliates—Certain officers of the Trusts are officers of the Trusts’ investment adviser, Foresters Investment Management Company, Inc. (“FIMCO”), their underwriter, Foresters Financial Services, Inc. (“FFS”) and their transfer agent, Foresters Investor Services, Inc. (“FIS”). Trustees of the Trusts who are not officers or directors of FIMCO or its affiliates are remunerated by the Funds. For the year ended September 30, 2019,
278
total trustees fees accrued by the Income Funds and Equity Funds amounted to $158,674 and $518,621, respectively.
The Investment Advisory Agreements provide as compensation to FIMCO for each Fund, an annual fee, payable monthly, at the following rates:
Floating Rate Fund—.60% on the first $250 million of the Fund’s average daily net assets, .55% on the next $250 million, .50% on the next $500 million, .45% on the next $1 billion and .40% on average daily net assets over $2 billion. During the period October 1, 2018 to January 31, 2019 (expiration of expense limitation agreement), FIMCO has assumed, pursuant to an expense limitation agreement, $8,398 in other expenses to limit the Fund’s overall expense ratio (exclusive of certain expenses) to 1.10% on Class A shares, .90% on Advisor Class shares and .70% on Institutional Class shares. During the period January 31, 2019 through September 30, 2019, FIMCO voluntarily waived $15,672 in advisory fees.
Fund For Income and International Opportunities Bond Fund—.75% on the first $250 million of each Fund’s average daily net assets, .72% on the next $250 million, .69% on the next $250 million, .66% on the next $500 million, declining by .02% on each $500 million thereafter, down to .60% on average daily net assets over $2.25 billion. During the period October 1, 2018 through January 31, 2019 (expiration of advisory fee waiver), FIMCO has waived $54,695 in advisory fees on Fund For Income to limit the advisory fee to .70% of its average daily net assets. FIMCO also voluntarily waived an additional $51,953 in advisory fees on Fund For Income during the period January 31, 2019 through September 30, 2019. During the period June 1, 2019 through September 30, 2019, FIMCO voluntarily waived $54,020 in advisory fees on International Opportunities Bond Fund to limit the advisory fee to .60% of its average daily net assets.
Government Cash Management Fund—.50% of the Fund’s average daily net assets. For the year ended September 30, 2019, FIMCO has waived $383,241 in advisory fees to limit the Fund’s overall expense ratio (exclusive of certain expenses) to .60% on Class A shares, 1.35% on Class B shares and .60% on Institutional Class shares.
Investment Grade Fund—.66% on the first $500 million of the Fund’s average daily net assets, declining by .02% on each $500 million thereafter, down to .60% on average daily net assets over $1.5 billion. During the period October 1, 2018 to January 31, 2019, FIMCO has waived $212,088 in advisory fees on Investment Grade Fund to limit the advisory fee to .55% of its average daily net assets. During the period February 1, 2019 to September 30, 2019, FIMCO has waived $237,223 in advisory fees on Investment Grade Fund to limit the advisory fee to .59% of its average daily net assets.
Limited Duration Bond Fund—.41% on the first $500 million of the Fund’s average daily net assets, .39% on the next $500 million, .37% on the next $500 million and .35% on average daily net assets over $1.5 billion. For the year ended September 30, 2019, FIMCO has waived $621,462 in advisory fees and assumed $37,656 in other expenses to limit the Fund’s overall
279
Notes to Financial Statements (continued)
FIRST INVESTORS INCOME FUNDS
FIRST INVESTORS EQUITY FUNDS
September 30, 2019
expense ratio (exclusive of certain expenses) to .79% on Class a shares, .51% on Advisor Class shares and .36% on Institutional Class shares.
Strategic Income Fund—.05% of the Fund’s average daily net assets. During the period June 1, 2019 through September 30, 2019, FIMCO voluntarily waived $24,157 in advisory fees to limit the advisory fee to .00% of its average daily net assets.
Covered Call Strategy and Premium Income Funds—.80% on the first $300 million of each Fund’s average daily net assets, .75% on the next $200 million, .70% on the next $500 million, declining by .05% on each $1 billion thereafter, down to .55% on average daily net assets over $3 billion. During the period January 31, 2019 through September 30, 2019, FIMCO voluntarily waived $19,961 in advisory fees on the Covered Call Strategy Fund. During the period October 1, 2018 through January 31, 2019, FIMCO has waived, pursuant to an expense limitation agreement $17,774 in advisory fees and assumed $5,607 in other expenses to limit the Premium Income Fund’s overall expense ratio (exclusive of certain expenses) to 1.30% on Class A shares, 1.02% on Advisor Class shares and .89% on Institutional Class shares. During the period February 1, 2019 through September 30, 2019, FIMCO has waived, pursuant to an expense limitation agreement that became effective on February 1, 2019, $34,910 in advisory fees to limit the Premium Income Fund’s overall expense ratio (exclusive of certain expenses) to 1.30% on Class A shares, 1.06% on Advisor Class shares and .99% on Institutional Class shares.
Equity Income, Growth & Income, Opportunity, and Select Growth Funds—.75% on the first $300 million of each Fund’s average daily net assets, .72% on the next $200 million, .69% on the next $250 million, .66% on the next $500 million, declining by .02% on each $500 million thereafter, down to .60% on average daily net assets over $2.25 billion. During the period January 31, 2019 through September 30, 2019, FIMCO voluntarily waived $69,729 in advisory fees of the Select Growth Fund.
Global Fund—.95% on the first $600 million, .92% on the next $400 million, .90% on the next $500 million and .88% on average daily net assets over $1.5 billion. During the period October 1, 2018 through January 31, 2019 (expiration of advisory fee waiver), FIMCO has waived $94,872 in advisory fees to limit the advisory fee to .90% of the Fund’s average daily net assets.
Hedged U.S. Equity Opportunities Fund—1.15% on the first $100 million of each Fund’s average daily net assets, 1.10% on the next $400 million, 1.05% on the next $500 million, declining by .05% on each $1 billion thereafter, down to .90% on average daily net assets over $3 billion.
International Fund—.98% on the first $300 million of the Fund’s average daily net assets, .95% on the next $300 million, .92% on the next $400 million, .90% on the next $500 million and .88% on average daily net assets over $1.5 billion.
Special Situations Fund—.90% on the first $200 million of the Fund’s average daily net assets, .75% on the next $300 million, .72% on the next $250 million, .69% on the next $250 million, .66% on the next $500 million and .64% on average daily net assets over $1.5 billion.
280
Total Return Fund—.75% on the first $300 million of the Fund’s average daily net assets, .70% on the next $200 million, .65% on the next $500 million, .60% on the next $1 billion, .55% on the next $1 billion, down to .50% on average daily net assets over $3 billion.
For the year ended September 30, 2019, total advisory fees accrued to FIMCO by the Income Funds and Equity Funds were $12,453,071 and $53,520,446, respectively, of which $1,654,511 and $237,246, respectively, was waived by FIMCO as noted above.
FIMCO has entered into an expense limitation agreement with the Floating Rate Fund (“FRF”) on January 31, 2019, to limit FRF’s total annual fund operating expenses (exclusive of interest expenses, taxes, brokerage commissions, acquired fund fees and expenses, dividend costs related to short sales, and extraordinary expenses, such as litigation expenses, if any) to 1.10% of the average daily net assets on Class A shares. The agreement expires on January 31, 2020. During the period January 31, 2019 to September 30, 2019, FRF repaid FIMCO $75,429 under the terms of the agreement. FIMCO and FRF have agreed that any expenses of FRF assumed by FIMCO pursuant to this agreement be repaid to FIMCO by FRF within three years after the date the fee limitation and/or expense reimbursement has been made by FIMCO, provided that such repayment does not cause the expenses of FRF’s Class A shares to exceed the applicable expense ratio in place at the time the expenses are waived or assumed or the current limits established under the expense limitation agreement. The expense limitation agreement may be terminated or amended prior to January 31, 2020, with the approval of the Board. FIMCO had entered into an expense limitation agreement with the FRF to limit FRF’s total annual fund operating expenses (exclusive of interest expenses, taxes, brokerage commissions, acquired fund fees and expenses, dividend costs related to short sales, and extraordinary expenses, such as litigation expenses, if any) to 1.10% of the average daily net assets on Class A shares, .90% of the average daily net assets on Advisor Class shares and .70% of the average daily net assets on Institutional Class shares. The agreement expired on January 31, 2019. During the period October 1, 2018 to January 31, 2019 (expiration of the expense limitation agreement), FIMCO assumed $8,398, under the terms of the agreement. FIMCO and FRF have agreed that any expenses of FRF assumed by FIMCO pursuant to this agreement be repaid to FIMCO by FRF within three years after the date the fee limitation and/or expense reimbursement has been made by FIMCO, provided that such repayment does not cause the expenses of FRF’s Class A shares, Advisor Class shares and Institutional Class shares to exceed the applicable expense ratio in place at the time the expenses are waived or assumed or the current limits established under the expense limitation agreement. For the period October 21, 2013 (commencement of operations) through January 31, 2019 (expiration of the expense limitation agreement), FIMCO assumed $766,764 of which FRF repaid $75,429, and under the terms of the agreement of which $223,534 expired on September 30, 2017, $198,431 expired on September 30, 2018, $86,184 expired on September 30, 2019, $131,427 expires on September 30, 2020, $43,361 expires on September 30, 2021 and $8,398 expires on September 30, 2022.
Effective June 1, 2018, FIMCO has entered into an expense limitation agreement with the Government Cash Management Fund (“GCM”) to limit GCM’s total annual fund operating expenses (exclusive of interest expenses, taxes, brokerage commissions, acquired fund fees and
281
Notes to Financial Statements (continued)
FIRST INVESTORS INCOME FUNDS
FIRST INVESTORS EQUITY FUNDS
September 30, 2019
expenses, dividend costs related to short sales, and extraordinary expenses, such as litigation expenses, if any) to .80% of the average daily net assets on Class A shares and .80% of the average daily net assets on Institutional Class shares. The agreement expires on January 31, 2020. For the period ended September 30, 2019, FIMCO assumed $40,108 under the terms of the agreement. FIMCO and GCM have agreed that any expenses of GCM assumed by FIMCO and/or FIS pursuant to this agreement be repaid to FIMCO by GCM within three years after the date the fee limitation and/or expense reimbursement has been made by FIMCO, provided that such repayment does not cause the expenses of GCM’s Class A shares and Institutional Class shares to exceed the applicable expense ratio in place at the time the expenses are waived or assumed or the current limits established under the expense limitation agreement. For the period June 1, 2018 (commencement of expense limitation agreement) through September 30, 2019, FIMCO assumed $131,287 under the terms of the agreement of which expires $91,179 September 30, 2021 and $40,108 expires on September 30, 2022. The expense limitation agreement may be terminated or amended prior to January 31, 2020, with the approval of the Board.
FIMCO had entered into an expense limitation agreement with the International Opportunities Bond Fund (“IOBF”) to limit IOBF’s total annual fund operating expenses (exclusive of interest expenses, taxes, brokerage commissions, acquired fund fees and expenses, dividend costs related to short sales, and extraordinary expenses, such as litigation expenses, if any) to 1.30% of the average daily net assets on Class A shares. The agreement expired on January 31, 2016. FIMCO and IOBF have agreed that any expenses of IOBF assumed by FIMCO pursuant to this agreement be repaid to FIMCO by IOBF within three years after the date the fee limitation and/or expense reimbursement has been made by FIMCO, provided that such repayment does not cause the expenses of IOBF’s Class A shares to exceed the applicable expense ratio in place at the time the expenses are waived or assumed or the current limits established under the expense limitation agreement. For the period August 20, 2012 (commencement of operations) to January 31, 2016 (expiration of the expense limitation agreement), FIMCO assumed $684,479 under the terms of the agreement of which $278,248 expired on September 30, 2015, $228,243 expired on September 30, 2016, $94,746 expired on September 30, 2017, $62,359 expired on September 30, 2018, and $20,883 expired on September 30, 2019.
FIMCO has entered into an expense limitation agreement with the Limited Duration Bond Fund (“LDB”) on March 14, 2018, to limit LDB’s total annual fund operating expenses (exclusive of interest expenses, taxes, brokerage commissions, acquired fund fees and expenses, dividend costs related to short sales, and extraordinary expenses, such as litigation expenses, if any) to .79% of the average daily net assets on Class A shares, .51% of the average daily net assets on Advisor Class shares and .36% of the average daily net assets on Institutional Class shares. The agreement expires on January 31, 2020. For the period ended September 30, 2019, FIMCO assumed $659,118 under the terms of the agreement. FIMCO and LDB have agreed that any expenses of LDB assumed by FIMCO pursuant to this agreement be repaid to FIMCO by LDB within three years after the date the fee limitation and/or expense reimbursement has been made by FIMCO, provided that such repayment does not cause the expenses of LDB’s Class A shares, Advisor Class shares and Institutional Class shares to exceed the applicable expense ratio in
282
place at the time the expenses are waived or assumed or the current limits established under the expense limitation agreement. For the period March 14, 2018 to September 30, 2019, FIMCO assumed $875,805 under the terms of the agreement of which $216,687 expires on September 30, 2021 and $659,118 expires on September 30, 2022. The expense limitation agreement may be terminated or amended prior to January 31, 2020, with the approval of the Board. FIMCO had previously entered into an expense limitation agreement with LDB to limit LDB’s total annual fund operating expenses (exclusive of interest expenses, taxes, brokerage commissions, acquired fund fees and expenses, dividend costs related to short sales, and extraordinary expenses, such as litigation expenses, if any) to 1.05% of the average daily net assets on Class A shares, .75% of the average daily net assets on Advisor Class shares and .60% of the average daily net assets on Institutional Class shares. The agreement expired on January 31, 2018. FIMCO and LDB have agreed that any expenses of LDB assumed by FIMCO pursuant to this agreement be repaid to FIMCO by LDB within three years after the date the fee limitation and/or expense reimbursement has been made by FIMCO, provided that such repayment does not cause the expenses of LDB’s Class A shares, Advisor Class shares and Institutional Class shares to exceed the applicable expense ratio in place at the time the expenses are waived or assumed or the current limits established under the expense limitation agreement. For the period May 19, 2014 (commencement of operations) to January 31, 2018 (expiration of the expense limitation agreement), FIMCO assumed $894,488 under the terms of the agreement of which $143,148 expired on September 30, 2017, $179,140 expired on September 30, 2018, $224,276 expired on September 30, 2019, $274,706 expires on September 30, 2020, and $73,218 expires on September 30, 2021.
FIMCO had entered into an expense limitation agreement with the Covered Call Strategy Fund (“CCS”) to limit CCS’s total annual fund operating expenses (exclusive of interest expenses, taxes, brokerage commissions, acquired fund fees and expenses, dividend costs related to short sales, and extraordinary expenses, such as litigation expenses, if any) to 1.30% of the average daily net assets on Class A shares, .97% of the average daily net assets on Advisor Class shares and .84% of the average daily net assets on Institutional Class shares. The agreement expired on January 31, 2019. FIMCO and CCS have agreed that any expenses of CCS assumed by FIMCO pursuant to this agreement be repaid to FIMCO by CCS within three years after the date the fee limitation and/or expense reimbursement has been made by FIMCO, provided that such repayment does not cause the expenses of CCS’s Class A shares, Advisor Class shares and Institutional Class shares to exceed the applicable expense ratio in place at the time the expenses are waived or assumed or the current limits established under the expense limitation agreement. For the period ended September 30, 2019, CCS repaid FIMCO $96,283 under the terms of the agreement. For the period April 1, 2016 (commencement of operations) through January 31, 2019, (expiration of the expense limitation agreement), FIMCO assumed $304,868, of which CCS repaid $96,283, and under the terms of the agreement of which $34,218 expired on September 30, 2019, $137,941 expires on September 30, 2020 and $36,426 expires on September 30, 2021.
FIMCO had entered into an expense limitation agreement with the Hedged U.S. Equity Opportunities Fund (“HUSEO”) to limit HUSEO’s total annual fund operating expenses
283
Notes to Financial Statements (continued)
FIRST INVESTORS INCOME FUNDS
FIRST INVESTORS EQUITY FUNDS
September 30, 2019
(exclusive of interest expenses, taxes, brokerage commissions, acquired fund fees and expenses, dividend costs related to short sales, and extraordinary expenses, such as litigation expenses, if any) to 1.75% of the average daily net assets on Class A shares, 1.42% of the average daily net assets on Advisor Class shares and 1.31% of the average daily net assets on Institutional Class shares. The agreement expired on January 31, 2019. FIMCO and HUSEO have agreed that any expenses of HUSEO assumed by FIMCO pursuant to this agreement be repaid to FIMCO by HUSEO within three years after the date the fee limitation and/or expense reimbursement has been made by FIMCO, provided that such repayment does not cause the expenses of HUSEO’s Class A shares, Advisor Class shares and Institutional Class shares to exceed the applicable expense ratio in place at the time the expenses are waived or assumed or the current limits established under the expense limitation agreement. For the year ended September 30, 2019, HUSEO repaid $86,400 under terms of the agreement. For the period August 1, 2016 (commencement of operations) to January 31, 2019 (expiration of the expense limitation agreement), FIMCO assumed $272,154, of which HUSEO repaid $86,400 under the terms of the agreement and of which $185,754 expires on September 30, 2020.
FIMCO has entered into an expense limitation agreement with the Premium Income Fund (“PIF”) on January 31, 2019, to limit PIF’s total annual fund operating expenses (exclusive of interest expenses, taxes, brokerage commissions, acquired fund fees and expenses, dividend costs related to short sales, and extraordinary expenses, such as litigation expenses, if any) to 1.30% of the average daily net assets on Class A shares, 1.06% of the average daily net assets on Advisor Class shares and .99% of the average daily net assets on Institutional Class shares. The agreement expires on January 31, 2020. During the period January 31, 2019 to September 30, 2019, FIMCO assumed $34,910 under the terms of the agreement of which expires on September 30, 2022. FIMCO and PIF have agreed that any expenses of PIF assumed by FIMCO pursuant to this agreement be repaid to FIMCO by PIF within three years after the date the fee limitation and/or expense reimbursement has been made by FIMCO, provided that such repayment does not cause the expenses of PIF’s Class A shares, Advisor Class shares and Institutional Class shares to exceed the applicable expense ratio in place at the time the expenses are waived or assumed or the current limits established under the expense limitation agreement. FIMCO had previously entered into an expense limitation agreement with PIF to limit PIF’s total annual fund operating expenses (exclusive of interest expenses, taxes, brokerage commissions, acquired fund fees and expenses, dividend costs related to short sales, and extraordinary expenses, such as litigation expenses, if any) to 1.30% of the average daily net assets on Class A shares, 1.02% of the average daily net assets on Advisor Class shares and .89% of the average daily net assets on Institutional Class shares. The agreement expired on January 31, 2019. FIMCO and PIF have agreed that any expenses of PIF assumed by FIMCO pursuant to this agreement be repaid to FIMCO by PIF within three years after the date the fee limitation and/or expense reimbursement has been made by FIMCO, provided that such repayment does not cause the expenses of PIF’s Class A shares, Advisor Class shares and Institutional Class shares to exceed the applicable expense ratio in place at the time the expenses are waived or assumed or the current limits established under the expense limitation agreement. For the period October 1, 2018 to January 31, 2019, FIMCO assumed $23,381 under the terms of the agreement. For
284
the period April 2, 2018 (commencement of operations) to January 31, 2019 (expiration of the expense limitation agreement), FIMCO assumed $179,141 under the terms of the agreement of which $155,760 expires on September 30, 2021 and $23,381 expires on September 30, 2022.
For the year ended September 30, 2019, FFS, as underwriter, received from the Income Funds and Equity Funds $1,130,689 and $11,041,275, respectively, in commissions in connection with the sale of shares of the Funds, after allowing $29,929 and $311,733, respectively, to other dealers. For the year ended September 30, 2019, shareholder servicing costs for the Income Funds and Equity Funds included $2,918,916 and $8,778,095, respectively, in transfer agent fees accrued to FIS, of which FIS voluntarily waived $47,670 on the Government Cash Management Fund.
Pursuant to Distribution Plans adopted under Rule 12b-1 of the 1940 Act, each Fund, other than the Government Cash Management Fund, is authorized to pay FFS a fee up to .30% (and for certain Funds, up to .25%) of the average daily net assets of the Class A shares and 1% of the average daily net assets of the Class B shares on an annualized basis each fiscal year, payable monthly. The Government Cash Management Fund is authorized to pay FFS a fee up to 1% of the average daily net assets of the Class B shares. The fee consists of a distribution fee and a service fee. The service fee is paid for the ongoing servicing of clients who are shareholders of that Fund. For the year ended September 30, 2019, total distribution plan fees accrued to FFS by the Income Funds and Equity Funds amounted to $3,830,155 and $15,937,108, respectively.
Brandywine Global Investment Management, LLC, serves as investment subadviser to International Opportunities Bond Fund. Muzinich & Co., Inc. serves as investment subadviser to Floating Rate Fund and Fund For Income. Effective January 31, 2018, Muzinich & Co., Inc. serves as investment subadviser to Investment Grade Fund, Limited Duration Bond Fund and Total Return Fund. Ziegler Capital Management, LLC serves as investment subadviser to Covered Call Strategy Fund and Premium Income Fund. Wellington Management Company, LLP serves as investment subadviser to Hedged U.S. Equity Opportunities Fund. Vontobel Asset Management, Inc. serves as investment subadviser to International Fund. Smith Asset Management Group, L.P. serves as investment subadviser to Select Growth Fund. The subadvisers are paid by FIMCO and not by the Funds.
4. Restricted Securities—Certain restricted securities are exempt from the registration requirements under Rule 144A of the Securities Act of 1933 and may only be sold to qualified institutional investors. Unless otherwise noted, these 144A securities are deemed to be liquid. At September 30, 2019, Floating Rate Fund held four 144A securities with an aggregate value of $3,215,472 representing 3.1% of the Fund’s net assets, Fund For Income held one hundred eighty-five 144A securities with an aggregate value of $313,675,504 representing 57.8% of the Fund’s net assets, Investment Grade Fund held nine 144A securities with an aggregate value of $34,834,819 representing 8.8% of the Fund’s net assets, Limited Duration Bond Fund held nineteen 144A securities with an aggregate value of $67,099,674 representing 20.6% of the Fund’s net assets and Total Return Fund held one hundred forty-nine 144A securities with an
285
Notes to Financial Statements (continued)
FIRST INVESTORS INCOME FUNDS
FIRST INVESTORS EQUITY FUNDS
September 30, 2019
aggregate value of $33,087,788 representing 4.1% of the Fund’s net assets. These securities are valued as set forth in Note 1A.
5. Derivatives—Some of the Funds may invest in various derivatives. A derivative is a financial instrument which has a value that is based on – or “derived from” – the values of other assets, reference rates, or indices. The Funds may invest in derivatives for hedging purposes.
Derivatives may relate to a wide variety of underlying references, such as commodities, stocks, bonds, interest rates, currency exchange rates, and related indices. Derivatives include futures contracts and options on futures contracts, forward-commitment transactions, options on securities, caps, floors, collars, swap contracts, and other financial instruments. Some derivatives, such as futures contracts and certain options, are traded on U.S. commodity and securities exchanges, while other derivatives, such as swap contracts, are privately negotiated and entered into in the OTC market. The risks associated with the use of derivatives are different from, and possibly greater than, the risks associated with investing directly in securities and other traditional investments.
The use of a derivative involves the risk that a loss may be sustained as a result of the insolvency or bankruptcy of the other party to the contract (usually referred to as a “counterparty”) or the failure of the counterparty to make required payments or otherwise comply with the terms of the contract. Additionally, the use of credit derivatives can result in losses if FIMCO, or a Fund’s subadviser, as applicable, does not correctly evaluate the creditworthiness of the issuer on which the credit derivative is based.
Derivatives may be subject to liquidity risk, which exists when a particular derivative is difficult to purchase or sell. If a derivative transaction is particularly large or if the relevant market is relatively illiquid (as is the case with many OTC derivatives), it may not be possible to initiate a transaction or liquidate a position at an advantageous time or price.
Derivatives may be subject to pricing or “basis” risk, which exists when a particular derivative becomes extraordinarily expensive relative to historical prices or the prices of corresponding cash market instruments. Under certain market conditions, it may not be economically feasible to initiate a transaction or liquidate a position in time to avoid a loss or take advantage of an opportunity.
Because many derivatives have leverage or borrowing components, adverse changes in the value or level of the underlying asset, reference rate, or index can result in a loss substantially greater than the amount invested in the derivative itself. Certain derivatives have the potential for unlimited loss, regardless of the size of the initial investment.
Like most other investments, derivative instruments are subject to the risk that the market value of the instrument will change in a way detrimental to the Funds’ interest. The Funds bear the risk that FIMCO will incorrectly forecast future market trends or the values of assets, reference rates, indices, or other financial or economic factors in establishing derivative positions for the Funds. If FIMCO attempts to use a derivative as a hedge against, or as a substitute for, a portfolio
286
investment, the Funds will be exposed to the risk that the derivative will have or will develop an imperfect or no correlation with the portfolio investment. This could cause substantial losses for the Funds. While hedging strategies involving derivative instruments can reduce the risk of loss, they can also reduce the opportunity for gain or even result in losses by offsetting favorable price movements in other investments. Many derivatives, in particular OTC derivatives, are complex and often valued subjectively. Improper valuations can result in increased cash payment requirements to counterparties or a loss of value to a Fund.
The following provides more information on specific types of derivatives and activity in the Funds.
Options Contracts—Some of the Funds may write covered call and put options on securities, derivative instruments, or currencies the Fund owns or in which it may invest. Writing put options tends to increase a Fund’s exposure to the underlying instrument. Writing call options tends to decrease a Fund’s exposure to the underlying instrument. When a Fund writes a call or put option, an amount equal to the premium received is recorded as a liability and subsequently marked to market to reflect the current value of the option written. These liabilities are reflected as written options outstanding in the Statement of Assets and Liabilities. Payments received or made, if any, from writing options with premiums to be determined on a future date are reflected as such on the Statement of Assets and Liabilities. Premiums received from writing options which expire are treated as realized gains. Premiums received from writing options which are exercised or closed are added to the proceeds or offset against amounts paid on the underlying future, swap, security or currency transaction to determine the realized gain or loss. A Fund, as a writer of an option, has no control over whether the underlying future, swap, security or currency may be sold (call) or purchased (put) and, as a result, bears the market risk of an unfavorable change in the price of the future, swap, security or currency underlying the written option. The risk exists that a Fund may not be able to enter into a closing transaction because of an illiquid market.
Some of the Funds may also purchase put and call options. Purchasing call options tends to increase a Fund’s exposure to the underlying instrument. Purchasing put options tends to decrease a Fund’s exposure to the underlying instrument. A Fund pays a premium which is included in its Statement of Assets and Liabilities as an investment and subsequently marked to market to reflect the current value of the option. Premiums paid for purchasing options which expire are treated as realized losses. The risk associated with purchasing put and call options is limited to the premium paid. Premiums paid for purchasing options which are exercised or closed are added to the amounts paid or offset against the proceeds on the underlying future, swap, security or currency transaction to determine the realized gain or loss.
287
Notes to Financial Statements (continued)
FIRST INVESTORS INCOME FUNDS
FIRST INVESTORS EQUITY FUNDS
September 30, 2019
The premium amount and the number of option contracts written or purchased by the Funds during the year ended September 30, 2019, were as follows:
| | | Covered Call Strategy | | | Equity Income | | | Growth & Income | |
| | | Call Options | | | Call Options | | | Call Options | |
| | | Number of
Contracts | | | Premium
Amount | | | Number of
Contracts | | | Premium
Amount | | | Number of
Contracts | | | Premium
Amount | |
Options outstanding at September 30, 2018 | | | (37,287 | ) | | $ | (4,894,698 | ) | | | — | | | $ | — | | | | — | | | $ | — | |
Call options written | | | (230,984 | ) | | | (46,537,285 | ) | | | (1,822 | ) | | | (254,152 | ) | | | (3,538 | ) | | | (484,606 | ) |
Call options exercised | | | 2,461 | | | | 515,982 | | | | 672 | | | | 87,135 | | | | 1,588 | | | | 242,763 | |
Call options purchased to cover | | | 192,362 | | | | 33,903,644 | | | | — | | | | — | | | | — | | | | — | |
Call options expirations | | | 47,517 | | | | 6,543,468 | | | | 1,150 | | | | 167,017 | | | | 1,950 | | | | 241,843 | |
Options outstanding at September 30, 2019 | | | (25,931 | ) | | $ | (10,468,889 | ) | | | — | | | $ | — | | | | — | | | $ | — | |
| | | Hedged U.S. Equity Opportunities | | | Premium Income | |
| | | Put Options | | | Call Options | |
| | | Number of
Contracts | | | Premium
Amount | | | Number of
Contracts | | | Premium
Amount | | | Number of
Contracts | | | Premium
Amount | |
Options outstanding at September 30, 2018 | | | 177 | | | $ | 1,516,217 | | | | (132 | ) | | $ | (608,359 | ) | | | (13,818 | ) | | $ | (15,158,255 | ) |
Put options written | | | — | | | | — | | | | (227 | ) | | | (1,211,742 | ) | | | — | | | | — | |
Put options purchased to cover | | | — | | | | — | | | | 170 | | | | 969,499 | | | | — | | | | — | |
Put options written expirations | | | — | | | | — | | | | 23 | | | | 63,950 | | | | — | | | | — | |
Put options purchased | | | 227 | | | | 2,143,052 | | | | — | | | | — | | | | — | | | | — | |
Put options sold | | | (61 | ) | | | (705,485 | ) | | | — | | | | — | | | | — | | | | — | |
Put options purchased expired | | | (177 | ) | | | (1,516,216 | ) | | | — | | | | — | | | | — | | | | — | |
Call options written | | | — | | | | — | | | | — | | | | — | | | | (49,682 | ) | | | (61,789,236 | ) |
Call options exercised | | | — | | | | — | | | | — | | | | — | | | | 6,429 | | | | 5,266,267 | |
Call options purchased to cover | | | — | | | | — | | | | — | | | | — | | | | 36,323 | | | | 46,172,153 | |
Call options expirations | | | — | | | | — | | | | — | | | | — | | | | 299 | | | | 414,302 | |
Options outstanding at September 30, 2019 | | | 166 | | | $ | 1,437,568 | | | | (166 | ) | | $ | (786,652 | ) | | | (20,449 | ) | | $ | (25,094,769 | ) |
288
Derivative Investment Holdings Categorized by Risk Exposure—The following table sets forth the fair value and the location in the Statement of Assets and Liabilities of the Funds’ derivative contracts by primary risk exposure as of September 30, 2019:
| | Asset derivatives | Liability derivatives |
Risk exposure category | Statement of Assets
and Liabilities
location | | Value | | Statement of Assets
and Liabilities
location | | Value | | | | | |
Options Contracts: | | | | | | | | | | | | | | | |
Covered Call Strategy | Purchased Options, at value | | | N/A | | Written Options, at value | | $ | 13,732,077 | | Purchased Options, at value | | | N/A | |
Hedged U.S. Equity Opportunities | Purchased Options, at value | | $ | 731,965 | | Written Options, at value | | $ | 352,340 | | Purchased Options, at value | | $ | — | |
Premium Income | Purchased Options, at value | | | N/A | | Written Options, at value | | $ | 29,088,288 | | Purchased Options, at value | | | N/A | |
The following table sets forth the Funds’ realized gain (loss), as reflected in the Statement of Operations, by primary risk exposure and by type of derivative contract for the year ended September 30, 2019:
Risk exposure category | | Written options | | | Purchased options | |
Options contracts: | | | | | | | | |
Covered Call Strategy | | $ | (6,548,114 | ) | | | N/A | |
Equity Income | | $ | 167,018 | | | | N/A | |
Growth & Income | | $ | 241,845 | | | | N/A | |
Hedged U.S. Equity Opportunities | | $ | (1,946,305 | ) | | $ | 726,762 | |
Premium Income | | $ | 2,288,508 | | | | N/A | |
The following table sets forth the Funds’ change in unrealized appreciation (depreciation) by primary risk exposure and by type of derivative contract for the year ended September 30, 2019:
Risk exposure category | | Written options | | | Purchased options | |
Options Contracts: | | | | | | | | |
Covered Call Strategy | | $ | (3,264,321 | ) | | $ | N/A | |
Hedged U.S. Equity Opportunities | | $ | 140,894 | | | $ | 185,284 | |
Premium Income | | $ | (2,668,324 | ) | | $ | N/A | |
Futures Contracts—The Funds may enter into futures contracts including interest rate futures contracts and index futures, including futures on equity market indices and debt market indices. A futures contract is an agreement between two parties to buy or sell a specified underlying instrument for a fixed price at a specified future date. The Funds may use futures contracts to manage exposure to the stock market. Upon entering into a futures contract, a fund is required
289
Notes to Financial Statements (continued)
FIRST INVESTORS INCOME FUNDS
FIRST INVESTORS EQUITY FUNDS
September 30, 2019
to deposit either cash or securities (initial margin) with a clearing broker in an amount equal to a certain percentage of the face value of the contract. Futures contracts are marked-to-market daily and subsequent daily payments (variation margin) are made or received by a fund depending on the daily fluctuations in the value of the futures contracts and are recorded as unrealized appreciation or (depreciation). This receivable and/or payable, if any, is included in daily variation margin on futures contracts in the Statement of Assets and Liabilities. Realized gain or (loss) is recorded upon the expiration or closing of a futures contract. The net realized gain (loss) and change in net unrealized appreciation (depreciation) on futures contracts during the period is presented in the Statement of Operations. Any open futures contracts at period end are presented in the Schedule of Investments under the caption “Futures Contracts”. The notional amount at value reflects each contract’s exposure to the underlying instrument or index at period end.
The Funds may enter into interest rate futures contracts on U.S. Treasury obligations and options thereon that are traded on a U.S. exchange. An interest rate futures contract provides for the future sale by one party and the purchase by another party of a specified amount of a particular financial instrument (debt security) at a specified price, date, time and place. Such investments may be used for, among other purposes, the purpose of hedging against changes in the value of a Fund’s portfolio securities due to anticipated changes in interest rates and market conditions. A public market exists for interest rate futures contracts covering a number of debt securities, including long-term U.S. Treasury Bonds, 10-year U.S. Treasury Notes and three-month U.S. Treasury Bills. No price is paid upon entering into futures contracts. Instead, upon entering into a futures contract, a Fund is required to deposit with its custodian in a segregated account in the name of the futures broker through which the transaction is effected an amount of cash or U.S. Government securities generally equal to 3%-5% or less of the contract value. This amount is known as “initial margin.”
An option on an interest rate futures contract generally gives the purchaser the right, in return for the premium paid, to assume a position in a futures contract at a specified exercise price at any time prior to the expiration date of the option. The Funds may purchase put and call options on interest rate futures contracts on U.S. Treasury obligations which are traded on a U.S. exchange as a hedge against changes in interest rates, and may enter into closing transactions with respect to such options to terminate existing positions. There is no guarantee such closing transactions can be effected. When writing a call or put option on a futures contract, margin also must be deposited in accordance with applicable exchange rules. Initial margin on futures contracts is in the nature of a performance bond or good-faith deposit that is returned to a Fund upon termination of the transaction, assuming all obligations have been satisfied. Under certain circumstances, such as periods of high volatility, a Fund may be required by an exchange to increase the level of its initial margin payment. Subsequent payments, called “variation margin,” to and from the broker, are made on a daily basis as the value of the futures position varies, a process known as “marking to market.” Variation margin does not involve borrowing to finance the futures transactions, but rather represents a daily settlement of a Fund’s obligation to or from a clearing organization. A Fund is also obligated to make initial and variation margin payments when it writes options on futures contracts.
290
To the extent that a Fund participates in the futures or options markets, it will incur investment risks and transaction costs to which it would not be subject absent the use of these strategies. The use of these strategies involves certain special risks, including: (1) dependence on the ability of the Funds’ investment adviser, FIMCO, or a Fund’s subadviser, as applicable, to predict correctly movements in the direction of interest rates and securities prices; (2) imperfect correlation between the price of futures contracts and options thereon and movements in the prices of the securities or currencies being hedged; (3) the fact that skills needed to use these strategies are different from those needed to select portfolio securities; (4) the leverage (if any) that is created by investing in the option or futures contract; and (5) the possible absence of a liquid secondary market for any particular instrument at any time. If FIMCO’s, or a Fund’s subadviser, as applicable, prediction of movements in the direction of the securities and interest rate markets is inaccurate, the adverse consequences to that Fund may leave it in a worse position than if such strategies were not used. Derivatives may be difficult to sell, unwind or value.
The following table summarizes the value of the Funds’ futures contracts held as of September 30, 2019 and the related location in the Statement of Assets and Liabilities:
| | | Statement of Assets
and Liabilities
Location | |
Futures Contracts | | Unrealized
appreciation in
value of investments | |
Hedged U.S. Equity Opportunities | | $ | 165,885 | |
The amount of unrealized appreciation (depreciation) on futures contracts recognized by the Funds in the accompanying Statement of Operations for the year ended September 30, 2019 is summarized in the following table:
| | | Statement of
Operations Location | |
Futures Contracts | | Unrealized
appreciation in
value of investments | |
Hedged U.S. Equity Opportunities | | $ | 324,875 | |
291
Notes to Financial Statements (continued)
FIRST INVESTORS INCOME FUNDS
FIRST INVESTORS EQUITY FUNDS
September 30, 2019
The following table summarizes the realized gain on futures contracts during the year ended September 30, 2019, and the related location in the accompanying Statement of Operations.
| | | Statement of
Operations | |
Futures Contracts | | Realized gain
on futures contracts | |
Hedged U.S. Equity Opportunities | | $ | 364,036 | |
Foreign Exchange Contracts—The International Opportunities Bond Fund, Global Fund and Hedged U.S. Equity Opportunities Fund may enter into foreign exchange contracts for the purchase or sale of foreign currencies at negotiated rates at future dates. These contracts are considered derivative instruments and a Fund may invest in them in order to hedge its currency exposure in bond positions or to gain currency exposure held by the Fund. A Fund could be exposed to risk if counterparties to the contracts are unable to meet the terms of their contracts or if the value of the foreign currency changes unfavorably. Foreign exchange contracts are “marked-to-market” daily at the applicable translation rate and the resulting unrealized gains and losses are reflected in the Funds’ assets. During the period, the Funds used currency forwards to hedge currency exposure from certain bonds as well as to gain currency exposure in certain countries.
Disclosures about Offsetting Assets and Liabilities—Disclosures about Offsetting Assets and Liabilities requires an entity to disclose information about offsetting and related arrangements to enable users of its financial statements to understand the effect of those arrangements on its financial position. The guidance requires retrospective application for all comparative periods presented.
A Fund may mitigate credit risk with respect to OTC derivative counterparties through credit support annexes included with an International Swaps and Derivatives Association, Inc. Master Agreements or other Master Netting Agreements which are the standard contracts governing most derivative transactions between the Fund and each of its counterparties. These agreements may allow the Fund and each counterparty to offset certain derivative financial instruments’ payables and/or receivables against each other and/or with collateral, which is generally held by the Fund’s custodian. The amount of collateral moved to/from applicable counterparties is based upon minimum transfer amounts specified in the agreement. To the extent amounts due to the Fund from its counterparties are not fully collateralized contractually or otherwise, the Fund bears the risk of loss from counterparty non-performance.
The Funds’ Statement of Assets and Liabilities (“SOAL”) presents financial instruments on a gross basis, therefore there are no net amounts and no offset amounts within the SOAL to present
292
below. Gross amounts of the financial instruments, amounts related to financial instruments/cash collateral not offset in the SOAL and net amounts are presented below:
International Opportunities Bond
Description/Financial
Instrument/Statement of
Assets and Liabilities Category | Counterparty | | Gross Amounts
Presented in
Statement of Assets
and Liabilities | | | Financial
Instruments* | | | Net Amount | |
Unrealized gain on foreign exchange contracts | HSBC | | $ | 26,459 | | | $ | (26,459 | ) | | $ | — | |
| | | | | | | | | | | | | | |
Unrealized loss on foreign exchange contracts | CITI | | $ | (311,354 | ) | | $ | — | | | $ | (311,354 | ) |
| | GS | | | (90,135 | ) | | | — | | | | (90,135 | ) |
| | HSBC | | | (430,516 | ) | | | 26,459 | | | | (404,057 | ) |
| | MS | | | (176,494 | ) | | | — | | | | (176,494 | ) |
| | Total | | $ | (1,008,499 | ) | | $ | 26,459 | | | $ | (982,040 | ) |
Hedged U.S. Equity Opportunities
Description/Financial
Instrument/Statement of
Assets and Liabilities Category | Counterparty | | Gross Amounts
Presented in
Statement of Assets
and Liabilities | | | Financial
Instruments* | | | Net Amount | |
Unrealized gain on foreign exchange contracts | BAM | | $ | 1,234 | | | $ | — | | | $ | 1,234 | |
| | DMG | | | 16,089 | | | | (4,113 | ) | | | 11,976 | |
| | UBS | | | 12,369 | | | | — | | | | 12,369 | |
| | | | $ | 29,692 | | | $ | (4,113 | ) | | $ | 25,579 | |
Unrealized loss on foreign exchange contracts | BOM | | $ | (5,556 | ) | | $ | — | | | $ | (5,556 | ) |
| | DMG | | | (4,113 | ) | | | 4,113 | | | | — | |
| | Total | | $ | (9,669 | ) | | $ | 4,113 | | | $ | (5,556 | ) |
* | Amounts related to master netting arrangements (for example, ISDA) which have been determined by the Fund to be legally enforceable in the event of default and where certain other criteria are met in accordance with applicable offsetting accounting guidance. |
A summary of abbreviations for counterparties appear at the end of the Portfolio of Investments for the respective Funds.
293
Notes to Financial Statements (continued)
FIRST INVESTORS INCOME FUNDS
FIRST INVESTORS EQUITY FUNDS
September 30, 2019
During the year ended September 30, 2019, the volume of derivative activity for the Funds based on average monthly market values for forward foreign currency contracts (to buy) and for forward foreign currency contracts (to sell) were as follows:
| | | Forward Foreign Currency Contracts | |
| | | to Buy | | | to Sell | |
International Opportunities Bond | | $ | 55,794,644 | | | $ | 11,609,624 | |
Hedged U.S. Equity Opportunities | | | 955,030 | | | | 4,038,721 | |
Fair Value of Derivative Instruments—The fair value of derivative instruments held by the Funds as of September 30, 2019, was as follows:
| | Assets Derivatives | Liability Derivatives |
Derivatives not
accounted for as hedging
instruments under ASC 815 | Statements of Assets
and Liabilities Location | Statements of Assets
and Liabilities Location |
Foreign exchange, options
and futures contracts: | Unrealized
appreciation of
foreign exchange,
options and
futures contracts | | Value | | Unrealized
depreciation of
foreign exchange,
options and
futures contracts | | Value | |
International Opportunities Bond | | | $ | 26,459 | | | | $ | (1,008,499 | ) |
Hedged U.S. Equity Opportunities | | | $ | 29,692 | | | | $ | (9,669 | ) |
The effect of the Funds’ derivative instruments on the Statement of Operations are as follows:
Amount of Realized Gain or Loss Recognized on Derivatives | | | | |
Derivatives not accounted for as hedging instruments under ASC 815 | | Net Realized
Gain (Loss) on
Foreign Exchange
Transactions | |
Foreign exchange transactions: | | | | |
International Opportunities Bond | | $ | (3,529,943 | ) |
Global | | $ | (416,670 | ) |
Hedged U.S. Equity Opportunities | | $ | 79,013 | |
International | | $ | (309,025 | ) |
��
294
Amount of Change in Unrealized Appreciation or Depreciation Recognized on Derivatives |
Derivatives not accounted for as hedging instruments under ASC 815 | | Net Unrealized
Appreciation
(Depreciation) on
Foreign Exchange
Transactions | |
Foreign exchange transactions: | | | | |
International Opportunities Bond | | $ | (796,780 | ) |
Global | | $ | (32,865 | ) |
Hedged U.S. Equity Opportunities | | $ | 15,975 | |
International | | $ | (15,793 | ) |
6. High Yield Credit Risk—The investments in high yield securities of Floating Rate Fund, Fund For Income, Investment Grade Fund, Limited Duration Bond Fund and Total Return Fund, whether rated or unrated, may be considered speculative and subject to greater market fluctuations and risks of loss of income and principal than lower-yielding, higher-rated, fixed-income securities. The risk of loss due to default by the issuer may be significantly greater for holders of high-yielding securities, because such securities are generally unsecured and are often subordinated to other creditors of the issuer.
7. Capital—The Trusts are authorized to issue an unlimited number of shares of beneficial interest without par value. The Trusts consist of the Funds listed on the cover page, each of which is a separate and distinct series of the Trusts. Each Fund has designated three classes of shares, Class A, Advisor Class and Institutional Class shares (each, a “Class”) except for Government Cash Management Fund which has designated only Class A, and Institutional Class shares, Strategic Income Fund which has designated only Class A and Advisor Class shares. All Class B shares were converted to Class A shares on June 14, 2019. Not all classes of shares of each Fund may be available in all jurisdictions. Effective February 1, 2019, Class B shares are no longer offered for sale to the public. Each share of each Class has an equal beneficial interest in the assets, has identical voting, dividend, liquidation and other rights and is subject to the same terms and conditions except that expenses allocated to a Class may be borne solely by that Class as determined by the Board and a Class may have exclusive voting rights with respect to matters affecting only that Class. Government Cash Management Fund’s Class A, and Institutional Class shares are sold without an initial sales charge; however, The shares sold by the other Funds have a public offering price that reflects different sales charges and expense levels. Class A shares are sold with an initial sales charge of up to 4% for the First Investors Income Funds, except for Floating Rate Fund and Limited Duration Bond Fund which have an initial sales charge of up to 2.5% (effective June 12, 2017, the maximum sales charge on Class A shares was changed from 5.75% to 4% on the Income Funds, except for Floating Rate Fund and Limited Duration Bond Fund which was changed to 2.5%) and 5.75% for the First Investors Equity Funds and together with the Class B shares are subject to distribution plan fees as described in Note 3. There are no sales charges associated with the purchase of Advisor Class and Institutional Class shares. Realized and unrealized gains or losses, investment income and expenses (other than distribution
295
Notes to Financial Statements (continued)
FIRST INVESTORS INCOME FUNDS
FIRST INVESTORS EQUITY FUNDS
September 30, 2019
plan fees and shareholder servicing costs) are allocated daily to each class of shares based upon the relative proportion of net assets to each class.
8. Litigation—The Blue Chip and Equity Income Funds have been named, and have received notice that they may be putative members of the proposed defendant class of shareholders, in a lawsuit filed in the United States Bankruptcy Court for the District of Delaware on November 1, 2010, by the Official Committee of Unsecured Creditors of Tribune Company (the “Committee”). The Committee is seeking to recover all payments made to beneficial owners of common stock in connection with a leveraged buyout of the Tribune Company (“LBO”), including payments made in connection with a 2007 tender offer into which the Blue Chip and Equity Income Funds tendered their shares of common stock of the Tribune Company. On December 9, 2011, the Blue Chip Fund was reorganized into the Growth & Income Fund pursuant to a Plan of Reorganization and Termination, whereby all of the assets of the Blue Chip Fund were transferred to the Growth & Income Fund, the Growth & Income Fund assumed all of the liabilities of the Blue Chip Fund, including any contingent liabilities with respect to pending or threatened litigation or actions, and shareholders of Blue Chip Fund became shareholders of Growth & Income Fund. The adversary proceeding brought by the Committee has been transferred to the Southern District of New York and administratively consolidated with other similar suits as discussed below. In addition, on June 2, 2011, the Blue Chip and Equity Income Funds were named as defendants in a lawsuit brought in connection with the Tribune Company’s LBO by Deutsche Bank Trust Company Americas, in its capacity as successor indenture trustee for a certain series of Senior Notes, Law Debenture Trust Company of New York, in its capacity as successor indenture trustee for a certain series of Senior Notes, and Wilmington Trust Company, in its capacity as successor indenture trustee for the PHONES Notes (together, the “Bondholder Plaintiffs”) in the Supreme Court of the State of New York. The Blue Chip and Equity Income Funds have also been named in a similar suit filed on behalf of participants in Tribune defined-compensation plans (the “Retiree Plaintiffs”). As with the Bondholder Plaintiffs and the Committee, the Retiree Plaintiffs seek to recover payments of the proceeds of the LBO. (All of these suits have been removed to the United States District Court for the Southern District of New York and administratively consolidated with other substantially similar suits against other former Tribune shareholders (the “MDL Proceeding”)). On September 23, 2013, the Judge in the MDL Proceeding dismissed various state law constructive fraudulent transfer suits, resulting in the Funds being dismissed from the Bondholder and Retiree Plaintiffs’ actions. On September 30, 2013, counsel for the plaintiffs in those suits appealed the MDL Judge’s dismissal ruling to the Second Circuit. On March 24, 2016, the Second Circuit Court of Appeals affirmed the MDL Judge’s dismissal of the various state law constructive fraudulent transfer suits. In September 2016, the Bondholder and Retiree Plaintiffs petitioned the U.S. Supreme Court to review the Second Circuit’s decision. The Supreme Court has not yet ruled on that request. On January 9, 2017, the Tribune MDL judge granted the defendants’ motion to dismiss the Committee lawsuit alleging a single claim for intentional fraudulent transfer. An appeal of that decision to the Second Circuit is expected, but has not yet been made. The extent of the Funds’ potential liability in any such actions has not been determined. The Funds have been advised by counsel that the Funds could be held liable to return all or part of the proceeds received in any of these actions, as well as interest and court costs, even though the Funds had no knowledge of, or participation in,
296
any misconduct. The Equity Income Fund received proceeds of $1,526,566 in connection with the LBO, representing 0.32% of its net assets as of September 30, 2019. The Blue Chip Fund received proceeds of $790,772 in connection with the LBO, representing 0.05% of the net assets of Growth & Income Fund as of September 30, 2019. The Equity Income and Growth & Income Funds cannot predict the outcomes of these proceedings, and thus have not accrued any of the amounts sought in the various actions in the accompanying financial statements.
9. Reorganization of Government Fund into Limited Duration Bond Fund—On September 21, 2018, the Limited Duration Bond Fund acquired all of the net assets of the Government Fund in connection with a tax-free reorganization that was approved by the Income Funds’ Board of Trustees. The Limited Duration Bond Fund issued 20,370,413 Class A shares, 52,807 Advisor Class shares and 111 Institutional Class shares to the Government Fund in connection with the reorganization. In return, it received net assets of $187,297,416 from the Government Fund (which included $2,066,343 of unrealized depreciation and $27,873,276 of accumulated net realized losses). The Limited Duration Bond Fund’s shares were issued at their current net asset values as of the date of the reorganization. The aggregate net assets of the Limited Duration Bond Fund and Government Fund immediately before the acquisition were $322,964,766 consisting of, with respect to Limited Duration Bond Fund, $135,667,350 ($61,845,002 Class A, $34,993,936 Advisor Class and $38,828,412 Institutional Class) and, with respect to Government Fund, $187,297,416 ($186,810,690 Class A, $485,702 Advisor Class and $1,024 Institutional Class).
Reorganization of Balanced Income Fund into Total Return Fund—On September 21, 2018, the Total Return Fund acquired all of the net assets of the Balanced Income Fund in connection with a tax-free reorganization that was approved by the Income Funds and Equity Funds Board of Trustees. The Total Return Fund issued 2,466,173 Class A shares and 2,516 Advisor Class shares to the Balanced Income Fund in connection with the reorganization. In return, it received net assets of $50,516,080 from the Balanced Income Fund (which included $2,722,435 of unrealized appreciation and $237,931 of accumulated net realized losses). The Total Return Fund’s shares were issued at their current net asset values as of the date of the reorganization. The aggregate net assets of the Total Return Fund and Balanced Income Fund immediately before the acquisition were $939,139,408 consisting of, with respect to Total Return Fund, $888,623,328 ($846,769,158 Class A, $6,101,354 Class B, $958,144 Advisor Class and $34,794,672 Institutional Class) and, with respect to Balanced Income Fund, $50,516,080 ($50,464,265 Class A and $51,815 Advisor Class).
10. Asset Purchase Agreements with Macquarie and Cetera—On April 9, 2019, The Independent Order of Foresters, the ultimate parent company of FIMCO, which is the investment adviser to the separate series of the First Investors Income Funds, First Investors Equity Funds, First Investors Tax Exempt Funds and First Investors Life Series Funds (the “Funds”), FFS, which is the Funds’ distributor, and FIS, which is the Funds’ transfer agent, announced that it had entered into the two definitive purchase agreements described below that, once completed, resulted in the sale of its U.S. North American Asset Management businesses.
297
Notes to Financial Statements (continued)
FIRST INVESTORS INCOME FUNDS
FIRST INVESTORS EQUITY FUNDS
September 30, 2019
First, FIMCO entered into an Asset Purchase Agreement with Macquarie Management Holdings, Inc. (“Macquarie”) whereby Macquarie, a global investment management firm headquartered in Philadelphia, Pennsylvania, purchased FIMCO’s assets related to the mutual fund management business, including the Funds (the “Transaction”). The Transaction did not result in any material changes to the Funds’ investment objectives and principal investment strategies. However, upon the completion of the Transaction, each Fund was reorganized into a substantially similar fund that is managed by Delaware Management Company, a subsidiary of Macquarie (the “Reorganizations”). The Funds’ Board of Trustees approved the Reorganizations on June 10, 2019. Fund shareholders approved the reorganizations at a special shareholder meeting on October 1, 2019. On October 4, 2019, Macquarie completed the purchase of FIMCO’s assets related to the mutual fund management business, including the Funds.
Second, FFS and Foresters Advisory Services, LLC (“FAS”) entered into an Asset Purchase Agreement with Cetera Financial Group, Inc. (“Cetera”), a U.S.-based wealth management firm headquartered in Denver, Colorado. The agreement with Cetera did not require the approval of Fund shareholders. On June 20, 2019, Cetera completed the purchase of FFS’ retail brokerage business and FAS’ retail advisory business.
11. Tax Components of Capital and Distributions to Shareholders—The tax character of distributions declared for the years ended September 30, 2019 and September 30, 2018 were as follows:
| | | Year Ended September 30, 2019 | |
| | | Distributions Declared from | | | | | |
Fund | | Ordinary
Income | | | Long-Term
Capital Gain | | | Total | |
Floating Rate | | $ | 8,275,922 | | | $ | — | | | $ | 8,275,922 | |
Fund For Income | | | 31,278,634 | | | | — | | | | 31,278,634 | |
Government Cash Management | | | 2,943,310 | | | | — | | | | 2,943,310 | |
International Opportunities Bond | | | 2,748,448 | | | | — | | | | 2,748,448 | |
Investment Grade | | | 19,183,394 | | | | — | | | | 19,183,394 | |
Limited Duration Bond | | | 9,792,168 | | | | — | | | | 9,792,168 | |
Strategic Income | | | 4,822,991 | | | | — | | | | 4,822,991 | |
Covered Call Strategy | | | 3,653,544 | | | | — | | | | 3,653,544 | |
Equity Income | | | 14,534,135 | | | | 63,672,704 | | | | 78,206,839 | |
Global | | | 2,520,015 | | | | 68,121,835 | | | | 70,641,850 | |
Growth & Income | | | 27,212,978 | | | | 288,031,290 | | | | 315,244,268 | |
Hedged U.S. Equity Opportunities | | | 2,127,641 | | | | 898,411 | | | | 3,026,052 | |
International | | | 805,814 | | | | 24,167,313 | | | | 24,973,127 | |
Opportunity | | | 11,273,772 | | | | 93,509,315 | | | | 104,783,087 | |
Premium Income | | | 4,196,161 | | | | — | | | | 4,196,161 | |
Select Growth | | | 139,861 | | | | 36,242,180 | | | | 36,382,041 | |
Special Situations | | | 7,966,976 | | | | 79,456,117 | | | | 87,423,093 | |
Total Return | | | 15,493,514 | | | | 68,019,438 | | | | 83,512,952 | |
298
| | | Year Ended September 30, 2018 | |
| | | Distributions Declared from | | | | | |
Fund | | Ordinary
Income | | | Long-Term
Capital Gain | | | Total | |
Floating Rate | | $ | 7,331,705 | | | $ | — | | | $ | 7,331,705 | |
Fund For Income | | | 35,408,355 | | | | — | | | | 35,408,355 | |
Government Cash Management | | | 1,351,094 | | | | — | | | | 1,351,094 | |
International Opportunities Bond | | | 4,560,231 | | | | — | | | | 4,560,231 | |
Investment Grade…. | | | 22,161,164 | | | | — | | | | 22,161,164 | |
Limited Duration Bond | | | 3,854,857 | | | | — | | | | 3,854,857 | |
Strategic Income | | | 5,491,764 | | | | — | | | | 5,491,764 | |
Covered Call Strategy. | | | 3,645,728 | | | | — | | | | 3,645,728 | |
Equity Income | | | 15,326,911 | | | | 16,324,412 | | | | 31,651,323 | |
Global | | | 7,425,106 | | | | 37,893,056 | | | | 45,318,162 | |
Growth & Income | | | 35,231,978 | | | | 64,202,763 | | | | 99,434,741 | |
Hedged U.S. Equity Opportunities | | | — | | | | — | | | | — | |
International | | | 522,398 | | | | — | | | | 522,398 | |
Opportunity. | | | 6,881,745 | | | | 58,395,168 | | | | 65,276,913 | |
Premium Income | | | 347,190 | | | | — | | | | 347,190 | |
Select Growth | | | 363,284 | | | | 47,676,209 | | | | 48,039,493 | |
Special Situations | | | 3,559,349 | | | | 15,893,646 | | | | 19,452,995 | |
Total Return | | | 18,048,089 | | | | 14,207,523 | | | | 32,255,612 | |
299
Notes to Financial Statements (continued)
FIRST INVESTORS INCOME FUNDS
FIRST INVESTORS EQUITY FUNDS
September 30, 2019
As of September 30, 2019, the components of distributable earnings (deficit) on a tax basis were as follows:
Fund | | Undistributed
Ordinary
Income | | | Undistributed
Capital Gains | | | Capital
Losses
Carryover | | | Other
Accumulated
Losses | | | Unrealized
Appreciation
(Depreciation) | | | Total
Distributable
Earnings
(Deficit) | |
Floating Rate | | $ | 285,107 | | | $ | — | | | $ | (3,294,146 | ) | | $ | (695,603 | ) | | $ | (1,160,408 | ) | | $ | (4,865,050 | ) |
Fund For Income | | | 209,104 | | | | — | | | | (40,084,848 | ) | | | (4,499,724 | ) | | | 3,837,015 | | | | (40,538,453 | ) |
International Opportunities Bond | | | 1,224,588 | | | | — | | | | (3,918,295 | ) | | | (6,692,303 | ) | | | (14,223,445 | ) | | | (23,609,455 | ) |
Investment Grade | | | 60,507 | | | | — | | | | (5,860,069 | ) | | | (4,588,634 | ) | | | 21,361,575 | | | | 10,973,379 | |
Limited Duration Bond | | | 27 | | | | — | | | | (10,981,230 | ) | | | (24,337,313 | )* | | | 2,620,353 | | | | (32,698,163 | ) |
Strategic Income | | | 14,872 | | | | — | | | | (3,308,655 | ) | | | (965,977 | ) | | | (4,346,985 | ) | | | (8,606,745 | ) |
Covered Call Strategy | | | 137,500 | | | | — | | | | (9,178,030 | ) | | | (15,600,148 | ) | | | 54,892,060 | | | | 30,251,382 | |
Equity Income | | | 11,798 | | | | 32,560,970 | | | | — | | | | — | | | | 138,364,045 | | | | 170,936,813 | |
Global | | | 3,514,280 | | | | — | | | | (5,175,460 | ) | | | (389,745 | ) | | | 60,736,573 | | | | 58,685,648 | |
Growth & Income | | | 450,700 | | | | 147,616,624 | | | | — | | | | — | | | | 462,024,378 | | | | 610,091,702 | |
Hedged U.S. Equity Opportunities | | | 5,717,724 | | | | 4,721,779 | | | | — | | | | — | | | | 20,793,352 | | | | 31,232,855 | |
International | | | 1,593,450 | | | | 13,318,437 | | | | — | | | | (292,018 | ) | | | 82,432,348 | | | | 97,052,217 | |
Opportunity | | | 3,563,058 | | | | 86,205,703 | | | | — | | | | — | | | | 228,414,384 | | | | 318,183,145 | |
Premium Income | | | 430,320 | | | | 1,130,216 | | | | — | | | | — | | | | (1,533,688 | ) | | | 26,848 | |
Select Growth | | | 1,620,611 | | | | 59,227,009 | | | | — | | | | — | | | | 104,710,492 | | | | 165,558,112 | |
Special Situations | | | 1,371,824 | | | | 34,313,616 | | | | — | | | | — | | | | 43,278,865 | | | | 78,964,305 | |
Total Return | | | 257,166 | | | | 44,834,860 | | | | — | | | | — | | | | 145,583,364 | | | | 190,675,390 | |
* | Includes $23,458,410 of long-term capital losses acquired by the Fund’s merger with the First Investors Government Fund on September 21, 2018. Per the IRS, use of these losses is limited to $4,374,271 per year. |
300
Other accumulated losses as of September 30, 2019 consist of late year loss deferrals in the following categories:
Fund | | Capital Losses | | | Currency Losses | | | Total | |
Floating Rate | | $ | (695,603 | ) | | $ | — | | | $ | (695,603 | ) |
Fund For Income | | | (4,499,724 | ) | | | — | | | | (4,499,724 | ) |
International Opportunities Bond | | | (4,017,026 | ) | | | (3,657,313 | ) | | | (7,674,339 | ) |
Investment Grade | | | (4,588,634 | ) | | | — | | | | (4,588,634 | ) |
Limited Duration Bond | | | (878,903 | ) | | | — | | | | (878,903 | ) |
Strategic Income | | | (965,977 | ) | | | — | | | | (965,977 | ) |
Covered Call Strategy | | | (15,600,148 | ) | | | — | | | | (15,600,148 | ) |
Global | | | — | | | | (389,745 | ) | | | (389,745 | ) |
International | | | — | | | | (292,018 | ) | | | (292,018 | ) |
For the year ended September 30, 2019, the following reclassifications were made to reflect permanent differences between book and tax reporting which are primarily due to the differences between book and tax treatment of bond premium amortization.
Fund | | Capital
Paid In | | | Distributable
Earnings | |
Fund For Income | | $ | 3,171 | | | $ | (3,171 | ) |
12. Subsequent Events—Subsequent events occurring after September 30, 2019 have been evaluated for potential impact to this report through the date the financial statements were issued. As described in Note 10 in the Notes to Financial Statements, on October 1, 2019, at a special shareholder meeting, Fund shareholders approved the Reorganizations and on October 4, 2019, Macquarie completed the purchase of FIMCO’s assets related to the mutual fund management business, including the Funds. All the fee waivers and expense limitation agreements described in Note 3 were terminated at the time of the Reorganizations. Macquarie has implemented fee waivers through two years from the closing date of the Reorganizations as necessary to ensure that the total expense ratio for each class of shares of the corresponding Delaware Fund (after waivers if applicable) is no higher than that of the corresponding class of the corresponding First Investors Fund (after waivers if applicable). There were no other subsequent events to report that would have a material impact on the Funds’ financial statements.
301
Financial Highlights
FIRST INVESTORS INCOME FUNDS
The following table sets forth the per share operating performance data for a share outstanding, total return, ratios to average net assets and other supplemental data for each fiscal year ended September 30 unless otherwise indicated.
| | | P E R
S H A R E
D A T A | | | | |
| | | | | | | Investment
Operations | | | Less
Distributions from | | | | | | | | | |
| | | | | | | | | | | Net Realized | | | | | | | | | | | | | | | | | | | | | |
| | Net Asset
Value,
Beginning
of Year | | | Net
Investment
Income (c) | | | and
Unrealized
Gain
(Loss) on
Investments | | | Total
From
Investment
Operations | | | Net
Investment
Income | | | Net
Realized
Gain | | | Total
Distributions | | | Net Asset
Value,
End of
Year | |
FLOATING RATE FUND | | | | |
Class A | | | | | | | | | | | | | | | | | | | | | | | | | | | | | | | | |
2015 | | $ | 9.88 | | | $ | .26 | | | $ | (.27 | ) | | $ | (.01 | ) | | $ | .29 | | | | — | | | $ | .29 | | | $ | 9.58 | |
2016 | | | 9.58 | | | | .27 | | | | .09 | | | | .36 | | | | .28 | | | | — | | | | .28 | | | | 9.66 | |
2017 | | | 9.66 | | | | .27 | | | | .05 | | | | .32 | | | | .31 | | | | — | | | | .31 | | | | 9.67 | |
2018 | | | 9.67 | | | | .32 | | | | .04 | | | | .36 | | | | .32 | | | | — | | | | .32 | | | | 9.71 | |
2019 | | | 9.71 | | | | .39 | | | | (.13 | ) | | | .26 | | | | .39 | | | | — | | | | .39 | | | | 9.58 | |
Advisor Class | | | | | | | | | | | | | | | | | | | | | | | | | | | | |
2015 | | | 9.88 | | | | .28 | | | | (.26 | ) | | | .02 | | | | .32 | | | | — | | | | .32 | | | | 9.58 | |
2016 | | | 9.58 | | | | .29 | | | | .08 | | | | .37 | | | | .30 | | | | — | | | | .30 | | | | 9.65 | |
2017 | | | 9.65 | | | | .26 | | | | .09 | | | | .35 | | | | .32 | | | | — | | | | .32 | | | | 9.68 | |
2018 | | | 9.68 | | | | .34 | | | | .04 | | | | .38 | | | | .34 | | | | — | | | | .34 | | | | 9.72 | |
2019 | | | 9.72 | | | | .39 | | | | (.13 | ) | | | .26 | | | | .41 | | | | — | | | | .41 | | | | 9.57 | |
Institutional Class | | | | | | | | | | | | | | | | | | | | | | | | | | | | |
2015 | | | 9.86 | | | | .30 | | | | (.25 | ) | | | .05 | | | | .34 | | | | — | | | | .34 | | | | 9.57 | |
2016 | | | 9.57 | | | | .31 | | | | .08 | | | | .39 | | | | .32 | | | | — | | | | .32 | | | | 9.64 | |
2017 | | | 9.64 | | | | .26 | | | | .11 | | | | .37 | | | | .34 | | | | — | | | | .34 | | | | 9.67 | |
2018 | | | 9.67 | | | | .36 | | | | .04 | | | | .40 | | | | .36 | | | | — | | | | .36 | | | | 9.71 | |
2019 | | | 9.71 | | | | .41 | | | | (.11 | ) | | | .30 | | | | .42 | | | | — | | | | .42 | | | | 9.59 | |
302
See notes to financial statements
| | | R A T I O S / S U P P L E M E N T A L D A T A | |
| | | | | | | | | | | | | | | | | | | | | | | | | | | | | | | | |
| | | | | | | | | | | | | | | Ratio to
Average Net
Assets** | | | Ratio to
Average Net
Assets
Before
Expenses
Waived or
Assumed | | | | | |
| | | | | | Total
Return* | | | Net Assets
End of
Year (in
thousands) | | | Net
Expenses
After Fee
Credits | | | Net
Expenses
Before Fee
Credits*** | | | Net
Investment
Income | | | Expenses*** | | | Net
Investment
Income | | | Portfolio
Turnover
Rate | |
| | | | | | | | | | | | | | | | | | | | | | | | | | | | | | | | | | | | | |
| | | | | | | | | | | | | | | | | | | | | | | | | | | | | | | | | | | | | |
| | | | | | | | (.08 | )% | | $ | 57,101 | | | | 1.10 | % | | | 1.10 | % | | | 2.72 | % | | | 1.33 | % | | | 2.49 | % | | | 49 | % |
| | | | | | | | 3.69 | | | | 61,243 | | | | 1.10 | | | | 1.10 | | | | 2.86 | | | | 1.27 | | | | 2.69 | | | | 38 | |
| | | | | | | | 3.47 | | | | 66,769 | | | | 1.10 | | | | 1.10 | | | | 2.90 | | | | 1.24 | | | | 2.76 | | | | 89 | |
| | | | | | | | 3.83 | | | | 68,567 | | | | 1.10 | | | | 1.10 | | | | 3.25 | | | | 1.21 | | | | 3.14 | | | | 60 | |
| | | | | | | | 2.71 | | | | 64,136 | | | | 1.10 | | | | 1.10 | | | | 4.12 | | | | 1.10 | | | | 4.12 | | | | 88 | |
| | | | | | | | | | | | | | | | | | | | | | | | | | | | | | | | | | | | | |
| | | | | | | | .18 | | | | 50,122 | | | | .90 | | | | .90 | | | | 2.92 | | | | 1.03 | | | | 2.79 | | | | 49 | |
| | | | | | | | 3.92 | | | | 61,844 | | | | .90 | | | | .90 | | | | 3.06 | | | | .98 | | | | 2.98 | | | | 38 | |
| | | | | | | | 3.70 | | | | 98,958 | | | | .90 | | | | .90 | | | | 3.07 | | | | .92 | | | | 3.05 | | | | 89 | |
| | | | | | | | 4.03 | | | | 144,799 | | | | .90 | | | | .90 | | | | 3.46 | | | | .86 | | | | 3.50 | | | | 60 | |
| | | | | | | | 2.72 | | | | 40,542 | | | | .90 | | | | .90 | | | | 4.09 | | | | .84 | | | | 4.15 | | | | 88 | |
| | | | | | | | | | | | | | | | | | | | | | | | | | | | | | | | | | | | | |
| | | | | | | | .47 | | | | 10,458 | | | | .70 | | | | .70 | | | | 3.17 | | | | .90 | | | | 2.97 | | | | 49 | |
| | | | | | | | 4.14 | | | | 11,456 | | | | .70 | | | | .70 | | | | 3.27 | | | | .83 | | | | 3.14 | | | | 38 | |
| | | | | | | | 3.87 | | | | 21,277 | | | | .70 | | | | .70 | | | | 3.23 | | | | .80 | | | | 3.13 | | | | 89 | |
| | | | | | | | 4.20 | | | | 32,019 | | | | .70 | | | | .70 | | | | 3.68 | | | | .75 | | | | 3.63 | | | | 60 | |
| | | | | | | | 3.21 | | | | 497 | | | | .75 | | | | .75 | | | | 4.31 | | | | .78 | | | | 4.28 | | | | 88 | |
303
Financial Highlights (continued)
FIRST INVESTORS INCOME FUNDS
| | | P E R
S H A R E
D A T A | | | | |
| | | | | | | Investment
Operations | | | Less
Distributions from | | | | | | | | | |
| | | | | | | | | | | Net Realized | | | | | | | | | | | | | | | | | | | | | |
| | Net Asset
Value,
Beginning
of Year | | | Net
Investment
Income(c) | | | and
Unrealized
Gain
(Loss) on
Investments | | | Total
From
Investment
Operations | | | Net
Investment
Income | | | Net
Realized
Gain | | | Total
Distributions | | | Net Asset
Value,
End of
Year | |
FUND FOR INCOME | | | | |
Class A | | | | |
2015 | | $ | 2.59 | | | $ | .11 | | | $ | (.18 | ) | | $ | (.07 | ) | | $ | .13 | | | | — | | | $ | .13 | | | $ | 2.39 | |
2016 | | | 2.39 | | | | .11 | | | | .10 | | | | .21 | | | | .12 | | | | — | | | | .12 | | | | 2.48 | |
2017 | | | 2.48 | | | | .11 | | | | .05 | | | | .16 | | | | .12 | | | | — | | | | .12 | | | | 2.52 | |
2018 | | | 2.52 | | | | .11 | | | | (.06 | ) | | | .05 | | | | .13 | | | | — | | | | .13 | | | | 2.44 | |
2019 | | | 2.44 | | | | .12 | | | | .02 | | | | .14 | | | | .13 | | | | — | | | | .13 | | | | 2.45 | |
Advisor Class | | | | | | | | | | | | | | | | | | | | | | | | | | | | |
2015 | | | 2.59 | | | | .12 | | | | (.18 | ) | | | (.06 | ) | | | .14 | | | | — | | | | .14 | | | | 2.39 | |
2016 | | | 2.39 | | | | .12 | | | | .10 | | | | .22 | | | | .13 | | | | — | | | | .13 | | | | 2.48 | |
2017 | | | 2.48 | | | | .12 | | | | .05 | | | | .17 | | | | .13 | | | | — | | | | .13 | | | | 2.52 | |
2018 | | | 2.52 | | | | .12 | | | | (.07 | ) | | | .05 | | | | .13 | | | | — | | | | .13 | | | | 2.44 | |
2019 | | | 2.44 | | | | .12 | | | | — | | | | .12 | | | | .13 | | | | — | | | | .13 | | | | 2.43 | |
Institutional Class | | | | | | | | | | | | | | | | | | | | | | | | |
2015 | | | 2.60 | | | | .12 | | | | (.17 | ) | | | (.05 | ) | | | .15 | | | | — | | | | .15 | | | | 2.40 | |
2016 | | | 2.40 | | | | .12 | | | | .10 | | | | .22 | | | | .13 | | | | — | | | | .13 | | | | 2.49 | |
2017 | | | 2.49 | | | | .13 | | | | .05 | | | | .18 | | | | .13 | | | | — | | | | .13 | | | | 2.54 | |
2018 | | | 2.54 | | | | .12 | | | | (.07 | ) | | | .05 | | | | .14 | | | | — | | | | .14 | | | | 2.45 | |
2019 | | | 2.45 | | | | .13 | | | | .02 | | | | .15 | | | | .14 | | | | — | | | | .14 | | | | 2.46 | |
304
See notes to financial statements
| | | | | | R A T I O S / S U P P L E M E N T A L D A T A | |
| | | | | | | | | | | | | | | | | | | | | | | | | | | | | |
Ratio to
Average Net
| | | | | |
| | | | | | | | | | | | | | | | | | Ratio to
Average Net
Assets** | | | Assets
Before
Expenses
Waived or
Assumed | | | | | |
| | | | | | | | | Total
Return* | | | Net Assets
End of
Year (in
thousands) | | | Net
Expenses
After Fee
Credits | | | Net
Expenses
Before Fee
Credits*** | | | Net
Investment
Income | | | Expenses*** | | | Net
Investment
Income | | | Portfolio
Turnover
Rate | |
| | | | | | | | | | | | | | | | | | | | | | | | | | | | | | | | | | | | | | | | |
| | | | | | | | | | | | | | | | | | | | | | | | | | | | | | | | | | | | | | | | |
| | | | | | | | | | | (2.85 | )% | | $ | 567,249 | | | | 1.21 | % | | | 1.21 | % | | | 4.39 | % | | | 1.23 | % | | | 4.37 | % | | | 47 | % |
| | | | | | | | | | | 9.07 | | | | 571,028 | | | | 1.22 | | | | 1.22 | | | | 4.76 | | | | 1.24 | | | | 4.74 | | | | 55 | |
| | | | | | | | | | | 6.79 | | | | 572,631 | | | | 1.21 | | | | 1.21 | | | | 4.57 | | | | 1.23 | | | | 4.55 | | | | 65 | |
| | | | | | | | | | | 1.88 | | | | 523,932 | | | | 1.22 | | | | 1.22 | | | | 4.46 | | | | 1.24 | | | | 4.44 | | | | 67 | |
| | | | | | | | | | | 5.80 | | | | 477,952 | | | | 1.20 | | | | 1.20 | | | | 4.72 | | | | 1.22 | | | | 4.70 | | | | 71 | |
| | | | | | | | | | | | | | | | | | | | | | | | | | | | | | | | | | | | | | | | |
| | | | | | | | | | | (2.47 | ) | | | 41,699 | | | | .93 | | | | .93 | | | | 4.65 | | | | .95 | | | | 4.63 | | | | 47 | |
| | | | | | | | | | | 9.34 | | | | 68,198 | | | | .93 | | | | .94 | | | | 5.02 | | | | .96 | | | | 5.00 | | | | 55 | |
| | | | | | | | | | | 7.05 | | | | 73,403 | | | | .94 | | | | .94 | | | | 4.84 | | | | .96 | | | | 4.82 | | | | 65 | |
| | | | | | | | | | | 2.17 | | | | 79,880 | | | | .93 | | | | .93 | | | | 4.76 | | | | .95 | | | | 4.74 | | | | 67 | |
| | | | | | | | | | | 5.13 | | | | 28,107 | | | | 1.01 | | | | 1.01 | | | | 4.98 | | | | 1.03 | | | | 4.96 | | | | 71 | |
| | | | | | | | | | | | | | | | | | | | | | | | | | | | | | | | | | | | | | | | |
| | | | | | | | | | | (2.28 | ) | | | 51,704 | | | | .78 | | | | .78 | | | | 4.81 | | | | .80 | | | | 4.79 | | | | 47 | |
| | | | | | | | | | | 9.58 | | | | 62,340 | | | | .79 | | | | .79 | | | | 5.19 | | | | .81 | | | | 5.17 | | | | 55 | |
| | | | | | | | | | | 7.59 | | | | 78,784 | | | | .78 | | | | .78 | | | | 4.99 | | | | .80 | | | | 4.97 | | | | 65 | |
| | | | | | | | | | | 1.91 | | | | 33,545 | | | | .79 | | | | .79 | | | | 4.88 | | | | .81 | | | | 4.86 | | | | 67 | |
| | | | | | | | | | | 6.23 | | | | 36,692 | | | | .80 | | | | .80 | | | | 5.12 | | | | .82 | | | | 5.10 | | | | 71 | |
305
Financial Highlights (continued)
FIRST INVESTORS INCOME FUNDS
| | | P E R
S H A R E
D A T A | | | | |
| | | | | | | Investment
Operations | | | Less
Distributions from | | | | | | | | | |
| | | | | | | | | | | Net Realized | | | | | | | | | | | | | | | | | | | | | |
| | Net Asset
Value,
Beginning
of Year | | | Net
Investment
Income (c) | | | and
Unrealized
Gain on
Investments | | | Total
From
Investment
Operations | | | Net
Investment
Income | | | Net
Realized
Gain | | | Total
Distributions | | | Net Asset
Value,
End of
Year | |
GOVERNMENT CASH MANAGEMENT FUND(f) | | | | |
Class A | | | | | | | | | | | | | | | | | | | | | | | | | | | | | | |
2015 | | $ | 1.00 | | | $ | — | | | | — | | | $ | — | | | $ | — | | | | — | | | $ | — | | | $ | 1.00 | |
2016 | | | 1.00 | | | | — | | | | — | | | | — | | | | — | | | | — | | | | — | | | | 1.00 | |
2017 | | | 1.00 | | | | .00 | (d) | | | — | | | | .00 | (d) | | | .00 | (d) | | | — | | | | .00 | (d) | | | 1.00 | |
2018 | | | 1.00 | | | | .01 | | | | — | | | | .01 | | | | .01 | | | | — | | | | .01 | | | | 1.00 | |
2019 | | | 1.00 | | | | .02 | | | | — | | | | .02 | | | | .02 | | | | — | | | | .02 | | | | 1.00 | |
Institutional Class | | | | | | | | | | | | | | | | | | | | | | | | | | | | |
2015 | | | 1.00 | | | | — | | | | — | | | | — | | | | — | | | | — | | | | — | | | | 1.00 | |
2016 | | | 1.00 | | | | — | | | | — | | | | — | | | | — | | | | — | | | | — | | | | 1.00 | |
2017 | | | 1.00 | | | | .00 | (d) | | | — | | | | .00 | (d) | | | .00 | (d) | | | — | | | | .00 | (d) | | | 1.00 | |
2018 | | | 1.00 | | | | .01 | | | | — | | | | .01 | | | | .01 | | | | — | | | | .01 | | | | 1.00 | |
2019 | | | 1.00 | | | | .02 | | | | — | | | | .02 | | | | .02 | | | | — | | | | .02 | | | | 1.00 | |
306
See notes to financial statements
| | | | | | R A T I O S / S U P P L E M E N T A L D A T A | |
| | | | | | | | | | | | | | | | | | | | | | | | | | | | | |
Ratio to
Average Net
| | | | | |
| | | | | | | | | | | | | | | | | | Ratio to
Average Net
Assets** | | | Assets
Before
Expenses
Waived or
Assumed | | | | | |
| | | | | | | | | Total
Return* | | | Net Assets
End of
Year (in
thousands) | | | Net
Expenses
After Fee
Credits | | | Net
Expenses
Before Fee
Credits*** | | | Net
Investment
Income | | | Expenses*** | | | Net
Investment
Income
(Loss) | | | Portfolio
Turnover
Rate | �� |
| | | | | | | | | | | | | | | | | | | | | | | | | | | | | | | | | | | | | | | | |
| | | | | | | | | | | | | | | | | | | | | | | | | | | | | | | | | | | | | | | | |
| | | | | | | | | | | .00 | % | | $ | 109,566 | | | | .10 | % | | | .10 | % | | | .00 | % | | | 1.08 | % | | | (.98 | )% | | | N/A | |
| | | | | | | | | | | .00 | | | | 122,037 | | | | .33 | | | | .33 | | | | .00 | | | | 1.05 | | | | (.72 | ) | | | N/A | |
| | | | | | | | | | | .08 | | | | 127,079 | | | | .60 | | | | .60 | | | | .08 | | | | 1.02 | | | | (.34 | ) | | | N/A | |
| | | | | | | | | | | .96 | | | | 153,695 | | | | .60 | | | | .60 | | | | .98 | | | | 1.01 | | | | .57 | | | | N/A | |
| | | | | | | | | | | 1.73 | | | | 168,905 | | | | .60 | | | | .60 | | | | 1.72 | | | | .85 | | | | 1.47 | | | | N/A | |
| | | | | | | | | | | | | | | | | | | | | | | | | | | | | | | | | | | | | | | | |
| | | | | | | | | | | .00 | | | | 2,267 | | | | .10 | | | | .10 | | | | .00 | | | | .67 | | | | (.57 | ) | | | N/A | |
| | | | | | | | | | | .00 | | | | 2,844 | | | | .33 | | | | .33 | | | | .00 | | | | .68 | | | | (.35 | ) | | | N/A | |
| | | | | | | | | | | .07 | | | | 2,394 | | | | .60 | | | | .60 | | | | .06 | | | | .68 | | | | (.02 | ) | | | N/A | |
| | | | | | | | | | | .97 | | | | 1 | | | | .60 | | | | .60 | | | | .96 | | | | .68 | | | | .88 | | | | N/A | |
| | | | | | | | | | | 1.76 | | | | 1 | | | | .60 | | | | .60 | | | | 1.77 | | | | .69 | | | | 1.68 | | | | N/A | |
307
Financial Highlights (continued)
FIRST INVESTORS INCOME FUNDS
| | | P E R
S H A R E
D A T A | | | | |
| | | | | | | Investment
Operations | | | Less
Distributions from | | | | | | | | | |
| | | | | | | | | | | Net Realized | | | | | | | | | | | | | | | | | | | | | |
| | Net Asset
Value,
Beginning
of Year | | | Net
Investment
Income(c) | | | and
Unrealized
Gain
(Loss) on
Investments | | | Total
From
Investment
Operations | | | Net
Investment
Income | | | Net
Realized
Gain | | | Total
Distributions | | | Net Asset
Value,
End of
Year | |
INTERNATIONAL OPPORTUNITIES BOND FUND | | | | |
Class A | | | | | | | | | | | | | | | | | | | | | | | | | | | | | | | | |
2015 | | $ | 9.85 | | | $ | .12 | | | $ | (1.06 | ) | | $ | (.94 | ) | | $ | .28 | | | | — | | | $ | .28 | | | $ | 8.63 | |
2016 | | | 8.63 | | | | .20 | | | | .51 | | | | .71 | | | | .13 | | | | — | | | | .13 | | | | 9.21 | |
2017 | | | 9.21 | | | | .22 | | | | .21 | | | | .43 | | | | .15 | | | | — | | | | .15 | | | | 9.49 | |
2018 | | | 9.49 | | | | .23 | | | | (.64 | ) | | | (.41 | ) | | | .30 | | | | — | | | | .30 | | | | 8.78 | |
2019 | | | 8.78 | | | | .25 | | | | (.30 | ) | | | (.05 | ) | | | .16 | | | | — | | | | .16 | | | | 8.57 | |
Advisor Class | | | | | | | | | | | | | | | | | | | | | | | | | | | | |
2015 | | | 9.85 | | | | .14 | | | | (1.06 | ) | | | (.92 | ) | | | .29 | | | | — | | | | .29 | | | | 8.64 | |
2016 | | | 8.64 | | | | .23 | | | | .51 | | | | .74 | | | | .13 | | | | — | | | | .13 | | | | 9.25 | |
2017 | | | 9.25 | | | | .24 | | | | .23 | | | | .47 | | | | .16 | | | | — | | | | .16 | | | | 9.56 | |
2018 | | | 9.56 | | | | .27 | | | | (.66 | ) | | | (.39 | ) | | | .30 | | | | — | | | | .30 | | | | 8.87 | |
2019 | | | 8.87 | | | | .28 | | | | (.31 | ) | | | (.03 | ) | | | .16 | | | | — | | | | .16 | | | | 8.68 | |
Institutional Class | | | | | | | | | | | | | | | | | | | | | | | | | | | | |
2015 | | | 9.88 | | | | .17 | | | | (1.08 | ) | | | (.91 | ) | | | .30 | | | | — | | | | .30 | | | | 8.67 | |
2016 | | | 8.67 | | | | .24 | | | | .52 | | | | .76 | | | | .14 | | | | — | | | | .14 | | | | 9.29 | |
2017 | | | 9.29 | | | | .22 | | | | .27 | | | | .49 | | | | .19 | | | | — | | | | .19 | | | | 9.59 | |
2018 | | | 9.59 | | | | .28 | | | | (.65 | ) | | | (.37 | ) | | | .30 | | | | — | | | | .30 | | | | 8.92 | |
2019 | | | 8.92 | | | | .30 | | | | (.33 | ) | | | (.03 | ) | | | .12 | | | | — | | | | .12 | | | | 8.77 | |
308
See notes to financial statements
| | | | | | R A T I O S / S U P P L E M E N T A L D A T A | |
| | | | | | | | | | | | | | | | | | | | | | | | | | | | | |
Ratio to
Average Net
| | | | | |
| | | | | | | | | | | | | | | | | | Ratio to
Average Net
Assets** | | | Assets
Before
Expenses
Waived or
Assumed | | | | | |
| | | | | | | | | Total
Return* | | | Net Assets
End of
Year (in
thousands) | | | Net
Expenses
After Fee
Credits | | | Net
Expenses
Before Fee
Credits*** | | | Net
Investment
Income | | | Expenses*** | | | Net
Investment
Income | | | Portfolio
Turnover
Rate | |
| | | | | | | | | | | | | | | | | | | | | | | | | | | | | | | | | | | | | | | | |
| | | | | | | | | | | | | | | | | | | | | | | | | | | | | | | | | | | | | | | | |
| | | | | | | | | | | (9.72 | )% | | $ | 69,394 | | | | 1.30 | % | | | 1.30 | % | | | 1.29 | % | | | 1.38 | % | | | 1.21 | % | | | 61 | % |
| | | | | | | | | | | 8.30 | | | | 65,456 | | | | 1.38 | | | | 1.38 | | | | 2.29 | | | | 1.41 | | | | 2.26 | | | | 72 | |
| | | | | | | | | | | 4.70 | | | | 59,782 | | | | 1.41 | | | | 1.41 | | | | 2.35 | | | | N/A | | | | N/A | | | | 76 | |
| | | | | | | | | | | (4.50 | ) | | | 54,060 | | | | 1.40 | | | | 1.40 | | | | 2.49 | | | | N/A | | | | N/A | | | | 41 | |
| | | | | | | | | | | (.56 | ) | | | 42,814 | | | | 1.36 | | | | 1.36 | | | | 2.92 | | | | 1.41 | | | | 2.87 | | | | 85 | |
| | | | | | | | | | | | | | | | | | | | | | | | | | | | | | | | | | | | | | | | |
| | | | | | | | | | | (9.51 | ) | | | 50,912 | | | | 1.04 | | | | 1.04 | | | | 1.56 | | | | N/A | | | | N/A | | | | 61 | |
| | | | | | | | | | | 8.70 | | | | 50,749 | | | | 1.08 | | | | 1.08 | | | | 2.60 | | | | N/A | | | | N/A | | | | 72 | |
| | | | | | | | | | | 5.07 | | | | 68,162 | | | | 1.11 | | | | 1.11 | | | | 2.66 | | | | N/A | | | | N/A | | | | 76 | |
| | | | | | | | | | | (4.17 | ) | | | 87,491 | | | | 1.08 | | | | 1.08 | | | | 2.82 | | | | N/A | | | | N/A | | | | 41 | |
| | | | | | | | | | | (.30 | ) | | | 50,335 | | | | 1.08 | | | | 1.08 | | | | 3.26 | | | | 1.13 | | | | 3.21 | | | | 85 | |
| | | | | | | | | | | | | | | | | | | | | | | | | | | | | | | | | | | | | | | | |
| | | | | | | | | | | (9.36 | ) | | | 19,097 | | | | .90 | | | | .90 | | | | 1.69 | | | | N/A | | | | N/A | | | | 61 | |
| | | | | | | | | | | 8.85 | | | | 8,289 | | | | .93 | | | | .93 | | | | 2.75 | | | | N/A | | | | N/A | | | | 72 | |
| | | | | | | | | | | 5.27 | | | | 8,669 | | | | .94 | | | | .95 | | | | 2.80 | | | | N/A | | | | N/A | | | | 76 | |
| | | | | | | | | | | (4.03 | ) | | | 9,868 | | | | .93 | | | | .93 | | | | 2.98 | | | | N/A | | | | N/A | | | | 41 | |
| | | | | | | | | | | (.25 | ) | | | 14,000 | | | | .91 | | | | .91 | | | | 3.37 | | | | .96 | | | | 3.32 | | | | 85 | |
309
Financial Highlights (continued)
FIRST INVESTORS INCOME FUNDS
| | | P E R
S H A R E
D A T A | | | | |
| | | | | | | Investment
Operations | | | Less
Distributions from | | | | | | | | | |
| | | | | | | | | | | Net Realized | | | | | | | | | | | | | | | | | | | | | |
| | Net Asset
Value,
Beginning
of Year | | | Net
Investment
Income(c) | | | and
Unrealized
Gain
(Loss) on
Investments | | | Total
From
Investment
Operations | | | Net
Investment
Income | | | Net
Realized
Gain | | | Total
Distributions | | | Net Asset
Value,
End of
Year | |
INVESTMENT GRADE FUND | | | | |
Class A | | | | | | | | | | | | | | | | | | | | | | | | | | | | | | | | |
2015 | | $ | 9.92 | | | $ | .28 | | | $ | (.17 | ) | | $ | .11 | | | $ | .39 | | | | — | | | $ | .39 | | | $ | 9.64 | |
2016 | | | 9.64 | | | | .27 | | | | .35 | | | | .62 | | | | .36 | | | | — | | | | .36 | | | | 9.90 | |
2017 | | | 9.90 | | | | .26 | | | | (.17 | ) | | | .09 | | | | .33 | | | | — | | | | .33 | | | | 9.66 | |
2018 | | | 9.66 | | | | .26 | | | | (.42 | ) | | | (.16 | ) | | | .33 | | | | — | | | | .33 | | | | 9.17 | |
2019 | | | 9.17 | | | | .26 | | | | .82 | | | | 1.08 | | | | .32 | | | | — | | | | .32 | | | | 9.93 | |
Advisor Class | | | | | | | | | | | | | | | | | | | | | | | | | | | | |
2015 | | | 9.92 | | | | .31 | | | | (.16 | ) | | | .15 | | | | .40 | | | | — | | | | .40 | | | | 9.67 | |
2016 | | | 9.67 | | | | .30 | | | | .34 | | | | .64 | | | | .37 | | | | — | | | | .37 | | | | 9.94 | |
2017 | | | 9.94 | | | | .26 | | | | (.14 | ) | | | .12 | | | | .35 | | | | — | | | | .35 | | | | 9.71 | |
2018 | | | 9.71 | | | | .30 | | | | (.42 | ) | | | (.12 | ) | | | .36 | | | | — | | | | .36 | | | | 9.23 | |
2019 | | | 9.23 | | | | .30 | | | | .82 | | | | 1.12 | | | | .36 | | | | — | | | | .36 | | | | 9.99 | |
Institutional Class | | | | | | | | | | | | | | | | | | | | | | | | |
2015 | | | 9.94 | | | | .32 | | | | (.17 | ) | | | .15 | | | | .43 | | | | — | | | | .43 | | | | 9.66 | |
2016 | | | 9.66 | | | | .31 | | | | .35 | | | | .66 | | | | .40 | | | | — | | | | .40 | | | | 9.92 | |
2017 | | | 9.92 | | | | .31 | | | | (.18 | ) | | | .13 | | | | .37 | | | | — | | | | .37 | | | | 9.68 | |
2018 | | | 9.68 | | | | .31 | | | | (.42 | ) | | | (.11 | ) | | | .37 | | | | — | | | | .37 | | | | 9.20 | |
2019 | | | 9.20 | | | | .30 | | | | .82 | | | | 1.12 | | | | .36 | | | | — | | | | .36 | | | | 9.96 | |
310
See notes to financial statements
| | | | | | R A T I O S / S U P P L E M E N T A L D A T A | |
| | | | | | | | | | | | | | | | | | | | | | | | | | | | | |
Ratio to
Average Net
| | | | | |
| | | | | | | | | | | | | | | | | | Ratio to
Average Net
Assets** | | | Assets
Before
Expenses
Waived,
Assumed or
Reimbursed | | | | | |
| | | | | | | | | Total
Return* | | | Net Assets
End of
Year (in
thousands) | | | Net
Expenses
After Fee
Credits | | | Net
Expenses
Before Fee
Credits*** | | | Net
Investment
Income | | | Expenses*** | | | Net
Investment
Income | | | Portfolio
Turnover
Rate | |
| | | | | | | | | | | | | | | | | | | | | | | | | | | | | | | | | | | | | | | | |
| | | | | | | | | | | | | | | | | | | | | | | | | | | | | | | | | | | | | | | | |
| | | | | | | | | | | 1.12 | % | | $ | 458,704 | | | | 1.04 | % | | | 1.04 | % | | | 2.85 | % | | | 1.15 | % | | | 2.74 | % | | | 36 | % |
| | | | | | | | | | | 6.55 | | | | 477,010 | | | | 1.04 | | | | 1.05 | | | | 2.78 | | | | 1.15 | | | | 2.68 | | | | 37 | |
| | | | | | | | | | | .97 | | | | 462,999 | | | | 1.04 | | | | 1.04 | | | | 2.68 | | | | 1.15 | | | | 2.57 | | | | 52 | |
| | | | | | | | | | | (1.69 | ) | | | 400,673 | | | | 1.06 | | | | 1.06 | | | | 2.80 | | | | 1.17 | | | | 2.69 | | | | 58 | |
| | | | | | | | | | | 12.00 | | | | 363,366 | | | | 1.07 | | | | 1.07 | | | | 2.83 | | | | 1.16 | | | | 2.74 | | | | 60 | |
| | | | | | | | | | | | | | | | | | | | | | | | | | | | | | | | | | | | | | | | |
| | | | | | | | | | | 1.53 | | | | 63,614 | | | | .73 | | | | .73 | | | | 3.17 | | | | .84 | | | | 3.06 | | | | 36 | |
| | | | | | | | | | | 6.78 | | | | 83,659 | | | | .74 | | | | .74 | | | | 3.08 | | | | .85 | | | | 2.97 | | | | 37 | |
| | | | | | | | | | | 1.32 | | | | 136,316 | | | | .72 | | | | .72 | | | | 2.99 | | | | .82 | | | | 2.89 | | | | 52 | |
| | | | | | | | | | | (1.25 | ) | | | 180,286 | | | | .72 | | | | .72 | | | | 3.15 | | | | .83 | | | | 3.04 | | | | 58 | |
| | | | | | | | | | | 12.37 | | | | 11,518 | | | | .75 | | | | .75 | | | | 3.22 | | | | .84 | | | | 3.13 | | | | 60 | |
| | | | | | | | | | | | | | | | | | | | | | | | | | | | | | | | | | | | | | | | |
| | | | | | | | | | | 1.48 | | | | 15,025 | | | | .63 | | | | .63 | | | | 3.26 | | | | .74 | | | | 3.15 | | | | 36 | |
| | | | | | | | | | | 6.97 | | | | 31,395 | | | | .63 | | | | .63 | | | | 3.17 | | | | .74 | | | | 3.06 | | | | 37 | |
| | | | | | | | | | | 1.41 | | | | 26,127 | | | | .63 | | | | .63 | | | | 3.10 | | | | .74 | | | | 2.99 | | | | 52 | |
| | | | | | | | | | | (1.18 | ) | | | 23,974 | | | | .64 | | | | .64 | | | | 3.23 | | | | .75 | | | | 3.12 | | | | 58 | |
| | | | | | | | | | | 12.43 | | | | 23,083 | | | | .67 | | | | .67 | | | | 3.19 | | | | .76 | | | | 3.10 | | | | 60 | |
311
Financial Highlights (continued)
FIRST INVESTORS INCOME FUNDS
| | | P E R
S H A R E
D A T A | | | | |
| | | | | | | Investment
Operations | | | Less
Distributions from | | | | | | | | | |
| | | | | | | | | | | Net Realized | | | | | | | | | | | | | | | | | | | | | |
| | Net Asset
Value,
Beginning
of Year | | | Net
Investment
Income
(Loss)(c) | | | and
Unrealized
Gain
(Loss) on
Investments | | | Total
From
Investment
Operations | | | Net
Investment
Income | | | Net
Realized
Gain | | | Total
Distributions | | | Net Asset
Value,
End of
Year | |
LIMITED DURATION BOND FUND(e) | | | | |
Class A | | | | | | | | | | | | | | | | | | | | | | | | | | | | | | | | |
2015 | | $ | 9.89 | | | $ | .03 | | | $ | .04 | | | $ | .07 | | | $ | .20 | | | | — | | | $ | .20 | | | $ | 9.76 | |
2016 | | | 9.76 | | | | (.03 | ) | | | .15 | | | | .12 | | | | .22 | | | | — | | | | .22 | | | | 9.66 | |
2017 | | | 9.66 | | | | .08 | | | | (.06 | ) | | | .02 | | | | .21 | | | | — | | | | .21 | | | | 9.47 | |
2018 | | | 9.47 | | | | — | | | | (.05 | ) | | | (.05 | ) | | | .25 | | | | — | | | | .25 | | | | 9.17 | |
2019 | | | 9.17 | | | | .21 | | | | .19 | | | | .40 | | | | .26 | | | | — | | | | .26 | | | | 9.31 | |
Advisor Class | | | | | | | | | | | | | | | | | | | | | | | | | | | | |
2015 | | | 9.91 | | | | .06 | | | | .05 | | | | .11 | | | | .22 | | | | — | | | | .22 | | | | 9.80 | |
2016 | | | 9.80 | | | | — | | | | .14 | | | | .14 | | | | .25 | | | | — | | | | .25 | | | | 9.69 | |
2017 | | | 9.69 | | | | .13 | | | | (.08 | ) | | | .05 | | | | .24 | | | | — | | | | .24 | | | | 9.50 | |
2018 | | | 9.50 | | | | .03 | | | | (.05 | ) | | | (.02 | ) | | | .28 | | | | — | | | | .28 | | | | 9.20 | |
2019 | | | 9.20 | | | | .23 | | | | .19 | | | | .42 | | | | .28 | | | | — | | | | .28 | | | | 9.34 | |
Institutional Class | | | | | | | | | | | | | | | | | | | | | | | | | | | | |
2015 | | | 9.92 | | | | .08 | | | | .04 | | | | .12 | | | | .23 | | | | — | | | | .23 | | | | 9.81 | |
2016 | | | 9.81 | | | | .02 | | | | .14 | | | | .16 | | | | .27 | | | | — | | | | .27 | | | | 9.70 | |
2017 | | | 9.70 | | | | .11 | | | | (.04 | ) | | | .07 | | | | .25 | | | | — | | | | .25 | | | | 9.52 | |
2018 | | | 9.52 | | | | .04 | | | | (.06 | ) | | | (.02 | ) | | | .29 | | | | — | | | | .29 | | | | 9.21 | |
2019 | | | 9.21 | | | | .25 | | | | .19 | | | | .44 | | | | .30 | | | | — | | | | .30 | | | | 9.35 | |
312
See notes to financial statements
| | | | | | R A T I O S / S U P P L E M E N T A L D A T A | |
| | | | | | | | | | | | | | | | | | | | | | | | | | | | | |
Ratio to
Average Net
| | | | | |
| | | | | | | | | | | | | | | | | | Ratio to
Average Net
Assets** | | | Assets
Before
Expenses
Waived,
Assumed or
Reimbursed | | | | | |
| | | | | | | | | Total
Return* | | | Net Assets
End of
Year (in
thousands) | | | Net
Expenses
After Fee
Credits | | | Net
Expenses
Before Fee
Credits*** | | | Net
Investment
Income
(Loss) | | | Expenses*** | | | Net
Investment
Income
(Loss) | | | Portfolio
Turnover
Rate | |
| | | | | | | | | | | | | | | | | | | | | | | | | | | | | | | | | | | | | | | | |
| | | | | | | | | | | | | | | | | | | | | | | | | | | | | | | | | | | | | | | | |
| | | | | | | | | | | .67 | % | | $ | 26,852 | | | | 1.05 | % | | | 1.05 | % | | | .37 | % | | | 1.32 | % | | | .10 | % | | | 57 | % |
| | | | | | | | | | | 1.21 | | | | 48,342 | | | | 1.05 | | | | 1.05 | | | | (.25 | ) | | | 1.23 | | | | (.43 | ) | | | 54 | |
| | | | | | | | | | | .22 | | | | 62,841 | | | | 1.05 | | | | 1.05 | | | | .85 | | | | 1.22 | | | | .68 | | | | 60 | |
| | | | | | | | | | | (.52 | ) | | | 247,902 | | | | .89 | | | | .89 | | | | .02 | | | | 1.11 | | | | (.20 | ) | | | 102 | |
| | | | | | | | | | | 4.37 | | | | 220,830 | | | | .79 | | | | .79 | | | | 2.22 | | | | .99 | | | | 2.02 | | | | 87 | |
| | | | | | | | | | | | | | | | | | | | | | | | | | | | | | | | | | | | | | | | |
| | | | | | | | | | | 1.08 | | | | 40,502 | | | | .75 | | | | .75 | | | | .66 | | | | 1.09 | | | | .32 | | | | 57 | |
| | | | | | | | | | | 1.47 | | | | 50,645 | | | | .75 | | | | .75 | | | | .04 | | | | 1.01 | | | | (.22 | ) | | | 54 | |
| | | | | | | | | | | .54 | | | | 31,638 | | | | .75 | | | | .75 | | | | 1.14 | | | | 1.02 | | | | .87 | | | | 60 | |
| | | | | | | | | | | (.25 | ) | | | 35,498 | | | | .62 | | | | .62 | | | | .33 | | | | .84 | | | | .11 | | | | 102 | |
| | | | | | | | | | | 4.65 | | | | 56,209 | | | | .51 | | | | .51 | | | | 2.47 | | | | .69 | | | | 2.29 | | | | 87 | |
| | | | | | | | | | | | | | | | | �� | | | | | | | | | | | | | | | | | | | | | | | |
| | | | | | | | | | | 1.21 | | | | 6,747 | | | | .60 | | | | .60 | | | | .81 | | | | .92 | | | | .49 | | | | 57 | |
| | | | | | | | | | | 1.64 | | | | 22,296 | | | | .60 | | | | .60 | | | | .20 | | | | .82 | | | | (.02 | ) | | | 54 | |
| | | | | | | | | | | .77 | | | | 41,065 | | | | .60 | | | | .60 | | | | 1.30 | | | | .82 | | | | 1.08 | | | | 60 | |
| | | | | | | | | | | (.19 | ) | | | 38,822 | | | | .47 | | | | .47 | | | | .46 | | | | .68 | | | | .25 | | | | 102 | |
| | | | | | | | | | | 4.83 | | | | 47,965 | | | | .36 | | | | .36 | | | | 2.64 | | | | .56 | | | | 2.44 | | | | 87 | |
313
Financial Highlights (continued)
FIRST INVESTORS INCOME FUNDS
| | | P E R
S H A R E
D A T A | | | | |
| | | | | | | Investment
Operations | | | Less
Distributions from | | | | | | | | | |
| | | | | | | | | | | Net Realized | | | | | | | | | | | | | | | | | | | | | |
| | Net Asset
Value,
Beginning
of Year | | | Net
Investment
Income
(a)(c) | | | and
Unrealized
Gain
(Loss) on
Investments | | | Total
From
Investment
Operations | | | Net
Investment
Income | | | Net
Realized
Gain | | | Total
Distributions | | | Net Asset
Value,
End of
Year | |
STRATEGIC INCOME FUND | | | | | | | | | | | | | | | | |
Class A | | | | | | | | | | | | | | | | | | | | | | | | | | | | | | | | |
2015 | | $ | 9.94 | | | $ | .34 | | | $ | (.57 | ) | | $ | (.23 | ) | | $ | .34 | | | $ | .07 | | | $ | .41 | | | $ | 9.30 | |
2016 | | | 9.30 | | | | .30 | | | | .22 | | | | .52 | | | | .32 | | | | .02 | | | | .34 | | | | 9.48 | |
2017 | | | 9.48 | | | | .30 | | | | .05 | | | | .35 | | | | .30 | | | | — | | | | .30 | | | | 9.53 | |
2018 | | | 9.53 | | | | .31 | | | | (.32 | ) | | | (.01 | ) | | | .32 | | | | — | | | | .32 | | | | 9.20 | |
2019 | | | 9.20 | | | | .30 | | | | .12 | | | | .42 | | | | .30 | | | | — | | | | .30 | | | | 9.32 | |
Advisor Class | | | | | | | | | | | | | | | | | | | | | | | | | | | | |
2015 | | | 9.92 | | | | .38 | | | | (.56 | ) | | | (.18 | ) | | | .38 | | | | .07 | | | | .45 | | | | 9.29 | |
2016 | | | 9.29 | | | | .33 | | | | .23 | | | | .56 | | | | .36 | | | | .02 | | | | .38 | | | | 9.47 | |
2017 | | | 9.47 | | | | .29 | | | | .09 | | | | .38 | | | | .33 | | | | — | | | | .33 | | | | 9.52 | |
2018 | | | 9.52 | | | | .34 | | | | (.32 | ) | | | .02 | | | | .35 | | | | — | | | | .35 | | | | 9.19 | |
2019 | | | 9.19 | | | | .33 | | | | .13 | | | | .46 | | | | .33 | | | | — | | | | .33 | | | | 9.32 | |
* | Calculated without sales charges. |
** | Net of expenses waived or assumed (Note 3). |
*** | The ratios do not include a reduction of expenses from cash balances maintained with the custodian or from brokerage service arrangements (Note 1G). |
(a) | Recognition of net investment income by the Fund is affected by the timing of the declaration of dividends by the underlying investment companies in which the Fund invests. The ratio does not include net investment income of the investment companies in which the Fund invests. |
(b) | Does not include expenses of the investment companies in which the Fund invests. |
(c) | Based on average shares during the period. |
(d) | Due to rounding, amount is less than .005 per share. |
(e) | Prior to January 31, 2018, known as Limited Duration High Quality Bond Fund. |
(f) | Prior to October 3, 2016, known as Cash Management Fund. |
314
See notes to financial statements
| | | | | | R A T I O S / S U P P L E M E N T A L D A T A | |
| | | | | | | | | | | | | | | | | | | | | | | | | | | | | |
Ratio to
Average Net
| | | | | |
| | | | | | | | | | | | | | | | | | Ratio to
Average Net
Assets** | | | Assets
Before
Expenses
Waived,
Assumed or
Reimbursed | | | | | |
| | | | | | | | | Total
Return* | | | Net Assets
End of
Year (in
thousands) | | | Net
Expenses
After Fee
Credits(b) | | | Net
Expenses
Before Fee
Credits***(b) | | | Net
Investment
Income(a) | | | Expenses*** | | | Net
Investment
Income | | | Portfolio
Turnover
Rate | |
| | | | | | | | | | | | | | | | | | | | | | | | | | | | | | | | | | | | | | | | |
| | | | | | | | | | | | | | | | | | | | | | | | | | | | | | | | | | | | | | | | |
| | | | | | | | | | | (2.37 | )% | | $ | 131,734 | | | | .59 | % | | | .59 | % | | | 3.55 | % | | | N/A | | | | N/A | | | | 40 | % |
| | | | | | | | | | | 5.64 | | | | 149,190 | | | | .58 | | | | .58 | | | | 3.19 | | | | N/A | | | | N/A | | | | 49 | |
| | | | | | | | | | | 3.73 | | | | 162,789 | | | | .57 | | | | .57 | | | | 3.24 | | | | N/A | | | | N/A | | | | 37 | |
| | | | | | | | | | | (.10 | ) | | | 152,180 | | | | .56 | | | | .56 | | | | 3.36 | | | | N/A | | | | N/A | | | | 58 | |
| | | | | | | | | | | 4.67 | | | | 137,155 | | | | .53 | | | | .53 | | | | 3.24 | | | | .55 | | | | 3.22 | | | | 70 | |
| | | | | | | | | | | | | | | | | | | | | | | | | | | | | | | | | | | | | | | | |
| | | | | | | | | | | (1.93 | ) | | | 306 | | | | .19 | | | | .19 | | | | 3.95 | | | | N/A | | | | N/A | | | | 40 | |
| | | | | | | | | | | 6.14 | | | | 415 | | | | .17 | | | | .17 | | | | 3.59 | | | | N/A | | | | N/A | | | | 49 | |
| | | | | | | | | | | 4.14 | | | | 963 | | | | .18 | | | | .18 | | | | 3.66 | | | | N/A | | | | N/A | | | | 37 | |
| | | | | | | | | | | .22 | | | | 759 | | | | .21 | | | | .21 | | | | 3.70 | | | | N/A | | | | N/A | | | | 58 | |
| | | | | | | | | | | 5.11 | | | | 566 | | | | .19 | | | | .19 | | | | 3.60 | | | | .21 | | | | 3.58 | | | | 70 | |
315
Financial Highlights
FIRST INVESTORS EQUITY FUNDS
The following table sets forth the per share operating performance data for a share outstanding, total return, ratios to average net assets and other supplemental data for each fiscal year ended September 30, except as otherwise indicated.
| | | P E R S
H A R E
D A T A | | | | |
| | | | | | | Investment
Operations | | | Less
Distributions from | | | | | | | | | |
| | | | | | | | | | | | | | | | | | | | | | | | | | | | | | | | | |
| | Net Asset
Value,
Beginning
of Period/
Year | | | Net
Investment
Income(a) | | | Net Realized
and
Unrealized
Gain
(Loss) on
Investments | | | Total
From
Investment
Operations | | | Net
Investment
Income | | | Net
Realized
Gain | | | Total
Distributions | | | Net Asset
Value,
End of
Period/
Year | |
COVERED CALL STRATEGY FUND | | | | |
Class A | | | | | | | | | | | | | | | | | | | | | | | | | | | | | | | | |
2016(d) | | $ | 10.00 | | | $ | .06 | | | $ | .33 | | | $ | .39 | | | $ | .03 | | | $ | — | | | $ | .03 | | | $ | 10.36 | |
2017 | | | 10.36 | | | | .10 | | | | .85 | | | | .95 | | | | .11 | | | | .02 | | | | .13 | | | | 11.18 | |
2018 | | | 11.18 | | | | .11 | | | | .64 | | | | .75 | | | | .10 | | | | — | | | | .10 | | | | 11.83 | |
2019 | | | 11.83 | | | | .12 | | | | (.02 | ) | | | .10 | | | | .12 | | | | — | | | | .12 | | | | 11.81 | |
Advisor Class | | | | | | | | | | | | | | | | | | | | | | | | |
2016(d) | | | 10.00 | | | | .08 | | | | .32 | | | | .40 | | | | .06 | | | | — | | | | .06 | | | | 10.34 | |
2017 | | | 10.34 | | | | .13 | | | | .86 | | | | .99 | | | | .15 | | | | .02 | | | | .17 | | | | 11.16 | |
2018 | | | 11.16 | | | | .14 | | | | .64 | | | | .78 | | | | .14 | | | | — | | | | .14 | | | | 11.80 | |
2019 | | | 11.80 | | | | .16 | | | | (.02 | ) | | | .14 | | | | .16 | | | | — | | | | .16 | | | | 11.78 | |
Institutional Class | | | | | | | | | | | | | | | | | | | | | | | | |
2016(d) | | | 10.00 | | | | .09 | | | | .33 | | | | .42 | | | | .07 | | | | — | | | | .07 | | | | 10.35 | |
2017 | | | 10.35 | | | | .16 | | | | .85 | | | | 1.01 | | | | .17 | | | | .02 | | | | .19 | | | | 11.17 | |
2018 | | | 11.17 | | | | .16 | | | | .63 | | | | .79 | | | | .24 | | | | — | | | | .24 | | | | 11.72 | |
2019 | | | 11.72 | | | | .17 | | | | (.02 | ) | | | .15 | | | | .18 | | | | — | | | | .18 | | | | 11.69 | |
316
See notes to financial statements
| | | | | | R A T I O S / S U P P L E M E N T A L D A T A | |
| | | | | | | | | | | | | | | | | | | | | | | | | | | | | |
Ratio to
Average Net
| | | | | |
| | | | | | | | | | | | | | | | | | Ratio to
Average Net
Assets** | | | Assets
Before
Expenses
Waived or
Assumed | | | | | |
| | | | | | | | | Total
Return* | | | Net Assets
End of
Period/
Year (in
thousands) | | | Net
Expenses
After Fee
Credits | | | Net
Expenses
Before Fee
Credits*** | | | Net
Investment
Income | | | Expenses*** | | | Net
Investment
Income | | | Portfolio
Turnover
Rate | |
| | | | | | | | | | | | | | | | | | | | | | | | | | | | | | | | | | | | | | | | |
| | | | | | | | | | | | | | | | | | | | | | | | | | | | | | | | | | | | | | | | |
| | | | | | | | | | | 3.94 | %†† | | $ | 48,514 | | | | 1.30 | %† | | | 1.30 | %† | | | 1.19 | %† | | | 1.73 | %† | | | .76 | %† | | | 83 | %†† |
| | | | | | | | | | | 9.17 | | | | 167,906 | | | | 1.30 | | | | 1.30 | | | | 1.18 | | | | 1.36 | | | | 1.12 | | | | 121 | |
| | | | | | | | | | | 6.79 | | | | 237,103 | | | | 1.30 | | | | 1.30 | | | | .95 | | | | 1.28 | | | | .97 | | | | 107 | |
| | | | | | | | | | | .97 | | | | 211,777 | | | | 1.30 | | | | 1.30 | | | | 1.11 | | | | 1.28 | | | | 1.13 | | | | 34 | |
| | | | | | | | | | | | | | | | | | | | | | | | | | | | | | | | | | | | | | | | |
| | | | | | | | | | | 4.05 | †† | | | 39,129 | | | | .97 | † | | | .97 | † | | | 1.64 | † | | | 1.50 | † | | | 1.11 | † | | | 83 | †† |
| | | | | | | | | | | 9.62 | | | | 109,360 | | | | .97 | | | | .97 | | | | 1.53 | | | | 1.06 | | | | 1.44 | | | | 121 | |
| | | | | | | | | | | 7.09 | | | | 114,275 | | | | .97 | | | | .97 | | | | 1.25 | | | | 1.03 | | | | 1.19 | | | | 107 | |
| | | | | | | | | | | 1.25 | | | | 66,252 | | | | 1.00 | | | | 1.00 | | | | 1.41 | | | | .96 | | | | 1.45 | | | | 34 | |
| | | | | | | | | | | | | | | | | | | | | | | | | | | | | | | | | | | | | | | | |
| | | | | | | | | | | 4.18 | †† | | | 4,214 | | | | .84 | † | | | .84 | † | | | 1.76 | † | | | 1.25 | † | | | 1.35 | † | | | 83 | †† |
| | | | | | | | | | | 9.77 | | | | 7,334 | | | | .84 | | | | .84 | | | | 1.65 | | | | .96 | | | | 1.53 | | | | 121 | |
| | | | | | | | | | | 7.19 | | | | 2,913 | | | | .84 | | | | .84 | | | | 1.38 | | | | .89 | | | | 1.33 | | | | 107 | |
| | | | | | | | | | | 1.42 | | | | 1,477 | | | | .87 | | | | .87 | | | | 1.54 | | | | .90 | | | | 1.51 | | | | 34 | |
317
Financial Highlights (continued)
FIRST INVESTORS EQUITY FUNDS
| | | P E R
S H A R E
D A T A | | | | |
| | | | | | | Investment
Operations | | | Less
Distributions from | | | | | | | | | |
| | | | | | | | | | | Net Realized | | | | | | | | | | | | | | | | | | | | | |
| | Net Asset
Value,
Beginning
of Year | | | Net
Investment
Income(a) | | | and
Unrealized
Gain
(Loss) on
Investments | | | Total
From
Investment
Operations | | | Net
Investment
Income | | | Net
Realized
Gain | | | Total
Distributions | | | Net Asset
Value,
End of
Year | |
EQUITY INCOME FUND | | | | | | | | | | | | | | | | | | | | | | | | |
Class A | | | | | | | | | | | | | | | | | | | | | | | | | | | | | | | | |
2015 | | $ | 9.99 | | | $ | .15 | | | $ | (.54 | ) | | $ | (.39 | ) | | $ | .15 | | | $ | .46 | | | $ | .61 | | | $ | 8.99 | |
2016 | | | 8.99 | | | | .16 | | | | 1.08 | | | | 1.24 | | | | .16 | | | | .35 | | | | .51 | | | | 9.72 | |
2017 | | | 9.72 | | | | .16 | | | | 1.22 | | | | 1.38 | | | | .21 | | | | .18 | | | | .39 | | | | 10.71 | |
2018 | | | 10.71 | | | | .26 | | | | .65 | | | | .91 | | | | .17 | | | | .36 | | | | .53 | | | | 11.09 | |
2019 | | | 11.09 | | | | .15 | | | | (.16 | ) | | | (.01 | ) | | | .26 | | | | 1.14 | | | | 1.40 | | | | 9.68 | |
Advisor Class | | | | | | | | | | | | | | | | | | | | | | | | | | | | |
2015 | | | 9.99 | | | | .19 | | | | (.55 | ) | | | (.36 | ) | | | .17 | | | | .46 | | | | .63 | | | | 9.00 | |
2016 | | | 9.00 | | | | .20 | | | | 1.08 | | | | 1.28 | | | | .19 | | | | .35 | | | | .54 | | | | 9.74 | |
2017 | | | 9.74 | | | | .19 | | | | 1.23 | | | | 1.42 | | | | .21 | | | | .18 | | | | .39 | | | | 10.77 | |
2018 | | | 10.77 | | | | .31 | | | | .65 | | | | .96 | | | | .21 | | | | .36 | | | | .57 | | | | 11.16 | |
2019 | | | 11.16 | | | | .20 | | | | (.20 | ) | | | — | | | | .29 | | | | 1.14 | | | | 1.43 | | | | 9.73 | |
Institutional Class | | | | | | | | | | | | | | | | | | | | | | | | |
2015 | | | 10.03 | | | | .19 | | | | (.55 | ) | | | (.36 | ) | | | .17 | | | | .46 | | | | .63 | | | | 9.04 | |
2016 | | | 9.04 | | | | .20 | | | | 1.09 | | | | 1.29 | | | | .20 | | | | .35 | | | | .55 | | | | 9.78 | |
2017 | | | 9.78 | | | | .37 | | | | 1.06 | | | | 1.43 | | | | .31 | | | | .18 | | | | .49 | | | | 10.72 | |
2018 | | | 10.72 | | | | .31 | | | | .66 | | | | .97 | | | | .21 | | | | .36 | | | | .57 | | | | 11.12 | |
2019 | | | 11.12 | | | | .19 | | | | (.17 | ) | | | .02 | | | | .33 | | | | 1.14 | | | | 1.47 | | | | 9.67 | |
318
See notes to financial statements
| | | | | | R A T I O S / S U P P L E M E N T A L D A T A | |
| | | | | | | | | | | | | | | | | | | | | | | | | | | | | |
Ratio to
Average Net
| | | | | |
| | | | | | | | | | | | | | | | | | Ratio to
Average Net
Assets** | | | Assets
Before
Expenses
Waived or
Assumed | | | | | |
| | | | | | | | | Total
Return* | | | Net Assets
End of
Year (in
thousands) | | | Net
Expenses
After Fee
Credits | | | Net
Expenses
Before Fee
Credits*** | | | Net
Investment
Income | | | Expenses*** | | | Net
Investment
Income | | | Portfolio
Turnover
Rate | |
| | | | | | | | | | | | | | | | | | | | | | | | | | | | | | | | | | | | | | | | |
| | | | | | | | | | | | | | | | | | | | | | | | | | | | | | | | | | | | | | | | |
| | | | | | | | | | | (4.31 | )% | | $ | 485,342 | | | | 1.21 | % | | | 1.21 | % | | | 1.52 | % | | | N/A | | | | N/A | | | | 23 | % |
| | | | | | | | | | | 14.16 | | | | 529,327 | | | | 1.22 | | | | 1.22 | | | | 1.72 | | | | N/A | | | | N/A | | | | 22 | |
| | | | | | | | | | | 14.46 | | | | 564,918 | | | | 1.20 | | | | 1.20 | | | | 1.58 | | | | N/A | | | | N/A | | | | 15 | |
| | | | | | | | | | | 8.68 | | | | 545,810 | | | | 1.20 | | | | 1.20 | | | | 2.42 | | | | N/A | | | | N/A | | | | 35 | |
| | | | | | | | | | | 1.83 | | | | 468,634 | | | | 1.19 | | | | 1.19 | | | | 1.58 | | | | N/A | | | | N/A | | | | 39 | |
| | | | | | | | | | | | | | | | | | | | | | | | | | | | | | | | | | | | | | | | |
| | | | | | | | | | | (3.96 | ) | | | 38,482 | | | | .84 | | | | .84 | | | | 1.90 | | | | N/A | | | | N/A | | | | 23 | |
| | | | | | | | | | | 14.63 | | | | 54,576 | | | | .85 | | | | .85 | | | | 2.08 | | | | N/A | | | | N/A | | | | 22 | |
| | | | | | | | | | | 14.87 | | | | 71,611 | | | | .84 | | | | .84 | | | | 1.94 | | | | N/A | | | | N/A | | | | 15 | |
| | | | | | | | | | | 9.09 | | | | 80,387 | | | | .85 | | | | .85 | | | | 2.79 | | | | N/A | | | | N/A | | | | 35 | |
| | | | | | | | | | | 1.97 | | | | 1,786 | | | | .86 | | | | .86 | | | | 2.08 | | | | N/A | | | | N/A | | | | 39 | |
| | | | | | | | | | | | | | | | | | | | | | | | | | | | | | | | | | | | | | | | |
| | | | | | | | | | | (3.97 | ) | | | 9,773 | | | | .81 | | | | .81 | | | | 1.93 | | | | N/A | | | | N/A | | | | 23 | |
| | | | | | | | | | | 14.67 | | | | 2,448 | | | | .78 | | | | .78 | | | | 2.08 | | | | N/A | | | | N/A | | | | 22 | |
| | | | | | | | | | | 14.84 | | | | 2,193 | | | | .80 | | | | .80 | | | | 2.02 | | | | N/A | | | | N/A | | | | 15 | |
| | | | | | | | | | | 9.21 | | | | 2,499 | | | | .80 | | | | .80 | | | | 2.81 | | | | N/A | | | | N/A | | | | 35 | |
| | | | | | | | | | | 2.18 | | | | 1,411 | | | | .81 | | | | .81 | | | | 1.94 | | | | N/A | | | | N/A | | | | 39 | |
319
Financial Highlights (continued)
FIRST INVESTORS EQUITY FUNDS
| | | P E R
S H A R E
D A T A | | | | |
| | | | | | | Investment
Operations | | | Less
Distributions from | | | | | | | | | |
| | | | | | | | | | | Net Realized | | | | | | | | | | | | | | | | | | | | | |
| | Net Asset
Value,
Beginning
of Year | | | Net
Investment
Income
(Loss)(a) | | | and
Unrealized
Gain
(Loss) on
Investments | | | Total
From
Investment
Operations | | | Net
Investment
Income | | | Net
Realized
Gain | | | Total
Distributions | | | Net Asset
Value,
End of
Year | |
GLOBAL FUND | | | | |
Class A | | | | | | | | | | | | | | | | | | | | | | | | | | | | | | | | |
2015 | | $ | 8.66 | | | $ | — | | | $ | .11 | | | $ | .11 | | | $ | — | | | $ | 1.51 | | | $ | 1.51 | | | $ | 7.26 | |
2016 | | | 7.26 | | | | .01 | | | | .43 | | | | .44 | | | | .00 | (b) | | | .40 | | | | .40 | | | | 7.30 | |
2017 | | | 7.30 | | | | .02 | | | | 1.29 | | | | 1.31 | | | | .01 | | | | — | | | | .01 | | | | 8.60 | |
2018 | | | 8.60 | | | | (.01 | ) | | | .89 | | | | .88 | | | | .04 | | | | .63 | | | | .67 | | | | 8.81 | |
2019 | | | 8.81 | | | | .04 | | | | (.35 | ) | | | (.31 | ) | | | — | | | | 1.00 | | | | 1.00 | | | | 7.50 | |
Advisor Class | | | | | | | | | | | | | | | | | | | | | | | | | | | | |
2015 | | | 8.72 | | | | .03 | | | | .12 | | | | .15 | | | | — | | | | 1.51 | | | | 1.51 | | | | 7.36 | |
2016 | | | 7.36 | | | | .04 | | | | .44 | | | | .48 | | | | .01 | | | | .40 | | | | .41 | | | | 7.43 | |
2017 | | | 7.43 | | | | .06 | | | | 1.31 | | | | 1.37 | | | | .02 | | | | — | | | | .02 | | | | 8.78 | |
2018 | | | 8.78 | | | | .02 | | | | .91 | | | | .93 | | | | .05 | | | | .63 | | | | .68 | | | | 9.03 | |
2019 | | | 9.03 | | | | .07 | | | | (.36 | ) | | | (.29 | ) | | | — | | | | 1.00 | | | | 1.00 | | | | 7.74 | |
Institutional Class | | | | | | | | | | | | | | | | | | | | | | | | | | | | |
2015 | | | 8.75 | | | | .04 | | | | .11 | | | | .15 | | | | — | | | | 1.51 | | | | 1.51 | | | | 7.39 | |
2016 | | | 7.39 | | | | .04 | | | | .45 | | | | .49 | | | | .01 | | | | .40 | | | | .41 | | | | 7.47 | |
2017 | | | 7.47 | | | | .06 | | | | 1.31 | | | | 1.37 | | | | .02 | | | | — | | | | .02 | | | | 8.82 | |
2018 | | | 8.82 | | | | .03 | | | | .91 | | | | .94 | | | | .05 | | | | .63 | | | | .68 | | | | 9.08 | |
2019 | | | 9.08 | | | | .07 | | | | (.35 | ) | | | (.28 | ) | | | — | | | | 1.00 | | | | 1.00 | | | | 7.80 | |
320
See notes to financial statements
| | | | | | R A T I O S / S U P P L E M E N T A L D A T A | |
| | | | | | | | | | | | | | | | | | | | | | | | | | | | | |
Ratio to
Average Net
| | | | | |
| | | | | | | | | | | | | | | | | | Ratio to
Average Net
Assets** | | | Assets
Before
Expenses
Waived or
Assumed | | | | | |
| | | | | | | | | Total
Return* | | | Net Assets
End of
Year (in
thousands) | | | Net
Expenses
After Fee
Credits | | | Net
Expenses
Before Fee
Credits*** | | | Net
Investment
Income
(Loss) | | | Expenses*** | | | Net
Investment
Income
(Loss) | | | Portfolio
Turnover
Rate | |
| | | | | | | | | | | | | | | | | | | | | | | | | | | | | | | | | | | | | | | | |
| | | | | | | | | | | | | | | | | | | | | | | | | | | | | | | | | | | | | | | | |
| | | | | | | | | | | .87 | % | | $ | 331,382 | | | | 1.47 | % | | | 1.47 | % | | | (.01 | )% | | | 1.52 | % | | | (.06 | )% | | | 97 | % |
| | | | | | | | | | | 6.03 | | | | 339,956 | | | | 1.47 | | | | 1.47 | | | | .09 | | | | 1.52 | | | | .04 | | | | 94 | |
| | | | | | | | | | | 17.99 | | | | 379,176 | | | | 1.44 | | | | 1.44 | | | | .30 | | | | 1.49 | | | | .25 | | | | 117 | |
| | | | | | | | | | | 10.69 | | | | 393,697 | | | | 1.43 | | | | 1.43 | | | | (.16 | ) | | | 1.48 | | | | (.21 | ) | | | 132 | |
| | | | | | | | | | | (1.48 | ) | | | 344,592 | | | | 1.44 | | | | 1.44 | | | | .55 | | | | 1.46 | | | | .53 | | | | 119 | |
| | | | | | | | | | | | | | | | | | | | | | | | | | | | | | | | | | | | | | | | |
| | | | | | | | | | | 1.37 | | | | 114,556 | | | | 1.06 | | | | 1.06 | | | | .43 | | | | 1.11 | | | | .38 | | | | 97 | |
| | | | | | | | | | | 6.48 | | | | 169,088 | | | | 1.05 | | | | 1.05 | | | | .53 | | | | 1.10 | | | | .48 | | | | 94 | |
| | | | | | | | | | | 18.46 | | | | 191,839 | | | | 1.04 | | | | 1.04 | | | | .70 | | | | 1.09 | | | | .65 | | | | 117 | |
| | | | | | | | | | | 11.03 | | | | 228,234 | | | | 1.05 | | | | 1.05 | | | | .25 | | | | 1.10 | | | | .20 | | | | 132 | |
| | | | | | | | | | | (1.20 | ) | | | 75,077 | | | | 1.09 | | | | 1.09 | | | | .95 | | | | 1.11 | | | | .93 | | | | 119 | |
| | | | | | | | | | | | | | | | | | | | | | | | | | | | | | | | | | | | | | | | |
| | | | | | | | | | | 1.37 | | | | 2,955 | | | | 1.02 | | | | 1.02 | | | | .45 | | | | 1.07 | | | | .40 | | | | 97 | |
| | | | | | | | | | | 6.61 | | | | 3,288 | | | | 1.01 | | | | 1.01 | | | | .55 | | | | 1.06 | | | | .50 | | | | 94 | |
| | | | | | | | | | | 18.38 | | | | 3,800 | | | | 1.00 | | | | 1.00 | | | | .74 | | | | 1.05 | | | | .69 | | | | 117 | |
| | | | | | | | | | | 11.12 | | | | 4,419 | | | | 1.00 | | | | 1.00 | | | | .29 | | | | 1.05 | | | | .24 | | | | 132 | |
| | | | | | | | | | | (1.08 | ) | | | 1,946 | | | | 1.02 | | | | 1.02 | | | | .95 | | | | 1.04 | | | | .93 | | | | 119 | |
321
Financial Highlights (continued)
FIRST INVESTORS EQUITY FUNDS
| | | P E R
S H A R E
D A T A | | | | |
| | | | | | | Investment
Operations | | | Less
Distributions from | | | | | | | | | |
| | | | | | | | | | | Net Realized | | | | | | | | | | | | | | | | | | | | | |
| | Net Asset
Value,
Beginning
of Year | | | Net
Investment
Income(a) | | | and
Unrealized
Gain
(Loss) on
Investments | | | Total
From
Investment
Operations | | | Net
Investment
Income | | | Net
Realized
Gain | | | Total
Distributions | | | Net Asset
Value,
End of
Year | |
GROWTH & INCOME FUND | | | | |
Class A | | | | | | | | | | | | | | | | | | | | | | | | | | | | | | | | |
2015 | | $ | 22.76 | | | $ | .20 | | | $ | (1.37 | ) | | $ | (1.17 | ) | | $ | .19 | | | $ | 1.05 | | | $ | 1.24 | | | $ | 20.35 | |
2016 | | | 20.35 | | | | .26 | | | | 2.07 | | | | 2.33 | | | | .24 | | | | .93 | | | | 1.17 | | | | 21.51 | |
2017 | | | 21.51 | | | | .25 | | | | 2.66 | | | | 2.91 | | | | .37 | | | | .75 | | | | 1.12 | | | | 23.30 | |
2018 | | | 23.30 | | | | .26 | | | | 2.11 | | | | 2.37 | | | | .32 | | | | .94 | | | | 1.26 | | | | 24.41 | |
2019 | | | 24.41 | | | | .27 | | | | (.54 | ) | | | (.27 | ) | | | .27 | | | | 4.02 | | | | 4.29 | | | | 19.85 | |
Advisor Class | | | | | | | | | | | | | | | | | | | | | | | | | | | | |
2015 | | | 22.84 | | | | .29 | | | | (1.38 | ) | | | (1.09 | ) | | | .24 | | | | 1.05 | | | | 1.29 | | | | 20.46 | |
2016 | | | 20.46 | | | | .35 | | | | 2.08 | | | | 2.43 | | | | .29 | | | | .93 | | | | 1.22 | | | | 21.67 | |
2017 | | | 21.67 | | | | .33 | | | | 2.69 | | | | 3.02 | | | | .48 | | | | .75 | | | | 1.23 | | | | 23.46 | |
2018 | | | 23.46 | | | | .35 | | | | 2.11 | | | | 2.46 | | | | .40 | | | | .94 | | | | 1.34 | | | | 24.58 | |
2019 | | | 24.58 | | | | .33 | | | | (.55 | ) | | | (.22 | ) | | | .47 | | | | 4.02 | | | | 4.49 | | | | 19.87 | |
Institutional Class | | | | | | | | | | | | | | | | | | | | | | | | | | | | |
2015 | | | 22.78 | | | | .29 | | | | (1.39 | ) | | | (1.10 | ) | | | .24 | | | | 1.05 | | | | 1.29 | | | | 20.39 | |
2016 | | | 20.39 | | | | .35 | | | | 2.07 | | | | 2.42 | | | | .30 | | | | .93 | | | | 1.23 | | | | 21.58 | |
2017 | | | 21.58 | | | | .34 | | | | 2.67 | | | | 3.01 | | | | .45 | | | | .75 | | | | 1.20 | | | | 23.39 | |
2018 | | | 23.39 | | | | .36 | | | | 2.12 | | | | 2.48 | | | | .41 | | | | .94 | | | | 1.35 | | | | 24.52 | |
2019 | | | 24.52 | | | | .35 | | | | (.56 | ) | | | (.21 | ) | | | .37 | | | | 4.02 | | | | 4.39 | | | | 19.92 | |
322
See notes to financial statements
| | | | | | R A T I O S / S U P P L E M E N T A L D A T A | |
| | | | | | | | | | | | | | | | | | | | | | | | | | | | | |
Ratio to
Average Net
| | | | | |
| | | | | | | | | | | | | | | | | | Ratio to
Average Net
Assets** | | | Assets
Before
Expenses
Waived or
Assumed | | | | | |
| | | | | | | | | Total
Return* | | | Net Assets
End of
Year (in
thousands) | | | Net
Expenses
After Fee
Credits | | | Net
Expenses
Before Fee
Credits*** | | | Net
Investment
Income | | | Expenses*** | | | Net
Investment
Income | | | Portfolio
Turnover
Rate | |
| | | | | | | | | | | | | | | | | | | | | | | | | | | | | | | | | | | | | | | | |
| | | | | | | | | | | | | | | | | | | | | | | | | | | | | | | | | | | | | | | | |
| | | | | | | | | | | (5.62 | )% | | $ | 1,496,803 | | | | 1.15 | % | | | 1.15 | % | | | .89 | % | | | N/A | | | | N/A | | | | 23 | % |
| | | | | | | | | | | 11.72 | | | | 1,588,423 | | | | 1.16 | | | | 1.16 | | | | 1.28 | | | | N/A | | | | N/A | | | | 23 | |
| | | | | | | | | | | 13.99 | | | | 1,675,590 | | | | 1.15 | | | | 1.15 | | | | 1.13 | | | | N/A | | | | N/A | | | | 16 | |
| | | | | | | | | | | 10.35 | | | | 1,653,563 | | | | 1.14 | | | | 1.14 | | | | 1.08 | | | | N/A | | | | N/A | | | | 34 | |
| | | | | | | | | | | 2.02 | | | | 1,464,393 | | | | 1.13 | | | | 1.13 | | | | 1.37 | | | | N/A | | | | N/A | | | | 55 | |
| | | | | | | | | | | | | | | | | | | | | | | | | | | | | | | | | | | | | | | | |
| | | | | | | | | | | (5.24 | ) | | | 141,229 | | | | .75 | | | | .75 | | | | 1.29 | | | | N/A | | | | N/A | | | | 23 | |
| | | | | | | | | | | 12.18 | | | | 132,486 | | | | .77 | | | | .77 | | | | 1.68 | | | | N/A | | | | N/A | | | | 23 | |
| | | | | | | | | | | 14.42 | | | | 166,851 | | | | .78 | | | | .78 | | | | 1.50 | | | | N/A | | | | N/A | | | | 16 | |
| | | | | | | | | | | 10.73 | | | | 142,220 | | | | .79 | | | | .79 | | | | 1.44 | | | | N/A | | | | N/A | | | | 34 | |
| | | | | | | | | | | 2.26 | | | | 21,597 | | | | .83 | | | | .83 | | | | 1.66 | | | | N/A | | | | N/A | | | | 55 | |
| | | | | | | | | | | | | | | | | | | | | | | | | | | | | | | | | | | | | | | | |
| | | | | | | | | | | (5.27 | ) | | | 9,380 | | | | .75 | | | | .75 | | | | 1.29 | | | | N/A | | | | N/A | | | | 23 | |
| | | | | | | | | | | 12.18 | | | | 10,596 | | | | .74 | | | | .74 | | | | 1.70 | | | | N/A | | | | N/A | | | | 23 | |
| | | | | | | | | | | 14.47 | | | | 10,839 | | | | .74 | | | | .74 | | | | 1.54 | | | | N/A | | | | N/A | | | | 16 | |
| | | | | | | | | | | 10.85 | | | | 11,067 | | | | .74 | | | | .74 | | | | 1.49 | | | | N/A | | | | N/A | | | | 34 | |
| | | | | | | | | | | 2.34 | | | | 5,597 | | | | .75 | | | | .75 | | | | 1.75 | | | | N/A | | | | N/A | | | | 55 | |
323
Financial Highlights (continued)
FIRST INVESTORS EQUITY FUNDS
| | | P E R
S H A R E
D A T A | | | | |
| | | | | | | Investment
Operations | | | Less
Distributions from | | | | | | | | | |
| | | | | | | | | | | Net Realized | | | | | | | | | | | | | | | | | | | | | |
| | Net Asset
Value,
Beginning
of Period/
Year | | | Net
Investment
Income
(Loss)(a) | | | and
Unrealized
Gain
(Loss) on
Investments | | | Total
From
Investment
Operations | | | Net
Investment
Income | | | Net
Realized
Gain | | | Total
Distributions | | | Net Asset
Value,
End of
Period/
Year | |
HEDGED U.S. EQUITY OPPORTUNITIES FUND | | | | |
Class A | | | | | | | | | | | | | | | | | | | | | | | | | | | | | |
2016(c) | | $ | 10.00 | | | $ | — | | | $ | (.09 | ) | | $ | (.09 | ) | | $ | — | | | $ | — | | | $ | — | | | $ | 9.91 | |
2017 | | | 9.91 | | | | (.02 | ) | | | .88 | | | | .86 | | | | — | | | | — | | | | — | | | | 10.77 | |
2018 | | | 10.77 | | | | (.03 | ) | | | 1.16 | | | | 1.13 | | | | — | | | | — | | | | — | | | | 11.90 | |
2019 | | | 11.90 | | | | (.01 | ) | | | .68 | | | | .67 | | | | — | | | | .21 | | | | .21 | | | | 12.36 | |
Advisor Class | | | | | | | | | | | | | | | | | | | | | | | | | | | | |
2016(c) | | | 10.00 | | | | — | | | | (.09 | ) | | | (.09 | ) | | | — | | | | — | | | | — | | | | 9.91 | |
2017 | | | 9.91 | | | | .01 | | | | .89 | | | | .90 | | | | .00 | (b) | | | — | | | | .00 | (b) | | | 10.81 | |
2018 | | | 10.81 | | | | .02 | | | | 1.16 | | | | 1.18 | | | | — | | | | — | | | | — | | | | 11.99 | |
2019 | | | 11.99 | | | | .03 | | | | .67 | | | | .70 | | | | .00 | (b) | | | .21 | | | | .21 | | | | 12.48 | |
Institutional Class | | | | | | | | | | | | | | | | | | | | | | | | | | | | |
2016(c) | | | 10.00 | | | | .01 | | | | (.10 | ) | | | (.09 | ) | | | — | | | | — | | | | — | | | | 9.91 | |
2017 | | | 9.91 | | | | .02 | | | | .89 | | | | .91 | | | | .00 | (b) | | | — | | | | .00 | (b) | | | 10.82 | |
2018 | | | 10.82 | | | | .02 | | | | 1.17 | | | | 1.19 | | | | — | | | | — | | | | — | | | | 12.01 | |
2019 | | | 12.01 | | | | .04 | | | | .69 | | | | .73 | | | | .00 | (b) | | | .21 | | | | .21 | | | | 12.53 | |
324
See notes to financial statements
| | | | | | R A T I O S / S U P P L E M E N T A L D A T A | |
| | | | | | | | | | | | | | | | | | | | | | | | | | | | | |
Ratio to
Average Net
| | | | | |
| | | | | | | | | | | | | | | | | | Ratio to
Average Net
Assets** | | | Assets
Before
Expenses
Waived or
Assumed | | | | | |
| | | | | | | | | Total
Return* | | | Net Assets
End of
Period/
Year (in
thousands) | | | Net
Expenses
After Fee
Credits | | | Net
Expenses
Before Fee
Credits*** | | | Net
Investment
Income
(Loss) | | | Expenses*** | | | Net
Investment
Income
(Loss) | | | Portfolio
Turnover
Rate | |
| | | | | | | | | | | | | | | | | | | | | | | | | | | | | | | | | | | | | | | | |
| | | | | | | | | | | | | | | | | | | | | | | | | | | | | | | | | | | | | | | | |
| | | | | | | | | | | (.90 | )%†† | | $ | 9,265 | | | | 1.75 | %† | | | 1.75 | %† | | | (.02 | )%† | | | 4.24 | %† | | | (2.51 | )%† | | | 7 | %†† |
| | | | | | | | | | | 8.68 | | | | 44,228 | | | | 1.75 | | | | 1.75 | | | | (.21 | ) | | | 2.09 | | | | (.55 | ) | | | 75 | |
| | | | | | | | | | | 10.49 | | | | 66,746 | | | | 1.75 | | | | 1.75 | | | | (.22 | ) | | | 1.76 | | | | (.23 | ) | | | 56 | |
| | | | | | | | | | | 5.92 | | | | 78,297 | | | | 1.75 | | | | 1.75 | | | | (.05 | ) | | | 1.68 | | | | .02 | | | | 124 | |
| | | | | | | | | | | | | | | | | | | | | | | | | | | | | | | | | | | | | | | | |
| | | | | | | | | | | (.90 | )†† | | | 24,539 | | | | 1.42 | † | | | 1.42 | † | | | .26 | † | | | 3.37 | † | | | (1.69 | )† | | | 7 | †† |
| | | | | | | | | | | 9.11 | | | | 33,770 | | | | 1.42 | | | | 1.42 | | | | .10 | | | | 1.76 | | | | (.24 | ) | | | 75 | |
| | | | | | | | | | | 10.92 | | | | 94,955 | | | | 1.42 | | | | 1.42 | | | | .16 | | | | 1.40 | | | | .18 | | | | 56 | |
| | | | | | | | | | | 6.14 | | | | 44,543 | | | | 1.42 | | | | 1.42 | | | | .27 | | | | 1.39 | | | | .30 | | | | 124 | |
| | | | | | | | | | | | | | | | | | | | | | | | | | | | | | | | | | | | | | | | |
| | | | | | | | | | | (.90 | )†† | | | 99 | | | | 1.31 | † | | | 1.31 | † | | | .30 | † | | | 3.24 | † | | | (1.63 | )† | | | 7 | †† |
| | | | | | | | | | | 9.21 | | | | 472 | | | | 1.31 | | | | 1.31 | | | | .23 | | | | 1.74 | | | | (.20 | ) | | | 75 | |
| | | | | | | | | | | 11.00 | | | | 574 | | | | 1.31 | | | | 1.31 | | | | .21 | | | | 1.39 | | | | .13 | | | | 56 | |
| | | | | | | | | | | 6.39 | | | | 341 | | | | 1.31 | | | | 1.31 | | | | .37 | | | | 1.30 | | | | .38 | | | | 124 | |
325
Financial Highlights (continued)
FIRST INVESTORS EQUITY FUNDS
| | | P E R
S H A R E
D A T A | | | | |
| | | | | | | Investment
Operations | | | Less
Distributions from | | | | | | | | | |
| | | | | | | | | | | Net Realized | | | | | | | | | | | | | | | | | | | | | |
| | Net Asset
Value,
Beginning
of Year | | | Net
Investment
Income(a) | | | and
Unrealized
Gain
(Loss) on
Investments | | | Total
From
Investment
Operations | | | Net
Investment
Income | | | Net
Realized
Gain | | | Total
Distributions | | | Net Asset
Value,
End of
Year | |
INTERNATIONAL FUND | | | | | | | | | | | | | | | | | | | | |
Class A | | | | | | | | | | | | | | | | | | | | | | | | | | | | | | | | |
2015 | | $ | 13.06 | | | $ | .05 | | | $ | (.41 | ) | | $ | (.36 | ) | | $ | .05 | | | $ | — | | | $ | .05 | | | $ | 12.65 | |
2016 | | | 12.65 | | | | .06 | | | | 1.05 | | | | 1.11 | | | | .05 | | | | — | | | | .05 | | | | 13.71 | |
2017 | | | 13.71 | | | | .02 | | | | 2.02 | | | | 2.04 | | | | .07 | | | | — | | | | .07 | | | | 15.68 | |
2018 | | | 15.68 | | | | .01 | | | | .28 | | | | .29 | | | | .02 | | | | — | | | | .02 | | | | 15.95 | |
2019 | | | 15.95 | | | | .03 | | | | .88 | | | | .91 | | | | .03 | | | | .96 | | | | .99 | | | | 15.87 | |
Advisor Class | | | | | | | | | | | | | | | | | | | | | | | | | | | | |
2015 | | | 13.13 | | | | .11 | | | | (.43 | ) | | | (.32 | ) | | | .05 | | | | — | | | | .05 | | | | 12.76 | |
2016 | | | 12.76 | | | | .11 | | | | 1.06 | | | | 1.17 | | | | .06 | | | | — | | | | .06 | | | | 13.87 | |
2017 | | | 13.87 | | | | .08 | | | | 2.05 | | | | 2.13 | | | | .08 | | | | — | | | | .08 | | | | 15.92 | |
2018 | | | 15.92 | | | | .08 | | | | .27 | | | | .35 | | | | .03 | | | | — | | | | .03 | | | | 16.24 | |
2019 | | | 16.24 | | | | .09 | | | | .90 | | | | .99 | | | | .04 | | | | .96 | | | | 1.00 | | | | 16.23 | |
Institutional Class | | | | | | | | | | | | | | | | | | | | | | | | | | | | |
2015 | | | 13.19 | | | | .12 | | | | (.43 | ) | | | (.31 | ) | | | .10 | | | | — | | | | .10 | | | | 12.78 | |
2016 | | | 12.78 | | | | .13 | | | | 1.07 | | | | 1.20 | | | | .07 | | | | — | | | | .07 | | | | 13.91 | |
2017 | | | 13.91 | | | | .09 | | | | 2.05 | | | | 2.14 | | | | .09 | | | | — | | | | .09 | | | | 15.96 | |
2018 | | | 15.96 | | | | .09 | | | | .29 | | | | .38 | | | | .04 | | | | — | | | | .04 | | | | 16.30 | |
2019 | | | 16.30 | | | | .07 | | | | .93 | | | | 1.00 | | | | .05 | | | | .96 | | | | 1.01 | | | | 16.29 | |
326
See notes to financial statements
| | | | | | R A T I O S / S U P P L E M E N T A L D A T A | |
| | | | | | | | | | | | | | | | | | | | | | | | | | | | | |
Ratio to
Average Net
| | | | | |
| | | | | | | | | | | | | | | | | | Ratio to
Average Net
Assets** | | | Assets
Before
Expenses
Waived or
Assumed | | | | | |
| | | | | | | | | Total
Return* | | | Net Assets
End of
Year (in
thousands) | | | Net
Expenses
After Fee
Credits | | | Net
Expenses
Before Fee
Credits*** | | | Net
Investment
Income | | | Expenses*** | | | Net
Investment
Income | | | Portfolio
Turnover
Rate | |
| | | | | | | | | | | | | | | | | | | | | | | | | | | | | | | | | | | | | | | | |
| | | | | | | | | | | | | | | | | | | | | | | | | | | | | | | | | | | | | | | | |
| | | | | | | | | | | (2.78 | )% | | $ | 194,991 | | | | 1.64 | % | | | 1.64 | % | | | .40 | % | | | N/A | | | | N/A | | | | 27 | % |
| | | | | | | | | | | 8.80 | | | | 209,205 | | | | 1.61 | | | | 1.61 | | | | .45 | | | | N/A | | | | N/A | | | | 28 | |
| | | | | | | | | | | 15.00 | | | | 238,770 | | | | 1.58 | | | | 1.58 | | | | .17 | | | | N/A | | | | N/A | | | | 38 | |
| | | | | | | | | | | 1.83 | | | | 259,683 | | | | 1.56 | | | | 1.56 | | | | .09 | | | | N/A | | | | N/A | | | | 36 | |
| | | | | | | | | | | 7.01 | | | | 248,302 | | | | 1.55 | | | | 1.55 | | | | .19 | | | | N/A | | | | N/A | | | | 76 | |
| | | | | | | | | | | | | | | | | | | | | | | | | | | | | | | | | | | | | | | | |
| | | | | | | | | | | (2.45 | ) | | | 57,623 | | | | 1.24 | | | | 1.24 | | | | .83 | | | | N/A | | | | N/A | | | | 27 | |
| | | | | | | | | | | 9.22 | | | | 81,525 | | | | 1.23 | | | | 1.24 | | | | .85 | | | | N/A | | | | N/A | | | | 28 | |
| | | | | | | | | | | 15.50 | | | | 111,334 | | | | 1.18 | | | | 1.18 | | | | .59 | | | | N/A | | | | N/A | | | | 38 | |
| | | | | | | | | | | 2.21 | | | | 136,628 | | | | 1.18 | | | | 1.18 | | | | .48 | | | | N/A | | | | N/A | | | | 36 | |
| | | | | | | | | | | 7.43 | | | | 200,720 | | | | 1.17 | | | | 1.17 | | | | .61 | | | | N/A | | | | N/A | | | | 76 | |
| | | | | | | | | | | | | | | | | | | | | | | | | | | | | | | | | | | | | | | | |
| | | | | | | | | | | (2.33 | ) | | | 2,347 | | | | 1.14 | | | | 1.14 | | | | .89 | | | | N/A | | | | N/A | | | | 27 | |
| | | | | | | | | | | 9.39 | | | | 2,695 | | | | 1.12 | | | | 1.12 | | | | .95 | | | | N/A | | | | N/A | | | | 28 | |
| | | | | | | | | | | 15.54 | | | | 3,274 | | | | 1.09 | | | | 1.09 | | | | .65 | | | | N/A | | | | N/A | | | | 38 | |
| | | | | | | | | | | 2.36 | | | | 3,509 | | | | 1.09 | | | | 1.09 | | | | .56 | | | | N/A | | | | N/A | | | | 36 | |
| | | | | | | | | | | 7.46 | | | | 1,352 | | | | 1.09 | | | | 1.09 | | | | .44 | | | | N/A | | | | N/A | | | | 76 | |
327
Financial Highlights (continued)
FIRST INVESTORS EQUITY FUNDS
| | | P E R
S H A R E
D A T A | | | | |
| | | | | | | Investment
Operations | | | Less
Distributions from | | | | | | | | | |
| | | | | | | | | | | Net Realized | | | | | | | | | | | | | | | | | | | | | |
| | Net Asset
Value,
Beginning
of Year | | | Net
Investment
Income(a) | | | and
Unrealized
Gain
(Loss) on
Investments | | | Total
From
Investment
Operations | | | Net
Investment
Income | | | Net
Realized
Gain | | | Total
Distributions | | | Net Asset
Value,
End of
Year | |
OPPORTUNITY FUND | | | | | | | | | | | | | | | | | | | | |
Class A | | | | | | | | | | | | | | | | | | | | | | | | | | | | | | | | |
2015 | | $ | 40.90 | | | $ | .04 | | | $ | (.39 | ) | | $ | (.35 | ) | | $ | .06 | | | $ | 2.70 | | | $ | 2.76 | | | $ | 37.79 | |
2016 | | | 37.79 | | | | .20 | | | | 2.52 | | | | 2.72 | | | | .04 | | | | 3.18 | | | | 3.22 | | | | 37.29 | |
2017 | | | 37.29 | | | | .11 | | | | 6.03 | | | | 6.14 | | | | .22 | | | | 1.35 | | | | 1.57 | | | | 41.86 | |
2018 | | | 41.86 | | | | .39 | | | | 2.31 | | | | 2.70 | | | | .12 | | | | 2.38 | | | | 2.50 | | | | 42.06 | |
2019 | | | 42.06 | | | | .12 | | | | (.60 | ) | | | (.48 | ) | | | .38 | | | | 3.41 | | | | 3.79 | | | | 37.79 | |
Advisor Class | | | | | | | | | | | | | | | | | | | | | | | | | | | | |
2015 | | | 41.20 | | | | .16 | | | | (.40 | ) | | | (.24 | ) | | | .08 | | | | 2.70 | | | | 2.78 | | | | 38.18 | |
2016 | | | 38.18 | | | | .30 | | | | 2.56 | | | | 2.86 | | | | .07 | | | | 3.18 | | | | 3.25 | | | | 37.79 | |
2017 | | | 37.79 | | | | .24 | | | | 6.12 | | | | 6.36 | | | | .24 | | | | 1.35 | | | | 1.59 | | | | 42.56 | |
2018 | | | 42.56 | | | | .61 | | | | 2.27 | | | | 2.88 | | | | .15 | | | | 2.38 | | | | 2.53 | | | | 42.91 | |
2019 | | | 42.91 | | | | .23 | | | | (.58 | ) | | | (.35 | ) | | | .40 | | | | 3.41 | | | | 3.81 | | | | 38.75 | |
Institutional Class | | | | | | | | | | | | | | | | | | | | | | | | | | | | |
2015 | | | 41.15 | | | | .22 | | | | (.40 | ) | | | (.18 | ) | | | .20 | | | | 2.70 | | | | 2.90 | | | | 38.07 | |
2016 | | | 38.07 | | | | .36 | | | | 2.54 | | | | 2.90 | | | | .08 | | | | 3.18 | | | | 3.26 | | | | 37.71 | |
2017 | | | 37.71 | | | | .27 | | | | 6.12 | | | | 6.39 | | | | .26 | | | | 1.35 | | | | 1.61 | | | | 42.49 | |
2018 | | | 42.49 | | | | .59 | | | | 2.33 | | | | 2.92 | | | | .16 | | | | 2.38 | | | | 2.54 | | | | 42.87 | |
2019 | | | 42.87 | | | | .27 | | | | (.59 | ) | | | (.32 | ) | | | .43 | | | | 3.41 | | | | 3.84 | | | | 38.71 | |
328
See notes to financial statements
| | | | | | R A T I O S / S U P P L E M E N T A L D A T A | |
| | | | | | | | | | | | | | | | | | | | | | | | | | | | | |
Ratio to
Average Net
| | | | | |
| | | | | | | | | | | | | | | | | | Ratio to
Average Net
Assets** | | | Assets
Before
Expenses
Waived or
Assumed | | | | | |
| | | | | | | | | Total
Return* | | | Net Assets
End of
Year (in
thousands) | | | Net
Expenses
After Fee
Credits | | | Net
Expenses
Before Fee
Credits*** | | | Net
Investment
Income | | | Expenses*** | | | Net
Investment
Income | | | Portfolio
Turnover
Rate | |
| | | | | | | | | | | | | | | | | | | | | | | | | | | | | | | | | | | | | | | | |
| | | | | | | | | | | | | | | | | | | | | | | | | | | | | | | | | | | | | | | | |
| | | | | | | | | | | (1.16 | )% | | $ | 818,955 | | | | 1.20 | % | | | 1.20 | % | | | .11 | % | | | N/A | | | | N/A | | | | 37 | % |
| | | | | | | | | | | 7.39 | | | | 880,274 | | | | 1.22 | | | | 1.22 | | | | .54 | | | | N/A | | | | N/A | | | | 36 | |
| | | | | | | | | | | 16.99 | | | | 1,002,618 | | | | 1.20 | | | | 1.20 | | | | .27 | | | | N/A | | | | N/A | | | | 32 | |
| | | | | | | | | | | 6.49 | | | | 1,010,312 | | | | 1.20 | | | | 1.20 | | | | .93 | | | | N/A | | | | N/A | | | | 35 | |
| | | | | | | | | | | .80 | | | | 915,339 | | | | 1.19 | | | | 1.20 | | | | .32 | | | | N/A | | | | N/A | | | | 47 | |
| | | | | | | | | | | | | | | | | | | | | | | | | | | | | | | | | | | | | | | | |
| | | | | | | | | | | (.87 | ) | | | 48,322 | | | | .91 | | | | .91 | | | | .40 | | | | N/A | | | | N/A | | | | 37 | |
| | | | | | | | | | | 7.69 | | | | 73,477 | | | | .93 | | | | .93 | | | | .83 | | | | N/A | | | | N/A | | | | 36 | |
| | | | | | | | | | | 17.37 | | | | 81,773 | | | | .88 | | | | .88 | | | | .59 | | | | N/A | | | | N/A | | | | 32 | |
| | | | | | | | | | | 6.82 | | | | 149,481 | | | | .89 | | | | .89 | | | | 1.42 | | | | N/A | | | | N/A | | | | 35 | |
| | | | | | | | | | | 1.14 | | | | 10,325 | | | | .91 | | | | .92 | | | | .62 | | | | N/A | | | | N/A | | | | 47 | |
| | | | | | | | | | | | | | | | | | | | | | | | | | | | | | | | | | | | | | | | |
| | | | | | | | | | | (.74 | ) | | | 4,228 | | | | .78 | | | | .78 | | | | .52 | | | | N/A | | | | N/A | | | | 37 | |
| | | | | | | | | | | 7.84 | | | | 4,975 | | | | .79 | | | | .79 | | | | .98 | | | | N/A | | | | N/A | | | | 36 | |
| | | | | | | | | | | 17.49 | | | | 5,678 | | | | .78 | | | | .78 | | | | .70 | | | | N/A | | | | N/A | | | | 32 | |
| | | | | | | | | | | 6.95 | | | | 5,793 | | | | .77 | | | | .77 | | | | 1.38 | | | | N/A | | | | N/A | | | | 35 | |
| | | | | | | | | | | 1.23 | | | | 2,338 | | | | .77 | | | | .78 | | | | .73 | | | | N/A | | | | N/A | | | | 47 | |
329
Financial Highlights (continued)
FIRST INVESTORS EQUITY FUNDS
| | | P E R
S H A R E
D A T A | | | | |
| | | | | | | Investment
Operations | | | Less
Distributions from | | | | | | | | | |
| | | | | | | | | | | Net Realized | | | | | | | | | | | | | | | | | | | | | |
| | Net Asset
Value,
Beginning
of Period/
Year | | | Net
Investment
Income
(Loss)(a) | | | and
Unrealized
Gain
(Loss) on
Investments | | | Total
From
Investment
Operations | | | Net
Investment
Income | | | Net
Realized
Gain | | | Total
Distributions | | | Net Asset
Value,
End of
Period/
Year | |
PREMIUM INCOME FUND | | | | | | | | | | | | | | | | | | | | | | | | |
Class A | | | | | | | | | | | | | | | | | | | | | | | | | | | | | | | | |
2018(e) | | $ | 10.00 | | | $ | .08 | | | $ | .23 | | | $ | .31 | | | $ | .05 | | | $ | — | | | $ | .05 | | | $ | 10.26 | |
2019 | | | 10.26 | | | | .18 | | | | .05 | | | | .23 | | | | .17 | | | | .18 | | | | .35 | | | | 10.14 | |
Advisor Class | | | | | | | | | | | | | | | | | | | | | | | | | | | | |
2018(e) | | | 10.00 | | | | .10 | | | | .22 | | | | .32 | | | | .06 | | | | — | | | | .06 | | | | 10.26 | |
2019 | | | 10.26 | | | | .20 | | | | .07 | | | | .27 | | | | .19 | | | | .18 | | | | .37 | | | | 10.16 | |
Institutional Class | | | | | | | | | | | | | | | | | | | | | | | | | | | | |
2018(e) | | | 10.00 | | | | .10 | | | | .23 | | | | .33 | | | | .17 | | | | — | | | | .17 | | | | 10.16 | |
2019 | | | 10.16 | | | | .20 | | | | (.27 | ) | | | (.07 | ) | | | 4.38 | | | | .18 | | | | 4.56 | | | | 5.53 | |
| | | | | | | | | | | | | | | | | | | | | | | | | | | | | | | | | |
SELECT GROWTH FUND | | | | | | | | | | | | | | | | | | | | | | | | |
Class A | | | | | | | | | | | | | | | | | | | | | | | | | | | | | | | | |
2015 | | $ | 10.97 | | | $ | .02 | | | $ | .65 | | | $ | .67 | | | $ | .00 | (b) | | $ | — | | | $ | .00 | (b) | | $ | 11.64 | |
2016 | | | 11.64 | | | | .02 | | | | .73 | | | | .75 | | | | .02 | | | | 1.13 | | | | 1.15 | | | | 11.24 | |
2017 | | | 11.24 | | | | — | | | | 2.38 | | | | 2.38 | | | | .03 | | | | 1.55 | | | | 1.58 | | | | 12.04 | |
2018 | | | 12.04 | | | | (.01 | ) | | | 2.66 | | | | 2.65 | | | | .01 | | | | 1.07 | | | | 1.08 | | | | 13.61 | |
2019 | | | 13.61 | | | | .02 | | | | (.92 | ) | | | (.90 | ) | | | — | | | | .62 | | | | .62 | | | | 12.09 | |
Advisor Class | | | | | | | | | | | | | | | | | | | | | | | | | | | | |
2015 | | | 11.01 | | | | .07 | | | | .66 | | | | .73 | | | | .01 | | | | — | | | | .01 | | | | 11.73 | |
2016 | | | 11.73 | | | | .07 | | | | .73 | | | | .80 | | | | .03 | | | | 1.13 | | | | 1.16 | | | | 11.37 | |
2017 | | | 11.37 | | | | .05 | | | | 2.40 | | | | 2.45 | | | | .04 | | | | 1.55 | | | | 1.59 | | | | 12.23 | |
2018 | | | 12.23 | | | | .04 | | | | 2.71 | | | | 2.75 | | | | .02 | | | | 1.07 | | | | 1.09 | | | | 13.89 | |
2019 | | | 13.89 | | | | .06 | | | | (.94 | ) | | | (.88 | ) | | | .01 | | | | .62 | | | | .63 | | | | 12.38 | |
Institutional Class | | | | | | | | | | | | | | | | | | | | | | | | | | | | |
2015 | | | 11.06 | | | | .07 | | | | .66 | | | | .73 | | | | .02 | | | | — | | | | .02 | | | | 11.77 | |
2016 | | | 11.77 | | | | .07 | | | | .74 | | | | .81 | | | | .03 | | | | 1.13 | | | | 1.16 | | | | 11.42 | |
2017 | | | 11.42 | | | | .05 | | | | 2.41 | | | | 2.46 | | | | .04 | | | | 1.55 | | | | 1.59 | | | | 12.29 | |
2018 | | | 12.29 | | | | .05 | | | | 2.72 | | | | 2.77 | | | | .02 | | | | 1.07 | | | | 1.09 | | | | 13.97 | |
2019 | | | 13.97 | | | | .07 | | | | (.95 | ) | | | (.88 | ) | | | .01 | | | | .62 | | | | .63 | | | | 12.46 | |
330
See notes to financial statements
| | | | | | R A T I O S / S U P P L E M E N T A L D A T A | |
| | | | | | | | | | | | | | | | | | | | | | | | | | | | | |
Ratio to
Average Net
| | | | | |
| | | | | | | | | | | | | | | | | | Ratio to
Average Net
Assets** | | | Assets
Before
Expenses
Waived or
Assumed | | | | | |
| | | | | | | | | Total
Return* | | | Net Assets
End of
Period/
Year (in
thousands) | | | Net
Expenses
After Fee
Credits | | | Net
Expenses
Before Fee
Credits*** | | | Net
Investment
Income
(Loss) | | | Expenses*** | | | Net
Investment
Income | | | Portfolio
Turnover
Rate | |
| | | | | | | | | | | | | | | | | | | | | | | | | | | | | | | | | | | | | | | | |
| | | | | | | | | | | | | | | | | | | | | | | | | | | | | | | | | | | | | | | | |
| | | | | | | | | | | 3.06 | %†† | | $ | 41,688 | | | | 1.30 | %† | | | 1.30 | %† | | | 1.57 | %† | | | 2.07 | %† | | | .80 | %† | | | 77 | %†† |
| | | | | | | | | | | 2.33 | | | | 60,830 | | | | 1.30 | | | | 1.30 | | | | 1.74 | | | | 1.35 | | | | 1.69 | | | | 63 | |
| | | | | | | | | | | | | | | | | | | | | | | | | | | | | | | | | | | | | | | | |
| | | | | | | | | | | 3.18 | †† | | | 34,170 | | | | 1.02 | † | | | 1.02 | † | | | 1.86 | † | | | 1.52 | † | | | 1.36 | † | | | 77 | †† |
| | | | | | | | | | | 2.67 | | | | 67,844 | | | | 1.05 | | | | 1.05 | | | | 1.98 | | | | 1.10 | | | | 1.93 | | | | 63 | |
| | | | | | | | | | | | | | | | | | | | | | | | | | | | | | | | | | | | | | | | |
| | | | | | | | | | | 3.27 | †† | | | 3,877 | | | | .89 | † | | | .89 | † | | | 1.88 | † | | | 1.88 | † | | | .89 | † | | | 77 | †† |
| | | | | | | | | | | 2.90 | | | | 29 | | | | .90 | | | | .90 | | | | 2.06 | | | | 1.05 | | | | 1.91 | | | | 63 | |
| | | | | | | | | | | | | | | | | | | | | | | | | | | | | | | | | | | | | | | | |
| | | | | | | | | | | | | | | | | | | | | | | | | | | | | | | | | | | | | | | | |
| | | | | | | | | | | | | | | | | | | | | | | | | | | | | | | | | | | | | | | | |
| | | | | | | | | | | 6.12 | % | | $ | 352,651 | | | | 1.25 | % | | | 1.25 | % | | | .16 | % | | | N/A | | | | N/A | | | | 48 | % |
| | | | | | | | | | | 6.50 | | | | 373,279 | | | | 1.27 | | | | 1.27 | | | | .22 | | | | N/A | | | | N/A | | | | 59 | |
| | | | | | | | | | | 24.16 | | | | 444,933 | | | | 1.25 | | | | 1.25 | | | | .00 | | | | N/A | | | | N/A | | | | 58 | |
| | | | | | | | | | | 23.22 | | | | 570,309 | | | | 1.22 | | | | 1.22 | | | | (.06 | ) | | | N/A | | | | N/A | | | | 37 | |
| | | | | | | | | | | (6.01 | ) | | | 507,351 | | | | 1.19 | | | | 1.19 | | | | .16 | | | | 1.20 | | | | .15 | | | | 51 | |
| | | | | | | | | | | | | | | | | | | | | | | | | | | | | | | | | | | | | | | | |
| | | | | | | | | | | 6.61 | | | | 46,793 | | | | .84 | | | | .84 | | | | .57 | | | | N/A | | | | N/A | | | | 48 | |
| | | | | | | | | | | 6.93 | | | | 66,588 | | | | .85 | | | | .86 | | | | .62 | | | | N/A | | | | N/A | | | | 59 | |
| | | | | | | | | | | 24.61 | | | | 81,203 | | | | .84 | | | | .84 | | | | .40 | | | | N/A | | | | N/A | | | | 58 | |
| | | | | | | | | | | 23.74 | | | | 194,554 | | | | .83 | | | | .83 | | | | .34 | | | | N/A | | | | N/A | | | | 37 | |
| | | | | | | | | | | (5.74 | ) | | | 143,304 | | | | .88 | | | | .88 | | | | .50 | | | | .89 | | | | .49 | | | | 51 | |
| | | | | | | | | | | | | | | | | | | | | | | | | | | | | | | | | | | | | | | | |
| | | | | | | | | | | 6.56 | | | | 3,608 | | | | .82 | | | | .82 | | | | .59 | | | | N/A | | | | N/A | | | | 48 | |
| | | | | | | | | | | 7.00 | | | | 3,915 | | | | .83 | | | | .83 | | | | .66 | | | | N/A | | | | N/A | | | | 59 | |
| | | | | | | | | | | 24.61 | | | | 4,950 | | | | .82 | | | | .82 | | | | .43 | | | | N/A | | | | N/A | | | | 58 | |
| | | | | | | | | | | 23.81 | | | | 7,836 | | | | .80 | | | | .80 | | | | .35 | | | | N/A | | | | N/A | | | | 37 | |
| | | | | | | | | | | (5.66 | ) | | | 4,044 | | | | .79 | | | | .79 | | | | .57 | | | | .80 | | | | .56 | | | | 51 | |
331
Financial Highlights (continued)
FIRST INVESTORS EQUITY FUNDS
| | | P E R
S H A R E
D A T A | | | | |
| | | | | | | Investment
Operations | | | Less
Distributions from | | | | | | | | | |
| | | | | | | | | | | Net Realized | | | | | | | | | | | | | | | | | | | | | |
| | Net Asset
Value,
Beginning
of Year | | | Net
Investment
Income(a) | | | and
Unrealized
Gain
(Loss) on
Investments | | | Total
From
Investment
Operations | | | Net
Investment
Income | | | Net
Realized
Gain | | | Total
Distributions | | | Net Asset
Value,
End of
Year | |
SPECIAL SITUATIONS FUND | | | | |
Class A | | | | | | | | | | | | | | | | | | | | | | | | | | | | | | | | |
2015 | | $ | 26.65 | | | $ | .02 | | | $ | .07 | | | $ | .09 | | | $ | .04 | | | $ | 1.43 | | | $ | 1.47 | | | $ | 25.27 | |
2016 | | | 25.27 | | | | .17 | | | | 2.36 | | | | 2.53 | | | | .02 | | | | 1.44 | | | | 1.46 | | | | 26.34 | |
2017 | | | 26.34 | | | | — | | | | 5.24 | | | | 5.24 | | | | .16 | | | | .24 | | | | .40 | | | | 31.18 | |
2018 | | | 31.18 | | | | .03 | | | | 2.29 | | | | 2.32 | | | | .01 | | | | .87 | | | | .88 | | | | 32.62 | |
2019 | | | 32.62 | | | | .09 | | | | (3.69 | ) | | | (3.60 | ) | | | .08 | | | | 3.83 | | | | 3.91 | | | | 25.11 | |
Advisor Class | | | | | | | | | | | | | | | | | | | | | | | | | | | | |
2015 | | | 26.71 | | | | .10 | | | | .08 | | | | .18 | | | | .08 | | | | 1.43 | | | | 1.51 | | | | 25.38 | |
2016 | | | 25.38 | | | | .23 | | | | 2.39 | | | | 2.62 | | | | .04 | | | | 1.44 | | | | 1.48 | | | | 26.52 | |
2017 | | | 26.52 | | | | .08 | | | | 5.29 | | | | 5.37 | | | | .18 | | | | .24 | | | | .42 | | | | 31.47 | |
2018 | | | 31.47 | | | | .14 | | | | 2.32 | | | | 2.46 | | | | .04 | | | | .87 | | | | .91 | | | | 33.02 | |
2019 | | | 33.02 | | | | .18 | | | | (3.72 | ) | | | (3.54 | ) | | | .10 | | | | 3.83 | | | | 3.93 | | | | 25.55 | |
Institutional Class | | | | | | | | | | | | | | | | | | | | | | | | |
2015 | | | 26.84 | | | | .14 | | | | .08 | | | | .22 | | | | .16 | | | | 1.43 | | | | 1.59 | | | | 25.47 | |
2016 | | | 25.47 | | | | .28 | | | | 2.39 | | | | 2.67 | | | | .05 | | | | 1.44 | | | | 1.49 | | | | 26.65 | |
2017 | | | 26.65 | | | | .12 | | | | 5.31 | | | | 5.43 | | | | .18 | | | | .24 | | | | .42 | | | | 31.66 | |
2018 | | | 31.66 | | | | .17 | | | | 2.34 | | | | 2.51 | | | | .05 | | | | .87 | | | | .92 | | | | 33.25 | |
2019 | | | 33.25 | | | | .21 | | | | (3.76 | ) | | | (3.55 | ) | | | .12 | | | | 3.83 | | | | 3.95 | | | | 25.75 | |
332
See notes to financial statements
| | | | | | R A T I O S / S U P P L E M E N T A L D A T A | |
| | | | | | | | | | | | | | | | | | | | | | | | | | | | | |
Ratio to
Average Net
| | | | | |
| | | | | | | | | | | | | | | | | | Ratio to
Average Net
Assets** | | | Assets
Before
Expenses
Waived or
Assumed | | | | | |
| | | | | | | | | Total
Return* | | | Net Assets
End of
Year (in
thousands) | | | Net
Expenses
After Fee
Credits | | | Net
Expenses
Before Fee
Credits*** | | | Net
Investment
Income
(Loss) | | | Expenses*** | | | Net
Investment
Income | | | Portfolio
Turnover
Rate | |
| | | | | | | | | | | | | | | | | | | | | | | | | | | | | | | | | | | | | | | | |
| | | | | | | | | | | | | | | | | | | | | | | | | | | | | | | | | | | | | | | | |
| | | | | | | | | | | .12 | % | | $ | 432,235 | | | | 1.32 | % | | | 1.32 | % | | | .07 | % | | | 1.33 | % | | | .06 | % | | | 43 | % |
| | | | | | | | | | | 10.35 | | | | 472,720 | | | | 1.33 | | | | 1.34 | | | | .68 | | | | 1.34 | | | | .68 | | | | 39 | |
| | | | | | | | | | | 20.06 | | | | 549,780 | | | | 1.31 | | | | 1.31 | | | | (.01 | ) | | | N/A | | | | N/A | | | | 27 | |
| | | | | | | | | | | 7.50 | | | | 580,730 | | | | 1.29 | | | | 1.29 | | | | .08 | | | | N/A | | | | N/A | | | | 48 | |
| | | | | | | | | | | (9.54 | ) | | | 476,826 | | | | 1.31 | | | | 1.31 | | | | .36 | | | | N/A | | | | N/A | | | | 51 | |
| | | | | | | | | | | | | | | | | | | | | | | | | | | | | | | | | | | | | | | | |
| | | | | | | | | | | .46 | | | | 38,790 | | | | 1.02 | | | | 1.03 | | | | .37 | | | | 1.04 | | | | .36 | | | | 43 | |
| | | | | | | | | | | 10.67 | | | | 59,159 | | | | 1.03 | | | | 1.03 | | | | .94 | | | | 1.04 | | | | .93 | | | | 39 | |
| | | | | | | | | | | 20.45 | | | | 120,912 | | | | .97 | | | | .97 | | | | .34 | | | | N/A | | | | N/A | | | | 27 | |
| | | | | | | | | | | 7.86 | | | | 140,657 | | | | .95 | | | | .95 | | | | .43 | | | | N/A | | | | N/A | | | | 48 | |
| | | | | | | | | | | (9.19 | ) | | | 12,228 | | | | 1.01 | | | | 1.01 | | | | .69 | | | | N/A | | | | N/A | | | | 51 | |
| | | | | | | | | | | | | | | | | | | | | | | | | | | | | | | | | | | | | | | | |
| | | | | | | | | | | .60 | | | | 5,905 | | | | .88 | | | | .88 | | | | .51 | | | | .89 | | | | .50 | | | | 43 | |
| | | | | | | | | | | 10.84 | | | | 6,914 | | | | .88 | | | | .89 | | | | 1.11 | | | | .90 | | | | 1.10 | | | | 39 | |
| | | | | | | | | | | 20.56 | | | | 8,712 | | | | .87 | | | | .87 | | | | .42 | | | | N/A | | | | N/A | | | | 27 | |
| | | | | | | | | | | 7.98 | | | | 9,592 | | | | .86 | | | | .86 | | | | .52 | | | | N/A | | | | N/A | | | | 48 | |
| | | | | | | | | | | (9.16 | ) | | | 3,898 | | | | .88 | | | | .88 | | | | .79 | | | | N/A | | | | N/A | | | | 51 | |
333
Financial Highlights (continued)
FIRST INVESTORS EQUITY FUNDS
| | | P E R
S H A R E
D A T A | | | | |
| | | | | | | Investment
Operations | | | Less
Distributions from | | | | | | | | | |
| | | | | | | | | | | Net Realized | | | | | | | | | | | | | | | | | | | | | |
| | Net Asset
Value,
Beginning
of Year | | | Net
Investment
Income(a) | | | and
Unrealized
Gain
(Loss) on
Investments | | | Total
From
Investment
Operations | | | Net
Investment
Income | | | Net
Realized
Gain | | | Total
Distributions | | | Net Asset
Value,
End of
Year | |
TOTAL RETURN FUND | | | | |
Class A | | | | | | | | | | | | | | | | | | | | | | | | | | | | | | | | |
2015 | | $ | 19.63 | | | $ | .21 | | | $ | (.68 | ) | | $ | (.47 | ) | | $ | .28 | | | $ | .67 | | | $ | .95 | | | $ | 18.21 | |
2016 | | | 18.21 | | | | .23 | | | | 1.26 | | | | 1.49 | | | | .27 | | | | .43 | | | | .70 | | | | 19.00 | |
2017 | | | 19.00 | | | | .23 | | | | 1.27 | | | | 1.50 | | | | .32 | | | | .30 | | | | .62 | | | | 19.88 | |
2018 | | | 19.88 | | | | .31 | | | | .74 | | | | 1.05 | | | | .36 | | | | .35 | | | | .71 | | | | 20.22 | |
2019 | | | 20.22 | | | | .28 | | | | .39 | | | | .67 | | | | .34 | | | | 1.52 | | | | 1.86 | | | | 19.03 | |
Advisor Class | | | | | | | | | | | | | | | | | | | | | | | | | | | | |
2015 | | | 19.64 | | | | .29 | | | | (.69 | ) | | | (.40 | ) | | | .31 | | | | .67 | | | | .98 | | | | 18.26 | |
2016 | | | 18.26 | | | | .26 | | | | 1.27 | | | | 1.53 | | | | .32 | | | | .43 | | | | .75 | | | | 19.04 | |
2017 | | | 19.04 | | | | .32 | | | | 1.30 | | | | 1.62 | | | | .38 | | | | .30 | | | | .68 | | | | 19.98 | |
2018 | | | 19.98 | | | | .37 | | | | .75 | | | | 1.12 | | | | .43 | | | | .35 | | | | .78 | | | | 20.32 | |
2019 | | | 20.32 | | | | .34 | | | | .40 | | | | .74 | | | | .44 | | | | 1.52 | | | | 1.96 | | | | 19.10 | |
Institutional Class | | | | | | | | | | | | | | | | | | | | | | | | | | | | |
2015 | | | 19.65 | | | | .29 | | | | (.70 | ) | | | (.41 | ) | | | .28 | | | | .67 | | | | .95 | | | | 18.29 | |
2016 | | | 18.29 | | | | .31 | | | | 1.28 | | | | 1.59 | | | | .32 | | | | .43 | | | | .75 | | | | 19.13 | |
2017 | | | 19.13 | | | | .32 | | | | 1.27 | | | | 1.59 | | | | .37 | | | | .30 | | | | .67 | | | | 20.05 | |
2018 | | | 20.05 | | | | .40 | | | | .74 | | | | 1.14 | | | | .46 | | | | .35 | | | | .81 | | | | 20.38 | |
2019 | | | 20.38 | | | | .35 | | | | .41 | | | | .76 | | | | .48 | | | | 1.52 | | | | 2.00 | | | | 19.14 | |
* | Calculated without sales charges. |
** | Net of expenses waived or assumed (Note 3). |
*** | The ratios do not include a reduction of expenses from cash balances maintained with the custodian or from brokerage service arrangements (Note 1G). |
† | Annualized |
†† | Not annualized |
(a) | Based on average shares during the period. |
(b) | Due to rounding, amount is less than .005 per share. |
(c) | For the period August 1, 2016 (commencement of operations) to September 30, 2016. |
(d) | For the period April 1, 2016 (commencement of operations) to September 30, 2016. |
(e) | For the period April 2, 2018 (commencement of operations) to September 30, 2018. |
334
See notes to financial statements
| | | | | | R A T I O S / S U P P L E M E N T A L D A T A | |
| | | | | | | | | | | | | | | | | | | | | | | | | | | | | |
Ratio to
Average Net
| | | | | |
| | | | | | | | | | | | | | | | | | Ratio to
Average Net
Assets** | | | Assets
Before
Expenses
Waived or
Assumed | | | | | |
| | | | | | | | | Total
Return* | | | Net Assets
End of
Year (in
thousands) | | | Net
Expenses
After Fee
Credits | | | Net
Expenses
Before Fee
Credits*** | | | Net
Investment
Income | | | Expenses*** | | | Net
Investment
Income | | | Portfolio
Turnover
Rate | |
| | | | | | | | | | | | | | | | | | | | | | | | | | | | | | | | | | | | | | | | |
| | | | | | | | | | | | | | | | | | | | | | | | | | | | | | | | | | | | | | | | |
| | | | | | | | | | | (2.65 | )% | | $ | 784,281 | | | | 1.18 | % | | | 1.18 | % | | | 1.05 | % | | | N/A | | | | N/A | | | | 40 | % |
| | | | | | | | | | | 8.36 | | | | 845,726 | | | | 1.19 | | | | 1.19 | | | | 1.27 | | | | N/A | | | | N/A | | | | 63 | |
| | | | | | | | | | | 8.09 | | | | 877,311 | | | | 1.19 | | | | 1.19 | | | | 1.22 | | | | N/A | | | | N/A | | | | 39 | |
| | | | | | | | | | | 5.32 | | | | 889,473 | | | | 1.18 | | | | 1.18 | | | | 1.55 | | | | N/A | | | | N/A | | | | 53 | |
| | | | | | | | | | | 4.58 | | | | 800,910 | | | | 1.17 | | | | 1.17 | | | | 1.50 | | | | N/A | | | | N/A | | | | 59 | |
| | | | | | | | | | | | | | | | | | | | | | | | | | | | | | | | | | | | | | | | |
| | | | | | | | | | | (2.24 | ) | | | 976 | | | | .78 | | | | .78 | | | | 1.44 | | | | N/A | | | | N/A | | | | 40 | |
| | | | | | | | | | | 8.55 | | | | 1,213 | | | | .82 | | | | .82 | | | | 1.63 | | | | N/A | | | | N/A | | | | 63 | |
| | | | | | | | | | | 8.69 | | | | 996 | | | | .80 | | | | .80 | | | | 1.61 | | | | N/A | | | | N/A | | | | 39 | |
| | | | | | | | | | | 5.69 | | | | 1,006 | | | | .84 | | | | .84 | | | | 1.83 | | | | N/A | | | | N/A | | | | 53 | |
| | | | | | | | | | | 4.93 | | | | 1,166 | | | | .85 | | | | .85 | | | | 1.80 | | | | N/A | | | | N/A | | | | 59 | |
| | | | | | | | | | | | | | | | | | | | | | | | | | | | | | | | | | | | | | | | |
| | | | | | | | | | | (2.28 | ) | | | 30,644 | | | | .77 | | | | .77 | | | | 1.47 | | | | N/A | | | | N/A | | | | 40 | |
| | | | | | | | | | | 8.88 | | | | 32,525 | | | | .77 | | | | .77 | | | | 1.68 | | | | N/A | | | | N/A | | | | 63 | |
| | | | | | | | | | | 8.50 | | | | 33,545 | | | | .77 | | | | .77 | | | | 1.65 | | | | N/A | | | | N/A | | | | 39 | |
| | | | | | | | | | | 5.77 | | | | 34,555 | | | | .77 | | | | .77 | | | | 1.96 | | | | N/A | | | | N/A | | | | 53 | |
| | | | | | | | | | | 5.06 | | | | 1,976 | | | | .79 | | | | .79 | | | | 1.86 | | | | N/A | | | | N/A | | | | 59 | |
335
Report of Independent Registered Public
Accounting Firm
To the Shareholders and Board of Trustees of
First Investors Income Funds
First Investors Equity Funds
Opinion on the Financial Statements
We have audited the accompanying statement of assets and liabilities of the Floating Rate Fund, Fund For Income, Government Cash Management Fund, International Opportunities Bond Fund, Investment Grade Fund, Limited Duration Bond Fund and Strategic Income Fund, (the “Income Funds”), each a series of the First Investors Income Funds and the Covered Call Strategy Fund, Equity Income Fund, Global Fund, Growth & Income Fund, Hedged U.S. Equity Opportunities Fund, International Fund, Opportunity Fund, Premium Income Fund, Select Growth Fund, Special Situations Fund and Total Return Fund (the “Equity Funds”), each a series of First Investors Equity Funds, including the portfolio of investments, as of September 30, 2019, the related statement of operations, the statements of changes in net assets for each of the periods indicated, and financial highlights for each of the periods indicated thereon, and the related notes (collectively referred to as the “financial statements”). In our opinion, the financial statements present fairly, in all material respects, the financial position of the Income Funds and Equity Funds as of September 30, 2019, the results of their operations, the changes in their net assets, and their financial highlights for each of the periods indicated thereon, in conformity with accounting principles generally accepted in the United States of America.
Basis for Opinion
These financial statements are the responsibility of the Income Funds’ and Equity Funds’ management. Our responsibility is to express an opinion on the Income Funds’ and Equity Funds’ financial statements based on our audits. We are a public accounting firm registered with the Public Company Accounting Oversight Board (United States) (“PCAOB”) and are required to be independent with respect to the Income Funds and Equity Funds in accordance with the U.S. federal securities laws and the applicable rules and regulations of the Securities and Exchange Commission and the PCAOB. We have served as the auditor of one or more of the funds in the First Investors Family of Funds since 1978.
We conducted our audits in accordance with the standards of the PCAOB. Those standards require that we plan and perform the audit to obtain reasonable assurance about whether the financial statements are free of material misstatement, whether due to error or fraud. The Income Funds and Equity Funds are not required to have, nor were we engaged to perform, an audit of their internal control over financial reporting. As part of our audits we are required to obtain an understanding of internal control over financial reporting, but not for the purpose of expressing an opinion on the effectiveness of the Income Funds’ and Equity Funds’ internal control over financial reporting. Accordingly, we express no such opinion.
Our audits included performing procedures to assess the risks of material misstatement of the financial statements, whether due to error or fraud, and performing procedures that respond to those risks. Such procedures included examining, on a test basis, evidence regarding the amounts and disclosures in the financial statements. Our audits also included evaluating the accounting principles used and significant estimates made by management, as well as evaluating the overall
336
presentation of the financial statements. Our procedures included confirmation of securities owned as of September 30, 2019 by correspondence with the custodian and brokers; when replies were not received from brokers, we performed other auditing procedures. We believe that our audits provide a reasonable basis for our opinion.
TAIT, WELLER & BAKER LLP
Philadelphia, Pennsylvania
November 26, 2019
337
Board Considerations of Advisory Contracts and Fees
(unaudited)
FIRST INVESTORS INCOME FUNDS
Annual Consideration of the Investment Advisory Agreements and the Sub-Advisory Agreements with Brandywine Global Investment Management, LLC and Muzinich & Co., Inc.
The First Investors Income Funds’ (the “Trust”) investment advisory agreements with the Trust’s investment adviser and, as applicable, sub-advisers, on behalf of each of the Trust’s funds, can remain in effect after an initial term of no greater than two years only if they are renewed at least annually thereafter (i) by the vote of the Trustees or by a vote of the shareholders of each fund and (ii) by the vote of a majority of the Trustees who are not parties to the advisory agreement (and sub-advisory agreement, as applicable) or “interested persons” of any party thereto (the “Independent Trustees”), cast in person at a meeting called specifically for the purpose of voting on such approval.
The Board of Trustees (the “Board”) has six regularly scheduled meetings each year and takes into account throughout the year matters bearing on the approval of the advisory agreement (and sub-advisory agreements, as applicable). In particular, the Board and its standing committees also consider at each meeting at least certain of the factors that are relevant to the annual renewal of each fund’s advisory agreement (and sub-advisory agreements, as applicable), including investment performance, sub-adviser updates and reviews, reports with respect to brokerage and portfolio transactions, portfolio turnover rates, risk management (including as it relates to cybersecurity risk), compliance monitoring, and the services and support provided to each fund and its shareholders. In addition the Board meets with representatives of each sub-adviser in person at least once per year.
On April 18, 2019 (the “April Meeting”), the Independent Trustees met telephonically with senior management personnel of Foresters Investment Management Company, Inc. (“FIMCO”), which is the Trust’s investment adviser, Trust counsel, independent legal counsel to the Independent Trustees (“Independent Legal Counsel”) and others to give preliminary consideration to information bearing on the continuation of the advisory agreement (and sub-advisory agreements, as applicable) with respect to each fund. The primary purpose of the April Meeting was to ensure that the Independent Trustees had ample opportunity to consider matters they deemed relevant in determining whether to continue the advisory agreement (or sub-advisory agreements, as applicable), and to request any additional information they considered reasonably necessary to their deliberations. The Independent Trustees also met telephonically in executive session with Independent Legal Counsel on April 15, 2019, prior to the April Meeting, to consider the continuation of the advisory agreement (or sub-advisory agreements, as applicable) outside the presence of management. As part of the April Meeting, the Independent Trustees asked FIMCO to respond to certain additional questions prior to the contract approval meeting of the Board to be held on May 16, 2019 (the “May Meeting”). In addition, Independent Legal Counsel, in conjunction with the Board, and personnel from FIMCO reviewed each sub-adviser’s response in connection with the request for information with respect to the applicable sub-advisory agreements and requested follow-up information or clarifications from each sub-adviser, as applicable, which was provided prior to the May Meeting.
At the May Meeting, the Board, including a majority of the Independent Trustees, approved the renewal of the investment advisory agreement (the “Advisory Agreement”) between FIMCO and
338
each of the following funds (each a “Fund” and collectively the “Funds”): Floating Rate Fund, Fund For Income, Government Cash Management Fund, International Opportunities Bond Fund, Investment Grade Fund, Limited Duration Bond Fund and Strategic Income Fund. In addition, at the May Meeting, the Board, including a majority of the Independent Trustees, approved the renewal of the sub-advisory agreements (each, a “Sub-Advisory Agreement” and collectively, the “Sub-Advisory Agreements”) with: (1) Brandywine Global Investment Management, LLC (“Brandywine”) with respect to the International Opportunities Bond Fund; and (2) Muzinich & Co., Inc. (“Muzinich”) with respect to the Floating Rate Fund, Fund For Income, Investment Grade Fund and Limited Duration Bond Fund. The International Opportunities Bond Fund, Floating Rate Fund, Fund For Income, Investment Grade Fund and Limited Duration Bond Fund are collectively referred to as the “Sub-Advised Funds.”
In reaching its decisions to approve the continuation of the Advisory Agreement for each Fund and the Sub-Advisory Agreements for the Sub-Advised Funds, the Board considered information furnished and discussed throughout the year at regularly scheduled Board and Committee meetings as well as a wide range of information provided specifically in relation to the renewal of the Advisory Agreement and Sub-Advisory Agreements for the April Meeting and May Meeting. Information furnished at Board and/or Committee meetings throughout the year included FIMCO’s analysis of each Fund’s investment performance and the performance of the sub-advisers to the respective Sub-Advised Funds, presentations given by representatives of FIMCO, Brandywine and Muzinich and various reports on compliance and other services provided by FIMCO and its affiliates.
In preparation for the April Meeting and/or May Meeting, the Independent Trustees requested and received information compiled by Broadridge Financial Solutions, Inc. (“Broadridge”), an independent provider of investment company data, that included, among other things: (1) the investment performance over various time periods and the fees and expenses of each Fund as compared to a comparable group of funds as determined by Broadridge (“Peer Group”); and (2) comparative information on each Fund’s volatility versus total return. The Board also considered that FIMCO charges different fee rates to various mutual funds that have similar investment mandates and FIMCO’s explanation for these differences.
Additionally, in response to specific requests from the Independent Trustees in connection with the April Meeting and/or May Meeting, FIMCO furnished, and the Board considered, information concerning various aspects of its operations, including: (1) the nature, extent and quality of services provided by FIMCO and its affiliates to the Funds, including investment advisory and administrative services to the Funds and, as applicable, services in connection with selecting, overseeing and evaluating the sub-advisers; (2) the actual management fees paid by each Fund to FIMCO; (3) the costs of providing services to each Fund and the profitability of FIMCO and its affiliate, Foresters Investor Services, Inc. (“FIS”), the Funds’ affiliated transfer agent, from the relationship with each Fund; and (4) any “fall out” or ancillary benefits accruing to FIMCO or its affiliates as a result of the relationship with each Fund. FIMCO also provided, and the Board considered, an analysis of the overall profitability of the First Investors mutual fund business that included various entities affiliated with FIMCO as well as comparative profitability information based on analysis performed by FIMCO of the financial statements of
339
Board Considerations of Advisory Contracts and Fees (continued) (unaudited)
FIRST INVESTORS INCOME FUNDS
certain publicly-traded mutual fund asset managers. The Board also considered FIMCO’s and each sub-adviser’s personnel and methods, including the education, experience of key personnel, and the number of their advisory and analytical personnel; general information regarding the compensation of FIMCO’s and each sub-adviser’s advisory personnel; FIMCO’s and each sub-adviser’s investment management process; FIMCO’s and each sub-adviser’s compliance program; the time and attention of FIMCO’s and each sub-adviser’s personnel devoted to the management of the Funds; FIMCO’s and each sub-adviser’s cybersecurity practices and related controls and business continuity plans; and material pending, threatened or settled litigation involving FIMCO and each sub-adviser, and any ongoing or completed audits, investigations or examinations by the Securities and Exchange Commission. The Board also considered information provided by FIMCO related to the decision by The Independent Order of Foresters, the parent company of FIMCO, to sell its U.S. North American Asset Management businesses including FIMCO and that part of FIMCO’s business relating to the operation of the Funds to Macquarie Management Holdings, Inc., which would result in the reorganization of each of the Funds into corresponding series of the Delaware Funds by Macquarie (the “Reorganizations”), and that such Reorganizations were expected to be completed during the last quarter of the year, if approved by the Board at a meeting to be held on June 10, 2019, and by shareholders of the Funds. In addition to evaluating, among other considerations, the written information provided by FIMCO, the Board also evaluated the answers to questions posed by the Board to representatives of FIMCO.
In addition, in response to specific requests from the Independent Trustees in connection with the April Meeting and/or May Meeting, Brandywine and Muzinich furnished, and the Board reviewed, information concerning various aspects of their respective operations, including: (1) the nature, extent and quality of services provided by Brandywine and Muzinich to the applicable Sub-Advised Funds; (2) the sub-advisory fee rates charged by Brandywine and Muzinich and a comparison of those fee rates to the fee rates of Brandywine and Muzinich for providing advisory services to other investment companies or accounts or compared to their standard fee schedule, as applicable, with an investment mandate similar to the applicable Sub-Advised Funds; (3) profitability and/or financial information provided by Brandywine and Muzinich; and (4) any “fall out” or ancillary benefits accruing to Brandywine and Muzinich as a result of the relationship with each applicable Sub-Advised Fund. The Board also considered FIMCO’s representations that it found the sub-adviser responses to the information requests in connection with the renewal of the Sub-Advisory Agreements to be satisfactory and to raise no issues of general concern.
In considering the information and materials described above, the Independent Trustees took into account management style, investment strategies and prevailing market conditions. Moreover, the Independent Trustees received assistance from and met separately with Independent Legal Counsel prior to the April Meeting and prior to and during the May Meeting and were provided with a written description of their statutory responsibilities and the legal standards that are applicable to approvals of advisory agreements (and sub-advisory agreements, as applicable). Although the Advisory Agreement for all of the Funds and the Sub-Advisory Agreements for
340
the Sub-Advised Funds were considered at the same Board meeting, the Independent Trustees addressed each Fund separately during the April Meeting and May Meeting.
Based on all of the information presented, the Board, including a majority of its Independent Trustees, determined on a Fund-by-Fund basis that the fees charged under the Advisory Agreement and each Sub-Advisory Agreement are reasonable in relation to the services that are provided under each Agreement. The Board did not identify any single factor as being of paramount importance in reaching its conclusions and determinations with respect to the continuance of the Advisory Agreement for each Fund and Sub-Advisory Agreements and different Trustees may have given different weight to different factors. Although not meant to be all-inclusive, the following describes some of the factors that were considered by the Board in deciding to approve the continuance of the Advisory Agreement for each Fund and the Sub-Advisory Agreements with Brandywine and Muzinich.
Nature, Extent and Quality of Services
In examining the nature, extent and quality of the services provided by FIMCO, the Board recognized that FIMCO is dedicated to providing investment management services exclusively to the Funds and the other funds in the First Investors fund complex and that, unlike many other mutual fund managers, FIMCO is not in the business of providing management services to hedge funds, pension funds or private accounts. In this connection, the Board was advised that certain key FIMCO personnel provide separately managed account services to a FIMCO-affiliated investment adviser, but that these personnel spend most of their time serving their FIMCO clients. As a result, the Board considered that FIMCO’s personnel devote substantially all of their time to serving the funds in the First Investors fund complex. The Board also considered management’s explanation regarding the significant costs involved in providing the level of personal service that the First Investors fund complex seeks to deliver to its shareholders, which are primarily shareholders in the broad middle market.
The Board noted that FIMCO has undertaken extensive responsibilities as manager of the Funds, including: (1) the provision of investment advice to the Funds; (2) implementing policies and procedures designed to ensure compliance with each Fund’s investment objectives and policies as well as new laws and regulatory initiatives; (3) the review of brokerage arrangements; (4) oversight of general portfolio compliance with applicable laws; (5) the provision of certain administrative services to the Funds, including fund accounting; (6) the implementation of Board directives as they relate to the Funds; and (7) evaluating and monitoring any sub-advisers on an ongoing basis, including, but not limited to, monitoring each sub-adviser’s investment performance, evaluating each sub-adviser’s compliance program on an annual basis and monitoring investments for compliance purposes, including monitoring each sub-adviser’s soft dollar practices (as applicable), portfolio allocation and best execution. The Board noted that FIMCO provided the same sorts of administrative and other services, except for direct management of the portfolio, for the Sub-Advised Funds as it does for the other funds that do not employ a sub-adviser. The Board noted that FIMCO provides not only advisory services, but historically also has provided certain administrative personnel and services that many other advisers do not provide without imposition of separate fees. The Board also noted the
341
Board Considerations of Advisory Contracts and Fees (continued) (unaudited)
FIRST INVESTORS INCOME FUNDS
steps that FIMCO has taken to encourage strong performance, including the manner in which portfolio managers and analysts are provided significant incentive compensation for good Fund performance. In addition, the Board considered information regarding the overall financial strength of FIMCO and its affiliates and the resources and staffing in place with respect to the services provided to the Funds.
The Board also considered the nature, extent and quality of the services provided to the Funds by FIMCO’s affiliates, including transfer agency and distribution services. The Board took into account the fact that FIS is dedicated to providing transfer agency services exclusively to the Funds and the other funds in the First Investors fund complex. As a result, FIS can tailor its processes and services to satisfy the needs of the Funds’ shareholder base. The Board noted that the Funds’ shares are distributed primarily through Foresters Financial Services, Inc. (“FFS”), which is an affiliate of FIMCO.
Furthermore, the Board considered the nature, extent and quality of the investment management services provided by Brandywine and Muzinich to the applicable Sub-Advised Funds. The Board considered Brandywine’s and Muzinich’s investment management process in managing the applicable Sub-Advised Funds and the experience and capability of its personnel responsible for the portfolio management of the applicable Sub-Advised Funds. The Board also considered information regarding the resources and staffing in place with respect to the services provided by each sub-adviser. Additionally, with respect to the Sub-Advised Funds, the Board considered the differences in fees paid by each Sub-Advised Fund to FIMCO and the fees paid by FIMCO to each sub-adviser, as well as representations by FIMCO that these fee differentials are warranted by its ongoing services and assumption of risks.
Based on the information considered, the Board concluded that the nature, extent and quality of the services provided to each Fund by FIMCO and the applicable Sub-Advised Funds by Brandywine and Muzinich were appropriate and consistent with the terms of the Advisory Agreement and Sub-Advisory Agreements, as applicable, and supported approval of the Advisory Agreement and each Sub-Advisory Agreement.
Investment Performance
The Board placed significant emphasis on the investment performance of each of the Funds. While consideration was given to performance reports and discussions held at prior Board or Committee meetings, as applicable, particular attention was given to the performance information compiled by Broadridge. In particular, the Board reviewed the total return of each Fund, as applicable, over the most recent calendar year (“1-year period”) and the annualized total return over the most recent three calendar year period (“3-year period”) and five calendar year period (“5-year period”). In addition, the Board considered the total return information provided by FIMCO for each Fund through April 30, 2019. The Board also reviewed the annual yield of each Fund for each of the past five calendar years (or shorter period as applicable). With regard to the total return and yield information, the Board considered the total return and yield of each Fund on a percentile and quintile basis as compared to its Peer Group. For purposes of the data provided, the first quintile is defined as 20% of the funds in the applicable Peer Group with the
342
highest performance or yield, as applicable, and the fifth quintile is defined as 20% of the funds in the applicable Peer Group with the lowest performance or yield. The Board also considered FIMCO’s representations that it monitors to ensure portfolio managers invest in a manner consistent with the mandate for the Fund or Funds they manage. The Board also considered a special performance report prepared by FIMCO analyzing the performance of the Limited Duration Bond Fund.
On a Fund-by-Fund basis, the total return performance reports indicated, and the Board noted, that: (i) the Floating Rate Fund fell within the fifth quintile for the 3-year period and 5-year period and in the second quintile for the 1-year period; (ii) the Fund For Income fell within the fourth quintile for the 3-year period and 5-year period and in the second quintile for the 1-year period; (iii) the Government Cash Management Fund fell within the fourth quintile for each of the performance periods shown by Broadridge; (iv) the International Opportunities Bond Fund fell within the fifth quintile for the 1-year period and 5-year period and in the fourth quintile for the 3-year period; (v) the Investment Grade Fund fell within the fifth quintile for the 3-year period and 5-year period and in the second quintile for the 1-year period; (vi) the Limited Duration Bond Fund fell within the fifth quintile for the 1-year period and 3-year period (the only periods for which information was provided due to the short operating history of the Fund); and (vii) the Strategic Income Fund fell within the fifth quintile for the 3-year period and 5-year period and in the second quintile for the 1-year period. With respect to the Limited Duration Bond Fund, the Board considered FIMCO’s explanations regarding the Fund’s underperformance and strategy going forward.
The Board also reviewed the yields of the Funds and noted that the yield for: (i) the Floating Rate Fund fell outside of the top three quintiles for each of the past five calendar years; (ii) the Fund For Income fell within one of the top three quintiles for three of the past five calendar years; (iii) the Government Cash Management Fund fell outside of the top three quintiles for each of the past five calendar years; (iv) the International Opportunities Bond Fund fell within one of the top three quintiles for four of the past five calendar years; (v) the Investment Grade Fund fell within one of the top two quintiles for each of the past five calendar years; (vi) the Limited Duration Bond Fund fell within one of the top two quintiles for each of the past four years (the only periods available due to its relatively short operating history); and (vii) the Strategic Income Fund fell outside of the top three quintiles for each of the past five calendar years. Moreover, the Board considered the volatility versus total return data provided by Broadridge as well as FIMCO’s representation that it believes that the Funds generally use a more conservative investment style than many of their peers.
Based on the information considered, the Board concluded that the investment performance of each Fund was either (a) acceptable or better, or (b) subject to reasonable steps to monitor or address certain periods of underperformance.
343
Board Considerations of Advisory Contracts and Fees (continued) (unaudited)
FIRST INVESTORS INCOME FUNDS
Fund Expenses, Costs of Services, Economies of Scale and Related Benefits
Management Fees and Expenses. The Board also gave substantial consideration to the fees payable under each Fund’s Advisory Agreement as well as under the Sub-Advisory Agreements for the Sub-Advised Funds.
The Board reviewed the information compiled by Broadridge comparing each Fund’s contractual management fee rate (at common asset levels) and actual management fee rate (which included the effect of any fee waivers) as a percentage of average net assets to other funds in its Peer Group. In this regard, the Board considered the contractual and actual management fees of each Fund on a quintile basis as compared to its Peer Group and noted the relative position of each Fund within the Peer Group. The Board also considered that FIMCO provides not only advisory services but also certain administrative personnel to the Funds under each Fund’s Advisory Agreement and that many other advisers do not provide such administrative personnel under their advisory agreements and that FIMCO also provides certain administrative services without the imposition of a separate fee. The Board considered that it had previously approved the: (i) extension, on a contractual basis, of the existing total expense cap limitation for the Government Cash Management Fund until January 31, 2020; (ii) the imposition, on a contractual basis, of a management fee cap for the Investment Grade Fund until January 1, 2020; (iii) extension, on a contractual basis, of the existing total expense cap for the Limited Duration Bond Fund until January 1, 2020; and (iv) imposition, on a contractual basis, of a total expense cap for Class A shares of the Floating Rate Fund. The Board also considered that, with respect to the Government Cash Management Fund, FIMCO has historically waived a significant portion of its management fees and reimbursed a portion of other expenses to avoid a negative return for shareholders during periods of historically low interest rates during recent prior years. In particular, the Board noted that: (i) the Floating Rate Fund’s contractual management fee was in the first quintile and actual management fee was in the second quintile of its Peer Group; (ii) the Fund For Income’s contractual and actual management fees were in the fifth quintile of its Peer Group; (iii) the Government Cash Management Fund’s contractual management fee was in the third quintile and actual management fee was in the first quintile of its Peer Group; (iv) the International Opportunities Bond Fund’s contractual management fee was in the fourth quintile and actual management fee was in the fifth quintile of its Peer Group; (v) the Investment Grade Fund’s contractual and actual management fees were in the fifth quintile of its Peer Group; (vi) the Limited Duration Bond Fund’s contractual and actual management fees were in the third quintile of its Peer Group; and (vii) the Strategic Income Fund’s contractual management fee was in the first quintile and actual management fee was in the fifth quintile of its Peer Group (although there were only a limited number of peers in the Peer Group). The Board also considered that FIMCO had agreed to voluntarily waive 15 basis points of the management fee of the International Opportunities Bond Fund and its entire 5 basis points management fee on the Strategic Income Fund for a period of one year in response to a Board request at the May Meeting.
The Board also reviewed the information compiled by Broadridge comparing each Fund’s Class A share total expense ratio, taking into account FIMCO’s expense waivers (as applicable), and the ratio of the sum of actual management and other non-management fees (i.e., fees other
344
than management, transfer agency and Rule 12b-1/non-Rule 12b-1 shareholder service fees) to other funds in its Peer Group, including on a quintile basis. In particular, the Board noted that: (i) the total expense ratio for each Fund except the Floating Rate Fund and Government Cash Management was not in the top three quintiles of their respective Peer Groups; and (ii) the ratio of the sum of actual management and other non-management fees for each Fund except the Floating Rate Fund and Government Cash Management Fund was not in the top three quintiles of their respective Peer Groups. The Board also considered that FIMCO had proposed, and the Board had previously approved, to lower the Rule 12b-1 fee by 5 basis points for each of the Fund For Income, International Opportunities Bond Fund, Investment Grade Fund and Strategic Income Fund effective as of April 1, 2019 and that, as a result, the total expense ratios of such Funds would be reduced going forward. In considering the level of the total expense ratio and the ratio of the sum of actual management and other non-management fees, the Board took into account management’s explanation that: (i) the average account size of many of the First Investors funds is small by comparison to the industry average account size and that funds with small average account sizes generally have higher expense ratios than funds with larger average account sizes; (ii) there are significant costs involved in providing the level of personal service that the First Investors fund complex seeks to deliver to its shareholders; (iii) overall Fund expenses cover certain check-writing and wiring privileges for Government Cash Management Fund shareholders at no additional cost; and (iv) Broadridge expense comparisons do not take into account the size of a fund complex, and as a result, in most cases the First Investors funds are compared to funds in complexes that are much larger than First Investors. The Board also noted that Broadridge’s customized expense groups tend to be fairly small in number and the funds included in the Peer Group generally change from year to year, thereby introducing an element of randomness that affects comparative results each year. While recognizing the limitations inherent in Broadridge’s methodology, the Board believed that the data provided by Broadridge was a generally appropriate measure of comparative expenses.
In considering the sub-advisory fee rates charged by and costs and profitability of Brandywine and Muzinich with regard to the respective Sub-Advised Funds, the Board noted that FIMCO pays Brandywine and Muzinich, as the case may be, a sub-advisory fee from its own advisory fee rather than each Fund paying Brandywine and Muzinich a fee directly. The Board also considered arrangements pursuant to which Muzinich (but not its Sub-Advised Funds) pays a portion of its sub-advisory fee to a solicitor that introduced Muzinich to FIMCO. Brandywine and Muzinich provided, and the Board reviewed, information comparing the fees charged by Brandywine and Muzinich for services to the respective Sub-Advised Funds versus the fee rates of Brandywine and Muzinich for providing advisory services to other comparable investment companies or accounts or compared to their standard fee schedule, as applicable. Based on a review of this information, the Board noted that the fees charged by Brandywine and Muzinich, as the case may be, for services to each applicable Sub-Advised Fund appeared competitive to the fees Brandywine and Muzinich charge to their other comparable investment companies or accounts or compared to their standard fee schedule, as applicable.
The foregoing comparisons assisted the Trustees by providing them with a basis for evaluating each Fund’s management fee and expense ratio on a relative basis and the Board concluded
345
Board Considerations of Advisory Contracts and Fees (continued) (unaudited)
FIRST INVESTORS INCOME FUNDS
that each Fund’s management fees appeared reasonable in relation to the services and benefits provided to each Fund.
Profitability. The Board reviewed the materials it received from FIMCO regarding its revenues and costs in providing investment management and certain administrative services to the Funds. In particular, the Board considered the analysis of FIMCO’s profitability with respect to each Fund, calculated for the year ended December 31, 2018, as well as overall profitability information relating to the past five calendar years. The Board also considered the information provided by FIMCO comparing the profitability of certain publicly-traded mutual fund asset managers as analyzed by FIMCO based on publicly available financial statements and noted FIMCO’s analysis that its profit margin is substantially lower than the average of such publicly-traded managers. In reviewing the profitability information, the Board also considered the “fall-out” or ancillary benefits that may accrue to FIMCO and its affiliates as a result of their relationship with the Funds, which are discussed below. Based on the information provided, the Board also noted that FIMCO operates the Limited Duration Bond Fund and Strategic Income Fund at a loss. The Board acknowledged that, as a business matter, FIMCO was entitled to earn reasonable profits for its services to the Funds and concluded that the level of profitability to FIMCO of its contractual arrangements with each Fund did not appear so high as to call into question the appropriateness of the fees paid to FIMCO by any Fund or otherwise to preclude the proposed continuation of the Advisory Agreement for any of the Funds. The Board also considered the profitability and/or financial information provided by Brandywine and Muzinich.
Economies of Scale. With respect to whether economies of scale are realized by FIMCO and the extent to which any economies of scale are reflected in the level of management fee rates charged, the Board considered that the Advisory Agreement fee schedule for each Fund, except the Strategic Income Fund and Government Cash Management Fund, includes breakpoints to account for management economies of scale as each Fund’s assets increase. With respect to the Strategic Income Fund and Government Cash Management Fund, the Board concluded that the fee structure is appropriate at current asset levels.
“Fall Out” or Ancillary Benefits. The Board considered the “fall-out” or ancillary benefits that may accrue to FIMCO, Brandywine and Muzinich as a result of their relationship with the Funds. In that regard, the Board considered the fact that FIMCO and Brandywine (but not Muzinich) may receive research from broker-dealers that execute brokerage transactions for the funds in the First Investors fund complex. However, the Board noted that FIMCO and the sub-advisers must select brokers based on each Fund’s requirements for seeking best execution. The Board also considered the profits earned by FIS and the revenues received by FFS as a result of FIMCO’s management of the First Investors funds.
* * *
In summary, based on all relevant information and factors, none of which was individually determinative of the outcome, the Board, including a majority of the Independent Trustees, approved the renewal of the Advisory Agreement and each Sub-Advisory Agreement.
346
Board Considerations of Advisory Contracts and Fees
(unaudited)
FIRST INVESTORS EQUITY FUNDS
Annual Consideration of the Investment Advisory Agreements and the Sub-Advisory Agreements with Muzinich & Co., Inc., Smith Group Asset Management, LP, Vontobel Asset Management, Inc., Wellington Management Company, LLP and Ziegler Capital Management, LLC
The First Investors Equity Funds’ (the “Trust”) investment advisory agreements with the Trust’s investment adviser and, as applicable, sub-advisers, on behalf of each of the Trust’s funds, can remain in effect after an initial term of no greater than two years only if they are renewed at least annually thereafter (i) by the vote of the Trustees or by a vote of the shareholders of each fund and (ii) by the vote of a majority of the Trustees who are not parties to the advisory agreement (and sub-advisory agreements, as applicable) or “interested persons” of any party thereto (the “Independent Trustees”), cast in person at a meeting called specifically for the purpose of voting on such approval.
The Board of Trustees (the “Board”) has six regularly scheduled meetings each year and takes into account throughout the year matters bearing on the approval of the advisory agreement (and sub-advisory agreements, as applicable). In particular, the Board and its standing committees also consider at each meeting at least certain of the factors that are relevant to the annual renewal of each fund’s advisory agreement (and sub-advisory agreements, as applicable), including investment performance, sub-adviser updates and reviews, reports with respect to brokerage and portfolio transactions, use of soft dollars for research products and services, portfolio turnover rates, risk management (including as it relates to cybersecurity risk), compliance monitoring, and the services and support provided to each fund and its shareholders. In addition, the Board meets with representatives of each sub-adviser in person at least once per year.
On April 18, 2019 (the “April Meeting”), the Independent Trustees met telephonically with senior management personnel of Foresters Investment Management Company, Inc. (“FIMCO”), which is the Trust’s investment adviser, Trust counsel, independent legal counsel to the Independent Trustees (“Independent Legal Counsel”) and others to give preliminary consideration to information bearing on the continuation of the advisory agreement (and sub-advisory agreements, as applicable) with respect to each fund. The primary purpose of the April Meeting was to ensure that the Independent Trustees had ample opportunity to consider matters they deemed relevant in determining whether to continue the advisory agreement (or sub-advisory agreements, as applicable), and to request any additional information they considered reasonably necessary to their deliberations. The Independent Trustees also met telephonically in executive session with Independent Legal Counsel on April 15, 2019, prior to the April Meeting, to consider the continuation of the advisory agreement (or sub-advisory agreements, as applicable) outside the presence of management. As part of the April Meeting, the Independent Trustees asked FIMCO to respond to certain additional questions prior to the contract approval meeting of the Board to be held on May 16, 2019 (the “May Meeting”). In addition, Independent Legal Counsel, in conjunction with the Board, and personnel from FIMCO reviewed each sub-adviser’s response in connection with the request for information with respect to the applicable sub-advisory agreements and requested follow-up information or clarifications from each sub-adviser, as applicable, which was provided prior to the May Meeting.
347
Board Considerations of Advisory Contracts and Fees (continued) (unaudited)
FIRST INVESTORS EQUITY FUNDS
At the May Meeting, the Board, including a majority of the Independent Trustees, approved the renewal of the investment advisory agreement (the “Advisory Agreement”) between FIMCO and each of the following funds (each a “Fund” and collectively the “Funds”): Covered Call Strategy Fund, Equity Income Fund, Global Fund, Growth & Income Fund, Hedged U.S. Equity Opportunities Fund, International Fund, Opportunity Fund, Premium Income Fund, Select Growth Fund, Special Situations Fund and Total Return Fund. In addition, at the May Meeting, the Board, including a majority of the Independent Trustees, approved the renewal of the sub-advisory agreements (each a “Sub-Advisory Agreement” and collectively the “Sub-Advisory Agreements”) with: (1) Muzinich & Co. Inc. (“Muzinich”) with respect to the Total Return Fund; (2) Smith Group Asset Management, LP (“Smith Group”) with respect to the Select Growth Fund; (3) Vontobel Asset Management, Inc. (“Vontobel”) with respect to the International Fund; (4) Wellington Management Company, LLP (“WMC”) with respect to the Hedged U.S. Equity Opportunities Fund; and (5) Ziegler Capital Management, LLC (“Ziegler”) with respect to the Covered Call Strategy Fund and Premium Income Fund. The Total Return Fund, Select Growth Fund, International Fund, Hedged U.S. Equity Opportunities Fund, Covered Call Strategy Fund and Premium Income Fund are collectively referred to as the “Sub-Advised Funds.”
In reaching its decisions to approve the continuation of the Advisory Agreement for each Fund and the Sub-Advisory Agreements for the Sub-Advised Funds, the Board considered information furnished and discussed throughout the year at regularly scheduled Board and Committee meetings as well as a wide range of information provided specifically in relation to the renewal of the Advisory Agreement and Sub-Advisory Agreements for the April Meeting and May Meeting. Information furnished at Board and/or Committee meetings throughout the year included FIMCO’s analysis of each Fund’s investment performance and the performance of the sub-advisers to the respective Sub-Advised Funds, presentations given by representatives of FIMCO, Muzinich, Smith Group, Vontobel, Wellington and Ziegler and various reports on compliance and other services provided by FIMCO and its affiliates.
In preparation for the April Meeting and/or May Meeting, the Independent Trustees requested and received information compiled by Broadridge Financial Solutions, Inc. (“Broadridge”), an independent provider of investment company data, that included, among other things: (1) the investment performance over various time periods and the fees and expenses of each Fund as compared to a comparable group of funds as determined by Broadridge (“Peer Group”); and (2) comparative information on each Fund’s volatility versus total return. The Board also considered that FIMCO charges different fee rates to various mutual funds that have similar investment mandates and FIMCO’s explanation for these differences.
Additionally, in response to specific requests from the Independent Trustees in connection with the April Meeting and/or May Meeting, FIMCO furnished, and the Board considered, information concerning various aspects of its operations, including: (1) the nature, extent and quality of services provided by FIMCO and its affiliates to the Funds, including investment advisory and administrative services to the Funds and, as applicable, services in connection with selecting, overseeing and evaluating the sub-advisers; (2) the actual management fees paid by each Fund to FIMCO; (3) the costs of providing services to each Fund and the profitability of FIMCO and its affiliate, Foresters Investor Services, Inc. (“FIS”), the Funds’ affiliated transfer
348
agent, from the relationship with each Fund; and (4) any “fall out” or ancillary benefits accruing to FIMCO or its affiliates as a result of the relationship with each Fund. FIMCO also provided, and the Board considered, an analysis of the overall profitability of the First Investors mutual fund business that included various entities affiliated with FIMCO as well as comparative profitability information based on analysis performed by FIMCO of the financial statements of certain publicly-traded mutual fund asset managers. The Board also considered FIMCO’s and each sub-adviser’s personnel and methods, including the education, experience of key personnel, and the number of their advisory and analytical personnel; general information regarding the compensation of FIMCO’s and each sub-adviser’s advisory personnel; FIMCO’s and each sub-adviser’s investment management process; FIMCO’s and each sub-adviser’s compliance program; the time and attention of FIMCO’s and each sub-adviser’s personnel devoted to the management of the Funds; FIMCO’s and each sub-adviser’s cybersecurity practices and related controls and business continuity plans; and material pending, threatened or settled litigation involving FIMCO and each sub-adviser, and any ongoing or completed audits, investigations or examinations by the Securities and Exchange Commission. The Board also considered information provided by FIMCO related to the decision by The Independent Order of Foresters, the parent company of FIMCO, to sell its U.S. North American Asset Management businesses including FIMCO and that part of FIMCO’s business relating to the operation of the Funds to Macquarie Management Holdings, Inc., which would result in the reorganization of each of the Funds into corresponding series of the Delaware Funds by Macquarie (the “Reorganizations”), and that such Reorganizations were expected to be completed during the last quarter of the year, if approved by the Board at a meeting to be held on June 10, 2019, and by shareholders of the Funds. In addition to evaluating, among other considerations, the written information provided by FIMCO, the Board also evaluated the answers to questions posed by the Board to representatives of FIMCO.
In addition, in response to specific requests from the Independent Trustees in connection with the April Meeting and/or May Meeting, Muzinich, Smith Group, Vontobel, WMC and Ziegler furnished, and the Board reviewed, information concerning various aspects of their respective operations, including: (1) the nature, extent and quality of services provided by Muzinich, Smith Group, Vontobel, WMC and Ziegler to the applicable Sub-Advised Funds; (2) the sub-advisory fee rates charged by Muzinich, Smith Group, Vontobel, WMC and Ziegler and a comparison of those fee rates to the fee rates of Muzinich, Smith Group, Vontobel, WMC and Ziegler for providing advisory services to other investment companies or accounts or compared to their standard fee schedule, as applicable, with an investment mandate similar to the applicable Sub-Advised Funds; (3) profitability and/or financial information provided by Muzinich, Smith Group, Vontobel, WMC and Ziegler; and (4) any “fall out” or ancillary benefits accruing to Muzinich, Smith Group, Vontobel, WMC and Ziegler as a result of the relationship with each applicable Sub-Advised Fund. The Board also considered FIMCO’s representations that it found the sub-adviser responses to the information requests in connection with the renewal of the Sub-Advisory Agreements to be satisfactory and to raise no issues of general concern.
In considering the information and materials described above, the Independent Trustees took into account management style, investment strategies and prevailing market conditions. Moreover,
349
Board Considerations of Advisory Contracts and Fees (continued) (unaudited)
FIRST INVESTORS EQUITY FUNDS
the Independent Trustees received assistance from and met separately with Independent Legal Counsel prior to the April Meeting and prior to and during the May Meeting and were provided with a written description of their statutory responsibilities and the legal standards that are applicable to approvals of advisory agreements (and sub-advisory agreements, as applicable). Although the Advisory Agreement for all of the Funds and the Sub-Advisory Agreements for the Sub-Advised Funds were considered at the same Board meeting, the Independent Trustees addressed each Fund separately during the April Meeting and May Meeting.
Based on all of the information presented, the Board, including a majority of its Independent Trustees, determined on a Fund-by-Fund basis that the fees charged under the Advisory Agreement and each Sub-Advisory Agreement are reasonable in relation to the services that are provided under each Agreement. The Board did not identify any single factor as being of paramount importance in reaching its conclusions and determinations with respect to the continuance of the Advisory Agreement for each Fund and Sub-Advisory Agreements and different Trustees may have given different weight to different factors. Although not meant to be all-inclusive, the following describes some of the factors that were considered by the Board in deciding to approve the continuance of the Advisory Agreement for each Fund and Sub-Advisory Agreements with Muzinich, Smith Group, Vontobel, WMC and Ziegler.
Nature, Extent and Quality of Services
In examining the nature, extent and quality of the services provided by FIMCO, the Board recognized that FIMCO is dedicated to providing investment management services exclusively to the Funds and the other funds in the First Investors fund complex and that, unlike many other mutual fund managers, FIMCO is not in the business of providing management services to hedge funds, pension funds or private accounts. In this connection, the Board was advised that certain key FIMCO personnel provide separately managed account services to a FIMCO-affiliated investment adviser, but that these personnel spend most of their time serving their FIMCO clients. As a result, the Board considered that FIMCO’s personnel devote substantially all of their time to serving the funds in the First Investors fund complex. The Board also considered management’s explanation regarding the significant costs involved in providing the level of personal service that the First Investors fund complex seeks to deliver to its shareholders, which are primarily shareholders in the broad middle market.
The Board noted that FIMCO has undertaken extensive responsibilities as manager of the Funds, including: (1) the provision of investment advice to the Funds; (2) implementing policies and procedures designed to ensure compliance with each Fund’s investment objectives and policies as well as new laws and regulatory initiatives; (3) the review of brokerage arrangements; (4) oversight of general portfolio compliance with applicable laws; (5) the provision of certain administrative services to the Funds, including fund accounting; (6) the implementation of Board directives as they relate to the Funds; and (7) evaluating and monitoring any sub-advisers on an ongoing basis, including, but not limited to, monitoring each sub-adviser’s investment performance, evaluating each sub-adviser’s compliance program on an annual basis and monitoring investments for compliance purposes, including monitoring each sub-adviser’s soft dollar practices (as applicable), portfolio allocation and best execution. The Board also noted
350
that FIMCO provided the same sorts of administrative and other services, except for direct management of the portfolio, for the Sub-Advised Funds as it does for the other funds that do not employ a sub-adviser. The Board noted that FIMCO provides not only advisory services, but historically also has provided certain administrative personnel and services that many other advisers do not provide without imposition of separate fees. The Board also noted the steps that FIMCO has taken to encourage strong performance, including the manner in which portfolio managers and analysts are provided significant incentive compensation for good Fund performance. In addition, the Board considered information regarding the overall financial strength of FIMCO and its affiliates and the resources and staffing in place with respect to the services provided to the Funds.
The Board also considered the nature, extent and quality of the services provided to the Funds by FIMCO’s affiliates, including transfer agency and distribution services. The Board took into account the fact that FIS is dedicated to providing transfer agency services exclusively to the Funds and the other funds in the First Investors fund complex. As a result, FIS can tailor its processes and services to satisfy the needs of the Funds’ shareholder base. The Board noted that the Funds’ shares are distributed primarily through Foresters Financial Services, Inc. (“FFS”), which is an affiliate of FIMCO.
Furthermore, the Board considered the nature, extent and quality of the investment management services provided by Muzinich, Smith Group, Vontobel, WMC and Ziegler to the applicable Sub-Advised Funds. The Board considered Muzinich’s, Smith Group’s, Vontobel’s, WMC’s and Ziegler’s investment management process in managing the applicable Sub-Advised Funds and the experience and capability of their respective personnel responsible for the portfolio management of the applicable Sub-Advised Funds. The Board also considered information regarding the resources and staffing in place with respect to the services provided by each sub-adviser. Additionally, with respect to the Sub-Advised Funds, the Board considered the differences in fees paid by each Sub-Advised Fund to FIMCO and the fees paid by FIMCO to each sub-adviser, as well as representations by FIMCO that these fee differentials are warranted by its ongoing services and assumption of risks.
Based on the information considered, the Board concluded that the nature, extent and quality of the services provided to each Fund by FIMCO and the applicable Sub-Advised Funds by Muzinich, Smith Group, Vontobel, WMC and Ziegler were appropriate and consistent with the terms of the Advisory Agreement and Sub-Advisory Agreements, as applicable, and supported approval of the Advisory Agreement and each Sub-Advisory Agreement.
Investment Performance
The Board placed significant emphasis on the investment performance of each of the Funds. While consideration was given to performance reports and discussions held at prior Board or Committee meetings, as applicable, particular attention was given to the performance information compiled by Broadridge. In particular, the Board reviewed the performance of each Fund, as applicable, over the most recent calendar year (“1-year period”) and the annualized performance over the most recent three calendar year period (“3-year period”) and five calendar
351
Board Considerations of Advisory Contracts and Fees (continued) (unaudited)
FIRST INVESTORS EQUITY FUNDS
year period (“5-year period”). In addition, the Board considered the performance information provided by FIMCO for each Fund through April 30, 2019. With regard to the performance information, the Board considered the performance of each Fund on a percentile and quintile basis as compared to its Peer Group. For purposes of the performance data provided, the first quintile is defined as 20% of the funds in the applicable Peer Group with the highest performance and the fifth quintile is defined as 20% of the funds in the applicable Peer Group with the lowest performance. The Board also considered FIMCO’s representations that it monitors to ensure portfolio managers invest in a manner consistent with the mandate for the Fund or Funds they manage. The Board also considered a special performance report prepared by FIMCO analyzing the performance of the Opportunity Fund.
On a Fund-by-Fund basis, the performance reports indicated, and the Board noted, that each Fund except the Growth & Income Fund, Opportunity Fund, Total Return Fund and Covered Call Strategy Fund fell within one of the top three quintiles for at least one of the performance periods provided by Broadridge. The Board also noted that the Premium Income Fund had no quintile information provided by Broadridge because of its short operating history. In particular, the Board noted that: (i) the Equity Income Fund fell within the top three quintiles for the 1-year period; (ii) the Global Fund fell within the top three quintiles for the 5-year period; (iii) the International Fund fell within the top three quintiles for the 1-year period, 3-year period and 5-year period; (iv) the Select Growth Fund fell within the top three quintiles for the 3-year period and 5-year period; (v) the Special Situations Fund fell within the top three quintiles for the 5-year period; and (vi) the Hedged U.S. Equity Opportunities Fund fell within the top three quintiles for the 1-year period (the only period for which performance information was provided due to the short operating history of the Fund). With respect to the Growth & Income Fund and Total Return Fund, the Board considered that while each Fund did not fall within the top three quintiles for any of the periods, there was improvement in each Fund’s shorter term performance over the 1-year period. With respect to the Opportunity Fund, the Board considered FIMCO’s explanations regarding the Fund’s underperformance and noted that FIMCO had added a new assistant portfolio manager on the Fund recently. The Board also considered that the Covered Call Strategy Fund had a short operating history with only one full year of performance information. The Board also considered the volatility versus total return data provided by Broadridge as well as FIMCO’s representation that it believes that the Funds generally use a more conservative investment style than many of their peers.
Based on the information considered, the Board concluded that the investment performance of each Fund was either (a) acceptable or better, or (b) subject to reasonable steps to monitor or address certain periods of underperformance.
Fund Expenses, Costs of Services, Economies of Scale and Related Benefits
Management Fees and Expenses. The Board also gave substantial consideration to the fees payable under each Fund’s Advisory Agreement as well as under the Sub-Advisory Agreements for the Sub-Advised Funds.
352
The Board reviewed the information compiled by Broadridge comparing each Fund’s contractual management fee rate (at common asset levels) and actual management fee rate (which included the effect of any fee waivers) as a percentage of average net assets to other funds in its Peer Group. In this regard, the Board considered the contractual and actual management fees of each Fund on a quintile basis as compared to its Peer Group and noted the relative position of each Fund within the Peer Group. The Board also considered that FIMCO provides not only advisory services but also certain administrative personnel to the Funds under each Fund’s Advisory Agreement and that many other advisers do not provide such administrative personnel under their advisory agreements and that FIMCO also provides certain administrative services without the imposition of a separate fee. The Board considered that it had previously approved the extension of the contractual total expense cap for the Premium Income Fund until January 1, 2020. In particular, the Board noted that: (i) the contractual and actual management fees for all of the Funds except the Equity Income Fund, Global Fund, International Fund, Total Return Fund and Hedged U.S. Equity Opportunities Fund were in the top three quintiles of their respective Peer Groups; (ii) the Equity Income Fund’s contractual management fee was in the third quintile and actual management fee was in the fourth quintile of its Peer Group; (iii) the Global Fund’s, International Fund’s and Hedged U.S. Equity Opportunities Fund’s contractual and actual management fees were in the fifth quintile of their respective Peer Groups; and (iv) the Total Return Fund’s contractual management fee was in the fourth quintile and actual management fee was in the fifth quintile of its Peer Group.
The Board also reviewed the information compiled by Broadridge comparing each Fund’s Class A share total expense ratio, taking into account FIMCO’s expense waivers (as applicable), and the ratio of the sum of actual management and other non-management fees (i.e., fees other than management, transfer agency and Rule 12b-1/non-Rule 12b-1 shareholder service fees) to other funds in its Peer Group, including on a quintile basis. In particular, the Board noted that: (i) the total expense ratio for each Fund except the Opportunity Fund, Select Growth Fund and Premium Income Fund was not in the top three quintiles of their respective Peer Groups; and (ii) the ratio of the sum of actual management and other non-management fees was in the top three quintiles for all of the Funds except the Equity Income Fund, Global Fund, International Fund, Total Return Fund and Hedged U.S. Equity Opportunities Fund. The Board also considered that FIMCO had proposed, and the Board had previously approved, to lower the Rule 12b-1 fee by 5 basis points for each of the Equity Income Fund, Global Fund, Growth & Income Fund, International Fund, Opportunity Fund, Select Growth Fund, Special Situations Fund and Total Return Fund effective as of April 1, 2019 and that, as a result, the total expense ratios of such Funds would be reduced going forward. The Board noted that the Covered Call Strategy Fund, Hedged U.S. Equity Opportunities Fund and Premium Income Fund already charged Rule 12b-1 fees at such lower level. In considering the level of the total expense ratio and the ratio of the sum of actual management and other non-management fees, the Board took into account management’s explanation that: (i) the average account size of many of the First Investors funds is small by comparison to the industry average account size and that funds with small average account sizes generally have higher expense ratios than funds with larger average account sizes; (ii) there are significant costs involved in providing the level of personal service that the First Investors fund complex seeks to deliver to its shareholders; and (iii) Broadridge expense
353
Board Considerations of Advisory Contracts and Fees (continued) (unaudited)
FIRST INVESTORS EQUITY FUNDS
comparisons do not take into account the size of a fund complex, and as a result, in certain cases the First Investors funds are compared to funds in complexes that are much larger than First Investors. The Board also noted that Broadridge’s customized expense groups tend to be fairly small in number and the funds included in the Peer Group generally change from year to year, thereby introducing an element of randomness that affects comparative results each year. While recognizing the limitations inherent in Broadridge’s methodology, the Board believed that the data provided by Broadridge was a generally appropriate measure of comparative expenses.
In considering the sub-advisory fee rates charged by and costs and profitability of Muzinich, Smith Group, Vontobel, WMC and Ziegler with regard to the respective Sub-Advised Funds, the Board noted that FIMCO pays Muzinich, Smith Group, Vontobel, WMC and Ziegler, as the case may be, a sub-advisory fee from its own advisory fee rather than each Fund paying Muzinich, Smith Group, Vontobel, WMC and Ziegler a fee directly. The Board also considered an arrangement pursuant to which Muzinich, Smith Group and Vontobel (but not the Sub-Advised Funds) each pays a portion of its sub-advisory fee to a solicitor that introduced each such subadviser to FIMCO. Muzinich, Smith Group, Vontobel, WMC and Ziegler provided, and the Board reviewed, information comparing the fees charged by Muzinich, Smith Group, Vontobel, WMC and Ziegler for services to the respective Sub-Advised Funds versus the fee rates of Muzinich, Smith Group, Vontobel, WMC and Ziegler for providing advisory services to other comparable investment companies or accounts or compared to their standard fee schedule, as applicable. Based on a review of this information, the Board noted that the fees charged by Muzinich, Smith Group, Vontobel, WMC and Ziegler, as the case may be, for services to each applicable Sub-Advised Fund appeared competitive to the fees Muzinich, Smith Group, Vontobel, WMC and Ziegler charge to their other comparable investment companies or accounts or compared to their standard fee schedule, as applicable.
The foregoing comparisons assisted the Trustees by providing them with a basis for evaluating each Fund’s management fee and expense ratio on a relative basis and the Board concluded that each Fund’s management fees appeared reasonable in relation to the services and benefits provided to each Fund.
Profitability. The Board reviewed the materials it received from FIMCO regarding its revenues and costs in providing investment management and certain administrative services to the Funds. In particular, the Board considered the analysis of FIMCO’s profitability with respect to each Fund, calculated for the year ended December 31, 2018, as well as overall profitability information relating to the past five calendar years. The Board also considered the information provided by FIMCO comparing the profitability of certain publicly-traded mutual fund asset managers as analyzed by FIMCO based on publicly available financial statements and noted FIMCO’s analysis that its profit margin is substantially lower than the average of such publicly-traded managers. In reviewing the profitability information, the Board also considered the “fall-out” or ancillary benefits that may accrue to FIMCO and its affiliates as a result of their relationship with the Funds, which are discussed below. Based on the information provided, the Board also noted that FIMCO operates the Premium Income Fund at a loss. The Board acknowledged that, as a business matter, FIMCO was entitled to earn reasonable profits for its services to the Funds and concluded that the level of profitability to FIMCO of its contractual
354
arrangements with each Fund did not appear so high as to call into question the appropriateness of the fees paid to FIMCO by any Fund or otherwise to preclude the proposed continuation of the Advisory Agreement for any of the Funds. The Board also considered the profitability and/or financial information provided by Muzinich, Smith Group, Vontobel, WMC and Ziegler.
Economies of Scale. With respect to whether economies of scale are realized by FIMCO and the extent to which any economies of scale are reflected in the level of management fee rates charged, the Board considered that the Advisory Agreement fee schedule for each Fund includes breakpoints to account for management economies of scale as each Fund’s assets increase.
“Fall Out” or Ancillary Benefits. The Board considered the “fall-out” or ancillary benefits that may accrue to FIMCO, Muzinich, Smith Group, Vontobel, WMC and Ziegler as a result of their relationship with the Funds. In that regard, the Board considered the fact that FIMCO and each sub-adviser (except Muzinich and Ziegler) may receive research from broker-dealers that execute brokerage transactions for the funds in the First Investors fund complex. However, the Board noted that FIMCO and the sub-advisers must select brokers based on each Fund’s requirements for seeking best execution. The Board also considered the profits earned by FIS and the revenues received by FFS as a result of FIMCO’s management of the First Investors funds.
* * *
In summary, based on all relevant information and factors, none of which was individually determinative of the outcome, the Board, including a majority of the Independent Trustees, approved the renewal of the Advisory Agreement and each Sub-Advisory Agreement.
355
FIRST INVESTORS INCOME FUNDS
FIRST INVESTORS EQUITY FUNDS
Trustees and Officers*
Name, Year of Birth
and Address | Position
Held with
Funds | Length of
Time Served
(Including with
Predecessor Funds) | Number of
Portfolios in
Fund Complex
Overseen | Other
Trusteeships/
Directorships
Held |
DISINTERESTED TRUSTEES |
Susan E. Artmann (1954) c/o First Investors Funds,
Legal Department
40 Wall Street
New York, NY 10005 | Trustee | Since 11/1/12 | 36 | None |
Principal Occupation During Past 5 Years: None/Retired. |
Mary J. Barneby (1952) c/o First Investors Funds,
Legal Department
40 Wall Street
New York, NY 10005 | Trustee | Since 11/1/12 | 36 | None |
Principal Occupation During Past 5 Years: Chief Executive Officer, Girl Scouts of Connecticut (since October 2012). |
Charles R. Barton, III (1965) c/o First Investors Funds,
Legal Department
40 Wall Street
New York, NY 10005 | Trustee | Since 1/1/06 | 36 | None |
Principal Occupation During Past 5 Years: Chief Operating Officer (since 2007), Board Director (since 1989, currently Ex-Officio) and Trustee (since 1994) of The Barton Group/Barton Mines Corporation (mining and industrial abrasives distribution); President of Noe Pierson Corporation (land holding and management services provider) (since 2004). |
Arthur M. Scutro, Jr. (1941) c/o First Investors Funds,
Legal Department
40 Wall Street
New York, NY 10005 | Trustee and Chairman
| Trustee since 1/1/06 and Chairman since 1/1/13 | 36 | None |
Principal Occupation During Past 5 Years: None/Retired |
356
Name, Year of Birth
and Address | Position
Held with
Funds | Length of
Time Served
(Including with
Predecessor Funds) | Number of
Portfolios in
Fund Complex
Overseen | Other
Trusteeships/
Directorships
Held |
DISINTERESTED TRUSTEES (continued) |
Mark R. Ward (1952) c/o First Investors Funds,
Legal Department
40 Wall Street
New York, NY 10005 | Trustee | Since 1/1/10 | 36 | None |
Principal Occupation During Past 5 Years: Self-employed, consultant (since 2008). |
* | Each Trustee serves for an indefinite term with the Funds, until his/her successor is elected. |
357
FIRST INVESTORS INCOME FUNDS
FIRST INVESTORS EQUITY FUNDS
Trustees and Officers* (continued)
Name, Year of Birth
and Address | Position
Held with
Funds | Length of
Time Served
(Including with
Predecessor Funds) | Number of
Portfolios in
Fund Complex
Overseen | Other
Trusteeships/
Directorships
Held |
OFFICERS WHO ARE NOT TRUSTEES |
E. Blake Moore Jr. (1958) c/o First Investors Funds,
Legal Department
40 Wall Street
New York, NY 10005 | President | Since 2/22/2018 | N/A | None |
Principal Occupation During Past 5 Years: President, Foresters Invesment Management Company, Inc. (since February 2018); Managing Director and Head of Americas, UBS Asset Management (Americas) Inc. (2015-2017); Executive Vice President , Mackenzie Investments (Canada) (2011-2014). |
Joseph I. Benedek (1957) c/o Foresters Investment Management Company, Inc.
Raritan Plaza I
Edison, NJ 08837 | Treasurer | Since 1988 | N/A | None |
Principal Occupation During Past 5 Years: Treasurer of Foresters Investment Management Company, Inc. |
Scott K. Richardson (1966) c/o First Investors Funds,
Legal Department
40 Wall Street
New York, NY 10005 | Secretary | Since 9/17/2018 | N/A | None |
Principal Occupation During Past 5 Years: Senior Vice President, General Counsel/Chief Legal & Regulatory Officer, Foresters Investment Management Company, Inc. (since September 2018); Executive Director, Morgan Stanley Wealth Management (2005-2018). |
Marc S. Milgram (1957) c/o First Investors Funds,
Legal Department
40 Wall Street
New York, NY 10005 | Chief Compliance Officer | Since 2010 | N/A | None |
Principal Occupation During Past 5 Years: Chief Compliance Officer of Foresters Investment Management Company, Inc. |
358
FIRST INVESTORS INCOME FUNDS
FIRST INVESTORS EQUITY FUNDS
Shareholder Information
Investment Adviser
Foresters Investment Management Company, Inc.
40 Wall Street
New York, NY 10005
Subadviser
(Covered Call Strategy Fund and Premium Income Fund)
Ziegler Capital Management, LLC
70 W. Madison Street
Chicago, IL 60602
Subadviser
(Floating Rate Fund, Fund For Income, Investment Grade Fund, Limited Duration Bond Fund and Total Return Fund)
Muzinich & Co., Inc.
450 Park Avenue
New York, NY 10022
Subadviser
(Hedged U.S. Equity Opportunities Fund)
Wellington Management Company, LLP
280 Congress Street
Boston, MA 02210
Subadviser
(International Fund)
Vontobel Asset Management, Inc.
1540 Broadway
New York, NY 10036
Subadviser
(International Opportunities Bond Fund)
Brandywine Global Investment Management, LLC
1735 Market Street
Philadelphia, PA 19103
Subadviser
(Select Growth Fund)
Smith Asset Management Group, L.P.
100 Crescent Court
Dallas, TX 75201
Underwriter
Foresters Financial Services, Inc.
40 Wall Street
New York, NY 10005
Custodian
The Bank of New York Mellon
240 Greenwich Street
New York, NY 10286
Transfer Agent
Foresters Investor Services, Inc.
Raritan Plaza I – 8th Floor
Edison, NJ 08837-3620
Independent Registered Public Accounting Firm
Tait, Weller & Baker LLP
Two Liberty Place
50 South 16th Street
Philadelphia, PA 19102
Legal Counsel
K&L Gates LLP
1601 K Street, N.W.
Washington, D.C. 20006
359
A description of the policies and procedures that the Funds use to vote proxies relating to a portfolio’s securities is available, without charge, upon request by calling toll free 1-800-423-4026 or can be viewed online or downloaded from the EDGAR database on the U.S. Securities and Exchange Commission’s (“SEC”) internet website at http://www.sec.gov. In addition, information regarding how the Funds voted proxies relating to portfolio securities during the most recent 12-month period ended June 30, is available, without charge, upon request in writing or by calling 1-800-423-4026 and on the SEC’s internet website at http://www.sec.gov.
The Funds file their complete schedule of portfolio holdings with the SEC on Form N-PORT for the first and third quarters of each fiscal year. The Funds’ Form N-PORT is available on the SEC’s website at http://www.sec.gov; and may also be reviewed and copied at the SEC’s Public Reference Room in Washington D.C. Information on the operation of the Public Reference Room may be obtained by calling 1-800-SEC-0330. The schedule of portfolio holdings is available, without charge, upon request in writing or by calling 1-800-423-4026.
360
NOTES
361
Foresters Financial
40 Wall Street
New York, NY 10005

(1017727-11/19)
IEAR19
The Registrant has adopted a code of ethics that applies to the Registrant's principal executive officer and principal financial officer. On February 22, 2018, revisions were made to the code of ethics to reflect the appointment of a new President of the First Investors Funds.
For the year ended September 30, 2019, there were no waivers granted from a provision of the code of ethics.
A copy of the Registrant's code of ethics is filed under Item 12(a)(1).
| Item 3. | Audit Committee Financial Expert |
The Registrant's Board has determined that it had at least one "audit committee financial expert" serving on its audit committee. Arthur M. Scutro, Jr. and Mark R. Ward were the "audit committee financial experts" during all or part of the period and were considered to be "independent" as defined in Item 3 of Form N-CSR.
| Item 4. | Principal Accountant Fees and Services |
| | Fiscal Year Ended |
| | September 30, |
| | 2019 | | 2018 |
| (a) | Audit Fees | | | |
| | First Investors Income Funds | $ | 214,200 | | $ | 221,500 |
| | | | |
| (b) | Audit-Related Fees | | | |
| | First Investors Income Funds | $ | 0 | | $ | 0 |
| | | | |
| (c) | Tax Fees | | | |
| | First Investors Income Funds | $ | 35,700 | | $ | 39,000 |
| | | | |
| | Nature of services: tax returns preparation and tax compliance | | | |
| | | | |
| (d) | All Other Fees | | | |
| | First Investors Income Funds | $ | 0 | | $ | 0 |
(e)(1) Audit committee's pre-approval policies
The Charter of the Audit Committee requires the Audit Committee (a) to pre-approve, and to recommend to the full Board, the selection, retention or termination of the independent auditors to provide audit, review or attest services to the First Investors Funds (“Funds”) and, in connection therewith, evaluate the independence of the auditors and to obtain the auditors’ specific representations as to their independence; (b) to pre-approve all non-audit services to be provided to the Funds by the independent auditor; and (c) to pre-approve all non-audit services to be provided by the Funds’ independent auditor to the Funds’ investment adviser or to any entity that controls, is controlled by or is under common control with the Funds’ investment adviser and that provides ongoing services to the Funds, if the engagement relates directly to the operations and financial reporting of the Funds. The Audit Committee has not adopted pre-approval policies or procedures to permit the services in (b) and (c) above to be pre-approved by other means.
(e)(2) None, or 0%, of the services relating to the Audit-Related Fees, Tax Fees and All Other Fees paid by the Registrant and Related Entities disclosed above were approved by the Audit Committee pursuant to paragraph (c)(7)(i)(C) of Rule 2-01 of Regulation S-X (which permits audit committee
approval after the start of the engagement with respect to services other than audit review or attest services, if certain conditions are satisfied).
(f) Not Applicable
(g) Aggregate non-audit fees billed by the Registrant's accountant for services rendered to the Registrant and the Registrant's investment adviser and any entity controlling, controlled by, or under common control with the adviser that provides ongoing services to the Registrant for the two fiscal years ended September 30, 2019 and 2018 were $180,100 and $180,100, respectively.
(h) Not Applicable
| Item 5. | Audit Committee of Listed Registrants |
Not applicable
| Item 6. | Schedule of Investments |
| (a) | Schedule is included as part of the report to shareholders filed under Item 1 of this Form. |
| Item 7. | Disclosure of Proxy Voting Policies & Procedures for Closed-End Management Investment Companies |
Not applicable to open-end investment companies
| Item 8. | Portfolio Managers of Closed-End Management Investment Companies |
Not applicable to open-end investment companies
| Item 9. | Purchases of Equity Securities by Closed-End Management Investment Companies and Affiliated Purchasers |
Not applicable to open-end investment companies
| Item 10. | Submission of Matters to a Vote of Security Holders |
There were no material changes to the procedure by which shareholders may recommend nominees to the Registrant's Board of Trustees.
| Item 11. | Controls and Procedures |
(a) The Registrant's President and Principal Financial Officer have concluded that the Registrant's disclosure controls and procedures (as defined in Rule 30a-3(c) under the Investment Company Act of 1940, as amended) are effective, based on their evaluation of these
disclosure controls and procedures as of a date within 90 days of the filing date of this report.
(b) There were no changes in the Registrant's internal control over financial reporting (as defined in Rule 30a-3(d) under the Investment Company Act of 1940, as amended) that occurred during the second fiscal quarter of the period covered by this report that have materially affected, or are reasonably likely to materially affect, the Registrant's internal control over
financial reporting.
| Item 12. | Disclosure of Securities Lending Activities for Closed-End Management Investment Companies |
Not applicable to open-end investment companies
| (a)(1) | Code of Ethics - Filed herewith |
| | |
| | |
| (a)(2) | Certifications pursuant to Section 302 of the Sarbanes-Oxley Act of 2002 - Filed herewith |
| | |
| | |
| (a)(3) | Not applicable |
| | |
| (a)(4) | Not applicable |
| | |
| (b) | Certifications pursuant to Section 906 of the Sarbanes-Oxley Act of 2002 - Filed herewith |
| | |
SIGNATURES
Pursuant to the requirements of the Securities Exchange Act of 1934 and the Investment Company Act of 1940, the Registrant has duly caused this report to be signed on its behalf by the undersigned, thereunto duly authorized.
First Investors Income Funds
| By | /s/ E. Blake Moore Jr. |
| | E. Blake Moore Jr. |
| | President and Principal Executive Officer |
| | |
| Date: | November 25, 2019 |
Pursuant to the requirements of the Securities Exchange Act of 1934 and the Investment Company Act of 1940, this report has been signed below by the following persons on behalf of the Registrant and in the capacities and on the dates indicated.
| By | /s/ E. Blake Moore Jr. |
| | E. Blake Moore Jr. |
| | President and Principal Executive Officer |
| | |
| By | /s/ Joseph I. Benedek |
| | Joseph I. Benedek |
| | Treasurer and Principal Financial Officer |
| | |
| Date: | November 25, 2019 |