Table of Contents
UNITED STATES
SECURITIES AND EXCHANGE COMMISSION
Washington, D. C. 20549
FORM 10-K
| x | ANNUAL REPORT PURSUANT TO SECTION 13 OR 15(d) OF THE SECURITIES EXCHANGE ACT OF 1934 |
| For the fiscal year ended | Commission file number 0-24630 | |
| December 31, 2006 |
or
| ¨ | TRANSITION REPORT PURSUANT TO SECTION 13 OR 15(d) OF THE SECURITIES EXCHANGE ACT OF 1934 |
| For the transition period from to . |
MIDWESTONE FINANCIAL GROUP, INC.
| (State of Incorporation) | (I.R.S. Employer Identification No.) | |
| Iowa | 42-1003699 |
222 First Avenue East, Oskaloosa, Iowa 52577
Registrant’s telephone number: 641-673-8448
Securities registered pursuant to Section 12(b) of the Act:
Title of each class | Name of each exchange on which registered | |
| None | None |
Securities registered pursuant to Section 12(g) of the Act:
Common Stock, $5 par value
Indicate by check mark if the registrant is a well-known seasoned issuer, as defined in Rule 405 of the Securities Act. Yes ¨ No x
Indicate by check mark if the registrant is not required to file reports pursuant to Section 13 or Section 15(d) of the Act. Yes ¨ No x
Indicate by check mark whether the registrant (1) has filed all reports required to be filed by Section 13 or 15(d) of the Securities Exchange Act of 1934 during the preceding 12 months (or for such shorter period that the registrant was required to file such reports) and (2) has been subject to such filing requirements for the past 90 days. Yes x. No ¨.
Indicate by check mark if disclosure of delinquent filers pursuant to Item 405 of Regulation S-K is not contained herein, and will not be contained, to the best of the registrant’s knowledge, in definitive proxy or information statements incorporated by reference in Part III of this Form 10-K or any amendment to this Form 10-K. ¨
Indicate by check mark whether the registrant is a large accelerated filer, an accelerated filer, or a non-accelerated filer (as defined in Rule 12b-2 of the Act).
| Large Accelerated Filer ¨ | Accelerated Filer ¨ | Non-accelerated Filer x |
Indicate by check mark whether the registrant is a shell company (as defined in Rule 12b-2 of the Act). Yes ¨ No x
The aggregate market value of the voting stock held by non-affiliates of the registrant as of the last business day of the registrant’s most recently completed second fiscal quarter, June 30, 2006, was $63,700,759.
Indicate the number of shares outstanding of each of the issuer’s classes of common stock, as of the most recent practicable date, March 23, 2007.
3,705,411 shares Common Stock, $5 par value
DOCUMENTS INCORPORATED BY REFERENCE
The definitive proxy statement of MidWestOne Financial Group, Inc. for the 2007 annual meeting of shareholders is incorporated by reference into Part II and Part III hereof to the extent indicated in such Parts.
Table of Contents
| PART I | ||||
| Item 1. | 1 | |||
| 1 | ||||
B. Subsidiaries | 1 | |||
| 2 | ||||
D. Competition | 6 | |||
| 6 | ||||
F. Employees | 8 | |||
| Item 1A. | 9 | |||
| Item 1B. | 11 | |||
| Item 2. | 12 | |||
| Item 3. | 13 | |||
| Item 4. | 13 | |||
| PART II | ||||
| Item 5. | Market for the Registrant’s Common Equity and Related Stockholder Matters | 14 | ||
| Item 6. | 16 | |||
| Item 7. | Management’s Discussion and Analysis of Financial Condition and Results of Operations | 16 | ||
| Item 7A. | 40 | |||
| Item 8. | 41 | |||
| Item 9. | Changes in and Disagreements with Accountants on Accounting and Financial Disclosure | 41 | ||
| Item 9A. | 41 | |||
| PART III | ||||
| Item 10. | 42 | |||
| Item 11. | 42 | |||
| Item 12. | Security Ownership of Certain Beneficial Owners and Management | 42 | ||
| Item 13. | 42 | |||
| Item 14. | 42 | |||
| PART IV | ||||
| Item 15. | 43 | |||
Table of Contents
MidWestOne Financial Group, Inc. (the “Company”) is a community-based financial holding company headquartered in Oskaloosa, Mahaska County, Iowa. The Company, through its wholly owned subsidiaries, provides a wide range of services, including traditional banking services, trust services, residential mortgage services, insurance brokerage and retail securities brokerage services. The Company provides a full range of services to individual and corporate customers. The Company’s principal operating subsidiary is MidWestOne Bank (referred to as the “Bank”) with headquarters in Oskaloosa.
The Bank subsidiary engages in retail and commercial banking and related financial services, providing the usual products and services such as deposits, commercial, agricultural, real estate, and consumer loans, and trust services. The Bank is a community-oriented, full-service commercial bank, providing traditional banking services to individuals, small to medium sized businesses, farmers, government and public entities and not-for-profit organizations. The Bank operates out of 19 locations in south central and eastern Iowa.
MidWestOne Investment Services, Inc. (“MWI”) provides retail brokerage and financial planning services throughout the banking offices of the Company. MWI is a wholly-owned subsidiary of the Company that was established in 2004.
Cook & Son Agency, Inc. (“Cook”) provides insurance agency services for individuals and corporations in the markets served by the Company. Cook was acquired by the Company on September 1, 2005, and currently serves customers in the Pella, Iowa area.
The Company also owns 100% of the stock of a commercial finance company MIC Financial, Inc. (“MIC Financial”). MIC Financial provided factoring, equipment leasing and accounts receivable financing to small business clients. MIC Financial is no longer offering these services and is now inactive.
Since 1988, the Company, either directly or through the Bank, has invested in loan pool participations that have been purchased by certain non-affiliated independent service corporations (collectively, the “Servicer”) from various sources including large financial institutions and the Federal Deposit Insurance Corporation (“FDIC”). These loan pool investments generally consist of nonperforming and distressed loans that have been sold at prices reflecting varying discounts from the aggregate outstanding principal amount of the underlying loans. The amount of the discount depends on the credit quality of the portfolio. The Servicer collects these loans from the borrowers.
The Company was incorporated in Iowa in 1973 and was a bank holding company registered under the Bank Holding Company Act of 1956. Effective January 9, 2005, the Company became a financial holding company pursuant to the provisions of the Gramm-Leach-Bliley Act of 1999. The Company provides support services to the Bank including management assistance, auditing services and loan review.
MidWestOne Bank—The Company currently has one bank subsidiary operating under the name of MidWestOne Bank. Prior to January 1, 2006, the Company had four bank subsidiaries. On January 1, 2006, the four banks were merged into one Iowa-chartered subsidiary bank with headquarters located in Oskaloosa, Iowa. All previously existing banking locations were retained as branches of the newly consolidated bank and all banking services provided by the individual banks are offered by the new consolidated bank.
1
Table of Contents
The Bank is a full-service, commercial bank chartered as an Iowa state bank in 1931. The Bank was known as Mahaska State Bank until 2003, when the name was changed to MidWestOne Bank & Trust. On January 1, 2006, the Bank adopted the name MidWestOne Bank. The Bank operates in 12 counties with 19 offices in 13 communities in south central and eastern Iowa. The Bank serves Mahaska County from its main bank and two branch offices in Oskaloosa. It also serves Benton County from its two offices in Belle Plaine, Black Hawk County from its offices in Hudson and Waterloo, Des Moines County from its two offices in Burlington, Iowa County from its office in North English, Jefferson County from its two offices in Fairfield, Keokuk County from its office in Sigourney, Lee County from its office in Fort Madison, Louisa County from its office in Wapello, Marion County from its two offices in Pella, Scott County from its office in Davenport and Wapello County from its office in Ottumwa. The Bank provides a wide array of retail and commercial banking services, including demand, savings and time deposits; real estate, commercial, agricultural and consumer loans; and trust services.
MIC Financial, Inc.—MIC Financial is an Iowa corporation that was formed by the Company in 1974 under the name of MIC Leasing Co. The company operated under the name of On-Site Commercial Services until June 1997 when the name was officially changed to On-Site Credit Services, Inc. Effective March 21, 2000, the name was changed to MIC Financial, Inc. As of December 31, 2006, the company had no remaining assets.
MidWestOne Investment Services, Inc.—MWI is an Iowa corporation that was formed in 2004. The entity provides retail brokerage and financial planning services in conjunction with the Company’s bank subsidiary locations in Pella, Oskaloosa, Sigourney and Burlington, Iowa.
Cook & Son Agency, Inc.—Cook is an Iowa corporation that was acquired by the Company in 2005. Cook acts as an insurance agency for individuals and businesses in the Pella, Iowa area.
The Company through the Bank, has participation interests in pools of loans purchased at varying discounts from the aggregate outstanding principal amount of the underlying loans. The Company has been purchasing participation interests in discounted loans since 1988. These pools of loans are currently held and serviced by a separate independent servicing corporation (referred to as the “Servicer”) known as States Resources Corporation. The Company does not have any ownership interest in or control over States Resources Corporation. States Resources Corporation was founded in 1998 and is owned by Randal Vardaman. Prior to the formation of States Resources Corporation, Mr. Vardaman owned various other independent loan servicing corporations. The Company has maintained a business relationship with Mr. Vardaman and the various predecessor corporations owned by him since 1988. Mr. Vardaman has been engaged in credit analysis and loan portfolio management in various positions since 1970.
The Company has invested in loan pools purchased by the Servicer from large nonaffiliated banking organizations and from the FDIC acting as receiver of failed banks and savings institutions. The loans comprising the pools were originated throughout the United States. As part of the agreement to purchase participation interests in the loan pools, the Company and the Bank have contracted with the Servicer to service the underlying loans within the respective loan pools that are owned of record by the Servicer. The Servicer also evaluates various loan pools prior to purchase and makes recommendations to the Company concerning the creditworthiness of proposed loan pool purchases and proposes appropriate bids to the Company and any other potential loan pool participants.
The Servicer and its predecessor organizations have bid on loan pools from various regional offices of the FDIC and from other sources since 1988. The Company and the Bank have purchased participation interests in such pools of loans. The purchase prices paid by the Company for loan pool participations have ranged from 5.5% to 97.7% of the aggregate outstanding principal amount of the loans comprising such pools at the time of purchase. The Servicer acquires the loan pools without recourse against the sellers and, accordingly, the risk of noncollectibility is, for the most part, assumed by the Company and any other investors in a particular pool.
2
Table of Contents
Each pool has a different composition and different characteristics. The composition of a loan pool is generally determined by the seller based on its desire to maximize the price it receives for all loans among the various pools. Many of the pools consist of loans primarily secured by single-family, multi-family, and small commercial real estate. Some pools may consist of a large number of small consumer loans that are secured by other assets such as automobiles or mobile homes, while other pools may consist of small to medium balance commercial loans. Some may contain a mixture of such loans and other types of loans. The pools the Company is currently investing in are comprised primarily of past-due nonperforming loans secured by commercial real estate and other commercial assets. The price bid and paid for such a loan pool is determined based on the composition of the particular pool, the amounts the Servicer believes can be collected on such a pool, and the risks associated with the collection of such amounts.
In considering an investment in a loan pool, the Servicer will evaluate loans owned and being offered and make recommendations to the Company and other prospective investors concerning the creditworthiness of the proposed loan pool purchase. The Servicer performs a comprehensive analysis of the loan pool in an attempt to ensure proper valuation and adequate safeguards in the event of default. The bid price on the loan pools will be reflective of the results of the Servicer’s pre-acquisition review of the loan files. In many cases the loan files may not be current and substantial uncertainties may exist regarding the collectibility of the various loans in the pool. Management believes that in many instances the non-current loans can be brought current once the Servicer has an opportunity to contact the debtor. The Company makes its own decisions as to whether or not to participate in a particular loan pool that has been recommended by the Servicer, based on the Company’s experience with the various categories and qualities of loans.
The sales of loan pools by the sellers is generally conducted by sealed bid auction. A sealed bid auction requires each bidder to submit a confidential bid on the subject loan pool and the loan pool is awarded to the highest bidder. In recent years, the Servicer and the Company have faced increasing competition in bidding for loan pools.
Since 1988, the Servicer and its predecessor organizations, on behalf of the Company and other investors, have bid on a large number of loan pools and have been successful in purchasing 129 loan pools including 6 in 2007. The Company and other investors in the loan pools fund the purchase by the Servicer and each investor receives a percentage interest in the loan pool based on its proportional investment relative to the total purchase price of the pool. Each investor receives a loan pool participation certificate reflecting this interest.
The purchased loan pools consist of loans evidenced by promissory notes. Loans purchased are generally secured by either real property or personal property. Some loan pools may contain unsecured loans. The value of the collateral may range from nominal to substantial and often may be difficult to establish prior to acquisition of the pools with the level of certainty that is typically required in a financial institution. The nature and structure of the due diligence process generally precludes inspection or appraisal of collateral prior to placing a bid on a loan pool.
Upon the acquisition of a participation interest in a loan pool, the Company assumes the risk that the Servicer will be unable to recover an amount equal to the purchase price plus the carrying costs, if any, and collection costs on such accounts. The extent of such risk is dependent on a number of factors, including the Servicer’s ability to locate the debtors, the debtors’ financial condition, the possibility that a debtor may file for protection under applicable bankruptcy laws, the Servicer’s ability to locate the collateral, if any, for the loan and to obtain possession of such collateral, the value of such collateral, and the length of time it takes to realize the ultimate recovery either through collection procedures or through a resale of the loans following a restructure.
A cost “basis” is assigned to each individual loan acquired on a cents per dollar (discounted price) based on the Servicer’s assessment of the recovery potential of each such loan in relation to the total discounted price paid to acquire the pool. This methodology assigns a higher basis to performing loans with greater potential collectibility and a lower basis to those loans identified as having little or no potential for collection.
3
Table of Contents
Loan pool participations are shown on the Company’s balance sheet as a separate asset category. The original carrying value of loan pool participations represents the discounted price paid by the Company to acquire its participation interests in various loan pools purchased by the Servicer. The Company’s investment balance is reduced as the Servicer collects principal payments on the loans and remits the proportionate share of such payments to the Company.
Loan pools acquired subsequent to January 1, 2005, are accounted for in accordance with the provisions of Statement of Position 03-3, “Accounting for Certain Loans or Debt Securities Acquired in a Transfer” (“SOP 03-3”) issued by the Accounting Standards Executive Committee of the American Institute of Certified Public Accountants.
SOP 03-3 provides updated guidance on the accounting for purchased loans that show evidence of deterioration of credit quality since origination and for which it is probable, at acquisition, that the purchaser will be unable to collect all contractually required payments receivable. SOP 03-3 generally requires that the excess of the estimated cash flows expected to be collected on the loan over the initial investment be accreted over the estimated remaining life of the loan. According to SOP 03-3, in order to apply the interest method of recognition to these types of loans, there must be sufficient information to reasonably estimate the amount and timing of the cash flows expected to be collected. When that is not the case, the loan should be accounted for on nonaccrual status applying cash basis income recognition to the loan.
The Company has developed and implemented procedures to determine if accretion of the discount (“accretable yield”) on the purchased loans in a pool is required under SOP 03-3. These procedures were applied to all loans acquired subsequent to January 1, 2005 (the adoption date of SOP 03-3). Given the impaired nature of the loan pools typically purchased, the individual loans are evaluated individually with a determination made utilizing various criteria including: past-due status, late payments, legal status of the loan (not in foreclosure, judgment against the borrower, or referred to legal counsel), frequency of payments made, collateral adequacy and the borrower’s financial condition. If all the criteria are met, the individual loan will utilize the accounting treatment required by SOP 03-3 with the accretable yield difference between the expected cash flows and the purchased basis accreted into income on the level yield basis over the anticipated life of the loan. If any of the six criteria are not met, the loan is accounted for on the cash-basis of accounting.
In the event that a prepayment is received on a loan accounted for under SOP 03-3, the accretable yield is recomputed and the revised amount accreted over the estimated remaining life of the loan on the level yield basis. If a loan subject to accretable yield under SOP 03-3 fails to make timely payments, it is subject to classification and an allowance for loss would be established.
For those pools acquired prior to December 31, 2004, the accounting treatment utilized is the nonaccrual (or cash) basis in one of three methods, depending on the circumstances. First, if a borrower makes regular payments on a loan, the payment received is first applied to interest income in the amount of interest due at the contract rate. Further payments are applied to principal in a ratio reflecting the proportion of cost basis to loan principal amount. Payments in excess of interest and this ratio are recorded as discount income. Discount income earned over the life of a loan represents loan principal collected in excess of the price originally paid to acquire the loan from the FDIC or any other sellers, which price constitutes the cost “basis” of the loan.
Secondly, if the borrower fails to make regular payments, the Servicer and the Company evaluate the collateral supporting the loan. If it is determined that the loan is well secured, then payments are applied as previously described. If it is determined that the collateral is deficient, payments are applied to the principal balance of the loan with no recognition of interest due. The cost recovery method governs the application of payments received to the outstanding principal balance. Under this method, any amount received is initially applied to the cost “basis” of the loan and any additional amounts received are recognized as discount income.
4
Table of Contents
Third, where the Servicer negotiates a settlement of a loan for a lump sum, the payment is first applied to principal to the extent of the assigned cost “basis” with the excess treated as discount income up to the original principal value of the loan, and any remainder is treated as interest income on loan pool participations.
In each case, where changed circumstances or new information lead the Servicer to believe that collection of the note or recovery of the basis through collateral would be less than originally determined, the cost basis assigned to the loan is written down or written off through a charge against discount income. The Servicer and representatives of the Company continually evaluate the collectability of the loans and the recovery of the underlying basis. On a quarterly basis, those loans that are determined to have a possible recovery of less than the assigned basis amount are placed on a “watch list.” The amount of basis exceeding the estimated recovery amount on the “watch list” loans is written off by a charge against discount income.
The Company does not recognize as income any accrued interest receivable on the loan pools accounted for on a cash basis. Interest income is only recognized when collected and actually remitted to the Company by the Servicer for those loans acquired prior to December 31, 2004, and for those loans subject to nonaccrual status in accordance with SOP 03-3. Many of the pools that have been purchased by the Servicer do not include purchased interest in the cost basis. Interest income collected by the Servicer is included in the Company’s consolidated financial statements as interest income and discount on loan pool participations.
Interest income and discount on loan pool participations recorded by the Company is net of collection expenses incurred by the Servicer and net of the servicing fee and share of recovery profit paid to the Servicer. Collection costs include salary and benefits paid by the Servicer to its employees, legal fees, costs to maintain and insure real estate owned, and other operating expenses. Under the terms of the States Resources agreement, the Servicer receives a servicing fee based on one percent of the gross monthly collections of principal and interest, net of collection costs. Additionally, the Servicer receives a tiered percentage share of the recovery profit in excess of the investors’ required return on investment on each individual loan pool. The Servicer’s percentage share of recovery profit is linked to a ten-tier index and ranges from zero to twenty-seven percent depending upon the return on investment achieved. The investor’s minimum required return on investment is based on the two-year treasury rate at the time a loan pool is purchased plus 4.0 percent. For every one percent increase obtained over the investor’s minimum required return, the Servicer percentage moves up one tier level. In the event that the return on a particular pool does not exceed the required return on investment, the Servicer does not receive a percentage share of the recovery profit. Discount income is added to interest income and reflected as one amount on the Company’s consolidated statement of income. Profit (or loss) from collection activities is determined on a monthly basis. The Servicer provides the Company with monthly reports detailing collections of principal and interest, face value of loans collected and those written off, actual operating expenses incurred, remaining asset balances (both in terms of cost basis and principal amount of loans), a comparison of actual collections and expenses with target collections and budgeted expenses, and summaries of remaining collection targets. The Servicer also provides aging reports and “watch lists” for the loan pools. Monthly meetings are held between the Company and representatives of the Servicer to review collection efforts and results, to discuss future plans of action, and to discuss potential opportunities. Additionally, the Company’s and the Servicer’s personnel communicate on almost a daily basis to discuss various issues regarding the loan pools. Company management personnel visit the Servicer’s operation in Omaha, Nebraska on a regular basis; and the Company’s loan review officer and its internal auditor perform asset reviews and audit procedures on a regular basis.
The Company’s overall cost basis in its loan pool participations represents a discount from the aggregate outstanding principal amount of the loans underlying the pools. For example, as of December 31, 2006 and 2005, such cost basis was $98,885,000 and $103,570,000, respectively, while the contractual outstanding principal amounts of the underlying loans as of such dates were approximately $147,995,000 and $150,556,000, respectively. The discounted cost basis inherently reflects the assessed collectibility of the underlying loans. The Company does not include any amounts related to the loan pool participations in its totals of nonperforming loans. As part of the ongoing collection process, the Servicer may, from time to time, foreclose on real estate
5
Table of Contents
mortgages and acquire title to property in satisfaction of such debts. This real estate may be held by the Servicer as “real estate owned” for a period of time until it can be sold. Since the Company’s investment in loan pools is classified as participations in pools of loans, the Company does not include the real estate owned that is held by the Servicer with the amount of any other real estate it may hold directly as a result of its own foreclosure activities.
The underlying loans in the loan pool participations include both fixed rate and variable rate instruments. No amounts for interest due are reflected in the carrying value of the loan pool participations. Based on historical experience, the average period of collectibility for loans underlying the Company’s loan pool participations, many of which have exceeded contractual maturity dates, is approximately three to five years. Management has reviewed the recoverability of the underlying loans and believes that the carrying value does not exceed the net realizable value of its investment in loan pool participations.
The Company competes in the commercial banking industry through the Bank. This industry is highly competitive, and the Bank faces strong direct competition for deposits, loans, and other financial-related services. The offices in Benton, Black Hawk, Des Moines, Iowa, Jefferson, Keokuk, Lee, Louisa, Mahaska, Marion, Scott and Wapello counties in south central and eastern Iowa compete with other commercial banks, thrifts, credit unions, stockbrokers, finance divisions of auto and farm equipment companies, agricultural suppliers, and other agricultural-related lenders. Some of these competitors are local, while others are statewide or nationwide. The Bank competes for deposits principally by offering depositors a wide variety of deposit programs, convenient office locations, hours and other services, and for loan originations primarily through interest rates and loan fees they charge, the efficiency and quality of services they provide to borrowers and the variety of their loan products. Some of the financial institutions and financial service organizations with which the Bank competes are not subject to the same degree of regulation as that imposed on federally insured Iowa-chartered banks. As a result, such competitors have advantages over the Bank in providing certain services. As of December 31, 2006, there were approximately 74 other banks having 225 offices or branches operating within the 12 counties in which the Company has locations. Based on deposit information collected by the FDIC as of June 30, 2006, the Company maintained approximately 6.5 percent of the bank deposits within the 12 counties. New competitors may develop that are substantially larger and have significantly greater resources than the Bank. Currently, major competitors in some of the Company’s markets include Wells Fargo Bank, U. S. Bank, Regions Bank and Bank of the West.
The Company also faces competition with respect to its investments in loan pool participations. The Company’s financial success regarding loan pools to date is largely attributable to the Servicer’s ability to determine which loan pools to bid on and ultimately purchase, the availability of assets to fund the purchases and the Servicer’s ability to collect on the underlying assets. Investments in loan pools have become increasingly popular in recent years, leading financial institutions and other competitors to become active at loan pool auctions conducted by the FDIC and other sellers. There is no assurance that the Company, through the Servicer, will be able to bid successfully in the future. Certain existing competitors of the Company are substantially larger and have significantly greater financial resources than the Company. Increased participation by new institutions or other investors may also create increased buying interest which could also result in higher bid prices for the type of loan pools considered for investment by the Company. In addition, new and existing competitors may develop due diligence procedures comparable to the Servicer’s procedures. The emergence of such competition could have a material adverse effect on the Company’s business and financial results. The Company expects that its success in the future will depend more on the performance of the Bank subsidiary and less on the investment in loan pool participations.
Financial holding companies and banks are extensively regulated under federal and state law. References under this heading to applicable statutes or regulations are brief summaries of the portions thereof and do not
6
Table of Contents
purport to be complete and are qualified in their entirety by reference to those statutes and regulations. Any change in applicable laws or regulations may have a material adverse effect on the business of the Company and the Bank.
The Company, as a financial holding company, is subject to regulation under the Bank Holding Company Act of 1956 (the “Act”) and is registered with the Board of Governors of the Federal Reserve System. Under the Act, the Company is prohibited, with certain exceptions, from acquiring direct or indirect ownership or control of more than 5% of the voting shares of any company which is not a bank and from engaging in any business other than that of banking, managing and controlling banks or furnishing services to affiliated banks, except that the Company may engage in and own shares of companies engaged in certain businesses found by the Board of Governors to be so closely related to banking “as to be proper incident thereto,” such as owning a savings association. The Act does not place territorial restrictions on the activities of bank-related subsidiaries of bank holding companies. The Company is required by the Act to file periodic reports of its operations with the Board of Governors and is subject to examination by the Board of Governors. Under the Act and Federal Reserve Board regulations, the Company and the Bank are prohibited from engaging in certain tie-in arrangements in connection with an extension of credit, lease, sale of property, or furnishing of services.
Iowa law permits bank holding companies domiciled in Iowa to make acquisitions throughout the state. Iowa law also permits bank holding companies located in the Midwestern Region (defined to include Illinois, Iowa, Minnesota, Missouri, Nebraska, South Dakota, and Wisconsin) to acquire banks or bank holding companies located in Iowa subject to approval by the Iowa Division of Banking and subject to certain statutory limitations. In addition, the Company may acquire banks or bank holding companies located in the Midwestern Region or outside the Midwestern Region, provided the Company’s principal place of business remains in the Midwestern Region and the acquisition is authorized by the laws of the state in which the acquisition is to be made.
The Company and its subsidiaries are affiliates within the meaning of the Federal Reserve Act. As affiliates, they are subject to certain restrictions on loans by an affiliated bank or thrift (collectively “affiliated banks”) to the Company, other affiliated banks or such other subsidiaries, on investments by an affiliated bank in their stock or securities and on an affiliated bank taking such stock and securities as collateral for loans to any borrower. The Company is also subject to certain restrictions with respect to direct issuance, flotation, underwriting, public sale or distribution of certain securities.
Under Iowa law, the Bank is subject to supervision and examination by the Iowa Division of Banking. The Bank is required to pay supervisory assessments to the Iowa Division of Banking to fund the operations of that agency. The amount of the assessment is calculated on the basis of the institution’s total assets. As an affiliate of the Bank, the Company is also subject to examination by the Iowa Division of Banking.
The customer deposits in the Bank are insured by the Federal Deposit Insurance Corporation (the “FDIC”), thus the Bank is subject to the supervision and examination by the FDIC. The Bank is required to maintain certain minimum capital ratios established by these regulators. The Bank is assessed fees by the FDIC to insure the funds of customers on deposit.
In addition, Iowa state law imposes restrictions on the operations of state-chartered banks including limitations on the amount a bank can lend to a single borrower and limitations on the nature and amount of securities in which it may invest. Iowa state-chartered banks are limited to loaning money to a single borrower in an amount not to exceed 15% of the individual bank’s aggregate capital, plus additional amounts under certain circumstances.
Iowa law currently permits the establishment of branches anywhere within the state, subject to the receipt of all required regulatory approvals. The number of offices a state bank may establish is not limited.
The Company operates within a regulatory structure that continuously evolves. In the last several years, significant changes have occurred that affect the Company. There can be no assurance that the Iowa or federal
7
Table of Contents
regulators will not in the future impose further restrictions or limits on the Company’s business operations including loan pool activities.
The FDIC Improvement Act of 1991 (the “FDICIA”) was primarily designed to recapitalize the FDIC’s Bank Insurance Fund (the “BIF”) and the Savings Association Insurance Fund (the “SAIF”). To accomplish this purpose the FDIC was granted additional borrowing authority, granted the power to levy emergency special assessments on all insured depository institutions, granted the power to change the BIF and SAIF rates on deposits on a semi-annual basis, and directed to draft regulations that provided for a “Risk-Based Assessment System” that was implemented on January 1, 1994. The FDICIA also imposed additional regulatory safety and soundness standards upon depository institutions and granted additional authority to the FDIC. The FDICIA generally requires that all institutions be examined by the FDIC annually. Under the provisions of the FDICIA, all regulatory authorities are required to examine their regulatory accounting standards and, to the extent possible, are required to conform to generally accepted accounting principles. Finally, the FDICIA requires the federal banking regulators to take prompt corrective action with respect to depository institutions that fall below certain capital standards and prohibits any depository institution from making any capital distribution that would cause it to be undercapitalized.
Legislation became effective on September 30, 1995, which served to lessen or remove certain legal barriers to interstate banking and branching by financial institutions. The legislation has resulted in an increase in the nationwide consolidation activity occurring among financial institutions by facilitating interstate bank operations and acquisitions.
On November 2, 1999, the Gramm-Leach-Bliley Act was enacted into law. This legislation provides for significant financial services reform by repealing key provisions of the Glass Steagall Act thereby permitting commercial banks to affiliate with investment banks, it substantially modifies the Bank Holding Company Act of 1956 to permit companies that own banks to engage in any type of financial activity, and it allows subsidiaries of banks to engage in a broad range of financial activities that are not permitted for banks themselves. The Gramm-Leach-Bliley Act significantly changed the competitive environment in which the Company and its subsidiaries conduct business, including the opportunity for brokerage and financial services such as those offered through MWI and insurance agency services offered by Cook.
In early 2006, the Federal Deposit Insurance Reform Act of 2005 (the Reform Act) was signed into law. The Reform Act implements deposit insurance reform through the merger of the Bank Insurance Fund and the Savings Association Insurance Fund, increases the coverage limit and indexes the limit for retirement accounts, establishes the methodology for deposit premium assessment based on risk criteria and grants a one-time initial assessment credit based on an institution’s past contributions to the deposit insurance fund. The new assessment rates are effective January 1, 2007. The Company’s one-time assessment credit of $494,000 will offset the premium assessment for all of 2007 and is expected to offset a portion of the 2008 premium assessment. Once the one-time assessment credit is fully utilized, the Company will incur deposit premium assessment costs that will reduce future profitability.
The earnings of the Company are affected by the policies of regulatory authorities, including the Federal Reserve System. Federal Reserve System monetary policies have had a significant effect on the operating results of banks and thrifts in the past and are expected to do so in the future. Because of changing conditions in the economy and in the money markets as a result of actions by monetary and fiscal authorities, interest rates, credit availability and deposit levels may change due to circumstances beyond the control of the Company. Future policies of the Federal Reserve System and other authorities cannot be predicted, nor can their effect on future earnings be predicted.
On December 31, 2006, the Company had 225 full-time equivalent employees. The Company provides its employees with a comprehensive program of benefits, some of which are on a contributory basis, including comprehensive medical and dental plans, life insurance, long-term and short-term disability coverage, a 401(k)
8
Table of Contents
plan, and an employee stock ownership plan. None of the Company’s employees are represented by unions. Management considers its relationship with its employees to be excellent.
The performance of the Company is subject to various risks. We consider the risks described below to be the most significant risks we face, but such risks are not the only risk factors that could affect us. Additional risks and uncertainties not currently known to us or that we currently deem to be immaterial also may materially and adversely affect our business, financial condition or results of operations.
We may be adversely affected by economic conditions in the local economies in which we conduct our operations, and in the United States in general.
Unfavorable or uncertain economic and market conditions may adversely affect our business and profitability. Our business faces various material risks, including credit risk and the risk that the demand for our products and services will decrease. Foreign or domestic terrorism or geopolitical events could shock commodity and financial markets and cause an economic downturn. In an economic downturn, our credit risk and litigation expense would increase. Also, decreases in consumer confidence, real estate values, interest rates and investment returns, usually associated with a downturn, could make the types of loans we originate less profitable.
We invest in pools of performing and nonperforming loans that comprise a significant component of our assets and generate substantial interest income with yields that may fluctuate considerably resulting in inconsistent profitability from period to period.
As of December 31, 2006, approximately fourteen percent of the Company’s earning assets were invested in loan pools. For the year ended December 31, 2006, approximately seventeen percent of the Company’s gross total revenue was derived from the loan pools. The loan pool investment is a “non-traditional” activity that the Company has been involved with since 1988 that has historically provided a higher return than typical loans and investment securities. The return on the Company’s investment in loan pools and the effect on the Company’s profitability is somewhat unpredictable due to fluctuations in the balance of loan pools and collections from borrowers by the loan pool Servicer. Balances of the loan pools are affected by the ability to purchase additional loan pools to maintain the level of investment and by the payment and refinancing activities of the borrowers resulting in pay-offs of the underlying loans and reduction in the balances. Purchase of the new loan pools are subject to many factors that are outside the Company’s control including: availability, competition, credit and performance quality of assets offered for sale, asset size and type, and the economic and interest rate environment. Collections from the individual borrowers are managed by the Servicer and are affected by the borrower’s financial ability and willingness to pay, foreclosure and legal action, collateral value, and the economy in general. Any of these identified factors, and others not identified, can affect the Company’s return on the loan pool investment. We believe that the higher return historically realized on the loan pool investment compensates for the unpredictability of purchases and collections on the pools.
Our growth strategy involves risks that may negatively impact our net income and we may experience difficulties in managing our growth.
We may acquire banks and related businesses as part of our growth strategy that we believe provide a strategic and/or a geographic fit with our business. To the extent that we grow through acquisitions, we cannot assure you that we will be able to adequately and profitably manage this growth. There are risks typically associated with acquiring other banks and businesses, including the difficulty and expense of integrating operations and personnel, the possible loss of key customers and/or employees of the acquired business, potential asset quality issues, the potential disruption to our business, diversion of management’s time and attention, and the possibility of unknown or contingent liabilities. In addition to acquisitions, we may expand into new communities by opening “de novo” banks and/or branches. As we expand via the opening of de novo banks or branches, we are likely to incur higher operating expenses relative to operating income from the new operations, which may have an adverse effect on our net income, return on average equity and return on average assets.
9
Table of Contents
Our ability to retain and attract qualified employees is critical to the success of our business and the failure to do so may materially adversely affect our performance.
Our people are our most important resource and competition for qualified employees is intense. In order to retain and attract qualified employees, we must compensate such employees at market levels. Typically, those levels have caused employee compensation to be our greatest noninterest expense. If we are unable to continue to retain and attract qualified employees, or if compensation costs required to retain and attract qualified employees becomes more expensive, our performance, including our competitive position, could be affected.
Our allowance for loan losses may be insufficient to absorb possible losses in our loan portfolio.
Like all financial institutions, we maintain an allowance for loan losses to provide for loans in our portfolio that may not be repaid in their entirety. We believe that our allowance for loan losses is maintained at a level adequate to absorb probable losses inherent in our loan portfolio as of the corresponding balance sheet date. However, our allowance for loan losses may not be sufficient to cover actual losses, and future provisions for loan losses could materially adversely affect our operating results.
We are subject to substantial regulation which could adversely affect our business and operations.
As a financial institution, we are subject to extensive regulation, which materially affects our business. Statutes, regulations and policies that we are subject to may be changed at any time, and the interpretation and the application of those laws and regulations by our regulators is also subject to change. There can be no assurance that future changes in regulations or in their interpretation or application will not adversely affect us. We have established policies, procedures and systems designed to comply with these regulatory and operational risk requirements. We do, however, face complexity and costs associated with our compliance efforts. Adverse publicity and damage to our reputation arising from the failure or perceived failure to comply with legal, regulatory or contractual requirements could affect our ability to attract and retain customers or could result in enforcement actions, fines, penalties and lawsuits.
If we are not able to anticipate and keep pace with rapid changes in technology, or do not respond to rapid technological changes in our industry, our business can be adversely affected.
The financial services industry continues to experience rapid technological changes with frequent introductions of new technology-driven products and services. The effective use of technology increases efficiency and enables financial institutions to better serve customers and reduce costs. Our future success will depend, in part, upon our ability to address the needs of our customers by using technology to provide products and services that will satisfy customer demands for convenience, as well as to create additional efficiencies in our operations. Many of our competitors have substantially greater resources to invest in technological improvements. As a result, we may not be able to effectively implement new technology-driven products and services or be successful in marketing these products and services to our customers.
We are subject to security and operational risks relating to our use of technology that could damage our reputation and our business.
Security breaches in our internet banking activities could expose us to possible liability and damage our reputation. Any compromise of our security could also prevent customers from using our internet banking services that involve the transmission of confidential information. We rely on standard internet security systems to provide the security and authentication necessary to effect secure transmission of data. These precautions may not protect our systems from compromises or breaches of our security measures that could result in damage to our reputation and our business.
10
Table of Contents
We are subject to operational risk and an operational failure that could materially adversely affect our business.
Operational risk refers to the risk of loss arising from inadequate or failed internal processes, people, and/or systems. Operational risk also refers to the risk that external events, such as external changes (e.g., natural disasters, terrorist attacks and/or health epidemics), failures or frauds, will result in losses to our business. We seek to monitor and control our risk exposure through a variety of financial, credit, operational, compliance and legal reporting systems. We employ risk monitoring and risk mitigation techniques, but those techniques and the judgments that accompany their application may not be adequate to deal with unexpected economic and financial events or the specifics and timing of such events. Employee errors and employee or customer misconduct could subject us to financial losses or regulatory sanctions and seriously harm our reputation. We maintain a system of internal control and insurance coverage to mitigate against operational risks, including data processing system failures and errors and customer or employee fraud.
We experience intense competition for loans and deposits.
The banking business is highly competitive and we experience competition in all of our markets from many other financial institutions. We compete with large regional banks, local community banks, credit unions, thrifts, securities and brokerage companies, mortgage companies, insurance companies, finance companies, money market mutual funds, and other non-bank financial service providers. We compete with these institutions both in attracting deposits and making loans as well as in providing other financial services. Increased competition in our market may result in a decrease in amounts of our loans and deposits, reduced spreads between loan rates and deposit rates, or loan terms that are more favorable to the borrowers. Any of these could have a material adverse effect on our ability to grow and remain profitable.
Changing interest rates may adversely affect our profits.
The spread between the interest rates earned on investments, loans and loan pools and the interest rates paid on deposits and other interest-bearing liabilities affects, in part, our profitability. Like other financial institutions, our net interest spread and margin will be affected by general economic conditions and other factors that influence market interest rates and our ability to respond to changes in such rates. Our assets and liabilities at any given time will be such that they are affected differently by a given change in interest rates. As a result, an increase or decrease in rates, the length of loan and certificate of deposit terms or the mix of adjustable and fixed rate loans in our portfolio could have a positive or negative effect on our profitability. We measure interest rate risk under various rate scenarios and using specific criteria and assumptions. This process is summarized under Item 7A of Part II of this Form 10-K. Although we believe our current level of interest rate sensitivity is reasonable and effectively managed, significant fluctuations in interest rates may have an adverse effect on our business, financial condition and results of operations.
If we do not continue to meet or exceed regulatory capital requirements and maintain our “well-capitalized” status, there could be an adverse effect on the manner in which we do business and on the confidence our customers have in us.
Under regulatory capital guidelines, we must meet guidelines that involve quantitative measures of assets, liabilities and certain off-balance sheet items. Failure to meet minimum capital requirements could have a material effect on our financial conditions and could subject us to a variety of enforcement actions, as well as certain restrictions on our business. Failure to maintain the status of “well-capitalized” under the regulatory framework could adversely affect the confidence that our customers have in us, which could lead to a decline in the demand for our products and affect the prices that we are able to charge for our products and services.
Item 1B. Unresolved Staff Comments
NONE
11
Table of Contents
The Company owns its headquarters building located at 222 First Avenue East, Oskaloosa, Iowa. This building is a two-story combination office, data processing facility, and motor bank that was constructed in 1975. The Company’s offices are located on the second floor and the data processing area is located on the first floor. The Bank rents the first floor motor bank area, which includes four drive-up lanes and two walk-up windows and the basement from the Company. The basement contains a meeting room, kitchen, and storage. The Bank leases the facility on a month-to-month basis from the Company.
The principal offices of the Bank are located at 124 South First Street, Oskaloosa, Iowa, in a two-story building owned by the Bank that contains a full banking facility. The Bank also owns a second building in Oskaloosa located at 301 A Avenue West. This one-story banking facility includes two drive-up lanes and is located five blocks northwest of the bank’s principal offices. In addition, the Bank owns a 24-hour automatic teller machine located at 211 South First Street, Oskaloosa, Iowa. The Bank also has four branch locations located outside of Oskaloosa in the communities of North English, Belle Plaine, Hudson and Waterloo, Iowa. All of these branches are full-banking facilities. North English is located 40 miles northeast of Oskaloosa and the branch has two drive-up lanes and a 24-hour automatic teller machine. Belle Plaine is located 60 miles northeast of Oskaloosa and the branch occupies a 6,500 square foot building. This branch also has a motor bank located one block away with one drive-up lane and a 24-hour automatic teller machine. Hudson is located 80 miles north of Oskaloosa and the 2,592 square foot branch has two drive-up lanes and a 24-hour automatic teller machine. Waterloo is located 90 miles north of Oskaloosa and the 3,837 square foot branch has one drive-up lane.
The Bank owns four facilities in the communities of Ottumwa, Fairfield, and Sigourney, Iowa. The Ottumwa building is a two-story brick structure constructed in 1981 and completely remodeled and expanded in 2005. The approximately 10,910 square foot building has several offices, two drive-up lanes, and a drive-up 24 hour automatic teller machine. The building is located at 116 West Main in Ottumwa’s downtown business district. The Fairfield facility is a two-story building located at 58 East Burlington on the southeast corner of the downtown square. The building’s 8,932 square feet is all utilized by the Bank. The Bank also owns and occupies a 3,500 square foot branch facility at 2408 West Burlington Street in Fairfield. The Sigourney facility located at 112 North Main Street is one-half block northwest of the community’s courthouse square in the downtown business district. The 4,596 square foot one-story masonry building was constructed in 1972 as a banking facility with one drive-up window.
The Bank leases a facility in Pella’s downtown business district that opened on January 29, 2001. The 5,700 square foot facility is located in a retail/office complex and is leased for a period of ten years with options to renew. The Bank owns a branch facility at 500 Oskaloosa Street in Pella, Iowa. The facility is located approximately six blocks south of the community’s main business district. The building was acquired in the summer of 1997 and was completely renovated to become a modern banking facility containing approximately 1,860 square feet of usable space with two drive-up teller lanes.
The Bank owns two offices in Burlington, Iowa and two branch office facilities in other communities near Burlington. The Burlington office located at 3225 Division Street, on the western side of the community, is adjacent to one of the major highways through Burlington. It is a one-story facility of approximately 10,300 square feet, constructed in 1974, with four drive-up lanes and one ATM. The Bank also owns a branch facility located in Burlington’s main downtown business district at 323 Jefferson Street. This facility is approximately 2,400 square feet and was the main office until 1974. The branch located in Fort Madison, Iowa at 926 Avenue G was acquired in 1975, has one drive-up window, and contains approximately 3,300 square feet on one level. The 960 square foot Wapello, Iowa branch is located on Highway 61 and was acquired in 1974.
The Bank leases a branch office facility in downtown Davenport, Iowa that was occupied on February 26, 2007. The branch contains approximately 6,450 square feet and has two drive-up lanes and an ATM. The lease agreement is for a period of twelve years with a bargain purchase option.
12
Table of Contents
The Bank is in the process of constructing a new branch facility in Cedar Falls. Iowa, in a new commercial/retail/residential development on the city’s south side. The new facility will contain approximately 7,250 square feet of space on one level and will have two drive-up lanes and an ATM. The new facility will be in an area that will attract more retail deposits and loans. It is anticipated that the new facility will be occupied in the early fall of 2007. The Bank will own this facility.
MidWestOne Investments, Inc. leases approximately 2,600 square feet of office space adjoining the Bank facility in downtown Pella. The office space is leased for a period of ten years with options to renew.
Cook & Son Agency, Inc. rents office space of approximately 1,260 square feet in downtown Pella. The rental agreement is on a month-to-month basis.
MidWestOne Financial Group, Inc. and its subsidiaries are involved in various claims and legal actions arising in the ordinary course of business. In the opinion of management, the ultimate disposition of these matters will not have a material adverse effect on the Company’s financial position or results of operations.
Item 4. Submission of Matters to a Vote of Security Holders
There were no matters submitted during the fourth quarter of the fiscal year covered by this report to a vote of security holders, through the solicitation of proxies or otherwise.
13
Table of Contents
Item 5. Market for the Registrant’s Common Equity and Related Stockholder Matters
The Company’s common stock, par value $5.00 per share, is listed for quotation on the NASDAQ Global Market under the symbol “OSKY”. As of December 31, 2006, there were 3,715,431 shares of common stock outstanding held by approximately 412 holders of record. Additionally, there are an estimated 1,200 beneficial holders whose stock was held in street name by brokerage houses as of that date. The closing price of the Company’s common stock was $19.94 on December 31, 2006. The following table sets forth the high and low closing price per share of the Company’s stock during 2006 and 2005.
| 2006 | 2005 | |||||||||||
| Closing price | Closing price | |||||||||||
Quarter Ended | High | Low | High | Low | ||||||||
March 31 | $ | 19.80 | $ | 17.50 | $ | 20.26 | $ | 17.48 | ||||
June 30 | 19.70 | 18.75 | 18.90 | 17.50 | ||||||||
September 30 | 19.86 | 18.80 | 19.24 | 18.38 | ||||||||
December 31 | 20.55 | 18.85 | 18.74 | 17.25 | ||||||||
The Company paid dividends to common shareholders in 2006 and in 2005 of $.71 and $.68 per share, respectively. The Company has paid per share cash dividends with respect to its common stock as follows:
Quarter | 1st | 2nd | 3rd | 4th | ||||||||
2006 | $ | 0.17 | $ | 0.18 | $ | 0.18 | $ | 0.18 | ||||
2005 | $ | 0.17 | $ | 0.17 | $ | 0.17 | $ | 0.17 | ||||
Dividend declarations are evaluated and determined by the Board of Directors on a quarterly basis. In January 2007, the Board of Directors declared a dividend of $.18 per common share payable March 15, 2007. The Company’s loan agreement with Harris N.A. allows the Company to pay dividends so long as no default or event of default exists. Except for certain regulatory restrictions that may affect dividend payments, there are no other restrictions on the Company’s present or future ability to pay dividends. The Company currently anticipates that comparable cash dividends will continue to be paid in the future.
The Company repurchased shares on the open market in 2006 as authorized by a stock repurchase program adopted by the Board of Directors on April 28, 2006. The Board authorized the repurchase of up to $2,000,000 of the outstanding shares of the Company through December 31, 2006. During the period from April through December 2006, the Company repurchased 65,500 shares for $1,268,325, or an average of $19.36 per share. During the year 2006, the Company received 1,550 shares in exchange from the exercise of stock options previously granted.
The Company did not repurchase any of its common stock on the open market during the fourth quarter of 2006.
The Company has two stock incentive plans under which shares of common stock are reserved for issuance pursuant to options or other awards that may be granted to officers, key employees and certain nonaffiliated directors of the Company. The stock incentive plans have been approved by the Company’s shareholders. The Company does not have any stock incentive plans that have not been approved by the Company’s shareholders. A summary of the shares that potentially could be issued, the weighted-average price and the remaining shares of the approved stock incentive plans as of December 31, 2006 follows:
Plan Category | Number of Securities to be issued upon exercise of outstanding options | Weighted-average exercise price of outstanding options | Number of securities remaining available for future issuance | ||||
Stock incentive plans approved by shareholders | 501,556 | $ | 17.05 | 324,398 | |||
14
Table of Contents
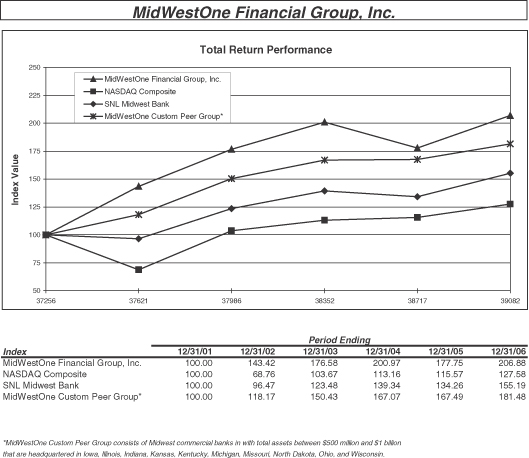
Financial Performance
The following graph illustrates the cumulative, five-year total return experienced by the Company’s shareholders since December 31, 2001, through December 31, 2006, compared to the NASDAQ Composite, SNL Midwest Bank Index and the MidWestOne Custom Peer Group. The indexes assume the investment of $100 on December 31, 2001 with all dividends reinvested. The Company’s stock price performance shown in the following graph is not indicative of future stock price performance.
15
Table of Contents
Item 6. Selected Financial Data
The following table sets forth certain selected consolidated financial data at or for the periods indicated. This information should be read in conjunction with the Company’s Consolidated Financial Statements and Notes thereto included herein. See “Item 8, Consolidated Financial Statements and Supplementary Data.”
Year Ended December 31 (In thousands, except per share data) | 2006 | 2005 | 2004 | 2003 | 2002 | |||||||||||
Summary of income data: | ||||||||||||||||
Interest income excluding loan pool participations | $ | 37,312 | 29,858 | 27,977 | 28,593 | 27,482 | ||||||||||
Interest and discount on loan pool participations | 9,142 | 10,222 | 9,395 | 8,985 | 10,058 | |||||||||||
Total interest income | 46,454 | 40,080 | 37,372 | 37,578 | 37,540 | |||||||||||
Total interest expense | 21,209 | 15,426 | 13,370 | 14,767 | 17,027 | |||||||||||
Net interest income | 25,245 | 24,654 | 24,002 | 22,811 | 20,513 | |||||||||||
Provision for loan losses | 180 | 468 | 858 | 589 | 1,070 | |||||||||||
Noninterest income | 5,928 | 4,428 | 4,276 | 4,358 | 3,787 | |||||||||||
Noninterest expenses | 21,459 | 19,415 | 18,513 | 17,387 | 14,426 | |||||||||||
Income before income tax | 9,534 | 9,199 | 8,907 | 9,193 | 8,804 | |||||||||||
Income tax expense | 3,093 | 3,111 | 3,078 | 3,267 | 3,015 | |||||||||||
Net income | $ | 6,441 | 6,088 | 5,829 | 5,926 | 5,789 | ||||||||||
Per share data: | ||||||||||||||||
Net income—basic | $ | 1.74 | 1.63 | 1.54 | 1.54 | 1.49 | ||||||||||
Net income—diluted | 1.71 | 1.59 | 1.50 | 1.50 | 1.46 | |||||||||||
Cash dividends declared | 0.71 | 0.68 | 0.68 | 0.64 | 0.64 | |||||||||||
Book value | 16.83 | 15.77 | 15.18 | 14.84 | 14.17 | |||||||||||
Net tangible book value | 12.92 | 11.77 | 11.32 | 11.08 | 11.53 | |||||||||||
Selected financial ratios: | ||||||||||||||||
Net income to average assets | 0.92 | % | 0.93 | % | 0.92 | % | 0.98 | % | 1.07 | % | ||||||
Net income to average equity | 10.65 | 10.49 | 10.23 | 10.52 | 10.91 | |||||||||||
Dividend payout ratio | 40.80 | 41.72 | 44.16 | 41.56 | 42.95 | |||||||||||
Total shareholder’s equity to total assets | 8.39 | 8.63 | 8.75 | 9.01 | 10.37 | |||||||||||
Tangible shareholder’s equity to tangible assets | 6.57 | 6.59 | 6.67 | 6.88 | 8.60 | |||||||||||
Tier 1 capital ratio | 10.01 | 10.38 | 10.88 | 11.20 | 14.67 | |||||||||||
Net interest margin | 3.99 | 4.11 | 4.14 | 4.10 | 4.10 | |||||||||||
Gross revenue of loan pools to total gross revenue | 17.45 | 22.97 | 22.17 | 21.42 | 24.34 | |||||||||||
Allowance for loan losses to total loans | 1.13 | 1.16 | 1.19 | 1.29 | 1.30 | |||||||||||
Non-performing loans to total loans | 1.15 | 0.77 | 0.73 | 0.83 | 0.86 | |||||||||||
Net loans charged off (recovered) to average loans | (0.11 | ) | 0.05 | 0.25 | 0.08 | 0.15 | ||||||||||
| December 31 (In thousands) | 2006 | 2005 | 2004 | 2003 | 2002 | |||||||||||
Selected balance sheet data: | ||||||||||||||||
Total assets | $ | 744,911 | 676,332 | 650,564 | 623,306 | 537,026 | ||||||||||
Total loans net of unearned discount | 503,832 | 433,437 | 398,854 | 377,017 | 306,024 | |||||||||||
Total loan pool participations | 98,885 | 103,570 | 105,502 | 89,059 | 82,341 | |||||||||||
Allowance for loan losses | 5,693 | 5,011 | 4,745 | 4,857 | 3,967 | |||||||||||
Total deposits | 560,615 | 505,245 | 475,102 | 453,125 | 395,546 | |||||||||||
Total shareholders’ equity | 62,533 | 58,386 | 56,930 | 56,144 | 55,698 | |||||||||||
Item 7. Management’s Discussion and Analysis of Financial Condition and Results of Operations
The following presents management’s discussion and analysis of the consolidated financial condition and results of operations of the Company as of the dates and for the periods indicated. This discussion should be read in conjunction with the Consolidated Financial Statements and the Notes thereto and the Selected Financial Data presented herein.
SAFE HARBOR STATEMENT
This report contains certain forward-looking statements within the meanings of such term in the Private Securities Litigation Reform Act of 1995. The Company and its representatives may, from time to time, make
16
Table of Contents
written or oral statements that are “forward-looking” and provide information other than historical information, including statements contained in the Form 10-K, the Company’s other filings with the Securities and Exchange Commission or in communications to its stockholders. These statements involve known and unknown risks, uncertainties and other factors that may cause actual results to be materially different from any results, levels of activity, performance or achievements expressed or implied by any forward-looking statement. These factors include, among other things, the factors listed below.
Forward-looking statements, which may be based upon beliefs, expectations and assumptions of the Company’s management and on information currently available to management, are generally identifiable by the use of words such as “believe”, “expect”, “anticipate”, “should”, “could”, “would”, “plans”, “intend”, “project”, “estimate”, “forecast”, “may” or similar expressions. These forward-looking statements are subject to certain risks and uncertainties that could cause actual results to differ materially from those expressed in, or implied by, these statements. The Company wishes to caution readers not to place undue reliance on any such forward-looking statements, which speak only as of the date made. Additionally, the Company undertakes no obligation to update any statement in light of new information or future events.
The Company’s ability to predict results or the actual effect of future plans or strategies is inherently uncertain. Factors that could have an impact on the Company’s ability to achieve operating results, growth plan goals and future prospects include, but are not limited to, the following:
| • | Management’s ability to reduce and effectively manage interest rate risk and the impact of interest rates in general on the volatility of the Company’s net interest income. |
| • | Changes in the economic environment, competition, or other factors that may affect the Company’s ability to acquire loan pool participations. |
| • | Fluctuations in the value of the Company’s investment securities. |
| • | The ability to attract and retain key executives and employees experienced in banking and financial services. |
| • | The sufficiency of the allowance for loan losses to absorb the amount of actual losses inherent in the existing loan portfolio. |
| • | The Company’s ability to adapt successfully to technological changes to compete effectively in the marketplace. |
| • | Credit risks and risks from concentrations (by geographic area and by industry) within the Bank’s loan portfolio. |
| • | The effects of competition from other commercial banks, thrifts, mortgage banking firms, consumer finance companies, credit unions, securities brokerage firms, insurance companies, money market and other mutual funds, and other financial institutions operating in the Company’s market or elsewhere or providing similar services. |
| • | The failure of assumptions underlying the establishment of allowances for loan losses and estimation of values of collateral and various financial assets and liabilities. |
| • | Volatility of rate sensitive deposits. |
| • | Operation risks, including data processing system failures or fraud. |
| • | Asset/liability matching risks and liquidity risks. |
| • | Changes in the economic environment, competition, or other factors that may influence the anticipated growth rate of loans and deposits and the quality of the loan portfolio and loan and deposit pricing. |
| • | The Company’s ability to successfully pursue acquisition and expansion strategies and integrate any acquired companies. |
17
Table of Contents
| • | The costs, effects and outcomes of existing or future litigation. |
| • | Governmental monetary and fiscal policies, as well as legislative and regulatory changes, that may result in the imposition of costs and constraints on the Company. |
| • | Changes in general economic or industry conditions, nationally or in the communities in which the Company conducts business. |
| • | Acts of war or terrorism. |
| • | Changes in accounting policies and practices, as may be adopted by state and federal regulatory agencies and the Financial Accounting Standards Board. |
| • | The ability of the Company to manage the risks associated with the foregoing as well as anticipated. |
These risks and uncertainties should be considered in evaluation of the forward-looking statement and undue reliance should not be placed on such statements. The Company cautions that the foregoing list of important factors may not be all-inclusive and specifically declines to undertake any obligation to publicly revise any forward-looking statements that have been made to reflect any events or circumstances after the date of such statements or to reflect the occurrence of anticipated or unanticipated events.
OVERVIEW
The Company is a diversified financial services holding company providing full-service community banking through its banking subsidiaries in south central and eastern Iowa. The Company’s recent initiatives include the expansion of its banking activity through the establishment of a branch office in Davenport, Iowa in early 2006 and continued focus on non-banking activities to provide additional financial services such as investment brokerage and property casualty insurance to customers in the markets it serves. Additionally, the Company derives a substantial portion of its revenue from its investments in pools of performing and non-performing loans referred to as loan pool participations. The profitability of the Company depends primarily on its net interest income, provision for loan losses, noninterest income and noninterest expenses.
Net interest income is the difference between total interest income and total interest expense. Interest income is earned by the Company on its loans made to customers, the investment securities it holds in its portfolio, and the interest and discount recovery generated from its loan pool participations. The interest expense incurred by the Company results from the interest paid on customer deposits and borrowed funds. Fluctuations in net interest income can result from the changes in volumes of assets and liabilities as well as changes in market interest rates. The provision for loan losses reflects the cost of credit risk in the Company’s loan portfolio and is dependent on increases in the loan portfolio and management’s assessment of the collectibility of the loan portfolio under current economic conditions. Noninterest income consists of service charges on deposit accounts, commissions and fees for securities brokerage, commissions from the sale of insurance policies, fees received for data processing services provided to nonaffiliated banks, mortgage loan origination fees, other fees and commissions, and realized security gains or losses. Noninterest expenses include salaries and employee benefits, occupancy and equipment expenses, professional fees, other noninterest expenses, and the amortization of intangible assets. These noninterest expenses are significantly influenced by the growth of operations, with additional employees necessary to staff new banking centers.
PERFORMANCE SUMMARY
For the year ended December 31, 2006, the Company recorded net income of $6,441,000, or $1.74 per share basic and $1.71 per share diluted. This compares with $6,088,000, or $1.63 per share basic and $1.59 per share diluted, for the year ended December 31, 2005. Net income was $353,000, or 6 percent, greater in 2006 due to an increase in net interest income, a reduction in loan loss provision and an increase in noninterest income that was offset, in part, by increased noninterest expense.
18
Table of Contents
On January 6, 2006, the Company received the proceeds from the recovery of an agricultural loan that had been charged off in 2001. The proceeds included a loan principal recovery of $901,000 that was credited to the allowance for loan losses, $364,000 in interest that was recorded to interest income on loans and $50,000 credited to other loan income for the reimbursement of attorney fees incurred by the Company in 2001. The interest income and fees contributed $.08 per share basic and diluted to the Company’s earnings in 2006.
Total assets of the Company increased $68,579,000 or 10 percent to $744,911,000 as of December 31, 2006 compared to $676,332,000 as of December 31, 2005. The Company’s total loans outstanding increased $70,395,000 or 16 percent to $503,832,000 at December 31, 2006. Loan pool participations as of December 31, 2006 totaled $98,885,000, a decrease of 5 percent from the December 31, 2005 balance of $103,570,000. Deposits increased $55,370,000 or 11 percent to $560,615,000 as of December 31, 2006.
Return on average assets is a measure of profitability that indicates how effectively a financial institution utilizes its assets. It is calculated by dividing net income by average total assets. The Company’s return on average assets was .92 percent for 2006, .93 percent for 2005 and .92 percent for 2004. Although net income for the year 2006 was greater, average assets also increased during the year at a proportionally greater amount, thus contributing to the lower return on average assets in 2006. Return on average equity indicates what the Company earned on its shareholders’ investment and is calculated by dividing net income by average total shareholders’ equity. The return on average equity for the Company was 10.65 percent for 2006, 10.49 percent for 2005 and 10.23 percent for 2004. The return on average shareholders’ equity increased in 2006 reflecting the improved earnings of the Company with an increase in average shareholders’ equity.
Various operating and equity ratios for the Company are presented in the table below for the years indicated. The dividend payout ratio represents the percentage of the Company’s net income that is paid to shareholders in the form of cash dividends. Average equity to average assets is a measure of capital adequacy that presents the percentage of average total shareholders’ equity compared to the average assets of the Company. The equity to assets ratio expresses this ratio using the period-end amounts instead of on an average basis.
| Year ended December 31, | |||||||||
| 2006 | 2005 | 2004 | |||||||
Return on average total assets | 0.92 | % | 0.93 | % | 0.92 | % | |||
Return on average equity | 10.65 | 10.49 | 10.23 | ||||||
Dividend payout ratio | 40.80 | 41.72 | 44.16 | ||||||
Average equity to average assets | 8.65 | 8.86 | 9.03 | ||||||
Equity to assets ratio (at period end) | 8.39 | 8.63 | 8.75 | ||||||
Results of Operations
2006 Compared to 2005
Net Interest Income.Net interest income is the total of interest income earned on earning assets less interest expense paid on interest bearing liabilities. Net interest income is affected by changes in the volume and yields on earning assets and the volume and rates paid on interest bearing liabilities. Net interest margin is a ratio measurement of the net return on interest earning assets computed by dividing net interest income on a tax-equivalent basis by the annual average balance of all interest earning assets.
Net interest income increased $591,000 or 2 percent in 2006 to $25,245,000 compared with $24,654,000 in 2005 due primarily to greater loan volumes and higher market interest rates. The net interest margin decreased in 2006 to 3.99 percent compared with 4.11 percent in 2005 as the increase in net interest income was proportionately less than the increase in average earning assets.
Total interest income increased $6,374,000 or 16 percent in 2006 compared with 2005. Interest and fees on loans and interest on other earning assets increased in 2006, while interest and discount on loan pools and interest
19
Table of Contents
income on investment securities declined. Interest income on loans totaled $33,897,000 in 2006, an increase of $7,379,000 or 28 percent compared with 2005. The higher interest income on loans was due to growth in loan volumes and higher market interest rates. The average volume of loans outstanding in 2006 was $57,340,000 greater than in 2005. Most of this increase was in the agricultural operating, agricultural real estate, commercial and commercial real estate loan categories. A significant portion of the Company’s loan growth is attributable to opening a new branch in the Davenport, Iowa market early in 2006 and to continued expansion and loan demand in the Waterloo/Cedar Falls, Iowa market. The increase in the national prime rate has benefited the Company as the overall average rate on the total loan portfolio increased to 7.23 percent for 2006 compared with 6.41 percent for 2005. Interest and discount on loan pools decreased $1,080,000 or 11 percent in 2006 compared with 2005. The average balance of loan pools was $92,133,000 in 2006 compared with $100,808,000 in 2005, a decrease of $8,675,000 or 9 percent. This decrease in volume contributed to the reduction in interest income, as did a lower yield on the loan pools. The average yield on loan pools declined to 9.92 percent in 2006 from 10.14 percent in 2005. The lower yield on loan pools in 2006 was due to reduced collection cash flow. Interest income on investment securities declined $19,000 in 2006 to $3,299,000. This compares with $3,318,000 in 2005. The average balance of investment securities declined $9,463,000 as the proceeds from maturing securities were utilized to fund loan growth. The average tax-equivalent yield on the investment portfolio increased to 4.59 percent in 2006 compared with 3.99 percent in 2005 as lower-yielding securities matured and were replaced with securities having a higher market rate, which helped to offset the decrease in volume. The overall yield on earning assets increased to 7.27 percent in 2006 from 6.66 percent in 2005, while total earning assets averaged $647,609,000, or $40,513,000 higher in 2006.
Growth in deposits, additional borrowed funds and higher market interest rates contributed to an increase in total interest expense for 2006 in comparison to 2005. Total interest expense increased $5,783,000 or 37 percent in 2006 to $21,209,000. Total interest-bearing deposits averaged $34,377,000 higher in 2006 compared with 2005, while the average rate paid on deposits increased to 3.21 percent in 2006 versus 2.28 percent in 2005. Interest expense on deposits was $15,045,000 in 2006, an increase of $5,156,000 or 52 percent from 2005. Factors that contributed to the increase in interest expense on deposits for the year 2006 compared to 2005 include higher market interest rates and growth in the interest-bearing deposit totals resulting from an emphasis by the Company on attracting more deposits. In order to attract more deposits in its markets, the Company increased the rates it paid on selected terms of certificates of deposit to meet or exceed the competition’s rates. Throughout the year 2006, the Company averaged $7,849,000 in Fed Funds Purchased compared with $7,698,000 for 2005. Interest expense on Fed Funds Purchased increased $146,000 in 2006 compared with 2005 primarily due to higher market interest rates. The interest rates on Fed Funds Purchased correlate directly with the actions taken by the Federal Reserve to raise the discount rate in 2006. The average rate paid by the Company on Fed Funds Purchased increased to 5.32 percent in 2006 compared with 3.54 percent in 2005, which increased interest expense. The average balance of Federal Home Loan Bank Advances was $6,764,000 greater in 2006, with the average rate paid increasing to 4.83 percent in 2006 from 4.61 percent in 2005. The additional Federal Home Loan Bank Advances were utilized to fund loan growth. The increase in average rate was due to maturing advances that either were paid off or renewed at higher rates during the year. Interest expense on Federal Home Loan Bank Advances was $513,000 higher in 2006 compared with 2005. The average rate paid on all interest-bearing liabilities increased to 3.64 percent for 2006, compared with 2.82 percent for 2005.
20
Table of Contents
The following table presents a comparison of the average balance of earning assets, interest-bearing liabilities, interest income and expense, and average yields and costs for the years indicated. Interest income on tax-exempt securities is reported on a fully tax-equivalent basis assuming a 34 percent tax rate. Dividing income or expense by the average balances of assets or liabilities results in such yields and costs. Average balances are derived from daily balances. Nonaccrual loans are included in the loan category.
| Year ended December 31, | |||||||||||||||||||||||||||
| 2006 | 2005 | 2004 | |||||||||||||||||||||||||
Average Balance | Interest Income (2)/ Expense | Average Rate/ Yield | Average Balance | Interest Income (2)/ Expense | Average Rate/ Yield | Average Balance | Interest Income (2)/ Expense | Average Rate/ Yield | |||||||||||||||||||
| (dollars in thousands) | |||||||||||||||||||||||||||
Average earning assets: | |||||||||||||||||||||||||||
Loans (1) | $ | 471,312 | $ | 34,052 | 7.23 | % | $ | 413,972 | $ | 26,518 | 6.41 | % | $ | 391,131 | $ | 23,885 | 6.11 | % | |||||||||
Loan pool participations | 92,133 | 9,142 | 9.92 | 100,808 | 10,222 | 10.14 | 89,430 | 9,395 | 10.50 | ||||||||||||||||||
Interest-bearing deposits | 541 | 32 | 5.78 | 393 | 9 | 2.25 | 498 | 4 | 0.84 | ||||||||||||||||||
Investment securities available for sale: | |||||||||||||||||||||||||||
Taxable investments | 58,097 | 2,379 | 4.09 | 74,869 | 2,671 | 3.57 | 90,214 | 3,455 | 3.83 | ||||||||||||||||||
Tax exempt investments | 11,351 | 652 | 5.75 | 4,193 | 239 | 5.70 | 3,478 | 203 | 5.83 | ||||||||||||||||||
Investment securities held to maturity: | |||||||||||||||||||||||||||
Taxable investments | 456 | 26 | 5.72 | 220 | 13 | 5.90 | 1,347 | 118 | 8.77 | ||||||||||||||||||
Tax exempt investments | 12,056 | 702 | 5.83 | 12,141 | 721 | 5.93 | 7,415 | 501 | 6.76 | ||||||||||||||||||
Federal funds sold | 1,663 | 84 | 5.05 | 500 | 13 | 2.70 | 3,329 | 50 | 1.49 | ||||||||||||||||||
Total earning assets | $ | 647,609 | $ | 47,069 | 7.27 | $ | 607,096 | $ | 40,406 | 6.66 | $ | 586,842 | $ | 37,611 | 6.41 | ||||||||||||
Average interest-bearing liabilities: | |||||||||||||||||||||||||||
Interest-bearing checking | $ | 64,056 | $ | 347 | 0.54 | $ | 67,591 | $ | 321 | 0.47 | $ | 64,203 | $ | 239 | 0.37 | ||||||||||||
Savings | 114,040 | 2,818 | 2.47 | 119,850 | 1,677 | 1.40 | 124,106 | 1,328 | 1.07 | ||||||||||||||||||
Certificates of deposit | 289,932 | 11,880 | 4.10 | 246,210 | 7,891 | 3.20 | 232,373 | 6,770 | 2.91 | ||||||||||||||||||
Federal funds purchased | 7,849 | 418 | 5.32 | 7,698 | 272 | 3.54 | 5,578 | 82 | 1.47 | ||||||||||||||||||
Federal Home Loan Bank advances | 92,091 | 4,446 | 4.83 | 85,327 | 3,933 | 4.61 | 82,250 | 3,975 | 4.83 | ||||||||||||||||||
Notes payable | 4,881 | 373 | 7.63 | 9,998 | 583 | 5.83 | 10,108 | 428 | 4.23 | ||||||||||||||||||
Long-term debt | 10,310 | 927 | 8.99 | 10,310 | 749 | 7.26 | 10,310 | 548 | 5.32 | ||||||||||||||||||
Total interest-bearing liabilities | $ | 583,159 | $ | 21,209 | 3.64 | $ | 546,984 | $ | 15,426 | 2.82 | $ | 528,928 | $ | 13,370 | 2.53 | ||||||||||||
Net interest income | $ | 25,860 | 3.63 | $ | 24,980 | 3.84 | $ | 24,241 | 3.88 | ||||||||||||||||||
Net interest margin (3) | 3.99 | % | 4.11 | % | 4.13 | % | |||||||||||||||||||||
| (1) | Average loans outstanding includes the daily average balance of non-performing loans. Interest on these loans does not include additional interest of $196,000, $353,000, and $166,000 for 2006, 2005 and 2004, respectively, which would have been accrued based on the original terms of these loans compared to the interest that was actually recorded. Interest earned on loans includes loan fees (which are not material in amount). |
| (2) | Includes interest income and discount realized on loan pool participations. |
| (3) | Net interest margin is net interest income divided by average total earning assets. |
21
Table of Contents
The following table sets forth an analysis of volume and rate changes in interest income and interest expense of the Company’s average earning assets and average interest-bearing liabilities reported on a fully tax-equivalent basis assuming a 34% tax rate. The table distinguishes between the changes related to average outstanding balances (changes in volume holding the initial interest rate constant) and the changes related to average interest rates (changes in average rate holding the initial outstanding balance constant). The change in interest due to both volume and rate has been allocated to volume and rate changes in proportion to the relationship of the absolute dollar amounts of the change in each.
| Year ended December 31, | ||||||||||||||||||||||||
| 2006 Compared to 2005 Increase/ (Decrease) Due to | 2005 Compared to 2004 Increase/ (Decrease) Due to | |||||||||||||||||||||||
| Volume | Rate | Net | Volume | Rate | Net | |||||||||||||||||||
| (in thousands) | ||||||||||||||||||||||||
Interest income from average earning assets: | ||||||||||||||||||||||||
Loans | $ | 3,917 | $ | 3,617 | $ | 7,534 | $ | 1,432 | $ | 1,201 | $ | 2,633 | ||||||||||||
Loan pool participations (1) | (865 | ) | (215 | ) | (1,080 | ) | 1,162 | (335 | ) | 827 | ||||||||||||||
Interest-bearing deposits | 5 | 18 | 23 | (1 | ) | 6 | 5 | |||||||||||||||||
Investment securities available for sale: | ||||||||||||||||||||||||
Taxable investments | (651 | ) | 359 | (292 | ) | (559 | ) | (225 | ) | (784 | ) | |||||||||||||
Tax exempt investments | 411 | 2 | 413 | 41 | (5 | ) | 36 | |||||||||||||||||
Investment securities held to maturity: | ||||||||||||||||||||||||
Taxable investments | 13 | — | 13 | (75 | ) | (30 | ) | (105 | ) | |||||||||||||||
Tax exempt investments | (6 | ) | (13 | ) | (19 | ) | 287 | (67 | ) | 220 | ||||||||||||||
Federal funds sold | 52 | 19 | 71 | (60 | ) | 23 | (37 | ) | ||||||||||||||||
Total income from earning assets | 2,876 | 3,787 | 6,663 | 2,227 | 568 | 2,795 | ||||||||||||||||||
Interest expense from average interest-bearing liabilities: | ||||||||||||||||||||||||
Interest-bearing checking | (18 | ) | 44 | 26 | 14 | 68 | 82 | |||||||||||||||||
Savings | (85 | ) | 1,226 | 1,141 | (47 | ) | 396 | 349 | ||||||||||||||||
Certificates of deposit | 1,553 | 2,436 | 3,989 | 418 | 703 | 1,121 | ||||||||||||||||||
Federal funds purchased | 6 | 140 | 146 | 40 | 150 | 190 | ||||||||||||||||||
Federal Home Loan Bank advances | 321 | 192 | 513 | 146 | (188 | ) | (42 | ) | ||||||||||||||||
Notes payable | (356 | ) | �� | 146 | (210 | ) | (5 | ) | 160 | 155 | ||||||||||||||
Long-term debt | — | 178 | 178 | — | 201 | 201 | ||||||||||||||||||
Total expense from interest-bearing liabilities | 1,421 | 4,362 | 5,783 | 566 | 1,490 | 2,056 | ||||||||||||||||||
Net interest income | $ | 1,455 | $ | (575 | ) | $ | 880 | $ | 1,661 | $ | (922 | ) | $ | 739 | ||||||||||
| (1) | Includes interest income and discount realized on loan pool participations. |
PROVISION FOR LOAN LOSSES.The provision for loan losses recorded by the Company for 2006 was $180,000, a decrease of $288,000 or 62 percent, compared with the provision of $468,000 for 2005. Early in 2006, the Company recovered $901,000 from an agricultural loan that had been charged off in 2001. This amount was credited to the allowance for loan losses. Management determines an appropriate provision based on its evaluation of the adequacy of the allowance for loan losses in relationship to a continuing review of current collection risks within its loan portfolio, identified problem loans, the current local and national economic conditions, actual loss experience, regulatory policies, and industry trends. The reduction in the provision for loan losses in 2006 compared with 2005 primarily reflects the recovery of the previously charged off loan. Net loan recoveries for 2006 totaled $502,000 compared with net charge-offs of $202,000 in 2005. The effect of the recovery was partially offset by growth in the Company’s loan portfolio, identified problem loans and local economic conditions as management evaluated the allowance for loan losses and the provision for losses required to maintain an adequate level in the allowance.
22
Table of Contents
NONINTEREST INCOME.Noninterest income (including realized investment security gains and losses) increased $1,500,000 or 34 percent in 2006 to $5,928,000. This compares with noninterest income of $4,428,000 for 2005. The Company recognized losses of $212,000 from the sale of investment securities available for sale in 2006 compared with realized gains of $28,000 in 2005. During 2006, the Company executed two sales of investment securities available for sale. The first sale involved five securities having a par value of $6,530,000 with a remaining average maturity of 10 months and a yield of 2.57 percent. These securities were sold with a recognized loss of $126,000 with the proceeds utilized to fund loan demand. A second sale of $4,000,000 with a remaining average maturity of 10 months and a weighted-average yield of 3.11 percent resulted in a loss of $86,000. The proceeds from this sale were reinvested in similar securities with an average maturity of 7.4 years and yield of 5.81 percent. The transaction was undertaken to improve the overall yield of the Company’s investment portfolio in view of the interest rate yield curve. Excluding security losses recognized and gains realized, noninterest income was $6,140,000 for 2006 compared with $4,400,000 for 2005. Service charges increased $526,000 in 2006 with much of the additional income due to increased overdraft fees following the implementation of an overdraft protection program late in 2005. Brokerage commissions attributable to MWI increased $431,000 or 76 percent in 2006 as a result of growth in investment sales to clients. Insurance commissions generated by Cook and by Bank sales of credit life insurance totaled $705,000 in 2006 compared with $218,000 in 2005, in increase of $487,000. The Company acquired Cook in September 2005, so there is not a full-year comparison. Secondary market mortgage loan origination fees increased $137,000 or 31 percent reflecting additional lending activity in the Davenport market and continued demand in other markets. Mortgage origination fees are very dependent on new mortgage loan originations and customers refinancing real estate loans to take advantage of lower market interest rates. Depending on future interest rates, the level of refinancing activity may change. If the refinancing activity slows, mortgage origination fee income may be reduced in subsequent periods. Other operating income totaled $483,000 in 2006, an increase of $209,000 or 76 percent in 2006. The increase was primarily due to the nonrecurring gain on the sale of the Company’s minority interest in a commercial real estate development partnership.
NONINTEREST EXPENSE.Noninterest expense totaled $21,459,000 for 2006 compared with $19,415,000 for 2005, an increase of $2,044,000 or 11 percent. Salaries and employee benefits increased $1,716,000 or 16 percent in 2006 due to the additional employees of the new Davenport office, the full year effects of the Cook acquisition, annual compensation adjustments, greater health insurance costs and increased other benefit costs. Net occupancy expense increased $23,000 to $3,491,000 in 2006. Data processing expense was $656,000 in 2006 compared with $451,000 in 2006, reflecting higher computer supplies and personal computer expenses. Other intangible asset amortization decreased to $289,000 in 2006 from $305,000 in 2005 reflecting the utilization of accelerated amortization method for the customer list intangible of MWI and Cook. Professional fees were $507,000 or 52 percent lower in 2006 compared with 2005 primarily due to reduced attorney and consultant fees. Other operating expense increased $623,000 or 18 percent in 2006 reflecting increased advertising, donations, internet banking costs, loan department expenses relating to foreclosed property, cash shortages and losses.
INCOME TAX EXPENSE.Income taxes decreased $18,000 in 2006 compared with 2005 due to an increase in the amount of tax-exempt income. The Company’s consolidated income tax rate varies from the statutory rate mainly due to the amount of tax-exempt income. The 2006 effective income tax as a percentage of income before tax was 32.4 percent, compared with 33.8 percent for 2005.
2005 Compared to 2004
Net Interest Income.Net interest income increased $652,000 or 3 percent in 2005 to $24,654,000 compared with $24,002,000 in 2004 due primarily to greater loan volumes and higher interest rates. The net interest margin decreased slightly in 2005 to 4.11 percent compared with 4.14 percent in 2004 as the increase in net interest income was proportionately less than the increase in average earning assets.
Total interest income increased $2,708,000 or 7 percent in 2005 compared with 2004. Interest and fees on loans and interest and discount on loan pools increased in 2005, while interest income on investment securities
23
Table of Contents
and other earning assets declined. Interest income on loans totaled $26,518,000 in 2005, an increase of $2,633,000 or 11 percent compared with 2004. The higher interest income on loans was due to growth in loan volumes and higher market interest rates. The average volume of loans outstanding in 2005 was $22,841,000 greater than in 2004. Most of this increase was in the commercial, commercial real estate and residential real estate loan categories. A significant portion of the Company’s loan growth is attributable to the Waterloo/Cedar Falls, Iowa market. The increase in the prime rate during 2005 benefited the Company as the overall average rate on the total loan portfolio increased to 6.41 percent for 2005 compared with 6.11 percent for 2004. Interest and discount on loan pools increased $827,000 or 9 percent in 2005 compared with 2004. The average balance of loan pools was $100,808,000 in 2005 compared with $89,430,000 in 2004, an increase of $11,378,000 or 13 percent. This increase in volume contributed to the higher interest income. The average yield on loan pools declined to 10.14 percent in 2005 from 10.50 percent in 2004, thereby offsetting some of the increase in interest and discount income attributable to the higher volume. The lower yield on loan pools in 2005 was due to reduced collection cash flow. Interest income on investment securities declined $720,000 in 2005 to $3,318,000. This compares with $4,038,000 in 2004 and reflects a decline in the average balance of investment securities of $11,031,000 as the proceeds from maturing securities were utilized to fund loan growth. The average tax-equivalent yield on the investment portfolio declined to 3.99 percent in 2005 compared with 4.18 percent in 2004 as higher-yielding securities matured and were replaced with securities having a lower market yield, also contributing to the reduction in interest income. The overall yield on earning assets increased to 6.66 percent in 2005 from 6.41 percent in 2004, while total earning assets averaged $607,096,000, or $20,254,000 higher in 2005.
Growth in deposits, greater utilization of borrowed funds and higher market interest rates all contributed to an increase in total interest expense for 2005 in comparison to 2004. Interest expense increased $2,056,000 or 15 percent in 2005 to $15,426,000. Total interest-bearing deposits averaged $12,969,000 higher in 2005 compared with 2004, while the average rate paid on deposits increased to 2.28 percent in 2005 versus 1.98 percent in 2004. Interest expense on deposits was $9,889,000 in 2005, an increase of $1,552,000 or 19 percent from 2004. Factors that contributed to the increase in interest expense on deposits for the year 2005 compared to 2004 include higher market interest rates and growth in the interest-bearing deposit totals resulting from an emphasis by the Company on attracting more deposits. In order to attract more deposits in its markets, the Company increased the rates it paid on selected terms of certificates of deposit to meet or exceed the competition’s rates. Throughout the year 2005, the Company averaged $7,698,000 in Fed Funds Purchased compared with $5,578,000 for 2004, with the greater balance contributing to the $190,000 increased interest expense. The interest rates on Fed Funds Purchased correlate directly with the actions taken by the Federal Reserve to raise the discount rate in 2005. The average rate paid by the Company on Fed Funds Purchased increased to 3.54 percent in 2005 compared with 1.47 percent in 2004, also contributing to the increased interest expense. The average balance of Federal Home Loan Bank Advances was $3,077,000 greater in 2005, but the average rate paid declined to 4.61 percent in 2005. This decline in average rate was due to maturing advances that either were paid off or renewed at lower rates during the year. Interest expense on Federal Home Loan Bank Advances was $42,000 lower in 2005 compared with 2004. The average rate paid on all interest-bearing liabilities was 2.82 percent for 2005 compared with 2.53 percent for 2004.
PROVISION FOR LOAN LOSSES.The provision for loan losses recorded by the Company for 2005 was $468,000, a decrease of $390,000 or 45 percent, compared with the provision of $858,000 for 2004. Management determines an appropriate provision based on its evaluation of the adequacy of the allowance for loan losses in relationship to a continuing review of current collection risks within its loan portfolio, identified problem loans, the current local and national economic conditions, actual loss experience, regulatory policies, and industry trends. The reduction in the provision for loan losses in 2005 primarily reflects the decrease in net loans charged off in 2005 compared with 2004. Net loan charge-offs for 2005 were $202,000 compared with $970,000 in 2004. The effect of the reduction in net charge-offs was partially offset by growth in the Company’s loan portfolio, identified problem loans and local economic conditions as management evaluated the allowance for loan losses and the provision for losses required to maintain an adequate level in the allowance.
24
Table of Contents
NONINTEREST INCOME.Noninterest income (including realized investment security gains) increased $152,000 or 4 percent in 2005 to $4,428,000. This compares with noninterest income of $4,276,000 for 2004. The Company realized gains of $28,000 from the sale of investment securities available for sale in 2005 compared with $226,000 in 2004. Excluding security gains realized, noninterest income was $4,400,000 for 2005 and $4,050,000 for 2004. Service charges and other fees increased $388,000 in 2005 with much of the additional income due to increased brokerage commissions attributable to MWI. Data processing income and secondary market mortgage loan origination fees declined slightly. Other operating income increased minimally in 2005.
NONINTEREST EXPENSE.Noninterest expense totaled $19,415,000 for 2005 compared with $18,513,000 for 2004, an increase of $902,000 or 5 percent. Salaries and employee benefits increased $291,000 or 3 percent in 2005 due to the additional employees of MWI and Cook, annual compensation adjustments, greater health insurance costs and increased other benefit costs. Net occupancy expense increased $246,000 or 8 percent in 2005 mainly due to increased real estate taxes, higher utilities cost and greater maintenance agreement cost on data processing equipment. Professional fees were $121,000 or 14 percent higher in 2005 compared with 2004 primarily due to consultant fees. Other operating expense increased $243,000 in 2005 reflecting increased advertising, donations, internet banking costs, loan department expenses relating to foreclosed property, cash shortages and losses.
INCOME TAX EXPENSE.Income taxes increased $33,000 in 2005 compared with 2004. The amount of income before tax was greater in 2005, thus increasing income tax expense. The Company’s consolidated income tax rate varies from the statutory rate mainly due to the amount of tax-exempt income. The 2005 effective income tax as a percentage of income before tax was 33.8 percent, compared with 34.6 percent for 2004.
ANALYSIS OF FINANCIAL CONDITION
LOANS
The Company’s loan portfolio increased $70,395,000 or 16 percent to $503,832,000 on December 31, 2006 from $433,437,000 on December 31, 2005. Most of this increase was in the commercial, commercial real estate and agricultural loan categories. A significant portion of the Company’s commercial and commercial real estate loan growth is attributable to the Davenport, Iowa market that the Company entered by establishing a branch office in January 2006 and the Waterloo/Cedar Falls, Iowa market that the Company entered through a bank acquisition in 2003. As of December 31, 2006, the Company’s loan to deposit ratio was 89.9 percent, compared with 85.8 percent at December 31, 2005.
The Company’s loan portfolio largely reflects the profile of the communities in which it operates. Total real estate loans (including 1-4 family residential, commercial, agricultural, construction, and multi-family real estate) were $332,534,000 as of December 31, 2006 compared with $293,363,000 as of December 31, 2005. Real estate loans of all types are the Company’s largest category of loans, comprising 66.0 percent of total loans at year-end 2006 and 67.7 percent at December 31, 2005. Commercial loans are the next largest category of loans at December 31, 2006, totaling approximately $89,236,000 or 17.7 percent of total loans compared with $72,248,000 or 16.7 percent of loans at December 31, 2005. As a percentage of the Company’s total loans as of December 31, 2006 agricultural loans were 13.2 percent compared with 12.8 percent as of December 31, 2005. Agricultural loans totaled $66,393,000 on December 31, 2006 compared with $55,471,000 as of December 31, 2005. The remaining 3.1 percent of the portfolio as of December 31, 2006 consisted of $15,579,000 in consumer and other loans compared with $12,355,000 as of December 31, 2005.
25
Table of Contents
The following table shows the composition of the Company’s loan portfolio as of the dates indicated. Total loans do not include the Company’s investment in loan pool participations.
| December 31, | ||||||||||||||||||||||||||||||
| 2006 | 2005 | 2004 | 2003 | 2002 | ||||||||||||||||||||||||||
| Amount | % of Total | Amount | % of Total | Amount | % of Total | Amount | % of Total | Amount | % of Total | |||||||||||||||||||||
| (dollars in thousands) | ||||||||||||||||||||||||||||||
Agricultural | $ | 66,393 | 13.2 | % | $ | 55,471 | 12.8 | % | $ | 53,545 | 13.4 | % | $ | 56,036 | 14.9 | % | $ | 38,004 | 12.4 | % | ||||||||||
Commercial | 89,326 | 17.7 | 72,248 | 16.7 | 70,104 | 17.6 | 60,532 | 16.0 | 39,324 | 12.9 | ||||||||||||||||||||
Real estate: | ||||||||||||||||||||||||||||||
1-4 family residences | 131,223 | 26.0 | 130,605 | 30.1 | 132,702 | 33.3 | 132,801 | 35.2 | 133,850 | 43.7 | ||||||||||||||||||||
5+ residential property | 14,752 | 2.9 | 11,077 | 2.5 | 10,210 | 2.5 | 7,323 | 1.9 | 4,373 | 1.4 | ||||||||||||||||||||
Agricultural | 52,765 | 10.5 | 40,641 | 9.4 | 38,163 | 9.6 | 42,809 | 11.4 | 28,947 | 9.5 | ||||||||||||||||||||
Construction | 57,669 | 11.5 | 36,654 | 8.5 | 20,113 | 5.0 | 10,475 | 2.8 | 8,058 | 2.6 | ||||||||||||||||||||
Commercial | 76,125 | 15.1 | 74,386 | 17.2 | 63,334 | 15.9 | 56,360 | 14.9 | 41,622 | 13.6 | ||||||||||||||||||||
Real estate total | 332,534 | 66.0 | 293,363 | 67.7 | 264,522 | 66.3 | 249,768 | 66.2 | 216,850 | 70.8 | ||||||||||||||||||||
Installment | 15,579 | 3.1 | 12,355 | 2.8 | 10,464 | 2.6 | 10,415 | 2.8 | 11,517 | 3.8 | ||||||||||||||||||||
Lease financing | — | — | — | — | 219 | 0.1 | 266 | 0.1 | 329 | 0.1 | ||||||||||||||||||||
Total loans (1) | $ | 503,832 | 100.0 | % | $ | 433,437 | 100.0 | % | $ | 398,854 | 100.0 | % | $ | 377,017 | 100.0 | % | $ | 306,024 | 100.0 | % | ||||||||||
Total assets | $ | 744,911 | $ | 676,332 | $ | 650,564 | $ | 623,306 | $ | 537,026 | ||||||||||||||||||||
Loans to total assets | 67.6 | % | 64.1 | % | 61.3 | % | 60.5 | % | 57.0 | % | ||||||||||||||||||||
| (1) | Total loans do not include the Company’s investments in loan pool participations. |
The following table sets forth the remaining maturities for certain loan categories as of December 31, 2006.
Due Within One Year | Due in One to Five Years | Due After Five Years | Total | Total for Loans Due Within One Year Having: | Total for Loans Due After One Year Having: | |||||||||||||||||||
| Fixed Rates | Variable Rates | Fixed Rates | Variable Rates | |||||||||||||||||||||
| (in thousands) | ||||||||||||||||||||||||
Agricultural | $ | 46,323 | $ | 16,741 | $ | 3,329 | $ | 66,393 | $ | 11,876 | $ | 34,447 | $ | 11,756 | $ | 8,314 | ||||||||
Commercial | 48,679 | 33,058 | 7,589 | 89,326 | 18,315 | 30,364 | 29,652 | 10,995 | ||||||||||||||||
Real estate: | ||||||||||||||||||||||||
1-4 family residences | 8,371 | 33,278 | 89,574 | 131,223 | 7,000 | 1,371 | 39,966 | 82,886 | ||||||||||||||||
5+ residential property | 749 | 12,376 | 1,627 | 14,752 | 749 | — | 12,052 | 1,951 | ||||||||||||||||
Agricultural | 4,962 | 24,548 | 23,255 | 52,765 | 4,763 | 199 | 30,769 | 17,034 | ||||||||||||||||
Construction | 34,104 | 19,209 | 4,356 | 57,669 | 21,001 | 13,103 | 18,974 | 4,591 | ||||||||||||||||
Commercial | 5,773 | 46,134 | 24,218 | 76,125 | 4,561 | 1,212 | 50,898 | 19,454 | ||||||||||||||||
Real estate total | 53,959 | 135,545 | 143,030 | 332,534 | 38,074 | 15,885 | 152,659 | 125,916 | ||||||||||||||||
Installment | 4,140 | 10,580 | 859 | 15,579 | 3,918 | 222 | 11,011 | 428 | ||||||||||||||||
Total loans | $ | 153,101 | $ | 195,924 | $ | 154,807 | $ | 503,832 | $ | 72,183 | $ | 80,918 | $ | 205,078 | $ | 145,653 | ||||||||
INVESTMENT IN LOAN POOLS
The Company invests in pools of performing and nonperforming loans categorized as loan pool participations. These loan pool participations are purchased at a discount from the aggregate outstanding principal amount of the underlying loans. Income is derived from this investment in the form of interest collected and the repayment of principal in excess of the purchase cost which is herein referred to as “discount.” For a more detailed discussion of loan pool participations and related accounting treatment, refer to Part I, Item 1. Business, Section C. Loan Pool Participations in this document.
26
Table of Contents
At year-end 2006, the Company’s loan pool participation total was $98,885,000 compared with $103,570,000 in 2005, a decrease of $4,685,000 or 5 percent. The balance of the loan pool participations represents the purchase cost of the loans. The average loan pool participation investment for 2006 was $92,133,000 compared with an average of $100,808,000 for 2005. The average balance of loan pool participations is affected by the ability of the Servicer to purchase loan pools, collection activity, and refinancing and settlements from borrowers. The ability of the Servicer to purchase pools of loans is influenced by the availability of pools from selling banks, competition from other buyers, liquidity of the Company and the interest rate environment. The Company is under no obligation to invest in pools of loans identified by the Servicer. Loan pool participation purchases made by the Company during 2006 totaled $40,071,000 compared with purchases of $51,058,000 in 2005. Approximately $18,921,000 or 47 percent of the loan pool purchases for 2006 were made in the fourth quarter of the year. Throughout 2006, loan pool participations represented 14.2 percent of average earning assets while in 2005 they represented 16.6 percent of average earning assets.
LOAN QUALITY
Total loans increased 16 percent during 2006 to $503,832,000 as of December 31, 2006. Non-performing assets as of December 31, 2006 totaled $5,989,000 or 1.19 percent of total loans. The year-end 2006 total of non-performing assets increased $164,000 or 3 percent when compared with the December 31, 2005 amount of $5,825,000 or 1.34 percent of total loans. Non-performing assets consist of nonaccrual loans, loans past due 90 days and still accruing, troubled debt restructurings and other real estate owned. Nonaccrual loans decreased $795,000 to a December 31, 2006 total of $727,000. Loans past due 90 days and over as of year-end 2006 totaled $3,060,000, an increase of $1,389,000 compared with the year-end 2005 total. Approximately one-half of the increase in loans past due 90 days and over is attributable to one credit, which is a truck terminal/warehouse facility. Troubled debt restructurings were $2,014,000 on December 31, 2006 and $159,000 on December 31, 2005. The increase in troubled debt restructurings is attributable to a truck stop/convenience store that was carried in other real estate on December 31, 2005 as a result of foreclosure late in 2005. The property was subsequently acquired by a new party who injected additional capital into the operation. The additional capital reduced the Company’s loan exposure in the credit. The operation continued to struggle financially under the new buyer, who negotiated a restructure of the terms of the loan. Other real estate owned consists of real estate acquired by the Company through foreclosure. Other real estate owned decreased $2,285,000 in 2006 as a result of the truck stop/convenience store property restructure to $188,000 as of December 31, 2006 from the December 31, 2005 total of $2,473,000. The Company does not have any commitments to lend additional funds to any borrowers who have non-performing loans or troubled debt restructurings. Efforts to further improve asset quality continue.
The following table provides information on the Company’s non-performing loans as of the dates indicated.
| December 31, | ||||||||||||||||||||
| 2006 | 2005 | 2004 | 2003 | 2002 | ||||||||||||||||
| (dollars in thousands) | ||||||||||||||||||||
90 days past due | $ | 3,060 | $ | 1,671 | $ | 858 | $ | 825 | $ | 1,401 | ||||||||||
Restructured | 2,014 | 159 | 486 | 567 | 206 | |||||||||||||||
Nonaccrual | 727 | 1,522 | 1,571 | 1,737 | 1,038 | |||||||||||||||
Total non-performing loans | $ | 5,801 | $ | 3,352 | $ | 2,915 | $ | 3,129 | $ | 2,645 | ||||||||||
Ratio of nonperforming loans to total loans | 1.15 | % | 0.77 | % | 0.73 | % | 0.83 | % | 0.86 | % | ||||||||||
The allowance for loan losses was $5,693,000 on December 31, 2006 and totaled $5,011,000 as of December 31, 2005. The allowance represented 1.13 percent of total loans at December 31, 2006 and 1.16 percent of loans on December 31, 2005. Additions to the allowance for the year 2006 were the result of growth in agricultural loans, agricultural real estate loans, commercial loans and commercial real estate loans. The allowance as a percentage of non-performing assets was 95.1 percent on December 31, 2006 and 86.0 percent on
27
Table of Contents
December 31, 2005. The allowance as a percentage of non-performing loans was 98.1 percent and 149.5 percent as of December 31, 2006 and 2005, respectively. The decrease in the percentage of the allowance relative to non-performing loans reflects the increase in troubled debt restructure of the truck stop/convenience store property, which is included in the non-performing loan category. In January 2006 the Company received the proceeds from the recovery of an agricultural loan that had been charged off in 2001 totaling $901,000. This amount was credited to the allowance for loan losses as a charge-off recovery in 2006. Net loan recoveries were $502,000 or (.11%) of average loans compared with 2005 net charge-offs of $202,000 or .05 percent of average loans. The allowance for loan losses is maintained at a level considered by management to be adequate to provide for loan losses inherent in the portfolio at the balance sheet date.
The following table sets forth loans charged off and recovered by the type of loan and an analysis of the allowance for loan losses for the years indicated.
| Year ended December 31, | ||||||||||||||||||||
| 2006 | 2005 | 2004 | 2003 | 2002 | ||||||||||||||||
| (dollars in thousands) | ||||||||||||||||||||
Amount of loans outstanding at end of period (net of unearned interest) (1) | $ | 503,832 | $ | 433,437 | $ | 398,854 | $ | 377,017 | $ | 306,024 | ||||||||||
Average amount of loans outstanding for the period (net of unearned interest) | $ | 471,312 | $ | 413,972 | $ | 391,131 | $ | 366,754 | $ | 313,041 | ||||||||||
Allowance for loan losses at beginning of period | $ | 5,011 | $ | 4,745 | $ | 4,857 | $ | 3,967 | $ | 3,381 | ||||||||||
Charge-offs: | ||||||||||||||||||||
Agricultural | 113 | 67 | 333 | 65 | 43 | |||||||||||||||
Commercial | 119 | 141 | 282 | 44 | 204 | |||||||||||||||
Real estate—mortgage | 285 | 50 | 350 | 150 | 221 | |||||||||||||||
Installment | 43 | 54 | 77 | 88 | 105 | |||||||||||||||
Lease financing | — | 153 | — | — | — | |||||||||||||||
Total charge-offs | 560 | 465 | 1,042 | 347 | 573 | |||||||||||||||
Recoveries: | ||||||||||||||||||||
Agricultural | 968 | 160 | 18 | 5 | 42 | |||||||||||||||
Commercial | 81 | 15 | 7 | 7 | 15 | |||||||||||||||
Real estate—mortgage | 6 | 72 | 17 | 7 | 1 | |||||||||||||||
Installment | 7 | 16 | 30 | 22 | 31 | |||||||||||||||
Total recoveries | 1,062 | 263 | 72 | 41 | 89 | |||||||||||||||
Net loans charged off (recovered) | (502 | ) | 202 | 970 | 306 | 484 | ||||||||||||||
Provision for loan losses | 180 | 468 | 858 | 589 | 1,070 | |||||||||||||||
Allowance at date of acquisition | — | — | — | 607 | — | |||||||||||||||
Allowance for loan losses at end of period | $ | 5,693 | $ | 5,011 | $ | 4,745 | $ | 4,857 | $ | 3,967 | ||||||||||
Net loans charged off (recovered) to average loans | (0.11 | )% | 0.05 | % | 0.25 | % | 0.08 | % | 0.15 | % | ||||||||||
Allowance for loan losses to total loans at end of period | 1.13 | % | 1.16 | % | 1.19 | % | 1.29 | % | 1.30 | % | ||||||||||
| (1) | Loans do not include, and the allowance for loan losses does not include, any allowance for investments in loan pool participations. |
28
Table of Contents
The Company has allocated the allowance for loan losses to provide for loan losses within the categories of loans set forth in the table below. The allocation of the allowance and the ratio of loans within each category to total loans as of the dates indicated are as follows:
| December 31, | ||||||||||||||||||||||||||||||
| 2006 | 2005 | 2004 | 2003 | 2002 | ||||||||||||||||||||||||||
Allowance Amount | Percent of Loans to Total Loans | Allowance Amount | Percent of Loans to Total Loans | Allowance Amount | Percent of Loans to Total Loans | Allowance Amount | Percent of Loans to Total Loans | Allowance Amount | Percent of Loans to Total Loans | |||||||||||||||||||||
| (dollars in thousands) | ||||||||||||||||||||||||||||||
Agricultural | $ | 1,189 | 13.2 | % | $ | 1,333 | 12.8 | % | $ | 1,183 | 13.4 | % | $ | 1,231 | 14.9 | % | $ | 831 | 12.4 | % | ||||||||||
Commercial | 1,343 | 17.7 | 1,069 | 16.7 | 1,245 | 17.6 | 1,038 | 16.1 | 626 | 12.9 | ||||||||||||||||||||
Real estate— mortgage | 3,021 | 66.0 | 2,410 | 67.7 | 2,089 | 66.3 | 2,329 | 66.1 | 2,199 | 70.8 | ||||||||||||||||||||
Installment | 140 | 3.1 | 199 | 2.8 | 156 | 2.6 | 183 | 2.8 | 255 | 3.8 | ||||||||||||||||||||
Lease financing | — | — | — | — | 72 | 0.1 | 76 | 0.1 | 56 | 0.1 | ||||||||||||||||||||
Total | $ | 5,693 | 100.0 | % | $ | 5,011 | 100.0 | % | $ | 4,745 | 100.0 | % | $ | 4,857 | 100.0 | % | $ | 3,967 | 100.0 | % | ||||||||||
INVESTMENT SECURITIES
The Company manages its investment portfolio to provide both a source of liquidity and earnings. The portfolio largely consists of U.S. Government agency securities, corporate securities, mortgage-backed securities, and municipal bonds. Investment securities available for sale totaled $70,743,000 on December 31, 2006 compared to $74,506,000 at December 31, 2005. The Company’s investment in available for sale securities balances was reduced to fund loan growth in 2006. Securities classified as held to maturity decreased by $766,000 to a balance of $12,220,000 on December 31, 2006.
The following table sets forth certain information with respect to the book value of the Company’s investment portfolio as of December 31, 2006, 2005, and 2004.
| December 31, | |||||||||
| 2006 | 2005 | 2004 | |||||||
| (in thousands) | |||||||||
Securities available for sale: | |||||||||
U.S. government agency securities | $ | 23,776 | $ | 31,039 | $ | 39,873 | |||
Mortgage-backed securities | 16,166 | 19,292 | 24,645 | ||||||
Obligations of states and political subdivisions | 17,131 | 7,250 | 3,128 | ||||||
Corporate debt securities | 7,436 | 11,182 | 14,143 | ||||||
Total debt securities | 64,509 | 68,763 | 81,789 | ||||||
Federal Home Loan Bank stock | 5,439 | 4,937 | 5,096 | ||||||
Equity securities | 795 | 806 | 910 | ||||||
Total securities available for sale | 70,743 | 74,506 | 87,795 | ||||||
Securities held to maturity: | |||||||||
Mortgage-backed securities | 129 | 157 | 279 | ||||||
Obligations of states and political subdivisions | 12,091 | 12,829 | 8,911 | ||||||
Corporate debt securities | — | — | — | ||||||
Total securities held to maturity | 12,220 | 12,986 | 9,190 | ||||||
Total investment securities | $ | 82,963 | $ | 87,492 | $ | 96,985 | |||
29
Table of Contents
The following table sets forth the contractual maturities of investment securities as of December 31, 2006, and the weighted average yields (for tax-exempt obligations on a fully tax-equivalent basis assuming a 34% tax rate) of such securities. As of December 31, 2006, the Company held no securities with a book value exceeding 10% of shareholders’ equity.
| Maturity | ||||||||||||||||||||||||
| Within One Year | After One but Within Five Years | After Five but Within Ten Years | After Ten Years | |||||||||||||||||||||
| Amount | Yield | Amount | Yield | Amount | Yield | Amount | Yield | |||||||||||||||||
| (dollars in thousands) | ||||||||||||||||||||||||
Securities available for sale: | ||||||||||||||||||||||||
U.S. government agency securities | $ | 4,515 | 3.12 | % | $ | 16,209 | 4.69 | % | $ | 3,052 | 5.80 | % | $ | — | — | % | ||||||||
Mortgage-backed securities | — | — | 16,166 | 4.05 | — | — | — | — | ||||||||||||||||
Obligations of states and political subdivisions | 1,821 | 5.88 | 3,590 | 6.01 | 7,512 | 5.76 | 4,208 | 6.00 | ||||||||||||||||
Corporate debt securities | 4,916 | 3.72 | 2,520 | 4.96 | — | — | — | — | ||||||||||||||||
Total securities available for sale | 11,252 | 3.83 | 38,485 | 4.56 | 10,564 | 5.77 | 4,208 | 6.00 | ||||||||||||||||
Securities held to maturity: | ||||||||||||||||||||||||
Mortgage-backed securities | — | — | — | — | — | — | 129 | 6.02 | ||||||||||||||||
Obligations of states and political subdivisions | 1,122 | 5.04 | 7,035 | 5.87 | 3,934 | 6.29 | — | — | ||||||||||||||||
Total securities held to maturity | 1,122 | 5.04 | 7,035 | 5.87 | 3,934 | 6.29 | 129 | 6.02 | ||||||||||||||||
Total investment securities | $ | 12,374 | 3.94 | % | $ | 45,520 | 4.76 | % | $ | 14,498 | 5.91 | % | $ | 4,337 | 6.00 | % | ||||||||
GOODWILL AND OTHER INTANGIBLE ASSETS
Goodwill totaled $13,405,000 on December 31, 2006 and December 31, 2005. Goodwill is subject to testing for impairment on an annual basis in accordance with the provisions of FASB Statement No. 142 “Goodwill and Other Intangible Assets.” No impairment write-down of goodwill was recorded in 2006, 2005 or 2004. Other intangible assets decreased to $1,128,000 as of December 31, 2006 compared with $1,417,00 on December 31, 2005 due to amortization. Amortization of intangible assets is recorded using an accelerated method based on the estimated life of the core deposit intangible and the estimated life of customer lists.
DEPOSITS
Total deposits were $560,615,000 on December 31, 2006 compared with $505,245,000 as of December 31, 2005, an increase of $55,370,000 or 11 percent. Deposit growth occurred mainly in the noninterest-bearing demand deposits and certificates of deposits. Balances of interest-bearing demand deposits, savings and money market deposit categories declined. As of December 31, 2006, certificates of deposit were the largest component of the Company’s deposit base representing approximately 58.8 percent of total deposits. This compares with 54.3 percent of total deposits on December 31, 2005. Savings and money market accounts were the next largest category at 18.1 percent, while interest-bearing demand deposits comprised 11.7 percent and non-interest bearing demand deposits were 11.5 percent of total deposits at year-end. The Company does not utilize brokered deposits as a source of funds.
30
Table of Contents
The following table sets forth the average amount of and the average rate paid on deposits by deposit category for the years indicated.
| Year ended December 31, | ||||||||||||||||||
| 2006 | 2005 | 2004 | ||||||||||||||||
Average Balance | Rate | Average Balance | Rate | Average Balance | Rate | |||||||||||||
| (dollars in thousands) | ||||||||||||||||||
Non-interest bearing demand deposits | $ | 48,902 | N/A | $ | 44,762 | N/A | $ | 40,690 | N/A | |||||||||
Interest-bearing checking | 64,056 | 0.54 | % | 67,591 | 0.47 | % | 64,203 | 0.37 | % | |||||||||
Savings | 114,040 | 2.47 | 119,850 | 1.40 | 124,106 | 1.07 | ||||||||||||
Certificates of deposit | 289,932 | 4.10 | 246,210 | 3.20 | 232,373 | 2.91 | ||||||||||||
Total deposits | $ | 516,930 | 2.91 | % | $ | 478,413 | 2.07 | % | $ | 461,372 | 1.81 | % | ||||||
The following table summarizes certificates of deposit in amounts of $100,000 or more by time remaining until maturity as of December 31, 2006. These time deposits are made by individuals, corporations and public entities, all of which are located in the Company’s market area or are State of Iowa public funds.
December 31, 2006 | |||
| (in thousands) | |||
Three months or less | $ | 16,171 | |
Over three through six months | 10,743 | ||
Over six months through one year | 39,195 | ||
Over one year | 7,715 | ||
Total | $ | 73,824 | |
FEDERAL HOME LOAN BANK ADVANCES
As of December 31, 2006, the Company’s subsidiary bank had borrowed $99,100,000 in fixed-rate advances from the Federal Home Loan Bank of Des Moines. Advances from the Federal Home Loan Bank at year-end 2006 increased $16,000,000 from 2005 to aid in funding the growth in loans. The Company utilizes Federal Home Loan Bank advances as an alternate source of funds to supplement deposits.
NOTES PAYABLE
As of December 31, 2006, the Company had $3,000,000 borrowed on a term note from Harris N.A. that matures November 30, 2009. The term note calls for semi-annual principal payments of $500,000 due May 31 and November 30 until maturity. The Company also had borrowed $1,050,000 on its revolving line of credit with the same unaffiliated bank. The Company maintains a revolving line arrangement that provides for a maximum line of $9,000,000 and matures on April 30, 2007. Management anticipates that this revolving line of credit will be renewed for a period of one year on substantially the same terms and conditions. Both of these credit facilities are priced on a variable basis at the national prime rate less .60 percent, with interest due quarterly. The Company had no material commitments for capital expenditures as of December 31, 2006.
LONG-TERM DEBT
On June 20, 2002, the Company obtained $10,310,000 in long-term subordinated debt from its participation in the issuance of a pooled trust preferred security. This security is a hybrid capital instrument that is included in Tier 1 capital for regulatory purposes, yet is non-dilutive to common shareholders and to return on equity. The trust preferred has a 30-year maturity, does not require any principal amortization and is callable in five years at par at the issuer’s option. The interest rate is variable based on the three month Libor rate plus 3.65 percent, with
31
Table of Contents
the interest payable quarterly. Under the terms of the trust preferred agreement, the Company may, at its option, call the security at par on June 20, 2007. In the event the Company does refinance its trust preferred debt, the unamortized issuance costs associated with the original security would be expensed in the period of call. As of December 31, 2006, the unamortized issuance costs associated with the trust preferred security total $262,000.
The following table summaries the outstanding amount of and the average rate on borrowed funds as of December 31, 2006, 2005 and 2004.
| December 31, | ||||||||||||||||||
| 2006 | 2005 | 2004 | ||||||||||||||||
| Balance | Average Rate | Balance | Average Rate | Balance | Average Rate | |||||||||||||
| (dollars in thousands) | ||||||||||||||||||
Long-term debt (1) | $ | 10,310 | 9.02 | % | $ | 10,310 | 7.80 | % | $ | 10,310 | 5.72 | % | ||||||
Notes payable (2) | 4,050 | 7.65 | 6,100 | 6.65 | 9,700 | 4.95 | ||||||||||||
Federal Home Loan Bank advances | 99,100 | 4.90 | 83,100 | 4.58 | 91,874 | 4.39 | ||||||||||||
Federal funds purchased | 465 | 5.50 | 7,575 | 4.33 | 2,090 | 2.46 | ||||||||||||
Total | $ | 113,925 | 5.37 | % | $ | 107,085 | 4.99 | % | $ | 113,974 | 4.52 | % | ||||||
| (1) | On June 27, 2002, the Company obtained $10,310,000 in long-term subordinated debt from its participation in the issuance of a pooled trust preferred security. The trust preferred has a 30 year maturity, does not require any principal amortization and is callable after five years at par at the issuer’s option. The interest rate is variable based on the three month Libor rate plus 3.65 percent, with interest payable quarterly. |
| (2) | The notes payable balance at December 31, 2006, consists of $1,050,000 in advances on a revolving line of credit and $3,000,000 on a term note, both with Harris N.A. Both notes have a variable interest rate at 0.60 percent below the lender’s prime rate. Interest is payable quarterly. The revolving line of credit has a maximum limit of $9,000,000 and matures April 30, 2007. The term note calls for six semi-annual payments of $500,000 until maturity on November 30, 2009. |
The maximum amount of borrowed funds outstanding at any month end for the years ended December 31, 2006, 2005 and 2004 were as follows:
| 2006 | 2005 | 2004 | |||||||
| (in thousands) | |||||||||
Long-term debt | $ | 10,310 | $ | 10,310 | $ | 10,310 | |||
Notes payable | 6,100 | 10,900 | 10,700 | ||||||
Federal Home Loan Bank advances | 103,100 | 90,890 | 91,874 | ||||||
Federal funds purchased | 18,095 | 26,845 | 15,645 | ||||||
The following table sets forth the average amount of and the average rate paid on borrowed funds for the years ended December 31, 2006, 2005 and 2004.
| Year ended December 31, | ||||||||||||||||||
| 2006 | 2005 | 2004 | ||||||||||||||||
Average Balance | Average Rate | Average Balance | Average Rate | Average Balance | Average Rate | |||||||||||||
| (dollars in thousands) | ||||||||||||||||||
Long-term debt | $ | 10,310 | 8.99 | % | $ | 10,310 | 7.26 | % | $ | 10,310 | 5.32 | % | ||||||
Notes payable | 4,881 | 7.63 | 9,998 | 5.83 | 10,108 | 4.23 | ||||||||||||
Federal Home Loan Bank advances | 92,091 | 4.83 | 85,327 | 4.61 | 82,250 | 4.83 | ||||||||||||
Federal funds purchased | 7,849 | 5.32 | 7,698 | 3.54 | 5,578 | 1.47 | ||||||||||||
Total | $ | 115,131 | 5.35 | % | $ | 113,333 | 4.89 | % | $ | 108,246 | 4.65 | % | ||||||
32
Table of Contents
CONTRACTUAL OBLIGATIONS AND OTHER COMMITMENTS
The following table summarizes contractual obligations and other commitments as of December 31, 2006:
Payments due by Period:
| Total | Less than 1 year | 1 to 3 years | 3 to 5 years | More than 5 years | |||||||||
| (Amounts in thousands) | |||||||||||||
Contractual obligations | |||||||||||||
Time certificates of deposit | $ | 329,399 | 268,133 | 53,203 | 3,994 | 4,069 | |||||||
Federal funds purchased | 465 | 465 | 0 | 0 | 0 | ||||||||
Federal Home Loan Bank advances | 99,100 | 27,500 | 49,300 | 17,000 | 5,300 | ||||||||
Long-term debt | 13,310 | 1,000 | 2,000 | 0 | 10,310 | ||||||||
Lines of credit | 1,050 | 1,050 | 0 | 0 | 0 | ||||||||
Noncancelable operating leases and capital lease obligations | 1,484 | 182 | 365 | 276 | 661 | ||||||||
Total | $ | 444,808 | 298,330 | 104,868 | 21,270 | 20,340 | |||||||
Amount of Commitment—Expiration by Period: | |||||||||||||
Commitments to lend to borrowers | $ | 90,290 | 90,290 | 0 | 0 | 0 | |||||||
Commitments to purchase (sell) loans | (580 | ) | (580 | ) | 0 | 0 | 0 | ||||||
Standby letters of credit | �� | 2,495 | 2,476 | 19 | 0 | 0 | |||||||
Total | $ | 92,205 | 92,766 | 19 | 0 | 0 | |||||||
CAPITAL RESOURCES
As of December 31, 2006, total shareholders’ equity was $62,533,000. Total equity increased by $4,147,000 in 2006 from $58,386,000 at December 31, 2005 as a result of the retention of earnings and unrealized gains arising during the year on securities available for sale, which was partially offset by the repurchase of the Company’s stock. The Company repurchased shares on the open market in 2006 as authorized by a stock repurchase program adopted by the Board of Directors on April 29, 2006. The Board authorized the repurchase of up to $2,000,000 of the outstanding shares of the Company through December 31, 2006. During the period from April through December 2006, the Company repurchased 65,500 shares for $1,268,325, or an average of $19.36 per share. During the year 2006, the Company received 1,550 shares in exchange from the exercise of stock options previously granted. A total of 68,469 shares were reissued upon the exercise of stock options throughout 2006. Restricted stock units representing 12,625 shares were awarded to directors and employees during 2006. A total of 3,715,431 shares were outstanding at December 31, 2006.
Shareholders’ equity as a percentage of total assets was 8.4 percent on December 31, 2006, versus 8.6 percent on December 31, 2005. Tangible shareholders’ equity was 6.6 percent at the end of 2006 and 6.3 percent at year-end 2005. Tangible equity is the ratio of shareholders’ equity less goodwill and intangible assets in proportion to total assets less goodwill and intangible assets.
The Company’s risk-based Tier 1 core capital ratio was 10.0 percent as of December 31, 2006, and the Total Capital ratio was 11.3 percent. Risk-based capital guidelines require the classification of assets and some off-balance-sheet items in terms of credit-risk exposure and the measuring of capital as a percentage of the risk-adjusted asset totals. Tier 1 core capital is the Company’s total common shareholders’ equity plus the $10,310,000 trust preferred security, reduced by goodwill. Total Capital adds the allowance for loan losses to the Tier 1 capital amount. As of December 31, 2005, the Company’s Tier 1 capital ratio was 10.4 percent, and the
33
Table of Contents
Total Capital ratio was 11.6 percent. They exceeded the minimum regulatory requirements of 4.0 percent for Tier 1 capital and 8.0 percent for Total Capital. The Company’s Tier 1 Leverage ratio, which measures Tier 1 capital in relation to total assets, was 8.2 percent as of December 31, 2006 and 8.3 percent at December 31, 2005, exceeding the regulatory minimum requirement range of 3.0 percent to 5.0 percent.
The Company’s common stock closed the year 2006 at $19.94 per share, representing 1.18 times the December 31, 2006 book value per share of $16.83. The book value per share was $15.77 on December 31, 2005. Tangible book value per share was $12.92 on December 31, 2006 compared with $11.77 on December 31, 2005.
LIQUIDITY
Liquidity management involves the ability to meet the cash flow requirements of depositors and borrowers. Liquidity management is conducted by the Company on both a daily and long-term basis. The Company adjusts its investments in liquid assets based upon management’s assessment of expected loan demand, projected loan sales, expected deposit flows, yields available on interest-bearing deposits, and the objectives of its asset/liability management program. Excess liquidity is invested generally in short-term U.S. Government and agency securities, short-term state and political subdivision securities, and other investment securities.
Liquid assets of cash on hand, balances due from other banks, and federal funds sold are maintained to meet customer needs. The Company had liquid assets of $20,726,000 as of December 31, 2006, compared with $13,520,000 as of December 31, 2005. Investment securities classified as available for sale and securities and loans maturing within one year totaled $224,966,000 and $199,428,000 as of December 31, 2006 and 2005, respectively. Assets maturing within one year, combined with liquid assets, were 43.8 percent at December 31, 2006 and 42.1 percent at December 31, 2005 of total deposits as of the same dates.
The Company’s principal sources of funds are deposits, advances from the Federal Home Loan Bank, principal repayments on loans, proceeds from the sale of loans, principal recoveries on loan pool participations, proceeds from the maturity and sale of investment securities, its commercial bank line of credit, and funds provided by operations. While scheduled loan amortization and maturing interest-bearing deposits are relatively predictable sources of funds, deposit flows and loan prepayments are greatly influenced by economic conditions, the general level of interest rates, and competition. Principal recoveries on loan pool participations are also influenced by economic conditions and to a lesser extent, the interest rate environment. The Company utilizes particular sources of funds based on comparative costs and availability. This includes fixed-rate advances from the Federal Home Loan Bank that were obtained at a more favorable cost than deposits. The Company generally manages the pricing of its deposits to maintain a steady deposit base but has from time to time decided not to pay rates on deposits as high as its competition.
Net cash provided by operations is another major source of liquidity. The net cash provided by operating activities was $11,571,000 in 2006 and $6,161,000 in 2005. This trend of strong cash from operations is expected to continue into the foreseeable future.
The Company anticipates that it will have sufficient funds available to fund its loan commitments. As of December 31, 2006, the Company had outstanding commitments to extend credit to borrowers of $90,290,000, issued standby letters of credit of $2,495,000 and had commitments to sell loans of $580,000. Certificates of deposit maturing in one year or less totaled $268,133,000 as of December 31, 2006. Management believes that a significant portion of these deposits will remain with the Company.
The declaration of dividends is subject to, among other things, the Company’s financial condition and results of operations, the Bank’s compliance with regulatory capital requirements, tax considerations, industry standards, economic conditions, regulatory restrictions, general business practices and other factors. Refer to Note 19 of the Notes to Consolidated Financial Statements for information on regulatory limitations on dividends from the Bank to the Company and additional information on dividends. The payment of dividends is dependent
34
Table of Contents
upon the Company having adequate cash or other assets that can be converted into cash to pay dividends to its stockholders. The Company does not anticipate a liquidity problem in 2007 relating to the payment of dividends.
The Company was in compliance with all the covenants of its loan agreement with Harris, N.A. as of December 31, 2006 and at the end of each calendar quarter throughout the year 2006. The Company continues to seek acquisition opportunities that would strengthen its presence in current and new market areas. There are currently no pending acquisitions that would require the Company to secure capital from public or private markets.
ASSET-LIABILITY MANAGEMENT
The Company’s strategy with respect to asset-liability management is to maximize net interest income while limiting exposure to risks associated with volatile interest rates. This strategy is implemented by the Bank’s asset-liability committee that takes action based upon its analysis of expected changes in the composition and volumes of the balance sheet and the fluctuations in market interest rates. One of the measures of interest-rate sensitivity is the gap ratio. This ratio indicates the amount of interest-earning assets repricing within a given period in comparison to the amount of interest-bearing liabilities repricing within the same period of time. A gap ratio of 1.0 indicates a matched position, in which case the effect on net interest income due to interest rate movements will be minimal. A gap ratio of less than 1.0 indicates that more liabilities than assets reprice within the time period and a ratio greater than 1.0 indicates that more assets reprice than liabilities.
As of December 31, 2006, the Company’s cumulative gap ratios for assets and liabilities repricing within three months and within one year were .51 and .56, respectively, meaning more liabilities than assets are repriceable within these periods. The gap position is largely the result of classifying interest-bearing demand deposit accounts, money market accounts, and savings accounts as immediately repriceable. Historically, the Company has not repriced these accounts as frequently or as quickly as it adjusts the rates on new and renewing certificates of deposit. During 2006, the Company has offered twelve-month certificates of deposit at competitive market rates. This has increased the one-year liability sensitive position of the Company compared to previous years. Loan pool participations are repriced over a three-year period based on the historical average for return of pool investment.
35
Table of Contents
The following table sets forth the scheduled repricing or maturity of the Company’s consolidated assets and liabilities as of December 31, 2006, based on the assumptions described below. The effect of these assumptions is to quantify the dollar amount of items that are interest rate sensitive and can be repriced within each of the periods specified. The table does not necessarily indicate the impact of general interest rate movements on the Company’s interest margin because the repricing of certain categories of assets and liabilities is subject to competitive and other pressures beyond the Company’s control. As a result, certain assets and liabilities indicated as maturing or otherwise repricing within a stated period may, in fact, mature or reprice at different times and at different volumes.
Three Months or Less | Over Three Months to One Year | One to Three Years | Three Years or More | Total | |||||||||||||||
| (dollars in thousands) | |||||||||||||||||||
Interest earning assets: | |||||||||||||||||||
Loans | $ | 113,850 | $ | 110,118 | $ | 121,875 | $ | 157,989 | $ | 503,832 | |||||||||
Loan pool participations | 8,241 | 24,721 | 65,923 | — | 98,885 | ||||||||||||||
Interest-bearing deposits in banks | 447 | — | — | — | 447 | ||||||||||||||
Investment securities: | |||||||||||||||||||
Available for sale | 7,738 | 7,987 | 17,000 | 38,018 | 70,743 | ||||||||||||||
Held to maturity | 250 | 2,540 | 5,210 | 4,220 | 12,220 | ||||||||||||||
Total interest earning assets | 130,526 | 145,366 | 210,008 | 200,227 | 686,127 | ||||||||||||||
Interest-bearing liabilities: | |||||||||||||||||||
Interest-bearing checking | 65,482 | — | — | — | 65,482 | ||||||||||||||
Savings | 101,443 | — | — | — | 101,443 | ||||||||||||||
Certificates of deposit | 61,232 | 206,901 | 53,203 | 8,063 | 329,399 | ||||||||||||||
Federal funds purchased | 465 | — | — | — | 465 | ||||||||||||||
Federal Home Loan Bank advances | 2,500 | 25,000 | 49,300 | 22,300 | 99,100 | ||||||||||||||
Notes payable | 4,050 | — | — | — | 4,050 | ||||||||||||||
Long-term debt | 10,310 | — | — | — | 10,310 | ||||||||||||||
Total interest-bearing liabilities | 245,482 | 231,901 | 102,503 | 30,363 | 610,249 | ||||||||||||||
Interest sensitivity gap per period | $ | (114,956 | ) | $ | (86,535 | ) | $ | 107,505 | $ | 169,864 | |||||||||
Cumulative Interest sensitivity gap | $ | (114,956 | ) | $ | (201,491 | ) | $ | (93,986 | ) | $ | 75,878 | ||||||||
Interest sensitivity gap ratio | 0.53 | % | 0.63 | % | 2.05 | % | 6.59 | % | |||||||||||
Cumulative Interest sensitivity gap ratio | 0.53 | % | 0.58 | % | 0.84 | % | 1.12 | % | |||||||||||
In the table above, interest-bearing checking and savings are included as interest-bearing liabilities in the three months or less category.
Loan pool participations are included in the interest rate sensitivity analysis using an estimated three-year average life. The historical average for the return of original investment on the pools is approximately 36 months. Given the non-performing aspect of the loan pool portfolio, management feels that the use of contractual weighted-average maturity data is inappropriate.
FUTURE PROSPECTS
Inflation can have a significant effect on the operating results of all industries. Management believes that inflation does not affect the banking industry as much as it does other industries with a high proportion of fixed assets and inventory. Inflation does, however, have an impact on the growth of total assets and the need to maintain a proper level of shareholders’ capital.
Interest rates are significantly affected by inflation. It is difficult to assess the impact rate changes have since neither the timing nor the magnitude of changes in the various inflation indices coincides with changes in
36
Table of Contents
interest rates. There is, of course, an impact on longer-term earning assets; however, this effect continues to diminish as investment maturities are shortened and interest-earning assets and interest-bearing liabilities shift from fixed-rate long-term to rate-sensitive short-term.
During 2006 the national inflation rate increased as the economy continued to grow. The Federal Reserve continued to move interest rates upward with increases in the fed funds rate that served to increase the prime rate to 8.25 percent as of December 31, 2006, compared to 7.25 percent as of December 31, 2005. Management of the Company believes that the 2007 rate of inflation will increase somewhat and that interest rates will moderate slightly. The Company is in a negative gap position with a greater amount of interest-bearing liabilities repriceable compared to repriceable interest-earning assets. If interest rates decline, the Company’s net interest margin may improve as interest expense may decrease faster than interest income. If interest rates increase, the Company’s net interest margin may contract as interest expense may increase faster than interest income. Management continues to focus on managing the net interest margin in 2007.
Management anticipates that in 2007 it will continue to focus on growing the Company through increased deposits. Growth in the loan portfolio will remain a priority. On January 23, 2006, the Bank opened a new branch facility in the downtown business district of Davenport, Iowa. This location was a temporary location. On February 26, 2007, the Davenport branch was relocated to a permanent facility two blocks from the original location. Additional branch locations in the Davenport/Bettendorf area are also being considered. A new branch location in Cedar Falls, Iowa is under construction with completion anticipated in the third quarter of 2007.
Opportunities to acquire additional loan pool participation investments will continue. Bids on pool participations during the year will take into account the availability of funds to invest, the market for such pools in terms of price and availability, and the potential return on the pools relative to risk.
CRITICAL ACCOUNTING POLICIES
The Company has identified two critical accounting policies and practices relative to the financial condition and results of operation. These two accounting policies relate to the allowance for loan losses and to loan pool accounting.
Critical Accounting Policies
The allowance for loan losses represents management’s estimate of the probable credit losses inherent in the loan portfolio. These potential losses could be either identified or unidentified. The accuracy of this estimate could have a material impact on the Company’s earnings. To the extent actual outcomes differ from management estimates, additional provision for loan losses could be required that could adversely affect earnings or financial position in future periods.
The loan portfolio represents the largest asset type on the consolidated balance sheet. Loan losses are charged against the allowance, while recoveries of amounts previously charged off are credited to the allowance. A provision for loan losses is charged to operations based on management’s periodic evaluation of various factors.
Estimating the amount of the allowance for loan losses requires significant judgment and the use of estimates related to the amount and timing of potential losses. In evaluating the portfolio, management takes into consideration numerous factors; some are quantitative while others require qualitative judgment. These factors include: current economic conditions and trends, historical loan loss experience, the composition of the loan portfolio including mix and loan type, loan collateral values, loan classification, loan delinquencies, specific impaired loans and estimated probable credit losses. Nonperforming, classified and large loans are specifically reviewed for impairment and the allowance is allocated on a loan by loan basis as deemed necessary. Loans not specifically allocated and homogeneous loans are grouped into categories to which a loss percentage, based on historical experience, is allocated.
37
Table of Contents
The adequacy of the allowance for loan losses is monitored on an on-going basis by the loan review officer, senior management and the Bank’s board of directors. In addition, the various regulatory agencies that examine the Bank periodically review the allowance for loan losses. These agencies may require the Company to make additional provisions to the allowance based upon their judgment about information available to them at the time of their examination.
There can be no assurances that the allowance for loan losses will be adequate to cover all loan losses, but management believes that the allowance for loan losses was adequate as of December 31, 2006.
The loan pool accounting practice is also considered a critical accounting policy by the Company. The loan pool accounting practice relates to management’s opinion that the investment amount reflected on the Company’s financial statements does not exceed the estimated net realizable value of the fair value of the underlying collateral securing the purchased loans. In evaluating the purchased loan portfolio, management takes into account many of the same factors that are considered relative to the adequacy of the Company’s allowance for loan losses. In addition to the aforementioned factors, consideration is also given to the borrower’s current financial situation, underlying collateral values, historical collection experience and the borrower’s repayment history. The procedures employed to evaluate the fair value of the loan pool assets are essentially similar to those employed in evaluating the adequacy of the allowance for loan losses with an estimate of potential loss based on impairment by homogeneous and non-homogeneous loans.
The evaluation of the net realizable value of the purchased loans is performed by the Company’s loan review officer and monitored by the senior management and the Bank’s board of directors. Impairment of the net realizable value is recognized as a write-down in the basis of the asset and reflected as a reduction in the interest and discount income. To the extent that the net realizable value of the loan pools is impaired, the Company’s yield on the loan pools would be reduced. Management believes that as of December 31, 2006, the net realizable value of the loan pool investment exceeds the carrying amount reflected on the Company’s books.
IMPACT OF THE SARBANES-OXLEY ACT OF 2002
The Sarbanes-Oxley Act was signed into law on July 30, 2002. The Act aimed to correct what were perceived as structural weaknesses affecting the capital markets, which may have contributed to massive losses such as experienced by the stockholders of Enron and WorldCom. These structural weaknesses were revealed by substantial misstatements in the financial statements of these companies, the apparent failure of boards of directors and public accountants to detect and correct these errors on a timely basis, and the apparent failures of stock analysts to detect weaknesses in financial information. The Act aimed to increase the reliability of financial information by placing corporate executives under considerable pressure to make sure financial information is correct. This included a requirement for the CEO and CFO to certify reports submitted to the SEC and to report on the effectiveness of internal control. The Act strengthened the power and independence of corporate audit committees by requiring the committee to take charge of hiring, overseeing, and compensating the Company’s auditor and requiring that the audit committee members be independent of the Company. Auditors now report directly to the audit committee. The Act also limited the non-audit services that the Company’s audit firm may provide and required that any allowable non-audit services must be pre-approved by the audit committee. The Act added more disclosure to be included in financial reports filed with the SEC. It added new sanctions and increases the severity of a number of civil and criminal penalties related to securities law violations, in addition to severe penalties for certification of faulty financial statements. Additionally, the Act placed a number of restrictions on the activities of securities firms and their employees that are supposed to isolate security analysts from pressures that may compromise the objectivity of their reports.
The implementation deadlines for Section 404 of the Sarbanes-Oxley Act of 2002 continue to evolve. Section 404 requires that management of the Company assess the effectiveness of the Company’s internal control over financial reporting as of the end of the fiscal year, and to include in the Company’s annual report to shareholders management’s conclusion, as a result of that assessment, about whether the Company’s internal
38
Table of Contents
control is effective. Additionally, the Company’s external auditors are required under Section 404 to evaluate and attest to management’s assessment. Under the definitions of Sarbanes-Oxley, the Company is a “non-accelerated filer” since it has “public float” of less than $75,000,000. “Public float” for this purpose is the market value of the Company’s outstanding common equity held by non-affiliates as of the end of its second fiscal quarter. For the Company, this is the quarter ended June 30. In December 2006, the SEC revised the compliance deadline for non-accelerated filers. Under the new rule, non-accelerated filers must comply with the management-assessment requirement for the first fiscal year ending on or after December 15, 2007. The requirement to provide an auditors’ report on internal control over financial reporting now applies to the first fiscal year ending on or after December 15, 2008.
Management and the Company’s audit committee are working together to ensure that the financial information reported by the Company is correct and reliable, that the required evaluation of internal controls takes place, and that certification by management is performed. Management is committed to meeting the SEC requirements. During the year 2006, the Company continued to utilize the services of an outside consultant to assist management in the evaluation of the adequacy of its internal control structures and procedures for financial reporting. Additionally, an assistant internal auditor was hired by the Company to facilitate the process.
Effect of New Financial Accounting Standards
In February 2006, the Financial Accounting Standards Board (“FASB”) issued SFAS No. 155, “Accounting for Certain Hybrid Financial Instruments.” SFAS No. 155 is an amendment of SFAS No. 133, “Accounting for Derivative Instruments and Hedging Activities,” and SFAS No. 140, “Accounting for Transfers and Servicing of Financial Assets and Extinguishments of Liabilities.” This Statement eliminates the exemption from applying SFAS No. 133 to interests in securitized financial assets so that similar instruments are accounted for similarly regardless of the form of the instruments. The Statement also allows an entity to elect fair value measurement at acquisition, at issuance or when a previously recognized financial instrument is subject to a remeasurement event, at an instrument-by-instrument basis. SFAS No. 155 is effective for the Company beginning January 1, 2007. The Company does not expect this Statement to have a material effect on its financial condition or results of operations.
In March 2006, the FASB issued SFAS No. 156, “Accounting for Servicing of Financial Assets.” SFAS No. 156 is an amendment to SFAS No. 140 that requires an entity to recognize a servicing asset or liability each time it undertakes an obligation to service a financial asset and requires each servicing asset or liability to be initially measured at fair value. Entities are permitted to choose the fair value measurement method or the amortization method for subsequent reporting periods. SFAS No. 156 is effective for the Company beginning January 1, 2007. The Company does not expect this Statement to have a material effect on its financial condition or results of operations.
In July 2006, the FASB issued Financial Interpretation No. 48 (“FIN 48”), “Accounting for Income Tax Uncertainties.” FIN 48 supplements SFAS No. 109, “Accounting for Income Taxes,” by defining the threshold for recognizing the benefits in the financial statements as “more-likely-than-not” to be sustained by the applicable taxing authority. The benefit recognized for a tax position that meets the “more-likely-than-not” criterion is measured based on the largest benefit that is more than fifty percent likely to be realized, taking into consideration the amount and probabilities of the outcome upon settlement. The Company adopted FIN 48 on January 1, 2007. The Company does not expect this Statement to have a material effect on its financial condition or results of operations.
In September 2006, the FASB issued SFAS No. 157, “Fair Value Measurements.” SFAS No. 157 establishes a framework for measuring fair value in U.S. generally accepted accounting principles and extends disclosures about fair value measurements. SFAS No. 157 applies whenever other standards require or permit assets or liabilities to be measured at fair value. This Statement does not expand the use of fair value in any new circumstances. SFAS No. 157 is effective for the Company beginning January 1, 2008. The Company does not expect the adoption of this Statement to have a material effect on its financial condition or results of operations.
39
Table of Contents
In September 2006, the FASB issued SFAS No. 158, “Employers’ Accounting for Defined Benefit Pension and Other Postretirement Plans.” SFAS No. 158 is an amendment to SFAS Nos. 87, 88, 106 and 132(R). This Statement requires employers to fully recognize the overfunded or underfunded status of a defined benefit retirement plan, retiree healthcare or other postretirement plans as an asset or liability in their financial statements as of the end of the fiscal year. SFAS No. 158 is effective for the Company for 2006. The adoption of this Statement did not have an impact on the Company’s financial condition or results of operations.
In September 2006, the Emerging Issues Task Force (“EITF”) ratified Issue No. 06-4, “Accounting for Deferred Compensation and Postretirement Benefit Aspects of Endorsement Split-Dollar Life Insurance Arrangements.” This EITF Issue addresses accounting for separate agreements that split life insurance policy benefits between an employer and employee. The Issue requires the employer to recognize a liability for future benefits payable to the employee under these agreements. The effects of applying this Issue must be recognized through either a change in accounting principle through an adjustment to equity or through the retrospective application to all prior periods. The Issue is effective for the Company beginning January 1, 2008. The adoption of the Issue will not have a material effect on the Company’s financial condition or results of operations.
In September 2006, the EITF ratified Issue No. 06-5, “Accounting for Purchases of Life Insurance—Determining the Amount That Could Be Realized in Accordance with FASB Technical Bulletin No. 85-4, Accounting for Purchase of Life Insurance.” EITF Issue No. 06-5 addresses accounting for what could be realized as an asset and provides clarification regarding additional amounts included in the contractual terms of an individual policy in determining the amount that could be realized under the insurance contract. The effects of applying this Issue must be recognized through either a change in accounting principle through an adjustment to equity or through the retrospective application to all prior periods. The Issue is effective for the Company beginning January 1, 2007. The Company does not expect the adoption of the Issue to have a material effect on its financial condition or results of operations.
In September 2006, the Securities and Exchange Commission (“SEC”) issued Staff Accounting Bulletin (“SAB”) No. 108, “Considering the Effects of Prior Year Misstatements in Current Year Financial Statements.” SAB No. 108 addresses how the effects of prior year uncorrected errors must be considered in quantifying misstatements in the current year financial statements. The effects of prior year uncorrected errors include the potential accumulation of improper amounts that may result in a material misstatement on the statement of financial condition or the reversal of prior period errors in the current period that result in a material misstatement of the current period results of operations. Adjustments to current or prior period financial statements would be required in the event that after application of various approaches for assessing materiality of a misstatement in current period financial statements and consideration of all relevant quantitative and qualitative factors, a misstatement is determined to be material. SAB No. 108 is applicable to all financial statements issued after November 15, 2006. The adoption of SAB No. 108 did not have an effect on the Company’s financial condition or results of operations.
In February 2007, the FASB issued SFAS No. 159, “The Fair Value Option for Financial Assets and Financial Liabilities.” SFAS No. 159 allows companies to elect fair-value measurement of specified financial instruments and warranty and insurance contracts when an eligible asset or liability is initially recognized or when an event, such as a business combination, triggers a new basis of accounting for that asset or liability. The election, called the “fair-value option,” will enable some companies to reduce the volatility in reported earnings caused by measuring related assets and liabilities differently. The election is available for eligible assets or liabilities on a contract-by-contract basis without electing it for identical assets or liabilities under certain restrictions. SFAS No. 159 is effective as of the beginning of the Company’s first fiscal year beginning after November 15, 2007. The Company does not anticipate that the adoption of this Statement will have a material effect on its financial condition or results of operations.
Item 7A. Quantitative and Qualitative Disclosures About Market Risk
Market risk is the risk of earnings volatility that results from adverse changes in interest rates and market prices. The Company’s market risk is comprised primarily of interest rate risk arising from its core banking
40
Table of Contents
activities of lending and deposit taking. Interest rate risk is the risk that changes in market interest rates may adversely affect the Company’s net interest income. Management continually develops and applies strategies to mitigate this risk. Management does not believe that the Company’s primary market risk exposures and how those exposures were managed in 2006 changed when compared to 2005.
The Company uses a third-party computer software simulation modeling program to measure its exposure to potential interest rate changes. For various assumed hypothetical changes in market interest rates, numerous other assumptions are made such as prepayment speeds on loans and securities backed by mortgages, the slope of the Treasury yield curve, the rates and volumes of the Company’s deposits, and the rates and volumes of the Company’s loans. This analysis measures the estimated change in net interest income in the event of hypothetical changes in interest rates. The following table presents the Company’s projected changes in net interest income for the various rate shock levels at December 31, 2006.
| $ Change | % Change | ||||||
+200 bp | $ | (1,116,000 | ) | -4.13 | % | ||
+100 bp | (568,000 | ) | -2.10 | % | |||
Base | 0 | 0.00 | % | ||||
-100 bp | 124,000 | 0.46 | % | ||||
-200 bp | (343,000 | ) | -1.27 | % | |||
As shown above, at December 31, 2006, the effect of an immediate and sustained 200 basis point increase in interest rates would decrease the Company’s net interest income by approximately $1,116,000. The effect of a ramped 200 basis point decrease in rates would decrease the Company’s net interest income by approximately $343,000. An increase in interest rates would cause more of the Company’s interest-bearing liabilities to reprice than interest-earning assets, thus reducing net interest income. As the rate on many of the interest-bearing liabilities could not be decreased by another 200 basis points, any additional reductions in market interest rates could reduce the Company’s net interest income as rates on repriceable assets are reduced while rates on liabilities cannot be lowered proportionally.
Computations of the prospective effects of hypothetical interest rate changes are based on numerous assumptions. Actual values may differ from those projections set forth above. Further, the computations do not contemplate any actions the Company may undertake in response to changes in interest rates.
Item 8. Financial Statements and Supplementary Data
See Consolidated Financial Statements on pages F-1 through F-29.
Item 9. Changes in and Disagreements with Accountants on Accounting and Financial Disclosure
Within the two most recent fiscal years or any subsequent interim period, there have been no changes in or disagreements with accountants of the Company.
Item 9A. Controls and Procedures
As of the end of the period covered by this report, an evaluation was performed under the supervision and with the participation of the Company’s Chief Executive Officer and Chief Financial Officer of the effectiveness of the Company’s disclosure controls and procedures (as defined in Exchange Act Rule 240.13a-15(e)). Based on that evaluation, the Chief Executive Officer and the Chief Financial Officer have concluded that the Company’s current disclosure controls and procedures are effective to ensure that information required to be disclosed by the Company in the reports that it files or submits under the Securities Exchange Act of 1934 is recorded, processed, summarized and reported, within the time periods specified in the Securities and Exchange Commission’s rules and forms.
There were no changes in the Company’s internal control over financial reporting that occurred during the period covered by this report that have materially affected, or are reasonably likely to materially affect, the Company’s internal control over financial reporting.
41
Table of Contents
Item 10. Directors and Executive Officers of the Registrant
Information regarding directors of the Company is included in the Company’s Proxy Statement for its 2007 Annual Meeting of Shareholders (“Proxy Statement”) under the heading “Election of Directors.” Information regarding the executive officers of the Company is included under the heading “Executive Officers” in the Company’s Proxy Statement. The definitive Proxy Statement of MidWestOne Financial Group, Inc. is incorporated herein by reference. Also incorporated herein by reference from the definitive Proxy Statement is the information pertaining to Section 16(a) Beneficial Ownership Reporting Compliance.
The Company has adopted a code of ethics which applies to all directors, officers and employees, including the chairman, president and chief executive officer, chief financial officer and controller. The chairman, president and chief executive officer, chief financial officer and controller have each signed such code of ethics and agreed to be bound by same. A copy of the code of ethics was filed as Exhibit 14 to the Company’s Form 10-K for the year ended December 31, 2004.
Item 11. Executive Compensation
Information regarding compensation of executive officers and directors is included in the Company’s Proxy Statement under the headings “Executive Compensation” and “Directors’ Compensation.” The definitive proxy statement of MidWestOne Financial Group, Inc. is incorporated herein by reference.
Item 12. Security Ownership of Certain Beneficial Owners and Management
Information regarding security ownership of certain beneficial owners and management is included in the Company’s Proxy Statement under the heading “Ownership of Securities by Certain Beneficial Owners.” The definitive Proxy Statement of MidWestOne Financial Group, Inc. is incorporated herein by reference. Reference is also made to Item 5 hereof, pertaining to the issuance of shares of the Company pursuant to the Stock Incentive Plan approved by the shareholders.
Item 13. Certain Relationships and Related Transactions
Information regarding certain relationships and related transactions is included in the Company’s Proxy Statement under the heading “Loans to Officers and Directors and Other Transactions with Officers and Directors.” The definitive Proxy Statement of MidWestOne Financial Group, Inc. is incorporated herein by reference.
Item 14. Principal Accounting Fees and Services
Fees billed for the last two fiscal years for services provided by the principal accountant for audit fees, audit-related fees, tax fees and all other fees are presented under the heading “Independent Registered Public Accounting Firm” of the Company’s definitive Proxy Statement. The definitive Proxy Statement of MidWestOne Financial Group, Inc. is incorporated herein by reference.
The Audit Committee pre-approved the fees for the audit, audit-related and tax services provided by the principal accountant for the years ended December 31, 2006 and 2005.
42
Table of Contents
Item 15. Exhibits and Financial Statement Schedules
The following exhibits and financial statement schedules are filed as part of this report:
| (a) | 1. Financial Statements: See pages F-1 through F-34 of this document. |
| 2. | Exhibits (not covered by independent auditors’ report). |
Exhibit 3.1
Articles of Incorporation, as amended through April 30, 1998, of Mahaska Investment Company. The Articles of Incorporation, as amended, of Mahaska Investment Company are incorporated by reference to the Company’s quarterly report on Form 10-Q for the quarter ended September 30, 1998.
Exhibit 3.1.1
Amendment to the Articles of Incorporation of Mahaska Investment Company changing the name of the corporation to MidWestOne Financial Group, Inc. is incorporated by reference to the Company’s quarterly report on Form 10-Q for the quarter ended June 30, 2003.
Exhibit 3.2
Bylaws of Mahaska Investment Company. The Amended and Restated Bylaws of Mahaska Investment Company dated July 23, 1998, are incorporated by reference to the Company’s quarterly report on Form 10-Q for the Quarter ended September 30, 1998.
Exhibit 10.1
MidwestOne Financial Group, Inc. Employee Stock Ownership Plan & Trust as restated and amended.
Exhibit 10.2.1
1993 Stock Incentive Plan. This 1993 Stock Incentive Plan is incorporated by reference to Form S-1 Registration Number 33-81922 of Mahaska Investment Company.
Exhibit 10.2.2
1996 Stock Incentive Plan. This 1996 Stock Incentive Plan is incorporated by reference to the Company’s Annual Report on Form 10-K for the year ended December 31, 1996.
Exhibit 10.2.3
1998 Stock Incentive Plan. This 1998 Stock Incentive Plan is incorporated by reference to the Company’s Annual Report on Form 10-K for the year ended December 31, 1997.
Exhibit 10.2.4
2006 Stock Incentive Plan. This 2006 Stock Incentive Plan is incorporated by reference to the Company’s Definitive Proxy Statement on Form 14A filed March 21, 2006.
Exhibit 10.3
States Resources Corp. Loan Participation and Servicing Agreement dated February 5, 1999 between States Resources Corp. and Mahaska Investment Company. This agreement is incorporated herein by reference to the Form 10-K report filed by Mahaska Investment Company for the Year ended December 31, 1999.
43
Table of Contents
Exhibit 10.5
Second Amended and Restated Credit Agreement dated November 30, 2003 between MidWestOne Financial Group, Inc. and Harris Trust and Savings Bank. This Second Amended and Restated Credit Agreement is incorporated herein by reference to the Form 10-K Annual Report filed by MidwestOne Financial Group, Inc. for the year ended December 31, 2003.
Exhibit 10.5.1
Fifth Amendment to the Second Amended and Restated Credit Agreement dated November 27, 2006 between MidWestOne Financial Group, Inc. and Harris N.A.
Exhibit 13
The Annual Report to Shareholders of MidWestOne Financial Group, Inc. for the 2006 calendar year.
Exhibit 21
Subsidiaries
Exhibit 23
Consent of Independent Registered Public Accounting Firm
Exhibit 31.1
Certification of Chief Executive Officer Pursuant to Rule 13a – 14(a) of the Securities Exchange Act of 1934.
Exhibit 31.2
Certification of Chief Financial Officer Pursuant to Rule 13a – 14(a) of the Securities Exchange Act of 1934.
Exhibit 32.1
Certification of the Chief Executive Officer and the Chief Financial Officer pursuant to Rule 13a – 14(a) of the Securities Exchange Act of 1934 and 18 U.S.C., Section 1350, as adopted pursuant to Section 906 of the Sarbanes-Oxley Act of 2002.
The Company will furnish to any shareholder upon request and upon payment of a fee of $.50 per page, a copy of any exhibit. Requests for copies should be directed to David A. Meinert, Executive Vice President and Chief Financial Officer, MidWestOne Financial Group, Inc., P.O. Box 1104, Oskaloosa, Iowa 52577-1104.
44
Table of Contents
SIGNATURES
Pursuant to the requirements of Section 13 or 15(d) of the Securities Exchange Act of 1934, the registrant has duly caused this report to be signed on its behalf by the undersigned, thereunto duly authorized.
| MIDWESTONE FINANCIAL GROUP, INC. | ||
| (Registrant) | ||
By: | /s/ CHARLES S. HOWARD | |
| Charles S. Howard | ||
| Chairman, President, Chief Executive Officer and Director | ||
March 23, 2007
By: | /s/ DAVID A. MEINERT | |
| David A. Meinert | ||
| Executive Vice President, Chief Financial Officer and Director | ||
March 23, 2007
Pursuant to the requirements of the Securities Exchange Act of 1934, this report has been signed below by the following persons on behalf of the registrant and in the capacities and on the dates indicated.
| By: | /s/ RICHARD R. DONOHUE Richard R. Donohue | Director | March 23, 2007 Date | |||
| By: | /s/ DONAL D. HILL Donal D. Hill | Director | March 23, 2007 Date | |||
| By: | /s/ CHARLES S. HOWARD Charles S. Howard | Director, Chairman of the Board, President and Chief Executive Officer | March 23, 2007 Date | |||
| By: | /s/ BARBARA J. KNIFF-MCCULLA Barbara J. Kniff-McCulla | Director | March 23, 2007 Date | |||
| By: | /s/ DAVID A. MEINERT David A. Meinert | Director, Executive Vice President and Chief Financial Officer (Principal Accounting Officer) | March 23, 2007 Date | |||
| By: | /s/ JOHN P. POTHOVEN John P. Pothoven | Director | March 23, 2007 Date | |||
| By: | /s/ JAMES G. WAKE James G. Wake | Director | March 23, 2007 Date | |||
| By: | /s/ MICHAEL R. WELTER Michael R. Welter | Director | March 23, 2007 Date | |||
45
Table of Contents
| By: | /s/ ROBERT D. WERSEN Robert D. Wersen | Director | March 23, 2007 Date | |||
| By: | /s/ EDWARD C. WHITHAM Edward C. Whitham | Director | March 23, 2007 Date | |||
| By: | /s/ R. SCOTT ZAISER R. Scott Zaiser | Director | March 23, 2007 Date | |||
46
Table of Contents
Consolidated Balance Sheets
| December 31 | |||||||
| 2006 | 2005 | ||||||
| (in thousands) | |||||||
Assets: | |||||||
Cash and due from banks | $ | 20,279 | 13,103 | ||||
Interest-bearing deposits in banks | 447 | 417 | |||||
Cash and cash equivalents | 20,726 | 13,520 | |||||
Investment securities (notes 2 and 10): | |||||||
Available for sale, at fair value | 70,743 | 74,506 | |||||
Held to maturity (fair value of $12,168 in 2006 and $12,925 in 2005) | 12,220 | 12,986 | |||||
Loans, net of unearned discount (notes 3, 5 and 10) | 503,832 | 433,437 | |||||
Allowance for loan losses (note 4) | (5,693 | ) | (5,011 | ) | |||
Net loans | 498,139 | 428,426 | |||||
Loan pool participations (note 6) | 98,885 | 103,570 | |||||
Premises and equipment, net (note 7) | 12,327 | 10,815 | |||||
Accrued interest receivable | 6,587 | 5,334 | |||||
Goodwill (note 8) | 13,405 | 13,405 | |||||
Other intangible assets (note 8) | 1,128 | 1,417 | |||||
Bank-owned life insurance | 7,798 | 7,523 | |||||
Other real estate owned (note 3) | 188 | 2,473 | |||||
Other assets | 2,765 | 2,357 | |||||
Total assets | $ | 744,911 | 676,332 | ||||
Liabilities and Shareholders’ Equity: | |||||||
Deposits (notes 2 and 9): | |||||||
Demand | $ | 64,291 | 50,309 | ||||
Interest-bearing checking | 65,482 | 65,435 | |||||
Savings | 101,443 | 115,218 | |||||
Certificates of deposit | 329,399 | 274,283 | |||||
Total deposits | 560,615 | 505,245 | |||||
Federal funds purchased | 465 | 7,575 | |||||
Federal Home Loan Bank advances (note 10) | 99,100 | 83,100 | |||||
Notes payable (note 11) | 4,050 | 6,100 | |||||
Long-term debt (note 12) | 10,310 | 10,310 | |||||
Accrued interest payable | 2,804 | 1,672 | |||||
Other liabilities | 5,034 | 3,944 | |||||
Total liabilities | 682,378 | 617,946 | |||||
Shareholders’ equity: | |||||||
Common stock, $5 par value; authorized 20,000,000 shares; issued 4,912,849 shares as of December 31, 2006 and 2005 (note 11) | 24,564 | 24,564 | |||||
Capital surplus | 13,076 | 12,886 | |||||
Treasury stock at cost, 1,197,418 and 1,211,462 shares as of December 31, 2006 and 2005, respectively | (17,099 | ) | (16,951 | ) | |||
Retained earnings (note 19) | 42,447 | 38,630 | |||||
Accumulated other comprehensive loss | (455 | ) | (743 | ) | |||
Total shareholders’ equity | 62,533 | 58,386 | |||||
Total liabilities and shareholders’ equity | $ | 744,911 | 676,332 | ||||
See accompanying notes to consolidated financial statements.
F-1
Table of Contents
Consolidated Statements of Income
| Year ended December 31 | ||||||||||
| 2006 | 2005 | 2004 | ||||||||
(in thousands, except per share amounts) | ||||||||||
Interest income: | ||||||||||
Interest and fees on loans | $ | 33,897 | 26,518 | 23,885 | ||||||
Interest income and discount on loan pool participations | 9,142 | 10,222 | 9,395 | |||||||
Interest on bank deposits | 32 | 9 | 4 | |||||||
Interest on federal funds sold | 84 | 13 | 50 | |||||||
Interest on investment securities: | ||||||||||
Available for sale | 2,809 | 2,829 | 3,589 | |||||||
Held to maturity | 490 | 489 | 449 | |||||||
Total interest income | 46,454 | 40,080 | 37,372 | |||||||
Interest expense: | ||||||||||
Interest on deposits (note 9): | ||||||||||
Interest-bearing checking | 347 | 321 | 239 | |||||||
Savings | 2,818 | 1,677 | 1,328 | |||||||
Certificates of deposit | 11,880 | 7,891 | 6,770 | |||||||
Interest on federal funds purchased | 418 | 272 | 82 | |||||||
Interest on Federal Home Loan Bank advances | 4,446 | 3,933 | 3,975 | |||||||
Interest on notes payable | 373 | 583 | 428 | |||||||
Interest on long-term debt | 927 | 749 | 548 | |||||||
Total interest expense | 21,209 | 15,426 | 13,370 | |||||||
Net interest income | 25,245 | 24,654 | 24,002 | |||||||
Provision for loan losses (note 4) | �� | 180 | 468 | 858 | ||||||
Net interest income after provision for loan losses | 25,065 | 24,186 | 23,144 | |||||||
Noninterest income: | ||||||||||
Deposit service charges | 2,114 | 1,588 | 1,611 | |||||||
Other customer service charges and fees | 716 | 721 | 681 | |||||||
Brokerage commissions | 995 | 564 | 326 | |||||||
Insurance commissions | 705 | 218 | 85 | |||||||
Data processing income | 219 | 203 | 209 | |||||||
Mortgage origination fees | 580 | 443 | 455 | |||||||
Bank-owned life insurance income | 328 | 389 | 224 | |||||||
Other operating income | 483 | 274 | 459 | |||||||
(Losses)/gains on sale of available for sale securities (note 2) | (212 | ) | 28 | 226 | ||||||
Total noninterest income | 5,928 | 4,428 | 4,276 | |||||||
Noninterest expense: | ||||||||||
Salaries and employee benefits expense (notes 15 and 16) | 12,546 | 10,830 | 10,539 | |||||||
Net occupancy expense | 3,491 | 3,468 | 3,222 | |||||||
Professional fees | 468 | 975 | 854 | |||||||
Data processing expense | 656 | 451 | 447 | |||||||
Other intangible asset amortization | 289 | 305 | 308 | |||||||
Other operating expense | 4,009 | 3,386 | 3,143 | |||||||
Total noninterest expense | 21,459 | 19,415 | 18,513 | |||||||
Income before income tax expense | 9,534 | 9,199 | 8,907 | |||||||
Income tax expense (note 14) | 3,093 | 3,111 | 3,078 | |||||||
Net income | $ | 6,441 | 6,088 | 5,829 | ||||||
Net income per share—basic | $ | 1.74 | $ | 1.63 | $ | 1.54 | ||||
Net income per share—diluted | $ | 1.71 | $ | 1.59 | $ | 1.50 | ||||
See accompanying notes to consolidated financial statements.
F-2
Table of Contents
Consolidated Statements of Changes in Shareholders’ Equity and Comprehensive Income
| Common Stock | Capital Surplus | Treasury Stock | Retained Earnings | Accumulated Other Comprehensive Income (Loss) | Total | |||||||||||||
| (in thousands, except share data) | ||||||||||||||||||
Balance at December 31, 2003 | $ | 24,564 | 12,976 | (14,589 | ) | 31,832 | 1,361 | 56,144 | ||||||||||
Comprehensive income: | ||||||||||||||||||
Net income | — | — | — | 5,829 | — | 5,829 | ||||||||||||
Unrealized losses arising during the year on securities available for sale, net of tax benefit of $750 | — | — | — | — | (1,256 | ) | (1,256 | ) | ||||||||||
Less realized gains on securities available for sale, net of tax of $84 | — | — | — | — | (140 | ) | (140 | ) | ||||||||||
| �� | ||||||||||||||||||
Total comprehensive income | — | — | — | 5,829 | (1,396 | ) | 4,433 | |||||||||||
Dividends paid ($.68 per share) | — | — | — | (2,576 | ) | — | (2,576 | ) | ||||||||||
Treasury stock reissued for the purchase of KCI (6,601 shares) | — | 27 | 88 | — | — | 115 | ||||||||||||
Stock options exercised (77,456 shares) | — | (129 | ) | 1,005 | — | — | 876 | |||||||||||
Treasury stock purchased (115,379 shares) | — | — | (2,144 | ) | — | — | (2,144 | ) | ||||||||||
ESOP shares allocated | — | 82 | — | — | — | 82 | ||||||||||||
Balance at December 31, 2004 | 24,564 | 12,956 | (15,640 | ) | 35,085 | (35 | ) | 56,930 | ||||||||||
Comprehensive income: | ||||||||||||||||||
Net income | — | — | — | 6,088 | — | 6,088 | ||||||||||||
Unrealized losses arising during the year on securities available for sale, net of tax benefit of $410 | — | — | — | — | (687 | ) | (687 | ) | ||||||||||
Less realized gains on securities available for sale, net of tax of $7 | — | — | — | — | (21 | ) | (21 | ) | ||||||||||
Total comprehensive income | — | — | — | 6,088 | (708 | ) | 5,380 | |||||||||||
Dividends paid ($.68 per share) | — | — | — | (2,543 | ) | — | (2,543 | ) | ||||||||||
Treasury stock reissued for the purchase of Cook (4,393 shares) | — | 21 | 61 | — | — | 82 | ||||||||||||
Stock options exercised (73,405 shares) | — | (160 | ) | 1,002 | — | — | 842 | |||||||||||
Treasury stock purchased (127,797 shares) | — | — | (2,374 | ) | — | — | (2,374 | ) | ||||||||||
ESOP shares allocated | — | 69 | — | — | — | 69 | ||||||||||||
Balance at December 31, 2005 | 24,564 | 12,886 | (16,951 | ) | 38,630 | (743 | ) | 58,386 | ||||||||||
Comprehensive income: | ||||||||||||||||||
Net income | — | — | — | 6,441 | — | 6,441 | ||||||||||||
Unrealized gains arising during the year on securities available for sale, net of tax of $92 | — | — | — | — | 155 | 155 | ||||||||||||
Less realized losses on securities available for sale, net of tax benefit of $79 | — | — | — | — | 133 | 133 | ||||||||||||
Total comprehensive income | — | — | — | 6,441 | 288 | 6,729 | ||||||||||||
Dividends paid ($.71 per share) | — | — | — | (2,624 | ) | — | (2,624 | ) | ||||||||||
Stock-based compensation | — | 81 | 178 | — | — | 259 | ||||||||||||
Stock options exercised (68,469 shares) | — | (16 | ) | 972 | — | — | 956 | |||||||||||
Treasury stock purchased (67,050 shares) | — | — | (1,298 | ) | — | — | (1,298 | ) | ||||||||||
ESOP shares allocated | — | 125 | — | — | — | 125 | ||||||||||||
Balance at December 31, 2006 | $ | 24,564 | 13,076 | (17,099 | ) | 42,447 | (455 | ) | 62,533 | |||||||||
See accompanying notes to consolidated financial statements.
F-3
Table of Contents
Consolidated Statements of Cash Flows
| Year ended December 31 | ||||||||||
| 2006 | 2005 | 2004 | ||||||||
| (in thousands) | ||||||||||
Cash flows from operating activities: | ||||||||||
Net income | $ | 6,441 | 6,088 | 5,829 | ||||||
Adjustments to reconcile net income to net cash provided by operating activities: | ||||||||||
Depreciation and amortization | 1,903 | 2,084 | 2,213 | |||||||
Provision for loan losses | 180 | 468 | 858 | |||||||
Loss (gain) on sale of available for sale securities | 212 | (28 | ) | (226 | ) | |||||
Gain on sale of other assets | — | — | (106 | ) | ||||||
Loss on sale of premises and equipment | — | 13 | 33 | |||||||
Stock-based compensation | 259 | — | — | |||||||
Excess tax benefits related to stock options | (88 | ) | — | — | ||||||
Amortization of investment securities and loan premiums | 349 | 681 | 782 | |||||||
Accretion of investment securities and loan discounts | (85 | ) | (86 | ) | (93 | ) | ||||
Deferred tax benefit | (341 | ) | (352 | ) | (567 | ) | ||||
Decrease (increase) in other assets | 519 | (3,849 | ) | (1,570 | ) | |||||
Increase in other liabilities | 2,222 | 1,142 | 58 | |||||||
Total adjustments | 5,130 | 73 | 1,382 | |||||||
Net cash provided by operating activities | 11,571 | 6,161 | 7,211 | |||||||
Cash flows from investing activities: | ||||||||||
Investment securities available for sale: | ||||||||||
Proceeds from sales | 10,414 | 5,113 | 17,835 | |||||||
Proceeds from maturities | 16,804 | 26,024 | 20,447 | |||||||
Purchases | (23,489 | ) | (19,492 | ) | (29,376 | ) | ||||
Investment securities held to maturity: | ||||||||||
Proceeds from maturities | 736 | 973 | 4,752 | |||||||
Purchases | — | (4,806 | ) | (1,739 | ) | |||||
Net increase in loans | (69,846 | ) | (34,797 | ) | (22,864 | ) | ||||
Purchases of loan pool participations | (40,071 | ) | (51,058 | ) | (61,511 | ) | ||||
Principal recovery on sale of loan pool participations | 4,763 | 12,387 | 3,931 | |||||||
Principal recovery on loan pool participations, net of charge-offs | 39,993 | 40,603 | 41,137 | |||||||
Purchases of premises and equipment | (3,126 | ) | (2,236 | ) | (1,798 | ) | ||||
Proceeds from sale of premises and equipment | — | 197 | 7 | |||||||
Cash paid for the purchase of KCI | — | — | (450 | ) | ||||||
Cash paid for the purchase of Cook | — | (136 | ) | — | ||||||
Net cash used in investing activities | (63,822 | ) | (27,228 | ) | (29,629 | ) | ||||
Cash flows from financing activities: | ||||||||||
Net increase in deposits | 55,370 | 30,143 | 21,977 | |||||||
Net (decrease) increase in federal funds purchased | (7,110 | ) | 5,485 | (8,360 | ) | |||||
Federal Home Loan Bank advances | 110,000 | 15,000 | 21,000 | |||||||
Repayment of Federal Home Loan Bank advances | (94,000 | ) | (23,850 | ) | (8,262 | ) | ||||
Advances on notes payable | 450 | 2,600 | 2,200 | |||||||
Principal payments on notes payable | (2,500 | ) | (6,200 | ) | (1,500 | ) | ||||
Excess tax benefits related to stock options | 88 | — | — | |||||||
Dividends paid | (2,624 | ) | (2,543 | ) | (2,576 | ) | ||||
Purchases of treasury stock | (1,298 | ) | (2,374 | ) | (2,144 | ) | ||||
Proceeds from stock options exercised | 956 | 842 | 876 | |||||||
ESOP shares allocated | 125 | 69 | 82 | |||||||
Net cash provided by financing activities | 59,457 | 19,172 | 23,293 | |||||||
Net increase (decrease) in cash and cash equivalents | 7,206 | (1,895 | ) | 875 | ||||||
Cash and cash equivalents at beginning of year | 13,520 | 15,415 | 14,540 | |||||||
Cash and cash equivalents at end of year | $ | 20,726 | 13,520 | 15,415 | ||||||
Supplemental disclosure of cash flow information: | ||||||||||
Cash paid during the period for: | ||||||||||
Interest | $ | 20,077 | 14,830 | 13,493 | ||||||
Income taxes | $ | 3,672 | 3,300 | 3,766 | ||||||
Acquisitions: | ||||||||||
Treasury stock reissued for the purchase of KCI | $ | — | — | 115 | ||||||
Treasury stock reissued for the purchase of Cook | $ | — | 82 | — | ||||||
See accompanying notes to consolidated financial statements.
F-4
Table of Contents
December 31, 2006, 2005, and 2004
1. Summary of Significant Accounting Policies
Nature of Operations
MidWestOne Bank (the “Bank”) engages in retail and commercial banking and related financial services, providing the usual products and services such as deposits, commercial, agricultural, real estate, and consumer loans, and trust services. The Bank also provides data processing services to non-affiliated banks.
Since 1988, MidWestOne Financial Group, Inc. and subsidiaries (the “Company”), either directly or through the Bank, has invested in loan pool participations that have been purchased by certain non-affiliated independent service corporations (collectively, the “Servicer”) from other financial institutions, the Federal Deposit Insurance Corporation (“FDIC”), or other sources. These loan pool investments are comprised of packages of loans previously made by financial institutions, which often include distressed or nonperforming loans, that have been sold at prices reflecting various discounts from the aggregate outstanding principal amount of the underlying loans depending on the credit quality of the portfolio. The Servicer collects and remits these amounts, less servicing fees, to the participants.
Principles of Consolidation
The accounting and reporting policies of the Company conform to U.S. generally accepted accounting principles. The consolidated financial statements of the Company include its 100 percent owned subsidiaries, MidWestOne Bank, MidWestOne Investment Services, Inc. and Cook and Son Agency, Inc. All material intercompany transactions have been eliminated in consolidation.
Merger of Subsidiary Banks
Effective January 1, 2006, the Company’s subsidiary banks of MidWestOne Bank & Trust, Central Valley Bank, Pella State Bank, and MidWestOne Bank were merged into one state chartered bank with the name MidWestOne Bank. The new name better describes the Company’s focus, enhances the opportunity for local and regional growth and strengthens the overall corporate identity.
Acquisition of Securities Brokerage Company
On July 30, 2004, the Company completed its acquisition of Koogler Company of Iowa (“KCI”), a sole proprietorship, which was a broker and registered investment advisor. The acquisition was a purchase transaction with the Company acquiring KCI’s book of business in exchange for $450,000 in cash and 6,601 shares of the Company’s stock with a fair market value of $115,000. Contemporaneously with this acquisition, the Company formed a new wholly owned subsidiary called MidWestOne Investment Services, Inc. (“MWI”) to provide investment advisory and brokerage services throughout the banking offices of the Company.
Acquisition of Insurance Agency
The Company acquired all the outstanding shares of Cook & Son Agency, Inc. (“Cook”) on September 1, 2005, with Cook becoming a wholly owned subsidiary of the Company. Cook is a full-service property and casualty insurance agency located in Pella, Iowa.
The transaction was accounted for as a purchase transaction with the revenues and expenses reflected on the Company’s financial statements from September 1, 2005 forward. The Company acquired Cook’s book of business in exchange for $830,000 in cash and 4,393 shares of the Company’s stock with a fair market value of $82,000. The excess of purchase price over the identifiable fair value of the tangible assets acquired and liabilities assumed of $653,000 was recorded as goodwill of $249,000 and other intangible assets of $404,000.
F-5
Table of Contents
Use of Estimates in the Preparation of Financial Statements
The preparation of the consolidated financial statements in conformity with U.S. generally accepted accounting principles requires management to make estimates and assumptions that affect the reported amounts of assets and liabilities and disclosure of contingent assets and liabilities at the date of the financial statements and the reported amounts of revenues and expenses during the reporting period. Actual results could differ from those estimates. Significant estimates that are particularly sensitive to change relate to the allowance for loan losses and the carrying basis of the loan pool participations.
Cash and Due from Banks
The Company is required to maintain certain daily reserve balances on hand in accordance with federal banking regulations. The average reserve balances maintained in accordance with such regulations for the years ended December 31, 2006 and 2005 were $4,640,000 and $2,408,000, respectively.
Consolidated Statements of Cash Flows
For purposes of reporting cash flows, cash and cash equivalents include cash and due from banks and interest-bearing deposits in banks.
Investment Securities
The Company classifies investment securities based on the intended holding period. Securities which may be sold prior to maturity to meet liquidity needs, to respond to market changes, or to adjust the Company’s asset-liability position are classified as available for sale. Securities held principally for the purpose of near-term sales are classified as trading. Securities the Company intends to hold until maturity are classified as held to maturity.
Investment securities available for sale are recorded at fair value. The aggregate unrealized gains and losses, net of the income tax effect, are recorded as a component of other comprehensive income until realized. Securities with unrealized losses are analyzed quarterly for other-than-temporary impairment. If a security is determined to have an other-than-temporary impairment, a loss is recognized on the consolidated statements of income and a new cost basis is established. Securities held to maturity are recorded at cost, adjusted for amortization of premiums and accretion of discounts. Amortization of premiums and accretion of discounts are computed using the level yield method over the remaining maturities of the securities.
Net gains or losses on the sales of securities are shown in the consolidated statements of income using the specific identification method and are recognized on a trade date basis.
Loans
Loans are stated at the principal amount outstanding, net of deferred loan fees and allowance for loan losses. Interest on loans is credited to income as earned based on the principal amount outstanding. Deferred loan fees are amortized using the level yield method over the remaining maturities of the loans.
It is the Company’s policy to discontinue the accrual of interest income on any loan when, in the opinion of management, there is reasonable doubt as to the collectibility of interest or principal, normally when a loan is 90 days past due. When interest accruals are deemed uncollectible, interest credited to income in the current year is reversed and interest accrued in prior years is charged to the allowance for loan losses. Interest income on nonaccrual loans is only recognized on a cash basis. Nonaccrual loans are returned to an accrual status when, in the opinion of management, the financial position of the borrower indicates there is no longer any reasonable doubt as to timely payment of principal or interest.
A loan is considered impaired when, based on current information and events, it is probable that a creditor will be unable to collect all amounts due according to the contractual terms of the loan agreement. All
F-6
Table of Contents
non-homogeneous loans are reviewed for impairment on an individual basis. All impaired loans, including nonaccrual loans and loans that are restructured in a troubled debt restructuring involving a modification of terms, are either measured at the present value of expected future cash flows discounted at the loan’s initial effective interest rate, the fair value of the collateral of an impaired collateral-dependent loan, or an observable market price, if one exists. If the measure of the impaired loan is less than the recorded investment in the loan, impairment will be recognized through the allowance for loan losses.
Allowance for Loan Losses
The allowance for loan losses is established through a provision for loan losses charged to expense. Loans are charged against the allowance for loan losses when management believes collectibility of the principal is unlikely.
Management believes the allowance for loan losses is adequate to absorb probable losses in the loan portfolio on the balance sheet date. While management uses available information to recognize loan losses, future additions to the allowance may be necessary based on changes in economic conditions. In addition, various regulatory agencies, as an integral part of the examination process, periodically review the Bank’s allowance for loan losses. Such agencies may require the subsidiary bank to increase its allowance for loan losses based on their judgments and interpretations about information available to them at the time of their examinations.
Loan Pool Participations
The Company has invested in participation in pools of loans acquired from the FDIC and other sources at substantial discounts. The pools consist of loans to borrowers located throughout the United States.
The Company carries its investment in the loan pools as a separate earning asset on the balance sheet. Principal or interest restructures, write-downs, or write-offs within the pools are not included in the Company’s disclosures for its loan portfolio. The loan pools are managed by a non-affiliate Servicer operating in Omaha, Nebraska.
Each pool has a different composition and different characteristics. The composition of a loan pool is generally determined by the seller based on its desire to maximize the price it receives for all loans among the various pools. Many of the pools consist of loans primarily secured by single-family, multi-family, and small commercial real estate. Some pools may consist of a large number of small consumer loans that are secured by other assets such as automobiles or mobile homes, while other pools may consist of small to medium balance commercial loans. Some may contain a mixture of various types of loans.
The Company invests in pools consisting of both performing loans and past-due nonperforming loans. The price bid and paid for such a loan pool is determined based on the composition of the particular pool, the amounts the Servicer believes can be collected on such a pool, and the risks associated with the collection of such amounts.
Upon the acquisition of a participation interest in a loan pool, the Company assumes the risk of loss. The extent of such risk is dependent on a number of factors, including the Servicer’s ability to locate the debtors, the debtors’ financial condition, the possibility the debtor may file for protection under applicable bankruptcy laws, the Servicer’s ability to locate the collateral, if any, for the loan and to obtain possession of such collateral, the value of such collateral, and the length of time it takes to realize the ultimate recovery either through collection procedures or through a resale of the loans following a restructure.
A cost “basis” is assigned to each individual loan acquired on a cents per dollar (discounted price) based on the Servicer’s assessment of the recovery potential of each such loan. This methodology assigns a higher basis to performing loans with greater potential collectibility and a lower basis to those loans identified as having little or no potential for collection.
F-7
Table of Contents
Loan pool participations are shown on the Company’s balance sheet as a separate asset category. The original carrying value of the loan pool participations represents the discounted price paid by the Company to acquire its participation interests in various loan pools purchased by the Servicer. The Company’s investment balance is reduced as the Servicer collects principal payments on the loans and remits the proportionate share of such payments to the Company.
Prior to January 1, 2005, the investment in loan pools was accounted for on a nonaccrual (or cash) basis. Beginning January 1, 2005, subsequent pools acquired are accounted for in accordance with the provisions of Statement of Position 03-3 (“SOP 03-3”) issued by the Accounting Standards Executive Committee of the American Institute of Certified Public Accountants. No change is required for those pools acquired prior to December 31, 2004, and the accounting treatment utilized on those pools remains on the cash basis.
SOP 03-3 provides updated guidance on the accounting for purchased loans that show evidence of deterioration of credit quality since origination and for which it is probable, at acquisition, that the purchaser will be unable to collect all contractually required payments receivable. SOP 03-3 generally requires that the excess of the estimated cash flows expected to be collected on the loan over the initial investment be accreted over the estimated remaining life of the loan. According to SOP 03-3, in order to apply the interest method of recognition to these types of loans, there must be sufficient information to reasonably estimate the amount and timing of the cash flows expected to be collected. When that is not the case, the loan should be accounted for as a nonaccrual status applying the cash basis income recognition to the loan.
The Company has developed and implemented procedures to determine if accretion of the discount (“accretable yield”) on the purchased loans in a pool is required under SOP 03-3. These procedures were applied to all loans acquired subsequent to January 1, 2005 (the adoption date for SOP 03-3) that had been held by the Servicer for at least six months as of December 31, 2006. Given the impaired nature of the loan pools typically purchased, the individual loans are evaluated for SOP 03-3 purposes by the end of a six-month window from the date of purchase. This provides time for the Servicer to assess the quality of the loans and assign basis to each loan within the pool. Purchased loans are evaluated individually with a determination made utilizing various criteria including: past-due status, late payments, legal status of the loan (not in foreclosure, judgment against the borrower, for referred to legal counsel), frequency of payments made, collateral adequacy and the borrower’s financial condition. If all criteria for being able to reasonably estimate the amount and timing of cash flows are met, the individual loan will utilize the accounting treatment required by SOP 03-3 with the accretable yield difference between the expected cash flows and the purchased basis accreted into income on the level yield basis over the anticipated life of the loan. If any of the six criteria are not met, the loan is accounted for on the cash-basis of accounting.
In the event that a prepayment is received on a loan accounted for under SOP 03-3, the accretable yield is recomputed and the revised amount accreted over the estimated remaining life of the loan on the level yield basis. If a loan subject to accretable yield under SOP 03-3 fails to make timely payments, it is subject to classification and an allowance for loss would be established. An allowance of $49,000 and $10,000 existed as of December 31, 2006 and 2005, respectively, related to loans subject to accretable yield.
Collection expenses incurred by the Servicer are netted against discount income. Discount income is added to interest income and reflected as one amount on the Company’s consolidated statements of income. The Servicer and representatives of the Company continually evaluate the collectability of the loans and the recovery of the underlying basis. On a quarterly basis, those loans that are determined to have a possible recovery of less than the assigned basis amount are placed on a “watch list.” The amount of basis exceeding the estimated recovery amount on the “watch list” loans is written off by a charge against discount income.
Interest income is only recognized when collected and actually remitted to the Company by the Servicer for those loans acquired prior to December 31, 2004, and for those loans subject to nonaccrual status in accordance with SOP 03-3. Many of the pools that have been purchased by the Servicer do not include purchased interest in the cost basis. Interest income collected by the Servicer is reflected in the Company’s consolidated financial statements as interest income included as part of the interest income and discount on loan pool participations.
F-8
Table of Contents
Premises and Equipment
Premises and equipment are stated at cost less accumulated depreciation. Depreciation is computed using the straight-line or accelerated method over the estimated useful lives of the respective assets, which range from 5 to 40 years for buildings and improvements and 3 to 10 years for furniture and equipment.
Intangible Assets
Intangible assets consist of goodwill and other intangible assets. Goodwill represents the excess of the purchase price of acquired subsidiaries’ net assets over their fair value. The Company assesses goodwill for impairment annually, and more frequently in the presence of certain circumstances. Impairment exists when the carrying amount of the goodwill exceeds its implied fair value. No impairment write-down of goodwill has been recorded in 2006, 2005 or 2004.
Other intangible assets consist of core deposit premium and customer list intangible which are being amortized using the effective-yield method over 10 years. Annually, the Company reviews the core deposit premium and customer list intangible for events or circumstances that may indicate a change in the recoverability of the underlying basis. For the years ended December 31, 2006, 2005 and 2004, there were no events or circumstances that triggered an impairment charge against intangible assets.
Bank-Owned Life Insurance
The Company and its subsidiaries have purchased life insurance policies on the lives of certain officers. The one-time premiums paid for the policies, which equal the initial cash surrender value, are recorded as an asset. Increases or decreases in the cash surrender value, other than proceeds from death benefits, are recorded as noninterest income. Proceeds from death benefits first reduce the cash surrender value attributable to the individual policy and then any additional proceeds are recorded as noninterest income.
Other Real Estate Owned
Other real estate owned represents property acquired through foreclosure or deeded to the Bank in lieu of foreclosure on real estate mortgage loans on which the borrowers have defaulted as to payment of principal and interest. Other real estate owned is carried at the lower of the cost of acquisition or fair value, less estimated costs of disposition. Reductions in the balance of other real estate at the date of acquisition are charged to the allowance for loan losses. Expenses incurred subsequent to the acquisition of the property and any subsequent write-downs to reflect current fair market value are charged as noninterest expense as incurred. Gains or losses on the disposition of other real estate owned are recognized in noninterest income or expense in the period in which they are realized.
Income Taxes
The Company files a consolidated federal income tax return. For state purposes, the Bank files a franchise return and the remaining entities file a consolidated income tax return.
Deferred tax assets and liabilities are recognized for the future tax consequences attributable to temporary differences between the financial statement carrying amounts and of existing assets and liabilities and their respective tax bases. Deferred tax assets and liabilities are measured using enacted tax rates expected to apply to taxable income in the years in which those temporary differences are expected to be recovered or settled. The effect on deferred tax assets and liabilities of a change in tax rates is recognized in income in the period that includes the enactment date.
Fair Value of Financial Instruments
Fair value estimates are made at a specific point in time, based on relevant market information about the financial instrument. These estimates do not reflect any premium or discount that could result from offering the
F-9
Table of Contents
Company’s entire holdings of a particular financial instrument for sale at one time. Unless included in assets available for sale, it is the Company’s general practice and intent to hold its financial instruments to maturity and not to engage in trading or sale activities.
Fair value estimates are based on judgments regarding future expected loss experience, current economic conditions, risk characteristics of various financial instruments and other factors. These estimates are subjective in nature and involve uncertainties and matters of significant judgment and therefore cannot be determined with precision. Changes in assumptions could significantly affect the estimates.
Estimated fair values have been determined by the Company using the best available information and an estimation method suitable for each category of financial instruments.
Trust Department Assets
Property held for customers in fiduciary or agency capacities is not included in the accompanying consolidated balance sheets, as such items are not assets of the Company. Trust department assets totaled $39,072,000 and $35,286,000 as of December 31, 2006 and 2005, respectively.
Earnings Per Share
Basic earnings per share amounts are computed by dividing net income by the weighted average number of shares outstanding during the year. Diluted earnings per share amounts are computed by dividing net income by the weighted average number of shares and all potentially dilutive shares outstanding during the year. As of December 31, 2006, the Company had 129,605 common stock options outstanding that could potentially be dilutive in the future but are not included in the diluted earnings per share calculation because they are currently anti-dilutive. The following information was used in the computation of earnings per share on both a basic and diluted basis for the years ended December 31, 2006, 2005 and 2004:
| 2006 | 2005 | 2004 | |||||
(in thousands, except per share amounts) | |||||||
Basic EPS computation | |||||||
Numerator: | |||||||
Net income | $ | 6,441 | 6,088 | 5,829 | |||
Denominator: | |||||||
Weighted average shares outstanding | 3,695 | 3,745 | 3,778 | ||||
Basic EPS | $ | 1.74 | 1.63 | 1.54 | |||
Diluted EPS computation | |||||||
Numerator: | |||||||
Net income | $ | 6,441 | 6,088 | 5,829 | |||
Denominator: | |||||||
Weighted average shares outstanding | 3,695 | 3,745 | 3,778 | ||||
Weighted average dilutive shares outstanding for stock options | 70 | 78 | 101 | ||||
| 3,765 | 3,823 | 3,879 | |||||
Diluted EPS | $ | 1.71 | 1.59 | 1.50 | |||
Stock Incentive Plan
The Company adopted Statement of Financial Accounting Standards (“SFAS”) No. 123(R), “Share-Based Payment,” on January 1, 2006. SFAS 123(R) requires that the cost resulting from share-based awards be recognized in the financial statements. The Company is utilizing the “modified prospective” transition method to
F-10
Table of Contents
measure the cost of the awards over the remaining vesting period for those options that had been granted prior to January 1, 2006 and were not fully vested as of that date. The expense is based on the fair value determined at the grant date. The adoption by the Company of SFAS 123(R) resulted in compensation expense, net of tax, of $236,000 or $.06 per share diluted for the year ended December 31, 2006.
Prior to adoption of SFAS 123(R), the Company applied APB Opinion No. 25 and related interpretations in accounting for share-based payments. Accordingly, no compensation cost was recognized in the financial statements for the share-based payments prior to January 1, 2006. Results for periods prior to January 1, 2006 have not been restated.
Had compensation cost for the Company’s stock incentive plan been determined in accordance with SFAS 123(R), the Company’s net income and earnings per share for the years ended December 31, 2005 and 2004 would have been reduced to the pro forma amounts indicated below:
| 2005 | 2004 | ||||
(in thousands, except per share data) | |||||
Net income: | |||||
As reported | $ | 6,088 | 5,829 | ||
Compensation expense that would have been recorded under SFAS No. 123 (R), net of tax | 341 | 278 | |||
Net income as adjusted | $ | 5,747 | 5,551 | ||
Earnings per share: | |||||
As reported—basic | $ | 1.63 | 1.54 | ||
As reported—diluted | 1.59 | 1.50 | |||
Pro forma—basic | 1.54 | 1.47 | |||
Pro forma—diluted | 1.54 | 1.46 | |||
Concentrations of Credit Risk
The Company originates real estate, consumer, agricultural and commercial loans primarily in its eastern and southeast Iowa market areas and adjacent counties. Although the Company has a diversified portfolio, a substantial portion of its borrowers’ ability to repay their loans is dependent upon economic conditions in the Company’s market areas.
Reclassifications
Certain reclassifications have been made to prior years consolidated financial statements in order to conform to the current year presentation.
F-11
Table of Contents
2. Investment Securities
A summary of investment securities by type as of December 31, 2006 and 2005, follows:
December 31, 2006 | Amortized Cost | Gross Unrealized Gains | Gross Unrealized Losses | Fair Value | |||||
| (in thousands) | |||||||||
Investment Securities Available for Sale: | |||||||||
U.S. government agency securities | $ | 23,837 | 102 | 163 | 23,776 | ||||
Mortgage-backed securities | 16,915 | 1 | 750 | 16,166 | |||||
Obligations of states and political subdivisions | 17,114 | 130 | 113 | 17,131 | |||||
Corporate debt securities | 7,486 | 2 | 52 | 7,436 | |||||
Total debt securities | 65,352 | 235 | 1,078 | 64,509 | |||||
Federal Home Loan Bank stock | 5,439 | — | — | 5,439 | |||||
Other equity securities | 685 | 111 | 1 | 795 | |||||
Total | $ | 71,476 | 346 | 1,079 | 70,743 | ||||
Investment Securities Held to Maturity: | |||||||||
Mortgage-backed securities | $ | 129 | 1 | — | 130 | ||||
Obligations of states and political subdivisions | 12,091 | 66 | 119 | 12,038 | |||||
Total | $ | 12,220 | 67 | 119 | 12,168 | ||||
December 31, 2005 | Amortized Cost | Gross Unrealized Gains | Gross Unrealized Losses | Fair Value | |||||
| (in thousands) | |||||||||
Investment Securities Available for Sale: | |||||||||
U.S. government agency securities | $ | 31,513 | 14 | 488 | 31,039 | ||||
Mortgage-backed securities | 19,959 | 1 | 668 | 19,292 | |||||
Obligations of states and political subdivisions | 7,252 | 64 | 66 | 7,250 | |||||
Corporate debt securities | 11,346 | — | 164 | 11,182 | |||||
Total debt securities | 70,070 | 79 | 1,386 | 68,763 | |||||
Federal Home Loan Bank stock | 4,937 | — | — | 4,937 | |||||
Other equity securities | 691 | 115 | — | 806 | |||||
Total | $ | 75,698 | 194 | 1,386 | 74,506 | ||||
Investment Securities Held to Maturity: | |||||||||
Mortgage-backed securities | $ | 157 | 2 | — | 159 | ||||
Obligations of states and political subdivisions | 12,829 | 101 | 164 | 12,766 | |||||
Total | $ | 12,986 | 103 | 164 | 12,925 | ||||
During the years ended December 31, 2006, 2005, and 2004, the Company incurred no other–than-temporary impairment losses on securities available for sale.
The following table summarizes the amount of unrealized losses, defined as the amount by which amortized cost exceeds fair value, and the related fair value of investments with unrealized losses in the Company’s securities portfolio as of December 31, 2006 and 2005. The investments were segregated into two categories: those that have been in a continuous unrealized loss position for less than twelve months and those that have been in a continuous unrealized loss position for twelve or more months. The reference point for determining how long an investment was in an unrealized loss position was December 31, 2006 and 2005. All of the investments held by the Company as of December 31, 2006 and 2005, that had unrealized losses for a period of less than twelve months were due to the increased rates being offered by year-end 2006 and 2005 on similar investment securities.
F-12
Table of Contents
Various types of investment securities held by the Company as of December 31, 2006 had unrealized losses for a period greater than twelve months. The unrealized loss for U.S. government agencies and mortgage-backed securities primarily relates to nineteen securities issued by FNMA, FHLB and FHLMC. The unrealized losses reported for obligations of states and political subdivisions relates primarily to fifty-four securities issued by various Iowa communities and entities. Nine corporate debt securities and one equity security had unrealized losses for a period of greater than twelve months. Management does not believe that any remaining individual unrealized loss for a period greater than twelve months as of December 31, 2006 represents other-than-temporary impairment. The unrealized losses in the debt securities are the result of changes in interest rates and are not related to credit downgrades of the securities. The Company has the ability and intent to hold the securities contained in the table for a time necessary to recover its amortized cost.
| Less Than 12 Months | 12 Months or Longer | Total | |||||||||||
December 31, 2006 | Fair Value | Unrealized Losses | Fair Value | Unrealized Losses | Fair Value | Unrealized Losses | |||||||
| (in thousands) | |||||||||||||
U.S. government agency securities | $ | 3,962 | 14 | 10,745 | 149 | 14,707 | 163 | ||||||
Mortgage-backed securities | — | — | 16,124 | 750 | 16,124 | 750 | |||||||
Obligations of states and political subdivisions | 6,142 | 70 | 10,869 | 162 | 17,011 | 232 | |||||||
Corporate debt securities | — | — | 6,441 | 52 | 6,441 | 52 | |||||||
Equity securities | — | — | 2 | 1 | 2 | 1 | |||||||
Total temporarily impaired securities | $ | 10,104 | 84 | 44,181 | 1,114 | 54,285 | 1,198 | ||||||
Various types of investment securities held by the Company as of December 31, 2005 had unrealized losses for a period greater than twelve months. The unrealized loss for U.S. government agencies and mortgage-backed securities primarily relates to twenty-four securities issued by Fed Farm Credit, FNMA, FHLB and FHLMC. The unrealized losses reported for obligations of states and political subdivisions relates primarily to thirteen securities issued by various Iowa communities and entities. Six corporate debt securities and one equity security had unrealized losses for a period of greater than twelve months. Management does not believe that any remaining individual unrealized loss for a period greater than twelve months as of December 31, 2005 represents other-than-temporary impairment. The unrealized losses in the debt securities are the result of changes in interest rates and are not related to credit downgrades of the securities. The Company has the ability to hold the securities contained in the table for a time necessary to recover its amortized cost.
| Less Than 12 Months | 12 Months or Longer | Total | |||||||||||
December 31, 2005 | Fair Value | Unrealized Losses | Fair Value | Unrealized Losses | Fair Value | Unrealized Losses | |||||||
| (in thousands) | |||||||||||||
U.S. government agency securities | $ | 6,253 | 79 | 19,786 | 409 | 26,039 | 488 | ||||||
Mortgage-backed securities | — | — | 19,223 | 668 | 19,223 | 668 | |||||||
Obligations of states and political subdivisions | 11,742 | 184 | 3,222 | 46 | 14,964 | 230 | |||||||
Corporate debt securities | 6,746 | 78 | 4,436 | 86 | 11,182 | 164 | |||||||
Equity securities | 3 | — | 4 | — | 7 | — | |||||||
Total temporarily impaired securities | $ | 24,744 | 341 | 46,671 | 1,209 | 71,415 | 1,550 | ||||||
F-13
Table of Contents
Proceeds from the sale of investment securities available for sale during 2006, 2005, and 2004 were $10,414,000, $5,113,000, and $17,835,000, respectively. Gross gains and losses realized on the sale of investment securities available for sale for the years ended December 31 were as follows:
| 2006 | 2005 | 2004 | ||||||||
| (in thousands) | ||||||||||
Realized gains | $ | 1 | 82 | 238 | ||||||
Realized losses | (213 | ) | (54 | ) | (12 | ) | ||||
Total | $ | (212 | ) | 28 | 226 | |||||
As of December 31, 2006 and 2005, investment securities with carrying values of approximately $8,701,000 and $27,969,000 respectively, were pledged as collateral to secure public fund deposits and for other purposes required or permitted by law. The merger of the Company’s four banks into one charter on January 1, 2006 increased the capital of the consolidated Bank and thereby reduced the amount of collateral required to secure public fund deposits. Public funds approximated $41,968,000 and $41,104,000 at December 31, 2006 and 2005, respectively.
The amortized cost and approximate fair value of investment securities as of December 31, 2006, by contractual maturity, are shown as follows. Expected maturities will differ from contractual maturities because issuers may have the right to call or repay obligations with or without call or prepayment penalties.
| Amortized Cost | Fair Value | ||||
| (in thousands) | |||||
Investment Securities Available for Sale: | |||||
Due in 1 year or less | $ | 11,323 | 11,252 | ||
Due after 1 year through 5 years | 39,347 | 38,485 | |||
Due after 5 years through 10 years | 10,504 | 10,564 | |||
Due after 10 years | 4,178 | 4,208 | |||
Total | $ | 65,352 | 64,509 | ||
Investment Securities Held to Maturity: | |||||
Due in 1 year or less | $ | 1,122 | 1,117 | ||
Due after 1 year through 5 years | 7,035 | 6,952 | |||
Due after 5 years through 10 years | 3,934 | 3,969 | |||
Due after 10 years | 129 | 130 | |||
Total | $ | 12,220 | 12,168 | ||
3. Loans
A summary of the respective loan categories as of December 31, 2006 and 2005, follows:
| 2006 | 2005 | ||||||||||
(dollars in thousands) | Amount | % | Amount | % | |||||||
Real estate loans | $ | 332,534 | 66.0 | % | 293,363 | 67.7 | % | ||||
Commercial loans | 89,326 | 17.7 | 72,248 | 16.7 | |||||||
Agricultural loans | 66,393 | 13.2 | 55,471 | 12.8 | |||||||
Loans to individuals | 15,579 | 3.1 | 12,355 | 2.8 | |||||||
Total | $ | 503,832 | 100.0 | % | 433,437 | 100.0 | % | ||||
F-14
Table of Contents
Total nonperfoming loans and assets at December 31, 2006 and 2005, were:
| 2006 | 2005 | ||||
| (in thousands) | |||||
Impaired loans: | |||||
Nonaccrual | $ | 727 | 1,522 | ||
Restructured | 2,014 | 159 | |||
Total impaired loans | 2,741 | 1,681 | |||
Loans past due 90 days and more | 3,060 | 1,671 | |||
Total nonperforming loans | 5,801 | 3,352 | |||
Other real estate owned | 188 | 2,473 | |||
Total nonperforming assets | $ | 5,989 | 5,825 | ||
The average balances of nonperforming loans for the years ended December 31, 2006 and 2005, were $3,472,000 and $3,640,000, respectively. The allowance for credit losses related to nonperforming loans at December 31, 2006 and 2005, was $350,000 and $304,000, respectively. Nonperforming loans of $2,213,000 and $1,389,000 at December 31, 2006 and 2005, respectively, were not subject to a related allowance for credit losses because of the net realizable value of loan collateral, guarantees and other factors. As of December 31, 2006, the Company has no commitments to lend additional funds to any borrowers who have nonperforming loans. The effect of nonaccrual and restructured loans on interest income for each of the three years ended December 31, 2006, 2005, and 2004 was:
| 2006 | 2005 | 2004 | |||||
| (in thousands) | |||||||
Interest income: | |||||||
As originally contracted | $ | 395 | 377 | 202 | |||
As recognized | 199 | 24 | 36 | ||||
Reduction of interest income | $ | 196 | 353 | 166 | |||
4. Allowance for Loan Losses
Changes in the allowance for loan losses for the years ended December 31, 2006, 2005, and 2004 were as follows:
| 2006 | 2005 | 2004 | ||||||||
| (in thousands) | ||||||||||
Balance at beginning of year | $ | 5,011 | 4,745 | 4,857 | ||||||
Provision for loan losses | 180 | 468 | 858 | |||||||
Recoveries on loans previously charged off | 1,062 | 263 | 72 | |||||||
Loans charged off | (560 | ) | (465 | ) | (1,042 | ) | ||||
Balance at end of year | $ | 5,693 | 5,011 | 4,745 | ||||||
F-15
Table of Contents
5. Loans to Related Parties
Certain directors and officers of the Company, including their immediate families and companies in which they are principal owners, were loan customers of the Bank. All loans to this group were made in the ordinary course of business at prevailing terms and conditions. The loan activity of this group, including loans as of December 31, 2006, 2005 and 2004, was as follows:
| 2006 | 2005 | 2004 | |||||
| (in thousands) | |||||||
Aggregate balance at beginning of year | $ | 5,951 | 7,929 | 5,839 | |||
Advances | 15,576 | 7,156 | 12,402 | ||||
Payments | 15,995 | 9,134 | 10,312 | ||||
Aggregate balance at end of year | $ | 5,532 | 5,951 | 7,929 | |||
6. Loan Pool Participations
A summary of the changes in the carrying value of loan pool participations for the years ended December 31, 2006, 2005 and 2004 were as follows:
| 2006 | 2005 | 2004 | ||||||||
| (in thousands) | ||||||||||
Balance at beginning of year, net of allowance of $2,234, $2,054 and $1,255 | $ | 103,570 | 105,502 | 89,059 | ||||||
Purchases | 40,071 | 51,058 | 61,511 | |||||||
Principal payments | (42,173 | ) | (50,506 | ) | (42,920 | ) | ||||
Net charge-offs | (2,583 | ) | (2,484 | ) | (2,148 | ) | ||||
Balance at end of year, net of allowance of $2,234, $2,234 and $2,054 | $ | 98,885 | 103,570 | 105,502 | ||||||
Total face value at end of year | $ | 146,529 | 150,556 | 151,731 | ||||||
The Company evaluated all loans purchased after January 1, 2005 under the SOP 03-3 criteria and determined that certain loans did not meet the criteria for level-yield income recognition required by SOP 03-3. The outstanding balance of those loans was $44,816,000, with a carrying value of $31,088,000, and $20,296,000, with a carrying value of $14,584,000, as of December 31, 2006 and 2005, respectively. Additionally, the Company purchased $36,850,000 in loans during the fourth quarter of 2006 that were in the process of being evaluated under SOP 03-3 as of December 31, 2006 in accordance with the Company’s accounting policy on loan pool participations.
The outstanding balances and carrying values as of December 31 of the loans purchased after January 1, 2005 that met the level-yield income recognition criteria under SOP 03-3 are as follows:
| 2006 | 2005 | |||||
| (in thousands) | ||||||
Agricultural | $ | 75 | — | |||
Commercial | 570 | 530 | ||||
Real estate: | ||||||
1-4 family residences | 322 | 340 | ||||
Agricultural | 288 | 295 | ||||
Land development | 7 | 10 | ||||
Commercial | 4,266 | 1,378 | ||||
Total real estate | 4,883 | 2,023 | ||||
Loans to individuals | 1 | — | ||||
Outstanding balance | $ | 5,529 | $ | 2,553 | ||
Carrying amount, net of allowance of $49 and $10 | $ | 5,023 | 2,220 | |||
F-16
Table of Contents
Changes in accretable yield on the loans purchased after January 1, 2005 that met the level-yield income recognition criteria under SOP 03-3 were as follows:
| Accretable Yield | |||||||
| 2006 | 2005 | ||||||
| (in thousands) | |||||||
Balance at beginning of year | $ | 758 | — | ||||
Additions | 977 | 793 | |||||
Accretion | (359 | ) | (56 | ) | |||
Reclassifications from nonaccretable difference | 188 | 21 | |||||
Balance at end of year | $ | 1,564 | 758 | ||||
Cash flows expected to be collected at acquisition | $ | 4,477 | 3,075 | ||||
Basis in acquired loans at acquisition | 3,500 | 2,282 | |||||
7. Premises and Equipment
A summary of premises and equipment as of December 31, 2006 and 2005 was as follows:
| 2006 | 2005 | ||||
| (in thousands) | |||||
Land and improvements | $ | 2,410 | 1,309 | ||
Building and improvements | 10,997 | 10,663 | |||
Leasehold improvements | 1,634 | 1,461 | |||
Premises leased under capital leases | 913 | — | |||
Furniture and equipment | 12,184 | 11,595 | |||
Total premises and equipment at cost | 28,138 | 25,028 | |||
Less accumulated depreciation and amortization | 15,811 | 14,213 | |||
Total | $ | 12,327 | 10,815 | ||
Depreciation and amortization expense was $1,598,000, $1,687,000 and $1,687,000 for the years ended December 31, 2006, 2005 and 2004, respectively.
Capital Lease
At December 31, 2006, the Company was obligated under a capital lease for the new bank premises located in Davenport, Iowa. This lease has a term through July 2018 and provides a bargain purchase option on the leased property at the expiration of the lease period. The present value of the related lease payments is recorded in other liabilities. The following is an analysis of leased property under capital leases:
| Asset Balances at December 31, | ||||||
| 2006 | 2005 | |||||
Bank building | $ | 913 | 0 | |||
Less: Accumulated amortization | (10 | ) | 0 | |||
Total | $ | 903 | 0 | |||
F-17
Table of Contents
The following summary reflects the future minimum rental payments, by year, required under the capital lease agreement together with the present value of the net minimum lease payments as of December 31, 2006:
Year ending December 31, | Total (in thousands) | |||
2007 | $ | 78 | ||
2008 | 78 | |||
2009 | 78 | |||
2010 | 81 | |||
2011 | 84 | |||
2012 and thereafter | 583 | |||
Total payments required | 982 | |||
Less: Amount representing interest | (253 | ) | ||
Present value of net minimum lease payments | $ | 729 | ||
8. Goodwill and Other Intangible Assets
As a result of the acquisition of Cook on September 1, 2005, the Company recorded goodwill of $249,000 and other intangible assets of $404,000.
As a result of the acquisition of KCI on June 30, 2004, the Company recorded goodwill of $179,000 and other intangible assets of $383,000.
The gross carrying amount of intangible assets and the associated accumulated amortization at December 31, 2006 and 2005 is presented in the table below. Amortization expense for intangible assets was $289,000, $305,000, and $308,000 for the years ended December 31, 2006, 2005, and 2004, respectively.
Gross Carrying Amount | Accumulated Amortization | Unamortized Intangible Assets | |||||
| (in thousands) | |||||||
Other intangible assets: | |||||||
Core deposit premium | $ | 3,281 | 2,716 | 565 | |||
Customer list intangible | $ | 786 | 223 | 563 | |||
Total | $ | 4,067 | 2,939 | 1,128 | |||
Projections of amortization expense are based on existing asset balances and the remaining useful lives. The following table shows the estimated future amortization expense for amortizing intangible assets for each of the years ended December 31:
Core Deposit Premium | Customer List Intangible | Totals | |||||
| (in thousands) | |||||||
2007 | $ | 155 | 97 | 252 | |||
2008 | 156 | 87 | 243 | ||||
2009 | 127 | 79 | 206 | ||||
2010 | 41 | 71 | 112 | ||||
2011 | 41 | 62 | 103 | ||||
Thereafter | 45 | 167 | 212 | ||||
F-18
Table of Contents
9. Deposits
The scheduled maturities of certificate of deposit accounts are as follows as of December 31, 2006:
| (in thousands) | |||
2007 | $ | 268,133 | |
2008 | 36,979 | ||
2009 | 16,224 | ||
2010 | 2,810 | ||
2011 | 1,184 | ||
Thereafter | 4,069 | ||
Total | $ | 329,399 | |
Time deposits in excess of $100,000 approximated $73,824,000 and $58,471,000 as of December 31, 2006 and 2005, respectively. Interest expense on such deposits for the years ended December 31, 2006, 2005, and 2004 was approximately $2,521,000, $1,486,000, and $1,009,000, respectively.
10. Federal Home Loan Bank Advances
At December 31, 2006 and 2005, Federal Home Loan Bank (FHLB) advances consisted of the following:
| 2006 | Weighted- Average interest rate | 2005 | Weighted- Average interest rate | ||||||||
| (in thousands) | |||||||||||
Maturity in year ending: | |||||||||||
2006 | — | — | 14,000 | 4.34 | % | ||||||
2007 | $ | 27,500 | 4.78 | % | 11,500 | 3.81 | |||||
2008 | 26,600 | 4.85 | 24,600 | 4.71 | |||||||
2009 | 22,700 | 4.86 | 14,700 | 4.57 | |||||||
2010 | 17,000 | 5.16 | 13,000 | 5.08 | |||||||
2011 | 5,000 | 5.02 | 5,000 | 5.02 | |||||||
Thereafter | 300 | 5.97 | 300 | 5.97 | |||||||
Total | $ | 99,100 | 4.90 | 83,100 | 4.58 | ||||||
Many of the advances listed above have call provisions which allow the FHLB to request that the advance be paid back or refinanced at the rates then being offered by the FHLB. As of December 31, 2006, the Company had advances from the FHLB with the following call features:
| Callable Quarterly in year 2007 | |||
Year of Maturity | (in thousands) | ||
2008 | $ | 2,000 | |
2009 | 500 | ||
2010 | 6,000 | ||
Total | $ | 8,500 | |
Advances from the FHLB are secured by stock in the FHLB. In addition, the Bank has agreed to maintain unencumbered additional security in the form of certain residential mortgage loans, certain commercial real estate loans, certain agricultural real estate loans, and certain investment securities totaling $213,521,000 and $175,127,000 as of December 31, 2006 and 2005, respectively.
F-19
Table of Contents
11. Notes Payable
The notes payable balance as of December 31, 2006, consists of $1,050,000 in advances on a revolving line of credit and $3,000,000 on a term note, both with Harris N.A. As of December 31, 2005, the notes payable balance consisted of $2,100,000 in advances on the revolving line and $4,000,000 on the term note. Both notes have a variable interest rate at 0.60 percent below the lender’s prime rate. Interest is payable quarterly. As of December 31, 2006, the interest rate on the notes payable was 7.65 percent. During 2006, the interest rate ranged from 6.65 percent to 7.65 percent. During 2005, the interest rate ranged from 4.95 percent to 6.65 percent. As of December 31, 2005, the interest rate on the notes payable was 6.65 percent. The weighted average interest paid on the notes payable for the years ended December 31, 2006, 2005, and 2004 was 7.63%, 5.83%, and 4.23%, respectively.
Both notes are secured by all of the common stock of the subsidiaries. The revolving line of credit has a maximum limit of $9,000,000 and matures April 30, 2007. The term note calls for semi-annual payments of $500,000 until maturity on November 30, 2009.
The Company was in compliance with all covenants of its loan agreement with Harris N.A. as of December 31, 2006.
12. Long-term Debt
On June 20, 2002, the Company obtained $10,310,000 in long-term subordinated debt from its participation in the issuance of a pooled trust preferred security. The trust preferred has a 30 year maturity, does not require any principal amortization and is callable in five years at par at the issuer’s option. The interest rate is variable based on the three month Libor rate plus 3.65 percent, with interest payable quarterly. During the year 2006, the interest rate ranged from 7.80 percent to 9.16 percent. As of December 31, 2006, the interest rate on the long-term subordinated debt was 9.16 percent. As of December 31, 2005, the interest rate was 7.80 percent. During the year 2005, the interest rate ranged from 5.72 percent to 7.80 percent. The weighted average interest paid on the trust preferred for the years ended December 31, 2006, 2005, and 2004 was 8.99%, 7.26%, and 5.32%, respectively.
F-20
Table of Contents
13. Fair Value of Financial Instruments
The fair value of the Company’s financial instruments as of December 31, 2006 and 2005, were as follows:
2006 | Carrying Value | Fair Value | |||
| (in thousands) | |||||
Financial assets: | |||||
Cash and due from banks | $ | 20,279 | 20,279 | ||
Interest-bearing deposits with banks | 447 | 447 | |||
Investment securities | 82,963 | 82,911 | |||
Loans, net | 498,139 | 493,944 | |||
Loan pool participations | 98,885 | 98,885 | |||
Cash surrender value of life insurance | 7,798 | 7,798 | |||
Accrued interest receivable | 6,587 | 6,587 | |||
Financial liabilities: | |||||
Deposits | $ | 560,615 | 560,669 | ||
Federal funds purchased | 465 | 465 | |||
Federal Home Loan Bank advances | 99,100 | 98,856 | |||
Notes payable | 4,050 | 4,050 | |||
Long-term debt | 10,310 | 10,310 | |||
Accrued interest payable | 2,804 | 2,804 | |||
2005 | Carrying Value | Fair Value | |||
| (in thousands) | |||||
Financial assets: | |||||
Cash and due from banks | $ | 13,103 | 13,103 | ||
Interest-bearing deposits with banks | 417 | 417 | |||
Investment securities | 87,492 | 87,431 | |||
Loans, net | 428,426 | 423,630 | |||
Loan pool participations | 103,570 | 103,570 | |||
Cash surrender value of life insurance | 7,523 | 7,523 | |||
Accrued interest receivable | 5,334 | 5,334 | |||
Financial liabilities: | |||||
Deposits | $ | 505,245 | 505,745 | ||
Federal funds purchased | 7,575 | 7,575 | |||
Federal Home Loan Band advances | 83,100 | 83,044 | |||
Notes payable | 6,100 | 6,100 | |||
Long-term debt | 10,310 | 10,310 | |||
Accrued interest payable | 1,672 | 1,672 | |||
The recorded amount of cash and due from banks, interest-bearing deposits with banks and accrued interest receivable and payable approximates fair value due to the short-term nature of these instruments.
The estimated fair value of investment securities has been determined using available quoted market prices.
Loans have been valued using a present value discounted cash flow with a discount rate approximating the current market rate for similar loans.
The recorded amount of the loan pool participations approximates fair value due to the characteristics of the loan pool participations. Any additional value attained in the loan pool participations over purchase cost is directly attributable to the expertise of the Servicer to collect a higher percentage of the contract value of loans in the pools over the discounted purchase price.
F-21
Table of Contents
Deposit liabilities with no stated maturities have an estimated fair value equal to the recorded balance. Deposits with stated maturities have been valued using a present value discounted cash flow with a discount rate approximating the current market rate for similar deposits. The fair value estimate does not include the benefit that results from the low-cost funding provided by the deposit liabilities compared to the cost of borrowing funds in the market. The Company believes the value of these depositor relationships to be significant.
The recorded amount of federal funds purchased approximates fair value due to the short-term nature of these instruments.
The estimated fair value of the Federal Home Loan Bank advances was determined using a present value discounted cash flow with a discount rate approximating the current market rate for similar borrowings.
The recorded amount of the notes payable approximates fair value as a result of the variable nature of these instruments.
The recorded amount of the long-term debt approximates fair value due to the variable nature of this instrument.
14. Income Taxes
Income tax expense (benefit) for the years ended December 31, 2006, 2005 and 2004, is as follows:
2006 | Federal | State | Total | |||||||
| (in thousands) | ||||||||||
Current | $ | 2,971 | 463 | 3,434 | ||||||
Deferred | (309 | ) | (32 | ) | (341 | ) | ||||
Total | $ | 2,662 | 431 | 3,093 | ||||||
2005 | Federal | State | Total | |||||||
| (in thousands) | ||||||||||
Current | $ | 3,017 | 446 | 3,463 | ||||||
Deferred | (325 | ) | (27 | ) | (352 | ) | ||||
Total | $ | 2,692 | 419 | 3,111 | ||||||
2004 | Federal | State | Total | |||||||
| (in thousands) | ||||||||||
Current | $ | 3,160 | 485 | 3,645 | ||||||
Deferred | (481 | ) | (86 | ) | (567 | ) | ||||
Total | $ | 2,679 | 399 | 3,078 | ||||||
Income tax expense differs from the amount computed by applying the United States federal income tax rate of 34 percent in 2006, 2005, and 2004, to income before income tax expense. The reasons for these differences are a follows:
| 2006 | 2005 | 2004 | ||||||||
| (in thousands) | ||||||||||
Provision at statutory rate | $ | 3,242 | 3,127 | 3,028 | ||||||
State franchise tax (net of federal tax benefit) | 285 | 276 | 263 | |||||||
Nontaxable interest income | (340 | ) | (267 | ) | (210 | ) | ||||
Life insurance cash value increase | (94 | ) | (113 | ) | (62 | ) | ||||
Other, net | — | 88 | 59 | |||||||
Total | $ | 3,093 | 3,111 | 3,078 | ||||||
F-22
Table of Contents
The tax effect of temporary differences that give rise to significant portions of the deferred tax assets and liabilities at December 31, 2006 and 2005, are as follows:
| 2006 | 2005 | ||||||
| (in thousands) | |||||||
Deferred tax assets: | |||||||
Allowance for loan losses | $ | 2,957 | 2,702 | ||||
Deferred compensation | 820 | 828 | |||||
Net operating loss | 1,426 | 1,226 | |||||
Unrealized loss on available for sale securities | 277 | 448 | |||||
Gross deferred tax assets | 5,480 | 5,204 | |||||
Deferred tax liabilities: | |||||||
Depreciation and amortization | (386 | ) | (579 | ) | |||
Federal Home Loan Bank stock | (109 | ) | (109 | ) | |||
Premium amortization | (727 | ) | (554 | ) | |||
Deferred loan fees | (8 | ) | (11 | ) | |||
Purchase accounting adjustments | (514 | ) | (595 | ) | |||
Prepaid expenses | (92 | ) | (70 | ) | |||
Other | (61 | ) | (73 | ) | |||
Gross deferred tax liabilities | (1,897 | ) | (1,991 | ) | |||
Valuation allowance | (1,426 | ) | (1,226 | ) | |||
Net deferred tax asset | $ | 2,157 | 1,987 | ||||
The Company has recorded a deferred tax asset for the future tax benefits of Iowa net operating loss carry forwards. The net operating loss carry forwards will expire, if not utilized, between 2007 and 2021. The Company has recorded a valuation allowance to reduce the net operating loss carry forwards. At December 31, 2006 and 2005, the Company believes it is more likely than not that the Iowa net operating loss carry forwards will not be realized. The increase in net operating loss carry forward in 2006 compared with 2005 reflects the additional Iowa income tax net operating loss generated during 2006 less any expiring carry forward. A valuation allowance related to the remaining deferred tax assets has not been provided because management believes it is more likely than not that the results of future operations will generate sufficient taxable income to realize the deferred tax assets.
15. Stock Incentive Plan
The Company adopted SFAS No. 123(R) “Share-Based Payment,” on January 1, 2006. SFAS No. 123(R) requires that the cost resulting from share-based awards be recognized in the financial statements. The Company is utilizing the “modified prospective” transition method to measure the cost of the awards over the remaining vesting period for those options that had been granted prior to January 1, 2006 and were not fully vested as of that date. The expense is based on the fair value determined at the grant date. Prior to the adoption of SFAS No. 123(R), the Company applied APB Opinion No. 25 and related interpretations in accounting for this plan. Accordingly, no compensation cost was recognized in the financial statements for the share-based payments granted prior to January 1, 2006. Results for periods prior to January 1, 2006 have not been restated.
The Company’s 1998 Stock Incentive Plan reserved up to 550,000 shares of stock for issuance pursuant to options or other awards which may be granted to officers, key employees and certain non-employee directors of the Company. The compensation committee of the Company’s board of directors determines the award of options. The exercise price of each option equals the market price of the Company’s stock on the date of grant. The options’ maximum term is ten years, with vesting occurring at the rate of thirty-three percent on the one-year anniversary of the date of grant, sixty-six percent vesting on the two-year anniversary, and one hundred percent vesting on the three-year anniversary of the date of grant. No awards were granted pursuant to the 1998 plan in
F-23
Table of Contents
2006. As of December 31, 2006, the Company had a total of 95,023 shares available for future grants under the 1998 Stock Incentive Plan.
The Company’s 2006 Stock Incentive Plan was approved at the annual meeting of shareholders on April 28, 2006. The 2006 Plan reserves up to 250,000 shares of common stock for issuance pursuant to options and restricted stock units which may be granted to officers and key employees of the Company as determined by the compensation committee of the board of directors. The plan also provides that each non-employee director of the Company be awarded 1,000 stock options as of the date of each annual meeting of shareholders of the Company. The exercise price of each option equals the market price of the Company’s stock on the date of grant. The options’ maximum term is ten years, with vesting occurring at the rate of thirty-three percent on the one-year anniversary of the date of grant, sixty-six percent vesting on the two-year anniversary, and on hundred percent vesting on the three-year anniversary of the date of grant. The plan also provides that 1,000 shares of restricted stock are awarded to existing non-employee directors of the Company upon the adoption of the plan. Any non-employee director subsequently elected to the board will be awarded 1,000 restricted shares of stock upon their initial election to the board of directors. The restricted stock units awarded to non-employee directors will vest thirty-three percent upon the first anniversary of the date of grant, an additional thirty-three percent upon the second anniversary of the date of grant and the remaining thirty-four percent upon the third-anniversary of the date of grant. Each portion of the restricted shares will not, however, be transferable until the third anniversary after such portion vests.
Upon adoption of the 2006 Stock Incentive Plan on April 28, 2006, the eight existing non-employee directors were awarded a total of 8,000 stock options at the exercise price of $19.07, which was the closing stock price on the date of grant. The fair value of each stock option of $2.64 was estimated on the date of the grant using the Black-Scholes model. The expected dividend yield of 3.92 percent was calculated based on the historical annual dividends paid by the Company and the average closing stock price for the sixty month-ends preceding the date of grant. Expected volatility of 16.9 percent was based on historical volatility of the Company’s stock price over the past five years preceding the date of grant. Historical experience was utilized to determine the expected life of the stock options, which is 5.2 years. The risk-free interest rate of 4.90 percent used was the rate on a five year Treasury bond as of the grant date. All inputs into the Black-Scholes model are estimates at the time of grant. Actual results in the future could differ from these estimates, however such results would not impact future reported income. Compensation expense related to the options awarded is based on the fair value of the options and is expensed on a straight-line basis over the three-year vesting period of the options. The following assumptions were used for the grants in 2006, 2005 and 2004:
| 2006 | 2005 | 2004 | |||||||
Assumptions: | |||||||||
Risk-free interest rate | 4.90 | % | 4.23 | % | 3.66 | % | |||
Expected option life | 5 | 5 | 5 | ||||||
Expected volatility | 16.90 | % | 20.80 | % | 25.80 | % | |||
Dividend yield | 3.92 | % | 4.28 | % | 4.94 | % |
As of December 31, 2006, the Company had $163,000 of total unrecognized compensation expense related to the unvested stock options. This expense is expected to be recognized over a weighted-average period of 18 months.
During the year 2006 a total of 68,469 options were exercised. The weighted-average exercise price of these options was $12.69 and the intrinsic value totaled $461,000.
F-24
Table of Contents
A summary of stock option activity is presented in the following table:
| 2006 | 2005 | 2004 | |||||||||||||
| Shares | Weighted- Average Exercise Price | Shares | Weighted- Average Exercise Price | Shares | Weighted- Average Exercise Price | ||||||||||
Balance at beginning of year | 571,732 | $ | 16.56 | 598,719 | $ | 15.80 | 573,453 | $ | 14.19 | ||||||
Granted | 8,000 | 19.07 | 62,523 | 17.56 | 106,502 | 20.30 | |||||||||
Exercised | 68,469 | 12.69 | 73,405 | 10.73 | 77,456 | 10.03 | |||||||||
Forfeited | 9,707 | 20.41 | 16,105 | 19.28 | 3,780 | 17.11 | |||||||||
Outstanding at end of year | 501,556 | $ | 17.05 | 571,732 | $ | 16.56 | 598,719 | $ | 15.80 | ||||||
Options exercisable at year end | 435,828 | $ | 16.75 | 440,179 | $ | 15.79 | 389,350 | $ | 14.15 | ||||||
Weighted-average fair value of options granted during the year | $ | 2.64 | $ | 2.53 | $ | 3.10 | |||||||||
As of December 31, 2006, exercisable stock options had a weighted-average remaining contractual term of 5.42 years, a weighted-average exercise price of $16.75 and an aggregate intrinsic value of $1,446,000.
In accordance with the provisions of the 2006 Stock Incentive Plan, the Company issued 1,000 restricted stock units to each of the non-employee directors of the Company as of the date of the adoption of the plan. A total of 8,000 restricted stock units were issued from shares held in treasury at the current market price of $19.07 per share. The vesting and terms of these restricted stock units are discussed previously in the description of the 2006 Stock Incentive Plan. The total share-based compensation amount related to the issuance of these restricted stock units was $153,000. This amount will be recognized as share-based compensation expense on a straight-line basis over the three years from the date of issuance to coincide with the vesting schedule of these restricted stock units. During 2006, share-based compensation expense of $34,000 related to the restricted stock units was recognized. Unrecognized compensation cost of the restricted stock units was $119,000 as of December 31, 2006 that will be recognized over the remaining twenty-eight months of the vesting period.
The compensation committee of the Company’s board of directors awarded 4,625 shares of restricted stock to officers of the Company as of the close of business December 29, 2006, pursuant to the 2006 Stock Incentive Plan. The award price was $19.94 per share based on the closing market price of the Company’s common stock on that date. The awards will vest ratably over a period of four years. Unrecognized compensation cost related to the 4,625 shares of restricted stock was $92,000 as of December 31, 2006. This amount will be recognized over the forty-eight months of the vesting period.
Information concerning the issuance of restricted stock units and restricted stock is presented in the following table:
| 2006 | |||||
| Number | Weighted- Average Grant-Date Fair Value | ||||
Balance at beginning of year | 0 | $ | — | ||
Granted | 12,625 | 19.39 | |||
Forfeited | 0 | — | |||
Outstanding at end of year | 12,625 | $ | 19.39 | ||
The grant of stock options and the award of restricted stock units and restricted stock utilized 20,625 shares in 2006. As of December 31, 2006, the Company had a total of 229,375 shares available for future grants under the 2006 Stock Incentive Plan.
F-25
Table of Contents
Total compensation expense recognized under share-based payment arrangements for the year ended December 31, 2006 was $259,000, with a related income tax benefit of $23,000.
The Company has a policy of utilizing treasury stock to satisfy share option exercises and the award of restricted stock units. As of December 31, 2006, the Company held 1,197,418 shares in treasury. The Company periodically repurchases shares on the open market for the treasury.
16. Employee Benefit Plans
The Company maintains an employee stock ownership plan (“ESOP”) covering substantially all employees meeting minimum age and service requirements. Contributions are determined by the board of directors of each subsidiary. Contributions relating to the plan were $247,000, $318,000, and $237,000 for 2006, 2005, and 2004, respectively. As of December 31, 2006 and 2005 the ESOP owned 484,190 and 513,549 shares of the Company’s common stock, respectively. The reduction in shares owned by the ESOP as of December 31, 2006 compared to December 31, 2005 reflects the distribution of shares to retiring and terminated employees during the year. The Company’s ESOP was leveraged until all debt was repaid on September 28, 2006. As of December 31, 2006, there was no outstanding debt related to the ESOP and there were no shares unallocated to the participants. The release of shares to be allocated to the participants was based on the proportionate reduction in principal paid during the period as a percentage of the principal amount of the debt as of the beginning of each year. As of December 31, 2005, the ESOP had 12,012 unallocated shares with a fair market value of $216,000. The amount of expense recognized on the allocation of shares to the participants was $125,000, $69,000 and 82,000 for the years ended December 31, 2006, 2005 and 2004, respectively.
The Company has a 401(k) plan for its employees whereby the Company matches 50 percent of employee contributions up to a maximum employee contribution of 6 percent of compensation. Contributions relating to the plan were $215,000 in 2006, $193,000 in 2005, and $189,000 in 2004.
The Company has also provided deferred compensation plans to certain executive officers, which provide for a series of payments to be made for a period of 10 or 15 years beginning at age 65. The present value of the future payments is being accrued over the respective employees remaining active service periods. The total expense related to these plans was $226,000, $321,000, and $161,000, for the years ended December 31, 2006, 2005, and 2004, respectively. The total deferred compensation liability was $1,860,000 and $1,670,000 as of December 31, 2006 and 2005, respectively.
F-26
Table of Contents
17. Regulatory Capital Requirements
The Company is subject to various capital requirements administered by the federal banking agencies. Failure to meet minimum capital requirements can initiate certain mandatory, and possible additional discretionary, actions by regulators that, if undertaken, could have a direct material effect on the Company’s financial statements. Under capital adequacy guidelines and the regulatory framework for prompt corrective action, the Company must meet specific capital guidelines that involve quantitative measures of the Company’s assets, liabilities and certain off-balance sheet items as calculated under regulatory accounting practices. The Company capital amounts and classifications are also subject to qualitative judgments by the regulators about components, risk weightings, and other factors. Quantitative measures established by regulation to ensure capital adequacy require the Company to maintain minimum amounts and ratios (set forth in the following table) of total capital and Tier 1 capital to risk-weighted assets and of Tier 1 capital to average assets. As of December 31, 2006 and 2005, the Company and its subsidiary bank(s) were well capitalized under the regulatory framework. The Company and its bank subsidiary(s) actual capital amounts and ratios are also presented in the following table.
| Actual | Minimum for Capital Adequacy Purposes | To Be Well Capitalized Under Prompt Corrective Action Provisions | ||||||||||||||||
| Amount | Ratio | Amount | Ratio | Amount | Ratio | |||||||||||||
| (in thousands) | ||||||||||||||||||
As of December 31, 2006: | ||||||||||||||||||
Total capital (to risk-weighted assets): | ||||||||||||||||||
Consolidated | $ | 66,113 | 11.3 | % | $ | 46,975 | 8.0 | % | N/A | N/A | ||||||||
MidWestOne Bank | 62,975 | 10.8 | 46,525 | 8.0 | $ | 58,157 | 10.0 | % | ||||||||||
Tier 1 capital (to risk-weighted assets): | ||||||||||||||||||
Consolidated | $ | 58,765 | 10.0 | % | $ | 23,487 | 4.0 | % | N/A | N/A | ||||||||
MidWestOne Bank | 55,697 | 9.6 | 23,263 | 4.0 | $ | 34,894 | 6.0 | % | ||||||||||
Tier 1 capital (to average assets): | ||||||||||||||||||
Consolidated | $ | 58,765 | 8.2 | % | $ | 21,404 | 3.0 | % | N/A | N/A | ||||||||
MidWestOne Bank | 55,697 | 7.9 | 21,228 | 3.0 | $ | 35,381 | 5.0 | % | ||||||||||
As of December 31, 2005: | ||||||||||||||||||
Total capital (to risk-weighted assets): | ||||||||||||||||||
Consolidated | $ | 61,197 | 11.6 | % | $ | 42,106 | 8.0 | % | N/A | N/A | ||||||||
MidWestOne Bank & Trust | 26,737 | 10.0 | 21,324 | 8.0 | $ | 26,655 | 10.0 | % | ||||||||||
Central Valley Bank | 11,239 | 11.9 | 7,567 | 8.0 | 9,458 | 10.0 | ||||||||||||
Pella State Bank | 6,121 | 12.7 | 3,871 | 8.0 | 4,838 | 10.0 | ||||||||||||
MidWestOne Bank | 15,606 | 13.7 | 9,117 | 8.0 | 11,396 | 10.0 | ||||||||||||
Tier 1 capital (to risk-weighted assets): | ||||||||||||||||||
Consolidated | $ | 54,618 | 10.4 | % | $ | 21,053 | 4.0 | % | N/A | N/A | ||||||||
MidWestOne Bank & Trust | 23,405 | 8.8 | 10,662 | 4.0 | $ | 15,993 | 6.0 | % | ||||||||||
Central Valley Bank | 10,057 | 10.6 | 3,783 | 4.0 | 5,675 | 6.0 | ||||||||||||
Pella State Bank | 5,516 | 11.4 | 1,935 | 4.0 | 2,903 | 6.0 | ||||||||||||
MidWestOne Bank | 14,247 | 12.5 | 4,559 | 4.0 | 6,838 | 6.0 | ||||||||||||
Tier 1 capital (to average assets): | ||||||||||||||||||
Consolidated | $ | 54,618 | 8.3 | % | $ | 19,784 | 3.0 | % | N/A | N/A | ||||||||
MidWestOne Bank & Trust | 23,405 | 8.0 | 8,764 | 3.0 | $ | 14,606 | 5.0 | % | ||||||||||
Central Valley Bank | 10,057 | 8.0 | 3,770 | 3.0 | 6,284 | 5.0 | ||||||||||||
Pella State Bank | 5,516 | 8.6 | 1,920 | 3.0 | 3,201 | 5.0 | ||||||||||||
MidWestOne Bank | 14,247 | 8.3 | 5,135 | 3.0 | 8,559 | 5.0 | ||||||||||||
18. Business Segments
The Company has determined that it currently operates in three business segments. The determination of business segments is based on the differences in products and services of the various segments. These segments
F-27
Table of Contents
are commercial banking, investment brokerage and insurance brokerage. The commercial banking segment’s products and services consist primarily of taking deposits and making loans to customers. This activity is conducted in a consistent manner in all locations. The investment brokerage activity consists of offering financial planning and consultation services and the retail brokerage of investment securities to clients. Insurance brokerage involves the issuance of property and casualty insurance policies and the processing of claims for clients.
The Company’s wholly-owned subsidiary bank(s), MidWestOne Bank & Trust (“MBT”), Central Valley Bank (“CVB”), Pella State Bank (“PSB”) and MidWestOne Bank (“MWB”), were previously identified as reportable operating segments in accordance with the provisions of SFAS No. 131, “Disclosures about Segments of an Enterprise and Related Information.” Effective January 1, 2006, the Company’s subsidiary banks were merged into one bank. The information related to commercial banking is now reported as one business segment. Investment brokerage and insurance brokerage segment activity does not meet the quantitative threshold criteria and is included in the “Other” category.
The following table sets forth certain information about the reported profit or loss and assets for each of the Company’s reportable segments.
| MWB | Other | Total | ||||||
| (in thousands) | ||||||||
At or for the year ended December 31, 2006: | ||||||||
Total interest income | $ | 46,383 | 71 | 46,454 | ||||
Total interest expense | 19,909 | 1,300 | 21,209 | |||||
Provision for loan losses | 180 | — | 180 | |||||
Total noninterest income | 4,270 | 1,658 | 5,928 | |||||
Other intangible asset amortization | 184 | 105 | 289 | |||||
Total other noninterest expense | 17,977 | 3,193 | 21,170 | |||||
Income tax expense (benefit) | 4,116 | (1,023 | ) | 3,093 | ||||
Net income (loss) | 8,287 | (1,846 | ) | 6,441 | ||||
Goodwill | 12,976 | 429 | 13,405 | |||||
Total assets | 737,936 | 6,975 | 744,911 | |||||
At or for the year ended December 31, 2005: | ||||||||
Total interest income | $ | 39,028 | 1,052 | 40,080 | ||||
Total interest expense | 14,094 | 1,332 | 15,426 | |||||
Provision for loan losses | 368 | 100 | 468 | |||||
Total noninterest income | 3,263 | 1,165 | 4,428 | |||||
Other intangible asset amortization | 219 | 86 | 305 | |||||
Total other noninterest expense | 15,604 | 3,506 | 19,110 | |||||
Income tax expense (benefit) | 4,065 | (954 | ) | 3,111 | ||||
Net income (loss) | 7,941 | (1,853 | ) | 6,088 | ||||
Goodwill | 12,976 | 429 | 13,405 | |||||
Total assets | 667,855 | 8,477 | 676,332 | |||||
At or for the year ended December 31, 2004: | ||||||||
Total interest income | $ | 36,722 | 650 | 37,372 | ||||
Total interest expense | 12,394 | 976 | 13,370 | |||||
Provision for loan losses | 852 | 6 | 858 | |||||
Total noninterest income | 3,836 | 440 | 4,276 | |||||
Other intangible asset amortization | 276 | 32 | 308 | |||||
Total other noninterest expense | 15,568 | 2,637 | 18,205 | |||||
Income tax expense (benefit) | 3,949 | (871 | ) | 3,078 | ||||
Net income (loss) | 7,519 | (1,690 | ) | 5,829 | ||||
F-28
Table of Contents
19. Dividend Restrictions
The Company derives a substantial portion of its cash flow, including that available for dividend payments to shareholders, from the Bank in the form of dividends received. The Bank is subject to certain statutory and regulatory restrictions that affect dividend payments. Based on minimum regulating guidelines as published by those regulators, the maximum dividends which could be paid by the Bank to the Company at December 31, 2006, without prior regulatory approval, approximated $8,577,000.
Under the terms of the Company’s notes payable, the Company is not allowed to pay dividends to its shareholders if it is in default (as defined by the loan agreement) or an event of default exists. The Company was not in default and no events of default existed as of December 31, 2006.
20. Commitments and Contingencies
The Company is a party to financial instruments with off-balance-sheet risk in the normal course of business to meet the financing needs of its customers, which include commitments to extend credit. The Company’s exposure to credit loss in the event of nonperformance by the other party to the commitments to extend credit is represented by the contractual amount of those instruments. The Company uses the same credit policies in making commitments as it does for on-balance-sheet instruments.
Commitments to extend credit are agreements to lend to a customer as long as there is no violation of any conditions established in the contract. Commitments generally have fixed expiration dates or other termination clauses and may require payment of a fee. Since many of the commitments are expected to expire without being drawn upon, the total commitment amounts do not necessarily represent future cash requirements. The Company evaluates each customer’s creditworthiness on a case-by-case basis. As of December 31, 2006 and 2005, outstanding commitments to extend credit totaled approximately $90,290,000 and $79,755,000, respectively.
The Company had commitments to sell mortgage loans on the secondary market totaling $580,000 and $433,000 as of December 31, 2006 and 2005, respectively.
Commitments under standby letters of credit outstanding aggregated $2,495,000 and $3,750,000 as of December 31, 2006 and 2005, respectively. The Company does not anticipate any losses as a result of these transactions.
Certain facilities are leased under operating leases. Rental expense was $115,000, $116,000, and $88,000 for the years ended December 31, 2006, 2005 and 2004, respectively. Future minimum rental commitments under noncancelable leases are as follows as of December 31, 2006:
Year ending December 31, | (in thousands) | ||
2007 | $ | 104 | |
2008 | 104 | ||
2009 | 105 | ||
2010 | 82 | ||
2011 | 29 | ||
Thereafter | 78 | ||
Total | $ | 502 | |
The Company is involved in various legal actions and proceedings arising from the normal course of operations. Management believes, based upon known facts and the advice of legal counsel, that the ultimate liability, if any, not covered by insurance, arising from all legal actions and proceedings will not have a material adverse effect upon the consolidated financial position of the Company.
F-29
Table of Contents
21. MidWestOne Financial Group (Parent Company Only)
Balance Sheets
| December 31 | |||||||
| 2006 | 2005 | ||||||
| (in thousands) | |||||||
Assets: | |||||||
Cash on deposit at bank subsidiary | $ | 1,786 | 924 | ||||
Cash at other institutions | 56 | 109 | |||||
Cash and cash equivalents | 1,842 | 1,033 | |||||
Investment equity securities | 761 | 772 | |||||
Loans | — | 168 | |||||
Investments in: | |||||||
Bank subsidiaries | 68,710 | 66,132 | |||||
Bank-related subsidiaries | 1,927 | 1,860 | |||||
Premises and equipment | 774 | 1,854 | |||||
Cash surrender value of life insurance | 3,399 | 3,701 | |||||
Other assets | 445 | 439 | |||||
Total assets | $ | 77,858 | 75,959 | ||||
Liabilities and Shareholders’ Equity: | |||||||
Notes payable | $ | 4,050 | 6,100 | ||||
Long-term debt | 10,310 | 10,310 | |||||
Accrued expenses payable and other liabilities | 965 | 1,163 | |||||
Total liabilities | 15,325 | 17,573 | |||||
Shareholders’ equity: | |||||||
Common stock | 24,564 | 24,564 | |||||
Capital surplus | 13,076 | 12,886 | |||||
Treasury stock at cost | (17,099 | ) | (16,951 | ) | |||
Retained earnings | 42,447 | 38,630 | |||||
Accumulated other comprehensive loss | (455 | ) | (743 | ) | |||
Total shareholders’ equity | 62,533 | 58,386 | |||||
Total liabilities and shareholders’ equity | $ | 77,858 | 75,959 | ||||
F-30
Table of Contents
Statements of Income
| Year ended December 31 | ||||||||||
| 2006 | 2005 | 2004 | ||||||||
| (in thousands) | ||||||||||
Income: | ||||||||||
Dividends from subsidiaries | $ | 6,000 | 6,200 | 5,700 | ||||||
Interest income and discount on loan pool participations | — | 996 | 590 | |||||||
Management, audit, and loan review fees | 285 | 2,077 | 1,868 | |||||||
Other operating income | 297 | 570 | 345 | |||||||
Total income | 6,582 | 9,843 | 8,503 | |||||||
Expense: | ||||||||||
Salaries and benefits expense | 1,315 | 2,515 | 2,309 | |||||||
Interest on notes payable | 373 | 583 | 428 | |||||||
Interest on long-term debt | 927 | 748 | 548 | |||||||
Other operating expense | 960 | 2,274 | 1,935 | |||||||
Total expense | 3,575 | 6,120 | 5,220 | |||||||
Income before income tax benefit and equity in undistributed earnings of subsidiaries | 3,007 | 3,723 | 3,283 | |||||||
Income tax benefit | (1,066 | ) | (842 | ) | (822 | ) | ||||
Income before equity in undistributed earnings of subsidiaries | 4,073 | 4,565 | 4,105 | |||||||
Equity in undistributed earnings of subsidiaries | 2,368 | 1,523 | 1,724 | |||||||
Net income | $ | 6,441 | 6,088 | 5,829 | ||||||
F-31
Table of Contents
Statements of Cash Flows
| Year ended December 31 | ||||||||||
| 2006 | 2005 | 2004 | ||||||||
| (in thousands) | ||||||||||
Cash flows from operating activities: | ||||||||||
Net income | $ | 6,441 | 6,088 | 5,829 | ||||||
Adjustments to reconcile net income to net cash provided by operating activities: | ||||||||||
Equity in undistributed earnings of subsidiaries | (2,368 | ) | (1,523 | ) | (1,724 | ) | ||||
Depreciation and amortization | 134 | 715 | 706 | |||||||
Investment securities gains | (1 | ) | (83 | ) | (2 | ) | ||||
Stock-based compensation | 259 | — | — | |||||||
Excess tax benefits related to stock options | (88 | ) | — | — | ||||||
Decrease (increase) in other assets | 296 | (165 | ) | (2,069 | ) | |||||
(Decrease) increase in other liabilities | (196 | ) | 336 | 196 | ||||||
Total adjustments | (1,964 | ) | (720 | ) | (2,893 | ) | ||||
Net cash provided by operating activities | 4,477 | 5,368 | 2,936 | |||||||
Cash flows from investing activities: | ||||||||||
Proceeds from investment securities sales | 8 | 123 | 17 | |||||||
Proceeds from investment securities maturities | — | — | 65 | |||||||
Net decrease in loans | 168 | 138 | 129 | |||||||
Purchases of loan pool participations | — | — | (646 | ) | ||||||
Principal recovery on sales of loan pool participations | — | 2,115 | 142 | |||||||
Principal recovery on loan pool participations | — | 1,308 | 2,403 | |||||||
Purchases of bank premises and equipment | (4 | ) | (123 | ) | (954 | ) | ||||
Proceeds from sale of bank premises and equipment | 950 | — | — | |||||||
Cash paid for the purchase of KCI | — | — | (450 | ) | ||||||
Cash paid for the purchase of Cook | — | (830 | ) | — | ||||||
Advances for bank-related subsidiary equity | — | (380 | ) | (236 | ) | |||||
Repayment of bank-related subsidiary equity | 13 | 135 | 108 | |||||||
Net cash provided by investing activities | 1,135 | 2,486 | 578 | |||||||
Cash flows from financing activities: | ||||||||||
Advances on notes payable | 450 | 2,600 | 2,200 | |||||||
Principal payments on notes payable | (2,500 | ) | (6,200 | ) | (1,500 | ) | ||||
Excess tax benefits related to stock options | 88 | — | — | |||||||
Dividends paid | (2,624 | ) | (2,543 | ) | (2,576 | ) | ||||
Purchases of treasury stock | (1,298 | ) | (2,374 | ) | (2,144 | ) | ||||
Proceeds from stock options exercised | 956 | 842 | 876 | |||||||
ESOP shares allocated | 125 | 69 | 82 | |||||||
Net cash used in financing activities | (4,803 | ) | (7,606 | ) | (3,062 | ) | ||||
Net increase in cash and cash equivalents | 809 | 248 | 452 | |||||||
Cash and cash equivalents at beginning of year | 1,033 | 785 | 333 | |||||||
Cash and cash equivalents at end of year | $ | 1,842 | 1,033 | 785 | ||||||
Supplemental disclosure of cash flow information: | ||||||||||
Acquisitions: | ||||||||||
Treasury stock reissued for the purchase of KCI | $ | — | — | 115 | ||||||
Treasury stock reissued for the purchase of Cook | $ | — | 82 | — | ||||||
F-32
Table of Contents
22. Quarterly Results of Operations
| Quarter Ended | ||||||||||||
| December | September | June | March | |||||||||
| (in thousands, except per share amounts) | ||||||||||||
2006: | ||||||||||||
Interest income | $ | 12,036 | 11,926 | 11,214 | 11,278 | |||||||
Interest expense | 6,075 | 5,630 | 5,016 | 4,488 | ||||||||
Net interest income | 5,961 | 6,296 | 6,198 | 6,790 | ||||||||
Provision for loan losses | 90 | 90 | — | — | ||||||||
Noninterest income | 1,561 | 1,326 | 1,602 | 1,439 | ||||||||
Noninterest expense | 5,420 | 5,390 | 5,315 | 5,334 | ||||||||
Income before income taxes | 2,012 | 2,142 | 2,485 | 2,895 | ||||||||
Income taxes | 591 | 696 | 830 | 976 | ||||||||
Net income | $ | 1,421 | 1,446 | 1,655 | 1,919 | |||||||
Net income per share—basic | $ | 0.39 | $ | 0.40 | $ | 0.44 | $ | 0.52 | ||||
Net income per share—diluted | $ | 0.38 | $ | 0.38 | $ | 0.44 | $ | 0.51 | ||||
2005: | ||||||||||||
Interest income | 10,630 | 9,692 | 9,990 | $ | 9,768 | |||||||
Interest expense | 4,378 | 3,954 | 3,615 | 3,479 | ||||||||
Net interest income | 6,252 | 5,738 | 6,375 | 6,289 | ||||||||
Provision for loan losses | 93 | 76 | 108 | 191 | ||||||||
Noninterest income | 1,187 | 1,156 | 1,091 | 994 | ||||||||
Noninterest expense | 4,869 | 5,047 | 5,049 | 4,450 | ||||||||
Income before income taxes | 2,477 | 1,771 | 2,309 | 2,642 | ||||||||
Income taxes | 831 | 590 | 778 | 912 | ||||||||
Net income | 1,646 | 1,181 | 1,531 | $ | 1,730 | |||||||
Net income per share—basic | $ | 0.45 | $ | 0.31 | $ | 0.41 | $ | 0.46 | ||||
Net income per share—diluted | $ | 0.43 | $ | 0.31 | $ | 0.40 | $ | 0.45 | ||||
F-33
Table of Contents
The Board of Directors
MidWestOne Financial Group, Inc.:
We have audited the accompanying consolidated balance sheets of MidWestOne Financial Group, Inc. and subsidiaries (the “Company”) as of December 31, 2006 and 2005, and the related consolidated statements of income, changes in shareholders’ equity and comprehensive income, and cash flows for each of the years in the three-year period ended December 31, 2006. These consolidated financial statements are the responsibility of the Company’s management. Our responsibility is to express an opinion on these consolidated financial statements based on our audits.
We conducted our audits in accordance with the standards of the Public Company Accounting Oversight Board (United States). Those standards require that we plan and perform the audit to obtain reasonable assurance about whether the financial statements are free of material misstatement. An audit includes examining, on a test basis, evidence supporting the amounts and disclosures in the financial statements. An audit also includes assessing the accounting principles used and significant estimates made by management, as well as evaluating the overall financial statement presentation. We believe that our audits provide a reasonable basis for our opinion.
In our opinion, the consolidated financial statements referred to above present fairly, in all material respects, the financial position of MidWestOne Financial Group, Inc. and subsidiaries as of December 31, 2006 and 2005, and the results of their operations and their cash flows for each of the years in the three-year period ended December 31, 2006, in conformity with U.S. generally accepted accounting principles.
As discussed in Notes 1 and 15 to the consolidated financial statements, effective January 1, 2006, the Company changed its method of accounting for stock-based compensation.

KPMG LLP
Des Moines, Iowa
March 23, 2007
F-34